UNITED STATES
SECURITIES AND EXCHANGE COMMISSION
Washington, D.C. 20549
FORM N-CSR
CERTIFIED SHAREHOLDER REPORT
OF
REGISTERED MANAGEMENT INVESTMENT COMPANIES
Investment Company Act file number: 811-4526
Name of Registrant: Vanguard Quantitative Funds
Address of Registrant:
P.O. Box 2600
Valley Forge, PA 19482
Name and address of agent for service:
Heidi Stam, Esquire
P.O. Box 876
Valley Forge, PA 19482
Registrant’s telephone number, including area code: (610) 669-1000
Date of fiscal year end: September 30
Date of reporting period: October 1, 2009 – March 31, 2010
Item 1: Reports to Shareholders
 |
| Vanguard Growth and Income Fund |
| Semiannual Report |
|
| March 31, 2010 |
|
 |
> Vanguard Growth and Income Fund returned almost 12%, about one percentage point ahead of the peer-group average.
> The fund more or less matched the return of the S&P 500 Index, a benchmark it seeks to outperform, as pockets of strength were neutralized by patches of weakness.
> Signs that the nascent economic recovery was sustainable buoyed investor spirits.
| Contents | |
| Your Fund’s Total Returns. | 1 |
| Chairman’s Letter. | 2 |
| Advisor’s Report. | 6 |
| Fund Profile. | 9 |
| Performance Summary. | 10 |
| Financial Statements. | 11 |
| About Your Fund’s Expenses. | 22 |
| Glossary. | 24 |
Please note: The opinions expressed in this report are just that—informed opinions. They should not be considered promises or advice. Also, please keep in mind that the information and opinions cover the period through the date on the front of this report. Of course, the risks of investing in your fund are spelled out in the prospectus.
See the Glossary for definitions of investment terms used in this report.
Cover photograph: Veronica Coia.
| |
| Your Fund’s Total Returns | |
| |
| |
| |
| |
| Six Months Ended March 31, 2010 | |
| | Total |
| | Returns |
| Vanguard Growth and Income Fund | |
| Investor Shares | 11.71% |
| Admiral™ Shares | 11.77 |
| S&P 500 Index | 11.75 |
| Large-Cap Core Funds Average | 10.80 |
| Large-Cap Core Funds Average: Derived from data provided by Lipper Inc. | |
Admiral Shares are a lower-cost class of shares available to many longtime shareholders and to those with significant investments in the fund.
| | | | |
| Your Fund’s Performance at a Glance | | | | |
| September 30, 2009 , Through March 31, 2010 | | | | |
| | | | Distributions Per Share |
| | Starting | Ending | Income | Capital |
| | Share Price | Share Price | Dividends | Gains |
| Vanguard Growth and Income Fund | | | | |
| Investor Shares | $22.34 | $24.73 | $0.216 | $0.000 |
| Admiral Shares | 36.48 | 40.38 | 0.377 | 0.000 |
1

Chairman’s Letter
Dear Shareholder,
During the past six months, the broad U.S. stock market generated a double-digit gain as investors became increasingly optimistic about the strength of the economic recovery. Vanguard Growth and Income Fund’s Investor Shares returned 11.71%; its lower-cost Admiral Shares returned 11.77%.
The fund’s return was superior to the average return of its peer group, and in line with that of the S&P 500 Index. Market-beating stock selections in a handful of sectors were neutralized by weakness elsewhere.
Stock market rally continued despite a few minor setbacks
After a steep but short-lived decline, stocks resumed their uphill trek in February. The broad U.S. stock market ended the six-month period up about 12%. Since stocks began their historic recovery in March just over a year ago, U.S. equities have risen more than 70%.
During the six months, small-capitalization companies outperformed larger-cap companies, while growth stocks trumped their value counterparts, though the differences weren’t all that significant.
2
Foreign stocks didn’t fare as well as domestic stocks, but still ended the period on a positive note. Investors’ concerns about Greece’s creditworthiness, as well as that of economies such as Spain and Portugal, weighed on the European markets. In Asia, possible changes to China’s monetary policies and weakness in the Japanese market hindered the region’s results. Emerging-market stocks, which made a quick and substantial recovery from the global financial crisis, continued to outperform developed-market stocks.
Investors still favored riskier bond options
The broad U.S. taxable bond market returned about 2% for the period, as investors continued to prefer higher-risk corporate bonds over government issues. The broad municipal bond market returned 0.28%. The yields of longer-term U.S. Treasury bonds rose during the six months, while those of the shortest-term securities remained near 0%.
The Federal Reserve Board has kept its target for short-term interest rates unchanged at 0% to 0.25% since December 2008 and has said that it expects to maintain that rate for “an extended period.” In late February, Fed Chairman Ben Bernanke said that low interest rates were still necessary to help the economy recover, but that the central bank would be ready to tighten credit “at the appropriate time.” The Fed has, however, begun to wind down credit programs established during the financial crisis.
| | | |
| Market Barometer | | | |
| |
| | | | Total Returns |
| | | Periods Ended March 31, 2010 |
| | Six | One | Five Years |
| | Months | Year | (Annualized) |
| Stocks | | | |
| Russell 1000 Index (Large-caps) | 12.11% | 51.60% | 2.31% |
| Russell 2000 Index (Small-caps) | 13.07 | 62.76 | 3.36 |
| Dow Jones U.S. Total Stock Market Index | 12.48 | 52.88 | 2.82 |
| MSCI All Country World Index ex USA (International) | 5.51 | 61.67 | 6.59 |
| |
| Bonds | | | |
| Barclays Capital U.S. Aggregate Bond Index (Broad | | | |
| taxable market) | 1.99% | 7.69% | 5.44% |
| Barclays Capital Municipal Bond Index | 0.28 | 9.69 | 4.58 |
| Citigroup Three-Month U.S. Treasury Bill Index | 0.05 | 0.13 | 2.76 |
| |
| CPI | | | |
| Consumer Price Index | 0.77% | 2.31% | 2.40% |
3
Strengths and weaknesses produced index-like performance
Although a double-digit gain is gratifying in absolute terms, Vanguard Growth and Income Fund’s six-month relative performance can best be described as acceptable. The fund’s advisor, Mellon Capital Management, relies on quantitative stock-selection models in its attempt to capture the risk characteristics of the S&P 500 Index but outperform the unmanaged benchmark by buying the most—and avoiding the least—attractive stocks in each sector. During the past six months, the fund’s return more or less matched that of the index.
The advisor’s models identified a number of superior performers in the consumer staples and health care sectors. While the index’s consumer staples stocks returned about 11%, the fund’s holdings returned almost 17%. The materials sector was another notable strength. The advisor’s selections returned 14%, about four percentage points more than the index’s materials stocks.
The fund surrendered most of its edge over the index with subpar selections in the industrial, utilities, financial, and telecommunication services sectors. For example, industrial stocks generated surprisingly strong returns as the economy
| | | |
| Expense Ratios | | | |
| Your Fund Compared With Its Peer Group | | | |
| | Investor | Admiral | Peer Group |
| | Shares | Shares | Average |
| Growth and Income Fund | 0.35% | 0.21% | 1.27% |
The fund expense ratios shown are from the prospectus dated January 27, 2010, and represent estimated costs for the current fiscal year based on the fund’s net assets as of the prospectus date. For the six months ended March 31, 2010, the fund’s annualized expense ratios were 0.33% for Investor Shares and 0.18% for Admiral Shares. The peer-group expense ratio is derived from data provided by Lipper Inc. and captures information through year-end 2009.
Peer group: Large-Cap Core Funds.
4
ground into gear and idled factories came back on line, boosting the stock prices of railroads and machinery makers. The index’s industrial stocks returned 19%. Vanguard Growth and Income Fund’s industrial holdings, by contrast, finished the period with a return of about 15%.
The net result of the fund’s strengths and weaknesses was a very strong absolute return, but no clear advantage over the index.
A useful role in a well-diversified portfolio
One of our responsibilities at Vanguard is to carefully monitor a fund’s performance and report to you on the reasons for its successes or shortfalls. At the same time, we’re careful to remember that it’s unwise to make too much of short-term results. Vanguard Growth and Income Fund has delivered unspectacular returns during the past few years of financial upheaval, generally falling short of its benchmark index.
Nevertheless, our long experience with the fund’s advisor and its disciplined approach to security selection give us confidence in its ability to build a portfolio that can earn index-beating returns without taking on excessive risk. Combined with other low-cost stock and bond funds, in proportions consistent with your unique circumstances, Vanguard Growth and Income Fund can play a useful role in helping you meet your long-term financial goals.
On another matter, I would like to inform you that as of January 1, 2010, we completed a leadership transition that began in March 2008. I succeeded Jack Brennan as chairman of Vanguard and each of the funds. Jack has agreed to serve as chairman emeritus and senior advisor. Under Jack’s leadership, Vanguard has grown to become a preeminent firm in the mutual fund industry. Jack’s energy, his relentless pursuit of perfection, and his unwavering focus on always doing the right thing for our clients are evident in every facet of Vanguard policy today.
Thank you for entrusting your assets to Vanguard.
Sincerely,

F. William McNabb III
Chairman and Chief Executive Officer
April 16, 2010
5
Advisor’s Report
Vanguard Growth and Income Fund’s Investor Shares returned 11.71% for the six months ended March 31. The Admiral Shares returned 11.77%. The S&P 500 Index returned 11.75%, while the average return of large-cap core funds was 10.80%.
Significant market gains over the period
The S&P 500 Index has risen more than 75% from its low in March 2009 amid increasing confidence in the sustainability of the economic recovery. Although the government has wound down several market support programs in the past two quarters, economic signals have continued to show improvement. Corporate earnings have also improved, initially on margin improvement because of cost controls and more recently also because of revenue gains.
As the fourth quarter of 2009 began, the S&P 500 initially fell because of concerns about the sustainability of the recovery and about a “double dip” recession. Outside of the areas most directly affected by the government stimulus efforts, there was considerable uncertainty regarding near-term economic prospects. U.S. unemployment continued to rise, exceeding the 10% mark in October. However, as companies began to rebuild inventories and as expectations improved for corporate earnings, markets gained in November and December.
At the start of the year, gains continued amid good economic news, particularly in the manufacturing sector. Then, from mid-January to mid-February, the markets declined as investors became concerned about several global economic issues. China’s tightening of its monetary policy and the fiscal health of Greece were of particular concern. However, the rally resumed in late February and March, as the economy showed continued improvement, merger-and-acquisition activity picked up, and corporate earnings expectations rose.
Fund performance was in line with that of the S&P 500 benchmark
The fund performed in line with the S&P 500 Index over the period, underperforming it slightly during the fourth quarter and outperforming in the first quarter of 2010. In aggregate, the fund’s performance was not affected significantly either by differences in sector weightings relative to the benchmark or by stock selection within sectors, as our stock picks in some areas outperformed the benchmark and in other areas lagged the benchmark.
The tenor of the U.S. equity market was more favorable to our stock selection process in the last six months than it was earlier in 2009. Our investment process seeks stocks with strong business and price momentum at attractive valuations that we believe can sustain that earnings
6
momentum. Particularly in the first quarter of 2010, the market began rewarding companies with positive earnings expectations, after rewarding stocks for which earnings momentum had not yet materialized through the beginning part of the rally that started in March 2009.
Stock selection was strongest in the health care and consumer staples sectors. In consumer staples, the fund benefited from an overweight position in Coca-Cola Enterprises, which soared in late February after announcing the sale of its North American bottling operations to Coca Cola. The fund held an overweight position in Tyson Foods, which reported strong fourth-quarter earnings, announced higher expected margins, and rose sharply.
Among health care stocks, Merck KGaA, a German company, announced its acquisition of Millipore, a supplier of tools and technology to the life sciences research industry that gained more than 50% during the reporting period. Other strong performers in the sector were Cardinal Health, a drug distributor, and Stryker, a maker of orthopedic replacements.
Stock selection was less favorable within the industrials and technology sectors. Qualcomm, the telecom chipset producer, fell sharply in late January when it scaled back its sales forecasts. Disk drive manufacturer Western Digital reported strong fourth-quarter earnings, but underperformed the sector on concerns that margins had peaked. Within industrials, the fund did not own Boeing, which performed well as the long-delayed 787 plane appeared to come closer to launch. Genuine Parts, a replacement parts distributor that is no longer in the portfolio, underperformed its peers in the industry.
The fund’s positioning and risk controls
Over the past six months, we have made a number of significant enhancements to our stock selection model. We have implemented new research and also synthesized many of our best ideas with those of our new colleagues at Mellon Capital Management, our recent merger partner. We continue to emphasize the same three primary attributes of attractive valuation, favorable momentum, and the sustainability and quality of earnings, and we have been able to improve and further diversify the stock selection metrics we employ. For example, our estimate of earnings quality now incorporates a significantly expanded set of financial statement measures, broadening our ability to assess forward-looking earnings potential. We are enthusiastic about continuing process enhancements.
In 2009, we were particularly watchful of market volatility and uncertainty, and strictly limited differences in industry and sector positions relative to the S&P 500.
7
The fund’s weighting in financials, in particular, closely tracked the sector’s weighting in the benchmark. In response to continuing difficulties in credit markets, we also ensured that the fund did not become overweighted in companies with higher levels of leverage than their industry norms. More recently, as market volatility has declined, we have returned our risk control protocols to normal. And, as markets have again begun to reward fundamentals, we have seen the fund’s performance improve. We believe that the Growth and Income Fund is well positioned in the current environment.
Oliver E. Buckley,
Executive Vice President and Chief Investment Officer,
Active Equity Strategies
Mellon Capital Management Corp.
April 20, 2010
8
Growth and Income Fund
Fund Profile
As of March 31, 2010
| | |
| Share-Class Characteristics | |
| | Investor | Admiral |
| | Shares | Shares |
| Ticker Symbol | VQNPX | VGIAX |
| Expense Ratio1 | 0.35% | 0.21% |
| 30-Day SEC | | |
| Yield | 1.44% | 1.59% |
| | | |
| Portfolio Characteristics | | |
| | | | DJ |
| | | | U.S. Total |
| | | S&P 500 | Market |
| | Fund | Index | Index |
| Number of Stocks | 137 | 500 | 4,159 |
| Median Market Cap | $39.6B | $48.2B | $31.4B |
| Price/Earnings Ratio | 16.8x | 20.9x | 23.0x |
| Price/Book Ratio | 2.2x | 2.2x | 2.2x |
| Return on Equity | 21.4% | 20.6% | 19.1% |
| Earnings Growth Rate | 11.3% | 6.8% | 6.9% |
| Dividend Yield | 1.9% | 1.9% | 1.7% |
| Foreign Holdings | 0.0% | 0.0% | 0.0% |
| Turnover Rate | | | |
| (Annualized) | 90% | — | — |
| Short-Term Reserves | 0.0% | — | — |
| | | |
| Sector Diversification (% of equity exposure) |
| | | | DJ |
| | | | U.S. Total |
| | | S&P 500 | Market |
| | Fund | Index | Index |
| Consumer | | | |
| Discretionary | 9.7% | 10.1% | 11.0% |
| Consumer Staples | 10.4 | 11.3 | 9.8 |
| Energy | 10.4 | 10.9 | 10.0 |
| Financials | 16.6 | 16.5 | 17.3 |
| Health Care | 13.5 | 12.1 | 12.4 |
| Industrials | 9.2 | 10.5 | 10.9 |
| Information | | | |
| Technology | 20.3 | 18.9 | 18.5 |
| Materials | 3.1 | 3.5 | 4.0 |
| Telecommunication | | | |
| Services | 3.2 | 2.8 | 2.6 |
| Utilities | 3.6 | 3.4 | 3.5 |
| | |
| Volatility Measures | | |
| | | DJ |
| | | U.S. Total |
| | S&P 500 | Market |
| | Index | Index |
| R-Squared | 0.99 | 0.99 |
| Beta | 1.02 | 0.99 |
These measures show the degree and timing of the fund’s fluctuations compared with the indexes over 36 months.
| | |
| Ten Largest Holdings (% of total net assets) |
| Exxon Mobil Corp. | Integrated Oil & | |
| | Gas | 3.2% |
| Microsoft Corp. | Systems Software | 2.7 |
| Johnson & Johnson | Pharmaceuticals | 2.7 |
| International Business | Computer | |
| Machines Corp. | Hardware | 2.7 |
| Apple Inc. | Computer | |
| | Hardware | 2.6 |
| JPMorgan Chase & Co. | Diversified Financial | |
| | Services | 2.5 |
| AT&T Inc. | Integrated | |
| | Telecommunication | |
| | Services | 2.4 |
| Procter & Gamble Co. | Household | |
| | Products | 2.1 |
| Pfizer Inc. | Pharmaceuticals | 2.1 |
| Goldman Sachs Group | Investment Banking | |
| Inc. | & Brokerage | 1.9 |
| Top Ten | | 24.9% |
The holdings listed exclude any temporary cash investments and equity index products.
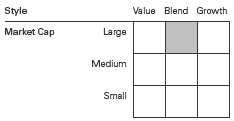
Investment Focus
1 The expense ratios shown are from the prospectus dated January 27, 2010, and represent estimated costs for the current fiscal year based on the fund’s net assets as of the prospectus date. For the six months ended March 31, 2010, the annualized expense ratios were 0.33% for Investor Shares and 0.18% for Admiral Shares.
9
Growth and Income Fund
Performance Summary
All of the returns in this report represent past performance, which is not a guarantee of future results that may be achieved by the fund. (Current performance may be lower or higher than the performance data cited. For performance data current to the most recent month-end, visit our website at www.vanguard.com/performance.) Note, too, that both investment returns and principal value can fluctuate widely, so an investor’s shares, when sold, could be worth more or less than their original cost. The returns shown do not reflect taxes that a shareholder would pay on fund distributions or on the sale of fund shares.
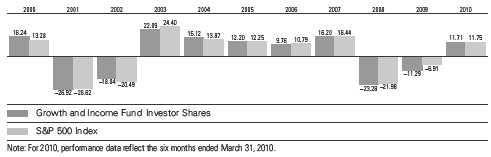
Fiscal-Year Total Returns (%): September 30, 1999, Through March 31, 2010
| | | | |
| Average Annual Total Returns: Periods Ended March 31, 2010 | | | |
| |
| | Inception | One | Five | Ten |
| | Date | Year | Years | Years |
| Investor Shares | 12/10/1986 | 47.20% | 0.21% | -1.01% |
| Admiral Shares | 5/14/2001 | 47.43 | 0.36 | 0.691 |
| 1 Return since inception. | | | | |
Vanguard fund total returns do not include any transaction or account fees that applied in the periods shown. Fund prospectuses provide
information about current fees.
See Financial Highlights for dividend and capital gains information.
10
Growth and Income Fund
Financial Statements (unaudited)
Statement of Net Assets
As of March 31, 2010
The fund reports a complete list of its holdings in regulatory filings four times in each fiscal year, at the quarter-ends. For the second and fourth fiscal quarters, the lists appear in the fund’s semiannual and annual reports to shareholders. For the first and third fiscal quarters, the fund files the lists with the Securities and Exchange Commission on Form N-Q. Shareholders can look up the fund’s Forms N-Q on the SEC’s website at www.sec.gov. Forms N-Q may also be reviewed and copied at the SEC’s Public Reference Room (see the back cover of this report for further information).
| | | |
| | | | Market |
| | | | Value• |
| | | Shares | ($000) |
| Common Stocks (99.0%)1 | | |
| Consumer Discretionary (9.6%) | |
| | Comcast Corp. Class A | 3,261,700 | 61,385 |
| | Target Corp. | 953,500 | 50,154 |
| | TJX Cos. Inc. | 1,085,300 | 46,147 |
| | Time Warner Inc. | 1,412,100 | 44,156 |
| * | Viacom Inc. Class B | 1,162,600 | 39,970 |
| | Wyndham | | |
| | Worldwide Corp. | 1,538,300 | 39,581 |
| | Mattel Inc. | 1,689,300 | 38,415 |
| * | Starbucks Corp. | 1,400,100 | 33,980 |
| | Gap Inc. | 1,407,700 | 32,532 |
| * | AutoNation Inc. | 1,139,600 | 20,604 |
| | Sherwin-Williams Co. | 153,700 | 10,402 |
| * | Amazon.com Inc. | 65,900 | 8,945 |
| | Time Warner Cable Inc. | 139,866 | 7,456 |
| * | Bed Bath & Beyond Inc. | 137,400 | 6,013 |
| * | Kohl’s Corp. | 105,300 | 5,768 |
| | Omnicom Group Inc. | 148,300 | 5,756 |
| | | | 451,264 |
| Consumer Staples (10.3%) | | |
| | Procter & Gamble Co. | 1,575,400 | 99,676 |
| | Philip Morris | | |
| | International Inc. | 1,174,500 | 61,262 |
| | Walgreen Co. | 1,591,400 | 59,025 |
| | Kimberly-Clark Corp. | 733,700 | 46,135 |
| | PepsiCo Inc. | 694,300 | 45,935 |
| | Hormel Foods Corp. | 920,600 | 38,674 |
| | Wal-Mart Stores Inc. | 685,200 | 38,097 |
| | Tyson Foods Inc. Class A | 1,035,600 | 19,832 |
| | Coca-Cola Enterprises Inc. | 582,800 | 16,120 |
| | Safeway Inc. | 506,200 | 12,584 |
| | ConAgra Foods Inc. | 450,100 | 11,284 |
| | Coca-Cola Co. | 182,100 | 10,016 |
| | Kraft Foods Inc. | 248,700 | 7,521 |
| | Lorillard Inc. | 90,900 | 6,839 |
| | Hershey Co. | 146,000 | 6,250 |
| | Molson Coors Brewing Co. | | |
| | Class B | 118,200 | 4,971 |
| | | | 484,221 |
| | | |
| | | | Market |
| | | | Value• |
| | | Shares | ($000) |
| Energy (10.3%) | | |
| | Exxon Mobil Corp. | 2,216,636 | 148,470 |
| | Chevron Corp. | 965,000 | 73,176 |
| | Williams Cos. Inc. | 1,966,400 | 45,424 |
| | National Oilwell Varco Inc. | 1,095,900 | 44,472 |
| | Pioneer Natural | | |
| | Resources Co. | 635,700 | 35,803 |
| | Apache Corp. | 280,600 | 28,481 |
| | Occidental Petroleum Corp. | 310,700 | 26,266 |
| | Peabody Energy Corp. | 516,800 | 23,618 |
| | XTO Energy Inc. | 442,100 | 20,858 |
| | Spectra Energy Corp. | 738,600 | 16,641 |
| | Chesapeake Energy Corp. | 416,000 | 9,834 |
| * | FMC Technologies Inc. | 151,900 | 9,817 |
| | | | 482,860 |
| Financials (16.4%) | | |
| | JPMorgan Chase & Co. | 2,658,900 | 118,986 |
| | Goldman Sachs Group Inc. | 522,600 | 89,171 |
| | American Express Co. | 1,691,500 | 69,791 |
| | Wells Fargo & Co. | 1,996,800 | 62,140 |
| | Prudential Financial Inc. | 886,200 | 53,615 |
| | Travelers Cos. Inc. | 992,300 | 53,525 |
| | Unum Group | 1,699,500 | 42,097 |
| | Bank of America Corp. | 2,192,899 | 39,143 |
| | Hudson City Bancorp Inc. | 2,590,100 | 36,676 |
| | Franklin Resources Inc. | 273,300 | 30,309 |
| | Northern Trust Corp. | 530,500 | 29,315 |
| | Loews Corp. | 672,600 | 25,075 |
| | Fifth Third Bancorp | 1,405,700 | 19,103 |
| | Chubb Corp. | 349,400 | 18,116 |
| | Ameriprise Financial Inc. | 359,200 | 16,293 |
| * | First Horizon National Corp. | 995,100 | 13,981 |
| | XL Capital Ltd. Class A | 655,000 | 12,380 |
| | Principal Financial Group Inc. | 377,600 | 11,030 |
| * | Berkshire Hathaway Inc. | | |
| | Class B | 113,800 | 9,249 |
| | Public Storage | 71,200 | 6,550 |
| | HCP Inc. | 186,800 | 6,164 |
| | State Street Corp. | 132,900 | 5,999 |
| | | | 768,708 |
11
| | | |
| Growth and Income Fund | | |
| |
| |
| |
| | | | Market |
| | | | Value• |
| | | Shares | ($000) |
| Health Care (13.4%) | | |
| | Johnson & Johnson | 1,912,300 | 124,682 |
| | Pfizer Inc. | 5,619,421 | 96,373 |
| * | Amgen Inc. | 1,128,100 | 67,415 |
| | Bristol-Myers Squibb Co. | 2,078,892 | 55,506 |
| | Stryker Corp. | 842,600 | 48,214 |
| | McKesson Corp. | 538,100 | 35,364 |
| | Allergan Inc. | 493,900 | 32,262 |
| | Aetna Inc. | 889,100 | 31,216 |
| | UnitedHealth Group Inc. | 910,500 | 29,746 |
| | Cardinal Health Inc. | 822,600 | 29,638 |
| * | Humana Inc. | 438,500 | 20,509 |
| * | Gilead Sciences Inc. | 356,800 | 16,227 |
| * | Forest Laboratories Inc. | 470,700 | 14,761 |
| | Eli Lilly & Co. | 292,200 | 10,584 |
| * | Zimmer Holdings Inc. | 159,600 | 9,448 |
| | Becton Dickinson and Co. | 77,100 | 6,070 |
| | | | 628,015 |
| Industrials (9.1%) | | |
| | General Electric Co. | 3,355,100 | 61,063 |
| | 3M Co. | 689,900 | 57,655 |
| | United Parcel | | |
| | Service Inc. Class B | 759,300 | 48,907 |
| | Raytheon Co. | 814,600 | 46,530 |
| | Caterpillar Inc. | 623,700 | 39,200 |
| | CH Robinson | | |
| | Worldwide Inc. | 531,300 | 29,673 |
| | Illinois Tool Works Inc. | 505,300 | 23,931 |
| | WW Grainger Inc. | 218,700 | 23,646 |
| | ITT Corp. | 425,300 | 22,800 |
| * | Jacobs Engineering | | |
| | Group Inc. | 427,200 | 19,305 |
| | CSX Corp. | 320,600 | 16,319 |
| | Textron Inc. | 644,000 | 13,672 |
| | L-3 Communications | | |
| | Holdings Inc. | 136,800 | 12,535 |
| | General Dynamics Corp. | 94,200 | 7,272 |
| | Fluor Corp. | 121,100 | 5,632 |
| | | | 428,140 |
| Information Technology (20.1%) | |
| | Microsoft Corp. | 4,268,200 | 124,930 |
| | International Business | | |
| | Machines Corp. | 970,100 | 124,415 |
| * | Apple Inc. | 514,300 | 120,825 |
| | QUALCOMM Inc. | 1,646,600 | 69,141 |
| | Oracle Corp. | 2,690,800 | 69,127 |
| * | Google Inc. Class A | 121,140 | 68,688 |
| * | Computer Sciences Corp. | 1,100,100 | 59,944 |
| | Intel Corp. | 1,655,800 | 36,858 |
| * | Western Digital Corp. | 932,200 | 36,346 |
| * | Dell Inc. | 2,077,500 | 31,183 |
| * | Intuit Inc. | 802,200 | 27,548 |
| | KLA-Tencor Corp. | 797,700 | 24,665 |
| | Xerox Corp. | 2,403,700 | 23,436 |
| * | Micron Technology Inc. | 2,128,600 | 22,116 |
| | | | |
| | | | | Market |
| | | | | Value• |
| | | | Shares | ($000) |
| * | Cisco Systems Inc. | | 790,000 | 20,564 |
| * | SanDisk Corp. | | 427,300 | 14,797 |
| | Harris Corp. | | 241,100 | 11,450 |
| | Jabil Circuit Inc. | | 692,800 | 11,216 |
| | CA Inc. | | 466,100 | 10,939 |
| | Xilinx Inc. | | 375,600 | 9,578 |
| | Texas Instruments Inc. | 273,100 | 6,683 |
| | Total System Services Inc. | 367,100 | 5,749 |
| | Mastercard Inc. Class A | 22,600 | 5,740 |
| | Western Union Co. | | 304,700 | 5,168 |
| | | | | 941,106 |
| Materials (3.1%) | | | |
| | International Paper Co. | 1,208,900 | 29,751 |
| | Freeport-McMoRan | | | |
| | Copper & Gold Inc. | | 296,800 | 24,795 |
| | EI du Pont de | | | |
| | Nemours & Co. | | 520,900 | 19,398 |
| | Newmont Mining Corp. | 369,000 | 18,793 |
| * | Titanium Metals Corp. | 985,500 | 16,349 |
| | Eastman Chemical Co. | 224,700 | 14,309 |
| | Bemis Co. Inc. | | 484,800 | 13,924 |
| | Sealed Air Corp. | | 263,800 | 5,561 |
| | | | | 142,880 |
| Telecommunication Services (3.2%) | |
| | AT&T Inc. | | 4,423,400 | 114,301 |
| | Verizon | | | |
| | Communications Inc. | 1,097,100 | 34,032 |
| | | | | 148,333 |
| Utilities (3.5%) | | | |
| | FPL Group Inc. | | 1,018,300 | 49,215 |
| | Exelon Corp. | | 967,300 | 42,377 |
| | Constellation Energy | | | |
| | Group Inc. | | 1,055,900 | 37,073 |
| | Oneok Inc. | | 507,800 | 23,181 |
| | Integrys Energy Group Inc. | 210,700 | 9,983 |
| | Ameren Corp. | | 164,500 | 4,290 |
| | | | | 166,119 |
| Total Common Stocks | | | |
| (Cost $4,079,098) | | | 4,641,646 |
| Temporary Cash Investment (1.0%)1 | |
| Money Market Fund (1.0%) | | |
| 2 | Vanguard Market | | | |
| | Liquidity Fund, 0.183% | | |
| | (Cost $47,732) | 47,732,044 | 47,732 |
| Total Investments (100.0%) | | |
| (Cost $4,126,830) | | | 4,689,378 |
| Other Assets and Liabilities (0.0%) | |
| Other Assets3 | | | 211,879 |
| Liabilities | | | (210,853) |
| | | | | 1,026 |
| Net Assets (100%) | | | 4,690,404 |
12
Growth and Income Fund
| |
| At March 31, 2010, net assets consisted of: |
| | Amount |
| | ($000) |
| Paid-in Capital | 5,952,588 |
| Undistributed Net Investment Income | 4,087 |
| Accumulated Net Realized Losses | (1,829,621) |
| Unrealized Appreciation (Depreciation) | |
| Investment Securities | 562,548 |
| Futures Contracts | 802 |
| Net Assets | 4,690,404 |
| |
| Investor Shares—Net Assets | |
| Applicable to 134,225,957 outstanding | |
| $.001 par value shares of beneficial | |
| interest (unlimited authorization) | 3,318,887 |
| Net Asset Value Per Share— | |
| Investor Shares | $24.73 |
| |
| Admiral Shares—Net Assets | |
| Applicable to 33,963,441 outstanding | |
| $.001 par value shares of beneficial | |
| interest (unlimited authorization) | 1,371,517 |
| Net Asset Value Per Share— | |
| Admiral Shares | $40.38 |
• See Note A in Notes to Financial Statements.
* Non-income-producing security.
1 The fund invests a portion of its cash reserves in equity markets through the use of index futures contracts. After giving effect to futures investments, the fund’s effective common stock and temporary cash investment positions represent 99.9% and 0.1%, respectively, of ne t assets.
2 Affiliated money market fund available only to Vanguard funds and certain trusts and accounts managed by Vanguard. Rate shown is the 7-day yield.
3 Cash of $5,580,000 has been segregated as initial margin for open futures contracts.
See accompanying Notes, which are an integral part of the Financial Statements.
13
Growth and Income Fund
Statement of Operations
| |
| | Six Months Ended |
| | March 31, 2010 |
| | ($000) |
| Investment Income | |
| Income | |
| Dividends | 46,688 |
| Interest1 | 54 |
| Security Lending | 846 |
| Total Income | 47,588 |
| Expenses | |
| Investment Advisory Fees—Note B | |
| Basic Fee | 2,320 |
| Performance Adjustment | (1,233) |
| The Vanguard Group—Note C | |
| Management and Administrati ve—Investor Shares | 4,172 |
| Management and Administrati ve—Admiral Shares | 771 |
| Marketing and Distribution& #151;Investor Shares | 308 |
| Marketing and Distribution& #151;Admiral Shares | 123 |
| Custodian Fees | 20 |
| Shareholders’ Reports—Investor Shares | 43 |
| Shareholders’ Reports—Admiral Shares | 4 |
| Trustees’ Fees and Expenses | 5 |
| Total Expenses | 6,533 |
| Expenses Paid Indirectly | (116) |
| Net Expenses | 6,417 |
| Net Investment Income | 41,171 |
| Realized Net Gain (Loss) | |
| Investment Securities Sold | 108,079 |
| Futures Contracts | 2,972 |
| Realized Net Gain (Loss) | 111,051 |
| Change in Unrealized Appreciation (Depreciation) | |
| Investment Securities | 359,917 |
| Futures Contracts | 642 |
| Change in Unrealized Appreciation (Depreciation) | 360,559 |
| Net Increase (Decrease) in Net Assets Resulting from Operations | 512,781 |
| 1 Interest income from an affiliated company of the fund was $54,000. | |
See accompanying Notes, which are an integral part of the Financial Statements.
14
| | |
| Growth and Income Fund | | |
| |
| |
| Statement of Changes in Net Assets | | |
| |
| | Six Months Ended | Year Ended |
| | March 31, | September 30, |
| | 2010 | 2009 |
| | ($000) | ($000) |
| Increase (Decrease) in Net Assets | | |
| Operations | | |
| Net Investment Income | 41,171 | 98,334 |
| Realized Net Gain (Loss) | 111,051 | (1,371,420) |
| Change in Unrealized Appreciation (Depreciation) | 360,559 | 545,703 |
| Net Increase (Decrease) in Net Assets Resulting from Operations | 512,781 | (727,383) |
| Distributions | | |
| Net Investment Income | | |
| Investor Shares | (30,073) | (73,186) |
| Admiral Shares | (13,454) | (36,418) |
| Realized Capital Gain | | |
| Investor Shares | — | — |
| Admiral Shares | — | — |
| Total Distributions | (43,527) | (109,604) |
| Capital Share Transactions | | |
| Investor Shares | (263,929) | (120,422) |
| Admiral Shares | (209,097) | (174,315) |
| Net Increase (Decrease) from Capital Share Transactions | (473,026) | (294,737) |
| Total Increase (Decrease) | (3,772) | (1,131,724) |
| Net Assets | | |
| Beginning of Period | 4,694,176 | 5,825,900 |
| End of Period1 | 4,690,404 | 4,694,176 |
| 1 Net Assets—End of Period includes undistributed net investment income of $4,087,000 and $6,443,000. | |
See accompanying Notes, which are an integral part of the Financial Statements.
15
| | | | | | | |
| Growth and Income Fund | | | | | | | |
| |
| |
| Financial Highlights | | | | | | |
| |
| |
| Investor Shares | | | | | | | |
| | Six Months | | | | | |
| | | Ended | | | | | |
| For a Share Outstanding | March 31, | | | Year Ended September 30, |
| Throughout Each Period | | 2010 | 2009 | 2008 | 2007 | 2006 | 2005 |
| Net Asset Value, Beginning of Period | $22.34 | $25.84 | $38.62 | $33.79 | $31.29 | $28.31 |
| Investment Operations | | | | | | | |
| Net Investment Income | | .207 | .447 | .546 | .600 | .550 | .460 |
| Net Realized and Unrealized Gain (Loss) | | | | | | |
| on Investments | | 2.399 | (3.453) | (8.758) | 4.840 | 2.470 | 2.980 |
| Total from Investment Operations | | 2.606 | (3.006) | (8.212) | 5.440 | 3.020 | 3.440 |
| Distributions | | | | | | | |
| Dividends from Net Investment Income | (.216) | (.494) | (.560) | (.610) | (.520) | (.460) |
| Distributions from Realized Capital Gains | — | — | (4.008) | — | — | — |
| Total Distributions | | (.216) | (.494) | (4.568) | (.610) | (.520) | (.460) |
| Net Asset Value, End of Period | | $24.73 | $22.34 | $25.84 | $38.62 | $33.79 | $31.29 |
| |
| Total Return1 | | 11.71% | -11.29% | -23.28% | 16.20% | 9.76% | 12.20% |
| |
| Ratios/Supplemental Data | | | | | | | |
| Net Assets, End of Period (Millions) | $3,319 | $3,253 | $3,919 | $5,465 | $5,088 | $5,202 |
| Ratio of Total Expenses to | | | | | | | |
| Average Net Assets2 | | 0.33%3 | 0.35% | 0.31% | 0.32% | 0.38% | 0.40% |
| Ratio of Net Investment Income to | | | | | | | |
| Average Net Assets | | 1.73%3 | 2.28% | 1.69% | 1.61% | 1.65% | 1.53% |
| Portfolio Turnover Rate | | 90%3 | 83% | 96% | 100% | 93% | 84% |
1 Total returns do not include the account service fee that may be applicable to certain accounts with balances below $10,000.
2 Includes performance-based investment advisory fee increases (decreases) of (0.05%), (0.04%), (0.02%), 0.00%, 0.01%, and 0.01%.
3 Annualized.
See accompanying Notes, which are an integral part of the Financial Statements.
16
| | | | | | | |
| Growth and Income Fund | | | | | | | |
| |
| |
| Financial Highlights | | | | | | |
| |
| |
| Admiral Shares | | | | | | | |
| | Six Months | | | | | |
| | | Ended | | | | | |
| For a Share Outstanding | March 31, | | | Year Ended September 30, |
| Throughout Each Period | | 2010 | 2009 | 2008 | 2007 | 2006 | 2005 |
| Net Asset Value, Beginning of Period | $36.48 | $42.20 | $63.08 | $55.20 | $51.12 | $46.25 |
| Investment Operations | | | | | | | |
| Net Investment Income | | .365 | .775 | .963 | 1.070 | .997 | .849 |
| Net Realized and Unrealized Gain (Loss) | | | | | | |
| on Investments | | 3.912 | (5.638) | (14.313) | 7.903 | 4.036 | 4.853 |
| Total from Investment Operations | | 4.277 | (4.863) | (13.350) | 8.973 | 5.033 | 5.702 |
| Distributions | | | | | | | |
| Dividends from Net Investment Income | (.377) | (.857) | (.985) | (1.093) | (.953) | (.832) |
| Distributions from Realized Capital Gains | — | — | (6.545) | — | — | — |
| Total Distributions | | (.377) | (.857) | (7.530) | (1.093) | (.953) | (.832) |
| Net Asset Value, End of Period | | $40.38 | $36.48 | $42.20 | $63.08 | $55.20 | $51.12 |
| |
| Total Return | | 11.77% | -11.15% | -23.19% | 16.37% | 9.97% | 12.39% |
| |
| Ratios/Supplemental Data | | | | | | | |
| Net Assets, End of Period (Millions) | $1,372 | $1,441 | $1,907 | $2,794 | $2,321 | $2,039 |
| Ratio of Total Expenses to | | | | | | | |
| Average Net Assets1 | | 0.18%2 | 0.21% | 0.16% | 0.18% | 0.20% | 0.23% |
| Ratio of Net Investment Income to | | | | | | | |
| Average Net Assets | | 1.88%2 | 2.42% | 1.84% | 1.75% | 1.83% | 1.68% |
| Portfolio Turnover Rate | | 90%2 | 83% | 96% | 100% | 93% | 84% |
1 Includes performance-based investment advisory fee increases (decreases) of (0.05%), (0.04%), (0.02% ), 0.00%, 0.01%, and 0.01%.
2 Annualized.
See accompanying Notes, which are an integral part of the Financial Statements.
17
Growth and Income Fund
Notes to Financial Statements
Vanguard Growth and Income Fund is registered under the Investment Company Act of 1940 as an open-end investment company, or mutual fund. The fund offers two classes of shares: Investor Shares and Admiral Shares. Investor Shares are available to any investor who meets the fund’s minimum purchase require ments. Admiral Shares are designed for investors who meet certain administrative, service, tenure, and account-size criteria.
A. The following significant accounting policies conform to generally accepted accounting principles for U.S. mutual funds. The fund consistently follows such policies in preparing its financial statements.
1. Security Valuation: Securities are valued as of the close of trading on the New York Stock Exchange (generally 4 p.m., Eastern time) on the valuation date. Equity securities are valued at the latest quoted sales prices or official closing prices taken from the primary market in which each security trades; such securities not traded on the valuation date are value d at the mean of the latest quoted bid and asked prices. Securities for which market quotations are not re adily available, or whose values have been materially affected by events occurring before the fund’s pricing time but after the close of the securities’ primary markets, are valued by methods deemed by the board of trustees to represent fair value.
Investments in Vanguard Market Liquidity Fund are valued at that fund’s net asset value. Temporary cash investments acquired over 60 days to maturity are valued using the latest bid prices or using valuations based on a matrix system (which considers such factors as security prices, yields, maturities, and ratings), both as furnished by independent pricing serv ices. Other temporary cash investments are valued at amortized cost, which approximates market value.
2. Futures Contracts: The fund uses index futures contracts to a limited extent, with the objective of maintaining full exposure to the stock market while maintaining liquidity. The fund may purchase or sell futures contracts to achieve a desired level of investment, whether to accommodate portfolio turnover or cash flows from capital share transactions. The primary risks associated with the use of futures contracts are imperfect correlation between changes in market va lues of stocks held by the fund and the prices of futures contracts, and the possibility of an illiquid market.
Futures contracts are valued at their quoted daily settlement prices. The aggregate principal amounts of the contracts are not recorded in the Statement of Net Assets. Fluctuations in the value of the contracts are recorded in the Statement of Net Assets as an asset (liability) and in the Statement of Operations as unrealized appreciation (depreciation) until the contracts are closed, when they are recorded as realized futures gains (losses).
3. Federal Income Taxes: The fund intends to continue to qualify as a regulated investment company and distribute all of its taxable income. Management has analyzed the fund’s tax positions taken for all open federal income tax years (September 30, 2006–2009), and for the period ended March 31, 2010, and has concluded that no provision for federal income t ax is required in the fund’s financial statements.
4. Distributions: Distributions to shareholders are recorded on the ex-dividend date.
18
Growth and Income Fund
5. Security Lending: The fund may lend its securities to qualified institutional borrowers to earn additional income. Security loans are required to be secured at all times by collateral at least equal to the market value of securities loaned. The fund invests cash collateral received in Vanguard Market Liquidity Fund, and records a liability for the return of the collateral, during the period the securities are on loan. Security lending income represents the income earned on investing cash collateral, less expenses associated with the loan.
6. Other: Dividend income is recorded on the ex-dividend date. Interest income includes income distributions received from Vanguard Market Liquidity Fund and is accrued daily. Security transactions are accounted for on the date securities are bought or sold. Costs used to determine realized gains (losses) on the sale of investment securities are those of the specific securities sold.
Each class of shares has equal rights as to assets and earnings, except that each class separately bears certain class-specific expenses related to maintenance of shareholder accounts (included in Management and Administrative expenses) and shareholder reporting. Marketing an d distribution expenses are alloc ated to each class of shares base d on a method approved by the board of trustees. Income, other non-class-specific expenses, and gains and losses on investments are allocated to each class of shares based on its relative net assets.
B. Mellon Capital Management Corporation provides investment advisory service s to the fund for a fee calculated at an annual percentage rate of average net assets. The basic fee is subject to quarterly adjustments based on the fund’s performance for the preceding three years relative to the S&P 500 Index. For the six months ended March 31, 2010, the investment advisory fee represented an effective annual basic rate of 0.10% of the fund’s average net assets before a decrease of $1,233,000 (0.05%) based on performance.
C. The Vanguard Group furnishes at cost corporate management, administrative, marketing, and distribution services. The costs of such services are allocated to the fund under methods approved by the board of trustees. The fund has committed to provide up to 0.40% of its net assets in capital contributions to Vanguard. At March 31, 2010, the fund had contributed capital of $874,000 to Vanguard (included in Other Assets), representing 0.02% of the fund’s net assets and 0.35% of Vanguard’s capitalization. The fund’s trustees and officers are also directors and officers of Vanguard.
D. The fund has asked its investment advisor to direct certain security trades, subject to obtaining the best price and execution, to brokers who have agreed to rebate to the fund part of the commissions generated. Such rebates are used solely to reduce the fund’s management and administrative expenses. For the six months ended March 31, 2010, these arrangemen ts reduced the fund’s expenses by $116,000 (an annual rate of 0.01% of average net assets).
E. Various inputs may be used to determine the value of the fund’s investments. These inputs are summarized in three broad levels for financial statement purposes. The inputs or methodologies used to value securities are not necessarily an indication of the risk associated with investing in those securities.
19
Growth and Income Fund
Level 1—Quoted prices in active markets for identical securities.
Level 2—Other significant observable inputs (including quoted prices for similar securities, interest rates, prepayment speeds, credit risk, etc.).
Level 3—Significant unobservable inputs (including the fund’s own assumptions used to determine the fair value of investments).
At March 31, 2010, 100% of the fund’s investments were valued based on Level 1 inputs.
F. At March 31, 2010, the aggregate settlement value of open futures contracts and the related unrealized appreciation (depreciation) were:
| | | | |
| | | | | ($000) |
| | | | Aggregate | |
| | | Number of | Settlement | Unrealized |
| | | Long (Short) | Value | Appreciation |
| Futures Contracts | Expiration | Contracts | Long (Short) | (Depreciation) |
| S&P 500 Index | June 2010 | 156 | 45,443 | 802 |
Unrealized appreciation (depreciation) on open futures contracts is required t o be treated as realized gain (loss) for tax purposes.
G. Distributions are determined on a tax basis and may differ from net investment income and realized capital gains for financial reporting purposes. Differences may be permanent or temporary. Permanent differences are reclassified among capital accounts in the financial statements to reflect their tax character. Temporary differences arise when certain items of income, expense, gain, or loss are recognized in different periods for financial statement and tax purposes; these differences will reverse at some time in the future. Differences in classification may also result from the treatment of shor t-term gains as ordinary income for tax purposes.
The fund’s tax-basis capital gains and losses are determined only at the end of each fiscal year. For tax purposes, at September 30, 2009, the fund had available capital loss carryforwards totaling $845,748,000 to offset future net capital gains through September 30, 2017. In addition, the fund realized losses of $1,093,871,000 during the period from November 1, 2008, through September 30, 2009, which are deferred and will be treated as realized for tax purposes in fiscal 2010. The fund will use these capital losses to offset net taxable capital gains, if any, realized during the year ending September 30, 2010; should the fund realize net capital losses for the year, the losses will be added to the loss carryforward balance above.
At March 31, 2010, the cost of investment securities for tax purposes was $4,126,830,000. Net unrealized appreciation of investment securities for tax purposes was $562,548,000, consisting of unrealized gains of $677,398,000 on securities that had risen in value since their purchase and $114,850,000 in unrealized losses on securities that had fallen in value since their purchase.
20
Growth and Income Fund
H. During the six months ended March 31, 2010, the fund purchased $2,035,583,000 of investment securities and sold $2,482,737,000 of investment securities, other than temporary cash investments.
| | | | |
| I. Capital share transactions for each class of shares were: | | |
| | Six Months Ended | | Year Ended |
| | March 31, 2010 | September 30, 2009 |
| | Amount | Shares | Amount | Shares |
| | ($000) | (000) | ($000) | (000) |
| Investor Shares | | | | |
| Issued | 127,309 | 5,472 | 342,754 | 17,955 |
| Issued in Lieu of Cash Distributions | 29,184 | 1,235 | 70,600 | 3,711 |
| Redeemed | (420,422) | (18,067) | (533,776) | (27,759) |
| Net Increase (Decrease)—Investor Shares | (263,929) | (11,360) | (120,422) | (6,093) |
| Admiral Shares | | | | |
| Issued | 71,182 | 1,873 | 152,599 | 4,878 |
| Issued in Lieu of Cash Distributions | 12,161 | 315 | 32,886 | 1,059 |
| Redeemed | (292,440) | (7,733) | (359,800) | (11,621) |
| Net Increase (Decrease)—Admiral Shares | (209,097) | (5,545) | (174,315) | (5,684) |
J. In preparing the financial statements as of March 31, 2010, management considered the impact of subsequent events for potential recognition or disclosure in these financial statements.
21
About Your Fund’s Expenses
As a shareholder of the fund, you incur ongoing costs, which include costs for portfolio management, administrative services, and shareholder reports (like this one), among others. Operating expenses, which are deducted from a fund’s gross income, directly reduce the investment return of the fund.
A fund’s expenses are expressed as a percentage of its average net assets. This figure is known as the expense ratio. The following examples are intended to help you understand the ongoing costs (in dollars) of investing in your fund and to compare these costs with those of other mutual funds. The examples are based on an investment of $1,000 made at the beginning of the period shown and held for the entire period.
The accompanying table illustrates your fund’s costs in two ways:
• Based on actual fund return. This section helps you to estimate the actual expenses that you paid over the period. The ”Ending Account Value“ shown is derived from the fund‘s actual return, and the third column shows the dollar amount that would have been paid by an investor who started with $1,000 in the fund. You may use the information here, together with the amount you invested, to estimate the expenses that you paid over the period.
To do so, simply divide your account value by $1,000 (for example, an $8,600 account value divided by $1,000 = 8.6), then multiply the result by the number given for your fund under the heading ”Expenses Paid During Period.“
• Based on hypothetical 5% yearly return. This section is intended to help you compare your fund‘s costs with those of other mutual funds. It assumes that the fund had a yearly return of 5% before expenses, but that the expense ratio is unchanged. In this case—because the return used is not the fund’s actual return—the results do not apply to your investment. The example is useful in making comparisons because the Securities and Exchange Commission requires all mutual funds to calculate expenses based on a 5% return. You can assess your fund’s costs by comparing this hypothetical example with the hypothetical examples that appear in shareholder reports of other funds.
Note that the expenses shown in the table are meant to highlight and help you compare ongoing costs only and do not reflect transaction costs incurred by the fund for buying and selling securities. Further, the expenses do not include the account service fee described in the prospectus. If such a fee were applied to your account, your costs would be higher. Your fund does not charge transaction fees, such as purchase or redemption fees, nor does it carry a “sales load.” The calculations assume no shares were bought or sold during the period. Your actual costs may have been higher or lower, depending on the amount of your investment and the timing of any purchases or redemptions.
You can find more information about the fund’s expenses, including annual expense ratios, in the Financial Statements section of this report. For additional information on operating expenses and other shareholder costs, please refer to your fund’s current prospectus.
22
| | | |
| Six Months Ended March 31, 2010 | | | |
| | Beginning | Ending | Expenses |
| | Account Value | Account Value | Paid During |
| Growth and Income Fund | 9/30/2009 | 3/31/2010 | Period |
| Based on Actual Fund Return | | | |
| Investor Shares | $1,000.00 | $1,117.10 | $1.74 |
| Admiral Shares | 1,000.00 | 1,117.72 | 0.95 |
| Based on Hypothetical 5% Yearly Return | | | |
| Investor Shares | $1,000.00 | $1,023.29 | $1.66 |
| Admiral Shares | 1,000.00 | 1,024.03 | 0.91 |
The calculations are based on expenses incurred in the most recent six-month period. The fund’s annualized six-month expense ratios for that period are 0.33% for Investor Shares and 0.18% for Admiral Shares. The dollar amounts shown as “Expenses Paid” are equal to the annualized expense ratio multiplied by the average account value over the period, multiplied by the number of days in the most recent six-month period, then divided by the number of days in the most recent 12-month period.
23
Glossary
30-Day SEC Yield. A fund’s 30-day SEC yield is derived using a formula specified by the U.S. Securities and Exchange Commission. Under the formula, data related to the fund’s security holdings in the previous 30 days are used to calculate the fund’s hypothetical net income for that period, which is then annualized and divided by the fund’s estimated average net assets over the calculation period. For the purposes of this calculation, a security’s income is based on its current market yield to maturity (in the case of bonds) or its projected dividend yield (for stocks). Because the SEC yield represents hypothetical annualized income, it will differ—at times significantly—from the fund’s actual experience. As a result, the fund’s income distributions may be higher or lower than implied by the SEC yield.
Beta. A measure of the magnitude of a fund’s past share-price fluctuations in relation to the ups and downs of a given market index. The index is assigned a beta of 1.00. Compared with a given index, a fund with a beta of 1.20 typically would have seen its share price rise or fall by 12% when the index rose or fell by 10%. For this report, beta is based on returns over the past 36 months for both the fund and the index. Note that a fund’s beta should be reviewed in conjunction with its R-squared (see definition). The lower the R-squared, the less correlation there is between the fund and the index, and the less reliable beta is as an indicator of volatility.
Dividend Yield. Dividend income earned by stocks, expressed as a percentage of the aggregate market value (or of net asset value, for a fund). The yield is determined by dividing the amount of the annual dividends by the aggregate value (or net asset value) at the end of the period. For a fund, the dividend yield is based solely on stock holdings and does not include any income produced by other investments.
Earnings Growth Rate. The average annual rate of growth in earnings over the past five years for the stocks now in a fund.
Equity Exposure. A measure that reflects a fund’s investments in stocks and stock futures. Any holdings in short-term reserves are excluded.
Expense Ratio. The percentage of a fund’s average net assets used to pay its annual administrative and advisory expenses. These expenses directly reduce returns to investors.
Foreign Holdings. The percentage of a fund represented by stocks or depositary receipts of companies based outside the United States.
Inception Date. The date on which the assets of a fund (or one of its share classes) are first invested in accordance with the fund’s investment objective. For funds with a subscription period, the inception date is the day after that period ends. Investment performance is measured from the inception date.
Median Market Cap. An indicator of the size of companies in which a fund invests; the midpoint of market capitalization (market price x shares outstanding) of a fund’s stocks, weighted by the proportion of the fund’s assets invested in each stock. Stocks representing half of the fund’s assets have market capitalizations above the median, and the rest are below it.
Price/Book Ratio. The share price of a stock divided by its net worth, or book value, per share. For a fund, the weighted average price/book ratio of the stocks it holds.
24
Price/Earnings Ratio. The ratio of a stock’s current price to its per-share earnings over the past year. For a fund, the weighted average P/E of the stocks it holds. P/E is an indicator of market expectations about corporate prospects; the higher the P/E, the greater the expectations for a company’s future growth.
R-Squared. A measure of how much of a fund’s past returns can be explained by the returns from the market in general, as measured by a given index. If a fund’s total returns were precisely synchronized with an index’s returns, its R-squared would be 1.00. If the fund’s returns bore no relationship to the index’s returns, its R-squared would be 0. For this report, R-squared is based on returns over the past 36 months for both the fund and the index.
Return on Equity. The annual average rate of return generated by a company during the past five years for each dollar of shareholder’s equity (net income divided by shareholder’s equity). For a fund, the weighted average return on equity for the companies whose stocks it holds.
Short-Term Reserves. The percentage of a fund invested in highly liquid, short-term securities that can be readily converted to cash.
Turnover Rate. An indication of the fund’s trading activity. Funds with high turnover rates incur higher transaction costs and may be more likely to distribute capital gains (which may be taxable to investors). The turnover rate excludes in-kind transactions, which have minimal impact on costs.
25
This page intentionally left blank.
This page intentionally left blank.
The People Who Govern Your Fund
The trustees of your mutual fund are there to see that the fund is operated and managed in your best interests since, as a shareholder, you are a part owner of the fund. Your fund’s trustees also serve on the board of directors of The Vanguard Group, Inc., which is owned by the Vanguard funds and provides services to them on an at-cost basis.
A majority of Vanguard’s board members are independent, meaning that they have no affiliation with Vanguard or the funds they oversee, apart from the sizable personal investments they have made as private individuals. The independent board members have distinguished backgrounds in business, academia, and public service. Each of the trustees and executive officers oversees 162 Vanguard funds.
The following table provides information for each trustee and executive officer of the fund. More information about the trustees is in the Statement of Additional Informatio n, which can be obtained, wit hout charge, by contacting Vanguard at 800-662-7447, or online at www.vanguard.com.
| |
| Interested Trustee1 | Rajiv L. Gupta |
| | Born 1945. Trustee Since December 2001.2 |
| F. William McNabb III | Principal Occupation (s) During the Past Five Years: |
| Born 1957. Trustee Since July 2009. Chairman of the | Chairman and Chief Executive Officer (retired 2009) |
| Board. Principal Occupation(s) During the Past Five | and President (2006–2008) of Rohm and Haas Co. |
| Years: Chairman of the Board of The Vanguard Group, | (chemicals); Director of Tyco International, Ltd. |
| Inc., and of each of the investment companies served | (diversified manufacturing and services) and Hewlett- |
| by The Vanguard Group, since January 2010; Director | Packard Co. (electronic computer manufacturing); |
| of The Vanguard Group since 2008; Chief Executive | Trustee of The Conference Board; Member of the |
| Officer and President of The Vanguard Group and of | Board of Managers of Delphi Automotive LLP |
| each of the investment companies served by The | (automotive components). |
| Vanguard Group since 2008; Director of Vanguard | |
| Marketing Corporation; Managing Director of The | Amy Gutmann |
| Vanguard Group (1995–2008). | Born 1949. Trustee Since June 2006. Principal |
| | Occupation(s) During the Past Five Years: President |
| | of the University of Pennsylvania; Christopher H. |
| Independent Trustees | Browne Distinguished Professor of Political Science |
| | in the School of Arts and Sciences with secondary |
| Emerson U. Fullwood | appointments at the Annenberg School for Commu- |
| Born 1948. Trustee Since January 2008. Principal | nication and the Graduate School of Education of |
| Occupation(s) During the Past Five Years: Executive | the University of Pennsylvania; Director of Carnegie |
| Chief Staff and Marketing Officer for North America | Corporation of New York, Schuylkill River Development |
| and Corporate Vice President (retired 2008) of Xerox | Corporation, and Greater Philadelphia Chamber of |
| Corporation (documen t management products and | Commerce; Trustee of the National Constitution Center; |
| services); Director of SPX Corporation (multi-industry | Chair of the Presidential Commission for the Study of |
| manufacturing), the United Way of Rochester, | Bioethical Issues. |
| Amerigroup Corporation (managed health care), | |
| the University of Rochester Medical Center, and | |
| Monroe Community College Foundation. | |
| | |
| JoAnn Heffernan Heisen | Executive Officers | |
| Born 1950. Trustee Since July 1998. Principal | | |
| Occupation(s) During the Past Five Years: Corporate | Thomas J. Higgins | |
| Vice President and Chief Global Diversity Officer since | Born 1957. Chief Financial Officer Since September |
| 2006 (retired 2008) and Member of the Executive | 2008. Principal Occupation(s) During the Past Five |
| Committee (retired 2008) of Johnson & Johnson | Years: Principal of The Vanguard Group, Inc.; Chief |
| (pharmaceuticals/consumer products); Vice President | Financial Officer of each of the investment companies |
| and Chief Information Officer of Johnson & Johnson | served by The Vanguard Group since 2008; Treasurer |
| (1997–2005); Director of the University Medical Center | of each of the investment companies served by The |
| at Princeton and Women’s Research and Education | Vanguard Group (1998–2008). |
| Institute; Member of the Advisory Board of the | | |
| Maxwell School of Citizenship and Public Affairs | Kathryn J. Hyatt | |
| at Syracuse University. | Born 1955. Treasurer Since November 2008. Principal |
| | Occupation(s) During the Past Five Years: Principal |
| F. Joseph Loughrey | of The Vanguard Group, Inc.; Treasurer of each of |
| Born 1949. Trustee Since October 2009. Principal | the investment companies served by The Vanguard |
| Occupation(s) During the Past Five Years: President | Group since 2008; Assistant Treasurer of each of the |
| and Chief Operating Officer since 2005 (retired 2009) | investment companies served by The Vanguard Group |
| and Vice Chairman of the Board (2008–2009) of | (1988–2008). | |
| Cummins Inc. (industrial machinery); Director of | | |
| SKF AB (industrial machinery), Hillenbrand, Inc. | Heidi Stam | |
| (specialized consumer services), Sauer-Danfoss Inc. | Born 1956. Secretary Since July 2005. Principal |
| (machinery), the Lumina Foundation for Education, | Occupation(s) During the Past Five Years: Managing |
| and Oxfam America; Chairman of the Advisory Council | Director of The Vanguard Group, Inc., since 2006; |
| for the College of Arts and Letters at the University of | General Counsel of The Vanguard Group since 2005; |
| Notre Dame. | Secretary of The Vanguard Group and of each of the |
| | investment companies served by The Vanguard Group |
| André F. Perold | since 2005; Director and Senior Vice President of |
| Born 1952. Trustee Since December 2004. Principal | Vanguard Marketing Corporation since 2005; |
| Occupation(s) During the Past Five Years: George | Principal of The Vanguard Group (1997–2006). |
| Gund Professor of Finance and Banking at the Harvard | | |
| Business School; Chair of the Investment Committee | | |
| of HighVista Strategies LLC (private investment firm). | Vanguard Senior Management Team |
| |
| Alfred M. Rankin, Jr. | R. Gregory Barton | Michael S. Miller |
| Born 1941. Trustee Since January 1993. Principal | Mortimer J. Buckley | James M. Norris |
| Occupation(s) During the Past Five Years: Chairman, | Kathleen C. Gubanich | Glenn W. Reed |
| President, and Chief Executive Officer of NACCO | Paul A. Heller | George U. Sauter |
| Industries, Inc. (forklift trucks/housewares/lignite); | | |
| Director of Goodrich Corporation (industrial products/ | | |
| aircraft systems and services); Chairman of the Federal | Chairman Emeritus and Senior Advisor |
| Reserve Bank of Cleveland; Trustee of The Cleveland | | |
| Museum of Art. | John J. Brennan | |
| | Chairman, 1996–2009 | |
| Peter F. Volanakis | Chief Executive Officer and President, 1996–2008 |
| Born 1955. Trustee Since July 2009. Principal | | |
| Occupation(s) During the Past Five Years: President | | |
| since 2007 and Chief Operating Officer since 2005 | Founder | |
| of Corning Incorporated (communications equipment); | | |
| President of Corning Technologies (2001–2005); | John C. Bogle | |
| Director of Corning Incorporated and Dow Corning; | Chairman and Chief Executive Officer, 1974–1996 |
| Trustee of the Corning Incorporated Foundation and | | |
| the Corning Museum of Glass; Overseer of the | | |
| Amos Tuck School of Business Administration at | | |
| Dartmouth College. | | |
1 Mr. McNabb is considered an “interested person,” as defined in the Investment Company Act of 1940, because he is an officer of the Vanguard funds.
2 December 2002 for Vanguard Equity Income Fund, Vanguard Growth Equity Fund, the Vanguard Municipal Bond Funds, and the Vanguard State Tax-Exempt Funds.
| 
|
| P.O. Box 2600 |
| Valley Forge, PA 19482-2600 |
Connect with Vanguard® > www.vanguard.com
|
| Fund Information > 800-662-7447 |
| Direct Investor Account Services > 800-662-2739 |
| Institutional Investor Services > 800-523-1036 |
| Text Telephone for People |
| With Hearing Impairment > 800-749-7273 |
| |
| This material may be used in conjunction |
| with the offering of shares of any Vanguard |
| fund only if preceded or accompanied by |
| the fund’s current prospectus. |
| |
| All comparative mutual fund data are from Lipper Inc. or |
| Morningstar, Inc., unless otherwise noted. |
| |
| You can obtain a free copy of Vanguard’s proxy voting |
| guidelines by visiting our website, www.vanguard.com, |
| and searching for “proxy voting guidelines,” or by calling |
| Vanguard at 800-662-2739. The guidelines are also |
| available from the SEC’s website, www.sec.gov. In |
| addition, you may obtain a free report on how your fund |
| voted the proxies for securities it owned during the 12 |
| months ended June 30. To get the report, visit either |
| www.vanguard.com or www.sec.gov. |
| |
| You can review and copy information about your fund at |
| the SEC’s Public Reference Room in Washington, D.C. To |
| find out more about this public service, call the SEC at |
| 202-551-8090. Information about your fund is also |
| available on the SEC’s website, and you can receive |
| copies of this information, for a fee, by sending a |
| request in either of two ways: via e-mail addressed to |
| publicinfo@sec.gov or via regular mail addressed to the |
| Public Reference Section, Securities and Exchange |
| Commission, Washington, DC 20549-1520. |

© 2010 The Vanguard Group, Inc.
All rights reserved.
Vanguard Marketing Corporation, Distributor.
Q932 052010
 |
| Vanguard Structured Equity Funds |
| Semiannual Report |
|
| March 31, 2010 |
|
 |
|
| Vanguard Structured Large-Cap Equity Fund |
| Vanguard Structured Large-Cap Growth Fund |
| Vanguard Structured Large-Cap Value Fund |
| Vanguard Structured Broad Market Fund |
|
> For the fiscal half-year, the four Vanguard Structured Equity Funds delivered double-digit returns as stock prices rallied.
> The Large-Cap Equity and Broad Market Funds outperformed their benchmark indexes, while the Large-Cap Growth and Large-Cap Value Funds trailed.
> The advisor’s stock-selection models enjoyed notable success in consumer-oriented sectors, but generally lagged in the industrial and financial sectors.
| |
| Contents | |
| Your Fund’s Total Returns | 1 |
| Chairman’s Letter | 2 |
| Advisor’s Report | 6 |
| Structured Large-Cap Equity Fund | 8 |
| Structured Large-Cap Growth Fund | 20 |
| Structured Large-Cap Value Fund | 32 |
| Structured Broad Market Fund | 43 |
| About Your Fund’s Expenses | 58 |
| Trustees Approve Advisory Arrangement | 60 |
| Glossary | 61 |
Please note: The opinions expressed in this report are just that—informed opinions. They should not be considered promises or advice. Also, please keep in mind that the information and opinions cover the period through the date on the front of this report. Of course, the risks of investing in your fund are spelled out in the prospectus.
Cover photograph: Veronica Coia.
| | |
| Your Fund’s Total Returns | | |
| |
| |
| |
| |
| Six Months Ended March 31, 2010 | | |
| | Ticker | Total |
| | Symbol | Returns |
| Vanguard Structured Large-Cap Equity Fund | | |
| Institutional Shares1 | VSLIX | 12.14% |
| Institutional Plus Shares2 | VSLPX | 12.16 |
| S&P 500 Index | | 11.75 |
| Large-Cap Core Funds Average3 | | 10.80 |
| |
| Vanguard Structured Large-Cap Growth Fund | | |
| Institutional Shares1 | VSTLX | 12.56% |
| Institutional Plus Shares2 | VSGPX | 12.61 |
| Russell 1000 Growth Index | | 12.96 |
| Large-Cap Growth Funds Average3 | | 11.58 |
| |
| Vanguard Structured Large-Cap Value Fund | | |
| Institutional Plus Shares2 | VSLVX | 10.03% |
| Russell 1000 Value Index | | 11.28 |
| Large-Cap Value Funds Average3 | | 10.59 |
| |
| Vanguard Structured Broad Market Fund | | |
| Institutional Shares1 | VSBMX | 12.38% |
| Institutional Plus Shares2 | VSBPX | 12.43 |
| Russell 3000 Index | | 12.19 |
| Multi-Cap Core Funds Average3 | | 11.00 |
1 This class of shares carries low expenses and is available for a minimum investment of $5 million.
2 This class of shares also carries low expenses and is available for a minimum investment of $200 million.
3 Derived from data provided by Lipper Inc.
1

Chairman’s Letter
Dear Shareholder,
The Vanguard Structured Equity Funds generated double-digit returns for the six months ended March 31, 2010, as stocks rallied on optimism about the strength of the U.S. economic recovery and the rebound in corporate earnings.
The Large-Cap Equity and Broad Market Funds outperformed their unmanaged benchmark indexes, while the Large-Cap Growth and Large-Cap Value Funds fell short. In general, the funds’ quantitative stock-selection models delivered strong returns in consumer-oriented sectors, but struggled in industrials and financials.
Stock market rally continued despite a few minor setbacks
After a steep but short-lived decline, stocks resumed their uphill trek in February. The broad U.S. stock market ended the six-month period up about 12%. Since stocks began their historic recovery in March just over a year ago, U.S. equities have risen more than 70%.
During the six months, small-capitalization companies outperformed larger-cap companies, while growth stocks trumped their value counterparts, though the differences weren’t all that significant.
Foreign stocks didn’t fare as well as domestic stocks, but still ended the period on a positive note. Investors’ concerns about Greece’s creditworthiness, as well as that of economies such as Spain and Portugal, weighed on the European
2
markets. In Asia, possible changes to China’s monetary policies and weakness in the Japanese market hindered the region’s results. Emerging-market stocks, which made a quick and substantial recovery from the global financial crisis, continued to outperform developed-market stocks.
Investors still favored riskier bond options
The broad U.S. taxable bond market returned about 2% for the period, as investors continued to prefer higher-risk corporate bonds over government issues. The broad municipal bond market returned 0.28%. The yields of longer-term U.S. Treasury bonds rose during the six months, while those of the shortest-term securities remained near 0%.
The Federal Reserve Board has kept its target for short-term interest rates unchanged at 0% to 0.25% since December 2008 and has said that it expects to maintain that rate for “an extended period.” In late February, Fed Chairman Ben Bernanke said that low interest rates were still necessary to help the economy recover, but that the central bank would be ready to tighten credit “at the appropriate time.” The Fed has, however, begun to wind down credit programs established during the financial crisis.
| | | |
| Market Barometer | | | |
| | | | Total Returns |
| | | Periods Ended March 31, 2010 |
| | Six Months | One Year | Five Years1 |
| Stocks | | | |
| Russell 1000 Index (Large-caps) | 12.11% | 51.60% | 2.31% |
| Russell 2000 Index (Small-caps) | 13.07 | 62.76 | 3.36 |
| Dow Jones U.S. Total Stock Market Index | 12.48 | 52.88 | 2.82 |
| MSCI All Country World Index ex USA (International) | 5.51 | 61.67 | 6.59 |
| |
| Bonds | | | |
| Barclays Capital U.S. Aggregate Bond Index | | | |
| (Broad taxable market) | 1.99% | 7.69% | 5.44% |
| Barclays Capital Municipal Bond Index | 0.28 | 9.69 | 4.58 |
| Citigroup 3-Month Treasury Bill Index | 0.05 | 0.13 | 2.76 |
| |
| CPI | | | |
| Consumer Price Index | 0.77% | 2.31% | 2.40% |
1 Annualized.
3
Mixed results during a period of strength
The Vanguard Structured Equity Funds delivered strong returns during the past six months, a welcome contrast to the performance we reported to you a year ago, when stock prices were near their bear-market bottom. Returns ranged from 10.03% for the Institutional Plus Shares of Vanguard Structured Large-Cap Value Fund to 12.61% for the Institutional Plus Shares of Vanguard Structured Large-Cap Growth Fund. On a relative basis—the more meaningful standard for these quantitatively managed portfolios—results were mixed.
The Structured Large-Cap Equity and Structured Broad Market Funds outperformed their indexes by modest margins, consistent with their attempts to produce index-beating returns while keeping portfolio risk levels in line with those of their benchmarks. The stock-selection models used by the funds’ advisor, Vanguard Quantitative Equity Group, delivered impressive results in the consumer discretionary, consumer staples, and information technology sectors.
While consumer discretionary stocks in the Standard & Poor’s 500 Index returned about 20%, for example, those in the Structured Large-Cap Equity Fund returned almost 27%. The Structured Broad Market Fund delivered a similar margin of advantage among the retailers, restaurants, and entertainment purveyors that make up the consumer discretionary sector.
The Structured Large-Cap Growth and Large-Cap Value Funds trailed the returns of their indexes, as the funds’ stock selection in both the industrial and financial sectors restrained performance. The industrial stocks in the Russell 1000 Growth Index, for example, rose almost 18% as the economic recovery gathered momentum, boosting the stock prices of transportation companies and machinery makers. The Large-Cap Growth Fund’s industrial stocks returned about 5 percentage points less. The shortfalls in the financial sector were smaller. In the Large-Cap Value Fund, however, their consequence loomed larger, simply because financials are by far the index’sand the fund’s—largest exposure.
Risk-controlled portfolios with the potential for outperformance
Like many funds that use quantitative strategies, the Vanguard Structured Equity Funds have struggled during the financial upheaval of the past few years, generally falling short of their benchmark indexes. The kinds of stocks favored by many quantitative managers—those with modest valuations and seemingly attractive earnings prospects—have trailed stocks with, in the view of many “quant” managers, more dubious profiles—that is, higher valuations and uncertain earnings prospects.
Cycles eventually turn, of course, and our long experience with the fund’s advisor and its disciplined approach to security selection give us confidence in its ability to build portfolios that, over the long term,
4
can earn index-beating returns with risk profiles similar to those of their bench-marks. Such a combination can help institutional investors maintain diversified exposure to the broad stock market, or to selected segments, while also seeking to capture increments of alpha that can hasten an institution’s progress toward its financial goals.
On another matter, I would like to inform you that as of January 1, 2010, we completed a leadership transition that began in March 2008. I succeeded Jack Brennan as chairman of Vanguard and each of the funds. Jack has agreed to serve as chairman emeritus and senior advisor. Under Jack’s leadership, Vanguard has grown to become a preeminent firm in the mutual fund industry. Jack’s energy, his relentless pursuit of perfectio n, and his unwavering focus on always doing the right thing for our clients are evident in every facet of Vanguard policy today.
Thank you for entrusting your assets to Vanguard.
Sincerely,

F. William McNabb III
Chairman and Chief Executive Officer
April 21, 2010
| | | | |
| Your Fund’s Performance at a Glance | | | | |
| September 30, 2009–March 31, 2010 | | | | |
| | | | Distributions Per Share |
| | Starting | Ending | Income | Capital |
| | Share Price | Share Price | Dividends | Gains |
| Structured Large-Cap Equity Fund | | | | |
| Institutional Shares | $19.47 | $21.44 | $0.371 | $0.000 |
| Institutional Plus Shares | 38.97 | 42.89 | 0.772 | 0.000 |
| Structured Large-Cap Growth Fund | | | | |
| Institutional Shares | $21.38 | $23.75 | $0.300 | $0.000 |
| Institutional Plus Shares | 42.60 | 47.31 | 0.627 | 0.000 |
| Structured Large-Cap Value Fund | | | | |
| Institutional Plus Shares | $36.43 | $39.16 | $0.870 | $0.000 |
| Structured Broad Market Fund | | | | |
| Institutional Shares | $18.99 | $20.98 | $0.338 | $0.000 |
| Institutional Plus Shares | 37.94 | 41.91 | 0.701 | 0.000 |
5
Advisor’s Report
The first six months of the fiscal year ended March 31, 2010, was a mixed period for Vanguard’s Structured Equity Funds.
The Structured Large-Cap Equity Fund returned 12.14% for Institutional Shares and 12.16% for Institutional Plus Shares, leading the S&P 500 Index by 0.39 and 0.41 percentage point, respectively.
The Structured Large-Cap Growth Fund returned 12.56% for Institutional Shares and 12.61% for Institutional Plus shares, trailing the performance of the Russell 1000 Growth Index by 0.40 and 0.35 percentage point, respectively.
The Structured Large-Cap Value Fund’s Institutional Plus Shares returned 10.03%, underperforming the Russell 1000 Value Index by 1.25 percentage points.
The Structured Broad Market Fund returned 12.38% for Institutional Shares and 12.43% for Institutional Plus Shares, leading the Russell 3000 Index by 0.19 and 0.24 percentage point, respectively.
The investment environment
Signs that the recession might be ending raised stock prices and lowered expected volatility over the half-year.
As investors became less concerned about systemic risk, the ability to discriminate among stocks has improved. The funds’ stock-selection model benefited from the improved environment, and our model components posted positive returns for the six months. The model we use considers multiple factors because our research (and common sense) tells us there is no single indicator for picking attractive stocks. Our process involves five themes, each with several components: valuation, growth, management decisions, market sentiment, and quality.
Valuation measures the price we pay for earnings and cash flows. How much we pay for earnings depends on the growth of earnings, which our growth model evaluates. Company managers, who are privy to more specific knowledge about a company’s prospects and earnings than are market participants, take actions that signal their opinions of a firm’s future. Managers’ opinions are reflected in their investment decisions or their purchases and sales of company stock. Investors express their opinions of a company through their activity in the market, which we capture in our market sentiment model. Finally, our quality model measures balance-sheet strength and the sustainability of earnings. Over the past six months, our valuation model provided our best-performing signals. Market sentiment was mixed, with stronger results in large-capitalization companies than in small-cap issues. Our quality and growth models also pr oduced positive returns for the period, along with our management indicator.
Although our model worked overall, some of the Structured Equity Funds lagged their benchmark returns for the period. Why?
6
The model’s return is a theoretical return, which measures the average return of our process across all stocks in the market. The theoretical return assumes that a fund can purchase every attractive stock and sell each unattractive stock every day, without transaction costs. That is, of course, impossible for a real portfolio, which needs to trade off transaction costs and risk against the possible gain from a trade. The model return tells us whether our process is working in general, but it is only a rough indicator of our actual portfolio returns. It is common for the portfolio’s return to vary from the model return.
Structured Large-Cap Equity Fund
Ford Motor and Wyndham Worldwide were the top two contributors to the Structured Large-Cap Equity Fund’s return. The portfolio’s relative return was restrained by underweightings to Amazon.com and Walt Disney.
Structured Large-Cap Growth Fund
Big Lots made the biggest contribution to the Structured Large-Cap Growth Fund’s performance, followed by Mylan and Coca-Cola Enterprises. Notable weaknesses included our underweightings of Visa and Amazon.com relative to the benchmark.
Structured Large-Cap Value Fund
Again, our best-performing stocks were Ford and Wyndham Worldwide. Our underweightings in Boeing and Walt Disney hurt relative performance.
Structured Broad Market Fund
Ford and Talbots provided the largest positive contributions to return, while underweightings in Boeing and Walt Disney restrained relative results.
James. D. Troyer, CFA
Principal and Portfolio Manager
James P. Stetler
Principal and Portfolio Manager
Joel M. Dickson, Ph.D.
Principal and Head,
Vanguard Active Quantitative Equity Management
Vanguard Quantitative Equity Group
April 22, 2010
7
Structured Large-Cap Equity Fund
Fund Profile
As of March 31, 2010
| | | |
| Portfolio Characteristics | | |
| | | Comparative | Broad |
| | Fund | Index1 | Index2 |
| Number of Stocks | 194 | 500 | 4,159 |
| Median Market Cap | $52.7B | $48.2B | $31.4.B |
| Price/Earnings Ratio | 16.6x | 20.9x | 23.0x |
| Price/Book Ratio | 2.3x | 2.2x | 2.2x |
| Yield3 | | 1.9% | 1.7% |
| Institutional Shares | 1.5% | | |
| Institutional | | | |
| Plus Shares | 1.6% | | |
| Return on Equity | 21.5% | 20.6% | 19.1% |
| Earnings Growth Rate | 11.6% | 6.8% | 6.9% |
| Foreign Holdings | 0.0% | 0.0% | 0.0% |
| Turnover Rate4 | 60% | — | — |
| Expense Ratio5 | | — | — |
| Institutional Shares | 0.25% | | |
| Institutional | | | |
| Plus Shares | 0.17% | | |
| Short-Term Reserves | 0.0% | — | — |
| | | |
| Sector Diversification (% of equity exposure) |
| | Comparative | Broad |
| | Fund | Index1 | Index2 |
| Consumer Discretionary | 10.5% | 10.1% | 11.0% |
| Consumer Staples | 11.1 | 11.3 | 9.8 |
| Energy | 11.4 | 10.9 | 10.0 |
| Financials | 16.4 | 16.5 | 17.3 |
| Health Care | 12.1 | 12.1 | 12.4 |
| Industrials | 10.3 | 10.5 | 10.9 |
| Information Technology | 19.1 | 18.9 | 18.5 |
| Materials | 3.1 | 3.5 | 4.0 |
| Telecommunication | | | |
| Services | 2.8 | 2.8 | 2.6 |
| Utilities | 3.2 | 3.4 | 3.5 |
| | |
| Volatility Measures6 | |
| | Fund Versus | Fund Versus |
| | Comparative Index1 | Broad Index2 |
| R-Squared | 1.00 | 0.99 |
| Beta | 0.99 | 0.96 |
| | |
| Ten Largest Holdings7 (% of total net assets) |
| Exxon Mobil Corp. | integrated oil & gas | 3.5% |
| Microsoft Corp. | systems software | 2.6 |
| Apple Inc. | computer hardware | 2.6 |
| JPMorgan Chase & Co. | other diversified | |
| | financial services | 2.2 |
| International Business | | |
| Machines Corp. | computer hardware | 2.1 |
| Wells Fargo & Co. | diversified banks | 2.0 |
| AT&T Inc. | integrated | |
| | telecommunication | |
| | services | 1.9 |
| Chevron Corp. | integrated oil & gas | 1.9 |
| Google Inc. Class A | Internet software & | |
| | services | 1.8 |
| Johnson & Johnson | pharmaceuticals | 1.8 |
| Top Ten | | 22.4% |
Investment Focus
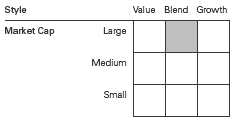
1 S&P 500 Index.
2 Dow Jones U.S.Total Stock Market Index.
3 30-day SEC yield for the fund; annualized dividend yield for the indexes. See the Glossary.
4 Annualized.
5 The expense ratios shown are from the prospectus dated January 27, 2010, and represent estimated costs for the current fiscal year based
on the fund’s net assets as of the prospectus date. For the six months ended March 31, 2010, the annualized expense ratios were 0.24%
for the Institutional Shares and 0.17% for the Institutional Plus Shares.
6 For an explanation of R-squared, beta, and other terms used here, see the Glossary.
7 The holdings listed exclude any temporary cash investments and equity index products.
8
Structured Large-Cap Equity Fund
Performance Summary
All of the returns in this report represent past performance, which is not a guarantee of future results that may be achieved by the fund. (Current performance may be lower or higher than the performance data cited. For performance data current to the most recent month-end, visit our website at www.vanguard.com/performance.) Note, too, that both investment returns and principal value can fluctuate widely, so an investor’s shares, when sold, could be worth more or less than their original cost. The returns shown do not reflect taxes that a shareholder would pay on fund distributions or on the sale of fund shares.
Fiscal-Year Total Returns (%): May 16, 2006–March 31, 2010
| | | |
| Average Annual Total Returns: Periods Ended March 31, 2010 | | |
| | | | Since |
| | Inception Date | One Year | Inception2 |
| Institutional Shares | 5/16/2006 | 47.33% | –1.51% |
| Institutional Plus Shares | 5/15/2006 | 47.37 | –1.47 |
1 Six months ended March 31, 2010.
2 Performance for the fund and its comparative standards is calculated since the following inception dates: May 15, 2006, for Institutional
Plus Shares; May 16, 2006, for Institutional Shares.
See Financial Highlights for dividend and capital gains information.
9
Structured Large-Cap Equity Fund
Financial Statements (unaudited)
Statement of Net Assets
As of March 31, 2010
The fund reports a complete list of its holdings in regulatory filings four times in each fiscal year, at the quarter-ends. For the second and fourth fiscal quarters, the lists appear in the fund’s semiannual and annual reports to shareholders. For the first and third fiscal quarters, the fund files the lists with the Securities and Exchange Commission on Form N-Q. Shareholders can look up the fund’s Forms N-Q on the SEC’s website at www.sec.gov. Forms N-Q may also be reviewed and copied at the SEC’s Public Reference Room (see the back cover of this report for further information).
| | | |
| | | | Market |
| | | | Value• |
| | | Shares | ($000) |
| Common Stocks (99.9%)1 | | |
| Consumer Discretionary (10.5%) | |
| * | Ford Motor Co. | 447,606 | 5,626 |
| | McDonald’s Corp. | 74,597 | 4,977 |
| | Comcast Corp. Class A | 252,785 | 4,757 |
| | TJX Cos. Inc. | 103,416 | 4,397 |
| | Gap Inc. | 179,722 | 4,153 |
| | Wyndham Worldwide Corp. | 154,140 | 3,966 |
| | Time Warner Cable Inc. | 73,200 | 3,902 |
| | Ltd Brands Inc. | 157,793 | 3,885 |
| | Gannett Co. Inc. | 222,500 | 3,676 |
| * | Starbucks Corp. | 131,200 | 3,184 |
| | Time Warner Inc. | 100,800 | 3,152 |
| * | AutoNation Inc. | 135,400 | 2,448 |
| | Stanley Black & Decker Inc. | 41,500 | 2,383 |
| | McGraw-Hill Cos. Inc. | 62,200 | 2,217 |
| | Comcast Corp. | 111,200 | 1,998 |
| * | Big Lots Inc. | 51,400 | 1,872 |
| | DR Horton Inc. | 141,600 | 1,784 |
| * | Amazon.com Inc. | 11,000 | 1,493 |
| | Target Corp. | 23,800 | 1,252 |
| | Lennar Corp. Class A | 62,700 | 1,079 |
| | Yum! Brands Inc. | 27,775 | 1,065 |
| | Darden Restaurants Inc. | 20,200 | 900 |
| | Ross Stores Inc. | 10,900 | 583 |
| | Macy’s Inc. | 21,900 | 477 |
| | Whirlpool Corp. | 5,358 | 468 |
| | Walt Disney Co. | 12,629 | 441 |
| * | Harman International | | |
| | Industries Inc. | 4,200 | 197 |
| | Mattel Inc. | 8,600 | 196 |
| | Leggett & Platt Inc. | 8,200 | 177 |
| * | DIRECTV Class A | 3,200 | 108 |
| * | New York Times Co. Class A | 6,400 | 71 |
| | | | 66,884 |
| Consumer Staples (11.1%) | | |
| | Wal-Mart Stores Inc. | 191,396 | 10,642 |
| | Philip Morris | | |
| | International Inc. | 177,436 | 9,255 |
| | Procter & Gamble Co. | 144,894 | 9,167 |
| | | |
| | | | Market |
| | | | Value• |
| | | Shares | ($000) |
| | General Mills Inc. | 65,683 | 4,650 |
| | Coca-Cola Co. | 80,940 | 4,452 |
| | Kimberly-Clark Corp. | 69,644 | 4,379 |
| | Coca-Cola Enterprises Inc. | 146,600 | 4,055 |
| | Estee Lauder Cos. Inc. | | |
| | Class A | 61,800 | 4,009 |
| | Sara Lee Corp. | 251,700 | 3,506 |
| | ConAgra Foods Inc. | 121,038 | 3,034 |
| | PepsiCo Inc. | 45,792 | 3,030 |
| | SUPERVALU Inc. | 161,300 | 2,691 |
| | Dr Pepper Snapple | | |
| | Group Inc. | 70,800 | 2,490 |
| | Campbell Soup Co. | 49,258 | 1,741 |
| | Hershey Co. | 31,141 | 1,333 |
| | Reynolds American Inc. | 10,400 | 561 |
| | Tyson Foods Inc. Class A | 23,700 | 454 |
| | Walgreen Co. | 9,600 | 356 |
| | Molson Coors Brewing Co. | | |
| | Class B | 7,370 | 310 |
| * | Whole Foods Market Inc. | 8,300 | 300 |
| | Colgate-Palmolive Co. | 1,700 | 145 |
| | Hormel Foods Corp. | 2,100 | 88 |
| | | | 70,648 |
| Energy (11.4%) | | |
| | Exxon Mobil Corp. | 332,539 | 22,273 |
| | Chevron Corp. | 160,456 | 12,167 |
| | ConocoPhillips | 122,959 | 6,292 |
| | Apache Corp. | 51,946 | 5,273 |
| | Peabody Energy Corp. | 85,602 | 3,912 |
| | National Oilwell Varco Inc. | 94,354 | 3,829 |
| | Anadarko Petroleum Corp. | 51,492 | 3,750 |
| | Consol Energy Inc. | 85,105 | 3,631 |
| | Occidental Petroleum Corp. | 39,951 | 3,377 |
| * | FMC Technologies Inc. | 41,500 | 2,682 |
| | Schlumberger Ltd. | 29,955 | 1,901 |
| | Murphy Oil Corp. | 27,185 | 1,528 |
| | El Paso Corp. | 64,050 | 694 |
| | Massey Energy Co. | 7,215 | 377 |
| * | Rowan Cos. Inc. | 11,700 | 341 |
| | Williams Cos. Inc. | 10,300 | 238 |
| | | | 72,265 |
10
| | | |
| Structured Large-Cap Equity Fund | |
| |
| |
| |
| | | | Market |
| | | | Value• |
| | | Shares | ($000) |
| Financials (16.3%) | | |
| | JPMorgan Chase & Co. | 314,279 | 14,064 |
| | Wells Fargo & Co. | 411,435 | 12,804 |
| | Goldman Sachs Group Inc. | 49,998 | 8,531 |
| | Bank of America Corp. | 408,753 | 7,296 |
| | US Bancorp | 247,924 | 6,416 |
| | Travelers Cos. Inc. | 92,968 | 5,015 |
| | Aflac Inc. | 92,194 | 5,005 |
| | Franklin Resources Inc. | 37,926 | 4,206 |
| | Chubb Corp. | 80,843 | 4,192 |
| | Ameriprise Financial Inc. | 90,200 | 4,091 |
| * | CB Richard Ellis Group Inc. | | |
| | Class A | 240,900 | 3,818 |
| | American Express Co. | 92,285 | 3,808 |
| | Unum Group | 144,713 | 3,585 |
| * | Berkshire Hathaway Inc. | | |
| | Class B | 43,105 | 3,503 |
| | Discover Financial Services | 220,700 | 3,288 |
| | Hudson City Bancorp Inc. | 179,701 | 2,545 |
| | State Street Corp. | 48,734 | 2,200 |
| | Simon Property Group Inc. | 25,517 | 2,141 |
| | PNC Financial Services | | |
| | Group Inc. | 28,000 | 1,672 |
| * | Berkshire Hathaway Inc. | | |
| | Class A | 11 | 1,340 |
| * | Citigroup Inc. | 327,456 | 1,326 |
| | Ventas Inc. | 14,104 | 670 |
| * | SLM Corp. | 49,000 | 613 |
| | Capital One Financial Corp. | 13,100 | 542 |
| | Public Storage | 3,629 | 334 |
| | Progressive Corp. | 16,400 | 313 |
| | ProLogis | 23,500 | 310 |
| | Federated Investors Inc. | | |
| | Class B | 7,890 | 208 |
| | M&T Bank Corp. | 1,600 | 127 |
| | Fifth Third Bancorp | 4,900 | 67 |
| | | | 104,030 |
| Health Care (12.1%) | | |
| | Johnson & Johnson | 174,846 | 11,400 |
| | Merck & Co. Inc. | 271,894 | 10,155 |
| | Pfizer Inc. | 412,719 | 7,078 |
| * | Amgen Inc. | 113,113 | 6,760 |
| * | Medco Health Solutions Inc. | 79,966 | 5,163 |
| * | WellPoint Inc. | 78,984 | 5,085 |
| | UnitedHealth Group Inc. | 149,474 | 4,883 |
| | McKesson Corp. | 66,600 | 4,377 |
| * | Mylan Inc. | 176,600 | 4,011 |
| | AmerisourceBergen Corp. | | |
| | Class A | 137,298 | 3,971 |
| | Eli Lilly & Co. | 99,787 | 3,614 |
| | Abbott Laboratories | 65,068 | 3,428 |
| | Quest Diagnostics Inc. | 55,698 | 3,247 |
| * | Cephalon Inc. | 18,205 | 1,234 |
| | Baxter International Inc. | 20,018 | 1,165 |
| * | Forest Laboratories Inc. | 22,100 | 693 |
| * | Hospira Inc. | 6,000 | 340 |
| | | |
| | | | Market |
| | | | Value• |
| | | Shares | ($000) |
| * | Life Technologies Corp. | 6,400 | 334 |
| * | Tenet Healthcare Corp. | 20,500 | 117 |
| | CIGNA Corp. | 2,200 | 80 |
| * | King Pharmaceuticals Inc. | 5,600 | 66 |
| | | | 77,201 |
| Industrials (10.3%) | | |
| | General Electric Co. | 499,722 | 9,095 |
| | United Parcel Service Inc. | | |
| | Class B | 114,221 | 7,357 |
| | 3M Co. | 82,013 | 6,854 |
| | FedEx Corp. | 55,600 | 5,193 |
| | Lockheed Martin Corp. | 60,038 | 4,996 |
| | Raytheon Co. | 80,727 | 4,611 |
| | Northrop Grumman Corp. | 67,916 | 4,453 |
| | Boeing Co. | 60,700 | 4,407 |
| | United Technologies Corp. | 53,536 | 3,941 |
| | Flowserve Corp. | 35,074 | 3,868 |
| | Honeywell International Inc. | 53,783 | 2,435 |
| | CSX Corp. | 41,618 | 2,118 |
| | L-3 Communications | | |
| | Holdings Inc. | 19,487 | 1,786 |
| | RR Donnelley & Sons Co. | 63,700 | 1,360 |
| | Pitney Bowes Inc. | 37,600 | 919 |
| | Waste Management Inc. | 17,630 | 607 |
| | ITT Corp. | 9,800 | 525 |
| | Avery Dennison Corp. | 10,900 | 397 |
| | Cummins Inc. | 5,000 | 310 |
| | Southwest Airlines Co. | 15,000 | 198 |
| | Caterpillar Inc. | 2,000 | 126 |
| | | | 65,556 |
| Information Technology (19.1%) | |
| | Microsoft Corp. | 573,841 | 16,796 |
| * | Apple Inc. | 69,942 | 16,431 |
| | International Business | | |
| | Machines Corp. | 105,640 | 13,548 |
| * | Google Inc. Class A | 20,255 | 11,485 |
| | Hewlett-Packard Co. | 209,100 | 11,114 |
| | Oracle Corp. | 373,088 | 9,585 |
| * | Cisco Systems Inc. | 235,115 | 6,120 |
| * | eBay Inc. | 185,700 | 5,005 |
| | Intel Corp. | 194,653 | 4,333 |
| * | Computer Sciences Corp. | 67,698 | 3,689 |
| * | Western Digital Corp. | 92,300 | 3,599 |
| * | Motorola Inc. | 508,800 | 3,572 |
| | Texas Instruments Inc. | 129,068 | 3,158 |
| * | Symantec Corp. | 158,807 | 2,687 |
| | Xilinx Inc. | 99,853 | 2,546 |
| * | Micron Technology Inc. | 242,700 | 2,522 |
| * | LSI Corp. | 323,600 | 1,980 |
| | QUALCOMM Inc. | 26,557 | 1,115 |
| * | Teradata Corp. | 23,739 | 686 |
| | CA Inc. | 23,663 | 555 |
| * | VeriSign Inc. | 9,400 | 245 |
| * | Red Hat Inc. | 7,600 | 222 |
| * | BMC Software Inc. | 5,700 | 217 |
| * | JDS Uniphase Corp. | 8,800 | 110 |
11
| | | |
| Structured Large-Cap Equity Fund | |
| |
| |
| |
| | | | Market |
| | | | Value• |
| | | Shares | ($000) |
| * | Advanced Micro Devices Inc. | 11,400 | 106 |
| | Jabil Circuit Inc. | 5,500 | 89 |
| | Molex Inc. | 3,800 | 79 |
| * | Teradyne Inc. | 6,700 | 75 |
| | | | 121,669 |
| Materials (3.1%) | | |
| | EI du Pont de Nemours | | |
| | & Co. | 148,253 | 5,521 |
| | Freeport-McMoRan | | |
| | Copper & Gold Inc. | 65,000 | 5,430 |
| | International Paper Co. | 147,000 | 3,618 |
| * | Pactiv Corp. | 88,400 | 2,226 |
| | Eastman Chemical Co. | 26,600 | 1,694 |
| | Ball Corp. | 19,400 | 1,035 |
| | AK Steel Holding Corp. | 3,400 | 78 |
| | Newmont Mining Corp. | 1,400 | 71 |
| | | | 19,673 |
| Telecommunication Services (2.8%) | |
| | AT&T Inc. | 478,935 | 12,376 |
| | Qwest Communications | | |
| | International Inc. | 517,300 | 2,700 |
| | Verizon Communications Inc. | 67,496 | 2,094 |
| | Windstream Corp. | 65,006 | 708 |
| * | Sprint Nextel Corp. | 22,300 | 85 |
| | | | 17,963 |
| Utilities (3.2%) | | |
| | Public Service Enterprise | | |
| | Group Inc. | 128,000 | 3,779 |
| | Constellation Energy | | |
| | Group Inc. | 89,800 | 3,153 |
| * | AES Corp. | 273,441 | 3,008 |
| | American Electric | | |
| | Power Co. Inc. | 72,324 | 2,472 |
| | Exelon Corp. | 54,400 | 2,383 |
| | CMS Energy Corp. | 99,238 | 1,534 |
| | Entergy Corp. | 18,700 | 1,521 |
| | DTE Energy Co. | 23,600 | 1,053 |
| | Integrys Energy Group Inc. | 10,200 | 483 |
| | NiSource Inc. | 25,500 | 403 |
| | Nicor Inc. | 9,300 | 390 |
| | CenterPoint Energy Inc. | 12,700 | 182 |
| | | | 20,361 |
| Total Common Stocks | | |
| (Cost $564,968) | | 636,250 |
| | |
| | Face | Market |
| | Amount | Value• |
| | ($000) | ($000) |
| Temporary Cash Investment (0.1%)1 | |
| U.S. Government and Agency Obligations (0.1%) |
| 2,3 Freddie Mac Discount | | |
| Notes, 0.245%, 9/21/10 | | |
| (Cost $400) | 400 | 400 |
| Total Investments (100.0%) | | |
| (Cost $565,368) | | 636,650 |
| Other Assets and Liabilities (0.0%) | |
| Other Assets | | 960 |
| Liabilities | | (985) |
| | | (25) |
| Net Assets (100%) | | 636,625 |
| |
| |
| At March 31, 2010, net assets consisted of: | |
| | | Amount |
| | | ($000) |
| Paid-in Capital | | 836,801 |
| Undistributed Net Investment Income | 2,350 |
| Accumulated Net Realized Losses | (273,807) |
| Unrealized Appreciation (Depreciation) | |
| Investment Securities | | 71,282 |
| Futures Contracts | | (1) |
| Net Assets | | 636,625 |
| |
| Institutional Shares—Net Assets | |
| Applicable to 5,495,221 outstanding | |
| $.001 par value shares of beneficial | |
| interest (unlimited authorization) | 117,799 |
| Net Asset Value Per Share— | | |
| Institutional Shares | | $21.44 |
| |
| Institutional Plus Shares—Net Assets | |
| Applicable to 12,097,743 outstanding | |
| $.001 par value shares of beneficial | |
| interest (unlimited authorization) | 518,826 |
| Net Asset Value Per Share— | | |
| Institutional Plus Shares | | $42.89 |
• See Note A in Notes to Financial Statements.
* Non-income-producing security.
1 The fund invests a portion of its cash reserves in equity markets through the use of index futures contracts. After giving effect to futures
investments, the fund’s effective common stock and temporary cash investment positions represent 100.0% and 0.0%, respectively, of
net assets.
2 The issuer operates under a congressional charter; its securities are not backed by the full faith and credit of the U.S. government.
3 Securities with a value of $400,000 have been segregated as initial margin for open futures contracts.
See accompanying Notes, which are an integral part of the Financial Statements.
12
| |
| Structured Large-Cap Equity Fund | |
| |
| |
| Statement of Operations | |
| |
| | Six Months Ended |
| | March 31, 2010 |
| | ($000) |
| Investment Income | |
| Income | |
| Dividends | 6,269 |
| Interest | 2 |
| Security Lending | 57 |
| Total Income | 6,328 |
| Expenses | |
| The Vanguard Group—Note B | |
| Investment Advisory Services | 264 |
| Management and Administrative—Institutional Shares | 73 |
| Management and Administrative—Institutional Plus Shares | 157 |
| Marketing and Distribution—Institutional Shares | 9 |
| Marketing and Distribution—Institutional Plus Shares | 37 |
| Custodian Fees | 8 |
| Total Expenses | 548 |
| Net Investment Income | 5,780 |
| Realized Net Gain (Loss) | |
| Investment Securities Sold | 8,803 |
| Futures Contracts | (37) |
| Realized Net Gain (Loss) | 8,766 |
| Change in Unrealized Appreciation (Depreciation) | |
| Investment Securities | 54,736 |
| Futures Contracts | 7 |
| Change in Unrealized Appreciation (Depreciation) | 54,743 |
| Net Increase (Decrease) in Net Assets Resulting from Operations | 69,289 |
See accompanying Notes, which are an integral part of the Financial Statements.
13
| | |
| Structured Large-Cap Equity Fund | | |
| |
| |
| Statement of Changes in Net Assets | | |
| |
| | Six Months Ended | Year Ended |
| | March 31, | September 30, |
| | 2010 | 2009 |
| | ($000) | ($000) |
| Increase (Decrease) in Net Assets | | |
| Operations | | |
| Net Investment Income | 5,780 | 12,474 |
| Realized Net Gain (Loss) | 8,766 | (242,061) |
| Change in Unrealized Appreciation (Depreciation) | 54,743 | 118,445 |
| Net Increase (Decrease) in Net Assets Resulting from Operations | 69,289 | (111,142) |
| Distributions | | |
| Net Investment Income | | |
| Institutional Shares | (2,024) | (3,907) |
| Institutional Plus Shares | (9,247) | (13,919) |
| Realized Capital Gain | | |
| Institutional Shares | — | — |
| Institutional Plus Shares | — | — |
| Total Distributions | (11,271) | (17,826) |
| Capital Share Transactions | | |
| Institutional Shares | 610 | (10,600) |
| Institutional Plus Shares | 4,834 | (99,837) |
| Net Increase (Decrease) from Capital Share Transactions | 5,444 | (110,437) |
| Total Increase (Decrease) | 63,462 | (239,405) |
| Net Assets | | |
| Beginning of Period | 573,163 | 812,568 |
| End of Period1 | 636,625 | 573,163 |
| 1 Net Assets—End of Period includes undistributed net investment income of $2,350,000 and $7,841,000. | |
See accompanying Notes, which are an integral part of the Financial Statements.
14
| | | | | |
| Structured Large-Cap Equity Fund | | | | | |
| |
| |
| Financial Highlights | | | | | |
| |
| |
| Institutional Shares | | | | | |
| | Six Months | | | | May 16, |
| | Ended | | | | 20061 to |
| | March 31, | Year Ended September 30, | Sept. 30, |
| For a Share Outstanding Throughout Each Period | 2010 | 2009 | 2008 | 2007 | 2006 |
| Net Asset Value, Beginning of Period | $19.47 | $22.56 | $29.98 | $26.03 | $24.96 |
| Investment Operations | | | | | |
| Net Investment Income | .190 | .546 | .492 | .4762 | .130 |
| Net Realized and Unrealized Gain (Loss) | | | | | |
| on Investments | 2.151 | (2.993) | (7.091) | 3.657 | .940 |
| Total from Investment Operations | 2.341 | (2.447) | (6.599) | 4.133 | 1.070 |
| Distributions | | | | | |
| Dividends from Net Investment Income | (.371) | (.643) | (.430) | (.172) | — |
| Distributions from Realized Capital Gains | — | — | (.391) | (.011) | — |
| Total Distributions | (.371) | (.643) | (.821) | (.183) | — |
| Net Asset Value, End of Period | $21.44 | $19.47 | $22.56 | $29.98 | $26.03 |
| |
| Total Return | 12.14% | –10.25% | –22.52% | 15.94% | 4.29% |
| |
| Ratios/Supplemental Data | | | | | |
| Net Assets, End of Period (Millions) | $118 | $106 | $135 | $187 | $127 |
| Ratio of Total Expenses to | | | | | |
| Average Net Assets | 0.24%3 | 0.25% | 0.20% | 0.25% | 0.25%3 |
| Ratio of Net Investment Income to | | | | | |
| Average Net Assets | 1.87%3 | 2.33% | 1.91% | 1.69% | 1.67%3 |
| Portfolio Turnover Rate4 | 60%3 | 80% | 72% | 54% | 30% |
1 Inception.
2 Calculated based on average shares outstanding.
3 Annualized.
4 Excludes the value of portfolio securities received or delivered as a result of in-kind purchases or redemptions of the fund’s capital shares.
See accompanying Notes, which are an integral part of the Financial Statements.
15
| | | | | |
| Structured Large-Cap Equity Fund | | | | | |
| |
| |
| Financial Highlights | | | | | |
| |
| |
| Institutional Plus Shares | | | | | |
| | Six Months | | | | May 15, |
| | Ended | | | | 20061 to |
| | March 31, | Year Ended September 30, | Sept. 30, |
| For a Share Outstanding Throughout Each Period | 2010 | 2009 | 2008 | 2007 | 2006 |
| Net Asset Value, Beginning of Period | $38.97 | $45.15 | $60.02 | $52.07 | $50.00 |
| Investment Operations | | | | | |
| Net Investment Income | .394 | 1.116 | 1.025 | 1.0182 | .250 |
| Net Realized and Unrealized Gain (Loss) | | | | | |
| on Investments | 4.298 | (5.980) | (14.193) | 7.317 | 1.820 |
| Total from Investment Operations | 4.692 | (4.864) | (13.168) | 8.335 | 2.070 |
| Distributions | | | | | |
| Dividends from Net Investment Income | (.772) | (1.316) | (.920) | (.363) | — |
| Distributions from Realized Capital Gains | — | — | (.782) | (.022) | — |
| Total Distributions | (.772) | (1.316) | (1.702) | (.385) | — |
| Net Asset Value, End of Period | $42.89 | $38.97 | $45.15 | $60.02 | $52.07 |
| |
| Total Return | 12.16% | –10.16% | –22.46% | 16.07% | 4.14% |
| |
| Ratios/Supplemental Data | | | | | |
| Net Assets, End of Period (Millions) | $519 | $467 | $677 | $819 | $203 |
| Ratio of Total Expenses to | | | | | |
| Average Net Assets | 0.17%3 | 0.17% | 0.12% | 0.15% | 0.15%3 |
| Ratio of Net Investment Income to | | | | | |
| Average Net Assets | 1.94%3 | 2.41% | 1.99% | 1.79% | 1.77%3 |
| Portfolio Turnover Rate4 | 60%3 | 80% | 72% | 54% | 30% |
1 Inception.
2 Calculated based on average shares outstanding.
3 Annualized.
4 Excludes the value of portfolio securities received or delivered as a result of in-kind purchases or redemptions of the fund’s capital shares.
See accompanying Notes, which are an integral part of the Financial Statements.
16
Structured Large-Cap Equity Fund
Notes to Financial Statements
Vanguard Structured Large-Cap Equity Fund is registered under the Investment Company Act of 1940 as an open-end investment company, or mutual fund. The fund offers two classes of shares: Institutional Shares and Institutional Plus Shares. Institutional Shares are available to investors who invest a minimum of $5 million. Institutional Plus Shares are available to investors who invest a minimum of $200 million ($100 million for investors with total Vanguard investments of at least $1 billion).
A. The following significant accounting policies conform to generally accepted accounting principles for U.S. mutual funds. The fund consistently follows such policies in preparing its financial statements.
1. Security Valuation: Securities are valued as of the close of trading on the New York Stock Exchange (generally 4 p.m., Eastern time) on the valuation date. Equity securities are valued at the latest quoted sales prices or official closing prices taken from the primary market in which each security trades; such securities not traded on the valuation date are valued at the mean of the latest quoted bid and asked prices. Securities for which market quotations are not readily available, or whose values have been materially affected by events occurring before the fund’s pricing time but after the close of the securities’ primary markets, are valued by methods deemed by the board of trustees to represent fair value. Investments in Vanguard Market Liquidity Fund are valued at that fund’s net asset value. Temporary cash investments acquired over 60 days to maturity are valued using the latest bid prices or using valuations based on a matrix system (which considers such factors as security prices, yields, maturities, and ratings), both as furnished by independent pricing services. Other temporary cash investments are valued at amortized cost, which approximates market value.
2. Futures Contracts: The fund uses index futures contracts to a limited extent, with the objective of maintaining full exposure to the stock market while maintaining liquidity. The fund may purchase or sell futures contracts to achieve a desired level of investment, whether to accommodate portfolio turnover or cash flows from capital share transactions. The primary risks associated with the use of futures contracts are imperfect correlation between changes in market values of stocks held by the fund and the prices of futures contracts, and the possibility of an illiquid market.
Futures contracts are valued at their quoted daily settlement prices. The aggregate principal amounts of the contracts are not recorded in the Statement of Net Assets. Fluctuations in the value of the contracts are recorded in the Statement of Net Assets as an asset (liability) and in the Statement of Operations as unrealized appreciation (depreciation) until the contracts are closed, when they are recorded as realized futures gains (losses).
3. Federal Income Taxes: The fund intends to continue to qualify as a regulated investment company and distribute all of its taxable income. Management has analyzed the fund’s tax positions taken for all open federal income tax years (September 30, 2006–2009), and for the period ended March 31, 2010, and has concluded that no provision for federal income tax is required in the fund’s financial statements.
4. Distributions: Distributions to shareholders are recorded on the ex-dividend date.
5. Security Lending: The fund may lend its securities to qualified institutional borrowers to earn additional income. Security loans are required to be secured at all times by collateral at least equal to the market value of securities loaned. The fund invests cash collateral received in Vanguard Market Liquidity Fund, and records a liability for the return of the collateral, during the period the securities are on loan. Security lending income represents the income earned on investing cash collateral, less expenses associated with the loan.
17
Structured Large-Cap Equity Fund
6. Other: Dividend income is recorded on the ex-dividend date. Interest income includes income distributions received from Vanguard Market Liquidity Fund and is accrued daily. Security transactions are accounted for on the date securities are bought or sold. Costs used to determine realized gains (losses) on the sale of investment securities are those of the specific securities sold.
Each class of shares has equal rights as to assets and earnings, except that each class separately bears certain class-specific expenses related to maintenance of shareholder accounts (included in Management and Administrative expenses) and shareholder reporting. Marketing and distribution expenses are allocated to each class of shares based on a method approved by the board of trustees. Income, other non-class-specific expenses, and gains and losses on investments are allocated to each class of shares based on its relative net assets.
B. The Vanguard Group furnishes at cost investment advisory, corporate management, administrative, marketing, and distribution services. The costs of such services are allocated to the fund under methods approved by the board of trustees. The fund has committed to provide up to 0.40% of its net assets in capital contributions to Vanguard. At March 31, 2010, the fund had contributed capital of $118,000 to Vanguard (included in Other Assets), representing 0.02% of the fund’s net assets and 0.05% of Vanguard’s capitalization. The fund’s trustees and officers are also directors and officers of Vanguard.
C. Various inputs may be used to determine the value of the fund’s investments. These inputs are summarized in three broad levels for financial statement purposes. The inputs or methodologies used to value securities are not necessarily an indication of the risk associated with investing in those securities.
Level 1—Quoted prices in active markets for identical securities.
Level 2—Other significant observable inputs (including quoted prices for similar securities, interest rates, prepayment speeds, credit risk, etc.).
Level 3—Significant unobservable inputs (including the fund’s own assumptions used to determine the fair value of investments).
The following table summarizes the fund’s investments as of March 31, 2010, based on the inputs used to value them:
| | | |
| | Level 1 | Level 2 | Level 3 |
| Investments | ($000) | ($000) | ($000) |
| Common Stocks | 636,250 | — | — |
| Temporary Cash Investments | — | 400 | — |
| Futures Contracts—Liabilities1 | (1) | — | — |
| Total | 636,249 | 400 | — |
| 1 Represents variation margin on the last day of the reporting period. | | | |
D. At March 31, 2010, the aggregate settlement value of open futures contracts and the related unrealized appreciation (depreciation) were:
| | | | |
| | | | | ($000) |
| | | | Aggregate | |
| | | Number of | Settlement | Unrealized |
| | | Long (Short) | Value | Appreciation |
| Futures Contracts | Expiration | Contracts | Long (Short) | (Depreciation) |
| E-mini S&P 500 Index | June 2010 | 4 | 233 | (1) |
18
Structured Large-Cap Equity Fund
Unrealized appreciation (depreciation) on open futures contracts is required to be treated as realized gain (loss) for tax purposes.
E. Distributions are determined on a tax basis and may differ from net investment income and realized capital gains for financial reporting purposes. Differences may be permanent or temporary. Permanent differences are reclassified among capital accounts in the financial statements to reflect their tax character. Temporary differences arise when certain items of income, expense, gain, or loss are recognized in different periods for financial statement and tax purposes; these differences will reverse at some time in the future. Differences in classification may also result from the treatment of short-term gains as ordinary income for tax purposes.
The fund’s tax-basis capital gains and losses are determined only at the end of each fiscal year. For tax purposes, at September 30, 2009, the fund had available capital loss carryforwards totaling $163,235,000 to offset future net capital gains through September 30, 2017. In addition, the fund realized losses of $119,350,000 during the period from November 1, 2008, through September 30, 2009, which are deferred and will be treated as realized for tax purposes in fiscal 2010. The fund will use these capital losses to offset net taxable capital gains, if any, realized during the year ending September 30, 2010; should the fund realize net capital losses for the year, the losses will be added to the loss carryforward balance above.
At March 31, 2010, the cost of investment securities for tax purposes was $565,368,000. Net unrealized appreciation of investment securities for tax purposes was $71,282,000, consisting of unrealized gains of $92,914,000 on securities that had risen in value since their purchase and $21,632,000 in unrealized losses on securities that had fallen in value since their purchase.
F. During the six months ended March 31, 2010, the fund purchased $178,993,000 of investment securities and sold $177,722,000 of investment securities, other than temporary cash investments.
| | | | |
| G. Capital share transactions for each class of shares were: | | | |
| | Six Months Ended | | Year Ended |
| | March 31, 2010 | September 30, 2009 |
| | Amount | Shares | Amount | Shares |
| | ($000) | (000) | ($000) | (000) |
| Institutional Shares | | | | |
| Issued | 821 | 40 | 4,395 | 272 |
| Issued in Lieu of Cash Distributions | 343 | 17 | 1,002 | 62 |
| Redeemed | (554) | (27) | (15,997) | (874) |
| Net Increase (Decrease)—Institutional Shares | 610 | 30 | (10,600) | (540) |
| Institutional Plus Shares | | | | |
| Issued | — | — | 41,945 | 1,312 |
| Issued in Lieu of Cash Distributions | 4,834 | 120 | 7,918 | 246 |
| Redeemed | — | — | (149,700) | (4,575) |
| Net Increase (Decrease)—Institutional Plus Shares | 4,834 | 120 | (99,837) | (3,017) |
H. In preparing the financial statements as of March 31, 2010, management considered the impact of subsequent events for potential recognition or disclosure in these financial statements.
19
Structured Large-Cap Growth Fund
Fund Profile
As of March 31, 2010
| | | |
| Portfolio Characteristics | | |
| | | Comparative | Broad |
| | Fund | Index1 | Index2 |
| Number of Stocks | 191 | 621 | 4,159 |
| Median Market Cap | $41.6B | $39.0.B | $31.4.B |
| Price/Earnings Ratio | 17.4x | 20.2x | 23.0x |
| Price/Book Ratio | 3.3x | 3.6x | 2.2x |
| Yield3 | | 1.5% | 1.7% |
| Institutional Shares | 1.2% | | |
| Institutional | | | |
| Plus Shares | 1.3% | | |
| Return on Equity | 24.9% | 24.7% | 19.1% |
| Earnings Growth Rate | 15.3% | 14.4% | 6.9% |
| Foreign Holdings | 0.0% | 0.0% | 0.0% |
| Turnover Rate4 | 51% | — | — |
| Expense Ratio5 | | — | — |
| Institutional Shares | 0.25% | | |
| Institutional | | | |
| Plus Shares | 0.17% | | |
| Short-Term Reserves | 0.1% | — | — |
| | | |
| Sector Diversification (% of equity exposure) |
| | | Comparative | Broad |
| | Fund | Index1 | Index2 |
| Consumer Discretionary | 11.4% | 10.9% | 11.0% |
| Consumer Staples | 16.2 | 15.9 | 9.8 |
| Energy | 3.9 | 3.9 | 10.0 |
| Financials | 5.6 | 5.2 | 17.3 |
| Health Care | 16.0 | 15.9 | 12.4 |
| Industrials | 10.3 | 10.7 | 10.9 |
| Information Technology | 31.1 | 32.3 | 18.5 |
| Materials | 3.9 | 3.8 | 4.0 |
| Telecommunication | | | |
| Services | 0.9 | 0.6 | 2.6 |
| Utilities | 0.7 | 0.8 | 3.5 |
| | |
| Volatility Measures6 | |
| | Fund Versus | Fund Versus |
| | Comparative Index1 | Broad Index2 |
| R-Squared | 1.00 | 0.96 |
| Beta | 1.00 | 0.95 |
| | |
| Ten Largest Holdings7 (% of total net assets) |
| Microsoft Corp. | systems software | 4.4% |
| Apple Inc. | computer hardware | 3.6 |
| International Business | | |
| Machines Corp. | computer hardware | 2.9 |
| Google Inc. Class A | Internet software | |
| | & services | 2.9 |
| Cisco Systems Inc. | communications | |
| | equipment | 2.5 |
| Johnson & Johnson | pharmaceuticals | 2.4 |
| Hewlett-Packard Co. | computer hardware | 2.2 |
| Wal-Mart Stores Inc. | hypermarkets & | |
| | super centers | 2.1 |
| Procter & Gamble Co. | household products | 1.9 |
| Philip Morris | | |
| International Inc. | tobacco | 1.8 |
| Top Ten | | 26.7% |
Investment Focus
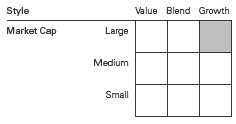
1 Russell 1000 Growth Index.
2 Dow Jones U.S.Total Stock Market Index.
3 30-day SEC yield for the fund; annualized dividend yield for the indexes. See the Glossary.
4 Annualized.
5 The expense ratios shown are from the prospectus dated January 27, 2010, and represent estimated costs for the current fiscal year based
on the fund’s net assets as of the prospectus date. For the six months ended March 31, 2010, the annualized expense ratios were 0.24%
for the Institutional Shares and 0.17% for the Institutional Plus Shares.
6 For an explanation of R-squared, beta, and other terms used here, see the Glossary.
7 The holdings listed exclude any temporary cash investments and equity index products.
20
Structured Large-Cap Growth Fund
Performance Summary
All of the returns in this report represent past performance, which is not a guarantee of future results that may be achieved by the fund. (Current performance may be lower or higher than the performance data cited. For performance data current to the most recent month-end, visit our website at www.vanguard.com/performance.) Note, too, that both investment returns and principal value can fluctuate widely, so an investor’s shares, when sold, could be worth more or less than their original cost. The returns shown do not reflect taxes that a shareholder would pay on fund distributions or on the sale of fund shares.
Fiscal-Year Total Returns (%): June 22, 2007–March 31, 2010
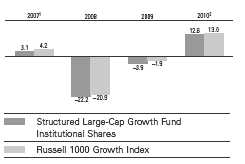
| | | |
| Average Annual Total Returns: Periods Ended March 31, 2010 | | |
| | | | Since |
| | Inception Date | One Year | Inception1 |
| Institutional Shares | 6/22/2007 | 48.01% | –5.00% |
| Institutional Plus Shares | 1/19/2006 | 48.11 | 0.40 |
1 The fund commenced operations as a registered investment company on October 3, 2006. The fund’s performance includes the
performance of a predecessor trust, Vanguard Fiduciary Trust Company Structured Large-Cap Growth Trust, from January 19, 2006,
to October 3, 2006.
2 Six months ended March 31, 2010.
See Financial Highlights for dividend and capital gains information.
21
Structured Large-Cap Growth Fund
Financial Statements (unaudited)
Statement of Net Assets
As of March 31, 2010
The fund reports a complete list of its holdings in regulatory filings four times in each fiscal year, at the quarter-ends. For the second and fourth fiscal quarters, the lists appear in the fund’s semiannual and annual reports to shareholders. For the first and third fiscal quarters, the fund files the lists with the Securities and Exchange Commission on Form N-Q. Shareholders can look up the fund’s Forms N-Q on the SEC’s website at www.sec.gov. Forms N-Q may also be reviewed and copied at the SEC’s Public Reference Room (see the back cover of this report for further information).
| | | |
| | | | Market |
| | | | Value• |
| | | Shares | ($000) |
| Common Stocks (99.6%)1 | | |
| Consumer Discretionary (11.3%) | | |
| | McDonald’s Corp. | 9,464 | 631 |
| | TJX Cos. Inc. | 9,800 | 417 |
| * | Starbucks Corp. | 15,900 | 386 |
| | Gap Inc. | 15,200 | 351 |
| | Ross Stores Inc. | 6,200 | 332 |
| | Mattel Inc. | 14,200 | 323 |
| | Darden Restaurants Inc. | 6,500 | 289 |
| * | TRW Automotive | | |
| | Holdings Corp. | 9,900 | 283 |
| * | Big Lots Inc. | 7,500 | 273 |
| | Comcast Corp. | 12,300 | 221 |
| * | Aeropostale Inc. | 7,500 | 216 |
| * | Amazon.com Inc. | 1,500 | 204 |
| | McGraw-Hill Cos. Inc. | 4,800 | 171 |
| | Target Corp. | 3,120 | 164 |
| | Yum! Brands Inc. | 4,000 | 153 |
| | Ltd Brands Inc. | 6,000 | 148 |
| * | AutoNation Inc. | 8,000 | 145 |
| * | DIRECTV Class A | 4,000 | 135 |
| | H&R Block Inc. | 6,900 | 123 |
| * | Panera Bread Co. Class A | 1,600 | 122 |
| | Omnicom Group Inc. | 2,802 | 109 |
| * | AutoZone Inc. | 320 | 55 |
| | Sherwin-Williams Co. | 800 | 54 |
| | Home Depot Inc. | 1,400 | 45 |
| * | ITT Educational Services Inc. | 400 | 45 |
| | Advance Auto Parts Inc. | 900 | 38 |
| * | Hanesbrands Inc. | 1,000 | 28 |
| | Comcast Corp. Class A | 1,429 | 27 |
| * | Dollar Tree Inc. | 300 | 18 |
| * | Career Education Corp. | 500 | 16 |
| | Wyndham Worldwide Corp. | 500 | 13 |
| | MDC Holdings Inc. | 300 | 10 |
| | | | 5,545 |
| Consumer Staples (16.2%) | | |
| | Wal-Mart Stores Inc. | 18,557 | 1,032 |
| | Procter & Gamble Co. | 14,503 | 917 |
| | Philip Morris International Inc. | 16,469 | 859 |
| | | |
| | | | Market |
| | | | Value• |
| | | Shares | ($000) |
| | PepsiCo Inc. | 11,501 | 761 |
| | Coca-Cola Co. | 13,548 | 745 |
| | Colgate-Palmolive Co. | 7,405 | 631 |
| | Walgreen Co. | 11,910 | 442 |
| | General Mills Inc. | 4,900 | 347 |
| | Coca-Cola Enterprises Inc. | 12,300 | 340 |
| | Estee Lauder Cos. Inc. | | |
| | Class A | 5,000 | 324 |
| | Hershey Co. | 7,000 | 300 |
| | Sara Lee Corp. | 20,800 | 290 |
| | Kimberly-Clark Corp. | 3,100 | 195 |
| | Sysco Corp. | 5,094 | 150 |
| | Mead Johnson Nutrition Co. | 2,803 | 146 |
| | CVS Caremark Corp. | 3,884 | 142 |
| | Altria Group Inc. | 5,269 | 108 |
| | Campbell Soup Co. | 2,600 | 92 |
| | Hormel Foods Corp. | 2,000 | 84 |
| | | | 7,905 |
| Energy (3.9%) | | |
| | Exxon Mobil Corp. | 10,573 | 708 |
| | Peabody Energy Corp. | 7,400 | 338 |
| | Consol Energy Inc. | 6,550 | 279 |
| * | FMC Technologies Inc. | 3,400 | 220 |
| * | Cameron International Corp. | 2,000 | 86 |
| | El Paso Corp. | 6,700 | 73 |
| | Schlumberger Ltd. | 1,000 | 64 |
| | Diamond Offshore Drilling Inc. | 600 | 53 |
| | Massey Energy Co. | 577 | 30 |
| * | Oceaneering International Inc. | 400 | 25 |
| | EXCO Resources Inc. | 800 | 15 |
| | | | 1,891 |
| Financials (5.5%) | | |
| | Franklin Resources Inc. | 3,100 | 344 |
| | Goldman Sachs Group Inc. | 1,816 | 310 |
| | BlackRock Inc. | 1,300 | 283 |
| | American Express Co. | 6,427 | 265 |
| | Endurance Specialty | | |
| | Holdings Ltd. | 6,900 | 256 |
| | Hudson City Bancorp Inc. | 17,500 | 248 |
| * | CNA Financial Corp. | 8,700 | 232 |
22
Structured Large-Cap Growth Fund
| | | |
| | | | Market |
| | | | Value• |
| | | Shares | ($000) |
| | Aflac Inc. | 3,969 | 216 |
| | Wells Fargo & Co. | 3,580 | 111 |
| | State Street Corp. | 2,366 | 107 |
| | Public Storage | 600 | 55 |
| * | TD Ameritrade Holding Corp. | 2,500 | 48 |
| * | CB Richard Ellis Group Inc. | | |
| | Class A | 2,400 | 38 |
| | Digital Realty Trust Inc. | 700 | 38 |
| * | St. Joe Co. | 1,000 | 32 |
| | Capitol Federal Financial | 700 | 26 |
| | Federated Investors Inc. | | |
| | Class B | 900 | 24 |
| | Simon Property Group Inc. | 251 | 21 |
| | Jefferies Group Inc. | 600 | 14 |
| | Rayonier Inc. | 300 | 14 |
| | BOK Financial Corp. | 200 | 11 |
| | Ameriprise Financial Inc. | 200 | 9 |
| | | | 2,702 |
| Health Care (16.0%) | | |
| | Johnson & Johnson | 17,912 | 1,168 |
| * | Amgen Inc. | 13,200 | 789 |
| | Abbott Laboratories | 12,969 | 683 |
| | Merck & Co. Inc. | 17,149 | 640 |
| * | Medco Health Solutions Inc. | 8,290 | 535 |
| | McKesson Corp. | 5,440 | 357 |
| | AmerisourceBergen Corp. | | |
| | Class A | 11,560 | 334 |
| | Perrigo Co. | 5,600 | 329 |
| | Baxter International Inc. | 5,142 | 299 |
| * | Hospira Inc. | 5,000 | 283 |
| | CIGNA Corp. | 7,700 | 282 |
| * | Cephalon Inc. | 4,038 | 274 |
| | Bristol-Myers Squibb Co. | 9,981 | 266 |
| * | WellPoint Inc. | 4,100 | 264 |
| * | Forest Laboratories Inc. | 6,300 | 198 |
| | Medtronic Inc. | 4,240 | 191 |
| | Eli Lilly & Co. | 4,600 | 167 |
| * | Community Health | | |
| | Systems Inc. | 4,000 | 148 |
| * | Gilead Sciences Inc. | 3,070 | 140 |
| * | Laboratory Corp. of | | |
| | America Holdings | 1,500 | 113 |
| | Quest Diagnostics Inc. | 1,400 | 82 |
| * | Dendreon Corp. | 1,500 | 55 |
| * | Mylan Inc. | 2,100 | 48 |
| * | Valeant Pharmaceuticals | | |
| | International | 900 | 39 |
| * | Myriad Genetics Inc. | 1,600 | 38 |
| * | Health Management | | |
| | Associates Inc. Class A | 4,000 | 34 |
| * | Waters Corp. | 500 | 34 |
| | Universal Health | | |
| | Services Inc. Class B | 400 | 14 |
| | | | 7,804 |
| | | |
| | | | Market |
| | | | Value• |
| | | Shares | ($000) |
| Industrials (10.2%) | | |
| | 3M Co. | 9,126 | 763 |
| | United Parcel Service Inc. | | |
| | Class B | 10,047 | 647 |
| | United Technologies Corp. | 6,482 | 477 |
| | Lockheed Martin Corp. | 4,704 | 391 |
| | Honeywell International Inc. | 6,380 | 289 |
| * | Owens Corning | 11,200 | 285 |
| | Northrop Grumman Corp. | 4,000 | 262 |
| | Joy Global Inc. | 4,500 | 255 |
| * | Alliant Techsystems Inc. | 3,100 | 252 |
| | Raytheon Co. | 4,204 | 240 |
| | ITT Corp. | 3,600 | 193 |
| | L-3 Communications | | |
| | Holdings Inc. | 1,600 | 147 |
| | RR Donnelley & Sons Co. | 5,900 | 126 |
| | Waste Management Inc. | 3,458 | 119 |
| | Iron Mountain Inc. | 3,700 | 101 |
| | CH Robinson Worldwide Inc. | 1,500 | 84 |
| | Pitney Bowes Inc. | 3,200 | 78 |
| | Flowserve Corp. | 500 | 55 |
| * | Armstrong World | | |
| | Industries Inc. | 1,200 | 44 |
| | Emerson Electric Co. | 846 | 43 |
| | Southwest Airlines Co. | 2,600 | 34 |
| * | URS Corp. | 500 | 25 |
| | Hubbell Inc. Class B | 400 | 20 |
| * | Navistar International Corp. | 400 | 18 |
| * | WESCO International Inc. | 500 | 17 |
| | Avery Dennison Corp. | 400 | 15 |
| | Crane Co. | 400 | 14 |
| | Copa Holdings SA Class A | 200 | 12 |
| | | | 5,006 |
| Information Technology (31.0%) | | |
| | Microsoft Corp. | 73,585 | 2,154 |
| * | Apple Inc. | 7,512 | 1,765 |
| | International Business | | |
| | Machines Corp. | 11,107 | 1,424 |
| * | Google Inc. Class A | 2,485 | 1,409 |
| * | Cisco Systems Inc. | 47,450 | 1,235 |
| | Hewlett-Packard Co. | 20,677 | 1,099 |
| | Oracle Corp. | 32,096 | 825 |
| | Texas Instruments Inc. | 21,461 | 525 |
| | Intel Corp. | 21,920 | 488 |
| | QUALCOMM Inc. | 10,903 | 458 |
| * | Marvell Technology | | |
| | Group Ltd. | 17,400 | 355 |
| * | Western Digital Corp. | 8,500 | 331 |
| * | BMC Software Inc. | 8,610 | 327 |
| * | Seagate Technology | 16,834 | 307 |
| * | eBay Inc. | 11,300 | 304 |
| * | Micron Technology Inc. | 27,700 | 288 |
| * | Symantec Corp. | 16,600 | 281 |
| | Global Payments Inc. | 6,100 | 278 |
23
| | | |
| Structured Large-Cap Growth Fund | |
| |
| |
| |
| | | | Market |
| | | | Value• |
| | | Shares | ($000) |
| * | Teradata Corp. | 7,400 | 214 |
| * | Vishay Intertechnology Inc. | 20,300 | 208 |
| | Mastercard Inc. Class A | 700 | 178 |
| * | Rovi Corp. | 4,600 | 171 |
| * | Alliance Data Systems Corp. | 2,100 | 134 |
| * | ON Semiconductor Corp. | 9,400 | 75 |
| | Visa Inc. Class A | 800 | 73 |
| | CA Inc. | 2,800 | 66 |
| | Xilinx Inc. | 2,500 | 64 |
| * | Red Hat Inc. | 2,100 | 61 |
| * | Hewitt Associates Inc. Class A | 800 | 32 |
| * | NetApp Inc. | 900 | 29 |
| * | Cypress Semiconductor Corp. | 1,100 | 13 |
| | Jabil Circuit Inc. | 400 | 6 |
| | | | 15,177 |
| Materials (3.9%) | | |
| | Freeport-McMoRan | | |
| | Copper & Gold Inc. | 5,400 | 451 |
| | EI du Pont de Nemours & Co. | 10,100 | 376 |
| | Walter Energy Inc. | 3,600 | 332 |
| | Praxair Inc. | 2,670 | 222 |
| | Celanese Corp. Class A | 6,670 | 213 |
| | Monsanto Co. | 2,027 | 145 |
| * | Owens-Illinois Inc. | 1,300 | 46 |
| | Newmont Mining Corp. | 900 | 46 |
| | Ball Corp. | 600 | 32 |
| * | Pactiv Corp. | 1,200 | 30 |
| | Lubrizol Corp. | 100 | 9 |
| | | | 1,902 |
| Telecommunication Services (0.9%) | |
| * | NeuStar Inc. Class A | 11,100 | 280 |
| * | American Tower Corp. | | |
| | Class A | 1,800 | 77 |
| * | tw telecom inc Class A | 2,700 | 49 |
| | Windstream Corp. | 3,000 | 32 |
| | | | 438 |
| Utilities (0.7%) | | |
| | Integrys Energy Group Inc. | 5,300 | 251 |
| * | AES Corp. | 5,000 | 55 |
| | Exelon Corp. | 572 | 25 |
| | Constellation Energy | | |
| | Group Inc. | 500 | 18 |
| | | | 349 |
| Total Common Stocks | | |
| (Cost $39,190) | | 48,719 |
| | |
| | Face | Market |
| | Amount | Value• |
| | ($000) | ($000) |
| Temporary Cash Investment (0.4%)1 | |
| U.S. Government and Agency Obligations (0.4%) |
| 2,3 Freddie Mac Discount | | |
| Notes, 0.230%, 6/21/10 | | |
| (Cost $200) | 200 | 200 |
| Total Investments (100.0%) | | |
| (Cost $39,390) | | 48,919 |
| Other Assets and Liabilities (0.0%) | |
| Other Assets | | 115 |
| Liabilities | | (127) |
| | | (12) |
| Net Assets (100%) | | 48,907 |
| |
| |
| At March 31, 2010, net assets consisted of: | |
| | | Amount |
| | | ($000) |
| Paid-in Capital | | 53,495 |
| Undistributed Net Investment Income | 176 |
| Accumulated Net Realized Losses | (14,295) |
| Unrealized Appreciation (Depreciation) | |
| Investment Securities | | 9,529 |
| Futures Contracts | | 2 |
| Net Assets | | 48,907 |
| |
| Institutional Shares—Net Assets | |
| Applicable to 429,489 outstanding | |
| $.001 par value shares of beneficial | |
| interest (unlimited authorization) | 10,201 |
| Net Asset Value Per Share— | | |
| Institutional Shares | | $23.75 |
| |
| Institutional Plus Shares—Net Assets | |
| Applicable to 818,142 outstanding | |
| $.001 par value shares of beneficial | |
| interest (unlimited authorization) | 38,706 |
| Net Asset Value Per Share— | | |
| Institutional Plus Shares | | $47.31 |
• See Note A in Notes to Financial Statements.
* Non-income-producing security.
1 The fund invests a portion of its cash reserves in equity markets through the use of index futures contracts. After giving effect to futures
investments, the fund’s effective common stock and temporary cash investment positions represent 99.9% and 0.1%, respectively, of net
assets.
2 The issuer operates under a congressional charter; its securities are not backed by the full faith and credit of the U.S. government.
3 Securities with a value of $200,000 have been segregated as initial margin for open futures contracts.
See accompanying Notes, which are an integral part of the Financial Statements.
24
| |
| Structured Large-Cap Growth Fund | |
| |
| |
| Statement of Operations | |
| |
| | Six Months Ended |
| | March 31, 2010 |
| | ($000) |
| Investment Income | |
| Income | |
| Dividends | 485 |
| Security Lending | 2 |
| Total Income | 487 |
| Expenses | |
| The Vanguard Group—Note B | |
| Management and Administrative—Institutional Shares | 11 |
| Management and Administrative—Institutional Plus Shares | 31 |
| Marketing and Distribution—Institutional Shares | 1 |
| Marketing and Distribution—Institutional Plus Shares | 3 |
| Custodian Fees | 3 |
| Total Expenses | 49 |
| Net Investment Income | 438 |
| Realized Net Gain (Loss) | |
| Investment Securities Sold | 2,329 |
| Futures Contracts | 27 |
| Realized Net Gain (Loss) | 2,356 |
| Change in Unrealized Appreciation (Depreciation) | |
| Investment Securities | 3,392 |
| Futures Contracts | 4 |
| Change in Unrealized Appreciation (Depreciation) | 3,396 |
| Net Increase (Decrease) in Net Assets Resulting from Operations | 6,190 |
See accompanying Notes, which are an integral part of the Financial Statements.
25
| | |
| Structured Large-Cap Growth Fund | | |
| |
| |
| Statement of Changes in Net Assets | | |
| |
| | Six Months Ended | Year Ended |
| | March 31, | September 30, |
| | 2010 | 2009 |
| | ($000) | ($000) |
| Increase (Decrease) in Net Assets | | |
| Operations | | |
| Net Investment Income | 438 | 755 |
| Realized Net Gain (Loss) | 2,356 | (12,827) |
| Change in Unrealized Appreciation (Depreciation) | 3,396 | 9,941 |
| Net Increase (Decrease) in Net Assets Resulting from Operations | 6,190 | (2,131) |
| Distributions | | |
| Net Investment Income | | |
| Institutional Shares | (140) | (137) |
| Institutional Plus Shares | (644) | (618) |
| Realized Capital Gain | | |
| Institutional Shares | — | — |
| Institutional Plus Shares | — | — |
| Total Distributions | (784) | (755) |
| Capital Share Transactions | | |
| Institutional Shares | (864) | 137 |
| Institutional Plus Shares | (9,352) | 618 |
| Net Increase (Decrease) from Capital Share Transactions | (10,216) | 755 |
| Total Increase (Decrease) | (4,810) | (2,131) |
| Net Assets | | |
| Beginning of Period | 53,717 | 55,848 |
| End of Period1 | 48,907 | 53,717 |
| 1 Net Assets—End of Period includes undistributed net investment income of $176,000 and $522,000. | |
See accompanying Notes, which are an integral part of the Financial Statements.
26
| | | | |
| Structured Large-Cap Growth Fund | | | | |
| |
| |
| Financial Highlights | | | | |
| |
| |
| Institutional Shares | | | | |
| | Six Months | | | June 22, |
| | Ended | Year Ended | 20071 to |
| | March 31, | September 30, | Sept. 30, |
| For a Share Outstanding Throughout Each Period | 2010 | 2009 | 2008 | 2007 |
| Net Asset Value, Beginning of Period | $21.38 | $22.63 | $29.93 | $29.04 |
| Investment Operations | | | | |
| Net Investment Income | .184 | .290 | .283 | .050 |
| Net Realized and Unrealized Gain (Loss) on Investments | 2.486 | (1.243) | (6.742) | .840 |
| Total from Investment Operations | 2.670 | (.953) | (6.459) | .890 |
| Distributions | | | | |
| Dividends from Net Investment Income | (.300) | (.297) | (.270) | — |
| Distributions from Realized Capital Gains | — | — | (.571) | — |
| Total Distributions | (.300) | (.297) | (.841) | — |
| Net Asset Value, End of Period | $23.75 | $21.38 | $22.63 | $29.93 |
| |
| Total Return | 12.56% | –3.89% | –22.20% | 3.06% |
| |
| Ratios/Supplemental Data | | | | |
| Net Assets, End of Period (Millions) | $10 | $10 | $10 | $9 |
| Ratio of Total Expenses to Average Net Assets | 0.24%2 | 0.25% | 0.20% | 0.25%2 |
| Ratio of Net Investment Income to Average Net Assets | 1.55%2 | 1.60% | 1.07% | 0.84%2 |
| Portfolio Turnover Rate | 51%2 | 66% | 70% | 56% |
| 1 Inception. | | | | |
| 2 Annualized. | | | | |
See accompanying Notes, which are an integral part of the Financial Statements.
27
| | | | |
| Structured Large-Cap Growth Fund | | | | |
| |
| |
| Financial Highlights | | | | |
| |
| |
| Institutional Plus Shares | | | | |
| | Six Months | | | Oct. 3, |
| | Ended | Year Ended | 20061 to |
| | March 31, | September 30, | Sept. 30, |
| For a Share Outstanding Throughout Each Period | 2010 | 2009 | 2008 | 2007 |
| Net Asset Value, Beginning of Period | $42.60 | $45.07 | $59.60 | $50.00 |
| Investment Operations | | | | |
| Net Investment Income | .381 | .607 | .591 | .547 |
| Net Realized and Unrealized Gain (Loss) on Investments | 4.956 | (2.464) | (13.420) | 9.256 |
| Total from Investment Operations | 5.337 | (1.857) | (12.829) | 9.803 |
| Distributions | | | | |
| Dividends from Net Investment Income | (.627) | (.613) | (.564) | (.150) |
| Distributions from Realized Capital Gains | — | — | (1.137) | (.053) |
| Total Distributions | (.627) | (.613) | (1.701) | (.203) |
| Net Asset Value, End of Period | $47.31 | $42.60 | $45.07 | $59.60 |
| |
| Total Return | 12.61% | –3.79% | –22.16% | 19.66% |
| |
| Ratios/Supplemental Data | | | | |
| Net Assets, End of Period (Millions) | $39 | $44 | $45 | $58 |
| Ratio of Total Expenses to Average Net Assets | 0.17%2 | 0.17% | 0.12% | 0.15%2 |
| Ratio of Net Investment Income to Average Net Assets | 1.62%2 | 1.68% | 1.15% | 0.94%2 |
| Portfolio Turnover Rate | 51%2 | 66% | 70% | 56% |
1 Commencement of operations as a registered investment company.
2 Annualized.
See accompanying Notes, which are an integral part of the Financial Statements.
28
Structured Large-Cap Growth Fund
Notes to Financial Statements
Vanguard Structured Large-Cap Growth Fund is registered under the Investment Company Act of 1940 as an open-end investment company, or mutual fund. The fund offers two classes of shares: Institutional Shares and Institutional Plus Shares. Institutional Shares are available to investors who invest a minimum of $5 million. Institutional Plus Shares are available to investors who invest a minimum of $200 million ($100 million for investors with total Vanguard investments of at least $1 billion).
A. The following significant accounting policies conform to generally accepted accounting principles for U.S. mutual funds. The fund consistently follows such policies in preparing its financial statements.
1. Security Valuation: Securities are valued as of the close of trading on the New York Stock Exchange (generally 4 p.m., Eastern time) on the valuation date. Equity securities are valued at the latest quoted sales prices or official closing prices taken from the primary market in which each security trades; such securities not traded on the valuation date are valued at the mean of the latest quoted bid and asked prices. Securities for which market quotations are not readily available, or whose values have been materially affected by events occurring before the fund’s pricing time but after the close of the securities’ primary markets, are valued by methods deemed by the board of trustees to represent fair value. Investments in Vanguard Market Liquidity Fund are valued at that fund’s net asset value. Temporary cash investments acquired over 60 days to maturity are valued using the latest bid prices or using valuations based on a matrix system (which considers such factors as security prices, yields, maturities, and ratings), both as furnished by independent pricing services. Other temporary cash investments are valued at amortized cost, which approximates market value.
2. Futures Contracts: The fund uses index futures contracts to a limited extent, with the objective of maintaining full exposure to the stock market while maintaining liquidity. The fund may purchase or sell futures contracts to achieve a desired level of investment, whether to accommodate portfolio turnover or cash flows from capital share transactions. The primary risks associated with the use of futures contracts are imperfect correlation between changes in market values of stocks held by the fund and the prices of futures contracts, and the possibility of an illiquid market.
Futures contracts are valued at their quoted daily settlement prices. The aggregate principal amounts of the contracts are not recorded in the Statement of Net Assets. Fluctuations in the value of the contracts are recorded in the Statement of Net Assets as an asset (liability) and in the Statement of Operations as unrealized appreciation (depreciation) until the contracts are closed, when they are recorded as realized futures gains (losses).
3. Federal Income Taxes: The fund intends to continue to qualify as a regulated investment company and distribute all of its taxable income. Management has analyzed the fund’s tax positions taken for all open federal income tax years (September 30, 2007–2009), and for the period ended March 31, 2010, and has concluded that no provision for federal income tax is required in the fund’s financial statements.
4. Distributions: Distributions to shareholders are recorded on the ex-dividend date.
5. Other: Dividend income is recorded on the ex-dividend date. Interest income includes income distributions received from Vanguard Market Liquidity Fund and is accrued daily. Security transactions are accounted for on the date securities are bought or sold. Costs used to determine realized gains (losses) on the sale of investment securities are those of the specific securities sold.
Each class of shares has equal rights as to assets and earnings, except that each class separately bears certain class-specific expenses related to maintenance of shareholder accounts (included in Management and Administrative expenses) and shareholder reporting. Marketing and distribution
29
Structured Large-Cap Growth Fund
expenses are allocated to each class of shares based on a method approved by the board of trustees. Income, other non-class-specific expenses, and gains and losses on investments are allocated to each class of shares based on its relative net assets.
B. The Vanguard Group furnishes at cost investment advisory, corporate management, administrative, marketing, and distribution services. The costs of such services are allocated to the fund under methods approved by the board of trustees. The fund has committed to provide up to 0.40% of its net assets in capital contributions to Vanguard. At March 31, 2010, the fund had contributed capital of $9,000 to Vanguard (included in Other Assets), representing 0.02% of the fund’s net assets and 0.00% of Vanguard’s capitalization. The fund’s trustees and officers are also directors and officers of Vanguard.
C. Various inputs may be used to determine the value of the fund’s investments. These inputs are summarized in three broad levels for financial statement purposes. The inputs or methodologies used to value securities are not necessarily an indication of the risk associated with investing in those securities.
Level 1—Quoted prices in active markets for identical securities.
Level 2—Other significant observable inputs (including quoted prices for similar securities, interest rates, prepayment speeds, credit risk, etc.).
Level 3—Significant unobservable inputs (including the fund’s own assumptions used to determine the fair value of investments).
The following table summarizes the fund’s investments as of March 31, 2010, based on the inputs used to value them:
| | | |
| | Level 1 | Level 2 | Level 3 |
| Investments | ($000) | ($000) | ($000) |
| Common Stocks | 48,719 | — | — |
| Temporary Cash Investments | — | 200 | — |
| Futures Contracts—Liabilities1 | (1) | — | — |
| Total | 48,718 | 200 | — |
| 1 Represents variation margin on the last day of the reporting period. | | | |
D. At March 31, 2010, the aggregate settlement value of open futures contracts and the related unrealized appreciation (depreciation) were:
| | | | |
| | | | | ($000) |
| | | Number of | Aggregate | Unrealized |
| | | Long (Short) | Settlement | Appreciation |
| Futures Contracts | Expiration | Contracts | Value | (Depreciation) |
| E-mini S&P 500 Index | June 2010 | 3 | 175 | 2 |
Unrealized appreciation (depreciation) on open futures contracts is required to be treated as realized gain (loss) for tax purposes.
E. Distributions are determined on a tax basis and may differ from net investment income and realized capital gains for financial reporting purposes. Differences may be permanent or temporary. Permanent differences are reclassified among capital accounts in the financial statements to reflect their tax character. Temporary differences arise when certain items of income, expense, gain, or loss are
30
Structured Large-Cap Growth Fund
recognized in different periods for financial statement and tax purposes; these differences will reverse at some time in the future. Differences in classification may also result from the treatment of short-term gains as ordinary income for tax purposes.
The fund’s tax-basis capital gains and losses are determined only at the end of each fiscal year. For tax purposes, at September 30, 2009, the fund had available capital loss carryforwards totaling $5,741,000 to offset future net capital gains through September 30, 2017. In addition, the fund realized losses of $10,912,000 during the period from November 1, 2008, through September 30, 2009, which are deferred and will be treated as realized for tax purposes in fiscal 2010. The fund will use these capital losses to offset net taxable capital gains, if any, realized during the year ending September 30, 2010; should the fund realize net capital losses for the year, the losses will be added to the loss carryforward balance above.
At March 31, 2010, the cost of investment securities for tax purposes was $39,390,000. Net unrealized appreciation of investment securities for tax purposes was $9,529,000, consisting of unrealized gains of $9,906,000 on securities that had risen in value since their purchase and $377,000 in unrealized losses on securities that had fallen in value since their purchase.
F. During the six months ended March 31, 2010, the fund purchased $13,514,000 of investment securities and sold $24,001,000 of investment securities, other than temporary cash investments.
G. Capital share transactions for each class of shares were:
| | | | |
| | Six Months Ended | | Year Ended |
| | March 31, 2010 | September 30, 2009 |
| | Amount | Shares | Amount | Shares |
| | ($000) | (000) | ($000) | (000) |
| Institutional Shares | | | | |
| Issued | — | — | — | — |
| Issued in Lieu of Cash Distributions | 140 | 6 | 137 | 8 |
| Redeemed | (1,004) | (43) | — | — |
| Net Increase (Decrease)—Institutional Shares | (864) | (37) | 137 | 8 |
| Institutional Plus Shares | | | | |
| Issued | — | — | — | — |
| Issued in Lieu of Cash Distributions | 644 | 14 | 618 | 18 |
| Redeemed | (9,996) | (223) | — | — |
| Net Increase (Decrease)—Institutional Plus Shares | (9,352) | (209) | 618 | 18 |
H. In preparing the financial statements as of March 31, 2010, management considered the impact of subsequent events for potential recognition or disclosure in these financial statements.
31
Structured Large-Cap Value Fund
Fund Profile
As of March 31, 2010
| | | |
| Portfolio Characteristics | | |
| | | Comparative | Broad |
| | Fund | Index1 | Index2 |
| Number of Stocks | 179 | 672 | 4,159 |
| Median Market Cap | $34.4B | $34.4B | 31.4B |
| Price/Earnings Ratio | 18.0x | 23.0x | 23.0x |
| Price/Book Ratio | 1.7x | 1.6x | 2.2x |
| Yield | | | |
| Institutional | | | |
| Plus Shares3 | 1.9% | 2.1% | 1.7% |
| Return on Equity | 16.0% | 15.6% | 19.1% |
| Earnings Growth Rate | 4.4% | –0.6% | 6.9% |
| Foreign Holdings | 0.0% | 0.0% | 0.0% |
| Turnover Rate4 | 54% | — | — |
| Expense Ratio5 | | — | — |
| Institutional | | | |
| Plus Shares | 0.17% | | |
| Short-Term Reserves | 0.1% | — | — |
| | | |
| Sector Diversification (% of equity exposure) |
| | | Comparative | Broad |
| | Fund | Index1 | Index2 |
| Consumer Discretionary | 10.6% | 10.6% | 11.0% |
| Consumer Staples | 4.8 | 5.5 | 9.8 |
| Energy | 18.0 | 17.6 | 10.0 |
| Financials | 25.0 | 26.1 | 17.3 |
| Health Care | 9.5 | 8.7 | 12.4 |
| Industrials | 11.1 | 10.9 | 10.9 |
| Information Technology | 5.7 | 5.0 | 18.5 |
| Materials | 4.4 | 4.1 | 4.0 |
| Telecommunication | | | |
| Services | 5.0 | 5.1 | 2.6 |
| Utilities | 5.9 | 6.4 | 3.5 |
| | |
| Volatility Measures6 | |
| | Fund Versus | Fund Versus |
| | Comparative Index1 | Broad Index2 |
| R-Squared | 1.00 | 0.97 |
| Beta | 0.98 | 1.01 |
| | |
| Ten Largest Holdings7 (% of total net assets) |
| Exxon Mobil Corp. | integrated oil & gas | 4.6% |
| JPMorgan Chase & Co. | other diversified | |
| | financial services | 3.4 |
| General Electric Co. | industrial | |
| | conglomerates | 3.2 |
| AT&T Inc. | integrated | |
| | telecommunication | |
| | services | 3.1 |
| Chevron Corp. | integrated oil & gas | 3.1 |
| Wells Fargo & Co. | diversified banks | 2.9 |
| Pfizer Inc. | pharmaceuticals | 2.8 |
| Bank of America Corp. | other diversified | |
| | financial services | 2.5 |
| Goldman Sachs Group Inc. | investment banking | |
| | & brokerage | 1.9 |
| ConocoPhillips | integrated oil & gas | 1.8 |
| Top Ten | | 29.3% |
Investment Focus
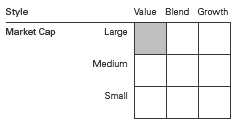
1 Russell 1000 Value Index.
2 Dow Jones U.S.Total Stock Market Index.
3 30-day SEC yield for the fund; annualized dividend yield for the indexes. See the Glossary.
4 Annualized.
5 The expense ratio shown is from the prospectus dated January 27, 2010, and represents estimated costs for the current fiscal year based
on the fund’s net assets as of the prospectus date. For the six months ended March 31, 2010, the annualized expense ratio was 0.17%.
6 For an explanation of R-squared, beta, and other terms used here, see the Glossary.
7 The holdings listed exclude any temporary cash investments and equity index products.
32
Structured Large-Cap Value Fund
Performance Summary
All of the returns in this report represent past performance, which is not a guarantee of future results that may be achieved by the fund. (Current performance may be lower or higher than the performance data cited. For performance data current to the most recent month-end, visit our website at www.vanguard.com/performance.) Note, too, that both investment returns and principal value can fluctuate widely, so an investor’s shares, when sold, could be worth more or less than their original cost. The returns shown do not reflect taxes that a shareholder would pay on fund distributions or on the sale of fund shares.
Fiscal-Year Total Returns (%): December 15, 2005–March 31, 2010
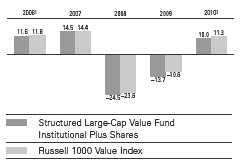
| | | |
| Average Annual Total Returns: Periods Ended March 31, 2010 | | |
| | | | Since |
| | Inception Date | One Year | Inception1 |
| Institutional Plus Shares | 12/15/2005 | 47.70% | –2.03% |
1 The fund commenced operations as a registered investment company on January 18, 2007. The fund’s performance includes the
performance of a predecessor trust, Vanguard Fiduciary Trust Company Structured Large-Cap Value Trust, from December 15, 2005,
to January 18, 2007.
2 Six months ended March 31, 2010.
See Financial Highlights for dividend and capital gains information.
33
Structured Large-Cap Value Fund
Financial Statements (unaudited)
Statement of Net Assets
As of March 31, 2010
The fund reports a complete list of its holdings in regulatory filings four times in each fiscal year, at the quarter-ends. For the second and fourth fiscal quarters, the lists appear in the fund’s semiannual and annual reports to shareholders. For the first and third fiscal quarters, the fund files the lists with the Securities and Exchange Commission on Form N-Q. Shareholders can look up the fund’s Forms N-Q on the SEC’s website at www.sec.gov. Forms N-Q may also be reviewed and copied at the SEC’s Public Reference Room (see the back cover of this report for further information).
| | | |
| | | | Market |
| | | | Value• |
| | | Shares | ($000) |
| Common Stocks (99.9%) | | |
| Consumer Discretionary (10.5%) | | |
| * | Ford Motor Co. | 52,400 | 659 |
| | Time Warner Inc. | 19,740 | 617 |
| | Comcast Corp. Class A | 30,476 | 574 |
| | Time Warner Cable Inc. | 9,400 | 501 |
| | Gannett Co. Inc. | 20,000 | 330 |
| | Wyndham Worldwide Corp. | 12,600 | 324 |
| | Gap Inc. | 13,700 | 317 |
| | Walt Disney Co. | 8,890 | 310 |
| * | Liberty Media Corp.—Starz | 5,200 | 284 |
| | Ltd Brands Inc. | 10,300 | 254 |
| * | AutoNation Inc. | 13,300 | 240 |
| | DR Horton Inc. | 16,500 | 208 |
| | Comcast Corp. | 11,200 | 201 |
| | Home Depot Inc. | 6,000 | 194 |
| * | Autoliv Inc. | 3,700 | 191 |
| | News Corp. Class A | 11,210 | 161 |
| | Cablevision Systems Corp. | | |
| | Class A | 5,000 | 121 |
| | Whirlpool Corp. | 1,200 | 105 |
| * | NVR Inc. | 100 | 73 |
| * | Liberty Media Corp.— | | |
| | Interactive | 2,700 | 41 |
| * | TRW Automotive | | |
| | Holdings Corp. | 1,253 | 36 |
| | Scripps Networks | | |
| | Interactive Inc. Class A | 500 | 22 |
| | DISH Network Corp. Class A | 900 | 19 |
| * | Madison Square Garden Inc. | | |
| | Class A | 450 | 10 |
| | | | 5,792 |
| Consumer Staples (4.8%) | | |
| | Kraft Foods Inc. | 16,376 | 495 |
| | General Mills Inc. | 5,700 | 404 |
| | Dr Pepper Snapple Group Inc. | 11,300 | 397 |
| | Procter & Gamble Co. | 5,215 | 330 |
| | Coca-Cola Enterprises Inc. | 9,800 | 271 |
| | Sara Lee Corp. | 14,600 | 203 |
| | | |
| | | | Market |
| | | | Value• |
| | | Shares | ($000) |
| | SUPERVALU Inc. | 11,000 | 183 |
| | Mead Johnson Nutrition Co. | 2,696 | 140 |
| * | Rite Aid Corp. | 62,500 | 94 |
| | CVS Caremark Corp. | 1,600 | 59 |
| * | NBTY Inc. | 500 | 24 |
| | Kimberly-Clark Corp. | 300 | 19 |
| | Hershey Co. | 300 | 13 |
| | | | 2,632 |
| Energy (18.0%) | | |
| | Exxon Mobil Corp. | 37,510 | 2,512 |
| | Chevron Corp. | 22,290 | 1,690 |
| | ConocoPhillips | 19,274 | 986 |
| | Apache Corp. | 5,900 | 599 |
| | Devon Energy Corp. | 7,900 | 509 |
| | Spectra Energy Corp. | 18,800 | 424 |
| | Occidental Petroleum Corp. | 5,000 | 423 |
| | Williams Cos. Inc. | 18,000 | 416 |
| | National Oilwell Varco Inc. | 10,100 | 410 |
| | Anadarko Petroleum Corp. | 5,450 | 397 |
| * | Rowan Cos. Inc. | 11,100 | 323 |
| | Murphy Oil Corp. | 5,700 | 320 |
| * | Newfield Exploration Co. | 5,700 | 297 |
| | EXCO Resources Inc. | 10,800 | 198 |
| | Schlumberger Ltd. | 1,900 | 121 |
| | Chesapeake Energy Corp. | 2,900 | 69 |
| * | Plains Exploration & | | |
| | Production Co. | 1,400 | 42 |
| | Massey Energy Co. | 635 | 33 |
| | Tidewater Inc. | 700 | 33 |
| | El Paso Corp. | 2,800 | 30 |
| * | Helix Energy Solutions | | |
| | Group Inc. | 1,600 | 21 |
| | XTO Energy Inc. | 400 | 19 |
| | | | 9,872 |
| Financials (25.1%) | | |
| | JPMorgan Chase & Co. | 41,880 | 1,874 |
| | Wells Fargo & Co. | 51,465 | 1,602 |
| | Bank of America Corp. | 77,035 | 1,375 |
| | Goldman Sachs Group Inc. | 6,125 | 1,045 |
34
| | | |
| Structured Large-Cap Value Fund | |
| |
| |
| |
| | | | Market |
| | | | Value• |
| | | Shares | ($000) |
| | US Bancorp | 29,269 | 758 |
| | Travelers Cos. Inc. | 10,300 | 556 |
| | American Express Co. | 11,600 | 479 |
| | Chubb Corp. | 8,300 | 430 |
| * | Citigroup Inc. | 105,988 | 429 |
| | Unum Group | 14,900 | 369 |
| | Franklin Resources Inc. | 3,300 | 366 |
| | Torchmark Corp. | 5,800 | 310 |
| | Discover Financial Services | 19,900 | 297 |
| | Hudson City Bancorp Inc. | 20,000 | 283 |
| | BlackRock Inc. | 1,300 | 283 |
| | PNC Financial Services | | |
| | Group Inc. | 3,800 | 227 |
| | SL Green Realty Corp. | 3,900 | 223 |
| | American Financial Group Inc. | 7,400 | 211 |
| | Ameriprise Financial Inc. | 4,300 | 195 |
| | ProLogis | 14,200 | 188 |
| | White Mountains | | |
| | Insurance Group Ltd. | 500 | 178 |
| | Macerich Co. | 4,341 | 166 |
| | Jefferies Group Inc. | 6,900 | 163 |
| | Ventas Inc. | 3,400 | 161 |
| | Bank of Hawaii Corp. | 3,330 | 150 |
| | New York Community | | |
| | Bancorp Inc. | 9,000 | 149 |
| | PartnerRe Ltd. | 1,600 | 128 |
| | State Street Corp. | 2,800 | 126 |
| | HRPT Properties Trust | 16,100 | 125 |
| | Annaly Capital | | |
| | Management Inc. | 7,100 | 122 |
| | BOK Financial Corp. | 1,700 | 89 |
| | Liberty Property Trust | 2,600 | 88 |
| | Hospitality Properties Trust | 3,600 | 86 |
| * | AmeriCredit Corp. | 3,600 | 86 |
| | Brandywine Realty Trust | 6,400 | 78 |
| | Unitrin Inc. | 2,600 | 73 |
| | Vornado Realty Trust | 621 | 47 |
| | Mack-Cali Realty Corp. | 1,300 | 46 |
| | Rayonier Inc. | 1,000 | 45 |
| | Simon Property Group Inc. | 505 | 42 |
| | Progressive Corp. | 2,000 | 38 |
| | Equity Residential | 880 | 35 |
| | Prudential Financial Inc. | 500 | 30 |
| | Allstate Corp. | 750 | 24 |
| | Morgan Stanley | 690 | 20 |
| | | | 13,795 |
| Health Care (9.4%) | | |
| | Pfizer Inc. | 88,731 | 1,522 |
| | Merck & Co. Inc. | 18,033 | 674 |
| | Johnson & Johnson | 9,790 | 638 |
| * | WellPoint Inc. | 7,390 | 476 |
| | UnitedHealth Group Inc. | 11,700 | 382 |
| | McKesson Corp. | 5,600 | 368 |
| | AmerisourceBergen Corp. | | |
| | Class A | 10,500 | 304 |
| | | |
| | | | Market |
| | | | Value• |
| | | Shares | ($000) |
| | Eli Lilly & Co. | 7,930 | 287 |
| * | Forest Laboratories Inc. | 5,500 | 172 |
| | Universal Health | | |
| | Services Inc. Class B | 4,200 | 147 |
| * | LifePoint Hospitals Inc. | 2,600 | 96 |
| | CIGNA Corp. | 1,500 | 55 |
| | Bristol-Myers Squibb Co. | 2,029 | 54 |
| | Cooper Cos. Inc. | 400 | 16 |
| | | | 5,191 |
| Industrials (11.1%) | | |
| | General Electric Co. | 97,350 | 1,772 |
| | FedEx Corp. | 6,100 | 570 |
| | Northrop Grumman Corp. | 6,850 | 449 |
| | CSX Corp. | 7,700 | 392 |
| | United Technologies Corp. | 4,700 | 346 |
| | Caterpillar Inc. | 5,500 | 346 |
| | Raytheon Co. | 5,800 | 331 |
| | Joy Global Inc. | 5,200 | 294 |
| * | Hertz Global Holdings Inc. | 27,300 | 273 |
| | RR Donnelley & Sons Co. | 10,200 | 218 |
| | L-3 Communications | | |
| | Holdings Inc. | 2,100 | 192 |
| * | URS Corp. | 3,200 | 159 |
| | Pitney Bowes Inc. | 6,400 | 156 |
| | Boeing Co. | 1,900 | 138 |
| | Hubbell Inc. Class B | 2,600 | 131 |
| * | Owens Corning | 4,500 | 114 |
| | ITT Corp. | 2,000 | 107 |
| * | Oshkosh Corp. | 1,800 | 73 |
| | General Dynamics Corp. | 180 | 14 |
| | | | 6,075 |
| Information Technology (5.7%) | | |
| | Hewlett-Packard Co. | 10,700 | 569 |
| | Intel Corp. | 22,700 | 505 |
| * | Computer Sciences Corp. | 6,200 | 338 |
| * | Micron Technology Inc. | 30,900 | 321 |
| * | Marvell Technology | | |
| | Group Ltd. | 14,900 | 304 |
| * | eBay Inc. | 9,500 | 256 |
| * | Western Digital Corp. | 5,400 | 211 |
| * | Ingram Micro Inc. | 10,800 | 189 |
| | CA Inc. | 6,700 | 157 |
| * | Teradata Corp. | 4,000 | 116 |
| * | Tech Data Corp. | 1,800 | 75 |
| * | LSI Corp. | 10,000 | 61 |
| * | EMC Corp. | 2,200 | 40 |
| | | | 3,142 |
| Materials (4.4%) | | |
| | EI du Pont de | | |
| | Nemours & Co. | 13,800 | 514 |
| | Freeport-McMoRan | | |
| | Copper & Gold Inc. | 5,000 | 418 |
| | International Paper Co. | 14,300 | 352 |
| | AK Steel Holding Corp. | 12,500 | 286 |
35
| | | |
| Structured Large-Cap Value Fund | |
| |
| |
| |
| | | | Market |
| | | | Value• |
| | | Shares | ($000) |
| * | Owens-Illinois Inc. | 6,800 | 241 |
| | Eastman Chemical Co. | 3,300 | 210 |
| * | Pactiv Corp. | 7,500 | 189 |
| | Sonoco Products Co. | 5,300 | 163 |
| | Dow Chemical Co. | 910 | 27 |
| | | | 2,400 |
| Telecommunication Services (5.0%) | |
| | AT&T Inc. | 66,113 | 1,708 |
| | Verizon Communications Inc. | 18,140 | 563 |
| | Windstream Corp. | 19,700 | 215 |
| * | Sprint Nextel Corp. | 42,700 | 162 |
| | Qwest Communications | | |
| | International Inc. | 15,200 | 79 |
| * | NII Holdings Inc. | 400 | 17 |
| | | | 2,744 |
| Utilities (5.9%) | | |
| | Exelon Corp. | 9,800 | 429 |
| | Public Service Enterprise | | |
| | Group Inc. | 12,700 | 375 |
| | Oneok Inc. | 6,900 | 315 |
| | NiSource Inc. | 19,400 | 307 |
| | Integrys Energy Group Inc. | 6,100 | 289 |
| | Constellation Energy | | |
| | Group Inc. | 8,000 | 281 |
| | Atmos Energy Corp. | 9,200 | 263 |
| | National Fuel Gas Co. | 5,000 | 253 |
| * | AES Corp. | 22,300 | 245 |
| | CenterPoint Energy Inc. | 14,700 | 211 |
| | CMS Energy Corp. | 7,400 | 114 |
| | NSTAR | 2,900 | 103 |
| | Edison International | 1,500 | 51 |
| | DTE Energy Co. | 300 | 13 |
| | | | 3,249 |
| Total Common Stocks | | |
| (Cost $49,478) | | 54,892 |
| | |
| | Face | Market |
| | Amount | Value• |
| | ($000) | ($000) |
| Temporary Cash Investment (0.1%) | |
| U.S. Government and Agency Obligations (0.1%) |
| 1 Freddie Mac Discount | | |
| Notes, 0.230%, 6/21/10 | | |
| (Cost $50) | 50 | 50 |
| Total Investments (100.0%) | | |
| (Cost $49,528) | | 54,942 |
| Other Assets and Liabilities (0.0%) | |
| Other Assets | | 81 |
| Liabilities | | (96) |
| | | (15) |
| Net Assets (100%) | | |
| Applicable to 1,402,807 outstanding | |
| $.001 par value shares of beneficial | |
| interest (unlimited authorization) | 54,927 |
| Net Asset Value Per Share | | $39.16 |
| |
| |
| At March 31, 2010, net assets consisted of: | |
| | | Amount |
| | | ($000) |
| Paid-in Capital | | 71,583 |
| Undistributed Net Investment Income | 259 |
| Accumulated Net Realized Losses | (22,329) |
| Unrealized Appreciation (Depreciation) | 5,414 |
| Net Assets | | 54,927 |
• See Note A in Notes to Financial Statements.
* Non-income-producing security.
1 The issuer operates under a congressional charter; its securities are not backed by the full faith and credit of the U.S. government.
See accompanying Notes, which are an integral part of the Financial Statements.
36
| |
| Structured Large-Cap Value Fund | |
| |
| |
| Statement of Operations | |
| |
| | Six Months Ended |
| | March 31, 2010 |
| | ($000) |
| Investment Income | |
| Income | |
| Dividends | 637 |
| Security Lending | 3 |
| Total Income | 640 |
| Expenses | |
| The Vanguard Group—Note B | |
| Management and Administrative | 37 |
| Marketing and Distribution | 4 |
| Custodian Fees | 4 |
| Total Expenses | 45 |
| Net Investment Income | 595 |
| Realized Net Gain (Loss) | |
| Investment Securities Sold | 17 |
| Futures Contracts | 15 |
| Realized Net Gain (Loss) | 32 |
| Change in Unrealized Appreciation (Depreciation) | |
| Investment Securities | 4,368 |
| Futures Contracts | 1 |
| Change in Unrealized Appreciation (Depreciation) | 4,369 |
| Net Increase (Decrease) in Net Assets Resulting from Operations | 4,996 |
See accompanying Notes, which are an integral part of the Financial Statements.
37
| | |
| Structured Large-Cap Value Fund | | |
| |
| |
| Statement of Changes in Net Assets | | |
| |
| | Six Months Ended | Year Ended |
| | March 31, | September 30, |
| | 2010 | 2009 |
| | ($000) | ($000) |
| Increase (Decrease) in Net Assets | | |
| Operations | | |
| Net Investment Income | 595 | 1,253 |
| Realized Net Gain (Loss) | 32 | (17,720) |
| Change in Unrealized Appreciation (Depreciation) | 4,369 | 8,525 |
| Net Increase (Decrease) in Net Assets Resulting from Operations | 4,996 | (7,942) |
| Distributions | | |
| Net Investment Income | (1,191) | (1,827) |
| Realized Capital Gain | — | — |
| Total Distributions | (1,191) | (1,827) |
| Capital Share Transactions | | |
| Issued | — | — |
| Issued in Lieu of Cash Distributions | 1,191 | 1,827 |
| Redeemed | — | — |
| Net Increase (Decrease) from Capital Share Transactions | 1,191 | 1,827 |
| Total Increase (Decrease) | 4,996 | (7,942) |
| Net Assets | | |
| Beginning of Period | 49,931 | 57,873 |
| End of Period1 | 54,927 | 49,931 |
| 1 Net Assets—End of Period includes undistributed net investment income of $259,000 and $855,000. | |
See accompanying Notes, which are an integral part of the Financial Statements.
38
| | | | |
| Structured Large-Cap Value Fund | | | | |
| |
| |
| Financial Highlights | | | | |
| |
| |
| Institutional Plus Shares | | | | |
| | Six Months | | | Jan. 18, |
| | Ended | Year Ended | 20071 to |
| | March 31, | September 30, | Sept. 30, |
| For a Share Outstanding Throughout Each Period | 2010 | 2009 | 2008 | 2007 |
| Net Asset Value, Beginning of Period | $36.43 | $44.00 | $63.87 | $60.09 |
| Investment Operations | | | | |
| Net Investment Income | .431 | .926 | 1.426 | 1.030 |
| Net Realized and Unrealized Gain (Loss) on Investments | 3.169 | (7.108) | (15.946) | 2.750 |
| Total from Investment Operations | 3.600 | (6.182) | (14.520) | 3.780 |
| Distributions | | | | |
| Dividends from Net Investment Income | (.870) | (1.388) | (1.370) | — |
| Distributions from Realized Capital Gains | — | — | (3.980) | — |
| Total Distributions | (.870) | (1.388) | (5.350) | — |
| Net Asset Value, End of Period | $39.16 | $36.43 | $44.00 | $63.87 |
| |
| Total Return | 10.03% | –13.73% | –24.47% | 6.29% |
| |
| Ratios/Supplemental Data | | | | |
| Net Assets, End of Period (Millions) | $55 | $50 | $58 | $79 |
| Ratio of Total Expenses to Average Net Assets | 0.17%2 | 0.17% | 0.12% | 0.15%2 |
| Ratio of Net Investment Income to Average Net Assets | 2.31%2 | 2.90% | 2.63% | 2.29%2 |
| Portfolio Turnover Rate | 54%2 | 68% | 104% | 48% |
1 Commencement of operations as a registered investment company.
2 Annualized.
See accompanying Notes, which are an integral part of the Financial Statements.
39
Structured Large-Cap Value Fund
Notes to Financial Statements
Vanguard Structured Large-Cap Value Fund is registered under the Investment Company Act of 1940 as an open-end investment company, or mutual fund. The fund offers two classes of shares: Institutional Shares and Institutional Plus Shares. Institutional Shares are available to investors who invest a minimum of $5 million. Institutional Plus Shares are available to investors who invest a minimum of $200 million ($100 million for investors with total Vanguard investments of at least $1 billion). The fund has not issued any Institutional Shares through March 31, 2010.
A. The following significant accounting policies conform to generally accepted accounting principles for U.S. mutual funds. The fund consistently follows such policies in preparing its financial statements.
1. Security Valuation: Securities are valued as of the close of trading on the New York Stock Exchange (generally 4 p.m., Eastern time) on the valuation date. Equity securities are valued at the latest quoted sales prices or official closing prices taken from the primary market in which each security trades; such securities not traded on the valuation date are valued at the mean of the latest quoted bid and asked prices. Securities for which market quotations are not readily available, or whose values have been materially affected by events occurring before the fund’s pricing time but after the close of the securities’ primary markets, are valued by methods deemed by the board of trustees to represent fair value. Temporary cash investments acquired over 60 days to maturity are valued using the latest bid prices or using valuations based on a matrix system (which considers such factors as security prices, yields, maturities, and ratings), both as furnished by independent pricing services. Other temporary cash investments are valued at amortized cost, which approximates market value.
2. Futures Contracts: The fund uses index futures contracts to a limited extent, with the objective of maintaining full exposure to the stock market while maintaining liquidity. The fund may purchase or sell futures contracts to achieve a desired level of investment, whether to accommodate portfolio turnover or cash flows from capital share transactions. The primary risks associated with the use of futures contracts are imperfect correlation between changes in market values of stocks held by the fund and the prices of futures contracts, and the possibility of an illiquid market.
Futures contracts are valued at their quoted daily settlement prices. The aggregate principal amounts of the contracts are not recorded in the Statement of Net Assets. Fluctuations in the value of the contracts are recorded in the Statement of Net Assets as an asset (liability) and in the Statement of Operations as unrealized appreciation (depreciation) until the contracts are closed, when they are recorded as realized futures gains (losses).
3. Federal Income Taxes: The fund intends to continue to qualify as a regulated investment company and distribute all of its taxable income. Management has analyzed the fund’s tax positions taken for all open federal income tax years (September 30, 2007–2009), and for the period ended March 31, 2010, and has concluded that no provision for federal income tax is required in the fund’s financial statements.
4. Distributions: Distributions to shareholders are recorded on the ex-dividend date.
5. Security Lending: The fund may lend its securities to qualified institutional borrowers to earn additional income. Security loans are required to be secured at all times by collateral at least equal to the market value of securities loaned. The fund invests cash collateral received in Vanguard Market Liquidity Fund, and records a liability for the return of the collateral, during the period the securities are on loan. Security lending income represents the income earned on investing cash collateral, less expenses associated with the loan.
40
Structured Large-Cap Value Fund
6. Other: Dividend income is recorded on the ex-dividend date. Security transactions are accounted for on the date securities are bought or sold. Costs used to determine realized gains (losses) on the sale of investment securities are those of the specific securities sold.
B. The Vanguard Group furnishes at cost investment advisory, corporate management, administrative, marketing, and distribution services. The costs of such services are allocated to the fund under methods approved by the board of trustees. The fund has committed to provide up to 0.40% of its net assets in capital contributions to Vanguard. At March 31, 2010, the fund had contributed capital of $10,000 to Vanguard (included in Other Assets), representing 0.02% of the fund’s net assets and 0.00% of Vanguard’s capitalization. The fund’s trustees and officers are also directors and officers of Vanguard.
C. Various inputs may be used to determine the value of the fund’s investments. These inputs are summarized in three broad levels for financial statement purposes. The inputs or methodologies used to value securities are not necessarily an indication of the risk associated with investing in those securities.
Level 1—Quoted prices in active markets for identical securities.
Level 2—Other significant observable inputs (including quoted prices for similar securities, interest rates, prepayment speeds, credit risk, etc.).
Level 3—Significant unobservable inputs (including the fund’s own assumptions used to determine the fair value of investments).
The following table summarizes the fund’s investments as of March 31, 2010, based on the inputs used to value them:
| | | |
| | Level 1 | Level 2 | Level 3 |
| Investments | ($000) | ($000) | ($000) |
| Common Stocks | 54,892 | — | — |
| Temporary Cash Investments | — | 50 | — |
| Total | 54,892 | 50 | — |
D. Distributions are determined on a tax basis and may differ from net investment income and realized capital gains for financial reporting purposes. Differences may be permanent or temporary. Permanent differences are reclassified among capital accounts in the financial statements to reflect their tax character. Temporary differences arise when certain items of income, expense, gain, or loss are recognized in different periods for financial statement and tax purposes; these differences will reverse at some time in the future. Differences in classification may also result from the treatment of short-term gains as ordinary income for tax purposes.
The fund’s tax-basis capital gains and losses are determined only at the end of each fiscal year. For tax purposes, at September 30, 2009, the fund had available capital loss carryforwards totaling $5,409,000 to offset future net capital gains through September 30, 2017. In addition, the fund realized losses of $16,953,000 during the period from November 1, 2008, through September 30, 2009, which are deferred and will be treated as realized for tax purposes in fiscal 2010. The fund will use these capital losses to offset net taxable capital gains, if any, realized during the year ending September 30, 2010; should the fund realize net capital losses for the year, the losses will be added to the loss carryforward balance above.
41
Structured Large-Cap Value Fund
At March 31, 2010, the cost of investment securities for tax purposes was $49,528,000. Net unrealized appreciation of investment securities for tax purposes was $5,414,000, consisting of unrealized gains of $7,868,000 on securities that had risen in value since their purchase and $2,454,000 in unrealized losses on securities that had fallen in value since their purchase.
E. During the six months ended March 31, 2010, the fund purchased $14,523,000 of investment securities and sold $13,850,000 of investment securities, other than temporary cash investments.
| | |
| F. Capital shares issued and redeemed were: | | |
| | Six Months Ended | Year Ended |
| | March 31, 2010 | September 30, 2009 |
| | Shares | Shares |
| | (000) | (000) |
| Issued | — | — |
| Issued in Lieu of Cash Distributions | 32 | 55 |
| Redeemed | — | — |
| Net Increase (Decrease) in Shares Outstanding | 32 | 55 |
G. In preparing the financial statements as of March 31, 2010, management considered the impact of subsequent events for potential recognition or disclosure in these financial statements.
42
Structured Broad Market Fund
Fund Profile
As of March 31, 2010
| | | |
| Portfolio Characteristics | | |
| | | Comparative | Broad |
| | Fund | Index1 | Index2 |
| Number of Stocks | 325 | 2,950 | 4,159 |
| Median Market Cap | $29.5B | $31.2B | $31.4B |
| Price/Earnings Ratio | 17.0x | 22.5x | 23.0x |
| Price/Book Ratio | 2.4x | 2.2x | 2.2x |
| Yield3 | | 1.8% | 1.7% |
| Institutional Shares | 1.6% | | |
| Institutional | | | |
| Plus Shares | 1.7% | | |
| Return on Equity | 20.7% | 19.3% | 19.1% |
| Earnings Growth Rate | 12.6% | 7.0% | 6.9% |
| Foreign Holdings | 0.2% | 0.0% | 0.0% |
| Turnover Rate4 | 46% | — | — |
| Expense Ratio5 | | — | — |
| Institutional Shares | 0.25% | | |
| Institutional | | | |
| Plus Shares | 0.17% | | |
| Short-Term Reserves | 0.1% | — | — |
| | | |
| Sector Diversification (% of equity exposure) |
| | | Comparative | Broad |
| | Fund | Index1 | Index2 |
| Consumer Discretionary | 11.7% | 11.1% | 11.0% |
| Consumer Staples | 9.9 | 10.1 | 9.8 |
| Energy | 10.7 | 10.3 | 10.0 |
| Financials | 16.0 | 16.1 | 17.3 |
| Health Care | 12.0 | 12.5 | 12.4 |
| Industrials | 11.3 | 11.1 | 10.9 |
| Information Technology | 18.4 | 18.5 | 18.5 |
| Materials | 4.1 | 4.0 | 4.0 |
| Telecommunication | | | |
| Services | 2.5 | 2.7 | 2.6 |
| Utilities | 3.4 | 3.6 | 3.5 |
| | |
| Volatility Measures6 | |
| | Fund Versus | Fund Versus |
| | Comparative Index1 | Broad Index2 |
| R-Squared | 1.00 | 1.00 |
| Beta | 0.99 | 0.99 |
| | |
| Ten Largest Holdings7 (% of total net assets) |
| Exxon Mobil Corp. | integrated oil & gas | 3.1% |
| Apple Inc. | computer hardware | 2.2 |
| Microsoft Corp. | systems software | 2.2 |
| International Business | | |
| Machines Corp. | computer hardware | 1.9 |
| AT&T Inc. | integrated | |
| | telecommunication | |
| | services | 1.7 |
| Chevron Corp. | integrated oil & gas | 1.7 |
| Google Inc. Class A | Internet software | |
| | & services | 1.6 |
| Wal-Mart Stores Inc. | hypermarkets & | |
| | super centers | 1.5 |
| Johnson & Johnson | pharmaceuticals | 1.5 |
| Hewlett-Packard Co. | computer hardware | 1.4 |
| Top Ten | | 18.8% |
Investment Focus
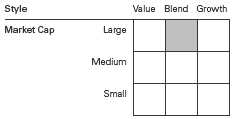
1 Russell 3000 Index.
2 Dow Jones U.S.Total Stock Market Index.
3 30-day SEC yield for the fund; annualized dividend yield for the indexes. See the Glossary.
4 Annualized.
5 The expense ratios shown are from the prospectus dated January 27, 2010, and represent estimated costs for the current fiscal year based
on the fund’s net assets as of the prospectus date. For the six months ended March 31, 2010, the annualized expense ratios were 0.24%
for the Institutional Shares and 0.17% for the Institutional Plus Shares.
6 For an explanation of R-squared, beta, and other terms used here, see the Glossary.
7 The holdings listed exclude any temporary cash investments and equity index products.
43
Structured Broad Market Fund
Performance Summary
All of the returns in this report represent past performance, which is not a guarantee of future results that may be achieved by the fund. (Current performance may be lower or higher than the performance data cited. For performance data current to the most recent month-end, visit our website at www.vanguard.com/performance.) Note, too, that both investment returns and principal value can fluctuate widely, so an investor’s shares, when sold, could be worth more or less than their original cost. The returns shown do not reflect taxes that a shareholder would pay on fund distributions or on the sale of fund shares.
Fiscal-Year Total Returns (%): November 30, 2006–March 31, 2010
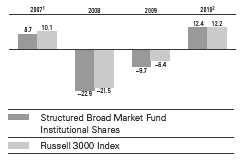
| | | | |
| Average Annual Total Returns: Periods Ended March 31, 2010 | | | |
| | | | | Since |
| | Inception Date | One Year | Five Years | Inception1 |
| Institutional Shares | 11/30/2006 | 49.13% | — | –4.76% |
| Institutional Plus Shares | 5/3/2004 | 49.26 | 1.32% | 2.66 |
1 The fund commenced operations as a registered investment company on October 3, 2006. The fund’s performance includes the
performance of a predecessor trust, Vanguard Fiduciary Trust Company Structured Large-Cap Broad Market Trust, from May 3, 2004,
to October 3, 2006.
2 Six months ended March 31, 2010.
See Financial Highlights for dividend and capital gains information.
44
Structured Broad Market Fund
Financial Statements (unaudited)
Statement of Net Assets
As of March 31, 2010
The fund reports a complete list of its holdings in regulatory filings four times in each fiscal year, at the quarter-ends. For the second and fourth fiscal quarters, the lists appear in the fund’s semiannual and annual reports to shareholders. For the first and third fiscal quarters, the fund files the lists with the Securities and Exchange Commission on Form N-Q. Shareholders can look up the fund’s Forms N-Q on the SEC’s website at www.sec.gov. Forms N-Q may also be reviewed and copied at the SEC’s Public Reference Room (see the back cover of this report for further information).
| | | |
| | | | Market |
| | | | Value• |
| | | Shares | ($000) |
| Common Stocks (99.8%)1 | | |
| Consumer Discretionary (11.7%) | |
| * | Ford Motor Co. | 192,062 | 2,414 |
| | Comcast Corp. Class A | 110,891 | 2,087 |
| | McDonald’s Corp. | 30,431 | 2,030 |
| | Wyndham Worldwide Corp. | 70,200 | 1,806 |
| | Gap Inc. | 76,300 | 1,763 |
| *,^ | Talbots Inc. | 131,200 | 1,700 |
| | McGraw-Hill Cos. Inc. | 46,900 | 1,672 |
| * | Starbucks Corp. | 62,900 | 1,527 |
| | Time Warner Cable Inc. | 24,762 | 1,320 |
| | Time Warner Inc. | 37,400 | 1,170 |
| | Ltd Brands Inc. | 43,300 | 1,066 |
| * | Big Lots Inc. | 29,000 | 1,056 |
| * | Aeropostale Inc. | 36,525 | 1,053 |
| | TJX Cos. Inc. | 24,400 | 1,038 |
| | Jarden Corp. | 30,200 | 1,005 |
| | Ross Stores Inc. | 17,900 | 957 |
| * | Beazer Homes USA Inc. | 183,100 | 831 |
| | DR Horton Inc. | 55,300 | 697 |
| | Gannett Co. Inc. | 42,000 | 694 |
| | DISH Network Corp. | | |
| | Class A | 32,750 | 682 |
| * | Tempur-Pedic | | |
| | International Inc. | 21,400 | 646 |
| | Darden Restaurants Inc. | 11,300 | 503 |
| | Cablevision Systems Corp. | | |
| | Class A | 17,500 | 423 |
| * | Autoliv Inc. | 8,100 | 417 |
| * | AutoZone Inc. | 2,400 | 415 |
| * | CEC Entertainment Inc. | 10,504 | 400 |
| | Comcast Corp. | 22,000 | 395 |
| * | Warnaco Group Inc. | 7,700 | 367 |
| * | TRW Automotive | | |
| | Holdings Corp. | 12,663 | 362 |
| * | Dollar Tree Inc. | 5,900 | 349 |
| | KB Home | 20,500 | 343 |
| * | Bally Technologies Inc. | 7,800 | 316 |
| * | Valassis | | |
| | Communications Inc. | 11,300 | 315 |
| | | |
| | | | Market |
| | | | Value• |
| | | Shares | ($000) |
| | Lincoln Educational | | |
| | Services Corp. | 11,609 | 294 |
| * | Viacom Inc. Class B | 8,395 | 289 |
| * | AutoNation Inc. | 15,000 | 271 |
| | Service Corp. International | 26,400 | 242 |
| | Standard Motor | | |
| | Products Inc. | 23,800 | 236 |
| * | Dana Holding Corp. | 16,400 | 195 |
| * | Stein Mart Inc. | 20,900 | 189 |
| | Tupperware Brands Corp. | 3,900 | 188 |
| | Yum! Brands Inc. | 4,400 | 169 |
| | Sherwin-Williams Co. | 2,100 | 142 |
| | Whirlpool Corp. | 1,400 | 122 |
| | H&R Block Inc. | 6,300 | 112 |
| * | Career Education Corp. | 2,500 | 79 |
| | Brinker International Inc. | 3,900 | 75 |
| * | NVR Inc. | 100 | 73 |
| * | Lithia Motors Inc. Class A | 10,700 | 69 |
| * | Corinthian Colleges Inc. | 3,500 | 62 |
| | Advance Auto Parts Inc. | 1,300 | 55 |
| | | | 34,681 |
| Consumer Staples (9.9%) | | |
| | Wal-Mart Stores Inc. | 79,065 | 4,396 |
| | Philip Morris | | |
| | International Inc. | 74,350 | 3,878 |
| | Procter & Gamble Co. | 46,751 | 2,958 |
| | Coca-Cola Enterprises Inc. | 62,500 | 1,729 |
| | General Mills Inc. | 23,900 | 1,692 |
| | Mead Johnson Nutrition Co. | 30,732 | 1,599 |
| | Coca-Cola Co. | 26,690 | 1,468 |
| | Kimberly-Clark Corp. | 21,000 | 1,321 |
| | Dr Pepper Snapple Group Inc. | 36,800 | 1,294 |
| * | Whole Foods Market Inc. | 33,300 | 1,204 |
| | Kraft Foods Inc. | 37,700 | 1,140 |
| | Colgate-Palmolive Co. | 13,230 | 1,128 |
| | PepsiCo Inc. | 15,500 | 1,025 |
| | Archer-Daniels-Midland Co. | 35,100 | 1,014 |
| | ConAgra Foods Inc. | 39,500 | 990 |
| | Casey’s General Stores Inc. | 24,500 | 769 |
| | Clorox Co. | 5,700 | 366 |
45
Structured Broad Market Fund
| | | |
| | | | Market |
| | | | Value• |
| | | Shares | ($000) |
| | Sanderson Farms Inc. | 6,100 | 327 |
| | Del Monte Foods Co. | 18,600 | 272 |
| | CVS Caremark Corp. | 6,536 | 239 |
| | Estee Lauder Cos. Inc. | | |
| | Class A | 1,900 | 123 |
| * | United Natural Foods Inc. | 3,200 | 90 |
| * | Boston Beer Co. Inc. Class A | 1,400 | 73 |
| | Tyson Foods Inc. Class A | 3,100 | 59 |
| | Sara Lee Corp. | 3,700 | 52 |
| | | | 29,206 |
| Energy (10.7%) | | |
| | Exxon Mobil Corp. | 137,820 | 9,231 |
| | Chevron Corp. | 66,965 | 5,078 |
| | Apache Corp. | 23,140 | 2,349 |
| | Occidental Petroleum Corp. | 24,840 | 2,100 |
| * | Newfield Exploration Co. | 32,900 | 1,712 |
| | National Oilwell Varco Inc. | 41,700 | 1,692 |
| * | FMC Technologies Inc. | 23,100 | 1,493 |
| | Diamond Offshore | | |
| | Drilling Inc. | 13,100 | 1,163 |
| | Murphy Oil Corp. | 20,600 | 1,158 |
| | Peabody Energy Corp. | 21,700 | 992 |
| * | Rowan Cos. Inc. | 32,200 | 937 |
| | Anadarko Petroleum Corp. | 11,240 | 819 |
| | ConocoPhillips | 13,800 | 706 |
| | Consol Energy Inc. | 12,900 | 550 |
| | Schlumberger Ltd. | 5,100 | 324 |
| * | James River Coal Co. | 15,500 | 246 |
| | Ship Finance | | |
| | International Ltd. | 13,100 | 233 |
| * | Bristow Group Inc. | 5,900 | 223 |
| | El Paso Corp. | 19,700 | 214 |
| * | Oil States International Inc. | 4,200 | 190 |
| | Tidewater Inc. | 3,000 | 142 |
| | Southern Union Co. | 3,700 | 94 |
| * | Cal Dive International Inc. | 8,800 | 64 |
| * | PHI Inc. | 2,500 | 53 |
| | | | 31,763 |
| Financials (15.9%) | | |
| | Goldman Sachs Group Inc. | 21,111 | 3,602 |
| | Wells Fargo & Co. | 92,070 | 2,865 |
| | JPMorgan Chase & Co. | 55,936 | 2,503 |
| | Bank of America Corp. | 135,445 | 2,418 |
| | Aflac Inc. | 39,640 | 2,152 |
| | US Bancorp | 79,650 | 2,061 |
| | Franklin Resources Inc. | 17,700 | 1,963 |
| | Travelers Cos. Inc. | 32,900 | 1,775 |
| | Unum Group | 68,100 | 1,687 |
| | State Street Corp. | 36,000 | 1,625 |
| | BlackRock Inc. | 7,000 | 1,524 |
| | PNC Financial Services | | |
| | Group Inc. | 24,600 | 1,469 |
| | BOK Financial Corp. | 25,300 | 1,327 |
| | Chubb Corp. | 25,070 | 1,300 |
| | Progressive Corp. | 60,300 | 1,151 |
| | Discover Financial Services | 73,400 | 1,094 |
| | | |
| | | | Market |
| | | | Value• |
| | | Shares | ($000) |
| | Hudson City Bancorp Inc. | 70,800 | 1,003 |
| | New York Community | | |
| | Bancorp Inc. | 59,630 | 986 |
| | Moody’s Corp. | 30,100 | 895 |
| | NYSE Euronext | 29,000 | 859 |
| * | CB Richard Ellis Group Inc. | | |
| | Class A | 53,700 | 851 |
| | SL Green Realty Corp. | 13,900 | 796 |
| | Capital One Financial Corp. | 15,300 | 634 |
| | American Financial | | |
| | Group Inc. | 21,300 | 606 |
| | Simon Property Group Inc. | 7,109 | 596 |
| | Ameriprise Financial Inc. | 13,100 | 594 |
| * | SLM Corp. | 45,100 | 565 |
| | American Express Co. | 13,420 | 554 |
| | Oriental Financial Group Inc. | 40,000 | 540 |
| | Macerich Co. | 13,787 | 528 |
| | Everest Re Group Ltd. | 6,100 | 494 |
| | Hospitality Properties Trust | 18,500 | 443 |
| | Bank of Hawaii Corp. | 9,600 | 431 |
| | Associated Estates | | |
| | Realty Corp. | 29,300 | 404 |
| | Mid-America Apartment | | |
| | Communities Inc. | 7,800 | 404 |
| * | St. Joe Co. | 12,300 | 398 |
| | Sun Communities Inc. | 15,600 | 393 |
| | Highwoods Properties Inc. | 11,929 | 378 |
| | HRPT Properties Trust | 42,800 | 333 |
| * | AmeriCredit Corp. | 13,700 | 325 |
| | Nelnet Inc. Class A | 13,900 | 258 |
| * | First Horizon National Corp. | 17,743 | 249 |
| | Cullen/Frost Bankers Inc. | 4,400 | 246 |
| | Brandywine Realty Trust | 18,200 | 222 |
| | Federated Investors Inc. | | |
| | Class B | 7,800 | 206 |
| * | World Acceptance Corp. | 5,700 | 206 |
| | Endurance Specialty | | |
| | Holdings Ltd. | 5,000 | 186 |
| * | Citigroup Inc. | 37,700 | 153 |
| | Aspen Insurance | | |
| | Holdings Ltd. | 4,400 | 127 |
| | U-Store-It Trust | 15,500 | 112 |
| * | TD Ameritrade Holding Corp. | 5,016 | 96 |
| | Banco Latinoamericano | | |
| | de Comercio Exterior SA | 5,600 | 80 |
| | First Citizens | | |
| | BancShares Inc. Class A | 400 | 79 |
| | Pennsylvania Real Estate | | |
| | Investment Trust | 6,100 | 76 |
| | Territorial Bancorp Inc. | 2,700 | 51 |
| | Montpelier Re Holdings Ltd. | 2,900 | 49 |
| * | Arch Capital Group Ltd. | 600 | 46 |
| | City Holding Co. | 1,300 | 45 |
| * | Santander BanCorp | 3,400 | 42 |
| | Parkway Properties Inc. | 2,200 | 41 |
46
| | | |
| Structured Broad Market Fund | | |
| |
| |
| |
| | | | Market |
| | | | Value• |
| | | Shares | ($000) |
| | Flagstone Reinsurance | | |
| | Holdings Ltd. | 3,600 | 41 |
| | International Bancshares Corp. | 1,700 | 39 |
| | White Mountains | | |
| | Insurance Group Ltd. | 100 | 35 |
| | | | 47,211 |
| Health Care (12.0%) | | |
| | Johnson & Johnson | 66,907 | 4,362 |
| | Merck & Co. Inc. | 82,283 | 3,073 |
| * | Amgen Inc. | 40,015 | 2,391 |
| * | Medco Health Solutions Inc. | 36,585 | 2,362 |
| | McKesson Corp. | 29,000 | 1,906 |
| | Abbott Laboratories | 34,100 | 1,796 |
| | Pfizer Inc. | 102,764 | 1,763 |
| * | WellPoint Inc. | 26,650 | 1,716 |
| * | Forest Laboratories Inc. | 52,300 | 1,640 |
| * | Mylan Inc. | 62,411 | 1,417 |
| | Bristol-Myers Squibb Co. | 50,452 | 1,347 |
| * | Warner Chilcott PLC Class A | 50,800 | 1,298 |
| | Eli Lilly & Co. | 29,220 | 1,058 |
| | AmerisourceBergen Corp. | | |
| | Class A | 36,400 | 1,053 |
| | Quest Diagnostics Inc. | 17,100 | 997 |
| | UnitedHealth Group Inc. | 29,875 | 976 |
| | Universal Health | | |
| | Services Inc. Class B | 23,200 | 814 |
| * | Laboratory Corp. of | | |
| | America Holdings | 8,900 | 674 |
| * | DaVita Inc. | 10,300 | 653 |
| | CIGNA Corp. | 17,000 | 622 |
| | Cooper Cos. Inc. | 12,700 | 494 |
| * | Myriad Genetics Inc. | 13,200 | 318 |
| | Baxter International Inc. | 5,360 | 312 |
| * | Emergency Medical | | |
| | Services Corp. Class A | 5,376 | 304 |
| * | Lincare Holdings Inc. | 6,000 | 269 |
| * | Life Technologies Corp. | 5,000 | 261 |
| * | Mettler-Toledo | | |
| | International Inc. | 2,100 | 229 |
| * | Cephalon Inc. | 3,200 | 217 |
| * | Health Management | | |
| | Associates Inc. Class A | 20,000 | 172 |
| * | Human Genome | | |
| | Sciences Inc. | 4,728 | 143 |
| * | Bruker Corp. | 9,500 | 139 |
| * | Salix Pharmaceuticals Ltd. | 2,800 | 104 |
| * | Catalyst Health Solutions Inc. | 2,400 | 99 |
| * | Affymetrix Inc. | 11,800 | 87 |
| * | King Pharmaceuticals Inc. | 6,000 | 71 |
| | Perrigo Co. | 1,200 | 71 |
| * | Endo Pharmaceuticals | | |
| | Holdings Inc. | 2,500 | 59 |
| * | Par Pharmaceutical Cos. Inc. | 1,800 | 45 |
| * | Community Health | | |
| | Systems Inc. | 1,200 | 44 |
| | | |
| | | | Market |
| | | | Value• |
| | | Shares | ($000) |
| * | Biospecifics | | |
| | Technologies Corp. | 1,400 | 39 |
| * | Accelrys Inc. | 5,900 | 36 |
| | | | 35,431 |
| Industrials (11.3%) | | |
| | United Technologies Corp. | 42,140 | 3,102 |
| | General Electric Co. | 159,380 | 2,901 |
| | United Parcel Service Inc. | | |
| | Class B | 41,900 | 2,699 |
| | 3M Co. | 28,430 | 2,376 |
| | General Dynamics Corp. | 25,400 | 1,961 |
| | Joy Global Inc. | 31,100 | 1,760 |
| | Lockheed Martin Corp. | 21,150 | 1,760 |
| | CSX Corp. | 27,937 | 1,422 |
| | Honeywell International Inc. | 29,424 | 1,332 |
| | Northrop Grumman Corp. | 18,130 | 1,189 |
| | Waste Management Inc. | 31,300 | 1,078 |
| * | Oshkosh Corp. | 26,600 | 1,073 |
| | Bucyrus International Inc. | | |
| | Class A | 16,100 | 1,062 |
| | Raytheon Co. | 18,000 | 1,028 |
| * | Avis Budget Group Inc. | 81,100 | 933 |
| | Flowserve Corp. | 7,500 | 827 |
| * | Dollar Thrifty Automotive | | |
| | Group Inc. | 23,200 | 745 |
| | ITT Corp. | 13,000 | 697 |
| | FedEx Corp. | 7,400 | 691 |
| | L-3 Communications | | |
| | Holdings Inc. | 7,100 | 651 |
| * | Hertz Global Holdings Inc. | 63,600 | 635 |
| * | General Cable Corp. | 22,700 | 613 |
| | RR Donnelley & Sons Co. | 27,100 | 579 |
| * | EMCOR Group Inc. | 19,600 | 483 |
| | Pitney Bowes Inc. | 14,300 | 350 |
| | Hubbell Inc. Class B | 6,200 | 313 |
| | Towers Watson & Co. | | |
| | Class A | 5,800 | 275 |
| | Avery Dennison Corp. | 6,500 | 237 |
| * | Owens Corning | 7,000 | 178 |
| * | Genco Shipping & | | |
| | Trading Ltd. | 4,300 | 91 |
| * | EnerSys | 3,500 | 86 |
| * | Alliant Techsystems Inc. | 1,000 | 81 |
| | Apogee Enterprises Inc. | 3,700 | 58 |
| | Carlisle Cos. Inc. | 1,400 | 53 |
| | Ampco-Pittsburgh Corp. | 1,373 | 34 |
| | | | 33,353 |
| Information Technology (18.3%) | |
| * | Apple Inc. | 28,120 | 6,606 |
| | Microsoft Corp. | 225,297 | 6,594 |
| | International Business | | |
| | Machines Corp. | 43,342 | 5,559 |
| * | Google Inc. Class A | 8,390 | 4,757 |
| | Hewlett-Packard Co. | 79,599 | 4,231 |
| | Oracle Corp. | 152,048 | 3,906 |
47
Structured Broad Market Fund
| | | |
| | | | Market |
| | | | Value• |
| | | Shares | ($000) |
| * | Cisco Systems Inc. | 91,950 | 2,393 |
| | Intel Corp. | 64,790 | 1,442 |
| * | Micron Technology Inc. | 136,100 | 1,414 |
| * | Marvell Technology | | |
| | Group Ltd. | 64,800 | 1,321 |
| | Texas Instruments Inc. | 52,870 | 1,294 |
| * | Symantec Corp. | 76,200 | 1,289 |
| * | Western Digital Corp. | 32,900 | 1,283 |
| * | Alliance Data Systems Corp. | 19,900 | 1,273 |
| * | eBay Inc. | 39,900 | 1,075 |
| * | Computer Sciences Corp. | 19,500 | 1,063 |
| * | Seagate Technology | 52,903 | 966 |
| * | Sybase Inc. | 18,462 | 861 |
| * | Multi-Fineline Electronix Inc. | 30,200 | 778 |
| * | Teradata Corp. | 25,700 | 742 |
| | Xilinx Inc. | 21,600 | 551 |
| | Earthlink Inc. | 58,000 | 495 |
| * | Lexmark International Inc. | | |
| | Class A | 12,800 | 462 |
| * | Sohu.com Inc. | 7,500 | 409 |
| * | SanDisk Corp. | 11,600 | 402 |
| * | Plexus Corp. | 9,900 | 357 |
| | Opnet Technologies Inc. | 21,000 | 339 |
| * | Hewitt Associates Inc. | | |
| | Class A | 8,400 | 334 |
| | CA Inc. | 10,100 | 237 |
| * | ON Semiconductor Corp. | 26,300 | 210 |
| * | Fairchild Semiconductor | | |
| | International Inc. Class A | 16,900 | 180 |
| * | TIBCO Software Inc. | 16,400 | 177 |
| * | Radisys Corp. | 16,700 | 150 |
| | KLA-Tencor Corp. | 4,300 | 133 |
| * | Veeco Instruments Inc. | 2,800 | 122 |
| * | SolarWinds Inc. | 4,612 | 100 |
| * | Teradyne Inc. | 8,500 | 95 |
| | Global Payments Inc. | 1,900 | 87 |
| * | Saba Software Inc. | 16,100 | 80 |
| * | RF Micro Devices Inc. | 15,900 | 79 |
| * | TriQuint Semiconductor Inc. | 9,800 | 69 |
| | QUALCOMM Inc. | 1,320 | 55 |
| * | Rovi Corp. | 1,400 | 52 |
| * | Lattice Semiconductor Corp. | 13,400 | 49 |
| | MAXIMUS Inc. | 700 | 43 |
| * | Manhattan Associates Inc. | 1,500 | 38 |
| * | Quest Software Inc. | 2,100 | 37 |
| * | LSI Corp. | 4,800 | 29 |
| | | | 54,218 |
| Materials (4.1%) | | |
| | Freeport-McMoRan | | |
| | Copper & Gold Inc. | 30,000 | 2,506 |
| | EI du Pont de Nemours | | |
| | & Co. | 58,980 | 2,196 |
| | International Paper Co. | 64,400 | 1,585 |
| | Ball Corp. | 21,700 | 1,158 |
| * | Pactiv Corp. | 39,700 | 1,000 |
| | | |
| | | | Market |
| | | | Value• |
| | | Shares | ($000) |
| | Celanese Corp. Class A | 29,600 | 943 |
| | Eastman Chemical Co. | 12,100 | 771 |
| * | Owens-Illinois Inc. | 16,700 | 594 |
| | Lubrizol Corp. | 5,100 | 468 |
| * | Clearwater Paper Corp. | 5,200 | 256 |
| | Innophos Holdings Inc. | 8,500 | 237 |
| | Rock-Tenn Co. Class A | 4,200 | 191 |
| | Glatfelter | 9,100 | 132 |
| | AK Steel Holding Corp. | 5,300 | 121 |
| * | Solutia Inc. | 4,600 | 74 |
| | | | 12,232 |
| Telecommunication Services (2.5%) | |
| | AT&T Inc. | 197,829 | 5,112 |
| | Qwest Communications | | |
| | International Inc. | 141,700 | 740 |
| | Verizon Communications Inc. | 18,157 | 563 |
| * | American Tower Corp. | | |
| | Class A | 11,300 | 482 |
| | Windstream Corp. | 26,538 | 289 |
| * | NII Holdings Inc. | 5,000 | 208 |
| | | | 7,394 |
| Utilities (3.4%) | | |
| | Constellation Energy | | |
| | Group Inc. | 48,900 | 1,717 |
| | Public Service Enterprise | | |
| | Group Inc. | 56,800 | 1,677 |
| * | AES Corp. | 127,900 | 1,407 |
| | Exelon Corp. | 18,440 | 808 |
| | American Electric | | |
| | Power Co. Inc. | 21,200 | 725 |
| | Edison International | 18,840 | 644 |
| | FirstEnergy Corp. | 13,600 | 532 |
| | CMS Energy Corp. | 33,400 | 516 |
| | DTE Energy Co. | 11,300 | 504 |
| | NiSource Inc. | 25,700 | 406 |
| | IDACORP Inc. | 10,000 | 346 |
| | Integrys Energy Group Inc. | 5,900 | 279 |
| | Entergy Corp. | 1,800 | 146 |
| | Oneok Inc. | 1,900 | 87 |
| | Hawaiian Electric | | |
| | Industries Inc. | 2,500 | 56 |
| | Nicor Inc. | 1,300 | 54 |
| | Piedmont Natural | | |
| | Gas Co. Inc. | 1,900 | 52 |
| | Southwest Gas Corp. | 1,700 | 51 |
| | | | 10,007 |
| Total Common Stocks | | |
| (Cost $248,871) | | 295,496 |
| Temporary Cash Investments (0.7%)1 | |
| Money Market Fund (0.7%) | | |
| 2,3 | Vanguard Market Liquidity | | |
| | Fund, 0.183% | 1,883,112 | 1,883 |
48
Structured Broad Market Fund
| | |
| | Face | Market |
| | Amount | Value• |
| | ($000) | ($000) |
| U.S. Government and Agency Obligations (0.0%) |
| 4,5 Freddie Mac Discount | | |
| Notes, 0.320%, 9/7/10 | 70 | 70 |
| Total Temporary Cash Investments | |
| (Cost $1,953) | | 1,953 |
| Total Investments (100.5%) | | |
| (Cost $250,824) | | 297,449 |
| Other Assets and Liabilities (–0.5%) | |
| Other Assets | | 732 |
| Liabilities3 | | (2,247) |
| | | (1,515) |
| Net Assets (100%) | | 295,934 |
| |
| At March 31, 2010, net assets consisted of: | |
| | Amount |
| | ($000) |
| Paid-in Capital | 345,330 |
| Undistributed Net Investment Income | 1,199 |
| Accumulated Net Realized Losses | (97,230) |
| Unrealized Appreciation (Depreciation) | |
| Investment Securities | 46,625 |
| Futures Contracts | 10 |
| Net Assets | 295,934 |
| |
| Institutional Shares—Net Assets | |
| Applicable to 219,759 outstanding | |
| $.001 par value shares of beneficial | |
| interest (unlimited authorization) | 4,611 |
| Net Asset Value Per Share— | |
| Institutional Shares | $20.98 |
| |
| Institutional Plus Shares—Net Assets | |
| Applicable to 6,951,209 outstanding | |
| $.001 par value shares of beneficial | |
| interest (unlimited authorization) | 291,323 |
| Net Asset Value Per Share— | |
| Institutional Plus Shares | $41.91 |
• See Note A in Notes to Financial Statements.
* Non-income-producing security.
^ Part of security position is on loan to broker-dealers. The total value of securities on loan is $1,121,000.
1 The fund invests a portion of its cash reserves in equity markets through the use of index futures contracts. After giving effect to futures
investments, the fund’s effective common stock and temporary cash investment positions represent 100.0% and 0.5%, respectively, of
net assets.
2 Affiliated money market fund available only to Vanguard funds and certain trusts and accounts managed by Vanguard. Rate shown is
the 7-day yield.
3 Includes $1,211,000 of collateral received for securities on loan.
4 The issuer operates under a congressional charter; its securities are not backed by the full faith and credit of the U.S. government.
5 Securities with a value of $70,000 have been segregated as initial margin for open futures contracts.
See accompanying Notes, which are an integral part of the Financial Statements.
49
| |
| Structured Broad Market Fund | |
| |
| |
| Statement of Operations | |
| |
| | Six Months Ended |
| | March 31, 2010 |
| | ($000) |
| Investment Income | |
| Income | |
| Dividends | 2,921 |
| Interest1 | 2 |
| Security Lending | 84 |
| Total Income | 3,007 |
| Expenses | |
| The Vanguard Group—Note B | |
| Investment Advisory Services | 130 |
| Management and Administrative—Institutional Shares | 3 |
| Management and Administrative—Institutional Plus Shares | 81 |
| Marketing and Distribution—Institutional Shares | — |
| Marketing and Distribution—Institutional Plus Shares | 27 |
| Custodian Fees | 5 |
| Total Expenses | 246 |
| Net Investment Income | 2,761 |
| Realized Net Gain (Loss) | |
| Investment Securities Sold | 4,276 |
| Futures Contracts | 69 |
| Realized Net Gain (Loss) | 4,345 |
| Change in Unrealized Appreciation (Depreciation) | |
| Investment Securities | 26,466 |
| Futures Contracts | 5 |
| Change in Unrealized Appreciation (Depreciation) | 26,471 |
| Net Increase (Decrease) in Net Assets Resulting from Operations | 33,577 |
| 1 Interest income from an affiliated company of the fund was $1,000. | |
See accompanying Notes, which are an integral part of the Financial Statements.
50
| | |
| Structured Broad Market Fund | | |
| |
| |
| Statement of Changes in Net Assets | | |
| |
| | Six Months Ended | Year Ended |
| | March 31, | September 30, |
| | 2010 | 2009 |
| | ($000) | ($000) |
| Increase (Decrease) in Net Assets | | |
| Operations | | |
| Net Investment Income | 2,761 | 4,976 |
| Realized Net Gain (Loss) | 4,345 | (74,111) |
| Change in Unrealized Appreciation (Depreciation) | 26,471 | 54,465 |
| Net Increase (Decrease) in Net Assets Resulting from Operations | 33,577 | (14,670) |
| Distributions | | |
| Net Investment Income | | |
| Institutional Shares | (67) | (76) |
| Institutional Plus Shares | (5,073) | (5,098) |
| Realized Capital Gain | | |
| Institutional Shares | — | — |
| Institutional Plus Shares | — | — |
| Total Distributions | (5,140) | (5,174) |
| Capital Share Transactions | | |
| Institutional Shares | 442 | 76 |
| Institutional Plus Shares | (11,251) | 45,610 |
| Net Increase (Decrease) from Capital Share Transactions | (10,809) | 45,686 |
| Total Increase (Decrease) | 17,628 | 25,842 |
| Net Assets | | |
| Beginning of Period | 278,306 | 252,464 |
| End of Period1 | 295,934 | 278,306 |
| 1 Net Assets—End of Period includes undistributed net investment income of $1,199,000 and $3,578,000. | |
See accompanying Notes, which are an integral part of the Financial Statements.
51
| | | | |
| Structured Broad Market Fund | | | | |
| |
| |
| Financial Highlights | | | | |
| |
| |
| Institutional Shares | | | | |
| | Six Months | | | Nov. 30, |
| | Ended | Year Ended | 20061 to |
| | March 31, | September 30, | Sept. 30, |
| For a Share Outstanding Throughout Each Period | 2010 | 2009 | 2008 | 2007 |
| Net Asset Value, Beginning of Period | $18.99 | $21.53 | $28.67 | $26.59 |
| Investment Operations | | | | |
| Net Investment Income | .185 | .3522 | .402 | .3612 |
| Net Realized and Unrealized Gain (Loss) on Investments | 2.143 | (2.500) | (6.833) | 1.930 |
| Total from Investment Operations | 2.328 | (2.148) | (6.431) | 2.291 |
| Distributions | | | | |
| Dividends from Net Investment Income | (.338) | (.392) | (.280) | (.116) |
| Distributions from Realized Capital Gains | — | — | (.429) | (.095) |
| Total Distributions | (.338) | (.392) | (.709) | (.211) |
| Net Asset Value, End of Period | $20.98 | $18.99 | $21.53 | $28.67 |
| |
| Total Return | 12.38% | –9.67% | –22.95% | 8.68% |
| |
| Ratios/Supplemental Data | | | | |
| Net Assets, End of Period (Millions) | $5 | $4 | $4 | $14 |
| Ratio of Total Expenses to Average Net Assets | 0.24%3 | 0.25% | 0.20% | 0.25%3 |
| Ratio of Net Investment Income to Average Net Assets | 1.85%3 | 2.15% | 1.72% | 1.55%3 |
| Portfolio Turnover Rate | 46%3 | 62% | 70% | 66% |
1 Inception.
2 Calculated based on average shares outstanding.
3 Annualized.
See accompanying Notes, which are an integral part of the Financial Statements.
52
| | | | |
| Structured Broad Market Fund | | | | |
| |
| |
| Financial Highlights | | | | |
| |
| |
| Institutional Plus Shares | | | | |
| | Six Months | | | Oct. 3, |
| | Ended | Year Ended | 20061 to |
| | March 31, | September 30, | Sept. 30, |
| For a Share Outstanding Throughout Each Period | 2010 | 2009 | 2008 | 2007 |
| Net Asset Value, Beginning of Period | $37.94 | $43.07 | $57.39 | $50.00 |
| Investment Operations | | | | |
| Net Investment Income | .383 | .7252 | .873 | .9042 |
| Net Realized and Unrealized Gain (Loss) on Investments | 4.288 | (5.006) | (13.714) | 6.910 |
| Total from Investment Operations | 4.671 | (4.281) | (12.841) | 7.814 |
| Distributions | | | | |
| Dividends from Net Investment Income | (.701) | (.849) | (.621) | (.234) |
| Distributions from Realized Capital Gains | — | — | (.858) | (.190) |
| Total Distributions | (.701) | (.849) | (1.479) | (.424) |
| Net Asset Value, End of Period | $41.91 | $37.94 | $43.07 | $57.39 |
| |
| Total Return | 12.43% | –9.60% | –22.91% | 15.69% |
| |
| Ratios/Supplemental Data | | | | |
| Net Assets, End of Period (Millions) | $291 | $275 | $248 | $285 |
| Ratio of Total Expenses to Average Net Assets | 0.17%3 | 0.17% | 0.12% | 0.15%3 |
| Ratio of Net Investment Income to Average Net Assets | 1.92%3 | 2.23% | 1.80% | 1.65%3 |
| Portfolio Turnover Rate | 46%3 | 62% | 70% | 66% |
1 Commencement of operations as a registered investment company.
2 Calculated based on average shares outstanding.
3 Annualized.
See accompanying Notes, which are an integral part of the Financial Statements.
53
Structured Broad Market Fund
Notes to Financial Statements
Vanguard Structured Broad Market Fund is registered under the Investment Company Act of 1940 as an open-end investment company, or mutual fund. The fund offers two classes of shares: Institutional Shares and Institutional Plus Shares. Institutional Shares are available to investors who invest a minimum of $5 million. Institutional Plus Shares are available to investors who invest a minimum of $200 million ($100 million for investors with total Vanguard investments of at least $1 billion).
A. The following significant accounting policies conform to generally accepted accounting principles for U.S. mutual funds. The fund consistently follows such policies in preparing its financial statements.
1. Security Valuation: Securities are valued as of the close of trading on the New York Stock Exchange (generally 4 p.m., Eastern time) on the valuation date. Equity securities are valued at the latest quoted sales prices or official closing prices taken from the primary market in which each security trades; such securities not traded on the valuation date are valued at the mean of the latest quoted bid and asked prices. Securities for which market quotations are not readily available, or whose values have been materially affected by events occurring before the fund’s pricing time but after the close of the securities’ primary markets, are valued by methods deemed by the board of trustees to represent fair value. Investments in Vanguard Market Liquidity Fund are valued at that fund’s net asset value. Temporary cash investments acquired over 60 days to maturity are valued using the latest bid prices or using valuations based on a matrix system (which considers such factors as security prices, yields, maturities, and ratings), both as furnished by independent pricing services. Other temporary cash investments are valued at amortized cost, which approximates market value.
2. Futures Contracts: The fund uses index futures contracts to a limited extent, with the objective of maintaining full exposure to the stock market while maintaining liquidity. The fund may purchase or sell futures contracts to achieve a desired level of investment, whether to accommodate portfolio turnover or cash flows from capital share transactions. The primary risks associated with the use of futures contracts are imperfect correlation between changes in market values of stocks held by the fund and the prices of futures contracts, and the possibility of an illiquid market.
Futures contracts are valued at their quoted daily settlement prices. The aggregate principal amounts of the contracts are not recorded in the Statement of Net Assets. Fluctuations in the value of the contracts are recorded in the Statement of Net Assets as an asset (liability) and in the Statement of Operations as unrealized appreciation (depreciation) until the contracts are closed, when they are recorded as realized futures gains (losses).
3. Federal Income Taxes: The fund intends to continue to qualify as a regulated investment company and distribute all of its taxable income. Management has analyzed the fund’s tax positions taken for all open federal income tax years (September 30, 2007–2009), and for the period ended March 31, 2010, and has concluded that no provision for federal income tax is required in the fund’s financial statements.
4. Distributions: Distributions to shareholders are recorded on the ex-dividend date.
5. Security Lending: The fund may lend its securities to qualified institutional borrowers to earn additional income. Security loans are required to be secured at all times by collateral at least equal to the market value of securities loaned. The fund invests cash collateral received in Vanguard Market Liquidity Fund, and records a liability for the return of the collateral, during the period the securities are on loan. Security lending income represents the income earned on investing cash collateral, less expenses associated with the loan.
54
Structured Broad Market Fund
6. Other: Dividend income is recorded on the ex-dividend date. Interest income includes income distributions received from Vanguard Market Liquidity Fund and is accrued daily. Security transactions are accounted for on the date securities are bought or sold. Costs used to determine realized gains (losses) on the sale of investment securities are those of the specific securities sold.
Each class of shares has equal rights as to assets and earnings, except that each class separately bears certain class-specific expenses related to maintenance of shareholder accounts (included in Management and Administrative expenses) and shareholder reporting. Marketing and distribution expenses are allocated to each class of shares based on a method approved by the board of trustees. Income, other non-class-specific expenses, and gains and losses on investments are allocated to each class of shares based on its relative net assets.
B. The Vanguard Group furnishes at cost investment advisory, corporate management, administrative, marketing, and distribution services. The costs of such services are allocated to the fund under methods approved by the board of trustees. The fund has committed to provide up to 0.40% of its net assets in capital contributions to Vanguard. At March 31, 2010, the fund had contributed capital of $55,000 to Vanguard (included in Other Assets), representing 0.02% of the fund’s net assets and 0.02% of Vanguard’s capitalization. The fund’s trustees and officers are also directors and officers of Vanguard.
C. Various inputs may be used to determine the value of the fund’s investments. These inputs are summarized in three broad levels for financial statement purposes. The inputs or methodologies used to value securities are not necessarily an indication of the risk associated with investing in those securities.
Level 1—Quoted prices in active markets for identical securities.
Level 2—Other significant observable inputs (including quoted prices for similar securities, interest rates, prepayment speeds, credit risk, etc.).
Level 3—Significant unobservable inputs (including the fund’s own assumptions used to determine the fair value of investments).
The following table summarizes the fund’s investments as of March 31, 2010, based on the inputs used to value them:
| | | |
| | Level 1 | Level 2 | Level 3 |
| Investments | ($000) | ($000) | ($000) |
| Common Stocks | 295,496 | — | — |
| Temporary Cash Investments | 1,883 | 70 | — |
| Futures Contracts—Liabilities1 | (2) | — | — |
| Total | 297,377 | 70 | — |
| 1 Represents variation margin on the last day of the reporting period. | | | |
55
Structured Broad Market Fund
D. At March 31, 2010, the aggregate settlement value of open futures contracts and the related unrealized appreciation (depreciation) were:
| | | | |
| | | | | ($000) |
| | | | Aggregate | |
| | | Number of | Settlement | Unrealized |
| | | Long (Short) | Value | Appreciation |
| Futures Contracts | Expiration | Contracts | Long (Short) | (Depreciation) |
| S&P 500 Index | June 2010 | 2 | 583 | 10 |
Unrealized appreciation (depreciation) on open futures contracts is required to be treated as realized gain (loss) for tax purposes.
E. Distributions are determined on a tax basis and may differ from net investment income and realized capital gains for financial reporting purposes. Differences may be permanent or temporary. Permanent differences are reclassified among capital accounts in the financial statements to reflect their tax character. Temporary differences arise when certain items of income, expense, gain, or loss are recognized in different periods for financial statement and tax purposes; these differences will reverse at some time in the future. Differences in classification may also result from the treatment of short-term gains as ordinary income for tax purposes.
The fund’s tax-basis capital gains and losses are determined only at the end of each fiscal year. For tax purposes, at September 30, 2009, the fund had available capital loss carryforwards totaling $53,713,000 to offset future net capital gains through September 30, 2017. In addition, the fund realized losses of $47,850,000 during the period from November 1, 2008, through September 30, 2009, which are deferred and will be treated as realized for tax purposes in fiscal 2010. The fund will use these capital losses to offset net taxable capital gains, if any, realized during the year ending September 30, 2010; should the fund realize net capital losses for the year, the losses will be added to the loss carryforward balance above.
At March 31, 2010, the cost of investment securities for tax purposes was $250,824,000. Net unrealized appreciation of investment securities for tax purposes was $46,625,000, consisting of unrealized gains of $55,100,000 on securities that had risen in value since their purchase and $8,475,000 in unrealized losses on securities that had fallen in value since their purchase.
F. During the six months ended March 31, 2010, the fund purchased $65,623,000 of investment securities and sold $77,981,000 of investment securities, other than temporary cash investments.
56
| | | | |
| Structured Broad Market Fund | | | | |
| |
| |
| |
| |
| G. Capital share transactions for each class of shares were: | | | |
| | Six Months Ended | | Year Ended |
| | March 31, 2010 | September 30, 2009 |
| | Amount | Shares | Amount | Shares |
| | ($000) | (000) | ($000) | (000) |
| Institutional Shares | | | | |
| Issued | 375 | 19 | — | — |
| Issued in Lieu of Cash Distributions | 67 | 3 | 76 | 5 |
| Redeemed | — | — | — | — |
| Net Increase (Decrease)—Institutional Shares | 442 | 22 | 76 | 5 |
| Institutional Plus Shares | | | | |
| Issued | 1,974 | 49 | 43,734 | 1,413 |
| Issued in Lieu of Cash Distributions | 1,775 | 45 | 1,876 | 58 |
| Redeemed | (15,000) | (379) | — | — |
| Net Increase (Decrease)—Institutional Plus Shares | (11,251) | (285) | 45,610 | 1,471 |
H. In preparing the financial statements as of March 31, 2010, management considered the impact of subsequent events for potential recognition or disclosure in these financial statements.
57
About Your Fund’s Expenses
As a shareholder of the fund, you incur ongoing costs, which include costs for portfolio management, administrative services, and shareholder reports (like this one), among others. Operating expenses, which are deducted from a fund’s gross income, directly reduce the investment return of the fund.
A fund’s expenses are expressed as a percentage of its average net assets. This figure is known as the expense ratio. The following examples are intended to help you understand the ongoing costs (in dollars) of investing in your fund and to compare these costs with those of other mutual funds. The examples are based on an investment of $1,000 made at the beginning of the period shown and held for the entire period.
The accompanying table illustrates your fund’s costs in two ways:
• Based on actual fund return. This section helps you to estimate the actual expenses that you paid over the period. The “Ending Account Value” shown is derived from the fund’s actual return, and the third column shows the dollar amount that would have been paid by an investor who started with $1,000 in the fund. You may use the information here, together with the amount you invested, to estimate the expenses that you paid over the period.
To do so, simply divide your account value by $1,000 (for example, an $8,600 account value divided by $1,000 = 8.6), then multiply the result by the number given for your fund under the heading “Expenses Paid During Period.”
• Based on hypothetical 5% yearly return. This section is intended to help you compare your fund’s costs with those of other mutual funds. It assumes that the fund had a yearly return of 5% before expenses, but that the expense ratio is unchanged. In this case—because the return used is not the fund’s actual return—the results do not apply to your investment. The example is useful in making comparisons because the Securities and Exchange Commission requires all mutual funds to calculate expenses based on a 5% return. You can assess your fund’s costs by comparing this hypothetical example with the hypothetical examples that appear in shareholder reports of other funds.
Note that the expenses shown in the table are meant to highlight and help you compare ongoing costs only and do not reflect transaction costs incurred by the fund for buying and selling securities. Your fund does not charge transaction fees, such as purchase or redemption fees, nor does it carry a “sales load.”
The calculations assume no shares were bought or sold during the period. Your actual costs may have been higher or lower, depending on the amount of your investment and the timing of any purchases or redemptions.
You can find more information about the fund’s expenses, including annual expense ratios, in the Financial Statements section of this report. For additional information on operating expenses and other shareholder costs, please refer to your fund’s current prospectus.
58
| | | |
| Six Months Ended March 31, 2010 | | | |
| | Beginning | Ending | Expenses |
| | Account Value | Account Value | Paid During |
| Structured Equity Fund | 9/30/2009 | 3/31/2010 | Period1 |
| Based on Actual Fund Return | | | |
| Structured Large-Cap Equity | | | |
| Institutional Shares | $1,000.00 | $1,121.41 | $1.27 |
| Institutional Plus Shares | 1,000.00 | 1,121.62 | 0.90 |
| Structured Large-Cap Growth | | | |
| Institutional Shares | $1,000.00 | $1,125.65 | $1.27 |
| Institutional Plus Shares | 1,000.00 | 1,126.09 | 0.90 |
| Structured Large-Cap Value | | | |
| Institutional Plus Shares | $1,000.00 | $1,100.34 | $0.89 |
| Structured Broad Market | | | |
| Institutional Shares | $1,000.00 | $1,123.77 | $1.27 |
| Institutional Plus Shares | 1,000.00 | 1,124.34 | 0.90 |
| Based on Hypothetical 5% Yearly Return | | | |
| Structured Large-Cap Equity | | | |
| Institutional Shares | $1,000.00 | $1,023.73 | $1.21 |
| Institutional Plus Shares | 1,000.00 | 1,024.08 | 0.86 |
| Structured Large-Cap Growth | | | |
| Institutional Shares | $1,000.00 | $1,023.73 | $1.21 |
| Institutional Plus Shares | 1,000.00 | 1,024.08 | 0.86 |
| Structured Large-Cap Value | | | |
| Institutional Plus Shares | $1,000.00 | $1,024.08 | $0.86 |
| Structured Broad Market | | | |
| Institutional Shares | $1,000.00 | $1,023.73 | $1.21 |
| Institutional Plus Shares | 1,000.00 | 1,024.08 | 0.86 |
1 The calculations are based on expenses incurred in the most recent six-month period. The funds’ annualized six-month expense ratios for that period are 0.24% for the Structured Large-Cap Equity Fund Institutional Shares, 0.17% for the Institutional Plus Shares; 0.24% for the Structured Large-Cap Growth Fund Institutional Shares, 0.17% for the Institutional Plus Shares; 0.17% for the Structured Large-Cap Value Fund Institutional Plus Shares; 0.24% for the Structured Broad Market Fund Institutional Shares, 0.17% for the Institutional Plus Shares.
The dollar amounts shown as “Expenses Paid” are equal to the annualized expense ratio multiplied by the average account value over the period, multiplied by the number of days in the most recent six-month period, then divided by the number of days in the most recent 12-month period.
59
Trustees Approve Advisory Arrangement
The board of trustees of Vanguard Structured Large-Cap Equity, Structured Large-Cap Growth, Structured Large-Cap Value, and Structured Broad Market Funds has renewed the funds’ investment advisory arrangement with The Vanguard Group, Inc. Vanguard—through its Quantitative Equity Group—serves as investment advisor to the funds. The board determined that continuing the funds’ internalized management structure was in the best interests of the funds and their shareholders.
The board based its decision upon an evaluation of the advisor’s investment staff, portfolio management process, and performance. The trustees considered the factors discussed below, among others. However, no single factor determined whether the board approved the arrangement. Rather, it was the totality of the circumstances that drove the board’s decision.
Nature, extent, and quality of services
The board considered the quality of each fund’s investment management since its inception, and took into account the organizational depth and stability of the advisor. Vanguard has been managing investments for more than three decades. The Quantitative Equity Group adheres to a sound, disciplined investment management process; the team has considerable experience, stability, and depth.
The board concluded that Vanguard’s experience, stability, depth, and performance, among other factors, warranted continuation of the advisory arrangement.
Investment performance
The board considered the performance of the funds since their inceptions. The board concluded that the advisor has carried out each fund’s investment strategy in disciplined fashion, and that each fund has modestly underperformed its applicable benchmark and relevant peer group over the short- and long-term. Information about each fund’s most recent performance can be found in the Performance Summary pages of this report.
Cost
The board concluded that the funds’ expense ratios were well below the average expense ratios charged by funds in their respective peer groups, and that the funds’ advisory expenses were also well below their peer-group averages. Information about the funds’ expenses appears in the About Your Fund’s Expenses section of this report as well as in the Financial Statements sections.
The board does not conduct a profitability analysis of Vanguard, because of Vanguard’s unique “at-cost” structure. Unlike most other mutual fund management companies, Vanguard is owned by the funds it oversees, and produces “profits” only in the form of reduced expenses for fund shareholders.
The benefit of economies of scale
The board concluded that the funds’ low-cost arrangement with Vanguard ensures that the funds will realize economies of scale as they grow, with the cost to shareholders declining as fund assets increase.
The board will consider whether to renew the advisory arrangement again after a one-year period.
60
Glossary
Beta. A measure of the magnitude of a fund’s past share-price fluctuations in relation to the ups and downs of a given market index. The index is assigned a beta of 1.00. Compared with a given index, a fund with a beta of 1.20 typically would have seen its share price rise or fall by 12% when the index rose or fell by 10%. For this report, beta is based on returns over the past 36 months for both the fund and the index. Note that a fund’s beta should be reviewed in conjunction with its R-squared (see definition). The lower the R-squared, the less correlation there is between the fund and the index, and the less reliable beta is as an indicator of volatility.
Earnings Growth Rate. The average annual rate of growth in earnings over the past five years for the stocks now in a fund.
Equity Exposure. A measure that reflects a fund’s investments in stocks and stock futures. Any holdings in short-term reserves are excluded.
Expense Ratio. The percentage of a fund’s average net assets used to pay its annual administrative and advisory expenses. These expenses directly reduce returns to investors.
Foreign Holdings. The percentage of a fund represented by stocks or depositary receipts of companies based outside the United States.
Median Market Cap. An indicator of the size of companies in which a fund invests; the midpoint of market capitalization (market price x shares outstanding) of a fund’s stocks, weighted by the proportion of the fund’s assets invested in each stock. Stocks representing half of the fund’s assets have market capitalizations above the median, and the rest are below it.
Price/Book Ratio. The share price of a stock divided by its net worth, or book value, per share. For a fund, the weighted average price/book ratio of the stocks it holds.
Price/Earnings Ratio. The ratio of a stock’s current price to its per-share earnings over the past year. For a fund, the weighted average P/E of the stocks it holds. P/E is an indicator of market expectations about corporate prospects; the higher the P/E, the greater the expectations for a company’s future growth.
R-Squared. A measure of how much of a fund’s past returns can be explained by the returns from the market in general, as measured by a given index. If a fund’s total returns were precisely synchronized with an index’s returns, its R-squared would be 1.00. If the fund’s returns bore no relationship to the index’s returns, its R-squared would be 0. For this report, R-squared is based on returns over the past 36 months for both the fund and the index.
Return on Equity. The annual average rate of return generated by a company during the past five years for each dollar of shareholder’s equity (net income divided by shareholder’s equity). For a fund, the weighted average return on equity for the companies whose stocks it holds.
Short-Term Reserves. The percentage of a fund invested in highly liquid, short-term securities that can be readily converted to cash.
Turnover Rate. An indication of the fund’s trading activity. Funds with high turnover rates incur higher transaction costs and may be more likely to distribute capital gains (which may be taxable to investors). The turnover rate excludes in-kind transactions, which have minimal impact on costs.
61
Yield. A fund’s 30-day SEC yield is derived using a formula specified by the U.S. Securities and Exchange Commission. Under the formula, data related to the fund’s security holdings in the previous 30 days are used to calculate the fund’s hypothetical net income for that period, which is then annualized and divided by the fund’s estimated average net assets over the calculation period. For the purposes of this calculation, a security’s income is based on its current market yield to maturity (in the case of bonds) or its projected dividend yield (for stocks). Because the SEC yield represents hypothetical annualized income, it will differ—at times significantly—from the fund’s actual experience. As a result, the fund’s income distributions may be higher or lower than implied by the SEC yield.
62
This page intentionally left blank.
The People Who Govern Your Fund
The trustees of your mutual fund are there to see that the fund is operated and managed in your best interests since, as a shareholder, you are a part owner of the fund. Your fund’s trustees also serve on the board of directors of The Vanguard Group, Inc., which is owned by the Vanguard funds and provides services to them on an at-cost basis.
A majority of Vanguard’s board members are independent, meaning that they have no affiliation with Vanguard or the funds they oversee, apart from the sizable personal investments they have made as private individuals. The independent board members have distinguished backgrounds in business, academia, and public service. Each of the trustees and executive officers oversees 162 Vanguard funds.
The following table provides information for each trustee and executive officer of the fund. More information about the trustees is in the Statement of Additional Information, which can be obtained, without charge, by contacting Vanguard at 800-662-7447, or online at www.vanguard.com.
| |
| Interested Trustee1 | Rajiv L. Gupta |
| | Born 1945. Trustee Since December 2001.2 |
| F. William McNabb III | Principal Occupation(s) During the Past Five Years: |
| Born 1957. Trustee Since July 2009. Chairman of the | Chairman and Chief Executive Officer (retired 2009) |
| Board. Principal Occupation(s) During the Past Five | and President (2006–2008) of Rohm and Haas Co. |
| Years: Chairman of the Board of The Vanguard Group, | (chemicals); Director of Tyco International, Ltd. |
| Inc., and of each of the investment companies served | (diversified manufacturing and services) and Hewlett- |
| by The Vanguard Group, since January 2010; Director | Packard Co. (electronic computer manufacturing); |
| of The Vanguard Group since 2008; Chief Executive | Trustee of The Conference Board; Member of the |
| Officer and President of The Vanguard Group and of | Board of Managers of Delphi Automotive LLP |
| each of the investment companies served by The | (automotive components). |
| Vanguard Group since 2008; Director of Vanguard | |
| Marketing Corporation; Managing Director of The | Amy Gutmann |
| Vanguard Group (1995–2008). | Born 1949. Trustee Since June 2006. Principal |
| | Occupation(s) During the Past Five Years: President |
| | of the University of Pennsylvania; Christopher H. |
| Independent Trustees | Browne Distinguished Professor of Political Science |
| | in the School of Arts and Sciences with secondary |
| Emerson U. Fullwood | appointments at the Annenberg School for Commu- |
| Born 1948. Trustee Since January 2008. Principal | nication and the Graduate School of Education of |
| Occupation(s) During the Past Five Years: Executive | the University of Pennsylvania; Director of Carnegie |
| Chief Staff and Marketing Officer for North America | Corporation of New York, Schuylkill River Development |
| and Corporate Vice President (retired 2008) of Xerox | Corporation, and Greater Philadelphia Chamber of |
| Corporation (document management products and | Commerce; Trustee of the National Constitution Center; |
| services); Director of SPX Corporation (multi-industry | Chair of the Presidential Commission for the Study of |
| manufacturing), the United Way of Rochester, | Bioethical Issues. |
| Amerigroup Corporation (managed health care), | |
| the University of Rochester Medical Center, and | |
| Monroe Community College Foundation. | |
| | |
| JoAnn Heffernan Heisen | Executive Officers | |
| Born 1950. Trustee Since July 1998. Principal | | |
| Occupation(s) During the Past Five Years: Corporate | Thomas J. Higgins | |
| Vice President and Chief Global Diversity Officer since | Born 1957. Chief Financial Officer Since September |
| 2006 (retired 2008) and Member of the Executive | 2008. Principal Occupation(s) During the Past Five |
| Committee (retired 2008) of Johnson & Johnson | Years: Principal of The Vanguard Group, Inc.; Chief |
| (pharmaceuticals/consumer products); Vice President | Financial Officer of each of the investment companies |
| and Chief Information Officer of Johnson & Johnson | served by The Vanguard Group since 2008; Treasurer |
| (1997–2005); Director of the University Medical Center | of each of the investment companies served by The |
| at Princeton and Women’s Research and Education | Vanguard Group (1998–2008). |
| Institute; Member of the Advisory Board of the | | |
| Maxwell School of Citizenship and Public Affairs | Kathryn J. Hyatt | |
| at Syracuse University. | Born 1955. Treasurer Since November 2008. Principal |
| | Occupation(s) During the Past Five Years: Principal |
| F. Joseph Loughrey | of The Vanguard Group, Inc.; Treasurer of each of |
| Born 1949. Trustee Since October 2009. Principal | the investment companies served by The Vanguard |
| Occupation(s) During the Past Five Years: President | Group since 2008; Assistant Treasurer of each of the |
| and Chief Operating Officer since 2005 (retired 2009) | investment companies served by The Vanguard Group |
| and Vice Chairman of the Board (2008–2009) of | (1988–2008). | |
| Cummins Inc. (industrial machinery); Director of | | |
| SKF AB (industrial machinery), Hillenbrand, Inc. | Heidi Stam | |
| (specialized consumer services), Sauer-Danfoss Inc. | Born 1956. Secretary Since July 2005. Principal |
| (machinery), the Lumina Foundation for Education, | Occupation(s) During the Past Five Years: Managing |
| and Oxfam America; Chairman of the Advisory Council | Director of The Vanguard Group, Inc., since 2006; |
| for the College of Arts and Letters at the University of | General Counsel of The Vanguard Group since 2005; |
| Notre Dame. | Secretary of The Vanguard Group and of each of the |
| | investment companies served by The Vanguard Group |
| André F. Perold | since 2005; Director and Senior Vice President of |
| Born 1952. Trustee Since December 2004. Principal | Vanguard Marketing Corporation since 2005; |
| Occupation(s) During the Past Five Years: George | Principal of The Vanguard Group (1997–2006). |
| Gund Professor of Finance and Banking at the Harvard | | |
| Business School; Chair of the Investment Committee | | |
| of HighVista Strategies LLC (private investment firm). | Vanguard Senior Management Team |
| |
| Alfred M. Rankin, Jr. | R. Gregory Barton | Michael S. Miller |
| Born 1941. Trustee Since January 1993. Principal | Mortimer J. Buckley | James M. Norris |
| Occupation(s) During the Past Five Years: Chairman, | Kathleen C. Gubanich | Glenn W. Reed |
| President, and Chief Executive Officer of NACCO | Paul A. Heller | George U. Sauter |
| Industries, Inc. (forklift trucks/housewares/lignite); | | |
| Director of Goodrich Corporation (industrial products/ | | |
| aircraft systems and services); Chairman of the Federal | Chairman Emeritus and Senior Advisor |
| Reserve Bank of Cleveland; Trustee of The Cleveland | | |
| Museum of Art. | John J. Brennan | |
| | Chairman, 1996–2009 | |
| Peter F. Volanakis | Chief Executive Officer and President, 1996–2008 |
| Born 1955. Trustee Since July 2009. Principal | | |
| Occupation(s) During the Past Five Years: President | | |
| since 2007 and Chief Operating Officer since 2005 | Founder | |
| of Corning Incorporated (communications equipment); | | |
| President of Corning Technologies (2001–2005); | John C. Bogle | |
| Director of Corning Incorporated and Dow Corning; | Chairman and Chief Executive Officer, 1974–1996 |
| Trustee of the Corning Incorporated Foundation and | | |
| the Corning Museum of Glass; Overseer of the | | |
| Amos Tuck School of Business Administration at | | |
| Dartmouth College. | | |
1 Mr. McNabb is considered an “interested person,” as defined in the Investment Company Act of 1940, because he is an officer of the Vanguard funds.
2 December 2002 for Vanguard Equity Income Fund, Vanguard Growth Equity Fund, the Vanguard Municipal Bond Funds, and the Vanguard
State Tax-Exempt Funds.
| |
|  |
| P.O. Box 2600 |
| Valley Forge, PA 19482-2600 |
Connect with Vanguard® > www.vanguard.com
| |
| Fund Information > 800-662-7447 | All comparative mutual fund data are from Lipper Inc. |
| | or Morningstar, Inc., unless otherwise noted. |
| Direct Investor Account Services > 800-662-2739 | |
| | |
| Institutional Investor Services > 800-523-1036 | You can obtain a free copy of Vanguard’s proxy voting |
| | guidelines by visiting our website, www.vanguard.com, |
| Text Telephone for People | and searching for “proxy voting guidelines,” or by |
| With Hearing Impairment > 800-749-7273 | calling Vanguard at 800-662-2739. The guidelines are |
| | also available from the SEC’s website, www.sec.gov. |
| | In addition, you may obtain a free report on how your |
| | fund voted the proxies for securities it owned during |
| This material may be used in conjunction | the 12 months ended June 30. To get the report, visit |
| with the offering of shares of any Vanguard | either www.vanguard.com or www.sec.gov. |
| fund only if preceded or accompanied by | |
| the fund’s current prospectus. | You can review and copy information about your fund |
| | at the SEC’s Public Reference Room in Washington, D.C. |
| CFA® is a trademark owned by CFA Institute. | To find out more about this public service, call the SEC |
| | at 202-551-8090. Information about your fund is also |
| | available on the SEC’s website, and you can receive |
| | copies of this information, for a fee, by sending a |
| | request in either of two ways: via e-mail addressed to |
| | publicinfo@sec.gov or via regular mail addressed to the |
| | Public Reference Section, Securities and Exchange |
| | Commission, Washington, DC 20549-1520. |
|
| © 2010 The Vanguard Group, Inc. |
| All rights reserved. |
| Vanguard Marketing Corporation, Distributor. |
| |
| Q08702 052010 |
Item 2: Not Applicable.
Item 3: Not Applicable.
Item 4: Not Applicable.
Item 5: Not Applicable.
Item 6: Not Applicable.
Item 7: Not Applicable.
Item 8: Not Applicable.
Item 9: Not Applicable.
Item 10: Not Applicable.
Item 11: Controls and Procedures.
(a) Disclosure Controls and Procedures. The Principal Executive and Financial Officers concluded that the Registrant's Disclosure Controls and Procedures are effective based on their evaluation of the Disclosure Controls and Procedures as of a date within 90 days of the filing date of this report.
(b) Internal Control Over Financial Reporting. There were no significant changes in Registrant’s Internal Control Over Financial Reporting or in other factors that could significantly affect this control subsequent to the date of the evaluation, including any corrective actions with regard to significant deficiencies and material weaknesses.
Item 12: Exhibits.
(a) Code of Ethics.
(b) Certifications.
Pursuant to the requirements of the Securities Exchange Act of 1934 and the Investment Company Act of 1940, the registrant has duly caused this report to be signed on its behalf by the undersigned, thereunto duly authorized.
| |
| | VANGUARD QUANTITATIVE FUNDS |
| |
| By: | /s/ F. WILLIAM MCNABB III* |
| | F. WILLIAM MCNABB III |
| | CHIEF EXECUTIVE OFFICER |
| |
| Date: May 21, 2010 |
Pursuant to the requirements of the Securities Exchange Act of 1934 and the Investment Company Act of 1940, this report has been signed below by the following persons on behalf of the registrant and in the capacities and on the dates indicated.
| |
| | VANGUARD QUANTITATIVE FUNDS |
| |
| By: | /s/ F. WILLIAM MCNABB III* |
| | F. WILLIAM MCNABB III |
| | CHIEF EXECUTIVE OFFICER |
| |
| Date: May 21, 2010 |
| |
| | VANGUARD QUANTITATIVE FUNDS |
| |
| By: | /s/ THOMAS J. HIGGINS* |
| | THOMAS J. HIGGINS |
| | CHIEF FINANCIAL OFFICER |
| |
| Date: May 21, 2010 |
*By: /s/ Heidi Stam
Heidi Stam, pursuant to a Power of Attorney filed on April 26, 2010, see file Number 33-53683,
is Incorporated by Reference.