UNITED STATES
SECURITIES AND EXCHANGE COMMISSION
Washington, D.C. 20549
FORM N-CSR
CERTIFIED SHAREHOLDER REPORT
OF
REGISTERED MANAGEMENT INVESTMENT COMPANIES
Investment Company Act file number: 811-4526
Name of Registrant: Vanguard Quantitative Funds
Address of Registrant:
P.O. Box 2600
Valley Forge, PA 19482
Name and address of agent for service:
Heidi Stam, Esquire
P.O. Box 876
Valley Forge, PA 19482
Registrant’s telephone number, including area code: (610) 669-1000
Date of fiscal year end: September 30
Date of reporting period: October 1, 2011 – March 31, 2012
Item 1: Reports to Shareholders
 |
|
| Semiannual Report | March 31, 2012 |
| |
| Vanguard Growth and Income Fund |
> For the six months ended March 31, Vanguard Growth and Income Fund returned nearly 27%.
> For the period, the fund outpaced its benchmark, the S&P 500 Index, as well as its large-cap core fund peers.
> Strong stock selection within the information technology and consumer sectors boosted returns relative to the benchmark.
| |
| Contents | |
| Your Fund’s Total Returns. | 1 |
| Chairman’s Letter. | 2 |
| Advisors’ Report. | 6 |
| Fund Profile. | 10 |
| Performance Summary. | 11 |
| Financial Statements. | 12 |
| About Your Fund’s Expenses. | 31 |
| Glossary. | 33 |
Please note: The opinions expressed in this report are just that—informed opinions. They should not be considered promises or advice. Also, please keep in mind that the information and opinions cover the period through the date on the front of this report. Of course, the risks of investing in your fund are spelled out in the prospectus.
See the Glossary for definitions of investment terms used in this report.
About the cover: Vanguard was named for the HMS Vanguard, flagship of British Admiral Horatio Nelson. A ship—whose performance and safety depend on the work of all hands—has served as a fitting metaphor for the Vanguard crew as we strive to help clients reach their financial goals.
Your Fund’s Total Returns
| |
| Six Months Ended March 31, 2012 | |
| | Total |
| | Returns |
| Vanguard Growth and Income Fund | |
| Investor Shares | 26.83% |
| Admiral™ Shares | 26.91 |
| S&P 500 Index | 25.89 |
| Large-Cap Core Funds Average | 24.87 |
| Large-Cap Core Funds Average: Derived from data provided by Lipper Inc. |
| Admiral Shares carry lower expenses and are available to investors who meet certain account-balance requirements. |
| | | | |
| Your Fund’s Performance at a Glance | | | | |
| September 30, 2011, Through March 31, 2012 | | | | |
| | | | Distributions Per Share |
| | Starting | Ending | Income | Capital |
| | Share Price | Share Price | Dividends | Gains |
| Vanguard Growth and Income Fund | | | | |
| Investor Shares | $23.86 | $29.97 | $0.259 | $0.000 |
| Admiral Shares | 38.97 | 48.95 | 0.450 | 0.000 |
1

Chairman’s Letter
Dear Shareholder,
The first half of your fund’s fiscal year was, like last year’s, characterized by bullish sentiment in nearly all corners of the stock market. Benefiting from this upbeat environment, Vanguard Growth and Income Fund returned nearly 27% for the six months ended March 31, 2012, besting the return of its benchmark, the S&P 500 Index, and the average return of peer-group funds.
As I noted in our last report, Vanguard Growth and Income Fund adopted a multimanager approach on September 30, 2011. The fund’s new advisors, each of which manages approximately one-third of the fund’s assets, are D. E. Shaw Investment Management, L.L.C., Los Angeles Capital, and Vanguard’s Equity Investment Group.
The objective and investment strategy of the fund have not changed. The advisors have continued to follow a quantitative approach, using computer models to select a broadly diversified group of stocks that, as a whole, have investment characteristics similar to those of the S&P 500 Index but are hoped to provide a higher total return than that of the benchmark.
The advisors’ stock selections gained 10% or more in all ten market sectors for the period. Those selections outperformed in most market sectors, with particular success in the technology and consumer sectors.
2
A surge of optimism fueled a powerful global rally in stocks
During the past six months, optimism displaced the apprehension that had restrained stock prices through summer 2011. The broad U.S. stock market returned more than 26%. Markets abroad returned 15.37%. Investors’ good spirits reflected confidence that the slow, grinding economic expansion in the United States was at last gathering momentum, and that Europe’s debt crisis could be wrestled under control.
By the end of the period, however, that confidence had begun to evaporate in the face of ambiguous economic reports and renewed concern about Europe. The abrupt mood swing was consistent with the financial markets’ volatility since the 2008–2009 financial crisis.
For most bonds except munis, six-month returns were subdued
The broad taxable bond market produced a modest six-month return of 1.43%. In general, interest rates remained more or less steady at very low levels. In some segments of the bond market, however, yields crept lower still, boosting bond prices. The broad municipal bond market, for example, produced a solid six-month return of 3.91% as investors bid up muni prices.
As it has since December 2008, the Federal Reserve Board kept its target for the shortest-term interest rates between 0% and 0.25%. That policy has kept a tight lid on the returns available from money market funds and savings accounts.
| | | |
| Market Barometer | | | |
| |
| | | | Total Returns |
| | | Periods Ended March 31, 2012 |
| | Six | One | Five Years |
| | Months | Year | (Annualized) |
| Stocks | | | |
| Russell 1000 Index (Large-caps) | 26.27% | 7.86% | 2.19% |
| Russell 2000 Index (Small-caps) | 29.83 | -0.18 | 2.13 |
| Dow Jones U.S. Total Stock Market Index | 26.60 | 7.16 | 2.47 |
| MSCI All Country World Index ex USA (International) | 15.37 | -7.18 | -1.56 |
| |
| Bonds | | | |
| Barclays Capital U.S. Aggregate Bond Index (Broad | | | |
| taxable market) | 1.43% | 7.71% | 6.25% |
| Barclays Capital Municipal Bond Index (Broad | | | |
| tax-exempt market) | 3.91 | 12.07 | 5.42 |
| Citigroup Three-Month U.S. Treasury Bill Index | 0.00 | 0.05 | 1.11 |
| |
| CPI | | | |
| Consumer Price Index | 1.10% | 2.65% | 2.24% |
3
Technology and consumer stocks provided notable outperformance
Vanguard Growth and Income Fund seeks to outperform the Standard & Poor’s 500 Index by investing in large-and mid-capitalization U.S. companies that reflect the index’s composition but which the fund’s advisors believe are poised to outperform.
This strategy was rewarded during the period as the fund’s return outpaced that of its benchmark and bested the average return of its peer funds by about 2 percentage points.
Information technology stocks, which made up about one-fifth of fund assets and represented the largest sector in the fund, provided the biggest margin of outperformance and about one-fourth of the fund’s return. Rising demand for computer hardware and IT services prompted investors to bid up the fund’s holdings by more than 34%, a return that was several percentage points higher than the return for the market overall.
The advisors’ selections in the consumer discretionary and consumer staples sectors also lifted relative performance. The fund’s internet and traditional retailers did well, as did several big-name food providers, as consumers gained confidence about the economy and increased their spending.
The fund’s holdings in financials offset some of its outperformance in other areas. While the fund’s portfolio of financial stocks outdistanced the overall market,
| | | |
| Expense Ratios | | | |
| Your Fund Compared With Its Peer Group | | | |
| | Investor | Admiral | Peer Group |
| | Shares | Shares | Average |
| Growth and Income Fund | 0.34% | 0.23% | 1.19% |
The fund expense ratios shown are from the prospectus dated January 26, 2012, and represent estimated costs for the current fiscal year. For the six months ended March 31, 2012, the fund’s annualized expense ratios were 0.36% for Investor Shares and 0.25% for Admiral Shares. The peer-group expense ratio is derived from data provided by Lipper Inc. and captures information through year-end 2011.
Peer group: Large-Cap Core Funds.
4
it trailed its counterpart in the index by several percentage points, providing the only notable drag on the fund’s relative showing.
More information about the advisors’ management of the fund can be found in the Advisors’ Report that follows this letter.
Stay focused on what you can control
As we tend to do after any period of strong performance, we caution shareholders that rising markets can’t be expected to continue indefinitely. Nor is it prudent to think that the lower volatility witnessed in much of the six-month period is a sign that the stress fractures in the global financial system have completely healed.
I note these concerns not to discourage you but as a way of helping you to maintain realistic expectations. We’re sure to experience stock downturns in the future, and when they occur, it will be essential to maintain a long-term perspective.
In addition to keeping a long-term view, it’s constructive to focus on two key elements of an investment plan: how much you’re investing and how long you’re investing for. This point was underscored in a recent Vanguard research paper, Penny Saved, Penny Earned, available at vanguard.com/research. The study found that retirement investors have a greater likelihood of reaching their goals by increasing their savings rate and savings time horizon. Those two factors, independently or together, can generally provide a higher chance of success than simply counting on the possibility of higher portfolio returns, the study’s authors concluded.
As always, Vanguard encourages you to create a long-term investment plan that includes a mix of stocks, bonds, and short-term investments that are appropriate for your goals and risk tolerance. A well-balanced portfolio can help cushion some of the market’s volatility while allowing you to participate in its long-term potential for growth. The Growth and Income Fund, which provides diversified, low-cost exposure to hundreds of large- and mid-cap U.S. stocks, can be a useful component in such a portfolio.
Thank you for your confidence in Vanguard.
Sincerely,

F. William McNabb III
Chairman and Chief Executive Officer
April 16, 2012
5
Advisors’ Report
Vanguard Growth and Income Fund’s Investor Shares returned 26.83% for the six months ended March 31. The Admiral Shares returned 26.91%. The S&P 500 Index returned 25.89%, while the average return of large-cap core funds was 24.87%.
Your fund is managed by three independent advisors, a strategy that enhances the fund’s diversification by providing exposure to distinct, yet complementary, investment approaches. It is not uncommon for different advisors to have different views about individual securities or the broader investment environment.
The advisors, the percentage of fund assets each manages, and brief descriptions of their investment strategies are presented in the table below. The advisors have also prepared a discussion of the investment environment that existed during the fiscal half-year and of how the portfolio’s positioning reflects this assessment. These comments were prepared on April 20, 2012.
| | | |
| Vanguard Growth and Income Fund Investment Advisors |
| |
| | Fund Assets Managed | |
| Investment Advisor | % | $ Million | Investment Strategy |
| D. E. Shaw Investment | 33 | 1,434 | Employs quantitative models that seek to capture |
| Management, L.L.C. | | | predominantly “bottom up” stock-specific return |
| | | | opportunities while aiming to keep the portfolio’s |
| | | �� | sector weights, size, and style characteristics similar to |
| | | | the benchmark. |
| Vanguard Equity Investment | 33 | 1,413 | Employs a quantitative, fundamental management |
| Group | | | approach, using models that assess valuation, growth |
| | | | prospects, management decisions, market sentiment, |
| | | | and earnings quality of companies versus their peers. |
| Los Angeles Capital | 32 | 1,400 | Employs a quantitative model that emphasizes stocks |
| | | | with characteristics investors are currently seeking and |
| | | | underweights stocks with characteristics investors are |
| | | | currently avoiding. As such, the portfolio’s sector |
| | | | weights, size, and style characteristics may differ |
| | | | modestly from the benchmark in a risk-controlled |
| | | | manner. |
| Cash Investments | 2 | 94 | These short-term reserves are invested by Vanguard in |
| | | | equity index products to simulate investments in |
| | | | stocks. Each advisor also may maintain a modest cash |
| | | | position. |
6
D. E. Shaw Investment Management, L.L.C.
Portfolio Manager:
Anthony Foley, Managing Director and Chief Investment Officer
Europe’s sovereign-debt crisis dominated perceptions about equity valuations in the early part of the fourth quarter of 2011. Europe’s banking sector seemed to be bolstered by the coordinated action of several central banks to boost liquidity. Over time, a steady drip of positive economic news suggesting that the U.S. economy was recovering—albeit slowly—began to outweigh negative news from Europe. This improving economic sentiment appeared to help drive equity markets higher in the second half of December, and that trend continued through the end of the first quarter of 2012 amid signs that the U.S. economy was gaining strength.
We evaluate our portfolio’s relative performance over the reporting period in light of three major factors: bottom-up stock selection; common risk factors such as value, growth, and capitalization; and industry groups.
In stock selection, Apple Inc., Priceline.com Inc., and JPMorgan Chase were among the best relative performers. An overweight position in International Flavors & Fragrances and underweight positions in Citigroup and Walgreen detracted the most from relative performance.
In our management of common risk factors, we received positive contributions, mostly in the first quarter of 2012, from a modest tilt toward low-dividend-yield stocks. The largest detractor was a tilt toward higher-volatility stocks. Overall, most of our portfolio’s performance was the product of many small, positive risk-factor exposures and relatively few negative ones.
Industry exposures subtracted slightly from the portfolio’s performance.
We believe equity markets are currently characterized by markedly lower levels of correlations among individual stocks than in recent years. Other things being equal, a reduction in correlations increases the potential for diversified, bottom-up stock selection strategies to outperform. At the same time, short-term stock market volatility is low by the standards of the last few years, even though many individual names have experienced substantial cumulative price movements in the past six months.
Substantial disappointment about the prospects for economic growth in the United States and a resurgence of concerns about the European debt crisis constitute clear risks in this environment. More generally, any macroeconomic shock that could significantly increase uncertainty or risk aversion among market participants could well have the same effect.
7
Los Angeles Capital
Portfolio Managers:
Thomas D. Stevens, CFA, Chairman and Principal
Hal W. Reynolds, CFA,
Chief Investment Officer and Principal
Over the six-month period, the market was led by significant gains in two risky sectors, technology and diversified financials. Apple’s shares rose 57% as its profits doubled from a year earlier, while large banks such as JPMorgan Chase and Bank of America, which were the primary beneficiaries of the Federal Reserve’s policy of maintaining low interest rates over the past four years, generated returns of 55% and 57%, respectively.
While much has been made of Apple’s quarterly profits soaring to $13.1 billion for the period that ended December 31, profit growth for the remainder of the market appears to have come to a standstill, with little to no growth over the past year. Despite slight improvements in the macroeconomic environment from small but steady employment gains, first-quarter equity returns were driven almost exclusively by a falling equity risk premium; market risk fell by one-third from year-end levels, and high-yield spreads, a measure of default risk, fell by more than 1 percentage point. Not surprisingly, risky stocks with weaker balance sheets were among the best performers during the quarter. With the significant rise in bank stocks, combined with low interest rates and contracting high-yield spreads, default risks appeared to be on the decline.
Over the six months, we maintained a bias toward higher-quality companies with strong balance sheets, above-average earnings growth, higher dividend yields, and positive earnings surprises. Overweight positions in technology names such as Apple, Microsoft, and Novellus contributed to performance. Conversely, our portfolio’s overweighting in higher-quality names with higher dividend yields, as well as underweight positions in Bank of America, JPMorgan Chase, and Citigroup, detracted from our relative results.
In an environment characterized by lower growth rates, we have maintained our bias toward larger-capitalization securities with higher earnings quality and higher dividend yields. As default risks have eased, we have increased our weighting in financials but remain underweighted in economically sensitive sectors such as materials and consumer cyclicals. The portfolio’s price/ earnings ratio and beta remain below those of the benchmark, while its earnings-per-share growth and dividend yield remain higher.
Vanguard Equity Investment Group
Portfolio Managers:
James D. Troyer, CFA, Principal
James P. Stetler, Principal
Michael R. Roach, CFA
Returns for the period for large-capitalization stocks were led by financial, information technology, and consumer discretionary companies. Telecommunications and utilities were the laggards. While all ten
8
sector groups provided positive returns, more economically sensitive sectors generally outperformed defensive ones.
Since the equity market started its current rally last fall, investors’ concerns regarding a double-dip recession, slowing growth in China, and Europe’s troubles appear to have eased. As a result of deep cost-cutting and conservatism, larger U.S. companies are coming out of the recession in the best fiscal health in recent years. They are more productive and more profitable, and have more cash and less leverage.
Although overall portfolio performance is affected by the macroeconomic factors described above, our approach to investing focuses on specific stock fundamentals. Specifically, we evaluate these five components:
1. Valuation, which measures the price we pay for earnings and cash flows.
2. Growth, which considers the growth of earnings.
3. Management decisions, an assessment of the actions taken by company management that signal its informed opinions of a firm’s future.
4. Market sentiment, which captures how investors reflect their opinions of a company through their activity in the market.
5. Quality, which measures balance-sheet strength and the sustainability of earnings.
For the fiscal half-year, our stock selection models produced mixed results. Our management-decisions, growth, and quality models were effective in distinguishing the outperformers from the underperformers. However, our market-sentiment and valuation indicators were not effective, and in fact detracted from our results.
Our selections within materials, energy, and health care added the most to our relative returns. In materials, CF Industries, Eastman Chemical, and International Paper were the largest contributors to our results.
In energy, Marathon Petroleum, National Oilwell, and Marathon Oil added the most to our relative returns. In health care, Aetna, Pfizer, and United Health were the largest contributors to our returns. Our selections were disappointing in financials; most of our underperformance in this sector resulted from underweight positions in Bank of America, Goldman Sachs, and MetLife.
9
Growth and Income Fund
Fund Profile
As of March 31, 2012
| | |
| Share-Class Characteristics | |
| | Investor | Admiral |
| | Shares | Shares |
| Ticker Symbol | VQNPX | VGIAX |
| Expense Ratio1 | 0.34% | 0.23% |
| 30-Day SEC Yield | 1.79% | 1.90% |
| | | |
| Portfolio Characteristics | | |
| | | | DJ |
| | | | U.S. Total |
| | | S&P 500 | Market |
| | Fund | Index | Index |
| Number of Stocks | 817 | 500 | 3,716 |
| Median Market Cap | $57.6B | $57.6B | $35.6B |
| Price/Earnings Ratio | 15.2x | 16.2x | 17.1x |
| Price/Book Ratio | 2.3x | 2.3x | 2.3x |
| Return on Equity | 19.4% | 19.6% | 18.1% |
| Earnings Growth Rate | 10.4% | 8.8% | 8.5% |
| Dividend Yield | 2.2% | 2.1% | 1.9% |
| Foreign Holdings | 0.1% | 0.0% | 0.0% |
| Turnover Rate | | | |
| (Annualized) | 100% | — | — |
| Short-Term Reserves | 0.6% | — | — |
| | | |
| Sector Diversification (% of equity exposure) |
| | | | DJ |
| | | | U.S. Total |
| | | S&P 500 | Market |
| | Fund | Index | Index |
| Consumer | | | |
| Discretionary | 11.6% | 10.9% | 12.0% |
| Consumer Staples | 10.5 | 10.8 | 9.4 |
| Energy | 10.8 | 11.2 | 10.5 |
| Financials | 16.2 | 14.9 | 15.9 |
| Health Care | 11.1 | 11.4 | 11.5 |
| Industrials | 10.2 | 10.6 | 11.0 |
| Information | | | |
| Technology | 21.6 | 20.5 | 19.8 |
| Materials | 2.8 | 3.5 | 4.0 |
| Telecommunication | | | |
| Services | 2.6 | 2.8 | 2.5 |
| Utilities | 2.6 | 3.4 | 3.4 |
| | |
| Volatility Measures | | |
| | | DJ |
| | | U.S. Total |
| | S&P 500 | Market |
| | Index | Index |
| R-Squared | 0.99 | 0.99 |
| Beta | 1.00 | 0.95 |
These measures show the degree and timing of the fund’s fluctuations compared with the indexes over 36 months.
| | |
| Ten Largest Holdings (% of total net assets) |
| Apple Inc. | Computer | |
| | Hardware | 5.0% |
| Exxon Mobil Corp. | Integrated Oil & | |
| | Gas | 2.7 |
| Microsoft Corp. | Systems Software | 2.3 |
| International Business | IT Consulting & | |
| Machines Corp. | Other Services | 2.1 |
| Pfizer Inc. | Pharmaceuticals | 2.1 |
| Philip Morris | | |
| International Inc. | Tobacco | 1.8 |
| JPMorgan Chase & Co. | Diversified Financial | |
| | Services | 1.8 |
| Chevron Corp. | Integrated Oil & | |
| | Gas | 1.7 |
| Procter & Gamble Co. | Household | |
| | Products | 1.6 |
| General Electric Co. | Industrial | |
| | Conglomerates | 1.6 |
| Top Ten | | 22.7% |
The holdings listed exclude any temporary cash investments and equity index products.
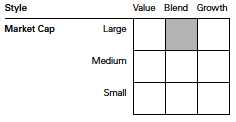
Investment Focus
1 The expense ratios shown are from the prospectus dated January 26, 2012, and represent estimated costs for the current fiscal year. For the six months ended March 31, 2012, the annualized expense ratios were 0.36% for Investor Shares and 0.25% for Admiral Shares.
10
Growth and Income Fund
Performance Summary
All of the returns in this report represent past performance, which is not a guarantee of future results that may be achieved by the fund. (Current performance may be lower or higher than the performance data cited. For performance data current to the most recent month-end, visit our website at vanguard.com/performance.) Note, too, that both investment returns and principal value can fluctuate widely, so an investor’s shares, when sold, could be worth more or less than their original cost. The returns shown do not reflect taxes that a shareholder would pay on fund distributions or on the sale of fund shares.
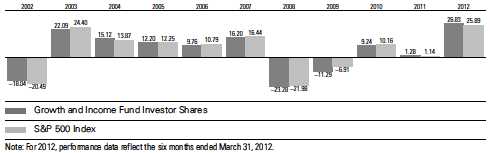
Fiscal-Year Total Returns (%): September 30, 2001, Through March 31, 2012
| | | | |
| Average Annual Total Returns: Periods Ended March 31, 2012 | | | |
| |
| | Inception | One | Five | Ten |
| | Date | Year | Years | Years |
| Investor Shares | 12/10/1986 | 9.16% | 0.38% | 3.55% |
| Admiral Shares | 5/14/2001 | 9.27 | 0.50 | 3.70 |
See Financial Highlights for dividend and capital gains information.
11
Growth and Income Fund
Financial Statements (unaudited)
Statement of Net Assets
As of March 31, 2012
The fund reports a complete list of its holdings in regulatory filings four times in each fiscal year, at the quarter-ends. For the second and fourth fiscal quarters, the lists appear in the fund’s semiannual and annual reports to shareholders. For the first and third fiscal quarters, the fund files the lists with the Securities and Exchange Commission on Form N-Q. Shareholders can look up the fund’s Forms N-Q on the SEC’s website at sec.gov. Forms N-Q may also be reviewed and copied at the SEC’s Public Reference Room (see the back cover of this report for further information).
| | | |
| | | | Market |
| | | | Value |
| | | Shares | ($000) |
| Common Stocks (97.5%)1 | | |
| Consumer Discretionary (11.3%) | |
| | Home Depot Inc. | 769,132 | 38,695 |
| * | priceline.com Inc. | 51,343 | 36,839 |
| | McDonald’s Corp. | 347,109 | 34,051 |
| | Time Warner Inc. | 660,136 | 24,920 |
| | Time Warner Cable Inc. | 279,600 | 22,787 |
| | Wyndham Worldwide | | |
| | Corp. | 449,134 | 20,889 |
| | Viacom Inc. Class B | 407,750 | 19,352 |
| * | DIRECTV Class A | 358,057 | 17,667 |
| | Macy’s Inc. | 415,200 | 16,496 |
| | Coach Inc. | 206,200 | 15,935 |
| | Wynn Resorts Ltd. | 125,005 | 15,611 |
| * | O’Reilly Automotive Inc. | 162,900 | 14,881 |
| | News Corp. Class A | 719,456 | 14,166 |
| * | AutoZone Inc. | 37,747 | 14,034 |
| | CBS Corp. Class B | 385,900 | 13,086 |
| | TJX Cos. Inc. | 320,600 | 12,731 |
| | Target Corp. | 214,900 | 12,522 |
| * | Bed Bath & Beyond Inc. | 151,800 | 9,984 |
| | Gap Inc. | 361,316 | 9,445 |
| | Harley-Davidson Inc. | 174,000 | 8,540 |
| | Limited Brands Inc. | 172,100 | 8,261 |
| * | Big Lots Inc. | 185,158 | 7,965 |
| | McGraw-Hill Cos. Inc. | 163,077 | 7,904 |
| | Ford Motor Co. | 559,700 | 6,991 |
| | Ralph Lauren Corp. Class A | 39,100 | 6,816 |
| | Walt Disney Co. | 149,077 | 6,527 |
| | Starbucks Corp. | 110,317 | 6,166 |
| | Washington Post Co. | | |
| | Class B | 16,174 | 6,042 |
| | Expedia Inc. | 170,500 | 5,702 |
| | Genuine Parts Co. | 86,566 | 5,432 |
| * | Amazon.com Inc. | 26,400 | 5,346 |
| | Gannett Co. Inc. | 312,754 | 4,795 |
| | Lowe’s Cos. Inc. | 133,600 | 4,192 |
| | | |
| | | | Market |
| | | | Value |
| | | Shares | ($000) |
| * | Goodyear Tire & Rubber | | |
| | Co. | 247,900 | 2,781 |
| | Nordstrom Inc. | 49,800 | 2,775 |
| | Staples Inc. | 163,200 | 2,641 |
| | Cablevision Systems Corp. | | |
| | Class A | 178,863 | 2,626 |
| | Harman International | | |
| | Industries Inc. | 53,730 | 2,515 |
| | Comcast Corp. Class A | 78,800 | 2,365 |
| * | Discovery Communications | | |
| | Inc. | 47,121 | 2,209 |
| * | Apollo Group Inc. Class A | 47,042 | 1,818 |
| | Kohl’s Corp. | 28,400 | 1,421 |
| * | Netflix Inc. | 12,200 | 1,403 |
| * | Sears Holdings Corp. | 19,500 | 1,292 |
| | DeVry Inc. | 30,900 | 1,047 |
| | Whirlpool Corp. | 12,700 | 976 |
| | Six Flags Entertainment | | |
| | Corp. | 18,100 | 847 |
| | Hasbro Inc. | 22,807 | 837 |
| | Family Dollar Stores Inc. | 10,571 | 669 |
| * | Coinstar Inc. | 10,400 | 661 |
| | Omnicom Group Inc. | 12,800 | 648 |
| * | Orbitz Worldwide Inc. | 181,014 | 552 |
| | CTC Media Inc. | 44,541 | 518 |
| | Interpublic Group of Cos. | | |
| | Inc. | 44,165 | 504 |
| | Best Buy Co. Inc. | 16,400 | 388 |
| * | Delphi Automotive plc | 12,100 | 382 |
| | Blyth Inc. | 5,100 | 382 |
| | Marriott International Inc. | | |
| | Class A | 9,800 | 371 |
| | Domino’s Pizza Inc. | 7,700 | 279 |
| | Weight Watchers | | |
| | International Inc. | 3,499 | 270 |
| *,^ | LodgeNet Interactive Corp. | 75,900 | 266 |
| | H&R Block Inc. | 13,900 | 229 |
| | Newell Rubbermaid Inc. | 12,300 | 219 |
12
Growth and Income Fund
| | | |
| | | | Market |
| | | | Value |
| | | Shares | ($000) |
| * | NVR Inc. | 300 | 218 |
| | Ameristar Casinos Inc. | 11,509 | 214 |
| * | Aeropostale Inc. | 9,200 | 199 |
| * | Beazer Homes USA Inc. | 60,400 | 196 |
| * | Boyd Gaming Corp. | 24,843 | 195 |
| * | Liz Claiborne Inc. | 13,100 | 175 |
| * | Perry Ellis International Inc. | 8,029 | 150 |
| | Oxford Industries Inc. | 2,501 | 127 |
| | Scripps Networks Interactive | | |
| | Inc. Class A | 2,602 | 127 |
| * | Carmike Cinemas Inc. | 8,900 | 124 |
| | Abercrombie & Fitch Co. | 2,500 | 124 |
| * | Cumulus Media Inc. Class A | 30,952 | 108 |
| | Fred’s Inc. Class A | 7,000 | 102 |
| * | Charter Communications Inc. | | |
| | Class A | 1,600 | 102 |
| | Lear Corp. | 2,100 | 98 |
| * | Scientific Games Corp. | | |
| | Class A | 7,034 | 82 |
| * | Capella Education Co. | 2,200 | 79 |
| * | G-III Apparel Group Ltd. | 2,299 | 65 |
| | HOT Topic Inc. | 6,400 | 65 |
| * | VOXX International Corp. | | |
| | Class A | 4,600 | 62 |
| | Standard Motor Products Inc. | 3,433 | 61 |
| | Movado Group Inc. | 2,000 | 49 |
| * | Pinnacle Entertainment Inc. | 4,247 | 49 |
| | Universal Technical Institute | | |
| | Inc. | 3,561 | 47 |
| * | TripAdvisor Inc. | 1,300 | 46 |
| | American Greetings Corp. | | |
| | Class A | 3,000 | 46 |
| | PEP Boys-Manny Moe | | |
| | & Jack | 3,051 | 46 |
| * | Kenneth Cole Productions | | |
| | Inc. Class A | 2,800 | 45 |
| * | Lions Gate Entertainment | | |
| | Corp. | 3,100 | 43 |
| * | Charming Shoppes Inc. | 7,100 | 42 |
| | Yum! Brands Inc. | 559 | 40 |
| * | Barnes & Noble Inc. | 2,900 | 38 |
| * | Smith & Wesson Holding | | |
| | Corp. | 4,650 | 36 |
| * | Pier 1 Imports Inc. | 1,700 | 31 |
| * | Career Education Corp. | 3,619 | 29 |
| * | Isle of Capri Casinos Inc. | 3,462 | 24 |
| * | Wet Seal Inc. Class A | 6,841 | 24 |
| * | Liberty Global Inc. Class A | 400 | 20 |
| * | Coldwater Creek Inc. | 15,600 | 18 |
| * | Education Management | | |
| | Corp. | 1,300 | 18 |
| | Cinemark Holdings Inc. | 800 | 18 |
| | Churchill Downs Inc. | 300 | 17 |
| * | Overstock.com Inc. | 3,109 | 16 |
| | | |
| | | | Market |
| | | | Value |
| | | Shares | ($000) |
| * | Talbots Inc. | 4,768 | 14 |
| * | Penn National Gaming Inc. | 323 | 14 |
| * | American Apparel Inc. | 14,397 | 12 |
| | Cato Corp. Class A | 400 | 11 |
| * | Knology Inc. | 566 | 10 |
| * | Furniture Brands | | |
| | International Inc. | 6,000 | 10 |
| | Strayer Education Inc. | 100 | 9 |
| | Sonic Automotive Inc. | | |
| | Class A | 500 | 9 |
| | Advance Auto Parts Inc. | 100 | 9 |
| * | Valuevision Media Inc. | | |
| | Class A | 4,200 | 9 |
| | NIKE Inc. Class B | 80 | 9 |
| | Stage Stores Inc. | 500 | 8 |
| | Service Corp. International | 700 | 8 |
| | Chico’s FAS Inc. | 500 | 8 |
| * | Conn’s Inc. | 436 | 7 |
| * | New York & Co. Inc. | 1,700 | 6 |
| * | School Specialty Inc. | 1,500 | 5 |
| | International Game | | |
| | Technology | 274 | 5 |
| | DR Horton Inc. | 300 | 5 |
| * | PulteGroup Inc. | 500 | 4 |
| | International Speedway | | |
| | Corp. Class A | 124 | 3 |
| * | Multimedia Games Holding | | |
| | Co. Inc. | 280 | 3 |
| * | Dex One Corp. | 1,800 | 3 |
| * | Red Robin Gourmet Burgers | |
| | Inc. | 67 | 2 |
| | Lithia Motors Inc. Class A | 93 | 2 |
| * | Midas Inc. | 200 | 2 |
| * | O’Charleys Inc. | 212 | 2 |
| | Arcos Dorados Holdings Inc. | |
| | Class A | 100 | 2 |
| | | | 492,267 |
| Consumer Staples (10.2%) | | |
| | Philip Morris International | | |
| | Inc. | 899,089 | 79,668 |
| | Procter & Gamble Co. | 1,046,530 | 70,337 |
| | Coca-Cola Co. | 581,717 | 43,053 |
| | Wal-Mart Stores Inc. | 632,379 | 38,702 |
| | Altria Group Inc. | 1,068,168 | 32,974 |
| | Walgreen Co. | 741,497 | 24,833 |
| | Lorillard Inc. | 161,021 | 20,849 |
| | Dr Pepper Snapple | | |
| | Group Inc. | 342,801 | 13,784 |
| | PepsiCo Inc. | 198,595 | 13,177 |
| | Kroger Co. | 490,900 | 11,895 |
| | Estee Lauder Cos. Inc. | | |
| | Class A | 150,700 | 9,334 |
| | ConAgra Foods Inc. | 352,183 | 9,248 |
| | Whole Foods Market Inc. | 109,000 | 9,069 |
13
Growth and Income Fund
| | | |
| | | | Market |
| | | | Value |
| | | Shares | ($000) |
| | Colgate-Palmolive Co. | 81,712 | 7,990 |
| * | Constellation Brands Inc. | | |
| | Class A | 317,100 | 7,480 |
| | Kraft Foods Inc. | 185,300 | 7,043 |
| | Reynolds American Inc. | 165,142 | 6,844 |
| | Kimberly-Clark Corp. | 91,561 | 6,765 |
| | CVS Caremark Corp. | 129,300 | 5,793 |
| | Beam Inc. | 77,100 | 4,516 |
| | Avon Products Inc. | 170,000 | 3,291 |
| | Sysco Corp. | 102,599 | 3,064 |
| | Safeway Inc. | 139,104 | 2,811 |
| | Costco Wholesale Corp. | 30,393 | 2,760 |
| | Mead Johnson Nutrition | | |
| | Co. | 26,800 | 2,210 |
| ^ | SUPERVALU Inc. | 211,000 | 1,205 |
| | Archer-Daniels-Midland | | |
| | Co. | 32,125 | 1,017 |
| | Coca-Cola Enterprises Inc. | 22,300 | 638 |
| | Sara Lee Corp. | 24,100 | 519 |
| * | Fresh Market Inc. | 10,300 | 494 |
| | Tyson Foods Inc. Class A | 20,981 | 402 |
| | Brown-Forman Corp. | | |
| | Class B | 4,000 | 334 |
| | Molson Coors Brewing Co. | | |
| | Class B | 6,400 | 290 |
| | Hershey Co. | 3,384 | 208 |
| * | Dean Foods Co. | 14,400 | 174 |
| * | Spectrum Brands Holdings | | |
| | Inc. | 4,378 | 153 |
| * | Post Holdings Inc. | 3,280 | 108 |
| | JM Smucker Co. | 1,070 | 87 |
| * | Susser Holdings Corp. | 2,900 | 74 |
| * | Cott Corp. | 9,600 | 63 |
| * | Smart Balance Inc. | 9,363 | 62 |
| * | Rite Aid Corp. | 30,000 | 52 |
| | Fresh Del Monte Produce | | |
| | Inc. | 1,885 | 43 |
| *,^ | Star Scientific Inc. | 12,600 | 41 |
| | Hormel Foods Corp. | 1,400 | 41 |
| * | Central European | | |
| | Distribution Corp. | 5,100 | 26 |
| | Clorox Co. | 144 | 10 |
| * | Pantry Inc. | 600 | 8 |
| | Kellogg Co. | 61 | 3 |
| | Cosan Ltd. | 64 | 1 |
| | | | 443,543 |
| Energy (10.5%) | | |
| | Exxon Mobil Corp. | 1,374,516 | 119,212 |
| | Chevron Corp. | 699,250 | 74,988 |
| | ConocoPhillips | 891,284 | 67,746 |
| | Occidental Petroleum | | |
| | Corp. | 337,695 | 32,159 |
| | Anadarko Petroleum Corp. | 229,396 | 17,971 |
| | Devon Energy Corp. | 224,291 | 15,952 |
| | Schlumberger Ltd. | 212,719 | 14,875 |
| | | |
| | | | Market |
| | | | Value |
| | | Shares | ($000) |
| | National Oilwell Varco Inc. | 170,624 | 13,559 |
| | Marathon Petroleum Corp. | 281,000 | 12,184 |
| | Apache Corp. | 120,450 | 12,098 |
| | Marathon Oil Corp. | 369,334 | 11,708 |
| | Spectra Energy Corp. | 318,800 | 10,058 |
| | Valero Energy Corp. | 336,600 | 8,674 |
| * | Tesoro Corp. | 255,950 | 6,870 |
| | Diamond Offshore | | |
| | Drilling Inc. | 86,000 | 5,740 |
| | Helmerich & Payne Inc. | 94,700 | 5,109 |
| | Hess Corp. | 53,100 | 3,130 |
| | Noble Energy Inc. | 28,800 | 2,816 |
| | Halliburton Co. | 77,593 | 2,575 |
| | Williams Cos. Inc. | 70,100 | 2,160 |
| | Pioneer Natural Resources | | |
| | Co. | 19,196 | 2,142 |
| | Peabody Energy Corp. | 71,000 | 2,056 |
| * | WPX Energy Inc. | 112,899 | 2,033 |
| * | Denbury Resources Inc. | 101,400 | 1,848 |
| | Chesapeake Energy Corp. | 52,700 | 1,221 |
| | Baker Hughes Inc. | 19,781 | 830 |
| | El Paso Corp. | 27,100 | 801 |
| | Sunoco Inc. | 20,400 | 778 |
| * | Hercules Offshore Inc. | 109,000 | 516 |
| * | Comstock Resources Inc. | 27,200 | 431 |
| *,^ | ATP Oil & Gas Corp. | 53,700 | 395 |
| | Suncor Energy Inc. | 9,500 | 311 |
| * | Ocean Rig UDW Inc. | 14,951 | 253 |
| * | Laredo Petroleum Holdings | | |
| | Inc. | 10,400 | 244 |
| | Talisman Energy Inc. | 17,983 | 227 |
| | Teekay Tankers Ltd. | | |
| | Class A | 33,100 | 201 |
| * | Rentech Inc. | 85,997 | 179 |
| * | Cheniere Energy Inc. | 11,821 | 177 |
| | Crosstex Energy Inc. | 10,600 | 150 |
| * | Lone Pine Resources Inc. | 21,200 | 138 |
| * | Exterran Holdings Inc. | 10,309 | 136 |
| | W&T Offshore Inc. | 6,300 | 133 |
| | Range Resources Corp. | 2,100 | 122 |
| * | Harvest Natural Resources | | |
| | Inc. | 14,100 | 100 |
| | Cameco Corp. | 4,000 | 86 |
| * | Endeavour International | | |
| | Corp. | 5,700 | 67 |
| * | SEACOR Holdings Inc. | 700 | 67 |
| * | SemGroup Corp. Class A | 2,200 | 64 |
| * | Energy Partners Ltd. | 3,700 | 61 |
| * | Cloud Peak Energy Inc. | 3,778 | 60 |
| * | ZaZa Energy Corp. | 9,300 | 43 |
| * | Plains Exploration & | | |
| | Production Co. | 900 | 38 |
| * | FMC Technologies Inc. | 612 | 31 |
| | Targa Resources Corp. | 600 | 27 |
| | Alon USA Energy Inc. | 2,969 | 27 |
14
Growth and Income Fund
| | | |
| | | | Market |
| | | | Value |
| | | Shares | ($000) |
| * | Matador Resources Co. | 2,294 | 25 |
| * | Amyris Inc. | 4,800 | 25 |
| | DHT Holdings Inc. | 15,783 | 15 |
| * | USEC Inc. | 13,277 | 14 |
| * | Contango Oil & Gas Co. | 200 | 12 |
| * | Callon Petroleum Co. | 1,700 | 11 |
| * | Nabors Industries Ltd. | 400 | 7 |
| * | Newfield Exploration Co. | 200 | 7 |
| | Consol Energy Inc. | 200 | 7 |
| * | DHT Holdings Inc. Rights | | |
| | Exp. 04/27/2012 | 63 | 7 |
| | Murphy Oil Corp. | 100 | 6 |
| | Cabot Oil & Gas Corp. | 100 | 3 |
| | Delek US Holdings Inc. | 200 | 3 |
| | | | 455,719 |
| Exchange-Traded Fund (0.2%) | |
| | SPDR S&P 500 ETF Trust | 62,800 | 8,837 |
| |
| Financials (15.8%) | | |
| | JPMorgan Chase & Co. | 1,727,001 | 79,407 |
| | Wells Fargo & Co. | 1,936,600 | 66,115 |
| * | Berkshire Hathaway Inc. | | |
| | Class B | 326,055 | 26,459 |
| | Simon Property Group | | |
| | Inc. | 171,838 | 25,033 |
| | Bank of America Corp. | 2,555,000 | 24,451 |
| | US Bancorp | 746,041 | 23,635 |
| | American Express Co. | 401,237 | 23,216 |
| | Citigroup Inc. | 610,900 | 22,328 |
| | Franklin Resources Inc. | 166,050 | 20,595 |
| | CME Group Inc. | 69,511 | 20,112 |
| | Goldman Sachs Group | | |
| | Inc. | 142,900 | 17,772 |
| | Marsh & McLennan Cos. | | |
| | Inc. | 508,625 | 16,678 |
| | Public Storage | 116,989 | 16,164 |
| | ACE Ltd. | 215,924 | 15,806 |
| | Torchmark Corp. | 316,200 | 15,763 |
| | Discover Financial | | |
| | Services | 452,500 | 15,086 |
| * | NASDAQ OMX Group Inc. | 564,922 | 14,631 |
| | Fifth Third Bancorp | 856,200 | 12,030 |
| | T. Rowe Price Group Inc. | 183,766 | 12,000 |
| * | American Tower | | |
| | Corporation | 189,015 | 11,912 |
| | Aflac Inc. | 251,252 | 11,555 |
| | MetLife Inc. | 294,950 | 11,016 |
| | Invesco Ltd. | 403,855 | 10,771 |
| | Prudential Financial Inc. | 141,866 | 8,993 |
| | HCP Inc. | 223,145 | 8,805 |
| * | American International | | |
| | Group Inc. | 278,900 | 8,598 |
| | Assurant Inc. | 189,533 | 7,676 |
| | Legg Mason Inc. | 259,092 | 7,236 |
| | Hudson City Bancorp Inc. | 985,400 | 7,203 |
| | | |
| | | | Market |
| | | | Value |
| | | Shares | ($000) |
| | Equity Residential | 114,939 | 7,197 |
| | ProLogis Inc. | 188,000 | 6,772 |
| ^ | Federated Investors Inc. | | |
| | Class B | 287,762 | 6,449 |
| | Kimco Realty Corp. | 305,020 | 5,875 |
| | Chubb Corp. | 79,784 | 5,514 |
| | BlackRock Inc. | 24,900 | 5,102 |
| | M&T Bank Corp. | 58,102 | 5,048 |
| | Ameriprise Financial Inc. | 87,884 | 5,021 |
| | Health Care REIT Inc. | 71,700 | 3,941 |
| | Moody’s Corp. | 91,150 | 3,837 |
| | Regions Financial Corp. | 569,100 | 3,750 |
| | BB&T Corp. | 116,900 | 3,669 |
| | Loews Corp. | 87,100 | 3,473 |
| | Plum Creek Timber Co. Inc. | 78,386 | 3,258 |
| | State Street Corp. | 60,700 | 2,762 |
| | PNC Financial Services | | |
| | Group Inc. | 41,542 | 2,679 |
| | Unum Group | 109,254 | 2,675 |
| | Charles Schwab Corp. | 185,317 | 2,663 |
| | Leucadia National Corp. | 101,287 | 2,644 |
| | SunTrust Banks Inc. | 105,900 | 2,560 |
| | Travelers Cos. Inc. | 42,216 | 2,499 |
| | KeyCorp | 279,999 | 2,380 |
| | People’s United Financial | | |
| | Inc. | 179,684 | 2,379 |
| | Vornado Realty Trust | 25,500 | 2,147 |
| | MI Developments Inc. | 61,000 | 2,110 |
| | Equity Lifestyle Properties | | |
| | Inc. | 28,500 | 1,988 |
| | Erie Indemnity Co. | | |
| | Class A | 25,106 | 1,957 |
| * | IntercontinentalExchange | | |
| | Inc. | 12,900 | 1,773 |
| | Capital One Financial Corp. | 27,334 | 1,524 |
| | SLM Corp. | 95,381 | 1,503 |
| * | E*Trade Financial Corp. | 130,641 | 1,430 |
| | Northern Trust Corp. | 27,900 | 1,324 |
| | Bank of New York Mellon | | |
| | Corp. | 53,883 | 1,300 |
| | NYSE Euronext | 42,548 | 1,277 |
| | Apartment Investment & | | |
| | Management Co. | 40,756 | 1,076 |
| | AvalonBay Communities | | |
| | Inc. | 7,611 | 1,076 |
| * | CNO Financial Group Inc. | 128,300 | 998 |
| * | Genworth Financial Inc. | | |
| | Class A | 87,500 | 728 |
| | Two Harbors Investment | | |
| | Corp. | 60,300 | 611 |
| | First Horizon National Corp. | 54,400 | 565 |
| | Credicorp Ltd. | 3,990 | 526 |
| | Symetra Financial Corp. | 44,059 | 508 |
| | Boston Properties Inc. | 4,500 | 472 |
| | Ventas Inc. | 8,200 | 468 |
15
Growth and Income Fund
| | | |
| | | | Market |
| | | | Value |
| | | Shares | ($000) |
| * | First Industrial Realty Trust | | |
| | Inc. | 37,000 | 457 |
| | XL Group plc Class A | 19,400 | 421 |
| | RLJ Lodging Trust | 18,500 | 345 |
| * | NewStar Financial Inc. | 24,100 | 268 |
| | Willis Group Holdings plc | 7,200 | 252 |
| | DuPont Fabros Technology | | |
| | Inc. | 9,500 | 232 |
| * | eHealth Inc. | 12,946 | 211 |
| | Alleghany Corp. | 613 | 202 |
| | Aon Corp. | 4,100 | 201 |
| | Horace Mann Educators | | |
| | Corp. | 11,000 | 194 |
| * | Strategic Hotels & Resorts | | |
| | Inc. | 29,352 | 193 |
| | Zions Bancorporation | 8,319 | 179 |
| | Extra Space Storage Inc. | 5,584 | 161 |
| | Huntington Bancshares Inc. | 24,100 | 155 |
| * | Sunstone Hotel Investors | | |
| | Inc. | 15,600 | 152 |
| | Dynex Capital Inc. | 15,820 | 151 |
| | MarketAxess Holdings Inc. | 3,600 | 134 |
| * | CBRE Group Inc. Class A | 6,623 | 132 |
| | Starwood Property Trust Inc. | 6,200 | 130 |
| | Comerica Inc. | 4,000 | 129 |
| | Principal Financial Group Inc. | 4,382 | 129 |
| | FBL Financial Group Inc. | | |
| | Class A | 3,799 | 128 |
| | Invesco Mortgage Capital | | |
| | Inc. | 6,900 | 122 |
| | RLI Corp. | 1,508 | 108 |
| * | Central Pacific Financial | | |
| | Corp. | 7,421 | 96 |
| | Weyerhaeuser Co. | 4,300 | 94 |
| | Newcastle Investment Corp. | 13,786 | 87 |
| | Potlatch Corp. | 2,300 | 72 |
| | Healthcare Realty Trust Inc. | 3,208 | 71 |
| | Hartford Financial Services | | |
| | Group Inc. | 3,300 | 70 |
| * | Sterling Financial Corp. | 3,103 | 65 |
| * | Citizens Republic Bancorp | | |
| | Inc. | 4,101 | 64 |
| | PrivateBancorp Inc. Class A | 3,983 | 60 |
| | Lincoln National Corp. | 1,652 | 44 |
| | Saul Centers Inc. | 1,000 | 40 |
| | PS Business Parks Inc. | 600 | 39 |
| * | United Community Banks | | |
| | Inc. | 3,974 | 39 |
| * | MBIA Inc. | 3,500 | 34 |
| | STAG Industrial Inc. | 2,277 | 32 |
| | Ashford Hospitality Trust Inc. | 3,331 | 30 |
| | Taubman Centers Inc. | 400 | 29 |
| * | iStar Financial Inc. | 3,900 | 28 |
| | Employers Holdings Inc. | 1,400 | 25 |
| | | |
| | | | Market |
| | | | Value |
| | | Shares | ($000) |
| | First Financial Bankshares | | |
| | Inc. | 700 | 25 |
| | Cash America International | | |
| | Inc. | 500 | 24 |
| * | Popular Inc. | 11,500 | 24 |
| | Terreno Realty Corp. | 1,581 | 23 |
| | CapitalSource Inc. | 3,200 | 21 |
| * | Southwest Bancorp Inc. | 2,039 | 19 |
| | Apollo Residential | | |
| | Mortgage Inc. | 1,000 | 18 |
| | CVB Financial Corp. | 1,500 | 18 |
| * | First Cash Financial | | |
| | Services Inc. | 325 | 14 |
| | Ramco-Gershenson | | |
| | Properties Trust | 1,100 | 13 |
| | Monmouth Real Estate | | |
| | Investment Corp. Class A | 1,100 | 11 |
| * | Virtus Investment Partners | | |
| | Inc. | 100 | 9 |
| | Winthrop Realty Trust | 700 | 8 |
| | Cogdell Spencer Inc. | 1,600 | 7 |
| * | PHH Corp. | 437 | 7 |
| * | Tejon Ranch Co. | 200 | 6 |
| | Platinum Underwriters | | |
| | Holdings Ltd. | 100 | 4 |
| | First Financial Bancorp | 200 | 3 |
| | CNA Financial Corp. | 100 | 3 |
| * | Phoenix Cos. Inc. | 1,180 | 3 |
| * | ICG Group Inc. | 256 | 2 |
| * | Altisource Portfolio | | |
| | Solutions SA | 27 | 2 |
| * | Netspend Holdings Inc. | 100 | 1 |
| | BGC Partners Inc. Class A | 70 | 1 |
| | Sovran Self Storage Inc. | 7 | — |
| | UDR Inc. | 7 | — |
| | | | 684,625 |
| Health Care (10.8%) | | |
| | Pfizer Inc. | 3,982,988 | 90,254 |
| | Abbott Laboratories | 713,123 | 43,707 |
| | Merck & Co. Inc. | 1,123,996 | 43,161 |
| | Johnson & Johnson | 606,142 | 39,981 |
| | Bristol-Myers Squibb Co. | 1,042,886 | 35,197 |
| | WellPoint Inc. | 409,562 | 30,226 |
| | UnitedHealth Group Inc. | 409,198 | 24,118 |
| | Eli Lilly & Co. | 544,775 | 21,938 |
| | Covidien plc | 285,995 | 15,638 |
| | Baxter International Inc. | 259,668 | 15,523 |
| | Humana Inc. | 142,516 | 13,180 |
| | Aetna Inc. | 258,320 | 12,957 |
| | Amgen Inc. | 145,700 | 9,906 |
| | Medtronic Inc. | 167,054 | 6,547 |
| * | Biogen Idec Inc. | 48,489 | 6,108 |
| | Stryker Corp. | 110,041 | 6,105 |
| * | Forest Laboratories Inc. | 172,411 | 5,981 |
16
Growth and Income Fund
| | | |
| | | | Market |
| | | | Value |
| | | Shares | ($000) |
| | McKesson Corp. | 61,963 | 5,438 |
| | St. Jude Medical Inc. | 104,800 | 4,644 |
| | PerkinElmer Inc. | 163,980 | 4,536 |
| | Becton Dickinson and Co. | 54,002 | 4,193 |
| | Thermo Fisher Scientific | | |
| | Inc. | 74,200 | 4,183 |
| * | Tenet Healthcare Corp. | 764,185 | 4,058 |
| | Zimmer Holdings Inc. | 35,800 | 2,301 |
| * | Mylan Inc. | 70,400 | 1,651 |
| * | Watson Pharmaceuticals | | |
| | Inc. | 21,300 | 1,428 |
| | Allergan Inc. | 14,900 | 1,422 |
| * | DaVita Inc. | 15,500 | 1,398 |
| * | Medco Health Solutions | | |
| | Inc. | 18,500 | 1,301 |
| | Cardinal Health Inc. | 25,600 | 1,104 |
| * | Celgene Corp. | 14,200 | 1,101 |
| * | Intuitive Surgical Inc. | 1,822 | 987 |
| * | Express Scripts Inc. | 12,700 | 688 |
| * | Idenix Pharmaceuticals Inc. | 65,100 | 637 |
| * | XenoPort Inc. | 127,355 | 573 |
| * | Theravance Inc. | 27,200 | 530 |
| | Agilent Technologies Inc. | 10,600 | 472 |
| * | MedAssets Inc. | 33,141 | 436 |
| * | Arthrocare Corp. | 11,120 | 299 |
| * | Furiex Pharmaceuticals Inc. | 12,000 | 284 |
| * | Orexigen Therapeutics Inc. | 61,300 | 251 |
| * | Life Technologies Corp. | 5,100 | 249 |
| * | Neurocrine Biosciences Inc. | 27,322 | 218 |
| * | Emergent Biosolutions Inc. | 13,030 | 208 |
| * | Pharmacyclics Inc. | 7,400 | 205 |
| * | Pain Therapeutics Inc. | 41,100 | 148 |
| * | AngioDynamics Inc. | 11,100 | 136 |
| * | Allos Therapeutics Inc. | 91,600 | 136 |
| * | LCA-Vision Inc. | 20,697 | 130 |
| * | Transcend Services Inc. | 3,500 | 103 |
| | Omnicare Inc. | 2,800 | 100 |
| * | NuVasive Inc. | 5,819 | 98 |
| * | Enzon Pharmaceuticals Inc. | 12,400 | 85 |
| * | GTx Inc. | 20,600 | 79 |
| * | Warner Chilcott plc Class A | 4,500 | 76 |
| * | Array Biopharma Inc. | 21,300 | 73 |
| * | Halozyme Therapeutics Inc. | 5,500 | 70 |
| | Hill-Rom Holdings Inc. | 2,100 | 70 |
| | Medicis Pharmaceutical | | |
| | Corp. Class A | 1,800 | 68 |
| | AmerisourceBergen Corp. | | |
| | Class A | 1,700 | 67 |
| * | Alnylam Pharmaceuticals | | |
| | Inc. | 5,700 | 63 |
| * | Pozen Inc. | 10,020 | 60 |
| * | NPS Pharmaceuticals Inc. | 7,400 | 51 |
| * | Amicus Therapeutics Inc. | 8,179 | 43 |
| * | TranS1 Inc. | 10,180 | 37 |
| | | |
| | | | Market |
| | | | Value |
| | | Shares | ($000) |
| * | Valeant Pharmaceuticals | | |
| | International Inc. | 666 | 36 |
| * | KV Pharmaceutical Co. | | |
| | Class A | 25,700 | 34 |
| * | PharMerica Corp. | 2,700 | 34 |
| * | Cambrex Corp. | 4,600 | 32 |
| *,^ | Biosante Pharmaceuticals | | |
| | Inc. | 44,500 | 30 |
| * | Health Net Inc. | 700 | 28 |
| | Invacare Corp. | 1,663 | 28 |
| * | Arqule Inc. | 3,700 | 26 |
| * | Endocyte Inc. | 5,200 | 26 |
| * | Ardea Biosciences Inc. | 1,100 | 24 |
| * | Sciclone Pharmaceuticals | | |
| | Inc. | 3,700 | 23 |
| * | Agenus Inc. | 2,700 | 18 |
| * | Auxilium Pharmaceuticals | | |
| | Inc. | 900 | 17 |
| * | Zoll Medical Corp. | 180 | 17 |
| * | Rigel Pharmaceuticals Inc. | 1,900 | 15 |
| * | Sun Healthcare Group Inc. | 2,000 | 14 |
| * | Viropharma Inc. | 400 | 12 |
| * | BioDelivery Sciences | | |
| | International Inc. | 4,765 | 11 |
| * | Biolase Technology Inc. | 3,654 | 10 |
| * | Ligand Pharmaceuticals | | |
| | Inc. Class B | 600 | 10 |
| * | Ironwood Pharmaceuticals | | |
| | Inc. Class A | 700 | 9 |
| * | Targacept Inc. | 1,563 | 8 |
| * | Edwards Lifesciences Corp. | 100 | 7 |
| * | AMAG Pharmaceuticals Inc. | 433 | 7 |
| * | OncoGenex Pharmaceutical | | |
| | Inc. | 500 | 7 |
| * | Brookdale Senior Living Inc. | | |
| | Class A | 300 | 6 |
| * | Dynavax Technologies Corp. | 998 | 5 |
| | HCA Holdings Inc. | 200 | 5 |
| * | Myriad Genetics Inc. | 200 | 5 |
| * | Myrexis Inc. | 1,550 | 5 |
| * | Trius Therapeutics Inc. | 800 | 4 |
| * | Sunrise Senior Living Inc. | 400 | 2 |
| * | Boston Scientific Corp. | 146 | 1 |
| * | Vanda Pharmaceuticals Inc. | 100 | — |
| | | | 467,531 |
| Industrials (9.9%) | | |
| | General Electric Co. | 3,501,600 | 70,277 |
| | Tyco International Ltd. | 523,080 | 29,387 |
| | General Dynamics Corp. | 365,410 | 26,814 |
| | Northrop Grumman Corp. | 422,206 | 25,788 |
| | Lockheed Martin Corp. | 284,854 | 25,597 |
| | Union Pacific Corp. | 228,435 | 24,552 |
| | United Technologies Corp. | 291,900 | 24,210 |
| | Caterpillar Inc. | 209,821 | 22,350 |
17
Growth and Income Fund
| | | |
| | | | Market |
| | | | Value |
| | | Shares | ($000) |
| | Norfolk Southern Corp. | 308,802 | 20,328 |
| | Raytheon Co. | 368,831 | 19,467 |
| | Cummins Inc. | 121,567 | 14,593 |
| | Precision Castparts Corp. | 79,367 | 13,723 |
| | CSX Corp. | 566,389 | 12,189 |
| | L-3 Communications | | |
| | Holdings Inc. | 150,985 | 10,685 |
| | WW Grainger Inc. | 39,859 | 8,562 |
| | United Parcel Service Inc. | | |
| | Class B | 103,093 | 8,322 |
| | Equifax Inc. | 177,400 | 7,852 |
| | PACCAR Inc. | 137,600 | 6,444 |
| | Republic Services Inc. | | |
| | Class A | 210,300 | 6,427 |
| | Emerson Electric Co. | 117,329 | 6,122 |
| | Parker Hannifin Corp. | 71,822 | 6,073 |
| | Southwest Airlines Co. | 651,000 | 5,364 |
| | Snap-on Inc. | 52,422 | 3,196 |
| | Expeditors International of | | |
| | Washington Inc. | 63,965 | 2,975 |
| | Fluor Corp. | 49,000 | 2,942 |
| | Covanta Holding Corp. | 174,300 | 2,829 |
| | Cintas Corp. | 67,600 | 2,645 |
| * | Sensata Technologies | | |
| | Holding NV | 70,500 | 2,360 |
| | Illinois Tool Works Inc. | 36,650 | 2,093 |
| | Honeywell International Inc. | 33,700 | 2,057 |
| * | Verisk Analytics Inc. | | |
| | Class A | 32,600 | 1,531 |
| | Rockwell Automation Inc. | 18,937 | 1,509 |
| | Xylem Inc. | 46,900 | 1,302 |
| | Goodrich Corp. | 8,200 | 1,029 |
| * | Nielsen Holdings NV | 31,600 | 952 |
| | Masco Corp. | 67,937 | 908 |
| * | Esterline Technologies | | |
| | Corp. | 7,100 | 507 |
| * | WABCO Holdings Inc. | 8,320 | 503 |
| | Cooper Industries plc | 7,654 | 490 |
| | Dun & Bradstreet Corp. | 5,707 | 484 |
| | Flowserve Corp. | 3,495 | 404 |
| * | AerCap Holdings NV | 31,800 | 353 |
| * | Portfolio Recovery | | |
| | Associates Inc. | 4,682 | 336 |
| * | FuelCell Energy Inc. | 197,227 | 310 |
| | Albany International Corp. | 13,100 | 301 |
| * | Swift Transportation Co. | 25,600 | 295 |
| | Fastenal Co. | 5,100 | 276 |
| | Avery Dennison Corp. | 9,100 | 274 |
| * | Atlas Air Worldwide | | |
| | Holdings Inc. | 4,900 | 241 |
| | Ryder System Inc. | 4,400 | 232 |
| | 3M Co. | 2,300 | 205 |
| | Boeing Co. | 2,400 | 179 |
| * | EnerNOC Inc. | 22,200 | 160 |
| | | |
| | | | Market |
| | | | Value |
| | | Shares | ($000) |
| | John Bean Technologies | | |
| | Corp. | 8,753 | 142 |
| * | Federal Signal Corp. | 24,806 | 138 |
| * | Dycom Industries Inc. | 5,100 | 119 |
| * | EnPro Industries Inc. | 2,300 | 95 |
| | Timken Co. | 1,800 | 91 |
| | Aceto Corp. | 7,996 | 76 |
| * | Meritor Inc. | 8,100 | 65 |
| * | Interline Brands Inc. | 3,000 | 65 |
| | Quad/Graphics Inc. | 4,338 | 60 |
| * | GeoEye Inc. | 2,500 | 60 |
| * | Old Dominion Freight Line | | |
| | Inc. | 1,200 | 57 |
| | Corporate Executive Board | | |
| | Co. | 1,200 | 52 |
| * | United Rentals Inc. | 1,100 | 47 |
| * | Shaw Group Inc. | 1,400 | 44 |
| * | DigitalGlobe Inc. | 2,261 | 30 |
| * | GrafTech International Ltd. | 2,098 | 25 |
| * | Pendrell Corp. | 9,585 | 25 |
| * | ACCO Brands Corp. | 2,000 | 25 |
| * | Pacer International Inc. | 3,900 | 25 |
| | Arkansas Best Corp. | 1,300 | 24 |
| | Star Bulk Carriers Corp. | 27,146 | 24 |
| * | Navigant Consulting Inc. | 1,600 | 22 |
| * | Safe Bulkers Inc. | 3,300 | 22 |
| * | American Reprographics Co. | 3,710 | 20 |
| | Unifirst Corp. | 300 | 18 |
| | Kaman Corp. | 535 | 18 |
| * | Alaska Air Group Inc. | 500 | 18 |
| | LB Foster Co. Class A | 470 | 13 |
| * | Quality Distribution Inc. | 897 | 12 |
| * | Odyssey Marine Exploration | | |
| | Inc. | 3,523 | 11 |
| * | Accuride Corp. | 1,235 | 11 |
| * | NCI Building Systems Inc. | 900 | 10 |
| * | CRA International Inc. | 400 | 10 |
| * | KEYW Holding Corp. | 1,236 | 10 |
| | URS Corp. | 200 | 9 |
| * | Jacobs Engineering Group | | |
| | Inc. | 146 | 7 |
| | Iron Mountain Inc. | 223 | 6 |
| * | Beacon Roofing Supply Inc. | 200 | 5 |
| * | SYKES Enterprises Inc. | 321 | 5 |
| * | JetBlue Airways Corp. | 1,013 | 5 |
| * | Republic Airways Holdings | | |
| | Inc. | 904 | 5 |
| * | Navistar International Corp. | 100 | 4 |
| | Quanex Building Products | | |
| | Corp. | 200 | 4 |
| | Deere & Co. | 41 | 3 |
| | Comfort Systems USA Inc. | 72 | 1 |
| | | | 430,542 |
18
Growth and Income Fund
| | | |
| | | | Market |
| | | | Value |
| | | Shares | ($000) |
| Information Technology (21.1%) | |
| * | Apple Inc. | 364,423 | 218,461 |
| | Microsoft Corp. | 3,057,197 | 98,595 |
| | International Business | | |
| | Machines Corp. | 432,754 | 90,294 |
| | QUALCOMM Inc. | 862,906 | 58,695 |
| | Intel Corp. | 1,811,209 | 50,913 |
| | Cisco Systems Inc. | 2,074,789 | 43,882 |
| * | Google Inc. Class A | 68,009 | 43,610 |
| | Visa Inc. Class A | 311,530 | 36,760 |
| | Oracle Corp. | 885,525 | 25,822 |
| | Mastercard Inc. Class A | 55,939 | 23,525 |
| | Accenture plc Class A | 320,000 | 20,640 |
| | Motorola Solutions Inc. | 315,500 | 16,037 |
| * | Symantec Corp. | 649,600 | 12,147 |
| | Hewlett-Packard Co. | 505,700 | 12,051 |
| | KLA-Tencor Corp. | 216,505 | 11,782 |
| * | Dell Inc. | 677,026 | 11,239 |
| | Intuit Inc. | 153,500 | 9,230 |
| * | LSI Corp. | 1,054,800 | 9,156 |
| * | Western Digital Corp. | 220,200 | 9,114 |
| * | eBay Inc. | 216,066 | 7,971 |
| | Jabil Circuit Inc. | 315,100 | 7,915 |
| * | Novellus Systems Inc. | 135,350 | 6,755 |
| | Applied Materials Inc. | 542,625 | 6,750 |
| | VeriSign Inc. | 163,700 | 6,276 |
| * | Marvell Technology Group | | |
| | Ltd. | 395,336 | 6,219 |
| | CA Inc. | 193,000 | 5,319 |
| * | Cognizant Technology | | |
| | Solutions Corp. Class A | 63,218 | 4,865 |
| | Total System Services Inc. | 208,100 | 4,801 |
| * | Autodesk Inc. | 97,400 | 4,122 |
| * | Citrix Systems Inc. | 49,557 | 3,911 |
| | Texas Instruments Inc. | 112,102 | 3,768 |
| | Broadcom Corp. Class A | 94,355 | 3,708 |
| | Analog Devices Inc. | 76,684 | 3,098 |
| * | F5 Networks Inc. | 22,700 | 3,064 |
| * | Juniper Networks Inc. | 131,000 | 2,997 |
| * | Zebra Technologies Corp. | 72,734 | 2,995 |
| * | Fiserv Inc. | 36,700 | 2,547 |
| * | Compuware Corp. | 230,811 | 2,121 |
| | Seagate Technology plc | 78,500 | 2,116 |
| | Automatic Data Processing | | |
| | Inc. | 36,000 | 1,987 |
| * | BMC Software Inc. | 46,100 | 1,851 |
| * | Quest Software Inc. | 67,463 | 1,570 |
| | Altera Corp. | 34,700 | 1,382 |
| * | SanDisk Corp. | 27,800 | 1,379 |
| | Harris Corp. | 29,693 | 1,339 |
| | Paychex Inc. | 37,300 | 1,156 |
| * | Micron Technology Inc. | 127,400 | 1,032 |
| | Corning Inc. | 68,300 | 962 |
| | Linear Technology Corp. | 27,101 | 913 |
| | Xerox Corp. | 85,900 | 694 |
| | | |
| | | | Market |
| | | | Value |
| | | Shares | ($000) |
| | Microchip Technology Inc. | 17,252 | 642 |
| * | Acxiom Corp. | 42,800 | 628 |
| * | JDS Uniphase Corp. | 41,800 | 606 |
| * | Tessera Technologies Inc. | 34,400 | 593 |
| * | Polycom Inc. | 30,600 | 584 |
| | Avago Technologies Ltd. | 14,821 | 578 |
| * | AOL Inc. | 30,100 | 571 |
| * | Research In Motion Ltd. | 35,900 | 528 |
| | Computer Sciences Corp. | 15,826 | 474 |
| * | Electronic Arts Inc. | 22,823 | 376 |
| * | Agilysys Inc. | 30,416 | 273 |
| * | Mentor Graphics Corp. | 17,700 | 263 |
| * | NetApp Inc. | 5,400 | 242 |
| * | Red Hat Inc. | 3,200 | 192 |
| * | Comverse Technology Inc. | 26,900 | 185 |
| * | Salesforce.com Inc. | 1,187 | 183 |
| | Fidelity National Information | | |
| | Services Inc. | 5,500 | 182 |
| * | STEC Inc. | 18,437 | 174 |
| * | Vocus Inc. | 10,501 | 139 |
| * | SS&C Technologies | | |
| | Holdings Inc. | 5,500 | 128 |
| * | Dolby Laboratories Inc. | | |
| | Class A | 3,100 | 118 |
| * | ShoreTel Inc. | 20,200 | 115 |
| * | NXP Semiconductor NV | 4,100 | 109 |
| * | Unisys Corp. | 5,400 | 106 |
| * | Brocade Communications | | |
| | Systems Inc. | 17,800 | 102 |
| * | Dice Holdings Inc. | 10,200 | 95 |
| * | Digital River Inc. | 4,700 | 88 |
| * | Amkor Technology Inc. | 10,535 | 65 |
| * | Orbotech Ltd. | 5,300 | 61 |
| * | PMC - Sierra Inc. | 8,100 | 59 |
| * | Flextronics International Ltd. | 6,787 | 49 |
| * | DTS Inc. | 1,500 | 45 |
| * | THQ Inc. | 78,931 | 44 |
| * | InterXion Holding NV | 2,400 | 43 |
| * | Mattson Technology Inc. | 15,334 | 42 |
| * | Omnivision Technologies | | |
| | Inc. | 1,900 | 38 |
| * | VASCO Data Security | | |
| | International Inc. | 3,400 | 37 |
| * | WebMD Health Corp. | 1,400 | 36 |
| * | Global Cash Access | | |
| | Holdings Inc. | 4,383 | 34 |
| | TE Connectivity Ltd. | 905 | 33 |
| * | Ingram Micro Inc. | 1,700 | 32 |
| * | MoneyGram International | | |
| | Inc. | 1,700 | 31 |
| * | Web.com Group Inc. | 1,882 | 27 |
| * | IntraLinks Holdings Inc. | 5,100 | 27 |
| | Micrel Inc. | 2,500 | 26 |
| * | Allot Communications Ltd. | 1,079 | 25 |
| * | CoreLogic Inc. | 1,500 | 24 |
19
Growth and Income Fund
| | | |
| | | | Market |
| | | | Value• |
| | | Shares | ($000) |
| * | TIBCO Software Inc. | 800 | 24 |
| * | Demand Media Inc. | 3,200 | 23 |
| * | Checkpoint Systems Inc. | 2,011 | 23 |
| * | VMware Inc. Class A | 200 | 22 |
| * | Ancestry.com Inc. | 954 | 22 |
| *,^ | FriendFinder Networks Inc. | 14,515 | 20 |
| * | Applied Micro Circuits Corp. | 2,800 | 19 |
| * | LTX-Credence Corp. | 2,697 | 19 |
| * | TNS Inc. | 851 | 18 |
| * | UTStarcom Holdings Corp. | 11,400 | 16 |
| * | MIPS Technologies Inc. | | |
| | Class A | 3,000 | 16 |
| * | Entropic Communications | | |
| | Inc. | 2,600 | 15 |
| * | Powerwave Technologies | | |
| | Inc. | 6,500 | 13 |
| * | Imation Corp. | 1,800 | 11 |
| * | Integrated Device | | |
| | Technology Inc. | 1,500 | 11 |
| * | Aspen Technology Inc. | 516 | 11 |
| * | Silicon Image Inc. | 1,500 | 9 |
| * | Smith Micro Software Inc. | 3,500 | 8 |
| | Xilinx Inc. | 204 | 7 |
| * | Akamai Technologies Inc. | 200 | 7 |
| * | Entegris Inc. | 700 | 6 |
| * | Yandex NV Class A | 213 | 6 |
| * | Glu Mobile Inc. | 1,151 | 6 |
| * | Symmetricom Inc. | 893 | 5 |
| * | Amtech Systems Inc. | 500 | 4 |
| * | Comverge Inc. | 2,130 | 4 |
| * | EchoStar Corp. Class A | 100 | 3 |
| * | Convergys Corp. | 200 | 3 |
| * | Photronics Inc. | 393 | 3 |
| * | PLX Technology Inc. | 600 | 2 |
| * | Infinera Corp. | 271 | 2 |
| * | SunPower Corp. Class A | 300 | 2 |
| * | Monster Worldwide Inc. | 100 | 1 |
| * | Network Equipment | | |
| | Technologies Inc. | 600 | 1 |
| | | | 916,950 |
| Materials (2.7%) | | |
| | Freeport-McMoRan | | |
| | Copper & Gold Inc. | 661,373 | 25,159 |
| | Monsanto Co. | 278,300 | 22,197 |
| | CF Industries Holdings Inc. | 58,250 | 10,639 |
| | International Paper Co. | 265,200 | 9,309 |
| | EI du Pont de Nemours & | | |
| | Co. | 173,796 | 9,194 |
| | Eastman Chemical Co. | 155,045 | 8,014 |
| | PPG Industries Inc. | 64,000 | 6,131 |
| | Newmont Mining Corp. | 116,924 | 5,995 |
| | International Flavors & | | |
| | Fragrances Inc. | 67,758 | 3,971 |
| | Sealed Air Corp. | 161,210 | 3,113 |
| | Airgas Inc. | 30,200 | 2,687 |
| | | |
| | | | Market |
| | | | Value• |
| | | Shares | ($000) |
| | FMC Corp. | 23,674 | 2,506 |
| | Ball Corp. | 39,100 | 1,677 |
| | Nucor Corp. | 35,300 | 1,516 |
| * | Owens-Illinois Inc. | 43,346 | 1,012 |
| * | Georgia Gulf Corp. | 25,900 | 903 |
| | Cliffs Natural Resources | | |
| | Inc. | 12,640 | 875 |
| | Mosaic Co. | 11,300 | 625 |
| | Innophos Holdings Inc. | 10,900 | 546 |
| | MeadWestvaco Corp. | 17,066 | 539 |
| * | SunCoke Energy Inc. | 29,739 | 423 |
| * | Headwaters Inc. | 95,155 | 398 |
| * | Mercer International Inc. | 45,741 | 365 |
| | Titanium Metals Corp. | 20,300 | 275 |
| | Noranda Aluminum | | |
| | Holding Corp. | 17,400 | 173 |
| | Myers Industries Inc. | 8,100 | 119 |
| * | Clearwater Paper Corp. | 3,400 | 113 |
| | Boise Inc. | 13,200 | 108 |
| * | KapStone Paper and | | |
| | Packaging Corp. | 5,226 | 103 |
| * | Jaguar Mining Inc. | 18,200 | 85 |
| | Domtar Corp. | 800 | 76 |
| * | Agnico-Eagle Mines Ltd. | 2,100 | 70 |
| * | Silver Standard Resources | | |
| | Inc. | 4,600 | 69 |
| *,^ | Rare Element Resources | | |
| | Ltd. | 7,500 | 47 |
| * | AbitibiBowater Inc. | 2,886 | 41 |
| * | General Moly Inc. | 9,800 | 33 |
| | Packaging Corp. of | | |
| | America | 800 | 24 |
| | Valspar Corp. | 400 | 19 |
| * | Taseko Mines Ltd. | 4,800 | 17 |
| * | OM Group Inc. | 609 | 17 |
| * | Flotek Industries Inc. | 1,300 | 16 |
| | Commercial Metals Co. | 796 | 12 |
| | Ecolab Inc. | 170 | 11 |
| | Sherwin-Williams Co. | 100 | 11 |
| | Air Products & Chemicals | | |
| | Inc. | 100 | 9 |
| | Barrick Gold Corp. | 200 | 9 |
| * | Ferro Corp. | 1,400 | 8 |
| * | NovaGold Resources Inc. | 1,000 | 7 |
| | United States Steel Corp. | 200 | 6 |
| * | Louisiana-Pacific Corp. | 600 | 6 |
| | American Vanguard Corp. | 213 | 5 |
| * | Golden Star Resources Ltd. | 1,000 | 2 |
| * | Richmont Mines Inc. | 164 | 1 |
| * | Aurizon Mines Ltd. | 189 | 1 |
| | | | 119,287 |
| Telecommunication Services (2.5%) | |
| | AT&T Inc. | 1,820,264 | 56,847 |
| | Verizon Communications | | |
| | Inc. | 1,106,739 | 42,311 |
20
Growth and Income Fund
| | | |
| | | | Market |
| | | | Value |
| | | Shares | ($000) |
| | CenturyLink Inc. | 83,500 | 3,227 |
| * | Crown Castle International | | |
| | Corp. | 59,700 | 3,184 |
| * | Sprint Nextel Corp. | 447,800 | 1,276 |
| * | MetroPCS | | |
| | Communications Inc. | 43,100 | 389 |
| * | Level 3 Communications Inc. | 9,000 | 231 |
| * | Vonage Holdings Corp. | 61,600 | 136 |
| | Frontier Communications | | |
| | Corp. | 27,500 | 115 |
| | USA Mobility Inc. | 2,723 | 38 |
| * | Clearwire Corp. Class A | 16,300 | 37 |
| | Windstream Corp. | 400 | 5 |
| | | | 107,796 |
| Utilities (2.5%) | | |
| | Northeast Utilities | 346,900 | 12,877 |
| | FirstEnergy Corp. | 278,300 | 12,688 |
| | Public Service Enterprise | | |
| | Group Inc. | 374,665 | 11,468 |
| | American Electric Power | | |
| | Co. Inc. | 226,800 | 8,750 |
| | DTE Energy Co. | 143,000 | 7,869 |
| | Ameren Corp. | 239,100 | 7,790 |
| | Pinnacle West Capital | | |
| | Corp. | 157,100 | 7,525 |
| | PG&E Corp. | 172,676 | 7,496 |
| * | AES Corp. | 495,000 | 6,470 |
| | Exelon Corp. | 152,200 | 5,968 |
| | CenterPoint Energy Inc. | 232,537 | 4,586 |
| | Edison International | 78,553 | 3,339 |
| | CMS Energy Corp. | 123,300 | 2,713 |
| | Entergy Corp. | 33,600 | 2,258 |
| | Integrys Energy Group Inc. | 38,277 | 2,028 |
| | Dominion Resources Inc. | 28,194 | 1,444 |
| * | NRG Energy Inc. | 47,200 | 740 |
| | AGL Resources Inc. | 18,391 | 721 |
| | NorthWestern Corp. | 7,261 | 257 |
| | Consolidated Edison Inc. | 2,207 | 129 |
| | Westar Energy Inc. | 4,500 | 126 |
| | MGE Energy Inc. | 1,800 | 80 |
| | California Water Service | | |
| | Group | 4,300 | 78 |
| | IDACORP Inc. | 900 | 37 |
| * | Calpine Corp. | 1,800 | 31 |
| | Atmos Energy Corp. | 700 | 22 |
| | Sempra Energy | 128 | 8 |
| | Xcel Energy Inc. | 211 | 5 |
| | NV Energy Inc. | 200 | 3 |
| | | | 107,506 |
| Total Common Stocks | | |
| (Cost $3,549,295) | | 4,234,603 |
| | | |
| | | | Market |
| | | | Value |
| | | Shares | ($000) |
| Temporary Cash Investments (3.0%)1 | |
| Money Market Fund (2.7%) | | |
| 2,3 | Vanguard Market | | |
| | Liquidity Fund, | | |
| | 0.123% | 117,330,442 | 117,330 |
| |
| | | Face | |
| | | Amount | |
| | | ($000) | |
| U.S. Government and Agency Obligations (0.3%) |
| 4 | Federal Home Loan Bank | |
| | Discount Notes, | | |
| | 0.130%, 7/20/12 | 100 | 100 |
| 5,6 | Freddie Mac | | |
| | Discount Notes, | | |
| | 0.050%, 4/4/12 | 8,000 | 8,000 |
| 5,6 | Freddie Mac | | |
| | Discount Notes, | | |
| | 0.050%, 4/24/12 | 3,000 | 3,000 |
| 5,6 | Freddie Mac | | |
| | Discount Notes, | | |
| | 0.135%, 8/6/12 | 100 | 100 |
| 6 | United States Treasury | | |
| | Note/Bond, | | |
| | 1.000%, 4/30/12 | 100 | 100 |
| | | | 11,300 |
| Total Temporary Cash Investments | |
| (Cost $128,630) | | 128,630 |
| Total Investments (100.5%) | | |
| (Cost $3,677,925) | | 4,363,233 |
| Other Assets and Liabilities (-0.5%) | |
| Other Assets | | 36,133 |
| Liabilities3 | | (58,468) |
| | | | (22,335) |
| Net Assets (100%) | | 4,340,898 |
21
Growth and Income Fund
| |
| At March 31, 2012, net assets consisted of: |
| | Amount |
| | ($000) |
| Paid-in Capital | 4,790,079 |
| Undistributed Net Investment Income | 6,929 |
| Accumulated Net Realized Losses | (1,143,068) |
| Unrealized Appreciation (Depreciation) | |
| Investment Securities | 685,308 |
| Futures Contracts | 1,650 |
| Net Assets | 4,340,898 |
| |
| Investor Shares—Net Assets | |
| Applicable to 95,498,227 outstanding | |
| $.001 par value shares of beneficial | |
| interest (unlimited authorization) | 2,862,335 |
| Net Asset Value Per Share— | |
| Investor Shares | $29.97 |
| |
| Admiral Shares—Net Assets | |
| Applicable to 30,208,162 outstanding | |
| $.001 par value shares of beneficial | |
| interest (unlimited authorization) | 1,478,563 |
| Net Asset Value Per Share— | |
| Admiral Shares | $48.95 |
See Note A in Notes to Financial Statements.
* Non-income-producing security.
^ Part of security position is on loan to broker-dealers. The total value of securities on loan is $5,182,000.
1 The fund invests a portion of its cash reserves in equity markets through the use of index futures contracts. After giving effect to futures investments, the fund’s effective common stock and temporary cash investment positions represent 99.8% and 0.7%, respectively, of net assets.
2 Affiliated money market fund available only to Vanguard funds and certain trusts and accounts managed by Vanguard. Rate shown is the 7-day yield.
3 Includes $5,779,000 of collateral received for securities on loan.
4 The issuer operates under a congressional charter; its securities are generally neither guaranteed by the U.S. Treasury nor backed by the full faith and credit of the U.S. government.
5 The issuer was placed under federal conservatorship in September 2008; since that time, its daily operations have been managed by the Federal Housing Finance Agency and it receives capital from the U.S. Treasury in exchange for senior preferred stock.
6 Securities with a value of $11,200,000 have been segregated as initial margin for open futures contracts.
REIT—Real Estate Investment Trust.
See accompanying Notes, which are an integral part of the Financial Statements.
22
Growth and Income Fund
| |
| Statement of Operations | |
| |
| | Six Months Ended |
| | March 31, 2012 |
| | ($000) |
| Investment Income | |
| Income | |
| Dividends1 | 46,261 |
| Interest2 | 101 |
| Security Lending | 232 |
| Total Income | 46,594 |
| Expenses | |
| Investment Advisory Fees—Note B | |
| Basic Fee | 2,168 |
| Performance Adjustment | 94 |
| The Vanguard Group—Note C | |
| Management and Administrative—Investor Shares | 3,069 |
| Management and Administrative—Admiral Shares | 797 |
| Marketing and Distribution—Investor Shares | 275 |
| Marketing and Distribution—Admiral Shares | 117 |
| Custodian Fees | 97 |
| Shareholders’ Reports—Investor Shares | 31 |
| Shareholders’ Reports—Admiral Shares | 2 |
| Trustees’ Fees and Expenses | 5 |
| Total Expenses | 6,655 |
| Expenses Paid Indirectly | (31) |
| Net Expenses | 6,624 |
| Net Investment Income | 39,970 |
| Realized Net Gain (Loss) | |
| Investment Securities Sold | 235,016 |
| Futures Contracts | 21,616 |
| Realized Net Gain (Loss) | 256,632 |
| Change in Unrealized Appreciation (Depreciation) | |
| Investment Securities | 645,817 |
| Futures Contracts | 14,375 |
| Change in Unrealized Appreciation (Depreciation) | 660,192 |
| Net Increase (Decrease) in Net Assets Resulting from Operations | 956,794 |
| 1 Dividends are net of foreign withholding taxes of $5,000. |
| 2 Interest income from an affiliated company of the fund was $97,000. |
See accompanying Notes, which are an integral part of the Financial Statements.
23
Growth and Income Fund
| | |
| Statement of Changes in Net Assets | | |
| |
| | Six Months Ended | Year Ended |
| | March 31, | September 30, |
| | 2012 | 2011 |
| | ($000) | ($000) |
| Increase (Decrease) in Net Assets | | |
| Operations | | |
| Net Investment Income | 39,970 | 79,488 |
| Realized Net Gain (Loss) | 256,632 | 362,030 |
| Change in Unrealized Appreciation (Depreciation) | 660,192 | (312,354) |
| Net Increase (Decrease) in Net Assets Resulting from Operations | 956,794 | 129,164 |
| Distributions | | |
| Net Investment Income | | |
| Investor Shares | (26,232) | (53,125) |
| Admiral Shares | (13,689) | (26,147) |
| Realized Capital Gain | | |
| Investor Shares | — | — |
| Admiral Shares | — | — |
| Total Distributions | (39,921) | (79,272) |
| Capital Share Transactions | | |
| Investor Shares | (304,008) | (500,958) |
| Admiral Shares | 48,979 | (89,097) |
| Net Increase (Decrease) from Capital Share Transactions | (255,029) | (590,055) |
| Total Increase (Decrease) | 661,844 | (540,163) |
| Net Assets | | |
| Beginning of Period | 3,679,054 | 4,219,217 |
| End of Period1 | 4,340,898 | 3,679,054 |
| 1 Net Assets—End of Period includes undistributed net investment income of $6,929,000 and $6,880,000. |
See accompanying Notes, which are an integral part of the Financial Statements.
24
Growth and Income Fund
Financial Highlights
| | | | | | |
| Investor Shares | | | | | | |
| | Six Months | | | | | |
| | Ended | | | | | |
| For a Share Outstanding | March 31, | | | Year Ended September 30, |
| Throughout Each Period | 2012 | 2011 | 2010 | 2009 | 2008 | 2007 |
| Net Asset Value, Beginning of Period | $23.86 | $23.98 | $22.34 | $25.84 | $38.62 | $33.79 |
| Investment Operations | | | | | | |
| Net Investment Income | .262 | .482 | .418 | .447 | .546 | .600 |
| Net Realized and Unrealized Gain (Loss) | | | | | | |
| on Investments | 6.107 | (.124) | 1.630 | (3.453) | (8.758) | 4.840 |
| Total from Investment Operations | 6.369 | .358 | 2.048 | (3.006) | (8.212) | 5.440 |
| Distributions | | | | | | |
| Dividends from Net Investment Income | (.259) | (.478) | (.408) | (.494) | (.560) | (.610) |
| Distributions from Realized Capital Gains | — | — | — | — | (4.008) | — |
| Total Distributions | (.259) | (.478) | (.408) | (.494) | (4.568) | (.610) |
| Net Asset Value, End of Period | $29.97 | $23.86 | $23.98 | $22.34 | $25.84 | $38.62 |
| |
| Total Return1 | 26.83% | 1.28% | 9.24% | -11.29% | -23.28% | 16.20% |
| |
| Ratios/Supplemental Data | | | | | | |
| Net Assets, End of Period (Millions) | $2,862 | $2,548 | $3,020 | $3,253 | $3,919 | $5,465 |
| Ratio of Total Expenses to | | | | | | |
| Average Net Assets2 | 0.36% | 0.32% | 0.32% | 0.35% | 0.31% | 0.32% |
| Ratio of Net Investment Income to | | | | | | |
| Average Net Assets | 1.93% | 1.78% | 1.74% | 2.28% | 1.69% | 1.61% |
| Portfolio Turnover Rate | 100% | 120% | 94% | 83% | 96% | 100% |
The expense ratio, net income ratio, and turnover rate for the current period have been annualized.
1 Total returns do not include account service fees that may have applied in the periods shown. Fund prospectuses provide information about any applicable account service fees.
2 Includes performance-based investment advisory fee increases (decreases) of 0.00%, (0.04%), (0.04%), (0.04%), (0.02%), and 0.00%.
See accompanying Notes, which are an integral part of the Financial Statements.
25
Growth and Income Fund
Financial Highlights
| | | | | | |
| Admiral Shares | | | | | | |
| | Six Months | | | | | |
| | Ended | | | | | |
| For a Share Outstanding | March 31, | | | Year Ended September 30, |
| Throughout Each Period | 2012 | 2011 | 2010 | 2009 | 2008 | 2007 |
| Net Asset Value, Beginning of Period | $38.97 | $39.15 | $36.48 | $42.20 | $63.08 | $55.20 |
| Investment Operations | | | | | | |
| Net Investment Income | .455 | .832 | .722 | .775 | .963 | 1.070 |
| Net Realized and Unrealized Gain (Loss) | | | | | | |
| on Investments | 9.975 | (.199) | 2.666 | (5.638) | (14.313) | 7.903 |
| Total from Investment Operations | 10.430 | .633 | 3.388 | (4.863) | (13.350) | 8.973 |
| Distributions | | | | | | |
| Dividends from Net Investment Income | (.450) | (.813) | (.718) | (.857) | (.985) | (1.093) |
| Distributions from Realized Capital Gains | — | — | — | — | (6.545) | — |
| Total Distributions | (.450) | (.813) | (.718) | (.857) | (7.530) | (1.093) |
| Net Asset Value, End of Period | $48.95 | $38.97 | $39.15 | $36.48 | $42.20 | $63.08 |
| |
| Total Return1 | 26.91% | 1.39% | 9.37% | -11.15% | -23.19% | 16.37% |
| |
| Ratios/Supplemental Data | | | | | | |
| Net Assets, End of Period (Millions) | $1,479 | $1,131 | $1,199 | $1,441 | $1,907 | $2,794 |
| Ratio of Total Expenses to | | | | | | |
| Average Net Assets2 | 0.25% | 0.21% | 0.21% | 0.21% | 0.16% | 0.18% |
| Ratio of Net Investment Income to | | | | | | |
| Average Net Assets | 2.04% | 1.89% | 1.85% | 2.42% | 1.84% | 1.75% |
| Portfolio Turnover Rate | 100% | 120% | 94% | 83% | 96% | 100% |
The expense ratio, net income ratio, and turnover rate for the current period have been annualized.
1 Total returns do not include account service fees that may have applied in the periods shown. Fund prospectuses provide information about any applicable account service fees.
2 Includes performance-based investment advisory fee increases (decreases) of 0.00%, (0.04%), (0.04%), (0.04%), (0.02%), and 0.00%.
See accompanying Notes, which are an integral part of the Financial Statements.
26
Growth and Income Fund
Notes to Financial Statements
Vanguard Growth and Income Fund is registered under the Investment Company Act of 1940 as an open-end investment company, or mutual fund. The fund offers two classes of shares: Investor Shares and Admiral Shares. Investor Shares are available to any investor who meets the fund’s minimum purchase requirements. Admiral Shares are designed for investors who meet certain administrative, service, and account-size criteria.
A. The following significant accounting policies conform to generally accepted accounting principles for U.S. mutual funds. The fund consistently follows such policies in preparing its financial statements.
1. Security Valuation: Securities are valued as of the close of trading on the New York Stock Exchange (generally 4 p.m., Eastern time) on the valuation date. Equity securities are valued at the latest quoted sales prices or official closing prices taken from the primary market in which each security trades; such securities not traded on the valuation date are valued at the mean of the latest quoted bid and asked prices. Securities for which market quotations are not readily available, or whose values have been materially affected by events occurring before the fund’s pricing time but after the close of the securities’ primary markets, are valued by methods deemed by the board of trustees to represent fair value. Investments in Vanguard Market Liquidity Fund are valued at that fund’s net asset value. Temporary cash investments acquired over 60 days to maturity are valued using the latest bid prices or using valuations based on a matrix system (which considers such factors as security prices, yields, maturities, and ratings), both as furnished by independent pricing services. Other temporary cash investments are valued at amortized cost, which approximates market value.
2. Futures Contracts: The fund uses index futures contracts to a limited extent, with the objective of maintaining full exposure to the stock market while maintaining liquidity. The fund may purchase or sell futures contracts to achieve a desired level of investment, whether to accommodate portfolio turnover or cash flows from capital share transactions. The primary risks associated with the use of futures contracts are imperfect correlation between changes in market values of stocks held by the fund and the prices of futures contracts, and the possibility of an illiquid market.
Futures contracts are valued at their quoted daily settlement prices. The aggregate principal amounts of the contracts are not recorded in the Statement of Net Assets. Fluctuations in the value of the contracts are recorded in the Statement of Net Assets as an asset (liability) and in the Statement of Operations as unrealized appreciation (depreciation) until the contracts are closed, when they are recorded as realized futures gains (losses).
3. Federal Income Taxes: The fund intends to continue to qualify as a regulated investment company and distribute all of its taxable income. Management has analyzed the fund’s tax positions taken for all open federal income tax years (September 30, 2008–2011), and for the period ended March 31, 2012, and has concluded that no provision for federal income tax is required in the fund’s financial statements.
4. Distributions: Distributions to shareholders are recorded on the ex-dividend date.
5. Security Lending: The fund may lend its securities to qualified institutional borrowers to earn additional income. Security loans are required to be secured at all times by collateral at least equal to the market value of securities loaned. The fund invests cash collateral received in Vanguard Market Liquidity Fund, and records a liability for the return of the collateral, during the period the securities are on loan. Security lending income represents fees charged to borrowers plus income earned on investing cash collateral, less expenses associated with the loan.
27
Growth and Income Fund
6. Other: Dividend income is recorded on the ex-dividend date. Interest income includes income distributions received from Vanguard Market Liquidity Fund and is accrued daily. Security transactions are accounted for on the date securities are bought or sold. Costs used to determine realized gains (losses) on the sale of investment securities are those of the specific securities sold.
Each class of shares has equal rights as to assets and earnings, except that each class separately bears certain class-specific expenses related to maintenance of shareholder accounts (included in Management and Administrative expenses) and shareholder reporting. Marketing and distribution expenses are allocated to each class of shares based on a method approved by the board of trustees. Income, other non-class-specific expenses, and gains and losses on investments are allocated to each class of shares based on its relative net assets.
B. D. E. Shaw Investment Management, L.L.C., and Los Angeles Capital Management and Equity Research, Inc., each provide investment advisory services to a portion of the fund for a fee calculated at an annual percentage rate of average net assets managed by the advisor. The basic fees for D. E. Shaw Investment Management, L.L.C., are subject to quarterly adjustments based on performance since September 30, 2011, relative to the S&P 500 Index. In accordance with the advisory contract entered into with Los Angeles Capital Management and Equity Research, Inc., beginning October 1, 2012, the investment advisory fee will be subject to quarterly adjustments based on performance since September 30, 2011, relative to the S&P 500 Index.
The Vanguard Group provides investment advisory services to a portion of the fund on an at-cost basis; the fund paid Vanguard advisory fees of $166,000 for the six months ended March 31, 2012.
For the six months ended March 31, 2012, the aggregate investment advisory fee represented an effective annual basic rate of 0.11% of the fund’s average net assets, before an increase of $94,000 (0.00%) based on performance.
C. The Vanguard Group furnishes at cost corporate management, administrative, marketing, and distribution services. The costs of such services are allocated to the fund under methods approved by the board of trustees. The fund has committed to provide up to 0.40% of its net assets in capital contributions to Vanguard. At March 31, 2012, the fund had contributed capital of $627,000 to Vanguard (included in Other Assets), representing 0.01% of the fund’s net assets and 0.25% of Vanguard’s capitalization. The fund’s trustees and officers are also directors and officers of Vanguard.
D. The fund has asked its investment advisors to direct certain security trades, subject to obtaining the best price and execution, to brokers who have agreed to rebate to the fund part of the commissions generated. Such rebates are used solely to reduce the fund’s management and administrative expenses. For the six months ended March 31, 2012, these arrangements reduced the fund’s expenses by $31,000 (an annual rate of 0.00% of average net assets).
E. Various inputs may be used to determine the value of the fund’s investments. These inputs are summarized in three broad levels for financial statement purposes. The inputs or methodologies used to value securities are not necessarily an indication of the risk associated with investing in those securities.
Level 1—Quoted prices in active markets for identical securities.
Level 2—Other significant observable inputs (including quoted prices for similar securities, interest rates, prepayment speeds, credit risk, etc.).
Level 3—Significant unobservable inputs (including the fund’s own assumptions used to determine the fair value of investments).
28
Growth and Income Fund
The following table summarizes the market value of the fund’s investments as of March 31, 2012, based on the inputs used to value them:
| | | |
| | Level 1 | Level 2 | Level 3 |
| Investments | ($000) | ($000) | ($000) |
| Common Stocks | 4,234,603 | — | — |
| Temporary Cash Investments | 117,330 | 11,300 | — |
| Futures Contracts—Assets1 | 344 | — | — |
| Total | 4,352,277 | 11,300 | — |
| 1 Represents variation margin on the last day of the reporting period. | | | |
F. At March 31, 2012, the aggregate settlement value of open futures contracts and the related unrealized appreciation (depreciation) were:
| | | | |
| | | | | ($000) |
| | | | Aggregate | |
| | | Number of | Settlement | Unrealized |
| | | Long (Short) | Value | Appreciation |
| Futures Contracts | Expiration | Contracts | Long (Short) | (Depreciation) |
| E-mini S&P 500 Index | June 2012 | 114 | 7,998 | 26 |
| S&P 500 Index | June 2012 | 252 | 88,402 | 1,624 |
Unrealized appreciation (depreciation) on open futures contracts is required to be treated as realized gain (loss) for tax purposes.
G. Distributions are determined on a tax basis and may differ from net investment income and realized capital gains for financial reporting purposes. Differences may be permanent or temporary. Permanent differences are reclassified among capital accounts in the financial statements to reflect their tax character. Temporary differences arise when certain items of income, expense, gain, or loss are recognized in different periods for financial statement and tax purposes; these differences will reverse at some time in the future. Differences in classification may also result from the treatment of short-term gains as ordinary income for tax purposes.
The fund’s tax-basis capital gains and losses are determined only at the end of each fiscal year. For tax purposes, at September 30, 2011, the fund had available capital loss carryforwards totaling $1,406,097,000 to offset future net capital gains of $559,187,000 through September 30, 2017, and $846,910,000 through September 30, 2018. The fund will use these capital losses to offset net taxable capital gains, if any, realized during the year ending September 30, 2012; should the fund realize net capital losses for the year, the losses will be added to the loss carryforward balance above.
At March 31, 2012, the cost of investment securities for tax purposes was $3,677,927,000. Net unrealized appreciation of investment securities for tax purposes was $685,308,000, consisting of unrealized gains of $723,508,000 on securities that had risen in value since their purchase and $38,200,000 in unrealized losses on securities that had fallen in value since their purchase.
H. During the six months ended March 31, 2012, the fund purchased $1,944,895,000 of investment securities and sold $1,929,041,000 of investment securities, other than temporary cash investments.
29
Growth and Income Fund
I. Capital share transactions for each class of shares were:
| | | | |
| | Six Months Ended | | Year Ended |
| | March 31, 2012 | September 30, 2011 |
| | Amount | Shares | Amount | Shares |
| | ($000) | (000) | ($000) | (000) |
| Investor Shares | | | | |
| Issued | 97,828 | 3,559 | 212,372 | 7,984 |
| Issued in Lieu of Cash Distributions | 25,521 | 958 | 51,795 | 1,927 |
| Redeemed | (427,357) | (15,791) | (765,125) | (29,070) |
| Net Increase (Decrease)—Investor Shares | (304,008) | (11,274) | (500,958) | (19,159) |
| Admiral Shares | | | | |
| Issued | 154,701 | 3,538 | 352,128 | 8,358 |
| Issued in Lieu of Cash Distributions | 12,635 | 291 | 24,071 | 549 |
| Redeemed | (118,357) | (2,649) | (465,296) | (10,508) |
| Net Increase (Decrease)—Admiral Shares | 48,979 | 1,180 | (89,097) | (1,601) |
J. In preparing the financial statements as of March 31, 2012, management considered the impact of subsequent events for potential recognition or disclosure in these financial statements.
30
About Your Fund’s Expenses
As a shareholder of the fund, you incur ongoing costs, which include costs for portfolio management, administrative services, and shareholder reports (like this one), among others. Operating expenses, which are deducted from a fund’s gross income, directly reduce the investment return of the fund.
A fund’s expenses are expressed as a percentage of its average net assets. This figure is known as the expense ratio. The following examples are intended to help you understand the ongoing costs (in dollars) of investing in your fund and to compare these costs with those of other mutual funds. The examples are based on an investment of $1,000 made at the beginning of the period shown and held for the entire period.
The accompanying table illustrates your fund’s costs in two ways:
• Based on actual fund return. This section helps you to estimate the actual expenses that you paid over the period. The ”Ending Account Value“ shown is derived from the fund‘s actual return, and the third column shows the dollar amount that would have been paid by an investor who started with $1,000 in the fund. You may use the information here, together with the amount you invested, to estimate the expenses that you paid over the period.
To do so, simply divide your account value by $1,000 (for example, an $8,600 account value divided by $1,000 = 8.6), then multiply the result by the number given for your fund under the heading ”Expenses Paid During Period.“
• Based on hypothetical 5% yearly return. This section is intended to help you compare your fund‘s costs with those of other mutual funds. It assumes that the fund had a yearly return of 5% before expenses, but that the expense ratio is unchanged. In this case—because the return used is not the fund’s actual return—the results do not apply to your investment. The example is useful in making comparisons because the Securities and Exchange Commission requires all mutual funds to calculate expenses based on a 5% return. You can assess your fund’s costs by comparing this hypothetical example with the hypothetical examples that appear in shareholder reports of other funds.
Note that the expenses shown in the table are meant to highlight and help you compare ongoing costs only and do not reflect transaction costs incurred by the fund for buying and selling securities. Further, the expenses do not include any purchase, redemption, or account service fees described in the fund prospectus. If such fees were applied to your account, your costs would be higher. Your fund does not carry a “sales load.”
The calculations assume no shares were bought or sold during the period. Your actual costs may have been higher or lower, depending on the amount of your investment and the timing of any purchases or redemptions.
You can find more information about the fund’s expenses, including annual expense ratios, in the Financial Statements section of this report. For additional information on operating expenses and other shareholder costs, please refer to your fund’s current prospectus.
31
| | | |
| Six Months Ended March 31, 2012 | | | |
| | Beginning | Ending | Expenses |
| | Account Value | Account Value | Paid During |
| Growth and Income Fund | 9/30/2011 | 3/31/2012 | Period |
| Based on Actual Fund Return | | | |
| Investor Shares | $1,000.00 | $1,268.29 | $2.04 |
| Admiral Shares | 1,000.00 | 1,269.09 | 1.42 |
| Based on Hypothetical 5% Yearly Return | | | |
| Investor Shares | $1,000.00 | $1,023.20 | $1.82 |
| Admiral Shares | 1,000.00 | 1,023.75 | 1.26 |
The calculations are based on expenses incurred in the most recent six-month period. The fund’s annualized six-month expense ratios for that period are 0.36% for Investor Shares and 0.25% for Admiral Shares. The dollar amounts shown as “Expenses Paid” are equal to the annualized expense ratio multiplied by the average account value over the period, multiplied by the number of days in the most recent six-month period, then divided by the number of days in the most recent 12-month period.
32
Glossary
30-Day SEC Yield. A fund’s 30-day SEC yield is derived using a formula specified by the U.S. Securities and Exchange Commission. Under the formula, data related to the fund’s security holdings in the previous 30 days are used to calculate the fund’s hypothetical net income for that period, which is then annualized and divided by the fund’s estimated average net assets over the calculation period. For the purposes of this calculation, a security’s income is based on its current market yield to maturity (for bonds), its actual income (for asset-backed securities), or its projected dividend yield (for stocks). Because the SEC yield represents hypothetical annualized income, it will differ—at times significantly—from the fund’s actual experience. As a result, the fund’s income distributions may be higher or lower than implied by the SEC yield.
Beta. A measure of the magnitude of a fund’s past share-price fluctuations in relation to the ups and downs of a given market index. The index is assigned a beta of 1.00. Compared with a given index, a fund with a beta of 1.20 typically would have seen its share price rise or fall by 12% when the index rose or fell by 10%. For this report, beta is based on returns over the past 36 months for both the fund and the index. Note that a fund’s beta should be reviewed in conjunction with its R-squared (see definition). The lower the R-squared, the less correlation there is between the fund and the index, and the less reliable beta is as an indicator of volatility.
Dividend Yield. Dividend income earned by stocks, expressed as a percentage of the aggregate market value (or of net asset value, for a fund). The yield is determined by dividing the amount of the annual dividends by the aggregate value (or net asset value) at the end of the period. For a fund, the dividend yield is based solely on stock holdings and does not include any income produced by other investments.
Earnings Growth Rate. The average annual rate of growth in earnings over the past five years for the stocks now in a fund.
Equity Exposure. A measure that reflects a fund’s investments in stocks and stock futures. Any holdings in short-term reserves are excluded.
Expense Ratio. A fund’s total annual operating expenses expressed as a percentage of the fund’s average net assets. The expense ratio includes management and administrative expenses, but does not include the transaction costs of buying and selling portfolio securities.
Foreign Holdings. The percentage of a fund represented by securities or depositary receipts of companies based outside the United States.
Inception Date. The date on which the assets of a fund (or one of its share classes) are first invested in accordance with the fund’s investment objective. For funds with a subscription period, the inception date is the day after that period ends. Investment performance is measured from the inception date.
Median Market Cap. An indicator of the size of companies in which a fund invests; the midpoint of market capitalization (market price x shares outstanding) of a fund’s stocks, weighted by the proportion of the fund’s assets invested in each stock. Stocks representing half of the fund’s assets have market capitalizations above the median, and the rest are below it.
Price/Book Ratio. The share price of a stock divided by its net worth, or book value, per share. For a fund, the weighted average price/book ratio of the stocks it holds.
33
Price/Earnings Ratio. The ratio of a stock’s current price to its per-share earnings over the past year. For a fund, the weighted average P/E of the stocks it holds. P/E is an indicator of market expectations about corporate prospects; the higher the P/E, the greater the expectations for a company’s future growth.
R-Squared. A measure of how much of a fund’s past returns can be explained by the returns from the market in general, as measured by a given index. If a fund’s total returns were precisely synchronized with an index’s returns, its R-squared would be 1.00. If the fund’s returns bore no relationship to the index’s returns, its R-squared would be 0. For this report, R-squared is based on returns over the past 36 months for both the fund and the index.
Return on Equity. The annual average rate of return generated by a company during the past five years for each dollar of shareholder’s equity (net income divided by shareholder’s equity). For a fund, the weighted average return on equity for the companies whose stocks it holds.
Short-Term Reserves. The percentage of a fund invested in highly liquid, short-term securities that can be readily converted to cash.
Turnover Rate. An indication of the fund’s trading activity. Funds with high turnover rates incur higher transaction costs and may be more likely to distribute capital gains (which may be taxable to investors). The turnover rate excludes in-kind transactions, which have minimal impact on costs.
34
This page intentionally left blank.
The People Who Govern Your Fund
The trustees of your mutual fund are there to see that the fund is operated and managed in your best interests since, as a shareholder, you are a part owner of the fund. Your fund’s trustees also serve on the board of directors of The Vanguard Group, Inc., which is owned by the Vanguard funds and provides services to them on an at-cost basis.
A majority of Vanguard’s board members are independent, meaning that they have no affiliation with Vanguard or the funds they oversee, apart from the sizable personal investments they have made as private individuals. The independent board members have distinguished backgrounds in business, academia, and public service. Each of the trustees and executive officers oversees 179 Vanguard funds.
The following table provides information for each trustee and executive officer of the fund. More information about the trustees is in the Statement of Additional Information, which can be obtained, without charge, by contacting Vanguard at 800-662-7447, or online at vanguard.com.
| |
| InterestedTrustee1 | and Delphi Automotive LLP (automotive components); |
| Senior Advisor at New Mountain Capital; Trustee of |
| F. William McNabb III | The Conference Board. |
| Born 1957. Trustee Since July 2009. Chairman of the | |
| Board. Principal Occupation(s) During the Past Five | Amy Gutmann |
| Years: Chairman of the Board of The Vanguard Group, | Born 1949. Trustee Since June 2006. Principal |
| Inc., and of each of the investment companies served | Occupation(s) During the Past Five Years: President |
| by The Vanguard Group, since January 2010; Director | of the University of Pennsylvania; Christopher H. |
| of The Vanguard Group since 2008; Chief Executive | Browne Distinguished Professor of Political Science |
| Officer and President of The Vanguard Group and of | in the School of Arts and Sciences with secondary |
| each of the investment companies served by The | appointments at the Annenberg School for Commu- |
| Vanguard Group since 2008; Director of Vanguard | nication and the Graduate School of Education |
| Marketing Corporation; Managing Director of The | of the University of Pennsylvania; Director of |
| Vanguard Group (1995–2008). | Carnegie Corporation of New York, Schuylkill River |
| Development Corporation, and Greater Philadelphia |
| Chamber of Commerce; Trustee of the National |
| IndependentTrustees | Constitution Center; Chair of the Presidential |
| Commission for the Study of Bioethical Issues. |
| Emerson U. Fullwood | |
| Born 1948. Trustee Since January 2008. Principal | |
| Occupation(s) During the Past Five Years: Executive | JoAnn Heffernan Heisen |
| Chief Staff and Marketing Officer for North America | Born 1950. Trustee Since July 1998. Principal |
| and Corporate Vice President (retired 2008) of Xerox | Occupation(s) During the Past Five Years: Corporate |
| Corporation (document management products and | Vice President and Chief Global Diversity Officer |
| services); Executive in Residence and 2010 | (retired 2008) and Member of the Executive |
| Distinguished Minett Professor at the Rochester | Committee (1997–2008) of Johnson & Johnson |
| Institute of Technology; Director of SPX Corporation | (pharmaceuticals/medical devices/consumer |
| (multi-industry manufacturing), the United Way of | products); Director of Skytop Lodge Corporation |
| Rochester, Amerigroup Corporation (managed health | (hotels), the University Medical Center at Princeton, |
| care), the University of Rochester Medical Center, | the Robert Wood Johnson Foundation, and the Center |
| Monroe Community College Foundation, and North | for Talent Innovation; Member of the Advisory Board |
| Carolina A&T University. | of the Maxwell School of Citizenship and Public Affairs |
| | at Syracuse University. |
| |
| Rajiv L. Gupta | F. Joseph Loughrey |
| Born 1945. Trustee Since December 2001.2 | Born 1949. Trustee Since October 2009. Principal |
| Principal Occupation(s) During the Past Five Years: | Occupation(s) During the Past Five Years: President |
| Chairman and Chief Executive Officer (retired 2009) | and Chief Operating Officer (retired 2009) of Cummins |
| and President (2006–2008) of Rohm Haas Co. | Inc. (industrial machinery); Director of SKF AB |
| (chemicals); Director of Tyco International, Ltd. | (industrial machinery), Hillenbrand, Inc. (specialized |
| (diversified manufacturing and services), Hewlett- | consumer services), the Lumina Foundation for |
| Packard Co. (electronic computer manufacturing), | |
| | |
| Education, and Oxfam America; Chairman of the | Executive Officers | |
| Advisory Council for the College of Arts and Letters | | |
| and Member of the Advisory Board to the Kellogg | Glenn Booraem | |
| Institute for International Studies at the University | Born 1967. Controller Since July 2010. Principal |
| of Notre Dame. | Occupation(s) During the Past Five Years: Principal |
| | of The Vanguard Group, Inc.; Controller of each of |
| Mark Loughridge | the investment companies served by The Vanguard |
| Born 1953. Trustee Since March 2012. Principal | Group; Assistant Controller of each of the investment |
| Occupation(s) During the Past Five Years: Senior Vice | companies served by The Vanguard Group (2001–2010). |
| President and Chief Financial Officer at IBM (information | | |
| technology services); Fiduciary Member of IBM’s | Thomas J. Higgins | |
| Retirement Plan Committee. | Born 1957. Chief Financial Officer Since September |
| | 2008. Principal Occupation(s) During the Past Five |
| Scott C. Malpass | Years: Principal of The Vanguard Group, Inc.; Chief |
| Born 1962. Trustee Since March 2012. Principal | Financial Officer of each of the investment companies |
| Occupation(s) During the Past Five Years: Chief | served by The Vanguard Group; Treasurer of each of |
| Investment Officer and Vice President at the University | the investment companies served by The Vanguard |
| of Notre Dame; Assistant Professor of Finance at the | Group (1998–2008). | |
| Mendoza College of Business at Notre Dame; Member | | |
| of the Notre Dame 403(b) Investment Committee; | Kathryn J. Hyatt | |
| Director of TIFF Advisory Services, Inc. (investment | Born 1955. Treasurer Since November 2008. Principal |
| advisor); Member of the Investment Advisory | Occupation(s) During the Past Five Years: Principal of |
| Committees of the Financial Industry Regulatory | The Vanguard Group, Inc.; Treasurer of each of the |
| Authority (FINRA) and of Major League Baseball. | investment companies served by The Vanguard |
| | Group; Assistant Treasurer of each of the investment |
| André F. Perold | companies served by The Vanguard Group (1988–2008). |
| Born 1952. Trustee Since December 2004. Principal | | |
| Occupation(s) During the Past Five Years: George | Heidi Stam | |
| Gund Professor of Finance and Banking at the Harvard | Born 1956. Secretary Since July 2005. Principal |
| Business School (retired 2011); Chief Investment | Occupation(s) During the Past Five Years: Managing |
| Officer and Managing Partner of HighVista Strategies | Director of The Vanguard Group, Inc.; General Counsel |
| LLC (private investment firm); Director of Rand | of The Vanguard Group; Secretary of The Vanguard |
| Merchant Bank; Overseer of the Museum of Fine | Group and of each of the investment companies |
| Arts Boston. | served by The Vanguard Group; Director and Senior |
| | Vice President of Vanguard Marketing Corporation; |
| Alfred M. Rankin, Jr. | Principal of The Vanguard Group (1997–2006). |
| Born 1941. Trustee Since January 1993. Principal | | |
| Occupation(s) During the Past Five Years: Chairman, | Vanguard Senior ManagementTeam | |
| President, and Chief Executive Officer of NACCO | | |
| Industries, Inc. (forklift trucks/housewares/lignite); | Mortimer J. Buckley | Michael S. Miller |
| Director of Goodrich Corporation (industrial products/ | Kathleen C. Gubanich | James M. Norris |
| aircraft systems and services) and the National | Paul A. Heller | Glenn W. Reed |
| Association of Manufacturers; Chairman of the Board | Martha G. King | George U. Sauter |
| of the Federal Reserve Bank of Cleveland and of | Chris D. McIsaac | |
| University Hospitals of Cleveland; Advisory Chairman | | |
| of the Board of The Cleveland Museum of Art. | | |
| | Chairman Emeritus and Senior Advisor |
| | |
| Peter F. Volanakis | John J. Brennan | |
| Born 1955. Trustee Since July 2009. Principal | Chairman, 1996–2009 | |
| Occupation(s) During the Past Five Years: President | Chief Executive Officer and President, 1996–2008 | |
| and Chief Operating Officer (retired 2010) of Corning | | |
| Incorporated (communications equipment); Director | | |
| of SPX Corporation (multi-industry manufacturing); | Founder | |
| Overseer of the Amos Tuck School of Business | John C. Bogle | |
| Administration at Dartmouth College; Advisor to the | Chairman and Chief Executive Officer, 1974–1996 | |
| Norris Cotton Cancer Center. | | |
1 Mr. McNabb is considered an “interested person,” as defined in the Investment Company Act of 1940, because he is an officer of the Vanguard funds.
2 December 2002 for Vanguard Equity Income Fund, Vanguard Growth Equity Fund, the Vanguard Municipal Bond Funds, and the Vanguard State Tax-Exempt Funds.
|  |
| P.O. Box 2600 |
| Valley Forge, PA 19482-2600 |
Connect with Vanguard® > vanguard.com
| |
| Fund Information > 800-662-7447 | CFA® is a trademark owned by CFA Institute. |
| Direct Investor Account Services > 800-662-2739 | |
| Institutional Investor Services > 800-523-1036 | |
| Text Telephone for People | |
| With Hearing Impairment > 800-749-7273 | |
| |
| This material may be used in conjunction | |
| with the offering of shares of any Vanguard | |
| fund only if preceded or accompanied by | |
| the fund’s current prospectus. | |
| |
| All comparative mutual fund data are from Lipper Inc. or | |
| Morningstar, Inc., unless otherwise noted. | |
| |
| You can obtain a free copy of Vanguard’s proxy voting | |
| guidelines by visiting vanguard.com/proxyreporting or by | |
| calling Vanguard at 800-662-2739. The guidelines are | |
| also available from the SEC’s website, sec.gov. In | |
| addition, you may obtain a free report on how your fund | |
| voted the proxies for securities it owned during the 12 | |
| months ended June 30. To get the report, visit either | |
| vanguard.com/proxyreporting or sec.gov. | |
| |
| You can review and copy information about your fund at | |
| the SEC’s Public Reference Room in Washington, D.C. To | |
| find out more about this public service, call the SEC at | |
| 202-551-8090. Information about your fund is also | |
| available on the SEC’s website, and you can receive | |
| copies of this information, for a fee, by sending a | |
| request in either of two ways: via e-mail addressed to | |
| publicinfo@sec.gov or via regular mail addressed to the | |
| Public Reference Section, Securities and Exchange | |
| Commission, Washington, DC 20549-1520. | |
| | © 2012 The Vanguard Group, Inc. |
| | All rights reserved. |
| | Vanguard Marketing Corporation, Distributor. |
| |
| | Q932 052012 |
|
| Semiannual Report | March 31, 2012 |
| Vanguard Structured Equity Funds |
| Vanguard Structured Large-Cap Equity Fund |
| Vanguard Structured Broad Market Fund |
> For the six months ended March 31, 2012, Vanguard Structured Large-Cap Equity Fund returned about 27% and Vanguard Structured Broad Market Fund returned about 28%.
> The funds benefited from a rising stock market, which lifted returns in all sectors.
> Each fund outpaced its benchmark and its peers, as good stock selections outweighed subpar choices.
| |
| Contents | |
| Your Fund’s Total Returns. | 1 |
| Chairman’s Letter. | 2 |
| Advisor’s Report. | 6 |
| Structured Large-Cap Equity Fund. | 9 |
| Structured Broad Market Fund. | 21 |
| About Your Fund’s Expenses. | 35 |
| Trustees Approve Advisory Arrangement. | 37 |
| Glossary. | 38 |
Please note: The opinions expressed in this report are just that—informed opinions. They should not be considered promises or advice. Also, please keep in mind that the information and opinions cover the period through the date on the front of this report. Of course, the risks of investing in your fund are spelled out in the prospectus.
See the Glossary for definitions of investment terms used in this report.
About the cover: Vanguard was named for the HMS Vanguard, flagship of British Admiral Horatio Nelson. A ship—whose performance and safety depend on the work of all hands—has served as a fitting metaphor for the Vanguard crew as we strive to help clients reach their financial goals.
Your Fund’s Total Returns
| |
| Six Months Ended March 31, 2012 | |
| | Total |
| | Returns |
| Vanguard Structured Large-Cap Equity Fund | |
| Institutional Shares | 26.95% |
| Institutional Plus Shares | 26.98 |
| S&P 500 Index | 25.89 |
| Large-Cap Core Funds Average | 24.87 |
| Large-Cap Core Funds Average: Derived from data provided by Lipper Inc. | |
| Vanguard Structured Broad Market Fund | |
| Institutional Shares | 27.93% |
| Institutional Plus Shares | 28.02 |
| Russell 3000 Index | 26.55 |
| Multi-Cap Core Funds Average | 24.34 |
| Multi-Cap Core Funds Average: Derived from data provided by Lipper Inc. | |
Institutional Shares and Institutional Plus Shares are available to certain institutional investors who meet specific administrative, service, and account-size criteria.
| | | | |
| Your Fund’s Performance at a Glance | | | | |
| September 30, 2011, Through March 31, 2012 | | | | |
| | | | Distributions Per Share |
| | Starting | Ending | Income | Capital |
| | Share Price | Share Price | Dividends | Gains |
| Vanguard Structured Large-Cap Equity Fund | | | | |
| Institutional Shares | $21.49 | $26.70 | $0.497 | $0.000 |
| Institutional Plus Shares | 42.48 | 52.76 | 1.010 | 0.000 |
| Vanguard Structured Broad Market Fund | | | | |
| Institutional Shares | $21.03 | $26.38 | $0.447 | $0.000 |
| Institutional Plus Shares | 42.02 | 52.71 | 0.923 | 0.000 |
1

Chairman’s Letter
Dear Shareholder,
For the fiscal half-year ended March 31, 2012, the two Vanguard Structured Equity Funds delivered strong returns, snapping back sharply from the stock market slump of the previous six months.
Vanguard Structured Large-Cap Equity Fund returned about 27% and Vanguard Broad Market Fund returned about 28%. Both funds outpaced their benchmarks—the S&P 500 Index and Russell 3000 Index, respectively—and their peer groups.
Excellent stock selection was responsible for the funds’ success. The funds’ advisor uses a quantitative investment approach that is designed to make discriminating choices among stocks that are expected to pay off over the long term, while maintaining a risk profile similar to that of the benchmark index. In other words, the goal is “same risk, better returns.” To this end, the advisor relies on sophisticated computer models that evaluate stocks based on characteristics such as issuers’ balance sheet strength, earnings growth, and valuations. The Advisor’s Report that follows this letter describes this investment approach in more detail.
A surge of optimism fueled a powerful global rally in stocks
During the past six months, optimism displaced the apprehension that had restrained stock prices through summer 2011. The broad U.S. stock market returned more than 26%. Markets abroad
2
returned 15.37%. Investors’ good spirits reflected confidence that the slow, grinding economic expansion in the United States was at last gathering momentum, and that Europe’s debt crisis could be contained.
By the end of the period, however, that confidence had begun to evaporate in the face of ambiguous economic reports and renewed concern about Europe. The abrupt mood swing was consistent with the financial markets’ volatility since the 2008–2009 financial crisis.
Aside from munis, most bonds saw subdued six-month returns
The broad taxable bond market produced a modest six-month return of 1.43%. In general, interest rates remained more or less steady at very low levels. In some segments of the bond market, however, yields crept lower still, boosting bond prices. The broad municipal bond market, for example, produced a solid six-month return of 3.91% as investors bid up muni prices.
As it has since December 2008, the Federal Reserve Board kept its target for the shortest-term interest rates between 0% and 0.25%. That policy has kept a tight lid on the returns available from money market funds and savings accounts.
Stock selection helped funds make the most of a rising market
Both funds benefited from a rising stock market during the period, and they were further helped by the stock selections made by their advisor, Vanguard Equity
| | | |
| Market Barometer | | | |
| |
| | | | Total Returns |
| | | Periods Ended March 31, 2012 |
| | Six | One | Five Years |
| | Months | Year | (Annualized) |
| Stocks | | | |
| Russell 1000 Index (Large-caps) | 26.27% | 7.86% | 2.19% |
| Russell 2000 Index (Small-caps) | 29.83 | -0.18 | 2.13 |
| Dow Jones U.S. Total Stock Market Index | 26.60 | 7.16 | 2.47 |
| MSCI All Country World Index ex USA (International) | 15.37 | -7.18 | -1.56 |
| |
| Bonds | | | |
| Barclays Capital U.S. Aggregate Bond Index (Broad | | | |
| taxable market) | 1.43% | 7.71% | 6.25% |
| Barclays Capital Municipal Bond Index (Broad | | | |
| tax-exempt market) | 3.91 | 12.07 | 5.42 |
| Citigroup Three-Month U.S. Treasury Bill Index | 0.00 | 0.05 | 1.11 |
| |
| CPI | | | |
| Consumer Price Index | 1.10% | 2.65% | 2.24% |
3
Investment Group. In each case, stocks contributing the most to the funds’ performance compared with that of their benchmark indexes were concentrated in a handful of sectors; because of the different characteristics of each fund’s benchmark, these sectors varied by fund. (Vanguard Structured Large-Cap Equity Fund’s benchmark, the S&P 500 Index, covers 500 or so mostly large-cap stocks, as its name implies; Vanguard Structured Broad Market Fund looks to the Russell 3000 Index, which represents almost the entire market of large-, mid-, and small-cap stocks.)
The Structured Large-Cap Equity Fund outpaced its benchmark by about 1 percentage point and its peer group by about 2 percentage points. The advisor’s selections in the economically sensitive materials and industrial sectors stood out, as the economy continued its slow but steady growth. Machinery manufacturers and diversified chemical and metals and mining companies, for example, did well for the fund.
Energy stocks were also top performers, as oil prices (West Texas crude) began creeping up, once again, to more than $100 per barrel. And the fund got a boost from its consumer staples stocks, such as those of soft-drink and packaged foods companies.
Other stock choices, such as those in the large information technology sector, did well but contributed little when compared with their counterparts in the index. The fund’s health care stocks trailed those in the index.
Stock selections for the Structured Broad Market Fund helped the fund to outpace its benchmark by more than 1 percentage point and the average return of its peer funds by more than 3 percentage points. The materials sector contributed strong relative returns, as did the consumer sectors, particularly household, personal, and tobacco products companies in consumer staples and internet and catalog retailers in consumer discretionary.
Stock choices in the industrial, energy, and IT sectors also boosted returns. However, good selections in real estate investment trusts (REITs) and consumer finance firms couldn’t offset disappointing selections among capital-market companies and commercial banks. The fund’s holdings in both the tiny telecommunications sector and health care trailed their counterparts in the index.
Volatility is the norm, but there’s an antidote
As the Equity Investment Group notes in the report that follows, stock market volatility has substantially declined after the big swings we saw last year. What that bodes for the future is unclear: It has been shown time and again that nobody knows for certain which way the market is headed next, or when the next dip or climb will arrive.
4
Because the market is so unpredictable, we believe the best way to invest is to create a diversified and balanced portfolio that includes a mix of stocks, bonds, and cash reserves tailored to your unique goals, time horizon, and risk tolerance.
Such a portfolio can help you to keep your footing when the markets are turbulent, as we point out in Recent Stock Market Volatility: Extraordinary or “Ordinary”?
The research paper describes why bouts of high volatility have always been a feature of stock market investing, and how balanced, diversified portfolios have experienced lower levels of volatility than the headlines would suggest. You can find the paper at vanguard.com/research.
As always, thank you for entrusting your assets to Vanguard.
Sincerely,

F. William McNabb III
Chairman and Chief Executive Officer
April 19, 2012
5
Advisor’s Report
For the six months ended March 31, 2012, Vanguard’s structured equity funds posted solid results. Vanguard Structured Large-Cap Equity Fund returned 26.95% for Institutional Shares and 26.98% for Institutional Plus Shares, outperforming the return of its benchmark, the S&P 500 Index, by 1.06 and 1.09 percentage points, respectively. Vanguard Structured Broad Market Fund returned 27.93% for Institutional Shares and 28.02% for Institutional Plus Shares, outperforming its benchmark, the Russell 3000 Index, by 1.38 and 1.47 percentage points, respectively.
Financials, information technology, and consumer discretionary were the top performers in both benchmark indexes, although all ten sectors gained.
Since the equity market started its rally last fall, investor concerns about a possible double-dip recession in the United States, slowing growth in China, and Europe’s fiscal troubles appear to have eased. Against that backdrop, data showing improvements in the U.S. employment and housing pictures as well as continued strength in manufacturing activity seem to have whetted investor appetite for equities.
As a result of deep cost-cutting and fiscal conservatism during the recession, larger U.S. companies are emerging from the recession healthier than they have been in years: They are more productive, more profitable, and have more cash and less leverage. In addition, valuations of U.S.
stocks relative to bonds, measured by comparing earnings yields of stocks with coupon yields of 10-year U.S. Treasury bonds, indicate a level of attractiveness not seen since the early 1970s.
Market volatility declined by more than 60% during this period to below-average levels, but it will likely stay with us for some time. U.S. budget and deficit problems remain unresolved, world economic growth is uncertain, and the presidential election is still months away. (Volatility is measured by the CBOE Volatility Index, or VIX.)
Our approach to investing
Although overall portfolio performance is affected by the macroeconomic factors described above, our approach to investing focuses on specific stock fundamentals. Our model consists of these five components:
1. Valuation, which measures the price we pay for earnings and cash flows.
2. Growth, which considers the growth of earnings.
3. Management decisions, an assessment of the actions taken by company management that signal its informed opinions of a firm’s future.
4. Market sentiment, which captures how investors reflect their opinions of a company through their activity in the market.
5. Quality, which measures balance-sheet strength and the sustainability of earnings.
6
Our risk-control process then neutralizes our exposure to market-capitalization, volatility, and industry risks relative to our benchmark. In our view, such risk exposures are not justified by the rewards available. As a result of these risk controls, our 3-year tracking error was 1.29% for Structured Large-Cap and 1.79% for Structured Broad Market, both well within expectations.
For the fiscal half-year, our stock selection model performed well in the unpredictable market, with a majority of the components contributing positively to performance in various degrees for each of the structured portfolios. For both funds, the quality, management decisions, and growth indicators helped most. Our valuation component was neutral for Structured Broad Market and detracted from the performance of Structured Large-Cap. Our market sentiment indicator was not effective during this period for either fund, and in fact detracted from results.
The model was effective across most sectors. In Structured Large-Cap, our stock selection results during the period were positive in seven out of ten sectors. For Structured Broad Market, our stock selection results were positive in six out of ten sectors, neutral in two.
Structured Large-Cap Fund
Company selections within materials, energy, and industrials added most to our relative returns. In materials, CF Industries, Eastman Chemical, and PPG Industries were the largest contributors. In energy, Marathon Oil, Marathon Petroleum, and National Oilwell were the top relative performers. In industrials, Caterpillar, Eaton, and General Electric led.
Selection results were disappointing in technology, consumer discretionary, and health care; most of our under-performance in these sectors resulted from underweighted positions in Qualcomm, EMC, Comcast, Home Depot, and Amgen.
Structured Broad Market Fund
Company selections within consumer staples, consumer discretionary, and materials added most to our relative returns. In consumer staples, Philip Morris, Constellation Brands, and Herbalife were the largest contributors. In consumer discretionary, CBS, Macy’s, and Polaris Industries were the top relative performers. In materials, CF Industries, Eastman Chemical, and International Paper led.
7
Selection results were disappointing in financials and health care. Most of our underperformance in financials was due to underweighted positions in Bank of America, Citigroup, and Wells Fargo. Similarly, our underperformance in health care was largely attributable to underweighted positions in Merck, Amgen, and Medco Health Solutions.
The long-term outlook
While we cannot predict how the broader political or economic events will affect the markets, we are confident that the stock market can provide worthwhile returns for long-term investors. With that in mind, we believe that equity exposure will remain an important part of a diversified investment plan.
We thank you for your investment and look forward to the second half of the fiscal year.
James P. Stetler
Principal and Portfolio Manager
James D. Troyer, CFA
Principal and Portfolio Manager
Michael R. Roach, CFA
Portfolio Manager
Vanguard Equity Investment Group
April 23, 2012
8
Structured Large-Cap Equity Fund
Fund Profile
As of March 31, 2012
| | |
| Share-Class Characteristics | |
| | Institutional | Institutional |
| | Shares | Plus Shares |
| Ticker Symbol | VSLIX | VSLPX |
| Expense Ratio1 | 0.24% | 0.17% |
| 30-Day SEC Yield | 1.94% | 2.01% |
| | | |
| Portfolio Characteristics | | |
| | | | DJ |
| | | | U.S. Total |
| | | S&P 500 | Market |
| | Fund | Index | Index |
| Number of Stocks | 153 | 500 | 3,716 |
| Median Market Cap | $57.6B | $57.6B | $35.6B |
| Price/Earnings Ratio | 14.0x | 16.2x | 17.1x |
| Price/Book Ratio | 2.4x | 2.3x | 2.3x |
| Return on Equity | 19.9% | 19.6% | 18.1% |
| Earnings Growth Rate | 9.6% | 8.8% | 8.5% |
| Dividend Yield | 2.2% | 2.1% | 1.9% |
| Foreign Holdings | 0.0% | 0.0% | 0.0% |
| Turnover Rate | | | |
| (Annualized) | 60% | — | — |
| Short-Term Reserves | 0.0% | — | — |
| | | |
| Sector Diversification (% of equity exposure) |
| | | | DJ |
| | | | U.S. Total |
| | | S&P 500 | Market |
| | Fund | Index | Index |
| Consumer | | | |
| Discretionary | 10.6% | 10.9% | 12.0% |
| Consumer Staples | 9.9 | 10.8 | 9.4 |
| Energy | 11.8 | 11.2 | 10.5 |
| Financials | 15.2 | 14.9 | 15.9 |
| Health Care | 11.9 | 11.4 | 11.5 |
| Industrials | 10.0 | 10.6 | 11.0 |
| Information | | | |
| Technology | 20.9 | 20.5 | 19.8 |
| Materials | 3.7 | 3.5 | 4.0 |
| Telecommunication | | | |
| Services | 3.1 | 2.8 | 2.5 |
| Utilities | 2.9 | 3.4 | 3.4 |
| | |
| Volatility Measures | | |
| | | DJ |
| | | U.S. Total |
| | S&P 500 | Market |
| | Index | Index |
| R-Squared | 0.99 | 0.99 |
| Beta | 0.97 | 0.92 |
These measures show the degree and timing of the fund’s fluctuations compared with the indexes over 36 months.
| | |
| Ten Largest Holdings (% of total net assets) |
| Apple Inc. | Computer | |
| | Hardware | 4.9% |
| Exxon Mobil Corp. | Integrated Oil & | |
| | Gas | 3.7 |
| International Business | IT Consulting & | |
| Machines Corp. | Other Services | 2.5 |
| General Electric Co. | Industrial | |
| | Conglomerates | 2.2 |
| Chevron Corp. | Integrated Oil & | |
| | Gas | 2.1 |
| Microsoft Corp. | Systems Software | 2.0 |
| JPMorgan Chase & Co. | Diversified Financial | |
| | Services | 1.9 |
| Wells Fargo & Co. | Diversified Banks | 1.9 |
| Pfizer Inc. | Pharmaceuticals | 1.9 |
| AT&T Inc. | Integrated | |
| | Telecommunication | |
| | Services | 1.8 |
| Top Ten | | 24.9% |
The holdings listed exclude any temporary cash investments and equity index products.
Investment Focus
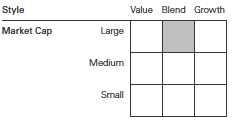
1 The expense ratios shown are from the prospectus dated January 26, 2012. For the six months ended March 31, 2012, the annualized expense ratios were 0.24% for Institutional Shares and 0.17% for Institutional Plus Shares.
9
Structured Large-Cap Equity Fund
Performance Summary
All of the returns in this report represent past performance, which is not a guarantee of future results that may be achieved by the fund. (Current performance may be lower or higher than the performance data cited. For performance data current to the most recent month-end, visit our website at vanguard.com/performance.) Note, too, that both investment returns and principal value can fluctuate widely, so an investor’s shares, when sold, could be worth more or less than their original cost. The returns shown do not reflect taxes that a shareholder would pay on fund distributions or on the sale of fund shares.
Fiscal-Year Total Returns (%): May 16, 2006, Through March 31, 2012
| | | | |
| Average Annual Total Returns: Periods Ended March 31, 2012 | | | |
| | Inception | One | Five | Since |
| | Date | Year | Years | Inception |
| Institutional Shares | 5/16/2006 | 11.12% | 1.65% | 3.43% |
| Institutional Plus Shares | 5/15/2006 | 11.17 | 1.73 | 3.48 |
See Financial Highlights for dividend and capital gains information.
10
Strutured Large-Cap Equity Fund
Financial Statements (unaudited)
Statement of Net Assets
As of March 31, 2012
The fund reports a complete list of its holdings in regulatory filings four times in each fiscal year, at the quarter-ends. For the second and fourth fiscal quarters, the lists appear in the fund’s semiannual and annual reports to shareholders. For the first and third fiscal quarters, the fund files the lists with the Securities and Exchange Commission on Form N-Q. Shareholders can look up the fund’s Forms N-Q on the SEC’s website at sec.gov. Forms N-Q may also be reviewed and copied at the SEC’s Public Reference Room (see the back cover of this report for further information).
| | | |
| | | | Market |
| | | | Value |
| | | Shares | ($000) |
| Common Stocks (99.8%)1 | | |
| Consumer Discretionary (10.6%) | |
| * | priceline.com Inc. | 5,700 | 4,090 |
| | News Corp. Class A | 204,700 | 4,031 |
| * | DIRECTV Class A | 77,600 | 3,829 |
| | CBS Corp. Class B | 111,190 | 3,770 |
| | Time Warner Cable Inc. | 44,500 | 3,627 |
| | McDonald’s Corp. | 35,547 | 3,487 |
| | Macy’s Inc. | 83,400 | 3,313 |
| | Coach Inc. | 41,900 | 3,238 |
| | Limited Brands Inc. | 64,018 | 3,073 |
| * | AutoZone Inc. | 7,860 | 2,922 |
| | Wynn Resorts Ltd. | 21,650 | 2,704 |
| | Viacom Inc. Class B | 47,340 | 2,247 |
| * | Bed Bath & Beyond Inc. | 29,700 | 1,953 |
| | Home Depot Inc. | 30,575 | 1,538 |
| | Wyndham Worldwide Corp. | 27,900 | 1,298 |
| | Ross Stores Inc. | 19,800 | 1,150 |
| | VF Corp. | 7,650 | 1,117 |
| | Harley-Davidson Inc. | 17,000 | 834 |
| | Ford Motor Co. | 60,706 | 758 |
| | TJX Cos. Inc. | 18,000 | 715 |
| | Harman International | | |
| | Industries Inc. | 14,660 | 686 |
| | Ralph Lauren Corp. Class A | 3,700 | 645 |
| | Comcast Corp. | 10,525 | 311 |
| | Walt Disney Co. | 6,529 | 286 |
| * | Amazon.com Inc. | 900 | 182 |
| | Comcast Corp. Class A | 5,300 | 159 |
| | | | 51,963 |
| Consumer Staples (9.9%) | | |
| | Philip Morris International | | |
| | Inc. | 95,936 | 8,501 |
| | Procter & Gamble Co. | 104,694 | 7,036 |
| | Altria Group Inc. | 144,900 | 4,473 |
| | Coca-Cola Co. | 52,740 | 3,903 |
| | Lorillard Inc. | 24,600 | 3,185 |
| | Kroger Co. | 121,700 | 2,949 |
| | Whole Foods Market Inc. | 34,100 | 2,837 |
| | | |
| | | | Market |
| | | | Value |
| | | Shares | ($000) |
| | ConAgra Foods Inc. | 105,400 | 2,768 |
| * | Constellation Brands Inc. | | |
| | Class A | 114,500 | 2,701 |
| | Wal-Mart Stores Inc. | 37,346 | 2,286 |
| | Estee Lauder Cos. Inc. | | |
| | Class A | 28,100 | 1,741 |
| | Coca-Cola Enterprises Inc. | 60,300 | 1,725 |
| | PepsiCo Inc. | 22,492 | 1,492 |
| | Kraft Foods Inc. | 32,100 | 1,220 |
| | CVS Caremark Corp. | 19,100 | 856 |
| | Safeway Inc. | 21,100 | 426 |
| | Dr Pepper Snapple | | |
| | Group Inc. | 8,200 | 330 |
| | | | 48,429 |
| Energy (11.7%) | | |
| | Exxon Mobil Corp. | 209,439 | 18,165 |
| | Chevron Corp. | 97,556 | 10,462 |
| | ConocoPhillips | 82,159 | 6,245 |
| | Occidental Petroleum Corp. | 37,661 | 3,586 |
| | National Oilwell Varco Inc. | 41,300 | 3,282 |
| | Marathon Oil Corp. | 103,000 | 3,265 |
| | Marathon Petroleum Corp. | 62,300 | 2,701 |
| | Valero Energy Corp. | 101,000 | 2,603 |
| * | Tesoro Corp. | 87,500 | 2,349 |
| | Schlumberger Ltd. | 18,625 | 1,302 |
| | Halliburton Co. | 35,100 | 1,165 |
| | Chesapeake Energy Corp. | 45,950 | 1,065 |
| | Helmerich & Payne Inc. | 17,840 | 962 |
| | Apache Corp. | 2,300 | 231 |
| | | | 57,383 |
| Financials (15.2%) | | |
| | JPMorgan Chase & Co. | 206,179 | 9,480 |
| | Wells Fargo & Co. | 277,335 | 9,468 |
| | Citigroup Inc. | 140,525 | 5,136 |
| | US Bancorp | 160,224 | 5,076 |
| | American Express Co. | 84,000 | 4,860 |
| | MetLife Inc. | 102,500 | 3,828 |
| | Discover Financial Services | 102,250 | 3,409 |
| | ACE Ltd. | 45,300 | 3,316 |
11
Strutured Large-Cap Equity Fund
| | | |
| | | | Market |
| | | | Value |
| | | Shares | ($000) |
| | Chubb Corp. | 44,143 | 3,051 |
| | Simon Property Group Inc. | 19,900 | 2,899 |
| | Torchmark Corp. | 57,650 | 2,874 |
| | Moody’s Corp. | 67,100 | 2,825 |
| | Kimco Realty Corp. | 121,800 | 2,346 |
| | Assurant Inc. | 56,500 | 2,288 |
| * | NASDAQ OMX Group Inc. | 85,400 | 2,212 |
| * | Berkshire Hathaway Inc. | | |
| | Class B | 20,505 | 1,664 |
| | HCP Inc. | 41,800 | 1,649 |
| | PNC Financial Services | | |
| | Group Inc. | 22,600 | 1,458 |
| * | Berkshire Hathaway Inc. | | |
| | Class A | 11 | 1,341 |
| | Bank of America Corp. | 127,653 | 1,222 |
| | Invesco Ltd. | 41,700 | 1,112 |
| | Fifth Third Bancorp | 69,100 | 971 |
| | Ventas Inc. | 11,700 | 668 |
| | Prudential Financial Inc. | 8,100 | 513 |
| | Health Care REIT Inc. | 8,800 | 484 |
| | Capital One Financial Corp. | 1,800 | 100 |
| | | | 74,250 |
| Health Care (11.9%) | | |
| | Pfizer Inc. | 400,219 | 9,069 |
| | UnitedHealth Group Inc. | 87,154 | 5,137 |
| | Johnson & Johnson | 67,946 | 4,482 |
| | Bristol-Myers Squibb Co. | 132,300 | 4,465 |
| | Merck & Co. Inc. | 114,644 | 4,402 |
| | Eli Lilly & Co. | 94,687 | 3,813 |
| * | Biogen Idec Inc. | 28,000 | 3,527 |
| | Abbott Laboratories | 57,368 | 3,516 |
| | McKesson Corp. | 37,600 | 3,300 |
| | Aetna Inc. | 64,070 | 3,214 |
| | Agilent Technologies Inc. | 70,750 | 3,149 |
| | Humana Inc. | 33,020 | 3,054 |
| | AmerisourceBergen Corp. | | |
| | Class A | 67,798 | 2,690 |
| * | Watson Pharmaceuticals | | |
| | Inc. | 37,840 | 2,538 |
| | WellPoint Inc. | 21,300 | 1,572 |
| | | | 57,928 |
| Industrials (10.0%) | | |
| | General Electric Co. | 532,022 | 10,678 |
| | Caterpillar Inc. | 46,200 | 4,921 |
| | Union Pacific Corp. | 39,500 | 4,245 |
| | Tyco International Ltd. | 64,000 | 3,596 |
| | Lockheed Martin Corp. | 37,100 | 3,334 |
| | Cummins Inc. | 27,095 | 3,252 |
| | Raytheon Co. | 59,600 | 3,146 |
| | Northrop Grumman Corp. | 48,916 | 2,988 |
| | Eaton Corp. | 57,200 | 2,850 |
| | Norfolk Southern Corp. | 42,700 | 2,811 |
| | Parker Hannifin Corp. | 32,000 | 2,706 |
| | PACCAR Inc. | 28,700 | 1,344 |
| | | |
| | | | Market |
| | | | Value |
| | | Shares | ($000) |
| | General Dynamics Corp. | 10,400 | 763 |
| | FedEx Corp. | 8,000 | 736 |
| | United Technologies Corp. | 7,736 | 642 |
| | United Parcel Service Inc. | | |
| | Class B | 6,521 | 526 |
| | Cintas Corp. | 2,900 | 113 |
| | | | 48,651 |
| Information Technology (20.8%) | |
| * | Apple Inc. | 40,012 | 23,986 |
| | International Business | | |
| | Machines Corp. | 57,640 | 12,027 |
| | Microsoft Corp. | 301,041 | 9,709 |
| | Intel Corp. | 288,953 | 8,122 |
| | Cisco Systems Inc. | 280,515 | 5,933 |
| | Oracle Corp. | 150,388 | 4,385 |
| | Accenture plc Class A | 64,400 | 4,154 |
| * | Google Inc. Class A | 5,805 | 3,722 |
| | Mastercard Inc. Class A | 8,300 | 3,490 |
| * | Dell Inc. | 203,100 | 3,371 |
| | Broadcom Corp. Class A | 84,500 | 3,321 |
| | Motorola Solutions Inc. | 61,950 | 3,149 |
| | Intuit Inc. | 49,700 | 2,988 |
| * | Western Digital Corp. | 71,700 | 2,968 |
| | Jabil Circuit Inc. | 109,000 | 2,738 |
| | KLA-Tencor Corp. | 44,600 | 2,427 |
| * | Symantec Corp. | 128,700 | 2,407 |
| | QUALCOMM Inc. | 22,857 | 1,555 |
| | Visa Inc. Class A | 9,200 | 1,086 |
| * | Cognizant Technology | | |
| | Solutions Corp. Class A | 2,800 | 215 |
| * | Advanced Micro Devices | | |
| | Inc. | 10,600 | 85 |
| | | | 101,838 |
| Materials (3.7%) | | |
| | Monsanto Co. | 49,700 | 3,964 |
| | International Paper Co. | 91,700 | 3,219 |
| | PPG Industries Inc. | 31,900 | 3,056 |
| | CF Industries Holdings Inc. | 16,285 | 2,974 |
| | Eastman Chemical Co. | 48,400 | 2,502 |
| | Newmont Mining Corp. | 18,700 | 959 |
| | Nucor Corp. | 21,100 | 906 |
| | EI du Pont de Nemours | | |
| | & Co. | 12,548 | 664 |
| | | | 18,244 |
| Telecommunication Services (3.1%) | |
| | AT&T Inc. | 286,735 | 8,955 |
| | Verizon Communications | | |
| | Inc. | 160,596 | 6,140 |
| * | MetroPCS Communications | | |
| | Inc. | 14,900 | 134 |
| | | | 15,229 |
12
Strutured Large-Cap Equity Fund
| | | |
| | | | Market |
| | | | Value |
| | | Shares | ($000) |
| Utilities (2.9%) | | |
| | American Electric Power | | |
| | Co. Inc. | 77,100 | 2,975 |
| | DTE Energy Co. | 49,400 | 2,719 |
| | Ameren Corp. | 82,700 | 2,694 |
| | FirstEnergy Corp. | 56,900 | 2,594 |
| | CMS Energy Corp. | 103,838 | 2,284 |
| | Pinnacle West Capital Corp. | 16,700 | 800 |
| | | | 14,066 |
| Total Common Stocks | | |
| (Cost $376,831) | | 487,981 |
| Temporary Cash Investments (0.2%)1 | |
| Money Market Fund (0.2%) | | |
| 2 | Vanguard Market | | |
| | Liquidity Fund, | | |
| | 0.123% | 949,361 | 949 |
| |
| | | Face | |
| | | Amount | |
| | | ($000) | |
| U.S. Government and Agency Obligations (0.0%) |
| 3 | Fannie Mae Discount | | |
| | Notes, 0.040%, 4/24/12 | 100 | 100 |
| 3,4 | Freddie Mac Discount | | |
| | Notes, 0.050%, 4/24/12 | 100 | 100 |
| | | | 200 |
| Total Temporary Cash Investments | |
| (Cost $1,149) | | 1,149 |
| Total Investments (100.0%) | | |
| (Cost $377,980) | | 489,130 |
| Other Assets and Liabilities (0.0%) | |
| Other Assets | | 680 |
| Liabilities | | (917) |
| | | | (237) |
| Net Assets (100%) | | 488,893 |
| |
| At March 31, 2012, net assets consisted of: |
| | Amount |
| | ($000) |
| Paid-in Capital | 578,694 |
| Undistributed Net Investment Income | 1,773 |
| Accumulated Net Realized Losses | (202,729) |
| Unrealized Appreciation (Depreciation) | |
| Investment Securities | 111,150 |
| Futures Contracts | 5 |
| Net Assets | 488,893 |
| |
| Institutional Shares—Net Assets | |
| Applicable to 552,844 outstanding | |
| $.001 par value shares of beneficial | |
| interest (unlimited authorization) | 14,759 |
| Net Asset Value Per Share— | |
| Institutional Shares | $26.70 |
| |
| Institutional Plus Shares—Net Assets | |
| Applicable to 8,986,619 outstanding | |
| $.001 par value shares of beneficial | |
| interest (unlimited authorization) | 474,134 |
| Net Asset Value Per Share— | |
| Institutional Plus Shares | $52.76 |
See Note A in Notes to Financial Statements.
* Non-income-producing security.
1 The fund invests a portion of its cash reserves in equity markets through the use of index futures contracts. After giving effect to futures investments, the fund’s effective common stock and temporary cash investment positions represent 100.0% and 0.0%, respectively, of net assets.
2 Affiliated money market fund available only to Vanguard funds and certain trusts and accounts managed by Vanguard. Rate shown is the 7-day yield.
3 The issuer was placed under federal conservatorship in September 2008; since that time, its daily operations have been managed by the Federal Housing Finance Agency and it receives capital from the U.S. Treasury in exchange for senior preferred stock.
4 Securities with a value of $100,000 have been segregated as initial margin for open futures contracts.
REIT—Real Estate Investment Trust.
See accompanying Notes, which are an integral part of the Financial Statements.
13
Strutured Large-Cap Equity Fund
| |
| Statement of Operations | |
| |
| | Six Months Ended |
| | March 31, 2012 |
| | ($000) |
| Investment Income | |
| Income | |
| Dividends | 5,195 |
| Interest1 | 1 |
| Total Income | 5,196 |
| Expenses | |
| The Vanguard Group—Note B | |
| Investment Advisory Services | 161 |
| Management and Administrative—Institutional Shares | 9 |
| Management and Administrative—Institutional Plus Shares | 161 |
| Marketing and Distribution—Institutional Shares | 2 |
| Marketing and Distribution—Institutional Plus Shares | 44 |
| Custodian Fees | 5 |
| Total Expenses | 382 |
| Net Investment Income | 4,814 |
| Realized Net Gain (Loss) | |
| Investment Securities Sold | 11,093 |
| Futures Contracts | 151 |
| Realized Net Gain (Loss) | 11,244 |
| Change in Unrealized Appreciation (Depreciation) | |
| Investment Securities | 88,291 |
| Futures Contracts | 31 |
| Change in Unrealized Appreciation (Depreciation) | 88,322 |
| Net Increase (Decrease) in Net Assets Resulting from Operations | 104,380 |
| 1 Interest income from an affiliated company of the fund was $1,000. |
See accompanying Notes, which are an integral part of the Financial Statements.
14
Strutured Large-Cap Equity Fund
| | |
| Statement of Changes in Net Assets | | |
| |
| | Six Months Ended | Year Ended |
| | March 31, | September 30, |
| | 2012 | 2011 |
| | ($000) | ($000) |
| Increase (Decrease) in Net Assets | | |
| Operations | | |
| Net Investment Income | 4,814 | 9,663 |
| Realized Net Gain (Loss) | 11,244 | 61,992 |
| Change in Unrealized Appreciation (Depreciation) | 88,322 | (33,034) |
| Net Increase (Decrease) in Net Assets Resulting from Operations | 104,380 | 38,621 |
| Distributions | | |
| Net Investment Income | | |
| Institutional Shares | (271) | (183) |
| Institutional Plus Shares | (9,009) | (11,627) |
| Realized Capital Gain | | |
| Institutional Shares | — | — |
| Institutional Plus Shares | — | — |
| Total Distributions | (9,280) | (11,810) |
| Capital Share Transactions | | |
| Institutional Shares | 97 | (90,798) |
| Institutional Plus Shares | 2,999 | (210,058) |
| Net Increase (Decrease) from Capital Share Transactions | 3,096 | (300,856) |
| Total Increase (Decrease) | 98,196 | (274,045) |
| Net Assets | | |
| Beginning of Period | 390,697 | 664,742 |
| End of Period1 | 488,893 | 390,697 |
| 1 Net Assets—End of Period includes undistributed net investment income of $1,773,000 and $6,239,000. |
See accompanying Notes, which are an integral part of the Financial Statements.
15
Strutured Large-Cap Equity Fund
Financial Highlights
| | | | | | |
| Institutional Shares | | | | | | |
| | Six Months | | | | | |
| | Ended | | | | | |
| For a Share Outstanding | March 31, | | | Year Ended September 30, |
| Throughout Each Period | 2012 | 2011 | 2010 | 2009 | 2008 | 2007 |
| Net Asset Value, Beginning of Period | $21.49 | $20.97 | $19.47 | $22.56 | $29.98 | $26.03 |
| Investment Operations | | | | | | |
| Net Investment Income | .256 | .4281 | .366 | .546 | .492 | .4761 |
| Net Realized and Unrealized Gain (Loss) | | | | | | |
| on Investments | 5.451 | .458 | 1.505 | (2.993) | (7.091) | 3.657 |
| Total from Investment Operations | 5.707 | .886 | 1.871 | (2.447) | (6.599) | 4.133 |
| Distributions | | | | | | |
| Dividends from Net Investment Income | (.497) | (.366) | (.371) | (.643) | (.430) | (.172) |
| Distributions from Realized Capital Gains | — | — | — | — | (.391) | (.011) |
| Total Distributions | (.497) | (.366) | (.371) | (.643) | (.821) | (.183) |
| Net Asset Value, End of Period | $26.70 | $21.49 | $20.97 | $19.47 | $22.56 | $29.98 |
| |
| Total Return | 26.95% | 4.14% | 9.68% | -10.25% | -22.52% | 15.94% |
| |
| Ratios/Supplemental Data | | | | | | |
| Net Assets, End of Period (Millions) | $15 | $12 | $95 | $106 | $135 | $187 |
| Ratio of Total Expenses to | | | | | | |
| Average Net Assets | 0.24% | 0.24% | 0.24% | 0.25% | 0.20% | 0.25% |
| Ratio of Net Investment Income to | | | | | | |
| Average Net Assets | 2.10% | 1.95% | 1.86% | 2.33% | 1.91% | 1.69% |
| Portfolio Turnover Rate | 60% | 67% | 61% | 80%2 | 72% | 54%2 |
The expense ratio, net income ratio, and turnover rate for the current period have been annualized.
1 Calculated based on average shares outstanding.
2 Excludes the value of portfolio securities received or delivered as a result of in-kind purchases or redemptions of the fund’s capital shares.
See accompanying Notes, which are an integral part of the Financial Statements.
16
Strutured Large-Cap Equity Fund
Financial Highlights
| | | | | | |
| Institutional Plus Shares | | | | | | |
| | Six Months | | | | | |
| | Ended | | | | | |
| For a Share Outstanding | March 31, | | | Year Ended September 30, |
| Throughout Each Period | 2012 | 2011 | 2010 | 2009 | 2008 | 2007 |
| Net Asset Value, Beginning of Period | $42.48 | $41.98 | $38.97 | $45.15 | $60.02 | $52.07 |
| Investment Operations | | | | | | |
| Net Investment Income | .523 | .9101 | .768 | 1.116 | 1.025 | 1.0181 |
| Net Realized and Unrealized Gain (Loss) | | | | | | |
| on Investments | 10.767 | .906 | 3.014 | (5.980) | (14.193) | 7.317 |
| Total from Investment Operations | 11.290 | 1.816 | 3.782 | (4.864) | (13.168) | 8.335 |
| Distributions | | | | | | |
| Dividends from Net Investment Income | (1.010) | (1.316) | (.772) | (1.316) | (.920) | (.363) |
| Distributions from Realized Capital Gains | — | — | — | — | (.782) | (.022) |
| Total Distributions | (1.010) | (1.316) | (.772) | (1.316) | (1.702) | (.385) |
| Net Asset Value, End of Period | $52.76 | $42.48 | $41.98 | $38.97 | $45.15 | $60.02 |
| |
| Total Return | 26.98% | 4.18% | 9.78% | -10.16% | -22.46% | 16.07% |
| |
| Ratios/Supplemental Data | | | | | | |
| Net Assets, End of Period (Millions) | $474 | $379 | $570 | $467 | $677 | $819 |
| Ratio of Total Expenses to | | | | | | |
| Average Net Assets | 0.17% | 0.17% | 0.17% | 0.17% | 0.12% | 0.15% |
| Ratio of Net Investment Income to | | | | | | |
| Average Net Assets | 2.17% | 2.02% | 1.93% | 2.41% | 1.99% | 1.79% |
| Portfolio Turnover Rate | 60% | 67% | 61% | 80%2 | 72% | 54%2 |
The expense ratio, net income ratio, and turnover rate for the current period have been annualized.
1 Calculated based on average shares outstanding.
2 Excludes the value of portfolio securities received or delivered as a result of in-kind purchases or redemptions of the fund’s capital shares.
See accompanying Notes, which are an integral part of the Financial Statements.
17
Strutured Large-Cap Equity Fund
Notes to Financial Statements
Vanguard Structured Large-Cap Equity Fund is registered under the Investment Company Act of 1940 as an open-end investment company, or mutual fund. The fund offers two classes of shares: Institutional Shares and Institutional Plus Shares. Institutional Shares and Institutional Plus Shares are designed for investors who meet certain administrative, service, and account-size criteria.
A. The following significant accounting policies conform to generally accepted accounting principles for U.S. mutual funds. The fund consistently follows such policies in preparing its financial statements.
1. Security Valuation: Securities are valued as of the close of trading on the New York Stock Exchange (generally 4 p.m., Eastern time) on the valuation date. Equity securities are valued at the latest quoted sales prices or official closing prices taken from the primary market in which each security trades; such securities not traded on the valuation date are valued at the mean of the latest quoted bid and asked prices. Securities for which market quotations are not readily available, or whose values have been materially affected by events occurring before the fund’s pricing time but after the close of the securities’ primary markets, are valued by methods deemed by the board of trustees to represent fair value. Investments in Vanguard Market Liquidity Fund are valued at that fund’s net asset value. Temporary cash investments acquired over 60 days to maturity are valued using the latest bid prices or using valuations based on a matrix system (which considers such factors as security prices, yields, maturities, and ratings), both as furnished by independent pricing services. Other temporary cash investments are valued at amortized cost, which approximates market value.
2. Futures Contracts: The fund uses index futures contracts to a limited extent, with the objective of maintaining full exposure to the stock market while maintaining liquidity. The fund may purchase or sell futures contracts to achieve a desired level of investment, whether to accommodate portfolio turnover or cash flows from capital share transactions. The primary risks associated with the use of futures contracts are imperfect correlation between changes in market values of stocks held by the fund and the prices of futures contracts, and the possibility of an illiquid market.
Futures contracts are valued at their quoted daily settlement prices. The aggregate principal amounts of the contracts are not recorded in the Statement of Net Assets. Fluctuations in the value of the contracts are recorded in the Statement of Net Assets as an asset (liability) and in the Statement of Operations as unrealized appreciation (depreciation) until the contracts are closed, when they are recorded as realized futures gains (losses).
3. Federal Income Taxes: The fund intends to continue to qualify as a regulated investment company and distribute all of its taxable income. Management has analyzed the fund’s tax positions taken for all open federal income tax years (September 30, 2008–2011), and for the period ended March 31, 2012, and has concluded that no provision for federal income tax is required in the fund’s financial statements.
4. Distributions: Distributions to shareholders are recorded on the ex-dividend date.
5. Other: Dividend income is recorded on the ex-dividend date. Interest income includes income distributions received from Vanguard Market Liquidity Fund and is accrued daily. Security transactions are accounted for on the date securities are bought or sold. Costs used to determine realized gains (losses) on the sale of investment securities are those of the specific securities sold.
18
Strutured Large-Cap Equity Fund
Each class of shares has equal rights as to assets and earnings, except that each class separately bears certain class-specific expenses related to maintenance of shareholder accounts (included in Management and Administrative expenses) and shareholder reporting. Marketing and distribution expenses are allocated to each class of shares based on a method approved by the board of trustees. Income, other non-class-specific expenses, and gains and losses on investments are allocated to each class of shares based on its relative net assets.
B. The Vanguard Group furnishes at cost investment advisory, corporate management, administrative, marketing, and distribution services. The costs of such services are allocated to the fund under methods approved by the board of trustees. The fund has committed to provide up to 0.40% of its net assets in capital contributions to Vanguard. At March 31, 2012, the fund had contributed capital of $71,000 to Vanguard (included in Other Assets), representing 0.01% of the fund’s net assets and 0.03% of Vanguard’s capitalization. The fund’s trustees and officers are also directors and officers of Vanguard.
C. Various inputs may be used to determine the value of the fund’s investments. These inputs are summarized in three broad levels for financial statement purposes. The inputs or methodologies used to value securities are not necessarily an indication of the risk associated with investing in those securities.
Level 1—Quoted prices in active markets for identical securities.
Level 2—Other significant observable inputs (including quoted prices for similar securities, interest rates, prepayment speeds, credit risk, etc.).
Level 3—Significant unobservable inputs (including the fund’s own assumptions used to determine the fair value of investments).
The following table summarizes the market value of the fund’s investments as of March 31, 2012, based on the inputs used to value them:
| | | |
| | Level 1 | Level 2 | Level 3 |
| Investments | ($000) | ($000) | ($000) |
| Common Stocks | 487,981 | — | — |
| Temporary Cash Investments | 949 | 200 | — |
| Futures Contracts—Assets1 | 3 | — | — |
| Total | 488,933 | 200 | — |
| 1 Represents variation margin on the last day of the reporting period. | | | |
D. At March 31, 2012, the aggregate settlement value of open futures contracts and the related unrealized appreciation (depreciation) were:
| | | | |
| | | | | ($000) |
| | | | Aggregate | |
| | | Number of | Settlement | Unrealized |
| | | Long (Short) | Value | Appreciation |
| Futures Contracts | Expiration | Contracts | Long (Short) | (Depreciation) |
| E-mini S&P 500 Index | June 2012 | 13 | 912 | 5 |
Unrealized appreciation (depreciation) on open futures contracts is required to be treated as realized gain (loss) for tax purposes.
19
Strutured Large-Cap Equity Fund
E. Distributions are determined on a tax basis and may differ from net investment income and realized capital gains for financial reporting purposes. Differences may be permanent or temporary. Permanent differences are reclassified among capital accounts in the financial statements to reflect their tax character. Temporary differences arise when certain items of income, expense, gain, or loss are recognized in different periods for financial statement and tax purposes; these differences will reverse at some time in the future. Differences in classification may also result from the treatment of short-term gains as ordinary income for tax purposes.
The fund’s tax-basis capital gains and losses are determined only at the end of each fiscal year. For tax purposes, at September 30, 2011, the fund had available capital loss carryforwards totaling $213,911,000 to offset future net capital gains of $101,200,000 through September 30, 2017, and $112,711,000 through September 30, 2018. The fund will use these capital losses to offset net taxable capital gains, if any, realized during the year ending September 30, 2012; should the fund realize net capital losses for the year, the losses will be added to the loss carryforward balance above.
At March 31, 2012, the cost of investment securities for tax purposes was $377,980,000. Net unrealized appreciation of investment securities for tax purposes was $111,150,000, consisting of unrealized gains of $114,285,000 on securities that had risen in value since their purchase and $3,135,000 in unrealized losses on securities that had fallen in value since their purchase.
F. During the six months ended March 31, 2012, the fund purchased $132,225,000 of investment securities and sold $133,461,000 of investment securities, other than temporary cash investments.
G. Capital share transactions for each class of shares were:
| | | | |
| | Six Months Ended | | Year Ended |
| | March 31, 2012 | September 30, 2011 |
| | Amount | Shares | Amount | Shares |
| | ($000) | (000) | ($000) | (000) |
| Institutional Shares | | | | |
| Issued | 222 | 9 | 1,694 | 73 |
| Issued in Lieu of Cash Distributions | — | — | — | — |
| Redeemed | (125) | (5) | (92,492) | (4,062) |
| Net Increase (Decrease)—Institutional Shares | 97 | 4 | (90,798) | (3,989) |
| Institutional Plus Shares | | | | |
| Issued | — | — | — | — |
| Issued in Lieu of Cash Distributions | 2,999 | 66 | 3,795 | 85 |
| Redeemed | — | — | (213,853) | (4,734) |
| Net Increase (Decrease)—Institutional Plus Shares | 2,999 | 66 | (210,058) | (4,649) |
At March 31, 2012, two shareholders were each a record or beneficial owner of 33% or more of the fund’s net assets, with a combined ownership of 97%. If one or more of these shareholders were to redeem their total investment in the fund, the redemption might result in an increase in the fund’s expense ratio, cause the fund to incur higher transaction costs, or result in the realization of taxable capital gains.
H. In preparing the financial statements as of March 31, 2012, management considered the impact of subsequent events for potential recognition or disclosure in these financial statements.
20
Structured Broad Market Fund
Fund Profile
As of March 31, 2012
| | |
| Share-Class Characteristics | |
| | Institutional | Institutional |
| | Shares | Plus Shares |
| Ticker Symbol | VSBMX | VSBPX |
| Expense Ratio1 | 0.24% | 0.17% |
| 30-Day SEC Yield | 1.77% | 1.84% |
| | | |
| Portfolio Characteristics | | |
| | | | DJ |
| | | Russell | U.S. Total |
| | | 3000 | Market |
| | Fund | Index | Index |
| Number of Stocks | 195 | 2,918 | 3,716 |
| Median Market Cap | $26.0B | $36.0B | $35.6B |
| Price/Earnings Ratio | 13.8x | 17.1x | 17.1x |
| Price/Book Ratio | 2.5x | 2.3x | 2.3x |
| Return on Equity | 19.3% | 17.9% | 18.1% |
| Earnings Growth Rate | 11.3% | 8.5% | 8.5% |
| Dividend Yield | 2.0% | 1.9% | 1.9% |
| Foreign Holdings | 0.0% | 0.0% | 0.0% |
| Turnover Rate | | | |
| (Annualized) | 58% | — | — |
| Short-Term Reserves | 0.1% | — | — |
| | | |
| Sector Diversification (% of equity exposure) |
| | | | DJ |
| | | Russell | U.S. Total |
| | | 3000 | Market |
| | Fund | Index | Index |
| Consumer | | | |
| Discretionary | 12.8% | 12.0% | 12.0% |
| Consumer Staples | 8.8 | 9.3 | 9.4 |
| Energy | 11.0 | 10.5 | 10.5 |
| Financials | 15.3 | 15.9 | 15.9 |
| Health Care | 11.0 | 11.5 | 11.5 |
| Industrials | 10.8 | 11.3 | 11.0 |
| Information | | | |
| Technology | 20.1 | 19.7 | 19.8 |
| Materials | 4.4 | 4.0 | 4.0 |
| Telecommunication | | | |
| Services | 2.8 | 2.4 | 2.5 |
| Utilities | 3.0 | 3.4 | 3.4 |
| | |
| Volatility Measures | | |
| | | DJ |
| | | U.S. Total |
| | Russell 3000 | Market |
| | Index | Index |
| R-Squared | 0.99 | 0.99 |
| Beta | 0.99 | 0.99 |
These measures show the degree and timing of the fund’s fluctuations compared with the indexes over 36 months.
| | |
| Ten Largest Holdings (% of total net assets) |
| Apple Inc. | Computer | |
| | Hardware | 4.1% |
| Exxon Mobil Corp. | Integrated Oil & | |
| | Gas | 3.2 |
| International Business | IT Consulting & | |
| Machines Corp. | Other Services | 2.1 |
| Microsoft Corp. | Systems Software | 2.0 |
| Chevron Corp. | Integrated Oil & | |
| | Gas | 1.8 |
| JPMorgan Chase & Co. | Diversified Financial | |
| | Services | 1.7 |
| Pfizer Inc. | Pharmaceuticals | 1.6 |
| AT&T Inc. | Integrated | |
| | Telecommunication | |
| | Services | 1.6 |
| Philip Morris | | |
| International Inc. | Tobacco | 1.6 |
| General Electric Co. | Industrial | |
| | Conglomerates | 1.5 |
| Top Ten | | 21.2% |
The holdings listed exclude any temporary cash investments and equity index products.
Investment Focus
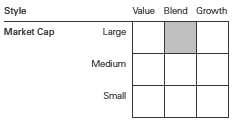
1 The expense ratios shown are from the prospectus dated January 26, 2012. For the six months ended March 31, 2012, the annualized expense ratios were 0.24% for Institutional Shares and 0.17% for Institutional Plus Shares.
21
Structured Broad Market Fund
Performance Summary
All of the returns in this report represent past performance, which is not a guarantee of future results that may be achieved by the fund. (Current performance may be lower or higher than the performance data cited. For performance data current to the most recent month-end, visit our website at vanguard.com/performance.) Note, too, that both investment returns and principal value can fluctuate widely, so an investor’s shares, when sold, could be worth more or less than their original cost. The returns shown do not reflect taxes that a shareholder would pay on fund distributions or on the sale of fund shares.
Fiscal-Year Total Returns (%): November 30, 2006, Through March 31, 2012
| | | | |
| Average Annual Total Returns: Periods Ended March 31, 2012 | | | |
| |
| | Inception | One | Five | Since |
| | Date | Year | Years | Inception |
| Institutional Shares | 11/30/2006 | 9.59% | 1.52% | 1.96% |
| Institutional Plus Shares | 5/3/2004 | 9.67 | 1.60 | 5.49 |
The fund commenced operations as a registered investment company on October 3, 2006. The fund’s performance includes the performance of a predecessor trust, Vanguard Fiduciary Trust Company Structured Broad Market Trust, from May 3, 2004, to October 3, 2006.
See Financial Highlights for dividend and capital gains information.
22
Structured Broad Market Fund
Financial Statements (unaudited)
Statement of Net Assets
As of March 31, 2012
The fund reports a complete list of its holdings in regulatory filings four times in each fiscal year, at the quarter-ends. For the second and fourth fiscal quarters, the lists appear in the fund’s semiannual and annual reports to shareholders. For the first and third fiscal quarters, the fund files the lists with the Securities and Exchange Commission on Form N-Q. Shareholders can look up the fund’s Forms N-Q on the SEC’s website at sec.gov. Forms N-Q may also be reviewed and copied at the SEC’s Public Reference Room (see the back cover of this report for further information).
| | | |
| | | | Market |
| | | | Value |
| | | Shares | ($000) |
| Common Stocks (99.7%)1 | | |
| Consumer Discretionary (12.8%) | |
| * | priceline.com Inc. | 4,000 | 2,870 |
| | CBS Corp. Class B | 80,800 | 2,740 |
| | Time Warner Cable Inc. | 31,962 | 2,605 |
| | Macy’s Inc. | 63,300 | 2,515 |
| | Las Vegas Sands Corp. | 43,000 | 2,475 |
| | Coach Inc. | 30,500 | 2,357 |
| | Limited Brands Inc. | 48,850 | 2,345 |
| | DISH Network Corp. | | |
| | Class A | 68,500 | 2,256 |
| | Viacom Inc. Class B | 47,395 | 2,249 |
| * | AutoZone Inc. | 6,000 | 2,231 |
| | TJX Cos. Inc. | 53,100 | 2,109 |
| | Dillard’s Inc. Class A | 33,300 | 2,099 |
| | News Corp. Class A | 101,400 | 1,997 |
| | Polaris Industries Inc. | 26,300 | 1,897 |
| * | Tempur-Pedic International | | |
| | Inc. | 21,400 | 1,807 |
| ^ | Weight Watchers | | |
| | International Inc. | 21,800 | 1,683 |
| | Brinker International Inc. | 60,000 | 1,653 |
| | Wynn Resorts Ltd. | 13,200 | 1,648 |
| * | Goodyear Tire & Rubber Co. | 128,100 | 1,437 |
| | Advance Auto Parts Inc. | 15,800 | 1,399 |
| * | DIRECTV Class A | 26,400 | 1,303 |
| | Ford Motor Co. | 96,462 | 1,205 |
| | Comcast Corp. Class A | 30,391 | 912 |
| | Foot Locker Inc. | 27,200 | 844 |
| | McDonald’s Corp. | 5,911 | 580 |
| * | Bed Bath & Beyond Inc. | 4,300 | 283 |
| | Ross Stores Inc. | 4,000 | 232 |
| | | | 47,731 |
| Consumer Staples (8.8%) | | |
| | Philip Morris International | | |
| | Inc. | 65,450 | 5,800 |
| | Procter & Gamble Co. | 37,951 | 2,551 |
| | Herbalife Ltd. | 33,500 | 2,306 |
| | Whole Foods Market Inc. | 27,000 | 2,246 |
| | | |
| | | | Market |
| | | | Value |
| | | Shares | ($000) |
| | Lorillard Inc. | 17,300 | 2,240 |
| | Kroger Co. | 89,000 | 2,156 |
| * | Constellation Brands Inc. | | |
| | Class A | 86,300 | 2,036 |
| | ConAgra Foods Inc. | 63,600 | 1,670 |
| | Dr Pepper Snapple Group | | |
| | Inc. | 41,400 | 1,665 |
| | Reynolds American Inc. | 38,600 | 1,600 |
| | Coca-Cola Co. | 20,490 | 1,516 |
| | Estee Lauder Cos. Inc. | | |
| | Class A | 24,000 | 1,487 |
| | Coca-Cola Enterprises Inc. | 40,600 | 1,161 |
| | B&G Foods Inc. Class A | 39,000 | 878 |
| * | Smithfield Foods Inc. | 38,600 | 850 |
| | Wal-Mart Stores Inc. | 13,765 | 842 |
| | Nu Skin Enterprises Inc. | | |
| | Class A | 12,700 | 735 |
| | PepsiCo Inc. | 8,800 | 584 |
| | CVS Caremark Corp. | 12,700 | 569 |
| | | | 32,892 |
| Energy (10.9%) | | |
| | Exxon Mobil Corp. | 137,020 | 11,884 |
| | Chevron Corp. | 63,865 | 6,849 |
| | ConocoPhillips | 56,740 | 4,313 |
| | National Oilwell Varco Inc. | 33,700 | 2,678 |
| | Marathon Oil Corp. | 76,100 | 2,412 |
| | Marathon Petroleum Corp. | 53,800 | 2,333 |
| | Occidental Petroleum Corp. | 24,040 | 2,289 |
| | Valero Energy Corp. | 84,500 | 2,178 |
| | HollyFrontier Corp. | 57,700 | 1,855 |
| * | CVR Energy Inc. | 53,900 | 1,442 |
| * | Tesoro Corp. | 29,300 | 786 |
| | Chesapeake Energy Corp. | 33,400 | 774 |
| | Schlumberger Ltd. | 7,800 | 545 |
| * | Helix Energy Solutions | | |
| | Group Inc. | 21,100 | 376 |
| | Pioneer Natural | | |
| | Resources Co. | 900 | 100 |
| | | | 40,814 |
23
Structured Broad Market Fund
| | | |
| | | | Market |
| | | | Value |
| | | Shares | ($000) |
| Financials (15.2%) | | |
| | JPMorgan Chase & Co. | 140,536 | 6,462 |
| | Wells Fargo & Co. | 129,570 | 4,423 |
| | US Bancorp | 113,950 | 3,610 |
| | American Express Co. | 58,720 | 3,398 |
| | Discover Financial Services | 78,000 | 2,600 |
| | Chubb Corp. | 33,970 | 2,348 |
| | Aflac Inc. | 49,040 | 2,255 |
| | Fifth Third Bancorp | 160,000 | 2,248 |
| | Torchmark Corp. | 43,200 | 2,153 |
| | Moody’s Corp. | 50,600 | 2,130 |
| | KeyCorp | 248,200 | 2,110 |
| | Assurant Inc. | 45,800 | 1,855 |
| | Simon Property Group Inc. | 12,300 | 1,792 |
| * | Berkshire Hathaway Inc. | | |
| | Class B | 17,500 | 1,420 |
| | Allied World Assurance | | |
| | Co. Holdings AG | 20,341 | 1,397 |
| | Reinsurance Group of | | |
| | America Inc. Class A | 22,800 | 1,356 |
| * | World Acceptance Corp. | 21,956 | 1,345 |
| | Public Storage | 8,900 | 1,230 |
| | Citigroup Inc. | 29,800 | 1,089 |
| | Taubman Centers Inc. | 14,300 | 1,043 |
| | CBL & Associates | | |
| | Properties Inc. | 51,500 | 974 |
| | Kimco Realty Corp. | 48,700 | 938 |
| | Digital Realty Trust Inc. | 12,400 | 917 |
| | Health Care REIT Inc. | 16,600 | 912 |
| * | Credit Acceptance Corp. | 8,800 | 889 |
| | Hospitality Properties Trust | 31,500 | 834 |
| | American Financial | | |
| | Group Inc. | 21,300 | 822 |
| | Nelnet Inc. Class A | 31,100 | 806 |
| | Lexington Realty Trust | 78,600 | 707 |
| | Commerce Bancshares Inc. | 14,910 | 604 |
| | Camden Property Trust | 9,000 | 592 |
| * | NASDAQ OMX Group Inc. | 19,300 | 500 |
| | Cash America | | |
| | International Inc. | 8,600 | 412 |
| | Bank of America Corp. | 19,000 | 182 |
| | HCP Inc. | 4,500 | 178 |
| * | Forest City Enterprises Inc. | | |
| | Class A | 7,600 | 119 |
| | National Retail Properties | | |
| | Inc. | 4,100 | 111 |
| | | | 56,761 |
| Health Care (11.0%) | | |
| | Pfizer Inc. | 270,264 | 6,124 |
| | Abbott Laboratories | 68,100 | 4,174 |
| | UnitedHealth Group Inc. | 61,475 | 3,623 |
| | Bristol-Myers Squibb Co. | 95,452 | 3,222 |
| | Eli Lilly & Co. | 69,920 | 2,816 |
| | Aetna Inc. | 51,700 | 2,593 |
| | McKesson Corp. | 29,000 | 2,545 |
| | | |
| | | | Market |
| | | | Value |
| | | Shares | ($000) |
| | Johnson & Johnson | 37,007 | 2,441 |
| | Agilent Technologies Inc. | 53,700 | 2,390 |
| | Humana Inc. | 24,350 | 2,252 |
| | AmerisourceBergen Corp. | | |
| | Class A | 52,300 | 2,075 |
| * | Charles River Laboratories | | |
| | International Inc. | 42,600 | 1,537 |
| * | Biogen Idec Inc. | 9,700 | 1,222 |
| | Cooper Cos. Inc. | 12,700 | 1,038 |
| | Merck & Co. Inc. | 22,183 | 852 |
| * | Watson Pharmaceuticals | | |
| | Inc. | 10,000 | 671 |
| | Cardinal Health Inc. | 10,000 | 431 |
| * | Mettler-Toledo | | |
| | International Inc. | 2,100 | 388 |
| * | WellCare Health Plans Inc. | 5,100 | 367 |
| * | Par Pharmaceutical | | |
| | Cos. Inc. | 2,800 | 108 |
| | | | 40,869 |
| Industrials (10.8%) | | |
| | General Electric Co. | 286,380 | 5,748 |
| | Union Pacific Corp. | 27,700 | 2,977 |
| | Cummins Inc. | 20,800 | 2,497 |
| | Lockheed Martin Corp. | 27,200 | 2,444 |
| | Eaton Corp. | 41,500 | 2,068 |
| | Parker Hannifin Corp. | 24,200 | 2,046 |
| | Northrop Grumman Corp. | 32,630 | 1,993 |
| | Caterpillar Inc. | 18,500 | 1,971 |
| | PACCAR Inc. | 41,500 | 1,944 |
| | Sauer-Danfoss Inc. | 38,000 | 1,786 |
| | Norfolk Southern Corp. | 26,400 | 1,738 |
| * | CNH Global NV | 42,300 | 1,679 |
| * | Delta Air Lines Inc. | 157,000 | 1,556 |
| * | Alaska Air Group Inc. | 34,800 | 1,247 |
| | United Technologies Corp. | 14,140 | 1,173 |
| * | United Rentals Inc. | 27,100 | 1,162 |
| * | AGCO Corp. | 21,000 | 991 |
| | Raytheon Co. | 17,300 | 913 |
| | Honeywell International Inc. | 14,524 | 887 |
| | Pitney Bowes Inc. | 41,000 | 721 |
| | FedEx Corp. | 6,200 | 570 |
| | L-3 Communications | | |
| | Holdings Inc. | 7,700 | 545 |
| | Cintas Corp. | 13,200 | 516 |
| | United Parcel Service Inc. | | |
| | Class B | 4,600 | 371 |
| | Towers Watson & Co. | | |
| | Class A | 5,000 | 330 |
| | Deluxe Corp. | 7,100 | 166 |
| * | Dollar Thrifty Automotive | | |
| | Group Inc. | 1,160 | 94 |
| | | | 40,133 |
24
Structured Broad Market Fund
| | | |
| | | | Market |
| | | | Value |
| | | Shares | ($000) |
| Information Technology (20.1%) | |
| * | Apple Inc. | 25,520 | 15,298 |
| | International Business | | |
| | Machines Corp. | 37,742 | 7,875 |
| | Microsoft Corp. | 234,097 | 7,550 |
| | Intel Corp. | 179,890 | 5,057 |
| | Cisco Systems Inc. | 157,850 | 3,339 |
| | Accenture plc Class A | 45,800 | 2,954 |
| * | Dell Inc. | 148,300 | 2,462 |
| * | VMware Inc. Class A | 21,200 | 2,382 |
| | Motorola Solutions Inc. | 46,700 | 2,374 |
| | Intuit Inc. | 37,900 | 2,279 |
| * | Western Digital Corp. | 54,800 | 2,268 |
| * | Alliance Data Systems | | |
| | Corp. | 17,000 | 2,141 |
| * | Anixter International Inc. | 27,400 | 1,987 |
| * | LSI Corp. | 226,700 | 1,968 |
| * | Google Inc. Class A | 3,020 | 1,937 |
| * | Cadence Design Systems | | |
| | Inc. | 158,300 | 1,874 |
| | Jabil Circuit Inc. | 70,800 | 1,778 |
| | KLA-Tencor Corp. | 30,100 | 1,638 |
| | Fair Isaac Corp. | 29,000 | 1,273 |
| | Broadcom Corp. Class A | 30,700 | 1,207 |
| | MKS Instruments Inc. | 36,300 | 1,072 |
| | Oracle Corp. | 28,048 | 818 |
| | Mastercard Inc. Class A | 1,600 | 673 |
| | QUALCOMM Inc. | 8,400 | 571 |
| * | Advanced Micro Devices | | |
| | Inc. | 66,500 | 533 |
| * | Autodesk Inc. | 12,000 | 508 |
| | OPNET | 12,900 | 374 |
| | Heartland Payment | | |
| | Systems Inc. | 12,800 | 369 |
| * | Motorola Mobility | | |
| | Holdings Inc. | 4,837 | 190 |
| | MAXIMUS Inc. | 3,400 | 138 |
| * | Novellus Systems Inc. | 1,600 | 80 |
| | | | 74,967 |
| Materials (4.4%) | | |
| | Monsanto Co. | 35,700 | 2,847 |
| | International Paper Co. | 68,100 | 2,390 |
| | CF Industries Holdings Inc. | 12,600 | 2,301 |
| | PPG Industries Inc. | 23,400 | 2,242 |
| | FMC Corp. | 19,400 | 2,054 |
| | Eastman Chemical Co. | 37,000 | 1,912 |
| | Southern Copper Corp. | 28,501 | 904 |
| | Domtar Corp. | 8,500 | 811 |
| | Celanese Corp. Class A | 13,700 | 633 |
| * | Rockwood Holdings Inc. | 7,500 | 391 |
| | | | 16,485 |
| | | |
| | | | Market |
| | | | Value |
| | | Shares | ($000) |
| Telecommunication Services (2.8%) | |
| | AT&T Inc. | 194,729 | 6,081 |
| | Verizon Communications | | |
| | Inc. | 111,057 | 4,246 |
| | | | 10,327 |
| Utilities (2.9%) | | |
| | American Electric Power | | |
| | Co. Inc. | 56,500 | 2,180 |
| | CMS Energy Corp. | 93,600 | 2,059 |
| | Ameren Corp. | 62,300 | 2,030 |
| | Cleco Corp. | 47,500 | 1,883 |
| | PNM Resources Inc. | 98,800 | 1,808 |
| | Consolidated Edison Inc. | 13,900 | 812 |
| | DTE Energy Co. | 3,900 | 215 |
| | | | 10,987 |
| Total Common Stocks | | |
| (Cost $291,319) | | 371,966 |
| Temporary Cash Investments (0.8%)1 | |
| Money Market Fund (0.7%) | | |
| 2,3 | Vanguard Market | | |
| | Liquidity Fund, | | |
| | 0.123% | 2,942,000 | 2,942 |
| |
| | | Face | |
| | | Amount | |
| | | ($000) | |
| U.S. Government and Agency Obligations (0.1%) |
| 4,5 | Federal Home Loan | | |
| | Bank Discount Notes, | | |
| | 0.030%, 4/9/12 | 100 | 100 |
| 5,6 | Freddie Mac Discount | | |
| | Notes, 0.040%, 4/3/12 | 100 | 100 |
| | | | 200 |
| Total Temporary Cash Investments | |
| (Cost $3,142) | | 3,142 |
| Total Investments (100.5%) | | |
| (Cost $294,461) | | 375,108 |
| Other Assets and Liabilities (-0.5%) | |
| Other Assets | | 558 |
| Liabilities3 | | (2,393) |
| | | | (1,835) |
| Net Assets (100%) | | 373,273 |
25
Structured Broad Market Fund
| |
| At March 31, 2012, net assets consisted of: | |
| | Amount |
| | ($000) |
| Paid-in Capital | 345,164 |
| Undistributed Net Investment Income | 1,324 |
| Accumulated Net Realized Losses | (53,870) |
| Unrealized Appreciation (Depreciation) | |
| Investment Securities | 80,647 |
| Futures Contracts | 8 |
| Net Assets | 373,273 |
| |
| Institutional Shares—Net Assets | |
| Applicable to 270,959 outstanding | |
| $.001 par value shares of beneficial | |
| interest (unlimited authorization) | 7,148 |
| Net Asset Value Per Share— | |
| Institutional Shares | $26.38 |
| |
| Institutional Plus Shares—Net Assets | |
| Applicable to 6,946,417 outstanding | |
| $.001 par value shares of beneficial | |
| interest (unlimited authorization) | 366,125 |
| Net Asset Value Per Share— | |
| Institutional Plus Shares | $52.71 |
See Note A in Notes to Financial Statements.
* Non-income-producing security.
^ Part of security position is on loan to broker-dealers. The total value of securities on loan is $1,598,000.
1 The fund invests a portion of its cash reserves in equity markets through the use of index futures contracts. After giving effect to futures investments, the fund’s effective common stock and temporary cash investment positions represent 100.0% and 0.5%, respectively, of net assets.
2 Affiliated money market fund available only to Vanguard funds and certain trusts and accounts managed by Vanguard. Rate shown is the 7-day yield.
3 Includes $1,635,000 of collateral received for securities on loan.
4 The issuer operates under a congressional charter; its securities are generally neither guaranteed by the U.S. Treasury nor backed by the full faith and credit of the U.S. government.
5 Securities with a value of $200,000 have been segregated as initial margin for open futures contracts.
6 The issuer was placed under federal conservatorship in September 2008; since that time, its daily operations have been managed by the Federal Housing Finance Agency and it receives capital from the U.S. Treasury in exchange for senior preferred stock.
REIT—Real Estate Investment Trust.
See accompanying Notes, which are an integral part of the Financial Statements.
26
Structured Broad Market Fund
| |
| Statement of Operations | |
| |
| | Six Months Ended |
| | March 31, 2012 |
| | ($000) |
| Investment Income | |
| Income | |
| Dividends | 3,920 |
| Interest1 | 1 |
| Total Income | 3,921 |
| Expenses | |
| The Vanguard Group—Note B | |
| Investment Advisory Services | 134 |
| Management and Administrative—Institutional Shares | 5 |
| Management and Administrative—Institutional Plus Shares | 118 |
| Marketing and Distribution—Institutional Shares | — |
| Marketing and Distribution—Institutional Plus Shares | 28 |
| Custodian Fees | 5 |
| Total Expenses | 290 |
| Net Investment Income | 3,631 |
| Realized Net Gain (Loss) | |
| Investment Securities Sold | 8,913 |
| Futures Contracts | 271 |
| Realized Net Gain (Loss) | 9,184 |
| Change in Unrealized Appreciation (Depreciation) | |
| Investment Securities | 69,128 |
| Futures Contracts | 75 |
| Change in Unrealized Appreciation (Depreciation) | 69,203 |
| Net Increase (Decrease) in Net Assets Resulting from Operations | 82,018 |
| 1 Interest income from an affiliated company of the fund was $1,000. |
See accompanying Notes, which are an integral part of the Financial Statements.
27
Structured Broad Market Fund
| | |
| Statement of Changes in Net Assets | | |
| |
| | Six Months Ended | Year Ended |
| | March 31, | September 30, |
| | 2012 | 2011 |
| | ($000) | ($000) |
| Increase (Decrease) in Net Assets | | |
| Operations | | |
| Net Investment Income | 3,631 | 5,614 |
| Realized Net Gain (Loss) | 9,184 | 29,319 |
| Change in Unrealized Appreciation (Depreciation) | 69,203 | (24,482) |
| Net Increase (Decrease) in Net Assets Resulting from Operations | 82,018 | 10,451 |
| Distributions | | |
| Net Investment Income | | |
| Institutional Shares | (119) | (94) |
| Institutional Plus Shares | (6,371) | (5,546) |
| Realized Capital Gain | | |
| Institutional Shares | — | — |
| Institutional Plus Shares | — | — |
| Total Distributions | (6,490) | (5,640) |
| Capital Share Transactions | | |
| Institutional Shares | 119 | 843 |
| Institutional Plus Shares | 1,981 | (18,297) |
| Net Increase (Decrease) from Capital Share Transactions | 2,100 | (17,454) |
| Total Increase (Decrease) | 77,628 | (12,643) |
| Net Assets | | |
| Beginning of Period | 295,645 | 308,288 |
| End of Period1 | 373,273 | 295,645 |
| 1 Net Assets—End of Period includes undistributed net investment income of $1,324,000 and $4,183,000. |
See accompanying Notes, which are an integral part of the Financial Statements.
28
Structured Broad Market Fund
Financial Highlights
| | | | | | |
| Institutional Shares | | | | | | |
| | Six Months | | | | | Nov. 30, |
| | Ended | | | | | 20061 to |
| | | | Year Ended September 30, | |
| For a Share Outstanding | March 31, | | | | | Sept. 30, |
| Throughout Each Period | 2012 | 2011 | 2010 | 2009 | 2008 | 2007 |
| Net Asset Value, Beginning of Period | $21.03 | $20.70 | $18.99 | $21.53 | $28.67 | $26.59 |
| Investment Operations | | | | | | |
| Net Investment Income | .249 | .3852 | .376 | .3522 | .402 | .3612 |
| Net Realized and Unrealized Gain (Loss) | | | | | | |
| on Investments | 5.548 | .338 | 1.672 | (2.500) | (6.833) | 1.930 |
| Total from Investment Operations | 5.797 | .723 | 2.048 | (2.148) | (6.431) | 2.291 |
| Distributions | | | | | | |
| Dividends from Net Investment Income | (.447) | (.393) | (.338) | (.392) | (.280) | (.116) |
| Distributions from Realized Capital Gains | — | — | — | — | (.429) | (.095) |
| Total Distributions | (.447) | (.393) | (.338) | (.392) | (.709) | (.211) |
| Net Asset Value, End of Period | $26.38 | $21.03 | $20.70 | $18.99 | $21.53 | $28.67 |
| |
| Total Return | 27.93% | 3.37% | 10.88% | -9.67% | -22.95% | 8.68% |
| |
| Ratios/Supplemental Data | | | | | | |
| Net Assets, End of Period (Millions) | $7 | $6 | $5 | $4 | $4 | $14 |
| Ratio of Total Expenses to | | | | | | |
| Average Net Assets | 0.24% | 0.24% | 0.24% | 0.25% | 0.20% | 0.25%3 |
| Ratio of Net Investment Income to | | | | | | |
| Average Net Assets | 2.08% | 1.64% | 1.91% | 2.15% | 1.72% | 1.55%3 |
| Portfolio Turnover Rate | 58% | 56% | 52% | 62% | 70% | 66% |
The expense ratio, net income ratio, and turnover rate for the current period have been annualized.
1 Inception.
2 Calculated based on average shares outstanding.
3 Annualized.
See accompanying Notes, which are an integral part of the Financial Statements.
29
Structured Broad Market Fund
Financial Highlights
| | | | | | |
| Institutional Plus Shares | | | | | | |
| | Six Months | | | | | Oct. 3, |
| | Ended | | | | | 20061 to |
| | | | Year Ended September 30, | |
| For a Share Outstanding | March 31, | | | | | Sept. 30, |
| Throughout Each Period | 2012 | 2011 | 2010 | 2009 | 2008 | 2007 |
| Net Asset Value, Beginning of Period | $42.02 | $41.36 | $37.94 | $43.07 | $57.39 | $50.00 |
| Investment Operations | | | | | | |
| Net Investment Income | .515 | .7962 | .778 | .7252 | .873 | .9042 |
| Net Realized and Unrealized Gain (Loss) | | | | | | |
| on Investments | 11.098 | .672 | 3.343 | (5.006) | (13.714) | 6.910 |
| Total from Investment Operations | 11.613 | 1.468 | 4.121 | (4.281) | (12.841) | 7.814 |
| Distributions | | | | | | |
| Dividends from Net Investment Income | (.923) | (.808) | (.701) | (.849) | (.621) | (.234) |
| Distributions from Realized Capital Gains | — | — | — | — | (.858) | (.190) |
| Total Distributions | (.923) | (.808) | (.701) | (.849) | (1.479) | (.424) |
| Net Asset Value, End of Period | $52.71 | $42.02 | $41.36 | $37.94 | $43.07 | $57.39 |
| |
| Total Return | 28.02% | 3.43% | 10.96% | -9.60% | -22.91% | 15.69% |
| |
| Ratios/Supplemental Data | | | | | | |
| Net Assets, End of Period (Millions) | $366 | $290 | $304 | $275 | $248 | $285 |
| Ratio of Total Expenses to | | | | | | |
| Average Net Assets | 0.17% | 0.17% | 0.17% | 0.17% | 0.12% | 0.15%3 |
| Ratio of Net Investment Income to | | | | | | |
| Average Net Assets | 2.15% | 1.71% | 1.98% | 2.23% | 1.80% | 1.65%3 |
| Portfolio Turnover Rate | 58% | 56% | 52% | 62% | 70% | 66% |
The expense ratio, net income ratio, and turnover rate for the current period have been annualized.
1 Commencement of operations as a registered investment company.
2 Calculated based on average shares outstanding.
3 Annualized.
See accompanying Notes, which are an integral part of the Financial Statements.
30
Structured Broad Market Fund
Notes to Financial Statements
Vanguard Structured Broad Market Fund is registered under the Investment Company Act of 1940 as an open-end investment company, or mutual fund. The fund offers two classes of shares: Institutional Shares and Institutional Plus Shares. Institutional Shares and Institutional Plus Shares are designed for investors who meet certain administrative, service, and account-size criteria.
A. The following significant accounting policies conform to generally accepted accounting principles for U.S. mutual funds. The fund consistently follows such policies in preparing its financial statements.
1. Security Valuation: Securities are valued as of the close of trading on the New York Stock Exchange (generally 4 p.m., Eastern time) on the valuation date. Equity securities are valued at the latest quoted sales prices or official closing prices taken from the primary market in which each security trades; such securities not traded on the valuation date are valued at the mean of the latest quoted bid and asked prices. Securities for which market quotations are not readily available, or whose values have been materially affected by events occurring before the fund’s pricing time but after the close of the securities’ primary markets, are valued by methods deemed by the board of trustees to represent fair value. Investments in Vanguard Market Liquidity Fund are valued at that fund’s net asset value. Temporary cash investments acquired over 60 days to maturity are valued using the latest bid prices or using valuations based on a matrix system (which considers such factors as security prices, yields, maturities, and ratings), both as furnished by independent pricing services. Other temporary cash investments are valued at amortized cost, which approximates market value.
2. Futures Contracts: The fund uses index futures contracts to a limited extent, with the objective of maintaining full exposure to the stock market while maintaining liquidity. The fund may purchase or sell futures contracts to achieve a desired level of investment, whether to accommodate portfolio turnover or cash flows from capital share transactions. The primary risks associated with the use of futures contracts are imperfect correlation between changes in market values of stocks held by the fund and the prices of futures contracts, and the possibility of an illiquid market.
Futures contracts are valued at their quoted daily settlement prices. The aggregate principal amounts of the contracts are not recorded in the Statement of Net Assets. Fluctuations in the value of the contracts are recorded in the Statement of Net Assets as an asset (liability) and in the Statement of Operations as unrealized appreciation (depreciation) until the contracts are closed, when they are recorded as realized futures gains (losses).
3. Federal Income Taxes: The fund intends to continue to qualify as a regulated investment company and distribute all of its taxable income. Management has analyzed the fund’s tax positions taken for all open federal income tax years (September 30, 2008–2011), and for the period ended March 31, 2012, and has concluded that no provision for federal income tax is required in the fund’s financial statements.
4. Distributions: Distributions to shareholders are recorded on the ex-dividend date.
5. Security Lending: The fund may lend its securities to qualified institutional borrowers to earn additional income. Security loans are required to be secured at all times by collateral at least equal to the market value of securities loaned. The fund invests cash collateral received in Vanguard Market Liquidity Fund, and records a liability for the return of the collateral, during the period the securities are on loan. Security lending income represents fees charged to borrowers plus income earned on investing cash collateral, less expenses associated with the loan.
31
Structured Broad Market Fund
6. Other: Dividend income is recorded on the ex-dividend date. Interest income includes income distributions received from Vanguard Market Liquidity Fund and is accrued daily. Security transactions are accounted for on the date securities are bought or sold. Costs used to determine realized gains (losses) on the sale of investment securities are those of the specific securities sold.
Each class of shares has equal rights as to assets and earnings, except that each class separately bears certain class-specific expenses related to maintenance of shareholder accounts (included in Management and Administrative expenses) and shareholder reporting. Marketing and distribution expenses are allocated to each class of shares based on a method approved by the board of trustees. Income, other non-class-specific expenses, and gains and losses on investments are allocated to each class of shares based on its relative net assets.
B. The Vanguard Group furnishes at cost investment advisory, corporate management, administrative, marketing, and distribution services. The costs of such services are allocated to the fund under methods approved by the board of trustees. The fund has committed to provide up to 0.40% of its net assets in capital contributions to Vanguard. At March 31, 2012, the fund had contributed capital of $54,000 to Vanguard (included in Other Assets), representing 0.01% of the fund’s net assets and 0.02% of Vanguard’s capitalization. The fund’s trustees and officers are also directors and officers of Vanguard.
C. Various inputs may be used to determine the value of the fund’s investments. These inputs are summarized in three broad levels for financial statement purposes. The inputs or methodologies used to value securities are not necessarily an indication of the risk associated with investing in those securities.
Level 1—Quoted prices in active markets for identical securities.
Level 2—Other significant observable inputs (including quoted prices for similar securities, interest rates, prepayment speeds, credit risk, etc.).
Level 3—Significant unobservable inputs (including the fund’s own assumptions used to determine the fair value of investments).
The following table summarizes the market value of the fund’s investments as of March 31, 2012, based on the inputs used to value them:
| | | |
| | Level 1 | Level 2 | Level 3 |
| Investments | ($000) | ($000) | ($000) |
| Common Stocks | 371,966 | — | — |
| Temporary Cash Investments | 2,942 | 200 | — |
| Futures Contracts—Assets1 | 5 | — | — |
| Total | 374,913 | 200 | — |
| 1 Represents variation margin on the last day of the reporting period. |
32
Structured Broad Market Fund
D. At March 31, 2012, the aggregate settlement value of open futures contracts and the related unrealized appreciation (depreciation) were:
| | | | |
| | | | | ($000) |
| | | | Aggregate | |
| | | Number of | Settlement | Unrealized |
| | | Long (Short) | Value | Appreciation |
| Futures Contracts | Expiration | Contracts | Long (Short) | (Depreciation) |
| E-mini S&P 500 Index | June 2012 | 18 | 1,263 | 8 |
Unrealized appreciation (depreciation) on open futures contracts is required to be treated as realized gain (loss) for tax purposes.
E. Distributions are determined on a tax basis and may differ from net investment income and realized capital gains for financial reporting purposes. Differences may be permanent or temporary. Permanent differences are reclassified among capital accounts in the financial statements to reflect their tax character. Temporary differences arise when certain items of income, expense, gain, or loss are recognized in different periods for financial statement and tax purposes; these differences will reverse at some time in the future. Differences in classification may also result from the treatment of short-term gains as ordinary income for tax purposes.
The fund’s tax-basis capital gains and losses are determined only at the end of each fiscal year. For tax purposes, at September 30, 2011, the fund had available capital loss carryforwards totaling $63,115,000 to offset future net capital gains of $24,472,000 through September 30, 2017, and $38,643,000 through September 30, 2018. The fund will use these capital losses to offset net taxable capital gains, if any, realized during the year ending September 30, 2012; should the fund realize net capital losses for the year, the losses will be added to the loss carryforward balance above.
At March 31, 2012, the cost of investment securities for tax purposes was $294,461,000. Net unrealized appreciation of investment securities for tax purposes was $80,647,000, consisting of unrealized gains of $85,375,000 on securities that had risen in value since their purchase and $4,728,000 in unrealized losses on securities that had fallen in value since their purchase.
F. During the six months ended March 31, 2012, the fund purchased $97,890,000 of investment securities and sold $97,988,000 of investment securities, other than temporary cash investments.
33
Structured Broad Market Fund
G. Capital share transactions for each class of shares were:
| | | | |
| | Six Months Ended | | Year Ended |
| | March 31, 2012 | September 30, 2011 |
| | Amount | Shares | Amount | Shares |
| | ($000) | (000) | ($000) | (000) |
| Institutional Shares | | | | |
| Issued | — | — | 749 | 32 |
| Issued in Lieu of Cash Distributions | 119 | 5 | 94 | 4 |
| Redeemed | — | — | — | — |
| Net Increase (Decrease)—Institutional Shares | 119 | 5 | 843 | 36 |
| Institutional Plus Shares | | | | |
| Issued | — | — | — | — |
| Issued in Lieu of Cash Distributions | 1,981 | 44 | 1,703 | 38 |
| Redeemed | — | — | (20,000) | (475) |
| Net Increase (Decrease)—Institutional Plus Shares | 1,981 | 44 | (18,297) | (437) |
At March 31, 2012, one shareholder was the record or beneficial owner of 89% of the fund’s net assets. If the shareholder were to redeem its total investment in the fund, the redemption might result in an increase in the fund’s expense ratio, cause the fund to incur higher transaction costs, or result in the realization of taxable capital gains.
H. In preparing the financial statements as of March 31, 2012, management considered the impact of subsequent events for potential recognition or disclosure in these financial statements.
34
About Your Fund’s Expenses
As a shareholder of the fund, you incur ongoing costs, which include costs for portfolio management, administrative services, and shareholder reports (like this one), among others. Operating expenses, which are deducted from a fund’s gross income, directly reduce the investment return of the fund.
A fund’s expenses are expressed as a percentage of its average net assets. This figure is known as the expense ratio. The following examples are intended to help you understand the ongoing costs (in dollars) of investing in your fund and to compare these costs with those of other mutual funds. The examples are based on an investment of $1,000 made at the beginning of the period shown and held for the entire period.
The accompanying table illustrates your fund’s costs in two ways:
• Based on actual fund return. This section helps you to estimate the actual expenses that you paid over the period. The ”Ending Account Value“ shown is derived from the fund‘s actual return, and the third column shows the dollar amount that would have been paid by an investor who started with $1,000 in the fund. You may use the information here, together with the amount you invested, to estimate the expenses that you paid over the period.
To do so, simply divide your account value by $1,000 (for example, an $8,600 account value divided by $1,000 = 8.6), then multiply the result by the number given for your fund under the heading ”Expenses Paid During Period.“
• Based on hypothetical 5% yearly return. This section is intended to help you compare your fund‘s costs with those of other mutual funds. It assumes that the fund had a yearly return of 5% before expenses, but that the expense ratio is unchanged. In this case—because the return used is not the fund’s actual return—the results do not apply to your investment. The example is useful in making comparisons because the Securities and Exchange Commission requires all mutual funds to calculate expenses based on a 5% return. You can assess your fund’s costs by comparing this hypothetical example with the hypothetical examples that appear in shareholder reports of other funds.
Note that the expenses shown in the table are meant to highlight and help you compare ongoing costs only and do not reflect transaction costs incurred by the fund for buying and selling securities. Further, the expenses do not include any purchase, redemption, or account service fees described in the fund prospectus. If such fees were applied to your account, your costs would be higher. Your fund does not carry a “sales load.”
The calculations assume no shares were bought or sold during the period. Your actual costs may have been higher or lower, depending on the amount of your investment and the timing of any purchases or redemptions.
You can find more information about the fund’s expenses, including annual expense ratios, in the Financial Statements section of this report. For additional information on operating expenses and other shareholder costs, please refer to your fund’s current prospectus.
35
| | | |
| Six Months Ended March 31, 2012 | | | |
| | Beginning | Ending | Expenses |
| | Account Value | Account Value | Paid During |
| | 9/30/2011 | 3/31/2012 | Period |
| Based on Actual Fund Return | | | |
| Structured Large-Cap Equity Fund | | | |
| Institutional Shares | $1,000.00 | $1,269.46 | $1.36 |
| Institutional Plus Shares | 1,000.00 | 1,269.77 | 0.96 |
| Structured Broad Market Fund | | | |
| Institutional Shares | $1,000.00 | $1,279.34 | $1.37 |
| Institutional Plus Shares | 1,000.00 | 1,280.19 | 0.97 |
| Based on Hypothetical 5% Yearly Return | | | |
| Structured Large-Cap Equity Fund | | | |
| Institutional Shares | $1,000.00 | $1,023.80 | $1.21 |
| Institutional Plus Shares | 1,000.00 | 1,024.15 | 0.86 |
| Structured Broad Market Fund | | | |
| Institutional Shares | $1,000.00 | $1,023.80 | $1.21 |
| Institutional Plus Shares | 1,000.00 | 1,024.15 | 0.86 |
The calculations are based on expenses incurred in the most recent six-month period. The funds’ annualized six-month expense ratios for that period are: for the Structured Large-Cap Equity Fund, 0.24% for Institutional Shares and 0.17% for Institutional Plus Shares; for the Structured Broad Market Fund, 0.24% for Institutional Shares and 0.17% for Institutional Plus Shares. The dollar amounts shown as “Expenses Paid” are equal to the annualized expense ratio multiplied by the average account value over the period, multiplied by the number of days in the most recent six-month period, then divided by the number of days in the most recent 12-month period.
36
Trustees Approve Advisory Arrangement
The board of trustees of Vanguard Structured Large-Cap Equity and Structured Broad Market Funds has renewed the funds’ investment advisory arrangement with The Vanguard Group, Inc. Vanguard—through its Equity Investment Group—serves as investment advisor to the funds. The board determined that continuing the funds’ internalized management structure was in the best interests of the funds and their shareholders.
The board based its decision upon an evaluation of the advisor’s investment staff, portfolio management process, and performance. The trustees considered the factors discussed below, among others. However, no single factor determined whether the board approved the arrangement. Rather, it was the totality of the circumstances that drove the board’s decision.
Nature, extent, and quality of services
The board considered the quality of each fund’s investment management since its inception, and took into account the organizational depth and stability of the advisor. The board noted that Vanguard has been managing investments for more than three decades. The Equity Investment Group adheres to a sound, disciplined investment management process; the team has considerable experience, stability, and depth.
The board concluded that Vanguard’s experience, stability, depth, and performance, among other factors, warranted continuation of the advisory arrangement.
Investment performance
The board considered the performance of the funds since their inceptions, including any periods of outperformance or underperformance of a relevant benchmark and peer group. The board concluded that the advisor has carried out each fund’s investment strategy in disciplined fashion and that each fund outperformed its benchmark over the most recent one-year period but modestly underperformed it over the longer term. The board noted that each fund has outperformed its relevant peer group over both the short and long term. Information about each fund’s most recent performance can be found in the Performance Summary pages of this report.
Cost
The board concluded that the funds’ expense ratios were well below the average expense ratios charged by funds in their respective peer groups and that the funds’ advisory fee rates were also well below their peer-group averages. Information about the funds’ expenses appears in the About Your Fund’s Expenses section of this report as well as in the Financial Statements sections.
The board does not conduct a profitability analysis of Vanguard, because of Vanguard’s unique “at-cost” structure. Unlike most other mutual fund management companies, Vanguard is owned by the funds it oversees, and produces “profits” only in the form of reduced expenses for fund shareholders.
The benefit of economies of scale
The board concluded that the funds’ low-cost arrangement with Vanguard ensures that the funds will realize economies of scale as they grow, with the cost to shareholders declining as fund assets increase.
The board will consider whether to renew the advisory arrangement again after a one-year period.
37
Glossary
30-Day SEC Yield. A fund’s 30-day SEC yield is derived using a formula specified by the U.S. Securities and Exchange Commission. Under the formula, data related to the fund’s security holdings in the previous 30 days are used to calculate the fund’s hypothetical net income for that period, which is then annualized and divided by the fund’s estimated average net assets over the calculation period. For the purposes of this calculation, a security’s income is based on its current market yield to maturity (for bonds), its actual income (for asset-backed securities), or its projected dividend yield (for stocks). Because the SEC yield represents hypothetical annualized income, it will differ—at times significantly—from the fund’s actual experience. As a result, the fund’s income distributions may be higher or lower than implied by the SEC yield.
Beta. A measure of the magnitude of a fund’s past share-price fluctuations in relation to the ups and downs of a given market index. The index is assigned a beta of 1.00. Compared with a given index, a fund with a beta of 1.20 typically would have seen its share price rise or fall by 12% when the index rose or fell by 10%. For this report, beta is based on returns over the past 36 months for both the fund and the index. Note that a fund’s beta should be reviewed in conjunction with its R-squared (see definition). The lower the R-squared, the less correlation there is between the fund and the index, and the less reliable beta is as an indicator of volatility.
Dividend Yield. Dividend income earned by stocks, expressed as a percentage of the aggregate market value (or of net asset value, for a fund). The yield is determined by dividing the amount of the annual dividends by the aggregate value (or net asset value) at the end of the period. For a fund, the dividend yield is based solely on stock holdings and does not include any income produced by other investments.
Earnings Growth Rate. The average annual rate of growth in earnings over the past five years for the stocks now in a fund.
Equity Exposure. A measure that reflects a fund’s investments in stocks and stock futures. Any holdings in short-term reserves are excluded.
Expense Ratio. A fund’s total annual operating expenses expressed as a percentage of the fund’s average net assets. The expense ratio includes management and administrative expenses, but does not include the transaction costs of buying and selling portfolio securities.
Foreign Holdings. The percentage of a fund represented by securities or depositary receipts of companies based outside the United States.
Median Market Cap. An indicator of the size of companies in which a fund invests; the midpoint of market capitalization (market price x shares outstanding) of a fund’s stocks, weighted by the proportion of the fund’s assets invested in each stock. Stocks representing half of the fund’s assets have market capitalizations above the median, and the rest are below it.
Price/Book Ratio. The share price of a stock divided by its net worth, or book value, per share. For a fund, the weighted average price/book ratio of the stocks it holds.
Price/Earnings Ratio. The ratio of a stock’s current price to its per-share earnings over the past year. For a fund, the weighted average P/E of the stocks it holds. P/E is an indicator of market expectations about corporate prospects; the higher the P/E, the greater the expectations for a company’s future growth.
38
R-Squared. A measure of how much of a fund’s past returns can be explained by the returns from the market in general, as measured by a given index. If a fund’s total returns were precisely synchronized with an index’s returns, its R-squared would be 1.00. If the fund’s returns bore no relationship to the index’s returns, its R-squared would be 0. For this report, R-squared is based on returns over the past 36 months for both the fund and the index.
Return on Equity. The annual average rate of return generated by a company during the past five years for each dollar of shareholder’s equity (net income divided by shareholder’s equity). For a fund, the weighted average return on equity for the companies whose stocks it holds.
Short-Term Reserves. The percentage of a fund invested in highly liquid, short-term securities that can be readily converted to cash.
Turnover Rate. An indication of the fund’s trading activity. Funds with high turnover rates incur higher transaction costs and may be more likely to distribute capital gains (which may be taxable to investors). The turnover rate excludes in-kind transactions, which have minimal impact on costs.
39
The People Who Govern Your Fund
The trustees of your mutual fund are there to see that the fund is operated and managed in your best interests since, as a shareholder, you are a part owner of the fund. Your fund’s trustees also serve on the board of directors of The Vanguard Group, Inc., which is owned by the Vanguard funds and provides services to them on an at-cost basis.
A majority of Vanguard’s board members are independent, meaning that they have no affiliation with Vanguard or the funds they oversee, apart from the sizable personal investments they have made as private individuals. The independent board members have distinguished backgrounds in business, academia, and public service. Each of the trustees and executive officers oversees 179 Vanguard funds.
The following table provides information for each trustee and executive officer of the fund. More information about the trustees is in the Statement of Additional Information, which can be obtained, without charge, by contacting Vanguard at 800-662-7447, or online at vanguard.com.
| |
| InterestedTrustee1 | and Delphi Automotive LLP (automotive components); |
| | Senior Advisor at New Mountain Capital; Trustee of |
| F. William McNabb III | The Conference Board. |
| Born 1957. Trustee Since July 2009. Chairman of the | |
| Board. Principal Occupation(s) During the Past Five | Amy Gutmann |
| Years: Chairman of the Board of The Vanguard Group, | Born 1949. Trustee Since June 2006. Principal |
| Inc., and of each of the investment companies served | Occupation(s) During the Past Five Years: President |
| by The Vanguard Group, since January 2010; Director | of the University of Pennsylvania; Christopher H. |
| of The Vanguard Group since 2008; Chief Executive | Browne Distinguished Professor of Political Science |
| Officer and President of The Vanguard Group and of | in the School of Arts and Sciences with secondary |
| each of the investment companies served by The | appointments at the Annenberg School for Commu- |
| Vanguard Group since 2008; Director of Vanguard | nication and the Graduate School of Education |
| Marketing Corporation; Managing Director of The | of the University of Pennsylvania; Director of |
| Vanguard Group (1995–2008). | Carnegie Corporation of New York, Schuylkill River |
| Development Corporation, and Greater Philadelphia |
| Chamber of Commerce; Trustee of the National |
| IndependentTrustees | Constitution Center; Chair of the Presidential |
| | Commission for the Study of Bioethical Issues. |
| Emerson U. Fullwood | |
| Born 1948. Trustee Since January 2008. Principal | |
| Occupation(s) During the Past Five Years: Executive | JoAnn Heffernan Heisen |
| Chief Staff and Marketing Officer for North America | Born 1950. Trustee Since July 1998. Principal |
| and Corporate Vice President (retired 2008) of Xerox | Occupation(s) During the Past Five Years: Corporate |
| Corporation (document management products and | Vice President and Chief Global Diversity Officer |
| services); Executive in Residence and 2010 | (retired 2008) and Member of the Executive |
| Distinguished Minett Professor at the Rochester | Committee (1997–2008) of Johnson & Johnson |
| Institute of Technology; Director of SPX Corporation | (pharmaceuticals/medical devices/consumer |
| (multi-industry manufacturing), the United Way of | products); Director of Skytop Lodge Corporation |
| Rochester, Amerigroup Corporation (managed health | (hotels), the University Medical Center at Princeton, |
| care), the University of Rochester Medical Center, | the Robert Wood Johnson Foundation, and the Center |
| Monroe Community College Foundation, and North | for Talent Innovation; Member of the Advisory Board |
| Carolina A&T University. | of the Maxwell School of Citizenship and Public Affairs |
| | at Syracuse University. |
| Rajiv L. Gupta | |
| Born 1945. Trustee Since December 2001.2 | F. Joseph Loughrey |
| Principal Occupation(s) During the Past Five Years: | Born 1949. Trustee Since October 2009. Principal |
| Chairman and Chief Executive Officer (retired 2009) | Occupation(s) During the Past Five Years: President |
| and President (2006–2008) of Rohm Haas Co. | and Chief Operating Officer (retired 2009) of Cummins |
| (chemicals); Director of Tyco International, Ltd. | Inc. (industrial machinery); Director of SKF AB |
| (diversified manufacturing and services), Hewlett- | (industrial machinery), Hillenbrand, Inc. (specialized |
| Packard Co. (electronic computer manufacturing), | consumer services), the Lumina Foundation for |
| |
| | |
| Education, and Oxfam America; Chairman of the | Executive Officers | |
| Advisory Council for the College of Arts and Letters | | |
| and Member of the Advisory Board to the Kellogg | Glenn Booraem | |
| Institute for International Studies at the University | Born 1967. Controller Since July 2010. Principal |
| of Notre Dame. | Occupation(s) During the Past Five Years: Principal |
| | of The Vanguard Group, Inc.; Controller of each of |
| Mark Loughridge | the investment companies served by The Vanguard |
| Born 1953. Trustee Since March 2012. Principal | Group; Assistant Controller of each of the investment |
| Occupation(s) During the Past Five Years: Senior Vice | companies served by The Vanguard Group (2001–2010). |
| President and Chief Financial Officer at IBM (information | | |
| technology services); Fiduciary Member of IBM’s | Thomas J. Higgins | |
| Retirement Plan Committee. | Born 1957. Chief Financial Officer Since September |
| | 2008. Principal Occupation(s) During the Past Five |
| Scott C. Malpass | Years: Principal of The Vanguard Group, Inc.; Chief |
| Born 1962. Trustee Since March 2012. Principal | Financial Officer of each of the investment companies |
| Occupation(s) During the Past Five Years: Chief | served by The Vanguard Group; Treasurer of each of |
| Investment Officer and Vice President at the University | the investment companies served by The Vanguard |
| of Notre Dame; Assistant Professor of Finance at the | Group (1998–2008). | |
| Mendoza College of Business at Notre Dame; Member | | |
| of the Notre Dame 403(b) Investment Committee; | Kathryn J. Hyatt | |
| Director of TIFF Advisory Services, Inc. (investment | Born 1955. Treasurer Since November 2008. Principal |
| advisor); Member of the Investment Advisory | Occupation(s) During the Past Five Years: Principal of |
| Committees of the Financial Industry Regulatory | The Vanguard Group, Inc.; Treasurer of each of the |
| Authority (FINRA) and of Major League Baseball. | investment companies served by The Vanguard |
| | Group; Assistant Treasurer of each of the investment |
| André F. Perold | companies served by The Vanguard Group (1988–2008). |
| Born 1952. Trustee Since December 2004. Principal | | |
| Occupation(s) During the Past Five Years: George | Heidi Stam | |
| Gund Professor of Finance and Banking at the Harvard | Born 1956. Secretary Since July 2005. Principal |
| Business School (retired 2011); Chief Investment | Occupation(s) During the Past Five Years: Managing |
| Officer and Managing Partner of HighVista Strategies | Director of The Vanguard Group, Inc.; General Counsel |
| LLC (private investment firm); Director of Rand | of The Vanguard Group; Secretary of The Vanguard |
| Merchant Bank; Overseer of the Museum of Fine | Group and of each of the investment companies |
| Arts Boston. | served by The Vanguard Group; Director and Senior |
| | Vice President of Vanguard Marketing Corporation; |
| Alfred M. Rankin, Jr. | Principal of The Vanguard Group (1997–2006). |
| Born 1941. Trustee Since January 1993. Principal | | |
| Occupation(s) During the Past Five Years: Chairman, | Vanguard Senior ManagementTeam | |
| President, and Chief Executive Officer of NACCO | | |
| Industries, Inc. (forklift trucks/housewares/lignite); | Mortimer J. Buckley | Michael S. Miller |
| Director of Goodrich Corporation (industrial products/ | Kathleen C. Gubanich | James M. Norris |
| aircraft systems and services) and the National | Paul A. Heller | Glenn W. Reed |
| Association of Manufacturers; Chairman of the Board | Martha G. King | George U. Sauter |
| of the Federal Reserve Bank of Cleveland and of | Chris D. McIsaac | |
| University Hospitals of Cleveland; Advisory Chairman | | |
| of the Board of The Cleveland Museum of Art. | | |
| | Chairman Emeritus and Senior Advisor |
| Peter F. Volanakis | | |
| Born 1955. Trustee Since July 2009. Principal | John J. Brennan | |
| Occupation(s) During the Past Five Years: President | Chairman, 1996–2009 | |
| and Chief Operating Officer (retired 2010) of Corning | Chief Executive Officer and President, 1996–2008 |
| Incorporated (communications equipment); Director | | |
| of SPX Corporation (multi-industry manufacturing); | Founder | |
| Overseer of the Amos Tuck School of Business | John C. Bogle | |
| Administration at Dartmouth College; Advisor to the | Chairman and Chief Executive Officer, 1974–1996 | |
| Norris Cotton Cancer Center. | | |
1 Mr. McNabb is considered an “interested person,” as defined in the Investment Company Act of 1940, because he is an officer of the Vanguard funds.
2 December 2002 for Vanguard Equity Income Fund, Vanguard Growth Equity Fund, the Vanguard Municipal Bond Funds, and the Vanguard State Tax-Exempt Funds.
|  |
| P.O. Box 2600 |
| Valley Forge, PA 19482-2600 |
Connect with Vanguard® > vanguard.com
| |
| Fund Information > 800-662-7447 | CFA® is a trademark owned by CFA Institute. |
| Direct Investor Account Services > 800-662-2739 | |
| Institutional Investor Services > 800-523-1036 | |
| Text Telephone for People | |
| With Hearing Impairment > 800-749-7273 | |
| |
| This material may be used in conjunction | |
| with the offering of shares of any Vanguard | |
| fund only if preceded or accompanied by | |
| the fund’s current prospectus. | |
| |
| All comparative mutual fund data are from Lipper Inc. or | |
| Morningstar, Inc., unless otherwise noted. | |
| |
| You can obtain a free copy of Vanguard’s proxy voting | |
| guidelines by visiting vanguard.com/proxyreporting or by | |
| calling Vanguard at 800-662-2739. The guidelines are | |
| also available from the SEC’s website, sec.gov. In | |
| addition, you may obtain a free report on how your fund | |
| voted the proxies for securities it owned during the 12 | |
| months ended June 30. To get the report, visit either | |
| vanguard.com/proxyreporting or sec.gov. | |
| |
| You can review and copy information about your fund at | |
| the SEC’s Public Reference Room in Washington, D.C. To | |
| find out more about this public service, call the SEC at | |
| 202-551-8090. Information about your fund is also | |
| available on the SEC’s website, and you can receive | |
| copies of this information, for a fee, by sending a | |
| request in either of two ways: via e-mail addressed to | |
| publicinfo@sec.gov or via regular mail addressed to the | |
| Public Reference Section, Securities and Exchange | |
| Commission, Washington, DC 20549-1520. | |
| | © 2012 The Vanguard Group, Inc. |
| | All rights reserved. |
| | Vanguard Marketing Corporation, Distributor. |
| |
| | Q08702 052012 |
Item 2:
Not Applicable.
Item 3:
Not Applicable.
Item 4: Principal Accountant Fees and Services.
Not Applicable.
Item 5: Audit Committee of Listed Registrants.
Not Applicable.
Item 6: Investments.
Not Applicable.
Item 7: Disclosure of Proxy Voting Policies and Procedures for Closed-End Management Investment Companies.
Not Applicable.
Item 8: Portfolio Managers of Closed-End Management Investment Companies.
Not Applicable.
Item 9: Purchase of Equity Securities by Closed-End Management Investment Company and Affiliated Purchasers.
Not Applicable.
Item 10: Submission of Matters to a Vote of Security Holders.
Not Applicable.
Item 11: Controls and Procedures.
(a) Disclosure Controls and Procedures. The Principal Executive and Financial Officers concluded that the Registrant's Disclosure Controls and Procedures are effective based on their evaluation of the Disclosure Controls and Procedures as of a date within 90 days of the filing date of this report.
(b) Internal Control Over Financial Reporting. There were no significant changes in Registrant’s Internal Control Over Financial Reporting or in other factors that could significantly affect this control subsequent to the date of the evaluation, including any corrective actions with regard to significant deficiencies and material weaknesses.
Item 12: Exhibits.
(a) Certifications.
Pursuant to the requirements of the Securities Exchange Act of 1934 and the Investment Company Act of 1940, the registrant has duly caused this report to be signed on its behalf by the undersigned, thereunto duly authorized.
| |
| | VANGUARD QUANTITATIVE FUNDS |
| |
| By: | /s/ F. WILLIAM MCNABB III* |
| | F. WILLIAM MCNABB III |
| | CHIEF EXECUTIVE OFFICER |
| |
| Date: May 22, 2012 |
Pursuant to the requirements of the Securities Exchange Act of 1934 and the Investment Company Act of 1940, this report has been signed below by the following persons on behalf of the registrant and in the capacities and on the dates indicated.
| |
| | VANGUARD QUANTITATIVE FUNDS |
| |
| By: | /s/ F. WILLIAM MCNABB III* |
| | F. WILLIAM MCNABB III |
| | CHIEF EXECUTIVE OFFICER |
| |
| Date: May 22, 2012 |
| |
| | VANGUARD QUANTITATIVE FUNDS |
| |
| By: | /s/ THOMAS J. HIGGINS* |
| | THOMAS J. HIGGINS |
| | CHIEF FINANCIAL OFFICER |
| |
| Date: May 22, 2012 |
* By: /s/ Heidi Stam
Heidi Stam, pursuant to a Power of Attorney filed on March 27, 2012 see file Number 2-11444,
Incorporated by Reference.