UNITED STATES
SECURITIES AND EXCHANGE COMMISSION
Washington, D.C. 20549
FORM N-CSR
CERTIFIED SHAREHOLDER REPORT OF
REGISTERED MANAGEMENT INVESTMENT COMPANIES
Investment Company Act file number: 811-04526
Name of Registrant: Vanguard Quantitative Funds
Address of Registrant:
P.O. Box 2600
Valley Forge, PA 19482
Name and address of agent for service:
Heidi Stam, Esquire
P.O. Box 876
Valley Forge, PA 19482
Registrant’s telephone number, including area code: (610) 669-1000
Date of fiscal year end: September 30
Date of reporting period: October 1, 2013 – March 31, 2014
Item 1: Reports to Shareholders

Semiannual Report | March 31, 2014
Vanguard Growth and Income Fund

Vanguard’s Principles for Investing Success
We want to give you the best chance of investment success. These principles, grounded in Vanguard’s research and experience, can put you on the right path.
Goals. Create clear, appropriate investment goals.
Balance. Develop a suitable asset allocation using broadly diversified funds. Cost. Minimize cost.
Discipline. Maintain perspective and long-term discipline.
A single theme unites these principles: Focus on the things you can control.
We believe there is no wiser course for any investor.
| |
| Contents | |
| Your Fund’s Total Returns. | 1 |
| Chairman’s Letter. | 2 |
| Advisors’ Report. | 8 |
| Fund Profile. | 13 |
| Performance Summary. | 15 |
| Financial Statements. | 16 |
| About Your Fund’s Expenses. | 32 |
| Glossary. | 34 |
Please note: The opinions expressed in this report are just that—informed opinions. They should not be considered promises or advice.
Also, please keep in mind that the information and opinions cover the period through the date on the front of this report. Of course, the risks of investing in your fund are spelled out in the prospectus.
See the Glossary for definitions of investment terms used in this report.
About the cover: The ship’s wheel represents leadership and guidance, essential qualities in navigating difficult seas.
This one is a replica based on an 18th-century British vessel. The HMSVanguard, another ship of that era, served as the flagship for British Admiral Horatio Nelson when he defeated a French fleet at the Battle of the Nile.
| | | | |
| Your Fund’s Total Returns | | | | |
| |
| |
| |
| |
| Six Months Ended March 31, 2014 | | | | |
| | | | | Total |
| | | | | Returns |
| Vanguard Growth and Income Fund | | | | |
| Investor Shares | | | | 12.58% |
| Admiral™ Shares | | | | 12.64 |
| S&P 500 Index | | | | 12.51 |
| Large-Cap Core Funds Average | | | | 11.80 |
| Large-Cap Core Funds Average: Derived from data provided by Lipper, a Thomson Reuters Company. | | |
| Admiral Shares carry lower expenses and are available to investors who meet certain account-balance requirements. | |
| |
| |
| Your Fund’s Performance at a Glance | | | | |
| September 30, 2013, Through March 31, 2014 | | | | |
| | | | Distributions Per Share |
| | Starting | Ending | Income | Capital |
| | Share Price | Share Price | Dividends | Gains |
| Vanguard Growth and Income Fund | | | | |
| Investor Shares | $36.02 | $40.21 | $0.323 | $0.000 |
| Admiral Shares | 58.82 | 65.66 | 0.561 | 0.000 |
1

Chairman’s Letter
Dear Shareholder,
Stocks finished the six months ended March 31, 2014, substantially higher, although markets became choppier in the final three months. Initially, stocks were buoyed by solid corporate earnings, positive economic data, and continuing monetary support from the Federal Reserve. The outlook clouded, however, as investors considered weather-affected economic data and bouts of political and economic instability in some emerging markets.
Vanguard Growth and Income Fund’s performance outpaced the average return of its peers and was in line with its benchmark for the half year. Investor Shares returned 12.58% and Admiral Shares 12.64%, compared with a return of 12.51% for the Standard & Poor’s 500 Index.
The fund’s gains were broadbased, with returns in the double digits for seven out of ten market sectors. Turning in the strongest performances were materials, information technology, and health care. But the advisors’ quantitative model found only limited opportunities to edge ahead of the benchmark.
Despite recent volatility, U.S. stocks were productive
The broad U.S. stock market recorded a gain of about 12% for the six months ended March 31, although its path became increasingly rocky over the period’s second half. Corporate earnings, for the most part, continued to rise as the U.S. economy showed modest growth.
2
The Federal Reserve’s stimulative bondbuying program has helped support the market for several years. But since January, the Fed has been making monthly cuts in its purchases, creating some apprehension among investors. Slow economic growth in China and the conflict in Ukraine have also caused market turbulence.
International stocks returned about 5%. The developed markets of Europe, where the economy has improved, posted strong results; the developed markets of the Pacific region and emerging markets were weaker.
Bonds reclaimed ground after a difficult stretch
Over the six months, the broad U.S. taxable bond market returned 1.70%, a welcome result in view of the market’s struggles for much of calendaryear 2013. The yield of the 10year Treasury note finished the half year at 2.72%, up from 2.63% at September’s end but down from nearly 3% on December 31. (Bond prices and yields move in opposite directions.)
Many bond investors have been focusing on the possibility of interest rates moving higher and the negative effect that would have on bond prices. However, there’s a
| | | |
| Market Barometer | | | |
| |
| | | | Total Returns |
| | | Periods Ended March 31, 2014 |
| | Six | One | Five Years |
| | Months | Year | (Annualized) |
| Stocks | | | |
| Russell 1000 Index (Large-caps) | 12.48% | 22.41% | 21.73% |
| Russell 2000 Index (Small-caps) | 9.94 | 24.90 | 24.31 |
| Russell 3000 Index (Broad U.S. market) | 12.28 | 22.61 | 21.93 |
| FTSE All-World ex US Index (International) | 5.25 | 12.50 | 15.93 |
| |
| Bonds | | | |
| Barclays U.S. Aggregate Bond Index (Broad taxable market) | 1.70% | -0.10% | 4.80% |
| Barclays Municipal Bond Index (Broad tax-exempt market) | 3.65 | 0.39 | 5.71 |
| Citigroup Three-Month U.S. Treasury Bill Index | 0.00 | 0.05 | 0.08 |
| |
| CPI | | | |
| Consumer Price Index | 0.92% | 1.51% | 2.13% |
3
flip side to rising rates. As noted recently by the new head of our Fixed Income Group, Greg Davis, longterm investors can benefit over time because they’re “going to be reinvesting those coupon payments and principal payments at higher rates.”
Municipal bonds returned 3.65% for the six months, another major improvement over calendaryear 2013, as investors waded back into the muni market. Many had fled last year when challenges surfaced for some issuers. Money market and savings account returns remained meager because of the Fed’s target of 0%–0.25% for shortterm interest rates.
International bond markets (as measured by the Barclays Global Aggregate Index ex USD) returned 2.05%.
A different path to a similar return
Vanguard Growth and Income Fund has three advisors. Each uses its own computerdriven quantitative analysis to identify attractively valued, quality stocks among large and midsized U.S. companies. They all share the same aim, however. They seek to hold a portfolio that will outpace the S&P 500 Index over the long term without taking on significant additional risk through market capitalization tilts or sector allocation strategies.
| | | |
| Expense Ratios | | | |
| Your Fund Compared With Its Peer Group | | | |
| | Investor | Admiral | Peer Group |
| | Shares | Shares | Average |
| Growth and Income Fund | 0.36% | 0.26% | 1.15% |
The fund expense ratios shown are from the prospectus dated January 27, 2014, and represent estimated costs for the current fiscal year. For the six months ended March 31, 2014, the fund’s annualized expense ratios were 0.37% for Investor Shares and 0.26% for Admiral Shares. The peer-group expense ratio is derived from data provided by Lipper, a Thomson Reuters Company, and captures information through year-end 2013.
Peer group: Large-Cap Core Funds.
4
Over the sixmonth period, the fund’s outperformance was slight. All ten largecap market sectors posted gains of more than 5% for the index, and the fund managed to eke out better returns in seven of them. In information technology, the fund made up for its slightly smaller allocation through good stock selection.
|
| The appeal of low-cost investing is growing |
| |
| Minimizing investment costs is a critical part of every investor’s toolkit. Why? Because every |
| dollar paid for fund management expenses is simply a dollar less that can work on your behalf. |
| |
| Put another way, the lower your mutual fund’s costs, the greater your share of the fund’s return. |
| Not surprisingly, research indicates that lowercost investments have tended to outperform |
| their highercost counterparts. |
| |
| Investors are catching on to the value of lowercost mutual funds. Funds with lower expense |
| ratios dominated in attracting investment dollars over the decade ended December 31, 2012, |
| according to a Vanguard research paper titled Costs Matter: Are Fund Investors Voting With |
| Their Feet? (You can read the paper at vanguard.com/matter.) And, as the chart below shows, |
| Vanguard’s leadership in keeping down costs for investors seems to have encouraged the |
| industry to reduce its average costs—at least over the past decade. |
| |
| Even so, Vanguard’s average expenses continue to be less than onefifth the industry average: |
| 0.19% versus 1.08% (as of December 31, 2013). That cost difference remains a powerful tool |
| in the hands of Vanguard clients. |
| |
| Vanguard fund costs remain far below industry average |
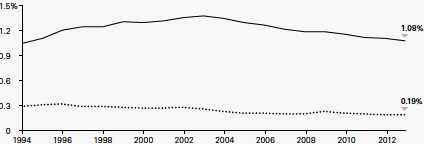
Industry average expense ratio
Vanguard average expense ratio
Sources: Vanguard and Lipper, a Thomson Reuters Company.
5
Its computer hardware and semiconductor holdings did particularly well, offsetting a few missed opportunities among software and internetrelated stocks.
The energy sector returned a little more for the fund than for the index, thanks in part to the contribution of oil and gas drilling stocks. In industrials, positions among defense contractors and airlines, two segments whose returns were very strong, also added to relative performance.
Health care posted the largest sector gain for the index, about 16.5% during the sixmonth period, and just a little less than that for the fund. Pharmaceutical stocks continued to find favor with investors based on promising product pipelines and the expectation of greater demand from the rising number of individuals with health insurance. The fund roughly matched the index’s return in this large segment, but its holdings in the much smaller biotechnology area disappointed. Relative return was also subpar in financials, largely because of the fund’s positions among large banks and insurance companies.
More information about the advisors’ management of the fund can be found in the Advisors’ Report that follows this letter.
Divining the future is tricky, but preparing for it is prudent
Predictions are often made but rarely come true. In an interview with our newsletter In The Vanguard, University of Pennsylvania professor Philip Tetlock noted, “As a whole, experts [are] slightly more accurate than the proverbial dartthrowing chimpanzee.”
Dr. Tetlock’s extensive research on the accuracy of predictions found that it’s best to think in terms of probabilities and to avoid bold, specific declarations about what the future holds. At Vanguard, we agree that forecasting the economy and capital markets should be leavened with modesty. Joe Davis, our chief economist, is fond of saying that we “treat the future with the humility it deserves.”
That’s why our economists don’t make the pinpoint projections that you’ll see elsewhere. Instead, using sophisticated statistical models, we provide a range and probability of potential outcomes—for example, the return of U.S. stocks. And we explain our rationale for such outcomes, allowing you to make betterinformed decisions about risk and return.
In January, as they do each year, our economists issued Vanguard’s Economic and Investment Outlook. They also update their perspectives periodically and address significant developments, such as changes in Federal Reserve policy. (You can read our most recent outlook at vanguard.com/ research.)
Our forecasts acknowledge that no one can envision every scenario. And that underlines one of Vanguard’s core investment principles: Develop a suitable
6
asset allocation using broadly diversified funds. Having a balanced portfolio can help you get through unforeseen events and achieve your goals—even without a crystal ball.
As always, thank you for entrusting your assets to Vanguard.
Sincerely,

F. William McNabb III
Chairman and Chief Executive Officer
April 14, 2014
7
Advisors’ Report
Vanguard Growth and Income Fund’s Investor Shares returned 12.58% for the six months ended March 31, 2014. The Admiral Shares returned 12.64%. The Standard & Poor’s 500 Index returned 12.51%, and the average return of largecapitalization core funds was 11.80%.
Your fund is managed by three independent advisors, a strategy that enhances the fund’s diversification by providing exposure to distinct yet complementary investment approaches. It is not uncommon for different advisors to have different views about individual securities or the broader investment environment.
The advisors, the percentage of fund assets each manages, and brief descriptions of their investment strategies are presented in the table below. The advisors have also prepared a discussion of the investment environment that existed during the fiscal half year and of how the portfolio’s positioning reflects this assessment. (Please note that Los Angeles Capital’s discussion refers to industry sectors as defined by Russell classifications, rather than by the Global Industry Classification Standard used elsewhere in this report.) These comments were prepared on April 16, 2014.
Vanguard Growth and Income Fund Investment Advisors
| | | |
| | Fund Assets Managed | |
| Investment Advisor | % | $ Million | Investment Strategy |
| Vanguard Equity Investment | 33 | 1,836 | Employs a quantitative fundamental management |
| Group | | | approach, using models that assess valuation, growth |
| | | | prospects, management decisions, market sentiment, |
| | | | and earnings and balance-sheet quality of companies |
| | | | as compared with their peers. |
| D. E. Shaw Investment | 33 | 1,811 | Employs quantitative models that seek to capture |
| Management, L.L.C. | | | predominantly “bottom up” stock-specific return |
| | | | opportunities while aiming to keep the portfolio’s |
| | | | sector weights, size, and style characteristics similar to |
| | | | the benchmark. |
| Los Angeles Capital | 32 | 1,808 | Employs a quantitative model that emphasizes stocks |
| | | | with characteristics investors are currently seeking and |
| | | | underweights stocks with characteristics investors are |
| | | | currently avoiding. The portfolio’s sector weights, size, |
| | | | and style characteristics may differ modestly from the |
| | | | benchmark in a risk-controlled manner. |
| Cash Investments | 2 | 122 | These short-term reserves are invested by Vanguard in |
| | | | equity index products to simulate investments in |
| | | | stocks. Each advisor also may maintain a modest cash |
| | | | position. |
8
Vanguard Equity Investment Group
Portfolio Managers:
James D. Troyer, CFA, Principal James P. Stetler, Principal Michael R. Roach, CFA
For the fiscal half year ended March 31, equities continued to produce aboveaverage returns. The broad U.S. equity market was up about 12%. Largecap stocks gained more than smallcaps. U.S. equities outpaced those of other developed countries, and emerging markets continued to underperform. Performance in the fund’s benchmark index was broadbased, with all ten sectors generating positive returns. Health care, information technology, and materials companies did best. Consumer staples, consumer discretionary, and telecommunications services brought up the rear.
The Federal Reserve announced reductions to its stimulative bondbuying. Chairwoman Janet Yellen’s testimony to Congress suggested that this tapering was likely to continue despite winterrelated weakness in economic data. There were no major fiscal surprises during the period, and without new policy stimulus (and even with reductions), the economy seems to be improving. The Institute for Supply Management (ISM) Manufacturing Index has consistently been above 50—a reading that points to expansion. GDP has been in the range of 2% to 4%, in line with historical averages.
Globally, market participants have kept a nervous eye on the tensions in Ukraine. China has seen its growth rate decelerate as it goes through economic rebalancing to increase consumption and reduce investment; Latin America, in turn, has struggled because of China’s weaker demand. The uncertainty triggered by these developments has increased volatility in equity markets.
Although it’s important to understand how these macroeconomic factors affect overall portfolio performance, our approach to investing focuses on specific stock fundamentals. Our process compares stocks within industry groups to identify those with characteristics that we believe will enable them to outperform over the long run. We use a strict quantitative process that concentrates on valuation and other factors focused on fundamental growth. We then construct our portfolio aiming to maximize expected return and minimize exposure to risks relative to our benchmark, such as marketcap risk, that our research indicates do not improve returns.
Over the period, the model was effective in producing positive stock selection results for our portfolio in eight of the ten sectors The strongest results were in industrials, energy, and consumer discretionary; we underperformed in telecommunications and financials.
9
Among individual stocks, the largest contributors came from overweight positions in HewlettPackard, Valero Energy, and Wynn Resorts. Compared with the benchmark, we benefited from underweighting or avoiding poorly performing stocks such as TwentyFirst Century Fox and Starbucks.
Unfortunately, we were not able to avoid all poor performers. Overweight positions in Best Buy, Celgene, and GameStop detracted from results. And underweighting companies that our model’s fundamentals did not positively identify, including Actavis and Allergan, hurt our relative performance.
The stockspecific risk we have taken in the portfolio has paid off so far this year, but risk can reward or punish us in the near term. We look forward to the rest of the fiscal year; we believe that the fund offers a strong mix of stocks with attractive valuation and growth characteristics compared with its benchmark.
D. E. Shaw Investment Management, L.L.C.
Portfolio Manager:
Anne Dinning, Ph.D., Managing Director and Chief Investment Officer U.S. equity markets rallied in the fourth quarter of 2013. Inflation remained low, and data releases showed improvements in employment, GDP growth, housing prices, and consumer balance sheets.
The markets seemed bolstered by the resolution, albeit temporary, of political discord over the federal budget and debt ceiling. The Federal Reserve’s decision to hold back on tapering its quantitative easing program also helped.
By contrast, the first quarter of 2014 appeared more challenging. Concerns about weaker macroeconomic data, a slowdown in economic growth in emerging markets—particularly China—and geopolitical turmoil in Ukraine may have made investors more riskaverse. Market volatility and correlations among stocks, both of which fell during the fourth quarter of 2013, rebounded and ended up higher. We believe that an environment characterized by low correlations can provide more opportunities for our investment process, which focuses on idiosyncratic stock selection, to add value.
We generally attribute portfolio performance to three main sources: bottomup stock selection; exposure to common risk factors such as value, growth, and market capitalization; and exposure to industry groups. Over the six months, stock selection disappointed. The three largest singlestock contributors to relative return were overweight positions in Tyco International, LSI, and Priceline Group.
The three biggest detractors were underweight positions in Google (during the fourth quarter of 2013) and Microsoft and an overweight position in ADT.
Common risk factors modestly helped relative performance. Small exposures to lowdividendyield, smallcap, and value stocks were beneficial, but sector and industry deviations from benchmark weights had no material impact.
10
Despite weak macroeconomic data and heightened geopolitical risks, U.S. equity markets rose to record highs in the first quarter of 2014. Healthier consumer balance sheets and job expansion may indicate continued growth. Slowerthanexpected GDP growth in Europe and emerging markets and an escalation of geopolitical turmoil in Ukraine constitute clear risks.
Los Angeles Capital
Portfolio Managers: Thomas D. Stevens, CFA, Chairman and Principal Hal W. Reynolds, CFA,
Chief Investment Officer and Principal The S&P 500 Index generated a 12.51% return for the six months ended March 31. Stable interest rates, a narrowing equity risk premium, and improved growth in earnings per share all contributed. After last year’s significant gains, market volatility spiked in January as prices fell before rebounding over the rest of the period. This enabled equities to post positive returns for the seventh consecutive quarter. Unlike all four quarters in 2013, firstquarter 2014 bond returns kept pace with equities, suggesting a potential shift in momentum.
The bestperforming stocks over the six months offered aboveaverage projected earnings growth and had positive estimate revisions but traded at favorable earnings multiples. Companies with weaker balance sheets trading at low multiples to book value generally lagged. Largercap securities outperformed, particularly those with better growth prospects. Recently, investors have begun to shift their focus back to companies with higher profit margins and the potential to increase dividends.
All sectors performed well. Among the best were technology and health care. Consumer cyclicals, consumer staples, telecommunications, and energy underperformed. Financials rose as interest rates stabilized and credit spreads tightened.
As the market continued to digest the inevitable impact of the Fed’s tapering of its bond purchases, the consensus view that inflation would remain in check was reflected in favorable longterm interest rates and aboveaverage equity valuations.
Over the six months, the portfolio maintained a bias toward higherquality companies with aboveaverage earnings yields and higher projected growth rates, all of which contributed to returns. Also helping was an overweight to stocks that were undervalued compared with the market’s appraisal of their balance sheets. Detracting slightly were small underweightings to pharmaceuticals, diversified financials, and software companies, all of which performed well.
The market continues to favor higherquality companies. However, investor emphasis has begun to shift back to value from growth, to operating margins from projected growth rates, and toward the diversification benefits of larger market capitalization and away from higherrisk
11
midcaps. Fourthquarter profit growth was strong, but analysts expect firstquarter yearoveryear profit growth for the S&P 500 Index to be flat. This March was the fifth anniversary of the 2009 market low that followed the 2008 collapse of the financial and real estate sectors. Developedmarket valuation multiples remain above their longterm averages, largely as a result of the Fed’s monetary policies. A forthcoming pullback in riskier factors would be consistent with past investor behavior during the latter stages of a bull market.
12
Growth and Income Fund
Fund Profile
As of March 31, 2014
| | | |
| Share-Class Characteristics | | |
| | Investor | | Admiral |
| | Shares | | Shares |
| Ticker Symbol | VQNPX | | VGIAX |
| Expense Ratio1 | 0.36% | | 0.26% |
| 30-Day SEC Yield | 1.63% | | 1.74% |
| |
| Portfolio Characteristics | | |
| | | | DJ |
| | | | U.S. |
| | | | Total |
| | | | Market |
| | | S&P 500 | FA |
| | Fund | Index | Index |
| Number of Stocks | 641 | 500 | 3,674 |
| Median Market Cap | $60.0B | $66.3B | $43.7B |
| Price/Earnings Ratio | 18.0x | 18.6x | 20.1x |
| Price/Book Ratio | 2.5x | 2.6x | 2.6x |
| Return on Equity | 18.0% | 18.6% | 17.2% |
| Earnings Growth | | | |
| Rate | 12.3% | 12.1% | 12.4% |
| Dividend Yield | 2.0% | 2.0% | 1.9% |
| Foreign Holdings | 0.1% | 0.0% | 0.0% |
| Turnover Rate | | | |
| (Annualized) | 140% | — | — |
| Short-Term Reserves | 0.3% | — | — |
| | |
| Volatility Measures | | |
| | | DJ |
| | U.S. Total |
| | S&P 500 | Market |
| | Index | FA Index |
| R-Squared | 0.99 | 0.99 |
| Beta | 1.01 | 0.96 |
| These measures show the degree and timing of the fund’s fluctuations compared with the indexes over 36 months. |
| |
| |
| Ten Largest Holdings (% of total net assets) |
| Apple Inc. | Computer Hardware | 3.1% |
| Johnson & Johnson | Pharmaceuticals | 2.2 |
| Exxon Mobil Corp. | Integrated Oil & Gas | 1.9 |
| General Electric Co. | Industrial | |
| | Conglomerates | 1.9 |
| Google Inc. | Internet Software & | |
| | Services | 1.8 |
| AT&T Inc. | Integrated | |
| | Telecommunication | |
| | Services | 1.6 |
| Bank of America Corp. | Diversified Banks | 1.4 |
| Wells Fargo & Co. | Diversified Banks | 1.4 |
| JPMorgan Chase & Co. | Diversified Banks | 1.3 |
| Microsoft Corp. | Systems Software | 1.3 |
| Top Ten | | 17.9% |
| The holdings listed exclude any temporary cash investments and equity index products. |
| | |
Investment Focus

1 The expense ratios shown are from the prospectus dated January 27, 2014, and represent estimated costs for the current fiscal year. For the six months ended March 31, 2014, the annualized expense ratios were 0.37% for Investor Shares and 0.26% for Admiral Shares.
13
Growth and Income Fund
Sector Diversification (% of equity exposure)
| | | |
| | | | DJ |
| | | | U.S. Total |
| | | S&P 500 | Market |
| | Fund | Index | FA Index |
| Consumer | | | |
| Discretionary | 13.5% | 12.1% | 12.8% |
| Consumer Staples | 8.0 | 9.7 | 8.4 |
| Energy | 8.9 | 10.1 | 9.4 |
| Financials | 14.9 | 16.4 | 17.6 |
| Health Care | 15.3 | 13.4 | 13.0 |
| Industrials | 11.8 | 10.7 | 11.5 |
| Information | | | |
| Technology | 17.8 | 18.6 | 18.1 |
| Materials | 3.6 | 3.5 | 3.9 |
| Telecommunication | | | |
| Services | 3.2 | 2.4 | 2.2 |
| Utilities | 3.0 | 3.1 | 3.1 |
14
Growth and Income Fund
Performance Summary
All of the returns in this report represent past performance, which is not a guarantee of future results that may be achieved by the fund. (Current performance may be lower or higher than the performance data cited. For performance data current to the most recent month-end, visit our website at vanguard.com/performance.) Note, too, that both investment returns and principal value can fluctuate widely, so an investor’s shares, when sold, could be worth more or less than their original cost. The returns shown do not reflect taxes that a shareholder would pay on fund distributions or on the sale of fund shares.
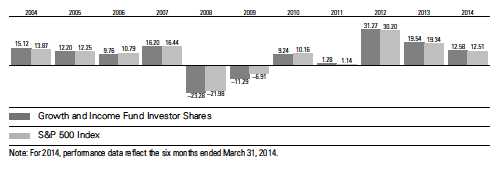
Fiscal-Year Total Returns (%): September 30, 2003, Through March 31, 2014
| | | | |
| Average Annual Total Returns: Periods Ended March 31, 2014 | | | |
| |
| | Inception | One | Five | Ten |
| | Date | Year | Years | Years |
| Investor Shares | 12/10/1986 | 22.00% | 20.83% | 6.63% |
| Admiral Shares | 5/14/2001 | 22.14 | 20.97 | 6.77 |
See Financial Highlights for dividend and capital gains information.
15
Growth and Income Fund
Financial Statements (unaudited)
Statement of Net Assets
As of March 31, 2014
The fund reports a complete list of its holdings in regulatory filings four times in each fiscal year, at the quarter-ends. For the second and fourth fiscal quarters, the lists appear in the fund’s semiannual and annual reports to shareholders. For the first and third fiscal quarters, the fund files the lists with the Securities and Exchange Commission on Form N-Q. Shareholders can look up the fund’s Forms N-Q on the SEC’s website at sec.gov. Forms N-Q may also be reviewed and copied at the SEC’s Public Reference Room (see the back cover of this report for further information).
| | | |
| | | | Market |
| | | | Value |
| | | Shares | ($000) |
| Common Stocks (97.5%)1 | | |
| Consumer Discretionary (13.1%) | |
| | NIKE Inc. Class B | 454,143 | 33,543 |
| | Comcast Corp. Class A | 602,638 | 30,144 |
| | McDonald’s Corp. | 295,314 | 28,950 |
| | Ford Motor Co. | 1,840,450 | 28,711 |
| * | priceline.com Inc. | 22,695 | 27,050 |
| | Home Depot Inc. | 334,412 | 26,462 |
| | Wyndham Worldwide | | |
| | Corp. | 353,351 | 25,876 |
| | Cablevision Systems | | |
| | Corp. Class A | 1,502,404 | 25,346 |
| | Goodyear Tire & | | |
| | Rubber Co. | 969,060 | 25,322 |
| | Walt Disney Co. | 309,725 | 24,800 |
| * | DIRECTV | 311,817 | 23,829 |
| | Best Buy Co. Inc. | 750,228 | 19,814 |
| | Time Warner Cable Inc. | 143,720 | 19,715 |
| | Lowe’s Cos. Inc. | 363,533 | 17,777 |
| | GameStop Corp. Class A | 408,870 | 16,805 |
| | General Motors Co. | 487,091 | 16,766 |
| * | MGM Resorts International | 621,200 | 16,064 |
| | TJX Cos. Inc. | 222,000 | 13,464 |
| | Whirlpool Corp. | 86,586 | 12,941 |
| | Viacom Inc. Class B | 151,700 | 12,893 |
| | Macy’s Inc. | 199,880 | 11,851 |
| | Kohl’s Corp. | 201,777 | 11,461 |
| * | Netflix Inc. | 31,400 | 11,054 |
| * | Amazon.com Inc. | 32,000 | 10,769 |
| | Wynn Resorts Ltd. | 48,400 | 10,752 |
| | Coach Inc. | 211,500 | 10,503 |
| * | Charter Communications | | |
| | Inc. Class A | 84,295 | 10,385 |
| | Delphi Automotive plc | 149,518 | 10,146 |
| | Interpublic Group of | | |
| | Cos. Inc. | 583,825 | 10,007 |
| | Time Warner Inc. | 149,775 | 9,785 |
| | Graham Holdings Co. | | |
| | Class B | 13,654 | 9,609 |
| | | |
| | | | Market |
| | | | Value |
| | | Shares | ($000) |
| | Starwood Hotels & | | |
| | Resorts Worldwide Inc. | 117,400 | 9,345 |
| | Staples Inc. | 821,972 | 9,321 |
| | Johnson Controls Inc. | 173,460 | 8,208 |
| * | O’Reilly Automotive Inc. | 53,300 | 7,909 |
| | Expedia Inc. | 106,320 | 7,708 |
| | Omnicom Group Inc. | 92,450 | 6,712 |
| | PVH Corp. | 51,616 | 6,440 |
| | Mattel Inc. | 143,840 | 5,769 |
| * | Fossil Group Inc. | 46,600 | 5,434 |
| | Newell Rubbermaid Inc. | 174,020 | 5,203 |
| | PulteGroup Inc. | 251,730 | 4,831 |
| | Target Corp. | 78,007 | 4,720 |
| | Darden Restaurants Inc. | 89,430 | 4,539 |
| | Harman International | | |
| | Industries Inc. | 41,790 | 4,446 |
| | Family Dollar Stores Inc. | 75,854 | 4,400 |
| | Twenty-First Century Fox | | |
| | Inc. Class A | 136,000 | 4,348 |
| * | Liberty Media Corp. Class A | 33,000 | 4,314 |
| | International Game | | |
| | Technology | 270,860 | 3,808 |
| | Gannett Co. Inc. | 137,454 | 3,794 |
| | CBS Corp. Class B | 61,033 | 3,772 |
| | DR Horton Inc. | 170,980 | 3,702 |
| * | Dollar General Corp. | 65,420 | 3,629 |
| * | Discovery Communications | | |
| | Inc. Class A | 40,710 | 3,367 |
| * | Chipotle Mexican Grill Inc. | | |
| | Class A | 5,410 | 3,073 |
| | H&R Block Inc. | 96,060 | 2,900 |
| | Yum! Brands Inc. | 38,330 | 2,890 |
| * | Michael Kors Holdings Ltd. | 30,408 | 2,836 |
| * | Jarden Corp. | 39,300 | 2,351 |
| * | AutoNation Inc. | 42,160 | 2,244 |
| * | Ulta Salon Cosmetics | | |
| | & Fragrance Inc. | 22,800 | 2,223 |
| * | Boyd Gaming Corp. | 167,700 | 2,214 |
| * | Visteon Corp. | 22,600 | 1,999 |
| | L Brands Inc. | 34,983 | 1,986 |
16
| | | |
| Growth and Income Fund | | |
| |
| |
| |
| | | | Market |
| | | | Value |
| | | Shares | ($000) |
| * | TripAdvisor Inc. | 20,000 | 1,812 |
| | Carnival Corp. | 47,510 | 1,799 |
| * | Apollo Education Group Inc. | 50,460 | 1,728 |
| | Gap Inc. | 41,000 | 1,642 |
| | Hasbro Inc. | 28,517 | 1,586 |
| * | Kate Spade & Co. | 33,500 | 1,242 |
| | Advance Auto Parts Inc. | 8,800 | 1,113 |
| * | Mohawk Industries Inc. | 6,000 | 816 |
| * | AutoZone Inc. | 1,400 | 752 |
| | Nordstrom Inc. | 12,000 | 749 |
| * | Liberty Global plc | 16,800 | 684 |
| * | Live Nation | | |
| | Entertainment Inc. | 31,161 | 678 |
| * | Liberty Global plc Class A | 15,887 | 661 |
| | Leggett & Platt Inc. | 17,020 | 556 |
| * | Sears Holdings Corp. | 9,100 | 435 |
| | Lear Corp. | 4,400 | 368 |
| * | Christopher & Banks Corp. | 55,410 | 366 |
| | Service Corp. International | 14,700 | 292 |
| * | News Corp. Class A | 11,790 | 203 |
| * | ANN Inc. | 4,700 | 195 |
| * | Lee Enterprises Inc. | 37,100 | 166 |
| | Ruth’s Hospitality Group Inc. | 11,944 | 144 |
| | ARAMARK Holdings Corp. | 4,800 | 139 |
| * | Sally Beauty Holdings Inc. | 5,000 | 137 |
| * | Biglari Holdings Inc. | 271 | 132 |
| * | Central European Media | | |
| | Enterprises Ltd. Class A | 31,500 | 93 |
| | Churchill Downs Inc. | 911 | 83 |
| * | Liberty Interactive Corp. | | |
| | Class A | 2,300 | 66 |
| * | New York & Co. Inc. | 13,589 | 60 |
| * | Nautilus Inc. | 5,964 | 57 |
| * | Liberty Ventures Class A | 401 | 52 |
| | Extended Stay America Inc. | 2,000 | 46 |
| * | Container Store Group Inc. | 1,152 | 39 |
| * | Beazer Homes USA Inc. | 1,900 | 38 |
| | SeaWorld Entertainment Inc. | 1,200 | 36 |
| | Regis Corp. | 2,464 | 34 |
| ^ | Blyth Inc. | 2,482 | 27 |
| * | Orbitz Worldwide Inc. | 3,300 | 26 |
| * | Taylor Morrison Home Corp. | | |
| | Class A | 900 | 21 |
| | Hooker Furniture Corp. | 1,220 | 19 |
| * | Ambassadors Group Inc. | 4,798 | 19 |
| * | Ruby Tuesday Inc. | 3,100 | 17 |
| * | William Lyon Homes Class A | 500 | 14 |
| * | Overstock.com Inc. | 600 | 12 |
| * | Hovnanian Enterprises Inc. | | |
| | Class A | 2,345 | 11 |
| * | Libbey Inc. | 420 | 11 |
| | Lincoln Educational | | |
| | Services Corp. | 2,615 | 10 |
| | Morningstar Inc. | 100 | 8 |
| * | Iconix Brand Group Inc. | 100 | 4 |
| * | Express Inc. | 200 | 3 |
| | | |
| | | | Market |
| | | | Value |
| | | Shares | ($000) |
| * | Build-A-Bear Workshop Inc. 250 | 2 |
| | Furniture Brands | | |
| | International Inc. | 600 | — |
| | | | 732,232 |
| Consumer Staples (7.8%) | | |
| | PepsiCo Inc. | 702,491 | 58,658 |
| | Coca-Cola Co. | 1,064,374 | 41,149 |
| | Procter & Gamble Co. | 499,300 | 40,244 |
| | Philip Morris | | |
| | International Inc. | 434,089 | 35,539 |
| | Wal-Mart Stores Inc. | 440,249 | 33,648 |
| | CVS Caremark Corp. | 373,250 | 27,941 |
| | Archer-Daniels-Midland Co. | 516,290 | 22,402 |
| | Kroger Co. | 467,885 | 20,423 |
| | Mondelez International Inc. | | |
| | Class A | 519,355 | 17,944 |
| | Walgreen Co. | 260,300 | 17,188 |
| | Kimberly-Clark Corp. | 154,451 | 17,028 |
| | Kraft Foods Group Inc. | 257,615 | 14,452 |
| | Tyson Foods Inc. Class A | 271,670 | 11,956 |
| * | Constellation Brands Inc. | | |
| | Class A | 138,000 | 11,726 |
| | Coca-Cola Enterprises Inc. | 242,540 | 11,584 |
| | Safeway Inc. | 251,420 | 9,287 |
| | Hershey Co. | 86,100 | 8,989 |
| | Avon Products Inc. | 532,710 | 7,799 |
| | Campbell Soup Co. | 115,100 | 5,166 |
| | Dr Pepper Snapple | | |
| | Group Inc. | 75,911 | 4,134 |
| | ConAgra Foods Inc. | 110,291 | 3,422 |
| | General Mills Inc. | 59,680 | 3,093 |
| | Molson Coors Brewing Co. | | |
| | Class B | 39,860 | 2,346 |
| | Costco Wholesale Corp. | 17,730 | 1,980 |
| | Dean Foods Co. | 82,585 | 1,277 |
| | Reynolds American Inc. | 16,665 | 890 |
| | Altria Group Inc. | 20,538 | 769 |
| | Beam Inc. | 4,300 | 358 |
| | Energizer Holdings Inc. | 3,534 | 356 |
| * | Monster Beverage Corp. | 2,110 | 146 |
| | Cott Corp. | 8,600 | 73 |
| | McCormick & Co. Inc. | 900 | 65 |
| * | Crimson Wine Group Ltd. | 6,540 | 58 |
| * | Pantry Inc. | 1,200 | 18 |
| * | Diamond Foods Inc. | 200 | 7 |
| * | Farmer Bros Co. | 300 | 6 |
| | | | 432,121 |
| Energy (8.6%) | | |
| | Exxon Mobil Corp. | 1,105,181 | 107,954 |
| | Chevron Corp. | 525,184 | 62,450 |
| | Occidental Petroleum Corp. | 491,090 | 46,796 |
| | EOG Resources Inc. | 156,300 | 30,661 |
| | Devon Energy Corp. | 365,337 | 24,452 |
| | Schlumberger Ltd. | 247,369 | 24,119 |
| | ConocoPhillips | 294,905 | 20,747 |
| | Anadarko Petroleum Corp. | 226,046 | 19,160 |
17
| | | |
| Growth and Income Fund | | |
| |
| |
| |
| | | | Market |
| | | | Value |
| | | Shares | ($000) |
| | Marathon Petroleum Corp. | 199,400 | 17,356 |
| | Murphy Oil Corp. | 224,794 | 14,131 |
| | Valero Energy Corp. | 244,400 | 12,978 |
| | Chesapeake Energy Corp. | 492,900 | 12,628 |
| | Helmerich & Payne Inc. | 90,000 | 9,680 |
| | Kinder Morgan Inc. | 249,153 | 8,095 |
| | Hess Corp. | 90,350 | 7,488 |
| | Tesoro Corp. | 126,670 | 6,408 |
| | Apache Corp. | 70,943 | 5,885 |
| * | Southwestern Energy Co. | 125,000 | 5,751 |
| | Cabot Oil & Gas Corp. | 164,400 | 5,570 |
| | Halliburton Co. | 91,500 | 5,388 |
| * | Cameron International Corp. | 67,680 | 4,181 |
| | Nabors Industries Ltd. | 146,813 | 3,619 |
| | Peabody Energy Corp. | 192,377 | 3,143 |
| * | Newfield Exploration Co. | 98,280 | 3,082 |
| | National Oilwell Varco Inc. | 39,299 | 3,060 |
| | EQT Corp. | 30,300 | 2,938 |
| | QEP Resources Inc. | 81,900 | 2,411 |
| | Phillips 66 | 27,600 | 2,127 |
| * | Rowan Cos. plc Class A | 49,000 | 1,650 |
| | Noble Corp. plc | 44,600 | 1,460 |
| | CONSOL Energy Inc. | 26,360 | 1,053 |
| * | Harvest Natural | | |
| | Resources Inc. | 150,200 | 565 |
| *,^ | SandRidge Energy Inc. | 90,900 | 558 |
| | Frank’s International NV | 13,200 | 327 |
| * | FMC Technologies Inc. | 5,920 | 310 |
| * | EnLink Midstream LLC | 4,500 | 153 |
| * | McDermott International Inc. | 15,200 | 119 |
| | Plains GP Holdings LP | | |
| | Class A | 2,900 | 81 |
| * | Penn Virginia Corp. | 4,300 | 75 |
| | Cenovus Energy Inc. | 2,300 | 67 |
| | DHT Holdings Inc. | 7,256 | 57 |
| ^ | USEC Inc. | 11,600 | 47 |
| | Cosan Ltd. | 3,568 | 41 |
| * | Hercules Offshore Inc. | 8,088 | 37 |
| * | Hyperdynamics Corp. | 21,100 | 37 |
| | Denbury Resources Inc. | 2,150 | 35 |
| | North American Energy | | |
| | Partners Inc. | 3,300 | 24 |
| * | RSP Permian Inc. | 600 | 17 |
| * | CHC Group Ltd. | 2,200 | 16 |
| | Encana Corp. | 700 | 15 |
| | Tsakos Energy Navigation Ltd. | 1,600 | 12 |
| * | Gevo Inc. | 7,900 | 9 |
| * | Endeavour International Corp. | 2,100 | 7 |
| * | North Atlantic Drilling Ltd. | 600 | 5 |
| | Comstock Resources Inc. | 100 | 2 |
| * | Ceres Inc. | 2,500 | 2 |
| | | | 479,039 |
| Financials (14.4%) | | |
| | Bank of America Corp. | 4,653,000 | 80,032 |
| | Wells Fargo & Co. | 1,520,207 | 75,615 |
| | JPMorgan Chase & Co. | 1,238,571 | 75,194 |
| | | |
| | | | Market |
| | | | Value |
| | | Shares | ($000) |
| | Citigroup Inc. | 1,287,648 | 61,292 |
| * | Berkshire Hathaway Inc. | | |
| | Class B | 363,140 | 45,382 |
| | American International | | |
| | Group Inc. | 766,420 | 38,329 |
| | McGraw Hill Financial Inc. | 310,500 | 23,691 |
| | Goldman Sachs Group Inc. | 137,820 | 22,582 |
| | American Express Co. | 238,557 | 21,477 |
| | Aon plc | 238,760 | 20,123 |
| | Capital One Financial Corp. | 218,157 | 16,833 |
| | Ameriprise Financial Inc. | 151,134 | 16,635 |
| | Travelers Cos. Inc. | 189,716 | 16,145 |
| | CME Group Inc. | 176,300 | 13,048 |
| | Unum Group | 362,464 | 12,799 |
| | Marsh & McLennan | | |
| | Cos. Inc. | 250,867 | 12,368 |
| | Aflac Inc. | 189,430 | 11,942 |
| | Fifth Third Bancorp | 516,800 | 11,861 |
| | Chubb Corp. | 131,304 | 11,725 |
| | Simon Property Group Inc. | 70,499 | 11,562 |
| | Regions Financial Corp. | 1,014,200 | 11,268 |
| | SLM Corp. | 460,100 | 11,263 |
| | Public Storage | 58,760 | 9,900 |
| | Assurant Inc. | 149,710 | 9,725 |
| | Bank of New York | | |
| | Mellon Corp. | 259,675 | 9,164 |
| | Lincoln National Corp. | 176,360 | 8,936 |
| | HCP Inc. | 186,744 | 7,244 |
| | General Growth | | |
| | Properties Inc. | 304,699 | 6,703 |
| | Legg Mason Inc. | 134,286 | 6,585 |
| | MetLife Inc. | 123,210 | 6,505 |
| | BB&T Corp. | 158,050 | 6,349 |
| | SunTrust Banks Inc. | 159,050 | 6,329 |
| | KeyCorp | 427,940 | 6,094 |
| | Crown Castle | | |
| | International Corp. | 79,500 | 5,865 |
| * | E*TRADE Financial Corp. | 241,819 | 5,567 |
| | Progressive Corp. | 228,573 | 5,536 |
| * | CBRE Group Inc. Class A | 195,770 | 5,370 |
| | Ventas Inc. | 84,800 | 5,136 |
| | Morgan Stanley | 157,080 | 4,896 |
| | Moody’s Corp. | 56,700 | 4,497 |
| | Vornado Realty Trust | 44,433 | 4,379 |
| | Principal Financial Group Inc. 93,710 | 4,310 |
| | Discover Financial Services | 70,730 | 4,116 |
| | XL Group plc Class A | 129,410 | 4,044 |
| | NASDAQ OMX Group Inc. | 102,740 | 3,795 |
| | Equity Residential | 64,800 | 3,758 |
| | People’s United | | |
| | Financial Inc. | 231,042 | 3,436 |
| | Prudential Financial Inc. | 40,070 | 3,392 |
| * | Realogy Holdings Corp. | 76,400 | 3,320 |
| | Kimco Realty Corp. | 130,600 | 2,857 |
| | Host Hotels & Resorts Inc. | 110,300 | 2,232 |
| | First Horizon National Corp. | 178,470 | 2,202 |
18
| | | |
| Growth and Income Fund | | |
| |
| |
| |
| | | | Market |
| | | | Value |
| | | Shares | ($000) |
| | Loews Corp. | 45,410 | 2,000 |
| | State Street Corp. | 28,200 | 1,961 |
| | Granite REIT | 47,800 | 1,733 |
| | ACE Ltd. | 13,100 | 1,298 |
| | Northern Trust Corp. | 15,580 | 1,021 |
| | Comerica Inc. | 18,646 | 966 |
| | Hartford Financial Services | | |
| | Group Inc. | 27,160 | 958 |
| | PNC Financial Services | | |
| | Group Inc. | 8,800 | 766 |
| | Symetra Financial Corp. | 37,262 | 738 |
| | American Tower Corporation | 8,235 | 674 |
| | Equity Lifestyle | | |
| | Properties Inc. | 15,375 | 625 |
| * | Alleghany Corp. | 1,437 | 585 |
| | Columbia Property Trust Inc. | 20,100 | 548 |
| | Leucadia National Corp. | 18,743 | 525 |
| | Prologis Inc. | 12,634 | 516 |
| | BlackRock Inc. | 1,600 | 503 |
| | Plum Creek Timber Co. Inc. | 11,400 | 479 |
| | Erie Indemnity Co. Class A | 6,709 | 468 |
| | AG Mortgage Investment | | |
| | Trust Inc. | 25,973 | 455 |
| * | Howard Hughes Corp. | 3,100 | 442 |
| | PacWest Bancorp | 7,700 | 331 |
| | US Bancorp | 7,534 | 323 |
| * | NewStar Financial Inc. | 22,800 | 316 |
| | Cincinnati Financial Corp. | 5,900 | 287 |
| | CapitalSource Inc. | 19,370 | 283 |
| | Brixmor Property Group Inc. | 12,000 | 256 |
| * | PHH Corp. | 7,100 | 183 |
| * | Tree.com Inc. | 4,400 | 137 |
| * | Third Point Reinsurance Ltd. | 7,800 | 124 |
| | Starwood Property Trust Inc. | 4,862 | 115 |
| * | Flagstar Bancorp Inc. | 4,891 | 109 |
| | FelCor Lodging Trust Inc. | 11,365 | 103 |
| | Healthcare Trust of America | | |
| | Inc. Class A | 8,500 | 97 |
| | CIT Group Inc. | 1,900 | 93 |
| | Ashford Hospitality Prime Inc. | 5,892 | 89 |
| | Retail Properties of | | |
| | America Inc. | 6,200 | 84 |
| | Umpqua Holdings Corp. | 4,000 | 75 |
| | Ryman Hospitality | | |
| | Properties Inc. | 1,600 | 68 |
| | Old National Bancorp | 3,600 | 54 |
| | CorEnergy Infrastructure | | |
| | Trust Inc. | 6,019 | 41 |
| * | JGWPT Holdings Inc. | | |
| | Class A | 2,214 | 40 |
| | PS Business Parks Inc. | 400 | 33 |
| | Artisan Partners Asset | | |
| | Management Inc. Class A | 500 | 32 |
| | Geo Group Inc. | 800 | 26 |
| | Sterling Financial Corp. | 700 | 23 |
| | MVC Capital Inc. | 1,516 | 20 |
| | | |
| | | | Market |
| | | | Value |
| | | Shares | ($000) |
| | ZAIS Financial Corp. | 771 | 13 |
| | Spirit Realty Capital Inc. | 1,098 | 12 |
| | MCG Capital Corp. | 2,400 | 9 |
| | Prospect Capital Corp. | 800 | 9 |
| * | Hilltop Holdings Inc. | 300 | 7 |
| * | Suffolk Bancorp | 300 | 7 |
| | Prosperity Bancshares Inc. | 62 | 4 |
| | SI Financial Group Inc. | 100 | 1 |
| | | | 804,073 |
| Health Care (15.0%) | | |
| | Johnson & Johnson | 1,229,026 | 120,727 |
| | Pfizer Inc. | 2,197,389 | 70,580 |
| | Merck & Co. Inc. | 1,192,656 | 67,707 |
| | Eli Lilly & Co. | 715,205 | 42,097 |
| | AbbVie Inc. | 801,073 | 41,175 |
| * | Gilead Sciences Inc. | 425,980 | 30,185 |
| | Medtronic Inc. | 407,435 | 25,074 |
| | UnitedHealth Group Inc. | 294,648 | 24,158 |
| | Cigna Corp. | 276,149 | 23,122 |
| * | Mylan Inc. | 459,510 | 22,438 |
| * | Celgene Corp. | 155,750 | 21,743 |
| * | Express Scripts Holding Co. | 286,190 | 21,490 |
| | WellPoint Inc. | 212,560 | 21,160 |
| * | Biogen Idec Inc. | 67,300 | 20,585 |
| * | Boston Scientific Corp. | 1,433,079 | 19,375 |
| | Cardinal Health Inc. | 271,218 | 18,980 |
| | Thermo Fisher | | |
| | Scientific Inc. | 150,410 | 18,085 |
| | Amgen Inc. | 127,990 | 15,786 |
| | McKesson Corp. | 88,917 | 15,700 |
| * | DaVita HealthCare | | |
| | Partners Inc. | 201,501 | 13,873 |
| | Abbott Laboratories | 343,293 | 13,220 |
| * | Actavis plc | 52,860 | 10,881 |
| | CR Bard Inc. | 71,800 | 10,625 |
| * | Laboratory Corp. of | | |
| | America Holdings | 107,110 | 10,519 |
| * | Hospira Inc. | 243,020 | 10,511 |
| | Baxter International Inc. | 138,358 | 10,180 |
| | Agilent Technologies Inc. | 179,300 | 10,026 |
| | Bristol-Myers Squibb Co. | 180,542 | 9,379 |
| | Quest Diagnostics Inc. | 152,360 | 8,825 |
| * | Tenet Healthcare Corp. | 205,356 | 8,791 |
| | Humana Inc. | 72,300 | 8,150 |
| * | Vertex Pharmaceuticals Inc. 97,000 | 6,860 |
| | Becton Dickinson and Co. | 49,582 | 5,805 |
| | AmerisourceBergen Corp. | | |
| | Class A | 88,470 | 5,803 |
| | Zoetis Inc. | 192,100 | 5,559 |
| * | Edwards Lifesciences Corp. 69,200 | 5,133 |
| | Allergan Inc. | 38,510 | 4,779 |
| | Covidien plc | 60,635 | 4,466 |
| * | CareFusion Corp. | 107,100 | 4,308 |
| * | Forest Laboratories Inc. | 45,600 | 4,207 |
| | PerkinElmer Inc. | 64,042 | 2,886 |
19
| | | |
| Growth and Income Fund | | |
| |
| |
| |
| | | | Market |
| | | | Value |
| | | Shares | ($000) |
| | Zimmer Holdings Inc. | 21,329 | 2,017 |
| * | Valeant Pharmaceuticals | | |
| | International Inc. | 14,500 | 1,912 |
| * | Regeneron | | |
| | Pharmaceuticals Inc. | 6,280 | 1,886 |
| * | Sarepta Therapeutics Inc. | 70,360 | 1,691 |
| * | Alexion Pharmaceuticals Inc. | 11,110 | 1,690 |
| * | BioCryst | | |
| | Pharmaceuticals Inc. | 122,600 | 1,297 |
| * | Health Net Inc. | 29,100 | 990 |
| | Perrigo Co. plc | 5,830 | 902 |
| * | Dynavax Technologies | | |
| | Corp. | 446,200 | 803 |
| * | Brookdale Senior Living | | |
| | Inc. Class A | 21,700 | 727 |
| * | Theravance Inc. | 21,400 | 662 |
| * | Pain Therapeutics Inc. | 79,550 | 438 |
| * | Zogenix Inc. | 134,400 | 382 |
| * | XenoPort Inc. | 73,637 | 381 |
| * | Puma Biotechnology Inc. | 3,403 | 354 |
| * | Vanda Pharmaceuticals Inc. | 20,500 | 333 |
| * | Omeros Corp. | 21,700 | 262 |
| | Pozen Inc. | 26,825 | 215 |
| * | Amicus Therapeutics Inc. | 103,161 | 214 |
| | Aetna Inc. | 2,454 | 184 |
| * | Horizon Pharma Inc. | 11,200 | 169 |
| * | BioTelemetry Inc. | 16,100 | 162 |
| * | Vical Inc. | 116,281 | 150 |
| * | Agenus Inc. | 47,172 | 150 |
| * | Medical Action | | |
| | Industries Inc. | 18,528 | 129 |
| * | HCA Holdings Inc. | 2,000 | 105 |
| * | Geron Corp. | 47,500 | 99 |
| * | ARIAD Pharmaceuticals Inc. | 11,409 | 92 |
| * | ANI Pharmaceuticals Inc. | 2,800 | 88 |
| * | Amedisys Inc. | 5,712 | 85 |
| * | LCA-Vision Inc. | 15,797 | 85 |
| * | Oncothyreon Inc. | 26,656 | 80 |
| | HealthSouth Corp. | 2,100 | 75 |
| * | AMAG Pharmaceuticals Inc. | 3,800 | 74 |
| * | Concert Pharmaceuticals Inc. | 5,463 | 73 |
| * | Dicerna Pharmaceuticals Inc. | 2,500 | 71 |
| * | Repros Therapeutics Inc. | 3,800 | 67 |
| *,^ | ImmunoCellular | | |
| | Therapeutics Ltd. | 54,392 | 66 |
| | Patterson Cos. Inc. | 1,428 | 60 |
| * | Durect Corp. | 42,200 | 56 |
| * | Aerie Pharmaceuticals Inc. | 2,584 | 55 |
| * | Albany Molecular | | |
| | Research Inc. | 2,500 | 46 |
| * | Acceleron Pharma Inc. | 1,320 | 46 |
| * | Zalicus Inc. | 33,500 | 41 |
| * | Rigel Pharmaceuticals Inc. | 9,910 | 38 |
| * | Idenix Pharmaceuticals Inc. | 5,300 | 32 |
| * | GTx Inc. | 20,800 | 32 |
| * | Karyopharm Therapeutics Inc. | 1,000 | 31 |
| | | |
| | | | Market |
| | | | Value |
| | | Shares | ($000) |
| * | Eagle Pharmaceuticals Inc. | 2,386 | 30 |
| * | KaloBios Pharmaceuticals Inc. | 9,367 | 25 |
| * | Celsion Corp. | 7,500 | 25 |
| * | Keryx Biopharmaceuticals Inc. 1,200 | 20 |
| * | Arqule Inc. | 9,700 | 20 |
| * | Sunesis Pharmaceuticals Inc. | 2,818 | 19 |
| * | Cleveland Biolabs Inc. | 22,800 | 16 |
| * | Biodel Inc. | 5,200 | 14 |
| * | Retrophin Inc. | 600 | 13 |
| * | Receptos Inc. | 300 | 13 |
| * | GlycoMimetics Inc. | 700 | 11 |
| * | Dendreon Corp. | 3,600 | 11 |
| * | Orexigen Therapeutics Inc. | 1,400 | 9 |
| * | Genocea Biosciences Inc. | 400 | 7 |
| * | Vivus Inc. | 943 | 6 |
| * | Novavax Inc. | 1,100 | 5 |
| * | Affymax Inc. | 4,600 | 4 |
| * | Baxano Surgical Inc. | 1,480 | 2 |
| * | Myrexis Inc. | 1,550 | — |
| | | | 834,800 |
| Industrials (11.5%) | | |
| | General Electric Co. | 4,128,130 | 106,877 |
| | Boeing Co. | 486,910 | 61,102 |
| | General Dynamics Corp. | 344,890 | 37,565 |
| | Lockheed Martin Corp. | 190,624 | 31,117 |
| | United Technologies Corp. | 237,610 | 27,762 |
| | United Parcel Service Inc. | | |
| | Class B | 274,558 | 26,736 |
| | Delta Air Lines Inc. | 679,180 | 23,534 |
| | Tyco International Ltd. | 533,200 | 22,608 |
| | Southwest Airlines Co. | 869,308 | 20,524 |
| | Northrop Grumman Corp. | 161,430 | 19,917 |
| | Danaher Corp. | 250,268 | 18,770 |
| | Union Pacific Corp. | 98,076 | 18,405 |
| | Raytheon Co. | 183,030 | 18,082 |
| | Emerson Electric Co. | 259,549 | 17,338 |
| | Pitney Bowes Inc. | 618,800 | 16,083 |
| | Honeywell International Inc. | 154,580 | 14,339 |
| | Republic Services Inc. | | |
| | Class A | 357,280 | 12,205 |
| | FedEx Corp. | 84,150 | 11,155 |
| | ADT Corp. | 364,000 | 10,902 |
| | 3M Co. | 76,020 | 10,313 |
| | Rockwell Automation Inc. | 78,700 | 9,802 |
| | Snap-on Inc. | 76,500 | 8,681 |
| | L-3 Communications | | |
| | Holdings Inc. | 70,545 | 8,335 |
| | Caterpillar Inc. | 73,201 | 7,274 |
| | Precision Castparts Corp. | 27,500 | 6,951 |
| | Stanley Black & Decker Inc. | 73,290 | 5,954 |
| | Rockwell Collins Inc. | 74,590 | 5,943 |
| | Deere & Co. | 64,832 | 5,887 |
| | CSX Corp. | 186,829 | 5,412 |
| | Ingersoll-Rand plc | 86,460 | 4,949 |
| | Joy Global Inc. | 81,850 | 4,747 |
20
| | | |
| Growth and Income Fund | | |
| |
| |
| |
| | | | Market |
| | | | Value |
| | | Shares | ($000) |
| | Textron Inc. | 116,420 | 4,574 |
| | Allegion plc | 79,220 | 4,133 |
| | Iron Mountain Inc. | 141,089 | 3,890 |
| | Masco Corp. | 171,760 | 3,815 |
| | Xylem Inc. | 100,370 | 3,655 |
| | PACCAR Inc. | 49,910 | 3,366 |
| | Dun & Bradstreet Corp. | 33,330 | 3,311 |
| | CH Robinson Worldwide Inc. | 52,920 | 2,773 |
| | Pentair Ltd. | 33,573 | 2,664 |
| | Norfolk Southern Corp. | 24,150 | 2,347 |
| | Flowserve Corp. | 17,220 | 1,349 |
| | Waste Management Inc. | 24,890 | 1,047 |
| | Huntington Ingalls | | |
| | Industries Inc. | 9,300 | 951 |
| * | Spirit AeroSystems | | |
| | Holdings Inc. Class A | 20,500 | 578 |
| * | AerCap Holdings NV | 10,518 | 444 |
| | Babcock & Wilcox Co. | 12,800 | 425 |
| | Dover Corp. | 4,800 | 392 |
| * | Spirit Airlines Inc. | 4,700 | 279 |
| * | United Continental | | |
| | Holdings Inc. | 4,700 | 210 |
| | Covanta Holding Corp. | 9,100 | 164 |
| * | Meritor Inc. | 11,000 | 135 |
| | RR Donnelley & Sons Co. | 6,500 | 116 |
| | TransDigm Group Inc. | 400 | 74 |
| | Owens Corning | 1,600 | 69 |
| | Waste Connections Inc. | 1,170 | 51 |
| * | Norcraft Cos. Inc. | 2,800 | 47 |
| * | Box Ships Inc. | 18,631 | 45 |
| | Alliant Techsystems Inc. | 300 | 43 |
| * | ARC Document Solutions Inc. | 5,362 | 40 |
| * | Colfax Corp. | 500 | 36 |
| | Intersections Inc. | 4,360 | 26 |
| | Matson Inc. | 900 | 22 |
| | Cintas Corp. | 131 | 8 |
| * | Scorpio Bulkers Inc. | 300 | 3 |
| | Baltic Trading Ltd. | 300 | 2 |
| | | | 640,353 |
| Information Technology (17.3%) | |
| | Apple Inc. | 323,083 | 173,412 |
| * | Google Inc. Class A | 90,909 | 101,319 |
| | Microsoft Corp. | 1,737,474 | 71,219 |
| | International Business | | |
| | Machines Corp. | 294,377 | 56,665 |
| | Hewlett-Packard Co. | 1,446,920 | 46,822 |
| | Visa Inc. Class A | 187,932 | 40,567 |
| * | Facebook Inc. Class A | 462,214 | 27,844 |
| | Computer Sciences Corp. | 437,090 | 26,584 |
| | Cisco Systems Inc. | 1,066,787 | 23,907 |
| | Motorola Solutions Inc. | 370,756 | 23,836 |
| | MasterCard Inc. Class A | 302,660 | 22,609 |
| | Oracle Corp. | 547,455 | 22,396 |
| | Texas Instruments Inc. | 405,152 | 19,103 |
| | Western Digital Corp. | 206,525 | 18,963 |
| | | |
| | | | Market |
| | | | Value |
| | | Shares | ($000) |
| | Intel Corp. | 680,159 | 17,555 |
| | Seagate Technology plc | 284,240 | 15,963 |
| | Harris Corp. | 214,610 | 15,701 |
| | Xerox Corp. | 1,344,830 | 15,197 |
| | Accenture plc Class A | 181,800 | 14,493 |
| * | VeriSign Inc. | 240,020 | 12,939 |
| | Fidelity National | | |
| | Information Services Inc. | 241,887 | 12,929 |
| * | Teradata Corp. | 247,540 | 12,176 |
| | Western Union Co. | 732,992 | 11,992 |
| * | Micron Technology Inc. | 500,361 | 11,839 |
| | Broadcom Corp. Class A | 370,513 | 11,664 |
| | Intuit Inc. | 149,000 | 11,582 |
| * | Electronic Arts Inc. | 385,320 | 11,178 |
| * | Fiserv Inc. | 175,610 | 9,955 |
| * | First Solar Inc. | 130,280 | 9,092 |
| * | Yahoo! Inc. | 251,020 | 9,012 |
| | LSI Corp. | 787,370 | 8,716 |
| * | Lam Research Corp. | 139,430 | 7,669 |
| | EMC Corp. | 267,053 | 7,320 |
| | Corning Inc. | 302,275 | 6,293 |
| | Symantec Corp. | 301,386 | 6,019 |
| | CA Inc. | 178,530 | 5,529 |
| * | Red Hat Inc. | 89,904 | 4,763 |
| | QUALCOMM Inc. | 58,600 | 4,621 |
| | NetApp Inc. | 116,960 | 4,316 |
| * | Juniper Networks Inc. | 153,140 | 3,945 |
| | Xilinx Inc. | 71,600 | 3,886 |
| * | Cognizant Technology | | |
| | Solutions Corp. Class A | 70,000 | 3,543 |
| * | Citrix Systems Inc. | 42,930 | 2,465 |
| | TE Connectivity Ltd. | 35,000 | 2,107 |
| * | CoreLogic Inc. | 61,900 | 1,859 |
| | NVIDIA Corp. | 94,520 | 1,693 |
| * | Autodesk Inc. | 32,000 | 1,574 |
| * | AOL Inc. | 33,000 | 1,444 |
| * | Zebra Technologies Corp. | 17,700 | 1,229 |
| * | eBay Inc. | 20,800 | 1,149 |
| * | Zynga Inc. Class A | 242,000 | 1,041 |
| | Linear Technology Corp. | 21,000 | 1,022 |
| * | Akamai Technologies Inc. | 12,050 | 701 |
| * | NCR Corp. | 18,600 | 680 |
| | KLA-Tencor Corp. | 9,330 | 645 |
| * | Genpact Ltd. | 36,100 | 629 |
| * | Aeroflex Holding Corp. | 66,427 | 552 |
| * | Flextronics International Ltd. | 37,600 | 347 |
| | Diebold Inc. | 8,500 | 339 |
| * | Sigma Designs Inc. | 53,930 | 257 |
| | Analog Devices Inc. | 3,700 | 197 |
| * | Mellanox Technologies Ltd. | 4,200 | 164 |
| | Marvell Technology | | |
| | Group Ltd. | 10,000 | 157 |
| * | Silicon Image Inc. | 21,700 | 150 |
| | Altera Corp. | 3,867 | 140 |
| * | Lionbridge Technologies Inc. | 9,111 | 61 |
21
| | | |
| Growth and Income Fund | | |
| |
| |
| |
| | | | Market |
| | | | Value |
| | | Shares | ($000) |
| | Automatic Data | | |
| | Processing Inc. | 700 | 54 |
| * | Agilysys Inc. | 3,462 | 46 |
| | Tessera Technologies Inc. | 1,800 | 42 |
| * | NCI Inc. Class A | 3,044 | 32 |
| * | Tremor Video Inc. | 7,092 | 29 |
| * | Vocus Inc. | 2,100 | 28 |
| * | Alliance Data Systems Corp. | 100 | 27 |
| * | TiVo Inc. | 1,700 | 22 |
| * | Quantum Corp. | 17,100 | 21 |
| | AVX Corp. | 1,200 | 16 |
| * | Fabrinet | 701 | 15 |
| | IXYS Corp. | 888 | 10 |
| * | Identive Group Inc. | 6,900 | 8 |
| * | Mattson Technology Inc. | 2,800 | 6 |
| * | Amtech Systems Inc. | 500 | 6 |
| * | UTStarcom Holdings Corp. | 1,453 | 4 |
| * | Net 1 UEPS Technologies Inc. 395 | 4 |
| | FLIR Systems Inc. | 100 | 4 |
| * | Orbotech Ltd. | 200 | 3 |
| * | Novatel Wireless Inc. | 1,526 | 3 |
| * | FormFactor Inc. | 400 | 3 |
| | Pulse Electronics Corp. | 540 | 2 |
| | Applied Materials Inc. | 100 | 2 |
| * | Smith Micro Software Inc. | 969 | 2 |
| * | MaxLinear Inc. | 200 | 2 |
| | | | 966,126 |
| Materials (3.5%) | | |
| | LyondellBasell Industries | | |
| | NV Class A | 348,700 | 31,013 |
| | Dow Chemical Co. | 533,313 | 25,914 |
| | Sealed Air Corp. | 763,252 | 25,088 |
| | Ball Corp. | 332,916 | 18,247 |
| | Monsanto Co. | 126,600 | 14,403 |
| | Air Products & | | |
| | Chemicals Inc. | 105,100 | 12,511 |
| | PPG Industries Inc. | 62,655 | 12,121 |
| | EI du Pont de | | |
| | Nemours & Co. | 165,356 | 11,095 |
| | Avery Dennison Corp. | 206,000 | 10,438 |
| | Valspar Corp. | 111,800 | 8,063 |
| * | Owens-Illinois Inc. | 207,932 | 7,034 |
| | Mosaic Co. | 89,130 | 4,457 |
| | Eastman Chemical Co. | 41,136 | 3,546 |
| | Alcoa Inc. | 243,490 | 3,134 |
| | Sigma-Aldrich Corp. | 23,900 | 2,232 |
| | Freeport-McMoRan | | |
| | Copper & Gold Inc. | 55,463 | 1,834 |
| | Nucor Corp. | 33,180 | 1,677 |
| | Rockwood Holdings Inc. | 22,100 | 1,644 |
| | Newmont Mining Corp. | 26,270 | 616 |
| | Ecolab Inc. | 4,500 | 486 |
| | Vulcan Materials Co. | 6,521 | 433 |
| | International Flavors | | |
| | & Fragrances Inc. | 2,800 | 268 |
| * | Mercer International Inc. | 32,426 | 243 |
| | | |
| | | | Market |
| | | | Value |
| | | Shares | ($000) |
| | CF Industries Holdings Inc. | 510 | 133 |
| | MeadWestvaco Corp. | 2,600 | 98 |
| | Mesabi Trust | 4,567 | 96 |
| | Bemis Co. Inc. | 2,039 | 80 |
| * | Vista Gold Corp. | 112,900 | 58 |
| * | Rare Element | | |
| | Resources Ltd. | 29,988 | 44 |
| * | Golden Star Resources Ltd. | 39,700 | 24 |
| | Huntsman Corp. | 700 | 17 |
| * | Resolute Forest Products Inc. | 669 | 14 |
| *,^ | Tanzanian Royalty | | |
| | Exploration Corp. | 4,100 | 10 |
| | Globe Specialty Metals Inc. | 100 | 2 |
| | | | 197,073 |
| Other (0.3%) | | |
| | SPDR S&P 500 ETF Trust | 89,500 | 16,740 |
| |
| Telecommunication Services (3.1%) | |
| | AT&T Inc. | 2,556,378 | 89,652 |
| | Verizon | | |
| | Communications Inc. | 1,074,329 | 51,106 |
| | CenturyLink Inc. | 626,656 | 20,579 |
| | Frontier | | |
| | Communications Corp. | 1,105,200 | 6,300 |
| * | Sprint Corp. | 360,105 | 3,309 |
| | Windstream Holdings Inc. | 331,000 | 2,728 |
| * | tw telecom inc Class A | 10,000 | 313 |
| | | | 173,987 |
| Utilities (2.9%) | | |
| | Exelon Corp. | 1,039,103 | 34,872 |
| | Ameren Corp. | 573,850 | 23,643 |
| | AES Corp. | 1,637,333 | 23,381 |
| | Dominion Resources Inc. | 260,664 | 18,504 |
| | American Electric Power | | |
| | Co. Inc. | 342,320 | 17,342 |
| | PG&E Corp. | 328,300 | 14,183 |
| | Edison International | 225,999 | 12,794 |
| | FirstEnergy Corp. | 247,697 | 8,429 |
| | Southern Co. | 59,730 | 2,624 |
| | Entergy Corp. | 23,000 | 1,538 |
| | NiSource Inc. | 33,500 | 1,190 |
| | Duke Energy Corp. | 12,830 | 914 |
| | CenterPoint Energy Inc. | 34,450 | 816 |
| | Northeast Utilities | 17,210 | 783 |
| | Integrys Energy Group Inc. | 12,700 | 758 |
| | Portland General Electric Co. | 2,900 | 94 |
| * | Calpine Corp. | 3,100 | 65 |
| * | Dynegy Inc. Class A | 1,800 | 45 |
| | CMS Energy Corp. | 1,209 | 35 |
| | NorthWestern Corp. | 700 | 33 |
| | Pattern Energy Group Inc. | 900 | 24 |
| | | | 162,067 |
| Total Common Stocks | | |
| (Cost $4,537,315) | | 5,438,611 |
22
| | | |
| Growth and Income Fund | | |
| |
| |
| |
| | | | Market |
| | | | Value |
| | | Shares | ($000) |
| Temporary Cash Investments (2.6%)1 | |
| Money Market Fund (2.5%) | | |
| 2,3 | Vanguard Market | | |
| | Liquidity Fund, | | |
| | 0.122% | 137,267,400 | 137,267 |
| |
| | | Face | |
| | | Amount | |
| | | ($000) | |
| U.S. Government and Agency Obligations (0.1%) |
| 4,5 | Federal Home Loan | | |
| | Bank Discount Notes, | | |
| | 0.055%–0.056%, 4/9/14 | 800 | 800 |
| 4,5 | Federal Home Loan | | |
| | Bank Discount Notes, | | |
| | 0.060%, 5/7/14 | 300 | 300 |
| 4,5 | Federal Home Loan | | |
| | Bank Discount Notes, | | |
| | 0.050%, 5/30/14 | 100 | 100 |
| 4 | Federal Home Loan | | |
| | Bank Discount Notes, | | |
| | 0.065%, 6/27/14 | 900 | 900 |
| 4,5 | Federal Home Loan | | |
| | Bank Discount Notes, | | |
| | 0.092%, 7/18/14 | 5,000 | 4,999 |
| | | | 7,099 |
| Total Temporary Cash Investments | |
| (Cost $144,366) | | 144,366 |
| Total Investments (100.1%) | | |
| (Cost $4,681,681) | | 5,582,977 |
| Other Assets and Liabilities (-0.1%) | |
| Other Assets | | 71,642 |
| Liabilities3 | | (77,632) |
| | | | (5,990) |
| Net Assets (100%) | | 5,576,987 |
| |
| At March 31, 2014, net assets consisted of: |
| | Amount |
| | ($000) |
| Paid-in Capital | 4,591,110 |
| Undistributed Net Investment Income | 9,380 |
| Accumulated Net Realized Gains | 74,218 |
| Unrealized Appreciation (Depreciation) | |
| Investment Securities | 901,296 |
| Futures Contracts | 983 |
| Net Assets | 5,576,987 |
| |
| |
| Investor Shares—Net Assets | |
| Applicable to 74,972,857 outstanding | |
| $.001 par value shares of beneficial | |
| interest (unlimited authorization) | 3,014,863 |
| Net Asset Value Per Share— | |
| Investor Shares | $40.21 |
| |
| |
| Admiral Shares—Net Assets | |
| Applicable to 39,019,491 outstanding | |
| $.001 par value shares of beneficial | |
| interest (unlimited authorization) | 2,562,124 |
| Net Asset Value Per Share— | |
| Admiral Shares | $65.66 |
See Note A in Notes to Financial Statements.
* Non-income-producing security.
^ Includes partial security positions on loan to broker-dealers. The total value of securities on loan is $178,000.
1 The fund invests a portion of its cash reserves in equity markets through the use of index futures contracts. After giving effect to futures investments, the fund’s effective common stock and temporary cash investment positions represent 99.8% and 0.3%, respectively, of net assets.
2 Affiliated money market fund available only to Vanguard funds and certain trusts and accounts managed by Vanguard. Rate shown is the 7-day yield.
3 Includes $227,000 of collateral received for securities on loan.
4 The issuer operates under a congressional charter; its securities are generally neither guaranteed by the U.S. Treasury nor backed by the full faith and credit of the U.S. government.
5 Securities with a value of $6,099,000 have been segregated as initial margin for open futures contracts.
REIT—Real Estate Investment Trust.
See accompanying Notes, which are an integral part of the Financial Statements.
23
| |
| Growth and Income Fund | |
| |
| |
| Statement of Operations | |
| |
| | Six Months Ended |
| | March 31, 2014 |
| | ($000) |
| Investment Income | |
| Income | |
| Dividends1 | 53,378 |
| Interest2 | 88 |
| Securities Lending | 47 |
| Total Income | 53,513 |
| Expenses | |
| Investment Advisory Fees—Note B | |
| Basic Fee | 2,789 |
| Performance Adjustment | 434 |
| The Vanguard Group—Note C | |
| Management and Administrative—Investor Shares | 3,305 |
| Management and Administrative—Admiral Shares | 1,402 |
| Marketing and Distribution—Investor Shares | 226 |
| Marketing and Distribution—Admiral Shares | 161 |
| Custodian Fees | 181 |
| Shareholders’ Reports—Investor Shares | 34 |
| Shareholders’ Reports—Admiral Shares | 6 |
| Trustees’ Fees and Expenses | 5 |
| Total Expenses | 8,543 |
| Net Investment Income | 44,970 |
| Realized Net Gain (Loss) | |
| Investment Securities Sold | 381,572 |
| Futures Contracts | 11,452 |
| Realized Net Gain (Loss) | 393,024 |
| Change in Unrealized Appreciation (Depreciation) | |
| Investment Securities | 189,567 |
| Futures Contracts | 1,797 |
| Change in Unrealized Appreciation (Depreciation) | 191,364 |
| Net Increase (Decrease) in Net Assets Resulting from Operations | 629,358 |
| 1 Dividends are net of foreign withholding taxes of $9,000. | |
| 2 Interest income from an affiliated company of the fund was $85,000. | |
See accompanying Notes, which are an integral part of the Financial Statements.
24
| | |
| Growth and Income Fund | | |
| |
| |
| Statement of Changes in Net Assets | | |
| |
| | Six Months Ended | Year Ended |
| | March 31, | September 30, |
| | 2014 | 2013 |
| | ($000) | ($000) |
| Increase (Decrease) in Net Assets | | |
| Operations | | |
| Net Investment Income | 44,970 | 90,414 |
| Realized Net Gain (Loss) | 393,024 | 617,757 |
| Change in Unrealized Appreciation (Depreciation) | 191,364 | 125,858 |
| Net Increase (Decrease) in Net Assets Resulting from Operations | 629,358 | 834,029 |
| Distributions | | |
| Net Investment Income | | |
| Investor Shares | (24,787) | (53,617) |
| Admiral Shares | (21,165) | (36,430) |
| Realized Capital Gain | | |
| Investor Shares | — | — |
| Admiral Shares | — | — |
| Total Distributions | (45,952) | (90,047) |
| Capital Share Transactions | | |
| Investor Shares | (179,543) | (383,262) |
| Admiral Shares | 146,613 | 276,911 |
| Net Increase (Decrease) from Capital Share Transactions | (32,930) | (106,351) |
| Total Increase (Decrease) | 550,476 | 637,631 |
| Net Assets | | |
| Beginning of Period | 5,026,511 | 4,388,880 |
| End of Period1 | 5,576,987 | 5,026,511 |
1 Net Assets—End of Period includes undistributed net investment income of $9,380,000 and $10,362,000.
See accompanying Notes, which are an integral part of the Financial Statements.
25
| | | | | | |
| Growth and Income Fund | | | | | | |
| |
| |
| Financial Highlights | | | | | | |
| |
| |
| Investor Shares | | | | | | |
| | Six Months | | | | | |
| | Ended | | | | | |
| For a Share Outstanding | March 31, | | | Year Ended September 30, |
| Throughout Each Period | 2014 | 2013 | 2012 | 2011 | 2010 | 2009 |
| Net Asset Value, Beginning of Period | $36.02 | $30.73 | $23.86 | $23.98 | $22.34 | $25.84 |
| Investment Operations | | | | | | |
| Net Investment Income | . 315 | .631 | .549 | .482 | .418 | .447 |
| Net Realized and Unrealized Gain (Loss) | | | | | | |
| on Investments | 4.198 | 5.288 | 6.846 | (.124) | 1.630 | (3.453) |
| Total from Investment Operations | 4.513 | 5.919 | 7.395 | .358 | 2.048 | (3.006) |
| Distributions | | | | | | |
| Dividends from Net Investment Income | (. 323) | (. 629) | (. 525) | (. 478) | (. 408) | (. 494) |
| Distributions from Realized Capital Gains | — | — | — | — | — | — |
| Total Distributions | (. 323) | (. 629) | (. 525) | (. 478) | (. 408) | (. 494) |
| Net Asset Value, End of Period | $40.21 | $36.02 | $30.73 | $23.86 | $23.98 | $22.34 |
| |
| Total Return1 | 12.58% | 19.54% | 31.27% | 1.28% | 9.24% | -11.29% |
| |
| Ratios/Supplemental Data | | | | | | |
| Net Assets, End of Period (Millions) | $3,015 | $2,869 | $2,798 | $2,548 | $3,020 | $3,253 |
| Ratio of Total Expenses to | | | | | | |
| Average Net Assets2 | 0.37% | 0.36% | 0.36% | 0.32% | 0.32% | 0.35% |
| Ratio of Net Investment Income to | | | | | | |
| Average Net Assets | 1.65% | 1.90% | 1.94% | 1.78% | 1.74% | 2.28% |
| Portfolio Turnover Rate | 140% | 109% | 102% | 120% | 94% | 83% |
The expense ratio, net income ratio, and turnover rate for the current period have been annualized.
1 Total returns do not include account service fees that may have applied in the periods shown. Fund prospectuses provide information about any applicable account service fees.
2 Includes performance-based investment advisory fee increases (decreases) of 0.02%, 0.01%, 0.01%, (0.04%), (0.04%), and (0.04%).
See accompanying Notes, which are an integral part of the Financial Statements.
26
| | | | | | |
| Growth and Income Fund | | | | | | |
| |
| |
| Financial Highlights | | | | | | |
| |
| |
| Admiral Shares | | | | | | |
| | Six Months | | | | | |
| | Ended | | | | | |
| For a Share Outstanding | March 31, | | | Year Ended September 30, |
| Throughout Each Period | 2014 | 2013 | 2012 | 2011 | 2010 | 2009 |
| Net Asset Value, Beginning of Period | $58.82 | $50.18 | $38.97 | $39.15 | $36.48 | $42.20 |
| Investment Operations | | | | | | |
| Net Investment Income | .552 | 1.097 | .952 | .832 | .722 | .775 |
| Net Realized and Unrealized Gain (Loss) | | | | | | |
| on Investments | 6.849 | 8.633 | 11.168 | (.199) | 2.666 | (5.638) |
| Total from Investment Operations | 7.401 | 9.730 | 12.120 | .633 | 3.388 | (4.863) |
| Distributions | | | | | | |
| Dividends from Net Investment Income | (. 561) | (1.090) | (. 910) | (. 813) | (.718) | (. 857) |
| Distributions from Realized Capital Gains | — | — | — | — | — | — |
| Total Distributions | (. 561) | (1.090) | (. 910) | (. 813) | (.718) | (. 857) |
| Net Asset Value, End of Period | $65.66 | $58.82 | $50.18 | $38.97 | $39.15 | $36.48 |
| |
| Total Return | 12.64% | 19.69% | 31.40% | 1.39% | 9.37% | -11.15% |
| |
| Ratios/Supplemental Data | | | | | | |
| Net Assets, End of Period (Millions) | $2,562 | $2,157 | $1,591 | $1,131 | $1,199 | $1,441 |
| Ratio of Total Expenses to | | | | | | |
| Average Net Assets1 | 0.26% | 0.26% | 0.25% | 0.21% | 0.21% | 0.21% |
| Ratio of Net Investment Income to | | | | | | |
| Average Net Assets | 1.76% | 2.00% | 2.05% | 1.89% | 1.85% | 2.42% |
| Portfolio Turnover Rate | 140% | 109% | 102% | 120% | 94% | 83% |
The expense ratio, net income ratio, and turnover rate for the current period have been annualized.
1 Includes performance-based investment advisory fee increases (decreases) of 0.02%, 0.01%, 0.01%, (0.04%), (0.04%), and (0.04%).
See accompanying Notes, which are an integral part of the Financial Statements.
27
Growth and Income Fund
Notes to Financial Statements
Vanguard Growth and Income Fund is registered under the Investment Company Act of 1940 as an open-end investment company, or mutual fund. The fund offers two classes of shares: Investor Shares and Admiral Shares. Investor Shares are available to any investor who meets the fund’s minimum purchase requirements. Admiral Shares are designed for investors who meet certain administrative, service, and account-size criteria.
A. The following significant accounting policies conform to generally accepted accounting principles for U.S. mutual funds. The fund consistently follows such policies in preparing its financial statements.
1. Security Valuation: Securities are valued as of the close of trading on the New York Stock Exchange (generally 4 p.m., Eastern time) on the valuation date. Equity securities are valued at the latest quoted sales prices or official closing prices taken from the primary market in which each security trades; such securities not traded on the valuation date are valued at the mean of the latest quoted bid and asked prices. Securities for which market quotations are not readily available, or whose values have been materially affected by events occurring before the fund’s pricing time but after the close of the securities’ primary markets, are valued by methods deemed by the board of trustees to represent fair value. Investments in Vanguard Market Liquidity Fund are valued at that fund’s net asset value. Temporary cash investments acquired over 60 days to maturity are valued using the latest bid prices or using valuations based on a matrix system (which considers such factors as security prices, yields, maturities, and ratings), both as furnished by independent pricing services. Other temporary cash investments are valued at amortized cost, which approximates market value.
2. Futures Contracts: The fund uses index futures contracts to a limited extent, with the objective of maintaining full exposure to the stock market while maintaining liquidity. The fund may purchase or sell futures contracts to achieve a desired level of investment, whether to accommodate portfolio turnover or cash flows from capital share transactions. The primary risks associated with the use of futures contracts are imperfect correlation between changes in market values of stocks held by the fund and the prices of futures contracts, and the possibility of an illiquid market. Counterparty risk involving futures is mitigated because a regulated clearinghouse is the counterparty instead of the clearing broker. To further mitigate counterparty risk, the fund trades futures contracts on an exchange, monitors the financial strength of its clearing brokers and clearinghouse, and has entered into clearing agreements with its clearing brokers. The clearinghouse imposes initial margin requirements to secure the fund’s performance and requires daily settlement of variation margin representing changes in the market value of each contract.
Futures contracts are valued at their quoted daily settlement prices. The aggregate notional amounts of the contracts are not recorded in the Statement of Net Assets. Fluctuations in the value of the contracts are recorded in the Statement of Net Assets as an asset (liability) and in the Statement of Operations as unrealized appreciation (depreciation) until the contracts are closed, when they are recorded as realized futures gains (losses).
During the six months ended March 31, 2014, the fund’s average investments in long and short futures contracts represented 2% and 0% of net assets, respectively, based on quarterly average aggregate settlement values.
3. Federal Income Taxes: The fund intends to continue to qualify as a regulated investment company and distribute all of its taxable income. Management has analyzed the fund’s tax positions taken for all open federal income tax years (September 30, 2010–2013), and for the period ended March 31, 2014, and has concluded that no provision for federal income tax is required in the fund’s financial statements.
4. Distributions: Distributions to shareholders are recorded on the ex-dividend date.
28
Growth and Income Fund
5. Securities Lending: To earn additional income, the fund lends its securities to qualified institutional borrowers. Security loans are required to be secured at all times by collateral in an amount at least equal to the market value of securities loaned. Daily market fluctuations could cause the value of loaned securities to be more or less than the value of the collateral received. When this occurs, the collateral is adjusted and settled on the next business day. The fund further mitigates its counterparty risk by entering into securities lending transactions only with a diverse group of prequalified counter-parties, monitoring their financial strength, and entering into master securities lending agreements with its counterparties. The master securities lending agreements provide that, in the event of a counterparty’s default (including bankruptcy), the fund may terminate any loans with that borrower, determine the net amount owed, and sell or retain the collateral up to the net amount owed to the fund; however, such actions may be subject to legal proceedings. While collateral mitigates counter-party risk, in the absence of a default the fund may experience delays and costs in recovering the securities loaned. The fund invests cash collateral received in Vanguard Market Liquidity Fund, and records a liability in the Statement of Net Assets for the return of the collateral, during the period the securities are on loan. Securities lending income represents fees charged to borrowers plus income earned on invested cash collateral, less expenses associated with the loan.
6. Credit Facility: The fund and certain other funds managed by The Vanguard Group participate in a $2.89 billion committed credit facility provided by a syndicate of lenders pursuant to a credit agreement which may be renewed annually; each fund is individually liable for its borrowings, if any, under the credit facility. Borrowings may be utilized for temporary and emergency purposes, and are subject to the fund’s regulatory and contractual borrowing restrictions. The participating funds are charged administrative fees and an annual commitment fee of 0.06% of the undrawn amount of the facility, which are allocated to the funds in accordance with a methodology approved by the board of trustees and included in Management and Administrative expenses on the fund’s Statement of Operations. Any borrowings under this facility bear interest at a rate equal to the higher of the Federal Funds Rate or LIBOR Reference Rate plus an agreed-upon spread.
The fund had no borrowings outstanding at March 31, 2014, or at any time during the period then ended.
7. Other: Dividend income is recorded on the ex-dividend date. Interest income includes income distributions received from Vanguard Market Liquidity Fund and is accrued daily. Premiums and discounts on debt securities purchased are amortized and accreted, respectively, to interest income over the lives of the respective securities. Security transactions are accounted for on the date securities are bought or sold. Costs used to determine realized gains (losses) on the sale of investment securities are those of the specific securities sold.
Each class of shares has equal rights as to assets and earnings, except that each class separately bears certain class-specific expenses related to maintenance of shareholder accounts (included in Management and Administrative expenses) and shareholder reporting. Marketing and distribution expenses are allocated to each class of shares based on a method approved by the board of trustees. Income, other non-class-specific expenses, and gains and losses on investments are allocated to each class of shares based on its relative net assets.
B. D. E. Shaw Investment Management, L.L.C., and Los Angeles Capital Management and Equity Research, Inc., each provide investment advisory services to a portion of the fund for a fee calculated at an annual percentage rate of average net assets managed by the advisor. The basic fees of D. E.
29
Growth and Income Fund
Shaw Investment Management, L.L.C., and Los Angeles Capital Management and Equity Research, Inc., are subject to quarterly adjustments based on performance since September 30, 2011, relative to the S&P 500 Index.
The Vanguard Group provides investment advisory services to a portion of the fund on an at-cost basis; the fund paid Vanguard advisory fees of $314,000 for the six months ended March 31, 2014.
For the six months ended March 31, 2014, the aggregate investment advisory fee represented an effective annual basic rate of 0.10% of the fund’s average net assets, before an increase of $434,000 (0.02%) based on performance.
C. The Vanguard Group furnishes at cost corporate management, administrative, marketing, and distribution services. The costs of such services are allocated to the fund under methods approved by the board of trustees. The fund has committed to provide up to 0.40% of its net assets in capital contributions to Vanguard. At March 31, 2014, the fund had contributed capital of $595,000 to Vanguard (included in Other Assets), representing 0.01% of the fund’s net assets and 0.24% of Vanguard’s capitalization. The fund’s trustees and officers are also directors and officers of Vanguard.
D. Various inputs may be used to determine the value of the fund’s investments. These inputs are summarized in three broad levels for financial statement purposes. The inputs or methodologies used to value securities are not necessarily an indication of the risk associated with investing in those securities.
Level 1—Quoted prices in active markets for identical securities.
Level 2—Other significant observable inputs (including quoted prices for similar securities, interest rates, prepayment speeds, credit risk, etc.).
Level 3—Significant unobservable inputs (including the fund’s own assumptions used to determine the fair value of investments).
The following table summarizes the market value of the fund’s investments as of March 31, 2014, based on the inputs used to value them:
| | | |
| | Level 1 | Level 2 | Level 3 |
| Investments | ($000) | ($000) | ($000) |
| Common Stocks | 5,438,611 | — | — |
| Temporary Cash Investments | 137,267 | 7,099 | — |
| Futures Contracts—Assets1 | 953 | — | — |
| Total | 5,576,831 | 7,099 | — |
| 1 Represents variation margin on the last day of the reporting period. | | | |
E. At March 31, 2014, the aggregate settlement value of open futures contracts and the related unrealized appreciation (depreciation) were:
| | | | |
| | | | | ($000) |
| | | | Aggregate | |
| | | Number of | Settlement | Unrealized |
| | | Long (Short) | Value | Appreciation |
| Futures Contracts | Expiration | Contracts | Long (Short) | (Depreciation) |
| S&P 500 Index | June 2014 | 262 | 122,131 | 962 |
| E-mini S&P 500 Index | June 2014 | 33 | 3,077 | 21 |
| | | | | 983 |
30
Growth and Income Fund
Unrealized appreciation (depreciation) on open futures contracts is required to be treated as realized gain (loss) for tax purposes.
F. Distributions are determined on a tax basis and may differ from net investment income and realized capital gains for financial reporting purposes. Differences may be permanent or temporary. Permanent differences are reclassified among capital accounts in the financial statements to reflect their tax character. Temporary differences arise when certain items of income, expense, gain, or loss are recognized in different periods for financial statement and tax purposes. These differences will reverse at some time in the future. Differences in classification may also result from the treatment of short-term gains as ordinary income for tax purposes.
The fund’s tax-basis capital gains and losses are determined only at the end of each fiscal year. For tax purposes, at September 30, 2013, the fund had available capital losses totaling $318,390,000 to offset future net capital gains through September 30, 2018. The fund will use these capital losses to offset net taxable capital gains, if any, realized during the year ending September 30, 2014; should the fund realize net capital losses for the year, the losses will be added to the loss carryforward balance above.
At March 31, 2014, the cost of investment securities for tax purposes was $4,681,681,000. Net unrealized appreciation of investment securities for tax purposes was $901,296,000, consisting of unrealized gains of $954,744,000 on securities that had risen in value since their purchase and $53,448,000 in unrealized losses on securities that had fallen in value since their purchase.
G. During the six months ended March 31, 2014, the fund purchased $3,673,236,000 of investment securities and sold $3,713,707,000 of investment securities, other than temporary cash investments.
H. Capital share transactions for each class of shares were:
| | | | |
| | Six Months Ended | | Year Ended |
| | March 31, 2014 | September 30, 2013 |
| | Amount | Shares | Amount | Shares |
| | ($000) | (000) | ($000) | (000) |
| Investor Shares | | | | |
| Issued | 104,266 | 2,703 | 212,836 | 6,415 |
| Issued in Lieu of Cash Distributions | 24,135 | 633 | 52,142 | 1,640 |
| Redeemed | (307,944) | (8,018) | (648,240) | (19,450) |
| Net Increase (Decrease)—Investor Shares | (179,543) | (4,682) | (383,262) | (11,395) |
| Admiral Shares | | | | |
| Issued | 246,980 | 3,932 | 485,483 | 8,814 |
| Issued in Lieu of Cash Distributions | 19,689 | 317 | 33,824 | 649 |
| Redeemed | (120,056) | (1,903) | (242,396) | (4,496) |
| Net Increase (Decrease)—Admiral Shares | 146,613 | 2,346 | 276,911 | 4,967 |
I. Management has determined that no material events or transactions occurred subsequent to March 31, 2014, that would require recognition or disclosure in these financial statements.
31
About Your Fund’s Expenses
As a shareholder of the fund, you incur ongoing costs, which include costs for portfolio management, administrative services, and shareholder reports (like this one), among others. Operating expenses, which are deducted from a fund’s gross income, directly reduce the investment return of the fund.
A fund’s expenses are expressed as a percentage of its average net assets. This figure is known as the expense ratio. The following examples are intended to help you understand the ongoing costs (in dollars) of investing in your fund and to compare these costs with those of other mutual funds. The examples are based on an investment of $1,000 made at the beginning of the period shown and held for the entire period.
The accompanying table illustrates your fund’s costs in two ways:
• Based on actual fund return. This section helps you to estimate the actual expenses that you paid over the period. The ”Ending Account Value“ shown is derived from the fund‘s actual return, and the third column shows the dollar amount that would have been paid by an investor who started with $1,000 in the fund. You may use the information here, together with the amount you invested, to estimate the expenses that you paid over the period.
To do so, simply divide your account value by $1,000 (for example, an $8,600 account value divided by $1,000 = 8.6), then multiply the result by the number given for your fund under the heading ”Expenses Paid During Period.“
• Based on hypothetical 5% yearly return. This section is intended to help you compare your fund‘s costs with those of other mutual funds. It assumes that the fund had a yearly return of 5% before expenses, but that the expense ratio is unchanged. In this case—because the return used is not the fund’s actual return—the results do not apply to your investment. The example is useful in making comparisons because the Securities and Exchange Commission requires all mutual funds to calculate expenses based on a 5% return. You can assess your fund’s costs by comparing this hypothetical example with the hypothetical examples that appear in shareholder reports of other funds.
Note that the expenses shown in the table are meant to highlight and help you compare ongoing costs only and do not reflect transaction costs incurred by the fund for buying and selling securities. Further, the expenses do not include any purchase, redemption, or account service fees described in the fund prospectus. If such fees were applied to your account, your costs would be higher. Your fund does not carry a “sales load.”
The calculations assume no shares were bought or sold during the period. Your actual costs may have been higher or lower, depending on the amount of your investment and the timing of any purchases or redemptions.
You can find more information about the fund’s expenses, including annual expense ratios, in the Financial Statements section of this report. For additional information on operating expenses and other shareholder costs, please refer to your fund’s current prospectus.
32
| | | |
| Six Months Ended March 31, 2014 | | | |
| | Beginning | Ending | Expenses |
| | Account Value | Account Value | Paid During |
| Growth and Income Fund | 9/30/2013 | 3/31/2014 | Period |
| Based on Actual Fund Return | | | |
| Investor Shares | $1,000.00 | $1,125.79 | $1.96 |
| Admiral Shares | 1,000.00 | 1,126.36 | 1.38 |
| Based on Hypothetical 5% Yearly Return | | | |
| Investor Shares | $1,000.00 | $1,023.09 | $1.87 |
| Admiral Shares | 1,000.00 | 1,023.64 | 1.31 |
The calculations are based on expenses incurred in the most recent six-month period. The fund’s annualized six-month expense ratios for that period are 0.37% for Investor Shares and 0.26% for Admiral Shares. The dollar amounts shown as “Expenses Paid” are equal to the annualized expense ratio multiplied by the average account value over the period, multiplied by the number of days in the most recent six-month period, then divided by the number of days in the most recent 12-month period.
33
Glossary
30-Day SEC Yield. A fund’s 30-day SEC yield is derived using a formula specified by the U.S. Securities and Exchange Commission. Under the formula, data related to the fund’s security holdings in the previous 30 days are used to calculate the fund’s hypothetical net income for that period, which is then annualized and divided by the fund’s estimated average net assets over the calculation period. For the purposes of this calculation, a security’s income is based on its current market yield to maturity (for bonds), its actual income (for asset-backed securities), or its projected dividend yield (for stocks). Because the SEC yield represents hypothetical annualized income, it will differ—at times significantly—from the fund’s actual experience. As a result, the fund’s income distributions may be higher or lower than implied by the SEC yield.
Beta. A measure of the magnitude of a fund’s past share-price fluctuations in relation to the ups and downs of a given market index. The index is assigned a beta of 1.00. Compared with a given index, a fund with a beta of 1.20 typically would have seen its share price rise or fall by 12% when the index rose or fell by 10%. For this report, beta is based on returns over the past 36 months for both the fund and the index. Note that a fund’s beta should be reviewed in conjunction with its R-squared (see definition). The lower the R-squared, the less correlation there is between the fund and the index, and the less reliable beta is as an indicator of volatility.
Dividend Yield. Dividend income earned by stocks, expressed as a percentage of the aggregate market value (or of net asset value, for a fund). The yield is determined by dividing the amount of the annual dividends by the aggregate value (or net asset value) at the end of the period. For a fund, the dividend yield is based solely on stock holdings and does not include any income produced by other investments.
Earnings Growth Rate. The average annual rate of growth in earnings over the past five years for the stocks now in a fund.
Equity Exposure. A measure that reflects a fund’s investments in stocks and stock futures. Any holdings in short-term reserves are excluded.
Expense Ratio. A fund’s total annual operating expenses expressed as a percentage of the fund’s average net assets. The expense ratio includes management and administrative expenses, but does not include the transaction costs of buying and selling portfolio securities.
Foreign Holdings. The percentage of a fund represented by securities or depositary receipts of companies based outside the United States.
Inception Date. The date on which the assets of a fund (or one of its share classes) are first invested in accordance with the fund’s investment objective. For funds with a subscription period, the inception date is the day after that period ends. Investment performance is measured from the inception date.
Median Market Cap. An indicator of the size of companies in which a fund invests; the midpoint of market capitalization (market price x shares outstanding) of a fund’s stocks, weighted by the proportion of the fund’s assets invested in each stock. Stocks representing half of the fund’s assets have market capitalizations above the median, and the rest are below it.
Price/Book Ratio. The share price of a stock divided by its net worth, or book value, per share. For a fund, the weighted average price/book ratio of the stocks it holds.
34
Price/Earnings Ratio. The ratio of a stock’s current price to its per-share earnings over the past year. For a fund, the weighted average P/E of the stocks it holds. P/E is an indicator of market expectations about corporate prospects; the higher the P/E, the greater the expectations for a company’s future growth.
R-Squared. A measure of how much of a fund’s past returns can be explained by the returns from the market in general, as measured by a given index. If a fund’s total returns were precisely synchronized with an index’s returns, its R-squared would be 1.00. If the fund’s returns bore no relationship to the index’s returns, its R-squared would be 0. For this report, R-squared is based on returns over the past 36 months for both the fund and the index.
Return on Equity. The annual average rate of return generated by a company during the past five years for each dollar of shareholder’s equity (net income divided by shareholder’s equity). For a fund, the weighted average return on equity for the companies whose stocks it holds.
Short-Term Reserves. The percentage of a fund invested in highly liquid, short-term securities that can be readily converted to cash.
Turnover Rate. An indication of the fund’s trading activity. Funds with high turnover rates incur higher transaction costs and may be more likely to distribute capital gains (which may be taxable to investors). The turnover rate excludes in-kind transactions, which have minimal impact on costs.
35
The People Who Govern Your Fund
The trustees of your mutual fund are there to see that the fund is operated and managed in your best interests since, as a shareholder, you are a part owner of the fund. Your fund’s trustees also serve on the board of directors of The Vanguard Group, Inc., which is owned by the Vanguard funds and provides services to them on an at-cost basis.
A majority of Vanguard’s board members are independent, meaning that they have no affiliation with Vanguard or the funds they oversee, apart from the sizable personal investments they have made as private individuals. The independent board members have distinguished backgrounds in business, academia, and public service. Each of the trustees and executive officers oversees 179 Vanguard funds.
The following table provides information for each trustee and executive officer of the fund. More information about the trustees is in the Statement of Additional Information, which can be obtained, without charge, by contacting Vanguard at 800-662-7447, or online at vanguard.com.
| |
| InterestedTrustee1 | and Delphi Automotive LLP (automotive components); |
| | Senior Advisor at New Mountain Capital. |
| F. William McNabb III | |
| Born 1957. Trustee Since July 2009. Chairman of the | Amy Gutmann |
| Board. Principal Occupation(s) During the Past Five | Born 1949. Trustee Since June 2006. Principal |
| Years: Chairman of the Board of The Vanguard Group, | Occupation(s) During the Past Five Years: President of |
| Inc., and of each of the investment companies served | the University of Pennsylvania; Christopher H. Browne |
| by The Vanguard Group, since January 2010; Director | Distinguished Professor of Political Science, School of |
| of The Vanguard Group since 2008; Chief Executive | Arts and Sciences, and Professor of Communication, |
| Officer and President of The Vanguard Group, and of | Annenberg School for Communication, with secondary |
| each of the investment companies served by The | faculty appointments in the Department of Philosophy, |
| Vanguard Group, since 2008; Director of Vanguard | School of Arts and Sciences, and at the Graduate |
| Marketing Corporation; Managing Director of The | School of Education, University of Pennsylvania; |
| Vanguard Group (1995–2008). | Trustee of the National Constitution Center; Chair |
| | of the Presidential Commission for the Study of |
| | Bioethical Issues. |
| IndependentTrustees | |
| | JoAnn Heffernan Heisen |
| Emerson U. Fullwood | Born 1950. Trustee Since July 1998. Principal |
| Born 1948. Trustee Since January 2008. Principal | Occupation(s) During the Past Five Years: Corporate |
| Occupation(s) During the Past Five Years: Executive | Vice President and Chief Global Diversity Officer |
| Chief Staff and Marketing Officer for North America | (retired 2008) and Member of the Executive |
| and Corporate Vice President (retired 2008) of Xerox | Committee (1997–2008) of Johnson & Johnson |
| Corporation (document management products and | (pharmaceuticals/medical devices/consumer |
| services); Executive in Residence and 2009–2010 | products); Director of Skytop Lodge Corporation |
| Distinguished Minett Professor at the Rochester | (hotels), the University Medical Center at Princeton, |
| Institute of Technology; Director of SPX Corporation | the Robert Wood Johnson Foundation, and the Center |
| (multi-industry manufacturing), the United Way of | for Talent Innovation; Member of the Advisory Board |
| Rochester, Amerigroup Corporation (managed health | of the Maxwell School of Citizenship and Public Affairs |
| care), the University of Rochester Medical Center, | at Syracuse University. |
| Monroe Community College Foundation, and North | |
| Carolina A&T University. | F. Joseph Loughrey |
| | Born 1949. Trustee Since October 2009. Principal |
| Rajiv L. Gupta | Occupation(s) During the Past Five Years: President |
| Born 1945. Trustee Since December 2001.2 | and Chief Operating Officer (retired 2009) of Cummins |
| Principal Occupation(s) During the Past Five Years: | Inc. (industrial machinery); Chairman of the Board |
| Chairman and Chief Executive Officer (retired 2009) | of Hillenbrand, Inc. (specialized consumer services), |
| and President (2006–2008) of Rohm and Haas Co. | and of Oxfam America; Director of SKF AB (industrial |
| (chemicals); Director of Tyco International, Ltd. | machinery), Hyster-Yale Materials Handling, Inc. |
| (diversified manufacturing and services), Hewlett- | (forklift trucks), the Lumina Foundation for Education, |
| Packard Co. (electronic computer manufacturing), | |
| | |
| and the V Foundation for Cancer Research; Member | Executive Officers | |
| of the Advisory Council for the College of Arts and | | |
| Letters and of the Advisory Board to the Kellogg | Glenn Booraem | |
| Institute for International Studies, both at the | Born 1967. Controller Since July 2010. Principal |
| University of Notre Dame. | Occupation(s) During the Past Five Years: Principal |
| | of The Vanguard Group, Inc.; Controller of each of |
| Mark Loughridge | the investment companies served by The Vanguard |
| Born 1953. Trustee Since March 2012. Principal | Group; Assistant Controller of each of the investment |
| Occupation(s) During the Past Five Years: Senior Vice | companies served by The Vanguard Group (2001–2010). |
| President and Chief Financial Officer (retired 2013) | | |
| at IBM (information technology services); Fiduciary | Thomas J. Higgins | |
| Member of IBM’s Retirement Plan Committee (2004– | Born 1957. Chief Financial Officer Since September |
| 2013); Member of the Council on Chicago Booth. | 2008. Principal Occupation(s) During the Past Five |
| | Years: Principal of The Vanguard Group, Inc.; Chief |
| Scott C. Malpass | Financial Officer of each of the investment companies |
| Born 1962. Trustee Since March 2012. Principal | served by The Vanguard Group; Treasurer of each of |
| Occupation(s) During the Past Five Years: Chief | the investment companies served by The Vanguard |
| Investment Officer and Vice President at the University | Group (1998–2008). | |
| of Notre Dame; Assistant Professor of Finance at the | | |
| Mendoza College of Business at Notre Dame; Member | Kathryn J. Hyatt | |
| of the Notre Dame 403(b) Investment Committee; | Born 1955. Treasurer Since November 2008. Principal |
| Board Member of TIFF Advisory Services, Inc. | Occupation(s) During the Past Five Years: Principal of |
| (investment advisor); Member of the Investment | The Vanguard Group, Inc.; Treasurer of each of the |
| Advisory Committees of the Financial Industry | investment companies served by The Vanguard |
| Regulatory Authority (FINRA) and of Major League | Group; Assistant Treasurer of each of the investment |
| Baseball. | companies served by The Vanguard Group (1988–2008). |
| |
| André F. Perold | Heidi Stam | |
| Born 1952. Trustee Since December 2004. Principal | Born 1956. Secretary Since July 2005. Principal |
| Occupation(s) During the Past Five Years: George | Occupation(s) During the Past Five Years: Managing |
| Gund Professor of Finance and Banking, Emeritus | Director of The Vanguard Group, Inc.; General Counsel |
| at the Harvard Business School (retired 2011); | of The Vanguard Group; Secretary of The Vanguard |
| Chief Investment Officer and Managing Partner of | Group and of each of the investment companies |
| HighVista Strategies LLC (private investment firm); | served by The Vanguard Group; Director and Senior |
| Director of Rand Merchant Bank; Overseer of the | Vice President of Vanguard Marketing Corporation. |
| Museum of Fine Arts Boston. | | |
| | Vanguard Senior ManagementTeam |
| Alfred M. Rankin, Jr. | | |
| Born 1941. Trustee Since January 1993. Principal | Mortimer J. Buckley | Chris D. McIsaac |
| Occupation(s) During the Past Five Years: Chairman, | Kathleen C. Gubanich | Michael S. Miller |
| President, and Chief Executive Officer of NACCO | Paul A. Heller | James M. Norris |
| Industries, Inc. (housewares/lignite), and of Hyster- | Martha G. King | Glenn W. Reed |
| Yale Materials Handling, Inc. (forklift trucks); Chairman | John T. Marcante | |
| of the Board of University Hospitals of Cleveland. | | |
| |
| Peter F. Volanakis | Chairman Emeritus and Senior Advisor |
| Born 1955. Trustee Since July 2009. Principal | | |
| Occupation(s) During the Past Five Years: President | John J. Brennan | |
| and Chief Operating Officer (retired 2010) of Corning | Chairman, 1996–2009 | |
| Incorporated (communications equipment); Trustee of | Chief Executive Officer and President, 1996–2008 |
| Colby-Sawyer College; Member of the Advisory Board | | |
| of the Norris Cotton Cancer Center and of the Advisory | Founder | |
| Board of the Parthenon Group (strategy consulting). | | |
| | John C. Bogle | |
| | Chairman and Chief Executive Officer, 1974–1996 |
1 Mr. McNabb is considered an “interested person,” as defined in the Investment Company Act of 1940, because he is an officer of the Vanguard funds.
2 December 2002 for Vanguard Equity Income Fund, the Vanguard Municipal Bond Funds, and the Vanguard State Tax-Exempt Funds.
|  |
| P.O. Box 2600 |
| Valley Forge, PA 19482-2600 |
Connect with Vanguard® > vanguard.com
| |
| Fund Information > 800-662-7447 | CFA® is a trademark owned by CFA Institute. |
| Direct Investor Account Services > 800-662-2739 | |
| Institutional Investor Services > 800-523-1036 | |
| Text Telephone for People | |
| With Hearing Impairment > 800-749-7273 | |
| |
| This material may be used in conjunction | |
| with the offering of shares of any Vanguard | |
| fund only if preceded or accompanied by | |
| the fund’s current prospectus. | |
| |
| All comparative mutual fund data are from Lipper, a | |
| Thomson Reuters Company, or Morningstar, Inc., unless | |
| otherwise noted. | |
| |
| You can obtain a free copy of Vanguard’s proxy voting | |
| guidelines by visiting vanguard.com/proxyreporting or by | |
| calling Vanguard at 800-662-2739. The guidelines are | |
| also available from the SEC’s website, sec.gov. In | |
| addition, you may obtain a free report on how your fund | |
| voted the proxies for securities it owned during the 12 | |
| months ended June 30. To get the report, visit either | |
| vanguard.com/proxyreporting or sec.gov. | |
| |
| You can review and copy information about your fund at | |
| the SEC’s Public Reference Room in Washington, D.C. To | |
| find out more about this public service, call the SEC at | |
| 202-551-8090. Information about your fund is also | |
| available on the SEC’s website, and you can receive | |
| copies of this information, for a fee, by sending a | |
| request in either of two ways: via e-mail addressed to | |
| publicinfo@sec.gov or via regular mail addressed to the | |
| Public Reference Section, Securities and Exchange | |
| Commission, Washington, DC 20549-1520. | |
| |
| | © 2014 The Vanguard Group, Inc. |
| | All rights reserved. |
| | Vanguard Marketing Corporation, Distributor. |
| |
| | Q932 052014 |

Semiannual Report | March 31, 2014
Vanguard Structured Equity Funds

Vanguard’s Principles for Investing Success
We want to give you the best chance of investment success. These principles, grounded in Vanguard’s research and experience, can put you on the right path
Goals. Create clear, appropriate investment goals.
Balance. Develop a suitable asset allocation using broadly diversified funds. Cost. Minimize cost.
Discipline. Maintain perspective and long-term discipline.
A single theme unites these principles: Focus on the things you can control.
We believe there is no wiser course for any investor.
| |
| Contents | |
| Your Fund’s Total Returns. | 1 |
| Chairman’s Letter. | 2 |
| Advisor’s Report. | 7 |
| Structured Large-Cap Equity Fund. | 9 |
| Structured Broad Market Fund. | 23 |
| About Your Fund’s Expenses. | 38 |
| Trustees Approve Advisory Arrangement. | 40 |
| Glossary. | 41 |
Please note: The opinions expressed in this report are just that—informed opinions. They should not be considered promises or advice.
Also, please keep in mind that the information and opinions cover the period through the date on the front of this report. Of course, the risks of investing in your fund are spelled out in the prospectus.
See the Glossary for definitions of investment terms used in this report.
About the cover: The ship’s wheel represents leadership and guidance, essential qualities in navigating difficult seas.
This one is a replica based on an 18th-century British vessel. The HMSVanguard, another ship of that era, served as the flagship for British Admiral Horatio Nelson when he defeated a French fleet at the Battle of the Nile.
| |
| Your Fund’s Total Returns | |
| |
| |
| |
| |
| Six Months Ended March 31, 2014 | |
| | Total |
| | Returns |
| Vanguard Structured Large-Cap Equity Fund | |
| Institutional Shares | 14.14% |
| Institutional Plus Shares | 14.17 |
| S&P 500 Index | 12.51 |
| Large-Cap Core Funds Average | 11.80 |
| Large-Cap Core Funds Average: Derived from data provided by Lipper, a Thomson Reuters Company. | |
| Vanguard Structured Broad Market Fund | |
| Institutional Shares | 15.09% |
| Institutional Plus Shares | 15.10 |
| Russell 3000 Index | 12.28 |
| Multi-Cap Core Funds Average | 11.19 |
| Multi-Cap Core Funds Average: Derived from data provided by Lipper, a Thomson Reuters Company. | |
Institutional Shares and Institutional Plus Shares are available to certain institutional investors who meet specific administrative, service, and account-size criteria.
| | | | |
| Your Fund’s Performance at a Glance | | | | |
| September 30, 2013, Through March 31, 2014 | | | | |
| | | | Distributions Per Share |
| | Starting | Ending | Income | Capital |
| | Share Price | Share Price | Dividends | Gains |
| Vanguard Structured Large-Cap Equity Fund | | | | |
| Institutional Shares | $32.42 | $36.35 | $0.613 | $0.000 |
| Institutional Plus Shares | 64.10 | 71.90 | 1.201 | 0.000 |
| Vanguard Structured Broad Market Fund | | | | |
| Institutional Shares | $32.59 | $35.43 | $0.564 | $1.374 |
| Institutional Plus Shares | 65.15 | 70.79 | 1.169 | 2.745 |
1

Chairman’s Letter
Dear Shareholder,
Stocks finished substantially higher for the six months ended March 31, 2014, although markets became choppier in the final three months. Initially, stocks were buoyed by solid corporate earnings, positive economic data, and continuing monetary support from the Federal Reserve. The outlook clouded as investors considered weather-affected economic data and bouts of political and economic instability in some emerging markets.
In this environment, Vanguard Structured Broad Market Fund, composed of stocks across the capitalization spectrum, returned 15.09%. It outdistanced its benchmark, the Russell 3000 Index, by nearly 3 percentage points and the average return of its peer group by nearly 4 points. (Returns cited in this letter are for Institutional Shares.)
Although large-cap stocks fared much the same as the overall market, Vanguard Structured Large-Cap Equity Fund didn’t find quite as many opportunities to outshine its benchmark as its broad market counterpart. The fund returned 14.14%, besting the return of its benchmark, the Standard & Poor’s 500 Index, by more than a percentage point and its peer group average by more than 2 points.
In both the Broad Market and Large-Cap Equity Funds, eight of the ten market sectors advanced by double digits. Industrials and information technology were among the top performers for both
2
funds relative to their benchmark indexes, while telecommunication services and financials posted subpar returns.
Despite recent volatility, U.S. stocks were productive
The broad U.S. stock market recorded a gain of about 12% for the six months ended March 31, although it became increasingly rocky over the period’s second half. Corporate earnings, for the most part, continued to rise as the U.S. economy grew modestly.
The Fed’s stimulative bond-buying program has helped support the market for several years. But since January, the Fed has been making monthly cuts in its purchases, creating some apprehension among investors. Slow economic growth in China and the conflict in Ukraine have also caused market turbulence.
International stocks returned about 5%. The developed markets of Europe, where the economy has improved, posted strong results; the developed markets of the Pacific region and emerging markets were weaker.
Bonds reclaimed some ground following a difficult stretch
Over the six months, the broad U.S. taxable bond market returned 1.70%, a welcome result in view of the market’s struggles for much of calendar 2013. The yield of the 10-year Treasury note finished
| | | |
| Market Barometer | | | |
| |
| | | | Total Returns |
| | | Periods Ended March 31, 2014 |
| | Six | One | Five Years |
| | Months | Year | (Annualized) |
| Stocks | | | |
| Russell 1000 Index (Large-caps) | 12.48% | 22.41% | 21.73% |
| Russell 2000 Index (Small-caps) | 9.94 | 24.90 | 24.31 |
| Russell 3000 Index (Broad U.S. market) | 12.28 | 22.61 | 21.93 |
| FTSE All-World ex US Index (International) | 5.25 | 12.50 | 15.93 |
| |
| Bonds | | | |
| Barclays U.S. Aggregate Bond Index (Broad taxable market) | 1.70% | -0.10% | 4.80% |
| Barclays Municipal Bond Index (Broad tax-exempt market) | 3.65 | 0.39 | 5.71 |
| Citigroup Three-Month U.S. Treasury Bill Index | 0.00 | 0.05 | 0.08 |
| |
| CPI | | | |
| Consumer Price Index | 0.92% | 1.51% | 2.13% |
3
the half year at 2.72%, up from 2.63% at September’s end but down from nearly 3% on December 31. (Bond prices and yields move in opposite directions.)
Many bond investors have been focusing on the possibility of interest rates moving higher and the negative effect that would have on bond prices. However, there’s a
The appeal of low-cost investing is growing
Minimizing investment costs is a critical part of every investor’s toolkit. Why? Because every
dollar paid for fund management expenses is simply a dollar less that can work on your behalf.
Put another way, the lower your mutual fund’s costs, the greater your share of the fund’s return.
Not surprisingly, research indicates that lower-cost investments have tended to outperform
their higher-cost counterparts.
Investors are catching on to the value of lower-cost mutual funds. Funds with lower expense
ratios dominated in attracting investment dollars over the decade ended December 31, 2012,
according to a Vanguard research paper titled Costs Matter: Are Fund Investors Voting With
Their Feet? (You can read the paper at vanguard.com/matter.) And, as the chart below shows,
Vanguard’s leadership in keeping down costs for investors seems to have encouraged the
industry to reduce its average costs—at least over the past decade.
Even so, Vanguard’s average expenses continue to be less than one-fifth the industry average:
0.19% versus 1.08% (as of December 31, 2013). That cost difference remains a powerful tool
in the hands of Vanguard clients.
Vanguard fund costs remain far below industry average
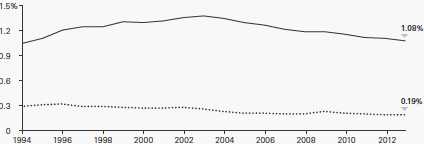
Industry average expense ratio
Vanguard average expense ratio
Sources: Vanguard and Lipper, a Thomson Reuters Company.
4
flip side to rising rates. As noted recently by the new head of our Fixed Income Group, Greg Davis, long-term investors can benefit over time because “you’re going to be reinvesting those coupon payments and principal payments at higher rates.”
Municipal bonds returned 3.65% for the six months, another major improvement over calendar 2013, as investors waded back into the muni market. Many had fled last year when challenges surfaced for some issuers. For money market and savings accounts, returns remained meager because of the Fed’s target of 0%–0.25% for short-term interest rates.
International bond markets (as measured by the Barclays Global Aggregate Index ex USD) returned 2.05%.
Stocks flagged by the funds’ models generated benchmark-beating returns
The funds’ advisor, Vanguard Equity Investment Group, uses computer-driven quantitative models to select stocks for its Broad Market and Large-Cap Equity Funds from among those in their benchmarks. The models are built to identify stocks with characteristics that the advisor believes are most likely to produce above-average returns over the long term. The result is that each fund holds a narrower slice of its market, but without taking on significant additional risk through market-cap tilts or sector allocation strategies. The Broad Market Fund held about 210 stocks at the end of March, compared with about 3,000 in its benchmark. The Large-Cap Equity Fund held about 170, versus about 500 in its benchmark.
The advisor’s models were particularly successful in the industrials sector, which was responsible for more than one-quarter of each fund’s outperformance. The funds’ investments in defense-related stocks generated outsized returns despite federal spending cuts last year. Airline stocks were another bright spot, helped by industry consolidation and greater pricing power.
Both funds also tapped into pockets of outperformance in IT, in which computer hardware companies and semiconductor manufacturers stood out. The Broad Market Fund also did significantly better than its benchmark among software companies and service providers.
In some instances, the funds’ relative performance by sector diverged. Strength among a handful of companies active in oil and gas drilling and refining made energy one of the Broad Market Fund’s three best-performing sectors. Consumer staples had that role in the Large-Cap Equity Fund, thanks largely to strong returns from packaged-food producers as well as food and drug retailers.
In a few sectors, the models disappointed. Stock selection in financials and telecommunication services proved subpar for the Broad Market Fund, as did health care picks for the Large-Cap Equity Fund.
5
More information about the advisor’s management of the funds can be found in the Advisor’s Report that follows this letter.
Divining the future is tricky, but preparing for it is prudent
Predictions are often made but rarely come true. In an interview with our newsletter In The Vanguard, University of Pennsylvania professor Philip Tetlock noted, “As a whole, experts [are] slightly more accurate than the proverbial dart-throwing chimpanzee.”
Dr. Tetlock’s extensive research on the accuracy of predictions found that it’s best to think in terms of probabilities and to avoid bold, specific declarations about what the future holds. At Vanguard, we agree that forecasting the economy and capital markets should be leavened with modesty. Joe Davis, our chief economist, is fond of saying that we “treat the future with the humility it deserves.”
That’s why our economists don’t make the pinpoint projections that you’ll see elsewhere. Instead, using sophisticated statistical models, we provide a range and probability of potential outcomes—for example, the return of U.S. stocks. And we explain our rationale for such outcomes, allowing you to make better-informed decisions about risk and return.
In January, as they do each year, our economists issued Vanguard’s Economic and Investment Outlook. They also update their perspectives periodically and address significant developments, such as changes in Federal Reserve policy. (You can read our most recent outlook at vanguard.com/research.)
Our forecasts acknowledge that no one can envision every scenario. And that underlines one of Vanguard’s core investment principles: Develop a suitable asset allocation using broadly diversified funds. Having a balanced portfolio can help you get through unforeseen events and achieve your goals—even without a crystal ball.
As always, thank you for entrusting your assets to Vanguard.
Sincerely,

F. William McNabb III
Chairman and Chief Executive Officer
April 17, 2014
6
Advisor’s Report
For the six-month period ended March 31, 2014, Vanguard Structured Large-Cap Equity Fund returned 14.14% for Institutional Shares and 14.17% for Institutional Plus Shares, outperforming its benchmark, the Standard & Poor’s 500 Index, by more than 1.6 percentage points.
Vanguard Structured Broad Market Fund returned 15.09% for Institutional Shares and 15.10% for Institutional Plus Shares, outperforming its benchmark, the Russell 3000 Index, by more than 2.8 percentage points.
The broad U.S. equity market was up about 12% for the period, with large-capitalization stocks showing more strength than smaller-caps. U.S. equities outpaced those of other developed countries, while emerging markets continued to underperform. Performance was strong across the broad U.S. stock market, with all ten sectors generating positive returns. Results were best in health care, information technology, and industrials. Telecommunication services, consumer discretionary, and consumer staples lagged.
The Federal Reserve announced reductions to its stimulative bond-buying programs. And Chairwoman Janet Yellen’s testimony to Congress suggested that tapering was likely to continue despite winter-related weakness in recent economic data. There were no major fiscal surprises during the period, and without new policy stimulus (and even with reductions), the economy seems to be improving. The Institute for Supply Management (ISM) Manufacturing Index has consistently been above 50—a reading that points to expansion. Annualized GDP growth has been in the range of 2% to 4%, in line with historical averages.
Globally, market participants have kept a nervous eye on the tensions in Ukraine. China has seen its growth rate decelerate as it goes through economic rebalancing to increase consumption and reduce investment; Latin America, in turn, has struggled because of China’s weaker demand. The uncertainty triggered by these developments has driven equity market volatility higher.
Although it’s important to understand how these macroeconomic factors affect overall portfolio performance, our approach to investing focuses on specific stock fundamentals. Our process compares stocks within industry groups to identify those with characteristics that we believe will enable them to outperform over the long run. We use a strict quantitative process that concentrates on a combination of valuation and other factors focused on fundamental growth. We then construct our portfolios, aiming to maximize return and minimize exposure to risks relative to our benchmark, such as market-cap risk, that our research indicates do not improve returns.
Over the period, the model’s effectiveness across sectors was strong. The Structured Large-Cap Equity Fund produced positive stock selection results in seven of the ten benchmark sectors, most strongly in
7
industrials, consumer staples, and information technology. We underperformed in telecommunication services, health care, and financials. The Structured Broad Market Fund produced positive stock selection results in eight sectors, most beneficially in IT, industrials, and energy. We underperformed in financials and telecom.
Structured Large-Cap Equity Fund
Among individual stocks, the largest contributors were overweight positions in HewlettPackard, Tyson Foods, and Wynn Resorts. Relative to the fund’s benchmark, we benefited from underweighting or avoiding poorly performing stocks such as TwentyFirst Century Fox and Starbucks.
Unfortunately, we were not able to avoid all poor performers. Overweight positions in stocks including Best Buy, GameStop, and Western Union detracted from performance. Underweighting companies that our model’s fundamentals did not positively identify, such as Actavis and Corning, hurt our overall outperformance.
Structured Broad Market Fund
Among individual stocks, the largest contributors were overweight positions in Helmerich & Payne, HewlettPackard, and Endo International. Compared with the benchmark, we benefited from underweighting or avoiding poorly performing stocks such as Ford Motor and LinkedIn.
Overweight positions in Best Buy and Portfolio Recovery Associates detracted from results. Underweighting companies that our model’s fundamentals did not positively identify, such as Forest Laboratories and Illumina, hurt our overall outperformance.
The stockspecific risk we take in both portfolios has paid off so far this year, but risk can reward or punish us in the near term. We nevertheless believe that the funds offer a strong mix of stocks with attractive valuations and growth characteristics relative to their benchmarks.
We thank you for your investment and look forward to the second half of the fiscal year.
Portfolio Managers: James P. Stetler, Principal
James D. Troyer, CFA, Principal
Michael R. Roach, CFA
Vanguard Equity Investment Group April 22, 2014
8
Structured Large-Cap Equity Fund
| | | |
| Fund Profile | | | |
| As of March 31, 2014 | | | |
| |
| |
| Share-Class Characteristics | | |
| | Institutional | Institutional |
| | Shares | Plus Shares |
| Ticker Symbol | VSLIX | | VSLPX |
| Expense Ratio1 | 0.24% | | 0.17% |
| 30-Day SEC Yield | 1.87% | | 1.94% |
| |
| Portfolio Characteristics | | |
| | | | DJ |
| | | | U.S. |
| | | | Total |
| | | | Market |
| | | S&P 500 | FA |
| | Fund | Index | Index |
| Number of Stocks | 171 | 500 | 3,674 |
| Median Market Cap | $60.0B | $66.3B | $43.7B |
| Price/Earnings Ratio | 17.2x | 18.6x | 20.1x |
| Price/Book Ratio | 2.7x | 2.6x | 2.6x |
| Return on Equity | 18.7% | 18.6% | 17.2% |
| Earnings Growth | | | |
| Rate | 12.7% | 12.1% | 12.4% |
| Dividend Yield | 2.1% | 2.0% | 1.9% |
| Foreign Holdings | 0.0% | 0.0% | 0.0% |
| Turnover Rate | | | |
| (Annualized) | 72% | — | — |
| Short-Term Reserves | 0.0% | — | — |
| | |
| Volatility Measures | | |
| | | DJ |
| | U.S. Total |
| | S&P 500 | Market |
| | Index | FA Index |
| R-Squared | 0.99 | 0.98 |
| Beta | 1.01 | 0.96 |
| These measures show the degree and timing of the fund’s fluctuations compared with the indexes over 36 months. |
| |
| |
| Ten Largest Holdings (% of total net assets) |
| Apple Inc. | Computer Hardware | 2.4% |
| Johnson & Johnson | Pharmaceuticals | 2.2 |
| Exxon Mobil Corp. | Integrated Oil & Gas | 2.0 |
| Wells Fargo & Co. | Diversified Banks | 1.8 |
| General Electric Co. | Industrial | |
| | Conglomerates | 1.8 |
| Pfizer Inc. | Pharmaceuticals | 1.7 |
| Microsoft Corp. | Systems Software | 1.7 |
| International Business | IT Consulting & | |
| Machines Corp. | Other Services | 1.7 |
| Bank of America Corp. | Diversified Banks | 1.6 |
| Verizon Communications Integrated | |
| Inc. | Telecommunication | |
| | Services | 1.5 |
| Top Ten | | 18.4% |
| The holdings listed exclude any temporary cash investments and equity index products. |
| | |
Investment Focus

1 The expense ratios shown are from the prospectus dated January 27, 2014. For the six months ended March 31, 2014, the annualized expense ratios were 0.24% for Institutional Shares and 0.17% for Institutional Plus Shares.
9
Structured Large-Cap Equity Fund
Sector Diversification (% of equity exposure)
| | | |
| | | | DJ |
| | | | U.S. |
| | | | Total |
| | | | Market |
| | | S&P 500 | FA |
| | Fund | Index | Index |
| Consumer Discretionary | 11.9% | 12.1% | 12.8% |
| Consumer Staples | 9.0 | 9.7 | 8.4 |
| Energy | 10.6 | 10.1 | 9.4 |
| Financials | 15.5 | 16.4 | 17.6 |
| Health Care | 14.2 | 13.4 | 13.0 |
| Industrials | 10.6 | 10.7 | 11.5 |
| Information Technology | 17.8 | 18.6 | 18.1 |
| Materials | 3.9 | 3.5 | 3.9 |
| Telecommunication | | | |
| Services | 2.9 | 2.4 | 2.2 |
| Utilities | 3.6 | 3.1 | 3.1 |
10
Structured Large-Cap Equity Fund
Performance Summary
All of the returns in this report represent past performance, which is not a guarantee of future results that may be achieved by the fund. (Current performance may be lower or higher than the performance data cited. For performance data current to the most recent month-end, visit our website at vanguard.com/performance.) Note, too, that both investment returns and principal value can fluctuate widely, so an investor’s shares, when sold, could be worth more or less than their original cost. The returns shown do not reflect taxes that a shareholder would pay on fund distributions or on the sale of fund shares.
Fiscal-Year Total Returns (%): May 16, 2006, Through March 31, 2014
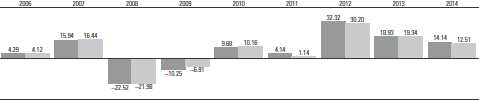
Structured Large-Cap Equity Fund Institutional Shares
S&P 500 Index
Note: For 2014, performance data reflect the six months ended March 31, 2014.
| | | | |
| Average Annual Total Returns: Periods Ended March 31, 2014 | | | |
| |
| | Inception | One | Five | Since |
| | Date | Year | Years | Inception |
| Institutional Shares | 5/16/2006 | 22.61% | 21.93% | 7.17% |
| Institutional Plus Shares | 5/15/2006 | 22.68 | 22.01 | 7.23 |
See Financial Highlights for dividend and capital gains information.
11
Structured Large-Cap Equity Fund
Financial Statements (unaudited)
Statement of Net Assets
As of March 31, 2014
The fund reports a complete list of its holdings in regulatory filings four times in each fiscal year, at the quarter-ends. For the second and fourth fiscal quarters, the lists appear in the fund’s semiannual and annual reports to shareholders. For the first and third fiscal quarters, the fund files the lists with the Securities and Exchange Commission on Form N-Q. Shareholders can look up the fund’s Forms N-Q on the SEC’s website at sec.gov. Forms N-Q may also be reviewed and copied at the SEC’s Public Reference Room (see the back cover of this report for further information).
| | | |
| | | | Market |
| | | | Value |
| | | Shares | ($000) |
| Common Stocks (99.7%)1 | | |
| Consumer Discretionary (11.9%) | |
| | Home Depot Inc. | 109,275 | 8,647 |
| | Comcast Corp. Class A | 168,100 | 8,408 |
| | Lowe’s Cos. Inc. | 122,850 | 6,007 |
| | Viacom Inc. Class B | 61,500 | 5,227 |
| | Wynn Resorts Ltd. | 19,900 | 4,421 |
| | GameStop Corp. Class A | 107,000 | 4,398 |
| | Best Buy Co. Inc. | 163,800 | 4,326 |
| * | DIRECTV | 55,900 | 4,272 |
| | Goodyear Tire & Rubber Co. | 161,900 | 4,230 |
| | Whirlpool Corp. | 27,300 | 4,080 |
| | NIKE Inc. Class B | 51,200 | 3,782 |
| | Cablevision Systems Corp. | | |
| | Class A | 218,300 | 3,683 |
| | Walt Disney Co. | 45,479 | 3,642 |
| * | O’Reilly Automotive Inc. | 24,000 | 3,561 |
| | Macy’s Inc. | 58,600 | 3,474 |
| | Starwood Hotels & Resorts | | |
| | Worldwide Inc. | 42,900 | 3,415 |
| | TJX Cos. Inc. | 54,000 | 3,275 |
| | CBS Corp. Class B | 43,480 | 2,687 |
| * | Amazon.com Inc. | 6,200 | 2,086 |
| | Graham Holdings Co. | | |
| | Class B | 2,200 | 1,548 |
| | Time Warner Cable Inc. | 11,200 | 1,536 |
| | McDonald’s Corp. | 6,547 | 642 |
| | Comcast Corp. | 10,525 | 513 |
| | Johnson Controls Inc. | 8,600 | 407 |
| * | AutoZone Inc. | 500 | 269 |
| | BorgWarner Inc. | 3,100 | 191 |
| | | | 88,727 |
| Consumer Staples (9.0%) | | |
| | PepsiCo Inc. | 109,592 | 9,151 |
| | CVS Caremark Corp. | 104,800 | 7,845 |
| | Procter & Gamble Co. | 80,594 | 6,496 |
| | Kimberly-Clark Corp. | 52,000 | 5,733 |
| | Kroger Co. | 118,700 | 5,181 |
| | Archer-Daniels-Midland Co. | 119,200 | 5,172 |
| | Kraft Foods Group Inc. | 89,266 | 5,008 |
| | |
| | | Market |
| | | Value |
| | Shares | ($000) |
| Tyson Foods Inc. Class A | 105,500 | 4,643 |
| Hershey Co. | 40,100 | 4,187 |
| Walgreen Co. | 59,000 | 3,896 |
| Coca-Cola Co. | 79,880 | 3,088 |
| Philip Morris International | | |
| Inc. | 31,736 | 2,598 |
| Wal-Mart Stores Inc. | 26,946 | 2,060 |
| Mondelez International Inc. | | |
| Class A | 49,100 | 1,696 |
| Altria Group Inc. | 4,000 | 150 |
| | | 66,904 |
| Energy (10.5%) | | |
| Exxon Mobil Corp. | 154,239 | 15,066 |
| ConocoPhillips | 108,359 | 7,623 |
| Occidental Petroleum Corp. | 75,200 | 7,166 |
| Schlumberger Ltd. | 70,325 | 6,857 |
| EOG Resources Inc. | 33,100 | 6,493 |
| Chevron Corp. | 53,256 | 6,333 |
| Valero Energy Corp. | 99,500 | 5,283 |
| Devon Energy Corp. | 74,600 | 4,993 |
| Marathon Petroleum Corp. | 57,200 | 4,979 |
| Murphy Oil Corp. | 69,800 | 4,388 |
| Chesapeake Energy Corp. | 158,200 | 4,053 |
| Helmerich & Payne Inc. | 33,500 | 3,603 |
| Phillips 66 | 17,479 | 1,347 |
| Hess Corp. | 7,100 | 588 |
| | | 78,772 |
| Financials (15.5%) | | |
| Wells Fargo & Co. | 271,635 | 13,511 |
| Bank of America Corp. | 696,253 | 11,976 |
| American Express Co. | 77,000 | 6,932 |
| Goldman Sachs Group Inc. | 40,100 | 6,570 |
| Citigroup Inc. | 132,025 | 6,284 |
| JPMorgan Chase & Co. | 100,379 | 6,094 |
| Travelers Cos. Inc. | 60,100 | 5,115 |
| Ameriprise Financial Inc. | 42,800 | 4,711 |
| Fifth Third Bancorp | 203,500 | 4,670 |
| McGraw Hill Financial Inc. | 57,100 | 4,357 |
| Lincoln National Corp. | 85,100 | 4,312 |
| Simon Property Group Inc. | 25,000 | 4,100 |
12
Structured Large-Cap Equity Fund
| | | |
| | | | Market |
| | | | Value |
| | | Shares | ($000) |
| * | Berkshire Hathaway Inc. | | |
| | Class B | 31,305 | 3,912 |
| | Unum Group | 107,600 | 3,799 |
| | Assurant Inc. | 45,800 | 2,975 |
| | Regions Financial Corp. | 265,600 | 2,951 |
| | BlackRock Inc. | 9,200 | 2,893 |
| | Public Storage | 17,100 | 2,881 |
| | General Growth Properties | | |
| | Inc. | 106,700 | 2,347 |
| * | Berkshire Hathaway Inc. | | |
| | Class A | 11 | 2,061 |
| | Ventas Inc. | 30,800 | 1,866 |
| * | E*TRADE Financial Corp. | 76,200 | 1,754 |
| | KeyCorp | 117,100 | 1,668 |
| | PNC Financial Services | | |
| | Group Inc. | 14,800 | 1,288 |
| | Kimco Realty Corp. | 57,200 | 1,252 |
| | Discover Financial Services | 21,350 | 1,242 |
| | ACE Ltd. | 12,100 | 1,199 |
| | Host Hotels & Resorts Inc. | 47,300 | 957 |
| | Chubb Corp. | 10,000 | 893 |
| | Capital One Financial Corp. | 9,700 | 749 |
| | Legg Mason Inc. | 8,000 | 392 |
| | Plum Creek Timber Co. Inc. | 6,950 | 292 |
| | | | 116,003 |
| Health Care (14.1%) | | |
| | Johnson & Johnson | 164,446 | 16,153 |
| | Pfizer Inc. | 401,075 | 12,882 |
| | AbbVie Inc. | 142,168 | 7,307 |
| | Medtronic Inc. | 108,600 | 6,683 |
| | Eli Lilly & Co. | 111,987 | 6,591 |
| * | Express Scripts Holding Co. | 84,800 | 6,368 |
| * | Celgene Corp. | 41,200 | 5,751 |
| | WellPoint Inc. | 49,700 | 4,948 |
| * | Gilead Sciences Inc. | 68,100 | 4,826 |
| | Cardinal Health Inc. | 68,800 | 4,815 |
| | CR Bard Inc. | 29,200 | 4,321 |
| | Cigna Corp. | 46,600 | 3,902 |
| * | Mylan Inc. | 78,000 | 3,809 |
| | Merck & Co. Inc. | 59,244 | 3,363 |
| | Zoetis Inc. | 110,600 | 3,201 |
| | Abbott Laboratories | 70,400 | 2,711 |
| | Amgen Inc. | 18,200 | 2,245 |
| | Thermo Fisher Scientific Inc. | 16,100 | 1,936 |
| * | Boston Scientific Corp. | 78,000 | 1,055 |
| * | Biogen Idec Inc. | 3,300 | 1,009 |
| | UnitedHealth Group Inc. | 10,000 | 820 |
| | McKesson Corp. | 3,300 | 583 |
| | Bristol-Myers Squibb Co. | 4,000 | 208 |
| | Allergan Inc. | 1,500 | 186 |
| | | | 105,673 |
| Industrials (10.6%) | | |
| | General Electric Co. | 519,922 | 13,461 |
| | Boeing Co. | 58,900 | 7,391 |
| | | |
| | | | Market |
| | | | Value |
| | | Shares | ($000) |
| | United Parcel Service Inc. | | |
| | Class B | 68,321 | 6,653 |
| | Lockheed Martin Corp. | 36,500 | 5,958 |
| | General Dynamics Corp. | 51,200 | 5,577 |
| | Raytheon Co. | 55,100 | 5,443 |
| | Northrop Grumman Corp. | 43,016 | 5,307 |
| | Southwest Airlines Co. | 208,900 | 4,932 |
| | L-3 Communications | | |
| | Holdings Inc. | 37,900 | 4,478 |
| | Emerson Electric Co. | 60,400 | 4,035 |
| | Pitney Bowes Inc. | 151,400 | 3,935 |
| | Honeywell International Inc. | 30,300 | 2,811 |
| | Union Pacific Corp. | 10,200 | 1,914 |
| | 3M Co. | 14,000 | 1,899 |
| | Delta Air Lines Inc. | 52,600 | 1,823 |
| | United Technologies Corp. | 8,986 | 1,050 |
| | Rockwell Automation Inc. | 8,400 | 1,046 |
| | Pentair Ltd. | 9,000 | 714 |
| | Fluor Corp. | 8,500 | 661 |
| | | | 79,088 |
| Information Technology (17.7%) | |
| | Apple Inc. | 33,382 | 17,917 |
| | Microsoft Corp. | 307,741 | 12,614 |
| | International Business | | |
| | Machines Corp. | 64,340 | 12,385 |
| * | Google Inc. Class A | 9,105 | 10,148 |
| * | Facebook Inc. Class A | 127,700 | 7,693 |
| | Hewlett-Packard Co. | 219,050 | 7,088 |
| | MasterCard Inc. Class A | 92,000 | 6,872 |
| | Texas Instruments Inc. | 131,000 | 6,177 |
| | Accenture plc Class A | 72,300 | 5,764 |
| | Western Digital Corp. | 54,100 | 4,967 |
| | Intuit Inc. | 61,300 | 4,765 |
| | Seagate Technology plc | 82,200 | 4,616 |
| * | Electronic Arts Inc. | 156,300 | 4,534 |
| | Computer Sciences Corp. | 70,300 | 4,276 |
| | Harris Corp. | 56,000 | 4,097 |
| * | Micron Technology Inc. | 109,700 | 2,596 |
| | Motorola Solutions Inc. | 39,250 | 2,523 |
| | Oracle Corp. | 53,488 | 2,188 |
| | Applied Materials Inc. | 95,700 | 1,954 |
| | QUALCOMM Inc. | 23,157 | 1,826 |
| | Intel Corp. | 69,953 | 1,806 |
| | Western Union Co. | 104,100 | 1,703 |
| | Cisco Systems Inc. | 67,015 | 1,502 |
| | TE Connectivity Ltd. | 19,000 | 1,144 |
| | Visa Inc. Class A | 4,800 | 1,036 |
| * | Cognizant Technology | | |
| | Solutions Corp. Class A | 9,600 | 486 |
| | | | 132,677 |
| Materials (3.9%) | | |
| | Dow Chemical Co. | 130,400 | 6,336 |
| | EI du Pont de Nemours | | |
| | & Co. | 91,500 | 6,140 |
13
| | |
| Structured Large-Cap Equity Fund | |
| |
| |
| |
| | | Market |
| | | Value |
| | Shares | ($000) |
| LyondellBasell Industries | | |
| NV Class A | 64,800 | 5,763 |
| PPG Industries Inc. | 22,614 | 4,375 |
| Avery Dennison Corp. | 70,400 | 3,567 |
| Ball Corp. | 48,200 | 2,642 |
| | | 28,823 |
| Telecommunication Services (2.9%) | |
| Verizon Communications | | |
| Inc. | 242,196 | 11,522 |
| AT&T Inc. | 298,835 | 10,480 |
| | | 22,002 |
| Utilities (3.6%) | | |
| Dominion Resources Inc. | 80,400 | 5,708 |
| Edison International | 91,900 | 5,202 |
| American Electric Power | | |
| Co. Inc. | 95,100 | 4,818 |
| Exelon Corp. | 132,300 | 4,440 |
| Ameren Corp. | 101,300 | 4,174 |
| AES Corp. | 111,100 | 1,586 |
| Entergy Corp. | 15,100 | 1,009 |
| | | 26,937 |
| Total Common Stocks | | |
| (Cost $578,249) | | 745,606 |
| Temporary Cash Investments (0.3%)1 | |
| Money Market Fund (0.3%) | | |
| 2 Vanguard Market Liquidity | | |
| Fund, 0.122% | 2,236,666 | 2,237 |
| |
| | Face | |
| | Amount | |
| | ($000) | |
| U.S. Government and Agency Obligations (0.0%) |
| 3,4 Federal Home Loan Bank | | |
| Discount Notes, | | |
| 0.079%, 4/30/14 | 200 | 200 |
| Total Temporary Cash Investments | |
| (Cost $2,437) | | 2,437 |
| Total Investments (100.0%) | | |
| (Cost $580,686) | | 748,043 |
| |
| | Market |
| | Value |
| | ($000) |
| Other Assets and Liabilities (0.0%) | |
| Other Assets | 1,679 |
| Liabilities | (1,875) |
| | (196) |
| Net Assets (100%) | 747,847 |
| |
| |
| At March 31, 2014, net assets consisted of: | |
| | Amount |
| | ($000) |
| Paid-in Capital | 650,128 |
| Undistributed Net Investment Income | 2,950 |
| Accumulated Net Realized Losses | (72,601) |
| Unrealized Appreciation (Depreciation) | |
| Investment Securities | 167,357 |
| Futures Contracts | 13 |
| Net Assets | 747,847 |
| |
| |
| Institutional Shares—Net Assets | |
| Applicable to 1,540,282 outstanding | |
| $.001 par value shares of beneficial | |
| interest (unlimited authorization) | 55,987 |
| Net Asset Value Per Share— | |
| Institutional Shares | $36.35 |
| |
| |
| Institutional Plus Shares—Net Assets | |
| Applicable to 9,622,393 outstanding | |
| $.001 par value shares of beneficial | |
| interest (unlimited authorization) | 691,860 |
| Net Asset Value Per Share— | |
| Institutional Plus Shares | $71.90 |
See Note A in Notes to Financial Statements.
* Non-income-producing security.
1 The fund invests a portion of its cash reserves in equity markets through the use of index futures contracts. After giving effect to futures investments, the fund’s effective common stock and temporary cash investment positions represent 100.0% and 0.0%, respectively, of net assets.
2 Affiliated money market fund available only to Vanguard funds and certain trusts and accounts managed by Vanguard. Rate shown is the 7-day yield.
3 The issuer operates under a congressional charter; its securities are generally neither guaranteed by the U.S. Treasury nor backed by the full faith and credit of the U.S. government.
4 Securities with a value of $200,000 have been segregated as initial margin for open futures contracts.
See accompanying Notes, which are an integral part of the Financial Statements.
14
| |
| Structured Large-Cap Equity Fund | |
| |
| |
| Statement of Operations | |
| |
| | Six Months Ended |
| | March 31, 2014 |
| | ($000) |
| Investment Income | |
| Income | |
| Dividends | 7,703 |
| Interest1 | 2 |
| Total Income | 7,705 |
| Expenses | |
| The Vanguard Group—Note B | |
| Investment Advisory Services | 263 |
| Management and Administrative—Institutional Shares | 39 |
| Management and Administrative—Institutional Plus Shares | 265 |
| Marketing and Distribution—Institutional Shares | 5 |
| Marketing and Distribution—Institutional Plus Shares | 44 |
| Custodian Fees | 8 |
| Total Expenses | 624 |
| Net Investment Income | 7,081 |
| Realized Net Gain (Loss) | |
| Investment Securities Sold | 48,153 |
| Futures Contracts | 227 |
| Realized Net Gain (Loss) | 48,380 |
| Change in Unrealized Appreciation (Depreciation) | |
| Investment Securities | 37,918 |
| Futures Contracts | 33 |
| Change in Unrealized Appreciation (Depreciation) | 37,951 |
| Net Increase (Decrease) in Net Assets Resulting from Operations | 93,412 |
| 1 Interest income from an affiliated company of the fund was $1,000. | |
See accompanying Notes, which are an integral part of the Financial Statements.
15
| | |
| Structured Large-Cap Equity Fund | | |
| |
| |
| Statement of Changes in Net Assets | | |
| |
| | Six Months Ended | Year Ended |
| | March 31, | September 30, |
| | 2014 | 2013 |
| | ($000) | ($000) |
| Increase (Decrease) in Net Assets | | |
| Operations | | |
| Net Investment Income | 7,081 | 12,100 |
| Realized Net Gain (Loss) | 48,380 | 62,931 |
| Change in Unrealized Appreciation (Depreciation) | 37,951 | 21,069 |
| Net Increase (Decrease) in Net Assets Resulting from Operations | 93,412 | 96,100 |
| Distributions | | |
| Net Investment Income | | |
| Institutional Shares | (930) | (313) |
| Institutional Plus Shares | (11,472) | (10,525) |
| Realized Capital Gain | | |
| Institutional Shares | — | — |
| Institutional Plus Shares | — | — |
| Total Distributions | (12,402) | (10,838) |
| Capital Share Transactions | | |
| Institutional Shares | (2,350) | 34,877 |
| Institutional Plus Shares | 4,790 | 31,530 |
| Net Increase (Decrease) from Capital Share Transactions | 2,440 | 66,407 |
| Total Increase (Decrease) | 83,450 | 151,669 |
| Net Assets | | |
| Beginning of Period | 664,397 | 512,728 |
| End of Period1 | 747,847 | 664,397 |
| 1 Net Assets—End of Period includes undistributed net investment income of $2,950,000 and $8,271,000. | |
See accompanying Notes, which are an integral part of the Financial Statements.
16
| | | | | | |
| Structured Large-Cap Equity Fund | | | | | | |
| |
| |
| Financial Highlights | | | | | | |
| |
| |
| Institutional Shares | | | | | | |
| | Six Months | | | | | |
| | Ended | | | | | |
| For a Share Outstanding | March 31, | | | Year Ended September 30, |
| Throughout Each Period | 2014 | 2013 | 2012 | 2011 | 2010 | 2009 |
| Net Asset Value, Beginning of Period | $32.42 | $27.83 | $21.49 | $20.97 | $19.47 | $22.56 |
| Investment Operations | | | | | | |
| Net Investment Income | . 335 | . 618 | . 531 | . 4281 | .366 | .546 |
| Net Realized and Unrealized Gain (Loss) | | | | | | |
| on Investments | 4.208 | 4.542 | 6.306 | .458 | 1.505 | (2.993) |
| Total from Investment Operations | 4.543 | 5.160 | 6.837 | .886 | 1.871 | (2.447) |
| Distributions | | | | | | |
| Dividends from Net Investment Income | (. 613) | (. 570) | (. 497) | (. 366) | (. 371) | (. 643) |
| Distributions from Realized Capital Gains | — | — | — | — | — | — |
| Total Distributions | (. 613) | (. 570) | (. 497) | (. 366) | (. 371) | (. 643) |
| Net Asset Value, End of Period | $36.35 | $32.42 | $27.83 | $21.49 | $20.97 | $19.47 |
| |
| Total Return | 14.14% | 18.93% | 32.32% | 4.14% | 9.68% | -10.25% |
| |
| Ratios/Supplemental Data | | | | | | |
| Net Assets, End of Period (Millions) | $56 | $52 | $15 | $12 | $95 | $106 |
| Ratio of Total Expenses to | | | | | | |
| Average Net Assets | 0.24% | 0.24% | 0.24% | 0.24% | 0.24% | 0.25% |
| Ratio of Net Investment Income to | | | | | | |
| Average Net Assets | 1.94% | 2.09% | 2.10% | 1.95% | 1.86% | 2.33% |
| Portfolio Turnover Rate | 72% | 62% | 64% | 67% | 61% | 80%2 |
The expense ratio, net income ratio, and turnover rate for the current period have been annualized.
1 Calculated based on average shares outstanding.
2 Excludes the value of portfolio securities received or delivered as a result of in-kind purchases or redemptions of the fund’s capital shares.
See accompanying Notes, which are an integral part of the Financial Statements.
17
| | | | | | |
| Structured Large-Cap Equity Fund | | | | | | |
| |
| |
| Financial Highlights | | | | | | |
| |
| |
| Institutional Plus Shares | | | | | | |
| | Six Months | | | | | |
| | Ended | | | | | |
| For a Share Outstanding | March 31, | | | Year Ended September 30, |
| Throughout Each Period | 2014 | 2013 | 2012 | 2011 | 2010 | 2009 |
| Net Asset Value, Beginning of Period | $64.10 | $55.02 | $42.48 | $41.98 | $38.97 | $45.15 |
| Investment Operations | | | | | | |
| Net Investment Income | .690 | 1.207 | 1.084 | .9101 | .768 | 1.116 |
| Net Realized and Unrealized Gain (Loss) | | | | | | |
| on Investments | 8.311 | 9.037 | 12.466 | .906 | 3.014 | (5.980) |
| Total from Investment Operations | 9.001 | 10.244 | 13.550 | 1.816 | 3.782 | (4.864) |
| Distributions | | | | | | |
| Dividends from Net Investment Income | (1.201) | (1.164) | (1.010) | (1.316) | (.772) | (1.316) |
| Distributions from Realized Capital Gains | — | — | — | — | — | — |
| Total Distributions | (1.201) | (1.164) | (1.010) | (1.316) | (.772) | (1.316) |
| Net Asset Value, End of Period | $71.90 | $64.10 | $55.02 | $42.48 | $41.98 | $38.97 |
| |
| Total Return | 14.17% | 19.02% | 32.42% | 4.18% | 9.78% | -10.16% |
| |
| Ratios/Supplemental Data | | | | | | |
| Net Assets, End of Period (Millions) | $692 | $612 | $497 | $379 | $570 | $467 |
| Ratio of Total Expenses to | | | | | | |
| Average Net Assets | 0.17% | 0.17% | 0.17% | 0.17% | 0.17% | 0.17% |
| Ratio of Net Investment Income to | | | | | | |
| Average Net Assets | 2.01% | 2.16% | 2.17% | 2.02% | 1.93% | 2.41% |
| Portfolio Turnover Rate | 72% | 62% | 64% | 67% | 61% | 80%2 |
The expense ratio, net income ratio, and turnover rate for the current period have been annualized.
1 Calculated based on average shares outstanding.
2 Excludes the value of portfolio securities received or delivered as a result of in-kind purchases or redemptions of the fund’s capital shares.
See accompanying Notes, which are an integral part of the Financial Statements.
18
Structured Large-Cap Equity Fund
Notes to Financial Statements
Vanguard Structured Large-Cap Equity Fund is registered under the Investment Company Act of 1940 as an open-end investment company, or mutual fund. The fund offers two classes of shares: Institutional Shares and Institutional Plus Shares. Institutional Shares and Institutional Plus Shares are designed for investors who meet certain administrative, service, and account-size criteria.
A. The following significant accounting policies conform to generally accepted accounting principles for U.S. mutual funds. The fund consistently follows such policies in preparing its financial statements.
1. Security Valuation: Securities are valued as of the close of trading on the New York Stock Exchange (generally 4 p.m., Eastern time) on the valuation date. Equity securities are valued at the latest quoted sales prices or official closing prices taken from the primary market in which each security trades; such securities not traded on the valuation date are valued at the mean of the latest quoted bid and asked prices. Securities for which market quotations are not readily available, or whose values have been materially affected by events occurring before the fund’s pricing time but after the close of the securities’ primary markets, are valued by methods deemed by the board of trustees to represent fair value. Investments in Vanguard Market Liquidity Fund are valued at that fund’s net asset value. Temporary cash investments acquired over 60 days to maturity are valued using the latest bid prices or using valuations based on a matrix system (which considers such factors as security prices, yields, maturities, and ratings), both as furnished by independent pricing services. Other temporary cash investments are valued at amortized cost, which approximates market value.
2. Futures Contracts: The fund uses index futures contracts to a limited extent, with the objective of maintaining full exposure to the stock market while maintaining liquidity. The fund may purchase or sell futures contracts to achieve a desired level of investment, whether to accommodate portfolio turnover or cash flows from capital share transactions. The primary risks associated with the use of futures contracts are imperfect correlation between changes in market values of stocks held by the fund and the prices of futures contracts, and the possibility of an illiquid market. Counterparty risk involving futures is mitigated because a regulated clearinghouse is the counterparty instead of the clearing broker. To further mitigate counterparty risk, the fund trades futures contracts on an exchange, monitors the financial strength of its clearing brokers and clearinghouse, and has entered into clearing agreements with its clearing brokers. The clearinghouse imposes initial margin requirements to secure the fund’s performance and requires daily settlement of variation margin representing changes in the market value of each contract.
Futures contracts are valued at their quoted daily settlement prices. The aggregate notional amounts of the contracts are not recorded in the Statement of Net Assets. Fluctuations in the value of the contracts are recorded in the Statement of Net Assets as an asset (liability) and in the Statement of Operations as unrealized appreciation (depreciation) until the contracts are closed, when they are recorded as realized futures gains (losses).
During the six months ended March 31, 2014, the fund’s average investments in long and short futures contracts represented less than 1% and 0% of net assets, respectively, based on quarterly average aggregate settlement values.
3. Federal Income Taxes: The fund intends to continue to qualify as a regulated investment company and distribute all of its taxable income. Management has analyzed the fund’s tax positions taken for all open federal income tax years (September 30, 2010–2013), and for the period ended March 31, 2014, and has concluded that no provision for federal income tax is required in the fund’s financial statements.
19
Structured Large-Cap Equity Fund
4. Distributions: Distributions to shareholders are recorded on the ex-dividend date.
5. Credit Facility: The fund and certain other funds managed by The Vanguard Group participate in a $2.89 billion committed credit facility provided by a syndicate of lenders pursuant to a credit agreement, which may be renewed annually; each fund is individually liable for its borrowings, if any, under the credit facility. Borrowings may be utilized for temporary and emergency purposes, and are subject to the fund’s regulatory and contractual borrowing restrictions. The participating funds are charged administrative fees and an annual commitment fee of 0.06% of the undrawn amount of the facility, which are allocated to the funds in accordance with a methodology approved by the board of trustees and included in Management and Administrative expenses on the fund’s Statement of Operations. Any borrowings under this facility bear interest at a rate equal to the higher of the Federal Funds Rate or LIBOR Reference Rate plus an agreed-upon spread.
The fund had no borrowings outstanding at March 31, 2014, or at any time during the period then ended.
6. Other: Dividend income is recorded on the ex-dividend date. Interest income includes income distributions received from Vanguard Market Liquidity Fund and is accrued daily. Premiums and discounts on debt securities purchased are amortized and accreted, respectively, to interest income over the lives of the respective securities. Security transactions are accounted for on the date securities are bought or sold. Costs used to determine realized gains (losses) on the sale of investment securities are those of the specific securities sold.
Each class of shares has equal rights as to assets and earnings, except that each class separately bears certain class-specific expenses related to maintenance of shareholder accounts (included in Management and Administrative expenses) and shareholder reporting. Marketing and distribution expenses are allocated to each class of shares based on a method approved by the board of trustees. Income, other non-class-specific expenses, and gains and losses on investments are allocated to each class of shares based on its relative net assets.
B. The Vanguard Group furnishes at cost investment advisory, corporate management, administrative, marketing, and distribution services. The costs of such services are allocated to the fund under methods approved by the board of trustees. The fund has committed to provide up to 0.40% of its net assets in capital contributions to Vanguard. At March 31, 2014, the fund had contributed capital of $80,000 to Vanguard (included in Other Assets), representing 0.01% of the fund’s net assets and 0.03% of Vanguard’s capitalization. The fund’s trustees and officers are also directors and officers of Vanguard.
C. Various inputs may be used to determine the value of the fund’s investments. These inputs are summarized in three broad levels for financial statement purposes. The inputs or methodologies used to value securities are not necessarily an indication of the risk associated with investing in those securities.
Level 1—Quoted prices in active markets for identical securities.
Level 2—Other significant observable inputs (including quoted prices for similar securities, interest rates, prepayment speeds, credit risk, etc.).
Level 3—Significant unobservable inputs (including the fund’s own assumptions used to determine the fair value of investments).
20
Structured Large-Cap Equity Fund
The following table summarizes the market value of the fund’s investments as of March 31, 2014, based on the inputs used to value them:
| | | |
| | Level 1 | Level 2 | Level 3 |
| Investments | ($000) | ($000) | ($000) |
| Common Stocks | 745,606 | — | — |
| Temporary Cash Investments | 2,237 | 200 | — |
| Futures Contracts—Assets1 | 16 | — | — |
| Total | 747,859 | 200 | — |
| 1 Represents variation margin on the last day of the reporting period. | | | |
D. At March 31, 2014, the aggregate settlement value of open futures contracts and the related unrealized appreciation (depreciation) were:
| | | | |
| | | | | ($000) |
| | | | Aggregate | |
| | | Number of | Settlement | Unrealized |
| | | Long (Short) | Value | Appreciation |
| Futures Contracts | Expiration | Contracts | Long (Short) | (Depreciation) |
| S&P 500 Index | June 2014 | 4 | 1,865 | 11 |
| E-mini S&P 500 Index | June 2014 | 4 | 373 | 2 |
| | | | | 13 |
Unrealized appreciation (depreciation) on open futures contracts is required to be treated as realized gain (loss) for tax purposes.
E. Distributions are determined on a tax basis and may differ from net investment income and realized capital gains for financial reporting purposes. Differences may be permanent or temporary. Permanent differences are reclassified among capital accounts in the financial statements to reflect their tax character. Temporary differences arise when certain items of income, expense, gain, or loss are recognized in different periods for financial statement and tax purposes. These differences will reverse at some time in the future. Differences in classification may also result from the treatment of short-term gains as ordinary income for tax purposes.
The fund’s tax-basis capital gains and losses are determined only at the end of each fiscal year. For tax purposes, at September 30, 2013, the fund had available capital losses totaling $121,009,000 to offset future net capital gains of $8,299,000 through September 30, 2017, and $112,710,000 through September 30, 2018. The fund will use these capital losses to offset net taxable capital gains, if any, realized during the year ending September 30, 2014; should the fund realize net capital losses for the year, the losses will be added to the loss carryforward balance above.
At March 31, 2014, the cost of investment securities for tax purposes was $580,686,000. Net unrealized appreciation of investment securities for tax purposes was $167,357,000, consisting of unrealized gains of $169,641,000 on securities that had risen in value since their purchase and $2,284,000 in unrealized losses on securities that had fallen in value since their purchase.
21
Structured Large-Cap Equity Fund
F. During the six months ended March 31, 2014, the fund purchased $256,053,000 of investment securities and sold $258,357,000 of investment securities, other than temporary cash investments.
G. Capital share transactions for each class of shares were:
| | | | |
| | Six Months Ended | | Year Ended |
| | March 31, 2014 | September 30, 2013 |
| | Amount | Shares | Amount | Shares |
| | ($000) | (000) | ($000) | (000) |
| Institutional Shares | | | | |
| Issued | 3,117 | 91 | 38,717 | 1,188 |
| Issued in Lieu of Cash Distributions | 696 | 20 | — | — |
| Redeemed | (6,163) | (179) | (3,840) | (129) |
| Net Increase (Decrease)—Institutional Shares | (2,350) | (68) | 34,877 | 1,059 |
| Institutional Plus Shares | | | | |
| Issued | 532 | 8 | 27,997 | 444 |
| Issued in Lieu of Cash Distributions | 4,258 | 63 | 3,533 | 66 |
| Redeemed | — | — | — | — |
| Net Increase (Decrease)—Institutional Plus Shares | 4,790 | 71 | 31,530 | 510 |
At March 31, 2014, two shareholders were each a record or beneficial owner of 35% or more of the fund’s net assets, with a combined ownership of 93%. If one of these shareholders were to redeem its investment in the fund, the redemption might result in an increase in the fund’s expense ratio, cause the fund to incur higher transaction costs, or lead to the realization of taxable capital gains.
H. Management has determined that no material events or transactions occurred subsequent to March 31, 2014, that would require recognition or disclosure in these financial statements.
22
Structured Broad Market Fund
Fund Profile
As of March 31, 2014
| | | |
| Share-Class Characteristics | | |
| | Institutional | Institutional |
| | Shares | Plus Shares |
| Ticker Symbol | VSBMX | | VSBPX |
| Expense Ratio1 | 0.25% | | 0.18% |
| 30-Day SEC Yield | 1.63% | | 1.70% |
| |
| Portfolio Characteristics | | |
| | | | DJ |
| | | | U.S. |
| | | | Total |
| | | Russell | Market |
| | | 3000 | FA |
| | Fund | Index | Index |
| Number of Stocks | 214 | 2,992 | 3,674 |
| Median Market Cap | $37.9B | $46.1B | $43.7B |
| Price/Earnings Ratio | 17.6x | 20.0x | 20.1x |
| Price/Book Ratio | 2.8x | 2.6x | 2.6x |
| Return on Equity | 17.1% | 17.3% | 17.2% |
| Earnings Growth | | | |
| Rate | 14.3% | 12.5% | 12.4% |
| Dividend Yield | 1.8% | 1.9% | 1.9% |
| Foreign Holdings | 0.0% | 0.0% | 0.0% |
| Turnover Rate | | | |
| (Annualized) | 62% | — | — |
| Short-Term Reserves | 0.0% | — | — |
| | |
| Volatility Measures | | |
| | | DJ |
| | Russell | U.S. Total |
| | 3000 | Market |
| | Index | FA Index |
| R-Squared | 0.99 | 0.99 |
| Beta | 1.06 | 1.06 |
| These measures show the degree and timing of the fund’s |
| fluctuations compared with the indexes over 36 months. | |
| |
| Ten Largest Holdings (% of total net assets) |
| Apple Inc. | Computer Hardware | 1.8% |
| Johnson & Johnson | Pharmaceuticals | 1.8 |
| General Electric Co. | Industrial | |
| | Conglomerates | 1.7 |
| Wells Fargo & Co. | Diversified Banks | 1.6 |
| Exxon Mobil Corp. | Integrated Oil & Gas | 1.5 |
| Pfizer Inc. | Pharmaceuticals | 1.4 |
| Bank of America Corp. | Diversified Banks | 1.4 |
| Verizon Communications Integrated | |
| Inc. | Telecommunication | |
| | Services | 1.4 |
| AT&T Inc. | Integrated | |
| | Telecommunication | |
| | Services | 1.2 |
| International Business | IT Consulting & | |
| Machines Corp. | Other Services | 1.2 |
| Top Ten | | 15.0% |
| The holdings listed exclude any temporary cash investments and |
| equity index products. | | |
Investment Focus
1 The expense ratios shown are from the prospectus dated January 27, 2014. For the six months ended March 31, 2014, the annualized expense ratios were 0.24% for Institutional Shares and 0.17% for Institutional Plus Shares.
23
Structured Broad Market Fund
Sector Diversification (% of equity exposure)
| | | |
| | | | DJ |
| | | | U.S. |
| | | | Total |
| | | Russell | Market |
| | | 3000 | FA |
| | Fund | Index | Index |
| Consumer Discretionary | 12.1% | 12.9% | 12.8% |
| Consumer Staples | 8.5 | 8.4 | 8.4 |
| Energy | 9.1 | 9.3 | 9.4 |
| Financials | 16.7 | 17.6 | 17.6 |
| Health Care | 13.8 | 13.0 | 13.0 |
| Industrials | 11.2 | 11.5 | 11.5 |
| Information Technology | 18.2 | 18.2 | 18.1 |
| Materials | 4.3 | 3.8 | 3.9 |
| Telecommunication | | | |
| Services | 2.7 | 2.2 | 2.2 |
| Utilities | 3.4 | 3.1 | 3.1 |
24
Structured Broad Market Fund
Performance Summary
All of the returns in this report represent past performance, which is not a guarantee of future results that may be achieved by the fund. (Current performance may be lower or higher than the performance data cited. For performance data current to the most recent month-end, visit our website at vanguard.com/performance.) Note, too, that both investment returns and principal value can fluctuate widely, so an investor’s shares, when sold, could be worth more or less than their original cost. The returns shown do not reflect taxes that a shareholder would pay on fund distributions or on the sale of fund shares.
Fiscal-Year Total Returns (%): November 30, 2006, Through March 31, 2014

Structured Broad Market Fund Institutional Shares
Russell 3000 Index
Note: For 2014, performance data reflect the six months ended March 31, 2014.
| | | | |
| Average Annual Total Returns: Periods Ended March 31, 2014 | | | |
| |
| | Inception | One | Five | Since |
| | Date | Year | Years | Inception |
| Institutional Shares | 11/30/2006 | 25.45% | 23.10% | 6.72% |
| Institutional Plus Shares | 5/3/2004 | 25.52 | 23.18 | 8.38 |
The fund commenced operations as a registered investment company on October 3, 2006. The fund’s performance includes the performance of a predecessor trust, Vanguard Fiduciary Trust Company Structured Broad Market Trust, from May 3, 2004, to October 3, 2006.
See Financial Highlights for dividend and capital gains information.
25
Structured Broad Market Fund
Financial Statements (unaudited)
Statement of Net Assets
As of March 31, 2014
The fund reports a complete list of its holdings in regulatory filings four times in each fiscal year, at the quarter-ends. For the second and fourth fiscal quarters, the lists appear in the fund’s semiannual and annual reports to shareholders. For the first and third fiscal quarters, the fund files the lists with the Securities and Exchange Commission on Form N-Q. Shareholders can look up the fund’s Forms N-Q on the SEC’s website at sec.gov. Forms N-Q may also be reviewed and copied at the SEC’s Public Reference Room (see the back cover of this report for further information).
| | | |
| | | | Market |
| | | | Value |
| | | Shares | ($000) |
| Common Stocks (99.5%)1 | | |
| Consumer Discretionary (12.1%) | |
| | Home Depot Inc. | 68,400 | 5,412 |
| | Comcast Corp. Class A | 94,891 | 4,746 |
| | Lowe’s Cos. Inc. | 82,200 | 4,020 |
| | TJX Cos. Inc. | 64,300 | 3,900 |
| | Viacom Inc. Class B | 43,600 | 3,706 |
| | CBS Corp. Class B | 58,900 | 3,640 |
| | Macy’s Inc. | 59,800 | 3,546 |
| | NIKE Inc. Class B | 44,600 | 3,294 |
| * | O’Reilly Automotive Inc. | 21,900 | 3,250 |
| | Las Vegas Sands Corp. | 38,500 | 3,110 |
| | Goodyear Tire & Rubber Co. | 118,600 | 3,099 |
| | Whirlpool Corp. | 20,700 | 3,094 |
| | Wynn Resorts Ltd. | 13,200 | 2,932 |
| | Gap Inc. | 73,100 | 2,928 |
| | Cablevision Systems Corp. | | |
| | Class A | 163,200 | 2,753 |
| | Hanesbrands Inc. | 24,100 | 1,843 |
| * | Red Robin Gourmet | | |
| | Burgers Inc. | 23,100 | 1,656 |
| | Best Buy Co. Inc. | 56,300 | 1,487 |
| | GameStop Corp. Class A | 32,700 | 1,344 |
| * | Jack in the Box Inc. | 19,800 | 1,167 |
| | Time Warner Cable Inc. | 7,600 | 1,043 |
| * | Tower International Inc. | 38,100 | 1,037 |
| * | DIRECTV | 13,500 | 1,032 |
| | Walt Disney Co. | 9,700 | 777 |
| * | Amazon.com Inc. | 2,000 | 673 |
| * | Starz | 15,782 | 509 |
| | Domino’s Pizza Inc. | 5,500 | 423 |
| * | Visteon Corp. | 2,400 | 212 |
| | | | 66,633 |
| Consumer Staples (8.4%) | | |
| | CVS Caremark Corp. | 65,000 | 4,866 |
| | PepsiCo Inc. | 56,300 | 4,701 |
| | Archer-Daniels-Midland Co. | 84,600 | 3,671 |
| | Tyson Foods Inc. Class A | 81,900 | 3,604 |
| * | Pilgrim’s Pride Corp. | 164,050 | 3,432 |
| | Kroger Co. | 77,300 | 3,374 |
| | | |
| | | | Market |
| | | | Value |
| | | Shares | ($000) |
| | Kraft Foods Group Inc. | 59,400 | 3,332 |
| | Procter & Gamble Co. | 39,351 | 3,172 |
| | Nu Skin Enterprises Inc. | | |
| | Class A | 36,400 | 3,016 |
| | Kimberly-Clark Corp. | 24,600 | 2,712 |
| | Walgreen Co. | 35,700 | 2,357 |
| | Andersons Inc. | 39,750 | 2,355 |
| | Altria Group Inc. | 51,800 | 1,939 |
| | Coca-Cola Co. | 33,780 | 1,306 |
| | Philip Morris International | | |
| | Inc. | 14,550 | 1,191 |
| | Wal-Mart Stores Inc. | 8,465 | 647 |
| * | Rite Aid Corp. | 65,000 | 408 |
| | Sanderson Farms Inc. | 3,900 | 306 |
| | | | 46,389 |
| Energy (9.0%) | | |
| | Exxon Mobil Corp. | 86,220 | 8,422 |
| | ConocoPhillips | 68,240 | 4,801 |
| | EOG Resources Inc. | 22,000 | 4,316 |
| | Chevron Corp. | 32,565 | 3,872 |
| | Valero Energy Corp. | 69,900 | 3,712 |
| | Devon Energy Corp. | 51,600 | 3,453 |
| | Helmerich & Payne Inc. | 30,500 | 3,280 |
| | Hess Corp. | 39,100 | 3,241 |
| | Chesapeake Energy Corp. | 120,000 | 3,074 |
| * | SEACOR Holdings Inc. | 31,800 | 2,748 |
| | Cimarex Energy Co. | 22,800 | 2,716 |
| | Murphy Oil Corp. | 38,800 | 2,439 |
| | Occidental Petroleum Corp. | 20,200 | 1,925 |
| | Phillips 66 | 13,870 | 1,069 |
| | Schlumberger Ltd. | 5,810 | 566 |
| | | | 49,634 |
| Financials (16.6%) | | |
| | Wells Fargo & Co. | 181,370 | 9,021 |
| | Bank of America Corp. | 444,300 | 7,642 |
| | American Express Co. | 54,100 | 4,871 |
| | Goldman Sachs Group Inc. | 27,200 | 4,457 |
| | PNC Financial Services | | |
| | Group Inc. | 46,600 | 4,054 |
| | Fifth Third Bancorp | 157,000 | 3,603 |
26
| | | |
| Structured Broad Market Fund | | |
| |
| |
| |
| | | | Market |
| | | | Value |
| | | Shares | ($000) |
| | Allstate Corp. | 59,800 | 3,383 |
| | Travelers Cos. Inc. | 38,500 | 3,276 |
| | Ameriprise Financial Inc. | 29,600 | 3,258 |
| | Lincoln National Corp. | 63,400 | 3,212 |
| | Everest Re Group Ltd. | 19,700 | 3,015 |
| | State Street Corp. | 42,800 | 2,977 |
| * | Berkshire Hathaway Inc. | | |
| | Class B | 23,500 | 2,937 |
| | JPMorgan Chase & Co. | 47,336 | 2,874 |
| | Discover Financial Services | 45,400 | 2,642 |
| | Citigroup Inc. | 54,300 | 2,585 |
| | Regions Financial Corp. | 229,400 | 2,549 |
| | Simon Property Group Inc. | 14,700 | 2,411 |
| | Public Storage | 10,400 | 1,752 |
| | US Bancorp | 40,250 | 1,725 |
| | Host Hotels & Resorts Inc. | 71,400 | 1,445 |
| | RLJ Lodging Trust | 50,400 | 1,348 |
| * | Howard Hughes Corp. | 8,800 | 1,256 |
| | Omega Healthcare | | |
| | Investors Inc. | 34,900 | 1,170 |
| | Ventas Inc. | 19,000 | 1,151 |
| | Nelnet Inc. Class A | 27,800 | 1,137 |
| | Kimco Realty Corp. | 48,700 | 1,066 |
| | Assurant Inc. | 16,200 | 1,052 |
| | Corrections Corp. of | | |
| | America | 31,800 | 996 |
| | Weingarten Realty Investors | 31,500 | 945 |
| | Brandywine Realty Trust | 64,400 | 931 |
| | Retail Properties of America | | |
| | Inc. | 66,900 | 906 |
| * | World Acceptance Corp. | 11,256 | 845 |
| | Geo Group Inc. | 22,800 | 735 |
| | Waddell & Reed Financial | | |
| | Inc. Class A | 8,000 | 589 |
| | Universal Insurance | | |
| | Holdings Inc. | 44,500 | 565 |
| | KeyCorp | 39,600 | 564 |
| | Montpelier Re Holdings Ltd. | 17,100 | 509 |
| | General Growth Properties | | |
| | Inc. | 20,600 | 453 |
| * | Realogy Holdings Corp. | 8,800 | 382 |
| | WP Carey Inc. | 6,300 | 378 |
| | XL Group plc Class A | 10,100 | 316 |
| * | E*TRADE Financial Corp. | 12,400 | 285 |
| | Hospitality Properties Trust | 8,700 | 250 |
| * | United Community Banks | | |
| | Inc. | 5,800 | 113 |
| * | RE/MAX Holdings Inc. | 3,500 | 101 |
| | | | 91,732 |
| Health Care (13.8%) | | |
| | Johnson & Johnson | 100,907 | 9,912 |
| | Pfizer Inc. | 238,258 | 7,653 |
| | AbbVie Inc. | 93,600 | 4,811 |
| | Medtronic Inc. | 71,300 | 4,388 |
| | Eli Lilly & Co. | 73,620 | 4,333 |
| | McKesson Corp. | 22,900 | 4,044 |
| | | |
| | | | Market |
| | | | Value |
| | | Shares | ($000) |
| * | Celgene Corp. | 27,300 | 3,811 |
| | WellPoint Inc. | 35,200 | 3,504 |
| | Cigna Corp. | 40,100 | 3,358 |
| | Cardinal Health Inc. | 47,900 | 3,352 |
| | CR Bard Inc. | 21,200 | 3,137 |
| * | Mylan Inc. | 63,100 | 3,081 |
| * | Endo Health Solutions Inc. | 41,900 | 2,876 |
| * | Covance Inc. | 26,200 | 2,722 |
| | Omnicare Inc. | 44,600 | 2,661 |
| * | Biogen Idec Inc. | 8,500 | 2,600 |
| * | Charles River Laboratories | | |
| | International Inc. | 42,600 | 2,571 |
| * | Gilead Sciences Inc. | 25,600 | 1,814 |
| | Abbott Laboratories | 38,000 | 1,463 |
| | Merck & Co. Inc. | 23,983 | 1,362 |
| * | Boston Scientific Corp. | 81,100 | 1,097 |
| | Amgen Inc. | 5,200 | 641 |
| * | Salix Pharmaceuticals Ltd. | 5,000 | 518 |
| * | Alliance HealthCare | | |
| | Services Inc. | 6,900 | 231 |
| | | | 75,940 |
| Industrials (11.1%) | | |
| | General Electric Co. | 356,980 | 9,242 |
| | Boeing Co. | 39,950 | 5,013 |
| | Union Pacific Corp. | 21,900 | 4,110 |
| | Lockheed Martin Corp. | 25,000 | 4,081 |
| | Delta Air Lines Inc. | 112,600 | 3,902 |
| | Raytheon Co. | 39,400 | 3,892 |
| | General Dynamics Corp. | 34,600 | 3,769 |
| | Northrop Grumman Corp. | 30,130 | 3,717 |
| | Alaska Air Group Inc. | 32,300 | 3,014 |
| | Huntington Ingalls | | |
| | Industries Inc. | 27,600 | 2,822 |
| | Masco Corp. | 125,700 | 2,792 |
| | Honeywell International Inc. | 27,000 | 2,504 |
| | Rockwell Automation Inc. | 17,500 | 2,180 |
| * | United Rentals Inc. | 20,400 | 1,937 |
| | United Parcel Service Inc. | | |
| | Class B | 17,300 | 1,685 |
| | Pitney Bowes Inc. | 56,700 | 1,474 |
| | Towers Watson & Co. | | |
| | Class A | 10,900 | 1,243 |
| | Southwest Airlines Co. | 48,200 | 1,138 |
| | L-3 Communications | | |
| | Holdings Inc. | 6,800 | 803 |
| | Trinity Industries Inc. | 9,700 | 699 |
| * | WABCO Holdings Inc. | 6,000 | 633 |
| * | AECOM Technology Corp. | 15,000 | 483 |
| * | United Continental Holdings | | |
| | Inc. | 7,500 | 335 |
| | | | 61,468 |
| Information Technology (18.1%) | |
| | Apple Inc. | 18,720 | 10,048 |
| | International Business | | |
| | Machines Corp. | 33,442 | 6,437 |
27
| | | |
| Structured Broad Market Fund | | |
| |
| |
| |
| | | | Market |
| | | | Value |
| | | Shares | ($000) |
| | Microsoft Corp. | 140,897 | 5,775 |
| * | Facebook Inc. Class A | 86,300 | 5,199 |
| * | Google Inc. Class A | 4,480 | 4,993 |
| | MasterCard Inc. Class A | 64,500 | 4,818 |
| | Hewlett-Packard Co. | 148,100 | 4,793 |
| | Texas Instruments Inc. | 83,100 | 3,918 |
| | Western Digital Corp. | 38,900 | 3,572 |
| * | Alliance Data Systems | | |
| | Corp. | 12,100 | 3,297 |
| | Computer Sciences Corp. | 50,800 | 3,090 |
| * | Take-Two Interactive | | |
| | Software Inc. | 139,100 | 3,050 |
| * | Advanced Micro Devices | | |
| | Inc. | 730,200 | 2,928 |
| | Motorola Solutions Inc. | 44,200 | 2,842 |
| | Anixter International Inc. | 27,400 | 2,782 |
| * | Freescale Semiconductor | | |
| | Ltd. | 110,900 | 2,707 |
| * | Unisys Corp. | 88,000 | 2,680 |
| * | Gartner Inc. | 37,400 | 2,597 |
| * | Ubiquiti Networks Inc. | 55,400 | 2,519 |
| * | Manhattan Associates Inc. | 66,400 | 2,326 |
| * | Electronic Arts Inc. | 74,000 | 2,147 |
| | Heartland Payment | | |
| | Systems Inc. | 50,900 | 2,110 |
| | Harris Corp. | 27,900 | 2,041 |
| * | VMware Inc. Class A | 17,500 | 1,890 |
| | CDW Corp. | 66,600 | 1,827 |
| * | Brocade Communications | | |
| | Systems Inc. | 148,800 | 1,579 |
| * | ON Semiconductor Corp. | 134,400 | 1,263 |
| | Intuit Inc. | 15,000 | 1,166 |
| | Broadridge Financial | | |
| | Solutions Inc. | 24,500 | 910 |
| * | Aspen Technology Inc. | 18,500 | 784 |
| | Oracle Corp. | 15,848 | 648 |
| | Intel Corp. | 19,390 | 500 |
| | Lexmark International Inc. | | |
| | Class A | 10,200 | 472 |
| | QUALCOMM Inc. | 5,900 | 465 |
| | Cisco Systems Inc. | 17,850 | 400 |
| | Applied Materials Inc. | 15,000 | 306 |
| | Symantec Corp. | 15,200 | 304 |
| * | Applied Micro Circuits Corp. | 21,700 | 215 |
| | LSI Corp. | 13,900 | 154 |
| | Visa Inc. Class A | 500 | 108 |
| | | | 99,660 |
| Materials (4.3%) | | |
| | Dow Chemical Co. | 86,900 | 4,222 |
| | LyondellBasell Industries | | |
| | NV Class A | 43,400 | 3,860 |
| | PPG Industries Inc. | 18,650 | 3,608 |
| | Packaging Corp. of America | 44,000 | 3,096 |
| | Sherwin-Williams Co. | 9,900 | 1,952 |
| | |
| | | Market |
| | | Value |
| | Shares | ($000) |
| EI du Pont de Nemours & | | |
| Co. | 26,700 | 1,792 |
| International Paper Co. | 33,600 | 1,542 |
| Avery Dennison Corp. | 29,100 | 1,474 |
| Westlake Chemical Corp. | 17,600 | 1,165 |
| Scotts Miracle-Gro Co. | | |
| Class A | 14,800 | 907 |
| | | 23,618 |
| Telecommunication Services (2.7%) | |
| Verizon Communications | | |
| Inc. | 158,457 | 7,538 |
| AT&T Inc. | 191,929 | 6,731 |
| * FairPoint Communications | | |
| Inc. | 50,300 | 684 |
| | | 14,953 |
| Utilities (3.4%) | | |
| Exelon Corp. | 114,300 | 3,836 |
| Edison International | 65,200 | 3,691 |
| Ameren Corp. | 73,400 | 3,024 |
| AES Corp. | 200,600 | 2,865 |
| PG&E Corp. | 56,900 | 2,458 |
| American Electric Power | | |
| Co. Inc. | 38,200 | 1,935 |
| Dominion Resources Inc. | 14,000 | 994 |
| | | 18,803 |
| Total Common Stocks | | |
| (Cost $412,560) | | 548,830 |
| Temporary Cash Investments (0.5%)1 | |
| Money Market Fund (0.4%) | | |
| 2 Vanguard Market Liquidity | | |
| Fund, 0.122% | 2,303,010 | 2,303 |
|
| Face |
| Amount |
| ($000) |
| U.S. Government and Agency Obligations (0.1%) |
| | | |
| 3,4 | Federal Home Loan Bank | | |
| | Discount Notes, 0.050%, | | |
| | 5/30/14 | 300 | 300 |
| 3,5 | Freddie Mac Discount | | |
| | Notes, 0.105%, 6/18/14 | 100 | 100 |
| | | | 400 |
| Total Temporary Cash Investments | | |
| (Cost $2,703) | | 2,703 |
| Total Investments (100.0%) | | |
| (Cost $415,263) | | 551,533 |
| Other Assets and Liabilities (0.0%) | | |
| Other Assets | | 981 |
| Liabilities | | (882) |
| | | | 99 |
| Net Assets (100%) | | 551,632 |
28
Structured Broad Market Fund
| |
| At March 31, 2014, net assets consisted of: | |
| | Amount |
| | ($000) |
| Paid-in Capital | 388,554 |
| Undistributed Net Investment Income | 1,928 |
| Accumulated Net Realized Gains | 24,861 |
| Unrealized Appreciation (Depreciation) | |
| Investment Securities | 136,270 |
| Futures Contracts | 19 |
| Net Assets | 551,632 |
| |
| |
| Institutional Shares—Net Assets | |
| Applicable to 674,633 outstanding | |
| $.001 par value shares of beneficial | |
| interest (unlimited authorization) | 23,900 |
| Net Asset Value Per Share— | |
| Institutional Shares | $35.43 |
| |
| |
| Institutional Plus Shares—Net Assets | |
| Applicable to 7,454,603 outstanding | |
| $.001 par value shares of beneficial | |
| interest (unlimited authorization) | 527,732 |
| Net Asset Value Per Share— | |
| Institutional Plus Shares | $70.79 |
See Note A in Notes to Financial Statements.
* Non-income-producing security.
1 The fund invests a portion of its cash reserves in equity markets through the use of index futures contracts. After giving effect to futures investments, the fund’s effective common stock and temporary cash investment positions represent 100.0% and 0.0%, respectively, of net assets.
2 Affiliated money market fund available only to Vanguard funds and certain trusts and accounts managed by Vanguard. Rate shown is the 7-day yield.
3 Securities with a value of $300,000 have been segregated as initial margin for open futures contracts.
4 The issuer operates under a congressional charter; its securities are generally neither guaranteed by the U.S. Treasury nor backed by the full faith and credit of the U.S. government.
5 The issuer was placed under federal conservatorship in September 2008; since that time, its daily operations have been managed by the Federal Housing Finance Agency and it receives capital from the U.S. Treasury, as needed to maintain a positive net worth, in exchange for senior preferred stock.
See accompanying Notes, which are an integral part of the Financial Statements.
29
| |
| Structured Broad Market Fund | |
| |
| |
| Statement of Operations | |
| |
| | Six Months Ended |
| | March 31, 2014 |
| | ($000) |
| Investment Income | |
| Income | |
| Dividends | 5,016 |
| Interest1 | 2 |
| Total Income | 5,018 |
| Expenses | |
| The Vanguard Group—Note B | |
| Investment Advisory Services | 241 |
| Management and Administrative—Institutional Shares | 14 |
| Management and Administrative—Institutional Plus Shares | 152 |
| Marketing and Distribution—Institutional Shares | — |
| Marketing and Distribution—Institutional Plus Shares | 32 |
| Custodian Fees | 6 |
| Total Expenses | 445 |
| Net Investment Income | 4,573 |
| Realized Net Gain (Loss) | |
| Investment Securities Sold | 29,683 |
| Futures Contracts | 257 |
| Realized Net Gain (Loss) | 29,940 |
| Change in Unrealized Appreciation (Depreciation) | |
| Investment Securities | 37,553 |
| Futures Contracts | 45 |
| Change in Unrealized Appreciation (Depreciation) | 37,598 |
| Net Increase (Decrease) in Net Assets Resulting from Operations | 72,111 |
| 1 Interest income from an affiliated company of the fund was $1,000. | |
See accompanying Notes, which are an integral part of the Financial Statements.
30
| | |
| Structured Broad Market Fund | | |
| |
| |
| Statement of Changes in Net Assets | | |
| |
| | Six Months Ended | Year Ended |
| | March 31, | September 30, |
| | 2014 | 2013 |
| | ($000) | ($000) |
| Increase (Decrease) in Net Assets | | |
| Operations | | |
| Net Investment Income | 4,573 | 8,642 |
| Realized Net Gain (Loss) | 29,940 | 52,044 |
| Change in Unrealized Appreciation (Depreciation) | 37,598 | 28,374 |
| Net Increase (Decrease) in Net Assets Resulting from Operations | 72,111 | 89,060 |
| Distributions | | |
| Net Investment Income | | |
| Institutional Shares | (270) | (156) |
| Institutional Plus Shares | (8,224) | (8,303) |
| Realized Capital Gain1 | | |
| Institutional Shares | (657) | — |
| Institutional Plus Shares | (19,311) | — |
| Total Distributions | (28,462) | (8,459) |
| Capital Share Transactions | | |
| Institutional Shares | 6,680 | 5,441 |
| Institutional Plus Shares | 20,694 | 7,941 |
| Net Increase (Decrease) from Capital Share Transactions | 27,374 | 13,382 |
| Total Increase (Decrease) | 71,023 | 93,983 |
| Net Assets | | |
| Beginning of Period | 480,609 | 386,626 |
| End of Period2 | 551,632 | 480,609 |
1 Includes fiscal 2014 short-term gain distributions totaling $1,585,000. Short-term gain distributions are treated as ordinary income dividends for tax purposes.
2 Net Assets—End of Period includes undistributed net investment income of $1,928,000 and $5,849,000.
See accompanying Notes, which are an integral part of the Financial Statements.
31
| | | | | | |
| Structured Broad Market Fund | | | | | | |
| |
| |
| Financial Highlights | | | | | | |
| |
| |
| Institutional Shares | | | | | | |
| | Six Months | | | | | |
| | Ended | | | | | |
| For a Share Outstanding | March 31, | | | Year Ended September 30, |
| Throughout Each Period | 2014 | 2013 | 2012 | 2011 | 2010 | 2009 |
| Net Asset Value, Beginning of Period | $32.59 | $27.10 | $21.03 | $20.70 | $18.99 | $21.53 |
| Investment Operations | | | | | | |
| Net Investment Income | . 302 | . 573 | . 544 | . 3851 | .376 | .3521 |
| Net Realized and Unrealized Gain (Loss) | | | | | | |
| on Investments | 4.476 | 5.492 | 5.973 | .338 | 1.672 | (2.500) |
| Total from Investment Operations | 4.778 | 6.065 | 6.517 | .723 | 2.048 | (2.148) |
| Distributions | | | | | | |
| Dividends from Net Investment Income | (. 564) | (. 575) | (. 447) | (. 393) | (. 338) | (. 392) |
| Distributions from Realized Capital Gains | (1.374) | — | — | — | — | — |
| Total Distributions | (1.938) | (. 575) | (. 447) | (. 393) | (. 338) | (. 392) |
| Net Asset Value, End of Period | $35.43 | $32.59 | $27.10 | $21.03 | $20.70 | $18.99 |
| |
| Total Return | 15.09% | 22.85% | 31.43% | 3.37% | 10.88% | -9.67% |
| |
| Ratios/Supplemental Data | | | | | | |
| Net Assets, End of Period (Millions) | $24 | $16 | $7 | $6 | $5 | $4 |
| Ratio of Total Expenses to | | | | | | |
| Average Net Assets | 0.24% | 0.24% | 0.24% | 0.24% | 0.24% | 0.25% |
| Ratio of Net Investment Income to | | | | | | |
| Average Net Assets | 1.74% | 1.94% | 2.19% | 1.64% | 1.91% | 2.15% |
| Portfolio Turnover Rate | 62% | 63% | 58% | 56% | 52% | 62% |
| The expense ratio, net income ratio, and turnover rate for the current period have been annualized. | | | |
| 1 Calculated based on average shares outstanding. |
See accompanying Notes, which are an integral part of the Financial Statements.
32
| | | | | | |
| Structured Broad Market Fund | | | | | | |
| |
| |
| Financial Highlights | | | | | | |
| |
| |
| Institutional Plus Shares | | | | | | |
| | Six Months | | | | | |
| | Ended | | | | | |
| For a Share Outstanding | March 31, | | | Year Ended September 30, |
| Throughout Each Period | 2014 | 2013 | 2012 | 2011 | 2010 | 2009 |
| Net Asset Value, Beginning of Period | $65.15 | $54.17 | $42.02 | $41.36 | $37.94 | $43.07 |
| Investment Operations | | | | | | |
| Net Investment Income | .623 | 1.186 | 1.122 | .7961 | .778 | .7251 |
| Net Realized and Unrealized Gain (Loss) | | | | | | |
| on Investments | 8.931 | 10.980 | 11.951 | .672 | 3.343 | (5.006) |
| Total from Investment Operations | 9.554 | 12.166 | 13.073 | 1.468 | 4.121 | (4.281) |
| Distributions | | | | | | |
| Dividends from Net Investment Income | (1.169) | (1.186) | (.923) | (.808) | (.701) | (.849) |
| Distributions from Realized Capital Gains | (2.745) | — | — | — | — | — |
| Total Distributions | (3.914) | (1.186) | (.923) | (.808) | (.701) | (.849) |
| Net Asset Value, End of Period | $70.79 | $65.15 | $54.17 | $42.02 | $41.36 | $37.94 |
| |
| Total Return | 15.10% | 22.95% | 31.56% | 3.43% | 10.96% | -9.60% |
| |
| Ratios/Supplemental Data | | | | | | |
| Net Assets, End of Period (Millions) | $528 | $465 | $379 | $290 | $304 | $275 |
| Ratio of Total Expenses to | | | | | | |
| Average Net Assets | 0.17% | 0.17% | 0.17% | 0.17% | 0.17% | 0.17% |
| Ratio of Net Investment Income to | | | | | | |
| Average Net Assets | 1.81% | 2.01% | 2.26% | 1.71% | 1.98% | 2.23% |
| Portfolio Turnover Rate | 62% | 63% | 58% | 56% | 52% | 62% |
| The expense ratio, net income ratio, and turnover rate for the current period have been annualized. | | | |
| 1 Calculated based on average shares outstanding. |
See accompanying Notes, which are an integral part of the Financial Statements.
33
Structured Broad Market Fund
Notes to Financial Statements
Vanguard Structured Broad Market Fund is registered under the Investment Company Act of 1940 as an open-end investment company, or mutual fund. The fund offers two classes of shares: Institutional Shares and Institutional Plus Shares. Institutional Shares and Institutional Plus Shares are designed for investors who meet certain administrative, service, and account-size criteria.
A. The following significant accounting policies conform to generally accepted accounting principles for U.S. mutual funds. The fund consistently follows such policies in preparing its financial statements.
1. Security Valuation: Securities are valued as of the close of trading on the New York Stock Exchange (generally 4 p.m., Eastern time) on the valuation date. Equity securities are valued at the latest quoted sales prices or official closing prices taken from the primary market in which each security trades; such securities not traded on the valuation date are valued at the mean of the latest quoted bid and asked prices. Securities for which market quotations are not readily available, or whose values have been materially affected by events occurring before the fund’s pricing time but after the close of the securities’ primary markets, are valued by methods deemed by the board of trustees to represent fair value. Investments in Vanguard Market Liquidity Fund are valued at that fund’s net asset value. Temporary cash investments acquired over 60 days to maturity are valued using the latest bid prices or using valuations based on a matrix system (which considers such factors as security prices, yields, maturities, and ratings), both as furnished by independent pricing services. Other temporary cash investments are valued at amortized cost, which approximates market value.
2. Futures Contracts: The fund uses index futures contracts to a limited extent, with the objective of maintaining full exposure to the stock market while maintaining liquidity. The fund may purchase or sell futures contracts to achieve a desired level of investment, whether to accommodate portfolio turnover or cash flows from capital share transactions. The primary risks associated with the use of futures contracts are imperfect correlation between changes in market values of stocks held by the fund and the prices of futures contracts, and the possibility of an illiquid market. Counterparty risk involving futures is mitigated because a regulated clearinghouse is the counterparty instead of the clearing broker. To further mitigate counterparty risk, the fund trades futures contracts on an exchange, monitors the financial strength of its clearing brokers and clearinghouse, and has entered into clearing agreements with its clearing brokers. The clearinghouse imposes initial margin requirements to secure the fund’s performance and requires daily settlement of variation margin representing changes in the market value of each contract.
Futures contracts are valued at their quoted daily settlement prices. The aggregate notional amounts of the contracts are not recorded in the Statement of Net Assets. Fluctuations in the value of the contracts are recorded in the Statement of Net Assets as an asset (liability) and in the Statement of Operations as unrealized appreciation (depreciation) until the contracts are closed, when they are recorded as realized futures gains (losses).
During the six months ended March 31, 2014, the fund’s average investments in long and short futures contracts represented less than 1% and 0% of net assets, respectively, based on quarterly average aggregate settlement values.
3. Federal Income Taxes: The fund intends to continue to qualify as a regulated investment company and distribute all of its taxable income. Management has analyzed the fund’s tax positions taken for all open federal income tax years (September 30, 2010–2013), and for the period ended March 31, 2014, and has concluded that no provision for federal income tax is required in the fund’s financial statements.
34
Structured Broad Market Fund
4. Distributions: Distributions to shareholders are recorded on the ex-dividend date.
5. Credit Facility: The fund and certain other funds managed by The Vanguard Group participate in a $2.89 billion committed credit facility provided by a syndicate of lenders pursuant to a credit agreement, which may be renewed annually; each fund is individually liable for its borrowings, if any, under the credit facility. Borrowings may be utilized for temporary and emergency purposes, and are subject to the fund’s regulatory and contractual borrowing restrictions. The participating funds are charged administrative fees and an annual commitment fee of 0.06% of the undrawn amount of the facility, which are allocated to the funds in accordance with a methodology approved by the board of trustees and included in Management and Administrative expenses on the fund’s Statement of Operations. Any borrowings under this facility bear interest at a rate equal to the higher of the Federal Funds Rate or LIBOR Reference Rate plus an agreed-upon spread.
The fund had no borrowings outstanding at March 31, 2014, or at any time during the period then ended.
6. Other: Dividend income is recorded on the ex-dividend date. Interest income includes income distributions received from Vanguard Market Liquidity Fund and is accrued daily. Premiums and discounts on debt securities purchased are amortized and accreted, respectively, to interest income over the lives of the respective securities. Security transactions are accounted for on the date securities are bought or sold. Costs used to determine realized gains (losses) on the sale of investment securities are those of the specific securities sold.
Each class of shares has equal rights as to assets and earnings, except that each class separately bears certain class-specific expenses related to maintenance of shareholder accounts (included in Management and Administrative expenses) and shareholder reporting. Marketing and distribution expenses are allocated to each class of shares based on a method approved by the board of trustees. Income, other non-class-specific expenses, and gains and losses on investments are allocated to each class of shares based on its relative net assets.
B. The Vanguard Group furnishes at cost investment advisory, corporate management, administrative, marketing, and distribution services. The costs of such services are allocated to the fund under methods approved by the board of trustees. The fund has committed to provide up to 0.40% of its net assets in capital contributions to Vanguard. At March 31, 2014, the fund had contributed capital of $59,000 to Vanguard (included in Other Assets), representing 0.01% of the fund’s net assets and 0.02% of Vanguard’s capitalization. The fund’s trustees and officers are also directors and officers of Vanguard.
C. Various inputs may be used to determine the value of the fund’s investments. These inputs are summarized in three broad levels for financial statement purposes. The inputs or methodologies used to value securities are not necessarily an indication of the risk associated with investing in those securities.
Level 1—Quoted prices in active markets for identical securities.
Level 2—Other significant observable inputs (including quoted prices for similar securities, interest rates, prepayment speeds, credit risk, etc.).
Level 3—Significant unobservable inputs (including the fund’s own assumptions used to determine the fair value of investments).
35
Structured Broad Market Fund
The following table summarizes the market value of the fund’s investments as of March 31, 2014, based on the inputs used to value them:
| | | |
| | Level 1 | Level 2 | Level 3 |
| Investments | ($000) | ($000) | ($000) |
| Common Stocks | 548,830 | — | — |
| Temporary Cash Investments | 2,303 | 400 | — |
| Futures Contracts—Assets1 | 21 | — | — |
| Total | 551,154 | 400 | — |
| 1 Represents variation margin on the last day of the reporting period. | | | |
D. At March 31, 2014, the aggregate settlement value of open futures contracts and the related unrealized appreciation (depreciation) were:
| | | | |
| | | | | ($000) |
| | | | Aggregate | |
| | | Number of | Settlement | Unrealized |
| | | Long (Short) | Value | Appreciation |
| Futures Contracts | Expiration | Contracts | Long (Short) | (Depreciation) |
| S&P 500 Index | June 2014 | 5 | 2,331 | 17 |
| E-mini S&P 500 Index | June 2014 | 5 | 466 | 2 |
| | | | | 19 |
Unrealized appreciation (depreciation) on open futures contracts is required to be treated as realized gain (loss) for tax purposes.
E. Distributions are determined on a tax basis and may differ from net investment income and realized capital gains for financial reporting purposes. Differences may be permanent or temporary. Permanent differences are reclassified among capital accounts in the financial statements to reflect their tax character. Temporary differences arise when certain items of income, expense, gain, or loss are recognized in different periods for financial statement and tax purposes. These differences will reverse at some time in the future. Differences in classification may also result from the treatment of short-term gains as ordinary income for tax purposes. The fund’s tax-basis capital gains and losses are determined only at the end of each fiscal year.
At March 31, 2014, the cost of investment securities for tax purposes was $415,263,000. Net unrealized appreciation of investment securities for tax purposes was $136,270,000, consisting of unrealized gains of $138,235,000 on securities that had risen in value since their purchase and $1,965,000 in unrealized losses on securities that had fallen in value since their purchase.
F. During the six months ended March 31, 2014, the fund purchased $164,230,000 of investment securities and sold $160,636,000 of investment securities, other than temporary cash investments.
36
Structured Broad Market Fund
G. Capital share transactions for each class of shares were:
| | | | |
| | Six Months Ended | | Year Ended |
| | March 31, 2014 | September 30, 2013 |
| | Amount | Shares | Amount | Shares |
| | ($000) | (000) | ($000) | (000) |
| Institutional Shares | | | | |
| Issued | 6,144 | 180 | 5,285 | 201 |
| Issued in Lieu of Cash Distributions | 536 | 16 | 156 | 6 |
| Redeemed | — | — | — | — |
| Net Increase (Decrease)—Institutional Shares | 6,680 | 196 | 5,441 | 207 |
| Institutional Plus Shares | | | | |
| Issued | 7,201 | 110 | 74,668 | 1,229 |
| Issued in Lieu of Cash Distributions | 20,486 | 310 | 2,609 | 49 |
| Redeemed | (6,993) | (103) | (69,336) | (1,141) |
| Net Increase (Decrease)—Institutional Plus Shares | 20,694 | 317 | 7,941 | 137 |
At March 31, 2014, one shareholder was the record or beneficial owner of 96% of the fund’s net assets. If the shareholder were to redeem its investment in the fund, the redemption might result in an increase in the fund’s expense ratio, cause the fund to incur higher transaction costs, or lead to the realization of taxable capital gains.
H. Management has determined that no material events or transactions occurred subsequent to March 31, 2014, that would require recognition or disclosure in these financial statements.
37
About Your Fund’s Expenses
As a shareholder of the fund, you incur ongoing costs, which include costs for portfolio management, administrative services, and shareholder reports (like this one), among others. Operating expenses, which are deducted from a fund’s gross income, directly reduce the investment return of the fund.
A fund’s expenses are expressed as a percentage of its average net assets. This figure is known as the expense ratio. The following examples are intended to help you understand the ongoing costs (in dollars) of investing in your fund and to compare these costs with those of other mutual funds. The examples are based on an investment of $1,000 made at the beginning of the period shown and held for the entire period.
The accompanying table illustrates your fund’s costs in two ways:
• Based on actual fund return. This section helps you to estimate the actual expenses that you paid over the period. The ”Ending Account Value“ shown is derived from the fund‘s actual return, and the third column shows the dollar amount that would have been paid by an investor who started with $1,000 in the fund. You may use the information here, together with the amount you invested, to estimate the expenses that you paid over the period.
To do so, simply divide your account value by $1,000 (for example, an $8,600 account value divided by $1,000 = 8.6), then multiply the result by the number given for your fund under the heading ”Expenses Paid During Period.“
• Based on hypothetical 5% yearly return. This section is intended to help you compare your fund‘s costs with those of other mutual funds. It assumes that the fund had a yearly return of 5% before expenses, but that the expense ratio is unchanged. In this case—because the return used is not the fund’s actual return—the results do not apply to your investment. The example is useful in making comparisons because the Securities and Exchange Commission requires all mutual funds to calculate expenses based on a 5% return. You can assess your fund’s costs by comparing this hypothetical example with the hypothetical examples that appear in shareholder reports of other funds.
Note that the expenses shown in the table are meant to highlight and help you compare ongoing costs only and do not reflect transaction costs incurred by the fund for buying and selling securities. Further, the expenses do not include any purchase, redemption, or account service fees described in the fund prospectus. If such fees were applied to your account, your costs would be higher. Your fund does not carry a “sales load.”
The calculations assume no shares were bought or sold during the period. Your actual costs may have been higher or lower, depending on the amount of your investment and the timing of any purchases or redemptions.
You can find more information about the fund’s expenses, including annual expense ratios, in the Financial Statements section of this report. For additional information on operating expenses and other shareholder costs, please refer to your fund’s current prospectus.
38
| | | |
| Six Months Ended March 31, 2014 | | | |
| | Beginning | Ending | Expenses |
| | Account Value | Account Value | Paid During |
| | 9/30/2013 | 3/31/2014 | Period |
| Based on Actual Fund Return | | | |
| Structured Large-Cap Equity Fund | | | |
| Institutional Shares | $1,000.00 | $1,141.38 | $1.28 |
| Institutional Plus Shares | 1,000.00 | 1,141.66 | 0.91 |
| Structured Broad Market Fund | | | |
| Institutional Shares | $1,000.00 | $1,150.91 | $1.29 |
| Institutional Plus Shares | 1,000.00 | 1,151.00 | 0.91 |
| Based on Hypothetical 5% Yearly Return | | | |
| Structured Large-Cap Equity Fund | | | |
| Institutional Shares | $1,000.00 | $1,023.73 | $1.21 |
| Institutional Plus Shares | 1,000.00 | 1,024.08 | 0.86 |
| Structured Broad Market Fund | | | |
| Institutional Shares | $1,000.00 | $1,023.73 | $1.21 |
| Institutional Plus Shares | 1,000.00 | 1,024.08 | 0.86 |
The calculations are based on expenses incurred in the most recent six-month period. The funds’ annualized six-month expense ratios for that period are: for the Structured Large-Cap Equity Fund, 0.24% for Institutional Shares and 0.17% for Institutional Plus Shares; for the Structured Broad Market Fund, 0.24% for Institutional Shares and 0.17% for Institutional Plus Shares. The dollar amounts shown as “Expenses Paid” are equal to the annualized expense ratio multiplied by the average account value over the period, multiplied by the number of days in the most recent six-month period, then divided by the number of days in the most recent 12-month period.
39
Trustees Approve Advisory Arrangement
The board of trustees of Vanguard Structured Large-Cap Equity and Structured Broad Market Funds has renewed the funds’ investment advisory arrangement with The Vanguard Group, Inc. (Vanguard). Vanguard—through its Equity Investment Group—serves as investment advisor to the funds. The board determined that continuing the funds’ internalized management structure was in the best interests of the funds and their shareholders.
The board based its decision upon an evaluation of the advisor’s investment staff, portfolio management process, and performance. The trustees considered the factors discussed below, among others. However, no single factor determined whether the board approved the arrangement. Rather, it was the totality of the circumstances that drove the board’s decision.
Nature, extent, and quality of services
The board considered the quality of each fund’s investment management services over both the short and long term, and took into account the organizational depth and stability of the advisor. The board noted that Vanguard has been managing investments for more than three decades. The Equity Investment Group adheres to a sound, disciplined investment management process; the team has considerable experience, stability, and depth.
The board concluded that Vanguard’s experience, stability, depth, and performance, among other factors, warranted continuation of the advisory arrangement.
Investment performance
The board considered the performance of the funds since their inceptions, including any periods of outperformance or underperformance relative to a benchmark index and peer group. The board concluded that the performance was such that the advisory arrangement should continue. Information about each fund’s most recent performance can be found in the Performance Summary pages of this report.
Cost
The board concluded that the funds’ expense ratios were well below the average expense ratios charged by funds in their respective peer groups and that the funds’ advisory fee rates were also well below their peer-group averages. Information about the funds’ expenses appears in the About Your Fund’s Expenses section of this report as well as in the Financial Statements sections.
The board does not conduct a profitability analysis of Vanguard, because of Vanguard’s unique “at-cost” structure. Unlike most other mutual fund management companies, Vanguard is owned by the funds it oversees, and produces “profits” only in the form of reduced expenses for fund shareholders.
The benefit of economies of scale
The board concluded that the funds’ at-cost arrangement with Vanguard ensures that the funds will realize economies of scale as they grow, with the cost to shareholders declining as fund assets increase.
The board will consider whether to renew the advisory arrangement again after a one-year period.
40
Glossary
30-Day SEC Yield. A fund’s 30-day SEC yield is derived using a formula specified by the U.S. Securities and Exchange Commission. Under the formula, data related to the fund’s security holdings in the previous 30 days are used to calculate the fund’s hypothetical net income for that period, which is then annualized and divided by the fund’s estimated average net assets over the calculation period. For the purposes of this calculation, a security’s income is based on its current market yield to maturity (for bonds), its actual income (for asset-backed securities), or its projected dividend yield (for stocks). Because the SEC yield represents hypothetical annualized income, it will differ—at times significantly—from the fund’s actual experience. As a result, the fund’s income distributions may be higher or lower than implied by the SEC yield.
Beta. A measure of the magnitude of a fund’s past share-price fluctuations in relation to the ups and downs of a given market index. The index is assigned a beta of 1.00. Compared with a given index, a fund with a beta of 1.20 typically would have seen its share price rise or fall by 12% when the index rose or fell by 10%. For this report, beta is based on returns over the past 36 months for both the fund and the index. Note that a fund’s beta should be reviewed in conjunction with its R-squared (see definition). The lower the R-squared, the less correlation there is between the fund and the index, and the less reliable beta is as an indicator of volatility.
Dividend Yield. Dividend income earned by stocks, expressed as a percentage of the aggregate market value (or of net asset value, for a fund). The yield is determined by dividing the amount of the annual dividends by the aggregate value (or net asset value) at the end of the period. For a fund, the dividend yield is based solely on stock holdings and does not include any income produced by other investments.
Earnings Growth Rate. The average annual rate of growth in earnings over the past five years for the stocks now in a fund.
Equity Exposure. A measure that reflects a fund’s investments in stocks and stock futures. Any holdings in short-term reserves are excluded.
Expense Ratio. A fund’s total annual operating expenses expressed as a percentage of the fund’s average net assets. The expense ratio includes management and administrative expenses, but does not include the transaction costs of buying and selling portfolio securities.
Foreign Holdings. The percentage of a fund represented by securities or depositary receipts of companies based outside the United States.
Median Market Cap. An indicator of the size of companies in which a fund invests; the midpoint of market capitalization (market price x shares outstanding) of a fund’s stocks, weighted by the proportion of the fund’s assets invested in each stock. Stocks representing half of the fund’s assets have market capitalizations above the median, and the rest are below it.
Price/Book Ratio. The share price of a stock divided by its net worth, or book value, per share. For a fund, the weighted average price/book ratio of the stocks it holds.
Price/Earnings Ratio. The ratio of a stock’s current price to its per-share earnings over the past year. For a fund, the weighted average P/E of the stocks it holds. P/E is an indicator of market expectations about corporate prospects; the higher the P/E, the greater the expectations for a company’s future growth.
41
R-Squared. A measure of how much of a fund’s past returns can be explained by the returns from the market in general, as measured by a given index. If a fund’s total returns were precisely synchronized with an index’s returns, its R-squared would be 1.00. If the fund’s returns bore no relationship to the index’s returns, its R-squared would be 0. For this report, R-squared is based on returns over the past 36 months for both the fund and the index.
Return on Equity. The annual average rate of return generated by a company during the past five years for each dollar of shareholder’s equity (net income divided by shareholder’s equity). For a fund, the weighted average return on equity for the companies whose stocks it holds.
Short-Term Reserves. The percentage of a fund invested in highly liquid, short-term securities that can be readily converted to cash.
Turnover Rate. An indication of the fund’s trading activity. Funds with high turnover rates incur higher transaction costs and may be more likely to distribute capital gains (which may be taxable to investors). The turnover rate excludes in-kind transactions, which have minimal impact on costs.
42
This page intentionally left blank.
The People Who Govern Your Fund
The trustees of your mutual fund are there to see that the fund is operated and managed in your best interests since, as a shareholder, you are a part owner of the fund. Your fund’s trustees also serve on the board of directors of The Vanguard Group, Inc., which is owned by the Vanguard funds and provides services to them on an at-cost basis.
A majority of Vanguard’s board members are independent, meaning that they have no affiliation with Vanguard or the funds they oversee, apart from the sizable personal investments they have made as private individuals. The independent board members have distinguished backgrounds in business, academia, and public service. Each of the trustees and executive officers oversees 179 Vanguard funds.
The following table provides information for each trustee and executive officer of the fund. More information about the trustees is in the Statement of Additional Information, which can be obtained, without charge, by contacting Vanguard at 800-662-7447, or online at vanguard.com.
| |
| InterestedTrustee1 | and Delphi Automotive LLP (automotive components); |
| | Senior Advisor at New Mountain Capital. |
| F. William McNabb III | |
| Born 1957. Trustee Since July 2009. Chairman of the | Amy Gutmann |
| Board. Principal Occupation(s) During the Past Five | Born 1949. Trustee Since June 2006. Principal |
| Years: Chairman of the Board of The Vanguard Group, | Occupation(s) During the Past Five Years: President of |
| Inc., and of each of the investment companies served | the University of Pennsylvania; Christopher H. Browne |
| by The Vanguard Group, since January 2010; Director | Distinguished Professor of Political Science, School of |
| of The Vanguard Group since 2008; Chief Executive | Arts and Sciences, and Professor of Communication, |
| Officer and President of The Vanguard Group, and of | Annenberg School for Communication, with secondary |
| each of the investment companies served by The | faculty appointments in the Department of Philosophy, |
| Vanguard Group, since 2008; Director of Vanguard | School of Arts and Sciences, and at the Graduate |
| Marketing Corporation; Managing Director of The | School of Education, University of Pennsylvania; |
| Vanguard Group (1995–2008). | Trustee of the National Constitution Center; Chair |
| | of the Presidential Commission for the Study of |
| | Bioethical Issues. |
| IndependentTrustees | |
| | JoAnn Heffernan Heisen |
| Emerson U. Fullwood | Born 1950. Trustee Since July 1998. Principal |
| Born 1948. Trustee Since January 2008. Principal | Occupation(s) During the Past Five Years: Corporate |
| Occupation(s) During the Past Five Years: Executive | Vice President and Chief Global Diversity Officer |
| Chief Staff and Marketing Officer for North America | (retired 2008) and Member of the Executive |
| and Corporate Vice President (retired 2008) of Xerox | Committee (1997–2008) of Johnson & Johnson |
| Corporation (document management products and | (pharmaceuticals/medical devices/consumer |
| services); Executive in Residence and 2009–2010 | products); Director of Skytop Lodge Corporation |
| Distinguished Minett Professor at the Rochester | (hotels), the University Medical Center at Princeton, |
| Institute of Technology; Director of SPX Corporation | the Robert Wood Johnson Foundation, and the Center |
| (multi-industry manufacturing), the United Way of | for Talent Innovation; Member of the Advisory Board |
| Rochester, Amerigroup Corporation (managed health | of the Maxwell School of Citizenship and Public Affairs |
| care), the University of Rochester Medical Center, | at Syracuse University. |
| Monroe Community College Foundation, and North | |
| Carolina A&T University. | F. Joseph Loughrey |
| | Born 1949. Trustee Since October 2009. Principal |
| Rajiv L. Gupta | Occupation(s) During the Past Five Years: President |
| Born 1945. Trustee Since December 2001.2 | and Chief Operating Officer (retired 2009) of Cummins |
| Principal Occupation(s) During the Past Five Years: | Inc. (industrial machinery); Chairman of the Board |
| Chairman and Chief Executive Officer (retired 2009) | of Hillenbrand, Inc. (specialized consumer services), |
| and President (2006–2008) of Rohm and Haas Co. | and of Oxfam America; Director of SKF AB (industrial |
| (chemicals); Director of Tyco International, Ltd. | machinery), Hyster-Yale Materials Handling, Inc. |
| (diversified manufacturing and services), Hewlett- | (forklift trucks), the Lumina Foundation for Education, |
| Packard Co. (electronic computer manufacturing), | |
| | |
| and the V Foundation for Cancer Research; Member | Executive Officers | |
| of the Advisory Council for the College of Arts and | | |
| Letters and of the Advisory Board to the Kellogg | Glenn Booraem | |
| Institute for International Studies, both at the | Born 1967. Controller Since July 2010. Principal |
| University of Notre Dame. | Occupation(s) During the Past Five Years: Principal |
| | of The Vanguard Group, Inc.; Controller of each of |
| Mark Loughridge | the investment companies served by The Vanguard |
| Born 1953. Trustee Since March 2012. Principal | Group; Assistant Controller of each of the investment |
| Occupation(s) During the Past Five Years: Senior Vice | companies served by The Vanguard Group (2001–2010). |
| President and Chief Financial Officer (retired 2013) | | |
| at IBM (information technology services); Fiduciary | Thomas J. Higgins | |
| Member of IBM’s Retirement Plan Committee (2004– | Born 1957. Chief Financial Officer Since September |
| 2013); Member of the Council on Chicago Booth. | 2008. Principal Occupation(s) During the Past Five |
| | Years: Principal of The Vanguard Group, Inc.; Chief |
| Scott C. Malpass | Financial Officer of each of the investment companies |
| Born 1962. Trustee Since March 2012. Principal | served by The Vanguard Group; Treasurer of each of |
| Occupation(s) During the Past Five Years: Chief | the investment companies served by The Vanguard |
| Investment Officer and Vice President at the University | Group (1998–2008). | |
| of Notre Dame; Assistant Professor of Finance at the | | |
| Mendoza College of Business at Notre Dame; Member | Kathryn J. Hyatt | |
| of the Notre Dame 403(b) Investment Committee; | Born 1955. Treasurer Since November 2008. Principal |
| Board Member of TIFF Advisory Services, Inc. | Occupation(s) During the Past Five Years: Principal of |
| (investment advisor); Member of the Investment | The Vanguard Group, Inc.; Treasurer of each of the |
| Advisory Committees of the Financial Industry | investment companies served by The Vanguard |
| Regulatory Authority (FINRA) and of Major League | Group; Assistant Treasurer of each of the investment |
| Baseball. | companies served by The Vanguard Group (1988–2008). |
| |
| André F. Perold | Heidi Stam | |
| Born 1952. Trustee Since December 2004. Principal | Born 1956. Secretary Since July 2005. Principal |
| Occupation(s) During the Past Five Years: George | Occupation(s) During the Past Five Years: Managing |
| Gund Professor of Finance and Banking, Emeritus | Director of The Vanguard Group, Inc.; General Counsel |
| at the Harvard Business School (retired 2011); | of The Vanguard Group; Secretary of The Vanguard |
| Chief Investment Officer and Managing Partner of | Group and of each of the investment companies |
| HighVista Strategies LLC (private investment firm); | served by The Vanguard Group; Director and Senior |
| Director of Rand Merchant Bank; Overseer of the | Vice President of Vanguard Marketing Corporation. |
| Museum of Fine Arts Boston. | | |
| | Vanguard Senior ManagementTeam |
| Alfred M. Rankin, Jr. | | |
| Born 1941. Trustee Since January 1993. Principal | Mortimer J. Buckley | Chris D. McIsaac |
| Occupation(s) During the Past Five Years: Chairman, | Kathleen C. Gubanich | Michael S. Miller |
| President, and Chief Executive Officer of NACCO | Paul A. Heller | James M. Norris |
| Industries, Inc. (housewares/lignite), and of Hyster- | Martha G. King | Glenn W. Reed |
| Yale Materials Handling, Inc. (forklift trucks); Chairman | John T. Marcante | |
| of the Board of University Hospitals of Cleveland. | | |
| |
| Peter F. Volanakis | Chairman Emeritus and Senior Advisor |
| Born 1955. Trustee Since July 2009. Principal | | |
| Occupation(s) During the Past Five Years: President | John J. Brennan | |
| and Chief Operating Officer (retired 2010) of Corning | Chairman, 1996–2009 | |
| Incorporated (communications equipment); Trustee of | Chief Executive Officer and President, 1996–2008 |
| Colby-Sawyer College; Member of the Advisory Board | | |
| of the Norris Cotton Cancer Center and of the Advisory | Founder | |
| Board of the Parthenon Group (strategy consulting). | | |
| | John C. Bogle | |
| | Chairman and Chief Executive Officer, 1974–1996 |
1 Mr. McNabb is considered an “interested person,” as defined in the Investment Company Act of 1940, because he is an officer of the Vanguard funds.
2 December 2002 for Vanguard Equity Income Fund, the Vanguard Municipal Bond Funds, and the Vanguard State Tax-Exempt Funds.
|  |
| P.O. Box 2600 |
| Valley Forge, PA 19482-2600 |
Connect with Vanguard® > vanguard.com
| |
| Fund Information > 800-662-7447 | CFA® is a trademark owned by CFA Institute. |
| Direct Investor Account Services > 800-662-2739 | |
| Institutional Investor Services > 800-523-1036 | |
| Text Telephone for People | |
| With Hearing Impairment > 800-749-7273 | |
| |
| This material may be used in conjunction | |
| with the offering of shares of any Vanguard | |
| fund only if preceded or accompanied by | |
| the fund’s current prospectus. | |
| |
| All comparative mutual fund data are from Lipper, a | |
| Thomson Reuters Company, or Morningstar, Inc., unless | |
| otherwise noted. | |
| |
| You can obtain a free copy of Vanguard’s proxy voting | |
| guidelines by visiting vanguard.com/proxyreporting or by | |
| calling Vanguard at 800-662-2739. The guidelines are | |
| also available from the SEC’s website, sec.gov. In | |
| addition, you may obtain a free report on how your fund | |
| voted the proxies for securities it owned during the 12 | |
| months ended June 30. To get the report, visit either | |
| vanguard.com/proxyreporting or sec.gov. | |
| |
| You can review and copy information about your fund at | |
| the SEC’s Public Reference Room in Washington, D.C. To | |
| find out more about this public service, call the SEC at | |
| 202-551-8090. Information about your fund is also | |
| available on the SEC’s website, and you can receive | |
| copies of this information, for a fee, by sending a | |
| request in either of two ways: via e-mail addressed to | |
| publicinfo@sec.gov or via regular mail addressed to the | |
| Public Reference Section, Securities and Exchange | |
| Commission, Washington, DC 20549-1520. | |
| |
| | © 2014 The Vanguard Group, Inc. |
| | All rights reserved. |
| | Vanguard Marketing Corporation, Distributor. |
| |
| | Q08702 052014 |
Item 2: Code of Ethics.
Not Applicable.
Item 3:
Not Applicable.
Item 4: Principal Accountant Fees and Services.
Not. Applicable.
Item 5: Audit Committee of Listed Registrants.
Not Applicable.
Item 6: Investments.
Not Applicable.
Item 7: Disclosure of Proxy Voting Policies and Procedures for Closed-End Management Investment Companies.
Not Applicable.
Item 8: Portfolio Managers of Closed-End Management Investment Companies.
Not Applicable.
Item 9: Purchase of Equity Securities by Closed-End Management Investment Company and Affiliated Purchasers.
Not Applicable.
Item 10: Submission of Matters to a Vote of Security Holders.
Not Applicable.
Item 11: Controls and Procedures.
(a) Disclosure Controls and Procedures. The Principal Executive and Financial Officers concluded that the Registrant’s Disclosure Controls and Procedures are effective based on their evaluation of the Disclosure Controls and Procedures as of a date within 90 days of the filing date of this report.
(b) Internal Control Over Financial Reporting. There were no significant changes in Registrant’s Internal Control Over Financial Reporting or in other factors that could significantly affect this control subsequent to the date of the evaluation, including any corrective actions with regard to significant deficiencies and material weaknesses.
Item 12: Exhibits.
(a) Certifications
Pursuant to the requirements of the Securities Exchange Act of 1934 and the Investment Company Act of 1940, the registrant has duly caused this report to be signed on its behalf by the undersigned, thereunto duly authorized.
| |
| | VANGUARD QUANTITATIVE FUNDS |
| |
| By: | /s/ F. WILLIAM MCNABB III* |
| | F. WILLIAM MCNABB III |
| | CHIEF EXECUTIVE OFFICER |
| |
| Date: May 19, 2014 |
Pursuant to the requirements of the Securities Exchange Act of 1934 and the Investment Company Act of 1940, this report has been signed below by the following persons on behalf of the registrant and in the capacities and on the dates indicated.
| |
| | VANGUARD QUANTITATIVE FUNDS |
| |
| By: | /s/ F. WILLIAM MCNABB III* |
| | F. WILLIAM MCNABB III |
| | CHIEF EXECUTIVE OFFICER |
| |
| Date: May 19, 2014 |
| |
| | VANGUARD QUANTITATIVE FUNDS |
| |
| By: | /s/ THOMAS J. HIGGINS* |
| | THOMAS J. HIGGINS |
| | CHIEF FINANCIAL OFFICER |
| |
| Date: May 19, 2014 |
* By: /s/ Heidi Stam
Heidi Stam, pursuant to a Power of Attorney filed on April 22, 2014 see file Number 2-17620, Incorporated by Reference.