UNITED STATES
SECURITIES AND EXCHANGE COMMISSION
Washington, D.C. 20549
FORM N-CSR
CERTIFIED SHAREHOLDER REPORT
OF
REGISTERED MANAGEMENT INVESTMENT COMPANIES
Investment Company Act file number: 811-4526
Name of Registrant: Vanguard Quantitative Funds
Address of Registrant:
P.O. Box 2600
Valley Forge, PA 19482
Name and address of agent for service:
Heidi Stam, Esquire
P.O. Box 876
Valley Forge, PA 19482
Registrant’s telephone number, including area code: (610) 669-1000
Date of fiscal year end: September 30
Date of reporting period: October 1, 2010 – March 31, 2011
Item 1: Reports to Shareholders
 |
| Vanguard Growth and Income Fund |
| Semiannual Report |
|
| March 31, 2011 |
|
 |
|
|
|
> For the six months ended March 31, Vanguard Growth and Income Fund returned almost 18%.
> The fund outpaced its benchmark, the S&P 500 Index, as well as the average return of its large-capitalization core fund peers for the period.
> Strong stock selection within the consumer staples and financial sectors boosted returns relative to the benchmark.
| |
| Contents | |
| Your Fund’s Total Returns. | 1 |
| Chairman’s Letter. | 2 |
| Advisor’s Report. | 6 |
| Fund Profile. | 9 |
| Performance Summary. | 11 |
| Financial Statements. | 12 |
| About Your Fund’s Expenses. | 22 |
| Glossary. | 24 |
Please note: The opinions expressed in this report are just that—informed opinions. They should not be considered promises or advice. Also, please keep in mind that the information and opinions cover the period through the date on the front of this report. Of course, the risks of investing in your fund are spelled out in the prospectus.
See the Glossary for definitions of investment terms used in this report.
Cover photograph: Jean Maher.
Your Fund’s Total Returns
| |
| Six Months Ended March 31, 2011 | |
| | Total |
| | Returns |
| Vanguard Growth and Income Fund | |
| Investor Shares | 17.67% |
| Admiral™ Shares | 17.75 |
| S&P 500 Index | 17.31 |
| Large-Cap Core Funds Average | 16.47 |
Large-Cap Core Funds Average: Derived from data provided by Lipper Inc.
Admiral Shares carry lower expenses and are available to investors who meet certain account-balance requirements.
| | | | |
| Your Fund’s Performance at a Glance | | | | |
| September 30, 2010 , Through March 31, 2011 | | | | |
| | | | Distributions Per Share |
| | Starting | Ending | Income | Capital |
| | Share Price | Share Price | Dividends | Gains |
| Vanguard Growth and Income Fund | | | | |
| Investor Shares | $23.98 | $27.96 | $0.243 | $0.000 |
| Admiral Shares | 39.15 | 45.67 | 0.406 | 0.000 |
1

Chairman’s Letter
Dear Shareholder,
Most global stock markets proved resilient over the past six months, despite Japan’s devastating earthquake and tsunami and the political unrest in North Africa and the Middle East. For the six months ended March 31, 2011, the S&P 500 Index returned about 17%. Vanguard Growth and Income Fund did a bit better, outperforming both its benchmark and the average return of its peers. (The fund’s Investor Shares returned 17.67%; Admiral Shares returned 17.75%.)
The fund notched positive results in all ten market sectors for the period. However, it was the advisor’s strong stock selection in the consumer staples and financial sectors that gave the fund a slight advantage over its benchmark.
Despite distressing headlines, stock markets rallied
Global stock markets produced exceptional returns for the six months ended March 31, a period punctuated by unnerving developments such as political upheaval in the Middle East and North Africa, new sovereign debt dilemmas in Europe, and a nuclear emergency in Japan. On a more optimistic note, the U.S. economy continued to grind into gear. Job growth picked up, fueling hopes that the good news might be persistent enough to bring down the high unemployment rate.
The broad U.S. stock market returned more than 18%. The stocks of smaller companies, which are keenly sensitive
2
to the rhythms of the business cycle, did even better. Non-U.S. stock markets trailed their American counterparts, though as a group, their six-month return topped 10%. European stocks performed best.
All but the shortest-term rates moved higher, affecting bond prices
With the exception of the shortest-term securities, the rates on fixed income investments moved higher during the six-month period. At the start of the period, the 10-year U.S. Treasury note yielded a meager 2.51%. By the end, the rate had climbed to 3.45% as investors demanded more compensation for the possibility that inflation will continue to accelerate from financial-crisis lows.
Rising rates put short-term pressure on bond prices. The broad U.S. taxable bond market produced a slightly negative return. The broad municipal bond market, which came under pressure both from rising rates and concern (exaggerated, in Vanguard’s view) about the financial strength of state and municipal borrowers, returned –3.68%.
As it has since December 2008, the Federal Reserve held its target for short-term interest rates near 0%. This stance kept the returns available from money market instruments, such as the 3-month Treasury bill, in the same neighborhood.
| | | |
| Market Barometer | | | |
| | | Total Returns |
| | | Periods Ended March 31, 2011 |
| | Six | One | Five Years |
| | Months | Year | (Annualized) |
| Stocks | | | |
| Russell 1000 Index (Large-caps) | 18.13% | 16.69% | 2.93% |
| Russell 2000 Index (Small-caps) | 25.48 | 25.79 | 3.35 |
| Dow Jones U.S. Total Stock Market Index | 18.51 | 17.50 | 3.27 |
| MSCI All Country World Index ex USA (International) | 10.85 | 13.15 | 3.59 |
| |
| Bonds | | | |
| Barclays Capital U.S. Aggregate Bond Index (Broad | | | |
| taxable market) | -0.88% | 5.12% | 6.03% |
| Barclays Capital Municipal Bond Index (Broad | | | |
| tax-exempt market) | -3.68 | 1.63 | 4.14 |
| Citigroup Three-Month U.S. Treasury Bill Index | 0.06 | 0.15 | 2.09 |
| |
| CPI | | | |
| Consumer Price Index | 2.30% | 2.68% | 2.26% |
3
Consumer staples and financials drove outperformance
Vanguard Growth and Income Fund seeks to outperform the Standard & Poor’s 500 Index by investing in large- and mid-capitalization U.S. companies that its advisor, Mellon Capital Management, believes are attractively valued companies with strong prospective growth in earnings and share price. The advisor follows a quantitative investment approach in its attempt to create a portfolio with a risk profile similar to that of its benchmark index but made up of stock selections that can help it to outperform the unmanaged benchmark.
This strategy paid off during the half-year: The fund modestly outpaced its benchmark and bested the average return of its peer funds by more than a full percentage point.
Holdings in consumer staples helped the fund the most in outperforming its index, with its selections returning about half a percentage point more than those in the benchmark. Stock selection in beverages and food products provided a notable boost. In financials, sizable holdings in diversified financial services firms—specifically JPMorgan Chase (+21%) and Moody’s (+37%)—added value. The fund also benefited from not holding some of the index’s weaker-performing insurance companies.
| | | |
| Expense Ratios | | | |
| Your Fund Compared With Its Peer Group | | | |
| | Investor | Admiral | Peer Group |
| | Shares | Shares | Average |
| Growth and Income Fund | 0.32% | 0.21% | 1.26% |
The fund expense ratios shown are from the prospectus dated January 27, 2011, and represent estimated costs for the current fiscal year. For the six months ended March 31, 2011, the fund’s annualized expense ratios were 0.33% for Investor Shares and 0.22% for Admiral Shares. The peer-group expense ratio is derived from data provided by Lipper Inc. and captures information through year-end 2010.
Peer group: Large-Cap Core Funds.
4
The fund’s holdings in health care, infor-mation technology, industrials, and utilities offset some of its outperformance in other areas. Pharmaceutical stocks, including Johnson & Johnson (–3%) and Eli Lilly (–1%), were the biggest detractors.
Don’t lose sight of your long-term goals
It wasn’t long ago that investors witnessed firsthand just how temperamental the financial markets can be. Although the markets have been in recovery for a while now, the effects of the financial crisis are still being felt. And while the performance of U.S. stocks over the last six months was nothing short of impressive, we still can’t be sure what the future holds. We know only that the market will continue to experience its inevitable ups and downs.
At Vanguard, we believe that the best way to deal with the market’s volatility is to block out the short-term noise. Instead, we counsel investors to focus on creating a long-term investment plan that includes a mix of stock, bond, and money market funds that are appropriate for your goals and risk tolerance. Once you have a plan in place, it’s important to stick with it, regardless of what’s going on in the market.
With its experienced management team and broad exposure to U.S.-based companies, Vanguard Growth and Income Fund can play an important role in such a well-balanced long-term plan. And the fund’s low expenses will help you keep a larger proportion of the return on your investment.
As always, thank you for entrusting your assets to Vanguard.
Sincerely,

F. William McNabb III
Chairman and Chief Executive Officer
April 12, 2011
5
Advisor’s Report
Vanguard Growth and Income Fund’s Investor Shares returned 17.67% for the six months ended March 31. The Admiral Shares returned 17.75%. The S&P 500 Index returned 17.31%, while the average return of large-cap core funds was 16.47%.
Significant market gains over the period
The S&P 500 Index has now doubled since its low in March 2009. The gyrations in stock index levels seen throughout much of 2010 as investors toggled between “risk-on” and “risk-off” states has largely abated. Since October of last year, aside from some bumps at the end of February and the first half of March, U.S. equity indexes have proceeded smoothly upward.
During the fourth quarter of last year, as the “slow but steady” improvement in the economy moved forward, the S&P 500 Index rose slightly less than 11%, driven in part by improvements in corporate earnings numbers. Investors’ search for returns may have also played a role here, as fixed income yields remained historically low during the Federal Reserve’s continuation of its “quantitative easing” program. And, while it remained below levels we would have expected 18 months into a recovery, consumer confidence showed signs of improvement. While reasons for concern remained—most notably, historically high unemployment and a real estate market that continued to deteriorate—investors seemed to feel, on balance, that there was reason for optimism.
The market continued its rise into 2011, with the S&P 500 gaining. Political unrest began to spread across the Middle East in January, troubling the markets because of its potential to disrupt oil production. However, with the resignation of Hosni Mubarak in mid-January, the situation, at least in Egypt, appeared to have come to a hopeful resolution. The violence that was widely feared was, to a considerable degree, avoided. From February 18 through March 16, markets dropped more than 6% on concerns over the deteriorating situation in other Middle Eastern countries, notably Libya, and in response to the multiple tragic events in northeastern Japan. During the final two weeks of the quarter, however, markets rallied, regaining about 4.2%, and the S&P 500 closed out the quarter up 6%.
Performance exceeded the S&P 500 benchmark for the period
The fund returned just under 18% for the period, outperforming the S&P 500 by slightly less than 50 basis points. Neither industry/sector weight differences compared with the benchmark nor differences in risk factor exposures had a significant impact on relative performance. Instead, performance was driven by stock selection within a number of industries.
Our stock selection methodology favors names with strong earnings and price momentum that we believe will continue and attractive valuation. During the period, all three of these “themes” contributed to positive benchmark-relative performance.
6
The behavioral and earnings sustainability themes slightly outperformed our valuation metrics. More generally, high beta names outperformed, as did both stocks with higher turnovers and those with lower market capitalizations.
Among top performers in the fund was coffee retailer Starbucks Corp., which rose 46% for the period. The company exceeded its first-quarter consensus earnings estimate by over 15%, and beat its prior-year first-quarter earnings by 40%. Also contributing to the fund’s outperform-ance was copper mining firm Freeport McMoRan: In an environment of rising commodity prices, its stock rose 32% during the six months, amid expectations of increased earnings as its African mines began to operate at full capacity.
The fund benefited from our underweighted position in network equipment manufacturer Cisco Systems, as the firm’s share price fell 21% during the period, lagging other computer hardware firms. In February, the firm announced fiscal second-quarter profits had declined 18%, year over year; this marked the fourth consecutive quarter of declining profits. In November of last year, Cisco Systems lowered its earnings guidance below analyst expectations, with its CEO citing “challenging economic conditions.” Our underweighting in Merck & Co. also helped relative results, as the company lagged peers for the period. In February, the company unexpectedly halted late-stage trials of its blood thinner Vorapaxar.
On the other hand, our underweighted position in Pfizer Inc., which rose 21% for the period, restrained relative performance. The firm’s share price has risen steadily since December of last year. Our over-weighting in computer printer maker Lexmark International subtracted value as well, its share price dropped 17%, lagging other computer hardware firms.
The firm announced in November both that its third-quarter financial results had fallen short of analyst expectations, and that its CEO was leaving the firm. Shares fell more than 20% in the wake of the combined messages.
Telecom equipment manufacturer Tellabs, Inc., in which we had an overweighted position, dropped 29% during the reporting period, lagging results for other electrical equipment firms. In January, Tellabs reported sales below consensus estimates, as well as diluted earnings per share below estimates. Finally, Harris Corp., also a telecom equipment manufacturer, rose 13% during the six-month period, but underperformed competitors. Our over-weighted position in the company also subtracted value on an industry-neutral basis.
7
The fund’s positioning and risk controls
We reported in a previous letter that we had completed our synthesis of the Franklin Portfolio and Mellon Capital stock selection models. As of this writing, we have also substantively completed the integration of the legacy portfolio management methodologies. We continue to expand our research agenda, making use of our now significantly enhanced, post-merger research capabilities.
Warren Chiang, CFA, Managing Director and Head of Active Equity Strategies
Langton C. Garvin, CFA, Director and Active Equity Strategist
Mellon Capital Management Corp.
April 12, 2011
8
Growth and Income Fund
Fund Profile
As of March 31, 2011
| | |
| Share-Class Characteristics | |
| | Investor | Admiral |
| | Shares | Shares |
| Ticker Symbol | VQNPX | VGIAX |
| Expense Ratio1 | 0.32% | 0.21% |
| 30-Day SEC Yield | 1.69% | 1.80% |
| | | |
| Portfolio Characteristics | | |
| | | | DJ |
| | | | U.S. Total |
| | | S&P 500 | Market |
| | Fund | Index | Index |
| Number of Stocks | 122 | 500 | 3,817 |
| Median Market Cap | $41.0B | $50.0B | $31.4B |
| Price/Earnings Ratio | 13.8x | 16.7x | 17.9x |
| Price/Book Ratio | 2.2x | 2.3x | 2.3x |
| Return on Equity | 20.0% | 20.3% | 18.9% |
| Earnings Growth Rate | 6.4% | 5.4% | 5.9% |
| Dividend Yield | 2.0% | 1.9% | 1.7% |
| Foreign Holdings | 0.0% | 0.0% | 0.0% |
| Turnover Rate | | | |
| (Annualized) | 69% | — | — |
| Short-Term Reserves | -5.0% | — | — |
The fund invested a portion of its cash reserves in equity markets through the use of index futures contracts. After the effect of the futures investments, the fund's temporary cash position was negative.
| | |
| Volatility Measures | | |
| | | DJ |
| | | U.S. Total |
| | S&P 500 | Market |
| | Index | Index |
| R-Squared | 0.99 | 0.99 |
| Beta | 1.02 | 1.00 |
These measures show the degree and timing of the fund’s fluctuations compared with the indexes over 36 months.
| | |
| Ten Largest Holdings (% of total net assets) |
| Chevron Corp. | Integrated Oil & | |
| | Gas | 3.3% |
| International Business | IT Consulting & | |
| Machines Corp. | Other Services | 2.9 |
| Apple Inc. | Computer | |
| | Hardware | 2.9 |
| AT&T Inc. | Integrated | |
| | Telecommunication | |
| | Services | 2.8 |
| Microsoft Corp. | Systems Software | 2.8 |
| Johnson & Johnson | Pharmaceuticals | 2.5 |
| JPMorgan Chase & Co. | Diversified Financial | |
| | Services | 2.5 |
| Exxon Mobil Corp. | Integrated Oil & | |
| | Gas | 2.3 |
| ConocoPhillips | Integrated Oil & | |
| | Gas | 2.3 |
| Intel Corp. | Semiconductors | 2.1 |
| Top Ten | | 26.4% |
The holdings listed exclude any temporary cash investments and equity index products.
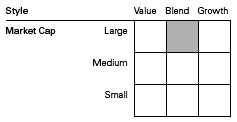
Investment Focus
1 The expense ratios shown are from the prospectus dated January 27, 2011, and represent estimated costs for the current fiscal year. For the six months ended March 31, 2011, the annualized expense ratios were 0.33% for Investor Shares and 0.22% for Admiral Shares.
9
Growth and Income Fund
| | | |
| Sector Diversification (% of equity exposure) |
| | | | DJ |
| | | | U.S. Total |
| | | S&P 500 | Market |
| | Fund | Index | Index |
| Consumer | | | |
| Discretionary | 8.1% | 10.4% | 11.8% |
| Consumer Staples | 10.1 | 10.2 | 9.2 |
| Energy | 13.0 | 13.3 | 11.8 |
| Financials | 15.4 | 15.8 | 16.2 |
| Health Care | 12.8 | 11.0 | 10.7 |
| Industrials | 10.0 | 11.3 | 11.6 |
| Information | | | |
| Technology | 20.6 | 18.1 | 18.5 |
| Materials | 3.5 | 3.7 | 4.5 |
| Telecommunication | | | |
| Services | 3.9 | 3.0 | 2.6 |
| Utilities | 2.6 | 3.2 | 3.1 |
10
Growth and Income Fund
Performance Summary
All of the returns in this report represent past performance, which is not a guarantee of future results that may be achieved by the fund. (Current performance may be lower or higher than the performance data cited. For performance data current to the most recent month-end, visit our website at vanguard.com/performance.) Note, too, that both investment returns and principal value can fluctuate widely, so an investor’s shares, when sold, could be worth more or less than their original cost. The returns shown do not reflect taxes that a shareholder would pay on fund distributions or on the sale of fund shares.
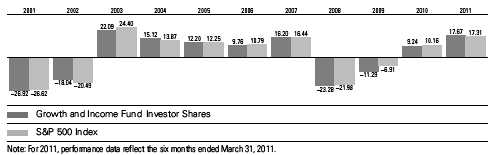
Fiscal-Year Total Returns (%): September 30, 2000, Through March 31, 2011
| | | | |
| Average Annual Total Returns: Periods Ended March 31, 2011 | | | |
| |
| | Inception | One | Five | Ten |
| | Date | Year | Years | Years |
| Investor Shares | 12/10/1986 | 15.07% | 0.92% | 2.80% |
| Admiral Shares | 5/14/2001 | 15.22 | 1.06 | 2.071 |
| 1 Return since inception. | | | | |
See Financial Highlights for dividend and capital gains information.
11
Growth and Income Fund
Financial Statements (unaudited)
Statement of Net Assets
As of March 31, 2011
The fund reports a complete list of its holdings in regulatory filings four times in each fiscal year, at the quarter-ends. For the second and fourth fiscal quarters, the lists appear in the fund’s semiannual and annual reports to shareholders. For the first and third fiscal quarters, the fund files the lists with the Securities and Exchange Commission on Form N-Q. Shareholders can look up the fund’s Forms N-Q on the SEC’s website at sec.gov. Forms N-Q may also be reviewed and copied at the SEC’s Public Reference Room (see the back cover of this report for further information).
| | | |
| | | | Market |
| | | | Value |
| | | Shares | ($000) |
| Common Stocks (99.3%)1 | | |
| Consumer Discretionary (7.9%) | |
| | Target Corp. | 1,359,200 | 67,974 |
| | News Corp. Class A | 3,381,424 | 59,378 |
| * | Ford Motor Co. | 3,277,500 | 48,867 |
| | Wynn Resorts Ltd. | 366,059 | 46,581 |
| | VF Corp. | 358,500 | 35,323 |
| * | AutoZone Inc. | 103,400 | 28,286 |
| | Time Warner Inc. | 732,000 | 26,132 |
| | Kohl’s Corp. | 320,734 | 17,012 |
| | Limited Brands Inc. | 192,300 | 6,323 |
| * | DIRECTV Class A | 123,500 | 5,780 |
| * | O’ReillyAutomotive Inc. | 98,976 | 5,687 |
| | Carnival Corp. | 65,200 | 2,501 |
| | Gannett Co. Inc. | 126,274 | 1,923 |
| | | | 351,767 |
| Consumer Staples (10.1%) | | |
| | Kroger Co. | 2,715,600 | 65,093 |
| | Dr Pepper Snapple | | |
| | Group Inc. | 1,733,400 | 64,413 |
| | Coca-Cola | | |
| | Enterprises Inc. | 2,270,800 | 61,993 |
| | Philip Morris | | |
| | International Inc. | 844,100 | 55,398 |
| | Wal-Mart Stores Inc. | 749,800 | 39,027 |
| | CVS Caremark Corp. | 1,125,600 | 38,631 |
| | Colgate-Palmolive Co. | 399,300 | 32,247 |
| | Walgreen Co. | 518,373 | 20,807 |
| | Tyson Foods Inc. Class A | 949,100 | 18,213 |
| | Hormel Foods Corp. | 582,600 | 16,220 |
| | Procter & Gamble Co. | 222,900 | 13,731 |
| * | Constellation Brands Inc. | | |
| | Class A | 676,788 | 13,725 |
| | Hershey Co. | 143,711 | 7,811 |
| | | | 447,309 |
| Energy (12.9%) | | |
| | Chevron Corp. | 1,353,500 | 145,407 |
| | ExxonMobil Corp. | 1,192,536 | 100,328 |
| | ConocoPhillips | 1,254,400 | 100,176 |
| | Devon Energy Corp. | 702,400 | 64,459 |
| | | |
| | | | Market |
| | | | Value |
| | | Shares | ($000) |
| | Valero Energy Corp. | 1,919,300 | 57,234 |
| | Occidental | | |
| | Petroleum Corp. | 353,300 | 36,916 |
| | Helmerich & Payne Inc. | 475,600 | 32,669 |
| | Marathon Oil Corp. | 221,100 | 11,787 |
| | National Oilwell Varco Inc. | 81,800 | 6,484 |
| | Halliburton Co. | 129,200 | 6,439 |
| | Sunoco Inc. | 127,600 | 5,817 |
| | Murphy Oil Corp. | 78,500 | 5,764 |
| | | | 573,480 |
| Financials (15.3%) | | |
| | JPMorgan Chase & Co. | 2,394,800 | 110,400 |
| | Weyerhaeuser Co. | 2,451,100 | 60,297 |
| | Prudential Financial Inc. | 939,600 | 57,861 |
| | Comerica Inc. | 1,497,106 | 54,974 |
| | KeyCorp | 5,876,281 | 52,181 |
| | Aflac Inc. | 903,084 | 47,665 |
| | Fifth Third Bancorp | 3,214,300 | 44,614 |
| | Franklin Resources Inc. | 338,100 | 42,290 |
| | Moody’s Corp. | 1,055,200 | 35,782 |
| | MetLife Inc. | 611,800 | 27,366 |
| | State Street Corp. | 556,400 | 25,005 |
| | Leucadia National Corp. | 588,232 | 22,082 |
| | Goldman Sachs Group Inc. | 96,100 | 15,229 |
| | Travelers Cos. Inc. | 239,100 | 14,222 |
| * | Berkshire Hathaway Inc. | | |
| | Class B | 145,800 | 12,193 |
| | American Express Co. | 238,700 | 10,789 |
| * | CBRichard Ellis Group | | |
| | Inc. Class A | 319,234 | 8,523 |
| * | Citigroup Inc. | 1,627,600 | 7,194 |
| | Wells Fargo & Co. | 195,300 | 6,191 |
| | Unum Group | 222,800 | 5,848 |
| | HCP Inc. | 149,600 | 5,676 |
| | Huntington Bancshares Inc. | 723,000 | 4,801 |
| | Torchmark Corp. | 59,800 | 3,975 |
| | Ameriprise Financial Inc. | 58,900 | 3,598 |
| | PNC Financial Services | | |
| | Group Inc. | 30,511 | 1,922 |
| | | | 680,678 |
12
Growth and Income Fund
| | | |
| | | | Market |
| | | | Value |
| | | Shares | ($000) |
| Health Care (12.8%) | | |
| | Johnson & Johnson | 1,911,500 | 113,256 |
| | Eli Lilly & Co. | 1,951,300 | 68,627 |
| * | ExpressScripts Inc. | 1,204,500 | 66,982 |
| * | Amgen Inc. | 1,021,800 | 54,615 |
| * | Humana Inc. | 736,600 | 51,518 |
| | Abbott Laboratories | 1,041,100 | 51,066 |
| * | Zimmer Holdings Inc. | 814,500 | 49,302 |
| | Bristol-Myers Squibb Co. | 1,780,092 | 47,048 |
| | CIGNA Corp. | 435,900 | 19,302 |
| * | Biogen Idec Inc. | 249,200 | 18,289 |
| | Cardinal Health Inc. | 355,705 | 14,630 |
| | Merck & Co. Inc. | 195,100 | 6,440 |
| | St. Jude Medical Inc. | 121,100 | 6,208 |
| * | Varian Medical | | |
| | Systems Inc. | 44,800 | 3,030 |
| | | | 570,313 |
| Industrials (9.8%) | | |
| | General Electric Co. | 4,031,900 | 80,839 |
| | United Parcel Service Inc. | | |
| | Class B | 958,700 | 71,250 |
| | Textron Inc. | 2,089,300 | 57,226 |
| | L-3 Communications | | |
| | Holdings Inc. | 579,400 | 45,373 |
| | Cummins Inc. | 395,700 | 43,377 |
| | 3M Co. | 302,600 | 28,293 |
| | General Dynamics Corp. | 322,800 | 24,713 |
| | Caterpillar Inc. | 208,200 | 23,183 |
| | United Technologies Corp. | 262,300 | 22,204 |
| | PACCAR Inc. | 402,000 | 21,045 |
| | CSX Corp. | 94,500 | 7,428 |
| | Norfolk Southern Corp. | 93,600 | 6,484 |
| | Northrop Grumman Corp. | 83,700 | 5,249 |
| * | Huntington Ingalls | | |
| | Industries Inc. | 13,950 | 579 |
| | | | 437,243 |
| Information Technology (20.5%) | |
| | International Business | | |
| | Machines Corp. | 789,100 | 128,678 |
| * | Apple Inc. | 368,000 | 128,230 |
| | Microsoft Corp. | 4,878,500 | 123,719 |
| | Intel Corp. | 4,727,000 | 95,344 |
| | Xerox Corp. | 5,554,900 | 59,160 |
| | Corning Inc. | 2,810,200 | 57,974 |
| | CAInc. | 1,877,100 | 45,388 |
| | Computer Sciences Corp. | 894,800 | 43,604 |
| * | SanDisk Corp. | 928,500 | 42,795 |
| | Oracle Corp. | 1,191,700 | 39,767 |
| * | Google Inc. Class A | 57,440 | 33,672 |
| * | Lexmark International Inc. | | |
| | Class A | 731,500 | 27,095 |
| | Visa Inc. Class A | 311,400 | 22,925 |
| | | |
| | | | Market |
| | | | Value |
| | | Shares | ($000) |
| * | EMCCorp. | 625,400 | 16,604 |
| * | Novellus Systems Inc. | 404,300 | 15,012 |
| * | Intuit Inc. | 206,300 | 10,954 |
| | Cisco Systems Inc. | 569,000 | 9,758 |
| * | NetApp Inc. | 180,400 | 8,692 |
| | | | 909,371 |
| Materials (3.4%) | | |
| | Freeport-McMoRan | | |
| | Copper & Gold Inc. | 1,464,700 | 81,364 |
| | PPG Industries Inc. | 343,134 | 32,670 |
| | EI du Pont de Nemours | | |
| | & Co. | 260,100 | 14,298 |
| | Newmont Mining Corp. | 221,700 | 12,100 |
| * | Titanium Metals Corp. | 352,900 | 6,557 |
| | Ecolab Inc. | 118,794 | 6,061 |
| | | | 153,050 |
| Telecommunication Services (4.0%) | |
| | AT&T Inc. | 4,061,900 | 124,294 |
| | Verizon | | |
| | Communications Inc. | 1,349,900 | 52,025 |
| | | | 176,319 |
| Utilities (2.6%) | | |
| | Wisconsin Energy Corp. | 1,388,400 | 42,346 |
| | DTEEnergy Co. | 651,400 | 31,893 |
| | Entergy Corp. | 233,200 | 15,673 |
| | American Electric | | |
| | Power Co. Inc. | 271,800 | 9,551 |
| | Consolidated Edison Inc. | 163,800 | 8,308 |
| | CMSEnergy Corp. | 298,800 | 5,869 |
| | | | 113,640 |
| Total Common Stocks | | |
| (Cost $3,694,818) | | 4,413,170 |
| Temporary Cash Investment (1.7%)1 | |
| Money Market Fund (1.7%) | | |
| 2 | Vanguard Market Liquidity | | |
| | Fund, 0.208% | | |
| | (Cost $77,436) | 77,436,050 | 77,436 |
| Total Investments (101.0%) | | |
| (Cost $3,772,254) | | 4,490,606 |
| Other Assets and Liabilities (-1.0%) | |
| Other Assets3 | | 344,271 |
| Liabilities | | (389,791) |
| | | | (45,520) |
| Net Assets (100%) | | 4,445,086 |
13
Growth and Income Fund
| |
| | Market |
| | Value |
| | ($000) |
| Statement of Assets and Liabilities | |
| Assets | |
| Investments in Securities, at Value | 4,490,606 |
| Receivables for | |
| Investment Securities Sold | 329,094 |
| Other Assets | 15,177 |
| Total Assets | 4,834,877 |
| Liabilities | |
| Payables for | |
| Investment Securities Purchased | 117,219 |
| Payables for Capital Shares Redeemed | 254,551 |
| Other Liabilities | 18,021 |
| Total Liabilities | 389,791 |
| Net Assets | 4,445,086 |
| |
| At March 31, 2011, net assets consisted of: |
| | Amount |
| | ($000) |
| Paid-in Capital | 5,174,420 |
| Undistributed Net Investment Income | 4,668 |
| Accumulated Net Realized Losses | (1,452,450) |
| Unrealized Appreciation (Depreciation) | |
| Investment Securities | 718,352 |
| Futures Contracts | 96 |
| Net Assets | 4,445,086 |
| |
| Investor Shares—Net Assets | |
| Applicable to 110,245,486 outstanding | |
| $.001 par value shares of beneficial | |
| interest (unlimited authorization) | 3,082,976 |
| Net Asset Value Per Share— | |
| Investor Shares | $27.96 |
| |
| Admiral Shares—Net Assets | |
| Applicable to 29,826,250 outstanding | |
| $.001 par value shares of beneficial | |
| interest (unlimited authorization) | 1,362,110 |
| Net Asset Value Per Share— | |
| Admiral Shares | $45.67 |
See Note A in Notes to Financial Statements.
* Non-income-producing security.
1 The fund invests a portion of its cash reserves in equity markets through the use of index futures contracts. After giving effect to futures investments, the fund’s effective common stock and temporary cash investment positions represent 105.0% and -4.0%, respectively, of net assets.
2 Affiliated money market fund available only to Vanguard funds and certain trusts and accounts managed by Vanguard. Rate shown is the 7-day yield.
3 Cash of $7,110,000 has been segregated as initial margin for open futures contracts.
See accompanying Notes, which are an integral part of the Financial Statements.
14
Growth and Income Fund
| |
| Statement of Operations | |
| |
| | SixMonths Ended |
| | March 31, 2011 |
| | ($000) |
| Investment Income | |
| Income | |
| Dividends | 46,228 |
| Interest1 | 85 |
| Security Lending | 46 |
| Total Income | 46,359 |
| Expenses | |
| Investment Advisory Fees—Note B | |
| Basic Fee | 2,263 |
| Performance Adjustment | (715) |
| The Vanguard Group—Note C | |
| Management and Administrative—Investor Shares | 3,563 |
| Management and Administrative—Admiral Shares | 937 |
| Marketing and Distribution—Investor Shares | 329 |
| Marketing and Distribution—Admiral Shares | 134 |
| Custodian Fees | 21 |
| Shareholders’ Reports—Investor Shares | 42 |
| Shareholders’ Reports—Admiral Shares | 3 |
| Trustees’ Fees and Expenses | 5 |
| Total Expenses | 6,582 |
| Expenses Paid Indirectly | (115) |
| Net Expenses | 6,467 |
| Net Investment Income | 39,892 |
| Realized Net Gain (Loss) | |
| Investment Securities Sold | 298,178 |
| Futures Contracts | 11,102 |
| Realized Net Gain (Loss) | 309,280 |
| Change in Unrealized Appreciation (Depreciation) | |
| Investment Securities | 381,575 |
| Futures Contracts | (2,247) |
| Change in Unrealized Appreciation (Depreciation) | 379,328 |
| Net Increase (Decrease) in Net Assets Resulting from Operations | 728,500 |
| 1 Interest income from an affiliated company of the fund was $85,000. | |
See accompanying Notes, which are an integral part of the Financial Statements.
15
Growth and Income Fund
| | |
| Statement of Changes in Net Assets | | |
| |
| | Six Months Ended | Year Ended |
| | March 31, | September 30, |
| | 2011 | 2010 |
| | ($000) | ($000) |
| Increase (Decrease) in Net Assets | | |
| Operations | | |
| Net Investment Income | 39,892 | 79,921 |
| Realized Net Gain (Loss) | 309,280 | 178,942 |
| Change in Unrealized Appreciation (Depreciation) | 379,328 | 136,329 |
| Net Increase (Decrease) in Net Assets Resulting from Operations | 728,500 | 395,192 |
| Distributions | | |
| Net Investment Income | | |
| Investor Shares | (27,712) | (55,197) |
| Admiral Shares | (14,176) | (24,503) |
| Realized Capital Gain | | |
| Investor Shares | — | — |
| Admiral Shares | — | — |
| Total Distributions | (41,888) | (79,700) |
| Capital Share Transactions | | |
| Investor Shares | (405,990) | (455,269) |
| Admiral Shares | (54,753) | (335,182) |
| Net Increase (Decrease) from Capital Share Transactions | (460,743) | (790,451) |
| Total Increase (Decrease) | 225,869 | (474,959) |
| Net Assets | | |
| Beginning of Period | 4,219,217 | 4,694,176 |
| End of Period1 | 4,445,086 | 4,219,217 |
| 1 Net Assets—End of Period includes undistributed net investment income of $4,668,000 and $6,664,000. | |
See accompanying Notes, which are an integral part of the Financial Statements.
16
Growth and Income Fund
Financial Highlights
| | | | | | |
| Investor Shares | | | | | | |
| | Six Months | | | | | |
| | Ended | | | | | |
| For a Share Outstanding | March 31, | | | Year Ended September 30, |
| Throughout Each Period | 2011 | 2010 | 2009 | 2008 | 2007 | 2006 |
| Net Asset Value, Beginning of Period | $23.98 | $22.34 | $25.84 | $38.62 | $33.79 | $31.29 |
| Investment Operations | | | | | | |
| Net Investment Income | .232 | .418 | .447 | .546 | .600 | .550 |
| Net Realized and Unrealized Gain (Loss) | | | | | | |
| on Investments | 3.991 | 1.630 | (3.453) | (8.758) | 4.840 | 2.470 |
| Total from Investment Operations | 4.223 | 2.048 | (3.006) | (8.212) | 5.440 | 3.020 |
| Distributions | | | | | | |
| Dividends from Net Investment Income | (.243) | (.408) | (.494) | (.560) | (.610) | (.520) |
| Distributions from Realized Capital Gains | — | — | — | (4.008) | — | — |
| Total Distributions | (.243) | (.408) | (.494) | (4.568) | (.610) | (.520) |
| Net Asset Value, End of Period | $27.96 | $23.98 | $22.34 | $25.84 | $38.62 | $33.79 |
| |
| Total Return1 | 17.67% | 9.24% | -11.29% | -23.28% | 16.20% | 9.76% |
| |
| Ratios/Supplemental Data | | | | | | |
| Net Assets, End of Period (Millions) | $3,083 | $3,020 | $3,253 | $3,919 | $5,465 | $5,088 |
| Ratio of Total Expenses to | | | | | | |
| Average Net Assets2 | 0.33% | 0.32% | 0.35% | 0.31% | 0.32% | 0.38% |
| Ratio of Net Investment Income to | | | | | | |
| Average Net Assets | 1.73% | 1.74% | 2.28% | 1.69% | 1.61% | 1.65% |
| Portfolio Turnover Rate | 69% | 94% | 83% | 96% | 100% | 93% |
The expense ratio, net income ratio, and turnover rate for the current period have been annualized.
1 Total returns do not include account service fees that may have applied in the periods shown. Fund prospectuses provide information about any applicable account service fees.
2 Includes performance-based investment advisory fee increases (decreases) of (0.03%), (0.04%), (0.04%), (0.02%), 0.00%, and 0.01%.
See accompanying Notes, which are an integral part of the Financial Statements.
17
Growth and Income Fund
Financial Highlights
| | | | | | |
| Admiral Shares | | | | | | |
| | Six Months | | | | | |
| | Ended | | | | | |
| For a Share Outstanding | March 31, | | | Year Ended September 30, |
| Throughout Each Period | 2011 | 2010 | 2009 | 2008 | 2007 | 2006 |
| Net Asset Value, Beginning of Period | $39.15 | $36.48 | $42.20 | $63.08 | $55.20 | $51.12 |
| Investment Operations | | | | | | |
| Net Investment Income | .399 | .722 | .775 | .963 | 1.070 | .997 |
| Net Realized and Unrealized Gain (Loss) | | | | | | |
| on Investments | 6.527 | 2.666 | (5.638) | (14.313) | 7.903 | 4.036 |
| Total from Investment Operations | 6.926 | 3.388 | (4.863) | (13.350) | 8.973 | 5.033 |
| Distributions | | | | | | |
| Dividends from Net Investment Income | (.406) | (.718) | (.857) | (.985) | (1.093) | (.953) |
| Distributions from Realized Capital Gains | — | — | — | (6.545) | — | — |
| Total Distributions | (.406) | (.718) | (.857) | (7.530) | (1.093) | (.953) |
| Net Asset Value, End of Period | $45.67 | $39.15 | $36.48 | $42.20 | $63.08 | $55.20 |
| |
| Total Return | 17.75% | 9.37% | -11.15% | -23.19% | 16.37% | 9.97% |
| |
| Ratios/Supplemental Data | | | | | | |
| Net Assets, End of Period (Millions) | $1,362 | $1,199 | $1,441 | $1,907 | $2,794 | $2,321 |
| Ratio of Total Expenses to | | | | | | |
| Average Net Assets1 | 0.22% | 0.21% | 0.21% | 0.16% | 0.18% | 0.20% |
| Ratio of Net Investment Income to | | | | | | |
| Average Net Assets | 1.84% | 1.85% | 2.42% | 1.84% | 1.75% | 1.83% |
| Portfolio Turnover Rate | 69% | 94% | 83% | 96% | 100% | 93% |
The expense ratio, net income ratio, and turnover rate for the current period have been annualized.
1 Includes performance-based investment advisory fee increases (decreases) of (0.03%), (0.04%), (0.04%), (0.02%), 0.00%, and 0.01%.
See accompanying Notes, which are an integral part of the Financial Statements.
18
Growth and Income Fund
Notes to Financial Statements
Vanguard Growth and Income Fund is registered under the Investment Company Act of 1940 as an open-end investment company, or mutual fund. The fund offers two classes of shares: Investor Shares and Admiral Shares. Investor Shares are available to any investor who meets the fund’s minimum purchase requirements. Admiral Shares are designed for investors who meet certain administrative, service, and account-size criteria.
A. The following significant accounting policies conform to generally accepted accounting principles for U.S. mutual funds. The fund consistently follows such policies in preparing its financial statements.
1. Security Valuation: Securities are valued as of the close of trading on the New York Stock Exchange (generally 4 p.m., Eastern time) on the valuation date. Equity securities are valued at the latest quoted sales prices or official closing prices taken from the primary market in which each security trades; such securities not traded on the valuation date are valued at the mean of the latest quoted bid and asked prices. Securities for which market quotations are not readily available, or whose values have been materially affected by events occurring before the fund’s pricing time but after the close of the securities’ primary markets, are valued by methods deemed by the board of trustees to represent fair value. Investments in Vanguard Market Liquidity Fund are valued at that fund’s net asset value.
2. Futures Contracts: The fund uses index futures contracts to a limited extent, with the objective of maintaining full exposure to the stock market while maintaining liquidity. The fund may purchase or sell futures contracts to achieve a desired level of investment, whether to accommodate portfolio turnover or cash flows from capital share transactions. The primary risks associated with the use of futures contracts are imperfect correlation between changes in market values of stocks held by the fund and the prices of futures contracts, and the possibility of an illiquid market.
Futures contracts are valued at their quoted daily settlement prices. The aggregate principal amounts of the contracts are not recorded in the Statement of Net Assets. Fluctuations in the value of the contracts are recorded in the Statement of Net Assets as an asset (liability) and in the Statement of Operations as unrealized appreciation (depreciation) until the contracts are closed, when they are recorded as realized futures gains (losses).
3. Federal Income Taxes: The fund intends to continue to qualify as a regulated investment company and distribute all of its taxable income. Management has analyzed the fund’s tax positions taken for all open federal income tax years (September 30, 2007–2010), and for the period ended March 31, 2011, and has concluded that no provision for federal income tax is required in the fund’s financial statements.
4. Distributions: Distributions to shareholders are recorded on the ex-dividend date.
5. Security Lending: The fund may lend its securities to qualified institutional borrowers to earn additional income. Security loans are required to be secured at all times by collateral at least equal to the market value of securities loaned. The fund invests cash collateral received in Vanguard Market Liquidity Fund, and records a liability for the return of the collateral, during the period the securities are on loan. Security lending income represents fees charged to borrowers plus income earned on investing cash collateral, less expenses associated with the loan.
6. Other: Dividend income is recorded on the ex-dividend date. Interest income includes income distributions received from Vanguard Market Liquidity Fund and is accrued daily. Security transactions are accounted for on the date securities are bought or sold. Costs used to determine realized gains (losses) on the sale of investment securities are those of the specific securities sold.
Each class of shares has equal rights as to assets and earnings, except that each class separately bears certain class-specific expenses related to maintenance of shareholder accounts (included in Management and Administrative expenses) and shareholder reporting. Marketing and distribution
19
Growth and Income Fund
expenses are allocated to each class of shares based on a method approved by the board of trustees. Income, other non-class-specific expenses, and gains and losses on investments are allocated to each class of shares based on its relative net assets.
B. Mellon Capital Management Corporation provides investment advisory services to the fund for a fee calculated at an annual percentage rate of average net assets. The basic fee is subject to quarterly adjustments based on the fund’s performance for the preceding three years relative to the S&P 500 Index. For the six months ended March 31, 2011, the investment advisory fee represented an effective annual basic rate of 0.10% of the fund’s average net assets before a decrease of $715,000 (0.03%) based on performance.
C. The Vanguard Group furnishes at cost corporate management, administrative, marketing, and distribution services. The costs of such services are allocated to the fund under methods approved by the board of trustees. The fund has committed to provide up to 0.40% of its net assets in capital contributions to Vanguard. At March 31, 2011, the fund had contributed capital of $766,000 to Vanguard (included in Other Assets), representing 0.02% of the fund’s net assets and 0.31% of Vanguard’s capitalization. The fund’s trustees and officers are also directors and officers of Vanguard.
D. The fund has asked its investment advisor to direct certain security trades, subject to obtaining the best price and execution, to brokers who have agreed to rebate to the fund part of the commissions generated. Such rebates are used solely to reduce the fund’s management and administrative expenses. For the six months ended March 31, 2011, these arrangements reduced the fund’s expenses by $115,000 (an annual rate of 0.01% of average net assets).
E. Various inputs may be used to determine the value of the fund’s investments. These inputs are summarized in three broad levels for financial statement purposes. The inputs or methodologies used to value securities are not necessarily an indication of the risk associated with investing in those securities.
Level 1—Quoted prices in active markets for identical securities.
Level 2—Other significant observable inputs (including quoted prices for similar securities, interest rates, prepayment speeds, credit risk, etc.).
Level 3—Significant unobservable inputs (including the fund’s own assumptions used to determine the fair value of investments).
At March 31, 2011, 100% of the fund’s investments were valued based on Level 1 inputs.
F. At March 31, 2011, the aggregate settlement value of open futures contracts and the related unrealized appreciation (depreciation) were:
| | | | |
| | | | | ($000) |
| | | | Aggregate | |
| | | Number of | Settlement | Unrealized |
| | | Long (Short) | Value | Appreciation |
| Futures Contracts | Expiration | Contracts | Long (Short) | (Depreciation) |
| S&P 500 Index | June 2011 | 776 | 256,274 | 96 |
Unrealized appreciation (depreciation) on open futures contracts is required to be treated as realized gain (loss) for tax purposes.
20
Growth and Income Fund
G. Distributions are determined on a tax basis and may differ from net investment income and realized capital gains for financial reporting purposes. Differences may be permanent or temporary. Permanent differences are reclassified among capital accounts in the financial statements to reflect their tax character. Temporary differences arise when certain items of income, expense, gain, or loss are recognized in different periods for financial statement and tax purposes; these differences will reverse at some time in the future. Differences in classification may also result from the treatment of short-term gains as ordinary income for tax purposes.
The fund’s tax-basis capital gains and losses are determined only at the end of each fiscal year. For tax purposes, at September 30, 2010, the fund had available capital loss carryforwards totaling $1,692,658,000 to offset future net capital gains of $845,748,000 through September 30, 2017, and $846,910,000 through September 30, 2018. In addition, the fund realized losses of $67,319,000 during the period from November 1, 2009, through September 30, 2010, which are deferred and will be treated as realized for tax purposes in fiscal 2011. The fund will use these capital losses to offset net taxable capital gains, if any, realized during the year ending September 30, 2011; should the fund realize net capital losses for the year, the losses will be added to the loss carryforward balance above.
At March 31, 2011, the cost of investment securities for tax purposes was $3,772,254,000. Net unrealized appreciation of investment securities for tax purposes was $718,352,000, consisting of unrealized gains of $777,158,000 on securities that had risen in value since their purchase and $58,806,000 in unrealized losses on securities that had fallen in value since their purchase.
H. During the six months ended March 31, 2011, the fund purchased $1,513,987,000 of investment securities and sold $1,930,447,000 of investment securities, other than temporary cash investments.
I. Capital share transactions for each class of shares were:
| | | | |
| | Six Months Ended | | Year Ended |
| | March 31, 2011 | September 30, 2010 |
| | Amount | Shares | Amount | Shares |
| | ($000) | (000) | ($000) | (000) |
| Investor Shares | | | | |
| Issued | 116,448 | 4,384 | 231,031 | 9,843 |
| Issued in Lieu of Cash Distributions | 27,025 | 1,025 | 53,684 | 2,315 |
| Redeemed | (549,463) | (21,095) | (739,984) | (31,813) |
| Net Increase (Decrease)—Investor Shares | (405,990) | (15,686) | (455,269) | (19,655) |
| Admiral Shares | | | | |
| Issued | 299,540 | 7,150 | 131,639 | 3,429 |
| Issued in Lieu of Cash Distributions | 13,116 | 305 | 22,345 | 590 |
| Redeemed | (367,409) | (8,258) | (489,166) | (12,898) |
| Net Increase (Decrease)—Admiral Shares | (54,753) | (803) | (335,182) | (8,879) |
J. In preparing the financial statements as of March 31, 2011, management considered the impact of subsequent events for potential recognition or disclosure in these financial statements.
21
About Your Fund’s Expenses
As a shareholder of the fund, you incur ongoing costs, which include costs for portfolio management, administrative services, and shareholder reports (like this one), among others. Operating expenses, which are deducted from a fund’s gross income, directly reduce the investment return of the fund.
A fund’s expenses are expressed as a percentage of its average net assets. This figure is known as the expense ratio. The following examples are intended to help you understand the ongoing costs (in dollars) of investing in your fund and to compare these costs with those of other mutual funds. The examples are based on an investment of $1,000 made at the beginning of the period shown and held for the entire period.
The accompanying table illustrates your fund’s costs in two ways:
• Based on actual fund return. This section helps you to estimate the actual expenses that you paid over the period. The ”Ending Account Value“ shown is derived from the fund‘s actual return, and the third column shows the dollar amount that would have been paid by an investor who started with $1,000 in the fund. You may use the information here, together with the amount you invested, to estimate the expenses that you paid over the period.
To do so, simply divide your account value by $1,000 (for example, an $8,600 account value divided by $1,000 = 8.6), then multiply the result by the number given for your fund under the heading ”Expenses Paid During Period.“
• Based on hypothetical 5% yearly return. This section is intended to help you compare your fund‘s costs with those of other mutual funds. It assumes that the fund had a yearly return of 5% before expenses, but that the expense ratio is unchanged. In this case—because the return used is not the fund’s actual return—the results do not apply to your investment. The example is useful in making comparisons because the Securities and Exchange Commission requires all mutual funds to calculate expenses based on a 5% return. You can assess your fund’s costs by comparing this hypothetical example with the hypothetical examples that appear in shareholder reports of other funds.
Note that the expenses shown in the table are meant to highlight and help you compare ongoing costs only and do not reflect transaction costs incurred by the fund for buying and selling securities. Further, the expenses do not include the account service fee described in the prospectus. If such a fee were applied to your account, your costs would be higher. Your fund does not charge transaction fees, such as purchase or redemption fees, nor does it carry a “sales load.”
The calculations assume no shares were bought or sold during the period. Your actual costs may have been higher or lower, depending on the amount of your investment and the timing of any purchases or redemptions.
You can find more information about the fund’s expenses, including annual expense ratios, in the Financial Statements section of this report. For additional information on operating expenses and other shareholder costs, please refer to your fund’s current prospectus.
22
| | | |
| Six Months Ended March 31, 2011 | | | |
| | Beginning | Ending | Expenses |
| | Account Value | Account Value | Paid During |
| Growth and Income Fund | 9/30/2010 | 3/31/2011 | Period |
| Based on Actual Fund Return | | | |
| Investor Shares | $1,000.00 | $1,176.72 | $1.79 |
| Admiral Shares | 1,000.00 | 1,177.54 | 1.19 |
| Based on Hypothetical 5% Yearly Return | | | |
| Investor Shares | $1,000.00 | $1,023.29 | $1.66 |
| Admiral Shares | 1,000.00 | 1,023.83 | 1.11 |
The calculations are based on expenses incurred in the most recent six-month period. The fund’s annualized six-month expense ratios for that period are 0.33% for Investor Shares and 0.22% for Admiral Shares. The dollar amounts shown as “Expenses Paid” are equal to the annualized expense ratio multiplied by the average account value over the period, multiplied by the number of days in the most recent six-month period, then divided by the number of days in the most recent 12-month period.
23
Glossary
30-Day SEC Yield. A fund’s 30-day SEC yield is derived using a formula specified by the U.S. Securities and Exchange Commission. Under the formula, data related to the fund’s security holdings in the previous 30 days are used to calculate the fund’s hypothetical net income for that period, which is then annualized and divided by the fund’s estimated average net assets over the calculation period. For the purposes of this calculation, a security’s income is based on its current market yield to maturity (in the case of bonds) or its projected dividend yield (for stocks). Because the SEC yield represents hypothetical annualized income, it will differ—at times significantly—from the fund’s actual experience. As a result, the fund’s income distributions may be higher or lower than implied by the SEC yield.
Beta. A measure of the magnitude of a fund’s past share-price fluctuations in relation to the ups and downs of a given market index. The index is assigned a beta of 1.00. Compared with a given index, a fund with a beta of 1.20 typically would have seen its share price rise or fall by 12% when the index rose or fell by 10%. For this report, beta is based on returns over the past 36 months for both the fund and the index. Note that a fund’s beta should be reviewed in conjunction with its R-squared (see definition). The lower the R-squared, the less correlation there is between the fund and the index, and the less reliable beta is as an indicator of volatility.
Dividend Yield. Dividend income earned by stocks, expressed as a percentage of the aggregate market value (or of net asset value, for a fund). The yield is determined by dividing the amount of the annual dividends by the aggregate value (or net asset value) at the end of the period. For a fund, the dividend yield is based solely on stock holdings and does not include any income produced by other investments.
Earnings Growth Rate. The average annual rate of growth in earnings over the past five years for the stocks now in a fund.
Equity Exposure. A measure that reflects a fund’s investments in stocks and stock futures. Any holdings in short-term reserves are excluded.
Expense Ratio. The percentage of a fund’s average net assets used to pay its annual administrative and advisory expenses. These expenses directly reduce returns to investors.
Foreign Holdings. The percentage of a fund represented by stocks or depositary receipts of companies based outside the United States.
Inception Date. The date on which the assets of a fund (or one of its share classes) are first invested in accordance with the fund’s investment objective. For funds with a subscription period, the inception date is the day after that period ends. Investment performance is measured from the inception date.
Median Market Cap. An indicator of the size of companies in which a fund invests; the midpoint of market capitalization (market price x shares outstanding) of a fund’s stocks, weighted by the proportion of the fund’s assets invested in each stock. Stocks representing half of the fund’s assets have market capitalizations above the median, and the rest are below it.
Price/Book Ratio. The share price of a stock divided by its net worth, or book value, per share. For a fund, the weighted average price/book ratio of the stocks it holds.
24
Price/Earnings Ratio. The ratio of a stock’s current price to its per-share earnings over the past year. For a fund, the weighted average P/E of the stocks it holds. P/E is an indicator of market expectations about corporate prospects; the higher the P/E, the greater the expectations for a company’s future growth.
R-Squared. A measure of how much of a fund’s past returns can be explained by the returns from the market in general, as measured by a given index. If a fund’s total returns were precisely synchronized with an index’s returns, its R-squared would be 1.00. If the fund’s returns bore no relationship to the index’s returns, its R-squared would be 0. For this report, R-squared is based on returns over the past 36 months for both the fund and the index.
Return on Equity. The annual average rate of return generated by a company during the past five years for each dollar of shareholder’s equity (net income divided by shareholder’s equity). For a fund, the weighted average return on equity for the companies whose stocks it holds.
Short-Term Reserves. The percentage of a fund invested in highly liquid, short-term securities that can be readily converted to cash.
Turnover Rate. An indication of the fund’s trading activity. Funds with high turnover rates incur higher transaction costs and may be more likely to distribute capital gains (which may be taxable to investors). The turnover rate excludes in-kind transactions, which have minimal impact on costs.
25
This page intentionally left blank.
This page intentionally left blank.
The People Who Govern Your Fund
The trustees of your mutual fund are there to see that the fund is operated and managed in your best interests since, as a shareholder, you are a part owner of the fund. Your fund’s trustees also serve on the board of directors of The Vanguard Group, Inc., which is owned by the Vanguard funds and provides services to them on an at-cost basis.
A majority of Vanguard’s board members are independent, meaning that they have no affiliation with Vanguard or the funds they oversee, apart from the sizable personal investments they have made as private individuals. The independent board members have distinguished backgrounds in business, academia, and public service. Each of the trustees and executive officers oversees 179 Vanguard funds.
The following table provides information for each trustee and executive officer of the fund. More information about the trustees is in the Statement of Additional Information, which can be obtained, without charge, by contacting Vanguard at 800-662-7447, or online at vanguard.com.
| |
| Interested Trustee1 | and President (2006–2008) of Rohm and Haas Co. |
| | (chemicals); Director of Tyco International, Ltd. |
| F. William McNabb III | (diversified manufacturing and services) and Hewlett- |
| Born 1957. Trustee Since July 2009. Chairman of the | Packard Co. (electronic computer manufacturing); |
| Board. Principal Occupation(s) During the Past Five | Senior Advisor at New Mountain Capital; Trustee |
| Years: Chairman of the Board of The Vanguard Group, | of The Conference Board; Member of the Board of |
| Inc., and of each of the investment companies served | Managers of Delphi Automotive LLP (automotive |
| by The Vanguard Group, since January 2010; Director | components). |
| of The Vanguard Group since 2008; Chief Executive | |
| Officer and President of The Vanguard Group and of | Amy Gutmann |
| each of the investment companies served by The | Born 1949. Trustee Since June 2006. Principal |
| Vanguard Group since 2008; Director of Vanguard | Occupation(s) During the Past Five Years: President |
| Marketing Corporation; Managing Director of The | of the University of Pennsylvania; Christopher H. |
| Vanguard Group (1995–2008). | Browne Distinguished Professor of Political Science |
| | in the School of Arts and Sciences with secondary |
| | appointments at the Annenberg School for Commu- |
| Independent Trustees | nication and the Graduate School of Education |
| | of the University of Pennsylvania; Director of |
| Emerson U. Fullwood | Carnegie Corporation of New York, Schuylkill River |
| Born 1948. Trustee Since January 2008. Principal | Development Corporation, and Greater Philadelphia |
| Occupation(s) During the Past Five Years: Executive | Chamber of Commerce; Trustee of the National |
| Chief Staff and Marketing Officer for North America | Constitution Center; Chair of the Presidential |
| and Corporate Vice President (retired 2008) of Xerox | Commission for the Study of Bioethical Issues. |
| Corporation (document management products and | |
| services); Executive in Residence and 2010 | JoAnn Heffernan Heisen |
| Distinguished Minett Professor at the Rochester | Born 1950. Trustee Since July 1998. Principal |
| Institute of Technology; Director of SPX Corporation | Occupation(s) During the Past Five Years: Corporate |
| (multi-industry manufacturing), the United Way of | Vice President and Chief Global Diversity Officer |
| Rochester, Amerigroup Corporation (managed health | (retired 2008) and Member of the Executive |
| care), the University of Rochester Medical Center, | Committee (1997–2008) of Johnson & Johnson |
| Monroe Community College Foundation, and North | (pharmaceuticals/consumer products); Director of |
| Carolina A&T University. | Skytop Lodge Corporation (hotels), the University |
| | Medical Center at Princeton, the Robert Wood |
| Rajiv L. Gupta | Johnson Foundation, and the Center for Work Life |
| Born 1945. Trustee Since December 2001. 2 | Policy; Member of the Advisory Board of the |
| Principal Occupation(s) During the Past Five Years: | Maxwell School of Citizenship and Public Affairs |
| Chairman and Chief Executive Officer (retired 2009) | at Syracuse University. |
| | |
| F. Joseph Loughrey | Thomas J. Higgins | |
| Born 1949. Trustee Since October 2009. Principal | Born 1957. Chief Financial Officer Since September |
| Occupation(s) During the Past Five Years: President | 2008. Principal Occupation(s) During the Past Five |
| and Chief Operating Officer (retired 2009) and Vice | Years: Principal of The Vanguard Group, Inc.; Chief |
| Chairman of the Board (2008–2009) of Cummins Inc. | Financial Officer of each of the investment companies |
| (industrial machinery); Director of SKF AB (industrial | served by The Vanguard Group since 2008; Treasurer |
| machinery), Hillenbrand, Inc. (specialized consumer | of each of the investment companies served by The |
| services), the Lumina Foundation for Education, and | Vanguard Group (1998–2008). |
| Oxfam America; Chairman of the Advisory Council | | |
| for the College of Arts and Letters and Member | Kathryn J. Hyatt | |
| of the Advisory Board to the Kellogg Institute for | Born 1955. Treasurer Since November 2008. Principal |
| International Studies at the University of Notre Dame. | Occupation(s) During the Past Five Years: Principal |
| | of The Vanguard Group, Inc.; Treasurer of each of |
| André F. Perold | the investment companies served by The Vanguard |
| Born 1952. Trustee Since December 2004. Principal | Group since 2008; Assistant Treasurer of each of the |
| Occupation(s) During the Past Five Years: George | investment companies served by The Vanguard Group |
| Gund Professor of Finance and Banking at the Harvard | (1988–2008). | |
| Business School; Chair of the Investment Committee | | |
| of HighVista Strategies LLC (private investment firm). | Heidi Stam | |
| | Born 1956. Secretary Since July 2005. Principal |
| Alfred M. Rankin, Jr. | Occupation(s) During the Past Five Years: Managing |
| Born 1941. Trustee Since January 1993. Principal | Director of The Vanguard Group, Inc., since 2006; |
| Occupation(s) During the Past Five Years: Chairman, | General Counsel of The Vanguard Group since 2005; |
| President, and Chief Executive Officer of NACCO | Secretary of The Vanguard Group and of each of the |
| Industries, Inc. (forklift trucks/housewares/lignite); | investment companies served by The Vanguard Group |
| Director of Goodrich Corporation (industrial products/ | since 2005; Director and Senior Vice President of |
| aircraft systems and services) and the National | Vanguard Marketing Corporation since 2005; |
| Association of Manufacturers; Chairman of the | Principal of The Vanguard Group (1997–2006). |
| Federal Reserve Bank of Cleveland; Vice Chairman | | |
| of University Hospitals of Cleveland; President of | | |
| the Board of The Cleveland Museum of Art. | Vanguard Senior Management Team |
| |
| Peter F. Volanakis | R. Gregory Barton | Michael S. Miller |
| Born 1955. Trustee Since July 2009. Principal | Mortimer J. Buckley | James M. Norris |
| Occupation(s) During the Past Five Years: President | Kathleen C. Gubanich | Glenn W. Reed |
| and Chief Operating Officer (retired 2010) of Corning | Paul A. Heller | George U. Sauter |
| Incorporated (communications equipment); Director of | | |
| Corning Incorporated (2000–2010) and Dow Corning | | |
| (2001–2010); Overseer of the Amos Tuck School of | Chairman Emeritus and Senior Advisor |
| Business Administration at Dartmouth College. | | |
| | John J. Brennan | |
| | Chairman, 1996–2009 | |
| Executive Officers | Chief Executive Officer and President, 1996–2008 |
| |
| Glenn Booraem | | |
| Born 1967. Controller Since July 2010. Principal | Founder | |
| Occupation(s) During the Past Five Years: Principal | | |
| of The Vanguard Group, Inc.; Controller of each of | John C. Bogle | |
| the investment companies served by The Vanguard | Chairman and Chief Executive Officer, 1974–1996 |
| Group since 2010; Assistant Controller of each of | | |
| the investment companies served by The Vanguard | | |
| Group (2001–2010). | | |
1 Mr. McNabb is considered an “interested person,” as defined in the Investment Company Act of 1940, because he is an officer of the Vanguard funds.
2 December 2002 for Vanguard Equity Income Fund, Vanguard Growth Equity Fund, the Vanguard Municipal Bond Funds, and the Vanguard State Tax-Exempt Funds.
|  |
| P.O. Box 2600 |
| Valley Forge, PA 19482-2600 |
Connect with Vanguard® > vanguard.com
| Fund Information > 800-662-7447 | CFA® is a trademark owned by CFA Institute. |
| Direct Investor Account Services > 800-662-2739 | |
| Institutional Investor Services > 800-523-1036 | |
| Text Telephone for People | |
| With Hearing Impairment > 800-749-7273 | |
| |
| This material may be used in conjunction | |
| with the offering of shares of any Vanguard | |
| fund only if preceded or accompanied by | |
| the fund’s current prospectus. | |
| |
| All comparative mutual fund data are from Lipper Inc. or | |
| Morningstar, Inc., unless otherwise noted. | |
| |
| You can obtain a free copy of Vanguard’s proxy voting | |
| guidelines by visiting vanguard.com/proxyreporting or by | |
| calling Vanguard at 800-662-2739. The guidelines are | |
| also available from the SEC’s website, sec.gov. In | |
| addition, you may obtain a free report on how your fund | |
| voted the proxies for securities it owned during the 12 | |
| months ended June 30. To get the report, visit either | |
| vanguard.com/proxyreporting or sec.gov. | |
| |
| You can review and copy information about your fund at | |
| the SEC’s Public Reference Room in Washington, D.C. To | |
| find out more about this public service, call the SEC at | |
| 202-551-8090. Information about your fund is also | |
| available on the SEC’s website, and you can receive | |
| copies of this information, for a fee, by sending a | |
| request in either of two ways: via e-mail addressed to | |
| publicinfo@sec.gov or via regular mail addressed to the | |
| Public Reference Section, Securities and Exchange | |
| Commission, Washington, DC 20549-1520. | |
| | © 2011 The Vanguard Group, Inc. |
| | All rights reserved. |
| | Vanguard Marketing Corporation, Distributor. |
| |
| | Q932 052011 |
 |
| Vanguard Structured Equity Funds |
| Semiannual Report |
|
| March 31, 2011 |
| |
 |
| |
| |
| Vanguard Structured Large-Cap Equity Fund |
| Vanguard Structured Broad Market Fund |
|
|
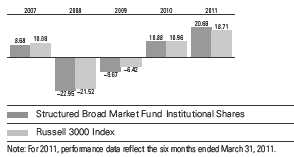
> For the six months ended March 31, 2011, Vanguard Structured Broad Market Fund returned about 21% and Vanguard Structured Large-Cap Equity Fund returned about 19%.
> All ten market sectors recorded positive returns for the half-year as the stock market moved resiliently forward.
> Both funds outperformed their benchmark indexes as the advisor’s stock selection models found success across a variety of industries.
| |
| Contents | |
| Your Fund’s Total Returns. | 1 |
| Chairman’s Letter. | 2 |
| Advisor’s Report. | 6 |
| Structured Large-Cap Equity Fund. | 8 |
| Structured Broad Market Fund. | 20 |
| About Your Fund’s Expenses. | 34 |
| Trustees Approve Advisory Arrangement. | 36 |
| Glossary. | 37 |
Please note: The opinions expressed in this report are just that—informed opinions. They should not be considered promises or advice.
Also, please keep in mind that the information and opinions cover the period through the date on the front of this report. Of course, the
risks of investing in your fund are spelled out in the prospectus.
See the Glossary for definitions of investment terms used in this report.
Cover photograph: Jean Maher.
Your Fund’s Total Returns
| |
| Six Months Ended March 31, 2011 | |
| | Total |
| | Returns |
| Vanguard Structured Large-Cap Equity Fund | |
| Institutional Shares | 18.97% |
| Institutional Plus Shares | 18.99 |
| S&P 500 Index | 17.31 |
| Large-Cap Core Funds Average | 16.47 |
| Large-Cap Core Funds Average: Derived from data provided by Lipper Inc. | |
| Vanguard Structured Broad Market Fund | |
| Institutional Shares | 20.68% |
| Institutional Plus Shares | 20.73 |
| Russell 3000 Index | 18.71 |
| Multi-Cap Core Funds Average | 17.68 |
Multi-Cap Core Funds Average: Derived from data provided by Lipper Inc.
Institutional and Institutional Plus Shares are available to certain institutional investors who meet specific administrative, service, andaccount-size criteria.
| | | | |
| Your Fund’s Performance at a Glance | | | | |
| September 30, 2010 , Through March 31, 2011 | | | | |
| | | | Distributions Per Share |
| | Starting | Ending | Income | Capital |
| | Share Price | Share Price | Dividends | Gains |
| Vanguard Structured Large-Cap Equity Fund | | | | |
| Institutional Shares | $20.97 | $24.55 | $0.366 | $0.000 |
| Institutional Plus Shares | 41.98 | 48.52 | 1.316 | 0.000 |
| Vanguard Structured Broad Market Fund | | | | |
| Institutional Shares | $20.70 | $24.55 | $0.393 | $0.000 |
| Institutional Plus Shares | 41.36 | 49.05 | 0.808 | 0.000 |
1

Chairman’s Letter
Dear Shareholder,
Vanguard’s Structured Equity Funds delivered strong performances for the six months ended March 31, 2011, as stocks extended their two-year recovery and quantitative equity strategies returned to favor. Both the Structured Broad Market Fund and the Structured Large-Cap Equity Fund achieved their goal of surpassing their benchmark indexes while seeking to match the risk characteristics of the benchmarks.
The Structured Large-Cap Equity Fund achieved double-digit gains in all ten sectors, and the Broad Market Fund did the same in all but the smaller utilities sector. Superior stock selection from both funds’ quantitative models was most evident in the consumer staples, health care, and industrial sectors.
As you may be aware, in February the board of trustees approved the permanent closure and liquidation of Vanguard Structured Large-Cap Value Fund and Vanguard Structured Large-Cap Growth Fund.
Despite distressing headlines, stock markets rallied
Global stock markets produced exceptional returns for the six months ended March 31, a period punctuated by unnerving developments such as political upheaval in the Middle East and North Africa, new sovereign-debt dilemmas in Europe, and a nuclear emergency in Japan. On a more
2
optimistic note, the U.S. economy continued to grind into gear. Job growth picked up, fueling hopes that the good news might be persistent enough to bring down the high unemployment rate.
The broad U.S. stock market returned more than 18%. The stocks of smaller companies, which are keenly sensitive to the rhythms of the business cycle, did even better. Non-U.S. stock markets trailed their American counterparts, though as a group, their six-month return topped 10%. European stocks performed best.
All but the shortest-term rates moved higher, affecting bond prices
With the exception of the shortest-term securities, the rates on fixed income investments moved higher during the half-year. At the start of the period, the 10-year U.S. Treasury note yielded a meager 2.51%. By the end, the rate had climbed to 3.45% as investors demanded more compensation for the possibility that inflation will continue to accelerate from financial-crisis lows.
Rising rates put short-term pressure on bond prices. The broad U.S. taxable bond market produced a slightly negative return. The broad municipal bond market, which came under pressure both from rising rates and concern (exaggerated, in Vanguard’s view) about the financial strength of state and municipal borrowers, returned –3.68%.
As it has since December 2008, the Federal Reserve held its target for short-term interest rates near 0%. This stance
| | | |
| Market Barometer | | | |
| |
| | | Total Returns |
| | | Periods Ended March 31, 2011 |
| | Six | One | Five Years |
| | Months | Year | (Annualized) |
| Stocks | | | |
| Russell 1000 Index (Large-caps) | 18.13% | 16.69% | 2.93% |
| Russell 2000 Index (Small-caps) | 25.48 | 25.79 | 3.35 |
| Dow Jones U.S. Total Stock Market Index | 18.51 | 17.50 | 3.27 |
| MSCI All Country World Index ex USA (International) | 10.85 | 13.15 | 3.59 |
| |
| Bonds | | | |
| Barclays Capital U.S. Aggregate Bond Index (Broad | | | |
| taxable market) | -0.88% | 5.12% | 6.03% |
| Barclays Capital Municipal Bond Index (Broad | | | |
| tax-exempt market) | -3.68 | 1.63 | 4.14 |
| Citigroup Three-Month U.S. Treasury Bill Index | 0.06 | 0.15 | 2.09 |
| |
| CPI | | | |
| Consumer Price Index | 2.30% | 2.68% | 2.26% |
3
kept the returns available from money market instruments, such as the 3-month Treasury bill, in the same neighborhood.
Quantitative equity strategies found success over the six months
While the past few years were rough on quantitative equity strategies generally owing to the abnormal market environment, the past six months were more conducive to adding value. The Structured Broad Market Fund returned about 21%, ahead of its market benchmark, the Russell 3000 Index, and the average return of multi-capitalization core funds. Results were also strong for the Structured Large-Cap Equity Fund, which returned about 19% and outpaced both its bench-mark, the Standard & Poor’s 500 Index, and the average return of its peer group, large-cap core funds.
The recent outperformance is a welcome turnaround for the funds. During the financial crisis, both suffered from disappointing stock selection in addition to the challenging market turbulence. When the stock market began to recover two years ago, the funds struggled to keep pace with their benchmarks as lower-quality equities led the rebound rather than the higher-quality stocks favored by the funds’ quantitative models.
Now that the recovery has moved into a more mature phase, the stocks of more fundamentally attractive, profitable companies are advancing. The funds benefited from the market environment over the half-year as well as from superior stock selection in eight of the ten industry sectors.
Energy, information technology, and industrial companies contributed the most to the returns of both funds. Rising oil prices lifted the energy sector, while the IT and industrial sectors were helped by increases in corporate and consumer spending as well as by the more favorable economic environment. The Structured Broad Market Fund also benefited from its exposure to mid- and small-cap stocks, which outpaced large-cap stocks over the period.
The computer-driven analysis employed by the advisor, Vanguard Quantitative Equity Group, delivered its strongest stock selection in the consumer staples, health care, financial, and industrial sectors. The Structured Broad Market Fund’s consumer staples and health care stocks returned about 16% and 17%, respectively, while those sectors in the Russell 3000 Index returned about 9% and 12%. The fund’s financial stocks also performed impressively compared with those in the index. For the Large-Cap Equity Fund, consumer staples stocks returned almost 13%, compared with about 8% for the sector in the S&P 500.
Only energy stocks restrained either fund’s performance relative to its benchmark.
4
The funds aim to outperform without increasing risk
Different stock investing strategies, like stocks themselves, experience periods of strength and weakness. The early stages of the market recovery didn’t feature much discrimination among individual securities in terms of quality. Indeed, the more “blue chip” stocks chosen by many quantitative equity strategies weren’t rewarded as much as stocks with unproven earnings records.
Over the past six months, quantitative strategies found success again as the hunt for quality stocks resumed. The two Structured Equity Funds ably fulfilled their mission of surpassing the returns of their market benchmarks while staying within the risk profiles of those indexes. We believe that, as part of a well-diversified long-term strategy, the funds can play an important role in helping your organization progress toward its investment goals.
On another matter, I want to note that Joel M. Dickson, who previously oversaw Vanguard’s Active Quantitative Equity Management Group, has assumed a new leadership role at Vanguard in our Investment Strategy Group. Sandip Bhagat, CFA, who already had been overseeing Vanguard’s active and index quantitative equity strategies, is now directly managing the Quantitative Equity Group’s researchers, portfolio managers, and traders. I would like to thank Joel for the services he has provided to the Structured Equity Funds. James Stetler continues as portfolio manager of the Broad Market Fund, and James Troyer continues in that role for the Large-Cap Equity Fund.
Thank you for entrusting your assets to Vanguard.
Sincerely,

F. William McNabb III
Chairman and Chief Executive Officer
April 19, 2011
5
Advisor’s Report
Vanguard’s Structured Equity Funds posted solid returns for the first half of the 2011 fiscal year. For the six months through March 31, the Structured Large-Cap Equity Fund returned 18.97% for Institutional Shares and 18.99% for Institutional Plus Shares, topping the return of its benchmark, the S&P 500 Index, by 1.66 and 1.68 percentage points, respectively.
The Structured Broad Market Fund returned 20.68% for Institutional Shares and 20.73% for Institutional Plus Shares, outperforming the benchmark Russell 3000 Index by 1.97 and 2.02 percentage points, respectively.
The investment environment
The U.S. equity market remained resilient amid various global economic and geopolitical concerns, continuing its rebound from the low point reached in early 2009 during the financial crisis.
Strong corporate earnings and better-than-expected job growth have buoyed equities, despite the volatility generated by the turmoil in the Arab world, the ongoing European sovereign-debt crisis, and the uncertainty following the natural disaster in Japan. The stock market did pull back in mid-February as investors digested the protests in the Middle East and Northern Africa—along with a 20% increase in crude oil prices—but the market then stabilized and moved up to levels not seen since mid-2008.
Although overall portfolio performance is affected by the macro factors described above, our approach to investing focuses on specific stock fundamentals. Because we believe there is no single indicator for picking attractive stocks, our model is diversified across five factors: (1) valuation, which measures the price we would pay for earnings and cash flows; (2) growth, which considers the growth of earnings when factoring how much we pay for them; (3) management decisions, assessing the actions of company managers as a signal of their own informed view about their firm’s future; (4) market sentiment, which captures investors’ opinion of a company as reflected in their market behavior; and (5) quality, which measures balance-sheet strength and the sustainability of earnings. Our risk-control process then neutralizes our exposure to market-capitalization, volatility, and industry risks relative to our benchmark. In our view, such risk exposures are not justified by the rewards available.
Our stock selection model performed well in the unpredictable market of the past six months. A majority of the five factors contributed positively to performance in each of the Structured Equity Funds. The Structured Large-Cap Equity Fund benefited most from our valuation component, while the growth and market-sentiment factors played a bigger role in identifying strong performers for the Structured Broad Market Fund, which has greater exposure to mid- and small-cap companies.
The model’s breadth was demonstrated by its effectiveness across sectors. Each fund’s holdings outperformed its benchmark’s stocks in eight of the ten sectors.
6
Structured Large-Cap Equity Fund
The portfolio’s best-performing sectors during the half-year were energy (+39%), industrials (+24%), and materials (+22%). The weakest were utilities (+10%), health care (+12%), and consumer staples (+13%).
Among individual stocks, the largest contributions came from our overweighted positions in JDS Uniphase (+68%), CBS (+50%), and Marathon Oil (+63%). In addition, in performance compared with the benchmark, we benefited from underweighting or avoiding poorly performing stocks such as Cisco Systems (–21%), Merck (–8%), and Abbott Laboratories (–4%).
Unfortunately, we were not able to avoid all bad performers. Overweighted positions in Motorola Mobility (–24%), Nike (–16%), and Lexmark International (–17%) directly lowered performance.
Structured Broad Market Fund
The best-performing sectors in the portfolio were energy (+41%), industrials (+27%), and materials (+26%). The sectors that returned the least were utilities (+6%), telecommunication services (+11%), and consumer staples (+16%).
At the individual stock level, the fund benefited most from overweighted positions in National Oilwell Varco, Estee Lauder (+54%), and Altera (+46%). In comparison with the benchmark, we further benefited from underweighting or avoiding poorly performing stocks such as Cisco Systems, Merck, and Best Buy (–29%).
Overweighted positions in Talbots (–52%), Motorola Mobility, and Delta Air Lines (–16%) directly lowered performance. Also unhelpful, in relative terms, were underweightings of Schlumberger, Walt Disney (+31%), and Oracle Systems (+25%).
Although we cannot predict how the broader political or economic events will affect the stock market, we are confident that the market can provide worthwhile returns for long-term investors. With that in mind, we believe that equity exposure continues to be an important part of a diversified investment plan. Within such a plan, we believe that a portfolio of companies with lower relative price/earnings and cash-flow ratios, growth rates near market levels, higher returns on equity, quality balance sheets, and positive market sentiment can play a useful role. The Structured Equity Funds seek to fulfill this description. We thank you for your investment and look forward to the second half of the fiscal year.
James. D. Troyer, CFA
Principal and Portfolio Manager
James P. Stetler
Principal and Portfolio Manager
Vanguard Quantitative Equity Group
April 21, 2011
7
Structured Large-Cap Equity Fund
Fund Profile
As of March 31, 2011
| | |
| Share-Class Characteristics | |
| | Institutional | Institutional |
| | Shares | Plus Shares |
| Ticker Symbol | VSLIX | VSLPX |
| Expense Ratio1 | 0.24% | 0.17% |
| 30-Day SEC Yield | 1.69% | 1.76% |
| | | |
| Portfolio Characteristics | | |
| | | | DJ |
| | | | U.S. Total |
| | | S&P 500 | Market |
| | Fund | Index | Index |
| Number of Stocks | 148 | 500 | 3,817 |
| Median Market Cap | $50.7B | $50.0B | $31.4B |
| Price/Earnings Ratio | 15.1x | 16.7x | 17.9x |
| Price/Book Ratio | 2.5x | 2.3x | 2.3x |
| Return on Equity | 20.6% | 20.3% | 18.9% |
| Earnings Growth Rate | 5.0% | 5.4% | 5.9% |
| Dividend Yield | 1.9% | 1.9% | 1.7% |
| Foreign Holdings | 0.0% | 0.0% | 0.0% |
| Turnover Rate | | | |
| (Annualized) | 67% | — | — |
| Short-Term Reserves | -0.1% | — | — |
| | | |
| Sector Diversification (% of equity exposure) |
| | | | DJ |
| | | | U.S. Total |
| | | S&P 500 | Market |
| | Fund | Index | Index |
| Consumer | | | |
| Discretionary | 10.5% | 10.4% | 11.8% |
| Consumer Staples | 9.9 | 10.2 | 9.2 |
| Energy | 13.6 | 13.3 | 11.8 |
| Financials | 16.6 | 15.8 | 16.2 |
| Health Care | 11.1 | 11.0 | 10.7 |
| Industrials | 10.9 | 11.3 | 11.6 |
| Information | | | |
| Technology | 17.3 | 18.1 | 18.5 |
| Materials | 3.8 | 3.7 | 4.5 |
| Telecommunication | | | |
| Services | 3.5 | 3.0 | 2.6 |
| Utilities | 2.8 | 3.2 | 3.1 |
| | |
| Volatility Measures | | |
| | | DJ |
| | | U.S. Total |
| | S&P 500 | Market |
| | Index | Index |
| R-Squared | 1.00 | 0.99 |
| Beta | 0.99 | 0.96 |
These measures show the degree and timing of the fund’s fluctuations compared with the indexes over 36 months.
| | |
| Ten Largest Holdings (% of total net assets) |
| Exxon Mobil Corp. | Integrated Oil & | |
| | Gas | 4.0% |
| Apple Inc. | Computer | |
| | Hardware | 3.1 |
| Chevron Corp. | Integrated Oil & | |
| | Gas | 2.3 |
| General Electric Co. | Industrial | |
| | Conglomerates | 2.3 |
| International Business | IT Consulting & | |
| Machines Corp. | Other Services | 2.2 |
| Microsoft Corp. | Systems Software | 2.0 |
| AT&T Inc. | Integrated | |
| | Telecommunication | |
| | Services | 2.0 |
| JPMorgan Chase & Co. | Diversified Financial | |
| | Services | 2.0 |
| Procter & Gamble Co. | Household | |
| | Products | 1.9 |
| Wells Fargo & Co. | Diversified Banks | 1.9 |
| Top Ten | | 23.7% |
The holdings listed exclude any temporary cash investments and equity index products.
Investment Focus
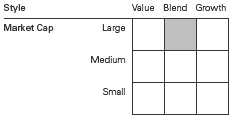
1 The expense ratios shown are from the prospectus dated January 27, 2011. For the six months ended March 31, 2011, the annualized expense ratios were 0.24% for Institutional Shares and 0.17% for Institutional Plus Shares.
8
Structured Large-Cap Equity Fund
Performance Summary
All of the returns in this report represent past performance, which is not a guarantee of future results that may be achieved by the fund. (Current performance may be lower or higher than the performance data cited. For performance data current to the most recent month-end, visit our website at vanguard.com/performance.) Note, too, that both investment returns and principal value can fluctuate widely, so an investor’s shares, when sold, could be worth more or less than their original cost. The returns shown do not reflect taxes that a shareholder would pay on fund distributions or on the sale of fund shares.
Fiscal-Year Total Returns (%): May 16, 2006, Through March 31, 2011
| | | |
| Average Annual Total Returns: Periods Ended March 31, 2011 | | |
| |
| | Inception | One | Since |
| | Date | Year | Inception |
| Institutional Shares | 5/16/2006 | 16.36% | 1.92% |
| Institutional Plus Shares | 5/15/2006 | 16.46 | 1.97 |
See Financial Highlights for dividend and capital gains information.
9
Structured Large-Cap Equity Fund
Financial Statements (unaudited)
Statement of Net Assets
As of March 31, 2011
The fund reports a complete list of its holdings in regulatory filings four times in each fiscal year, at the quarter-ends. For the second and fourth fiscal quarters, the lists appear in the fund’s semiannual and annual reports to shareholders. For the first and third fiscal quarters, the fund files the lists with the Securities and Exchange Commission on Form N-Q. Shareholders can look up the fund’s Forms N-Q on the SEC’s website at sec.gov. Forms N-Q may also be reviewed and copied at the SEC’s Public Reference Room (see the back cover of this report for further information).
| | | |
| | | | Market |
| | | | Value |
| | | Shares | ($000) |
| Common Stocks (99.8%)1 | | |
| Consumer Discretionary (10.4%) | |
| * | Ford Motor Co. | 282,806 | 4,217 |
| * | DIRECTV Class A | 78,600 | 3,678 |
| | Starbucks Corp. | 95,850 | 3,542 |
| | Time Warner Cable Inc. | 47,500 | 3,389 |
| | CBS Corp. Class B | 127,360 | 3,189 |
| | NIKE Inc. Class B | 38,500 | 2,914 |
| | VF Corp. | 28,700 | 2,828 |
| | Limited Brands Inc. | 83,918 | 2,759 |
| * | AutoZone Inc. | 9,660 | 2,643 |
| | Comcast Corp. Class A | | |
| | Special Shares | 111,200 | 2,582 |
| | Macy’s Inc. | 105,200 | 2,552 |
| | Target Corp. | 48,600 | 2,430 |
| | Ross Stores Inc. | 27,800 | 1,977 |
| | Comcast Corp. Class A | 77,925 | 1,926 |
| | Wynn Resorts Ltd. | 8,100 | 1,031 |
| | TJX Cos. Inc. | 15,666 | 779 |
| | McDonald’s Corp. | 9,697 | 738 |
| | Walt Disney Co. | 14,829 | 639 |
| * | Amazon.com Inc. | 3,000 | 540 |
| | Coach Inc. | 9,600 | 500 |
| | Gannett Co. Inc. | 28,400 | 433 |
| | Viacom Inc. Class B | 9,200 | 428 |
| | Starwood Hotels & Resorts | | |
| | Worldwide Inc. | 7,000 | 407 |
| | Carnival Corp. | 9,700 | 372 |
| | | | 46,493 |
| Consumer Staples (9.9%) | | |
| | Procter & Gamble Co. | 136,044 | 8,380 |
| | Philip Morris | | |
| | International Inc. | 104,436 | 6,854 |
| | Wal-Mart Stores Inc. | 113,496 | 5,907 |
| | Altria Group Inc. | 167,000 | 4,347 |
| | Coca-Cola Co. | 48,240 | 3,201 |
| | Kroger Co. | 121,300 | 2,908 |
| | Coca-Cola Enterprises Inc. | 101,100 | 2,760 |
| | Sara Lee Corp. | 151,000 | 2,668 |
| | Dr Pepper Snapple | | |
| | Group Inc. | 69,600 | 2,586 |
| | | |
| | | | Market |
| | | | Value |
| | | Shares | ($000) |
| | Colgate-Palmolive Co. | 22,600 | 1,825 |
| | PepsiCo Inc. | 23,392 | 1,507 |
| | Walgreen Co. | 26,200 | 1,052 |
| | | | 43,995 |
| Energy (13.6%) | | |
| | Exxon Mobil Corp. | 212,039 | 17,839 |
| | Chevron Corp. | 97,256 | 10,448 |
| | ConocoPhillips | 84,559 | 6,753 |
| | Occidental Petroleum Corp. | 39,951 | 4,175 |
| | Marathon Oil Corp. | 70,000 | 3,732 |
| | Hess Corp. | 39,600 | 3,374 |
| | Peabody Energy Corp. | 44,582 | 3,208 |
| | National Oilwell Varco Inc. | 37,200 | 2,949 |
| | El Paso Corp. | 163,725 | 2,947 |
| | Sunoco Inc. | 58,900 | 2,685 |
| | Schlumberger Ltd. | 23,825 | 2,222 |
| | Devon Energy Corp. | 2,900 | 266 |
| | | | 60,598 |
| Financials (16.5%) | | |
| | JPMorgan Chase & Co. | 193,029 | 8,899 |
| | Wells Fargo & Co. | 260,535 | 8,259 |
| * | Citigroup Inc. | 1,227,256 | 5,425 |
| | US Bancorp | 156,224 | 4,129 |
| | American Express Co. | 87,015 | 3,933 |
| | Capital One Financial Corp. | 64,400 | 3,346 |
| | Travelers Cos. Inc. | 56,068 | 3,335 |
| | Franklin Resources Inc. | 24,726 | 3,093 |
| | Discover Financial Services | 127,700 | 3,080 |
| | Chubb Corp. | 49,643 | 3,044 |
| | Ameriprise Financial Inc. | 47,400 | 2,895 |
| | Torchmark Corp. | 40,500 | 2,692 |
| | Bank of America Corp. | 201,753 | 2,689 |
| * | CB Richard Ellis Group Inc. | | |
| | Class A | 99,700 | 2,662 |
| | HCP Inc. | 69,200 | 2,625 |
| | ACE Ltd. | 34,400 | 2,226 |
| | KeyCorp | 202,400 | 1,797 |
| * | Berkshire Hathaway Inc. | | |
| | Class B | 20,105 | 1,681 |
| | Apartment Investment & | | |
| | Management Co. | 64,500 | 1,643 |
10
Structured Large-Cap Equity Fund
| | | |
| | | | Market |
| | | | Value |
| | | Shares | ($000) |
| | Vornado Realty Trust | 17,700 | 1,549 |
| | Goldman Sachs Group Inc. | 9,098 | 1,442 |
| * | Berkshire Hathaway Inc. | | |
| | Class A | 11 | 1,378 |
| | Aflac Inc. | 19,094 | 1,008 |
| | Fifth Third Bancorp | 58,300 | 809 |
| | | | 73,639 |
| Health Care (11.1%) | | |
| | Johnson & Johnson | 121,646 | 7,208 |
| | UnitedHealth Group Inc. | 96,804 | 4,376 |
| | Bristol-Myers Squibb Co. | 147,200 | 3,890 |
| | Eli Lilly & Co. | 101,287 | 3,562 |
| | Pfizer Inc. | 169,419 | 3,441 |
| * | Express Scripts Inc. | 59,600 | 3,314 |
| * | Biogen Idec Inc. | 43,100 | 3,163 |
| * | Agilent Technologies Inc. | 68,950 | 3,088 |
| * | Humana Inc. | 43,480 | 3,041 |
| | AmerisourceBergen Corp. | | |
| | Class A | 76,098 | 3,010 |
| | CIGNA Corp. | 63,300 | 2,803 |
| | Cardinal Health Inc. | 60,800 | 2,501 |
| * | Forest Laboratories Inc. | 71,700 | 2,316 |
| * | Watson Pharmaceuticals Inc. | 27,700 | 1,551 |
| | Merck & Co. Inc. | 44,894 | 1,482 |
| | Abbott Laboratories | 9,768 | 479 |
| | Aetna Inc. | 6,270 | 235 |
| | | | 49,460 |
| Industrials (10.8%) | | |
| | General Electric Co. | 502,822 | 10,082 |
| | Caterpillar Inc. | 46,400 | 5,167 |
| | United Parcel Service Inc. | | |
| | Class B | 65,621 | 4,877 |
| | Deere & Co. | 42,050 | 4,074 |
| | CSX Corp. | 45,348 | 3,564 |
| | Eaton Corp. | 57,200 | 3,171 |
| | Parker Hannifin Corp. | 32,400 | 3,068 |
| | Cummins Inc. | 27,795 | 3,047 |
| | Northrop Grumman Corp. | 46,016 | 2,886 |
| | PACCAR Inc. | 38,100 | 1,994 |
| | General Dynamics Corp. | 20,700 | 1,585 |
| | Southwest Airlines Co. | 83,800 | 1,058 |
| | Union Pacific Corp. | 9,500 | 934 |
| | Dover Corp. | 10,300 | 677 |
| | United Technologies Corp. | 7,736 | 655 |
| | Pitney Bowes Inc. | 22,400 | 575 |
| | Avery Dennison Corp. | 9,000 | 378 |
| * | Huntington Ingalls | | |
| | Industries Inc. | 7,669 | 318 |
| | 3M Co. | 1,613 | 151 |
| | | | 48,261 |
| Information Technology (17.4%) | |
| * | Apple Inc. | 40,042 | 13,953 |
| | International Business | | |
| | Machines Corp. | 60,090 | 9,799 |
| | Microsoft Corp. | 356,541 | 9,042 |
| * | Google Inc. Class A | 10,155 | 5,953 |
| | | |
| | | | Market |
| | | | Value |
| | | Shares | ($000) |
| | Texas Instruments Inc. | 104,200 | 3,601 |
| * | Cognizant Technology | | |
| | Solutions Corp. Class A | 41,600 | 3,386 |
| | Intel Corp. | 144,253 | 2,910 |
| | Western Union Co. | 133,900 | 2,781 |
| * | NetApp Inc. | 56,065 | 2,701 |
| * | Fiserv Inc. | 40,800 | 2,559 |
| | Oracle Corp. | 72,188 | 2,409 |
| * | Novellus Systems Inc. | 64,000 | 2,376 |
| * | Motorola Solutions Inc. | 50,350 | 2,250 |
| * | JDS Uniphase Corp. | 100,200 | 2,088 |
| * | Motorola Mobility | | |
| | Holdings Inc. | 83,656 | 2,041 |
| | Cisco Systems Inc. | 99,015 | 1,698 |
| | Hewlett-Packard Co. | 34,400 | 1,409 |
| * | Teradata Corp. | 23,739 | 1,204 |
| * | SanDisk Corp. | 23,500 | 1,083 |
| * | Teradyne Inc. | 55,952 | 997 |
| | QUALCOMM Inc. | 17,057 | 935 |
| * | Dell Inc. | 63,200 | 917 |
| * | Autodesk Inc. | 18,000 | 794 |
| * | Lexmark International Inc. | | |
| | Class A | 16,000 | 593 |
| | | | 77,479 |
| Materials (3.8%) | | |
| | EI du Pont de | | |
| | Nemours & Co. | 78,563 | 4,319 |
| | Freeport-McMoRan | | |
| | Copper & Gold Inc. | 76,900 | 4,272 |
| | Dow Chemical Co. | 102,600 | 3,873 |
| | PPG Industries Inc. | 33,600 | 3,199 |
| | Newmont Mining Corp. | 12,000 | 655 |
| | Eastman Chemical Co. | 4,400 | 437 |
| | | | 16,755 |
| Telecommunication Services (3.5%) | |
| | AT&T Inc. | 293,235 | 8,973 |
| | Verizon | | |
| | Communications Inc. | 163,896 | 6,316 |
| | Qwest Communications | | |
| | International Inc. | 47,000 | 321 |
| | | | 15,610 |
| Utilities (2.8%) | | |
| | Oneok Inc. | 40,100 | 2,682 |
| | CMS Energy Corp. | 129,438 | 2,542 |
| | Northeast Utilities | 72,700 | 2,516 |
| | Integrys Energy Group Inc. | 49,200 | 2,485 |
| | Ameren Corp. | 48,700 | 1,367 |
| | FirstEnergy Corp. | 11,138 | 413 |
| | TECO Energy Inc. | 12,000 | 225 |
| | Entergy Corp. | 800 | 54 |
| | | | 12,284 |
| Total Common Stocks | | |
| (Cost $343,213) | | 444,574 |
11
Structured Large-Cap Equity Fund
| | |
| | | Market |
| | | Value |
| | Shares | ($000) |
| Temporary Cash Investments (0.1%)1 | |
| Money Market Fund (0.1%) | |
| 2 Vanguard Market | | |
| Liquidity Fund, 0.208% | 311,314 | 311 |
| |
| | Face | |
| | Amount | |
| | ($000) | |
| U.S. Government and Agency Obligations (0.0%) |
| 3,4 Federal Home Loan Bank | |
| Discount Notes, 0.150%, | |
| 5/13/11 | 100 | 100 |
| Total Temporary Cash Investments | |
| (Cost $411) | | 411 |
| Total Investments (99.9%) | | |
| (Cost $343,624) | | 444,985 |
| Other Assets and Liabilities (0.1%) | |
| Other Assets | | 618 |
| Liabilities | | (183) |
| | | 435 |
| Net Assets (100%) | | 445,420 |
| |
| At March 31, 2011, net assets consisted of: |
| | Amount |
| | ($000) |
| Paid-in Capital | 574,771 |
| Undistributed Net Investment Income | 1,974 |
| Accumulated Net Realized Losses | (232,696) |
| Unrealized Appreciation (Depreciation) | |
| Investment Securities | 101,361 |
| Futures Contracts | 10 |
| Net Assets | 445,420 |
| |
| Institutional Shares—Net Assets | |
| Applicable to 514,403 outstanding | |
| $.001 par value shares of beneficial | |
| interest (unlimited authorization) | 12,629 |
| Net Asset Value Per Share— | |
| Institutional Shares | $24.55 |
| |
| Institutional Plus Shares—Net Assets | |
| Applicable to 8,920,216 outstanding | |
| $.001 par value shares of beneficial | |
| interest (unlimited authorization) | 432,791 |
| Net Asset Value Per Share— | |
| Institutional Plus Shares | $48.52 |
See Note A in Notes to Financial Statements.
* Non-income-producing security.
1 The fund invests a portion of its cash reserves in equity markets through the use of index futures contracts. After giving effect to futures investments, the fund’s effective common stock and temporary cash investment positions represent 100.0% and –0.1%, respectively, of net assets.
2 Affiliated money market fund available only to Vanguard funds and certain trusts and accounts managed by Vanguard. Rate shown is the 7-day yield.
3 The issuer operates under a congressional charter; its securities are not backed by the full faith and credit of the U.S. government.
4 Securities with a value of $100,000 have been segregated as initial margin for open futures contracts.
See accompanying Notes, which are an integral part of the Financial Statements.
12
Structured Large-Cap Equity Fund
| |
| Statement of Operations | |
| |
| | Six Months Ended |
| | March 31, 2011 |
| | ($000) |
| Investment Income | |
| Income | |
| Dividends | 5,856 |
| Interest1 | 2 |
| Security Lending | 1 |
| Total Income | 5,859 |
| Expenses | |
| The Vanguard Group—Note B | |
| Investment Advisory Services | 329 |
| Management and Administrative—Institutional Shares | 13 |
| Management and Administrative—Institutional Plus Shares | 40 |
| Marketing and Distribution—Institutional Shares | 8 |
| Marketing and Distribution—Institutional Plus Shares | 60 |
| Custodian Fees | 11 |
| Total Expenses | 461 |
| Net Investment Income | 5,398 |
| Realized Net Gain (Loss) | |
| Investment Securities Sold | 43,010 |
| Futures Contracts | 259 |
| Realized Net Gain (Loss) | 43,269 |
| Change in Unrealized Appreciation (Depreciation) | |
| Investment Securities | 45,523 |
| Futures Contracts | (19) |
| Change in Unrealized Appreciation (Depreciation) | 45,504 |
| Net Increase (Decrease) in Net Assets Resulting from Operations | 94,171 |
| 1 Interest income from an affiliated company of the fund was $1,000. | |
See accompanying Notes, which are an integral part of the Financial Statements.
13
Structured Large-Cap Equity Fund
| | |
| Statement of Changes in Net Assets | | |
| |
| | Six Months Ended | Year Ended |
| | March 31, | September 30, |
| | 2011 | 2010 |
| | ($000) | ($000) |
| Increase (Decrease) in Net Assets | | |
| Operations | | |
| Net Investment Income | 5,398 | 11,816 |
| Realized Net Gain (Loss) | 43,269 | 6,608 |
| Change in Unrealized Appreciation (Depreciation) | 45,504 | 39,329 |
| Net Increase (Decrease) in Net Assets Resulting from Operations | 94,171 | 57,753 |
| Distributions | | |
| Net Investment Income | | |
| Institutional Shares | (183) | (2,024) |
| Institutional Plus Shares | (11,627) | (9,247) |
| Realized Capital Gain | | |
| Institutional Shares | — | — |
| Institutional Plus Shares | — | — |
| Total Distributions | (11,810) | (11,271) |
| Capital Share Transactions | | |
| Institutional Shares | (91,626) | (19,348) |
| Institutional Plus Shares | (210,057) | 64,445 |
| Net Increase (Decrease) from Capital Share Transactions | (301,683) | 45,097 |
| Total Increase (Decrease) | (219,322) | 91,579 |
| Net Assets | | |
| Beginning of Period | 664,742 | 573,163 |
| End of Period1 | 445,420 | 664,742 |
| 1 Net Assets—End of Period includes undistributed net investment income of $1,974,000 and $8,386,000. | |
See accompanying Notes, which are an integral part of the Financial Statements.
14
Structured Large-Cap Equity Fund
| | | | | | |
| Financial Highlights | | | | | | |
| |
| |
| Institutional Shares | | | | | | |
| | Six Months | | | | | May 16, |
| | Ended | | | | | 20061 to |
| For a Share Outstanding | March 31, | Year Ended September 30, | Sept. 30, |
| Throughout Each Period | 2011 | 2010 | 2009 | 2008 | 2007 | 2006 |
| Net Asset Value, Beginning of Period | $20.97 | $19.47 | $22.56 | $29.98 | $26.03 | $24.96 |
| Investment Operations | | | | | | |
| Net Investment Income | .2242 | .366 | .546 | .492 | .4762 | .130 |
| Net Realized and Unrealized Gain (Loss) | | | | | | |
| on Investments | 3.722 | 1.505 | (2.993) | (7.091) | 3.657 | .940 |
| Total from Investment Operations | 3.946 | 1.871 | (2.447) | (6.599) | 4.133 | 1.070 |
| Distributions | | | | | | |
| Dividends from Net Investment Income | (.366) | (.371) | (.643) | (.430) | (.172) | — |
| Distributions from Realized Capital Gains | — | — | — | (.391) | (.011) | — |
| Total Distributions | (.366) | (.371) | (.643) | (.821) | (.183) | — |
| Net Asset Value, End of Period | $24.55 | $20.97 | $19.47 | $22.56 | $29.98 | $26.03 |
| |
| Total Return | 18.97% | 9.68% | -10.25% | -22.52% | 15.94% | 4.29% |
| |
| Ratios/Supplemental Data | | | | | | |
| Net Assets, End of Period (Millions) | $13 | $95 | $106 | $135 | $187 | $127 |
| Ratio of Total Expenses to | | | | | | |
| Average Net Assets | 0.24% | 0.24% | 0.25% | 0.20% | 0.25% | 0.25%3 |
| Ratio of Net Investment Income to | | | | | | |
| Average Net Assets | 1.98% | 1.86% | 2.33% | 1.91% | 1.69% | 1.67%3 |
| Portfolio Turnover Rate | 67% | 61% | 80%4 | 72% | 54%4 | 30% |
The expense ratio, net income ratio, and turnover rate for the current period have been annualized.
1 Inception.
2 Calculated based on average shares outstanding.
3 Annualized.
4 Excludes the value of portfolio securities received or delivered as a result of in-kind purchases or redemptions of the fund’s capital shares.
See accompanying Notes, which are an integral part of the Financial Statements.
15
Structured Large-Cap Equity Fund
| | | | | | |
| Financial Highlights | | | | | | |
| |
| |
| Institutional Plus Shares | | | | | | |
| | Six Months | | | | | May 15, |
| | Ended | | | | | 20061 to |
| For a Share Outstanding | March 31, | Year Ended September 30, | Sept. 30, |
| Throughout Each Period | 2011 | 2010 | 2009 | 2008 | 2007 | 2006 |
| Net Asset Value, Beginning of Period | $41.98 | $38.97 | $45.15 | $60.02 | $52.07 | $50.00 |
| Investment Operations | | | | | | |
| Net Investment Income | .4532 | .768 | 1.116 | 1.025 | 1.0182 | .250 |
| Net Realized and Unrealized Gain (Loss) | | | | | | |
| on Investments | 7.403 | 3.014 | (5.980) | (14.193) | 7.317 | 1.820 |
| Total from Investment Operations | 7.856 | 3.782 | (4.864) | (13.168) | 8.335 | 2.070 |
| Distributions | | | | | | |
| Dividends from Net Investment Income | (1.316) | (.772) | (1.316) | (.920) | (.363) | — |
| Distributions from Realized Capital Gains | — | — | — | (.782) | (.022) | — |
| Total Distributions | (1.316) | (.772) | (1.316) | (1.702) | (.385) | — |
| Net Asset Value, End of Period | $48.52 | $41.98 | $38.97 | $45.15 | $60.02 | $52.07 |
| |
| Total Return | 18.99% | 9.78% | -10.16% | -22.46% | 16.07% | 4.14% |
| |
| Ratios/Supplemental Data | | | | | | |
| Net Assets, End of Period (Millions) | $433 | $570 | $467 | $677 | $819 | $203 |
| Ratio of Total Expenses to | | | | | | |
| Average Net Assets | 0.17% | 0.17% | 0.17% | 0.12% | 0.15% | 0.15%3 |
| Ratio of Net Investment Income to | | | | | | |
| Average Net Assets | 2.05% | 1.93% | 2.41% | 1.99% | 1.79% | 1.77%3 |
| Portfolio Turnover Rate | 67% | 61% | 80%4 | 72% | 54%4 | 30% |
The expense ratio, net income ratio, and turnover rate for the current period have been annualized.
1 Inception.
2 Calculated based on average shares outstanding.
3 Annualized.
4 Excludes the value of portfolio securities received or delivered as a result of in-kind purchases or redemptions of the fund’s capital shares.
See accompanying Notes, which are an integral part of the Financial Statements.
16
Structured Large-Cap Equity Fund
Notes to Financial Statements
Vanguard Structured Large-Cap Equity Fund is registered under the Investment Company Act of 1940 as an open-end investment company, or mutual fund. The fund offers two classes of shares: Institutional Shares and Institutional Plus Shares. Institutional Shares and Institutional Plus Shares are designed for investors who meet certain administrative, service, and account-size criteria.
A. The following significant accounting policies conform to generally accepted accounting principles for U.S. mutual funds. The fund consistently follows such policies in preparing its financial statements.
1. Security Valuation: Securities are valued as of the close of trading on the New York Stock Exchange (generally 4 p.m., Eastern time) on the valuation date. Equity securities are valued at the latest quoted sales prices or official closing prices taken from the primary market in which each security trades; such securities not traded on the valuation date are valued at the mean of the latest quoted bid and asked prices. Securities for which market quotations are not readily available, or whose values have been materially affected by events occurring before the fund’s pricing time but after the close of the securities’ primary markets, are valued by methods deemed by the board of trustees to represent fair value. Investments in Vanguard Market Liquidity Fund are valued at that fund’s net asset value. Temporary cash investments acquired over 60 days to maturity are valued using the latest bid prices or using valuations based on a matrix system (which considers such factors as security prices, yields, maturities, and ratings), both as furnished by independent pricing services. Other temporary cash investments are valued at amortized cost, which approximates market value.
2. Futures Contracts: The fund uses index futures contracts to a limited extent, with the objective of maintaining full exposure to the stock market while maintaining liquidity. The fund may purchase or sell futures contracts to achieve a desired level of investment, whether to accommodate portfolio turnover or cash flows from capital share transactions. The primary risks associated with the use of futures contracts are imperfect correlation between changes in market values of stocks held by the fund and the prices of futures contracts, and the possibility of an illiquid market.
Futures contracts are valued at their quoted daily settlement prices. The aggregate principal amounts of the contracts are not recorded in the Statement of Net Assets. Fluctuations in the value of the contracts are recorded in the Statement of Net Assets as an asset (liability) and in the Statement of Operations as unrealized appreciation (depreciation) until the contracts are closed, when they are recorded as realized futures gains (losses).
3. Federal Income Taxes: The fund intends to continue to qualify as a regulated investment company and distribute all of its taxable income. Management has analyzed the fund’s tax positions taken for all open federal income tax years (September 30, 2007–2010), and for the period ended March 31, 2011, and has concluded that no provision for federal income tax is required in the fund’s financial statements.
4. Distributions: Distributions to shareholders are recorded on the ex-dividend date.
5. Security Lending: The fund may lend its securities to qualified institutional borrowers to earn additional income. Security loans are required to be secured at all times by collateral at least equal to the market value of securities loaned. The fund invests cash collateral received in Vanguard Market Liquidity Fund, and records a liability for the return of the collateral, during the period the securities are on loan. Security lending income represents fees charged to borrowers plus income earned on investing cash collateral, less expenses associated with the loan.
6. Other: Dividend income is recorded on the ex-dividend date. Interest income includes income distributions received from Vanguard Market Liquidity Fund and is accrued daily. Security transactions are accounted for on the date securities are bought or sold. Costs used to determine realized gains (losses) on the sale of investment securities are those of the specific securities sold.
17
Structured Large-Cap Equity Fund
Each class of shares has equal rights as to assets and earnings, except that each class separately bears certain class-specific expenses related to maintenance of shareholder accounts (included in Management and Administrative expenses) and shareholder reporting. Marketing and distribution expenses are allocated to each class of shares based on a method approved by the board of trustees. Income, other non-class-specific expenses, and gains and losses on investments are allocated to each class of shares based on its relative net assets.
B. The Vanguard Group furnishes at cost investment advisory, corporate management, administrative, marketing, and distribution services. The costs of such services are allocated to the fund under methods approved by the board of trustees. The fund has committed to provide up to 0.40% of its net assets in capital contributions to Vanguard. At March 31, 2011, the fund had contributed capital of $72,000 to Vanguard (included in Other Assets), representing 0.02% of the fund’s net assets and 0.03% of Vanguard’s capitalization. The fund’s trustees and officers are also directors and officers of Vanguard.
C. Various inputs may be used to determine the value of the fund’s investments. These inputs are summarized in three broad levels for financial statement purposes. The inputs or methodologies used to value securities are not necessarily an indication of the risk associated with investing in those securities.
Level 1—Quoted prices in active markets for identical securities.
Level 2—Other significant observable inputs (including quoted prices for similar securities, interest rates, prepayment speeds, credit risk, etc.).
Level 3—Significant unobservable inputs (including the fund’s own assumptions used to determine the fair value of investments).
The following table summarizes the fund’s investments as of March 31, 2011, based on the inputs used to value them:
| | | |
| | Level 1 | Level 2 | Level 3 |
| Investments | ($000) | ($000) | ($000) |
| Common Stocks | 444,574 | — | — |
| Temporary Cash Investments | 311 | 100 | — |
| Futures Contracts—Liabilities1 | (2) | — | — |
| Total | 444,883 | 100 | — |
| 1 Represents variation margin on the last day of the reporting period. | | | |
D. At March 31, 2011, the aggregate settlement value of open futures contracts and the related unrealized appreciation (depreciation) were:
| | | | |
| | | | | ($000) |
| | | | Aggregate | |
| | | Number of | Settlement | Unrealized |
| | | Long (Short) | Value | Appreciation |
| Futures Contracts | Expiration | Contracts | Long (Short) | (Depreciation) |
| E-mini S&P 500 Index | June 2011 | 8 | 529 | 7 |
| S&P 500 Index | June 2011 | 1 | 330 | 3 |
Unrealized appreciation (depreciation) on open futures contracts is required to be treated as realized gain (loss) for tax purposes.
18
Structured Large-Cap Equity Fund
E. Distributions are determined on a tax basis and may differ from net investment income and realized capital gains for financial reporting purposes. Differences may be permanent or temporary. Permanent differences are reclassified among capital accounts in the financial statements to reflect their tax character. Temporary differences arise when certain items of income, expense, gain, or loss are recognized in different periods for financial statement and tax purposes; these differences will reverse at some time in the future. Differences in classification may also result from the treatment of short-term gains as ordinary income for tax purposes.
The fund’s tax-basis capital gains and losses are determined only at the end of each fiscal year. For tax purposes, at September 30, 2010, the fund had available capital loss carryforwards totaling $275,945,000 to offset future net capital gains of $163,235,000 through September 30, 2017, and $112,710,000 through September 30, 2018. The fund will use these capital losses to offset net taxable capital gains, if any, realized during the year ending September 30, 2011; should the fund realize net capital losses for the year, the losses will be added to the loss carryforward balance above.
At March 31, 2011, the cost of investment securities for tax purposes was $343,624,000. Net unrealized appreciation of investment securities for tax purposes was $101,361,000, consisting of unrealized gains of $103,771,000 on securities that had risen in value since their purchase and $2,410,000 in unrealized losses on securities that had fallen in value since their purchase.
F. During the six months ended March 31, 2011, the fund purchased $179,725,000 of investment securities and sold $486,533,000 of investment securities, other than temporary cash investments.
G. Capital share transactions for each class of shares were:
| | | | |
| | Six Months Ended | | Year Ended |
| | March 31, 2011 | September 30, 2010 |
| | Amount | Shares | Amount | Shares |
| | ($000) | (000) | ($000) | (000) |
| Institutional Shares | | | | |
| Issued | 655 | 29 | 1,649 | 41 |
| Issued in Lieu of Cash Distributions | — | — | 343 | 17 |
| Redeemed | (92,281) | (4,053) | (21,340) | (986) |
| Net Increase (Decrease)—Institutional Shares | (91,626) | (4,024) | (19,348) | (928) |
| Institutional Plus Shares | | | | |
| Issued | — | — | 59,610 | 1,471 |
| Issued in Lieu of Cash Distributions | 3,795 | 85 | 4,835 | 120 |
| Redeemed | (213,852) | (4,734) | — | — |
| Net Increase (Decrease)—Institutional Plus Shares | (210,057) | (4,649) | 64,445 | 1,591 |
H. In preparing the financial statements as of March 31, 2011, management considered the impact of subsequent events for potential recognition or disclosure in these financial statements.
19
Structured Broad Market Fund
Fund Profile
As of March 31, 2011
| | |
| Share-Class Characteristics | |
| | Institutional | Institutional |
| | Shares | Plus Shares |
| Ticker Symbol | VSBMX | VSBPX |
| Expense Ratio1 | 0.24% | 0.17% |
| 30-Day SEC Yield | 1.45% | 1.52% |
| | | |
| Portfolio Characteristics | | |
| | | | DJ |
| | | Russell | U.S. Total |
| | | 3000 | Market |
| | Fund | Index | Index |
| Number of Stocks | 259 | 2,921 | 3,817 |
| Median Market Cap $25.9B | $32.1B | $31.4B |
| Price/Earnings Ratio | 15.3x | 17.8x | 17.9x |
| Price/Book Ratio | 2.5x | 2.3x | 2.3x |
| Return on Equity | 19.8% | 18.8% | 18.9% |
| Earnings Growth Rate | 5.9% | 5.6% | 5.9% |
| Dividend Yield | 1.7% | 1.8% | 1.7% |
| Foreign Holdings | 0.1% | 0.0% | 0.0% |
| Turnover Rate | | | |
| (Annualized) | 52% | — | — |
| Short-Term Reserves | 0.0% | — | — |
| | | |
| Sector Diversification (% of equity exposure) |
| | | | DJ |
| | | Russell | U.S. Total |
| | | 3000 | Market |
| | Fund | Index | Index |
| Consumer | | | |
| Discretionary | 10.8% | 11.3% | 11.8% |
| Consumer Staples | 8.6 | 8.8 | 9.2 |
| Energy | 12.7 | 12.4 | 11.8 |
| Financials | 16.9 | 16.1 | 16.2 |
| Health Care | 11.1 | 11.2 | 10.7 |
| Industrials | 11.9 | 11.9 | 11.6 |
| Information | | | |
| Technology | 17.7 | 18.0 | 18.5 |
| Materials | 4.5 | 4.3 | 4.5 |
| Telecommunication | | | |
| Services | 2.8 | 2.7 | 2.6 |
| Utilities | 3.0 | 3.3 | 3.1 |
| | |
| Volatility Measures | | |
| | | DJ |
| | | U.S. Total |
| | Russell 3000 | Market |
| | Index | Index |
| R-Squared | 1.00 | 0.99 |
| Beta | 0.99 | 0.99 |
These measures show the degree and timing of the fund’s fluctuations compared with the indexes over 36 months.
| | |
| Ten Largest Holdings (% of total net assets) |
| Exxon Mobil Corp. | Integrated Oil & | |
| | Gas | 3.3% |
| Apple Inc. | Computer | |
| | Hardware | 2.6 |
| Chevron Corp. | Integrated Oil & | |
| | Gas | 2.0 |
| International Business | IT Consulting & | |
| Machines Corp. | Other Services | 1.9 |
| Microsoft Corp. | Systems Software | 1.7 |
| JPMorgan Chase & Co. | Diversified Financial | |
| | Services | 1.7 |
| AT&T Inc. | Integrated | |
| | Telecommunication | |
| | Services | 1.7 |
| ConocoPhillips | Integrated Oil & | |
| | Gas | 1.3 |
| Johnson & Johnson | Pharmaceuticals | 1.3 |
| Wal-Mart Stores Inc. | Hypermarkets & | |
| | Super Centers | 1.2 |
| Top Ten | | 18.7% |
The holdings listed exclude any temporary cash investments and equity index products.
Investment Focus
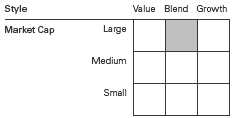
1 The expense ratios shown are from the prospectus dated January 27, 2011. For the six months ended March 31, 2011, the annualized expense ratios were 0.24% for Institutional Shares and 0.17% for Institutional Plus Shares.
20
Structured Broad Market Fund
Performance Summary
All of the returns in this report represent past performance, which is not a guarantee of future results that may be achieved by the fund. (Current performance may be lower or higher than the performance data cited. For performance data current to the most recent month-end, visit our website at vanguard.com/performance.) Note, too, that both investment returns and principal value can fluctuate widely, so an investor’s shares, when sold, could be worth more or less than their original cost. The returns shown do not reflect taxes that a shareholder would pay on fund distributions or on the sale of fund shares.
Fiscal-Year Total Returns (%): November 30, 2006, Through March 31, 2011
| | | | |
| Average Annual Total Returns: Periods Ended March 31, 2011 | | | |
| |
| | Inception | One | Five | Since |
| | Date | Year | Years | Inception |
| Institutional Shares | 11/30/2006 | 19.07% | — | 0.28% |
| Institutional Plus Shares | 5/3/2004 | 19.15 | 2.07% | 4.90 |
The fund commenced operations as a registered investment company on October 3, 2006. The fund's performance includes the performance of a predecessor trust, Vanguard Fiduciary Trust Company Structured Broad Market Trust, from May 3, 2004, to October 3, 2006.
See Financial Highlights for dividend and capital gains information.
21
Structured Broad Market Fund
Financial Statements (unaudited)
Statement of Net Assets
As of March 31, 2011
The fund reports a complete list of its holdings in regulatory filings four times in each fiscal year, at the quarter-ends. For the second and fourth fiscal quarters, the lists appear in the fund’s semiannual and annual reports to shareholders. For the first and third fiscal quarters, the fund files the lists with the Securities and Exchange Commission on Form N-Q. Shareholders can look up the fund’s Forms N-Q on the SEC’s website at sec.gov. Forms N-Q may also be reviewed and copied at the SEC’s Public Reference Room (see the back cover of this report for further information).
| | | |
| | | | Market |
| | | | Value |
| | | Shares | ($000) |
| Common Stocks (99.4%)1 | | |
| Consumer Discretionary (10.8%) | |
| * | Ford Motor Co. | 176,162 | 2,627 |
| | Starbucks Corp. | 67,600 | 2,498 |
| | CBS Corp. Class B | 92,200 | 2,309 |
| | Comcast Corp. Class A | 93,391 | 2,309 |
| | TJX Cos. Inc. | 39,900 | 1,984 |
| * | AutoZone Inc. | 7,200 | 1,970 |
| | Limited Brands Inc. | 58,300 | 1,917 |
| | Time Warner Cable Inc. | 24,762 | 1,766 |
| * | Chipotle Mexican Grill Inc. | | |
| | Class A | 5,700 | 1,552 |
| | Williams-Sonoma Inc. | 36,682 | 1,486 |
| | Brinker International Inc. | 52,000 | 1,316 |
| | Ross Stores Inc. | 17,900 | 1,273 |
| * | Tempur-Pedic | | |
| | International Inc. | 21,400 | 1,084 |
| | Macy’s Inc. | 43,500 | 1,055 |
| | Advance Auto Parts Inc. | 15,800 | 1,037 |
| * | Las Vegas Sands Corp. | 22,900 | 967 |
| | Time Warner Inc. | 26,000 | 928 |
| | Polo Ralph Lauren Corp. | | |
| | Class A | 7,500 | 927 |
| | Gannett Co. Inc. | 49,700 | 757 |
| | VF Corp. | 7,400 | 729 |
| * | TRW Automotive | | |
| | Holdings Corp. | 12,663 | 697 |
| * | Liberty Media Corp. - | | |
| | Interactive | 42,300 | 678 |
| | McDonald’s Corp. | 8,631 | 657 |
| | Cablevision Systems Corp. | | |
| | Class A | 17,500 | 606 |
| | Autoliv Inc. | 8,100 | 601 |
| | Whirlpool Corp. | 6,700 | 572 |
| | Foot Locker Inc. | 27,200 | 536 |
| | Polaris Industries Inc. | 6,100 | 531 |
| | Comcast Corp. Class A | | |
| | Special Shares | 22,000 | 511 |
| | | |
| | | | Market |
| | | | Value |
| | | Shares | ($000) |
| * | Warnaco Group Inc. | 7,700 | 440 |
| | Viacom Inc. Class B | 8,395 | 390 |
| | Dillard’s Inc. Class A | 6,100 | 245 |
| | Family Dollar Stores Inc. | 2,900 | 149 |
| | | | 37,104 |
| Consumer Staples (8.5%) | | |
| | Wal-Mart Stores Inc. | 76,565 | 3,985 |
| | Procter & Gamble Co. | 45,551 | 2,806 |
| | Costco Wholesale Corp. | 31,000 | 2,273 |
| | Estee Lauder Cos. Inc. | | |
| | Class A | 23,400 | 2,255 |
| | Sara Lee Corp. | 112,600 | 1,990 |
| | Hershey Co. | 35,600 | 1,935 |
| | Coca-Cola Enterprises Inc. | 69,800 | 1,905 |
| * | Constellation Brands Inc. | | |
| | Class A | 86,300 | 1,750 |
| | Kroger Co. | 64,900 | 1,556 |
| | Dr Pepper Snapple Group Inc. | 41,400 | 1,538 |
| | Coca-Cola Co. | 22,290 | 1,479 |
| | Philip Morris International Inc. | 19,550 | 1,283 |
| | Hormel Foods Corp. | 29,200 | 813 |
| | B&G Foods Inc. Class A | 39,000 | 732 |
| * | Smithfield Foods Inc. | 28,100 | 676 |
| | PepsiCo Inc. | 9,900 | 638 |
| | Tyson Foods Inc. Class A | 25,100 | 482 |
| | Colgate-Palmolive Co. | 5,330 | 430 |
| | ConAgra Foods Inc. | 11,100 | 263 |
| | Altria Group Inc. | 9,800 | 255 |
| | Nu Skin Enterprises Inc. | | |
| | Class A | 5,800 | 167 |
| * | Boston Beer Co. Inc. | | |
| | Class A | 1,400 | 130 |
| | MGP Ingredients Inc. | 12,234 | 107 |
| | | | 29,448 |
| Energy (12.6%) | | |
| | Exxon Mobil Corp. | 135,320 | 11,384 |
| | Chevron Corp. | 63,865 | 6,861 |
| | ConocoPhillips | 58,100 | 4,640 |
22
Structured Broad Market Fund
| | | |
| | | | Market |
| | | | Value |
| | | Shares | ($000) |
| | Apache Corp. | 23,140 | 3,029 |
| | National Oilwell Varco Inc. | 33,700 | 2,671 |
| | Marathon Oil Corp. | 49,700 | 2,649 |
| | Occidental | | |
| | Petroleum Corp. | 22,740 | 2,376 |
| | Peabody Energy Corp. | 31,900 | 2,296 |
| * | Newfield Exploration Co. | 28,500 | 2,166 |
| | Cimarex Energy Co. | 15,100 | 1,740 |
| | Devon Energy Corp. | 17,400 | 1,597 |
| | Schlumberger Ltd. | 10,300 | 961 |
| | El Paso Corp. | 19,700 | 355 |
| | Pioneer Natural | | |
| | Resources Co. | 3,100 | 316 |
| | Ship Finance | | |
| | International Ltd. | 13,100 | 272 |
| | Southern Union Co. | 3,700 | 106 |
| | | | 43,419 |
| Financials (16.8%) | | |
| | JPMorgan Chase & Co. | 129,036 | 5,949 |
| | Wells Fargo & Co. | 95,070 | 3,014 |
| | Capital One Financial Corp. | 48,100 | 2,499 |
| | American Express Co. | 55,220 | 2,496 |
| | PNC Financial | | |
| | Services Group Inc. | 36,900 | 2,324 |
| | Travelers Cos. Inc. | 37,500 | 2,230 |
| | Ameriprise Financial Inc. | 36,000 | 2,199 |
| | Moody’s Corp. | 62,700 | 2,126 |
| | US Bancorp | 79,650 | 2,105 |
| | Chubb Corp. | 34,270 | 2,101 |
| | Aflac Inc. | 34,640 | 1,828 |
| | Assurant Inc. | 45,900 | 1,768 |
| * | Berkshire Hathaway Inc. | | |
| | Class B | 18,900 | 1,581 |
| | Franklin Resources Inc. | 12,100 | 1,513 |
| * | World Acceptance Corp. | 21,956 | 1,432 |
| | Bank of America Corp. | 101,445 | 1,352 |
| | Progressive Corp. | 51,200 | 1,082 |
| | Fifth Third Bancorp | 76,800 | 1,066 |
| | Public Storage | 9,600 | 1,065 |
| | BOK Financial Corp. | 18,800 | 972 |
| | Vornado Realty Trust | 11,100 | 971 |
| | Discover Financial Services | 40,200 | 970 |
| | HCP Inc. | 24,500 | 930 |
| | M&T Bank Corp. | 10,500 | 929 |
| | Plum Creek Timber Co. Inc. | 21,000 | 916 |
| | Macerich Co. | 18,387 | 911 |
| | Taubman Centers Inc. | 14,800 | 793 |
| | Apartment Investment & | | |
| | Management Co. | 29,600 | 754 |
| | American Financial | | |
| | Group Inc. | 21,300 | 746 |
| | New York Community | | |
| | Bancorp Inc. | 41,030 | 708 |
| | SunTrust Banks Inc. | 23,800 | 686 |
| | | |
| | | | Market |
| | | | Value |
| | | Shares | ($000) |
| | Nelnet Inc. Class A | 29,600 | 646 |
| | Sun Communities Inc. | 17,800 | 635 |
| * | Credit Acceptance Corp. | 8,800 | 624 |
| | Torchmark Corp. | 8,600 | 572 |
| * | NASDAQ OMX Group Inc. | 19,300 | 499 |
| | Prudential Financial Inc. | 7,500 | 462 |
| | Bank of Hawaii Corp. | 9,600 | 459 |
| | Cash America | | |
| | International Inc. | 9,700 | 447 |
| * | Citigroup Inc. | 100,000 | 442 |
| | Hospitality | | |
| | Properties Trust | 18,500 | 428 |
| | CBL & Associates | | |
| | Properties Inc. | 22,900 | 399 |
| | Lexington Realty Trust | 29,400 | 275 |
| | Goldman Sachs Group Inc. | 1,711 | 271 |
| | Rayonier Inc. | 4,200 | 262 |
| * | CB Richard Ellis Group Inc. | | |
| | Class A | 9,200 | 246 |
| | Endurance Specialty | | |
| | Holdings Ltd. | 5,000 | 244 |
| | Pennsylvania Real Estate | | |
| | Investment Trust | 16,495 | 235 |
| | NYSE Euronext | 5,900 | 207 |
| | Aspen Insurance | | |
| | Holdings Ltd. | 4,400 | 121 |
| | National Retail | | |
| | Properties Inc. | 4,100 | 107 |
| * | Arch Capital Group Ltd. | 600 | 59 |
| | Montpelier Re | | |
| | Holdings Ltd. | 2,900 | 51 |
| | City Holding Co. | 1,300 | 46 |
| | Axis Capital Holdings Ltd. | 1,300 | 45 |
| | | | 57,798 |
| Health Care (11.0%) | | |
| | Johnson & Johnson | 73,407 | 4,349 |
| | UnitedHealth Group Inc. | 69,275 | 3,131 |
| | Eli Lilly & Co. | 70,920 | 2,494 |
| * | Biogen Idec Inc. | 31,900 | 2,341 |
| * | Humana Inc. | 33,200 | 2,322 |
| | McKesson Corp. | 29,000 | 2,293 |
| * | Agilent Technologies Inc. | 50,800 | 2,275 |
| | AmerisourceBergen Corp. | | |
| | Class A | 55,100 | 2,180 |
| | Pfizer Inc. | 93,264 | 1,894 |
| * | Forest Laboratories Inc. | 52,300 | 1,689 |
| * | Mylan Inc. | 62,411 | 1,415 |
| * | Amgen Inc. | 26,415 | 1,412 |
| * | Express Scripts Inc. | 25,000 | 1,390 |
| | Bristol-Myers Squibb Co. | 50,452 | 1,334 |
| * | Waters Corp. | 14,800 | 1,286 |
| | CIGNA Corp. | 28,100 | 1,244 |
| | Cooper Cos. Inc. | 12,700 | 882 |
| | Cardinal Health Inc. | 21,400 | 880 |
23
Structured Broad Market Fund
| | | |
| | | | Market |
| | | | Value |
| | | Shares | ($000) |
| | Merck & Co. Inc. | 18,483 | 610 |
| | Lincare Holdings Inc. | 17,750 | 527 |
| | Warner Chilcott plc Class A | 21,400 | 498 |
| * | Mettler-Toledo | | |
| | International Inc. | 2,100 | 361 |
| * | Health Net Inc. | 8,800 | 288 |
| * | Health Management | | |
| | Associates Inc. Class A | 20,000 | 218 |
| * | Bruker Corp. | 9,500 | 198 |
| * | Cephalon Inc. | 1,700 | 129 |
| | Perrigo Co. | 1,200 | 96 |
| * | Endo Pharmaceuticals | | |
| | Holdings Inc. | 2,500 | 95 |
| * | Par Pharmaceutical Cos. Inc. | 1,800 | 56 |
| * | Community Health | | |
| | Systems Inc. | 1,200 | 48 |
| | | | 37,935 |
| Industrials (11.8%) | | |
| | Caterpillar Inc. | 32,200 | 3,586 |
| | General Electric Co. | 159,380 | 3,196 |
| | Deere & Co. | 29,700 | 2,878 |
| | Eaton Corp. | 42,200 | 2,340 |
| | CSX Corp. | 29,637 | 2,330 |
| | Parker Hannifin Corp. | 24,200 | 2,291 |
| | Cummins Inc. | 20,800 | 2,280 |
| | Joy Global Inc. | 22,600 | 2,233 |
| | PACCAR Inc. | 41,500 | 2,173 |
| | Northrop Grumman Corp. | 32,630 | 2,046 |
| | United Parcel Service Inc. | | |
| | Class B | 27,100 | 2,014 |
| * | United Continental | | |
| | Holdings Inc. | 80,000 | 1,839 |
| * | Sauer-Danfoss Inc. | 32,400 | 1,650 |
| | Timken Co. | 30,100 | 1,574 |
| | Dover Corp. | 18,600 | 1,223 |
| | United Technologies Corp. | 14,140 | 1,197 |
| | Rockwell Automation Inc. | 10,400 | 984 |
| | Honeywell International Inc. | 14,524 | 867 |
| * | Delta Air Lines Inc. | 78,600 | 770 |
| | Avery Dennison Corp. | 16,800 | 705 |
| | RR Donnelley & Sons Co. | 27,100 | 513 |
| | Waste Connections Inc. | 17,200 | 495 |
| | Pitney Bowes Inc. | 14,300 | 367 |
| | Southwest Airlines Co. | 25,600 | 323 |
| * | Huntington Ingalls | | |
| | Industries Inc. | 5,438 | 226 |
| | Textron Inc. | 8,000 | 219 |
| | Deluxe Corp. | 7,100 | 188 |
| * | EnerSys | 3,500 | 139 |
| * | Dollar Thrifty Automotive | | |
| | Group Inc. | 660 | 44 |
| * | Esterline Technologies Corp. | 600 | 42 |
| | | | 40,732 |
| | | |
| | | | Market |
| | | | Value |
| | | Shares | ($000) |
| Information Technology (17.7%) | |
| * | Apple Inc. | 25,820 | 8,997 |
| | International Business | | |
| | Machines Corp. | 39,842 | 6,497 |
| | Microsoft Corp. | 235,897 | 5,982 |
| | Hewlett-Packard Co. | 57,099 | 2,339 |
| | Altera Corp. | 51,400 | 2,263 |
| * | Intuit Inc. | 37,900 | 2,013 |
| * | NetApp Inc. | 40,600 | 1,956 |
| | Accenture plc Class A | 35,200 | 1,935 |
| * | Fiserv Inc. | 30,200 | 1,894 |
| | Texas Instruments Inc. | 52,870 | 1,827 |
| * | VMware Inc. Class A | 21,200 | 1,729 |
| * | IAC/InterActiveCorp | 55,300 | 1,708 |
| * | Google Inc. Class A | 2,690 | 1,577 |
| * | Motorola Solutions Inc. | 32,100 | 1,435 |
| * | Red Hat Inc. | 29,200 | 1,325 |
| * | Motorola Mobility | | |
| | Holdings Inc. | 54,187 | 1,322 |
| | Intel Corp. | 64,790 | 1,307 |
| * | Teradata Corp. | 25,700 | 1,303 |
| * | Dell Inc. | 84,100 | 1,220 |
| * | Vishay Intertechnology Inc. | 63,200 | 1,121 |
| * | Silicon Image Inc. | 112,800 | 1,012 |
| | Oracle Corp. | 26,948 | 899 |
| | Anixter International Inc. | 12,800 | 895 |
| | Cisco Systems Inc. | 48,150 | 826 |
| | Opnet Technologies Inc. | 21,000 | 819 |
| * | Novellus Systems Inc. | 17,700 | 657 |
| * | Fairchild Semiconductor | | |
| | International Inc. Class A | 36,000 | 655 |
| * | Advanced Micro | | |
| | Devices Inc. | 66,500 | 572 |
| * | SanDisk Corp. | 11,600 | 535 |
| * | Autodesk Inc. | 12,000 | 529 |
| * | Electronic Arts Inc. | 25,000 | 488 |
| * | Lexmark International Inc. | | |
| | Class A | 12,800 | 474 |
| * | JDS Uniphase Corp. | 22,000 | 459 |
| * | TIBCO Software Inc. | 16,400 | 447 |
| * | Ancestry.com Inc. | 10,900 | 387 |
| * | RF Micro Devices Inc. | 52,300 | 335 |
| * | Power-One Inc. | 36,100 | 316 |
| | QUALCOMM Inc. | 3,300 | 181 |
| * | Teradyne Inc. | 8,500 | 151 |
| * | Veeco Instruments Inc. | 2,800 | 142 |
| | MAXIMUS Inc. | 1,700 | 138 |
| * | Lattice Semiconductor Corp. | 13,400 | 79 |
| | Black Box Corp. | 1,800 | 63 |
| * | Manhattan Associates Inc. | 1,500 | 49 |
| | | | 60,858 |
24
Structured Broad Market Fund
| | | |
| | | | Market |
| | | | Value |
| | | Shares | ($000) |
| Materials (4.5%) | | |
| | EI du Pont de | | |
| | Nemours & Co. | 55,980 | 3,077 |
| | Newmont Mining Corp. | 34,700 | 1,894 |
| | Ball Corp. | 45,600 | 1,635 |
| | Ashland Inc. | 24,000 | 1,386 |
| | Freeport-McMoRan | | |
| | Copper & Gold Inc. | 23,400 | 1,300 |
| | Eastman Chemical Co. | 12,100 | 1,202 |
| | Dow Chemical Co. | 31,300 | 1,182 |
| | International Paper Co. | 30,600 | 924 |
| | Domtar Corp. | 8,500 | 780 |
| | Celanese Corp. Class A | 13,700 | 608 |
| * | Clearwater Paper Corp. | 5,200 | 423 |
| | Innophos Holdings Inc. | 8,500 | 392 |
| | Rock-Tenn Co. Class A | 5,500 | 381 |
| | Lubrizol Corp. | 1,600 | 214 |
| * | Solutia Inc. | 4,600 | 117 |
| | | | 15,515 |
| Telecommunication Services (2.7%) | |
| | AT&T Inc. | 191,629 | 5,864 |
| | Verizon | | |
| | Communications Inc. | 86,857 | 3,348 |
| | Qwest Communications | | |
| | International Inc. | 34,600 | 236 |
| | | | 9,448 |
| Utilities (3.0%) | | |
| | Dominion Resources Inc. | 48,600 | 2,173 |
| | Exelon Corp. | 49,340 | 2,035 |
| | Northeast Utilities | 54,600 | 1,889 |
| | CMS Energy Corp. | 91,000 | 1,787 |
| | Entergy Corp. | 13,900 | 934 |
| | Integrys Energy Group Inc. | 10,200 | 515 |
| | Oneok Inc. | 7,400 | 495 |
| | IDACORP Inc. | 6,700 | 255 |
| | CenterPoint Energy Inc. | 6,700 | 118 |
| | Southwest Gas Corp. | 1,700 | 66 |
| | Piedmont Natural | | |
| | Gas Co. Inc. | 1,900 | 58 |
| | | | 10,325 |
| Total Common Stocks | | |
| (Cost $264,948) | | 342,582 |
| Temporary Cash Investments (0.6%)1 | |
| Money Market Fund (0.5%) | | |
| 2 | Vanguard Market | | |
| | Liquidity Fund, 0.208% | 1,828,000 | 1,828 |
| | | |
| | | Face | Market |
| | | Amount | Value |
| | | ($000) | ($000) |
| U.S. Government and Agency Obligations (0.1%) |
| 3,4 | Federal Home Loan Bank | | |
| | Discount Notes, | | |
| | 0.150%, 5/13/11 | 100 | 100 |
| 3,4 | Freddie Mac Discount | | |
| | Notes, 0.160%, 5/25/11 | 150 | 150 |
| | | | 250 |
| Total Temporary Cash Investments | |
| (Cost $2,077) | | 2,078 |
| Total Investments (100.0%) | | |
| (Cost $267,025) | | 344,660 |
| Other Assets and Liabilities (0.0%) | |
| Other Assets | | 2,266 |
| Liabilities | | (2,182) |
| | | | 84 |
| Net Assets (100%) | | 344,744 |
25
Structured Broad Market Fund
| |
| At March 31, 2011, net assets consisted of: | |
| | Amount |
| | ($000) |
| Paid-in Capital | 342,689 |
| Undistributed Net Investment Income | 1,232 |
| Accumulated Net Realized Losses | (76,823) |
| Unrealized Appreciation (Depreciation) | |
| Investment Securities | 77,635 |
| Futures Contracts | 11 |
| Net Assets | 344,744 |
| |
| Institutional Shares—Net Assets | |
| Applicable to 250,644 outstanding $.001 | |
| par value shares of beneficial interest | |
| (unlimited authorization) | 6,154 |
| Net Asset Value Per Share— | |
| Institutional Shares | $24.55 |
| |
| Institutional Plus Shares—Net Assets | |
| Applicable to 6,902,312 outstanding $.001 | |
| par value shares of beneficial interest | |
| (unlimited authorization) | 338,590 |
| Net Asset Value Per Share— | |
| Institutional Plus Shares | $49.05 |
See Note A in Notes to Financial Statements.
* Non-income-producing security.
1 The fund invests a portion of its cash reserves in equity markets through the use of index futures contracts. After giving effect to futures investments, the fund’s effective common stock and temporary cash investment positions represent 100.0% and 0.0%, respectively, of net assets.
2 Affiliated money market fund available only to Vanguard funds and certain trusts and accounts managed by Vanguard. Rate shown is the 7-day yield.
3 The issuer operates under a congressional charter; its securities are not backed by the full faith and credit of the U.S. government.
4 Securities with a value of $250,000 have been segregated as initial margin for open futures contracts.
See accompanying Notes, which are an integral part of the Financial Statements.
26
Structured Broad Market Fund
| |
| Statement of Operations | |
| |
| | Six Months Ended |
| | March 31, 2011 |
| | ($000) |
| Investment Income | |
| Income | |
| Dividends | 2,932 |
| Interest1 | 2 |
| Security Lending | 1 |
| Total Income | 2,935 |
| Expenses | |
| The Vanguard Group—Note B | |
| Investment Advisory Services | 169 |
| Management and Administrative—Institutional Shares | 4 |
| Management and Administrative—Institutional Plus Shares | 62 |
| Marketing and Distribution—Institutional Shares | — |
| Marketing and Distribution—Institutional Plus Shares | 32 |
| Custodian Fees | 5 |
| Total Expenses | 272 |
| Net Investment Income | 2,663 |
| Realized Net Gain (Loss) | |
| Investment Securities Sold | 15,259 |
| Futures Contracts | 291 |
| Realized Net Gain (Loss) | 15,550 |
| Change in Unrealized Appreciation (Depreciation) | |
| Investment Securities | 41,711 |
| Futures Contracts | 1 |
| Change in Unrealized Appreciation (Depreciation) | 41,712 |
| Net Increase (Decrease) in Net Assets Resulting from Operations | 59,925 |
| 1 Interest income from an affiliated company of the fund was $2,000. | |
See accompanying Notes, which are an integral part of the Financial Statements.
27
Structured Broad Market Fund
| | |
| Statement of Changes in Net Assets | | |
| |
| | Six Months Ended | Year Ended |
| | March 31, | September 30, |
| | 2011 | 2010 |
| | ($000) | ($000) |
| Increase (Decrease) in Net Assets | | |
| Operations | | |
| Net Investment Income | 2,663 | 5,771 |
| Realized Net Gain (Loss) | 15,550 | 9,202 |
| Change in Unrealized Appreciation (Depreciation) | 41,712 | 15,770 |
| Net Increase (Decrease) in Net Assets Resulting from Operations | 59,925 | 30,743 |
| Distributions | | |
| Net Investment Income | | |
| Institutional Shares | (94) | (67) |
| Institutional Plus Shares | (5,546) | (5,073) |
| Realized Capital Gain | | |
| Institutional Shares | — | — |
| Institutional Plus Shares | — | — |
| Total Distributions | (5,640) | (5,140) |
| Capital Share Transactions | | |
| Institutional Shares | 468 | 630 |
| Institutional Plus Shares | (18,297) | 3,749 |
| Net Increase (Decrease) from Capital Share Transactions | (17,829) | 4,379 |
| Total Increase (Decrease) | 36,456 | 29,982 |
| Net Assets | | |
| Beginning of Period | 308,288 | 278,306 |
| End of Period1 | 344,744 | 308,288 |
| 1 Net Assets—End of Period includes undistributed net investment income of $1,232,000 and $4,209,000. | |
See accompanying Notes, which are an integral part of the Financial Statements.
28
Structured Broad Market Fund
Financial Highlights
| | | | | |
| Institutional Shares | | | | | |
| | Six Months | | | | Nov. 30, |
| | Ended | | | | 20061 to |
| | March 31, | Year Ended September 30, | Sept. 30, |
| For a Share Outstanding Throughout Each Period | 2011 | 2010 | 2009 | 2008 | 2007 |
| Net Asset Value, Beginning of Period | $20.70 | $18.99 | $21.53 | $28.67 | $26.59 |
| Investment Operations | | | | | |
| Net Investment Income | .204 | .376 | .3522 | .402 | .3612 |
| Net Realized and Unrealized Gain (Loss) | | | | | |
| on Investments | 4.039 | 1.672 | (2.500) | (6.833) | 1.930 |
| Total from Investment Operations | 4.243 | 2.048 | (2.148) | (6.431) | 2.291 |
| Distributions | | | | | |
| Dividends from Net Investment Income | (.393) | (.338) | (.392) | (.280) | (.116) |
| Distributions from Realized Capital Gains | — | — | — | (.429) | (.095) |
| Total Distributions | (.393) | (.338) | (.392) | (.709) | (.211) |
| Net Asset Value, End of Period | $24.55 | $20.70 | $18.99 | $21.53 | $28.67 |
| |
| Total Return | 20.68% | 10.88% | -9.67% | -22.95% | 8.68% |
| |
| Ratios/Supplemental Data | | | | | |
| Net Assets, End of Period (Millions) | $6 | $5 | $4 | $4 | $14 |
| Ratio of Total Expenses to | | | | | |
| Average Net Assets | 0.24% | 0.24% | 0.25% | 0.20% | 0.25%3 |
| Ratio of Net Investment Income to | | | | | |
| Average Net Assets | 1.60% | 1.91% | 2.15% | 1.72% | 1.55%3 |
| Portfolio Turnover Rate | 52% | 52% | 62% | 70% | 66% |
The expense ratio, net income ratio, and turnover rate for the current period have been annualized.
1 Inception.
2 Calculated based on average shares outstanding.
3 Annualized.
See accompanying Notes, which are an integral part of the Financial Statements.
29
Structured Broad Market Fund
Financial Highlights
| | | | | |
| Institutional Plus Shares | | | | | |
| | Six Months | | | | Oct. 3, |
| | Ended | | | | 20061 to |
| | March 31, | Year Ended September 30, | Sept. 30, |
| For a Share Outstanding Throughout Each Period | 2011 | 2010 | 2009 | 2008 | 2007 |
| Net Asset Value, Beginning of Period | $41.36 | $37.94 | $43.07 | $57.39 | $50.00 |
| Investment Operations | | | | | |
| Net Investment Income | .418 | .778 | .7252 | .873 | .9042 |
| Net Realized and Unrealized Gain (Loss) | | | | | |
| on Investments | 8.080 | 3.343 | (5.006) | (13.714) | 6.910 |
| Total from Investment Operations | 8.498 | 4.121 | (4.281) | (12.841) | 7.814 |
| Distributions | | | | | |
| Dividends from Net Investment Income | (.808) | (.701) | (.849) | (.621) | (.234) |
| Distributions from Realized Capital Gains | — | — | — | (.858) | (.190) |
| Total Distributions | (.808) | (.701) | (.849) | (1.479) | (.424) |
| Net Asset Value, End of Period | $49.05 | $41.36 | $37.94 | $43.07 | $57.39 |
| |
| Total Return | 20.73% | 10.96% | -9.60% | -22.91% | 15.69% |
| |
| Ratios/Supplemental Data | | | | | |
| Net Assets, End of Period (Millions) | $339 | $304 | $275 | $248 | $285 |
| Ratio of Total Expenses to | | | | | |
| Average Net Assets | 0.17% | 0.17% | 0.17% | 0.12% | 0.15%3 |
| Ratio of Net Investment Income to | | | | | |
| Average Net Assets | 1.67% | 1.98% | 2.23% | 1.80% | 1.65%3 |
| Portfolio Turnover Rate | 52% | 52% | 62% | 70% | 66% |
The expense ratio, net income ratio, and turnover rate for the current period have been annualized.
1 Commencement of operations as a registered investment company.
2 Calculated based on average shares outstanding.
3 Annualized.
See accompanying Notes, which are an integral part of the Financial Statements.
30
Structured Broad Market Fund
Notes to Financial Statements
Vanguard Structured Broad Market Fund is registered under the Investment Company Act of 1940 as an open-end investment company, or mutual fund. The fund offers two classes of shares: Institutional Shares and Institutional Plus Shares. Institutional Shares and Institutional Plus Shares are designed for investors who meet certain administrative, service, and account-size criteria.
A. The following significant accounting policies conform to generally accepted accounting principles for U.S. mutual funds. The fund consistently follows such policies in preparing its financial statements.
1. Security Valuation: Securities are valued as of the close of trading on the New York Stock Exchange (generally 4 p.m., Eastern time) on the valuation date. Equity securities are valued at the latest quoted sales prices or official closing prices taken from the primary market in which each security trades; such securities not traded on the valuation date are valued at the mean of the latest quoted bid and asked prices. Securities for which market quotations are not readily available, or whose values have been materially affected by events occurring before the fund’s pricing time but after the close of the securities’ primary markets, are valued by methods deemed by the board of trustees to represent fair value. Investments in Vanguard Market Liquidity Fund are valued at that fund’s net asset value. Temporary cash investments acquired over 60 days to maturity are valued using the latest bid prices or using valuations based on a matrix system (which considers such factors as security prices, yields, maturities, and ratings), both as furnished by independent pricing services. Other temporary cash investments are valued at amortized cost, which approximates market value.
2. Futures Contracts: The fund uses index futures contracts to a limited extent, with the objective of maintaining full exposure to the stock market while maintaining liquidity. The fund may purchase or sell futures contracts to achieve a desired level of investment, whether to accommodate portfolio turnover or cash flows from capital share transactions. The primary risks associated with the use of futures contracts are imperfect correlation between changes in market values of stocks held by the fund and the prices of futures contracts, and the possibility of an illiquid market.
Futures contracts are valued at their quoted daily settlement prices. The aggregate principal amounts of the contracts are not recorded in the Statement of Net Assets. Fluctuations in the value of the contracts are recorded in the Statement of Net Assets as an asset (liability) and in the Statement of Operations as unrealized appreciation (depreciation) until the contracts are closed, when they are recorded as realized futures gains (losses).
3. Federal Income Taxes: The fund intends to continue to qualify as a regulated investment company and distribute all of its taxable income. Management has analyzed the fund’s tax positions taken for all open federal income tax years (September 30, 2007–2010), and for the period ended March 31, 2011, and has concluded that no provision for federal income tax is required in the fund’s financial statements.
4. Distributions: Distributions to shareholders are recorded on the ex-dividend date.
5. Security Lending: The fund may lend its securities to qualified institutional borrowers to earn additional income. Security loans are required to be secured at all times by collateral at least equal to the market value of securities loaned. The fund invests cash collateral received in Vanguard Market Liquidity Fund, and records a liability for the return of the collateral, during the period the securities are on loan. Security lending income represents fees charged to borrowers plus income earned on investing cash collateral, less expenses associated with the loan.
6. Other: Dividend income is recorded on the ex-dividend date. Interest income includes income distributions received from Vanguard Market Liquidity Fund and is accrued daily. Security transactions are accounted for on the date securities are bought or sold. Costs used to determine realized gains (losses) on the sale of investment securities are those of the specific securities sold.
31
Structured Broad Market Fund
Each class of shares has equal rights as to assets and earnings, except that each class separately bears certain class-specific expenses related to maintenance of shareholder accounts (included in Management and Administrative expenses) and shareholder reporting. Marketing and distribution expenses are allocated to each class of shares based on a method approved by the board of trustees. Income, other non-class-specific expenses, and gains and losses on investments are allocated to each class of shares based on its relative net assets.
B. The Vanguard Group furnishes at cost investment advisory, corporate management, administrative, marketing, and distribution services. The costs of such services are allocated to the fund under methods approved by the board of trustees. The fund has committed to provide up to 0.40% of its net assets in capital contributions to Vanguard. At March 31, 2011, the fund had contributed capital of $55,000 to Vanguard (included in Other Assets), representing 0.02% of the fund’s net assets and 0.02% of Vanguard’s capitalization. The fund’s trustees and officers are also directors and officers of Vanguard.
C. Various inputs may be used to determine the value of the fund’s investments. These inputs are summarized in three broad levels for financial statement purposes. The inputs or methodologies used to value securities are not necessarily an indication of the risk associated with investing in those securities.
Level 1—Quoted prices in active markets for identical securities.
Level 2—Other significant observable inputs (including quoted prices for similar securities, interest rates, prepayment speeds, credit risk, etc.).
Level 3—Significant unobservable inputs (including the fund’s own assumptions used to determine the fair value of investments).
The following table summarizes the fund’s investments as of March 31, 2011, based on the inputs used to value them:
| | | |
| | Level 1 | Level 2 | Level 3 |
| Investments | ($000) | ($000) | ($000) |
| Common Stocks | 342,582 | — | — |
| Temporary Cash Investments | 1,828 | 250 | — |
| Futures Contracts—Assets1 | 3 | — | — |
| Futures Contracts—Liabilities1 | (8) | — | — |
| Total | 344,405 | 250 | — |
| 1 Represents variation margin on the last day of the reporting period. | | | |
D. At March 31, 2011, the aggregate settlement value of open futures contracts and the related unrealized appreciation (depreciation) were:
| | | | |
| | | | | ($000) |
| | | | Aggregate | |
| | | Number of | Settlement | Unrealized |
| | | Long (Short) | Value | Appreciation |
| Futures Contracts | Expiration | Contracts | Long (Short) | (Depreciation) |
| E-mini S&P 500 Index | June 2011 | 5 | 1,651 | 13 |
| S&P 500 Index | June 2011 | 8 | 528 | (2) |
Unrealized appreciation (depreciation) on open futures contracts is required to be treated as realized gain (loss) for tax purposes.
32
Structured Broad Market Fund
E. Distributions are determined on a tax basis and may differ from net investment income and realized capital gains for financial reporting purposes. Differences may be permanent or temporary. Permanent differences are reclassified among capital accounts in the financial statements to reflect their tax character. Temporary differences arise when certain items of income, expense, gain, or loss are recognized in different periods for financial statement and tax purposes; these differences will reverse at some time in the future. Differences in classification may also result from the treatment of short-term gains as ordinary income for tax purposes.
The fund’s tax-basis capital gains and losses are determined only at the end of each fiscal year. For tax purposes, at September 30, 2010, the fund had available capital loss carryforwards totaling $92,356,000 to offset future net capital gains of $53,713,000 through September 30, 2017, and $38,643,000 through September 30, 2018. The fund will use these capital losses to offset net taxable capital gains, if any, realized during the year ending September 30, 2011; should the fund realize net capital losses for the year, the losses will be added to the loss carryforward balance above.
At March 31, 2011, the cost of investment securities for tax purposes was $267,025,000. Net unrealized appreciation of investment securities for tax purposes was $77,635,000, consisting of unrealized gains of $82,031,000 on securities that had risen in value since their purchase and $4,396,000 in unrealized losses on securities that had fallen in value since their purchase.
F. During the six months ended March 31, 2011, the fund purchased $82,157,000 of investment securities and sold $104,020,000 of investment securities, other than temporary cash investments.
G. Capital share transactions for each class of shares were:
| | | | |
| | Six Months Ended | | Year Ended |
| | March 31, 2011 | September 30, 2010 |
| | Amount | Shares | Amount | Shares |
| | ($000) | (000) | ($000) | (000) |
| Institutional Shares | | | | |
| Issued | 374 | 17 | 563 | 29 |
| Issued in Lieu of Cash Distributions | 94 | 4 | 67 | 3 |
| Redeemed | — | — | — | — |
| Net Increase (Decrease)—Institutional Shares | 468 | 21 | 630 | 32 |
| Institutional Plus Shares | | | | |
| Issued | — | — | 16,974 | 437 |
| Issued in Lieu of Cash Distributions | 1,703 | 38 | 1,775 | 45 |
| Redeemed | (20,000) | (475) | (15,000) | (379) |
| Net Increase (Decrease)—Institutional Plus Shares | (18,297) | (437) | 3,749 | 103 |
H. In preparing the financial statements as of March 31, 2011, management considered the impact of subsequent events for potential recognition or disclosure in these financial statements.
33
About Your Fund’s Expenses
As a shareholder of the fund, you incur ongoing costs, which include costs for portfolio management, administrative services, and shareholder reports (like this one), among others. Operating expenses, which are deducted from a fund’s gross income, directly reduce the investment return of the fund.
A fund’s expenses are expressed as a percentage of its average net assets. This figure is known as the expense ratio. The following examples are intended to help you understand the ongoing costs (in dollars) of investing in your fund and to compare these costs with those of other mutual funds. The examples are based on an investment of $1,000 made at the beginning of the period shown and held for the entire period.
The accompanying table illustrates your fund’s costs in two ways:
• Based on actual fund return. This section helps you to estimate the actual expenses that you paid over the period. The ”Ending Account Value“ shown is derived from the fund‘s actual return, and the third column shows the dollar amount that would have been paid by an investor who started with $1,000 in the fund. You may use the information here, together with the amount you invested, to estimate the expenses that you paid over the period.
To do so, simply divide your account value by $1,000 (for example, an $8,600 account value divided by $1,000 = 8.6), then multiply the result by the number given for your fund under the heading ”Expenses Paid During Period.“
• Based on hypothetical 5% yearly return. This section is intended to help you compare your fund‘s costs with those of other mutual funds. It assumes that the fund had a yearly return of 5% before expenses, but that the expense ratio is unchanged. In this case—because the return used is not the fund’s actual return—the results do not apply to your investment. The example is useful in making comparisons because the Securities and Exchange Commission requires all mutual funds to calculate expenses based on a 5% return. You can assess your fund’s costs by comparing this hypothetical example with the hypothetical examples that appear in shareholder reports of other funds.
Note that the expenses shown in the table are meant to highlight and help you compare ongoing costs only and do not reflect transaction costs incurred by the fund for buying and selling securities. Your fund does not charge transaction fees, such as purchase or redemption fees, nor does it carry a “sales load.”
The calculations assume no shares were bought or sold during the period. Your actual costs may have been higher or lower, depending on the amount of your investment and the timing of any purchases or redemptions.
You can find more information about the fund’s expenses, including annual expense ratios, in the Financial Statements section of this report. For additional information on operating expenses and other shareholder costs, please refer to your fund’s current prospectus.
34
| | | |
| Six Months Ended March 31, 2011 | | | |
| | Beginning | Ending | Expenses |
| | Account Value | Account Value | Paid During |
| | 9/30/2010 | 3/31/2011 | Period |
| Based on Actual Fund Return | | | |
| Structured Large-Cap Equity Fund | | | |
| Institutional Shares | $1,000.00 | $1,189.70 | $1.31 |
| Institutional Plus Shares | 1,000.00 | 1,189.88 | 0.93 |
| Structured Broad Market Fund | | | |
| Institutional Shares | $1,000.00 | $1,206.76 | $1.32 |
| Institutional Plus Shares | 1,000.00 | 1,207.30 | 0.94 |
| Based on Hypothetical 5% Yearly Return | | | |
| Structured Large-Cap Equity Fund | | | |
| Institutional Shares | $1,000.00 | $1,023.73 | $1.21 |
| Institutional Plus Shares | 1,000.00 | 1,024.08 | 0.86 |
| Structured Broad Market Fund | | | |
| Institutional Shares | $1,000.00 | $1,023.73 | $1.21 |
| Institutional Plus Shares | 1,000.00 | 1,024.08 | 0.86 |
The calculations are based on expenses incurred in the most recent six-month period. The funds’ annualized six-month expense ratios for that period are: for the Structured Large-Cap Equity Fund, 0.24% for Institutional Shares and 0.17% for Institutional Plus Shares; for the Structured Broad Market Fund, 0.24% for Institutional Shares and 0.17% for Institutional Plus Shares. The dollar amounts shown as “Expenses Paid” are equal to the annualized expense ratio multiplied by the average account value over the period, multiplied by the number of days in the most recent six-month period, then divided by the number of days in the most recent 12-month period.
35
Trustees Approve Advisory Arrangement
The board of trustees of Vanguard Structured Large-Cap Equity and Structured Broad Market Funds has renewed the funds’ investment advisory arrangement with The Vanguard Group, Inc. Vanguard—through its Quantitative Equity Group—serves as investment advisor to the funds. The board determined that continuing the funds’ internalized management structure was in the best interests of the funds and their shareholders.
The board based its decision upon an evaluation of the advisor’s investment staff, portfolio management process, and performance. The trustees considered the factors discussed below, among others. However, no single factor determined whether the board approved the arrangement. Rather, it was the totality of the circumstances that drove the board’s decision.
Nature, extent, and quality of services
The board considered the quality of each fund’s investment management since its inception, and took into account the organizational depth and stability of the advisor. The board noted that Vanguard has been managing investments for more than three decades. The Quantitative Equity Group adheres to a sound, disciplined investment management process; the team has considerable experience, stability, and depth.
The board concluded that Vanguard’s experience, stability, depth, and performance, among other factors, warranted continuation of the advisory arrangement.
Investment performance
The board considered the performance of the funds since their inceptions, including any periods of outperformance or underperformance of a relevant benchmark and peer group. The board concluded that the advisor has carried out each fund’s investment strategy in disciplined fashion, and that each fund has performed competitively versus its benchmark and relevant peer group over the last one-year period and has modestly underperformed both over the longer term. Information about each fund’s most recent performance can be found in the Performance Summary pages of this report.
Cost
The board concluded that the funds’ expense ratios were well below the average expense ratios charged by funds in their respective peer groups and that the funds’ advisory fee rates were also well below their peer-group averages. Information about the funds’ expenses appears in the About Your Fund’s Expenses section of this report as well as in the Financial Statements sections.
The board does not conduct a profitability analysis of Vanguard, because of Vanguard’s unique “at-cost” structure. Unlike most other mutual fund management companies, Vanguard is owned by the funds it oversees, and produces “profits” only in the form of reduced expenses for fund shareholders.
The benefit of economies of scale
The board concluded that the funds’ low-cost arrangement with Vanguard ensures that the funds will realize economies of scale as they grow, with the cost to shareholders declining as fund assets increase.
The board will consider whether to renew the advisory arrangement again after a one-year period.
36
Glossary
30-Day SEC Yield. A fund’s 30-day SEC yield is derived using a formula specified by the U.S. Securities and Exchange Commission. Under the formula, data related to the fund’s security holdings in the previous 30 days are used to calculate the fund’s hypothetical net income for that period, which is then annualized and divided by the fund’s estimated average net assets over the calculation period. For the purposes of this calculation, a security’s income is based on its current market yield to maturity (in the case of bonds) or its projected dividend yield (for stocks). Because the SEC yield represents hypothetical annualized income, it will differ—at times significantly—from the fund’s actual experience. As a result, the fund’s income distributions may be higher or lower than implied by the SEC yield.
Beta. A measure of the magnitude of a fund’s past share-price fluctuations in relation to the ups and downs of a given market index. The index is assigned a beta of 1.00. Compared with a given index, a fund with a beta of 1.20 typically would have seen its share price rise or fall by 12% when the index rose or fell by 10%. For this report, beta is based on returns over the past 36 months for both the fund and the index. Note that a fund’s beta should be reviewed in conjunction with its R-squared (see definition). The lower the R-squared, the less correlation there is between the fund and the index, and the less reliable beta is as an indicator of volatility.
Dividend Yield. Dividend income earned by stocks, expressed as a percentage of the aggregate market value (or of net asset value, for a fund). The yield is determined by dividing the amount of the annual dividends by the aggregate value (or net asset value) at the end of the period. For a fund, the dividend yield is based solely on stock holdings and does not include any income produced by other investments.
Earnings Growth Rate. The average annual rate of growth in earnings over the past five years for the stocks now in a fund.
Equity Exposure. A measure that reflects a fund’s investments in stocks and stock futures. Any holdings in short-term reserves are excluded.
Expense Ratio. The percentage of a fund’s average net assets used to pay its annual administrative and advisory expenses. These expenses directly reduce returns to investors.
Foreign Holdings. The percentage of a fund represented by stocks or depositary receipts of companies based outside the United States.
Median Market Cap. An indicator of the size of companies in which a fund invests; the midpoint of market capitalization (market price x shares outstanding) of a fund’s stocks, weighted by the proportion of the fund’s assets invested in each stock. Stocks representing half of the fund’s assets have market capitalizations above the median, and the rest are below it.
Price/Book Ratio. The share price of a stock divided by its net worth, or book value, per share. For a fund, the weighted average price/book ratio of the stocks it holds.
Price/Earnings Ratio. The ratio of a stock’s current price to its per-share earnings over the past year. For a fund, the weighted average P/E of the stocks it holds. P/E is an indicator of market expectations about corporate prospects; the higher the P/E, the greater the expectations for a company’s future growth.
37
R-Squared. A measure of how much of a fund’s past returns can be explained by the returns from the market in general, as measured by a given index. If a fund’s total returns were precisely synchronized with an index’s returns, its R-squared would be 1.00. If the fund’s returns bore no relationship to the index’s returns, its R-squared would be 0. For this report, R-squared is based on returns over the past 36 months for both the fund and the index.
Return on Equity. The annual average rate of return generated by a company during the past five years for each dollar of shareholder’s equity (net income divided by shareholder’s equity). For a fund, the weighted average return on equity for the companies whose stocks it holds.
Short-Term Reserves. The percentage of a fund invested in highly liquid, short-term securities that can be readily converted to cash.
Turnover Rate. An indication of the fund’s trading activity. Funds with high turnover rates incur higher transaction costs and may be more likely to distribute capital gains (which may be taxable to investors). The turnover rate excludes in-kind transactions, which have minimal impact on costs.
38
This page intentionally left blank.
The People Who Govern Your Fund
The trustees of your mutual fund are there to see that the fund is operated and managed in your best interests since, as a shareholder, you are a part owner of the fund. Your fund’s trustees also serve on the board of directors of The Vanguard Group, Inc., which is owned by the Vanguard funds and provides services to them on an at-cost basis.
A majority of Vanguard’s board members are independent, meaning that they have no affiliation with Vanguard or the funds they oversee, apart from the sizable personal investments they have made as private individuals. The independent board members have distinguished backgrounds in business, academia, and public service. Each of the trustees and executive officers oversees 179 Vanguard funds.
The following table provides information for each trustee and executive officer of the fund. More information about the trustees is in the Statement of Additional Information, which can be obtained, without charge, by contacting Vanguard at 800-662-7447, or online at vanguard.com.
| |
| Interested Trustee1 | and President (2006–2008) of Rohm and Haas Co. |
| | (chemicals); Director of Tyco International, Ltd. |
| F. William McNabb III | (diversified manufacturing and services) and Hewlett- |
| Born 1957. Trustee Since July 2009. Chairman of the | Packard Co. (electronic computer manufacturing); |
| Board. Principal Occupation(s) During the Past Five | Senior Advisor at New Mountain Capital; Trustee |
| Years: Chairman of the Board of The Vanguard Group, | of The Conference Board; Member of the Board of |
| Inc., and of each of the investment companies served | Managers of Delphi Automotive LLP (automotive |
| by The Vanguard Group, since January 2010; Director | components). |
| of The Vanguard Group since 2008; Chief Executive | |
| Officer and President of The Vanguard Group and of | Amy Gutmann |
| each of the investment companies served by The | Born 1949. Trustee Since June 2006. Principal |
| Vanguard Group since 2008; Director of Vanguard | Occupation(s) During the Past Five Years: President |
| Marketing Corporation; Managing Director of The | of the University of Pennsylvania; Christopher H. |
| Vanguard Group (1995–2008). | Browne Distinguished Professor of Political Science |
| | in the School of Arts and Sciences with secondary |
| | appointments at the Annenberg School for Commu- |
| Independent Trustees | nication and the Graduate School of Education |
| | of the University of Pennsylvania; Director of |
| Emerson U. Fullwood | Carnegie Corporation of New York, Schuylkill River |
| Born 1948. Trustee Since January 2008. Principal | Development Corporation, and Greater Philadelphia |
| Occupation(s) During the Past Five Years: Executive | Chamber of Commerce; Trustee of the National |
| Chief Staff and Marketing Officer for North America | Constitution Center; Chair of the Presidential |
| and Corporate Vice President (retired 2008) of Xerox | Commission for the Study of Bioethical Issues. |
| Corporation (document management products and | |
| services); Executive in Residence and 2010 | JoAnn Heffernan Heisen |
| Distinguished Minett Professor at the Rochester | Born 1950. Trustee Since July 1998. Principal |
| Institute of Technology; Director of SPX Corporation | Occupation(s) During the Past Five Years: Corporate |
| (multi-industry manufacturing), the United Way of | Vice President and Chief Global Diversity Officer |
| Rochester, Amerigroup Corporation (managed health | (retired 2008) and Member of the Executive |
| care), the University of Rochester Medical Center, | Committee (1997–2008) of Johnson & Johnson |
| Monroe Community College Foundation, and North | (pharmaceuticals/consumer products); Director of |
| Carolina A&T University. | Skytop Lodge Corporation (hotels), the University |
| | Medical Center at Princeton, the Robert Wood |
| Rajiv L. Gupta | Johnson Foundation, and the Center for Work Life |
| Born 1945. Trustee Since December 2001.2 | Policy; Member of the Advisory Board of the |
| Principal Occupation(s) During the Past Five Years: | Maxwell School of Citizenship and Public Affairs |
| Chairman and Chief Executive Officer (retired 2009) | at Syracuse University. |
| | |
| F. Joseph Loughrey | Thomas J. Higgins | |
| Born 1949. Trustee Since October 2009. Principal | Born 1957. Chief Financial Officer Since September |
| Occupation(s) During the Past Five Years: President | 2008. Principal Occupation(s) During the Past Five |
| and Chief Operating Officer (retired 2009) and Vice | Years: Principal of The Vanguard Group, Inc.; Chief |
| Chairman of the Board (2008–2009) of Cummins Inc. | Financial Officer of each of the investment companies |
| (industrial machinery); Director of SKF AB (industrial | served by The Vanguard Group since 2008; Treasurer |
| machinery), Hillenbrand, Inc. (specialized consumer | of each of the investment companies served by The |
| services), the Lumina Foundation for Education, and | Vanguard Group (1998–2008). |
| Oxfam America; Chairman of the Advisory Council | | |
| for the College of Arts and Letters and Member | Kathryn J. Hyatt | |
| of the Advisory Board to the Kellogg Institute for | Born 1955. Treasurer Since November 2008. Principal |
| International Studies at the University of Notre Dame. | Occupation(s) During the Past Five Years: Principal |
| | of The Vanguard Group, Inc.; Treasurer of each of |
| André F. Perold | the investment companies served by The Vanguard |
| Born 1952. Trustee Since December 2004. Principal | Group since 2008; Assistant Treasurer of each of the |
| Occupation(s) During the Past Five Years: George | investment companies served by The Vanguard Group |
| Gund Professor of Finance and Banking at the Harvard | (1988–2008). | |
| Business School; Chair of the Investment Committee | | |
| of HighVista Strategies LLC (private investment firm). | Heidi Stam | |
| | Born 1956. Secretary Since July 2005. Principal |
| Alfred M. Rankin, Jr. | Occupation(s) During the Past Five Years: Managing |
| Born 1941. Trustee Since January 1993. Principal | Director of The Vanguard Group, Inc., since 2006; |
| Occupation(s) During the Past Five Years: Chairman, | General Counsel of The Vanguard Group since 2005; |
| President, and Chief Executive Officer of NACCO | Secretary of The Vanguard Group and of each of the |
| Industries, Inc. (forklift trucks/housewares/lignite); | investment companies served by The Vanguard Group |
| Director of Goodrich Corporation (industrial products/ | since 2005; Director and Senior Vice President of |
| aircraft systems and services) and the National | Vanguard Marketing Corporation since 2005; |
| Association of Manufacturers; Chairman of the | Principal of The Vanguard Group (1997–2006). |
| Federal Reserve Bank of Cleveland; Vice Chairman | | |
| of University Hospitals of Cleveland; President of | | |
| the Board of The Cleveland Museum of Art. | Vanguard Senior Management Team |
| |
| Peter F. Volanakis | R. Gregory Barton | Michael S. Miller |
| Born 1955. Trustee Since July 2009. Principal | Mortimer J. Buckley | James M. Norris |
| Occupation(s) During the Past Five Years: President | Kathleen C. Gubanich | Glenn W. Reed |
| and Chief Operating Officer (retired 2010) of Corning | Paul A. Heller | George U. Sauter |
| Incorporated (communications equipment); Director of | | |
| Corning Incorporated (2000–2010) and Dow Corning | | |
| (2001–2010); Overseer of the Amos Tuck School of | Chairman Emeritus and Senior Advisor |
| Business Administration at Dartmouth College. | | |
| | John J. Brennan | |
| | Chairman, 1996–2009 | |
| Executive Officers | Chief Executive Officer and President, 1996–2008 |
| |
| Glenn Booraem | | |
| Born 1967. Controller Since July 2010. Principal | Founder | |
| Occupation(s) During the Past Five Years: Principal | | |
| of The Vanguard Group, Inc.; Controller of each of | John C. Bogle | |
| the investment companies served by The Vanguard | Chairman and Chief Executive Officer, 1974–1996 |
| Group since 2010; Assistant Controller of each of | | |
| the investment companies served by The Vanguard | | |
| Group (2001–2010). | | |
1 Mr. McNabb is considered an “interested person,” as defined in the Investment Company Act of 1940, because he is an officer of the Vanguard funds.
2 December 2002 for Vanguard Equity Income Fund, Vanguard Growth Equity Fund, the Vanguard Municipal Bond Funds, and the Vanguard State Tax-Exempt Funds.
|  |
| P.O. Box 2600 |
| Valley Forge, PA 19482-2600 |
Connect with Vanguard® > vanguard.com
| Fund Information > 800-662-7447 | CFA® is a trademark owned by CFA Institute. |
| Direct Investor Account Services > 800-662-2739 | |
| Institutional Investor Services > 800-523-1036 | |
| Text Telephone for People | |
| With Hearing Impairment > 800-749-7273 | |
| |
| This material may be used in conjunction | |
| with the offering of shares of any Vanguard | |
| fund only if preceded or accompanied by | |
| the fund’s current prospectus. | |
| |
| All comparative mutual fund data are from Lipper Inc. or | |
| Morningstar, Inc., unless otherwise noted. | |
| |
| You can obtain a free copy of Vanguard’s proxy voting | |
| guidelines by visiting vanguard.com/proxyreporting or by | |
| calling Vanguard at 800-662-2739. The guidelines are | |
| also available from the SEC’s website, sec.gov. In | |
| addition, you may obtain a free report on how your fund | |
| voted the proxies for securities it owned during the 12 | |
| months ended June 30. To get the report, visit either | |
| vanguard.com/proxyreporting or sec.gov. | |
| |
| You can review and copy information about your fund at | |
| the SEC’s Public Reference Room in Washington, D.C. To | |
| find out more about this public service, call the SEC at | |
| 202-551-8090. Information about your fund is also | |
| available on the SEC’s website, and you can receive | |
| copies of this information, for a fee, by sending a | |
| request in either of two ways: via e-mail addressed to | |
| publicinfo@sec.gov or via regular mail addressed to the | |
| Public Reference Section, Securities and Exchange | |
| Commission, Washington, DC 20549-1520. | |
| | © 2011 The Vanguard Group, Inc. |
| | All rights reserved. |
| | Vanguard Marketing Corporation, Distributor. |
| |
| | Q08702 052011 |
Item 2: Code of Ethics.
Not Applicable.
Item 3: Audit Committee Financial Expert.
Not Applicable.
Item 4: Principal Accountant Fees and Services.
Not Applicable.
Item 5: Audit Committee of Listed Registrants.
Not Applicable.
Item 6: Investments.
Not Applicable.
Item 7: Disclosure of Proxy Voting Policies and Procedures for Closed-End Management Investment Companies.
Not Applicable.
Item 8: Portfolio Managers of Closed-End Management Investment Companies.
Not Applicable.
Item 9: Purchase of Equity Securities by Closed-End Management Investment Company and Affiliated Purchasers.
Not Applicable.
Item 10: Submission of Matters to a Vote of Security Holders.
Not Applicable.
Item 11: Controls and Procedures.
(a) Disclosure Controls and Procedures. The Principal Executive and Financial Officers concluded that the Registrant's Disclosure Controls and Procedures are effective based on their evaluation of the Disclosure Controls and Procedures as of a date within 90 days of the filing date of this report.
(b) Internal Control Over Financial Reporting. There were no significant changes in Registrant’s Internal Control Over Financial Reporting or in other factors that could significantly affect this control subsequent to the date of the evaluation, including any corrective actions with regard to significant deficiencies and material weaknesses.
Item 12: Exhibits.
(a) Code of Ethics.
(b) Certifications.
Pursuant to the requirements of the Securities Exchange Act of 1934 and the Investment Company Act of 1940, the registrant has duly caused this report to be signed on its behalf by the undersigned, thereunto duly authorized.
| |
| | VANGUARD QUANTITATIVE FUNDS |
| |
| By: | /s/ F. WILLIAM MCNABB III* |
| | F. WILLIAM MCNABB III |
| | CHIEF EXECUTIVE OFFICER |
| |
| Date: May 19, 2011 |
Pursuant to the requirements of the Securities Exchange Act of 1934 and the Investment Company Act of 1940, this report has been signed below by the following persons on behalf of the registrant and in the capacities and on the dates indicated.
| |
| | VANGUARD QUANTITATIVE FUNDS |
| |
| By: | /s/ F. WILLIAM MCNABB III* |
| | F. WILLIAM MCNABB III |
| | CHIEF EXECUTIVE OFFICER |
| |
| Date: May 19, 2011 |
| |
| | VANGUARD QUANTITATIVE FUNDS |
| |
| By: | /s/ THOMAS J. HIGGINS* |
| | THOMAS J. HIGGINS |
| | CHIEF FINANCIAL OFFICER |
| |
| Date: May 19, 2011 |
* By: /s/ Heidi Stam
Heidi Stam, pursuant to a Power of Attorney filed on April 26, 2010, see file Number 33-53683,
Incorporated by Reference.