UNITED STATES
SECURITIES AND EXCHANGE COMMISSION
Washington, D.C. 20549
FORM N-CSR
CERTIFIED SHAREHOLDER REPORT OF REGISTERED
MANAGEMENT INVESTMENT COMPANIES
Investment Company Act file number: 811-04852
Victory Portfolios
(Exact name of registrant as specified in charter)
| 4900 Tiedeman Road, 4th Floor, Brooklyn, Ohio | 44144 |
| (Address of principal executive offices) | (Zip code) |
Citi Fund Services Ohio, Inc., 4400 Easton Commons, Suite 200, Columbus, OH 43219
(Name and address of agent for service)
Registrant’s telephone number, including area code: 800-539-3863
Date of fiscal year end: October 31
Date of reporting period: October 31, 2020
Item 1. Reports to Stockholders.

October 31, 2020
Annual Report
Victory Diversified Stock Fund
Victory NewBridge Large Cap Growth Fund
Victory Special Value Fund
Victory Strategic Allocation Fund
Victory INCORE Fund for Income
Victory INCORE Investment Grade Convertible Fund
Beginning January 1, 2021, as permitted by regulations adopted by the Securities and Exchange Commission, paper copies of the Victory Funds' shareholder reports will no longer be sent by mail, unless you specifically request paper copies of the reports from the Victory Funds or from your financial intermediary, such as a broker-dealer or bank. Instead, the reports will be made available on www.VictoryFunds.com, and you will be notified by mail each time a report is posted and provided with a website link to access the report.
If you already elected to receive shareholder reports electronically, you will not be affected by this change; and you need not take any action. You may elect to receive shareholder reports and other communications from the Victory Funds or your financial intermediary electronically by notifying your financial intermediary directly or, if you are a direct investor, by calling 800-539-3863 or by sending an e-mail request to TA.Processing@FISGlobal.com.
You may elect to receive all future reports in paper free of charge. If you invest through a financial intermediary, you can contact your financial intermediary to request that you continue to receive paper copies of your reports. If you invest directly with the Victory Funds, you can call 800-539-3863 or send an e-mail request to TA.Processing@FISGlobal.com. Your election to receive reports in paper will apply to all Victory Funds you hold directly or through your financial intermediary.
www.vcm.com
News, Information And Education 24 Hours A Day, 7 Days A Week
The Victory Funds site gives fund shareholders, prospective shareholders, and investment professionals a convenient way to access fund information, get guidance, and track fund performance anywhere they can access the Internet. The site includes:
• Detailed performance records
• Daily share prices
• The latest fund news
• Investment resources to help you become a better investor
• A section dedicated to investment professionals
Whether you're a potential investor searching for the fund that matches your investment philosophy, a seasoned investor interested in planning tools, or an investment professional, www.vcm.com has what you seek. Visit us anytime. We're always open.
Victory Portfolios
Table of Contents
Shareholder Letter (Unaudited) | | | 4 | | |
Managers' Commentary and Investment Overview
(Unaudited) | | | 6 | | |
Investment Objective and Portfolio Holdings
(Unaudited) | | | 20 | | |
Financial Statements | |
Victory Diversified Stock Fund | |
Schedule of Portfolio Investments | | | 26 | | |
Statement of Assets and Liabilities | | | 40-41 | | |
Statement of Operations | | | 44 | | |
Statements of Changes in Net Assets | | | 46-48 | | |
Financial Highlights | | | 52-53 | | |
Victory NewBridge Large Cap Growth Fund | |
Schedule of Portfolio Investments | | | 29 | | |
Statement of Assets and Liabilities | | | 40-41 | | |
Statement of Operations | | | 44 | | |
Statements of Changes in Net Assets | | | 46-48 | | |
Financial Highlights | | | 54-55 | | |
Victory Special Value Fund | |
Schedule of Portfolio Investments | | | 31 | | |
Statement of Assets and Liabilities | | | 40-41 | | |
Statement of Operations | | | 44 | | |
Statements of Changes in Net Assets | | | 46-48 | | |
Financial Highlights | | | 56-57 | | |
Victory Strategic Allocation Fund | |
Schedule of Portfolio Investments | | | 34 | | |
Statement of Assets and Liabilities | | | 42-43 | | |
Statement of Operations | | | 45 | | |
Statements of Changes in Net Assets | | | 49-51 | | |
Financial Highlights | | | 58-59 | | |
Victory INCORE Fund for Income | |
Schedule of Portfolio Investments | | | 35 | | |
Statement of Assets and Liabilities | | | 42-43 | | |
Statement of Operations | | | 45 | | |
Statements of Changes in Net Assets | | | 49-51 | | |
Financial Highlights | | | 60-61 | | |
Victory INCORE Investment Grade Convertible Fund | |
Schedule of Portfolio Investments | | | 37 | | |
Statement of Assets and Liabilities | | | 42-43 | | |
Statement of Operations | | | 45 | | |
Statements of Changes in Net Assets | | | 49-51 | | |
Financial Highlights | | | 62-63 | | |
Notes to Financial Statements | | | 64 | | |
Report of Independent
Registered Public Accounting Firm | | | 78 | | |
1
Supplemental Information (Unaudited) | | | |
Trustee and Officer Information | | | 79 | | |
Proxy Voting and Portfolio Holdings Information | | | 82 | | |
Expense Examples | | | 82 | | |
Additional Federal Income Tax Information | | | 84 | | |
Liquidity Risk Management Program | | | 85 | | |
Privacy Policy (inside back cover) | | | |
The Funds are distributed by Victory Capital Services, Inc. Victory Capital Management Inc. is the investment adviser to the Funds and receives fees from the Funds for performing services for the Funds.
This report is not authorized for distribution to prospective investors unless preceded or accompanied by a current prospectus of the Victory Funds.
For additional information about any Victory Fund, including fees, expenses, and risks, view our prospectus online at vcm.com or call 800-539-3863. Read it carefully before you invest or send money.
The information in this annual report is based on data obtained from recognized services and sources and is believed to be reliable. Any opinions, projections, or recommendations in this report are subject to change without notice and are not intended as individual investment advice. Past investment performance of the Funds, markets or securities mentioned herein should not be considered to be indicative of future results.
• NOT FDIC INSURED • NO BANK GUARANTEE • MAY LOSE VALUE

Call Victory at:
800-539-FUND (800-539-3863)
Visit our website at:
www.vcm.com
2
This page is intentionally left blank.
3
Victory Funds Letter to Shareholders
(Unaudited)
Dear Shareholder,
It's safe to say that the fiscal year ended October 31, 2020, has been like no other. The range of emotions that investors have experienced touched both ends of the spectrum. The annual reporting period began with relatively calm markets and more mundane questions surrounding interest rates, global trade and earnings growth. Yet those concerns took a back seat in early 2020.
A novel coronavirus and the subsequent spread of the disease that it causes ("COVID-19") throughout Asia, Europe and eventually the United States became an unprecedented event. To combat the pandemic, governments everywhere issued austere shelter-in-place orders, and the global economy slowed markedly. Equity markets sold off sharply in March and April, and U.S. GDP shrunk by a whopping 31.4% during the second quarter.
It's no surprise that so many investors flocked to the perceived safety of U.S. Treasurys. Meanwhile, liquidity evaporated (for a short spell) in many other segments of the fixed income market, including higher-yielding credits and municipal bonds. The outlook was tenuous, and credit spreads widened while prices declined for any securities perceived to be higher risk.
The U.S. Federal Reserve (the "Fed") and other monetary authorities worldwide leapt into action — cutting interest rates, (re)starting quantitative easing and, in the case of the Fed, launching an array of programs to provide liquidity to stabilize fixed income markets. The U.S. government also stepped up to provide fiscal stimulus in the form of the Coronavirus Aid, Relief, and Economic Security Act (CARES Act).
In retrospect, it's amazing how quickly those actions helped to end the stock market's freefall and restored order across much of the fixed income universe. The rebound was almost as robust as the drawdown. Through all the unprecedented events and extreme volatility, the S&P 500® Index registered an impressive annual return of 9.7% for the 12-month period ended October 31, 2020. Meanwhile, the yield on 10-year U.S. Treasurys declined 81 basis points over the same period, reflecting both the Fed's interest rate cuts and its pledge to keep rates low longer. The yield on 10-Year U.S. Treasurys was 0.88% as of October 31, 2020.
The good news is that over the summer and into the fall, the economy regained its footing, and GDP increased at an annual rate of 33.1% in the third quarter of 2020, according to the "advance" estimate released by the Bureau of Economic Analysis. Does this mean it's clear for investors now? Is it ever?
We must accept the fact that the economy and markets remain unpredictable even as we are cautiously optimistic on the reported progress toward a COVID-19 vaccine. Looking ahead, investors should expect continued bouts of volatility — both to the upside and downside — depending on the pandemic news. And let's not forget that there are other factors at play, including new political leadership and the potential for new policies and priorities.
4
Fortunately, we believe all of Victory Capital's autonomous Investment Franchises are in capable hands to withstand the ups and downs. The investment professionals who manage our funds have vetted investment philosophies and risk protocols, and market volatility can even create opportunities that benefit astute active managers.
On the following pages, you will find information relating to your Victory Funds investment. If you have any questions, we encourage you to contact your financial advisor. Or, if you invest with us directly, you may call (800) 539-3863, or visit our website at www.vcm.com.
My colleagues and I sincerely appreciate the confidence you have placed in the Victory Funds, and we value the opportunity to help meet your investment goals.

Christopher K. Dyer, CFA
President,
Victory Funds
5
Victory Diversified Stock Fund
Managers' Commentary
(Unaudited)
What were the market conditions during the reporting period?
For the 12 months ended October 31, 2020, the pandemic related to the novel coronavirus and the disease it causes ("COVID-19") created an extremely volatile trailing-twelve-months period for equities, with the S&P 500® Index (the "Index") selling off approximately 34% from its February 2020 highs before rebounding off the March lows to return approximately 48% over the next seven months to close out the period. All in, the Index managed a 9.71% total return over the entire 12-month period, though this was primarily driven by 1) large capitalization names, and 2) growth stocks. Large-cap names possess the necessary flexibility, brand awareness, scale and balance sheet strength to both endure and invest through theses turbulent times, suggesting improved competitive positioning both during and after the pandemic.
Growth stocks, on the other hand, rely more on product adoption and market share gains than overall economic growth, and fundamentals have proven more resilient. In addition, powerful secular drivers that underpin many of these names, are expected to accelerate post-COVID-19 (e.g., cloud computing and collaboration software and services). Finally, we believe lower interest rates benefit growth stocks disproportionately by reducing the discount rate applied to future profits, as these stocks inherently derive a larger portion of their intrinsic or net present value from future/expected earnings.
How did Victory Diversified Stock Fund (the "Fund") perform during the reporting period?
The Fund seeks to provide long-term capital appreciation. The Fund returned 5.47% (Class A Shares at net asset value) for the fiscal year ended October 31, 2020, underperforming the Index, which returned 9.71% for the period.
What strategies did you employ during the reporting period?
The Fund looks to invest in stocks with market capitalizations of $1 billion and above that we believe are of high quality with the potential for above-average earnings growth, as well as current earnings momentum. Using this framework, the Fund generated the strongest returns within the Technology, Consumer Discretionary, and Communication Services sectors over the trailing twelve months, while Materials and Energy were the most challenged. In Technology, the Fund's large-cap and cloud holdings drove performance, with both expected to be more resilient or even benefit during the pandemic. Apple was one of the strongest performers, benefiting from its fortress balance sheet, attractive growth/value profile, and potential for accelerating business momentum as we enter a new 5G handset supercycle. In Consumer Discretionary, retail and homebuilder exposures drove positive performance. Amazon was our top performer in the sector, as the company stands to benefit from an accelerated shift to e-commerce and cloud computing as a result of COVID-19. In Communication Services, strong returns were broad-based across the Fund's holdings, though positions in Facebook and Alphabet generated outsized strength. While both stocks experienced top-line pressure from reduced advertising budgets amidst the pandemic-induced recession, trends improved materially as economic conditions improved, validating the strategic value the platforms provide to advertisers. With regard to Materials and Energy, both sectors have experienced massive negative demand shocks due to the pandemic and equity prices have sold off in response.
6
Victory Diversified Stock Fund
Investment Overview
(Unaudited)
Average Annual Total Return
Year Ended October 31, 2020
| | Class A | | Class C | | Class I | | Class R | | Class R6 | | Class Y | | | |
INCEPTION DATE | | 10/28/89 | | 3/1/02 | | 8/31/07 | | 3/26/99 | | 3/3/14 | | 1/28/13 | | | |
| | Net Asset
Value | | Maximum
Offering
Price | | Net Asset
Value | | Contingent
Deferred
Charges | | Net Asset
Value | | Net Asset
Value | | Net Asset
Value | | Net Asset
Value | | S&P 500®
Index1 | |
One Year | | | 5.47 | % | | | –0.61 | % | | | 4.53 | % | | | 3.55 | % | | | 5.81 | % | | | 5.25 | % | | | 5.86 | % | | | 5.72 | % | | | 9.71 | % | |
Five Year | | | 7.16 | % | | | 5.90 | % | | | 6.24 | % | | | 6.24 | % | | | 7.45 | % | | | 6.86 | % | | | 7.50 | % | | | 7.40 | % | | | 11.71 | % | |
Ten Year | | | 9.56 | % | | | 8.92 | % | | | 8.65 | % | | | 8.65 | % | | | 9.86 | % | | | 9.26 | % | | | N/A | | | | N/A | | | | 13.01 | % | |
Since Inception | | | N/A | | | | N/A | | | | N/A | | | | N/A | | | | N/A | | | | N/A | | | | 7.66 | % | | | 9.57 | % | | | N/A | | |
Past performance is not indicative of future results. The performance data quoted represents past performance and current returns may be lower or higher. The investment return and principal value will fluctuate so that an investor's shares, when redeemed, may be worth more or less than the original cost. To obtain performance information current to the most recent month's end, please visit www.vcm.com. | |
The maximum offering price (MOP) reflects a maximum sales charge of 5.75% for Class A Shares. Class C Shares are not subject to an initial sales charge, but are subject to a deferred sales charge of 1.00% on shares redeemed within one year of purchase. NAV does not reflect sales charges.
Total return measures the price change in a share assuming the reinvestment of all net investment income and realized capital gain distributions, if any. The total returns quoted above may differ from the total returns shown in the Financial Highlights because they do not reflect adjustments made to the enclosed financial statements in accordance with U.S. generally accepted accounting principles or the deduction of taxes that a shareholder would pay on net investment income and realized capital gain distributions, including reinvested distributions, or redemptions of shares.
The total return figures set forth above include all waivers of fees for various periods since inception. Without such fee waivers, the total returns would
have been lower. Some fee waivers are voluntary and may be modified or terminated at any time.
Victory Diversified Stock Fund — Growth of $10,000
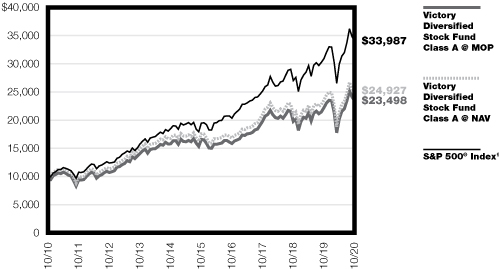
1The S&P 500® Index is an unmanaged index comprised of 500 domestically traded common stocks, is weighted according to the market value of each common stock in the index, and includes reinvestment of dividends. This index does not include the effect of sales charges, commissions, expenses or taxes, is not representative of the Fund, and it is not possible to invest directly in an index.
The graph reflects investment of growth of a hypothetical $10,000 investment in Class A Shares of the Fund. The performance of other classes of the Fund's shares will be greater than or less than the line shown based on the differences in loads and fees paid by shareholders investing in the different classes. Past performance is no guarantee of future results.
The graph and table do not reflect the deduction of taxes that a shareholder would pay on Fund distributions or the redemption of Fund shares.
7
Victory NewBridge Large Cap Growth Fund
Managers' Commentary
(Unaudited)
What were the market conditions during the reporting period?
It took an outbreak of the novel coronavirus and the disease it causes ("COVID-19") to end the eleven-year bull market in U.S. stocks, the longest on record and almost the strongest. Prior to its official end on March 11, 2020, when the Dow Jones Industrial Average declined 20% from its peak and the World Health Organization officially declared the coronavirus outbreak a global pandemic, the turbulence of the third quarter of 2019 was offset by a rebound in equities in the last three months of the year that continued into February of 2020. With respect to 2020, one can essentially view the year as pre-COVID-19 and during COVID-19. The first period lasted until February 19th, when the portfolio's and benchmark's returns peaked. The portfolio outperformed its benchmark during this positive-return market environment. The second period began on February 20th, which was highlighted by the realization that the pandemic was well under way; followed by closing borders and significant portions of the economy. Both the portfolio and benchmark declined quickly and significantly amidst record-setting volatility before staging an equally incredible recovery fueled by immediate and enormous fiscal stimulus. The portfolio maintained its relative outperformance in both periods through October 31, 2020, primarily though stock selection.
As the U.S. economy went from full employment to recession in two weeks and the economy contended with widespread shutdowns and closures, several industries were acutely affected and experienced a disproportionately negative impact. Travel, Hospitality, Food, and Retail saw revenues plunge as doors, economies, and borders closed. Companies and consumers worked diligently to adapt their businesses to the limitations brought on by the pandemic as frontline workers responded courageously and tirelessly to contain the crisis and help those in need. With much of the economy closed for months, every component of the economy was faced with the historic challenge of operating in a fog of uncertainty. Technology and Communications proved to be enormously helpful as Wi-Fi connections, video conferencing, and the ability to order most anything from a smartphone or laptop allowed consumers and companies to communicate, adapt, and transact. Millions of employees worked from home and e-commerce companies became ever more indispensable. Although an undoubtedly difficult and tragic year, one can only imagine how much more devastating it would have been had the pandemic unfolded five years ago before the emergence of many critical technologies.
In such an environment, growth companies prevailed as a result of the dramatic increase in demand for products and services that enabled companies to continue to operate. Transcending the usual classifications of sectors, industries, and factors, most companies were further categorized as either stay-at-home or go-out stocks. Many stay-at-home stocks were found in, but not limited to, Technology, Communications, and Media. Providers of video conferencing for work and home schooling benefitted as did streaming and video gaming companies due to millions being quarantined with few entertainment activities. Retailers with an online presence and logistics companies that delivered goods to home-bound consumers also fared significantly better than those dependent on physical presence and traveling consumers. As the global army of researchers work at breakneck speed to develop a vaccine, investors increasingly look ahead with optimism and each step further tends to shift investment from the stay-at-home stocks to the beleaguered go-out group.
The pandemic may have taken most of the spotlight at a time in which one of the biggest risks highlighted by investors coming into the year was the U.S. Presidential election. Of
8
Victory NewBridge Large Cap Growth Fund (continued)
course, that didn't mean political risk was eliminated. It was just postponed. Heading into what many believed would be a very contentious contest, the combination of how the pandemic is managed as we approach the holiday season combined with the outcome of the election may reignite investor risk aversion for the balance of the year and into 2021. While we don't know precisely when, our view is that a globally concerted effort to defeat the virus fueled by ingenuity, commitment, collaboration, aided by technology, communication, and innovation will prevail. Adversity and challenges bring out the best in people. While the magnitude of the task at hand is truly historic, this time is no different.
How did Victory NewBridge Large Cap Growth Fund (the "Fund") perform during the reporting period?
The Fund seeks to deliver long-term capital appreciation by investing in high-quality, large-cap companies with the prospect of growth in excess of the overall market. The Fund returned 39.61% (Class A Shares at net asset value) for the fiscal year ended October 31, 2020, outperforming the Russell 1000® Growth Index (the "Index"), which returned 29.22% during the period.
What strategies did you employ during the reporting period?
As active managers assigned the responsibility of investing the Fund in large-capitalization U.S. growth companies, we continued to do so in the 12 months ended October 31, 2020. The volatile and unusual environment created by the COVID-19 pandemic did present both challenges and opportunities. Heading into the lockdown, the market had been reaching new highs against the backdrop of increasing valuations. As the harsh reality of what was unfolding sunk in, the Dow Jones Industrial Average shed more than 35%, while the Index declined 33%. The Fund outperformed at the beginning of the year, declined less than the Index in the turbulent downdraft and outperformed in the ensuing market rebound.
In both periods, pre-pandemic and during, we maintained our focus by investing in growth companies we believed were, and would continue to be, capable of performing well against peers and expectations due to well-positioned businesses with attractive profitability profiles, strong financials, and talented and responsible management teams. As we continually monitored the portfolio throughout the year using our traditional screens and risk analysis, we also included an additional view to incorporate the current environment and evaluate how the portfolio is positioned within the context of stay-at-home beneficiaries and go-out stocks.
Throughout our long tenure together, we have traversed many notable and precipitous market selloffs such as the technology bust of 2000, September 11, 2001, the Great Recession, the fourth quarter of 2018, and now a global pandemic. These events have trained us to not panic or act emotionally. Instead, our experience together has shown us that, while painful, broad market selloffs also present opportunities. Difficult as the months of March and April were, we stayed the course and took advantage of the volatility by making changes we believed would benefit the portfolio such as adding Uber, Shopify, Trade Desk, Adobe, Masimo Corp, Twilio, and Trane Technologies. The performance throughout the year supports those decisions overall. In our view, the portfolio remains well balanced among sectors and industries as well as companies that have managed to grow despite or because of the pandemic and those which will likely rebound sharply as the economy fully reopens and takes the next step towards recovery. It's been a long year marked by tremendous loss on all levels. Looking ahead, it's our contention that the path forward, while not necessarily smooth, will require the innovation, boundless energy, and strong leadership we look for in the companies in which we invest.
9
Victory NewBridge Large Cap Growth Fund
Investment Overview
(Unaudited)
Average Annual Total Return
Year Ended October 31, 2020
| | Class A | | Class C | | Class I | | Class Y | | | |
INCEPTION DATE | | 12/31/03 | | 12/31/03 | | 3/1/11 | | 1/28/13 | | | |
| | Net Asset
Value | | Maximum
Offering
Price | | Net Asset
Value | | Contingent
Deferred
Charges | | Net Asset
Value | | Net Asset
Value | | Russell 1000®
Growth Index1 | |
One Year | | | 39.61 | % | | | 31.51 | % | | | 37.97 | % | | | 37.16 | % | | | 39.95 | % | | | 39.72 | % | | | 29.22 | % | |
Five Year | | | 13.36 | % | | | 12.02 | % | | | 12.43 | % | | | 12.43 | % | | | 13.81 | % | | | 13.70 | % | | | 17.32 | % | |
Ten Year | | | 12.54 | % | | | 11.88 | % | | | 11.61 | % | | | 11.61 | % | | | N/A | | | | N/A | | | | 16.31 | % | |
Since Inception | | | N/A | | | | N/A | | | | N/A | | | | N/A | | | | 12.15 | % | | | 14.00 | % | | | N/A | | |
Past performance is not indicative of future results. The performance data quoted represents past performance and current returns may be lower or higher. The investment return and principal value will fluctuate so that an investor's shares, when redeemed, may be worth more or less than the original cost. To obtain performance information current to the most recent month's end, please visit www.vcm.com.
The maximum offering price (MOP) reflects a maximum sales charge of 5.75% for Class A Shares. Class C Shares are not subject to an initial sales charge, but are subject to a deferred sales charge of 1.00% on shares redeemed within one year of purchase. NAV does not reflect sales charges.
The total returns quoted above may differ from the total returns shown in the Financial Highlights because they do not reflect adjustments made to the enclosed financial statements in accordance with U.S. generally accepted accounting principles or the deduction of taxes that a shareholder would pay on net investment income and realized capital gain distributions, including reinvested distributions, or redemptions of shares.
The total return figures set forth above include all waivers of fees for various periods since inception. Without such fee waivers, the total returns would have been lower. Some fee waivers are voluntary and may be modified or terminated at any time.
Victory NewBridge Large Cap Growth Fund — Growth of $10,000
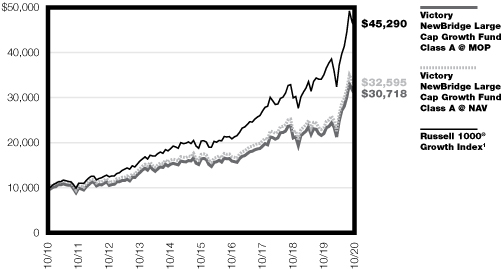
1The Russell 1000® Growth Index is an unmanaged index that measures the performance of those Russell 1000 companies with higher price-to-book ratios and higher forecasted growth values. This index does not include the effect of sales charges, commissions, expenses or taxes, is not representative of the Fund and it is not possible to invest directly in an index.
The graph reflects investment growth of a hypothetical $10,000 investment in Class A Shares of the Fund. The performance of other classes of the Fund's shares will be greater than or less than the line shown based on the differences in loads and fees paid by shareholders investing in the different classes. Past performance is no guarantee of future results.
The graph and table do not reflect the deduction of taxes that a shareholder would pay on Fund distributions or the redemption of Fund shares.
10
Victory Special Value Fund
Managers' Commentary
(Unaudited)
What were the market conditions during the reporting period?
For the 12 months ended October 31, 2020, the pandemic related to the novel coronavirus and the disease it causes ("COVID-19") created an extremely volatile trailing-twelve-months period for equities, with the S&P 500® Index (the "Index") selling off approximately 34% from its February 2020 highs before rebounding off the March lows to return approximately 48% over the next seven months to close out the period. All in, the Index managed a 9.71% total return over the entire 12-month period, though this was primarily driven by 1) large capitalization names, and 2) growth stocks. Large-cap names possess the necessary flexibility, brand awareness, scale and balance sheet strength to both endure and invest through theses turbulent times, suggesting improved competitive positioning both during and after the pandemic. Growth stocks, on the other hand, rely more on product adoption and market share gains than overall economic growth, and fundamentals have proven more resilient. In addition, powerful secular drivers that underpin many of these names, are expected to accelerate post-COVID-19 (e.g., cloud computing and collaboration software and services). Finally, we believe lower interest rates benefit growth stocks disproportionately by reducing the discount rate applied to future profits, as these stocks inherently derive a larger portion of their intrinsic or net-present-value from future/expected earnings.
How did Victory Special Value Fund (the "Fund") perform during the reporting period?
The Fund seeks to provide long-term capital appreciation. The Fund returned 5.15% (Class A Shares at net asset value) for the fiscal year ended October 31, 2020, underperforming the Index, which returned 9.71% for the period.
What strategies did you employ during the reporting period?
The Fund looks to invest in stocks with market capitalizations of $1 billion and above that we believe are of high quality with the potential for above-average earnings growth, as well as current earnings momentum. Using this framework, the Fund generated the strongest returns within the Technology, Consumer Discretionary and Communication Services sectors over the trailing-twelve-months, while Materials and Energy were the most challenged. In Technology, the Fund's large-cap and cloud holdings drove performance, with both expected to be more resilient or even benefit during the pandemic. Apple was one of the strongest performers, benefiting from its fortress balance sheet, attractive growth/value profile, and potential for accelerating business momentum as we enter a new 5G handset supercycle. In Consumer Discretionary, retail and homebuilder exposures drove positive performance. Amazon was our top performer in the sector, as the company stands to benefit from an accelerated shift to e-commerce and cloud computing as a result of COVID-19. In Communication Services, strong returns were broad-based across the Fund's holdings, though positions in Facebook and Alphabet generated outsized strength. While both stocks experienced top-line pressure from reduced advertising budgets amidst the pandemic-induced recession, trends improved materially as economic conditions improved, validating the strategic value the platforms provide to advertisers. With regards to Materials and Energy, both sectors have experienced massive negative demand shocks due to the pandemic and equity prices have sold off in response.
11
Victory Special Value Fund
Investment Overview
(Unaudited)
Average Annual Total Return
Year Ended October 31, 2020
| | Class A | | Class C | | Class I | | Class R | | Class Y | | | |
INCEPTION DATE | | 12/3/93 | | 3/1/03 | | 8/31/07 | | 12/21/99 | | 1/28/13 | | | |
| | Net Asset
Value | | Maximum
Offering
Price | | Net Asset
Value | | Contingent
Deferred
Charges | | Net Asset
Value | | Net Asset
Value | | Net Asset
Value | | S&P 500®
Index1 | |
One Year | | | 5.15 | % | | | –0.89 | % | | | 4.26 | % | | | 3.26 | % | | | 5.35 | % | | | 4.82 | % | | | 5.40 | % | | | 9.71 | % | |
Five Year | | | 6.73 | % | | | 5.47 | % | | | 5.76 | % | | | 5.76 | % | | | 6.87 | % | | | 6.42 | % | | | 6.98 | % | | | 11.71 | % | |
Ten Year | | | 7.62 | % | | | 6.99 | % | | | 6.66 | % | | | 6.66 | % | | | 7.85 | % | | | 7.30 | % | | | N/A | | | | 13.01 | % | |
Since Inception | | | N/A | | | | N/A | | | | N/A | | | | N/A | | | | N/A | | | | N/A | | | | 8.27 | % | | | N/A | | |
Past performance is not indicative of future results. The performance data quoted represents past performance and current returns may be lower or higher. The investment return and principal value will fluctuate so that an investor's shares, when redeemed, may be worth more or less than the original cost. To obtain performance information current to the most recent month's end, please visit www.vcm.com.
The maximum offering price (MOP) reflects a maximum sales charge of 5.75% for Class A Shares. Class C Shares are not subject to an initial sales charge, but are subject to a deferred sales charge of 1.00% on shares redeemed within one year of purchase. NAV does not reflect sales charges.
The total returns quoted above may differ from the total returns shown in the Financial Highlights because they do not reflect adjustments made to the enclosed financial statements in accordance with U.S. generally accepted accounting principles or the deduction of taxes that a shareholder would pay on net investment income and realized capital gain distributions, including reinvested distributions, or redemptions of shares.
The total return figures set forth above include all waivers of fees for various periods since inception. Without such fee waivers, the total returns would have been lower. Some fee waivers are voluntary and may be modified or terminated at any time.
Victory Special Value Fund — Growth of $10,000
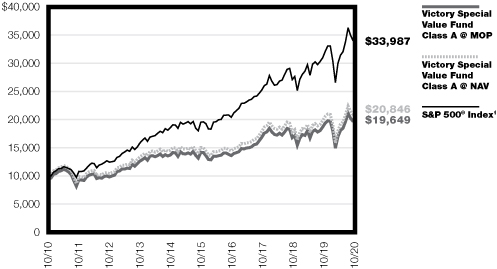
1The S&P 500® Index, an unmanaged index comprised of 500 domestically traded common stocks, is weighted according to the market value of each common stock in the index, and includes reinvestment of dividends. This index does not include the effect of sales charges, commissions, expenses or taxes, is not representative of the Fund and it is not possible to invest directly in an index.
The graph reflects investment growth of a hypothetical $10,000 investment in Class A Shares of the Fund. The performance of other classes of the Fund's shares will be greater than or less than the line shown based on the differences in loads and fees paid by shareholders investing in the different classes.
Past performance is no guarantee of future results.
The graph and table do not reflect the deduction of taxes that a shareholder would pay on Fund distributions or the redemption of Fund shares.
12
Victory Strategic Allocation Fund
Managers' Commentary
(Unaudited)
What were the market conditions during the reporting period?
Global equities (as measured by the MSCI All Country World Index) registered positive gains over the last 12 months. Though economic output and corporate earnings remain subdued from the impact of the novel coronavirus and the disease it causes ("COVID-19") earlier in the year, signs of a recovery across regions fueled market gains in July and August as COVID-19 restrictions eased and governmental (and, especially, central bank) support remained steadfast. September, however, ushered in a market pullback, with virus hot spots popping up in Europe and parts of Asia as well as a breakdown of stimulus talks in the United States. U.S. equities and Emerging Market equities (as measured by the S&P 500® Index and MSCI Emerging Markets Index, respectively) were the stronger-performing regions during the 12 months ended October 31, 2020, while the Non-U.S. Developed Market equities and World Commodity Producer equities (as measured by the MSCI EAFE Index and MSCI World Commodity Producers Index, respectively) were the laggards.
How did Victory Strategic Allocation Fund (the "Fund") perform during the reporting period?
The Fund seeks to provide income and long-term growth of capital. The Fund returned 3.99% (Class A Shares at net asset value) for the fiscal year ended October 31, 2020, underperforming the MSCI All Country World Index (the "Index") and the "Custom Index" (60% MSCI ACWI/40% Bloomberg Barclays U.S. Aggregate Bond Index), which returned 4.89% and 6.03%, respectively, during the period.
What strategies did you employ during the reporting period?
The Fund was positioned throughout the period to provide more diversification by more equally weighting the U.S. and foreign equity markets when compared to the Index, which detracted from Fund performance versus its Custom Index. The valuation of equity markets abroad appears more compelling and commensurate with the risks facing those markets, in our view. This detracted from the Fund's return as those exposures did not keep pace with the strong U.S. equity markets. The Fund also continued to be positioned to exhibit less interest rate risk associated with the U.S. Treasury market versus its Custom Index by partially substituting an equity income-oriented strategy. This negatively impacted Fund performance as interest rates on 30- Year and 10-Year U.S. Treasurys fell to near all-time historic lows.
13
Victory Strategic Allocation Fund
Investment Overview
(Unaudited)
Average Annual Total Return
Year Ended October 31, 2020
| | Class A | | Class C | | Class I | | Class R | | | | | |
INCEPTION DATE | | 12/10/93 | | 3/1/03 | | 8/31/07 | | 12/15/99 | | | | | |
| | Net Asset
Value | | Maximum
Offering
Price | | Net Asset
Value | | Contingent
Deferred
Charges | | Net Asset
Value | | Net Asset
Value | | MSCI All
Country
World
Index1 | | 60% MSCI
All Country
World
Index/40%
Barclays
U.S.
Aggregate
Bond
Index2 | |
One Year | | | 3.99 | % | | | 1.64 | % | | | 3.23 | % | | | 2.23 | % | | | 4.22 | % | | | 3.74 | % | | | 4.89 | % | | | 6.03 | % | |
Five Year | | | 4.74 | % | | | 4.26 | % | | | 3.98 | % | | | 3.98 | % | | | 4.99 | % | | | 4.47 | % | | | 8.11 | % | | | 6.75 | % | |
Ten Year | | | 6.83 | % | | | 6.59 | % | | | 6.06 | % | | | 6.06 | % | | | 7.17 | % | | | 6.53 | % | | | 7.90 | % | | | 6.40 | % | |
Past performance is not indicative of future results. The performance data quoted represents past performance and current returns may be lower or higher. The investment return and principal value will fluctuate so that an investor's shares, when redeemed, may be worth more or less than the original cost. To obtain performance information current to the most recent month's end, please visit www.vcm.com.
The maximum offering price (MOP) reflects a maximum sales charge of 2.25% for Class A Shares. Class C Shares are not subject to an initial sales charge, but are subject to a deferred sales charge of 1.00% on shares redeemed within one year of purchase. NAV does not reflect sales charges.
The total returns quoted above may differ from the total returns shown in the Financial Highlights because they do not reflect adjustments made to the enclosed financial statements in accordance with U.S. generally accepted accounting principles or the deduction of taxes that a shareholder would pay on net investment income and realized capital gain distributions, including reinvested distributions, or redemptions of shares.
The total return figures set forth above include all waivers of fees for various periods since inception. Without such fee waivers, the total returns would have been lower. Some fee waivers are voluntary and may be modified or terminated at any time.
Victory Strategic Allocation Fund — Growth of $10,000
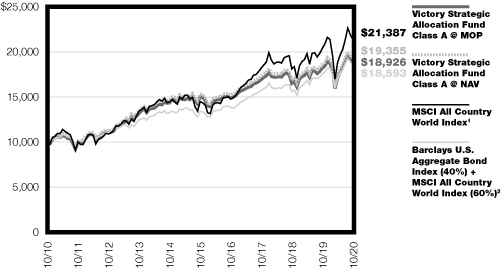
1The MSCI All Country World Index is a market capitalization weighted index designed to provide a broad measure of equity-market performance throughout the world. This index does not include the effect of sales charges, commissions, expenses or taxes, is not representative of the Fund and it is not possible to invest directly in an index.
2The Barclays U.S. Aggregate Bond Index is a broad-based flagship benchmark that measures the investment grade, U.S. dollar-denominated, fixed-rate taxable bond market. The index includes U.S. Treasurys, government-related and corporate securities, MBS (agency fixed-rate and hybrid ARM pass-throughs), ABS and CMBS (agency and nonagency). This index does not include the effect of sales charges, commissions, expenses or taxes, is not representative of the Fund and it is not possible to invest directly in an index.
The graph reflects investment growth of a hypothetical $10,000 investment in Class A Shares of the Fund. The performance of other classes of the Fund's shares will be greater than or less than the line shown based on the differences in loads and fees paid by shareholders investing in the different classes. Past performance is no guarantee of future results.
The graph and table do not reflect the deduction of taxes that a shareholder would pay on Fund distributions or the redemption of Fund shares.
14
Victory Taxable Fixed Income Fund
Victory INCORE Fund for Income
Managers' Commentary
(Unaudited)
What were the market conditions during the reporting period?
The novel coronavirus and the disease it causes (COVID-19) and the resulting pandemic dominated the last nine months of the 12-month period ended October 31, 2020. Despite these dire times, and due to aggressive measures to support the U.S. economy, all major indices were positive for the period, with the Dow Jones Industrial Average at 0.34%. The S&P 500® Index was up 9.71% and the NASDAQ Composite Index was up a whopping 32.94%; interesting times indeed. Due to safe-haven demand, interest rates fell for U.S. Treasury bonds and they fell more for shorter maturities than longer, steepening the U.S. Treasury yield curve. Prices move opposite yields. In the U.S. housing market, the pandemic spurred a flight from community living in large cities to single-family home ownership away from big cities. Due to this development, home sales and home prices increased year over year. As a result, the available supply of homes for sale fell as did affordability, despite lower borrowing costs. The rate for a 30-year fixed mortgage fell from 3.78% to 2.81% for conventional borrowers. The U.S. fixed income markets also had a good year despite the pandemic, as evidenced by the Bloomberg Barclays U.S. Aggregate Bond Index, which returned 6.19%. Within fixed income markets, U.S. Treasury bonds returned 6.95%, and relative to U.S. Treasury bonds, duration neutral, asset-backed securities outperformed most (+0.80%), while mortgage-backed securities outperformed slightly (+0.13%), followed closely by commercial mortgage-backed securities (-0.98%), while corporate and agency debt underperformed the most at (-1.02%) and (-3.45%), respectively. Drilling deeper still, within the mortgage market, Fannie Mae ("FNMA") led Freddie Mac ("FHLMC"), which in turn led Ginnie Mae ("GNMA"). Both FNMA and FHLMC (conventional mortgage providers) slightly outperformed duration-neutral U.S. Treasury bonds while GNMA slightly lagged.
How did Victory INCORE Fund for Income (the "Fund") perform during the reporting period?
The Fund's objective is to deliver high, reliable income via securities backed by the 100% full faith and credit of the U.S. government. The Fund returned 2.75% (Class A Shares at net asset value) for the fiscal year ended October 31, 2020, underperforming the Bloomberg Barclays U.S. Capital 1-5 Year U.S. Government Bond Index, which returned 4.22% during the period.
What strategies did you employ during the reporting period?
We continued to focus solely on our objective. As such, we continued to pursue GNMA borrowers making above-market payments, who have proven to be unable or unwilling to refinance efficiently. We also continued to selectively buy or create high-coupon GNMA platinum pools as opportunities arose. No matter the circumstances, the goal of our strategy remains to deliver high, reliable income consistent with preservation of capital.
15
Victory Taxable Fixed Income Fund
Victory INCORE Fund for Income
Investment Overview
(Unaudited)
Average Annual Total Return
Year Ended October 31, 2020
| | Class A | | Class C | | Class I | | Class R | | Class R6 | | Class Y | | | |
INCEPTION DATE | | 3/26/99 | | 3/1/02 | | 3/1/11 | | 9/16/87 | | 3/4/15 | | 1/28/13 | | | |
| | | Net Asset
Value | | Maximum
Offering
Price | | Net Asset
Value | | Contingent
Deferred
Charges | | Net Asset
Value | | Net Asset
Value | | Net Asset
Value | | Net Asset
Value | | Bloomberg
Barclays
Capital
1-5 Year U.S.
Gov't Bond
Index1 | |
One Year | | | 2.75 | % | | | 0.41 | % | | | 1.85 | % | | | 0.87 | % | | | 3.01 | % | | | 2.87 | % | | | 3.18 | % | | | 2.95 | % | | | 4.22 | % | |
Five Year | | | 1.66 | % | | | 1.20 | % | | | 0.84 | % | | | 0.84 | % | | | 1.92 | % | | | 1.66 | % | | | 1.95 | % | | | 1.86 | % | | | 2.23 | % | |
Ten Year | | | 1.65 | % | | | 1.42 | % | | | 0.85 | % | | | 0.85 | % | | | N/A | | | | 1.64 | % | | | N/A | | | | N/A | | | | 1.26 | % | |
Since Inception | | | N/A | | | | N/A | | | | N/A | | | | N/A | | | | 2.02 | % | | | N/A | | | | 1.84 | % | | | 1.61 | % | | | N/A | | |
Past performance is not indicative of future results. The performance data quoted represents past performance and current returns may be lower or higher. The investment return and principal value will fluctuate so that an investor's shares, when redeemed, may be worth more or less than the original cost. To obtain performance information current to the most recent month's end, please visit www.vcm.com.
The maximum offering price (MOP) figures reflect a maximum sales charge of 2.25% for Class A Shares. Class C Shares are not subject to an initial sales charge, but are subject to a deferred sales charge of 1.00% on shares redeemed within one year of purchase. NAV does not reflect sales charges.
The total returns quoted above may differ from the total returns shown in the Financial Highlights because they do not reflect adjustments made to the enclosed financial statements in accordance with U.S. generally accepted accounting principles or the deduction of taxes that a shareholder would pay on net investment income and realized capital gain distributions, including reinvested distributions, or redemptions of shares.
The total return figures set forth above include all waivers of fees for various periods since inception. Without such fee waivers, the total returns would have been lower. Some fee waivers are voluntary and may be modified or terminated at any time.
Victory INCORE Fund for Income — Growth of $10,000
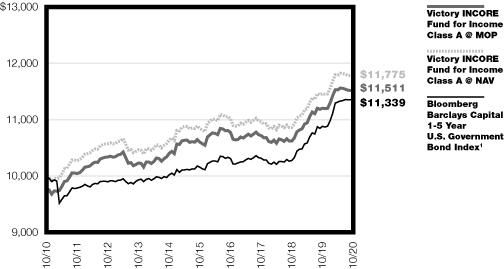
1Bloomberg Barclays Capital 1-5 Year U.S. Government Bond Index is a market-weighted index measuring the performance of Treasury and Agency securities issued by the United States Government with maturities of one to five years. The index does not include the effect of sales charges, commissions, expenses or taxes is not representative of the Fund and it is not possible to invest directly in an index.
The graph reflects investment growth of a hypothetical $10,000 investment in Class A Shares of the Fund. The performance of other classes of the Fund's shares will be greater than or less than the line shown based on the differences in loads and fees paid by shareholders investing in the different classes. Past performance is no guarantee of future results.
The graph and table do not reflect the deduction of taxes that a shareholder would pay on Fund distributions or the redemption of Fund shares.
16
Victory INCORE Investment Grade Convertible Fund
Managers' Commentary
(Unaudited)
What were the market conditions during the reporting period?
Equity and convertible markets began the fiscal year ended October 31, 2020 on a very strong note on the heels of a U.S. Federal Reserve (the "Fed") rate cut and signals that the Fed would likely leave rates on hold throughout 2020. Market strength continued into January and early February with the expectation of an accelerating economy looking to benefit from the completion of the NAFTA renegotiation (USMCA) and the China phase one trade deal. However, the social and economic trajectory of the United States changed abruptly in late February as consumers and broad financial markets came to the realization that the effects of the novel coronavirus and the disease it causes ("COVID-19") virus were no longer confined to international markets. The negative economic backdrop caused by reactions to COVID-19 had a very detrimental effect on U.S. equity performance. After reaching an all-time closing high of 3,386 on February 19th, the S&P 500® Index fell 430 points (-12.7%) over the next seven days to month-end. The last day of February was particularly wild, as the Dow Jones Industrial Average, at one point, was down over 1,000 points before rallying 600 points in the final minutes of the day. Stocks began March on an up note encouraged by presidential candidate Joe Biden's strong Super Tuesday results, coming on the heels of the Fed's emergency mid-meeting half-point rate cut. Markets, however, soon fell victim to increasingly bad news concerning the spread of COVID-19, which was exacerbated by tumbling oil prices. From the March 4th close to March 23rd, the S&P 500® Index fell an astonishing 28%. This period included three 9%-plus daily swings in the S&P 500® Index, and three days where the Dow Jones Industrial Average fell by over 2,000 points. Stocks began a strong rally post March 23rd, as passage of a $2 trillion U.S. government stimulus program blossomed into reality. The market rally continued into the second calendar quarter as investors seemed to overlook much of the dour economic news, including negative U.S. GDP, declining earnings, and spiking unemployment. More positive news later in the quarter, such as optimistic vaccine news and a stunning May jobs report led to the stock market's best quarterly return in 20 years. Stocks continued to advance in July and August despite a U.S. Commerce Department report of a 9.5% drop in second quarter U.S. GDP. The stock market finished August with five consecutive monthly gains before giving back some in the final two months of the fiscal year. Thanks to the strong start to the year, the S&P 500® Index managed a gain of 9.71% for the fiscal year. Bonds, as measured by the Bloomberg Barclays U.S. Aggregate Bond Index, also produced good results with a 6.19% return. After outperforming both stocks and bonds during the previous fiscal year, investment-grade convertibles lagged behind both asset classes in the fiscal year ended October 31, 2020.
How did Victory INCORE Investment Grade Convertible Fund (the "Fund") perform during the reporting period?
The Fund seeks to provide a high level of current income together with long-term capital appreciation. The Fund returned 4.43% (Class A Shares at net asset value) for the fiscal year ended October 31, 2020, outperforming the ICE BofA Investment Grade U.S. Convertible 5% Constrained Index, which returned 1.20% during the period.
17
Victory INCORE Investment Grade Convertible Fund (continued)
What strategies did you employ during the reporting period?
In managing the Fund, we strive to invest in high-quality convertibles with attractive underlying common stocks. We structure the Fund by spreading out our holdings across the three types of convertibles: 1) equity-sensitive, high-delta convertibles; 2) total return, middle-of-the-road convertibles; and 3) defensive, fixed-income-oriented convertibles. With this structure, we seek to provide a favorable balance between upside potential and downside exposure to equities. As of October 31, 2020, the Fund is overweight compared to the benchmark in the Health Care, and Information Technology sectors. It is underweighted in the Industrials, Utilities, and Energy sectors. It is approximately equally weighted in the Financials and Consumer Discretionary sectors. The Fund is broadly diversified among individual issues, economic sectors, credits, and convertible types. Performance during the fiscal year was aided by overweights in the Health Care and Information Technology sectors, as well as positive security selection in the same sectors. Performance was negatively impacted by underweights in the Industrials and Utilities sectors.
18
Victory INCORE Investment Grade Convertible Fund
Investment Overview
(Unaudited)
Average Annual Total Return
Year Ending October 31, 2020
| | Class A | | Class I | | | |
INCEPTION DATE | | 4/14/88 | | 8/31/07 | | | |
| | Net Asset
Value | | Maximum
Offering Price | | Net Asset
Value | | ICE BofAML
Investment Grade
U.S. Convertible
5% Constrained
Index1,2 | |
One Year | | | 4.43 | % | | | 2.10 | % | | | 4.91 | % | | | 1.20 | % | |
Five Year | | | 8.19 | % | | | 7.70 | % | | | 8.67 | % | | | 9.74 | % | |
Ten Year | | | 7.97 | % | | | 7.73 | % | | | 8.44 | % | | | 9.18 | % | |
Past performance is not indicative of future results. The performance data quoted represents past performance and current returns may be lower or higher. The investment return and principal value will fluctuate so that an investor's shares, when redeemed, may be worth more or less than the original cost. To obtain performance information current to the most recent month's end, please visit www.vcm.com.
The maximum offering price (MOP) figures reflect a maximum sales charge of 2.25% for Class A Shares. NAV does not reflect sales charges.
The total returns quoted above may differ from the total returns shown in the Financial Highlights because they do not reflect adjustments made to the enclosed financial statements in accordance with U.S. generally accepted accounting principles or the deduction of taxes that a shareholder would pay on net investment income and realized capital gain distributions, including reinvested distributions, or redemptions of shares.
The total return figures set forth above include all waivers of fees for various periods since inception. Without such fee waivers, the total returns would have been lower. Some fee waivers are voluntary and may be modified or terminated at any time.
Victory INCORE Investment Grade Convertible Fund — Growth of $10,000
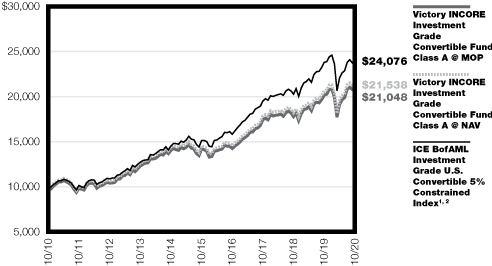
1ICE BofAML Investment Grade U.S. Convertible 5% Constrained Index is a market capitalization-weighted index of domestic corporate convertible securities. Bonds and preferred stocks must be convertible only to common stock, ADR's or cash equivalent and have a market value of at least $50 million. Composed of Coupon, OID, or zero coupon convertible bonds rated by Moody's and/or S&P with an average rating of Baa3/BBB- or higher. This Index does not include the effect of sales charges, commissions, expenses or taxes, is not representative of the Fund and it is not possible to invest directly in an index.
The graph reflects investment growth of a hypothetical $10,000 investment in Class A Shares of the Fund. The performance of other classes of the Fund's shares will be greater than or less than the line shown based on the differences in loads and fees paid by shareholders investing in the different classes. Past performance is no guarantee of future results.
2The ICE BofAML Investment Grade U.S. Convertible 5% Constrained Index commenced on January 1, 2012. Performance from October 31, 2010 to December 31, 2011 reflects performance of ICE BofAML All Investment Grade U.S. Convertibles Index. Performance from January 1, 2012 to present reflects the ICE BofAML Investment Grade U.S. Convertible 5% Constrained Index.
The graph and table do not reflect the deduction of taxes that a shareholder would pay on Fund distributions or the redemption of Fund shares.
19
Victory Portfolios
Victory Diversified Stock Fund | | October 31, 2020 | |
(Unaudited)
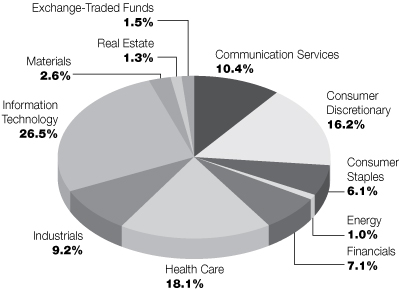
Investment Objective & Portfolio Holdings:
Victory Diversified Stock Fund seeks to provide long-term growth of capital.
Sector Allocation*:
October 31, 2020
(% of Total Investments)
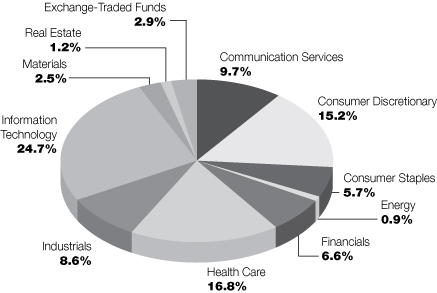
* Does not include futures, money market instruments, and short-term investments purchased with cash collateral from securities loaned.
20
Victory Portfolios
Victory NewBridge Large Cap Growth Fund | | October 31, 2020 | |
(Unaudited)
Investment Objective & Portfolio Holdings:
Victory NewBridge Large Cap Growth Fund seeks to provide long-term capital appreciation.
Sector Allocation*:
October 31, 2020
(% of Total Investments)
* Does not include futures, money market instruments, and short-term investments purchased with cash collateral from securities loaned.
21
Victory Portfolios
Victory Special Value Fund | | October 31, 2020 | |
(Unaudited)
Investment Objective & Portfolio Holdings:
Victory Special Value Fund seeks to provide long-term growth of capital and dividend income.
Sector Allocation*:
October 31, 2020
(% of Total Investments)
* Does not include futures, money market instruments, and short-term investments purchased with cash collateral from securities loaned.
22
Victory Portfolios
Victory Strategic Allocation Fund | | October 31, 2020 | |
(Unaudited)
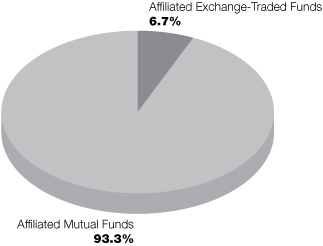
Investment Objective & Portfolio Holdings:
Victory Strategic Allocation Fund seeks to provide income and long-term growth of capital.
Portfolio Holdings:
October 31, 2020
(% of Total Investments)
23
Victory Portfolios
Victory INCORE Fund for Income | | October 31, 2020 | |
(Unaudited)
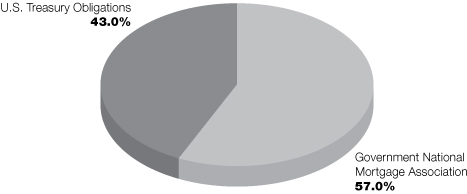
Investment Objective & Portfolio Holdings:
Victory INCORE Fund for Income seeks to provide a high level of current income consistent with preservation of shareholders' capital.
Portfolio Holdings:
October 31, 2020
(% of Total Investments)
24
Victory Portfolios
Victory INCORE Investment Grade Convertible Fund | | October 31, 2020 | |
(Unaudited)
Investment Objective & Portfolio Holdings:
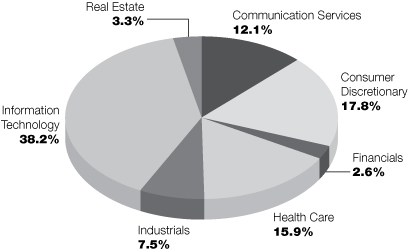
Victory INCORE Investment Grade Convertible Fund seeks to provide a high level of current income together with long-term capital appreciation.
Sector Allocation*:
October 31, 2020
(% of Total Investments)
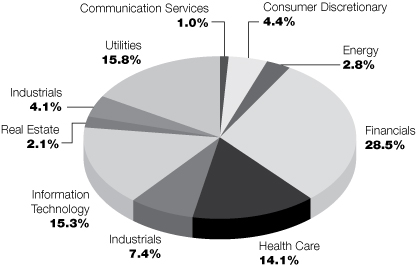
* Does not include futures, money market instruments, and short-term investments purchased with cash collateral from securities loaned.
25
Victory Portfolios
Victory Diversified Stock Fund | | Schedule of Portfolio Investments
October 31, 2020 | |
(Amounts in Thousands, Except for Shares)
Security Description | | Shares | | Value | |
Common Stocks (96.1%) | |
Communication Services (10.1%): | |
Alphabet, Inc., Class C (a) | | | 6,226 | | | $ | 10,092 | | |
Charter Communications, Inc., Class A (a) | | | 6,269 | | | | 3,786 | | |
Facebook, Inc., Class A (a) | | | 17,339 | | | | 4,562 | | |
Nexstar Media Group, Inc., Class A | | | 39,555 | | | | 3,259 | | |
T-Mobile U.S., Inc. (a) | | | 23,100 | | | | 2,531 | | |
Zynga, Inc., Class A (a) | | | 170,764 | | | | 1,535 | | |
| | | | 25,765 | | |
Communications Equipment (1.3%): | |
Lumentum Holdings, Inc. (a) | | | 40,748 | | | | 3,369 | | |
Consumer Discretionary (15.9%): | |
Amazon.com, Inc. (a) | | | 3,373 | | | | 10,241 | | |
Asbury Automotive Group, Inc. (a) (b) | | | 26,288 | | | | 2,707 | | |
Boyd Gaming Corp. | | | 97,372 | | | | 3,089 | | |
D.R. Horton, Inc. | | | 33,356 | | | | 2,229 | | |
Dollar General Corp. | | | 17,171 | | | | 3,584 | | |
Group 1 Automotive, Inc. | | | 24,085 | | | | 2,555 | | |
LCI Industries | | | 13,819 | | | | 1,515 | | |
LGI Homes, Inc. (a) | | | 19,351 | | | | 2,068 | | |
Lowe's Cos., Inc. | | | 17,163 | | | | 2,713 | | |
Meritage Homes Corp. (a) | | | 22,959 | | | | 1,999 | | |
Target Corp. | | | 13,928 | | | | 2,120 | | |
TopBuild Corp. (a) | | | 12,480 | | | | 1,912 | | |
Williams-Sonoma, Inc. (b) | | | 41,101 | | | | 3,750 | | |
| | | | 40,482 | | |
Consumer Staples (5.9%): | |
Monster Beverage Corp. (a) | | | 32,365 | | | | 2,478 | | |
PepsiCo, Inc. | | | 23,273 | | | | 3,103 | | |
Philip Morris International, Inc. | | | 29,292 | | | | 2,080 | | |
The Kroger Co. | | | 85,676 | | | | 2,760 | | |
The Procter & Gamble Co. | | | 18,901 | | | | 2,591 | | |
Walmart, Inc. | | | 14,913 | | | | 2,069 | | |
| | | | 15,081 | | |
Energy (1.0%): | |
Chevron Corp. | | | 11,621 | | | | 808 | | |
Phillips 66 | | | 17,470 | | | | 815 | | |
Valero Energy Corp. | | | 20,753 | | | | 801 | | |
| | | | 2,424 | | |
Financials (6.9%): | |
Ameriprise Financial, Inc. | | | 16,010 | | | | 2,576 | | |
Flagstar Bancorp, Inc. | | | 66,386 | | | | 1,948 | | |
JPMorgan Chase & Co. | | | 36,454 | | | | 3,574 | | |
Morgan Stanley | | | 48,126 | | | | 2,317 | | |
See notes to financial statements.
26
Victory Portfolios
Victory Diversified Stock Fund | | Schedule of Portfolio Investments — continued
October 31, 2020 | |
(Amounts in Thousands, Except for Shares)
Security Description | | Shares | | Value | |
Primerica, Inc. | | | 28,466 | | | $ | 3,138 | | |
T. Rowe Price Group, Inc. | | | 18,787 | | | | 2,380 | | |
Western Alliance Bancorp | | | 41,537 | | | | 1,711 | | |
| | | | 17,644 | | |
Health Care (17.6%): | |
AbbVie, Inc. | | | 53,460 | | | | 4,550 | | |
AmerisourceBergen Corp. | | | 17,071 | | | | 1,640 | | |
Amgen, Inc. | | | 8,446 | | | | 1,832 | | |
Bristol-Myers Squibb Co. | | | 80,376 | | | | 4,697 | | |
Charles River Laboratories International, Inc. (a) | | | 14,177 | | | | 3,227 | | |
Cigna Corp. | | | 15,406 | | | | 2,572 | | |
Hologic, Inc. (a) | | | 39,628 | | | | 2,727 | | |
ICON PLC (a) | | | 17,635 | | | | 3,180 | | |
Medtronic PLC | | | 8,851 | | | | 890 | | |
Merck & Co., Inc. | | | 47,741 | | | | 3,591 | | |
Pfizer, Inc. | | | 62,984 | | | | 2,235 | | |
Regeneron Pharmaceuticals, Inc. (a) | | | 6,380 | | | | 3,468 | | |
Stryker Corp. | | | 13,939 | | | | 2,816 | | |
Thermo Fisher Scientific, Inc. | | | 3,626 | | | | 1,716 | | |
UnitedHealth Group, Inc. | | | 18,203 | | | | 5,555 | | |
| | | | 44,696 | | |
Industrials (9.0%): | |
Federal Signal Corp. | | | 72,267 | | | | 2,073 | | |
Kansas City Southern | | | 21,941 | | | | 3,865 | | |
L3Harris Technologies, Inc. | | | 13,898 | | | | 2,239 | | |
Lockheed Martin Corp. | | | 7,971 | | | | 2,791 | | |
Masco Corp. | | | 66,909 | | | | 3,586 | | |
Old Dominion Freight Line, Inc. | | | 13,980 | | | | 2,661 | | |
UFP Industries, Inc. | | | 56,659 | | | | 2,828 | | |
XPO Logistics, Inc. (a) | | | 30,508 | | | | 2,746 | | |
| | | | 22,789 | | |
IT Services (5.4%): | |
Akamai Technologies, Inc. (a) | | | 33,804 | | | | 3,215 | | |
Booz Allen Hamilton Holdings Corp. | | | 41,846 | | | | 3,286 | | |
EPAM Systems, Inc. (a) | | | 8,750 | | | | 2,703 | | |
Fiserv, Inc. (a) | | | 29,027 | | | | 2,771 | | |
Visa, Inc., Class A | | | 9,256 | | | | 1,682 | | |
| | | | 13,657 | | |
Materials (2.6%): | |
Berry Global Group, Inc. (a) | | | 67,909 | | | | 3,167 | | |
Silgan Holdings, Inc. | | | 97,864 | | | | 3,371 | | |
| | | | 6,538 | | |
Real Estate (1.3%): | |
American Tower Corp. | | | 14,475 | | | | 3,324 | | |
See notes to financial statements.
27
Victory Portfolios
Victory Diversified Stock Fund | | Schedule of Portfolio Investments — continued
October 31, 2020 | |
(Amounts in Thousands, Except for Shares)
Security Description | | Shares | | Value | |
Semiconductors & Semiconductor Equipment (4.4%): | |
Advanced Micro Devices, Inc. (a) | | | 42,140 | | | $ | 3,173 | | |
Broadcom, Inc. | | | 9,386 | | | | 3,282 | | |
NVIDIA Corp. | | | 9,433 | | | | 4,729 | | |
| | | | 11,184 | | |
Software (9.3%): | |
Adobe, Inc. (a) | | | 5,982 | | | | 2,675 | | |
Cadence Design Systems, Inc. (a) | | | 23,616 | | | | 2,583 | | |
Microsoft Corp. | | | 77,437 | | | | 15,678 | | |
ServiceNow, Inc. (a) | | | 6,062 | | | | 3,015 | | |
| | | | 23,951 | | |
Technology Hardware, Storage & Peripherals (5.4%): | |
Apple, Inc. | | | 127,491 | | | | 13,879 | | |
Total Common Stocks (Cost $185,847) | | | 244,783 | | |
Exchange-Traded Funds (3.1%) | |
SPDR S&P 500 ETF Trust (b) | | | 23,802 | | | | 7,772 | | |
Total Exchange-Traded Funds (Cost $7,586) | | | 7,772 | | |
Collateral for Securities Loaned^ (5.5%) | |
BlackRock Liquidity Funds TempFund, Institutional Class, 0.10% (c) | | | 321,333 | | | | 321 | | |
Fidelity Investments Money Market Government Portfolio,
Institutional Class, 0.02% (c) | | | 4,288,131 | | | | 4,288 | | |
Goldman Sachs Financial Square Prime Obligations Fund,
Institutional Class, 0.02% (c) | | | 2,234,542 | | | | 2,235 | | |
JPMorgan Prime Money Market Fund, Capital Class, 0.07% (c) | | | 1,358,519 | | | | 1,359 | | |
Morgan Stanley Institutional Liquidity Prime Portfolio,
Institutional Class, 0.11% (c) | | | 5,749,144 | | | | 5,749 | | |
Total Collateral for Securities Loaned (Cost $13,952) | | | 13,952 | | |
Total Investments (Cost $207,385) — 104.7% | | | 266,507 | | |
Liabilities in excess of other assets — (4.7)% | | | (11,901 | ) | |
NET ASSETS — 100.00% | | $ | 254,606 | | |
^ Purchased with cash collateral from securities on loan.
(a) Non-income producing security.
(b) All or a portion of this security is on loan.
(c) Rate disclosed is the daily yield on October 31, 2020.
ETF — Exchange-Traded Fund
PLC — Public Limited Company
See notes to financial statements.
28
Victory Portfolios
Victory NewBridge Large Cap Growth Fund | | Schedule of Portfolio Investments
October 31, 2020 | |
(Amounts in Thousands, Except for Shares)
Security Description | | Shares | | Value | |
Common Stocks (99.1%) | |
Communication Services (12.4%): | |
Activision Blizzard, Inc. | | | 6,431 | | | $ | 487 | | |
Alphabet, Inc., Class C (a) | | | 499 | | | | 809 | | |
Facebook, Inc., Class A (a) | | | 3,009 | | | | 792 | | |
| | | | 2,088 | | |
Consumer Discretionary (18.2%): | |
Alibaba Group Holding Ltd., ADR (a) | | | 1,989 | | | | 606 | | |
Amazon.com, Inc. (a) | | | 454 | | | | 1,378 | | |
Burlington Stores, Inc. (a) | | | 2,529 | | | | 490 | | |
Lululemon Athletica, Inc. (a) | | | 1,845 | | | | 589 | | |
| | | | 3,063 | | |
Financials (2.6%): | |
MSCI, Inc. | | | 1,270 | | | | 444 | | |
Health Care (16.3%): | |
Edwards Lifesciences Corp. (a) | | | 6,220 | | | | 446 | | |
Masimo Corp. (a) | | | 1,481 | | | | 331 | | |
UnitedHealth Group, Inc. | | | 1,599 | | | | 488 | | |
Veeva Systems, Inc., Class A (a) | | | 2,166 | | | | 585 | | |
Vertex Pharmaceuticals, Inc. (a) | | | 1,444 | | | | 301 | | |
Zoetis, Inc. | | | 3,672 | | | | 582 | | |
| | | | 2,733 | | |
Industrials (7.6%): | |
CoStar Group, Inc. (a) | | | 659 | | | | 543 | | |
Trane Technologies PLC | | | 2,653 | | | | 352 | | |
Uber Technologies, Inc. (a) | | | 11,545 | | | | 386 | | |
| | | | 1,281 | | |
IT Services (16.2%): | |
EPAM Systems, Inc. (a) | | | 1,737 | | | | 537 | | |
PayPal Holdings, Inc. (a) | | | 4,342 | | | | 808 | | |
Shopify, Inc., Class A (a) | | | 383 | | | | 354 | | |
Twilio, Inc., Class A (a) | | | 691 | | | | 193 | | |
Visa, Inc., Class A | | | 4,687 | | | | 852 | | |
| | | | 2,744 | | |
Real Estate (3.4%): | |
American Tower Corp. | | | 2,462 | | | | 565 | | |
Semiconductors & Semiconductor Equipment (5.3%): | |
NVIDIA Corp. | | | 1,795 | | | | 900 | | |
Software (17.1%): | |
Adobe, Inc. (a) | | | 1,486 | | | | 664 | | |
Cadence Design Systems, Inc. (a) | | | 2,447 | | | | 268 | | |
salesforce.com, Inc. (a) | | | 2,742 | | | | 637 | | |
See notes to financial statements.
29
Victory Portfolios
Victory NewBridge Large Cap Growth Fund | | Schedule of Portfolio Investments — continued
October 31, 2020 | |
(Amounts in Thousands, Except for Shares)
Security Description | | Shares | | Value | |
ServiceNow, Inc. (a) | | | 1,872 | | | $ | 932 | | |
The Trade Desk, Inc., Class A (a) (b) | | | 717 | | | | 406 | | |
| | | | 2,907 | | |
Total Common Stocks (Cost $7,647) | | | 16,725 | | |
Collateral for Securities Loaned^ (2.7%) | |
BlackRock Liquidity Funds TempFund, Institutional Class, 0.10% (c) | | | 10,306 | | | | 10 | | |
Fidelity Investments Money Market Government Portfolio,
Institutional Class, 0.02% (c) | | | 137,499 | | | | 137 | | |
Goldman Sachs Financial Square Prime Obligations Fund,
Institutional Class, 0.02% (c) | | | 71,693 | | | | 72 | | |
JPMorgan Prime Money Market Fund, Capital Class, 0.07% (c) | | | 43,570 | | | | 44 | | |
Morgan Stanley Institutional Liquidity Prime Portfolio,
Institutional Class, 0.11% (c) | | | 184,384 | | | | 184 | | |
Total Collateral for Securities Loaned (Cost $447) | | | 447 | | |
Total Investments (Cost $8,094) — 101.8% | | | 17,172 | | |
Liabilities in excess of other assets — (1.8)% | | | (310 | ) | |
NET ASSETS — 100.00% | | $ | 16,862 | | |
^ Purchased with cash collateral from securities on loan.
(a) Non-income producing security.
(b) All or a portion of this security is on loan.
(c) Rate disclosed is the daily yield on October 31, 2020.
ADR — American Depositary Receipt
PLC — Public Limited Company
See notes to financial statements.
30
Victory Portfolios
Victory Special Value Fund | | Schedule of Portfolio Investments
October 31, 2020 | |
(Amounts in Thousands, Except for Shares)
Security Description | | Shares | | Value | |
Common Stocks (97.8%) | |
Communication Services (10.3%): | |
Alphabet, Inc., Class C (a) | | | 1,064 | | | $ | 1,725 | | |
Charter Communications, Inc., Class A (a) | | | 1,060 | | | | 640 | | |
Facebook, Inc., Class A (a) | | | 2,999 | | | | 789 | | |
Nexstar Media Group, Inc., Class A | | | 6,841 | | | | 564 | | |
T-Mobile U.S., Inc. (a) | | | 3,965 | | | | 434 | | |
Zynga, Inc., Class A (a) | | | 29,500 | | | | 265 | | |
| | | | 4,417 | | |
Communications Equipment (1.3%): | |
Lumentum Holdings, Inc. (a) | | | 6,998 | | | | 579 | | |
Consumer Discretionary (16.1%): | |
Amazon.com, Inc. (a) | | | 567 | | | | 1,721 | | |
Asbury Automotive Group, Inc. (a) | | | 4,548 | | | | 468 | | |
Boyd Gaming Corp. | | | 16,638 | | | | 528 | | |
D.R. Horton, Inc. | | | 5,723 | | | | 383 | | |
Dollar General Corp. | | | 2,934 | | | | 612 | | |
Group 1 Automotive, Inc. | | | 4,132 | | | | 438 | | |
LCI Industries | | | 2,362 | | | | 259 | | |
LGI Homes, Inc. (a) | | | 3,332 | | | | 356 | | |
Lowe's Cos., Inc. | | | 2,947 | | | | 466 | | |
Meritage Homes Corp. (a) | | | 3,954 | | | | 344 | | |
Target Corp. | | | 2,404 | | | | 366 | | |
TopBuild Corp. (a) | | | 2,149 | | | | 329 | | |
Williams-Sonoma, Inc. | | | 7,100 | | | | 649 | | |
| | | | 6,919 | | |
Consumer Staples (6.1%): | |
Monster Beverage Corp. (a) | | | 5,591 | | | | 428 | | |
PepsiCo, Inc. | | | 4,050 | | | | 540 | | |
Philip Morris International, Inc. | | | 5,044 | | | | 358 | | |
The Kroger Co. | | | 14,754 | | | | 476 | | |
The Procter & Gamble Co. | | | 3,255 | | | | 446 | | |
Walmart, Inc. | | | 2,568 | | | | 356 | | |
| | | | 2,604 | | |
Energy (1.0%): | |
Chevron Corp. | | | 2,000 | | | | 139 | | |
Phillips 66 | | | 3,008 | | | | 140 | | |
Valero Energy Corp. | | | 3,496 | | | | 135 | | |
| | | | 414 | | |
Financials (7.1%): | |
Ameriprise Financial, Inc. | | | 2,708 | | | | 436 | | |
Flagstar Bancorp, Inc. | | | 11,431 | | | | 335 | | |
JPMorgan Chase & Co. | | | 6,258 | | | | 613 | | |
Morgan Stanley | | | 8,253 | | | | 397 | | |
See notes to financial statements.
31
Victory Portfolios
Victory Special Value Fund | | Schedule of Portfolio Investments — continued
October 31, 2020 | |
(Amounts in Thousands, Except for Shares)
Security Description | | Shares | | Value | |
Primerica, Inc. | | | 4,903 | | | $ | 541 | | |
T. Rowe Price Group, Inc. | | | 3,246 | | | | 411 | | |
Western Alliance Bancorp | | | 7,154 | | | | 295 | | |
| | | | 3,028 | | |
Health Care (17.9%): | |
AbbVie, Inc. | | | 9,210 | | | | 784 | | |
AmerisourceBergen Corp. | | | 2,935 | | | | 282 | | |
Amgen, Inc. | | | 1,454 | | | | 315 | | |
Bristol-Myers Squibb Co. | | | 13,902 | | | | 813 | | |
Charles River Laboratories International, Inc. (a) | | | 2,441 | | | | 556 | | |
Cigna Corp. | | | 2,653 | | | | 443 | | |
Hologic, Inc. (a) | | | 6,846 | | | | 471 | | |
ICON PLC (a) | | | 3,036 | | | | 547 | | |
Medtronic PLC | | | 1,523 | | | | 153 | | |
Merck & Co., Inc. | | | 8,223 | | | | 618 | | |
Pfizer, Inc. | | | 10,847 | | | | 385 | | |
Regeneron Pharmaceuticals, Inc. (a) | | | 1,087 | | | | 591 | | |
Stryker Corp. | | | 2,410 | | | | 487 | | |
Thermo Fisher Scientific, Inc. | | | 625 | | | | 296 | | |
UnitedHealth Group, Inc. | | | 3,135 | | | | 957 | | |
| | | | 7,698 | | |
Industrials (9.1%): | |
Federal Signal Corp. | | | 12,444 | | | | 357 | | |
Kansas City Southern | | | 3,763 | | | | 663 | | |
L3Harris Technologies, Inc. | | | 2,394 | | | | 386 | | |
Lockheed Martin Corp. | | | 1,378 | | | | 482 | | |
Masco Corp. | | | 11,318 | | | | 606 | | |
Old Dominion Freight Line, Inc. | | | 2,415 | | | | 460 | | |
UFP Industries, Inc. | | | 9,690 | | | | 484 | | |
XPO Logistics, Inc. (a) | | | 5,276 | | | | 475 | | |
| | | | 3,913 | | |
IT Services (5.5%): | |
Akamai Technologies, Inc. (a) | | | 5,813 | | | | 553 | | |
Booz Allen Hamilton Holdings Corp. | | | 7,231 | | | | 567 | | |
EPAM Systems, Inc. (a) | | | 1,507 | | | | 466 | | |
Fiserv, Inc. (a) | | | 4,999 | | | | 477 | | |
Visa, Inc., Class A | | | 1,595 | | | | 290 | | |
| | | | 2,353 | | |
Materials (2.6%): | |
Berry Global Group, Inc. (a) | | | 11,649 | | | | 543 | | |
Silgan Holdings, Inc. | | | 16,926 | | | | 583 | | |
| | | | 1,126 | | |
Real Estate (1.3%): | |
American Tower Corp. | | | 2,448 | | | | 562 | | |
See notes to financial statements.
32
Victory Portfolios
Victory Special Value Fund | | Schedule of Portfolio Investments — continued
October 31, 2020 | |
(Amounts in Thousands, Except for Shares)
Security Description | | Shares | | Value | |
Semiconductors & Semiconductor Equipment (4.5%): | |
Advanced Micro Devices, Inc. (a) | | | 7,192 | | | $ | 541 | | |
Broadcom, Inc. | | | 1,623 | | | | 567 | | |
NVIDIA Corp. | | | 1,612 | | | | 809 | | |
| | | | 1,917 | | |
Software (9.5%): | |
Adobe, Inc. (a) | | | 1,034 | | | | 462 | | |
Cadence Design Systems, Inc. (a) | | | 4,049 | | | | 443 | | |
Microsoft Corp. | | | 13,202 | | | | 2,674 | | |
ServiceNow, Inc. (a) | | | 1,025 | | | | 510 | | |
| | | | 4,089 | | |
Technology Hardware, Storage & Peripherals (5.5%): | |
Apple, Inc. | | | 21,566 | | | | 2,348 | | |
Total Common Stocks (Cost $32,441) | | | 41,967 | | |
Exchange-Traded Funds (1.5%) | |
SPDR S&P 500 ETF Trust | | | 1,995 | | | | 651 | | |
Total Exchange-Traded Funds (Cost $702) | | | 651 | | |
Total Investments (Cost $33,143) — 99.3% | | | 42,618 | | |
Other assets in excess of liabilities — 0.7% | | | 289 | | |
NET ASSETS — 100.00% | | $ | 42,907 | | |
(a) Non-income producing security.
ETF — Exchange-Traded Fund
PLC — Public Limited Company
See notes to financial statements.
33
Victory Portfolios
Victory Strategic Allocation Fund | | Schedule of Portfolio Investments
October 31, 2020 | |
(Amounts in Thousands, Except for Shares)
Security Description | | Shares | | Value | |
Affiliated Exchange-Traded Funds (6.6%) | |
VictoryShares U.S. Multi-Factor Minimum Volatility ETF | | | 53,070 | | | $ | 1,629 | | |
Total Affiliated Exchange-Traded Funds (Cost $1,357) | | | 1,629 | | |
Affiliated Mutual Funds (92.6%) | |
Victory INCORE Total Return Bond Fund, Class R6 | | | 310,252 | | | | 3,081 | | |
Victory Integrity Discovery Fund, Class Y | | | 28,829 | | | | 820 | | |
Victory Market Neutral Income Fund, Class I | | | 557,908 | | | | 5,412 | | |
Victory RS Global Fund, Class Y (a) | | | 476,267 | | | | 7,049 | | |
Victory RS Partners Fund, Class Y | | | 40,388 | | | | 830 | | |
Victory Sophus Emerging Markets Small Cap Fund, Class Y | | | 289,495 | | | | 1,916 | | |
Victory Trivalent Emerging Markets Small-Cap Fund, Class Y | | | 149,184 | | | | 1,987 | | |
Victory Trivalent International Small-Cap Fund, Class I | | | 122,564 | | | | 1,710 | | |
Total Affiliated Mutual Funds (Cost $21,897) | | | 22,805 | | |
Total Investments (Cost $23,254) — 99.2% | | | 24,434 | | |
Other assets in excess of liabilities — 0.8% | | | 204 | | |
NET ASSETS — 100.00% | | $ | 24,638 | | |
(a) Represents investments greater than 25% of the Fund's net assets. Performance of the Fund may be adversely impacted by concentrated investments in securities. The financial statements and portfolio holdings for these securities can be found at www.sec.gov.
ETF — Exchange-Traded Fund
See notes to financial statements.
34
Victory Portfolios
Victory INCORE Fund for Income | | Schedule of Portfolio Investments
October 31, 2020 | |
(Amounts in Thousands, Except for Shares)
Security Description | | Principal
Amount | | Value | |
Government National Mortgage Association (56.2%) | |
Multi-family (0.4%): | |
Collateralized Mortgage Obligations (0.2%): | |
Government National Mortgage Assoc. | |
Series 2012-33, Class AB, 7.00%, 3/16/46 | | $ | 2,204 | | | $ | 2,346 | | |
Pass-throughs (0.2%): | |
Government National Mortgage Assoc. | |
7.50%, 8/15/21 | | | 4 | | | | 4 | | |
7.92%, 7/1/23 | | | 194 | | | | 194 | | |
8.00%, 1/15/31 – 11/15/33 | | | 1,103 | | | | 1,104 | | |
7.75%, 9/15/33 | | | 398 | | | | 399 | | |
| | | | 1,701 | | |
Single Family (55.8%): | |
Collateralized Mortgage Obligations (2.0%): | |
Government National Mortgage Assoc. | |
Series 1999-4, Class ZB, 6.00%, 2/20/29 | | | 198 | | | | 198 | | |
Series 2001-10, Class PE, 6.50%, 3/16/31 | | | 154 | | | | 154 | | |
Series 2005-74, Class HB, 7.50%, 9/16/35 | | | 12 | | | | 13 | | |
Series 2005-74, Class HC, 7.50%, 9/16/35 | | | 61 | | | | 71 | | |
Series 2011-166, Class NT, 7.75%, 11/20/31 (a) | | | 942 | | | | 1,099 | | |
Series 2012-106, Class JM, 7.31%, 10/20/34 (a) | | | 700 | | | | 830 | | |
Series 2012-30, Class WB, 7.06%, 11/20/39 (a) | | | 2,877 | | | | 3,358 | | |
Series 2013-190, Class KT, 8.10%, 9/20/30 (a) | | | 341 | | | | 393 | | |
Series 2013-51, Class BL, 6.07%, 4/20/34 (a) | | | 1,921 | | | | 2,234 | | |
Series 2013-64, Class KY, 6.84%, 12/20/38 (a) | | | 1,145 | | | | 1,309 | | |
Series 2013-70, Class KP, 7.07%, 2/20/39 (a) | | | 960 | | | | 1,130 | | |
Series 2014-69, Class W, 7.20%, 11/20/34 (a) | | | 145 | | | | 170 | | |
Series 2014-74, Class PT, 7.77%, 5/16/44 (a) | | | 231 | | | | 261 | | |
Series 2015-77, Class PT, 7.65%, 6/20/39 (a) | | | 525 | | | | 600 | | |
Series 2019-22, Class PT, 7.92%, 2/20/49 (a) | | | 8,071 | | | | 9,254 | | |
| | | | 21,074 | | |
Pass-throughs (53.8%): | |
Government National Mortgage Assoc. | |
9.00%, 12/15/20 – 12/15/30 | | | 2,763 | | | | 3,072 | | |
9.50%, 2/15/21 – 9/15/27 | | | 152 | | | | 164 | | |
6.00%, 1/15/22 – 9/20/50 | | | 65,712 | | | | 77,894 | | |
7.95%, 9/15/22 | | | 6 | | | | 6 | | |
7.50%, 1/15/23 – 5/15/49 | | | 76,872 | | | | 89,383 | | |
7.13%, 3/15/23 – 7/15/25 | | | 423 | | | | 433 | | |
7.00%, 6/15/23 – 9/20/50 | | | 101,241 | | | | 119,541 | | |
5.50%, 7/15/23 – 11/15/45 | | | 12,257 | | | | 14,534 | | |
6.50%, 8/20/23 – 2/20/41 | | | 146,059 | | | | 171,343 | | |
8.00%, 6/20/24 – 5/15/49 | | | 44,391 | | | | 52,680 | | |
10.00%, 4/15/25 – 2/15/26 | | | 8 | | | | 8 | | |
6.13%, 6/20/28 – 9/20/29 | | | 401 | | | | 427 | | |
6.28%, 10/20/28 – 10/20/29 | | | 734 | | | | 797 | | |
6.10%, 5/20/29 – 7/20/31 | | | 568 | | | | 621 | | |
7.30%, 4/20/30 – 2/20/31 | | | 215 | | | | 226 | | |
See notes to financial statements.
35
Victory Portfolios
Victory INCORE Fund for Income | | Schedule of Portfolio Investments — continued
October 31, 2020 | |
(Amounts in Thousands, Except for Shares)
Security Description | | Shares or
Principal
Amount | | Value | |
6.49%, 5/20/31 – 3/20/32 | | $ | 1,022 | | | $ | 1,133 | | |
8.50%, 6/15/31 – 7/15/32 | | | 7,518 | | | | 8,709 | | |
4.50%, 12/15/33 – 5/15/41 | | | 5,122 | | | | 5,798 | | |
5.00%, 1/20/34 – 1/15/40 | | | 11,385 | | | | 13,343 | | |
4.00%, 8/15/41 | | | 899 | | | | 994 | | |
| | | | 561,106 | | |
Total Government National Mortgage Association (Cost $574,256) | | | 586,227 | | |
U.S. Treasury Obligations (42.5%) | |
U.S. Treasury Bills, 0.10%, 3/4/21 (b) | | | 25,831 | | | | 25,822 | | |
U.S. Treasury Bonds | |
7.63%, 11/15/22 | | | 95,879 | | | | 110,456 | | |
7.13%, 2/15/23 | | | 91,095 | | | | 105,578 | | |
7.50%, 11/15/24 | | | 155,516 | | | | 200,743 | | |
Total U.S. Treasury Obligations (Cost $443,324) | | | 442,599 | | |
Investment Companies (0.0%) (c) | |
BlackRock Liquidity Fedfund, 0.04% | | | 100,482 | | | | 100 | | |
Total Investment Companies (Cost $100) | | | 100 | | |
Total Investments (Cost $1,017,680) — 98.7% | | | 1,028,926 | | |
Other assets in excess of liabilities — 1.3% | | | 12,974 | | |
NET ASSETS — 100.00% | | $ | 1,041,900 | | |
(a) The rate for certain asset-backed and mortgage-backed securities may vary based on factors relating to the pool of assets underlying the security. The rate disclosed is the rate in effect at October 31, 2020.
(b) Rate represents the effective yield at October 31, 2020.
(c) Amount represents less than 0.05% of net assets.
See notes to financial statements.
36
Victory Portfolios
Victory INCORE Investment Grade Convertible Fund | | Schedule of Portfolio Investments
October 31, 2020 | |
(Amounts in Thousands, Except for Shares)
Security Description | | Principal
Amount | | Value | |
Convertible Corporate Bonds (65.2%) | |
Communication Services (1.0%): | |
Snap, Inc., 0.75%, 8/1/26 | | $ | 1,595 | | | $ | 2,965 | | |
Consumer Discretionary (4.6%): | |
Booking Holdings, Inc. | |
0.90%, 9/15/21 | | | 2,722 | | | | 2,844 | | |
0.75%, 5/1/25 (a) (b) | | | 8,415 | | | | 10,582 | | |
| | | | 13,426 | | |
Energy (2.9%): | |
Pioneer Natural Resources Co., 0.25%, 5/15/25 (a) | | | 8,015 | | | | 8,539 | | |
Financials (16.4%): | |
Ares Capital Corp. | |
3.75%, 2/1/22 | | | 8,240 | | | | 8,361 | | |
4.63%, 3/1/24 | | | 3,845 | | | | 3,981 | | |
Barclays Bank PLC | |
0.00%, 2/4/25 | | | 3,025 | | | | 3,647 | | |
0.00%, 2/18/25 | | | 1,595 | | | | 1,654 | | |
BlackRock Capital Investment Corp., 5.00%, 6/15/22 | | | 3,712 | | | | 3,640 | | |
Blackstone Mortgage Trust, Inc., 4.75%, 3/15/23 | | | 3,000 | | | | 2,891 | | |
JPMorgan Chase Financial Co. LLC, 0.25%, 5/1/23 (a) | | | 9,355 | | | | 9,399 | | |
MGIC Investment Corp. Convertible Subordinated Notes, 9.00%, 4/1/63 (a) | | | 4,127 | | | | 5,339 | | |
Prospect Capital Corp., 4.95%, 7/15/22, Callable 4/15/22 @ 100 | | | 5,923 | | | | 6,070 | | |
TPG Specialty Lending, Inc., 4.50%, 8/1/22 | | | 2,985 | | | | 3,059 | | |
| | | | 48,041 | | |
Health Care (14.6%): | |
Anthem, Inc., 2.75%, 10/15/42 | | | 3,549 | | | | 13,621 | | |
Bristol-Myers Squibb Co., Convertible Subordinated Notes,
0.24% (LIBOR03M-50bps), 9/15/23, Callable 12/10/20 @ 100 (c) (d) | | | 2,466 | | | | 3,680 | | |
Danaher Corp., Convertible Subordinated Notes, 0.00%, 1/22/21,
Callable 11/25/20 @ 99.62 (e) | | | 1,205 | | | | 10,562 | | |
Illumina, Inc., 0.00%, 8/15/23 (b) | | | 3,975 | | | | 4,183 | | |
Illumina, Inc., Convertible Subordinated Notes, 0.50%, 6/15/21 | | | 6,987 | | | | 8,627 | | |
Teladoc Health, Inc., 3.00%, 12/15/22 | | | 500 | | | | 2,233 | | |
| | | | 42,906 | | |
Industrials (7.7%): | |
Fortive Corp., 0.88%, 2/15/22 | | | 6,901 | | | | 6,870 | | |
Macquarie Infrastructure, 2.00%, 10/1/23 | | | 5,966 | | | | 5,468 | | |
Southwest Airlines Co., 1.25%, 5/1/25 | | | 7,690 | | | | 10,231 | | |
| | | | 22,569 | | |
Information Technology (15.8%): | |
Akamai Technologies, Inc., 0.13%, 5/1/25 | | | 1,922 | | | | 2,249 | | |
Euronet Worldwide, Inc., 0.75%, 3/15/49, Callable 3/20/25 @ 100 | | | 7,300 | | | | 7,017 | | |
Micron Technology, Inc., Convertible Subordinated Notes,
3.13%, 5/1/32, callable 5/4/2021 @ 100 | | | 1,462 | | | | 7,369 | | |
Novellus Systems, Inc., Convertible Subordinated Notes, 2.63%, 5/15/41 | | | 1,256 | | | | 13,467 | | |
See notes to financial statements.
37
Victory Portfolios
Victory INCORE Investment Grade Convertible Fund | | Schedule of Portfolio Investments — continued
October 31, 2020 | |
(Amounts in Thousands, Except for Shares)
Security Description | | Shares or
Principal
Amount | | Value | |
Nuance Communication, Inc. Convertible Subordinated Notes,
1.00%, 12/15/35, Callable 12/20/22 @ 100 | | $ | 1,410 | | | $ | 1,993 | | |
ServiceNow, Inc., 0.00%, 6/1/22 | | | 520 | | | | 1,901 | | |
Western Digital Corp., 1.50%, 2/1/24 | | | 13,000 | | | | 12,431 | | |
| | | | 46,427 | | |
Real Estate (2.2%): | |
Spirit Realty Capital, Inc., 3.75%, 5/15/21 | | | 6,255 | | | | 6,342 | | |
| | | | 6,342 | | |
Total Convertible Corporate Bonds (Cost $168,791) | | | 191,215 | | |
Convertible Preferred Stocks (33.9%) | |
Financials (13.3%): | |
AMG Capital Trust II, 5.15%, 10/15/37 | | | 181,860 | | | | 8,556 | | |
Bank of America Corp., Series L, 7.25% (f) | | | 7,130 | | | | 10,459 | | |
KKR & Co., Inc., Series C, 6.00%, 9/15/23 | | | 53,700 | | | | 2,795 | | |
New York Community Capital Trust, 6.00%, 11/1/51 | | | 57,174 | | | | 2,500 | | |
Wells Fargo & Co., Series L, 7.50% (f) | | | 10,819 | | | | 14,592 | | |
| | | | 38,902 | | |
Industrials (4.3%): | |
Stanley Black & Decker, Inc., 5.25%, 11/15/22 | | | 119,525 | | | | 12,476 | | |
Utilities (16.3%): | |
American Electric Power Co., Inc., 6.13%, 3/15/22 | | | 98,985 | | | | 5,285 | | |
CenterPoint Energy, Inc. Convertible Subordinated Notes, 4.57%, 9/15/29 (d) | | | 80,000 | | | | 4,565 | | |
Dominion Energy, Inc., Series A, 7.25%, 6/1/22 | | | 100,003 | | | | 10,387 | | |
DTE Energy Co., 6.25%, 11/1/22 | | | 152,215 | | | | 7,242 | | |
NextEra Energy, Inc., 4.87%, 9/1/22 | | | 127,545 | | | | 7,270 | | |
NextEra Energy, Inc., 5.28%, 3/1/23 | | | 75,000 | | | | 3,709 | | |
Southern Co., 6.75%, 8/1/22 | | | 199,220 | | | | 9,629 | | |
| | | | 48,087 | | |
Total Convertible Preferred Stocks (Cost $96,922) | | | 99,465 | | |
Collateral for Securities Loaned^ (4.6%) | |
BlackRock Liquidity Funds TempFund, Institutional Class, 0.10% (h) | | | 314,223 | | | | 314 | | |
Fidelity Investments Money Market Government Portfolio,
Institutional Shares, 0.02% (h) | | | 4,193,209 | | | | 4,193 | | |
Goldman Sachs Financial Square Prime Obligations Fund, Institutional
Class, 0.02% (h) | | | 2,185,099 | | | | 2,185 | | |
JPMorgan Prime Money Market Fund, Capital Class, 0.07% (h) | | | 1,328,500 | | | | 1,329 | | |
Morgan Stanley Institutional Liquidity Prime Portfolio, Institutional
Class, 0.11% (h) | | | 5,621,935 | | | | 5,622 | | |
Total Collateral for Securities Loaned (Cost $13,643) | | | 13,643 | | |
Total Investments (Cost $279,356) — 103.7% | | | 304,323 | | |
Liabilities in excess of other assets — (3.7)% | | | (10,829 | ) | |
NET ASSETS — 100.00% | | $ | 293,494 | | |
See notes to financial statements.
38
Victory Portfolios
Victory INCORE Investment Grade Convertible Fund | | Schedule of Portfolio Investments — continued
October 31, 2020 | |
^ Purchased with cash collateral from securities on loan.
(a) Rule 144A security or other security that is restricted as to resale to institutional investors. The Fund's Adviser has deemed this security to be liquid based upon procedures approved by the Board of Trustees. As of October 31, 2020, the fair value of these securities was $33,859 (thousands) and amounted to 11.5% of net assets.
(b) All or a portion of this security is on loan.
(c) Variable or Floating-Rate Security. Rate disclosed is as of October 31, 2020.
(d) Continuously callable with 30 days' notice.
(e) Continuously callable with 15 days' notice.
(f) Security is perpetual and has no final maturity date but may be subject to calls at various dates in the future.
(g) Non-income producing security.
(h) Rate disclosed is the daily yield on October 31, 2020.
bps — Basis points
LIBOR — London InterBank Offered Rate
LIBOR03M — 3 Month US Dollar LIBOR, rate disclosed as of October 31, 2020, based on the last reset date of the security
LLC — Limited Liability Company
PLC — Public Limited Company
See notes to financial statements.
39
Victory Portfolios | | Statements of Assets and Liabilities
October 31, 2020 | |
(Amounts in Thousands, Except Per Share Amounts)
| | | Victory
Diversified
Stock Fund | | Victory
NewBridge
Large Cap
Growth Fund | | Victory
Special
Value Fund | |
Assets: | |
Investments, at value (Cost $207,385, $8,094 and
$33,143) | | $ | 266,507 | (a) | | $ | 17,172 | (b) | | $ | 42,618 | | |
Cash and cash equivalents | | | 2,259 | | | | 111 | | | | 415 | | |
Receivables: | |
Interest and dividends | | | 204 | | | | 1 | | | | 35 | | |
Capital shares issued | | | 6 | | | | — | (c) | | | 28 | | |
Investments sold | | | 5,368 | | | | 121 | | | | 948 | | |
From Adviser | | | 5 | | | | 8 | | | | 8 | | |
Prepaid expenses | | | 14 | | | | 4 | | | | 26 | | |
Total Assets | | | 274,363 | | | | 17,417 | | | | 44,078 | | |
Liabilities: | |
Payables: | |
Collateral received on loaned securities | | | 13,952 | | | | 447 | | | | — | | |
Investments purchased | | | 5,197 | | | | 62 | | | | 849 | | |
Capital shares redeemed | | | 359 | | | | 20 | | | | 271 | | |
Accrued expenses and other payables: | |
Investment advisory fees | | | 149 | | | | 12 | | | | 30 | | |
Administration fees | | | 14 | | | | 1 | | | | 2 | | |
Custodian fees | | | 2 | | | | — | (c) | | | 1 | | |
Transfer agent fees | | | 29 | | | | 3 | | | | — | (c) | |
Compliance fees | | | — | (c) | | | — | (c) | | | — | (c) | |
Trustees' fees | | | — | (c) | | | — | (c) | | | — | (c) | |
| 12b-1 fees | | | 32 | | | | 1 | | | | 7 | | |
Other accrued expenses | | | 23 | | | | 9 | | | | 11 | | |
Total Liabilities | | | 19,757 | | | | 555 | | | | 1,171 | | |
Net Assets: | |
Capital | | | 190,171 | | | | 5,716 | | | | 32,145 | | |
Total accumulated earnings/(loss) | | | 64,435 | | | | 11,146 | | | | 10,762 | | |
Net Assets | | $ | 254,606 | | | $ | 16,862 | | | $ | 42,907 | | |
Net Assets | |
Class A Shares | | $ | 184,217 | | | $ | 7,757 | | | $ | 24,302 | | |
Class C Shares | | | 3,046 | | | | 1,190 | | | | 863 | | |
Class I Shares | | | 21,071 | | | | 6,171 | | | | 3,283 | | |
Class R Shares | | | 39,432 | | | | — | | | | 13,875 | | |
Class R6 Shares | | | 3,103 | | | | — | | | | — | | |
Class Y Shares | | | 3,737 | | | | 1,744 | | | | 584 | | |
Total | | $ | 254,606 | | | $ | 16,862 | | | $ | 42,907 | | |
Shares (unlimited number of shares authorized with
a par value of $0.001 per share): | |
Class A Shares | | | 10,579 | | | | 1,230 | | | | 927 | | |
Class C Shares | | | 190 | | | | 603 | | | | 38 | | |
Class I Shares | | | 1,213 | | | | 859 | | | | 123 | | |
Class R Shares | | | 2,318 | | | | — | | | | 557 | | |
Class R6 Shares | | | 179 | | | | — | | | | — | | |
Class Y Shares | | | 215 | | | | 257 | | | | 22 | | |
Total | | | 14,694 | | | | 2,949 | | | | 1,667 | | |
(continues on next page)
See notes to financial statements.
40
Victory Portfolios | | Statements of Assets and Liabilities
October 31, 2020 | |
(Amounts in Thousands, Except Per Share Amounts) (continued)
| | | Victory
Diversified
Stock Fund | | Victory
NewBridge
Large Cap
Growth Fund | | Victory
Special
Value Fund | |
Net asset value, offering (except Class A Shares) and
redemption price per share: (d) | |
Class A Shares | | $ | 17.41 | | | $ | 6.31 | | | $ | 26.23 | | |
Class C Shares (e) | | | 16.05 | | | | 1.97 | | | | 22.72 | | |
Class I Shares | | | 17.37 | | | | 7.18 | | | | 26.59 | | |
Class R Shares | | | 17.01 | | | | — | | | | 24.93 | | |
Class R6 Shares | | | 17.38 | | | | — | | | | — | | |
Class Y Shares | | | 17.41 | | | | 6.79 | | | | 26.44 | | |
Maximum Sales Charge — Class A Shares | | | 5.75 | % | | | 5.75 | % | | | 5.75 | % | |
Maximum offering price
(100%/(100%-maximum sales charge) of net asset
value adjusted to the nearest cent) per share —
Class A Shares | | $ | 18.47 | | | $ | 6.69 | | | $ | 27.83 | | |
(a) Includes $13,419 of securities on loan.
(b) Includes $402 of securities on loan.
(c) Rounds to less than $1 thousand.
(d) Per share amount may not recalculate due to rounding of net assets and/or shares outstanding.
(e) Redemption price per share varies by the length of time shares are held.
See notes to financial statements.
41
Victory Portfolios | | Statements of Assets and Liabilities
October 31, 2020 | |
(Amounts in Thousands, Except Per Share Amounts)
| | | Victory
Strategic
Allocation
Fund | | Victory
INCORE
Fund for
Income | | Victory
INCORE
Investment
Grade
Convertible
Fund | |
Assets: | |
Affiliated Investments, at value (Cost $23,254,
$— and $—) | | $ | 24,434 | | | $ | — | | | $ | — | | |
Unaffiliated Investments, at value (Cost $—,
$1,017,680 and $279,356) | | | — | | | | 1,028,926 | | | | 304,323 | (a) | |
Cash and cash equivalents | | | — | | | | — | | | | 2,233 | | |
Receivables: | |
Interest and dividends | | | — | (b) | | | 12,984 | | | | 1,043 | | |
Capital shares issued | | | 134 | | | | 1,375 | | | | 131 | | |
Investments sold | | | 147 | | | | — | | | | — | | |
From Adviser | | | 17 | | | | 51 | | | | — | | |
Prepaid expenses | | | 23 | | | | 57 | | | | 44 | | |
Total Assets | | | 24,755 | | | | 1,043,393 | | | | 307,774 | | |
Liabilities: | |
Payables: | |
Collateral received on loaned securities | | | — | | | | — | | | | 13,643 | | |
Payable to custodian | | | 67 | | | | — | | | | — | | |
Capital shares redeemed | | | 34 | | | | 755 | | | | 347 | | |
Accrued expenses and other payables: | |
Investment advisory fees | | | 2 | | | | 410 | | | | 191 | | |
Administration fees | | | 1 | | | | 56 | | | | 16 | | |
Custodian fees | | | — | (b) | | | 9 | | | | 2 | | |
Transfer agent fees | | | 1 | | | | 135 | | | | 54 | | |
Compliance fees | | | — | (b) | | | 1 | | | | — | (b) | |
Trustees' fees | | | — | (b) | | | 2 | | | | 1 | | |
| 12b-1 fees | | | 3 | | | | 30 | | | | 2 | | |
Other accrued expenses | | | 9 | | | | 95 | | | | 24 | | |
Total Liabilities | | | 117 | | | | 1,493 | | | | 14,280 | | |
Net Assets: | |
Capital | | | 23,783 | | | | 1,366,312 | | | | 262,657 | | |
Total accumulated earnings/(loss) | | | 855 | | | | (324,412 | ) | | | 30,837 | | |
Net Assets | | $ | 24,638 | | | $ | 1,041,900 | | | $ | 293,494 | | |
Net Assets | |
Class A Shares | | $ | 14,364 | | | $ | 151,236 | | | $ | 16,571 | | |
Class C Shares | | | 2,009 | | | | 20,801 | | | | — | | |
Class I Shares | | | 7,006 | | | | 590,749 | | | | 276,923 | | |
Class R Shares | | | 1,259 | | | | 43,684 | | | | — | | |
Class R6 Shares | | | — | | | | 49,009 | | | | — | | |
Class Y Shares | | | — | | | | 186,421 | | | | — | | |
Total | | $ | 24,638 | | | $ | 1,041,900 | | | $ | 293,494 | | |
(continues on next page)
See notes to financial statements.
42
Victory Portfolios | | Statements of Assets and Liabilities
October 31, 2020 | |
(Amounts in Thousands, Except Per Share Amounts) (continued)
| | | Victory
Strategic
Allocation
Fund | | Victory
INCORE
Fund for
Income | | Victory
INCORE
Investment
Grade
Convertible
Fund | |
Shares (unlimited number of shares authorized with
a par value of $0.001 per share): | |
Class A Shares | | | 871 | | | | 18,010 | | | | 957 | | |
Class C Shares | | | 124 | | | | 2,502 | | | | — | | |
Class I Shares | | | 423 | | | | 70,383 | | | | 15,992 | | |
Class R Shares | | | 77 | | | | 5,198 | | | | — | | |
Class R6 Shares | | | — | | | | 5,846 | | | | — | | |
Class Y Shares | | | — | | | | 22,201 | | | | — | | |
Total | | | 1,495 | | | | 124,140 | | | | 16,949 | | |
Net asset value, offering (except Class A Shares)
and redemption price per share: (c) | |
Class A Shares | | $ | 16.48 | | | $ | 8.40 | | | $ | 17.31 | | |
Class C Shares (d) | | | 16.19 | | | | 8.31 | | | | — | | |
Class I Shares | | | 16.57 | | | | 8.39 | | | | 17.32 | | |
Class R Shares | | | 16.44 | | | | 8.40 | | | | — | | |
Class R6 Shares | | | — | | | | 8.38 | | | | — | | |
Class Y Shares | | | — | | | | 8.40 | | | | — | | |
Maximum Sales Charge — Class A Shares | | | 2.25 | % | | | 2.25 | % | | | 2.25 | % | |
Maximum offering price
(100%/(100%-maximum sales charge) of net asset
value adjusted to the nearest cent) per share —
Class A Shares | | $ | 16.86 | | | $ | 8.59 | | | $ | 17.71 | | |
(a) Includes $13,266 of securities on loan.
(b) Rounds to less than $1 thousand.
(c) Per share amount may not recalculate due to rounding of net assets and/or shares outstanding.
(d) Redemption price per share varies by the length of time shares are held.
See notes to financial statements.
43
Victory Portfolios | | Statements of Operations
For the Year Ended October 31, 2020 | |
(Amounts in Thousands)
| | | Victory
Diversified
Stock Fund | | Victory
NewBridge
Large Cap
Growth Fund | | Victory
Special
Value Fund | |
Investment Income: | |
Dividends | | $ | 3,667 | | | $ | 45 | | | $ | 654 | | |
Interest | | | 20 | | | | 2 | | | | 4 | | |
Securities lending (net of fees) | | | 13 | | | | — | (a) | | | 1 | | |
Total Income | | | 3,700 | | | | 47 | | | | 659 | | |
Expenses: | |
Investment advisory fees | | | 1,741 | | | | 122 | | | | 360 | | |
Administration fees | | | 163 | | | | 10 | | | | 29 | | |
Sub-Administration fees | | | 14 | | | | 11 | | | | 14 | | |
12b-1 fees — Class A Shares | | | 478 | | | | 16 | | | | 64 | | |
12b-1 fees — Class C Shares | | | 42 | | | | 15 | | | | 11 | | |
12b-1 fees — Class R Shares | | | 209 | | | | — | | | | 89 | | |
Custodian fees | | | 13 | | | | 2 | | | | 3 | | |
Transfer agent fees — Class A Shares | | | 150 | | | | 7 | | | | 29 | | |
Transfer agent fees — Class C Shares | | | 6 | | | | 2 | | | | 2 | | |
Transfer agent fees — Class I Shares | | | 15 | | | | 5 | | | | 3 | | |
Transfer agent fees — Class R Shares | | | 37 | | | | — | | | | 27 | | |
Transfer agent fees — Class R6 Shares | | | — | (a) | | | — | | | | — | | |
Transfer agent fees — Class Y Shares | | | 7 | | | | 2 | | | | 1 | | |
Trustees' fees | | | 23 | | | | 2 | | | | 5 | | |
Compliance fees | | | 2 | | | | — | (a) | | | — | (a) | |
Legal and audit fees | | | 20 | | | | 8 | | | | 10 | | |
State registration and filing fees | | | 77 | | | | 45 | | | | 63 | | |
Other expenses | | | 38 | | | | 11 | | | | 13 | | |
Total Expenses | | | 3,035 | | | | 258 | | | | 723 | | |
Expenses waived/reimbursed by Adviser | | | (36 | ) | | | (58 | ) | | | (76 | ) | |
Net Expenses | | | 2,999 | | | | 200 | | | | 647 | | |
Net Investment Income (Loss) | | | 701 | | | | (153 | ) | | | 12 | | |
Realized/Unrealized Gains (Losses) from Investments: | |
Net realized gains (losses) from investment securities | | | 6,025 | | | | 2,698 | | | | 1,501 | | |
Net change in unrealized appreciation/depreciation on
investment securities | | | 6,403 | | | | 2,842 | | | | 855 | | |
Net realized/unrealized gains (losses) on investments | | | 12,428 | | | | 5,540 | | | | 2,356 | | |
Change in net assets resulting from operations | | $ | 13,129 | | | $ | 5,387 | | | $ | 2,368 | | |
(a) Rounds to less than $1 thousand.
See notes to financial statements.
44
Victory Portfolios | | Statements of Operations
For the Year Ended October 31, 2020 | |
(Amounts in Thousands)
| | | Victory
Strategic
Allocation
Fund | | Victory
INCORE
Fund for
Income | | Victory
INCORE
Investment
Grade
Convertible
Fund | |
Investment Income: | |
Dividends from unaffiliated investments | | $ | — | | | $ | 16 | | | $ | 5,177 | | |
Income distributions from affiliated funds | | | 451 | | | | — | | | | — | | |
Interest from unaffiliated investments | | | — | (a) | | | 13,606 | | | | 3,551 | | |
Securities lending (net of fees) | | | — | | | | — | | | | 58 | | |
Total Income | | | 451 | | | | 13,622 | | | | 8,786 | | |
Expenses: | |
Investment advisory fees | | | 24 | | | | 4,031 | | | | 2,232 | | |
Administration fees | | | 15 | | | | 526 | | | | 181 | | |
Sub-Administration fees | | | 10 | | | | 17 | | | | 14 | | |
12b-1 fees — Class A Shares | | | 37 | | | | 327 | | | | 72 | | |
12b-1 fees — Class C Shares | | | 25 | | | | 210 | | | | — | | |
12b-1 fees — Class R Shares | | | 6 | | | | 100 | | | | — | | |
Custodian fees | | | 2 | | | | 48 | | | | 14 | | |
Transfer agent fees — Class A Shares | | | 20 | | | | 100 | | | | 46 | | |
Transfer agent fees — Class C Shares | | | 3 | | | | 23 | | | | — | | |
Transfer agent fees — Class I Shares | | | 5 | | | | 396 | | | | 256 | | |
Transfer agent fees — Class R Shares | | | 1 | | | | 26 | | | | — | | |
Transfer agent fees — Class R6 Shares | | | — | | | | 2 | | | | — | | |
Transfer agent fees — Class Y Shares | | | — | | | | 140 | | | | — | | |
Trustees' fees | | | 3 | | | | 68 | | | | 25 | | |
Compliance fees | | | — | (a) | | | 7 | | | | 3 | | |
Legal and audit fees | | | 9 | | | | 143 | | | | 29 | | |
State registration and filing fees | | | 49 | | | | 114 | | | | 63 | | |
Interest expense on interfund lending | | | — | | | | 1 | | | | — | (a) | |
Other expenses | | | 14 | | | | 165 | | | | 48 | | |
Recoupment of prior expenses waived/reimbursed by Adviser | | | — | | | | 11 | | | | — | | |
Total Expenses | | | 223 | | | | 6,455 | | | | 2,983 | | |
Expenses waived/reimbursed by Adviser | | | (119 | ) | | | (105 | ) | | | — | | |
Expenses waived/reimbursed by Sub-Administrator | | | — | | | | (75 | ) | | | — | | |
Net Expenses | | | 104 | | | | 6,275 | | | | 2,983 | | |
Net Investment Income (Loss) | | | 347 | | | | 7,347 | | | | 5,803 | | |
Realized/Unrealized Gains (Losses) from Investments: | |
Net realized gains (losses) from sales of affiliated funds | | | (173 | ) | | | — | | | | — | | |
Capital gain distributions received from affiliated funds | | | 30 | | | | — | | | | — | | |
Net realized gains (losses) from unaffiliated investment securities | | | 47 | | | | 877 | | | | 8,565 | | |
Net change in unrealized appreciation/depreciation on affiliated
funds | | | 644 | | | | — | | | | — | | |
Net change in unrealized appreciation/depreciation on
unaffiliated investment securities | | | — | | | | 12,254 | | | | 1,342 | | |
Net realized/unrealized gains (losses) on investments | | | 548 | | | | 13,131 | | | | 9,907 | | |
Change in net assets resulting from operations | | $ | 895 | | | $ | 20,478 | | | $ | 15,710 | | |
(a) Rounds to less than $1 thousand.
See notes to financial statements.
45
Victory Portfolios | | Statements of Changes in Net Assets | |
(Amounts in Thousands)
| | | Victory
Diversified Stock Fund | | Victory
NewBridge Large Cap
Growth Fund | | Victory
Special Value Fund | |
| | | Year
Ended
October 31,
2020 | | Year
Ended
October 31,
2019 | | Year
Ended
October 31,
2020 | | Year
Ended
October 31,
2019 | | Year
Ended
October 31,
2020 | | Year
Ended
October 31,
2019 | |
From Investment Activities: | |
Operations: | |
Net investment income (loss) | | $ | 701 | | | $ | 1,645 | | | $ | (153 | ) | | $ | (160 | ) | | $ | 12 | | | $ | 167 | | |
Net realized gains (losses) from
investments | | | 6,025 | | | | 18,632 | | | | 2,698 | | | | 3,860 | | | | 1,501 | | | | 1,560 | | |
Net change in unrealized
appreciation/depreciation
on investments | | | 6,403 | | | | 13,132 | | | | 2,842 | | | | (2,906 | ) | | | 855 | | | | 4,228 | | |
Change in net assets resulting
from operations | | | 13,129 | | | | 33,409 | | | | 5,387 | | | | 794 | | | | 2,368 | | | | 5,955 | | |
Distributions to Shareholders: | |
Class A Shares | | | (13,665 | ) | | | (28,297 | ) | | | (1,005 | ) | | | (1,659 | ) | | | (912 | ) | | | (3,327 | ) | |
Class C Shares | | | (369 | ) | | | (1,188 | ) | | | (746 | ) | | | (1,416 | ) | | | (40 | ) | | | (223 | ) | |
Class I Shares | | | (1,940 | ) | | | (4,956 | ) | | | (987 | ) | | | (2,847 | ) | | | (114 | ) | | | (366 | ) | |
Class R Shares | | | (3,072 | ) | | | (5,943 | ) | | | — | | | | (265 | ) | | | (660 | ) | | | (2,640 | ) | |
Class R6 Shares | | | (57 | ) | | | (255 | ) | | | — | | | | — | | | | — | | | | — | | |
Class Y Shares | | | (287 | ) | | | (476 | ) | | | (385 | ) | | | (957 | ) | | | (19 | ) | | | (47 | ) | |
Change in net assets resulting from
distributions to shareholders | | | (19,390 | ) | | | (41,115 | ) | | | (3,123 | ) | | | (7,144 | ) | | | (1,745 | ) | | | (6,603 | ) | |
Change in net assets resulting from
capital transactions | | | (36,149 | ) | | | (78,621 | ) | | | (1,443 | ) | | | (969 | ) | | | (11,653 | ) | | | (10,771 | ) | |
Change in net assets | | | (42,410 | ) | | | (86,327 | ) | | | 821 | | | | (7,319 | ) | | | (11,030 | ) | | | (11,419 | ) | |
Net Assets: | |
Beginning of period | | | 297,016 | | | | 383,343 | | | | 16,041 | | | | 23,360 | | | | 53,937 | | | | 65,356 | | |
End of period | | $ | 254,606 | | | $ | 297,016 | | | $ | 16,862 | | | $ | 16,041 | | | $ | 42,907 | | | $ | 53,937 | | |
(continues on next page)
See notes to financial statements.
46
Victory Portfolios | | Statements of Changes in Net Assets | |
(Amounts in Thousands) (continued)
| | | Victory
Diversified Stock Fund | | Victory
NewBridge Large Cap
Growth Fund | | Victory
Special Value Fund | |
| | | Year
Ended
October 31,
2020 | | Year
Ended
October 31,
2019 | | Year
Ended
October 31,
2020 | | Year
Ended
October 31,
2019 | | Year
Ended
October 31,
2020 | | Year
Ended
October 31,
2019 | |
Capital Transactions: | |
Class A Shares | |
Proceeds from shares issued | | $ | 7,727 | | | $ | 10,469 | | | $ | 1,914 | | | $ | 1,642 | | | $ | 2,733 | | | $ | 2,878 | | |
Distributions reinvested | | | 12,429 | | | | 25,681 | | | | 817 | | | | 1,429 | | | | 818 | | | | 2,670 | | |
Cost of shares redeemed | | | (36,795 | ) | | | (90,032 | ) | | | (1,714 | ) | | | (1,465 | ) | | | (7,356 | ) | | | (9,989 | ) | |
Total Class A Shares | | $ | (16,639 | ) | | $ | (53,882 | ) | | $ | 1,017 | | | $ | 1,606 | | | $ | (3,805 | ) | | $ | (4,441 | ) | |
Class C Shares | |
Proceeds from shares issued | | $ | 169 | | | $ | 864 | | | $ | 286 | | | $ | 448 | | | $ | 446 | | | $ | 345 | | |
Distributions reinvested | | | 311 | | | | 962 | | | | 569 | | | | 1,198 | | | | 29 | | | | 134 | | |
Cost of shares redeemed | | | (3,132 | ) | | | (7,037 | ) | | | (1,193 | ) | | | (1,643 | ) | | | (870 | ) | | | (1,334 | ) | |
Total Class C Shares | | $ | (2,652 | ) | | $ | (5,211 | ) | | $ | (338 | ) | | $ | 3 | | | $ | (395 | ) | | $ | (855 | ) | |
Class I Shares | |
Proceeds from shares issued | | $ | 2,816 | | | $ | 3,181 | | | $ | 522 | | | $ | 557 | | | $ | 436 | | | $ | 588 | | |
Distributions reinvested | | | 1,805 | | | | 4,500 | | | | 927 | | | | 2,644 | | | | 98 | | | | 317 | | |
Cost of shares redeemed | | | (14,222 | ) | | | (21,038 | ) | | | (2,375 | ) | | | (5,198 | ) | | | (601 | ) | | | (1,283 | ) | |
Total Class I Shares | | $ | (9,601 | ) | | $ | (13,357 | ) | | $ | (926 | ) | | $ | (1,997 | ) | | $ | (67 | ) | | $ | (378 | ) | |
Class R Shares | |
Proceeds from shares issued | | $ | 1,667 | | | $ | 1,997 | | | $ | — | | | $ | 84 | | | $ | 2,086 | | | $ | 2,963 | | |
Distributions reinvested | | | 2,947 | | | | 5,689 | | | | — | | | | 265 | | | | 613 | | | | 2,334 | | |
Cost of shares redeemed | | | (12,020 | ) | | | (13,852 | ) | | | — | | | | (814 | ) | | | (10,132 | ) | | | (10,470 | ) | |
Total Class R Shares | | $ | (7,406 | ) | | $ | (6,166 | ) | | $ | — | | | $ | (465 | ) | | $ | (7,433 | ) | | $ | (5,173 | ) | |
Class R6 Shares | |
Proceeds from shares issued | | $ | 2,494 | | | $ | 180 | | | $ | — | | | $ | — | | | $ | — | | | $ | — | | |
Distributions reinvested | | | 57 | | | | 255 | | | | — | | | | — | | | | — | | | | — | | |
Cost of shares redeemed | | | (1,945 | ) | | | (314 | ) | | | — | | | | — | | | | — | | | | — | | |
Total Class R6 Shares | | $ | 606 | | | $ | 121 | | | $ | — | | | $ | — | | | $ | — | | | $ | — | | |
Class Y Shares | |
Proceeds from shares issued | | $ | 188 | | | $ | 867 | | | $ | 310 | | | $ | 554 | | | $ | 105 | | | $ | 144 | | |
Distributions reinvested | | | 244 | | | | 387 | | | | 184 | | | | 397 | | | | 14 | | | | 33 | | |
Cost of shares redeemed | | | (889 | ) | | | (1,380 | ) | | | (1,690 | ) | | | (1,067 | ) | | | (72 | ) | | | (101 | ) | |
Total Class Y Shares | | $ | (457 | ) | | $ | (126 | ) | | $ | (1,196 | ) | | $ | (116 | ) | | $ | 47 | | | $ | 76 | | |
Change in net assets resulting from
capital transactions | | $ | (36,149 | ) | | $ | (78,621 | ) | | $ | (1,443 | ) | | $ | (969 | ) | | $ | (11,653 | ) | | $ | (10,771 | ) | |
(continues on next page)
See notes to financial statements.
47
Victory Portfolios | | Statements of Changes in Net Assets | |
(Amounts in Thousands) (continued)
| | | Victory
Diversified Stock Fund | | Victory
NewBridge Large Cap
Growth Fund | | Victory
Special Value Fund | |
| | | Year
Ended
October 31,
2020 | | Year
Ended
October 31,
2019 | | Year
Ended
October 31,
2020 | | Year
Ended
October 31,
2019 | | Year
Ended
October 31,
2020 | | Year
Ended
October 31,
2019 | |
Share Transactions: | |
Class A Shares | |
Issued | | | 473 | | | | 648 | | | | 336 | | | | 295 | | | | 111 | | | | 121 | | |
Reinvested | | | 719 | | | | 1,778 | | | | 171 | | | | 297 | | | | 31 | | | | 126 | | |
Redeemed | | | (2,225 | ) | | | (5,576 | ) | | | (314 | ) | | | (254 | ) | | | (294 | ) | | | (416 | ) | |
Total Class A Shares | | | (1,033 | ) | | | (3,150 | ) | | | 193 | | | | 338 | | | | (152 | ) | | | (169 | ) | |
Class C Shares | |
Issued | | | 11 | | | | 60 | | | | 176 | | | | 203 | | | | 21 | | | | 17 | | |
Reinvested | | | 19 | | | | 71 | | | | 377 | | | | 562 | | | | 1 | | | | 7 | | |
Redeemed | | | (199 | ) | | | (458 | ) | | | (678 | ) | | | (645 | ) | | | (39 | ) | | | (61 | ) | |
Total Class C Shares | | | (169 | ) | | | (327 | ) | | | (125 | ) | | | 120 | | | | (17 | ) | | | (37 | ) | |
Class I Shares | |
Issued | | | 169 | | | | 194 | | | | 86 | | | | 87 | | | | 18 | | | | 23 | | |
Reinvested | | | 105 | | | | 311 | | | | 170 | | | | 497 | | | | 4 | | | | 15 | | |
Redeemed | | | (856 | ) | | | (1,291 | ) | | | (383 | ) | | | (850 | ) | | | (24 | ) | | | (52 | ) | |
Total Class I Shares | | | (582 | ) | | | (786 | ) | | | (127 | ) | | | (266 | ) | | | (2 | ) | | | (14 | ) | |
Class R Shares | |
Issued | | | 102 | | | | 126 | | | | — | | | | 13 | | | | 95 | | | | 130 | | |
Reinvested | | | 174 | | | | 403 | | | | — | | | | 72 | | | | 25 | | | | 116 | | |
Redeemed | | | (734 | ) | | | (869 | ) | | | — | | | | (194 | ) | | | (422 | ) | | | (447 | ) | |
Total Class R Shares | | | (458 | ) | | | (340 | ) | | | — | | | | (109 | ) | | | (302 | ) | | | (201 | ) | |
Class R6 Shares | |
Issued | | | 154 | | | | 11 | | | | — | | | | — | | | | — | | | | — | | |
Reinvested | | | 3 | | | | 18 | | | | — | | | | — | | | | — | | | | — | | |
Redeemed | | | (109 | ) | | | (20 | ) | | | — | | | | — | | | | — | | | | — | | |
Total Class R6 Shares | | | 48 | | | | 9 | | | | — | | | | — | | | | — | | | | — | | |
Class Y Shares | |
Issued | | | 12 | | | | 54 | | | | 59 | | | | 107 | | | | 4 | | | | 6 | | |
Reinvested | | | 14 | | | | 27 | | | | 36 | | | | 78 | | | | 1 | | | | 2 | | |
Redeemed | | | (52 | ) | | | (84 | ) | | | (264 | ) | | | (173 | ) | | | (3 | ) | | | (5 | ) | |
Total Class Y Shares | | | (26 | ) | | | (3 | ) | | | (169 | ) | | | 12 | | | | 2 | | | | 3 | | |
Change in Shares | | | (2,220 | ) | | | (4,597 | ) | | | (228 | ) | | | 95 | | | | (471 | ) | | | (418 | ) | |
See notes to financial statements.
48
Victory Portfolios | | Statements of Changes in Net Assets | |
(Amounts in Thousands)
| | | Victory
Strategic
Allocation Fund | | Victory INCORE
Fund for Income | | Victory
INCORE Investment Grade
Convertible Fund | |
| | | Year
Ended
October 31,
2020 | | Year
Ended
October 31,
2019 | | Year
Ended
October 31,
2020 | | Year
Ended
October 31,
2019 | | Year
Ended
October 31,
2020 | | Year
Ended
October 31,
2019 | |
From Investment Activities: | |
Operations: | |
Net investment income (loss) | | $ | 347 | | | $ | 715 | | | $ | 7,347 | | | $ | 12,415 | | | $ | 5,803 | | | $ | 3,557 | | |
Net realized gains (losses) from
investments | | | (96 | ) | | | 393 | | | | 877 | | | | 37 | | | | 8,565 | | | | 9,776 | | |
Net change in unrealized
appreciation/depreciation
on investments | | | 644 | | | | 1,486 | | | | 12,254 | | | | 22,751 | | | | 1,342 | | | | 14,314 | | |
Change in net assets resulting
from operations | | | 895 | | | | 2,594 | | | | 20,478 | | | | 35,203 | | | | 15,710 | | | | 27,647 | | |
Distributions to Shareholders: | |
Class A Shares | | | (582 | ) | | | (574 | ) | | | (6,067 | ) | | | (7,959 | ) | | | (1,183 | ) | | | (663 | ) | |
Class C Shares | | | (99 | ) | | | (114 | ) | | | (809 | ) | | | (1,264 | ) | | | — | | | | — | | |
Class I Shares | | | (239 | ) | | | (231 | ) | | | (25,543 | ) | | | (21,576 | ) | | | (15,554 | ) | | | (7,328 | ) | |
Class R Shares | | | (45 | ) | | | (44 | ) | | | (1,831 | ) | | | (2,160 | ) | | | — | | | | — | | |
Class R6 Shares | | | — | | | | — | | | | (1,832 | ) | | | (815 | ) | | | — | | | | — | | |
Class Y Shares | | | — | | | | — | | | | (5,074 | ) | | | (2,348 | ) | | | — | | | | — | | |
Change in net assets resulting from
distributions to shareholders | | | (965 | ) | | | (963 | ) | | | (41,156 | ) | | | (36,122 | ) | | | (16,737 | ) | | | (7,991 | ) | |
Change in net assets resulting from
capital transactions | | | (901 | ) | | | (9,554 | ) | | | 346,322 | | | | 111,166 | | | | 14,191 | | | | 119,535 | | |
Change in net assets | | | (971 | ) | | | (7,923 | ) | | | 325,644 | | | | 110,247 | | | | 13,164 | | | | 139,191 | | |
Net Assets: | |
Beginning of period | | | 25,609 | | | | 33,532 | | | | 716,256 | | | | 606,009 | | | | 280,330 | | | | 141,139 | | |
End of period | | $ | 24,638 | | | $ | 25,609 | | | $ | 1,041,900 | | | $ | 716,256 | | | $ | 293,494 | | | $ | 280,330 | | |
(continues on next page)
See notes to financial statements.
49
Victory Portfolios | | Statements of Changes in Net Assets | |
(Amounts in Thousands) (continued)
| | | Victory
Strategic
Allocation Fund | | Victory INCORE
Fund for Income | | Victory
INCORE Investment Grade
Convertible Fund | |
| | | Year
Ended
October 31,
2020 | | Year
Ended
October 31,
2019 | | Year
Ended
October 31,
2020 | | Year
Ended
October 31,
2019 | | Year
Ended
October 31,
2020 | | Year
Ended
October 31,
2019 | |
Capital Transactions: | |
Class A Shares | |
Proceeds from shares issued | | $ | 2,364 | | | $ | 1,078 | | | $ | 73,304 | | | $ | 52,087 | | | $ | 26,469 | | | $ | 5,609 | | |
Distributions reinvested | | | 557 | | | | 546 | | | | 5,164 | | | | 6,231 | | | | 1,032 | | | | 531 | | |
Cost of shares redeemed | | | (3,895 | ) | | | (5,939 | ) | | | (60,933 | ) | | | (75,399 | ) | | | (29,802 | ) | | | (5,263 | ) | |
Total Class A Shares | | $ | (974 | ) | | $ | (4,315 | ) | | $ | 17,535 | | | $ | (17,081 | ) | | $ | (2,301 | ) | | $ | 877 | | |
Class C Shares | |
Proceeds from shares issued | | $ | 574 | | | $ | 281 | | | $ | 6,690 | | | $ | 3,731 | | | $ | — | | | $ | — | | |
Distributions reinvested | | | 98 | | | | 106 | | | | 690 | | | | 1,066 | | | | — | | | | — | | |
Cost of shares redeemed | | | (1,845 | ) | | | (1,868 | ) | | | (8,697 | ) | | | (14,281 | ) | | | — | | | | — | | |
Total Class C Shares | | $ | (1,173 | ) | | $ | (1,481 | ) | | $ | (1,317 | ) | | $ | (9,484 | ) | | $ | — | | | $ | — | | |
Class I Shares | |
Proceeds from shares issued | | $ | 2,267 | | | $ | 673 | | | $ | 410,936 | | | $ | 212,608 | | | $ | 181,653 | | | $ | 188,612 | | |
Distributions reinvested | | | 233 | | | | 223 | | | | 21,645 | | | | 15,748 | | | | 15,054 | | | | 6,976 | | |
Cost of shares redeemed | | | (1,204 | ) | | | (4,348 | ) | | | (277,267 | ) | | | (111,040 | ) | | | (180,215 | ) | | | (76,930 | ) | |
Total Class I Shares | | $ | 1,296 | | | $ | (3,452 | ) | | $ | 155,314 | | | $ | 117,316 | | | $ | 16,492 | | | $ | 118,658 | | |
Class R Shares | |
Proceeds from shares issued | | $ | 30 | | | $ | 90 | | | $ | 18,508 | | | $ | 5,048 | | | $ | — | | | $ | — | | |
Distributions reinvested | | | 45 | | | | 39 | | | | 1,753 | | | | 2,042 | | | | — | | | | — | | |
Cost of shares redeemed | | | (125 | ) | | | (435 | ) | | | (14,365 | ) | | | (11,905 | ) | | | — | | | | — | | |
Total Class R Shares | | $ | (50 | ) | | $ | (306 | ) | | $ | 5,896 | | | $ | (4,815 | ) | | $ | — | | | $ | — | | |
Class R6 Shares | |
Proceeds from shares issued | | $ | — | | | $ | — | | | $ | 49,482 | | | $ | 8,367 | | | $ | — | | | $ | — | | |
Distributions reinvested | | | — | | | | — | | | | 1,818 | | | | 811 | | | | — | | | | — | | |
Cost of shares redeemed | | | — | | | | — | | | | (17,319 | ) | | | (7,027 | ) | | | — | | | | — | | |
Total Class R6 Shares | | $ | — | | | $ | — | | | $ | 33,981 | | | $ | 2,151 | | | $ | — | | | $ | — | | |
Class Y Shares | |
Proceeds from shares issued | | $ | — | | | $ | — | | | $ | 189,431 | | | $ | 44,007 | | | $ | — | | | $ | — | | |
Distributions reinvested | | | — | | | | — | | | | 3,546 | | | | 1,155 | | | | — | | | | — | | |
Cost of shares redeemed | | | — | | | | — | | | | (58,064 | ) | | | (22,083 | ) | | | — | | | | — | | |
Total Class Y Shares | | $ | — | | | $ | — | | | $ | 134,913 | | | $ | 23,079 | | | $ | — | | | $ | — | | |
Change in net assets resulting from
capital transactions | | $ | (901 | ) | | $ | (9,554 | ) | | $ | 346,322 | | | $ | 111,166 | | | $ | 14,191 | | | $ | 119,535 | | |
(continues on next page)
See notes to financial statements.
50
Victory Portfolios | | Statements of Changes in Net Assets | |
(Amounts in Thousands) (continued)
| | | Victory
Strategic
Allocation Fund | | Victory INCORE
Fund for Income | | Victory
INCORE Investment Grade
Convertible Fund | |
| | | Year
Ended
October 31,
2020 | | Year
Ended
October 31,
2019 | | Year
Ended
October 31,
2020 | | Year
Ended
October 31,
2019 | | Year
Ended
October 31,
2020 | | Year
Ended
October 31,
2019 | |
Share Transactions: | |
Class A Shares | |
Issued | | | 146 | | | | 69 | | | | 8,586 | | | | 6,053 | | | | 1,717 | | | | 345 | | |
Reinvested | | | 34 | | | | 37 | | | | 608 | | | | 727 | | | | 62 | | | | 34 | | |
Redeemed | | | (242 | ) | | | (387 | ) | | | (7,145 | ) | | | (8,762 | ) | | | (1,755 | ) | | | (326 | ) | |
Total Class A Shares | | | (62 | ) | | | (281 | ) | | | 2,049 | | | | (1,982 | ) | | | 24 | | | | 53 | | |
Class C Shares | |
Issued | | | 36 | | | | 18 | | | | 789 | | | | 438 | | | | — | | | | — | | |
Reinvested | | | 6 | | | | 7 | | | | 82 | | | | 125 | | | | — | | | | — | | |
Redeemed | | | (115 | ) | | | (121 | ) | | | (1,028 | ) | | | (1,674 | ) | | | — | | | | — | | |
Total Class C Shares | | | (73 | ) | | | (96 | ) | | | (157 | ) | | | (1,111 | ) | | | — | | | | — | | |
Class I Shares | |
Issued | | | 140 | | | | 43 | | | | 48,019 | | | | 24,691 | | | | 11,013 | | | | 11,502 | | |
Reinvested | | | 14 | | | | 15 | | | | 2,546 | | | | 1,837 | | | | 889 | | | | 445 | | |
Redeemed | | | (78 | ) | | | (279 | ) | | | (32,536 | ) | | | (12,911 | ) | | | (10,994 | ) | | | (4,689 | ) | |
Total Class I Shares | | | 76 | | | | (221 | ) | | | 18,029 | | | | 13,617 | | | | 908 | | | | 7,258 | | |
Class R Shares | |
Issued | | | 2 | | | | 6 | | | | 2,167 | | | | 586 | | | | — | | | | — | | |
Reinvested | | | 3 | | | | 3 | | | | 206 | | | | 238 | | | | — | | | | — | | |
Redeemed | | | (8 | ) | | | (28 | ) | | | (1,682 | ) | | | (1,384 | ) | | | — | | | | — | | |
Total Class R Shares | | | (3 | ) | | | (19 | ) | | | 691 | | | | (560 | ) | | | — | | | | — | | |
Class R6 Shares | |
Issued | | | — | | | | — | | | | 5,802 | | | | 974 | | | | — | | | | — | | |
Reinvested | | | — | | | | — | | | | 214 | | | | 95 | | | | — | | | | — | | |
Redeemed | | | — | | | | — | | | | (2,027 | ) | | | (820 | ) | | | — | | | | — | | |
Total Class R6 Shares | | | — | | | | — | | | | 3,989 | | | | 249 | | | | — | | | | — | | |
Class Y Shares | |
Issued | | | — | | | | — | | | | 22,159 | | | | 5,117 | | | | — | | | | — | | |
Reinvested | | | — | | | | — | | | | 418 | | | | 135 | | | | — | | | | — | | |
Redeemed | | | — | | | | — | | | | (6,797 | ) | | | (2,567 | ) | | | — | | | | — | | |
Total Class Y Shares | | | — | | | | — | | | | 15,780 | | | | 2,685 | | | | — | | | | — | | |
Change in Shares | | | (62 | ) | | | (617 | ) | | | 40,381 | | | | 12,898 | | | | 932 | | | | 7,311 | | |
See notes to financial statements.
51
Victory Portfolios | | Financial Highlights | |
For a Share Outstanding Throughout Each Period
| | | | Investment Activities | | Distributions to
Shareholders From | |
| | | Net Asset
Value,
Beginning of
Period | | Net
Investment
Income
(Loss)(a) | | Net Realized
and Unrealized
Gains (Losses)
on Investments | | Total from
Investment
Activities | | Net
Investment
Income | | Net Realized
Gains from
Investments | |
Victory Diversified Stock Fund | |
Class A | |
Year Ended 10/31/20 | | $ | 17.65 | | | | 0.05 | | | | 0.90 | | | | 0.95 | | | | (0.04 | ) | | | (1.15 | ) | |
Year Ended 10/31/19 | | $ | 17.90 | | | | 0.09 | | | | 1.65 | | | | 1.74 | | | | (0.08 | ) | | | (1.91 | ) | |
Year Ended 10/31/18 | | $ | 22.03 | | | | 0.06 | | | | 0.17 | | | | 0.23 | | | | (0.06 | ) | | | (4.30 | ) | |
Year Ended 10/31/17 | | $ | 18.01 | | | | 0.13 | | | | 4.28 | | | | 4.41 | | | | (0.17 | ) | | | (0.22 | ) | |
Year Ended 10/31/16 | | $ | 20.80 | | | | 0.20 | | | | (1.04 | ) | | | (0.84 | ) | | | (0.19 | ) | | | (1.76 | ) | |
Class C | |
Year Ended 10/31/20 | | $ | 16.46 | | | | (0.10 | ) | | | 0.84 | | | | 0.74 | | | | — | | | | (1.15 | ) | |
Year Ended 10/31/19 | | $ | 16.90 | | | | (0.05 | ) | | | 1.52 | | | | 1.47 | | | | — | | | | (1.91 | ) | |
Year Ended 10/31/18 | | $ | 21.12 | | | | (0.10 | ) | | | 0.18 | | | | 0.08 | | | | — | | | | (4.30 | ) | |
Year Ended 10/31/17 | | $ | 17.30 | | | | (0.02 | ) | | | 4.10 | | | | 4.08 | | | | (0.04 | ) | | | (0.22 | ) | |
Year Ended 10/31/16 | | $ | 20.07 | | | | 0.04 | | | | (1.00 | ) | | | (0.96 | ) | | | (0.05 | ) | | | (1.76 | ) | |
Class I | |
Year Ended 10/31/20 | | $ | 17.61 | | | | 0.09 | | | | 0.90 | | | | 0.99 | | | | (0.08 | ) | | | (1.15 | ) | |
Year Ended 10/31/19 | | $ | 17.87 | | | | 0.13 | | | | 1.65 | | | | 1.78 | | | | (0.13 | ) | | | (1.91 | ) | |
Year Ended 10/31/18 | | $ | 22.00 | | | | 0.11 | | | | 0.16 | | | | 0.27 | | | | (0.10 | ) | | | (4.30 | ) | |
Year Ended 10/31/17 | | $ | 17.98 | | | | 0.19 | | | | 4.27 | | | | 4.46 | | | | (0.22 | ) | | | (0.22 | ) | |
Year Ended 10/31/16 | | $ | 20.77 | | | | 0.24 | | | | (1.03 | ) | | | (0.79 | ) | | | (0.24 | ) | | | (1.76 | ) | |
Class R | |
Year Ended 10/31/20 | | $ | 17.29 | | | | — | (d) | | | 0.88 | | | | 0.88 | | | | (0.01 | ) | | | (1.15 | ) | |
Year Ended 10/31/19 | | $ | 17.58 | | | | 0.04 | | | | 1.62 | | | | 1.66 | | | | (0.04 | ) | | | (1.91 | ) | |
Year Ended 10/31/18 | | $ | 21.71 | | | | 0.01 | | | | 0.16 | | | | 0.17 | | | | — | (d) | | | (4.30 | ) | |
Year Ended 10/31/17 | | $ | 17.75 | | | | 0.07 | | | | 4.23 | | | | 4.30 | | | | (0.12 | ) | | | (0.22 | ) | |
Year Ended 10/31/16 | | $ | 20.54 | | | | 0.14 | | | | (1.04 | ) | | | (0.90 | ) | | | (0.13 | ) | | | (1.76 | ) | |
Class R6 | |
Year Ended 10/31/20 | | $ | 17.62 | | | | 0.08 | | | | 0.92 | | | | 1.00 | | | | (0.09 | ) | | | (1.15 | ) | |
Year Ended 10/31/19 | | $ | 17.88 | | | | 0.14 | | | | 1.64 | | | | 1.78 | | | | (0.13 | ) | | | (1.91 | ) | |
Year Ended 10/31/18 | | $ | 22.00 | | | | 0.11 | | | | 0.17 | | | | 0.28 | | | | (0.10 | ) | | | (4.30 | ) | |
Year Ended 10/31/17 | | $ | 17.98 | | | | 0.18 | | | | 4.29 | | | | 4.47 | | | | (0.23 | ) | | | (0.22 | ) | |
Year Ended 10/31/16 | | $ | 20.77 | | | | 0.26 | | | | (1.05 | ) | | | (0.79 | ) | | | (0.24 | ) | | | (1.76 | ) | |
Class Y | |
Year Ended 10/31/20 | | $ | 17.65 | | | | 0.09 | | | | 0.90 | | | | 0.99 | | | | (0.08 | ) | | | (1.15 | ) | |
Year Ended 10/31/19 | | $ | 17.90 | | | | 0.12 | | | | 1.66 | | | | 1.78 | | | | (0.12 | ) | | | (1.91 | ) | |
Year Ended 10/31/18 | | $ | 22.02 | | | | 0.11 | | | | 0.16 | | | | 0.27 | | | | (0.09 | ) | | | (4.30 | ) | |
Year Ended 10/31/17 | | $ | 18.00 | | | | 0.17 | | | | 4.28 | | | | 4.45 | | | | (0.21 | ) | | | (0.22 | ) | |
Year Ended 10/31/16 | | $ | 20.79 | | | | 0.23 | | | | (1.03 | ) | | | (0.80 | ) | | | (0.23 | ) | | | (1.76 | ) | |
(a) Per share net investment income (loss) has been calculated using the average daily shares method.
(b) Portfolio turnover is calculated on the basis of the Fund as a whole without distinguishing between the classes of shares issued.
(c) Portfolio turnover increase due to a change within the portfolio holdings during the year.
(d) Amount is less than $0.005 per share.
See notes to financial statements.
52
Victory Portfolios | | Financial Highlights — continued | |
For a Share Outstanding Throughout Each Period
| | | | | Ratios to Average Net Assets | | Supplemental Data | |
| | | Total
Distributions | | Net Asset
Value,
End of
Period | | Total
Return
(Excludes
Sales
Charge) | | Net
Expenses | | Net
Investment
Income
(Loss) | | Gross
Expenses | | Net Assets,
End of
Period
(000's) | | Portfolio
Turnover(b) | |
Victory Diversified Stock Fund | |
Class A | |
Year Ended 10/31/20 | | | (1.19 | ) | | $ | 17.41 | | | | 5.47 | % | | | 1.09 | % | | | 0.29 | % | | | 1.09 | % | | $ | 184,217 | | | | 95 | % | |
Year Ended 10/31/19 | | | (1.99 | ) | | $ | 17.65 | | | | 12.27 | % | | | 1.08 | % | | | 0.55 | % | | | 1.08 | % | | $ | 204,945 | | | | 132 | % | |
Year Ended 10/31/18 | | | (4.36 | ) | | $ | 17.90 | | | | (0.20 | )% | | | 1.05 | % | | | 0.32 | % | | | 1.05 | % | | $ | 264,297 | | | | 112 | % | |
Year Ended 10/31/17 | | | (0.39 | ) | | $ | 22.03 | | | | 24.85 | % | | | 1.05 | % | | | 0.66 | % | | | 1.05 | % | | $ | 311,255 | | | | 133 | %(c) | |
Year Ended 10/31/16 | | | (1.95 | ) | | $ | 18.01 | | | | (4.21 | )% | | | 1.07 | % | | | 1.06 | % | | | 1.07 | % | | $ | 352,748 | | | | 74 | % | |
Class C | |
Year Ended 10/31/20 | | | (1.15 | ) | | $ | 16.05 | | | | 4.53 | % | | | 2.05 | % | | | (0.64 | )% | | | 2.14 | % | | $ | 3,046 | | | | 95 | % | |
Year Ended 10/31/19 | | | (1.91 | ) | | $ | 16.46 | | | | 11.19 | % | | | 2.02 | % | | | (0.35 | )% | | | 2.02 | % | | $ | 5,909 | | | | 132 | % | |
Year Ended 10/31/18 | | | (4.30 | ) | | $ | 16.90 | | | | (1.02 | )% | | | 1.89 | % | | | (0.53 | )% | | | 1.89 | % | | $ | 11,586 | | | | 112 | % | |
Year Ended 10/31/17 | | | (0.26 | ) | | $ | 21.12 | | | | 23.82 | % | | | 1.87 | % | | | (0.12 | )% | | | 1.87 | % | | $ | 36,001 | | | | 133 | %(c) | |
Year Ended 10/31/16 | | | (1.81 | ) | | $ | 17.30 | | | | (5.01 | )% | | | 1.90 | % | | | 0.23 | % | | | 1.90 | % | | $ | 50,213 | | | | 74 | % | |
Class I | |
Year Ended 10/31/20 | | | (1.23 | ) | | $ | 17.37 | | | | 5.81 | % | | | 0.84 | % | | | 0.56 | % | | | 0.86 | % | | $ | 21,071 | | | | 95 | % | |
Year Ended 10/31/19 | | | (2.04 | ) | | $ | 17.61 | | | | 12.52 | % | | | 0.84 | % | | | 0.81 | % | | | 0.84 | % | | $ | 31,619 | | | | 132 | % | |
Year Ended 10/31/18 | | | (4.40 | ) | | $ | 17.87 | | | | 0.05 | % | | | 0.79 | % | | | 0.58 | % | | | 0.79 | % | | $ | 46,122 | | | | 112 | % | |
Year Ended 10/31/17 | | | (0.44 | ) | | $ | 22.00 | | | | 25.21 | % | | | 0.80 | % | | | 0.99 | % | | | 0.80 | % | | $ | 74,466 | | | | 133 | %(c) | |
Year Ended 10/31/16 | | | (2.00 | ) | | $ | 17.98 | | | | (3.96 | )% | | | 0.80 | % | | | 1.33 | % | | | 0.80 | % | | $ | 162,923 | | | | 74 | % | |
Class R | |
Year Ended 10/31/20 | | | (1.16 | ) | | $ | 17.01 | | | | 5.25 | % | | | 1.37 | % | | | 0.01 | % | | | 1.37 | % | | $ | 39,432 | | | | 95 | % | |
Year Ended 10/31/19 | | | (1.95 | ) | | $ | 17.29 | | | | 11.90 | % | | | 1.37 | % | | | 0.26 | % | | | 1.37 | % | | $ | 47,981 | | | | 132 | % | |
Year Ended 10/31/18 | | | (4.30 | ) | | $ | 17.58 | | | | (0.47 | )% | | | 1.34 | % | | | 0.03 | % | | | 1.34 | % | | $ | 54,776 | | | | 112 | % | |
Year Ended 10/31/17 | | | (0.34 | ) | | $ | 21.71 | | | | 24.56 | % | | | 1.33 | % | | | 0.38 | % | | | 1.33 | % | | $ | 66,310 | | | | 133 | %(c) | |
Year Ended 10/31/16 | | | (1.89 | ) | | $ | 17.75 | | | | (4.55 | )% | | | 1.36 | % | | | 0.77 | % | | | 1.36 | % | | $ | 69,751 | | | | 74 | % | |
Class R6 | |
Year Ended 10/31/20 | | | (1.24 | ) | | $ | 17.38 | | | | 5.86 | % | | | 0.78 | % | | | 0.49 | % | | | 1.34 | % | | $ | 3,103 | | | | 95 | % | |
Year Ended 10/31/19 | | | (2.04 | ) | | $ | 17.62 | | | | 12.58 | % | | | 0.78 | % | | | 0.83 | % | | | 1.24 | % | | $ | 2,313 | | | | 132 | % | |
Year Ended 10/31/18 | | | (4.40 | ) | | $ | 17.88 | | | | 0.10 | % | | | 0.78 | % | | | 0.58 | % | | | 1.21 | % | | $ | 2,189 | | | | 112 | % | |
Year Ended 10/31/17 | | | (0.45 | ) | | $ | 22.00 | | | | 25.24 | % | | | 0.78 | % | | | 0.94 | % | | | 1.29 | % | | $ | 2,427 | | | | 133 | %(c) | |
Year Ended 10/31/16 | | | (2.00 | ) | | $ | 17.98 | | | | (3.93 | )% | | | 0.78 | % | | | 1.40 | % | | | 0.92 | % | | $ | 2,332 | | | | 74 | % | |
Class Y | |
Year Ended 10/31/20 | | | (1.23 | ) | | $ | 17.41 | | | | 5.72 | % | | | 0.86 | % | | | 0.52 | % | | | 1.31 | % | | $ | 3,737 | | | | 95 | % | |
Year Ended 10/31/19 | | | (2.03 | ) | | $ | 17.65 | | | | 12.53 | % | | | 0.86 | % | | | 0.76 | % | | | 1.33 | % | | $ | 4,249 | | | | 132 | % | |
Year Ended 10/31/18 | | | (4.39 | ) | | $ | 17.90 | | | | 0.01 | % | | | 0.86 | % | | | 0.54 | % | | | 1.13 | % | | $ | 4,373 | | | | 112 | % | |
Year Ended 10/31/17 | | | (0.43 | ) | | $ | 22.02 | | | | 25.11 | % | | | 0.86 | % | | | 0.88 | % | | | 0.94 | % | | $ | 8,843 | | | | 133 | %(c) | |
Year Ended 10/31/16 | | | (1.99 | ) | | $ | 18.00 | | | | (4.01 | )% | | | 0.86 | % | | | 1.27 | % | | | 0.96 | % | | $ | 11,907 | | | | 74 | % | |
See notes to financial statements.
53
Victory Portfolios | | Financial Highlights | |
For a Share Outstanding Throughout Each Period
| | | | Investment Activities | | Distributions to
Shareholders From | |
| | | Net Asset
Value,
Beginning of
Period | | Net
Investment
Income
(Loss)(a) | | Net Realized
and Unrealized
Gains (Losses)
on Investments | | Total from
Investment
Activities | | Net Realized
Gains from
Investments | | Total
Distributions | |
Victory NewBridge Large Cap Growth Fund | |
Class A | |
Year Ended 10/31/20 | | $ | 5.52 | | | | (0.06 | ) | | | 1.91 | | | | 1.85 | | | | (1.06 | ) | | | (1.06 | ) | |
Year Ended 10/31/19 | | $ | 7.94 | | | | (0.05 | ) | | | 0.05 | (c) | | | — | (d) | | | (2.42 | ) | | | (2.42 | ) | |
Year Ended 10/31/18 | | $ | 10.23 | | | | (0.09 | ) | | | 0.85 | | | | 0.76 | | | | (3.05 | ) | | | (3.05 | ) | |
Year Ended 10/31/17 | | $ | 12.79 | | | | (0.09 | ) | | | 1.82 | | | | 1.73 | | | | (4.29 | ) | | | (4.29 | ) | |
Year Ended 10/31/16 | | $ | 19.17 | | | | (0.11 | ) | | | (0.22 | ) | | | (0.33 | ) | | | (6.05 | ) | | | (6.05 | ) | |
Class C | |
Year Ended 10/31/20 | | $ | 2.43 | | | | (0.03 | ) | | | 0.63 | | | | 0.60 | | | | (1.06 | ) | | | (1.06 | ) | |
Year Ended 10/31/19 | | $ | 5.00 | | | | (0.06 | ) | | | (0.09 | )(c) | | | (0.15 | ) | | | (2.42 | ) | | | (2.42 | ) | |
Year Ended 10/31/18 | | $ | 7.59 | | | | (0.10 | ) | | | 0.56 | | | | 0.46 | | | | (3.05 | ) | | | (3.05 | ) | |
Year Ended 10/31/17 | | $ | 10.65 | | | | (0.12 | ) | | | 1.35 | | | | 1.23 | | | | (4.29 | ) | | | (4.29 | ) | |
Year Ended 10/31/16 | | $ | 17.06 | | | | (0.18 | ) | | | (0.18 | ) | | | (0.36 | ) | | | (6.05 | ) | | | (6.05 | ) | |
Class I | |
Year Ended 10/31/20 | | $ | 6.13 | | | | (0.04 | ) | | | 2.15 | | | | 2.11 | | | | (1.06 | ) | | | (1.06 | ) | |
Year Ended 10/31/19 | | $ | 8.49 | | | | (0.04 | ) | | | 0.10 | (c) | | | 0.06 | | | | (2.42 | ) | | | (2.42 | ) | |
Year Ended 10/31/18 | | $ | 10.71 | | | | (0.06 | ) | | | 0.89 | | | | 0.83 | | | | (3.05 | ) | | | (3.05 | ) | |
Year Ended 10/31/17 | | $ | 13.13 | | | | (0.05 | ) | | | 1.92 | | | | 1.87 | | | | (4.29 | ) | | | (4.29 | ) | |
Year Ended 10/31/16 | | $ | 19.47 | | | | (0.05 | ) | | | (0.24 | ) | | | (0.29 | ) | | | (6.05 | ) | | | (6.05 | ) | |
Class Y | |
Year Ended 10/31/20 | | $ | 5.86 | | | | (0.04 | ) | | | 2.03 | | | | 1.99 | | | | (1.06 | ) | | | (1.06 | ) | |
Year Ended 10/31/19 | | $ | 8.24 | | | | (0.04 | ) | | | 0.08 | (c) | | | 0.04 | | | | (2.42 | ) | | | (2.42 | ) | |
Year Ended 10/31/18 | | $ | 10.48 | | | | (0.06 | ) | | | 0.87 | | | | 0.81 | | | | (3.05 | ) | | | (3.05 | ) | |
Year Ended 10/31/17 | | $ | 12.96 | | | | (0.06 | ) | | | 1.87 | | | | 1.81 | | | | (4.29 | ) | | | (4.29 | ) | |
Year Ended 10/31/16 | | $ | 19.31 | | | | (0.07 | ) | | | (0.23 | ) | | | (0.30 | ) | | | (6.05 | ) | | | (6.05 | ) | |
(a) Per share net investment income (loss) has been calculated using the average daily shares method.
(b) Portfolio turnover is calculated on the basis of the Fund as a whole without distinguishing between the classes of shares issued.
(c) The amount shown for a share outstanding throughout the period does not accord with the change in aggregate gains and losses in the portfolio of securities during the period because of timing of sales and purchases of fund shares in relation to fluctuating market values during the period.
(d) Amount is less than $0.005 per share.
See notes to financial statements.
54
Victory Portfolios | | Financial Highlights — continued | |
For a Share Outstanding Throughout Each Period
| | | | | Ratios to Average Net Assets | | Supplemental Data | |
| | | Net Asset
Value,
End of
Period | | Total
Return
(Excludes
Sales
Charge) | | Net
Expenses | | Net
Investment
Income
(Loss) | | Gross
Expenses | | Net Assets,
End of
Period
(000's) | | Portfolio
Turnover(b) | |
Victory NewBridge Large Cap Growth Fund | |
Class A | |
Year Ended 10/31/20 | | $ | 6.31 | | | | 39.61 | % | | | 1.36 | % | | | (1.08 | )% | | | 1.52 | % | | $ | 7,757 | | | | 39 | % | |
Year Ended 10/31/19 | | $ | 5.52 | | | | 4.56 | % | | | 1.36 | % | | | (0.97 | )% | | | 1.60 | % | | $ | 5,732 | | | | 62 | % | |
Year Ended 10/31/18 | | $ | 7.94 | | | | 9.41 | % | | | 1.36 | % | | | (1.05 | )% | | | 1.47 | % | | $ | 5,546 | | | | 41 | % | |
Year Ended 10/31/17 | | $ | 10.23 | | | | 20.84 | % | | | 1.40 | % | | | (0.94 | )% | | | 1.40 | % | | $ | 7,639 | | | | 60 | % | |
Year Ended 10/31/16 | | $ | 12.79 | | | | (3.00 | )% | | | 1.30 | % | | | (0.79 | )% | | | 1.30 | % | | $ | 11,700 | | | | 52 | % | |
Class C | |
Year Ended 10/31/20 | | $ | 1.97 | | | | 37.97 | % | | | 2.10 | % | | | (1.79 | )% | | | 2.67 | % | | $ | 1,190 | | | | 39 | % | |
Year Ended 10/31/19 | | $ | 2.43 | | | | 3.92 | % | | | 2.10 | % | | | (1.71 | )% | | | 2.70 | % | | $ | 1,768 | | | | 62 | % | |
Year Ended 10/31/18 | | $ | 5.00 | | | | 8.47 | % | | | 2.10 | % | | | (1.78 | )% | | | 2.40 | % | | $ | 3,042 | | | | 41 | % | |
Year Ended 10/31/17 | | $ | 7.59 | | | | 20.06 | % | | | 2.10 | % | | | (1.64 | )% | | | 2.27 | % | | $ | 4,201 | | | | 60 | % | |
Year Ended 10/31/16 | | $ | 10.65 | | | | (3.79 | )% | | | 2.10 | % | | | (1.59 | )% | | | 2.15 | % | | $ | 6,321 | | | | 52 | % | |
Class I | |
Year Ended 10/31/20 | | $ | 7.18 | | | | 39.95 | % | | | 0.95 | % | | | (0.66 | )% | | | 1.31 | % | | $ | 6,171 | | | | 39 | % | |
Year Ended 10/31/19 | | $ | 6.13 | | | | 5.11 | % | | | 0.95 | % | | | (0.56 | )% | | | 1.26 | % | | $ | 6,043 | | | | 62 | % | |
Year Ended 10/31/18 | | $ | 8.49 | | | | 9.74 | % | | | 0.95 | % | | | (0.63 | )% | | | 1.09 | % | | $ | 10,633 | | | | 41 | % | |
Year Ended 10/31/17 | | $ | 10.71 | | | | 21.52 | % | | | 0.95 | % | | | (0.47 | )% | | | 1.01 | % | | $ | 16,103 | | | | 60 | % | |
Year Ended 10/31/16 | | $ | 13.13 | | | | (2.67 | )% | | | 0.88 | % | | | (0.36 | )% | | | 0.88 | % | | $ | 31,299 | | | | 52 | % | |
Class Y | |
Year Ended 10/31/20 | | $ | 6.79 | | | | 39.72 | % | | | 1.02 | % | | | (0.73 | )% | | | 1.78 | % | | $ | 1,744 | | | | 39 | % | |
Year Ended 10/31/19 | | $ | 5.86 | | | | 5.06 | % | | | 1.02 | % | | | (0.63 | )% | | | 1.69 | % | | $ | 2,498 | | | | 62 | % | |
Year Ended 10/31/18 | | $ | 8.24 | | | | 9.75 | % | | | 1.02 | % | | | (0.72 | )% | | | 1.48 | % | | $ | 3,411 | | | | 41 | % | |
Year Ended 10/31/17 | | $ | 10.48 | | | | 21.30 | % | | | 1.02 | % | | | (0.55 | )% | | | 1.42 | % | | $ | 2,128 | | | | 60 | % | |
Year Ended 10/31/16 | | $ | 12.96 | | | | (2.76 | )% | | | 1.02 | % | | | (0.50 | )% | | | 1.08 | % | | $ | 4,344 | | | | 52 | % | |
See notes to financial statements.
55
Victory Portfolios | | Financial Highlights | |
For a Share Outstanding Throughout Each Period
| | | | Investment Activities | | Distributions to
Shareholders From | |
| | | Net Asset
Value,
Beginning of
Period | | Net
Investment
Income
(Loss)(a) | | Net Realized
and Unrealized
Gains (Losses)
on Investments | | Total from
Investment
Activities | | Net
Investment
Income | | Net Realized
Gains from
Investments | |
Victory Special Value Fund | |
Class A | |
Year Ended 10/31/20 | | $ | 25.78 | | | | 0.04 | | | | 1.29 | | | | 1.33 | | | | (0.09 | ) | | | (0.79 | ) | |
Year Ended 10/31/19 | | $ | 26.10 | | | | 0.10 | | | | 2.26 | | | | 2.36 | | | | (0.03 | ) | | | (2.65 | ) | |
Year Ended 10/31/18 | | $ | 26.31 | | | | 0.05 | | | | (0.15 | ) | | | (0.10 | ) | | | (0.11 | ) | | | — | | |
Year Ended 10/31/17 | | $ | 21.48 | | | | 0.13 | | | | 4.95 | | | | 5.08 | | | | (0.25 | ) | | | — | | |
Year Ended 10/31/16 | | $ | 22.46 | | | | 0.20 | | | | (1.11 | ) | | | (0.91 | ) | | | (0.07 | ) | | | — | | |
Class C | |
Year Ended 10/31/20 | | $ | 22.54 | | | | (0.16 | ) | | | 1.13 | | | | 0.97 | | | | — | | | | (0.79 | ) | |
Year Ended 10/31/19 | | $ | 23.34 | | | | (0.09 | ) | | | 1.94 | | | | 1.85 | | | | — | | | | (2.65 | ) | |
Year Ended 10/31/18 | | $ | 23.66 | | | | (0.18 | ) | | | (0.14 | ) | | | (0.32 | ) | | | — | | | | — | | |
Year Ended 10/31/17 | | $ | 19.34 | | | | (0.08 | ) | | | 4.45 | | | | 4.37 | | | | (0.05 | ) | | | — | | |
Year Ended 10/31/16 | | $ | 20.34 | | | | 0.01 | | | | (1.01 | ) | | | (1.00 | ) | | | — | | | | — | | |
Class I | |
Year Ended 10/31/20 | | $ | 26.13 | | | | 0.08 | | | | 1.31 | | | | 1.39 | | | | (0.14 | ) | | | (0.79 | ) | |
Year Ended 10/31/19 | | $ | 26.39 | | | | 0.14 | | | | 2.30 | | | | 2.44 | | | | (0.05 | ) | | | (2.65 | ) | |
Year Ended 10/31/18 | | $ | 26.62 | | | | 0.09 | | | | (0.15 | ) | | | (0.06 | ) | | | (0.17 | ) | | | — | | |
Year Ended 10/31/17 | | $ | 21.76 | | | | 0.13 | | | | 5.01 | | | | 5.14 | | | | (0.28 | ) | | | — | | |
Year Ended 10/31/16 | | $ | 22.78 | | | | 0.23 | | | | (1.12 | ) | | | (0.89 | ) | | | (0.13 | ) | | | — | | |
Class R | |
Year Ended 10/31/20 | | $ | 24.55 | | | | (0.04 | ) | | | 1.23 | | | | 1.19 | | | | (0.02 | ) | | | (0.79 | ) | |
Year Ended 10/31/19 | | $ | 25.02 | | | | 0.03 | | | | 2.15 | | | | 2.18 | | | | — | | | | (2.65 | ) | |
Year Ended 10/31/18 | | $ | 25.24 | | | | (0.03 | ) | | | (0.15 | ) | | | (0.18 | ) | | | (0.04 | ) | | | — | | |
Year Ended 10/31/17 | | $ | 20.63 | | | | 0.05 | | | | 4.75 | | | | 4.80 | | | | (0.19 | ) | | | — | | |
Year Ended 10/31/16 | | $ | 21.57 | | | | 0.14 | | | | (1.07 | ) | | | (0.93 | ) | | | (0.01 | ) | | | — | | |
Class Y | |
Year Ended 10/31/20 | | $ | 25.98 | | | | 0.09 | | | | 1.32 | | | | 1.41 | | | | (0.16 | ) | | | (0.79 | ) | |
Year Ended 10/31/19 | | $ | 26.25 | | | | 0.15 | | | | 2.28 | | | | 2.43 | | | | (0.05 | ) | | | (2.65 | ) | |
Year Ended 10/31/18 | | $ | 26.47 | | | | 0.12 | | | | (0.17 | ) | | | (0.05 | ) | | | (0.17 | ) | | | — | | |
Year Ended 10/31/17 | | $ | 21.62 | | | | 0.18 | | | | 4.98 | | | | 5.16 | | | | (0.31 | ) | | | — | | |
Year Ended 10/31/16 | | $ | 22.62 | | | | 0.26 | | | | (1.12 | ) | | | (0.86 | ) | | | (0.14 | ) | | | — | | |
(a) Per share net investment income (loss) has been calculated using the average daily shares method.
(b) Portfolio turnover is calculated on the basis of the Fund as a whole without distinguishing between the classes of shares issued.
(c) During the year, additional fees were voluntarily waived or reimbursed. Had these fees not been waived or reimbursed, the net expense ratio for each class would have been 0.10% higher.
See notes to financial statements.
56
Victory Portfolios | | Financial Highlights — continued | |
For a Share Outstanding Throughout Each Period
| | | | | Ratios to Average Net Assets | | Supplemental Data | |
| | | Total
Distributions | | Net Asset
Value,
End of
Period | | Total
Return
(Excludes
Sales
Charge) | | Net
Expenses | | Net
Investment
Income
(Loss) | | Gross
Expenses | | Net Assets,
End of
Period
(000's) | | Portfolio
Turnover(b) | |
Victory Special Value Fund | |
Class A | |
Year Ended 10/31/20 | | | (0.88 | ) | | $ | 26.23 | | | | 5.15 | % | | | 1.23 | %(c) | | | 0.14 | % | | | 1.33 | % | | $ | 24,302 | | | | 102 | % | |
Year Ended 10/31/19 | | | (2.68 | ) | | $ | 25.78 | | | | 11.32 | % | | | 1.21 | % | | | 0.41 | % | | | 1.31 | % | | $ | 27,818 | | | | 126 | % | |
Year Ended 10/31/18 | | | (0.11 | ) | | $ | 26.10 | | | | (0.42 | )% | | | 1.17 | % | | | 0.19 | % | | | 1.27 | % | | $ | 32,565 | | | | 113 | % | |
Year Ended 10/31/17 | | | (0.25 | ) | | $ | 26.31 | | | | 23.84 | % | | | 1.17 | % | | | 0.53 | % | | | 1.27 | % | | $ | 35,223 | | | | 135 | % | |
Year Ended 10/31/16 | | | (0.07 | ) | | $ | 21.48 | | | | (4.06 | )% | | | 1.20 | % | | | 0.93 | % | | | 1.30 | % | | $ | 36,971 | | | | 76 | % | |
Class C | |
Year Ended 10/31/20 | | | (0.79 | ) | | $ | 22.72 | | | | 4.26 | % | | | 2.10 | %(c) | | | (0.72 | )% | | | 2.99 | % | | $ | 863 | | | | 102 | % | |
Year Ended 10/31/19 | | | (2.65 | ) | | $ | 22.54 | | | | 10.34 | % | | | 2.10 | % | | | (0.44 | )% | | | 2.79 | % | | $ | 1,241 | | | | 126 | % | |
Year Ended 10/31/18 | | | — | | | $ | 23.34 | | | | (1.35 | )% | | | 2.10 | % | | | (0.75 | )% | | | 2.27 | % | | $ | 2,145 | | | | 113 | % | |
Year Ended 10/31/17 | | | (0.05 | ) | | $ | 23.66 | | | | 22.65 | % | | | 2.10 | % | | | (0.38 | )% | | | 2.21 | % | | $ | 7,296 | | | | 135 | % | |
Year Ended 10/31/16 | | | — | | | $ | 19.34 | | | | (4.92 | )% | | | 2.09 | % | | | 0.04 | % | | | 2.19 | % | | $ | 7,955 | | | | 76 | % | |
Class I | |
Year Ended 10/31/20 | | | (0.93 | ) | | $ | 26.59 | | | | 5.35 | % | | | 1.05 | %(c) | | | 0.32 | % | | | 1.31 | % | | $ | 3,283 | | | | 102 | % | |
Year Ended 10/31/19 | | | (2.70 | ) | | $ | 26.13 | | | | 11.52 | % | | | 1.05 | % | | | 0.58 | % | | | 1.34 | % | | $ | 3,274 | | | | 126 | % | |
Year Ended 10/31/18 | | | (0.17 | ) | | $ | 26.39 | | | | (0.28 | )% | | | 1.02 | % | | | 0.31 | % | | | 1.16 | % | | $ | 3,678 | | | | 113 | % | |
Year Ended 10/31/17 | | | (0.28 | ) | | $ | 26.62 | | | | 23.86 | % | | | 1.15 | % | | | 0.56 | % | | | 1.25 | % | | $ | 3,703 | | | | 135 | % | |
Year Ended 10/31/16 | | | (0.13 | ) | | $ | 21.76 | | | | (3.93 | )% | | | 1.05 | % | | | 1.07 | % | | | 1.15 | % | | $ | 4,016 | | | | 76 | % | |
Class R | |
Year Ended 10/31/20 | | | (0.81 | ) | | $ | 24.93 | | | | 4.82 | % | | | 1.54 | %(c) | | | (0.16 | )% | | | 1.64 | % | | $ | 13,875 | | | | 102 | % | |
Year Ended 10/31/19 | | | (2.65 | ) | | $ | 24.55 | | | | 11.03 | % | | | 1.50 | % | | | 0.13 | % | | | 1.60 | % | | $ | 21,084 | | | | 126 | % | |
Year Ended 10/31/18 | | | (0.04 | ) | | $ | 25.02 | | | | (0.71 | )% | | | 1.46 | % | | | (0.10 | )% | | | 1.56 | % | | $ | 26,532 | | | | 113 | % | |
Year Ended 10/31/17 | | | (0.19 | ) | | $ | 25.24 | | | | 23.43 | % | | | 1.47 | % | | | 0.24 | % | | | 1.57 | % | | $ | 36,688 | | | | 135 | % | |
Year Ended 10/31/16 | | | (0.01 | ) | | $ | 20.63 | | | | (4.29 | )% | | | 1.46 | % | | | 0.67 | % | | | 1.56 | % | | $ | 34,784 | | | | 76 | % | |
Class Y | |
Year Ended 10/31/20 | | | (0.95 | ) | | $ | 26.44 | | | | 5.40 | % | | | 1.00 | %(c) | | | 0.36 | % | | | 3.68 | % | | $ | 584 | | | | 102 | % | |
Year Ended 10/31/19 | | | (2.70 | ) | | $ | 25.98 | | | | 11.57 | % | | | 1.00 | % | | | 0.60 | % | | | 4.50 | % | | $ | 520 | | | | 126 | % | |
Year Ended 10/31/18 | | | (0.17 | ) | | $ | 26.25 | | | | (0.21 | )% | | | 0.97 | % | | | 0.42 | % | | | 2.82 | % | | $ | 436 | | | | 113 | % | |
Year Ended 10/31/17 | | | (0.31 | ) | | $ | 26.47 | | | | 24.12 | % | | | 0.93 | % | | | 0.77 | % | | | 2.07 | % | | $ | 1,219 | | | | 135 | % | |
Year Ended 10/31/16 | | | (0.14 | ) | | $ | 21.62 | | | | (3.80 | )% | | | 0.93 | % | | | 1.20 | % | | | 1.75 | % | | $ | 1,170 | | | | 76 | % | |
See notes to financial statements.
57
Victory Portfolios | | Financial Highlights | |
For a Share Outstanding Throughout Each Period
| | | | Investment Activities | | Distributions to
Shareholders From | |
| | | Net Asset
Value,
Beginning of
Period | | Net
Investment
Income
(Loss)(a) | | Net Realized
and Unrealized
Gains (Losses)
on Investments | | Total from
Investment
Activities | | Net
Investment
Income | | Net Realized
Gains from
Investments | |
Victory Strategic Allocation Fund | |
Class A | |
Year Ended 10/31/20 | | $ | 16.47 | | | | 0.23 | | | | 0.41 | | | | 0.64 | | | | (0.23 | ) | | | (0.40 | ) | |
Year Ended 10/31/19 | | $ | 15.44 | | | | 0.43 | | | | 1.12 | | | | 1.55 | | | | (0.39 | ) | | | (0.13 | ) | |
Year Ended 10/31/18 | | $ | 16.41 | | | | 0.29 | | | | (0.68 | ) | | | (0.39 | ) | | | (0.39 | ) | | | (0.19 | ) | |
Year Ended 10/31/17 | | $ | 14.80 | | | | 0.50 | | | | 1.51 | | | | 2.01 | | | | (0.40 | ) | | | — | | |
Year Ended 10/31/16 | | $ | 15.10 | | | | 0.15 | | | | (0.28 | ) | | | (0.13 | ) | | | (0.17 | ) | | | — | | |
Class C | |
Year Ended 10/31/20 | | $ | 16.18 | | | | 0.13 | | | | 0.39 | | | | 0.52 | | | | (0.11 | ) | | | (0.40 | ) | |
Year Ended 10/31/19 | | $ | 15.19 | | | | 0.30 | | | | 1.10 | | | | 1.40 | | | | (0.28 | ) | | | (0.13 | ) | |
Year Ended 10/31/18 | | $ | 16.19 | | | | 0.21 | | | | (0.71 | ) | | | (0.50 | ) | | | (0.31 | ) | | | (0.19 | ) | |
Year Ended 10/31/17 | | $ | 14.65 | | | | 0.43 | | | | 1.44 | | | | 1.87 | | | | (0.33 | ) | | | — | | |
Year Ended 10/31/16 | | $ | 14.97 | | | | 0.06 | | | | (0.29 | ) | | | (0.23 | ) | | | (0.09 | ) | | | — | | |
Class I | |
Year Ended 10/31/20 | | $ | 16.56 | | | | 0.27 | | | | 0.41 | | | | 0.68 | | | | (0.27 | ) | | | (0.40 | ) | |
Year Ended 10/31/19 | | $ | 15.52 | | | | 0.46 | | | | 1.13 | | | | 1.59 | | | | (0.42 | ) | | | (0.13 | ) | |
Year Ended 10/31/18 | | $ | 16.48 | | | | 0.35 | | | | (0.70 | ) | | | (0.35 | ) | | | (0.42 | ) | | | (0.19 | ) | |
Year Ended 10/31/17 | | $ | 14.86 | | | | 0.55 | | | | 1.50 | | | | 2.05 | | | | (0.43 | ) | | | — | | |
Year Ended 10/31/16 | | $ | 15.16 | | | | 0.15 | | | | (0.24 | ) | | | (0.09 | ) | | | (0.21 | ) | | | — | | |
Class R | |
Year Ended 10/31/20 | | $ | 16.43 | | | | 0.19 | | | | 0.42 | | | | 0.61 | | | | (0.20 | ) | | | (0.40 | ) | |
Year Ended 10/31/19 | | $ | 15.41 | | | | 0.36 | | | | 1.14 | | | | 1.50 | | | | (0.35 | ) | | | (0.13 | ) | |
Year Ended 10/31/18 | | $ | 16.38 | | | | 0.27 | | | | (0.70 | ) | | | (0.43 | ) | | | (0.35 | ) | | | (0.19 | ) | |
Year Ended 10/31/17 | | $ | 14.79 | | | | 0.46 | | | | 1.49 | | | | 1.95 | | | | (0.36 | ) | | | — | | |
Year Ended 10/31/16 | | $ | 15.09 | | | | 0.09 | | | | (0.26 | ) | | | (0.17 | ) | | | (0.13 | ) | | | — | | |
(a) Per share net investment income (loss) has been calculated using the average daily shares method.
(b) The expense ratios exclude the impact of expenses paid by each underlying fund.
(c) Portfolio turnover is calculated on the basis of the Fund as a whole without distinguishing between the classes of shares issued.
(d) The amount includes a change in accounting estimate. Without this change in accounting estimate, the gross expense ratio would have been 0.67%, 1.54%, 0.42% and 1.43% for Class A, C, I and R, respectively.
(e) Effective with the December 30, 2015 strategy change, the Adviser began reimbursing expenses inclusive of acquired fund fees and expenses.
(f) Portfolio turnover increased due to a change in investment strategy.
See notes to financial statements.
58
Victory Portfolios | | Financial Highlights — continued | |
For a Share Outstanding Throughout Each Period
| | | | | Ratios to Average Net Assets | | Supplemental Data | |
| | | Total
Distributions | | Net Asset
Value,
End of
Period | | Total
Return
(Excludes
Sales
Charge) | | Net
Expenses(b) | | Net
Investment
Income
(Loss) | | Gross
Expenses(b) | | Net Assets,
End of
Period
(000's) | | Portfolio
Turnover(c) | |
Victory Strategic Allocation Fund | |
Class A | |
Year Ended 10/31/20 | | | (0.63 | ) | | $ | 16.48 | | | | 3.99 | % | | | 0.40 | % | | | 1.45 | % | | | 0.81 | % | | $ | 14,364 | | | | 13 | % | |
Year Ended 10/31/19 | | | (0.52 | ) | | $ | 16.47 | | | | 10.37 | % | | | 0.40 | % | | | 2.69 | % | | | 0.77 | % | | $ | 15,365 | | | | 5 | % | |
Year Ended 10/31/18 | | | (0.58 | ) | | $ | 15.44 | | | | (2.56 | )% | | | 0.40 | % | | | 1.77 | % | | | 0.28 | %(d) | | $ | 18,747 | | | | 40 | % | |
Year Ended 10/31/17 | | | (0.40 | ) | | $ | 16.41 | | | | 13.72 | % | | | 0.30 | % | | | 3.19 | % | | | 0.79 | % | | $ | 14,820 | | | | 51 | % | |
Year Ended 10/31/16 | | | (0.17 | ) | | $ | 14.80 | | | | (0.87 | )% | | | 0.31 | %(e) | | | 0.99 | % | | | 1.69 | % | | $ | 16,587 | | | | 192 | %(f) | |
Class C | |
Year Ended 10/31/20 | | | (0.51 | ) | | $ | 16.19 | | | | 3.23 | % | | | 1.15 | % | | | 0.82 | % | | | 1.90 | % | | $ | 2,009 | | | | 13 | % | |
Year Ended 10/31/19 | | | (0.41 | ) | | $ | 16.18 | | | | 9.53 | % | | | 1.15 | % | | | 1.94 | % | | | 1.72 | % | | $ | 3,193 | | | | 5 | % | |
Year Ended 10/31/18 | | | (0.50 | ) | | $ | 15.19 | | | | (3.26 | )% | | | 1.15 | % | | | 1.30 | % | | | 1.08 | %(d) | | $ | 4,445 | | | | 40 | % | |
Year Ended 10/31/17 | | | (0.33 | ) | | $ | 16.19 | | | | 12.88 | % | | | 1.03 | % | | | 2.78 | % | | | 1.58 | % | | $ | 8,814 | | | | 51 | % | |
Year Ended 10/31/16 | | | (0.09 | ) | | $ | 14.65 | | | | (1.56 | )% | | | 0.95 | %(e) | | | 0.44 | % | | | 2.65 | % | | $ | 9,724 | | | | 192 | %(f) | |
Class I | |
Year Ended 10/31/20 | | | (0.67 | ) | | $ | 16.57 | | | | 4.22 | % | | | 0.15 | % | | | 1.66 | % | | | 0.59 | % | | $ | 7,006 | | | | 13 | % | |
Year Ended 10/31/19 | | | (0.55 | ) | | $ | 16.56 | | | | 10.63 | % | | | 0.15 | % | | | 2.90 | % | | | 0.59 | % | | $ | 5,743 | | | | 5 | % | |
Year Ended 10/31/18 | | | (0.61 | ) | | $ | 15.52 | | | | (2.29 | )% | | | 0.15 | % | | | 2.11 | % | | | 0.01 | %(d) | | $ | 8,811 | | | | 40 | % | |
Year Ended 10/31/17 | | | (0.43 | ) | | $ | 16.48 | | | | 13.95 | % | | | 0.10 | % | | | 3.48 | % | | | 0.61 | % | | $ | 9,153 | | | | 51 | % | |
Year Ended 10/31/16 | | | (0.21 | ) | | $ | 14.86 | | | | (0.61 | )% | | | 0.24 | %(e) | | | 1.04 | % | | | 2.64 | % | | $ | 1,099 | | | | 192 | %(f) | |
Class R | |
Year Ended 10/31/20 | | | (0.60 | ) | | $ | 16.44 | | | | 3.74 | % | | | 0.65 | % | | | 1.18 | % | | | 1.76 | % | | $ | 1,259 | | | | 13 | % | |
Year Ended 10/31/19 | | | (0.48 | ) | | $ | 16.43 | | | | 10.08 | % | | | 0.65 | % | | | 2.30 | % | | | 1.87 | % | | $ | 1,308 | | | | 5 | % | |
Year Ended 10/31/18 | | | (0.54 | ) | | $ | 15.41 | | | | (2.77 | )% | | | 0.65 | % | | | 1.63 | % | | | 1.01 | %(d) | | $ | 1,529 | | | | 40 | % | |
Year Ended 10/31/17 | | | (0.36 | ) | | $ | 16.38 | | | | 13.36 | % | | | 0.56 | % | | | 2.96 | % | | | 1.80 | % | | $ | 1,892 | | | | 51 | % | |
Year Ended 10/31/16 | | | (0.13 | ) | | $ | 14.79 | | | | (1.14 | )% | | | 0.62 | %(e) | | | 0.58 | % | | | 2.13 | % | | $ | 1,702 | | | | 192 | %(f) | |
See notes to financial statements.
59
Victory Portfolios | | Financial Highlights | |
For a Share Outstanding Throughout Each Period
| | | | | Investment Activities | | Distributions to
Shareholders From | |
| | | Net Asset
Value,
Beginning of
Period | | Net
Investment
Income
(Loss)(a) | | Net Realized
and Unrealized
Gains (Losses)
on Investments | | Total from
Investment
Activities | | Net
Investment
Income | | Total
Distributions | |
Victory INCORE Fund for Income | |
Class A | |
Year Ended 10/31/20 | | $ | 8.56 | | | | 0.06 | | | | 0.17 | | | | 0.23 | | | | (0.39 | ) | | | (0.39 | ) | |
Year Ended 10/31/19 | | $ | 8.56 | | | | 0.18 | | | | 0.28 | | | | 0.46 | | | | (0.46 | ) | | | (0.46 | ) | |
Year Ended 10/31/18 | | $ | 9.09 | | | | 0.15 | (c) | | | (0.23 | )(c) | | | (0.08 | ) | | | (0.45 | ) | | | (0.45 | ) | |
Year Ended 10/31/17 | | $ | 9.63 | | | | 0.10 | | | | (0.15 | ) | | | (0.05 | ) | | | (0.49 | ) | | | (0.49 | ) | |
Year Ended 10/31/16 | | $ | 9.96 | | | | 0.11 | | | | 0.05 | | | | 0.16 | | | | (0.49 | ) | | | (0.49 | ) | |
Class C | |
Year Ended 10/31/20 | | $ | 8.48 | | | | — | (d) | | | 0.16 | | | | 0.16 | | | | (0.33 | ) | | | (0.33 | ) | |
Year Ended 10/31/19 | | $ | 8.48 | | | | 0.13 | | | | 0.26 | | | | 0.39 | | | | (0.39 | ) | | | (0.39 | ) | |
Year Ended 10/31/18 | | $ | 9.01 | | | | 0.08 | (c) | | | (0.23 | )(c) | | | (0.15 | ) | | | (0.38 | ) | | | (0.38 | ) | |
Year Ended 10/31/17 | | $ | 9.56 | | | | 0.03 | | | | (0.16 | ) | | | (0.13 | ) | | | (0.42 | ) | | | (0.42 | ) | |
Year Ended 10/31/16 | | $ | 9.89 | | | | 0.03 | | | | 0.06 | | | | 0.09 | | | | (0.42 | ) | | | (0.42 | ) | |
Class I | |
Year Ended 10/31/20 | | $ | 8.55 | | | | 0.08 | | | | 0.17 | | | | 0.25 | | | | (0.41 | ) | | | (0.41 | ) | |
Year Ended 10/31/19 | | $ | 8.55 | | | | 0.16 | | | | 0.32 | | | | 0.48 | | | | (0.48 | ) | | | (0.48 | ) | |
Year Ended 10/31/18 | | $ | 9.08 | | | | 0.15 | (c) | | | (0.21 | )(c) | | | (0.06 | ) | | | (0.47 | ) | | | (0.47 | ) | |
Year Ended 10/31/17 | | $ | 9.63 | | | | 0.13 | | | | (0.16 | ) | | | (0.03 | ) | | | (0.52 | ) | | | (0.52 | ) | |
Year Ended 10/31/16 | | $ | 9.96 | | | | 0.13 | | | | 0.06 | | | | 0.19 | | | | (0.52 | ) | | | (0.52 | ) | |
Class R | |
Year Ended 10/31/20 | | $ | 8.56 | | | | 0.06 | | | | 0.17 | | | | 0.23 | | | | (0.39 | ) | | | (0.39 | ) | |
Year Ended 10/31/19 | | $ | 8.57 | | | | 0.18 | | | | 0.27 | | | | 0.45 | | | | (0.46 | ) | | | (0.46 | ) | |
Year Ended 10/31/18 | | $ | 9.09 | | | | 0.15 | (c) | | | (0.22 | )(c) | | | (0.07 | ) | | | (0.45 | ) | | | (0.45 | ) | |
Year Ended 10/31/17 | | $ | 9.64 | | | | 0.10 | | | | (0.16 | ) | | | (0.06 | ) | | | (0.49 | ) | | | (0.49 | ) | |
Year Ended 10/31/16 | | $ | 9.97 | | | | 0.11 | | | | 0.05 | | | | 0.16 | | | | (0.49 | ) | | | (0.49 | ) | |
Class R6 | |
Year Ended 10/31/20 | | $ | 8.54 | | | | 0.08 | | | | 0.18 | | | | 0.26 | | | | (0.42 | ) | | | (0.42 | ) | |
Year Ended 10/31/19 | | $ | 8.55 | | | | 0.17 | | | | 0.30 | | | | 0.47 | | | | (0.48 | ) | | | (0.48 | ) | |
Year Ended 10/31/18 | | $ | 9.07 | | | | 0.13 | (c) | | | (0.18 | )(c) | | | (0.05 | ) | | | (0.47 | ) | | | (0.47 | ) | |
Year Ended 10/31/17 | | $ | 9.62 | | | | 0.12 | | | | (0.16 | ) | | | (0.04 | ) | | | (0.51 | ) | | | (0.51 | ) | |
Year Ended 10/31/16 | | $ | 9.95 | | | | 0.13 | | | | 0.06 | | | | 0.19 | | | | (0.52 | ) | | | (0.52 | ) | |
Class Y | |
Year Ended 10/31/20 | | $ | 8.56 | | | | 0.06 | | | | 0.19 | | | | 0.25 | | | | (0.41 | ) | | | (0.41 | ) | |
Year Ended 10/31/19 | | $ | 8.56 | | | | 0.13 | | | | 0.35 | | | | 0.48 | | | | (0.48 | ) | | | (0.48 | ) | |
Year Ended 10/31/18 | | $ | 9.08 | | | | 0.19 | (c) | | | (0.25 | )(c) | | | (0.06 | ) | | | (0.46 | ) | | | (0.46 | ) | |
Year Ended 10/31/17 | | $ | 9.64 | | | | 0.10 | | | | (0.15 | ) | | | (0.05 | ) | | | (0.51 | ) | | | (0.51 | ) | |
Year Ended 10/31/16 | | $ | 9.96 | | | | 0.13 | | | | 0.06 | | | | 0.19 | | | | (0.51 | ) | | | (0.51 | ) | |
(a) Per share net investment income (loss) has been calculated using the average daily shares method.
(b) Portfolio turnover is calculated on the basis of the Fund as a whole without distinguishing between the classes of shares issued.
(c) Net Investment Income (Loss) per share, Net Realized and Unrealized Gains (Losses) on Investments and the Ratio of Net Investment Income (Loss) have been restated. See Item 10 in the Notes to Financial Statements.
(d) Amount is less than $0.005 per share.
See notes to financial statements.
60
Victory Portfolios | | Financial Highlights — continued | |
For a Share Outstanding Throughout Each Period
| | | | | Ratios to Average Net Assets | | Supplemental Data | |
| | | Net Asset
Value,
End of
Period | | Total
Return
(Excludes
Sales
Charge) | | Net
Expenses | | Net
Investment
Income
(Loss) | | Gross
Expenses | | Net Assets,
End of
Period
(000's) | | Portfolio
Turnover(b) | |
Victory INCORE Fund for Income | |
Class A | |
Year Ended 10/31/20 | | $ | 8.40 | | | | 2.75 | % | | | 0.91 | % | | | 0.75 | % | | | 0.92 | % | | $ | 151,236 | | | | 55 | % | |
Year Ended 10/31/19 | | $ | 8.56 | | | | 5.50 | % | | | 0.92 | % | | | 2.12 | % | | | 0.94 | % | | $ | 136,570 | | | | 29 | % | |
Year Ended 10/31/18 | | $ | 8.56 | | | | (0.91 | )% | | | 0.92 | % | | | 1.64 | %(c) | | | 0.93 | % | | $ | 153,574 | | | | 27 | % | |
Year Ended 10/31/17 | | $ | 9.09 | | | | (0.51 | )% | | | 0.88 | % | | | 1.08 | % | | | 0.88 | % | | $ | 224,822 | | | | 30 | % | |
Year Ended 10/31/16 | | $ | 9.63 | | | | 1.62 | % | | | 0.91 | % | | | 1.10 | % | | | 0.91 | % | | $ | 400,740 | | | | 31 | % | |
Class C | |
Year Ended 10/31/20 | | $ | 8.31 | | | | 1.85 | % | | | 1.71 | % | | | (0.01 | )% | | | 1.74 | % | | $ | 20,801 | | | | 55 | % | |
Year Ended 10/31/19 | | $ | 8.48 | | | | 4.72 | % | | | 1.72 | % | | | 1.53 | % | | | 1.73 | % | | $ | 22,541 | | | | 29 | % | |
Year Ended 10/31/18 | | $ | 8.48 | | | | (1.69 | )% | | | 1.70 | % | | | 0.94 | %(c) | | | 1.71 | % | | $ | 31,976 | | | | 27 | % | |
Year Ended 10/31/17 | | $ | 9.01 | | | | (1.41 | )% | | | 1.67 | % | | | 0.29 | % | | | 1.67 | % | | $ | 50,316 | | | | 30 | % | |
Year Ended 10/31/16 | | $ | 9.56 | | | | 0.88 | % | | | 1.69 | % | | | 0.32 | % | | | 1.69 | % | | $ | 72,958 | | | | 31 | % | |
Class I | |
Year Ended 10/31/20 | | $ | 8.39 | | | | 3.01 | % | | | 0.64 | % | | | 0.95 | % | | | 0.66 | % | | $ | 590,749 | | | | 55 | % | |
Year Ended 10/31/19 | | $ | 8.55 | | | | 5.79 | % | | | 0.64 | % | | | 1.84 | % | | | 0.65 | % | | $ | 447,735 | | | | 29 | % | |
Year Ended 10/31/18 | | $ | 8.55 | | | | (0.64 | )% | | | 0.63 | % | | | 1.69 | %(c) | | | 0.63 | % | | $ | 331,338 | | | | 27 | % | |
Year Ended 10/31/17 | | $ | 9.08 | | | | (0.34 | )% | | | 0.61 | % | | | 1.34 | % | | | 0.61 | % | | $ | 520,056 | | | | 30 | % | |
Year Ended 10/31/16 | | $ | 9.63 | | | | 1.90 | % | | | 0.63 | % | | | 1.37 | % | | | 0.63 | % | | $ | 547,322 | | | | 31 | % | |
Class R | |
Year Ended 10/31/20 | | $ | 8.40 | | | | 2.74 | % | | | 0.91 | % | | | 0.76 | % | | | 0.92 | % | | $ | 43,684 | | | | 55 | % | |
Year Ended 10/31/19 | | $ | 8.56 | | | | 5.37 | % | | | 0.92 | % | | | 2.04 | % | | | 0.94 | % | | $ | 38,596 | | | | 29 | % | |
Year Ended 10/31/18 | | $ | 8.57 | | | | (0.79 | )% | | | 0.91 | % | | | 1.67 | %(c) | | | 0.91 | % | | $ | 43,405 | | | | 27 | % | |
Year Ended 10/31/17 | | $ | 9.09 | | | | (0.62 | )% | | | 0.88 | % | | | 1.08 | % | | | 0.88 | % | | $ | 58,783 | | | | 30 | % | |
Year Ended 10/31/16 | | $ | 9.64 | | | | 1.62 | % | | | 0.90 | % | | | 1.11 | % | | | 0.90 | % | | $ | 85,195 | | | | 31 | % | |
Class R6 | |
Year Ended 10/31/20 | | $ | 8.38 | | | | 3.06 | % | | | 0.63 | % | | | 0.88 | % | | | 0.64 | % | | $ | 49,009 | | | | 55 | % | |
Year Ended 10/31/19 | | $ | 8.54 | | | | 5.68 | % | | | 0.63 | % | | | 2.00 | % | | | 0.66 | % | | $ | 15,864 | | | | 29 | % | |
Year Ended 10/31/18 | | $ | 8.55 | | | | (0.52 | )% | | | 0.63 | % | | | 1.43 | %(c) | | | 0.69 | % | | $ | 13,741 | | | | 27 | % | |
Year Ended 10/31/17 | | $ | 9.07 | | | | (0.36 | )% | | | 0.63 | % | | | 1.31 | % | | | 0.73 | % | | $ | 9,407 | | | | 30 | % | |
Year Ended 10/31/16 | | $ | 9.62 | | | | 1.89 | % | | | 0.63 | % | | | 1.37 | % | | | 0.97 | % | | $ | 6,286 | | | | 31 | % | |
Class Y | |
Year Ended 10/31/20 | | $ | 8.40 | | | | 2.95 | % | | | 0.71 | % | | | 0.67 | % | | | 0.74 | % | | $ | 186,421 | | | | 55 | % | |
Year Ended 10/31/19 | | $ | 8.56 | | | | 5.72 | % | | | 0.71 | % | | | 1.48 | % | | | 0.79 | % | | $ | 54,950 | | | | 29 | % | |
Year Ended 10/31/18 | | $ | 8.56 | | | | (0.61 | )% | | | 0.71 | % | | | 2.14 | %(c) | | | 0.79 | % | | $ | 31,975 | | | | 27 | % | |
Year Ended 10/31/17 | | $ | 9.08 | | | | (0.53 | )% | | | 0.68 | % | | | 1.09 | % | | | 0.68 | % | | $ | 62,408 | | | | 30 | % | |
Year Ended 10/31/16 | | $ | 9.64 | | | | 1.92 | % | | | 0.71 | % | | | 1.30 | % | | | 0.89 | % | | $ | 8,119 | | | | 31 | % | |
See notes to financial statements.
61
Victory Portfolios | | Financial Highlights | |
For a Share Outstanding Throughout Each Period
| | | | Investment Activities | | Distributions to
Shareholders From | |
| | | Net Asset
Value,
Beginning of
Period | | Net
Investment
Income
(Loss)(a) | | Net Realized
and Unrealized
Gains (Losses)
on Investments | | Total from
Investment
Activities | | Net
Investment
Income | | Net Realized
Gains from
Investments | |
Victory INCORE Investment Grade Convertible Fund | |
Class A | |
Year Ended 10/31/20 | | $ | 17.51 | | | | 0.27 | | | | 0.47 | | | | 0.74 | | | | (0.35 | ) | | | (0.59 | ) | |
Year Ended 10/31/19 | | $ | 16.22 | | | | 0.21 | | | | 1.84 | | | | 2.05 | | | | (0.28 | ) | | | (0.48 | ) | |
Year Ended 10/31/18 | | $ | 16.53 | | | | 0.30 | | | | 0.01 | | | | 0.31 | | | | (0.53 | ) | | | (0.09 | ) | |
Year Ended 10/31/17 | | $ | 13.72 | | | | 0.17 | | | | 2.89 | | | | 3.06 | | | | (0.25 | ) | | | — | | |
Year Ended 10/31/16 | | $ | 14.00 | | | | 0.11 | | | | (0.07 | ) | | | 0.04 | | | | (0.32 | ) | | | — | | |
Class I | |
Year Ended 10/31/20 | | $ | 17.50 | | | | 0.33 | | | | 0.49 | | | | 0.82 | | | | (0.41 | ) | | | (0.59 | ) | |
Year Ended 10/31/19 | | $ | 16.21 | | | | 0.31 | | | | 1.83 | | | | 2.14 | | | | (0.37 | ) | | | (0.48 | ) | |
Year Ended 10/31/18 | | $ | 16.53 | | | | 0.36 | | | | (0.01 | ) | | | 0.35 | | | | (0.58 | ) | | | (0.09 | ) | |
Year Ended 10/31/17 | | $ | 13.71 | | | | 0.22 | | | | 2.90 | | | | 3.12 | | | | (0.30 | ) | | | — | | |
Year Ended 10/31/16 | | $ | 13.98 | | | | 0.17 | | | | (0.07 | ) | | | 0.10 | | | | (0.37 | ) | | | — | | |
(a) Per share net investment income (loss) has been calculated using the average daily shares method.
(b) Portfolio turnover is calculated on the basis of the Fund as a whole without distinguishing between the classes of shares issued.
See notes to financial statements.
62
Victory Portfolios | | Financial Highlights — continued | |
For a Share Outstanding Throughout Each Period
| | | | | Ratios to Average Net Assets | | Supplemental Data | |
| | | Total
Distributions | | Net Asset
Value,
End of
Period | | Total
Return
(Excludes
Sales
Charge) | | Net
Expenses | | Net
Investment
Income
(Loss) | | Gross
Expenses | | Net Assets,
End of
Period
(000's) | | Portfolio
Turnover(b) | |
Victory INCORE Investment Grade Convertible Fund | |
Class A | |
Year Ended 10/31/20 | | | (0.94 | ) | | $ | 17.31 | | | | 4.43 | % | | | 1.38 | % | | | 1.63 | % | | | 1.38 | % | | $ | 16,571 | | | | 34 | % | |
Year Ended 10/31/19 | | | (0.76 | ) | | $ | 17.51 | | | | 13.35 | % | | | 1.49 | % | | | 1.31 | % | | | 1.49 | % | | $ | 16,349 | | | | 35 | % | |
Year Ended 10/31/18 | | | (0.62 | ) | | $ | 16.22 | | | | 1.87 | % | | | 1.27 | % | | | 1.79 | % | | | 1.27 | % | | $ | 14,268 | | | | 41 | % | |
Year Ended 10/31/17 | | | (0.25 | ) | | $ | 16.53 | | | | 22.57 | % | | | 1.30 | % | | | 1.12 | % | | | 1.30 | % | | $ | 33,040 | | | | 39 | % | |
Year Ended 10/31/16 | | | (0.32 | ) | | $ | 13.72 | | | | 0.29 | % | | | 1.48 | % | | | 0.80 | % | | | 1.48 | % | | $ | 14,350 | | | | 22 | % | |
Class I | |
Year Ended 10/31/20 | | | (1.00 | ) | | $ | 17.32 | | | | 4.91 | % | | | 0.96 | % | | | 1.98 | % | | | 0.96 | % | | $ | 276,923 | | | | 34 | % | |
Year Ended 10/31/19 | | | (0.85 | ) | | $ | 17.50 | | | | 13.99 | % | | | 0.96 | % | | | 1.87 | % | | | 0.96 | % | | $ | 263,981 | | | | 35 | % | |
Year Ended 10/31/18 | | | (0.67 | ) | | $ | 16.21 | | | | 2.16 | % | | | 0.94 | % | | | 2.17 | % | | | 0.94 | % | | $ | 126,871 | | | | 41 | % | |
Year Ended 10/31/17 | | | (0.30 | ) | | $ | 16.53 | | | | 23.07 | % | | | 0.94 | % | | | 1.47 | % | | | 0.94 | % | | $ | 78,879 | | | | 39 | % | |
Year Ended 10/31/16 | | | (0.37 | ) | | $ | 13.71 | | | | 0.77 | % | | | 0.99 | % | | | 1.26 | % | | | 0.99 | % | | $ | 53,438 | | | | 22 | % | |
See notes to financial statements.
63
Victory Portfolios | | Notes to Financial Statements
October 31, 2020 | |
1. Organization:
Victory Portfolios (the "Trust") was organized on December 6, 1995 as a Delaware statutory trust as a successor to a company named "The Victory Portfolios," which was organized as a Massachusetts business trust on February 5, 1986. The Trust is registered under the Investment Company Act of 1940, as amended (the "1940 Act"), as an open-end investment company. The Trust is comprised of 42 funds and is authorized to issue an unlimited number of shares, which are units of beneficial interest with a par value of $0.001 per share. Each Fund is classified as diversified under the 1940 Act.
The accompanying financial statements are those of the following six Funds (collectively, the "Funds" and individually, a "Fund"):
Funds (Legal Name) | | Funds (Short Name) | | Investment Share
Classes Offered | |
Victory Diversified Stock Fund | | Diversified Stock Fund | | Class A, C, I, R, R6, and Y | |
Victory NewBridge Large Cap
Growth Fund | | NewBridge Large Cap
Growth Fund | | Class A, C, I and Y
| |
Victory Special Value Fund | | Special Value Fund | | Class A, C, I, R and Y | |
Victory Strategic Allocation Fund | | Strategic Allocation Fund | | Class A, C, I and R | |
Victory INCORE Fund for Income | | INCORE Fund for Income | | Class A, C, I, R, R6, Y and
Member Shares* | |
Victory INCORE Investment Grade
Convertible Fund | | INCORE Investment Grade
Convertible Fund | | Class A, I and
Member Shares* | |
* Member Shares commence operations on November 2, 2020.
Each class of shares of a Fund has substantially identical rights and privileges except with respect to sales charges, fees paid under distribution plans, expenses allocable exclusively to each class of shares, voting rights on matters solely affecting a single class of shares, and the exchange privilege of each class of shares.
Under the Trust's organizational documents, its officers and trustees are indemnified against certain liabilities arising out of the performance of their duties to the Funds. In addition, in the normal course of business, the Funds enter into contracts with their vendors and others that provide for general indemnifications. The Funds' maximum exposure under these arrangements is unknown, as this would involve future claims that may be made against the Funds. However, based on experience, the Funds expect that risk of loss to be remote.
2. Significant Accounting Policies:
The following is a summary of significant accounting policies followed by the Trust in the preparation of its financial statements. The policies are in conformity with generally accepted accounting principles in the United States of America ("GAAP"). The preparation of financial statements in accordance with GAAP requires management to make estimates and assumptions that affect the reported amounts of assets and liabilities and disclosure of contingent assets and liabilities at the date of the financial statements and the reported amounts of income and expenses for the period. Actual results could differ from those estimates.
The Funds follow the specialized accounting and reporting requirements under GAAP that are applicable to investment companies.
Investment Valuation:
The Funds record investments at fair value. Fair value is defined as the price that would be received to sell an asset or paid to transfer a liability in an orderly transaction between market participants at the measurement date.
64
Victory Portfolios | | Notes to Financial Statements — continued
October 31, 2020 | |
The valuation techniques described below maximize the use of observable inputs and minimize the use of unobservable inputs in determining fair value. The inputs used for valuing the Funds' investments are summarized in the three broad levels listed below:
• Level 1 — quoted prices in active markets for identical securities
• Level 2 — other significant observable inputs (including quoted prices for similar securities or interest rates applicable to those securities, etc.)
• Level 3 — significant unobservable inputs (including the Funds' own assumptions in determining the fair value of investments)
Changes in valuation techniques may result in transfers in or out of an assigned level within the disclosure hierarchy. The inputs or methodologies used for valuation techniques are not necessarily an indication of the risk associated with entering into those investments.
Portfolio securities listed or traded on securities exchanges, including Exchange-Traded Funds ("ETFs"), American Depositary Receipts ("ADRs") and Rights, are valued at the closing price on the exchange or system where the security is principally traded, if available, or at the Nasdaq Official Closing Price. If there have been no sales for that day on the exchange or system, then a security is valued at the last available bid quotation on the exchange or system where the security is principally traded. In each of these situations, valuations are typically categorized as Level 1 in the fair value hierarchy.
Investments in open-end investment companies are valued at net asset value. These valuations are typically categorized as Level 1 in the fair value hierarchy.
Debt securities of United States ("U.S.") issuers (other than short-term investments maturing in 60 days or less), including corporate and municipal securities, are valued on the basis of bid valuations provided by dealers or an independent pricing service approved by the Trust's Board of Trustees (the "Board"). Short-term investments maturing in 60 days or less may be valued at amortized cost, which approximates market value. Under the amortized cost method, premium or discount, if any, is amortized or accreted, respectively, on a constant basis to the maturity of the security. In each of these situations, valuations are typically categorized as Level 2 in the fair value hierarchy.
Investments for which there are no such quotations, or for which quotations do not appear reliable, are valued at fair value in accordance with procedures established by and under the general supervision and responsibility of the Board. These valuations are typically categorized as Level 2 or Level 3 in the fair value hierarchy, based on the observability of inputs used to determine the fair value.
A summary of the valuations as of October 31, 2020, based upon the three levels defined above, is included in the table below while the breakdown, by category, of investments is disclosed on the Schedules of Portfolio Investments (amounts in thousands):
| | Level 1 | | Level 2 | | Level 3 | | Total | |
Diversified Stock Fund | |
Common Stocks | | $ | 244,783 | | | $ | — | | | $ | — | | | $ | 244,783 | | |
Exchange-Traded Funds | | | 7,772 | | | | — | | | | — | | | | 7,772 | | |
Collateral for Securities Loaned | | | 13,952 | | | | — | | | | — | | | | 13,952 | | |
Total | | $ | 266,507 | | | $ | — | | | $ | — | | | $ | 266,507 | | |
NewBridge Large Cap Growth Fund | |
Common Stocks | | $ | 16,725 | | | $ | — | | | $ | — | | | $ | 16,725 | | |
Collateral for Securities Loaned | | | 447 | | | | — | | | | — | | | | 447 | | |
Total | | $ | 17,172 | | | $ | — | | | $ | — | | | $ | 17,172 | | |
Special Value Fund | |
Common Stocks | | $ | 41,967 | | | $ | — | | | $ | — | | | $ | 41,967 | | |
Exchange-Traded Funds | | | 651 | | | | — | | | | — | | | | 651 | | |
Total | | $ | 42,618 | | | $ | — | | | $ | — | | | $ | 42,618 | | |
65
Victory Portfolios | | Notes to Financial Statements — continued
October 31, 2020 | |
| | Level 1 | | Level 2 | | Level 3 | | Total | |
Strategic Allocation Fund | |
Affiliated Exchange-Traded Funds | | $ | 1,629 | | | $ | — | | | $ | — | | | $ | 1,629 | | |
Affiliated Mutual Funds | | | 22,805 | | | | — | | | | — | | | | 22,805 | | |
Total | | $ | 24,434 | | | $ | — | | | $ | — | | | $ | 24,434 | | |
INCORE Fund for Income | |
Government National Mortgage
Association | | $ | — | | | $ | 586,227 | | | $ | — | | | $ | 586,227 | | |
U.S. Treasury Obligations | | | — | | | | 442,599 | | | | — | | | | 442,599 | | |
Investment Companies | | | 100 | | | | — | | | | — | | | | 100 | | |
Total | | $ | 100 | | | $ | 1,028,826 | | | $ | — | | | $ | 1,028,926 | | |
INCORE Investment Grade Convertible Fund | |
Convertible Corporate Bonds | | $ | — | | | $ | 191,215 | | | $ | | | | $ | 191,215 | | |
Convertible Preferred Stocks | | | 94,900 | | | | 4,565 | | | | — | | | | 99,465 | | |
Collateral for Securities Loaned | | | 13,643 | | | | — | | | | — | | | | 13,643 | | |
Total | | $ | 108,543 | | | $ | 195,780 | | | $ | — | | | $ | 304,323 | | |
For the year ended October 31, 2020, there were no transfers in or out of the Level 3 fair value hierarchy.
Securities Purchased on a When-Issued Basis:
The Funds may purchase securities on a when-issued basis. When-issued securities are securities purchased for delivery beyond normal settlement periods at a stated price and/or yield, thereby involving the risk that the price and/or yield obtained may be more or less than those available in the market when delivery takes place. At the time a Fund makes the commitment to purchase a security on a when-issued basis, the Fund records the transaction and reflects the value of the security in determining net asset value. No interest accrues to the Fund until the transaction settles and payment takes place. Normally, the settlement date occurs within one month of the purchase. A segregated account is established and the Fund maintains cash and/or marketable securities at least equal in value to commitments for when-issued securities. If a Fund owns when-issued securities, these values are included in Payable for investments purchased on the accompanying Statements of Assets and Liabilities and the segregated assets are identified on the Schedules of Portfolio Investments.
Real Estate Investment Trusts ("REITs"):
The Funds may invest in REITs, which report information on the source of their distributions annually. REITs are pooled investment vehicles that invest primarily in income-producing real estate or real estate related loans or interests (such as mortgages). Certain distributions received from REITs during the year are recorded as realized gains or return of capital as estimated by the Funds or when such information becomes known.
Investment Companies:
Exchange-Traded Funds:
The Funds may invest in ETFs, the shares of which are bought and sold on a securities exchange. An ETF trades like common stock and represents a portfolio of securities designed to track the performance and dividend yield of a particular domestic or foreign market index. A Fund may purchase shares of an ETF to temporarily gain exposure to a portion of the U.S. or a foreign market while awaiting purchase of underlying securities. The risks of owning an ETF generally reflect the risks of owning the underlying securities they are designed to track, although the lack of liquidity of an ETF could result in it being more volatile. Additionally, ETFs have fees and expenses that reduce their value.
66
Victory Portfolios | | Notes to Financial Statements — continued
October 31, 2020 | |
Open-End Funds:
The Funds may invest in portfolios of open-end investment companies. These investment companies value securities in their portfolios for which market quotations are readily available at their market values (generally the last reported sale price) and all other securities and assets at their fair value by the methods established by the board of directors of the underlying funds.
Investment Transactions and Related Income:
Changes in holdings of investments are accounted for no later than one business day following the trade date. For financial reporting purposes, however, investment transactions are accounted for on trade date on the last business day of the reporting period. Interest income is determined on the basis of coupon interest accrued using the effective interest method which adjusts, where applicable, the amortization of premiums or accretion of discounts. Dividend income is recorded on the ex-dividend date. Gains or losses realized on sales of securities are recorded on the identified cost basis. Paydown gains or losses on applicable securities, if any, are recorded as components of Interest income on the Statements of Operations.
Withholding taxes on interest, dividends and gains as a result of certain investments in ADRs by the Funds have been provided for in accordance with each investment's applicable country's tax rules and rates.
Securities Lending:
The Trust has entered into a Master Securities Lending Agreement ("MSLA") with Citibank, N.A. ("Citibank" or the "Agent"). Under the terms of the MSLA, the Funds may lend securities to certain broker-dealers and banks in exchange for collateral in the amount of at least 102% of the value of U.S. securities loaned or at least 105% of the value of non-U.S. securities loaned, marked-to-market daily. Any collateral shortfalls associated with increases in the valuation of the securities loaned are adjusted the next business day. The collateral can be received in the form of cash collateral and/or non-cash collateral. Non-cash collateral can include U.S. Government Securities, letters of credit and certificates of deposit. The cash collateral is invested in short-term instruments or cash equivalents, primarily open-end investment companies, as noted on the Funds' Schedules of Portfolio Investments. The Trust does not have effective control of the non-cash collateral and therefore it is not disclosed on the Funds' Schedules of Portfolio Investments. During the time portfolio securities are on loan, the borrower will pay the Funds any dividends or interest paid on such securities plus any fee negotiated between the parties to the lending agreement. The Funds also earn a return from the collateral. The Funds pay the Agent various fees in connection with the investment of cash collateral and fees based on the investment income received from securities lending activities. Securities lending income (net of these fees) is disclosed on the Statements of Operations. Although risk is mitigated by the collateral, the Funds could experience a delay in recovering their securities and possible loss of income or value if the borrower fails to return them.
Securities lending transactions are entered into by a Fund under the MSLA, which permits the Fund, under certain circumstances such as an event of default, to offset amounts payable by the Fund to the same counterparty against amounts receivable from the counterparty to create a net payment due to or from the Fund.
The following table (amounts in thousands) is a summary of the Funds' securities lending transactions which are subject to offset under the MSLA as of October 31, 2020. These transactions are accounted for as secured borrowings with an overnight and continuous contractual maturity for cash collateral and greater than overnight and continuous contractual maturity for non-cash collateral.
67
Victory Portfolios | | Notes to Financial Statements — continued
October 31, 2020 | |
| | | Recognized
Assets
(Value of | | Value of
Cash | | Value of Non-cash Collateral
Received by Maturity | | | |
| | | Securities
on Loan) | | Collateral
Received* | | <30 Days | | Between
30 & 90 Days | | >90 Days | | Net Amount | |
Diversified Stock Fund | | $ | 13,419 | | | $ | 13,419 | | | $ | — | | | $ | — | | | $ | — | | | $ | — | | |
NewBridge Large Cap
Growth Fund | | | 402 | | | | 402 | | | | — | | | | — | | | | — | | | | — | | |
INCORE Investment Grade
Convertible Fund | | | 13,266 | | | | 13,266 | | | | — | | | | — | | | | — | | | | — | | |
* Collateral received in excess of the market value of securities on loan is not presented in this table. The total cash collateral received by each Fund is disclosed on the Statements of Assets and Liabilities.
Federal Income Taxes:
It is the policy of each Fund to continue to qualify as a regulated investment company by complying with the provisions available to certain investment companies, as defined in applicable sections of the Internal Revenue Code, and to make distributions of net investment income and net realized gains sufficient to relieve it from all, or substantially all, federal income taxes. Accordingly, no provision for federal income taxes is required in the financial statements. The Funds have a tax year end of October 31.
Management of the Funds has reviewed tax positions taken in tax years that remain subject to examination by all major tax jurisdictions, including federal (i.e., the last four tax years, which includes the current fiscal tax year end). Management believes that there is no tax liability resulting from unrecognized tax benefits related to uncertain tax positions taken.
Allocations:
Expenses directly attributable to a Fund are charged to the Fund, while expenses which are attributable to more than one fund in the Trust, or jointly with an affiliated trust, are allocated among the respective funds in the Trust and/or affiliated trust based upon net assets or another appropriate basis.
Income, expenses (other than class-specific expenses such as transfer agent fees, state registration fees, printing fees and 12b-1 fees), and realized and unrealized gains or losses on investments are allocated to each class of shares based on its relative net assets on the date income is earned or expenses and realized and unrealized gains and losses are incurred.
3. Purchases and Sales of Securities:
Purchases and sales of securities (excluding securities maturing less than one year from acquisition) for the year ended October 31, 2020 were as follows (amounts in thousands):
| | | Excluding
U.S. Government Securities | | U.S. Government Securities | |
| | | Purchases | | Sales | | Purchases | | Sales | |
Diversified Stock Fund | | $ | 251,849 | | | $ | 305,518 | | | $ | — | | | $ | — | | |
| NewBridge Large Cap Growth Fund | | | 6,198 | | | | 10,635 | | | | — | | | | — | | |
| Special Value Fund | | | 48,240 | | | | 61.377 | | | | — | | | | — | | |
| Strategic Allocation Fund | | | 3,114 | | | | 4.646 | | | | — | | | | — | | |
| INCORE Fund for Income | | | — | | | | — | | | | 789.785 | | | | 438.633 | | |
INCORE Investment Grade
Convertible Fund | | | 116,368 | | | | 97.421 | | | | — | | | | — | | |
68
Victory Portfolios | | Notes to Financial Statements — continued
October 31, 2020 | |
4. Fees and Transactions with Affiliates and Related Parties:
Investment advisory services are provided to the Funds by Victory Capital Management Inc. ("VCM" or the "Adviser"), a New York corporation registered as an investment adviser with the Securities and Exchange Commission ("SEC"). The Adviser is a wholly owned indirect subsidiary of Victory Capital Holdings, Inc., a publicly traded Delaware Corporation and a wholly owned direct subsidiary of Victory Capital Operating, LLC. Amounts incurred and paid to VCM for the year ended October 31, 2020, are reflected on the Statements of Operations as Investment advisory fees.
Under the terms of the Investment Advisory Agreement, the Adviser is entitled to receive fees based on a percentage of the average daily net assets of each Fund. The rates at which the Adviser is paid by each Fund are included in the table below. The Adviser may use its resources to assist with the Funds' distribution and marketing expenses.
| | | Flat Rate | |
Strategic Allocation Fund | | | 0.10 | % | |
| | | Tier Rate | |
Diversified Stock Fund | |
Up to $800 million | | | 0.65 | % | |
$800 million — $2.4 billion | | | 0.60 | % | |
Over $2.4 billion | | | 0.55 | % | |
NewBridge Large Cap Growth Fund | |
Up to $400 million | | | 0.75 | % | |
$400 million — $800 million | | | 0.65 | % | |
Over $800 million | | | 0.60 | % | |
Special Value Fund | |
Up to $400 million | | | 0.75 | % | |
$400 million — $800 million | | | 0.65 | % | |
Over $800 million | | | 0.60 | % | |
INCORE Fund for Income | |
Up to $400 million | | | 0.50 | % | |
$400 million — $800 million | | | 0.45 | % | |
Over $800 million | | | 0.40 | % | |
INCORE Investment Grade Convertible Fund | |
Up to $400 million | | | 0.75 | % | |
$400 million — $800 million | | | 0.65 | % | |
Over $800 million | | | 0.60 | % | |
VCM also serves as the Funds' administrator and fund accountant. Under an Administration and Fund Accounting Agreement, VCM is paid for its services an annual fee at a rate of 0.08% of the first $15 billion in average daily net assets of the Trust, Victory Variable Insurance Funds and Victory Portfolios II (collectively, the "Victory Funds Complex"), 0.05% of the average daily net assets above $15 billion to $30 billion of the Victory Funds Complex and 0.04% of the average daily net assets over $30 billion of the Victory Funds Complex. Amounts incurred for the year ended October 31, 2020, are reflected on the Statements of Operations as Administration fees.
Citi Fund Services Ohio, Inc. ("Citi"), an affiliate of Citibank, acts as sub-administrator and sub-fund accountant to the Funds pursuant to a Sub-Administration and Sub-Fund Accounting Services Agreement between VCM and Citi. VCM pays Citi a fee for providing these services. The Trust reimburses VCM and Citi for all of their reasonable out-of-pocket expenses incurred in providing these services and certain other expenses specifically allocated to the Funds. These costs and reimbursements for the year ended October 31, 2020, are reflected on the Statements of Operations as Sub-Administration fees.
69
Victory Portfolios | | Notes to Financial Statements — continued
October 31, 2020 | |
Citibank serves as the Funds' custodian. The Funds pay Citibank a fee for providing these services. Amounts incurred for the year ended October 31, 2020, are reflected on the Statements of Operations as Custodian fees.
FIS Investor Services, LLC ("FIS") serves as the Funds' transfer agent. Under the Transfer Agent Agreement, the Trust pays FIS a fee for its services and reimburses FIS for all of their reasonable out-of-pocket expenses incurred in providing these services. Amounts incurred for the year ended October 31, 2020, are reflected on the Statements of Operations as Transfer agent fees.
The Chief Compliance Officer ("CCO") is an employee of the Adviser, which pays the compensation of the CCO and his support staff. The Trust has entered into an Agreement to provide compliance services with the Adviser, pursuant to which the Adviser furnishes its compliance personnel, including the services of the CCO, and other resources reasonably necessary to provide the Trust with compliance oversight services related to the design, administration and oversight of a compliance program for the Trust in accordance with Rule 38a-1 under the 1940 Act. The Funds in the Victory Funds Complex, in aggregate, compensate the Adviser for these services. Amounts incurred for the year ended October 31, 2020, are reflected on the Statements of Operations as Compliance fees.
Sidley Austin LLP provides legal services to the Trust.
Victory Capital Services, Inc. (the "Distributor"), an affiliate of the Adviser, serves as distributor for the continuous offering of the shares of the Funds pursuant to a Distribution Agreement between the Distributor and the Trust. Effective June 30, 2020, the Distributor's name was changed from Victory Capital Advisers, Inc. Amounts incurred for the year ended October 31, 2020, are reflected on the Statements of Operations as 12b-1 fees.
Pursuant to the Distribution and Service Plans adopted in accordance with Rule 12b-1 under the 1940 Act, the Distributor may receive a monthly distribution and service fee, at an annual rate of up to 0.25% of the average daily net assets of Class A Shares, at an annual rate of up to 0.50% of the average daily net assets of Class R Shares of the Funds, except for INCORE Fund for Income, and 1.00% of the average daily net assets of Class C Shares of the Funds. The Distributor may receive a monthly distribution and service fee at an annual rate of up to 0.25% of the average daily net assets of Class R Shares of INCORE Fund for Income. The distribution and service fees paid to the Distributor may be used by the Distributor to pay for activities primarily intended to result in the sale of Class A, Class R or Class C Shares of the Funds.
In addition, the Distributor is entitled to receive commissions on sales of the Class A Shares of the Funds. For the year ended October 31, 2020, the Distributor received approximately $76 thousand from commissions earned on sales of Class A Shares of the Funds.
The Adviser has entered into expense limitation agreements with certain Funds. Under the terms of the agreements, the Adviser has agreed to waive fees or reimburse certain expenses to the extent that ordinary operating expenses incurred by certain classes of a Fund in any fiscal year exceed the expense limit for such classes of the Fund. Such excess amounts will be the liability of the Adviser. Interest, taxes, brokerage commissions, other expenditures which are capitalized in accordance with GAAP, and other extraordinary expenses not incurred in the ordinary course of a Fund's business are excluded from the expense limits. As of October 31, 2020, the expense limits (excluding voluntary waivers) are as follows:
| | | In effect November 1, 2019 until February 28, 2021 | |
| | | Class A
Shares | | Class C
Shares | | Class I
Shares | | Class R
Shares | | Class R6
Shares | | Class Y
Shares | | Member
Shares | |
Diversified Stock Fund | | | N/A | | | | 2.02 | %(a) | | | 0.83 | %(a) | | | N/A | | | | 0.78 | % | | | 0.86 | % | | | N/A | | |
NewBridge Large Cap
Growth Fund | | | 1.36 | % | | | 2.10 | % | | | 0.95 | % | | | N/A | | | | N/A | | | | 1.02 | % | | | N/A | | |
70
Victory Portfolios | | Notes to Financial Statements — continued
October 31, 2020 | |
| | | In effect November 1, 2019 until February 28, 2021 | |
| | | Class A
Shares | | Class C
Shares | | Class I
Shares | | Class R
Shares | | Class R6
Shares | | Class Y
Shares | | Member
Shares | |
Special Value Fund | | | N/A | | | | 2.20 | % | | | 1.15 | % | | | N/A | | | | N/A | | | | 1.10 | % | | | N/A | | |
Strategic Allocation Fund | | | 0.40 | %(a) | | | 1.15 | %(a) | | | 0.15 | %(a) | | | 0.65 | %(a) | | | N/A | | | | N/A | | | | N/A | | |
INCORE Fund for Income | | | 0.91 | % | | | 1.71 | % | | | 0.64 | % | | | 0.91 | % | | | 0.63 | % | | | 0.71 | % | | | 0.75 | %(b) | |
INCORE Investment Grade
Convertible Fund | | | 1.39 | %(a) | | | N/A | | | | N/A | | | | N/A | | | | N/A | | | | N/A | | | | 1.10 | %(b) | |
(a) In effect from March 1, 2020 until at least February 28, 2021.
(b) In effect from November 3, 2020 until at least February 28, 2022.
The Funds (except Strategic Allocation Fund) have agreed to repay fees and expenses that were waived or reimbursed by the Adviser for a period up to three fiscal years after such waiver or reimbursement was made to the extent such payments or repayments would not cause the expenses of a class to exceed the original expense limitation in place at time of the waiver or reimbursement or any expense limitation agreement in place at the time of repayment. As of November 11, 2010, the Strategic Allocation Fund is no longer subject to repaying waived or reimbursed fees to the Adviser. Amounts repaid to the Adviser during the year, if any, are reflected on the Statements of Operations as Recoupment of prior expenses waived/reimbursed by Adviser.
As of October 31, 2020, the following amounts are available to be repaid to the Adviser (amounts in thousands). The Funds have not recorded any amounts available to be repaid as a liability due to an assessment that such repayment is not probable at October 31, 2020.
| | | Expires
10/31/21 | | Expires
10/31/22 | | Expires
10/31/23 | | Total | |
Diversified Stock Fund | | $ | 27 | | | $ | 30 | | | $ | 36 | | | $ | 93 | | |
NewBridge Large Cap Growth Fund | | | 64 | | | | 76 | | | | 58 | | | | 198 | | |
Special Value Fund | | | 21 | | | | 33 | | | | 28 | | | | 82 | | |
| INCORE Fund for Income | | | 31 | | | | 86 | | | | 105 | | | | 222 | | |
The Adviser may voluntarily waive or reimburse additional fees to assist the Funds in maintaining competitive expense ratios. Voluntary waivers and reimbursements applicable to the Funds are not available to be recouped at a future time. For the year ended October 31, 2020, the Adviser voluntarily waived the following amounts (in thousands):
Special Value Fund | | $ | 48 | | |
Strategic Allocation Fund | | | 24 | | |
For the year ended October 31, 2020, the Sub-Administrator voluntarily reimbursed INCORE Fund for Income $75 thousand for expenses incurred by the Fund related to the Reclassification Adjustment disclosed in Item 10 of the Notes to Financial Statements. Had this voluntary waiver not occurred, the net expense ratios of each class in the Fund would have been 0.01% higher for the year ended October 31, 2020. This voluntary reimbursement is not available to be recouped at a future time.
Certain officers and/or interested trustees of the Funds are also officers and/or employees of the Adviser, Administrator, Fund Accountant, Sub-Administrator, Sub-Fund Accountant, Custodian, and Legal Counsel.
5. Risks:
Each Fund may be subject to other risks in addition to these identified risks.
An investment in the Funds' shares represents an indirect investment in the securities owned by the Funds, some of which will be traded on a national securities exchange or in the over-the-counter markets. The value of the securities in which the Funds invest, like other market investments, may move up or down, sometimes rapidly and unpredictably. The value of the securities in which the Funds invest may affect the value of the Funds' shares. An investment in the Funds' shares at any point in
71
Victory Portfolios | | Notes to Financial Statements — continued
October 31, 2020 | |
time may be worth less than the original investment, even after taking into account the reinvestment of the Funds' distributions.
The Funds will be subject to credit risk with respect to the amount each expects to receive from counterparties for financial instruments entered into by the Funds. The Funds may be negatively impacted if a counterparty becomes bankrupt or otherwise fails to perform its obligations due to financial difficulties. The Funds may experience significant delays in obtaining any recovery in bankruptcy or other reorganization proceeding and the Funds may obtain only limited recovery or may obtain no recovery in such circumstances. The Funds typically enter into transactions with counterparties whose credit ratings are investment grade, as determined by a nationally recognized statistical rating organization or, if unrated, judged by the Adviser to be of comparable quality.
The NewBridge Large Cap Growth Fund is subject to sector risk. To the extent that Fund focuses in one or more sectors, such as the Information Technology sector, market or economic factors impacting those sectors could have a significant effect on the value of the Fund's investments and could make the Fund's performance more volatile. For example, the values of companies in the Information Technology sector are particularly vulnerable to economic downturns, short product cycles and aggressive pricing, market competition and changes in government regulation.
The INCORE Fund for Income and the INCORE Investment Grade Convertible Bond Fund are subject to credit and interest rate risk with respect to fixed income securities. Credit risk refers to the ability of an issuer to make timely payments of interest and principal. Interest rates may rise or the rate of inflation may increase, impacting the value of investments in fixed income securities. A debt issuers' credit quality may be downgraded or an issuer may default. Interest rates may fluctuate due to changes in governmental fiscal policy initiatives and resulting market reaction to those initiatives.
An outbreak of disease called COVID-19 has spread internationally. The transmission of COVID-19 and efforts to contain its spread have resulted in international, national and local border closings and other significant travel restrictions and disruptions, significant disruptions to business operations, supply chains and consumer activity, significant challenges in healthcare service preparation and delivery, quarantines and general concern and uncertainty. These negative impacts have caused significant volatility and declines in global financial markets, which have caused losses for Fund investors during and subsequent to period end. The impact of the COVID-19 pandemic may last for an extended period of time, and could result in a substantial economic downturn or recession. Public health crises may exacerbate other pre-existing political, social, economic, market and financial risks. The extent of the impact to the financial performance of the Funds' investments will depend on future developments, including (i) the duration and spread of the outbreak, (ii) the restrictions and advisories, (iii) the effects on the financial markets, and (iv) the effects on the economy overall, all of which are highly uncertain and cannot be predicted.
Many debt securities, derivatives and other financial instruments, including some of the Funds investments, use the London Interbank Offered Rate ("LIBOR") as the reference or benchmark rate for variable interest rate calculations. However, the use of LIBOR started to come under pressure following manipulation allegations in 2012. Despite increased regulation and other corrective actions since that time, concerns have arisen regarding its viability as a benchmark, due largely to reduced activity in the financial markets that it measures. In June 2017, the Alternative Reference Rates Committee, a group of large U.S. banks working with the Federal Reserve, announced its selection of a new Secured Overnight Funding Rate ("SOFR"), which is intended to be a broad measure of secured overnight U.S. Treasury repo rates, as an appropriate replacement for LIBOR. The Federal Reserve Bank of New York began publishing the SOFR in 2018, expecting that it could be used on a voluntary basis in new instruments and transactions. Bank working groups and regulators in other countries have suggested other alternatives for their markets, including the Sterling Overnight Interbank Average Rate ("SONIA") in England. In July 2017, the Financial Conduct Authority (the "FCA"), the United Kingdom financial regulatory body, announced that after 2021 it will cease its active encouragement of UK banks to provide the quotations needed to sustain LIBOR. That announcement suggests that LIBOR may cease to be published after that time. For U.S. dollar LIBOR, however, the relevant date may be deferred to June 30, 2023 for the most common tenors (overnight and one, three, six and 12 months). As to those tenors, the LIBOR administrator has published a consultation regarding its intention to cease publication
72
Victory Portfolios | | Notes to Financial Statements — continued
October 31, 2020 | |
of U.S. dollar LIBOR as of June 30, 2023 (instead of December 31, 2021, as previously expected), apparently based on continued rate submissions from banks. It is expected that there will be enough time for market participants to transition to the use of a different benchmark for both new and existing securities and transactions. Various financial industry groups have begun planning for that transition, but there are obstacles to converting certain longer-term securities and transactions to a new benchmark. Transition planning is at an early stage, and neither the effect of the transition process nor its ultimate success can yet be known. Although the foregoing may provide some sense of timing, there is no assurance that LIBOR, nor any particular currency and tenor, will continue to be published until any particular date, and it appears highly likely that LIBOR will be discontinued or modified after December 31, 2021 or June 30, 2023, depending on the currency and tenor. The transition process might lead to increased volatility and illiquidity in markets that currently rely on the LIBOR to determine interest rates. It could also lead to a reduction in the value of some LIBOR-based investments and reduce the effectiveness of new hedges placed against existing LIBOR-based instruments. Since the usefulness of LIBOR as a benchmark could deteriorate during the transition period, these effects could occur before the end of 2021.
6. Borrowing and Interfund Lending:
Line of Credit:
For the year ended October 31, 2020, the Victory Funds Complex and the USAA Mutual Funds Complex (another series of mutual funds managed by the Adviser) participated in a short-term demand note "Line of Credit" agreement with Citibank. The Line of Credit agreement with Citibank was renewed on June 29, 2020 with a termination date of June 28, 2021. Under the agreement with Citibank, the Victory Funds Complex and USAA Mutual Funds Complex, combined, may borrow up to $600 million, of which $300 million is committed and $300 million is uncommitted. $40 million of the Line of Credit is reserved for use by the Victory Floating Rate Fund (herein, the "Fund"), another series of the Victory Funds Complex, with that Fund paying the related commitment fees for that amount. The purpose of the agreement is to meet temporary or emergency cash needs. For the year ended October 31, 2020, Citibank received an annual commitment fee of 0.15% on $300 million for providing the Line of Credit. For the year ended October 31, 2020, Citibank earned approximately $450 thousand in commitment fees from the combined Victory Funds Complex and USAA Mutual Funds Complex. Each fund in the Victory Funds Complex pays a pro-rata portion of the commitment fees plus any interest (one month LIBOR plus one percent) on amounts borrowed. Effective June 29, 2020, under an amended Line of Credit agreement, Citibank will also receive an annual upfront fee of 0.10% on the $300 million committed line of credit. Each fund in the Victory Funds Complex will pay a pro-rata portion of the upfront fee. Interest charged to each Fund during the period, if applicable, is presented on the Statements of Operations under Line of credit fees.
The Funds did not utilize the Line of Credit during the fiscal year ended October 31, 2020.
Interfund Lending:
The Trust and Adviser rely on an exemptive order granted by the SEC in March 2017 (the "Order"), permitting the establishment and operation of an Interfund Lending Facility (the "Facility"). The Facility allows each Fund to directly lend and borrow money to or from any other Victory Fund relying upon the Order at rates beneficial to both the borrowing and lending funds. Advances under the Facility are allowed for temporary or emergency purposes, including the meeting of redemption requests that otherwise might require the untimely disposition of securities, and are subject to each fund's borrowing restrictions. The interfund loan rate is determined, as specified in the Order, by averaging the current repurchase agreement rate and the current bank loan rate. As a Borrower, interest charged to each Fund during the period, if applicable, is presented on the Statements of Operations under Interest expense on interfund lending. As a Lender, interest earned by each Fund during the period, if applicable, is presented on the Statements of Operations under Interfund lending income.
73
Victory Portfolios | | Notes to Financial Statements — continued
October 31, 2020 | |
The average borrowing for the days outstanding and average interest rate for each Fund during the year ended October 31, 2020, were as follows (amounts in thousands):
| | | Borrower or
Lender | | Amount
Outstanding at
October 31, 2020 | | Average
Borrowing* | | Days
Borrowing
Outstanding | | Average
Interest
Rate* | | Maximum
Borrowing
During the
Period | |
INCORE Fund for
Income | | Borrower | | $ | — | | | $ | 8,347 | | | | 5 | | | | 0.64 | % | | $ | 17,207 | | |
INCORE Investment
Grade Convertible
Fund | | Borrower | | | — | | | | 17,925 | | | | 1 | | | | 0.61 | % | | | 17,925 | | |
* For the year ended October 31, 2020, based on the number of days borrowings were outstanding.
7. Federal Income Tax Information:
Dividends from net investment income, if any, are declared and paid monthly for the INCORE Fund for Income. Dividends from net investment income, if any, are declared and paid quarterly for the Diversified Stock Fund, Strategic Allocation Fund and INCORE Investment Grade Convertible Fund. Dividends from net investment income, if any, are declared and paid annually for the NewBridge Large Cap Growth Fund and Special Value Fund. Distributable net realized gains, if any, are declared and distributed at least annually from each Fund.
The amounts of dividends from net investment income and distributions from net realized gains (collectively, distributions to shareholders) are determined in accordance with federal income tax regulations, which may differ from GAAP. To the extent these "book/tax" differences are permanent in nature (e.g., net operating loss and distribution reclassification), such amounts are reclassified within the components of net assets based on their federal tax-basis treatment; temporary differences (e.g., wash sales) do not require reclassification. To the extent dividends and distributions exceed net investment income and net realized gains for tax purposes, they are reported as distributions of capital. Net investment losses incurred by a Fund may be reclassified as an offset to capital on the accompanying Statements of Assets and Liabilities.
As of October 31, 2020, on the Statements of Assets and Liabilities, as a result of permanent book-to-tax differences, reclassification adjustments were as follows (amounts in thousands):
| | Total
Accumulated
Earnings/(Loss) | | Capital | |
Diversified Stock Fund | | $ | (3 | ) | | $ | 3 | | |
| Newbridge Large Cap Growth Fund | | | (319 | ) | | | 319 | | |
INCORE Fund for Income | | | 2 | | | | (2 | ) | |
The tax character of distributions paid during the tax years ended, as noted below, were as follows (total distributions paid may differ from the Statements of Changes in Net Assets because, for tax purposes, dividends are recognized when actually paid) (amounts in thousands):
| | | Year Ended October 31, 2020 | | Year Ended October 31, 2019 | |
| | | Distributions Paid From | | | | Distributions Paid From | | | |
| | Ordinary
Income | | Net
Long-Term
Capital Gains | | Total
Distributions
Paid | | Ordinary
Income | | Net
Long-Term
Capital Gains | | Total
Distributions
Paid | |
Diversified Stock Fund | | $ | 665 | | | $ | 18,725 | | | $ | 19,390 | | | $ | 26,283 | | | $ | 14,832 | | �� | $ | 41,115 | | |
NewBridge Large Cap
Growth Fund | | | — | | | | 3,123 | | | | 3,123 | | | | 29 | | | | 7,115 | | | | 7,144 | | |
Special Value Fund | | | 134 | | | | 1,611 | | | | 1,745 | | | | 3,982 | | | | 2,621 | | | | 6,603 | | |
74
Victory Portfolios | | Notes to Financial Statements — continued
October 31, 2020 | |
| | | Year Ended October 31, 2020 | | Year Ended October 31, 2019 | |
| | | Distributions Paid From | | | | Distributions Paid From | | | |
| | | Ordinary
Income | | Net
Long-Term
Capital Gains | | Total
Distributions
Paid | | Ordinary
Income | | Net
Long-Term
Capital Gains | | Total
Distributions
Paid | |
Strategic Allocation Fund | | $ | 462 | | | $ | 503 | | | $ | 965 | | | $ | 709 | | | $ | 254 | | | $ | 963 | | |
INCORE Fund for Income | | | 41,156 | | | | — | | | | 41,156 | | | | 36,122 | | | | — | | | | 36,122 | | |
INCORE Investment Grade
Convertible Fund | | | 9,063 | | | | 7,674 | | | | 16,737 | | | | 3,943 | | | | 4,048 | | | | 7,991 | | |
As of October 31, 2020, the components of accumulated earnings (deficit) on a tax basis were as follows (amounts in thousands):
| | Undistributed
Ordinary
Income | | Undistributed
Long-Term
Capital Gains | | Accumulated
Earnings | | Accumulated
Capital and
Other
Losses | | Qualified
Late-Year
Losses* | | Unrealized
Appreciation
(Depreciation)** | | Total
Accumulated
Earnings
(Deficit) | |
Diversified Stock Fund | | $ | 20 | | | $ | 6,599 | | | $ | 6,619 | | | $ | — | | | $ | — | | | $ | 57,921 | | | $ | 64,540 | | |
NewBridge Large Cap
Growth Fund | | | — | | | | 2,142 | | | | 2,142 | | | | — | | | | (53 | ) | | | 9,058 | | | | 11,147 | | |
Special Value Fund | | | 5 | | | | 1,628 | | | | 1,633 | | | | — | | | | — | | | | 9,155 | | | | 10,788 | | |
Strategic Allocation Fund | | | 1 | | | | — | | | | 1 | | | | (76 | ) | | | — | | | | 931 | | | | 856 | | |
INCORE Fund for Income | | | 1,911 | | | | — | | | | 1,911 | | | | (315,464 | ) | | | — | | | | (10,836 | ) | | | (324,389 | ) | |
INCORE Investment Grade
Convertible Fund | | | 10,754 | | | | — | | | | 10,754 | | | | (1,509 | ) | | | — | | | | 21,594 | | | | 30,839 | | |
* Qualified late-year losses are comprised of post-October capital losses incurred after October 31 and certain late-year ordinary losses. Late-year ordinary losses represent ordinary losses incurred after December 31 and specified losses incurred after October 31. These losses are deemed to arise on the first day of the Fund's next taxable year.
** The difference between the book-basis and tax-basis unrealized appreciation (depreciation) is attributable primarily to tax deferral of losses on wash sales.
As of the tax year ended October 31, 2020, the following Funds had net capital loss carryforwards ("CLCFs") as summarized in the tables below.
CLCFs not limited as a result as either short-term or long-term depending on the originating capital loss were as follows (amounts in thousands).
| | Short-Term
Amount | | Long-Term
Amount | | Total | |
Strategic Allocation Fund | | $ | — | | | $ | (76 | ) | | $ | (76 | ) | |
INCORE Fund for Income | | | (110,087 | ) | | | (205,377 | ) | | | (315,464 | ) | |
| INCORE Investment Grade Convertible Fund | | | — | | | | (1,509 | ) | | | (1,509 | ) | |
As of October 31, 2020, the cost basis for federal income tax purposes, gross unrealized appreciation, gross unrealized depreciation and net unrealized appreciation (depreciation) for investments and derivatives were as follows (amounts in thousands):
| | Cost of
Investments
for Federal
Tax Purposes | | Net
Gross
Unrealized
Appreciation | | Gross
Unrealized
Depreciation | | Net
Unrealized
Appreciation
(Depreciation) | |
Diversified Stock | | $ | 208,586 | | | $ | 65,647 | | | $ | (7,726 | ) | | $ | 57,921 | | |
Newbridge Large Cap Growth Fund | | | 8,114 | | | | 9,181 | | | | (123 | ) | | | 9,058 | | |
| Special Value | | | 33,463 | | | | 10,625 | | | | (1,470 | ) | | | 9,155 | | |
Strategic Allocation | | | 23,503 | | | | 2,214 | | | | (1,283 | ) | | | 931 | | |
INCORE Fund for Income | | | 1,039,762 | | | | 14,530 | | | | (25,366 | ) | | | (10,836 | ) | |
INCORE Investment Grade Convertible
Fund | | | 282,729 | | | | 30,257 | | | | (8,663 | ) | | | 21,594 | | |
75
Victory Portfolios | | Notes to Financial Statements — continued
October 31, 2020 | |
8. Affiliated Securities:
An affiliated security is a security in which the Fund has ownership of at least 5% of the security's outstanding voting shares or an investment company managed by VCM. Transactions in affiliated securities during the year ended October 31, 2020, were as follows (amounts in thousands):
| | | Fair
Value
10/31/2019 | | Purchases
at Cost | | Proceeds
from
Sales | | Net
Realized
Gains
(Losses)
from
Sales | | Capital Gain
Distributions | | Net
Change in
Unrealized
Appreciation/
Depreciation | | Fair
Value
10/31/2020 | | Dividend
Income | |
Strategic Allocation Fund | |
Victory INCORE Total
Return Bond Fund,
Class R6 | | $ | 3,151 | | | $ | 90 | | | $ | (263 | ) | | $ | 2 | | | $ | — | | | $ | 101 | | | $ | 3,081 | | | $ | 89 | | |
Victory Integrity
Discovery Fund,
Class Y | | | 929 | | | | 145 | | | | (77 | ) | | | (14 | ) | | | 21 | | | | (163 | ) | | | 820 | | | | — | | |
Victory Market
Neutral Income
Fund, Class I | | | 5,437 | | | | 295 | | | | (378 | ) | | | — | * | | | — | | | | 58 | | | | 5,412 | | | | 170 | | |
Victory RS Global
Fund, Class Y | | | 7,443 | | | | 254 | | | | (1,059 | ) | | | 88 | | | | 5 | | | | 323 | | | | 7,049 | | | | 98 | | |
Victory RS Partners
Fund, Class Y | | | — | | | | 729 | | | | — | | | | — | | | | — | | | | 101 | | | | 830 | | | | — | | |
Victory Sophus
Emerging Markets
Small Cap Fund,
Class Y | | | 2,061 | | | | 150 | | | | (180 | ) | | | (113 | ) | | | 4 | | | | (2 | ) | | | 1,916 | | | | 20 | | |
Victory Trivalent
Emerging Markets
Small-Cap Fund,
Class Y | | | 1,968 | | | | 18 | | | | (306 | ) | | | (89 | ) | | | — | | | | 396 | | | | 1,987 | | | | 20 | | |
Victory Trivalent
International
Small-Cap Fund,
Class I | | | — | | | | 1,390 | | | | (148 | ) | | | 39 | | | | — | | | | 429 | | | | 1,710 | | | | — | | |
VictoryShares
International
Volatility Wtd ETF | | | 1,807 | | | | — | | | | (1,466 | ) | | | (60 | ) | | | — | | | | (281 | ) | | | — | | | | 14 | | |
VictoryShares
U.S. Multi-Factor
Minimum
Volatility ETF | | | 1,802 | | | | 51 | | | | (150 | ) | | | 34 | | | | — | | | | (108 | ) | | | 1,629 | | | | 35 | | |
VictoryShares
U.S. Small Cap
Volatility Wtd ETF | | | 889 | | | | — | | | | (619 | ) | | | (60 | ) | | | — | | | | (210 | ) | | | — | | | | 5 | | |
| | | $ | 25,487 | | | $ | 3,122 | | | $ | (4,646 | ) | | $ | (173 | ) | | $ | 30 | | | $ | 644 | | | $ | 24,434 | | | $ | 451 | | |
* Rounds to less than $1 thousand.
9. Fund Ownership:
Ownership of more than 25% of the voting securities of a fund creates presumptions of control of the fund, under section 2(a)(9) of the 1940 Act. As of October 31, 2020, the shareholders listed below held
76
Victory Portfolios | | Notes to Financial Statements — continued
October 31, 2020 | |
more than 25% of the shares outstanding of the Funds and may be deemed to control those Funds. Shareholders of record may hold Fund shares for the benefit of their customers.
| | | Shareholder | | Percent | |
Special Value Fund | | Talcott Resolution Life Insurance Co. | | | 31.8 | % | |
INCORE Investment Grade Convertible Fund | | Morgan Stanley Smith Barney, LLC | | | 39.6 | % | |
10. Reclassification Adjustment:
INCORE Fund for Income has restated certain elements of its 2018 financial statements resulting from the identification of a GAAP reclassification error for the Fund's paydown gain (loss) transactions. The Fund accounts for paydown gain (loss) on a tax basis, requiring a GAAP reclassification to its periodic financial statements. This GAAP reclassification was not applied to the Fund's 2018 annual financial statements, which resulted in net investment income being overstated by approximately $18.237 million with an equal and offsetting adjustment to net realized gain (loss) on investment transactions. Certain amounts in the Financial Highlights were misstated; net investment income (loss) per share, net realized and unrealized gains (losses) per share and ratio of net investment income (loss) to average net assets. However, this reclassification had no impact on the Fund's net assets, NAV, performance, or taxable distributions paid and reported to shareholders for the fiscal and tax years ended 2018.
11. Recent Accounting Pronouncements:
In March 2017, the Financial Accounting Standards Board ("FASB") issued Accounting Standards Update ("ASU") No. 2017-08 "Premium Amortization on Purchased Callable Debt Securities" ("ASU 2017-08"), which shortens the premium amortization period for purchased non-contingently callable debt securities. ASU 2017-08 specifies that the premium amortization period ends at the earliest call date, for purchased non-contingently callable debt securities. Management has reviewed the impact of the adoption of ASU 2017-08 and has concluded that there is no material impact on information presented in the financial statements for the Funds.
77
REPORT OF INDEPENDENT REGISTERED PUBLIC ACCOUNTING FIRM
To the Shareholders and Board of Trustees of Victory Portfolios
Opinion on the Financial Statements
We have audited the accompanying statements of assets and liabilities, including the schedules of portfolio investments, of Victory Diversified Stock Fund, Victory NewBridge Large Cap Growth Fund, Victory Special Value Fund, Victory Strategic Allocation Fund, Victory INCORE Fund for Income and Victory INCORE Investment Grade Convertible Fund (the "Funds"), each a series of Victory Portfolios, as of October 31, 2020, the related statements of operations for the year then ended and the statements of changes in net assets, including the related notes, and the financial highlights for each of the two years in the period then ended (collectively referred to as the "financial statements"). In our opinion, the financial statements present fairly, in all material respects, the financial position of each of the Funds as of October 31, 2020, the results of their operations for the year then ended and the changes in their net assets and the financial highlights for each of the two years in the period then ended, in conformity with accounting principles generally accepted in the United States of America.
The Funds' financial highlights for the years ended October 31, 2018 and prior, were audited by other auditors whose report dated December 21, 2018, expressed an unqualified opinion on those financial highlights.
Basis for Opinion
These financial statements are the responsibility of the Funds' management. Our responsibility is to express an opinion on the Funds' financial statements based on our audits. We are a public accounting firm registered with the Public Company Accounting Oversight Board (United States) ("PCAOB") and are required to be independent with respect to the Funds in accordance with the U.S. federal securities laws and the applicable rules and regulations of the Securities and Exchange Commission and the PCAOB.
We conducted our audits in accordance with the standards of the PCAOB. Those standards require that we plan and perform the audits to obtain reasonable assurance about whether the financial statements are free of material misstatement whether due to error or fraud.
Our audits included performing procedures to assess the risks of material misstatement of the financial statements, whether due to error or fraud, and performing procedures that respond to those risks. Such procedures included examining, on a test basis, evidence regarding the amounts and disclosures in the financial statements. Our procedures included confirmation of securities owned as of October 31, 2020, by correspondence with the custodian and brokers or by other appropriate auditing procedures where replies from brokers were not received. Our audits also included evaluating the accounting principles used and significant estimates made by management, as well as evaluating the overall presentation of the financial statements. We believe that our audits provide a reasonable basis for our opinion.
We have served as the auditor of one or more investment companies advised by Victory Capital Management, Inc. since 2015.

COHEN & COMPANY, LTD.
Cleveland, Ohio
December 23, 2020
78
Victory Portfolios | | Supplemental Information
October 31, 2020 | |
(Unaudited)
Trustee and Officer Information
Board of Trustees:
Overall responsibility for management of the Trust rests with the Board. The Trust is managed by the Board in accordance with the laws of the State of Delaware. There are currently nine Trustees, eight of whom are not "interested persons" of the Trust within the meaning of that term under the 1940 Act ("Independent Trustees") and one of whom is an "interested person" of the Trust within the meaning of that term under the 1940 Act ("Interested Trustee"). The Trustees, in turn, elect the officers of the Trust to actively supervise its day-to-day operations.
The following tables list the Trustees, their date of birth, position with the Trust, commencement of service, principal occupations during the past five years and any directorships of other investment companies or companies whose securities are registered under the Securities Exchange Act of 1934, as amended, or who file reports under that Act. Each Trustee oversees 42 portfolios in the Trust, nine portfolios in Victory Variable Insurance Funds, and 25 portfolios in Victory Portfolios II, each a registered investment company that, together with the Trust, comprise the Victory Fund Complex. David C. Brown is a Trustee who oversees 47 portfolios in the USAA Mutual Funds Trust. Each Trustee's address is c/o Victory Portfolios, 4900 Tiedeman Road, 4th Floor, Brooklyn, Ohio 44144. Each Trustee has an indefinite term.
Name and Date of Birth | | Position
Held with
the Trust | | Date
Commenced
Service | | Principal Occupation
During Past 5 Years | | Other
Directorships
Held During
Past 5 Years | |
Independent Trustees. | |
David Brooks Adcock, Born October 1951 | | Trustee | | May 2005 | | Consultant (since 2006). | | Chair and Trustee, Turner Funds (December 2016-December 2017). | |
Nigel D. T. Andrews, Born April 1947 | | Vice Chair and Trustee | | August 2002 | | Retired. | | Director, TCG BDC II, Inc. (since 2017); Director, TCG BDC I, Inc. (formerly Carlyle GMS Finance, Inc.) (since 2012). | |
E. Lee Beard,* Born August 1951 | | Trustee | | May 2005 | | Retired (since 2015) | | None. | |
Dennis M. Bushe, Born January 1944 | | Trustee | | July 2016 | | Retired. | | Trustee, RS Investment Trust and RS Variable Products Trust (November 2011-July 2016). | |
79
Victory Portfolios | | Supplemental Information — continued
October 31, 2020 | |
(Unaudited)
Name and Date of Birth | | Position
Held with
the Trust | | Date
Commenced
Service | | Principal Occupation
During Past 5 Years | | Other
Directorships
Held During
Past 5 Years | |
John L. Kelly,
Born April 1953 | | Trustee | | February 2015 | | Partner, McCarvill Capital Partners (September 2016- September 2017); Advisor, (January 2016-April 2016) and Managing Partner (August 2014-January 2016) Endgate Commodities LLC. | | Director, Caledonia Mining Corporation (since May 2012). | |
David L. Meyer,* Born April 1957 | | Trustee | | December 2008 | | Retired. | | None. | |
Gloria S. Nelund, Born May 1961 | | Trustee | | July 2016 | | Chair, CEO and Co-Founder of TriLinc Global, LLC, an investment firm. | | TriLinc Global Impact Fund, LLC (since 2012); Trustee, RS Investment Trust and RS Variable Products Trust (November 2007-July 2016). | |
Leigh A. Wilson, Born December 1944 | | Chair and Trustee | | November 1994 | | Private Investor. | | Chair (since 2013), Caledonia Mining Corporation. | |
Interested Trustee. | |
David C. Brown,** Born May 1972 | | Trustee | | May 2008 | | Chairman and Chief Executive Officer (since 2013), the Adviser; Chairman and Chief Executive Officer (since 2013), Victory Capital Holdings, Inc. | | Trustee, USAA Mutual Funds Trust. | |
* The Board has designated Ms. Beard and Mr. Meyer as its Audit Committee Financial Experts.
** Mr. Brown is an "Interested Person" by reason of his relationship with the Adviser.
The Statement of Additional Information includes additional information about the Trustees of the Trust and is available, without charge, by calling 800-539-3863.
80
Victory Portfolios | | Supplemental Information — continued
October 31, 2020 | |
(Unaudited)
Officers:
The officers of the Trust, their date of births, commencement of service and their principal occupations during the past five years, are detailed in the following table. Each officer serves until the earlier of his or her resignation, removal, retirement, death, or the election of a successor. The mailing address of each officer of the Trust is 4900 Tiedeman Road, 4th Floor, Brooklyn, Ohio 44144. The officers of the Trust receive no compensation directly from the Trust for performing the duties of their offices.
Name and Date of Birth | | Position with
the Trust | | Date
Commenced
Service | | Principal Occupation During Past 5 Years | |
Christopher K. Dyer, Born February 1962 | | President | | February 2006* | | Director of Mutual Fund Administration, the Adviser. | |
Scott A. Stahorsky, Born July 1969 | | Vice President | | December 2014 | | Manager, Fund Administration, the Adviser (since 2015); Senior Analyst, Fund Administration, the Adviser (prior to 2015). | |
Erin G. Wagner, Born February 1974 | | Secretary | | December 2014 | | Associate General Counsel, the Adviser (since 2013). | |
Allan Shaer, Born March 1965 | | Treasurer | | May 2017 | | Senior Vice President, Financial Administration, Citi Fund Services Ohio, Inc. (since 2016); Vice President, Mutual Fund Administration, JP Morgan Chase (2011-2016). | |
Christopher A. Ponte, Born March 1984 | | Assistant Treasurer | | December 2017 | | Manager, Fund Administration, the Adviser (since 2017); Senior Analyst, Fund Administration, the Adviser (prior to 2017); Chief Financial Officer, Victory Capital Advisers, Inc. (since 2018). | |
Colin Kinney, Born October 1973 | | Chief Compliance Officer | | July 2017 | | Chief Compliance Officer (since 2013) and Chief Risk Officer (2009-2017), the Adviser. | |
Chuck Booth,
Born April 1960 | | Anti-Money Laundering Compliance Officer and Identity Theft Officer | | May 2015 | | Director, Regulatory Administration and CCO Support Services, Citi Fund Services Ohio, Inc. | |
Jay G. Baris, Born January 1954 | | Assistant Secretary | | December 1997 | | Partner, Sidley Austin LLP (since April 2020); Partner, Shearman & Sterling LLP (January 2018-April 2020); Partner, Morrison & Foerster LLP (2011-January 2018). | |
* On December 3, 2014, Mr. Dyer resigned as Secretary of the Trust and accepted the position of President.
81
Victory Portfolios | | Supplemental Information — continued
October 31, 2020 | |
(Unaudited)
Proxy Voting and Portfolio Holdings Information
Proxy Voting:
Information regarding the policies and procedures each Fund uses to determine how to vote proxies relating to portfolio securities is available without charge, upon request, by calling 800-539-3863. The information is also included in the Funds' Statement of Additional Information, which is available on the SEC's website at www.sec.gov.
Information relating to how the Funds voted proxies relating to portfolio securities held during the most recent twelve months ended June 30 is available on the SEC's website at www.sec.gov.
Availability of Schedules of Portfolio Investments:
The Trust files a complete list of Schedules of Portfolio Investments with the SEC for the first and third quarter of each fiscal year on Form N-PORT. Forms N-PORT are available on the SEC's web site at www.sec.gov.
Expense Examples
As a shareholder of the Funds, you may incur two types of costs: (1) transaction costs, including sales charges (loads) on purchases; and (2) ongoing costs, including management fees, distribution and service (12b-1) fees and other Fund expenses. These examples are intended to help you understand your ongoing costs (in dollars) of investing in the Funds and to compare these costs with the ongoing costs of investing in other mutual funds.
These examples are based on an investment of $1,000 invested at the beginning of the period and held for the entire period from May 1, 2020 through October 31, 2020.
The Actual Expense figures in the table below provide information about actual account values and actual expenses. You may use the information below, together with the amount you invested, to estimate the expenses that you paid over the period. Simply divide your account value by $1,000 (for example, an $8,600 account value divided by $1,000 = 8.6), then multiply the result by the number in the table under the heading entitled "Actual Expenses Paid During Period" to estimate the expenses you paid on your account during this period.
The Hypothetical Expense figures in the table below provide information about hypothetical account values and hypothetical expenses based on each Fund's actual expense ratio and an assumed rate of return of 5% per year before expenses, which is not the Fund's actual return. The hypothetical account values and expenses may not be used to estimate the actual ending account balance or expenses you paid for the period. You may use this information to compare this 5% hypothetical example with the 5% hypothetical examples that appear in shareholder reports of other funds.
Please note the expenses shown in the table are meant to highlight your ongoing costs only and do not reflect any transactional costs. Therefore, the table is useful in comparing ongoing costs only, and will not help you determine the relative total costs of owning different funds. In addition, if these transactional costs were included, your costs would have been higher.
| | | Beginning
Account
Value
5/1/20 | | Actual
Ending
Account
Value
10/31/20 | | Hypothetical
Ending
Account
Value
10/31/20 | | Actual
Expenses
Paid
During
Period
5/1/20-
10/31/20* | | Hypothetical
Expenses
Paid
During
Period
5/1/20-
10/31/20* | | Annualized
Expense
Ratio
During
Period
5/1/20-
10/31/20 | |
Diversified Stock | |
Class A Shares | | $ | 1,000.00 | | | $ | 1,159.50 | | | $ | 1,019.66 | | | $ | 5.92 | | | $ | 5.53 | | | | 1.09 | % | |
Class C Shares | | | 1,000.00 | | | | 1,155.40 | | | | 1,014.98 | | | | 10.94 | | | | 10.23 | | | | 2.02 | % | |
Class I Shares | | | 1,000.00 | | | | 1,162.10 | | | | 1,020.96 | | | | 4.51 | | | | 4.22 | | | | 0.83 | % | |
Class R Shares | | | 1,000.00 | | | | 1,158.80 | | | | 1,018.25 | | | | 7.43 | | | | 6.95 | | | | 1.37 | % | |
Class R6 Shares | | | 1,000.00 | | | | 1,162.30 | | | | 1,021.22 | | | | 4.24 | | | | 3.96 | | | | 0.78 | % | |
Class Y Shares | | | 1,000.00 | | | | 1,161.70 | | | | 1,020.81 | | | | 4.67 | | | | 4.37 | | | | 0.86 | % | |
82
Victory Portfolios | | Supplemental Information — continued
October 31, 2020 | |
(Unaudited)
| | | Beginning
Account
Value
5/1/20 | | Actual
Ending
Account
Value
10/31/20 | | Hypothetical
Ending
Account
Value
10/31/20 | | Actual
Expenses
Paid
During
Period
5/1/20-
10/31/20* | | Hypothetical
Expenses
Paid
During
Period
5/1/20-
10/31/20* | | Annualized
Expense
Ratio
During
Period
5/1/20-
10/31/20 | |
Newbridge Large Cap Growth Fund | |
Class A Shares | | $ | 1,000.00 | | | $ | 1,239.70 | | | $ | 1,018.30 | | | $ | 7.66 | | | $ | 6.90 | | | | 1.36 | % | |
Class C Shares | | | 1,000.00 | | | | 1,231.30 | | | | 1,014.58 | | | | 11.78 | | | | 10.63 | | | | 2.10 | % | |
Class I Shares | | | 1,000.00 | | | | 1,242.20 | | | | 1,020.36 | | | | 5.35 | | | | 4.82 | | | | 0.95 | % | |
Class Y Shares | | | 1,000.00 | | | | 1,241.30 | | | | 1,020.01 | | | | 5.75 | | | | 5.18 | | | | 1.02 | % | |
Special Value | |
Class A Shares | | | 1,000.00 | | | | 1,157.50 | | | | 1,018.95 | | | | 6.67 | | | | 6.24 | | | | 1.23 | % | |
Class C Shares | | | 1,000.00 | | | | 1,152.70 | | | | 1,014.58 | | | | 11.36 | | | | 10.63 | | | | 2.10 | % | |
Class I Shares | | | 1,000.00 | | | | 1,159.00 | | | | 1,019.86 | | | | 5.70 | | | | 5.33 | | | | 1.05 | % | |
Class R Shares | | | 1,000.00 | | | | 1,156.30 | | | | 1,017.50 | | | | 8.24 | | | | 7.71 | | | | 1.52 | % | |
Class Y Shares | | | 1,000.00 | | | | 1,159.10 | | | | 1,020.11 | | | | 5.43 | | | | 5.08 | | | | 1.00 | % | |
Strategic Allocation | |
Class A Shares | | | 1,000.00 | | | | 1,103.90 | | | | 1,023.13 | | | | 2.12 | | | | 2.03 | | | | 0.40 | % | |
Class C Shares | | | 1,000.00 | | | | 1,100.20 | | | | 1,019.36 | | | | 6.07 | | | | 5.84 | | | | 1.15 | % | |
Class I Shares | | | 1,000.00 | | | | 1,105.30 | | | | 1,024.38 | | | | 0.79 | | | | 0.76 | | | | 0.15 | % | |
Class R Shares | | | 1,000.00 | | | | 1,102.10 | | | | 1,021.87 | | | | 3.43 | | | | 3.30 | | | | 0.65 | % | |
INCORE Fund for Income | |
Class A Shares | | | 1,000.00 | | | | 998.50 | | | | 1,020.56 | | | | 4.57 | | | | 4.62 | | | | 0.91 | % | |
Class C Shares | | | 1,000.00 | | | | 993.30 | | | | 1,016.54 | | | | 8.57 | | | | 8.67 | | | | 1.71 | % | |
Class I Shares | | | 1,000.00 | | | | 998.60 | | | | 1,021.92 | | | | 3.22 | | | | 3.25 | | | | 0.64 | % | |
Class R Shares | | | 1,000.00 | | | | 998.50 | | | | 1,020.56 | | | | 4.57 | | | | 4.62 | | | | 0.91 | % | |
Class R6 Shares | | | 1,000.00 | | | | 1,000.10 | | | | 1,022.17 | | | | 2.97 | | | | 3.00 | | | | 0.59 | % | |
Class Y Shares | | | 1,000.00 | | | | 999.50 | | | | 1,021.57 | | | | 3.57 | | | | 3.61 | | | | 0.71 | % | |
INCORE Investment Grade Convertible Fund | |
Class A Shares | | | 1,000.00 | | | | 1,100.90 | | | | 1,018.15 | | | | 7.34 | | | | 7.05 | | | | 1.39 | % | |
Class I Shares | | | 1,000.00 | | | | 1,104.20 | | | | 1,020.26 | | | | 5.13 | | | | 4.93 | | | | 0.97 | % | |
* Expenses are equal to the average account value multiplied by the Fund's annualized expense ratio multiplied by 184/366 (the number of days in the most recent fiscal half-year divided by the number of days in the fiscal year).
83
Victory Portfolios | | Supplemental Information — continued
October 31, 2020 | |
(Unaudited)
Additional Federal Income Tax Information
For the year ended October 31, 2020, the following Funds paid qualified dividend income for the purposes of reduced individual federal income tax rates of:
| | Amount | |
Diversified Stock Fund | | | 100 | % | |
Special Value Fund | | | 100 | % | |
Strategic Allocation Fund | | | 56 | % | |
Dividends qualified for corporate dividends received deductions of:
| | Amount | |
Diversified Stock Fund | | | 100 | % | |
Special Value Fund | | | 100 | % | |
Strategic Allocation Fund | | | 45 | % | |
For the year ended October 31, 2020, the following Funds designated short-term capital gain distributions (in thousands):
| | Amount | |
Strategic Allocation Fund | | $ | 110 | | |
INCORE Investment Grade Convertible Fund | | | 1,911 | | |
For the year ended October 31, 2020, the following Funds designated long-term capital gain distributions (in thousands):
| | Amount | |
Diversified Stock Fund | | $ | 18,725 | | |
| NewBridge Large Cap Growth Fund | | | 3,442 | | |
Special Value Fund | | | 1,611 | | |
Strategic Allocation Fund | | | 503 | | |
INCORE Investment Grade Convertible Fund | | | 7,675 | | |
84
Victory Portfolios | | Supplemental Information — continued
October 31, 2020 | |
(Unaudited)
Liquidity Risk Management Program:
The Victory Funds have adopted and implemented a written liquidity risk management program (the "LRMP") as required by Rule 22e-4 under the Act. The LRMP is reasonably designed to assess and manage each Fund's liquidity risk, taking into consideration each Fund's investment strategy and the liquidity of its portfolio investments during normal and reasonably foreseeable stressed market conditions; its short and long-term cash flow projections; and its cash holdings and access to other liquidity management tools such as available funding sources including the Victory Funds Complex Interfund Lending Facility and Line of Credit (discussed in the Notes to Financial Statements). The Board approved the appointment of VCM as the administrator of the LRMP. At an in-person meeting held on February 20, 2020, VCM provided an oral and written report to the Trustees on the operation and effectiveness of the LRMP during the previous year.
VCM manages liquidity risks associated with the Funds' investments by monitoring, among other things, cash and cash equivalents, any use of derivatives, the concentration of investments, the appropriateness of each Fund's investment strategy, and by classifying every fund investment as either highly liquid, moderately liquid, less liquid or illiquid on at least a monthly basis. To assist with the classification of Fund investments, VCM has retained a third-party provider of liquidity evaluation services. This provider determines preliminary liquidity classifications for all portfolio holdings based upon portfolio-level data and certain assumptions provided by VCM. VCM reviews the preliminary liquidity classifications and, when appropriate, considers other information including input from the Funds' portfolio managers (including the portfolio managers employed by any investment sub-advisers) in determining final liquidity classifications.
The report from VCM concluded that the Funds did not experience any significant liquidity challenges during the covered period, and the Funds' LRMP is reasonably designed to assess and manage its liquidity risk. The report also concluded that the LRMP continues to operate adequately and effectively to enable VCM to oversee and manage liquidity risk and ensure each Fund is able to meet redemption requests without significant dilution to the remaining investors' interest in each Fund. During the review period, each Fund's portfolio consisted primarily of highly liquid investments, which are defined as cash and any investments reasonably expected to be converted to cash in current market conditions in three business days or less without significantly changing the market value of the investment. Therefore, the Funds have not adopted a Highly Liquid Investment Minimum. The Funds' investments were below the limitation on illiquid investments during the review period. Additionally, VCM indicated that no events occurred that would require the filing of Form N-LIQUID and recommended no material changes to the LRMP.
85
Privacy Policy
Protecting the Privacy of Information
The Trust respects your right to privacy. We also know that you expect us to conduct and process your business in an accurate and efficient manner. To do so, we must collect and maintain certain personal information about you. This is the information we collect from you on applications or other forms, and from the transactions you make with us or third parties. It may include your name, address, social security number, account transactions and balances, and information about investment goals and risk tolerance.
We do not disclose any information about you or about former customers to anyone except as permitted or required by law. Specifically, we may disclose the information we collect to companies that perform services on our behalf, such as the transfer agent that processes shareholder accounts and printers and mailers that assist us in the distribution of investor materials. We may also disclose this information to companies that perform marketing services on our behalf. This allows us to continue to offer you Victory investment products and services that meet your investing needs, and to effect transactions that you request or authorize. These companies will use this information only in connection with the services for which we hired them. They are not permitted to use or share this information for any other purpose.
To protect your personal information internally, we permit access only by authorized employees and maintain physical, electronic and procedural safeguards to guard your personal information.*
* You may have received communications regarding information about privacy policies from other financial institutions which gave you the opportunity to "opt-out" of certain information sharing with companies which are not affiliated with that financial institution. The Trust does not share information with other companies for purposes of marketing solicitations for products other than the Trust. Therefore, the Trust does not provide opt-out options to their shareholders.
Victory Funds
P.O. Box 182593
Columbus, Ohio 43218-2593

Visit our website at: | | Call Victory at: | |
www.vcm.com | | 800-539-FUND (800-539-3863) | |

October 31, 2020
Annual Report
Victory Sycamore Established Value Fund
Victory Sycamore Small Company Opportunity Fund
Beginning January 1, 2021, as permitted by regulations adopted by the Securities and Exchange Commission, paper copies of the Victory Funds' shareholder reports will no longer be sent by mail, unless you specifically request paper copies of the reports from the Victory Funds or from your financial intermediary, such as a broker-dealer or bank. Instead, the reports will be made available on www.VictoryFunds.com, and you will be notified by mail each time a report is posted and provided with a website link to access the report. If you already elected to receive shareholder reports electronically, you will not be affected by this change, and you need not take any action.
You may elect to receive shareholder reports and other communications from the Victory Funds or your financial intermediary electronically sooner than January 1, 2021 by notifying your financial intermediary directly or, if you are a direct investor, by calling 800-539-3863 or by sending an e-mail request to TA.Processing@FISGlobal.com.
You may elect to receive all future reports in paper free of charge. If you invest through a financial intermediary, you can contact your financial intermediary to request that you continue to receive paper copies of your reports. If you invest directly with the Victory Funds, you can call 800-539-3863 or send an e-mail request to TA.Processing@FISGlobal.com. Your election to receive reports in paper will apply to all Victory Funds you hold directly or through your financial intermediary.
www.vcm.com
News, Information And Education 24 Hours A Day, 7 Days A Week
The Victory Funds site gives fund shareholders, prospective shareholders, and investment professionals a convenient way to access fund information, get guidance, and track fund performance anywhere they can access the Internet. The site includes:
• Detailed performance records
• Daily share prices
• The latest fund news
• Investment resources to help you become a better investor
• A section dedicated to investment professionals
Whether you're a potential investor searching for the fund that matches your investment philosophy, a seasoned investor interested in planning tools, or an investment professional, www.vcm.com has what you seek. Visit us anytime. We're always open.
Table of Contents
Shareholder Letter (Unaudited) | | | 4 | | |
Managers' Commentary and Investment
Overview (Unaudited) | | | 6 | | |
Investment Objective and Portfolio Holdings
(Unaudited) | | | 12 | | |
Financial Statements | |
Victory Sycamore Established Value Fund | |
Schedule of Portfolio Investments | | | 14 | | |
Statement of Assets and Liabilities | | | 21-22 | | |
Statement of Operations | | | 23 | | |
Statements of Changes in Net Assets | | | 24-26 | | |
Financial Highlights | | | 28-29 | | |
Victory Sycamore Small Company Opportunity Fund | |
Schedule of Portfolio Investments | | | 17 | | |
Statement of Assets and Liabilities | | | 21-22 | | |
Statement of Operations | | | 23 | | |
Statements of Changes in Net Assets | | | 24-26 | | |
Financial Highlights | | | 30-31 | | |
Notes to Financial Statements | | | 32 | | |
Report of Independent
Registered Public Accounting Firm | | | 42 | | |
Supplemental Information (Unaudited) | |
Trustee and Officer Information | | | 43 | | |
Proxy Voting and Portfolio Holdings Information | | | 46 | | |
Expense Examples | | | 46 | | |
Additional Federal Income Tax Information | | | 48 | | |
Liquidity Risk Management Program | | | 49 | | |
Privacy Policy (inside back cover) | | | |
1
The Funds are distributed by Victory Capital Services, Inc. Victory Capital Management Inc. is the investment adviser to the Funds and receives fees from the Funds for performing services for the Funds.
This report is not authorized for distribution to prospective investors unless preceded or accompanied by a current prospectus of the Victory Funds.
For additional information about any Victory Fund, including fees, expenses, and risks, view our prospectus online at vcm.com or call 800-539-3863. Read it carefully before you invest or send money.
The information in this annual report is based on data obtained from recognized services and sources and is believed to be reliable. Any opinions, projections, or recommendations in this report are subject to change without notice and are not intended as individual investment advice. Past investment performance of the Funds, markets or securities mentioned herein should not be considered to be indicative of future results.
• NOT FDIC INSURED • NO BANK GUARANTEE • MAY LOSE VALUE

Call Victory at:
800-539-FUND (800-539-3863)
Visit our website at:
www.vcm.com
2
This page is intentionally left blank.
3
Victory Funds Letter to Shareholders
(Unaudited)
Dear Shareholder,
It's safe to say that the fiscal year ended October 31, 2020, has been like no other. The range of emotions that investors have experienced touched both ends of the spectrum. The annual reporting period began with relatively calm markets and more mundane questions surrounding interest rates, global trade and earnings growth. Yet those concerns took a back seat in early 2020.
A novel coronavirus and the subsequent spread of the disease that it causes ("COVID-19") throughout Asia, Europe and eventually the United States became an unprecedented event. To combat the pandemic, governments everywhere issued austere shelter-in-place orders, and the global economy slowed markedly. Equity markets sold off sharply in March and April, and U.S. GDP shrunk by a whopping 31.4% during the second quarter.
It's no surprise that so many investors flocked to the perceived safety of U.S. Treasurys. Meanwhile, liquidity evaporated (for a short spell) in many other segments of the fixed income market, including higher-yielding credits and municipal bonds. The outlook was tenuous, and credit spreads widened while prices declined for any securities perceived to be higher risk.
The U.S. Federal Reserve (the "Fed") and other monetary authorities worldwide leapt into action — cutting interest rates, (re)starting quantitative easing and, in the case of the Fed, launching an array of programs to provide liquidity to stabilize fixed income markets. The U.S. government also stepped up to provide fiscal stimulus in the form of the Coronavirus Aid, Relief, and Economic Security Act (CARES Act).
In retrospect, it's amazing how quickly those actions helped to end the stock market's freefall and restored order across much of the fixed income universe. The rebound was almost as robust as the drawdown. Through all the unprecedented events and extreme volatility, the S&P 500® Index registered an impressive annual return of 9.7% for the 12-month period ended October 31, 2020. Meanwhile, the yield on 10-year U.S. Treasurys declined 81 basis points over the same period, reflecting both the Fed's interest rate cuts and its pledge to keep rates low longer. The yield on 10-Year U.S. Treasurys was 0.88% as of October 31, 2020.
The good news is that over the summer and into the fall, the economy regained its footing, and GDP increased at an annual rate of 33.1% in the third quarter of 2020, according to the "advance" estimate released by the Bureau of Economic Analysis. Does this mean it's clear for investors now? Is it ever?
We must accept the fact that the economy and markets remain unpredictable even as we are cautiously optimistic on the reported progress toward a COVID-19 vaccine. Looking ahead, investors should expect continued bouts of volatility — both to the upside and downside — depending on the pandemic news. And let's not forget that there are other factors at play, including new political leadership and the potential for new policies and priorities.
4
Fortunately, we believe all of Victory Capital's autonomous Investment Franchises are in capable hands to withstand the ups and downs. The investment professionals who manage our funds have vetted investment philosophies and risk protocols, and market volatility can even create opportunities that benefit astute active managers.
On the following pages, you will find information relating to your Victory Funds investment. If you have any questions, we encourage you to contact your financial advisor. Or, if you invest with us directly, you may call (800) 539-3863, or visit our website at www.vcm.com.
My colleagues and I sincerely appreciate the confidence you have placed in the Victory Funds, and we value the opportunity to help meet your investment goals.

Christopher K. Dyer, CFA
President,
Victory Funds
5
Victory Sycamore Established Value Fund
Managers' Commentary
(Unaudited)
What were the market conditions during the reporting period?
The U.S. equity market posted solid gains during the fourth quarter of 2019 and recorded the best annual performance since 2013. Investors began the year on a cautious note after the selloff in the fourth quarter of 2018. Concerns over slowing global growth, the possibility of policy error, and moderating corporate earnings contributed to the pullback in the back half of 2018. Consequently, the U.S. Federal Reserve (the "Fed") was quick to pivot early in the year. By the end of the first quarter, it was widely understood that further interest rate hikes in 2019 were essentially off the table which helped propel the market higher.
After a banner year for the U.S. equity market in 2019, the setup for 2020 was favorable; however, that quickly changed as the disease outbreak caused by the novel coronavirus ("COVID-19") burst outside of the epicenter of Wuhan, China. Given the drastic measures taken to stem the COVID-19 outbreak, economic activity came to an abrupt halt. The sudden drop in output was unprecedented. As investors digested the lack of clarity on the path of the virus and the potential economic impact from the mitigation efforts, the equity market sold off rapidly. Volatility spiked to levels only experienced in the 1929 and 1987 crashes. March 2020 was the most volatile month in history for the S&P 500® Index, with an average daily move of 4.95%. The velocity of the selloff was also noteworthy — taking only 22 days for the market to reach bear market territory, marking the fastest path to a 20% drop on record.
The selloff and speed with which the equity market entered bear market territory in the first quarter is noteworthy. Equally as impressive is how quickly the market was able to erase the losses incurred in subsequent months. Several reasons were cited as providing a tailwind for the equity market. First, the size and magnitude of the monetary and fiscal policy response have been unprecedented. Second, the reopening of states, as well as declining case counts in some of the original hot spots, captured headlines and fueled optimism. That led to a shift from mitigation response to efforts geared toward reigniting economic activity. As states relaxed mitigation efforts, the corporate narrative also shifted from talk about a sharp drop in demand to one of potential stabilization. This was especially the case for sectors and industries caught in the "eye of the storm," such as retail, restaurants and travel. Yet another factor was optimism around possible vaccines becoming available late this year or early next year. The lingering question for investors moving forward remains the path of the virus. Should the uncertainty abate, it would not be unreasonable to expect the equity market to continue its resilient streak as the economic recovery takes a more persistent form.
How did Victory Sycamore Established Value Fund (the "Fund") perform during the reporting period?
The Fund seeks to provide long-term capital growth. The Fund returned -5.22% (Class A Shares at net asset value) for the fiscal year ended October 31, 2020, outperforming the Russell Midcap® Value Index (the "Index"), which returned -6.94% during the period.
6
Victory Sycamore Established Value Fund (continued)
What strategies did you employ during the reporting period?
The investment team employs a bottom-up, fundamental stock selection process. For the reporting period, stock selection detracted from relative performance. However, sector weighting — a by-product of the bottom-up stock selection process — entirely offset the unfavorable impact from selection. Specifically, an underweight in Real Estate, Energy, and Utilities, as well as an overweight in Information Technology, Consumer Staples and Materials contributed to the Fund's overall performance. Stock selection in the Consumer Staples, Real Estate, Health Care and Utilities sectors was also favorable. Conversely, stock selection in the Communication Services, Consumer Discretionary, Materials, Industrials, Financials and Energy sectors detracted from the Fund's return. An underweight relative to the Index in Communication Services also subtracted from performance.
7
Victory Sycamore Established Value Fund
Investment Overview
(Unaudited)
Average Annual Total Return
Year Ended October 31, 2020
| | Class A | | Class C | | Class I | | Class R | | Class R6 | | Class Y | | | |
INCEPTION DATE | | 5/5/00 | | 3/1/16 | | 3/1/10 | | 8/16/83 | | 3/4/14 | | 1/28/13 | | | |
| | | Net Asset
Value | | Maximum
Offering
Price | | Net Asset
Value | | Maximum
Offering
Price | | Net Asset
Value | | Net Asset
Value | | Net Asset
Value | | Net Asset
Value | | Russell
Midcap®
Value
Index1 | |
One Year | | | –5.22 | % | | | –10.68 | % | | | –5.93 | % | | | –6.82 | % | | | –4.92 | % | | | –5.41 | % | | | –4.89 | % | | | –4.92 | % | | | –6.94 | % | |
Five Year | | | 6.59 | % | | | 5.33 | % | | | N/A | | | | N/A | | | | 6.91 | % | | | 6.37 | % | | | 6.96 | % | | | 6.88 | % | | | 5.32 | % | |
Ten Year | | | 10.23 | % | | | 9.58 | % | | | N/A | | | | N/A | | | | 10.60 | % | | | 10.03 | % | | | N/A | | | | N/A | | | | 9.40 | % | |
Since Inception | | | N/A | | | | N/A | | | | 8.22 | % | | | 8.22 | % | | | N/A | | | | N/A | | | | 7.90 | % | | | 9.97 | % | | | N/A | | |
Past performance is not indicative of future results. The performance data quoted represents past performance and current returns may be lower or higher. The investment return and principal value will fluctuate so that an investor's shares, when redeemed, may be worth more or less than the original cost. To obtain performance information current to the most recent month's end, please visit www.vcm.com. | |
The maximum offering price (MOP) reflects a maximum sales charge of 5.75% for Class A Shares. Class C Shares are not subject to an initial sales charge, but are subject to a deferred sales charge of 1.00% on shares redeemed within one year of purchase. NAV does not reflect sales charges.
Total return measures the price change in a share assuming the reinvestment of all net investment income and realized capital gain distributions, if any. The total returns quoted above may differ from the total returns shown in the Financial Highlights because they do not reflect adjustments made to the enclosed financial statements in accordance with U.S. generally accepted accounting principles or the deduction of taxes that a shareholder would pay on net investment income and realized capital gain distributions, including reinvested distributions, or redemptions of shares.
The total return figures set forth above include all waivers of fees for various periods since inception. Without such fee waivers, the total returns would have been lower. Some fee waivers are voluntary and may be modified or terminated at any time.
Victory Sycamore Established Value Fund — Growth of $10,000
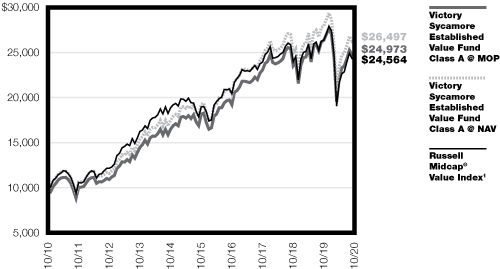
1The Russell Midcap® Value Index is an unmanaged Index made up of medium and medium/small companies in the Russell 1000® Index chosen for their value orientation. This Index does not include the effect of sales charges, commissions, expenses or taxes, is not representative of the Fund and it is not possible to invest directly in an index.
The graph reflects investment growth of a hypothetical $10,000 investment in Class A Shares of the Fund. The performance of other classes of the Fund's shares will be greater than or less than the line shown based on the differences in loads and fees paid by shareholders investing in the different classes. Past performance is no guarantee of future results.
The graph and table do not reflect the deduction of taxes that a shareholder would pay on Fund distributions or the redemption of Fund shares.
8
Victory Sycamore Small Company Opportunity Fund
Managers' Commentary
(Unaudited)
What were the market conditions during the reporting period?
The U.S. equity market posted solid gains during the fourth quarter of 2019 and recorded the best annual performance since 2013. Investors began the year on a cautious note after the selloff in the fourth quarter of 2018. Concerns over slowing global growth, the possibility of policy error, and moderating corporate earnings contributed to the pullback in the back half of 2018. Consequently, the U.S. Federal Reserve (the "Fed") was quick to pivot early in the year. By the end of the first quarter, it was widely understood that further interest rate hikes in 2019 were essentially off the table which helped propel the market higher.
After a banner year for the U.S. equity market in 2019, the set-up for 2020 was favorable; however, that quickly changed as the disease outbreak caused by the novel coronavirus ("COVID-19") burst outside of the epicenter of Wuhan, China. Given the drastic measures taken to stem the COVID-19 outbreak, economic activity came to an abrupt halt. The sudden drop in output was unprecedented. As investors digested the lack of clarity on the path of the virus and the potential economic impact from the mitigation efforts, the equity market sold off rapidly. Volatility spiked to levels only experienced in the 1929 and 1987 crashes. March 2020 was the most volatile month in history for the S&P 500® Index, with an average daily move of 4.95%. The velocity of the selloff was also noteworthy — taking only 22 days for the market to reach bear market territory, marking the fastest path to a 20% drop on record.
The selloff and speed with which the equity market entered bear market territory in the first quarter is noteworthy. Equally as impressive is how quickly, in subsequent months, the market was able to erase the losses incurred. Several reasons were cited as providing a tailwind for the equity market. First, the size and magnitude of the monetary and fiscal policy response have been unprecedented. Second, the reopening of states, as well as declining case counts in some of the original hot spots, captured headlines and fueled optimism. That led to a shift from mitigation response to efforts geared toward reigniting economic activity. As states relaxed mitigation efforts, the corporate narrative also shifted from talk about a sharp drop in demand to one of potential stabilization. This was especially the case for sectors and industries caught in the "eye of the storm," such as retail, restaurants and travel. Yet another factor was optimism around possible vaccines becoming available late this year or early next year. The lingering question for investors moving forward remains the path of the virus. Should the uncertainty abate, then it would not be unreasonable to expect the equity market to continue its resilient streak as the economic recovery takes a more persistent form.
How did Victory Sycamore Small Company Opportunity Fund (the "Fund") perform during the reporting period?
The Fund seeks to provide capital appreciation. The Fund returned -11.80% (Class A Shares at net asset value) for the fiscal year ended October 31, 2020, outperforming the Russell 2000® Value Index, which returned -13.92% during the period.
9
Victory Sycamore Small Company Opportunity Fund (continued)
What strategies did you employ during the reporting period?
The investment team employs a bottom-up, fundamental stock selection process. For the reporting period, stock selection detracted from relative performance; however, sector weighting — a by-product of the bottom-up stock selection process — entirely offset the unfavorable impact from selection. Specifically, an underweight in the Financials, Energy, Real Estate, Communication Services, and Utilities sectors contributed to the Fund's relative performance. An overweight in Consumer Discretionary, Industrials, Health Care, Consumer Staples, Materials and Information Technology was also beneficial.
Additionally, stock selection in the Financials, Industrials and Information Technology sectors was favorable. Conversely, stock selection in Health Care, Consumer Discretionary, Consumer Staples, Utilities, and Energy detracted from relative return. The Fund's average cash position over the reporting period was also a drag on performance.
10
Victory Sycamore Small Company Opportunity Fund
Investment Overview
(Unaudited)
Average Annual Total Return
Year Ended October 31, 2020
| | Class A | | Class I | | Class R | | Class R6 | | Class Y | | | |
INCEPTION DATE | | 3/26/99 | | 8/31/07 | | 8/16/83 | | 12/14/15 | | 1/28/13 | | | |
| | | Net Asset
Value | | Maximum
Offering
Price | | Net Asset
Value | | Net Asset
Value | | Net Asset
Value | | Net Asset
Value | | Russell 2000®
Value Index1 | |
One Year | | | –11.80 | % | | | –16.88 | % | | | –11.51 | % | | | –11.94 | % | | | –11.43 | % | | | –11.65 | % | | | –13.92 | % | |
Five Year | | | 6.45 | % | | | 5.20 | % | | | 6.80 | % | | | 6.23 | % | | | N/A | | | | 6.60 | % | | | 3.71 | % | |
Ten Year | | | 9.44 | % | | | 8.79 | % | | | 9.81 | % | | | 9.20 | % | | | N/A | | | | N/A | | | | 7.06 | % | |
Since Inception | | | N/A | | | | N/A | | | | N/A | | | | N/A | | | | 7.77 | % | | | 8.42 | % | | | N/A | | |
Past performance is not indicative of future results. The performance data quoted represents past performance and current returns may be lower or higher. The investment return and principal value will fluctuate so that an investor's shares, when redeemed, may be worth more or less than the original cost. To obtain performance information current to the most recent month's end, please visit www.vcm.com.
The maximum offering price (MOP) figures reflect a maximum sales charge of 5.75% for Class A Shares. NAV does not reflect sales charges.
Total return measures the price change in a share assuming the reinvestment of all net investment income and realized capital gain distributions, if any. The total returns quoted above may differ from the total returns shown in the Financial Highlights because they do not reflect adjustments made to the enclosed financial statements in accordance with U.S. generally accepted accounting principles or the deduction of taxes that a shareholder would pay on net investment income and realized capital gain distributions, including reinvested distributions, or redemptions of shares.
The total return figures set forth above include all waivers of fees for various periods since inception. Without such fee waivers, the total returns would have been lower. Some fee waivers are voluntary and may be modified or terminated at any time.
Victory Sycamore Small Company Opportunity Fund — Growth of $10,000
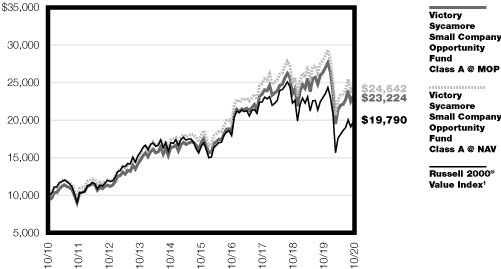
1The Russell 2000® Value Index is an unmanaged index that measures the performance of those Russell 2000® companies with lower price-to-book ratios and lower forecasted growth values. These indices do not include the effect of sales charges, commissions, expenses or taxes, are not representative of the Fund and it is not possible to invest directly in an index.
The graph reflects investment growth of a hypothetical $10,000 investment in Class A Shares of the Fund. The performance of other classes of the Fund's shares will be greater than or less than the line shown based on the differences in loads and fees paid by shareholders investing in the different classes. Past performance is no guarantee of future results.
The graph and table do not reflect the deduction of taxes that a shareholder would pay on Fund distributions or the redemption of Fund shares.
11
Victory Portfolios
Victory Sycamore Established Value Fund | | October 31, 2020 | |
(Unaudited)
Investment Objective & Portfolio Holdings:
Victory Sycamore Established Value Fund seeks to provide long-term capital growth.
Sector Allocation*:
October 31, 2020
(% of Total Investments)
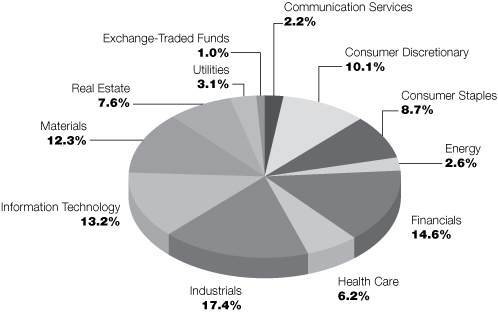
* Does not include futures, money market instruments, and short-term investments purchased with cash collateral from securities loaned.
12
Victory Portfolios
Victory Sycamore Small Company Opportunity Fund | | October 31, 2020 | |
(Unaudited)
Investment Objective & Portfolio Holdings:
Victory Sycamore Small Company Opportunity Fund seeks to provide capital appreciation.
Sector Allocation*:
October 31, 2020
(% of Total Investments)

* Does not include futures, money market instruments, and short-term investments purchased with cash collateral from securities loaned.
13
Victory Portfolios
Victory Sycamore Established Value Fund | | Schedule of Portfolio Investments
October 31, 2020 | |
(Amounts in Thousands, Except for Shares)
Security Description | | Shares | | Value | |
Common Stocks (98.3%) | |
Communication Services (2.2%): | |
The Interpublic Group of Cos., Inc. | | | 7,750,000 | | | $ | 140,197 | | |
ViacomCBS, Inc., Class B (a) | | | 3,140,000 | | | | 89,710 | | |
| | | | 229,907 | | |
Consumer Discretionary (10.1%): | |
Aptiv PLC (a) | | | 1,160,000 | | | | 111,928 | | |
AutoNation, Inc. (a) (b) | | | 1,217,700 | | | | 69,080 | | |
BorgWarner, Inc. | | | 6,325,000 | | | | 221,249 | | |
Darden Restaurants, Inc. | | | 1,820,000 | | | | 167,294 | | |
Las Vegas Sands Corp. | | | 2,125,000 | | | | 102,128 | | |
Marriott International, Inc., Class A | | | 1,040,000 | | | | 96,595 | | |
Ross Stores, Inc. | | | 1,275,000 | | | | 108,592 | | |
Yum! Brands, Inc. | | | 1,990,000 | | | | 185,727 | | |
| | | | 1,062,593 | | |
Consumer Staples (8.7%): | |
Archer-Daniels-Midland Co. | | | 6,075,000 | | | | 280,908 | | |
Hormel Foods Corp. (a) | | | 1,515,000 | | | | 73,765 | | |
Sysco Corp. | | | 2,880,000 | | | | 159,293 | | |
The Hershey Co. | | | 975,000 | | | | 134,024 | | |
The Kroger Co. | | | 3,200,000 | | | | 103,072 | | |
Tyson Foods, Inc., Class A | | | 2,800,000 | | | | 160,244 | | |
| | | | 911,306 | | |
Energy (2.6%): | |
Cimarex Energy Co. | | | 2,925,000 | | | | 74,207 | | |
Devon Energy Corp. (a) | | | 6,300,000 | | | | 56,259 | | |
Parsley Energy, Inc., Class A | | | 6,100,000 | | | | 61,061 | | |
Valero Energy Corp. | | | 2,112,000 | | | | 81,545 | | |
| | | | 273,072 | | |
Financials (14.6%): | |
Aflac, Inc. | | | 3,850,000 | | | | 130,708 | | |
Alleghany Corp. | | | 430,000 | | | | 235,180 | | |
American Financial Group, Inc. | | | 2,450,000 | | | | 183,603 | | |
Arthur J. Gallagher & Co. | | | 1,340,000 | | | | 138,971 | | |
Everest Re Group Ltd. (a) | | | 805,000 | | | | 158,649 | | |
Old Republic International Corp. | | | 6,800,000 | | | | 110,704 | | |
Prosperity Bancshares, Inc. (a) | | | 2,725,000 | | | | 150,176 | | |
TCF Financial Corp. | | | 3,840,000 | | | | 104,486 | | |
W.R. Berkley Corp. | | | 2,850,000 | | | | 171,342 | | |
Zions Bancorp NA | | | 4,520,000 | | | | 145,860 | | |
| | | | 1,529,679 | | |
Health Care (6.2%): | |
AmerisourceBergen Corp. | | | 330,000 | | | | 31,703 | | |
Hill-Rom Holdings, Inc. | | | 1,900,000 | | | | 173,033 | | |
Molina Healthcare, Inc. (b) | | | 595,000 | | | | 110,950 | | |
See notes to financial statements.
14
Victory Portfolios
Victory Sycamore Established Value Fund | | Schedule of Portfolio Investments — continued
October 31, 2020 | |
(Amounts in Thousands, Except for Shares)
Security Description | | Shares | | Value | |
Quest Diagnostics, Inc. | | | 1,575,000 | | | $ | 192,370 | | |
The Cooper Cos., Inc. | | | 440,000 | | | | 140,382 | | |
| | | | 648,438 | | |
Industrials (17.4%): | |
AGCO Corp. | | | 2,520,000 | | | | 194,116 | | |
Alaska Air Group, Inc. | | | 984,000 | | | | 37,284 | | |
Hubbell, Inc. | | | 1,175,000 | | | | 170,974 | | |
JB Hunt Transport Services, Inc. | | | 1,165,000 | | | | 141,827 | | |
Landstar System, Inc. | | | 1,440,000 | | | | 179,568 | | |
Lincoln Electric Holdings, Inc. | | | 610,000 | | | | 62,110 | | |
ManpowerGroup, Inc. | | | 2,000,000 | | | | 135,740 | | |
Owens Corning, Inc. | | | 2,800,000 | | | | 183,316 | | |
Parker-Hannifin Corp. | | | 887,000 | | | | 184,815 | | |
Republic Services, Inc. | | | 940,000 | | | | 82,880 | | |
Textron, Inc. | | | 5,075,000 | | | | 181,685 | | |
The Toro Co. | | | 696,400 | | | | 57,174 | | |
United Rentals, Inc. (a) (b) | | | 629,000 | | | | 112,144 | | |
Xylem, Inc. | | | 1,165,000 | | | | 101,518 | | |
| | | | 1,825,151 | | |
Information Technology (13.3%): | |
Amphenol Corp., Class A | | | 800,000 | | | | 90,272 | | |
Coherent, Inc. (b) | | | 1,195,000 | | | | 149,542 | | |
DXC Technology Co. | | | 3,685,000 | | | | 67,878 | | |
Flex Ltd. (b) | | | 15,000,000 | | | | 212,250 | | |
Genpact Ltd. | | | 4,575,000 | | | | 157,243 | | |
Hewlett Packard Enterprise Co. | | | 8,500,000 | | | | 73,440 | | |
Leidos Holdings, Inc. | | | 1,425,000 | | | | 118,275 | | |
MAXIMUS, Inc. | | | 2,350,000 | | | | 158,812 | | |
Motorola Solutions, Inc. | | | 770,000 | | | | 121,706 | | |
Nuance Communications, Inc. (b) | | | 2,360,000 | | | | 75,308 | | |
Skyworks Solutions, Inc. | | | 750,000 | | | | 105,968 | | |
Zebra Technologies Corp. (b) | | | 210,000 | | | | 59,564 | | |
| | | | 1,390,258 | | |
Materials (12.4%): | |
AptarGroup, Inc. | | | 1,220,000 | | | | 139,190 | | |
Avery Dennison Corp. | | | 1,820,000 | | | | 251,869 | | |
Corteva, Inc. | | | 1,630,600 | | | | 53,777 | | |
Eastman Chemical Co. | | | 2,185,000 | | | | 176,636 | | |
Packaging Corp. of America (a) | | | 1,330,000 | | | | 152,272 | | |
Reliance Steel & Aluminum Co. | | | 1,645,000 | | | | 179,289 | | |
Steel Dynamics, Inc. | | | 5,550,000 | | | | 174,714 | | |
Westlake Chemical Corp. (a) | | | 2,470,000 | | | | 167,021 | | |
| | | | 1,294,768 | | |
Real Estate (7.6%): | |
American Homes 4 Rent, Class A | | | 4,600,000 | | | | 130,042 | | |
Americold Realty Trust (a) | | | 1,680,000 | | | | 60,866 | | |
Healthcare Trust of America, Inc., Class A | | | 4,393,000 | | | | 106,750 | | |
Highwoods Properties, Inc. | | | 3,740,000 | | | | 111,340 | | |
See notes to financial statements.
15
Victory Portfolios
Victory Sycamore Established Value Fund | | Schedule of Portfolio Investments — continued
October 31, 2020 | |
(Amounts in Thousands, Except for Shares)
Security Description | | Shares | | Value | |
Lamar Advertising Co., Class A | | | 2,575,000 | | | $ | 159,547 | | |
National Retail Properties, Inc. | | | 3,030,000 | | | | 96,990 | | |
Public Storage | | | 570,000 | | | | 130,570 | | |
| | | | 796,105 | | |
Utilities (3.2%): | |
Alliant Energy Corp. | | | 3,100,000 | | | | 171,368 | | |
Xcel Energy, Inc. | | | 2,270,000 | | | | 158,968 | | |
| | | | 330,336 | | |
Total Common Stocks (Cost $10,052,512) | | | 10,291,613 | | |
Exchange-Traded Funds (1.0%) | |
iShares Russell Mid-Cap Value ETF (a) | | | 1,305,000 | | | | 106,488 | | |
Total Exchange-Traded Funds (Cost $82,743) | | | 106,488 | | |
Collateral for Securities Loaned^ (1.0%) | |
BlackRock Liquidity Funds TempFund, Institutional Class, 0.10% (c) | | | 2,412,854 | | | | 2,413 | | |
Fidelity Investments Money Market Government Portfolio,
Institutional Class, 0.02% (c) | | | 32,199,106 | | | | 32,199 | | |
Goldman Sachs Financial Square Prime Obligations Fund,
Institutional Class, 0.02% (c) | | | 16,778,930 | | | | 16,779 | | |
JPMorgan Prime Money Market Fund, Capital Class, 0.07% (c) | | | 10,200,973 | | | | 10,201 | | |
Morgan Stanley Institutional Liquidity Prime Portfolio,
Institutional Class, 0.11% (c) | | | 43,169,697 | | | | 43,170 | | |
Total Collateral for Securities Loaned (Cost $104,762) | | | 104,762 | | |
Total Investments (Cost $10,240,017) — 100.3% | | | 10,502,863 | | |
Liabilities in excess of other assets — (0.3)% | | | (29,284 | ) | |
NET ASSETS — 100.00% | | $ | 10,473,579 | | |
^ Purchased with cash collateral from securities on loan.
(a) All or a portion of this security is on loan.
(b) Non-income producing security.
(c) Rate disclosed is the daily yield on October 31, 2020.
ETF — Exchange-Traded Fund
PLC — Public Limited Company
See notes to financial statements.
16
Victory Portfolios
Victory Sycamore Small Company Opportunity Fund | | Schedule of Portfolio Investments
October 31, 2020 | |
(Amounts in Thousands, Except for Shares)
Security Description | | Shares | | Value | |
Common Stocks (97.9%) | |
Communication Services (0.7%): | |
The E.W. Scripps Co., Class A (a) (b) | | | 3,503,600 | | | $ | 31,813 | | |
Consumer Discretionary (11.7%): | |
Asbury Automotive Group, Inc. (b) (c) | | | 248,400 | | | | 25,580 | | |
Choice Hotels International, Inc. | | | 694,100 | | | | 60,630 | | |
Churchill Downs, Inc. | | | 283,200 | | | | 42,239 | | |
Core-Mark Holding Co., Inc. (a) | | | 2,504,200 | | | | 68,490 | | |
Helen of Troy Ltd. (c) | | | 250,600 | | | | 47,514 | | |
Hyatt Hotels Corp., Class A (b) | | | 725,500 | | | | 40,004 | | |
Murphy USA, Inc. (c) | | | 374,000 | | | | 45,736 | | |
Penske Automotive Group, Inc. | | | 927,875 | | | | 47,471 | | |
Sonic Automotive, Inc., Class A | | | 715,200 | | | | 25,790 | | |
Steven Madden Ltd. | | | 3,613,800 | | | | 86,767 | | |
Texas Roadhouse, Inc. | | | 454,925 | | | | 31,858 | | |
Visteon Corp. (c) | | | 500,600 | | | | 44,879 | | |
| | | | 566,958 | | |
Consumer Staples (4.7%): | |
Casey's General Stores, Inc. | | | 233,000 | | | | 39,276 | | |
Edgewell Personal Care Co. (c) | | | 1,579,400 | | | | 41,412 | | |
Ingredion, Inc. | | | 442,700 | | | | 31,383 | | |
Performance Food Group Co. (c) | | | 1,163,600 | | | | 39,109 | | |
Sanderson Farms, Inc. (b) | | | 612,988 | | | | 78,444 | | |
| | | | 229,624 | | |
Energy (1.1%): | |
Delek U.S. Holdings, Inc. | | | 1,842,100 | | | | 18,532 | | |
Helix Energy Solutions Group, Inc. (b) (c) | | | 6,040,300 | | | | 14,980 | | |
PDC Energy, Inc. (c) | | | 1,635,898 | | | | 19,499 | | |
| | | | 53,011 | | |
Financials (20.0%): | |
American Financial Group, Inc. | | | 482,000 | | | | 36,121 | | |
AMERISAFE, Inc. | | | 839,914 | | | | 49,538 | | |
Bank of Hawaii Corp. | | | 851,600 | | | | 51,641 | | |
Columbia Banking System, Inc. | | | 1,440,900 | | | | 40,936 | | |
Eagle Bancorp, Inc. | | | 780,000 | | | | 23,338 | | |
First American Financial Corp. | | | 1,359,000 | | | | 60,598 | | |
Horace Mann Educators Corp. | | | 1,317,800 | | | | 44,687 | | |
Independent Bank Corp. | | | 964,221 | | | | 55,240 | | |
Kemper Corp. | | | 926,000 | | | | 57,097 | | |
Lakeland Financial Corp. | | | 988,450 | | | | 50,539 | | |
Pinnacle Financial Partners, Inc. | | | 1,583,875 | | | | 72,526 | | |
RenaissanceRe Holdings Ltd. | | | 301,900 | | | | 48,823 | | |
Renasant Corp. (b) | | | 1,940,600 | | | | 55,327 | | |
Selective Insurance Group, Inc. | | | 761,100 | | | | 39,623 | | |
South State Corp. | | | 1,183,100 | | | | 72,642 | | |
State Auto Financial Corp. | | | 1,577,277 | | | | 19,464 | | |
Stewart Information Services Corp. | | | 1,292,200 | | | | 54,776 | | |
See notes to financial statements.
17
Victory Portfolios
Victory Sycamore Small Company Opportunity Fund | | Schedule of Portfolio Investments — continued
October 31, 2020 | |
(Amounts in Thousands, Except for Shares)
Security Description | | Shares | | Value | |
UMB Financial Corp. | | | 1,240,000 | | | $ | 75,478 | | |
White Mountains Insurance Group Ltd. | | | 66,000 | | | | 59,950 | | |
| | | | 968,344 | | |
Health Care (8.2%): | |
AngioDynamics, Inc. (a) (c) | | | 4,201,325 | | | | 43,442 | | |
Avanos Medical, Inc., Class I (c) | | | 1,740,525 | | | | 61,527 | | |
Cutera, Inc. (a) (c) | | | 1,255,700 | | | | 23,770 | | |
Hanger, Inc. (a) (c) | | | 2,242,640 | | | | 39,179 | | |
ICU Medical, Inc. (c) | | | 325,000 | | | | 57,782 | | |
Magellan Health, Inc. (c) | | | 794,300 | | | | 57,404 | | |
Natus Medical, Inc. (c) | | | 1,621,200 | | | | 29,522 | | |
NuVasive, Inc. (c) | | | 925,175 | | | | 41,106 | | |
Patterson Cos., Inc. (b) | | | 1,737,800 | | | | 43,228 | | |
| | | | 396,960 | | |
Industrials (24.8%): | |
ABM Industries, Inc. | | | 1,481,925 | | | | 51,452 | | |
Alamo Group, Inc. | | | 551,500 | | | | 66,362 | | |
Altra Industrial Motion Corp. | | | 1,133,100 | | | | 48,451 | | |
Applied Industrial Technologies, Inc. | | | 1,352,600 | | | | 82,576 | | |
Astec Industries, Inc. (b) | | | 743,000 | | | | 37,744 | | |
Carlisle Cos., Inc. | | | 398,000 | | | | 49,300 | | |
Columbus McKinnon Corp. | | | 886,800 | | | | 30,054 | | |
Crane Co. | | | 1,005,000 | | | | 51,004 | | |
EMCOR Group, Inc. | | | 939,200 | | | | 64,045 | | |
Encore Wire Corp. (a) | | | 1,071,400 | | | | 49,509 | | |
Forward Air Corp. | | | 790,000 | | | | 49,746 | | |
Hillenbrand, Inc. | | | 1,340,004 | | | | 39,195 | | |
ICF International, Inc. | | | 583,100 | | | | 38,129 | | |
Kennametal, Inc. | | | 1,366,200 | | | | 42,352 | | |
Korn Ferry | | | 1,242,400 | | | | 37,508 | | |
Marten Transport Ltd. | | | 3,006,200 | | | | 46,131 | | |
Mueller Industries, Inc. | | | 1,188,275 | | | | 34,377 | | |
MYR Group, Inc. (c) | | | 469,600 | | | | 20,075 | | |
Saia, Inc. (c) | | | 192,125 | | | | 28,369 | | |
TriMas Corp. (c) | | | 1,543,150 | | | | 37,545 | | |
U.S. Ecology, Inc. | | | 906,900 | | | | 27,679 | | |
UFP Industries, Inc. | | | 990,000 | | | | 49,411 | | |
UniFirst Corp. | | | 350,000 | | | | 57,334 | | |
Valmont Industries, Inc. | | | 418,500 | | | | 59,406 | | |
Viad Corp. | | | 1,003,550 | | | | 20,071 | | |
Watts Water Technologies, Inc., Class A | | | 479,800 | | | | 53,147 | | |
Werner Enterprises, Inc. | | | 920,000 | | | | 34,978 | | |
| | | | 1,205,950 | | |
Information Technology (11.9%): | |
ADTRAN, Inc. (a) | | | 2,649,600 | | | | 28,324 | | |
Advanced Energy Industries, Inc. (c) | | | 522,000 | | | | 35,219 | | |
Avnet, Inc. | | | 1,256,900 | | | | 31,008 | | |
Fabrinet (c) | | | 546,600 | | | | 32,807 | | |
See notes to financial statements.
18
Victory Portfolios
Victory Sycamore Small Company Opportunity Fund | | Schedule of Portfolio Investments — continued
October 31, 2020 | |
(Amounts in Thousands, Except for Shares)
Security Description | | Shares | | Value | |
Littelfuse, Inc. | | | 280,000 | | | $ | 55,424 | | |
ManTech International Corp., Class A | | | 560,000 | | | | 36,333 | | |
MAXIMUS, Inc. | | | 642,000 | | | | 43,386 | | |
MicroStrategy, Inc. (c) | | | 226,600 | | | | 37,858 | | |
MKS Instruments, Inc. | | | 310,000 | | | | 33,601 | | |
NETGEAR, Inc. (a) (c) | | | 1,783,200 | | | | 54,958 | | |
Plexus Corp. (c) | | | 703,300 | | | | 48,907 | | |
ScanSource, Inc. (c) | | | 1,223,700 | | | | 24,596 | | |
Sykes Enterprises, Inc. (c) | | | 1,890,000 | | | | 64,714 | | |
Verint Systems, Inc. (c) | | | 1,004,000 | | | | 48,714 | | |
| | | | 575,849 | | |
Materials (7.3%): | |
Avient Corp. | | | 770,200 | | | | 23,930 | | |
Cabot Corp. | | | 1,690,000 | | | | 64,238 | | |
Kaiser Aluminum Corp. | | | 473,425 | | | | 29,793 | | |
Livent Corp. (b) (c) | | | 2,095,000 | | | | 22,521 | | |
Minerals Technologies, Inc. | | | 1,093,225 | | | | 59,788 | | |
Silgan Holdings, Inc. | | | 910,900 | | | | 31,381 | | |
Sonoco Products Co. | | | 1,195,250 | | | | 58,435 | | |
Worthington Industries, Inc. | | | 1,341,600 | | | | 66,020 | | |
| | | | 356,106 | | |
Real Estate (5.1%): | |
Corporate Office Properties Trust | | | 1,316,900 | | | | 29,538 | | |
First Industrial Realty Trust, Inc. | | | 988,500 | | | | 39,352 | | |
Healthcare Realty Trust, Inc. | | | 1,500,000 | | | | 41,700 | | |
Rayonier, Inc. | | | 2,336,900 | | | | 59,312 | | |
Sunstone Hotel Investors, Inc. | | | 4,473,100 | | | | 33,190 | | |
Washington Real Estate Investment Trust | | | 2,430,000 | | | | 42,476 | | |
| | | | 245,568 | | |
Utilities (2.4%): | |
ALLETE, Inc. | | | 572,400 | | | | 29,525 | | |
MGE Energy, Inc. | | | 446,100 | | | | 29,005 | | |
NorthWestern Corp. | | | 597,750 | | | | 31,161 | | |
ONE Gas, Inc. | | | 367,600 | | | | 25,379 | | |
| | | | 115,070 | | |
Total Common Stocks (Cost $4,642,735) | | | 4,745,253 | | |
Exchange-Traded Funds (1.1%) | |
iShares Russell 2000 Value ETF (b) | | | 500,000 | | | | 51,495 | | |
Total Exchange-Traded Funds (Cost $57,343) | | | 51,495 | | |
See notes to financial statements.
19
Victory Portfolios
Victory Sycamore Small Company Opportunity Fund | | Schedule of Portfolio Investments — continued
October 31, 2020 | |
(Amounts in Thousands, Except for Shares)
Security Description | | Shares | | Value | |
Collateral for Securities Loaned^ (1.2%) | |
BlackRock Liquidity Funds TempFund, Institutional Class, 0.10% (d) | | | 1,392,500 | | | $ | 1,393 | | |
Fidelity Investments Money Market Government Portfolio,
Institutional Class, 0.02% (d) | | | 18,582,666 | | | | 18,583 | | |
Goldman Sachs Financial Square Prime Obligations Fund,
Institutional Class, 0.02% (d) | | | 9,683,413 | | | | 9,683 | | |
JPMorgan Prime Money Market Fund, Capital Class, 0.07% (d) | | | 5,887,159 | | | | 5,887 | | |
Morgan Stanley Institutional Liquidity Prime Portfolio,
Institutional Class, 0.11% (d) | | | 24,913,985 | | | | 24,914 | | |
Total Collateral for Securities Loaned (Cost $60,460) | | | 60,460 | | |
Total Investments (Cost $4,760,538) — 100.2% | | | 4,857,208 | | |
Liabilities in excess of other assets — (0.2)% | | | (11,749 | ) | |
NET ASSETS — 100.00% | | $ | 4,845,459 | | |
^ Purchased with cash collateral from securities on loan.
(a) Affiliated security (See Note 8).
(b) All or a portion of this security is on loan.
(c) Non-income producing security.
(d) Rate disclosed is the daily yield on October 31, 2020.
ETF — Exchange-Traded Fund
See notes to financial statements.
20
Victory Portfolios | | Statements of Assets and Liabilities
October 31, 2020 | |
(Amounts in Thousands, Except Per Share Amounts)
| | | Victory
Sycamore
Established
Value Fund | | Victory
Sycamore
Small Company
Opportunity
Fund | |
Assets: | |
Affiliated investments, at value (Cost $ — and $428,040) | | $ | — | | | $ | 339,485 | (a) | |
Unaffiliated investments, at value (Cost $10,240,017 and
$4,332,498) | | | 10,502,863 | (b) | | | 4,517,723 | (c) | |
Cash and cash equivalents | | | 97,055 | | | | 26,702 | | |
Receivables: | |
Interest and dividends | | | 4,781 | | | | 1,185 | | |
Capital shares issued | | | 8,783 | | | | 4,770 | | |
Investments sold | | | 11,067 | | | | 35,939 | | |
Prepaid expenses | | | 204 | | | | 112 | | |
Total Assets | | | 10,624,753 | | | | 4,925,916 | | |
Liabilities: | |
Payables: | |
Collateral received on loaned securities | | | 104,762 | | | | 60,460 | | |
Investments purchased | | | 21,127 | | | | 8,679 | | |
Capital shares redeemed | | | 19,055 | | | | 7,081 | | |
Accrued expenses and other payables: | |
Investment advisory fees | | | 4,157 | | | | 3,229 | | |
Administration fees | | | 568 | | | | 263 | | |
Custodian fees | | | 76 | | | | 37 | | |
Transfer agent fees | | | 677 | | | | 350 | | |
Compliance fees | | | 8 | | | | 4 | | |
Trustees' fees | | | 20 | | | | 10 | | |
| 12b-1 fees | | | 326 | | | | 84 | | |
Other accrued expenses | | | 398 | | | | 260 | | |
Total Liabilities | | | 151,174 | | | | 80,457 | | |
Net Assets: | |
| Capital | | | 9,752,656 | | | | 4,722,062 | | |
Total accumulated earnings/(loss) | | | 720,923 | | | | 123,397 | | |
Net Assets | | $ | 10,473,579 | | | $ | 4,845,459 | | |
Net Assets | |
Class A Shares | | $ | 1,380,509 | | | $ | 336,083 | | |
Class C Shares | | | 54,271 | | | | — | | |
Class I Shares | | | 3,306,226 | | | | 2,666,852 | | |
Class R Shares | | | 633,244 | | | | 200,617 | | |
Class R6 Shares | | | 4,499,129 | | | | 1,625,853 | | |
Class Y Shares | | | 600,200 | | | | 16,054 | | |
Total | | $ | 10,473,579 | | | $ | 4,845,459 | | |
Shares (unlimited number of shares authorized with a
par value of $0.001 per share): | |
Class A Shares | | | 38,618 | | | | 8,866 | | |
Class C Shares | | | 1,556 | | | | — | | |
Class I Shares | | | 92,435 | | | | 69,450 | | |
Class R Shares | | | 17,975 | | | | 5,706 | | |
Class R6 Shares | | | 125,729 | | | | 42,376 | | |
Class Y Shares | | | 16,782 | | | | 421 | | |
Total | | | 293,095 | | | | 126,819 | | |
(continues on next page)
See notes to financial statements.
21
Victory Portfolios | | Statements of Assets and Liabilities
October 31, 2020 | |
(Amounts in Thousands, Except Per Share Amounts) (continued)
| | | Victory
Sycamore
Established
Value Fund | | Victory
Sycamore
Small Company
Opportunity
Fund | |
Net asset value, offering (except Class A Shares)
and redemption price per share: (d) | |
Class A Shares | | $ | 35.75 | | | $ | 37.91 | | |
Class C Shares (e) | | | 34.89 | | | | — | | |
Class I Shares | | | 35.77 | | | | 38.40 | | |
Class R Shares | | | 35.23 | | | | 35.16 | | |
Class R6 Shares | | | 35.78 | | | | 38.37 | | |
Class Y Shares | | | 35.76 | | | | 38.10 | | |
Maximum Sales Charge — Class A Shares | | | 5.75 | % | | | 5.75 | % | |
Maximum offering price
(100%/(100%-maximum sales charge) of net asset value
adjusted to the nearest cent) per share — Class A Shares | | $ | 37.93 | | | $ | 40.22 | | |
(a) Includes $83 of securities on loan.
(b) Includes $103,365 of securities on loan.
(c) Includes $58,089 of securities on loan.
(d) Per share amount may not recalculate due to rounding of net assets and/or shares outstanding.
(e) Redemption price per share varies by the length of time shares are held.
See notes to financial statements.
22
Victory Portfolios | | Statements of Operations
For the Year Ended October 31, 2020 | |
(Amounts in Thousands)
| | | Victory
Sycamore
Established
Value Fund | | Victory
Sycamore
Small Company
Opportunity
Fund | |
Investment Income: | |
Dividends from unaffiliated investments | | $ | 238,551 | | | $ | 80,939 | | |
Dividends from affiliated investments | | | — | | | | 3,180 | | |
Interest from unaffiliated investments | | | 2,160 | | | | 775 | | |
Interfund lending | | | 46 | | | | 1 | | |
Securities lending (net of fees) | | | 377 | | | | 300 | | |
Foreign tax withholding | | | — | | | | (132 | ) | |
Total Income | | | 241,134 | | | | 85,063 | | |
Expenses: | |
Investment advisory fees | | | 48,627 | | | | 38,646 | | |
Administration fees | | | 6,519 | | | | 3,087 | | |
Sub-Administration fees | | | 14 | | | | 14 | | |
12b-1 fees — Class A Shares | | | 3,809 | | | | 934 | | |
12b-1 fees — Class C Shares | | | 646 | | | | — | | |
12b-1 fees — Class R Shares | | | 3,463 | | | | 1,148 | | |
Custodian fees | | | 459 | | | | 221 | | |
Transfer agent fees — Class A Shares | | | 1,915 | | | | 595 | | |
Transfer agent fees — Class C Shares | | | 85 | | | | — | | |
Transfer agent fees — Class I Shares | | | 2,015 | | | | 2,981 | | |
Transfer agent fees — Class R Shares | | | 574 | | | | 189 | | |
Transfer agent fees — Class R6 Shares | | | 741 | | | | 38 | | |
Transfer agent fees — Class Y Shares | | | 499 | | | | 49 | | |
Trustees' fees | | | 877 | | | | 417 | | |
Compliance fees | | | 92 | | | | 44 | | |
Legal and audit fees | | | 518 | | | | 248 | | |
State registration and filing fees | | | 288 | | | | 138 | | |
Other expenses | | | 1,124 | | | | 741 | | |
Total Expenses | | | 72,265 | | | | 49,490 | | |
Net Investment Income (Loss) | | | 168,869 | | | | 35,573 | | |
Realized/Unrealized Gains (Losses) from Investments: | |
Net realized gains (losses) from affiliated investment securities | | | — | | | | (9,238 | ) | |
Net realized gains (losses) from unaffiliated investment securities | | | 591,933 | | | | 22,963 | | |
Net realized gains (losses) from in-kind redemptions | | | — | | | | 18,032 | | |
Net change in unrealized appreciation/depreciation on affiliated
investment securities | | | — | | | | (50,359 | ) | |
Net change in unrealized appreciation/depreciation on unaffiliated
investment securities | | | (1,316,124 | ) | | | (629,662 | ) | |
Net realized/unrealized gains (losses) on investments | | | (724,191 | ) | | | (648,264 | ) | |
Change in net assets resulting from operations | | $ | (555,322 | ) | | $ | (612,691 | ) | |
See notes to financial statements.
23
Victory Portfolios | | Statements of Change in Net Assets | |
(Amounts in Thousands)
| | | Victory Sycamore
Established
Value Fund | | Victory Sycamore
Small Company
Opportunity Fund | |
| | | Year
Ended
October 31,
2020 | | Year
Ended
October 31,
2019 | | Year
Ended
October 31,
2020 | | Year
Ended
October 31,
2019 | |
From Investment Activities: | |
Operations: | |
Net investment income (loss) | | $ | 168,869 | | | $ | 138,347 | | | $ | 35,573 | | | $ | 40,419 | | |
Net realized gains (losses) from
investments | | | 591,933 | | | | 553,734 | | | | 31,757 | | | | 255,811 | | |
Net change in unrealized appreciation/
depreciation on investments | | | (1,316,124 | ) | | | 547,492 | | | | (680,021 | ) | | | 318,608 | | |
Change in net assets resulting from
operations | | | (555,322 | ) | | | 1,239,573 | | | | (612,691 | ) | | | 614,838 | | |
Distributions to Shareholders: | |
Class A Shares | | | (103,792 | ) | | | (169,100 | ) | | | (22,491 | ) | | | (53,953 | ) | |
Class C Shares | | | (4,182 | ) | | | (7,200 | ) | | | — | | | | — | | |
Class I Shares | | | (218,171 | ) | | | (316,124 | ) | | | (243,950 | ) | | | (475,137 | ) | |
Class R Shares | | | (46,556 | ) | | | (76,258 | ) | | | (14,387 | ) | | | (33,313 | ) | |
Class R6 Shares | | | (308,392 | ) | | | (354,635 | ) | | | (15,900 | ) | | | (23,009 | ) | |
Class Y Shares | | | (42,591 | ) | | | (43,476 | ) | | | (1,835 | ) | | | (3,713 | ) | |
Change in net assets resulting from
distributions to shareholders | | | (723,684 | ) | | | (966,793 | ) | | | (298,563 | ) | | | (589,125 | ) | |
Change in net assets resulting from capital
transactions | | | 124,104 | | | | 580,139 | | | | 133,993 | | | | 468,542 | | |
Change in net assets | | | (1,154,902 | ) | | | 852,919 | | | | (777,261 | ) | | | 494,255 | | |
Net Assets: | |
Beginning of period | | | 11,628,481 | | | | 10,775,562 | | | | 5,622,720 | | | | 5,128,465 | | |
End of period | | $ | 10,473,579 | | | $ | 11,628,481 | | | $ | 4,845,459 | | | $ | 5,622,720 | | |
(continues on next page)
See notes to financial statements.
24
Victory Portfolios | | Statements of Change in Net Assets | |
(Amounts in Thousands) (continued)
| | | Victory Sycamore
Established
Value Fund | | Victory Sycamore
Small Company
Opportunity Fund | |
| | | Year
Ended
October 31,
2020 | | Year
Ended
October 31,
2019 | | Year
Ended
October 31,
2020 | | Year
Ended
October 31,
2019 | |
Capital Transactions: | |
Class A Shares | |
Proceeds from shares issued | | $ | 323,380 | | | $ | 354,106 | | | $ | 93,340 | | | $ | 96,031 | | |
Distributions reinvested | | | 87,261 | | | | 140,929 | | | | 18,989 | | | | 45,327 | | |
Cost of shares redeemed | | | (638,669 | ) | | | (739,328 | ) | | | (155,298 | ) | | | (174,978 | ) | |
Total Class A Shares | | $ | (228,028 | ) | | $ | (244,293 | ) | | $ | (42,969 | ) | | $ | (33,620 | ) | |
Class C Shares | |
Proceeds from shares issued | | $ | 1,281 | | | $ | 3,767 | | | $ | — | | | $ | — | | |
Distributions reinvested | | | 3,900 | | | | 6,686 | | | | — | | | | — | | |
Cost of shares redeemed | | | (20,288 | ) | | | (22,418 | ) | | | — | | | | — | | |
Total Class C Shares | | $ | (15,107 | ) | | $ | (11,965 | ) | | $ | — | | | $ | — | | |
Class I Shares | |
Proceeds from shares issued | | $ | 1,126,708 | | | $ | 880,254 | | | $ | 1,115,785 | | | $ | 911,034 | | |
Distributions reinvested | | | 186,353 | | | | 273,354 | | | | 227,267 | | | | 434,644 | | |
Cost of shares redeemed | | | (1,094,095 | ) | | | (1,206,721 | ) | | | (2,509,736 | ) | | | (913,187 | ) | |
Total Class I Shares | | $ | 218,966 | | | $ | (53,113 | ) | | $ | (1,166,684 | ) | | $ | 432,491 | | |
Class R Shares | |
Proceeds from shares issued | | $ | 102,944 | | | $ | 119,414 | | | $ | 43,209 | | | $ | 40,972 | | |
Distributions reinvested | | | 45,322 | | | | 73,094 | | | | 13,958 | | | | 31,790 | | |
Cost of shares redeemed | | | (246,422 | ) | | | (279,535 | ) | | | (89,785 | ) | | | (77,878 | ) | |
Total Class R Shares | | $ | (98,156 | ) | | $ | (87,027 | ) | | $ | (32,618 | ) | | $ | (5,116 | ) | |
Class R6 Shares | |
Proceeds from shares issued | | $ | 1,467,343 | | | $ | 1,274,143 | | | $ | 1,529,209 | | | $ | 102,798 | | |
Distributions reinvested | | | 301,095 | | | | 345,033 | | | | 15,321 | | | | 22,339 | | |
Cost of shares redeemed | | | (1,544,569 | ) | | | (829,351 | ) | | | (158,934 | ) | | | (49,049 | ) | |
Total Class R6 Shares | | $ | 223,869 | | | $ | 789,825 | | | $ | 1,385,596 | | | $ | 76,088 | | |
Class Y Shares | |
Proceeds from shares issued | | $ | 286,306 | | | $ | 333,916 | | | $ | 10,492 | | | $ | 7,131 | | |
Distributions reinvested | | | 38,649 | | | | 37,685 | | | | 831 | | | | 1,272 | | |
Cost of shares redeemed | | | (302,395 | ) | | | (184,889 | ) | | | (20,655 | ) | | | (9,704 | ) | |
Total Class Y Shares | | $ | 22,560 | | | $ | 186,712 | | | $ | (9,332 | ) | | $ | (1,301 | ) | |
Change in net assets resulting from
capital transactions | | $ | 124,104 | | | $ | 580,139 | | | $ | 133,993 | | | $ | 468,542 | | |
(continues on next page)
See notes to financial statements.
25
Victory Portfolios | | Statements of Change in Net Assets | |
(Amounts in Thousands) (continued)
| | | Victory Sycamore
Established
Value Fund | | Victory Sycamore
Small Company
Opportunity Fund | |
| | | Year
Ended
October 31,
2020 | | Year
Ended
October 31,
2019 | | Year
Ended
October 31,
2020 | | Year
Ended
October 31,
2019 | |
Share Transactions: | |
Class A Shares | |
Issued | | | 9,415 | | | | 9,514 | | | | 2,491 | | | | 2,275 | | |
Reinvested | | | 2,275 | | | | 4,199 | | | | 420 | | | | 1,215 | | |
Redeemed | | | (18,025 | ) | | | (19,577 | ) | | | (4,039 | ) | | | (4,096 | ) | |
Total Class A Shares | | | (6,335 | ) | | | (5,864 | ) | | | (1,128 | ) | | | (606 | ) | |
Class C Shares | |
Issued | | | 37 | | | | 105 | | | | — | | | | — | | |
Reinvested | | | 102 | | | | 206 | | | | — | | | | — | | |
Redeemed | | | (602 | ) | | | (621 | ) | | | — | | | | — | | |
Total Class C Shares | | | (463 | ) | | | (310 | ) | | | — | | | | — | | |
Class I Shares | |
Issued | | | 32,071 | | | | 23,417 | | | | 29,815 | | | | 21,227 | | |
Reinvested | | | 4,896 | | | | 8,111 | | | | 4,969 | | | | 11,502 | | |
Redeemed | | | (31,823 | ) | | | (32,973 | ) | | | (65,620 | ) | | | (21,333 | ) | |
Total Class I Shares | | | 5,144 | | | | (1,445 | ) | | | (30,836 | ) | | | 11,396 | | |
Class R Shares | |
Issued | | | 3,001 | | | | 3,186 | | | | 1,236 | | | | 1,036 | | |
Reinvested | | | 1,194 | | | | 2,212 | | | | 333 | | | | 915 | | |
Redeemed | | | (7,057 | ) | | | (7,552 | ) | | | (2,499 | ) | | | (1,957 | ) | |
Total Class R Shares | | | (2,862 | ) | | | (2,154 | ) | | | (930 | ) | | | (6 | ) | |
Class R6 Shares | |
Issued | | | 42,781 | | | | 33,711 | | | | 40,067 | | | | 2,402 | | |
Reinvested | | | 7,945 | | | | 10,212 | | | | 335 | | | | 592 | | |
Redeemed | | | (43,689 | ) | | | (21,871 | ) | | | (4,097 | ) | | | (1,136 | ) | |
Total Class R6 Shares | | | 7,037 | | | | 22,052 | | | | 36,305 | | | | 1,858 | | |
Class Y Shares | |
Issued | | | 8,117 | | | | 8,883 | | | | 256 | | | | 172 | | |
Reinvested | | | 1,018 | | | | 1,114 | | | | 18 | | | | 34 | | |
Redeemed | | | (8,786 | ) | | | (4,909 | ) | | | (536 | ) | | | (230 | ) | |
Total Class Y Shares | | | 349 | | | | 5,088 | | | | (262 | ) | | | (24 | ) | |
Change in Shares | | | 2,870 | | | | 17,367 | | | | 3,149 | | | | 12,618 | | |
See notes to financial statements.
26
This page is intentionally left blank.
27
Victory Portfolios | | Financial Highlights | |
For a Share Outstanding Throughout Each Period
| | | | Investment Activities | | Distributions to
Shareholders From | |
| | | Net Asset
Value,
Beginning of
Period | | Net
Investment
Income
(Loss)(a) | | Net Realized
and Unrealized
Gains (Losses)
on Investments | | Total from
Investment
Activities | | Net
Investment
Income | | Net Realized
Gains from
Investments | |
Victory Sycamore Established Value Fund | |
Class A | |
Year Ended 10/31/20 | | $ | 40.09 | | | | 0.48 | | | | (2.44 | ) | | | (1.96 | ) | | | (0.48 | ) | | | (1.90 | ) | |
Year Ended 10/31/19 | | $ | 39.52 | | | | 0.40 | | | | 3.61 | | | | 4.01 | | | | (0.39 | ) | | | (3.05 | ) | |
Year Ended 10/31/18 | | $ | 40.01 | | | | 0.35 | | | | 0.48 | | | | 0.83 | | | | (0.33 | ) | | | (0.99 | ) | |
Year Ended 10/31/17 | | $ | 33.82 | | | | 0.22 | | | | 6.53 | | | | 6.75 | | | | (0.21 | ) | | | (0.35 | ) | |
Year Ended 10/31/16 | | $ | 35.55 | | | | 0.23 | | | | 1.50 | | | | 1.73 | | | | (0.22 | ) | | | (3.24 | ) | |
Class C | |
Year Ended 10/31/20 | | $ | 39.16 | | | | 0.20 | | | | (2.35 | ) | | | (2.15 | ) | | | (0.22 | ) | | | (1.90 | ) | |
Year Ended 10/31/19 | | $ | 38.69 | | | | 0.11 | | | | 3.53 | | | | 3.64 | | | | (0.12 | ) | | | (3.05 | ) | |
Year Ended 10/31/18 | | $ | 39.22 | | | | 0.03 | | | | 0.46 | | | | 0.49 | | | | (0.03 | ) | | | (0.99 | ) | |
Year Ended 10/31/17 | | $ | 33.26 | | | | (0.09 | ) | | | 6.44 | | | | 6.35 | | | | (0.04 | ) | | | (0.35 | ) | |
3/1/16(e) through
10/31/16 | | $ | 29.08 | | | | (0.09 | ) | | | 4.37 | | | | 4.28 | | | | (0.10 | ) | | | — | | |
Class I | |
Year Ended 10/31/20 | | $ | 40.12 | | | | 0.59 | | | | (2.45 | ) | | | (1.86 | ) | | | (0.59 | ) | | | (1.90 | ) | |
Year Ended 10/31/19 | | $ | 39.55 | | | | 0.52 | | | | 3.62 | | | | 4.14 | | | | (0.52 | ) | | | (3.05 | ) | |
Year Ended 10/31/18 | | $ | 40.04 | | | | 0.47 | | | | 0.48 | | | | 0.95 | | | | (0.45 | ) | | | (0.99 | ) | |
Year Ended 10/31/17 | | $ | 33.83 | | | | 0.32 | | | | 6.56 | | | | 6.88 | | | | (0.32 | ) | | | (0.35 | ) | |
Year Ended 10/31/16 | | $ | 35.56 | | | | 0.30 | | | | 1.52 | | | | 1.82 | | | | (0.31 | ) | | | (3.24 | ) | |
Class R | |
Year Ended 10/31/20 | | $ | 39.54 | | | | 0.40 | | | | (2.40 | ) | | | (2.00 | ) | | | (0.41 | ) | | | (1.90 | ) | |
Year Ended 10/31/19 | | $ | 39.03 | | | | 0.31 | | | | 3.57 | | | | 3.88 | | | | (0.32 | ) | | | (3.05 | ) | |
Year Ended 10/31/18 | | $ | 39.54 | | | | 0.26 | | | | 0.48 | | | | 0.74 | | | | (0.26 | ) | | | (0.99 | ) | |
Year Ended 10/31/17 | | $ | 33.43 | | | | 0.14 | | | | 6.46 | | | | 6.60 | | | | (0.14 | ) | | | (0.35 | ) | |
Year Ended 10/31/16 | | $ | 35.18 | | | | 0.17 | | | | 1.48 | | | | 1.65 | | | | (0.16 | ) | | | (3.24 | ) | |
Class R6 | |
Year Ended 10/31/20 | | $ | 40.13 | | | | 0.60 | | | | (2.45 | ) | | | (1.85 | ) | | | (0.60 | ) | | | (1.90 | ) | |
Year Ended 10/31/19 | | $ | 39.55 | | | | 0.52 | | | | 3.63 | | | | 4.15 | | | | (0.52 | ) | | | (3.05 | ) | |
Year Ended 10/31/18 | | $ | 40.05 | | | | 0.49 | | | | 0.48 | | | | 0.97 | | | | (0.48 | ) | | | (0.99 | ) | |
Year Ended 10/31/17 | | $ | 33.85 | | | | 0.35 | | | | 6.54 | | | | 6.89 | | | | (0.34 | ) | | | (0.35 | ) | |
Year Ended 10/31/16 | | $ | 35.56 | | | | 0.31 | | | | 1.55 | | | | 1.86 | | | | (0.33 | ) | | | (3.24 | ) | |
Class Y | |
Year Ended 10/31/20 | | $ | 40.11 | | | | 0.58 | | | | (2.45 | ) | | | (1.87 | ) | | | (0.58 | ) | | | (1.90 | ) | |
Year Ended 10/31/19 | | $ | 39.54 | | | | 0.50 | | | | 3.63 | | | | 4.13 | | | | (0.51 | ) | | | (3.05 | ) | |
Year Ended 10/31/18 | | $ | 40.04 | | | | 0.46 | | | | 0.48 | | | | 0.94 | | | | (0.45 | ) | | | (0.99 | ) | |
Year Ended 10/31/17 | | $ | 33.83 | | | | 0.31 | | | | 6.57 | | | | 6.88 | | | | (0.32 | ) | | | (0.35 | ) | |
Year Ended 10/31/16 | | $ | 35.56 | | | | 0.28 | | | | 1.53 | | | | 1.81 | | | | (0.30 | ) | | | (3.24 | ) | |
(a) Per share net investment income (loss) has been calculated using the average daily shares method.
(b) Not annualized for periods less than one year.
(c) Annualized for periods less than one year.
(d) Portfolio turnover is calculated on the basis of the Fund as a whole without distinguishing between the classes of shares issued.
(e) Commencement of operations.
See notes to financial statements.
28
Victory Portfolios | | Financial Highlights — continued | |
For a Share Outstanding Throughout Each Period
| | | | | Ratios to Average Net Assets | | Supplemental Data | |
| | | Total
Distributions | | Net Asset
Value,
End of
Period | | Total
Return
(Excludes
Sales
Charge)(b) | | Net
Expenses(c) | | Net
Investment
Income
(Loss)(c) | | Gross
Expenses(c) | | Net Assets,
End of
Period
(000's) | | Portfolio
Turnover(b)(d) | |
Victory Sycamore Established Value Fund | |
Class A | |
Year Ended 10/31/20 | | | (2.38 | ) | | $ | 35.75 | | | | (5.22 | )% | | | 0.92 | % | | | 1.34 | % | | | 0.92 | % | | $ | 1,380,509 | | | | 44 | % | |
Year Ended 10/31/19 | | | (3.44 | ) | | $ | 40.09 | | | | 11.96 | % | | | 0.92 | % | | | 1.06 | % | | | 0.92 | % | | $ | 1,802,034 | | | | 34 | % | |
Year Ended 10/31/18 | | | (1.32 | ) | | $ | 39.52 | | | | 2.01 | % | | | 0.89 | % | | | 0.85 | % | | | 0.89 | % | | $ | 2,008,143 | | | | 36 | % | |
Year Ended 10/31/17 | | | (0.56 | ) | | $ | 40.01 | | | | 20.12 | % | | | 0.90 | % | | | 0.58 | % | | | 0.90 | % | | $ | 2,386,049 | | | | 32 | % | |
Year Ended 10/31/16 | | | (3.46 | ) | | $ | 33.82 | | | | 5.80 | % | | | 0.95 | % | | | 0.69 | % | | | 0.95 | % | | $ | 1,735,974 | | | | 40 | % | |
Class C | |
Year Ended 10/31/20 | | | (2.12 | ) | | $ | 34.89 | | | | (5.93 | )% | | | 1.69 | % | | | 0.58 | % | | | 1.69 | % | | $ | 54,271 | | | | 44 | % | |
Year Ended 10/31/19 | | | (3.17 | ) | | $ | 39.16 | | | | 11.10 | % | | | 1.68 | % | | | 0.30 | % | | | 1.68 | % | | $ | 79,066 | | | | 34 | % | |
Year Ended 10/31/18 | | | (1.02 | ) | | $ | 38.69 | | | | 1.19 | % | | | 1.68 | % | | | 0.07 | % | | | 1.68 | % | | $ | 90,128 | | | | 36 | % | |
Year Ended 10/31/17 | | | (0.39 | ) | | $ | 39.22 | | | | 19.20 | % | | | 1.70 | % | | | (0.24 | )% | | | 1.70 | % | | $ | 101,506 | | | | 32 | % | |
3/1/16(e) through
10/31/16 | | | (0.10 | ) | | $ | 33.26 | | | | 14.75 | % | | | 1.80 | % | | | (0.40 | )% | | | 1.80 | % | | $ | 25,146 | | | | 40 | % | |
Class I | |
Year Ended 10/31/20 | | | (2.49 | ) | | $ | 35.77 | | | | (4.92 | )% | | | 0.60 | % | | | 1.64 | % | | | 0.60 | % | | $ | 3,306,226 | | | | 44 | % | |
Year Ended 10/31/19 | | | (3.57 | ) | | $ | 40.12 | | | | 12.31 | % | | | 0.60 | % | | | 1.37 | % | | | 0.60 | % | | $ | 3,501,630 | | | | 34 | % | |
Year Ended 10/31/18 | | | (1.44 | ) | | $ | 39.55 | | | | 2.30 | % | | | 0.59 | % | | | 1.14 | % | | | 0.59 | % | | $ | 3,509,093 | | | | 36 | % | |
Year Ended 10/31/17 | | | (0.67 | ) | | $ | 40.04 | | | | 20.50 | % | | | 0.62 | % | | | 0.85 | % | | | 0.62 | % | | $ | 5,263,053 | | | | 32 | % | |
Year Ended 10/31/16 | | | (3.55 | ) | | $ | 33.83 | | | | 6.08 | % | | | 0.69 | % | | | 0.91 | % | | | 0.69 | % | | $ | 2,590,122 | | | | 40 | % | |
Class R | |
Year Ended 10/31/20 | | | (2.31 | ) | | $ | 35.23 | | | | (5.41 | )% | | | 1.12 | % | | | 1.14 | % | | | 1.12 | % | | $ | 633,244 | | | | 44 | % | |
Year Ended 10/31/19 | | | (3.37 | ) | | $ | 39.54 | | | | 11.72 | % | | | 1.13 | % | | | 0.84 | % | | | 1.13 | % | | $ | 823,796 | | | | 34 | % | |
Year Ended 10/31/18 | | | (1.25 | ) | | $ | 39.03 | | | | 1.80 | % | | | 1.10 | % | | | 0.65 | % | | | 1.10 | % | | $ | 897,277 | | | | 36 | % | |
Year Ended 10/31/17 | | | (0.49 | ) | | $ | 39.54 | | | | 19.89 | % | | | 1.10 | % | | | 0.38 | % | | | 1.10 | % | | $ | 1,005,561 | | | | 32 | % | |
Year Ended 10/31/16 | | | (3.40 | ) | | $ | 33.43 | | | | 5.60 | % | | | 1.13 | % | | | 0.54 | % | | | 1.13 | % | | $ | 784,442 | | | | 40 | % | |
Class R6 | |
Year Ended 10/31/20 | | | (2.50 | ) | | $ | 35.78 | | | | (4.89 | )% | | | 0.57 | % | | | 1.68 | % | | | 0.57 | % | | $ | 4,499,129 | | | | 44 | % | |
Year Ended 10/31/19 | | | (3.57 | ) | | $ | 40.13 | | | | 12.35 | % | | | 0.58 | % | | | 1.38 | % | | | 0.58 | % | | $ | 4,762,844 | | | | 34 | % | |
Year Ended 10/31/18 | | | (1.47 | ) | | $ | 39.55 | | | | 2.34 | % | | | 0.57 | % | | | 1.19 | % | | | 0.57 | % | | $ | 3,822,378 | | | | 36 | % | |
Year Ended 10/31/17 | | | (0.69 | ) | | $ | 40.05 | | | | 20.54 | % | | | 0.54 | % | | | 0.91 | % | | | 0.54 | % | | $ | 1,314,843 | | | | 32 | % | |
Year Ended 10/31/16 | | | (3.57 | ) | | $ | 33.85 | | | | 6.20 | % | | | 0.59 | % | | | 0.93 | % | | | 0.59 | % | | $ | 458,750 | | | | 40 | % | |
Class Y | |
Year Ended 10/31/20 | | | (2.48 | ) | | $ | 35.76 | | | | (4.92 | )% | | | 0.63 | % | | | 1.63 | % | | | 0.63 | % | | $ | 600,200 | | | | 44 | % | |
Year Ended 10/31/19 | | | (3.56 | ) | | $ | 40.11 | | | | 12.28 | % | | | 0.63 | % | | | 1.32 | % | | | 0.63 | % | | $ | 659,111 | | | | 34 | % | |
Year Ended 10/31/18 | | | (1.44 | ) | | $ | 39.54 | | | | 2.27 | % | | | 0.62 | % | | | 1.13 | % | | | 0.62 | % | | $ | 448,543 | | | | 36 | % | |
Year Ended 10/31/17 | | | (0.67 | ) | | $ | 40.04 | | | | 20.51 | % | | | 0.60 | % | | | 0.81 | % | | | 0.60 | % | | $ | 487,044 | | | | 32 | % | |
Year Ended 10/31/16 | | | (3.54 | ) | | $ | 33.83 | | | | 6.03 | % | | | 0.72 | % | | | 0.85 | % | | | 0.72 | % | | $ | 50,765 | | | | 40 | % | |
See notes to financial statements.
29
Victory Portfolios | | Financial Highlights | |
For a Share Outstanding Throughout Each Period
| | | | Investment Activities | | Distributions to
Shareholders From | |
| | | Net Asset
Value,
Beginning of
Period | | Net
Investment
Income
(Loss)(a) | | Net Realized
and Unrealized
Gains (Losses)
on Investments | | Total from
Investment
Activities | | Net
Investment
Income | | Net Realized
Gains from
Investments | |
Victory Sycamore Small Company Opportunity Fund | |
Class A | |
Year Ended 10/31/20 | | $ | 45.16 | | | | 0.17 | | | | (5.14 | ) | | | (4.97 | ) | | | (0.20 | ) | | | (2.08 | ) | |
Year Ended 10/31/19 | | $ | 45.91 | | | | 0.22 | | | | 4.22 | | | | 4.44 | | | | (0.10 | ) | | | (5.09 | ) | |
Year Ended 10/31/18 | | $ | 48.23 | | | | 0.22 | | | | (0.09 | ) | | | 0.13 | | | | (0.21 | ) | | | (2.24 | ) | |
Year Ended 10/31/17 | | $ | 39.74 | | | | 0.11 | | | | 10.44 | | | | 10.55 | | | | (0.12 | ) | | | (1.94 | ) | |
Year Ended 10/31/16 | | $ | 40.01 | | | | 0.10 | | | | 3.05 | | | | 3.15 | | | | (0.05 | ) | | | (3.37 | ) | |
Class I | |
Year Ended 10/31/20 | | $ | 45.71 | | | | 0.31 | | | | (5.20 | ) | | | (4.89 | ) | | | (0.34 | ) | | | (2.08 | ) | |
Year Ended 10/31/19 | | $ | 46.43 | | | | 0.35 | | | | 4.28 | | | | 4.63 | | | | (0.26 | ) | | | (5.09 | ) | |
Year Ended 10/31/18 | | $ | 48.75 | | | | 0.37 | | | | (0.09 | ) | | | 0.28 | | | | (0.36 | ) | | | (2.24 | ) | |
Year Ended 10/31/17 | | $ | 40.12 | | | | 0.25 | | | | 10.55 | | | | 10.80 | | | | (0.23 | ) | | | (1.94 | ) | |
Year Ended 10/31/16 | | $ | 40.37 | | | | 0.21 | | | | 3.08 | | | | 3.29 | | | | (0.17 | ) | | | (3.37 | ) | |
Class R | |
Year Ended 10/31/20 | | $ | 42.05 | | | | 0.09 | | | | (4.76 | ) | | | (4.67 | ) | | | (0.14 | ) | | | (2.08 | ) | |
Year Ended 10/31/19 | | $ | 43.13 | | | | 0.13 | | | | 3.91 | | | | 4.04 | | | | (0.03 | ) | | | (5.09 | ) | |
Year Ended 10/31/18 | | $ | 45.47 | | | | 0.10 | | | | (0.08 | ) | | | 0.02 | | | | (0.12 | ) | | | (2.24 | ) | |
Year Ended 10/31/17 | | $ | 37.59 | | | | 0.01 | | | | 9.86 | | | | 9.87 | | | | (0.05 | ) | | | (1.94 | ) | |
Year Ended 10/31/16 | | $ | 38.06 | | | | 0.02 | | | | 2.88 | | | | 2.90 | | | | — | | | | (3.37 | ) | |
Class R6 | |
Year Ended 10/31/20 | | $ | 45.66 | | | | 0.19 | | | | (5.03 | ) | | | (4.84 | ) | | | (0.37 | ) | | | (2.08 | ) | |
Year Ended 10/31/19 | | $ | 46.38 | | | | 0.36 | | | | 4.28 | | | | 4.64 | | | | (0.27 | ) | | | (5.09 | ) | |
Year Ended 10/31/18 | | $ | 48.69 | | | | 0.30 | | | | — | (e) | | | 0.30 | | | | (0.37 | ) | | | (2.24 | ) | |
Year Ended 10/31/17 | | $ | 40.08 | | | | 0.21 | | | | 10.58 | | | | 10.79 | | | | (0.24 | ) | | | (1.94 | ) | |
12/15/15(f) through
10/31/16 | | $ | 38.97 | | | | 0.13 | | | | 4.54 | | | | 4.67 | | | | (0.19 | ) | | | (3.37 | ) | |
Class Y | |
Year Ended 10/31/20 | | $ | 45.39 | | | | 0.24 | | | | (5.16 | ) | | | (4.92 | ) | | | (0.29 | ) | | | (2.08 | ) | |
Year Ended 10/31/19 | | $ | 46.13 | | | | 0.30 | | | | 4.24 | | | | 4.54 | | | | (0.19 | ) | | | (5.09 | ) | |
Year Ended 10/31/18 | | $ | 48.33 | | | | 0.29 | | | | (0.09 | ) | | | 0.20 | | | | (0.16 | ) | | | (2.24 | ) | |
Year Ended 10/31/17 | | $ | 39.84 | | | | 0.20 | | | | 10.40 | | | | 10.60 | | | | (0.17 | ) | | | (1.94 | ) | |
Year Ended 10/31/16 | | $ | 40.10 | | | | 0.13 | | | | 3.07 | | | | 3.20 | | | | (0.09 | ) | | | (3.37 | ) | |
(a) Per share net investment income (loss) has been calculated using the average daily shares method.
(b) Not annualized for periods less than one year.
(c) Annualized for periods less than one year.
(d) Portfolio turnover is calculated on the basis of the Fund as a whole without distinguishing between the classes of shares issued.
(e) Amount is less than $0.005 per share.
(f) Commencement of operations.
See notes to financial statements.
30
Victory Portfolios | | Financial Highlights — continued | |
For a Share Outstanding Throughout Each Period
| | | | | Ratios to Average Net Assets | | Supplemental Data | |
| | | Total
Distributions | | Net Asset
Value,
End of
Period | | Total
Return
(Excludes
Sales
Charge)(b) | | Net
Expenses(c) | | Net
Investment
Income
(Loss)(c) | | Gross
Expenses(c) | | Net Assets,
End of
Period
(000's) | | Portfolio
Turnover(b)(d) | |
Victory Sycamore Small Company Opportunity Fund | |
Class A | |
Year Ended 10/31/20 | | | (2.28 | ) | | $ | 37.91 | | | | (11.80 | )% | | | 1.26 | % | | | 0.43 | % | | | 1.26 | % | | $ | 336,083 | | | | 37 | % | |
Year Ended 10/31/19 | | | (5.19 | ) | | $ | 45.16 | | | | 12.10 | % | | | 1.25 | % | | | 0.51 | % | | | 1.25 | % | | $ | 451,310 | | | | 34 | % | |
Year Ended 10/31/18 | | | (2.45 | ) | | $ | 45.91 | | | | 0.17 | % | | | 1.22 | % | | | 0.46 | % | | | 1.22 | % | | $ | 486,622 | | | | 43 | % | |
Year Ended 10/31/17 | | | (2.06 | ) | | $ | 48.23 | | | | 27.02 | % | | | 1.23 | % | | | 0.25 | % | | | 1.23 | % | | $ | 603,851 | | | | 36 | % | |
Year Ended 10/31/16 | | | (3.42 | ) | | $ | 39.74 | | | | 8.66 | % | | | 1.26 | % | | | 0.25 | % | | | 1.26 | % | | $ | 529,545 | | | | 59 | % | |
Class I | |
Year Ended 10/31/20 | | | (2.42 | ) | | $ | 38.40 | | | | (11.51 | )% | | | 0.93 | % | | | 0.78 | % | | | 0.93 | % | | $ | 2,666,852 | | | | 37 | % | |
Year Ended 10/31/19 | | | (5.35 | ) | | $ | 45.71 | | | | 12.49 | % | | | 0.92 | % | | | 0.82 | % | | | 0.92 | % | | $ | 4,584,086 | | | | 34 | % | |
Year Ended 10/31/18 | | | (2.60 | ) | | $ | 46.43 | | | | 0.49 | % | | | 0.88 | % | | | 0.76 | % | | | 0.88 | % | | $ | 4,127,411 | | | | 43 | % | |
Year Ended 10/31/17 | | | (2.17 | ) | | $ | 48.75 | | | | 27.44 | % | | | 0.90 | % | | | 0.56 | % | | | 0.90 | % | | $ | 4,003,419 | | | | 36 | % | |
Year Ended 10/31/16 | | | (3.54 | ) | | $ | 40.12 | | | | 8.99 | % | | | 0.96 | % | | | 0.56 | % | | | 0.96 | % | | $ | 2,428,803 | | | | 59 | % | |
Class R | |
Year Ended 10/31/20 | | | (2.22 | ) | | $ | 35.16 | | | | (11.94 | )% | | | 1.44 | % | | | 0.25 | % | | | 1.44 | % | | $ | 200,617 | | | | 37 | % | |
Year Ended 10/31/19 | | | (5.12 | ) | | $ | 42.05 | | | | 11.89 | % | | | 1.44 | % | | | 0.32 | % | | | 1.44 | % | | $ | 279,090 | | | | 34 | % | |
Year Ended 10/31/18 | | | (2.36 | ) | | $ | 43.13 | | | | (0.06 | )% | | | 1.44 | % | | | 0.23 | % | | | 1.44 | % | | $ | 286,480 | | | | 43 | % | |
Year Ended 10/31/17 | | | (1.99 | ) | | $ | 45.47 | | | | 26.73 | % | | | 1.45 | % | | | 0.03 | % | | | 1.45 | % | | $ | 333,944 | | | | 36 | % | |
Year Ended 10/31/16 | | | (3.37 | ) | | $ | 37.59 | | | | 8.42 | % | | | 1.48 | % | | | 0.05 | % | | | 1.48 | % | | $ | 302,652 | | | | 59 | % | |
Class R6 | |
Year Ended 10/31/20 | | | (2.45 | ) | | $ | 38.37 | | | | (11.43 | )% | | | 0.86 | % | | | 0.48 | % | | | 0.86 | % | | $ | 1,625,853 | | | | 37 | % | |
Year Ended 10/31/19 | | | (5.36 | ) | | $ | 45.66 | | | | 12.52 | % | | | 0.87 | % | | | 0.84 | % | | | 0.87 | % | | $ | 277,218 | | | | 34 | % | |
Year Ended 10/31/18 | | | (2.61 | ) | | $ | 46.38 | | | | 0.52 | % | | | 0.87 | % | | | 0.62 | % | | | 0.87 | % | | $ | 195,360 | | | | 43 | % | |
Year Ended 10/31/17 | | | (2.18 | ) | | $ | 48.69 | | | | 27.44 | % | | | 0.90 | % | | | 0.46 | % | | | 0.90 | % | | $ | 85,307 | | | | 36 | % | |
12/15/15(f) through
10/31/16 | | | (3.56 | ) | | $ | 40.08 | | | | 12.86 | % | | | 0.98 | % | | | 0.39 | % | | | 1.12 | % | | $ | 21,044 | | | | 59 | % | |
Class Y | |
Year Ended 10/31/20 | | | (2.37 | ) | | $ | 38.10 | | | | (11.65 | )% | | | 1.08 | % | | | 0.62 | % | | | 1.08 | % | | $ | 16,054 | | | | 37 | % | |
Year Ended 10/31/19 | | | (5.28 | ) | | $ | 45.39 | | | | 12.31 | % | | | 1.07 | % | | | 0.69 | % | | | 1.07 | % | | $ | 31,016 | | | | 34 | % | |
Year Ended 10/31/18 | | | (2.40 | ) | | $ | 46.13 | | | | 0.33 | % | | | 1.06 | % | | | 0.61 | % | | | 1.06 | % | | $ | 32,592 | | | | 43 | % | |
Year Ended 10/31/17 | | | (2.11 | ) | | $ | 48.33 | | | | 27.10 | % | | | 1.15 | % | | | 0.45 | % | | | 1.25 | % | | $ | 35,416 | | | | 36 | % | |
Year Ended 10/31/16 | | | (3.46 | ) | | $ | 39.84 | | | | 8.79 | % | | | 1.15 | % | | | 0.34 | % | | | 1.39 | % | | $ | 141,097 | | | | 59 | % | |
See notes to financial statements.
31
Victory Portfolios | | Notes to Financial Statements
October 31, 2020 | |
1. Organization:
Victory Portfolios (the "Trust") was organized on December 6, 1995 as a Delaware statutory trust as a successor to a company named "The Victory Portfolios," which was organized as a Massachusetts business trust on February 5, 1986. The Trust is registered under the Investment Company Act of 1940, as amended (the "1940 Act"), as an open-end investment company. The Trust is comprised of 42 funds and is authorized to issue an unlimited number of shares, which are units of beneficial interest with a par value of $0.001 per share. Each Fund is classified as diversified under the 1940 Act.
The accompanying financial statements are those of the following two Funds (collectively, the "Funds" and individually, a "Fund"):
Funds (Legal Name) | | Funds (Short Name)* | | Investment Share
Classes Offered | |
Victory Sycamore Established
Value Fund | | Sycamore Established Value Fund | | Class A, C, I, R, R6 and Y | |
Victory Sycamore Small Company
Opportunity Fund | | Sycamore Small Company
Opportunity Fund | | Class A, I, R, R6 and Y | |
* The Funds are generally closed to new investors. The Funds will continue to be available for investment (by direct purchase or exchange) by only: existing shareholders, investors that purchase shares through certain intermediaries, retirement plans that purchase shares through certain record keepers, and current and retired Fund trustees, officers, employees of Victory Capital Management Inc. and affiliated providers, and their family members.
Each class of shares of a Fund has substantially identical rights and privileges except with respect to sales charges, fees paid under distribution plans, expenses allocable exclusively to each class of shares, voting rights on matters solely affecting a single class of shares, and the exchange privilege of each class of shares.
Under the Trust's organizational documents, its officers and trustees are indemnified against certain liabilities arising out of the performance of their duties to the Funds. In addition, in the normal course of business, the Funds enter into contracts with their vendors and others that provide for general indemnifications. The Funds' maximum exposure under these arrangements is unknown, as this would involve future claims that may be made against the Funds. However, based on experience, the Funds expect that risk of loss to be remote.
2. Significant Accounting Policies:
The following is a summary of significant accounting policies followed by the Trust in the preparation of its financial statements. The policies are in conformity with generally accepted accounting principles in the United States of America ("GAAP"). The preparation of financial statements in accordance with GAAP requires management to make estimates and assumptions that affect the reported amounts of assets and liabilities and disclosure of contingent assets and liabilities at the date of the financial statements and the reported amounts of income and expenses for the period. Actual results could differ from those estimates.
The Funds follow the specialized accounting and reporting requirements under GAAP that are applicable to investment companies.
Investment Valuation:
The Funds record investments at fair value. Fair value is defined as the price that would be received to sell an asset or paid to transfer a liability in an orderly transaction between market participants at the measurement date.
32
Victory Portfolios | | Notes to Financial Statements — continued
October 31, 2020 | |
The valuation techniques described below maximize the use of observable inputs and minimize the use of unobservable inputs in determining fair value. The inputs used for valuing the Funds' investments are summarized in the three broad levels listed below:
• Level 1 — quoted prices in active markets for identical securities
• Level 2 — other significant observable inputs (including quoted prices for similar securities or interest rates applicable to those securities, etc.)
• Level 3 — significant unobservable inputs (including the Funds' own assumptions in determining the fair value of investments)
Changes in valuation techniques may result in transfers in or out of an assigned level within the disclosure hierarchy. The inputs or methodologies used for valuation techniques are not necessarily an indication of the risk associated with entering into those investments.
Portfolio securities listed or traded on securities exchanges, including Exchange-Traded Funds ("ETFs"), American Depositary Receipts ("ADRs") and Rights, are valued at the closing price on the exchange or system where the security is principally traded, if available, or at the Nasdaq Official Closing Price. If there have been no sales for that day on the exchange or system, then a security is valued at the last available bid quotation on the exchange or system where the security is principally traded. In each of these situations, valuations are typically categorized as Level 1 in the fair value hierarchy.
Investments in open-end investment companies are valued at net asset value. These valuations are typically categorized as Level 1 in the fair value hierarchy.
Investments for which there are no such quotations, or for which quotations do not appear reliable, are valued at fair value in accordance with procedures established by and under the general supervision and responsibility of the Trust's Board of Trustees (the "Board"). These valuations are typically categorized as Level 2 or Level 3 in the fair value hierarchy, based on the observability of inputs used to determine the fair value.
A summary of the valuations as of October 31, 2020, based upon the three levels defined above, is included in the table below while the breakdown, by category, of investments is disclosed on the Schedules of Portfolio Investments (amounts in thousands).
| | | Level 1 | | Level 2 | | Level 3 | | Total | |
Sycamore Established Value Fund | |
Common Stocks | | $ | 10,291,613 | | | $ | — | | | $ | — | | | $ | 10,291,613 | | |
Exchange-Traded Funds | | | 106,488 | | | | — | | | | — | | | | 106,488 | | |
Collateral for Securities Loaned | | | 104,762 | | | | — | | | | — | | | | 104,762 | | |
Total | | $ | 10,502,863 | | | $ | — | | | $ | — | | | $ | 10,502,863 | | |
Sycamore Small Company Opportunity Fund | |
Common Stocks | | $ | 4,745,253 | | | $ | — | | | $ | — | | | $ | 4,745,253 | | |
Exchange-Traded Funds | | | 51,495 | | | | — | | | | — | | | | 51,495 | | |
Collateral for Securities Loaned | | | 60,460 | | | | — | | | | — | | | | 60,460 | | |
Total | | $ | 4,857,208 | | | $ | — | | | $ | — | | | $ | 4,857,208 | | |
For the year ended October 31, 2020, there were no transfers in or out of the Level 3 fair value hierarchy.
Real Estate Investment Trusts ("REITs"):
The Funds may invest in REITs, which report information on the source of their distributions annually. REITs are pooled investment vehicles that invest primarily in income producing real estate or real estate related loans or interests (such as mortgages). Certain distributions received from REITs during the year are recorded as realized gains or return of capital as estimated by the Funds or when such information becomes known.
33
Victory Portfolios | | Notes to Financial Statements — continued
October 31, 2020 | |
Investment Companies:
Exchange-Traded Funds:
The Funds may invest in ETFs, the shares of which are bought and sold on a securities exchange. An ETF trades like common stock and represents a portfolio of securities designed to track the performance and dividend yield of a particular domestic or foreign market index. A Fund may purchase shares of an ETF to temporarily gain exposure to a portion of the U.S. or a foreign market while awaiting purchase of underlying securities. The risks of owning an ETF generally reflect the risks of owning the underlying securities they are designed to track, although the lack of liquidity of an ETF could result in it being more volatile. Additionally, ETFs have fees and expenses that reduce their value.
Open-End Funds:
The Funds may invest in portfolios of open-end investment companies. These investment companies value securities in their portfolios for which market quotations are readily available at their market values (generally the last reported sale price) and all other securities and assets at their fair value by the methods established by the board of directors of the underlying funds.
Investment Transactions and Related Income:
Changes in holdings of investments are accounted for no later than one business day following the trade date. For financial reporting purposes, however, investment transactions are accounted for on trade date on the last business day of the reporting period. Interest income is determined on the basis of coupon interest accrued using the effective interest method which adjusts, where applicable, the amortization of premiums or accretion of discounts. Dividend income is recorded on the ex-dividend date. Gains or losses realized on sales of securities are recorded on the identified cost basis.
Withholding taxes on interest, dividends and gains as a result of certain investments in ADRs by the Funds have been provided for in accordance with each investment's applicable country's tax rules and rates.
Securities Lending:
The Trust has entered into a Master Securities Lending Agreement ("MSLA") with Citibank, N.A. ("Citibank" or the "Agent"). Under the terms of the MSLA, the Funds may lend securities to certain broker-dealers and banks in exchange for collateral in the amount of at least 102% of the value of U.S. securities loaned or at least 105% of the value of non-U.S. securities loaned, marked-to-market daily. Any collateral shortfalls associated with increases in the valuation of the securities loaned are adjusted the next business day. The collateral can be received in the form of cash collateral and/or non-cash collateral. Non-cash collateral can include U.S. Government Securities, letters of credit and certificates of deposit. The cash collateral is invested in short-term instruments or cash equivalents, primarily open-end investment companies, as noted on the Funds' Schedules of Portfolio Investments. The Trust does not have effective control of the non-cash collateral and therefore it is not disclosed on the Funds' Schedules of Portfolio Investments. During the time portfolio securities are on loan, the borrower will pay the Funds any dividends or interest paid on such securities plus any fee negotiated between the parties to the lending agreement. The Funds also earn a return from the collateral. The Funds pay the Agent various fees in connection with the investment of cash collateral and fees based on the investment income received from securities lending activities. Securities lending income (net of these fees) is disclosed on the Statements of Operations. Although risk is mitigated by the collateral, the Funds could experience a delay in recovering their securities and possible loss of income or value if the borrower fails to return them.
Securities lending transactions are entered into by a Fund under the MSLA, which permits the Fund, under certain circumstances such as an event of default, to offset amounts payable by the Fund to the same counterparty against amounts receivable from the counterparty to create a net payment due to or from the Fund.
34
Victory Portfolios | | Notes to Financial Statements — continued
October 31, 2020 | |
The following table (amounts in thousands) is a summary of the Funds' securities lending transactions which are subject to offset under the MSLA as of October 31, 2020. These transactions are accounted for as secured borrowings with an overnight and continuous contractual maturity for cash collateral and greater than overnight and continuous contractual maturity for non-cash collateral.
| | | Gross
Amount of
Recognized
Assets
(Value of | | Value of
Cash | | Value of Non-cash Collateral
Received by Maturity | | | |
| | | Securities
on Loan) | | Collateral
Received* | | <30 Days | | Between
30 & 90 Days | | >90 Days | | Net Amount | |
Sycamore Established
Value Fund | | $ | 103,365 | | | $ | 103,365 | | | $ | — | | | $ | — | | | $ | — | | | $ | — | | |
Sycamore Small Company
Opportunity Fund | | | 58,172 | | | | 58,172 | | | | — | | | | — | | | | — | | | | — | | |
* Collateral received in excess of the market value of securities on loan is not presented in this table. The total cash collateral received by each Fund is disclosed on the Statements of Assets and Liabilities.
Federal Income Taxes:
It is the policy of each Fund to continue to qualify as a regulated investment company by complying with the provisions available to certain investment companies, as defined in applicable sections of the Internal Revenue Code, and to make distributions of net investment income and net realized gains sufficient to relieve it from all, or substantially all, federal income taxes. Accordingly, no provision for federal income taxes is required in the financial statements. The Funds have a tax year end of October 31.
Management of the Funds has reviewed tax positions taken in tax years that remain subject to examination by all major tax jurisdictions, including federal (i.e., the last four tax years, which includes the current fiscal tax year end). Management believes that there is no tax liability resulting from unrecognized tax benefits related to uncertain tax positions taken.
Allocations:
Expenses directly attributable to a Fund are charged to the Fund, while expenses which are attributable to more than one fund in the Trust, or jointly with an affiliated trust, are allocated among the respective funds in the Trust and/or affiliated trust based upon net assets or another appropriate basis.
Income, expenses (other than class-specific expenses such as transfer agent fees, state registration fees, printing fees and 12b-1 fees), and realized and unrealized gains or losses on investments are allocated to each class of shares based on its relative net assets on the date income is earned or expenses and realized and unrealized gains and losses are incurred.
3. Purchases and Sales of Securities:
Purchases and sales of securities (excluding securities maturing less than one year from acquisition) and purchases and sales of in-kind transactions for the year ended October 31, 2020, were as follows
35
Victory Portfolios | | Notes to Financial Statements — continued
October 31, 2020 | |
(amounts in thousands). Any realized gains or losses from in-kind redemptions are reflected on the Statements of Operations as Net realized gains (losses) from in-kind redemptions.
| | | Excluding
U.S. Government
Securities | | Associated
with In-Kind
Transactions | |
| | | Purchases | | Sales | | Purchases | | Sales | |
Sycamore Established Value Fund | | $ | 4,605,795 | | | $ | 4,711,653 | | | $ | — | | | $ | — | | |
Sycamore Small Company
Opportunity Fund | | | 1,949,208 | | | | 1,853,737 | | | | — | | | | 62,220 | | |
4. Fees and Transactions with Affiliates and Related Parties:
Investment advisory services are provided to the Funds by Victory Capital Management Inc. ("VCM" or the "Adviser"), a New York corporation registered as an investment adviser with the Securities and Exchange Commission ("SEC"). The Adviser is a wholly owned indirect subsidiary of Victory Capital Holdings, Inc., a publicly traded Delaware corporation and a wholly owned direct subsidiary of Victory Capital Operating, LLC. Amounts incurred and paid to VCM for the year ended October 31, 2020, are reflected on the Statements of Operations as Investment advisory fees.
Under the terms of the Investment Advisory Agreement, the Adviser is entitled to receive fees based on a percentage of the average daily net assets of each Fund. The rates at which the Adviser is paid by each Fund are included in the table below. The Adviser may use its resources to assist with the Funds' distribution and marketing expenses.
| | | Tier Rate | |
Sycamore Established Value Fund | |
Up to $100 million | | | 0.65 | % | |
$100 million — $200 million | | | 0.55 | % | |
Over $200 million | | | 0.45 | % | |
Sycamore Small Company Opportunity Fund | |
Up to $500 million | | | 0.85 | % | |
Over $500 million | | | 0.75 | % | |
VCM also serves as the Funds' administrator and fund accountant. Under an Administration and Fund Accounting Agreement, VCM is paid for its services an annual fee at a rate of 0.08% of the first $15 billion in average daily net assets of the Trust, Victory Variable Insurance Funds and Victory Portfolios II (collectively, the "Victory Funds Complex"), 0.05% of the average daily net assets above $15 billion to $30 billion of the Victory Funds Complex and 0.04% of the average daily net assets over $30 billion of the Victory Funds Complex. Amounts incurred for the year ended October 31, 2020, are reflected on the Statements of Operations as Administration fees.
Citi Fund Services Ohio, Inc. ("Citi"), an affiliate of Citibank, acts as sub-administrator and sub-fund accountant to the Funds pursuant to a Sub-Administration and Sub-Fund Accounting Services Agreement between VCM and Citi. VCM pays Citi a fee for providing these services. The Trust reimburses VCM and Citi for all of their reasonable out-of-pocket expenses incurred in providing these services and certain other expenses specifically allocated to the Funds. These costs and reimbursements for the year ended October 31, 2020, are reflected on the Statements of Operations as Sub-Administration fees.
Citibank serves as the Funds' custodian. The Funds pay Citibank a fee for providing these services. Amounts incurred for the year ended October 31, 2020, are reflected on the Statements of Operations as Custodian fees.
FIS Investor Services, LLC ("FIS") serves as the Funds' transfer agent. Under the Transfer Agent Agreement, the Trust pays FIS a fee for its services and reimburses FIS for all of their reasonable out-of-pocket
36
Victory Portfolios | | Notes to Financial Statements — continued
October 31, 2020 | |
expenses incurred in providing these services. Amounts incurred for the year ended October 31, 2020, are reflected on the Statements of Operations as Transfer agent fees.
The Chief Compliance Officer ("CCO") is an employee of the Adviser, which pays the compensation of the CCO and his support staff. The Trust has entered into an Agreement to provide compliance services with the Adviser, pursuant to which the Adviser furnishes its compliance personnel, including the services of the CCO, and other resources reasonably necessary to provide the Trust with compliance oversight services related to the design, administration and oversight of a compliance program for the Trust in accordance with Rule 38a-1 under the 1940 Act. The Funds in the Victory Funds Complex, in aggregate, compensate the Adviser for these services. Amounts incurred for the year ended October 31, 2020, are reflected on the Statements of Operations as Compliance fees.
Sidley Austin LLP provides legal services to the Trust.
Victory Capital Services, Inc. (the "Distributor"), an affiliate of the Adviser, serves as distributor for the continuous offering of the shares of the Funds pursuant to a Distribution Agreement between the Distributor and the Trust. Effective June 30, 2020, the Distributor's name was changed from Victory Capital Advisers, Inc. Amounts incurred for the year ended October 31, 2020, are reflected on the Statements of Operations as 12b-1 fees.
Pursuant to the Distribution and Service Plans adopted in accordance with Rule 12b-1 under the 1940 Act, the Distributor may receive a monthly distribution and service fee, at an annual rate of up to 0.25% of the average daily net assets of Class A Shares, at an annual rate of up to 0.50% of the average daily net assets of Class R Shares of the Funds, and 1.00% of the average daily net assets of Class C Shares of the Funds. The distribution and service fees paid to the Distributor may be used by the Distributor to pay for activities primarily intended to result in the sale of Class A, Class R or Class C Shares of the Funds.
In addition, the Distributor is entitled to receive commissions on sales of the Class A Shares of the Funds. For the year ended October 31, 2020, the Distributor received approximately $21 thousand from commissions earned on sales of Class A Shares of the Funds.
The Adviser has entered into expense limitation agreements with certain Funds. Under the terms of the agreements, the Adviser has agreed to waive fees or reimburse certain expenses to the extent that ordinary operating expenses incurred by certain classes of a Fund in any fiscal year exceed the expense limit for such classes of the Fund. Such excess amounts will be the liability of the Adviser. Interest, taxes, brokerage commissions, other expenditures which are capitalized in accordance with GAAP, and other extraordinary expenses not incurred in the ordinary course of a Fund's business are excluded from the expense limits. As of October 31, 2020, the expense limits (excluding voluntary waivers) are as follows:
| | | In effect November 1, 2019 until February 28, 2021 | |
| | | Class A
Shares | | Class C
Shares | | Class I
Shares | | Class R
Shares | | Class R6
Shares | | Class Y
Shares | |
Sycamore Established
Value Fund | | | N/A | | | | 1.84 | % | | | N/A | | | | N/A | | | | N/A | | | | N/A | | |
Sycamore Small Company
Opportunity Fund | | | N/A | | | | N/A | | | | N/A | | | | N/A | | | | N/A | | | | 1.15 | % | |
The Funds have agreed to repay fees and expenses that were waived or reimbursed by the Adviser for a period up to three fiscal years after such waiver or reimbursement was made to the extent such payments or repayments would not cause the expenses of a class to exceed the original expense limitation in place at the time of the waiver or reimbursement or any expense limitation agreement in place at the time of repayment. Amounts repaid to the Adviser during the year, if any, are reflected on the Statements of Operations as Recoupment of prior expenses waived/reimbursed by Adviser. As of October 31, 2020, the Funds had no amounts available to be repaid to the Adviser. The Funds have not recorded any amounts available to be repaid as a liability due to an assessment that such repayment is not probable at October 31, 2020.
37
Victory Portfolios | | Notes to Financial Statements — continued
October 31, 2020 | |
The Adviser may voluntarily waive or reimburse additional fees to assist the Funds in maintaining competitive expense ratios. Voluntary waivers and reimbursements applicable to the Funds are not available to be recouped at a future time. There were no voluntary waivers or reimbursements for the year ended October 31, 2020.
Certain officers and/or interested trustees of the Funds are also officers and/or employees of the Adviser, Administrator, Fund Accountant, Sub-Administrator, Sub-Fund Accountant, Custodian, and Legal Counsel.
5. Risks:
Each Fund may be subject to other risks in addition to these identified risks.
An investment in the Funds' shares represents an indirect investment in the securities owned by the Funds, some of which will be traded on a national securities exchange or in the over-the-counter markets. The value of the securities in which the Funds invest, like other market investments, may move up or down, sometimes rapidly and unpredictably. The value of the securities in which the Funds invest may affect the value of the Funds' shares. An investment in the Funds' shares at any point in time may be worth less than the original investment, even after taking into account the reinvestment of the Funds' distributions.
The Funds will be subject to credit risk with respect to the amount each expects to receive from counterparties for financial instruments entered into by the Funds. The Funds may be negatively impacted if a counterparty becomes bankrupt or otherwise fails to perform its obligations due to financial difficulties. The Funds may experience significant delays in obtaining any recovery in bankruptcy or other reorganization proceeding and the Funds may obtain only limited recovery or may obtain no recovery in such circumstances. The Funds typically enter into transactions with counterparties whose credit ratings are investment grade, as determined by a nationally recognized statistical rating organization or, if unrated, judged by the Adviser to be of comparable quality.
An outbreak of disease called COVID-19 has spread internationally. The transmission of COVID-19 and efforts to contain its spread have resulted in international, national and local border closings and other significant travel restrictions and disruptions, significant disruptions to business operations, supply chains and consumer activity, significant challenges in healthcare service preparation and delivery, quarantines and general concern and uncertainty. These negative impacts have caused significant volatility and declines in global financial markets, which have caused losses for Fund investors during and subsequent to period end. The impact of the COVID-19 pandemic may last for an extended period of time, and could result in a substantial economic downturn or recession. Public health crises may exacerbate other pre-existing political, social, economic, market and financial risks. The extent of the impact to the financial performance of the Funds' investments will depend on future developments, including (i) the duration and spread of the outbreak, (ii) the restrictions and advisories, (iii) the effects on the financial markets, and (iv) the effects on the economy overall, all of which are highly uncertain and cannot be predicted.
6. Borrowing and Interfund Lending:
Line of Credit:
For the year ended October 31, 2020, the Victory Funds Complex and the USAA Mutual Funds Complex (another series of mutual funds managed by the Adviser) participated in a short-term demand note "Line of Credit" agreement with Citibank. The Line of Credit agreement with Citibank was renewed on June 29, 2020 with a termination date of June 28, 2021. Under the agreement with Citibank, the Victory Funds Complex and USAA Mutual Funds Complex, combined, may borrow up to $600 million, of which $300 million is committed and $300 million is uncommitted. $40 million of the Line of Credit is reserved for use by the Victory Floating Rate Fund (herein, the "Fund"), another series of the Victory Funds
38
Victory Portfolios | | Notes to Financial Statements — continued
October 31, 2020 | |
Complex, with that Fund paying the related commitment fees for that amount. The purpose of the agreement is to meet temporary or emergency cash needs. For the year ended October 31, 2020, Citibank received an annual commitment fee of 0.15% on $300 million for providing the Line of Credit. For the year ended October 31, 2020, Citibank earned approximately $450 thousand in commitment fees from the combined Victory Funds Complex and USAA Mutual Funds Complex. Each fund in the Victory Funds Complex pays a pro-rata portion of the commitment fees plus any interest (one month LIBOR plus one percent) on amounts borrowed. Effective June 29, 2020, under an amended Line of Credit agreement, Citibank will also receive an annual upfront fee of 0.10% on the $300 million committed line of credit. Each fund in the Victory Funds Complex will pay a pro-rata portion of the upfront fee. Interest charged to each Fund during the period, if applicable, is presented on the Statements of Operations under Line of credit fees.
The Funds did not utilize the Line of Credit during the fiscal year ended October 31, 2020.
Interfund Lending:
The Trust and Adviser rely on an exemptive order granted by the SEC in March 2017 (the "Order"), permitting the establishment and operation of an Interfund Lending Facility (the "Facility"). The Facility allows each Fund to directly lend money to and borrow money from any other Victory Fund relying upon the Order at rates beneficial to both the borrowing and lending funds. Advances under the Facility are allowed for temporary or emergency purposes, including the meeting of redemption requests that otherwise might require the untimely disposition of securities, and are subject to each Fund's borrowing restrictions. The interfund loan rate is determined, as specified in the Order, by averaging the current repurchase agreement rate and the current bank loan rate. As a Borrower, interest charged to each Fund during the period, if applicable, is presented on the Statements of Operations under Interest expense on interfund lending. As a Lender, interest earned by each Fund during the period, if applicable, is presented on the Statements of Operations under Interfund lending income.
The average borrowing for the days outstanding and average interest rate for each Fund during the year ended October 31, 2020, were as follows (amounts in thousands):
| | | Borrower or
Lender | | Amount
Outstanding at
October 31, 2020 | | Average
Lending* | | Days
Lending
Outstanding | | Average
Interest
Rate* | | Maximum
Lending
During the
Period | |
Sycamore Established
Value Fund | | Lender | | $ | — | | | $ | 10,365 | | | | 126 | | | | 1.44 | % | | $ | 66,694 | | |
Sycamore Small
Company Opportunity
Fund | | Lender | | | — | | | | 11,414 | | | | 2 | | | | 0.83 | % | | | 20,857 | | |
* For the year ended October 31, 2020, based on the number of days borrowings were outstanding.
7. Federal Income Tax Information:
Dividends from net investment income, if any, are declared and paid quarterly for the Sycamore Established Value Fund. Dividends from net investment income, if any, are declared and paid annually for the Sycamore Small Company Opportunity Fund. Distributable net realized gains, if any, are declared and distributed at least annually from each Fund.
The amounts of dividends from net investment income and distributions from net realized gains (collectively, distributions to shareholders) are determined in accordance with federal income tax regulations, which may differ from GAAP. To the extent these "book/tax" differences are permanent in nature (e.g., net operating loss and distribution reclassification), such amounts are reclassified within the components of net assets based on their federal tax-basis treatment; temporary differences (e.g., wash sales) do not require reclassification. To the extent dividends and distributions exceed net
39
Victory Portfolios | | Notes to Financial Statements — continued
October 31, 2020 | |
investment income and net realized gains for tax purposes, they are reported as distributions of capital. Net investment losses incurred by a Fund may be reclassified as an offset to capital on the accompanying Statements of Assets and Liabilities.
As of October 31, 2020, on the Statements of Assets and Liabilities, as a result of permanent book-to-tax differences, reclassification adjustments were as follows (amounts in thousands):
| | | Total
Accumulated
Earnings/(Loss) | | Capital | |
Sycamore Established Value Fund | | $ | (129,514 | ) | | $ | 129,514 | | |
Sycamore Small Company Opportunity Fund | | | (17,233 | ) | | | 17,233 | | |
The tax character of distributions paid during the tax years ended, as noted below, were as follows (total distributions paid may differ from the Statements of Changes in Net Assets because, for tax purposes, dividends are recognized when actually paid) (amounts in thousands):
| | | Year Ended October 31, 2020 | | Year Ended October 31, 2019 | |
| | | Distributions Paid From | | | | Distributions Paid From | | | |
| | | Ordinary
Income | | Net
Long-Term
Capital Gains | | Total
Distributions
Paid | | Ordinary
Income | | Net
Long-Term
Capital Gains | | Total
Distributions
Paid | |
Sycamore Established
Value Fund | | $ | 206,073 | | | $ | 517,611 | | | $ | 723,684 | | | $ | 209,182 | | | $ | 757,611 | | | $ | 966,793 | | |
Sycamore Small Company
Opportunity Fund | | | 73,792 | | | | 224,771 | | | | 298,563 | | | | 134,592 | | | | 454,533 | | | | 589,125 | | |
As of October 31, 2020, the components of accumulated earnings (deficit) on a tax basis were as follows (amounts in thousands):
| | | Undistributed
Ordinary
Income | | Undistributed
Long-Term
Capital Gains | | Accumulated
Earnings | | Unrealized
Appreciation
(Depreciation)* | | Total
Accumulated
Earnings
(Loss) | |
Sycamore Established
Value Fund | | $ | 61,456 | | | $ | 433,347 | | | $ | 494,803 | | | $ | 226,139 | | | $ | 720,942 | | |
Sycamore Small Company
Opportunity Fund | | | 22,320 | | | | 19,433 | | | | 41,753 | | | | 81,664 | | | | 123,417 | | |
* The difference between the book-basis and tax-basis unrealized appreciation (depreciation) is attributable primarily to tax deferral of losses on wash sales.
As of October 31, 2020, the cost basis for federal income tax purposes, gross unrealized appreciation, gross unrealized depreciation and net unrealized appreciation (depreciation) for investments and derivatives were as follows (amounts in thousands):
| | | Cost of
Investments
for Federal
Tax Purposes | | Gross
Unrealized
Appreciation | | Gross
Unrealized
Depreciation | | Net
Unrealized
Appreciation
(Depreciation) | |
Sycamore Established Value | | $ | 10,276,724 | | | $ | 1,522,295 | | | $ | (1,296,156 | ) | | $ | 226,139 | | |
Sycamore Small Company Opportunity | | | 4,775,544 | | | | 683,177 | | | | (601,513 | ) | | | 81,664 | | |
40
Victory Portfolios | | Notes to Financial Statements — continued
October 31, 2020 | |
8. Affiliated Securities:
An affiliated security is a security in which the Fund has ownership of at least 5% of the security's outstanding voting shares or an investment company managed by VCM. Transactions in affiliated securities during the year ended October 31, 2020, were as follows (amounts in thousands):
| | | Fair
Value
10/31/2019 | | Purchases
at Cost | | Proceeds
from
Sales | | Net
Realized
Gains
(Losses)
from
Sales | | Capital
Gain
Distributions | | Net
Change in
Unrealized
Appreciation/
Depreciation | | Fair
Value
10/31/2020 | | Dividend
Income | |
Sycamore
Small Company
Opportunity
Fund | |
ADTRAN Inc. | | $ | 23,764 | | | $ | 386 | | | $ | (1,183 | ) | | $ | (776 | ) | | $ | — | | | $ | 6,133 | | | $ | 28,324 | | | $ | 981 | | |
| AngioDynamics, Inc. | | | 58,613 | | | | 5,801 | | | | (1,055 | ) | | | (835 | ) | | | — | | | | (19,082 | ) | | | 43,442 | | | | — | | |
Core-Mark Holding Co.,
Inc. | | | 63,584 | | | | 30,425 | | | | (19,806 | ) | | | (3,706 | ) | | | — | | | | (2,007 | ) | | | 68,490 | | | | 1,281 | | |
Cutera, Inc. | | | — | | | | 36,968 | | | | (547 | ) | | | (277 | ) | | | — | | | | (12,374 | ) | | | 23,770 | | | | — | | |
Encore Wire Corp. | | | 48,680 | | | | 11,447 | | | | (1,437 | ) | | | 86 | | | | — | | | | (9,267 | ) | | | 49,509 | | | | 81 | | |
Hanger, Inc. | | | 49,146 | | | | 4,482 | | | | (3,469 | ) | | | (304 | ) | | | — | | | | (10,676 | ) | | | 39,179 | | | | — | | |
NETGEAR, Inc. | | | 41,915 | | | | 9,277 | | | | (5,988 | ) | | | 613 | | | | — | | | | 9,141 | | | | 54,958 | | | | — | | |
The E.W. Scripps Co.,
Class A | | | 51,725 | | | | 6,076 | | | | (9,722 | ) | | | (4,039 | ) | | | — | | | | (12,227 | ) | | | 31,813 | | | | 837 | | |
| | | $ | 337,427 | | | $ | 104,862 | | | $ | (43,207 | ) | | $ | (9,238 | ) | | $ | — | | | $ | (50,359 | ) | | $ | 339,485 | | | $ | 3,180 | | |
9. Fund Ownership:
Ownership of more than 25% of the voting securities of a fund creates presumptions of control of the fund, under section 2(a)(9) of the 1940 Act. As of October 31, 2020, the shareholders listed below held more than 25% of the shares outstanding of the Funds and may be deemed to control those Funds.
| | | Shareholder | | Percent | |
Sycamore Small Company Opportunity Fund | | Edward D. Jones & Co., L.P. | | | 25.1 | % | |
41
REPORT OF INDEPENDENT REGISTERED PUBLIC ACCOUNTING FIRM
To the Shareholders and Board of Trustees of Board of Victory Portfolios
Opinion on the Financial Statements
We have audited the accompanying statements of assets and liabilities, including the schedules of portfolio investments, of Victory Sycamore Established Value Fund and Victory Sycamore Small Company Opportunity Fund (the "Funds"), each a series of Victory Portfolios, as of October 31, 2020, the related statements of operations for the year then ended and the statements of changes in net assets, including the related notes, and the financial highlights for each of the two years in the period then ended (collectively referred to as the "financial statements"). In our opinion, the financial statements present fairly, in all material respects, the financial position of each of the Funds as of October 31, 2020, the results of their operations for the year then ended and the changes in their net assets and the financial highlights for each of the two years in the period then ended, in conformity with accounting principles generally accepted in the United States of America.
The Funds' financial highlights for the years ended October 31, 2018 and prior, were audited by other auditors whose report dated December 21, 2018, expressed an unqualified opinion on those financial highlights.
Basis for Opinion
These financial statements are the responsibility of the Funds' management. Our responsibility is to express an opinion on the Funds' financial statements based on our audits. We are a public accounting firm registered with the Public Company Accounting Oversight Board (United States) ("PCAOB") and are required to be independent with respect to the Funds in accordance with the U.S. federal securities laws and the applicable rules and regulations of the Securities and Exchange Commission and the PCAOB.
We conducted our audits in accordance with the standards of the PCAOB. Those standards require that we plan and perform the audit to obtain reasonable assurance about whether the financial statements are free of material misstatement whether due to error or fraud.
Our audits included performing procedures to assess the risks of material misstatement of the financial statements, whether due to error or fraud, and performing procedures that respond to those risks. Such procedures included examining, on a test basis, evidence regarding the amounts and disclosures in the financial statements. Our procedures included confirmation of securities owned as of October 31, 2020, by correspondence with the custodian and brokers or by other appropriate auditing procedures where replies from brokers were not received. Our audits also included evaluating the accounting principles used and significant estimates made by management, as well as evaluating the overall presentation of the financial statements. We believe that our audits provide a reasonable basis for our opinion.
We have served as the auditor of one or more investment companies advised by Victory Capital Management, Inc. since 2015.
COHEN & COMPANY, LTD.
Cleveland, Ohio
December 23, 2020
42
Victory Portfolios | | Supplemental Information
October 31, 2020 | |
(Unaudited)
Trustee and Officer Information
Board of Trustees:
Overall responsibility for management of the Trust rests with the Board. The Trust is managed by the Board in accordance with the laws of the State of Delaware. There are currently nine Trustees, eight of whom are not "interested persons" of the Trust within the meaning of that term under the 1940 Act ("Independent Trustees") and one of whom is an "interested person" of the Trust within the meaning of that term under the 1940 Act ("Interested Trustee"). The Trustees, in turn, elect the officers of the Trust to actively supervise its day-to-day operations.
The following tables list the Trustees, their date of birth, position with the Trust, commencement of service, principal occupations during the past five years and any directorships of other investment companies or companies whose securities are registered under the Securities Exchange Act of 1934, as amended, or who file reports under that Act. Each Trustee oversees 42 portfolios in the Trust, nine portfolios in Victory Variable Insurance Funds, and 25 portfolios in Victory Portfolios II, each a registered investment company that, together with the Trust, comprise the Victory Fund Complex. David C. Brown is a Trustee who oversees 47 portfolios in the USAA Mutual Funds Trust. Each Trustee's address is c/o Victory Portfolios, 4900 Tiedeman Road, 4th Floor, Brooklyn, Ohio 44144. Each Trustee has an indefinite term.
Name and Date of Birth | | Position
Held with
the Trust | | Date
Commenced
Service | | Principal Occupation
During Past 5 Years | | Other
Directorships
Held During
Past 5 Years | |
Independent Trustees. | |
David Brooks Adcock,
Born October 1951 | | Trustee | | May 2005 | | Consultant (since 2006). | | Chair and Trustee, Turner Funds (December
2016-December
2017). | |
Nigel D. T. Andrews,
Born April 1947 | | Vice Chair and Trustee | | August 2002 | | Retired. | | Director, TCG BDC II, Inc. (since 2017); Director, TCG BDC I, Inc. (formerly Carlyle GMS Finance, Inc.) (since 2012). | |
E. Lee Beard,*
Born August 1951 | | Trustee | | May 2005 | | Retired (since 2015). | | None. | |
Dennis M. Bushe,
Born January 1944 | | Trustee | | July 2016 | | Retired. | | Trustee, RS Investment Trust and RS Variable Products Trust (November
2011-July 2016). | |
43
Victory Portfolios | | Supplemental Information — continued
October 31, 2020 | |
(Unaudited)
Name and Date of Birth | | Position
Held with
the Trust | | Date
Commenced
Service | | Principal Occupation
During Past 5 Years | | Other
Directorships
Held During
Past 5 Years | |
John L. Kelly,
Born April 1953 | | Trustee | | February 2015 | | Partner, McCarvill Capital Partners (September 2016-September 2017); Advisor (January 2016-April 2016) and Managing Partner (August 2014-January 2016) Endgate Commodities LLC. | | Director, Caledonia Mining Corporation (since May 2012). | |
David L. Meyer,*
Born April 1957 | | Trustee | | December 2008 | | Retired. | | None. | |
Gloria S. Nelund,
Born May 1961 | | Trustee | | July 2016 | | Chair, CEO and Co-Founder of TriLinc Global, LLC, an investment firm. | | TriLinc Global Impact Fund, LLC (since 2012); Trustee, RS Investment Trust and RS Variable Products Trust (November
2007-July 2016). | |
Leigh A. Wilson,
Born December 1944 | | Chair and Trustee | | November 1994 | | Private Investor. | | Chair (since 2013), Caledonia Mining Corporation. | |
Interested Trustee. | |
David C. Brown,**
Born May 1972 | | Trustee | | May 2008 | | Chairman and Chief Executive Officer (since 2013), the Adviser; Chairman and Chief Executive Officer (since 2013), Victory Capital Holdings, Inc. | | Trustee, USAA Mutual Funds Trust. | |
* The Board has designated Ms. Beard and Mr. Meyer as its Audit Committee Financial Experts.
** Mr. Brown is an "Interested Person" by reason of his relationship with the Adviser.
The Statement of Additional Information includes additional information about the Trustees of the Trust and is available, without charge, by calling 800-539-3863.
44
Victory Portfolios | | Supplemental Information — continued
October 31, 2020 | |
(Unaudited)
Officers:
The officers of the Trust, their date of births, commencement of service and their principal occupations during the past five years, are detailed in the following table. Each officer serves until the earlier of his or her resignation, removal, retirement, death, or the election of a successor. The mailing address of each officer of the Trust is 4900 Tiedeman Road, 4th Floor, Brooklyn, Ohio 44144. The officers of the Trust receive no compensation directly from the Trust for performing the duties of their offices.
Name and Date of Birth | | Position with
the Trust | | Date
Commenced
Service | | Principal Occupation During Past 5 Years | |
Christopher K. Dyer,
Born February 1962 | | President | | February 2006* | | Director of Mutual Fund Administration, the Adviser. | |
Scott A. Stahorsky,
Born July 1969 | | Vice President | | December 2014 | | Manager, Fund Administration, the Adviser (since 2015); Senior Analyst, Fund Administration, the Adviser (prior to 2015). | |
Erin G. Wagner,
Born February 1974 | | Secretary | | December 2014 | | Associate General Counsel, the Adviser (since 2013). | |
Allan Shaer,
Born March 1965 | | Treasurer | | May 2017 | | Senior Vice President, Financial Administration, Citi Fund Services Ohio, Inc. (since 2016); Vice President, Mutual Fund Administration, JP Morgan Chase (2011-2016). | |
Christopher A. Ponte,
Born March 1984 | | Assistant Treasurer | | December 2017 | | Manager, Fund Administration, the Adviser (since 2017); Senior Analyst, Fund Administration, the Adviser (prior to 2017); Chief Financial Officer, Victory Capital Services, Inc. (since 2018). | |
Colin Kinney,
Born October 1973 | | Chief Compliance Officer | | July 2017 | | Chief Compliance Officer (since 2013) and Chief Risk Officer (2009-2017), the Adviser. | |
Chuck Booth,
Born April 1960 | | Anti-Money Laundering Compliance Officer and Identity Theft Officer | | May 2015 | | Director, Regulatory Administration and CCO Support Services, Citi Fund Services Ohio, Inc. | |
Jay G. Baris,
Born January 1954 | | Assistant Secretary | | December 1997 | | Partner, Sidley Austin LLP (since April 2020); Partner, Shearman & Sterling LLP (January 2018-April 2020); Partner, Morrison & Foerster LLP (2011-January 2018). | |
* On December 3, 2014, Mr. Dyer resigned as Secretary of the Trust and accepted the position of President.
45
Victory Portfolios | | Supplemental Information — continued
October 31, 2020 | |
(Unaudited)
Proxy Voting and Portfolio Holdings Information
Proxy Voting:
Information regarding the policies and procedures each Fund uses to determine how to vote proxies relating to portfolio securities is available without charge, upon request, by calling 800-539-3863. The information is also included in the Funds' Statement of Additional Information, which is available on the SEC's website at www.sec.gov.
Information relating to how the Funds voted proxies relating to portfolio securities held during the most recent twelve months ended June 30 is available on the SEC's website at www.sec.gov.
Availability of Schedules of Portfolio Investments:
The Trust files a complete list of Schedules of Portfolio Investments with the SEC for the first and third quarter of each fiscal year on Form N-PORT. Forms N-PORT are available on the SEC's web site at www.sec.gov.
Expense Examples
As a shareholder of the Funds, you may incur two types of costs: (1) transaction costs, including sales charges (loads) on purchases; and (2) ongoing costs, including management fees, distribution and service (12b-1) fees and other Fund expenses. These examples are intended to help you understand your ongoing costs (in dollars) of investing in the Funds and to compare these costs with the ongoing costs of investing in other mutual funds.
These examples are based on an investment of $1,000 invested at the beginning of the period and held for the entire period from May 1, 2020 through October 31, 2020.
The Actual Expense figures in the table below provide information about actual account values and actual expenses. You may use the information below, together with the amount you invested, to estimate the expenses that you paid over the period. Simply divide your account value by $1,000 (for example, an $8,600 account value divided by $1,000 = 8.6), then multiply the result by the number in the table under the heading entitled "Actual Expenses Paid During Period" to estimate the expenses you paid on your account during this period.
The Hypothetical Expense figures in the table below provide information about hypothetical account values and hypothetical expenses based on each Fund's actual expense ratio and an assumed rate of return of 5% per year before expenses, which is not the Fund's actual return. The hypothetical account values and expenses may not be used to estimate the actual ending account balance or expenses you paid for the period. You may use this information to compare this 5% hypothetical example with the 5% hypothetical examples that appear in shareholder reports of other funds.
Please note the expenses shown in the table are meant to highlight your ongoing costs only and do not reflect any transactional costs. Therefore, the table is useful in comparing ongoing costs only, and will not help you determine the relative total costs of owning different funds. In addition, if these transactional costs were included, your costs would have been higher.
| | | Beginning
Account
Value
5/1/20 | | Actual
Ending
Account
Value
10/31/20 | | Hypothetical
Ending
Account
Value
10/31/20 | | Actual
Expenses
Paid
During
Period
5/1/20-
10/31/20* | | Hypothetical
Expenses
Paid
During
Period
5/1/20-
10/31/20* | | Annualized
Expense
Ratio
During
Period
5/1/20-
10/31/20 | |
Sycamore Established Value Fund | |
Class A Shares | | $ | 1,000.00 | | | $ | 1,129.90 | | | $ | 1,020.56 | | | $ | 4.87 | | | $ | 4.62 | | | | 0.91 | % | |
Class C Shares | | | 1,000.00 | | | | 1,125.40 | | | | 1,016.59 | | | | 9.08 | | | | 8.62 | | | | 1.70 | % | |
Class I Shares | | | 1,000.00 | | | | 1,131.60 | | | | 1,022.12 | | | | 3.21 | | | | 3.05 | | | | 0.60 | % | |
Class R Shares | | | 1,000.00 | | | | 1,128.90 | | | | 1,019.56 | | | | 5.94 | | | | 5.63 | | | | 1.11 | % | |
Class R6 Shares | | | 1,000.00 | | | | 1,131.80 | | | | 1,022.32 | | | | 3.00 | | | | 2.85 | | | | 0.56 | % | |
Class Y Shares | | | 1,000.00 | | | | 1,131.90 | | | | 1,022.02 | | | | 3.32 | | | | 3.15 | | | | 0.62 | % | |
46
Victory Portfolios | | Supplemental Information — continued
October 31, 2020 | |
(Unaudited)
| | | Beginning
Account
Value
5/1/20 | | Actual
Ending
Account
Value
10/31/20 | | Hypothetical
Ending
Account
Value
10/31/20 | | Actual
Expenses
Paid
During
Period
5/1/20-
10/31/20* | | Hypothetical
Expenses
Paid
During
Period
5/1/20-
10/31/20* | | Annualized
Expense
Ratio
During
Period
5/1/20-
10/31/20 | |
Sycamore Small Company Opportunity Fund | |
Class A Shares | | $ | 1,000.00 | | | $ | 1,084.70 | | | $ | 1,018.80 | | | $ | 6.60 | | | $ | 6.39 | | | | 1.26 | % | |
Class I Shares | | | 1,000.00 | | | | 1,086.30 | | | | 1,020.46 | | | | 4.88 | | | | 4.72 | | | | 0.93 | % | |
Class R Shares | | | 1,000.00 | | | | 1,083.50 | | | | 1,017.95 | | | | 7.49 | | | | 7.25 | | | | 1.43 | % | |
Class R6 Shares | | | 1,000.00 | | | | 1,086.70 | | | | 1,020.81 | | | | 4.51 | | | | 4.37 | | | | 0.86 | % | |
Class Y Shares | | | 1,000.00 | | | | 1,085.20 | | | | 1,019.61 | | | | 5.77 | | | | 5.58 | | | | 1.10 | % | |
* Expenses are equal to the average account value multiplied by the Fund's annualized expense ratio multiplied by 184/366 (the number of days in the most recent fiscal half-year divided by the number of days in the fiscal year).
47
Victory Portfolios | | Supplemental Information — continued
October 31, 2020 | |
(Unaudited)
Additional Federal Income Tax Information
For the year ended October 31, 2020, the following Funds paid qualified dividend income for the purposes of reduced individual federal income tax rates of:
| | Percent | |
Sycamore Established Value Fund | | | 89 | % | |
Sycamore Small Company Opportunity Fund | | | 100 | % | |
Dividends qualified for corporate dividends received deductions of:
| | Percent | |
Sycamore Established Value Fund | | | 87 | % | |
Sycamore Small Company Opportunity Fund | | | 100 | % | |
For the year ended October 31, 2020, the following Funds designated short-term capital gain distributions (in thousands):
| | Amount | |
Sycamore Established Value Fund | | $ | 35,201 | | |
Sycamore Small Company Opportunity Fund | | | 31,457 | | |
For the year ended October 31, 2020, the following Funds designated long-term capital gain distributions (in thousands):
| | Amount | |
Sycamore Established Value Fund | | $ | 640,308 | | |
Sycamore Small Company Opportunity Fund | | | 224,772 | | |
48
Victory Portfolios | | Supplemental Information — continued
October 31, 2020 | |
(Unaudited)
Liquidity Risk Management Program:
The Victory Funds have adopted and implemented a written liquidity risk management program (the "LRMP") as required by Rule 22e-4 under the Act. The LRMP is reasonably designed to assess and manage each Fund's liquidity risk, taking into consideration each Fund's investment strategy and the liquidity of its portfolio investments during normal and reasonably foreseeable stressed market conditions; its short and long-term cash flow projections; and its cash holdings and access to other liquidity management tools such as available funding sources including the Victory Funds Complex Interfund Lending Facility and Line of Credit (discussed in the Notes to Financial Statements). The Board approved the appointment of VCM as the administrator of the LRMP. At an in-person meeting held on February 20, 2020, VCM provided an oral and written report to the Trustees on the operation and effectiveness of the LRMP during the previous year.
VCM manages liquidity risks associated with the Funds' investments by monitoring, among other things, cash and cash equivalents, any use of derivatives, the concentration of investments, the appropriateness of each Fund's investment strategy, and by classifying every fund investment as either highly liquid, moderately liquid, less liquid or illiquid on at least a monthly basis. To assist with the classification of Fund investments, VCM has retained a third-party provider of liquidity evaluation services. This provider determines preliminary liquidity classifications for all portfolio holdings based upon portfolio-level data and certain assumptions provided by VCM. VCM reviews the preliminary liquidity classifications and, when appropriate, considers other information including input from the Funds' portfolio managers (including the portfolio managers employed by any investment sub-advisers) in determining final liquidity classifications.
The report from VCM concluded that the Funds did not experience any significant liquidity challenges during the covered period, and the Funds' LRMP is reasonably designed to assess and manage its liquidity risk. The report also concluded that the LRMP continues to operate adequately and effectively to enable VCM to oversee and manage liquidity risk and ensure each Fund is able to meet redemption requests without significant dilution to the remaining investors' interest in each Fund. During the review period, each Fund's portfolio consisted primarily of highly liquid investments, which are defined as cash and any investments reasonably expected to be converted to cash in current market conditions in three business days or less without significantly changing the market value of the investment. Therefore, the Funds have not adopted a Highly Liquid Investment Minimum. The Funds' investments were below the limitation on illiquid investments during the review period. Additionally, VCM indicated that no events occurred that would require the filing of Form N-LIQUID and recommended no material changes to the LRMP.
49
Privacy Policy
Protecting the Privacy of Information
The Trust respects your right to privacy. We also know that you expect us to conduct and process your business in an accurate and efficient manner. To do so, we must collect and maintain certain personal information about you. This is the information we collect from you on applications or other forms, and from the transactions you make with us or third parties. It may include your name, address, social security number, account transactions and balances, and information about investment goals and risk tolerance.
We do not disclose any information about you or about former customers to anyone except as permitted or required by law. Specifically, we may disclose the information we collect to companies that perform services on our behalf, such as the transfer agent that processes shareholder accounts and printers and mailers that assist us in the distribution of investor materials. We may also disclose this information to companies that perform marketing services on our behalf. This allows us to continue to offer you Victory investment products and services that meet your investing needs, and to effect transactions that you request or authorize. These companies will use this information only in connection with the services for which we hired them. They are not permitted to use or share this information for any other purpose.
To protect your personal information internally, we permit access only by authorized employees and maintain physical, electronic and procedural safeguards to guard your personal information.*
* You may have received communications regarding information about privacy policies from other financial institutions which gave you the opportunity to "opt-out" of certain information sharing with companies which are not affiliated with that financial institution. The Trust does not share information with other companies for purposes of marketing solicitations for products other than the Trust. Therefore, the Trust does not provide opt-out options to their shareholders.
Victory Funds
P.O. Box 182593
Columbus, Ohio 43218-2593

Visit our website at: | | Call Victory at: | |
www.vcm.com | | 800-539-FUND (800-539-3863) | |
Item 2. Code of Ethics.
| (a) | The registrant has adopted a code of ethics that applies to the registrant’s principal executive officer, principal financial officer, principal accounting officer or controller, or persons performing similar functions. This code of ethics in included as an Exhibit. |
| (b) | During the period covered by the report, with respect to the registrant’s code of ethics that applies to its principal executive officer, principal financial officer, principal accounting officer or controller, or persons performing similar functions; there have been no amendments to, nor any waivers granted from, a provision that relates to any element of the code of ethics definition enumerated in paragraph (b) of this Item 2. |
Item 3. Audit Committee Financial Expert.
(a)(1) The registrant’s board of directors has determined that the registrant has at least one audit committee financial expert serving on its audit committee.
(a)(2) The audit committee financial experts are David L. Meyer and E. Lee Beard, who are “independent” for purposes of this Item 3 of Form N-CSR.
Item 4. Principal Accountant Fees and Services.
| | | 2020 | | | 2019 | |
| (a) Audit Fees (1) | | $ | 96,000 | | | $ | 96,000 | |
| (b) Audit-Related Fees (2) | | | 0 | | | | 0 | |
| (c) Tax Fees (3) | | | 28,500 | | | | 28,500 | |
| (d) All Other Fees (4) | | | 818 | | | | 0 | |
(1) Audit fees include amounts related to the audit of the Registrant’s annual financial statements and services normally provided by the accountant in connection with statutory and regulatory filings. Audit fees billed were for professional services provided by Cohen & Company, Ltd. for audit compliance, audit advice and audit planning.
(2) Represents the fee for assurance and related services by Cohen & Company, Ltd. reasonably related to the performance of the audit of the Registrant’s financial statements that was not reported under (a) of this item.
(3) Represents the aggregate tax fee billed for professional services rendered by Cohen & Company, Ltd. for tax compliance, tax advice, international tax fee transactions and tax planning. Such tax services included the review of income and excise tax returns for the Registrant.
(4) For the fiscal year ended October 31, 2019, there were no fees billed for professional services rendered by Cohen & Company, Ltd. to the Registrant, other than the services reported in (a) through (c) of this item. For the fiscal year ended October 31, 2020, Cohen & Company, Ltd. billed fees for consent related to Member Class Registration Statements as of June 1, 2020.
Tax fees for 2019 and 2020 are for recurring tax fees for the preparation of the federal and state tax returns and procedures performed relating to the Registrant’s analysis of complex securities.
(e)(1) The Registrant’s Audit Committee must pre-approve non-audit services to be provided by the principal accountant and the fees charged with these services. The Committee may delegate authority to one or more Committee members to pre-approve these services, subject to subsequent review and approval by the Committee.
(e)(2) There were no services performed under Rule 2.01 (c)(7)(i)(C).
(f) Not applicable.
(g)
(h) The Registrant’s Audit Committee has evaluated the non-audit services that the principal accountant provided to the Registrant’s investment adviser (and the adviser’s relevant affiliated), which services the Committee did not pre-approve, and has concluded that the provision of those services was compatible with maintaining the accountant’s independence.
| Item 5. | Audit Committee of Listed Registrants. |
Not applicable.
(a) Not applicable.
(b) Not applicable.
Item 7. Disclosure of Proxy Voting Policies and Procedures for Closed-End Management Investment Companies.
Not applicable.
Item 8. Portfolio Managers of Closed-End Management Investment Companies.
Not applicable.
Item 9. Purchases of Equity Securities by Closed-End Management Investment Company and Affiliated Purchasers.
Not applicable.
Item 10. Submission of Matters to a Vote of Security Holders.
Not applicable.
Item 11. Controls and Procedures.
(a)The registrant’s principal executive officer and principal financial officer have concluded, based on their evaluation of the registrant's disclosure controls and procedures as conducted within 90 days of the filing date of this report, that these disclosure controls and procedures are adequately designed and are operating effectively to ensure that information required to be disclosed by the registrant on Form N-CSR is recorded, processed, summarized and reported within the time periods specified in the Securities and Exchange Commission's rules and forms.
(b)There were no changes in the registrant’s internal control over financial reporting (as defined in Rule 30a-3(d) under the Investment Company Act of 1940 (17 CFR 270.30a-3(d)) that occurred during the period covered by this report that have materially affected or are reasonably likely to materially affect, the registrant’s internal control over financial reporting.
Item 12. Disclosure of Securities Lending Activities for Closed-End Management Investment Companies.
(a)(1) Not applicable.
(a)(2) Not applicable.
(a)(3) Not applicable.
(a)(4) Not applicable.
(b) Not applicable.
Item 13. Exhibits.
(a)(1) The code of ethics that is the subject of the disclosure required by Item 2 is attached hereto.
(a)(2) Certifications pursuant to Rule 30a-2(a) are attached hereto.
(a)(3) Not applicable.
(b) Certifications pursuant to Rule 30a-2(b) are furnished herewith.
SIGNATURES
Pursuant to the requirements of the Securities Exchange Act of 1934 and the Investment Company Act of 1940, the registrant has duly caused this report to be signed on its behalf by the undersigned, thereunto duly authorized.
| (Registrant) | Victory Portfolios | |
| By (Signature and Title)* | /s/ Allan Shaer | |
| | Allan Shaer, Principal Financial Officer | |
Pursuant to the requirements of the Securities Exchange Act of 1934 and the Investment Company Act of 1940, this report has been signed below by the following persons on behalf of the registrant and in the capacities and on the dates indicated.
| By (Signature and Title)* | /s/ Christopher K. Dyer | |
| | Christopher K. Dyer, Principal Executive Officer | |
| By (Signature and Title)* | /s/ Allan Shaer | |
| | Allan Shaer, Principal Financial Officer | |