UNITED STATES
SECURITIES AND EXCHANGE COMMISSION
Washington, D.C. 20549
FORM N-CSR
CERTIFIED SHAREHOLDER REPORT OF REGISTERED
MANAGEMENT INVESTMENT COMPANIES
Investment Company Act file number: 811-04852
Victory Portfolios
(Exact name of registrant as specified in charter)
| 4900 Tiedeman Road, 4th Floor, Brooklyn, Ohio | 44144 |
| (Address of principal executive offices) | (Zip code) |
Citi Fund Services Ohio, Inc., 4400 Easton Commons, Suite 200, Columbus, OH 43219
(Name and address of agent for service)
Registrant’s telephone number, including area code: 800-539-3863
Date of fiscal year end: October 31
Date of reporting period: October 31, 2021
Item 1. Reports to Stockholders.

October 31, 2021
Annual Report
Victory Diversified Stock Fund
Victory NewBridge Large Cap Growth Fund
Victory Special Value Fund
Victory THB US Small Opportunities Fund
Victory Strategic Allocation Fund
Victory INCORE Fund for Income
Victory INCORE Investment Grade Convertible Fund
www.vcm.com
News, Information And Education 24 Hours A Day, 7 Days A Week
The Victory Capital website gives fund shareholders, prospective shareholders, and investment professionals a convenient way to access fund information, get guidance, and track fund performance anywhere they can access the Internet. The site includes:
• Detailed performance records
• Daily share prices
• The latest fund news
• Investment resources to help you become a better investor
• A section dedicated to investment professionals
Whether you're a potential investor searching for the fund that matches your investment philosophy, a seasoned investor interested in planning tools, or an investment professional, www.vcm.com has what you seek. Visit us anytime. We're always open.
TABLE OF CONTENTS
Shareholder Letter (Unaudited) | | | 3 | | |
Managers' Commentary/Investment
Overview (Unaudited) | | | 5 | | |
Investment Objectives and Portfolio
Holdings (Unaudited) | | | 25 | | |
Schedules of Portfolio Investments | |
Victory Diversified Stock Fund | | | 32 | | |
Victory NewBridge Large Cap Growth Fund | | | 35 | | |
Victory Special Value Fund | | | 37 | | |
Victory THB US Small Opportunities Fund | | | 40 | | |
Victory Strategic Allocation Fund | | | 43 | | |
Victory INCORE Fund for Income | | | 44 | | |
Victory INCORE Investment Grade Convertible Fund | | | 46 | | |
Financial Statements | | | |
Statements of Assets and Liabilities | | | 49 | | |
Statements of Operations | | | 54 | | |
Statements of Changes in Net Assets | | | 57 | | |
Financial Highlights | | | 66 | | |
Notes to Financial Statements | | | 84 | | |
Report of Independent Registered
Public Accounting Firm | | | 100 | | |
Supplemental Information (Unaudited) | | | 102 | | |
Trustee and Officer Information | | | 102 | | |
Proxy Voting and Portfolio Holdings Information | | | 105 | | |
Expense Examples | | | 105 | | |
Advisory Contract Approval | | | 107 | | |
Additional Federal Income Tax Information | | | 109 | | |
Privacy Policy (inside back cover) | | | |
1
IRA DISTRIBUTION WITHHOLDING DISCLOSURE
We generally must withhold federal income tax at a rate of 10% of the taxable portion of your distribution and, if you live in a state that requires state income tax withholding, at your state's tax rate. However, you may elect not to have withholding apply or to have income tax withheld at a higher rate. Any withholding election that you make will apply to any subsequent distribution unless and until you change or revoke the election. If you wish to make a withholding election, or change or revoke a prior withholding election, call 800-539-3863 (800-235-8396 for Member Class) and form W-4P (OMB No. 1545-0074 withholding certificate for pension or annuity payments) will be electronically sent.
If you do not have a withholding election in place by the date of a distribution, federal income tax will be withheld from the taxable portion of your distribution at a rate of 10%. If you must pay estimated taxes, you may be subject to estimated tax penalties if your estimated tax payments are not sufficient and sufficient tax is not withheld from your distribution.
For more specific information, please consult your tax adviser.
The Funds are distributed by Victory Capital Services, Inc. Victory Capital Management Inc. is the investment adviser to the Funds and receives fees from the Funds for performing services for the Funds.
This report is not authorized for distribution to prospective investors unless preceded or accompanied by a current prospectus of the Victory Funds.
For additional information about any Victory Fund, including fees, expenses, and risks, view our prospectus online at vcm.com or call 800-539-3863 (800-235-8396 for Member Class). Read it carefully before you invest or send money.
The information in this report is based on data obtained from recognized services and sources and is believed to be reliable. Any opinions, projections, or recommendations in this report are subject to change without notice and are not intended as individual investment advice. Past investment performance of the Funds, markets or securities mentioned herein should not be considered to be indicative of future results.
• NOT FDIC INSURED • NO BANK GUARANTEE • MAY LOSE VALUE

Call Victory at:
800-539-FUND (800-539-3863)
800-235-8396 for Member Class
Visit our website at:
www.vcm.com
2
Victory Funds Letter to Shareholders
(Unaudited)
Dear Shareholder,
There's no denying the enormous toll that COVID-19 has had on so many of us, both personally and professionally. But if our recent experience with this pandemic has taught us anything, it's that we — as a nation — are resilient. Through it all, our economy and the financial markets have endured and performed admirably.
Consider that just one year ago we were still anxiously awaiting the development and approval of an effective vaccine, while wondering if the initial sharp rebound in financial assets would hold. As it turns out, a vaccine was rolled out (domestically) faster than expectations, and a recovery that began during the second quarter of 2020 continued through most of the annual reporting period that ended October 31, 2021.
By all accounts, the economy, and life in general, continues trending toward a new normal. But it's always healthy to reflect on the events that transpired over the past year.
It may seem like an eternity ago, but in late 2020 financial markets were being alternately fueled and roiled by a variety of factors, including: the ebb and flow of COVID-19 cases; a contentious U.S. presidential election season; growing optimism for an effective vaccine; and a fluid debate regarding the need for more stimulus. Ultimately, stocks were propelled higher in late 2020, and the upward trajectory continued, more or less, for the first two quarters of 2021. Of course, nothing moves in a straight line, and heightened volatility re-emerged in September and October as our annual reporting period drew to a close.
More recently, investors have been pondering a new set of worries — some of them directly related to the U.S. Federal Reserve's (the "Fed") accommodative monetary policies and the various forms of fiscal stimuli that helped revive the economy from the depths of the crisis. Already, the Fed has definitively laid out a plan to begin tapering its aggressive bond buying program, and now we're all wondering how much higher interest rates will ultimately rise. Many CEOs are also expressing concerns about labor shortages, disrupted supply chains, rising commodity prices, and the potential for lasting inflation.
So how did markets actually fare during the most recent annual reporting period? Through all the volatility and surprises, the S&P 500® Index registered an impressive annual return of nearly 43% for the 12-month period ended October 31, 2021. Not coincidentally, this broad market index has been bounding around near its all-time high. Over this same annual period, the yield on the 10-Year U.S. Treasury jumped 67 basis points (a basis point is 1/100th of a percentage point), reflecting a very low starting rate, substantial fiscal stimulus, and the Fed's accommodative monetary policy. As the end of the reporting period approached, the yield on the 10-Year U.S. Treasury was hovering just below its high for the year, finishing at 1.55%, as of the end of October 2021.
All this merely exemplifies just how dynamic and resilient markets have been. Of course, there are myriad challenges ahead (some yet to be identified), and we should
3
not expect such robust equity returns each and every year. Although no one knows what the future holds, we can assure you that the investment professionals at all our independent franchises continually monitor the environment and work hard to position portfolios opportunistically no matter what the markets throw at us.
On the following pages you will find information relating to your Victory Funds investment. If you have any questions regarding the current market dynamics or your specific portfolio or investment plan, we encourage you to contact your financial advisor. If you invest with us directly, you may call (800) 539-3863 (800-235-8396 for Member Class) or visit our website at www.vcm.com.
From all of us here at Victory Capital, thank you for letting us help you work toward your investment goals.

Christopher K. Dyer, CFA
President,
Victory Funds
4
Victory Diversified Stock Fund
Managers' Commentary
(Unaudited)
What were the market conditions during the reporting period?
The S&P 500® Index (the "Index") was up approximately 43% over the trailing 12 months ended October 31, 2021. This rally has been broad-based, but far from uniform, with the Financials and Energy sectors garnering outsized returns of 111% and 72%, respectively, while the Utilities and Consumer Staples sectors were laggards, up just 11% and 19%, respectively. The Technology sector, which was largely a winner as the pandemic accelerated secular trends around digital transformation, cloud computing, and artificial intelligence, also outperformed, as did the Real Estate sector.
More recently, we've seen some dramatic changes in leadership. Specifically, in September, the market declined approximately 5% as interest rates rose and longer duration/growth equities underperformed after a strong July and August. But in October, the market rebounded along with growth stocks, while interest rates pulled back despite higher inflation data.
Indeed, as the pandemic subsides, supply chains normalize, and people return to work, the economic recovery should continue while inflation should moderate, which we see as a good backdrop for equities. We see noteworthy opportunities in housing, trucking/logistics, building products/construction, autos, energy, and banking. Extended valuations/sentiment and potential for rising rates keep us underweight on speculative growth stocks, while we see much stock-specific opportunity in semiconductors/semi-cap equipment and leading-edge life science tools/biotech.
How did Victory Diversified Stock Fund (the "Fund") perform during the reporting period?
The Fund returned 46.50% (Class A at net asset value) for the fiscal year ended October 31, 2021, outperforming the Index, which returned 42.91% for the period.
What strategies did you employ during the reporting period?
The Fund pursues investments that it believes are statistically cheap or intrinsically undervalued given growth prospects, while trying to identify the presence of a catalyst for future growth.
Using this framework, the Fund generated the strongest returns within the Energy, Financials, and Industrials sectors, each up 50% or more over the fiscal year, as well as strong relative performance within the Consumer Discretionary sector. The Technology and Real Estate sectors lagged on a relative basis but still generated positive absolute returns.
Within the Energy sector, exploration & production company Matador Resources Company was our top performer. The stock mainly benefited from strong energy prices and its peer-leading growth profile. Our bank holdings, particularly Western Alliance Bancorp and ServisFirst Bancshares, drove the strong stock selection in the Financials sector, mostly due to the move higher in interest rates, and again, stronger growth profiles.
5
Victory Diversified Stock Fund (continued)
Managers' Commentary (continued)
In the Technology sector, the Fund's largest detractor for the year was optical and photonic communications equipment vendor Lumentum Holdings ("Lumentum"). Lumentum has come under pressure as near-term headwinds drive negative estimate revisions, including supply chain constraints, inventory build at certain customers, COVID-19-related issues hampering network deployments, and the decline in the 3D-sensing market. We continue to hold the stock as growth looks primed to reaccelerate and the company maintains dominant market position and technological differentiation. In the Real Estate sector, our position in American Tower Corporation, an owner and developer of multitenant cellular communication towers, drove results.
6
Victory Diversified Stock Fund
Investment Overview
(Unaudited)
Average Annual Total Return
Year Ended October 31, 2021
| | Class A | | Class C | | Class I | | Class R | | Class R6 | | Class Y | | | |
INCEPTION DATE | | 10/28/89 | | 3/1/02 | | 8/31/07 | | 3/26/99 | | 3/3/14 | | 1/28/13 | | | |
| | Net Asset
Value | | Maximum
Offering
Price | | Net Asset
Value | | Contingent
Deferred
Charges | | Net Asset
Value | | Net Asset
Value | | Net Asset
Value | | Net Asset
Value | | S&P 500®
Index1 | |
One Year | | | 46.50 | % | | | 38.09 | % | | | 45.01 | % | | | 44.01 | % | | | 46.79 | % | | | 46.02 | % | | | 46.89 | % | | | 46.75 | % | | | 42.91 | % | |
Five Year | | | 16.67 | % | | | 15.29 | % | | | 15.61 | % | | | 15.61 | % | | | 16.96 | % | | | 16.35 | % | | | 17.02 | % | | | 16.91 | % | | | 18.93 | % | |
Ten Year | | | 13.79 | % | | | 13.12 | % | | | 12.81 | % | | | 12.81 | % | | | 14.09 | % | | | 13.47 | % | | | N/A | | | | N/A | | | | 16.21 | % | |
Since
Inception | | | N/A | | | | N/A | | | | N/A | | | | N/A | | | | N/A | | | | N/A | | | | 12.11 | % | | | 13.28 | % | | | N/A | | |
| The performance data quoted represents past performance and current returns may be lower or higher. The investment return and principal value will fluctuate so that an investor's shares, when redeemed, may be worth more or less than the original cost. To obtain performance information current to the most recent month's end, please visit www.vcm.com. | |
The maximum offering price ("MOP") figures reflect a maximum sales charge of 5.75% for Class A. Class C is not subject to an initial sales charge, but is subject to a deferred sales charge of 1.00% on shares redeemed within one year of purchase. Net Asset Value does not reflect sales charges.
Total return measures the price change in a share assuming the reinvestment of all net investment income and realized capital gain distributions, if any. The total returns quoted do not reflect adjustments made to the enclosed financial statements in accordance with U.S. Generally Accepted Accounting Principles or the deduction of taxes that a shareholder would pay on net investment income and realized capital gain distributions, including reinvested distributions, or redemptions of shares. The total return figures set forth above include all waivers of fees. Without such fee waivers, the total returns would have been lower.
Victory Diversified Stock Fund — Growth of $10,000

1The S&P 500® Index is an unmanaged index comprised of 500 domestically traded common stocks, is weighted according to the market value of each common stock in the index, and includes reinvestment of dividends. This index does not include the effect of sales charges, commissions, expenses or taxes, is not representative of the Fund, and it is not possible to invest directly in an index.
The graph reflects investment of growth of a hypothetical $10,000 investment in the Fund.
The graph and table do not reflect the deduction of taxes that a shareholder would pay on Fund distributions or the redemption of shares.
Past performance is not indicative of future results.
7
Victory NewBridge Large Cap Growth Fund
Managers' Commentary
(Unaudited)
What were the market conditions during the reporting period?
It's been approximately 20 months since the pandemic started to unfold in the United States in February 2020 and we continue to work through it on many levels. As heroic frontline workers and first responders worked tirelessly to save lives and serve those in need, others have done their best to adjust and adapt. Thankfully, a vast array of technological advancements allowed people to communicate, collaborate and transact in a way that wasn't possible only a few years ago. Communications networks were not robust or reliable enough to work remotely, have R&D teams collaborate from far-flung locations in a rush to develop much needed vaccines or have companies stay in business by shifting almost completely to e-commerce. Whereas last year was consumed by the need to save lives as vaccines were being developed in record-breaking time, this year the focus shifted more to repairing and reopening the economy; especially in the hardest-hit sectors and industries such as travel, hospitality, food service and retail. Much-needed relief arrived late last year on November 9, 2020; now known as "Pfizer Monday." Emergency-use authorization was also granted to Eli Lilly and a few days later, Moderna reported a 94.5% reduction in COVID-19 infection risk among those who received its vaccine. The good news came not a moment too soon as only a few weeks before, on November 4, the United States reached the scary milestone of 100,000 infections in one day for the first time.
The arrival of vaccine treatments also helped fuel a rebound in the 10-year U.S. Treasury yield that had been as low as 0.50% in August of 2020. From that point forward, the equity market's performance started to transition towards value/cyclical sectors as expectations of widespread vaccinations leading to a reopening economy increased. Along with those rising expectations came a rapid increase in the 10-year U.S. Treasury yield, which jumped from 0.50% in August to 1.74% in February 2021. The velocity and composition of the increase in interest rates led to this year's first selloff in growth stocks that lasted between mid-February and the first week in March. As the 10-year U.S. Treasury yield stopped rising and earning reports were reassuring, growth stocks did bounce from oversold levels and were on the rise once more. The second challenging period for growth came in late April and lasted through mid-May as Consumer Price Index ("CPI") figures showed marked inflation trends versus last year; especially in some commodities such as oil, copper and lumber. Renewed inflation concerns negatively influenced growth stocks once more and it wasn't until May that CPI figures showed that the rate of inflation had slowed sequentially before growth stocks staged their recovery from the second slide that began at the end of April. From mid-May through the beginning of September, equity markets in general shrugged off rising energy prices, ongoing negotiations over the U.S. administration's infrastructure package, a delayed recovery in travel and postponed return to offices due to the COVID-19 Delta variant. Unfortunately, September's market action held true to historical form — with increased volatility and a negative monthly return in several major indexes — mostly caused by macro factors (the Evergrande default, monetary and fiscal policy considerations, inflationary pressures, COVID-19 Delta variant issues, etc.). More consequentially, in the last week of September, the 10-year U.S. Treasury yield rose rapidly to above 1.50% for the first time since June, oil prices hit a three-year high, and the price of natural gas surged. While the speed of the backup in rates was likely the primary driver, these dynamics contributed
8
Victory NewBridge Large Cap Growth Fund (continued)
Managers' Commentary (continued)
to a very significant rotation away from growth stocks and into value. Investors continued to debate the duration of inflationary pressures with a rotation away from growth stocks for the third time this year, indicating that it may be more persistent than previously contemplated. Fortunately, October brought some relief as there were some signs of improvement or at least a belief that pressures may have peaked, leading to healthier investor sentiment and a bounce in growth stocks.
Overall, it appears that equity investors are coming to grips with a higher level of inflation in all its forms and are not quite willing to accept that a recession is imminent. Although the U.S. Federal Reserve (the "Fed") has expressed it will be vigilant, monetary policy remains accommodative, consumers are in good financial shape, demand remains robust and interest rates are still lower than the level immediately preceding the pandemic.
How did Victory NewBridge Large Cap Growth Fund perform during the reporting period?
The Fund returned 31.73% (Class A at net asset value) for the fiscal year ended October 31, 2021, underperforming the Russell 1000® Growth Index (the "Index"), which returned 43.21% for the period.
What strategies did you employ during the reporting period?
The majority of the underperformance was attributed to the Consumer Discretionary, Health Care and Information Technology sectors, which underperformed the respective sectors in the Index by -3.98%, -2.34% and -1.92%, respectively.
Within the Consumer Discretionary sector, not owning Tesla, which was up 187% during the period, represented a -2.09% drag; almost half of the underperformance. With respect to companies we did own that negatively impacted performance, Alibaba and Airbnb were the top two. Given the lack of clarity in China, we sold Alibaba. Understanding the near-term delays in travel-related businesses, we continue to own Airbnb as we believe the company is a long-term beneficiary and is managing costs well in the interim.
Similarly, not owning Microsoft in the Information Technology sector until early October represented a -1.45% relative performance drag. Beyond Microsoft, the Fund's investments in Twilio, Micron Technology and Visa were notable performance detractors as well. We exited Micron Technology but remain invested in Twilio and Visa.
In the Health Care sector, the distribution of underperformance was less concentrated. Our top detractors in descending order were Veeva Systems, Vertex Pharmaceuticals, TG Therapeutics and Align. All companies largely delivered what was expected of them but their valuations demanded more. We sold our position in Vertex, as the pace of development disappointed and weighed on performance. The top two drags on performance from companies we don't own were Moderna and Eli Lilly which were up 411% and 98%, respectively.
Having managed a focused portfolio of high-quality growth stocks through the tech boom and bust, September 11, the Great Financial Crisis, the fourth quarter of 2018, and the COVID-19 pandemic, we know not to panic nor act emotionally. Instead, experience has taught us never to short-change the hard work, perseverance, and ability to adapt that
9
Victory NewBridge Large Cap Growth Fund (continued)
Managers' Commentary (continued)
people draw on to overcome adversity. Difficult as it was, we adhered to our investment philosophy and process by focusing on company fundamentals and looking for investment opportunities created by the greatest increase in volatility in 12 years and we endeavor to do so in the future
Equities have gone through several significant style rotations over the last 12 months as investor preference oscillated between secular growth or "stay-at-home"/pandemic beneficiaries and value/cyclical or "reopening" stocks. The first phase, which began in late March 2020 and lasted until Pfizer Monday, was dominated by growth stocks as they demonstrated resiliency, and in many cases accelerated their growth opportunities by several years because they offered solutions to navigate an economy that was largely closed. Clear as it was that swift and significant monetary stimulus would be a huge tailwind for high-growth stocks initially, it was equally evident to us that the next phase would most likely benefit "reopening stocks" in the hardest-hit sectors and industries. Therefore, we thought it was prudent to maintain positions in select "reopening" stocks that we believe also have long-term growth prospects that meet our criteria. This diversified, barbell approach positioned the portfolio well for favorable COVID-19 headlines and reopening in a post-pandemic environment without having to time the transition, which in hindsight spans the last fiscal year ending October and was more challenging for our pure growth portfolio than the prior year. Looking ahead and preparing for what comes next, we continue to barbell the portfolio and believe the portfolio is well-positioned for the rest of this year and next.
While many are looking to the Fed to contain inflationary pressures, there are a few concomitant tools available. First, as the bond market anticipates a higher level of inflation, capital will cost more as interest rates rise. Despite the readily accepted conclusion that rising interest rates hurt long-duration assets like growth stocks, it is worth considering that what worked in 2020 might actually work again in 2022. Companies struggling to contend with labor shortages, escalating raw material costs and supply chain disruptions are likely to seek productivity-enhancing solutions, as opposed to relying solely on price increases that may lead to demand destruction or market share loss. In addition to helping manage inflationary pressures, many growth companies have enviable business models with high profit margins that require less debt and can self-finance current operations, R&D, and future growth in an environment in which capital is less abundant; thereby making them more attractive.
We are committed to adhering to our investment process and philosophy of finding and buying high-quality, high-growth stocks that will be successful over the longer term. We believe we have upgraded the growth and quality of the portfolio over the last several months and believe the portfolio and our investment process and philosophy are well-positioned in the current environment and the future.
10
Victory NewBridge Large Cap Growth Fund
Investment Overview
(Unaudited)
Average Annual Total Return
Year Ended October 31, 2021
| | Class A | | Class C | | Class I | | Class Y | | | |
INCEPTION DATE | | 12/31/03 | | 12/31/03 | | 3/1/11 | | 1/28/13 | | | |
| | Net Asset
Value | | Maximum
Offering
Price | | Net Asset
Value | | Contingent
Deferred
Charges | | Net Asset
Value | | Net Asset
Value | | Russell 1000®
Growth Index1 | |
One Year | | | 31.73 | % | | | 24.06 | % | | | 31.44 | % | | | 30.58 | % | | | 32.38 | % | | | 32.32 | % | | | 43.21 | % | |
Five Year | | | 20.52 | % | | | 19.10 | % | | | 19.67 | % | | | 19.67 | % | | | 21.03 | % | | | 20.92 | % | | | 25.49 | % | |
Ten Year | | | 15.12 | % | | | 14.44 | % | | | 14.24 | % | | | 14.24 | % | | | 15.55 | % | | | N/A | | | | 19.42 | % | |
Since Inception | | | N/A | | | | N/A | | | | N/A | | | | N/A | | | | N/A | | | | 15.96 | % | | | N/A | | |
The performance data quoted represents past performance and current returns may be lower or higher. The investment return and principal value will fluctuate so that an investor's shares, when redeemed, may be worth more or less than the original cost. To obtain performance information current to the most recent month's end, please visit www.vcm.com.
The maximum offering price ("MOP") figures reflect a maximum sales charge of 5.75% for Class A. Class C is not subject to an initial sales charge, but is subject to a deferred sales charge of 1.00% on shares redeemed within one year of purchase. Net Asset Value does not reflect sales charges.
Total return measures the price change in a share assuming the reinvestment of all net investment income and realized capital gain distributions, if any. The total returns quoted do not reflect adjustments made to the enclosed financial statements in accordance with U.S. Generally Accepted Accounting Principles or the deduction of taxes that a shareholder would pay on net investment income and realized capital gain distributions, including reinvested distributions, or redemptions of shares. The total return figures set forth above include all waivers of fees. Without such fee waivers, the total returns would have been lower.
Victory NewBridge Large Cap Growth Fund — Growth of $10,000
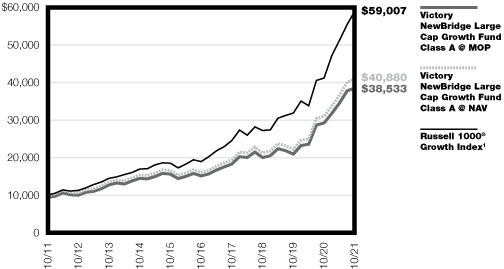
1The Russell 1000® Growth Index is an unmanaged index that measures the performance of those Russell 1000 companies with higher price-to-book ratios and higher forecasted growth values. This index does not include the effect of sales charges, commissions, expenses or taxes, is not representative of the Fund and it is not possible to invest directly in an index.
The graph reflects investment of growth of a hypothetical $10,000 investment in the Fund.
The graph and table do not reflect the deduction of taxes that a shareholder would pay on Fund distributions or the redemption of shares.
Past performance is not indicative of future results.
11
Victory Special Value Fund
Managers' Commentary
(Unaudited)
What were the market conditions during the reporting period?
The S&P 500® Index (the "Index") was up approximately 43% over the trailing 12 months ended October 31, 2021. This rally has been broad-based, but far from uniform, with the Financials and Energy sectors garnering outsized returns of 111% and 72%, respectively, while the Utilities and Consumer Staples sectors were laggards, up just 11% and 19%, respectively. The Technology sector, which was largely a winner as the pandemic accelerated secular trends around digital transformation, cloud computing, and artificial intelligence, also outperformed, as did the Real Estate sector.
More recently, we've seen some dramatic changes in leadership. Specifically, in September, the market declined approximately 5% as interest rates rose and longer duration/ growth equities underperformed after a strong July and August. But in October, the market rebounded along with growth stocks, while interest rates pulled back despite higher inflation data.
Indeed, as the pandemic subsides, supply chains normalize, and people return to work, the economic recovery should continue while inflation should moderate, which we see as a good backdrop for equities. We see noteworthy opportunities in housing, trucking/logistics, building products/construction, autos, energy, and banking. Extended valuations/sentiment and potential for rising rates keep us underweight on speculative growth stocks, while we see much stock-specific opportunity in semiconductors/semi-cap equipment and leading-edge life science tools/biotech.
How did Victory Special Value Fund (the "Fund") perform during the reporting period?
The Fund returned 46.06% (Class A at net asset value) for the fiscal year ended October 31, 2021, outperforming the Index, which returned 42.91% for the period.
What strategies did you employ during the reporting period?
The Fund pursues investments that it believes are statistically cheap or intrinsically undervalued given growth prospects, while trying to identify the presence of a catalyst for future growth.
Using this framework, the Fund generated the strongest returns within the Energy, Financials, and Industrials sectors, each up 50% or more over the trailing 12 months, as well as strong relative performance within the Consumer Discretionary sector. The Technology and Real Estate sectors lagged on a relative basis but still generated positive absolute returns.
Within the Energy sector, exploration & production company Matador Resources Company was our top performer. The stock mainly benefited from strong energy prices and its peer-leading growth profile. Our bank holdings, particularly Western Alliance Bancorp and ServisFirst Bancshares, drove the strong stock selection in the Financials sector, mostly due to the move higher in interest rates, and again, stronger growth profiles.
In the Technology sector, the Fund's largest detractor for the year was optical and photonic communications equipment vendor Lumentum Holdings ("Lumentum"). Lumentum has come under pressure as near-term headwinds drive negative estimate revisions, including supply
12
Victory Special Value Fund (continued)
Managers' Commentary (continued)
chain constraints, inventory build at certain customers, COVID-19-related issues hampering network deployments, and the decline in the 3D-sensing market. We continue to hold the stock as growth looks primed to reaccelerate and the company maintains dominant market position and technological differentiation. In the Real Estate sector, our position in American Tower Corporation, an owner and developer of multitenant cellular communication towers, drove results.
13
Victory Special Value Fund
Investment Overview
(Unaudited)
Average Annual Total Return
Year Ended October 31, 2021
| | Class A | | Class C | | Class I | | Class R | | Class Y | | | |
INCEPTION DATE | | 12/3/93 | | 3/1/03 | | 8/31/07 | | 12/21/99 | | 1/28/13 | | | |
| | Net Asset
Value | | Maximum
Offering
Price | | Net Asset
Value | | Contingent
Deferred
Charges | | Net Asset
Value | | Net Asset
Value | | Net Asset
Value | | S&P 500®
Index1 | |
One Year | | | 46.06 | % | | | 37.66 | % | | | 44.81 | % | | | 43.81 | % | | | 46.29 | % | | | 45.59 | % | | | 46.39 | % | | | 42.91 | % | |
Five Year | | | 16.09 | % | | | 14.72 | % | | | 15.05 | % | | | 15.05 | % | | | 16.25 | % | | | 15.74 | % | | | 16.35 | % | | | 18.93 | % | |
Ten Year | | | 11.89 | % | | | 11.23 | % | | | 10.89 | % | | | 10.89 | % | | | 12.10 | % | | | 11.56 | % | | | N/A | | | | 16.21 | % | |
Since Inception | | | N/A | | | | N/A | | | | N/A | | | | N/A | | | | N/A | | | | N/A | | | | 12.06 | % | | | N/A | | |
The performance data quoted represents past performance and current returns may be lower or higher. The investment return and principal value will fluctuate so that an investor's shares, when redeemed, may be worth more or less than the original cost. To obtain performance information current to the most recent month's end, please visit www.vcm.com.
The maximum offering price ("MOP") figures reflect a maximum sales charge of 5.75% for Class A. Class C is not subject to an initial sales charge, but is subject to a deferred sales charge of 1.00% on shares redeemed within one year of purchase. Net Asset Value does not reflect sales charges.
Total return measures the price change in a share assuming the reinvestment of all net investment income and realized capital gain distributions, if any. The total returns quoted do not reflect adjustments made to the enclosed financial statements in accordance with U.S. Generally Accepted Accounting Principles or the deduction of taxes that a shareholder would pay on net investment income and realized capital gain distributions, including reinvested distributions, or redemptions of shares. The total return figures set forth above include all waivers of fees. Without such fee waivers, the total returns would have been lower.
Victory Special Value Fund — Growth of $10,000
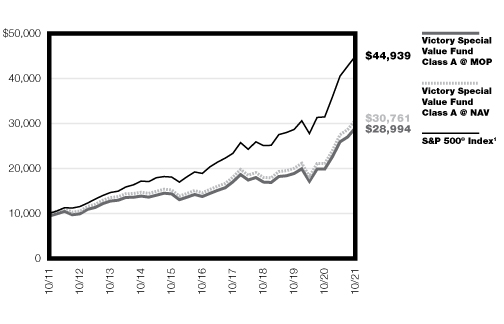
1The S&P 500® Index is an unmanaged index comprised of 500 domestically traded common stocks, is weighted according to the market value of each common stock in the index, and includes reinvestment of dividends. This index does not include the effect of sales charges, commissions, expenses or taxes, is not representative of the Fund, and it is not possible to invest directly in an index.
The graph reflects investment of growth of a hypothetical $10,000 investment in the Fund.
The graph and table do not reflect the deduction of taxes that a shareholder would pay on Fund distributions or the redemption of shares.
Past performance is not indicative of future results.
14
Victory THB US Small Opportunities Fund
Managers' Commentary
(Unaudited)
What were the market conditions during the reporting period?
The United States has managed with COVID-19 for 18 months and finally resumed pre-pandemic levels of activity across most parts of the economy. The solid economic foundation comprised of incredibly liquid consumers, a tight labor market, record-high consumer net worth, and accommodative monetary policy remains fully intact. Uncertainty regarding China and relations with Western countries has created new business opportunities for smaller, domestic companies.
Equity markets continued their recovery from the lows witnessed as the pandemic began. Smaller companies outpaced larger ones with the S&P 500® Index up approximately 43% and the Russell 2000® Index (Small Cap) up 51% for the period.
How did THB US Small Opportunities Fund (the "Fund") perform during the reporting period?
The Fund returned 56.27% (Class A at net asset value) for the fiscal year ended October 31, 2021, underperforming the Russell Microcap® Index, which returned 62.54% for the period.
What strategies did you employ during the reporting period?
The Fund utilizes a bottom-up, fundamental approach to find mispriced securities within the investment universe. The Fund selects investments based on an active fundamental process that combines financial analysis and proprietary research to evaluate potential investments' management and long-term outlook and business strategy. Using this process, the Fund generated the strongest returns within the Information Technology, Consumer Discretionary, and Health Care sectors over the trailing 12 months, while the Communication Services, Real Estate and Materials sectors were the most challenged. The Fund's top five-performing stocks (from a contribution standpoint) were Joint Corp. (Health Care), Perficient, Inc. (Information Technology), PAR Technology Corp. (Information Technology), Sonos, Inc. (Consumer Discretionary) and Ultra Clean Holdings, Inc. (Information Technology). The bottom five-performing stocks (from a contribution standpoint) were EverQuote, Inc. (Communication Services), Trean Insurance Group, Inc. (Financials), Ruth's Hospitality Group, Inc. (Consumer Discretionary), Broadwind, Inc. (Industrials) and Iteris, Inc. (Information Technology).
15
Victory THB US Small Opportunities Fund
Investment Overview
(Unaudited)
Average Annual Total Return
Year Ended October 31, 2021
| | Class A | | Class I | | | |
INCEPTION DATE | | 3/30/12 | | 3/30/12 | | | |
| | Net Asset Value | | Maximum
Offering
Price | | Net Asset Value | | Russell Microcap®
Index1 | |
One Year | | | 56.27 | % | | | 47.27 | % | | | 56.98 | % | | | 62.54 | % | |
Five Year | | | 16.29 | % | | | 14.93 | % | | | 16.80 | % | | | 16.33 | % | |
Since Inception | | | 12.63 | % | | | 11.93 | % | | | 13.12 | % | | | 13.61 | % | |
The performance data quoted represents past performance and current returns may be lower or higher. The investment return and principal value will fluctuate so that an investor's shares, when redeemed, may be worth more or less than the original cost. To obtain performance information current to the most recent month's end, please visit www.vcm.com. The performance figures for Class A and Class I reflect the historical performance of, respectively, the Investor Class and Institutional Class of the THB Asset Management Microcap Fund (the "Predecessor Fund"), a series of Advisors' Inner Circle Fund. The Fund's performance has not been restated to reflect any difference in the expenses of the Predecessor Fund prior to its reorganization into the Fund on May 3, 2021.
The maximum offering price ("MOP") figures reflect a maximum sales charge of 5.75% for Class A. Net Asset Value does not reflect sales charges.
Total return measures the price change in a share assuming the reinvestment of all net investment income and realized capital gain distributions, if any. The total returns quoted do not reflect adjustments made to the enclosed financial statements in accordance with U.S. Generally Accepted Accounting Principles or the deduction of taxes that a shareholder would pay on net investment income and realized capital gain distributions, including reinvested distributions, or redemptions of shares. The total return figures set forth above include all waivers of fees. Without such fee waivers, the total returns would have been lower.
Victory THB US Small Opportunities Fund — Growth of $10,000
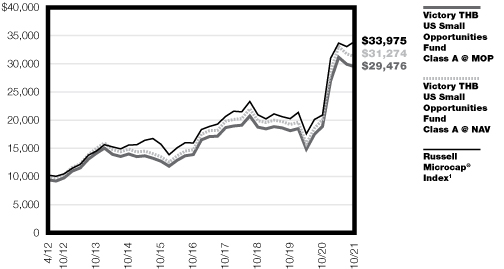
1Russell Microcap® Index is a capitalization weighted index of 2,000 small-cap and micro-cap stocks that captures the smallest 1,000 companies in the Russell 2000® Index, plus the next 1,000 smallest eligible securities by market capitalization.
The graph reflects investment of growth of a hypothetical $10,000 investment in the Fund.
The graph and table do not reflect the deduction of taxes that a shareholder would pay on Fund distributions or the redemption of shares.
Past performance is not indicative of future results.
16
Victory Strategic Allocation Fund
Managers' Commentary
(Unaudited)
What were the market conditions during the reporting period?
Over the last fiscal year, the global capital markets generally were strong except for fixed-income markets, as represented by the Bloomberg U.S. Aggregate Bond Index, registering a slight negative return. The U.S. Equity Markets were exceptionally strong leading the broad Non-U.S. Developed and Emerging Market equity markets. Commodity-oriented stocks were the strongest subcomponent of the broad global equity markets as global supply chain challenges have not kept pace with rising post-pandemic consumer demand and leading to elevated commodity price levels. Lackluster returns in the fixed-income markets were driven by rising interest rates accompanied by relatively low yields.
How did Victory Strategic Allocation Fund (the "Fund") perform during the reporting period?
The Fund returned 24.51% (Class A at net asset value) for the fiscal year ended October 31, 2021, underperforming the MSCI All Country World Index (ACWI) (the "Index"), which returned 37.28% for the period, and outperforming the "Custom Index" (60% MSCI ACWI/40% Bloomberg U.S. Aggregate Bond Index), which returned 21.02% for the period.
What strategies did you employ during the reporting period?
The Fund benefited from a slight overweight to equities overall and strong stock selection of the underlying Victory RS Global Fund. The Fund also continued to be positioned to exhibit less interest rate risk associated with the U.S. Treasury market versus its Custom Index by partially substituting an equity income-oriented strategy. This strategy outperformed the broad fixed-income markets. The Fund was positioned throughout the year to provide more diversification by more equally weighting the U.S. and foreign equity markets when compared to the Index, which detracted slightly from Fund performance versus its Custom Index.
17
Victory Strategic Allocation Fund
Investment Overview
(Unaudited)
Average Annual Total Return
Year Ended October 31, 2021
| | Class A | | Class C | | Class I | | Class R | | | | | |
INCEPTION DATE | | 12/10/93 | | 3/1/03 | | 8/31/07 | | 12/15/99 | | | | | |
| | Net Asset
Value | | Maximum
Offering
Price | | Net Asset
Value | | Contingent
Deferred
Charges | | Net Asset
Value | | Net Asset
Value | | MSCI All
Country
World
Index1 | | 60% MSCI
All Country
World
Index/40%
Bloomberg
U.S.
Aggregate
Bond Index2 | |
One Year | | | 24.51 | % | | | 21.71 | % | | | 23.57 | % | | | 22.57 | % | | | 24.86 | % | | | 24.20 | % | | | 37.28 | % | | | 21.02 | % | |
Five Year | | | 9.63 | % | | | 9.13 | % | | | 8.82 | % | | | 8.82 | % | | | 9.90 | % | | | 9.35 | % | | | 14.72 | % | | | 10.23 | % | |
Ten Year | | | 9.02 | % | | | 8.77 | % | | | 8.23 | % | | | 8.23 | % | | | 9.29 | % | | | 8.72 | % | | | 11.32 | % | | | 8.16 | % | |
The performance data quoted represents past performance and current returns may be lower or higher. The investment return and principal value will fluctuate so that an investor's shares, when redeemed, may be worth more or less than the original cost. To obtain performance information current to the most recent month's end, please visit www.vcm.com.
The maximum offering price ("MOP") figures reflect a maximum sales charge of 2.25% for Class A. Class C is not subject to an initial sales charge, but is subject to a deferred sales charge of 1.00% on shares redeemed within one year of purchase. Net Asset Value does not reflect sales charges.
Total return measures the price change in a share assuming the reinvestment of all net investment income and realized capital gain distributions, if any. The total returns quoted do not reflect adjustments made to the enclosed financial statements in accordance with U.S. Generally Accepted Accounting Principles or the deduction of taxes that a shareholder would pay on net investment income and realized capital gain distributions, including reinvested distributions, or redemptions of shares. The total return figures set forth above include all waivers of fees. Without such fee waivers, the total returns would have been lower.
Victory Strategic Allocation Fund — Growth of $10,000

1The MSCI All Country World Index is a market capitalization-weighted index designed to provide a broad measure of equity-market performance throughout the world. This index does not include the effect of sales charges, commissions, expenses or taxes, is not representative of the Fund and it is not possible to invest directly in an index.
2The Bloomberg U.S. Aggregate Bond Index is a broad-based flagship benchmark that measures the investment grade, U.S. dollar-denominated, fixed-rate taxable bond market. The index includes U.S. Treasurys, government-related and corporate securities, MBS (agency fixed-rate and hybrid ARM pass-throughs), ABS and CMBS (agency and nonagency). This index does not include the effect of sales charges, commissions, expenses or taxes, is not representative of the Fund and it is not possible to invest directly in an index.
The graph reflects investment of growth of a hypothetical $10,000 investment in the Fund.
The graph and table do not reflect the deduction of taxes that a shareholder would pay on Fund distributions or the redemption of shares.
Past performance is not indicative of future results.
18
Victory Taxable Fixed Income Funds
Victory INCORE Fund for Income
Managers' Commentary
(Unaudited)
What were the market conditions during the reporting period?
Major averages in the equity markets rocketed up 35% to 42%. Unlike last year, most bond prices fell (yields rose) as evidenced by the Bloomberg U.S. Aggregate Bond Index declining 0.48%. The two-year to 10-year section of the yield curve steepened, yet interestingly, the five-year to thirty-year portion flattened, as five-year yields increased the most. Prices move opposite of yields. During the year, a few sectors of the bond market outperformed duration-neutral U.S. Treasury bonds. The outperformance was led by corporate bonds at 2.18%. Commercial mortgage-backed securities outperformed by 0.59% and asset-backed by 0.24%. Agency debt and mortgage-backed bonds lagged U.S. Treasury bonds by -0.67% and -0.58%, respectively. The U.S. Treasury market had a total return of -2.45%. Within the mortgage market, Fannie Mae led Freddie Mac, which in turn led Ginnie Mae ("GNMA").
With vaccines now approved for emergency use for school-age children in the United States, a COVID-19 severity-reducing pill approved for use in the United Kingdom (and presumably soon in the United States, with another similar drug in progress), we are likely nearer to the end of the pandemic than the beginning. The pandemic caused a swift contraction in the global economy, which rapidly reversed, in nearly symmetrical fashion. While some measures of improvement have yet to reach pre-pandemic levels — such as U.S. employment, and some measures of inflation remain elevated, the ongoing improvement in medical advances argues for continued improvement, albeit at a lesser pace, as the economy has rebounded rapidly. Demand for durable goods is likely to slow as pandemic support has been withdrawn, interest rates and home prices are higher than the beginning of 2021, and thus affordability and related housing turnover — which had reached a fevered pitch as affluent city dwellers fled during work-from-home, has also slowed. Spending on travel should slowly resume, replacing some of the goods demand due to home-bound shoppers. In all, we expect growth and inflation to moderate. With central bankers firmly in control of monetary policy, rates should remain relatively range-bound, with the occasional slight increases as we begin to near pre-pandemic levels in most tenors.
How did Victory INCORE Fund for Income (the "Fund") perform during the reporting period?
The Fund returned -1.14% (Class A at net asset value) for the fiscal year ended October 31, 2021, underperforming the Bloomberg U.S. Capital 1-5 Year Government Bond Index, which returned -0.81% for the period.
What strategies did you employ during the reporting period?
The Fund's 4% allocation to GNMA-structured securities led performance. Our largest allocation to GNMA single-family pools, which typically drives our performance, was slightly positive. Our 24% allocation to U.S. Treasury bonds detracted slightly from performance and our roughly one-half percent allocation to GNMA multi-family weighed the most on performance. Our strategy has faced multiple headwinds with interest rates having risen rapidly in the past 12 months, to nearly pre-pandemic levels. Lower-coupon GNMA bonds (which the Fund does not own) had higher than normal delinquencies and defaults causing the GNMA label to underperform, while our strategy enjoyed a delinquency pipeline that was lower than pre-COVID-19 levels. And, strong demand for riskier rebound-sensitive assets
19
Victory Taxable Fixed Income Funds
Victory INCORE Fund for Income (continued)
Managers' Commentary (continued)
left safe-haven assets to languish. We think these three headwinds are abating and our investors will be rewarded for their patience.
Our objective remains to provide a high level of current income via securities backed by the full faith and credit of the U.S. government.
20
Victory Taxable Fixed Income Funds
Victory INCORE Fund for Income
Investment Overview
(Unaudited)
Average Annual Total Return
Year Ended October 31, 2021
| | | Class A | | Class C | | Class I | | Class R | | Class R6 | | Class Y | | Member
Class | | | |
INCEPTION DATE | | 3/26/99 | | 3/1/02 | | 3/1/11 | | 9/16/87 | | 3/4/15 | | 1/28/13 | | 11/3/20 | | | |
| | Net Asset
Value | | Maximum
Offering
Price | | Net Asset
Value | | Contingent
Deferred
Charges | | Net Asset
Value | | Net Asset
Value | | Net Asset
Value | | Net Asset
Value | | Net Asset
Value | | Bloomberg
Capital
1-5 Year U.S.
Government
Bond
Index1 | |
One Year | | | –1.14 | % | | | –3.33 | % | | | –1.81 | % | | | –2.75 | % | | | –0.77 | % | | | –1.14 | % | | | –0.89 | % | | | –0.94 | % | | | N/A | | | | –0.81 | % | |
Five Year | | | 1.10 | % | | | 0.65 | % | | | 0.30 | % | | | 0.30 | % | | | 1.38 | % | | | 1.10 | % | | | 1.39 | % | | | 1.29 | % | | | N/A | | | | 1.76 | % | |
Ten Year | | | 1.26 | % | | | 1.03 | % | | | 0.48 | % | | | 0.48 | % | | | 1.55 | % | | | 1.25 | % | | | N/A | | | | N/A | | | | N/A | | | | 1.40 | % | |
Since
Inception | | | N/A | | | | N/A | | | | N/A | | | | N/A | | | | N/A | | | | N/A | | | | 1.43 | % | | | 1.32 | % | | | –1.08 | % | | | N/A | | |
The performance data quoted represents past performance and current returns may be lower or higher. The investment return and principal value will fluctuate so that an investor's shares, when redeemed, may be worth more or less than the original cost. To obtain performance information current to the most recent month's end, please visit www.vcm.com.
The maximum offering price ("MOP") figures reflect a maximum sales charge of 2.25% for Class A. Class C is not subject to an initial sales charge, but is subject to a deferred sales charge of 1.00% on shares redeemed within one year of purchase. Net Asset Value does not reflect sales charges.
Total return measures the price change in a share assuming the reinvestment of all net investment income and realized capital gain distributions, if any. The total returns quoted do not reflect adjustments made to the enclosed financial statements in accordance with U.S. Generally Accepted Accounting Principles or the deduction of taxes that a shareholder would pay on net investment income and realized capital gain distributions, including reinvested distributions, or redemptions of shares. The total return figures set forth above include all waivers of fees. Without such fee waivers, the total returns would have been lower.
Victory INCORE Fund for Income — Growth of $10,000

1Bloomberg Capital 1-5 Year U.S. Government Bond Index is a market-weighted index measuring the performance of Treasury and Agency securities issued by the United States government with maturities of one to five years. The index does not include the effect of sales charges, commissions, expenses or taxes is not representative of the Fund and it is not possible to invest directly in an index.
The graph reflects investment of growth of a hypothetical $10,000 investment in the Fund.
The graph and table do not reflect the deduction of taxes that a shareholder would pay on Fund distributions or the redemption of shares.
Past performance is not indicative of future results.
21
Victory INCORE Investment Grade Convertible Fund
Managers' Commentary
(Unaudited)
What were the market conditions during the reporting period?
Stock and convertible markets experienced very strong returns during the fiscal year ended October 31, 2021. Over the period, stocks, as measured by the S&P 500® Index, returned 42.91%, while investment-grade convertibles, as measured by the ICE BofAML Investment Grade U.S. Convertible 5% Constrained Index (the "Index") returned 20.11%. Bonds, as measured by the Bloomberg U.S. Aggregate Bond Index, returned -0.48%. Convertible securities are either bonds or preferred stock that can be converted into the common stock of the issuing company. Because of this ability to convert to common stock, convertibles participate in the upward and downward movement of the stock market. But because they are part fixed income, they tend to move up and down at a reduced rate. Therefore, as was the case this year, it is typical that convertible returns end up in between stock and bond returns.
Stocks were strong right out of the gate in the fiscal year, reacting positively to the November 2020 U.S. presidential election results. Markets were further boosted mid-month by overwhelmingly efficacious vaccine data out of Pfizer, and later Moderna. During November, the S&P 500® Index returned 10.95%, and the Dow Jones Industrial Average had its best month since 1987, topping the 30,000 milestone for the first time. Market strength continued throughout December and into calendar 2021, fueled by passage of a $900 billion stimulus bill and the initial roll out of Pfizer's and Moderna's COVID-19 vaccines. Stocks fell sharply the last week of January causing a decline for the month, but then started a streak of seven consecutive monthly gains. While not in a straight line, and with some notable bumps along the way, the S&P 500® Index returned 22.82% from the end of January to the end of August. Over this period, stocks were spurred on by robust economic growth, continued fiscal and monetary stimulus, and expanding earnings. The streak of higher returns came to an end in September as the S&P 500® Index fell 4.65%. Losses in the month were triggered by concerns over the potential fallout resulting from the debt troubles of property developer China Evergrande Group. But stocks quickly resumed their upward climb as investors shrugged off higher inflation readings and supply chain disruptions, choosing instead to focus on strong third-quarter earnings. Stocks finished the fiscal year like they began it, with strong returns, as the S&P 500® Index posted a 7.0% gain in October.
How did Victory INCORE Investment Grade Convertible Fund (the "Fund") perform during the reporting period?
The Fund returned 20.62% (Class A at net asset value) for the fiscal year ended October 31, 2021, outperforming the ICE BofA Investment Grade U.S. Convertible 5% Constrained Index (the "Index"), which returned 20.11% for the period.
What strategies did you employ during the reporting period?
In managing the Fund, we strive to invest in high-quality convertibles with attractive underlying common stocks. We structure the Fund by spreading out our holdings across the three types of convertibles: 1) equity-sensitive, high-delta convertibles; 2) total return, middle-of-the-road convertibles; and 3) defensive, fixed-income-oriented convertibles. With this structure, we seek to provide a favorable balance between upside potential and downside exposure to equities. As of October 31, 2021, the Fund is overweight compared to the Index
22
Victory INCORE Investment Grade Convertible Fund (continued)
Managers' Commentary (continued)
in the Health Care and Information Technology sectors. It is underweighted in the Utilities sector. It is approximately equal weighted in the Consumer Discretionary, Energy, Financials, and Industrials sectors. The Fund is broadly diversified amongst individual issues, economic sectors, credits, and convertible types. Performance during the fiscal year was aided by overweights in the Health Care and Information Technology sectors, as well as positive security selection in the same sectors. Performance was negatively impacted by underweights in the Energy and Utilities sectors, and negative security selection in the Financials sector.
23
Victory INCORE Investment Grade Convertible Fund
Investment Overview
(Unaudited)
Average Annual Total Return
Year Ended October 31, 2021
| | Class A | | Class I | | Member Class | | | |
INCEPTION DATE | | 4/14/88 | | 8/31/07 | | 11/3/20 | | | |
| | Net Asset
Value | | Maximum
Offering Price | | Net Asset
Value | | Net Asset
Value | | ICE BofAML
Investment
Grade U.S. Conv
5% Constrained
Index1,2 | |
One Year | | | 20.62 | % | | | 17.90 | % | | | 21.19 | % | | | N/A | | | | 20.11 | % | |
Five Year | | | 12.26 | % | | | 11.74 | % | | | 12.75 | % | | | N/A | | | | 12.81 | % | |
Ten Year | | | 9.96 | % | | | 9.71 | % | | | 10.44 | % | | | N/A | | | | 11.05 | % | |
Since Inception | | | N/A | | | | N/A | | | | N/A | | | | 20.63 | % | | | N/A | | |
The performance data quoted represents past performance and current returns may be lower or higher. The investment return and principal value will fluctuate so that an investor's shares, when redeemed, may be worth more or less than the original cost. To obtain performance information current to the most recent month's end, please visit www.vcm.com.
The maximum offering price ("MOP") figures reflect a maximum sales charge of 2.25% for Class A. Net Asset Value does not reflect sales charges.
Total return measures the price change in a share assuming the reinvestment of all net investment income and realized capital gain distributions, if any. The total returns quoted do not reflect adjustments made to the enclosed financial statements in accordance with U.S. Generally Accepted Accounting Principles or the deduction of taxes that a shareholder would pay on net investment income and realized capital gain distributions, including reinvested distributions, or redemptions of shares. The total return figures set forth above include all waivers of fees. Without such fee waivers, the total returns would have been lower.
Victory INCORE Investment Grade Convertible Fund — Growth of $10,000
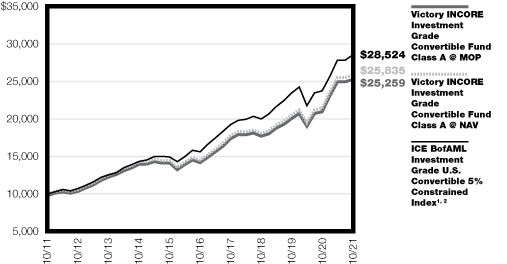
1ICE BofAML Investment Grade U.S. Convertible 5% Constrained Index is a market capitalization-weighted index of domestic corporate convertible securities. Bonds and preferred stocks must be convertible only to common stock, ADR's or cash equivalent and have a market value of at least $50 million. Composed of Coupon, OID, or zero coupon convertible bonds rated by Moody's and/or S&P with an average rating of Baa3/BBB- or higher. This Index does not include the effect of sales charges, commissions, expenses or taxes, is not representative of the Fund and it is not possible to invest directly in an index.
2The ICE BofAML Investment Grade U.S. Convertible 5% Constrained Index commenced on January 1, 2012. Performance from October 31, 2010 to December 31, 2011 reflects performance of ICE BofAML All Investment Grade U.S. Convertibles Index. Performance from January 1, 2012 to present reflects the ICE BofAML Investment Grade U.S. Convertible 5% Constrained Index.
The graph reflects investment of growth of a hypothetical $10,000 investment in the Fund.
The graph and table do not reflect the deduction of taxes that a shareholder would pay on Fund distributions or the redemption of shares.
Past performance is not indicative of future results.
24
Victory Portfolios
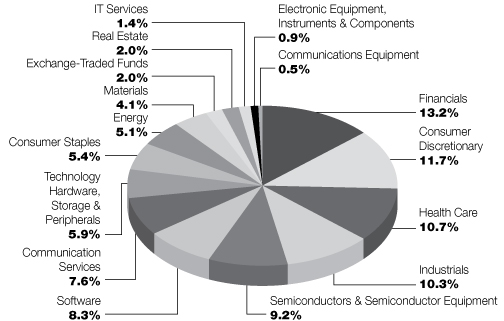
Victory Diversified Stock Fund | | October 31, 2021 | |
(Unaudited)
Investment Objective and Portfolio Holdings:
The Fund seeks to provide long?term growth of capital.
Top 10 Holdings*:
October 31, 2021
(% of Net Assets)
Microsoft Corp. | | | 6.7 | % | |
Apple, Inc. | | | 5.9 | % | |
Alphabet, Inc., Class A | | | 3.5 | % | |
NVIDIA Corp. | | | 2.7 | % | |
SPDR S&P 500 ETF Trust | | | 2.0 | % | |
JPMorgan Chase & Co. | | | 1.9 | % | |
Chevron Corp. | | | 1.9 | % | |
PepsiCo, Inc. | | | 1.9 | % | |
Meta Platforms, Inc., Class A | | | 1.9 | % | |
Advanced Micro Devices, Inc. | | | 1.9 | % | |
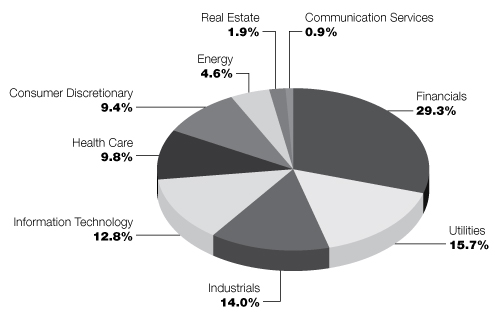
Sector Allocation*:
October 31, 2021
(% of Net Assets)
* Does not include futures contracts, money market instruments, and short-term investments purchased with cash collateral from securities loaned.
Percentages are of the net assets of the Fund and may not equal 100%.
Refer to the Schedule of Portfolio Investments for a complete list of securities.
25
Victory Portfolios
Victory NewBridge Large Cap Growth Fund | | October 31, 2021 | |
(Unaudited)
Investment Objective and Portfolio Holdings:
The Fund seeks to provide long?term capital appreciation.
Top 10 Holdings*:
October 31, 2021
(% of Net Assets)
Amazon.com, Inc. | | | 7.4 | % | |
NVIDIA Corp. | | | 7.1 | % | |
Alphabet, Inc., Class C | | | 6.0 | % | |
Visa, Inc., Class A | | | 4.3 | % | |
ServiceNow, Inc. | | | 4.2 | % | |
PayPal Holdings, Inc. | | | 4.1 | % | |
EPAM Systems, Inc. | | | 4.1 | % | |
Adobe, Inc. | | | 4.0 | % | |
Generac Holdings, Inc. | | | 3.6 | % | |
Thermo Fisher Scientific, Inc. | | | 3.4 | % | |
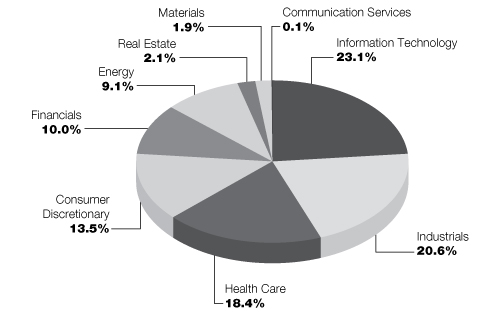
Sector Allocation*:
October 31, 2021
(% of Net Assets)

* Does not include futures contracts, money market instruments, and short-term investments purchased with cash collateral from securities loaned.
Percentages are of the net assets of the Fund and may not equal 100%.
Refer to the Schedule of Portfolio Investments for a complete list of securities.
26
Victory Portfolios
Victory Special Value Fund | | October 31, 2021 | |
(Unaudited)
Investment Objective and Portfolio Holdings:
The Fund seeks to provide long?term growth of capital and dividend income.
Top 10 Holdings*:
October 31, 2021
(% of Net Assets)
Microsoft Corp. | | | 6.6 | % | |
Apple, Inc. | | | 5.7 | % | |
Alphabet, Inc., Class C | | | 3.5 | % | |
NVIDIA Corp. | | | 2.8 | % | |
SPDR S&P 500 ETF Trust | | | 2.0 | % | |
JPMorgan Chase & Co. | | | 2.0 | % | |
Chevron Corp. | | | 1.9 | % | |
PepsiCo, Inc. | | | 1.9 | % | |
Meta Platforms, Inc., Class A | | | 1.9 | % | |
Advanced Micro Devices, Inc. | | | 1.8 | % | |
Sector Allocation*:
October 31, 2021
(% of Net Assets)

* Does not include futures contracts, money market instruments, and short-term investments purchased with cash collateral from securities loaned.
Percentages are of the net assets of the Fund and may not equal 100%.
Refer to the Schedule of Portfolio Investments for a complete list of securities.
27
Victory Portfolios
Victory THB US Small Opportunities Fund | | October 31, 2021 | |
(Unaudited)
Investment Objective and Portfolio Holdings:
The Fund seeks to provide capital appreciation.
Top 10 Holdings*:
October 31, 2021
(% of Net Assets)
Perficient, Inc. | | | 3.4 | % | |
First Busey Corp. | | | 3.2 | % | |
Transcat, Inc. | | | 2.7 | % | |
Napco Security Technologies, Inc. | | | 2.6 | % | |
Grid Dynamics Holdings, Inc. | | | 2.6 | % | |
ePlus, Inc. | | | 2.5 | % | |
BioLife Solutions, Inc. | | | 2.2 | % | |
PAR Technology Corp. | | | 2.1 | % | |
Renewable Energy Group, Inc. | | | 2.1 | % | |
Movado Group, Inc. | | | 2.0 | % | |
Sector Allocation*:
October 31, 2021
(% of Net Assets)
* Does not include futures contracts, money market instruments, and short-term investments purchased with cash collateral from securities loaned.
Percentages are of the net assets of the Fund and may not equal 100%.
Refer to the Schedule of Portfolio Investments for a complete list of securities.
28
Victory Portfolios
Victory Strategic Allocation Fund | | October 31, 2021 | |
(Unaudited)
Investment Objective and Portfolio Holdings:
The Fund seeks to provide income and long?term growth of capital.
Top 10 Holdings*:
October 31, 2021
(% of Net Assets)
Victory RS Global Fund, Class Y | | | 31.2 | % | |
Victory Market Neutral Income Fund, Class I | | | 19.2 | % | |
Victory INCORE Total Return Bond Fund, Class R6 | | | 10.9 | % | |
Victory Sophus Emerging Markets Fund, Class R6 | | | 9.4 | % | |
Victory Trivalent International Small-Cap Fund, Class I | | | 7.5 | % | |
VictoryShares U.S. Multi-Factor Minimum Volatility ETF | | | 7.4 | % | |
Victory INCORE Investment Grade Convertible Fund, Class I | | | 6.3 | % | |
Victory Integrity Discovery Fund, Class Y | | | 4.0 | % | |
Victory RS Partners Fund, Class Y | | | 3.8 | % | |
Asset Allocation*:
October 31, 2021
(% of Net Assets)
* Does not include futures contracts, money market instruments, and short-term investments purchased with cash collateral from securities loaned.
Percentages are of the net assets of the Fund and may not equal 100%.
Refer to the Schedule of Portfolio Investments for a complete list of securities.
29
Victory Portfolios
Victory INCORE Fund for Income | | October 31, 2021 | |
(Unaudited)
Investment Objective and Portfolio Holdings:
The Fund seeks to provide a high level of current income consistent with preservation of shareholders' capital.
Asset Allocation*:
October 31, 2021
(% of Net Assets)
* Does not include futures contracts, money market instruments, and short-term investments purchased with cash collateral from securities loaned.
Percentages are of the net assets of the Fund and may not equal 100%.
Refer to the Schedule of Portfolio Investments for a complete list of securities.
30
Victory Portfolios
Victory INCORE Investment Grade Convertible Fund | | October 31, 2021 | |
(Unaudited)
Investment Objective and Portfolio Holdings:
The Fund seeks to provide a high level of current income together with long?term capital appreciation.
Top 10 Holdings*:
October 31, 2021
(% of Net Assets)
Anthem, Inc. | | | 5.4 | % | |
Western Digital Corp. | | | 4.8 | % | |
Booking Holdings, Inc. | | | 4.7 | % | |
Pioneer Natural Resources Co. | | | 4.6 | % | |
Southwest Airlines Co. | | | 4.5 | % | |
Fortive Corp. | | | 4.4 | % | |
Stanley Black & Decker, Inc. | | | 4.0 | % | |
Wells Fargo & Co. | | | 3.9 | % | |
Euronet Worldwide, Inc. | | | 3.6 | % | |
Illumina, Inc. | | | 3.5 | % | |
Sector Allocation*:
October 31, 2021
(% of Net Assets)
* Does not include futures contracts, money market instruments, and short-term investments purchased with cash collateral from securities loaned.
Percentages are of the net assets of the Fund and may not equal 100%.
Refer to the Schedule of Portfolio Investments for a complete list of securities.
31
Victory Portfolios
Victory Diversified Stock Fund | | Schedule of Portfolio Investments
October 31, 2021 | |
(Amounts in Thousands, Except for Shares)
Security Description | | Shares | | Value | |
Common Stocks (96.3%) | |
Communication Services (7.6%): | |
Alphabet, Inc., Class C (a) | | | 3,979 | | | $ | 11,799 | | |
Charter Communications, Inc., Class A (a) | | | 4,151 | | | | 2,801 | | |
Meta Platforms, Inc., Class A (a) | | | 19,600 | | | | 6,342 | | |
Nexstar Media Group, Inc., Class A | | | 30,224 | | | | 4,532 | | |
| | | | 25,474 | | |
Communications Equipment (0.5%): | |
Lumentum Holdings, Inc. (a) | | | 20,925 | | | | 1,728 | | |
Consumer Discretionary (11.7%): | |
Amazon.com, Inc. (a) | | | 1,454 | | | | 4,903 | | |
Asbury Automotive Group, Inc. (a) | | | 25,436 | | | | 4,978 | | |
Brunswick Corp. | | | 21,798 | | | | 2,029 | | |
D.R. Horton, Inc. | | | 30,975 | | | | 2,765 | | |
Group 1 Automotive, Inc. | | | 26,961 | | | | 4,848 | | |
LCI Industries | | | 28,109 | | | | 3,925 | | |
Lowe's Cos., Inc. | | | 7,814 | | | | 1,827 | | |
Meritage Homes Corp. (a) | | | 38,254 | | | | 4,159 | | |
Patrick Industries, Inc. | | | 43,960 | | | | 3,425 | | |
Rent-A-Center, Inc. | | | 78,274 | | | | 4,169 | | |
Tesla, Inc. (a) | | | 1,964 | | | | 2,188 | | |
| | | | 39,216 | | |
Consumer Staples (5.4%): | |
BJ's Wholesale Club Holdings, Inc. (a) | | | 66,306 | | | | 3,875 | | |
Darling Ingredients, Inc. (a) | | | 25,636 | | | | 2,167 | | |
PepsiCo, Inc. (a) | | | 39,617 | | | | 6,402 | | |
Philip Morris International, Inc. | | | 58,595 | | | | 5,539 | | |
| | | | 17,983 | | |
Electronic Equipment, Instruments & Components (0.9%): | |
Fabrinet (a) | | | 30,746 | | | | 2,952 | | |
Energy (5.1%): | |
Chevron Corp. | | | 56,115 | | | | 6,425 | | |
Matador Resources Co. | | | 82,638 | | | | 3,458 | | |
Pioneer Natural Resources Co. | | | 20,575 | | | | 3,847 | | |
Valero Energy Corp. | | | 44,572 | | | | 3,447 | | |
| | | | 17,177 | | |
Financials (13.2%): | |
Ally Financial, Inc. | | | 46,089 | | | | 2,200 | | |
Ameriprise Financial, Inc. | | | 8,210 | | | | 2,480 | | |
Bank of America Corp. | | | 108,654 | | | | 5,192 | | |
Chubb Ltd. | | | 24,794 | | | | 4,844 | | |
JPMorgan Chase & Co. | | | 37,957 | | | | 6,449 | | |
Morgan Stanley | | | 42,028 | | | | 4,320 | | |
Primerica, Inc. | | | 24,856 | | | | 4,182 | | |
ServisFirst Bancshares, Inc. | | | 23,946 | | | | 1,923 | | |
Signature Bank (b) | | | 12,058 | | | | 3,591 | | |
See notes to financial statements.
32
Victory Portfolios
Victory Diversified Stock Fund | | Schedule of Portfolio Investments — continued
October 31, 2021 | |
(Amounts in Thousands, Except for Shares)
Security Description | | Shares | | Value | |
T. Rowe Price Group, Inc. | | | 16,406 | | | $ | 3,558 | | |
Western Alliance Bancorp | | | 46,491 | | | | 5,397 | | |
| | | | 44,136 | | |
Health Care (10.7%): | |
AbbVie, Inc. | | | 46,684 | | | | 5,353 | | |
AmerisourceBergen Corp. | | | 27,679 | | | | 3,377 | | |
ICON PLC (a) | | | 15,396 | | | | 4,415 | | |
Insulet Corp. (a) | | | 5,889 | | | | 1,826 | | |
McKesson Corp. | | | 21,511 | | | | 4,472 | | |
Regeneron Pharmaceuticals, Inc. (a) | | | 8,781 | | | | 5,619 | | |
Stryker Corp. (a) | | | 16,228 | | | | 4,318 | | |
Thermo Fisher Scientific, Inc. | | | 5,475 | | | | 3,466 | | |
UnitedHealth Group, Inc. | | | 6,576 | | | | 3,028 | | |
| | | | 35,874 | | |
Industrials (10.3%): | |
Builders FirstSource, Inc. (a) | | | 78,599 | | | | 4,580 | | |
Chart Industries, Inc. (a) | | | 12,113 | | | | 2,150 | | |
GXO Logistics, Inc. (a) | | | 26,640 | | | | 2,366 | | |
Marten Transport Ltd. | | | 194,779 | | | | 3,239 | | |
Old Dominion Freight Line, Inc. | | | 14,243 | | | | 4,862 | | |
Parker-Hannifin Corp. | | | 9,982 | | | | 2,960 | | |
Saia, Inc. (a) | | | 13,124 | | | | 4,103 | | |
Trex Co., Inc. (a) | | | 28,781 | | | | 3,062 | | |
UFP Industries, Inc. | | | 57,773 | | | | 4,728 | | |
XPO Logistics, Inc. (a) | | | 26,640 | | | | 2,286 | | |
| | | | 34,336 | | |
IT Services (1.4%): | |
EPAM Systems, Inc. (a) | | | 6,678 | | | | 4,496 | | |
Materials (4.1%): | |
Avery Dennison Corp. | | | 14,946 | | | | 3,254 | | |
Dow, Inc. | | | 43,692 | | | | 2,445 | | |
Summit Materials, Inc., Class A (a) | | | 123,246 | | | | 4,394 | | |
Valvoline, Inc. | | | 102,828 | | | | 3,492 | | |
| | | | 13,585 | | |
Real Estate (2.0%): | |
American Tower Corp. | | | 9,104 | | | | 2,567 | | |
CBRE Group, Inc., Class A (a) | | | 19,308 | | | | 2,009 | | |
Simon Property Group, Inc. | | | 14,543 | | | | 2,132 | | |
| | | | 6,708 | | |
Semiconductors & Semiconductor Equipment (9.2%): | |
Advanced Micro Devices, Inc. (a) | | | 51,483 | | | | 6,190 | | |
Applied Materials, Inc. | | | 28,985 | | | | 3,961 | | |
Broadcom, Inc. | | | 8,194 | | | | 4,356 | | |
Lam Research Corp. | | | 6,560 | | | | 3,697 | | |
NVIDIA Corp. | | | 35,518 | | | | 9,081 | | |
Qorvo, Inc. (a) | | | 21,129 | | | | 3,555 | | |
| | | | 30,840 | | |
See notes to financial statements.
33
Victory Portfolios
Victory Diversified Stock Fund | | Schedule of Portfolio Investments — continued
October 31, 2021 | |
(Amounts in Thousands, Except for Shares)
Security Description | | Shares | | Value | |
Software (8.3%): | |
Adobe, Inc. (a) | | | 2,744 | | | $ | 1,785 | | |
Cadence Design Systems, Inc. (a) | | | 20,624 | | | | 3,570 | | |
Microsoft Corp. | | | 67,620 | | | | 22,424 | | |
| | | | 27,779 | | |
Technology Hardware, Storage & Peripherals (5.9%): | |
Apple, Inc. | | | 131,499 | | | | 19,699 | | |
Total Common Stocks (Cost $200,175) | | | 321,983 | | |
Exchange-Traded Funds (2.0%) | |
SPDR S&P 500 ETF Trust | | | 14,576 | | | | 6,694 | | |
Total Exchange-Traded Funds (Cost $5,234) | | | 6,694 | | |
Collateral for Securities Loaned^ (0.1%) | |
BlackRock Liquidity Funds TempFund, Institutional Shares, 0.04% (c) | | | 7,280 | | | | 7 | | |
Fidelity Investments Money Market Government Portfolio,
Institutional Shares, 0.01% (c) | | | 228,954 | | | | 229 | | |
Goldman Sachs Financial Square Prime Obligations Fund,
Institutional Shares, 0.02% (c) | | | 3,633 | | | | 4 | | |
JPMorgan Prime Money Market Fund, Capital Shares, 0.07% (c) | | | 28,969 | | | | 29 | | |
Morgan Stanley Institutional Liquidity Prime Portfolio,
Institutional Shares, 0.06% (c) | | | 130,251 | | | | 130 | | |
Total Collateral for Securities Loaned (Cost $399) | | | 399 | | |
Total Investments (Cost $205,808) — 98.4% | | | 329,076 | | |
Other assets in excess of liabilities — 1.6% | | | 5,263 | | |
NET ASSETS — 100.00% | | $ | 334,339 | | |
^ Purchased with cash collateral from securities on loan.
(a) Non-income producing security.
(b) All or a portion of this security is on loan.
(c) Rate disclosed is the daily yield on October 31, 2021.
ETF — Exchange-Traded Fund
PLC — Public Limited Company
See notes to financial statements.
34
Victory Portfolios
Victory NewBridge Large Cap Growth Fund | | Schedule of Portfolio Investments
October 31, 2021 | |
(Amounts in Thousands, Except for Shares)
Security Description | | Shares | | Value | |
Common Stocks (99.1%) | |
Communication Services (9.4%): | |
Alphabet, Inc., Class C (a) | | | 362 | | | $ | 1,073 | | |
Meta Platforms, Inc., Class A (a) | | | 1,003 | | | | 325 | | |
Snap, Inc., Class A (a) | | | 5,210 | | | | 274 | | |
| | | | 1,672 | | |
Consumer Discretionary (20.6%): | |
Airbnb, Inc., Class A (a) | | | 2,152 | | | | 367 | | |
Amazon.com, Inc. (a) | | | 391 | | | | 1,319 | | |
Aptiv PLC (a) | | | 2,108 | | | | 365 | | |
Burlington Stores, Inc. (a) | | | 1,804 | | | | 498 | | |
Lululemon Athletica, Inc. (a) | | | 1,299 | | | | 605 | | |
NIKE, Inc., Class B | | | 3,145 | | | | 526 | | |
| | | | 3,680 | | |
Financials (3.0%): | |
MSCI, Inc. | | | 817 | | | | 543 | | |
Health Care (14.4%): | |
Align Technology, Inc. (a) | | | 759 | | | | 474 | | |
Masimo Corp. (a) | | | 1,517 | | | | 430 | | |
TG Therapeutics, Inc. (a) | | | 2,531 | | | | 79 | | |
Thermo Fisher Scientific, Inc. | | | 971 | | | | 615 | | |
Veeva Systems, Inc., Class A (a) | | | 1,486 | | | | 471 | | |
Zoetis, Inc. | | | 2,307 | | | | 499 | | |
| | | | 2,568 | | |
Industrials (9.2%): | |
CoStar Group, Inc. (a) | | | 3,755 | | | | 323 | | |
Generac Holdings, Inc. (a) | | | 1,284 | | | | 640 | | |
Kornit Digital Ltd. (a) | | | 1,154 | | | | 193 | | |
Uber Technologies, Inc. (a) | | | 11,052 | | | | 485 | | |
| | | | 1,641 | | |
IT Services (16.9%): | |
EPAM Systems, Inc. (a) | | | 1,082 | | | | 728 | | |
PayPal Holdings, Inc. (a) | | | 3,136 | | | | 729 | | |
Shopify, Inc., Class A (a) | | | 299 | | | | 439 | | |
Twilio, Inc., Class A (a) | | | 1,227 | | | | 358 | | |
Visa, Inc., Class A | | | 3,629 | | | | 769 | | |
| | | | 3,023 | | |
Semiconductors & Semiconductor Equipment (7.1%): | |
NVIDIA Corp. | | | 4,965 | | | | 1,269 | | |
Software (18.5%): | |
Adobe, Inc. (a) | | | 1,086 | | | | 706 | | |
Autodesk, Inc. (a) | | | 907 | | | | 288 | | |
Cadence Design Systems, Inc. (a) | | | 2,377 | | | | 412 | | |
Crowdstrike Holdings, Inc., Class A (a) | | | 1,026 | | | | 289 | | |
See notes to financial statements.
35
Victory Portfolios
Victory NewBridge Large Cap Growth Fund | | Schedule of Portfolio Investments — continued
October 31, 2021 | |
(Amounts in Thousands, Except for Shares)
Security Description | | Shares | | Value | |
Microsoft Corp. | | | 1,174 | | | $ | 389 | | |
ServiceNow, Inc. (a) | | | 1,069 | | | | 746 | | |
The Trade Desk, Inc., Class A (a) | | | 6,180 | | | | 463 | | |
| | | | 3,293 | | |
Total Common Stocks (Cost $7,951) | | | 17,689 | | |
Total Investments (Cost $7,951) — 99.1% | | | 17,689 | | |
Other assets in excess of liabilities — 0.9% | | | 153 | | |
NET ASSETS — 100.00% | | $ | 17,842 | | |
(a) Non-income producing security.
PLC — Public Limited Company
See notes to financial statements.
36
Victory Portfolios
Victory Special Value Fund | | Schedule of Portfolio Investments
October 31, 2021 | |
(Amounts in Thousands, Except for Shares)
Security Description | | Shares | | Value | |
Common Stocks (96.5%) | |
Communication Services (7.6%): | |
Alphabet, Inc., Class C (a) | | | 602 | | | $ | 1,785 | | |
Charter Communications, Inc., Class A (a) | | | 629 | | | | 425 | | |
Meta Platforms, Inc., Class A (a) | | | 3,035 | | | | 982 | | |
Nexstar Media Group, Inc., Class A | | | 4,637 | | | | 695 | | |
| | | | 3,887 | | |
Communications Equipment (0.5%): | |
Lumentum Holdings, Inc. (a) | | | 3,256 | | | | 269 | | |
Consumer Discretionary (11.9%): | |
Amazon.com, Inc. (a) | | | 223 | | | | 752 | | |
Asbury Automotive Group, Inc. (a) | | | 3,962 | | | | 775 | | |
Brunswick Corp. | | | 3,347 | | | | 312 | | |
D.R. Horton, Inc. | | | 4,916 | | | | 439 | | |
Group 1 Automotive, Inc. | | | 4,088 | | | | 735 | | |
LCI Industries | | | 4,374 | | | | 611 | | |
Lowe's Cos., Inc. | | | 1,211 | | | | 283 | | |
Meritage Homes Corp. (a) | | | 5,983 | | | | 651 | | |
Patrick Industries, Inc. | | | 6,947 | | | | 541 | | |
Rent-A-Center, Inc. | | | 12,191 | | | | 649 | | |
Tesla, Inc. (a) | | | 298 | | | | 332 | | |
| | | | 6,080 | | |
Consumer Staples (5.4%): | |
BJ's Wholesale Club Holdings, Inc. (a) (b) | | | 10,203 | | | | 596 | | |
Darling Ingredients, Inc. (a) | | | 3,886 | | | | 328 | | |
PepsiCo, Inc. (a) | | | 6,084 | | | | 983 | | |
Philip Morris International, Inc. | | | 8,997 | | | | 851 | | |
| | | | 2,758 | | |
Electronic Equipment, Instruments & Components (0.9%): | |
Fabrinet (a) | | | 4,731 | | | | 454 | | |
Energy (5.1%): | |
Chevron Corp. | | | 8,598 | | | | 985 | | |
Matador Resources Co. | | | 12,716 | | | | 532 | | |
Pioneer Natural Resources Co. | | | 3,157 | | | | 590 | | |
Valero Energy Corp. | | | 6,854 | | | | 530 | | |
| | | | 2,637 | | |
Financials (13.3%): | |
Ally Financial, Inc. | | | 7,076 | | | | 338 | | |
Ameriprise Financial, Inc. | | | 1,245 | | | | 376 | | |
Bank of America Corp. | | | 17,260 | | | | 825 | | |
Chubb Ltd. | | | 3,807 | | | | 744 | | |
JPMorgan Chase & Co. | | | 6,030 | | | | 1,024 | | |
Morgan Stanley | | | 6,447 | | | | 663 | | |
Primerica, Inc. | | | 3,833 | | | | 645 | | |
ServisFirst Bancshares, Inc. | | | 3,685 | | | | 296 | | |
See notes to financial statements.
37
Victory Portfolios
Victory Special Value Fund | | Schedule of Portfolio Investments — continued
October 31, 2021 | |
(Amounts in Thousands, Except for Shares)
Security Description | | Shares | | Value | |
Signature Bank | | | 1,828 | | | $ | 544 | | |
T. Rowe Price Group, Inc. | | | 2,538 | | | | 550 | | |
Western Alliance Bancorp | | | 7,055 | | | | 819 | | |
| | | | 6,824 | | |
Health Care (10.8%): | |
AbbVie, Inc. | | | 7,079 | | | | 812 | | |
AmerisourceBergen Corp. | | | 4,241 | | | | 517 | | |
ICON PLC (a) | | | 2,371 | | | | 680 | | |
Insulet Corp. (a) | | | 905 | | | | 281 | | |
McKesson Corp. | | | 3,333 | | | | 693 | | |
Regeneron Pharmaceuticals, Inc. (a) | | | 1,367 | | | | 875 | | |
Stryker Corp. (a) | | | 2,514 | | | | 669 | | |
Thermo Fisher Scientific, Inc. | | | 842 | | | | 533 | | |
UnitedHealth Group, Inc. | | | 1,002 | | | | 461 | | |
| | | | 5,521 | | |
Industrials (10.3%): | |
Builders FirstSource, Inc. (a) | | | 12,221 | | | | 712 | | |
Chart Industries, Inc. (a) | | | 1,858 | | | | 330 | | |
GXO Logistics, Inc. (a) | | | 4,121 | | | | 366 | | |
Marten Transport Ltd. | | | 30,183 | | | | 502 | | |
Old Dominion Freight Line, Inc. | | | 2,159 | | | | 737 | | |
Parker-Hannifin Corp. | | | 1,546 | | | | 458 | | |
Saia, Inc. (a) | | | 1,989 | | | | 622 | | |
Trex Co., Inc. (a) | | | 4,573 | | | | 487 | | |
UFP Industries, Inc. | | | 8,951 | | | | 732 | | |
XPO Logistics, Inc. (a) | | | 4,121 | | | | 354 | | |
| | | | 5,300 | | |
IT Services (1.4%): | |
EPAM Systems, Inc. (a) | | | 1,028 | | | | 692 | | |
Materials (4.1%): | |
Avery Dennison Corp. | | | 2,374 | | | | 517 | | |
Dow, Inc. | | | 6,791 | | | | 380 | | |
Summit Materials, Inc., Class A (a) | | | 19,202 | | | | 684 | | |
Valvoline, Inc. | | | 15,775 | | | | 536 | | |
| | | | 2,117 | | |
Real Estate (2.0%): | |
American Tower Corp. | | | 1,413 | | | | 399 | | |
CBRE Group, Inc., Class A (a) | | | 2,971 | | | | 309 | | |
Simon Property Group, Inc. | | | 2,261 | | | | 331 | | |
| | | | 1,039 | | |
Semiconductors & Semiconductor Equipment (9.3%): | |
Advanced Micro Devices, Inc. (a) | | | 7,775 | | | | 935 | | |
Applied Materials, Inc. | | | 4,399 | | | | 601 | | |
Broadcom, Inc. | | | 1,269 | | | | 675 | | |
Lam Research Corp. | | | 996 | | | | 561 | | |
See notes to financial statements.
38
Victory Portfolios
Victory Special Value Fund | | Schedule of Portfolio Investments — continued
October 31, 2021 | |
(Amounts in Thousands, Except for Shares)
Security Description | | Shares | | Value | |
NVIDIA Corp. | | | 5,533 | | | $ | 1,415 | | |
Qorvo, Inc. (a) | | | 3,368 | | | | 566 | | |
| | | | 4,753 | | |
Software (8.2%): | |
Adobe, Inc. (a) | | | 421 | | | | 274 | | |
Cadence Design Systems, Inc. (a) | | | 3,164 | | | | 548 | | |
Microsoft Corp. | | | 10,143 | | | | 3,363 | | |
| | | | 4,185 | | |
Technology Hardware, Storage & Peripherals (5.7%): | |
Apple, Inc. | | | 19,477 | | | | 2,918 | | |
Total Common Stocks (Cost $31,082) | | | 49,434 | | |
Exchange-Traded Funds (2.0%) | |
SPDR S&P 500 ETF Trust | | | 2,238 | | | | 1,028 | | |
Total Exchange-Traded Funds (Cost $942) | | | 1,028 | | |
Collateral for Securities Loaned^ (0.4%) | |
BlackRock Liquidity Funds TempFund, Institutional Shares, 0.04% (c) | | | 3,459 | | | | 3 | | |
Fidelity Investments Money Market Government Portfolio,
Institutional Shares, 0.01% (c) | | | 108,769 | | | | 109 | | |
Goldman Sachs Financial Square Prime Obligations Fund,
Institutional Shares, 0.02% (c) | | | 1,726 | | | | 2 | | |
JPMorgan Prime Money Market Fund, Capital Shares, 0.07% (c) | | | 13,762 | | | | 14 | | |
Morgan Stanley Institutional Liquidity Prime Portfolio,
Institutional Shares, 0.06% (c) | | | 61,878 | | | | 62 | | |
Total Collateral for Securities Loaned (Cost $190) | | | 190 | | |
Total Investments (Cost $32,214) — 98.9% | | | 50,652 | | |
Other assets in excess of liabilities — 1.1% | | | 553 | | |
NET ASSETS — 100.00% | | $ | 51,205 | | |
^ Purchased with cash collateral from securities on loan.
(a) Non-income producing security.
(b) All or a portion of this security is on loan.
(c) Rate disclosed is the daily yield on October 31, 2021.
ETF — Exchange-Traded Fund
PLC — Public Limited Company
See notes to financial statements.
39
Victory Portfolios
Victory THB US Small Opportunities Fund | | Schedule of Portfolio Investments
October 31, 2021 | |
(Amounts in Thousands, Except for Shares)
Security Description | | Shares | | Value | |
Common Stocks (98.8%) | |
Communication Services (0.1%): | |
EverQuote, Inc., Class A (a) | | | 9,000 | | | $ | 124 | | |
Consumer Discretionary (13.5%): | |
America's Car-Mart, Inc. (a) | | | 8,710 | | | | 1,041 | | |
Bassett Furniture Industries, Inc. | | | 61,560 | | | | 1,040 | | |
BJ's Restaurants, Inc. (a) (b) | | | 18,624 | | | | 621 | | |
Century Communities, Inc. | | | 15,640 | | | | 1,049 | | |
Chuy's Holdings, Inc. (a) (b) | | | 14,844 | | | | 433 | | |
Johnson Outdoors, Inc., Class A | | | 5,446 | | | | 578 | | |
Lazydays Holdings, Inc. (a) | | | 43,330 | | | | 914 | | |
M/I Homes, Inc. (a) | | | 26,205 | | | | 1,500 | | |
MasterCraft Boat Holdings, Inc. (a) | | | 31,610 | | | | 847 | | |
Movado Group, Inc. | | | 53,500 | | | | 1,782 | | |
Red Robin Gourmet Burgers, Inc. (a) | | | 33,540 | | | | 666 | | |
Ruth's Hospitality Group, Inc. (a) | | | 6,970 | | | | 135 | | |
The Cheesecake Factory, Inc. (a) | | | 11,890 | | | | 483 | | |
Universal Technical Institute, Inc. (a) | | | 118,960 | | | | 837 | | |
Vera Bradley, Inc. (a) (b) | | | 12,870 | | | | 126 | | |
| | | | 12,052 | | |
Energy (9.1%): | |
Clean Energy Fuels Corp. (a) | | | 160,180 | | | | 1,477 | | |
Expro Group Holdings NV (a) | | | 7,456 | | | | 128 | | |
Geospace Technologies Corp. (a) | | | 49,200 | | | | 468 | | |
Natural Gas Services Group, Inc. (a) | | | 11,768 | | | | 133 | | |
Profire Energy, Inc. (a) | | | 552,220 | | | | 657 | | |
Renewable Energy Group, Inc. (a) | | | 28,889 | | | | 1,849 | | |
RPC, Inc. (a) | | | 314,070 | | | | 1,693 | | |
TETRA Technologies, Inc. (a) | | | 551,060 | | | | 1,780 | | |
| | | | 8,185 | | |
Financials (10.0%): | |
BayCom Corp. (a) | | | 35,646 | | | | 673 | | |
eHealth, Inc. (a) | | | 14,980 | | | | 664 | | |
First Busey Corp. | | | 112,091 | | | | 2,857 | | |
Heritage Financial Corp. | | | 63,065 | | | | 1,567 | | |
Old Second Bancorp, Inc. (b) | | | 112,972 | | | | 1,530 | | |
Randolph Bancorp, Inc. (a) | | | 29,203 | | | | 686 | | |
The First Bancshares, Inc. | | | 20,617 | | | | 830 | | |
Trean Insurance Group, Inc. (a) | | | 13,000 | | | | 122 | | |
| | | | 8,929 | | |
Health Care (18.4%): | |
Addus HomeCare Corp. (a) | | | 11,661 | | | | 1,090 | | |
Amneal Pharmaceuticals, Inc. (a) | | | 240,048 | | | | 1,318 | | |
Atrion Corp. | | | 1,154 | | | | 840 | | |
BioLife Solutions, Inc. (a) | | | 37,744 | | | | 2,006 | | |
Cardiovascular Systems, Inc. (a) | | | 12,555 | | | | 440 | | |
Coherus Biosciences, Inc. (a) | | | 18,090 | | | | 303 | | |
See notes to financial statements.
40
Victory Portfolios
Victory THB US Small Opportunities Fund | | Schedule of Portfolio Investments — continued
October 31, 2021 | |
(Amounts in Thousands, Except for Shares)
Security Description | | Shares | | Value | |
CryoLife, Inc. (a) | | | 39,275 | | | $ | 811 | | |
Lantheus Holdings, Inc. (a) | | | 25,401 | | | | 594 | | |
LeMaitre Vascular, Inc. | | | 30,566 | | | | 1,590 | | |
Ligand Pharmaceuticals, Inc. (a) | | | 2,534 | | | | 370 | | |
Meridian Bioscience, Inc. (a) | | | 17,010 | | | | 320 | | |
Mesa Laboratories, Inc. | | | 2,583 | | | | 789 | | |
ModivCare, Inc. (a) | | | 5,452 | | | | 887 | | |
Organogenesis Holdings, Inc. (a) | | | 55,000 | | | | 604 | | |
Orthofix Medical, Inc. (a) | | | 3,756 | | | | 135 | | |
Pro-Dex, Inc. (a) | | | 10,616 | | | | 258 | | |
Retractable Technologies, Inc. (a) | | | 64,170 | | | | 607 | | |
The Joint Corp. (a) | | | 14,737 | | | | 1,289 | | |
Vanda Pharmaceuticals, Inc. (a) | | | 39,190 | | | | 671 | | |
Vericel Corp. (a) | | | 32,940 | | | | 1,516 | | |
| | | | 16,438 | | |
Industrials (20.6%): | |
Allied Motion Technologies, Inc. | | | 43,707 | | | | 1,536 | | |
ARC Document Solutions, Inc. | | | 329,470 | | | | 998 | | |
Bowman Consulting Group Ltd. (a) | | | 44,030 | | | | 678 | | |
CIRCOR International, Inc. (a) (b) | | | 39,750 | | | | 1,135 | | |
Concrete Pumping Holdings, Inc. (a) | | | 88,710 | | | | 763 | | |
Harsco Corp. (a) | | | 56,420 | | | | 965 | | |
Hyster-Yale Materials Handling, Inc. | | | 2,690 | | | | 129 | | |
IES Holdings, Inc. (a) | | | 10,300 | | | | 513 | | |
Insteel Industries, Inc. | | | 35,925 | | | | 1,461 | | |
Karat Packaging, Inc. (a) | | | 42,400 | | | | 964 | | |
MYR Group, Inc. (a) | | | 4,851 | | | | 496 | | |
NN, Inc. (a) | | | 26,170 | | | | 131 | | |
Northwest Pipe Co. (a) | | | 5,650 | | | | 134 | | |
Orion Group Holdings, Inc. (a) | | | 140,893 | | | | 627 | | |
Preformed Line Products Co. | | | 11,290 | | | | 784 | | |
The Greenbrier Cos., Inc. (a) | | | 37,000 | | | | 1,518 | | |
The Shyft Group, Inc. | | | 12,276 | | | | 506 | | |
TPI Composites, Inc. (a) | | | 33,785 | | | | 1,136 | | |
Transcat, Inc. (a) | | | 32,571 | | | | 2,439 | | |
U.S. Xpress Enterprises, Inc., Class A (a) | | | 69,940 | | | | 529 | | |
Ultralife Corp. (a) | | | 67,869 | | | | 425 | | |
Willdan Group, Inc. (a) | | | 16,780 | | | | 561 | | |
| | | | 18,428 | | |
Information Technology (23.1%): | |
Axcelis Technologies, Inc. (a) | | | 16,426 | | | | 902 | | |
CEVA, Inc. (a) | | | 13,800 | | | | 629 | | |
ePlus, Inc. (a) | | | 20,386 | | | | 2,254 | | |
Grid Dynamics Holdings, Inc. (a) | | | 79,750 | | | | 2,293 | | |
Ichor Holdings Ltd. (a) | | | 33,030 | | | | 1,444 | | |
Iteris, Inc. (a) | | | 24,600 | | | | 132 | | |
Luna Innovations, Inc. (a) | | | 159,510 | | | | 1,554 | | |
Methode Electronics, Inc. | | | 4,829 | | | | 203 | | |
Napco Security Technologies, Inc. (a) | | | 48,880 | | | | 2,344 | | |
See notes to financial statements.
41
Victory Portfolios
Victory THB US Small Opportunities Fund | | Schedule of Portfolio Investments — continued
October 31, 2021 | |
(Amounts in Thousands, Except for Shares)
Security Description | | Shares | | Value | |
NVE Corp. | | | 1,671 | | | $ | 114 | | |
PAR Technology Corp. (a) (b) | | | 30,586 | | | | 1,921 | | |
Perficient, Inc. (a) | | | 24,290 | | | | 3,002 | | |
Ping Identity Holding Corp. (a) | | | 21,480 | | | | 609 | | |
Ultra Clean Holdings, Inc. (a) | | | 34,393 | | | | 1,705 | | |
Upland Software, Inc. (a) | | | 3,960 | | | | 132 | | |
Vishay Precision Group, Inc. (a) | | | 12,394 | | | | 423 | | |
Wayside Technology Group, Inc. | | | 24,710 | | | | 657 | | |
Zix Corp. (a) | | | 40,701 | | | | 345 | | |
| | | | 20,663 | | |
Materials (1.9%): | |
Kaiser Aluminum Corp. | | | 6,150 | | | | 598 | | |
Koppers Holdings, Inc. (a) | | | 30,357 | | | | 1,065 | | |
| | | | 1,663 | | |
Real Estate (2.1%): | |
Gladstone Land Corp. | | | 55,090 | | | | 1,220 | | |
Postal Realty Trust, Inc., Class A | | | 32,500 | | | | 631 | | |
| | | | 1,851 | | |
Total Common Stocks (Cost $61,966) | | | 88,333 | | |
Collateral for Securities Loaned^ (1.0%) | |
BlackRock Liquidity Funds TempFund, Institutional Shares, 0.04% (c) | | | 15,794 | | | | 16 | | |
Fidelity Investments Money Market Government Portfolio,
Institutional Shares, 0.01% (c) | | | 496,714 | | | | 497 | | |
Goldman Sachs Financial Square Prime Obligations Fund,
Institutional Shares, 0.02% (c) | | | 7,882 | | | | 8 | | |
JPMorgan Prime Money Market Fund, Capital Shares, 0.07% (c) | | | 62,848 | | | | 63 | | |
Morgan Stanley Institutional Liquidity Prime Portfolio,
Institutional Shares, 0.06% (c) | | | 282,579 | | | | 282 | | |
Total Collateral for Securities Loaned (Cost $866) | | | 866 | | |
Total Investments (Cost $62,832) — 99.8% | | | 89,199 | | |
Other assets in excess of liabilities — 0.2% | | | 185 | | |
NET ASSETS — 100.00% | | $ | 89,384 | | |
^ Purchased with cash collateral from securities on loan.
(a) Non-income producing security.
(b) All or a portion of this security is on loan.
(c) Rate disclosed is the daily yield on October 31, 2021.
See notes to financial statements.
42
Victory Portfolios
Victory Strategic Allocation Fund | | Schedule of Portfolio Investments
October 31, 2021 | |
(Amounts in Thousands, Except for Shares)
Security Description | | Shares | | Value | |
Affiliated Exchange-Traded Funds (7.4%) | |
VictoryShares U.S. Multi-Factor Minimum Volatility ETF | | | 54,280 | | | $ | 2,171 | | |
Total Affiliated Exchange-Traded Funds (Cost $1,400) | | | 2,171 | | |
Affiliated Mutual Funds (92.3%) | |
Victory INCORE Investment Grade Convertible Fund, Class I | | | 92,530 | | | | 1,849 | | |
Victory INCORE Total Return Bond Fund, Class R6 | | | 325,348 | | | | 3,201 | | |
Victory Integrity Discovery Fund, Class Y | | | 23,089 | | | | 1,178 | | |
Victory Market Neutral Income Fund, Class I | | | 597,807 | | | | 5,661 | | |
Victory RS Global Fund, Class Y (a) | | | 449,755 | | | | 9,197 | | |
Victory RS Partners Fund, Class Y | | | 33,602 | | | | 1,130 | | |
Victory Sophus Emerging Markets Fund, Class R6 | | | 110,521 | | | | 2,770 | | |
Victory Trivalent International Small-Cap Fund, Class I | | | 118,131 | | | | 2,200 | | |
Total Affiliated Mutual Funds (Cost $21,777) | | | 27,186 | | |
Total Investments (Cost $23,177) — 99.7% | | | 29,357 | | |
Other assets in excess of liabilities — 0.3% | | | 75 | | |
NET ASSETS — 100.00% | | $ | 29,432 | | |
(a) Represents investments greater than 25% of the Fund's net assets. Performance of the Fund may be adversely impacted by concentrated investments in securities. The financial statements and portfolio holdings for these securities can be found at www.sec.gov.
ETF — Exchange-Traded Fund
See notes to financial statements.
43
Victory Portfolios
Victory INCORE Fund for Income | | Schedule of Portfolio Investments
October 31, 2021 | |
(Amounts in Thousands, Except for Shares)
Security Description | | Principal
Amount | | Value | |
Government National Mortgage Association (73.6%) | |
Multi-family (0.2%): | |
Collateralized Mortgage Obligations (0.0%): | |
Government National Mortgage Assoc.
Series 2012-33, Class AB, 7.00%, 3/16/46 | | $ | 113 | | | $ | 113 | | |
Pass-throughs (0.2%): | |
Government National Mortgage Assoc.
7.92%, 7/1/23 | | | 128 | | | | 128 | | |
8.00%, 1/15/31 – 11/15/33 | | | 1,037 | | | | 1,039 | | |
7.75%, 9/15/33 | | | 380 | | | | 381 | | |
| | | | 1,548 | | |
Single Family (73.4%): | |
Collateralized Mortgage Obligations (3.1%): | |
Government National Mortgage Assoc.
Series 1999-4, Class ZB, 6.00%, 2/20/29 | | | 147 | | | | 147 | | |
Series 2001-10, Class PE, 6.50%, 3/16/31 | | | 123 | | | | 123 | | |
Series 2005-74, Class HB, 7.50%, 9/16/35 | | | 8 | | | | 9 | | |
Series 2005-74, Class HC, 7.50%, 9/16/35 | | | 48 | | | | 54 | | |
Series 2011-166, Class NT, 7.75%, 11/20/31 (a) | | | 737 | | | | 840 | | |
Series 2012-106, Class JM, 7.33%, 10/20/34 (a) | | | 548 | | | | 640 | | |
Series 2012-30, Class WB, 7.05%, 11/20/39 (a) | | | 2,018 | | | | 2,314 | | |
Series 2013-190, Class KT, 8.11%, 9/20/30 (a) | | | 216 | | | | 247 | | |
Series 2013-51, Class BL, 6.07%, 4/20/34 (a) | | | 1,457 | | | | 1,671 | | |
Series 2013-64, Class KY, 6.77%, 12/20/38 (a) | | | 845 | | | | 955 | | |
Series 2013-70, Class KP, 7.08%, 2/20/39 (a) | | | 734 | | | | 855 | | |
Series 2014-69, Class W, 7.21%, 11/20/34 (a) | | | 108 | | | | 124 | | |
Series 2014-74, Class PT, 7.82%, 5/16/44 (a) | | | 162 | | | | 181 | | |
Series 2015-77, Class PT, 7.36%, 6/20/39 (a) | | | 314 | | | | 361 | | |
Series 2019-22, Class PT, 7.93%, 2/20/49 (a) | | | 5,674 | | | | 6,459 | | |
Series 2021-1, Class WT, 7.83%, 1/20/51 (a) | | | 5,914 | | | | 6,832 | | |
| | | | 21,812 | | |
Pass-throughs (70.3%): | |
Government National Mortgage Assoc.
8.50%, 12/15/21 – 7/15/32 | | | 4,750 | | | | 5,351 | | |
6.00%, 1/15/22 – 9/20/50 | | | 78,663 | | | | 92,024 | | |
8.00%, 4/15/22 – 5/15/49 | | | 32,821 | | | | 38,003 | | |
7.00%, 12/20/22 – 9/20/50 | | | 84,104 | | | | 97,345 | | |
7.13%, 3/15/23 – 7/15/25 | | | 120 | | | | 122 | | |
9.50%, 3/15/23 | | | — | (b) | | | — | (b) | |
5.50%, 7/15/23 – 11/15/45 | | | 13,599 | | | | 15,925 | | |
7.50%, 8/15/23 – 5/15/49 | | | 55,997 | | | | 63,730 | | |
9.00%, 11/15/24 – 9/15/30 | | | 1,317 | | | | 1,475 | | |
10.00%, 4/15/25 – 2/15/26 | | | — | (b) | | | — | (b) | |
6.50%, 12/15/25 – 2/20/41 | | | 127,557 | | | | 146,754 | | |
6.13%, 6/20/28 – 11/20/28 | | | 296 | | | | 316 | | |
6.28%, 10/20/28 – 9/20/29 | | | 575 | | | | 631 | | |
6.10%, 5/20/29 – 7/20/31 | | | 445 | | | | 487 | | |
See notes to financial statements.
44
Victory Portfolios
Victory INCORE Fund for Income | | Schedule of Portfolio Investments — continued
October 31, 2021 | |
(Amounts in Thousands, Except for Shares)
Security Description | | Shares or
Principal
Amount | | Value | |
7.30%, 4/20/30 – 2/20/31 | | $ | 178 | | | $ | 185 | | |
6.49%, 5/20/31 – 3/20/32 | | | 862 | | | | 956 | | |
4.50%, 12/15/33 – 5/15/41 | | | 10,168 | | | | 11,612 | | |
5.00%, 1/20/34 – 12/31/65 | | | 13,233 | | | | 15,265 | | |
4.00%, 8/15/41 | | | 647 | | | | 724 | | |
| | | | 490,905 | | |
Total Government National Mortgage Association (Cost $511,199) | | | 514,378 | | |
U.S. Treasury Obligations (26.6%) | |
U.S. Treasury Bills,
0.06%, 3/24/22 (c) | | | 12,898 | | | | 12,895 | | |
U.S. Treasury Bonds
7.13%, 2/15/23 | | | 145,926 | | | | 158,746 | | |
7.50%, 11/15/24 | | | 12,007 | | | | 14,435 | | |
Total U.S. Treasury Obligations (Cost $186,582) | | | 186,076 | | |
Investment Companies (0.0%) (d) | |
BlackRock Liquidity Funds Fedfund Portfolio, 0.02% (c) | | | 99,840 | | | | 100 | | |
Total Investment Companies (Cost $100) | | | 100 | | |
Total Investments (Cost $697,881) — 100.2% | | | 700,554 | | |
Liabilities in excess of other assets — (0.2)% | | | (1,585 | ) | |
NET ASSETS — 100.00% | | $ | 698,969 | | |
(a) The rate for certain asset-backed and mortgage-backed securities may vary based on factors relating to the pool of assets underlying the security. The rate disclosed is the rate in effect at October 31, 2021.
(b) Rounds to less than $1 thousand.
(c) Rate represents the effective yield at October 31, 2021.
(d) Amount represents less than 0.05% of net assets.
See notes to financial statements.
45
Victory Portfolios
Victory INCORE Investment Grade Convertible Fund | | Schedule of Portfolio Investments
October 31, 2021 | |
(Amounts in Thousands, Except for Shares)
Security Description | | Principal
Amount | | Value | |
Convertible Corporate Bonds (66.2%) | |
Communication Services (0.9%): | |
Snap, Inc., 0.75%, 8/1/26 | | $ | 1,595 | | | $ | 3,811 | | |
Consumer Discretionary (9.4%): | |
Booking Holdings, Inc., 0.75%, 5/1/25 (a) | | | 13,335 | | | | 19,793 | | |
Expedia Group, Inc., 0.00%, 2/15/26 (a) (b) | | | 13,706 | | | | 14,776 | | |
Ford Motor Co., 0.00%, 3/15/26 (b) | | | 4,720 | | | | 5,563 | | |
| | | | 40,132 | | |
Energy (4.6%): | |
Pioneer Natural Resources Co., 0.25%, 5/15/25 | | | 11,081 | | | | 19,667 | | |
Financials (16.8%): | |
Ares Capital Corp.
3.75%, 2/1/22 | | | 5,640 | | | | 6,293 | | |
4.63%, 3/1/24 | | | 9,015 | | | | 10,278 | | |
Barclays Bank PLC
0.00%, 2/4/25 | | | 6,120 | | | | 10,334 | | |
0.00%, 2/18/25 | | | 2,730 | | | | 2,995 | | |
BlackRock Capital Investment Corp., 5.00%, 6/15/22 | | | 3,712 | | | | 3,760 | | |
BlackRock TCP Capital Corp., 4.63%, 3/1/22 | | | 1,390 | | | | 1,407 | | |
GSK Finance NO 3 PLC, 0.00%, 6/22/23 (b) | | | 5,418 | | | | 5,289 | | |
Hannon Armstrong Sustainable Infrastructure Capital, Inc., 0.00%, 8/15/23 | | | 1,780 | | | | 2,318 | | |
JPMorgan Chase Financial Co. LLC, 0.25%, 5/1/23 (b) | | | 12,505 | | | | 14,193 | | |
MGIC Investment Corp., Convertible Subordinated Notes, 9.00%, 4/1/63 | | | 4,342 | | | | 5,939 | | |
Sixth Street Specialty Lending, Inc., 4.50%, 8/1/22 | | | 1,000 | | | | 1,256 | | |
TPG Specialty Lending, Inc., 4.50%, 8/1/22 | | | 5,816 | | | | 7,305 | | |
| | | | 71,367 | | |
Health Care (9.8%): | |
Anthem, Inc., 2.75%, 10/15/42 | | | 3,752 | | | | 23,061 | | |
Bristol-Myers Squibb Co., Convertible Subordinated Notes, 0.00%
(LIBOR03M-50bps), 9/15/23, Callable 12/13/21 @ 100 (c) (d) | | | 2,466 | | | | 3,635 | | |
Illumina, Inc., 0.00%, 8/15/23 (a) | | | 12,747 | | | | 14,995 | | |
| | | | 41,691 | | |
Industrials (10.0%): | |
Fortive Corp., 0.88%, 2/15/22 | | | 18,851 | | | | 18,889 | | |
Parsons Corp., 0.25%, 8/15/25 | | | 4,270 | | | | 4,321 | | |
Southwest Airlines Co., 1.25%, 5/1/25 | | | 13,760 | | | | 19,340 | | |
| | | | 42,550 | | |
Information Technology (12.8%): | |
Akamai Technologies, Inc., 0.13%, 5/1/25 | | | 2,704 | | | | 3,311 | | |
Euronet Worldwide, Inc., 0.75%, 3/15/49, Callable 3/20/25 @ 100 (a) | | | 14,260 | | | | 15,257 | | |
Nuance Communication, Inc., Convertible Subordinated Notes, 1.00%, 12/15/35,
Callable 12/20/22 @ 100 | | | 1,410 | | | | 3,209 | | |
ON Semiconductor Corp., 0.00%, 5/1/27 (a) (b) | | | 245 | | | | 296 | | |
Square, Inc., 0.25%, 11/1/27 (a) (b) | | | 5,030 | | | | 6,148 | | |
See notes to financial statements.
46
Victory Portfolios
Victory INCORE Investment Grade Convertible Fund | | Schedule of Portfolio Investments — continued
October 31, 2021 | |
(Amounts in Thousands, Except for Shares)
Security Description | | Shares or
Principal
Amount | | Value | |
Vishay Intertechnology, Inc., 2.25%, 6/15/25 | | $ | 5,655 | | | $ | 5,748 | | |
Western Digital Corp., 1.50%, 2/1/24 | | | 20,198 | | | | 20,297 | | |
| | | | 54,266 | | |
Real Estate (1.9%): | |
Kite Realty Group LP, 0.75%, 4/1/27 (b) | | | 8,035 | | | | 7,994 | | |
Total Convertible Corporate Bonds (Cost $248,636) | | | 281,478 | | |
Convertible Preferred Stocks (32.2%) | |
Financials (12.5%): | |
AMG Capital Trust II, 5.15%, 10/15/37 | | | 232,075 | | | | 13,649 | | |
Bank of America Corp., Series L, 7.25% (e) | | | 7,130 | | | | 10,212 | | |
KKR & Co., Inc., Series C, 6.00%, 9/15/23 (a) | | | 97,330 | | | | 9,737 | | |
New York Community Capital Trust, 6.00%, 11/1/51 | | | 53,619 | | | | 2,821 | | |
Wells Fargo & Co., Series L, 7.50% (e) | | | 10,809 | | | | 16,429 | | |
| | | | 52,848 | | |
Industrials (4.0%): | |
Stanley Black & Decker, Inc., 5.25%, 11/15/22 (a) | | | 158,925 | | | | 17,151 | | |
Utilities (15.7%): | |
American Electric Power Co., Inc., 6.13%, 3/15/22 | | | 49,970 | | | | 2,485 | | |
American Electric Power Co., Inc., 6.13%, 8/15/23 (a) | | | 49,910 | | | | 2,577 | | |
CenterPoint Energy, Inc., Convertible Subordinated Notes, 4.57%, 9/15/29 | | | 80,000 | | | | 4,825 | | |
Dominion Energy, Inc., Series A, 7.25%, 6/1/22 | | | 130,978 | | | | 13,120 | | |
DTE Energy Co., 6.25%, 11/1/22 | | | 254,998 | | | | 12,872 | | |
NextEra Energy, Inc., 4.87%, 9/1/22 | | | 127,545 | | | | 8,063 | | |
NextEra Energy, Inc., 5.28%, 3/1/23 | | | 149,805 | | | | 8,160 | | |
NiSource, Inc., 7.75%, 3/1/24 | | | 27,090 | | | | 2,905 | | |
The Southern Co., Series 2019, 6.75%, 8/1/22 | | | 229,220 | | | | 11,734 | | |
| | | | 66,741 | | |
Total Convertible Preferred Stocks (Cost $123,586) | | | 136,740 | | |
Collateral for Securities Loaned^ (18.1%) | |
BlackRock Liquidity Funds TempFund, Institutional Shares, 0.04% (f) | | | 1,406,344 | | | | 1,406 | | |
Fidelity Investments Money Market Government Portfolio,
Institutional Shares, 0.01% (f) | | | 44,228,960 | | | | 44,229 | | |
Goldman Sachs Financial Square Prime Obligations Fund,
Institutional Shares, 0.02% (f) | | | 701,835 | | | | 702 | | |
JPMorgan Prime Money Market Fund, Capital Shares, 0.07% (f) | | | 5,596,217 | | | | 5,596 | | |
Morgan Stanley Institutional Liquidity Prime Portfolio,
Institutional Shares, 0.06% (f) | | | 25,161,685 | | | | 25,162 | | |
Total Collateral for Securities Loaned (Cost $77,095) | | | 77,095 | | |
Total Investments (Cost $449,317) — 116.5% | | | 495,313 | | |
Liabilities in excess of other assets — (16.5)% | | | (70,035 | ) | |
NET ASSETS — 100.00% | | $ | 425,278 | | |
See notes to financial statements.
47
Victory Portfolios
Victory INCORE Investment Grade Convertible Fund | | Schedule of Portfolio Investments — continued
October 31, 2021 | |
^ Purchased with cash collateral from securities on loan.
(a) All or a portion of this security is on loan.
(b) Rule 144A security or other security that is restricted as to resale to institutional investors. The Fund's Adviser has deemed this security to be liquid (unless otherwise noted as illiquid) based upon procedures approved by the Board of Trustees. As of October 31, 2021, the fair value of these securities was $54,259 (thousands) and amounted to 12.8% of net assets.
(c) Variable or Floating-Rate Security. Rate disclosed is as of October 31, 2021.
(d) Continuously callable with 30 days' notice.
(e) Security is perpetual and has no final maturity date but may be subject to calls at various dates in the future.
(f) Rate disclosed is the daily yield on October 31, 2021.
bps — Basis points
Continuously callable — Investment is continuously callable or will be continuously callable on any date after the first call date until its maturity.
LIBOR — London InterBank Offered Rate
LIBOR03M — 3 Month US Dollar LIBOR, rate disclosed as of October 31, 2021, based on the last reset date of the security
LLC — Limited Liability Company
LP — Limited Partnership
PLC — Public Limited Company
See notes to financial statements.
48
Victory Portfolios | | Statements of Assets and Liabilities
October 31, 2021 | |
(Amounts in Thousands, Except Per Share Amounts)
| | | Victory
Diversified
Stock Fund | | Victory
NewBridge
Large Cap
Growth Fund | | Victory
Special
Value Fund | |
Assets: | |
Investments, at value (Cost $205,808, $7,951 and
$32,214) | | $ | 329,076 | (a) | | $ | 17,689 | | | $ | 50,652 | (b) | |
Cash | | | 3,860 | | | | 153 | | | | 536 | | |
Receivables: | |
Interest and dividends | | | 153 | | | | 1 | | | | 24 | | |
Capital shares issued | | | 12 | | | | — | (c) | | | 4 | | |
Investments sold | | | 4,953 | | | | 43 | | | | 710 | | |
From Adviser | | | 2 | | | | 10 | | | | 7 | | |
Prepaid expenses | | | 16 | | | | 6 | | | | 14 | | |
Total Assets | | | 338,072 | | | | 17,902 | | | | 51,947 | | |
Liabilities: | |
Payables: | |
Collateral received on loaned securities | | | 399 | | | | — | | | | 190 | | |
Investments purchased | | | 2,984 | | | | — | | | | 453 | | |
Capital shares redeemed | | | 58 | | | | 31 | | | | 39 | | |
Accrued expenses and other payables: | |
Investment advisory fees | | | 178 | | | | 11 | | | | 31 | | |
Administration fees | | | 17 | | | | 1 | | | | 3 | | |
Custodian fees | | | 2 | | | | — | (c) | | | 1 | | |
Transfer agent fees | | | 33 | | | | 3 | | | | 6 | | |
Compliance fees | | | — | (c) | | | — | (c) | | | — | (c) | |
Trustees' fees | | | — | (c) | | | — | (c) | | | — | (c) | |
| 12b-1 fees | | | 39 | | | | 1 | | | | 7 | | |
Other accrued expenses | | | 23 | | | | 13 | | | | 12 | | |
Total Liabilities | | | 3,733 | | | | 60 | | | | 742 | | |
Net Assets: | |
Capital | | | 166,754 | | | | 4,444 | | | | 24,953 | | |
Total accumulated earnings/(loss) | | | 167,585 | | | | 13,398 | | | | 26,252 | | |
Net Assets | | $ | 334,339 | | | $ | 17,842 | | | $ | 51,205 | | |
Net Assets | |
Class A | | $ | 246,063 | | | $ | 8,749 | | | $ | 28,945 | | |
Class C | | | 2,371 | | | | 695 | | | | 978 | | |
Class I | | | 27,856 | | | | 7,085 | | | | 3,861 | | |
Class R | | | 48,980 | | | | — | | | | 16,605 | | |
Class R6 | | | 4,040 | | | | — | | | | — | | |
Class Y | | | 5,029 | | | | 1,313 | | | | 816 | | |
Total | | $ | 334,339 | | | $ | 17,842 | | | $ | 51,205 | | |
Shares (unlimited number of shares authorized with
a par value of $0.001 per share): | |
Class A | | | 9,885 | | | | 1,181 | | | | 782 | | |
Class C (d) | | | 104 | | | | 82 | | | | 31 | | |
Class I | | | 1,119 | | | | 824 | | | | 102 | | |
Class R | | | 2,020 | | | | — | | | | 475 | | |
Class R6 | | | 162 | | | | — | | | | — | | |
Class Y | | | 202 | | | | 162 | | | | 22 | | |
Total | | | 13,492 | | | | 2,249 | | | | 1,412 | | |
(continues on next page)
See notes to financial statements.
49
Victory Portfolios | | Statements of Assets and Liabilities
October 31, 2021 | |
(Amounts in Thousands, Except Per Share Amounts) (continued)
| | | Victory
Diversified
Stock Fund | | Victory
NewBridge
Large Cap
Growth Fund | | Victory
Special
Value Fund | |
Net asset value, offering (except Class A) and
redemption price per share: (e) | |
Class A | | $ | 24.89 | | | $ | 7.41 | | | $ | 37.00 | | |
Class C (d) (f) | | | 22.70 | | | | 8.43 | | | | 31.59 | | |
Class I | | | 24.88 | | | | 8.60 | | | | 37.54 | | |
Class R | | | 24.25 | | | | — | | | | 34.99 | | |
Class R6 | | | 24.91 | | | | — | | | | — | | |
Class Y | | | 24.93 | | | | 8.08 | | | | 37.31 | | |
Maximum Sales Charge — Class A | | | 5.75 | % | | | 5.75 | % | | | 5.75 | % | |
Maximum offering price
(100%/(100%-maximum sales charge) of net asset
value adjusted to the nearest cent) per share —
Class A | | $ | 26.41 | | | $ | 7.86 | | | $ | 39.26 | | |
(a) Includes $387 of securities on loan.
(b) Includes $187 of securities on loan.
(c) Rounds to less than $1 thousand.
(d) As described in Note 10, Victory NewBridge Large Cap Growth Fund Class C share amounts have been adjusted for a 1:5 reverse stock split.
(e) Per share amount may not recalculate due to rounding of net assets and/or shares outstanding.
(f) Redemption price per share varies by the length of time shares are held.
See notes to financial statements.
50
Victory Portfolios | | Statements of Assets and Liabilities
October 31, 2021 | |
(Amounts in Thousands, Except Per Share Amounts)
| | | Victory
THB US
Small
Opportunities
Fund(a) | | Victory
Strategic
Allocation
Fund | | Victory
INCORE
Fund for
Income | |
Assets: | |
Affiliated investments, at value (Cost $—,
$23,177 and $—) | | $ | — | | | $ | 29,357 | | | $ | — | | |
Unaffiliated investments, at value (Cost $62,832,
$— and $697,881) | | | 89,199 | (b) | | | — | | | | 700,554 | | |
Cash | | | 3,507 | | | | 62 | | | | — | | |
Receivables: | |
Interest and dividends | | | 17 | | | | — | | | | 5,108 | | |
Capital shares issued | | | 8 | | | | 2 | | | | 352 | | |
From Adviser | | | 90 | | | | 17 | | | | — | | |
Prepaid expenses | | | — | | | | 21 | | | | 37 | | |
Total Assets | | | 92,821 | | | | 29,459 | | | | 706,051 | | |
Liabilities: | |
Payables: | |
Collateral received on loaned securities | | | 866 | | | | — | | | | — | | |
Investments purchased | | | 2,377 | | | | — | | | | — | | |
Capital shares redeemed | | | 14 | | | | — | (c) | | | 6,496 | | |
Accrued expenses and other payables: | |
Investment advisory fees | | | 87 | | | | 2 | | | | 321 | | |
Administration fees | | | 4 | | | | 2 | | | | 40 | | |
Custodian fees | | | 2 | | | | — | (c) | | | 6 | | |
Transfer agent fees | | | 8 | | | | 8 | | | | 118 | | |
Compliance fees | | | — | (c) | | | — | (c) | | | — | (c) | |
Trustees' fees | | | — | (c) | | | — | (c) | | | 1 | | |
| 12b-1 fees | | | — | (c) | | | 3 | | | | 22 | | |
Other accrued expenses | | | 79 | | | | 12 | | | | 78 | | |
Total Liabilities | | | 3,437 | | | | 27 | | | | 7,082 | | |
Net Assets: | |
| Capital | | | 55,208 | | | | 23,442 | | | | 1,071,103 | | |
Total accumulated earnings/(loss) | | | 34,176 | | | | 5,990 | | | | (372,134 | ) | |
Net Assets | | $ | 89,384 | | | $ | 29,432 | | | $ | 698,969 | | |
Net Assets | |
Class A | | $ | 2,437 | | | $ | 16,378 | | | $ | 128,802 | | |
Class C | | | — | | | | 2,507 | | | | 10,066 | | |
Class I | | | 86,947 | | | | 9,283 | | | | 385,332 | | |
Class R | | | — | | | | 1,264 | | | | 23,613 | | |
Class R6 | | | — | | | | — | | | | 29,691 | | |
Class Y | | | — | | | | — | | | | 120,588 | | |
Member Class | | | — | | | | — | | | | 877 | | |
Total | | $ | 89,384 | | | $ | 29,432 | | | $ | 698,969 | | |
(continues on next page)
See notes to financial statements.
51
Victory Portfolios | | Statements of Assets and Liabilities
October 31, 2021 | |
(Amounts in Thousands, Except Per Share Amounts) (continued)
| | | Victory
THB US
Small
Opportunities
Fund(a) | | Victory
Strategic
Allocation
Fund | | Victory
INCORE
Fund for
Income | |
Shares (unlimited number of shares authorized with
a par value of $0.001 per share): | |
Class A | | | 100 | | | | 821 | | | | 16,254 | | |
Class C | | | — | | | | 128 | | | | 1,284 | | |
Class I | | | 3,420 | | | | 463 | | | | 48,643 | | |
Class R | | | — | | | | 64 | | | | 2,977 | | |
Class R6 | | | — | | | | — | | | | 3,754 | | |
Class Y | | | — | | | | — | | | | 15,221 | | |
Member Class | | | — | | | | — | | | | 110 | | |
Total | | | 3,520 | | | | 1,476 | | | | 88,243 | | |
Net asset value, offering (except Class A)
and redemption price per share: (d) | |
Class A | | $ | 24.30 | | | $ | 19.94 | | | $ | 7.92 | | |
Class C (e) | | | — | | | | 19.56 | | | | 7.84 | | |
Class I | | | 25.42 | | | | 20.06 | | | | 7.92 | | |
Class R | | | — | | | | 19.89 | | | | 7.93 | | |
Class R6 | | | — | | | | — | | | | 7.91 | | |
Class Y | | | — | | | | — | | | | 7.92 | | |
Member Class | | | — | | | | — | | | | 7.95 | | |
Maximum Sales Charge — Class A | | | 5.75 | % | | | 2.25 | % | | | 2.25 | % | |
Maximum offering price
(100%/(100%-maximum sales charge) of net asset
value adjusted to the nearest cent) per share —
Class A | | $ | 25.78 | | | $ | 20.40 | | | $ | 8.10 | | |
(a) On May 3, 2021, the THB Asset Management Microcap Fund (the "Predecessor Fund") was reorganized into the Victory THB US Small Opportunities Fund (the "Victory THB Fund"). Investor Class and Institutional Class shares of the Predecessor Fund were exchanged on a tax-free basis for Class A and Class I shares, respectively, of the Victory THB Fund. Information presented prior to May 3, 2021, is that of the Predecessor Fund. See Note 1 in the Notes to Financial Statements.
(b) Includes $827 of securities on loan.
(c) Rounds to less than $1 thousand.
(d) Per share amount may not recalculate due to rounding of net assets and/or shares outstanding.
(e) Redemption price per share varies by the length of time shares are held.
See notes to financial statements.
52
Victory Portfolios | | Statements of Assets and Liabilities
October 31, 2021 | |
(Amounts in Thousands, Except Per Share Amounts)
| | | Victory INCORE
Investment Grade
Convertible Fund | |
Assets: | |
Investments, at value (Cost $449,317) | | $ | 495,313 | (a) | |
Cash | | | 5,747 | | |
Receivables: | |
Interest and dividends | | | 1,255 | | |
Capital shares issued | | | 555 | | |
Prepaid expenses | | | 20 | | |
Total Assets | | | 502,890 | | |
Liabilities: | |
Payables: | |
Collateral received on loaned securities | | | 77,095 | | |
Capital shares redeemed | | | 133 | | |
Accrued expenses and other payables: | |
Investment advisory fees | | | 266 | | |
Administration fees | | | 22 | | |
Custodian fees | | | 3 | | |
Transfer agent fees | | | 61 | | |
Compliance fees | | | — | (b) | |
Trustees' fees | | | — | (b) | |
| 12b-1 fees | | | 2 | | |
Other accrued expenses | | | 30 | | |
Total Liabilities | | | 77,612 | | |
Net Assets: | |
Capital | | | 348,784 | | |
Total accumulated earnings/(loss) | | | 76,494 | | |
Net Assets | | $ | 425,278 | | |
Net Assets | |
Class A | | $ | 21,644 | | |
Class I | | | 403,122 | | |
Member Class | | | 512 | | |
Total | | $ | 425,278 | | |
Shares (unlimited number of shares authorized with
a par value of $0.001 per share): | |
Class A | | | 1,084 | | |
Class I | | | 20,180 | | |
Member Class | | | 25 | | |
Total | | | 21,289 | | |
Net asset value, offering (except Class A)
and redemption price per share: (c) | |
Class A | | $ | 19.97 | | |
Class I | | | 19.98 | | |
Member Class | | | 20.71 | | |
Maximum Sales Charge — Class A | | | 2.25 | % | |
Maximum offering price
(100%/(100%-maximum sales charge) of net asset
value adjusted to the nearest cent) per share —
Class A | | $ | 20.43 | | |
(a) Includes $75,271 of securities on loan.
(b) Rounds to less than $1 thousand.
(c) Per share amount may not recalculate due to rounding of net assets and/or shares outstanding.
See notes to financial statements.
53
Victory Portfolios | | Statements of Operations
For the Year Ended October 31, 2021 | |
(Amounts in Thousands)
| | | Victory
Diversified
Stock Fund | | Victory
NewBridge
Large Cap
Growth Fund | | Victory
Special
Value Fund | |
Investment Income: | | | |
Dividends | | $ | 3,241 | | | $ | 28 | | | $ | 521 | | |
Interest | | | 1 | | | | — | (a) | | | — | (a) | |
Securities lending (net of fees) | | | 5 | | | | — | (a) | | | — | (a) | |
Total Income | | | 3,247 | | | | 28 | | | | 521 | | |
Expenses: | | | |
Investment advisory fees | | | 1,965 | | | | 132 | | | | 364 | | |
Administration fees | | | 169 | | | | 10 | | | | 27 | | |
Sub-Administration fees | | | 17 | | | | 14 | | | | 17 | | |
| 12b-1 fees — Class A | | | 552 | | | | 21 | | | | 69 | | |
| 12b-1 fees — Class C | | | 26 | | | | 9 | | | | 9 | | |
| 12b-1 fees — Class R | | | 229 | | | | — | | | | 79 | | |
Custodian fees | | | 14 | | | | 2 | | | | 3 | | |
Transfer agent fees — Class A | | | 154 | | | | 9 | | | | 31 | | |
Transfer agent fees — Class C | | | 4 | | | | 1 | | | | 1 | | |
Transfer agent fees — Class I | | | 14 | | | | 5 | | | | 3 | | |
Transfer agent fees — Class R | | | 35 | | | | — | | | | 23 | | |
Transfer agent fees — Class R6 | | | — | (a) | | | — | | | | — | | |
Transfer agent fees — Class Y | | | 5 | | | | 1 | | | | 1 | | |
Trustees' fees | | | 21 | | | | 3 | | | | 5 | | |
Compliance fees | | | 2 | | | | — | (a) | | | — | (a) | |
Legal and audit fees | | | 19 | | | | 8 | | | | 9 | | |
State registration and filing fees | | | 81 | | | | 52 | | | | 65 | | |
Other expenses | | | 34 | | | | 9 | | | | 12 | | |
Total Expenses | | | 3,341 | | | | 276 | | | | 718 | | |
Expenses waived/reimbursed by Adviser | | | (28 | ) | | | (63 | ) | | | (72 | ) | |
Net Expenses | | | 3,313 | | | | 213 | | | | 646 | | |
Net Investment Income (Loss) | | | (66 | ) | | | (185 | ) | | | (125 | ) | |
Realized/Unrealized Gains (Losses) from Investments: | | | |
Net realized gains (losses) from investment securities | | | 48,095 | | | | 4,481 | | | | 9,190 | | |
Net change in unrealized appreciation/depreciation on
investment securities | | | 64,146 | | | | 660 | | | | 8,963 | | |
Net realized/unrealized gains (losses) on investments | | | 112,241 | | | | 5,141 | | | | 18,153 | | |
Change in net assets resulting from operations | | $ | 112,175 | | | $ | 4,956 | | | $ | 18,028 | | |
(a) Rounds to less than $1 thousand.
See notes to financial statements.
54
Victory Portfolios | | Statements of Operations
For the Year Ended October 31, 2021 | |
(Amounts in Thousands)
| | | Victory
THB US
Small
Opportunities
Fund(a) | | Victory
Strategic
Allocation
Fund | | Victory
INCORE
Fund for
Income | |
Investment Income: | | | |
Income distributions from affiliated funds | | $ | — | | | $ | 936 | | | $ | — | | |
Dividends from unaffiliated investments | | | 429 | | | | — | | | | — | | |
Interest from unaffiliated investments | | | — | (b) | | | — | (b) | | | 9,513 | | |
Securities lending (net of fees) | | | 1 | | | | — | | | | — | | |
Total Income | | | 430 | | | | 936 | | | | 9,513 | | |
Expenses: | | | |
Investment advisory fees | | | 998 | | | | 28 | | | | 3,979 | | |
Administration fees | | | 94 | | | | 16 | | | | 478 | | |
Sub-Administration fees | | | 8 | | | | 13 | | | | 22 | | |
Shareholder servicing fees | | | 2 | | | | — | | | | — | | |
| 12b-1 fees — Class A | | | 7 | | | | 41 | | | | 345 | | |
| 12b-1 fees — Class C | | | — | | | | 23 | | | | 136 | | |
| 12b-1 fees — Class R | | | — | | | | 7 | | | | 93 | | |
Custodian fees | | | 6 | | | | 2 | | | | 54 | | |
Transfer agent fees | | | 58 | | | | — | | | | — | | |
Transfer agent fees — Class A | | | 3 | | | | 22 | | | | 117 | | |
Transfer agent fees — Class C | | | — | | | | 3 | | | | 16 | | |
Transfer agent fees — Class I | | | 34 | | | | 8 | | | | 435 | | |
Transfer agent fees — Class R | | | — | | | | 1 | | | | 27 | | |
Transfer agent fees — Class R6 | | | — | | | | — | | | | 3 | | |
Transfer agent fees — Class Y | | | — | | | | — | | | | 164 | | |
Transfer agent fees — Member Class (c) | | | — | | | | — | | | | 1 | | |
Trustees' fees | | | 15 | | | | 4 | | | | 58 | | |
Compliance fees | | | 5 | | | | — | (b) | | | 7 | | |
Legal and audit fees | | | 74 | | | | 8 | | | | 54 | | |
State registration and filing fees | | | 79 | | | | 61 | | | | 151 | | |
Interfund lending fees | | | — | | | | — | | | | — | (b) | |
Recoupment of prior expenses waived/reimbursed by Adviser | | | — | | | | — | | | | 34 | | |
Other expenses | | | 33 | | | | 11 | | | | 174 | | |
Total Expenses | | | 1,416 | | | | 248 | | | | 6,348 | | |
Expenses waived/reimbursed by Adviser | | | (362 | ) | | | (135 | ) | | | (197 | ) | |
Net Expenses | | | 1,054 | | | | 113 | | | | 6,151 | | |
Net Investment Income (Loss) | | | (624 | ) | | | 823 | | | | 3,362 | | |
Realized/Unrealized Gains (Losses) from Investments: | | | |
Net realized gains (losses) from sales of affiliated funds | | | — | | | | (162 | ) | | | — | | |
Net realized gains (losses) from unaffiliated investment
securities | | | 12,921 | | | | 2 | | | | (1,300 | ) | |
Capital gain distributions received from affiliated funds | | | — | | | | 288 | | | | — | | |
Net change in unrealized appreciation/depreciation on
affiliated funds | | | — | | | | 5,000 | | | | — | | |
Net change in unrealized appreciation/depreciation on
unaffiliated investment securities | | | 17,176 | | | | — | | | | (8,573 | ) | |
Net realized/unrealized gains (losses) on investments | | | 30,097 | | | | 5,128 | | | | (9,873 | ) | |
Change in net assets resulting from operations | | $ | 29,473 | | | $ | 5,951 | | | $ | (6,511 | ) | |
(a) On May 3, 2021, the THB Asset Management Microcap Fund (the "Predecessor Fund") was reorganized into the Victory THB US Small Opportunities Fund (the "Victory THB Fund"). Investor Class and Institutional Class shares of the Predecessor Fund were exchanged on a tax-free basis for Class A and Class I shares, respectively, of the Victory THB Fund. Information presented prior to May 3, 2021, is that of the Predecessor Fund. See Note 1 in the Notes to Financial Statements.
(b) Rounds to less than $1 thousand.
(c) Member Class commenced operations on November 3, 2020.
See notes to financial statements.
55
Victory Portfolios | | Statements of Operations
For the Year Ended October 31, 2021 | |
(Amounts in Thousands)
| | | Victory INCORE
Investment Grade
Convertible Fund | |
Investment Income: | |
Dividend | | $ | 6,102 | | |
Interest | | | 2,675 | | |
Securities lending (net of fees) | | | 205 | | |
Total Income | | | 8,982 | | |
Expenses: | |
Investment advisory fees | | | 2,675 | | |
Administration fees | | | 200 | | |
Sub-Administration fees | | | 16 | | |
| 12b-1 fees — Class A | | | 51 | | |
Custodian fees | | | 16 | | |
Transfer agent fees — Class A | | | 40 | | |
Transfer agent fees — Class I | | | 255 | | |
Transfer agent fees — Member Class (a) | | | 1 | | |
Trustees' fees | | | 24 | | |
Compliance fees | | | 3 | | |
Legal and audit fees | | | 27 | | |
State registration and filing fees | | | 77 | | |
Interfund lending fees | | | — | (b) | |
Other expenses | | | 46 | | |
Total Expenses | | | 3,431 | | |
Expenses waived/reimbursed by Adviser | | | (28 | ) | |
Net Expenses | | | 3,403 | | |
Net Investment Income (Loss) | | | 5,579 | | |
Realized/Unrealized Gains (Losses) from Investments: | |
Net realized gains (losses) from investment securities | | | 35,138 | | |
Net change in unrealized appreciation/depreciation on investment securities | | | 21,029 | | |
Net realized/unrealized gains (losses) on investments | | | 56,167 | | |
Change in net assets resulting from operations | | $ | 61,746 | | |
(a) Member Class commenced operations on November 3, 2020.
(b) Rounds to less than $1 thousand.
See notes to financial statements.
56
Victory Portfolios | | Statements of Changes in Net Assets | |
(Amounts in Thousands)
| | | Victory
Diversified Stock Fund | | Victory
NewBridge Large Cap
Growth Fund | |
Victory
Special Value Fund | |
| | | Year
Ended
October 31,
2021 | | Year
Ended
October 31,
2020 | | Year
Ended
October 31,
2021 | | Year
Ended
October 31,
2020 | | Year
Ended
October 31,
2021 | | Year
Ended
October 31,
2020 | |
From Investment Activities: | |
Operations: | |
Net investment
income (loss) | | $ | (66 | ) | | $ | 701 | | | $ | (185 | ) | | $ | (153 | ) | | $ | (125 | ) | | $ | 12 | | |
Net realized gains (losses)
from investments | | | 48,095 | | | | 6,025 | | | | 4,481 | | | | 2,698 | | | | 9,190 | | | | 1,501 | | |
Net change in unrealized
appreciation/
depreciation
on investments | | | 64,146 | | | | 6,403 | | | | 660 | | | | 2,842 | | | | 8,963 | | | | 855 | | |
Change in net assets resulting
from operations | | | 112,175 | | | | 13,129 | | | | 4,956 | | | | 5,387 | | | | 18,028 | | | | 2,368 | | |
Distributions to Shareholders: | |
Class A | | | (4,846 | ) | | | (13,665 | ) | | | (924 | ) | | | (1,005 | ) | | | (913 | ) | | | (912 | ) | |
Class C | | | (83 | ) | | | (369 | ) | | | (429 | ) | | | (746 | ) | | | (36 | ) | | | (40 | ) | |
Class I | | | (570 | ) | | | (1,940 | ) | | | (641 | ) | | | (987 | ) | | | (121 | ) | | | (114 | ) | |
Class R | | | (1,037 | ) | | | (3,072 | ) | | | — | | | | — | | | | (543 | ) | | | (660 | ) | |
Class R6 | | | (85 | ) | | | (57 | ) | | | — | | | | — | | | | — | | | | — | | |
Class Y | | | (99 | ) | | | (287 | ) | | | (148 | ) | | | (385 | ) | | | (23 | ) | | | (19 | ) | |
Change in net assets resulting
from distributions to
shareholders | | | (6,720 | ) | | | (19,390 | ) | | | (2,142 | ) | | | (3,123 | ) | | | (1,636 | ) | | | (1,745 | ) | |
Change in net assets resulting
from capital transactions | | | (25,722 | ) | | | (36,149 | ) | | | (1,834 | ) | | | (1,443 | ) | | | (8,094 | ) | | | (11,653 | ) | |
Change in net assets | | | 79,733 | | | | (42,410 | ) | | | 980 | | | | 821 | | | | 8,298 | | | | (11,030 | ) | |
Net Assets: | |
Beginning of period | | | 254,606 | | | | 297,016 | | | | 16,862 | | | | 16,041 | | | | 42,907 | | | | 53,937 | | |
End of period | | $ | 334,339 | | | $ | 254,606 | | | $ | 17,842 | | | $ | 16,862 | | | $ | 51,205 | | | $ | 42,907 | | |
(continues on next page)
See notes to financial statements.
57
Victory Portfolios | | Statements of Changes in Net Assets | |
(Amounts in Thousands) (continued)
| | | Victory
Diversified Stock Fund | | Victory
NewBridge Large Cap
Growth Fund | |
Victory
Special Value Fund | |
| | | Year
Ended
October 31,
2021 | | Year
Ended
October 31,
2020 | | Year
Ended
October 31,
2021 | | Year
Ended
October 31,
2020 | | Year
Ended
October 31,
2021 | | Year
Ended
October 31,
2020 | |
Capital Transactions: | |
Class A | |
Proceeds from shares
issued | | $ | 7,876 | | | $ | 7,727 | | | $ | 701 | | | $ | 1,914 | | | $ | 1,518 | | | $ | 2,733 | | |
Distributions reinvested | | | 4,436 | | | | 12,429 | | | | 740 | | | | 817 | | | | 831 | | | | 818 | | |
Cost of shares redeemed | | | (27,454 | ) | | | (36,795 | ) | | | (1,851 | ) | | | (1,714 | ) | | | (7,055 | ) | | | (7,356 | ) | |
Total Class A | | $ | (15,142 | ) | | $ | (16,639 | ) | | $ | (410 | ) | | $ | 1,017 | | | $ | (4,706 | ) | | $ | (3,805 | ) | |
Class C | |
Proceeds from shares
issued | | $ | 80 | | | $ | 169 | | | $ | 93 | | | $ | 286 | | | $ | 36 | | | $ | 446 | | |
Distributions reinvested | | | 82 | | | | 311 | | | | 338 | | | | 569 | | | | 36 | | | | 29 | | |
Cost of shares redeemed | | | (1,782 | ) | | | (3,132 | ) | | | (752 | ) | | | (1,193 | ) | | | (249 | ) | | | (870 | ) | |
Total Class C | | $ | (1,620 | ) | | $ | (2,652 | ) | | $ | (321 | ) | | $ | (338 | ) | | $ | (177 | ) | | $ | (395 | ) | |
Class I | |
Proceeds from shares
issued | | $ | 1,886 | | | $ | 2,816 | | | $ | 1,047 | | | $ | 522 | | | $ | 406 | | | $ | 436 | | |
Distributions reinvested | | | 537 | | | | 1,805 | | | | 624 | | | | 927 | | | | 101 | | | | 98 | | |
Cost of shares redeemed | | | (4,406 | ) | | | (14,222 | ) | | | (2,047 | ) | | | (2,375 | ) | | | (1,187 | ) | | | (601 | ) | |
Total Class I | | $ | (1,983 | ) | | $ | (9,601 | ) | | $ | (376 | ) | | $ | (926 | ) | | $ | (680 | ) | | $ | (67 | ) | |
Class R | |
Proceeds from shares
issued | | $ | 721 | | | $ | 1,667 | | | $ | — | | | $ | — | | | $ | 1,962 | | | $ | 2,086 | | |
Distributions reinvested | | | 1,016 | | | | 2,947 | | | | — | | | | — | | | | 530 | | | | 613 | | |
Cost of shares redeemed | | | (8,082 | ) | | | (12,020 | ) | | | — | | | | — | | | | (5,022 | ) | | | (10,132 | ) | |
Total Class R | | $ | (6,345 | ) | | $ | (7,406 | ) | | $ | — | | | $ | — | | | $ | (2,530 | ) | | $ | (7,433 | ) | |
Class R6 | |
Proceeds from shares
issued | | $ | 183 | | | $ | 2,494 | | | $ | — | | | $ | — | | | $ | — | | | $ | — | | |
Distributions reinvested | | | 85 | | | | 57 | | | | — | | | | — | | | | — | | | | — | | |
Cost of shares redeemed | | | (618 | ) | | | (1,945 | ) | | | — | | | | — | | | | — | | | | — | | |
Total Class R6 | | $ | (350 | ) | | $ | 606 | | | $ | — | | | $ | — | | | $ | — | | | $ | — | | |
Class Y | |
Proceeds from shares
issued | | $ | 284 | | | $ | 188 | | | $ | 266 | | | $ | 310 | | | $ | 82 | | | $ | 105 | | |
Distributions reinvested | | | 83 | | | | 244 | | | | 131 | | | | 184 | | | | 18 | | | | 14 | | |
Cost of shares redeemed | | | (649 | ) | | | (889 | ) | | | (1,124 | ) | | | (1,690 | ) | | | (101 | ) | | | (72 | ) | |
Total Class Y | | $ | (282 | ) | | $ | (457 | ) | | $ | (727 | ) | | $ | (1,196 | ) | | $ | (1 | ) | | $ | 47 | | |
Change in net assets resulting
from capital transactions | | $ | (25,722 | ) | | $ | (36,149 | ) | | $ | (1,834 | ) | | $ | (1,443 | ) | | $ | (8,094 | ) | | $ | (11,653 | ) | |
(continues on next page)
See notes to financial statements.
58
Victory Portfolios | | Statements of Changes in Net Assets | |
(Amounts in Thousands) (continued)
| | | Victory
Diversified Stock Fund | | Victory
NewBridge Large Cap
Growth Fund | |
Victory
Special Value Fund | |
| | | Year
Ended
October 31,
2021 | | Year
Ended
October 31,
2020 | | Year
Ended
October 31,
2021 | | Year
Ended
October 31,
2020 | | Year
Ended
October 31,
2021 | | Year
Ended
October 31,
2020 | |
Share Transactions: | |
Class A | |
Issued | | | 378 | | | | 473 | | | | 110 | | | | 336 | | | | 48 | | | | 111 | | |
Reinvested | | | 231 | | | | 719 | | | | 118 | | | | 171 | | | | 29 | | | | 31 | | |
Redeemed | | | (1,303 | ) | | | (2,225 | ) | | | (277 | ) | | | (314 | ) | | | (222 | ) | | | (294 | ) | |
Total Class A | | | (694 | ) | | | (1,033 | ) | | | (49 | ) | | | 193 | | | | (145 | ) | | | (152 | ) | |
Class C (a) | |
Issued | | | 3 | | | | 11 | | | | 13 | | | | 35 | | | | 2 | | | | 21 | | |
Reinvested | | | 5 | | | | 19 | | | | 47 | | | | 75 | | | | 1 | | | | 1 | | |
Redeemed | | | (94 | ) | | | (199 | ) | | | (99 | ) | | | (136 | ) | | | (10 | ) | | | (39 | ) | |
Total Class C | | | (86 | ) | | | (169 | ) | | | (39 | ) | | | (26 | ) | | | (7 | ) | | | (17 | ) | |
Class I | |
Issued | | | 86 | | | | 169 | | | | 139 | | | | 86 | | | | 13 | | | | 18 | | |
Reinvested | | | 28 | | | | 105 | | | | 86 | | | | 170 | | | | 3 | | | | 4 | | |
Redeemed | | | (208 | ) | | | (856 | ) | | | (260 | ) | | | (383 | ) | | | (37 | ) | | | (24 | ) | |
Total Class I | | | (94 | ) | | | (582 | ) | | | (35 | ) | | | (127 | ) | | | (21 | ) | | | (2 | ) | |
Class R | |
Issued | | | 35 | | | | 102 | | | | — | | | | — | | | | 65 | | | | 95 | | |
Reinvested | | | 54 | | | | 174 | | | | — | | | | — | | | | 20 | | | | 25 | | |
Redeemed | | | (387 | ) | | | (734 | ) | | | — | | | | — | | | | (167 | ) | | | (422 | ) | |
Total Class R | | | (298 | ) | | | (458 | ) | | | — | | | | — | | | | (82 | ) | | | (302 | ) | |
Class R6 | |
Issued | | | 8 | | | | 154 | | | | — | | | | — | | | | — | | | | — | | |
Reinvested | | | 4 | | | | 3 | | | | — | | | | — | | | | — | | | | — | | |
Redeemed | | | (29 | ) | | | (109 | ) | | | — | | | | — | | | | — | | | | — | | |
Total Class R6 | | | (17 | ) | | | 48 | | | | — | | | | — | | | | — | | | | — | | |
Class Y | |
Issued | | | 14 | | | | 12 | | | | 38 | | | | 59 | | | | 2 | | | | 4 | | |
Reinvested | | | 4 | | | | 14 | | | | 19 | | | | 36 | | | | 1 | | | | 1 | | |
Redeemed | | | (31 | ) | | | (52 | ) | | | (152 | ) | | | (264 | ) | | | (3 | ) | | | (3 | ) | |
Total Class Y | | | (13 | ) | | | (26 | ) | | | (95 | ) | | | (169 | ) | | | — | (b) | | | 2 | | |
Change in Shares | | | (1,202 | ) | | | (2,220 | ) | | | (218 | ) | | | (129 | ) | | | (255 | ) | | | (471 | ) | |
(a) As described in Note 10, Victory NewBridge Large Cap Growth Fund Class C share amounts have been adjusted for a 1:5 reverse stock split.
(b) Rounds to less than 1 thousand.
See notes to financial statements.
59
Victory Portfolios | | Statements of Changes in Net Assets | |
(Amounts in Thousands)
| | | Victory
THB US Small
Opportunities Fund(a) | | Victory
Strategic
Allocation Fund | |
Victory INCORE
Fund for Income | |
| | | Year
Ended
October 31,
2021 | | Year
Ended
October 31,
2020 | | Year
Ended
October 31,
2021 | | Year
Ended
October 31,
2020 | | Year
Ended
October 31,
2021 | | Year
Ended
October 31,
2020 | |
From Investment Activities: | |
Operations: | |
Net investment
income (loss) | | $ | (624 | ) | | $ | (393 | ) | | $ | 823 | | | $ | 347 | | | $ | 3,362 | | | $ | 7,347 | | |
Net realized gains (losses)
from investments | | | 12,921 | | | | (3,264 | ) | | | 128 | | | | (96 | ) | | | (1,300 | ) | | | 877 | | |
Net change in unrealized
appreciation/
depreciation
on investments | | | 17,176 | | | | 1,848 | | | | 5,000 | | | | 644 | | | | (8,573 | ) | | | 12,254 | | |
Change in net assets resulting
from operations | | | 29,473 | | | | (1,809 | ) | | | 5,951 | | | | 895 | | | | (6,511 | ) | | | 20,478 | | |
Distributions to Shareholders: | |
Class A | | | — | | | | (4 | ) | | | (464 | ) | | | (582 | ) | | | (6,501 | ) | | | (6,067 | ) | |
Class C | | | — | | | | — | | | | (54 | ) | | | (99 | ) | | | (542 | ) | | | (809 | ) | |
Class I | | | — | | | | (417 | ) | | | (264 | ) | | | (239 | ) | | | (23,178 | ) | | | (25,543 | ) | |
Class R | | | — | | | | — | | | | (34 | ) | | | (45 | ) | | | (1,747 | ) | | | (1,831 | ) | |
Class R6 | | | — | | | | — | | | | — | | | | — | | | | (1,851 | ) | | | (1,832 | ) | |
Class Y | | | — | | | | — | | | | — | | | | — | | | | (7,361 | ) | | | (5,074 | ) | |
Member Class (b) | | | — | | | | — | | | | — | | | | — | | | | (33 | ) | | | — | | |
Change in net assets resulting
from distributions to
shareholders | | | — | | | | (421 | ) | | | (816 | ) | | | (965 | ) | | | (41,213 | ) | | | (41,156 | ) | |
Change in net assets resulting
from capital transactions | | | 9,212 | | | | (21,101 | ) | | | (341 | ) | | | (901 | ) | | | (295,207 | ) | | | 346,322 | | |
Change in net assets | | | 38,685 | | | | (23,331 | ) | | | 4,794 | | | | (971 | ) | | | (342,931 | ) | | | 325,644 | | |
Net Assets: | |
Beginning of period | | | 50,699 | | | | 74,030 | | | | 24,638 | | | | 25,609 | | | | 1,041,900 | | | | 716,256 | | |
End of period | | $ | 89,384 | | | $ | 50,699 | | | $ | 29,432 | | | $ | 24,638 | | | $ | 698,969 | | | $ | 1,041,900 | | |
(a) On May 3, 2021, the THB Asset Management Microcap Fund (the "Predecessor Fund") was reorganized into the Victory THB US Small Opportunities Fund (the "Victory THB Fund"). Investor Class and Institutional Class shares of the Predecessor Fund were exchanged on a tax-free basis for Class A and Class I shares, respectively, of the Victory THB Fund. Information presented prior to May 3, 2021, is that of the Predecessor Fund. See Note 1 in the Notes to Financial Statements.
(b) Member Class commenced operations on November 3, 2020.
(continues on next page)
See notes to financial statements.
60
Victory Portfolios | | Statements of Changes in Net Assets | |
(Amounts in Thousands) (continued)
| | | Victory
THB US Small
Opportunities Fund(a) | | Victory
Strategic
Allocation Fund | |
Victory INCORE
Fund for Income | |
| | | Year
Ended
October 31,
2021 | | Year
Ended
October 31,
2020 | | Year
Ended
October 31,
2021 | | Year
Ended
October 31,
2020 | | Year
Ended
October 31,
2021 | | Year
Ended
October 31,
2020 | |
Capital Transactions: | |
Class A | |
Proceeds from shares issued | | $ | 5,749 | | | $ | 92 | | | $ | 1,793 | | | $ | 2,364 | | | $ | 43,381 | | | $ | 73,304 | | |
Distributions reinvested | | | — | | | | 4 | | | | 448 | | | | 557 | | | | 5,738 | | | | 5,164 | | |
Redemption Fees (b) | | | 1 | | | | — | | | | — | | | | — | | | | — | | | | — | | |
Cost of shares redeemed | | | (3,959 | ) | | | (241 | ) | | | (3,213 | ) | | | (3,895 | ) | | | (63,627 | ) | | | (60,933 | ) | |
Total Class A | | $ | 1,791 | | | $ | (145 | ) | | $ | (972 | ) | | $ | (974 | ) | | $ | (14,508 | ) | | $ | 17,535 | | |
Class C | |
Proceeds from shares issued | | $ | — | | | $ | — | | | $ | 650 | | | $ | 574 | | | $ | 1,685 | | | $ | 6,690 | | |
Distributions reinvested | | | — | | | | — | | | | 53 | | | | 98 | | | | 505 | | | | 690 | | |
Cost of shares redeemed | | | — | | | | — | | | | (623 | ) | | | (1,845 | ) | | | (12,166 | ) | | | (8,697 | ) | |
Total Class C | | $ | — | | | $ | — | | | $ | 80 | | | $ | (1,173 | ) | | $ | (9,976 | ) | | $ | (1,317 | ) | |
Class I | |
Proceeds from shares issued | | $ | 15,429 | | | $ | 6,642 | | | $ | 1,842 | | | $ | 2,267 | | | $ | 163,315 | | | $ | 410,936 | | |
Distributions reinvested | | | — | | | | 360 | | | | 261 | | | | 233 | | | | 20,000 | | | | 21,645 | | |
Redemption Fees (b) | | | 2 | | | | — | | | | — | | | | — | | | | — | | | | — | | |
Cost of shares redeemed | | | (8,010 | ) | | | (27,958 | ) | | | (1,305 | ) | | | (1,204 | ) | | | (362,435 | ) | | | (277,267 | ) | |
Total Class I | | $ | 7,421 | | | $ | (20,956 | ) | | $ | 798 | | | $ | 1,296 | | | $ | (179,120 | ) | | $ | 155,314 | | |
Class R | |
Proceeds from shares issued | | $ | — | | | $ | — | | | $ | 93 | | | $ | 30 | | | $ | 4,576 | | | $ | 18,508 | | |
Distributions reinvested | | | — | | | | — | | | | 34 | | | | 45 | | | | 1,705 | | | | 1,753 | | |
Cost of shares redeemed | | | — | | | | — | | | | (374 | ) | | | (125 | ) | | | (24,238 | ) | | | (14,365 | ) | |
Total Class R | | $ | — | | | $ | — | | | $ | (247 | ) | | $ | (50 | ) | | $ | (17,957 | ) | | $ | 5,896 | | |
Class R6 | |
Proceeds from shares issued | | $ | — | | | $ | — | | | $ | — | | | $ | — | | | $ | 11,111 | | | $ | 49,482 | | |
Distributions reinvested | | | — | | | | — | | | | — | | | | — | | | | 1,831 | | | | 1,818 | | |
Cost of shares redeemed | | | — | | | | — | | | | — | | | | — | | | | (30,159 | ) | | | (17,319 | ) | |
Total Class R6 | | $ | — | | | $ | — | | | $ | — | | | $ | — | | | $ | (17,217 | ) | | $ | 33,981 | | |
Class Y | |
Proceeds from shares issued | | $ | — | | | $ | — | | | $ | — | | | $ | — | | | $ | 94,608 | | | $ | 189,431 | | |
Distributions reinvested | | | — | | | | — | | | | — | | | | — | | | | 7,353 | | | | 3,546 | | |
Cost of shares redeemed | | | — | | | | — | | | | — | | | | — | | | | (159,309 | ) | | | (58,064 | ) | |
Total Class Y | | $ | — | | | $ | — | | | $ | — | | | $ | — | | | $ | (57,348 | ) | | $ | 134,913 | | |
Member Class (c) | |
Proceeds from shares issued | | $ | — | | | $ | — | | | $ | — | | | $ | — | | | $ | 1,372 | | | $ | — | | |
Distributions reinvested | | | — | | | | — | | | | — | | | | — | | | | 33 | | | | — | | |
Cost of shares redeemed | | | — | | | | — | | | | — | | | | — | | | | (486 | ) | | | — | | |
Total Member Class | | $ | — | | | $ | — | | | $ | — | | | $ | — | | | $ | 919 | | | $ | — | | |
Change in net assets resulting
from capital transactions | | $ | 9,212 | | | $ | (21,101 | ) | | $ | (341 | ) | | $ | (901 | ) | | $ | (295,207 | ) | | $ | 346,322 | | |
(a) On May 3, 2021, the THB Asset Management Microcap Fund (the "Predecessor Fund") was reorganized into the Victory THB US Small Opportunities Fund (the "Victory THB Fund"). Investor Class and Institutional Class shares of the Predecessor Fund were exchanged on a tax-free basis for Class A and Class I shares, respectively, of the Victory THB Fund. Information presented prior to May 3, 2021, is that of the Predecessor Fund. See Note 1 in the Notes to Financial Statements.
(b) Redemptions Fees — see Note 2 in the Notes to Financial Statements.
(c) Member Class commenced operations on November 3, 2020.
(continues on next page)
See notes to financial statements.
61
Victory Portfolios | | Statements of Changes in Net Assets | |
(Amounts in Thousands) (continued)
| | | Victory
THB US Small
Opportunities Fund(a) | | Victory
Strategic
Allocation Fund | |
Victory INCORE
Fund for Income | |
| | | Year
Ended
October 31,
2021 | | Year
Ended
October 31,
2020 | | Year
Ended
October 31,
2021 | | Year
Ended
October 31,
2020 | | Year
Ended
October 31,
2021 | | Year
Ended
October 31,
2020 | |
Share Transactions: | |
Class A | |
Issued | | | 227 | | | | 7 | | | | 95 | | | | 146 | | | | 5,258 | | | | 8,586 | | |
Reinvested | | | — | | | | — | (c) | | | 23 | | | | 34 | | | | 703 | | | | 608 | | |
Redeemed | | | (159 | ) | | | (17 | ) | | | (168 | ) | | | (242 | ) | | | (7,717 | ) | | | (7,145 | ) | |
Total Class A | | | 68 | | | | (10 | ) | | | (50 | ) | | | (62 | ) | | | (1,756 | ) | | | 2,049 | | |
Class C | |
Issued | | | — | | | | — | | | | 35 | | | | 36 | | | | 206 | | | | 789 | | |
Reinvested | | | — | | | | — | | | | 3 | | | | 6 | | | | 62 | | | | 82 | | |
Redeemed | | | — | | | | — | | | | (34 | ) | | | (115 | ) | | | (1,486 | ) | | | (1,028 | ) | |
Total Class C | | | — | | | | — | | | | 4 | | | | (73 | ) | | | (1,218 | ) | | | (157 | ) | |
Class I | |
Issued | | | 639 | | | | 465 | | | | 96 | | | | 140 | | | | 19,802 | | | | 48,019 | | |
Reinvested | | | — | | | | 22 | | | | 13 | | | | 14 | | | | 2,447 | | | | 2,546 | | |
Redeemed | | | (319 | ) | | | (2,105 | ) | | | (69 | ) | | | (78 | ) | | | (43,989 | ) | | | (32,536 | ) | |
Total Class I | | | 320 | | | | (1,618 | ) | | | 40 | | | | 76 | | | | (21,740 | ) | | | 18,029 | | |
Class R | |
Issued | | | — | | | | — | | | | 5 | | | | 2 | | | | 552 | | | | 2,167 | | |
Reinvested | | | — | | | | — | | | | 2 | | | | 3 | | | | 208 | | | | 206 | | |
Redeemed | | | — | | | | — | | | | (20 | ) | | | (8 | ) | | | (2,981 | ) | | | (1,682 | ) | |
Total Class R | | | — | | | | — | | | | (13 | ) | | | (3 | ) | | | (2,221 | ) | | | 691 | | |
Class R6 | |
Issued | | | — | | | | — | | | | — | | | | — | | | | 1,349 | | | | 5,802 | | |
Reinvested | | | — | | | | — | | | | — | | | | — | | | | 224 | | | | 214 | | |
Redeemed | | | — | | | | — | | | | — | | | | — | | | | (3,665 | ) | | | (2,027 | ) | |
Total Class R6 | | | — | | | | — | | | | — | | | | — | | | | (2,092 | ) | | | 3,989 | | |
Class Y | |
Issued | | | — | | | | — | | | | — | | | | — | | | | 11,518 | | | | 22,159 | | |
Reinvested | | | — | | | | — | | | | — | | | | — | | | | 900 | | | | 418 | | |
Redeemed | | | — | | | | — | | | | — | | | | — | | | | (19,398 | ) | | | (6,797 | ) | |
Total Class Y | | | — | | | | — | | | | — | | | | — | | | | (6,980 | ) | | | 15,780 | | |
Member Class (b) | |
Issued | | | — | | | | — | | | | — | | | | — | | | | 166 | | | | — | | |
Reinvested | | | — | | | | — | | | | — | | | | — | | | | 4 | | | | — | | |
Redeemed | | | — | | | | — | | | | — | | | | — | | | | (60 | ) | | | — | | |
Total Member Class | | | — | | | | — | | | | — | | | | — | | | | 110 | | | | — | | |
Change in Shares | | | 388 | | | | (1,628 | ) | | | (19 | ) | | | (62 | ) | | | (35,897 | ) | | | 40,381 | | |
(a) On May 3, 2021, the THB Asset Management Microcap Fund (the "Predecessor Fund") was reorganized into the Victory THB US Small Opportunities Fund (the "Victory THB Fund"). Investor Class and Institutional Class shares of the Predecessor Fund were exchanged on a tax-free basis for Class A and Class I shares, respectively, of the Victory THB Fund. Information presented prior to May 3, 2021, is that of the Predecessor Fund. See Note 1 in the Notes to Financial Statements.
(b) Member Class commenced operations on November 3, 2020.
(c) Rounds to less than 1 thousand.
See notes to financial statements.
62
Victory Portfolios | | Statements of Changes in Net Assets | |
(Amounts in Thousands)
| | | Victory
INCORE Investment Grade
Convertible Fund | |
| | | Year
Ended
October 31,
2021 | | Year
Ended
October 31,
2020 | |
From Investment Activities: | |
Operations: | |
Net investment income (loss) | | $ | 5,579 | | | $ | 5,803 | | |
Net realized gains (losses) from investments | | | 35,138 | | | | 8,565 | | |
Net change in unrealized appreciation/depreciation on investments | | | 21,029 | | | | 1,342 | | |
Change in net assets resulting from operations | | | 61,746 | | | | 15,710 | | |
Distributions to Shareholders: | |
Class A | | | (820 | ) | | | (1,183 | ) | |
Class I | | | (14,821 | ) | | | (15,554 | ) | |
Member Class (a) | | | (3 | ) | | | — | | |
Change in net assets resulting from distributions to shareholders | | | (15,644 | ) | | | (16,737 | ) | |
Change in net assets resulting from capital transactions | | | 85,682 | | | | 14,191 | | |
Change in net assets | | | 131,784 | | | | 13,164 | | |
Net Assets: | |
Beginning of period | | | 293,494 | | | | 280,330 | | |
End of period | | $ | 425,278 | | | $ | 293,494 | | |
(a) Member Class commenced operations on November 3, 2020.
(continues on next page)
See notes to financial statements.
63
Victory Portfolios | | Statements of Changes in Net Assets | |
(Amounts in Thousands) (continued)
| | | Victory
INCORE Investment Grade
Convertible Fund | |
| | | Year
Ended
October 31,
2021 | | Year
Ended
October 31,
2020 | |
Capital Transactions: | |
Class A | |
Proceeds from shares issued | | $ | 8,473 | | | $ | 26,469 | | |
Distributions reinvested | | | 711 | | | | 1,032 | | |
Cost of shares redeemed | | | (6,798 | ) | | | (29,802 | ) | |
Total Class A | | $ | 2,386 | | | $ | (2,301 | ) | |
Class I | |
Proceeds from shares issued | | $ | 174,838 | | | $ | 181,653 | | |
Distributions reinvested | | | 14,661 | | | | 15,054 | | |
Cost of shares redeemed | | | (106,697 | ) | | | (180,215 | ) | |
Total Class I | | $ | 82,802 | | | $ | 16,492 | | |
Member Class (a) | |
Proceeds from shares issued | | $ | 657 | | | $ | — | | |
Distributions reinvested | | | 3 | | | | — | | |
Cost of shares redeemed | | | (166 | ) | | | — | | |
Total Member Class | | $ | 494 | | | $ | — | | |
Change in net assets resulting from capital transactions | | $ | 85,682 | | | $ | 14,191 | | |
Share Transactions: | |
Class A | |
Issued | | | 441 | | | | 1,717 | | |
Reinvested | | | 39 | | | | 62 | | |
Redeemed | | | (353 | ) | | | (1,755 | ) | |
Total Class A | | | 127 | | | | 24 | | |
Class I | |
Issued | | | 8,995 | | | | 11,013 | | |
Reinvested | | | 797 | | | | 889 | | |
Redeemed | | | (5,604 | ) | | | (10,994 | ) | |
Total Class I | | | 4,188 | | | | 908 | | |
Member Class (a) | |
Issued | | | 33 | | | | — | | |
Reinvested | | | — | (b) | | | — | | |
Redeemed | | | (8 | ) | | | — | | |
Total Member Class | | | 25 | | | | — | | |
Change in Shares | | | 4,340 | | | | 932 | | |
(a) Member Class commenced operations on November 3, 2020.
(b) Rounds to less than 1 thousand.
See notes to financial statements.
64
This page is intentionally left blank.
65
Victory Portfolios | | Financial Highlights | |
For a Share Outstanding Throughout Each Period
| | | | Investment Activities | | Distributions to
Shareholders From | |
| | | Net Asset
Value,
Beginning of
Period | | Net
Investment
Income
(Loss)(a) | | Net Realized
and Unrealized
Gains (Losses)
on Investments | | Total from
Investment
Activities | | Net
Investment
Income | | Net Realized
Gains from
Investments | |
Victory Diversified Stock Fund | | | |
Class A | | | |
Year Ended October 31: | |
| | 2021 | | | $ | 17.41 | | | | — | (c) | | | 7.95 | | | | 7.95 | | | | (0.01 | ) | | | (0.46 | ) | |
| | 2020 | | | $ | 17.65 | | | | 0.05 | | | | 0.90 | | | | 0.95 | | | | (0.04 | ) | | | (1.15 | ) | |
| | 2019 | | | $ | 17.90 | | | | 0.09 | | | | 1.65 | | | | 1.74 | | | | (0.08 | ) | | | (1.91 | ) | |
| | 2018 | | | $ | 22.03 | | | | 0.06 | | | | 0.17 | | | | 0.23 | | | | (0.06 | ) | | | (4.30 | ) | |
| | 2017 | | | $ | 18.01 | | | | 0.13 | | | | 4.28 | | | | 4.41 | | | | (0.17 | ) | | | (0.22 | ) | |
Class C | | | |
Year Ended October 31: | |
| | 2021 | | | $ | 16.05 | | | | (0.18 | ) | | | 7.29 | | | | 7.11 | | | | — | | | | (0.46 | ) | |
| | 2020 | | | $ | 16.46 | | | | (0.10 | ) | | | 0.84 | | | | 0.74 | | | | — | | | | (1.15 | ) | |
| | 2019 | | | $ | 16.90 | | | | (0.05 | ) | | | 1.52 | | | | 1.47 | | | | — | | | | (1.91 | ) | |
| | 2018 | | | $ | 21.12 | | | | (0.10 | ) | | | 0.18 | | | | 0.08 | | | | — | | | | (4.30 | ) | |
| | 2017 | | | $ | 17.30 | | | | (0.02 | ) | | | 4.10 | | | | 4.08 | | | | (0.04 | ) | | | (0.22 | ) | |
Class I | | | |
Year Ended October 31: | |
| | 2021 | | | $ | 17.37 | | | | 0.05 | | | | 7.94 | | | | 7.99 | | | | (0.02 | ) | | | (0.46 | ) | |
| | 2020 | | | $ | 17.61 | | | | 0.09 | | | | 0.90 | | | | 0.99 | | | | (0.08 | ) | | | (1.15 | ) | |
| | 2019 | | | $ | 17.87 | | | | 0.13 | | | | 1.65 | | | | 1.78 | | | | (0.13 | ) | | | (1.91 | ) | |
| | 2018 | | | $ | 22.00 | | | | 0.11 | | | | 0.16 | | | | 0.27 | | | | (0.10 | ) | | | (4.30 | ) | |
| | 2017 | | | $ | 17.98 | | | | 0.19 | | | | 4.27 | | | | 4.46 | | | | (0.22 | ) | | | (0.22 | ) | |
Class R | | | |
Year Ended October 31: | |
| | 2021 | | | $ | 17.01 | | | | (0.06 | ) | | | 7.76 | | | | 7.70 | | | | — | | | | (0.46 | ) | |
| | 2020 | | | $ | 17.29 | | | | — | (c) | | | 0.88 | | | | 0.88 | | | | (0.01 | ) | | | (1.15 | ) | |
| | 2019 | | | $ | 17.58 | | | | 0.04 | | | | 1.62 | | | | 1.66 | | | | (0.04 | ) | | | (1.91 | ) | |
| | 2018 | | | $ | 21.71 | | | | 0.01 | | | | 0.16 | | | | 0.17 | | | | — | (c) | | | (4.30 | ) | |
| | 2017 | | | $ | 17.75 | | | | 0.07 | | | | 4.23 | | | | 4.30 | | | | (0.12 | ) | | | (0.22 | ) | |
(a) Per share net investment income (loss) has been calculated using the average daily shares method.
(b) Portfolio turnover is calculated on the basis of the Fund as a whole without distinguishing between the classes of shares issued.
(c) Amount is less than $0.005 per share.
(d) Amount is less than 0.005%.
See notes to financial statements.
66
Victory Portfolios | | Financial Highlights — continued | |
For a Share Outstanding Throughout Each Period
| | | | | Ratios to Average Net Assets | | Supplemental Data | |
| | | Total
Distributions | | Net Asset
Value,
End of
Period | | Total
Return
(Excludes
Sales
Charge) | | Net
Expenses | | Net
Investment
Income
(Loss) | | Gross
Expenses | | Net Assets,
End of
Period
(000's) | | Portfolio
Turnover(b) | |
Victory Diversified Stock Fund | |
Class A | |
Year Ended October 31: | |
| | 2021 | | | | (0.47 | ) | | $ | 24.89 | | | | 46.50 | % | | | 1.07 | % | | | 0.00 | %(d) | | | 1.07 | % | | $ | 246,063 | | | | 61 | % | |
| | 2020 | | | | (1.19 | ) | | $ | 17.41 | | | | 5.47 | % | | | 1.09 | % | | | 0.29 | % | | | 1.09 | % | | $ | 184,217 | | | | 95 | % | |
| | 2019 | | | | (1.99 | ) | | $ | 17.65 | | | | 12.27 | % | | | 1.08 | % | | | 0.55 | % | | | 1.08 | % | | $ | 204,945 | | | | 132 | % | |
| | 2018 | | | | (4.36 | ) | | $ | 17.90 | | | | (0.20 | )% | | | 1.05 | % | | | 0.32 | % | | | 1.05 | % | | $ | 264,297 | | | | 112 | % | |
| | 2017 | | | | (0.39 | ) | | $ | 22.03 | | | | 24.85 | % | | | 1.05 | % | | | 0.66 | % | | | 1.05 | % | | $ | 311,255 | | | | 133 | % | |
Class C | |
Year Ended October 31: | |
| | 2021 | | | | (0.46 | ) | | $ | 22.70 | | | | 45.01 | % | | | 2.02 | % | | | (0.93 | )% | | | 2.32 | % | | $ | 2,371 | | | | 61 | % | |
| | 2020 | | | | (1.15 | ) | | $ | 16.05 | | | | 4.53 | % | | | 2.05 | % | | | (0.64 | )% | | | 2.14 | % | | $ | 3,046 | | | | 95 | % | |
| | 2019 | | | | (1.91 | ) | | $ | 16.46 | | | | 11.19 | % | | | 2.02 | % | | | (0.35 | )% | | | 2.02 | % | | $ | 5,909 | | | | 132 | % | |
| | 2018 | | | | (4.30 | ) | | $ | 16.90 | | | | (1.02 | )% | | | 1.89 | % | | | (0.53 | )% | | | 1.89 | % | | $ | 11,586 | | | | 112 | % | |
| | 2017 | | | | (0.26 | ) | | $ | 21.12 | | | | 23.82 | % | | | 1.87 | % | | | (0.12 | )% | | | 1.87 | % | | $ | 36,001 | | | | 133 | % | |
Class I | |
Year Ended October 31: | |
| | 2021 | | | | (0.48 | ) | | $ | 24.88 | | | | 46.79 | % | | | 0.83 | % | | | 0.24 | % | | | 0.85 | % | | $ | 27,856 | | | | 61 | % | |
| | 2020 | | | | (1.23 | ) | | $ | 17.37 | | | | 5.81 | % | | | 0.84 | % | | | 0.56 | % | | | 0.86 | % | | $ | 21,071 | | | | 95 | % | |
| | 2019 | | | | (2.04 | ) | | $ | 17.61 | | | | 12.52 | % | | | 0.84 | % | | | 0.81 | % | | | 0.84 | % | | $ | 31,619 | | | | 132 | % | |
| | 2018 | | | | (4.40 | ) | | $ | 17.87 | | | | 0.05 | % | | | 0.79 | % | | | 0.58 | % | | | 0.79 | % | | $ | 46,122 | | | | 112 | % | |
| | 2017 | | | | (0.44 | ) | | $ | 22.00 | | | | 25.21 | % | | | 0.80 | % | | | 0.99 | % | | | 0.80 | % | | $ | 74,466 | | | | 133 | % | |
Class R | |
Year Ended October 31: | |
| | 2021 | | | | (0.46 | ) | | $ | 24.25 | | | | 46.02 | % | | | 1.35 | % | | | (0.28 | )% | | | 1.35 | % | | $ | 48,980 | | | | 61 | % | |
| | 2020 | | | | (1.16 | ) | | $ | 17.01 | | | | 5.25 | % | | | 1.37 | % | | | 0.01 | % | | | 1.37 | % | | $ | 39,432 | | | | 95 | % | |
| | 2019 | | | | (1.95 | ) | | $ | 17.29 | | | | 11.90 | % | | | 1.37 | % | | | 0.26 | % | | | 1.37 | % | | $ | 47,981 | | | | 132 | % | |
| | 2018 | | | | (4.30 | ) | | $ | 17.58 | | | | (0.47 | )% | | | 1.34 | % | | | 0.03 | % | | | 1.34 | % | | $ | 54,776 | | | | 112 | % | |
| | 2017 | | | | (0.34 | ) | | $ | 21.71 | | | | 24.56 | % | | | 1.33 | % | | | 0.38 | % | | | 1.33 | % | | $ | 66,310 | | | | 133 | % | |
(continues on next page)
See notes to financial statements.
67
Victory Portfolios | | Financial Highlights | |
For a Share Outstanding Throughout Each Period
| | | | Investment Activities | | Distributions to
Shareholders From | |
| | | Net Asset
Value,
Beginning of
Period | | Net
Investment
Income
(Loss)(a) | | Net Realized
and Unrealized
Gains (Losses)
on Investments | | Total from
Investment
Activities | | Net
Investment
Income | | Net Realized
Gains from
Investments | |
Victory Diversified Stock Fund | | | |
Class R6 | | | |
Year Ended October 31: | |
| | 2021 | | | $ | 17.38 | | | | 0.06 | | | | 7.95 | | | | 8.01 | | | | (0.02 | ) | | | (0.46 | ) | |
| | 2020 | | | $ | 17.62 | | | | 0.08 | | | | 0.92 | | | | 1.00 | | | | (0.09 | ) | | | (1.15 | ) | |
| | 2019 | | | $ | 17.88 | | | | 0.14 | | | | 1.64 | | | | 1.78 | | | | (0.13 | ) | | | (1.91 | ) | |
| | 2018 | | | $ | 22.00 | | | | 0.11 | | | | 0.17 | | | | 0.28 | | | | (0.10 | ) | | | (4.30 | ) | |
| | 2017 | | | $ | 17.98 | | | | 0.18 | | | | 4.29 | | | | 4.47 | | | | (0.23 | ) | | | (0.22 | ) | |
Class Y | | | |
Year Ended October 31: | |
| | 2021 | | | $ | 17.41 | | | | 0.05 | | | | 7.95 | | | | 8.00 | | | | (0.02 | ) | | | (0.46 | ) | |
| | 2020 | | | $ | 17.65 | | | | 0.09 | | | | 0.90 | | | | 0.99 | | | | (0.08 | ) | | | (1.15 | ) | |
| | 2019 | | | $ | 17.90 | | | | 0.12 | | | | 1.66 | | | | 1.78 | | | | (0.12 | ) | | | (1.91 | ) | |
| | 2018 | | | $ | 22.02 | | | | 0.11 | | | | 0.16 | | | | 0.27 | | | | (0.09 | ) | | | (4.30 | ) | |
| | 2017 | | | $ | 18.00 | | | | 0.17 | | | | 4.28 | | | | 4.45 | | | | (0.21 | ) | | | (0.22 | ) | |
(a) Per share net investment income (loss) has been calculated using the average daily shares method.
(b) Portfolio turnover is calculated on the basis of the Fund as a whole without distinguishing between the classes of shares issued.
See notes to financial statements.
68
Victory Portfolios | | Financial Highlights — continued | |
For a Share Outstanding Throughout Each Period (continued)
| | | | | Ratios to Average Net Assets | | Supplemental Data | |
| | | Total
Distributions | | Net Asset
Value,
End of
Period | | Total
Return
(Excludes
Sales
Charge) | | Net
Expenses | | Net
Investment
Income
(Loss) | | Gross
Expenses | | Net Assets,
End of
Period
(000's) | | Portfolio
Turnover(b) | |
Victory Diversified Stock Fund | |
Class R6 | |
Year Ended October 31: | |
| | 2021 | | | | (0.48 | ) | | $ | 24.91 | | | | 46.89 | % | | | 0.78 | % | | | 0.29 | % | | | 1.10 | % | | $ | 4,040 | | | | 61 | % | |
| | 2020 | | | | (1.24 | ) | | $ | 17.38 | | | | 5.86 | % | | | 0.78 | % | | | 0.49 | % | | | 1.34 | % | | $ | 3,103 | | | | 95 | % | |
| | 2019 | | | | (2.04 | ) | | $ | 17.62 | | | | 12.58 | % | | | 0.78 | % | | | 0.83 | % | | | 1.24 | % | | $ | 2,313 | | | | 132 | % | |
| | 2018 | | | | (4.40 | ) | | $ | 17.88 | | | | 0.10 | % | | | 0.78 | % | | | 0.58 | % | | | 1.21 | % | | $ | 2,189 | | | | 112 | % | |
| | 2017 | | | | (0.45 | ) | | $ | 22.00 | | | | 25.24 | % | | | 0.78 | % | | | 0.94 | % | | | 1.29 | % | | $ | 2,427 | | | | 133 | % | |
Class Y | |
Year Ended October 31: | |
| | 2021 | | | | (0.48 | ) | | $ | 24.93 | | | | 46.75 | % | | | 0.86 | % | | | 0.21 | % | | | 0.96 | % | | $ | 5,029 | | | | 61 | % | |
| | 2020 | | | | (1.23 | ) | | $ | 17.41 | | | | 5.72 | % | | | 0.86 | % | | | 0.52 | % | | | 1.31 | % | | $ | 3,737 | | | | 95 | % | |
| | 2019 | | | | (2.03 | ) | | $ | 17.65 | | | | 12.53 | % | | | 0.86 | % | | | 0.76 | % | | | 1.33 | % | | $ | 4,249 | | | | 132 | % | |
| | 2018 | | | | (4.39 | ) | | $ | 17.90 | | | | 0.01 | % | | | 0.86 | % | | | 0.54 | % | | | 1.13 | % | | $ | 4,373 | | | | 112 | % | |
| | 2017 | | | | (0.43 | ) | | $ | 22.02 | | | | 25.11 | % | | | 0.86 | % | | | 0.88 | % | | | 0.94 | % | | $ | 8,843 | | | | 133 | % | |
See notes to financial statements.
69
Victory Portfolios | | Financial Highlights | |
For a Share Outstanding Throughout Each Period
| | | | | Investment Activities | | Distributions to
Shareholders From | |
| | | Net Asset
Value,
Beginning of
Period | | Net
Investment
Income
(Loss)(a) | | Net Realized
and Unrealized
Gains (Losses)
on Investments | | Total from
Investment
Activities | | Net Realized
Gains from
Investments | | Total
Distributions | |
Victory NewBridge Large Cap Growth Fund | | | |
Class A | | | |
Year Ended October 31: | |
| | 2021 | | | $ | 6.31 | | | | (0.08 | ) | | | 1.94 | | | | 1.86 | | | | (0.76 | ) | | | (0.76 | ) | |
| | 2020 | | | $ | 5.52 | | | | (0.06 | ) | | | 1.91 | | | | 1.85 | | | | (1.06 | ) | | | (1.06 | ) | |
| | 2019 | | | $ | 7.94 | | | | (0.05 | ) | | | 0.05 | | | | — | (c) | | | (2.42 | ) | | | (2.42 | ) | |
| | 2018 | | | $ | 10.23 | | | | (0.09 | ) | | | 0.85 | | | | 0.76 | | | | (3.05 | ) | | | (3.05 | ) | |
| | 2017 | | | $ | 12.79 | | | | (0.09 | ) | | | 1.82 | | | | 1.73 | | | | (4.29 | ) | | | (4.29 | ) | |
Class C | | | |
Year Ended October 31: | |
| | 2021 | (d) | | $ | 9.87 | | | | (0.15 | ) | | | 2.51 | | | | 2.36 | | | | (3.80 | ) | | | (3.80 | ) | |
| | 2020 | (d) | | $ | 12.15 | | | | (0.15 | ) | | | 3.17 | | | | 3.02 | | | | (5.30 | ) | | | (5.30 | ) | |
| | 2019 | (d) | | $ | 25.00 | | | | (0.30 | ) | | | (0.45 | ) | | | (0.75 | ) | | | (12.10 | ) | | | (12.10 | ) | |
| | 2018 | (d) | | $ | 37.93 | | | | (0.50 | ) | | | 2.82 | | | | 2.32 | | | | (15.25 | ) | | | (15.25 | ) | |
| | 2017 | (d) | | $ | 53.25 | | | | (0.60 | ) | | | 6.73 | | | | 6.13 | | | | (21.45 | ) | | | (21.45 | ) | |
Class I | | | |
Year Ended October 31: | |
| | 2021 | | | $ | 7.18 | | | | (0.06 | ) | | | 2.24 | | | | 2.18 | | | | (0.76 | ) | | | (0.76 | ) | |
| | 2020 | | | $ | 6.13 | | | | (0.04 | ) | | | 2.15 | | | | 2.11 | | | | (1.06 | ) | | | (1.06 | ) | |
| | 2019 | | | $ | 8.49 | | | | (0.04 | ) | | | 0.10 | | | | 0.06 | | | | (2.42 | ) | | | (2.42 | ) | |
| | 2018 | | | $ | 10.71 | | | | (0.06 | ) | | | 0.89 | | | | 0.83 | | | | (3.05 | ) | | | (3.05 | ) | |
| | 2017 | | | $ | 13.13 | | | | (0.05 | ) | | | 1.92 | | | | 1.87 | | | | (4.29 | ) | | | (4.29 | ) | |
Class Y | | | |
Year Ended October 31: | |
| | 2021 | | | $ | 6.79 | | | | (0.06 | ) | | | 2.11 | | | | 2.05 | | | | (0.76 | ) | | | (0.76 | ) | |
| | 2020 | | | $ | 5.86 | | | | (0.04 | ) | | | 2.03 | | | | 1.99 | | | | (1.06 | ) | | | (1.06 | ) | |
| | 2019 | | | $ | 8.24 | | | | (0.04 | ) | | | 0.08 | | | | 0.04 | | | | (2.42 | ) | | | (2.42 | ) | |
| | 2018 | | | $ | 10.48 | | | | (0.06 | ) | | | 0.87 | | | | 0.81 | | | | (3.05 | ) | | | (3.05 | ) | |
| | 2017 | | | $ | 12.96 | | | | (0.06 | ) | | | 1.87 | | | | 1.81 | | | | (4.29 | ) | | | (4.29 | ) | |
(a) Per share net investment income (loss) has been calculated using the average daily shares method.
(b) Portfolio turnover is calculated on the basis of the Fund as a whole without distinguishing between the classes of shares issued.
(c) Amount is less than $0.005 per share.
(d) As described in note 10, per share amounts adjusted for a 1:5 reverse stock split.
See notes to financial statements.
70
Victory Portfolios | | Financial Highlights — continued | |
For a Share Outstanding Throughout Each Period
| | | | | Ratios to Average Net Assets | | Supplemental Data | |
| | | Net Asset
Value,
End of
Period | | Total
Return
(Excludes
Sales
Charge) | | Net
Expenses | | Net
Investment
Income
(Loss) | | Gross
Expenses | | Net Assets,
End of
Period
(000's) | | Portfolio
Turnover(b) | |
Victory NewBridge Large Cap Growth Fund | |
Class A | |
Year Ended October 31: | |
| | 2021 | | | $ | 7.41 | | | | 31.73 | % | | | 1.36 | % | | | (1.20 | )% | | | 1.56 | % | | $ | 8,749 | | | | 39 | % | |
| | 2020 | | | $ | 6.31 | | | | 39.61 | % | | | 1.36 | % | | | (1.08 | )% | | | 1.52 | % | | $ | 7,757 | | | | 39 | % | |
| | 2019 | | | $ | 5.52 | | | | 4.56 | % | | | 1.36 | % | | | (0.97 | )% | | | 1.60 | % | | $ | 5,732 | | | | 62 | % | |
| | 2018 | | | $ | 7.94 | | | | 9.41 | % | | | 1.36 | % | | | (1.05 | )% | | | 1.47 | % | | $ | 5,546 | | | | 41 | % | |
| | 2017 | | | $ | 10.23 | | | | 20.84 | % | | | 1.40 | % | | | (0.94 | )% | | | 1.40 | % | | $ | 7,639 | | | | 60 | % | |
Class C | |
Year Ended October 31: | |
| | 2021 | (d) | | $ | 8.43 | | | | 31.44 | % | | | 2.10 | % | | | (1.93 | )% | | | 3.58 | % | | $ | 695 | | | | 39 | % | |
| | 2020 | (d) | | $ | 9.87 | | | | 37.97 | % | | | 2.10 | % | | | (1.79 | )% | | | 2.67 | % | | $ | 1,190 | | | | 39 | % | |
| | 2019 | (d) | | $ | 12.15 | | | | 3.92 | % | | | 2.10 | % | | | (1.71 | )% | | | 2.70 | % | | $ | 1,768 | | | | 62 | % | |
| | 2018 | (d) | | $ | 25.00 | | | | 8.47 | % | | | 2.10 | % | | | (1.78 | )% | | | 2.40 | % | | $ | 3,042 | | | | 41 | % | |
| | 2017 | (d) | | $ | 37.93 | | | | 20.06 | % | | | 2.10 | % | | | (1.64 | )% | | | 2.27 | % | | $ | 4,201 | | | | 60 | % | |
Class I | |
Year Ended October 31: | |
| | 2021 | | | $ | 8.60 | | | | 32.38 | % | | | 0.95 | % | | | (0.79 | )% | | | 1.34 | % | | $ | 7,085 | | | | 39 | % | |
| | 2020 | | | $ | 7.18 | | | | 39.95 | % | | | 0.95 | % | | | (0.66 | )% | | | 1.31 | % | | $ | 6,171 | | | | 39 | % | |
| | 2019 | | | $ | 6.13 | | | | 5.11 | % | | | 0.95 | % | | | (0.56 | )% | | | 1.26 | % | | $ | 6,043 | | | | 62 | % | |
| | 2018 | | | $ | 8.49 | | | | 9.74 | % | | | 0.95 | % | | | (0.63 | )% | | | 1.09 | % | | $ | 10,633 | | | | 41 | % | |
| | 2017 | | | $ | 10.71 | | | | 21.52 | % | | | 0.95 | % | | | (0.47 | )% | | | 1.01 | % | | $ | 16,103 | | | | 60 | % | |
Class Y | |
Year Ended October 31: | |
| | 2021 | | | $ | 8.08 | | | | 32.32 | % | | | 1.02 | % | | | (0.86 | )% | | | 1.49 | % | | $ | 1,313 | | | | 39 | % | |
| | 2020 | | | $ | 6.79 | | | | 39.72 | % | | | 1.02 | % | | | (0.73 | )% | | | 1.78 | % | | $ | 1,744 | | | | 39 | % | |
| | 2019 | | | $ | 5.86 | | | | 5.06 | % | | | 1.02 | % | | | (0.63 | )% | | | 1.69 | % | | $ | 2,498 | | | | 62 | % | |
| | 2018 | | | $ | 8.24 | | | | 9.75 | % | | | 1.02 | % | | | (0.72 | )% | | | 1.48 | % | | $ | 3,411 | | | | 41 | % | |
| | 2017 | | | $ | 10.48 | | | | 21.30 | % | | | 1.02 | % | | | (0.55 | )% | | | 1.42 | % | | $ | 2,128 | | | | 60 | % | |
See notes to financial statements.
71
Victory Portfolios | | Financial Highlights | |
For a Share Outstanding Throughout Each Period
| | | | Investment Activities | | Distributions to
Shareholders From | |
| | | Net Asset
Value,
Beginning of
Period | | Net
Investment
Income
(Loss)(a) | | Net Realized
and Unrealized
Gains (Losses)
on Investments | | Total from
Investment
Activities | | Net
Investment
Income | | Net Realized
Gains from
Investments | |
Victory Special Value Fund | | | |
Class A | | | |
Year Ended October 31: | |
| | 2021 | | | $ | 26.23 | | | | (0.05 | ) | | | 11.82 | | | | 11.77 | | | | — | (c) | | | (1.00 | ) | |
| | 2020 | | | $ | 25.78 | | | | 0.04 | | | | 1.29 | | | | 1.33 | | | | (0.09 | ) | | | (0.79 | ) | |
| | 2019 | | | $ | 26.10 | | | | 0.10 | | | | 2.26 | | | | 2.36 | | | | (0.03 | ) | | | (2.65 | ) | |
| | 2018 | | | $ | 26.31 | | | | 0.05 | | | | (0.15 | ) | | | (0.10 | ) | | | (0.11 | ) | | | — | | |
| | 2017 | | | $ | 21.48 | | | | 0.13 | | | | 4.95 | | | | 5.08 | | | | (0.25 | ) | | | — | | |
Class C | | | |
Year Ended October 31: | |
| | 2021 | | | $ | 22.72 | | | | (0.28 | ) | | | 10.15 | | | | 9.87 | | | | — | | | | (1.00 | ) | |
| | 2020 | | | $ | 22.54 | | | | (0.16 | ) | | | 1.13 | | | | 0.97 | | | | — | | | | (0.79 | ) | |
| | 2019 | | | $ | 23.34 | | | | (0.09 | ) | | | 1.94 | | | | 1.85 | | | | — | | | | (2.65 | ) | |
| | 2018 | | | $ | 23.66 | | | | (0.18 | ) | | | (0.14 | ) | | | (0.32 | ) | | | — | | | | — | | |
| | 2017 | | | $ | 19.34 | | | | (0.08 | ) | | | 4.45 | | | | 4.37 | | | | (0.05 | ) | | | — | | |
Class I | | | |
Year Ended October 31: | |
| | 2021 | | | $ | 26.59 | | | | 0.01 | | | | 11.99 | | | | 12.00 | | | | (0.05 | ) | | | (1.00 | ) | |
| | 2020 | | | $ | 26.13 | | | | 0.08 | | | | 1.31 | | | | 1.39 | | | | (0.14 | ) | | | (0.79 | ) | |
| | 2019 | | | $ | 26.39 | | | | 0.14 | | | | 2.30 | | | | 2.44 | | | | (0.05 | ) | | | (2.65 | ) | |
| | 2018 | | | $ | 26.62 | | | | 0.09 | | | | (0.15 | ) | | | (0.06 | ) | | | (0.17 | ) | | | — | | |
| | 2017 | | | $ | 21.76 | | | | 0.13 | | | | 5.01 | | | | 5.14 | | | | (0.28 | ) | | | — | | |
Class R | | | |
Year Ended October 31: | |
| | 2021 | | | $ | 24.93 | | | | (0.14 | ) | | | 11.20 | | | | 11.06 | | | | — | | | | (1.00 | ) | |
| | 2020 | | | $ | 24.55 | | | | (0.04 | ) | | | 1.23 | | | | 1.19 | | | | (0.02 | ) | | | (0.79 | ) | |
| | 2019 | | | $ | 25.02 | | | | 0.03 | | | | 2.15 | | | | 2.18 | | | | — | | | | (2.65 | ) | |
| | 2018 | | | $ | 25.24 | | | | (0.03 | ) | | | (0.15 | ) | | | (0.18 | ) | | | (0.04 | ) | | | — | | |
| | 2017 | | | $ | 20.63 | | | | 0.05 | | | | 4.75 | | | | 4.80 | | | | (0.19 | ) | | | — | | |
Class Y | | | |
Year Ended October 31: | |
| | 2021 | | | $ | 26.44 | | | | 0.02 | | | | 11.92 | | | | 11.94 | | | | (0.07 | ) | | | (1.00 | ) | |
| | 2020 | | | $ | 25.98 | | | | 0.09 | | | | 1.32 | | | | 1.41 | | | | (0.16 | ) | | | (0.79 | ) | |
| | 2019 | | | $ | 26.25 | | | | 0.15 | | | | 2.28 | | | | 2.43 | | | | (0.05 | ) | | | (2.65 | ) | |
| | 2018 | | | $ | 26.47 | | | | 0.12 | | | | (0.17 | ) | | | (0.05 | ) | | | (0.17 | ) | | | — | | |
| | 2017 | | | $ | 21.62 | | | | 0.18 | | | | 4.98 | | | | 5.16 | | | | (0.31 | ) | | | — | | |
(a) Per share net investment income (loss) has been calculated using the average daily shares method.
(b) Portfolio turnover is calculated on the basis of the Fund as a whole without distinguishing between the classes of shares issued.
(c) Amount is less than $0.005 per share.
(d) During the year, additional fees were voluntarily waived or reimbursed. Had these fees not been waived or reimbursed, the net expense ratio for each class would have been 0.10% higher.
See notes to financial statements.
72
Victory Portfolios | | Financial Highlights — continued | |
For a Share Outstanding Throughout Each Period
| | | | | Ratios to Average Net Assets | | Supplemental Data | |
| | | Total
Distributions | | Net Asset
Value,
End of
Period | | Total
Return
(Excludes
Sales
Charge) | | Net
Expenses | | Net
Investment
Income
(Loss) | | Gross
Expenses | | Net Assets,
End of
Period
(000's) | | Portfolio
Turnover(b) | |
Victory Special Value Fund | |
Class A | |
Year Ended October 31: | |
| | 2021 | | | | (1.00 | ) | | $ | 37.00 | | | | 46.06 | % | | | 1.23 | %(d) | | | (0.16 | )% | | | 1.33 | % | | $ | 28,945 | | | | 70 | % | |
| | 2020 | | | | (0.88 | ) | | $ | 26.23 | | | | 5.15 | % | | | 1.23 | %(d) | | | 0.14 | % | | | 1.33 | % | | $ | 24,302 | | | | 102 | % | |
| | 2019 | | | | (2.68 | ) | | $ | 25.78 | | | | 11.32 | % | | | 1.21 | % | | | 0.41 | % | | | 1.31 | % | | $ | 27,818 | | | | 126 | % | |
| | 2018 | | | | (0.11 | ) | | $ | 26.10 | | | | (0.42 | )% | | | 1.17 | % | | | 0.19 | % | | | 1.27 | % | | $ | 32,565 | | | | 113 | % | |
| | 2017 | | | | (0.25 | ) | | $ | 26.31 | | | | 23.84 | % | | | 1.17 | % | | | 0.53 | % | | | 1.27 | % | | $ | 35,223 | | | | 135 | % | |
Class C | |
Year Ended October 31: | |
| | 2021 | | | | (1.00 | ) | | $ | 31.59 | | | | 44.81 | % | | | 2.10 | %(d) | | | (1.02 | )% | | | 3.53 | % | | $ | 978 | | | | 70 | % | |
| | 2020 | | | | (0.79 | ) | | $ | 22.72 | | | | 4.26 | % | | | 2.10 | %(d) | | | (0.72 | )% | | | 2.99 | % | | $ | 863 | | | | 102 | % | |
| | 2019 | | | | (2.65 | ) | | $ | 22.54 | | | | 10.34 | % | | | 2.10 | % | | | (0.44 | )% | | | 2.79 | % | | $ | 1,241 | | | | 126 | % | |
| | 2018 | | | | — | | | $ | 23.34 | | | | (1.35 | )% | | | 2.10 | % | | | (0.75 | )% | | | 2.27 | % | | $ | 2,145 | | | | 113 | % | |
| | 2017 | | | | (0.05 | ) | | $ | 23.66 | | | | 22.65 | % | | | 2.10 | % | | | (0.38 | )% | | | 2.21 | % | | $ | 7,296 | | | | 135 | % | |
Class I | |
Year Ended October 31: | |
| | 2021 | | | | (1.05 | ) | | $ | 37.54 | | | | 46.29 | % | | | 1.05 | %(d) | | | 0.02 | % | | | 1.33 | % | | $ | 3,861 | | | | 70 | % | |
| | 2020 | | | | (0.93 | ) | | $ | 26.59 | | | | 5.35 | % | | | 1.05 | %(d) | | | 0.32 | % | | | 1.31 | % | | $ | 3,283 | | | | 102 | % | |
| | 2019 | | | | (2.70 | ) | | $ | 26.13 | | | | 11.52 | % | | | 1.05 | % | | | 0.58 | % | | | 1.34 | % | | $ | 3,274 | | | | 126 | % | |
| | 2018 | | | | (0.17 | ) | | $ | 26.39 | | | | (0.28 | )% | | | 1.02 | % | | | 0.31 | % | | | 1.16 | % | | $ | 3,678 | | | | 113 | % | |
| | 2017 | | | | (0.28 | ) | | $ | 26.62 | | | | 23.86 | % | | | 1.15 | % | | | 0.56 | % | | | 1.25 | % | | $ | 3,703 | | | | 135 | % | |
Class R | |
Year Ended October 31: | |
| | 2021 | | | | (1.00 | ) | | $ | 34.99 | | | | 45.59 | % | | | 1.54 | %(d) | | | (0.47 | )% | | | 1.64 | % | | $ | 16,605 | | | | 70 | % | |
| | 2020 | | | | (0.81 | ) | | $ | 24.93 | | | | 4.82 | % | | | 1.54 | %(d) | | | (0.16 | )% | | | 1.64 | % | | $ | 13,875 | | | | 102 | % | |
| | 2019 | | | | (2.65 | ) | | $ | 24.55 | | | | 11.03 | % | | | 1.50 | % | | | 0.13 | % | | | 1.60 | % | | $ | 21,084 | | | | 126 | % | |
| | 2018 | | | | (0.04 | ) | | $ | 25.02 | | | | (0.71 | )% | | | 1.46 | % | | | (0.10 | )% | | | 1.56 | % | | $ | 26,532 | | | | 113 | % | |
| | 2017 | | | | (0.19 | ) | | $ | 25.24 | | | | 23.43 | % | | | 1.47 | % | | | 0.24 | % | | | 1.57 | % | | $ | 36,688 | | | | 135 | % | |
Class Y | |
Year Ended October 31: | |
| | 2021 | | | | (1.07 | ) | | $ | 37.31 | | | | 46.39 | % | | | 1.00 | %(d) | | | 0.07 | % | | | 1.77 | % | | $ | 816 | | | | 70 | % | |
| | 2020 | | | | (0.95 | ) | | $ | 26.44 | | | | 5.40 | % | | | 1.00 | %(d) | | | 0.36 | % | | | 3.68 | % | | $ | 584 | | | | 102 | % | |
| | 2019 | | | | (2.70 | ) | | $ | 25.98 | | | | 11.57 | % | | | 1.00 | % | | | 0.60 | % | | | 4.50 | % | | $ | 520 | | | | 126 | % | |
| | 2018 | | | | (0.17 | ) | | $ | 26.25 | | | | (0.21 | )% | | | 0.97 | % | | | 0.42 | % | | | 2.82 | % | | $ | 436 | | | | 113 | % | |
| | 2017 | | | | (0.31 | ) | | $ | 26.47 | | | | 24.12 | % | | | 0.93 | % | | | 0.77 | % | | | 2.07 | % | | $ | 1,219 | | | | 135 | % | |
See notes to financial statements.
73
Victory Portfolios | | Financial Highlights | |
For a Share Outstanding Throughout Each Period
| | | | | Investment Activities | | Distributions to
Shareholders From | |
| | | Net Asset
Value,
Beginning of
Period | | Net
Investment
Income
(Loss)(a) | | Net Realized
and Unrealized
Gains (Losses)
on Investments | | Total from
Investment
Activities | | Net Realized
Gains from
Investments | | Total
Distributions | |
Victory THB US Small Opportunities Fund (c) | | | |
Class A | | | |
Year Ended October 31: | |
| | 2021 | | | $ | 15.55 | | | | (0.20 | ) | | | 8.95 | | | | 8.75 | | | | — | | | | — | | |
| | 2020 | | | $ | 15.00 | | | | (0.17 | ) | | | 0.81 | (d) | | | 0.64 | | | | (0.09 | ) | | | (0.09 | ) | |
| | 2019 | | | $ | 16.08 | | | | (0.14 | ) | | | (0.44 | ) | | | (0.58 | ) | | | (0.50 | ) | | | (0.50 | ) | |
| | 2018 | | | $ | 18.14 | | | | (0.15 | ) | | | 0.24 | | | | 0.09 | | | | (2.15 | ) | | | (2.15 | ) | |
| | 2017 | | | $ | 13.49 | | | | (0.16 | ) | | | 4.81 | | | | 4.65 | | | | — | | | | — | | |
Class I | | | |
Year Ended October 31: | |
| | 2021 | | | $ | 16.20 | | | | (0.18 | ) | | | 9.40 | | | | 9.22 | | | | — | | | | — | | |
| | 2020 | | | $ | 15.56 | | | | (0.10 | ) | | | 0.83 | (d) | | | 0.73 | | | | (0.09 | ) | | | (0.09 | ) | |
| | 2019 | | | $ | 16.58 | | | | (0.08 | ) | | | (0.44 | ) | | | (0.52 | ) | | | (0.50 | ) | | | (0.50 | ) | |
| | 2018 | | | $ | 18.59 | | | | (0.10 | ) | | | 0.24 | | | | 0.14 | | | | (2.15 | ) | | | (2.15 | ) | |
| | 2017 | | | $ | 13.75 | | | | (0.08 | ) | | | 4.92 | | | | 4.84 | | | | — | | | | — | | |
(a) Per share net investment income (loss) has been calculated using the average daily shares method.
(b) Portfolio turnover is calculated on the basis of the Fund as a whole without distinguishing between the classes of shares issued.
(c) On May 3, 2021, the THB Asset Management Microcap Fund (the "Predecessor Fund") was reorganized into the Victory THB US Small Opportunities Fund (the "Victory THB Fund"). Investor Class and Institutional Class shares of the Predecessor Fund were exchanged on a tax-free basis for Class A and Class I shares, respectively, of the Victory THB Fund. Information presented prior to May 3, 2021, is that of the Predecessor Fund. See Note 1 in the Notes to Financial Statements.
(d) The amount shown for a share outstanding throughout the period does not accord with the change in net assets resulting from operations during the period because of the timing of sales and purchases of fund shares in relation to fluctuating market values during the period.
(e) Amount less than $0.005.
See notes to financial statements.
74
Victory Portfolios | | Financial Highlights — continued | |
For a Share Outstanding Throughout Each Period
| | | | | Ratios to Average Net Assets | | Supplemental Data | |
| | | Redemption
Fees | | Net Asset
Value,
End of
Period | | Total
Return
(Excludes
Sales
Charge) | | Net
Expenses | | Net
Investment
Income
(Loss) | | Gross
Expenses | | Net Assets,
End of
Period
(000's) | | Portfolio
Turnover(b) | |
Victory THB US Small Opportunities Fund (c) | |
Class A | |
Year Ended October 31: | |
| | 2021 | | | | — | | | $ | 24.30 | | | | 56.27 | % | | | 1.70 | % | | | (1.20 | )% | | | 2.45 | % | | $ | 2,437 | | | | 50 | % | |
| | 2020 | | | | — | | | $ | 15.55 | | | | 4.25 | % | | | 1.70 | % | | | (1.17 | )% | | | 2.45 | % | | $ | 493 | | | | 62 | % | |
| | 2019 | | | | — | | | $ | 15.00 | | | | (3.34 | )% | | | 1.70 | % | | | (0.92 | )% | | | 2.20 | % | | $ | 627 | | | | 31 | % | |
| | 2018 | | | | — | | | $ | 16.08 | | | | 0.45 | % | | | 1.55 | % | | | (0.86 | )% | | | 2.00 | % | | $ | 1,041 | | | | 35 | % | |
| | 2017 | | | | — | | | $ | 18.14 | | | | 34.47 | % | | | 1.75 | % | | | (0.97 | )% | | | 2.29 | % | | $ | 679 | | | | 58 | % | |
Class I | |
Year Ended October 31: | |
| | 2021 | | | | — | (e) | | $ | 25.42 | | | | 56.98 | % | | | 1.25 | % | | | (0.73 | )% | | | 1.67 | % | | $ | 86,947 | | | | 50 | % | |
| | 2020 | | | | — | | | $ | 16.20 | | | | 4.68 | % | | | 1.25 | % | | | (0.70 | )% | | | 1.98 | % | | $ | 50,206 | | | | 62 | % | |
| | 2019 | | | | — | | | $ | 15.56 | | | | (2.86 | )% | | | 1.25 | % | | | (0.48 | )% | | | 1.75 | % | | $ | 73,403 | | | | 31 | % | |
| | 2018 | | | | — | | | $ | 16.58 | | | | 0.73 | % | | | 1.25 | % | | | (0.55 | )% | | | 1.70 | % | | $ | 89,159 | | | | 35 | % | |
| | 2017 | | | | — | | | $ | 18.59 | | | | 35.20 | % | | | 1.25 | % | | | (0.48 | )% | | | 1.78 | % | | $ | 81,076 | | | | 58 | % | |
See notes to financial statements.
75
Victory Portfolios | | Financial Highlights | |
For a Share Outstanding Throughout Each Period
| | | | | Investment Activities | | Distributions to
Shareholders From | |
| | | Net Asset
Value,
Beginning of
Period | | Net
Investment
Income
(Loss)(a) | | Net Realized
and Unrealized
Gains (Losses)
on Investments | | Total from
Investment
Activities | | Net
Investment
Income | | Net Realized
Gains from
Investments | |
Victory Strategic Allocation Fund | | | |
Class A | | | |
Year Ended October 31: | |
| | 2021 | | | $ | 16.48 | | | | 0.56 | | | | 3.46 | | | | 4.02 | | | | (0.56 | ) | | | — | | |
| | 2020 | | | $ | 16.47 | | | | 0.23 | | | | 0.41 | | | | 0.64 | | | | (0.23 | ) | | | (0.40 | ) | |
| | 2019 | | | $ | 15.44 | | | | 0.43 | | | | 1.12 | | | | 1.55 | | | | (0.39 | ) | | | (0.13 | ) | |
| | 2018 | | | $ | 16.41 | | | | 0.29 | | | | (0.68 | ) | | | (0.39 | ) | | | (0.39 | ) | | | (0.19 | ) | |
| | 2017 | | | $ | 14.80 | | | | 0.50 | | | | 1.51 | | | | 2.01 | | | | (0.40 | ) | | | — | | |
Class C | | | |
Year Ended October 31: | |
| | 2021 | | | $ | 16.19 | | | | 0.40 | | | | 3.40 | | | | 3.80 | | | | (0.43 | ) | | | — | | |
| | 2020 | | | $ | 16.18 | | | | 0.13 | | | | 0.39 | | | | 0.52 | | | | (0.11 | ) | | | (0.40 | ) | |
| | 2019 | | | $ | 15.19 | | | | 0.30 | | | | 1.10 | | | | 1.40 | | | | (0.28 | ) | | | (0.13 | ) | |
| | 2018 | | | $ | 16.19 | | | | 0.21 | | | | (0.71 | ) | | | (0.50 | ) | | | (0.31 | ) | | | (0.19 | ) | |
| | 2017 | | | $ | 14.65 | | | | 0.43 | | | | 1.44 | | | | 1.87 | | | | (0.33 | ) | | | — | | |
Class I | | | |
Year Ended October 31: | |
| | 2021 | | | $ | 16.57 | | | | 0.61 | | | | 3.48 | | | | 4.09 | | | | (0.60 | ) | | | — | | |
| | 2020 | | | $ | 16.56 | | | | 0.27 | | | | 0.41 | | | | 0.68 | | | | (0.27 | ) | | | (0.40 | ) | |
| | 2019 | | | $ | 15.52 | | | | 0.46 | | | | 1.13 | | | | 1.59 | | | | (0.42 | ) | | | (0.13 | ) | |
| | 2018 | | | $ | 16.48 | | | | 0.35 | | | | (0.70 | ) | | | (0.35 | ) | | | (0.42 | ) | | | (0.19 | ) | |
| | 2017 | | | $ | 14.86 | | | | 0.55 | | | | 1.50 | | | | 2.05 | | | | (0.43 | ) | | | — | | |
Class R | | | |
Year Ended October 31: | |
| | 2021 | | | $ | 16.44 | | | | 0.51 | | | | 3.45 | | | | 3.96 | | | | (0.51 | ) | | | — | | |
| | 2020 | | | $ | 16.43 | | | | 0.19 | | | | 0.42 | | | | 0.61 | | | | (0.20 | ) | | | (0.40 | ) | |
| | 2019 | | | $ | 15.41 | | | | 0.36 | | | | 1.14 | | | | 1.50 | | | | (0.35 | ) | | | (0.13 | ) | |
| | 2018 | | | $ | 16.38 | | | | 0.27 | | | | (0.70 | ) | | | (0.43 | ) | | | (0.35 | ) | | | (0.19 | ) | |
| | 2017 | | | $ | 14.79 | | | | 0.46 | | | | 1.49 | | | | 1.95 | | | | (0.36 | ) | | | — | | |
(a) Per share net investment income (loss) has been calculated using the average daily shares method.
(b) The expense ratios exclude the impact of expenses paid by each underlying fund.
(c) Portfolio turnover is calculated on the basis of the Fund as a whole without distinguishing between the classes of shares issued.
(d) The amount includes a change in accounting estimate. Without this change in accounting estimate, the gross expense ratio would have been 0.67%, 1.54%, 0.42% and 1.43% for Class A, C, I and R, respectively.
See notes to financial statements.
76
Victory Portfolios | | Financial Highlights — continued | |
For a Share Outstanding Throughout Each Period
| | | | | Ratios to Average Net Assets | | Supplemental Data | |
| | | Total
Distributions | | Net Asset
Value,
End of
Period | | Total
Return
(Excludes
Sales
Charge) | | Net
Expenses(b) | | Net
Investment
Income
(Loss) | | Gross
Expenses(b) | | Net Assets,
End of
Period
(000's) | | Portfolio
Turnover(c) | |
Victory Strategic Allocation Fund | |
Class A | |
Year Ended October 31: | |
| | 2021 | | | | (0.56 | ) | | $ | 19.94 | | | | 24.51 | % | | | 0.40 | % | | | 2.92 | % | | | 0.80 | % | | $ | 16,378 | | | | 22 | % | |
| | 2020 | | | | (0.63 | ) | | $ | 16.48 | | | | 3.99 | % | | | 0.40 | % | | | 1.45 | % | | | 0.81 | % | | $ | 14,364 | | | | 13 | % | |
| | 2019 | | | | (0.52 | ) | | $ | 16.47 | | | | 10.37 | % | | | 0.40 | % | | | 2.69 | % | | | 0.77 | % | | $ | 15,365 | | | | 5 | % | |
| | 2018 | | | | (0.58 | ) | | $ | 15.44 | | | | (2.56 | )% | | | 0.40 | % | | | 1.77 | % | | | 0.28 | %(d) | | $ | 18,747 | | | | 40 | % | |
| | 2017 | | | | (0.40 | ) | | $ | 16.41 | | | | 13.72 | % | | | 0.30 | % | | | 3.19 | % | | | 0.79 | % | | $ | 14,820 | | | | 51 | % | |
Class C | |
Year Ended October 31: | |
| | 2021 | | | | (0.43 | ) | | $ | 19.56 | | | | 23.57 | % | | | 1.15 | % | | | 2.10 | % | | | 2.02 | % | | $ | 2,507 | | | | 22 | % | |
| | 2020 | | | | (0.51 | ) | | $ | 16.19 | | | | 3.23 | % | | | 1.15 | % | | | 0.82 | % | | | 1.90 | % | | $ | 2,009 | | | | 13 | % | |
| | 2019 | | | | (0.41 | ) | | $ | 16.18 | | | | 9.53 | % | | | 1.15 | % | | | 1.94 | % | | | 1.72 | % | | $ | 3,193 | | | | 5 | % | |
| | 2018 | | | | (0.50 | ) | | $ | 15.19 | | | | (3.26 | )% | | | 1.15 | % | | | 1.30 | % | | | 1.08 | %(d) | | $ | 4,445 | | | | 40 | % | |
| | 2017 | | | | (0.33 | ) | | $ | 16.19 | | | | 12.88 | % | | | 1.03 | % | | | 2.78 | % | | | 1.58 | % | | $ | 8,814 | | | | 51 | % | |
Class I | |
Year Ended October 31: | |
| | 2021 | | | | (0.60 | ) | | $ | 20.06 | | | | 24.86 | % | | | 0.15 | % | | | 3.13 | % | | | 0.56 | % | | $ | 9,283 | | | | 22 | % | |
| | 2020 | | | | (0.67 | ) | | $ | 16.57 | | | | 4.22 | % | | | 0.15 | % | | | 1.66 | % | | | 0.59 | % | | $ | 7,006 | | | | 13 | % | |
| | 2019 | | | | (0.55 | ) | | $ | 16.56 | | | | 10.63 | % | | | 0.15 | % | | | 2.90 | % | | | 0.59 | % | | $ | 5,743 | | | | 5 | % | |
| | 2018 | | | | (0.61 | ) | | $ | 15.52 | | | | (2.29 | )% | | | 0.15 | % | | | 2.11 | % | | | 0.01 | %(d) | | $ | 8,811 | | | | 40 | % | |
| | 2017 | | | | (0.43 | ) | | $ | 16.48 | | | | 13.95 | % | | | 0.10 | % | | | 3.48 | % | | | 0.61 | % | | $ | 9,153 | | | | 51 | % | |
Class R | |
Year Ended October 31: | |
| | 2021 | | | | (0.51 | ) | | $ | 19.89 | | | | 24.20 | % | | | 0.65 | % | | | 2.69 | % | | | 1.82 | % | | $ | 1,264 | | | | 22 | % | |
| | 2020 | | | | (0.60 | ) | | $ | 16.44 | | | | 3.74 | % | | | 0.65 | % | | | 1.18 | % | | | 1.76 | % | | $ | 1,259 | | | | 13 | % | |
| | 2019 | | | | (0.48 | ) | | $ | 16.43 | | | | 10.08 | % | | | 0.65 | % | | | 2.30 | % | | | 1.87 | % | | $ | 1,308 | | | | 5 | % | |
| | 2018 | | | | (0.54 | ) | | $ | 15.41 | | | | (2.77 | )% | | | 0.65 | % | | | 1.63 | % | | | 1.01 | %(d) | | $ | 1,529 | | | | 40 | % | |
| | 2017 | | | | (0.36 | ) | | $ | 16.38 | | | | 13.36 | % | | | 0.56 | % | | | 2.96 | % | | | 1.80 | % | | $ | 1,892 | | | | 51 | % | |
See notes to financial statements.
77
Victory Portfolios | | Financial Highlights | |
For a Share Outstanding Throughout Each Period
| | | | Investment Activities | | Distributions to
Shareholders From | |
| | | Net Asset
Value,
Beginning of
Period | | Net
Investment
Income
(Loss)(a) | | Net Realized
and Unrealized
Gains (Losses)
on Investments | | Total from
Investment
Activities | | Net
Investment
Income | | Total
Distributions | |
Victory INCORE Fund for Income | | | |
Class A | | | |
Year Ended October 31: | |
| | 2021 | | | $ | 8.40 | | | | 0.02 | | | | (0.11 | ) | | | (0.09 | ) | | | (0.39 | ) | | | (0.39 | ) | |
| | 2020 | | | $ | 8.56 | | | | 0.06 | | | | 0.17 | | | | 0.23 | | | | (0.39 | ) | | | (0.39 | ) | |
| | 2019 | | | $ | 8.56 | | | | 0.18 | | | | 0.28 | | | | 0.46 | | | | (0.46 | ) | | | (0.46 | ) | |
| | 2018 | | | $ | 9.09 | | | | 0.15 | (e) | | | (0.23 | )(e) | | | (0.08 | ) | | | (0.45 | ) | | | (0.45 | ) | |
| | 2017 | | | $ | 9.63 | | | | 0.10 | | | | (0.15 | ) | | | (0.05 | ) | | | (0.49 | ) | | | (0.49 | ) | |
Class C | | | |
Year Ended October 31: | |
| | 2021 | | | $ | 8.31 | | | | (0.05 | ) | | | (0.10 | ) | | | (0.15 | ) | | | (0.32 | ) | | | (0.32 | ) | |
| | 2020 | | | $ | 8.48 | | | | — | (f) | | | 0.16 | | | | 0.16 | | | | (0.33 | ) | | | (0.33 | ) | |
| | 2019 | | | $ | 8.48 | | | | 0.13 | | | | 0.26 | | | | 0.39 | | | | (0.39 | ) | | | (0.39 | ) | |
| | 2018 | | | $ | 9.01 | | | | 0.08 | (e) | | | (0.23 | )(e) | | | (0.15 | ) | | | (0.38 | ) | | | (0.38 | ) | |
| | 2017 | | | $ | 9.56 | | | | 0.03 | | | | (0.16 | ) | | | (0.13 | ) | | | (0.42 | ) | | | (0.42 | ) | |
Class I | | | |
Year Ended October 31: | |
| | 2021 | | | $ | 8.39 | | | | 0.04 | | | | (0.10 | ) | | | (0.06 | ) | | | (0.41 | ) | | | (0.41 | ) | |
| | 2020 | | | $ | 8.55 | | | | 0.08 | | | | 0.17 | | | | 0.25 | | | | (0.41 | ) | | | (0.41 | ) | |
| | 2019 | | | $ | 8.55 | | | | 0.16 | | | | 0.32 | | | | 0.48 | | | | (0.48 | ) | | | (0.48 | ) | |
| | 2018 | | | $ | 9.08 | | | | 0.15 | (e) | | | (0.21 | )(e) | | | (0.06 | ) | | | (0.47 | ) | | | (0.47 | ) | |
| | 2017 | | | $ | 9.63 | | | | 0.13 | | | | (0.16 | ) | | | (0.03 | ) | | | (0.52 | ) | | | (0.52 | ) | |
Class R | | | |
Year Ended October 31: | |
| | 2021 | | | $ | 8.40 | | | | 0.02 | | | | (0.10 | ) | | | (0.08 | ) | | | (0.39 | ) | | | (0.39 | ) | |
| | 2020 | | | $ | 8.56 | | | | 0.06 | | | | 0.17 | | | | 0.23 | | | | (0.39 | ) | | | (0.39 | ) | |
| | 2019 | | | $ | 8.57 | | | | 0.18 | | | | 0.27 | | | | 0.45 | | | | (0.46 | ) | | | (0.46 | ) | |
| | 2018 | | | $ | 9.09 | | | | 0.15 | (e) | | | (0.22 | )(e) | | | (0.07 | ) | | | (0.45 | ) | | | (0.45 | ) | |
| | 2017 | | | $ | 9.64 | | | | 0.10 | | | | (0.16 | ) | | | (0.06 | ) | | | (0.49 | ) | | | (0.49 | ) | |
* Includes adjustments in accordance with U.S. Generally Accepted Accounting Principles.
(a) Per share net investment income (loss) has been calculated using the average daily shares method.
(b) Not annualized for periods less than one year.
(c) Annualized for periods less than one year.
(d) Portfolio turnover is calculated on the basis of the Fund as a whole without distinguishing between the classes of shares issued.
(e) The Fund restated certain elements of its 2018 financial statements resulting from the identification of a GAAP reclassification error for the Fund's paydown gain (loss) transactions. However, this reclassification had no impact on the Fund's net assets, NAV, performance, or taxable distributions paid and reported to shareholders for the fiscal and tax years ended 2018.
(f) Amount is less than $0.005 per share.
See notes to financial statements.
78
Victory Portfolios | | Financial Highlights — continued | |
For a Share Outstanding Throughout Each Period
| | | | | Ratios to Average Net Assets | | Supplemental Data | |
| | | Net Asset
Value,
End of
Period | | Total
Return
(Excludes
Sales
Charge)*(b) | | Net
Expenses(c) | | Net
Investment
Income
(Loss)(c) | | Gross
Expenses(c) | | Net Assets,
End of
Period
(000's) | | Portfolio
Turnover(b)(d) | |
Victory INCORE Fund for Income | |
Class A | |
Year Ended October 31: | |
| | 2021 | | | $ | 7.92 | | | | (1.14 | )% | | | 0.91 | % | | | 0.25 | % | | | 0.92 | % | | $ | 128,802 | | | | 27 | % | |
| | 2020 | | | $ | 8.40 | | | | 2.75 | % | | | 0.91 | % | | | 0.75 | % | | | 0.92 | % | | $ | 151,236 | | | | 55 | % | |
| | 2019 | | | $ | 8.56 | | | | 5.50 | % | | | 0.92 | % | | | 2.12 | % | | | 0.94 | % | | $ | 136,570 | | | | 29 | % | |
| | 2018 | | | $ | 8.56 | | | | (0.91 | )% | | | 0.92 | % | | | 1.64 | %(e) | | | 0.93 | % | | $ | 153,574 | | | | 27 | % | |
| | 2017 | | | $ | 9.09 | | | | (0.51 | )% | | | 0.88 | % | | | 1.08 | % | | | 0.88 | % | | $ | 224,822 | | | | 30 | % | |
Class C | |
Year Ended October 31: | |
| | 2021 | | | $ | 7.84 | | | | (1.81 | )% | | | 1.71 | % | | | (0.62 | )% | | | 1.79 | % | | $ | 10,066 | | | | 27 | % | |
| | 2020 | | | $ | 8.31 | | | | 1.85 | % | | | 1.71 | % | | | (0.01 | )% | | | 1.74 | % | | $ | 20,801 | | | | 55 | % | |
| | 2019 | | | $ | 8.48 | | | | 4.72 | % | | | 1.72 | % | | | 1.53 | % | | | 1.73 | % | | $ | 22,541 | | | | 29 | % | |
| | 2018 | | | $ | 8.48 | | | | (1.69 | )% | | | 1.70 | % | | | 0.94 | %(e) | | | 1.71 | % | | $ | 31,976 | | | | 27 | % | |
| | 2017 | | | $ | 9.01 | | | | (1.41 | )% | | | 1.67 | % | | | 0.29 | % | | | 1.67 | % | | $ | 50,316 | | | | 30 | % | |
Class I | |
Year Ended October 31: | |
| | 2021 | | | $ | 7.92 | | | | (0.77 | )% | | | 0.64 | % | | | 0.48 | % | | | 0.67 | % | | $ | 385,332 | | | | 27 | % | |
| | 2020 | | | $ | 8.39 | | | | 3.01 | % | | | 0.64 | % | | | 0.95 | % | | | 0.66 | % | | $ | 590,749 | | | | 55 | % | |
| | 2019 | | | $ | 8.55 | | | | 5.79 | % | | | 0.64 | % | | | 1.84 | % | | | 0.65 | % | | $ | 447,735 | | | | 29 | % | |
| | 2018 | | | $ | 8.55 | | | | (0.64 | )% | | | 0.63 | % | | | 1.69 | %(e) | | | 0.63 | % | | $ | 331,338 | | | | 27 | % | |
| | 2017 | | | $ | 9.08 | | | | (0.34 | )% | | | 0.61 | % | | | 1.34 | % | | | 0.61 | % | | $ | 520,056 | | | | 30 | % | |
Class R | |
Year Ended October 31: | |
| | 2021 | | | $ | 7.93 | | | | (1.03 | )% | | | 0.91 | % | | | 0.23 | % | | | 0.93 | % | | $ | 23,613 | | | | 27 | % | |
| | 2020 | | | $ | 8.40 | | | | 2.74 | % | | | 0.91 | % | | | 0.76 | % | | | 0.92 | % | | $ | 43,684 | | | | 55 | % | |
| | 2019 | | | $ | 8.56 | | | | 5.37 | % | | | 0.92 | % | | | 2.04 | % | | | 0.94 | % | | $ | 38,596 | | | | 29 | % | |
| | 2018 | | | $ | 8.57 | | | | (0.79 | )% | | | 0.91 | % | | | 1.67 | %(e) | | | 0.91 | % | | $ | 43,405 | | | | 27 | % | |
| | 2017 | | | $ | 9.09 | | | | (0.62 | )% | | | 0.88 | % | | | 1.08 | % | | | 0.88 | % | | $ | 58,783 | | | | 30 | % | |
(continues on next page)
See notes to financial statements.
79
Victory Portfolios | | Financial Highlights | |
For a Share Outstanding Throughout Each Period
| | | | | Investment Activities | | Distributions to
Shareholders From | |
| | | Net Asset
Value,
Beginning of
Period | | Net
Investment
Income
(Loss)(a) | | Net Realized
and Unrealized
Gains (Losses)
on Investments | | Total from
Investment
Activities | | Net
Investment
Income | | Total
Distributions | |
Victory INCORE Fund for Income | | | |
Class R6 | | | |
Year Ended October 31: | |
| | 2021 | | | $ | 8.38 | | | | 0.04 | | | | (0.10 | ) | | | (0.06 | ) | | | (0.41 | ) | | | (0.41 | ) | |
| | 2020 | | | $ | 8.54 | | | | 0.08 | | | | 0.18 | | | | 0.26 | | | | (0.42 | ) | | | (0.42 | ) | |
| | 2019 | | | $ | 8.55 | | | | 0.17 | | | | 0.30 | | | | 0.47 | | | | (0.48 | ) | | | (0.48 | ) | |
| | 2018 | | | $ | 9.07 | | | | 0.13 | (e) | | | (0.18 | )(e) | | | (0.05 | ) | | | (0.47 | ) | | | (0.47 | ) | |
| | 2017 | | | $ | 9.62 | | | | 0.12 | | | | (0.16 | ) | | | (0.04 | ) | | | (0.51 | ) | | | (0.51 | ) | |
Class Y | | | |
Year Ended October 31: | |
| | 2021 | | | $ | 8.40 | | | | 0.03 | | | | (0.11 | ) | | | (0.08 | ) | | | (0.40 | ) | | | (0.40 | ) | |
| | 2020 | | | $ | 8.56 | | | | 0.06 | | | | 0.19 | | | | 0.25 | | | | (0.41 | ) | | | (0.41 | ) | |
| | 2019 | | | $ | 8.56 | | | | 0.13 | | | | 0.35 | | | | 0.48 | | | | (0.48 | ) | | | (0.48 | ) | |
| | 2018 | | | $ | 9.08 | | | | 0.19 | (e) | | | (0.25 | )(e) | | | (0.06 | ) | | | (0.46 | ) | | | (0.46 | ) | |
| | 2017 | | | $ | 9.64 | | | | 0.10 | | | | (0.15 | ) | | | (0.05 | ) | | | (0.51 | ) | | | (0.51 | ) | |
Member Class | | | |
November 3, 2020 (f)
through
October 31, 2021 | | $ | 8.41 | | | | 0.04 | | | | (0.13 | ) | | | (0.09 | ) | | | (0.37 | ) | | | (0.37 | ) | |
* Includes adjustments in accordance with U.S. Generally Accepted Accounting Principles.
(a) Per share net investment income (loss) has been calculated using the average daily shares method.
(b) Not annualized for periods less than one year.
(c) Annualized for periods less than one year.
(d) Portfolio turnover is calculated on the basis of the Fund as a whole without distinguishing between the classes of shares issued.
(e) The Fund restated certain elements of its 2018 financial statements resulting from the identification of a GAAP reclassification error for the Fund's paydown gain (loss) transactions. However, this reclassification had no impact on the Fund's net assets, NAV, performance, or taxable distributions paid and reported to shareholders for the fiscal and tax years ended 2018.
(f) Commencement of operations.
See notes to financial statements.
80
Victory Portfolios | | Financial Highlights — continued | |
For a Share Outstanding Throughout Each Period (continued)
| | | | | Ratios to Average Net Assets | | Supplemental Data | |
| | | Net Asset
Value,
End of
Period | | Total
Return
(Excludes
Sales
Charge)*(b) | | Net
Expenses(c) | | Net
Investment
Income
(Loss)(c) | | Gross
Expenses(c) | | Net Assets,
End of
Period
(000's) | | Portfolio
Turnover(b)(d) | |
Victory INCORE Fund for Income | |
Class R6 | |
Year Ended October 31: | |
| | 2021 | | | $ | 7.91 | | | | (0.77 | )% | | | 0.63 | % | | | 0.46 | % | | | 0.64 | % | | $ | 29,691 | | | | 27 | % | |
| | 2020 | | | $ | 8.38 | | | | 3.06 | % | | | 0.63 | % | | | 0.88 | % | | | 0.64 | % | | $ | 49,009 | | | | 55 | % | |
| | 2019 | | | $ | 8.54 | | | | 5.68 | % | | | 0.63 | % | | | 2.00 | % | | | 0.66 | % | | $ | 15,864 | | | | 29 | % | |
| | 2018 | | | $ | 8.55 | | | | (0.52 | )% | | | 0.63 | % | | | 1.43 | %(e) | | | 0.69 | % | | $ | 13,741 | | | | 27 | % | |
| | 2017 | | | $ | 9.07 | | | | (0.36 | )% | | | 0.63 | % | | | 1.31 | % | | | 0.73 | % | | $ | 9,407 | | | | 30 | % | |
Class Y | |
Year Ended October 31: | |
| | 2021 | | | $ | 7.92 | | | | (0.94 | )% | | | 0.71 | % | | | 0.40 | % | | | 0.71 | % | | $ | 120,588 | | | | 27 | % | |
| | 2020 | | | $ | 8.40 | | | | 2.95 | % | | | 0.71 | % | | | 0.67 | % | | | 0.74 | % | | $ | 186,421 | | | | 55 | % | |
| | 2019 | | | $ | 8.56 | | | | 5.72 | % | | | 0.71 | % | | | 1.48 | % | | | 0.79 | % | | $ | 54,950 | | | | 29 | % | |
| | 2018 | | | $ | 8.56 | | | | (0.61 | )% | | | 0.71 | % | | | 2.14 | %(e) | | | 0.79 | % | | $ | 31,975 | | | | 27 | % | |
| | 2017 | | | $ | 9.08 | | | | (0.53 | )% | | | 0.68 | % | | | 1.09 | % | | | 0.68 | % | | $ | 62,408 | | | | 30 | % | |
Member Class | |
November 3, 2020 (f)
through
October 31, 2021 | | $ | 7.95 | | | | (1.08 | )% | | | 0.75 | % | | | 0.52 | % | | | 4.45 | % | | $ | 877 | | | | 27 | % | |
See notes to financial statements.
81
Victory Portfolios | | Financial Highlights | |
For a Share Outstanding Throughout Each Period
| | | | | Investment Activities | | Distributions to
Shareholders From | |
| | | Net Asset
Value,
Beginning of
Period | | Net
Investment
Income
(Loss)(a) | | Net Realized
and Unrealized
Gains (Losses)
on Investments | | Total from
Investment
Activities | | Net
Investment
Income | | Net Realized
Gains from
Investments | |
Victory INCORE Investment Grade Convertible Fund | | | |
Class A | | | |
Year Ended October 31: | |
| | 2021 | | | $ | 17.31 | | | | 0.22 | | | | 3.27 | | | | 3.49 | | | | (0.83 | ) | | | — | | |
| | 2020 | | | $ | 17.51 | | | | 0.27 | | | | 0.47 | | | | 0.74 | | | | (0.35 | ) | | | (0.59 | ) | |
| | 2019 | | | $ | 16.22 | | | | 0.21 | | | | 1.84 | | | | 2.05 | | | | (0.28 | ) | | | (0.48 | ) | |
| | 2018 | | | $ | 16.53 | | | | 0.30 | | | | 0.01 | | | | 0.31 | | | | (0.53 | ) | | | (0.09 | ) | |
| | 2017 | | | $ | 13.72 | | | | 0.17 | | | | 2.89 | | | | 3.06 | | | | (0.25 | ) | | | — | | |
Class I | | | |
Year Ended October 31: | |
| | 2021 | | | $ | 17.32 | | | | 0.31 | | | | 3.27 | | | | 3.58 | | | | (0.92 | ) | | | — | | |
| | 2020 | | | $ | 17.50 | | | | 0.33 | | | | 0.49 | | | | 0.82 | | | | (0.41 | ) | | | (0.59 | ) | |
| | 2019 | | | $ | 16.21 | | | | 0.31 | | | | 1.83 | | | | 2.14 | | | | (0.37 | ) | | | (0.48 | ) | |
| | 2018 | | | $ | 16.53 | | | | 0.36 | | | | (0.01 | ) | | | 0.35 | | | | (0.58 | ) | | | (0.09 | ) | |
| | 2017 | | | $ | 13.71 | | | | 0.22 | | | | 2.90 | | | | 3.12 | | | | (0.30 | ) | | | — | | |
Member Class | | | |
November 3, 2020 (e)
through
October 31, 2021 | | $ | 17.36 | | | | 0.26 | | | | 3.31 | | | | 3.57 | | | | (0.22 | ) | | | — | | |
(a) Per share net investment income (loss) has been calculated using the average daily shares method.
(b) Not annualized for periods less than one year.
(c) Annualized for periods less than one year.
(d) Portfolio turnover is calculated on the basis of the Fund as a whole without distinguishing between the classes of shares issued.
(e) Commencement of operations.
See notes to financial statements.
82
Victory Portfolios | | Financial Highlights — continued | |
For a Share Outstanding Throughout Each Period
| | | | | Ratios to Average Net Assets | | Supplemental Data | |
| | | Total
Distributions | | Net Asset
Value,
End of
Period | | Total
Return
(Excludes
Sales
Charge)(b) | | Net
Expenses(c) | | Net
Investment
Income
(Loss)(c) | | Gross
Expenses(c) | | Net Assets,
End of
Period
(000's) | | Portfolio
Turnover(b)(d) | |
Victory INCORE Investment Grade Convertible Fund | |
Class A | |
Year Ended October 31: | |
| | 2021 | | | | (0.83 | ) | | $ | 19.97 | | | | 20.62 | % | | | 1.39 | % | | | 1.12 | % | | | 1.41 | % | | $ | 21,644 | | | | 28 | % | |
| | 2020 | | | | (0.94 | ) | | $ | 17.31 | | | | 4.43 | % | | | 1.38 | % | | | 1.63 | % | | | 1.38 | % | | $ | 16,571 | | | | 34 | % | |
| | 2019 | | | | (0.76 | ) | | $ | 17.51 | | | | 13.35 | % | | | 1.49 | % | | | 1.31 | % | | | 1.49 | % | | $ | 16,349 | | | | 35 | % | |
| | 2018 | | | | (0.62 | ) | | $ | 16.22 | | | | 1.87 | % | | | 1.27 | % | | | 1.79 | % | | | 1.27 | % | | $ | 14,268 | | | | 41 | % | |
| | 2017 | | | | (0.25 | ) | | $ | 16.53 | | | | 22.57 | % | | | 1.30 | % | | | 1.12 | % | | | 1.30 | % | | $ | 33,040 | | | | 39 | % | |
Class I | |
Year Ended October 31: | |
| | 2021 | | | | (0.92 | ) | | $ | 19.98 | | | | 21.19 | % | | | 0.93 | % | | | 1.59 | % | | | 0.93 | % | | $ | 403,122 | | | | 28 | % | |
| | 2020 | | | | (1.00 | ) | | $ | 17.32 | | | | 4.91 | % | | | 0.96 | % | | | 1.98 | % | | | 0.96 | % | | $ | 276,923 | | | | 34 | % | |
| | 2019 | | | | (0.85 | ) | | $ | 17.50 | | | | 13.99 | % | | | 0.96 | % | | | 1.87 | % | | | 0.96 | % | | $ | 263,981 | | | | 35 | % | |
| | 2018 | | | | (0.67 | ) | | $ | 16.21 | | | | 2.16 | % | | | 0.94 | % | | | 2.17 | % | | | 0.94 | % | | $ | 126,871 | | | | 41 | % | |
| | 2017 | | | | (0.30 | ) | | $ | 16.53 | | | | 23.07 | % | | | 0.94 | % | | | 1.47 | % | | | 0.94 | % | | $ | 78,879 | | | | 39 | % | |
Member Class | |
November 3, 2020 (e)
through
October 31, 2021 | | | (0.22 | ) | | $ | 20.71 | | | | 20.63 | % | | | 1.10 | % | | | 1.30 | % | | | 9.99 | % | | $ | 512 | | | | 28 | % | |
See notes to financial statements.
83
Victory Portfolios | | Notes to Financial Statements
October 31, 2021 | |
1. Organization:
Victory Portfolios (the "Trust") is organized as a Delaware statutory trust and the Trust is registered under the Investment Company Act of 1940, as amended (the "1940 Act"), as an open-end investment company. The Trust is comprised of 41 funds and is authorized to issue an unlimited number of shares, which are units of beneficial interest with a par value of $0.001 per share.
The accompanying financial statements are those of the following seven Funds (collectively, the "Funds" and individually, a "Fund"). Each Fund is classified as diversified under the 1940 Act. The Victory THB US Small Opportunities Fund ("Acquiring Fund") has been newly formed for the purpose of completing the reorganization ("Reorganization") with the THB Asset Management Microcap Fund ("Predecessor Fund"), a series of the Advisors' Inner Circle Fund ("THB Trust"), a registered investment company. The Reorganization was accomplished by a tax-free exchange of shares of the Predecessor Fund's shares, valued at the Predecessor Fund's net assets for the exact same shares and value of the Acquiring Fund's shares. Investor Class and Institutional Class shares of the Predecessor Fund were exchanged for Class A and Class I shares, respectively, of the Acquiring Fund.
Funds (Legal Name) | | Funds (Short Name) | | Investment Share
Classes Offered | |
Victory Diversified Stock Fund | | Diversified Stock Fund | | A, C, I, R, R6, and Y | |
Victory NewBridge Large Cap
Growth Fund | | Newbridge Large Cap
Growth Fund | | A, C, I, and Y
| |
Victory Special Value Fund | | Special Value Fund | | A, C, I, R, and Y | |
Victory THB US Small
Opportunities Fund | | THB US Small Opportunities Fund
| | A and I
| |
Victory Strategic Allocation Fund | | Strategic Allocation Fund | | A, C, I, and R | |
Victory INCORE Fund for Income
| | INCORE Fund for Income
| | A, C, I, R, R6, Y, and
Member Class* | |
Victory INCORE Investment Grade
Convertible Fund | | INCORE Investment Grade
Convertible Fund | | A, I, and
Member Class* | |
* Member Class commenced operations on November 3, 2020.
On November 4, 2020, Victory Capital Management Inc. ("VCM" or the "Adviser") entered into an agreement to acquire certain assets, intellectual property, books & records, and liabilities of Thomson Horstmann & Bryant, Inc. ("THB"), the investment adviser to the Predecessor Fund, from its current shareholders (the "Transaction"). The closing of the Transaction occurred on March 1, 2021, and VCM became the interim investment adviser to the Predecessor Fund subject to shareholder approval. A special shareholder meeting was held on April 21, 2021, at which shareholders of the Predecessor Fund approved the Reorganization of the Predecessor Fund into the Acquiring Fund. Effective May 3, 2021, VCM became the investment adviser and administrator of the Acquiring Fund. Victory Capital Services, Inc. also became the Acquiring Fund's distributor.
On February 2, 2021, the Board of Trustees (the "Board") of the Trust approved the Agreement and Plan of Reorganization, dated February 26, 2021, which provided for the Reorganization of the Predecessor Fund into the Acquiring Fund. The Acquiring Fund commenced operations on May 3, 2021, upon the completion of the Reorganization which occurred as of the close of business on April 30, 2021. The Funds have the same investment objectives, and substantially the same principal investment strategies and principal risks. The Acquiring Fund is the accounting successor of the Predecessor Fund and assumed the performance, financial and other historical information of the Predecessor Fund. Information presented for periods prior to the date of these financial statements reflects, where applicable, the historical information of the Predecessor Fund.
Each class of shares of a Fund has substantially identical rights and privileges except with respect to sales charges, fees paid under distribution plans, expenses allocable exclusively to each class of shares, voting rights on matters solely affecting a single class of shares, and the exchange privilege of each class of shares.
Strategic Allocation Fund is a "fund of funds" in that it invests in a selection of affiliated mutual funds and exchange-traded funds managed by the Funds' Adviser, an affiliate of the Fund.
84
Victory Portfolios | | Notes to Financial Statements — continued
October 31, 2021 | |
Each Fund may rely on certain Securities and Exchange Commission ("SEC") exemptive orders or rules that permit funds meeting various conditions to invest in an Exchange-Traded Fund ("ETF") in amounts exceeding limits set forth in the Investment Company Act of 1940, as amended, that would otherwise be applicable.
Under the Trust's organizational documents, its officers and trustees are indemnified against certain liabilities arising out of the performance of their duties to the Funds. In addition, in the normal course of business, the Funds enter into contracts with their vendors and others that provide for general indemnifications. The Funds' maximum exposure under these arrangements is unknown, as this would involve future claims that may be made against the Funds. However, based on experience, the Funds expect that risk of loss to be remote.
2. Significant Accounting Policies:
The following is a summary of significant accounting policies followed by the Trust in the preparation of its financial statements. The policies are in conformity with Generally Accepted Accounting Principles in the United States of America ("GAAP"). The preparation of financial statements in accordance with GAAP requires management to make estimates and assumptions that affect the reported amounts of assets and liabilities and disclosure of contingent assets and liabilities at the date of the financial statements and the reported amounts of income and expenses for the period. Actual results could differ from those estimates. The Funds follow the specialized accounting and reporting requirements under GAAP that are applicable to investment companies under Accounting Standards Codification Topic 946.
Investment Valuation:
The Funds record investments at fair value. Fair value is defined as the price that would be received to sell an asset or paid to transfer a liability in an orderly transaction between market participants at the measurement date.
The valuation techniques described below maximize the use of observable inputs and minimize the use of unobservable inputs in determining fair value. The inputs used for valuing the Funds' investments are summarized in the three broad levels listed below:
• Level 1 — quoted prices in active markets for identical securities
• Level 2 — other significant observable inputs (including quoted prices for similar securities or interest rates applicable to those securities, etc.)
• Level 3 — significant unobservable inputs (including the Funds' own assumptions in determining the fair value of investments)
Changes in valuation techniques may result in transfers in or out of an assigned level within the disclosure hierarchy. The inputs or methodologies used for valuation techniques are not necessarily an indication of the risk associated with entering into those investments.
The Adviser has established the Pricing and Liquidity Committee (the "Committee"), and subject to the Board's oversight, the Committee administers and oversees the Funds' valuation policies and procedures, which are approved by the Board.
Portfolio securities listed or traded on securities exchanges, including ETFs, are valued at the closing price on the exchange or system where the security is principally traded, if available, or at the Nasdaq Official Closing Price. If there have been no sales for that day on the exchange or system, then a security is valued at the last available bid quotation on the exchange or system where the security is principally traded. In each of these situations, valuations are typically categorized as Level 1 in the fair value hierarchy.
Investments in open-end investment companies are valued at their net asset value ("NAV"). These valuations are typically categorized as Level 1 in the fair value hierarchy.
Investments in the underlying affiliated Funds and other open-end investment companies, other than ETFs, are valued at their NAV at the end of each business day and are typically categorized in Level 1 of the fair value hierarchy.
85
Victory Portfolios | | Notes to Financial Statements — continued
October 31, 2021 | |
The underlying affiliated Funds have specific valuation procedures. In the event that price quotations or valuations are not readily available, are not reflective of market value, or a significant event has been recognized in relation to a security or class of securities, the securities are valued in good faith by the Committee in accordance with valuation procedures approved by the Board. The effect of fair value pricing is that securities may not be priced on the basis of quotations from the primary market in which they are traded and the actual price realized from the sale of a security may differ materially from the fair value price. Valuing these securities at fair value is intended to cause the Fund's NAV to be more reliable than it otherwise would be.
Debt securities are valued each business day by a pricing service approved by the Board. The approved pricing service uses the evaluated bid or the last sale price to value securities. Debt obligations maturing within 60 days may be valued at their amortized cost, provided that the amortized cost represents the fair value of such securities. These valuations are typically categorized as Level 2 in the fair value hierarchy.
In the event that price quotations or valuations are not readily available, investments are valued at fair value in accordance with procedures established by and under the general supervision and responsibility of the Board. These valuations are typically categorized as Level 2 or Level 3 in the fair value hierarchy, based on the observability of inputs used to determine the fair value. The effect of fair value pricing is that securities may not be priced on the basis of quotations from the primary market in which they are traded and the actual price realized from the sale of a security may differ materially from the fair value price. Valuing these securities at fair value is intended to cause the Fund's NAV to be more reliable than it otherwise would be.
A summary of the valuations as of October 31, 2021, is included in the table below while the breakdown, by category, of investments is disclosed on the Schedules of Portfolio Investments (amounts in thousands):
| | | Level 1 | | Level 2 | | Level 3 | | Total | |
Diversified Stock Fund | |
Common Stocks | | $ | 321,983 | | | $ | — | | | $ | — | | | $ | 321,983 | | |
Exchange-Traded Funds | | | 6,694 | | | | — | | | | — | | | | 6,694 | | |
Collateral for Securities Loaned | | | 399 | | | | — | | | | — | | | | 399 | | |
Total | | $ | 329,076 | | | $ | — | | | $ | — | | | $ | 329,076 | | |
NewBridge Large Cap Growth Fund | |
Common Stocks | | $ | 17,689 | | | $ | — | | | $ | — | | | $ | 17,689 | | |
Total | | $ | 17,689 | | | $ | — | | | $ | — | | | $ | 17,689 | | |
Special Value Fund | |
Common Stocks | | $ | 49,434 | | | $ | — | | | $ | — | | | $ | 49,434 | | |
Exchange-Traded Funds | | | 1,028 | | | | — | | | | — | | | | 1,028 | | |
Collateral for Securities Loaned | | | 190 | | | | — | | | | — | | | | 190 | | |
Total | | $ | 50,652 | | | $ | — | | | $ | — | | | $ | 50,652 | | |
THB US Small Opportunities Fund | |
Common Stocks | | $ | 88,333 | | | $ | — | | | $ | — | | | $ | 88,333 | | |
Collateral for Securities Loaned | | | 866 | | | | — | | | | — | | | | 866 | | |
Total | | $ | 89,199 | | | $ | — | | | $ | — | | | $ | 89,199 | | |
Strategic Allocation Fund | |
Affiliated Exchange-Traded Funds | | $ | 2,171 | | | $ | — | | | $ | — | | | $ | 2,171 | | |
Affiliated Mutual Funds | | | 27,186 | | | | — | | | | — | | | | 27,186 | | |
Total | | $ | 29,357 | | | $ | — | | | $ | — | | | $ | 29,357 | | |
86
Victory Portfolios | | Notes to Financial Statements — continued
October 31, 2021 | |
| | | Level 1 | | Level 2 | | Level 3 | | Total | |
INCORE Fund for Income | |
Government National Mortgage Association | | $ | — | | | $ | 514,378 | | | $ | — | | | $ | 514,378 | | |
U.S. Treasury Obligations | | | — | | | | 186,076 | | | | — | | | | 186,076 | | |
Investment Companies | | | 100 | | | | — | | | | — | | | | 100 | | |
Total | | $ | 100 | | | $ | 700,454 | | | $ | — | | | $ | 700,554 | | |
INCORE Investment Grade Convertible Fund | |
Convertible Corporate Bonds | | $ | — | | | $ | 281,478 | | | $ | — | | | $ | 281,478 | | |
| Convertible Preferred Stocks | | | 129,010 | | | | 7,730 | | | | — | | | | 136,740 | | |
Collateral for Securities Loaned | | | 77,095 | | | | — | | | | — | | | | 77,095 | | |
Total | | $ | 206,105 | | | $ | 289,208 | | | $ | — | | | $ | 495,313 | | |
For the year ended October 31, 2021, there were no transfers in or out of Level 3 in the fair value hierarchy.
Real Estate Investment Trusts ("REITs"):
The Funds may invest in REITs, which report information on the source of their distributions annually. REITs are pooled investment vehicles that invest primarily in income-producing real estate or real-estate related loans or interests (such as mortgages). Certain distributions received from REITs during the year are recorded as realized gains or return of capital as estimated by the Funds or when such information becomes known.
Investment Companies:
Exchange-Traded Funds:
The Funds may invest in ETFs, the shares of which are bought and sold on a securities exchange. An ETF trades like common stock and represents a fixed portfolio of securities often designed to track the performance and dividend yield of a particular domestic or foreign market index. The Funds may purchase shares of an ETF to temporarily gain exposure to a portion of the U.S. or a foreign market while awaiting purchase of underlying securities. The risks of owning an ETF generally reflect the risks of owning the underlying securities they are designed to track, although the lack of liquidity of an ETF could result in it being more volatile. Additionally, ETFs have fees and expenses that reduce their value.
Open-End Funds:
The Funds may invest in portfolios of open-end investment companies. These investment companies value securities in their portfolios for which market quotations are readily available at their market values (generally the last reported sale price) and all other securities and assets at their fair value by the methods established by the board of directors of the underlying funds.
Investment Transactions and Related Income:
Changes in holdings of investments are accounted for no later than one business day following the trade date. For financial reporting purposes, however, investment transactions are accounted for on trade date or the last business day of the reporting period. Interest income is determined on the basis of coupon interest accrued using the effective interest method which adjusts, where applicable, the amortization of premiums or accretion of discounts. Dividend income is recorded on the ex-dividend date. Gains or losses realized on sales of securities are recorded on the identified cost basis. Paydown gains or losses on applicable securities, if any, are recorded as components of Interest income on the Statements of Operations.
87
Victory Portfolios | | Notes to Financial Statements — continued
October 31, 2021 | |
Securities Lending:
The Funds, through a Securities Lending Agreement with Citibank, N.A. ("Citibank"), may lend their securities to qualified financial institutions, such as certain broker-dealers and banks, to earn additional income, net of income retained by Citibank. Borrowers are required to initially secure their loans for collateral in the amount of at least 102% of the value of U.S. securities loaned or at least 105% of the value of non-U.S. securities loaned, marked-to-market daily. Any collateral shortfalls associated with increases in the valuation of the securities loaned are generally cured the next business day. The collateral can be received in the form of cash collateral and/or non-cash collateral. Non-cash collateral can include U.S. Government Securities, and other securities as permitted by SEC guidelines. The cash collateral is invested in short-term instruments or cash equivalents, primarily open-end investment companies, as noted on the Funds' Schedules of Portfolio Investments. The Funds do not have effective control of the non-cash collateral and therefore it is not disclosed on the Funds' Schedules of Portfolio Investments. Collateral requirements are determined daily based on the value of the Funds' securities on loan as of the end of the prior business day. During the time portfolio securities are on loan, the borrower will pay the Funds any dividends or interest paid on such securities plus any fee negotiated between the parties to the lending agreement. The Funds also earn a return from the collateral. The Funds pay Citibank various fees in connection with the investment of cash collateral and fees based on the investment income received from securities lending activities. Securities lending income (net of these fees) is disclosed on the Statements of Operations. Loans are terminable upon demand and the borrower must return the loaned securities within the lesser of one standard settlement period or five business days. Although risk is mitigated by the collateral, the Funds could experience a delay in recovering its securities and possible loss of income or value if the borrower fails to return them and the value of the short-term investments will be less than the amount of cash collateral required to be returned to the borrower.
The Funds' agreement with Citibank does not include master netting provisions. Non-cash collateral received by the Funds may not be sold or re-pledged, except to satisfy borrower default.
The following table (amounts in thousands) is a summary of the Funds' securities lending transactions as of October 31, 2021.
| | | Value of
Securities on Loan | | Non-Cash Collateral | | Cash Collateral | |
Diversified Stock Fund | | $ | 387 | | | $ | — | | | $ | 399 | | |
Special Value Fund | | | 187 | | | | — | | | | 190 | | |
THB US Small Opportunities Fund | | | 827 | | | | — | | | | 866 | | |
INCORE Investment Grade
Convertible Fund | | | 75,271 | | | | — | | | | 77,095 | | |
Federal Income Taxes:
It is the policy of each Fund to continue to qualify as a regulated investment company by complying with the provisions available to certain investment companies, as defined in applicable sections of the Internal Revenue Code, and to make distributions of net investment income and net realized gains sufficient to relieve it from all, or substantially all, federal income taxes. Accordingly, no provision for federal income taxes is required in the financial statements. The Funds have a tax year end of October 31.
Management of the Funds has reviewed tax positions taken in tax years that remain subject to examination by all major tax jurisdictions, including federal (i.e., the last four tax years, which includes the current fiscal tax year end). Management believes that there is no tax liability resulting from unrecognized tax benefits related to uncertain tax positions taken.
Allocations:
Expenses directly attributable to the Funds are charged to the Funds, while expenses that are attributable to more than one fund in the Trust, or jointly with an affiliated trust, are allocated among the respective funds in the Trust and/or an affiliated trust based upon net assets or another appropriate basis.
88
Victory Portfolios | | Notes to Financial Statements — continued
October 31, 2021 | |
Income, expenses (other than class-specific expenses such as transfer agent fees, state registration fees, 12b-1 fees, and printing fees), and realized and unrealized gains or losses on investments are allocated to each class of shares based on its relative net assets on the date income is earned or expenses and realized and unrealized gains and losses are incurred.
Redemption Fees:
The Funds currently do not receive a redemption fee. Prior to the Transaction, the Predecessor Fund retained redemption fees of 2.00% on redemptions of fund shares held for less than 30 days. Class I (formerly Institutional Class shares) and Class A (formerly Investor Class shares) had approximately $2 thousand and $1 thousand in redemptions fees, respectively, as presented on the Statements of Changes in Net Assets.
3. Purchases and Sales:
Purchases and sales of securities (excluding securities maturing less than one year from acquisition) for the year ended October 31, 2021, were as follows (amounts in thousands).
| | | Excluding
U.S. Government Securities | | U.S. Government Securities | |
| | | Purchases | | Sales | | Purchases | | Sales | |
Diversified Stock Fund | | $ | 181,691 | | | $ | 217,761 | | | $ | — | | | $ | — | | |
NewBridge Large Cap Growth Fund | | | 6,692 | | | | 10,869 | | | | — | | | | — | | |
Special Value Fund | | | 33,282 | | | | 43,591 | | | | — | | | | — | | |
| THB US Small Opportunities Fund | | | 48,122 | | | | 40,212 | | | | — | | | | — | | |
Strategic Allocation Fund | | | 6,189 | | | | 6,105 | | | | — | | | | — | | |
INCORE Fund for Income | | | — | | | | — | | | | 212,391 | | | | 478,867 | | |
INCORE Investment Grade
Convertible Fund | | | 154,797 | | | | 96,628 | | | | — | | | | — | | |
4. Fees and Transactions with Affiliates and Related Parties:
Investment Advisory Fees:
Investment advisory services are provided to each Fund by the Adviser, which is a New York corporation registered as an investment adviser with the SEC. The Adviser is an indirect wholly owned subsidiary of Victory Capital Holdings, Inc., a publicly traded Delaware corporation, and a wholly owned direct subsidiary of Victory Capital Operating, LLC.
Under the terms of the Investment Advisory Agreement, the Adviser is entitled to receive fees based on a percentage of the average daily net assets of each Fund. The rates at which the Adviser is paid by each Fund are included in the table below.
| | | Adviser Fee Tier Rates | |
| | | Up to $800 million | | $800 million – $2.4 billion | | Over $2.4 billion | |
Diversified Stock Fund | | | 0.65 | % | | | 0.60 | % | | | 0.55 | % | |
| | | Up to $400 million | | $400 million – $800 million | | Over $800 million | |
NewBridge Large Cap
Growth Fund | | | 0.75 | % | | | 0.65 | % | | | 0.60 | % | |
Special Value Fund | | | 0.75 | % | | | 0.65 | % | | | 0.60 | % | |
| | | Flat Rate | | | | | |
THB US Small Opportunities Fund | | | 1.15 | %* | | | | | | | | | |
Strategic Allocation Fund | | | 0.10 | % | | | | | | | | | |
| | | Up to $400 million | | $400 million – $800 million | | Over $800 million | |
INCORE Fund for Income | | | 0.50 | % | | | 0.45 | % | | | 0.40 | % | |
INCORE Investment Grade
Convertible Fund | | | 0.75 | % | | | 0.65 | % | | | 0.60 | % | |
89
Victory Portfolios | | Notes to Financial Statements — continued
October 31, 2021 | |
* Prior to the transaction on March 1, 2021, as previously disclosed in Note 1, THB provided investment management services to the Predecessor Fund, pursuant to an advisory agreement. Under this agreement, THB was responsible for managing the business and affairs of the Fund. The Fund's investment management fee was accrued daily and paid monthly at an annualized rate of 1.25% of the Fund's average daily net assets. The amount incurred and paid to THB from November 1, 2020, through February 28, 2021, was approximately $291 thousand and is included within the Investment advisory fees on the Statements of Operations.
Effective March 1, 2021, VCM became the interim investment adviser to the Predecessor Fund subject to shareholder approval of the Reorganization of the Fund into a series of the Trust. VCM served as interim investment adviser pursuant to an interim investment advisory agreement and was paid the same fee as THB stated in the preceding paragraph. All references to the "Adviser" in this report should be deemed to include VCM after March 1, 2021. Effective with the Reorganization as of the close of business on April 30, 2021, VCM became Adviser to the Acquiring Fund and its investment advisory fee changed from 1.25% of average daily net assets to 1.15% of average daily net assets. In addition, all amounts stated in this report regarding the amounts paid to the Adviser for investment advisory services reflect payments made to THB for the period November 1, 2020, through February 28, 2021, and to VCM for the period March 1, 2021, through October 31, 2021.
Amounts incurred and paid to VCM for the year ended October 31, 2021, are reflected on the Statements of Operations as Investment advisory fees.
Administration and Servicing Fees:
VCM serves as the Funds' administrator and fund accountant. Under the Administration and Fund Accounting Agreement, VCM is entitled to receive fees based on a percentage of the average daily net assets of the Trust, Victory Variable Insurance Funds and Victory Portfolios II. The tiered rates at which VCM is paid by the Funds are shown in the table below:
Net Assets | |
| Up to $15 billion | | $15 billion – $30 billion | | Over $30 billion | |
0.08 %, plus | | | 0.05 | %, plus | | | 0.04 | % | |
Effective with the Reorganization, VCM became the Acquiring Fund's administrator and fund accountant. Prior to this date, SEI Global Funds Services ("SEI"), a wholly owned subsidiary of SEI Investments Company, provided certain administration and servicing functions for the Predecessor Fund. For such services, SEI received a fee subject to certain minimums, which varied depending on the number of share classes and the average daily net assets of the Predecessor Fund. The amount incurred and paid to SEI from November 1, 2020, through April 30, 2021, was approximately $69 thousand and is reflected within the Administration fees on the Statements of Operations. Amounts incurred for the year ended October 31, 2021, are reflected on the Statements of Operations as Administration fees.
Citi Fund Services Ohio, Inc. ("Citi"), an affiliate of Citibank, acts as sub-administrator and sub-fund accountant to the Funds pursuant to the Sub-Administration and Sub-Fund Accounting Services Agreement between VCM and Citi. VCM pays Citi a fee for providing these services. The Trust reimburses VCM and Citi for out-of-pocket expenses incurred in providing these services and certain other expenses specifically allocated to the Funds. Amounts incurred for the year ended October 31, 2021, are reflected on the Statements of Operations as Sub-Administration fees.
Effective with the Reorganization, Citi acts as sub-administrator and sub-fund accountant to the Acquiring Fund.
The Chief Compliance Officer ("CCO") is an employee of the Adviser, which pays the compensation of the CCO and his support staff. The Trust has entered into an agreement to provide compliance services with the Adviser, pursuant to which the Adviser furnishes its compliance personnel, including the services of the CCO, and other resources reasonably necessary to provide the Trust with compliance oversight services related to the design, administration, and oversight of a compliance program for the Trust in accordance with Rule 38a-1 under the 1940 Act. The funds in the Trust, Victory Variable
90
Victory Portfolios | | Notes to Financial Statements — continued
October 31, 2021 | |
Insurance Funds, Victory Portfolios II, and USAA Mutual Funds Trust (collectively, the " Victory Funds Complex"), in aggregate, compensate the Adviser for these services. Amounts incurred for the year ended October 31, 2021, are reflected on the Statements of Operations as Compliance fees.
Prior to the Reorganization, SEI provided certain compliance and regulatory oversight services for the Predecessor Fund.
Transfer Agency Fees:
FIS Investor Services, LLC ("FIS") serves as the Funds' transfer agent. Under the Transfer Agent Agreement, the Trust pays FIS a fee for its services and reimburses FIS for all of their reasonable out-of-pocket expenses incurred in providing these services. Amounts incurred for the year ended October 31, 2021, are reflected on the Statements of Operations as Transfer agent fees.
Victory Capital Transfer Agency, Inc., an affiliate of the Adviser, serves as sub-transfer agent for the Member Class. Victory Capital Transfer Agency, Inc. receives no fee or other compensation for these services.
Prior to the Reorganization, DST Systems, Inc. served as the transfer agent and dividend disbursing agent for the Predecessor Fund. The amount incurred and paid for the period November 1, 2020, through April 30, 2021, was approximately $58 thousand, and is reflected within the Transfer agent fees on the Statements of Operations.
Distributor/Underwriting Services:
Victory Capital Services, Inc. (the "Distributor"), an affiliate of the Adviser, serves as Distributor for the continuous offering of the shares of the Funds pursuant to a Distribution Agreement between the Distributor and the Trust.
Pursuant to the Distribution and Service Plans adopted in accordance with Rule 12b-1 under the 1940 Act, the Distributor may receive a monthly distribution and service fee up to the annual rate shown in the table below:
| | | Class A | | Class C | | Class R | |
Diversified Stock Fund | | | 0.25 | % | | | 1.00 | % | | | 0.50 | % | |
Newbridge Large Cap Growth Fund | | | 0.25 | % | | | 1.00 | % | | | N/A | | |
Special Value Fund | | | 0.25 | % | | | 1.00 | % | | | 0.50 | % | |
THB US Small Opportunities Fund | | | 0.25 | % | | | N/A | | | | N/A | | |
Strategic Allocation Fund | | | 0.25 | % | | | 1.00 | % | | | 0.50 | % | |
INCORE Fund for Income | | | 0.25 | % | | | 1.00 | % | | | 0.25 | % | |
INCORE Investment Grade Convertible Fund | | | 0.25 | % | | | N/A | | | | N/A | | |
The distribution and service fees paid to the Distributor may be used by the Distributor to pay for activities primarily intended to result in the sale of Class A, Class C, and Class R.
The maximum annual distribution fees for Class A (formerly Investor Class) of the Predecessor Fund was 0.25% of average daily net assets. For the period ended April 30, 2021, the Predecessor Fund's Class A (formerly Investor Class) incurred approximately $2 thousand of distribution fees, an effective rate of 0.25%
Effective with the Reorganization, Victory Capital Services, Inc. serves as the Distributor for the Acquiring Fund. Prior to the close of the Reorganization, the Fund had adopted a similar distribution plan for Investor Class. For the period November 1, 2020, to April 30, 2021, THB US Small Opportunities Fund Class A had incurred and paid approximately $2 thousand to third-party service providers and are included in the 12b-1 fees reflected on the Statements of Operations.
Amounts incurred for the year ended October 31, 2021, are reflected on the Statements of Operations as 12b-1 fees.
91
Victory Portfolios | | Notes to Financial Statements — continued
October 31, 2021 | |
In addition, the Distributor is entitled to receive commissions on sale of Class A. For the year ended October 31, 2021, the Distributor received approximately $22 thousand from commissions earned on the sale of Class A.
Prior to the Reorganization, the Predecessor Fund had entered into shareholder servicing agreements with third-party service providers pursuant to which the service providers provided certain shareholder services to Predecessor Fund shareholders (the "Service Plan"). Under the Service Plan, the Fund may have paid service providers a fee at a rate of up to 0.25% annually of the average daily net assets attributable to the former Investor Class (currently Class A), subject to the arrangement for provision of shareholder and administrative services. The Predecessor Fund's former Investor Class (currently Class A) incurred approximately $2 thousand of shareholder servicing fees, an effective rate of 0.20%. These fees are disclosed as Shareholder servicing fees on the Statements of Operations.
Other Fees:
Citibank serves as the Funds' custodian. The Funds pay Citibank a fee for providing these services. Effective with the Reorganization, Citibank acts as custodian for the Acquiring Fund. Prior to the close of the Reorganization, MUFG Union Bank, N.A. served as custodian for the Predecessor Fund. For the period November 1, 2020, to April 30, 2021, the Predecessor Fund incurred and paid approximately $3 thousand to MUFG Union Bank, N.A. Amounts incurred for the year ended October 31, 2021, are reflected on the Statements of Operations as Custodian fees.
Sidley Austin LLP provides legal services to the Trust.
The Adviser has entered into expense limitation agreements with certain Funds. Under the terms of the agreements, the Adviser has agreed to waive fees or reimburse certain expenses to the extent that ordinary operating expenses incurred by certain classes of the Fund in any fiscal year exceed the expense limit for such classes of the Fund. Such excess amounts will be the liability of the Adviser. Acquired fund fees and expenses, interest, taxes, brokerage commissions, other expenditures that are capitalized in accordance with GAAP, and other extraordinary expenses not incurred in the ordinary course of a Fund's business are excluded from the expense limits. As of October 31, 2021, the expense limits (excluding voluntary waivers) are as follows:
| | | In effect until February 28, 2022 | |
| | | Class A | | Class C | | Class I | | Class R | | Class R6 | | Class Y | | Member
Class | |
Diversified Stock Fund | | | N/A | | | | 2.02 | % | | | 0.83 | % | | | N/A | | | | 0.78 | % | | | 0.86 | % | | | N/A | | |
NewBridge Large Cap
Growth Fund | | | 1.36 | % | | | 2.10 | % | | | 0.95 | % | | | N/A | | | | N/A | | | | 1.02 | % | | | N/A | | |
Special Value Fund | | | N/A | | | | 2.20 | % | | | 1.15 | % | | | N/A | | | | N/A | | | | 1.10 | % | | | N/A | | |
THB US Small
Opportunities Fund | | | 1.70 | %(a) | | | N/A | | | | 1.25 | %(a) | | | N/A | | | | N/A | | | | N/A | | | | N/A | | |
Strategic Allocation Fund | | | 0.40 | % | | | 1.15 | % | | | 0.15 | % | | | 0.65 | % | | | N/A | | | | N/A | | | | N/A | | |
INCORE Fund for Income | | | 0.91 | % | | | 1.71 | % | | | 0.64 | % | | | 0.91 | % | | | 0.63 | % | | | 0.71 | % | | | 0.75 | % | |
INCORE Investment Grade
Convertible Fund | | | 1.39 | % | | | N/A | | | | N/A | | | | N/A | | | | N/A | | | | N/A | | | | 1.10 | % | |
(a) In effect May 1, 2021, until May 3, 2023.
Under the terms of the expense limitation agreements, as amended May 1, 2021, the Funds (except Strategic Allocation Fund) have agreed to repay fees and expenses that were waived or reimbursed by the Adviser for a period of up to three years (thirty-six (36) months) after the waiver or reimbursement took place, subject to the lesser of any operating expense limits in effect at the time of: (a) the original waiver or expense reimbursement; or (b) the recoupment, after giving effect to the recoupment amount. Prior to May 1, 2021, the Funds were permitted to recoup fees waived and expenses reimbursed for up to three years after the fiscal year in which the waiver or reimbursement took place, subject to the limitations above. This change did not have any effect on the amounts previously reported for recoupment.
92
Victory Portfolios | | Notes to Financial Statements — continued
October 31, 2021 | |
As of October 31, 2021, the following amounts are available to be repaid to the Adviser (amounts in thousands). The Funds have not recorded any amounts available to be repaid as a liability due to an assessment that repayments are not probable at October 31, 2021.
| | | Expires
10/31/22 | | Expires
10/31/23 | | Expires
10/31/24 | | Total | |
Diversified Stock Fund | | $ | 30 | | | $ | 36 | | | $ | 28 | | | $ | 94 | | |
NewBridge Large Cap Growth Fund | | | 72 | | | | 58 | | | | 63 | | | | 193 | | |
Special Value Fund | | | 33 | | | | 28 | | | | 23 | | | | 84 | | |
THB US Small Opportunities Fund | | | — | | | | — | | | | 13 | | | | 13 | | |
| INCORE Fund for Income | | | 78 | | | | 105 | | | | 197 | | | | 380 | | |
INCORE Investment Grade Convertible Fund | | | — | | | | — | | | | 28 | | | | 28 | | |
Effective with the Reorganization, the amounts that were previously waived and/or reimbursed by THB for the Predecessor Fund are no longer eligible for recoupment by the Adviser.
The Adviser may voluntarily waive or reimburse additional fees to assist the Fund in maintaining competitive expense ratios. Voluntary waivers and reimbursements applicable to the Funds are not available to be recouped at a future time. For the year ended October 31, 2021, the Adviser voluntarily waived the following (amount in thousands):
Certain officers and/or interested trustees of the Funds are also officers and/or employees of the Adviser, administrator, fund accountant, sub-administrator, sub-fund accountant, custodian, legal counsel, and Distributor.
5. Risks:
The Funds may be subject to other risks in addition to these identified risks.
Convertible Securities Risk — Convertible securities rank senior to the issuer's common stock, but may be subordinate to senior debt obligations. In part, the total return for a convertible security may depend upon the performance of the underlying stock into which it can be converted. Synthetic convertibles may respond differently to market fluctuations than traditional convertible securities. They are also subject to counterparty risk.
Equity Risk — The value of the equity securities in which a Fund invests may decline in response to developments affecting individual companies and/or general economic conditions in the United States or abroad. A company's earnings or dividends may not increase as expected (or may decline) because of poor management, competitive pressures, reliance on particular suppliers or geographical regions, labor problems or shortages, corporate restructurings, fraudulent disclosures, man-made or natural disasters, military confrontations or wars, terrorism, public health crises, or other events, conditions and factors. Price changes may be temporary or last for extended periods.
Stock Market Risk — Overall stock market risks may affect the value of the Fund. Domestic and international factors such as political events, war, trade disputes, interest rate levels and other fiscal and monetary policy changes, pandemics and other public health crises, and related geopolitical events, as well as environmental disasters such as earthquakes, fires, and floods, may add to instability in world economies and markets generally. The impact of these and other factors may be short-term or may last for extended periods.
Micro-Capitalization Stock Risk — Micro-capitalization companies tend to be less seasoned and may lose market share or profits to a greater extent than larger, more established companies. Since micro-capitalization company stocks typically have narrower markets and are traded in lower volumes than larger company stocks, they may be more difficult to purchase and sell. Micro-capitalization companies may have limited markets, product lines, or financial resources and lack management experience and may experience higher failure rates than larger companies.
93
Victory Portfolios | | Notes to Financial Statements — continued
October 31, 2021 | |
Debt Securities and Interest Rate Risk — The INCORE Fund for Income and the INCORE Investment Grade Convertible Bond Fund are subject to debt securities and interest rate risk. The value of a debt security or other income-producing security changes in response to various factors including, for example, market-related factors (such as changes in interest rates or changes in the risk appetite of investors generally) and changes in the actual or perceived ability of the issuer (or of issuers generally) to meet its (or their) obligations. Interest rates may rise or the rate of inflation may increase, impacting the value of investments in fixed income securities. A debt issuer's credit quality may be downgraded or an issuer may default. Interest rates may fluctuate due to changes in governmental fiscal policy initiatives and resulting market reaction to those initiatives.
High-Yield/Junk Bond Risk — Lower-quality debt securities can involve a substantially greater risk of default than higher quality debt securities, and their values can decline significantly over short and longer periods of time. Lower-quality debt securities tend to be more sensitive to adverse news about the issuer, or the market or economy in general.
LIBOR Discontinuation Risk — Many debt securities, derivatives, and other financial instruments, including some of the Funds' investments, use the London Interbank Offered Rate ("LIBOR") as the reference or benchmark rate for variable interest rate calculations. LIBOR is being discontinued as a floating rate benchmark. The Secured Overnight Financing Rate ("SOFR") is expected to replace U.S. dollar LIBOR as the principal floating rate benchmark. The LIBOR discontinuation has affected, and will continue to affect, financial markets generally. The date of the LIBOR discontinuation will vary depending on the LIBOR currency and tenor. The UK Financial Conduct Authority (the "FCA"), which is the regulator of the LIBOR administrator, has announced that, after specified dates, LIBOR settings will cease to be provided by any administrator or will no longer be representative. Those dates are: (i) June 30, 2023, in the case of the principal U.S. dollar LIBOR tenors (overnight and one-, three-, six- and 12-month; and (ii) December 31, 2021, in all other cases (i.e., one-week and two-month U.S. dollar LIBOR and all tenors of non-U.S. dollar LIBOR). Accordingly, many existing LIBOR obligations will transition to another benchmark after June 30, 2023, or, in some cases, after December 31, 2021. The FCA and certain U.S. regulators have stated that, despite expected publication of U.S. dollar LIBOR through June 30, 2023, no new contracts using U.S. dollar LIBOR should be entered into after December 31, 2021. Although the foregoing reflects the likely timing of the LIBOR discontinuation and certain consequences, there is no assurance that LIBOR, of any particular currency or tenor, will continue to be published until any particular date or in any particular form, and there is no assurance regarding the consequences of the LIBOR discontinuation. In the United States, there have been efforts to identify alternative reference interest rates for U.S. dollar LIBOR. The cash markets have generally coalesced around recommendations from the Alternative Reference Rates Committee (the "ARRC"), which was convened by the Board of Governors of the Federal Reserve System and the Federal Reserve Bank of New York. The ARRC has recommended that U.S. dollar LIBOR be replaced by rates based on SOFR plus, in the case of existing LIBOR contracts and obligations, a spread adjustment. For purposes of the following discussion, the term "LIBOR" refers solely to U.S. dollar LIBOR. SOFR has a limited history, having been first published in April 2018. The future performance of SOFR, and SOFR-based reference rates, cannot be predicted based on SOFR's history or otherwise. SOFR has been more volatile than other benchmark or market rates, such as three-month LIBOR, during certain periods. Future levels of SOFR may bear little or no relation to historical levels of SOFR, LIBOR or other rates. SOFR-based rates will differ from LIBOR, and the differences may be material. SOFR is intended to be a broad measure of the cost of borrowing funds overnight in transactions that are collateralized by U.S. Treasury securities. In contrast, LIBOR is intended to be an unsecured rate that represents interbank funding costs for different short-term tenors. For these reasons, among others, there is no assurance that SOFR, or rates derived from SOFR, will perform in the same or a similar way as LIBOR would have performed at any time, and there is no assurance that SOFR-based rates will be a suitable substitute for LIBOR. Non-LIBOR floating rate obligations, including SOFR-based obligations, may have returns and values that fluctuate more than those of floating rate obligations that are based on LIBOR or other rates. Resulting changes in the financial markets may adversely affect financial markets generally and
94
Victory Portfolios | | Notes to Financial Statements — continued
October 31, 2021 | |
may also adversely affect our operations specifically, particularly as financial markets transition away from LIBOR.
6. Borrowing and Interfund Lending:
Line of Credit:
The Victory Funds Complex participates in a short-term demand note "Line of Credit" agreement with Citibank. The Line of Credit agreement with Citibank was renewed on June 28, 2021, with a termination date of June 27, 2022. Under the agreement with Citibank, the Victory Funds Complex may borrow up to $600 million, of which $300 million is committed and $300 million is uncommitted. $40 million of the Line of Credit is reserved for use by the Victory Floating Rate Fund, another series of the Victory Funds Complex, with Victory Floating Rate Fund paying the related commitment fees for that amount. The purpose of the Line of Credit is to meet temporary or emergency cash needs. For the year ended October 31, 2021, Citibank received an annual commitment fee of 0.15% on $300 million for providing the Line of Credit. Each fund in the Victory Funds Complex pays a pro-rata portion of the commitment fees plus any interest (one-month LIBOR plus one percent, with LIBOR to be replaced by a different benchmark rate in accordance with the terms of the agreement) on amounts borrowed. Prior to June 29, 2021, the Victory Funds Complex paid an annual commitment fee of 0.15% and an upfront fee of 0.10%. Interest charged to each Fund during the period, if applicable, is reflected on the Statements of Operations under Line of credit fees.
The Funds had no borrowings under the Line of Credit agreement during the year ended October 31, 2021.
Interfund Lending:
The Trust and Adviser rely on an exemptive order granted by the SEC in March 2017 (the "Order"), permitting the establishment and operation of an Interfund Lending Facility (the "Facility"). The Facility allows each Fund to directly lend and borrow money to or from any other fund in the Victory Funds Complex that is permitted to participate in the Facility, relying upon the Order at rates beneficial to both the borrowing and lending funds. Advances under the Facility are allowed for temporary or emergency purposes, including the meeting of redemption requests that otherwise might require the untimely disposition of securities, and are subject to each Fund's borrowing restrictions. The interfund loan rate is determined, as specified in the Order, by averaging the current repurchase agreement rate and the current bank loan rate. As a Borrower, interest charged to each Fund, if any, during the period, is presented on the Statements of Operations under Interfund lending fees. As a Lender, interest earned by each Fund, if any, during the period, is presented on the Statements of Operations under Interfund lending fees.
The average borrowing or lending for the days outstanding and average interest rate for the Funds that utilized this Facility during the year ended October 31, 2021, were as follows (amounts in thousands):
| | | Borrower or
Lender | | Amount
Outstanding at
October 31, 2021 | | Average
Borrowing* | | Days
Borrowing
Outstanding | | Average
Interest
Rate | | Maximum
Borrowing
During the
Period | |
INCORE Fund for Income | | Borrower | | $ | — | | | $ | 825 | | | | 3 | | | | 0.57 | % | | $ | 825 | | |
INCORE Investment Grade
Convertible Fund | | Borrower | | | — | | | | 946 | | | | 1 | | | | 0.61 | % | | | 946 | | |
* For the year ended October 31, 2021, based on the number of days borrowings were outstanding.
95
Victory Portfolios | | Notes to Financial Statements — continued
October 31, 2021 | |
7. Federal Income Tax Information:
Distributable net realized gains, if any, are declared and distributed at least annually from each Fund. Dividends from net investment income, if any, are declared and paid as noted in the table below.
| | | Declared | | Paid | |
Diversified Stock Fund | | Quarterly | | Quarterly | |
NewBridge Large Cap Growth Fund | | Annually | | Annually | |
Special Value Fund | | Annually | | Annually | |
THB US Small Opportunities Fund | | Quarterly | | Quarterly | |
Strategic Allocation Fund | | Quarterly | | Quarterly | |
INCORE Fund for Income | | Monthly | | Monthly | |
INCORE Investment Grade Convertible Fund | | Quarterly | | Quarterly | |
The amounts of dividends from net investment income and distributions from net realized gains (collectively, distributions to shareholders) are determined in accordance with federal income tax regulations, which may differ from GAAP. To the extent these "book/tax" differences are permanent in nature (e.g., net operating loss and distribution reclassification), such amounts are reclassified within the components of net assets based on their federal tax-basis treatment; temporary differences (e.g., wash sales) do not require reclassification. To the extent dividends and distributions exceed net investment income and net realized gains for tax purposes, they are reported as distributions of capital. Net investment losses incurred by a Fund may be reclassified as an offset to capital on the accompanying Statements of Assets and Liabilities.
As of October 31, 2021, on the Statements of Assets and Liabilities, as a result of permanent book-to-tax differences, reclassification adjustments were as follows (amounts in thousands):
| | | Total
Accumulated
Earnings/(Loss) | | Capital | |
| Diversified Stock Fund | | $ | (2,305 | ) | | $ | 2,305 | | |
| NewBridge Large Cap Growth Fund | | | (562 | ) | | | 562 | | |
| Special Value Fund | | | (902 | ) | | | 902 | | |
| THB US Small Opportunities Fund | | | (636 | ) | | | 636 | | |
| INCORE Fund for Income | | | 2 | | | | (2 | ) | |
| INCORE Investment Grade Convertible Fund | | | (445 | ) | | | 445 | | |
The tax character of distributions paid during the tax years ended as noted below, were as follows (total distributions paid may differ from the Statements of Changes in Net Assets because, for tax purposes, dividends are recognized when actually paid) (amounts in thousands).
| | | Year Ended October 31, 2021 | | Year Ended October 31, 2020 | |
| | | Distributions Paid From | | | | Distributions Paid From | | | |
| | Ordinary
Income | | Net
Long-Term
Capital Gains | | Total
Distributions
Paid | | Ordinary
Income | | Net
Long-Term
Capital Gains | | Total
Distributions
Paid | |
Diversified Stock Fund | | $ | 121 | | | $ | 6,599 | | | $ | 6,720 | | | $ | 665 | | | $ | 18,725 | | | $ | 19,390 | | |
NewBridge Large Cap
Growth Fund | | | — | | | | 2,142 | | | | 2,142 | | | | — | | | | 3,123 | | | | 3,123 | | |
Special Value Fund | | | 8 | | | | 1,628 | | | | 1,636 | | | | 134 | | | | 1,611 | | | | 1,745 | | |
THB US Small
Opportunities Fund | | | — | | | | — | | | | — | | | | — | | | | 421 | | | | 421 | | |
Strategic Allocation Fund | | | 816 | | | | — | | | | 816 | | | | 462 | | | | 503 | | | | 965 | | |
INCORE Fund for Income | | | 41,213 | | | | — | | | | 41,213 | | | | 41,156 | | | | — | | | | 41,156 | | |
INCORE Investment Grade
Convertible Fund | | | 15,644 | | | | — | | | | 15,644 | | | | 9,063 | | | | 7,674 | | | | 16,737 | | |
96
Victory Portfolios | | Notes to Financial Statements — continued
October 31, 2021 | |
As of October 31, 2021, the components of accumulated earnings/(loss) on a tax basis were as follows (amounts in thousands):
| | Undistributed
Ordinary
Income | | Undistributed
Long-Term
Capital Gains | | Other
Earnings
(Deficit) | | Accumulated
Earnings | | Accumulated
Capital and
Other
Losses | | Qualified
Late-Year
Losses* | | Unrealized
Appreciation
(Depreciation)** | | Total
Accumulated
Earnings
(Loss) | |
Diversified
Stock Fund | | $ | 12,565 | | | $ | 32,506 | | | $ | (60 | ) | | $ | 45,011 | | | $ | — | | | $ | — | | | $ | 122,574 | | | $ | 167,585 | | |
NewBridge
Large Cap
Growth Fund | | | — | | | | 3,855 | | | | (1 | ) | | | 3,854 | | | | — | | | | (158 | ) | | | 9,702 | | | | 13,398 | | |
Special
Value Fund | | | 2,136 | | | | 5,833 | | | | (15 | ) | | | 7,954 | | | | — | | | | — | | | | 18,298 | | | | 26,252 | | |
THB US Small
Opportunities
Fund | | | 3,026 | | | | 5,061 | | | | — | | | | 8,087 | | | | — | | | | — | | | | 26,089 | | | | 34,176 | | |
Strategic
Allocation
Fund | | | 8 | | | | — | | | | (1 | ) | | | 7 | | | | (122 | ) | | | — | | | | 6,105 | | | | 5,990 | | |
INCORE Fund for
Income | | | 1,649 | | | | — | | | | (10 | ) | | | 1,639 | | | | (351,533 | ) | | | — | | | | (22,240 | ) | | | (372,134 | ) | |
INCORE Investment
Grade
Convertible
Fund | | | 28,857 | | | | 5,772 | | | | (1 | ) | | | 34,628 | | | | — | | | | — | | | | 41,866 | | | | 76,494 | | |
* Qualified late-year losses are comprised of post-October capital losses incurred after October 31 and certain late-year ordinary losses. Late-year ordinary losses represent ordinary losses incurred after December 31 and specified losses incurred after October 31. These losses are deemed to arise on the first day of the Fund's next taxable year.
** The difference between the book-basis and tax-basis unrealized appreciation (depreciation) is attributable primarily to tax deferral of losses on wash sales.
At October 31, 2021, the Funds had net capital loss carryforwards as shown in the table below (amounts in thousands). It is unlikely that the Board will authorize a distribution of capital gains realized in the future until the capital loss carryforwards have been used.
| | | Short Term
Amount | | Long Term
Amount | | Total | |
| Strategic Allocation Fund | | $ | — | | | $ | (122 | ) | | $ | (122 | ) | |
| INCORE Fund for Income | | | (127,550 | ) | | | (223,983 | ) | | | (351,533 | ) | |
During the tax year ended October 31, 2021, the following Fund utilized capital loss carryforwards (amount in thousands):
| | Amount | |
THB US Small Opportunities Fund | | $ | 2,988 | | |
INCORE Investment Grade Convertible Fund | | | 1,509 | | |
As of October 31, 2021, the cost basis for federal income tax purposes, gross unrealized appreciation, gross unrealized depreciation, and net unrealized appreciation (depreciation) for investments were as follows (amounts in thousands):
| | Cost of
Investments
for Federal
Tax Purposes | | Net
Gross
Unrealized
Appreciation | | Gross
Unrealized
Depreciation | | Net
Unrealized
Appreciation
(Depreciation) | |
Diversified Stock Fund | | $ | 206,502 | | | $ | 125,380 | | | $ | (2,806 | ) | | $ | 122,574 | | |
NewBridge Large Cap Growth Fund | | | 7,987 | | | | 9,837 | | | | (135 | ) | | | 9,702 | | |
97
Victory Portfolios | | Notes to Financial Statements — continued
October 31, 2021 | |
| | | Cost of
Investments
for Federal
Tax Purposes | | Net
Gross
Unrealized
Appreciation | | Gross
Unrealized
Depreciation | | Net
Unrealized
Appreciation
(Depreciation) | |
Special Value Fund | | $ | 32,354 | | | $ | 18,757 | | | $ | (459 | ) | | $ | 18,298 | | |
THB US Small Opportunities Fund | | | 63,110 | | | | 27,519 | | | | (1,430 | ) | | | 26,089 | | |
Strategic Allocation Fund | | | 23,252 | | | | 6,470 | | | | (365 | ) | | | 6,105 | | |
INCORE Fund for Income | | | 722,794 | | | | 6,887 | | | | (29,127 | ) | | | (22,240 | ) | |
INCORE Investment Grade Convertible
Fund | | | 453,447 | | | | 48,626 | | | | (6,760 | ) | | | 41,866 | | |
8. Affiliated Securities:
An affiliated security is a security in which a Fund has ownership of at least 5% of the security's outstanding voting shares, an investment company managed by VCM, or an issuer under common control with a Fund or VCM. The Funds do not invest in affiliated securities for the purpose of exercising management or control. These securities are noted as affiliated on a Fund's Schedule of Portfolio Investments. Transactions in affiliated securities during the year ended October 31, 2021, were as follows (amounts in thousands):
| | | Fair
Value
10/31/2020 | | Purchases
at Cost | | Proceeds
from
Sales | | Realized
Gains
(Losses) | | Capital Gain
Distribution | | Net
Change in
Unrealized
Appreciation/
Depreciation | | Fair
Value
10/31/2021 | | Dividend
Income | |
Strategic Allocation Fund | |
Victory INCORE Total
Return Bond Fund
Class R6 | | $ | 3,081 | | | $ | 147 | | | $ | — | | | $ | — | | | $ | — | | | $ | (27 | ) | | $ | 3,201 | | | $ | 77 | | |
Victory Integrity
Discovery Fund
Class Y | | | 820 | | | | — | | | | (248 | ) | | | 10 | | | | — | | | | 596 | | | | 1,178 | | | | — | | |
Victory Market
Neutral Income
Fund Class I | | | 5,412 | | | | 384 | | | | — | | | | — | | | | 101 | | | | (135 | ) | | | 5,661 | | | | 212 | | |
Victory RS Global
Fund Class Y | | | 7,049 | | | | 64 | | | | (526 | ) | | | 136 | | | | 3 | | | | 2,474 | | | | 9,197 | | | | 61 | | |
Victory RS Partners
Fund Class Y | | | 830 | | | | 14 | | | | (219 | ) | | | 68 | | | | 14 | | | | 437 | | | | 1,130 | | | | — | * | |
Victory INCORE
Investment Grade
Convertible Fund | | | — | | | | 1,838 | | | | — | | | | — | | | | — | | | | 11 | | | | 1,849 | | | | 13 | | |
Victory Sophus
Emerging Markets
Fund Class R6 | | | — | | | | 2,990 | | | | — | | | | — | | | | — | | | | (220 | ) | | | 2,770 | | | | — | * | |
Victory Sophus
Emerging Markets
Small Cap Fund
Class Y | | | 1,916 | | | | 682 | | | | (2,579 | ) | | | (682 | ) | | | 170 | | | | 663 | | | | — | | | | 513 | | |
Victory Trivalent
Emerging Markets
Small-Cap Fund
Class Y | | | 1,987 | | | | 19 | | | | (2,454 | ) | | | 281 | | | | — | | | | 167 | | | | — | | | | 19 | | |
98
Victory Portfolios | | Notes to Financial Statements — continued
October 31, 2021 | |
| | | Fair
Value
10/31/2020 | | Purchases
at Cost | | Proceeds
from
Sales | | Realized
Gains
(Losses) | | Capital Gain
Distribution | | Net
Change in
Unrealized
Appreciation/
Depreciation | | Fair
Value
10/31/2021 | | Dividend
Income | |
Victory Trivalent
International
Small-Cap Fund
Class I | | $ | 1,710 | | | $ | 8 | | | $ | (78 | ) | | $ | 25 | | | $ | — | | | $ | 535 | | | $ | 2,200 | | | $ | 8 | | |
VictoryShares
U.S. Multi-Factor
Minimum
Volatility ETF | | | 1,629 | | | | 43 | | | | — | | | | — | | | | — | | | | 499 | | | | 2,171 | | | | 33 | | |
| | | $ | 24,434 | | | $ | 6,189 | | | $ | (6,104 | ) | | $ | (162 | ) | | $ | 288 | | | $ | 5,000 | | | $ | 29,357 | | | $ | 936 | | |
* Rounds to less than $1 thousand
9. Fund Ownership:
Ownership of more than 25% of the voting securities of a fund creates presumptions of control of the fund, under section 2(a)(9) of the 1940 Act. As of October 31, 2021, the shareholders listed below held more than 5% of the shares outstanding of a Fund.
Fund | | Shareholder | | Percent | |
THB US Small Opportunities Fund | | Charles Schwab & Co., Inc. | | | 81.2 | % | |
THB US Small Opportunities Fund | | Albury's Own Pty Ltd. | | | 6.0 | % | |
THB US Small Opportunities Fund | | DF Global Pty Ltd. | | | 5.2 | % | |
10. Subsequent Events:
Effective December 3, 2021, the Victory Newbridge Large Cap Growth Fund underwent a 1-for-5 reverse stock split of the issued and outstanding Class C shares of the Fund. The reverse stock split was not a taxable event, nor did it have an impact on the Fund's holdings or performance. No changes are contemplated at this time for the other share classes offered by the Fund.
99
REPORT OF INDEPENDENT REGISTERED PUBLIC ACCOUNTING FIRM
To the Shareholders and Board of Trustees of Victory Portfolios
Opinion on the Financial Statements
We have audited the accompanying statements of assets and liabilities, including the schedules of portfolio investments, of Victory Portfolios comprising the funds listed below (the "Funds") as of October 31, 2021, the related statements of operations, the statements of changes in net assets, the related notes, and the financial highlights for each of the periods indicated below (collectively referred to as the "financial statements"). In our opinion, the financial statements present fairly, in all material respects, the financial position of each of the Funds as of October 31, 2021, the results of their operations, the changes in net assets, and the financial highlights for each of the periods indicated below in conformity with accounting principles generally accepted in the United States of America.
| Fund Name | | Statements of
Operations | | Statements of Changes
in Net Assets | | Financial Highlights | |
Victory Diversified Stock Fund, Victory NewBridge Large Cap Growth Fund, Victory Special Value Fund, Victory Strategic Allocation Fund, Victory INCORE Fund for Income, and Victory INCORE Investment Grade Convertible Fund | | For the year ended October 31, 2021 | | For the two years ended October 31, 2021 and 2020 | | For the three years ended October 31, 2021, 2020 and 2019 | |
Victory THB US Small Opportunities Fund | | For the year ended October 31, 2021 | |
The Funds' financial highlights for the years ended October 31, 2018 and prior, were audited by other auditors whose report dated December 21, 2018, expressed an unqualified opinion on those financial highlights for all Funds other than Victory THB US Small Opportunities Fund.
The Victory THB US Small Opportunities Fund's financial statements and financial highlights for the years ended October 31, 2020 and prior, were audited by other auditors whose report dated December 29, 2020, expressed an unqualified opinion on those financial statements and financial highlights.
Basis for Opinion
These financial statements are the responsibility of the Funds' management. Our responsibility is to express an opinion on the Funds' financial statements based on our audits. We are a public accounting firm registered with the Public Company Accounting Oversight Board (United States) ("PCAOB") and are required to be independent with respect to the Funds in accordance with the U.S. federal securities laws and the applicable rules and regulations of the Securities and Exchange Commission and the PCAOB.
We conducted our audits in accordance with the standards of the PCAOB. Those standards require that we plan and perform the audit to obtain reasonable assurance about whether the financial statements are free of material misstatement whether due to error or fraud.
100
Our audits included performing procedures to assess the risks of material misstatement of the financial statements, whether due to error or fraud, and performing procedures that respond to those risks. Such procedures included examining, on a test basis, evidence regarding the amounts and disclosures in the financial statements. Our procedures included confirmation of securities owned as of October 31, 2021, by correspondence with the custodians and brokers; when replies were not received from brokers, we performed other auditing procedures. Our audits also included evaluating the accounting principles used and significant estimates made by management, as well as evaluating the overall presentation of the financial statements. We believe that our audits provide a reasonable basis for our opinion.
We have served as the auditor of one or more investment companies advised by Victory Capital Management, Inc. since 2015.
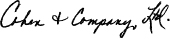
COHEN & COMPANY, LTD.
Cleveland, Ohio
December 23, 2021
101
Victory Portfolios | | Supplemental Information
October 31, 2021 | |
(Unaudited)
Trustee and Officer Information
Board of Trustees:
Overall responsibility for management of the Trust rests with the Board. The Trust is managed by the Board in accordance with the laws of the State of Delaware. There are currently nine Trustees, eight of whom are not "interested persons" of the Trust within the meaning of that term under the 1940 Act ("Independent Trustees") and one of whom is an "interested person" of the Trust within the meaning of that term under the 1940 Act ("Interested Trustee"). The Trustees, in turn, elect the officers of the Trust to actively supervise its day-to-day operations.
The following tables list the Trustees, their date of birth, position with the Trust, commencement of service, principal occupations during the past five years and any directorships of other investment companies or companies whose securities are registered under the Securities Exchange Act of 1934, as amended, or who file reports under that Act. Each Trustee oversees 41 portfolios in the Trust, eight portfolios in Victory Variable Insurance Funds, and 25 portfolios in Victory Portfolios II, each a registered investment company that, together with the Trust, comprise the Victory Funds Complex. David C. Brown is a Trustee of USAA Mutual Funds and oversees 46 portfolios of the USAA Mutual Funds Trust. Each Trustee's address is c/o Victory Portfolios, 4900 Tiedeman Road, 4th Floor, Brooklyn, Ohio 44144. Each Trustee has an indefinite term.
Name and Date of Birth | | Position
Held with
the Trust | | Date
Commenced
Service | | Principal Occupation
During Past 5 Years | | Other
Directorships
Held During
Past 5 Years | |
Independent Trustees. | |
David Brooks Adcock,
Born October 1951 | | Trustee | | May 2005 | | Consultant (since 2006). | | Chair and Trustee, Turner Funds (December 2016-December 2017). | |
Nigel D. T. Andrews,
Born April 1947 | | Trustee | | August 2002 | | Retired. | | Director, TCG BDC II, Inc. (since 2017); Director, TCG BDC I, Inc. (formerly Carlyle GMS Finance, Inc.) (since 2012); Trustee, Carlyle Secured Lending III (since 2021). | |
E. Lee Beard,*
Born August 1951 | | Trustee | | May 2005 | | Retired (since 2015) | | None. | |
Dennis M. Bushe,
Born January 1944 | | Trustee | | July 2016 | | Retired. | | None. | |
102
Victory Portfolios | | Supplemental Information — continued
October 31, 2021 | |
(Unaudited)
Name and Date of Birth | | Position
Held with
the Trust | | Date
Commenced
Service | | Principal Occupation
During Past 5 Years | | Other
Directorships
Held During
Past 5 Years | |
John L. Kelly,
Born April 1953 | | Vice Chair and Trustee | | February 2015 | | Partner, McCarvill Capital Partners (September 2016- September 2017). | | Director, Caledonia Mining Corporation (since May 2012). | |
David L. Meyer,*
Born April 1957 | | Trustee | | December 2008 | | Retired. | | None. | |
Gloria S. Nelund,
Born May 1961 | | Trustee | | July 2016 | | Chair, CEO and Co-Founder of TriLinc Global, LLC, an investment firm. | | TriLinc Global Impact Fund, LLC (since 2012). | |
Leigh A. Wilson,
Born December 1944 | | Chair and Trustee | | November 1994 | | Private Investor. | | Chair (since 2013), Caledonia Mining Corporation. | |
Interested Trustee. | |
David C. Brown,**
Born May 1972 | | Trustee | | May 2008 | | Chairman and Chief Executive Officer (since 2013), the Adviser; Chairman and Chief Executive Officer (since 2013), Victory Capital Holdings, Inc.; Chairman and Chief Executive Officer (since 2019), Victory Capital Transfer Agency, Inc. | | Trustee, USAA Mutual Funds Trust; Board Member, Victory Capital Services, Inc. | |
* The Board has designated Ms. Beard and Mr. Meyer as its Audit Committee Financial Experts.
** Mr. Brown is an "Interested Person" by reason of his relationship with the Adviser.
The Statement of Additional Information includes additional information about the Trustees of the Trust and is available, without charge, by calling 800-539-3863.
103
Victory Portfolios | | Supplemental Information — continued
October 31, 2021 | |
(Unaudited)
Officers:
The officers of the Trust, their date of birth, commencement of service and their principal occupations during the past five years, are detailed in the following table. Each officer serves until the earlier of his or her resignation, removal, retirement, death, or the election of a successor. The mailing address of each officer of the Trust is 4900 Tiedeman Road, 4th Floor, Brooklyn, Ohio 44144. The officers of the Trust receive no compensation directly from the Trust for performing the duties of their offices.
Name and Date of Birth | | Position with
the Trust | | Date
Commenced
Service | | Principal Occupation During Past 5 Years | |
Christopher K. Dyer,
Born February 1962 | | President | | February 2006* | | Director of Mutual Fund Administration, the Adviser; Chief Operating Officer, Victory Capital Services, Inc. (since 2020); Vice President, Victory Capital Transfer Agency, Inc. (since 2019). | |
Scott A. Stahorsky,
Born July 1969 | | Vice President | | December 2014 | | Manager, Fund Administration, the Adviser. | |
Erin G. Wagner,
Born February 1974 | | Secretary | | December 2014 | | Associate General Counsel, the Adviser (since 2013). | |
Allan Shaer,
Born March 1965 | | Treasurer | | May 2017 | | Senior Vice President, Financial Administration, Citi Fund Services Ohio, Inc. (since 2016); Vice President, Mutual Fund Administration, JP Morgan Chase (2011-2016). | |
Christopher A. Ponte,
Born March 1984 | | Assistant Treasurer | | December 2017 | | Manager, Fund Administration, the Adviser (since 2017); Senior Analyst, Fund Administration, the Adviser (prior to 2017); Chief Financial Officer, Victory Capital Services, Inc. (since 2018). | |
Colin Kinney,
Born October 1973 | | Chief Compliance Officer | | July 2017 | | Chief Compliance Officer (since 2013) and Chief Risk Officer (2009-2017), the Adviser. | |
Sean Fox,
Born September 1976 | | Deputy Chief Compliance
Officer | | July 2021 | | Sr. Compliance Officer, the Adviser (2019-2021); Compliance Officer, the Adviser (2015-2019). | |
Chuck Booth,
Born April 1960 | | Anti-Money Laundering Compliance Officer and Identity Theft Officer | | May 2015 | | Director, Regulatory Administration and CCO Support Services, Citi Fund Services Ohio, Inc. | |
Jay G. Baris,
Born January 1954 | | Assistant Secretary | | December 1997 | | Partner, Sidley Austin LLP (since April 2020); Partner, Shearman & Sterling LLP (January 2018-April 2020); Partner, Morrison & Foerster LLP (2011-January 2018). | |
* On December 3, 2014, Mr. Dyer resigned as Secretary of the Trust and accepted the position of President.
104
Victory Portfolios | | Supplemental Information — continued
October 31, 2021 | |
(Unaudited)
Proxy Voting and Portfolio Holdings Information
Proxy Voting:
Information regarding the policies and procedures each Fund uses to determine how to vote proxies relating to portfolio securities is available without charge, upon request, by calling 800-539-3863. The information is also included in the Funds' Statement of Additional Information, which is available on the SEC's website at www.sec.gov.
Information relating to how the Funds voted proxies relating to portfolio securities held during the most recent 12 months ended June 30 is available on the SEC's website at www.sec.gov.
Availability of Schedules of Portfolio Investments:
The Trust files a complete list of Schedules of Portfolio Investments with the SEC for the first and third quarter of each fiscal year on Form N-PORT. Forms N-PORT are available on the SEC's website at www.sec.gov.
Expense Examples
As a shareholder of the Funds, you may incur two types of costs: (1) transaction costs, including sales charges (loads) on purchases; and (2) ongoing costs, including management fees, distribution and service (12b-1) fees and other Fund expenses. These examples are intended to help you understand your ongoing costs (in dollars) of investing in the Funds and to compare these costs with the ongoing costs of investing in other mutual funds.
These examples are based on an investment of $1,000 invested at the beginning of the period and held for the entire period from May 1, 2021, through October 31, 2021.
The Actual Expense figures in the table below provide information about actual account values and actual expenses. You may use the information below, together with the amount you invested, to estimate the expenses that you paid over the period. Simply divide your account value by $1,000 (for example, an $8,600 account value divided by $1,000 = 8.6), then multiply the result by the number in the table under the heading entitled "Actual Expenses Paid During Period" to estimate the expenses you paid on your account during this period.
The Hypothetical Expense figures in the table below provide information about hypothetical account values and hypothetical expenses based on each Fund's actual expense ratio and an assumed rate of return of 5% per year before expenses, which is not the Fund's actual return. The hypothetical account values and expenses may not be used to estimate the actual ending account balance or expenses you paid for the period. You may use this information to compare this 5% hypothetical example with the 5% hypothetical examples that appear in shareholder reports of other funds.
Please note the expenses shown in the table below are meant to highlight your ongoing costs only and do not reflect any transactional costs. Therefore, the hypothetical expenses in the table are useful in comparing ongoing costs only and will not help you determine the relative total costs of owning different funds. In addition, if these transactional costs were included, your costs would have been higher.
| | | Beginning
Account
Value
5/1/21 | | Actual
Ending
Account
Value
10/31/21 | | Hypothetical
Ending
Account
Value
10/31/21 | | Actual
Expenses
Paid
During
Period
5/1/21-
10/31/21* | | Hypothetical
Expenses
Paid
During
Period
5/1/21-
10/31/21* | | Annualized
Expense
Ratio
During
Period
5/1/21-
10/31/21 | |
Diversified Stock Fund | |
Class A | | $ | 1,000.00 | | | $ | 1,120.60 | | | $ | 1,019.81 | | | $ | 5.72 | | | $ | 5.45 | | | | 1.07 | % | |
Class C | | | 1,000.00 | | | | 1,114.90 | | | | 1,015.02 | | | | 10.77 | | | | 10.26 | | | | 2.02 | % | |
Class I | | | 1,000.00 | | | | 1,121.70 | | | | 1,021.02 | | | | 4.44 | | | | 4.23 | | | | 0.83 | % | |
Class R | | | 1,000.00 | | | | 1,119.00 | | | | 1,018.40 | | | | 7.21 | | | | 6.87 | | | | 1.35 | % | |
Class R6 | | | 1,000.00 | | | | 1,122.50 | | | | 1,021.27 | | | | 4.17 | | | | 3.97 | | | | 0.78 | % | |
Class Y | | | 1,000.00 | | | | 1,121.50 | | | | 1,020.87 | | | | 4.60 | | | | 4.38 | | | | 0.86 | % | |
105
Victory Portfolios | | Supplemental Information — continued
October 31, 2021 | |
(Unaudited)
| | | Beginning
Account
Value
5/1/21 | | Actual
Ending
Account
Value
10/31/21 | | Hypothetical
Ending
Account
Value
10/31/21 | | Actual
Expenses
Paid
During
Period
5/1/21-
10/31/21* | | Hypothetical
Expenses
Paid
During
Period
5/1/21-
10/31/21* | | Annualized
Expense
Ratio
During
Period
5/1/21-
10/31/21 | |
Newbridge Large Cap Growth Fund | |
Class A | | $ | 1,000.00 | | | $ | 1,116.00 | | | $ | 1,018.35 | | | $ | 7.25 | | | $ | 6.92 | | | | 1.36 | % | |
Class C | | | 1,000.00 | | | | 1,111.80 | | | | 1,014.62 | | | | 11.18 | | | | 10.66 | | | | 2.10 | % | |
Class I | | | 1,000.00 | | | | 1,118.30 | | | | 1,020.42 | | | | 5.07 | | | | 4.84 | | | | 0.95 | % | |
Class Y | | | 1,000.00 | | | | 1,119.10 | | | | 1,020.06 | | | | 5.45 | | | | 5.19 | | | | 1.02 | % | |
Special Value Fund | |
Class A | | $ | 1,000.00 | | | $ | 1,119.10 | | | $ | 1,019.00 | | | $ | 6.57 | | | $ | 6.26 | | | | 1.23 | % | |
Class C | | | 1,000.00 | | | | 1,114.60 | | | | 1,014.62 | | | | 11.19 | | | | 10.66 | | | | 2.10 | % | |
Class I | | | 1,000.00 | | | | 1,120.20 | | | | 1,019.91 | | | | 5.61 | | | | 5.35 | | | | 1.05 | % | |
Class R | | | 1,000.00 | | | | 1,117.50 | | | | 1,017.49 | | | | 8.17 | | | | 7.78 | | | | 1.53 | % | |
Class Y | | | 1,000.00 | | | | 1,120.70 | | | | 1,020.16 | | | | 5.35 | | | | 5.09 | | | | 1.00 | % | |
THB US Small Opportunities Fund | |
Class A | | $ | 1,000.00 | | | $ | 948.10 | | | $ | 1,016.64 | | | $ | 8.35 | | | $ | 8.64 | | | | 1.70 | % | |
Class I | | | 1,000.00 | | | | 950.70 | | | | 1,018.90 | | | | 6.15 | | | | 6.36 | | | | 1.25 | % | |
Strategic Allocation Fund | |
Class A | | $ | 1,000.00 | | | $ | 1,033.30 | | | $ | 1,023.19 | | | $ | 2.05 | | | $ | 2.04 | | | | 0.40 | % | |
Class C | | | 1,000.00 | | | | 1,029.20 | | | | 1,019.41 | | | | 5.88 | | | | 5.85 | | | | 1.15 | % | |
Class I | | | 1,000.00 | | | | 1,034.40 | | | | 1,024.45 | | | | 0.77 | | | | 0.77 | | | | 0.15 | % | |
Class R | | | 1,000.00 | | | | 1,032.00 | | | | 1,021.93 | | | | 3.33 | | | | 3.31 | | | | 0.65 | % | |
INCORE Fund for Income | |
Class A | | $ | 1,000.00 | | | $ | 992.50 | | | $ | 1,020.62 | | | $ | 4.57 | | | $ | 4.63 | | | | 0.91 | % | |
Class C | | | 1,000.00 | | | | 988.40 | | | | 1,016.59 | | | | 8.57 | | | | 8.69 | | | | 1.71 | % | |
Class I | | | 1,000.00 | | | | 993.90 | | | | 1,021.98 | | | | 3.22 | | | | 3.26 | | | | 0.64 | % | |
Class R | | | 1,000.00 | | | | 992.50 | | | | 1,020.62 | | | | 4.57 | | | | 4.63 | | | | 0.91 | % | |
Class R6 | | | 1,000.00 | | | | 993.70 | | | | 1,021.83 | | | | 3.37 | | | | 3.41 | | | | 0.67 | % | |
Class Y | | | 1,000.00 | | | | 993.50 | | | | 1,021.42 | | | | 3.77 | | | | 3.82 | | | | 0.75 | % | |
Member Class | | | 1,000.00 | | | | 993.40 | | | | 1,021.42 | | | | 3.77 | | | | 3.82 | | | | 0.75 | % | |
INCORE Investment Grade Convertible Fund | |
Class A | | $ | 1,000.00 | | | $ | 1,012.40 | | | $ | 1,018.20 | | | $ | 7.05 | | | $ | 7.07 | | | | 1.39 | % | |
Class I | | | 1,000.00 | | | | 1,014.80 | | | | 1,020.57 | | | | 4.67 | | | | 4.69 | | | | 0.92 | % | |
Member Class | | | 1,000.00 | | | | 1,014.00 | | | | 1,019.66 | | | | 5.58 | | | | 5.60 | | | | 1.10 | % | |
* Expenses are equal to the average account value multiplied by the Fund's annualized expense ratio multiplied by 184/365 (the number of days in the most recent fiscal half-year divided by the number of days in the fiscal year).
106
Victory Portfolios | | Supplemental Information — continued
October 31, 2021 | |
(Unaudited)
Considerations of the Board in Approving the Investment Advisory Agreement (the "Agreement")
The Board approved the Agreement on behalf of the Victory THB US Small Opportunities Fund (the "Fund") at a meeting, which was called for that purpose, on February 2, 2021. In considering whether to approve the Agreement, the Board requested, and the Adviser provided, information that the Board believed to be reasonably necessary to reach its conclusions.
The Board, including the Independent Trustees, evaluated the information provided and its extensive experience with the Adviser and was advised by legal counsel to the Fund, which also serves as independent legal counsel to the Independent Trustees. The Board reviewed numerous factors with respect to the Fund. The Board recognized that management was proposing to add the Fund as an investment portfolio of the Trust and that the Fund had not yet commenced operations and thus had no performance record or historical expenses, but would assume the performance of the THB Asset Management Microcap Fund (the "Predecessor Fund"), a series of The Advisors' Inner Circle Fund, and managed by Thomson Hortsmann & Bryant, Inc., the Predecessor Fund's adviser. In considering whether the compensation to be paid to the Adviser was fair and reasonable, the Board also evaluated, among other things, the following factors:
• The requirements of the Fund for the services to be provided by the Adviser;
• The nature, quality and extent of the services expected to be provided;
• The performance of the Predecessor Fund as compared to comparable funds;
• The fees payable for the services and whether the fee arrangements provided for economies of scale that would benefit Fund shareholders as the Fund grows;
• Whether the fee would be sufficient to enable the Adviser to attract and retain experienced personnel and continue to provide quality services to the Fund;
• The fees paid by other clients of the Adviser whose accounts are managed in a similar investment style and any differences in the services provided to the other clients compared to those provided to the Fund;
• The total expenses of the Fund;
• Management's commitment to operating the Fund at competitive expense levels;
• The profitability of the Adviser (as reflected by comparing fees earned against an estimate of the Adviser's costs) with respect to the Adviser's relationship with the Fund;
• Research and other service benefits received by the Adviser obtained through payment of client commissions for securities transactions;
• Other benefits received by the Adviser, and its affiliates, including revenues paid to the Adviser, or its affiliates, by the Fund for administration and fund accounting services, and distribution;
• The capabilities and financial condition of the Adviser;
• Current economic and industry trends; and
• The historical relationship between the Trust and the Adviser.
The Board reviewed the Fund's proposed gross management fee both in the context of the Adviser's expected profitability from the Fund and the historical costs associated with operating similar funds. The Board acknowledged that the Fund's profitability is inherently difficult to estimate in a startup phase. In addition, the Board compared the Fund's expected operating expense ratio and management fee with comparable funds in a peer group of funds with similar investment strategies. The Board considered the Adviser's commitment to competitive total operating expense ratios through its contractual agreement to waive its fees and reimburse expenses for a specified period of time, noting that this could result in substantial initial subsidies by the Adviser. The Trustees noted that no breakpoints in the advisory fee schedule for the Fund were being proposed at this time.
The Board reviewed various other factors with respect to the Fund. In their deliberations, the Trustees did not rank the importance of any particular information or factor considered and each Trustee attributed different weights to various factors.
107
Victory Portfolios | | Supplemental Information — continued
October 31, 2021 | |
(Unaudited)
The Board took into consideration regular reports from the Adviser throughout the COVID-19 pandemic public health crisis concerning how the ongoing pandemic has affected market volatility, investment risk and the implementation and effectiveness of business continuity plans. These reports also had confirmed that the pandemic had no material impact on the Adviser's operations.
Approval of the Agreement on Behalf of the Fund
Based on its review of the information requested and provided, and following extended discussions, the Board determined that the Agreement, on behalf of the Fund, was consistent with the best interests of the Fund and its future shareholders, and the Board unanimously approved the Agreement, on behalf of the Fund, for an initial two-year period on the basis of the foregoing review and discussions and the following considerations, among others:
• The fairness and reasonableness of the investment advisory fee to be paid to the Adviser under the Agreement in light of the investment advisory services to be provided, the costs of these services, the expected profitability of the Adviser's relationship with the Fund and the comparability of the fee to be paid to the fees paid by other investment companies;
• The nature, quality and extent of the investment advisory services to be provided by Adviser;
• The Adviser's entrepreneurial commitment to the management of the Fund and its inclusion in a broad-based family of funds, which could entail a substantial commitment of the Adviser's resources to the successful operation of the Fund;
• The Adviser's representations regarding its staffing and capabilities to manage the Fund, including the retention of personnel with relevant portfolio management experience;
• The Adviser's efforts to enhance investment results by, among other things, developing quality portfolio management teams; and
• The overall high quality of the personnel, operations, financial condition, investment management capabilities, methodologies and performance of the Adviser.
108
Victory Portfolios | | Supplemental Information — continued
October 31, 2021 | |
(Unaudited)
Additional Federal Income Tax Information
For the year ended October 31, 2021, the following Funds paid qualified dividend income for the purposes of reduced individual federal income tax rates of:
| | | Percent | |
| Diversified Stock Fund | | | 35 | % | |
| Special Value Fund | | | 70 | % | |
| Strategic Allocation Fund | | | 96 | % | |
| INCORE Investment Grade Convertible Fund | | | 2 | % | |
Dividends qualified for corporate dividends received deductions of:
| | | Percent | |
| Diversified Stock Fund | | | 35 | % | |
| Special Value Fund | | | 70 | % | |
| Strategic Allocation Fund | | | 18 | % | |
| INCORE Investment Grade Convertible Fund | | | 2 | % | |
For the year ended October 31, 2021, the following Funds designated short-term capital gain distributions (in thousands):
| | | Amount | |
| Diversified Stock Fund | | $ | 748 | | |
| Special Value Fund | | | 245 | | |
THB US Small Opportunities Fund | | | 238 | | |
| INCORE Investment Grade Convertible Fund | | | 67 | | |
For the year ended October 31, 2021, the following Funds designated long-term capital gain distributions (in thousands):
| | | Amount | |
| Diversified Stock Fund | | $ | 8,258 | | |
| NewBridge Large Cap Growth Fund | | | 2,706 | | |
| Special Value Fund | | | 2,288 | | |
THB US Small Opportunities Fund | | | 398 | | |
| INCORE Investment Grade Convertible Fund | | | 378 | | |
109
Privacy Policy
Protecting the Privacy of Information
The Trust respects your right to privacy. We also know that you expect us to conduct and process your business in an accurate and efficient manner. To do so, we must collect and maintain certain personal information about you. This is the information we collect from you on applications or other forms, and from the transactions you make with us or third parties. It may include your name, address, social security number, account transactions and balances, and information about investment goals and risk tolerance.
We do not disclose any information about you or about former customers to anyone except as permitted or required by law. Specifically, we may disclose the information we collect to companies that perform services on our behalf, such as the transfer agent that processes shareholder accounts and printers and mailers that assist us in the distribution of investor materials. We may also disclose this information to companies that perform marketing services on our behalf. This allows us to continue to offer you Victory investment products and services that meet your investing needs, and to effect transactions that you request or authorize. These companies will use this information only in connection with the services for which we hired them. They are not permitted to use or share this information for any other purpose.
To protect your personal information internally, we permit access only by authorized employees and maintain physical, electronic, and procedural safeguards to guard your personal information.*
* You may have received communications regarding information about privacy policies from other financial institutions which gave you the opportunity to "opt-out" of certain information sharing with companies which are not affiliated with that financial institution. The Trust does not share information with other companies for purposes of marketing solicitations for products other than the Trust. Therefore, the Trust does not provide opt-out options to their shareholders.
Victory Funds
P.O. Box 182593
Columbus, Ohio 43218-2593

Visit our website at: | | Call Victory at: | |
www.vcm.com | | 800-539-FUND (800-539-3863) | |
| | | 800-235-8396 for Member Class | |

October 31, 2021
Annual Report
Victory Sycamore Established Value Fund
Victory Sycamore Small Company Opportunity Fund
www.vcm.com
News, Information And Education 24 Hours A Day, 7 Days A Week
The Victory Capital website gives fund shareholders, prospective shareholders, and investment professionals a convenient way to access fund information, get guidance, and track fund performance anywhere they can access the Internet. The site includes:
• Detailed performance records
• Daily share prices
• The latest fund news
• Investment resources to help you become a better investor
• A section dedicated to investment professionals
Whether you're a potential investor searching for the fund that matches your investment philosophy, a seasoned investor interested in planning tools, or an investment professional, www.vcm.com has what you seek. Visit us anytime. We're always open.
TABLE OF CONTENTS
Shareholder Letter (Unaudited) | | | 3 | | |
Managers' Commentary / Investment
Overview (Unaudited) | | | 5 | | |
Investment Objective and Portfolio
Holdings (Unaudited) | | | 11 | | |
Schedules of Portfolio Investments | |
Victory Sycamore Established Value Fund | | | 13 | | |
Victory Sycamore Small Company Opportunity Fund | | | 16 | | |
Financial Statements | |
Statements of Assets and Liabilities | | | 20 | | |
Statements of Operations | | | 22 | | |
Statements of Changes in Net Assets | | | 23 | | |
Financial Highlights | | | 26 | | |
Notes to Financial Statements | | | 30 | | |
Report of Independent Registered Public
Accounting Firm | | | 39 | | |
Supplemental Information (Unaudited) | | | 40 | | |
Trustee and Officer Information | | | 40 | | |
Proxy Voting and Portfolio Holdings Information | | | 43 | | |
Expense Examples | | | 43 | | |
Additional Federal Income Tax Information | | | 45 | | |
Privacy Policy (inside back cover) | | | |
1
IRA DISTRIBUTION WITHHOLDING DISCLOSURE
We generally must withhold federal income tax at a rate of 10% of the taxable portion of your distribution and, if you live in a state that requires state income tax withholding, at your state's tax rate. However, you may elect not to have withholding apply or to have income tax withheld at a higher rate. Any withholding election that you make will apply to any subsequent distribution unless and until you change or revoke the election. If you wish to make a withholding election, or change or revoke a prior withholding election, call 800-539-3863 and form W-4P (OMB No. 1545-0074 withholding certificate for pension or annuity payments) will be electronically sent.
If you do not have a withholding election in place by the date of a distribution, federal income tax will be withheld from the taxable portion of your distribution at a rate of 10%. If you must pay estimated taxes, you may be subject to estimated tax penalties if your estimated tax payments are not sufficient and sufficient tax is not withheld from your distribution.
For more specific information, please consult your tax adviser.
The Funds are distributed by Victory Capital Services, Inc. Victory Capital Management Inc. is the investment adviser to the Funds and receives fees from the Funds for performing services for the Funds.
This report is not authorized for distribution to prospective investors unless preceded or accompanied by a current prospectus of the Victory Funds.
For additional information about any Victory Fund, including fees, expenses, and risks, view our prospectus online at vcm.com or call 800-539-3863. Read it carefully before you invest or send money.
The information in this annual report is based on data obtained from recognized services and sources and is believed to be reliable. Any opinions, projections, or recommendations in this report are subject to change without notice and are not intended as individual investment advice. Past investment performance of the Funds, markets or securities mentioned herein should not be considered to be indicative of future results.
• NOT FDIC INSURED • NO BANK GUARANTEE • MAY LOSE VALUE

Call Victory at:
800-539-FUND (800-539-3863)
Visit our website at:
www.vcm.com
2
Victory Funds Letter to Shareholders
(Unaudited)
Dear Shareholder,
There's no denying the enormous toll that COVID-19 has had on so many of us, both personally and professionally. But if our recent experience with this pandemic has taught us anything, it's that we — as a nation — are resilient. Through it all, our economy and the financial markets have endured and performed admirably.
Consider that just one year ago we were still anxiously awaiting the development and approval of an effective vaccine, while wondering if the initial sharp rebound in financial assets would hold. As it turns out, a vaccine was rolled out (domestically) faster than expectations, and a recovery that began during the second quarter of 2020 continued through most of the annual reporting period that ended October 31, 2021.
By all accounts, the economy, and life in general, continues trending toward a new normal. But it's always healthy to reflect on the events that transpired over the past year.
It may seem like an eternity ago, but in late 2020 financial markets were being alternately fueled and roiled by a variety of factors, including: the ebb and flow of COVID-19 cases; a contentious U.S. presidential election season; growing optimism for an effective vaccine; and a fluid debate regarding the need for more stimulus. Ultimately, stocks were propelled higher in late 2020, and the upward trajectory continued, more or less, for the first two quarters of 2021. Of course, nothing moves in a straight line, and heightened volatility re-emerged in September and October as our annual reporting period drew to a close.
More recently, investors have been pondering a new set of worries — some of them directly related to the U.S. Federal Reserve's (the "Fed") accommodative monetary policies and the various forms of fiscal stimuli that helped revive the economy from the depths of the crisis. Already, the Fed has definitively laid out a plan to begin tapering its aggressive bond buying program, and now we're all wondering how much higher interest rates will ultimately rise. Many CEOs are also expressing concerns about labor shortages, disrupted supply chains, rising commodity prices, and the potential for lasting inflation.
So how did markets actually fare during the most recent annual reporting period? Through all the volatility and surprises, the S&P 500® Index registered an impressive annual return of nearly 43% for the 12-month period ended October 31, 2021. Not coincidentally, this broad market index has been bounding around near its all-time high. Over this same annual period, the yield on the 10-Year U.S. Treasury jumped 67 basis points (a basis point is 1/100th of a percentage point), reflecting a very low starting rate, substantial fiscal stimulus, and the Fed's accommodative monetary policy. As the end of the reporting period approached, the yield on the 10-Year U.S. Treasury was hovering just below its high for the year, finishing at 1.55%, as of the end of October 2021.
All this merely exemplifies just how dynamic and resilient markets have been. Of course, there are myriad challenges ahead (some yet to be identified), and we should
3
not expect such robust equity returns each and every year. Although no one knows what the future holds, we can assure you that the investment professionals at all our independent franchises continually monitor the environment and work hard to position portfolios opportunistically no matter what the markets throw at us.
On the following pages you will find information relating to your Victory Funds investment. If you have any questions regarding the current market dynamics or your specific portfolio or investment plan, we encourage you to contact your financial advisor. If you invest with us directly, you may call (800) 539-3863 or visit our website at www.vcm.com.
From all of us here at Victory Capital, thank you for letting us help you work toward your investment goals.

Christopher K. Dyer, CFA
President,
Victory Funds
4
Victory Sycamore Established Value Fund
Managers' Commentary
(Unaudited)
What were the market conditions during the reporting period?
The fiscal year ended October 31, 2021, was marked by solid equity market performance across all major U.S. indices. The potential for a COVID-19 vaccine (or vaccines) to become widely available in early 2021, fading U.S. presidential election uncertainty, and the accumulation of massive stimulus conspired to fuel investor optimism early in the period. Market participants shifted their focus to the reopening of the economy, which buoyed cyclical-leaning pockets of the market. Additionally, the abundance of liquidity in the economy and the increase in retail investor participation in the market led to excessive risk-taking. That helped fuel the "meme" stock craze early in 2021.
The overconfidence in the cyclical positioning from earlier in the year began to abate during the summer, as lingering risks began to emerge. Given the persistent investor worries about a possible correction spurred by tapering, rising rates, spread of the COVID-19 Delta variant, "sticky" inflation, peak corporate growth, slowing growth in China and a stalemate in Washington, D.C. (to name a few), it was not entirely surprising that the market took a breather during the third quarter of 2021.
Investors have enjoyed a strong rebound from the pandemic low that has been largely uninterrupted. Moving forward, market participants will have to contend with policy shifts that may inject an element of uncertainty into the market. However, that is not necessarily a bad thing for equities. Investors should not expect the level of returns we've seen over the past several quarters to continue indefinitely. The pause during the third quarter may offer the market an opportunity to hit the "reset" button and gravitate toward a more normalized return environment for equities.
How did Victory Sycamore Established Value Fund (the "Fund") perform during the reporting period?
The Fund returned 52.05% (Class A at net asset value) for the fiscal year ended October 31, 2021, outperforming the Russell Midcap® Value Index (the "Index"), which returned 48.60% for the period.
What strategies did you employ during the reporting period?
The investment team employs a bottom-up, fundamental stock selection process to invest in better businesses that trade at a discount to the team's estimate of intrinsic value and possess fundamental drivers that will narrow the valuation gap. By investing in businesses that exhibit these attributes, we seek to minimize downside risk without sacrificing the upside potential.
During the 12-month period, both stock selection and sector allocation were favorable, with stock selection having a larger impact on relative performance. Sector weighting is a by-product of the bottom-up security selection process and not a result of top-down tactical decisions. Index returns were positive across each of the 11 major economic sectors and varied widely, with five sectors outpacing the Index. Energy was the top-performing sector, posting a return of 128.8%. By contrast, Utilities was the worst-performing sector for the period and significantly lagged the Index, returning 10.4%.
5
Victory Sycamore Established Value Fund (continued)
Managers' Commentary (continued)
Specifically, for the Fund, stock selection in Industrials, Energy, Consumer Staples, Communication Services and Health Care sectors contributed to overall relative return. However, an overweight in Consumer Staples partially offset the favorable impact of selection in the sector. An underweight in Utilities (the worst-performing sector), Health Care, Communication Services and Information Technology also contributed to relative performance for the period. Conversely, stock selection in the Financials, Consumer Discretionary, Real Estate and Materials sectors had an unfavorable impact on relative performance for the period. The Fund's cash position was also a drag on performance.
6
Victory Sycamore Established Value Fund
Investment Overview
(Unaudited)
Average Annual Total Return
Year Ended October 31, 2021
| | Class A | | Class C | | Class I | | Class R | | Class R6 | | Class Y | | | |
INCEPTION DATE | | 5/5/00 | | 3/1/16 | | 3/1/10 | | 8/16/83 | | 3/4/14 | | 1/28/13 | | | |
| |
Net Asset
Value | |
Maximum
Offering
Price | |
Net Asset
Value | |
Contingent
Deferred
Charges | |
Net Asset
Value | |
Net Asset
Value | |
Net Asset
Value | |
Net Asset
Value | | Russell
Midcap®
Value
Index1 | |
One Year | | | 52.05 | % | | | 43.31 | % | | | 50.91 | % | | | 49.91 | % | | | 52.54 | % | | | 51.74 | % | | | 52.62 | % | | | 52.49 | % | | | 48.60 | % | |
Five Year | | | 14.60 | % | | | 13.26 | % | | | 13.73 | % | | | 13.73 | % | | | 14.96 | % | | | 14.37 | % | | | 15.00 | % | | | 14.94 | % | | | 12.30 | % | |
Ten Year | | | 14.23 | % | | | 13.56 | % | | | N/A | | | | N/A | | | | 14.62 | % | | | 14.02 | % | | | N/A | | | | N/A | | | | 13.18 | % | |
Since Inception | | | N/A | | | | N/A | | | | 14.76 | % | | | 14.76 | % | | | N/A | | | | N/A | | | | 12.89 | % | | | 14.15 | % | | | N/A | | |
The performance data quoted represents past performance and current returns may be lower or higher. The investment return and principal value will fluctuate so that an investor's shares, when redeemed, may be worth more or less than the original cost. To obtain performance information current to the most recent month's end, please visit www.vcm.com. | |
The maximum offering price ("MOP") figures reflect a maximum sales charge of 5.75% for Class A. Class C is not subject to an initial sales charge, but is subject to a deferred sales charge of 1.00% on shares redeemed within one year of purchase. Net Asset Value does not reflect sales charges.
Total return measures the price change in a share assuming the reinvestment of all net investment income and realized capital gain distributions, if any. The total returns quoted do not reflect adjustments made to the enclosed financial statements in accordance with U.S. Generally Accepted Accounting Principles or the deduction of taxes that a shareholder would pay on net investment income and realized capital gain distributions, including reinvested distributions, or redemptions of shares. The total return figures set forth above include all waivers of fees. Without such fee waivers, the total returns would have been lower.
Victory Sycamore Established Value Fund — Growth of $10,000
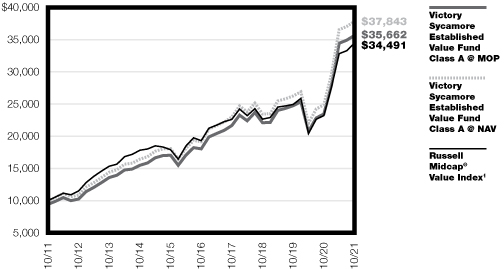
1The Russell Midcap® Value Index is an unmanaged Index made up of medium and medium/small companies in the Russell 1000® Index chosen for their value orientation. This Index does not include the effect of sales charges, commissions, expenses or taxes, is not representative of the Fund and it is not possible to invest directly in an index.
The graph reflects investment of growth of a hypothetical $10,000 investment in the Fund.
The graph and table do not reflect the deduction of taxes that a shareholder would pay on Fund distributions or the redemption of shares.
Past performance is not indicative of future results.
7
Victory Sycamore Small Company Opportunity Fund
Managers' Commentary
(Unaudited)
What were the market conditions during the reporting period?
The fiscal year ended October 31, 2021, was marked by solid equity market performance across all major U.S. indices. The potential for a COVID-19 vaccine (or vaccines) to become widely available in early 2021, fading U.S. presidential election uncertainty, and the accumulation of massive stimulus conspired to fuel investor optimism early in the period. Market participants shifted their focus to the reopening of the economy, which buoyed cyclical-leaning pockets of the market. Additionally, the abundance of liquidity in the economy and the increase in retail investor participation in the market led to excessive risk-taking. That helped fuel the "meme" stock craze early in 2021. Furthermore, the plethora of stimulus in the system helped stocks with lower-quality attributes outperform, which created a meaningful headwind for quality-oriented small cap value managers for the period.
The overconfidence in the cyclical positioning from earlier in the year began to abate during the summer, as lingering risks began to emerge. Given the persistent investor worries about a possible correction spurred by tapering, rising rates, spread of the COVID-19 Delta variant, "sticky" inflation, peak corporate growth, slowing growth in China and a stalemate in Washington, D.C. (to name a few), it was not entirely surprising that the market took a breather during the third quarter of 2021.
Investors have enjoyed a strong rebound from the pandemic low that has been largely uninterrupted. Moving forward, market participants will have to contend with policy shifts that may inject an element of uncertainty into the market. However, that is not necessarily a bad thing for equities. Investors should not expect the level of returns we've seen over the past several quarters to continue indefinitely. The pause during the third quarter may offer the market an opportunity to hit the "reset" button and gravitate toward a more normalized return environment for equities.
How did Victory Sycamore Small Company Opportunity Fund (the "Fund") perform during the reporting period?
The Fund returned 50.11% (Class A at net asset value), underperforming the Russell 2000® Value Index (the "Index"), which returned 64.30% for the period.
What strategies did you employ during the reporting period?
The investment team employs a bottom-up, fundamental stock selection process to invest in better businesses that trade at a discount to the team's estimate of intrinsic value and possess fundamental drivers that will narrow the valuation gap. By investing in businesses that exhibit these attributes, we seek to minimize downside risk without sacrificing the upside potential.
During the 12-month period, both stock selection and sector allocation were unfavorable, with stock selection having a larger negative impact on relative performance. Sector weighting is a by-product of the bottom-up security selection process and not a result of top-down tactical decisions. Index returns were positive across each of the 11 major economic sectors and varied widely, with five sectors outpacing the Index. Energy was the top-performing sector, posting a return of 179.1%. By contrast, Utilities was the worst-performing sector and significantly lagged the Index, returning 19.8%.
8
Victory Sycamore Small Company Opportunity Fund (continued)
Managers' Commentary (continued)
Specifically, stock selection in the Consumer Discretionary, Materials, Information Technology, Financials, Real Estate, Industrials and Consumer Staples sectors detracted from relative return for the period. An overweight in Information Technology and an underweight in Health Care partially offset the unfavorable impact from selection in those sectors. An underweight in Energy (the top-performing sector) also detracted from relative performance. Additionally, the Fund's cash position during the period was a drag on performance. Conversely, an underweight in Utilities (the worst-performing sector) and Health Care contributed to overall relative return.
9
Victory Sycamore Small Company Opportunity Fund
Investment Overview
(Unaudited)
Average Annual Total Return
Year Ended October 31, 2021
| | Class A | | Class I | | Class R | | Class R6 | | Class Y | | | |
INCEPTION DATE | | 3/26/99 | | 8/31/07 | | 8/16/83 | | 12/14/15 | | 1/28/13 | | | |
| | Net Asset
Value | | Maximum
Offering
Price | | Net Asset
Value | | Net Asset
Value | | Net Asset
Value | | Net Asset
Value | | Russell 2000®
Value Index1 | |
One Year | | | 50.11 | % | | | 41.49 | % | | | 50.66 | % | | | 49.85 | % | | | 50.71 | % | | | 50.55 | % | | | 64.30 | % | |
Five Year | | | 13.56 | % | | | 12.22 | % | | | 13.94 | % | | | 13.34 | % | | | 13.98 | % | | | 13.76 | % | | | 12.61 | % | |
Ten Year | | | 12.97 | % | | | 12.31 | % | | | 13.36 | % | | | 12.73 | % | | | N/A | | | | N/A | | | | 12.12 | % | |
Since Inception | | | N/A | | | | N/A | | | | N/A | | | | N/A | | | | 14.09 | % | | | 12.56 | % | | | N/A | | |
The performance data quoted represents past performance and current returns may be lower or higher. The investment return and principal value will fluctuate so that an investor's shares, when redeemed, may be worth more or less than the original cost. To obtain performance information current to the most recent month's end, please visit www.vcm.com.
The maximum offering price ("MOP") figures reflect a maximum sales charge of 5.75% for Class A. Net Asset Value does not reflect sales charges.
Total return measures the price change in a share assuming the reinvestment of all net investment income and realized capital gain distributions, if any. The total returns quoted do not reflect adjustments made to the enclosed financial statements in accordance with U.S. Generally Accepted Accounting Principles or the deduction of taxes that a shareholder would pay on net investment income and realized capital gain distributions, including reinvested distributions, or redemptions of shares. The total return figures set forth above include all waivers of fees. Without such fee waivers, the total returns would have been lower.
Victory Sycamore Small Company Opportunity Fund — Growth of $10,000
1The Russell 2000® Value Index is an unmanaged index that measures the performance of those Russell 2000® companies with lower price-to-book ratios and lower forecasted growth values. This index does not include the effect of sales charges, commissions, expenses or taxes, is not representative of the Fund and it is not possible to invest directly in an index.
The graph reflects investment of growth of a hypothetical $10,000 investment in the Fund.
The graph and table do not reflect the deduction of taxes that a shareholder would pay on Fund distributions or the redemption of shares.
Past performance is not indicative of future results.
10
Victory Portfolios
Victory Sycamore Established Value Fund | | October 31, 2021 | |
(Unaudited)
Investment Objective and Portfolio Holdings:
The Fund seeks to provide long-term capital growth by investing primarily in common stocks.
Top 10 Holdings*:
October 31, 2021
(% of Net Assets)
Textron, Inc. | | | 2.2 | % | |
Archer-Daniels-Midland Co. | | | 2.0 | % | |
BorgWarner, Inc. | | | 2.0 | % | |
Alleghany Corp. | | | 2.0 | % | |
Zions Bancorp NA | | | 1.9 | % | |
American Financial Group, Inc. | | | 1.8 | % | |
W.R. Berkley Corp. | | | 1.8 | % | |
Tyson Foods, Inc. | | | 1.8 | % | |
Westlake Chemical Corp. | | | 1.8 | % | |
Valero Energy Corp. | | | 1.8 | % | |
Sector Allocation*:
October 31, 2021
(% of Net Assets)

* Does not include futures contracts, money market instruments, and short-term investments purchased with cash collateral from securities loaned.
Percentages are of the net assets of the Fund and may not equal 100%.
Refer to the Schedule of Portfolio Investments for a complete list of securities.
11
Victory Portfolios
Victory Sycamore Small Company Opportunity Fund | | October 31, 2021 | |
(Unaudited)
Investment Objective and Portfolio Holdings:
The Fund seeks to provide capital appreciation.
Top 10 Holdings*:
October 31, 2021
(% of Net Assets)
Independent Bank Corp. | | | 1.7 | % | |
UMB Financial Corp. | | | 1.7 | % | |
Crane Co. | | | 1.6 | % | |
Applied Industrial Technologies, Inc. | | | 1.6 | % | |
PDC Energy, Inc. | | | 1.6 | % | |
Performance Food Group Co. | | | 1.5 | % | |
SouthState Corp. | | | 1.5 | % | |
EMCOR Group, Inc. | | | 1.5 | % | |
UFP Industries, Inc. | | | 1.4 | % | |
Apple Hospitality REIT, Inc. | | | 1.4 | % | |
Sector Allocation*:
October 31, 2021
(% of Net Assets)
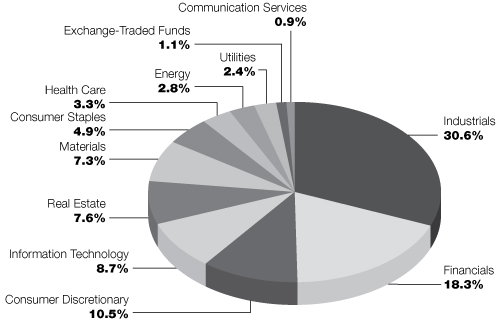
* Does not include futures contracts, money market instruments, and short-term investments purchased with cash collateral from securities loaned.
Percentages are of the net assets of the Fund and may not equal 100%.
Refer to the Schedule of Portfolio Investments for a complete list of securities.
12
Victory Portfolios
Victory Sycamore Established Value Fund | | Schedule of Portfolio Investments
October 31, 2021 | |
(Amounts in Thousands, Except for Shares)
Security Description | | Shares | | Value | |
Common Stocks (97.3%) | |
Communication Services (1.5%): | |
Live Nation Entertainment, Inc. (a) | | | 810,000 | | | $ | 81,931 | | |
The Interpublic Group of Cos., Inc. | | | 4,340,000 | | | | 158,714 | | |
| | | | 240,645 | | |
Consumer Discretionary (8.8%): | |
Aptiv PLC (a) | | | 1,290,000 | | | | 223,028 | | |
BorgWarner, Inc. | | | 7,175,000 | | | | 323,377 | | |
Hilton Worldwide Holdings, Inc. (a) | | | 760,000 | | | | 109,402 | | |
Newell Brands, Inc. | | | 5,850,000 | | | | 133,907 | | |
Ross Stores, Inc. | | | 1,635,700 | | | | 185,161 | | |
VF Corp. | | | 2,884,700 | | | | 210,237 | | |
Yum! Brands, Inc. | | | 2,185,000 | | | | 272,994 | | |
| | | | 1,458,106 | | |
Consumer Staples (7.2%): | |
Archer-Daniels-Midland Co. | | | 5,095,000 | | | | 327,303 | | |
Sysco Corp. | | | 3,675,000 | | | | 282,607 | | |
The Hershey Co. | | | 1,633,600 | | | | 286,452 | | |
Tyson Foods, Inc., Class A | | | 3,742,000 | | | | 299,248 | | |
| | | | 1,195,610 | | |
Energy (4.7%): | |
Coterra Energy, Inc. | | | 10,821,086 | | | | 230,706 | | |
Devon Energy Corp. | | | 6,541,400 | | | | 262,179 | | |
Valero Energy Corp. | | | 3,750,000 | | | | 289,987 | | |
| | | | 782,872 | | |
Financials (13.9%): | |
Alleghany Corp. (a) | | | 495,000 | | | | 322,433 | | |
American Financial Group, Inc. | | | 2,227,300 | | | | 303,002 | | |
Everest Re Group Ltd. | | | 960,000 | | | | 251,040 | | |
Huntington Bancshares, Inc. | | | 13,875,000 | | | | 218,392 | | |
Old Republic International Corp. | | | 3,465,200 | | | | 89,506 | | |
Prosperity Bancshares, Inc. | | | 2,725,000 | | | | 205,220 | | |
The Bank of New York Mellon Corp. | | | 4,730,000 | | | | 280,016 | | |
W.R. Berkley Corp. | | | 3,800,000 | | | | 302,480 | | |
Zions Bancorp NA | | | 5,100,000 | | | | 321,249 | | |
| | | | 2,293,338 | | |
Health Care (5.0%): | |
Hill-Rom Holdings, Inc. | | | 1,405,000 | | | | 217,634 | | |
Molina Healthcare, Inc. (a) | | | 400,000 | | | | 118,288 | | |
Quest Diagnostics, Inc. | | | 1,810,600 | | | | 265,760 | | |
The Cooper Cos., Inc. | | | 541,000 | | | | 225,554 | | |
| | | | 827,236 | | |
Industrials (22.9%): | |
AGCO Corp. | | | 1,850,000 | | | | 226,089 | | |
Alaska Air Group, Inc. (a) | | | 4,270,000 | | | | 225,456 | | |
Hubbell, Inc. | | | 1,325,000 | | | | 264,165 | | |
See notes to financial statements.
13
Victory Portfolios
Victory Sycamore Established Value Fund | | Schedule of Portfolio Investments — continued
October 31, 2021 | |
(Amounts in Thousands, Except for Shares)
Security Description | | Shares | | Value | |
J.B. Hunt Transport Services, Inc. | | | 1,275,000 | | | $ | 251,417 | | |
Landstar System, Inc. | | | 1,400,000 | | | | 246,134 | | |
Leidos Holdings, Inc. | | | 2,305,000 | | | | 230,454 | | |
Lincoln Electric Holdings, Inc. | | | 1,065,000 | | | | 151,656 | | |
ManpowerGroup, Inc. | | | 1,511,000 | | | | 146,038 | | |
Oshkosh Corp. | | | 1,525,000 | | | | 163,175 | | |
Owens Corning, Inc. | | | 1,890,000 | | | | 176,545 | | |
Parker-Hannifin Corp. | | | 835,000 | | | | 247,653 | | |
Republic Services, Inc. | | | 1,220,000 | | | | 164,212 | | |
Textron, Inc. | | | 4,950,000 | | | | 365,558 | | |
The Middleby Corp. (a) | | | 1,425,000 | | | | 259,977 | | |
The Toro Co. | | | 2,085,000 | | | | 199,055 | | |
United Rentals, Inc. (a) | | | 495,000 | | | | 187,659 | | |
Vertiv Holdings Co. | | | 7,232,700 | | | | 185,736 | | |
Xylem, Inc. | | | 677,000 | | | | 88,409 | | |
| | | | 3,779,388 | | |
Information Technology (9.5%): | |
Amphenol Corp., Class A | | | 2,410,000 | | | | 185,016 | | |
DXC Technology Co. (a) | | | 5,520,000 | | | | 179,786 | | |
Flex Ltd. (a) | | | 12,650,000 | | | | 213,785 | | |
Genpact Ltd. | | | 5,301,200 | | | | 261,614 | | |
Global Payments, Inc. | | | 1,075,000 | | | | 153,714 | | |
Hewlett Packard Enterprise Co. | | | 11,200,000 | | | | 164,080 | | |
MAXIMUS, Inc. | | | 2,969,900 | | | | 251,165 | | |
Motorola Solutions, Inc. | | | 680,000 | | | | 169,041 | | |
| | | | 1,578,201 | | |
Materials (12.1%): | |
AptarGroup, Inc. | | | 1,005,600 | | | | 121,456 | | |
Avery Dennison Corp. | | | 1,165,000 | | | | 253,644 | | |
Corteva, Inc. | | | 3,830,000 | | | | 165,265 | | |
Eastman Chemical Co. | | | 1,595,000 | | | | 165,928 | | |
International Flavors & Fragrances, Inc. | | | 1,433,000 | | | | 211,296 | | |
Packaging Corp. of America | | | 1,985,000 | | | | 272,679 | | |
Reliance Steel & Aluminum Co. | | | 1,500,000 | | | | 219,240 | | |
RPM International, Inc. | | | 975,000 | | | | 85,020 | | |
Steel Dynamics, Inc. | | | 3,200,000 | | | | 211,456 | | |
Westlake Chemical Corp. | | | 3,020,000 | | | | 293,967 | | |
| | | | 1,999,951 | | |
Real Estate (9.4%): | |
Alexandria Real Estate Equities, Inc. | | | 1,050,000 | | | | 214,347 | | |
American Homes 4 Rent, Class A | | | 4,850,000 | | | | 196,910 | | |
Americold Realty Trust | | | 3,792,400 | | | | 111,762 | | |
Camden Property Trust | | | 1,330,000 | | | | 216,923 | | |
Equity LifeStyle Properties, Inc. | | | 2,615,000 | | | | 220,994 | | |
Highwoods Properties, Inc. | | | 3,335,000 | | | | 149,541 | | |
Lamar Advertising Co., Class A | | | 1,910,000 | | | | 216,212 | | |
National Retail Properties, Inc. | | | 4,875,000 | | | | 221,130 | | |
| | | | 1,547,819 | | |
See notes to financial statements.
14
Victory Portfolios
Victory Sycamore Established Value Fund | | Schedule of Portfolio Investments — continued
October 31, 2021 | |
(Amounts in Thousands, Except for Shares)
Security Description | | Shares | | Value | |
Utilities (2.3%): | |
Alliant Energy Corp. | | | 3,650,000 | | | $ | 206,481 | | |
Xcel Energy, Inc. | | | 2,685,000 | | | | 173,424 | | |
| | | | 379,905 | | |
Total Common Stocks (Cost $11,845,503) | | | 16,083,071 | | |
Exchange-Traded Funds (1.2%) | |
iShares Russell Mid-Cap Value ETF (b) | | | 1,705,000 | | | | 203,373 | | |
Total Exchange-Traded Funds (Cost $129,315) | | | 203,373 | | |
Collateral for Securities Loaned^ (0.0%) (c) | |
BlackRock Liquidity Funds TempFund, Institutional Shares, 0.04% (d) | | | 446 | | | | — | (e) | |
Fidelity Investments Money Market Government Portfolio, Institutional
Shares, 0.01% (d) | | | 14,041 | | | | 14 | | |
Goldman Sachs Financial Square Prime Obligations Fund, Institutional
Shares, 0.02% (d) | | | 223 | | | | — | (e) | |
JPMorgan Prime Money Market Fund, Capital Shares, 0.07% (d) | | | 1,777 | | | | 2 | | |
Morgan Stanley Institutional Liquidity Prime Portfolio, Institutional
Shares, 0.06% (d) | | | 7,988 | | | | 8 | | |
Total Collateral for Securities Loaned (Cost $24) | | | 24 | | |
Total Investments (Cost $11,974,842) — 98.5% | | | 16,286,468 | | |
Other assets in excess of liabilities — 1.5% | | | 243,974 | | |
NET ASSETS — 100.00% | | $ | 16,530,442 | | |
^ Purchased with cash collateral from securities on loan.
(a) Non-income producing security.
(b) All or a portion of this security is on loan.
(c) Amount represents less than 0.05% of net assets.
(d) Rate disclosed is the daily yield on October 31, 2021.
(e) Rounds to less than $1 thousand.
ETF — Exchange-Traded Fund
PLC — Public Limited Company
See notes to financial statements.
15
Victory Portfolios
Victory Sycamore Small Company Opportunity Fund | | Schedule of Portfolio Investments
October 31, 2021 | |
(Amounts in Thousands, Except for Shares)
Security Description | | Shares | | Value | |
Common Stocks (97.3%) | |
Aerospace & Defense (0.8%): | |
Hexcel Corp. (a) (b) | | | 950,000 | | | $ | 53,903 | | |
Air Freight & Logistics (1.5%): | |
Forward Air Corp. | | | 510,000 | | | | 51,286 | | |
Hub Group, Inc., Class A (a) | | | 735,000 | | | | 57,749 | | |
| | | | 109,035 | | |
Airlines (0.4%): | |
Frontier Group Holdings, Inc. (a) (b) | | | 1,794,400 | | | | 28,082 | | |
Building Products (1.9%): | |
Gibraltar Industries, Inc. (a) | | | 570,000 | | | | 37,141 | | |
UFP Industries, Inc. | | | 1,196,500 | | | | 97,910 | | |
| | | | 135,051 | | |
Commercial Services & Supplies (3.9%): | |
ABM Industries, Inc. | | | 1,012,800 | | | | 44,573 | | |
McGrath RentCorp | | | 835,000 | | | | 60,237 | | |
U.S. Ecology, Inc. (a) | | | 763,400 | | | | 24,574 | | |
UniFirst Corp. | | | 420,000 | | | | 83,143 | | |
Viad Corp. (a) (c) | | | 1,384,182 | | | | 61,416 | | |
| | | | 273,943 | | |
Communication Services (0.9%): | |
The E.W. Scripps Co., Class A | | | 3,270,000 | | | | 60,822 | | |
Construction & Engineering (3.2%): | |
Comfort Systems USA, Inc. | | | 443,700 | | | | 40,585 | | |
EMCOR Group, Inc. | | | 865,000 | | | | 105,089 | | |
MYR Group, Inc. (a) | | | 300,900 | | | | 30,737 | | |
Valmont Industries, Inc. | | | 200,000 | | | | 47,792 | | |
| | | | 224,203 | | |
Consumer Discretionary (10.5%): | |
Carter's, Inc. | | | 694,000 | | | | 68,373 | | |
Choice Hotels International, Inc. (b) | | | 516,100 | | | | 72,574 | | |
Citi Trends, Inc. (a) (c) | | | 515,500 | | | | 39,879 | | |
Columbia Sportswear Co. | | | 655,000 | | | | 68,015 | | |
Helen of Troy Ltd. (a) (b) | | | 270,000 | | | | 60,736 | | |
Hyatt Hotels Corp., Class A (a) (b) | | | 955,100 | | | | 81,375 | | |
LCI Industries | | | 394,600 | | | | 55,102 | | |
Mattel, Inc. (a) | | | 3,568,900 | | | | 77,838 | | |
Murphy USA, Inc. | | | 317,200 | | | | 51,688 | | |
Signet Jewelers Ltd. (b) | | | 570,000 | | | | 50,833 | | |
Sonic Automotive, Inc., Class A (b) | | | 580,000 | | | | 28,669 | | |
Visteon Corp. (a) | | | 801,400 | | | | 90,702 | | |
| | | | 745,784 | | |
Consumer Staples (4.9%): | |
Edgewell Personal Care Co. | | | 1,165,000 | | | | 40,763 | | |
Ingredion, Inc. | | | 785,000 | | | | 74,756 | | |
See notes to financial statements.
16
Victory Portfolios
Victory Sycamore Small Company Opportunity Fund | | Schedule of Portfolio Investments — continued
October 31, 2021 | |
(Amounts in Thousands, Except for Shares)
Security Description | | Shares | | Value | |
Lancaster Colony Corp. (b) | | | 270,000 | | | $ | 45,900 | | |
Performance Food Group Co. (a) | | | 2,403,123 | | | | 108,693 | | |
Spectrum Brands Holdings, Inc. | | | 484,500 | | | | 45,422 | | |
The Hain Celestial Group, Inc. (a) (b) | | | 697,300 | | | | 31,288 | | |
| | | | 346,822 | | |
Electrical Equipment (0.6%): | |
Encore Wire Corp. | | | 340,000 | | | | 45,580 | | |
Energy (2.8%): | |
Delek U.S. Holdings, Inc. | | | 2,922,100 | | | | 56,835 | | |
Helix Energy Solutions Group, Inc. (a) (b) (c) | | | 8,130,000 | | | | 30,731 | | |
PDC Energy, Inc. | | | 2,100,000 | | | | 109,851 | | |
| | | | 197,417 | | |
Financials (18.3%): | |
AMERISAFE, Inc. (c) | | | 1,015,000 | | | | 60,179 | | |
Bank of Hawaii Corp. | | | 1,141,200 | | | | 96,432 | | |
Cohen & Steers, Inc. | | | 497,900 | | | | 47,246 | | |
Columbia Banking System, Inc. | | | 1,228,900 | | | | 41,942 | | |
Eagle Bancorp, Inc. | | | 1,100,000 | | | | 62,249 | | |
First American Financial Corp. | | | 850,000 | | | | 62,169 | | |
Independent Bank Corp. (b) | | | 1,450,000 | | | | 122,525 | | |
Kemper Corp. | | | 1,001,100 | | | | 63,550 | | |
Lakeland Financial Corp. (b) | | | 972,100 | | | | 69,865 | | |
Pinnacle Financial Partners, Inc. | | | 735,000 | | | | 70,979 | | |
RenaissanceRe Holdings Ltd. | | | 424,300 | | | | 60,166 | | |
Renasant Corp. | | | 2,584,100 | | | | 96,671 | | |
Ryan Specialty Group Holdings, Inc., Class A (a) (b) | | | 1,070,200 | | | | 40,443 | | |
Selective Insurance Group, Inc. | | | 1,001,200 | | | | 78,464 | | |
SouthState Corp. | | | 1,380,000 | | | | 107,764 | | |
Stewart Information Services Corp. | | | 867,400 | | | | 61,733 | | |
UMB Financial Corp. | | | 1,194,600 | | | | 118,050 | | |
Wintrust Financial Corp. | | | 364,500 | | | | 32,258 | | |
| | | | 1,292,685 | | |
Health Care (3.3%): | |
AngioDynamics, Inc. (a) | | | 1,621,600 | | | | 46,378 | | |
Apria, Inc. (a) | | | 1,122,500 | | | | 42,015 | | |
Hanger, Inc. (a) (c) | | | 2,575,000 | | | | 48,101 | | |
ICU Medical, Inc. (a) | | | 110,000 | | | | 25,754 | | |
Natus Medical, Inc. (a) | | | 1,687,200 | | | | 42,265 | | |
Patterson Cos., Inc. (b) | | | 958,900 | | | | 29,975 | | |
| | | | 234,488 | | |
Industrial Conglomerates (0.9%): | |
Carlisle Cos., Inc. | | | 275,000 | | | | 61,303 | | |
Information Technology (8.7%): | |
ADTRAN, Inc. | | | 1,300,000 | | | | 24,024 | | |
Advanced Energy Industries, Inc. (b) | | | 543,800 | | | | 49,932 | | |
Avnet, Inc. | | | 1,970,000 | | | | 75,077 | | |
Belden, Inc. | | | 760,000 | | | | 45,759 | | |
See notes to financial statements.
17
Victory Portfolios
Victory Sycamore Small Company Opportunity Fund | | Schedule of Portfolio Investments — continued
October 31, 2021 | |
(Amounts in Thousands, Except for Shares)
Security Description | | Shares | | Value | |
Cognyte Software Ltd. (a) | | | 1,980,000 | | | $ | 39,422 | | |
Cohu, Inc. (a) | | | 343,000 | | | | 10,990 | | |
Fabrinet (a) | | | 624,600 | | | | 59,961 | | |
Littelfuse, Inc. | | | 130,100 | | | | 38,321 | | |
MAXIMUS, Inc. | | | 268,000 | | | | 22,665 | | |
NETGEAR, Inc. (a) (c) | | | 1,975,000 | | | | 56,939 | | |
Plexus Corp. (a) | | | 638,000 | | | | 55,710 | | |
ScanSource, Inc. (a) (c) | | | 1,600,000 | | | | 57,248 | | |
Verint Systems, Inc. (a) | | | 1,650,000 | | | | 76,890 | | |
| | | | 612,938 | | |
Machinery (10.4%): | |
Alamo Group, Inc. | | | 463,000 | | | | 70,006 | | |
Altra Industrial Motion Corp. | | | 1,475,000 | | | | 76,921 | | |
Astec Industries, Inc. (c) | | | 1,200,000 | | | | 64,056 | | |
Columbus McKinnon Corp. (b) | | | 965,000 | | | | 45,616 | | |
Crane Co. | | | 1,115,000 | | | | 115,157 | | |
Hillenbrand, Inc. | | | 1,920,000 | | | | 87,283 | | |
Kennametal, Inc. | | | 1,950,000 | | | | 77,512 | | |
Mueller Industries, Inc. | | | 1,370,000 | | | | 72,117 | | |
The Manitowoc Co., Inc. (a) (b) | | | 1,125,000 | | | | 24,109 | | |
TriMas Corp. (a) | | | 1,820,000 | | | | 60,697 | | |
Watts Water Technologies, Inc., Class A | | | 225,400 | | | | 42,830 | | |
| | | | 736,304 | | |
Materials (7.3%): | |
Avient Corp. | | | 1,430,000 | | | | 77,048 | | |
Cabot Corp. | | | 1,685,000 | | | | 89,895 | | |
Kaiser Aluminum Corp. | | | 640,000 | | | | 62,170 | | |
Minerals Technologies, Inc. | | | 985,000 | | | | 69,876 | | |
Silgan Holdings, Inc. | | | 2,280,000 | | | | 91,656 | | |
Sonoco Products Co. | | | 1,380,000 | | | | 79,971 | | |
Worthington Industries, Inc. | | | 860,000 | | | | 46,715 | | |
| | | | 517,331 | | |
Professional Services (2.8%): | |
ICF International, Inc. | | | 770,000 | | | | 77,377 | | |
Korn Ferry | | | 925,000 | | | | 71,419 | | |
ManTech International Corp., Class A | | | 575,000 | | | | 49,577 | | |
| | | | 198,373 | | |
Real Estate (7.6%): | |
Apple Hospitality REIT, Inc. | | | 6,180,000 | | | | 97,088 | | |
Colliers International Group, Inc. | | | 345,000 | | | | 50,153 | | |
Corporate Office Properties Trust | | | 3,200,000 | | | | 86,784 | | |
Cushman & Wakefield PLC (a) | | | 2,806,000 | | | | 51,602 | | |
First Industrial Realty Trust, Inc. | | | 1,355,000 | | | | 78,902 | | |
Four Corners Property Trust, Inc. | | | 1,794,400 | | | | 52,038 | | |
Rayonier, Inc. | | | 2,350,000 | | | | 87,725 | | |
Sunstone Hotel Investors, Inc. (a) | | | 2,950,400 | | | | 36,408 | | |
| | | | 540,700 | | |
See notes to financial statements.
18
Victory Portfolios
Victory Sycamore Small Company Opportunity Fund | | Schedule of Portfolio Investments — continued
October 31, 2021 | |
(Amounts in Thousands, Except for Shares)
Security Description | | Shares | | Value | |
Road & Rail (2.0%): | |
Marten Transport Ltd. (c) | | | 4,170,000 | | | $ | 69,347 | | |
Werner Enterprises, Inc. (b) | | | 1,520,000 | | | | 68,887 | | |
| | | | 138,234 | | |
Trading Companies & Distributors (2.2%): | |
Applied Industrial Technologies, Inc. | | | 1,135,000 | | | | 110,640 | | |
Core & Main, Inc., Class A (a) | | | 1,728,600 | | | | 47,294 | | |
| | | | 157,934 | | |
Utilities (2.4%): | |
ALLETE, Inc. | | | 760,200 | | | | 46,783 | | |
MGE Energy, Inc. | | | 480,000 | | | | 36,427 | | |
NorthWestern Corp. | | | 795,700 | | | | 45,243 | | |
ONE Gas, Inc. | | | 659,800 | | | | 44,405 | | |
| | | | 172,858 | | |
Total Common Stocks (Cost $5,309,114) | | | 6,883,790 | | |
Exchange-Traded Funds (1.1%) | |
iShares Russell 2000 Value ETF (b) | | | 450,000 | | | | 74,871 | | |
Total Exchange-Traded Funds (Cost $51,468) | | | 74,871 | | |
Collateral for Securities Loaned^ (1.4%) | |
BlackRock Liquidity Funds TempFund, Institutional Shares, 0.04% (d) | | | 1,845,053 | | | | 1,845 | | |
Fidelity Investments Money Market Government Portfolio, Institutional
Shares, 0.01% (d) | | | 58,026,173 | | | | 58,026 | | |
Goldman Sachs Financial Square Prime Obligations Fund, Institutional
Shares, 0.02% (d) | | | 920,773 | | | | 921 | | |
JPMorgan Prime Money Market Fund, Capital Shares, 0.07% (d) | | | 7,341,956 | | | | 7,342 | | |
Morgan Stanley Institutional Liquidity Prime Portfolio, Institutional
Shares, 0.06% (d) | | | 33,010,866 | | | | 33,011 | | |
Total Collateral for Securities Loaned (Cost $101,145) | | | 101,145 | | |
Total Investments (Cost $5,461,727) — 99.8% | | | 7,059,806 | | |
Other assets in excess of liabilities — 0.2% | | | 13,643 | | |
NET ASSETS — 100.00% | | $ | 7,073,449 | | |
^ Purchased with cash collateral from securities on loan.
(a) Non-income producing security.
(b) All or a portion of this security is on loan.
(c) Affiliated security (See Note 8).
(d) Rate disclosed is the daily yield on October 31, 2021.
ETF — Exchange-Traded Fund
PLC — Public Limited Company
REIT — Real Estate Investment Trust
See notes to financial statements.
19
Victory Portfolios | | Statements of Assets and Liabilities
October 31, 2021 | |
(Amounts in Thousands, Except Per Share Amounts)
| | | Victory
Sycamore
Established
Value Fund | | Victory
Sycamore
Small Company
Opportunity
Fund | |
Assets: | |
Affiliated investments, at value (Cost $— and $481,056) | | $ | — | | | $ | 487,896 | | |
Unaffiliated investments, at value (Cost $11,974,842 and
$4,980,671) | | | 16,286,468 | (a) | | | 6,571,910 | (b) | |
Cash | | | 250,564 | | | | 121,320 | | |
Receivables: | |
Interest and dividends | | | 6,513 | | | | 1,778 | | |
Capital shares issued | | | 18,128 | | | | 5,515 | | |
Investments sold | | | 13,873 | | | | 19,943 | | |
Prepaid expenses | | | 115 | | | | 88 | | |
Total Assets | | | 16,575,661 | | | | 7,208,450 | | |
Liabilities: | |
Payables: | |
Collateral received on loaned securities | | | 24 | | | | 101,145 | | |
Investments purchased | | | 24,324 | | | | 21,990 | | |
Capital shares redeemed | | | 11,811 | | | | 6,138 | | |
Accrued expenses and other payables: | |
Investment advisory fees | | | 6,277 | | | | 4,506 | | |
Administration fees | | | 843 | | | | 365 | | |
Custodian fees | | | 114 | | | | 49 | | |
Transfer agent fees | | | 917 | | | | 433 | | |
Compliance fees | | | 9 | | | | 4 | | |
Trustees' fees | | | 21 | | | | 10 | | |
| 12b-1 fees | | | 434 | | | | 103 | | |
Other accrued expenses | | | 445 | | | | 258 | | |
Total Liabilities | | | 45,219 | | | | 135,001 | | |
Net Assets: | |
| Capital | | | 11,130,689 | | | | 4,680,461 | | |
Total accumulated earnings/(loss) | | | 5,399,753 | | | | 2,392,988 | | |
Net Assets | | $ | 16,530,442 | | | $ | 7,073,449 | | |
Net Assets | |
Class A | | $ | 1,788,115 | | | $ | 424,496 | | |
Class C | | | 67,718 | | | | — | | |
Class I | | | 5,315,482 | | | | 3,840,013 | | |
Class R | | | 936,593 | | | | 256,938 | | |
Class R6 | | | 7,548,781 | | | | 2,518,726 | | |
Class Y | | | 873,753 | | | | 33,276 | | |
Total | | $ | 16,530,442 | | | $ | 7,073,449 | | |
Shares (unlimited number of shares authorized with a
par value of $0.001 per share): | |
Class A | | | 34,640 | | | | 7,511 | | |
Class C | | | 1,347 | | | | — | | |
Class I | | | 102,885 | | | | 67,008 | | |
Class R | | | 18,432 | | | | 4,906 | | |
Class R6 | | | 146,048 | | | | 44,015 | | |
Class Y | | | 16,915 | | | | 585 | | |
Total | | | 320,267 | | | | 124,025 | | |
(continues on next page)
See notes to financial statements.
20
Victory Portfolios | | Statements of Assets and Liabilities
October 31, 2021 | |
(Amounts in Thousands, Except Per Share Amounts) (continued)
| | | Victory
Sycamore
Established
Value Fund | | Victory
Sycamore
Small Company
Opportunity
Fund | |
Net asset value, offering (except Class A)
and redemption price per share: (c) | |
Class A | | $ | 51.62 | | | $ | 56.52 | | |
Class C | | | 50.28 | | | | — | | |
Class I | | | 51.66 | | | | 57.31 | | |
Class R | | | 50.81 | | | | 52.37 | | |
Class R6 | | | 51.69 | | | | 57.22 | | |
Class Y | | | 51.66 | | | | 56.88 | | |
Maximum Sales Charge — Class A | | | 5.75 | % | | | 5.75 | % | |
Maximum offering price
(100%/(100%-maximum sales charge) of net asset value
adjusted to the nearest cent) per share — Class A | | $ | 54.77 | | | $ | 59.97 | | |
(a) Includes $24 of securities on loan.
(b) Includes $99,461 of securities on loan.
(c) Per share amount may not recalculate due to rounding of net assets and/or shares outstanding.
See notes to financial statements.
21
Victory Portfolios | | Statements of Operations
For the Year Ended October 31, 2021 | |
(Amounts in Thousands)
| | | Victory
Sycamore
Established
Value Fund | | Victory
Sycamore
Small Company
Opportunity
Fund | |
Investment Income: | | | |
Dividends from unaffiliated investments | | $ | 323,284 | | | $ | 77,696 | | |
Dividends from affiliated investments | | | — | | | | 8,599 | | |
Interest from unaffiliated investments | | | 89 | | | | 31 | | |
Interfund lending | | | 21 | | | | — | | |
Securities lending (net of fees) | | | 629 | | | | 55 | | |
Total Income | | | 324,023 | | | | 86,381 | | |
Expenses: | | | |
Investment advisory fees | | | 65,951 | | | | 50,300 | | |
Administration fees | | | 8,152 | | | | 3,715 | | |
Sub-Administration fees | | | 17 | | | | 17 | | |
| 12b-1 fees — Class A | | | 4,347 | | | | 1,057 | | |
| 12b-1 fees — Class C | | | 671 | | | | — | | |
| 12b-1 fees — Class R | | | 4,338 | | | | 1,274 | | |
Custodian fees | | | 615 | | | | 282 | | |
Transfer agent fees — Class A | | | 2,029 | | | | 657 | | |
Transfer agent fees — Class C | | | 72 | | | | — | | |
Transfer agent fees — Class I | | | 2,542 | | | | 1,970 | | |
Transfer agent fees — Class R | | | 719 | | | | 199 | | |
Transfer agent fees — Class R6 | | | 253 | | | | 39 | | |
Transfer agent fees — Class Y | | | 628 | | | | 31 | | |
Trustees' fees | | | 903 | | | | 413 | | |
Compliance fees | | | 106 | | | | 49 | | |
Legal and audit fees | | | 519 | | | | 240 | | |
State registration and filing fees | | | 299 | | | | 150 | | |
Other expenses | | | 1,165 | | | | 708 | | |
Total Expenses | | | 93,326 | | | | 61,101 | | |
Net Investment Income (Loss) | | | 230,697 | | | | 25,280 | | |
Realized/Unrealized Gains (Losses) from Investments: | | | |
Net realized gains (losses) from unaffiliated investment securities | | | 1,200,711 | | | | 861,108 | | |
Net realized gains (losses) from affiliated investment securities | | | — | | | | 4,984 | | |
Net realized gains (losses) from in-kind redemptions | | | — | | | | 25,718 | | |
Net change in unrealized appreciation/depreciation on unaffiliated
investment securities | | | 4,048,780 | | | | 1,441,199 | | |
Net change in unrealized appreciation/depreciation on affiliated
investment securities | | | — | | | | 60,210 | | |
Net realized/unrealized gains (losses) on investments | | | 5,249,491 | | | | 2,393,219 | | |
Change in net assets resulting from operations | | $ | 5,480,188 | | | $ | 2,418,499 | | |
See notes to financial statements.
22
Victory Portfolios | | Statements of Changes in Net Assets | |
(Amounts in Thousands)
| | | Victory Sycamore
Established
Value Fund | | Victory Sycamore
Small Company
Opportunity Fund | |
| | | Year
Ended
October 31,
2021 | | Year
Ended
October 31,
2020 | | Year
Ended
October 31,
2021 | | Year
Ended
October 31,
2020 | |
From Investment Activities: | |
Operations: | |
Net investment income (loss) | | $ | 230,697 | | | $ | 168,869 | | | $ | 25,280 | | | $ | 35,573 | | |
Net realized gains (losses) from
investments | | | 1,200,711 | | | | 591,933 | | | | 891,810 | | | | 31,757 | | |
Net change in unrealized appreciation/
depreciation on investments | | | 4,048,780 | | | | (1,316,124 | ) | | | 1,501,409 | | | | (680,021 | ) | |
Change in net assets resulting from
operations | | | 5,480,188 | | | | (555,322 | ) | | | 2,418,499 | | | | (612,691 | ) | |
Distributions to Shareholders: | |
Class A | | | (82,155 | ) | | | (103,792 | ) | | | (2,698 | ) | | | (22,491 | ) | |
Class C | | | (2,825 | ) | | | (4,182 | ) | | | — | | | | — | | |
Class I | | | (215,656 | ) | | | (218,171 | ) | | | (30,516 | ) | | | (243,950 | ) | |
Class R | | | (38,781 | ) | | | (46,556 | ) | | | (1,442 | ) | | | (14,387 | ) | |
Class R6 | | | (304,092 | ) | | | (308,392 | ) | | | (20,349 | ) | | | (15,900 | ) | |
Class Y | | | (38,108 | ) | | | (42,591 | ) | | | (228 | ) | | | (1,835 | ) | |
Change in net assets resulting from
distributions to shareholders | | | (681,617 | ) | | | (723,684 | ) | | | (55,233 | ) | | | (298,563 | ) | |
Change in net assets resulting from capital
transactions | | | 1,258,292 | | | | 124,104 | | | | (135,276 | ) | | | 133,993 | | |
Change in net assets | | | 6,056,863 | | | | (1,154,902 | ) | | | 2,227,990 | | | | (777,261 | ) | |
Net Assets: | |
Beginning of period | | | 10,473,579 | | | | 11,628,481 | | | | 4,845,459 | | | | 5,622,720 | | |
End of period | | $ | 16,530,442 | | | $ | 10,473,579 | | | $ | 7,073,449 | | | $ | 4,845,459 | | |
(continues on next page)
See notes to financial statements.
23
Victory Portfolios | | Statements of Changes in Net Assets | |
(Amounts in Thousands) (continued)
| | | Victory Sycamore
Established
Value Fund | | Victory Sycamore
Small Company
Opportunity Fund | |
| | | Year
Ended
October 31,
2021 | | Year
Ended
October 31,
2020 | | Year
Ended
October 31,
2021 | | Year
Ended
October 31,
2020 | |
Capital Transactions: | |
Class A | |
Proceeds from shares issued | | $ | 316,369 | | | $ | 323,380 | | | $ | 91,245 | | | $ | 93,340 | | |
Distributions reinvested | | | 69,394 | | | | 87,261 | | | | 2,255 | | | | 18,989 | | |
Cost of shares redeemed | | | (578,155 | ) | | | (638,669 | ) | | | (161,535 | ) | | | (155,298 | ) | |
Total Class A | | $ | (192,392 | ) | | $ | (228,028 | ) | | $ | (68,035 | ) | | $ | (42,969 | ) | |
Class C | |
Proceeds from shares issued | | $ | 1,691 | | | $ | 1,281 | | | $ | — | | | $ | — | | |
Distributions reinvested | | | 2,735 | | | | 3,900 | | | | — | | | | — | | |
Cost of shares redeemed | | | (14,289 | ) | | | (20,288 | ) | | | — | | | | — | | |
Total Class C | | $ | (9,863 | ) | | $ | (15,107 | ) | | $ | — | | | $ | — | | |
Class I | |
Proceeds from shares issued | | $ | 1,448,698 | | | $ | 1,126,708 | | | $ | 753,269 | | | $ | 1,115,785 | | |
Distributions reinvested | | | 184,882 | | | | 186,353 | | | | 28,267 | | | | 227,267 | | |
Cost of shares redeemed | | | (1,151,120 | ) | | | (1,094,095 | ) | | | (917,576 | ) | | | (2,509,736 | ) | |
Total Class I | | $ | 482,460 | | | $ | 218,966 | | | $ | (136,040 | ) | | $ | (1,166,684 | ) | |
Class R | |
Proceeds from shares issued | | $ | 184,333 | | | $ | 102,944 | | | $ | 45,316 | | | $ | 43,209 | | |
Distributions reinvested | | | 38,246 | | | | 45,322 | | | | 1,426 | | | | 13,958 | | |
Cost of shares redeemed | | | (206,480 | ) | | | (246,422 | ) | | | (83,973 | ) | | | (89,785 | ) | |
Total Class R | | $ | 16,099 | | | $ | (98,156 | ) | | $ | (37,231 | ) | | $ | (32,618 | ) | |
Class R6 | |
Proceeds from shares issued | | $ | 2,058,418 | | | $ | 1,467,343 | | | $ | 696,838 | | | $ | 1,529,209 | | |
Distributions reinvested | | | 298,880 | | | | 301,095 | | | | 19,320 | | | | 15,321 | | |
Cost of shares redeemed | | | (1,400,472 | ) | | | (1,544,569 | ) | | | (617,635 | ) | | | (158,934 | ) | |
Total Class R6 | | $ | 956,826 | | | $ | 223,869 | | | $ | 98,523 | | | $ | 1,385,596 | | |
Class Y | |
Proceeds from shares issued | | $ | 367,701 | | | $ | 286,306 | | | $ | 15,804 | | | $ | 10,492 | | |
Distributions reinvested | | | 36,208 | | | | 38,649 | | | | 207 | | | | 831 | | |
Cost of shares redeemed | | | (398,747 | ) | | | (302,395 | ) | | | (8,504 | ) | | | (20,655 | ) | |
Total Class Y | | $ | 5,162 | | | $ | 22,560 | | | $ | 7,507 | | | $ | (9,332 | ) | |
Change in net assets resulting from
capital transactions | | $ | 1,258,292 | | | $ | 124,104 | | | $ | (135,276 | ) | | $ | 133,993 | | |
(continues on next page)
See notes to financial statements.
24
Victory Portfolios | | Statements of Changes in Net Assets | |
(Amounts in Thousands) (continued)
| | | Victory Sycamore
Established
Value Fund | | Victory Sycamore
Small Company
Opportunity Fund | |
| | | Year
Ended
October 31,
2021 | | Year
Ended
October 31,
2020 | | Year
Ended
October 31,
2021 | | Year
Ended
October 31,
2020 | |
Share Transactions: | |
Class A | |
Issued | | | 6,696 | | | | 9,415 | | | | 1,750 | | | | 2,491 | | |
Reinvested | | | 1,666 | | | | 2,275 | | | | 49 | | | | 420 | | |
Redeemed | | | (12,340 | ) | | | (18,025 | ) | | | (3,154 | ) | | | (4,039 | ) | |
Total Class A | | | (3,978 | ) | | | (6,335 | ) | | | (1,355 | ) | | | (1,128 | ) | |
Class C | |
Issued | | | 37 | | | | 37 | | | | — | | | | — | | |
Reinvested | | | 69 | | | | 102 | | | | — | | | | — | | |
Redeemed | | | (315 | ) | | | (602 | ) | | | — | | | | — | | |
Total Class C | | | (209 | ) | | | (463 | ) | | | — | | | | — | | |
Class I | |
Issued | | | 30,624 | | | | 32,071 | | | | 14,282 | | | | 29,815 | | |
Reinvested | | | 4,393 | | | | 4,896 | | | | 605 | | | | 4,969 | | |
Redeemed | | | (24,567 | ) | | | (31,823 | ) | | | (17,329 | ) | | | (65,620 | ) | |
Total Class I | | | 10,450 | | | | 5,144 | | | | (2,442 | ) | | | (30,836 | ) | |
Class R | |
Issued | | | 4,046 | | | | 3,001 | | | | 918 | | | | 1,236 | | |
Reinvested | | | 935 | | | | 1,194 | | | | 33 | | | | 333 | | |
Redeemed | | | (4,524 | ) | | | (7,057 | ) | | | (1,751 | ) | | | (2,499 | ) | |
Total Class R | | | 457 | | | | (2,862 | ) | | | (800 | ) | | | (930 | ) | |
Class R6 | |
Issued | | | 43,452 | | | | 42,781 | | | | 12,955 | | | | 40,067 | | |
Reinvested | | | 7,091 | | | | 7,945 | | | | 414 | | | | 335 | | |
Redeemed | | | (30,224 | ) | | | (43,689 | ) | | | (11,730 | ) | | | (4,097 | ) | |
Total Class R6 | | | 20,319 | | | | 7,037 | | | | 1,639 | | | | 36,305 | | |
Class Y | |
Issued | | | 7,724 | | | | 8,117 | | | | 320 | | | | 256 | | |
Reinvested | | | 861 | | | | 1,018 | | | | 4 | | | | 18 | | |
Redeemed | | | (8,452 | ) | | | (8,786 | ) | | | (160 | ) | | | (536 | ) | |
Total Class Y | | | 133 | | | | 349 | | | | 164 | | | | (262 | ) | |
Change in Shares | | | 27,172 | | | | 2,870 | | | | (2,794 | ) | | | 3,149 | | |
See notes to financial statements.
25
Victory Portfolios | | Financial Highlights | |
For a Share Outstanding Throughout Each Period
| | | | | Investment Activities | | Distributions to
Shareholders From | |
| | | Net Asset
Value,
Beginning of
Period | | Net
Investment
Income
(Loss)(a) | | Net Realized
and Unrealized
Gains (Losses)
on Investments | | Total from
Investment
Activities | | Net
Investment
Income | | Net Realized
Gains from
Investments | |
Victory Sycamore Established Value Fund | | | |
Class A | | | |
Year Ended October 31: | |
2021 | | $ | 35.75 | | | | 0.62 | | | | 17.44 | | | | 18.06 | | | | (0.52 | ) | | | (1.67 | ) | |
2020 | | $ | 40.09 | | | | 0.48 | | | | (2.44 | ) | | | (1.96 | ) | | | (0.48 | ) | | | (1.90 | ) | |
2019 | | $ | 39.52 | | | | 0.40 | | | | 3.61 | | | | 4.01 | | | | (0.39 | ) | | | (3.05 | ) | |
2018 | | $ | 40.01 | | | | 0.35 | | | | 0.48 | | | | 0.83 | | | | (0.33 | ) | | | (0.99 | ) | |
2017 | | $ | 33.82 | | | | 0.22 | | | | 6.53 | | | | 6.75 | | | | (0.21 | ) | | | (0.35 | ) | |
Class C | | | |
Year Ended October 31: | |
2021 | | $ | 34.89 | | | | 0.26 | | | | 17.00 | | | | 17.26 | | | | (0.20 | ) | | | (1.67 | ) | |
2020 | | $ | 39.16 | | | | 0.20 | | | | (2.35 | ) | | | (2.15 | ) | | | (0.22 | ) | | | (1.90 | ) | |
2019 | | $ | 38.69 | | | | 0.11 | | | | 3.53 | | | | 3.64 | | | | (0.12 | ) | | | (3.05 | ) | |
2018 | | $ | 39.22 | | | | 0.03 | | | | 0.46 | | | | 0.49 | | | | (0.03 | ) | | | (0.99 | ) | |
2017 | | $ | 33.26 | | | | (0.09 | ) | | | 6.44 | | | | 6.35 | | | | (0.04 | ) | | | (0.35 | ) | |
Class I | | | |
Year Ended October 31: | |
2021 | | $ | 35.77 | | | | 0.77 | | | | 17.44 | | | | 18.21 | | | | (0.65 | ) | | | (1.67 | ) | |
2020 | | $ | 40.12 | | | | 0.59 | | | | (2.45 | ) | | | (1.86 | ) | | | (0.59 | ) | | | (1.90 | ) | |
2019 | | $ | 39.55 | | | | 0.52 | | | | 3.62 | | | | 4.14 | | | | (0.52 | ) | | | (3.05 | ) | |
2018 | | $ | 40.04 | | | | 0.47 | | | | 0.48 | | | | 0.95 | | | | (0.45 | ) | | | (0.99 | ) | |
2017 | | $ | 33.83 | | | | 0.32 | | | | 6.56 | | | | 6.88 | | | | (0.32 | ) | | | (0.35 | ) | |
Class R | | | |
Year Ended October 31: | |
2021 | | $ | 35.23 | | | | 0.52 | | | | 17.16 | | | | 17.68 | | | | (0.43 | ) | | | (1.67 | ) | |
2020 | | $ | 39.54 | | | | 0.40 | | | | (2.40 | ) | | | (2.00 | ) | | | (0.41 | ) | | | (1.90 | ) | |
2019 | | $ | 39.03 | | | | 0.31 | | | | 3.57 | | | | 3.88 | | | | (0.32 | ) | | | (3.05 | ) | |
2018 | | $ | 39.54 | | | | 0.26 | | | | 0.48 | | | | 0.74 | | | | (0.26 | ) | | | (0.99 | ) | |
2017 | | $ | 33.43 | | | | 0.14 | | | | 6.46 | | | | 6.60 | | | | (0.14 | ) | | | (0.35 | ) | |
Class R6 | | | |
Year Ended October 31: | |
2021 | | $ | 35.78 | | | | 0.80 | | | | 17.45 | | | | 18.25 | | | | (0.67 | ) | | | (1.67 | ) | |
2020 | | $ | 40.13 | | | | 0.60 | | | | (2.45 | ) | | | (1.85 | ) | | | (0.60 | ) | | | (1.90 | ) | |
2019 | | $ | 39.55 | | | | 0.52 | | | | 3.63 | | | | 4.15 | | | | (0.52 | ) | | | (3.05 | ) | |
2018 | | $ | 40.05 | | | | 0.49 | | | | 0.48 | | | | 0.97 | | | | (0.48 | ) | | | (0.99 | ) | |
2017 | | $ | 33.85 | | | | 0.35 | | | | 6.54 | | | | 6.89 | | | | (0.34 | ) | | | (0.35 | ) | |
Class Y | | | |
Year Ended October 31: | |
2021 | | $ | 35.76 | | | | 0.77 | | | | 17.45 | | | | 18.22 | | | | (0.65 | ) | | | (1.67 | ) | |
2020 | | $ | 40.11 | | | | 0.58 | | | | (2.45 | ) | | | (1.87 | ) | | | (0.58 | ) | | | (1.90 | ) | |
2019 | | $ | 39.54 | | | | 0.50 | | | | 3.63 | | | | 4.13 | | | | (0.51 | ) | | | (3.05 | ) | |
2018 | | $ | 40.04 | | | | 0.46 | | | | 0.48 | | | | 0.94 | | | | (0.45 | ) | | | (0.99 | ) | |
2017 | | $ | 33.83 | | | | 0.31 | | | | 6.57 | | | | 6.88 | | | | (0.32 | ) | | | (0.35 | ) | |
(a) Per share net investment income (loss) has been calculated using the average daily shares method.
See notes to financial statements.
26
Victory Portfolios | | Financial Highlights — continued | |
For a Share Outstanding Throughout Each Period
| | | | | Ratios to Average Net Assets | | Supplemental Data | |
| | | Total
Distributions | | Net Asset
Value,
End of
Period | | Total
Return
(Excludes
Sales
Charge) | | Net
Expenses | | Net
Investment
Income
(Loss) | | Gross
Expenses | | Net Assets,
End of
Period
(000's) | | Portfolio
Turnover(b) | |
Victory Sycamore Established Value Fund | |
Class A | |
Year Ended October 31: | |
2021 | | | (2.19 | ) | | $ | 51.62 | | | | 52.05 | % | | | 0.90 | % | | | 1.32 | % | | | 0.90 | % | | $ | 1,788,115 | | | | 32 | % | |
2020 | | | (2.38 | ) | | $ | 35.75 | | | | (5.22 | )% | | | 0.92 | % | | | 1.34 | % | | | 0.92 | % | | $ | 1,380,509 | | | | 44 | % | |
2019 | | | (3.44 | ) | | $ | 40.09 | | | | 11.96 | % | | | 0.92 | % | | | 1.06 | % | | | 0.92 | % | | $ | 1,802,034 | | | | 34 | % | |
2018 | | | (1.32 | ) | | $ | 39.52 | | | | 2.01 | % | | | 0.89 | % | | | 0.85 | % | | | 0.89 | % | | $ | 2,008,143 | | | | 36 | % | |
2017 | | | (0.56 | ) | | $ | 40.01 | | | | 20.12 | % | | | 0.90 | % | | | 0.58 | % | | | 0.90 | % | | $ | 2,386,049 | | | | 32 | % | |
Class C | |
Year Ended October 31: | |
2021 | | | (1.87 | ) | | $ | 50.28 | | | | 50.91 | % | | | 1.66 | % | | | 0.56 | % | | | 1.66 | % | | $ | 67,718 | | | | 32 | % | |
2020 | | | (2.12 | ) | | $ | 34.89 | | | | (5.93 | )% | | | 1.69 | % | | | 0.58 | % | | | 1.69 | % | | $ | 54,271 | | | | 44 | % | |
2019 | | | (3.17 | ) | | $ | 39.16 | | | | 11.10 | % | | | 1.68 | % | | | 0.30 | % | | | 1.68 | % | | $ | 79,066 | | | | 34 | % | |
2018 | | | (1.02 | ) | | $ | 38.69 | | | | 1.19 | % | | | 1.68 | % | | | 0.07 | % | | | 1.68 | % | | $ | 90,128 | | | | 36 | % | |
2017 | | | (0.39 | ) | | $ | 39.22 | | | | 19.20 | % | | | 1.70 | % | | | (0.24 | )% | | | 1.70 | % | | $ | 101,506 | | | | 32 | % | |
Class I | |
Year Ended October 31: | |
2021 | | | (2.32 | ) | | $ | 51.66 | | | | 52.54 | % | | | 0.58 | % | | | 1.63 | % | | | 0.58 | % | | $ | 5,315,482 | | | | 32 | % | |
2020 | | | (2.49 | ) | | $ | 35.77 | | | | (4.92 | )% | | | 0.60 | % | | | 1.64 | % | | | 0.60 | % | | $ | 3,306,226 | | | | 44 | % | |
2019 | | | (3.57 | ) | | $ | 40.12 | | | | 12.31 | % | | | 0.60 | % | | | 1.37 | % | | | 0.60 | % | | $ | 3,501,630 | | | | 34 | % | |
2018 | | | (1.44 | ) | | $ | 39.55 | | | | 2.30 | % | | | 0.59 | % | | | 1.14 | % | | | 0.59 | % | | $ | 3,509,093 | | | | 36 | % | |
2017 | | | (0.67 | ) | | $ | 40.04 | | | | 20.50 | % | | | 0.62 | % | | | 0.85 | % | | | 0.62 | % | | $ | 5,263,053 | | | | 32 | % | |
Class R | |
Year Ended October 31: | |
2021 | | | (2.10 | ) | | $ | 50.81 | | | | 51.74 | % | | | 1.11 | % | | | 1.11 | % | | | 1.11 | % | | $ | 936,593 | | | | 32 | % | |
2020 | | | (2.31 | ) | | $ | 35.23 | | | | (5.41 | )% | | | 1.12 | % | | | 1.14 | % | | | 1.12 | % | | $ | 633,244 | | | | 44 | % | |
2019 | | | (3.37 | ) | | $ | 39.54 | | | | 11.72 | % | | | 1.13 | % | | | 0.84 | % | | | 1.13 | % | | $ | 823,796 | | | | 34 | % | |
2018 | | | (1.25 | ) | | $ | 39.03 | | | | 1.80 | % | | | 1.10 | % | | | 0.65 | % | | | 1.10 | % | | $ | 897,277 | | | | 36 | % | |
2017 | | | (0.49 | ) | | $ | 39.54 | | | | 19.89 | % | | | 1.10 | % | | | 0.38 | % | | | 1.10 | % | | $ | 1,005,561 | | | | 32 | % | |
Class R6 | |
Year Ended October 31: | |
2021 | | | (2.34 | ) | | $ | 51.69 | | | | 52.62 | % | | | 0.54 | % | | | 1.68 | % | | | 0.54 | % | | $ | 7,548,781 | | | | 32 | % | |
2020 | | | (2.50 | ) | | $ | 35.78 | | | | (4.89 | )% | | | 0.57 | % | | | 1.68 | % | | | 0.57 | % | | $ | 4,499,129 | | | | 44 | % | |
2019 | | | (3.57 | ) | | $ | 40.13 | | | | 12.35 | % | | | 0.58 | % | | | 1.38 | % | | | 0.58 | % | | $ | 4,762,844 | | | | 34 | % | |
2018 | | | (1.47 | ) | | $ | 39.55 | | | | 2.34 | % | | | 0.57 | % | | | 1.19 | % | | | 0.57 | % | | $ | 3,822,378 | | | | 36 | % | |
2017 | | | (0.69 | ) | | $ | 40.05 | | | | 20.54 | % | | | 0.54 | % | | | 0.91 | % | | | 0.54 | % | | $ | 1,314,843 | | | | 32 | % | |
Class Y | |
Year Ended October 31: | |
2021 | | | (2.32 | ) | | $ | 51.66 | | | | 52.49 | % | | | 0.61 | % | | | 1.62 | % | | | 0.61 | % | | $ | 873,753 | | | | 32 | % | |
2020 | | | (2.48 | ) | | $ | 35.76 | | | | (4.92 | )% | | | 0.63 | % | | | 1.63 | % | | | 0.63 | % | | $ | 600,200 | | | | 44 | % | |
2019 | | | (3.56 | ) | | $ | 40.11 | | | | 12.28 | % | | | 0.63 | % | | | 1.32 | % | | | 0.63 | % | | $ | 659,111 | | | | 34 | % | |
2018 | | | (1.44 | ) | | $ | 39.54 | | | | 2.27 | % | | | 0.62 | % | | | 1.13 | % | | | 0.62 | % | | $ | 448,543 | | | | 36 | % | |
2017 | | | (0.67 | ) | | $ | 40.04 | | | | 20.51 | % | | | 0.60 | % | | | 0.81 | % | | | 0.60 | % | | $ | 487,044 | | | | 32 | % | |
(b) Portfolio turnover is calculated on the basis of the Fund as a whole without distinguishing between the classes of shares issued.
See notes to financial statements.
27
Victory Portfolios | | Financial Highlights | |
For a Share Outstanding Throughout Each Period
| | | | | Investment Activities | | Distributions to
Shareholders From | |
| | | Net Asset
Value,
Beginning of
Period | | Net
Investment
Income
(Loss)(a) | | Net Realized
and Unrealized
Gains (Losses)
on Investments | | Total from
Investment
Activities | | Net
Investment
Income | | Net Realized
Gains from
Investments | |
Victory Sycamore Small Company Opportunity Fund | | | |
Class A | | | |
Year Ended October 31: | |
2021 | | $ | 37.91 | | | | 0.04 | | | | 18.89 | | | | 18.93 | | | | (0.17 | ) | | | (0.15 | ) | |
2020 | | $ | 45.16 | | | | 0.17 | | | | (5.14 | ) | | | (4.97 | ) | | | (0.20 | ) | | | (2.08 | ) | |
2019 | | $ | 45.91 | | | | 0.22 | | | | 4.22 | | | | 4.44 | | | | (0.10 | ) | | | (5.09 | ) | |
2018 | | $ | 48.23 | | | | 0.22 | | | | (0.09 | ) | | | 0.13 | | | | (0.21 | ) | | | (2.24 | ) | |
2017 | | $ | 39.74 | | | | 0.11 | | | | 10.44 | | | | 10.55 | | | | (0.12 | ) | | | (1.94 | ) | |
Class I | | | |
Year Ended October 31: | |
2021 | | $ | 38.40 | | | | 0.22 | | | | 19.13 | | | | 19.35 | | | | (0.29 | ) | | | (0.15 | ) | |
2020 | | $ | 45.71 | | | | 0.31 | | | | (5.20 | ) | | | (4.89 | ) | | | (0.34 | ) | | | (2.08 | ) | |
2019 | | $ | 46.43 | | | | 0.35 | | | | 4.28 | | | | 4.63 | | | | (0.26 | ) | | | (5.09 | ) | |
2018 | | $ | 48.75 | | | | 0.37 | | | | (0.09 | ) | | | 0.28 | | | | (0.36 | ) | | | (2.24 | ) | |
2017 | | $ | 40.12 | | | | 0.25 | | | | 10.55 | | | | 10.80 | | | | (0.23 | ) | | | (1.94 | ) | |
Class R | | | |
Year Ended October 31: | |
2021 | | $ | 35.16 | | | | (0.05 | ) | | | 17.52 | | | | 17.47 | | | | (0.11 | ) | | | (0.15 | ) | |
2020 | | $ | 42.05 | | | | 0.09 | | | | (4.76 | ) | | | (4.67 | ) | | | (0.14 | ) | | | (2.08 | ) | |
2019 | | $ | 43.13 | | | | 0.13 | | | | 3.91 | | | | 4.04 | | | | (0.03 | ) | | | (5.09 | ) | |
2018 | | $ | 45.47 | | | | 0.10 | | | | (0.08 | ) | | | 0.02 | | | | (0.12 | ) | | | (2.24 | ) | |
2017 | | $ | 37.59 | | | | 0.01 | | | | 9.86 | | | | 9.87 | | | | (0.05 | ) | | | (1.94 | ) | |
Class R6 | | | |
Year Ended October 31: | |
2021 | | $ | 38.37 | | | | 0.24 | | | | 19.10 | | | | 19.34 | | | | (0.34 | ) | | | (0.15 | ) | |
2020 | | $ | 45.66 | | | | 0.19 | | | | (5.03 | ) | | | (4.84 | ) | | | (0.37 | ) | | | (2.08 | ) | |
2019 | | $ | 46.38 | | | | 0.36 | | | | 4.28 | | | | 4.64 | | | | (0.27 | ) | | | (5.09 | ) | |
2018 | | $ | 48.69 | | | | 0.30 | | | | — | (c) | | | 0.30 | | | | (0.37 | ) | | | (2.24 | ) | |
2017 | | $ | 40.08 | | | | 0.21 | | | | 10.58 | | | | 10.79 | | | | (0.24 | ) | | | (1.94 | ) | |
Class Y | | | |
Year Ended October 31: | |
2021 | | $ | 38.10 | | | | 0.16 | | | | 19.00 | | | | 19.16 | | | | (0.23 | ) | | | (0.15 | ) | |
2020 | | $ | 45.39 | | | | 0.24 | | | | (5.16 | ) | | | (4.92 | ) | | | (0.29 | ) | | | (2.08 | ) | |
2019 | | $ | 46.13 | | | | 0.30 | | | | 4.24 | | | | 4.54 | | | | (0.19 | ) | | | (5.09 | ) | |
2018 | | $ | 48.33 | | | | 0.29 | | | | (0.09 | ) | | | 0.20 | | | | (0.16 | ) | | | (2.24 | ) | |
2017 | | $ | 39.84 | | | | 0.20 | | | | 10.40 | | | | 10.60 | | | | (0.17 | ) | | | (1.94 | ) | |
(a) Per share net investment income (loss) has been calculated using the average daily shares method.
(b) Portfolio turnover is calculated on the basis of the Fund as a whole without distinguishing between the classes of shares issued.
(c) Amount is less than $0.005 per share.
See notes to financial statements.
28
Victory Portfolios | | Financial Highlights — continued | |
For a Share Outstanding Throughout Each Period
| | | | | Ratios to Average Net Assets | | Supplemental Data | |
| | | Total
Distributions | | Net Asset
Value,
End of
Period | | Total
Return
(Excludes
Sales
Charge) | | Net
Expenses | | Net
Investment
Income
(Loss) | | Gross
Expenses | | Net Assets,
End of
Period
(000's) | | Portfolio
Turnover(b) | |
Victory Sycamore Small Company Opportunity Fund | |
Class A | |
Year Ended October 31: | |
2021 | | | (0.32 | ) | | $ | 56.52 | | | | 50.11 | % | | | 1.24 | % | | | 0.07 | % | | | 1.24 | % | | $ | 424,496 | | | | 41 | % | |
2020 | | | (2.28 | ) | | $ | 37.91 | | | | (11.80 | )% | | | 1.26 | % | | | 0.43 | % | | | 1.26 | % | | $ | 336,083 | | | | 37 | % | |
2019 | | | (5.19 | ) | | $ | 45.16 | | | | 12.10 | % | | | 1.25 | % | | | 0.51 | % | | | 1.25 | % | | $ | 451,310 | | | | 34 | % | |
2018 | | | (2.45 | ) | | $ | 45.91 | | | | 0.17 | % | | | 1.22 | % | | | 0.46 | % | | | 1.22 | % | | $ | 486,622 | | | | 43 | % | |
2017 | | | (2.06 | ) | | $ | 48.23 | | | | 27.02 | % | | | 1.23 | % | | | 0.25 | % | | | 1.23 | % | | $ | 603,851 | | | | 36 | % | |
Class I | |
Year Ended October 31: | |
2021 | | | (0.44 | ) | | $ | 57.31 | | | | 50.66 | % | | | 0.89 | % | | | 0.41 | % | | | 0.89 | % | | $ | 3,840,013 | | | | 41 | % | |
2020 | | | (2.42 | ) | | $ | 38.40 | | | | (11.51 | )% | | | 0.93 | % | | | 0.78 | % | | | 0.93 | % | | $ | 2,666,852 | | | | 37 | % | |
2019 | | | (5.35 | ) | | $ | 45.71 | | | | 12.49 | % | | | 0.92 | % | | | 0.82 | % | | | 0.92 | % | | $ | 4,584,086 | | | | 34 | % | |
2018 | | | (2.60 | ) | | $ | 46.43 | | | | 0.49 | % | | | 0.88 | % | | | 0.76 | % | | | 0.88 | % | | $ | 4,127,411 | | | | 43 | % | |
2017 | | | (2.17 | ) | | $ | 48.75 | | | | 27.44 | % | | | 0.90 | % | | | 0.56 | % | | | 0.90 | % | | $ | 4,003,419 | | | | 36 | % | |
Class R | |
Year Ended October 31: | |
2021 | | | (0.26 | ) | | $ | 52.37 | | | | 49.85 | % | | | 1.42 | % | | | (0.11 | )% | | | 1.42 | % | | $ | 256,938 | | | | 41 | % | |
2020 | | | (2.22 | ) | | $ | 35.16 | | | | (11.94 | )% | | | 1.44 | % | | | 0.25 | % | | | 1.44 | % | | $ | 200,617 | | | | 37 | % | |
2019 | | | (5.12 | ) | | $ | 42.05 | | | | 11.89 | % | | | 1.44 | % | | | 0.32 | % | | | 1.44 | % | | $ | 279,090 | | | | 34 | % | |
2018 | | | (2.36 | ) | | $ | 43.13 | | | | (0.06 | )% | | | 1.44 | % | | | 0.23 | % | | | 1.44 | % | | $ | 286,480 | | | | 43 | % | |
2017 | | | (1.99 | ) | | $ | 45.47 | | | | 26.73 | % | | | 1.45 | % | | | 0.03 | % | | | 1.45 | % | | $ | 333,944 | | | | 36 | % | |
Class R6 | |
Year Ended October 31: | |
2021 | | | (0.49 | ) | | $ | 57.22 | | | | 50.71 | % | | | 0.85 | % | | | 0.44 | % | | | 0.85 | % | | $ | 2,518,726 | | | | 41 | % | |
2020 | | | (2.45 | ) | | $ | 38.37 | | | | (11.43 | )% | | | 0.86 | % | | | 0.48 | % | | | 0.86 | % | | $ | 1,625,853 | | | | 37 | % | |
2019 | | | (5.36 | ) | | $ | 45.66 | | | | 12.52 | % | | | 0.87 | % | | | 0.84 | % | | | 0.87 | % | | $ | 277,218 | | | | 34 | % | |
2018 | | | (2.61 | ) | | $ | 46.38 | | | | 0.52 | % | | | 0.87 | % | | | 0.62 | % | | | 0.87 | % | | $ | 195,360 | | | | 43 | % | |
2017 | | | (2.18 | ) | | $ | 48.69 | | | | 27.44 | % | | | 0.90 | % | | | 0.46 | % | | | 0.90 | % | | $ | 85,307 | | | | 36 | % | |
Class Y | |
Year Ended October 31: | |
2021 | | | (0.38 | ) | | $ | 56.88 | | | | 50.55 | % | | | 0.95 | % | | | 0.31 | % | | | 0.95 | % | | $ | 33,276 | | | | 41 | % | |
2020 | | | (2.37 | ) | | $ | 38.10 | | | | (11.65 | )% | | | 1.08 | % | | | 0.62 | % | | | 1.08 | % | | $ | 16,054 | | | | 37 | % | |
2019 | | | (5.28 | ) | | $ | 45.39 | | | | 12.31 | % | | | 1.07 | % | | | 0.69 | % | | | 1.07 | % | | $ | 31,016 | | | | 34 | % | |
2018 | | | (2.40 | ) | | $ | 46.13 | | | | 0.33 | % | | | 1.06 | % | | | 0.61 | % | | | 1.06 | % | | $ | 32,592 | | | | 43 | % | |
2017 | | | (2.11 | ) | | $ | 48.33 | | | | 27.10 | % | | | 1.15 | % | | | 0.45 | % | | | 1.25 | % | | $ | 35,416 | | | | 36 | % | |
See notes to financial statements.
29
Victory Portfolios | | Notes to Financial Statements
October 31, 2021 | |
1. Organization:
Victory Portfolios (the "Trust") is organized as a Delaware statutory trust and the Trust is registered under the Investment Company Act of 1940, as amended (the "1940 Act"), as an open-end investment company. The Trust is comprised of 41 funds and is authorized to issue an unlimited number of shares, which are units of beneficial interest with a par value of $0.001 per share.
The accompanying financial statements are those of the following two Funds (collectively, the "Funds" and individually, a "Fund"). Each Fund is classified as diversified under the 1940 Act.
Funds (Legal Name) | | Funds (Short Name)* | | Investment Share
Classes Offered | |
Victory Sycamore Established
Value Fund | | Sycamore Established Value Fund | | A, C, I, R, R6, and Y | |
Victory Sycamore Small Company
Opportunity Fund | | Sycamore Small Company
Opportunity Fund | | A, I, R, R6, and Y | |
* The Funds are generally closed to new investors. The Funds will continue to be available for investment (by direct purchase or exchange) by the following: existing shareholders, investors that purchase shares through certain intermediaries, retirement plans that purchase shares through certain record keepers, and current and retired Fund trustees, officers, employees of Victory Capital Management Inc. ("VCM" or the "Adviser") and affiliated providers, and their family members.
Each class of shares of a Fund has substantially identical rights and privileges except with respect to sales charges, fees paid under distribution plans, expenses allocable exclusively to each class of shares, voting rights on matters solely affecting a single class of shares, and the exchange privilege of each class of shares.
Under the Trust's organizational documents, its officers and trustees are indemnified against certain liabilities arising out of the performance of their duties to the Funds. In addition, in the normal course of business, the Funds enter into contracts with their vendors and others that provide for general indemnifications. The Funds' maximum exposure under these arrangements is unknown, as this would involve future claims that may be made against the Funds. However, based on experience, the Funds expect that risk of loss to be remote.
2. Significant Accounting Policies:
The following is a summary of significant accounting policies followed by the Trust in the preparation of its financial statements. The policies are in conformity with Generally Accepted Accounting Principles in the United States of America ("GAAP"). The preparation of financial statements in accordance with GAAP requires management to make estimates and assumptions that affect the reported amounts of assets and liabilities and disclosure of contingent assets and liabilities at the date of the financial statements and the reported amounts of income and expenses for the period. Actual results could differ from those estimates. The Funds follow the specialized accounting and reporting requirements under GAAP that are applicable to investment companies under Accounting Standards Codification Topic 946.
Investment Valuation:
The Funds record investments at fair value. Fair value is defined as the price that would be received to sell an asset or paid to transfer a liability in an orderly transaction between market participants at the measurement date.
The valuation techniques described below maximize the use of observable inputs and minimize the use of unobservable inputs in determining fair value. The inputs used for valuing the Funds' investments are summarized in the three broad levels listed below:
• Level 1 — quoted prices in active markets for identical securities
• Level 2 — other significant observable inputs (including quoted prices for similar securities or interest rates applicable to those securities, etc.)
30
Victory Portfolios | | Notes to Financial Statements — continued
October 31, 2021 | |
• Level 3 — significant unobservable inputs (including the Funds' own assumptions in determining the fair value of investments)
Changes in valuation techniques may result in transfers in or out of an assigned level within the disclosure hierarchy. The inputs or methodologies used for valuation techniques are not necessarily an indication of the risk associated with entering into those investments.
The Adviser has established the Pricing and Liquidity Committee (the "Committee"), and subject to the Trust's Board of Trustees' (the "Board") oversight, the Committee administers and oversees the Funds' valuation policies and procedures, which are approved by the Board.
Portfolio securities listed or traded on securities exchanges, including exchange-traded funds ("ETFs"), are valued at the closing price on the exchange or system where the security is principally traded, if available, or at the Nasdaq Official Closing Price. If there have been no sales for that day on the exchange or system, then a security is valued at the last available bid quotation on the exchange or system where the security is principally traded. In each of these situations, valuations are typically categorized as Level 1 in the fair value hierarchy.
Investments in open-end investment companies are valued at their net asset value ("NAV"). These valuations are typically categorized as Level 1 in the fair value hierarchy.
In the event that price quotations or valuations are not readily available, investments are valued at fair value in accordance with procedures established by and under the general supervision and responsibility of the Board. These valuations are typically categorized as Level 2 or Level 3 in the fair value hierarchy, based on the observability of inputs used to determine the fair value. The effect of fair value pricing is that securities may not be priced on the basis of quotations from the primary market in which they are traded and the actual price realized from the sale of a security may differ materially from the fair value price. Valuing these securities at fair value is intended to cause the Fund's NAV to be more reliable than it otherwise would be.
A summary of the valuations as of October 31, 2021, is included in the table below while the breakdown, by category, of investments is disclosed on the Schedules of Portfolio Investments (amounts in thousands):
| | | Level 1 | | Level 2 | | Level 3 | | Total | |
Sycamore Established Value Fund | |
Common Stocks | | $ | 16,083,071 | | | $ | — | | | $ | — | | | $ | 16,083,071 | | |
Exchange-Traded Funds | | | 203,373 | | | | — | | | | — | | | | 203,373 | | |
Collateral for Securities Loaned | | | 24 | | | | — | | | | — | | | | 24 | | |
Total | | $ | 16,286,468 | | | $ | — | | | $ | — | | | $ | 16,286,468 | | |
Sycamore Small Company Opportunity Fund | |
Common Stocks | | $ | 6,883,790 | | | $ | — | | | $ | — | | | $ | 6,883,790 | | |
Exchange-Traded Funds | | | 74,871 | | | | — | | | | — | | | | 74,871 | | |
Collateral for Securities Loaned | | | 101,145 | | | | — | | | | — | | | | 101,145 | | |
Total | | $ | 7,059,806 | | | $ | — | | | $ | — | | | $ | 7,059,806 | | |
For the year ended October 31, 2021, there were no transfers in or out of Level 3 in the fair value hierarchy.
Real Estate Investment Trusts ("REITs"):
The Funds may invest in REITs, which report information on the source of their distributions annually. REITs are pooled investment vehicles that invest primarily in income-producing real estate or real-estate related loans or interests (such as mortgages). Certain distributions received from REITs during the year are recorded as realized gains or return of capital as estimated by the Funds or when such information becomes known.
31
Victory Portfolios | | Notes to Financial Statements — continued
October 31, 2021 | |
Investment Companies:
Exchange-Traded Funds:
The Funds may invest in ETFs, the shares of which are bought and sold on a securities exchange. An ETF trades like common stock and represents a fixed portfolio of securities often designed to track the performance and dividend yield of a particular domestic or foreign market index. The Funds may purchase shares of an ETF to temporarily gain exposure to a portion of the U.S. or a foreign market while awaiting purchase of underlying securities. The risks of owning an ETF generally reflect the risks of owning the underlying securities they are designed to track, although the lack of liquidity of an ETF could result in it being more volatile. Additionally, ETFs have fees and expenses that reduce their value.
Open-End Funds:
The Funds may invest in portfolios of open-end investment companies. These investment companies value securities in their portfolios for which market quotations are readily available at their market values (generally the last reported sale price) and all other securities and assets at their fair value by the methods established by the board of directors of the underlying funds.
Investment Transactions and Related Income:
Changes in holdings of investments are accounted for no later than one business day following the trade date. For financial reporting purposes, however, investment transactions are accounted for on trade date or the last business day of the reporting period. Interest income is determined on the basis of coupon interest accrued using the effective interest method which adjusts, where applicable, the amortization of premiums or accretion of discounts. Dividend income is recorded on the ex-dividend date. Gains or losses realized on sales of securities are recorded on the identified cost basis.
Securities Lending:
The Funds, through a Securities Lending Agreement with Citibank, N.A. ("Citibank"), may lend their securities to qualified financial institutions, such as certain broker-dealers and banks, to earn additional income, net of income retained by Citibank. Borrowers are required to initially secure their loans for collateral in the amount of at least 102% of the value of U.S. securities loaned or at least 105% of the value of non-U.S. securities loaned, marked-to-market daily. Any collateral shortfalls associated with increases in the valuation of the securities loaned are generally cured the next business day. The collateral can be received in the form of cash collateral and/or non-cash collateral. Non-cash collateral can include U.S. Government Securities and other securities as permitted by Securities and Exchange Commission ("SEC") guidelines. The cash collateral is invested in short-term instruments or cash equivalents, primarily open-end investment companies, as noted on the Funds' Schedules of Portfolio Investments. The Funds do not have effective control of the non-cash collateral and therefore it is not disclosed on the Funds' Schedules of Portfolio Investments. Collateral requirements are determined daily based on the value of the Funds' securities on loan as of the end of the prior business day. During the time portfolio securities are on loan, the borrower will pay the Funds any dividends or interest paid on such securities plus any fee negotiated between the parties to the lending agreement. The Funds also earn a return from the collateral. The Funds pay Citibank various fees in connection with the investment of cash collateral and fees based on the investment income received from securities lending activities. Securities lending income (net of these fees) is disclosed on the Statements of Operations. Loans are terminable upon demand and the borrower must return the loaned securities within the lesser of one standard settlement period or five business days. Although risk is mitigated by the collateral, the Funds could experience a delay in recovering its securities and possible loss of income or value if the borrower fails to return them and the value of the short-term investments will be less than the amount of cash collateral required to be returned to the borrower.
The Funds' agreement with Citibank does not include master netting provisions. Non-cash collateral received by the Funds may not be sold or re-pledged, except to satisfy borrower default.
32
Victory Portfolios | | Notes to Financial Statements — continued
October 31, 2021 | |
The following table (amounts in thousands) is a summary of the Funds' securities lending transactions as of October 31, 2021.
| | | Value of
Securities on Loan | | Non-Cash
Collateral | | Cash
Collateral | |
Sycamore Established Value Fund | | $ | 24 | | | $ | — | | | $ | 24 | | |
Sycamore Small Company Opportunity Fund | | | 99,461 | | | | — | | | | 101,145 | | |
Federal Income Taxes:
It is the policy of each Fund to continue to qualify as a regulated investment company by complying with the provisions available to certain investment companies, as defined in applicable sections of the Internal Revenue Code, and to make distributions of net investment income and net realized gains sufficient to relieve it from all, or substantially all, federal income taxes. Accordingly, no provision for federal income taxes is required in the financial statements. The Funds have a tax year end of October 31.
Management of the Funds has reviewed tax positions taken in tax years that remain subject to examination by all major tax jurisdictions, including federal (i.e., the last four tax years, which includes the current fiscal tax year end). Management believes that there is no tax liability resulting from unrecognized tax benefits related to uncertain tax positions taken.
Allocations:
Expenses directly attributable to the Funds are charged to the Funds, while expenses that are attributable to more than one fund in the Trust, or jointly with an affiliated trust, are allocated among the respective funds in the Trust and/or an affiliated trust based upon net assets or another appropriate basis.
Income, expenses (other than class-specific expenses such as transfer agent fees, state registration fees, 12b-1 fees, and printing fees), and realized and unrealized gains or losses on investments are allocated to each class of shares based on its relative net assets on the date income is earned or expenses and realized and unrealized gains and losses are incurred.
3. Purchases and Sales:
Purchases and sale of securities (excluding securities maturing less than one year from acquisition) and purchases and sales of in-kind transactions for the year ended October 31, 2021, were as follows (amounts in thousands). Any realized gains or losses from in-kind redemptions, if any, are reflected on the Statements of Operations as Net realized gains (losses) from in-kind redemptions.
| | | Excluding
U.S. Government
Securities | | Associated
with In-Kind
Transactions | |
| | | Purchases | | Sales | | Purchases | | Sales | |
Sycamore Established Value Fund | | $ | 5,169,934 | | | $ | 4,525,652 | | | $ | — | | | $ | — | | |
Sycamore Small Company Opportunity Fund | | | 2,644,616 | | | | 2,771,036 | | | | — | | | | 58,987 | | |
4. Fees and Transactions with Affiliates and Related Parties:
Investment Advisory Fees:
Investment advisory services are provided to the Funds by the Adviser, which is a New York corporation registered as an investment adviser with the SEC. The Adviser is an indirect wholly owned subsidiary of Victory Capital Holdings, Inc., a publicly traded Delaware corporation, and a wholly owned direct subsidiary of Victory Capital Operating, LLC.
33
Victory Portfolios | | Notes to Financial Statements — continued
October 31, 2021 | |
Under the terms of the Investment Advisory Agreement, the Adviser is entitled to receive fees based on a percentage of the average daily net assets of each Fund. The rates at which the Adviser is paid by each Fund are included in the table below.
| | | Adviser Fee Tier Rates | |
| | | Up to $100 million | | $100 million — $200 million | | Over $200 million | |
Sycamore Established Value Fund | | | 0.65 | % | | | 0.55 | % | | | 0.45 | % | |
| | | Up to $500 million | | | | Over $500 million | |
Sycamore Small Company
Opportunity Fund | | | 0.85 | % | | | | | | | 0.75 | % | |
Amounts incurred and paid to VCM for the year ended October 31, 2021, are reflected on the Statements of Operations as Investment advisory fees.
Administration and Servicing Fees:
VCM serves as the Funds' administrator and fund accountant. Under the Administration and Fund Accounting Agreement, VCM is entitled to receive fees based on a percentage of the average daily net assets of the Trust, Victory Variable Insurance Funds and Victory Portfolios II. The tiered rates at which VCM is paid by the Funds are shown in the table below:
| | | Net Assets | |
| | | Up to $15 billion | | $15 billion — $30 billion | | Over $30 billion | |
| | | | | | 0.08 | %, plus | | | 0.05 | %, plus | | | 0.04 | % | |
Amounts incurred for the year ended October 31, 2021, are reflected on the Statements of Operations as Administration fees.
Citi Fund Services Ohio, Inc. ("Citi"), an affiliate of Citibank, acts as sub-administrator and sub-fund accountant to the Funds pursuant to the Sub-Administration and Sub-Fund Accounting Services Agreement between VCM and Citi. VCM pays Citi a fee for providing these services. The Trust reimburses VCM and Citi for out-of-pocket expenses incurred in providing these services and certain other expenses specifically allocated to the Funds. Amounts incurred for the year ended October 31, 2021, are reflected on the Statements of Operations as Sub-Administration fees.
The Chief Compliance Officer ("CCO") is an employee of the Adviser, which pays the compensation of the CCO and his support staff. The Trust has entered into an agreement to provide compliance services with the Adviser, pursuant to which the Adviser furnishes its compliance personnel, including the services of the CCO, and other resources reasonably necessary to provide the Trust with compliance oversight services related to the design, administration, and oversight of a compliance program for the Trust in accordance with Rule 38a-1 under the 1940 Act. The funds in the Trust, Victory Variable Insurance Funds, Victory Portfolios II, and USAA Mutual Funds Trust (collectively, the "Victory Funds Complex"), in aggregate, compensate the Adviser for these services. Amounts incurred for the year ended October 31, 2021, are reflected on the Statements of Operations as Compliance fees.
Transfer Agency Fees:
FIS Investor Services, LLC ("FIS") serves as the Funds' transfer agent. Under the Transfer Agent Agreement, the Trust pays FIS a fee for its services and reimburses FIS for all of their reasonable out-of-pocket expenses incurred in providing these services. Amounts incurred for the year ended October 31, 2021, are reflected on the Statements of Operations as Transfer agent fees.
Distributor/Underwriting Services:
Victory Capital Services, Inc. (the "Distributor"), an affiliate of the Adviser, serves as Distributor for the continuous offering of the shares of the Funds pursuant to a Distribution Agreement between the Distributor and the Trust.
34
Victory Portfolios | | Notes to Financial Statements — continued
October 31, 2021 | |
Pursuant to the Distribution and Service Plans adopted in accordance with Rule 12b-1 under the 1940 Act, the Distributor may receive a monthly distribution and service fee up to the annual rate shown in the table below:
| | | Class A | | Class C | | Class R | |
Sycamore Established Value Fund | | | 0.25 | % | | | 1.00 | % | | | 0.50 | % | |
Sycamore Small Company Opportunity Fund | | | 0.25 | % | | | N/A | | | | 0.50 | % | |
The distribution and service fees paid to the Distributor may be used by the Distributor to pay for activities primarily intended to result in the sale of Class A, Class C, and Class R. Amounts incurred for the year ended October 31, 2021, are reflected on the Statements of Operations as 12b-1 fees.
In addition, the Distributor is entitled to receive commissions on sale of the Class A. For the year ended October 31, 2021, the Distributor received approximately $19 thousand from commissions earned on the sale of Class A.
Other Fees:
Citibank serves as the Funds' custodian. The Funds pay Citibank a fee for providing these services. Amounts incurred for the year ended October 31, 2021, are reflected on the Statements of Operations as Custodian fees.
Sidley Austin LLP provides legal services to the Trust.
The Adviser has entered into expense limitation agreements with the Funds. Under the terms of the agreements, the Adviser has agreed to waive fees or reimburse certain expenses to the extent that ordinary operating expenses incurred by certain classes of the Fund in any fiscal year exceed the expense limit for such classes of the Fund. Such excess amounts will be the liability of the Adviser. Acquired fund fees and expenses, interest, taxes, brokerage commissions, other expenditures that are capitalized in accordance with GAAP, and other extraordinary expenses not incurred in the ordinary course of a Fund's business are excluded from the expense limits. As of October 31, 2021, the expense limits are as follows:
| | | In effect until February 28, 2022 | |
| | | Class C | | Class Y | |
Sycamore Established Value Fund | | | 1.84 | % | | | N/A | | |
Sycamore Small Company Opportunity Fund | | | N/A | | | | 1.15 | % | |
Under the terms of the expense limitation agreements, as amended May 1, 2021, the Funds have agreed to repay fees and expenses that were waived or reimbursed by the Adviser for a period of up to three years (thirty-six (36) months) after the waiver or reimbursement took place, subject to the lesser of any operating expense limits in effect at the time of: (a) the original waiver or expense reimbursement; or (b) the recoupment, after giving effect to the recoupment amount. Prior to May 1, 2021, the Funds were permitted to recoup fees waived and expenses reimbursed for up to three years after the fiscal year in which the waiver or reimbursement took place, subject to the limitations above. This change did not have any effect on the amounts previously reported for recoupment.
As of October 31, 2021, the Funds had no amounts available to be repaid to the Adviser. The Funds have not recorded any amounts available to be repaid as a liability due to an assessment that repayments are not probable at October 31, 2021.
The Adviser may voluntarily waive or reimburse additional fees to assist the Funds in maintaining competitive expense ratios. Voluntary waivers and reimbursements applicable to the Funds are not available to be recouped at a future time.
Certain officers and/or interested trustees of the Funds are also officers and/or employees of the Adviser, administrator, fund accountant, sub-administrator, sub-fund accountant, custodian, legal counsel, and Distributor.
35
Victory Portfolios | | Notes to Financial Statements — continued
October 31, 2021 | |
5. Risks:
The Funds may be subject to other risks in addition to these identified risks.
Equity Risk — The value of the equity securities in which the Fund invests may decline in response to developments affecting individual companies and/or general economic conditions in the United States or abroad. A company's earnings or dividends may not increase as expected (or may decline) because of poor management, competitive pressures, reliance on particular suppliers or geographical regions, labor problems or shortages, corporate restructurings, fraudulent disclosures, man-made or natural disasters, military confrontations or wars, terrorism, public health crises, or other events, conditions and factors. Price changes may be temporary or last for extended periods.
Stock Market Risk — Overall stock market risks may affect the value of the Fund. Domestic and international factors such as political events, war, trade disputes, interest rate levels and other fiscal and monetary policy changes, pandemics and other public health crises, and related geopolitical events, as well as environmental disasters such as earthquakes, fires, and floods, may add to instability in world economies and markets generally. The impact of these and other factors may be short-term or may last for extended periods.
Small-Capitalization Stock Risk — Small-capitalization companies are subject to a number of risks not associated with larger, more established companies, potentially making their stock prices more volatile and increasing the risk of loss. Smaller companies may have limited markets, product lines, or financial resources and lack management experience and may experience higher failure rates than larger companies.
Mid-Capitalization Stock Risk — Mid-sized companies may be subject to a number of risks not associated with larger, more established companies, potentially making their stock prices more volatile and increasing the risk of loss.
6. Borrowing and Interfund Lending:
Line of Credit:
The Victory Funds Complex participates in a short-term demand note "Line of Credit" agreement with Citibank. The Line of Credit agreement with Citibank was renewed on June 28, 2021, with a termination date of June 27, 2022. Under the agreement with Citibank, the Victory Funds Complex may borrow up to $600 million, of which $300 million is committed and $300 million is uncommitted. $40 million of the Line of Credit is reserved for use by the Victory Floating Rate Fund, another series of the Victory Funds Complex, with Victory Floating Rate Fund paying the related commitment fees for that amount. The purpose of the Line of Credit is to meet temporary or emergency cash needs. For the year ended October 31, 2021, Citibank received an annual commitment fee of 0.15% on $300 million for providing the Line of Credit. Each fund in the Victory Funds Complex pays a pro-rata portion of the commitment fees plus any interest (one-month LIBOR plus one percent, with LIBOR to be replaced by a different benchmark rate in accordance with the terms of the agreement) on amounts borrowed. Prior to June 29, 2021, the Victory Funds Complex paid an annual commitment fee of 0.15% and an upfront fee of 0.10%. Interest charged to each Fund during the period, if applicable, is reflected on the Statements of Operations under Line of credit fees.
The Funds had no borrowings under the Line of Credit agreement during the year ended October 31, 2021.
Interfund Lending:
The Trust and Adviser rely on an exemptive order granted by the SEC in March 2017 (the "Order"), permitting the establishment and operation of an Interfund Lending Facility (the "Facility"). The Facility allows each Fund to directly lend and borrow money to or from any other fund in the Victory Funds Complex that is permitted to participate in the Facility, relying upon the Order at rates beneficial to both the borrowing and lending funds. Advances under the Facility are allowed for temporary or emergency purposes, including the meeting of redemption requests that otherwise might require the untimely disposition of securities, and are subject to each Fund's borrowing restrictions. The interfund
36
Victory Portfolios | | Notes to Financial Statements — continued
October 31, 2021 | |
loan rate is determined, as specified in the Order, by averaging the current repurchase agreement rate and the current bank loan rate. As a Borrower, interest charged to each Fund, if any, during the period, is reflected on the Statements of Operations under Interfund lending fees. As a Lender, interest earned by each Fund, if any, during the period, is presented on the Statements of Operations under Interfund lending.
The average borrowing or lending for the days outstanding and average interest rate for the Funds that utilized this Facility during the year ended October 31, 2021, were as follows (amounts in thousands):
| | | Borrower or
Lender | | Amount
Outstanding at
October 31, 2021 | | Average
Borrowing* | | Days
Lending
Outstanding | | Average
Interest
Rate | | Maximum
Lending
During the
Period | |
Sycamore Established
Value Fund | | Lender | | $ | — | | | $ | 8,775 | | | | 151 | | | | 0.28 | % | | $ | 64,000 | | |
* For the year ended October 31, 2021, based on the number of days borrowings were outstanding.
7. Federal Income Tax Information:
Distributable net realized gains, if any, are declared and distributed at least annually from each Fund. Dividends from net investment income, if any, are declared and paid as noted in the table below.
| | | Declared | | Paid | |
Sycamore Established Value Fund | | Quarterly | | Quarterly | |
Sycamore Small Company Opportunity Fund | | Annually | | Annually | |
The amounts of dividends from net investment income and distributions from net realized gains (collectively, distributions to shareholders) are determined in accordance with federal income tax regulations, which may differ from GAAP. To the extent these "book/tax" differences are permanent in nature (e.g., net operating loss and distribution reclassification), such amounts are reclassified within the components of net assets based on their federal tax-basis treatment; temporary differences (e.g., wash sales) do not require reclassification. To the extent dividends and distributions exceed net investment income and net realized gains for tax purposes, they are reported as distributions of capital. Net investment losses incurred by the Funds may be reclassified as an offset to capital on the accompanying Statements of Assets and Liabilities.
As of October 31, 2021, on the Statements of Assets and Liabilities, as a result of permanent book-to-tax differences, reclassification adjustments were as follows (amounts in thousands):
| | Total
Accumulated
Earnings/(Loss) | | Capital | |
Sycamore Established Value Fund | | $ | (119,741 | ) | | $ | 119,741 | | |
Sycamore Small Company Opportunity Fund | | | (93,675 | ) | | | 93,675 | | |
The tax character of distributions paid during the tax years ended as noted below, were as follows (total distributions paid may differ from the Statements of Changes in Net Assets because, for tax purposes, dividends are recognized when actually paid) (amounts in thousands).
| | Year Ended October 31, 2021 | | Year Ended October 31, 2020 | |
| | Distributions Paid From: | | | | Distributions Paid From: | | | |
| | Ordinary
Income | | Net
Long-Term
Capital Gains | | Total
Distributions
Paid | | Ordinary
Income | | Net
Long-Term
Capital Gains | | Total
Distributions
Paid | |
Sycamore Established
Value Fund | | $ | 248,269 | | | $ | 433,348 | | | $ | 681,617 | | | $ | 206,073 | | | $ | 517,611 | | | $ | 723,684 | | |
Sycamore Small Company
Opportunity Fund | | | 32,840 | | | | 22,393 | | | | 55,233 | | | | 73,792 | | | | 224,771 | | | | 298,563 | | |
37
Victory Portfolios | | Notes to Financial Statements — continued
October 31, 2021 | |
As of October 31, 2021, the components of accumulated earnings/(loss) on a tax basis were as follows (amounts in thousands):
| | Undistributed
Ordinary
Income | | Undistributed
Long-Term
Capital Gains | | Other
Earnings
(Deficit) | | Accumulated
Earnings | | Unrealized
Appreciation
(Depreciation)* | | Total
Accumulated
Earnings
(Loss) | |
Sycamore Established
Value Fund | | $ | 255,037 | | | $ | 859,845 | | | $ | (9 | ) | | $ | 1,114,873 | | | $ | 4,284,880 | | | $ | 5,399,753 | | |
Sycamore Small Company
Opportunity Fund | | | 149,603 | | | | 662,345 | | | | (9 | ) | | | 811,939 | | | | 1,581,049 | | | | 2,392,988 | | |
* The difference between the book-basis and tax-basis unrealized appreciation (depreciation) is attributable primarily to tax deferral of losses on wash sales.
As of the tax year ended October 31, 2021, the Funds had no capital loss carryforwards, for the federal income tax purposes.
As of October 31, 2021, the cost basis for federal income tax purposes, gross unrealized appreciation, gross unrealized depreciation, and net unrealized appreciation (depreciation) for investments were as follows (amounts in thousands):
| | Cost of
Investments
for Federal
Tax Purposes | | Net
Gross
Unrealized
Appreciation | | Gross
Unrealized
Depreciation | | Net
Unrealized
Appreciation
(Depreciation) | |
Sycamore Established Value Fund | | $ | 12,001,588 | | | $ | 4,417,741 | | | $ | (132,861 | ) | | $ | 4,284,880 | | |
Sycamore Small Company
Opportunity Fund | | | 5,478,757 | | | | 1,725,653 | | | | (144,604 | ) | | | 1,581,049 | | |
8. Affiliated Securities:
An affiliated security is a security in which a Fund has ownership of at least 5% of the security's outstanding voting shares, an investment company managed by VCM, or an issuer under common control with a Fund or VCM as of the year ended October 31, 2021. The Funds do not invest in affiliated securities for the purpose of exercising management or control. These securities are noted as affiliated on a Fund's Schedule of Portfolio Investments. Transactions in affiliated securities during the year ended October 31, 2021 were as follows (amounts in thousands):
| | | Fair
Value
10/31/2020 | | Purchases
at Cost | | Proceeds
from
Sales | | Realized
Gains
(Losses) | | Capital
Gain
Distribution | | Net
Change in
Unrealized
Appreciation/
Depreciation | | Fair
Value
10/31/2021 | | Dividend
Income | |
Sycamore Small Company
Opportunity Fund | |
AMERISAFE, Inc. | | $ | 49,538 | | | $ | 10,432 | | | $ | (482 | ) | | $ | 45 | | | $ | — | | | $ | 646 | | | $ | 60,179 | | | $ | 4,020 | | |
Astec Industries, Inc. | | | 37,744 | | | | 28,674 | | | | (620 | ) | | | 307 | | | | — | | | | (2,049 | ) | | | 64,056 | | | | 393 | | |
Citi Trends, Inc. | | | — | | | | 26,838 | | | | (390 | ) | | | 228 | | | | — | | | | 13,203 | | | | 39,879 | | | | — | | |
Hanger, Inc. | | | 39,179 | | | | 12,428 | | | | (4,353 | ) | | | 590 | | | | — | | | | 257 | | | | 48,101 | | | | — | | |
Helix Energy Solutions
Group, Inc. | | | 14,980 | | | | 13,527 | | | | (405 | ) | | | (126 | ) | | | — | | | | 2,755 | | | | 30,731 | | | | — | | |
Marten Transport Ltd. | | | 46,131 | | | | 20,389 | | | | (584 | ) | | | 179 | | | | — | | | | 3,232 | | | | 69,347 | | | | 4,186 | | |
NETGEAR, Inc. | | | 54,958 | | | | 25,150 | | | | (20,979 | ) | | | 3,336 | | | | — | | | | (5,526 | ) | | | 56,939 | | | | — | | |
ScanSource, Inc. | | | 24,596 | | | | 10,972 | | | | (357 | ) | | | 27 | | | | — | | | | 22,010 | | | | 57,248 | | | | — | | |
Viad Corp. | | | 20,071 | | | | 15,835 | | | | (570 | ) | | | 398 | | | | — | | | | 25,682 | | | | 61,416 | | | | — | | |
| | | $ | 287,197 | | | $ | 164,245 | | | $ | (28,740 | ) | | $ | 4,984 | | | $ | — | | | $ | 60,210 | | | $ | 487,896 | | | $ | 8,599 | | |
38
REPORT OF INDEPENDENT REGISTERED PUBLIC ACCOUNTING FIRM
To the Shareholders and Board of Trustees of Board of Victory Portfolios
Opinion on the Financial Statements
We have audited the accompanying statements of assets and liabilities, including the schedules of portfolio investments, of Victory Sycamore Established Value Fund and Victory Sycamore Small Company Opportunity Fund (the "Funds"), each a series of Victory Portfolios, as of October 31, 2021, the related statements of operations for the year then ended, the statements of changes in net assets for each of the two years in the period then ended, the related notes, and the financial highlights for each of the three years in the period then ended (collectively referred to as the "financial statements"). In our opinion, the financial statements present fairly, in all material respects, the financial position of each of the Funds as of October 31, 2021, the results of their operations for the year then ended, the changes in their net assets for each of the two years in the period then ended, and the financial highlights for each of the three years in the period then ended, in conformity with accounting principles generally accepted in the United States of America.
The Funds' financial highlights for the years ended October 31, 2018 and prior, were audited by other auditors whose report dated December 21, 2018, expressed an unqualified opinion on those financial highlights.
Basis for Opinion
These financial statements are the responsibility of the Funds' management. Our responsibility is to express an opinion on the Funds' financial statements based on our audits. We are a public accounting firm registered with the Public Company Accounting Oversight Board (United States) ("PCAOB") and are required to be independent with respect to the Funds in accordance with the U.S. federal securities laws and the applicable rules and regulations of the Securities and Exchange Commission and the PCAOB.
We conducted our audits in accordance with the standards of the PCAOB. Those standards require that we plan and perform the audit to obtain reasonable assurance about whether the financial statements are free of material misstatement whether due to error or fraud.
Our audits included performing procedures to assess the risks of material misstatement of the financial statements, whether due to error or fraud, and performing procedures that respond to those risks. Such procedures included examining, on a test basis, evidence regarding the amounts and disclosures in the financial statements. Our procedures included confirmation of securities owned as of October 31, 2021, by correspondence with the custodian and brokers, when replies were not received from brokers, we performed other auditing procedures. Our audits also included evaluating the accounting principles used and significant estimates made by management, as well as evaluating the overall presentation of the financial statements. We believe that our audits provide a reasonable basis for our opinion.
We have served as the auditor of one or more investment companies advised by Victory Capital Management, Inc. since 2015.

COHEN & COMPANY, LTD.
Cleveland, Ohio
December 23, 2021
39
Victory Portfolios | | Supplemental Information
October 31, 2021 | |
(Unaudited)
Trustee and Officer Information
Board of Trustees:
Overall responsibility for management of the Trust rests with the Board. The Trust is managed by the Board in accordance with the laws of the State of Delaware. There are currently nine Trustees, eight of whom are not "interested persons" of the Trust within the meaning of that term under the 1940 Act ("Independent Trustees") and one of whom is an "interested person" of the Trust within the meaning of that term under the 1940 Act ("Interested Trustee"). The Trustees, in turn, elect the officers of the Trust to actively supervise its day-to-day operations.
The following tables list the Trustees, their date of birth, position with the Trust, commencement of service, principal occupations during the past five years and any directorships of other investment companies or companies whose securities are registered under the Securities Exchange Act of 1934, as amended, or who file reports under that Act. Each Trustee oversees 41 portfolios in the Trust, eight portfolios in Victory Variable Insurance Funds, and 25 portfolios in Victory Portfolios II, each a registered investment company that, together with the Trust, comprise the Victory Fund Complex. David C. Brown is a Trustee of USAA Mutual Funds and oversees 46 portfolios of the USAA Mutual Funds Trust. Each Trustee's address is c/o Victory Portfolios, 4900 Tiedeman Road, 4th Floor, Brooklyn, Ohio 44144. Each Trustee has an indefinite term.
Name and Date of Birth | | Position
Held with
the Trust | | Date
Commenced
Service | | Principal Occupation
During Past 5 Years | | Other
Directorships
Held During
Past 5 Years | |
Independent Trustees. | |
David Brooks Adcock,
Born October 1951 | | Trustee | | May 2005 | | Consultant (since 2006). | | Chair and Trustee, Turner Funds (December 2016-December 2017). | |
Nigel D. T. Andrews,
Born April 1947 | | Trustee | | August 2002 | | Retired. | | Director, TCG BDC II, Inc. (since 2017); Director, TCG BDC I, Inc. (formerly Carlyle GMS Finance, Inc.) (since 2012); Trustee, Carlyle Secured Lending III (since 2021). | |
E. Lee Beard,*
Born August 1951 | | Trustee | | May 2005 | | Retired (since 2015) | | None. | |
Dennis M. Bushe,
Born January 1944 | | Trustee | | July 2016 | | Retired. | | None. | |
40
Victory Portfolios | | Supplemental Information — continued
October 31, 2021 | |
(Unaudited)
Name and Date of Birth | | Position
Held with
the Trust | | Date
Commenced
Service | | Principal Occupation
During Past 5 Years | | Other
Directorships
Held During
Past 5 Years | |
John L. Kelly,
Born April 1953 | | Vice Chair and Trustee | | February 2015 | | Partner, McCarvill Capital Partners (September 2016- September 2017). | | Director, Caledonia Mining Corporation (since May 2012). | |
David L. Meyer,*
Born April 1957 | | Trustee | | December 2008 | | Retired. | | None. | |
Gloria S. Nelund,
Born May 1961 | | Trustee | | July 2016 | | Chair, CEO and Co-Founder of TriLinc Global, LLC, an investment firm. | | TriLinc Global Impact Fund, LLC (since 2012). | |
Leigh A. Wilson,
Born December 1944 | | Chair and Trustee | | November 1994 | | Private Investor. | | Chair (since 2013), Caledonia Mining Corporation. | |
Interested Trustee. | |
David C. Brown,**
Born May 1972 | | Trustee | | May 2008 | | Chairman and Chief Executive Officer (since 2013), the Adviser; Chairman and Chief Executive Officer (since 2013), Victory Capital Holdings, Inc.; Chairman and Chief Executive Officer (since 2019), Victory Capital Transfer Agency, Inc. | | Trustee, USAA Mutual Funds Trust; Board Member, Victory Capital Services, Inc. | |
* The Board has designated Ms. Beard and Mr. Meyer as its Audit Committee Financial Experts.
** Mr. Brown is an "Interested Person" by reason of his relationship with the Adviser.
The Statement of Additional Information includes additional information about the Trustees of the Trust and is available, without charge, by calling 800-539-3863.
41
Victory Portfolios | | Supplemental Information — continued
October 31, 2021 | |
(Unaudited)
Officers:
The officers of the Trust, their date of birth, commencement of service and their principal occupations during the past five years, are detailed in the following table. Each officer serves until the earlier of his or her resignation, removal, retirement, death, or the election of a successor. The mailing address of each officer of the Trust is 4900 Tiedeman Road, 4th Floor, Brooklyn, Ohio 44144. The officers of the Trust receive no compensation directly from the Trust for performing the duties of their offices.
Name and Date of Birth | | Position with
the Trust | | Date
Commenced
Service | | Principal Occupation During Past 5 Years | |
Christopher K. Dyer,
Born February 1962 | | President | | February 2006* | | Director of Mutual Fund Administration, the Adviser; Chief Operating Officer, Victory Capital Services, Inc. (since 2020); Vice President, Victory Capital Transfer Agency, Inc. (since 2019). | |
Scott A. Stahorsky,
Born July 1969 | | Vice President | | December 2014 | | Manager, Fund Administration, the Adviser. | |
Erin G. Wagner,
Born February 1974 | | Secretary | | December 2014 | | Associate General Counsel, the Adviser (since 2013). | |
Allan Shaer,
Born March 1965 | | Treasurer | | May 2017 | | Senior Vice President, Financial Administration, Citi Fund Services Ohio, Inc. (since 2016); Vice President, Mutual Fund Administration, JP Morgan Chase (2011-2016). | |
Christopher A. Ponte,
Born March 1984 | | Assistant Treasurer | | December 2017 | | Manager, Fund Administration, the Adviser (since 2017); Senior Analyst, Fund Administration, the Adviser (prior to 2017); Chief Financial Officer, Victory Capital Services, Inc. (since 2018). | |
Colin Kinney,
Born October 1973 | | Chief Compliance Officer | | July 2017 | | Chief Compliance Officer (since 2013) and Chief Risk Officer (2009-2017), the Adviser. | |
Sean Fox,
Born September 1976 | | Deputy Chief Compliance Officer | | July 2021 | | Sr. Compliance Officer, the Adviser (2019-2021); Compliance Officer, the Adviser (2015-2019). | |
Chuck Booth,
Born April 1960 | | Anti-Money Laundering Compliance Officer and Identity Theft Officer | | May 2015 | | Director, Regulatory Administration and CCO Support Services, Citi Fund Services Ohio, Inc. | |
Jay G. Baris,
Born January 1954 | | Assistant Secretary | | December 1997 | | Partner, Sidley Austin LLP (since April 2020); Partner, Shearman & Sterling LLP (January 2018-April 2020); Partner, Morrison & Foerster LLP (2011-January 2018). | |
* On December 3, 2014, Mr. Dyer resigned as Secretary of the Trust and accepted the position of President.
42
Victory Portfolios | | Supplemental Information — continued
October 31, 2021 | |
(Unaudited)
Proxy Voting and Portfolio Holdings Information
Proxy Voting:
Information regarding the policies and procedures each Fund uses to determine how to vote proxies relating to portfolio securities is available without charge, upon request, by calling 800-539-3863. The information is also included in the Funds' Statement of Additional Information, which is available on the SEC's website at www.sec.gov.
Information relating to how the Funds voted proxies relating to portfolio securities held during the most recent 12 months ended June 30 is available on the SEC's website at www.sec.gov.
Availability of Schedules of Portfolio Investments:
The Trust files a complete list of Schedules of Portfolio Investments with the SEC for the first and third quarter of each fiscal year on Form N-PORT. Forms N-PORT are available on the SEC's website at www.sec.gov.
Expense Examples
As a shareholder of the Funds, you may incur two types of costs: (1) transaction costs, including sales charges (loads) on purchases; and (2) ongoing costs, including management fees, distribution and service (12b-1) fees and other Fund expenses. These examples are intended to help you understand your ongoing costs (in dollars) of investing in the Funds and to compare these costs with the ongoing costs of investing in other mutual funds.
These examples are based on an investment of $1,000 invested at the beginning of the period and held for the entire period from May 1, 2021, through October 31, 2021.
The Actual Expense figures in the table below provide information about actual account values and actual expenses. You may use the information below, together with the amount you invested, to estimate the expenses that you paid over the period. Simply divide your account value by $1,000 (for example, an $8,600 account value divided by $1,000 = 8.6), then multiply the result by the number in the table under the heading entitled "Actual Expenses Paid During Period" to estimate the expenses you paid on your account during this period.
The Hypothetical Expense figures in the table below provide information about hypothetical account values and hypothetical expenses based on each Fund's actual expense ratio and an assumed rate of return of 5% per year before expenses, which is not the Fund's actual return. The hypothetical account values and expenses may not be used to estimate the actual ending account balance or expenses you paid for the period. You may use this information to compare this 5% hypothetical example with the 5% hypothetical examples that appear in shareholder reports of other funds.
Please note the expenses shown in the table below are meant to highlight your ongoing costs only and do not reflect any transactional costs. Therefore, the hypothetical expenses in the table are useful in comparing ongoing costs only and will not help you determine the relative total costs of owning different funds. In addition, if these transactional costs were included, your costs would have been higher.
| | | Beginning
Account
Value
5/1/21 | | Actual
Ending
Account
Value
10/31/21 | | Hypothetical
Ending
Account
Value
10/31/21 | | Actual
Expenses
Paid
During
Period
5/1/21-
10/31/21* | | Hypothetical
Expenses
Paid
During
Period
5/1/21-
10/31/21* | | Annualized
Expense
Ratio
During
Period
5/1/21-
10/31/21 | |
Sycamore Established Value Fund | |
Class A | | $ | 1,000.00 | | | $ | 1,035.50 | | | $ | 1,020.67 | | | $ | 4.62 | | | $ | 4.58 | | | | 0.90 | % | |
Class C | | | 1,000.00 | | | | 1,031.70 | | | | 1,016.89 | | | | 8.45 | | | | 8.39 | | | | 1.65 | % | |
Class I | | | 1,000.00 | | | | 1,037.40 | | | | 1,022.28 | | | | 2.98 | | | | 2.96 | | | | 0.58 | % | |
Class R | | | 1,000.00 | | | | 1,034.60 | | | | 1,019.56 | | | | 5.74 | | | | 5.70 | | | | 1.12 | % | |
Class R6 | | | 1,000.00 | | | | 1,037.40 | | | | 1,022.48 | | | | 2.77 | | | | 2.75 | | | | 0.54 | % | |
Class Y | | | 1,000.00 | | | | 1,037.10 | | | | 1,022.13 | | | | 3.13 | | | | 3.11 | | | | 0.61 | % | |
43
Victory Portfolios | | Supplemental Information — continued
October 31, 2021 | |
(Unaudited)
| | | Beginning
Account
Value
5/1/21 | | Actual
Ending
Account
Value
10/31/21 | | Hypothetical
Ending
Account
Value
10/31/21 | | Actual
Expenses
Paid
During
Period
5/1/21-
10/31/21* | | Hypothetical
Expenses
Paid
During
Period
5/1/21-
10/31/21* | | Annualized
Expense
Ratio
During
Period
5/1/21-
10/31/21 | |
Sycamore Small Company Opportunity Fund | |
Class A | | $ | 1,000.00 | | | $ | 1,007.80 | | | $ | 1,018.90 | | | $ | 6.33 | | | $ | 6.36 | | | | 1.25 | % | |
Class I | | | 1,000.00 | | | | 1,009.90 | | | | 1,020.77 | | | | 4.46 | | | | 4.48 | | | | 0.88 | % | |
Class R | | | 1,000.00 | | | | 1,007.10 | | | | 1,018.05 | | | | 7.18 | | | | 7.22 | | | | 1.42 | % | |
Class R6 | | | 1,000.00 | | | | 1,010.10 | | | | 1,020.87 | | | | 4.36 | | | | 4.38 | | | | 0.86 | % | |
Class Y | | | 1,000.00 | | | | 1,009.80 | | | | 1,020.62 | | | | 4.61 | | | | 4.63 | | | | 0.91 | % | |
* Expenses are equal to the average account value multiplied by the Fund's annualized expense ratio multiplied by 184/365 (the number of days in the most recent fiscal half-year divided by the number of days in the fiscal year).
44
Victory Portfolios | | Supplemental Information — continued
October 31, 2021 | |
(Unaudited)
Additional Federal Income Tax Information
For the year ended October 31, 2021, the following Funds paid qualified dividend income for the purposes of reduced individual federal income tax rates of:
| | | Percent | |
Sycamore Established Value Fund | | | 68 | % | |
Sycamore Small Company Opportunity Fund | | | 75 | % | |
Dividends qualified for corporate dividends received deductions of:
| | | Percent | |
Sycamore Established Value Fund | | | 67 | % | |
Sycamore Small Company Opportunity Fund | | | 75 | % | |
For the year ended October 31, 2021, the following Funds designated short-term capital gain distributions (in thousands):
| | | Amount | |
Sycamore Established Value Fund | | $ | 86,476 | | |
Sycamore Small Company Opportunity Fund | | | 11,539 | | |
For the year ended October 31, 2021, the following Funds designated long-term capital gain distributions (in thousands):
| | | Amount | |
Sycamore Established Value Fund | | $ | 536,970 | | |
| Sycamore Small Company Opportunity Fund | | | 79,328 | | |
45
Privacy Policy
Protecting the Privacy of Information
The Trust respects your right to privacy. We also know that you expect us to conduct and process your business in an accurate and efficient manner. To do so, we must collect and maintain certain personal information about you. This is the information we collect from you on applications or other forms, and from the transactions you make with us or third parties. It may include your name, address, social security number, account transactions and balances, and information about investment goals and risk tolerance.
We do not disclose any information about you or about former customers to anyone except as permitted or required by law. Specifically, we may disclose the information we collect to companies that perform services on our behalf, such as the transfer agent that processes shareholder accounts and printers and mailers that assist us in the distribution of investor materials. We may also disclose this information to companies that perform marketing services on our behalf. This allows us to continue to offer you Victory investment products and services that meet your investing needs, and to effect transactions that you request or authorize. These companies will use this information only in connection with the services for which we hired them. They are not permitted to use or share this information for any other purpose.
To protect your personal information internally, we permit access only by authorized employees and maintain physical, electronic, and procedural safeguards to guard your personal information.*
* You may have received communications regarding information about privacy policies from other financial institutions which gave you the opportunity to "opt-out" of certain information sharing with companies which are not affiliated with that financial institution. The Trust does not share information with other companies for purposes of marketing solicitations for products other than the Trust. Therefore, the Trust does not provide opt-out options to their shareholders.
Victory Funds
P.O. Box 182593
Columbus, Ohio 43218-2593

Visit our website at: | | Call Victory at: | |
www.vcm.com | | 800-539-FUND (800-539-3863) | |
Item 2. Code of Ethics.
(a) The registrant has adopted a code of ethics that applies to the registrant’s principal executive officer, principal financial officer, principal accounting officer or controller, or persons performing similar functions. This code of ethics in included as an Exhibit.
(b) During the period covered by the report, with respect to the registrant’s code of ethics that applies to its principal executive officer, principal financial officer, principal accounting officer or controller, or persons performing similar functions; there have been no amendments to, nor any waivers granted from, a provision that relates to any element of the code of ethics definition enumerated in paragraph (b) of this Item 2.
Item 3. Audit Committee Financial Expert.
(a)(1) The registrant’s board of directors has determined that the registrant has at least one audit committee financial expert serving on its audit committee.
(a)(2) The audit committee financial experts are David L. Meyer and E. Lee Beard, who are “independent” for purposes of this Item 3 of Form N-CSR.
Item 4. Principal Accountant Fees and Services.
| | | 2021 | | | 2020 | |
| (a) Audit Fees (1) | | $ | 110,500 | | | $ | 96,000 | |
| (b) Audit-Related Fees (2) | | | 0 | | | | 0 | |
| (c) Tax Fees (3) | | | 31,750 | | | | 28,500 | |
| (d) All Other Fees (4) | | | 0 | | | | 818 | |
(1) Audit fees include amounts related to the audit of the Registrant’s annual financial statements and services normally provided by the accountant in connection with statutory and regulatory filings. Audit fees billed were for professional services provided by Cohen Fund Audit Services, Ltd for audit compliance, audit advice and audit planning.
(2) Represents the fee for assurance and related services by Cohen Fund Audit Services, Ltd reasonably related to the performance of the audit of the Registrant’s financial statements that was not reported under (a) of this item.
(3) Represents the aggregate tax fee billed for professional services rendered by Cohen Fund Audit Services, Ltd for tax compliance, tax advice, international tax fee transactions and tax planning. Such tax services included the review of income and excise tax returns for the Registrant.
(4) For the fiscal year ended October 31, 2021, there were no fees billed for professional services rendered by Cohen Fund Audit Services, Ltd to the Registrant, other than the services reported in (a) through (c) of this item. For the fiscal year ended October 31, 2020, Cohen & Company, Ltd. billed fees for consent related to Member Class Registration Statements as of June 1, 2020.
Tax fees for 2020 and 2021 are for recurring tax fees for the preparation of the federal and state tax returns and procedures performed relating to the Registrant’s analysis of complex securities.
(e)(1) The Registrant’s Audit Committee must pre-approve non-audit services to be provided by the principal accountant and the fees charged with these services. The Committee may delegate authority to one or more Committee members to pre-approve these services, subject to subsequent review and approval by the Committee.
(e)(2) There were no services performed under Rule 2.01 (c)(7)(i)(C).
(f) Not applicable.
(g)
(h) The Registrant’s Audit Committee has evaluated the non-audit services that the principal accountant provided to the Registrant’s investment adviser (and the adviser’s relevant affiliated), which services the Committee did not pre-approve, and has concluded that the provision of those services was compatible with maintaining the accountant’s independence.
Item 5. Audit Committee of Listed Registrants.
Not applicable.
Item 6. Investments.
(a) Not applicable.
(b) Not applicable.
Item 7. Disclosure of Proxy Voting Policies and Procedures for Closed-End Management Investment Companies.
Not applicable.
Item 8. Portfolio Managers of Closed-End Management Investment Companies.
Not applicable.
Item 9. Purchases of Equity Securities by Closed-End Management Investment Company and Affiliated Purchasers.
Not applicable.
Item 10. Submission of Matters to a Vote of Security Holders.
Not applicable.
Item 11. Controls and Procedures.
(a) The registrant’s principal executive officer and principal financial officer have concluded, based on their evaluation of the registrant's disclosure controls and procedures as conducted within 90 days of the filing date of this report, that these disclosure controls and procedures are adequately designed and are operating effectively to ensure that information required to be disclosed by the registrant on Form N-CSR is recorded, processed, summarized and reported within the time periods specified in the Securities and Exchange Commission's rules and forms.
(b) There were no changes in the registrant’s internal control over financial reporting (as defined in Rule 30a-3(d) under the Investment Company Act of 1940 (17 CFR 270.30a-3(d)) that occurred during the period covered by this report that have materially affected or are reasonably likely to materially affect, the registrant’s internal control over financial reporting.
Item 12. Disclosure of Securities Lending Activities for Closed-End Management Investment Companies.
(a)(1) Not applicable.
(a)(2) Not applicable.
(a)(3) Not applicable.
(a)(4) Not applicable.
(b) Not applicable.
Item 13. Exhibits.
(a)(1) The code of ethics that is the subject of the disclosure required by Item 2 is attached hereto.
(a)(2) Certifications pursuant to Rule 30a-2(a) are attached hereto.
(a)(3) Not applicable.
(b) Certifications pursuant to Rule 30a-2(b) are furnished herewith.
SIGNATURES
Pursuant to the requirements of the Securities Exchange Act of 1934 and the Investment Company Act of 1940, the registrant has duly caused this report to be signed on its behalf by the undersigned, thereunto duly authorized.
| (Registrant) | Victory Portfolios | |
| By (Signature and Title)* | /s/ Allan Shaer | | |
| | Allan Shaer, Principal Financial Officer | |
Pursuant to the requirements of the Securities Exchange Act of 1934 and the Investment Company Act of 1940, this report has been signed below by the following persons on behalf of the registrant and in the capacities and on the dates indicated.
| By (Signature and Title)* | /s/ Christopher K. Dyer | |
| | Christopher K. Dyer, Principal Executive Officer | |
| By (Signature and Title)* | /s/ Allan Shaer | |
| | Allan Shaer, Principal Financial Officer | |