UNITED STATES
SECURITIES AND EXCHANGE COMMISSION
Washington, D.C. 20549
FORM N-CSR
CERTIFIED SHAREHOLDER REPORT OF REGISTERED
MANAGEMENT INVESTMENT COMPANIES
Investment Company Act file number: 811-04852
Victory Portfolios
(Exact name of registrant as specified in charter)
4900 Tiedeman Road, 4th Floor, Brooklyn, Ohio 44144
(Address of principal executive offices) (Zip code)
Citi Fund Services Ohio, Inc., 4400 Easton Commons, Suite 200, Columbus, Ohio 43219
(Name and address of agent for service)
Registrant’s telephone number, including area code: 800-539-3863
Date of fiscal year end: December 31
Date of reporting period: December 31, 2021
Item 1. Reports to Stockholders.

December 31, 2021
Annual Report
Victory INCORE Investment Quality Bond Fund
Victory INCORE Low Duration Bond Fund
Victory High Yield Fund
Victory Tax-Exempt Fund
Victory High Income Municipal Bond Fund
Victory Floating Rate Fund
Victory Strategic Income Fund
www.vcm.com
News, Information And Education 24 Hours A Day, 7 Days A Week
The Victory Capital website gives fund shareholders, prospective shareholders, and investment professionals a convenient way to access fund information, get guidance, and track fund performance anywhere they can access the Internet. The site includes:
• Detailed performance records
• Daily share prices
• The latest fund news
• Investment resources to help you become a better investor
• A section dedicated to investment professionals
Whether you're a potential investor searching for the fund that matches your investment philosophy, a seasoned investor interested in planning tools, or an investment professional, www.vcm.com has what you seek. Visit us anytime. We're always open.
TABLE OF CONTENTS
Shareholder Letter (Unaudited) | | | 3 | | |
Managers' Commentary / Investment Overview
(Unaudited) | | | 5 | | |
Investment Objectives and Portfolio
Holdings (Unaudited) | | | 22 | | |
Schedules of Portfolio Investments | |
Victory INCORE Investment Quality Bond Fund | | | 29 | | |
Victory INCORE Low Duration Bond Fund | | | 39 | | |
Victory High Yield Fund | | | 47 | | |
Victory Tax-Exempt Fund | | | 54 | | |
Victory High Income Municipal Bond Fund | | | 58 | | |
Victory Floating Rate Fund | | | 63 | | |
Strategic Income Fund | | | 73 | | |
Financial Statements | |
Statements of Assets and Liabilities | | | 80 | | |
Statements of Operations | | | 83 | | |
Statements of Changes in Net Assets | | | 86 | | |
Financial Highlights | | | 94 | | |
Notes to Financial Statements | | | 108 | | |
Report of Independent Registered Public
Accounting Firm | | | 126 | | |
Supplemental Information (Unaudited) | | | 127 | | |
Trustee and Officer Information | | | 127 | | |
Proxy Voting and Portfolio Holdings Information | | | 130 | | |
Expense Examples | | | 130 | | |
Additional Federal Income Tax Information | | | 132 | | |
Advisory Contract Approval | | | 133 | | |
Privacy Policy (inside back cover) | | | |
1
IRA DISTRIBUTION WITHHOLDING DISCLOSURE
We generally must withhold federal income tax at a rate of 10% of the taxable portion of your distribution and, if you live in a state that requires state income tax withholding, at your state's tax rate. However, you may elect not to have withholding apply or to have income tax withheld at a higher rate. Any withholding election that you make will apply to any subsequent distribution unless and until you change or revoke the election. If you wish to make a withholding election, or change or revoke a prior withholding election, call 800-539-3863 (800-235-8396 for Member Class) and form W-4P (OMB No. 1545-0074 withholding certificate for pension or annuity payments) will be electronically sent.
If you do not have a withholding election in place by the date of a distribution, federal income tax will be withheld from the taxable portion of your distribution at a rate of 10%. If you must pay estimated taxes, you may be subject to estimated tax penalties if your estimated tax payments are not sufficient and sufficient tax is not withheld from your distribution.
For more specific information, please consult your tax adviser.
The Funds are distributed by Victory Capital Services, Inc. Victory Capital Management Inc. is the investment adviser to the Funds and receives fees from the Funds for performing services for the Funds.
This report is not authorized for distribution to prospective investors unless preceded or accompanied by a current prospectus of the Victory Funds.
For additional information about any Victory Fund, including fees, expenses, and risks, view our prospectus online at vcm.com or call 800-539-3863 (800-235-8396 for Member Class). Read it carefully before you invest or send money.
The information in this report is based on data obtained from recognized services and sources and is believed to be reliable. Any opinions, projections, or recommendations in this report are subject to change without notice and are not intended as individual investment advice. Past investment performance of the Funds, markets or securities mentioned herein should not be considered to be indicative of future results.
• NOT FDIC INSURED • NO BANK GUARANTEE • MAY LOSE VALUE

Call Victory at:
800-539-FUND (800-539-3863)
800-235-8396 for Member Class
Visit our website at:
www.vcm.com
2
Victory Funds Letter to Shareholders
(Unaudited)
Dear Shareholder,
Another year has passed, but unfortunately the pandemic endures. Yet, looking back on the year ended 2021, it is evident that financial markets have endured as well, despite stiff headwinds — including new COVID-19 variants; disruption among global supply chains; uncomfortable inflation readings; and the fear of rising interest rates.
Through it all, the S&P 500® Index, the bell-weather proxy for our domestic stock market, once again registered a positive annual total return (that makes it 12 out of the past 13 years). This was largely driven by a U.S. economy that bounced back quickly after what was effectively a global economic shutdown in 2020, and we witnessed robust earnings growth across many sectors thanks in no small part to continued fiscal stimulus and accommodative monetary policy. Underlying this positive performance were interesting differences among investment styles and market capitalizations. For example, growth-oriented investments outperformed value within large-caps but underperformed within both mid-caps and small-caps (as measured by the Russell family of indices). Perhaps this reflects investors' expectations for higher interest rates next year?
There were other notable subplots to 2021. Early in the year we watched in disbelief as "meme stocks" — a few names that gained massive notoriety on social media platforms — went on stomach-churning roller coaster rides. Also, intriguing was how the biotech sector struggled mightily despite the success and fanfare surrounding the COVID-19 vaccines. Meanwhile, rising oil prices fueled impressive gains across the energy landscape, while crypto assets captivated investors. Now we're all watching how crypto's underlying blockchain technologies might disrupt business-as-usual across industries in the years ahead. These were just a few of the highlights of the past year.
Through all the twists and turns, the S&P 500® Index registered an impressive annual total return of nearly 29% for the 12-month period ended December 31, 2021. Over this same annual period, the yield on the 10-Year U.S. Treasury jumped 59 basis points (a basis point is 1/100th of a percentage point), reflecting substantial fiscal stimuli and the U.S. Federal Reserve's (the "Fed") accommodative monetary stance (recently). At the end of our reporting period, the yield on the 10-Year U.S. Treasury was trending higher and finished at 1.52%.
Despite the resiliency of financial markets, we fully acknowledge that the volatility and unusual events of recent years may have made investors uneasy at times. However, this simply underscores why it's important for investors to remain calm and unemotional in the face of market turmoil. A long-term perspective, a well-diversified portfolio across asset classes and investment types, and a clear understanding of individual risk tolerance are some of the key ingredients for staying the course and progressing on your investment goals.
Of course, no one knows for certain what 2022 will bring. We are already facing a potential end to the Fed's accommodative monetary policies and the various forms of fiscal stimuli that helped revive the economy from the depths of the pandemic-induced market downturn. By all accounts, the Fed appears ready to raise short-term
3
interest rates, perhaps as early as the end of the first quarter, though any move will certainly be data dependent, and some are expressing concerns about labor shortages, disrupted supply chains, rising commodity prices, and the potential for lasting inflation. There will likely be new headwinds, some yet to be identified.
Thus, we cannot tell you with any certainty what markets will do in the future, but we can assure you that the investment professionals at our investment franchises continually monitor the market environment and work hard to position portfolios opportunistically no matter what the markets bring.
On the following pages, you will find information relating to your Victory Funds investment, brought to you by Victory Capital. If you have any questions, we encourage you to contact your financial advisor. Or, if you invest with us directly, you may call 800-539-3863 (800-235-8396 for Member Class) or visit our website at www.vcm.com.
From all of us here at Victory Capital, thank you for your ongoing confidence and for letting us help you work toward your investment goals.

Christopher K. Dyer, CFA
President,
Victory Funds
4
Victory INCORE Investment Quality Bond Fund
Managers' Commentary
(Unaudited)
What were the market conditions during the reporting period?
The main themes for 2021 were the reopening of the economy and the debate over transitory versus persistent inflation. Inflation has proven much more persistent than the U.S. Federal Reserve had previously expected, and consumer and business behavior is changing in response. Supply chains are being on-shored or near-shored for reliability in a move away from "just-in-time." Labor scarcity is contributing to delays and pushing wages higher. Looking at the positives, corporate fundamentals have been improving and default rates are expected to remain low. Companies have shown resilience through the pandemic as profitability has expanded amidst rising costs. Revenue and earnings before interest, taxes, depreciation, and amortization (EBITDA) have quickly recovered above pre-COVID-19 levels, and leverage is trending lower from its peak in 2020. For the year, the Bloomberg U.S. Treasuries Index returned -2.32% while the Bloomberg US Aggregate Bond Index (the "Index") returned -1.54%, their first negative performance since the taper-tantrum of 2013, albeit, after two back-to-back years of solid, high-single-digit returns in fixed income. The ICE BofAML Investment Grade Convertible Bond Index returned 10.42% for the year, while U.S. equity indices continued to perform well, with total returns between 20% — 30% for the year.
How did Victory INCORE Investment Quality Bond Fund (the "Fund") perform during the reporting period?
The Fund returned -0.37% (Class A at net asset value) for the fiscal year ended December 31, 2021, outperforming the Index, which returned -1.54% during the reporting period.
What strategies did you employ during the reporting period?
The Fund started the fourth quarter of 2021 underweight U.S. Treasurys and mortgage-backed securities, with corresponding overweight allocations to investment-grade corporate bonds, high-yield corporate bonds, and investment-grade convertible bonds. We maintain a corporate credit overweight as corporate fundamentals have been improving and default rates are expected to remain low. The Fund's shorter relative duration position and overweight to investment-grade convertible bonds contributed positively, while an overweight to corporate bonds detracted. Allocations to credit, investment-grade convertible bonds, as well as a shorter-duration position relative to the Index contributed positively throughout the year. In addition, the Fund's employment of a derivatives strategy overlay to efficiently manage the overall portfolio risks associated with the Fund's strategy contributed positively to performance during the year.
5
Victory INCORE Investment Quality Bond Fund
Investment Overview
(Unaudited)
Average Annual Total Return
Year Ended December 31, 2021
| | | Class A | | Class C | | Class R | | Class Y | | | |
INCEPTION DATE | | 2/16/93 | | 8/7/00 | | 5/15/01 | | 5/12/09 | | | |
| | | Net Asset
Value | | Maximum
Offering
Price | | Net Asset
Value | | Contingent
Deferred
Charges | | Net Asset
Value | | Net Asset
Value | | Bloomberg
US
Aggregate
Bond Index1 | |
One Year | | | –0.37 | % | | | –2.64 | % | | | –1.23 | % | | | –2.21 | % | | | –0.77 | % | | | –0.22 | % | | | –1.54 | % | |
Five Year | | | 3.51 | % | | | 3.03 | % | | | 2.61 | % | | | 2.61 | % | | | 3.07 | % | | | 3.74 | % | | | 3.57 | % | |
Ten Year | | | 3.04 | % | | | 2.81 | % | | | 2.17 | % | | | 2.17 | % | | | 2.62 | % | | | 3.25 | % | | | 2.90 | % | |
The performance data quoted represents past performance and current returns may be lower or higher. The investment return and principal value will fluctuate so that an investor's shares, when redeemed, may be worth more or less than the original cost. To obtain performance information current to the most recent month's end, please visit www.vcm.com.
The maximum offering price ("MOP") figures reflect a maximum sales charge of 2.25% for Class A. Class C is not subject to an initial sales charge, but is subject to a deferred sales charge of 1.00% on shares redeemed within one year of purchase. Net Asset Value ("NAV") does not reflect sales charges.
Total return measures the price change in a share assuming the reinvestment of all net investment income and realized capital gain distributions, if any. The total returns quoted do not reflect adjustments made to the enclosed financial statements in accordance with U.S. Generally Accepted Accounting Principles or the deduction of taxes that a shareholder would pay on net investment income and realized capital gain distributions, including reinvested distributions, or redemptions of shares. The total return figures set forth above include all waivers of fees. Without such fee waivers, the total returns would have been lower.
Victory INCORE Investment Quality Bond Fund — Growth of $10,000
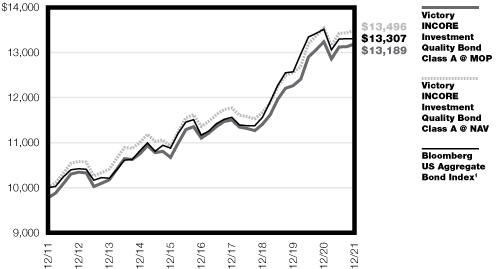
1The Bloomberg US Aggregate Bond Index covers the U.S. investment-grade-rated bond market, including government and credit securities, agency mortgage pass-through securities, asset-backed securities, and commercial mortgage-backed securities that have remaining maturities of more than one year. This index does not include the effect of sales charges, commissions, expenses, or taxes, is not representative of the Fund, and it is not possible to invest directly in an index. As of August 24, 2021, Bloomberg rebranded the Bloomberg Barclays fixed income indices as "Bloomberg Indices."
The graph reflects investment of growth of a hypothetical $10,000 investment in the Fund.
The graph and table do not reflect the deduction of taxes that a shareholder would pay on Fund distributions or the redemption of shares.
Past performance is not indicative of future results.
6
Victory INCORE Low Duration Bond Fund
Managers' Commentary
(Unaudited)
What were the market conditions during the reporting period?
The main themes for 2021 were the reopening of the economy and the debate over transitory versus persistent inflation. Inflation has proven much more persistent than the U.S. Federal Reserve had previously expected, and consumer and business behavior is changing in response. Supply chains are being on-shored or near-shored for reliability in a move away from "just-in-time." Labor scarcity is contributing to delays and pushing wages higher. Looking at the positives, corporate fundamentals have been improving and default rates are expected to remain low. Companies have shown resilience through the pandemic as profitability has expanded amidst rising costs. Revenue and earnings before interest, taxes, depreciation, and amortization (EBITDA) have quickly recovered above pre-COVID-19 levels, and leverage is trending lower from its peak in 2020. For the year, the Bloomberg U.S. Treasuries Index returned -2.32% while the Bloomberg US Aggregate Bond Index returned -1.54%, their first negative performance since the taper-tantrum of 2013, albeit, after two back-to-back years of solid, high-single-digit returns in fixed income. The ICE BofAML Investment Grade Convertible Bond Index returned 10.42% for the year, while U.S. equity indices continued to perform well, with total returns between 20% — 30% for the year.
How did Victory INCORE Low Duration Bond Fund (the "Fund") perform during the reporting period?
The Fund returned 0.71% (Class A at net asset value) for the fiscal year ended December 31, 2021, outperforming the Bloomberg U.S. 1-3 Year Government Bond Index (the "Index"), which returned -0.60% during the reporting period.
What strategies did you employ during the reporting period?
The Fund started the fourth quarter of 2021 underweight U.S. Treasurys and mortgage-backed securities, with corresponding overweight allocations to investment-grade corporate bonds, high-yield corporate bonds, and investment-grade convertible bonds. We maintained a corporate credit overweight as corporate fundamentals have been improving and default rates are expected to remain low. The Fund's shorter relative duration position and overweight to investment-grade convertible bonds contributed positively, while an overweight to corporate bonds detracted. Allocations to credit, investment-grade convertible bonds, as well as a shorter duration position relative to the Index contributed positively throughout the year. In addition, the Fund's employment of a derivatives strategy overlay to efficiently manage the overall portfolio risks associated with the Fund's strategy contributed positively to performance during the year.
7
Victory INCORE Low Duration Bond Fund
Investment Overview
(Unaudited)
Average Annual Total Return
Year Ended December 31, 2021
| | | Class A | | Class C | | Class R | | Class Y | | | |
INCEPTION DATE | | 7/30/03 | | 7/30/03 | | 7/30/03 | | 5/12/09 | | | |
| | | Net Asset
Value | | Maximum
Offering
Price | | Net Asset
Value | | Contingent
Deferred
Charges | | Net Asset
Value | | Net Asset
Value | | Bloomberg
U.S.
Government 1-3
Year Bond Index1 | |
One Year | | | 0.71 | % | | | –1.51 | % | | | –0.07 | % | | | –1.07 | % | | | 0.29 | % | | | 0.94 | % | | | –0.60 | % | |
Five Year | | | 2.04 | % | | | 1.58 | % | | | 1.28 | % | | | 1.28 | % | | | 1.64 | % | | | 2.28 | % | | | 1.62 | % | |
Ten Year | | | 1.62 | % | | | 1.39 | % | | | 0.85 | % | | | 0.85 | % | | | 1.21 | % | | | 1.86 | % | | | 1.10 | % | |
The performance data quoted represents past performance and current returns may be lower or higher. The investment return and principal value will fluctuate so that an investor's shares, when redeemed, may be worth more or less than the original cost. To obtain performance information current to the most recent month's end, please visit www.vcm.com.
The maximum offering price ("MOP") figures reflect a maximum sales charge of 2.25% for Class A. Class C is not subject to an initial sales charge, but is subject to a deferred sales charge of 1.00% on shares redeemed within one year of purchase. Net Asset Value ("NAV") does not reflect sales charges.
Total return measures the price change in a share assuming the reinvestment of all net investment income and realized capital gain distributions, if any. The total returns quoted do not reflect adjustments made to the enclosed financial statements in accordance with U.S. Generally Accepted Accounting Principles or the deduction of taxes that a shareholder would pay on net investment income and realized capital gain distributions, including reinvested distributions, or redemptions of shares. The total return figures set forth above include all waivers of fees. Without such fee waivers, the total returns would have been lower.
Victory INCORE Low Duration Bond Fund — Growth of $10,000
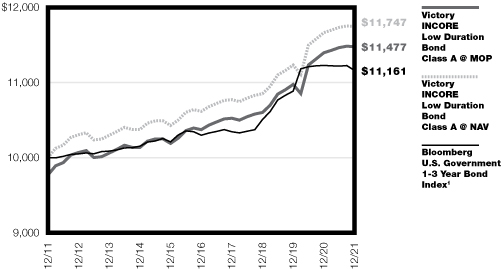
1The Bloomberg U.S. Government 1-3 Year Bond Index is generally considered to be representative of U.S. government bonds with maturities between one and three years. This index does not include the effect of sales charges, commissions, expenses or taxes, is not representative of the Fund, and it is not possible to invest directly in an index. As of August 24, 2021, Bloomberg rebranded the Bloomberg Barclays fixed income indices as "Bloomberg Indices."
The graph reflects investment of growth of a hypothetical $10,000 investment in the Fund.
The graph and table do not reflect the deduction of taxes that a shareholder would pay on Fund distributions or the redemption of shares.
Past performance is not indicative of future results.
8
Victory High Yield Fund
Managers' Commentary
(Unaudited)
What were the market conditions during the reporting period?
Riskier asset classes were rewarded in 2021, particularly stocks, with the S&P 500® Index returning a stunning 28.71% for the year. This was equally applicable in fixed income, with high-yield bonds and leveraged loans outperforming, as most major fixed income indexes posted negative returns for the year. The 10-year U.S. Treasury returned -3.6%.
Even as the U.S. Federal Reserve (the "Fed") began to shift its focus from stimulus to inflation control late in the year, it is hard to overstate the influence of its accommodation on the markets. This supportive monetary policy was combined with strong economic growth, rising corporate earnings, and falling unemployment rates to help markets counter the continued impact of COVID-19, labor shortages, political gridlock, and supply chain disruptions.
The year began on a hopeful note, with COVID-19 vaccines rolling out and economic growth far outpacing expectations. But growth was tempered by vaccine shortages early in the year, followed by COVID-19 variant spikes and surging inflation later in the year. The Fed continued to exert a steadying influence on securities markets, but political stalemate clouded the fate of economic recovery legislation.
Through it all, investors stayed tuned to clear messages from strong revenue growth, improving margins, and healthier balance sheets. Reduced debt levels, falling default rates, higher profits, and ratings upgrades were particularly beneficial in the high-yield and leveraged-loan markets, where fixed income investors flocked in search of higher yields and lower interest rate risk.
The default rate is typically the biggest driver of returns in the below-investment-grade sphere, and it ended the year under 0.5%, which is substantially below historical averages and below similar points in past economic recoveries.
How did Victory High Yield Bond Fund (the "Fund") perform during the reporting period?
The Fund returned 4.86% (Class A at net asset value) for the fiscal year ended December 31, 2021, underperforming the Bloomberg U.S. Corporate High Yield Bond Index (the "Index"), which returned 5.28%.
What strategies did you employ during the reporting period?
The Fund's management team takes a bottom-up approach to evaluating investments. We look for companies with strong free cash flow or situations in which our analysis finds less risk and more potential positive catalysts than the market is pricing in. We analyze each situation and layer it over our larger market views, favoring some sectors for their cyclical strength during the ongoing economic rebound and others because of more secular, long-term trends.
The Fund had exposure to some sectors that were particularly volatile at certain times during the year. Security selection in CCC-rated bonds and the Media and Entertainment sector detracted from performance relative to the Index during the year. The Fund's out-of-index exposure to leveraged loans and security selection in B-rated bonds contributed to relative performance.
9
Victory High Yield Fund (continued)
Managers' Commentary (continued)
As the name suggests, the interest rates on floating-rate loans can increase in tandem with rising rates in the market, which gives them potential to not only mitigate duration risk but also to benefit as market rates increase and the Fed tightens monetary policy.
Even as interest rates rise, potentially making some bonds less attractive and putting some heavily indebted companies at risk, we still believe there are attractive opportunities given the historically low default rate, improving credit fundamentals, and extraordinary amounts of cash on the sidelines. We believe our exposure to floating-rate loans was appropriate during 2021 and positions the portfolio to benefit over time.
10
Victory High Yield Fund
Investment Overview
(Unaudited)
Average Annual Total Return
Year Ended December 31, 2021
| | | Class A | | Class C | | Class R | | Class Y | | | |
INCEPTION DATE | | 9/1/98 | | 8/7/00 | | 5/15/01 | | 5/12/09 | | | |
| | | Net Asset
Value | | Maximum
Offering
Price | | Net Asset
Value | | Contingent
Deferred
Charges | | Net Asset
Value | | Net Asset
Value | | Bloomberg
US
Corporate High
Yield Index1 | |
One Year | | | 4.86 | % | | | 2.46 | % | | | 4.26 | % | | | 3.27 | % | | | 4.55 | % | | | 5.31 | % | | | 5.28 | % | |
Five Year | | | 7.41 | % | | | 6.90 | % | | | 6.68 | % | | | 6.68 | % | | | 7.06 | % | | | 7.70 | % | | | 6.30 | % | |
Ten Year | | | 6.68 | % | | | 6.43 | % | | | 5.94 | % | | | 5.94 | % | | | 6.30 | % | | | 6.95 | % | | | 6.83 | % | |
The performance data quoted represents past performance and current returns may be lower or higher. The investment return and principal value will fluctuate so that an investor's shares, when redeemed, may be worth more or less than the original cost. To obtain performance information current to the most recent month's end, please visit www.vcm.com.
The maximum offering price ("MOP") figures reflect a maximum sales charge of 2.25% for Class A. Class C is not subject to an initial sales charge, but is subject to a deferred sales charge of 1.00% on shares redeemed within one year of purchase. Net Asset Value ("NAV") does not reflect sales charges.
Total return measures the price change in a share assuming the reinvestment of all net investment income and realized capital gain distributions, if any. The total returns quoted do not reflect adjustments made to the enclosed financial statements in accordance with U.S. Generally Accepted Accounting Principles or the deduction of taxes that a shareholder would pay on net investment income and realized capital gain distributions, including reinvested distributions, or redemptions of shares. The total return figures set forth above include all waivers of fees. Without such fee waivers, the total returns would have been lower.
Victory High Yield Fund — Growth of $10,000
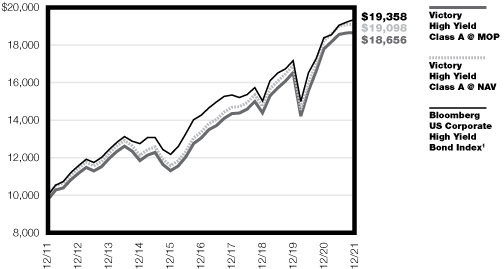
1The Bloomberg US Corporate High Yield Index is generally considered to be representative of the investable universe of the U.S.-dominated high-yield debt market. This index does not include the effect of sales charges, commissions, expenses or taxes, is not representative of the Fund, and it is not possible to invest directly in an index. As of August 24, 2021, Bloomberg rebranded the Bloomberg Barclays fixed income indices as "Bloomberg Indices."
The graph reflects investment of growth of a hypothetical $10,000 investment in the Fund.
The graph and table do not reflect the deduction of taxes that a shareholder would pay on Fund distributions or the redemption of shares.
Past performance is not indicative of future results.
11
Victory Tax-Exempt Fund
Managers' Commentary
(Unaudited)
What were the market conditions during the reporting period?
The municipal market faced several headwinds in 2021; however, it also benefited from several tailwinds that drove returns of 1.52% for the broad municipal market index (Bloomberg Municipal Bond Index (the "Index")) in 2021. While these returns trailed last year's, they were relatively better than most other U.S.-based fixed-income asset classes that had negative returns in 2021. Throughout 2021, the major headwinds faced by the municipal market were: rising U.S. Treasury yields (rising yields = falling bond prices), rising inflation, low municipal / U.S. Treasury ratios (i.e., relatively expensive municipal bonds), and low absolute yields. The predominant tailwinds that helped municipal bonds included: record setting fund flows into municipal bond mutual funds, improved pricing on lower-rated municipal bonds, significant stimulus for state and local governments, and an improvement in the average credit quality of the municipal market.
How did the Victory Tax-Exempt Fund (the "Fund") perform during the reporting period?
The Fund returned 3.94% (Class A at net asset value) for the fiscal year ended December 31, 2021, outperforming the Index, which returned 1.52% for the reporting period.
What strategies did you employ during the reporting period?
The Fund tends to be more credit-heavy than the Index, holding more BBB-category rated (the lowest category, highest risk level of investment grade) bonds than the Index. We overweight these credits to provide additional tax-free income to our investors. These bonds performed well in 2021, as demand for municipal bonds was strong, BBB bonds offered attractive yields, and the creditworthiness of BBB bonds strengthened throughout the year. This dynamic helped drive the Fund's relative outperformance in 2021. Lastly, the Fund reduced its weighting to its Top Ten issuers to increase the portfolio's diversification.
The largest detractors from relative performance were interest rates and our allocation to cash. The Fund's longer duration detracted from performance as interest rates increased in 2021. The Fund's allocation to cash detracted from performance as low interest rates on very short-term investments lagged the Index.
We remain committed to our core competency of evaluating, taking, and managing credit risk in the municipal market. We continue to build our portfolios bond-by-bond, relying on our assessment of fundamental credit risk and attempting to capture and distribute incremental yield that will drive higher long-term income to our investors. While there might be some volatility in the municipal market in the short term, we remain confident that the right approach is to focus on what matters in the long term.
12
Victory Tax-Exempt Fund
Investment Overview
(Unaudited)
Average Annual Total Return
Year Ended December 31, 2021
| | | Class A | | Class C | | Class Y | | | |
INCEPTION DATE | | 2/16/93 | | 8/7/00 | | 5/12/09 | | | |
| | | Net Asset
Value | | Maximum
Offering
Price | | Net Asset
Value | | Contingent
Deferred
Charges | | Net Asset
Value | | Bloomberg
Municipal
Bond Index1 | |
One Year | | | 3.94 | % | | | 1.59 | % | | | 3.13 | % | | | 2.15 | % | | | 4.06 | % | | | 1.52 | % | |
Five Year | | | 5.31 | % | | | 4.83 | % | | | 4.47 | % | | | 4.47 | % | | | 5.42 | % | | | 4.17 | % | |
Ten Year | | | 3.81 | % | | | 3.57 | % | | | 2.99 | % | | | 2.99 | % | | | 3.94 | % | | | 3.72 | % | |
The performance data quoted represents past performance and current returns may be lower or higher. The investment return and principal value will fluctuate so that an investor's shares, when redeemed, may be worth more or less than the original cost. To obtain performance information current to the most recent month's end, please visit www.vcm.com.
The maximum offering price ("MOP") figures reflect a maximum sales charge of 2.25% for Class A. Class C is not subject to an initial sales charge, but is subject to a deferred sales charge of 1.00% on shares redeemed within one year of purchase. Net Asset Value ("NAV") does not reflect sales charges.
Total return measures the price change in a share assuming the reinvestment of all net investment income and realized capital gain distributions, if any. The total returns quoted do not reflect adjustments made to the enclosed financial statements in accordance with U.S. Generally Accepted Accounting Principles or the deduction of taxes that a shareholder would pay on net investment income and realized capital gain distributions, including reinvested distributions, or redemptions of shares. The total return figures set forth above include all waivers of fees. Without such fee waivers, the total returns would have been lower.
Victory Tax-Exempt Fund — Growth of $10,000
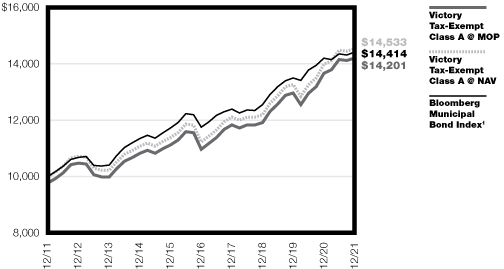
1The Bloomberg Municipal Bond Index is generally considered to be representative of the municipal bond market. This index does not include the effect of sales charges, commissions, expenses or taxes, is not representative of the Fund, and it is not possible to invest directly in an index. As of August 24, 2021, Bloomberg rebranded the Bloomberg Barclays fixed income indices as "Bloomberg Indices."
The graph reflects investment of growth of a hypothetical $10,000 investment in the Fund.
The graph and table do not reflect the deduction of taxes that a shareholder would pay on Fund distributions or the redemption of shares.
Past performance is not indicative of future results.
13
Victory High Income Municipal Bond Fund
Managers' Commentary
(Unaudited)
What were the market conditions during the reporting period?
The municipal market faced several headwinds in 2021; however, it also benefited from several tailwinds that drove returns of 1.52% for the broad municipal market index (Bloomberg Municipal Bond Index (the "Index") in 2021. While these returns trailed last year's, they were relatively better than most other U.S.-based fixed- income asset classes that had negative returns in 2021. Throughout 2021, the major headwinds faced by the municipal market were: rising U.S. Treasury yields (rising yields = falling bond prices), rising inflation, low municipal / U.S. Treasury ratios (i.e., relatively expensive municipal bonds), and low absolute yields. The predominant tailwinds that helped municipal bonds included: record setting fund flows into municipal bond mutual funds, improved pricing on lower-rated municipal bonds, significant stimulus for state and local governments, and an improvement in the average credit quality of the municipal market.
How did the Victory High Income Municipal Bond Fund (the "Fund") perform during the reporting period?
The Fund returned 5.91% (Class A at net asset value) for the fiscal year ended December 31, 2021, outperforming the Index, which returned 1.52% during the reporting period.
What strategies did you employ during the reporting period?
The Fund tends to be more credit-heavy than the Index, holding more BBB-category rated (the lowest category, highest risk level of investment grade) and high-yield (non-investment grade) bonds than the Index. We overweight these credits to provide additional tax-free income to our investors. These bonds performed well in 2021, as demand for municipal bonds was strong, lower-rated bonds offered attractive yields, and the creditworthiness of lower-rated bonds strengthened throughout the year. This dynamic helped drive the Fund's relative outperformance in 2021. Lastly, the Fund increased its number of holdings and reduced its weighting to its Top Ten issuers to increase the portfolio's diversification.
The largest detractors from relative performance were interest rates and our allocation to cash. The Fund's longer duration detracted from performance as interest rates increased in 2021. The Fund's allocation to cash detracted from performance as low interest rates on very short-term investments lagged the Index.
We remain committed to our core competency of evaluating, taking, and managing credit risk in the municipal market. We continue to build our portfolios bond-by-bond, relying on our assessment of fundamental credit risk and attempting to capture and distribute incremental yield that will drive higher long-term income to our investors. While there might be some volatility in the municipal market in the short term, we remain confident that the right approach is to focus on what matters in the long term.
14
Victory High Income Municipal Bond Fund
Investment Overview
(Unaudited)
Average Annual Total Return
Year Ended December 31, 2021
| | Class A | | Class C | | Class Y | | Member
Class | | | | | |
INCEPTION DATE | | 12/31/09 | | 12/31/09 | | 12/31/09 | | 11/2/20 | | | | | |
| | | Net Asset
Value | | Maximum
Offering
Price | | Net Asset
Value | | Contingent
Deferred
Charges | | Net Asset
Value | | Net Asset
Value | | Bloomberg
Municipal
Bond Index1 | | Bloomberg
High
Yield Municipal
Bond Index2 | |
One Year | | | 5.91 | % | | | 3.53 | % | | | 5.12 | % | | | 4.12 | % | | | 6.16 | % | | | 6.07 | % | | | 1.52 | % | | | 7.77 | % | |
Five Year | | | 5.69 | % | | | 5.21 | % | | | 4.89 | % | | | 4.89 | % | | | 5.93 | % | | | NA | | | | 4.17 | % | | | 7.53 | % | |
Ten Year | | | 4.73 | % | | | 4.49 | % | | | 3.92 | % | | | 3.92 | % | | | 4.97 | % | | | NA | | | | 3.72 | % | | | 6.72 | % | |
Since Inception | | | NA | | | | NA | | | | NA | | | | NA | | | | NA | | | | 8.92 | % | | | NA | | | | NA | | |
The performance data quoted represents past performance and current returns may be lower or higher. The investment return and principal value will fluctuate so that an investor's shares, when redeemed, may be worth more or less than the original cost. To obtain performance information current to the most recent month's end, please visit www.vcm.com.
The maximum offering price ("MOP") figures reflect a maximum sales charge of 2.25% for Class A. Class C is not subject to an initial sales charge, but is subject to a deferred sales charge of 1.00% on shares redeemed within one year of purchase. Net Asset Value ("NAV") does not reflect sales charges.
Total return measures the price change in a share assuming the reinvestment of all net investment income and realized capital gain distributions, if any. The total returns quoted do not reflect adjustments made to the enclosed financial statements in accordance with U.S. Generally Accepted Accounting Principles or the deduction of taxes that a shareholder would pay on net investment income and realized capital gain distributions, including reinvested distributions, or redemptions of shares. The total return figures set forth above include all waivers of fees. Without such fee waivers, the total returns would have been lower.
Victory High Income Municipal Bond Fund — Growth of $10,000
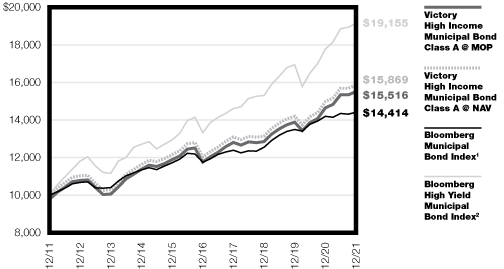
1The Bloomberg Municipal Bond Index is generally considered to be representative of the municipal bond market. This index does not include the effect of sales charges, commissions, expenses or taxes, is not representative of the Fund, and it is not possible to invest directly in an index. As of August 24, 2021, Bloomberg rebranded the Bloomberg Barclays fixed income indices as "Bloomberg Indices."
2The Bloomberg High Yield Municipal Bond Index is generally considered to be representative of the investable universe of the U.S high-yield municipal debt market. This index does not include the effect of sales charges, commissions, expenses or taxes, is not representative of the Fund, and it is not possible to invest directly in an index. As of August 24, 2021, Bloomberg rebranded the Bloomberg Barclays fixed income indices as "Bloomberg Indices."
The graph reflects investment of growth of a hypothetical $10,000 investment in the Fund.
The graph and table do not reflect the deduction of taxes that a shareholder would pay on Fund distributions or the redemption of shares.
Past performance is not indicative of future results.
15
Victory Floating Rate Fund
Managers' Commentary
(Unaudited)
What were the market conditions during the reporting period?
Riskier asset classes were rewarded in 2021, particularly stocks, with the S&P 500® Index returning a stunning 28.71% for the year. This was equally applicable in fixed income, with leveraged loans and high-yield bonds outperforming as most major fixed-income indexes posted negative returns for the year. The 10-year U.S. Treasury returned -3.6%.
Even as the U.S. Federal Reserve (the "Fed") began to shift its focus from stimulus to inflation control late in the year, it is hard to overstate the influence of its accommodation on the markets. Supportive monetary policy was combined with strong economic growth, rising corporate earnings, and falling unemployment rates to help markets counter the continued impact of COVID-19, labor shortages, political gridlock, and supply chain disruptions.
The year began on a hopeful note, with COVID-19 vaccines rolling out and economic growth far outpacing expectations. But growth was tempered by vaccine shortages early in the year followed by COVID-19 variant spikes and surging inflation later in the year. The Fed continued to exert a steadying influence on securities markets, but political stalemate clouded the fate of economic recovery legislation.
Through it all, investors stayed tuned to clear messages from strong revenue growth, improving margins and healthier balance sheets. Reduced debt levels, falling default rates, higher profits, and ratings upgrades were particularly beneficial in the high-yield and leveraged-loan markets, where fixed income investors flocked in search of higher yields and lower interest rate risk.
The default rate is typically the biggest driver of returns in the below-investment-grade sphere, and leveraged loans ended the year at 0.65%, which is substantially below historical averages and below similar points in past economic recoveries.
How did Victory Floating Rate Fund (the "Fund") perform during the reporting period?
The Fund returned 3.89% (Class A at net asset value) for the fiscal year ended December 31, 2021, underperforming the S&P/LSTA Leveraged Loan Index (the "Index"), which returned 5.20% for the reporting period.
What strategies did you employ during the reporting period?
The Fund's management team takes a bottom-up approach to evaluating investments. We look for companies with strong free cash flow or situations in which our analysis finds less risk and more potential positive catalysts than the market is pricing in. We analyze each situation and layer it over our larger market views, favoring some sectors for their cyclical strength during the ongoing economic rebound and others because of more secular, long-term trends.
The Fund had exposure to some sectors that were particularly volatile at certain times during the year. An overweight and security selection in the media and entertainment sector detracted from performance relative to the Index. So did security selection in B-rated loans and bonds rated CCC and below. However, the Fund's out-of-index exposure to high yield bonds was an overall contributor to relative performance. Other contributors included security selection in loans rated B and above, and security selection in the Energy sector.
16
Victory Floating Rate Fund (continued)
Managers' Commentary (continued)
As the name suggests, the interest rates on floating-rate loans can increase in tandem with rising rates in the market, which gives them potential to not only mitigate duration risk but also to benefit from increasing interest rates.
An allocation to high-yield bonds has long been a mainstay of our strategy because it offers enhanced liquidity and flexibility to choose the most attractive way to investment in the companies we favor.
Even as interest rates rise, potentially putting some heavily indebted companies at risk, we still believe there are attractive opportunities given the historically low default rate, improving credit fundamentals, and large sums of cash on the sidelines. We expect strong investor demand for floating-rate loans as market rates rise.
17
Victory Floating Rate Fund
Investment Overview
(Unaudited)
Average Annual Total Return
Year Ended December 31, 2021
| | | Class A | | Class C | | Class R | | Class Y | | Member Class | | | |
INCEPTION DATE | | 12/31/09 | | 12/31/09 | | 12/31/09 | | 12/31/09 | | 11/2/20 | | | |
| | | Net Asset
Value | | Maximum
Offering
Price | | Net Asset
Value | | Contingent
Deferred
Charges | | Net Asset
Value | | Net Asset
Value | | Net Asset
Value | | S&P/LSTA U.S.
Leveraged
Loan Index1 | |
One Year | | | 3.89 | % | | | 1.50 | % | | | 3.05 | % | | | 2.05 | % | | | 3.40 | % | | | 4.12 | % | | | 4.15 | % | | | 5.20 | % | |
Five Year | | | 4.42 | % | | | 3.95 | % | | | 3.57 | % | | | 3.57 | % | | | 3.83 | % | | | 4.62 | % | | | NA | | | | 4.27 | % | |
Ten Year | | | 4.45 | % | | | 4.21 | % | | | 3.62 | % | | | 3.62 | % | | | 3.90 | % | | | 4.67 | % | | | NA | | | | 4.69 | % | |
Since Inception | | | NA | | | | NA | | | | NA | | | | NA | | | | NA | | | | NA | | | | 7.39 | % | | | NA | | |
The performance data quoted represents past performance and current returns may be lower or higher. The investment return and principal value will fluctuate so that an investor's shares, when redeemed, may be worth more or less than the original cost. To obtain performance information current to the most recent month's end, please visit www.vcm.com.
The maximum offering price ("MOP") figures reflect a maximum sales charge of 2.25% for Class A. Class C is not subject to an initial sales charge, but is subject to a deferred sales charge of 1.00% on shares redeemed within one year of purchase. Net Asset Value ("NAV") does not reflect sales charges.
Total return measures the price change in a share assuming the reinvestment of all net investment income and realized capital gain distributions, if any. The total returns quoted do not reflect adjustments made to the enclosed financial statements in accordance with U.S. Generally Accepted Accounting Principles or the deduction of taxes that a shareholder would pay on net investment income and realized capital gain distributions, including reinvested distributions, or redemptions of shares. The total return figures set forth above include all waivers of fees. Without such fee waivers, the total returns would have been lower.
Victory Floating Rate Fund — Growth of $10,000
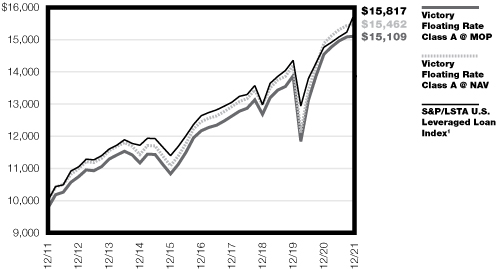
1The S&P/LSTA U.S. Leveraged Loan Index covers more than 1,100 loan facilities and reflects the market-value-weighted performance of U.S. dollar-denominated institutional leveraged loans. This index does not include the effect of sales charges, commissions, expenses or taxes, is not representative of the Fund, and it is not possible to invest directly in an index.
The graph reflects investment of growth of a hypothetical $10,000 investment in the Fund.
The graph and table do not reflect the deduction of taxes that a shareholder would pay on Fund distributions or the redemption of shares.
Past performance is not indicative of future results.
18
Victory Strategic Income Fund
Managers' Commentary
(Unaudited)
What were the market conditions during the reporting period?
The S&P 500® Index returned a stunning 28.71% for the year. Riskier assets also outperformed in fixed income, with high-yield bonds and leveraged loans outperforming as most major fixed-income indexes posted negative returns for the year. The 10-year U.S. Treasury returned -3.6% in 2021.
Even as the U.S. Federal Reserve (the "Fed") began to shift its focus from stimulus to inflation control late in the year, it is hard to overstate the influence of its support on the markets. Fed stimulus combined with strong economic growth, rising corporate earnings, and falling unemployment rates to help key segments of the securities markets repel the damage from resurgent COVID-19 infections, spiking inflation, labor shortages, political gridlock, and supply chain disruptions.
The year began on a hopeful note, with COVID-19 vaccines rolling out and economic growth far outpacing expectations. The economy kept growing throughout the year, and companies reported healthy revenue growth, improving margins and profits, and healthier balance sheets. But growth, which had been tempered by vaccine shortages early in the year, lost some momentum in the third and fourth quarters due to COVID-19 variant spikes, supply chain disruptions, and surging inflation.
The Fed continued to exert a steadying influence on securities markets as it took a measured and predictable approach to winding down stimulus, but on the fiscal policy side political stalemate clouded the fate of economic recovery legislation.
How did Victory Strategic Income Fund (the "Fund") perform during the reporting period?
The Fund returned -0.20% (Class A at net asset value) for the fiscal year ended December 31, 2021, outperforming the Bloomberg US Aggregate Bond Index (the "Index"), which returned -1.54% for the reporting period.
What strategies did you employ during the reporting period?
An overweight in corporate debt has long been a mainstay of our strategy, and while we still don't view strongly defensive portfolio positioning as warranted, we believe that inflation, rising interest rates, and the highly contagious new COVID-19 Omicron variant may intensify economic and investment risks in the short to medium term. We adjusted our risk exposures accordingly late in the year, largely by favoring less-volatile sectors within investment-grade corporate bonds.
We maintained out-of-index exposures to high-yield bonds and leveraged loans, which generated attractive yields and contributed to performance relative to the Index during the year. In addition, since the adjustable rates on loans increase as market rates rise, loans also arguably provide some protection against rate increases. Default rates, which are key in high-yield and leveraged-loan investing, are historically low and expected to remain so in 2022.
19
Victory Strategic Income Fund (continued)
Managers' Commentary (continued)
We brought duration, a measure of a bond's sensitivity to interest rate changes, more into line with the Index in the second half for the year, but duration and yield curve positioning detracted from relative performance for the full year.
Given uncertainty about rising rates and the potential for rate volatility, we had a less positive outlook on U.S. Treasurys and mortgage-backed securities in 2021.
In addition, the Fund's employment of a derivatives strategy overlay to efficiently manage the overall portfolio risk associated with the Fund's strategy contributed negatively to performance during the year.
We believe that with a strong and predictable hand from central banks and a thoughtful approach to increased market risks, there is still more upside than downside potential in some traditionally riskier segments of the market, and we continue to carefully analyze potential opportunities for the Fund.
20
Victory Strategic Income Fund
Investment Overview
(Unaudited)
Average Annual Total Return
Year Ended December 31, 2021
| | | Class A | | Class C | | Class R | | Class Y | | | |
INCEPTION DATE | | 12/31/09 | | 12/31/09 | | 12/31/09 | | 12/31/09 | | | |
| | | Net Asset
Value | | Maximum
Offering
Price | | Net Asset
Value | | Contingent
Deferred
Charges | | Net Asset
Value | | Net Asset
Value | | Bloomberg
US
Aggregate
Bond Index1 | |
One Year | | | –0.20 | % | | | –2.43 | % | | | –1.07 | % | | | –2.03 | % | | | –0.68 | % | | | 0.01 | % | | | –1.54 | % | |
Five Year | | | 4.41 | % | | | 3.94 | % | | | 3.57 | % | | | 3.57 | % | | | 3.98 | % | | | 4.64 | % | | | 3.57 | % | |
Ten Year | | | 3.84 | % | | | 3.60 | % | | | 3.02 | % | | | 3.02 | % | | | 3.41 | % | | | 4.07 | % | | | 2.90 | % | |
The performance data quoted represents past performance and current returns may be lower or higher. The investment return and principal value will fluctuate so that an investor's shares, when redeemed, may be worth more or less than the original cost. To obtain performance information current to the most recent month's end, please visit www.vcm.com.
The maximum offering price ("MOP") figures reflect a maximum sales charge of 2.25% for Class A. Class C is not subject to an initial sales charge, but is subject to a deferred sales charge of 1.00% on shares redeemed within one year of purchase. Net Asset Value ("NAV") does not reflect sales charges.
Total return measures the price change in a share assuming the reinvestment of all net investment income and realized capital gain distributions, if any. The total returns quoted do not reflect adjustments made to the enclosed financial statements in accordance with U.S. Generally Accepted Accounting Principles or the deduction of taxes that a shareholder would pay on net investment income and realized capital gain distributions, including reinvested distributions, or redemptions of shares. The total return figures set forth above include all waivers of fees. Without such fee waivers, the total returns would have been lower.
Victory Strategic Income Fund — Growth of $10,000
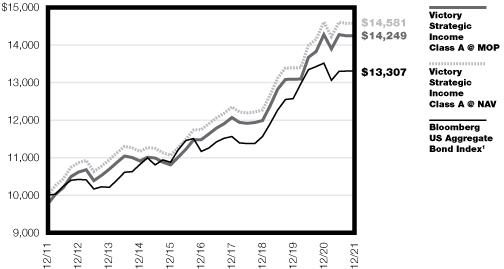
1The Bloomberg US Aggregate Bond Index covers the U.S. investment-grade rated bond market, including government and credit securities, agency mortgage pass-through securities, asset-backed securities, and commercial mortgage-backed securities that have remaining maturities of more than one year. This index does not include the effect of sales charges, commissions, expenses, or taxes, is not representative of the Fund, and it is not possible to invest directly in an index. As of August 24, 2021, Bloomberg rebranded the Bloomberg Barclays fixed income indices as "Bloomberg Indices."
The graph reflects investment of growth of a hypothetical $10,000 investment in the Fund.
The graph and table do not reflect the deduction of taxes that a shareholder would pay on Fund distributions or the redemption of shares.
Past performance is not indicative of future results.
21
Victory Portfolios
Victory INCORE Investment Quality Bond Fund | | December 31, 2021 | |
(Unaudited)
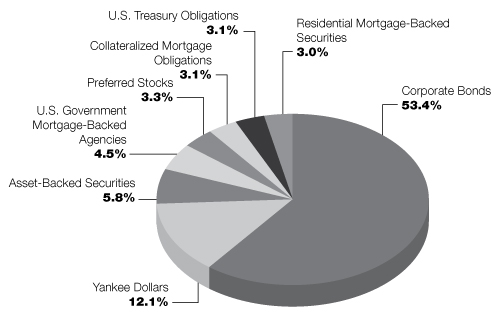
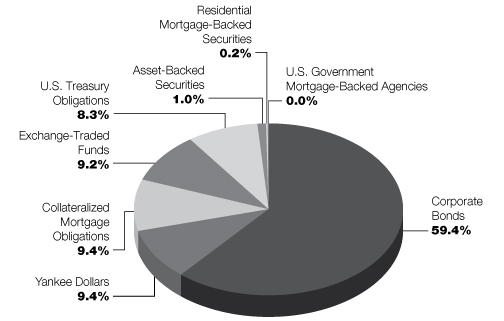
Investment Objective and Portfolio Holdings:
The Fund seeks to provide a high level of current income and capital appreciation without undue risk to principal.
Asset Allocation*:
December 31, 2021
(% of Net Assets)
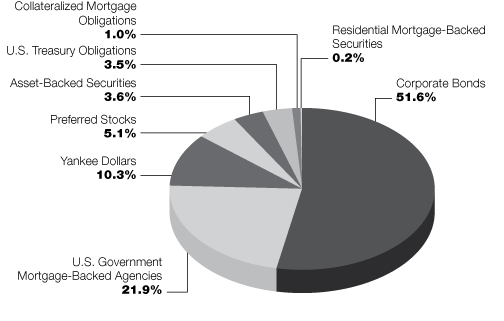
* Does not include futures contracts, money market instruments, and short-term investments purchased with cash collateral from securities loaned.
Percentages are of the net assets of the Fund and may not equal 100%.
Refer to the Schedule of Portfolio Investments for a complete list of securities.
22
Victory Portfolios
Victory INCORE Low Duration Bond Fund | | December 31, 2021 | |
(Unaudited)
Investment Objective and Portfolio Holdings:
The Fund seeks to provide a high level of current income consistent with preservation of capital.
Asset Allocation*:
December 31, 2021
(% of Net Assets)
* Does not include futures contracts, money market instruments, and short-term investments purchased with cash collateral from securities loaned.
Percentages are of the net assets of the Fund and may not equal 100%.
Refer to the Schedule of Portfolio Investments for a complete list of securities.
23
Victory Portfolios
Victory High Yield Fund | | December 31, 2021 | |
(Unaudited)
Investment Objective and Portfolio Holdings:
The Fund seeks to provide current income. Capital appreciation is a secondary objective.
Asset Allocation*:
December 31, 2021
(% of Net Assets)

* Does not include futures contracts, money market instruments, and short-term investments purchased with cash collateral from securities loaned.
Percentages are of the net assets of the Fund and may not equal 100%.
Refer to the Schedule of Portfolio Investments for a complete list of securities.
24
Victory Portfolios
Victory Tax-Exempt Fund | | December 31, 2021 | |
(Unaudited)
Investment Objective and Portfolio Holdings:
The Fund seeks to maximize current income exempt from federal income taxes, consistent with the preservation of capital.
Asset Allocation*:
December 31, 2021
(% of Net Assets)
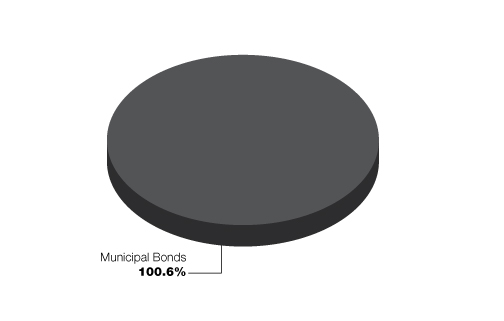
* Does not include futures contracts, money market instruments, and short-term investments purchased with cash collateral from securities loaned.
Percentages are of the net assets of the Fund and may not equal 100%.
Refer to the Schedule of Portfolio Investments for a complete list of securities.
25
Victory Portfolios
Victory High Income Municipal Bond Fund | | December 31, 2021 | |
(Unaudited)
Investment Objective and Portfolio Holdings:
The Fund seeks to provide a high current income exempt from federal income taxes with a secondary objective of capital appreciation.
Asset Allocation*:
December 31, 2021
(% of Net Assets)
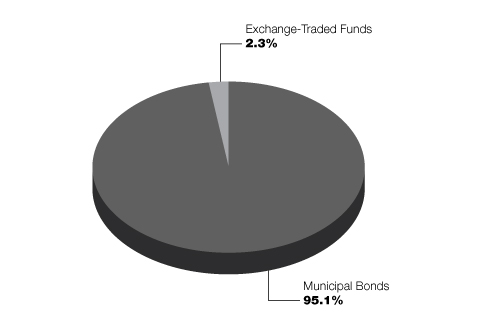
* Does not include futures contracts, money market instruments, and short-term investments purchased with cash collateral from securities loaned.
Percentages are of the net assets of the Fund and may not equal 100%.
Refer to the Schedule of Portfolio Investments for a complete list of securities.
26
Victory Portfolios
Victory Floating Rate Fund | | December 31, 2021 | |
(Unaudited)
Investment Objective and Portfolio Holdings:
The Fund seeks to provide a high level of current income.
Top 10 Holdings*:
December 31, 2021
(% of Net Assets)
Petco Health and Wellness Co., Inc., Initial Term Loans, First Lien | | | 1.8 | % | |
The Michaels Cos., Inc., Term B Loans, First Lien | | | 1.7 | % | |
AAdvantage Loyalty IP Ltd., Initial Term Loan, First Lien | | | 1.7 | % | |
iHeartCommunications, Inc., Term Loans, First Lien | | | 1.6 | % | |
SWF Holdings Corp., Initial Term Loans, First Lien | | | 1.6 | % | |
CP ATLAS BUYER, Inc., Term B Loans, First Lien | | | 1.5 | % | |
ACProducts, Inc., Initial Term Loans, First Lien | | | 1.3 | % | |
Air Canada, Term Loan, First Lien | | | 1.3 | % | |
The Hertz Corp., Initial Term B Loans, First Lien | | | 1.2 | % | |
SRS Distribution, Inc., 2021 Refinancing Term Loans, First Lien | | | 1.2 | % | |
Sector Allocation*:
December 31, 2021
(% of Net Assets)
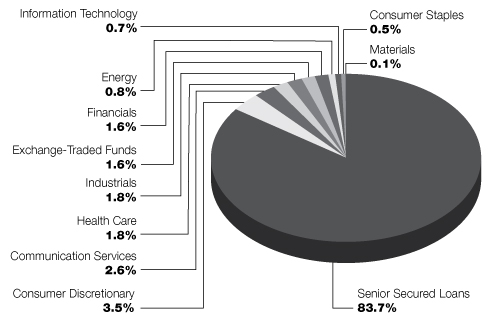
* Does not include futures contracts, money market instruments, and short-term investments purchased with cash collateral from securities loaned.
Percentages are of the net assets of the Fund and may not equal 100%.
Refer to the Schedule of Portfolio Investments for a complete list of securities.
27
Victory Portfolios
Victory Strategic Income Fund | | December 31, 2021 | |
(Unaudited)
Investment Objective and Portfolio Holdings:
The Fund seeks to provide a high current income with a secondary objective of capital appreciation.
Asset Allocation*:
December 31, 2021
(% of Net Assets)
* Does not include futures contracts, money market instruments, and short-term investments purchased with cash collateral from securities loaned.
Percentages are of the net assets of the Fund and may not equal 100%.
Refer to the Schedule of Portfolio Investments for a complete list of securities.
28
Victory Portfolios
Victory INCORE Investment Quality Bond Fund | | Schedule of Portfolio Investments
December 31, 2021 | |
Security Description | | Shares or
Principal
Amount | | Value | |
Asset-Backed Securities (3.6%) | |
Drive Auto Receivables Trust, Series 2021-1, Class C, 1.02%, 6/15/27,
Callable 10/15/23 @ 100 | | $ | 125,000 | | | $ | 124,855 | | |
GM Financial Consumer Automobile Receivables Trust, Series 2021-2,
Class C, 1.28%, 1/19/27, Callable 10/16/24 @ 100 | | | 105,000 | | | | 103,530 | | |
Santander Drive Auto Receivables Trust, Series 2021-4, Class C, 1.26%, 2/16/27,
Callable 9/15/25 @ 100 | | | 100,000 | | | | 98,932 | | |
Santander Retail Auto Lease Trust, Series 2021-A, Class C, 1.14%, 3/20/26,
Callable 4/20/24 @ 100 (a) (b) | | | 287,000 | | | | 284,286 | | |
Westlake Automobile Receivables Trust, Series 2021-1A, Class C, 0.95%, 3/16/26,
Callable 3/15/24 @ 100 (b) | | | 142,000 | | | | 141,029 | | |
Westlake Automobile Receivables Trust, Series 2021-2A, Class C, 0.89%, 7/15/26,
Callable 10/15/24 @ 100 (b) | | | 136,000 | | | | 133,644 | | |
Total Asset-Backed Securities (Cost $894,903) | | | 886,276 | | |
Collateralized Mortgage Obligations (1.0%) | |
BANK, Series 2020-BN26, Class AS, 2.69%, 3/15/63, Callable 3/15/30 @ 100 | | | 130,000 | | | | 132,695 | | |
Citigroup Commercial Mortgage Trust, Series 2020-GC46, Class AS, 2.92%,
1/15/53, Callable 2/15/30 @ 100 | | | 117,000 | | | | 121,144 | | |
Total Collateralized Mortgage Obligations (Cost $254,189) | | | 253,839 | | |
Preferred Stocks (5.1%) | |
Financials (2.2%): | |
AMG Capital Trust II, 10/15/37, 5.15% | | | 2,435 | | | | 142,393 | | |
Bank of America Corp., Series L, 7.25% (a) (c) | | | 112 | | | | 161,885 | | |
KKR & Co., Inc., Series C, 9/15/23, 6.00% (d) | | | 990 | | | | 92,218 | | |
Wells Fargo & Co., Series L, 7.50% (c) | | | 95 | | | | 141,600 | | |
| | | | 538,096 | | |
Health Care (0.1%): | |
Danaher Corp., Series B, 4/15/23, 5.00% (d) | | | 17 | | | | 29,549 | | |
Industrials (0.5%): | |
Stanley Black & Decker, Inc., 11/15/22, 5.25% (d) | | | 1,201 | | | | 131,137 | | |
Utilities (2.3%): | |
American Electric Power Co., Inc., 8/15/23, 6.13% | | | 655 | | | | 34,453 | | |
CenterPoint Energy, Inc., 9/15/29, 4.57% | | | 455 | | | | 26,476 | | |
Dominion Energy, Inc., Series A, 6/1/22, 7.25% | | | 1,180 | | | | 118,755 | | |
DTE Energy Co., 11/1/22, 6.25% | | | 1,765 | | | | 90,615 | | |
NextEra Energy, Inc., 3/1/23, 5.28% | | | 2,875 | | | | 165,428 | | |
NiSource, Inc., 3/1/24, 7.75% | | | 85 | | | | 9,519 | | |
The Southern Co., Series 2019, 8/1/22, 6.75% | | | 1,962 | | | | 105,458 | | |
| | | | 550,704 | | |
Total Preferred Stocks (Cost $1,169,710) | | | 1,249,486 | | |
See notes to financial statements.
29
Victory Portfolios
Victory INCORE Investment Quality Bond Fund | | Schedule of Portfolio Investments — continued
December 31, 2021 | |
Security Description | | Principal
Amount | | Value | |
Corporate Bonds (51.6%) | |
Communication Services (2.3%): | |
AT&T, Inc.
4.25%, 3/1/27, Callable 12/1/26 @ 100 (a) | | $ | 46,000 | | | $ | 51,048 | | |
1.65%, 2/1/28, Callable 12/1/27 @ 100 (d) | | | 51,000 | | | | 49,945 | | |
5.15%, 11/15/46, Callable 5/15/46 @ 100 (a) | | | 126,000 | | | | 160,397 | | |
CenturyLink, Inc., 6.75%, 12/1/23 | | | 50,000 | | | | 53,956 | | |
Comcast Corp.
3.45%, 2/1/50, Callable 8/1/49 @ 100 | | | 70,000 | | | | 74,787 | | |
2.80%, 1/15/51, Callable 7/15/50 @ 100 | | | 56,000 | | | | 53,522 | | |
Sirius XM Radio, Inc., 4.13%, 7/1/30, Callable 7/1/25 @ 102.06 (b) | | | 62,000 | | | | 62,166 | | |
Verizon Communications, Inc.
3.38%, 2/15/25 (a) | | | 38,000 | | | | 40,389 | | |
3.55%, 3/22/51, Callable 9/22/50 @ 100 (a) | | | 20,000 | | | | 21,621 | | |
| | | | 567,831 | | |
Consumer Discretionary (7.5%): | |
Aptiv PLC, 5.40%, 3/15/49, Callable 9/15/48 @ 100 | | | 34,000 | | | | 45,101 | | |
Booking Holdings, Inc., 0.75%, 5/1/25 (a) (d) | | | 120,000 | | | | 176,621 | | |
Dana, Inc., 5.63%, 6/15/28, Callable 6/15/23 @ 102.81 | | | 48,000 | | | | 50,999 | | |
Expedia Group, Inc.
3.60%, 12/15/23, Callable 11/15/23 @ 100 | | | 87,000 | | | | 90,445 | | |
2/15/26 (b) (d) | | | 120,000 | | | | 138,666 | | |
Ford Motor Co., 3/15/26 (b) | | | 40,000 | | | | 55,045 | | |
General Motors Co., 4.88%, 10/2/23 (a) | | | 96,000 | | | | 101,985 | | |
Hilton Domestic Operating Co., Inc., 4.88%, 1/15/30, Callable 1/15/25 @ 102.44 | | | 48,000 | | | | 51,567 | | |
Hilton Worldwide Finance LLC/Hilton Worldwide Finance Corp., 4.88%, 4/1/27,
Callable 4/1/22 @ 102.44 | | | 55,000 | | | | 56,789 | | |
Lear Corp., 3.50%, 5/30/30, Callable 2/28/30 @ 100 | | | 18,000 | | | | 19,165 | | |
Lennar Corp., 5.00%, 6/15/27, Callable 12/15/26 @ 100 | | | 93,000 | | | | 105,466 | | |
Marriott International, Inc., 3.60%, 4/15/24, Callable 3/15/24 @ 100 | | | 142,000 | | | | 148,712 | | |
Meritage Homes Corp., 6.00%, 6/1/25, Callable 3/1/25 @ 100 | | | 27,000 | | | | 30,191 | | |
Murphy Oil USA, Inc., 3.75%, 2/15/31, Callable 2/15/26 @ 101.88 (b) | | | 43,000 | | | | 42,735 | | |
NIKE, Inc., 3.88%, 11/1/45, Callable 5/1/45 @ 100 | | | 73,000 | | | | 87,743 | | |
NVR, Inc.
3.95%, 9/15/22, Callable 6/15/22 @ 100 (a) | | | 126,000 | | | | 127,813 | | |
3.00%, 5/15/30, Callable 11/15/29 @ 100 | | | 118,000 | | | | 122,590 | | |
PulteGroup, Inc., 5.00%, 1/15/27, Callable 10/15/26 @ 100 (d) | | | 100,000 | | | | 114,307 | | |
Ross Stores, Inc.
3.38%, 9/15/24, Callable 6/15/24 @ 100 | | | 70,000 | | | | 73,268 | | |
0.88%, 4/15/26, Callable 3/15/26 @ 100 | | | 53,000 | | | | 51,453 | | |
Whirlpool Corp., 2.40%, 5/15/31, Callable 2/15/31 @ 100 | | | 80,000 | | | | 80,150 | | |
Yum! Brands, Inc., 3.63%, 3/15/31, Callable 12/15/30 @ 100 | | | 73,000 | | | | 72,772 | | |
| | | | 1,843,583 | | |
Consumer Staples (2.3%): | |
7-Eleven, Inc., 0.80%, 2/10/24, Callable 2/10/22 @ 100 (a) (b) | | | 156,000 | | | | 154,209 | | |
Altria Group, Inc., 4.40%, 2/14/26, Callable 12/14/25 @ 100 (a) | | | 34,000 | | | | 37,337 | | |
BAT Capital Corp., 5.28%, 4/2/50, Callable 10/2/49 @ 100 | | | 75,000 | | | | 85,123 | | |
Church & Dwight Co., Inc., 2.30%, 12/15/31, Callable 9/15/31 @ 100 | | | 50,000 | | | | 50,352 | | |
See notes to financial statements.
30
Victory Portfolios
Victory INCORE Investment Quality Bond Fund | | Schedule of Portfolio Investments — continued
December 31, 2021 | |
Security Description | | Principal
Amount | | Value | |
Estee Lauder Cos., Inc., 4.15%, 3/15/47, Callable 9/15/46 @ 100 | | $ | 52,000 | | | $ | 65,052 | | |
Reynolds American, Inc., 5.70%, 8/15/35, Callable 2/15/35 @ 100 | | | 92,000 | | | | 109,276 | | |
Tyson Foods, Inc., 5.10%, 9/28/48, Callable 3/28/48 @ 100 | | | 39,000 | | | | 52,463 | | |
| | | | 553,812 | | |
Energy (4.7%): | |
Chevron USA, Inc., 3.85%, 1/15/28, Callable 10/15/27 @ 100 | | | 135,000 | | | | 149,994 | | |
Continental Resources, Inc.
4.50%, 4/15/23, Callable 1/15/23 @ 100 (a) | | | 113,000 | | | | 116,661 | | |
2.27%, 11/15/26, Callable 11/15/23 @ 100 (b) | | | 93,000 | | | | 92,353 | | |
EOG Resources, Inc., 4.95%, 4/15/50, Callable 10/15/49 @ 100 | | | 65,000 | | | | 88,457 | | |
EQM Midstream Partners LP, 4.75%, 7/15/23, Callable 6/15/23 @ 100 (a) | | | 39,000 | | | | 40,525 | | |
HollyFrontier Corp., 2.63%, 10/1/23 | | | 116,000 | | | | 118,286 | | |
Marathon Oil Corp., 6.60%, 10/1/37 (d) | | | 105,000 | | | | 138,949 | | |
Pioneer Natural Resources Co.
0.25%, 5/15/25 (a) | | | 105,000 | | | | 187,839 | | |
1.90%, 8/15/30, Callable 5/15/30 @ 100 | | | 109,000 | | | | 103,485 | | |
Plains All American Pipeline LP/PAA Finance Corp., 2.85%, 1/31/23, Callable
10/31/22 @ 100 (a) | | | 120,000 | | | | 121,729 | | |
| | | | 1,158,278 | | |
Financials (11.9%): | |
Aflac, Inc.
2.88%, 10/15/26, Callable 7/15/26 @ 100 (a) | | | 85,000 | | | | 89,612 | | |
4.75%, 1/15/49, Callable 7/15/48 @ 100 | | | 20,000 | | | | 26,674 | | |
Alleghany Corp., 3.63%, 5/15/30, Callable 2/15/30 @ 100 | | | 55,000 | | | | 59,663 | | |
Ares Capital Corp., 4.63%, 3/1/24 | | | 135,000 | | | | 153,944 | | |
Bank of America Corp.
4.20%, 8/26/24 (a) | | | 51,000 | | | | 54,650 | | |
3.25%, 10/21/27, Callable 10/21/26 @ 100 | | | 100,000 | | | | 106,624 | | |
2.57% (SOFR+121bps), 10/20/32, Callable 10/20/31 @ 100 (e) | | | 120,000 | | | | 120,679 | | |
Capital One Financial Corp., 2.36%, 7/29/32, Callable 7/29/31 @ 100 (a) | | | 146,000 | | | | 138,515 | | |
Cincinnati Financial Corp., 6.13%, 11/1/34 | | | 100,000 | | | | 135,965 | | |
Citigroup, Inc.
3.88%, 3/26/25 | | | 35,000 | | | | 37,311 | | |
4.60%, 3/9/26 (a) | | | 36,000 | | | | 39,751 | | |
4.45%, 9/29/27 (a) | | | 63,000 | | | | 70,225 | | |
Ford Motor Credit Co. LLC, 4.06%, 11/1/24, Callable 10/1/24 @ 100 (a) | | | 200,000 | | | | 210,526 | | |
General Motors Financial Co., Inc., 4.15%, 6/19/23, Callable 5/19/23 @ 100 | | | 49,000 | | | | 50,972 | | |
Globe Life, Inc., 2.15%, 8/15/30, Callable 5/15/30 @ 100 | | | 110,000 | | | | 108,499 | | |
JPMorgan Chase & Co.
2.95%, 10/1/26, Callable 7/1/26 @ 100 (a) | | | 170,000 | | | | 179,551 | | |
2.55%, 11/8/32, Callable 11/8/31 @ 100 | | | 135,000 | | | | 136,112 | | |
5.60%, 7/15/41 | | | 52,000 | | | | 72,388 | | |
JPMorgan Chase Financial Co. LLC, 0.25%, 5/1/23 (b) | | | 100,000 | | | | 110,590 | | |
Level 3 Financing, Inc., 3.75%, 7/15/29, Callable 1/15/24 @ 101.88 (b) | | | 75,000 | | | | 71,813 | | |
Morgan Stanley, 3.13%, 7/27/26, MTN (a) | | | 280,000 | | | | 296,836 | | |
Old Republic International Corp., 3.85%, 6/11/51, Callable 12/11/50 @ 100 | | | 42,000 | | | | 45,268 | | |
Regions Financial Corp., 1.80%, 8/12/28, Callable 6/12/28 @ 100 (d) | | | 89,000 | | | | 87,143 | | |
Sixth Street Specialty Lending, Inc., 4.50%, 8/1/22 | | | 40,000 | | | | 49,234 | | |
See notes to financial statements.
31
Victory Portfolios
Victory INCORE Investment Quality Bond Fund | | Schedule of Portfolio Investments — continued
December 31, 2021 | |
Security Description | | Principal
Amount | | Value | |
SVB Financial Group, 3.13%, 6/5/30, Callable 3/5/30 @ 100 (a) | | $ | 164,000 | | | $ | 172,193 | | |
Wells Fargo & Co.
4.30%, 7/22/27, MTN (a) | | | 180,000 | | | | 201,202 | | |
4.90%, 11/17/45 (a) | | | 80,000 | | | | 101,116 | | |
| | | | 2,927,056 | | |
Health Care (5.7%): | |
AbbVie, Inc.
3.20%, 11/21/29, Callable 8/21/29 @ 100 | | | 66,000 | | | | 70,656 | | |
4.45%, 5/14/46, Callable 11/14/45 @ 100 | | | 62,000 | | | | 75,134 | | |
Anthem, Inc.
2.38%, 1/15/25, Callable 12/15/24 @ 100 | | | 65,000 | | | | 66,895 | | |
2.75%, 10/15/42 | | | 27,000 | | | | 177,459 | | |
Baxter International, Inc., 2.54%, 2/1/32, Callable 11/1/31 @ 100 (b) | | | 141,000 | | | | 142,449 | | |
Centene Corp., 4.25%, 12/15/27, Callable 12/15/22 @ 102.13 | | | 73,000 | | | | 76,365 | | |
HCA, Inc., 4.13%, 6/15/29, Callable 3/15/29 @ 100 | | | 73,000 | | | | 80,489 | | |
Hologic, Inc., 3.25%, 2/15/29, Callable 9/28/23 @ 101.63 (b) | | | 114,000 | | | | 114,513 | | |
Illumina, Inc., 8/15/23 (d) | | | 110,000 | | | | 126,164 | | |
Mylan, Inc., 4.55%, 4/15/28, Callable 1/15/28 @ 100 | | | 91,000 | | | | 101,935 | | |
Regeneron Pharmaceuticals, Inc., 2.80%, 9/15/50, Callable 3/15/50 @ 100 | | | 63,000 | | | | 59,187 | | |
Universal Health Services, Inc.
1.65%, 9/1/26, Callable 8/1/26 @ 100 (b) | | | 154,000 | | | | 151,421 | | |
2.65%, 10/15/30, Callable 7/15/30 @ 100 (b) | | | 44,000 | | | | 43,683 | | |
Viatris, Inc.
2.30%, 6/22/27, Callable 4/22/27 @ 100 | | | 40,000 | | | | 40,354 | | |
4.00%, 6/22/50, Callable 12/22/49 @ 100 | | | 75,000 | | | | 80,183 | | |
| | | | 1,406,887 | | |
Industrials (5.7%): | |
Acuity Brands Lighting, Inc., 2.15%, 12/15/30, Callable 9/15/30 @ 100 | | | 105,000 | | | | 102,321 | | |
Air Lease Corp.
0.70%, 2/15/24, Callable 1/15/24 @ 100, MTN | | | 120,000 | | | | 118,211 | | |
0.80%, 8/18/24, Callable 7/18/24 @ 100 | | | 58,000 | | | | 56,846 | | |
CSX Corp., 3.35%, 9/15/49, Callable 3/15/49 @ 100 | | | 85,000 | | | | 90,423 | | |
Delta Air Lines, Inc., 3.80%, 4/19/23, Callable 3/19/23 @ 100 (a) | | | 130,000 | | | | 132,798 | | |
Fortive Corp., 0.88%, 2/15/22 (a) | | | 170,000 | | | | 170,100 | | |
Hillenbrand, Inc., 5.00%, 9/15/26, Callable 7/15/26 @ 100 (a) | | | 195,000 | | | | 217,208 | | |
Norfolk Southern Corp.
2.30%, 5/15/31, Callable 2/15/31 @ 100 | | | 40,000 | | | | 40,254 | | |
2.90%, 8/25/51, Callable 2/25/51 @ 100 (d) | | | 50,000 | | | | 49,324 | | |
Oshkosh Corp., 3.10%, 3/1/30, Callable 12/1/29 @ 100 | | | 60,000 | | | | 62,291 | | |
Rockwell Automation, Inc., 6.25%, 12/1/37 | | | 60,000 | | | | 83,603 | | |
Sensata Technologies, Inc., 3.75%, 2/15/31, Callable 2/15/26 @ 101.88 (b) | | | 57,000 | | | | 56,879 | | |
Snap-on, Inc., 4.10%, 3/1/48, Callable 9/1/47 @ 100 | | | 56,000 | | | | 67,869 | | |
Southwest Airlines Co., 1.25%, 5/1/25 (a) | | | 115,000 | | | | 153,495 | | |
| | | | 1,401,622 | | |
Information Technology (5.0%): | |
Akamai Technologies, Inc., 0.13%, 5/1/25 | | | 50,000 | | | | 65,571 | | |
Apple, Inc., 4.65%, 2/23/46, Callable 8/23/45 @ 100 | | | 53,000 | | | | 69,800 | | |
Block, Inc., 0.25%, 11/1/27 (d) | | | 20,000 | | | | 21,212 | | |
See notes to financial statements.
32
Victory Portfolios
Victory INCORE Investment Quality Bond Fund | | Schedule of Portfolio Investments — continued
December 31, 2021 | |
Security Description | | Principal
Amount | | Value | |
Broadcom, Inc., 5.00%, 4/15/30, Callable 1/15/30 @ 100 | | $ | 123,000 | | | $ | 143,192 | | |
Cadence Design Systems, Inc., 4.38%, 10/15/24, Callable 7/15/24 @ 100 (a) | | | 153,000 | | | | 164,493 | | |
Euronet Worldwide, Inc., 0.75%, 3/15/49, Callable 3/20/25 @ 100 (d) | | | 125,000 | | | | 135,374 | | |
Micron Technology, Inc., 5.33%, 2/6/29, Callable 11/6/28 @ 100 (a) | | | 167,000 | | | | 196,995 | | |
NCR Corp., 5.25%, 10/1/30, Callable 10/1/25 @ 102.63 (b) | | | 38,000 | | | | 39,110 | | |
NetApp, Inc., 3.25%, 12/15/22, Callable 9/15/22 @ 100 | | | 70,000 | | | | 71,175 | | |
Texas Instruments, Inc., 4.15%, 5/15/48, Callable 11/15/47 @ 100 | | | 51,000 | | | | 64,063 | | |
Vishay Intertechnology, Inc., 2.25%, 6/15/25 | | | 40,000 | | | | 41,423 | | |
Western Digital Corp.
1.50%, 2/1/24 (a) | | | 170,000 | | | | 172,441 | | |
2.85%, 2/1/29, Callable 12/1/28 @ 100 | | | 53,000 | | | | 53,501 | | |
| | | | 1,238,350 | | |
Materials (0.9%): | |
Celanese US Holdings LLC, 4.63%, 11/15/22 (a) | | | 100,000 | | | | 103,183 | | |
Newmont Corp., 2.60%, 7/15/32, Callable 4/15/32 @ 100 | | | 86,000 | | | | 86,228 | | |
Nucor Corp., 2.00%, 6/1/25, Callable 5/1/25 @ 100 | | | 37,000 | | | | 37,757 | | |
| | | | 227,168 | | |
Real Estate (3.9%): | |
Highwoods Realty LP, 3.63%, 1/15/23, Callable 10/15/22 @ 100 (a) | | | 285,000 | | | | 289,942 | | |
Iron Mountain, Inc., 5.25%, 7/15/30, Callable 7/15/25 @ 102.63 (b) | | | 48,000 | | | | 50,619 | | |
Kite Realty Group LP, 0.75%, 4/1/27 (b) | | | 70,000 | | | | 72,665 | | |
Kite Realty Group Trust, 4.00%, 3/15/25, Callable 12/15/24 @ 100 (a) | | | 155,000 | | | | 162,457 | | |
Physicians Realty LP
3.95%, 1/15/28, Callable 10/15/27 @ 100 | | | 60,000 | | | | 65,740 | | |
2.63%, 11/1/31, Callable 8/1/31 @ 100 | | | 48,000 | | | | 47,905 | | |
Piedmont Operating Partnership LP, 3.15%, 8/15/30, Callable 5/15/30 @ 100 | | | 58,000 | | | | 59,483 | | |
Regency Centers LP, 4.65%, 3/15/49, Callable 9/15/48 @ 100 | | | 49,000 | | | | 61,171 | | |
Sabra Health Care LP, 5.13%, 8/15/26, Callable 5/15/26 @ 100 | | | 65,000 | | | | 71,609 | | |
STORE Capital Corp., 2.75%, 11/18/30, Callable 8/18/30 @ 100 | | | 80,000 | | | | 79,826 | | |
| | | | 961,417 | | |
Utilities (1.7%): | |
Ameren Illinois Co., 1.55%, 11/15/30, Callable 8/15/30 @ 100 | | | 100,000 | | | | 94,732 | | |
Consolidated Edison Co. of New York, Inc., 6.30%, 8/15/37 | | | 40,000 | | | | 55,889 | | |
Oklahoma G&E Co., 5.25%, 5/15/41, Callable 11/15/40 @ 100 | | | 105,000 | | | | 135,721 | | |
Public Service Electric & Gas Co., 4.00%, 6/1/44, Callable 12/1/43 @ 100 | | | 65,000 | | | | 73,722 | | |
Wisconsin Public Service Corp., 2.85%, 12/1/51, Callable 6/1/51 @ 100 (d) | | | 47,000 | | | | 46,458 | | |
| | | | 406,522 | | |
Total Corporate Bonds (Cost $12,186,949) | | | 12,692,526 | | |
Residential Mortgage-Backed Securities (0.2%) | |
Credit Suisse First Boston Mortgage Securities Corp., Series 2002-HE16,
Class M1, 1.42% (LIBOR01M+132bps), 10/25/32, Callable 1/25/22 @ 100 (e) | | | 53,822 | | | | 53,916 | | |
JPMorgan Mortgage Trust, Series 2004-S2, Class 1A3, 4.75%, 11/25/34, Callable
1/25/22 @ 100 (a) | | | 3,690 | | | | 2,598 | | |
Total Residential Mortgage-Backed Securities (Cost $56,497) | | | 56,514 | | |
See notes to financial statements.
33
Victory Portfolios
Victory INCORE Investment Quality Bond Fund | | Schedule of Portfolio Investments — continued
December 31, 2021 | |
Security Description | | Principal
Amount | | Value | |
Yankee Dollars (10.3%) | |
Communication Services (0.5%): | |
Vodafone Group PLC, 5.25%, 5/30/48 | | $ | 89,000 | | | $ | 116,421 | | |
Consumer Staples (3.7%): | |
Barry Callebaut Services NV, 5.50%, 6/15/23 (b) | | | 275,000 | | | | 291,866 | | |
Kerry Group Financial Services Unlimited Co., 3.20%, 4/9/23, Callable
1/9/23 @ 100 (a) (b) | | | 400,000 | | | | 409,308 | | |
Suntory Holdings Ltd., 2.25%, 10/16/24, Callable 9/16/24 @ 100 (a) (b) | | | 200,000 | | | | 203,968 | | |
| | | | 905,142 | | |
Energy (0.6%): | |
Ecopetrol SA, 5.88%, 9/18/23 (a) | | | 133,000 | | | | 141,019 | | |
Statoil ASA, 3.95%, 5/15/43 | | | 20,000 | | | | 23,403 | | |
| | | | 164,422 | | |
Financials (2.8%): | |
Barclays Bank PLC
2/4/25 (a) | | | 45,000 | | | | 76,569 | | |
2/18/25 | | | 30,000 | | | | 34,111 | | |
HSBC Holdings PLC, 2.87%, 11/22/32, Callable 11/22/31 @ 100 | | | 200,000 | | | | 201,820 | | |
Newcrest Finance Pty Ltd.
5.75%, 11/15/41 (b) | | | 45,000 | | | | 59,088 | | |
4.20%, 5/13/50, Callable 11/13/49 @ 100 (b) | | | 25,000 | | | | 28,642 | | |
NXP BV/NXP Funding LLC, 4.63%, 6/1/23 (a) (b) | | | 200,000 | | | | 209,424 | | |
Total Capital International SA, 2.99%, 6/29/41, Callable 12/29/40 @ 100 | | | 85,000 | | | | 86,618 | | |
| | | | 696,272 | | |
Industrials (1.1%): | |
AerCap Ireland Capital DAC/AerCap Global Aviation Trust, 6.50%, 7/15/25,
Callable 6/15/25 @ 100 (a) | | | 150,000 | | | | 171,533 | | |
Canadian National Railway Co., 3.20%, 8/2/46, Callable 2/2/46 @ 100 | | | 60,000 | | | | 63,527 | | |
Canadian Pacific Railway Co., 3.10%, 12/2/51, Callable 6/2/51 @ 100 | | | 33,000 | | | | 33,862 | | |
| | | | 268,922 | | |
Materials (1.4%): | |
Anglo American Capital PLC, 2.88%, 3/17/31, Callable
12/17/30 @ 100 (a) (b) (d) | | | 200,000 | | | | 198,982 | | |
Rio Tinto Finance USA Ltd., 5.20%, 11/2/40 | | | 50,000 | | | | 66,546 | | |
Vale Overseas Ltd., 6.25%, 8/10/26 | | | 63,000 | | | | 73,140 | | |
| | | | 338,668 | | |
Utilities (0.2%): | |
Iberdrola International BV, 6.75%, 9/15/33 | | | 35,000 | | | | 47,433 | | |
Total Yankee Dollars (Cost $2,440,713) | | | 2,537,280 | | |
See notes to financial statements.
34
Victory Portfolios
Victory INCORE Investment Quality Bond Fund | | Schedule of Portfolio Investments — continued
December 31, 2021 | |
Security Description | | Principal
Amount | | Value | |
U.S. Government Mortgage-Backed Agencies (21.9%) | |
Federal Home Loan Bank
0.88%, 10/21/25 | | $ | 255,000 | | | $ | 251,415 | | |
1.10%, 4/29/26 | | | 255,000 | | | | 251,874 | | |
Series 000F, 1.00%, 9/30/26 (a) | | | 265,000 | | | | 260,577 | | |
Series 2, 1.10%, 9/30/26 (a) | | | 260,000 | | | | 255,892 | | |
Series 1, 1.20%, 10/29/26 | | | 255,000 | | | | 252,062 | | |
| | | | 1,271,820 | | |
Federal Home Loan Mortgage Corp.
5.00%, 6/15/23 (a) | | | 5,575 | | | | 5,662 | | |
Series 4395, Class PA, 2.50%, 4/15/37 (a) | | | 83,221 | | | | 85,809 | | |
5.50%, 6/1/38 | | | 23,429 | | | | 26,715 | | |
7.00%, 9/1/38 (a) | | | 5,083 | | | | 5,945 | | |
Series 4320, Class AP, 3.50%, 7/15/39 – 10/15/40 (a) | | | 99,767 | | | | 104,135 | | |
4.50%, 1/1/41 – 7/1/44 (a) | | | 304,519 | | | | 335,347 | | |
Series 4444, Class CH, 3.00%, 1/15/41 (a) | | | 22,539 | | | | 22,783 | | |
2.50%, 7/1/50 | | | 100,408 | | | | 102,532 | | |
2.00%, 3/1/51 (a) | | | 269,550 | | | | 269,146 | | |
| | | | 958,074 | | |
Federal National Mortgage Association
5.50%, 4/1/22 – 1/1/38 (a) | | | 107,743 | | | | 122,134 | | |
7.00%, 8/1/23 – 12/1/27 | | | 50 | | | | 52 | | |
7.50%, 12/1/29 (a) | | | 3,054 | | | | 3,523 | | |
8.00%, 6/1/30 | | | 1,668 | | | | 1,961 | | |
8.00%, 9/1/30 (a) | | | 8,134 | | | | 9,428 | | |
7.50%, 2/1/31 | | | 9,240 | | | | 10,425 | | |
7.00%, 2/1/32 – 6/1/32 (a) | | | 13,518 | | | | 15,958 | | |
5.00%, 12/1/34 – 3/1/40 | | | 52,522 | | | | 58,985 | | |
Series 2005-19, Class PB, 5.50%, 3/25/35 | | | 101,002 | | | | 113,957 | | |
1.91% (LIBOR12M+166bps), 12/1/36 (a) (e) | | | 25,114 | | | | 25,689 | | |
6.00%, 2/1/37 (a) | | | 47,979 | | | | 55,398 | | |
4.50%, 12/1/38 – 5/25/40 (a) | | | 201,673 | | | | 213,430 | | |
Series 2013-33, Class UD, 2.50%, 4/25/39 (a) | | | 31,588 | | | | 31,883 | | |
3.50%, 8/1/39 – 12/25/50 (a) | | | 352,825 | | | | 370,731 | | |
3.00%, 6/1/40 – 9/1/46 (a) | | | 638,049 | | | | 670,295 | | |
4.00%, 11/1/43 – 10/1/48 (a) | | | 394,568 | | | | 431,302 | | |
3.50%, 7/1/46 | | | 31,383 | | | | 33,985 | | |
Series 2017-96, Class DA, 2.50%, 12/25/47 (a) | | | 96,736 | | | | 98,267 | | |
3.00%, 5/1/48 | | | 66,201 | | | | 69,346 | | |
4.00%, 6/1/49 | | | 11,198 | | | | 11,928 | | |
2.00%, 3/1/51 (a) | | | 300,897 | | | | 300,882 | | |
2.00%, 3/25/51 (f) | | | 500,000 | | | | 496,426 | | |
| | | | 3,145,985 | | |
Government National Mortgage Association
6.00%, 12/15/33 (a) | | | 9,146 | | | | 10,494 | | |
Total U.S. Government Mortgage-Backed Agencies (Cost $5,335,231) | | | 5,386,373 | | |
See notes to financial statements.
35
Victory Portfolios
Victory INCORE Investment Quality Bond Fund | | Schedule of Portfolio Investments — continued
December 31, 2021 | |
Security Description | | Shares or
Principal
Amount | | Value | |
U.S. Treasury Obligations (3.5%) | |
U.S. Treasury Bonds
2.88%, 5/15/43 (a) | | $ | 38,000 | | | $ | 44,324 | | |
1.25%, 5/15/50 (a) | | | 473,000 | | | | 402,124 | | |
U.S. Treasury Notes
0.25%, 3/15/24 (a) | | | 155,000 | | | | 153,147 | | |
0.75%, 4/30/26 (a) | | | 163,000 | | | | 159,816 | | |
1.63%, 5/15/31 (a) | | | 107,000 | | | | 108,371 | | |
Total U.S. Treasury Obligations (Cost $867,824) | | | 867,782 | | |
Collateral for Securities Loaned (5.7%)^ | |
BlackRock Liquidity Funds TempFund, Institutional Shares, 0.04% (g) | | | 32,513 | | | | 32,513 | | |
Fidelity Investments Money Market Government Portfolio, Institutional
Shares, 0.01% (g) | | | 638,555 | | | | 638,555 | | |
Goldman Sachs Financial Square Prime Obligations Fund, Institutional
Shares, 0.02% (g) | | | 16,225 | | | | 16,225 | | |
JPMorgan Prime Money Market Fund, Capital Shares, 0.07% (g) | | | 129,377 | | | | 129,377 | | |
Morgan Stanley Institutional Liquidity Prime Portfolio, Institutional
Shares, 0.06% (g) | | | 581,704 | | | | 581,704 | | |
Total Collateral for Securities Loaned (Cost $1,398,374) | | | 1,398,374 | | |
Total Investments (Cost $24,604,390) — 102.9% | | | 25,328,450 | | |
Liabilities in excess of other assets — (2.9)% | | | (707,881 | ) | |
NET ASSETS — 100.00% | | $ | 24,620,569 | | |
^ Purchased with cash collateral from securities on loan.
(a) All or a portion of this security has been segregated as collateral for derivative instruments, delayed delivery and/or when-issued securities.
(b) Rule 144A security or other security that is restricted as to resale to institutional investors. The Fund's Adviser has deemed this security to be liquid (unless otherwise noted as illiquid) based upon procedures approved by the Board of Trustees. As of December 31, 2021, the fair value of these securities was $3,359,153 and amounted to 13.6% of net assets.
(c) Security is perpetual and has no final maturity date but may be subject to calls at various dates in the future.
(d) All or a portion of this security is on loan.
(e) Variable or Floating-Rate Security. Rate disclosed is as of December 31, 2021.
(f) Security or a portion of the security purchased on a delayed-delivery and/or when-issued basis.
(g) Rate disclosed is the daily yield on December 31, 2021.
bps — Basis points
LIBOR — London InterBank Offered Rate
LIBOR01M — 1 Month US Dollar LIBOR, rate disclosed as of December 31, 2021, based on the last reset date of the security
LIBOR12M — 12 Month US Dollar LIBOR, rate disclosed as of December 31, 2021, based on the last reset date of the security
LLC — Limited Liability Company
See notes to financial statements.
36
Victory Portfolios
Victory INCORE Investment Quality Bond Fund | | Schedule of Portfolio Investments — continued
December 31, 2021 | |
LP — Limited Partnership
MTN — Medium Term Note
PLC — Public Limited Company
SOFR — Secured Overnight Financing Rate
Futures Contracts Purchased
| | | Number of
Contracts | | Expiration
Date | | Notional
Amount | | Value | | Unrealized
Appreciation
(Depreciation) | |
2-Year U.S. Treasury Note Futures | | | 4 | | | 3/31/22 | | $ | 874,419 | | | $ | 872,688 | | | $ | (1,731 | ) | |
Canadian Dollar Futures | | | 5 | | | 3/15/22 | | | 392,650 | | | | 395,250 | | | | 2,600 | | |
Ultra Long Term U.S. Treasury
Bond Futures | | | 7 | | | 3/22/22 | | | 1,379,844 | | | | 1,379,875 | | | | 31 | | |
| | | $ | 900 | | |
Futures Contracts Sold
| | | Number of
Contracts | | Expiration
Date | | Notional
Amount | | Value | | Unrealized
Appreciation
(Depreciation) | |
10-Year U.S. Treasury Note Futures | | | 11 | | | 3/22/22 | | $ | 1,432,411 | | | $ | 1,435,156 | | | $ | (2,745 | ) | |
E-Mini S&P 500 Futures | | | 5 | | | 3/18/22 | | | 117,563 | | | | 118,963 | | | | (1,400 | ) | |
| | | $ | (4,145 | ) | |
Total unrealized appreciation | | $ | 2,631 | | |
Total unrealized depreciation | | | (5,876 | ) | |
Total net unrealized appreciation (depreciation) | | $ | (3,245 | ) | |
Centrally Cleared
Credit Default Swap Agreements — Sell Protection (a)
Underlying
Instruments | | Fixed
Deal
Receive
Rate | | Maturity
Date | | Payment
Frequency | | Implied
Credit
Spread at
December 31,
2021 (b) | | Notional
Amount (c) | | Value | | Premiums
Paid
(Received) | | Unrealized
Appreciation
(Depreciation) | |
CDX North
America
Investment
Grade Index;
Series 37 | | | 1.00 | % | | 12/20/26 | | Quarterly | | | 0.49 | % | | $ | 1,000,000 | | | $ | 24,452 | | | $ | 24,194 | | | $ | 258 | | |
| | | $ | 24,452 | | | $ | 24,194 | | | $ | 258 | | |
See notes to financial statements.
37
Victory Portfolios
Victory INCORE Investment Quality Bond Fund | | Schedule of Portfolio Investments — continued
December 31, 2021 | |
(a) When a credit event occurs as defined under the terms of the swap agreement, the Fund as a seller of credit protection will either (i) pay to the buyer of protection an amount equal to the par value of the defaulted reference entity or (ii) pay a net amount equal to the par value of the defaulted reference entity less its recovery value.
(b) Implied credit spread, represented in absolute terms, utilized in determining the value of the credit default swap agreements as of period end will serve as an indicator of the current status of the payment/performance risk and represent the likelihood or risk of default for the credit derivative. The implied credit spread of a referenced entity reflects the cost of buying/selling protection and may include payments required to be made to enter into the agreement. Generally, wider credit spreads represent a perceived deterioration of the referenced entity's credit soundness and a greater likelihood or risk of default or other credit event occurring as defined under the terms of the swap agreement.
(c) The notional amount represents the maximum potential amount the Fund could be required to pay as a seller of credit protection if a credit event occurs, as defined under the terms of the swap agreement, for each security included in the CDX North America High Yield Index.
See notes to financial statements.
38
Victory Portfolios
Victory INCORE Low Duration Bond Fund | | Schedule of Portfolio Investments
December 31, 2021 | |
Security Description | | Shares or
Principal
Amount | | Value | |
Asset-Backed Securities (5.8%) | |
AmeriCredit Automobile Receivables Trust, Series 2021-1, Class C, 0.89%,
10/19/26, Callable 4/18/24 @ 100 | | $ | 1,815,000 | | | $ | 1,801,759 | | |
GM Financial Automobile Leasing Trust, Series 2021-1, Class C, 0.70%,
2/20/25, Callable 8/20/23 @ 100 | | | 1,168,000 | | | | 1,158,869 | | |
GM Financial Consumer Automobile Receivables Trust, Series 2021-2,
Class C, 1.28%, 1/19/27, Callable 10/16/24 @ 100 | | | 886,000 | | | | 873,596 | | |
JPMorgan Chase Bank NA, Series 2021-2, Class B, 0.89%, 12/26/28,
Callable 8/25/24 @ 100 (a) | | | 945,985 | | | | 940,835 | | |
Santander Drive Auto Receivables Trust, Series 2021-1, Class C, 0.75%,
2/17/26, Callable 9/15/23 @ 100 | | | 1,144,000 | | | | 1,141,550 | | |
Santander Drive Auto Receivables Trust, Series 2021-2, Class C, 0.90%,
6/15/26, Callable 1/15/24 @ 100 | | | 1,125,000 | | | | 1,123,881 | | |
Santander Drive Auto Receivables Trust, Series 2021-3, Class C, 0.95%,
9/15/27, Callable 2/15/24 @ 100 | | | 915,000 | | | | 911,703 | | |
Santander Retail Auto Lease Trust, Series 2021-A, Class C, 1.14%,
3/20/26, Callable 4/20/24 @ 100 (a) (b) | | | 2,200,000 | | | | 2,179,193 | | |
Westlake Automobile Receivables Trust, Series 2021-1A, Class C, 0.95%,
3/16/26, Callable 3/15/24 @ 100 (a) | | | 1,230,000 | | | | 1,221,593 | | |
Westlake Automobile Receivables Trust, Series 2021-2A, Class C, 0.89%,
7/15/26, Callable 10/15/24 @ 100 (a) | | | 1,223,000 | | | | 1,201,810 | | |
Total Asset-Backed Securities (Cost $12,650,798) | | | 12,554,789 | | |
Collateralized Mortgage Obligations (3.1%) | |
Galaxy CLO Ltd., Series 2017-24A, Class A, 1.24% (LIBOR03M+112bps),
1/15/31, Callable 1/15/22 @ 100 (a) (b) (c) | | | 2,000,000 | | | | 1,995,810 | | |
Steele Creek CLO Ltd., Series 2017-1A, Class A, 1.37% (LIBOR03M+125bps),
1/15/30, Callable 1/15/22 @ 100 (a) (b) (c) | | | 2,825,000 | | | | 2,816,378 | | |
Voya CLO Ltd., Series 2017-4A, Class A1, 1.25% (LIBOR03M+113bps),
10/15/30, Callable 1/15/22 @ 100 (a) (b) (c) | | | 2,000,000 | | | | 2,000,106 | | |
Total Collateralized Mortgage Obligations (Cost $6,825,000) | | | 6,812,294 | | |
Preferred Stocks (3.3%) | |
Financials (1.5%): | |
AMG Capital Trust II, 10/15/37, 5.15% | | | 13,990 | | | | 818,100 | | |
Bank of America Corp., Series L, 7.25% (b) (d) | | | 655 | | | | 946,737 | | |
KKR & Co., Inc., Series C, 9/15/23, 6.00% (e) | | | 6,495 | | | | 605,009 | | |
Wells Fargo & Co., Series L, 7.50% (d) | | | 550 | | | | 819,792 | | |
| | | | 3,189,638 | | |
Health Care (0.1%): | |
Danaher Corp., Series B, 4/15/23, 5.00% (e) | | | 146 | | | | 253,773 | | |
Industrials (0.3%): | |
Stanley Black & Decker, Inc., 11/15/22, 5.25% (e) | | | 6,815 | | | | 744,130 | | |
Utilities (1.4%): | |
American Electric Power Co., Inc., 8/15/23, 6.13% (e) | | | 3,530 | | | | 185,678 | | |
CenterPoint Energy, Inc., 9/15/29, 4.57% | | | 3,880 | | | | 225,777 | | |
See notes to financial statements.
39
Victory Portfolios
Victory INCORE Low Duration Bond Fund | | Schedule of Portfolio Investments — continued
December 31, 2021 | |
Security Description | | Shares or
Principal
Amount | | Value | |
| Dominion Energy, Inc., Series A, 6/1/22, 7.25% | | | 6,660 | | | $ | 670,262 | | |
DTE Energy Co., 11/1/22, 6.25% | | | 10,175 | | | | 522,384 | | |
NextEra Energy, Inc., 3/1/23, 5.28% | | | 14,070 | | | | 809,588 | | |
NiSource, Inc., 3/1/24, 7.75% | | | 735 | | | | 82,313 | | |
The Southern Co., Series 2019, 8/1/22, 6.75% | | | 8,901 | | | | 478,429 | | |
| | | | 2,974,431 | | |
Total Preferred Stocks (Cost $6,609,655) | | | 7,161,972 | | |
Corporate Bonds (53.4%) | |
Communication Services (2.9%): | |
AT&T, Inc., 1.70%, 3/25/26, Callable 3/25/23 @ 100 | | $ | 2,500,000 | | | | 2,489,700 | | |
CenturyLink, Inc., 6.75%, 12/1/23 | | | 424,000 | | | | 457,543 | | |
Charter Communications Operating LLC/Charter Communications
Operating Capital, 4.50%, 2/1/24, Callable 1/1/24 @ 100 | | | 496,000 | | | | 527,278 | | |
Fox Corp., 4.03%, 1/25/24, Callable 12/25/23 @ 100 | | | 1,388,000 | | | | 1,466,352 | | |
Verizon Communications, Inc.
3.38%, 2/15/25 (b) | | | 354,000 | | | | 376,259 | | |
1.26% (LIBOR03M+110bps), 5/15/25, Callable 3/15/25 @ 100 (b) (c) | | | 827,000 | | | | 842,399 | | |
| | | | 6,159,531 | | |
Consumer Discretionary (8.8%): | |
Amazon.com, Inc., 1.00%, 5/12/26, Callable 4/12/26 @ 100 | | | 2,500,000 | | | | 2,474,275 | | |
AutoZone, Inc., 3.13%, 4/18/24, Callable 3/18/24 @ 100 | | | 2,632,000 | | | | 2,742,097 | | |
Booking Holdings, Inc., 0.75%, 5/1/25 (b) (e) | | | 525,000 | | | | 772,716 | | |
D.R. Horton, Inc., 4.75%, 2/15/23, Callable 11/15/22 @ 100 (b) | | | 3,027,000 | | | | 3,126,588 | | |
Expedia Group, Inc.
3.60%, 12/15/23, Callable 11/15/23 @ 100 | | | 1,020,000 | | | | 1,060,392 | | |
2/15/26 (a) (e) | | | 590,000 | | | | 681,774 | | |
Ford Motor Co., 3/15/26 (a) | | | 290,000 | | | | 399,078 | | |
General Motors Co., 4.88%, 10/2/23 (b) | | | 1,297,000 | | | | 1,377,855 | | |
Hilton Worldwide Finance LLC/Hilton Worldwide Finance Corp., 4.88%,
4/1/27, Callable 4/1/22 @ 102.44 | | | 620,000 | | | | 640,169 | | |
Kohl's Corp., 4.25%, 7/17/25, Callable 4/17/25 @ 100 | | | 1,194,000 | | | | 1,278,965 | | |
Marriott International, Inc., 3.60%, 4/15/24, Callable 3/15/24 @ 100 | | | 1,247,000 | | | | 1,305,946 | | |
NVR, Inc., 3.95%, 9/15/22, Callable 6/15/22 @ 100 (b) | | | 3,283,000 | | | | 3,330,242 | | |
| | | | 19,190,097 | | |
Consumer Staples (2.1%): | |
7-Eleven, Inc., 0.80%, 2/10/24, Callable 2/10/22 @ 100 (a)(b) | | | 1,372,000 | | | | 1,356,249 | | |
Altria Group, Inc., 4.40%, 2/14/26, Callable 12/14/25 @ 100 (b) | | | 322,000 | | | | 353,608 | | |
Church & Dwight Co., Inc., 2.45%, 8/1/22, Callable 7/1/22 @ 100 (b) | | | 792,000 | | | | 799,397 | | |
Keurig Dr Pepper, Inc., 4.06%, 5/25/23, Callable 4/25/23 @ 100 (b) | | | 695,000 | | | | 724,308 | | |
Tyson Foods, Inc., 3.95%, 8/15/24, Callable 5/15/24 @ 100 | | | 1,170,000 | | | | 1,244,482 | | |
| | | | 4,478,044 | | |
Energy (3.0%): | |
Boardwalk Pipelines LP, 3.38%, 2/1/23, Callable 11/1/22 @ 100 | | | 400,000 | | | | 407,268 | | |
Continental Resources, Inc.
4.50%, 4/15/23, Callable 1/15/23 @ 100 (b) | | | 801,000 | | | | 826,952 | | |
2.27%, 11/15/26, Callable 11/15/23 @ 100 (a)(e) | | | 797,000 | | | | 791,453 | | |
See notes to financial statements.
40
Victory Portfolios
Victory INCORE Low Duration Bond Fund | | Schedule of Portfolio Investments — continued
December 31, 2021 | |
Security Description | | Principal
Amount | | Value | |
EQM Midstream Partners LP, 4.75%, 7/15/23, Callable 6/15/23 @ 100 (b) | | $ | 329,000 | | | $ | 341,861 | | |
HollyFrontier Corp., 2.63%, 10/1/23 | | | 971,000 | | | | 990,139 | | |
Pioneer Natural Resources Co.
0.55%, 5/15/23 | | | 1,130,000 | | | | 1,125,853 | | |
0.25%, 5/15/25 (b) | | | 595,000 | | | | 1,064,419 | | |
Plains All American Pipeline LP/PAA Finance Corp., 2.85%, 1/31/23,
Callable 10/31/22 @ 100 (b) | | | 1,010,000 | | | | 1,024,554 | | |
| | | | 6,572,499 | | |
Financials (13.6%): | |
Ares Capital Corp., 4.63%, 3/1/24 | | | 730,000 | | | | 832,441 | | |
Bank of America Corp.
4.20%, 8/26/24 (b) | | | 1,660,000 | | | | 1,778,790 | | |
1.53% (SOFR+65bps), 12/6/25, Callable 12/6/24 @ 100, MTN (c) | | | 1,350,000 | | | | 1,353,442 | | |
Capital One Financial Corp.
3.30%, 10/30/24, Callable 9/30/24 @ 100 (b) | | | 684,000 | | | | 721,025 | | |
1.34%, 12/6/24, Callable 12/6/23 @ 100 | | | 1,695,000 | | | | 1,705,662 | | |
Citigroup, Inc., 3.11% (SOFR+284bps), 4/8/26, Callable 4/8/25 @ 100 (c) | | | 2,772,000 | | | | 2,906,248 | | |
Dana Financing Luxembourg Sarl, 5.75%, 4/15/25,
Callable 2/7/22 @ 102.88 (a)(b) | | | 772,000 | | | | 792,257 | | |
Fifth Third Bancorp
1.63%, 5/5/23, Callable 4/5/23 @ 100 | | | 1,660,000 | | | | 1,675,587 | | |
3.65%, 1/25/24, Callable 12/25/23 @ 100 (b) | | | 799,000 | | | | 837,656 | | |
Ford Motor Credit Co. LLC, 3.10%, 5/4/23 (b) | | | 1,500,000 | | | | 1,526,640 | | |
General Motors Financial Co., Inc., 5.10%, 1/17/24,
Callable 12/17/23 @ 100 | | | 1,549,000 | | | | 1,661,008 | | |
Harley-Davidson Financial Services, Inc., 3.35%, 2/15/23,
Callable 1/15/23 @ 100 (a) | | | 1,488,000 | | | | 1,519,858 | | |
JPMorgan Chase & Co., 2.30%, 10/15/25, Callable 10/15/24 @ 100 | | | 3,000,000 | | | | 3,066,660 | | |
JPMorgan Chase Financial Co. LLC, 0.25%, 5/1/23 (a) | | | 800,000 | | | | 884,720 | | |
Morgan Stanley
4.88%, 11/1/22 (b) | | | 1,004,000 | | | | 1,038,236 | | |
0.53%, 1/25/24, Callable 1/25/23 @ 100 (c) | | | 2,575,000 | | | | 2,566,245 | | |
Sixth Street Specialty Lending, Inc., 4.50%, 8/1/22 | | | 300,000 | | | | 369,255 | | |
The Bank of New York Mellon Corp., 0.75%, 1/28/26, MTN,
Callable 12/28/25 @ 100 (e) | | | 1,097,000 | | | | 1,067,919 | | |
The Goldman Sachs Group, Inc., 1.89% (LIBOR03M+175bps), 10/28/27,
Callable 10/28/26 @ 100 (b) (c) | | | 1,500,000 | | | | 1,572,375 | | |
Wells Fargo & Co., 0.81%, 5/19/25, MTN, Callable 5/19/24 @ 100 | | | 585,000 | | | | 578,448 | | |
Zions Bancorp NA, 3.35%, 3/4/22, Callable 2/7/22 @ 100 | | | 1,090,000 | | | | 1,092,496 | | |
| | | | 29,546,968 | | |
Health Care (6.2%): | |
AbbVie, Inc., 3.85%, 6/15/24, Callable 3/15/24 @ 100 | | | 2,545,000 | | | | 2,690,752 | | |
Anthem, Inc., 2.75%, 10/15/42 | | | 110,000 | | | | 722,982 | | |
Biogen, Inc., 3.63%, 9/15/22 | | | 1,025,000 | | | | 1,046,002 | | |
Centene Corp., 4.25%, 12/15/27, Callable 12/15/22 @ 102.13 | | | 621,000 | | | | 649,622 | | |
HCA, Inc., 5.00%, 3/15/24 | | | 2,479,000 | | | | 2,666,908 | | |
Humana, Inc., 2.90%, 12/15/22, Callable 11/15/22 @ 100 (b) | | | 560,000 | | | | 570,931 | | |
Illumina, Inc., 8/15/23 (e) | | | 530,000 | | | | 607,883 | | |
Mylan, Inc., 3.13%, 1/15/23 (a) | | | 2,479,000 | | | | 2,533,935 | | |
See notes to financial statements.
41
Victory Portfolios
Victory INCORE Low Duration Bond Fund | | Schedule of Portfolio Investments — continued
December 31, 2021 | |
Security Description | | Principal
Amount | | Value | |
Universal Health Services, Inc., 1.65%, 9/1/26,
Callable 8/1/26 @ 100 (a) | | $ | 1,387,000 | | | $ | 1,363,768 | | |
Viatris, Inc., 1.13%, 6/22/22 | | | 525,000 | | | | 526,066 | | |
| | | | 13,378,849 | | |
Industrials (4.3%): | |
Air Lease Corp., 0.70%, 2/15/24, MTN, Callable 1/15/24 @ 100 (e) | | | 2,480,000 | | | | 2,443,023 | | |
Delta Air Lines, Inc., 3.80%, 4/19/23, Callable 3/19/23 @ 100 (b) | | | 1,115,000 | | | | 1,138,995 | | |
EnPro Industries, Inc., 5.75%, 10/15/26, Callable 2/7/22 @ 104.31 (b) | | | 725,000 | | | | 758,778 | | |
Fortive Corp., 0.88%, 2/15/22 (b) | | | 1,005,000 | | | | 1,005,593 | | |
Roper Technologies, Inc., 0.45%, 8/15/22 | | | 1,019,000 | | | | 1,018,715 | | |
Southwest Airlines Co.
4.75%, 5/4/23 | | | 1,937,000 | | | | 2,029,182 | | |
1.25%, 5/1/25 (b) | | | 710,000 | | | | 947,665 | | |
| | | | 9,341,951 | | |
Information Technology (4.7%): | |
Akamai Technologies, Inc., 0.13%, 5/1/25 | | | 375,000 | | | | 491,782 | | |
Block, Inc., 0.25%, 11/1/27 (e) | | | 195,000 | | | | 206,822 | | |
Broadcom Corp./Broadcom Cayman Finance Ltd., 3.63%, 1/15/24,
Callable 11/15/23 @ 100 (b) (e) | | | 2,175,000 | | | | 2,276,159 | | |
Cadence Design Systems, Inc., 4.38%, 10/15/24, Callable 7/15/24 @ 100 (b) | | | 1,173,000 | | | | 1,261,116 | | |
Euronet Worldwide, Inc., 0.75%, 3/15/49, Callable 3/20/25 @ 100 (e) | | | 730,000 | | | | 790,583 | | |
KLA Corp., 4.65%, 11/1/24, Callable 8/1/24 @ 100 | | | 496,000 | | | | 537,793 | | |
Marvell Technology Group Ltd., 4.20%, 6/22/23, Callable 5/22/23 @ 100 | | | 941,000 | | | | 977,671 | | |
NCR Corp., 5.00%, 10/1/28, Callable 10/1/23 @ 102.5 (a) | | | 642,000 | | | | 661,555 | | |
PayPal Holdings, Inc., 2.20%, 9/26/22 (b) | | | 757,000 | | | | 766,387 | | |
Seagate HDD Cayman, 4.88%, 3/1/24, Callable 1/1/24 @ 100 | | | 1,000,000 | | | | 1,060,300 | | |
Vishay Intertechnology, Inc., 2.25%, 6/15/25 | | | 225,000 | | | | 233,006 | | |
Western Digital Corp., 1.50%, 2/1/24 (b) | | | 995,000 | | | | 1,009,288 | | |
| | | | 10,272,462 | | |
Materials (2.9%): | |
Celanese US Holdings LLC, 4.63%, 11/15/22 (b)(e) | | | 855,000 | | | | 882,215 | | |
Graphic Packaging International LLC, 0.82%, 4/15/24,
Callable 3/15/24 @ 100 (a) | | | 1,987,000 | | | | 1,955,943 | | |
Nucor Corp., 4.00%, 8/1/23, Callable 5/1/23 @ 100 | | | 1,190,000 | | | | 1,240,968 | | |
Southern Copper Corp., 3.88%, 4/23/25 | | | 2,050,000 | | | | 2,194,832 | | |
| | | | 6,273,958 | | |
Real Estate (2.6%): | |
American Tower Corp., 3.00%, 6/15/23 (b) | | | 1,000,000 | | | | 1,028,200 | | |
Brandywine Operating Partnership LP, 3.95%, 2/15/23, Callable 11/15/22 @ 100 | | | 750,000 | | | | 768,308 | | |
Iron Mountain, Inc., 5.25%, 7/15/30, Callable 7/15/25 @ 102.63 (a) | | | 638,000 | | | | 672,809 | | |
Kite Realty Group LP, 0.75%, 4/1/27 (a) | | | 435,000 | | | | 451,560 | | |
Piedmont Operating Partnership LP, 3.40%, 6/1/23, Callable 3/1/23 @ 100 (b) | | | 1,629,000 | | | | 1,669,937 | | |
Post Apartment Homes LP, 3.38%, 12/1/22, Callable 9/1/22 @ 100 | | | 250,000 | | | | 253,943 | | |
Weingarten Realty Investors
3.38%, 10/15/22, Callable 7/15/22 @ 100 (b) | | | 365,000 | | | | 369,880 | | |
3.50%, 4/15/23, Callable 1/15/23 @ 100 | | | 497,000 | | | | 509,842 | | |
| | | | 5,724,479 | | |
See notes to financial statements.
42
Victory Portfolios
Victory INCORE Low Duration Bond Fund | | Schedule of Portfolio Investments — continued
December 31, 2021 | |
Security Description | | Principal
Amount | | Value | |
Utilities (2.3%): | |
Ameren Corp., 2.50%, 9/15/24, Callable 8/15/24 @ 100 | | $ | 588,000 | | | $ | 604,199 | | |
Exelon Corp.
3.50%, 6/1/22, Callable 5/1/22 @ 100 (b) | | | 2,681,000 | | | | 2,705,183 | | |
3.95%, 6/15/25, Callable 3/15/25 @ 100 (b) | | | 591,000 | | | | 633,126 | | |
NextEra Energy Capital Holdings, Inc., 0.65%, 3/1/23 | | | 1,129,000 | | | | 1,126,663 | | |
| | | | 5,069,171 | | |
Total Corporate Bonds (Cost $114,227,378) | | | 116,008,009 | | |
Residential Mortgage-Backed Securities (3.0%) | |
Bear Stearns Alt-A Trust, Series 2003-3, Class 2A, 2.74%, 10/25/33,
Callable 1/25/22 @ 100 (b) (f) | | | 1,117,894 | | | | 1,117,894 | | |
Credit Suisse First Boston Mortgage Securities Corp., Series 2003-23,
Class 2A8, 4.50%, 10/31/33 (b) | | | 13,087 | | | | 14,028 | | |
Credit Suisse First Boston Mortgage Securities Corp., Series 2004-AR7,
Class 4A1, 2.46%, 11/25/34, Callable 1/25/22 @ 100 (b) (f) | | | 831,618 | | | | 831,618 | | |
GSR Mortgage Loan Trust, Series 2004-15F, Class 5A1, 5.50%, 10/25/20 (b) | | | 15,575 | | | | 14,992 | | |
JPMorgan Mortgage Trust, Series 2004-S2, Class 1A3, 4.75%, 11/25/34,
Callable 1/25/22 @ 100 (b) | | | 6,680 | | | | 4,702 | | |
JPMorgan Mortgage Trust, Series 2004-S1, Class 1A7, 5.00%, 9/25/34,
Callable 1/25/22 @ 100 (b) | | | 44,062 | | | | 44,062 | | |
JPMorgan Mortgage Trust, Series 2014-5, Class A11, 2.87%, 10/25/29,
Callable 9/25/23 @ 100 (a) (b) (f) | | | 1,614,199 | | | | 1,622,668 | | |
JPMorgan Mortgage Trust, Series 2017-3, Class 2A2, 2.50%, 8/25/47,
Callable 6/25/23 @ 100 (a) (b) (f) | | | 759,064 | | | | 760,687 | | |
Madison Park Funding Ltd., Series 2007-4A, Class AR, 1.33%
(LIBOR03M+120bps), 7/29/30, Callable 1/29/22 @ 100 (a) (b) (c) | | | 2,250,000 | | | | 2,250,527 | | |
| Total Residential Mortgage-Backed Securities (Cost $6,669,095) | | | 6,661,178 | | |
Yankee Dollars (12.1%) | |
Communication Services (0.2%): | |
SES SA, 3.60%, 4/4/23 (a) | | | 503,000 | | | | 517,949 | | |
Consumer Discretionary (1.0%): | |
Stellantis NV, 5.25%, 4/15/23 | | | 2,048,000 | | | | 2,151,875 | | |
Consumer Staples (4.4%): | |
Barry Callebaut Services NV, 5.50%, 6/15/23 (a) | | | 2,346,000 | | | | 2,489,880 | | |
Heineken NV, 3.40%, 4/1/22 (a) | | | 1,570,000 | | | | 1,581,131 | | |
Kerry Group Financial Services Unlimited Co., 3.20%, 4/9/23,
Callable 1/9/23 @ 100 (a) (b) | | | 2,391,000 | | | | 2,446,638 | | |
Pernod Ricard SA, 4.25%, 7/15/22 (a) (b) | | | 833,000 | | | | 848,877 | | |
Suntory Holdings Ltd., 2.55%, 6/28/22, Callable 5/28/22 @ 100 (a) (b) | | | 2,122,000 | | | | 2,136,451 | | |
| | | | 9,502,977 | | |
See notes to financial statements.
43
Victory Portfolios
Victory INCORE Low Duration Bond Fund | | Schedule of Portfolio Investments — continued
December 31, 2021 | |
| Security Description | | Principal
Amount | | Value | |
Energy (1.6%): | |
Canadian Natural Resources Ltd.
2.95%, 1/15/23, Callable 12/15/22 @ 100 | | $ | 1,305,000 | | | $ | 1,329,169 | | |
3.80%, 4/15/24, Callable 1/15/24 @ 100 (e) | | | 1,180,000 | | | | 1,237,360 | | |
| Ecopetrol SA, 5.88%, 9/18/23 (b) | | | 846,000 | | | | 897,005 | | |
| | | | 3,463,534 | | |
Financials (2.4%): | |
Barclays Bank PLC
2/4/25 (b) | | | 270,000 | | | | 459,416 | | |
2/18/25 | | | 230,000 | | | | 261,514 | | |
HSBC Holdings PLC, 1.16% (SOFR+58bps), 11/22/24,
Callable 11/22/23 @ 100 (c) | | | 1,000,000 | | | | 997,050 | | |
NXP BV/NXP Funding LLC, 4.63%, 6/1/23 (a) (b) | | | 3,406,000 | | | | 3,566,491 | | |
| | | | 5,284,471 | | |
Industrials (0.8%): | |
AerCap Ireland Capital DAC/AerCap Global Aviation Trust, 1.75%, 1/30/26,
Callable 12/30/25 @ 100 | | | 1,100,000 | | | | 1,080,596 | | |
Sensata Technologies BV, 4.00%, 4/15/29, Callable 4/15/24 @ 102 (a) | | | 606,000 | | | | 618,920 | | |
| | | | 1,699,516 | | |
Materials (1.4%): | |
Anglo American Capital PLC, 3.63%, 9/11/24 (a) | | | 2,880,000 | | | | 3,023,741 | | |
Utilities (0.3%): | |
Enel Generacion Chile SA, 4.25%, 4/15/24, Callable 1/15/24 @ 100 (e) | | | 655,000 | | | | 684,540 | | |
Total Yankee Dollars (Cost $26,236,111) | | | 26,328,603 | | |
U.S. Government Mortgage-Backed Agencies (4.5%) | |
Federal Home Loan Mortgage Corp.
5.00%, 6/15/23 – 8/1/40 (b) | | | 509,247 | | | | 571,533 | | |
5.50%, 10/25/23 (b) | | | 1,517 | | | | 1,557 | | |
7.00%, 9/1/38 (b) | | | 2,440 | | | | 2,854 | | |
Series 4320, Class AP, 3.50%, 7/15/39 (b) | | | 776,935 | | | | 821,008 | | |
Series 3713, Class PA, 2.00%, 2/15/40 – 3/15/40 (b) | | | 2,304,739 | | | | 2,328,399 | | |
Series 4444, Class CH, 3.00%, 1/15/41 (b) | | | 413,207 | | | | 417,682 | | |
Series 4049, Class AB, 2.75%, 12/15/41 (b) | | | 142,623 | | | | 144,031 | | |
| | | | 4,287,064 | | |
Federal National Mortgage Association
6.00%, 2/1/37 (b) | | | 831,688 | | | | 960,305 | | |
Series 2013-33, Class UD, 2.50%, 4/25/39 (b) | | | 338,120 | | | | 341,273 | | |
Series 2011-21, Class PA, 4.50%, 5/25/40 (b) | | | 1,745,602 | | | | 1,831,225 | | |
Series 2011-101, Class LA, 3.00%, 10/25/40 (b) | | | 133,168 | | | | 134,144 | | |
5.00%, 2/1/41 – 10/1/41 (b) | | | 1,947,817 | | | | 2,185,362 | | |
| | | | 5,452,309 | | |
Total U.S. Government Mortgage-Backed Agencies (Cost $9,615,399) | | | 9,739,373 | | |
See notes to financial statements.
44
Victory Portfolios
Victory INCORE Low Duration Bond Fund | | Schedule of Portfolio Investments — continued
December 31, 2021 | |
Security Description | | Shares or
Principal
Amount | | Value | |
U.S. Treasury Obligations (3.1%) | |
U.S. Treasury Notes
0.13%, 2/15/24 | | $ | 2,271,000 | | | $ | 2,241,371 | | |
0.38%, 7/15/24 | | | 1,477,000 | | | | 1,458,768 | | |
0.75%, 11/15/24 (b) | | | 3,000,000 | | | | 2,983,828 | | |
Total U.S. Treasury Obligations (Cost $6,706,691) | | | 6,683,967 | | |
Collateral for Securities Loaned (2.8%)^ | |
BlackRock Liquidity Funds TempFund, Institutional Shares, 0.04% (g) | | | 141,342 | | | | 141,342 | | |
Fidelity Investments Money Market Government Portfolio, Institutional
Shares, 0.01% (g) | | | 2,775,971 | | | | 2,775,971 | | |
Goldman Sachs Financial Square Prime Obligations Fund, Institutional
Shares, 0.02% (g) | | | 70,537 | | | | 70,537 | | |
JPMorgan Prime Money Market Fund, Capital Shares, 0.07% (g) | | | 562,436 | | | | 562,436 | | |
Morgan Stanley Institutional Liquidity Prime Portfolio, Institutional
Shares, 0.06% (g) | | | 2,528,824 | | | | 2,528,824 | | |
Total Collateral for Securities Loaned (Cost $6,079,110) | | | 6,079,110 | | |
Total Investments (Cost $195,619,237) — 91.1% | | | 198,029,295 | | |
Other assets in excess of liabilities — 8.9% | | | 19,257,624 | | |
NET ASSETS — 100.00% | | $ | 217,286,919 | | |
^ Purchased with cash collateral from securities on loan.
(a) Rule 144A security or other security that is restricted as to resale to institutional investors. The Fund's Adviser has deemed this security to be liquid (unless otherwise noted as illiquid) based upon procedures approved by the Board of Trustees. As of December 31, 2021, the fair value of these securities was $48,284,644 and amounted to 22.2% of net assets.
(b) All or a portion of this security has been segregated as collateral for derivative instruments.
(c) Variable or Floating-Rate Security. Rate disclosed is as of December 31, 2021.
(d) Security is perpetual and has no final maturity date but may be subject to calls at various dates in the future.
(e) All or a portion of this security is on loan.
(f) The rate for certain asset-backed and mortgage-backed securities may vary based on factors relating to the pool of assets underlying the security. The rate disclosed is the rate in effect at December 31, 2021.
(g) Rate disclosed is the daily yield on December 31, 2021.
bps — Basis points
LIBOR — London InterBank Offered Rate
LIBOR03M — 3 Month US Dollar LIBOR, rate disclosed as of December 31, 2021, based on the last reset date of the security
LLC — Limited Liability Company
LP — Limited Partnership
MTN — Medium Term Note
PLC — Public Limited Company
SOFR — Secured Overnight Financing Rate
See notes to financial statements.
45
Victory Portfolios
Victory INCORE Low Duration Bond Fund | | Schedule of Portfolio Investments — continued
December 31, 2021 | |
Futures Contracts Purchased
| | | Number of
Contracts | | Expiration
Date | | Notional
Amount | | Value | | Unrealized
Appreciation
(Depreciation) | |
2-Year U.S. Treasury Note Futures | | | 39 | | | 3/31/22 | | $ | 8,525,583 | | | $ | 8,508,704 | | | $ | (16,879 | ) | |
Canadian Dollar Futures | | | 39 | | | 3/15/22 | | | 3,062,670 | | | | 3,082,950 | | | | 20,280 | | |
| | | $ | 3,401 | | |
Futures Contracts Sold
| | | Number of
Contracts | | Expiration
Date | | Notional
Amount | | Value | | Unrealized
Appreciation
(Depreciation) | |
10-Year U.S. Treasury Note Futures | | | 22 | | | 3/22/22 | | $ | 2,860,815 | | | $ | 2,870,313 | | | $ | (9,498 | ) | |
5-Year U.S. Treasury Note Futures | | | 86 | | | 3/31/22 | | | 10,408,569 | | | | 10,403,984 | | | | 4,585 | | |
Ultra Long Term U.S. Treasury
Bond Futures | | | 5 | | | 3/22/22 | | | 982,834 | | | | 985,625 | | | | (2,791 | ) | |
| | | $ | (7,704 | ) | |
Total unrealized appreciation | | $ | 24,865 | | |
Total unrealized depreciation | | | (29,168 | ) | |
Total net unrealized appreciation (depreciation) | | $ | (4,303 | ) | |
Centrally Cleared
Credit Default Swap Agreements — Sell Protection (a)
Underlying
Instruments | | Fixed
Deal
Receive
Rate | | Maturity
Date | | Payment
Frequency | | Implied
Credit
Spread at
December 31,
2021 (b) | | Notional
Amount (c) | | Value | | Premiums
Paid
(Received) | | Unrealized
Appreciation
(Depreciation) | |
CDX North
America High
Yield Index;
Series 37 | | | 5.00 | % | | 12/20/26 | | Quarterly | | | 2.92 | % | | $ | 8,000,000 | | | $ | 731,111 | | | $ | 689,600 | | | $ | 41,511 | | |
| | | $ | 731,111 | | | $ | 689,600 | | | $ | 41,511 | | |
(a) When a credit event occurs as defined under the terms of the swap agreement, the Fund as a seller of credit protection will either (i) pay to the buyer of protection an amount equal to the par value of the defaulted reference entity or (ii) pay a net amount equal to the par value of the defaulted reference entity less its recovery value.
(b) Implied credit spread, represented in absolute terms, utilized in determining the value of the credit default swap agreements as of period end will serve as an indicator of the current status of the payment/performance risk and represent the likelihood or risk of default for the credit derivative. The implied credit spread of a referenced entity reflects the cost of buying/selling protection and may include payments required to be made to enter into the agreement. Generally, wider credit spreads represent a perceived deterioration of the referenced entity's credit soundness and a greater likelihood or risk of default or other credit event occurring as defined under the terms of the swap agreement.
(c) The notional amount represents the maximum potential amount the Fund could be required to pay as a seller of credit protection if a credit event occurs, as defined under the terms of the swap agreement, for each security included in the CDX North America High Yield Index.
See notes to financial statements.
46
Victory Portfolios
Victory High Yield Fund | | Schedule of Portfolio Investments
December 31, 2021 | |
Security Description | | Shares or
Principal
Amount | | Value | |
Common Stocks (0.7%) | |
Communication Services (0.6%): | |
iHeartMedia, Inc., Class A (a) | | | 30,500 | | | $ | 641,720 | | |
Nexstar Media Group, Inc., Class A | | | 3,991 | | | | 602,561 | | |
Sinclair Broadcast Group, Inc., Class A | | | 17,500 | | | | 462,525 | | |
| | | | 1,706,806 | | |
Consumer Discretionary (0.0%): (i) | |
Men's Wearhouse, Inc. (k) | | | 31,563 | | | | 38,128 | | |
Health Care (0.1%): | |
Surgery Partners, Inc. (a) | | | 9,390 | | | | 501,520 | | |
Total Common Stocks (Cost $2,002,615) | | | 2,246,454 | | |
Senior Secured Loans (22.5%) | |
Air Canada, Term Loan, First Lien, 4.25%
(LIBOR06M+350bps), 7/27/28 (b) | | $ | 4,200,000 | | | | 4,182,738 | | |
Air Medical Group Holdings, Inc., Incremental Term Loan B, First Lien, 5.25%
(LIBOR06M+425bps), 3/14/25 (b) | | | 1,994,855 | | | | 1,985,240 | | |
Air Methods Corp., Initial Term Loans, First Lien, 4.50%
(LIBOR03M+350bps), 4/21/24 (b) | | | 1,958,974 | | | | 1,857,186 | | |
Caesars Resort Collection LLC, Term B-1 Loans, First Lien, 3.59%
(LIBOR01M+350bps), 6/19/25 (b) | | | 1,975,000 | | | | 1,974,506 | | |
Chariot Buyer LLC, Initial Term Loans, First Lien, 4.00%
(LIBOR01M+350bps), 11/3/28 (b) | | | 1,500,000 | | | | 1,498,125 | | |
CP Atlas Buyer, Inc., Term B Loans, First Lien, 4.25%
(LIBOR01M+375bps), 11/23/27 (b) | | | 1,995,106 | | | | 1,984,133 | | |
Dayco Products LLC, Term Loans, First Lien, 4.43%
(LIBOR03M+425bps), 5/19/24 (b) | | | 955,000 | | | | 935,900 | | |
Dynasty Acquisition Co., Inc., 2020 Specified Refi Term B-1 Loans,
First Lien, 3.63% (LIBOR03M+350bps), 4/8/26 (b) | | | 1,527,951 | | | | 1,484,313 | | |
Endo Luxembourg Finance Co. I S.a.r.l., Term B-1, First Lien, 5.75%
(LIBOR03M+500bps), 3/25/28 (b) | | | 3,479,981 | | | | 3,377,322 | | |
Global Medical Response, Inc., 2020 Term Loan, First Lien, 5.25%
(LIBOR06M+425bps), 10/2/25 (b) | | | 992,481 | | | | 987,271 | | |
Golden Nugget, Inc., Senior Secured Term Loan, First Lien, 3.25%
(LIBOR03M+250bps), 10/4/23 (b) | | | 1,966,334 | | | | 1,952,471 | | |
Great Outdoors Group LLC, Term B1, First Lien, 4.50%
(LIBOR01M+375bps), 3/5/28 (b) | | | 3,618,431 | | | | 3,619,191 | | |
Hertz Corp., Initial Term B Loans, First Lien, 6/14/28 (c) (d) | | | 841,424 | | | | 841,424 | | |
Hertz Corp., Initial Term C Loans, First Lien, 6/14/28 (c) (d) | | | 158,576 | | | | 158,576 | | |
Holley Purchaser, Inc., Delayed Draw Term Commitment, First Lien, 4.50%
(LIBOR03M+375bps), 11/12/28 (b) (j) | | | 392,563 | | | | 392,097 | | |
Holley Purchaser, Inc., Initial Term Loan, First Lien, 4.50%
(LIBOR03M+375bps), 11/10/28 (b) | | | 2,351,250 | | | | 2,341,939 | | |
Jo-Ann Stores LLC, Term B-1 Loan, First Lien, 5.50%
(LIBOR03M+475bps), 6/30/28 (b) | | | 2,992,500 | | | | 2,956,979 | | |
Knight Health Holdings LLC, Term Loan B, First Lien, 12/17/28 (c) (d) | | | 4,000,000 | | | | 3,740,000 | | |
Life Time, Inc., 2021 Refinancing Term Loan, First Lien, 5.75%
(LIBOR03M+475bps), 12/15/24 (b) | | | 805,183 | | | | 808,710 | | |
See notes to financial statements.
47
Victory Portfolios
Victory High Yield Fund | | Schedule of Portfolio Investments — continued
December 31, 2021 | |
Security Description | | Principal
Amount | | Value | |
LifeScan Global Corp., Initial Term Loan, First Lien, 6.13%
(LIBOR03M+600bps), 10/1/24 (b) | | $ | 3,992,647 | | | $ | 3,894,268 | | |
Lucid Energy Group II Borrower LLC, Term Loan, First Lien, 5.00%
(LIBOR03M+425bps), 11/24/28 (b) | | | 4,500,000 | | | | 4,441,500 | | |
Packaging Coordinators Midco, Inc., Term B Loans, First Lien, 4.25%
(LIBOR03M+350bps), 12/1/27 (b) | | | 1,097,236 | | | | 1,096,325 | | |
Petco Health and Wellness Co., Inc., Initial Term Loans, First Lien, 4.00%
(LIBOR03M+325bps), 2/25/28 (b) | | | 4,468,744 | | | | 4,458,957 | | |
PetSmart, Inc., Initial Term Loans, First Lien, 4.50%
(LIBOR06M+375bps), 2/12/28 (b) | | | 1,670,813 | | | | 1,671,865 | | |
Phoenix Newco, Inc., Initial Term Loans, First Lien, 4.00%
(LIBOR01M+350bps), 11/15/28 (b) | | | 4,000,000 | | | | 3,998,200 | | |
SRS Distribution, Inc., 2021 Refinancing Term Loans, First Lien, 4.25%
(LIBOR06M+375bps), 5/20/28 (b) | | | 498,750 | | | | 497,159 | | |
Standard Aero Ltd., 2020 SPCFD Refi Term B-2 Loans, First Lien, 3.63%
(LIBOR03M+350bps), 4/8/26 (b) | | | 821,479 | | | | 798,018 | | |
SWF Holdings Corp., Initial Term Loans, First Lien, 4.75%
(LIBOR01M+400bps), 10/6/28 (b) | | | 4,350,000 | | | | 4,306,500 | | |
Team Health Holdings, Inc., Initial Term Loans, First Lien, 3.75%
(LIBOR01M+275bps), 2/6/24 (b) | | | 1,461,637 | | | | 1,393,305 | | |
The Hertz Corp., Initial Term B Loans, First Lien, 3.75%
(LIBOR01M+325bps), 6/30/28 (b) | | | 2,511,650 | | | | 2,511,651 | | |
The Hertz Corp., Initial Term C Loan, First Lien, 3.75%
(LIBOR01M+325bps), 6/30/28 (b) | | | 475,728 | | | | 475,728 | | |
The Men's Wearhouse LLC, Term Loan, First Lien, 9.00%
(LIBOR03M+800bps), 12/1/25 (b) | | | 1,701,726 | | | | 1,432,649 | | |
The Michaels Cos., Inc., Term B Loans, First Lien, 5.00%
(LIBOR03M+425bps), 4/15/28 (b) | | | 3,983,741 | | | | 3,944,620 | | |
Traverse Midstream Partners LLC, Advance, First Lien, 5.25%
(SOFR03M+425bps), 9/27/24 (b) | | | 1,952,754 | | | | 1,941,780 | | |
United Airlines, Inc., Class B Term Loans, First Lien, 4.50%
(LIBOR03M+375bps), 4/21/28 (b) | | | 1,488,750 | | | | 1,490,775 | | |
Victoria's Secret & Co., Initial Term Loans, First Lien, 3.75%
(LIBOR03M+325bps), 8/2/28 (b) | | | 897,750 | | | | 894,949 | | |
Total Senior Secured Loans (Cost $76,325,286) | | | 76,326,370 | | |
Corporate Bonds (67.8%) | |
Communication Services (11.6%): | |
Audacy Capital Corp., 6.50%, 5/1/27, Callable 5/1/22 @ 104.88 (e) (f) | | | 2,500,000 | | | | 2,471,625 | | |
CSC Holdings LLC, 5.75%, 1/15/30, Callable 1/15/25 @ 102.88 (f) | | | 5,000,000 | | | | 4,999,300 | | |
Cumulus Media New Holdings, Inc., 6.75%, 7/1/26,
Callable 7/1/22 @ 103.38 (e) (f) | | | 4,960,000 | | | | 5,154,234 | | |
Entercom Media Corp., 6.75%, 3/31/29,
Callable 3/31/24 @ 103.38 (e) (f) | | | 1,800,000 | | | | 1,758,798 | | |
Frontier Communications Holdings LLC, 5.00%, 5/1/28,
Callable 5/1/24 @ 102.5 (f) | | | 2,250,000 | | | | 2,321,370 | | |
Gray Television, Inc., 4.75%, 10/15/30,
Callable 10/15/25 @ 102.38 (f) | | | 2,750,000 | | | | 2,737,158 | | |
iHeartCommunications, Inc., 8.38%, 5/1/27,
Callable 5/1/22 @ 104.19 | | | 4,510,000 | | | | 4,759,403 | | |
See notes to financial statements.
48
Victory Portfolios
Victory High Yield Fund | | Schedule of Portfolio Investments — continued
December 31, 2021 | |
Security Description | | Principal
Amount | | Value | |
Nexstar Broadcasting, Inc., 5.63%, 7/15/27,
Callable 7/15/22 @ 104.22 (f) | | $ | 4,000,000 | | | $ | 4,215,840 | | |
Sinclair Television Group, Inc., 5.50%, 3/1/30,
Callable 12/1/24 @ 102.75 (f) (g) | | | 3,000,000 | | | | 2,919,180 | | |
Sirius XM Radio, Inc., 5.50%, 7/1/29, Callable 7/1/24 @ 102.75 (f) (g) | | | 2,350,000 | | | | 2,535,015 | | |
TEGNA, Inc., 5.00%, 9/15/29, Callable 9/15/24 @ 102.5 (g) | | | 3,000,000 | | | | 3,076,500 | | |
Univision Communications, Inc., 5.13%, 2/15/25,
Callable 1/18/22 @ 101.71 (e) (f) | | | 2,500,000 | | | | 2,524,975 | | |
| | | | 39,473,398 | | |
Consumer Discretionary (16.9%): | |
Academy Ltd., 6.00%, 11/15/27, Callable 11/15/23 @ 103 (f) | | | 1,800,000 | | | | 1,922,400 | | |
Affinity Gaming, 6.88%, 12/15/27, Callable 12/1/23 @ 103.44 (f) | | | 2,750,000 | | | | 2,877,187 | | |
Ambience Merger Sub, Inc., 7.13%, 7/15/29,
Callable 7/15/24 @ 103.56 (f) | | | 4,800,000 | | | | 4,755,600 | | |
American Axle & Manufacturing, Inc., 5.00%, 10/1/29,
Callable 10/1/24 @ 102.5 (e) | | | 2,000,000 | | | | 1,963,080 | | |
Beazer Homes USA, Inc., 5.88%, 10/15/27,
Callable 10/15/22 @ 102.94 (e) | | | 2,000,000 | | | | 2,093,240 | | |
Clarios Global LP/Clarios US Finance Co., 8.50%, 5/15/27,
Callable 5/15/22 @ 104.25 (f) | | | 4,000,000 | | | | 4,240,640 | | |
Diamond Sports Group LLC/Diamond Sports Finance Co., 6.63%, 8/15/27,
Callable 8/15/22 @ 103.31 (e) (f) (g) | | | 6,900,000 | | | | 1,929,378 | | |
Genting New York LLC/GENNY Capital, Inc., 3.30%, 2/15/26,
Callable 1/15/26 @ 100 (e) (f) | | | 2,750,000 | | | | 2,722,583 | | |
LBM Acquisition LLC, 6.25%, 1/15/29, Callable 1/15/24 @ 103.13 (f) | | | 2,050,000 | | | | 2,042,005 | | |
Life Time, Inc., 5.75%, 1/15/26, Callable 1/15/23 @ 102.88 (f) | | | 4,000,000 | | | | 4,159,720 | | |
Magic Mergeco, Inc., 7.88%, 5/1/29, Callable 5/1/24 @ 103.94 (f) | | | 2,700,000 | | | | 2,661,876 | | |
Mattel, Inc., 5.45%, 11/1/41, Callable 5/1/41 @ 100 | | | 2,000,000 | | | | 2,387,020 | | |
MGM Resorts International, 5.50%, 4/15/27, Callable 1/15/27 @ 100 | | | 2,475,000 | | | | 2,653,249 | | |
PetSmart, Inc./PetSmart Finance Corp., 7.75%, 2/15/29,
Callable 2/15/24 @ 103.88 (f) (g) | | | 3,600,000 | | | | 3,930,156 | | |
Premier Entertainment Sub LLC/Premier Entertainment Finance Corp.
5.63%, 9/1/29, Callable 9/1/24 @ 102.81 (f) | | | 2,000,000 | | | | 1,986,800 | | |
5.88%, 9/1/31, Callable 9/1/26 @ 102.98 (f) | | | 3,800,000 | | | | 3,816,644 | | |
Scientific Games International, Inc., 8.25%, 3/15/26,
Callable 3/15/22 @ 104.13 (f) | | | 3,000,000 | | | | 3,162,630 | | |
Tenneco, Inc.
5.00%, 7/15/26, Callable 2/7/22 @ 102.5 (e) | | | 4,350,000 | | | | 4,202,970 | | |
7.88%, 1/15/29, Callable 1/15/24 @ 103.94 (f) | | | 650,000 | | | | 705,107 | | |
Viking Cruises Ltd., 13.00%, 5/15/25,
Callable 5/15/22 @ 109.75 (f) (g) | | | 2,700,000 | | | | 3,055,428 | | |
| | | | 57,267,713 | | |
Consumer Staples (2.6%): | |
Albertsons Cos., Inc./Safeway, Inc./New Albertsons LP/Albertsons LLC, 5.88%,
2/15/28, Callable 8/15/22 @ 104.41 (f) | | | 2,750,000 | | | | 2,920,115 | | |
Simmons Foods, Inc./Simmons prepared Foods, Inc./Simmons Pet Food, Inc./
Simmons Feed, 4.63%, 3/1/29, Callable 3/1/24 @ 102.31 (f) | | | 3,140,000 | | | | 3,094,564 | | |
Triton Water Holdings, Inc., 6.25%, 4/1/29, Callable 4/1/24 @ 103.13 (f) | | | 2,800,000 | | | | 2,706,984 | | |
| | | | 8,721,663 | | |
See notes to financial statements.
49
Victory Portfolios
Victory High Yield Fund | | Schedule of Portfolio Investments — continued
December 31, 2021 | |
Security Description | | Principal
Amount | | Value | |
Energy (3.2%): | |
Antero Midstream Partners LP/Antero Midstream Finance Corp.,
5.38%, 6/15/29, Callable 6/15/24 @ 102.69 (f) | | $ | 3,450,000 | | | $ | 3,644,235 | | |
Antero Resources Corp.
8.38%, 7/15/26, Callable 1/15/24 @ 104.19 (f) | | | 1,964,000 | | | | 2,235,837 | | |
7.63%, 2/1/29, Callable 2/1/24 @ 103.81 (f) | | | 750,000 | | | | 835,418 | | |
Comstock Resources, Inc., 6.75%, 3/1/29, Callable 3/1/24 @ 103.38 (f) | | | 2,426,000 | | | | 2,630,512 | | |
Range Resources Corp., 5.00%, 3/15/23, Callable 12/15/22 @ 100 | | | 1,350,000 | | | | 1,378,242 | | |
| | | | 10,724,244 | | |
Financials (6.9%): | |
AmWINS Group, Inc., 4.88%, 6/30/29, Callable 6/30/24 @ 102.44 (f) | | | 1,500,000 | | | | 1,517,835 | | |
BCPE Cycle Merger Sub II, Inc., 10.63%, 7/15/27,
Callable 7/15/22 @ 105.31 (f) | | | 3,890,000 | | | | 3,980,442 | | |
BCPE Ulysses Intermediate, Inc. (7.75% Cash or 8.50% PIK), 7.75%, 4/1/27,
Callable 4/1/23 @ 102 (f) | | | 450,000 | | | | 446,625 | | |
Compass Group Diversified Holdings LLC, 5.25%, 4/15/29,
Callable 4/15/24 @ 102.63 (f) | | | 1,200,000 | | | | 1,262,040 | | |
Gray Escrow II, Inc., 5.38%, 11/15/31, Callable 11/15/26 @ 102.69 (e) (f) | | | 950,000 | | | | 976,828 | | |
Gray Television, Inc., 7.00%, 5/15/27, Callable 5/15/22 @ 105.25 (f) | | | 3,000,000 | | | | 3,207,480 | | |
LABL Escrow Issuer LLC, 10.50%, 7/15/27,
Callable 7/15/22 @ 105.25 (f) (g) | | | 2,250,000 | | | | 2,361,353 | | |
Mozart Debt Merger Sub, Inc., 5.25%, 10/1/29,
Callable 10/1/24 @ 102.63 (f) | | | 450,000 | | | | 457,007 | | |
SWF Escrow Issuer Corp., 6.50%, 10/1/29,
Callable 10/1/24 @ 103.25 (f) | | | 2,100,000 | | | | 2,017,050 | | |
Victors Merger Corp., 6.38%, 5/15/29,
Callable 5/15/24 @ 103.19 (e) (f) | | | 3,800,000 | | | | 3,568,162 | | |
White Capital Parent LLC, 8.25%, 3/15/26,
Callable 3/15/22 @ 102 (f) | | | 2,100,000 | | | | 2,150,169 | | |
Wolverine Escrow LLC, 13.13%, 11/15/27,
Callable 11/15/22 @ 109.84 (e) (f) | | | 2,200,000 | | | | 1,403,688 | | |
| | | | 23,348,679 | | |
Health Care (7.4%): | |
Air Methods Corp., 8.00%, 5/15/25, Callable 2/7/22 @ 102 (e) (f) (g) | | | 2,500,000 | | | | 2,149,500 | | |
Bausch Health Cos., Inc., 5.25%, 1/30/30,
Callable 1/30/25 @ 102.63 (f) (g) | | | 2,250,000 | | | | 1,989,405 | | |
CHS/Community Health Systems, Inc., 6.13%, 4/1/30,
Callable 4/1/25 @ 103.06 (f) | | | 3,450,000 | | | | 3,412,015 | | |
Ortho-Clinical Diagnostics, Inc./Ortho-Clinical Diagnostics SA, 7.25%, 2/1/28,
Callable 2/1/23 @ 103.63 (f) | | | 3,714,000 | | | | 3,990,396 | | |
Radiology Partners, Inc., 9.25%, 2/1/28, Callable 2/1/23 @ 104.63 (f) (g) | | | 2,985,000 | | | | 3,136,071 | | |
Regional Care Hospital Partners Holdings, Inc./LifePoint Health, Inc., 9.75%,
12/1/26, Callable 2/7/22 @ 104.88 (f) | | | 3,000,000 | | | | 3,165,240 | | |
Team Health Holdings, Inc., 6.38%, 2/1/25, Callable 1/24/22 @ 101.59 (e) (f) | | | 3,250,000 | | | | 3,058,835 | | |
Tenet Healthcare Corp., 6.13%, 10/1/28, Callable 10/1/23 @ 103.06 (f) | | | 4,000,000 | | | | 4,226,440 | | |
| | | | 25,127,902 | | |
See notes to financial statements.
50
Victory Portfolios
Victory High Yield Fund | | Schedule of Portfolio Investments — continued
December 31, 2021 | |
Security Description | | Principal
Amount | | Value | |
Industrials (13.9%): | |
Ahern Rentals, Inc., 7.38%, 5/15/23, Callable 2/7/22 @ 100 (e) (f) | | $ | 1,700,000 | | | $ | 1,612,637 | | |
American Airlines, Inc., 11.75%, 7/15/25 (f) | | | 3,500,000 | | | | 4,351,410 | | |
American Airlines, Inc./AAdvantage Loyalty IP Ltd.
5.50%, 4/20/26 (f) | | | 1,300,000 | | | | 1,352,923 | | |
5.75%, 4/20/29 (f) | | | 1,850,000 | | | | 1,978,427 | | |
Apex Tool Group LLC/BC Mountain Finance, Inc., 9.00%, 2/15/23,
Callable 2/7/22 @ 100 (e) (f) | | | 2,000,000 | | | | 1,898,640 | | |
Aramark Services, Inc., 6.38%, 5/1/25, Callable 5/1/22 @ 103.19 (f) | | | 3,000,000 | | | | 3,135,540 | | |
Cargo Aircraft Management, Inc., 4.75%, 2/1/28, Callable 2/1/23 @ 102.38 (f) | | | 1,800,000 | | | | 1,834,416 | | |
Madison IAQ LLC
4.13%, 6/30/28, Callable 6/30/24 @ 102.06 (f) | | | 1,800,000 | | | | 1,809,486 | | |
5.88%, 6/30/29, Callable 6/30/24 @ 102.94 (f) | | | 2,800,000 | | | | 2,800,280 | | |
Mileage Plus Holdings LLC/Mileage Plus Intellectual Property Assets Ltd.,
6.50%, 6/20/27, Callable 6/30/23 @ 103.25 (f) | | | 3,000,000 | | | | 3,206,670 | | |
NESCO Holdings II, Inc., 5.50%, 4/15/29, Callable 4/15/24 @ 102.75 (f) | | | 2,050,000 | | | | 2,119,905 | | |
Pike Corp., 5.50%, 9/1/28, Callable 9/1/23 @ 102.75 (f) | | | 2,000,000 | | | | 2,006,560 | | |
SRS Distribution, Inc.
6.13%, 7/1/29, Callable 7/1/24 @ 103.06 (e) (f) | | | 1,125,000 | | | | 1,145,947 | | |
6.00%, 12/1/29, Callable 12/1/24 @ 103 (f) | | | 2,000,000 | | | | 2,011,960 | | |
The Hertz Corp., 5.00%, 12/1/29, Callable 12/1/24 @ 102.5 (f) | | | 4,500,000 | | | | 4,511,790 | | |
TransDigm, Inc., 4.63%, 1/15/29, Callable 1/15/24 @ 102.31 | | | 2,250,000 | | | | 2,243,183 | | |
Triumph Group, Inc., 6.25%, 9/15/24, Callable 2/7/22 @ 101.56 (f) | | | 3,525,000 | | | | 3,546,467 | | |
Wabash National Corp., 4.50%, 10/15/28, Callable 10/15/24 @ 102.25 (f) | | | 3,000,000 | | | | 3,026,310 | | |
WESCO Distribution, Inc., 7.25%, 6/15/28, Callable 6/15/23 @ 103.63 (f) | | | 2,250,000 | | | | 2,473,920 | | |
| | | | 47,066,471 | | |
Information Technology (1.8%): | |
Caesars Entertainment, Inc., 8.13%, 7/1/27, Callable 7/1/23 @ 104.06 (f) | | | 3,750,000 | | | | 4,150,725 | | |
Veritas U.S., Inc./Veritas Bermuda Ltd., 7.50%, 9/1/25,
Callable 2/7/22 @ 103.75 (f) | | | 1,800,000 | | | | 1,868,508 | | |
| | | | 6,019,233 | | |
Materials (2.5%): | |
Allegheny Technologies, Inc., 5.13%, 10/1/31, Callable 10/1/26 @ 102.56 | | | 3,000,000 | | | | 3,020,490 | | |
CVR Partners LP/CVR Nitrogen Finance Corp., 6.13%, 6/15/28,
Callable 6/15/24 @ 103.06 (e) (f) | | | 1,800,000 | | | | 1,902,510 | | |
Forterra Finance LLC/FRTA Finance Corp., 6.50%, 7/15/25 (f) | | | 1,200,000 | | | | 1,272,780 | | |
Midas OpCo Holdings LLC, 5.63%, 8/15/29, Callable 8/15/24 @ 102.81 (f) | | | 2,250,000 | | | | 2,302,515 | | |
| | | | 8,498,295 | | |
Real Estate (1.0%): | |
Adams Homes, Inc., 7.50%, 2/15/25, Callable 2/15/22 @ 103.75 (e) (f) | | | 3,371,000 | | | | 3,513,054 | | |
Total Corporate Bonds (Cost $227,339,985) | | | 229,760,652 | | |
Yankee Dollars (5.9%) | |
Consumer Discretionary (0.6%): | |
International Game Technology PLC, 5.25%, 1/15/29,
Callable 1/15/24 @ 102.63 (f) | | | 2,000,000 | | | | 2,121,680 | | |
See notes to financial statements.
51
Victory Portfolios
Victory High Yield Fund | | Schedule of Portfolio Investments — continued
December 31, 2021 | |
Security Description | | Shares or
Principal
Amount | | Value | |
Energy (1.1%): | |
Husky Holding Ltd. (13.0% Cash or 13.75% PIK), 13.00%, 2/15/25,
Callable 2/7/22 @ 109.75 (f) (g) | | $ | 500,000 | | | $ | 528,230 | | |
TechnipFMC PLC, 6.50%, 2/1/26, Callable 2/1/23 @ 103.25 (f) | | | 3,000,000 | | | | 3,205,650 | | |
| | | | 3,733,880 | | |
Health Care (0.7%): | |
Bausch Health Cos., Inc., 6.13%, 4/15/25, Callable 2/7/22 @ 102.04 (f) | | | 2,448,000 | | | | 2,498,625 | | |
Industrials (0.9%): | |
Bombardier, Inc., 7.88%, 4/15/27, Callable 4/15/22 @ 103.94 (e) (f) | | | 3,000,000 | | | | 3,110,970 | | |
Information Technology (0.8%): | |
ION Trading Technologies Sarl, 5.75%, 5/15/28, Callable 5/15/24 @ 102.88 (f) | | | 2,500,000 | | | | 2,575,375 | | |
Materials (1.8%): | |
Titan Acquisition Ltd./Titan Co-Borrower LLC, 7.75%, 4/15/26,
Callable 2/7/22 @ 103.88 (f) (g) | | | 2,000,000 | | | | 2,035,220 | | |
Trinseo Materials Operating SCA/Trinseo Materials Finance, Inc., 5.13%,
4/1/29, Callable 4/1/24 @ 102.56 (e) (f) | | | 3,900,000 | | | | 3,985,605 | | |
| | | | 6,020,825 | | |
Total Yankee Dollars (Cost $19,344,119) | | | 20,061,355 | | |
Exchange-Traded Funds (1.4%) | |
Invesco Senior Loan ETF (e) (g) | | | 107,000 | | | | 2,364,700 | | |
SPDR Blackstone Senior Loan ETF (g) | | | 50,750 | | | | 2,315,722 | | |
Total Exchange-Traded Funds (Cost $4,706,377) | | | 4,680,422 | | |
Collateral for Securities Loaned (11.5%)^ | |
BlackRock Liquidity Funds TempFund, Institutional Shares, 0.04% (h) | | | 902,658 | | | | 902,658 | | |
Fidelity Investments Money Market Government Portfolio,
Institutional Shares, 0.01% (h) | | | 17,728,318 | | | | 17,728,318 | | |
Goldman Sachs Financial Square Prime Obligations Fund,
Institutional Shares, 0.02% (h) | | | 450,471 | | | | 450,471 | | |
JPMorgan Prime Money Market Fund, Capital Shares, 0.07% (h) | | | 3,591,915 | | | | 3,591,915 | | |
Morgan Stanley Institutional Liquidity Prime Portfolio,
Institutional Shares, 0.06% (h) | | | 16,149,949 | | | | 16,149,949 | | |
Total Collateral for Securities Loaned (Cost $38,823,311) | | | 38,823,311 | | |
Total Investments (Cost $368,541,693) — 109.8% | | | 371,898,564 | | |
Liabilities in excess of other assets — (9.8)% | | | (33,111,226 | ) | |
NET ASSETS — 100.00% | | $ | 338,787,338 | | |
^ Purchased with cash collateral from securities on loan.
(a) Non-income producing security.
(b) Variable or Floating-Rate Security. Rate disclosed is as of December 31, 2021.
(c) The rates for this senior secured loan will be known on settlement date of the loan, subsequent to this report date. Senior secured loans have rates that will fluctuate over time in line with prevailing interest rates.
See notes to financial statements.
52
Victory Portfolios
Victory High Yield Fund | | Schedule of Portfolio Investments — continued
December 31, 2021 | |
(d) Security or a portion of the security purchased on a delayed-delivery and/or when-issued basis.
(e) All or a portion of this security is on loan.
(f) Rule 144A security or other security that is restricted as to resale to institutional investors. The Fund's Adviser has deemed this security to be liquid (unless otherwise noted as illiquid) based upon procedures approved by the Board of Trustees. As of December 31, 2021, the fair value of these securities was $222,044,630 and amounted to 65.5% of net assets.
(g) All or a portion of the security has been segregated as collateral for securities purchased on a delayed-delivery and/or when-issued basis.
(h) Rate disclosed is the daily yield on December 31, 2021.
(i) Amount represents less than 0.05% of net assets.
(j) The Fund may enter into certain credit agreements all or a portion of which may be unfunded. The Fund is obligated to fund these commitments at the borrower's discretion. At December 31, 2021 the Fund held unfunded or partially unfunded loan commitments of $273,911, which included a $1,089 unrealized loss.
(k) This security is classified as Level 3 within the fair value hierarchy. (See Note 2 in the Notes to Financial Statements)
bps — Basis points
ETF — Exchange-Traded Fund
LIBOR — London InterBank Offered Rate
LIBOR01M — 1 Month US Dollar LIBOR, rate disclosed as of December 31, 2021, based on the last reset date of the security
LIBOR03M — 3 Month US Dollar LIBOR, rate disclosed as of December 31, 2021, based on the last reset date of the security
LIBOR06M — 6 Month US Dollar LIBOR, rate disclosed as of December 31, 2021, based on the last reset date of the security
LLC — Limited Liability Company
LP — Limited Partnership
PIK — Payment-in-Kind
PLC — Public Limited Company
SOFR — Secured Overnight Financing Rate
See notes to financial statements.
53
Victory Portfolios
Victory Tax-Exempt Fund | | Schedule of Portfolio Investments
December 31, 2021 | |
Security Description | | Principal
Amount | | Value | |
Municipal Bonds (100.6%) | |
Arkansas (2.1%): | |
Arkansas Development Finance Authority Revenue, 3.20%,
12/1/49, Continuously Callable @100 | | $ | 750,000 | | | $ | 796,407 | | |
University of Central Arkansas Revenue, Series A, 3.00%,
11/1/49, Continuously Callable @100 | | | 265,000 | | | | 276,262 | | |
| | | | 1,072,669 | | |
California (0.6%): | |
Golden State Tobacco Securitization Corp. Revenue, Series A2, 5.00%,
6/1/47, Pre-refunded 6/1/22 @ 100 | | | 275,000 | | | | 280,437 | | |
Colorado (1.7%): | |
Colorado Health Facilities Authority Revenue, Series A, 4.00%,
12/1/50, Continuously Callable @103 | | | 750,000 | | | | 845,272 | | |
Connecticut (4.5%): | |
Connecticut Health and Educational Facilities Authority Revenue,
Series 2016 CT, 5.00%, 12/1/41, Continuously Callable @100 | | | 2,000,000 | | | | 2,323,442 | | |
Florida (10.8%): | |
Capital Trust Agency, Inc. Revenue, 5.00%, 8/1/55, Continuously
Callable @100 | | | 400,000 | | | | 456,369 | | |
City of Pompano Beach Revenue, 4.00%, 9/1/50, Continuously
Callable @103 | | | 500,000 | | | | 535,925 | | |
County of Miami-Dade Seaport Department Revenue, 4.00%, 10/1/50,
Continuously Callable @100 | | | 500,000 | | | | 577,892 | | |
Florida Development Finance Corp. Revenue, Series A, 5.00%, 6/15/55,
Continuously Callable @100 (a) | | | 500,000 | | | | 572,450 | | |
Hillsborough County IDA Revenue, 4.00%, 8/1/50, Continuously
Callable @100 | | | 500,000 | | | | 573,520 | | |
Miami-Dade County Public Facilities Revenue, Series A, 5.00%, 6/1/33,
Continuously Callable @100 | | | 2,000,000 | | | | 2,286,214 | | |
St. Johns County IDA Revenue, 4.00%, 8/1/55, Continuously
Callable @103 | | | 500,000 | | | | 563,626 | | |
| | | | 5,565,996 | | |
Georgia (4.4%): | |
Appling County Development Authority Revenue, 0.14%, 9/1/41, Continuously
Callable @100 (b) | | | 1,150,000 | | | | 1,150,000 | | |
The Burke County Development Authority Revenue (NBGA — Southern Co.),
0.12%, 11/1/52, Continuously Callable @100 (b) | | | 1,000,000 | | | | 1,000,000 | | |
The Development Authority of Monroe County Revenue, 0.14%, 11/1/48,
Continuously Callable @100 (b) | | | 100,000 | | | | 100,000 | | |
| | | | 2,250,000 | | |
Guam (2.3%): | |
Port Authority of Guam Revenue, Series A, 5.00%, 7/1/48, Continuously
Callable @100 | | | 1,000,000 | | | | 1,170,992 | | |
Illinois (23.1%): | |
Chicago Board of Education Revenue, 6.00%, 4/1/46, Continuously
Callable @100 (c) | | | 2,275,000 | | | | 2,781,429 | | |
See notes to financial statements.
54
Victory Portfolios
Victory Tax-Exempt Fund | | Schedule of Portfolio Investments — continued
December 31, 2021 | |
Security Description | | Principal
Amount | | Value | |
Chicago Transit Authority Sales Tax Receipts Revenue, Series 2014, 5.00%,
12/1/44, Continuously Callable @100 | | $ | 1,450,000 | | | $ | 1,616,171 | | |
City of Chicago Wastewater Transmission Revenue
Series A, 5.00%, 1/1/47, Continuously Callable @100 | | | 1,000,000 | | | | 1,164,893 | | |
Series C, 5.00%, 1/1/34, Continuously Callable @100 | | | 1,000,000 | | | | 1,121,329 | | |
City of Chicago, GO, Series A, 5.50%, 1/1/49, Continuously Callable @100 | | | 1,000,000 | | | | 1,228,046 | | |
Illinois, GO, Series 2013, 5.50%, 7/1/27, Continuously Callable @100 | | | 2,000,000 | | | | 2,136,704 | | |
Sales Tax Securitization Corp. Revenue, Series 2018 C, 5.00%, 1/1/43,
Continuously Callable @100 | | | 1,500,000 | | | | 1,826,109 | | |
| | | | 11,874,681 | | |
Iowa (1.0%): | |
Iowa Finance Authority Revenue, Series A-1, 4.00%, 5/15/55, Continuously
Callable @103 | | | 500,000 | | | | 533,756 | | |
Massachusetts (1.8%): | |
University of Massachusetts Building Authority Revenue
5.00%, 11/1/39, Pre-refunded 11/1/24 @ 100 | | | 220,000 | | | | 248,241 | | |
Series 1-2021, 5.00%, 11/1/39, Continuously Callable @100 | | | 410,000 | | | | 458,901 | | |
Series 1-2021, 5.00%, 11/1/39, Pre-refunded 11/1/24 @ 100 | | | 190,000 | | | | 214,389 | | |
| | | | 921,531 | | |
Michigan (1.1%): | |
Michigan Finance Authority Revenue, 4.00%, 12/1/51, Continuously
Callable @100 (d) | | | 500,000 | | | | 565,869 | | |
Missouri (2.5%): | |
Health & Educational Facilities Authority of the State of Missouri Revenue,
4.25%, 12/1/42, Continuously Callable @100 (a) | | | 1,150,000 | | | | 1,263,829 | | |
New Jersey (8.2%): | |
New Jersey Economic Development Authority Biomedical Research
Facilities Revenue, Series 2016 A, 5.00%, 7/15/29, Continuously
Callable @100 (c) | | | 885,000 | | | | 1,042,861 | | |
New Jersey Transportation Trust Fund Authority Revenue
5.00%, 6/15/28, Continuously Callable @100 | | | 1,000,000 | | | | 1,169,831 | | |
Series BB, 3.50%, 6/15/46, Continuously Callable @100 | | | 200,000 | | | | 215,124 | | |
Tobacco Settlement Financing Corp. Revenue, Series 2018 A, 5.00%,
6/1/46, Continuously Callable @100 | | | 1,500,000 | | | | 1,775,049 | | |
| | | | 4,202,865 | | |
New York (12.5%): | |
Metropolitan Transportation Authority Dedicated Tax Green Fund Revenue,
Series 2016 B1, 5.00%, 11/15/56, Continuously Callable @100 | | | 1,545,000 | | | | 1,820,263 | | |
Metropolitan Transportation Authority Revenue, Series D-3, 4.00%,
11/15/49, Continuously Callable @100 | | | 500,000 | | | | 567,414 | | |
New York Counties Tobacco Trust II Revenue, 5.75%, 6/1/43, Continuously
Callable @100 | | | 200,000 | | | | 200,695 | | |
New York State Dormitory Authority Revenue, 6.00%, 7/1/40, Continuously
Callable @100 (a) (e) | | | 440,000 | | | | 448,584 | | |
Port Authority of New York & New Jersey Revenue, 5.00%, 12/1/32,
Continuously Callable @100 | | | 1,000,000 | | | | 1,083,830 | | |
See notes to financial statements.
55
Victory Portfolios
Victory Tax-Exempt Fund | | Schedule of Portfolio Investments — continued
December 31, 2021 | |
Security Description | | Principal
Amount | | Value | |
TSASC, Inc. Revenue, Series A, 5.00%, 6/1/41, Continuously Callable @100 | | $ | 2,000,000 | | | $ | 2,303,700 | | |
| | | | 6,424,486 | | |
North Carolina (5.5%): | |
City of Charlotte Certificate of Participation, 4.00%, 6/1/49, Continuously
Callable @100 | | | 1,670,000 | | | | 1,914,553 | | |
North Carolina Medical Care Commission Revenue
Series A, 4.00%, 9/1/50, Continuously Callable @100 | | | 500,000 | | | | 528,950 | | |
Series A, 4.00%, 10/1/50, Continuously Callable @103 | | | 350,000 | | | | 390,138 | | |
| | | | 2,833,641 | | |
Ohio (7.5%): | |
Buckeye Tobacco Settlement Financing Authority Revenue,
Series B-2, 5.00%, 6/1/55, Continuously Callable @100 | | | 1,000,000 | | | | 1,159,715 | | |
County of Franklin Revenue, Series B, 5.00%, 7/1/45, Continuously
Callable @103 | | | 500,000 | | | | 586,838 | | |
County of Hardin Economic Development Facilities Revenue, 5.00%,
5/1/30, Continuously Callable @103 | | | 350,000 | | | | 383,331 | | |
Logan Elm Local School District, GO, 4.00%, 11/1/55, Continuously
Callable @100 | | | 1,500,000 | | | | 1,693,651 | | |
| | | | 3,823,535 | | |
Pennsylvania (5.3%): | |
Philadelphia School District, GO, Series A, 5.00%, 9/1/44, Continuously
Callable @100 | | | 1,000,000 | | | | 1,232,942 | | |
The Philadelphia School District, GO, Series A, 5.00%, 9/1/38, Continuously
Callable @100 | | | 1,200,000 | | | | 1,464,910 | | |
| | | | 2,697,852 | | |
Texas (1.1%): | |
City of Arlington Texas Revenue, 4.00%, 8/15/50, Continuously
Callable @100 | | | 500,000 | | | | 554,956 | | |
Utah (3.6%): | |
Jordanelle Special Service District Special Assessment, Series C, 12.00%,
8/1/30, Continuously Callable @100 (a) | | | 427,808 | | | | 429,255 | | |
Military Installation Development Authority Revenue, Series A-1, 4.00%,
6/1/41, Continuously Callable @103 | | | 250,000 | | | | 253,480 | | |
Utah Infrastructure Agency Revenue, Series A, 5.00%, 10/15/40, Continuously
Callable @100 | | | 1,000,000 | | | | 1,177,511 | | |
| | | | 1,860,246 | | |
Wisconsin (1.0%): | |
Wisconsin Health & Educational Facilities Authority Revenue, 4.00%,
1/1/47, Continuously Callable @103 | | | 500,000 | | | | 535,556 | | |
Total Municipal Bonds (Cost $47,196,338) | | | 51,601,611 | | |
Total Investments (Cost $47,196,338) — 100.6% | | | 51,601,611 | | |
Liabilities in excess of other assets — (0.6)% | | | (282,393 | ) | |
NET ASSETS — 100.00% | | $ | 51,319,218 | | |
See notes to financial statements.
56
Victory Portfolios
Victory Tax-Exempt Fund | | Schedule of Portfolio Investments — continued
December 31, 2021 | |
(a) Rule 144A security or other security that is restricted as to resale to institutional investors. The Fund's Adviser has deemed this security to be liquid (unless otherwise noted as illiquid) based upon procedures approved by the Board of Trustees. As of December 31, 2021, the fair value of these securities was $2,714,118 and amounted to 5.3% of net assets.
(b) Variable Rate Demand Notes that provide the rights to sell the security at face value on either that day or within the rate-reset period. The interest rate is reset on the put date at a stipulated daily, weekly, monthly, quarterly, or other specified time interval to reflect current market conditions. These securities do not indicate a reference rate and spread in their description.
(c) All or a portion of the security has been segregated as collateral for securities purchased on a delayed-delivery and/or when-issued basis.
(d) Security or a portion of the security purchased on a delayed-delivery and/or when-issued basis.
(e) The Fund's Adviser has deemed this security to be illiquid based upon procedures approved by the Board of Trustees. As of December 31, 2021, illiquid securities were 0.9% of net assets.
GO — General Obligation
IDA — Industrial Development Authority
See notes to financial statements.
57
Victory Portfolios
Victory High Income Municipal Bond Fund | | Schedule of Portfolio Investments
December 31, 2021 | |
Security Description | | Principal
Amount | | Value | |
Municipal Bonds (95.1%) | |
Arizona (4.0%): | |
Arizona IDA Revenue
4.00%, 7/15/51, Continuously Callable @100 (a) | | $ | 500,000 | | | $ | 542,137 | | |
4.00%, 12/15/51, Continuously Callable @100 (a) | | | 700,000 | | | | 754,904 | | |
La Paz County IDA Revenue, 4.00%, 2/15/51, Continuously Callable @100 | | | 280,000 | | | | 315,225 | | |
The IDA of the County of Pima Revenue, 4.00%, 6/15/51, Continuously
Callable @100 (a) (b) | | | 500,000 | | | | 516,718 | | |
| | | | 2,128,984 | | |
California (0.9%): | |
California County Tobacco Securitization Agency Revenue, Series B-1, 5.00%,
6/1/49, Continuously Callable @100 | | | 250,000 | | | | 303,493 | | |
Golden State Tobacco Securitization Corp. Revenue, Series A2, 5.00%,
6/1/47, Pre-refunded 6/1/22 @100 | | | 180,000 | | | | 183,559 | | |
| | | | 487,052 | | |
District of Columbia (0.9%): | |
District of Columbia Tobacco Settlement Financing Corp. Revenue, 6.50%,
5/15/33 (c) | | | 460,000 | | | | 497,075 | | |
Florida (6.8%): | |
County of St. Lucie Revenue, 0.09%, 9/1/28, Continuously
Callable @100 (d) | | | 100,000 | | | | 100,000 | | |
Escambia County Health Facilities Authority Revenue, 3.00%, 8/15/50,
Continuously Callable @100 | | | 1,000,000 | | | | 1,041,514 | | |
Florida Development Finance Corp. Revenue, 4.00%, 7/1/55, Continuously
Callable @100 | | | 500,000 | | | | 522,940 | | |
Seminole County Industrial Development Authority Revenue, 4.00%,
6/15/56, Continuously Callable @100 (a) | | | 705,000 | | | | 779,255 | | |
Sumter County Village Community Development District No. 10 Special
Assessment Revenue, Series 2014, 5.75%, 5/1/31, Continuously
Callable @100 | | | 1,145,000 | | | | 1,203,556 | | |
| | | | 3,647,265 | | |
Georgia (3.6%): | |
Appling County Development Authority Revenue, 0.14%, 9/1/41, Continuously
Callable @100 (d) | | | 1,000,000 | | | | 1,000,000 | | |
The Burke County Development Authority Revenue, Series 1, 0.09%, 7/1/49,
Continuously Callable @100 (d) | | | 900,000 | | | | 900,000 | | |
| | | | 1,900,000 | | |
Illinois (10.2%): | |
Chicago Board of Education Revenue, 6.00%, 4/1/46, Continuously
Callable @100 (c) | | | 1,500,000 | | | | 1,833,909 | | |
City of Chicago, GO, Series A, 5.50%, 1/1/49, Continuously Callable @100 | | | 1,000,000 | | | | 1,228,046 | | |
Illinois, GO
5.50%, 7/1/33, Continuously Callable @100 | | | 1,000,000 | | | | 1,068,352 | | |
5.50%, 7/1/38, Continuously Callable @100 | | | 1,250,000 | | | | 1,335,440 | | |
| | | | 5,465,747 | | |
See notes to financial statements.
58
Victory Portfolios
Victory High Income Municipal Bond Fund | | Schedule of Portfolio Investments — continued
December 31, 2021 | |
Security Description | | Principal
Amount | | Value | |
Indiana (3.1%): | |
Indiana Finance Authority Revenue
4.13%, 12/1/26 | | $ | 1,000,000 | | | $ | 1,092,368 | | |
Series A, 5.00%, 7/1/55, Continuously Callable @100 | | | 500,000 | | | | 563,406 | | |
| | | | 1,655,774 | | |
Iowa (2.1%): | |
Iowa Finance Authority Revenue
Series A, 5.00%, 5/15/48, Continuously Callable @100 | | | 500,000 | | | | 561,663 | | |
Series A-1, 4.00%, 5/15/55, Continuously Callable @103 | | | 500,000 | | | | 533,756 | | |
| | | | 1,095,419 | | |
Maryland (0.4%): | |
Maryland Economic Development Corp. Revenue, 4.25%, 7/1/50, Continuously
Callable @100 | | | 200,000 | | | | 230,427 | | |
Massachusetts (2.2%): | |
Massachusetts Development Finance Agency Revenue, 4.00%, 10/1/32,
Continuously Callable @105 (a) | | | 300,000 | | | | 321,846 | | |
Massachusetts Educational Financing Authority, Education Loan
Revenue Bonds, Issue J
Series 2011, 5.63%, 7/1/28, Continuously Callable @100 (c) | | | 235,000 | | | | 235,181 | | |
Series 2011, 5.63%, 7/1/29, Continuously Callable @100 (c) | | | 480,000 | | | | 480,369 | | |
Series 2011, 5.63%, 7/1/33, Continuously Callable @100 (c) | | | 120,000 | | | | 120,091 | | |
| | | | 1,157,487 | | |
Minnesota (0.8%): | |
City of Woodbury Revenue, 4.00%, 7/1/51, Continuously Callable @103 | | | 400,000 | | | | 436,908 | | |
Missouri (1.0%): | |
Health & Educational Facilities Authority of the State of Missouri
Revenue, 4.25%, 12/1/42, Continuously Callable @100 (a) | | | 500,000 | | | | 549,491 | | |
New Hampshire (2.5%): | |
New Hampshire Business Finance Authority Revenue
4.00%, 1/1/51, Continuously Callable @103 | | | 500,000 | | | | 543,899 | | |
Series B, 3.75%, 7/1/45, (Put Date 7/2/40) (a) (e) | | | 750,000 | | | | 794,615 | | |
| | | | 1,338,514 | | |
New Jersey (6.2%): | |
New Jersey Economic Development Authority Revenue, Series S, 4.00%,
6/15/50, Continuously Callable @100 | | | 450,000 | | | | 512,670 | | |
New Jersey Economic Development Authority School Facilities Construction
Revenue, Series 2015 WW, 5.25%, 6/15/32,
Pre-refunded 6/15/25 @ 100 (c) | | | 1,000,000 | | | | 1,155,965 | | |
New Jersey Economic Development Motor Vehicle Surcharges Subordinate
Revenue, Series A, 5.00%, 7/1/33, Continuously Callable @100 | | | 500,000 | | | | 588,218 | | |
New Jersey Higher Education Student Assistance Authority, Student Loan
Revenue Bonds, Series 2011-1, 5.75%, 12/1/28, Continuously
Callable @100 | | | 495,000 | | | | 495,425 | | |
New Jersey Transportation Trust Fund Authority Revenue, Series BB, 3.50%,
6/15/46, Continuously Callable @100 | | | 500,000 | | | | 537,811 | | |
| | | | 3,290,089 | | |
See notes to financial statements.
59
Victory Portfolios
Victory High Income Municipal Bond Fund | | Schedule of Portfolio Investments — continued
December 31, 2021 | |
Security Description | | Principal
Amount | | Value | |
New Mexico (1.0%): | |
New Mexico Hospital Equipment Loan Council Revenue, Series LA, 5.00%,
7/1/49, Continuously Callable @102 | | $ | 500,000 | | | $ | 546,918 | | |
New York (9.6%): | |
Build NYC Resource Corp. Revenue
4.00%, 6/15/51, Continuously Callable @100 | | | 500,000 | | | | 545,373 | | |
Series A, 5.00%, 6/15/51, Continuously Callable @100 (a) | | | 100,000 | | | | 117,326 | | |
Huntington Local Development Corp. Revenue, Series S, 3.00%, 7/1/25 | | | 500,000 | | | | 520,279 | | |
Metropolitan Transportation Authority Revenue
Series A-2, 5.00%, 11/15/45, (Put Date 5/15/30) (e) | | | 365,000 | | | | 463,825 | | |
Series D-3, 4.00%, 11/15/49, Continuously Callable @100 | | | 500,000 | | | | 567,413 | | |
New York State Dormitory Authority Revenue
6.00%, 7/1/40, Continuously Callable @100 (a) (f) | | | 1,000,000 | | | | 1,019,510 | | |
4.00%, 7/1/40, Continuously Callable @100 | | | 200,000 | | | | 225,220 | | |
New York Transportation Development Corp. Revenue, 5.00%, 10/1/40,
Continuously Callable @100 | | | 750,000 | | | | 913,395 | | |
Onondaga Civic Development Corp. Revenue, 5.00%, 10/1/40, Continuously
Callable @100 | | | 250,000 | | | | 270,394 | | |
Western Regional Off-Track Betting Corp. Revenue, 4.13%, 12/1/41,
Continuously Callable @100 (a) | | | 500,000 | | | | 504,801 | | |
| | | | 5,147,536 | | |
North Carolina (3.4%): | |
North Carolina Medical Care Commission Revenue, 5.00%, 10/1/50,
Continuously Callable @103 | | | 250,000 | | | | 284,167 | | |
University of North Carolina Hill Revenue, 5.00%, 2/1/49 | | | 1,000,000 | | | | 1,558,951 | | |
| | | | 1,843,118 | | |
North Dakota (2.0%): | |
Grand Forks, North Dakota Senior Housing and Nursing Facility
Revenue, 5.00%, 12/1/36, Continuously Callable @100 | | | 1,000,000 | | | | 1,064,638 | | |
Ohio (3.6%): | |
Buckeye Tobacco Settlement Financing Authority Revenue, Series B-2, 5.00%,
6/1/55, Continuously Callable @100 | | | 1,000,000 | | | | 1,159,715 | | |
County of Hardin Revenue, 5.50%, 5/1/50, Continuously Callable @103 | | | 500,000 | | | | 534,936 | | |
Northeast Ohio Medical University Revenue, Series A, 4.00%, 12/1/45,
Continuously Callable @100 | | | 225,000 | | | | 254,734 | | |
| | | | 1,949,385 | | |
Oklahoma (0.0%): (g) | |
Oklahoma Development Finance Authority Continuing Care Retirement
Community Revenue, Series 2012, 0.00%, 1/1/32, Continuously
Callable @100 (f) (h) | | | 1,885,000 | | | | 15,187 | | |
Oregon (1.8%): | |
Clackamas County Hospital Facility Authority Revenue
Series A, 5.00%, 11/15/52, Continuously Callable @102 | | | 500,000 | | | | 547,052 | | |
Series A, 5.38%, 11/15/55, Continuously Callable @102 | | | 100,000 | | | | 109,633 | | |
Yamhill County Hospital Authority Revenue, Series A, 5.00%, 11/15/51,
Continuously Callable @103 | | | 250,000 | | | | 289,690 | | |
| | | | 946,375 | | |
See notes to financial statements.
60
Victory Portfolios
Victory High Income Municipal Bond Fund | | Schedule of Portfolio Investments — continued
December 31, 2021 | |
Security Description | | Principal
Amount | | Value | |
Pennsylvania (2.3%): | |
Bucks County IDA Revenue, 5.00%, 7/1/54, Continuously Callable @100 | | $ | 500,000 | | | $ | 604,894 | | |
Pennsylvania Economic Development Financing Authority Revenue, 9.00%,
4/1/51, (Put Date 4/13/28) (a) (e) | | | 500,000 | | | | 613,389 | | |
| | | | 1,218,283 | | |
South Carolina (3.8%): | |
County of Richland SC, 3.63%, 11/1/31, Continuously Callable @103 (a) | | | 290,000 | | | | 291,014 | | |
Lancaster County Walnut Creek Improvement District Assessment Refunding
Revenue, Series 2016 A-1, 5.00%, 12/1/37, Continuously
Callable @100 | | | 1,675,000 | | | | 1,743,132 | | |
| | | | 2,034,146 | | |
South Dakota (0.6%): | |
Oglala Sioux Tribe, Series 2012, 5.00%, 10/1/22, Callable 2/7/22 @ 100 (a) | | | 335,000 | | | | 335,462 | | |
Texas (6.4%): | |
City of Houston TX Airport System Revenue, Series C, 4.00%, 7/15/41,
Continuously Callable @100 | | | 500,000 | | | | 534,143 | | |
Port of Port Arthur Navigation District Revenue
Series B, 0.21%, 4/1/40, Continuously Callable @100 (d) | | | 500,000 | | | | 500,000 | | |
Series C, 0.22%, 4/1/40, Continuously Callable @100 (d) | | | 1,300,000 | | | | 1,300,000 | | |
Texas Private Activity Bond Surface Transportation Corp. Revenue,
NTE Mobility Partners Segments 3 LLC — Segments 3A & 3B Facility,
Series 2013, 7.00%, 12/31/38, Continuously Callable @100 | | | 1,000,000 | | | | 1,105,419 | | |
| | | | 3,439,562 | | |
Utah (7.0%): | |
Jordanelle Special Service District Special Assessment, Series C, 12.00%,
8/1/30, Continuously Callable @100 (a) | | | 1,302,755 | | | | 1,307,161 | | |
Military Installation Development Authority Revenue
Series A-1, 4.00%, 6/1/41, Continuously Callable @103 | | | 250,000 | | | | 253,480 | | |
Series A-1, 4.00%, 6/1/52, Continuously Callable @103 | | | 250,000 | | | | 249,616 | | |
Utah Charter School Finance Authority Revenue, 2.75%, 4/15/50,
Continuously Callable @100 | | | 525,000 | | | | 537,708 | | |
Utah Infrastructure Agency Revenue, Series A, 5.38%, 10/15/40,
Continuously Callable @100 | | | 1,150,000 | | | | 1,379,466 | | |
| | | | 3,727,431 | | |
Vermont (1.6%): | |
Vermont Economic Development Authority Revenue, 4.00%, 5/1/45,
Continuously Callable @103 | | | 500,000 | | | | 544,161 | | |
Vermont Educational & Health Buildings Financing Agency Revenue, 5.00%,
10/15/46, Continuously Callable @100 | | | 250,000 | | | | 286,058 | | |
| | | | 830,219 | | |
West Virginia (2.2%): | |
The County Commission of Monongalia County, WV Special District Excise
Tax Revenue, Series 2017 A, 5.75%, 6/1/43, Continuously
Callable @100 (a) | | | 1,000,000 | | | | 1,152,641 | | |
See notes to financial statements.
61
Victory Portfolios
Victory High Income Municipal Bond Fund | | Schedule of Portfolio Investments — continued
December 31, 2021 | |
Security Description | | Shares or
Principal
Amount | | Value | |
Wisconsin (5.1%): | |
Public Finance Authority Revenue
Series A, 5.25%, 3/1/55, Continuously Callable @100 (a) | | $ | 500,000 | | | $ | 566,320 | | |
Series A, 5.00%, 7/1/55, Continuously Callable @100 (a) | | | 500,000 | | | | 545,073 | | |
Series A-1, 4.00%, 7/1/51, Continuously Callable @100 (a) | | | 500,000 | | | | 542,324 | | |
Wisconsin Health & Educational Facilities Authority Revenue
4.00%, 1/1/47, Continuously Callable @103 | | | 500,000 | | | | 535,556 | | |
4.00%, 12/1/51, Continuously Callable @100 | | | 500,000 | | | | 520,101 | | |
| | | | 2,709,374 | | |
Total Municipal Bonds (Cost $47,710,234) | | | 50,840,507 | | |
Exchange-Traded Funds (2.3%) | |
VanEck Vectors High-Yield Municipal Index ETF | | | 20,000 | | | | 1,248,600 | | |
Total Exchange-Traded Funds (Cost $1,192,740) | | | 1,248,600 | | |
Total Investments (Cost $48,902,974) — 97.4% | | | 52,089,107 | | |
Other assets in excess of liabilities — 2.6% | | | 1,395,628 | | |
NET ASSETS — 100.00% | | $ | 53,484,735 | | |
(a) Rule 144A security or other security that is restricted as to resale to institutional investors. The Fund's Adviser has deemed this security to be liquid (unless otherwise noted as illiquid) based upon procedures approved by the Board of Trustees. As of December 31, 2021, the fair value of these securities was $11,253,987 and amounted to 21.0% of net assets.
(b) Security or a portion of the security purchased on a delayed-delivery and/or when-issued basis.
(c) All or a portion of the security has been segregated as collateral for securities purchased on a delayed-delivery and/or when-issued basis.
(d) Variable Rate Demand Notes that provide the rights to sell the security at face value on either that day or within the rate-reset period. The interest rate is reset on the put date at a stipulated daily, weekly, monthly, quarterly, or other specified time interval to reflect current market conditions. These securities do not indicate a reference rate and spread in their description.
(e) Put Bond.
(f) The Fund's Adviser has deemed this security to be illiquid based upon procedures approved by the Board of Trustees. As of December 31, 2021, illiquid securities were 1.9% of net assets.
(g) Amount represents less than 0.05% of net assets.
(h) Currently the issuer is in default with respect to interest and/or principal payments.
ETF — Exchange-Traded Fund
GO — General Obligation
IDA — Industrial Development Authority
LLC — Limited Liability Company
See notes to financial statements.
62
Victory Portfolios
Victory Floating Rate Fund | | Schedule of Portfolio Investments
December 31, 2021 | |
Security Description | | Shares or
Principal
Amount | | Value | |
Common Stocks (0.0%) (a) | |
Consumer Discretionary (0.0%) | |
Men's Wearhouse, Inc. (h) | | | 51,299 | | | $ | 61,969 | | |
Total Common Stocks (Cost $192,371) | | | 61,969 | | |
Warrants (0.0%) (a) | |
Communication Services (0.0%): | |
Cineworld | | | 377,856 | | | | 166,191 | | |
Total Warrants (Cost $—) | | | 166,191 | | |
Senior Secured Loans (82.8%) | |
84 Lumber Co., Term B-1 Loans, First Lien, 3.75%
(LIBOR01M+300bps), 11/13/26 (b) | | $ | 16,854,812 | | | | 16,854,812 | | |
AAdvantage Loyalty IP Ltd., Initial Term Loan, First Lien, 5.50%
(LIBOR03M+475bps), 4/20/28 (b) | | | 35,334,127 | | | | 36,551,741 | | |
Academy Ltd., Refinancing Term Loans, First Lien, 4.50%
(LIBOR01M+375bps), 11/6/27 (b) | | | 8,195,658 | | | | 8,205,902 | | |
ACProducts, Inc., Initial Term Loans, First Lien, 4.75%
(LIBOR06M+425bps), 5/17/28 (b) | | | 28,862,481 | | | | 28,429,544 | | |
Acrisure LLC, 2021-1 Additional Term Loans, First Lien, 4.25%
(LIBOR03M+375bps), 2/15/27 (b) | | | 1,496,250 | | | | 1,491,881 | | |
Acrisure LLC, Term B, First Lien, 4.75%
(LIBOR01M+425bps), 2/15/27 (b) | | | 4,000,000 | | | | 3,993,320 | | |
Acrisure LLC, Term Loan B 2020, First Lien, 3.63%
(LIBOR03M+350bps), 2/15/27 (b) | | | 15,257,918 | | | | 15,067,194 | | |
Air Canada, Term Loan, First Lien, 4.25%
(LIBOR06M+350bps), 7/27/28 (b) | | | 28,000,000 | | | | 27,884,920 | | |
Air Medical Group Holdings, Inc., Incremental Term Loan B,
First Lien, 5.25% (LIBOR06M+425bps), 3/14/25 (b) | | | 7,853,163 | | | | 7,815,311 | | |
Air Methods Corp., Initial Term Loans, First Lien, 4.50%
(LIBOR03M+350bps), 4/21/24 (b) | | | 13,799,877 | | | | 13,082,835 | | |
Alliance Laundry Systems LLC, Initial Term B Loans, First Lien, 4.25%
(LIBOR03M+350bps), 10/8/27 (b) | | | 13,330,557 | | | | 13,324,292 | | |
Alliant Holdings Intermediate LLC, 2021-2 New Term Loans,
First Lien, 4.00% (LIBOR01M+350bps), 11/6/27 (b) | | | 2,992,500 | | | | 2,986,635 | | |
Alterra Mountain Co., Facility 2028 Term Loan B, First Lien, 4.00%
(LIBOR01M+350bps), 8/17/28 (b) | | | 4,987,500 | | | | 4,975,031 | | |
American Axle & Manufacturing, Inc., Term Loan B, First Lien, 3.00%
(LIBOR01M+225bps), 4/6/24 (b) | | | 4,736,505 | | | | 4,719,500 | | |
Amneal Pharmaceuticals LLC, Initial Term Loans, First Lien, 3.63%
(LIBOR01M+350bps), 3/23/25 (b) | | | 7,676,670 | | | | 7,590,307 | | |
Anchor Packaging LLC, Initial Term Loans, First Lien, 4.09%
(LIBOR01M+400bps), 7/18/26 (b) | | | 8,872,602 | | | | 8,761,694 | | |
AOT Packaging Products Acquisitionco LLC, Closing Date Initial Term
Loans, First Lien, 3.75% (LIBOR01M+325bps), 3/3/28 (b) | | | 10,388,043 | | | | 10,319,337 | | |
AOT Packaging Products Acquisitionco LLC, Delayed Draw Term Loan
Commitment, First Lien, 3.75% (LIBOR01M+325bps), 1/29/28 (b) (d) | | | 62,623 | | | | 32,074 | | |
See notes to financial statements.
63
Victory Portfolios
Victory Floating Rate Fund | | Schedule of Portfolio Investments — continued
December 31, 2021 | |
Security Description | | Principal
Amount | | Value | |
Apex Tool Group LLC, 2019 Term Loan B, First Lien, 6.75%
(US0003M+550bps), 8/21/24 (b) | | $ | 6,927,672 | | | $ | 6,785,862 | | |
AT Home Group, Inc., Initial Term Loan, First Lien, 4.75%
(LIBOR01M+425bps), 7/23/28 (b) | | | 23,823,961 | | | | 23,812,049 | | |
AT Home Group, Inc., Term Loan B, First Lien, 7/23/28 (c) (d) | | | 6,000,000 | | | | 5,997,000 | | |
AthenaHealth, Inc., Additional Term B-1, First Lien, 4.40%
(LIBOR03M+425bps), 2/11/26 (b) | | | 20,386,150 | | | | 20,365,763 | | |
Bally's Corp., Term B Facility Loans, First Lien, 3.75%
(LIBOR06M+325bps), 10/1/28 (b) | | | 15,000,000 | | | | 14,993,700 | | |
Boyd Gaming Corp., Refinancing Term B Loans, First Lien, 2.35%
(LIBOR01M+225bps), 9/15/23 (b) | | | 11,693,282 | | | | 11,678,666 | | |
Brand Energy and Infrastructure Services, Inc., Initial Term Loan,
First Lien, 5.25% (LIBOR03M+425bps), 6/21/24 (b) | | | 7,643,328 | | | | 7,463,939 | | |
Brookfield Property REIT, Inc., Initial Term B Loans, First Lien, 2.59%
(LIBOR01M+250bps), 8/24/25 (b) | | | 9,510,618 | | | | 9,363,965 | | |
BW NHHC Holdco, Inc., Term Loan Lien 2, Second Lien, 9.16%
(LIBOR03M+900bps), 5/15/26 (b) | | | 3,000,000 | | | | 1,740,000 | | |
Caesars Resort Collection LLC, Term B-1 Loans, First Lien, 3.59%
(LIBOR01M+350bps), 6/19/25 (b) | | | 7,907,425 | | | | 7,905,448 | | |
Calpine Corp., 2020 Term Loans, First Lien, 2.59% (LIBOR01M+250bps),
12/16/27 (b) | | | 2,965,167 | | | | 2,943,225 | | |
Chariot Buyer LLC, Initial Term Loans, First Lien, 4.00%
(LIBOR01M+350bps), 11/3/28 (b) | | | 13,000,000 | | | | 12,983,750 | | |
Chassix, Inc., Term Loan B, First Lien, 6.50% (LIBOR06M+550bps),
11/10/23 (b) | | | 3,825,491 | | | | 3,366,432 | | |
Clarios Global LP, Term B-1, First Lien, 3.34% (LIBOR01M+325bps),
4/30/26 (b) | | | 7,659,794 | | | | 7,608,090 | | |
Consolidated Communications, Inc., 2020 Term B-1, First Lien, 4.25%
(LIBOR01M+350bps), 10/2/27 (b) (d) | | | 10,644,610 | | | | 10,619,701 | | |
Cornerstone Building Brands, Inc., New Term Loan B, First Lien, 3.75%
(LIBOR01M+325bps), 4/12/28 (b) | | | 16,686,344 | | | | 16,623,770 | | |
CP Atlas Buyer, Inc., Term B Loans, First Lien, 4.25%
(LIBOR01M+375bps), 11/23/27 (b) | | | 33,003,998 | | | | 32,822,476 | | |
CPM Holdings, Inc., Initial Term Loans, First Lien, 3.60%
(LIBOR01M+350bps), 11/17/25 (b) | | | 2,909,991 | | | | 2,883,627 | | |
CPM Holdings, Inc., Initial Term Loans, Second Lien, 8.35%
(LIBOR01M+825bps), 11/16/26 (b) | | | 1,595,960 | | | | 1,589,975 | | |
Cumulus Media New Holdings, Inc., Initial Term Loan, First Lien, 4.75%
(LIBOR03M+375bps), 3/31/26 (b) | | | 13,827,962 | | | | 13,807,773 | | |
Dayco Products LLC, Term Loans, First Lien, 4.43% (LIBOR03M+425bps),
5/19/24 (b) | | | 7,640,000 | | | | 7,487,200 | | |
Delta 2 (Lux) S.a.r.l., New Term Loan B, First Lien, 3.50%
(LIBOR01M+250bps), 2/1/24 (b) | | | 21,000,000 | | | | 20,964,930 | | |
Delta Air Lines, Inc. and Skymiles IP Ltd., Initial Term Loan, First Lien,
10/20/27 (c) (d) | | | 5,000,000 | | | | 5,281,250 | | |
Delta Air Lines, Inc. and Skymiles IP Ltd., Initial Term Loan, First Lien,
4.75% (LIBOR03M+375bps), 9/16/27 (b) | | | 20,911,595 | | | | 22,087,872 | | |
Dynasty Acquisition Co., Inc., 2020 Specified Refi Term B-1 Loans,
First Lien, 3.63% (LIBOR03M+350bps), 4/8/26 (b) | | | 5,491,305 | | | | 5,334,474 | | |
Endo Luxembourg Finance Co. I S.a.r.l., Term B-1, First Lien, 5.75%
(LIBOR03M+500bps), 3/25/28 (b) | | | 24,749,195 | | | | 24,019,093 | | |
See notes to financial statements.
64
Victory Portfolios
Victory Floating Rate Fund | | Schedule of Portfolio Investments — continued
December 31, 2021 | |
Security Description | | Principal
Amount | | Value | |
Entercom Media Corp., New Term Loan, First Lien, 2.60%
(LIBOR01M+250bps), 11/17/24 (b) | | $ | 19,706,476 | | | $ | 19,430,586 | | |
Eyemart Express LLC, 8/5/27 (c) (d) | | | 12,190,464 | | | | 12,159,988 | | |
Eyemart Express LLC, Term B-1 Loan, First Lien, 4.00%
(LIBOR01M+300bps), 8/5/27 (b) | | | 14,962,500 | | | | 14,925,094 | | |
First Brands Group LLC, 3/30/27 (c) (d) | | | 1,500,000 | | | | 1,504,500 | | |
First Brands Group LLC, 2021 Term Loans, First Lien, 6.00%
(LIBOR03M+500bps), 3/24/27 (b) | | | 4,962,500 | | | | 4,977,387 | | |
Forterra Finance LLC, Replacement Term Loan, First Lien, 4.00%
(LIBOR01M+300bps), 10/25/23 (b) | | | 16,212,070 | | | | 16,191,805 | | |
Froneri International Ltd., Facility B2 Loan, First Lien, 2.34%
(LIBOR01M+225bps), 1/31/27 (b) | | | 6,899,937 | | | | 6,801,958 | | |
Frontier Communications Corp., DIP Term Loan, First Lien, 4.50%
(LIBOR03M+375bps), 10/8/27 (b) | | | 9,925,000 | | | | 9,905,150 | | |
Gates Global LLC, Initial B-3 Dollar Term Loan, First Lien, 3.25%
(LIBOR01M+250bps), 3/31/27 (b) | | | 10,928,919 | | | | 10,898,646 | | |
Global Medical Response, Inc., 2020 Term Loan, First Lien, 5.25%
(LIBOR06M+425bps), 10/2/25 (b) | | | 10,909,875 | | | | 10,852,598 | | |
Golden Nugget, Inc., Senior Secured Term Loan, First Lien, 3.25%
(LIBOR03M+250bps), 10/4/23 (b) | | | 10,962,028 | | | | 10,884,746 | | |
Graham Packaging Co., Inc., New Term Loans, First Lien, 3.75%
(LIBOR01M+300bps), 8/4/27 (b) | | | 15,738,695 | | | | 15,681,249 | | |
Great Outdoors Group LLC, Term B1, First Lien, 4.50%
(LIBOR01M+375bps), 3/5/28 (b) | | | 21,161,925 | | | | 21,166,369 | | |
Gulf Finance LLC, 7.75% (LIBOR01M+675bps), 8/25/26 (b) | | | 3,168,487 | | | | 2,950,654 | | |
Hillman Group, Inc. (The), Initial Term Loans, First Lien, 3.25%
(LIBOR01M+275bps), 7/14/28 (b) | | | 6,677,358 | | | | 6,643,971 | | |
Hillman Group, Inc., Delayed Draw Term loan, First Lien, 3.25%
(LIBOR01M+275bps), 2/24/28 (b) (d) (e) | | | 1,603,054 | | | | 1,595,358 | | |
Holley Purchaser, Inc., Delayed Draw Term Commitment, First Lien,
4.50% (LIBOR03M+375bps), 11/12/28 (b) (e) | | | 2,069,875 | | | | 2,067,420 | | |
Holley Purchaser, Inc., Initial Term Loan, First Lien, 4.50%
(LIBOR03M+375bps), 11/10/28 (b) | | | 12,397,500 | | | | 12,348,406 | | |
Hub International Ltd., Term Loan B, First Lien, 2.87%
(LIBOR03M+275bps), 4/25/25 (b) | | | 10,206,731 | | | | 10,081,494 | | |
iHeartCommunications, Inc., Second Amendment Incremental Term Loan,
First Lien, 3.75% (LIBOR01M+325bps), 5/1/26 (b) | | | 6,975,912 | | | | 6,969,355 | | |
iHeartCommunications, Inc., Term Loans, First Lien, 3.09%
(LIBOR01M+300bps), 5/1/26 (b) | | | 36,258,671 | | | | 35,993,258 | | |
Ineos U.S Petrochem LLC, 2026 Tranche B Dollar Term Loans, First Lien,
3.25% (LIBOR01M+275bps), 1/29/26 (b) | | | 7,960,000 | | | | 7,931,822 | | |
Innio North America Holding, Inc., Facility B USD, First Lien, 2.87%
(LIBOR03M+275bps), 11/6/25 (b) | | | 8,848,176 | | | | 8,626,971 | | |
Insulet Corp., Term Loan B, First Lien, 3.75% (LIBOR01M+325bps),
5/3/28 (b) | | | 3,980,000 | | | | 3,977,532 | | |
Intelsat Jackson Holdings S.A.,Term B-3, First Lien,
8.00% (Prime+475bps), 11/27/23 (b) | | | 11,750,000 | | | | 11,715,690 | | |
Janus International Group LLC Amendment No 3, Refinancing Term
Loans, First Lien, 4.25% (LIBOR02M+325bps), 2/15/25 (b) | | | 15,573,777 | | | | 15,534,842 | | |
Jo-Ann Stores LLC, Term B-1 Loan, First Lien, 5.50%
(LIBOR03M+475bps), 6/30/28 (b) | | | 22,443,750 | | | | 22,177,343 | | |
See notes to financial statements.
65
Victory Portfolios
Victory Floating Rate Fund | | Schedule of Portfolio Investments — continued
December 31, 2021 | |
Security Description | | Principal
Amount | | Value | |
Knight Health Holdings LLC, TLB, First Lien, 12/17/28 (c) (d) | | $ | 23,500,000 | | | $ | 21,972,500 | | |
LBM Acquisition LLC, Initial Delayed Draw Term Loan Commitment,
First Lien, 12/8/27 (c) | | | 1,030,303 | | | | 1,020,165 | | |
LBM Acquisition LLC, Initial Term Loan, First Lien, 4.50%
(LIBOR03M+375bps), 12/17/27 (b) (d) | | | 11,492,484 | | | | 11,379,398 | | |
LBM Acquisition LLC, Initial Term Loan, First Lien, 12/17/27 (c) (d) | | | 12,078,409 | | | | 11,959,558 | | |
Leslie's Poolmart, Inc., Term Loan B, First Lien, 3.00%
(LIBOR03M+250bps), 3/9/28 (b) | | | 20,438,661 | | | | 20,347,504 | | |
Life Time, Inc., 2021 Refinancing Term Loan, First Lien, 5.75%
(LIBOR03M+475bps), 12/15/24 (b) (d) | | | 14,796,530 | | | | 14,861,338 | | |
Lifepoint Health, Inc., Term B Loans, First Lien, 3.85%
(LIBOR01M+375bps), 11/16/25 (b) | | | 19,231,875 | | | | 19,195,912 | | |
LifeScan Global Corp., Initial Term Loan, First Lien, 6.13%
(LIBOR03M+600bps), 10/1/24 (b) | | | 22,704,462 | | | | 22,145,024 | | |
LifeScan Global Corp., Initial Term Loan, Second Lien, 9.63%
(LIBOR03M+950bps), 6/19/25 (b) | | | 3,750,000 | | | | 3,525,000 | | |
LSF11 A5 Holdco LLC, Term Loans, First Lien, 4.25%
(LIBOR03M+375bps), 10/15/28 (b) | | | 14,000,000 | | | | 13,976,620 | | |
Lucid Energy Group II Borrower LLC, 11/22/28 (c) (d) | | | 7,000,000 | | | | 6,909,000 | | |
Lucid Energy Group II Borrower LLC, Initial Term Loan,
First Lien, 5.00% (LIBOR03M+425bps), 2/18/25 (b) | | | 15,940,702 | | | | 15,733,473 | | |
Madison IAQ LLC, Initial Term Loans, First Lien, 3.75%
(LIBOR06M+325bps), 6/16/28 (b) | | | 20,397,500 | | | | 20,366,292 | | |
Majordrive Holdings IV LLC, Initial term Loans, First Lien, 4.50%
(LIBOR03M+400bps), 6/1/28 (b) | | | 3,731,250 | | | | 3,726,586 | | |
McGraw-Hill Education, Inc., Initial Term Loan, First Lien, 5.25%
(LIBOR01M+475bps), 7/30/28 (b) | | | 14,713,125 | | | | 14,630,437 | | |
Medline Industries, Inc., Initial Dollar Term Loans, First Lien, 3.75%
(LIBOR01M+325bps), 10/21/28 (b) | | | 14,500,000 | | | | 14,493,620 | | |
MHI Holdings LLC, Initial Term Loans, First Lien, 5.09%
(LIBOR01M+500bps), 9/20/26 (b) | | | 8,834,762 | | | | 8,832,023 | | |
Mileage Plus Holdings LLC, Initial Term Loan, First Lien, 6.25%
(LIBOR03M+525bps), 6/20/27 (b) (d) | | | 22,000,000 | | | | 23,168,860 | | |
Momentive Performance Materials, Inc., Initial Dollar Term Loan,
First Lien, 3.35% (LIBOR01M+325bps), 5/15/24 (b) | | | 5,667,135 | | | | 5,657,671 | | |
Navicure, Inc., Initial Term Loans, First Lien, 4.09%
(LIBOR01M+400bps), 10/23/26 (b) | | | 10,888,100 | | | | 10,869,917 | | |
NorthRiver Midstream Finance LP, Initial Term Loan B, First Lien,
3.38% (LIBOR03M+325bps), 10/1/25 (b) | | | 5,948,770 | | | | 5,933,898 | | |
Organon & Co., Dollar Term Loan, First Lien, 3.50%
(LIBOR03M+300bps), 6/2/28 (b) | | | 9,641,667 | | | | 9,643,691 | | |
Ortho-Clinical Diagnostics, Inc., Term Loan B New, First Lien, 3.10%
(LIBOR01M+300bps), 5/22/25 (b) | | | 5,097,949 | | | | 5,091,577 | | |
Packaging Coordinators Midco, Inc., Term B Loans, First Lien, 4.25%
(LIBOR03M+350bps), 12/1/27 (b) | | | 13,119,454 | | | | 13,108,564 | | |
Park River Holdings, Inc., Initial Term Loans, First Lien, 4.00%
(LIBOR03M+325bps), 1/20/28 (b) | | | 9,949,984 | | | | 9,848,892 | | |
Peraton Corp., Term Loan B, First Lien, 4.50%
(LIBOR01M+375bps), 2/1/28 (b) | | | 11,413,750 | | | | 11,409,641 | | |
Petco Health and Wellness Co., Inc., Initial Term Loans, First Lien,
4.00% (LIBOR03M+325bps), 2/25/28 (b) | | | 38,702,718 | | | | 38,617,959 | | |
See notes to financial statements.
66
Victory Portfolios
Victory Floating Rate Fund | | Schedule of Portfolio Investments — continued
December 31, 2021 | |
Security Description | | Principal
Amount | | Value | |
PetSmart, Inc., Initial Term Loans, First Lien, 4.50%
(LIBOR06M+375bps), 2/12/28 (b) | | $ | 17,705,625 | | | $ | 17,716,780 | | |
PG&E Corp., Term Loan, First Lien, 3.50%
(LIBOR03M+300bps), 6/23/25 (b) | | | 10,849,849 | | | | 10,719,651 | | |
Phoenix Newco, Inc., Initial Term Loans, First Lien, 4.00%
(LIBOR01M+350bps), 11/15/28 (b) | | | 20,000,000 | | | | 19,991,000 | | |
Presidio Holdings, Inc., Term Loan B, First Lien, 3.63%
(LIBOR03M+350bps), 12/19/26 (b) | | | 3,959,799 | | | | 3,949,899 | | |
Radiology Partners, Inc., Term Loan New, First Lien, 4.36%
(LIBOR01M+425bps), 7/9/25 (b) | | | 17,701,802 | | | | 17,421,583 | | |
Rent-A-Center, Facility Term Loan B2, First Lien, 3.75%
(LIBOR01M+325bps), 2/17/28 (b) | | | 8,138,500 | | | | 8,113,108 | | |
Revint Intermediate II LLC, Initial Term Loans, First Lien, 4.75%
(LIBOR01M+425bps), 10/15/27 (b) | | | 14,413,875 | | | | 14,413,875 | | |
Reynolds Group Holdings, Inc., Tranche B-2 U.S. Term Loans,
First Lien, 3.34% (LIBOR01M+325bps), 2/16/26 (b) | | | 6,930,000 | | | | 6,884,539 | | |
Ring Container Technologies Group LLC, Initial Term Loans, First Lien,
4.25% (LIBOR03M+375bps), 8/5/28 (b) | | | 7,500,000 | | | | 7,507,500 | | |
Rising Tide Holdins, Inc., Initial Term Loan, First Lien, 5.50%
(LIBOR01M+475bps), 6/1/28 (b) | | | 8,962,481 | | | | 8,928,872 | | |
Robertshaw U.S. Holding Corp., 2nd Lien Initial Term Loans,
Second Lien, 9.00% (LIBOR06M+800bps), 2/15/26 (b) | | | 4,000,000 | | | | 3,120,000 | | |
Robertshaw U.S. Holding Corp., Term Loan B, First Lien, 4.50%
(LIBOR06M+350bps), 2/28/25 (b) | | | 6,352,941 | | | | 5,968,588 | | |
Ryan Specialty Group LLC, Term Loan, First Lien, 3.75%
(LIBOR01M+300bps), 9/1/27 (b) | | | 7,907,425 | | | | 7,895,564 | | |
Scientific Games International, Inc., Term Loan B-5, First Lien, 2.84%
(LIBOR01M+275bps), 8/14/24 (b) | | | 7,917,738 | | | | 7,884,325 | | |
Sedgwick Claims Management Services, Inc., Initial Term Loans,
First Lien, 3.34% (LIBOR01M+325bps), 12/31/25 (b) | | | 4,961,637 | | | | 4,919,264 | | |
Sinclair Television Group, Inc., Term Loan B-3, First Lien, 3.10%
(LIBOR01M+300bps), 3/25/28 (b) | | | 7,967,481 | | | | 7,808,132 | | |
Sparta US Holdco LLC, Initial Term Loan, First Lien, 4.25%
(LIBOR03M+350bps), 4/30/28 (b) | | | 4,000,000 | | | | 4,001,240 | | |
SRS Distribution, Inc., 2021 Refinancing Term Loans, First Lien, 4.25%
(LIBOR06M+375bps), 5/20/28 (b) | | | 25,463,750 | | | | 25,382,521 | | |
Standard Aero Ltd., 2020 SPCFD Refi Term B-2 Loans, First Lien, 3.63%
(LIBOR03M+350bps), 4/8/26 (b) | | | 2,952,315 | | | | 2,867,997 | | |
Station Casinos LLC, Term B-1 Facility Loans, First Lien, 2.50%
(LIBOR01M+225bps), 2/8/27 (b) | | | 14,354,835 | | | | 14,221,048 | | |
Surgery Center Holdings, Inc., 2021 New Term Loans, First Lien,
4.50% (LIBOR01M+375bps), 8/31/26 (b) | | | 12,425,408 | | | | 12,409,876 | | |
Surgery Center Holdings, Inc., New Term Loans, First Lien,
8/31/26 (c) (d) | | | 10,000,000 | | | | 9,987,500 | | |
SWF Holdings Corp., Initial Term Loans, First Lien, 4.75%
(LIBOR01M+400bps), 10/6/28 (b) | | | 36,250,000 | | | | 35,887,500 | | |
Tailwind Smith Cooper Intermediate Corp., Initial Term Loans,
Second Lien, 9.10% (LIBOR01M+900bps), 5/28/27 (b) | | | 3,000,000 | | | | 2,854,770 | | |
Team Health Holdings, Inc., Initial Term Loans, First Lien, 3.75%
(LIBOR01M+275bps), 2/6/24 (b) (d) | | | 25,498,136 | | | | 24,305,779 | | |
See notes to financial statements.
67
Victory Portfolios
Victory Floating Rate Fund | | Schedule of Portfolio Investments — continued
December 31, 2021 | |
Security Description | | Principal
Amount | | Value | |
Tenneco, Inc., Tranche B Term Loan, First Lien, 3.09%
(LIBOR01M+300bps), 10/1/25 (b) | | $ | 15,558,709 | | | $ | 15,305,880 | | |
The Hertz Corp., Initial Term B Loans, First Lien, 3.75%
(LIBOR01M+325bps), 6/30/28 (b) | | | 27,000,243 | | | | 27,000,243 | | |
The Hertz Corp., Initial Term C Loan, First Lien, 3.75%
(LIBOR01M+325bps), 6/30/28 (b) | | | 5,114,078 | | | | 5,114,078 | | |
The Men's Wearhouse LLC, Term Loan, First Lien, 9.00%
(LIBOR03M+800bps), 12/1/25 (b) | | | 2,765,859 | | | | 2,328,521 | | |
The Michaels Cos., Inc., Term B Loans, First Lien, 5.00%
(LIBOR03M+425bps), 4/15/28 (b) | | | 38,338,672 | | | | 37,962,186 | | |
Thor Industries, Inc., Term B-1, First Lien, 3.13%
(LIBOR01M+300bps), 2/1/26 (b) | | | 8,753,496 | | | | 8,755,684 | | |
Titan Acquisition Ltd., Initial Term Loan, First Lien, 3.17%
(LIBOR06M+300bps), 3/28/25 (b) | | | 13,723,455 | | | | 13,479,452 | | |
TransDigm, Inc., Tranche F Refinancing Term Loan, First Lien, 2.34%
(LIBOR01M+225bps), 12/9/25 (b) | | | 14,856,003 | | | | 14,638,808 | | |
Traverse Midstream Partners LLC, Advance, First Lien, 5.25%
(SOFR03M+425bps), 9/27/24 (b) | | | 14,397,574 | | | | 14,316,660 | | |
Trident TPI Holdings, Inc., Tranche B-3 DDTL Commitments, First Lien,
4.50% (LIBOR03M+400bps), 9/17/28 (b) (e) | | | 558,442 | | | | 558,056 | | |
Trident TPI Holdings, Inc., Tranche B-3 Initial Term Loans,
First Lien, 4.50% (LIBOR03M+400bps), 9/17/28 (b) | | | 3,931,141 | | | | 3,924,380 | | |
Triton Water Holdings, Inc., Initial Term Loan, First Lien, 4.00%
(LIBOR03M+350bps), 3/31/28 (b) (d) | | | 9,971,556 | | | | 9,853,693 | | |
Truck Hero, Inc., Initial Term Loans, First Lien, 4.00%
(LIBOR01M+325bps), 1/20/28 (b) | | | 21,874,837 | | | | 21,733,088 | | |
U.S. Renal Care, Inc., Initial Term Loan, First Lien, 5.09%
(LIBOR01M+500bps), 7/26/26 (b) | | | 19,273,250 | | | | 18,702,376 | | |
United Airlines, Inc., Class B Term Loans, First Lien, 4.50%
(LIBOR03M+375bps), 4/21/28 (b) | | | 20,884,862 | | | | 20,913,265 | | |
Univision Communications, Inc., 2021 Replacement New First-Lien Term,
First Lien, 4.00% (LIBOR01M+325bps), 3/24/26 (b) | | | 14,776,075 | | | | 14,789,964 | | |
Univision Communications, Inc., Term Loan B, First Lien,
5/7/28 (c) (d) | | | 8,500,000 | | | | 8,478,750 | | |
Upstream Rehabilitation, August 2021 Incremental TL, First Lien,
4.34% (LIBOR01M+425bps), 11/20/26 (b) | | | 4,975,000 | | | | 4,975,000 | | |
USI, Inc., 2017 New Term Loans, First Lien, 3.13%
(LIBOR03M+300bps), 5/16/24 (b) | | | 12,621,484 | | | | 12,515,590 | | |
Utz Quality Foodz LLC, 2021 New Term Loans, First Lien, 3.09%
(LIBOR01M+300bps), 1/20/28 (b) | | | 7,920,008 | | | | 7,900,208 | | |
Verscend Holding Corp., New Term Loan B-1 Facility, First Lien, 4.09%
(LIBOR01M+400bps), 8/27/25 (b) | | | 7,838,342 | | | | 7,828,544 | | |
Victoria's Secret & Co., Initial Term Loans, First Lien, 3.75%
(LIBOR03M+325bps), 8/2/28 (b) | | | 2,992,500 | | | | 2,983,163 | | |
Weber-Stephen Products LLC, Initial Term B Loans, First Lien, 4.00%
(LIBOR01M+325bps), 10/30/27 (b) | | | 13,405,021 | | | | 13,416,147 | | |
Welbilt, Inc., Facility Term Loan, First Lien, 2.59%
(LIBOR01M+250bps), 10/23/25 (b) | | | 15,000,000 | | | | 14,931,300 | | |
WestJet Airlines Ltd., Initial Term Loan, First Lien, 4.00%
(LIBOR06M+300bps), 12/11/26 (b) (d) | | | 18,924,242 | | | | 18,319,991 | | |
See notes to financial statements.
68
Victory Portfolios
Victory Floating Rate Fund | | Schedule of Portfolio Investments — continued
December 31, 2021 | |
Security Description | | Principal
Amount | | Value | |
Whatabrands LLC, Initial Term B Loans, First Lien, 3.75%
(LIBOR01M+325bps), 7/21/28 (b) | | $ | 4,000,000 | | | $ | 3,981,800 | | |
White Cap Buyer LLC, Initial Closing Date Term Loan,
First Lien, 4.50% (LIBOR01M+400bps), 10/19/27 (b) | | | 11,394,925 | | | | 11,396,178 | | |
WireCo WorldGroup, Inc., Initial Term Loan, First Lien, 4.75%
(LIBOR06M+425bps), 11/13/28 (b) | | | 16,000,000 | | | | 15,970,080 | | |
WP CPP Holdings LLC, Term Loan, Second Lien, 8.75%
(LIBOR03M+775bps), 4/30/26 (b) | | | 2,000,000 | | | | 1,950,000 | | |
WP CPP Holdings LLC, Term Loans, First Lien, 4.75%
(LIBOR03M+375bps), 4/30/25 (b) | | | 9,815,260 | | | | 9,381,720 | | |
Total Senior Secured Loans (Cost $1,829,561,573) | | | 1,823,601,388 | | |
Corporate Bonds (12.5%) | |
Communication Services (2.6%): | |
Audacy Capital Corp., 6.50%, 5/1/27, Callable 5/1/22 @ 104.88 (f) | | | 2,000,000 | | | | 1,977,300 | | |
CSC Holdings LLC, 6.50%, 2/1/29, Callable 2/1/24 @ 103.25 (f) | | | 5,000,000 | | | | 5,364,300 | | |
Cumulus Media New Holdings, Inc., 6.75%, 7/1/26,
Callable 7/1/22 @ 103.38 (f) | | | 11,247,000 | | | | 11,687,433 | | |
Frontier Communications Holdings LLC, 5.00%, 5/1/28,
Callable 5/1/24 @ 102.5 (f) | | | 8,460,000 | | | | 8,728,351 | | |
iHeartCommunications, Inc., 8.38%, 5/1/27,
Callable 5/1/22 @ 104.19 | | | 3,000,000 | | | | 3,165,900 | | |
Nexstar Broadcasting, Inc., 4.75%, 11/1/28,
Callable 11/1/23 @ 102.38 (f) | | | 5,000,000 | | | | 5,114,100 | | |
Sinclair Television Group, Inc.,
5.50%, 3/1/30, Callable 12/1/24 @ 102.75 (f) (g) | | | 15,350,000 | | | | 14,936,471 | | |
Univision Communications, Inc.,
6.63%, 6/1/27, Callable 6/1/23 @ 103.31 (f) | | | 6,500,000 | | | | 6,997,380 | | |
| | | | 57,971,235 | | |
Consumer Discretionary (3.5%): | |
Academy Ltd., 6.00%, 11/15/27, Callable 11/15/23 @ 103 (f) | | | 2,000,000 | | | | 2,136,000 | | |
Affinity Gaming, 6.88%, 12/15/27, Callable 12/1/23 @ 103.44 (f) | | | 8,000,000 | | | | 8,370,000 | | |
Ambience Merger Sub, Inc., 7.13%, 7/15/29, Callable
7/15/24 @ 103.56 (f) | | | 6,000,000 | | | | 5,944,500 | | |
Diamond Sports Group LLC/Diamond Sports Finance Co., 6.63%,
8/15/27, Callable 8/15/22 @ 103.31 (f) (g) | | | 19,000,000 | | | | 5,312,780 | | |
Genting New York LLC/GENNY Capital, Inc., 3.30%, 2/15/26,
Callable 1/15/26 @ 100 (f) | | | 6,000,000 | | | | 5,940,180 | | |
Life Time, Inc., 5.75%, 1/15/26, Callable 1/15/23 @ 102.88 (f) | | | 6,000,000 | | | | 6,239,580 | | |
Magic Mergeco, Inc., 7.88%, 5/1/29, Callable 5/1/24 @ 103.94 (f) | | | 7,000,000 | | | | 6,901,160 | | |
PetSmart, Inc./PetSmart Finance Corp., 7.75%, 2/15/29,
Callable 2/15/24 @ 103.88 (f) (g) | | | 5,350,000 | | | | 5,840,648 | | |
Premier Entertainment Sub LLC/Premier Entertainment Finance Corp.
5.63%, 9/1/29, Callable 9/1/24 @ 102.81 (f) | | | 1,300,000 | | | | 1,291,420 | | |
5.88%, 9/1/31, Callable 9/1/26 @ 102.98 (f) | | | 5,600,000 | | | | 5,624,528 | | |
Scientific Games International, Inc., 8.25%, 3/15/26,
Callable 3/15/22 @ 104.13 (f) | | | 6,000,000 | | | | 6,325,260 | | |
See notes to financial statements.
69
Victory Portfolios
Victory Floating Rate Fund | | Schedule of Portfolio Investments — continued
December 31, 2021 | |
Security Description | | Principal
Amount | | Value | |
Tenneco, Inc.
5.00%, 7/15/26, Callable 2/7/22 @ 102.5 | | $ | 6,840,000 | | | $ | 6,608,808 | | |
7.88%, 1/15/29, Callable 1/15/24 @ 103.94 (f) | | | 4,160,000 | | | | 4,512,685 | | |
Viking Cruises Ltd., 13.00%, 5/15/25,
Callable 5/15/22 @ 109.75 (f) (g) | | | 6,000,000 | | | | 6,789,840 | | |
| | | | 77,837,389 | | |
Consumer Staples (0.5%): | |
Triton Water Holdings, Inc., 6.25%, 4/1/29,
Callable 4/1/24 @ 103.13 (f) | | | 10,595,000 | | | | 10,243,034 | | |
Energy (0.3%): | |
Antero Midstream Partners LP/Antero Midstream Finance Corp.,
5.38%, 6/15/29, Callable 6/15/24 @ 102.69 (f) | | | 2,334,000 | | | | 2,465,404 | | |
Antero Resources Corp., 8.38%, 7/15/26,
Callable 1/15/24 @ 104.19 (f) | | | 3,246,000 | | | | 3,695,279 | | |
| | | | 6,160,683 | | |
Financials (1.6%): | |
Compass Group Diversified Holdings LLC, 5.25%, 4/15/29,
Callable 4/15/24 @ 102.63 (f) | | | 4,000,000 | | | | 4,206,800 | | |
LABL Escrow Issuer LLC, 10.50%, 7/15/27,
Callable 7/15/22 @ 105.25 (f) (g) | | | 6,500,000 | | | | 6,821,685 | | |
Mozart Debt Merger Sub, Inc.
3.88%, 4/1/29, Callable 10/1/24 @ 101.94 (f) | | | 10,200,000 | | | | 10,164,504 | | |
5.25%, 10/1/29, Callable 10/1/24 @ 102.63 (f) | | | 2,200,000 | | | | 2,234,254 | | |
SWF Escrow Issuer Corp., 6.50%, 10/1/29,
Callable 10/1/24 @ 103.25 (f) | | | 3,100,000 | | | | 2,977,550 | | |
White Capital Parent LLC, 8.25%, 3/15/26,
Callable 3/15/22 @ 102 (f) | | | 2,250,000 | | | | 2,303,753 | | |
Wolverine Escrow LLC
9.00%, 11/15/26, Callable 11/15/22 @ 106.75 (f) | | | 2,653,000 | | | | 2,517,219 | | |
13.13%, 11/15/27, Callable 11/15/22 @ 109.84 (f) | | | 4,750,000 | | | | 3,030,690 | | |
| | | | 34,256,455 | | |
Health Care (1.8%): | |
Air Methods Corp., 8.00%, 5/15/25, Callable 2/7/22 @ 102 (f) (g) | | | 14,250,000 | | | | 12,252,150 | | |
| Bausch Health Cos., Inc., 5.25%, 1/30/30, Callable 1/30/25 @ 102.63 (f) (g) | | | 10,466,000 | | | | 9,253,828 | | |
Radiology Partners, Inc., 9.25%, 2/1/28, Callable 2/1/23 @ 104.63 (f) (g) | | | 2,500,000 | | | | 2,626,525 | | |
Team Health Holdings, Inc., 6.38%, 2/1/25, Callable 1/24/22 @ 101.59 (f) | | | 8,383,000 | | | | 7,889,912 | | |
Tenet Healthcare Corp., 6.13%, 10/1/28, Callable 10/1/23 @ 103.06 (f) | | | 7,000,000 | | | | 7,396,270 | | |
| | | | 39,418,685 | | |
Industrials (1.5%): | |
American Airlines, Inc., 11.75%, 7/15/25 (f) | | | 17,185,000 | | | | 21,365,423 | | |
Apex Tool Group LLC/BC Mountain Finance, Inc., 9.00%, 2/15/23,
Callable 2/7/22 @ 100 (f) | | | 4,000,000 | | | | 3,797,280 | | |
Mileage Plus Holdings LLC/Mileage Plus Intellectual Property
Assets Ltd., 6.50%, 6/20/27, Callable 6/30/23 @ 103.25 (f) | | | 4,000,000 | | | | 4,275,560 | | |
Wabash National Corp., 4.50%, 10/15/28, Callable 10/15/24 @ 102.25 (f) | | | 3,950,000 | | | | 3,984,642 | | |
| | | | 33,422,905 | | |
See notes to financial statements.
70
Victory Portfolios
Victory Floating Rate Fund | | Schedule of Portfolio Investments — continued
December 31, 2021 | |
Security Description | | Shares or
Principal
Amount | | Value | |
Information Technology (0.7%): | |
Caesars Entertainment, Inc., 8.13%, 7/1/27, Callable 7/1/23 @ 104.06 (f) | | $ | 13,800,000 | | | $ | 15,274,668 | | |
Total Corporate Bonds (Cost $280,696,205) | | | 274,585,054 | | |
Yankee Dollars (0.9%) | |
Energy (0.5%): | |
Husky Holding Ltd. (13.0% Cash or 13.75% PIK), 13.00%, 2/15/25,
Callable 2/7/22 @ 109.75 (f) (g) | | | 4,500,000 | | | | 4,754,070 | | |
TechnipFMC PLC, 6.50%, 2/1/26, Callable 2/1/23 @ 103.25 (f) | | | 4,800,000 | | | | 5,129,040 | | |
| | | | 9,883,110 | | |
Industrials (0.3%): | |
Bombardier, Inc., 7.88%, 4/15/27, Callable 4/15/22 @ 103.94 (f) | | | 6,500,000 | | | | 6,740,435 | | |
Materials (0.1%): | |
Titan Acquisition Ltd./Titan Co-Borrower LLC, 7.75%, 4/15/26,
Callable 2/7/22 @ 103.88 (f) (g) | | | 2,500,000 | | | | 2,544,025 | | |
Total Yankee Dollars (Cost $18,641,973) | | | 19,167,570 | | |
Exchange-Traded Funds (1.6%) | |
Invesco Senior Loan ETF (g) | | | 833,500 | | | | 18,420,350 | | |
SPDR Blackstone Senior Loan ETF (g) | | | 381,250 | | | | 17,396,438 | | |
Total Exchange-Traded Funds (Cost $35,969,352) | | | 35,816,788 | | |
Total Investments (Cost $2,165,061,474) — 97.8% | | | 2,153,398,960 | | |
Other assets in excess of liabilities — 2.2% | | | 49,040,415 | | |
NET ASSETS — 100.00% | | $ | 2,202,439,375 | | |
(a) Amount represents less than 0.05% of net assets.
(b) Variable or Floating-Rate Security. Rate disclosed is as of December 31, 2021.
(c) The rates for this senior secured loan will be known on settlement date of the loan, subsequent to this report date. Senior secured loans have rates that will fluctuate over time in line with prevailing interest rates.
(d) Security or a portion of the security purchased on a delayed-delivery and/or when-issued basis.
(e) The Fund may enter into certain credit agreements all or a portion of which may be unfunded. The Fund is obligated to fund these commitments at the borrower's discretion. At December 31, 2021 the Fund held unfunded or partially unfunded loan commitments of $3,245,141, which included a $13,692 unrealized loss.
(f) Rule 144A security or other security that is restricted as to resale to institutional investors. The Fund's Adviser has deemed this security to be liquid (unless otherwise noted as illiquid) based upon procedures approved by the Board of Trustees. As of December 31, 2021, the fair value of these securities was $283,977,916 and amounted to 12.9% of net assets.
(g) All or a portion of the security has been segregated as collateral for securities purchased on a delayed-delivery and/or when-issued basis.
(h) This security is classified as Level 3 within the fair value hierarchy. (See Note 2 in the Notes to Financial Statements)
bps — Basis points
See notes to financial statements.
71
Victory Portfolios
Victory Floating Rate Fund | | Schedule of Portfolio Investments — continued
December 31, 2021 | |
ETF — Exchange-Traded Fund
LIBOR — London InterBank Offered Rate
LIBOR01M — 1 Month US Dollar LIBOR, rate disclosed as of December 31, 2021, based on the last reset date of the security
LIBOR02M — 2 Month US Dollar LIBOR, rate disclosed as of December 31, 2021, based on the last reset date of the security
LIBOR03M — 3 Month US Dollar LIBOR, rate disclosed as of December 31, 2021, based on the last reset date of the security
LIBOR06M — 6 Month US Dollar LIBOR, rate disclosed as of December 31, 2021, based on the last reset date of the security
US0003M — 3 Month US Dollar LIBOR, rate disclosed as of December 31, 2021, based on the last reset date of the security
LLC — Limited Liability Company
LP — Limited Partnership
PIK — Payment-in-Kind
PLC — Public Limited Company
PRIME — U.S. Prime Rate
REIT — Real Estate Investment Trust
SOFR — Secured Overnight Financing Rate
See notes to financial statements.
72
Victory Portfolios
Victory Strategic Income Fund | | Schedule of Portfolio Investments
December 31, 2021 | |
Security Description | | Principal
Amount | | Value | |
Asset-Backed Securities (1.0%) | |
Commonbond Student Loan Trust, Series 2021-AGS, Class A, 1.20%, 8/25/50,
Callable 12/25/29 @ 100 (a) | | $ | 223,770 | | | $ | 221,462 | | |
Stack Infrastructure Issuer LLC, Series 2021-1A, Class A2, 1.88%, 3/26/46,
Callable 3/25/24 @ 100 (a) | | | 500,000 | | | | 486,476 | | |
Total Asset-Backed Securities (Cost $723,719) | | | 707,938 | | |
Collateralized Mortgage Obligations (9.4%) | |
AIMCO CLO, Series 2017-AA, Class DR, 3.28% (LIBOR03M+315bps), 4/20/34,
Callable 4/20/23 @ 100 (a) (b) | | | 400,000 | | | | 394,548 | | |
AIMCO CLO 14 Ltd., Series 2021-14A, Class D, 3.03%
(LIBOR03M+290bps), 4/20/34, Callable 4/20/23 @ 100 (a) (b) (c) | | | 800,000 | | | | 782,920 | | |
Battalion CLO XIX Ltd., Series 2021-19A, Class D, 3.37%
(LIBOR03M+325bps), 4/15/34, Callable 4/15/23 @ 100 (a) (b) (c) | | | 800,000 | | | | 796,392 | | |
BB-UBS Trust, Series 2012-SHOW, Class A, 3.43%, 11/5/36,
Callable 11/5/24 @ 100 (a) | | | 300,000 | | | | 310,749 | | |
Grace Trust, Series 2020-GRCE, Class C, 2.68%, 12/10/40,
Callable 12/10/30 @ 100 (a) (c) (d) | | | 650,000 | | | | 640,614 | | |
Greywolf CLO II Ltd., Series 2013-1A, Class C2RR, 4.32%
(LIBOR03M+420bps), 4/15/34, Callable 4/15/23 @ 100 (a) (b) (c) | | | 900,000 | | | | 887,432 | | |
GS Mortgage Securities Trust, Series 2017-FARM, Class B, 3.54%, 1/10/43,
Callable 1/10/28 @ 100 (a) (d) | | | 650,000 | | | | 684,629 | | |
Hilton USA Trust, Series 2016-SFP, Class A, 2.83%, 11/5/35 (a) (c) | | | 500,000 | | | | 501,699 | | |
JPMCC Commercial Mortgage Securities Trust, Series 2017-JP5,
Class B, 4.08%, 3/15/50 (d) | | | 200,000 | | | | 214,999 | | |
OHA Credit Funding 2 Ltd., Series 2019-2A, Class CR, 2.33%
(LIBOR03M+220bps), 4/21/34, Callable 4/21/23 @ 100 (a) (b) | | | 600,000 | | | | 600,618 | | |
SLG Office Trust, Series 2021-OVA, Class A, 2.59%, 7/15/41 (a) | | | 600,000 | | | | 615,136 | | |
Wells Fargo Commercial Mortgage Trust, Series 2017-C42,
Class B, 4.00%, 12/15/50 (d) | | | 150,000 | | | | 161,361 | | |
Total Collateralized Mortgage Obligations (Cost $6,681,023) | | | 6,591,097 | | |
Corporate Bonds (59.4%) | |
Communication Services (9.8%): | |
AT&T, Inc., 3.50%, 9/15/53, Callable 3/15/53 @ 100 | | | 200,000 | | | | 202,996 | | |
Charter Communications Operating LLC/Charter Communications
Operating Capital, 2.30%, 2/1/32, Callable 11/1/31 @ 100 (c) (e) | | | 300,000 | | | | 285,075 | | |
CSC Holdings LLC, 7.50%, 4/1/28, Callable 4/1/23 @ 103.75 (a) (c) | | | 1,000,000 | | | | 1,073,560 | | |
Frontier Communications Holdings LLC, 5.00%, 5/1/28,
Callable 5/1/24 @ 102.5 (a) | | | 500,000 | | | | 515,860 | | |
iHeartCommunications, Inc., 5.25%, 8/15/27,
Callable 8/15/22 @ 102.63 (a) (c) | | | 1,000,000 | | | | 1,039,880 | | |
Scripps Escrow, Inc., 5.88%, 7/15/27, Callable 7/15/22 @ 104.41 (a) | | | 250,000 | | | | 262,690 | | |
Sinclair Television Group, Inc., 5.50%, 3/1/30,
Callable 12/1/24 @ 102.75 (a) (c) | | | 1,500,000 | | | | 1,459,590 | | |
Sirius XM Radio, Inc., 5.50%, 7/1/29, Callable 7/1/24 @ 102.75 (a) (c) | | | 500,000 | | | | 539,365 | | |
Sprint Corp., 7.63%, 3/1/26, Callable 11/1/25 @ 100 | | | 500,000 | | | | 599,550 | | |
See notes to financial statements.
73
Victory Portfolios
Victory Strategic Income Fund | | Schedule of Portfolio Investments — continued
December 31, 2021 | |
Security Description | | Principal
Amount | | Value | |
Univision Communications, Inc., 4.50%, 5/1/29,
Callable 5/1/24 @ 102.25 (a) | | $ | 200,000 | | | $ | 202,530 | | |
Verizon Communications, Inc., 2.36%, 3/15/32,
Callable 12/15/31 @ 100 (a) | | | 750,000 | | | | 739,718 | | |
| | | | 6,920,814 | | |
Consumer Discretionary (12.6%): | |
Affinity Gaming, 6.88%, 12/15/27, Callable 12/1/23 @ 103.44 (a) | | | 1,500,000 | | | | 1,569,375 | �� | |
Expedia Group, Inc., 2.95%, 3/15/31, Callable 12/15/30 @ 100 | | | 1,180,000 | | | | 1,180,342 | | |
General Motors Co., 5.95%, 4/1/49, Callable 10/1/48 @ 100 | | | 200,000 | | | | 273,516 | | |
Life Time, Inc., 5.75%, 1/15/26, Callable 1/15/23 @ 102.88 (a) | | | 500,000 | | | | 519,965 | | |
Magic Mergeco, Inc., 7.88%, 5/1/29, Callable 5/1/24 @ 103.94 (a) | | | 500,000 | | | | 492,940 | | |
Marriott International, Inc., 2.85%, 4/15/31,
Callable 1/15/31 @ 100 (c) (e) | | | 1,180,000 | | | | 1,177,192 | | |
MGM Resorts International, 5.50%, 4/15/27,
Callable 1/15/27 @ 100 | | | 500,000 | | | | 536,010 | | |
PetSmart, Inc./PetSmart Finance Corp., 7.75%, 2/15/29,
Callable 2/15/24 @ 103.88 (a) (c) | | | 750,000 | | | | 818,782 | | |
Premier Entertainment Sub LLC/Premier Entertainment Finance Corp.,
5.88%, 9/1/31, Callable 9/1/26 @ 102.98 (a) | | | 200,000 | | | | 200,876 | | |
Ross Stores, Inc., 1.88%, 4/15/31, Callable 1/15/31 @ 100 | | | 1,000,000 | | | | 957,120 | | |
Viking Cruises Ltd., 13.00%, 5/15/25, Callable 5/15/22 @ 109.75 (a) (c) | | | 1,000,000 | | | | 1,131,640 | | |
| | | | 8,857,758 | | |
Consumer Staples (1.0%): | |
Constellation Brands, Inc., 4.10%, 2/15/48, Callable 8/15/47 @ 100 (c) | | | 400,000 | | | | 454,376 | | |
The Kroger Co., 1.70%, 1/15/31, Callable 10/15/30 @ 100 (e) | | | 300,000 | | | | 284,967 | | |
| | | | 739,343 | | |
Energy (7.1%): | |
Antero Resources Corp., 7.63%, 2/1/29, Callable 2/1/24 @ 103.81 (a) | | | 624,000 | | | | 695,067 | | |
Boardwalk Pipelines LP, 3.40%, 2/15/31, Callable 11/15/30 @ 100 | | | 1,000,000 | | | | 1,031,720 | | |
Hess Corp., 4.30%, 4/1/27, Callable 1/1/27 @ 100 (c) | | | 750,000 | | | | 817,890 | | |
Marathon Oil Corp., 4.40%, 7/15/27, Callable 4/15/27 @ 100 (c) | | | 150,000 | | | | 164,579 | | |
ONEOK, Inc.
3.40%, 9/1/29, Callable 6/1/29 @ 100 (c) | | | 250,000 | | | | 259,085 | | |
4.45%, 9/1/49, Callable 3/1/49 @ 100 | | | 200,000 | | | | 220,990 | | |
Ovintiv Exploration, Inc., 5.38%, 1/1/26, Callable 10/1/25 @ 100 (c) (e) | | | 1,600,000 | | | | 1,775,520 | | |
| | | | 4,964,851 | | |
Financials (8.3%): | |
Bank of America Corp.
2.69% (SOFR+110bps), 4/22/32, Callable 4/22/31 @ 100 (b) (c) | | | 200,000 | | | | 203,420 | | |
2.83% (SOFR+188bps), 10/24/51, Callable 10/24/50 @ 100, MTN (b) (c) | | | 500,000 | | | | 490,280 | | |
Chubb INA Holdings, Inc., 1.38%, 9/15/30, Callable 6/15/30 @ 100 | | | 1,550,000 | | | | 1,461,526 | | |
CNA Financial Corp., 2.05%, 8/15/30, Callable 5/15/30 @ 100 (c) | | | 1,100,000 | | | | 1,066,274 | | |
General Motors Financial Co., Inc., 3.60%, 6/21/30,
Callable 3/21/30 @ 100 (c) | | | 250,000 | | | | 266,867 | | |
Jefferies Group LLC/Jefferies Group Capital Finance, Inc.,
2.63%, 10/15/31, Callable 7/15/31 @ 100 | | | 700,000 | | | | 691,194 | | |
Liberty Mutual Group, Inc., 3.95%, 10/15/50,
Callable 4/15/50 @ 100 (a) (e) | | | 300,000 | | | | 333,705 | | |
See notes to financial statements.
74
Victory Portfolios
Victory Strategic Income Fund | | Schedule of Portfolio Investments — continued
December 31, 2021 | |
Security Description | | Principal
Amount | | Value | |
Morgan Stanley
2.48% (SOFR+136bps), 9/16/36, Callable 9/16/31 @ 100 (b) | | $ | 500,000 | | | $ | 481,285 | | |
3.22% (SOFR+149bps), 4/22/42, Callable 4/22/41 @ 100 (b) | | | 250,000 | | | | 262,998 | | |
Mozart Debt Merger Sub, Inc., 5.25%, 10/1/29, Callable 10/1/24 @ 102.63 (a) | | | 100,000 | | | | 101,557 | | |
SWF Escrow Issuer Corp., 6.50%, 10/1/29, Callable 10/1/24 @ 103.25 (a) | | | 500,000 | | | | 480,250 | | |
| | | | 5,839,356 | | |
Health Care (2.3%): | |
AbbVie, Inc., 4.25%, 11/21/49, Callable 5/21/49 @ 100 (c) | | | 400,000 | | | | 481,488 | | |
Bausch Health Cos., Inc., 5.25%, 1/30/30, Callable 1/30/25 @ 102.63 (a) (c) | | | 1,000,000 | | | | 884,180 | | |
Team Health Holdings, Inc., 6.38%, 2/1/25, Callable 1/24/22 @ 101.59 (a) (e) | | | 250,000 | | | | 235,295 | | |
| | | | 1,600,963 | | |
Industrials (8.7%): | |
Air Lease Corp.
4.63%, 10/1/28, Callable 7/1/28 @ 100 (c) | | | 1,100,000 | | | | 1,214,697 | | |
3.00%, 2/1/30, Callable 11/1/29 @ 100, MTN | | | 200,000 | | | | 200,492 | | |
American Airlines, Inc., 11.75%, 7/15/25 (a) | | | 200,000 | | | | 248,652 | | |
Caterpillar, Inc. | |
1.90%, 3/12/31, Callable 12/12/30 @ 100 (e) | | | 600,000 | | | | 596,352 | | |
3.25%, 4/9/50, Callable 10/9/49 @ 100 | | | 100,000 | | | | 110,878 | | |
Cornerstone Building Brands, Inc., 6.13%, 1/15/29,
Callable 9/15/23 @ 103.06 (a) (c) | | | 1,000,000 | | | | 1,066,780 | | |
The Boeing Co. | |
5.15%, 5/1/30, Callable 2/1/30 @ 100 (c) | | | 680,000 | | | | 794,247 | | |
3.75%, 2/1/50, Callable 8/1/49 @ 100 | | | 250,000 | | | | 259,052 | | |
The Hertz Corp., 5.00%, 12/1/29, Callable 12/1/24 @ 102.5 (a) | | | 500,000 | | | | 501,310 | | |
Waste Connections, Inc., 2.60%, 2/1/30, Callable 11/1/29 @ 100 | | | 1,100,000 | | | | 1,120,581 | | |
| | | | 6,113,041 | | |
Information Technology (3.5%): | |
Broadcom, Inc., 2.45%, 2/15/31, Callable 11/15/30 @ 100 (a) | | | 1,200,000 | | | | 1,174,860 | | |
VMware, Inc., 2.20%, 8/15/31, Callable 5/15/31 @ 100 | | | 1,300,000 | | | | 1,277,783 | | |
| | | | 2,452,643 | | |
Materials (1.7%): | |
Amcor Flexibles North America, Inc., 2.69%, 5/25/31,
Callable 2/25/31 @ 100 | | | 1,150,000 | | | | 1,163,628 | | |
Real Estate (3.2%): | |
Duke Realty, LP, 2.25%, 1/15/32, Callable 10/15/31 @ 100 | | | 900,000 | | | | 881,271 | | |
Life Storage, LP, 2.40%, 10/15/31, Callable 7/15/31 @ 100 | | | 150,000 | | | | 147,743 | | |
Simon Property Group LP, 2.20%, 2/1/31, Callable 11/1/30 @ 100 (c) (e) | | | 1,250,000 | | | | 1,224,962 | | |
| | | | 2,253,976 | | |
Utilities (1.2%): | |
Ameren Illinois Co., 4.50%, 3/15/49, Callable 9/15/48 @ 100 | | | 300,000 | | | | 384,408 | | |
Duke Energy Corp., 3.50%, 6/15/51, Callable 12/15/50 @ 100 | | | 320,000 | | | | 333,414 | | |
Pacific Gas and Electric Co., 3.50%, 8/1/50, Callable 2/1/50 @ 100 | | | 100,000 | | | | 93,657 | | |
| | | | 811,479 | | |
Total Corporate Bonds (Cost $41,748,630) | | | 41,717,852 | | |
See notes to financial statements.
75
Victory Portfolios
Victory Strategic Income Fund | | Schedule of Portfolio Investments — continued
December 31, 2021 | |
Security Description | | Principal
Amount | | Value | |
Residential Mortgage-Backed Securities (0.2%) | |
Bank of America Funding Corp., Series 2004-2, Class 1CB1, 5.75%, 9/20/34,
Callable 12/20/25 @ 100 (c) | | $ | 39,314 | | | $ | 40,963 | | |
Countrywide Home Loans, Inc., Series 2004-5, Class 2A9, 5.25%, 5/25/34,
Callable 1/25/22 @ 100 (c) | | | 59,700 | | | | 64,759 | | |
GSR Mortgage Loan Trust, Series 2004-15F, Class 5A1, 5.50%, 10/25/20 (c) | | | 1,614 | | | | 1,553 | | |
JPMorgan Mortgage Trust, Series 2005-A1, Class 6T1, 2.58%, 2/25/35,
Callable 1/25/22 @ 100 (c) (d) | | | 11,909 | | | | 11,909 | | |
JPMorgan Mortgage Trust, Series 2004-S2, Class 1A3, 4.75%, 11/25/34,
Callable 1/25/22 @ 100 (c) | | | 1,306 | | | | 919 | | |
Total Residential Mortgage-Backed Securities (Cost $115,743) | | | 120,103 | | |
Yankee Dollars (9.4%) | |
Consumer Discretionary (0.4%): | |
Nissan Motor Co. Ltd., 4.81%, 9/17/30, Callable 6/17/30 @ 100 (a) | | | 250,000 | | | | 279,765 | | |
Energy (0.9%): | |
Cenovus Energy, Inc.
2.65%, 1/15/32, Callable 10/15/31 @ 100 (e) | | | 400,000 | | | | 391,748 | | |
5.40%, 6/15/47, Callable 12/15/46 @ 100 (e) | | | 200,000 | | | | 248,924 | | |
| | | | 640,672 | | |
Financials (4.1%): | |
Credit Suisse Group AG, 3.87%, 1/12/29, Callable 1/12/28 @ 100 (a) (c) (e) | | | 1,500,000 | | | | 1,605,390 | | |
NXP BV/NXP Funding LLC/NXP USA, Inc., 3.40%, 5/1/30,
Callable 2/1/30 @ 100 (a) (c) | | | 1,200,000 | | | | 1,279,584 | | |
| | | | 2,884,974 | | |
Industrials (2.5%): | |
AerCap Ireland Capital DAC/AerCap Global Aviation Trust, 3.00%,
10/29/28, Callable 8/29/28 @ 100 | | | 1,700,000 | | | | 1,724,752 | | |
Materials (1.5%): | |
Nutrien, Ltd., 2.95%, 5/13/30, Callable 2/13/30 @ 100 | | | 1,000,000 | | | | 1,054,720 | | |
Total Yankee Dollars (Cost $6,605,638) | | | 6,584,883 | | |
U.S. Government Mortgage-Backed Agencies (0.0%) (f) | |
Federal National Mortgage Association
3.50%, 7/1/43 (c) | | | 42,410 | | | | 45,490 | | |
Total U.S. Government Mortgage-Backed Agencies (Cost $43,339) | | | 45,490 | | |
U.S. Treasury Obligations (8.3%) | |
U.S. Treasury Bonds
1.88%, 2/15/41 (c) | | | 3,950,000 | | | | 3,921,609 | | |
1.38%, 8/15/50 | | | 500,000 | | | | 440,235 | | |
See notes to financial statements.
76
Victory Portfolios
Victory Strategic Income Fund | | Schedule of Portfolio Investments — continued
December 31, 2021 | |
Security Description | | Shares or
Principal
Amount | | Value | |
U.S. Treasury Notes | |
1.63%, 5/15/31 (c) | | $ | 480,000 | | | $ | 486,150 | | |
1.38%, 11/15/31 | | | 1,000,000 | | | | 988,906 | | |
Total U.S. Treasury Obligations (Cost $5,687,311) | | | 5,836,900 | | |
Exchange-Traded Funds (9.2%) | |
Invesco Senior Loan ETF (c) (e) | | | 148,700 | | | | 3,286,270 | | |
SPDR Blackstone Senior Loan ETF (c) | | | 69,450 | | | | 3,169,003 | | |
Total Exchange-Traded Funds (Cost $6,500,577) | | | 6,455,273 | | |
Collateral for Securities Loaned (10.9%)^ | |
BlackRock Liquidity Funds TempFund, Institutional Shares,
0.04% (g) | | | 177,979 | | | | 177,979 | | |
Fidelity Investments Money Market Government Portfolio,
Institutional Shares, 0.01% (g) | | | 3,495,533 | | | | 3,495,533 | | |
Goldman Sachs Financial Square Prime Obligations Fund,
Institutional Shares, 0.02% (g) | | | 88,820 | | | | 88,820 | | |
JPMorgan Prime Money Market Fund, Capital Shares, 0.07% (g) | | | 708,226 | | | | 708,226 | | |
Morgan Stanley Institutional Liquidity Prime Portfolio,
Institutional Shares, 0.06% (g) | | | 3,184,323 | | | | 3,184,323 | | |
Total Collateral for Securities Loaned (Cost $7,654,881) | | | 7,654,881 | | |
Total Investments (Cost $75,760,861) — 107.8% | | | 75,714,417 | | |
Liabilities in excess of other assets — (7.8)% | | | (5,477,674 | ) | |
NET ASSETS — 100.00% | | $ | 70,236,743 | | |
^ Purchased with cash collateral from securities on loan.
(a) Rule 144A security or other security that is restricted as to resale to institutional investors. The Fund's Adviser has deemed this security to be liquid (unless otherwise noted as illiquid) based upon procedures approved by the Board of Trustees. As of December 31, 2021, the fair value of these securities was $26,375,841 and amounted to 37.6% of net assets.
(b) Variable or Floating-Rate Security. Rate disclosed is as of December 31, 2021.
(c) All or a portion of this security has been segregated as collateral for derivative instruments.
(d) The rate for certain asset-backed and mortgage-backed securities may vary based on factors relating to the pool of assets underlying the security. The rate disclosed is the rate in effect at December 31, 2021.
(e) All or a portion of this security is on loan.
(f) Amount represents less than 0.05% of net assets.
(g) Rate disclosed is the daily yield on December 31, 2021.
bps — Basis points
ETF — Exchange-Traded Fund
LIBOR — London InterBank Offered Rate
See notes to financial statements.
77
Victory Portfolios
Victory Strategic Income Fund | | Schedule of Portfolio Investments — continued
December 31, 2021 | |
LIBOR03M — 3 Month US Dollar LIBOR, rate disclosed as of December 31, 2021, based on the last reset date of the security
LLC — Limited Liability Company
LP — Limited Partnership
MTN — Medium Term Note
SOFR — Secured Overnight Financing Rate
Futures Contracts Purchased
| | | Number of
Contracts | | Expiration
Date | | Notional
Amount | | Value | | Unrealized
Appreciation
(Depreciation) | |
2-Year U.S. Treasury Note Futures | | | 42 | | | 3/31/22 | | $ | 9,181,095 | | | $ | 9,163,219 | | | $ | (17,876 | ) | |
5-Year U.S. Treasury Note Futures | | | 9 | | | 3/31/22 | | | 1,089,385 | | | | 1,088,789 | | | | (596 | ) | |
Ultra Long Term U.S. Treasury Bond Futures | | | 25 | | | 3/22/22 | | | 4,919,895 | | | | 4,928,125 | | | | 8,230 | | |
| | | | | | | | | | | $ | (10,242 | ) | |
Futures Contracts Sold | |
| | | Number of
Contracts | | Expiration
Date | | Notional
Amount | | Value | | Unrealized
Appreciation
(Depreciation) | |
10-Year US Treasury Note Futures | | | 71 | | | 3/22/22 | | $ | 10,330,234 | | | $ | 10,397,062 | | | $ | (66,828 | ) | |
Total unrealized appreciation | | $ | 8,230 | | |
Total unrealized depreciation | | | (85,300 | ) | |
Total net unrealized appreciation (depreciation) | | $ | (77,070 | ) | |
Centrally Cleared
Credit Default Swap Agreements - Buy Protection(a)
Underlying
Instruments | | Fixed
Deal
Pay
Rate | | Maturity
Date | | Payment
Frequency | | Implied
Credit
Spread at
December 31,
2021 (b) | | Notional
Amount (c) | | Value | | Premiums
Paid
(Received) | | Unrealized
Appreciation
(Depreciation) | |
CDX North
America High
Yield Index;
Series 37 | | | 5.00 | % | | 12/20/26 | | Quarterly | | | 2 94 | % | | $ | 7,400,000 | | | $ | (676,278 | ) | | $ | (645,084 | ) | | $ | (31,194 | ) | |
| | | $ | (676,278 | ) | | $ | (645,084 | ) | | $ | (31,194 | ) | |
(a) When a credit event occurs as defined under the terms of the swap agreement, the Fund as a buyer of credit protection will either (i) receive from the seller of protection an amount equal to the par value of the defaulted reference entity and deliver the reference entity or (ii) receive a net amount equal to the par value of the defaulted reference entity less its recovery value.
See notes to financial statements.
78
Victory Portfolios
Victory Strategic Income Fund | | Schedule of Portfolio Investments — continued
December 31, 2021 | |
(b) Implied credit spread, represented in absolute terms, utilized in determining the value of the credit default swap agreements as of period end will serve as an indicator of the current status of the payment/performance risk and represent the likelihood or risk of default for the credit derivative. The implied credit spread of a referenced entity reflects the cost of buying/selling protection and may include payments required to be made to enter into the agreement. Generally, wider credit spreads represent a perceived deterioration of the referenced entity's credit soundness and a greater likelihood or risk of default or other credit event occurring as defined under the terms of the swap agreement.
(c) The notional amount represents the maximum potential amount the Fund may receive as a buyer of credit protection if a credit event occurs, as defined under the terms of the swap agreement, for each security included in the CDX North America High Yield Index.
See notes to financial statements.
79
Victory Portfolios | | Statements of Assets and Liabilities
December 31, 2021 | |
| | | Victory INCORE
Investment Quality
Bond Fund | | Victory INCORE
Low Duration
Bond Fund | | Victory High
Yield Fund | |
Assets: | |
Investments, at value (Cost $24,604,390,
$195,619,237 and $368,541,693) | | $ | 25,328,450 | (a) | | $ | 198,029,295 | (b) | | $ | 371,898,564 | (c) | |
Cash | | | 744,603 | | | | 11,793,792 | | | | 6,282,594 | | |
Deposit with broker for futures contracts | | | 184,239 | | | | 1,575,170 | | | | — | | |
Deposit with broker for swap agreements | | | 103,785 | | | | 2,150,710 | | | | — | | |
Receivables: | |
Interest and dividends | | | 139,061 | | | | 1,145,639 | | | | 5,107,904 | | |
Capital shares issued | | | 12,039 | | | | 8,862,363 | | | | 318,049 | | |
Investments sold | | | — | | | | — | | | | 8,951 | | |
Variation margin on open futures contracts | | | 14,394 | | | | 24,643 | | | | — | | |
Variation margin on open swap agreements | | | 375 | | | | 5,975 | | | | — | | |
From Adviser | | | 20,565 | | | | 15,282 | | | | 60,551 | | |
Prepaid expenses | | | 17,414 | | | | 19,514 | | | | 21,781 | | |
Total Assets | | | 26,564,925 | | | | 223,622,383 | | | | 383,698,394 | | |
Liabilities: | |
Payables: | |
Collateral received on loaned securities | | | 1,398,374 | | | | 6,079,110 | | | | 38,823,311 | | |
Distributions | | | 570 | | | | 28,786 | | | | 220,118 | | |
Investments purchased | | | 496,680 | | | | — | | | | 4,995,000 | | |
Capital shares redeemed | | | 7,678 | | | | 39,951 | | | | 560,561 | | |
Variation margin on open futures contracts | | | 688 | | | | 15,234 | | | | — | | |
Accrued expenses and other payables: | |
Investment advisory fees | | | 10,435 | | | | 78,284 | | | | 173,889 | | |
Administration fees | | | 1,330 | | | | 11,034 | | | | 17,666 | | |
Custodian fees | | | 1,459 | | | | 2,770 | | | | 4,539 | | |
Transfer agent fees | | | 8,349 | | | | 38,736 | | | | 57,662 | | |
Compliance fees | | | 14 | | | | 118 | | | | 199 | | |
| 12b-1 fees | | | 3,010 | | | | 10,619 | | | | 23,821 | | |
Other accrued expenses | | | 15,769 | | | | 30,822 | | | | 34,290 | | |
Total Liabilities | | | 1,944,356 | | | | 6,335,464 | | | | 44,911,056 | | |
Net Assets: | |
Capital | | | 23,414,922 | | | | 243,473,924 | | | | 337,647,747 | | |
Total accumulated earnings/(loss) | | | 1,205,647 | | | | (26,187,005 | ) | | | 1,139,591 | | |
Net Assets | | $ | 24,620,569 | | | $ | 217,286,919 | | | $ | 338,787,338 | | |
Net Assets | |
Class A | | $ | 19,292,358 | | | $ | 76,900,829 | | | $ | 49,270,779 | | |
Class C | | | 483,645 | | | | 5,528,233 | | | | 32,889,212 | | |
Class R | | | 3,210,438 | | | | 1,213,690 | | | | 19,242,809 | | |
Class Y | | | 1,634,128 | | | | 133,644,167 | | | | 237,384,538 | | |
Total | | $ | 24,620,569 | | | $ | 217,286,919 | | | $ | 338,787,338 | | |
Shares (unlimited number of shares authorized
with a par value of $0.001 per share): | |
Class A | | | 1,914,673 | | | | 7,567,653 | | | | 7,251,094 | | |
Class C | | | 48,029 | | | | 543,932 | | | | 4,829,418 | | |
Class R | | | 317,819 | | | | 119,464 | | | | 2,824,423 | | |
Class Y | | | 162,388 | | | | 13,147,883 | | | | 35,104,424 | | |
Total | | | 2,442,909 | | | | 21,378,932 | | | | 50,009,359 | | |
Net asset value, offering (except Class A)
and redemption price per share: | |
Class A | | $ | 10.08 | | | $ | 10.16 | | | $ | 6.79 | | |
Class C (d) | | | 10.07 | | | | 10.16 | | | | 6.81 | | |
Class R | | | 10.10 | | | | 10.16 | | | | 6.81 | | |
Class Y | | | 10.06 | | | | 10.16 | | | | 6.76 | | |
Maximum Sales Charge — Class A | | | 2.25 | % | | | 2.25 | % | | | 2.25 | % | |
Maximum offering price
(100%/(100%-maximum sales charge) of
net asset value adjusted to the nearest cent)
per share — Class A | | $ | 10.31 | | | $ | 10.39 | | | $ | 6.95 | | |
(a) Includes $1,366,812 of securities on loan.
(b) Includes $5,943,432 of securities on loan.
(c) Includes $37,201,728 of securities on loan.
(d) Redemption price per share varies by the length of time shares are held.
See notes to financial statements.
80
Victory Portfolios | | Statements of Assets and Liabilities
December 31, 2021 | |
| | | Victory
Tax-Exempt
Fund | | Victory
High Income
Municipal Bond
Fund | | Victory
Floating
Rate Fund | |
Assets: | |
Investments, at value (Cost $47,196,338,
$48,902,974 and $2,165,061,474) | | $ | 51,601,611 | | | $ | 52,089,107 | | | $ | 2,153,398,960 | | |
Cash | | | 84,561 | | | | 604,099 | | | | 138,707,824 | | |
Receivables: | |
Interest and dividends | | | 497,986 | | | | 563,025 | | | | 11,102,173 | | |
Capital shares issued | | | 4,144 | | | | 823,431 | | | | 7,185,956 | | |
Investments sold | | | — | | | | — | | | | 3,592,877 | | |
From Adviser | | | 18,069 | | | | 26,869 | | | | 545,682 | | |
Prepaid expenses | | | 15,980 | | | | 28,841 | | | | 92,361 | | |
Total Assets | | | 52,222,351 | | | | 54,135,372 | | | | 2,314,625,833 | | |
Liabilities: | |
Payables: | |
Distributions | | | 8,448 | | | | 7,858 | | | | 1,164,416 | | |
Investments purchased | | | 563,920 | | | | 509,165 | | | | 99,924,621 | | |
Capital shares redeemed | | | 274,767 | | | | 79,485 | | | | 9,214,405 | | |
Accrued expenses and other payables: | |
Investment advisory fees | | | 22,126 | | | | 22,277 | | | | 1,203,149 | | |
Administration fees | | | 2,774 | | | | 2,696 | | | | 106,168 | | |
Custodian fees | | | 1,145 | | | | 1,236 | | | | 43,179 | | |
Transfer agent fees | | | 9,266 | | | | 7,276 | | | | 304,295 | | |
Compliance fees | | | 30 | | | | 30 | | | | 1,258 | | |
| 12b-1 fees | | | 4,756 | | | | 4,723 | | | | 73,808 | | |
Other accrued expenses | | | 15,901 | | | | 15,891 | | | | 151,159 | | |
Total Liabilities | | | 903,133 | | | | 650,637 | | | | 112,186,458 | | |
Net Assets: | |
Capital | | | 47,225,830 | | | | 50,316,447 | | | | 2,398,000,129 | | |
Total accumulated earnings/(loss) | | | 4,093,388 | | | | 3,168,288 | | | | (195,560,754 | ) | |
Net Assets | | $ | 51,319,218 | | | $ | 53,484,735 | | | $ | 2,202,439,375 | | |
Net Assets | |
Class A | | $ | 35,312,357 | | | $ | 34,351,945 | | | $ | 349,705,741 | | |
Class C | | | 2,037,408 | | | | 2,192,007 | | | | 81,108,871 | | |
Class R | | | — | | | | — | | | | 602,081 | | |
Class Y | | | 13,969,453 | | | | 14,087,370 | | | | 1,768,900,467 | | |
Member Class | | | — | | | | 2,853,413 | | | | 2,122,215 | | |
Total | | $ | 51,319,218 | | | $ | 53,484,735 | | | $ | 2,202,439,375 | | |
Shares (unlimited number of shares authorized
with a par value of $0.001 per share): | |
Class A | | | 3,609,810 | | | | 3,098,460 | | | | 37,484,031 | | |
Class C | | | 208,369 | | | | 197,738 | | | | 8,690,679 | | |
Class R | | | — | | | | — | | | | 64,554 | | |
Class Y | | | 1,428,631 | | | | 1,270,545 | | | | 189,510,202 | | |
Member Class | | | — | | | | 257,290 | | | | 227,514 | | |
Total | | | 5,246,810 | | | | 4,824,033 | | | | 235,976,980 | | |
Net asset value, offering (except Class A) and
redemption price per share: | |
Class A | | $ | 9.78 | | | $ | 11.09 | | | $ | 9.33 | | |
Class C (a) | | | 9.78 | | | | 11.09 | | | | 9.33 | | |
Class R | | | — | | | | — | | | | 9.33 | | |
Class Y | | | 9.78 | | | | 11.09 | | | | 9.33 | | |
Member Class | | | — | | | | 11.09 | | | | 9.33 | | |
Maximum Sales Charge — Class A | | | 2.25 | % | | | 2.25 | % | | | 2.25 | % | |
Maximum offering price
(100%/(100%-maximum sales charge) of
net asset value adjusted to the nearest cent)
per share — Class A | | $ | 10.01 | | | $ | 11.35 | | | $ | 9.54 | | |
(a) Redemption price per share varies by the length of time shares are held.
See notes to financial statements.
81
Victory Portfolios | | Statement of Assets and Liabilities
December 31, 2021 | |
| | | Victory
Strategic
Income Fund | |
Assets: | |
Investments, at value (Cost $75,760,861) | | $ | 75,714,417 | (a) | |
Cash | | | 956,142 | | |
Deposit with broker for futures contracts | | | 457,771 | | |
Deposit with broker for swap agreements | | | 354,882 | | |
Receivables: | |
Interest and dividends | | | 625,376 | | |
Capital shares issued | | | 14,619 | | |
Variation margin on open futures contracts | | | 41,664 | | |
From Adviser | | | 19,033 | | |
Prepaid expenses | | | 25,427 | | |
Total Assets | | | 78,209,331 | | |
Liabilities: | |
Payables: | |
Collateral received on loaned securities | | | 7,654,881 | | |
Distributions | | | 68,867 | | |
Capital shares redeemed | | | 142,370 | | |
Variation margin on open futures contracts | | | 18,859 | | |
Variation margin on swap agreements | | | 5,527 | | |
Accrued expenses and other payables: | |
Investment advisory fees | | | 36,226 | | |
Administration fees | | | 3,998 | | |
Custodian fees | | | 2,030 | | |
Transfer agent fees | | | 13,281 | | |
Compliance fees | | | 42 | | |
| 12b-1 fees | | | 7,182 | | |
Other accrued expenses | | | 19,325 | | |
Total Liabilities | | | 7,972,588 | | |
Net Assets: | |
Capital | | | 70,439,098 | | |
Total accumulated earnings/(loss) | | | (202,355 | ) | |
Net Assets | | $ | 70,236,743 | | |
Net Assets | |
Class A | | $ | 39,795,228 | | |
Class C | | | 5,045,500 | | |
Class R | | | 2,771,948 | | |
Class Y | | | 22,624,067 | | |
Total | | $ | 70,236,743 | | |
Shares (unlimited number of shares authorized with a par value of $0.001 per share): | |
Class A | | | 3,802,373 | | |
Class C | | | 479,830 | | |
Class R | | | 263,410 | | |
Class Y | | | 2,174,024 | | |
Total | | | 6,719,637 | | |
Net asset value, offering (except Class A) and redemption price per share: | |
Class A | | $ | 10.47 | | |
Class C (b) | | | 10.52 | | |
Class R | | | 10.52 | | |
Class Y | | | 10.41 | | |
Maximum Sales Charge — Class A | | | 2.25 | % | |
Maximum offering price
(100%/(100%-maximum
sales charge) of net asset value adjusted to the nearest cent) per share — Class A | | $ | 10.71 | | |
(a) Includes $7,446,153 of securities on loan.
(b) Redemption price per share varies by the length of time shares are held.
See notes to financial statements.
82
Victory Portfolios | | Statements of Operations
For the Year Ended December 31, 2021 | |
| | | Victory INCORE
Investment Quality
Bond Fund | | Victory
INCORE
Low Duration
Bond Fund | | Victory
High
Yield Fund | |
Investment Income: | | | |
Dividends | | $ | 49,534 | | | $ | 318,791 | | | $ | 111,119 | | |
Interest | | | 511,225 | | | | 3,654,611 | | | | 18,208,188 | | |
Securities lending (net of fees) | | | 2,344 | | | | 15,105 | | | | 137,039 | | |
Total Income | | | 563,103 | | | | 3,988,507 | | | | 18,456,346 | | |
Expenses: | | | |
Investment advisory fees | | | 136,296 | | | | 1,043,788 | | | | 1,772,507 | | |
Administration fees | | | 15,064 | | | | 128,205 | | | | 162,693 | | |
Sub-Administration fees | | | 17,000 | | | | 17,000 | | | | 17,000 | | |
| 12b-1 fees — Class A | | | 52,514 | | | | 199,044 | | | | 115,224 | | |
| 12b-1 fees — Class C | | | 7,506 | | | | 69,497 | | | | 289,204 | | |
| 12b-1 fees — Class R | | | 17,039 | | | | 5,643 | | | | 97,191 | | |
Custodian fees | | | 10,080 | | | | 17,984 | | | | 26,092 | | |
Transfer agent fees — Class A | | | 35,819 | | | | 94,244 | | | | 47,453 | | |
Transfer agent fees — Class C | | | 1,294 | | | | 9,349 | | | | 13,102 | | |
Transfer agent fees — Class R | | | 6,498 | | | | 2,047 | | | | 4,619 | | |
Transfer agent fees — Class Y | | | 2,698 | | | | 135,043 | | | | 225,555 | | |
Trustees' fees | | | 3,496 | | | | 17,489 | | | | 18,704 | | |
Compliance fees | | | 204 | | | | 1,742 | | | | 2,098 | | |
Legal and audit fees | | | 11,680 | | | | 20,533 | | | | 25,979 | | |
State registration and filing fees | | | 55,140 | | | | 67,509 | | | | 85,278 | | |
Other expenses | | | 20,520 | | | | 43,270 | | | | 49,634 | | |
Total Expenses | | | 392,848 | | | | 1,872,387 | | | | 2,952,333 | | |
Expenses waived/reimbursed by Adviser | | | (132,566 | ) | | | (175,522 | ) | | | (221,331 | ) | |
Net Expenses | | | 260,282 | | | | 1,696,865 | | | | 2,731,002 | | |
Net Investment Income (Loss) | | | 302,821 | | | | 2,291,642 | | | | 15,725,344 | | |
Realized/Unrealized Gains (Losses) from
Investments: | | | |
Net realized gains (losses) from investment
securities | | | 413,684 | | | | 1,930,506 | | | | 5,672,619 | | |
Net realized gains (losses) from futures contracts | | | (43,028 | ) | | | 554,474 | | | | — | | |
Net realized gains (losses) from swap agreements | | | 43,436 | | | | 280,211 | | | | — | | |
Net change in unrealized appreciation/depreciation
on investment securities | | | (886,683 | ) | | | (3,077,450 | ) | | | (7,935,627 | ) | |
Net change in unrealized appreciation/depreciation
on futures contracts | | | (5,660 | ) | | | 15,472 | | | | — | | |
Net change in unrealized appreciation/depreciation
on swap agreements | | | 258 | | | | 41,511 | | | | — | | |
Net realized/unrealized gains (losses) on investments | | | (477,993 | ) | | | (255,276 | ) | | | (2,263,008 | ) | |
Change in net assets resulting from operations | | $ | (175,172 | ) | | $ | 2,036,366 | | | $ | 13,462,336 | | |
See notes to financial statements.
83
Victory Portfolios | | Statements of Operations
For the Year Ended December 31, 2021 | |
| | | Victory
Tax-Exempt
Fund | | Victory
High Income
Municipal Bond
Fund | | Victory
Floating
Rate Fund | |
Investment Income: | | | |
Dividends | | $ | — | | | $ | 78,789 | | | $ | 467,219 | | |
| Interest | | | 1,865,305 | | | | 1,900,567 | | | | 78,732,975 | | |
Securities lending (net of fees) | | | 507 | | | | — | | | | — | | |
Total Income | | | 1,865,812 | | | | 1,979,356 | | | | 79,200,194 | | |
Expenses: | | | |
Investment advisory fees | | | 263,469 | | | | 247,283 | | | | 10,560,819 | | |
Administration fees | | | 29,080 | | | | 27,267 | | | | 891,563 | | |
Sub-Administration fees | | | 17,000 | | | | 17,000 | | | | 17,000 | | |
| 12b-1 fees — Class A | | | 89,603 | | | | 83,662 | | | | 724,145 | | |
| 12b-1 fees — Class C | | | 23,918 | | | | 29,419 | | | | 738,279 | | |
| 12b-1 fees — Class R | | | — | | | | — | | | | 2,515 | | |
Custodian fees | | | 6,988 | | | | 7,912 | | | | 258,539 | | |
Transfer agent fees — Class A | | | 29,585 | | | | 22,240 | | | | 307,460 | | |
Transfer agent fees — Class C | | | 3,699 | | | | 3,235 | | | | 81,486 | | |
Transfer agent fees — Class R | | | — | | | | — | | | | 969 | | |
Transfer agent fees — Class Y | | | 17,645 | | | | 8,731 | | | | 1,149,146 | | |
Transfer agent fees — Member Class | | | — | | | | 1,021 | | | | 2,048 | | |
Trustees' fees | | | 5,211 | | | | 4,605 | | | | 78,499 | | |
Compliance fees | | | 394 | | | | 356 | | | | 10,817 | | |
Legal and audit fees | | | 11,348 | | | | 11,919 | | | | 267,014 | | |
State registration and filing fees | | | 42,675 | | | | 62,490 | | | | 200,325 | | |
Interfund lending fees | | | 139 | | | | — | | | | — | | |
Other expenses | | | 14,985 | | | | 18,245 | | | | 265,526 | | |
Total Expenses | | | 555,739 | | | | 545,385 | | | | 15,556,150 | | |
Expenses waived/reimbursed by Adviser | | | (131,110 | ) | | | (156,099 | ) | | | (1,454,748 | ) | |
Net Expenses | | | 424,629 | | | | 389,286 | | | | 14,101,402 | | |
Net Investment Income (Loss) | | | 1,441,183 | | | | 1,590,070 | | | | 65,098,792 | | |
Realized/Unrealized Gains (Losses) from
Investments: | | | |
Net realized gains (losses) from investment
securities | | | 1,382,468 | | | | 209,201 | | | | 408,615 | | |
Net change in unrealized appreciation/depreciation
on investment securities | | | (770,070 | ) | | | 1,002,109 | | | | (12,438,598 | ) | |
Net realized/unrealized gains (losses) on investments | | | 612,398 | | | | 1,211,310 | | | | (12,029,983 | ) | |
Change in net assets resulting from operations | | $ | 2,053,581 | | | $ | 2,801,380 | | | $ | 53,068,809 | | |
See notes to financial statements.
84
Victory Portfolios | | Statement of Operations
For the Year Ended December 31, 2021 | |
| | | Victory
Strategic
Income Fund | |
Investment Income: | | | |
Dividends | | $ | 269,239 | | |
Interest | | | 2,302,749 | | |
Securities lending (net of fees) | | | 22,625 | | |
Total Income | | | 2,594,613 | | |
Expenses: | | | |
Investment advisory fees | | | 523,429 | | |
Administration fees | | | 48,298 | | |
Sub-Administration fees | | | 17,000 | | |
| 12b-1 fees — Class A | | | 106,322 | | |
| 12b-1 fees — Class C | | | 62,485 | | |
| 12b-1 fees — Class R | | | 14,349 | | |
Custodian fees | | | 12,666 | | |
Transfer agent fees — Class A | | | 19,619 | | |
Transfer agent fees — Class C | | | 3,366 | | |
Transfer agent fees — Class R | | | 496 | | |
Transfer agent fees — Class Y | | | 43,503 | | |
Trustees' fees | | | 7,923 | | |
Compliance fees | | | 664 | | |
Legal and audit fees | | | 15,164 | | |
State registration and filing fees | | | 52,740 | | |
Interfund lending fees | | | 197 | | |
Other expenses | | | 21,944 | | |
Total Expenses | | | 950,165 | | |
Expenses waived/reimbursed by Adviser | | | (136,239 | ) | |
Net Expenses | | | 813,926 | | |
Net Investment Income (Loss) | | | 1,780,687 | | |
Realized/Unrealized Gains (Losses) from Investments: | | | |
Net realized gains (losses) from investment securities | | | 726,528 | | |
Net realized gains (losses) from futures contracts | | | (176,808 | ) | |
Net realized gains (losses) from swap agreements | | | 74,546 | | |
Net change in unrealized appreciation/depreciation on investment securities | | | (3,361,033 | ) | |
Net change in unrealized appreciation/depreciation on futures contracts | | | (49,102 | ) | |
Net change in unrealized appreciation/depreciation on swap agreements | | | (31,194 | ) | |
Net realized/unrealized gains (losses) on investments | | | (2,817,063 | ) | |
Change in net assets resulting from operations | | $ | (1,036,376 | ) | |
See notes to financial statements.
85
Victory Portfolios | | Statements of Changes in Net Assets | |
| | | Victory
INCORE Investment
Quality Bond Fund | | Victory
INCORE Low Duration
Bond Fund | | Victory
High Yield Fund | |
| | | Year
Ended
December 31,
2021 | | Year
Ended
December 31,
2020 | | Year
Ended
December 31,
2021 | | Year
Ended
December 31,
2020 | | Year
Ended
December 31,
2021 | | Year
Ended
December 31,
2020 | |
From Investment Activities: | |
Operations: | |
Net investment
income (loss) | | $ | 302,821 | | | $ | 469,256 | | | $ | 2,291,642 | | | $ | 3,749,720 | | | $ | 15,725,344 | | | $ | 11,999,966 | | |
Net realized gains
(losses) from
investments | | | 414,092 | | | | 956,039 | | | | 2,765,191 | | | | 1,551,713 | | | | 5,672,619 | | | | (286,139 | ) | |
Net change in
unrealized
appreciation/
depreciation on
investments | | | (892,085 | ) | | | 884,218 | | | | (3,020,467 | ) | | | 4,094,555 | | | | (7,935,627 | ) | | | 6,963,613 | | |
Change in net assets resulting
from operations | | | (175,172 | ) | | | 2,309,513 | | | | 2,036,366 | | | | 9,395,988 | | | | 13,462,336 | | | | 18,677,440 | | |
Distributions to Shareholders: | |
Class A | | | (336,494 | ) | | | (443,929 | ) | | | (879,844 | ) | | | (868,824 | ) | | | (2,461,269 | ) | | | (1,891,442 | ) | |
Class C | | | (5,625 | ) | | | (31,603 | ) | | | (21,804 | ) | | | (238,443 | ) | | | (1,335,016 | ) | | | (1,103,322 | ) | |
Class R | | | (40,583 | ) | | | (56,460 | ) | | | (7,637 | ) | | | (10,980 | ) | | | (979,672 | ) | | | (990,013 | ) | |
Class Y | | | (38,987 | ) | | | (74,664 | ) | | | (1,922,795 | ) | | | (2,422,766 | ) | | | (11,295,501 | ) | | | (8,004,170 | ) | |
From return of capital: | |
Class A | | | — | | | | — | | | | — | | | | (220,729 | ) | | | — | | | | — | | |
Class C | | | — | | | | — | | | | — | | | | (60,578 | ) | | | — | | | | — | | |
Class R | | | — | | | | — | | | | — | | | | (2,790 | ) | | | — | | | | — | | |
Class Y | | | — | | | | — | | | | — | | | | (615,514 | ) | | | — | | | | — | | |
Change in net assets resulting
from distributions to
shareholders | | | (421,689 | ) | | | (606,656 | ) | | | (2,832,080 | ) | | | (4,440,624 | ) | | | (16,071,458 | ) | | | (11,988,947 | ) | |
Change in net assets resulting
from capital transactions | | | (5,104,106 | ) | | | (2,983,450 | ) | | | (42,237,361 | ) | | | (11,232,054 | ) | | | 88,777,937 | | | | 66,176,609 | | |
Change in net assets | | | (5,700,967 | ) | | | (1,280,593 | ) | | | (43,033,075 | ) | | | (6,276,690 | ) | | | 86,168,815 | | | | 72,865,102 | | |
Net Assets: | |
Beginning of period | | | 30,321,536 | | | | 31,602,129 | | | | 260,319,994 | | | | 266,596,684 | | | | 252,618,523 | | | | 179,753,421 | | |
End of period | | $ | 24,620,569 | | | $ | 30,321,536 | | | $ | 217,286,919 | | | $ | 260,319,994 | | | $ | 338,787,338 | | | $ | 252,618,523 | | |
(continues on next page)
See notes to financial statements.
86
Victory Portfolios | | Statements of Changes in Net Assets | |
(continued)
| | | Victory
INCORE Investment
Quality Bond Fund | | Victory
INCORE Low Duration
Bond Fund | | Victory
High Yield Fund | |
| | | Year
Ended
December 31,
2021 | | Year
Ended
December 31,
2020 | | Year
Ended
December 31,
2021 | | Year
Ended
December 31,
2020 | | Year
Ended
December 31,
2021 | | Year
Ended
December 31,
2020 | |
Capital Transactions: | |
Class A | |
Proceeds from shares
issued | | $ | 3,219,691 | | | $ | 3,741,042 | | | $ | 27,443,659 | | | $ | 26,390,247 | | | $ | 18,887,212 | | | $ | 11,313,136 | | |
Distributions reinvested | | | 327,179 | | | | 432,981 | | | | 797,627 | | | | 998,870 | | | | 1,668,744 | | | | 1,207,222 | | |
Cost of shares redeemed | | | (5,233,205 | ) | | | (5,934,340 | ) | | | (21,402,058 | ) | | | (20,255,290 | ) | | | (9,668,773 | ) | | | (6,047,019 | ) | |
Total Class A | | $ | (1,686,335 | ) | | $ | (1,760,317 | ) | | $ | 6,839,228 | | | $ | 7,133,827 | | | $ | 10,887,183 | | | $ | 6,473,339 | | |
Class C | |
Proceeds from shares
issued | | $ | 1,689 | | | $ | 371,418 | | | $ | 1,947,527 | | | $ | 1,293,466 | | | $ | 10,304,554 | | | $ | 6,325,319 | | |
Distributions reinvested | | | 5,578 | | | | 28,275 | | | | 20,254 | | | | 255,292 | | | | 672,575 | | | | 363,233 | | |
Cost of shares redeemed | | | (2,020,890 | ) | | | (853,248 | ) | | | (19,935,340 | ) | | | (17,694,441 | ) | | | (3,823,976 | ) | | | (2,370,736 | ) | |
Total Class C | | $ | (2,013,623 | ) | | $ | (453,555 | ) | | $ | (17,967,559 | ) | | $ | (16,145,683 | ) | | $ | 7,153,153 | | | $ | 4,317,816 | | |
Class R | |
Proceeds from shares
issued | | $ | 265,416 | | | $ | 520,871 | | | $ | 250,815 | | | $ | 440,750 | | | $ | 979,946 | | | $ | 573,952 | | |
Distributions reinvested | | | 40,505 | | | | 56,322 | | | | 7,615 | | | | 13,406 | | | | 107,948 | | | | 101,913 | | |
Cost of shares redeemed | | | (626,813 | ) | | | (529,270 | ) | | | (169,252 | ) | | | (494,683 | ) | | | (984,832 | ) | | | (503,868 | ) | |
Total Class R | | $ | (320,892 | ) | | $ | 47,923 | | | $ | 89,178 | | | $ | (40,527 | ) | | $ | 103,062 | | | $ | 171,997 | | |
Class Y | |
Proceeds from shares
issued | | $ | 432,578 | | | $ | 1,142,128 | | | $ | 70,433,564 | | | $ | 84,768,131 | | | $ | 189,927,452 | | | $ | 169,162,794 | | |
Distributions reinvested | | | 38,854 | | | | 73,672 | | | | 1,562,121 | | | | 2,450,105 | | | | 11,280,860 | | | | 7,507,572 | | |
Cost of shares redeemed | | | (1,554,688 | ) | | | (2,033,301 | ) | | | (103,193,893 | ) | | | (89,397,907 | ) | | | (130,573,773 | ) | | | (121,456,909 | ) | |
Total Class Y | | $ | (1,083,256 | ) | | $ | (817,501 | ) | | $ | (31,198,208 | ) | | $ | (2,179,671 | ) | | $ | 70,634,539 | | | $ | 55,213,457 | | |
Change in net assets resulting
from capital transactions | | $ | (5,104,106 | ) | | $ | (2,983,450 | ) | | $ | (42,237,361 | ) | | $ | (11,232,054 | ) | | $ | 88,777,937 | | | $ | 66,176,609 | | |
(continues on next page)
See notes to financial statements.
87
Victory Portfolios | | Statements of Changes in Net Assets | |
(continued)
| | | Victory
INCORE Investment
Quality Bond Fund | | Victory
INCORE Low Duration
Bond Fund | | Victory
High Yield Fund | |
| | | Year
Ended
December 31,
2021 | | Year
Ended
December 31,
2020 | | Year
Ended
December 31,
2021 | | Year
Ended
December 31,
2020 | | Year
Ended
December 31,
2021 | | Year
Ended
December 31,
2020 | |
Share Transactions: | |
Class A | |
Issued | | | 317,256 | | | | 374,189 | | | | 2,689,921 | | | | 2,611,845 | | | | 2,747,182 | | | | 1,750,643 | | |
Reinvested | | | 32,480 | | | | 42,958 | | | | 78,254 | | | | 99,098 | | | | 243,419 | | | | 188,872 | | |
Redeemed | | | (519,236 | ) | | | (596,219 | ) | | | (2,097,475 | ) | | | (2,017,103 | ) | | | (1,409,340 | ) | | | (962,364 | ) | |
Total Class A | | | (169,500 | ) | | | (179,072 | ) | | | 670,700 | | | | 693,840 | | | | 1,581,261 | | | | 977,151 | | |
Class C | |
Issued | | | 167 | | | | 37,380 | | | | 191,248 | | | | 128,943 | | | | 1,495,332 | | | | 971,560 | | |
Reinvested | | | 554 | | | | 2,808 | | | | 1,986 | | | | 25,402 | | | | 97,913 | | | | 56,460 | | |
Redeemed | | | (198,568 | ) | | | (84,915 | ) | | | (1,954,241 | ) | | | (1,751,574 | ) | | | (555,259 | ) | | | (372,697 | ) | |
Total Class C | | | (197,847 | ) | | | (44,727 | ) | | | (1,761,007 | ) | | | (1,597,229 | ) | | | 1,037,986 | | | | 655,323 | | |
Class R | |
Issued | | | 26,305 | | | | 51,521 | | | | 24,662 | | | | 43,544 | | | | 141,863 | | | | 87,110 | | |
Reinvested | | | 4,012 | | | | 5,574 | | | | 747 | | | | 1,331 | | | | 15,703 | | | | 15,967 | | |
Redeemed | | | (62,127 | ) | | | (52,365 | ) | | | (16,595 | ) | | | (49,038 | ) | | | (143,250 | ) | | | (80,100 | ) | |
Total Class R | | | (31,810 | ) | | | 4,730 | | | | 8,814 | | | | (4,163 | ) | | | 14,316 | | | | 22,977 | | |
Class Y | |
Issued | | | 42,628 | | | | 114,222 | | | | 6,908,185 | | | | 8,403,448 | | | | 27,774,023 | | | | 27,361,536 | | |
Reinvested | | | 3,862 | | | | 7,320 | | | | 153,191 | | | | 242,992 | | | | 1,654,148 | | | | 1,177,131 | | |
Redeemed | | | (153,909 | ) | | | (203,029 | ) | | | (10,114,574 | ) | | | (8,905,756 | ) | | | (19,136,526 | ) | | | (19,870,790 | ) | |
Total Class Y | | | (107,419 | ) | | | (81,487 | ) | | | (3,053,198 | ) | | | (259,316 | ) | | | 10,291,645 | | | | 8,667,877 | | |
Change in Shares | | | (506,576 | ) | | | (300,556 | ) | | | (4,134,691 | ) | | | (1,166,868 | ) | | | 12,925,208 | | | | 10,323,328 | | |
See notes to financial statements.
88
Victory Portfolios | | Statements of Changes in Net Assets | |
| | | Victory
Tax-Exempt Fund | | Victory
High Income
Municipal Bond Fund | | Victory
Floating Rate Fund | |
| | | Year
Ended
December 31,
2021 | | Year
Ended
December 31,
2020 | | Year
Ended
December 31,
2021 | | Year
Ended
December 31,
2020 | | Year
Ended
December 31,
2021 | | Year
Ended
December 31,
2020 | |
From Investment Activities: | |
Operations: | |
Net investment
income (loss) | | $ | 1,441,183 | | | $ | 1,817,046 | | | $ | 1,590,070 | | | $ | 1,501,425 | | | $ | 65,098,792 | | | $ | 29,438,801 | | |
Net realized gains
(losses) from
investments | | | 1,382,468 | | | | 799,972 | | | | 209,201 | | | | 894,229 | | | | 408,615 | | | | (12,797,385 | ) | |
Net change in
unrealized
appreciation/
depreciation on
investments | | | (770,070 | ) | | | 651,008 | | | | 1,002,109 | | | | (455,689 | ) | | | (12,438,598 | ) | | | 6,115,431 | | |
Change in net assets resulting
from operations | | | 2,053,581 | | | | 3,268,026 | | | | 2,801,380 | | | | 1,939,965 | | | | 53,068,809 | | | | 22,756,847 | | |
Distributions to Shareholders: | |
Class A | | | (1,954,076 | ) | | | (1,310,488 | ) | | | (1,162,366 | ) | | | (900,322 | ) | | | (11,345,229 | ) | | | (7,509,760 | ) | |
Class C | | | (103,696 | ) | | | (275,865 | ) | | | (78,359 | ) | | | (416,434 | ) | | | (2,286,259 | ) | | | (5,483,129 | ) | |
Class R | | | — | | | | — | | | | — | | | | — | | | | (16,736 | ) | | | (13,890 | ) | |
Class Y | | | (814,249 | ) | | | (993,693 | ) | | | (435,742 | ) | | | (434,615 | ) | | | (51,994,941 | ) | | | (16,288,620 | ) | |
Member Class (a) | | | — | | | | — | | | | (45,997 | ) | | | (633 | ) | | | (35,024 | ) | | | (293 | ) | |
Change in net assets resulting
from distributions to
shareholders | | | (2,872,021 | ) | | | (2,580,046 | ) | | | (1,722,464 | ) | | | (1,752,004 | ) | | | (65,678,189 | ) | | | (29,295,692 | ) | |
Change in net assets resulting
from capital transactions | | | (9,358,432 | ) | | | (5,160,426 | ) | | | 6,876,625 | | | | 1,573,250 | | | | 1,551,086,684 | | | | 84,613,158 | | |
Change in net assets | | | (10,176,872 | ) | | | (4,472,446 | ) | | | 7,955,541 | | | | 1,761,211 | | | | 1,538,477,304 | | | | 78,074,313 | | |
Net Assets: | |
Beginning of period | | | 61,496,090 | | | | 65,968,536 | | | | 45,529,194 | | | | 43,767,983 | | | | 663,962,071 | | | | 585,887,758 | | |
End of period | | $ | 51,319,218 | | | $ | 61,496,090 | | | $ | 53,484,735 | | | $ | 45,529,194 | | | $ | 2,202,439,375 | | | $ | 663,962,071 | | |
(a) Victory High Income Municipal Bond Fund and Victory Floating Rate Fund Member Class commenced operations on November 3, 2020.
(continues on next page)
See notes to financial statements.
89
Victory Portfolios | | Statements of Changes in Net Assets | |
(continued)
| | | Victory
Tax-Exempt Fund | | Victory
High Income
Municipal Bond Fund | | Victory
Floating Rate Fund | |
| | | Year
Ended
December 31,
2021 | | Year
Ended
December 31,
2020 | | Year
Ended
December 31,
2021 | | Year
Ended
December 31,
2020 | | Year
Ended
December 31,
2021 | | Year
Ended
December 31,
2020 | |
Capital Transactions: | |
Class A | |
Proceeds from shares
issued | | $ | 7,231,915 | | | $ | 5,775,996 | | | $ | 9,753,917 | | | $ | 9,315,877 | | | $ | 266,345,825 | | | $ | 79,846,398 | | |
Distributions
reinvested | | | 1,806,265 | | | | 1,202,398 | | | | 1,080,764 | | | | 818,111 | | | | 10,126,690 | | | | 6,658,816 | | |
Cost of shares
redeemed | | | (5,160,768 | ) | | | (5,606,292 | ) | | | (3,548,527 | ) | | | (3,158,508 | ) | | | (90,141,473 | ) | | | (66,492,431 | ) | |
Total Class A | | $ | 3,877,412 | | | $ | 1,372,102 | | | $ | 7,286,154 | | | $ | 6,975,480 | | | $ | 186,331,042 | | | $ | 20,012,783 | | |
Class C | |
Proceeds from
shares issued | | $ | 212,297 | | | $ | 658,815 | | | $ | 234,228 | | | $ | 382,792 | | | $ | 48,665,824 | | | $ | 8,695,794 | | |
Distributions
reinvested | | | 99,658 | | | | 245,751 | | | | 74,083 | | | | 379,132 | | | | 2,087,262 | | | | 4,727,020 | | |
Cost of shares
redeemed | | | (4,766,843 | ) | | | (5,678,979 | ) | | | (7,590,095 | ) | | | (5,351,211 | ) | | | (64,541,146 | ) | | | (63,036,997 | ) | |
Total Class C | | $ | (4,454,888 | ) | | $ | (4,774,413 | ) | | $ | (7,281,784 | ) | | $ | (4,589,287 | ) | | $ | (13,788,060 | ) | | $ | (49,614,183 | ) | |
Class R | |
Proceeds from
shares issued | | $ | — | | | $ | — | | | $ | — | | | $ | — | | | $ | 370,964 | | | $ | 81,023 | | |
Distributions
reinvested | | | — | | | | — | | | | — | | | | — | | | | 16,539 | | | | 13,070 | | |
Cost of shares
redeemed | | | — | | | | — | | | | — | | | | — | | | | (82,647 | ) | | | (245,870 | ) | |
Total Class R | | $ | — | | | $ | — | | | $ | — | | | $ | — | | | $ | 304,856 | | | $ | (151,777 | ) | |
Class Y | |
Proceeds from
shares issued | | $ | 7,289,073 | | | $ | 4,408,153 | | | $ | 5,118,372 | | | $ | 2,332,661 | | | $ | 1,691,635,496 | | | $ | 286,860,980 | | |
Distributions
reinvested | | | 789,622 | | | | 974,393 | | | | 423,799 | | | | 417,909 | | | | 45,070,085 | | | | 14,104,888 | | |
Cost of shares
redeemed | | | (16,859,651 | ) | | | (7,140,661 | ) | | | (1,382,882 | ) | | | (3,702,429 | ) | | | (360,535,842 | ) | | | (186,660,948 | ) | |
Total Class Y | | $ | (8,780,956 | ) | | $ | (1,758,115 | ) | | $ | 4,159,289 | | | $ | (951,859 | ) | | $ | 1,376,169,739 | | | $ | 114,304,920 | | |
Member Class (a) | |
Proceeds from shares
issued | | $ | — | | | $ | — | | | $ | 2,791,673 | | | $ | 138,283 | | | $ | 2,614,800 | | | $ | 69,505 | | |
Distributions
reinvested | | | — | | | | — | | | | 45,997 | | | | 633 | | | | 35,024 | | | | 290 | | |
Cost of shares
redeemed | | | — | | | | — | | | | (124,704 | ) | | | — | | | | (580,717 | ) | | | (8,380 | ) | |
Total Member
Class | | $ | — | | | $ | — | | | $ | 2,712,966 | | | $ | 138,916 | | | $ | 2,069,107 | | | $ | 61,415 | | |
Change in net assets resulting
from capital transactions | | $ | (9,358,432 | ) | | $ | (5,160,426 | ) | | $ | 6,876,625 | | | $ | 1,573,250 | | | $ | 1,551,086,684 | | | $ | 84,613,158 | | |
(a) Victory High Income Municipal Bond Fund and Victory Floating Rate Fund Member Class commenced operations on November 3, 2020.
(continues on next page)
See notes to financial statements.
90
Victory Portfolios | | Statements of Changes in Net Assets | |
(continued)
| | | Victory
Tax-Exempt Fund | | Victory
High Income
Municipal Bond Fund | | Victory
Floating Rate Fund | |
| | | Year
Ended
December 31,
2021 | | Year
Ended
December 31,
2020 | | Year
Ended
December 31,
2021 | | Year
Ended
December 31,
2020 | | Year
Ended
December 31,
2021 | | Year
Ended
December 31,
2020 | |
Share Transactions: | |
Class A | |
Issued | | | 722,275 | | | | 591,255 | | | | 892,208 | | | | 869,235 | | | | 28,352,164 | | | | 8,856,174 | | |
Reinvested | | | 182,127 | | | | 122,799 | | | | 97,863 | | | | 76,906 | | | | 1,079,897 | | | | 752,843 | | |
Redeemed | | | (514,040 | ) | | | (568,616 | ) | | | (321,447 | ) | | | (297,732 | ) | | | (9,602,493 | ) | | | (7,516,037 | ) | |
Total Class A | | | 390,362 | | | | 145,438 | | | | 668,624 | | | | 648,409 | | | | 19,829,568 | | | | 2,092,980 | | |
Class C | |
Issued | | | 21,295 | | | | 67,589 | | | | 21,158 | | | | 35,772 | | | | 5,176,179 | | | | 966,114 | | |
Reinvested | | | 10,059 | | | | 25,122 | | | | 6,716 | | | | 35,679 | | | | 222,482 | | | | 535,700 | | |
Redeemed | | | (476,876 | ) | | | (583,439 | ) | | | (695,638 | ) | | | (507,680 | ) | | | (6,865,599 | ) | | | (7,162,986 | ) | |
Total Class C | | | (445,522 | ) | | | (490,728 | ) | | | (667,764 | ) | | | (436,229 | ) | | | (1,466,938 | ) | | | (5,661,172 | ) | |
Class R | |
Issued | | | — | | | | — | | | | — | | | | — | | | | 39,473 | | | | 8,818 | | |
Reinvested | | | — | | | | — | | | | — | | | | — | | | | 1,764 | | | | 1,480 | | |
Redeemed | | | — | | | | — | | | | — | | | | — | | | | (8,787 | ) | | | (26,479 | ) | |
Total Class R | | | — | | | | — | | | | — | | | | — | | | | 32,450 | | | | (16,181 | ) | |
Class Y | |
Issued | | | 723,170 | | | | 454,324 | | | | 464,246 | | | | 219,079 | | | | 179,923,304 | | | | 32,140,981 | | |
Reinvested | | | 79,624 | | | | 99,525 | | | | 38,361 | | | | 39,262 | | | | 4,805,331 | | | | 1,588,219 | | |
Redeemed | | | (1,688,841 | ) | | | (725,840 | ) | | | (125,470 | ) | | | (352,658 | ) | | | (38,433,801 | ) | | | (21,256,634 | ) | |
Total Class Y | | | (886,047 | ) | | | (171,991 | ) | | | 377,137 | | | | (94,317 | ) | | | 146,294,834 | | | | 12,472,566 | | |
Member Class (a) | |
Issued | | | — | | | | — | | | | 251,536 | | | | 12,839 | | | | 278,912 | | | | 7,549 | | |
Reinvested | | | — | | | | — | | | | 4,154 | | | | 59 | | | | 3,741 | | | | 31 | | |
Redeemed | | | — | | | | — | | | | (11,298 | ) | | | — | | | | (61,820 | ) | | | (899 | ) | |
Total Member Class | | | — | | | | — | | | | 244,392 | | | | 12,898 | | | | 220,833 | | | | 6,681 | | |
Change in Shares | | | (941,207 | ) | | | (517,281 | ) | | | 622,389 | | | | 130,761 | | | | 164,910,747 | | | | 8,894,874 | | |
(a) Victory High Income Municipal Bond Fund and Victory Floating Rate Fund Member Class commenced operations on November 3, 2020.
See notes to financial statements.
91
Victory Portfolios | | Statements of Changes in Net Assets | |
| | | Victory
Strategic Income Fund | |
| | | Year
Ended
December 31,
2021 | | Year
Ended
December 31,
2020 | |
From Investment Activities: | |
Operations: | |
Net investment income (loss) | | $ | 1,780,687 | | | $ | 1,095,766 | | |
Net realized gains (losses) from investments | | | 624,266 | | | | 3,530,799 | | |
Net change in unrealized appreciation/depreciation on
investments | | | (3,441,329 | ) | | | 1,693,463 | | |
Change in net assets resulting from operations | | | (1,036,376 | ) | | | 6,320,028 | | |
Distributions to Shareholders: | |
Class A | | | (1,764,730 | ) | | | (1,174,119 | ) | |
Class C | | | (188,531 | ) | | | (212,356 | ) | |
Class R | | | (109,173 | ) | | | (78,861 | ) | |
Class Y | | | (1,273,398 | ) | | | (1,372,240 | ) | |
Change in net assets resulting from distributions to shareholders | | | (3,335,832 | ) | | | (2,837,576 | ) | |
Change in net assets resulting from capital transactions | | | (31,910,382 | ) | | | 52,004,480 | | |
Change in net assets | | | (36,282,590 | ) | | | 55,486,932 | | |
Net Assets: | |
Beginning of period | | | 106,519,333 | | | | 51,032,401 | | |
End of period | | $ | 70,236,743 | | | $ | 106,519,333 | | |
(continues on next page)
See notes to financial statements.
92
Victory Portfolios | | Statements of Changes in Net Assets | |
(continued)
| | | Victory
Strategic Income Fund | |
| | | Year
Ended
December 31,
2021 | | Year
Ended
December 31,
2020 | |
Capital Transactions: | |
Class A | |
Proceeds from shares issued | | $ | 6,142,599 | | | $ | 6,584,986 | | |
Distributions reinvested | | | 495,717 | | | | 249,590 | | |
Cost of shares redeemed | | | (5,965,516 | ) | | | (1,612,948 | ) | |
Total Class A | | $ | 672,800 | | | $ | 5,221,628 | | |
Class C | |
Proceeds from shares issued | | $ | 34,132 | | | $ | 1,041,663 | | |
Distributions reinvested | | | 100,365 | | | | 153,572 | | |
Cost of shares redeemed | | | (4,276,295 | ) | | | (1,365,907 | ) | |
Total Class C | | $ | (4,141,798 | ) | | $ | (170,672 | ) | |
Class R | |
Proceeds from shares issued | | $ | 7,722 | | | $ | 119,388 | | |
Distributions reinvested | | | 9,755 | | | | 9,184 | | |
Cost of shares redeemed | | | (103,373 | ) | | | (169,583 | ) | |
Total Class R | | $ | (85,896 | ) | | $ | (41,011 | ) | |
Class Y | |
Proceeds from shares issued | | $ | 27,884,093 | | | $ | 82,375,402 | | |
Distributions reinvested | | | 1,154,781 | | | | 1,284,394 | | |
Cost of shares redeemed | | | (57,394,362 | ) | | | (36,665,261 | ) | |
Total Class Y | | $ | (28,355,488 | ) | | $ | 46,994,535 | | |
Change in net assets resulting from capital transactions | | $ | (31,910,382 | ) | | $ | 52,004,480 | | |
Share Transactions: | |
Class A | |
Issued | | | 568,189 | | | | 608,160 | | |
Reinvested | | | 46,742 | | | | 23,022 | | |
Redeemed | | | (554,647 | ) | | | (150,322 | ) | |
Total Class A | | | 60,284 | | | | 480,860 | | |
Class C | |
Issued | | | 3,162 | | | | 98,031 | | |
Reinvested | | | 9,440 | | | | 14,102 | | |
Redeemed | | | (393,752 | ) | | | (128,480 | ) | |
Total Class C | | | (381,150 | ) | | | (16,347 | ) | |
Class R | |
Issued | | | 724 | | | | 10,816 | | |
Reinvested | | | 917 | | | | 845 | | |
Redeemed | | | (9,613 | ) | | | (15,565 | ) | |
Total Class R | | | (7,972 | ) | | | (3,904 | ) | |
Class Y | |
Issued | | | 2,592,788 | | | | 7,730,049 | | |
Reinvested | | | 109,276 | | | | 118,940 | | |
Redeemed | | | (5,398,797 | ) | | | (3,490,501 | ) | |
Total Class Y | | | (2,696,733 | ) | | | 4,358,488 | | |
Change in Shares | | | (3,025,571 | ) | | | 4,819,097 | | |
See notes to financial statements.
93
Victory Portfolios | | Financial Highlights | |
For a Share Outstanding Throughout Each Period
| | | | | Investment Activities | | Distributions to
Shareholders From | |
| | | Net Asset
Value,
Beginning of
Period | | Net
Investment
Income
(Loss)(a) | | Net Realized
and Unrealized
Gains (Losses)
on Investments | | Total from
Investment
Activities | | Net
Investment
Income | | Total
Distributions | |
Victory INCORE Investment Quality Bond Fund | | | |
Class A | | | |
Year Ended December 31: | |
2021 | | $ | 10.28 | | | | 0.12 | | | | (0.16 | ) | | | (0.04 | ) | | | (0.16 | ) | | | (0.16 | ) | |
2020 | | $ | 9.72 | | | | 0.16 | | | | 0.61 | | | | 0.77 | | | | (0.21 | ) | | | (0.21 | ) | |
2019 | | $ | 9.26 | | | | 0.20 | | | | 0.49 | | | | 0.69 | | | | (0.23 | ) | | | (0.23 | ) | |
2018 | | $ | 9.59 | | | | 0.21 | | | | (0.29 | ) | | | (0.08 | ) | | | (0.25 | ) | | | (0.25 | ) | |
2017 | | $ | 9.48 | | | | 0.18 | | | | 0.16 | | | | 0.34 | | | | (0.23 | ) | | | (0.23 | ) | |
Class C | | | |
Year Ended December 31: | |
2021 | | $ | 10.27 | | | | 0.03 | | | | (0.16 | ) | | | (0.13 | ) | | | (0.07 | ) | | | (0.07 | ) | |
2020 | | $ | 9.72 | | | | 0.08 | | | | 0.59 | | | | 0.67 | | | | (0.12 | ) | | | (0.12 | ) | |
2019 | | $ | 9.25 | | | | 0.12 | | | | 0.49 | | | | 0.61 | | | | (0.14 | ) | | | (0.14 | ) | |
2018 | | $ | 9.58 | | | | 0.13 | | | | (0.29 | ) | | | (0.16 | ) | | | (0.17 | ) | | | (0.17 | ) | |
2017 | | $ | 9.47 | | | | 0.10 | | | | 0.16 | | | | 0.26 | | | | (0.15 | ) | | | (0.15 | ) | |
Class R | | | |
Year Ended December 31: | |
2021 | | $ | 10.30 | | | | 0.08 | | | | (0.16 | ) | | | (0.08 | ) | | | (0.12 | ) | | | (0.12 | ) | |
2020 | | $ | 9.75 | | | | 0.12 | | | | 0.59 | | | | 0.71 | | | | (0.16 | ) | | | (0.16 | ) | |
2019 | | $ | 9.28 | | | | 0.16 | | | | 0.50 | | | | 0.66 | | | | (0.19 | ) | | | (0.19 | ) | |
2018 | | $ | 9.61 | | | | 0.18 | | | | (0.30 | ) | | | (0.12 | ) | | | (0.21 | ) | | | (0.21 | ) | |
2017 | | $ | 9.50 | | | | 0.14 | | | | 0.16 | | | | 0.30 | | | | (0.19 | ) | | | (0.19 | ) | |
Class Y | | | |
Year Ended December 31: | |
2021 | | $ | 10.27 | | | | 0.14 | | | | (0.16 | ) | | | (0.02 | ) | | | (0.19 | ) | | | (0.19 | ) | |
2020 | | $ | 9.71 | | | | 0.19 | | | | 0.60 | | | | 0.79 | | | | (0.23 | ) | | | (0.23 | ) | |
2019 | | $ | 9.25 | | | | 0.22 | | | | 0.49 | | | | 0.71 | | | | (0.25 | ) | | | (0.25 | ) | |
2018 | | $ | 9.58 | | | | 0.23 | | | | (0.29 | ) | | | (0.06 | ) | | | (0.27 | ) | | | (0.27 | ) | |
2017 | | $ | 9.47 | | | | 0.20 | | | | 0.16 | | | | 0.36 | | | | (0.25 | ) | | | (0.25 | ) | |
(a) Per share net investment income (loss) has been calculated using the average daily shares method.
(b) Portfolio turnover is calculated on the basis of the Fund as a whole without distinguishing between the classes of shares issued.
See notes to financial statements.
94
Victory Portfolios | | Financial Highlights — continued | |
For a Share Outstanding Throughout Each Period
| | | | | Ratios to Average Net Assets | | Supplemental Data | |
| | | Net Asset
Value,
End of
Period | | Total
Return
(Excludes
Sales
Charge) | | Net
Expenses | | Net
Investment
Income
(Loss) | | Gross
Expenses | | Net Assets,
End of
Period
(000's) | | Portfolio
Turnover(b) | |
Victory INCORE Investment Quality Bond Fund | |
Class A | |
Year Ended December 31: | |
2021 | | $ | 10.08 | | | | (0.37 | )% | | | 0.90 | % | | | 1.17 | % | | | 1.29 | % | | $ | 19,292 | | | | 67 | % | |
2020 | | $ | 10.28 | | | | 7.94 | % | | | 0.90 | % | | | 1.60 | % | | | 1.27 | % | | $ | 21,423 | | | | 80 | % | |
2019 | | $ | 9.72 | | | | 7.49 | % | | | 0.90 | % | | | 2.13 | % | | | 1.23 | % | | $ | 22,004 | | | | 92 | % | |
2018 | | $ | 9.26 | | | | (0.80 | )% | | | 0.90 | % | | | 2.27 | % | | | 1.13 | % | | $ | 24,049 | | | | 115 | % | |
2017 | | $ | 9.59 | | | | 3.62 | % | | | 0.90 | % | | | 1.86 | % | | | 1.07 | % | | $ | 31,306 | | | | 70 | % | |
Class C | |
Year Ended December 31: | |
2021 | | $ | 10.07 | | | | (1.23 | )% | | | 1.77 | % | | | 0.33 | % | | | 3.67 | % | | $ | 484 | | | | 67 | % | |
2020 | | $ | 10.27 | | | | 6.89 | % | | | 1.77 | % | | | 0.76 | % | | | 2.39 | % | | $ | 2,526 | | | | 80 | % | |
2019 | | $ | 9.72 | | | | 6.65 | % | | | 1.77 | % | | | 1.28 | % | | | 2.23 | % | | $ | 2,824 | | | | 92 | % | |
2018 | | $ | 9.25 | | | | (1.66 | )% | | | 1.77 | % | | | 1.42 | % | | | 2.10 | % | | $ | 3,634 | | | | 115 | % | |
2017 | | $ | 9.58 | | | | 2.74 | % | | | 1.77 | % | | | 0.99 | % | | | 1.91 | % | | $ | 6,127 | | | | 70 | % | |
Class R | |
Year Ended December 31: | |
2021 | | $ | 10.10 | | | | (0.77 | )% | | | 1.30 | % | | | 0.76 | % | | | 1.81 | % | | $ | 3,210 | | | | 67 | % | |
2020 | | $ | 10.30 | | | | 7.37 | % | | | 1.30 | % | | | 1.16 | % | | | 1.84 | % | | $ | 3,603 | | | | 80 | % | |
2019 | | $ | 9.75 | | | | 7.14 | % | | | 1.30 | % | | | 1.71 | % | | | 1.83 | % | | $ | 3,362 | | | | 92 | % | |
2018 | | $ | 9.28 | | | | (1.20 | )% | | | 1.30 | % | | | 1.88 | % | | | 1.69 | % | | $ | 3,192 | | | | 115 | % | |
2017 | | $ | 9.61 | | | | 3.16 | % | | | 1.30 | % | | | 1.44 | % | | | 1.65 | % | | $ | 3,940 | | | | 70 | % | |
Class Y | |
Year Ended December 31: | |
2021 | | $ | 10.06 | | | | (0.22 | )% | | | 0.66 | % | | | 1.42 | % | | | 1.53 | % | | $ | 1,634 | | | | 67 | % | |
2020 | | $ | 10.27 | | | | 8.21 | % | | | 0.66 | % | | | 1.91 | % | | | 1.31 | % | | $ | 2,770 | | | | 80 | % | |
2019 | | $ | 9.71 | | | | 7.76 | % | | | 0.66 | % | | | 2.35 | % | | | 1.24 | % | | $ | 3,412 | | | | 92 | % | |
2018 | | $ | 9.25 | | | | (0.56 | )% | | | 0.66 | % | | | 2.51 | % | | | 1.12 | % | | $ | 3,265 | | | | 115 | % | |
2017 | | $ | 9.58 | | | | 3.87 | % | | | 0.66 | % | | | 2.09 | % | | | 0.98 | % | | $ | 4,421 | | | | 70 | % | |
See notes to financial statements.
95
Victory Portfolios | | Financial Highlights | |
For a Share Outstanding Throughout Each Period
| | | | | Investment Activities | | Distributions to
Shareholders From | |
| | | Net Asset
Value,
Beginning of
Period | | Net
Investment
Income
(Loss)(a) | | Net Realized
and Unrealized
Gains (Losses)
on Investments | | Total from
Investment
Activities | | Net
Investment
Income | | Return of
Capital | |
Victory INCORE Low Duration Bond Fund | | | |
Class A | | | |
Year Ended December 31: | |
2021 | | $ | 10.20 | | | | 0.09 | | | | (0.02 | ) | | | 0.07 | | | | (0.11 | ) | | | — | | |
2020 | | $ | 9.99 | | | | 0.14 | | | | 0.24 | | | | 0.38 | | | | (0.14 | ) | | | (0.03 | ) | |
2019 | | $ | 9.86 | | | | 0.19 | | | | 0.15 | | | | 0.34 | | | | (0.20 | ) | | | (0.01 | ) | |
2018 | | $ | 9.99 | | | | 0.16 | | | | (0.08 | ) | | | 0.08 | | | | (0.21 | ) | | | — | | |
2017 | | $ | 10.03 | | | | 0.12 | | | | 0.02 | | | | 0.14 | | | | (0.18 | ) | | | — | | |
Class C | | | |
Year Ended December 31: | |
2021 | | $ | 10.20 | | | | 0.01 | | | | (0.02 | ) | | | (0.01 | ) | | | (0.03 | ) | | | — | | |
2020 | | $ | 9.99 | | | | 0.08 | | | | 0.22 | | | | 0.30 | | | | (0.07 | ) | | | (0.02 | ) | |
2019 | | $ | 9.85 | | | | 0.12 | | | | 0.16 | | | | 0.28 | | | | (0.14 | ) | | | — | (c) | |
2018 | | $ | 9.99 | | | | 0.09 | | | | (0.09 | ) | | | — | (c) | | | (0.14 | ) | | | — | | |
2017 | | $ | 10.02 | | | | 0.04 | | | | 0.03 | | | | 0.07 | | | | (0.10 | ) | | | — | | |
Class R | | | |
Year Ended December 31: | |
2021 | | $ | 10.20 | | | | 0.05 | | | | (0.02 | ) | | | 0.03 | | | | (0.07 | ) | | | — | | |
2020 | | $ | 9.99 | | | | 0.10 | | | | 0.24 | | | | 0.34 | | | | (0.10 | ) | | | (0.03 | ) | |
2019 | | $ | 9.86 | | | | 0.15 | | | | 0.15 | | | | 0.30 | | | | (0.16 | ) | | | (0.01 | ) | |
2018 | | $ | 9.99 | | | | 0.12 | | | | (0.08 | ) | | | 0.04 | | | | (0.17 | ) | | | — | | |
2017 | | $ | 10.02 | | | | 0.08 | | | | 0.03 | | | | 0.11 | | | | (0.14 | ) | | | — | | |
Class Y | | | |
Year Ended December 31: | |
2021 | �� | $ | 10.20 | | | | 0.11 | | | | (0.01 | ) | | | 0.10 | | | | (0.14 | ) | | | — | | |
2020 | | $ | 9.99 | | | | 0.17 | | | | 0.23 | | | | 0.40 | | | | (0.15 | ) | | | (0.04 | ) | |
2019 | | $ | 9.86 | | | | 0.21 | | | | 0.16 | | | | 0.37 | | | | (0.23 | ) | | | (0.01 | ) | |
2018 | | $ | 10.00 | | | | 0.19 | | | | (0.10 | ) | | | 0.09 | | | | (0.23 | ) | | | — | | |
2017 | | $ | 10.03 | | | | 0.15 | | | | 0.02 | | | | 0.17 | | | | (0.20 | ) | | | — | | |
(a) Per share net investment income (loss) has been calculated using the average daily shares method.
(b) Portfolio turnover is calculated on the basis of the Fund as a whole without distinguishing between the classes of shares issued.
(c) Amount is less than $0.005 per share.
See notes to financial statements.
96
Victory Portfolios | | Financial Highlights — continued | |
For a Share Outstanding Throughout Each Period
| | | | | Ratios to Average Net Assets | | Supplemental Data | |
| | | Total
Distributions | | Net Asset
Value,
End of
Period | | Total
Return
(Excludes
Sales
Charge) | | Net
Expenses | | Net
Investment
Income
(Loss) | | Gross
Expenses | | Net Assets,
End of
Period
(000's) | | Portfolio
Turnover(b) | |
Victory INCORE Low Duration Bond Fund | |
Class A | |
Year Ended December 31: | |
2021 | | | (0.11 | ) | | $ | 10.16 | | | | 0.71 | % | | | 0.85 | % | | | 0.87 | % | | | 0.95 | % | | $ | 76,901 | | | | 58 | % | |
2020 | | | (0.17 | ) | | $ | 10.20 | | | | 3.85 | % | | | 0.85 | % | | | 1.39 | % | | | 0.95 | % | | $ | 70,357 | | | | 85 | % | |
2019 | | | (0.21 | ) | | $ | 9.99 | | | | 3.51 | % | | | 0.85 | % | | | 1.93 | % | | | 0.95 | % | | $ | 61,972 | | | | 50 | % | |
2018 | | | (0.21 | ) | | $ | 9.86 | | | | 0.73 | % | | | 0.85 | % | | | 1.66 | % | | | 0.90 | % | | $ | 96,210 | | | | 45 | % | |
2017 | | | (0.18 | ) | | $ | 9.99 | | | | 1.47 | % | | | 0.85 | % | | | 1.21 | % | | | 0.90 | % | | $ | 149,287 | | | | 62 | % | |
Class C | |
Year Ended December 31: | |
2021 | | | (0.03 | ) | | $ | 10.16 | | | | (0.07 | )% | | | 1.62 | % | | | 0.10 | % | | | 1.91 | % | | $ | 5,528 | | | | 58 | % | |
2020 | | | (0.09 | ) | | $ | 10.20 | | | | 3.05 | % | | | 1.62 | % | | | 0.76 | % | | | 1.72 | % | | $ | 23,504 | | | | 85 | % | |
2019 | | | (0.14 | ) | | $ | 9.99 | | | | 2.81 | % | | | 1.62 | % | | | 1.17 | % | | | 1.70 | % | | $ | 38,969 | | | | 50 | % | |
2018 | | | (0.14 | ) | | $ | 9.85 | | | | (0.04 | )% | | | 1.62 | % | | | 0.88 | % | | | 1.68 | % | | $ | 62,103 | | | | 45 | % | |
2017 | | | (0.10 | ) | | $ | 9.99 | | | | 0.70 | % | | | 1.62 | % | | | 0.44 | % | | | 1.65 | % | | $ | 82,847 | | | | 62 | % | |
Class R | |
Year Ended December 31: | |
2021 | | | (0.07 | ) | | $ | 10.16 | | | | 0.29 | % | | | 1.27 | % | | | 0.45 | % | | | 2.30 | % | | $ | 1,214 | | | | 58 | % | |
2020 | | | (0.13 | ) | | $ | 10.20 | | | | 3.41 | % | | | 1.27 | % | | | 0.99 | % | | | 2.38 | % | | $ | 1,129 | | | | 85 | % | |
2019 | | | (0.17 | ) | | $ | 9.99 | | | | 3.17 | % | | | 1.27 | % | | | 1.50 | % | | | 2.13 | % | | $ | 1,147 | | | | 50 | % | |
2018 | | | (0.17 | ) | | $ | 9.86 | | | | 0.31 | % | | | 1.27 | % | | | 1.20 | % | | | 1.87 | % | | $ | 1,554 | | | | 45 | % | |
2017 | | | (0.14 | ) | | $ | 9.99 | | | | 1.05 | % | | | 1.27 | % | | | 0.79 | % | | | 1.68 | % | | $ | 2,078 | | | | 62 | % | |
Class Y | |
Year Ended December 31: | |
2021 | | | (0.14 | ) | | $ | 10.16 | | | | 0.94 | % | | | 0.62 | % | | | 1.10 | % | | | 0.67 | % | | $ | 133,644 | | | | 58 | % | |
2020 | | | (0.19 | ) | | $ | 10.20 | | | | 4.08 | % | | | 0.62 | % | | | 1.64 | % | | | 0.68 | % | | $ | 165,330 | | | | 85 | % | |
2019 | | | (0.24 | ) | | $ | 9.99 | | | | 3.76 | % | | | 0.62 | % | | | 2.12 | % | | | 0.69 | % | | $ | 164,509 | | | | 50 | % | |
2018 | | | (0.23 | ) | | $ | 9.86 | | | | 0.96 | % | | | 0.62 | % | | | 1.87 | % | | | 0.68 | % | | $ | 180,034 | | | | 45 | % | |
2017 | | | (0.20 | ) | | $ | 10.00 | | | | 1.71 | % | | | 0.62 | % | | | 1.44 | % | | | 0.65 | % | | $ | 271,294 | | | | 62 | % | |
See notes to financial statements.
97
Victory Portfolios | | Financial Highlights | |
For a Share Outstanding Throughout Each Period
| | | | | Investment Activities | | Distributions to
Shareholders From | |
| | | Net Asset
Value,
Beginning of
Period | | Net
Investment
Income
(Loss)(a) | | Net Realized
and Unrealized
Gains (Losses)
on Investments | | Total from
Investment
Activities | | Net
Investment
Income | | Total
Distributions | |
Victory High Yield Fund | | | |
Class A | | | |
Year Ended December 31: | |
2021 | | $ | 6.83 | | | | 0.36 | | | | (0.03 | ) | | | 0.33 | | | | (0.37 | ) | | | (0.37 | ) | |
2020 | | $ | 6.73 | | | | 0.37 | | | | 0.10 | | | | 0.47 | | | | (0.37 | ) | | | (0.37 | ) | |
2019 | | $ | 6.20 | | | | 0.37 | | | | 0.54 | | | | 0.91 | | | | (0.38 | ) | | | (0.38 | ) | |
2018 | | $ | 6.57 | | | | 0.39 | | | | (0.37 | ) | | | 0.02 | | | | (0.39 | ) | | | (0.39 | ) | |
2017 | | $ | 6.34 | | | | 0.39 | | | | 0.22 | | | | 0.61 | | | | (0.38 | ) | | | (0.38 | ) | |
Class C | | | |
Year Ended December 31: | |
2021 | | $ | 6.85 | | | | 0.31 | | | | (0.03 | ) | | | 0.28 | | | | (0.32 | ) | | | (0.32 | ) | |
2020 | | $ | 6.75 | | | | 0.33 | | | | 0.10 | | | | 0.43 | | | | (0.33 | ) | | | (0.33 | ) | |
2019 | | $ | 6.21 | | | | 0.33 | | | | 0.54 | | | | 0.87 | | | | (0.33 | ) | | | (0.33 | ) | |
2018 | | $ | 6.58 | | | | 0.34 | | | | (0.36 | ) | | | (0.02 | ) | | | (0.35 | ) | | | (0.35 | ) | |
2017 | | $ | 6.35 | | | | 0.34 | | | | 0.23 | | | | 0.57 | | | | (0.34 | ) | | | (0.34 | ) | |
Class R | | | |
Year Ended December 31: | |
2021 | | $ | 6.85 | | | | 0.34 | | | | (0.03 | ) | | | 0.31 | | | | (0.35 | ) | | | (0.35 | ) | |
2020 | | $ | 6.75 | | | | 0.35 | | | | 0.10 | | | | 0.45 | | | | (0.35 | ) | | | (0.35 | ) | |
2019 | | $ | 6.22 | | | | 0.35 | | | | 0.53 | | | | 0.88 | | | | (0.35 | ) | | | (0.35 | ) | |
2018 | | $ | 6.59 | | | | 0.37 | | | | (0.37 | ) | | | — | (c) | | | (0.37 | ) | | | (0.37 | ) | |
2017 | | $ | 6.35 | | | | 0.37 | | | | 0.23 | | | | 0.60 | | | | (0.36 | ) | | | (0.36 | ) | |
Class Y | | | |
Year Ended December 31: | |
2021 | | $ | 6.80 | | | | 0.38 | | | | (0.04 | ) | | | 0.34 | | | | (0.38 | ) | | | (0.38 | ) | |
2020 | | $ | 6.70 | | | | 0.39 | | | | 0.10 | | | | 0.49 | | | | (0.39 | ) | | | (0.39 | ) | |
2019 | | $ | 6.17 | | | | 0.39 | | | | 0.53 | | | | 0.92 | | | | (0.39 | ) | | | (0.39 | ) | |
2018 | | $ | 6.54 | | | | 0.41 | | | | (0.37 | ) | | | 0.04 | | | | (0.41 | ) | | | (0.41 | ) | |
2017 | | $ | 6.31 | | | | 0.40 | | | | 0.23 | | | | 0.63 | | | | (0.40 | ) | | | (0.40 | ) | |
* Includes adjustments in accordance with U.S. Generally Accepted Accounting Principles.
(a) Per share net investment income (loss) has been calculated using the average daily shares method.
(b) Portfolio turnover is calculated on the basis of the Fund as a whole without distinguishing between the classes of shares issued.
(c) Amount is less than $0.005 per share.
See notes to financial statements.
98
Victory Portfolios | | Financial Highlights — continued | |
For a Share Outstanding Throughout Each Period
| | | | | Ratios to Average Net Assets | | Supplemental Data | |
| | | Net Asset
Value,
End of
Period | | Total
Return
(Excludes
Sales
Charge)* | | Net
Expenses | | Net
Investment
Income
(Loss) | | Gross
Expenses | | Net Assets,
End of
Period
(000's) | | Portfolio
Turnover(b) | |
Victory High Yield Fund | |
Class A | |
Year Ended December 31: | |
2021 | | $ | 6.79 | | | | 4.86 | % | | | 1.00 | % | | | 5.22 | % | | | 1.08 | % | | $ | 49,271 | | | | 67 | % | |
2020 | | $ | 6.83 | | | | 7.61 | % | | | 1.00 | % | | | 5.85 | % | | | 1.12 | % | | $ | 38,735 | | | | 124 | % | |
2019 | | $ | 6.73 | | | | 14.90 | % | | | 1.00 | % | | | 5.70 | % | | | 1.12 | % | | $ | 31,602 | | | | 87 | % | |
2018 | | $ | 6.20 | | | | 0.28 | % | | | 1.00 | % | | | 6.01 | % | | | 1.12 | % | | $ | 23,797 | | | | 87 | % | |
2017 | | $ | 6.57 | | | | 9.93 | % | | | 1.00 | % | | | 5.99 | % | | | 1.13 | % | | $ | 21,882 | | | | 174 | % | |
Class C | |
Year Ended December 31: | |
2021 | | $ | 6.81 | | | | 4.11 | % | | | 1.70 | % | | | 4.51 | % | | | 1.78 | % | | $ | 32,889 | | | | 67 | % | |
2020 | | $ | 6.85 | | | | 6.84 | % | | | 1.70 | % | | | 5.14 | % | | | 1.81 | % | | $ | 25,957 | | | | 124 | % | |
2019 | | $ | 6.75 | | | | 14.24 | % | | | 1.70 | % | | | 5.00 | % | | | 1.82 | % | | $ | 21,163 | | | | 87 | % | |
2018 | | $ | 6.21 | | | | (0.43 | )% | | | 1.70 | % | | | 5.29 | % | | | 1.84 | % | | $ | 19,432 | | | | 87 | % | |
2017 | | $ | 6.58 | | | | 9.19 | % | | | 1.70 | % | | | 5.27 | % | | | 1.84 | % | | $ | 22,283 | | | | 174 | % | |
Class R | |
Year Ended December 31: | |
2021 | | $ | 6.81 | | | | 4.55 | % | | | 1.28 | % | �� | | 4.93 | % | | | 1.28 | % | | $ | 19,243 | | | | 67 | % | |
2020 | | $ | 6.85 | | | | 7.24 | % | | | 1.33 | % | | | 5.51 | % | | | 1.33 | % | | $ | 19,248 | | | | 124 | % | |
2019 | | $ | 6.75 | | | | 14.48 | % | | | 1.33 | % | | | 5.37 | % | | | 1.33 | % | | $ | 18,818 | | | | 87 | % | |
2018 | | $ | 6.22 | | | | (0.07 | )% | | | 1.35 | % | | | 5.64 | % | | | 1.35 | % | | $ | 17,595 | | | | 87 | % | |
2017 | | $ | 6.59 | | | | 9.64 | % | | | 1.35 | % | | | 5.61 | % | | | 1.36 | % | | $ | 19,217 | | | | 174 | % | |
Class Y | |
Year Ended December 31: | |
2021 | | $ | 6.76 | | | | 5.15 | % | | | 0.76 | % | | | 5.49 | % | | | 0.84 | % | | $ | 237,385 | | | | 67 | % | |
2020 | | $ | 6.80 | | | | 7.88 | % | | | 0.76 | % | | | 6.11 | % | | | 0.90 | % | | $ | 168,677 | | | | 124 | % | |
2019 | | $ | 6.70 | | | | 15.25 | % | | | 0.76 | % | | | 5.96 | % | | | 0.92 | % | | $ | 108,171 | | | | 87 | % | |
2018 | | $ | 6.17 | | | | 0.52 | % | | | 0.76 | % | | | 6.32 | % | | | 0.97 | % | | $ | 21,060 | | | | 87 | % | |
2017 | | $ | 6.54 | | | | 10.24 | % | | | 0.76 | % | | | 6.27 | % | | | 1.04 | % | | $ | 5,213 | | | | 174 | % | |
See notes to financial statements.
99
Victory Portfolios | | Financial Highlights | |
For a Share Outstanding Throughout Each Period
| | | | | Investment Activities | | Distributions to
Shareholders From | |
| | | Net Asset
Value,
Beginning of
Period | | Net
Investment
Income
(Loss)(a) | | Net Realized
and Unrealized
Gains (Losses)
on Investments | | Total from
Investment
Activities | | Net
Investment
Income | | Net Realized
Gains from
Investments | |
Victory Tax-Exempt Fund | | | |
Class A | | | |
Year Ended December 31: | |
2021 | | $ | 9.94 | | | | 0.27 | | | | 0.12 | | | | 0.39 | | | | (0.32 | ) | | | (0.23 | ) | |
2020 | | $ | 9.84 | | | | 0.29 | | | | 0.23 | | | | 0.52 | | | | (0.32 | ) | | | (0.10 | ) | |
2019 | | $ | 9.47 | | | | 0.30 | | | | 0.53 | | | | 0.83 | | | | (0.34 | ) | | | (0.12 | ) | |
2018 | | $ | 9.91 | | | | 0.36 | | | | (0.30 | ) | | | 0.06 | | | | (0.36 | ) | | | (0.14 | ) | |
2017 | | $ | 9.65 | | | | 0.36 | | | | 0.39 | | | | 0.75 | | | | (0.37 | ) | | | (0.12 | ) | |
Class C | | | |
Year Ended December 31: | |
2021 | | $ | 9.94 | | | | 0.20 | | | | 0.11 | | | | 0.31 | | | | (0.24 | ) | | | (0.23 | ) | |
2020 | | $ | 9.84 | | | | 0.22 | | | | 0.22 | | | | 0.44 | | | | (0.24 | ) | | | (0.10 | ) | |
2019 | | $ | 9.47 | | | | 0.23 | | | | 0.52 | | | | 0.75 | | | | (0.26 | ) | | | (0.12 | ) | |
2018 | | $ | 9.90 | | | | 0.28 | | | | (0.29 | ) | | | (0.01 | ) | | | (0.28 | ) | | | (0.14 | ) | |
2017 | | $ | 9.65 | | | | 0.29 | | | | 0.37 | | | | 0.66 | | | | (0.29 | ) | | | (0.12 | ) | |
Class Y | | | |
Year Ended December 31: | |
2021 | | $ | 9.94 | | | | 0.29 | | | | 0.11 | | | | 0.40 | | | | (0.33 | ) | | | (0.23 | ) | |
2020 | | $ | 9.84 | | | | 0.30 | | | | 0.23 | | | | 0.53 | | | | (0.33 | ) | | | (0.10 | ) | |
2019 | | $ | 9.46 | | | | 0.30 | | | | 0.55 | | | | 0.85 | | | | (0.35 | ) | | | (0.12 | ) | |
2018 | | $ | 9.90 | | | | 0.37 | | | | (0.30 | ) | | | 0.07 | | | | (0.37 | ) | | | (0.14 | ) | |
2017 | | $ | 9.65 | | | | 0.37 | | | | 0.38 | | | | 0.75 | | | | (0.38 | ) | | | (0.12 | ) | |
(a) Per share net investment income (loss) has been calculated using the average daily shares method.
(b) Portfolio turnover is calculated on the basis of the Fund as a whole without distinguishing between the classes of shares issued.
See notes to financial statements.
100
Victory Portfolios | | Financial Highlights — continued | |
For a Share Outstanding Throughout Each Period
| | | | | Ratios to Average Net Assets | | Supplemental Data | |
| | | Total
Distributions | | Net Asset
Value,
End of
Period | | Total
Return
(Excludes
Sales
Charge) | | Net
Expenses | | Net
Investment
Income
(Loss) | | Gross
Expenses | | Net Assets,
End of
Period
(000's) | | Portfolio
Turnover(b) | |
Victory Tax-Exempt Fund | |
Class A | |
Year Ended December 31: | |
2021 | | | (0.55 | ) | | $ | 9.78 | | | | 3.94 | % | | | 0.80 | % | | | 2.74 | % | | | 1.03 | % | | $ | 35,312 | | | | 6 | % | |
2020 | | | (0.42 | ) | | $ | 9.94 | | | | 5.39 | % | | | 0.80 | % | | | 3.00 | % | | | 1.04 | % | | $ | 32,001 | | | | 44 | % | |
2019 | | | (0.46 | ) | | $ | 9.84 | | | | 8.82 | % | | | 0.80 | % | | | 3.04 | % | | | 1.02 | % | | $ | 30,251 | | | | 64 | % | |
2018 | | | (0.50 | ) | | $ | 9.47 | | | | 0.69 | % | | | 0.80 | % | | | 3.68 | % | | | 0.97 | % | | $ | 29,993 | | | | 42 | % | |
2017 | | | (0.49 | ) | | $ | 9.91 | | | | 7.89 | % | | | 0.80 | % | | | 3.70 | % | | | 0.96 | % | | $ | 37,570 | | | | 84 | % | |
Class C | |
Year Ended December 31: | |
2021 | | | (0.47 | ) | | $ | 9.78 | | | | 3.13 | % | | | 1.60 | % | | | 2.01 | % | | | 2.38 | % | | $ | 2,037 | | | | 6 | % | |
2020 | | | (0.34 | ) | | $ | 9.94 | | | | 4.56 | % | | | 1.60 | % | | | 2.28 | % | | | 1.91 | % | | $ | 6,497 | | | | 44 | % | |
2019 | | | (0.38 | ) | | $ | 9.84 | | | | 7.97 | % | | | 1.60 | % | | | 2.34 | % | | | 1.82 | % | | $ | 11,259 | | | | 64 | % | |
2018 | | | (0.42 | ) | | $ | 9.47 | | | | (0.01 | )% | | | 1.60 | % | | | 2.88 | % | | | 1.78 | % | | $ | 17,986 | | | | 42 | % | |
2017 | | | (0.41 | ) | | $ | 9.90 | | | | 6.92 | % | | | 1.60 | % | | | 2.89 | % | | | 1.74 | % | | $ | 26,520 | | | | 84 | % | |
Class Y | |
Year Ended December 31: | |
2021 | | | (0.56 | ) | | $ | 9.78 | | | | 4.06 | % | | | 0.69 | % | | | 2.85 | % | | | 0.89 | % | | $ | 13,969 | | | | 6 | % | |
2020 | | | (0.43 | ) | | $ | 9.94 | | | | 5.51 | % | | | 0.69 | % | | | 3.12 | % | | | 0.85 | % | | $ | 22,998 | | | | 44 | % | |
2019 | | | (0.47 | ) | | $ | 9.84 | | | | 9.06 | % | | | 0.69 | % | | | 3.07 | % | | | 0.83 | % | | $ | 24,459 | | | | 64 | % | |
2018 | | | (0.51 | ) | | $ | 9.46 | | | | 0.80 | % | | | 0.69 | % | | | 3.79 | % | | | 0.77 | % | | $ | 20,260 | | | | 42 | % | |
2017 | | | (0.50 | ) | | $ | 9.90 | | | | 7.90 | % | | | 0.69 | % | | | 3.80 | % | | | 0.73 | % | | $ | 27,420 | | | | 84 | % | |
See notes to financial statements.
101
Victory Portfolios | | Financial Highlights | |
For a Share Outstanding Throughout Each Period
| | | | | Investment Activities | | Distributions to
Shareholders From | |
| | | Net Asset
Value,
Beginning of
Period | | Net
Investment
Income
(Loss)(a) | | Net Realized
and Unrealized
Gains (Losses)
on Investments | | Total from
Investment
Activities | | Net
Investment
Income | | Net Realized
Gains from
Investments | |
Victory High Income Municipal Bond Fund | | | | | |
Class A | | | | | |
Year Ended December 31: | |
2021 | | $ | 10.84 | | | | 0.36 | | | | 0.27 | | | | 0.63 | | | | (0.38 | ) | | | — | | |
2020 | | $ | 10.75 | | | | 0.42 | | | | 0.15 | | | | 0.57 | | | | (0.39 | ) | | | (0.09 | ) | |
2019 | | $ | 10.39 | | | | 0.35 | | | | 0.47 | | | | 0.82 | | | | (0.40 | ) | | | (0.06 | ) | |
2018 | | $ | 10.79 | | | | 0.43 | | | | (0.40 | ) | | | 0.03 | | | | (0.43 | ) | | | — | | |
2017 | | $ | 10.35 | | | | 0.46 | | | | 0.44 | | | | 0.90 | | | | (0.46 | ) | | | — | | |
Class C | | | | | |
Year Ended December 31: | |
2021 | | $ | 10.84 | | | | 0.28 | | | | 0.27 | | | | 0.55 | | | | (0.30 | ) | | | — | | |
2020 | | $ | 10.75 | | | | 0.33 | | | | 0.16 | | | | 0.49 | | | | (0.31 | ) | | | (0.09 | ) | |
2019 | | $ | 10.39 | | | | 0.28 | | | | 0.46 | | | | 0.74 | | | | (0.32 | ) | | | (0.06 | ) | |
2018 | | $ | 10.79 | | | | 0.35 | | | | (0.40 | ) | | | (0.05 | ) | | | (0.35 | ) | | | — | | |
2017 | | $ | 10.35 | | | | 0.38 | | | | 0.44 | | | | 0.82 | | | | (0.38 | ) | | | — | | |
Class Y | | | | | |
Year Ended December 31: | |
2021 | | $ | 10.84 | | | | 0.38 | | | | 0.28 | | | | 0.66 | | | | (0.41 | ) | | | — | | |
2020 | | $ | 10.75 | | | | 0.44 | | | | 0.16 | | | | 0.60 | | | | (0.42 | ) | | | (0.09 | ) | |
2019 | | $ | 10.39 | | | | 0.38 | | | | 0.47 | | | | 0.85 | | | | (0.43 | ) | | | (0.06 | ) | |
2018 | | $ | 10.79 | | | | 0.46 | | | | (0.40 | ) | | | 0.06 | | | | (0.46 | ) | | | — | | |
2017 | | $ | 10.35 | | | | 0.48 | | | | 0.44 | | | | 0.92 | | | | (0.48 | ) | | | — | | |
Member Class | | | | | |
Year Ended December 31: | |
2021 | | $ | 10.84 | | | | 0.34 | | | | 0.31 | | | | 0.65 | | | | (0.40 | ) | | | — | | |
November 3, 2020 (e)
through
December 31, 2020 | | | $10.56 | | | | 0.12 | | | | 0.31 | | | | 0.43 | | | | (0.06 | ) | | | (0.09 | ) | |
(a) Per share net investment income (loss) has been calculated using the average daily shares method.
(b) Not annualized for periods less than one year.
(c) Annualized for periods less than one year.
(d) Portfolio turnover is calculated on the basis of the Fund as a whole without distinguishing between the classes of shares issued.
(e) Commencement of operations.
See notes to financial statements.
102
Victory Portfolios | | Financial Highlights — continued | |
For a Share Outstanding Throughout Each Period
| | | | | Ratios to Average Net Assets | | Supplemental Data | |
| | | Total
Distributions | | Net Asset
Value,
End of
Period | | Total
Return
(Excludes
Sales
Charge)(b) | | Net
Expenses(c) | | Net
Investment
Income
(Loss)(c) | | Gross
Expenses(c) | | Net Assets,
End of
Period
(000's) | | Portfolio
Turnover(b)(d) | |
Victory High Income Municipal Bond Fund | |
Class A | |
Year Ended December 31: | |
2021 | | | (0.38 | ) | | $ | 11.09 | | | | 5.91 | % | | | 0.80 | % | | | 3.22 | % | | | 1.04 | % | | $ | 34,352 | | | | 19 | % | |
2020 | | | (0.48 | ) | | $ | 10.84 | | | | 5.52 | % | | | 0.80 | % | | | 3.95 | % | | | 1.10 | % | | $ | 26,330 | | | | 74 | % | |
2019 | | | (0.46 | ) | | $ | 10.75 | | | | 8.04 | % | | | 0.80 | % | | | 3.27 | % | | | 1.09 | % | | $ | 19,153 | | | | 49 | % | |
2018 | | | (0.43 | ) | | $ | 10.39 | | | | 0.34 | % | | | 0.80 | % | | | 4.13 | % | | | 1.02 | % | | $ | 16,483 | | | | 48 | % | |
2017 | | | (0.46 | ) | | $ | 10.79 | | | | 8.85 | % | | | 0.80 | % | | | 4.31 | % | | | 0.96 | % | | $ | 25,831 | | | | 66 | % | |
Class C | |
Year Ended December 31: | |
2021 | | | (0.30 | ) | | $ | 11.09 | | | | 5.12 | % | | | 1.57 | % | | | 2.50 | % | | | 2.20 | % | | $ | 2,192 | | | | 19 | % | |
2020 | | | (0.40 | ) | | $ | 10.84 | | | | 4.72 | % | | | 1.57 | % | | | 3.11 | % | | | 1.90 | % | | $ | 9,378 | | | | 74 | % | |
2019 | | | (0.38 | ) | | $ | 10.75 | | | | 7.22 | % | | | 1.57 | % | | | 2.61 | % | | | 1.85 | % | | $ | 13,995 | | | | 49 | % | |
2018 | | | (0.35 | ) | | $ | 10.39 | | | | (0.43 | )% | | | 1.57 | % | | | 3.35 | % | | | 1.78 | % | | $ | 19,282 | | | | 48 | % | |
2017 | | | (0.38 | ) | | $ | 10.79 | | | | 8.01 | % | | | 1.57 | % | | | 3.54 | % | | | 1.73 | % | | $ | 25,175 | | | | 66 | % | |
Class Y | |
Year Ended December 31: | |
2021 | | | (0.41 | ) | | $ | 11.09 | | | | 6.16 | % | | | 0.57 | % | | | 3.40 | % | | | 0.85 | % | | $ | 14,087 | | | | 19 | % | |
2020 | | | (0.51 | ) | | $ | 10.84 | | | | 5.76 | % | | | 0.57 | % | | | 4.14 | % | | | 0.93 | % | | $ | 9,682 | | | | 74 | % | |
2019 | | | (0.49 | ) | | $ | 10.75 | | | | 8.29 | % | | | 0.57 | % | | | 3.56 | % | | | 0.88 | % | | $ | 10,620 | | | | 49 | % | |
2018 | | | (0.46 | ) | | $ | 10.39 | | | | 0.57 | % | | | 0.57 | % | | | 4.36 | % | | | 0.78 | % | | $ | 11,683 | | | | 48 | % | |
2017 | | | (0.48 | ) | | $ | 10.79 | | | | 9.10 | % | | | 0.57 | % | | | 4.55 | % | | | 0.73 | % | | $ | 26,864 | | | | 66 | % | |
Member Class | |
Year Ended December 31: | |
2021 | | | (0.40 | ) | | $ | 11.09 | | | | 6.07 | % | | | 0.65 | % | | | 3.04 | % | | | 2.61 | % | | $ | 2,853 | | | | 19 | % | |
November 3, 2020 (e)
through
December 31, 2020 | | | (0.15 | ) | | $ | 10.84 | | | | 4.12 | % | | | 0.65 | % | | | 6.78 | % | | | 42.32 | % | | $ | 140 | | | | 74 | % | |
See notes to financial statements.
103
Victory Portfolios | | Financial Highlights | |
For a Share Outstanding Throughout Each Period
| | | | | Investment Activities | | Distributions to
Shareholders From | |
| | | Net Asset
Value,
Beginning of
Period | | Net
Investment
Income
(Loss)(a) | | Net Realized
and Unrealized
Gains (Losses)
on Investments | | Total from
Investment
Activities | | Net
Investment
Income | | Total
Distributions | |
Victory Floating Rate Fund | | | |
Class A | | | |
Year Ended December 31: | |
2021 | | $ | 9.34 | | | | 0.36 | | | | — | (e) | | | 0.36 | | | | (0.37 | ) | | | (0.37 | ) | |
2020 | | $ | 9.42 | | | | 0.49 | | | | (0.08 | ) | | | 0.41 | | | | (0.49 | ) | | | (0.49 | ) | |
2019 | | $ | 9.13 | | | | 0.55 | | | | 0.29 | | | | 0.84 | | | | (0.55 | ) | | | (0.55 | ) | |
2018 | | $ | 9.60 | | | | 0.52 | | | | (0.47 | ) | | | 0.05 | | | | (0.52 | ) | | | (0.52 | ) | |
2017 | | $ | 9.71 | | | | 0.46 | | | | (0.10 | ) | | | 0.36 | | | | (0.47 | ) | | | (0.47 | ) | |
Class C | | | |
Year Ended December 31: | |
2021 | | $ | 9.34 | | | | 0.29 | | | | (0.01 | ) | | | 0.28 | | | | (0.29 | ) | | | (0.29 | ) | |
2020 | | $ | 9.42 | | | | 0.43 | | | | (0.09 | ) | | | 0.34 | | | | (0.42 | ) | | | (0.42 | ) | |
2019 | | $ | 9.14 | | | | 0.48 | | | | 0.28 | | | | 0.76 | | | | (0.48 | ) | | | (0.48 | ) | |
2018 | | $ | 9.61 | | | | 0.44 | | | | (0.47 | ) | | | (0.03 | ) | | | (0.44 | ) | | | (0.44 | ) | |
2017 | | $ | 9.72 | | | | 0.38 | | | | (0.10 | ) | | | 0.28 | | | | (0.39 | ) | | | (0.39 | ) | |
Class R | | | |
Year Ended December 31: | |
2021 | | $ | 9.33 | | | | 0.31 | | | | — | (e) | | | 0.31 | | | | (0.31 | ) | | | (0.31 | ) | |
2020 | | $ | 9.41 | | | | 0.45 | | | | (0.09 | ) | | | 0.36 | | | | (0.44 | ) | | | (0.44 | ) | |
2019 | | $ | 9.13 | | | | 0.50 | | | | 0.28 | | | | 0.78 | | | | (0.50 | ) | | | (0.50 | ) | |
2018 | | $ | 9.60 | | | | 0.46 | | | | (0.46 | ) | | | — | (e) | | | (0.47 | ) | | | (0.47 | ) | |
2017 | | $ | 9.72 | | | | 0.41 | | | | (0.12 | ) | | | 0.29 | | | | (0.41 | ) | | | (0.41 | ) | |
Class Y | | | |
Year Ended December 31: | |
2021 | | $ | 9.35 | | | | 0.38 | | | | (0.01 | ) | | | 0.37 | | | | (0.39 | ) | | | (0.39 | ) | |
2020 | | $ | 9.43 | | | | 0.51 | | | | (0.08 | ) | | | 0.43 | | | | (0.51 | ) | | | (0.51 | ) | |
2019 | | $ | 9.14 | | | | 0.57 | | | | 0.29 | | | | 0.86 | | | | (0.57 | ) | | | (0.57 | ) | |
2018 | | $ | 9.61 | | | | 0.54 | | | | (0.47 | ) | | | 0.07 | | | | (0.54 | ) | | | (0.54 | ) | |
2017 | | $ | 9.72 | | | | 0.48 | | | | (0.10 | ) | | | 0.38 | | | | (0.49 | ) | | | (0.49 | ) | |
Member Class | | | |
Year Ended December 31: | |
2021 | | $ | 9.34 | | | | 0.38 | | | | (0.01 | ) | | | 0.37 | | | | (0.38 | ) | | | (0.38 | ) | |
November 3, 2020 (f)
through
December 31, 2020 | | $ | 9.02 | | | | 0.08 | | | | 0.32 | (g) | | | 0.40 | | | | (0.08 | ) | | | (0.08 | ) | |
* Includes adjustments in accordance with U.S. Generally Accepted Accounting Principles.
(a) Per share net investment income (loss) has been calculated using the average daily shares method.
(b) Not annualized for periods less than one year.
(c) Annualized for periods less than one year.
(d) Portfolio turnover is calculated on the basis of the Fund as a whole without distinguishing between the classes of shares issued.
See notes to financial statements.
104
Victory Portfolios | | Financial Highlights — continued | |
For a Share Outstanding Throughout Each Period
| | | | | Ratios to Average Net Assets | | Supplemental Data | |
| | | Net Asset
Value,
End of
Period | | Total
Return
(Excludes
Sales
Charge)*(b) | | Net
Expenses(c) | | Net
Investment
Income
(Loss)(c) | | Gross
Expenses(c) | | Net Assets,
End of
Period
(000's) | | Portfolio
Turnover(b)(d) | |
Victory Floating Rate Fund | |
Class A | |
Year Ended December 31: | |
2021 | | $ | 9.33 | | | | 3.89 | % | | | 1.00 | % | | | 3.88 | % | | | 1.12 | % | | $ | 349,706 | | | | 35 | % | |
2020 | | $ | 9.34 | | | | 4.81 | % | | | 1.00 | % | | | 5.54 | % | | | 1.17 | % | | $ | 164,864 | | | | 54 | % | |
2019 | | $ | 9.42 | | | | 9.43 | % | | | 1.00 | % | | | 5.89 | % | | | 1.17 | % | | $ | 146,584 | | | | 35 | % | |
2018 | | $ | 9.13 | | | | 0.43 | % | | | 1.00 | % | | | 5.41 | % | | | 1.14 | % | | $ | 118,672 | | | | 48 | % | |
2017 | | $ | 9.60 | | | | 3.76 | % | | | 1.00 | % | | | 4.76 | % | | | 1.10 | % | | $ | 148,060 | | | | 57 | % | |
Class C | |
Year Ended December 31: | |
2021 | | $ | 9.33 | | | | 3.05 | % | | | 1.80 | % | | | 3.09 | % | | | 1.89 | % | | $ | 81,109 | | | | 35 | % | |
2020 | | $ | 9.34 | | | | 3.96 | % | | | 1.80 | % | | | 4.81 | % | | | 1.94 | % | | $ | 94,885 | | | | 54 | % | |
2019 | | $ | 9.42 | | | | 8.49 | % | | | 1.80 | % | | | 5.08 | % | | | 1.92 | % | | $ | 149,054 | | | | 35 | % | |
2018 | | $ | 9.14 | | | | (0.38 | )% | | | 1.80 | % | | | 4.60 | % | | | 1.90 | % | | $ | 211,462 | | | | 48 | % | |
2017 | | $ | 9.61 | | | | 2.93 | % | | | 1.80 | % | | | 3.97 | % | | | 1.87 | % | | $ | 265,486 | | | | 57 | % | |
Class R | |
Year Ended December 31: | |
2021 | | $ | 9.33 | | | | 3.40 | % | | | 1.56 | % | | | 3.31 | % | | | 3.45 | % | | $ | 602 | | | | 35 | % | |
2020 | | $ | 9.33 | | | | 4.23 | % | | | 1.56 | % | | | 5.01 | % | | | 6.20 | % | | $ | 300 | | | | 54 | % | |
2019 | | $ | 9.41 | | | | 8.75 | % | | | 1.56 | % | | | 5.34 | % | | | 3.73 | % | | $ | 455 | | | | 35 | % | |
2018 | | $ | 9.13 | | | | (0.13 | )% | | | 1.56 | % | | | 4.84 | % | | | 2.99 | % | | $ | 716 | | | | 48 | % | |
2017 | | $ | 9.60 | | | | 3.07 | % | | | 1.56 | % | | | 4.20 | % | | | 2.26 | % | | $ | 916 | | | | 57 | % | |
Class Y | |
Year Ended December 31: | |
2021 | | $ | 9.33 | | | | 4.01 | % | | | 0.78 | % | | | 4.08 | % | | | 0.86 | % | | $ | 1,768,900 | | | | 35 | % | |
2020 | | $ | 9.35 | | | | 5.03 | % | | | 0.78 | % | | | 5.73 | % | | | 0.93 | % | | $ | 403,852 | | | | 54 | % | |
2019 | | $ | 9.43 | | | | 9.65 | % | | | 0.78 | % | | | 6.10 | % | | | 0.92 | % | | $ | 289,796 | | | | 35 | % | |
2018 | | $ | 9.14 | | | | 0.64 | % | | | 0.78 | % | | | 5.64 | % | | | 0.89 | % | | $ | 281,545 | | | | 48 | % | |
2017 | | $ | 9.61 | | | | 3.98 | % | | | 0.78 | % | | | 4.99 | % | | | 0.88 | % | | $ | 276,195 | | | | 57 | % | |
Member Class | |
Year Ended December 31: | |
2021 | | $ | 9.33 | | | | 4.04 | % | | | 0.85 | % | | | 4.02 | % | | | 3.64 | % | | $ | 2,122 | | | | 35 | % | |
November 3, 2020 (f)
through
December 31, 2020 | | $ | 9.34 | | | | 4.41 | % | | | 0.85 | % | | | 5.46 | % | | | 56.41 | % | | $ | 62 | | | | 54 | % | |
(e) Amount is less than $0.005 per share.
(f) Commencement of operations.
(g) The amount shown for a share outstanding throughout the period does not accord with the change in net assets resulting from operations during the period because of the timing of sales and purchases of fund shares in relation to fluctuating market values during the period.
See notes to financial statements.
105
Victory Portfolios | | Financial Highlights | |
For a Share Outstanding Throughout Each Period
| | | | | Investment Activities | | Distributions to
Shareholders From | | | |
| | | Net Asset
Value,
Beginning of
Period | | Net
Investment
Income
(Loss)(a) | | Net
Realized and
Unrealized
Gains
(Losses) on
Investments | | Total from
Investment
Activities | | Net
Investment
Income | | Net Realized
Gains from
Investments | | Return of
Capital | | Total
Distributions | |
Victory Strategic Income Fund | | | |
Class A | | | |
Year Ended December 31: | |
2021 | | $ | 10.95 | | | | 0.22 | | | | (0.24 | ) | | | (0.02 | ) | | | (0.22 | ) | | | (0.24 | ) | | | — | | | | (0.46 | ) | |
2020 | | $ | 10.35 | | | | 0.15 | | | | 0.78 | | | | 0.93 | | | | (0.15 | ) | | | (0.18 | ) | | | — | | | | (0.33 | ) | |
2019 | | $ | 9.74 | | | | 0.27 | | | | 0.61 | | | | 0.88 | | | | (0.25 | ) | | | — | | | | (0.02 | ) | | | (0.27 | ) | |
2018 | | $ | 10.14 | | | | 0.34 | | | | (0.41 | ) | | | (0.07 | ) | | | (0.33 | ) | | | — | | | | — | | | | (0.33 | ) | |
2017 | | $ | 9.99 | | | | 0.33 | | | | 0.17 | | | | 0.50 | | | | (0.35 | ) | | | — | | | | — | | | | (0.35 | ) | |
Class C | | | |
Year Ended December 31: | |
2021 | | $ | 11.01 | | | | 0.13 | | | | (0.24 | ) | | | (0.11 | ) | | | (0.14 | ) | | | (0.24 | ) | | | — | | | | (0.38 | ) | |
2020 | | $ | 10.40 | | | | 0.06 | | | | 0.80 | | | | 0.86 | | | | (0.07 | ) | | | (0.18 | ) | | | — | | | | (0.25 | ) | |
2019 | | $ | 9.79 | | | | 0.19 | | | | 0.61 | | | | 0.80 | | | | (0.18 | ) | | | — | | | | (0.01 | ) | | | (0.19 | ) | |
2018 | | $ | 10.19 | | | | 0.26 | | | | (0.41 | ) | | | (0.15 | ) | | | (0.25 | ) | | | — | | | | — | | | | (0.25 | ) | |
2017 | | $ | 10.04 | | | | 0.25 | | | | 0.17 | | | | 0.42 | | | | (0.27 | ) | | | — | | | | — | | | | (0.27 | ) | |
Class R | | | |
Year Ended December 31: | |
2021 | | $ | 11.01 | | | | 0.18 | | | | (0.25 | ) | | | (0.07 | ) | | | (0.18 | ) | | | (0.24 | ) | | | — | | | | (0.42 | ) | |
2020 | | $ | 10.41 | | | | 0.11 | | | | 0.78 | | | | 0.89 | | | | (0.11 | ) | | | (0.18 | ) | | | — | | | | (0.29 | ) | |
2019 | | $ | 9.79 | | | | 0.23 | | | | 0.62 | | | | 0.85 | | | | (0.22 | ) | | | — | | | | (0.01 | ) | | | (0.23 | ) | |
2018 | | $ | 10.20 | | | | 0.30 | | | | (0.42 | ) | | | (0.12 | ) | | | (0.29 | ) | | | — | | | | — | | | | (0.29 | ) | |
2017 | | $ | 10.04 | | | | 0.29 | | | | 0.18 | | | | 0.47 | | | | (0.31 | ) | | | — | | | | — | | | | (0.31 | ) | |
Class Y | | | |
Year Ended December 31: | |
2021 | | $ | 10.89 | | | | 0.23 | | | | (0.23 | ) | | | — | (d) | | | (0.24 | ) | | | (0.24 | ) | | | — | | | | (0.48 | ) | |
2020 | | $ | 10.29 | | | | 0.16 | | | | 0.80 | | | | 0.96 | | | | (0.18 | ) | | | (0.18 | ) | | | — | | | | (0.36 | ) | |
2019 | | $ | 9.69 | | | | 0.29 | | | | 0.61 | | | | 0.90 | | | | (0.28 | ) | | | — | | | | (0.02 | ) | | | (0.30 | ) | |
2018 | | $ | 10.09 | | | | 0.36 | | | | (0.41 | ) | | | (0.05 | ) | | | (0.35 | ) | | | — | | | | — | | | | (0.35 | ) | |
2017 | | $ | 9.94 | | | | 0.35 | | | | 0.18 | | | | 0.53 | | | | (0.38 | ) | | | — | | | | — | | | | (0.38 | ) | |
(a) Per share net investment income (loss) has been calculated using the average daily shares method.
(b) Portfolio turnover is calculated on the basis of the Fund as a whole without distinguishing between the classes of shares issued.
(c) Reflects an increase in trading activity due to asset allocation shifts.
(d) Amount is less than $0.005 per share.
See notes to financial statements.
106
Victory Portfolios | | Financial Highlights — continued | |
For a Share Outstanding Throughout Each Period
| | | | | | | Ratios to Average Net Assets | | Supplemental Data | |
| | | Net Asset
Value,
End of
Period | | Total
Return
(Excludes
Sales
Charge) | | Net
Expenses | | Net
Investment
Income
(Loss) | | Gross
Expenses | | Net Assets,
End of
Period
(000's) | | Portfolio
Turnover(b) | |
Victory Strategic Income Fund | |
Class A | |
Year Ended December 31: | |
2021 | | $ | 10.47 | | | | (0.20 | )% | | | 0.95 | % | | | 2.07 | % | | | 1.07 | % | | $ | 39,795 | | | | 201 | % | |
2020 | | $ | 10.95 | | | | 9.09 | % | | | 0.95 | % | | | 1.39 | % | | | 1.08 | % | | $ | 40,993 | | | | 194 | %(c) | |
2019 | | $ | 10.35 | | | | 9.17 | % | | | 0.95 | % | | | 2.61 | % | | | 1.11 | % | | $ | 33,767 | | | | 106 | % | |
2018 | | $ | 9.74 | | | | (0.66 | )% | | | 0.95 | % | | | 3.46 | % | | | 1.09 | % | | $ | 32,053 | | | | 115 | % | |
2017 | | $ | 10.14 | | | | 5.12 | % | | | 0.95 | % | | | 3.24 | % | | | 1.07 | % | | $ | 34,957 | | | | 138 | % | |
Class C | |
Year Ended December 31: | |
2021 | | $ | 10.52 | | | | (1.07 | )% | | | 1.74 | % | | | 1.23 | % | | | 1.96 | % | | $ | 5,046 | | | | 201 | % | |
2020 | | $ | 11.01 | | | | 8.28 | % | | | 1.74 | % | | | 0.59 | % | | | 1.96 | % | | $ | 9,477 | | | | 194 | %(c) | |
2019 | | $ | 10.40 | | | | 8.26 | % | | | 1.74 | % | | | 1.83 | % | | | 2.00 | % | | $ | 9,126 | | | | 106 | % | |
2018 | | $ | 9.79 | | | | (1.45 | )% | | | 1.74 | % | | | 2.65 | % | | | 1.97 | % | | $ | 10,221 | | | | 115 | % | |
2017 | | $ | 10.19 | | | | 4.27 | % | | | 1.74 | % | | | 2.44 | % | | | 1.89 | % | | $ | 11,671 | | | | 138 | % | |
Class R | |
Year Ended December 31: | |
2021 | | $ | 10.52 | | | | (0.68 | )% | | | 1.34 | % | | | 1.66 | % | | | 1.61 | % | | $ | 2,772 | | | | 201 | % | |
2020 | | $ | 11.01 | | | | 8.61 | % | | | 1.34 | % | | | 0.99 | % | | | 1.72 | % | | $ | 2,989 | | | | 194 | %(c) | |
2019 | | $ | 10.41 | | | | 8.79 | % | | | 1.34 | % | | | 2.21 | % | | | 1.77 | % | | $ | 2,866 | | | | 106 | % | |
2018 | | $ | 9.79 | | | | (1.15 | )% | | | 1.34 | % | | | 3.05 | % | | | 1.70 | % | | $ | 2,761 | | | | 115 | % | |
2017 | | $ | 10.20 | | | | 4.78 | % | | | 1.34 | % | | | 2.83 | % | | | 1.61 | % | | $ | 2,927 | | | | 138 | % | |
Class Y | |
Year Ended December 31: | |
2021 | | $ | 10.41 | | | | 0.01 | % | | | 0.74 | % | | | 2.18 | % | | | 0.93 | % | | $ | 22,624 | | | | 201 | % | |
2020 | | $ | 10.89 | | | | 9.37 | % | | | 0.74 | % | | | 1.53 | % | | | 0.91 | % | | $ | 53,060 | | | | 194 | %(c) | |
2019 | | $ | 10.29 | | | | 9.35 | % | | | 0.74 | % | | | 2.83 | % | | | 1.11 | % | | $ | 5,274 | | | | 106 | % | |
2018 | | $ | 9.69 | | | | (0.45 | )% | | | 0.74 | % | | | 3.72 | % | | | 1.06 | % | | $ | 4,798 | | | | 115 | % | |
2017 | | $ | 10.09 | | | | 5.38 | % | | | 0.74 | % | | | 3.46 | % | | | 0.95 | % | | $ | 10,180 | | | | 138 | % | |
See notes to financial statements.
107
Victory Portfolios | | Notes to Financial Statements
December 31, 2021 | |
1. Organization:
Victory Portfolios (the "Trust") is organized as a Delaware statutory trust and the Trust is registered under the Investment Company Act of 1940, as amended (the "1940 Act"), as an open-end investment company. The Trust is comprised of 41 funds and is authorized to issue an unlimited number of shares, which are units of beneficial interest with a par value of $0.001 per share.
The accompanying financial statements are those of the following seven Funds (collectively, the "Funds" and individually, a "Fund"). Each Fund is classified as diversified under the 1940 Act.
Funds (Legal Name) | | Funds (Short Name) | | Investment Share
Classes Offered | |
Victory INCORE Investment Quality
Bond Fund | | INCORE Investment Quality
Bond Fund | | A, C, R, and Y
| |
Victory INCORE Low Duration
Bond Fund | | INCORE Low Duration
Bond Fund | | A, C, R, and Y
| |
Victory High Yield Fund | | High Yield Fund | | A, C, R, and Y | |
Victory Tax-Exempt Fund | | Tax-Exempt Fund | | A, C, and Y | |
Victory High Income Municipal
Bond Fund | | High Income Municipal
Bond Fund | | A, C, Y, and
Member Class | |
Victory Floating Rate Fund | | Floating Rate Fund | | A, C, R, Y, and
Member Class | |
Victory Strategic Income Fund | | Strategic Income Fund | | A, C, R, and Y | |
Each class of shares of a Fund has substantially identical rights and privileges except with respect to sales charges, fees paid under distribution plans, expenses allocable exclusively to each class of shares, voting rights on matters solely affecting a single class of shares, and the exchange privilege of each class of shares.
Under the Trust's organizational documents, its officers and trustees are indemnified against certain liabilities arising out of the performance of their duties to the Funds. In addition, in the normal course of business, the Funds enter into contracts with their vendors and others that provide for general indemnifications. The Funds' maximum exposure under these arrangements is unknown, as this would involve future claims that may be made against the Fund. However, based on experience, the Funds expect that risk of loss to be remote.
2. Significant Accounting Policies:
The following is a summary of significant accounting policies followed by the Trust in the preparation of its financial statements. The policies are in conformity with U.S. Generally Accepted Accounting Principles ("GAAP"). The preparation of financial statements in accordance with GAAP requires management to make estimates and assumptions that affect the reported amounts of assets and liabilities and disclosure of contingent assets and liabilities at the date of the financial statements and the reported amounts of income and expenses for the period. Actual results could differ from those estimates. The Funds follow the specialized accounting and reporting requirements under GAAP that are applicable to investment companies under Accounting Standards Codification Topic 946.
Investment Valuation:
The Funds record investments at fair value. Fair value is defined as the price that would be received to sell an asset or paid to transfer a liability in an orderly transaction between market participants at the measurement date.
108
Victory Portfolios | | Notes to Financial Statements — continued
December 31, 2021 | |
The valuation techniques described below maximize the use of observable inputs and minimize the use of unobservable inputs in determining fair value. The inputs used for valuing the Funds' investments are summarized in the three broad levels listed below:
• Level 1 — quoted prices in active markets for identical securities
• Level 2 — other significant observable inputs (including quoted prices for similar securities or interest rates applicable to those securities, etc.)
• Level 3 — significant unobservable inputs (including the Funds' own assumptions in determining the fair value of investments)
Changes in valuation techniques may result in transfers in or out of an assigned level within the disclosure hierarchy. The inputs or methodologies used for valuation techniques are not necessarily an indication of the risk associated with entering into those investments.
Victory Capital Management Inc. ("VCM" or the "Adviser") has established the Pricing and Liquidity Committee (the "Committee"), and subject to the Trust's Board of Trustees' (the "Board") oversight, the Committee administers and oversees the Funds' valuation policies and procedures, which are approved by the Board.
Portfolio securities listed or traded on securities exchanges, including exchange-traded funds ("ETFs"), are valued at the closing price on the exchange or system where the security is principally traded, if available, or at the Nasdaq Official Closing Price. If there have been no sales for that day on the exchange or system, then a security is valued at the last available bid quotation on the exchange or system where the security is principally traded. In each of these situations, valuations are typically categorized as Level 1 in the fair value hierarchy.
Investments in open-end investment companies are valued at their net asset value ("NAV"). These valuations are typically categorized as Level 1 in the fair value hierarchy.
Debt securities are valued each business day by a pricing service approved by the Board. The approved pricing service uses the evaluated bid or the last sale price to value securities. Debt obligations maturing within 60 days may be valued at amortized cost, provided that the amortized cost represents the fair value of such securities. These valuations are typically categorized as Level 2 in the fair value hierarchy.
Futures contracts are valued at the settlement price established each day by the board of trade or an exchange on which they are traded. These valuations are typically categorized as Level 1 in the fair value hierarchy.
Swap agreements are valued at the mean between the current bid and ask prices. To the extent this model is utilized, these valuations are considered as Level 2 in the fair value hierarchy.
In the event that price quotations or valuations are not readily available, investments are valued at fair value in accordance with procedures established by and under the general supervision and responsibility of the Board. These valuations are typically categorized as Level 2 or Level 3 in the fair value hierarchy, based on the observability of inputs used to determine the fair value. The effect of fair value pricing is that securities may not be priced on the basis of quotations from the primary market in which they are traded and the actual price realized from the sale of a security may differ materially from the fair value price. Valuing these securities at fair value is intended to cause the Fund's NAV to be more reliable than it otherwise would be.
109
Victory Portfolios | | Notes to Financial Statements — continued
December 31, 2021 | |
A summary of the valuations as of December 31, 2021, is included in the table below while the breakdown, by category, of investments is disclosed on the Schedules of Portfolio Investments:
| | | Level 1 | | Level 2 | | Level 3 | | Total | |
INCORE Investment Quality Bond Fund | |
Asset-Backed Securities | | $ | — | | | $ | 886,276 | | | $ | — | | | $ | 886,276 | | |
Collateralized Mortgage Obligations | | | — | | | | 253,839 | | | | — | | | | 253,839 | | |
Preferred Stocks | | | 1,223,010 | | | | 26,476 | | | | — | | | | 1,249,486 | | |
Corporate Bonds | | | — | | | | 12,692,526 | | | | — | | | | 12,692,526 | | |
Residential Mortgage-Backed Securities | | | — | | | | 56,514 | | | | — | | | | 56,514 | | |
Yankee Dollars | | | — | | | | 2,537,280 | | | | — | | | | 2,537,280 | | |
U.S. Government Mortgage-Backed
Agencies | | | — | | | | 5,386,373 | | | | — | | | | 5,386,373 | | |
U.S. Treasury Obligations | | | — | | | | 867,782 | | | | — | | | | 867,782 | | |
Collateral for Securities Loaned | | | 1,398,374 | | | | — | | | | — | | | | 1,398,374 | | |
Total | | $ | 2,621,384 | | | $ | 22,707,066 | | | $ | — | | | $ | 25,328,450 | | |
Other Financial Investments^: | |
Assets: | |
Credit Default Swap | | $ | — | | | $ | 258 | | | $ | — | | | $ | 258 | | |
Futures | | | 2,631 | | | | — | | | | — | | | | 2,631 | | |
Liabilities: | |
Futures | | | (5,876 | ) | | | — | | | | — | | | | (5,876 | ) | |
Total | | $ | (3,245 | ) | | $ | 258 | | | $ | — | | | $ | (2,987 | ) | |
INCORE Low Duration Bond Fund | |
Asset-Backed Securities | | $ | — | | | $ | 12,554,789 | | | $ | — | | | $ | 12,554,789 | | |
Collateralized Mortgage Obligations | | | — | | | | 6,812,294 | | | | — | | | | 6,812,294 | | |
Preferred Stocks | | | 6,936,195 | | | | 225,777 | | | | — | | | | 7,161,972 | | |
Corporate Bonds | | | — | | | | 116,008,009 | | | | — | | | | 116,008,009 | | |
Residential Mortgage-Backed Securities | | | — | | | | 6,661,178 | | | | — | | | | 6,661,178 | | |
Yankee Dollars | | | — | | | | 26,328,603 | | | | — | | | | 26,328,603 | | |
U.S. Government Mortgage-Backed
Agencies | | | — | | | | 9,739,373 | | | | — | | | | 9,739,373 | | |
U.S. Treasury Obligations | | | — | | | | 6,683,967 | | | | — | | | | 6,683,967 | | |
Collateral for Securities Loaned | | | 6,079,110 | | | | — | | | | — | | | | 6,079,110 | | |
Total | | $ | 13,015,305 | | | $ | 185,013,990 | | | $ | — | | | $ | 198,029,295 | | |
Other Financial Investments^: | |
Assets: | |
Credit Default Swap | | $ | — | | | $ | 41,511 | | | $ | — | | | $ | 41,511 | | |
Futures | | | 24,865 | | | | — | | | | — | | | | 24,865 | | |
Liabilities: | |
Futures | | | (29,168 | ) | | | — | | | | — | | | | (29,168 | ) | |
Total | | $ | (4,303 | ) | | $ | 41,511 | | | $ | — | | | $ | 37,208 | | |
High Yield Fund | |
Common Stocks | | $ | 2,208,326 | | | $ | — | | | $ | 38,128 | | | $ | 2,246,454 | | |
| Senior Secured Loans | | | — | | | | 76,326,370 | | | | — | | | | 76,326,370 | | |
Corporate Bonds | | | — | | | | 229,760,652 | | | | — | | | | 229,760,652 | | |
Yankee Dollars | | | — | | | | 20,061,355 | | | | — | | | | 20,061,355 | | |
Exchange-Traded Funds | | | 4,680,422 | | | | — | | | | — | | | | 4,680,422 | | |
Collateral for Securities Loaned | | | 38,823,311 | | | | — | | | | — | | | | 38,823,311 | | |
Total | | $ | 45,712,059 | | | $ | 326,148,377 | | | $ | 38,128 | | | $ | 371,898,564 | | |
110
Victory Portfolios | | Notes to Financial Statements — continued
December 31, 2021 | |
| | | Level 1 | | Level 2 | | Level 3 | | Total | |
Tax-Exempt Fund | |
Municipal Bonds | | $ | — | | | $ | 51,601,611 | | | $ | — | | | $ | 51,601,611 | | |
Total | | $ | — | | | $ | 51,601,611 | | | $ | — | | | $ | 51,601,611 | | |
High Income Municipal Bond Fund | |
Municipal Bonds | | $ | — | | | $ | 50,840,507 | | | $ | — | | | $ | 50,840,507 | | |
Exchange-Traded Funds | | | 1,248,600 | | | | — | | | | — | | | | 1,248,600 | | |
Total | | $ | 1,248,600 | | | $ | 50,840,507 | | | $ | — | | | $ | 52,089,107 | | |
Floating Rate Fund | |
Common Stocks | | $ | — | | | $ | — | | | $ | 61,969 | | | $ | 61,969 | | |
| Warrants | | | — | | | | 166,191 | | | | — | | | | 166,191 | | |
| Senior Secured Loans | | | — | | | | 1,823,601,388 | | | | — | | | | 1,823,601,388 | | |
Corporate Bonds | | | — | | | | 274,585,054 | | | | — | | | | 274,585,054 | | |
Yankee Dollars | | | — | | | | 19,167,570 | | | | — | | | | 19,167,570 | | |
Exchange-Traded Funds | | | 35,816,788 | | | | — | | | | — | | | | 35,816,788 | | |
Total | | $ | 35,816,788 | | | $ | 2,117,520,203 | | | $ | 61,969 | | | $ | 2,153,398,960 | | |
Strategic Income Fund | |
Asset-Backed Securities | | $ | — | | | $ | 707,938 | | | $ | — | | | $ | 707,938 | | |
Collateralized Mortgage Obligations | | | — | | | | 6,591,097 | | | | — | | | | 6,591,097 | | |
Corporate Bonds | | | — | | | | 41,717,852 | | | | — | | | | 41,717,852 | | |
Residential Mortgage-Backed Securities | | | — | | | | 120,103 | | | | — | | | | 120,103 | | |
Yankee Dollars | | | — | | | | 6,584,883 | | | | — | | | | 6,584,883 | | |
U.S. Government Mortgage-Backed
Agencies | | | — | | | | 45,490 | | | | — | | | | 45,490 | | |
U.S. Treasury Obligations | | | — | | | | 5,836,900 | | | | — | | | | 5,836,900 | | |
Exchange-Traded Funds | | | 6,455,273 | | | | — | | | | — | | | | 6,455,273 | | |
Collateral for Securities Loaned | | | 7,654,881 | | | | — | | | | — | | | | 7,654,881 | | |
Total | | $ | 14,110,154 | | | $ | 61,604,263 | | | $ | — | | | $ | 75,714,417 | | |
Other Financial Investments^: | |
Assets: | |
Futures | | $ | 8,230 | | | $ | — | | | $ | — | | | $ | 8,230 | | |
Liabilities: | |
Credit Default Swap | | | — | | | | (31,194 | ) | | | — | | | | (31,194 | ) | |
Futures | | | (85,300 | ) | | | — | | | | — | | | | (85,300 | ) | |
Total | | $ | (77,070 | ) | | $ | (31,194 | ) | | $ | — | | | $ | (108,264 | ) | |
^ Futures contracts and credit default swaps are valued at the unrealized appreciation (depreciation) on the investment.
For the year ended December 31, 2021, there were no significant transfers in or out of Level 3 in the fair value hierarchy.
Real Estate Investment Trusts ("REITs"):
The Funds may invest in REITs, which report information on the source of their distributions annually. REITs are pooled investment vehicles that invest primarily in income-producing real estate or real-estate related loans or interests (such as mortgages). Certain distributions received from REITs during the year are recorded as realized gains or return of capital as estimated by the Funds or when such information becomes known.
111
Victory Portfolios | | Notes to Financial Statements — continued
December 31, 2021 | |
Investment Companies:
Exchange-Traded Funds:
The Funds may invest in ETFs, the shares of which are bought and sold on a securities exchange. An ETF trades like common stock and represents a fixed portfolio of securities often designed to track the performance and dividend yield of a particular domestic or foreign market index. The Funds may purchase shares of an ETF to temporarily gain exposure to a portion of the U.S. or a foreign market while awaiting purchase of underlying securities. The risks of owning an ETF generally reflect the risks of owning the underlying securities they are designed to track, although the lack of liquidity of an ETF could result in it being more volatile. Additionally, ETFs have fees and expenses that reduce their value.
Open-End Funds:
The Funds may invest in portfolios of open-end investment companies. These investment companies value securities in their portfolios for which market quotations are readily available at their market values (generally the last reported sale price) and all other securities and assets at their fair value by the methods established by the board of directors of the underlying funds.
Securities Purchased on a Delayed-Delivery or When-Issued Basis:
The Funds may purchase securities on a when-issued basis. When-issued securities are securities purchased for delivery beyond normal settlement periods at a stated price and/or yield, thereby involving the risk that the price and/or yield obtained may be more or less than those available in the market when delivery takes place. At the time a Fund makes the commitment to purchase a security on a when-issued basis, the Fund records the transaction and reflects the value of the security in determining net asset value. No interest accrues to the Fund until the transaction settles and payment takes place. Normally, the settlement date occurs within one month of the purchase. A segregated account is established and the Fund maintains cash and/or marketable securities at least equal in value to commitments for when-issued securities. If a Fund owns when-issued securities, these values are included in Payable for investments purchased on the accompanying Statements of Assets and Liabilities and the segregated assets are identified on the Schedules of Portfolio Investments.
Municipal Obligations:
The values of municipal obligations can fluctuate and may be affected by adverse tax, legislative, or political changes, and by financial developments affecting municipal issuers. Payment of municipal obligations may depend on a relatively limited source of revenue, resulting in greater credit risk. Future changes in federal tax laws or the activity of an issuer may adversely affect the tax-exempt status of municipal obligations.
Mortgage- and Asset-Backed Securities:
The values of some mortgage-related or asset-backed securities may be particularly sensitive to changes in prevailing interest rates. Early repayment of principal on some mortgage-related securities may expose the Fund to a lower rate of return upon reinvestment of principal. The values of mortgage- and asset-backed securities depend in part on the credit quality and adequacy of the underlying assets or collateral and may fluctuate in response to the market's perception of these factors as well as current and future repayment rates. Some mortgage-backed securities are backed by the full faith and credit of the U.S. government (e.g., mortgage-backed securities issued by the Government National Mortgage Association, commonly known as "Ginnie Mae"), while other mortgage-backed securities (e.g., mortgage-backed securities issued by the Federal National Mortgage Association and the Federal Home Loan Mortgage Corporation, commonly known as "Fannie Mae" and "Freddie Mac," respectively), are backed only by the credit of the government entity issuing them. In addition, some mortgage-backed securities are issued by private entities and, as such, are not guaranteed by the U.S. government or any agency or instrumentality of the U.S. government.
112
Victory Portfolios | | Notes to Financial Statements — continued
December 31, 2021 | |
Loans:
Floating rate loans in which a Fund invests are primarily "senior" loans. Senior floating rate loans typically hold a senior position in the capital structures of the borrower, are typically secured by specific collateral, and have a claim on the assets and/or stock of the borrower that is senior to that held by subordinated debtholders and stockholders of the borrower. While these protections may reduce risk, these investments still present significant credit risk. A significant portion of a Fund's floating rate investments may be issued in connection with highly leveraged transactions such as leveraged buyouts, leveraged recapitalization loans, and other types of acquisition financing. Obligations in these types of transactions are subject to greater credit risk (including default and bankruptcy) than many other investments and may be, or become, illiquid. See the note below regarding below investment grade securities.
A Fund may purchase second-lien loans (secured loans with a claim on collateral subordinate to a senior lender's claim on such collateral), fixed rate loans, unsecured loans, and other debt obligations.
Transactions in loans often settle on a delayed basis, and a Fund may not receive the proceeds from the sale of a loan or pay for a loan purchase for a substantial period of time after entering into the transactions.
Below-Investment-Grade-Securities:
Certain Funds may invest in below investment grade securities (i.e., lower-quality, "junk" debt), which are subject to various risks. Lower-quality debt is considered to be speculative because it is less certain that the issuer will be able to pay interest or repay the principal than in the case of investment grade debt. These securities can involve a substantially greater risk of default than higher-rated securities, and their values can decline significantly over short periods of time. Lower-quality debt securities tend to be more sensitive to adverse news about their issuers, the market and the economy in general, than higher-quality debt securities. The market for these securities can be less liquid, especially during periods of recession or general market decline.
Derivative Instruments:
Futures Contracts:
The Funds may enter into contracts for the future delivery of securities or foreign currencies and futures contracts based on a specific security, class of securities, foreign currency or an index, and purchase or sell options on any such futures contracts. A futures contract on a securities index is an agreement obligating either party to pay, and entitling the other party to receive, while the contract is outstanding, cash payments based on the level of a specified securities index. No physical delivery of the underlying asset is made. The Funds may enter into futures contracts in an effort to hedge against market risks. The acquisition of put and call options on futures contracts will give the Funds the right (but not the obligation), for a specified price, to sell or to purchase the underlying futures contract, upon exercise of the option, at any time during the option period. Futures transactions involve brokerage costs and require the Funds to segregate assets to cover contracts that would require it to purchase securities or currencies. A good faith margin deposit, known as initial margin, of cash or government securities with a broker or custodian is required to initiate and maintain open positions in futures contracts. Subsequent payments, known as variation margin, are made or received by the Funds based on the change in the market value of the position and are recorded as unrealized appreciation or depreciation until the contract is closed out, at which time the gain or loss is realized. The Funds may lose the expected benefit of futures transactions if interest rates, exchange rates or securities prices change in an unanticipated manner. Such unanticipated changes may also result in lower overall performance than if the Funds had not entered into any futures transactions. In addition, the value of the Funds' futures positions may not prove to be perfectly or even highly correlated with the value of its portfolio securities or foreign currencies, limiting the Funds' ability to hedge effectively against interest rate, exchange rate and/or market risk and giving rise to additional risks. There is no assurance of liquidity in the secondary market for purposes of closing out futures positions. The collateral held by the Funds is reflected on the Statements of Assets and Liabilities under Deposit with broker for futures contracts.
113
Victory Portfolios | | Notes to Financial Statements — continued
December 31, 2021 | |
Management has determined that no offsetting requirements exist as a result of their conclusion that the Funds are not subject to master netting agreements for futures contracts.
During the year ended December 31, 2021, the Funds entered into futures contracts primarily for the strategy of hedging or other purposes, including but not limited to, providing liquidity and equitizing cash.
Credit Derivatives:
The Funds may enter into credit derivatives, including centrally cleared credit default swaps on individual obligations or credit indices. The Funds may use these investments (i) as alternatives to direct long or short investment in a particular security or securities, (ii) to adjust the Funds' asset allocation or risk exposure, or (iii) for hedging purposes. The use by the Funds of centrally cleared credit default swaps may have the effect of creating a short position in a security. Credit derivatives can create investment leverage and may create additional investment risks that may subject the Funds to greater volatility than investments in more traditional securities, as described in the Funds' Statement of Additional Information.
Centrally cleared credit default swap ("CDS") agreements on credit indices involve one party making a stream of payments (referred to as the buyer of protection) to another party (the seller of protection) in exchange for the right to receive a specified return in the event of a write-down, principal shortfall, interest shortfall or default of all or part of the referenced entities comprising the credit index. A credit index is a basket of credit instruments or exposures designed to be representative of a specific sector of the credit market as a whole. These indices are made up of reference credits that are judged by a poll of dealers to be the most liquid entities in the CDS.
The counterparty risk for cleared swap agreements is generally lower than uncleared over-the-counter swap agreements because generally a clearing organization becomes substituted for each counterparty to a centrally cleared swap agreement and, in effect, guarantees each party's performance under the contract as each party to a trade looks only to the clearing organization for performance of financial obligations. However, there can be no assurance that the clearing organization, or its members, will satisfy its obligations to the Fund.
The Funds may enter into CDS agreements either as a buyer or seller. The Funds may buy protection under a CDS to attempt to mitigate the risk of default or credit quality deterioration in one or more individual holdings or in a segment of the fixed income securities market. The Funds may sell protection under a CDS in an attempt to gain exposure to an underlying issuer's credit quality characteristics without investing directly in that issuer.
For swaps entered with an individual counterparty, the Funds bear the risk of loss of the uncollateralized amount expected to be received under a CDS agreement in the event of the default or bankruptcy of the counterparty. CDS agreements are generally valued at a price at which the counterparty to such agreement would terminate the agreement. The Funds may also enter into cleared swaps.
Upon entering into a cleared CDS, the Funds may be required to deposit with the broker an amount of cash or cash equivalents in the range of approximately 3% to 6% of the notional amount for CDS on high yield debt issuers (this amount is subject to change by the clearing organization that clears the trade). This amount, known as "initial margin," is in the nature of a performance bond or good faith deposit on the CDS and is returned to a Fund upon termination of the CDS, assuming all contractual obligations have been satisfied. Subsequent payments, known as "variation margin," to and from the broker will be made daily as the price of the CDS fluctuates, making the long and short positions in the CDS contract more or less valuable, a process known as "marking-to-market". The premium (discount) payments are built into the daily price of the CDS and thus are amortized through the variation margin. The variation margin payment also includes the daily portion of the periodic payment stream.
The maximum potential amount of future payments (undiscounted) that the Funds as a seller of protection could be required to make under a CDS agreement equals the notional amount of the agreement. Notional amounts of each individual CDS agreement outstanding as of period end for which the Funds are the sellers of protection are disclosed on the Schedules of Portfolio Investments. These
114
Victory Portfolios | | Notes to Financial Statements — continued
December 31, 2021 | |
potential amounts would be partially offset by any recovery values of the respective referenced obligations, upfront payments received upon entering into the agreement, periodic interest payments, or net amounts received from the settlement of buy protection CDS agreements entered into by the Fund for the same referenced entity or entities. The collateral held by the Funds is reflected on the Statements of Assets and Liabilities under Deposit with broker for swap agreements.
Management has determined that no offsetting requirements exist as a result of their conclusion that the Funds are not subject to master netting agreements for swap agreements.
As of December 31, 2021, the INCORE Investment Quality Bond Fund, INCORE Low Duration Bond Fund and Strategic Income Fund entered into centrally cleared CDS agreements primarily for the strategy of asset allocation and risk exposure.
Summary of Derivative Instruments:
The following table summarizes the fair values of derivative instruments on the Statements of Assets and Liabilities, categorized by risk exposure, as of December 31, 2021:
| | | Assets | | Liabilities | |
| | | Variation Margin
Receivable on Open
Futures Contracts* | | Variation Margin
Receivable on Open
Swap Contracts* | | Variation Margin
Payable on Open
Futures Contracts* | | Variation Margin
Payable on Open
Swap Contracts* | |
Credit Risk Exposure: | |
INCORE Investment
Quality Bond Fund | | $ | — | | | $ | 258 | | | $ | — | | | $ | — | | |
INCORE Low Duration
Bond Fund | | | — | | | | 41,511 | | | | — | | | | — | | |
Strategic Income Fund | | | — | | | | — | | | | — | | | | 31,194 | | |
| | | Assets | | Liabilities | |
| | | Variation Margin
Receivable on Open
Futures Contracts* | | Variation Margin
Payable on Open
Futures Contracts* | |
Currency Risk Exposure: | |
INCORE Investment Quality Bond Fund | | $ | 2,600 | | | $ | — | | |
INCORE Low Duration Bond Fund | | | 20,280 | | | | — | | |
Equity Risk Exposure: | |
| INCORE Investment Quality Bond Fund | | | — | | | | 1,400 | | |
Interest Rate Risk Exposure: | |
| INCORE Investment Quality Bond Fund | | | 31 | | | | 4,476 | | |
| INCORE Low Duration Bond Fund | | | 4,585 | | | | 29,168 | | |
Strategic Income Fund | | | 8,230 | | | | 85,300 | | |
* Includes cumulative appreciation/depreciation of futures contracts and swap agreements as reported on the Schedules of Portfolio Investments. Only current day's variation margin for both futures contracts and swap agreements is reported within the Statements of Assets and Liabilities.
115
Victory Portfolios | | Notes to Financial Statements — continued
December 31, 2021 | |
The following table presents the effect of derivative instruments on the Statements of Operations, categorized by risk exposure, for the year ended December 31, 2021:
| | | Net Realized Gains (Losses)
on Derivatives
Recognized as a
Result from Operations | | Net Change in Unrealized
Appreciation/Depreciation
on Derivatives Recognized
as a Result of Operations | |
| | | Net Realized
Gains (Losses)
from Futures
Contracts | | Net Realized
Gains (Losses)
from Swap
Agreements | | Net Change in
Unrealized
Appreciation/
Depreciation
on Futures
Contracts | | Net Change in
Unrealized
Appreciation/
Depreciation
on Swap
Agreements | |
Credit Risk Exposure: | |
INCORE Investment Quality Bond Fund | | $ | — | | | $ | 43,436 | | | $ | — | | | $ | 258 | | |
INCORE Low Duration Bond Fund | | | — | | | | 280,211 | | | | — | | | | 41,511 | | |
Strategic Income Fund | | | — | | | | 74,546 | | | | — | | | | (31,194 | ) | |
Currency Risk Exposure: | |
INCORE Investment Quality Bond Fund | | | 19,209 | | | | — | | | | 2,600 | | | | — | | |
INCORE Low Duration Bond Fund | | | 157,653 | | | | — | | | | 20,280 | | | | — | | |
Equity Risk Exposure: | |
INCORE Investment Quality Bond Fund | | | (131 | ) | | | — | | | | (1,400 | ) | | | — | | |
Interest Rate Risk Exposure: | |
| INCORE Investment Quality Bond Fund | | | (62,106 | ) | | | — | | | | (6,860 | ) | | | — | | |
| INCORE Low Duration Bond Fund | | | 396,821 | | | | — | | | | (4,808 | ) | | | — | | |
Strategic Income Fund | | | (176,808 | ) | | | — | | | | (49,102 | ) | | | — | | |
All open derivative positions at year end are reflected on each respective Fund's Schedule of Portfolio Investments. The underlying face value of open derivative positions relative to each Fund's net assets at year end is generally representative of the notional amount of open positions to net assets throughout the year.
Investment Transactions and Related Income:
Changes in holdings of investments are accounted for no later than one business day following the trade date. For financial reporting purposes, however, investment transactions are accounted for on trade date or the last business day of the reporting period. Interest income is determined on the basis of coupon interest accrued using the effective interest method which adjusts, where applicable, the amortization of premiums or accretion of discounts. Dividend income is recorded on the ex-dividend date. Gains or losses realized on sales of securities are recorded on the identified cost basis. Paydown gains or losses on applicable securities, if any, are recorded as components of Interest income on the Statements of Operations.
The Funds may receive other income from investments in loan assignments and/or unfunded commitments, including amendment fees, consent fees, and commitment fees. These fees are recorded as income when received. These amounts, if received, are included in Interest income on the Statements of Operations.
Securities Lending:
The Funds, through a Securities Lending Agreement with Citibank, N.A. ("Citibank"), may lend their securities to qualified financial institutions, such as certain broker-dealers and banks, to earn additional income, net of income retained by Citibank. Borrowers are required to initially secure their loans for collateral in the amount of at least 102% of the value of U.S. securities loaned or at least 105% of the value of non-U.S. securities loaned, marked-to-market daily. Any collateral shortfalls associated with increases in the valuation of the securities loaned are generally cured the next business day. The collateral can be received in the form of cash collateral and/or non-cash collateral. Non-cash collateral can include U.S. Government Securities and other securities as permitted by Securities and Exchange Commission ("SEC") guidelines. The cash collateral is invested in short-term instruments or cash
116
Victory Portfolios | | Notes to Financial Statements — continued
December 31, 2021 | |
equivalents, primarily open-end investment companies, as noted on the Funds' Schedules of Portfolio Investments. The Funds effectively do not have control of the non-cash collateral and therefore it is not disclosed on the Funds' Schedules of Portfolio Investments. Collateral requirements are determined daily based on the value of the Funds' securities on loan as of the end of the prior business day. During the time portfolio securities are on loan, the borrower will pay the Funds any dividends or interest paid on such securities plus any fee negotiated between the parties to the lending agreement. The Funds also earn a return from the collateral. The Funds pay Citibank various fees in connection with the investment of cash collateral and fees based on the investment income received from securities lending activities. Securities lending income (net of these fees) is disclosed on the Statements of Operations. Loans are terminable upon demand and the borrower must return the loaned securities within the lesser of one standard settlement period or five business days. Although risk is mitigated by the collateral, a Fund could experience a delay in recovering its securities and possible loss of income or value if the borrower fails to return them. In addition, there is a risk that the value of the short-term investments will be less than the amount of cash collateral required to be returned to the borrower.
The Funds' agreement with Citibank does not include master netting provisions. Non-cash collateral received by the Funds may not be sold or repledged, except to satisfy borrower default.
The following table is a summary of the Funds' securities lending transactions as of December 31, 2021.
| | | Value of
Securities on Loan | | Non-Cash Collateral | | Cash Collateral | |
INCORE Investment Quality
Bond Fund | | $ | 1,366,812 | | | $ | — | | | $ | 1,398,374 | | |
INCORE Low Duration
Bond Fund | | | 5,943,432 | | | | — | | | | 6,079,110 | | |
High Yield Fund | | | 37,201,728 | | | | — | | | | 38,823,311 | | |
Strategic Income Fund | | | 7,446,153 | | | | — | | | | 7,654,881 | | |
Federal Income Taxes:
It is each Fund's policy to continue to qualify as a regulated investment company by complying with the provisions available to certain investment companies, as defined in applicable sections of the Internal Revenue Code, and to make distributions of net investment income and net realized gains sufficient to relieve it from all, or substantially all, federal income taxes. Accordingly, no provision for federal income taxes is required in the financial statements. The Funds have a tax year end of December 31.
For the year ended December 31, 2021, the Funds did not incur any income tax, interest, or penalties, and has recorded no liability for net unrecognized tax benefits relating to uncertain income tax positions.
Management of the Funds has reviewed tax positions taken in tax years that remain subject to examination by all major tax jurisdictions, including federal (i.e., the last four tax years, which includes the current fiscal tax year end). Management believes that there is no tax liability resulting from unrecognized tax benefits related to uncertain tax positions taken.
Allocations:
Expenses directly attributable to a Fund are charged to that Fund, while expenses that are attributable to more than one fund in the Trust, or jointly with an affiliated trust, are allocated among the respective funds in the Trust and/or an affiliated trust based upon net assets or another appropriate basis.
Income, expenses (other than class-specific expenses such as transfer agent fees, state registration fees, 12b-1 fees, and printing fees), and realized and unrealized gains or losses on investments are allocated to each class of shares based on its relative net assets on the date income is earned or expenses and realized and unrealized gains and losses are incurred.
Cross-Trade Transactions:
Pursuant to Rule 17a-7 under the 1940 Act, the Funds may engage in securities transactions with affiliated investment companies and advisory accounts managed by the Adviser and any applicable sub-adviser. Any such purchase or sale transaction must be effected without brokerage commission or
117
Victory Portfolios | | Notes to Financial Statements — continued
December 31, 2021 | |
other remuneration, except for customary transfer fees. The transaction must be effected at the current market price, which is either the security's last sale price on an exchange or, if there are no transactions in the security that day, at the average of the highest bid and lowest asked price. For the year ended December 31, 2021, the Fund engaged in the following securities transactions with affiliated funds, which resulted in the following net realized gains (losses):
| | | Purchases | | Sales | | Net Realized
Gains (Losses) | |
Tax-Exempt Fund | | $ | 3,000,000 | | | $ | 2,200,000 | | | $ | — | | |
High Income Municipal Bond Fund | | | 4,263,720 | | | | 6,800,000 | | | | — | | |
3. Purchases and Sales:
Purchases and sales of securities (excluding securities maturing less than one year from acquisition) for the year ended December 31, 2021, were as follows.
| | | Excluding
U.S. Government Securities | | U.S. Government Securities | |
| | | Purchases | | Sales | | Purchases | | Sales | |
INCORE Investment Quality
Bond Fund | | $ | 7,246,185 | | | $ | 10,186,711 | | | $ | 10,146,395 | | | $ | 12,598,521 | | |
INCORE Low Duration
Bond Fund | | | 103,594,330 | | | | 75,939,016 | | | | 23,952,864 | | | | 110,697,537 | | |
High Yield Fund | | | 280,250,943 | | | | 188,688,320 | | | | — | | | | — | | |
Tax-Exempt Fund | | | 3,080,080 | | | | 14,374,869 | | | | — | | | | — | | |
High Income Municipal
Bond Fund | | | 15,760,921 | | | | 9,005,491 | | | | — | | | | — | | |
| Floating Rate Fund | | | 2,058,093,059 | | | | 545,654,150 | | | | — | | | | — | | |
Strategic Income Fund | | | 154,708,837 | | | | 167,657,870 | | | | 16,773,896 | | | | 36,734,244 | | |
4. Fees and Transactions with Affiliates and Related Parties:
Investment Advisory Fees:
Investment advisory services are provided to the Funds by the Adviser, which is a New York corporation registered as an investment adviser with the SEC. The Adviser is an indirect wholly owned subsidiary of Victory Capital Holdings, Inc., a publicly traded Delaware corporation, and a wholly owned direct subsidiary of Victory Capital Operating, LLC.
VCM has entered into a Sub-Advisory Agreement with Park Avenue Institutional Advisers LLC ("Park Avenue"). Park Avenue is responsible for providing day-to-day investment advisory services to the High Yield Fund, the Floating Rate Fund and the Strategic Income Fund, subject to the oversight of the Board.
Under the terms of the Investment Advisory Agreement, the Adviser is entitled to receive fees based on a percentage of the average daily net assets of each Fund. The rates at which the Adviser is paid by each Fund are included in the table below.
| | | Flat Rate | |
INCORE Investment Quality Bond Fund | | | 0.50 | % | |
INCORE Low Duration Bond Fund | | | 0.45 | % | |
High Yield Fund | | | 0.60 | % | |
Tax-Exempt Fund | | | 0.50 | % | |
High Income Municipal Bond Fund | | | 0.50 | % | |
Floating Rate Fund | | | 0.65 | % | |
Strategic Income Fund | | | 0.60 | % | |
Amounts incurred and paid to VCM for the year ended December 31, 2021, are reflected on the Statements of Operations as Investment advisory fees.
118
Victory Portfolios | | Notes to Financial Statements — continued
December 31, 2021 | |
Administration and Servicing Fees:
VCM also serves as the Funds' administrator and fund accountant. Under the Administration and Fund Accounting Agreement, VCM is entitled to receive fees based on a percentage of the average daily net assets of the Trust, Victory Variable Insurance Funds and Victory Portfolios II. The tiered rates at which VCM is paid by the Funds are shown in the table below:
| Net Assets | |
Up to $15 billion | | $15 billion — $30 billion | | Over $30 billion | |
| | 0.08 | %, plus | | | 0.05 | %, plus | | | 0.04 | % | |
Amounts incurred for the year ended December 31, 2021, are reflected on the Statements of Operations as Administration fees.
Citi Fund Services Ohio, Inc. ("Citi"), an affiliate of Citibank, acts as sub-administrator and sub-fund accountant to the Funds pursuant to the Sub-Administration and Sub-Fund Accounting Services Agreement between VCM and Citi. VCM pays Citi a fee for providing these services. The Trust reimburses VCM and Citi for out-of-pocket expenses incurred in providing these services and certain other expenses specifically allocated to the Funds. Amounts incurred for the year ended December 31, 2021, are reflected on the Statements of Operations as Sub-Administration fees.
The Funds (as part of the Trust) have entered into an agreement with the Adviser to provide compliance services, pursuant to which the Adviser furnishes its compliance personnel, including the services of the Chief Compliance Officer ("CCO"), and other resources reasonably necessary to provide the Trust with compliance oversight services related to the design, administration, and oversight of a compliance program for the Trust in accordance with Rule 38a-1 under the 1940 Act. The CCO is an employee of the Adviser, which pays the compensation of the CCO and support staff. The funds in the Trust, Victory Variable Insurance Funds, Victory Portfolios II, and USAA Mutual Funds (collectively, the "Victory Funds Complex") in the aggregate, compensate the Adviser for these services. Amounts incurred for the year ended December 31, 2021, are reflected on the Statements of Operations as Compliance fees.
Transfer Agency Fees:
FIS Investor Services, LLC ("FIS") serves as the Funds' transfer agent. Under the Transfer Agent Agreement, the Trust pays FIS a fee for its services and reimburses FIS for all of their reasonable out-of-pocket expenses incurred in providing these services. Amounts incurred for the year ended December 31, 2021, are reflected on the Statements of Operations as Transfer agent fees.
Victory Capital Transfer Agency, Inc., an affiliate of the Adviser, serves as sub-transfer agent for the Member Class. Victory Capital Transfer Agency, Inc. receives no fee or other compensation for these services.
Distributor/Underwriting Services:
Victory Capital Services, Inc. (the "Distributor"), an affiliate of the Adviser, serves as Distributor for the continuous offering of the shares of the Funds pursuant to a Distribution Agreement between the Distributor and the Trust. Pursuant to the Distribution and Service Plans adopted in accordance with Rule 12b-1 under the 1940 Act, the Distributor may receive a monthly distribution and service fee at the annual rate shown in the table below:
| | | Class A | | Class C | | Class R | |
INCORE Investment Quality Bond Fund | | | 0.25 | % | | | 1.00 | % | | | 0.50 | % | |
INCORE Low Duration Bond Fund | | | 0.25 | % | | | 1.00 | % | | | 0.50 | % | |
High Yield Fund | | | 0.25 | % | | | 1.00 | % | | | 0.50 | % | |
Tax-Exempt Fund | | | 0.25 | % | | | 1.00 | % | | | N/A | | |
High Income Municipal Bond Fund | | | 0.25 | % | | | 1.00 | % | | | N/A | | |
Floating Rate Fund | | | 0.25 | % | | | 1.00 | % | | | 0.50 | % | |
Strategic Income Fund | | | 0.25 | % | | | 1.00 | % | | | 0.50 | % | |
The distribution and service fees paid to the Distributor may be used by the Distributor to pay for activities primarily intended to result in the sale of Class A, Class C, and Class R. Amounts incurred for the year ended December 31, 2021, are reflected on the Statements of Operations as 12b-1 fees.
119
Victory Portfolios | | Notes to Financial Statements — continued
December 31, 2021 | |
In addition, the Distributor is entitled to receive commissions on sale of the Class A. For the year ended December 31, 2021, the Distributor received $35,984 from commissions earned on the sale of Class A.
Other Fees:
Citibank serves as the Funds' custodian. The Funds pay Citibank a fee for providing these services. Amounts incurred for the year ended December 31, 2021, are reflected on the Statements of Operations as Custodian fees.
Sidley Austin LLP provides legal services to the Trust.
The Adviser has entered into expense limitation agreements with certain Funds. Under the terms of the agreements, the Adviser has agreed to waive fees or reimburse certain expenses to the extent that ordinary operating expenses incurred by certain classes of a Fund in any fiscal year exceed the expense limit for such classes of the Fund. Such excess amounts will be the liability of the Adviser. Acquired fund fees and expense, interest, taxes, brokerage commissions, other expenditures that are capitalized in accordance with GAAP, and other extraordinary expenses not incurred in the ordinary course of a Fund's business are excluded from the expense limits. As of December 31, 2021, the expense limits (excluding voluntary waivers) are as follows:
| | | In effect until April 30, 2022 | |
| | | Class A | | Class C | | Class R | | Class Y | | Member
Class | |
INCORE Investment Quality Bond Fund | | | 0.90 | % | | | 1.77 | % | | | 1.30 | % | | | 0.66 | % | | | N/A | | |
INCORE Low Duration Bond Fund | | | 0.85 | % | | | 1.62 | % | | | 1.27 | % | | | 0.62 | % | | | N/A | | |
High Yield Fund | | | 1.00 | % | | | 1.70 | % | | | 1.35 | % | | | 0.76 | % | | | N/A | | |
Tax-Exempt Fund | | | 0.80 | % | | | 1.60 | % | | | N/A | | | | 0.69 | % | | | N/A | | |
High Income Municipal Bond Fund | | | 0.80 | % | | | 1.57 | % | | | N/A | | | | 0.57 | % | | | 0.65 | % | |
Floating Rate Fund | | | 1.00 | % | | | 1.80 | % | | | 1.56 | % | | | 0.78 | % | | | 0.85 | % | |
Strategic Income Fund | | | 0.95 | % | | | 1.74 | % | | | 1.34 | % | | | 0.74 | % | | | N/A | | |
Under the terms of the expense limitation agreements, as amended May 1, 2021, the Funds have agreed to repay fees and expenses that were waived or reimbursed by the Adviser for a period of up to three years (thirty-six (36) months) after the waiver or reimbursement took place, subject to the lesser of any operating expense limits in effect at the time of: (a) the original waiver or expense reimbursement; or (b) the recoupment, after giving effect to the recoupment amount. Prior to May 1, 2021, the Funds were permitted to recoup fees waived and expenses reimbursed for up to three years after the fiscal year in which the waiver or reimbursement took place, subject to the limitations above. This change did not have any effect on the amounts previously reported for recoupment.
As of December 31, 2021, the following amounts are available to be repaid to the Adviser. The Funds have not recorded any amounts available to be repaid as a liability due to an assessment that repayments are not probable at December 31, 2021.
| | | Expires
2022 | | Expires
2023 | | Expires
2024 | | Total | |
INCORE Investment Quality Bond Fund | | $ | 127,606 | | | $ | 136,293 | | | $ | 132,566 | | | $ | 396,465 | | |
INCORE Low Duration Bond Fund | | | 163,391 | | | | 131,941 | | | | 105,938 | | | | 401,270 | | |
High Yield Fund | | | 181,413 | | | | 253,784 | | | | 221,331 | | | | 656,528 | | |
Tax-Exempt Fund | | | 132,065 | | | | 135,204 | | | | 131,110 | | | | 398,379 | | |
High Income Municipal Bond Fund | | | 132,417 | | | | 131,713 | | | | 156,099 | | | | 420,229 | | |
Floating Rate Fund | | | 841,459 | | | | 827,922 | | | | 1,454,748 | | | | 3,124,129 | | |
Strategic Income Fund | | | 110,089 | | | | 134,256 | | | | 136,239 | | | | 380,584 | | |
The Adviser may voluntarily waive or reimburse additional fees to assist the Funds in maintaining competitive expense ratios. These waivers are not available for recoupment and are reflected on the Statements of Operations as Expenses waived/reimbursed by Adviser. For the year ended December 31, 2021, the Adviser voluntarily waived the following amounts:
| INCORE Low Duration Bond Fund | | $ | 69,584 | | |
120
Victory Portfolios | | Notes to Financial Statements — continued
December 31, 2021 | |
Certain officers and/or interested trustees of the Funds are also officers and/or employees of the Adviser, administrator, fund accountant, sub-administrator, sub-fund accountant, custodian, legal counsel, and Distributor.
5. Risks:
The Funds may be subject to other risks in addition to these identified risks.
Debt Securities Risk — The value of a debt security or other income-producing security changes in response to various factors, including, for example, market-related factors (such as changes in interest rates or changes in the risk appetite of investors generally) and changes in the actual or perceived ability of the issuer (or of issuers generally) to meet its (or their) obligations. Other factors that may affect the value of debt securities, include, among others, public health crises and responses by governments and companies to such crises. These and other events may affect the creditworthiness of the issuer of a debt security and may impair an issuer's ability to timely meet its debt obligations as they come due.
Credit Risk — The Funds will be subject to credit risk with respect to the amount each expects to receive from counterparties for financial instruments entered into by the Funds. The Funds may be negatively impacted if a counterparty becomes bankrupt or otherwise fails to perform its obligations due to financial difficulties. The Funds may experience significant delays in obtaining any recovery in bankruptcy or other reorganization proceeding and the Funds may obtain only limited recovery or may obtain no recovery in such circumstances. The Funds typically enter into transactions with counterparties whose credit ratings are investment grade, as determined by a nationally recognized statistical rating organization or, if unrated, judged by the Adviser to be of comparable quality.
Derivatives Risk — The use of derivative instruments, such as futures contracts and credit default swaps, exposes the Fund to additional risks and transaction costs. Risks of derivative instruments include: (1) the risk that interest rates, securities prices, asset values, and currency markets will not move in the direction that a portfolio manager anticipates; (2) imperfect correlation between the prices of derivative instruments and movements in the prices of the securities, assets, interest rates or currencies being hedged; (3) the fact that skills needed to use these strategies are different than those needed to select portfolio securities; (4) the possible absence of a liquid secondary market for any particular instrument and possible exchange imposed price fluctuation limits, either of which may make it difficult or impossible to close out a position when desired; (5) the risk that adverse price movements in an instrument can result in a loss substantially greater than the Fund's initial investment in that instrument (in some cases, the potential loss is unlimited); (6) particularly in the case of privately-negotiated instruments, the risk that the counterparty will not perform its obligations, which could leave the Fund worse off than if it had not entered into the position; and (7) the inability to close out certain hedged positions to avoid adverse tax consequences.
LIBOR Discontinuation Risk — The London Interbank Offered Rate ("LIBOR") discontinuation may adversely affect the financial markets generally and the Funds' operations, finances and investments specifically. LIBOR has been the principal floating-rate benchmark in the financial markets, and a large portion of the Funds' assets are tied to LIBOR. However, LIBOR has been or will be discontinued as a floating rate benchmark. The date of discontinuation depends on the LIBOR currency and tenor. With limited exceptions, no new LIBOR obligations will be entered into after December 31, 2021. Existing LIBOR obligations have transitioned or will transition to another benchmark, depending on the LIBOR currency and tenor. For some existing LIBOR-based obligations, the contractual consequences of the discontinuation of LIBOR may not be clear.
Non-LIBOR floating-rate obligations, including Secured Overnight Financing Rate ("SOFR")-based obligations, may have returns and values that fluctuate more than those of floating-rate debt obligations that are based on LIBOR or other rates. Also, because SOFR and some alternative floating rates are relatively new market indexes, markets for certain non-LIBOR obligations may never develop or may not be liquid. Market terms for non-LIBOR floating rate obligations, such as the spread over the index reflected in interest-rate provisions, may evolve over time, and prices of non-LIBOR floating rate obligations may be different depending on when they are issued and changing views about correct spread levels.
121
Victory Portfolios | | Notes to Financial Statements — continued
December 31, 2021 | |
Various SOFR-based rates, including SOFR-based term rates, and various non-SOFR-based rates are expected to develop in response to the discontinuation of U.S. dollar LIBOR, which may create various risks for the Funds and the financial markets more generally. There are non-LIBOR forward-looking floating rates that are not based on SOFR and that may be considered by participants in the financial markets as LIBOR alternatives. Such rates include Ameribor (American Interbank Offered Rate), BSBY (Bloomberg Short-Term Bank Yield Index) and BYI (Bank Yield Index). Unlike forward-looking SOFR-based term rates, such rates are intended to reflect a bank credit spread component.
It is not clear how replacement rates for LIBOR — including SOFR-based rates and non-SOFR-based rates — will develop and to what extent they will be used. There is no assurance that these replacement rates will be suitable substitutes for LIBOR, and thus the substitution of such rates for LIBOR could have an adverse effect on the Funds and the financial markets more generally. Concerns about market depth and stability could affect the development of non-SOFR-based term rates, and such rates may create various risks, which may or may not be similar to the risks relating to SOFR.
6. Borrowing and Interfund Lending:
Line of Credit:
The Victory Funds Complex participates in a short-term demand note "Line of Credit" agreement with Citibank. The Line of Credit agreement with Citibank was renewed on June 28, 2021, with a termination date of June 27, 2022. Under the agreement with Citibank, the Victory Funds Complex may borrow up to $600 million, of which $300 million is committed and $300 million is uncommitted. $40 million of the Line of Credit is reserved for use by the Victory Floating Rate Fund, another series of the Victory Funds Complex, with Victory Floating Rate Fund paying the related commitment fees for that amount. The purpose of the Line of Credit is to meet temporary or emergency cash needs. For the year ended December 31, 2021, Citibank received an annual commitment fee of 0.15% on $300 million for providing the Line of Credit. Each fund in the Victory Funds Complex pays a pro-rata portion of the commitment fees plus any interest (one-month LIBOR plus one percent, with LIBOR to be replaced by a different benchmark rate in accordance with the terms of the agreement) on amounts borrowed. Prior to June 28, 2021, the Victory Funds Complex paid an annual commitment fee of 0.15% and an upfront fee of 0.10%. Each fund in the Victory Funds Complex paid a pro-rata portion of the upfront fee. Interest charged to each fund during the period, if applicable, is reflected on the Statements of Operations under Line of credit fees.
The Funds had no borrowings under the Line of Credit agreement during the year ended December 31, 2021.
Interfund Lending:
The Trust and Adviser rely on an exemptive order granted by the SEC in March 2017 (the "Order"), permitting the establishment and operation of an Interfund Lending Facility (the "Facility"). The Facility allows each Fund to directly lend and borrow money to or from any other fund in the Victory Funds Complex that is permitted to participate in the Facility, relying upon the Order at rates beneficial to both the borrowing and lending funds. Advances under the Facility are allowed for temporary or emergency purposes, including the meeting of redemption requests that otherwise might require the untimely disposition of securities, and are subject to each Fund's borrowing restrictions. The interfund loan rate is determined, as specified in the Order, by averaging the current repurchase agreement rate and the current bank loan rate. As a Borrower, interest charged to each Fund, if any, during the period, is reflected on the Statements of Operations under Interfund lending fees. As a Lender, interest earned by each Fund, if any, during the period, is reflected on the Statements of Operations under Interfund lending.
122
Victory Portfolios | | Notes to Financial Statements — continued
December 31, 2021 | |
The average borrowing or lending for the days outstanding and average interest rate for the Funds that utilized this Facility during the year ended December 31, 2021, were as follows:
| | | Borrower or
Lender | | Amount
Outstanding at
December 31,
2021 | | Average
Borrowing* | | Days
Borrowing
Outstanding | | Average
Interest
Rate | | Maximum
Borrowing
During the
Period | |
Tax-Exempt Fund | | Borrower | | $ | — | | | $ | 4,130,000 | | | | 2 | | | | 0.62 | % | | $ | 6,130,000 | | |
Strategic Income
Fund | | Borrower | | | — | | | | 3,107,000 | | | | 4 | | | | 0.57 | % | | | 3,108,000 | | |
* For the year ended December 31, 2021, based on the number of days borrowings were outstanding.
7. Federal Income Tax Information:
Dividends from net investment income, if any, are declared and paid as noted in the table below. Distributable net realized gains, if any, are declared and distributed at least annually from each Fund.
| | | Declared | | Paid | |
INCORE Investment Quality Bond Fund | | Monthly | | Monthly | |
INCORE Low Duration Bond Fund | | Monthly | | Monthly | |
High Yield Fund | | Monthly | | Monthly | |
Tax-Exempt Fund | | Monthly | | Monthly | |
High Income Municipal Bond Fund | | Monthly | | Monthly | |
Floating Rate Fund | | Monthly | | Monthly | |
Strategic Income Fund | | Monthly | | Monthly | |
The amounts of dividends from net investment income and distributions from net realized gains (collectively, distributions to shareholders) are determined in accordance with federal income tax regulations, which may differ from GAAP. To the extent these "book/tax" differences are permanent in nature (e.g., net operating loss and distribution reclassification), such amounts are reclassified within the components of net assets based on their federal tax-basis treatment; temporary differences (e.g., wash sales) do not require reclassification. To the extent dividends and distributions exceed net investment income and net realized gains for tax purposes, they are reported as distributions of capital. Net investment losses incurred by the Funds may be reclassified as an offset to capital on the accompanying Statements of Assets and Liabilities.
As of December 31, 2021, on the Statements of Assets and Liabilities, as a result of permanent book-to-tax differences, reclassification adjustments were as follows:
| | Total
Accumulated
Earnings/(Loss) | | Capital | |
INCORE Low Duration Bond Fund | | $ | (3,273 | ) | | $ | 3,273 | | |
The tax character of distributions paid during the tax years ended as noted below, were as follows (total distributions paid may differ from the Statements of Changes in Net Assets because, for tax purposes, dividends are recognized when actually paid).
| | | Year Ended December 31, 2021 | |
| | | Distributions Paid From: | | | | | | | |
| | Ordinary
Income | | Net
Long-Term
Capital Gains | | Total
Taxable
Distributions | | Tax-Exempt
Distributions | | Total
Distributions
Paid | |
INCORE Investment Quality Bond Fund | | $ | 421,689 | | | $ | — | | | $ | 421,689 | | | $ | — | | | $ | 421,689 | | |
INCORE Low Duration Bond Fund | | | 2,832,080 | | | | — | | | | 2,832,080 | | | | — | | | | 2,832,080 | | |
High Yield Fund | | | 16,071,458 | | | | — | | | | 16,071,458 | | | | — | | | | 16,071,458 | | |
Tax-Exempt Fund | | | 60,262 | | | | 1,145,374 | | | | 1,205,636 | | | | 1,666,385 | | | | 2,872,021 | | |
High Income Municipal Bond Fund | | | 2,423 | | | | — | | | | 2,423 | | | | 1,720,041 | | | | 1,722,464 | | |
Floating Rate Fund | | | 65,678,189 | | | | — | | | | 65,678,189 | | | | — | | | | 65,678,189 | | |
Strategic Income Fund | | | 2,768,189 | | | | 567,643 | | | | 3,335,832 | | | | — | | | | 3,335,832 | | |
123
Victory Portfolios | | Notes to Financial Statements — continued
December 31, 2021 | |
| | | Year Ended December 31, 2020 | |
| | | Distributions Paid From: | | | | | | | | | |
| | | Ordinary
Income | | Net
Long-Term
Capital Gains | | Total
Taxable
Distributions | | Tax-Exempt
Distributions | | Return
of
Capital | | Total
Distributions
Paid | |
INCORE Investment Quality
Bond Fund | | $ | 628,534 | | | $ | — | | | $ | 628,534 | | | $ | — | | | $ | — | | | $ | 628,534 | | |
INCORE Low Duration
Bond Fund | | | 3,852,115 | | | | — | | | | 3,852,115 | | | | — | | | | 899,611 | | | | 4,751,726 | | |
High Yield Fund | | | 11,988,947 | | | | — | | | | 11,988,947 | | | | — | | | | — | | | | 11,988,947 | | |
Tax-Exempt Fund | | | 16,565 | | | | 582,047 | | | | 598,612 | | | | 1,981,434 | | | | — | | | | 2,580,046 | | |
High Income Municipal
Bond Fund | | | 152,651 | | | | 185,634 | | | | 338,285 | | | | 1,413,719 | | | | — | | | | 1,752,004 | | |
Floating Rate Fund | | | 29,295,692 | | | | — | | | | 29,295,692 | | | | — | | | | — | | | | 29,295,692 | | |
Strategic Income Fund | | | 2,008,446 | | | | 903,103 | | | | 2,911,549 | | | | — | | | | — | | | | 2,911,549 | | |
As of December 31, 2021, the components of accumulated earnings/(loss) on a tax basis were as follows:
| | Undistributed
Ordinary
Income | | Undistributed
Tax-Exempt
Income | | Undistributed
Long-Term
Capital Gains | | Distributions
Payable | | Other
Earnings
(Deficit) | | Accumulated
Earnings | | Accumulated
Capital and
Other Losses | | Qualified
Late Year
Losses* | | Unrealized
Appreciation
(Depreciation)** | | Total
Accumulated
Earnings
(Loss) | |
INCORE Investment
Quality Bond
Fund | | $ | 204,372 | | | $ | — | | | $ | 297,331 | | | $ | — | | | $ | — | | | $ | 501,703 | | | $ | — | | | $ | — | | | $ | 703,944 | | | $ | 1,205,647 | | |
INCORE Low
Duration
Bond Fund | | | — | | | | — | | | | — | | | | (87,646 | ) | | | — | | | | (87,646 | ) | | | (28,367,982 | ) | | | — | | | | 2,268,623 | | | | (26,187,005 | ) | |
High Yield Fund | | | 44,744 | | | | — | | | | — | | | | — | | | | — | | | | 44,744 | | | | (1,672,868 | ) | | | — | | | | 2,767,715 | | | | 1,139,591 | | |
Tax-Exempt
Fund | | | 1,379 | | | | 10,972 | | | | 306,762 | | | | — | | | | — | | | | 319,113 | | | | — | | | | — | | | | 3,774,275 | | | | 4,093,388 | | |
High Income
Municipal
Bond Fund | | | 23,488 | | | | 146,600 | | | | 101,138 | | | | — | | | | (11,433 | ) | | | 259,793 | | | | — | | | | — | | | | 2,908,495 | | | | 3,168,288 | | |
Floating Rate
Fund | | | 288,568 | | | | — | | | | — | | | | — | | | | (11,770 | ) | | | 276,798 | | | | (183,509,921 | ) | | | — | | | | (12,327,631 | ) | | | (195,560,754 | ) | |
Strategic Income
Fund | | | — | | | | — | | | | — | | | | — | | | | (11,433 | ) | | | (11,433 | ) | | | — | | | | (119,942 | ) | | | (70,980 | ) | | | (202,355 | ) | |
* Qualified late-year losses are comprised of post-October capital losses incurred after October 31 and certain late-year ordinary losses. Late-year ordinary losses represent ordinary losses incurred after December 31 and specified losses incurred after October 31. These losses are deemed to arise on the first day of the Fund's next taxable year.
** The difference between the book-basis and tax-basis unrealized appreciation (depreciation) is attributable primarily to tax deferral of losses on wash sales, contingent payment debt instruments, and deemed dividends on Convertible Debt under Sec. 305(c).
At December 31, 2021, the Funds had net capital loss carryforwards as shown in the table below, which are not subject to expiration. It is unlikely that the Board will authorize a distribution of capital gains realized in the future until the capital loss carryforwards have been used.
| | Short-Term
Amount | | Long-Term
Amount | | Total | |
INCORE Low Duration Bond Fund | | $ | 10,648,311 | | | $ | 17,719,671 | | | $ | 28,367,982 | | |
High Yield Fund | | | — | | | | 1,672,868 | | | | 1,672,868 | | |
Floating Rate Fund | | | 28,463,563 | | | | 155,046,358 | | | | 183,509,921 | | |
124
Victory Portfolios | | Notes to Financial Statements — continued
December 31, 2021 | |
During the tax year ended December 31, 2021, the following Funds utilized capital loss carryforwards:
INCORE Low Duration Bond Fund | | $ | 2,244,173 | | |
High Yield Fund | | | 5,078,440 | | |
As of December 31, 2021, the cost basis for federal income tax purposes, gross unrealized appreciation, gross unrealized depreciation, and net unrealized appreciation (depreciation) for investments were as follows:
| | | Cost of
Investments
for Federal
Tax Purposes | | Gross
Unrealized
Appreciation | | Gross
Unrealized
Depreciation | | Net
Unrealized
Appreciation
(Depreciation) | |
INCORE Investment Quality
Bond Fund | | $ | 24,624,506 | | | $ | 851,991 | | | $ | (148,047 | ) | | $ | 703,944 | | |
INCORE Low Duration Bond Fund | | | 195,760,672 | | | | 3,272,566 | | | | (1,003,943 | ) | | | 2,268,623 | | |
High Yield Fund | | | 369,130,849 | | | | 7,694,745 | | | | (4,927,030 | ) | | | 2,767,715 | | |
Tax-Exempt Fund | | | 47,827,336 | | | | 3,780,096 | | | | (5,821 | ) | | | 3,774,275 | | |
High Income Municipal Bond Fund | | | 49,180,612 | | | | 2,973,824 | | | | (65,329 | ) | | | 2,908,495 | | |
Floating Rate Fund | | | 2,165,726,591 | | | | 8,815,254 | | | | (21,142,885 | ) | | | (12,327,631 | ) | |
Strategic Income Fund | | | 75,785,397 | | | | 549,693 | | | | (620,673 | ) | | | (70,980 | ) | |
125
REPORT OF INDEPENDENT REGISTERED PUBLIC ACCOUNTING FIRM
To the Shareholders and Board of Trustees of Victory Portfolios
Opinion on the Financial Statements
We have audited the accompanying statements of assets and liabilities, including the schedules of portfolio investments, of Victory INCORE Investment Quality Bond Fund, Victory INCORE Low Duration Bond Fund, Victory High Yield Fund, Victory Tax-Exempt Fund, Victory High Income Municipal Bond Fund, Victory Floating Rate Fund, and Victory Strategic Income Fund (the "Funds"), each a series of Victory Portfolios, as of December 31, 2021, the related statements of operations for the year then ended, the statements of changes in net assets for each of the two years in the period then ended, the related notes, and the financial highlights for each of the three years in the period then ended (collectively referred to as the "financial statements"). In our opinion, the financial statements present fairly, in all material respects, the financial position of each of the Funds as of December 31, 2021, the results of their operations for the year then ended, the changes in net assets for each of the two years in the period then ended and the financial highlights for each of the three years in the period then ended, in conformity with accounting principles generally accepted in the United States of America.
The Funds' financial highlights for the years ended December 31, 2018 and prior, were audited by other auditors whose report dated February 26, 2019, expressed an unqualified opinion on those financial highlights.
Basis for Opinion
These financial statements are the responsibility of the Funds' management. Our responsibility is to express an opinion on the Funds' financial statements based on our audits. We are a public accounting firm registered with the Public Company Accounting Oversight Board (United States) ("PCAOB") and are required to be independent with respect to the Funds in accordance with the U.S. federal securities laws and the applicable rules and regulations of the Securities and Exchange Commission and the PCAOB.
We conducted our audits in accordance with the standards of the PCAOB. Those standards require that we plan and perform the audit to obtain reasonable assurance about whether the financial statements are free of material misstatement whether due to error or fraud.
Our audits included performing procedures to assess the risks of material misstatement of the financial statements, whether due to error or fraud, and performing procedures that respond to those risks. Such procedures included examining, on a test basis, evidence regarding the amounts and disclosures in the financial statements. Our procedures included confirmation of securities owned as of December 31, 2021, by correspondence with the custodian, counterparties and brokers; when replies were not received from counterparties and brokers, we performed other auditing procedures. Our audits also included evaluating the accounting principles used and significant estimates made by management, as well as evaluating the overall presentation of the financial statements. We believe that our audits provide a reasonable basis for our opinion.
We have served as the auditor of one or more of the investment companies advised by Victory Capital Management, Inc. since 2015.

COHEN & COMPANY, LTD.
Cleveland, Ohio
February 23, 2022
126
Victory Portfolios | | Supplemental Information
December 31, 2021 | |
(Unaudited)
Trustee and Officer Information
Board of Trustees:
Overall responsibility for management of the Trust rests with the Board. The Trust is managed by the Board in accordance with the laws of the State of Delaware. There are currently nine Trustees, eight of whom are not "interested persons" of the Trust within the meaning of that term under the 1940 Act ("Independent Trustees") and one of whom is an "interested person" of the Trust within the meaning of that term under the 1940 Act ("Interested Trustee"). The Trustees, in turn, elect the officers of the Trust to actively supervise its day-to-day operations.
The following tables list the Trustees, their date of birth, their position with the Trust, their commencement of service, their principal occupations during the past five years, and any directorships of other investment companies or companies whose securities are registered under the Securities Exchange Act of 1934, as amended, or who file reports under that Act. Each Trustee oversees 41 portfolios in the Trust, eight portfolios in Victory Variable Insurance Funds, and 25 portfolios in Victory Portfolios II, each a registered investment company that, together with the Trust, comprise the Victory Funds Complex. David C. Brown is a Trustee of USAA Mutual Funds and oversees 46 portfolios of the USAA Mutual Funds Trust. Each Trustee's address is c/o Victory Portfolios, 4900 Tiedeman Road, 4th Floor, Brooklyn, Ohio 44144. Each Trustee has an indefinite term.
Name and Date of Birth | | Position
Held with
the Trust | | Date
Commenced
Service | | Principal Occupation
During Past 5 Years | | Other
Directorships
Held During
Past 5 Years | |
Independent Trustees. | |
David Brooks Adcock,
Born October 1951 | | Trustee | | May 2005 | | Consultant (since 2006). | | Chair and Trustee, Turner Funds (December 2016-December 2017). | |
Nigel D. T. Andrews,
Born April 1947 | | Trustee | | August 2002 | | Retired. | | Director, TCG BDC II, Inc. (since 2017); Director, TCG BDC I, Inc. (formerly Carlyle GMS Finance, Inc.) (since 2012); Trustee, Carlyle Secured Lending III (since 2021). | |
E. Lee Beard,*
Born August 1951 | | Trustee | | May 2005 | | Retired (since 2015) | | None. | |
Dennis M. Bushe,
Born January 1944 | | Trustee | | July 2016 | | Retired. | | None. | |
127
Victory Portfolios | | Supplemental Information — continued
December 31, 2021 | |
(Unaudited)
Name and Date of Birth | | Position
Held with
the Trust | | Date
Commenced
Service | | Principal Occupation
During Past 5 Years | | Other
Directorships
Held During
Past 5 Years | |
John L. Kelly,
Born April 1953 | | Vice Chair and Trustee | | February 2015 | | Partner, McCarvill Capital Partners (September 2016- September 2017). | | Director, Caledonia Mining Corporation (since May 2012). | |
David L. Meyer,*
Born April 1957 | | Trustee | | December 2008 | | Retired. | | None. | |
Gloria S. Nelund,
Born May 1961 | | Trustee | | July 2016 | | Chair, CEO and Co-Founder of TriLinc Global, LLC, an investment firm. | | TriLinc Global Impact Fund, LLC (since 2012). | |
Leigh A. Wilson,
Born December 1944 | | Chair and Trustee | | November 1994 | | Private Investor. | | Chair (since 2013), Caledonia Mining Corporation. | |
Interested Trustee. | |
David C. Brown,**
Born May 1972 | | Trustee | | May 2008 | | Chairman and Chief Executive Officer (since 2013), the Adviser; Chairman and Chief Executive Officer (since 2013), Victory Capital Holdings, Inc.; Chairman and Chief Executive Officer (since 2019), Victory Capital Transfer Agency, Inc. | | Trustee, USAA Mutual Funds Trust; Board Member, Victory Capital Services, Inc. | |
* The Board has designated Ms. Beard and Mr. Meyer as its Audit Committee Financial Experts.
** Mr. Brown is an "Interested Person" by reason of his relationship with the Adviser.
The Statement of Additional Information includes additional information about the Trustees of the Trust and is available, without charge, by calling 800-539-3863.
128
Victory Portfolios | | Supplemental Information — continued
December 31, 2021 | |
(Unaudited)
Officers:
The officers of the Trust, their date of birth, their commencement of service, and their principal occupations during the past five years, are detailed in the following table. Each officer serves until the earlier of his or her resignation, removal, retirement, death, or the election of a successor. The mailing address of each officer of the Trust is 4900 Tiedeman Road, 4th Floor, Brooklyn, Ohio 44144. The officers of the Trust receive no compensation directly from the Trust for performing the duties of their offices.
Name and Date of Birth | | Position with
the Trust | | Date
Commenced
Service | | Principal Occupation During Past 5 Years | |
Christopher K. Dyer,
Born February 1962 | | President | | February 2006* | | Director of Mutual Fund Administration, the Adviser; Chief Operating Officer, Victory Capital Services, Inc. (since 2020); Vice President, Victory Capital Transfer Agency, Inc. (since 2019). | |
Scott A. Stahorsky,
Born July 1969 | | Vice President | | December 2014 | | Manager, Fund Administration, the Adviser. | |
Erin G. Wagner,
Born February 1974 | | Secretary | | December 2014 | | Associate General Counsel, the Adviser (since 2013). | |
Allan Shaer,
Born March 1965 | | Treasurer | | May 2017 | | Senior Vice President, Financial Administration, Citi Fund Services Ohio, Inc. (since 2016); Vice President, Mutual Fund Administration, JP Morgan Chase (2011-2016). | |
Christopher A. Ponte,
Born March 1984 | | Assistant Treasurer | | December 2017 | | Manager, Fund Administration, the Adviser (since 2017); Senior Analyst, Fund Administration, the Adviser (prior to 2017); Chief Financial Officer, Victory Capital Services, Inc. (since 2018). | |
Colin Kinney,
Born October 1973 | | Chief Compliance Officer | | July 2017 | | Chief Compliance Officer (since 2013) and Chief Risk Officer (2009-2017), the Adviser. | |
Sean Fox,
Born September 1976 | | Deputy Chief Compliance
Officer | | July 2021 | | Sr. Compliance Officer, the Adviser (2019-2021); Compliance Officer, the Adviser (2015-2019). | |
Chuck Booth,
Born April 1960 | | Anti-Money Laundering Compliance Officer and Identity Theft Officer | | May 2015 | | Director, Regulatory Administration and CCO Support Services, Citi Fund Services Ohio, Inc. | |
Jay G. Baris,
Born January 1954 | | Assistant Secretary | | December 1997 | | Partner, Sidley Austin LLP (since April 2020); Partner, Shearman & Sterling LLP (January 2018-April 2020); Partner, Morrison & Foerster LLP (2011-January 2018). | |
* On December 3, 2014, Mr. Dyer resigned as Secretary of the Trust and accepted the position of President.
129
Victory Portfolios | | Supplemental Information — continued
December 31, 2021 | |
(Unaudited)
Proxy Voting and Portfolio Holdings Information
Proxy Voting:
Information regarding the policies and procedures each Fund uses to determine how to vote proxies relating to portfolio securities is available without charge, upon request, by calling 800-539-3863. The information is also included in the Funds' Statement of Additional Information, which is available on the SEC's website at www.sec.gov.
Information relating to how the Funds voted proxies relating to portfolio securities held during the most recent 12 months ended June 30 is available on the SEC's website at www.sec.gov.
Availability of Schedules of Portfolio Investments:
The Trust files a complete list of Schedules of Portfolio Investments with the SEC for the first and third quarter of each fiscal year on Form N-PORT. Forms N-PORT are available on the SEC's website at www.sec.gov.
Expense Examples
As a shareholder of the Funds, you may incur two types of costs: (1) transaction costs, including sales charges (loads) on purchases; and (2) ongoing costs, including management fees and other Fund expenses. These examples are intended to help you understand your ongoing costs (in dollars) of investing in the Fund and to compare these costs with the ongoing costs of investing in other mutual funds.
These examples are based on an investment of $1,000 invested at the beginning of the period and held for the entire period from January 1, 2021, through December 31, 2021.
The Actual Expense figures in the table below provide information about actual account values and actual expenses. You may use the information below, together with the amount you invested, to estimate the expenses that you paid over the period. Simply divide your account value by $1,000 (for example, an $8,600 account value divided by $1,000 = 8.6), then multiply the result by the number in the table under the heading entitled "Actual Expenses Paid During Period" to estimate the expenses you paid on your account during this period.
The Hypothetical Expense figures in the table below provide information about hypothetical account values and hypothetical expenses based on the Fund's actual expense ratio and an assumed rate of return of 5% per year before expenses, which is not the Fund's actual return. The hypothetical account values and expenses may not be used to estimate the actual ending account balance or expenses you paid for the period. You may use this information to compare this 5% hypothetical example with the 5% hypothetical examples that appear in shareholder reports of other funds.
Please note the expenses shown in the table below are meant to highlight your ongoing costs only and do not reflect any transactional costs. Therefore, the hypothetical expenses in the table are useful in comparing ongoing costs only and will not help you determine the relative total costs of owning different funds. In addition, if these transactional costs were included, your costs would have been higher.
| | | Beginning
Account
Value
7/1/21 | | Actual
Ending
Account
Value
12/31/21 | | Hypothetical
Ending
Account
Value
12/31/21 | | Actual
Expenses
Paid
During
Period
7/1/21-
12/31/21* | | Hypothetical
Expenses
Paid
During
Period
7/1/21-
12/31/21* | | Annualized
Expense
Ratio
During
Period
7/1/21-
12/31/21 | |
INCORE Investment Quality Bond Fund | |
Class A | | $ | 1,000.00 | | | $ | 1,005.10 | | | $ | 1,020.67 | | | $ | 4.55 | | | $ | 4.58 | | | | 0.90 | % | |
Class C | | | 1,000.00 | | | | 1,000.70 | | | | 1,016.28 | | | | 8.93 | | | | 9.00 | | | | 1.77 | % | |
Class R | | | 1,000.00 | | | | 1,003.10 | | | | 1,018.65 | | | | 6.56 | | | | 6.61 | | | | 1.30 | % | |
Class Y | | | 1,000.00 | | | | 1,006.40 | | | | 1,021.88 | | | | 3.34 | | | | 3.36 | | | | 0.66 | % | |
130
Victory Portfolios | | Supplemental Information — continued
December 31, 2021 | |
(Unaudited)
| | | Beginning
Account
Value
7/1/21 | | Actual
Ending
Account
Value
12/31/21 | | Hypothetical
Ending
Account
Value
12/31/21 | | Actual
Expenses
Paid
During
Period
7/1/21-
12/31/21* | | Hypothetical
Expenses
Paid
During
Period
7/1/21-
12/31/21* | | Annualized
Expense
Ratio
During
Period
7/1/21-
12/31/21 | |
INCORE Low Duration Bond Fund | |
Class A | | $ | 1,000.00 | | | $ | 1,001.10 | | | $ | 1,020.92 | | | $ | 4.29 | | | $ | 4.33 | | | | 0.85 | % | |
Class C | | | 1,000.00 | | | | 996.20 | | | | 1,017.04 | | | | 8.15 | | | | 8.24 | | | | 1.62 | % | |
Class R | | | 1,000.00 | | | | 999.00 | | | | 1,018.80 | | | | 6.40 | | | | 6.46 | | | | 1.27 | % | |
Class Y | | | 1,000.00 | | | | 1,001.30 | | | | 1,022.08 | | | | 3.13 | | | | 3.16 | | | | 0.62 | % | |
High Yield Fund | |
Class A | | | 1,000.00 | | | | 1,005.00 | | | | 1,020.16 | | | | 5.05 | | | | 5.09 | | | | 1.00 | % | |
Class C | | | 1,000.00 | | | | 1,001.30 | | | | 1,016.64 | | | | 8.58 | | | | 8.64 | | | | 1.70 | % | |
Class R | | | 1,000.00 | | | | 1,003.50 | | | | 1,018.75 | | | | 6.46 | | | | 6.51 | | | | 1.28 | % | |
Class Y | | | 1,000.00 | | | | 1,006.30 | | | | 1,021.37 | | | | 3.84 | | | | 3.87 | | | | 0.76 | % | |
Tax-Exempt Fund | |
Class A | | | 1,000.00 | | | | 1,003.60 | | | | 1,021.17 | | | | 4.04 | | | | 4.08 | | | | 0.80 | % | |
Class C | | | 1,000.00 | | | | 1,000.60 | | | | 1,017.14 | | | | 8.07 | | | | 8.13 | | | | 1.60 | % | |
Class Y | | | 1,000.00 | | | | 1,005.10 | | | | 1,021.73 | | | | 3.49 | | | | 3.52 | | | | 0.69 | % | |
High Income Municipal Bond Fund | |
Class A | | | 1,000.00 | | | | 1,011.00 | | | | 1,021.17 | | | | 4.06 | | | | 4.08 | | | | 0.80 | % | |
Class C | | | 1,000.00 | | | | 1,007.10 | | | | 1,017.29 | | | | 7.94 | | | | 7.98 | | | | 1.57 | % | |
Class Y | | | 1,000.00 | | | | 1,012.20 | | | | 1,022.33 | | | | 2.89 | | | | 2.91 | | | | 0.57 | % | |
Member Class | | | 1,000.00 | | | | 1,011.70 | | | | 1,021.93 | | | | 3.30 | | | | 3.31 | | | | 0.65 | % | |
Floating Rate Fund | |
Class A | | | 1,000.00 | | | | 1,010.00 | | | | 1,020.16 | | | | 5.07 | | | | 5.09 | | | | 1.00 | % | |
Class C | | | 1,000.00 | | | | 1,004.70 | | | | 1,016.13 | | | | 9.10 | | | | 9.15 | | | | 1.80 | % | |
Class R | | | 1,000.00 | | | | 1,007.00 | | | | 1,017.34 | | | | 7.89 | | | | 7.93 | | | | 1.56 | % | |
Class Y | | | 1,000.00 | | | | 1,010.00 | | | | 1,021.27 | | | | 3.95 | | | | 3.97 | | | | 0.78 | % | |
Member Class | | | 1,000.00 | | | | 1,010.70 | | | | 1,020.92 | | | | 4.31 | | | | 4.33 | | | | 0.85 | % | |
Strategic Income Fund | |
Class A | | | 1,000.00 | | | | 998.10 | | | | 1,020.42 | | | | 4.78 | | | | 4.84 | | | | 0.95 | % | |
Class C | | | 1,000.00 | | | | 994.10 | | | | 1,016.43 | | | | 8.75 | | | | 8.84 | | | | 1.74 | % | |
Class R | | | 1,000.00 | | | | 996.10 | | | | 1,018.45 | | | | 6.74 | | | | 6.82 | | | | 1.34 | % | |
Class Y | | | 1,000.00 | | | | 999.20 | | | | 1,021.48 | | | | 3.73 | | | | 3.77 | | | | 0.74 | % | |
* Expenses are equal to the average account value multiplied by the Fund's annualized expense ratio multiplied by 184/365 (the number of days in the most recent fiscal half-year divided by the number of days in the fiscal year).
131
Victory Portfolios | | Supplemental Information — continued
December 31, 2021 | |
(Unaudited)
Additional Federal Income Tax Information
For the year ended December 31, 2021, the following Funds paid qualified dividend income for the purposes of reduced individual federal income tax rates of:
| | Percent | |
INCORE Investment Quality Bond Fund | | | 2 | % | |
INCORE Low Duration Bond Fund | | | 3 | % | |
Dividends qualified for corporate dividends received deductions of:
| | Percent | |
INCORE Investment Quality Bond Fund | | | 2 | % | |
INCORE Low Duration Bond Fund | | | 3 | % | |
For the year ended December 31, 2021, the following Funds designated tax-exempt capital gain distributions:
| | Amount | |
Tax -Exempt Fund | | $ | 1,666,385 | | |
High Income Municipal Bond Fund | | | 1,720,041 | | |
For the year ended December 31, 2021, the following Funds designated short-term capital gain distributions:
| | Amount | |
INCORE Investment Quality Bond Fund | | $ | 196,069 | | |
Tax-Exempt Fund | | | 58,929 | | |
Strategic Income Fund | | | 1,005,312 | | |
For the year ended December 31, 2021, the following Funds designated long-term capital gain distributions:
| | Amount | |
Tax-Exempt Fund | | $ | 1,145,374 | | |
Strategic Income Fund | | | 567,643 | | |
132
Victory Portfolios | | Supplemental Information — continued
December 31, 2021 | |
(Unaudited)
Considerations of the Board in Continuing the Investment Advisory Agreements
The Board approved the advisory agreement with the Adviser, on behalf of each of the Funds (the "Advisory Agreement"), and the sub-advisory agreement between the Adviser and Park Avenue Institutional Advisers LLC (the "Sub-Adviser"), on behalf of each of the High Yield Fund, Floating Rate Fund and Strategic Income Fund (the "Sub-Advisory Agreement" and together with the Advisory Agreement, the "Agreements"), at a meeting, which was called for that purpose, on November 30, 2021. The Board also considered information relating to the Funds and the Agreements provided throughout the year and, more specifically, at the meetings on October 19, 2021 and November 30, 2021. In considering whether to approve the Agreement, the Board requested, and the Adviser and Sub-Adviser provided, information that the Board believed to be reasonably necessary to reach its conclusions.
The Board, including the Independent Trustees, evaluated this information along with other information obtained throughout the year and was advised by legal counsel to the Funds and independent legal counsel to the Independent Trustees. In addition, the Independent Trustees considered a past review of their overall process for conducting the annual review of the Funds' advisory arrangements by a consultant retained through their counsel.
The Board took into consideration regular reports from the Adviser and Sub-Adviser throughout the COVID-19 pandemic public health crisis concerning how the ongoing pandemic has affected market volatility, investment risk, liquidity and valuation of portfolio securities, and the implementation and effectiveness of business continuity plans. These reports also had confirmed that the pandemic had no material impact on the Adviser's (or the Sub-Adviser's) operations.
The Board considered each Fund's advisory fee, expense ratio and investment performance as significant factors in determining whether the Agreements should be continued. The Board reviewed numerous factors with respect to each Fund, including the services to be provided by the Sub-Adviser. In considering whether the compensation paid to the Adviser was fair and reasonable, the Board also evaluated, among other things, the following factors:
• The requirements of the Funds for the services provided by the Adviser;
• The nature, quality and extent of the services provided and expected to be provided;
• The performance of the Funds as compared to comparable funds;
• The fees payable for the services and whether the fee arrangements provided for economies of scale that would benefit Fund shareholders as the Funds grow (acknowledging that economies of scale can be complex to assess and typically are not directly measurable);
• Whether the fee would be sufficient to enable the Adviser to attract and retain experienced personnel and continue to provide quality services to the Funds;
• The fees paid by other clients of the Adviser whose accounts are managed in a similar investment style and any differences in the services provided to the other clients compared to those provided to the Funds;
• The total expenses of each Fund;
• Management's commitment to operating the Funds at competitive expense levels;
• The profitability of the Adviser (as reflected by comparing fees earned against an estimate of the Adviser's costs) with respect to the Adviser's relationship with the Funds;
• Research and other service benefits received by the Adviser obtained through payment of client commissions for securities transactions;
• Other benefits received by the Adviser, and its affiliates, including revenues paid to the Adviser, or its affiliates, by the Funds for administration and fund accounting services, and distribution;
• The capabilities and financial condition of the Adviser;
• Current economic and industry trends; and
• The historical relationship between each Fund and the Adviser.
For Funds with total net expense ratios that ranked within the fourth quartile (most expensive) in relation to their peers as evaluated by a consultant, the Board also considered a memorandum that it requested the Adviser
133
Victory Portfolios | | Supplemental Information — continued
December 31, 2021 | |
(Unaudited)
to prepare. The Adviser reviewed additional relevant circumstances, which included, among other things, specialized strategies, small or decreasing assets, or rapid or recent changes in peer expense ratios.
In considering whether the compensation paid to the Sub-Adviser was fair and reasonable, the Board also evaluated, among other things, the following factors:
• The requirements of each Fund for the services provided by the Sub-Adviser;
• The nature, quality and extent of the services provided and expected to be provided;
• The fees payable for the services;
• Representations by the Adviser that the sub-advisory fee for each Fund is within the range of fees agreed to in the market for similar services;
• Whether the fee would be sufficient to enable the Sub-Adviser to attract and retain experienced personnel and continue to provide quality services to the Funds;
• Management's commitment to operating the Fund at competitive expense levels;
• Research and other service benefits received by the Sub-Adviser obtained through payment of client commissions for securities transactions;
• Other benefits received by the Sub-Adviser as a result of its sub-advisory relationship with the Funds;
• The capabilities and financial condition of the Sub-Adviser;
• The nature, quality and extent of the oversight and compliance services provided by the Adviser;
• The historical relationship between each sub-advised Fund and the Sub-Adviser; and
• Current economic and industry trends.
The Board reviewed each Fund's current management fee, comprised of the advisory fee plus the administrative services fee paid to the Adviser, in the context of the Adviser's profitability with respect to each Fund individually. The Board retained a consultant to provide comparative information about fees and performance. The Board met with the consultant to review its inputs and methodologies, among other things. The Board compared each Fund's gross management fee and total operating expense ratio on a net and gross basis with the median gross management fee and median expense ratio of a universe of comparable mutual funds compiled by the consultant, and a peer group of funds with similar investment strategies selected by that consultant from the universe of comparable funds. The Board reviewed the factors and methodology used by the consultant in the selection of each Fund's peer group, including the consultant's selection of a broad universe of funds, the more specific universe of comparable funds, and peer groups of funds with comparable investment strategies and asset levels, among other factors. The Board also reviewed any changes to the consultant's methodology as compared to the prior year, including those resulting from the Adviser's input, if any. With respect to certain Funds, the Board also reviewed fees and other information related to the Adviser's management of similarly managed institutional or private accounts, and the differences in the services provided to the other accounts. The Board noted that none of the advisory fee arrangements for the Funds included breakpoints, which would be a structure that results in reduced fees as a fund grows. The Board also considered the Adviser's commitment to limit expenses as discussed in more detail below.
The Board also reviewed the compliance and administrative services provided to the Funds by the Adviser and its affiliates, including the Adviser's oversight of the Funds' day-to-day operations and oversight of Fund accounting, assistance in meeting legal and regulatory requirements, and other services necessary for the operation of the Funds and the Trust.
With respect to the High Yield Fund, Floating Rate Fund and Strategic Income Fund, the Board also considered information concerning the fee paid to the Sub-Adviser under the Sub-Advisory Agreement. The Board considered the relative roles and responsibilities of the Adviser and Sub-Adviser with respect to the applicable Funds and noted that, among other things: (1) the sub-advisory fees for these Funds are paid by the Adviser and, therefore, are not a direct expense of the Funds; and (2) the Adviser supervises the Sub-Adviser. The Board also considered the Adviser's representation that the fees to be paid to the Sub-Adviser are within the range of sub-advisory fees paid to other sub-advisers for similar services. The Board reviewed fees and other information related to
134
Victory Portfolios | | Supplemental Information — continued
December 31, 2021 | |
(Unaudited)
the Sub-Adviser's management of similarly managed institutional or private accounts, and the differences in the services provided to the other accounts. The Board recognized that because the sub-advisory fees are paid by the Adviser, any arrangement by the Sub-Adviser to either increase or reduce its fee would have no direct impact on the Fund or its shareholders.
The Board found that the gross annual management fee paid by each Fund was within the range of management fees paid by each Fund's respective peer group. The Board also found that each Fund's Class A net annual expense ratio was reasonable as compared with each Fund's respective peer group. The Board considered the Adviser's contractual agreement with each Fund to waive its fees and reimburse expenses of certain classes for a specified period of time, as described in the Fund's prospectus.
The Board reviewed each Fund's performance over one-, three-, five- and ten-year periods (as applicable) against the performance of the Fund's selected peer group and benchmark index. The Board recognized that the performance of the Fund and the peer group funds are net of expenses, while the performance of the benchmark index reflects gross returns.
The Board reviewed various other specific factors with respect to each Fund, as described below. In their deliberations, the Trustees did not rank the importance of any particular information or factor considered and each Trustee may have attributed different weights to various factors.
INCORE Investment Quality Bond Fund:
The Board compared the Fund's Class A performance for the one-, three-, five- and ten-year periods ended June 30, 2021, to that of the median performance of the Fund's peer group and benchmark index for the same periods and considered the fact that the Fund outperformed the benchmark index for the one-, five- and ten-year periods, underperformed the benchmark index for the three-year period, and underperformed the peer group median for all periods reviewed. The Board discussed with the Adviser how market conditions affected the Fund during periods of underperformance given the Fund's investment strategy and fee and expense profile.
Having considered, among other things: (1) the Fund's management fee compared to comparable mutual funds; (2) the Fund's total expense ratio compared to comparable mutual funds; (3) that the Adviser's willingness to limit the expenses of certain classes for a period of time would provide stability to the Fund's expenses for those share classes during that period; and (4) the Fund's performance during the periods reviewed, the Board concluded that the Agreement continued to be in the best interests of the Fund's shareholders.
INCORE Low Duration Bond Fund:
The Board compared the Fund's Class A performance for the one-, three-, five- and ten-year periods ended June 30, 2021, to that of the median performance of the Fund's peer group and benchmark index for the same periods and considered the fact that the Fund outperformed the benchmark index for all of the periods reviewed, outperformed the peer group median for the one-year period, and underperformed the peer group median for the three-, five- and ten-year periods.
Having considered, among other things: (1) the Fund's management fee compared to comparable mutual funds; (2) the Fund's total expense ratio compared to comparable mutual funds; (3) that the Adviser's willingness to limit the expenses of certain classes for a period of time would provide stability to the Fund's expenses for those share classes during that period; and (4) the Fund's performance during the periods reviewed, the Board concluded that the Agreement continued to be in the best interests of the Fund's shareholders.
High Yield Fund:
The Board compared the Fund's Class A performance for the one-, three-, five- and ten-year periods ended June 30, 2021, to that of the median performance of the Fund's peer group and benchmark index for the same periods and considered the fact that the Fund outperformed the benchmark index for the one-, three- and five-year periods, underperformed the benchmark index for the ten-year period, and outperformed the peer group median for all of the periods reviewed.
Having considered, among other things: (1) the Fund's management fee compared to comparable mutual funds; (2) the Fund's total expense ratio compared to comparable mutual funds; (3) that the Adviser's willingness to limit the expenses of certain classes for a period of time would provide stability to the Fund's expenses for those share classes during that period; and (4) the Fund's performance during the periods reviewed, the Board concluded that the Agreement continued to be in the best interests of the Fund's shareholders.
135
Victory Portfolios | | Supplemental Information — continued
December 31, 2021 | |
(Unaudited)
Tax-Exempt Fund:
Noting that as of April 1, 2020, Victory Capital assumed day-to-day portfolio management responsibilities from the Fund's former sub-adviser, the Board compared the Fund's Class A performance for the one-, three-, five- and ten-year periods ended June 30, 2021, to that of the median performance of the Fund's peer group and benchmark index for the same periods and considered the fact that the Fund outperformed the benchmark index for all periods reviewed, outperformed the peer group median for the one-, three- and five-year periods, and matched the peer group median for the ten-year period.
Having considered, among other things: (1) the Fund's management fee compared to comparable mutual funds; (2) the Fund's total expense ratio compared to comparable mutual funds; (3) that the Adviser's willingness to limit the expenses of certain classes for a period of time would provide stability to the Fund's expenses for those share classes during that period; and (4) the Fund's performance during the recent periods reviewed, the Board concluded that the Agreement continued to be in the best interests of the Fund's shareholders.
High Income Municipal Bond Fund:
Noting that as of April 1, 2020, Victory Capital assumed day-to-day portfolio management responsibilities from the Fund's former sub-adviser, the Board compared the Fund's Class A performance for the one-, three-, five- and ten-year periods ended June 30, 2021, to that of the median performance of the Fund's peer group and benchmark index for the same periods and considered the fact that the Fund outperformed the benchmark index for all of the periods reviewed, outperformed the peer group median for the one-, three- and five-year periods, and underperformed the peer group median for the ten-year period.
Having considered, among other things: (1) the Fund's management fee compared to comparable mutual funds; (2) the Fund's total expense ratio compared to comparable mutual funds; (3) that the Adviser's willingness to limit the expenses of certain classes for a period of time would provide stability to the Fund's expenses for those share classes during that period; and (4) the Fund's performance during the periods reviewed, the Board concluded that the Agreement continued to be in the best interests of the Fund's shareholders.
Floating Rate Fund:
The Board compared the Fund's Class A performance for the one-, three-, five- and ten-year periods ended June 30, 2021, to that of the median performance of the Fund's peer group and benchmark index for the same periods and considered the fact that the Fund outperformed the benchmark index for the one-, three- and five-year periods, underperformed the benchmark index for the ten-year period and outperformed the peer group median for all of the periods reviewed.
Having considered, among other things: (1) the Fund's management fee compared to comparable mutual funds; (2) the Fund's total expense ratio compared to comparable mutual funds; (3) that the Adviser's willingness to limit the expenses of certain classes for a period of time would provide stability to the Fund's expenses for those share classes during that period; and (4) the Fund's performance during the periods reviewed, the Board concluded that the Agreement continued to be in the best interests of the Fund's shareholders.
Strategic Income Fund:
The Board compared the Fund's Class A performance for the one-, three-, five- and ten-year periods ended June 30, 2021, to that of the median performance of the Fund's peer group and benchmark index for the same periods and considered the fact that the Fund outperformed the benchmark index for all periods reviewed, underperformed the peer group median for the one- and ten-year periods, and outperformed the peer group median for the three- and five-year periods.
Having considered, among other things: (1) the Fund's management fee compared to comparable mutual funds; (2) the Fund's total expense ratio compared to comparable mutual funds; (3) that the Adviser's willingness to limit the expenses of certain classes for a period of time would provide stability to the Fund's expenses for those share classes during that period; and (4) the Fund's performance during the periods reviewed, the Board concluded that the Agreement continued to be in the best interests of the Fund's shareholders.
136
Victory Portfolios | | Supplemental Information — continued
December 31, 2021 | |
(Unaudited)
Conclusion:
Based on its review of the information requested and provided, and following extended discussions, the Board determined that the Agreement, on behalf of the Funds discussed above, was consistent with the best interests of each Fund and its shareholders, and the Board unanimously approved the Agreement, on behalf of each Fund, for an additional annual period on the basis of the foregoing review and discussions and the following considerations, among others:
• The fairness and reasonableness of the investment advisory fee payable to the Adviser under the Agreement in light of the investment advisory services provided, the costs of these services, the profitability of the Adviser's relationship with the Fund and the comparability of the fee paid to the fees paid by other investment companies;
• The nature, quality and extent of the investment advisory services provided by the Adviser;
• The Adviser's entrepreneurial commitment to the management of the Funds and the creation of a broad-based family of funds, which could entail a substantial commitment of the Adviser's resources to the successful operation of the Funds;
• The Adviser's representations regarding its staffing and capabilities to manage the Funds, including the retention of personnel with relevant portfolio management experience;
• The Adviser's efforts to enhance investment results by, among other things, developing quality portfolio management teams; and
• The overall high quality of the personnel, operations, financial condition, investment management capabilities, methodologies and performance of the Adviser.
Based on its review of the information requested and provided, and following extended discussions, the Board concluded, among other things, that the Sub-Advisory Agreement, with respect to each of the High Yield Fund, Floating Rate Fund and Strategic Income Fund, was consistent with the best interests of each Fund and its shareholders and unanimously approved the Sub-Advisory Agreement (including the fees to be charged for services thereunder), on the basis of the foregoing review and discussions and the following considerations, among others:
• The fairness and reasonableness of the investment advisory fee payable to the Sub-Adviser under the Sub-Advisory Agreement in light of the investment advisory services provided, the costs of these services and the estimated profitability of the Sub-Adviser's relationship with each Fund;
• The nature, quality and extent of the investment advisory services provided by the portfolio management team of the Sub-Adviser, which have resulted in each Fund achieving its stated investment objective;
• The Sub-Adviser's representations regarding its staffing and capabilities to manage the Funds; and
• The overall high quality of the personnel, operations, financial condition, investment management capabilities, methodologies and performance of the Sub-Adviser.
137
Privacy Policy
Protecting the Privacy of Information
The Trust respects your right to privacy. We also know that you expect us to conduct and process your business in an accurate and efficient manner. To do so, we must collect and maintain certain personal information about you. This is the information we collect from you on applications or other forms, and from the transactions you make with us or third parties. It may include your name, address, social security number, account transactions and balances, and information about investment goals and risk tolerance.
We do not disclose any information about you or about former customers to anyone except as permitted or required by law. Specifically, we may disclose the information we collect to companies that perform services on our behalf, such as the transfer agent that processes shareholder accounts and printers and mailers that assist us in the distribution of investor materials. We may also disclose this information to companies that perform marketing services on our behalf. This allows us to continue to offer you Victory investment products and services that meet your investing needs, and to effect transactions that you request or authorize. These companies will use this information only in connection with the services for which we hired them. They are not permitted to use or share this information for any other purpose.
To protect your personal information internally, we permit access only by authorized employees and maintain physical, electronic, and procedural safeguards to guard your personal information.*
* You may have received communications regarding information about privacy policies from other financial institutions which gave you the opportunity to "opt-out" of certain information sharing with companies which are not affiliated with that financial institution. The Trust does not share information with other companies for purposes of marketing solicitations for products other than the Trust. Therefore, the Trust does not provide opt-out options to their shareholders.
Victory Funds
P.O. Box 182593
Columbus, Ohio 43218-2593

Visit our website at: | | Call Victory at: | |
www.vcm.com | | 800-539-FUND (800-539-3863) | |
| | | 800-235-8396 for Member Class | |

December 31, 2021
Annual Report
Victory RS Small Cap Growth Fund
Victory RS Select Growth Fund
Victory RS Mid Cap Growth Fund
Victory RS Growth Fund
Victory RS Science and Technology Fund
Victory RS Small Cap Equity Fund
www.vcm.com
News, Information And Education 24 Hours A Day, 7 Days A Week
The Victory Capital website gives fund shareholders, prospective shareholders, and investment professionals a convenient way to access fund information, get guidance, and track fund performance anywhere they can access the Internet. The site includes:
• Detailed performance records
• Daily share prices
• The latest fund news
• Investment resources to help you become a better investor
• A section dedicated to investment professionals
Whether you're a potential investor searching for the fund that matches your investment philosophy, a seasoned investor interested in planning tools, or an investment professional, www.vcm.com has what you seek. Visit us anytime. We're always open.
TABLE OF CONTENTS
Shareholder Letter (Unaudited) | | | 3 | | |
Manager's Commentary / Investment Overview
(Unaudited) | | | 5 | | |
Investment Objective and Portfolio
Holdings (Unaudited) | | | 30 | | |
Schedules of Portfolio Investments | |
| Victory RS Small Cap Growth Fund | | | 36 | | |
Victory RS Select Growth Fund | | | 40 | | |
Victory RS Mid Cap Growth Fund | | | 43 | | |
Victory RS Growth Fund | | | 46 | | |
Victory RS Science and Technology Fund | | | 48 | | |
Victory RS Small Cap Equity Fund | | | 52 | | |
Financial Statements | |
Statements of Assets and Liabilities | | | 54 | | |
Statements of Operations | | | 56 | | |
Statements of Changes in Net Assets | | | 58 | | |
Financial Highlights | | | 64 | | |
Notes to Financial Statements | | | 80 | | |
Report of Independent Registered Public
Accounting Firm | | | 92 | | |
Supplemental Information (Unaudited) | | | 93 | | |
Trustee and Officer Information | | | 93 | | |
Proxy Voting and Portfolio Holdings Information | | | 96 | | |
Expense Examples | | | 96 | | |
Additional Federal Income Tax Information | | | 98 | | |
Advisory Contract Approval | | | 99 | | |
Privacy Policy (inside back cover) | | | |
1
IRA DISTRIBUTION WITHHOLDING DISCLOSURE
We generally must withhold federal income tax at a rate of 10% of the taxable portion of your distribution and, if you live in a state that requires state income tax withholding, at your state's tax rate. However, you may elect not to have withholding apply or to have income tax withheld at a higher rate. Any withholding election that you make will apply to any subsequent distribution unless and until you change or revoke the election. If you wish to make a withholding election, or change or revoke a prior withholding election, call 800-539-3863 (800-235-8396 for Member Class) and form W-4P (OMB No. 1545-0074 withholding certificate for pension or annuity payments) will be electronically sent.
If you do not have a withholding election in place by the date of a distribution, federal income tax will be withheld from the taxable portion of your distribution at a rate of 10%. If you must pay estimated taxes, you may be subject to estimated tax penalties if your estimated tax payments are not sufficient and sufficient tax is not withheld from your distribution.
For more specific information, please consult your tax adviser.
The Funds are distributed by Victory Capital Services, Inc. Victory Capital Management Inc. is the investment adviser to the Funds and receives fees from the Funds for performing services for the Funds.
This report is not authorized for distribution to prospective investors unless preceded or accompanied by a current prospectus of the Victory Funds.
For additional information about any Victory Fund, including fees, expenses, and risks, view our prospectus online at vcm.com or call 800-539-3863 (800-235-8396 for Member Class). Read it carefully before you invest or send money.
The information in this report is based on data obtained from recognized services and sources and is believed to be reliable. Any opinions, projections, or recommendations in this report are subject to change without notice and are not intended as individual investment advice. Past investment performance of the Funds, markets or securities mentioned herein should not be considered to be indicative of future results.
• NOT FDIC INSURED • NO BANK GUARANTEE • MAY LOSE VALUE

Call Victory at:
800-539-FUND (800-539-3863)
800-235-8396 for Member Class
Visit our website at:
www.vcm.com
2
Victory Funds Letter to Shareholders
(Unaudited)
Dear Shareholder,
Another year has passed, but unfortunately the pandemic endures. Yet, looking back on the year ended 2021, it is evident that financial markets have endured as well, despite stiff headwinds — including new COVID-19 variants; disruption among global supply chains; uncomfortable inflation readings; and the fear of rising interest rates.
Through it all, the S&P 500® Index, the bell-weather proxy for our domestic stock market, once again registered a positive annual total return (that makes it 12 out of the past 13 years). This was largely driven by a U.S. economy that bounced back quickly after what was effectively a global economic shutdown in 2020, and we witnessed robust earnings growth across many sectors thanks in no small part to continued fiscal stimulus and accommodative monetary policy. Underlying this positive performance were interesting differences among investment styles and market capitalizations. For example, growth-oriented investments outperformed value within large-caps but underperformed within both mid-caps and small-caps (as measured by the Russell family of indices). Perhaps this reflects investors' expectations for higher interest rates next year?
There were other notable subplots to 2021. Early in the year we watched in disbelief as "meme stocks" — a few names that gained massive notoriety on social media platforms — went on stomach-churning roller coaster rides. Also, intriguing was how the biotech sector struggled mightily despite the success and fanfare surrounding the COVID-19 vaccines. Meanwhile, rising oil prices fueled impressive gains across the energy landscape, while crypto assets captivated investors. Now we're all watching how crypto's underlying blockchain technologies might disrupt business-as-usual across industries in the years ahead. These were just a few of the highlights of the past year.
Through all the twists and turns, the S&P 500® Index registered an impressive annual total return of nearly 29% for the 12-month period ended December 31, 2021. Over this same annual period, the yield on the 10-Year U.S. Treasury jumped 59 basis points (a basis point is 1/100th of a percentage point), reflecting substantial fiscal stimuli and the U.S. Federal Reserve's (the "Fed") accommodative monetary stance (recently). At the end of our reporting period, the yield on the 10-Year U.S. Treasury was trending higher and finished at 1.52%.
Despite the resiliency of financial markets, we fully acknowledge that the volatility and unusual events of recent years may have made investors uneasy at times. However, this simply underscores why it's important for investors to remain calm and unemotional in the face of market turmoil. A long-term perspective, a well-diversified portfolio across asset classes and investment types, and a clear understanding of individual risk tolerance are some of the key ingredients for staying the course and progressing on your investment goals.
3
Of course, no one knows for certain what 2022 will bring. We are already facing a potential end to the Fed's accommodative monetary policies and the various forms of fiscal stimuli that helped revive the economy from the depths of the pandemic-induced market downturn. By all accounts, the Fed appears ready to raise short-term interest rates, perhaps as early as the end of the first quarter, though any move will certainly be data dependent, and some are expressing concerns about labor shortages, disrupted supply chains, rising commodity prices, and the potential for lasting inflation. There will likely be new headwinds, some yet to be identified.
Thus, we cannot tell you with any certainty what markets will do in the future, but we can assure you that the investment professionals at our investment franchises continually monitor the market environment and work hard to position portfolios opportunistically no matter what the markets bring.
On the following pages, you will find information relating to your Victory Funds investment, brought to you by Victory Capital. If you have any questions, we encourage you to contact your financial advisor. Or, if you invest with us directly, you may call 800-539-3863 (800-235-8396 for Member Class) or visit our website at www.vcm.com.
From all of us here at Victory Capital, thank you for your ongoing confidence and for letting us help you work toward your investment goals.

Christopher K. Dyer, CFA
President,
Victory Funds
4
Victory RS Small Cap Growth Fund
Manager's Commentary
(Unaudited)
What were the market conditions during the reporting period?
U.S. stock performance followed up a strong 2019 and 2020 with another robust year, as the S&P 500® Index registered its twelfth year of positive returns in the last 13 years. This was driven largely by a resilient U.S. economy that bounced back quickly after what was effectively a global economic shutdown in 2020. We witnessed the highest levels of economic and earnings growth in decades, driven in part by continued fiscal stimulus and accommodative monetary policy. Yet, underlying this positive performance were interesting differences among investment styles and market capitalizations.
After a solid start to the 2021 calendar year, U.S. equity markets continued to rebound as the economy reopened after being shuttered by the COVID-19 pandemic. Aggressive fiscal and monetary measures convinced investors that had fled risk assets to re-enter as many companies reported better-than-expected earnings.
Although the market as a whole has headed higher, the inner dynamics of this past year were quite a contrast. In 2020, investors viewed the economic and business impact of the pandemic differently, rewarding the "haves" (often technology plays) relative to the "have-nots" (often legacy companies). In early 2021, the "have-nots" came roaring back at the start of the year. In fact, the strong sentiment for these legacy companies, which had been left largely for dead in the first 10 months of 2020, turned into outright exuberance as we approached the end of the first quarter of 2021. This was illustrated by value-oriented stocks in the Russell 1000® Value Index and the Russell 2000® Value Index returning 11.26% and 21.17%, respectively, materially outperforming growth-oriented stocks in the Russell 1000® Growth Index and the Russell 2000® Growth Index (the "Index"), which returned 0.94% and 4.88%, respectively.
Bellwether large-cap growth stocks led the way throughout the remainder of the year, providing investors with the highest return of any U.S. equity style during the second, third, and fourth quarters of 2021. The Russell 1000® Growth Index returned 25.21% during the final three quarters of the year, relative to the 10.37% return of the Russell 1000® Value Index and -2.67% return of the Index. This 30% performance gap between large- and small-cap growth stocks is a historic outlier, which has been driven largely by expansion among some of the largest technology stocks as investors piled into these well-known companies.
For the full year, U.S. stock performance was mixed, yet overall positive across market caps and styles, with large-cap stocks outperforming small- and mid-cap stocks as measured by the Russell family of indices. Meanwhile, growth-oriented investments outperformed value within large-caps, but materially underperformed within both mid-caps and small-caps as investors have shunned less established high-growth companies. In the broader context, however, growth stocks, as measured by the Russell 3000® Growth Index, have maintained their dominance versus value stocks, as measured by the Russell 3000® Value Index, over the past 1, 3, 5, 10, 15, and even 30 years.
5
Victory RS Small Cap Growth Fund (continued)
Managers' Commentary (continued)
How did Victory RS Small Cap Growth Fund (the "Fund") perform during the reporting period?
The Fund returned -11.06% (Class A at net asset value) for the fiscal year ended December 31, 2021, underperforming the Index, which returned 2.83% during the reporting period.
What strategies did you employ during the reporting period?
The Fund's relative performance was due to underperformance within the Health Care and Technology sectors, while positive stock selection within the Consumer Discretionary and Materials & Processing sectors offset some of the Fund's relative underperformance.
Within the Health Care sector, one of the largest drivers of underperformance was biotechnology holding Iovance Biotherapeutics, Inc. ("Iovance"). Iovance is focused on developing and commercializing new cancer immunotherapies that use tumor-infiltrating lymphocytes ("TILs"). TILs, as a ready-to-infuse cell therapy, have demonstrated breakthrough efficacy exceeding existing therapies in metastatic melanoma. Although we continue to believe in the long-term outlook for the treatment, the stock underperformed sharply in the first half of 2021 as the company lost a standoff with the FDA and faced a delay in its biologics license application submission for lifileucel, the company's TIL therapy candidate, as the FDA requested additional data on the treatment's potency. This setback was followed by the resignation of the company's CEO to pursue other opportunities. While we are likely to revisit the stock again in the future, we moved on from the holding.
Another underperformer within Health Care was medical equipment holding Eargo, Inc. ("Eargo"). Eargo underwhelmed when an audit into how the company's products were covered by insurance turned into a full Department of Justice investigation in the third quarter, which put their insurance channel sales business on hold for the foreseeable future. Given the noise and uncertain path forward, even in a best-case scenario, we decided to move on from the position.
Within the Technology sector, detractors included Bandwidth Inc. ("Bandwidth"), which had been a top performer for the Fund in 2020. Bandwidth is a communications platform-as-a-service solution focused on communications for enterprises. The stock had challenging performance throughout 2021, in part due to tough comparisons from COVID-19 utilization and political messaging, despite meeting or exceeding most expectations investors had for the company.
One contributor to performance within the Consumer Discretionary sector was specialty retail holding SiteOne Landscape Supply, Inc., the largest and only national wholesale distributor of landscape supplies in the United States. The stock performed very well in the year as top-line sales and bottom-line earnings both exceeded expectations, while strong execution and robust demand for professional landscaping products and services led to wider margins.
Another contributor to the Consumer Discretionary sector was homebuilder Meritage Homes Corporation, which engages in the development and sale of residential properties. The stock performed well in the fourth quarter of 2021, materially beating expectations across most metrics and raising fiscal year guidance. Gross margins came in 200 basis points (a basis
6
Victory RS Small Cap Growth Fund (continued)
Managers' Commentary (continued)
point is 1/100th of a percentage point) wider than expectations, highlighting their differentiated offering that we believe will make expectations too conservative given the company-specific growth levers for 2022 and beyond. We expect the company to expand their community count by more than most participants expect, which we believe will drive further margin expansion.
Within the Technology sector, a contributor to performance was semiconductor holding Lattice Semiconductor Corporation ("Lattice"), a company that develops and sells semiconductor products in Asia, Europe, and the Americas. Lattice performed exceptionally well during the year, posting solid beats and raises, and exhibited strength across segments, especially within industrials and auto on the continued macroeconomic improvement for automation, robotics, and embedded vision. In addition, the company hosted an analyst conference early in the year where they unveiled their new Avant platform, which is targeting the mid-range field-programmable gate array market and will allow integrated circuit design to be configured by customers or designers after manufacturing. We believe this doubles their addressable market and increases our already optimistic forecast for the company going forward.
Given the outsized impact of the virus globally, we believe investors should continue to expect all companies to feel some level of direct and secondary economic effects and markets to experience higher levels of volatility despite the outsized market performance to close out the year. As a result, we believe there will continue to be an abundance of opportunities across sectors in coming quarters and years as the economy transitions and new companies take leadership positions. We do not have a clear view or projection as to how large or prolonged the impact from the pandemic (both direct and indirect) will be, given the uncertainty regarding its continued spread, economic impact, politicization, potential scale of incremental fiscal and monetary stimulus not yet announced, or even the potential transformation of industries and consumer and social norms, but we believe there are clear pockets of the economy that remain better positioned than others given the ability of workers to remain productive (remotely or on-site) and end-customer demand to remain steady irrespective of the forward economic environment.
In this specific environment, we will focus further on companies with flexible business models that offer innovative products and services that will take market share from legacy companies that will be more strained by the challenging economic conditions. Now is when an active approach should shine. Specifically, our "farm team" approach identifies and monitors premier companies within each relative index, but then waits for a favorable price. This should allow us to upgrade the portfolio to our very best ideas as relative valuations shift, as it is rare that we can own our full "wish list" roster of companies. We believe that our process will allow us to take advantage of this dynamic environment and will pay off over time.
7
Victory RS Small Cap Growth Fund
Investment Overview
(Unaudited)
Average Annual Total Return
Year Ended December 31, 2021
| | | Class A | | Class C | | Class R | | Class R6 | | Class Y | | | |
INCEPTION DATE | | 11/30/87 | | 9/6/07 | | 1/22/07 | | 7/12/17 | | 5/1/07 | | | |
| | | Net Asset
Value | | Maximum
Offering
Price | | Net Asset
Value | | Contingent
Deferred
Charges | | Net Asset
Value | | Net Asset
Value | | Net Asset
Value | | Russell 2000®
Growth
Index1 | |
One Year | | | –11.06 | % | | | –16.18 | % | | | –11.73 | % | | | –12.45 | % | | | –11.53 | % | | | –10.74 | % | | | –10.82 | % | | | 2.83 | % | |
Five Year | | | 16.07 | % | | | 14.70 | % | | | 15.19 | % | | | 15.19 | % | | | 15.52 | % | | | NA | | | | 16.38 | % | | | 14.53 | % | |
Ten Year | | | 14.82 | % | | | 14.14 | % | | | 13.95 | % | | | 13.95 | % | | | 14.30 | % | | | NA | | | | 15.14 | % | | | 14.14 | % | |
Since Inception | | | NA | | | | NA | | | | NA | | | | NA | | | | NA | | | | 14.24 | % | | | NA | | | | NA | | |
The performance data quoted represents past performance and current returns may be lower or higher. The investment return and principal value will fluctuate so that an investor's shares, when redeemed, may be worth more or less than the original cost. To obtain performance information current to the most recent month's end, please visit www.vcm.com.
The maximum offering price (MOP) reflects a maximum sales charge of 5.75% for Class A. Class C is not subject to an initial sales charge, but is subject to a deferred sales charge of 1.00% on shares redeemed within one year of purchase. Net Asset Value ("NAV") does not reflect sales charges.
Total return measures the price change in a share assuming the reinvestment of all net investment income and realized capital gain distributions, if any. The total returns quoted do not reflect adjustments made to the enclosed financial statements in accordance with U.S. Generally Accepted Accounting Principles or the deduction of taxes that a shareholder would pay on net investment income and realized capital gain distributions, including reinvested distributions, or redemptions of shares. The total return figures set forth above include all waivers of fees. Without such fee waivers, the total returns would have been lower.
Victory RS Small Cap Growth Fund — Growth of $10,000
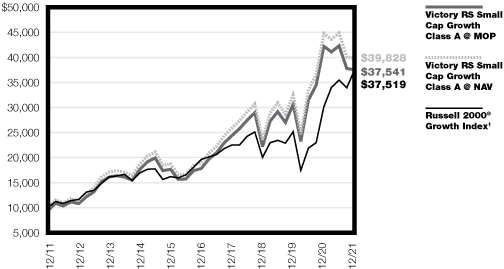
1The Russell 2000® Growth Index is an unmanaged market-capitalization-weighted index that measures the performance of those companies in the Russell 2000® Index with higher price-to-book ratios and higher forecasted growth values. Index results assume the reinvestment of dividends paid on the stocks constituting the index. This index does not include the effect of sales charges, commissions, expenses or taxes, is not representative of the Fund, and it is not possible to invest directly in an index.
The graph reflects investment of growth of a hypothetical $10,000 investment in the Fund.
The graph and table do not reflect the deduction of taxes that a shareholder would pay on Fund distributions or the redemption of shares.
Past performance is not indicative of future results.
8
Victory RS Select Growth Fund
Managers' Commentary
(Unaudited)
What were the market conditions during the reporting period?
U.S. stock performance followed up a strong 2019 and 2020 with another robust year, as the S&P 500® Index registered its twelfth year of positive returns in the last 13 years. This was driven largely by a resilient U.S. economy that bounced back quickly after what was effectively a global economic shutdown in 2020. We witnessed the highest levels of economic and earnings growth in decades, driven in part by continued fiscal stimulus and accommodative monetary policy. Yet, underlying this positive performance were interesting differences among investment styles and market capitalizations.
After a solid start to the 2021 calendar year, U.S. equity markets continued to rebound as the economy reopened after being shuttered by the COVID-19 pandemic. Aggressive fiscal and monetary measures convinced investors that had fled risk assets to re-enter as many companies reported better-than-expected earnings.
Although the market as a whole has headed higher, the inner dynamics of this past year were quite a contrast. In 2020, investors viewed the economic and business impact of the pandemic differently, rewarding the "haves" (often technology plays) relative to the "have-nots" (often legacy companies). In early 2021, the "have-nots" came roaring back at the start of the year. In fact, the strong sentiment for these legacy companies, which had been left largely for dead in the first 10 months of 2020, turned into outright exuberance as we approached the end of the first quarter of 2021. This was illustrated by value-oriented stocks in the Russell 1000® Value Index and the Russell 2000® Value Index returning 11.26% and 21.17%, respectively, materially outperforming growth-oriented stocks in the Russell 1000® Growth Index and the Russell 2000® Growth Index, which returned 0.94% and 4.88%, respectively.
Bellwether large-cap growth stocks led the way throughout the remainder of the year, providing investors with the highest return of any U.S. equity style during the second, third, and fourth quarters of 2021. The Russell 1000® Growth Index returned 25.21% during the final three quarters of the year, relative to the 10.37% return of the Russell 1000® Value Index and -2.67% return of the Russell 2000® Growth Index. This 30% performance gap between large- and small-cap growth stocks is a historic outlier, which has been driven largely by expansion among some of the largest technology stocks as investors piled into these well-known companies.
For the full year, U.S. stock performance was mixed, yet overall positive across market caps and styles, with large-cap stocks outperforming small- and mid-cap stocks as measured by the Russell family of indices. Meanwhile, growth-oriented investments outperformed value within large-caps, but materially underperformed within both mid-caps and small-caps as investors have shunned less established high-growth companies. In the broader context, however, growth stocks, as measured by the Russell 3000® Growth Index, have maintained their dominance versus value stocks, as measured by the Russell 3000® Value Index, over the past 1, 3, 5, 10, 15, and even 30 years.
9
Victory RS Select Growth Fund (continued)
Managers' Commentary (continued)
How did Victory RS Select Growth Fund (the "Fund") perform during the reporting period?
The Fund returned 6.89% (Class A at net asset value) for the fiscal year ended December 31, 2021, outperforming the Russell 2500TM Growth Index (the "Index"), which returned 5.04% during the reporting period.
What strategies did you employ during the reporting period?
The Fund seeks long-term capital growth by investing primarily in small- and mid-cap companies that we believe have the potential to produce sustainable earnings growth over a multi-year horizon. The Fund's outperformance was driven by stock selection within the Health Care, Materials & Processing, and Producer Durables sectors. Stock selection in the Technology and Financial Services sectors offset a portion of the Fund's outperformance.
Within the Health Care sector, a driver of relative outperformance was Tandem Diabetes Care, Inc., a company that engages in the design, development, and commercialization of products — mainly insulin pumps and related supplies — for people with insulin-dependent diabetes. The company performed exceptionally well during the year on strong results, continued execution, and a strong pipeline.
Within the Health Care sector, another driver of relative outperformance was within the Biotechnology sector, driven in part by Horizon Therapeutics Public Limited Company ("Horizon"). Horizon is a specialty pharmaceutical company with products in the areas of rheumatoid arthritis, osteoarthritis, and several different orphan areas. The company's portfolio includes Tepezza, which we believe will be the standard care for treatment of thyroid eye disease, and Krystexxa, which is the only FDA-approved biologic for chronic refractory gout (a common type of inflammatory arthritis).
One of the largest contributors to outperformance within the Materials & Processing sector was building company Advanced Drainage Systems, Inc. ("Advanced Drainage"). Advanced Drainage is a leading solutions provider of high performance thermoplastic corrugated pipe and related stormwater management and drainage products. We believe there are still underpenetrated markets that will allow them to take market share with superior products that are higher quality and cost effective. The company performed well in 2021 given their strong order book, book-to-bill ratio, and backlog, and we believe 2022 remains a great environment for the company.
Within the Technology sector, the largest detractor was RingCentral, Inc., a provider of software-as-a-service solutions for businesses to support modern communications. Despite strong results throughout 2021, highlighted by revenue acceleration, the stock underwhelmed as investors view competition as picking up, which has elicited fear that the company will not be able to grow or price as well as they have in the past. We believe these fears are unwarranted and we expect the stock to rebound.
Within the Technology sector, another detractor was Chegg, Inc., a direct-to-student learning platform aimed at helping students from high school through college and even into their careers. Given the company's attractive customer acquisition costs, backed by brand awareness and word of mouth, we believe there is a significant monetization opportunity ahead as the company shifted their customer interactions online. The company struggled in
10
Victory RS Select Growth Fund (continued)
Managers' Commentary (continued)
the most recent quarter as they guided significantly below expectations on reopening headwinds and lower college enrollments. After July and August were ahead of plan, September traffic was down 25% as it appears students opted to pursue jobs this fall given rising wages and record job openings.
Within the Technology sector, detractors included Bandwidth Inc. ("Bandwidth"), which had been a top performer for the Fund in 2020. Bandwidth is a communications platform-as-a-service solution focused on communications for enterprises. The stock had challenging performance throughout 2021, in part due to tough comparisons from COVID-19 utilization and political messaging, despite meeting or exceeding most expectations investors had for the company.
Given the outsized impact of the virus globally, we believe investors should continue to expect all companies to feel some level of direct and secondary economic effects and markets to experience higher levels of volatility despite the outsized market performance to close out the year. As a result, we believe there will continue to be an abundance of opportunities across sectors in coming quarters and years as the economy transitions and new companies take leadership positions. We do not have a clear view or projection as to how large or prolonged the impact from the pandemic (both direct and indirect) will be, given the uncertainty regarding its continued spread, economic impact, politicization, potential scale of incremental fiscal and monetary stimulus not yet announced, or even the potential transformation of industries and consumer and social norms, but we believe there are clear pockets of the economy that remain better positioned than others given the ability of workers to remain productive (remotely or on-site) and end-customer demand to remain steady irrespective of the forward economic environment.
In this specific environment, we will focus further on companies with flexible business models that offer innovative products and services that will take market share from legacy companies that will be more strained by the challenging economic conditions. Now is when an active approach should shine. Specifically, our "farm team" approach identifies and monitors premier companies within each relative index, but then waits for a favorable price. This should allow us to upgrade the portfolio to our very best ideas as relative valuations shift, as it is rare that we can own our full "wish list" roster of companies. We believe that our process will allow us to take advantage of this dynamic environment and will pay off over time.
11
Victory RS Select Growth Fund
Investment Overview
(Unaudited)
Average Annual Total Return
Year Ended December 31, 2021
| | | Class A | | Class C | | Class R | | Class R6 | | Class Y | | | | | |
INCEPTION DATE | | 8/1/96 | | 11/15/07 | | 2/12/07 | | 11/15/16 | | 5/1/09 | | | | | |
| | | Net Asset
Value | | Maximum
Offering
Price | | Net Asset
Value | | Contingent
Deferred
Charges | | Net Asset
Value | | Net Asset
Value | | Net Asset
Value | | Russell 2500®
Growth
Index1 | | Russell 2000®
Growth
Index2 | |
One Year | | | 6.89 | % | | | 0.75 | % | | | 6.02 | % | | | 5.30 | % | | | 6.31 | % | | | 7.23 | % | | | 7.15 | % | | | 5.04 | % | | | 2.83 | % | |
Five Year | | | 15.40 | % | | | 14.04 | % | | | 14.49 | % | | | 14.49 | % | | | 14.81 | % | | | 15.78 | % | | | 15.69 | % | | | 17.65 | % | | | 14.53 | % | |
Ten Year | | | 13.67 | % | | | 13.00 | % | | | 12.78 | % | | | 12.78 | % | | | 13.05 | % | | | NA | | | | 13.97 | % | | | 15.75 | % | | | 14.14 | % | |
Since
Inception | | | NA | | | | NA | | | | NA | | | | NA | | | | NA | | | | 15.84 | % | | | NA | | | | NA | | | | NA | | |
The performance data quoted represents past performance and current returns may be lower or higher. The investment return and principal value will fluctuate so that an investor's shares, when redeemed, may be worth more or less than the original cost. To obtain performance information current to the most recent month's end, please visit www.vcm.com.
The maximum offering price ("MOP") reflects a maximum sales charge of 5.75% for Class A. Class C is not subject to an initial sales charge, but is subject to a deferred sales charge of 1.00% on shares redeemed within one year of purchase. Net Asset Value ("NAV") does not reflect sales charges.
Total return measures the price change in a share assuming the reinvestment of all net investment income and realized capital gain distributions, if any. The total returns quoted do not reflect adjustments made to the enclosed financial statements in accordance with U.S. Generally Accepted Accounting Principles or the deduction of taxes that a shareholder would pay on net investment income and realized capital gain distributions, including reinvested distributions, or redemptions of shares. The total return figures set forth above include all waivers of fees. Without such fee waivers, the total returns would have been lower.
Victory RS Select Growth Fund — Growth of $10,000
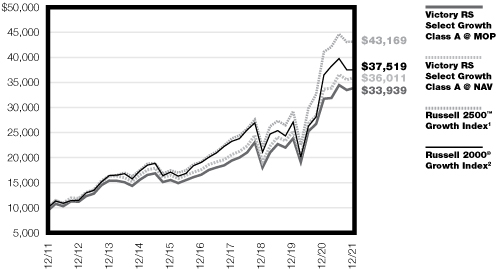
1The Russell 2500TM Growth Index is an unmanaged market capitalization-weighted index that measures the performance of those companies in the Russell 2500TM Index with higher price-to-book ratios and higher forecasted growth values. (The Russell 2500TM Index measures the performance of the 2,500 smallest companies in the Russell 3000® Index, which consists of the 3,000 largest U.S. companies based on total market capitalization.) Index results assume the reinvestment of dividends paid on the stocks constituting the index. This index does not include the effect of sales charges, commissions, expenses or taxes, is not representative of the Fund, and it is not possible to invest directly in an index.
2The Russell 2000® Growth Index is an unmanaged market-capitalization-weighted index that measures the performance of those companies in the Russell 2000® Index with higher price-to-book ratios and higher forecasted growth values. Index results assume the reinvestment of dividends paid on the stocks constituting the index. This index does not include the effect of sales charges, commissions, expenses or taxes, is not representative of the Fund, and it is not possible to invest directly in an index.
The graph reflects investment of growth of a hypothetical $10,000 investment in the Fund.
The graph and table do not reflect the deduction of taxes that a shareholder would pay on Fund distributions or the redemption of shares.
Past performance is not indicative of future results.
12
Victory RS Mid Cap Growth Fund
Managers' Commentary
(Unaudited)
What were the market conditions during the reporting period?
U.S. stock performance followed up a strong 2019 and 2020 with another robust year, as the S&P 500® Index registered its twelfth year of positive returns in the last 13 years. This was driven largely by a resilient U.S. economy that bounced back quickly after what was effectively a global economic shutdown in 2020. We witnessed the highest levels of economic and earnings growth in decades, driven in part by continued fiscal stimulus and accommodative monetary policy. Yet, underlying this positive performance were interesting differences among investment styles and market capitalizations.
After a solid start to the 2021 calendar year, U.S. equity markets continued to rebound as the economy reopened after being shuttered by the COVID-19 pandemic. Aggressive fiscal and monetary measures convinced investors that had fled risk assets to re-enter as many companies reported better-than-expected earnings.
Although the market as a whole has headed higher, the inner dynamics of this past year were quite a contrast. In 2020, investors viewed the economic and business impact of the pandemic differently, rewarding the "haves" (often technology companies) relative to the "have-nots" (often older, less innovative companies). In early 2021, the "have-nots" came roaring back at the start of the year. In fact, the strong sentiment for these companies, which had been left largely for dead in the first 10 months of 2020, turned into outright exuberance as we approached the end of the first quarter of 2021. This was illustrated by value-oriented stocks in the Russell 1000® Value Index and the Russell 2000® Value Index returning 11.26% and 21.17%, respectively, materially outperforming growth-oriented stocks in the Russell 1000® Growth Index and the Russell 2000® Growth Index, which returned 0.94% and 4.88%, respectively.
Bellwether large-cap growth stocks led the way throughout the remainder of the year, providing investors with the highest return of any U.S. equity style during the second, third, and fourth quarters of 2021. The Russell 1000® Growth Index returned 25.21% during the final three quarters of the year, relative to the 10.37% return of the Russell 1000® Value Index and -2.67% return of the Russell 2000® Growth Index. This 30% performance gap between large- and small-cap growth stocks is a historic outlier, which has been driven largely by expansion among some of the largest technology stocks as investors piled into these well-known companies.
For the full year, U.S. stock performance was mixed, yet overall positive across market caps and styles, with large-cap stocks outperforming small- and mid-cap stocks as measured by the Russell family of indices. Meanwhile, growth-oriented investments outperformed value within large-caps, but materially underperformed within both mid-caps and small-caps as investors have shunned less established high-growth companies. In the broader context, however, growth stocks, as measured by the Russell 3000® Growth Index, have maintained their dominance versus value stocks, as measured by the Russell 3000® Value Index, over the past 1, 3, 5, 10, 15, and even 30 years.
13
Victory RS Mid Cap Growth Fund (continued)
Managers' Commentary (continued)
How did Victory RS Mid Cap Growth Fund (the "Fund") perform during the reporting period?
The Fund returned 4.68% (Class A at net asset value) for the fiscal year ended December 31, 2021, underperforming the Russell Midcap® Index (the "Index"), which returned 12.73% during the reporting period.
What strategies did you employ during the reporting period?
The Fund seeks long-term capital growth by investing primarily in mid-cap companies that we believe have the potential to produce sustainable earnings growth over a multi-year horizon. The Fund's underperformance was driven by stock selection within the Technology and Health Care sectors, while stock selection in the Materials & Processing sector offset a portion of the Fund's negative relative performance.
Within the Technology sector, the largest detractor was RingCentral, Inc., a provider of software-as-a-service solutions for businesses to support modern communications. Despite strong results throughout 2021, highlighted by revenue acceleration, the stock underwhelmed as investors view competition as picking up, which has elicited fear that the company will not be able to grow or price as well as they have in the past. We believe these fears are unwarranted and we expect the stock to rebound.
Another top detractor within Technology was Wix.com Ltd. ("Wix"), a developer and marketer of a cloud-based platform that enables anyone to create a website or web application. Wix showed its resilience to COVID-19 in 2020 as the demand for the company's tools accelerated the migration of small businesses from bricks-and-mortar to having an online presence by years, as well as producing a spike in new online business formation following a rise in unemployment. The company struggled to repeat this strong performance in 2021 as the economy reopened; headwinds across various geographies led Wix to report lower than expected collections and reduced guidance. Despite these struggles, we have continued to hold Wix given that secular trends are intact, as people will continue to increase the amount of time as well as the amount of purchasing they do on the internet, and the company's competitive positioning continues to improve.
Within the Health Care sector, another driver of underperformance was biotechnology holding Iovance Biotherapeutics, Inc. ("Iovance"). Iovance is focused on developing and commercializing new cancer immunotherapies that use tumor-infiltrating lymphocytes ("TILs"). TILs, as a ready-to-infuse cell therapy, have demonstrated breakthrough efficacy exceeding existing therapies in metastatic melanoma. Although we continue to believe in the long-term outlook for the treatment, the stock underperformed as the company lost a standoff with the FDA and faced a delay in its biologics license application submission for lifileucel, the company's TIL therapy candidate, as the FDA requested additional data on the treatment's potency. This setback was followed by the resignation of the company's CEO to pursue other opportunities. While we are likely to revisit the stock again in the future, we have decided to move from the holding.
14
Victory RS Mid Cap Growth Fund (continued)
Managers' Commentary (continued)
Within the Materials & Processing sector, the largest contributor to performance was Builders FirstSource, Inc., a leading provider of building materials, manufactured components, and construction services that serves the U.S. residential construction market. The stock performed exceptionally well as strong earnings and better than expected guidance for growth and margins pushed the stock higher. The company also outlined a new digital strategy in the wake of a number of recent acquisitions made by the company that we believe will further expand the company's total addressable market, allowing key services across the value chain such as 3D visualization for the homebuyer and more efficient estimates/quotes for the builder.
One of the largest contributors to outperformance within Materials & Processing was building company Advanced Drainage Systems, Inc. ("Advanced Drainage"). Advanced Drainage is a leading solutions provider of high performance thermoplastic corrugated pipe and related stormwater management and drainage products. We initially purchased Advanced Drainage given its significant size and scale advantage, given its leadership position built over 50+ years that has led to its unsurpassed ability to provide comprehensive water management and drainage solutions. We believe there are still underpenetrated markets that will allow them to take market share with superior products that are higher quality and cost effective. The company performed well in 2021 given their strong order book, book-to-bill ratio, and backlog, and we believe 2022 remains a great environment for the company.
Within the Technology sector, a contributor to performance was semiconductor holding Lattice Semiconductor Corporation ("Lattice"), a company that develops and sells semiconductor products in Asia, Europe, and the Americas. Lattice performed exceptionally well during the year, posting solid beats and raises, and exhibited strength across segments, especially within industrials and auto on the continued macroeconomic improvement for automation, robotics, and embedded vision. In addition, the company hosted an analyst conference early in the year where they unveiled their new Avant platform, which is targeting the mid-range field-programmable gate array market and will allow integrated circuit design to be configured by customers or designers after manufacturing. We believe this doubles their addressable market and increases our already optimistic forecast for the company going forward.
Given the outsized impact of the virus globally, we believe investors should continue to expect all companies to feel some level of direct and secondary economic effects and markets to experience higher levels of volatility despite the outsized market performance to close out the year. As a result, we believe there will continue to be an abundance of opportunities across sectors in coming quarters and years as the economy transitions and new companies take leadership positions. We do not have a clear view or projection as to how large or prolonged the impact from the pandemic (both direct and indirect) will be, given the uncertainty regarding its continued spread, economic impact, politicization, potential scale of incremental fiscal and monetary stimulus not yet announced, or even the potential transformation of industries and consumer and social norms, but we believe there are clear pockets of the economy that remain better positioned than others given the ability of workers to remain productive (remotely or on-site) and end-customer demand to remain steady irrespective of the forward economic environment.
15
Victory RS Mid Cap Growth Fund (continued)
Managers' Commentary (continued)
In this specific environment, we will focus further on companies with flexible business models that offer innovative products and services that will take market share from legacy companies that will be more strained by the challenging economic conditions. Now is when an active approach should shine. Specifically, our "farm team" approach identifies and monitors premier companies within each relative index, but then waits for a favorable price. This should allow us to upgrade the portfolio to our very best ideas as relative valuations shift, as it is rare that we can own our full "wish list" roster of companies. We believe that our process will allow us to take advantage of this dynamic environment and will pay off over time.
16
Victory RS Mid Cap Growth Fund
Investment Overview
(Unaudited)
Average Annual Total Return
Year Ended December 31, 2021
| | | Class A | | Class C | | Class R | | Class R6 | | Class Y | | Member Class | | | |
INCEPTION DATE | | 7/12/95 | | 5/21/07 | | 12/4/06 | | 11/15/16 | | 5/1/07 | | 11/2/20 | | | |
| | | Net Asset
Value | | Maximum
Offering
Price | | Net Asset
Value | | Contingent
Deferred
Charges | | Net Asset
Value | | Net Asset
Value | | Net Asset
Value | | Net Asset
Value | | Russell
Midcap®
Growth
Index1 | |
One Year | | | 4.68 | % | | | –1.33 | % | | | 3.75 | % | | | 3.06 | % | | | 4.09 | % | | | 4.95 | % | | | 4.96 | % | | | 4.88 | % | | | 12.73 | % | |
Five Year | | | 15.08 | % | | | 13.73 | % | | | 14.05 | % | | | 14.05 | % | | | 14.41 | % | | | 15.39 | % | | | 15.37 | % | | | NA | | | | 19.83 | % | |
Ten Year | | | 14.23 | % | | | 13.56 | % | | | 13.21 | % | | | 13.21 | % | | | 13.60 | % | | | NA | | | | 14.52 | % | | | NA | | | | 16.63 | % | |
Since
Inception | | | NA | | | | NA | | | | NA | | | | NA | | | | NA | | | | 15.60 | % | | | NA | | | | 20.09 | % | | | NA | | |
The performance data quoted represents past performance and current returns may be lower or higher. The investment return and principal value will fluctuate so that an investor's shares, when redeemed, may be worth more or less than the original cost. To obtain performance information current to the most recent month's end, please visit www.vcm.com.
The maximum offering price ("MOP") figures reflect a maximum sales charge of 5.75% for Class A. Class C is not subject to an initial sales charge, but is subject to a deferred sales charge of 1.00% on shares redeemed within one year of purchase. Net Asset Value ("NAV") does not reflect sales charges.
Total return measures the price change in a share assuming the reinvestment of all net investment income and realized capital gain distributions, if any. The total returns quoted do not reflect adjustments made to the enclosed financial statements in accordance with U.S. Generally Accepted Accounting Principles or the deduction of taxes that a shareholder would pay on net investment income and realized capital gain distributions, including reinvested distributions, or redemptions of shares. The total return figures set forth above include all waivers of fees. Without such fee waivers, the total returns would have been lower.
Victory RS Mid Cap Growth Fund — Growth of $10,000
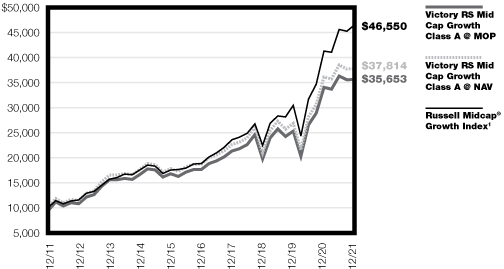
1The Russell Midcap® Growth Index is an unmanaged market capitalization-weighted index that measures the performance of those companies in the Russell Midcap® Index with higher price-to-book ratios and higher forecasted growth values. (The Russell Midcap® Index measures the performance of the 800 smallest companies in the Russell 1000® Index, which consists of the 1,000 largest U.S. companies based on total market capitalization.) Index results assume the reinvestment of dividends paid on the stocks constituting the index. This index does not include the effect of sales charges, commissions, expenses or taxes, is not representative of the Fund, and it is not possible to invest directly in an index.
The graph reflects investment of growth of a hypothetical $10,000 investment in the Fund.
The graph and table do not reflect the deduction of taxes that a shareholder would pay on Fund distributions or the redemption of shares.
Past performance is not indicative of future results.
17
Victory RS Growth Fund
Managers' Commentary
(Unaudited)
What were the market conditions during the reporting period?
U.S. stock performance followed up a strong 2019 and 2020 with another robust year, as the S&P 500® Index registered its twelfth year of positive returns in the last 13 years. This was driven largely by a resilient U.S. economy that bounced back quickly after what was effectively a global economic shutdown in 2020. We witnessed the highest levels of economic and earnings growth in decades, driven in part by continued fiscal stimulus and accommodative monetary policy. Yet, underlying this positive performance were interesting differences among investment styles and market capitalizations.
After a solid start to the 2021 calendar year, U.S. equity markets continued to rebound as the economy reopened after being shuttered by the COVID-19 pandemic. Aggressive fiscal and monetary measures convinced investors that had fled risk assets to re-enter as many companies reported better-than-expected earnings.
Although the market as a whole has headed higher, the inner dynamics of this past year were quite a contrast. In 2020, investors viewed the economic and business impact of the pandemic differently, rewarding the "haves" (often technology companies) relative to the "have-nots" (often older, less innovative companies). In early 2021, the "have-nots" came roaring back at the start of the year. In fact, the strong sentiment for these companies, which had been left largely for dead in the first 10 months of 2020, turned into outright exuberance as we approached the end of the first quarter of 2021. This was illustrated by value-oriented stocks in the Russell 1000® Value Index and the Russell 2000® Value Index returning 11.26% and 21.17%, respectively, materially outperforming growth-oriented stocks in the Russell 1000® Growth Index and the Russell 2000® Growth Index, which returned 0.94% and 4.88%, respectively.
Bellwether large-cap growth stocks led the way throughout the remainder of the year, providing investors with the highest return of any U.S. equity style during the second, third, and fourth quarters of 2021. The Russell 1000® Growth Index returned 25.21% during the final three quarters of the year, relative to the 10.37% return of the Russell 1000® Value Index and -2.67% return of the Russell 2000® Growth Index. This 30% performance gap between large- and small-cap growth stocks is a historic outlier, which has been driven largely by expansion among some of the largest technology stocks as investors piled into these well-known companies.
For the full year, U.S. stock performance was mixed, yet overall positive across market caps and styles, with large-cap stocks outperforming small- and mid-cap stocks as measured by the Russell family of indices. Meanwhile, growth-oriented investments outperformed value within large-caps, but materially underperformed within both mid-caps and small-caps as investors have shunned less established high-growth companies. In the broader context, however, growth stocks, as measured by the Russell 3000® Growth Index, have maintained their dominance versus value stocks, as measured by the Russell 3000® Value Index, over the past 1, 3, 5, 10, 15, and even 30 years.
18
Victory RS Growth Fund (continued)
Managers' Commentary (continued)
How did Victory RS Growth Fund (the "Fund") perform during the reporting period?
The Fund returned 19.91% (Class A at net asset value) for the fiscal year ended December 31, 2021, underperforming the Russell 1000® Growth Index (the "Index"), which returned 27.60% during the reporting period.
What strategies did you employ during the reporting period?
The Fund seeks long-term capital growth by investing primarily in large-cap companies that we believe have the potential to produce sustainable earnings growth over a multi-year horizon. The Fund's underperformance was driven by stock selection within the Health Care, Technology, and Financial Services sectors.
Within the Technology sector, the largest detractor was RingCentral, Inc., a provider of software-as-a-service solutions for businesses to support modern communications. Despite strong results throughout 2021, highlighted by revenue acceleration, the stock underwhelmed as investors view competition as picking up, which has elicited fear that the company will not be able to grow or price as well as they have in the past. We believe these fears are unwarranted and we expect the stock to rebound.
Another driver of relative underperformance within the Technology sector was Information Technology holding Twilio, Inc. ("Twilio"). Twilio provides a cloud communications platform that enables developers to build, scale, and operate communications within software applications. We own Twilio given their leading position in a rapidly growing market, driven by the company's broad and deep functionality, strong developer focus, and comprehensive documentation. In addition, the company has a compelling model for top-line growth, driven by its high net expansion rate among existing customers and rapid customer growth. After a strong 2020, the stock struggled through most of 2021 due to concerns around slowing organic growth. In our view, once the company gets past the most recent quarter, comparison growth figures will get a lot easier and the setup should be cleaner. The recent departure of their well-respected COO also raised some concerns, but we believe they have a strong executive team and we do not expect much disruption. We still believe they are a leading communications platform-as-a-service company with durable 30%+ growth for the foreseeable future; thus, we continue to hold.
Within the Consumer Staples sector, the largest detractor to performance was natural pet food provider Freshpet, Inc. ("Freshpet"). Expectations are that profitability will improve substantially as the company scales and we believe the market is in the early innings of household spend for pets, while their product's competitive differentiation will be difficult for other providers to match. Despite the strong secular story, the stock struggled in 2021 given supply chain frictions that led to delays on a new production line and cost pressures that rose much faster than anticipated, driving a top-line and bottom-line miss. We believe management when they noted the miss does not reflect reduced demand from customers, and we expect outsized growth in 2022 when new capacity comes online.
The largest contributor to performance for the calendar year was Tesla, Inc., the undisputed leading designer, manufacturer, and seller of high-performance electric vehicles. The stock performed exceptionally well in 2021 on record deliveries, highlighted by more than 300,000 deliveries in the last quarter of 2021 alone. Delivery of 1.5 to 2 million units in 2022 seems reasonable, which we believe can drive the stock even higher.
19
Victory RS Growth Fund (continued)
Managers' Commentary (continued)
Another strong contributor to performance was Producer Durables back-office support company Gartner, Inc., a leading global research and advisory firm helping senior executives in information technology, finance, human resources and other areas make better business decisions. The stock performed exceptionally well during the year, especially in the first quarter, as the strong cyclical recovery led to earnings per share a full 51% above expectations, with revenue upside across all segments, including a material beat in research. Looking ahead, we believe growth will continue to accelerate, driven by a ramp in sales force hiring, a strong pipeline, and positive momentum across end markets.
A contributor to performance within the Technology sector was Marvell Technology, Inc., a company that designs, develops, and sells analog, mixed-signal, digital signal processing, and embedded and standalone integrated circuits. The stock performed well in 2021, driven by growth that outpaced expectations based on a better product mix (more Enterprise Networking), and despite continued supply constraints that management is working to ease through incremental capacity to support growth projections. The company's data center business continues to be the most exciting opportunity for the company, with robust demand trends and strength across all cloud product lines, showing the company is a key beneficiary of the metaverse movement.
Given the outsized impact of the virus globally, we believe investors should continue to expect all companies to feel some level of direct and secondary economic effects and markets to experience higher levels of volatility despite the outsized market performance to close out the year. As a result, we believe there will continue to be an abundance of opportunities across sectors in coming quarters and years as the economy transitions and new companies take leadership positions. We do not have a clear view or projection as to how large or prolonged the impact from the pandemic (both direct and indirect) will be, given the uncertainty regarding its continued spread, economic impact, politicization, potential scale of incremental fiscal and monetary stimulus not yet announced, or even the potential transformation of industries and consumer and social norms, but we believe there are clear pockets of the economy that remain better positioned than others given the ability of workers to remain productive (remotely or on-site) and end-customer demand to remain steady irrespective of the forward economic environment.
In this specific environment, we will focus further on companies with flexible business models that offer innovative products and services that will take market share from legacy companies that will be more strained by the challenging economic conditions. Now is when an active approach should shine. Specifically, our "farm team" approach identifies and monitors premier companies within each relative index, but then waits for a favorable price. This should allow us to upgrade the portfolio to our very best ideas as relative valuations shift, as it is rare that we can own our full "wish list" roster of companies. We believe that our process will allow us to take advantage of this dynamic environment and will pay off over time.
20
Victory RS Growth Fund
Investment Overview
(Unaudited)
Average Annual Total Return
Year Ended December 31, 2021
| | | Class A | | Class C | | Class R | | Class Y | | | |
INCEPTION DATE | | 5/12/92 | | 6/30/07 | | 11/27/06 | | 5/1/07 | | | |
| | | Net Asset
Value | | Maximum
Offering
Price | | Net Asset
Value | | Contingent
Deferred
Charges | | Net Asset
Value | | Net Asset
Value | | Russell 1000®
Growth Index1 | |
One Year | | | 19.91 | % | | | 13.04 | % | | | 18.95 | % | | | 17.95 | % | | | 19.17 | % | | | 20.22 | % | | | 27.60 | % | |
Five Year | | | 20.99 | % | | | 19.57 | % | | | 19.99 | % | | | 19.99 | % | | | 20.26 | % | | | 21.31 | % | | | 25.32 | % | |
Ten Year | | | 17.36 | % | | | 16.67 | % | | | 16.38 | % | | | 16.38 | % | | | 16.66 | % | | | 17.68 | % | | | 19.79 | % | |
The performance data quoted represents past performance and current returns may be lower or higher. The investment return and principal value will fluctuate so that an investor's shares, when redeemed, may be worth more or less than the original cost. To obtain performance information current to the most recent month's end, please visit www.vcm.com.
The maximum offering price ("MOP") figures reflect a maximum sales charge of 5.75% for Class A. Class C is not subject to an initial sales charge, but is subject to a deferred sales charge of 1.00% on shares redeemed within one year of purchase. Net Asset Value ("NAV") does not reflect sales charges.
Total return measures the price change in a share assuming the reinvestment of all net investment income and realized capital gain distributions, if any. The total returns quoted do not reflect adjustments made to the enclosed financial statements in accordance with U.S. generally accepted accounting principles or the deduction of taxes that a shareholder would pay on net investment income and realized capital gain distributions, including reinvested distributions, or redemptions of shares. The total return figures set forth above include all waivers of fees. Without such fee waivers, the total returns would have been lower.
Victory RS Growth Fund — Growth of $10,000
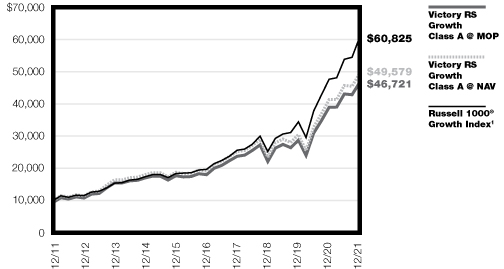
1The Russell 1000® Growth Index is an unmanaged index that measures the performance of those Russell 1000 companies with higher price-to-book
ratios and higher forecasted growth values. This index does not include the effect of sales charges, commissions, expenses or taxes, is not representative
of the Fund, and it is not possible to invest directly in an index.
The graph reflects investment of growth of a hypothetical $10,000 investment in the Fund.
The graph and table do not reflect the deduction of taxes that a shareholder would pay on Fund distributions or the redemption of shares.
Past performance is not indicative of future results.
21
Victory RS Science and Technology Fund
Managers' Commentary
(Unaudited)
What were the market conditions during the reporting period?
U.S. stock performance followed up a strong 2019 and 2020 with another robust year, as the S&P 500® Index registered its twelfth year of positive returns in the last 13 years. This was driven largely by a resilient U.S. economy that bounced back quickly after what was effectively a global economic shutdown in 2020. We witnessed the highest levels of economic and earnings growth in decades, driven in part by continued fiscal stimulus and accommodative monetary policy. Yet, underlying this positive performance were interesting differences among investment styles and market capitalizations.
After a solid start to the 2021 calendar year, U.S. equity markets continued to rebound as the economy reopened after being shuttered by the COVID-19 pandemic. Aggressive fiscal and monetary measures convinced investors that had fled risk assets to re-enter as many companies reported better-than-expected earnings.
Although the market as a whole has headed higher, the inner dynamics of this past year were quite a contrast. In 2020, investors viewed the economic and business impact of the pandemic differently, rewarding the "haves" (often technology companies) relative to the "have-nots" (often older, less innovative companies). In early 2021, the "have-nots" came roaring back at the start of the year. In fact, the strong sentiment for these companies, which had been left largely for dead in the first 10 months of 2020, turned into outright exuberance as we approached the end of the first quarter of 2021. This was illustrated by value-oriented stocks in the Russell 1000® Value Index and the Russell 2000® Value Index returning 11.26% and 21.17%, respectively, materially outperforming growth-oriented stocks in the Russell 1000® Growth Index and the Russell 2000® Growth Index, which returned 0.94% and 4.88%, respectively.
Bellwether large-cap growth stocks led the way throughout the remainder of the year, providing investors with the highest return of any U.S. equity style during the second, third, and fourth quarters of 2021. The Russell 1000® Growth Index returned 25.21% during the final three quarters of the year, relative to the 10.37% return of the Russell 1000® Value Index and -2.67% return of the Russell 2000® Growth Index. This 30% performance gap between large- and small-cap growth stocks is a historic outlier, which has been driven largely by expansion among some of the largest technology stocks as investors piled into these well-known companies.
For the full year, U.S. stock performance was mixed, yet overall positive across market caps and styles, with large-cap stocks outperforming small- and mid-cap stocks as measured by the Russell family of indices. Meanwhile, growth-oriented investments outperformed value within large-caps, but materially underperformed within both mid-caps and small-caps as investors have shunned less established high-growth companies. In the broader context, however, growth stocks, as measured by the Russell 3000® Growth Index, have maintained their dominance versus value stocks, as measured by the Russell 3000® Value Index, over the past 1, 3, 5, 10, 15, and even 30 years.
22
Victory RS Science and Technology Fund (continued)
Managers' Commentary (continued)
How did Victory RS Science and Technology Fund (the "Fund") perform during the reporting period?
The Fund returned -9.25% (Class A at net asset value) for the fiscal year ended December 31, 2021, underperforming the S&P North American Technology Sector Index (the "Index"), which returned 26.40% during the reporting period and the broader S&P 500® Index, which returned 28.71% during the reporting period.
What strategies did you employ during the reporting period?
The Fund's performance was hindered by exposure to innovative companies within the Health Care sector, as well as a tilt toward smaller-cap companies relative to the Index. Stock selection in the Technology sector helped add incrementally to performance.
Within the Health Care sector, one of the largest drivers of underperformance was biotechnology holding Iovance Biotherapeutics, Inc. ("Iovance"). Iovance is focused on developing and commercializing new cancer immunotherapies that use tumor-infiltrating lymphocytes ("TILs"). TILs, as a ready-to-infuse cell therapy, have demonstrated breakthrough efficacy exceeding existing therapies in metastatic melanoma. Although we continue to believe in the long-term outlook for the treatment, the stock underperformed sharply in the first half of 2021 as the company lost a standoff with the FDA and faced a delay in its biologics license application submission for lifileucel, the company's TIL therapy candidate, as the FDA requested additional data on the treatment's potency. This setback was followed by the resignation of the company's CEO to pursue other opportunities. While we are likely to revisit the stock again in the future, we moved on from the holding.
Within the Technology sector, the largest detractor was RingCentral, Inc., a provider of software-as-a-service solutions for businesses to support modern communications. Despite strong results throughout 2021, highlighted by revenue acceleration, the stock underwhelmed as investors view competition as picking up, which has elicited fear that the company will not be able to grow or price as well as they have in the past. We believe these fears are unwarranted and we expect the stock to rebound.
Within the Technology sector, another driver of relative underperformance was Information Technology holding Twilio, Inc. ("Twilio"). Twilio provides a cloud communications platform that enables developers to build, scale, and operate communications within software applications. After a strong 2020, the stock struggled through most of 2021 due to concerns around slowing organic growth. In our view, once the company gets past the fourth quarter of 2021, comparison growth figures will get a lot easier and the setup should be cleaner. The recent departure of their well-respected COO also raised some concerns, but we believe they have a strong executive team and we do not expect much disruption. We still believe they are a leading communications platform-as-a-service company with durable 30%+ growth for the foreseeable future; thus, we continue to hold.
Within the Financial Services sector, a contributor to performance was Visa Inc. ("Visa"), an operator of the market-leading global retail electronic payments network. The stock has performed exceptionally well in recent years and months, driven by the continued trend toward cash digitization and e-commerce that has sustained high levels of growth even as the economy reopened. Visa also benefited from an improvement in cross-border volumes, which beat expectations despite COVID-19 concerns, and record payment volume. The
23
Victory RS Science and Technology Fund (continued)
Managers' Commentary (continued)
company outlined high-end, mid-teens growth prospects for fiscal year 2022, which we believe is conservative.
Within the Technology sector, a contributor to performance was semiconductor holding Lattice Semiconductor Corporation ("Lattice"), a company that develops and sells semiconductor products in Asia, Europe, and the Americas. Lattice performed exceptionally well during the year, posting solid beats and raises, and exhibited strength across segments, especially within industrials and auto on the continued macroeconomic improvement for automation, robotics, and embedded vision. In addition, the company hosted an analyst conference early in the year where they unveiled their new Avant platform, which is targeting the mid-range field-programmable gate array market and will allow integrated circuit design to be configured by customers or designers after manufacturing. We believe this doubles their addressable market and increases our already optimistic forecast for the company going forward.
Another contributor to performance within Technology was Marvell Technology, Inc. ("Marvell"), a company that designs, develops, and sells analog, mixed-signal, digital signal processing, and embedded and standalone integrated circuits. The stock performed well in 2021, driven by growth that outpaced expectations based on a better product mix (more Enterprise Networking) and despite continued supply constraints that management is working to ease through incremental capacity to support growth projections. The company's data center business continues to be the most exciting opportunity for the company, with robust demand trends and strength across all cloud product lines, showing the company is a key beneficiary of the metaverse movement.
Given the outsized impact of the virus globally, we believe investors should continue to expect all companies to feel some level of direct and secondary economic effects and markets to experience higher levels of volatility despite the outsized market performance to close out the year. As a result, we believe there will continue to be an abundance of opportunities across sectors in coming quarters and years as the economy transitions and new companies take leadership positions. We do not have a clear view or projection as to how large or prolonged the impact from the pandemic (both direct and indirect) will be, given the uncertainty regarding its continued spread, economic impact, politicization, potential scale of incremental fiscal and monetary stimulus not yet announced, or even the potential transformation of industries and consumer and social norms, but we believe there are clear pockets of the economy that remain better positioned than others given the ability of workers to remain productive (remotely or on-site) and end-customer demand to remain steady irrespective of the forward economic environment.
In this specific environment, we will focus further on companies with flexible business models that offer innovative products and services that will take market share from legacy companies that will be more strained by the challenging economic conditions. Now is when an active approach should shine. Specifically, our "farm team" approach identifies and monitors premier companies within each relative index, but then waits for a favorable price. This should allow us to upgrade the portfolio to our very best ideas as relative valuations shift, as it is rare that we can own our full "wish list" roster of companies. We believe that our process will allow us to take advantage of this dynamic environment and will pay off over time.
24
Victory RS Science and Technology Fund
Investment Overview
(Unaudited)
Average Annual Total Return
Year Ended December 31, 2021
| | | Class A | | Class C | | Class R | | Class Y | | | | | |
INCEPTION DATE | | 11/15/95 | | 5/2/07 | | 1/19/07 | | 5/1/07 | | | | | |
| | | Net Asset
Value | | Maximum
Offering
Price | | Net Asset
Value | | Contingent
Deferred
Charges | | Net Asset
Value | | Net Asset
Value | | S&P North
American
Technology
Sector
Index1 | | S&P 500®
Index2 | |
One Year | | | –9.25 | % | | | –14.47 | % | | | –10.03 | % | | | –10.75 | % | | | –9.66 | % | | | –9.04 | % | | | 26.40 | % | | | 28.71 | % | |
Five Year | | | 24.56 | % | | | 23.09 | % | | | 23.56 | % | | | 23.56 | % | | | 23.99 | % | | | 24.85 | % | | | 29.99 | % | | | 18.47 | % | |
Ten Year | | | 19.61 | % | | | 18.91 | % | | | 18.66 | % | | | 18.66 | % | | | 19.07 | % | | | 19.93 | % | | | 23.54 | % | | | 16.55 | % | |
The performance data quoted represents past performance and current returns may be lower or higher. The investment return and principal value will fluctuate so that an investor's shares, when redeemed, may be worth more or less than the original cost. To obtain performance information current to the most recent month's end, please visit www.vcm.com.
The maximum offering price ("MOP") figures reflect a maximum sales charge of 5.75% for Class A. Class C is not subject to an initial sales charge, but is subject to a deferred sales charge of 1.00% on shares redeemed within one year of purchase. Net Asset Value ("NAV") does not reflect sales charges.
Total return measures the price change in a share assuming the reinvestment of all net investment income and realized capital gain distributions, if any. The total returns quoted do not reflect adjustments made to the enclosed financial statements in accordance with U.S. Generally Accepted Accounting Principles or the deduction of taxes that a shareholder would pay on net investment income and realized capital gain distributions, including reinvested distributions, or redemptions of shares. The total return figures set forth above include all waivers of fees. Without such fee waivers, the total returns would have been lower.
Victory RS Science and Technology Fund — Growth of $10,000
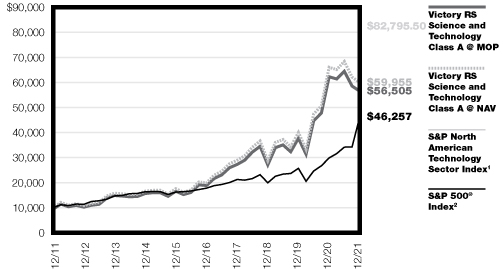
1The S&P North American Technology Sector Index is a modified capitalization-weighted index based on a universe of technology-related stocks. This index does not include the effect of sales charges, commissions, expenses or taxes, is not representative of the Fund, and it is not possible to invest directly in an index.
2The S&P 500® Index is an unmanaged index comprised of 500 domestically traded common stocks, is weighted according to the market value of each common stock in the index, and includes reinvestment of dividends. This index does not include the effect of sales charges, commissions, expenses or taxes, is not representative of the Fund, and it is not possible to invest directly in an index.
The graph reflects investment of growth of a hypothetical $10,000 investment in the Fund.
The graph and table do not reflect the deduction of taxes that a shareholder would pay on Fund distributions or the redemption of shares.
Past performance is not indicative of future results.
25
Victory RS Small Cap Equity Fund
Managers' Commentary
(Unaudited)
What were the market conditions during the reporting period?
U.S. stock performance followed up a strong 2019 and 2020 with another robust year, as the S&P 500® Index registered its twelfth year of positive returns in the last 13 years. This was driven largely by a resilient U.S. economy that bounced back quickly after what was effectively a global economic shutdown in 2020. We witnessed the highest levels of economic and earnings growth in decades, driven in part by continued fiscal stimulus and accommodative monetary policy. Yet, underlying this positive performance were interesting differences among investment styles and market capitalizations.
After a solid start to the 2021 calendar year, U.S. equity markets continued to rebound as the economy reopened after being shuttered by the COVID-19 pandemic. Aggressive fiscal and monetary measures convinced investors that had fled risk assets to re-enter as many companies reported better-than-expected earnings.
Although the market as a whole has headed higher, the inner dynamics of this past year were quite a contrast. In 2020, investors viewed the economic and business impact of the pandemic differently, rewarding the "haves" (often technology companies) relative to the "have-nots" (often older, less innovative companies). In early 2021, the "have-nots" came roaring back at the start of the year. In fact, the strong sentiment for these companies, which had been left largely for dead in the first 10 months of 2020, turned into outright exuberance as we approached the end of the first quarter of 2021. This was illustrated by value-oriented stocks in the Russell 1000® Value Index and the Russell 2000® Value Index returning 11.26% and 21.17%, respectively, materially outperforming growth-oriented stocks in the Russell 1000® Growth Index and the Russell 2000® Growth Index (the "Index"), which returned 0.94% and 4.88%, respectively.
Bellwether large-cap growth stocks led the way throughout the remainder of the year, providing investors with the highest return of any U.S. equity style during the second, third, and fourth quarters of 2021. The Russell 1000® Growth Index returned 25.21% during the final three quarters of the year, relative to the 10.37% return of the Russell 1000® Value Index and -2.67% return of the Index. This 30% performance gap between large- and small-cap growth stocks is a historic outlier, which has been driven largely by expansion among some of the largest technology stocks as investors piled into these well-known companies.
For the full year, U.S. stock performance was mixed, yet overall positive across market caps and styles, with large-cap stocks outperforming small- and mid-cap stocks as measured by the Russell family of indices. Meanwhile, growth-oriented investments outperformed value within large-caps, but materially underperformed within both mid-caps and small-caps as investors have shunned less established high-growth companies. In the broader context, however, growth stocks, as measured by the Russell 3000® Growth Index, have maintained their dominance versus value stocks, as measured by the Russell 3000® Value Index, over the past 1, 3, 5, 10, 15, and even 30 years.
26
Victory RS Small Cap Equity Fund (continued)
Managers' Commentary (continued)
How did Victory RS Small Cap Equity Fund (the "Fund") perform during the reporting period?
The Fund returned -7.36% (Class A at net asset value) for the fiscal year ended December 31, 2021, underperforming the Index, which returned 2.83% during the reporting period.
What strategies did you employ during the reporting period?
The Fund's underperformance was driven by stock selection within the Financial Services and Health Care sectors, while stock selection in the Technology and Producer Durables sectors offset some of the Fund's relative underperformance.
The largest contributor to performance was semiconductor & components holding SiTime Corporation, a leading provider of silicon timing solutions. The stock performed exceptionally well in 2021 as industry supply constraints accelerated adoption of their MEMS-based timing solutions by several years, which led to a large revenue and earnings beat, significant margin expansion, and improved visibility and raise of their fiscal year guidance. We believe the company is one of the best secular growth stories among small-cap semiconductors and remains under-owned by small-cap investors.
A top performer within the Materials & Processing sector was scientific instruments holding Evoqua Water Technologies Corp. The company has experienced accelerating organic growth and has clear margin drivers after completing a long cycle of tuck-in acquisitions. The stock performed exceptionally well in the year given strong earnings that materially beat expectations. We believe the stock is poised to continue to outperform as "The Street" recognizes the company's growth inflection and reasonable valuation.
Within the Technology sector, a contributor to performance was semiconductor holding Lattice Semiconductor Corporation ("Lattice"), a company that develops and sells semiconductor products in Asia, Europe, and the Americas. Lattice performed exceptionally well during the year, posting solid beats and raises, and exhibited strength across segments, especially within industrials and auto on the continued macroeconomic improvement for automation, robotics, and embedded vision. In addition, the company hosted an analyst conference early in the year where they unveiled their new Avant platform, which is targeting the mid-range field-programmable gate array market and will allow integrated circuit design to be configured by customers or designers after manufacturing. We believe this doubles their addressable market and increases our already optimistic forecast for the company going forward.
Within the Technology sector, detractors included Bandwidth Inc. ("Bandwidth"), which had been a top performer for the Fund in 2020. Bandwidth is a communications platform-as-a-Service solution focused on communications for enterprises. The stock had challenging performance throughout 2021, in part due to tough comparisons from COVID-19 utilization and political messaging, despite meeting or exceeding most expectations investors had for the company.
27
Victory RS Small Cap Equity Fund (continued)
Managers' Commentary (continued)
Within the Health Care sector, a top detractor to performance was biotechnology holding bluebird bio, Inc. ("bluebird"). Unfortunately, bluebird has underwhelmed, as the company suffered setbacks throughout the COVID-19 pandemic. The stock struggled to regain the confidence of investors in 2021 following their announcement that the company's market expansion studies will be delayed or in some cases halted, followed by a temporary suspension of their LentiGlobin sickle cell disease trial due to unexpected serious adverse reaction. We have moved on from the holding.
Within the Health Care sector, another driver of underperformance was biotechnology holding Iovance Biotherapeutics, Inc. ("Iovance"). Iovance is focused on developing and commercializing new cancer immunotherapies that use tumor-infiltrating lymphocytes ("TILs"). TILs, as a ready-to-infuse cell therapy, have demonstrated breakthrough efficacy exceeding existing therapies in metastatic melanoma. Although we continue to believe in the long-term outlook for the treatment, the stock underperformed as the company lost a standoff with the FDA and faced a delay in its biologics license application submission for lifileucel, the company's TIL therapy candidate, as the FDA requested additional data on the treatment's potency. This setback was followed by the resignation of the company's CEO to pursue other opportunities. While we are likely to revisit the stock again in the future, we have decided to move from the holding.
Given the outsized impact of the virus globally, we believe investors should continue to expect all companies to feel some level of direct and secondary economic effects and markets to experience higher levels of volatility despite the outsized market performance to close out the year. As a result, we believe there will continue to be an abundance of opportunities across sectors in coming quarters and years as the economy transitions and new companies take leadership positions. We do not have a clear view or projection as to how large or prolonged the impact from the pandemic (both direct and indirect) will be, given the uncertainty regarding its continued spread, economic impact, politicization, potential scale of incremental fiscal and monetary stimulus not yet announced, or even the potential transformation of industries and consumer and social norms, but we believe there are clear pockets of the economy that remain better positioned than others given the ability of workers to remain productive (remotely or on-site) and end-customer demand to remain steady irrespective of the forward economic environment.
In this specific environment, we will focus further on companies with flexible business models that offer innovative products and services that will take market share from legacy companies that will be more strained by the challenging economic conditions. Now is when an active approach should shine. Specifically, our "farm team" approach identifies and monitors premier companies within each relative index, but then waits for a favorable price. This should allow us to upgrade the portfolio to our very best ideas as relative valuations shift, as it is rare that we can own our full "wish list" roster of companies. We believe that our process will allow us to take advantage of this dynamic environment and will pay off over time.
28
Victory RS Small Cap Equity Fund
Investment Overview
(Unaudited)
Average Annual Total Return
Year Ended December 31, 2021
| | | Class A | | Class C | | Class R | | Class Y | | Member Class | | | |
INCEPTION DATE | | 5/1/97 | | 8/7/00 | | 5/15/01 | | 5/1/07 | | 11/2/20 | | | |
| | | Net Asset
Value | | Maximum
Offering
Price | | Net Asset
Value | | Contingent
Deferred
Charges | | Net Asset
Value | | Net Asset
Value | | Net Asset
Value | | Russell 2000®
Growth
Index1 | |
One Year | | | –7.36 | % | | | –12.69 | % | | | –8.14 | % | | | –8.88 | % | | | –7.87 | % | | | –7.25 | % | | | –7.35 | % | | | 2.83 | % | |
Five Year | | | 17.41 | % | | | 16.03 | % | | | 16.37 | % | | | 16.37 | % | | | 16.81 | % | | | 17.59 | % | | | NA | | | | 14.53 | % | |
Ten Year | | | 15.67 | % | | | 14.98 | % | | | 14.68 | % | | | 14.68 | % | | | 15.18 | % | | | 15.85 | % | | | NA | | | | 14.14 | % | |
Since Inception | | | NA | | | | NA | | | | NA | | | | NA | | | | NA | | | | NA | | | | 13.54 | % | | | NA | | |
The performance data quoted represents past performance and current returns may be lower or higher. The investment return and principal value will fluctuate so that an investor's shares, when redeemed, may be worth more or less than the original cost. To obtain performance information current to the most recent month's end, please visit www.vcm.com.
The maximum offering price ("MOP") figures reflect a maximum sales charge of 5.75% for Class A. Class C is not subject to an initial sales charge, but is subject to a deferred sales charge of 1.00% on shares redeemed within one year of purchase. Net Asset Value ("NAV") does not reflect sales charges.
Total return measures the price change in a share assuming the reinvestment of all net investment income and realized capital gain distributions, if any. The total returns quoted do not reflect adjustments made to the enclosed financial statements in accordance with U.S. Generally Accepted Accounting Principles or the deduction of taxes that a shareholder would pay on net investment income and realized capital gain distributions, including reinvested distributions, or redemptions of shares. The total return figures set forth above include all waivers of fees. Without such fee waivers, the total returns would have been lower.
Victory RS Small Cap Equity Fund — Growth of $10,000
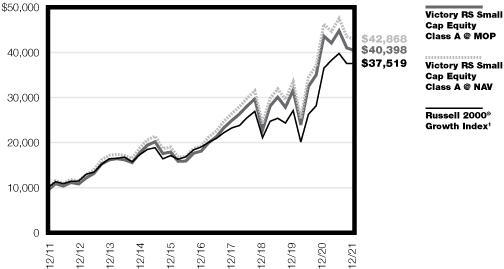
1The Russell 2000® Growth Index is an unmanaged market-capitalization-weighted index that measures the performance of those companies in the Russell 2000® Index with higher price-to-book ratios and higher forecasted growth values. Index results assume the reinvestment of dividends paid on the stocks constituting the index. This index does not include the effect of sales charges, commissions, expenses or taxes, is not representative of the Fund, and it is not possible to invest directly in an index.
The graph reflects investment of growth of a hypothetical $10,000 investment in the Fund.
The graph and table do not reflect the deduction of taxes that a shareholder would pay on Fund distributions or the redemption of shares.
Past performance is not indicative of future results.
29
Victory Portfolios
Victory RS Small Cap Growth Fund December 31, 2021
(Unaudited)
Investment Objective and Portfolio Holdings:
The Fund seeks to provide long-term capital growth.
Top 10 Holdings*:
December 31, 2021
(% of Net Assets)
MACOM Technology Solutions Holdings, Inc. | | | 3.2 | % | |
Avaya Holdings Corp. | | | 3.0 | % | |
Varonis Systems, Inc. | | | 2.6 | % | |
Advanced Energy Industries, Inc. | | | 2.3 | % | |
Evoqua Water Technologies Corp. | | | 2.2 | % | |
e.l.f. Beauty, Inc. | | | 1.9 | % | |
Saia, Inc. | | | 1.8 | % | |
Summit Materials, Inc. | | | 1.7 | % | |
Surgery Partners, Inc. | | | 1.7 | % | |
WNS Holdings Ltd. | | | 1.6 | % | |
Sector Allocation*:
December 31, 2021
(% of Net Assets)
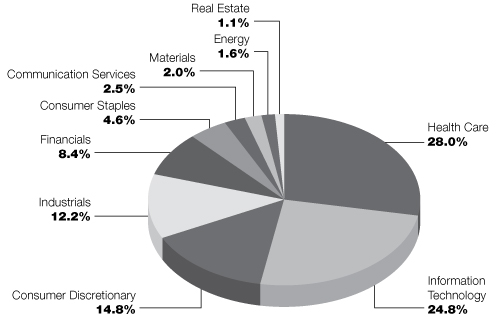
* Does not include futures contracts, money market instruments, and short-term investments purchased with cash collateral from securities loaned.
Percentages are of the net assets of the Fund and may not equal 100%.
Refer to the Schedule of Portfolio Investments for a complete list of securities.
30
Victory Portfolios
Victory RS Select Growth Fund December 31, 2021
(Unaudited)
Investment Objective and Portfolio Holdings:
The Fund seeks to provide long-term capital growth.
Top 10 Holdings*:
December 31, 2021
(% of Net Assets)
Horizon Therapeutics PLC | | | 3.6 | % | |
Dynatrace, Inc. | | | 3.3 | % | |
The Middleby Corp. | | | 2.9 | % | |
Churchill Downs, Inc. | | | 2.6 | % | |
Avantor, Inc. | | | 2.6 | % | |
Builders FirstSource, Inc. | | | 2.6 | % | |
Jazz Pharmaceuticals PLC | | | 2.5 | % | |
Halozyme Therapeutics, Inc. | | | 2.5 | % | |
Evoqua Water Technologies Corp. | | | 2.4 | % | |
Saia, Inc. | | | 2.2 | % | |
Sector Allocation*:
December 31, 2021
(% of Net Assets)
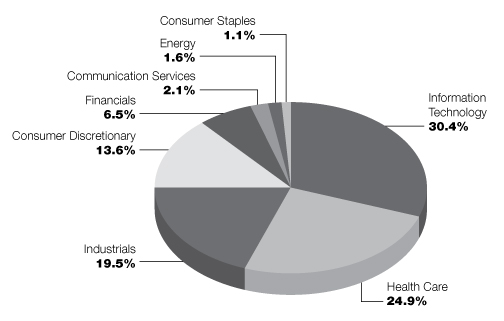
* Does not include futures contracts, money market instruments, and short-term investments purchased with cash collateral from securities loaned.
Percentages are of the net assets of the Fund and may not equal 100%.
Refer to the Schedule of Portfolio Investments for a complete list of securities.
31
Victory Portfolios
Victory RS Mid Cap Growth Fund December 31, 2021
(Unaudited)
Investment Objective and Portfolio Holdings:
The Fund seeks to provide long-term capital growth.
Top 10 Holdings*:
December 31, 2021
(% of Net Assets)
Synopsys, Inc. | | | 3.1 | % | |
West Pharmaceutical Services, Inc. | | | 2.3 | % | |
Palo Alto Networks, Inc. | | | 2.3 | % | |
Zscaler, Inc | | | 2.3 | % | |
Lululemon Athletica, Inc. | | | 2.3 | % | |
Avantor, Inc. | | | 2.2 | % | |
ZoomInfo Technologies, Inc. | | | 2.0 | % | |
RingCentral, Inc., Class A | | | 2.0 | % | |
LPL Financial Holdings, Inc. | | | 1.8 | % | |
Floor & Decor Holdings, Inc., Class A | | | 1.8 | % | |
Sector Allocation*:
December 31, 2021
(% of Net Assets)*

* Does not include futures contracts, money market instruments, and short-term investments purchased with cash collateral from securities loaned.
Percentages are of the net assets of the Fund and may not equal 100%.
Refer to the Schedule of Portfolio Investments for a complete list of securities.
32
Victory Portfolios
Victory RS Growth Fund December 31, 2021
(Unaudited)
Investment Objective and Portfolio Holdings:
The Fund seeks to provide long-term capital growth.
Top 10 Holdings*:
December 31, 2021
(% of Net Assets)
Microsoft Corp. | | | 11.9 | % | |
Apple, Inc. | | | 9.4 | % | |
Alphabet, Inc., Class C | | | 7.8 | % | |
Amazon.com, Inc. | | | 4.8 | % | |
Tesla, Inc. | | | 4.0 | % | |
NVIDIA Corp. | | | 3.8 | % | |
Visa, Inc., Class A | | | 2.9 | % | |
The Home Depot, Inc. | | | 2.8 | % | |
Lam Research Corp. | | | 2.3 | % | |
ServiceNow, Inc. | | | 2.1 | % | |
Sector Allocation*:
December 31, 2021
(% of Net Assets)*
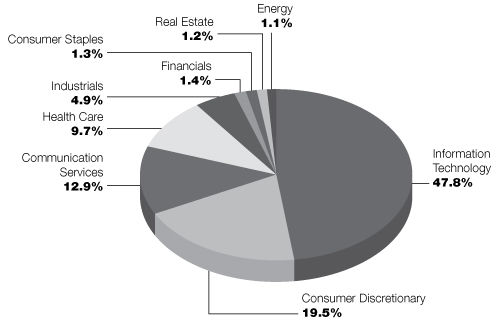
* Does not include futures contracts, money market instruments, and short-term investments purchased with cash collateral from securities loaned.
Percentages are of the net assets of the Fund and may not equal 100%.
Refer to the Schedule of Portfolio Investments for a complete list of securities.
33
Victory Portfolios
Victory RS Science and Technology Fund December 31, 2021
(Unaudited)
Investment Objective and Portfolio Holdings:
The Fund seeks to provide long-term capital growth.
Top 10 Holdings*:
December 31, 2021
(% of Net Assets)
Microsoft Corp. | | | 7.0 | % | |
Lam Research Corp. | | | 3.4 | % | |
NVIDIA Corp. | | | 3.3 | % | |
RingCentral, Inc., Class A | | | 3.2 | % | |
Amazon.com, Inc. | | | 3.1 | % | |
MACOM Technology Solutions Holdings, Inc. | | | 3.0 | % | |
Marvell Technology, Inc. | | | 2.4 | % | |
Ambarella, Inc. | | | 2.3 | % | |
Impinj, Inc. | | | 2.3 | % | |
ServiceNow, Inc. | | | 2.2 | % | |
Sector Allocation*:
December 31, 2021
(% of Net Assets)*
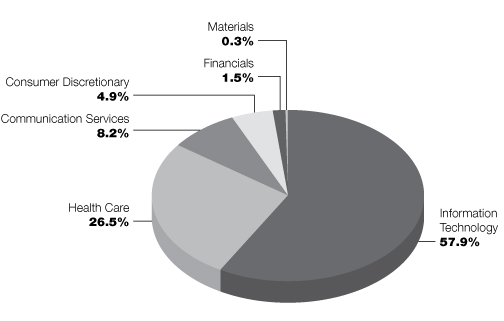
* Does not include futures contracts, money market instruments, and short-term investments purchased with cash collateral from securities loaned.
Percentages are of the net assets of the Fund and may not equal 100%.
Refer to the Schedule of Portfolio Investments for a complete list of securities.
34
Victory Portfolios
Victory RS Small Cap Equity Fund December 31, 2021
(Unaudited)
Investment Objective and Portfolio Holdings:
The Fund seeks to provide long-term capital growth.
Top 10 Holdings*:
December 31, 2021
(% of Net Assets)
PROG Holdings, Inc. | | | 6.4 | % | |
Evoqua Water Technologies Corp. | | | 6.3 | % | |
Avaya Holdings Corp. | | | 5.2 | % | |
MACOM Technology Solutions Holdings, Inc. | | | 5.1 | % | |
Paymentus Holdings, Inc., Class A | | | 4.1 | % | |
Acushnet Holdings Corp. | | | 3.7 | % | |
Shift4 Payments, Inc., Class A | | | 3.6 | % | |
Chart Industries, Inc. | | | 3.5 | % | |
ACI Worldwide, Inc. | | | 3.5 | % | |
John Bean Technologies Corp. | | | 3.5 | % | |
Sector Allocation*:
December 31, 2021
(% of Net Assets)*
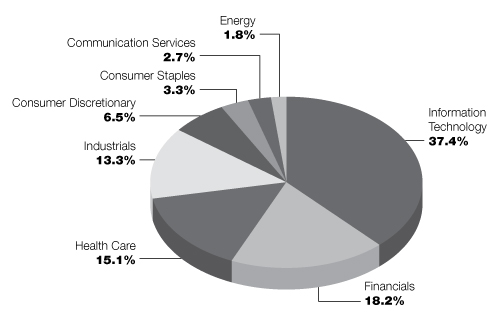
* Does not include futures contracts, money market instruments, and short-term investments purchased with cash collateral from securities loaned.
Percentages are of the net assets of the Fund and may not equal 100%.
Refer to the Schedule of Portfolio Investments for a complete list of securities.
35
Victory Portfolios
Victory RS Small Cap Growth Fund | | Schedule of Portfolio Investments
December 31, 2021 | |
Security Description | | Shares | | Value | |
Common Stocks (100.0%) | |
Biotechnology (12.9%): | |
Apellis Pharmaceuticals, Inc. (a) | | | 549,350 | | | $ | 25,973,268 | | |
Beam Therapeutics, Inc. (a) (b) | | | 258,800 | | | | 20,623,772 | | |
Bicycle Therapeutics PLC, ADR (a) (b) | | | 221,790 | | | | 13,500,357 | | |
Blueprint Medicines Corp. (a) | | | 183,730 | | | | 19,679,320 | | |
DermTech, Inc. (a) (b) | | | 413,570 | | | | 6,534,406 | | |
Editas Medicine, Inc. (a) (b) | | | 507,800 | | | | 13,482,090 | | |
Equillium, Inc. (a) (b) (c) | | | 1,578,220 | | | | 5,918,325 | | |
Fate Therapeutics, Inc. (a) | | | 445,310 | | | | 26,055,088 | | |
Intellia Therapeutics, Inc. (a) | | | 244,680 | | | | 28,930,963 | | |
Karuna Therapeutics, Inc. (a) | | | 134,640 | | | | 17,637,840 | | |
Opthea Ltd., ADR (a) | | | 764,370 | | | | 5,732,775 | | |
ORIC Pharmaceuticals, Inc. (a) (b) | | | 799,150 | | | | 11,747,505 | | |
Replimune Group, Inc. (a) | | | 431,490 | | | | 11,693,379 | | |
Rubius Therapeutics, Inc. (a) (b) | | | 1,179,390 | | | | 11,416,495 | | |
Sarepta Therapeutics, Inc. (a) | | | 213,870 | | | | 19,258,994 | | |
Scholar Rock Holding Corp. (a) (b) | | | 577,520 | | | | 14,345,597 | | |
SpringWorks Therapeutics, Inc. (a) | | | 341,520 | | | | 21,167,410 | | |
Twist Bioscience Corp. (a) | | | 221,210 | | | | 17,119,442 | | |
| | | | 290,817,026 | | |
Communication Services (2.5%): | |
Bandwidth, Inc., Class A (a) (b) | | | 474,470 | | | | 34,047,967 | | |
ZipRecruiter, Inc. (a) | | | 927,470 | | | | 23,131,102 | | |
| | | | 57,179,069 | | |
Consumer Discretionary (14.8%): | |
Acushnet Holdings Corp. | | | 504,950 | | | | 26,802,746 | | |
Crocs, Inc. (a) | | | 278,440 | | | | 35,701,577 | | |
Fox Factory Holding Corp. (a) | | | 188,900 | | | | 32,131,890 | | |
Gentherm, Inc. (a) | | | 228,680 | | | | 19,872,292 | | |
Meritage Homes Corp. (a) | | | 252,200 | | | | 30,783,532 | | |
Papa John's International, Inc. | | | 184,700 | | | | 24,651,909 | | |
Planet Fitness, Inc., Class A (a) | | | 336,150 | | | | 30,448,467 | | |
Porch Group, Inc. (a) (b) | | | 1,057,490 | | | | 16,486,269 | | |
Skyline Champion Corp. (a) | | | 223,650 | | | | 17,663,877 | | |
Steven Madden Ltd. | | | 386,430 | | | | 17,957,402 | | |
Warby Parker, Inc., Class A (a) (b) | | | 368,270 | | | | 17,146,651 | | |
Wingstop, Inc. | | | 206,480 | | | | 35,679,744 | | |
YETI Holdings, Inc. (a) | | | 314,530 | | | | 26,052,520 | | |
| | | | 331,378,876 | | |
Consumer Staples (4.6%): | |
BJ's Wholesale Club Holdings, Inc. (a) | | | 332,940 | | | | 22,296,992 | | |
Celsius Holdings, Inc. (a) (b) | | | 175,710 | | | | 13,102,695 | | |
e.l.f. Beauty, Inc. (a) (b) | | | 1,290,050 | | | | 42,842,561 | | |
Freshpet, Inc. (a) | | | 255,450 | | | | 24,336,721 | | |
| | | | 102,578,969 | | |
See notes to financial statements.
36
Victory Portfolios
Victory RS Small Cap Growth Fund | | Schedule of Portfolio Investments — continued
December 31, 2021 | |
Security Description | | Shares | | Value | |
Energy (1.6%): | |
Matador Resources Co. (b) | | | 637,010 | | | $ | 23,518,409 | | |
Ranger Oil Corp. (a) | | | 484,630 | | | | 13,046,240 | | |
| | | | 36,564,649 | | |
Financials (8.4%): | |
Customers Bancorp, Inc. | | | 233,840 | | | | 15,286,121 | | |
Focus Financial Partners, Inc., Class A (a) | | | 486,120 | | | | 29,031,086 | | |
Green Dot Corp., Class A (a) | | | 254,075 | | | | 9,207,678 | | |
Open Lending Corp., Class A (a) | | | 615,770 | | | | 13,842,510 | | |
PacWest Bancorp | | | 301,690 | | | | 13,627,337 | | |
PRA Group, Inc. (a) | | | 381,120 | | | | 19,136,035 | | |
PROG Holdings, Inc. (a) (b) | | | 690,530 | | | | 31,149,808 | | |
Walker & Dunlop, Inc. | | | 233,670 | | | | 35,256,130 | | |
Wintrust Financial Corp. | | | 253,490 | | | | 23,021,962 | | |
| | | | 189,558,667 | | |
Health Care Equipment & Supplies (4.6%): | |
Axonics, Inc. (a) (b) | | | 206,490 | | | | 11,563,440 | | |
CONMED Corp. (b) | | | 121,830 | | | | 17,270,621 | | |
CryoPort, Inc. (a) (b) | | | 482,090 | | | | 28,525,265 | | |
LivaNova PLC (a) | | | 141,470 | | | | 12,368,722 | | |
Nevro Corp. (a) | | | 188,230 | | | | 15,259,806 | | |
Shockwave Medical, Inc. (a) | | | 104,880 | | | | 18,703,251 | | |
| | | | 103,691,105 | | |
Health Care Providers & Services (3.9%): | |
HealthEquity, Inc. (a) | | | 438,570 | | | | 19,402,336 | | |
LHC Group, Inc. (a) (b) | | | 224,530 | | | | 30,812,252 | | |
Surgery Partners, Inc. (a) (b) | | | 694,680 | | | | 37,102,859 | | |
| | | | 87,317,447 | | |
Health Care Technology (5.0%): | |
Health Catalyst, Inc. (a) (b) | | | 420,560 | | | | 16,662,587 | | |
Inspire Medical Systems, Inc. (a) (b) | | | 129,650 | | | | 29,827,279 | | |
Omnicell, Inc. (a) | | | 202,080 | | | | 36,463,315 | | |
Vocera Communications, Inc. (a) (b) | | | 443,670 | | | | 28,767,563 | | |
| | | | 111,720,744 | | |
Industrials (12.2%): | |
Advanced Drainage Systems, Inc. | | | 134,500 | | | | 18,309,485 | | |
Arcosa, Inc. (b) | | | 487,310 | | | | 25,681,237 | | |
Chart Industries, Inc. (a) | | | 134,940 | | | | 21,521,581 | | |
Evoqua Water Technologies Corp. (a) | | | 1,080,820 | | | | 50,528,335 | | |
Herc Holdings, Inc. (b) | | | 155,740 | | | | 24,381,097 | | |
John Bean Technologies Corp. | | | 184,940 | | | | 28,399,386 | | |
Saia, Inc. (a) | | | 118,850 | | | | 40,056,015 | | |
Simpson Manufacturing Co., Inc. | | | 218,040 | | | | 30,322,823 | | |
SPX Flow, Inc. | | | 225,220 | | | | 19,477,026 | | |
The AZEK Co., Inc. (a) | | | 346,350 | | | | 16,015,224 | | |
| | | | 274,692,209 | | |
See notes to financial statements.
37
Victory Portfolios
Victory RS Small Cap Growth Fund | | Schedule of Portfolio Investments — continued
December 31, 2021 | |
Security Description | | Shares | | Value | |
Information Technology (24.8%): | |
ACI Worldwide, Inc. (a) | | | 652,330 | | | $ | 22,635,851 | | |
Advanced Energy Industries, Inc. | | | 561,140 | | | | 51,097,408 | | |
Avaya Holdings Corp. (a) | | | 3,354,460 | | | | 66,418,308 | | |
DigitalOcean Holdings, Inc. (a) (b) | | | 425,190 | | | | 34,155,513 | | |
Everbridge, Inc. (a) | | | 130,480 | | | | 8,785,218 | | |
Jamf Holding Corp. (a) (b) | | | 467,240 | | | | 17,759,792 | | |
Lattice Semiconductor Corp. (a) | | | 388,390 | | | | 29,929,333 | | |
MACOM Technology Solutions Holdings, Inc. (a) | | | 923,923 | | | | 72,343,171 | | |
Paya Holdings, Inc. (a) | | | 1,637,070 | | | | 10,379,024 | | |
Paymentus Holdings, Inc., Class A (a) (b) | | | 495,010 | | | | 17,315,450 | | |
Q2 Holdings, Inc. (a) | | | 199,890 | | | | 15,879,262 | | |
Silicon Laboratories, Inc. (a) | | | 153,850 | | | | 31,757,717 | | |
SiTime Corp. (a) (b) | | | 90,400 | | | | 26,445,616 | | |
Smartsheet, Inc., Class A (a) | | | 345,160 | | | | 26,732,642 | | |
Telos Corp. (a) (b) | | | 818,000 | | | | 12,613,560 | | |
Varonis Systems, Inc. (a) (b) | | | 1,177,310 | | | | 57,429,182 | | |
Wix.com Ltd. (a) (b) | | | 123,340 | | | | 19,461,819 | | |
WNS Holdings Ltd., ADR (a) | | | 415,827 | | | | 36,684,258 | | |
| | | | 557,823,124 | | |
Life Sciences Tools & Services (0.7%): | |
Codexis, Inc. (a) | | | 488,520 | | | | 15,276,020 | | |
Materials (2.0%): | |
Kronos Bio, Inc. (a) (b) | | | 602,070 | | | | 8,182,131 | | |
Summit Materials, Inc., Class A (a) | | | 939,450 | | | | 37,709,523 | | |
| | | | 45,891,654 | | |
Pharmaceuticals (0.9%): | |
Compass Pathways PLC, ADR (a) (b) | | | 357,990 | | | | 7,911,579 | | |
PMV Pharmaceuticals, Inc. (a) (b) | | | 503,110 | | | | 11,621,841 | | |
| | | | 19,533,420 | | |
Real Estate (1.1%): | |
National Storage Affiliates Trust | | | 347,270 | | | | 24,031,084 | | |
Total Common Stocks (Cost $1,805,404,209) | | | 2,248,054,063 | | |
Collateral for Securities Loaned (7.3%)^ | |
BlackRock Liquidity Funds TempFund Portfolio, Institutional Shares,
0.04% (d) | | | 3,804,301 | | | | 3,804,301 | | |
Fidelity Investments Money Market Government Portfolio, Institutional
Shares, 0.01% (d) | | | 74,716,974 | | | | 74,716,974 | | |
Goldman Sachs Financial Square Prime Obligations Fund, Institutional
Shares, 0.02% (d) | | | 1,898,534 | | | | 1,898,534 | | |
See notes to financial statements.
38
Victory Portfolios
Victory RS Small Cap Growth Fund | | Schedule of Portfolio Investments — continued
December 31, 2021 | |
Security Description | | Shares | | Value | |
JPMorgan Prime Money Market Fund, Capital Shares, 0.07% (d) | | | 15,138,323 | | | $ | 15,138,323 | | |
Morgan Stanley Institutional Liquidity Prime Portfolio, Institutional Shares,
0.06% (d) | | | 68,064,854 | | | | 68,064,854 | | |
Total Collateral for Securities Loaned (Cost $163,622,986) | | | 163,622,986 | | |
Total Investments (Cost $1,969,027,195) — 107.3% | | | 2,411,677,049 | | |
Liabilities in excess of other assets — (7.3)% | | | (164,145,166 | ) | |
NET ASSETS — 100.00% | | $ | 2,247,531,883 | | |
^ Purchased with cash collateral from securities on loan.
(a) Non-income producing security.
(b) All or a portion of this security is on loan.
(c) Affiliated security (See Note 8 in the Notes to Financial Statements).
(d) Rate disclosed is the daily yield on December 31, 2021.
ADR — American Depositary Receipt
PLC — Public Limited Company
See notes to financial statements.
39
Victory Portfolios
Victory RS Select Growth Fund | | Schedule of Portfolio Investments
December 31, 2021 | |
Security Description | | Shares | | Value | |
Common Stocks (99.7%) | |
Communication Services (2.1%): | |
Bandwidth, Inc., Class A (a) (b) | | | 25,810 | | | $ | 1,852,126 | | |
IAC/InterActiveCorp (a) | | | 18,050 | | | | 2,359,315 | | |
| | | | 4,211,441 | | |
Consumer Discretionary (13.6%): | |
Churchill Downs, Inc. (b) | | | 21,640 | | | | 5,213,076 | | |
Crocs, Inc. (a) | | | 28,600 | | | | 3,667,092 | | |
Floor & Decor Holdings, Inc., Class A (a) | | | 30,000 | | | | 3,900,300 | | |
Planet Fitness, Inc., Class A (a) | | | 46,560 | | | | 4,217,405 | | |
Pool Corp. | | | 6,420 | | | | 3,633,720 | | |
Wingstop, Inc. | | | 16,070 | | | | 2,776,896 | | |
YETI Holdings, Inc. (a) | | | 44,190 | | | | 3,660,257 | | |
| | | | 27,068,746 | | |
Consumer Staples (1.1%): | |
Freshpet, Inc. (a) | | | 22,640 | | | | 2,156,913 | | |
Energy (1.6%): | |
Diamondback Energy, Inc. | | | 29,140 | | | | 3,142,749 | | |
Financials (6.5%): | |
Focus Financial Partners, Inc., Class A (a) | | | 70,460 | | | | 4,207,871 | | |
LPL Financial Holdings, Inc. | | | 27,210 | | | | 4,356,049 | | |
Western Alliance Bancorp | | | 39,940 | | | | 4,299,541 | | |
| | | | 12,863,461 | | |
Health Care (24.9%): | |
Avantor, Inc. (a) | | | 123,660 | | | | 5,211,032 | | |
Charles River Laboratories International, Inc. (a) | | | 6,500 | | | | 2,449,070 | | |
Codexis, Inc. (a) | | | 87,200 | | | | 2,726,744 | | |
CryoPort, Inc. (a) | | | 39,040 | | | | 2,309,997 | | |
Envista Holdings Corp. (a) | | | 63,100 | | | | 2,843,286 | | |
Halozyme Therapeutics, Inc. (a) | | | 121,450 | | | | 4,883,504 | | |
HealthEquity, Inc. (a) | | | 44,750 | | | | 1,979,740 | | |
Horizon Therapeutics PLC (a) | | | 66,050 | | | | 7,117,548 | | |
Jazz Pharmaceuticals PLC (a) | | | 38,750 | | | | 4,936,750 | | |
LHC Group, Inc. (a) (b) | | | 16,950 | | | | 2,326,049 | | |
Omnicell, Inc. (a) | | | 16,840 | | | | 3,038,610 | | |
Shockwave Medical, Inc. (a) | | | 9,130 | | | | 1,628,153 | | |
Tandem Diabetes Care, Inc. (a) (b) | | | 28,400 | | | | 4,274,768 | | |
Tenet Healthcare Corp. (a) | | | 22,270 | | | | 1,819,236 | | |
Twist Bioscience Corp. (a) | | | 25,240 | | | | 1,953,324 | | |
| | | | 49,497,811 | | |
Industrials (19.5%): | |
Advanced Drainage Systems, Inc. | | | 26,430 | | | | 3,597,916 | | |
Axon Enterprise, Inc. (a) | | | 21,120 | | | �� | 3,315,840 | | |
Builders FirstSource, Inc. (a) | | | 59,730 | | | | 5,119,458 | | |
Chart Industries, Inc. (a) | | | 14,700 | | | | 2,344,503 | | |
Evoqua Water Technologies Corp. (a) | | | 100,180 | | | | 4,683,415 | | |
See notes to financial statements.
40
Victory Portfolios
Victory RS Select Growth Fund | | Schedule of Portfolio Investments — continued
December 31, 2021 | |
Security Description | | Shares | | Value | |
Saia, Inc. (a) | | | 13,240 | | | $ | 4,462,277 | | |
SiteOne Landscape Supply, Inc. (a) | | | 13,480 | | | | 3,265,935 | | |
The Middleby Corp. (a) | | | 29,620 | | | | 5,828,031 | | |
Trex Co., Inc. (a) | | | 16,610 | | | | 2,242,848 | | |
WillScot Mobile Mini Holdings Corp. (a) (b) | | | 97,070 | | | | 3,964,339 | | |
| | | | 38,824,562 | | |
IT Services (1.1%): | |
Shift4 Payments, Inc., Class A (a) (b) | | | 36,870 | | | | 2,135,879 | | |
Semiconductors & Semiconductor Equipment (12.1%): | |
Enphase Energy, Inc. (a) | | | 18,540 | | | | 3,391,708 | | |
Entegris, Inc. | | | 27,380 | | | | 3,794,320 | | |
Lattice Semiconductor Corp. (a) | | | 41,100 | | | | 3,167,166 | | |
MACOM Technology Solutions Holdings, Inc. (a) | | | 50,730 | | | | 3,972,159 | | |
MKS Instruments, Inc. | | | 23,870 | | | | 4,157,438 | | |
Monolithic Power Systems, Inc. | | | 5,875 | | | | 2,898,314 | | |
SiTime Corp. (a) | | | 9,100 | | | | 2,662,114 | | |
| | | | 24,043,219 | | |
Software (17.2%): | |
ACI Worldwide, Inc. (a) | | | 84,940 | | | | 2,947,418 | | |
Avaya Holdings Corp. (a) | | | 170,000 | | | | 3,366,000 | | |
Dynatrace, Inc. (a) | | | 107,140 | | | | 6,465,899 | | |
Fair Isaac Corp. (a) | | | 7,010 | | | | 3,040,027 | | |
Five9, Inc. (a) | | | 23,870 | | | | 3,277,828 | | |
Globant SA (a) | | | 7,250 | | | | 2,277,153 | | |
Paylocity Holding Corp. (a) | | | 12,090 | | | | 2,855,174 | | |
Q2 Holdings, Inc. (a) | | | 30,400 | | | | 2,414,976 | | |
RingCentral, Inc., Class A (a) | | | 18,030 | | | | 3,377,920 | | |
Varonis Systems, Inc. (a) | | | 86,910 | | | | 4,239,470 | | |
| | | | 34,261,865 | | |
Total Common Stocks (Cost $151,291,890) | | | 198,206,646 | | |
Collateral for Securities Loaned (0.8%)^ | |
BlackRock Liquidity Funds TempFund Portfolio, Institutional Shares, 0.04% (c) | | | 35,763 | | | | 35,763 | | |
Fidelity Investments Money Market Government Portfolio, Institutional Shares,
0.01% (c) | | | 702,394 | | | | 702,394 | | |
Goldman Sachs Financial Square Prime Obligations Fund, Institutional Shares,
0.02% (c) | | | 17,848 | | | | 17,848 | | |
JPMorgan Prime Money Market Fund, Capital Shares, 0.07% (c) | | | 142,311 | | | | 142,311 | | |
Morgan Stanley Institutional Liquidity Prime Portfolio, Institutional Shares,
0.06% (c) | | | 639,859 | | | | 639,859 | | |
Total Collateral for Securities Loaned (Cost $1,538,175) | | | 1,538,175 | | |
Total Investments (Cost $152,830,065) — 100.5% | | | 199,744,821 | | |
Liabilities in excess of other assets — (0.5)% | | | (1,061,872 | ) | |
NET ASSETS — 100.00% | | $ | 198,682,949 | | |
^ Purchased with cash collateral from securities on loan.
See notes to financial statements.
41
Victory Portfolios
Victory RS Select Growth Fund | | Schedule of Portfolio Investments — continued
December 31, 2021 | |
(a) Non-income producing security.
(b) All or a portion of this security is on loan.
(c) Rate disclosed is the daily yield on December 31, 2021.
PLC — Public Limited Company
See notes to financial statements.
42
Victory Portfolios
Victory RS Mid Cap Growth Fund | | Schedule of Portfolio Investments
December 31, 2021 | |
Security Description | | Shares | | Value | |
Common Stocks (98.7%) | |
Communication Services (4.7%): | |
Match Group, Inc. (a) | | | 22,164 | | | $ | 2,931,189 | | |
Take-Two Interactive Software, Inc. (a) | | | 24,300 | | | | 4,318,596 | | |
Twitter, Inc. (a) | | | 58,520 | | | | 2,529,234 | | |
ZoomInfo Technologies, Inc. (a) | | | 117,130 | | | | 7,519,746 | | |
| | | | 17,298,765 | | |
Communications Equipment (1.3%): | |
Arista Networks, Inc. (a) | | | 34,180 | | | | 4,913,375 | | |
Consumer Discretionary (14.5%): | |
Aptiv PLC (a) | | | 18,020 | | | | 2,972,399 | | |
Caesars Entertainment, Inc. (a) | | | 67,260 | | | | 6,290,828 | | |
Chipotle Mexican Grill, Inc. (a) | | | 3,370 | | | | 5,891,603 | | |
Darden Restaurants, Inc. | | | 15,440 | | | | 2,325,882 | | |
Etsy, Inc. (a) | | | 21,470 | | | | 4,700,642 | | |
Floor & Decor Holdings, Inc., Class A (a) | | | 52,440 | | | | 6,817,724 | | |
Lululemon Athletica, Inc. (a) | | | 21,260 | | | | 8,322,227 | | |
Meritage Homes Corp. (a) | | | 35,890 | | | | 4,380,733 | | |
O'Reilly Automotive, Inc. (a) | | | 6,440 | | | | 4,548,121 | | |
Pool Corp. | | | 6,770 | | | | 3,831,820 | | |
YETI Holdings, Inc. (a) | | | 45,960 | | | | 3,806,867 | | |
| | | | 53,888,846 | | |
Consumer Staples (0.7%): | |
Freshpet, Inc. (a) | | | 28,890 | | | | 2,752,350 | | |
Electronic Equipment, Instruments & Components (3.8%): | |
Keysight Technologies, Inc. (a) | | | 19,350 | | | | 3,995,969 | | |
Teledyne Technologies, Inc. (a) | | | 12,270 | | | | 5,360,640 | | |
Trimble, Inc. (a) | | | 55,220 | | | | 4,814,632 | | |
| | | | 14,171,241 | | |
Energy (1.6%): | |
Diamondback Energy, Inc. | | | 53,490 | | | | 5,768,897 | | |
Financials (6.5%): | |
LPL Financial Holdings, Inc. | | | 42,710 | | | | 6,837,444 | | |
MSCI, Inc. | | | 10,490 | | | | 6,427,118 | | |
Tradeweb Markets, Inc., Class A (b) | | | 43,100 | | | | 4,316,034 | | |
Western Alliance Bancorp | | | 61,660 | | | | 6,637,699 | | |
| | | | 24,218,295 | | |
Health Care (18.1%): | |
Align Technology, Inc. (a) | | | 5,530 | | | | 3,634,205 | | |
AmerisourceBergen Corp. | | | 38,020 | | | | 5,052,478 | | |
Apellis Pharmaceuticals, Inc. (a) | | | 59,410 | | | | 2,808,905 | | |
Avantor, Inc. (a) | | | 192,500 | | | | 8,111,950 | | |
Charles River Laboratories International, Inc. (a) | | | 11,430 | | | | 4,306,595 | | |
DexCom, Inc. (a) | | | 8,600 | | | | 4,617,770 | | |
Horizon Therapeutics PLC (a) | | | 41,770 | | | | 4,501,135 | | |
Intellia Therapeutics, Inc. (a) | | | 15,080 | | | | 1,783,059 | | |
See notes to financial statements.
43
Victory Portfolios
Victory RS Mid Cap Growth Fund | | Schedule of Portfolio Investments — continued
December 31, 2021 | |
Security Description | | Shares | | Value | |
Jazz Pharmaceuticals PLC (a) | | | 33,050 | | | $ | 4,210,570 | | |
Mirati Therapeutics, Inc. (a) | | | 17,920 | | | | 2,628,685 | | |
ResMed, Inc. | | | 15,160 | | | | 3,948,877 | | |
Sarepta Therapeutics, Inc. (a) | | | 31,590 | | | | 2,844,680 | | |
Tandem Diabetes Care, Inc. (a) | | | 18,320 | | | | 2,757,526 | | |
Tenet Healthcare Corp. (a) | | | 27,760 | | | | 2,267,714 | | |
Veeva Systems, Inc., Class A (a) | | | 20,120 | | | | 5,140,258 | | |
West Pharmaceutical Services, Inc. | | | 18,100 | | | | 8,489,081 | | |
| | | | 67,103,488 | | |
Industrials (14.5%): | |
Advanced Drainage Systems, Inc. | | | 18,420 | | | | 2,507,515 | | |
Axon Enterprise, Inc. (a) | | | 24,090 | | | | 3,782,130 | | |
Builders FirstSource, Inc. (a) | | | 53,470 | | | | 4,582,914 | | |
Carrier Global Corp. | | | 94,120 | | | | 5,105,069 | | |
Chart Industries, Inc. (a) | | | 19,330 | | | | 3,082,942 | | |
CoStar Group, Inc. (a) | | | 49,850 | | | | 3,939,645 | | |
Generac Holdings, Inc. (a) | | | 14,680 | | | | 5,166,186 | | |
IDEX Corp. | | | 19,910 | | | | 4,705,131 | | |
Regal Rexnord Corp. | | | 11,150 | | | | 1,897,507 | | |
Saia, Inc. (a) | | | 10,910 | | | | 3,676,997 | | |
SiteOne Landscape Supply, Inc. (a) | | | 11,020 | | | | 2,669,926 | | |
The Middleby Corp. (a) | | | 28,570 | | | | 5,621,433 | | |
Trex Co., Inc. (a) | | | 18,000 | | | | 2,430,540 | | |
WillScot Mobile Mini Holdings Corp. (a) | | | 110,310 | | | | 4,505,060 | | |
| | | | 53,672,995 | | |
IT Services (2.4%): | |
Gartner, Inc. (a) | | | 11,870 | | | | 3,968,378 | | |
Wix.com Ltd. (a) | | | 32,373 | | | | 5,108,136 | | |
| | | | 9,076,514 | | |
Real Estate (0.5%): | |
Extra Space Storage, Inc. | | | 8,170 | | | | 1,852,384 | | |
Semiconductors & Semiconductor Equipment (8.7%): | |
Enphase Energy, Inc. (a) | | | 23,540 | | | | 4,306,408 | | |
Entegris, Inc. | | | 47,680 | | | | 6,607,494 | | |
Lattice Semiconductor Corp. (a) | | | 64,730 | | | | 4,988,094 | | |
Marvell Technology, Inc. | | | 64,760 | | | | 5,665,852 | | |
Monolithic Power Systems, Inc. | | | 12,410 | | | | 6,122,225 | | |
Teradyne, Inc. | | | 27,790 | | | | 4,544,499 | | |
| | | | 32,234,572 | | |
Software (21.4%): | |
AppLovin Corp., Class A (a) (b) | | | 66,400 | | | | 6,258,864 | | |
Bill.com Holdings, Inc. (a) | | | 14,300 | | | | 3,562,845 | | |
Crowdstrike Holdings, Inc., Class A (a) | | | 19,860 | | | | 4,066,335 | | |
Datadog, Inc., Class A (a) | | | 17,470 | | | | 3,111,582 | | |
DocuSign, Inc. (a) | | | 15,410 | | | | 2,347,097 | | |
Dropbox, Inc., Class A (a) | | | 132,130 | | | | 3,242,470 | | |
Dynatrace, Inc. (a) | | | 107,400 | | | | 6,481,590 | | |
See notes to financial statements.
44
Victory Portfolios
Victory RS Mid Cap Growth Fund | | Schedule of Portfolio Investments — continued
December 31, 2021 | |
Security Description | | Shares | | Value | |
Fair Isaac Corp. (a) | | | 9,060 | | | $ | 3,929,050 | | |
Five9, Inc. (a) | | | 26,530 | | | | 3,643,100 | | |
Freshworks, Inc., Class A (a) (b) | | | 122,830 | | | | 3,225,516 | | |
Palo Alto Networks, Inc. (a) | | | 15,110 | | | | 8,412,644 | | |
Paycom Software, Inc. (a) | | | 8,660 | | | | 3,595,545 | | |
RingCentral, Inc., Class A (a) | | | 39,370 | | | | 7,375,969 | | |
Synopsys, Inc. (a) | | | 31,560 | | | | 11,629,860 | | |
Zscaler, Inc. (a) | | | 26,000 | | | | 8,354,580 | | |
| | | | 79,237,047 | | |
Total Common Stocks (Cost $264,820,102) | | | 366,188,769 | | |
Collateral for Securities Loaned (2.6%)^ | |
BlackRock Liquidity Funds TempFund Portfolio, Institutional Shares, 0.04% (c) | | | 223,160 | | | | 223,160 | | |
Fidelity Investments Money Market Government Portfolio, Institutional Shares,
0.01% (c) | | | 4,382,883 | | | | 4,382,883 | | |
Goldman Sachs Financial Square Prime Obligations Fund, Institutional Shares,
0.02% (c) | | | 111,368 | | | | 111,368 | | |
JPMorgan Prime Money Market Fund, Capital Shares, 0.07% (c) | | | 888,011 | | | | 888,011 | | |
Morgan Stanley Institutional Liquidity Prime Portfolio, Institutional Shares,
0.06% (c) | | | 3,992,671 | | | | 3,992,671 | | |
Total Collateral for Securities Loaned (Cost $9,598,093) | | | 9,598,093 | | |
Total Investments (Cost $274,418,195) — 101.3% | | | 375,786,862 | | |
Liabilities in excess of other assets — (1.3)% | | | (4,997,211 | ) | |
NET ASSETS — 100.00% | | $ | 370,789,651 | | |
^ Purchased with cash collateral from securities on loan.
(a) Non-income producing security.
(b) All or a portion of this security is on loan.
(c) Rate disclosed is the daily yield on December 31, 2021.
PLC — Public Limited Company
See notes to financial statements.
45
Victory Portfolios
Victory RS Growth Fund | | Schedule of Portfolio Investments
December 31, 2021 | |
Security Description | | Shares | | Value | |
Common Stocks (99.8%) | |
Communication Services (12.9%): | |
Alphabet, Inc., Class C (a) | | | 9,331 | | | $ | 27,000,088 | | |
Meta Platforms, Inc., Class A (a) | | | 21,400 | | | | 7,197,890 | | |
Netflix, Inc. (a) | | | 11,210 | | | | 6,753,353 | | |
Twitter, Inc. (a) | | | 77,770 | | | | 3,361,219 | | |
| | | | 44,312,550 | | |
Consumer Discretionary (19.5%): | |
Amazon.com, Inc. (a) | | | 4,920 | | | | 16,404,953 | | |
Aptiv PLC (a) | | | 19,440 | | | | 3,206,628 | | |
Caesars Entertainment, Inc. (a) | | | 63,310 | | | | 5,921,384 | | |
Chipotle Mexican Grill, Inc. (a) | | | 1,680 | | | | 2,937,060 | | |
Lululemon Athletica, Inc. (a) | | | 16,370 | | | | 6,408,036 | | |
O'Reilly Automotive, Inc. (a) | | | 6,510 | | | | 4,597,557 | | |
Target Corp. | | | 18,460 | | | | 4,272,383 | | |
Tesla, Inc. (a) | | | 13,080 | | | | 13,822,682 | | |
The Home Depot, Inc. | | | 23,125 | | | | 9,597,106 | | |
| | | | 67,167,789 | | |
Consumer Staples (1.3%): | |
Constellation Brands, Inc., Class A | | | 17,350 | | | | 4,354,330 | | |
Energy (1.1%): | |
Diamondback Energy, Inc. | | | 34,760 | | | | 3,748,866 | | |
Financials (1.4%): | |
LPL Financial Holdings, Inc. | | | 29,570 | | | | 4,733,861 | | |
Health Care (9.7%): | |
Align Technology, Inc. (a) | | | 5,300 | | | | 3,483,054 | | |
Avantor, Inc. (a) | | | 81,430 | | | | 3,431,460 | | |
Charles River Laboratories International, Inc. (a) | | | 10,030 | | | | 3,779,103 | | |
DexCom, Inc. (a) | | | 5,090 | | | | 2,733,076 | | |
Horizon Therapeutics PLC (a) | | | 30,970 | | | | 3,337,327 | | |
Jazz Pharmaceuticals PLC (a) | | | 28,020 | | | | 3,569,748 | | |
Tenet Healthcare Corp. (a) | | | 27,170 | | | | 2,219,517 | | |
West Pharmaceutical Services, Inc. | | | 9,970 | | | | 4,676,030 | | |
Zoetis, Inc. | | | 25,810 | | | | 6,298,414 | | |
| | | | 33,527,729 | | |
Industrials (4.9%): | |
Carrier Global Corp. | | | 64,720 | | | | 3,510,413 | | |
Generac Holdings, Inc. (a) | | | 12,270 | | | | 4,318,058 | | |
IDEX Corp. | | | 22,120 | | | | 5,227,399 | | |
IHS Markit Ltd. | | | 29,330 | | | | 3,898,544 | | |
| | | | 16,954,414 | | |
IT Services (6.5%): | |
Gartner, Inc. (a) | | | 11,030 | | | | 3,687,550 | | |
PayPal Holdings, Inc. (a) | | | 17,990 | | | | 3,392,554 | | |
Twilio, Inc., Class A (a) | | | 20,140 | | | | 5,303,668 | | |
Visa, Inc., Class A (b) | | | 46,497 | | | | 10,076,365 | | |
| | | | 22,460,137 | | |
See notes to financial statements.
46
Victory Portfolios
Victory RS Growth Fund | | Schedule of Portfolio Investments — continued
December 31, 2021 | |
Security Description | | Shares | | Value | |
Real Estate (1.2%): | |
Extra Space Storage, Inc. | | | 7,890 | | | $ | 1,788,900 | | |
SBA Communications Corp. | | | 6,420 | | | | 2,497,508 | | |
| | | | 4,286,408 | | |
Semiconductors & Semiconductor Equipment (10.6%): | |
Advanced Micro Devices, Inc. (a) | | | 45,750 | | | | 6,583,425 | | |
Lam Research Corp. | | | 10,770 | | | | 7,745,246 | | |
Marvell Technology, Inc. | | | 57,860 | | | | 5,062,171 | | |
NVIDIA Corp. | | | 44,770 | | | | 13,167,305 | | |
Teradyne, Inc. | | | 23,860 | | | | 3,901,826 | | |
| | | | 36,459,973 | | |
Software (21.3%): | |
AppLovin Corp., Class A (a) (b) | | | 38,720 | | | | 3,649,747 | | |
Fair Isaac Corp. (a) | | | 8,740 | | | | 3,790,276 | | |
Microsoft Corp. | | | 122,210 | | | | 41,101,667 | | |
Palo Alto Networks, Inc. (a) | | | 8,220 | | | | 4,576,567 | | |
RingCentral, Inc., Class A (a) | | | 20,450 | | | | 3,831,308 | | |
ServiceNow, Inc. (a) | | | 11,240 | | | | 7,295,996 | | |
Synopsys, Inc. (a) | | | 14,230 | | | | 5,243,755 | | |
Workday, Inc., Class A (a) | | | 14,630 | | | | 3,996,623 | | |
| | | | 73,485,939 | | |
Technology Hardware, Storage & Peripherals (9.4%): | |
Apple, Inc. | | | 182,948 | | | | 32,486,076 | | |
Total Common Stocks (Cost $179,413,657) | | | 343,978,072 | | |
Collateral for Securities Loaned (3.1%)^ | |
BlackRock Liquidity Funds TempFund Portfolio, Institutional Shares, 0.04% (c) | | | 245,729 | | | | 245,729 | | |
Fidelity Investments Money Market Government Portfolio, Institutional Shares,
0.01% (c) | | | 4,826,150 | | | | 4,826,150 | | |
Goldman Sachs Financial Square Prime Obligations Fund, Institutional Shares,
0.02% (c) | | | 122,631 | | | | 122,631 | | |
JPMorgan Prime Money Market Fund, Capital Shares, 0.07% (c) | | | 977,821 | | | | 977,821 | | |
Morgan Stanley Institutional Liquidity Prime Portfolio, Institutional Shares,
0.06% (c) | | | 4,396,473 | | | | 4,396,473 | | |
Total Collateral for Securities Loaned (Cost $10,568,804) | | | 10,568,804 | | |
Total Investments (Cost $189,982,461) — 102.9% | | | 354,546,876 | | |
Liabilities in excess of other assets — (2.9)% | | | (9,836,829 | ) | |
NET ASSETS — 100.00% | | $ | 344,710,047 | | |
^ Purchased with cash collateral from securities on loan.
(a) Non-income producing security.
(b) All or a portion of this security is on loan.
(c) Rate disclosed is the daily yield on December 31, 2021.
PLC — Public Limited Company
See notes to financial statements.
47
Victory Portfolios
Victory RS Science and Technology Fund | | Schedule of Portfolio Investments
December 31, 2021 | |
Security Description | | Shares | | Value | |
Common Stocks (99.3%) | |
Biotechnology (20.2%): | |
Alpha Teknova, Inc. (a) | | | 55,440 | | | $ | 1,135,411 | | |
Apellis Pharmaceuticals, Inc. (a) | | | 106,693 | | | | 5,044,445 | | |
Ardelyx, Inc. (a) (b) | | | 210,650 | | | | 231,715 | | |
Beam Therapeutics, Inc. (a) (b) | | | 28,450 | | | | 2,267,181 | | |
Better Therapeutics, Inc. | | | 276,000 | | | | 1,283,400 | | |
Bicycle Therapeutics PLC, ADR (a) | | | 40,879 | | | | 2,488,305 | | |
Blueprint Medicines Corp. (a) | | | 12,370 | | | | 1,324,951 | | |
Bridgebio Pharma, Inc. (a) | | | 61,390 | | | | 1,023,985 | | |
Cabaletta Bio, Inc. (a) | | | 158,460 | | | | 600,563 | | |
Caribou Biosciences, Inc. (a) | | | 57,980 | | | | 874,918 | | |
Celcuity, Inc. (a) (b) | | | 58,960 | | | | 777,682 | | |
Codiak Biosciences, Inc. (a) (b) | | | 87,660 | | | | 976,532 | | |
Crinetics Pharmaceuticals, Inc. (a) (b) | | | 76,348 | | | | 2,169,047 | | |
Cullinan Oncology, Inc. (a) (b) | | | 21,510 | | | | 331,899 | | |
DermTech, Inc. (a) (b) | | | 89,403 | | | | 1,412,567 | | |
Editas Medicine, Inc. (a) (b) | | | 53,430 | | | | 1,418,567 | | |
Equillium, Inc. (a) | | | 218,171 | | | | 818,141 | | |
Fate Therapeutics, Inc. (a) | | | 46,380 | | | | 2,713,694 | | |
Fusion Pharmaceuticals, Inc. (a) | | | 131,630 | | | | 548,897 | | |
Generation Bio Co. (a) (b) | | | 52,160 | | | | 369,293 | | |
Ginkgo Bioworks Holdings, Inc. (a) (b) | | | 174,460 | | | | 1,449,763 | | |
Gracell Biotechnologies, Inc., ADR (a) (b) | | | 36,220 | | | | 218,769 | | |
IGM Biosciences, Inc. (a) (b) | | | 13,910 | | | | 407,980 | | |
Ikena Oncology, Inc. (a) | | | 76,880 | | | | 964,075 | | |
Inhibrx, Inc. (a) | | | 48,750 | | | | 2,128,913 | | |
Intellia Therapeutics, Inc. (a) (b) | | | 30,390 | | | | 3,593,314 | | |
Iovance Biotherapeutics, Inc. (a) | | | 182,870 | | | | 3,490,988 | | |
Karuna Therapeutics, Inc. (a) | | | 11,420 | | | | 1,496,020 | | |
Kezar Life Sciences, Inc. (a) (b) | | | 239,696 | | | | 4,007,717 | | |
Kinnate Biopharma, Inc. (a) (b) | | | 82,950 | | | | 1,469,874 | | |
Lyell Immunopharma, Inc. (a) (b) | | | 137,830 | | | | 1,066,804 | | |
Marker Therapeutics, Inc. (a) | | | 445,930 | | | | 423,723 | | |
Merus NV (a) | | | 28,700 | | | | 912,660 | | |
Nuvalent, Inc., Class A (a) (b) | | | 48,450 | | | | 922,488 | | |
Omega Therapeutics, Inc. (a) (b) | | | 78,820 | | | | 893,031 | | |
Opthea Ltd., ADR (a) | | | 94,040 | | | | 705,300 | | |
ORIC Pharmaceuticals, Inc. (a) | | | 135,290 | | | | 1,988,763 | | |
Rain Therapeutics, Inc. (a) (b) | | | 72,400 | | | | 932,512 | | |
Regulus Therapeutics, Inc. (a) (b) | | | 1,768,489 | | | | 557,074 | | |
Replimune Group, Inc. (a) | | | 41,850 | | | | 1,134,135 | | |
Rubius Therapeutics, Inc. (a) (b) | | | 76,130 | | | | 736,938 | | |
Sarepta Therapeutics, Inc. (a) | | | 29,850 | | | | 2,687,993 | | |
Scholar Rock Holding Corp. (a) | | | 69,260 | | | | 1,720,418 | | |
Shattuck Labs, Inc. (a) | | | 135,930 | | | | 1,156,764 | | |
SpringWorks Therapeutics, Inc. (a) | | | 35,420 | | | | 2,195,332 | | |
Stoke Therapeutics, Inc. (a) | | | 29,330 | | | | 703,627 | | |
Surface Oncology, Inc. (a) (b) | | | 218,630 | | | | 1,045,051 | | |
See notes to financial statements.
48
Victory Portfolios
Victory RS Science and Technology Fund | | Schedule of Portfolio Investments — continued
December 31, 2021 | |
Security Description | | Shares | | Value | |
Sutro Biopharma, Inc. (a) | | | 98,910 | | | $ | 1,471,781 | | |
Twist Bioscience Corp. (a) | | | 13,000 | | | | 1,006,070 | | |
| | | | 69,299,070 | | |
Communication Services (8.2%): | |
Chicken Soup For The Soul Entertainment, Inc. (a) (b) | | | 60,680 | | | | 839,811 | | |
IAC/InterActiveCorp (a) | | | 14,330 | | | | 1,873,074 | | |
Match Group, Inc. (a) | | | 37,376 | | | | 4,942,976 | | |
Meta Platforms, Inc., Class A (a) | | | 17,980 | | | | 6,047,573 | | |
Roku, Inc. (a) | | | 10,430 | | | | 2,380,126 | | |
Snap, Inc., Class A (a) | | | 66,670 | | | | 3,135,490 | | |
Take-Two Interactive Software, Inc. (a) | | | 21,060 | | | | 3,742,783 | | |
Twitter, Inc. (a) | | | 110,080 | | | | 4,757,658 | | |
Vimeo, Inc. (a) (b) | | | 24,877 | | | | 446,791 | | |
| | | | 28,166,282 | | |
Consumer Discretionary (4.9%): | |
Amazon.com, Inc. (a) | | | 3,180 | | | | 10,603,201 | | |
Arco Platform Ltd., Class A (a) (b) | | | 46,560 | | | | 972,638 | | |
Booking Holdings, Inc. (a) | | | 1,600 | | | | 3,838,768 | | |
Farfetch Ltd., Class A (a) (b) | | | 40,790 | | | | 1,363,610 | | |
| | | | 16,778,217 | | |
Electronic Equipment, Instruments & Components (1.2%): | |
908 Devices, Inc. (a) (b) | | | 77,840 | | | | 2,013,721 | | |
Dolby Laboratories, Inc., Class A | | | 21,780 | | | | 2,073,891 | | |
| | | | 4,087,612 | | |
Financials (1.5%): | |
DA32 Life Science Tech Acquisition Corp., Class A (a) (c) | | | 239,885 | | | | 2,353,272 | | |
Omega Alpha SPAC, Class A (a) | | | 96,340 | | | | 941,242 | | |
Panacea Acquisition Corp. II (a) (c) | | | 192,150 | | | | 1,863,855 | | |
| | | | 5,158,369 | | |
Health Care Equipment & Supplies (1.3%): | |
BioLife Solutions, Inc. (a) | | | 43,660 | | | | 1,627,208 | | |
CryoPort, Inc. (a) | | | 50,543 | | | | 2,990,630 | | |
| | | | 4,617,838 | | |
Health Care Providers & Services (0.6%): | |
Science 37 Holdings, Inc. | | | 178,320 | | | | 2,223,650 | | |
Health Care Technology (0.7%): | |
Veeva Systems, Inc., Class A (a) | | | 9,880 | | | | 2,524,142 | | |
IT Services (7.2%): | |
Backblaze, Inc., Class A (a) (b) | | | 84,110 | | | | 1,420,618 | | |
GoDaddy, Inc., Class A (a) | | | 40,630 | | | | 3,447,862 | | |
PayPal Holdings, Inc. (a) | | | 14,300 | | | | 2,696,694 | | |
Twilio, Inc., Class A (a) | | | 25,200 | | | | 6,636,168 | | |
Visa, Inc., Class A | | | 19,320 | | | | 4,186,837 | | |
Wix.com Ltd. (a) | | | 41,160 | | | | 6,494,636 | | |
| | | | 24,882,815 | | |
See notes to financial statements.
49
Victory Portfolios
Victory RS Science and Technology Fund | | Schedule of Portfolio Investments — continued
December 31, 2021 | |
Security Description | | Shares | | Value | |
Life Sciences Tools & Services (2.7%): | |
10X Genomics, Inc., Class A (a) (b) | | | 18,650 | | | $ | 2,778,104 | | |
Absci Corp. (a) (b) | | | 62,880 | | | | 515,616 | | |
Berkeley Lights, Inc. (a) (b) | | | 56,140 | | | | 1,020,625 | | |
Codexis, Inc. (a) | | | 53,310 | | | | 1,667,004 | | |
Quanterix Corp. (a) | | | 43,490 | | | | 1,843,976 | | |
Singular Genomics Systems, Inc. (a) | | | 118,110 | | | | 1,365,352 | | |
| | | | 9,190,677 | | |
Materials (0.3%): | |
Kronos Bio, Inc. (a) (b) | | | 77,430 | | | | 1,052,274 | | |
Pharmaceuticals (1.0%): | |
Compass Pathways PLC, ADR (a) (b) | | | 43,050 | | | | 951,405 | | |
Marinus Pharmaceuticals, Inc. (a) | | | 63,624 | | | | 755,853 | | |
Nuvation Bio, Inc. (a) | | | 122,990 | | | | 1,045,415 | | |
PMV Pharmaceuticals, Inc. (a) (b) | | | 35,610 | | | | 822,591 | | |
| | | | 3,575,264 | | |
Semiconductors & Semiconductor Equipment (26.8%): | |
Ambarella, Inc. (a) | | | 39,130 | | | | 7,939,086 | | |
Applied Materials, Inc. | | | 37,670 | | | | 5,927,751 | | |
Ichor Holdings Ltd. (a) | | | 54,760 | | | | 2,520,603 | | |
Impinj, Inc. (a) (b) | | | 88,310 | | | | 7,833,097 | | |
Lam Research Corp. | | | 16,280 | | | | 11,707,762 | | |
Lattice Semiconductor Corp. (a) | | | 76,480 | | | | 5,893,549 | | |
MACOM Technology Solutions Holdings, Inc. (a) | | | 131,430 | | | | 10,290,969 | | |
Marvell Technology, Inc. | | | 92,910 | | | | 8,128,696 | | |
MKS Instruments, Inc. | | | 35,940 | | | | 6,259,670 | | |
Monolithic Power Systems, Inc. | | | 9,710 | | | | 4,790,234 | | |
NVIDIA Corp. | | | 38,700 | | | | 11,382,057 | | |
SiTime Corp. (a) | | | 17,370 | | | | 5,081,420 | | |
STMicroelectronics NV, NYS | | | 3,710 | | | | 181,345 | | |
Teradyne, Inc. | | | 25,090 | | | | 4,102,967 | | |
| | | | 92,039,206 | | |
Software (22.7%): | |
AppLovin Corp., Class A (a) (b) | | | 47,990 | | | | 4,523,537 | | |
Avaya Holdings Corp. (a) | | | 160,940 | | | | 3,186,612 | | |
Coupa Software, Inc. (a) | | | 11,170 | | | | 1,765,419 | | |
DocuSign, Inc. (a) | | | 23,930 | | | | 3,644,778 | | |
Domo, Inc., Class B (a) (b) | | | 59,220 | | | | 2,937,312 | | |
Dropbox, Inc., Class A (a) | | | 135,370 | | | | 3,321,980 | | |
Fair Isaac Corp. (a) | | | 6,910 | | | | 2,996,660 | | |
ironSource Ltd., Class A (a) | | | 182,760 | | | | 1,414,562 | | |
Microsoft Corp. | | | 72,040 | | | | 24,228,493 | | |
Paycom Software, Inc. (a) | | | 12,640 | | | | 5,248,002 | | |
RingCentral, Inc., Class A (a) | | | 59,570 | | | | 11,160,439 | | |
ServiceNow, Inc. (a) | | | 11,560 | | | | 7,503,712 | | |
Varonis Systems, Inc. (a) | | | 122,400 | | | | 5,970,672 | | |
| | | | 77,902,178 | | |
Total Common Stocks (Cost $205,522,092) | | | 341,497,594 | | |
See notes to financial statements.
50
Victory Portfolios
Victory RS Science and Technology Fund | | Schedule of Portfolio Investments — continued
December 31, 2021 | |
Security Description | | Shares | | Value | |
Warrants (0.1%) | |
Health Care (0.1%): | |
Nuvation Bio, Inc. | | | 47,260 | | | $ | 89,321 | | |
Regulus Therapeutics, Inc. (c) (d) (e) (f) | | | 1,326,367 | | | | — | | |
| | | | 89,321 | | |
Total Warrants (Cost $165,796) | | | 89,321 | | |
Collateral for Securities Loaned (8.1%)^ | |
BlackRock Liquidity Funds TempFund Portfolio, Institutional Shares, 0.04% (g) | | | 651,241 | | | | 651,241 | | |
Fidelity Investments Money Market Government Portfolio, Institutional Shares,
0.01% (g) | | | 12,790,461 | | | | 12,790,461 | | |
Goldman Sachs Financial Square Prime Obligations Fund, Institutional Shares,
0.02% (g) | | | 325,002 | | | | 325,002 | | |
JPMorgan Prime Money Market Fund, Capital Shares, 0.07% (g) | | | 2,591,461 | | | | 2,591,461 | | |
Morgan Stanley Institutional Liquidity Prime Portfolio, Institutional Shares,
0.06% (g) | | | 11,651,714 | | | | 11,651,714 | | |
Total Collateral for Securities Loaned (Cost $28,009,879) | | | 28,009,879 | | |
Total Investments (Cost $233,697,767) — 107.5% | | | 369,596,794 | | |
Liabilities in excess of other assets — (7.5)% | | | (25,769,959 | ) | |
NET ASSETS — 100.00% | | $ | 343,826,835 | | |
^ Purchased with cash collateral from securities on loan.
(a) Non-income producing security.
(b) All or a portion of this security is on loan.
(c) The Fund's Adviser has deemed this security to be illiquid based upon procedures approved by the Board of Trustees. As of December 31, 2021, illiquid securities were 1.2% of net assets.
(d) Security was fair valued based upon procedures approved by the Board of Trustees and represents 0.0% of net assets as of December 31, 2021. (See Note 2 in the Notes to Financial Statements)
(e) Restricted security that is not registered under the Securities Act of 1933.
(f) The following table details the acquisition date and cost of the Fund's restricted securities at December 31, 2021:
Security Name | | Acquisition Date | | Cost | |
Regulus Therapeutics, Inc. | | 12/3/20 | | $ | 165,796 | | |
(g) Rate disclosed is the daily yield on December 31, 2021.
ADR — American Depositary Receipt
NYS — New York Registered Shares
PLC — Public Limited Company
See notes to financial statements.
51
Victory Portfolios
Victory RS Small Cap Equity Fund | | Schedule of Portfolio Investments
December 31, 2021 | |
Security Description | | Shares | | Value | |
Common Stocks (98.3%) | |
Communication Services (2.7%): | |
ZipRecruiter, Inc. (a) | | | 73,140 | | | $ | 1,824,112 | | |
Consumer Discretionary (6.5%): | |
Acushnet Holdings Corp. (b) | | | 47,660 | | | | 2,529,793 | | |
Warby Parker, Inc., Class A (a) (b) | | | 41,640 | | | | 1,938,758 | | |
| | | | 4,468,551 | | |
Consumer Staples (3.3%): | |
e.l.f. Beauty, Inc. (a) | | | 68,170 | | | | 2,263,926 | | |
Energy (1.8%): | |
Renewable Energy Group, Inc. (a) | | | 29,320 | | | | 1,244,341 | | |
Financials (18.2%): | |
Customers Bancorp, Inc. (b) | | | 21,320 | | | | 1,393,688 | | |
Green Dot Corp., Class A (a) | | | 58,260 | | | | 2,111,342 | | |
Open Lending Corp., Class A (a) | | | 52,240 | | | | 1,174,355 | | |
PRA Group, Inc. (a) | | | 25,490 | | | | 1,279,853 | | |
PROG Holdings, Inc. (a) | | | 97,450 | | | | 4,395,970 | | |
Trupanion, Inc. (a) (b) | | | 16,200 | | | | 2,138,886 | | |
| | | | 12,494,094 | | |
Health Care (15.1%): | |
Apellis Pharmaceuticals, Inc. (a) | | | 16,530 | | | | 781,539 | | |
Bicycle Therapeutics PLC, ADR (a) | | | 14,130 | | | | 860,093 | | |
Blueprint Medicines Corp. (a) | | | 7,120 | | | | 762,623 | | |
Codexis, Inc. (a) | | | 19,380 | | | | 606,013 | | |
CryoPort, Inc. (a) | | | 35,320 | | | | 2,089,884 | | |
DermTech, Inc. (a) (b) | | | 31,210 | | | | 493,118 | | |
Editas Medicine, Inc. (a) (b) | | | 18,500 | | | | 491,175 | | |
Inspire Medical Systems, Inc. (a) | | | 2,810 | | | | 646,469 | | |
Quanterix Corp. (a) | | | 21,320 | | | | 903,968 | | |
Scholar Rock Holding Corp. (a) (b) | | | 20,750 | | | | 515,430 | | |
SpringWorks Therapeutics, Inc. (a) | | | 21,840 | | | | 1,353,643 | | |
Twist Bioscience Corp. (a) | | | 10,670 | | | | 825,751 | | |
| | | | 10,329,706 | | |
Industrials (13.3%): | |
Chart Industries, Inc. (a) | | | 15,120 | | | | 2,411,489 | | |
Evoqua Water Technologies Corp. (a) | | | 92,650 | | | | 4,331,387 | | |
John Bean Technologies Corp. | | | 15,450 | | | | 2,372,502 | | |
| | | | 9,115,378 | | |
IT Services (14.5%): | |
Flywire Corp. (a) (b) | | | 23,900 | | | | 909,634 | | |
Paya Holdings, Inc. (a) | | | 266,620 | | | | 1,690,371 | | |
Paymentus Holdings, Inc., Class A (a) (b) | | | 80,510 | | | | 2,816,240 | | |
Payoneer Global, Inc. (a) (b) | | | 278,880 | | | | 2,049,768 | | |
Shift4 Payments, Inc., Class A (a) (b) | | | 42,490 | | | | 2,461,445 | | |
| | | | 9,927,458 | | |
See notes to financial statements.
52
Victory Portfolios
Victory RS Small Cap Equity Fund | | Schedule of Portfolio Investments — continued
December 31, 2021 | |
Security Description | | Shares | | Value | |
Semiconductors & Semiconductor Equipment (7.7%): | |
MACOM Technology Solutions Holdings, Inc. (a) | | | 44,260 | | | $ | 3,465,558 | | |
SiTime Corp. (a) | | | 6,040 | | | | 1,766,942 | | |
| | | | 5,232,500 | | |
Software (15.2%): | |
ACI Worldwide, Inc. (a) | | | 68,890 | | | | 2,390,483 | | |
Avaya Holdings Corp. (a) | | | 181,120 | | | | 3,586,176 | | |
Jamf Holding Corp. (a) (b) | | | 35,040 | | | | 1,331,870 | | |
Q2 Holdings, Inc. (a) | | | 26,190 | | | | 2,080,534 | | |
Varonis Systems, Inc. (a) | | | 20,860 | | | | 1,017,551 | | |
| | | | 10,406,614 | | |
Total Common Stocks (Cost $66,650,905) | | | 67,306,680 | | |
Collateral for Securities Loaned (13.0%)^ | |
BlackRock Liquidity Funds TempFund Portfolio, Institutional Shares, 0.04% (c) | | | 207,413 | | | | 207,413 | | |
Fidelity Investments Money Market Government Portfolio, Institutional Shares,
0.01% (c) | | | 4,073,611 | | | | 4,073,611 | | |
Goldman Sachs Financial Square Prime Obligations Fund, Institutional Shares,
0.02% (c) | | | 103,509 | | | | 103,509 | | |
JPMorgan Prime Money Market Fund, Capital Shares, 0.07% (c) | | | 825,350 | | | | 825,350 | | |
Morgan Stanley Institutional Liquidity Prime Portfolio, Institutional Shares,
0.06% (c) | | | 3,710,934 | | | | 3,710,934 | | |
Total Collateral for Securities Loaned (Cost $8,920,817) | | | 8,920,817 | | |
Total Investments (Cost $75,571,722) — 111.3% | | | 76,227,497 | | |
Liabilities in excess of other assets — (11.3)% | | | (7,710,694 | ) | |
NET ASSETS — 100.00% | | $ | 68,516,803 | | |
^ Purchased with cash collateral from securities on loan.
(a) Non-income producing security.
(b) All or a portion of this security is on loan.
(c) Rate disclosed is the daily yield on December 31, 2021.
ADR — American Depositary Receipt
PLC — Public Limited Company
See notes to financial statements.
53
Victory Portfolios | | Statements of Assets and Liabilities
December 31, 2021 | |
| | | Victory
RS Small Cap
Growth Fund | | Victory
RS Select
Growth Fund | | Victory
RS Mid Cap
Growth Fund | |
Assets: | |
Affiliated investments, at value
(Cost $14,171,057, $- and $-) | | $ | 5,918,325 | (a) | | $ | — | | | $ | — | | |
Unaffiliated investments, at value
(Cost $1,954,856,138, $152,830,065 and
$274,418,195) | | | 2,405,758,724 | (b) | | | 199,744,821 | (c) | | | 375,786,862 | (d) | |
Cash | | | — | | | | — | | | | 4,947,383 | | |
Receivables: | |
Interest and dividends | | | 42,363 | | | | 18,644 | | | | 27,180 | | |
Capital shares issued | | | 1,164,696 | | | | 3,267 | | | | 96,165 | | |
Investments sold | | | 12,209,895 | | | | 1,943,301 | | | | — | | |
From Adviser | | | 9,596 | | | | 24,093 | | | | 55,973 | | |
Prepaid expenses | | | 42,898 | | | | 23,326 | | | | 34,734 | | |
Total Assets | | | 2,425,146,497 | | | | 201,757,452 | | | | 380,948,297 | | |
Liabilities: | |
Payables: | |
Collateral received on loaned securities | | | 163,622,986 | | | | 1,538,175 | | | | 9,598,093 | | |
To custodian | | | 978,632 | | | | 964,445 | | | | — | | |
Capital shares redeemed | | | 10,415,907 | | | | 309,939 | | | | 102,776 | | |
Accrued expenses and other payables: | |
Investment advisory fees | | | 1,857,815 | | | | 170,278 | | | | 285,297 | | |
Administration fees | | | 126,577 | | | | 10,629 | | | | 22,282 | | |
Custodian fees | | | 18,624 | | | | 1,780 | | | | 3,532 | | |
Transfer agent fees | | | 387,662 | | | | 40,950 | | | | 91,190 | | |
Compliance fees | | | 1,398 | | | | 119 | | | | 247 | | |
Trustees' fees | | | 509 | | | | — | | | | — | | |
| 12b-1 fees | | | 75,071 | | | | 16,973 | | | | 14,898 | | |
Other accrued expenses | | | 129,433 | | | | 21,215 | | | | 40,331 | | |
Total Liabilities | | | 177,614,614 | | | | 3,074,503 | | | | 10,158,646 | | |
Net Assets: | |
| Capital | | | 1,798,505,170 | | | | 122,482,964 | | | | 274,765,453 | | |
Total accumulated earnings/(loss) | | | 449,026,713 | | | | 76,199,985 | | | | 96,024,198 | | |
Net Assets | | $ | 2,247,531,883 | | | $ | 198,682,949 | | | $ | 370,789,651 | | |
Net Assets | |
Class A | | $ | 634,203,794 | | | $ | 117,016,589 | | | $ | 88,064,474 | | |
Class C | | | 11,387,397 | | | | 9,835,190 | | | | 12,054,255 | | |
Class R | | | 5,059,884 | | | | 408,346 | | | | 610,316 | | |
Class R6 | | | 611,157,211 | | | | 1,230,709 | | | | 19,731,266 | | |
Class Y | | | 985,723,597 | | | | 70,192,115 | | | | 249,372,674 | | |
Member Class | | | — | | | | — | | | | 956,666 | | |
Total | | $ | 2,247,531,883 | | | $ | 198,682,949 | | | $ | 370,789,651 | | |
Shares (unlimited number of shares authorized
with a par value of $0.001 per share): | |
Class A | | | 8,601,829 | | | | 3,738,996 | | | | 3,556,075 | | |
Class C | | | 200,268 | | | | 474,147 | | | | 623,338 | | |
Class R | | | 79,460 | | | | 18,844 | | | | 28,739 | | |
Class R6 | | | 7,699,978 | | | | 35,452 | | | | 745,576 | | |
Class Y | | | 12,477,999 | | | | 2,038,754 | | | | 9,435,324 | | |
Member Class | | | — | | | | — | | | | 38,518 | | |
Total | | | 29,059,534 | | | | 6,306,193 | | | | 14,427,570 | | |
Net asset value, offering (except Class A)
and redemption price per share: | |
Class A | | $ | 73.73 | | | $ | 31.30 | | | $ | 24.76 | | |
Class C (e) | | | 56.86 | | | | 20.74 | | | | 19.34 | | |
Class R | | | 63.68 | | | | 21.67 | | | | 21.24 | | |
Class R6 | | | 79.37 | | | | 34.71 | | | | 26.46 | | |
Class Y | | | 79.00 | | | | 34.43 | | | | 26.43 | | |
Member Class | | | — | | | | — | | | | 24.84 | | |
Maximum Sales Charge — Class A | | | 5.75 | % | | | 5.75 | % | | | 5.75 | % | |
Maximum offering price
(100%/(100%-maximum sales charge) of
net asset value adjusted to the nearest cent)
per share — Class A | | $ | 78.23 | | | $ | 33.21 | | | $ | 26.27 | | |
(a) Includes $7,875 of securities on loan.
(b) Includes $155,157,622 of securities on loan.
(c) Includes $1,483,139 of securities on loan.
(d) Includes $9,391,631 of securities on loan.
(e) Redemption price per share varies by the length of time shares are held.
See notes to financial statements.
54
Victory Portfolios | | Statements of Assets and Liabilities
December 31, 2021 | |
| | | Victory
RS Growth Fund | | Victory
RS Science and
Technology Fund | | Victory
RS Small Cap
Equity Fund | |
Assets: | |
Investments, at value (Cost $189,982,461,
$233,697,767 and $75,571,722) | | $ | 354,546,876 | (a) | | $ | 369,596,794 | (b) | | $ | 76,227,497 | (c) | |
Cash | | | 978,118 | | | | 1,937,403 | | | | 1,319,131 | | |
Receivables: | |
Interest and dividends | | | 26,310 | | | | 51,242 | | | | 920 | | |
Capital shares issued | | | 7,780 | | | | 785,515 | | | | 12,595 | | |
From Adviser | | | 38,744 | | | | — | | | | — | | |
Prepaid expenses | | | 21,304 | | | | 32,268 | | | | 23,595 | | |
Total Assets | | | 355,619,132 | | | | 372,403,222 | | | | 77,583,738 | | |
Liabilities: | |
Payables: | |
Collateral received on loaned securities | | | 10,568,804 | | | | 28,009,879 | | | | 8,920,817 | | |
Capital shares redeemed | | | 5,202 | | | | 86,469 | | | | 49,556 | | |
Accrued expenses and other payables: | |
Investment advisory fees | | | 217,655 | | | | 325,135 | | | | 56,661 | | |
Administration fees | | | 17,899 | | | | 19,048 | | | | 3,710 | | |
Custodian fees | | | 2,667 | | | | 4,137 | | | | 770 | | |
Transfer agent fees | | | 40,629 | | | | 63,092 | | | | 11,687 | | |
Compliance fees | | | 200 | | | | 205 | | | | 41 | | |
| 12b-1 fees | | | 34,244 | | | | 32,298 | | | | 7,298 | | |
Other accrued expenses | | | 21,785 | | | | 36,124 | | | | 16,395 | | |
Total Liabilities | | | 10,909,085 | | | | 28,576,387 | | | | 9,066,935 | | |
Net Assets: | |
| Capital | | | 177,381,800 | | | | 206,685,054 | | | | 64,518,357 | | |
Total accumulated earnings/(loss) | | | 167,328,247 | | | | 137,141,781 | | | | 3,998,446 | | |
Net Assets | | $ | 344,710,047 | | | $ | 343,826,835 | | | $ | 68,516,803 | | |
Net Assets | |
Class A | | $ | 308,662,914 | | | $ | 250,490,244 | | | $ | 60,699,049 | | |
Class C | | | 1,732,764 | | | | 11,167,985 | | | | 379,848 | | |
Class R | | | 542,484 | | | | 1,088,907 | | | | 2,948,882 | | |
Class Y | | | 33,771,885 | | | | 81,079,699 | | | | 3,095,289 | | |
Member Class | | | — | | | | — | | | | 1,393,735 | | |
Total | | $ | 344,710,047 | | | $ | 343,826,835 | | | $ | 68,516,803 | | |
Shares (unlimited number of shares
authorized with a par value of $0.001
per share): | |
Class A | | | 11,806,039 | | | | 8,838,728 | | | | 4,556,843 | | |
Class C | | | 86,911 | | | | 573,234 | | | | 28,151 | | |
Class R | | | 23,888 | | | | 48,513 | | | | 350,470 | | |
Class Y | | | 1,219,107 | | | | 2,574,934 | | | | 221,332 | | |
Member Class | | | — | | | | — | | | | 104,440 | | |
Total | | | 13,135,945 | | | | 12,035,409 | | | | 5,261,236 | | |
Net asset value, offering (except Class A) and
redemption price per share: | |
Class A | | $ | 26.14 | | | $ | 28.34 | | | $ | 13.32 | | |
Class C (d) | | | 19.94 | | | | 19.48 | | | | 13.49 | | |
Class R | | | 22.71 | | | | 22.45 | | | | 8.41 | | |
Class Y | | | 27.70 | | | | 31.49 | | | | 13.98 | | |
Member Class | | | — | | | | — | | | | 13.34 | | |
Maximum Sales Charge — Class A | | | 5.75 | % | | | 5.75 | % | | | 5.75 | % | |
Maximum offering price
(100%/(100%-maximum sales charge) of
net asset value adjusted to the nearest cent)
per share — Class A | | $ | 27.73 | | | $ | 30.07 | | | $ | 14.13 | | |
(a) Includes $10,309,097 of securities on loan.
(b) Includes $26,753,421 of securities on loan.
(c) Includes $8,525,312 of securities on loan.
(d) Redemption price per share varies by the length of time shares are held.
See notes to financial statements.
55
Victory Portfolios | | Statements of Operations
For the Year Ended December 31, 2021 | |
| | | Victory
RS Small Cap
Growth Fund | | Victory
RS Select
Growth Fund | | Victory
RS Mid Cap
Growth Fund | |
Investment Income: | | | |
Dividends from unaffiliated investments | | $ | 2,947,673 | | | $ | 418,940 | | | $ | 1,085,064 | | |
Interest from unaffiliated investments | | | 11,682 | | | | 560 | | | | 1,026 | | |
Securities lending (net of fees) | | | 649,861 | | | | 9,521 | | | | 16,542 | | |
Foreign tax withholding | | | — | | | | — | | | | (7,542 | ) | |
Total Income | | | 3,609,216 | | | | 429,021 | | | | 1,095,090 | | |
Expenses: | | | |
Investment advisory fees | | | 26,368,972 | | | | 2,295,937 | | | | 4,273,520 | | |
Administration fees | | | 1,534,205 | | | | 126,802 | | | | 278,270 | | |
Sub-Administration fees | | | 17,000 | | | | 17,000 | | | | 17,000 | | |
| 12b-1 fees — Class A | | | 1,910,737 | | | | 309,007 | | | | 233,517 | | |
| 12b-1 fees — Class C | | | 156,998 | | | | 158,213 | | | | 153,649 | | |
| 12b-1 fees — Class R | | | 37,077 | | | | 2,204 | | | | 3,072 | | |
Custodian fees | | | 150,132 | | | | 11,104 | | | | 22,918 | | |
Transfer agent fees — Class A | | | 1,034,432 | | | | 146,199 | | | | 120,878 | | |
Transfer agent fees — Class C | | | 17,779 | | | | 21,290 | | | | 12,659 | | |
Transfer agent fees — Class R | | | 14,068 | | | | 1,716 | | | | 1,427 | | |
Transfer agent fees — Class R6 | | | 26,420 | | | | 226 | | | | 824 | | |
Transfer agent fees — Class Y | | | 1,353,201 | | | | 85,761 | | | | 502,900 | | |
Transfer agent fees — Member Class | | | — | | | | — | | | | 1,167 | | |
Trustees' fees | | | 184,831 | | | | 16,482 | | | | 35,754 | | |
Compliance fees | | | 20,543 | | | | 1,689 | | | | 3,803 | | |
Legal and audit fees | | | 131,570 | | | | 17,659 | | | | 36,592 | | |
State registration and filing fees | | | 100,718 | | | | 43,324 | | | | 73,545 | | |
Interfund lending fees | | | 33 | | | | 108 | | | | 187 | | |
Other expenses | | | 228,390 | | | | 30,505 | | | | 82,013 | | |
Recoupment of prior expenses waived/reimbursed
by Adviser | | | 9,703 | | | | — | | | | 7,081 | | |
Total Expenses | | | 33,296,809 | | | | 3,285,226 | | | | 5,860,776 | | |
Expenses waived/reimbursed by Adviser | | | (315,198 | ) | | | (180,839 | ) | | | (678,326 | ) | |
Net Expenses | | | 32,981,611 | | | | 3,104,387 | | | | 5,182,450 | | |
Net Investment Income (Loss) | | | (29,372,395 | ) | | | (2,675,366 | ) | | | (4,087,360 | ) | |
Realized/Unrealized Gains (Losses) from
Investments: | | | |
Net realized gains (losses) from unaffiliated
investment securities | | | 337,743,674 | | | | 49,019,375 | | | | 141,961,315 | | |
Net realized gains (losses) from affiliated
investment securities | | | (555,630 | ) | | | — | | | | — | | |
Net change in unrealized appreciation/depreciation
on unaffiliated investment securities | | | (612,984,393 | ) | | | (30,101,172 | ) | | | (112,254,382 | ) | |
Net change in unrealized appreciation/depreciation
on affiliated investment securities | | | (3,719,968 | ) | | | — | | | | — | | |
Net realized/unrealized gains (losses)
on investments | | | (279,516,317 | ) | | | 18,918,203 | | | | 29,706,933 | | |
Change in net assets resulting from operations | | $ | (308,888,712 | ) | | $ | 16,242,837 | | | $ | 25,619,573 | | |
See notes to financial statements.
56
Victory Portfolios | | Statements of Operations
For the Year Ended December 31, 2021 | |
| | | Victory
RS Growth Fund | | Victory
RS Science and
Technology Fund | | Victory
RS Small Cap
Equity Fund | |
Investment Income: | | | |
Dividends | | $ | 1,267,532 | | | $ | 486,157 | | | $ | 8,805 | | |
Interest | | | 229 | | | | 3,053 | | | | 381 | | |
Securities lending (net of fees) | | | 6,474 | | | | 310,481 | | | | 42,621 | | |
Total Income | | | 1,274,235 | | | | 799,691 | | | | 51,807 | | |
Expenses: | | | |
Investment advisory fees | | | 2,450,574 | | | | 4,233,027 | | | | 594,969 | | |
Administration fees | | | 180,186 | | | | 233,984 | | | | 43,842 | | |
Sub-Administration fees | | | 16,792 | | | | 17,000 | | | | 13,708 | | |
| 12b-1 fees — Class A | | | 730,512 | | | | 765,036 | | | | 176,004 | | |
| 12b-1 fees — Class C | | | 23,098 | | | | 134,879 | | | | 4,928 | | |
| 12b-1 fees — Class R | | | 2,391 | | | | 6,243 | | | | 15,956 | | |
Custodian fees | | | 15,209 | | | | 27,915 | | | | 4,814 | | |
Transfer agent fees — Class A | | | 230,559 | | | | 350,323 | | | | 64,600 | | |
Transfer agent fees — Class C | | | 2,387 | | | | 15,069 | | | | 819 | | |
Transfer agent fees — Class R | | | 906 | | | | 2,547 | | | | 5,505 | | |
Transfer agent fees — Class Y | | | 22,129 | | | | 122,108 | | | | 4,021 | | |
Transfer agent fees — Member Class | | | — | | | | — | | | | 3,570 | | |
Trustees' fees | | | 21,821 | | | | 28,973 | | | | 6,821 | | |
Compliance fees | | | 2,361 | | | | 3,118 | | | | 585 | | |
Legal and audit fees | | | 22,758 | | | | 26,506 | | | | 11,882 | | |
State registration and filing fees | | | 22,052 | | | | 29,459 | | | | 65,973 | | |
Interfund lending fees | | | 21 | | | | 28 | | | | — | | |
Other expenses | | | 28,150 | | | | 54,741 | | | | 22,267 | | |
Recoupment of prior expenses waived/reimbursed
by Adviser | | | 112 | | | | 31,219 | | | | 2,683 | | |
Total Expenses | | | 3,772,018 | | | | 6,082,175 | | | | 1,042,947 | | |
Expenses waived/reimbursed by Adviser | | | (240,370 | ) | | | — | | | | (42,087 | ) | |
Net Expenses | | | 3,531,648 | | | | 6,082,175 | | | | 1,000,860 | | |
Net Investment Income (Loss) | | | (2,257,413 | ) | | | (5,282,484 | ) | | | (949,053 | ) | |
Realized/Unrealized Gains (Losses) from
Investments: | | | |
Net realized gains (losses) from investment
securities | | | 34,175,683 | | | | 62,995,967 | | | | 12,976,234 | | |
Net change in unrealized appreciation/depreciation
on investment securities | | | 27,407,434 | | | | (94,329,136 | ) | | | (17,969,992 | ) | |
Net realized/unrealized gains (losses)
on investments | | | 61,583,117 | | | | (31,333,169 | ) | | | (4,993,758 | ) | |
Change in net assets resulting from operations | | $ | 59,325,704 | | | $ | (36,615,653 | ) | | $ | (5,942,811 | ) | |
See notes to financial statements.
57
Victory Portfolios | | Statements of Changes in Net Assets | |
| | | Victory
RS Small Cap Growth Fund | | Victory
RS Select Growth Fund | | Victory
RS Mid Cap Growth Fund | |
| | | Year
Ended
December 31,
2021 | | Year
Ended
December 31,
2020 | | Year
Ended
December 31,
2021 | | Year
Ended
December 31,
2020 | | Year
Ended
December 31,
2021 | | Year
Ended
December 31,
2020 | |
From Investment
Activities: | |
Operations: | |
Net investment
income (loss) | | $ | (29,372,395 | ) | | $ | (23,079,075 | ) | | $ | (2,675,366 | ) | | $ | (2,301,900 | ) | | $ | (4,087,360 | ) | | $ | (3,021,997 | ) | |
Net realized gains
(losses) from
investments | | | 337,188,044 | | | | 162,042,534 | | | | 49,019,375 | | | | 43,552,171 | | | | 141,961,315 | | | | 51,251,043 | | |
Net change in
unrealized
appreciation/
depreciation on
investments | | | (616,704,361 | ) | | | 661,220,255 | | | | (30,101,172 | ) | | | 17,335,883 | | | | (112,254,382 | ) | | | 117,050,286 | | |
Change in net assets
resulting from
operations | | | (308,888,712 | ) | | | 800,183,714 | | | | 16,242,837 | | | | 58,586,154 | | | | 25,619,573 | | | | 165,279,332 | | |
Distributions to
Shareholders: | |
Class A | | | (93,199,400 | ) | | | (68,841,797 | ) | | | (26,927,629 | ) | | | (17,578,995 | ) | | | (26,057,513 | ) | | | (3,686,081 | ) | |
Class C | | | (2,137,568 | ) | | | (2,041,419 | ) | | | (3,086,031 | ) | | | (4,596,824 | ) | | | (4,637,294 | ) | | | (808,992 | ) | |
Class R | | | (815,659 | ) | | | (815,880 | ) | | | (117,749 | ) | | | (91,912 | ) | | | (194,304 | ) | | | (25,936 | ) | |
Class R6 | | | (88,002,280 | ) | | | (54,388,578 | ) | | | (257,285 | ) | | | (97,926 | ) | | | (6,204,984 | ) | | | (1,071,652 | ) | |
Class Y | | | (137,845,800 | ) | | | (112,328,839 | ) | | | (15,262,714 | ) | | | (13,684,054 | ) | | | (88,979,683 | ) | | | (18,217,120 | ) | |
Member Class (a) | | | — | | | | — | | | | — | | | | — | | | | (223,742 | ) | | | (3,963 | ) | |
Change in net assets
resulting from
distributions to
shareholders | | | (322,000,707 | ) | | | (238,416,513 | ) | | | (45,651,408 | ) | | | (36,049,711 | ) | | | (126,297,520 | ) | | | (23,813,744 | ) | |
Change in net assets
resulting from
capital transactions | | | (58,863,607 | ) | | | 88,379,490 | | | | (5,812,343 | ) | | | (8,797,091 | ) | | | (133,837,034 | ) | | | (56,148,955 | ) | |
Change in net assets | | | (689,753,026 | ) | | | 650,146,691 | | | | (35,220,914 | ) | | | 13,739,352 | | | | (234,514,981 | ) | | | 85,316,633 | | |
Net Assets: | |
Beginning of period | | | 2,937,284,909 | | | | 2,287,138,218 | | | | 233,903,863 | | | | 220,164,511 | | | | 605,304,632 | | | | 519,987,999 | | |
End of period | | $ | 2,247,531,883 | | | $ | 2,937,284,909 | | | $ | 198,682,949 | | | $ | 233,903,863 | | | $ | 370,789,651 | | | $ | 605,304,632 | | |
(a) Victory RS Mid Cap Growth Fund Member Class commenced operations on November 3, 2020.
(continues on next page)
See notes to financial statements.
58
Victory Portfolios | | Statements of Changes in Net Assets | |
(continued)
| | | Victory
RS Small Cap Growth Fund | | Victory
RS Select Growth Fund | | Victory
RS Mid Cap Growth Fund | |
| | | Year
Ended
December 31,
2021 | | Year
Ended
December 31,
2020 | | Year
Ended
December 31,
2021 | | Year
Ended
December 31,
2020 | | Year
Ended
December 31,
2021 | | Year
Ended
December 31,
2020 | |
Capital Transactions: | |
Class A | |
Proceeds from
shares issued | | $ | 89,844,368 | | | $ | 77,354,531 | | | $ | 17,921,964 | | | $ | 9,681,283 | | | $ | 6,325,210 | | | $ | 5,412,915 | | |
Distributions
reinvested | | | 89,403,944 | | | | 66,397,165 | | | | 25,918,091 | | | | 16,848,625 | | | | 24,440,661 | | | | 3,428,512 | | |
Cost of shares
redeemed | | | (186,733,595 | ) | | | (169,500,751 | ) | | | (22,842,642 | ) | | | (20,693,842 | ) | | | (13,937,984 | ) | | | (20,027,246 | ) | |
Total Class A | | $ | (7,485,283 | ) | | $ | (25,749,055 | ) | | $ | 20,997,413 | | | $ | 5,836,066 | | | $ | 16,827,887 | | | $ | (11,185,819 | ) | |
Class C | |
Proceeds from
shares issued | | $ | 2,244,719 | | | $ | 3,029,369 | | | $ | 306,365 | | | $ | 376,083 | | | $ | 259,376 | | | $ | 424,825 | | |
Distributions
reinvested | | | 2,073,757 | | | | 1,949,346 | | | | 3,077,902 | | | | 4,562,487 | | | | 4,489,037 | | | | 777,691 | | |
Cost of shares
redeemed | | | (9,438,427 | ) | | | (6,820,282 | ) | | | (15,624,585 | ) | | | (9,757,197 | ) | | | (6,018,465 | ) | | | (7,717,057 | ) | |
Total Class C | | $ | (5,119,951 | ) | | $ | (1,841,567 | ) | | $ | (12,240,318 | ) | | $ | (4,818,627 | ) | | $ | (1,270,052 | ) | | $ | (6,514,541 | ) | |
Class R | |
Proceeds from
shares issued | | $ | 2,591,119 | | | $ | 2,753,580 | | | $ | 57,546 | | | $ | 176,233 | | | $ | 38,547 | | | $ | 172,986 | | |
Distributions
reinvested | | | 815,659 | | | | 815,880 | | | | 102,008 | | | | 71,719 | | | | 194,304 | | | | 25,936 | | |
Cost of shares
redeemed | | | (5,227,473 | ) | | | (4,331,623 | ) | | | (172,852 | ) | | | (403,650 | ) | | | (49,826 | ) | | | (691,488 | ) | |
Total Class R | | $ | (1,820,695 | ) | | $ | (762,163 | ) | | $ | (13,298 | ) | | $ | (155,698 | ) | | $ | 183,025 | | | $ | (492,566 | ) | |
Class R6 | |
Proceeds from
shares issued | | $ | 253,929,075 | | | $ | 212,153,078 | | | $ | 694,851 | | | $ | 313,429 | | | $ | 6,226,411 | | | $ | 8,791,051 | | |
Distributions
reinvested | | | 58,606,415 | | | | 38,383,633 | | | | 203,176 | | | | 77,795 | | | | 2,271,808 | | | | 341,886 | | |
Cost of shares
redeemed | | | (210,549,047 | ) | | | (146,162,351 | ) | | | (204,355 | ) | | | (20,684 | ) | | | (11,402,846 | ) | | | (8,265,488 | ) | |
Total Class R6 | | $ | 101,986,443 | | | $ | 104,374,360 | | | $ | 693,672 | | | $ | 370,540 | | | $ | (2,904,627 | ) | | $ | 867,449 | | |
Class Y | |
Proceeds from
shares issued | | $ | 289,808,108 | | | $ | 320,717,460 | | | $ | 8,159,436 | | | $ | 19,406,953 | | | $ | 46,902,971 | | | $ | 81,010,960 | | |
Distributions
reinvested | | | 125,873,133 | | | | 101,937,080 | | | | 14,112,648 | | | | 12,776,316 | | | | 86,573,237 | | | | 17,755,174 | | |
Cost of shares
redeemed | | | (562,105,362 | ) | | | (410,296,625 | ) | | | (37,521,896 | ) | | | (42,212,641 | ) | | | (281,200,740 | ) | | | (137,693,578 | ) | |
Total Class Y | | $ | (146,424,121 | ) | | $ | 12,357,915 | | | $ | (15,249,812 | ) | | $ | (10,029,372 | ) | | $ | (147,724,532 | ) | | $ | (38,927,444 | ) | |
Member Class (a) | |
Proceeds from
shares issued | | $ | — | | | $ | — | | | $ | — | | | $ | — | | | $ | 1,578,737 | | | $ | 100,003 | | |
Distributions
reinvested | | | — | | | | — | | | | — | | | | — | | | | 223,742 | | | | 3,963 | | |
Cost of shares
redeemed | | | — | | | | — | | | | — | | | | — | | | | (751,214 | ) | | | — | | |
Total Member
Class | | $ | — | | | $ | — | | | $ | — | | | $ | — | | | $ | 1,051,265 | | | $ | 103,966 | | |
Change in net assets
resulting from capital
transactions | | $ | (58,863,607 | ) | | $ | 88,379,490 | | | $ | (5,812,343 | ) | | $ | (8,797,091 | ) | | $ | (133,837,034 | ) | | $ | (56,148,955 | ) | |
(a) Victory RS Mid Cap Growth Fund Member Class commenced operations on November 3, 2020.
(continues on next page)
See notes to financial statements.
59
Victory Portfolios | | Statements of Changes in Net Assets | |
(continued)
| | | Victory
RS Small Cap Growth Fund | | Victory
RS Select Growth Fund | | Victory
RS Mid Cap Growth Fund | |
| | | Year
Ended
December 31,
2021 | | Year
Ended
December 31,
2020 | | Year
Ended
December 31,
2021 | | Year
Ended
December 31,
2020 | | Year
Ended
December 31,
2021 | | Year
Ended
December 31,
2020 | |
Share Transactions: | |
Class A | |
Issued | | | 936,234 | | | | 954,550 | | | | 466,310 | | | | 266,397 | | | | 197,364 | | | | 195,313 | | |
Reinvested | | | 1,268,501 | | | | 691,709 | | | | 872,076 | | | | 454,141 | | | | 980,063 | | | | 106,113 | | |
Redeemed | | | (2,017,589 | ) | | | (2,137,356 | ) | | | (610,699 | ) | | | (587,787 | ) | | | (442,275 | ) | | | (723,305 | ) | |
Total Class A | | | 187,146 | | | | (491,097 | ) | | | 727,687 | | | | 132,751 | | | | 735,152 | | | | (421,879 | ) | |
Class C | |
Issued | | | 29,248 | | | | 48,086 | | | | 10,395 | | | | 14,337 | | | | 11,496 | | | | 19,661 | | |
Reinvested | | | 38,142 | | | | 25,020 | | | | 156,239 | | | | 164,533 | | | | 226,635 | | | | 28,311 | | |
Redeemed | | | (124,132 | ) | | | (104,879 | ) | | | (527,470 | ) | | | (351,862 | ) | | | (232,518 | ) | | | (348,027 | ) | |
Total Class C | | | (56,742 | ) | | | (31,773 | ) | | | (360,836 | ) | | | (172,992 | ) | | | 5,613 | | | | (300,055 | ) | |
Class R | |
Issued | | | 30,001 | | | | 35,926 | | | | 2,155 | | | | 6,241 | | | | 1,297 | | | | 8,775 | | |
Reinvested | | | 13,371 | | | | 9,567 | | | | 4,957 | | | | 2,516 | | | | 9,044 | | | | 889 | | |
Redeemed | | | (62,252 | ) | | | (62,256 | ) | | | (5,456 | ) | | | (13,699 | ) | | | (1,602 | ) | | | (29,410 | ) | |
Total Class R | | | (18,880 | ) | | | (16,763 | ) | | | 1,656 | | | | (4,942 | ) | | | 8,739 | | | | (19,746 | ) | |
Class R6 | |
Issued | | | 2,569,766 | | | | 2,557,025 | | | | 16,988 | | | | 7,416 | | | | 187,579 | | | | 336,247 | | |
Reinvested | | | 772,458 | | | | 376,827 | | | | 6,164 | | | | 1,942 | | | | 85,017 | | | | 10,112 | | |
Redeemed | | �� | (2,189,573 | ) | | | (1,820,549 | ) | | | (4,924 | ) | | | (532 | ) | | | (333,844 | ) | | | (302,470 | ) | |
Total Class R6 | | | 1,152,651 | | | | 1,113,303 | | | | 18,228 | | | | 8,826 | | | | (61,248 | ) | | | 43,889 | | |
Class Y | |
Issued | | | 2,889,358 | | | | 3,896,904 | | | | 196,234 | | | | 488,847 | | | | 1,505,331 | | | | 3,062,234 | | |
Reinvested | | | 1,666,973 | | | | 1,003,911 | | | | 431,711 | | | | 320,691 | | | | 3,196,451 | | | | 525,612 | | |
Redeemed | | | (5,767,523 | ) | | | (5,171,416 | ) | | | (876,979 | ) | | | (1,170,335 | ) | | | (8,783,601 | ) | | | (4,935,082 | ) | |
Total Class Y | | | (1,211,192 | ) | | | (270,601 | ) | | | (249,034 | ) | | | (360,797 | ) | | | (4,081,819 | ) | | | (1,347,236 | ) | |
Member Class (a) | |
Issued | | | — | | | | — | | | | — | | | | — | | | | 48,341 | | | | 3,179 | | |
Reinvested | | | — | | | | — | | | | — | | | | — | | | | 9,137 | | | | 123 | | |
Redeemed | | | — | | | | — | | | | — | | | | — | | | | (22,262 | ) | | | — | | |
Total Member Class | | | — | | | | — | | | | — | | | | — | | | | 35,216 | | | | 3,302 | | |
Change in Shares | | | 52,983 | | | | 303,069 | | | | 137,701 | | | | (397,154 | ) | | | (3,358,347 | ) | | | (2,041,725 | ) | |
(a) Victory RS Mid Cap Growth Fund Member Class commenced operations on November 3, 2020.
See notes to financial statements.
60
Victory Portfolios | | Statements of Changes in Net Assets | |
| | | Victory
RS Growth Fund | | Victory
RS Science and
Technology Fund | | Victory
RS Small Cap Equity Fund | |
| | | Year
Ended
December 31,
2021 | | Year
Ended
December 31,
2020 | | Year
Ended
December 31,
2021 | | Year
Ended
December 31,
2020 | | Year
Ended
December 31,
2021 | | Year
Ended
December 31,
2020 | |
From Investment Activities: | |
Operations: | |
Net investment
income (loss) | | $ | (2,257,413 | ) | | $ | (937,740 | ) | | $ | (5,282,484 | ) | | $ | (3,936,287 | ) | | $ | (949,053 | ) | | $ | (782,920 | ) | |
Net realized gains
(losses) from
investments | | | 34,175,683 | | | | 24,256,089 | | | | 62,995,967 | | | | 28,360,305 | | | | 12,976,234 | | | | 16,158,866 | | |
Net change in
unrealized
appreciation/
depreciation on
investments | | | 27,407,434 | | | | 59,111,905 | | | | (94,329,136 | ) | | | 150,652,970 | | | | (17,969,992 | ) | | | 7,993,132 | | |
Change in net assets resulting
from operations | | | 59,325,704 | | | | 82,430,254 | | | | (36,615,653 | ) | | | 175,076,988 | | | | (5,942,811 | ) | | | 23,369,078 | | |
Distributions to Shareholders: | |
Class A | | | (25,870,624 | ) | | | (23,219,855 | ) | | | (34,393,562 | ) | | | (18,144,054 | ) | | | (11,807,040 | ) | | | (14,114,946 | ) | |
Class C | | | (185,893 | ) | | | (395,459 | ) | | | (2,079,381 | ) | | | (1,381,276 | ) | | | (74,046 | ) | | | (349,747 | ) | |
Class R | | | (49,973 | ) | | | (39,454 | ) | | | (176,750 | ) | | | (84,683 | ) | | | (801,530 | ) | | | (788,226 | ) | |
Class Y | | | (2,769,379 | ) | | | (2,406,716 | ) | | | (10,284,801 | ) | | | (5,656,725 | ) | | | (754,635 | ) | | | (770,522 | ) | |
Member Class (a) | | | — | | | | — | | | | — | | | | — | | | | (248,472 | ) | | | (19,278 | ) | |
Change in net assets resulting
from distributions to
shareholders | | | (28,875,869 | ) | | | (26,061,484 | ) | | | (46,934,494 | ) | | | (25,266,738 | ) | | | (13,685,723 | ) | | | (16,042,719 | ) | |
Change in net assets resulting
from capital transactions | | | 5,846,536 | | | | (7,609,479 | ) | | | (22,173,579 | ) | | | 7,415,321 | | | | 3,027,200 | | | | 7,918,374 | | |
Change in net assets | | | 36,296,371 | | | | 48,759,291 | | | | (105,723,726 | ) | | | 157,225,571 | | | | (16,601,334 | ) | | | 15,244,733 | | |
Net Assets: | |
Beginning of period | | | 308,413,676 | | | | 259,654,385 | | | | 449,550,561 | | | | 292,324,990 | | | | 85,118,137 | | | | 69,873,404 | | |
End of period | | $ | 344,710,047 | | | $ | 308,413,676 | | | $ | 343,826,835 | | | $ | 449,550,561 | | | $ | 68,516,803 | | | $ | 85,118,137 | | |
(a) Victory RS Small Cap Equity Fund Member Class commenced operations on November 3, 2020.
(continues on next page)
See notes to financial statements.
61
Victory Portfolios | | Statements of Changes in Net Assets | |
(continued)
| | | Victory
RS Growth Fund | | Victory
RS Science and
Technology Fund | | Victory
RS Small Cap Equity Fund | |
| | | Year
Ended
December 31,
2021 | | Year
Ended
December 31,
2020 | | Year
Ended
December 31,
2021 | | Year
Ended
December 31,
2020 | | Year
Ended
December 31,
2021 | | Year
Ended
December 31,
2020 | |
Capital Transactions: | |
Class A | |
Proceeds from shares
issued | | $ | 8,581,742 | | | $ | 6,628,865 | | | $ | 39,004,944 | | | $ | 50,371,770 | | | $ | 6,230,569 | | | $ | 3,788,883 | | |
Distributions reinvested | | | 25,028,143 | | | | 22,517,933 | | | | 32,658,932 | | | | 17,377,233 | | | | 11,648,399 | | | | 13,882,892 | | |
Cost of shares redeemed | | | (26,382,488 | ) | | | (28,523,565 | ) | | | (80,772,344 | ) | | | (52,685,540 | ) | | | (16,789,674 | ) | | | (11,228,707 | ) | |
Total Class A | | $ | 7,227,397 | | | $ | 623,233 | | | $ | (9,108,468 | ) | | $ | 15,063,463 | | | $ | 1,089,294 | | | $ | 6,443,068 | | |
Class C | |
Proceeds from shares
issued | | $ | 35,326 | | | $ | 364,542 | | | $ | 1,707,463 | | | $ | 2,622,340 | | | $ | 287,897 | | | $ | 86,888 | | |
Distributions reinvested | | | 185,474 | | | | 391,789 | | | | 2,077,315 | | | | 1,369,319 | | | | 74,046 | | | | 349,747 | | |
Cost of shares redeemed | | | (2,443,080 | ) | | | (1,944,758 | ) | | | (7,751,009 | ) | | | (5,505,843 | ) | | | (383,060 | ) | | | (175,402 | ) | |
Total Class C | | $ | (2,222,280 | ) | | $ | (1,188,427 | ) | | $ | (3,966,231 | ) | | $ | (1,514,184 | ) | | $ | (21,117 | ) | | $ | 261,233 | | |
Class R | |
Proceeds from shares
issued | | $ | 44,677 | | | $ | 42,253 | | | $ | 339,728 | | | $ | 481,852 | | | $ | 135,914 | | | $ | 296,464 | | |
Distributions reinvested | | | 49,973 | | | | 39,454 | | | | 176,750 | | | | 84,683 | | | | 801,530 | | | | 788,226 | | |
Cost of shares redeemed | | | (6,705 | ) | | | (162,227 | ) | | | (401,462 | ) | | | (378,781 | ) | | | (247,781 | ) | | | (812,095 | ) | |
Total Class R | | $ | 87,945 | | | $ | (80,520 | ) | | $ | 115,016 | | | $ | 187,754 | | | $ | 689,663 | | | $ | 272,595 | | |
Class Y | |
Proceeds from shares
issued | | $ | 4,167,842 | | | $ | 2,195,308 | | | $ | 23,988,683 | | | $ | 29,550,096 | | | $ | 1,018,845 | | | $ | 537,133 | | |
Distributions reinvested | | | 2,657,237 | | | | 2,295,343 | | | | 9,629,680 | | | | 5,344,192 | | | | 752,967 | | | | 768,918 | | |
Cost of shares redeemed | | | (6,071,605 | ) | | | (11,454,416 | ) | | | (42,832,259 | ) | | | (41,216,000 | ) | | | (2,043,606 | ) | | | (589,970 | ) | |
Total Class Y | | $ | 753,474 | | | $ | (6,963,765 | ) | | $ | (9,213,896 | ) | | $ | (6,321,712 | ) | | $ | (271,794 | ) | | $ | 716,081 | | |
Member Class (a) | |
Proceeds from shares
issued | | $ | — | | | $ | — | | | $ | — | | | $ | — | | | $ | 3,375,015 | | | $ | 241,917 | | |
Distributions reinvested | | | — | | | | — | | | | — | | | | — | | | | 248,472 | | | | 19,278 | | |
Cost of shares redeemed | | | — | | | | — | | | | — | | | | — | | | | (2,082,333 | ) | | | (35,798 | ) | |
Total Member Class | | $ | — | | | $ | — | | | $ | — | | | $ | — | | | $ | 1,541,154 | | | $ | 225,397 | | |
Change in net assets resulting
from capital transactions | | $ | 5,846,536 | | | $ | (7,609,479 | ) | | $ | (22,173,579 | ) | | $ | 7,415,321 | | | $ | 3,027,200 | | | $ | 7,918,374 | | |
(a) Victory RS Small Cap Equity Fund Member Class commenced operations on November 3, 2020.
(continues on next page)
See notes to financial statements.
62
Victory Portfolios | | Statements of Changes in Net Assets | |
(continued)
| | | Victory
RS Growth Fund | | Victory
RS Science and
Technology Fund | | Victory
RS Small Cap Equity Fund | |
| | | Year
Ended
December 31,
2021 | | Year
Ended
December 31,
2020 | | Year
Ended
December 31,
2021 | | Year
Ended
December 31,
2020 | | Year
Ended
December 31,
2021 | | Year
Ended
December 31,
2020 | |
Share Transactions: | |
Class A | |
Issued | | | 331,479 | | | | 304,224 | | | | 1,081,400 | | | | 1,824,265 | | | | 357,336 | | | | 210,814 | | |
Reinvested | | | 986,288 | | | | 961,073 | | | | 1,203,351 | | | | 489,775 | | | | 919,369 | | | | 792,855 | | |
Redeemed | | | (1,018,990 | ) | | | (1,386,023 | ) | | | (2,265,845 | ) | | | (2,033,344 | ) | | | (971,778 | ) | | | (691,975 | ) | |
Total Class A | | | 298,777 | | | | (120,726 | ) | | | 18,906 | | | | 280,696 | | | | 304,927 | | | | 311,694 | | |
Class C (a) | |
Issued | | | 1,742 | | | | 21,225 | | | | 63,027 | | | | 134,359 | | | | 14,861 | | | | 2,323 | | |
Reinvested | | | 9,590 | | | | 21,201 | | | | 111,205 | | | | 52,324 | | | | 5,771 | | | | 19,561 | | |
Redeemed | | | (122,847 | ) | | | (115,239 | ) | | | (287,361 | ) | | | (293,019 | ) | | | (20,482 | ) | | | (3,513 | ) | |
Total Class C | | | (111,515 | ) | | | (72,813 | ) | | | (113,129 | ) | | | (106,336 | ) | | | 150 | | | | 18,371 | | |
Class R | |
Issued | | | 1,987 | | | | 2,271 | | | | 11,369 | | | | 21,258 | | | | 11,074 | | | | 25,117 | | |
Reinvested | | | 2,268 | | | | 1,903 | | | | 8,213 | | | | 2,892 | | | | 100,191 | | | | 63,413 | | |
Redeemed | | | (287 | ) | | | (9,571 | ) | | | (13,534 | ) | | | (16,429 | ) | | | (20,803 | ) | | | (61,871 | ) | |
Total Class R | | | 3,968 | | | | (5,397 | ) | | | 6,048 | | | | 7,721 | | | | 90,462 | | | | 26,659 | | |
Class Y | |
Issued | | | 159,034 | | | | 101,213 | | | | 604,120 | | | | 1,024,327 | | | | 56,893 | | | | 33,437 | | |
Reinvested | | | 98,559 | | | | 92,966 | | | | 319,286 | | | | 137,808 | | | | 56,614 | | | | 42,295 | | |
Redeemed | | | (227,354 | ) | | | (570,117 | ) | | | (1,098,885 | ) | | | (1,487,210 | ) | | | (129,973 | ) | | | (36,200 | ) | |
Total Class Y | | | 30,239 | | | | (375,938 | ) | | | (175,479 | ) | | | (325,075 | ) | | | (16,466 | ) | | | 39,532 | | |
Member Class (b) | |
Issued | | | — | | | | — | | | | — | | | | — | | | | 188,543 | | | | 12,775 | | |
Reinvested | | | — | | | | — | | | | — | | | | — | | | | 19,580 | | | | 1,100 | | |
Redeemed | | | — | | | | — | | | | — | | | | — | | | | (115,794 | ) | | | (1,764 | ) | |
Total Member Class | | | — | | | | — | | | | — | | | | — | | | | 92,329 | | | | 12,111 | | |
Change in Shares | | | 221,469 | | | | (574,874 | ) | | | (263,654 | ) | | | (142,994 | ) | | | 471,402 | | | | 408,367 | | |
(a) As described in Note 9, Victory RS Small Cap Equity Fund Class C share amounts have been adjusted for a 1:12 reverse stock split.
(b) Victory RS Small Cap Equity Fund Member Class commenced operations on November 3, 2020.
See notes to financial statements.
63
Victory Portfolios | | Financial Highlights | |
For a Share Outstanding Throughout Each Period
| | | | | Investment Activities | | Distributions
to
Shareholders
From | | | |
| | | Net Asset
Value,
Beginning of
Period | | Net
Investment
Income
(Loss)(a) | | Net
Realized and
Unrealized
Gains
(Losses) on
Investments | | Total from
Investment
Activities | | Net Realized
Gains from
Investments | |
Total
Distributions | | Net Asset
Value,
End of
Period | | Total
Return
(Excludes
Sales
Charge)*(b) | |
Victory RS Small Cap Growth Fund | | | |
Class A | | | |
Year Ended December 31: | |
2021 | | $ | 97.45 | | | | (1.20 | ) | | | (10.15 | ) | | | (11.35 | ) | | | (12.37 | ) | | | (12.37 | ) | | $ | 73.73 | | | | (11.06 | )% | |
2020 | | $ | 77.19 | | | | (0.97 | ) | | | 30.04 | | | | 29.07 | | | | (8.81 | ) | | | (8.81 | ) | | $ | 97.45 | | | | 37.84 | % | |
2019 | | $ | 61.11 | | | | (0.80 | ) | | | 23.84 | | | | 23.04 | | | | (6.96 | ) | | | (6.96 | ) | | $ | 77.19 | | | | 37.91 | % | |
2018 | | $ | 80.96 | | | | (0.83 | ) | | | (6.54 | ) | | | (7.37 | ) | | | (12.48 | ) | | | (12.48 | ) | | $ | 61.11 | | | | (8.97 | )% | |
2017 | | $ | 65.31 | | | | (0.75 | ) | | | 24.13 | | | | 23.38 | | | | (7.73 | ) | | | (7.73 | ) | | $ | 80.96 | | | | 36.86 | % | |
Class C | | | |
Year Ended December 31: | |
2021 | | $ | 79.07 | | | | (1.55 | ) | | | (8.29 | ) | | | (9.84 | ) | | | (12.37 | ) | | | (12.37 | ) | | $ | 56.86 | | | | (11.73 | )% | |
2020 | | $ | 64.34 | | | | (1.30 | ) | | | 24.84 | | | | 23.54 | | | | (8.81 | ) | | | (8.81 | ) | | $ | 79.07 | | | | 36.78 | % | |
2019 | | $ | 52.19 | | | | (1.17 | ) | | | 20.28 | | | | 19.11 | | | | (6.96 | ) | | | (6.96 | ) | | $ | 64.34 | | | | 36.88 | % | |
2018 | | $ | 71.70 | | | | (1.31 | ) | | | (5.72 | ) | | | (7.03 | ) | | | (12.48 | ) | | | (12.48 | ) | | $ | 52.19 | | | | (9.66 | )% | |
2017 | | $ | 58.97 | | | | (1.18 | ) | | | 21.64 | | | | 20.46 | | | | (7.73 | ) | | | (7.73 | ) | | $ | 71.70 | | | | 35.84 | % | |
Class R | | | |
Year Ended December 31: | |
2021 | | $ | 86.56 | | | | (1.45 | ) | | | (9.06 | ) | | | (10.51 | ) | | | (12.37 | ) | | | (12.37 | ) | | $ | 63.68 | | | | (11.51 | )% | |
2020 | | $ | 69.61 | | | | (1.20 | ) | | | 26.96 | | | | 25.76 | | | | (8.81 | ) | | | (8.81 | ) | | $ | 86.56 | | | | 37.20 | % | |
2019 | | $ | 55.87 | | | | (1.05 | ) | | | 21.75 | | | | 20.70 | | | | (6.96 | ) | | | (6.96 | ) | | $ | 69.61 | | | | 37.28 | % | |
2018 | | $ | 75.55 | | | | (1.15 | ) | | | (6.05 | ) | | | (7.20 | ) | | | (12.48 | ) | | | (12.48 | ) | | $ | 55.87 | | | | (9.39 | )% | |
2017 | | $ | 61.63 | | | | (1.04 | ) | | | 22.69 | | | | 21.65 | | | | (7.73 | ) | | | (7.73 | ) | | $ | 75.55 | | | | 36.24 | % | |
Class R6 | | | |
Year Ended December 31: | |
2021 | | $ | 103.42 | | | | (0.91 | ) | | | (10.77 | ) | | | (11.68 | ) | | | (12.37 | ) | | | (12.37 | ) | | $ | 79.37 | | | | (10.74 | )% | |
2020 | | $ | 81.24 | | | | (0.73 | ) | | | 31.72 | | | | 30.99 | | | | (8.81 | ) | | | (8.81 | ) | | $ | 103.42 | | | | 38.32 | % | |
2019 | | $ | 63.83 | | | | (0.58 | ) | | | 24.95 | | | | 24.37 | | | | (6.96 | ) | | | (6.96 | ) | | $ | 81.24 | | | | 38.38 | % | |
2018 | | $ | 83.67 | | | | (0.58 | ) | | | (6.78 | ) | | | (7.36 | ) | | | (12.48 | ) | | | (12.48 | ) | | $ | 63.83 | | | | (8.66 | )% | |
July 12, 2017 (e)
through
December 31, 2017 | | $ | 79.23 | | | | (0.41 | ) | | | 12.58 | | | | 12.17 | | | | (7.73 | ) | | | (7.73 | ) | | $ | 83.67 | | | | 16.23 | % | |
* Includes adjustments in accordance with U.S. Generally Accepted Accounting Principles.
(a) Per share net investment income (loss) has been calculated using the average daily shares method.
(b) Not annualized for periods less than one year.
(c) Annualized for periods less than one year.
(d) Portfolio turnover is calculated on the basis of the Fund as a whole without distinguishing between the classes of shares issued.
(e) Commencement of operations.
See notes to financial statements.
64
Victory Portfolios | | Financial Highlights — continued | |
For a Share Outstanding Throughout Each Period
| | | Ratios to Average Net Assets | | Supplemental Data | |
| | | Net
Expenses(c) | | Net
Investment
Income
(Loss)(c) | | Gross
Expenses(c) | | Net Assets,
End of
Period
(000's) | | Portfolio
Turnover(b)(d) | |
Victory RS Small Cap Growth Fund | |
Class A | |
Year Ended December 31: | |
2021 | | | 1.40 | % | | | (1.27 | )% | | | 1.42 | % | | $ | 634,204 | | | | 92 | % | |
2020 | | | 1.40 | % | | | (1.20 | )% | | | 1.43 | % | | $ | 820,006 | | | | 72 | % | |
2019 | | | 1.40 | % | | | (1.06 | )% | | | 1.44 | % | | $ | 687,425 | | | | 100 | % | |
2018 | | | 1.40 | % | | | (0.94 | )% | | | 1.45 | % | | $ | 499,350 | | | | 86 | % | |
2017 | | | 1.40 | % | | | (1.00 | )% | | | 1.44 | % | | $ | 575,227 | | | | 107 | % | |
Class C | |
Year Ended December 31: | |
2021 | | | 2.16 | % | | | (2.03 | )% | | | 2.16 | % | | $ | 11,387 | | | | 92 | % | |
2020 | | | 2.16 | % | | | (1.96 | )% | | | 2.26 | % | | $ | 20,323 | | | | 72 | % | |
2019 | | | 2.16 | % | | | (1.82 | )% | | | 2.27 | % | | $ | 18,581 | | | | 100 | % | |
2018 | | | 2.16 | % | | | (1.71 | )% | | | 2.26 | % | | $ | 13,602 | | | | 86 | % | |
2017 | | | 2.16 | % | | | (1.75 | )% | | | 2.23 | % | | $ | 13,633 | | | | 107 | % | |
Class R | |
Year Ended December 31: | |
2021 | | | 1.86 | % | | | (1.73 | )% | | | 1.86 | % | | $ | 5,060 | | | | 92 | % | |
2020 | | | 1.86 | % | | | (1.66 | )% | | | 1.97 | % | | $ | 8,513 | | | | 72 | % | |
2019 | | | 1.86 | % | | | (1.52 | )% | | | 1.93 | % | | $ | 8,012 | | | | 100 | % | |
2018 | | | 1.86 | % | | | (1.40 | )% | | | 1.87 | % | | $ | 7,285 | | | | 86 | % | |
2017 | | | 1.86 | % | | | (1.46 | )% | | | 1.94 | % | | $ | 7,698 | | | | 107 | % | |
Class R6 | |
Year Ended December 31: | |
2021 | | | 1.04 | % | | | (0.91 | )% | | | 1.04 | % | | $ | 611,157 | | | | 92 | % | |
2020 | | | 1.06 | % | | | (0.86 | )% | | | 1.06 | % | | $ | 677,128 | | | | 72 | % | |
2019 | | | 1.06 | % | | | (0.72 | )% | | | 1.06 | % | | $ | 441,471 | | | | 100 | % | |
2018 | | | 1.06 | % | | | (0.64 | )% | | | 1.10 | % | | $ | 113,288 | | | | 86 | % | |
July 12, 2017 (e)
through
December 31, 2017 | | | 1.06 | % | | | (1.03 | )% | | | 1.41 | % | | $ | 25,551 | | | | 107 | % | |
See notes to financial statements.
65
Victory Portfolios | | Financial Highlights | |
For a Share Outstanding Throughout Each Period
| | | | | Investment Activities | | Distributions
to
Shareholders
From | | | |
| | | Net Asset
Value,
Beginning of
Period | | Net
Investment
Income
(Loss)(a) | | Net
Realized and
Unrealized
Gains
(Losses) on
Investments | | Total from
Investment
Activities | | Net Realized
Gains from
Investments | |
Total
Distributions | | Net Asset
Value,
End of
Period | | Total
Return
(Excludes
Sales
Charge) | |
Victory RS Small Cap Growth Fund | | | |
Class Y | | | |
Year Ended December 31: | |
2021 | | $ | 103.10 | | | | (1.00 | ) | | | (10.73 | ) | | | (11.73 | ) | | | (12.37 | ) | | | (12.37 | ) | | $ | 79.00 | | | | (10.82 | )% | |
2020 | | $ | 81.06 | | | | (0.79 | ) | | | 31.64 | | | | 30.85 | | | | (8.81 | ) | | | (8.81 | ) | | $ | 103.10 | | | | 38.21 | % | |
2019 | | $ | 63.75 | | | | (0.62 | ) | | | 24.89 | | | | 24.27 | | | | (6.96 | ) | | | (6.96 | ) | | $ | 81.06 | | | | 38.29 | % | |
2018 | | $ | 83.64 | | | | (0.61 | ) | | | (6.80 | ) | | | (7.41 | ) | | | (12.48 | ) | | | (12.48 | ) | | $ | 63.75 | | | | (8.72 | )% | |
2017 | | $ | 67.08 | | | | (0.53 | ) | | | 24.82 | | | | 24.29 | | | | (7.73 | ) | | | (7.73 | ) | | $ | 83.64 | | | | 37.23 | % | |
(a) Per share net investment income (loss) has been calculated using the average daily shares method.
(b) Portfolio turnover is calculated on the basis of the Fund as a whole without distinguishing between the classes of shares issued.
See notes to financial statements.
66
Victory Portfolios | | Financial Highlights — continued | |
For a Share Outstanding Throughout Each Period (continued)
| | | Ratios to Average Net Assets | | Supplemental Data | |
| | | Net
Expenses | | Net
Investment
Income
(Loss) | | Gross
Expenses | | Net Assets,
End of
Period
(000's) | | Portfolio
Turnover(b) | |
Victory RS Small Cap Growth Fund | |
Class Y | |
Year Ended December 31: | |
2021 | | | 1.13 | % | | | (1.00 | )% | | | 1.14 | % | | $ | 985,724 | | | | 92 | % | |
2020 | | | 1.13 | % | | | (0.93 | )% | | | 1.15 | % | | $ | 1,411,316 | | | | 72 | % | |
2019 | | | 1.13 | % | | | (0.79 | )% | | | 1.15 | % | | $ | 1,131,648 | | | | 100 | % | |
2018 | | | 1.13 | % | | | (0.67 | )% | | | 1.15 | % | | $ | 967,112 | | | | 86 | % | |
2017 | | | 1.13 | % | | | (0.68 | )% | | | 1.17 | % | | $ | 1,081,427 | | | | 107 | % | |
See notes to financial statements.
67
Victory Portfolios | | Financial Highlights | |
For a Share Outstanding Throughout Each Period
| | | | | Investment Activities | | Distributions
to
Shareholders
From | | | |
| | | Net Asset
Value,
Beginning of
Period | | Net
Investment
Income
(Loss)(a) | | Net
Realized and
Unrealized
Gains
(Losses) on
Investments | | Total from
Investment
Activities | | Net Realized
Gains from
Investments | |
Total
Distributions | | Net Asset
Value,
End of
Period | | Total
Return
(Excludes
Sales
Charge) | |
Victory RS Select Growth Fund | | | |
Class A | | | |
Year Ended December 31: | |
2021 | | $ | 38.19 | | | | (0.49 | ) | | | 2.64 | | | | 2.15 | | | | (9.04 | ) | | | (9.04 | ) | | $ | 31.30 | | | | 6.89 | % | |
2020 | | $ | 33.81 | | | | (0.40 | ) | | | 11.43 | | | | 11.03 | | | | (6.65 | ) | | | (6.65 | ) | | $ | 38.19 | | | | 33.22 | % | |
2019 | | $ | 28.96 | | | | (0.37 | ) | | | 9.68 | | | | 9.31 | | | | (4.46 | ) | | | (4.46 | ) | | $ | 33.81 | | | | 32.29 | % | |
2018 | | $ | 46.03 | | | | (0.42 | ) | | | (3.12 | ) | | | (3.54 | ) | | | (13.53 | ) | | | (13.53 | ) | | $ | 28.96 | | | | (7.23 | )% | |
2017 | | $ | 45.04 | | | | (0.43 | ) | | | 8.16 | | | | 7.73 | | | | (6.74 | ) | | | (6.74 | ) | | $ | 46.03 | | | | 17.10 | % | |
Class C | | | |
Year Ended December 31: | |
2021 | | $ | 28.54 | | | | (0.59 | ) | | | 1.83 | | | | 1.24 | | | | (9.04 | ) | | | (9.04 | ) | | $ | 20.74 | | | | 6.02 | % | |
2020 | | $ | 26.77 | | | | (0.53 | ) | | | 8.95 | | | | 8.42 | | | | (6.65 | ) | | | (6.65 | ) | | $ | 28.54 | | | | 32.20 | % | |
2019 | | $ | 23.82 | | | | (0.53 | ) | | | 7.94 | | | | 7.41 | | | | (4.46 | ) | | | (4.46 | ) | | $ | 26.77 | | | | 31.28 | % | |
2018 | | $ | 40.80 | | | | (0.70 | ) | | | (2.75 | ) | | | (3.45 | ) | | | (13.53 | ) | | | (13.53 | ) | | $ | 23.82 | | | | (7.98 | )% | |
2017 | | $ | 40.89 | | | | (0.73 | ) | | | 7.38 | | | | 6.65 | | | | (6.74 | ) | | | (6.74 | ) | | $ | 40.80 | | | | 16.19 | % | |
Class R | | | |
Year Ended December 31: | |
2021 | | $ | 29.34 | | | | (0.53 | ) | | | 1.90 | | | | 1.37 | | | | (9.04 | ) | | | (9.04 | ) | | $ | 21.67 | | | | 6.31 | % | |
2020 | | $ | 27.30 | | | | (0.46 | ) | | | 9.15 | | | | 8.69 | | | | (6.65 | ) | | | (6.65 | ) | | $ | 29.34 | | | | 32.57 | % | |
2019 | | $ | 24.16 | | | | (0.45 | ) | | | 8.05 | | | | 7.60 | | | | (4.46 | ) | | | (4.46 | ) | | $ | 27.30 | | | | 31.63 | % | |
2018 | | $ | 41.06 | | | | (0.59 | ) | | | (2.78 | ) | | | (3.37 | ) | | | (13.53 | ) | | | (13.53 | ) | | $ | 24.16 | | | | (7.70 | )% | |
2017 | | $ | 41.00 | | | | (0.61 | ) | | | 7.41 | | | | 6.80 | | | | (6.74 | ) | | | (6.74 | ) | | $ | 41.06 | | | | 16.51 | % | |
Class R6 | | | |
Year Ended December 31: | |
2021 | | $ | 41.25 | | | | (0.38 | ) | | | 2.88 | | | | 2.50 | | | | (9.04 | ) | | | (9.04 | ) | | $ | 34.71 | | | | 7.23 | % | |
2020 | | $ | 35.99 | | | | (0.31 | ) | | | 12.22 | | | | 11.91 | | | | (6.65 | ) | | | (6.65 | ) | | $ | 41.25 | | | | 33.65 | % | |
2019 | | $ | 30.50 | | | | (0.27 | ) | | | 10.22 | | | | 9.95 | | | | (4.46 | ) | | | (4.46 | ) | | $ | 35.99 | | | | 32.76 | % | |
2018 | | $ | 47.53 | | | | (0.29 | ) | | | (3.21 | ) | | | (3.50 | ) | | | (13.53 | ) | | | (13.53 | ) | | $ | 30.50 | | | | (6.92 | )% | |
2017 | | $ | 46.16 | | | | (0.28 | ) | | | 8.39 | | | | 8.11 | | | | (6.74 | ) | | | (6.74 | ) | | $ | 47.53 | | | | 17.48 | % | |
Class Y | | | |
Year Ended December 31: | |
2021 | | $ | 41.02 | | | | (0.41 | ) | | | 2.86 | | | | 2.45 | | | | (9.04 | ) | | | (9.04 | ) | | $ | 34.43 | | | | 7.15 | % | |
2020 | | $ | 35.84 | | | | (0.33 | ) | | | 12.16 | | | | 11.83 | | | | (6.65 | ) | | | (6.65 | ) | | $ | 41.02 | | | | 33.57 | % | |
2019 | | $ | 30.41 | | | | (0.29 | ) | | | 10.18 | | | | 9.89 | | | | (4.46 | ) | | | (4.46 | ) | | $ | 35.84 | | | | 32.66 | % | |
2018 | | $ | 47.47 | | | | (0.30 | ) | | | (3.23 | ) | | | (3.53 | ) | | | (13.53 | ) | | | (13.53 | ) | | $ | 30.41 | | | | (7.02 | )% | |
2017 | | $ | 46.15 | | | | (0.31 | ) | | | 8.37 | | | | 8.06 | | | | (6.74 | ) | | | (6.74 | ) | | $ | 47.47 | | | | 17.40 | % | |
(a) Per share net investment income (loss) has been calculated using the average daily shares method.
(b) Portfolio turnover is calculated on the basis of the Fund as a whole without distinguishing between the classes of shares issued.
See notes to financial statements.
68
Victory Portfolios | | Financial Highlights — continued | |
For a Share Outstanding Throughout Each Period
| | | Ratios to Average Net Assets | | Supplemental Data | |
| | | Net
Expenses | | Net
Investment
Income
(Loss) | | Gross
Expenses | | Net Assets,
End of
Period
(000's) | | Portfolio
Turnover(b) | |
Victory RS Select Growth Fund | |
Class A | |
Year Ended December 31: | |
2021 | | | 1.40 | % | | | (1.21 | )% | | | 1.48 | % | | $ | 117,017 | | | | 75 | % | |
2020 | | | 1.40 | % | | | (1.14 | )% | | | 1.49 | % | | $ | 115,014 | | | | 73 | % | |
2019 | | | 1.40 | % | | | (1.06 | )% | | | 1.52 | % | | $ | 97,337 | | | | 74 | % | |
2018 | | | 1.40 | % | | | (0.86 | )% | | | 1.50 | % | | $ | 94,393 | | | | 79 | % | |
2017 | | | 1.40 | % | | | (0.88 | )% | | | 1.49 | % | | $ | 147,531 | | | | 69 | % | |
Class C | |
Year Ended December 31: | |
2021 | | | 2.18 | % | | | (1.99 | )% | | | 2.24 | % | | $ | 9,835 | | | | 75 | % | |
2020 | | | 2.18 | % | | | (1.92 | )% | | | 2.29 | % | | $ | 23,831 | | | | 73 | % | |
2019 | | | 2.18 | % | | | (1.84 | )% | | | 2.30 | % | | $ | 26,988 | | | | 74 | % | |
2018 | | | 2.18 | % | | | (1.64 | )% | | | 2.25 | % | | $ | 31,754 | | | | 79 | % | |
2017 | | | 2.18 | % | | | (1.66 | )% | | | 2.24 | % | | $ | 51,208 | | | | 69 | % | |
Class R | |
Year Ended December 31: | |
2021 | | | 1.91 | % | | | (1.72 | )% | | | 2.18 | % | | $ | 408 | | | | 75 | % | |
2020 | | | 1.91 | % | | | (1.64 | )% | | | 5.35 | % | | $ | 504 | | | | 73 | % | |
2019 | | | 1.91 | % | | | (1.57 | )% | | | 4.35 | % | | $ | 604 | | | | 74 | % | |
2018 | | | 1.91 | % | | | (1.38 | )% | | | 3.60 | % | | $ | 701 | | | | 79 | % | |
2017 | | | 1.91 | % | | | (1.39 | )% | | | 2.90 | % | | $ | 1,014 | | | | 69 | % | |
Class R6 | |
Year Ended December 31: | |
2021 | | | 1.06 | % | | | (0.88 | )% | | | 1.83 | % | | $ | 1,231 | | | | 75 | % | |
2020 | | | 1.06 | % | | | (0.80 | )% | | | 4.52 | % | | $ | 710 | | | | 73 | % | |
2019 | | | 1.06 | % | | | (0.72 | )% | | | 5.46 | % | | $ | 302 | | | | 74 | % | |
2018 | | | 1.06 | % | | | (0.59 | )% | | | 6.33 | % | | $ | 239 | | | | 79 | % | |
2017 | | | 1.06 | % | | | (0.55 | )% | | | 27.47 | % | | $ | 151 | | | | 69 | % | |
Class Y | |
Year Ended December 31: | |
2021 | | | 1.14 | % | | | (0.95 | )% | | | 1.21 | % | | $ | 70,192 | | | | 75 | % | |
2020 | | | 1.14 | % | | | (0.88 | )% | �� | | 1.24 | % | | $ | 93,844 | | | | 73 | % | |
2019 | | | 1.14 | % | | | (0.80 | )% | | | 1.23 | % | | $ | 94,933 | | | | 74 | % | |
2018 | | | 1.14 | % | | | (0.59 | )% | | | 1.21 | % | | $ | 120,696 | | | | 79 | % | |
2017 | | | 1.14 | % | | | (0.62 | )% | | | 1.20 | % | | $ | 244,689 | | | | 69 | % | |
See notes to financial statements.
69
Victory Portfolios | | Financial Highlights | |
For a Share Outstanding Throughout Each Period
| | | | | Investment Activities | | Distributions to
Shareholders From | |
| | | Net Asset
Value,
Beginning of
Period | | Net
Investment
Income
(Loss)(a) | | Net Realized
and Unrealized
Gains (Losses)
on Investments | | Total from
Investment
Activities | | Net Realized
Gains From
Investments | | Return of
Capital | |
Victory RS Mid Cap Growth Fund | | | |
Class A | | | |
Year Ended December 31: | |
2021 | | $ | 32.99 | | | | (0.33 | ) | | | 1.60 | | | | 1.27 | | | | (9.50 | ) | | | — | | |
2020 | | $ | 25.56 | | | | (0.20 | ) | | | 8.98 | | | | 8.78 | | | | (1.35 | ) | | | — | | |
2019 | | $ | 19.96 | | | | (0.17 | ) | | | 5.77 | | | | 5.60 | | | | — | | | | — | | |
2018 | | $ | 25.77 | | | | (0.14 | ) | | | (1.79 | ) | | | (1.93 | ) | | | (3.00 | ) | | | (0.88 | ) | |
2017 | | $ | 21.32 | | | | (0.10 | ) | | | 4.55 | | | | 4.45 | | | | — | | | | — | | |
Class C | | | |
Year Ended December 31: | |
2021 | | $ | 28.05 | | | | (0.52 | ) | | | 1.31 | | | | 0.79 | | | | (9.50 | ) | | | — | | |
2020 | | $ | 22.08 | | | | (0.38 | ) | | | 7.70 | | | | 7.32 | | | | (1.35 | ) | | | — | | |
2019 | | $ | 17.40 | | | | (0.34 | ) | | | 5.02 | | | | 4.68 | | | | — | | | | — | | |
2018 | | $ | 23.22 | | | | (0.35 | ) | | | (1.59 | ) | | | (1.94 | ) | | | (3.65 | ) | | | (0.23 | ) | |
2017 | | $ | 19.38 | | | | (0.28 | ) | | | 4.12 | | | | 3.84 | | | | — | | | | — | | |
Class R | | | |
Year Ended December 31: | |
2021 | | $ | 29.79 | | | | (0.47 | ) | | | 1.42 | | | | 0.95 | | | | (9.50 | ) | | | — | | |
2020 | | $ | 23.32 | | | | (0.33 | ) | | | 8.15 | | | | 7.82 | | | | (1.35 | ) | | | — | | |
2019 | | $ | 18.31 | | | | (0.28 | ) | | | 5.29 | | | | 5.01 | | | | — | | | | — | | |
2018 | | $ | 24.14 | | | | (0.29 | ) | | | (1.66 | ) | | | (1.95 | ) | | | (3.86 | ) | | | (0.02 | ) | |
2017 | | $ | 20.09 | | | | (0.23 | ) | | | 4.28 | | | | 4.05 | | | | — | | | | — | | |
Class R6 | | | |
Year Ended December 31: | |
2021 | | $ | 34.53 | | | | (0.25 | ) | | | 1.68 | | | | 1.43 | | | | (9.50 | ) | | | — | | |
2020 | | $ | 26.63 | | | | (0.14 | ) | | | 9.39 | | | | 9.25 | | | | (1.35 | ) | | | — | | |
2019 | | $ | 20.74 | | | | (0.11 | ) | | | 6.00 | | | | 5.89 | | | | — | | | | — | | |
2018 | | $ | 26.55 | | | | (0.07 | ) | | | (1.86 | ) | | | (1.93 | ) | | | (3.84 | ) | | | (0.04 | ) | |
2017 | | $ | 21.90 | | | | (0.04 | ) | | | 4.69 | | | | 4.65 | | | | — | | | | — | | |
Class Y | | | |
Year Ended December 31: | |
2021 | | $ | 34.50 | | | | (0.26 | ) | | | 1.69 | | | | 1.43 | | | | (9.50 | ) | | | — | | |
2020 | | $ | 26.61 | | | | (0.14 | ) | | | 9.38 | | | | 9.24 | | | | (1.35 | ) | | | — | | |
2019 | | $ | 20.73 | | | | (0.11 | ) | | | 5.99 | | | | 5.88 | | | | — | | | | — | | |
2018 | | $ | 26.54 | | | | (0.08 | ) | | | (1.85 | ) | | | (1.93 | ) | | | (1.17 | ) | | | (2.71 | ) | |
2017 | | $ | 21.90 | | | | (0.04 | ) | | | 4.68 | | | | 4.64 | | | | — | | | | — | | |
(a) Per share net investment income (loss) has been calculated using the average daily shares method.
(b) Portfolio turnover is calculated on the basis of the Fund as a whole without distinguishing between the classes of shares issued.
See notes to financial statements.
70
Victory Portfolios | | Financial Highlights — continued | |
For a Share Outstanding Throughout Each Period
| | | | | Ratios to Average Net Assets | | Supplemental Data | |
| | | Total
Distributions | | Net Asset
Value,
End of
Period | | Total
Return
(Excludes
Sales
Charge) | | Net
Expenses | | Net
Investment
Income
(Loss) | | Gross
Expenses | | Net Assets,
End of
Period
(000's) | | Portfolio
Turnover(b) | |
Victory RS Mid Cap Growth Fund | |
Class A | |
Year Ended December 31: | |
2021 | | | (9.50 | ) | | $ | 24.76 | | | | 4.68 | % | | | 1.20 | % | | | (0.98 | )% | | | 1.33 | % | | $ | 88,064 | | | | 90 | % | |
2020 | | | (1.35 | ) | | $ | 32.99 | | | | 34.47 | % | | | 1.20 | % | | | (0.75 | )% | | | 1.35 | % | | $ | 93,072 | | | | 92 | % | |
2019 | | | — | | | $ | 25.56 | | | | 28.06 | % | | | 1.20 | % | | | (0.67 | )% | | | 1.35 | % | | $ | 82,888 | | | | 86 | % | |
2018 | | | (3.88 | ) | | $ | 19.96 | | | | (7.37 | )% | | | 1.20 | % | | | (0.53 | )% | | | 1.34 | % | | $ | 75,451 | | | | 126 | % | |
2017 | | | — | | | $ | 25.77 | | | | 20.87 | % | | | 1.20 | % | | | (0.44 | )% | | | 1.29 | % | | $ | 108,271 | | | | 86 | % | |
Class C | |
Year Ended December 31: | |
2021 | | | (9.50 | ) | | $ | 19.34 | | | | 3.75 | % | | | 2.09 | % | | | (1.87 | )% | | | 2.09 | % | | $ | 12,054 | | | | 90 | % | |
2020 | | | (1.35 | ) | | $ | 28.05 | | | | 33.30 | % | | | 2.11 | % | | | (1.65 | )% | | | 2.14 | % | | $ | 17,325 | | | | 92 | % | |
2019 | | | — | | | $ | 22.08 | | | | 26.90 | % | | | 2.11 | % | | | (1.58 | )% | | | 2.12 | % | | $ | 20,266 | | | | 86 | % | |
2018 | | | (3.88 | ) | | $ | 17.40 | | | | (8.23 | )% | | | 2.11 | % | | | (1.44 | )% | | | 2.12 | % | | $ | 18,072 | | | | 126 | % | |
2017 | | | — | | | $ | 23.22 | | | | 19.81 | % | | | 2.10 | % | | | (1.33 | )% | | | 2.10 | % | | $ | 23,264 | | | | 86 | % | |
Class R | |
Year Ended December 31: | |
2021 | | | (9.50 | ) | | $ | 21.24 | | | | 4.09 | % | | | 1.80 | % | | | (1.58 | )% | | | 1.93 | % | | $ | 610 | | | | 90 | % | |
2020 | | | (1.35 | ) | | $ | 29.79 | | | | 33.67 | % | | | 1.80 | % | | | (1.34 | )% | | | 4.13 | % | | $ | 596 | | | | 92 | % | |
2019 | | | — | | | $ | 23.32 | | | | 27.36 | % | | | 1.80 | % | | | (1.26 | )% | | | 3.41 | % | | $ | 927 | | | | 86 | % | |
2018 | | | (3.88 | ) | | $ | 18.31 | | | | (7.99 | )% | | | 1.80 | % | | | (1.13 | )% | | | 2.68 | % | | $ | 1,144 | | | | 126 | % | |
2017 | | | — | | | $ | 24.14 | | | | 20.21 | % | | | 1.80 | % | | | (1.03 | )% | | | 2.43 | % | | $ | 1,685 | | | | 86 | % | |
Class R6 | |
Year Ended December 31: | |
2021 | | | (9.50 | ) | | $ | 26.46 | | | | 4.95 | % | | | 0.94 | % | | | (0.73 | )% | | | 0.98 | % | | $ | 19,731 | | | | 90 | % | |
2020 | | | (1.35 | ) | | $ | 34.53 | | | | 34.86 | % | | | 0.94 | % | | | (0.49 | )% | | | 1.01 | % | | $ | 27,861 | | | | 92 | % | |
2019 | | | — | | | $ | 26.63 | | | | 28.40 | % | | | 0.94 | % | | | (0.44 | )% | | | 1.05 | % | | $ | 20,321 | | | | 86 | % | |
2018 | | | (3.88 | ) | | $ | 20.74 | | | | (7.15 | )% | | | 0.94 | % | | | (0.26 | )% | | | 1.32 | % | | $ | 3,793 | | | | 126 | % | |
2017 | | | — | | | $ | 26.55 | | | | 21.23 | % | | | 0.94 | % | | | (0.17 | )% | | | 2.26 | % | | $ | 2,132 | | | | 86 | % | |
Class Y | |
Year Ended December 31: | |
2021 | | | (9.50 | ) | | $ | 26.43 | | | | 4.96 | % | | | 0.95 | % | | | (0.73 | )% | | | 1.09 | % | | $ | 249,373 | | | | 90 | % | |
2020 | | | (1.35 | ) | | $ | 34.50 | | | | 34.84 | % | | | 0.95 | % | | | (0.50 | )% | | | 1.10 | % | | $ | 466,342 | | | | 92 | % | |
2019 | | | — | | | $ | 26.61 | | | | 28.36 | % | | | 0.95 | % | | | (0.43 | )% | | | 1.10 | % | | $ | 395,586 | | | | 86 | % | |
2018 | | | (3.88 | ) | | $ | 20.73 | | | | (7.15 | )% | | | 0.95 | % | | | (0.27 | )% | | | 1.05 | % | | $ | 243,009 | | | | 126 | % | |
2017 | | | — | | | $ | 26.54 | | | | 21.19 | % | | | 0.95 | % | | | (0.18 | )% | | | 1.06 | % | | $ | 310,050 | | | | 86 | % | |
See notes to financial statements.
71
Victory Portfolios | | Financial Highlights | |
For a Share Outstanding Throughout Each Period
| | | | | Investment Activities | | Distributions
to
Shareholders
From | | | |
| | | Net Asset
Value,
Beginning of
Period | | Net
Investment
Income
(Loss)(a) | | Net
Realized and
Unrealized
Gains
(Losses) on
Investments | | Total from
Investment
Activities | | Net Realized
Gains From
Investments | | Total
Distributions | | Net Asset
Value,
End of
Period | | Total
Return
(Excludes
Sales
Charge)(b) | |
Member Class | |
Year Ended December 31: | |
2021 | | $ | 33.00 | | | | (0.28 | ) | | | 1.62 | | | | 1.34 | | | | (9.50 | ) | | | (9.50 | ) | | $ | 24.84 | | | | 4.88 | % | |
November 3, 2020 (e)
through
December 31, 2020 | | $ | 29.16 | | | | (0.04 | ) | | | 5.23 | | | | 5.19 | | | | (1.35 | ) | | | (1.35 | ) | | $ | 33.00 | | | | 17.94 | % | |
(a) Per share net investment income (loss) has been calculated using the average daily shares method.
(b) Not annualized for periods less than one year.
(c) Annualized for periods less than one year.
(d) Portfolio turnover is calculated on the basis of the Fund as a whole without distinguishing between the classes of shares issued.
(e) Commencement of operations.
See notes to financial statements.
72
Victory Portfolios | | Financial Highlights — continued | |
For a Share Outstanding Throughout Each Period (continued)
| | | Ratios to Average Net Assets | | Supplemental Data | |
| | | Net
Expenses(c) | | Net
Investment
Income
(Loss)(c) | | Gross
Expenses(c) | | Net Assets,
End of
Period
(000's) | | Portfolio
Turnover(b)(d) | |
Member Class | |
Year Ended December 31: | |
2021 | | | 1.05 | % | | | (0.85 | )% | | | 5.66 | % | | $ | 957 | | | | 90 | % | |
November 3, 2020 (e)
through
December 31, 2020 | | | 1.05 | % | | | (0.71 | )% | | | 31.23 | % | | $ | 109 | | | | 92 | % | |
See notes to financial statements.
73
Victory Portfolios | | Financial Highlights | |
For a Share Outstanding Throughout Each Period
| | | | | Investment Activities | | Distributions to
Shareholders From | |
| | | Net Asset
Value,
Beginning of
Period | | Net
Investment
Income
(Loss)(a) | | Net Realized
and Unrealized
Gains (Losses)
on Investments | | Total from
Investment
Activities | | Net
Investment
Income | | Net Realized
Gains From
Investments | |
Victory RS Growth Fund | | | |
Class A | | | |
Year Ended December 31: | |
2021 | | $ | 23.84 | | | | (0.18 | ) | | | 4.85 | | | | 4.67 | | | | (0.02 | ) | | | (2.35 | ) | |
2020 | | $ | 19.22 | | | | (0.08 | ) | | | 6.89 | | | | 6.81 | | | | — | | | | (2.19 | ) | |
2019 | | $ | 16.40 | | | | (0.03 | ) | | | 4.90 | | | | 4.87 | | | | — | | | | (2.05 | ) | |
2018 | | $ | 20.60 | | | | (0.06 | ) | | | (1.36 | ) | | | (1.42 | ) | | | — | | | | (2.78 | ) | |
2017 | | $ | 16.44 | | | | (0.02 | ) | | | 5.24 | | | | 5.22 | | | | — | | | | (1.06 | ) | |
Class C | | | |
Year Ended December 31: | |
2021 | | $ | 18.80 | | | | (0.31 | ) | | | 3.80 | | | | 3.49 | | | | — | | | | (2.35 | ) | |
2020 | | $ | 15.63 | | | | (0.20 | ) | | | 5.56 | | | | 5.36 | | | | — | | | | (2.19 | ) | |
2019 | | $ | 13.75 | | | | (0.16 | ) | | | 4.09 | | | | 3.93 | | | | — | | | | (2.05 | ) | |
2018 | | $ | 17.90 | | | | (0.21 | ) | | | (1.16 | ) | | | (1.37 | ) | | | — | | | | (2.78 | ) | |
2017 | | $ | 14.51 | | | | (0.15 | ) | | | 4.60 | | | | 4.45 | | | | — | | | | (1.06 | ) | |
Class R | | | |
Year Ended December 31: | |
2021 | | $ | 21.09 | | | | (0.30 | ) | | | 4.27 | | | | 3.97 | | | | — | | | | (2.35 | ) | |
2020 | | $ | 17.29 | | | | (0.19 | ) | | | 6.18 | | | | 5.99 | | | | — | | | | (2.19 | ) | |
2019 | | $ | 15.00 | | | | (0.14 | ) | | | 4.48 | | | | 4.34 | | | | — | | | | (2.05 | ) | |
2018 | | $ | 19.22 | | | | (0.18 | ) | | | (1.26 | ) | | | (1.44 | ) | | | — | | | | (2.78 | ) | |
2017 | | $ | 15.49 | | | | (0.13 | ) | | | 4.92 | | | | 4.79 | | | | — | | | | (1.06 | ) | |
Class Y | | | |
Year Ended December 31: | |
2021 | | $ | 25.13 | | | | (0.12 | ) | | | 5.13 | | | | 5.01 | | | | (0.09 | ) | | | (2.35 | ) | |
2020 | | $ | 20.11 | | | | (0.02 | ) | | | 7.23 | | | | 7.21 | | | | — | | | | (2.19 | ) | |
2019 | | $ | 17.04 | | | | 0.02 | | | | 5.10 | | | | 5.12 | | | | — | | | | (2.05 | ) | |
2018 | | $ | 21.23 | | | | — | (c) | | | (1.41 | ) | | | (1.41 | ) | | | — | | | | (2.78 | ) | |
2017 | | $ | 16.88 | | | | 0.03 | | | | 5.38 | | | | 5.41 | | | | — | | | | (1.06 | ) | |
(a) Per share net investment income (loss) has been calculated using the average daily shares method.
(b) Portfolio turnover is calculated on the basis of the Fund as a whole without distinguishing between the classes of shares issued.
(c) Amount is less than $0.005 per share.
See notes to financial statements.
74
Victory Portfolios | | Financial Highlights — continued | |
For a Share Outstanding Throughout Each Period
| | | | | Ratios to Average Net Assets | | Supplemental Data | |
| | | Total
Distributions | | Net Asset
Value,
End of
Period | | Total
Return
(Excludes
Sales
Charge) | | Net
Expenses | | Net
Investment
Income
(Loss) | | Gross
Expenses | | Net Assets,
End of
Period
(000's) | | Portfolio
Turnover(b) | |
Victory RS Growth Fund | |
Class A | |
Year Ended December 31: | |
2021 | | | (2.37 | ) | | $ | 26.14 | | | | 19.91 | % | | | 1.10 | % | | | (0.71 | )% | | | 1.17 | % | | $ | 308,663 | | | | 62 | % | |
2020 | | | (2.19 | ) | | $ | 23.84 | | | | 35.64 | % | | | 1.10 | % | | | (0.37 | )% | | | 1.19 | % | | $ | 274,388 | | | | 73 | % | |
2019 | | | (2.05 | ) | | $ | 19.22 | | | | 29.83 | % | | | 1.10 | % | | | (0.16 | )% | | | 1.19 | % | | $ | 223,503 | | | | 95 | % | |
2018 | | | (2.78 | ) | | $ | 16.40 | | | | (6.81 | )% | | | 1.10 | % | | | (0.28 | )% | | | 1.19 | % | | $ | 188,220 | | | | 87 | % | |
2017 | | | (1.06 | ) | | $ | 20.60 | | | | 31.75 | % | | | 1.10 | % | | | (0.09 | )% | | | 1.20 | % | | $ | 218,238 | | | | 74 | % | |
Class C | |
Year Ended December 31: | |
2021 | | | (2.35 | ) | | $ | 19.94 | | | | 18.95 | % | | | 1.93 | % | | | (1.54 | )% | | | 1.99 | % | | $ | 1,733 | | | | 62 | % | |
2020 | | | (2.19 | ) | | $ | 18.80 | | | | 34.55 | % | | | 1.93 | % | | | (1.20 | )% | | | 2.43 | % | | $ | 3,731 | | | | 73 | % | |
2019 | | | (2.05 | ) | | $ | 15.63 | | | | 28.74 | % | | | 1.93 | % | | | (0.99 | )% | | | 2.33 | % | | $ | 4,240 | | | | 95 | % | |
2018 | | | (2.78 | ) | | $ | 13.75 | | | | (7.56 | )% | | | 1.93 | % | | | (1.10 | )% | | | 2.20 | % | | $ | 4,409 | | | | 87 | % | |
2017 | | | (1.06 | ) | | $ | 17.90 | | | | 30.57 | % | | | 1.93 | % | | | (0.92 | )% | | | 2.10 | % | | $ | 6,974 | | | | 74 | % | |
Class R | |
Year Ended December 31: | |
2021 | | | (2.35 | ) | | $ | 22.71 | | | | 19.17 | % | | | 1.71 | % | | | (1.32 | )% | | | 1.71 | % | | $ | 542 | | | | 62 | % | |
2020 | | | (2.19 | ) | | $ | 21.09 | | | | 34.87 | % | | | 1.71 | % | | | (0.98 | )% | | | 6.08 | % | | $ | 420 | | | | 73 | % | |
2019 | | | (2.05 | ) | | $ | 17.29 | | | | 29.08 | % | | | 1.71 | % | | | (0.77 | )% | | | 5.41 | % | | $ | 438 | | | | 95 | % | |
2018 | | | (2.78 | ) | | $ | 15.00 | | | | (7.41 | )% | | | 1.71 | % | | | (0.88 | )% | | | 3.49 | % | | $ | 516 | | | | 87 | % | |
2017 | | | (1.06 | ) | | $ | 19.22 | | | | 30.92 | % | | | 1.71 | % | | | (0.70 | )% | | | 2.72 | % | | $ | 830 | | | | 74 | % | |
Class Y | |
Year Ended December 31: | |
2021 | | | (2.44 | ) | | $ | 27.70 | | | | 20.22 | % | | | 0.83 | % | | | (0.44 | )% | | | 0.91 | % | | $ | 33,772 | | | | 62 | % | |
2020 | | | (2.19 | ) | | $ | 25.13 | | | | 36.06 | % | | | 0.83 | % | | | (0.09 | )% | | | 0.99 | % | | $ | 29,875 | | | | 73 | % | |
2019 | | | (2.05 | ) | | $ | 20.11 | | | | 30.18 | % | | | 0.83 | % | | | 0.11 | % | | | 0.98 | % | | $ | 31,473 | | | | 95 | % | |
2018 | | | (2.78 | ) | | $ | 17.04 | | | | (6.56 | )% | | | 0.83 | % | | | (0.01 | )% | | | 0.97 | % | | $ | 26,457 | | | | 87 | % | |
2017 | | | (1.06 | ) | | $ | 21.23 | | | | 32.05 | % | | | 0.83 | % | | | 0.17 | % | | | 0.97 | % | | $ | 30,309 | | | | 74 | % | |
See notes to financial statements.
75
Victory Portfolios | | Financial Highlights | |
For a Share Outstanding Throughout Each Period
| | | | | Investment Activities | | Distributions
to
Shareholders
From | | | |
| | | Net Asset
Value,
Beginning of
Period | | Net
Investment
Income
(Loss)(a) | | Net
Realized and
Unrealized
Gains
(Losses) on
Investments | | Total from
Investment
Activities | | Net Realized
Gains From
Investments | |
Total
Distributions | | Net Asset
Value,
End of
Period | | Total
Return
(Excludes
Sales
Charge) | |
Victory RS Science and Technology Fund | | | |
Class A | | | |
Year Ended December 31: | |
2021 | | $ | 36.35 | | | | (0.46 | ) | | | (3.10 | ) | | | (3.56 | ) | | | (4.45 | ) | | | (4.45 | ) | | $ | 28.34 | | | | (9.25 | )% | |
2020 | | $ | 23.37 | | | | (0.34 | ) | | | 15.48 | | | | 15.14 | | | | (2.16 | ) | | | (2.16 | ) | | $ | 36.35 | | | | 65.03 | % | |
2019 | | $ | 18.34 | | | | (0.26 | ) | | | 7.43 | | | | 7.17 | | | | (2.14 | ) | | | (2.14 | ) | | $ | 23.37 | | | | 39.32 | % | |
2018 | | $ | 21.56 | | | | (0.27 | ) | | | 0.06 | | | | (0.21 | ) | | | (3.01 | ) | | | (3.01 | ) | | $ | 18.34 | | | | (0.73 | )% | |
2017 | | $ | 17.49 | | | | (0.25 | ) | | | 8.04 | | | | 7.79 | | | | (3.72 | ) | | | (3.72 | ) | | $ | 21.56 | | | | 44.74 | % | |
Class C | | | |
Year Ended December 31: | |
2021 | | $ | 26.81 | | | | (0.55 | ) | | | (2.33 | ) | | | (2.88 | ) | | | (4.45 | ) | | | (4.45 | ) | | $ | 19.48 | | | | (10.03 | )% | |
2020 | | $ | 17.73 | | | | (0.41 | ) | | | 11.65 | | | | 11.24 | | | | (2.16 | ) | | | (2.16 | ) | | $ | 26.81 | | | | 63.71 | % | |
2019 | | $ | 14.40 | | | | (0.35 | ) | | | 5.82 | | | | 5.47 | | | | (2.14 | ) | | | (2.14 | ) | | $ | 17.73 | | | | 38.27 | % | |
2018 | | $ | 17.73 | | | | (0.38 | ) | | | 0.06 | | | | (0.32 | ) | | | (3.01 | ) | | | (3.01 | ) | | $ | 14.40 | | | | (1.58 | )% | |
2017 | | $ | 14.96 | | | | (0.36 | ) | | | 6.85 | | | | 6.49 | | | | (3.72 | ) | | | (3.72 | ) | | $ | 17.73 | | | | 43.70 | % | |
Class R | | | |
Year Ended December 31: | |
2021 | | $ | 29.99 | | | | (0.51 | ) | | | (2.58 | ) | | | (3.09 | ) | | | (4.45 | ) | | | (4.45 | ) | | $ | 22.45 | | | | (9.66 | )% | |
2020 | | $ | 19.60 | | | | (0.39 | ) | | | 12.94 | | | | 12.55 | | | | (2.16 | ) | | | (2.16 | ) | | $ | 29.99 | | | | 64.32 | % | |
2019 | | $ | 15.70 | | | | (0.31 | ) | | | 6.35 | | | | 6.04 | | | | (2.14 | ) | | | (2.14 | ) | | $ | 19.60 | | | | 38.73 | % | |
2018 | | $ | 18.99 | | | | (0.33 | ) | | | 0.05 | | | | (0.28 | ) | | | (3.01 | ) | | | (3.01 | ) | | $ | 15.70 | | | | (1.20 | )% | |
2017 | | $ | 15.78 | | | | (0.31 | ) | | | 7.24 | | | | 6.93 | | | | (3.72 | ) | | | (3.72 | ) | | $ | 18.99 | | | | 44.05 | % | |
Class Y | | | |
Year Ended December 31: | |
2021 | | $ | 39.73 | | | | (0.41 | ) | | | (3.38 | ) | | | (3.79 | ) | | | (4.45 | ) | | | (4.45 | ) | | $ | 31.49 | | | | (9.04 | )% | |
2020 | | $ | 25.36 | | | | (0.29 | ) | | | 16.82 | | | | 16.53 | | | | (2.16 | ) | | | (2.16 | ) | | $ | 39.73 | | | | 65.40 | % | |
2019 | | $ | 19.72 | | | | (0.22 | ) | | | 8.00 | | | | 7.78 | | | | (2.14 | ) | | | (2.14 | ) | | $ | 25.36 | | | | 39.66 | % | |
2018 | | $ | 22.90 | | | | (0.22 | ) | | | 0.05 | | | | (0.17 | ) | | | (3.01 | ) | | | (3.01 | ) | | $ | 19.72 | | | | (0.51 | )% | |
2017 | | $ | 18.37 | | | | (0.21 | ) | | | 8.46 | | | | 8.25 | | | | (3.72 | ) | | | (3.72 | ) | | $ | 22.90 | | | | 45.11 | % | |
(a) Per share net investment income (loss) has been calculated using the average daily shares method.
(b) Portfolio turnover is calculated on the basis of the Fund as a whole without distinguishing between the classes of shares issued.
See notes to financial statements.
76
Victory Portfolios | | Financial Highlights — continued | |
For a Share Outstanding Throughout Each Period
| | | Ratios to Average Net Assets | | Supplemental Data | |
| | | Net
Expenses | | Net
Investment
Income
(Loss) | | Gross
Expenses | | Net Assets,
End of
Period
(000's) | | Portfolio
Turnover(b) | |
Victory RS Science and Technology Fund | |
Class A | |
Year Ended December 31: | |
2021 | | | 1.47 | % | | | (1.28 | )% | | | 1.47 | % | | $ | 250,490 | | | | 46 | % | |
2020 | | | 1.48 | % | | | (1.22 | )% | | | 1.48 | % | | $ | 320,605 | | | | 30 | % | |
2019 | | | 1.48 | % | | | (1.14 | )% | | | 1.48 | % | | $ | 199,591 | | | | 88 | % | |
2018 | | | 1.47 | % | | | (1.10 | )% | | | 1.47 | % | | $ | 140,389 | | | | 83 | % | |
2017 | | | 1.49 | % | | | (1.18 | )% | | | 1.49 | % | | $ | 146,002 | | | | 89 | % | |
Class C | |
Year Ended December 31: | |
2021 | | | 2.28 | % | | | (2.09 | )% | | | 2.28 | % | | $ | 11,168 | | | | 46 | % | |
2020 | | | 2.28 | % | | | (2.03 | )% | | | 2.32 | % | | $ | 18,398 | | | | 30 | % | |
2019 | | | 2.28 | % | | | (1.94 | )% | | | 2.34 | % | | $ | 14,054 | | | | 88 | % | |
2018 | | | 2.28 | % | | | (1.91 | )% | | | 2.31 | % | | $ | 11,857 | | | | 83 | % | |
2017 | | | 2.28 | % | | | (1.97 | )% | | | 2.31 | % | | $ | 11,831 | | | | 89 | % | |
Class R | |
Year Ended December 31: | |
2021 | | | 1.93 | % | | | (1.74 | )% | | | 1.93 | % | | $ | 1,089 | | | | 46 | % | |
2020 | | | 1.93 | % | | | (1.68 | )% | | | 3.69 | % | | $ | 1,273 | | | | 30 | % | |
2019 | | | 1.93 | % | | | (1.59 | )% | | | 4.28 | % | | $ | 681 | | | | 88 | % | |
2018 | | | 1.93 | % | | | (1.56 | )% | | | 2.75 | % | | $ | 707 | | | | 83 | % | |
2017 | | | 1.93 | % | | | (1.62 | )% | | | 2.54 | % | | $ | 1,705 | | | | 89 | % | |
Class Y | |
Year Ended December 31: | |
2021 | | | 1.23 | % | | | (1.05 | )% | | | 1.23 | % | | $ | 81,080 | | | | 46 | % | |
2020 | | | 1.24 | % | | | (0.99 | )% | | | 1.26 | % | | $ | 109,275 | | | | 30 | % | |
2019 | | | 1.24 | % | | | (0.89 | )% | | | 1.26 | % | | $ | 77,998 | | | | 88 | % | |
2018 | | | 1.24 | % | | | (0.85 | )% | | | 1.25 | % | | $ | 53,395 | | | | 83 | % | |
2017 | | | 1.24 | % | | | (0.92 | )% | | | 1.26 | % | | $ | 32,047 | | | | 89 | % | |
See notes to financial statements.
77
Victory Portfolios | | Financial Highlights | |
For a Share Outstanding Throughout Each Period
| | | | | Investment Activities | | Distributions
to
Shareholders
From | | | |
| | | Net Asset
Value,
Beginning of
Period | | Net
Investment
Income
(Loss)(a) | | Net
Realized and
Unrealized
Gains
(Losses) on
Investments | | Total from
Investment
Activities | | Net Realized
Gains From
Investments | |
Total
Distributions | | Net Asset
Value,
End of
Period | | Total
Return
(Excludes
Sales
Charge)(b) | |
Victory RS Small Cap Equity Fund | | | |
Class A | | | |
Year Ended December 31: | |
2021 | | $ | 18.02 | | | | (0.21 | ) | | | (1.28 | ) | | | (1.49 | ) | | | (3.21 | ) | | | (3.21 | ) | | $ | 13.32 | | | | (7.36 | )% | |
2020 | | $ | 16.05 | | | | (0.19 | ) | | | 6.17 | | | | 5.98 | | | | (4.01 | ) | | | (4.01 | ) | | $ | 18.02 | | | | 37.99 | % | |
2019 | | $ | 12.97 | | | | (0.15 | ) | | | 5.11 | | | | 4.96 | | | | (1.88 | ) | | | (1.88 | ) | | $ | 16.05 | | | | 38.49 | % | |
2018 | | $ | 18.88 | | | | (0.16 | ) | | | (1.47 | ) | | | (1.63 | ) | | | (4.28 | ) | | | (4.28 | ) | | $ | 12.97 | | | | (8.39 | )% | |
2017 | | $ | 14.41 | | | | (0.14 | ) | | | 5.55 | | | | 5.41 | | | | (0.94 | ) | | | (0.94 | ) | | $ | 18.88 | | | | 37.57 | % | |
Class C | | | |
Year Ended December 31: | |
| 2021(f) | | $ | 18.39 | | | | (0.37 | ) | | | (1.32 | ) | | | (1.69 | ) | | | (3.21 | ) | | | (3.21 | ) | | $ | 13.49 | | | | (8.14 | )% | |
| 2020(f) | | $ | 49.61 | | | | (0.84 | ) | | | 17.74 | | | | 16.90 | | | | (48.12 | ) | | | (48.12 | ) | | $ | 18.39 | | | | 36.75 | % | |
| 2019(f) | | $ | 52.83 | | | | (1.08 | ) | | | 20.42 | | | | 19.34 | | | | (22.56 | ) | | | (22.56 | ) | | $ | 49.61 | | | | 37.26 | % | |
| 2018(f) | | $ | 115.36 | | | | (2.04 | ) | | | (9.13 | ) | | | (11.17 | ) | | | (51.36 | ) | | | (51.36 | ) | | $ | 52.83 | | | | (9.23 | )% | |
| 2017(f) | | $ | 92.89 | | | | (1.80 | ) | | | 35.55 | | | | 33.75 | | | | (11.28 | ) | | | (11.28 | ) | | $ | 115.36 | | | | 36.34 | % | |
Class R | | | |
Year Ended December 31: | |
2021 | | $ | 12.79 | | | | (0.21 | ) | | | (0.96 | ) | | | (1.17 | ) | | | (3.21 | ) | | | (3.21 | ) | | $ | 8.41 | | | | (7.87 | )% | |
2020 | | $ | 12.32 | | | | (0.20 | ) | | | 4.68 | | | | 4.48 | | | | (4.01 | ) | | | (4.01 | ) | | $ | 12.79 | | | | 37.31 | % | |
2019 | | $ | 10.32 | | | | (0.18 | ) | | | 4.06 | | | | 3.88 | | | | (1.88 | ) | | | (1.88 | ) | | $ | 12.32 | | | | 37.91 | % | |
2018 | | $ | 16.08 | | | | (0.23 | ) | | | (1.25 | ) | | | (1.48 | ) | | | (4.28 | ) | | | (4.28 | ) | | $ | 10.32 | | | | (8.92 | )% | |
2017 | | $ | 12.44 | | | | (0.20 | ) | | | 4.78 | | | | 4.58 | | | | (0.94 | ) | | | (0.94 | ) | | $ | 16.08 | | | | 36.84 | % | |
Class Y | | | |
Year Ended December 31: | |
2021 | | $ | 18.71 | | | | (0.19 | ) | | | (1.33 | ) | | | (1.52 | ) | | | (3.21 | ) | | | (3.21 | ) | | $ | 13.98 | | | | (7.25 | )% | |
2020 | | $ | 16.52 | | | | (0.16 | ) | | | 6.36 | | | | 6.20 | | | | (4.01 | ) | | | (4.01 | ) | | $ | 18.71 | | | | 38.24 | % | |
2019 | | $ | 13.29 | | | | (0.13 | ) | | | 5.24 | | | | 5.11 | | | | (1.88 | ) | | | (1.88 | ) | | $ | 16.52 | | | | 38.69 | % | |
2018 | | $ | 19.20 | | | | (0.14 | ) | | | (1.49 | ) | | | (1.63 | ) | | | (4.28 | ) | | | (4.28 | ) | | $ | 13.29 | | | | (8.23 | )% | |
2017 | | $ | 14.62 | | | | (0.14 | ) | | | 5.66 | | | | 5.52 | | | | (0.94 | ) | | | (0.94 | ) | | $ | 19.20 | | | | 37.78 | % | |
Member Class | | | |
Year Ended December 31: | |
2021 | | $ | 18.04 | | | | (0.19 | ) | | | (1.30 | ) | | | (1.49 | ) | | | (3.21 | ) | | | (3.21 | ) | | $ | 13.34 | | | | (7.35 | )% | |
November 3, 2020 (g)
through
December 31, 2020 | | $ | 17.72 | | | | (0.04 | ) | | | 4.37 | | | | 4.33 | | | | (4.01 | ) | | | (4.01 | ) | | $ | 18.04 | | | | 25.09 | % | |
(a) Per share net investment income (loss) has been calculated using the average daily shares method.
(b) Not annualized for periods less than one year.
(c) Annualized for periods less than one year.
See notes to financial statements.
78
Victory Portfolios | | Financial Highlights — continued | |
For a Share Outstanding Throughout Each Period
| | | Ratios to Average Net Assets | | Supplemental Data | |
| | | Net
Expenses(c) | | Net
Investment
Income
(Loss)(c) | | Gross
Expenses(c) | | Net Assets,
End of
Period
(000's) | | Portfolio
Turnover(b)(d) | |
Victory RS Small Cap Equity Fund | |
Class A | |
Year Ended December 31: | |
2021 | | | 1.25 | % | | | (1.18 | )% | | | 1.25 | % | | $ | 60,699 | | | | 113 | % | |
2020 | | | 1.29 | % | | | (1.14 | )% | | | 1.29 | % | | $ | 76,611 | | | | 157 | %(e) | |
2019 | | | 1.26 | % | | | (0.93 | )% | | | 1.26 | % | | $ | 63,247 | | | | 89 | % | |
2018 | | | 1.22 | % | | | (0.78 | )% | | | 1.22 | % | | $ | 51,619 | | | | 77 | % | |
2017 | | | 1.25 | % | | | (0.84 | )% | | | 1.25 | % | | $ | 65,514 | | | | 79 | % | |
Class C | |
Year Ended December 31: | |
| 2021(f) | | | 2.10 | % | | | (2.04 | )% | | | 4.32 | % | | $ | 380 | | | | 113 | % | |
| 2020(f) | | | 2.10 | % | | | (1.94 | )% | | | 5.26 | % | | $ | 515 | | | | 157 | %(e) | |
| 2019(f) | | | 2.10 | % | | | (1.76 | )% | | | 3.86 | % | | $ | 478 | | | | 89 | % | |
| 2018(f) | | | 2.10 | % | | | (1.71 | )% | | | 4.24 | % | | $ | 616 | | | | 77 | % | |
| 2017(f) | | | 2.10 | % | | | (1.69 | )% | | | 3.87 | % | | $ | 533 | | | | 79 | % | |
Class R | |
Year Ended December 31: | |
2021 | | | 1.75 | % | | | (1.68 | )% | | | 1.89 | % | | $ | 2,949 | | | | 113 | % | |
2020 | | | 1.75 | % | | | (1.59 | )% | | | 2.05 | % | | $ | 3,325 | | | | 157 | %(e) | |
2019 | | | 1.75 | % | | | (1.42 | )% | | | 2.05 | % | | $ | 2,874 | | | | 89 | % | |
2018 | | | 1.75 | % | | | (1.30 | )% | | | 1.88 | % | | $ | 2,303 | | | | 77 | % | |
2017 | | | 1.75 | % | | | (1.34 | )% | | | 1.97 | % | | $ | 3,381 | | | | 79 | % | |
Class Y | |
Year Ended December 31: | |
2021 | | | 1.10 | % | | | (1.03 | )% | | | 1.10 | % | | $ | 3,095 | | | | 113 | % | |
2020 | | | 1.10 | % | | | (0.95 | )% | | | 1.58 | % | | $ | 4,449 | | | | 157 | %(e) | |
2019 | | | 1.10 | % | | | (0.77 | )% | | | 1.43 | % | | $ | 3,275 | | | | 89 | % | |
2018 | | | 1.10 | % | | | (0.69 | )% | | | 1.68 | % | | $ | 2,750 | | | | 77 | % | |
2017 | | | 1.10 | % | | | (0.78 | )% | | | 1.34 | % | | $ | 6,398 | | | | 79 | % | |
Member Class | |
Year Ended December 31: | |
2021 | | | 1.15 | % | | | (1.08 | )% | | | 3.55 | % | | $ | 1,394 | | | | 113 | % | |
November 3, 2020 (g)
through
December 31, 2020 | | | 1.15 | % | | | (1.14 | )% | | | 23.73 | % | | $ | 218 | | | | 157 | %(e) | |
(d) Portfolio turnover is calculated on the basis of the Fund as a whole without distinguishing between the classes of shares issued.
(e) Reflects increased trading activity due to changes in allocation strategies.
(f) As described in Note 9, per share amounts adjusted for a 1:12 reverse stock split.
(g) Commencement of operations.
See notes to financial statements.
79
Victory Portfolios | | Notes to Financial Statements
December 31, 2021 | |
1. Organization:
Victory Portfolios (the "Trust") is organized as a Delaware statutory trust and the Trust is registered under the Investment Company Act of 1940, as amended (the "1940 Act"), as an open-end investment company. The Trust is comprised of 41 funds and is authorized to issue an unlimited number of shares, which are units of beneficial interest with a par value of $0.001 per share.
The accompanying financial statements are those of the following six Funds (collectively, the "Funds" and individually, a "Fund"). Each Fund is classified as diversified under the 1940 Act.
Funds (Legal Name) | | Funds (Short Name) | | Investment Share
Classes Offered | |
Victory RS Small Cap Growth Fund | | RS Small Cap Growth Fund | | A, C, R, R6, and Y | |
Victory RS Select Growth Fund | | RS Select Growth Fund | | A, C, R, R6, and Y | |
Victory RS Mid Cap Growth Fund
| | RS Mid Cap Growth Fund
| | A, C, R, R6, Y, and
Member Class | |
Victory RS Growth Fund | | RS Growth Fund | | A, C, R, and Y | |
Victory RS Science and Technology
Fund | | RS Science and Technology
Fund | | A, C, R, and Y | |
Victory RS Small Cap Equity Fund
| | RS Small Cap Equity Fund
| | A, C, R, Y, and
Member Class | |
Each class of shares of a Fund has substantially identical rights and privileges except with respect to sales charges, fees paid under distribution plans, expenses allocable exclusively to each class of shares, voting rights on matters solely affecting a single class of shares, and the exchange privilege of each class of shares.
Under the Trust's organizational documents, its officers and trustees are indemnified against certain liabilities arising out of the performance of their duties to the Funds. In addition, in the normal course of business, the Funds enter into contracts with their vendors and others that provide for general indemnifications. The Funds' maximum exposure under these arrangements is unknown, as this would involve future claims that may be made against the Fund. However, based on experience, the Funds expect that risk of loss to be remote.
2. Significant Accounting Policies:
The following is a summary of significant accounting policies followed by the Trust in the preparation of its financial statements. The policies are in conformity with U.S. Generally Accepted Accounting Principles ("GAAP"). The preparation of financial statements in accordance with GAAP requires management to make estimates and assumptions that affect the reported amounts of assets and liabilities and disclosure of contingent assets and liabilities at the date of the financial statements and the reported amounts of income and expenses for the period. Actual results could differ from those estimates. The Funds follow the specialized accounting and reporting requirements under GAAP that are applicable to investment companies under Accounting Standards Codification Topic 946.
Investment Valuation:
The Funds record investments at fair value. Fair value is defined as the price that would be received to sell an asset or paid to transfer a liability in an orderly transaction between market participants at the measurement date.
The valuation techniques described below maximize the use of observable inputs and minimize the use of unobservable inputs in determining fair value. The inputs used for valuing the Funds' investments are summarized in the three broad levels listed below:
• Level 1 — quoted prices in active markets for identical securities
• Level 2 — other significant observable inputs (including quoted prices for similar securities or interest rates applicable to those securities, etc.)
• Level 3 — significant unobservable inputs (including the Funds' own assumptions in determining the fair value of investments)
80
Victory Portfolios | | Notes to Financial Statements — continued
December 31, 2021 | |
Changes in valuation techniques may result in transfers in or out of an assigned level within the disclosure hierarchy. The inputs or methodologies used for valuation techniques are not necessarily an indication of the risk associated with entering into those investments.
Victory Capital Management Inc. ("VCM" or the "Adviser") has established the Pricing and Liquidity Committee (the "Committee"), and subject to the Trust's Board of Trustees' (the "Board") oversight, the Committee administers and oversees the Funds' valuation policies and procedures, which are approved by the Board.
Portfolio securities listed or traded on securities exchanges, including exchange-traded funds ("ETFs") and American Depositary Receipts ("ADRs"), are valued at the closing price on the exchange or system where the security is principally traded, if available, or at the Nasdaq Official Closing Price. If there have been no sales for that day on the exchange or system, then a security is valued at the last available bid quotation on the exchange or system where the security is principally traded. In each of these situations, valuations are typically categorized as Level 1 in the fair value hierarchy.
Investments in open-end investment companies are valued at their net asset value ("NAV"). These valuations are typically categorized as Level 1 in the fair value hierarchy.
In the event that price quotations or valuations are not readily available, investments are valued at fair value in accordance with procedures established by and under the general supervision and responsibility of the Board. These valuations are typically categorized as Level 2 or Level 3 in the fair value hierarchy, based on the observability of inputs used to determine the fair value. The effect of fair value pricing is that securities may not be priced on the basis of quotations from the primary market in which they are traded and the actual price realized from the sale of a security may differ materially from the fair value price. Valuing these securities at fair value is intended to cause the Fund's NAV to be more reliable than it otherwise would be.
A summary of the valuations as of December 31, 2021, is included in the table below while the breakdown, by category, of investments is disclosed on the Schedules of Portfolio Investments:
| | | Level 1 | | Level 2 | | Level 3 | | Total | |
RS Small Cap Growth Fund | |
Common Stocks | | $ | 2,248,054,063 | | | $ | — | | | $ | — | | | $ | 2,248,054,063 | | |
Collateral for Securities Loaned | | | 163,622,986 | | | | — | | | | — | | | | 163,622,986 | | |
Total | | $ | 2,411,677,049 | | | $ | — | | | $ | — | | | $ | 2,411,677,049 | | |
RS Select Growth Fund | |
Common Stocks | | $ | 198,206,646 | | | $ | — | | | $ | — | | | $ | 198,206,646 | | |
Collateral for Securities Loaned | | | 1,538,175 | | | | — | | | | — | | | | 1,538,175 | | |
Total | | $ | 199,744,821 | | | $ | — | | | $ | — | | | $ | 199,744,821 | | |
RS Mid Cap Growth Fund | |
Common Stocks | | $ | 366,188,769 | | | $ | — | | | $ | — | | | $ | 366,188,769 | | |
Collateral for Securities Loaned | | | 9,598,093 | | | | — | | | | — | | | | 9,598,093 | | |
Total | | $ | 375,786,862 | | | $ | — | | | $ | — | | | $ | 375,786,862 | | |
RS Growth Fund | |
Common Stocks | | $ | 343,978,072 | | | $ | — | | | $ | — | | | $ | 343,978,072 | | |
Collateral for Securities Loaned | | | 10,568,804 | | | | — | | | | — | | | | 10,568,804 | | |
Total | | $ | 354,546,876 | | | $ | — | | | $ | — | | | $ | 354,546,876 | | |
RS Science and Technology Fund | |
Common Stocks | | $ | 341,497,594 | | | $ | — | | | $ | — | | | $ | 341,497,594 | | |
Warrants | | | 89,321 | | | | — | (a) | | | — | | | | 89,321 | | |
Collateral for Securities Loaned | | | 28,009,879 | | | | — | | | | — | | | | 28,009,879 | | |
Total | | $ | 369,596,794 | | | $ | — | | | $ | — | | | $ | 369,596,794 | | |
81
Victory Portfolios | | Notes to Financial Statements — continued
December 31, 2021 | |
| | | Level 1 | | Level 2 | | Level 3 | | Total | |
RS Small Cap Equity Fund | |
Common Stocks | | $ | 67,306,680 | | | $ | — | | | $ | — | | | $ | 67,306,680 | | |
Collateral for Securities Loaned | | | 8,920,817 | | | | — | | | | — | | | | 8,920,817 | | |
Total | | $ | 76,227,497 | | | $ | — | | | $ | — | | | $ | 76,227,497 | | |
(a) Zero market value security.
For the year ended December 31, 2021, there were no transfers in or out of Level 3 in the fair value hierarchy.
Real Estate Investment Trusts ("REITs"):
The Funds may invest in REITs, which report information on the source of their distributions annually. REITs are pooled investment vehicles that invest primarily in income-producing real estate or real-estate related loans or interests (such as mortgages). Certain distributions received from REITs during the year are recorded as realized gains or return of capital as estimated by the Funds or when such information becomes known.
Investment Companies:
Open-End Funds:
The Funds may invest in portfolios of open-end investment companies. These investment companies value securities in their portfolios for which market quotations are readily available at their market values (generally the last reported sale price) and all other securities and assets at their fair value by the methods established by the board of directors of the underlying funds.
Investment Transactions and Related Income:
Changes in holdings of investments are accounted for no later than one business day following the trade date. For financial reporting purposes, however, investment transactions are accounted for on trade date or the last business day of the reporting period. Interest income is determined on the basis of coupon interest accrued using the effective interest method which adjusts, where applicable, the amortization of premiums or accretion of discounts. Dividend income is recorded on the ex-dividend date. Gains or losses realized on sales of securities are recorded on the identified cost basis.
Withholding taxes on interest, dividends, and gains as a result of certain investments in ADRs by the Funds have been provided for in accordance with each investment's applicable country's tax rules and rates.
Securities Lending:
The Funds, through a Securities Lending Agreement with Citibank, N.A. ("Citibank"), may lend their securities to qualified financial institutions, such as certain broker-dealers and banks, to earn additional income, net of income retained by Citibank. Borrowers are required to initially secure their loans for collateral in the amount of at least 102% of the value of U.S. securities loaned or at least 105% of the value of non-U.S. securities loaned, marked-to-market daily. Any collateral shortfalls associated with increases in the valuation of the securities loaned are generally cured the next business day. The collateral can be received in the form of cash collateral and/or non-cash collateral. Non-cash collateral can include U.S. Government Securities and other securities as permitted by Securities and Exchange Commission ("SEC") guidelines. The cash collateral is invested in short-term instruments or cash equivalents, primarily open-end investment companies, as noted on the Funds' Schedules of Portfolio Investments. The Funds effectively do not have control of the non-cash collateral and therefore it is not disclosed on the Funds' Schedules of Portfolio Investments. Collateral requirements are determined daily based on the value of the Funds' securities on loan as of the end of the prior business day. During
82
Victory Portfolios | | Notes to Financial Statements — continued
December 31, 2021 | |
the time portfolio securities are on loan, the borrower will pay the Funds any dividends or interest paid on such securities plus any fee negotiated between the parties to the lending agreement. The Funds also earn a return from the collateral. The Funds pay Citibank various fees in connection with the investment of cash collateral and fees based on the investment income received from securities lending activities. Securities lending income (net of these fees) is disclosed on the Statements of Operations. Loans are terminable upon demand and the borrower must return the loaned securities within the lesser of one standard settlement period or five business days. Although risk is mitigated by the collateral, a Fund could experience a delay in recovering its securities and possible loss of income or value if the borrower fails to return them. In addition, there is a risk that the value of the short-term investments will be less than the amount of cash collateral required to be returned to the borrower.
The Funds' agreement with Citibank does not include master netting provisions. Non-cash collateral received by the Funds may not be sold or repledged, except to satisfy borrower default.
The following table is a summary of the Funds' securities lending transactions as of December 31, 2021.
| | | Value of
Securities on Loan | | Non-Cash Collateral | | Cash Collateral | |
RS Small Cap Growth Fund | | $ | 155,165,497 | | | $ | — | | | $ | 163,622,986 | | |
RS Select Growth Fund | | | 1,483,139 | | | | — | | | | 1,538,175 | | |
RS Mid Cap Growth Fund | | | 9,391,631 | | | | — | | | | 9,598,093 | | |
RS Growth Fund | | | 10,309,097 | | | | — | | | | 10,568,804 | | |
RS Science and Technology Fund | | | 26,753,421 | | | | — | | | | 28,009,879 | | |
RS Small Cap Equity Fund | | | 8,525,312 | | | | — | | | | 8,920,817 | | |
Federal Income Taxes:
It is each Fund's policy to continue to qualify as a regulated investment company by complying with the provisions available to certain investment companies, as defined in applicable sections of the Internal Revenue Code, and to make distributions of net investment income and net realized gains sufficient to relieve it from all, or substantially all, federal income taxes. Accordingly, no provision for federal income taxes is required in the financial statements. The Funds have a tax year end of December 31.
For the year ended December 31, 2021, the Funds did not incur any income tax, interest, or penalties, and have recorded no liability for net unrecognized tax benefits relating to uncertain income tax positions.
Management of the Funds has reviewed tax positions taken in tax years that remain subject to examination by all major tax jurisdictions, including federal (i.e., the last four tax years, which includes the current fiscal tax year end). Management believes that there is no tax liability resulting from unrecognized tax benefits related to uncertain tax positions taken.
Allocations:
Expenses directly attributable to a Fund are charged to that Fund, while expenses that are attributable to more than one fund in the Trust, or jointly with an affiliated trust, are allocated among the respective funds in the Trust and/or an affiliated trust based upon net assets or another appropriate basis.
Income, expenses (other than class-specific expenses such as transfer agent fees, state registration fees, 12b-1 fees, and printing fees), and realized and unrealized gains or losses on investments are allocated to each class of shares based on its relative net assets on the date income is earned or expenses and realized and unrealized gains and losses are incurred.
83
Victory Portfolios | | Notes to Financial Statements — continued
December 31, 2021 | |
3. Purchases and Sales:
Purchases and sales of securities (excluding securities maturing less than one year from acquisition) for the year ended December 31, 2021, were as follows:
| | | Excluding
U.S. Government Securities | |
| | | Purchases | | Sales | |
RS Small Cap Growth Fund | | $ | 2,484,827,112 | | | $ | 2,841,903,101 | | |
RS Select Growth Fund | | | 169,260,540 | | | | 219,730,940 | | |
RS Mid Cap Growth Fund | | | 450,400,585 | | | | 714,951,917 | | |
RS Growth Fund | | | 199,686,499 | | | | 222,958,534 | | |
RS Science and Technology Fund | | | 189,187,997 | | | | 256,186,857 | | |
RS Small Cap Equity Fund | | | 86,894,104 | | | | 97,679,962 | | |
4. Fees and Transactions with Affiliates and Related Parties:
Investment Advisory Fees:
Investment advisory services are provided to the Funds by the Adviser, which is a New York corporation registered as an investment adviser with the SEC. The Adviser is an indirect wholly owned subsidiary of Victory Capital Holdings, Inc., a publicly traded Delaware corporation, and a wholly owned direct subsidiary of Victory Capital Operating, LLC.
Under the terms of the Investment Advisory Agreement, the Adviser is entitled to receive fees based on a percentage of the average daily net assets of each Fund. The rates at which the Adviser is paid by each Fund are included in the table below.
| | | Flat Rate | |
RS Small Cap Growth Fund | | | 0.95 | % | |
RS Select Growth Fund | | | 1.00 | % | |
RS Mid Cap Growth Fund | | | 0.85 | % | |
RS Growth Fund | | | 0.75 | % | |
RS Science and Technology Fund | | | 1.00 | % | |
RS Small Cap Equity Fund | | | 0.75 | % | |
Amounts incurred and paid to VCM for the year ended December 31, 2021, are reflected on the Statements of Operations as Investment advisory fees.
Administration and Servicing Fees:
VCM also serves as the Funds' administrator and fund accountant. Under the Administration and Fund Accounting Agreement, VCM is entitled to receive fees based on a percentage of the average daily net assets of the Trust, Victory Variable Insurance Funds and Victory Portfolios II. The tiered rates at which VCM is paid by the Funds are shown in the table below:
Net Assets | |
Up to $15 billion | | $15 billion – $30 billion | | Over $30 billion | |
0.08%, plus | | 0.05%, plus | | 0.04% | |
Amounts incurred for the year ended December 31, 2021, are reflected on the Statements of Operations as Administration fees.
Citi Fund Services Ohio, Inc. ("Citi"), an affiliate of Citibank, acts as sub-administrator and sub-fund accountant to the Funds pursuant to the Sub-Administration and Sub-Fund Accounting Services
84
Victory Portfolios | | Notes to Financial Statements — continued
December 31, 2021 | |
Agreement between VCM and Citi. VCM pays Citi a fee for providing these services. The Trust reimburses VCM and Citi for out-of-pocket expenses incurred in providing these services and certain other expenses specifically allocated to the Funds. Amounts incurred for the year ended December 31, 2021, are reflected on the Statements of Operations as Sub-Administration fees.
The Funds (as part of the Trust) have entered into an agreement with the Adviser to provide compliance services, pursuant to which the Adviser furnishes its compliance personnel, including the services of the Chief Compliance Officer ("CCO"), and other resources reasonably necessary to provide the Trust with compliance oversight services related to the design, administration, and oversight of a compliance program for the Trust in accordance with Rule 38a-1 under the 1940 Act. The CCO is an employee of the Adviser, which pays the compensation of the CCO and support staff. The funds in the Trust, Victory Variable Insurance Funds, Victory Portfolios II and USAA Mutual Funds (collectively, the "Victory Funds Complex"), in aggregate, compensate the Adviser for these services. Amounts incurred for the year ended December 31, 2021, are reflected on the Statements of Operations as Compliance fees.
Transfer Agency Fees:
FIS Investor Services, LLC ("FIS") serves as the Funds' transfer agent. Under the Transfer Agent Agreement, the Trust pays FIS a fee for its services and reimburses FIS for all of their reasonable out-of-pocket expenses incurred in providing these services. Amounts incurred for the year ended December 31, 2021, are reflected on the Statements of Operations as Transfer agent fees.
Victory Capital Transfer Agency, Inc., an affiliate of the Adviser, serves as sub-transfer agent for the Member Class. Victory Capital Transfer Agency, Inc. receives no fee or other compensation for these services.
Distributor/Underwriting Services:
Victory Capital Services, Inc. (the "Distributor"), an affiliate of the Adviser, serves as Distributor for the continuous offering of the shares of the Funds pursuant to a Distribution Agreement between the Distributor and the Trust. Pursuant to the Distribution and Service Plans adopted in accordance with Rule 12b-1 under the 1940 Act, the Distributor may receive a monthly distribution and service fee up to the annual rate shown in the table below:
| | | Class A | | Class C | | Class R | |
RS Small Cap Growth Fund | | | 0.25 | % | | | 1.00 | % | | | 0.50 | % | |
RS Select Growth Fund | | | 0.25 | % | | | 1.00 | % | | | 0.50 | % | |
RS Mid Cap Growth Fund | | | 0.25 | % | | | 1.00 | % | | | 0.50 | % | |
RS Growth Fund | | | 0.25 | % | | | 1.00 | % | | | 0.50 | % | |
RS Science and Technology Fund | | | 0.25 | % | | | 1.00 | % | | | 0.50 | % | |
RS Small Cap Equity Fund | | | 0.25 | % | | | 1.00 | % | | | 0.50 | % | |
The distribution and service fees paid to the Distributor may be used by the Distributor to pay for activities primarily intended to result in the sale of Class A, Class C, and Class R. Amounts incurred for the year ended December 31, 2021, are reflected on the Statements of Operations as 12b-1 fees.
In addition, the Distributor is entitled to receive commissions on sale of the Class A. For the year ended December 31, 2021, the Distributor received $29,680 from commissions earned on the sale of Class A.
Other Fees:
Citibank serves as the Funds' custodian. The Funds pay Citibank a fee for providing these services. Amounts incurred for the year ended December 31, 2021, are reflected on the Statements of Operations as Custodian fees.
Sidley Austin LLP provides legal services to the Trust.
The Adviser has entered into expense limitation agreements with certain Funds. Under the terms of the agreements, the Adviser has agreed to waive fees or reimburse certain expenses to the extent that
85
Victory Portfolios | | Notes to Financial Statements — continued
December 31, 2021 | |
ordinary operating expenses incurred by certain classes of a Fund in any fiscal year exceed the expense limit for such classes of the Fund. Such excess amounts will be the liability of the Adviser. Acquired fund fees and expense, interest, taxes, brokerage commissions, other expenditures that are capitalized in accordance with GAAP, and other extraordinary expenses not incurred in the ordinary course of a Fund's business are excluded from the expense limits. As of December 31, 2021, the expense limits (excluding voluntary waivers) are as follows:
| | | In Effect Until April 30, 2022 | |
| | | Class A | | Class C | | Class R | | Class R6 | | Class Y | | Member Class | |
RS Small Cap Growth Fund | | | 1.40 | % | | | 2.16 | % | | | 1.86 | % | | | 1.06 | % | | | 1.13 | % | | | N/A | | |
RS Select Growth Fund | | | 1.40 | % | | | 2.18 | % | | | 1.91 | % | | | 1.06 | % | | | 1.14 | % | | | N/A | | |
RS Mid Cap Growth Fund | | | 1.20 | % | | | 2.11 | % | | | 1.80 | % | | | 0.94 | % | | | 0.95 | % | | | 1.05 | % | |
RS Growth Fund | | | 1.10 | % | | | 1.93 | % | | | 1.71 | % | | | N/A | | | | 0.83 | % | | | N/A | | |
RS Science and Technology Fund | | | 1.49 | % | | | 2.28 | % | | | 1.93 | % | | | N/A | | | | 1.24 | % | | | N/A | | |
RS Small Cap Equity Fund | | | 1.35 | % | | | 2.10 | % | | | 1.75 | % | | | N/A | | | | 1.10 | % | | | 1.15 | % | |
Under the terms of the expense limitation agreements, amended May 1, 2021, the Funds have agreed to repay fees and expenses that were waived or reimbursed by the Adviser for a period of up to three years (thirty six (36) months) after the waiver or reimbursement took place, subject to the lesser of any operating expense limits in effect at the time of: (a) the original waiver or expense reimbursement; or (b) the recoupment, after giving effect to the recoupment amount. Prior to May 1, 2021, the Funds were permitted to recoup fees waived and expenses reimbursed for up to three years after the fiscal year in which the waiver or reimbursement took place, subject to the limitations above. This change did not have any effect on the amounts previously reported for recoupment.
As of December 31, 2021, the following amounts are available to be repaid to the Adviser. The Funds have not recorded any amounts available to be repaid as a liability due to an assessment that repayments are not probable at December 31, 2021.
| | | Expires
2022 | | Expires
2023 | | Expires
2024 | | Total | |
RS Small Cap Growth Fund | | $ | 500,364 | | | $ | 486,591 | | | $ | 315,198 | | | $ | 1,302,153 | | |
RS Select Growth Fund | | | 285,457 | | | | 227,571 | | | | 180,839 | | | | 693,867 | | |
RS Mid Cap Growth Fund | | | 679,804 | | | | 755,044 | | | | 678,326 | | | | 2,113,174 | | |
RS Growth Fund | | | 288,176 | | | | 294,950 | | | | 240,370 | | | | 823,496 | | |
RS Science and Technology Fund | | | 22,186 | | | | 37,306 | | | | — | | | | 59,492 | | |
RS Small Cap Equity Fund | | | 29,231 | | | | 40,673 | | | | 48,087 | | | | 111,991 | | |
The Adviser may voluntarily waive or reimburse additional fees to assist the Funds in maintaining competitive expense ratios. These waivers are not available for recoupment and are reflected on the Statements of Operations as Expenses waived/reimbursed by Adviser. There were no voluntary waivers or reimbursements for the year ended December 31, 2021.
Certain officers and/or interested trustees of the Funds are also officers and/or employees of the Adviser, administrator, fund accountant, sub-administrator, sub-fund accountant, custodian, legal counsel, and Distributor.
5. Risks:
The Funds may be subject to other risks in addition to these identified risks.
Equity Risk — The value of the equity securities in which a Fund invests may decline in response to developments affecting individual companies and/or general economic conditions in the United States or abroad. A company's earnings or dividends may not increase as expected (or may decline) because of poor management, competitive pressures, reliance on particular suppliers or geographical regions, labor problems or shortages, corporate restructurings, fraudulent disclosures, man-made or natural disasters, military confrontations or wars, terrorism, public health crises, or other events, conditions and factors. Price changes may be temporary or last for extended periods.
86
Victory Portfolios | | Notes to Financial Statements — continued
December 31, 2021 | |
Stock Market Risk — Overall stock market risks may affect the value of the Fund. Domestic and international factors such as political events, war, trade disputes, interest rate levels and other fiscal and monetary policy changes, pandemics and other public health crises and related geopolitical events, as well as environmental disasters such as earthquakes, fire and floods, may add to instability in world economies and markets generally. The impact of these and other factors may be short-term or may last for extended periods.
Sector Risk — To the extent the Funds focus in one or more sectors, market or economic factors impacting those sectors could have a significant effect on the value of the Funds' investments and could make the Funds' performance more volatile. For example, the values of companies in the Information Technology sector are particularly vulnerable to economic downturns, short product cycles and aggressive pricing, market competition and changes in government regulation.
Concentration Risk — The RS Science and Technology Fund (herein, the "Fund") may concentrate its investments in a particular industry, as the term "concentration" is used in the 1940 Act. Concentrating investments in the Science and Technology-related sectors increases the risk of loss because the stocks of many or all of the companies in the sectors may decline in value due to developments adversely affecting the sectors. In addition, investors may buy or sell substantial amounts of the Fund's shares in response to factors affecting or expected to affect the sectors, resulting in extreme inflows and outflows of cash into and out of the Fund. Such inflows or outflows might affect management of the Fund adversely to the extent they cause the Fund's cash position or cash requirements to exceed normal levels.
Smaller-Capitalization Stock Risk — Small- and mid-sized capitalization companies are subject to a number of risks not associated with larger, more established companies, potentially making their stock prices more volatile and increasing the risk of loss. Smaller companies may have limited markets, product lines, or financial resources and lack management experience and may experience higher failure rates than larger companies.
6. Borrowing and Interfund Lending:
Line of Credit:
The Victory Funds Complex participates in a short-term demand note "Line of Credit" agreement with Citibank. The Line of Credit agreement with Citibank was renewed on June 28, 2021, with a termination date of June 27, 2022. Under the agreement with Citibank, the Victory Funds Complex may borrow up to $600 million, of which $300 million is committed and $300 million is uncommitted. $40 million of the Line of Credit is reserved for use by the Victory Floating Rate Fund, another series of the Victory Funds Complex, with Victory Floating Rate Fund paying the related commitment fees for that amount. The purpose of the Line of Credit is to meet temporary or emergency cash needs. For the year ended December 31, 2021, Citibank received an annual commitment fee of 0.15% on $300 million for providing the Line of Credit. Each fund in the Victory Funds Complex pays a pro-rata portion of the commitment fees plus any interest (one-month London Interbank Offered Rate ("LIBOR") plus one percent, with LIBOR to be replaced by a different benchmark rate in accordance with the terms of the agreement) on amounts borrowed. Prior to June 28, 2021, the Victory Funds Complex paid an annual commitment fee of 0.15% and an upfront fee of 0.10%. Each fund in the Victory Funds Complex paid a pro-rata portion of the upfront fee. Interest charged to each fund during the period, if applicable, is reflected on the Statements of Operations under Line of credit fees.
The average borrowing for the days outstanding and average interest rate for each Fund during the year ended December 31, 2021, were as follows:
| | | Amount
Outstanding at
December 31, 2021 | | Average
Borrowing* | | Days
Borrowings
Outstanding | | Average
Interest
Rate | | Maximum
Borrowing
During the
Period | |
RS Small Cap Growth
Fund | | $ | — | | | $ | 12,366,667 | | | | 12 | | | | 1.22 | % | | $ | 33,100,000 | | |
RS Mid Cap Growth
Fund | | | — | | | | 55,900,000 | | | | 4 | | | | 1.21 | % | | | 55,900,000 | | |
* For the year ended December 31, 2021, based on the number of days borrowings were outstanding.
87
Victory Portfolios | | Notes to Financial Statements — continued
December 31, 2021 | |
Interfund Lending:
The Trust and Adviser rely on an exemptive order granted by the SEC in March 2017 (the "Order"), permitting the establishment and operation of an Interfund Lending Facility (the "Facility"). The Facility allows each Fund to directly lend and borrow money to or from any other fund in the Victory Funds Complex that is permitted to participate in the Facility, relying upon the Order at rates beneficial to both the borrowing and lending funds. Advances under the Facility are allowed for temporary or emergency purposes, including the meeting of redemption requests that otherwise might require the untimely disposition of securities, and are subject to each Fund's borrowing restrictions. The interfund loan rate is determined, as specified in the Order, by averaging the current repurchase agreement rate and the current bank loan rate. As a Borrower, interest charged to each Fund, if any, during the period, is reflected on the Statements of Operations under Interfund lending fees. As a Lender, interest earned by each Fund, if any, during the period, is reflected on the Statements of Operations under Interfund lending.
The average borrowing or lending for the days outstanding and average interest rate for the Funds that utilized this Facility during the year ended December 31, 2021, were as follows:
| | | Borrower or
Lender | | Amount
Outstanding at
December 31, 2021 | | Average
Borrowing* | | Days
Borrowing
Outstanding | | Average
Interest
Rate | | Maximum
Borrowing
During the
Period | |
RS Small Cap
Growth Fund | | Borrower | | $ | — | | | $ | 2,064,000 | | | | 1 | | | | 0.58 | % | | $ | 2,064,000 | | |
RS Select Growth
Fund | | Borrower | | | — | | | | 3,492,500 | | | | 2 | | | | 0.57 | % | | | 3,837,000 | | |
RS Mid Cap
Growth Fund | | Borrower | | | — | | | | 6,020,000 | | | | 2 | | | | 0.56 | % | | | 10,776,000 | | |
RS Growth Fund | | Borrower | | | — | | | | 1,339,000 | | | | 1 | | | | 0.57 | % | | | 1,339,000 | | |
RS Science and
Technology
Fund | | Borrower | | | — | | | | 1,781,000 | | | | 1 | | | | 0.57 | % | | | 1,781,000 | | |
* For the year ended December 31, 2021, based on the number of days borrowings were outstanding.
7. Federal Income Tax Information:
Dividends from net investment income, if any, are declared and paid as noted in the table below. Distributable net realized gains, if any, are declared and distributed at least annually from each Fund.
| | | Declared | | Paid | |
RS Small Cap Growth Fund | | Annually | | Annually | |
RS Select Growth Fund | | Annually | | Annually | |
RS Mid Cap Growth Fund | | Annually | | Annually | |
RS Growth Fund | | Annually | | Annually | |
RS Science and Technology Fund | | Annually | | Annually | |
RS Small Cap Equity Fund | | Annually | | Annually | |
The amounts of dividends from net investment income and distributions from net realized gains (collectively, distributions to shareholders) are determined in accordance with federal income tax regulations, which may differ from GAAP. To the extent these "book/tax" differences are permanent in nature (e.g., net operating loss and distribution reclassification), such amounts are reclassified within the components of net assets based on their federal tax-basis treatment; temporary differences (e.g., wash sales) do not require reclassification. To the extent dividends and distributions exceed net investment income and net realized gains for tax purposes, they are reported as distributions of capital.
88
Victory Portfolios | | Notes to Financial Statements — continued
December 31, 2021 | |
Net investment losses incurred by the Funds may be reclassified as an offset to capital on the accompanying Statements of Assets and Liabilities.
As of December 31, 2021, on the Statements of Assets and Liabilities, as a result of permanent book-to-tax differences, reclassification adjustments were as follows:
| | | Total
Accumulated
Earnings/(Loss) | | Capital | |
RS Small Cap Growth Fund | | $ | (33,016,084 | ) | | $ | 33,016,084 | | |
| RS Select Growth Fund | | | (6,655,450 | ) | | | 6,655,450 | | |
| RS Mid Cap Growth Fund | | | (34,062,084 | ) | | | 34,062,084 | | |
RS Growth Fund | | | (1,147,828 | ) | | | 1,147,828 | | |
RS Science and Technology Fund | | | (8,835,194 | ) | | | 8,835,194 | | |
| RS Small Cap Equity Fund | | | (1,331,904 | ) | | | 1,331,904 | | |
The tax character of distributions paid during the tax years ended as noted below, were as follows (total distributions paid may differ from the Statements of Changes in Net Assets because, for tax purposes, dividends are recognized when actually paid).
| | Year Ended December 31, 2021 | |
| | Distributions Paid From: | | | |
| | Ordinary
Income | | Net
Long-Term
Capital Gains | | Total
Distributions
Paid | |
RS Small Cap Growth Fund | | $ | — | | | $ | 322,000,707 | | | $ | 322,000,707 | | |
RS Select Growth Fund | | | — | | | | 45,651,408 | | | | 45,651,408 | | |
RS Mid Cap Growth Fund | | | 27,743,023 | | | | 98,554,497 | | | | 126,297,520 | | |
RS Growth Fund | | | 7,459,930 | | | | 21,415,939 | | | | 28,875,869 | | |
RS Science and Technology Fund | | | — | | | | 46,934,494 | | | | 46,934,494 | | |
RS Small Cap Equity Fund | | | 3,798,901 | | | | 9,886,822 | | | | 13,685,723 | | |
| | Year Ended December 31, 2020 | |
| | Distributions Paid From: | | | |
| | Ordinary
Income | | Net
Long-Term
Capital Gains | | Total
Distributions
Paid | |
RS Small Cap Growth Fund | | $ | — | | | $ | 238,416,513 | | | $ | 238,416,513 | | |
RS Select Growth Fund | | | — | | | | 36,049,711 | | | | 36,049,711 | | |
RS Mid Cap Growth Fund | | | — | | | | 23,813,744 | | | | 23,813,744 | | |
RS Growth Fund | | | 735,571 | | | | 25,325,913 | | | | 26,061,484 | | |
RS Science and Technology Fund | | | 1,369,369 | | | | 23,897,369 | | | | 25,266,738 | | |
RS Small Cap Equity Fund | | | 125,322 | | | | 15,917,397 | | | | 16,042,719 | | |
89
Victory Portfolios | | Notes to Financial Statements — continued
December 31, 2021 | |
As of December 31, 2021, the components of accumulated earnings/(loss) on a tax basis were as follows:
| | Undistributed
Ordinary
Income | | Undistributed
Long-Term
Capital Gains | | Accumulated
Earnings | | Qualified
Late Year
Losses* | | Unrealized
Appreciation
(Depreciation)** | | Total
Accumulated
Earnings
(Loss) | |
RS Small Cap
Growth Fund | | $ | — | | | $ | 43,757,183 | | | $ | 43,757,183 | | | $ | — | | | $ | 405,269,530 | | | $ | 449,026,713 | | |
| RS Select Growth Fund | | | 4,809,206 | | | | 25,339,339 | | | | 30,148,545 | | | | — | | | | 46,051,440 | | | | 76,199,985 | | |
RS Mid Cap
Growth Fund | | | — | | | | 3,708,813 | | | | 3,708,813 | | | | (6,292,134 | ) | | | 98,607,519 | | | | 96,024,198 | | |
RS Growth Fund | | | — | | | | 4,816,020 | | | | 4,816,020 | | | | (969,876 | ) | | | 163,482,103 | | | | 167,328,247 | | |
RS Science and
Technology Fund | | | — | | | | 8,279,672 | | | | 8,279,672 | | | | (4,510,688 | ) | | | 133,372,797 | | | | 137,141,781 | | |
RS Small Cap
Equity Fund | | | 2,905,295 | | | | 1,044,839 | | | | 3,950,134 | | | | — | | | | 48,312 | | | | 3,998,446 | | |
* Qualified late-year losses are comprised of post-October capital losses incurred after October 31and certain late-year ordinary losses. Late-year ordinary losses represent ordinary losses incurred after December 31 and specified losses incurred after October 31. These losses are deemed to arise on the first day of the Fund's next taxable year.
** The difference between the book-basis and tax-basis unrealized appreciation (depreciation) is attributable primarily to tax deferral of losses on wash sales and passive foreign investment companies.
As of the tax year ended December 31, 2021, the fund had no capital loss carryforwards, for the federal income tax purposes.
As of December 31, 2021, the cost basis for federal income tax purposes, gross unrealized appreciation, gross unrealized depreciation, and net unrealized appreciation (depreciation) for investments were as follows:
| | | Cost of
Investments
for Federal
Tax Purposes | | Gross
Unrealized
Appreciation | | Gross
Unrealized
Depreciation | | Net
Unrealized
Appreciation
(Depreciation) | |
RS Small Cap Growth Fund | | $ | 2,006,407,519 | | | $ | 606,975,406 | | | $ | (201,705,876 | ) | | $ | 405,269,530 | | |
| RS Select Growth Fund | | | 153,693,381 | | | | 58,459,301 | | | | (12,407,861 | ) | | | 46,051,440 | | |
RS Mid Cap Growth Fund | | | 277,179,343 | | | | 110,816,043 | | | | (12,208,524 | ) | | | 98,607,519 | | |
RS Growth Fund | | | 191,064,773 | | | | 168,078,708 | | | | (4,596,605 | ) | | | 163,482,103 | | |
RS Science and Technology Fund | | | 236,223,997 | | | | 166,542,679 | | | | (33,169,882 | ) | | | 133,372,797 | | |
RS Small Cap Equity Fund | | | 76,179,185 | | | | 9,077,007 | | | | (9,028,695 | ) | | | 48,312 | | |
8. Affiliated Securities:
An affiliated security is a security in which a Fund has ownership of at least 5% of the security's outstanding voting shares, an investment company managed by VCM, or an issuer under common control with a Fund or VCM as of the year ended December 31, 2021. The Funds do not invest in affiliated securities for the purpose of exercising management or control. These securities are noted as affiliated on a Fund's Schedule of Portfolio Investments. Transactions in affiliated securities during the year ended December 31, 2021 were as follows:
| | Fair Value
12/31/20 | | Purchases
at Cost | | Proceeds
from
Sales | | Realized
Gains
(Losses) | | Capital
Gain
Distribution | | Net
Change in
Unrealized
Appreciation/
Depreciation | | Fair Value
12/31/21 | | Dividend
Income | |
RS Small Cap Growth Fund | |
Equillium, Inc. | | $ | 5,819,516 | | | $ | 4,808,297 | | | $ | (433,890 | ) | | $ | (555,630 | ) | | $ | — | | | $ | (3,719,968 | ) | | $ | 5,918,325 | | | $ | — | | |
90
Victory Portfolios | | Notes to Financial Statements — continued
December 31, 2021 | |
9. Stock Split:
Effective December 3, 2021, the RS Small Cap Equity Fund underwent a 12-for-1 reverse stock split of the issued and outstanding Class C shares of the Fund. The reverse stock split was not a taxable event, nor did it have an impact on the Fund's holdings or performance, and was intended to reduce marketplace confusion and bring greater uniformity to the ratio of capital gains to the NAV across all share classes of the Fund. No changes are contemplated at this time for the other share classes offered by the Fund.
91
REPORT OF INDEPENDENT REGISTERED PUBLIC ACCOUNTING FIRM
To the Shareholders and Board of Trustees of Victory Portfolios
Opinion on the Financial Statements
We have audited the accompanying statements of assets and liabilities, including the schedules of portfolio investments, of Victory RS Small Cap Growth Fund, Victory RS Select Growth Fund, Victory RS Mid Cap Growth Fund, Victory RS Growth Fund, Victory RS Science and Technology Fund, and Victory RS Small Cap Equity Fund (the "Funds"), each a series of Victory Portfolios, as of December 31, 2021, the related statements of operations for the year then ended, the statements of changes in net assets for each of the two years in the period then ended, the related notes, and the financial highlights for each of the three years in the period then ended (collectively referred to as the "financial statements"). In our opinion, the financial statements present fairly, in all material respects, the financial position of each of the Funds as of December 31, 2021, the results of their operations for the year then ended, the changes in net assets for each of the two years in the period then ended and the financial highlights for each of the three years in the period then ended, in conformity with accounting principles generally accepted in the United States of America.
The Funds' financial highlights for the years ended December 31, 2018 and prior, were audited by other auditors whose report dated February 26, 2019, expressed an unqualified opinion on those financial highlights.
Basis for Opinion
These financial statements are the responsibility of the Funds' management. Our responsibility is to express an opinion on the Funds' financial statements based on our audits. We are a public accounting firm registered with the Public Company Accounting Oversight Board (United States) ("PCAOB") and are required to be independent with respect to the Funds in accordance with the U.S. federal securities laws and the applicable rules and regulations of the Securities and Exchange Commission and the PCAOB.
We conducted our audits in accordance with the standards of the PCAOB. Those standards require that we plan and perform the audit to obtain reasonable assurance about whether the financial statements are free of material misstatement whether due to error or fraud.
Our audits included performing procedures to assess the risks of material misstatement of the financial statements, whether due to error or fraud, and performing procedures that respond to those risks. Such procedures included examining, on a test basis, evidence regarding the amounts and disclosures in the financial statements. Our procedures included confirmation of securities owned as of December 31, 2021, by correspondence with the custodian and brokers; when replies were not received from brokers, we performed other auditing procedures. Our audits also included evaluating the accounting principles used and significant estimates made by management, as well as evaluating the overall presentation of the financial statements. We believe that our audits provide a reasonable basis for our opinion.
We have served as the auditor of one or more of the investment companies advised by Victory Capital Management, Inc. since 2015.

COHEN & COMPANY, LTD.
Cleveland, Ohio
February 23, 2022
92
Victory Portfolios | | Supplemental Information
December 31, 2021 | |
(Unaudited)
Trustee and Officer Information
Board of Trustees:
Overall responsibility for management of the Trust rests with the Board. The Trust is managed by the Board in accordance with the laws of the State of Delaware. There are currently nine Trustees, eight of whom are not "interested persons" of the Trust within the meaning of that term under the 1940 Act ("Independent Trustees") and one of whom is an "interested person" of the Trust within the meaning of that term under the 1940 Act ("Interested Trustee"). The Trustees, in turn, elect the officers of the Trust to actively supervise its day-to-day operations.
The following tables list the Trustees, their date of birth, their position with the Trust, their commencement of service, their principal occupations during the past five years, and any directorships of other investment companies or companies whose securities are registered under the Securities Exchange Act of 1934, as amended, or who file reports under that Act. Each Trustee oversees 41 portfolios in the Trust, eight portfolios in Victory Variable Insurance Funds, and 25 portfolios in Victory Portfolios II, each a registered investment company that, together with the Trust, comprise the Victory Funds Complex. David C. Brown is a Trustee of USAA Mutual Funds and oversees 46 portfolios of the USAA Mutual Funds Trust. Each Trustee's address is c/o Victory Portfolios, 4900 Tiedeman Road, 4th Floor, Brooklyn, Ohio 44144. Each Trustee has an indefinite term.
Name and Date of Birth | | Position
Held with
the Trust | | Date
Commenced
Service | | Principal Occupation
During Past 5 Years | | Other
Directorships
Held During
Past 5 Years | |
Independent Trustees. | |
David Brooks Adcock,
Born October 1951 | | Trustee | | May 2005 | | Consultant (since 2006). | | Chair and Trustee, Turner Funds (December 2016-December 2017). | |
Nigel D. T. Andrews,
Born April 1947 | | Trustee | | August 2002 | | Retired. | | Director, TCG BDC II, Inc. (since 2017); Director, TCG BDC I, Inc. (formerly Carlyle GMS Finance, Inc.) (since 2012); Trustee, Carlyle Secured Lending III (since 2021). | |
E. Lee Beard,*
Born August 1951 | | Trustee | | May 2005 | | Retired (since 2015) | | None. | |
Dennis M. Bushe,
Born January 1944 | | Trustee | | July 2016 | | Retired. | | None. | |
93
Victory Portfolios | | Supplemental Information — continued
December 31, 2021 | |
(Unaudited)
Name and Date of Birth | | Position
Held with
the Trust | | Date
Commenced
Service | | Principal Occupation
During Past 5 Years | | Other
Directorships
Held During
Past 5 Years | |
John L. Kelly,
Born April 1953 | | Vice Chair and Trustee | | February 2015 | | Partner, McCarvill Capital Partners (September 2016- September 2017). | | Director, Caledonia Mining Corporation (since May 2012). | |
David L. Meyer,*
Born April 1957 | | Trustee | | December 2008 | | Retired. | | None. | |
Gloria S. Nelund,
Born May 1961 | | Trustee | | July 2016 | | Chair, CEO and Co-Founder of TriLinc Global, LLC, an investment firm. | | TriLinc Global Impact Fund, LLC (since 2012). | |
Leigh A. Wilson,
Born December 1944 | | Chair and Trustee | | November 1994 | | Private Investor. | | Chair (since 2013), Caledonia Mining Corporation. | |
Interested Trustee. | |
David C. Brown,**
Born May 1972 | | Trustee | | May 2008 | | Chairman and Chief Executive Officer (since 2013), the Adviser; Chairman and Chief Executive Officer (since 2013), Victory Capital Holdings, Inc.; Chairman and Chief Executive Officer (since 2019), Victory Capital Transfer Agency, Inc. | | Trustee, USAA Mutual Funds Trust; Board Member, Victory Capital Services, Inc. | |
* The Board has designated Ms. Beard and Mr. Meyer as its Audit Committee Financial Experts.
** Mr. Brown is an "Interested Person" by reason of his relationship with the Adviser.
The Statement of Additional Information includes additional information about the Trustees of the Trust and is available, without charge, by calling 800-539-3863.
94
Victory Portfolios | | Supplemental Information — continued
December 31, 2021 | |
(Unaudited)
Officers:
The officers of the Trust, their date of birth, their commencement of service, and their principal occupations during the past five years, are detailed in the following table. Each officer serves until the earlier of his or her resignation, removal, retirement, death, or the election of a successor. The mailing address of each officer of the Trust is 4900 Tiedeman Road, 4th Floor, Brooklyn, Ohio 44144. The officers of the Trust receive no compensation directly from the Trust for performing the duties of their offices.
Name and Date of Birth | | Position with
the Trust | | Date
Commenced
Service | | Principal Occupation During Past 5 Years | |
Christopher K. Dyer,
Born February 1962 | | President | | February 2006* | | Director of Mutual Fund Administration, the Adviser; Chief Operating Officer, Victory Capital Services, Inc. (since 2020); Vice President, Victory Capital Transfer Agency, Inc. (since 2019). | |
Scott A. Stahorsky,
Born July 1969 | | Vice President | | December 2014 | | Manager, Fund Administration, the Adviser. | |
Erin G. Wagner,
Born February 1974 | | Secretary | | December 2014 | | Associate General Counsel, the Adviser (since 2013). | |
Allan Shaer,
Born March 1965 | | Treasurer | | May 2017 | | Senior Vice President, Financial Administration, Citi Fund Services Ohio, Inc. (since 2016); Vice President, Mutual Fund Administration, JP Morgan Chase (2011-2016). | |
Christopher A. Ponte,
Born March 1984 | | Assistant Treasurer | | December 2017 | | Manager, Fund Administration, the Adviser (since 2017); Senior Analyst, Fund Administration, the Adviser (prior to 2017); Chief Financial Officer, Victory Capital Services, Inc. (since 2018). | |
Colin Kinney,
Born October 1973 | | Chief Compliance Officer | | July 2017 | | Chief Compliance Officer (since 2013) and Chief Risk Officer (2009-2017), the Adviser. | |
Sean Fox,
Born September 1976 | | Deputy Chief Compliance
Officer | | July 2021 | | Sr. Compliance Officer, the Adviser (2019-2021); Compliance Officer, the Adviser (2015-2019). | |
Chuck Booth,
Born April 1960 | | Anti-Money Laundering Compliance Officer and Identity Theft Officer | | May 2015 | | Director, Regulatory Administration and CCO Support Services, Citi Fund Services Ohio, Inc. | |
Jay G. Baris,
Born January 1954 | | Assistant Secretary | | December 1997 | | Partner, Sidley Austin LLP (since April 2020); Partner, Shearman & Sterling LLP (January 2018-April 2020); Partner, Morrison & Foerster LLP (2011-January 2018). | |
* On December 3, 2014, Mr. Dyer resigned as Secretary of the Trust and accepted the position of President.
95
Victory Portfolios | | Supplemental Information — continued
December 31, 2021 | |
(Unaudited)
Proxy Voting and Portfolio Holdings Information
Proxy Voting:
Information regarding the policies and procedures each Fund uses to determine how to vote proxies relating to portfolio securities is available without charge, upon request, by calling 800-539-3863. The information is also included in the Funds' Statement of Additional Information, which is available on the SEC's website at www.sec.gov.
Information relating to how the Funds voted proxies relating to portfolio securities held during the most recent 12 months ended June 30 is available on the SEC's website at www.sec.gov.
Availability of Schedules of Portfolio Investments:
The Trust files a complete list of Schedules of Portfolio Investments with the SEC for the first and third quarter of each fiscal year on Form N-PORT. Forms N-PORT are available on the SEC's website at www.sec.gov.
Expense Examples
As a shareholder of the Fund, you may incur two types of costs: (1) transaction costs, including sales charges (loads) on purchases; and (2) ongoing costs, including management fees and other Fund expenses. These examples are intended to help you understand your ongoing costs (in dollars) of investing in the Fund and to compare these costs with the ongoing costs of investing in other mutual funds.
These examples are based on an investment of $1,000 invested at the beginning of the period and held for the entire period from July 1, 2021, through December 31, 2021.
The Actual Expense figures in the table below provide information about actual account values and actual expenses. You may use the information below, together with the amount you invested, to estimate the expenses that you paid over the period. Simply divide your account value by $1,000 (for example, an $8,600 account value divided by $1,000 = 8.6), then multiply the result by the number in the table under the heading entitled "Actual Expenses Paid During Period" to estimate the expenses you paid on your account during this period.
The Hypothetical Expense figures in the table below provide information about hypothetical account values and hypothetical expenses based on the Fund's actual expense ratio and an assumed rate of return of 5% per year before expenses, which is not the Fund's actual return. The hypothetical account values and expenses may not be used to estimate the actual ending account balance or expenses you paid for the period. You may use this information to compare this 5% hypothetical example with the 5% hypothetical examples that appear in shareholder reports of other funds.
Please note the expenses shown in the table below are meant to highlight your ongoing costs only and do not reflect any transactional costs. Therefore, the hypothetical expenses in the table are useful in comparing ongoing costs only and will not help you determine the relative total costs of owning different funds. In addition, if these transactional costs were included, your costs would have been higher.
| | Beginning
Account
Value
7/1/21 | | Actual
Ending
Account
Value
12/31/21 | | Hypothetical
Ending
Account
Value
12/31/21 | | Actual
Expenses Paid
During Period
7/1/21-
12/31/21* | | Hypothetical
Expenses Paid
During Period
7/1/21-
12/31/21* | | Annualized
Expense Ratio
During Period
7/1/21-
12/31/21 | |
RS Small Cap Growth Fund | |
Class A | | $ | 1,000.00 | | | $ | 887.00 | | | $ | 1,018.15 | | | $ | 6.66 | | | $ | 7.12 | | | | 1.40 | % | |
Class C | | | 1,000.00 | | | | 883.60 | | | | 1,014.37 | | | | 10.21 | | | | 10.92 | | | | 2.15 | | |
Class R | | | 1,000.00 | | | | 883.90 | | | | 1,014.97 | | | | 9.64 | | | | 10.31 | | | | 2.03 | | |
Class R6 | | | 1,000.00 | | | | 888.60 | | | | 1,019.96 | | | | 4.95 | | | | 5.30 | | | | 1.04 | | |
Class Y | | | 1,000.00 | | | | 888.20 | | | | 1,019.51 | | | | 5.38 | | | | 5.75 | | | | 1.13 | | |
96
Victory Portfolios | | Supplemental Information — continued
December 31, 2021 | |
(Unaudited)
| | Beginning
Account
Value
7/1/21 | | Actual
Ending
Account
Value
12/31/21 | | Hypothetical
Ending
Account
Value
12/31/21 | | Actual
Expenses Paid
During Period
7/1/21-
12/31/21* | | Hypothetical
Expenses Paid
During Period
7/1/21-
12/31/21* | | Annualized
Expense Ratio
During Period
7/1/21-
12/31/21 | |
RS Select Growth Fund | |
Class A | | $ | 1,000.00 | | | $ | 984.40 | | | $ | 1,018.15 | | | $ | 7.00 | | | $ | 7.12 | | | | 1.40 | % | |
Class C | | | 1,000.00 | | | | 980.20 | | | | 1,014.22 | | | | 10.88 | | | | 11.07 | | | | 2.18 | | |
Class R | | | 1,000.00 | | | | 981.80 | | | | 1,015.58 | | | | 9.54 | | | | 9.70 | | | | 1.91 | | |
Class R6 | | | 1,000.00 | | | | 986.00 | | | | 1,019.86 | | | | 5.31 | | | | 5.40 | | | | 1.06 | | |
Class Y | | | 1,000.00 | | | | 985.70 | | | | 1,019.46 | | | | 5.71 | | | | 5.80 | | | | 1.14 | | |
RS Mid Cap Growth Fund | |
Class A | | | 1,000.00 | | | | 981.70 | | | | 1,019.16 | | | | 5.99 | | | | 6.11 | | | | 1.20 | | |
Class C | | | 1,000.00 | | | | 977.30 | | | | 1,014.47 | | | | 10.62 | | | | 10.82 | | | | 2.13 | | |
Class R | | | 1,000.00 | | | | 979.20 | | | | 1,016.13 | | | | 8.98 | | | | 9.15 | | | | 1.80 | | |
Class R6 | | | 1,000.00 | | | | 983.20 | | | | 1,020.47 | | | | 4.70 | | | | 4.79 | | | | 0.94 | | |
Class Y | | | 1,000.00 | | | | 983.20 | | | | 1,020.42 | | | | 4.75 | | | | 4.84 | | | | 0.95 | | |
Member Class | | | 1,000.00 | | | | 983.00 | | | | 1,019.91 | | | | 5.25 | | | | 5.35 | | | | 1.05 | | |
RS Growth Fund | |
Class A | | | 1,000.00 | | | | 1,084.10 | | | | 1,019.66 | | | | 5.78 | | | | 5.60 | | | | 1.10 | | |
Class C | | | 1,000.00 | | | | 1,079.80 | | | | 1,015.48 | | | | 10.12 | | | | 9.80 | | | | 1.93 | | |
Class R | | | 1,000.00 | | | | 1,081.00 | | | | 1,016.59 | | | | 8.97 | | | | 8.69 | | | | 1.71 | | |
Class Y | | | 1,000.00 | | | | 1,085.60 | | | | 1,021.02 | | | | 4.36 | | | | 4.23 | | | | 0.83 | | |
RS Science and Technology Fund | |
Class A | | | 1,000.00 | | | | 876.90 | | | | 1,017.74 | | | | 7.00 | | | | 7.53 | | | | 1.48 | | |
Class C | | | 1,000.00 | | | | 873.00 | | | | 1,013.41 | | | | 11.05 | | | | 11.88 | | | | 2.34 | | |
Class R | | | 1,000.00 | | | | 875.10 | | | | 1,015.48 | | | | 9.12 | | | | 9.80 | | | | 1.93 | | |
Class Y | | | 1,000.00 | | | | 878.00 | | | | 1,018.85 | | | | 5.96 | | | | 6.41 | | | | 1.26 | | |
RS Small Cap Equity Fund | |
Class A | | | 1,000.00 | | | | 901.90 | | | | 1,018.80 | | | | 6.09 | | | | 6.46 | | | | 1.27 | | |
Class C | | | 1,000.00 | | | | 895.20 | | | | 1,014.62 | | | | 10.03 | | | | 10.66 | | | | 2.10 | | |
Class R | | | 1,000.00 | | | | 899.50 | | | | 1,016.38 | | | | 8.38 | | | | 8.89 | | | | 1.75 | | |
Class Y | | | 1,000.00 | | | | 902.40 | | | | 1,019.66 | | | | 5.27 | | | | 5.60 | | | | 1.10 | | |
Member Class | | | 1,000.00 | | | | 902.00 | | | | 1,019.41 | | | | 5.51 | | | | 5.85 | | | | 1.15 | | |
* Expenses are equal to the average account value multiplied by the Fund's annualized expense ratio multiplied by 184/365 (the number of days in the most recent fiscal half-year divided by the number of days in the fiscal year).
97
Victory Portfolios | | Supplemental Information — continued
December 31, 2021 | |
(Unaudited)
Additional Federal Income Tax Information
For the year ended December 31, 2021, the following Funds paid qualified dividend income for the purposes of reduced individual federal income tax rates of:
| | Percent | |
RS Mid Cap Growth Fund | | | 4 | % | |
RS Growth Fund | | | 51 | % | |
RS Small Cap Equity Fund | | | 1 | % | |
Dividends qualified for corporate dividends received deductions of:
| | Percent | |
RS Mid Cap Growth Fund | | | 3 | % | |
RS Growth Fund | | | 51 | % | |
RS Small Cap Equity Fund | | | 1 | % | |
For the year ended December 31, 2021, the following Funds designated short-term capital gain distributions:
| | Amount | |
RS Select Growth Fund | | $ | 844,395 | | |
RS Mid Cap Growth Fund | | | 27,743,023 | | |
RS Growth Fund | | | 6,829,685 | | |
| RS Small Cap Equity Fund | | | 4,323,274 | | |
For the year ended December 31, 2021, the following Funds designated long-term capital gain distributions:
| | Amount | |
RS Small Cap Growth Fund | | $ | 378,260,925 | | |
| RS Select Growth Fund | | | 51,462,463 | | |
RS Mid Cap Growth Fund | | | 132,616,581 | | |
RS Growth Fund | | | 22,563,767 | | |
RS Science and Technology Fund | | | 55,769,688 | | |
RS Small Cap Equity Fund | | | 10,694,353 | | |
98
Victory Portfolios | | Supplemental Information — continued
December 31, 2021 | |
(Unaudited)
Considerations of the Board in Continuing the Investment Advisory Agreement (the "Agreement")
The Board approved the Agreement on behalf of each of the Funds at a meeting, which was called for that purpose, on November 30, 2021. The Board also considered information relating to the Funds and the Agreement provided throughout the year and, more specifically, at the meetings on October 19, 2021 and November 30, 2021. In considering whether to approve the Agreement, the Board requested, and the Adviser provided, information that the Board believed to be reasonably necessary to reach its conclusions.
The Board, including the Independent Trustees, evaluated this information along with other information obtained throughout the year and was advised by legal counsel to the Funds and independent legal counsel to the Independent Trustees. In addition, the Independent Trustees considered a past review of their overall process for conducting the annual review of the Funds' advisory arrangements by a consultant retained through their counsel.
The Board took into consideration regular reports from the Adviser throughout the COVID-19 pandemic public health crisis concerning how the ongoing pandemic has affected market volatility, investment risk, liquidity and valuation of portfolio securities, and the implementation and effectiveness of business continuity plans. These reports also had confirmed that the pandemic had no material impact on the Adviser's operations.
The Board considered each Fund's advisory fee, expense ratio and investment performance as significant factors in determining whether the Agreement should be continued. In considering whether the compensation paid to the Adviser was fair and reasonable, the Board also evaluated, among other things, the following factors:
• The requirements of the Funds for the services provided by the Adviser;
• The nature, quality and extent of the services provided and expected to be provided;
• The performance of the Funds as compared to comparable funds;
• The fees payable for the services and whether the fee arrangements provided for economies of scale that would benefit Fund shareholders as the Funds grow (acknowledging that economies of scale can be complex to assess and typically are not directly measurable);
• Whether the fee would be sufficient to enable the Adviser to attract and retain experienced personnel and continue to provide quality services to the Funds;
• The fees paid by other clients of the Adviser whose accounts are managed in a similar investment style and any differences in the services provided to the other clients compared to those provided to the Funds;
• The total expenses of each Fund;
• Management's commitment to operating the Funds at competitive expense levels;
• The profitability of the Adviser (as reflected by comparing fees earned against an estimate of the Adviser's costs) with respect to the Adviser's relationship with the Funds;
• Research and other service benefits received by the Adviser obtained through payment of client commissions for securities transactions;
• Other benefits received by the Adviser, and its affiliates, including revenues paid to the Adviser, or its affiliates, by the Funds for administration and fund accounting services, and distribution;
• The capabilities and financial condition of the Adviser;
• Current economic and industry trends; and
• The historical relationship between each Fund and the Adviser.
For Funds with total net expense ratios that ranked within the fourth quartile (most expensive) in relation to their peers as evaluated by a consultant, the Board also considered a memorandum that it requested the Adviser to prepare. The Adviser reviewed additional relevant circumstances, which included, among other things, specialized strategies, small or decreasing assets, or rapid or recent changes in peer expense ratios.
The Board reviewed each Fund's current management fee, comprised of the advisory fee plus the administrative services fee paid to the Adviser, in the context of the Adviser's profitability with respect to each Fund individually. The Board retained a consultant to provide comparative information about fees and performance. The Board met with the consultant to review its inputs and methodologies, among other things. The Board compared each Fund's gross management fee and total operating expense ratio on a net and gross basis with the median gross
99
Victory Portfolios | | Supplemental Information — continued
December 31, 2021 | |
(Unaudited)
management fee and median expense ratio of a universe of comparable mutual funds compiled by the consultant, and a peer group of funds with similar investment strategies selected by that consultant from the universe. The Board reviewed the factors and methodology used by the consultant in the selection of each Fund's peer group, including the consultant's selection of a broad universe of funds, the more specific universe of comparable funds, and peer groups of funds with comparable investment strategies and asset levels, among other factors. The Board also reviewed any changes to the consultant's methodology as compared to the prior year, including those resulting from the Adviser's input, if any. With respect to certain Funds, the Board also reviewed fees and other information related to the Adviser's management of similarly managed institutional or private accounts, and the differences in the services provided to the other accounts. The Board noted that none of the advisory fee arrangements for the Funds included breakpoints, which would be a structure that results in reduced fees as a fund grows. The Board also considered the Adviser's commitment to limit expenses as discussed in more detail below.
The Board also reviewed the compliance and administrative services provided to the Funds by the Adviser and its affiliates, including the Adviser's oversight of the Funds' day-to-day operations and oversight of Fund accounting, assistance in meeting legal and regulatory requirements, and other services necessary for the operation of the Funds and the Trust.
The Board found that the gross annual management fee paid by each Fund was within the range of management fees paid by each Fund's respective peer group. The Board also found that each Fund's Class A net annual expense ratio, taking into account any shareholder servicing or distribution fees, was reasonable as compared with each Fund's respective peer group. The Board considered the Adviser's contractual agreement with each Fund to waive its fees and reimburse expenses of certain classes for a specified period of time, as described in the Fund's prospectus.
The Board reviewed each Fund's performance over one-, three-, five- and ten-year periods (as applicable) against the performance of the Fund's selected peer group and benchmark index. The Board recognized that the performance of the Fund and the peer group funds are net of expenses, while the performance of the benchmark index reflects gross returns.
The Board reviewed various other specific factors with respect to each Fund, as described below. In their deliberations, the Trustees did not rank the importance of any particular information or factor considered and each Trustee may have attributed different weights to various factors.
RS Small Cap Growth Fund:
The Board compared the Fund's Class A performance for the one-, three-, five- and ten-year periods ended June 30, 2021, to that of the median performance of the Fund's peer group and benchmark index for the same periods and considered the fact that the Fund underperformed the benchmark index for the one- and three-year periods, outperformed the benchmark index for the five- and ten-year periods, underperformed the peer group median for the one-, three- and ten-year periods, and outperformed the peer group median for the five-year period.
Having considered, among other things: (1) the Fund's management fee compared to comparable mutual funds; (2) the Fund's total expense ratio compared to comparable mutual funds; (3) that the Adviser's willingness to limit the expenses of certain classes for a period of time would provide stability to the Fund's expenses for those share classes during that period; and (4) the Fund's performance during the periods reviewed, the Board concluded that the Agreement continued to be in the best interests of the Fund's shareholders.
RS Select Growth Fund:
The Board compared the Fund's Class A performance for the one-, three-, five- and ten-year periods ended June 30, 2021, to that of the median performance of the Fund's peer group and benchmark index for the same periods. The Board noted that while the Fund's absolute performance was strong, the Fund underperformed both the benchmark index and the peer group median for all of the periods reviewed.
Having considered, among other things: (1) the Fund's management fee compared to comparable mutual funds; (2) the Fund's total expense ratio compared to comparable mutual funds; (3) that the Adviser's willingness to limit the expenses of certain classes for a period of time would provide stability to the Fund's expenses for those
100
Victory Portfolios | | Supplemental Information — continued
December 31, 2021 | |
(Unaudited)
share classes during that period; and (4) the Fund's performance during the periods reviewed, the Board concluded that the Agreement continued to be in the best interests of the Fund's shareholders.
RS Mid Cap Growth Fund:
The Board compared the Fund's Class A performance for the one-, three-, five- and ten-year periods ended June 30, 2021, to that of the median performance of the Fund's peer group and benchmark index for the same periods. The Board noted that while the Fund's absolute performance was strong, the Fund underperformed both the benchmark index and the peer group median for all of the periods reviewed. The Board brought the Fund's underperformance to management's attention and discussed with the Adviser any steps that had been or could be taken to enhance performance in the future.
Having considered, among other things: (1) the Fund's management fee compared to comparable mutual funds; (2) the Fund's total expense ratio compared to comparable mutual funds; (3) that the Adviser's willingness to limit the expenses of certain classes for a period of time would provide stability to the Fund's expenses for those share classes during that period; and (4) the Fund's performance during the periods reviewed, the Board concluded that the Agreement continued to be in the best interests of the Fund's shareholders.
RS Growth Fund:
The Board compared the Fund's Class A performance for the one-, three-, five- and ten-year periods ended June 30, 2021, to that of the median performance of the Fund's peer group and benchmark index for the same periods and considered the fact that the Fund underperformed both the benchmark index and the peer group median for all of the periods reviewed. The Board considered the Fund's strong absolute performance during all periods reviewed. The Board brought the Fund's underperformance to management's attention and discussed with the Adviser any steps that had been or could be taken to enhance performance in the future.
Having considered, among other things: (1) the Fund's management fee compared to comparable mutual funds; (2) the Fund's total expense ratio compared to comparable mutual funds; (3) that the Adviser's willingness to limit the expenses of certain classes for a period of time would provide stability to the Fund's expenses for those share classes during that period; and (4) the Fund's performance during the periods reviewed, the Board concluded that the Agreement continued to be in the best interests of the Fund's shareholders.
RS Science and Technology Fund:
The Board compared the Fund's Class A performance for the one-, three-, five- and ten-year periods ended June 30, 2021, to that of the median performance of the Fund's peer group and benchmark index for the same periods and considered the fact that the Fund underperformed the benchmark index for the one-, three- and ten-year periods, outperformed the benchmark index for the five-year period, outperformed the peer group median for the one- and five-year periods, underperformed the peer group median for the three-year period and matched the peer group median for the ten-year period.
Having considered, among other things: (1) the Fund's management fee compared to comparable mutual funds; (2) the Fund's total expense ratio compared to comparable mutual funds; (3) that the Adviser's willingness to limit the expenses of certain classes for a period of time would provide stability to the Fund's expenses for those share classes during that period; and (4) the Fund's performance during the periods reviewed, the Board concluded that the Agreement continued to be in the best interests of the Fund's shareholders.
RS Small Cap Equity Fund:
The Board compared the Fund's Class A performance for the one-, three-, five- and ten-year periods ended June 30, 2021, to that of the median performance of the Fund's peer group and benchmark index for the same periods and considered the fact that the Fund underperformed the benchmark index for the one-year period, outperformed the benchmark index for the three-, five- and ten-year periods, underperformed the peer group median for the one-, three- and five-year periods, and outperformed the peer group median for the ten-year period.
101
Victory Portfolios | | Supplemental Information — continued
December 31, 2021 | |
(Unaudited)
Having considered, among other things: (1) the Fund's management fee compared to comparable mutual funds; (2) the Fund's total expense ratio compared to comparable mutual funds; (3) that the Adviser's willingness to limit the expenses of certain classes for a period of time would provide stability to the Fund's expenses for those share classes during that period; and (4) the Fund's performance during the periods reviewed, the Board concluded that the Agreement continued to be in the best interests of the Fund's shareholders.
Conclusion:
Based on its review of the information requested and provided, and following extended discussions, the Board determined that the Agreement, on behalf of the Funds discussed above, was consistent with the best interests of each Fund and its shareholders, and the Board unanimously approved the Agreement, on behalf of each Fund, for an additional annual period on the basis of the foregoing review and discussions and the following considerations, among others:
• The fairness and reasonableness of the investment advisory fee payable to the Adviser under the Agreement in light of the investment advisory services provided, the costs of these services, the profitability of the Adviser's relationship with the Fund and the comparability of the fee paid to the fees paid by other investment companies;
• The nature, quality and extent of the investment advisory services provided by the Adviser;
• The Adviser's entrepreneurial commitment to the management of the Funds and the creation of a broad-based family of funds, which could entail a substantial commitment of the Adviser's resources to the successful operation of the Funds;
• The Adviser's representations regarding its staffing and capabilities to manage the Funds, including the retention of personnel with relevant portfolio management experience;
• The Adviser's efforts to enhance investment results by, among other things, developing quality portfolio management teams; and
• The overall high quality of the personnel, operations, financial condition, investment management capabilities, methodologies and performance of the Adviser.
102
Privacy Policy
Protecting the Privacy of Information
The Trust respects your right to privacy. We also know that you expect us to conduct and process your business in an accurate and efficient manner. To do so, we must collect and maintain certain personal information about you. This is the information we collect from you on applications or other forms, and from the transactions you make with us or third parties. It may include your name, address, social security number, account transactions and balances, and information about investment goals and risk tolerance.
We do not disclose any information about you or about former customers to anyone except as permitted or required by law. Specifically, we may disclose the information we collect to companies that perform services on our behalf, such as the transfer agent that processes shareholder accounts and printers and mailers that assist us in the distribution of investor materials. We may also disclose this information to companies that perform marketing services on our behalf. This allows us to continue to offer you Victory investment products and services that meet your investing needs, and to effect transactions that you request or authorize. These companies will use this information only in connection with the services for which we hired them. They are not permitted to use or share this information for any other purpose.
To protect your personal information internally, we permit access only by authorized employees and maintain physical, electronic, and procedural safeguards to guard your personal information.*
* You may have received communications regarding information about privacy policies from other financial institutions which gave you the opportunity to "opt-out" of certain information sharing with companies which are not affiliated with that financial institution. The Trust does not share information with other companies for purposes of marketing solicitations for products other than the Trust. Therefore, the Trust does not provide opt-out options to their shareholders.
Victory Funds
P.O. Box 182593
Columbus, Ohio 43218-2593

Visit our website at: | | Call Victory at: | |
www.vcm.com | | 800-539-FUND (800-539-3863) | |
| | | 800-235-8396 for Member Class | |

December 31, 2021
Annual Report
Victory RS International Fund
Victory RS Global Fund
Victory Sophus Emerging Markets Fund
www.vcm.com
News, Information And Education 24 Hours A Day, 7 Days A Week
The Victory Capital website gives fund shareholders, prospective shareholders, and investment professionals a convenient way to access fund information, get guidance, and track fund performance anywhere they can access the Internet. The site includes:
• Detailed performance records
• Daily share prices
• The latest fund news
• Investment resources to help you become a better investor
• A section dedicated to investment professionals
Whether you're a potential investor searching for the fund that matches your investment philosophy, a seasoned investor interested in planning tools, or an investment professional, www.vcm.com has what you seek. Visit us anytime. We're always open.
Victory Portfolios
TABLE OF CONTENTS
Shareholder Letter (Unaudited) | | | 3 | | |
Manager's Commentary / Investment Overview
(Unaudited) | | | 5 | | |
Investment Objectives and Portfolio
Holdings (Unaudited) | | | 14 | | |
Schedules of Portfolio Investments | |
Victory RS International Fund | | | 17 | | |
Victory RS Global Fund | | | 22 | | |
Victory Sophus Emerging Markets Fund | | | 28 | | |
Financial Statements | |
Statements of Assets and Liabilities | | | 35 | | |
Statements of Operations | | | 37 | | |
Statements of Changes in Net Assets | | | 38 | | |
Financial Highlights | | | 42 | | |
Notes to Financial Statements | | | 48 | | |
Report of Independent Registered Public
Accounting Firm | | | 59 | | |
Supplemental Information (Unaudited) | | | 60 | | |
Trustee and Officer Information | | | 60 | | |
Proxy Voting and Portfolio Holdings Information | | | 63 | | |
Expense Examples | | | 63 | | |
Additional Federal Income Tax Information | | | 65 | | |
Advisory Contract Approval | | | 66 | | |
Privacy Policy (inside back cover) | | | |
1
IRA DISTRIBUTION WITHHOLDING DISCLOSURE
We generally must withhold federal income tax at a rate of 10% of the taxable portion of your distribution and, if you live in a state that requires state income tax withholding, at your state's tax rate. However, you may elect not to have withholding apply or to have income tax withheld at a higher rate. Any withholding election that you make will apply to any subsequent distribution unless and until you change or revoke the election. If you wish to make a withholding election, or change or revoke a prior withholding election, call 800-539-3863 and form W-4P (OMB No. 1545-0074 withholding certificate for pension or annuity payments) will be electronically sent.
If you do not have a withholding election in place by the date of a distribution, federal income tax will be withheld from the taxable portion of your distribution at a rate of 10%. If you must pay estimated taxes, you may be subject to estimated tax penalties if your estimated tax payments are not sufficient and sufficient tax is not withheld from your distribution.
For more specific information, please consult your tax adviser.
The Funds are distributed by Victory Capital Services, Inc. Victory Capital Management Inc. is the investment adviser to the Funds and receives fees from the Funds for performing services for the Funds.
This report is not authorized for distribution to prospective investors unless preceded or accompanied by a current prospectus of the Victory Funds.
For additional information about any Victory Fund, including fees, expenses, and risks, view our prospectus online at vcm.com or call 800-539-3863. Read it carefully before you invest or send money.
The information in this report is based on data obtained from recognized services and sources and is believed to be reliable. Any opinions, projections, or recommendations in this report are subject to change without notice and are not intended as individual investment advice. Past investment performance of the Funds, markets or securities mentioned herein should not be considered to be indicative of future results.
• NOT FDIC INSURED • NO BANK GUARANTEE • MAY LOSE VALUE

Call Victory at:
800-539-FUND (800-539-3863)
Visit our website at:
www.vcm.com
2
Victory Funds Letter to Shareholders
(Unaudited)
Dear Shareholder,
Another year has passed, but unfortunately the pandemic endures. Yet, looking back on the year ended 2021, it is evident that financial markets have endured as well, despite stiff headwinds — including new COVID-19 variants; disruption among global supply chains; uncomfortable inflation readings; and the fear of rising interest rates.
Through it all, the S&P 500® Index, the bell-weather proxy for our domestic stock market, once again registered a positive annual total return (that makes it 12 out of the past 13 years). This was largely driven by a U.S. economy that bounced back quickly after what was effectively a global economic shutdown in 2020, and we witnessed robust earnings growth across many sectors thanks in no small part to continued fiscal stimulus and accommodative monetary policy. Underlying this positive performance were interesting differences among investment styles and market capitalizations. For example, growth-oriented investments outperformed value within large-caps but underperformed within both mid-caps and small-caps (as measured by the Russell family of indices). Perhaps this reflects investors' expectations for higher interest rates next year?
There were other notable subplots to 2021. Early in the year we watched in disbelief as "meme stocks" — a few names that gained massive notoriety on social media platforms — went on stomach-churning roller coaster rides. Also, intriguing was how the biotech sector struggled mightily despite the success and fanfare surrounding the COVID-19 vaccines. Meanwhile, rising oil prices fueled impressive gains across the energy landscape, while crypto assets captivated investors. Now we're all watching how crypto's underlying blockchain technologies might disrupt business-as-usual across industries in the years ahead. These were just a few of the highlights of the past year.
Through all the twists and turns, the S&P 500® Index registered an impressive annual total return of nearly 29% for the 12-month period ended December 31, 2021. Over this same annual period, the yield on the 10-Year U.S. Treasury jumped 59 basis points (a basis point is 1/100th of a percentage point), reflecting substantial fiscal stimuli and the U.S. Federal Reserve's (the "Fed") accommodative monetary stance (recently). At the end of our reporting period, the yield on the 10-Year U.S. Treasury was trending higher and finished at 1.52%.
Despite the resiliency of financial markets, we fully acknowledge that the volatility and unusual events of recent years may have made investors uneasy at times. However, this simply underscores why it's important for investors to remain calm and unemotional in the face of market turmoil. A long-term perspective, a well-diversified portfolio across asset classes and investment types, and a clear understanding of individual risk tolerance are some of the key ingredients for staying the course and progressing on your investment goals.
Of course, no one knows for certain what 2022 will bring. We are already facing a potential end to the Fed's accommodative monetary policies and the various forms of fiscal stimuli that helped revive the economy from the depths of the pandemic-induced market downturn. By all accounts, the Fed appears ready to raise short-term
3
interest rates, perhaps as early as the end of the first quarter, though any move will certainly be data dependent, and some are expressing concerns about labor shortages, disrupted supply chains, rising commodity prices, and the potential for lasting inflation. There will likely be new headwinds, some yet to be identified.
Thus, we cannot tell you with any certainty what markets will do in the future, but we can assure you that the investment professionals at our investment franchises continually monitor the market environment and work hard to position portfolios opportunistically no matter what the markets bring.
On the following pages, you will find information relating to your Victory Funds investment, brought to you by Victory Capital. If you have any questions, we encourage you to contact your financial advisor. Or, if you invest with us directly, you may call 800-539-3863 or visit our website at www.vcm.com.
From all of us here at Victory Capital, thank you for your ongoing confidence and for letting us help you work toward your investment goals.

Christopher K. Dyer, CFA
President,
Victory Funds
4
Victory RS International Fund
Manager's Commentary
(Unaudited)
What were the market conditions during the reporting period?
International equities (as measured by the MSCI EAFE Index (the "Index")) returned 11.26% over the year ended December 31, 2021, despite the emergence of new COVID-19 variants and rising prices for food, fuel, and consumer goods across the globe. Value-oriented stocks and smaller-cap stocks led market returns earlier in the year, as investors deployed capital into segments likely to benefit from an economic recovery. Developed economies with stronger COVID-19 vaccination programs tended to do better in the second quarter of 2021, though emerging markets also advanced on improving economic outlooks. Markets declined in the third quarter of 2021 as global supply chain constraints, surging virus cases and inflation fears slowed economic recovery. The emergence of the highly contagious COVID-19 Omicron variant and the prospect of tightening monetary policy briefly paused international equities' upward trajectory in November, but markets proved resilient, closing the final quarter of 2021 up 2.69% despite growing virus caseloads, persistent inflation, and continued supply bottlenecks.
How did Victory RS International Fund (the "Fund") perform during the reporting period?
The Fund returned 14.05% (Class A at net asset value) for the fiscal year ended December 31, 2021, outperforming the Index, which returned 11.26% during the reporting period.
What strategies did you employ during the reporting period?
We employ a blended investment approach that relies on both rigorous quantitative techniques and experienced analyst judgement. At the heart of the investment process is our proprietary QVS (Quality, Value and Sentiment) Model (the "Model"), which is designed to identify companies that have the potential to consistently create shareholder value, are reasonably valued, and exhibit favorable market sentiment. The Model helps us focus our resources, as we conduct additional research only on companies with the strongest Model recommendations. Making correct macro allocation calls can be immensely challenging; therefore, we do not forecast regional performance and seek to remain sector- and region-neutral in constructing our portfolios. In our view, stock selection can be far more impactful to Fund performance than allocation.
The Fund's active return to the Index was aided by positive stock selection in several economic sectors, including Industrials, Consumer Staples, and Materials. Negative stock selection in the Utilities sector detracted from relative performance, as did the Fund's allocation to cash. From a regional perspective, Fund investments in Japan, the United Kingdom, and Europe contributed the most to relative performance. Country-level contributors included the Netherlands and Norway, while detractors included Switzerland and Italy.
Nippon Yusen KK, a global logistics and transport company based in Japan was the Fund's top contributor to relative performance for the year. Other key contributors included Capgemini SE, a technology and consulting services multinational based in France, and ASM International NV, a semiconductor equipment provider based in the Netherlands. Individual detractors from relative performance included Japanese software firm Oracle Corporation Japan, and Capcom Co., Ltd., a video game developer also based in Japan. In addition, the Fund lost relative performance from not owning ASML Holding NV, a semiconductor equipment provider based in the Netherlands that performed well within the Index.
5
Victory RS International Fund
Investment Overview
(Unaudited)
Average Annual Total Return
Year Ended December 31, 2021
| | | Class A | | Class C | | Class R | | Class R6 | | Class Y | | | |
INCEPTION DATE | | 2/16/93 | | 8/7/00 | | 5/15/01 | | 5/2/19 | | 3/10/09 | | | |
| | | Net Asset
Value | | Maximum
Offering
Price | | Net Asset
Value | | Contingent
Deferred
Charges | | Net Asset
Value | | Net Asset
Value | | Net Asset
Value | | MSCI EAFE
Index1 | |
One Year | | | 14.05 | % | | | 7.51 | % | | | 13.24 | % | | | 12.24 | % | | | 13.85 | % | | | 14.32 | % | | | 14.38 | % | | | 11.26 | % | |
Five Year | | | 10.40 | % | | | 9.10 | % | | | 9.56 | % | | | 9.56 | % | | | 10.10 | % | | | NA | | | | 10.67 | % | | | 9.55 | % | |
Ten Year | | | 8.03 | % | | | 7.39 | % | | | 7.12 | % | | | 7.12 | % | | | 7.63 | % | | | NA | | | | 8.34 | % | | | 8.03 | % | |
Since Inception | | | NA | | | | NA | | | | NA | | | | NA | | | | NA | | | | 10.28 | % | | | NA | | | | NA | | |
The performance data quoted represents past performance and current returns may be lower or higher. The investment return and principal value will fluctuate so that an investor's shares, when redeemed, may be worth more or less than the original cost. To obtain performance information current to the most recent month's end, please visit www.vcm.com.
The maximum offering price ("MOP") figures reflect a maximum sales charge of 5.75% for Class A. Class C is not subject to an initial sales charge, but is subject to a deferred sales charge of 1.00% on shares redeemed within one year of purchase. Net Asset Value ("NAV") does not reflect sales charges.
Total return measures the price change in a share assuming the reinvestment of all net investment income and realized capital gain distributions, if any. The total returns quoted do not reflect adjustments made to the enclosed financial statements in accordance with U.S. Generally Accepted Accounting Principles or the deduction of taxes that a shareholder would pay on net investment income and realized capital gain distributions, including reinvested distributions, or redemptions of shares. The total return figures set forth above include all waivers of fees. Without such fee waivers, the total returns would have been lower.
Victory RS International Fund — Growth of $10,000
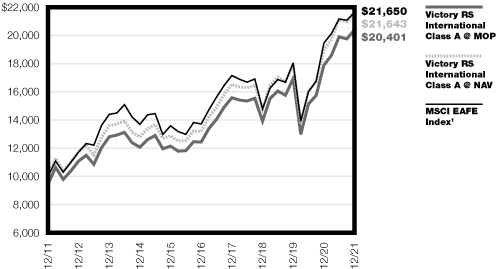
1The MSCI EAFE Index (Europe, Australasia, and Far East) is a free float-adjusted market capitalization index that is designed to measure the equity market performance of developed markets, excluding the U.S. and Canada. The index reflects the reinvestment of dividends paid on the stocks constituting the index net of withholding taxes. This index does not include the effect of sales charges, commissions, expenses or taxes, is not representative of the Fund, and it is not possible to invest directly in an index.
The graph reflects investment of growth of a hypothetical $10,000 investment in the Fund.
The graph and table do not reflect the deduction of taxes that a shareholder would pay on Fund distributions or the redemption of shares.
Past performance is not indicative of future results.
6
Managers' Commentary
(Unaudited)
What were the market conditions during the reporting period?
Global equities (as measured by the MSCI All Country World Index (the "Index")) returned 18.54% over the year ended December 31, 2021, despite the emergence of new COVID-19 variants and rising prices for food, fuel and consumer goods across the globe. Value-oriented stocks and smaller-cap stocks led market returns earlier in the year, as investors deployed capital into segments likely to benefit from an economic recovery. Developed economies with stronger COVID-19 vaccination programs tended to do better in the second quarter of 2021, though emerging markets also advanced on improving economic outlooks. Markets declined in the third quarter of 2021 as global supply chain constraints, surging virus cases and inflation fears slowed economic recovery. The emergence of the highly contagious COVID-19 Omicron variant and the prospect of tightening monetary policy briefly paused global equities' upward trajectory in November, but markets proved resilient, closing the final quarter of 2021 up 6.68% despite growing virus caseloads, persistent inflation, and continued supply bottlenecks.
How did Victory RS Global Fund (the "Fund") perform during the reporting period?
The Fund returned 22.39% (Class A at net asset value) for the fiscal year ended December 31, 2021, outperforming the Index, which returned 18.54% during the reporting period.
What strategies did you employ during the reporting period?
We employ a blended investment approach that relies on both rigorous quantitative techniques and experienced analyst judgement. At the heart of the investment process is our proprietary QVS (Quality, Value and Sentiment) Model (the "Model"), which is designed to identify companies that have the potential to consistently create shareholder value, are reasonably valued, and exhibit favorable market sentiment. The Model helps us focus our resources, as we conduct additional research only on companies with the strongest Model recommendations. Making correct macro allocation calls can be immensely challenging, therefore we do not forecast regional performance and seek to remain sector- and region-neutral in constructing our portfolios. In our view, stock selection can be far more impactful to Fund performance than allocation.
The Fund's active return to the Index was aided by positive stock selection in several economic sectors, including Information Technology, Industrials, and Financials. Negative stock selection in the Consumer Discretionary and Consumer Staples sectors detracted from relative performance, as did the Fund's allocation to cash. From a regional perspective, Fund investments in North American and Japan aided relative performance, while negative stock selection in emerging markets detracted from relative returns. Country-level contributors included the United States and Hong Kong, while detractors included France and China.
Nippon Yusen KK, a global logistics and transport company based in Japan was the Fund's top contributor to relative performance for the year. Other key contributors included graphics processing provider NVIDIA Corp., and cybersecurity firm Fortinet, Inc., both based in the United States.
7
Victory RS Global Fund (continued)
Managers' Commentary (continued)
Individual detractors from relative performance included Chinese multinational technology company Baidu, Inc., and condiment maker Foshan Haitian Flavouring & Food Co., Ltd., also based in China. Amedisys, Inc., a healthcare services provider based in the United States was also a detractor.
8
Victory RS Global Fund
Investment Overview
(Unaudited)
Average Annual Total Return
Year Ended December 31, 2021
| | | Class A | | Class C | | Class R | | Class R6 | | Class Y | | | |
INCEPTION DATE | | 5/16/11 | | 5/16/11 | | 5/16/11 | | 5/2/19 | | 5/16/11 | | | |
| | | Net Asset
Value | | Maximum
Offering
Price | | Net Asset
Value | | Contingent
Deferred
Charges | | Net Asset
Value | | Net Asset
Value | | Net Asset
Value | | MSCI All
Country
World
Index1 | |
One Year | | | 22.39 | % | | | 15.38 | % | | | 21.52 | % | | | 20.52 | % | | | 22.12 | % | | | 22.84 | % | | | 22.78 | % | | | 18.54 | % | |
Five Year | | | 17.05 | % | | | 15.67 | % | | | 16.17 | % | | | 16.17 | % | | | 16.76 | % | | | NA | | | | 17.36 | % | | | 14.40 | % | |
Ten Year | | | 14.48 | % | | | 13.80 | % | | | 13.64 | % | | | 13.64 | % | | | 16.51 | % | | | NA | | | | 14.83 | % | | | 11.85 | % | |
Since Inception | | | NA | | | | NA | | | | NA | | | | NA | | | | NA | | | | 19.82 | % | | | NA | | | | NA | | |
The performance data quoted represents past performance and current returns may be lower or higher. The investment return and principal value will fluctuate so that an investor's shares, when redeemed, may be worth more or less than the original cost. To obtain performance information current to the most recent month's end, please visit www.vcm.com.
The maximum offering price ("MOP") figures reflect a maximum sales charge of 5.75% for Class A. Class C is not subject to an initial sales charge, but is subject to a deferred sales charge of 1.00% on shares redeemed within one year of purchase. Net Asset Value ("NAV") does not reflect sales charges.
Total return measures the price change in a share assuming the reinvestment of all net investment income and realized capital gain distributions, if any. The total returns quoted do not reflect adjustments made to the enclosed financial statements in accordance with U.S. Generally Accepted Accounting Principles or the deduction of taxes that a shareholder would pay on net investment income and realized capital gain distributions, including reinvested distributions, or redemptions of shares. The total return figures set forth above include all waivers of fees. Without such fee waivers, the total returns would have been lower.
Victory RS Global Fund — Growth of $10,000
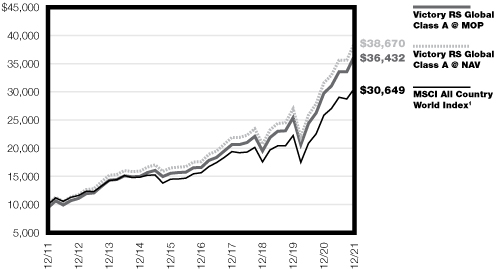
1A market capitalization weighted index designed to provide a broad measure of equity-market performance throughout the world. The MSCI All Country World Index (ACWI) is maintained by Morgan Stanley Capital International, and is comprised of stocks from both developed and emerging markets. The index reflects the reinvestment of dividends paid on the stocks constituting the index net of withholding taxes. This index does not include the effect of sales charges, commissions, expenses or taxes, is not representative of the Fund, and it is not possible to invest directly in an index.
The graph reflects investment of growth of a hypothetical $10,000 investment in the Fund.
The graph and table do not reflect the deduction of taxes that a shareholder would pay on Fund distributions or the redemption of shares.
Past performance is not indicative of future results.
9
Victory Sophus Emerging Markets Fund
Managers' Commentary
(Unaudited)
What were the market conditions during the reporting period?
Emerging markets, as measured by the MSCI Emerging Markets Index (the "Index"), underperformed developed markets significantly in 2021, returning 2.54%, versus the S&P 500® Index, which returned 28.71% and the MSCI World Index, which returned 21.82%. The Index rallied sharply at the beginning of 2021. Multiple vaccines had been developed and distributed, protocols were being published, and the markets looked forward to a rapid resumption of normality. Emerging markets outperformed developed markets for the first two months of the year; and although they started to lag developed markets after that, they continued to trend higher until mid-year when the spread of COVID-19 variants, first Delta and then Omicron, weighed on emerging markets for the rest of the year. The cost of the pandemic, in particular for poorer nations, loomed large. Insufficient health care, low unemployment benefits, and poor labor rights, would impact lesser developed economies more. On a positive note, certain countries, such as Mexico, benefited from the supply chain constraints. Other countries and markets gained from the rising price of energy and commodities. The one market that suffered throughout the bulk of the year was China, whipsawed by internal issues around reform, slowing growth, fears of social inequity, and tensions with the United States.
Latin America was the worst-performing region in emerging markets in 2021, falling 8.1%. The pandemic, politics, and a volatile year of growth and policymaking led to sharp underperformance in Brazil, Peru, and Chile, each down around 20% for the year, and Colombia, down 13.8%. Mexico was an outlier, rising 22.5% during 2021. Politics played a significant role in the region during 2021. In Brazil, President Bolsonaro handled the pandemic quite poorly, overseeing a very weak response to the ravages of COVID-19. Bolsonaro faces an election in 2022 and is pursuing an aggressive fiscal spending plan to regain popularity, despite very stretched government finances. Chile voted to rewrite its constitution and elected a left-leaning constitutional assembly in a heated environment. The country also faced a presidential election at the end of the year, which again was hard fought between the right and the left. Colombia will face presidential elections in 2022, along with Brazil, which will likely bring potential volatility. In addition to politics, Latin America is a large commodities exporter and suffered from volatility in metals and energy prices, especially as the COVID-19 Delta and Omicron variants spread throughout the global economy. Latin American currencies suffered as a result, with the Argentine peso, the Chilean peso, and the Colombian peso each down around 20% in 2021, and the Brazilian real down 7%. This has furthered fueled inflation in the region, which will weigh on the outlook as overall growth slows down.
Eastern Europe, Middle East, and Africa ("EEMEA") was the best-performing region in 2021, up 18.0%, well above Asia, which was down 5.1%, and Latin America, which was down 8.1%. Most markets in EEMEA did well in 2021, supported by strong energy prices helping markets such as Saudi Arabia, the UAE, Qatar, Kuwait, and Russia. Turkey was the only EEMEA country in negative territory for the year, down 28.4%, and was sharply lower in the fourth quarter of 2021, down 11.2%. Turkey's remarkably unstable monetary policy in a rising inflationary environment resulted in a 50% collapse of the lira during the fourth quarter of 2021.
10
Victory Sophus Emerging Markets Fund (continued)
Managers' Commentary (continued)
China was the worst-performing market in Asia in 2021, falling 21.7% after a very positive year in 2020, when it rose by 29.5%. Interestingly, the domestic stock market (A share) outperformed significantly, with the Shanghai Composite Index closing the year up 7.1% (9.9% in U.S. dollar terms). During 2021, China prioritized their Common Prosperity agenda to address several long-term structural concerns such as high living and social costs, low birth rate, environmental problems, and income inequality. The Chinese government maintained their strong commitment to addressing these social issues despite navigating a volatile period dealing with COVID-19 and continuing tension with the United States, which weighed on the market. The Chinese economy had also been slowing steadily all year, further disrupted by floods, with consumption, industrial production, and investment remaining weak. Exports, on the other hand, were strong, driven by global demand as countries exited lockdowns. China's supply chain maintained its competitiveness and remained largely undisrupted by COVID-19. The positive trade surplus and consistent bond inflows helped the renminbi rise 2.2% against a strong U.S. dollar. The Taiwanese stock market continued to do well during the fourth quarter of 2021, up 8.4%, benefiting from the semi-conductor chip shortage which led to a tight supply situation, suggesting that the earnings peak should be higher and the cycle more elongated than street estimates. During 2021, the Taiwan market rose 26.1%. India was flat in the fourth quarter of 2021 but was the best-performing market in Asia in 2021, up 26.2%. The Indian economy has survived the pandemic, unusually high rainfalls and higher inflation, in part thanks to an accommodative stance by the Reserve Bank of India. An attractive mid- to longer-term outlook continues to support valuations.
How did Victory Sophus Emerging Markets Fund (the "Fund") perform during the reporting period?
The Fund (Class A at net asset value) returned -4.35% for the fiscal year ended December 31, 2021, underperforming the Index, which returned -2.54% during the reporting period.
What strategies did you employ during the reporting period?
We employ a disciplined, bottom-up approach utilizing both quantitative and fundamental processes to invest in businesses that we believe have superior and sustainable earnings growth at attractive valuations, with revisions as the catalyst. By investing in companies with these characteristics, coupled with our risk-managed approach, we seek to provide a more consistent return pattern over time.
2021 was a tale of two halves. The Fund outperformed the Index by over 300 basis points (a basis point is 1/100th of a percentage point) during the first half of the year. During this period, Industrials was the biggest contributor to performance, benefiting mainly from exposure to shipping and marine companies. We also had positive contribution from the Real Estate sector in China, as well as the Materials sector, benefiting from rising commodity prices. On the other hand, an early tilt into Semi-Conductors was not rewarded until the second half of the year, when that sector outperformed. During the second half of the year, the Fund gave back the excess returns it generated in the first half of the year. The exposure to cyclical stocks in Industrials, in particular to machinery and construction and engineering companies, negatively impacted the Fund on concerns over global growth prospects slowing down, given the spread of COVID-19 variants around the world. Stock selection in Consumer Staples, Technology, and Materials also contributed negatively. For the year as a whole, the
11
Victory Sophus Emerging Markets Fund (continued)
Managers' Commentary (continued)
portfolio suffered in Brazil, which underperformed the Index significantly due to the poor handling of the pandemic fiscal concerns, political uncertainty ahead of elections in 2022, and a slowing economy. Underweight positions and poor stock selection in Taiwan and India, which outperformed Index strongly, also negatively impacted the Fund. On the contrary, stock selection in China, South Africa, and Korea benefited performance for the year. From a factor perspective, momentum and value were the best-performing factors for the year, while volatility, growth, and quality underperformed. Volatility, in particular, negatively impacted the Fund during the second half of the year.
12
Victory Sophus Emerging Markets Fund
Investment Overview
(Unaudited)
Average Annual Total Return
Year Ended December 31, 2021
| | | Class A | | Class C | | Class R | | Class R6 | | Class Y | | | |
INCEPTION DATE | | 5/1/97 | | 8/7/00 | | 5/15/01 | | 11/15/16 | | 3/10/09 | | | |
| | | Net Asset
Value | | Maximum
Offering
Price | | Net Asset
Value | | Contingent
Deferred
Charges | | Net Asset
Value | | Net Asset
Value | | Net Asset
Value | | MSCI
Emerging
Markets
Index1 | |
One Year | | | –4.35 | % | | | –9.86 | % | | | –5.16 | % | | | –6.07 | % | | | –4.57 | % | | | –3.93 | % | | | –4.01 | % | | | –2.54 | % | |
Five Year | | | 9.56 | % | | | 8.27 | % | | | 8.68 | % | | | 8.68 | % | | | 9.30 | % | | | 10.07 | % | | | 9.95 | % | | | 9.87 | % | |
Ten Year | | | 4.68 | % | | | 4.06 | % | | | 3.85 | % | | | 3.85 | % | | | 4.41 | % | | | NA | | | | 5.03 | % | | | 5.49 | % | |
Since Inception | | | NA | | | | NA | | | | NA | | | | NA | | | | NA | | | | 10.19 | % | | | NA | | | | NA | | |
The performance data quoted represents past performance and current returns may be lower or higher. The investment return and principal value will fluctuate so that an investor's shares, when redeemed, may be worth more or less than the original cost. To obtain performance information current to the most recent month's end, please visit www.vcm.com.
The maximum offering price ("MOP") figures reflect a maximum sales charge of 5.75% for Class A. Class C is not subject to an initial sales charge, but is subject to a deferred sales charge of 1.00% on shares redeemed within one year of purchase. Net Asset Value ("NAV") does not reflect sales charges.
Total return measures the price change in a share assuming the reinvestment of all net investment income and realized capital gain distributions, if any. The total returns quoted do not reflect adjustments made to the enclosed financial statements in accordance with U.S. Generally Accepted Accounting Principles or the deduction of taxes that a shareholder would pay on net investment income and realized capital gain distributions, including reinvested distributions, or redemptions of shares. The total return figures set forth above include all waivers of fees. Without such fee waivers, the total returns would have been lower.
Victory Sophus Emerging Markets Fund — Growth of $10,000
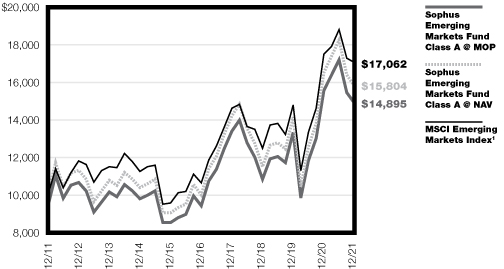
1The MSCI Emerging Markets Index is a free float-adjusted market capitalization index that is designed to measure equity performance of emerging markets. The index reflects the reinvestment of dividends paid on the stocks constituting the index net of withholding taxes. This index does not include the effect of sales charges, commissions, expenses or taxes, is not representative of the Fund, and it is not possible to invest directly in an index.
The graph reflects investment of growth of a hypothetical $10,000 investment in the Fund.
The graph and table do not reflect the deduction of taxes that a shareholder would pay on Fund distributions or the redemption of shares.
Past performance is not indicative of future results.
13
Victory Portfolios
Victory RS International Fund | | December 31, 2021 | |
(Unaudited)
Investment Objective and Portfolio Holdings:
The Fund seeks to provide long-term capital appreciation.
Top 10 Holdings*:
December 31, 2021
(% of Net Assets)
Nestle SA, Registered Shares | | | 4.2 | % | |
Roche Holding AG | | | 3.6 | % | |
LVMH Moet Hennessy Louis Vuitton SE | | | 3.1 | % | |
Toyota Motor Corp. | | | 3.1 | % | |
Siemens AG, Registered Shares | | | 2.6 | % | |
SAP SE | | | 2.2 | % | |
Diageo PLC | | | 2.1 | % | |
Atlas Copco AB, Class B | | | 2.0 | % | |
Capgemini SE | | | 2.0 | % | |
Allianz SE, Registered Shares | | | 1.9 | % | |
Sector Allocation*:
December 31, 2021
(% of Net Assets)
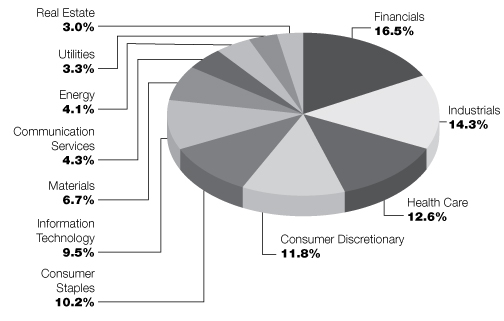
* Does not include futures contracts, money market instruments, and short-term investments purchased with cash collateral from securities loaned.
Percentages are of the net assets of the Fund and may not equal 100%.
Refer to the Schedule of Portfolio Investments for a complete list of securities.
14
Victory Portfolios
Victory RS Global Fund | | December 31, 2021 | |
(Unaudited)
Investment Objective and Portfolio Holdings:
The Fund seeks to provide long-term capital appreciation.
Top 10 Holdings*:
December 31, 2021
(% of Net Assets)
Apple, Inc. | | | 5.2 | % | |
Microsoft Corp. | | | 5.0 | % | |
NVIDIA Corp. | | | 2.5 | % | |
Alphabet, Inc., Class C | | | 2.5 | % | |
Amazon.com, Inc. | | | 2.2 | % | |
McDonald's Corp. | | | 2.1 | % | |
Meta Platforms, Inc., Class A | | | 2.0 | % | |
Prologis, Inc. | | | 1.9 | % | |
S&P Global, Inc. | | | 1.8 | % | |
Johnson & Johnson | | | 1.7 | % | |
Sector Allocation*:
December 31, 2021
(% of Net Assets)

* Does not include futures contracts, money market instruments, and short-term investments purchased with cash collateral from securities loaned.
Percentages are of the net assets of the Fund and may not equal 100%.
Refer to the Schedule of Portfolio Investments for a complete list of securities.
15
Victory Portfolios
Victory Sophus Emerging Markets Fund | | December 31, 2021 | |
(Unaudited)
Investment Objective and Portfolio Holdings:
The Fund seeks to provide long-term capital appreciation.
Top 10 Holdings*:
December 31, 2021
(% of Net Assets)
Taiwan Semiconductor Manufacturing Co. Ltd. | | | 7.9 | % | |
Samsung Electronics Co. Ltd. | | | 5.0 | % | |
Tencent Holdings Ltd. | | | 4.4 | % | |
Infosys Ltd. | | | 2.6 | % | |
Alibaba Group Holding Ltd. | | | 2.5 | % | |
China Merchants Bank Co. Ltd., Class H | | | 1.6 | % | |
MediaTek, Inc. | | | 1.5 | % | |
Sberbank of Russia PJSC | | | 1.4 | % | |
Gazprom PJSC | | | 1.4 | % | |
NetEase, Inc. | | | 1.3 | % | |
Sector Allocation*:
December 31, 2021
(% of Net Assets)
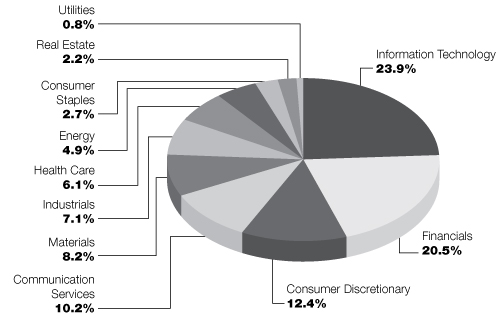
* Does not include futures contracts, money market instruments, and short-term investments purchased with cash collateral from securities loaned.
Percentages are of the net assets of the Fund and may not equal 100%.
Refer to the Schedule of Portfolio Investments for a complete list of securities.
16
Victory Portfolios
Victory RS International Fund | | Schedule of Portfolio Investments
December 31, 2021 | |
Security Description | | Shares | | Value | |
Common Stocks (96.3%) | |
Australia (6.0%): | |
Consumer Discretionary (1.0%): | |
Aristocrat Leisure Ltd. | | | 144,570 | | | $ | 4,585,186 | | |
Financials (1.2%): | |
Macquarie Group Ltd. | | | 34,550 | | | | 5,163,649 | | |
Health Care (1.4%): | |
CSL Ltd. | | | 28,765 | | | | 6,082,551 | | |
Materials (1.4%): | |
BHP Group Ltd. (a) | | | 195,626 | | | | 5,905,069 | | |
Real Estate (1.0%): | |
Scentre Group | | | 1,895,035 | | | | 4,358,397 | | |
| | | | 26,094,852 | | |
Belgium (1.0%): | |
Information Technology (1.0%): | |
Melexis NV | | | 36,426 | | | | 4,340,007 | | |
China (1.2%): | |
Communication Services (0.7%): | |
Tencent Holdings Ltd. | | | 49,600 | | | | 2,894,308 | | |
Financials (0.5%): | |
China Merchants Bank Co. Ltd., Class H | | | 285,000 | | | | 2,217,251 | | |
| | | | 5,111,559 | | |
Denmark (1.5%): | |
Consumer Discretionary (0.5%): | |
Pandora A/S | | | 17,394 | | | | 2,163,937 | | |
Consumer Staples (1.0%): | |
Royal Unibrew A/S | | | 38,474 | | | | 4,328,230 | | |
| | | | 6,492,167 | | |
France (8.9%): | |
Consumer Discretionary (4.1%): | |
La Francaise des Jeux SAEM (b) | | | 103,015 | | | | 4,564,971 | | |
LVMH Moet Hennessy Louis Vuitton SE | | | 16,405 | | | | 13,556,393 | | |
| | | | 18,121,364 | | |
Energy (0.4%): | |
Gaztransport Et Technigaz SA | | | 20,476 | | | | 1,910,342 | | |
Industrials (0.7%): | |
Safran SA | | | 24,828 | | | | 3,039,245 | | |
Information Technology (2.0%): | |
Capgemini SE | | | 35,808 | | | | 8,775,038 | | |
Materials (1.7%): | |
Arkema SA | | | 51,834 | | | | 7,315,420 | | |
| | | | 39,161,409 | | |
See notes to financial statements.
17
Victory Portfolios
Victory RS International Fund | | Schedule of Portfolio Investments — continued
December 31, 2021 | |
Security Description | | Shares | | Value | |
Germany (7.9%): | |
Consumer Discretionary (1.1%): | |
Volkswagen AG, Preference Shares | | | 23,797 | | | $ | 4,779,978 | | |
Financials (1.9%): | |
Allianz SE, Registered Shares | | | 36,006 | | | | 8,491,548 | | |
Industrials (2.7%): | |
Siemens AG, Registered Shares | | | 66,917 | | | | 11,589,145 | | |
Information Technology (2.2%): | |
SAP SE | | | 68,713 | | | | 9,669,742 | | |
| | | | 34,530,413 | | |
Hong Kong (2.9%): | |
Financials (1.5%): | |
AIA Group Ltd. | | | 636,600 | | | | 6,425,313 | | |
Real Estate (1.4%): | |
CK Asset Holdings Ltd. | | | 1,014,000 | | | | 6,396,483 | | |
| | | | 12,821,796 | | |
Italy (4.0%): | |
Health Care (1.4%): | |
Recordati Industria Chimica e Farmaceutica SpA | | | 92,193 | | | | 5,919,546 | | |
Utilities (2.6%): | |
Enel SpA | | | 816,635 | | | | 6,529,280 | | |
Snam SpA | | | 811,768 | | | | 4,888,971 | | |
| | | | 11,418,251 | | |
| | | | 17,337,797 | | |
Japan (21.5%): | |
Communication Services (1.6%): | |
Capcom Co. Ltd. | | | 139,700 | | | | 3,290,695 | | |
Kakaku.com, Inc. | | | 142,900 | | | | 3,820,850 | | |
| | | | 7,111,545 | | |
Consumer Discretionary (4.1%): | |
Toyota Motor Corp. | | | 732,000 | | | | 13,531,610 | | |
ZOZO, Inc. | | | 141,300 | | | | 4,406,520 | | |
| | | | 17,938,130 | | |
Consumer Staples (1.0%): | |
Toyo Suisan Kaisha Ltd. | | | 107,100 | | | | 4,541,659 | | |
Financials (2.5%): | |
JAFCO Group Co. Ltd. | | | 35,500 | | | | 2,042,725 | | |
Mitsubishi UFJ Financial Group, Inc. | | | 887,500 | | | | 4,830,861 | | |
Tokio Marine Holdings, Inc. | | | 70,900 | | | | 3,947,664 | | |
| | | | 10,821,250 | | |
See notes to financial statements.
18
Victory Portfolios
Victory RS International Fund | | Schedule of Portfolio Investments — continued
December 31, 2021 | |
Security Description | | Shares | | Value | |
Health Care (3.3%): | |
Hoya Corp. | | | 57,200 | | | $ | 8,489,488 | | |
Shionogi & Co. Ltd. | | | 82,100 | | | | 5,776,441 | | |
| | | | 14,265,929 | | |
Industrials (4.6%): | |
en Japan, Inc. | | | 91,500 | | | | 2,586,282 | | |
Fuji Electric Co. Ltd. | | | 153,700 | | | | 8,397,804 | | |
Nippon Yusen KK | | | 53,900 | | | | 4,110,749 | | |
OKUMA Corp. | | | 49,200 | | | | 2,190,018 | | |
Sanwa Holdings Corp. | | | 277,900 | | | | 2,967,926 | | |
| | | | 20,252,779 | | |
Information Technology (3.1%): | |
Fujitsu Ltd. | | | 38,600 | | | | 6,633,659 | | |
Oracle Corp. | | | 26,400 | | | | 2,006,050 | | |
Ulvac, Inc. | | | 76,000 | | | | 4,754,847 | | |
| | | | 13,394,556 | | |
Real Estate (0.6%): | |
Sumitomo Realty & Development Co. Ltd. | | | 89,400 | | | | 2,636,045 | | |
Utilities (0.7%): | |
Chubu Electric Power Co., Inc. | | | 303,100 | | | | 3,202,056 | | |
| | | | 94,163,949 | | |
Netherlands (5.4%): | |
Communication Services (1.2%): | |
Koninklijke KPN NV | | | 1,689,041 | | | | 5,236,602 | | |
Financials (1.6%): | |
ING Groep NV | | | 510,095 | | | | 7,091,199 | | |
Industrials (1.4%): | |
Wolters Kluwer NV | | | 51,288 | | | | 6,036,090 | | |
Information Technology (1.2%): | |
ASM International NV | | | 11,766 | | | | 5,193,240 | | |
| | | | 23,557,131 | | |
New Zealand (0.7%): | |
Health Care (0.7%): | |
Fisher & Paykel Healthcare Corp. Ltd. | | | 133,586 | | | | 2,991,937 | | |
Norway (1.8%): | |
Energy (0.5%): | |
Aker BP ASA | | | 68,655 | | | | 2,111,921 | | |
Financials (1.3%): | |
SpareBank 1 SMN | | | 331,931 | | | | 5,604,935 | | |
| | | | 7,716,856 | | |
Spain (1.4%): | |
Communication Services (0.0%): (c) | |
Telefonica SA (a) | | | 43,535 | | | | 188,760 | | |
See notes to financial statements.
19
Victory Portfolios
Victory RS International Fund | | Schedule of Portfolio Investments — continued
December 31, 2021 | |
Security Description | | Shares | | Value | |
Financials (1.4%): | |
Banco Bilbao Vizcaya Argentaria SA | | | 1,005,595 | | | $ | 5,963,615 | | |
| | | | 6,152,375 | | |
Sweden (2.6%): | |
Industrials (2.6%): | |
Atlas Copco AB, Class B | | | 149,705 | | | | 8,796,827 | | |
Nibe Industrier AB, Class B | | | 187,604 | | | | 2,835,690 | | |
| | | | 11,632,517 | | |
Switzerland (13.7%): | |
Consumer Staples (5.2%): | |
Coca-Cola HBC AG | | | 120,537 | | | | 4,172,888 | | |
Nestle SA, Registered Shares | | | 132,929 | | | | 18,565,303 | | |
| | | | 22,738,191 | | |
Financials (2.3%): | |
Partners Group Holding AG | | | 2,971 | | | | 4,906,170 | | |
UBS Group AG | | | 288,968 | | | | 5,188,481 | | |
| | | | 10,094,651 | | |
Health Care (5.3%): | |
Novartis AG, Registered Shares | | | 83,085 | | | | 7,303,252 | | |
Roche Holding AG | | | 37,894 | | | | 15,725,930 | | |
| | | | 23,029,182 | | |
Industrials (0.9%): | |
Adecco Group AG | | | 76,824 | | | | 3,916,039 | | |
| | | | 59,778,063 | | |
United Kingdom (15.8%): | |
Communication Services (0.8%): | |
ITV PLC (d) | | | 2,348,090 | | | | 3,529,996 | | |
Consumer Discretionary (1.0%): | |
Next PLC | | | 38,636 | | | | 4,272,495 | | |
Consumer Staples (3.0%): | |
Diageo PLC | | | 168,642 | | | | 9,219,034 | | |
Imperial Brands PLC | | | 182,689 | | | | 4,002,878 | | |
| | | | 13,221,912 | | |
Energy (3.2%): | |
| BP PLC | | | 1,624,955 | | | | 7,279,512 | | |
Royal Dutch Shell PLC, Class A | | | 304,913 | | | | 6,680,794 | | |
| | | | 13,960,306 | | |
Financials (2.3%): | |
Close Brothers Group PLC | | | 130,759 | | | | 2,493,500 | | |
Intermediate Capital Group PLC | | | 123,578 | | | | 3,679,586 | | |
Legal & General Group PLC | | | 943,550 | | | | 3,809,652 | | |
| | | | 9,982,738 | | |
See notes to financial statements.
20
Victory Portfolios
Victory RS International Fund | | Schedule of Portfolio Investments — continued
December 31, 2021 | |
Security Description | | Shares | | Value | |
Health Care (0.5%): | |
CVS Group PLC | | | 76,609 | | | $ | 2,327,728 | | |
Industrials (1.4%): | |
Ashtead Group PLC | | | 79,370 | | | | 6,397,233 | | |
Materials (3.6%): | |
Croda International PLC | | | 56,584 | | | | 7,749,008 | | |
Evraz PLC | | | 234,777 | | | | 1,919,151 | | |
Rio Tinto PLC | | | 90,486 | | | | 5,966,150 | | |
| | | | 15,634,309 | | |
| | | | 69,326,717 | | |
Total Common Stocks (Cost $345,307,949) | | | 421,209,545 | | |
Exchange-Traded Funds (0.8%) | |
United States (0.8%): | |
iShares MSCI EAFE ETF | | | 45,813 | | | | 3,604,567 | | |
Total Exchange-Traded Funds (Cost $3,525,477) | | | 3,604,567 | | |
Collateral for Securities Loaned (0.6%)^ | |
United States (0.6%): | |
BlackRock Liquidity Funds TempFund, Institutional Shares, 0.04% (e) | | | 55,088 | | | | 55,088 | | |
Fidelity Investments Money Market Government Portfolio, Institutional
Shares, 0.01% (e) | | | 1,081,934 | | | | 1,081,934 | | |
Goldman Sachs Financial Square Prime Obligations Fund, Institutional
Shares, 0.02% (e) | | | 27,492 | | | | 27,492 | | |
JPMorgan Prime Money Market Fund, Capital Shares, 0.07% (e) | | | 219,209 | | | | 219,209 | | |
Morgan Stanley Institutional Liquidity Prime Portfolio, Institutional
Shares, 0.06% (e) | | | 985,608 | | | | 985,608 | | |
Total Collateral for Securities Loaned (Cost $2,369,331) | | | 2,369,331 | | |
Total Investments (Cost $351,202,757) — 97.7% | | | 427,183,443 | | |
Other assets in excess of liabilities — 2.3% | | | 10,199,185 | | |
NET ASSETS — 100.00% | | $ | 437,382,628 | | |
^ Purchased with cash collateral from securities on loan.
(a) All or a portion of this security is on loan.
(b) Rule 144A security or other security that is restricted as to resale to institutional investors. The Fund's Adviser has deemed this security to be liquid (unless otherwise noted as illiquid) based upon procedures approved by the Board of Trustees. As of December 31, 2021, the fair value of these securities was $4,564,971 and amounted to 1.0% of net assets.
(c) Amount represents less than 0.05% of net assets.
(d) Non-income producing security.
(e) Rate disclosed is the daily yield on December 31, 2021.
ETF — Exchange-Traded Fund
PLC — Public Limited Company
See notes to financial statements.
21
Victory Portfolios
Victory RS Global Fund | | Schedule of Portfolio Investments
December 31, 2021 | |
Security Description | | Shares | | Value | |
Common Stocks (95.9%) | |
Australia (2.3%): | |
Consumer Discretionary (0.8%): | |
Aristocrat Leisure Ltd. | | | 92,104 | | | $ | 2,921,173 | | |
Financials (0.6%): | |
Macquarie Group Ltd. | | | 15,233 | | | | 2,276,639 | | |
Health Care (0.9%): | |
CSL Ltd. | | | 14,237 | | | | 3,010,508 | | |
| | | | 8,208,320 | | |
Belgium (0.6%): | |
Information Technology (0.6%): | |
Melexis NV | | | 17,777 | | | | 2,118,056 | | |
Bermuda (0.5%): | |
Industrials (0.5%): | |
Triton International Ltd. | | | 31,556 | | | | 1,900,618 | | |
Canada (4.3%): | |
Consumer Staples (1.0%): | |
Alimentation Couche-Tard, Inc. | | | 86,492 | | | | 3,624,349 | | |
Energy (0.5%): | |
Parex Resources, Inc. | | | 105,690 | | | | 1,805,788 | | |
Industrials (0.6%): | |
Canadian Pacific Railway Ltd. | | | 31,054 | | | | 2,233,786 | | |
Information Technology (1.3%): | |
Constellation Software, Inc. | | | 2,392 | | | | 4,438,552 | | |
Materials (0.9%): | |
Kirkland Lake Gold Ltd. | | | 70,458 | | | | 2,953,019 | | |
| | | | 15,055,494 | | |
China (2.2%): | |
Communication Services (0.9%): | |
Tencent Holdings Ltd. | | | 56,200 | | | | 3,279,438 | | |
Consumer Staples (0.5%): | |
Foshan Haitian Flavouring & Food Co. Ltd., Class A | | | 99,772 | | | | 1,644,228 | | |
Financials (0.8%): | |
Industrial & Commercial Bank of China Ltd., Class H | | | 5,045,000 | | | | 2,845,892 | | |
| | | | 7,769,558 | | |
Denmark (0.9%): | |
Consumer Discretionary (0.3%): | |
Pandora A/S | | | 8,347 | | | | 1,038,426 | | |
Consumer Staples (0.6%): | |
Royal Unibrew A/S | | | 19,613 | | | | 2,206,414 | | |
| | | | 3,244,840 | | |
See notes to financial statements.
22
Victory Portfolios
Victory RS Global Fund | | Schedule of Portfolio Investments — continued
December 31, 2021 | |
Security Description | | Shares | | Value | |
France (2.8%): | |
Consumer Discretionary (0.6%): | |
La Francaise des Jeux SAEM (a) | | | 43,483 | | | $ | 1,926,890 | | |
Energy (0.4%): | |
Gaztransport Et Technigaz SA | | | 15,811 | | | | 1,475,113 | | |
Industrials (0.8%): | |
Safran SA | | | 22,680 | | | | 2,776,304 | | |
Materials (1.0%): | |
Arkema SA | | | 24,580 | | | | 3,469,017 | | |
| | | | 9,647,324 | | |
Germany (0.6%): | |
Consumer Discretionary (0.6%): | |
Volkswagen AG, Preference Shares | | | 10,700 | | | | 2,149,253 | | |
Indonesia (1.0%): | |
Communication Services (1.0%): | |
PT Telkom Indonesia Persero Tbk | | | 11,697,000 | | | | 3,338,935 | | |
Ireland (1.2%): | |
Industrials (1.2%): | |
Eaton Corp. PLC | | | 24,750 | | | | 4,277,295 | | |
Italy (1.9%): | |
Health Care (0.7%): | |
Recordati Industria Chimica e Farmaceutica SpA | | | 38,406 | | | | 2,465,980 | | |
Utilities (1.2%): | |
Enel SpA | | | 227,207 | | | | 1,816,599 | | |
Snam SpA | | | 418,154 | | | | 2,518,383 | | |
| | | | 4,334,982 | | |
| | | | 6,800,962 | | |
Japan (5.4%): | |
Communication Services (1.0%): | |
Capcom Co. Ltd. | | | 68,900 | | | | 1,622,970 | | |
Kakaku.com, Inc. | | | 73,500 | | | | 1,965,238 | | |
| | | | 3,588,208 | | |
Consumer Discretionary (0.6%): | |
ZOZO, Inc. | | | 70,500 | | | | 2,198,582 | | |
Consumer Staples (0.4%): | |
Toyo Suisan Kaisha Ltd. | | | 29,500 | | | | 1,250,970 | | |
Financials (1.2%): | |
JAFCO Group Co. Ltd. | | | 23,600 | | | | 1,357,981 | | |
Mitsubishi UFJ Financial Group, Inc. | | | 504,100 | | | | 2,743,929 | | |
| | | | 4,101,910 | | |
Health Care (0.6%): | |
Hoya Corp. | | | 15,400 | | | | 2,285,631 | | |
See notes to financial statements.
23
Victory Portfolios
Victory RS Global Fund | | Schedule of Portfolio Investments — continued
December 31, 2021 | |
Security Description | | Shares | | Value | |
Industrials (1.1%): | |
Fuji Electric Co. Ltd. | | | 19,600 | | | $ | 1,070,898 | | |
Nippon Yusen KK | | | 34,400 | | | | 2,623,557 | | |
| | | | 3,694,455 | | |
Information Technology (0.5%): | |
Ulvac, Inc. | | | 29,000 | | | | 1,814,350 | | |
| | | | 18,934,106 | | |
Korea, Republic Of (1.3%): | |
Information Technology (1.3%): | |
Samsung Electronics Co. Ltd. | | | 71,254 | | | | 4,680,195 | | |
Netherlands (0.8%): | |
Information Technology (0.8%): | |
ASM International NV | | | 6,393 | | | | 2,821,722 | | |
New Zealand (0.5%): | |
Health Care (0.5%): | |
Fisher & Paykel Healthcare Corp. Ltd. | | | 75,553 | | | | 1,692,167 | | |
Norway (1.1%): | |
Energy (0.5%): | |
Aker BP ASA | | | 63,302 | | | | 1,947,256 | | |
Financials (0.6%): | |
SpareBank 1 SMN | | | 115,336 | | | | 1,947,545 | | |
| | | | 3,894,801 | | |
Singapore (0.3%): | |
Financials (0.3%): | |
Singapore Exchange Ltd. | | | 170,500 | | | | 1,177,218 | | |
South Africa (0.6%): | |
Consumer Discretionary (0.6%): | |
Mr Price Group Ltd. | | | 158,581 | | | | 1,990,207 | | |
Spain (0.7%): | |
Financials (0.7%): | |
Banco Bilbao Vizcaya Argentaria SA | | | 389,601 | | | | 2,310,503 | | |
Sweden (1.8%): | |
Industrials (1.8%): | |
Atlas Copco AB, Class B | | | 66,113 | | | | 3,884,871 | | |
Nibe Industrier AB, Class B | | | 162,348 | | | | 2,453,938 | | |
| | | | 6,338,809 | | |
Switzerland (2.5%): | |
Financials (0.6%): | |
Partners Group Holding AG | | | 1,316 | | | | 2,173,181 | | |
Health Care (1.4%): | |
Roche Holding AG | | | 12,091 | | | | 5,017,739 | | |
See notes to financial statements.
24
Victory Portfolios
Victory RS Global Fund | | Schedule of Portfolio Investments — continued
December 31, 2021 | |
Security Description | | Shares | | Value | |
Industrials (0.5%): | |
Adecco Group AG | | | 34,257 | | | $ | 1,746,222 | | |
| | | | 8,937,142 | | |
Taiwan (2.2%): | |
Financials (1.3%): | |
Cathay Financial Holding Co. Ltd. | | | 2,031,000 | | | | 4,577,198 | | |
Information Technology (0.9%): | |
Lite-On Technology Corp. | | | 1,296,000 | | | | 2,985,438 | | |
| | | | 7,562,636 | | |
United Kingdom (5.2%): | |
Communication Services (0.4%): | |
ITV PLC (b) | | | 878,554 | | | | 1,320,772 | | |
Consumer Discretionary (0.4%): | |
Next PLC | | | 13,829 | | | | 1,529,256 | | |
Consumer Staples (0.6%): | |
Imperial Brands PLC | | | 87,183 | | | | 1,910,257 | | |
Financials (0.9%): | |
Close Brothers Group PLC | | | 46,638 | | | | 889,360 | | |
Intermediate Capital Group PLC | | | 69,853 | | | | 2,079,902 | | |
| | | | 2,969,262 | | |
Industrials (0.6%): | |
Ashtead Group PLC | | | 26,720 | | | | 2,153,636 | | |
Materials (2.3%): | |
Croda International PLC | | | 27,195 | | | | 3,724,273 | | |
Evraz PLC | | | 175,191 | | | | 1,432,074 | | |
Rio Tinto PLC | | | 46,342 | | | | 3,055,537 | | |
| | | | 8,211,884 | | |
| | | | 18,095,067 | | |
United States (55.2%): | |
Communication Services (4.4%): | |
Alphabet, Inc., Class C (b) | | | 2,982 | | | | 8,628,685 | | |
Meta Platforms, Inc., Class A (b) | | | 20,531 | | | | 6,905,602 | | |
| | | | 15,534,287 | | |
Consumer Discretionary (7.8%): | |
Amazon.com, Inc. (b) | | | 2,289 | | | | 7,632,304 | | |
McDonald's Corp. | | | 27,408 | | | | 7,347,263 | | |
PulteGroup, Inc. | | | 97,545 | | | | 5,575,672 | | |
Ross Stores, Inc. | | | 37,374 | | | | 4,271,101 | | |
Tesla, Inc. (b) | | | 2,500 | | | | 2,641,950 | | |
| | | | 27,468,290 | | |
See notes to financial statements.
25
Victory Portfolios
Victory RS Global Fund | | Schedule of Portfolio Investments — continued
December 31, 2021 | |
Security Description | | Shares | | Value | |
Consumer Staples (4.3%): | |
Colgate-Palmolive Co. | | | 49,472 | | | $ | 4,221,940 | | |
PepsiCo, Inc. | | | 31,834 | | | | 5,529,884 | | |
The Estee Lauder Cos., Inc. | | | 14,619 | | | | 5,411,954 | | |
| | | | 15,163,778 | | |
Energy (1.5%): | |
Cactus, Inc., Class A | | | 62,330 | | | | 2,376,643 | | |
ConocoPhillips | | | 42,252 | | | | 3,049,749 | | |
| | | | 5,426,392 | | |
Financials (7.0%): | |
Bank of America Corp. | | | 106,421 | | | | 4,734,670 | | |
JPMorgan Chase & Co. | | | 31,861 | | | | 5,045,189 | | |
LPL Financial Holdings, Inc. | | | 21,268 | | | | 3,404,794 | | |
S&P Global, Inc. | | | 13,091 | | | | 6,178,036 | | |
Synchrony Financial | | | 50,963 | | | | 2,364,174 | | |
The PNC Financial Services Group, Inc. | | | 13,283 | | | | 2,663,507 | | |
| | | | 24,390,370 | | |
Health Care (7.2%): | |
Amedisys, Inc. (b) | | | 6,868 | | | | 1,111,792 | | |
Amgen, Inc. | | | 16,288 | | | | 3,664,311 | | |
CVS Health Corp. | | | 48,622 | | | | 5,015,845 | | |
Eli Lilly & Co. | | | 18,207 | | | | 5,029,138 | | |
IDEXX Laboratories, Inc. (b) | | | 6,719 | | | | 4,424,193 | | |
Johnson & Johnson | | | 34,231 | | | | 5,855,897 | | |
| | | | 25,101,176 | | |
Industrials (1.1%): | |
Honeywell International, Inc. | | | 18,353 | | | | 3,826,784 | | |
Information Technology (19.0%): | |
Apple, Inc. | | | 103,414 | | | | 18,363,224 | | |
Cisco Systems, Inc. | | | 90,552 | | | | 5,738,280 | | |
Fortinet, Inc. (b) | | | 15,584 | | | | 5,600,890 | | |
Mastercard, Inc., Class A | | | 15,390 | | | | 5,529,935 | | |
Microsoft Corp. | | | 52,672 | | | | 17,714,647 | | |
NVIDIA Corp. | | | 30,286 | | | | 8,907,415 | | |
Texas Instruments, Inc. | | | 26,427 | | | | 4,980,697 | | |
| | | | 66,835,088 | | |
Real Estate (1.9%): | |
Prologis, Inc. | | | 38,600 | | | | 6,498,696 | | |
Utilities (1.0%): | |
MGE Energy, Inc. | | | 40,519 | | | | 3,332,688 | | |
| | | | 193,577,549 | | |
Total Common Stocks (Cost $244,960,288) | | | 336,522,777 | | |
See notes to financial statements.
26
Victory Portfolios
Victory RS Global Fund | | Schedule of Portfolio Investments — continued
December 31, 2021 | |
Security Description | | Shares | | Value | |
Exchange-Traded Funds (1.2%) | |
United States (1.2%): | |
iShares MSCI ACWI ETF (c) | | | 39,156 | | | $ | 4,141,922 | | |
Total Exchange-Traded Funds (Cost $3,959,116) | | | 4,141,922 | | |
Collateral for Securities Loaned (1.2%)^ | |
United States (1.2%): | |
BlackRock Liquidity Funds TempFund, Institutional Shares, 0.04% (d) | | | 97,379 | | | | 97,379 | | |
Fidelity Investments Money Market Government Portfolio, Institutional
Shares, 0.01% (d) | | | 1,912,526 | | | | 1,912,526 | | |
Goldman Sachs Financial Square Prime Obligations Fund, Institutional
Shares, 0.02% (d) | | | 48,597 | | | | 48,597 | | |
JPMorgan Prime Money Market Fund, Capital Shares, 0.07% (d) | | | 387,495 | | | | 387,495 | | |
Morgan Stanley Institutional Liquidity Prime Portfolio, Institutional
Shares, 0.06% (d) | | | 1,742,252 | | | | 1,742,252 | | |
Total Collateral for Securities Loaned (Cost $4,188,249) | | | 4,188,249 | | |
Total Investments (Cost $253,107,653) — 98.3% | | | 344,852,948 | | |
Other assets in excess of liabilities — 1.7% | | | 6,042,646 | | |
NET ASSETS — 100.00% | | $ | 350,895,594 | | |
^ Purchased with cash collateral from securities on loan.
(a) Rule 144A security or other security that is restricted as to resale to institutional investors. The Fund's Adviser has deemed this security to be liquid (unless otherwise noted as illiquid) based upon procedures approved by the Board of Trustees. As of December 31, 2021, the fair value of these securities was $1,926,890 and amounted to 0.5% of net assets.
(b) Non-income producing security.
(c) All or a portion of this security is on loan.
(d) Rate disclosed is the daily yield on December 31, 2021.
ETF — Exchange-Traded Fund
PLC — Public Limited Company
See notes to financial statements.
27
Victory Portfolios
Victory Sophus Emerging Markets Fund | | Schedule of Portfolio Investments
December 31, 2021 | |
Security Description | | Shares | | Value | |
Common Stocks (99.0%) | |
Brazil (3.5%): | |
Consumer Discretionary (0.9%): | |
Vibra Energia SA | | | 1,222,400 | | | $ | 4,687,835 | | |
Consumer Staples (0.9%): | |
Sendas Distribuidora SA | | | 877,209 | | | | 2,046,513 | | |
SLC Agricola SA | | | 284,600 | | | | 2,301,670 | | |
| | | | 4,348,183 | | |
Financials (0.6%): | |
Itau Unibanco Holding SA, ADR | | | 759,065 | | | | 2,846,494 | | |
Industrials (0.7%): | |
Randon SA Implementos e Participacoes, Preference Shares | | | 941,100 | | | | 1,828,606 | | |
SIMPAR SA | | | 858,264 | | | | 1,789,400 | | |
| | | | 3,618,006 | | |
Materials (0.4%): | |
Dexco SA | | | 733,480 | | | | 1,961,306 | | |
| | | | 17,461,824 | | |
Canada (0.7%): | |
Energy (0.7%): | |
Parex Resources, Inc. | | | 217,556 | | | | 3,717,098 | | |
Chile (0.0%): (a) | |
Financials (0.0%): | |
Banco de Credito e Inversiones SA | | | 1 | | | | 29 | | |
China (26.1%): | |
Communication Services (6.6%): | |
Baidu, Inc., ADR (b) | | | 27,212 | | | | 4,048,874 | | |
NetEase, Inc., ADR | | | 64,371 | | | | 6,551,680 | | |
Tencent Holdings Ltd. | | | 379,015 | | | | 22,116,659 | | |
| | | | 32,717,213 | | |
Consumer Discretionary (6.5%): | |
Alibaba Group Holding Ltd., ADR (b) | | | 107,176 | | | | 12,731,437 | | |
BYD Co. Ltd., Class H | | | 83,000 | | | | 2,807,513 | | |
Fuyao Glass Industry Group Co. Ltd., Class H (c) | | | 425,600 | | | | 2,201,067 | | |
JD.com, Inc., ADR (b) | | | 93,073 | | | | 6,521,625 | | |
Jiumaojiu International Holdings Ltd. (c) | | | 1,080,000 | | | | 1,899,158 | | |
Meituan, Class B (b) (c) | | | 153,100 | | | | 4,427,410 | | |
Topsports International Holdings Ltd. (c) | | | 1,932,000 | | | | 1,956,860 | | |
| | | | 32,545,070 | | |
Consumer Staples (1.2%): | |
Chacha Food Co. Ltd., Class A | | | 297,578 | | | | 2,862,494 | | |
Inner Mongolia Yili Industrial Group Co. Ltd., Class A | | | 482,800 | | | | 3,142,784 | | |
| | | | 6,005,278 | | |
See notes to financial statements.
28
Victory Portfolios
Victory Sophus Emerging Markets Fund | | Schedule of Portfolio Investments — continued
December 31, 2021 | |
Security Description | | Shares | | Value | |
Financials (2.6%): | |
China Merchants Bank Co. Ltd., Class H | | | 1,050,000 | | | $ | 8,168,819 | | |
Postal Savings Bank of China Co. Ltd., Class H (c) | | | 6,904,000 | | | | 4,848,472 | | |
| | | | 13,017,291 | | |
Health Care (2.3%): | |
Hygeia Healthcare Holdings Co. Ltd. (c) (d) | | | 356,200 | | | | 2,231,070 | | |
Pharmaron Beijing Co. Ltd., Class H (c) | | | 133,900 | | | | 2,067,839 | | |
Shenzhen Mindray Bio-Medical Electronics Co. Ltd., Class A | | | 53,200 | | | | 3,179,768 | | |
Wuxi Biologics Cayman, Inc. (b) (c) | | | 352,905 | | | | 4,178,142 | | |
| | | | 11,656,819 | | |
Industrials (1.8%): | |
China Railway Group Ltd., Class H | | | 7,283,000 | | | | 3,853,958 | | |
Xinte Energy Co. Ltd., Class H | | | 1,084,800 | | | | 2,013,487 | | |
Zhefu Holding Group Co. Ltd., Class A | | | 2,575,500 | | | | 2,876,950 | | |
| | | | 8,744,395 | | |
Information Technology (2.8%): | |
Chinasoft International Ltd. | | | 3,510,000 | | | | 4,577,353 | | |
Luxshare Precision Industry Co. Ltd., Class A | | | 388,600 | | | | 3,001,700 | | |
WUS Printed Circuit Kunshan Co. Ltd., Class A | | | 1,510,850 | | | | 3,935,068 | | |
Yonyou Network Technology Co. Ltd., Class A | | | 474,000 | | | | 2,669,002 | | |
| | | | 14,183,123 | | |
Materials (1.5%): | |
China Hongqiao Group Ltd. | | | 2,966,000 | | | | 3,135,023 | | |
Wanhua Chemical Group Co. Ltd., Class A | | | 273,000 | | | | 4,324,969 | | |
| | | | 7,459,992 | | |
Utilities (0.8%): | |
China Longyuan Power Group Corp. Ltd., Class H | | | 1,761,000 | | | | 4,113,507 | | |
| | | | 130,442,688 | | |
Greece (1.2%): | |
Financials (0.6%): | |
National Bank of Greece SA (b) | | | 917,958 | | | | 3,062,303 | | |
Industrials (0.6%): | |
Mytilineos SA | | | 159,604 | | | | 2,749,380 | | |
| | | | 5,811,683 | | |
Hong Kong (4.0%): | |
Consumer Discretionary (1.1%): | |
Bosideng International Holdings Ltd. | | | 4,770,000 | | | | 3,005,214 | | |
JS Global Lifestyle Co. Ltd. (c) | | | 1,407,000 | | | | 2,369,353 | | |
| | | | 5,374,567 | | |
Financials (0.9%): | |
BOC Hong Kong Holdings Ltd. | | | 1,331,500 | | | | 4,366,802 | | |
Industrials (0.6%): | |
Pacific Basin Shipping Ltd. | | | 7,576,000 | | | | 2,785,115 | | |
See notes to financial statements.
29
Victory Portfolios
Victory Sophus Emerging Markets Fund | | Schedule of Portfolio Investments — continued
December 31, 2021 | |
Security Description | | Shares | | Value | |
Information Technology (0.5%): | |
ASM Pacific Technology Ltd. | | | 247,300 | | | $ | 2,672,598 | | |
Real Estate (0.9%): | |
China Resources Land Ltd. | | | 1,098,000 | | | | 4,626,681 | | |
| | | | 19,825,763 | | |
India (10.2%): | |
Consumer Discretionary (0.8%): | |
Balkrishna Industries Ltd. | | | 125,349 | | | | 3,907,061 | | |
Energy (1.0%): | |
Hindustan Petroleum Corp. Ltd. | | | 1,306,587 | | | | 5,125,466 | | |
Financials (1.3%): | |
Cholamandalam Investment & Finance Co. Ltd. | | | 491,534 | | | | 3,428,429 | | |
UTI Asset Management Co. Ltd. | | | 230,079 | | | | 3,254,106 | | |
| | | | 6,682,535 | | |
Health Care (1.5%): | |
Apollo Hospitals Enterprise Ltd. | | | 59,087 | | | | 3,977,612 | | |
Dr Reddy's Laboratories Ltd. | | | 49,598 | | | | 3,268,508 | | |
| | | | 7,246,120 | | |
Industrials (1.0%): | |
Larsen & Toubro Ltd. | | | 202,698 | | | | 5,148,936 | | |
Information Technology (3.1%): | |
Infosys Ltd., ADR | | | 509,189 | | | | 12,887,573 | | |
WNS Holdings Ltd., ADR (b) | | | 30,321 | | | | 2,674,919 | | |
| | | | 15,562,492 | | |
Materials (1.5%): | |
Dalmia Bharat Ltd. | | | 140,495 | | | | 3,482,599 | | |
Tata Steel Ltd. | | | 250,282 | | | | 3,721,955 | | |
| | | | 7,204,554 | | |
| | | | 50,877,164 | | |
Indonesia (1.2%): | |
Communication Services (0.7%): | |
PT Telkom Indonesia Persero Tbk | | | 12,432,900 | | | | 3,548,999 | | |
Financials (0.5%): | |
PT Bank Mandiri Persero Tbk | | | 5,126,200 | | | | 2,531,655 | | |
| | | | 6,080,654 | | |
Korea, Republic Of (16.1%): | |
Communication Services (1.4%): | |
JYP Entertainment Corp. | | | 76,554 | | | | 3,257,672 | | |
LG Uplus Corp. | | | 347,528 | | | | 3,965,915 | | |
| | | | 7,223,587 | | |
See notes to financial statements.
30
Victory Portfolios
Victory Sophus Emerging Markets Fund | | Schedule of Portfolio Investments — continued
December 31, 2021 | |
Security Description | | Shares | | Value | |
Consumer Discretionary (1.3%): | |
Hanon Systems | | | 273,996 | | | $ | 3,098,778 | | |
Shinsegae, Inc. | | | 14,882 | | | | 3,176,246 | | |
| | | | 6,275,024 | | |
Financials (3.3%): | |
DB Insurance Co. Ltd. | | | 68,718 | | | | 3,120,376 | | |
Hana Financial Group, Inc. | | | 128,564 | | | | 4,542,623 | | |
Samsung Securities Co. Ltd. | | | 85,695 | | | | 3,231,495 | | |
Woori Financial Group, Inc. | | | 529,829 | | | | 5,650,982 | | |
| | | | 16,545,476 | | |
Health Care (1.3%): | |
Hugel, Inc. (b) | | | 14,019 | | | | 1,808,975 | | |
InBody Co. Ltd. | | | 65,841 | | | | 1,279,901 | | |
Samsung Biologics Co. Ltd. (b) (c) | | | 4,472 | | | | 3,396,048 | | |
| | | | 6,484,924 | | |
Industrials (2.0%): | |
CJ Corp. | | | 31,998 | | | | 2,242,520 | | |
Hyundai Engineering & Construction Co. Ltd. | | | 67,564 | | | | 2,521,331 | | |
LG Corp. | | | 29,053 | | | | 1,977,811 | | |
Samsung Engineering Co. Ltd. (b) | | | 169,187 | | | | 3,253,353 | | |
| | | | 9,995,015 | | |
Information Technology (5.6%): | |
Innox Advanced Materials Co. Ltd. | | | 79,449 | | | | 3,078,963 | | |
Samsung Electronics Co. Ltd. | | | 387,173 | | | | 25,110,849 | | |
| | | | 28,189,812 | | |
Materials (1.2%): | |
Kolon Industries, Inc. | | | 34,845 | | | | 2,075,685 | | |
PI Advanced Materials Co. Ltd. | | | 81,503 | | | | 3,772,175 | | |
| | | | 5,847,860 | | |
| | | | 80,561,698 | | |
Malaysia (1.3%): | |
Consumer Discretionary (0.6%): | |
MR DIY Group M Bhd (c) | | | 3,680,200 | | | | 3,191,110 | | |
Financials (0.7%): | |
Public Bank Bhd | | | 3,465,200 | | | | 3,460,157 | | |
| | | | 6,651,267 | | |
Mexico (2.8%): | |
Consumer Discretionary (0.5%): | |
Alsea SAB de CV (b) | | | 1,389,303 | | | | 2,575,561 | | |
Financials (0.9%): | |
Grupo Financiero Banorte SAB de CV, Class O | | | 711,784 | | | | 4,625,175 | | |
Materials (0.8%): | |
Cemex SAB de CV, ADR (b) | | | 594,806 | | | | 4,032,785 | | |
See notes to financial statements.
31
Victory Portfolios
Victory Sophus Emerging Markets Fund | | Schedule of Portfolio Investments — continued
December 31, 2021 | |
Security Description | | Shares | | Value | |
Real Estate (0.6%): | |
Corp Inmobiliaria Vesta SAB de CV | | | 1,452,117 | | | $ | 2,924,678 | | |
| | | | 14,158,199 | | |
Peru (0.7%): | |
Financials (0.7%): | |
Credicorp Ltd. | | | 27,943 | | | | 3,411,002 | | |
Philippines (0.5%): | |
Financials (0.5%): | |
BDO Unibank, Inc. | | | 1,040,380 | | | | 2,462,984 | | |
Russian Federation (4.4%): | |
Consumer Staples (0.6%): | |
Magnit PJSC | | | 41,301 | | | | 2,991,986 | | |
Energy (2.4%): | |
Gazprom PJSC | | | 1,511,910 | | | | 6,936,375 | | |
Rosneft Oil Co. PJSC, GDR | | | 608,447 | | | | 4,893,523 | | |
| | | | 11,829,898 | | |
Financials (1.4%): | |
Sberbank of Russia PJSC, ADR | | | 446,943 | | | | 7,153,762 | | |
| | | | 7,153,762 | | |
| | | | 21,975,646 | | |
Saudi Arabia (2.7%): | |
Consumer Discretionary (0.7%): | |
Leejam Sports Co. JSC | | | 108,097 | | | | 3,131,494 | | |
Financials (2.0%): | |
Alinma Bank | | | 578,490 | | | | 3,685,797 | | |
The Saudi National Bank | | | 374,590 | | | | 6,422,538 | | |
| | | | 10,108,335 | | |
| | | | 13,239,829 | | |
Singapore (0.5%): | |
Communication Services (0.5%): | |
Sea Ltd., ADR (b) | | | 12,104 | | | | 2,707,786 | | |
South Africa (3.4%): | |
Communication Services (1.0%): | |
MTN Group Ltd. (b) | | | 459,506 | | | | 4,928,701 | | |
Financials (1.6%): | |
Absa Group Ltd. (d) | | | 372,031 | | | | 3,562,913 | | |
Capitec Bank Holdings Ltd. | | | 35,677 | | | | 4,568,308 | | |
| | | | 8,131,221 | | |
See notes to financial statements.
32
Victory Portfolios
Victory Sophus Emerging Markets Fund | | Schedule of Portfolio Investments — continued
December 31, 2021 | |
Security Description | | Shares | | Value | |
Materials (0.8%): | |
Impala Platinum Holdings Ltd. | | | 289,043 | | | $ | 4,080,167 | | |
| | | | 17,140,089 | | |
Taiwan (15.1%): | |
Financials (2.0%): | |
CTBC Financial Holding Co. Ltd. | | | 5,378,000 | | | | 5,039,934 | | |
Yuanta Financial Holding Co. Ltd. | | | 5,601,760 | | | | 5,118,689 | | |
| | | | 10,158,623 | | |
Health Care (0.5%): | |
Pegavision Corp. | | | 144,000 | | | | 2,215,925 | | |
Information Technology (11.9%): | |
ASE Technology Holding Co. Ltd. | | | 687,000 | | | | 2,655,676 | | |
Gold Circuit Electronics Ltd. | | | 1,207,000 | | | | 3,305,902 | | |
Hon Hai Precision Industry Co. Ltd. | | | 1,115,000 | | | | 4,182,920 | | |
MediaTek, Inc. | | | 175,000 | | | | 7,511,882 | | |
Taiwan Semiconductor Manufacturing Co. Ltd. | | | 1,774,998 | | | | 39,278,926 | | |
Unimicron Technology Corp. | | | 323,000 | | | | 2,688,969 | | |
| | | | 59,624,275 | | |
Materials (0.7%): | |
Formosa Plastics Corp. | | | 866,000 | | | | 3,251,510 | | |
| | | | 75,250,333 | | |
Thailand (3.5%): | |
Energy (0.8%): | |
PTT PCL (d) | | | 3,421,300 | | | | 3,883,314 | | |
Financials (0.9%): | |
The Siam Commercial Bank PCL | | | 1,194,200 | | | | 4,533,716 | | |
Health Care (0.5%): | |
Mega Lifesciences PCL | | | 1,817,500 | | | | 2,741,856 | | |
Materials (0.6%): | |
Indorama Ventures PCL | | | 2,412,300 | | | | 3,119,396 | | |
Real Estate (0.7%): | |
AP Thailand PCL | | | 11,383,200 | | | | 3,254,273 | | |
| | | | 17,532,555 | | |
Turkey (0.4%): | |
Industrials (0.4%): | |
Turkiye Sise ve Cam Fabrikalari A/S | | | 2,187,031 | | | | 2,225,834 | | |
United Kingdom (0.7%): | |
Materials (0.7%): | |
Anglo American PLC | | | 85,171 | | | | 3,502,649 | | |
Total Common Stocks (Cost $438,941,267) | | | 495,036,774 | | |
See notes to financial statements.
33
Victory Portfolios
Victory Sophus Emerging Markets Fund | | Schedule of Portfolio Investments — continued
December 31, 2021 | |
Security Description | | Shares | | Value | |
Collateral for Securities Loaned (0.7%)^ | |
United States (0.7%): | |
BlackRock Liquidity Funds TempFund, Institutional Shares, 0.04% (e) | | | 82,868 | | | $ | 82,868 | | |
Fidelity Investments Money Market Government Portfolio, Institutional
Shares, 0.01% (e) | | | 1,627,537 | | | | 1,627,537 | | |
Goldman Sachs Financial Square Prime Obligations Fund, Institutional
Shares, 0.02% (e) | | | 41,355 | | | | 41,355 | | |
JPMorgan Prime Money Market Fund, Capital Shares, 0.07% (e) | | | 329,753 | | | | 329,753 | | |
Morgan Stanley Institutional Liquidity Prime Portfolio, Institutional
Shares, 0.06% (e) | | | 1,482,636 | | | | 1,482,636 | | |
Total Collateral for Securities Loaned (Cost $3,564,149) | | | 3,564,149 | | |
Total Investments (Cost $442,505,416) — 99.7% | | | 498,600,923 | | |
Other assets in excess of liabilities — 0.3% | | | 1,517,668 | | |
NET ASSETS — 100.00% | | $ | 500,118,591 | | |
^ Purchased with cash collateral from securities on loan.
(a) Amount represents less than 0.05% of net assets.
(b) Non-income producing security.
(c) Rule 144A security or other security that is restricted as to resale to institutional investors. The Fund's Adviser has deemed this security to be liquid (unless otherwise noted as illiquid) based upon procedures approved by the Board of Trustees. As of December 31, 2021, the fair value of these securities was $32,766,529 and amounted to 6.6% of net assets.
(d) All or a portion of this security is on loan.
(e) Rate disclosed is the daily yield on December 31, 2021.
ADR — American Depositary Receipt
GDR — Global Depositary Receipt
PCL — Public Company Limited
PLC — Public Limited Company
See notes to financial statements.
34
Victory Portfolios | | Statements of Assets and Liabilities
December 31, 2021 | |
| | | Victory
RS International
Fund | | Victory
RS Global
Fund | | Victory Sophus
Emerging
Markets Fund | |
Assets: | |
Investments, at value (Cost $351,202,757,
$253,107,653 and $442,505,416) | | $ | 427,183,443 | (a) | | $ | 344,852,948 | (b) | | $ | 498,600,923 | (c) | |
Foreign currency, at value (Cost $220,176,
$82,855 and $515,215) | | | 221,713 | | | | 83,188 | | | | 515,123 | | |
Cash | | | 11,861,564 | | | | 9,468,379 | | | | 3,645,972 | | |
Receivables: | |
Interest and dividends | | | 86,681 | | | | 148,343 | | | | 1,231,982 | | |
Capital shares issued | | | 32,187 | | | | 727,655 | | | | 330,983 | | |
Investments sold | | | — | | | | — | | | | 1,256,592 | | |
Reclaims | | | 829,584 | | | | 114,760 | | | | 4,632 | | |
From Adviser | | | 81,895 | | | | 175,207 | | | | 277,624 | | |
Prepaid expenses | | | 25,727 | | | | 25,205 | | | | 25,131 | | |
Total Assets | | | 440,322,794 | | | | 355,595,685 | | | | 505,888,962 | | |
Liabilities: | |
Payables: | |
Collateral received on loaned securities | | | 2,369,331 | | | | 4,188,249 | | | | 3,564,149 | | |
Capital shares redeemed | | | 171,256 | | | | 216,400 | | | | 912,723 | | |
Accrued foreign capital gains taxes | | | — | | | | — | | | | 633,965 | | |
Accrued expenses and other payables: | |
Investment advisory fees | | | 290,782 | | | | 172,417 | | | | 427,649 | | |
Administration fees | | | 22,837 | | | | 17,140 | | | | 26,507 | | |
Custodian fees | | | 9,225 | | | | 7,505 | | | | 55,301 | | |
Transfer agent fees | | | 33,163 | | | | 57,070 | | | | 76,066 | | |
Compliance fees | | | 248 | | | | 196 | | | | 297 | | |
| 12b-1 fees | | | 3,680 | | | | 10,618 | | | | 9,227 | | |
Other accrued expenses | | | 39,644 | | | | 30,496 | | | | 64,487 | | |
Total Liabilities | | | 2,940,166 | | | | 4,700,091 | | | | 5,770,371 | | |
Net Assets: | |
| Capital | | | 364,377,992 | | | | 262,936,274 | | | | 446,404,910 | | |
Total accumulated earnings/(loss) | | | 73,004,636 | | | | 87,959,320 | | | | 53,713,681 | | |
Net Assets | | $ | 437,382,628 | | | $ | 350,895,594 | | | $ | 500,118,591 | | |
Net Assets | |
Class A | | $ | 25,554,606 | | | $ | 71,791,763 | | | $ | 54,194,111 | | |
Class C | | | 1,147,209 | | | | 4,220,614 | | | | 1,684,365 | | |
Class R | | | 1,959,159 | | | | 5,487,714 | | | | 11,840,164 | | |
Class R6 | | | 296,211,063 | | | | 99,708,440 | | | | 174,198,466 | | |
Class Y | | | 112,510,591 | | | | 169,687,063 | | | | 258,201,485 | | |
Total | | $ | 437,382,628 | | | $ | 350,895,594 | | | $ | 500,118,591 | | |
(continues on next page)
See notes to financial statements.
35
Victory Portfolios | | Statements of Assets and Liabilities
December 31, 2021 | |
(continued)
| | | Victory
RS International
Fund | | Victory
RS Global
Fund | | Victory Sophus
Emerging
Markets Fund | |
Shares (unlimited number of shares authorized
with a par value of $0.001 per share): | |
Class A | | | 1,731,378 | | | | 3,506,364 | | | | 2,388,270 | | |
Class C | | | 109,788 | | | | 213,898 | | | | 100,893 | | |
Class R | | | 142,722 | | | | 213,252 | | | | 558,880 | | |
Class R6 | | | 24,531,617 | | | | 6,600,177 | | | | 7,548,521 | | |
Class Y | | | 7,739,159 | | | | 8,356,672 | | | | 11,309,661 | | |
Total | | | 34,254,664 | | | | 18,890,363 | | | | 21,906,225 | | |
Net asset value, offering (except Class A)
and redemption price per share: | |
Class A | | $ | 14.76 | | | $ | 20.47 | | | $ | 22.69 | | |
Class C (d) | | | 10.45 | | | | 19.73 | | | | 16.69 | | |
Class R | | | 13.73 | | | | 25.73 | | | | 21.19 | | |
Class R6 | | | 12.07 | | | | 15.11 | | | | 23.08 | | |
Class Y | | | 14.54 | | | | 20.31 | | | | 22.83 | | |
Maximum Sales Charge — Class A | | | 5.75 | % | | | 5.75 | % | | | 5.75 | % | |
Maximum offering price (100%/(100%-maximum
sales charge) of net asset value adjusted to the
nearest cent) per share — Class A | | $ | 15.66 | | | $ | 21.72 | | | $ | 24.07 | | |
(a) Includes $2,251,095 of securities on loan.
(b) Includes $4,092,840 of securities on loan.
(c) Includes $3,370,251 of securities on loan.
(d) Redemption price per share varies by the length of time shares are held.
See notes to financial statements.
36
Victory Portfolios | | Statements of Operations
For the Year Ended December 31, 2021 | |
| | | Victory
RS International
Fund | | Victory
RS Global
Fund | | Victory Sophus
Emerging
Markets Fund | |
Investment Income: | | | |
Dividends | | $ | 13,484,140 | | | $ | 5,748,608 | | | $ | 12,286,185 | | |
Interest | | | 37 | | | | 543 | | | | 824 | | |
Securities lending (net of fees) | | | 19,497 | | | | 10,702 | | | | 22,751 | | |
Foreign tax withholding | | | (1,506,650 | ) | | | (447,365 | ) | | | (1,423,888 | ) | |
Total Income | | | 11,997,024 | | | | 5,312,488 | | | | 10,885,872 | | |
Expenses: | | | |
Investment advisory fees | | | 3,315,345 | | | | 1,993,966 | | | | 5,317,327 | | |
Administration fees | | | 228,496 | | | | 151,952 | | | | 293,367 | | |
Sub-Administration fees | | | 17,000 | | | | 17,000 | | | | 17,000 | | |
| 12b-1 fees — Class A | | | 64,289 | | | | 131,341 | | | | 153,085 | | |
| 12b-1 fees — Class C | | | 11,655 | | | | 37,338 | | | | 25,067 | | |
| 12b-1 fees — Class R | | | 9,967 | | | | 25,179 | | | | 66,102 | | |
Custodian fees | | | 63,117 | | | | 48,473 | | | | 338,498 | | |
Transfer agent fees — Class A | | | 48,347 | | | | 105,451 | | | | 104,165 | | |
Transfer agent fees — Class C | | | 1,512 | | | | 5,787 | | | | 3,653 | | |
Transfer agent fees — Class R | | | 3,856 | | | | 6,197 | | | | 21,810 | | |
Transfer agent fees — Class R6 | | | 562 | | | | 783 | | | | 2,824 | | |
Transfer agent fees — Class Y | | | 116,087 | | | | 162,579 | | | | 337,774 | | |
Trustees' fees | | | 26,913 | | | | 17,105 | | | | 34,116 | | |
Compliance fees | | | 2,984 | | | | 1,931 | | | | 3,840 | | |
Legal and audit fees | | | 28,380 | | | | 23,549 | | | | 54,619 | | |
State registration and filing fees | | | 66,308 | | | | 92,769 | | | | 76,931 | | |
Interfund lending fees | | | — | | | | — | | | | 197 | | |
Interest fees | | | — | | | | — | | | | 4,974 | | |
Other expenses | | | 70,228 | | | | 50,325 | | | | 117,130 | | |
Total Expenses | | | 4,075,046 | | | | 2,871,725 | | | | 6,972,479 | | |
Expenses waived/reimbursed by Adviser | | | (478,133 | ) | | | (1,055,677 | ) | | | (1,536,446 | ) | |
Net Expenses | | | 3,596,913 | | | | 1,816,048 | | | | 5,436,033 | | |
Net Investment Income (Loss) | | | 8,400,111 | | | | 3,496,440 | | | | 5,449,839 | | |
Realized/Unrealized Gains (Losses) from
Investments: | | | |
Net realized gains (losses) from investment
securities and foreign currency transactions | | | 18,558,540 | | | | 8,218,750 | | | | 41,883,141 | | |
Foreign taxes on realized gains | | | — | | | | (21,276 | ) | | | (407,188 | ) | |
Net change in unrealized appreciation/
depreciation on investment securities
and foreign currency translations | | | 27,076,805 | | | | 43,667,211 | | | | (72,527,725 | ) | |
Net change in accrued foreign taxes on
unrealized gains | | | — | | | | 42,924 | | | | (302,084 | ) | |
Net realized/unrealized gains (losses) on
investments | | | 45,635,345 | | | | 51,907,609 | | | | (31,353,856 | ) | |
Change in net assets resulting from operations | | $ | 54,035,456 | | | $ | 55,404,049 | | | $ | (25,904,017 | ) | |
See notes to financial statements.
37
Victory Portfolios | | Statements of Changes in Net Assets | |
| | | Victory
RS International Fund | | Victory RS Global Fund | | Victory Sophus
Emerging Markets Fund | |
| | | Year
Ended
December 31,
2021 | | Year
Ended
December 31,
2020 | | Year
Ended
December 31,
2021 | | Year
Ended
December 31,
2020 | | Year
Ended
December 31,
2021 | | Year
Ended
December 31,
2020 | |
From Investment
Activities: | |
Operations: | |
Net investment
income (loss) | | $ | 8,400,111 | | | $ | 6,233,926 | | | $ | 3,496,440 | | | $ | 1,597,803 | | | $ | 5,449,839 | | | $ | 2,682,534 | | |
Net realized gains
(losses) from
investments | | | 18,558,540 | | | | (8,724,622 | ) | | | 8,197,474 | | | | (1,393,847 | ) | | | 41,475,953 | | | | (8,613,532 | ) | |
Net change in
unrealized
appreciation/
depreciation
on investments | | | 27,076,805 | | | | 28,956,558 | | | | 43,710,135 | | | | 29,593,557 | | | | (72,829,809 | ) | | | 60,954,839 | | |
Change in net assets
resulting from
operations | | | 54,035,456 | | | | 26,465,862 | | | | 55,404,049 | | | | 29,797,513 | | | | (25,904,017 | ) | | | 55,023,841 | | |
Distributions to Shareholders: | |
Class A | | | (1,039,350 | ) | | | (274,567 | ) | | | (2,189,789 | ) | | | (331,988 | ) | | | (2,138,975 | ) | | | (535,962 | ) | |
Class C | | | (57,816 | ) | | | (10,582 | ) | | | (108,980 | ) | | | (1,968 | ) | | | (71,226 | ) | | | (13,061 | ) | |
Class R | | | (80,118 | ) | | | (18,299 | ) | | | (124,953 | ) | | | (15,302 | ) | | | (470,900 | ) | | | (104,197 | ) | |
Class R6 | | | (15,469,430 | ) | | | (4,128,368 | ) | | | (4,331,090 | ) | | | (385,647 | ) | | | (7,458,475 | ) | | | (1,356,685 | ) | |
Class Y | | | (4,887,821 | ) | | | (1,376,768 | ) | | | (5,612,312 | ) | | | (921,568 | ) | | | (11,195,767 | ) | | | (3,274,466 | ) | |
From return of capital: | |
Class A | | | — | | | | — | | | | — | | | | — | | | | (26,869 | ) | | | — | | |
Class C | | | — | | | | — | | | | — | | | | — | | | | (311 | ) | | | — | | |
Class R | | | — | | | | — | | | | — | | | | — | | | | (5,030 | ) | | | — | | |
Class R6 | | | — | | | | — | | | | — | | | | — | | | | (115,990 | ) | | | — | | |
Class Y | | | — | | | | — | | | | — | | | | — | | | | (170,813 | ) | | | — | | |
Change in net assets
resulting from
distributions to
shareholders | | | (21,534,535 | ) | | | (5,808,584 | ) | | | (12,367,124 | ) | | | (1,656,473 | ) | | | (21,654,356 | ) | | | (5,284,371 | ) | |
Change in net assets
resulting from
capital transactions | | | 23,244,315 | | | | 80,166,899 | | | | 87,147,589 | | | | 107,968,352 | | | | 74,677,705 | | | | 13,691,046 | | |
Change in net assets | | | 55,745,236 | | | | 100,824,177 | | | | 130,184,514 | | | | 136,109,392 | | | | 27,119,332 | | | | 63,430,516 | | |
Net Assets: | |
Beginning of period | | | 381,637,392 | | | | 280,813,215 | | | | 220,711,080 | | | | 84,601,688 | | | | 472,999,259 | | | | 409,568,743 | | |
End of period | | $ | 437,382,628 | | | $ | 381,637,392 | | | $ | 350,895,594 | | | $ | 220,711,080 | | | $ | 500,118,591 | | | $ | 472,999,259 | | |
(continues on next page)
See notes to financial statements.
38
Victory Portfolios | | Statements of Changes in Net Assets | |
(continued)
| | | Victory
RS International Fund | | Victory RS Global Fund | | Victory Sophus
Emerging Markets Fund | |
| | | Year
Ended
December 31,
2021 | | Year
Ended
December 31,
2020 | | Year
Ended
December 31,
2021 | | Year
Ended
December 31,
2020 | | Year
Ended
December 31,
2021 | | Year
Ended
December 31,
2020 | |
Capital Transactions: | |
Class A | |
Proceeds from
shares issued | | $ | 3,782,204 | | | $ | 5,891,859 | | | $ | 30,273,412 | | | $ | 27,939,328 | | | $ | 12,169,687 | | | $ | 6,957,366 | | |
Distributions
reinvested | | | 1,026,274 | | | | 269,013 | | | | 2,189,490 | | | | 331,945 | | | | 2,131,142 | | | | 522,611 | | |
Cost of shares
redeemed | | | (5,581,683 | ) | | | (6,074,845 | ) | | | (19,928,713 | ) | | | (9,924,361 | ) | | | (15,751,498 | ) | | | (16,658,257 | ) | |
Total Class A | | $ | (773,205 | ) | | $ | 86,027 | | | $ | 12,534,189 | | | $ | 18,346,912 | | | $ | (1,450,669 | ) | | $ | (9,178,280 | ) | |
Class C | |
Proceeds from
shares issued | | $ | — | | | $ | 214,019 | | | $ | 681,553 | | | $ | 1,659,100 | | | $ | 72,763 | | | $ | 127,024 | | |
Distributions
reinvested | | | 57,816 | | | | 10,582 | | | | 108,980 | | | | 1,968 | | | | 71,469 | | | | 13,061 | | |
Cost of shares
redeemed | | | (237,775 | ) | | | (487,454 | ) | | | (669,835 | ) | | | (1,700,108 | ) | | | (1,633,676 | ) | | | (2,713,128 | ) | |
Total Class C | | $ | (179,959 | ) | | $ | (262,853 | ) | | $ | 120,698 | | | $ | (39,040 | ) | | $ | (1,489,444 | ) | | $ | (2,573,043 | ) | |
Class R | |
Proceeds from
shares issued | | $ | 209,980 | | | $ | 518,709 | | | $ | 420,305 | | | $ | 1,990,563 | | | $ | 1,691,004 | | | $ | 1,471,645 | | |
Distributions
reinvested | | | 80,117 | | | | 18,299 | | | | 124,953 | | | | 15,299 | | | | 475,168 | | | | 104,042 | | |
Cost of shares
redeemed | | | (518,332 | ) | | | (1,230,005 | ) | | | (385,111 | ) | | | (602,183 | ) | | | (2,910,119 | ) | | | (3,568,641 | ) | |
Total Class R | | $ | (228,235 | ) | | $ | (692,997 | ) | | $ | 160,147 | | | $ | 1,403,679 | | | $ | (743,947 | ) | | $ | (1,992,954 | ) | |
Class R6 | |
Proceeds from
shares issued | | $ | 22,800,521 | | | $ | 73,968,309 | | | $ | 43,038,792 | | | $ | 41,962,795 | | | $ | 94,833,979 | | | $ | 46,226,922 | | |
Distributions
reinvested | | | 15,408,131 | | | | 4,107,091 | | | | 4,327,185 | | | | 385,647 | | | | 7,283,778 | | | | 1,298,132 | | |
Cost of shares
redeemed | | | (13,779,137 | ) | | | (19,424,029 | ) | | | (4,663,447 | ) | | | (752,758 | ) | | | (24,889,733 | ) | | | (19,463,001 | ) | |
Total Class R6 | | $ | 24,429,515 | | | $ | 58,651,371 | | | $ | 42,702,530 | | | $ | 41,595,684 | | | $ | 77,228,024 | | | $ | 28,062,053 | | |
Class Y | |
Proceeds from
shares issued | | $ | 32,525,272 | | | $ | 71,266,377 | | | $ | 53,808,588 | | | $ | 68,083,654 | | | $ | 83,395,279 | | | $ | 107,294,571 | | |
Distributions
reinvested | | | 4,884,864 | | | | 1,374,919 | | | | 5,608,671 | | | | 915,332 | | | | 11,334,737 | | | | 3,263,776 | | |
Cost of shares
redeemed | | | (37,413,937 | ) | | | (50,255,945 | ) | | | (27,787,234 | ) | | | (22,337,869 | ) | | | (93,596,275 | ) | | | (111,185,077 | ) | |
Total Class Y | | $ | (3,801 | ) | | $ | 22,385,351 | | | $ | 31,630,025 | | | $ | 46,661,117 | | | $ | 1,133,741 | | | $ | (626,730 | ) | |
Change in net assets
resulting from capital
transactions | | $ | 23,244,315 | | | $ | 80,166,899 | | | $ | 87,147,589 | | | $ | 107,968,352 | | | $ | 74,677,705 | | | $ | 13,691,046 | | |
(continues on next page)
See notes to financial statements.
39
Victory Portfolios | | Statements of Changes in Net Assets | |
(continued)
| | | Victory
RS International Fund | | Victory RS Global Fund | | Victory Sophus
Emerging Markets Fund | |
| | | Year
Ended
December 31,
2021 | | Year
Ended
December 31,
2020 | | Year
Ended
December 31,
2021 | | Year
Ended
December 31,
2020 | | Year
Ended
December 31,
2021 | | Year
Ended
December 31,
2020 | |
Share Transactions: | |
Class A | |
Issued | | | 260,078 | | | | 520,901 | | | | 1,528,049 | | | | 1,818,428 | | | | 476,833 | | | | 341,798 | | |
Reinvested | | | 69,890 | | | | 20,398 | | | | 108,460 | | | | 19,660 | | | | 94,077 | | | | 22,091 | | |
Redeemed | | | (378,820 | ) | | | (510,652 | ) | | | (1,087,051 | ) | | | (662,112 | ) | | | (619,797 | ) | | | (843,984 | ) | |
Total Class A | | | (48,852 | ) | | | 30,647 | | | | 549,458 | | | | 1,175,976 | | | | (48,887 | ) | | | (480,095 | ) | |
Class C | |
Issued | | | — | | | | 24,911 | | | | 36,053 | | | | 114,694 | | | | 3,730 | | | | 7,996 | | |
Reinvested | | | 5,554 | | | | 1,110 | | | | 5,629 | | | | 120 | | | | 4,307 | | | | 742 | | |
Redeemed | | | (23,450 | ) | | | (56,413 | ) | | | (36,997 | ) | | | (121,250 | ) | | | (84,587 | ) | | | (194,273 | ) | |
Total Class C | | | (17,896 | ) | | | (30,392 | ) | | | 4,685 | | | | (6,436 | ) | | | (76,550 | ) | | | (185,535 | ) | |
Class R | |
Issued | | | 15,426 | | | | 47,273 | | | | 17,638 | | | | 112,039 | | | | 72,211 | | | | 80,371 | | |
Reinvested | | | 5,866 | | | | 1,485 | | | | 4,939 | | | | 725 | | | | 22,482 | | | | 4,697 | | |
Redeemed | | | (37,328 | ) | | | (109,795 | ) | | | (15,790 | ) | | | (33,773 | ) | | | (120,823 | ) | | | (189,786 | ) | |
Total Class R | | | (16,036 | ) | | | (61,037 | ) | | | 6,787 | | | | 78,991 | | | | (26,130 | ) | | | (104,718 | ) | |
Class R6 | |
Issued | | | 1,830,467 | | | | 7,441,337 | | | | 3,002,088 | | | | 3,654,266 | | | | 3,586,805 | | | | 2,177,920 | | |
Reinvested | | | 1,278,135 | | | | 377,160 | | | | 289,548 | | | | 30,626 | | | | 315,585 | | | | 54,021 | | |
Redeemed | | | (1,169,870 | ) | | | (1,925,957 | ) | | | (325,083 | ) | | | (62,426 | ) | | | (961,564 | ) | | | (954,262 | ) | |
Total Class R6 | | | 1,938,732 | | | | 5,892,540 | | | | 2,966,553 | | | | 3,622,466 | | | | 2,940,826 | | | | 1,277,679 | | |
Class Y | |
Issued | | | 2,230,794 | | | | 6,057,992 | | | | 2,820,014 | | | | 4,700,411 | | | | 3,187,741 | | | | 5,108,144 | | |
Reinvested | | | 337,332 | | | | 105,805 | | | | 279,776 | | | | 54,670 | | | | 496,566 | | | | 137,133 | | |
Redeemed | | | (2,563,951 | ) | | | (4,344,365 | ) | | | (1,454,945 | ) | | | (1,611,862 | ) | | | (3,656,296 | ) | | | (5,852,490 | ) | |
Total Class Y | | | 4,175 | | | | 1,819,432 | | | | 1,644,845 | | | | 3,143,219 | | | | 28,011 | | | | (607,213 | ) | |
Change in Shares | | | 1,860,123 | | | | 7,651,190 | | | | 5,172,328 | | | | 8,014,216 | | | | 2,817,270 | | | | (99,882 | ) | |
See notes to financial statements.
40
This page is intentionally left blank.
41
Victory Portfolios | | Financial Highlights | |
For a Share Outstanding Throughout Each Period
| | | | | Investment Activities | | Distributions to
Shareholders From | |
| | | Net Asset
Value,
Beginning of
Period | | Net
Investment
Income
(Loss)(a) | | Net Realized
and Unrealized
Gains (Losses)
on Investments | | Total from
Investment
Activities | | Net
Investment
Income | | Net Realized
Gains from
Investments | |
Victory RS International Fund | | | |
Class A | | | |
Year Ended December 31: | |
2021 | | $ | 13.49 | | | | 0.27 | | | | 1.62 | | | | 1.89 | | | | (0.25 | ) | | | (0.37 | ) | |
2020 | | $ | 12.93 | | | | 0.21 | | | | 0.51 | | | | 0.72 | | | | (0.13 | ) | | | (0.03 | ) | |
2019 | | $ | 10.63 | | | | 0.26 | | | | 2.05 | | | | 2.31 | | | | — | (e) | | | (0.01 | ) | |
2018 | | $ | 12.12 | | | | 0.23 | | | | (1.52 | ) | | | (1.29 | ) | | | (0.20 | ) | | | — | | |
2017 | | $ | 9.84 | | | | 0.19 | | | | 2.29 | | | | 2.48 | | | | (0.20 | ) | | | — | | |
Class C | | | |
Year Ended December 31: | |
2021 | | $ | 9.72 | | | | 0.11 | | | | 1.17 | | | | 1.28 | | | | (0.18 | ) | | | (0.37 | ) | |
2020 | | $ | 9.36 | | | | 0.10 | | | | 0.34 | | | | 0.44 | | | | (0.05 | ) | | | (0.03 | ) | |
2019 | | $ | 7.76 | | | | 0.12 | | | | 1.49 | | | | 1.61 | | | | — | | | | (0.01 | ) | |
2018 | | $ | 8.89 | | | | 0.11 | | | | (1.11 | ) | | | (1.00 | ) | | | (0.13 | ) | | | — | | |
2017 | | $ | 7.26 | | | | 0.08 | | | | 1.68 | | | | 1.76 | | | | (0.13 | ) | | | — | | |
Class R | | | |
Year Ended December 31: | |
2021 | | $ | 12.58 | | | | 0.22 | | | | 1.51 | | | | 1.73 | | | | (0.21 | ) | | | (0.37 | ) | |
2020 | | $ | 12.07 | | | | 0.18 | | | | 0.45 | | | | 0.63 | | | | (0.09 | ) | | | (0.03 | ) | |
2019 | | $ | 9.95 | | | | 0.21 | | | | 1.92 | | | | 2.13 | | | | — | | | | (0.01 | ) | |
2018 | | $ | 11.35 | | | | 0.19 | | | | (1.42 | ) | | | (1.23 | ) | | | (0.17 | ) | | | — | | |
2017 | | $ | 9.23 | | | | 0.15 | | | | 2.14 | | | | 2.29 | | | | (0.17 | ) | | | — | | |
Class R6 | | | |
Year Ended December 31: | |
2021 | | $ | 11.14 | | | | 0.25 | | | | 1.34 | | | | 1.59 | | | | (0.29 | ) | | | (0.37 | ) | |
2020 | | $ | 10.70 | | | | 0.20 | | | | 0.43 | | | | 0.63 | | | | (0.16 | ) | | | (0.03 | ) | |
May 2, 2019 (f)
through
December 31, 2019 | | $ | 10.00 | | | | 0.06 | | | | 0.67 | | | | 0.73 | | | | (0.02 | ) | | | (0.01 | ) | |
Class Y | | | |
Year Ended December 31: | |
2021 | | $ | 13.29 | | | | 0.30 | | | | 1.60 | | | | 1.90 | | | | (0.28 | ) | | | (0.37 | ) | |
2020 | | $ | 12.74 | | | | 0.25 | | | | 0.49 | | | | 0.74 | | | | (0.16 | ) | | | (0.03 | ) | |
2019 | | $ | 10.47 | | | | 0.22 | | | | 2.08 | | | | 2.30 | | | | (0.02 | ) | | | (0.01 | ) | |
2018 | | $ | 11.93 | | | | 0.23 | | | | (1.47 | ) | | | (1.24 | ) | | | (0.22 | ) | | | — | | |
2017 | | $ | 9.69 | | | | 0.22 | | | | 2.26 | | | | 2.48 | | | | (0.24 | ) | | | — | | |
(a) Per share net investment income (loss) has been calculated using the average daily shares method.
(b) Not annualized for periods less than one year.
(c) Annualized for periods less than one year.
(d) Portfolio turnover is calculated on the basis of the Fund as a whole without distinguishing between the classes of shares issued.
(e) Amount is less than $0.005 per share.
(f) Commencement of operations.
See notes to financial statements.
42
Victory Portfolios | | Financial Highlights — continued | |
For a Share Outstanding Throughout Each Period
| | | | | Ratios to Average Net Assets | | Supplemental Data | |
| | | Total
Distributions | | Net Asset
Value,
End of
Period | | Total
Return
(Excludes
Sales
Charge)(b) | | Net
Expenses(c) | | Net
Investment
Income
(Loss)(c) | | Gross
Expenses(c) | | Net Assets,
End of
Period
(000's) | | Portfolio
Turnover(b)(d) | |
Victory RS International Fund | |
Class A | |
Year Ended December 31: | |
2021 | | | (0.62 | ) | | $ | 14.76 | | | | 14.05 | % | | | 1.13 | % | | | 1.80 | % | | | 1.40 | % | | $ | 25,555 | | | | 43 | % | |
2020 | | | (0.16 | ) | | $ | 13.49 | | | | 5.55 | % | | | 1.13 | % | | | 1.79 | % | | | 1.47 | % | | $ | 24,010 | | | | 52 | % | |
2019 | | | (0.01 | ) | | $ | 12.93 | | | | 21.72 | % | | | 1.13 | % | | | 2.18 | % | | | 1.55 | % | | $ | 22,620 | | | | 20 | % | |
2018 | | | (0.20 | ) | | $ | 10.63 | | | | (10.65 | )% | | | 1.13 | % | | | 1.97 | % | | | 1.61 | % | | $ | 15,716 | | | | 52 | % | |
2017 | | | (0.20 | ) | | $ | 12.12 | | | | 25.26 | % | | | 1.20 | % | | | 1.66 | % | | | 1.81 | % | | $ | 18,512 | | | | 60 | % | |
Class C | |
Year Ended December 31: | |
2021 | | | (0.55 | ) | | $ | 10.45 | | | | 13.24 | % | | | 1.88 | % | | | 1.03 | % | | | 3.07 | % | | $ | 1,147 | | | | 43 | % | |
2020 | | | (0.08 | ) | | $ | 9.72 | | | | 4.76 | % | | | 1.88 | % | | | 1.14 | % | | | 3.07 | % | | $ | 1,241 | | | | 52 | % | |
2019 | | | (0.01 | ) | | $ | 9.36 | | | | 20.70 | % | | | 1.88 | % | | | 1.39 | % | | | 3.14 | % | | $ | 1,480 | | | | 20 | % | |
2018 | | | (0.13 | ) | | $ | 7.76 | | | | (11.24 | )% | | | 1.88 | % | | | 1.23 | % | | | 3.52 | % | | $ | 702 | | | | 52 | % | |
2017 | | | (0.13 | ) | | $ | 8.89 | | | | 24.25 | % | | | 1.95 | % | | | 0.92 | % | | | 3.26 | % | | $ | 1,066 | | | | 60 | % | |
Class R | |
Year Ended December 31: | |
2021 | | | (0.58 | ) | | $ | 13.73 | | | | 13.85 | % | | | 1.38 | % | | | 1.58 | % | | | 2.16 | % | | $ | 1,959 | | | | 43 | % | |
2020 | | | (0.12 | ) | | $ | 12.58 | | | | 5.21 | % | | | 1.38 | % | | | 1.60 | % | | | 2.24 | % | | $ | 1,998 | | | | 52 | % | |
2019 | | | (0.01 | ) | | $ | 12.07 | | | | 21.37 | % | | | 1.38 | % | | | 1.87 | % | | | 2.32 | % | | $ | 2,652 | | | | 20 | % | |
2018 | | | (0.17 | ) | | $ | 9.95 | | | | (10.85 | )% | | | 1.38 | % | | | 1.73 | % | | | 2.31 | % | | $ | 1,786 | | | | 52 | % | |
2017 | | | (0.17 | ) | | $ | 11.35 | | | | 24.85 | % | | | 1.48 | % | | | 1.39 | % | | | 2.48 | % | | $ | 2,522 | | | | 60 | % | |
Class R6 | |
Year Ended December 31: | |
2021 | | | (0.66 | ) | | $ | 12.07 | | | | 14.32 | % | | | 0.83 | % | | | 2.06 | % | | | 0.91 | % | | $ | 296,211 | | | | 43 | % | |
2020 | | | (0.19 | ) | | $ | 11.14 | | | | 5.90 | % | | | 0.83 | % | | | 2.03 | % | | | 0.93 | % | | $ | 251,586 | | | | 52 | % | |
May 2, 2019 (f)
through
December 31, 2019 | | | (0.03 | ) | | $ | 10.70 | | | | 7.24 | % | | | 0.83 | % | | | 0.92 | % | | | 0.97 | % | | $ | 178,695 | | | | 20 | % | |
Class Y | |
Year Ended December 31: | |
2021 | | | (0.65 | ) | | $ | 14.54 | | | | 14.38 | % | | | 0.88 | % | | | 2.02 | % | | | 1.02 | % | | $ | 112,511 | | | | 43 | % | |
2020 | | | (0.19 | ) | | $ | 13.29 | | | | 5.80 | % | | | 0.88 | % | | | 2.11 | % | | | 1.09 | % | | $ | 102,803 | | | | 52 | % | |
2019 | | | (0.03 | ) | | $ | 12.74 | | | | 21.94 | % | | | 0.88 | % | | | 1.80 | % | | | 1.16 | % | | $ | 75,366 | | | | 20 | % | |
2018 | | | (0.22 | ) | | $ | 10.47 | | | | (10.38 | )% | | | 0.88 | % | | | 1.97 | % | | | 1.62 | % | | $ | 5,979 | | | | 52 | % | |
2017 | | | (0.24 | ) | | $ | 11.93 | | | | 25.56 | % | | | 0.94 | % | | | 1.98 | % | | | 1.85 | % | | $ | 3,122 | | | | 60 | % | |
See notes to financial statements.
43
Victory Portfolios | | Financial Highlights | |
For a Share Outstanding Throughout Each Period
| | | | | Investment Activities | | Distributions to
Shareholders From | |
| | | Net Asset
Value,
Beginning of
Period | | Net
Investment
Income
(Loss)(a) | | Net
Realized and
Unrealized
Gains
(Losses) on
Investments | | Total from
Investment
Activities | | Net
Investment
Income | | Net Realized
Gains from
Investments | | Return of
Capital | |
Victory RS Global Fund | | | |
Class A | | | |
Year Ended December 31: | |
2021 | | $ | 17.27 | | | | 0.20 | | | | 3.65 | | | | 3.85 | | | | (0.18 | ) | | | (0.47 | ) | | | — | | |
2020 | | $ | 14.86 | | | | 0.18 | | | | 2.35 | | | | 2.53 | | | | (0.11 | ) | | | (0.01 | ) | | | — | | |
2019 | | $ | 11.53 | | | | 0.21 | | | | 3.29 | | | | 3.50 | | | | (0.16 | ) | | | (0.01 | ) | | | — | | |
2018 | | $ | 12.75 | | | | 0.20 | | | | (0.90 | ) | | | (0.70 | ) | | | (0.16 | ) | | | (0.36 | ) | | | — | | |
2017 | | $ | 11.16 | | | | 0.15 | | | | 2.53 | | | | 2.68 | | | | — | | | | (1.00 | ) | | | (0.09 | ) | |
Class C | | | |
Year Ended December 31: | |
2021 | | $ | 16.68 | | | | 0.06 | | | | 3.52 | | | | 3.58 | | | | (0.06 | ) | | | (0.47 | ) | | | — | | |
2020 | | $ | 14.38 | | | | 0.07 | | | | 2.24 | | | | 2.31 | | | | — | (e) | | | (0.01 | ) | | | — | | |
2019 | | $ | 11.17 | | | | 0.14 | | | | 3.16 | | | | 3.30 | | | | (0.08 | ) | | | (0.01 | ) | | | — | | |
2018 | | $ | 12.38 | | | | 0.10 | | | | (0.87 | ) | | | (0.77 | ) | | | (0.08 | ) | | | (0.36 | ) | | | — | | |
2017 | | $ | 10.95 | | | | 0.05 | | | | 2.47 | | | | 2.52 | | | | — | | | | (1.00 | ) | | | (0.09 | ) | |
Class R | | | |
Year Ended December 31: | |
2021 | | $ | 21.57 | | | | 0.21 | | | | 4.55 | | | | 4.76 | | | | (0.13 | ) | | | (0.47 | ) | | | — | | |
2020 | | $ | 18.55 | | | | 0.18 | | | | 2.92 | | | | 3.10 | | | | (0.07 | ) | | | (0.01 | ) | | | — | | |
2019 | | $ | 14.37 | | | | 0.25 | | | | 4.07 | | | | 4.32 | | | | (0.13 | ) | | | (0.01 | ) | | | — | | |
2018 | | $ | 15.76 | | | | 0.20 | | | | (1.10 | ) | | | (0.90 | ) | | | (0.13 | ) | | | (0.36 | ) | | | — | | |
2017 | | $ | 13.62 | | | | 0.05 | | | | 3.18 | | | | 3.23 | | | | — | | | | (1.00 | ) | | | (0.09 | ) | |
Class R6 | | | |
Year Ended December 31: | |
2021 | | $ | 12.87 | | | | 0.20 | | | | 2.73 | | | | 2.93 | | | | (0.22 | ) | | | (0.47 | ) | | | — | | |
2020 | | $ | 11.07 | | | | 0.08 | | | | 1.83 | | | | 1.91 | | | | (0.10 | ) | | | (0.01 | ) | | | — | | |
May 2, 2019 (f)
through
December 31,
2019 | | $ | 10.00 | | | | 0.13 | | | | 1.12 | | | | 1.25 | | | | (0.17 | ) | | | (0.01 | ) | | | — | | |
Class Y | | | |
Year Ended December 31: | |
2021 | | $ | 17.12 | | | | 0.26 | | | | 3.62 | | | | 3.88 | | | | (0.22 | ) | | | (0.47 | ) | | | — | | |
2020 | | $ | 14.72 | | | | 0.20 | | | | 2.34 | | | | 2.54 | | | | (0.13 | ) | | | (0.01 | ) | | | — | | |
2019 | | $ | 11.42 | | | | 0.26 | | | | 3.24 | | | | 3.50 | | | | (0.19 | ) | | | (0.01 | ) | | | — | | |
2018 | | $ | 12.63 | | | | 0.23 | | | | (0.89 | ) | | | (0.66 | ) | | | (0.19 | ) | | | (0.36 | ) | | | — | | |
2017 | | $ | 11.04 | | | | 0.18 | | | | 2.50 | | | | 2.68 | | | | — | | | | (1.00 | ) | | | (0.09 | ) | |
(a) Per share net investment income (loss) has been calculated using the average daily shares method.
(b) Not annualized for periods less than one year.
(c) Annualized for periods less than one year.
(d) Portfolio turnover is calculated on the basis of the Fund as a whole without distinguishing between the classes of shares issued.
(e) Amount is less than $0.005 per share.
(f) Commencement of operations.
See notes to financial statements.
44
Victory Portfolios | | Financial Highlights — continued | |
For a Share Outstanding Throughout Each Period
| | | | | Ratios to Average Net Assets | | Supplemental Data | |
| | |
Total
Distributions | | Net Asset
Value,
End of
Period | | Total
Return
(Excludes
Sales
Charge)(b) | | Net
Expenses(c) | | Net
Investment
Income
(Loss)(c) | | Gross
Expenses(c) | | Net Assets,
End of
Period
(000's) | | Portfolio
Turnover(b)(d) | |
Victory RS Global Fund | |
Class A | |
Year Ended December 31: | |
2021 | | | (0.65 | ) | | $ | 20.47 | | | | 22.39 | % | | | 0.85 | % | | | 1.05 | % | | | 1.34 | % | | $ | 71,792 | | | | 38 | % | |
2020 | | | (0.12 | ) | | $ | 17.27 | | | | 17.00 | % | | | 0.85 | % | | | 1.22 | % | | | 1.40 | % | | $ | 51,066 | | | | 71 | % | |
2019 | | | (0.17 | ) | | $ | 14.86 | | | | 30.36 | % | | | 0.85 | % | | | 1.51 | % | | | 1.53 | % | | $ | 26,471 | | | | 46 | % | |
2018 | | | (0.52 | ) | | $ | 11.53 | | | | (5.45 | )% | | | 0.94 | % | | | 1.51 | % | | | 1.75 | % | | $ | 5,695 | | | | 58 | % | |
2017 | | | (1.09 | ) | | $ | 12.75 | | | | 24.48 | % | | | 1.17 | % | | | 1.24 | % | | | 1.90 | % | | $ | 3,456 | | | | 187 | % | |
Class C | |
Year Ended December 31: | |
2021 | | | (0.53 | ) | | $ | 19.73 | | | | 21.52 | % | | | 1.60 | % | | | 0.35 | % | | | 2.33 | % | | $ | 4,221 | | | | 38 | % | |
2020 | | | (0.01 | ) | | $ | 16.68 | | | | 16.06 | % | | | 1.60 | % | | | 0.48 | % | | | 2.53 | % | | $ | 3,491 | | | | 71 | % | |
2019 | | | (0.09 | ) | | $ | 14.38 | | | | 29.52 | % | | | 1.60 | % | | | 1.07 | % | | | 2.59 | % | | $ | 3,101 | | | | 46 | % | |
2018 | | | (0.44 | ) | | $ | 11.17 | | | | (6.20 | )% | | | 1.70 | % | | | 0.79 | % | | | 2.59 | % | | $ | 2,358 | | | | 58 | % | |
2017 | | | (1.09 | ) | | $ | 12.38 | | | | 23.47 | % | | | 1.91 | % | | | 0.41 | % | | | 3.00 | % | | $ | 2,167 | | | | 187 | % | |
Class R | |
Year Ended December 31: | |
2021 | | | (0.60 | ) | | $ | 25.73 | | | | 22.12 | % | | | 1.10 | % | | | 0.85 | % | | | 1.70 | % | | $ | 5,488 | | | | 38 | % | |
2020 | | | (0.08 | ) | | $ | 21.57 | | | | 16.70 | % | | | 1.10 | % | | | 0.98 | % | | | 1.93 | % | | $ | 4,454 | | | | 71 | % | |
2019 | | | (0.14 | ) | | $ | 18.55 | | | | 30.10 | % | | | 1.10 | % | | | 1.53 | % | | | 2.34 | % | | $ | 2,365 | | | | 46 | % | |
2018 | | | (0.49 | ) | | $ | 14.37 | | | | (5.68 | )% | | | 1.20 | % | | | 1.25 | % | | | 2.34 | % | | $ | 1,920 | | | | 58 | % | |
2017 | | | (1.09 | ) | | $ | 15.76 | | | | 24.09 | % | | | 1.61 | % | | | 0.38 | % | | | 2.76 | % | | $ | 2,281 | | | | 187 | % | |
Class R6 | |
Year Ended December 31: | |
2021 | | | (0.69 | ) | | $ | 15.11 | | | | 22.84 | % | | | 0.55 | % | | | 1.35 | % | | | 0.85 | % | | $ | 99,708 | | | | 38 | % | |
2020 | | | (0.11 | ) | | $ | 12.87 | | | | 17.27 | % | | | 0.55 | % | | | 0.64 | % | | | 1.16 | % | | $ | 46,776 | | | | 71 | % | |
May 2, 2019 (f)
through
December 31,
2019 | | | (0.18 | ) | | $ | 11.07 | | | | 12.47 | % | | | 0.55 | % | | | 1.85 | % | | | 28.85 | % | | $ | 124 | | | | 46 | % | |
Class Y | |
Year Ended December 31: | |
2021 | | | (0.69 | ) | | $ | 20.31 | | | | 22.78 | % | | | 0.60 | % | | | 1.34 | % | | | 0.96 | % | | $ | 169,687 | | | | 38 | % | |
2020 | | | (0.14 | ) | | $ | 17.12 | | | | 17.27 | % | | | 0.60 | % | | | 1.38 | % | | | 1.10 | % | | $ | 114,925 | | | | 71 | % | |
2019 | | | (0.20 | ) | | $ | 14.72 | | | | 30.69 | % | | | 0.60 | % | | | 1.95 | % | | | 1.17 | % | | $ | 52,541 | | | | 46 | % | |
2018 | | | (0.55 | ) | | $ | 11.42 | | | | (5.17 | )% | | | 0.70 | % | | | 1.80 | % | | | 1.20 | % | | $ | 25,544 | | | | 58 | % | |
2017 | | | (1.09 | ) | | $ | 12.63 | | | | 24.75 | % | | | 0.88 | % | | | 1.44 | % | | | 1.32 | % | | $ | 24,657 | | | | 187 | % | |
See notes to financial statements.
45
Victory Portfolios | | Financial Highlights | |
For a Share Outstanding Throughout Each Period
| | | | | Investment Activities | | Distributions to
Shareholders From | |
| | | Net Asset
Value,
Beginning of
Period | | Net
Investment
Income
(Loss)(a) | | Net
Realized and
Unrealized
Gains
(Losses) on
Investments | | Total from
Investment
Activities | | Net
Investment
Income | | Return of
Capital | | Net Realized
Gains from
Investments | |
Victory Sophus Emerging Markets Fund | | | |
Class A | | | |
Year Ended December 31: | |
2021 | | $ | 24.70 | | | | 0.18 | | | | (1.26 | ) | | | (1.08 | ) | | | (0.26 | ) | | | (0.01 | ) | | | (0.66 | ) | |
2020 | | $ | 21.37 | | | | 0.10 | | | | 3.45 | | | | 3.55 | | | | (0.22 | ) | | | — | | | | — | | |
2019 | | $ | 17.45 | | | | 0.37 | | | | 3.65 | | | | 4.02 | | | | (0.10 | ) | | | — | | | | — | | |
2018 | | $ | 22.52 | | | | 0.24 | | | | (4.54 | ) | | | (4.30 | ) | | | (0.13 | ) | | | — | | | | (0.64 | ) | |
2017 | | $ | 15.98 | | | | 0.16 | | | | 6.55 | | | | 6.71 | | | | (0.17 | ) | | | — | | | | — | | |
Class C | | | |
Year Ended December 31: | |
2021 | | $ | 18.38 | | | | (0.03 | ) | | | (0.92 | ) | | | (0.95 | ) | | | (0.08 | ) | | | — | (c) | | | (0.66 | ) | |
2020 | | $ | 15.94 | | | | (0.07 | ) | | | 2.58 | | | | 2.51 | | | | (0.07 | ) | | | — | | | | — | | |
2019 | | $ | 13.06 | | | | 0.14 | | | | 2.74 | | | | 2.88 | | | | — | | | | — | | | | — | | |
2018 | | $ | 17.07 | | | | 0.05 | | | | (3.42 | ) | | | (3.37 | ) | | | — | (c) | | | — | | | | (0.64 | ) | |
2017 | | $ | 12.17 | | | | — | (c) | | | 4.97 | | | | 4.97 | | | | (0.07 | ) | | | — | | | | — | | |
Class R | | | |
Year Ended December 31: | |
2021 | | $ | 23.13 | | | | 0.11 | | | | (1.18 | ) | | | (1.07 | ) | | | (0.20 | ) | | | (0.01 | ) | | | (0.66 | ) | |
2020 | | $ | 20.03 | | | | 0.05 | | | | 3.23 | | | | 3.28 | | | | (0.18 | ) | | | — | | | | — | | |
2019 | | $ | 16.37 | | | | 0.31 | | | | 3.41 | | | | 3.72 | | | | (0.06 | ) | | | — | | | | — | | |
2018 | | $ | 21.18 | | | | 0.18 | | | | (4.26 | ) | | | (4.08 | ) | | | (0.09 | ) | | | — | | | | (0.64 | ) | |
2017 | | $ | 15.03 | | | | 0.09 | | | | 6.17 | | | | 6.26 | | | | (0.11 | ) | | | — | | | | — | | |
Class R6 | | | |
Year Ended December 31: | |
2021 | | $ | 25.10 | | | | 0.31 | | | | (1.30 | ) | | | (0.99 | ) | | | (0.35 | ) | | | (0.02 | ) | | | (0.66 | ) | |
2020 | | $ | 21.68 | | | | 0.20 | | | | 3.52 | | | | 3.72 | | | | (0.30 | ) | | | — | | | | — | | |
2019 | | $ | 17.68 | | | | 0.52 | | | | 3.65 | | | | 4.17 | | | | (0.17 | ) | | | — | | | | — | | |
2018 | | $ | 22.81 | | | | 0.34 | | | | (4.62 | ) | | | (4.28 | ) | | | (0.21 | ) | | | — | | | | (0.64 | ) | |
2017 | | $ | 16.16 | | | | 0.34 | | | | 6.57 | | | | 6.91 | | | | (0.26 | ) | | | — | | | | — | | |
Class Y | | | |
Year Ended December 31: | |
2021 | | $ | 24.85 | | | | 0.27 | | | | (1.27 | ) | | | (1.00 | ) | | | (0.34 | ) | | | (0.02 | ) | | | (0.66 | ) | |
2020 | | $ | 21.48 | | | | 0.16 | | | | 3.50 | | | | 3.66 | | | | (0.29 | ) | | | — | | | | — | | |
2019 | | $ | 17.54 | | | | 0.45 | | | | 3.65 | | | | 4.10 | | | | (0.16 | ) | | | — | | | | — | | |
2018 | | $ | 22.64 | | | | 0.35 | | | | (4.61 | ) | | | (4.26 | ) | | | (0.20 | ) | | | — | | | | (0.64 | ) | |
2017 | | $ | 16.05 | | | | 0.21 | | | | 6.62 | | | | 6.83 | | | | (0.24 | ) | | | — | | | | — | | |
(a) Per share net investment income (loss) has been calculated using the average daily shares method.
(b) Portfolio turnover is calculated on the basis of the Fund as a whole without distinguishing between the classes of shares issued.
(c) Amount is less than $0.005 per share.
(d) Amount is less than 0.005%.
See notes to financial statements.
46
Victory Portfolios | | Financial Highlights — continued | |
For a Share Outstanding Throughout Each Period
| | | | Ratios to Average Net Assets | | Supplemental Data | |
| | | Total
Distributions | | Net Asset
Value,
End of
Period | | Total
Return
(Excludes
Sales
Charge) | | Net
Expenses | | Net
Investment
Income
(Loss) | | Gross
Expenses | | Net Assets,
End of
Period
(000's) | | Portfolio
Turnover(b) | |
Victory Sophus Emerging Markets Fund | |
Class A | |
Year Ended December 31: | |
2021 | | | (0.93 | ) | | $ | 22.69 | | | | (4.35 | )% | | | 1.34 | % | | | 0.69 | % | | | 1.60 | % | | $ | 54,194 | | | | 85 | % | |
2020 | | | (0.22 | ) | | $ | 24.70 | | | | 16.73 | % | | | 1.34 | % | | | 0.47 | % | | | 1.64 | % | | $ | 60,206 | | | | 109 | % | |
2019 | | | (0.10 | ) | | $ | 21.37 | | | | 22.96 | % | | | 1.34 | % | | | 1.95 | % | | | 1.62 | % | | $ | 62,346 | | | | 96 | % | |
2018 | | | (0.77 | ) | | $ | 17.45 | | | | (19.08 | )% | | | 1.34 | % | | | 1.11 | % | | | 1.61 | % | | $ | 56,823 | | | | 118 | % | |
2017 | | | (0.17 | ) | | $ | 22.52 | | | | 42.08 | % | | | 1.54 | % | | | 0.80 | % | | | 1.66 | % | | $ | 76,485 | | | | 113 | % | |
Class C | |
Year Ended December 31: | |
2021 | | | (0.74 | ) | | $ | 16.69 | | | | (5.16 | )% | | | 2.14 | % | | | (0.17 | )% | | | 2.77 | % | | $ | 1,684 | | | | 85 | % | |
2020 | | | (0.07 | ) | | $ | 18.38 | | | | 15.79 | % | | | 2.14 | % | | | (0.45 | )% | | | 2.69 | % | | $ | 3,261 | | | | 109 | % | |
2019 | | | — | | | $ | 15.94 | | | | 22.05 | % | | | 2.14 | % | | | 0.99 | % | | | 2.48 | % | | $ | 5,787 | | | | 96 | % | |
2018 | | | (0.64 | ) | | $ | 13.06 | | | | (19.75 | )% | | | 2.14 | % | | | 0.31 | % | | | 2.40 | % | | $ | 10,141 | | | | 118 | % | |
2017 | | | (0.07 | ) | | $ | 17.07 | | | | 40.96 | % | | | 2.34 | % | | | — | %(d) | | | 2.46 | % | | $ | 15,854 | | | | 113 | % | |
Class R | |
Year Ended December 31: | |
2021 | | | (0.87 | ) | | $ | 21.19 | | | | (4.57 | )% | | | 1.58 | % | | | 0.44 | % | | | 1.91 | % | | $ | 11,840 | | | | 85 | % | |
2020 | | | (0.18 | ) | | $ | 23.13 | | | | 16.46 | % | | | 1.58 | % | | | 0.25 | % | | | 1.95 | % | | $ | 13,531 | | | | 109 | % | |
2019 | | | (0.06 | ) | | $ | 20.03 | | | | 22.64 | % | | | 1.58 | % | | | 1.71 | % | | | 1.94 | % | | $ | 13,817 | | | | 96 | % | |
2018 | | | (0.73 | ) | | $ | 16.37 | | | | (19.24 | )% | | | 1.58 | % | | | 0.89 | % | | | 1.91 | % | | $ | 12,505 | | | | 118 | % | |
2017 | | | (0.11 | ) | | $ | 21.18 | | | | 41.69 | % | | | 1.83 | % | | | 0.50 | % | | | 2.00 | % | | $ | 17,875 | | | | 113 | % | |
Class R6 | |
Year Ended December 31: | |
2021 | | | (1.03 | ) | | $ | 23.08 | | | | (3.93 | )% | | | 0.89 | % | | | 1.17 | % | | | 1.17 | % | | $ | 174,198 | | | | 85 | % | |
2020 | | | (0.30 | ) | | $ | 25.10 | | | | 17.28 | % | | | 0.89 | % | | | 0.95 | % | | | 1.21 | % | | $ | 115,637 | | | | 109 | % | |
2019 | | | (0.17 | ) | | $ | 21.68 | | | | 23.55 | % | | | 0.89 | % | | | 2.69 | % | | | 1.22 | % | | $ | 72,196 | | | | 96 | % | |
2018 | | | (0.85 | ) | | $ | 17.68 | | | | (18.73 | )% | | | 0.89 | % | | | 1.59 | % | | | 1.24 | % | | $ | 29,228 | | | | 118 | % | |
2017 | | | (0.26 | ) | | $ | 22.81 | | | | 42.77 | % | | | 1.03 | % | | | 1.66 | % | | | 1.39 | % | | $ | 18,762 | | | | 113 | % | |
Class Y | |
Year Ended December 31: | |
2021 | | | (1.02 | ) | | $ | 22.83 | | | | (4.01 | )% | | | 0.99 | % | | | 1.05 | % | | | 1.29 | % | | $ | 258,201 | | | | 85 | % | |
2020 | | | (0.29 | ) | | $ | 24.85 | | | | 17.10 | % | | | 0.99 | % | | | 0.79 | % | | | 1.31 | % | | $ | 280,364 | | | | 109 | % | |
2019 | | | (0.16 | ) | | $ | 21.48 | | | | 23.40 | % | | | 0.99 | % | | | 2.32 | % | | | 1.30 | % | | $ | 255,423 | | | | 96 | % | |
2018 | | | (0.84 | ) | | $ | 17.54 | | | | (18.77 | )% | | | 0.99 | % | | | 1.64 | % | | | 1.30 | % | | $ | 178,132 | | | | 118 | % | |
2017 | | | (0.24 | ) | | $ | 22.64 | | | | 42.59 | % | | | 1.18 | % | | | 1.07 | % | | | 1.33 | % | | $ | 100,902 | | | | 113 | % | |
See notes to financial statements.
47
Victory Portfolios | | Notes to Financial Statements
December 31, 2021 | |
1. Organization:
Victory Portfolios (the "Trust") is organized as a Delaware statutory trust and the Trust is registered under the Investment Company Act of 1940, as amended (the "1940 Act"), as an open-end investment company. The Trust is comprised of 41 funds and is authorized to issue an unlimited number of shares, which are units of beneficial interest with a par value of $0.001 per share.
The accompanying financial statements are those of the following three Funds (collectively, the "Funds" and individually, a "Fund"). Each Fund is classified as diversified under the 1940 Act.
Funds (Legal Name) | | Funds (Short Name) | | Investment Share
Classes Offered | |
Victory RS International Fund | | RS International Fund | | A, C, R, R6, and Y | |
Victory RS Global Fund | | RS Global Fund | | A, C, R, R6, and Y | |
Victory Sophus Emerging Markets Fund | | Sophus Emerging Markets Fund | | A, C, R, R6, and Y | |
Each class of shares of a Fund has substantially identical rights and privileges except with respect to sales charges, fees paid under distribution plans, expenses allocable exclusively to each class of shares, voting rights on matters solely affecting a single class of shares, and the exchange privilege of each class of shares.
Under the Trust's organizational documents, its officers and trustees are indemnified against certain liabilities arising out of the performance of their duties to the Funds. In addition, in the normal course of business, the Funds enter into contracts with their vendors and others that provide for general indemnifications. The Funds' maximum exposure under these arrangements is unknown, as this would involve future claims that may be made against the Fund. However, based on experience, the Funds expect that risk of loss to be remote.
2. Significant Accounting Policies:
The following is a summary of significant accounting policies followed by the Trust in the preparation of its financial statements. The policies are in conformity with U.S. Generally Accepted Accounting Principles ("GAAP"). The preparation of financial statements in accordance with GAAP requires management to make estimates and assumptions that affect the reported amounts of assets and liabilities and disclosure of contingent assets and liabilities at the date of the financial statements and the reported amounts of income and expenses for the period. Actual results could differ from those estimates. The Funds follow the specialized accounting and reporting requirements under GAAP that are applicable to investment companies under Accounting Standards Codification Topic 946.
Investment Valuation:
The Funds record investments at fair value. Fair value is defined as the price that would be received to sell an asset or paid to transfer a liability in an orderly transaction between market participants at the measurement date.
The valuation techniques described below maximize the use of observable inputs and minimize the use of unobservable inputs in determining fair value. The inputs used for valuing the Funds' investments are summarized in the three broad levels listed below:
• Level 1 — quoted prices in active markets for identical securities
• Level 2 — other significant observable inputs (including quoted prices for similar securities or interest rates applicable to those securities, etc.)
• Level 3 — significant unobservable inputs (including the Funds' own assumptions in determining the fair value of investments)
Changes in valuation techniques may result in transfers in or out of an assigned level within the disclosure hierarchy. The inputs or methodologies used for valuation techniques are not necessarily an indication of the risk associated with entering into those investments.
48
Victory Portfolios | | Notes to Financial Statements — continued
December 31, 2021 | |
Victory Capital Management Inc. ("VCM" or the "Adviser") has established the Pricing and Liquidity Committee (the "Committee"), and subject to the Trust's Board of Trustees' (the "Board") oversight, the Committee administers and oversees the Funds' valuation policies and procedures, which are approved by the Board.
Portfolio securities listed or traded on securities exchanges, including exchange-traded funds ("ETFs") and American Depositary Receipts ("ADRs"), are valued at the closing price on the exchange or system where the security is principally traded, if available, or at the Nasdaq Official Closing Price. If there have been no sales for that day on the exchange or system, then a security is valued at the last available bid quotation on the exchange or system where the security is principally traded. In each of these situations, valuations are typically categorized as Level 1 in the fair value hierarchy.
Investments in open-end investment companies are valued at their net asset value ("NAV"). These valuations are typically categorized as Level 1 in the fair value hierarchy.
In the event that price quotations or valuations are not readily available, investments are valued at fair value in accordance with procedures established by and under the general supervision and responsibility of the Board. These valuations are typically categorized as Level 2 or Level 3 in the fair value hierarchy, based on the observability of inputs used to determine the fair value. The effect of fair value pricing is that securities may not be priced on the basis of quotations from the primary market in which they are traded and the actual price realized from the sale of a security may differ materially from the fair value price. Valuing these securities at fair value is intended to cause the Fund's NAV to be more reliable than it otherwise would be.
In accordance with procedures adopted by the Board, fair value pricing may be used if events materially affecting the value of foreign securities occur between the time the exchange on which they are traded closes and the time the Fund's net asset values are calculated. The Funds uses a systematic valuation model, provided daily by an independent third party to fair value their international equity securities. These valuations are considered as Level 2 in the fair value hierarchy.
A summary of the valuations as of December 31, 2021, is included in the table below while the breakdown, by category, of investments is disclosed on the Schedules of Portfolio Investments:
| | | Level 1 | | Level 2 | | Level 3 | | Total | |
RS International Fund | |
Common Stocks | | $ | — | | | $ | 421,209,545 | | | $ | — | | | $ | 421,209,545 | | |
Exchange-Traded Funds | | | 3,604,567 | | | | — | | | | — | | | | 3,604,567 | | |
Collateral for Securities Loaned | | | 2,369,331 | | | | — | | | | — | | | | 2,369,331 | | |
Total | | $ | 5,973,898 | | | $ | 421,209,545 | | | $ | — | | | $ | 427,183,443 | | |
RS Global Fund | |
Common Stocks | | $ | 214,810,956 | | | $ | 121,711,821 | | | $ | — | | | $ | 336,522,777 | | |
Exchange-Traded Funds | | | 4,141,922 | | | | — | | | | — | | | | 4,141,922 | | |
Collateral for Securities Loaned | | | 4,188,249 | | | | — | | | | — | | | | 4,188,249 | | |
Total | | $ | 223,141,127 | | | $ | 121,711,821 | | | $ | — | | | $ | 344,852,948 | | |
Sophus Emerging Markets Fund | |
Common Stocks | | $ | 73,187,811 | | | $ | 421,848,963 | | | $ | — | | | $ | 495,036,774 | | |
Collateral for Securities Loaned | | | 3,564,149 | | | | — | | | | — | | | | 3,564,149 | | |
Total | | $ | 76,751,960 | | | $ | 421,848,963 | | | $ | — | | | $ | 498,600,923 | | |
For the year ended December 31, 2021, there were no transfers in or out of Level 3 in the fair value hierarchy.
49
Victory Portfolios | | Notes to Financial Statements — continued
December 31, 2021 | |
Real Estate Investment Trusts ("REITs"):
The Funds may invest in REITs, which report information on the source of their distributions annually. REITs are pooled investment vehicles that invest primarily in income-producing real estate or real-estate related loans or interests (such as mortgages). Certain distributions received from REITs during the year are recorded as realized gains or return of capital as estimated by the Funds or when such information becomes known.
Investment Companies:
Exchange-Traded Funds:
The Funds may invest in ETFs, the shares of which are bought and sold on a securities exchange. An ETF trades like common stock and represents a fixed portfolio of securities often designed to track the performance and dividend yield of a particular domestic or foreign market index. The Funds may purchase shares of an ETF to temporarily gain exposure to a portion of the U.S. or a foreign market while awaiting purchase of underlying securities. The risks of owning an ETF generally reflect the risks of owning the underlying securities they are designed to track, although the lack of liquidity of an ETF could result in it being more volatile. Additionally, ETFs have fees and expenses that reduce their value.
Open-End Funds:
The Funds may invest in portfolios of open-end investment companies. These investment companies value securities in their portfolios for which market quotations are readily available at their market values (generally the last reported sale price) and all other securities and assets at their fair value by the methods established by the board of directors of the underlying funds.
Foreign Exchange Currency Contracts:
Certain Funds may enter into foreign exchange currency contracts to convert U.S. dollars to and from various foreign currencies. A foreign exchange currency contract is an obligation by a Fund to purchase or sell a specific currency at a future date at a price (in U.S. dollars) set at the time of the contract. The Funds do not engage in "cross-currency" foreign exchange contracts (i.e., contracts to purchase or sell one foreign currency in exchange for another foreign currency). The Funds' foreign exchange currency contracts might be considered spot contracts (typically a contract of one week or less) or forward contracts (typically a contract term over one week). A spot contract is entered into for purposes of hedging against foreign currency fluctuations relating to a specific portfolio transaction, such as the delay between a security transaction trade date and settlement date. Forward contracts are entered into for purposes of hedging portfolio holdings or concentrations of such holdings. The Funds enter into foreign exchange currency contracts solely for spot or forward hedging purposes, and not for speculative purposes (i.e., the Funds do not enter into such contracts solely for the purpose of earning foreign currency gains). Each foreign exchange currency contract is adjusted daily by the prevailing spot or forward rate of the underlying currency, and any appreciation or depreciation is recorded for financial statement purposes as unrealized until the contract settlement date, at which time the Fund record realized gains or losses equal to the difference between the value of a contract at the time it was opened and the value at the time it was closed. A Fund could be exposed to risk if a counterparty is unable to meet the terms of a foreign exchange currency contract or if the value of the foreign currency changes unfavorably. In addition, the use of foreign exchange currency contracts does not eliminate fluctuations in the underlying prices of the securities. For the year ended December 31, 2021, the Funds had no open forward foreign exchange currency contracts.
Investment Transactions and Related Income:
Changes in holdings of investments are accounted for no later than one business day following the trade date. For financial reporting purposes, however, investment transactions are accounted for on trade date or the last business day of the reporting period. Interest income is determined on the basis
50
Victory Portfolios | | Notes to Financial Statements — continued
December 31, 2021 | |
of coupon interest accrued using the effective interest method which adjusts, where applicable, the amortization of premiums or accretion of discounts. Dividend income is recorded on the ex-dividend date. Gains or losses realized on sales of securities are recorded on the identified cost basis.
Withholding taxes on interest, dividends, and gains as a result of certain investments in ADRs by the Funds have been provided for in accordance with each investment's applicable country's tax rules and rates.
Securities Lending:
The Funds, through a Securities Lending Agreement with Citibank, N.A. ("Citibank"), may lend their securities to qualified financial institutions, such as certain broker-dealers and banks, to earn additional income, net of income retained by Citibank. Borrowers are required to initially secure their loans for collateral in the amount of at least 102% of the value of U.S. securities loaned or at least 105% of the value of non-U.S. securities loaned, marked-to-market daily. Any collateral shortfalls associated with increases in the valuation of the securities loaned are generally cured the next business day. The collateral can be received in the form of cash collateral and/or non-cash collateral. Non-cash collateral can include U.S. Government Securities and other securities as permitted by Securities and Exchange Commission ("SEC") guidelines. The cash collateral is invested in short-term instruments or cash equivalents, primarily open-end investment companies, as noted on the Funds' Schedules of Portfolio Investments. The Funds effectively do not have control of the non-cash collateral and therefore it is not disclosed on the Funds' Schedules of Portfolio Investments. Collateral requirements are determined daily based on the value of the Funds' securities on loan as of the end of the prior business day. During the time portfolio securities are on loan, the borrower will pay the Funds any dividends or interest paid on such securities plus any fee negotiated between the parties to the lending agreement. The Funds also earn a return from the collateral. The Funds pay Citibank various fees in connection with the investment of cash collateral and fees based on the investment income received from securities lending activities. Securities lending income (net of these fees) is disclosed on the Statements of Operations. Loans are terminable upon demand and the borrower must return the loaned securities within the lesser of one standard settlement period or five business days. Although risk is mitigated by the collateral, a Fund could experience a delay in recovering its securities and possible loss of income or value if the borrower fails to return them. In addition, there is a risk that the value of the short-term investments will be less than the amount of cash collateral required to be returned to the borrower. The Funds' agreement with Citibank does not include master netting provisions. Non-cash collateral received by the Funds may not be sold or repledged, except to satisfy borrower default.
The following table is a summary of the Funds' securities lending transactions as of December 31, 2021.
| | | Value of
Securities on Loan | | Non-Cash
Collateral | | Cash
Collateral | |
RS International Fund | | $ | 2,251,095 | | | $ | — | | | $ | 2,369,331 | | |
RS Global Fund | | | 4,092,840 | | | | — | | | | 4,188,249 | | |
RS Sophus Emerging Markets Fund | | | 3,370,251 | | | | — | | | | 3,564,149 | | |
Foreign Currency Translations:
The accounting records of the Funds are maintained in U.S. dollars. Investment securities and other assets and liabilities of a Fund denominated in a foreign currency are translated into U.S. dollars at current exchange rates. Purchases and sales of securities, income receipts and expense payments are translated into U.S. dollars at the exchange rates on the date of the transactions. The Funds do not isolate the portion of the results of operations resulting from changes in foreign exchange rates on investments from fluctuations arising from changes in market prices of securities held. Such fluctuations are disclosed as Net change in unrealized appreciation/depreciation on investment securities and foreign currency translations on the Statements of Operations. Any realized gains or losses from these
51
Victory Portfolios | | Notes to Financial Statements — continued
December 31, 2021 | |
fluctuations are disclosed as Net realized gains (losses) from investment securities and foreign currency transactions on the Statements of Operations.
Foreign Taxes:
The Funds may be subject to foreign taxes related to foreign income received (a portion of which may be reclaimable), capital gains on the sale of securities, and certain foreign currency transactions. All foreign taxes are recorded in accordance with the applicable regulations and rates that exist in the foreign jurisdictions in which the Funds invest.
Federal Income Taxes:
It is each Fund's policy to continue to qualify as a regulated investment company by complying with the provisions available to certain investment companies, as defined in applicable sections of the Internal Revenue Code, and to make distributions of net investment income and net realized gains sufficient to relieve it from all, or substantially all, federal income taxes. Accordingly, no provision for federal income taxes is required in the financial statements. The Funds have a tax year end of December 31.
For the year ended December 31, 2021, the Funds did not incur any income tax, interest, or penalties, and has recorded no liability for net unrecognized tax benefits relating to uncertain income tax positions.
Management of the Funds has reviewed tax positions taken in tax years that remain subject to examination by all major tax jurisdictions, including federal (i.e., the last four tax years, which includes the current fiscal tax year end). Management believes that there is no tax liability resulting from unrecognized tax benefits related to uncertain tax positions taken.
Allocations:
Expenses directly attributable to a Fund are charged to that Fund, while expenses that are attributable to more than one fund in the Trust, or jointly with an affiliated trust, are allocated among the respective funds in the Trust and/or an affiliated trust based upon net assets or another appropriate basis.
Income, expenses (other than class-specific expenses such as transfer agent fees, state registration fees, 12b-1 fees, and printing fees), and realized and unrealized gains or losses on investments are allocated to each class of shares based on its relative net assets on the date income is earned or expenses and realized and unrealized gains and losses are incurred.
3. Purchases and Sales:
Purchases and sales of securities (excluding securities maturing less than one year from acquisition) for the year ended December 31, 2021, were as follows:
| | | Excluding
U.S. Government Securities | |
| | | Purchases | | Sales | |
RS International Fund | | $ | 181,130,871 | | | $ | 172,781,438 | | |
RS Global Fund | | | 175,353,141 | | | | 102,020,885 | | |
Sophus Emerging Markets Fund | | | 494,707,307 | | | | 437,884,303 | | |
4. Affiliated Fund Ownership:
The Funds offer shares for investment by other funds. The fund-of-funds do not invest in the underlying funds for the purpose of exercising management or control, and the affiliated fund-of-funds annual
52
Victory Portfolios | | Notes to Financial Statements — continued
December 31, 2021 | |
and semi-annual reports may be viewed at www.vcm.com. As of December 31, 2021, certain fund-of-funds owned total outstanding shares of the Funds as follows:
RS International Fund | | Ownership % | |
USAA Target Retirement Income Fund | | | 6.6 | | |
USAA Target Retirement 2030 Fund | | | 16.4 | | |
USAA Target Retirement 2040 Fund | | | 25.0 | | |
USAA Target Retirement 2050 Fund | | | 17.2 | | |
USAA Target Retirement 2060 Fund | | | 2.5 | | |
5. Fees and Transactions with Affiliates and Related Parties:
Investment Advisory Fees:
Investment advisory services are provided to the Funds by the Adviser, which is a New York corporation registered as an investment adviser with the SEC. The Adviser is an indirect wholly owned subsidiary of Victory Capital Holdings, Inc., a publicly traded Delaware corporation, and a wholly owned direct subsidiary of Victory Capital Operating, LLC.
Under the terms of the Investment Advisory Agreement, the Adviser is entitled to receive fees based on a percentage of the average daily net assets of each Fund. The rates at which the Adviser is paid by each Fund are included in the table below.
RS International Fund | | | 0.80 | % | |
RS Global Fund | | | 0.60 | %(a) | |
Sophus Emerging Markets Fund | | | 1.00 | % | |
(a) Effective September 1, 2021, the Advisor contractually reduced its Advisory fee to 0.60%. Prior to September 1, 2021, the rate at which the Adviser was paid was 0.80% of average daily net assets of the RS Global Fund.
Amounts incurred and paid to VCM for the year ended December 31, 2021, are reflected on the Statements of Operations as Investment advisory fees.
Administration and Servicing Fees:
VCM also serves as the Funds' administrator and fund accountant. Under the Administration and Fund Accounting Agreement, VCM is entitled to receive fees based on a percentage of the average daily net assets of the Trust, Victory Variable Insurance Funds and Victory Portfolios II. The tiered rates at which VCM is paid by the Funds are shown in the table below:
| Net Assets | |
Up to $15 billion | | $15 billion – $30 billion | | Over $30 billion | |
| | 0.08 | %, plus | | | 0.05 | %, plus | | | 0.04 | % | |
Amounts incurred for the year ended December 31, 2021, are reflected on the Statements of Operations as Administration fees.
Citi Fund Services Ohio, Inc. ("Citi"), an affiliate of Citibank, acts as sub-administrator and sub-fund accountant to the Funds pursuant to the Sub-Administration and Sub-Fund Accounting Services Agreement between VCM and Citi. VCM pays Citi a fee for providing these services. The Trust reimburses VCM and Citi for out-of-pocket expenses incurred in providing these services and certain other expenses specifically allocated to the Funds. Amounts incurred for the year ended December 31, 2021, are reflected on the Statements of Operations as Sub-Administration fees.
The Funds (as part of the Trust) have entered into an agreement with the Adviser to provide compliance services, pursuant to which the Adviser furnishes its compliance personnel, including the services of the Chief Compliance Officer ("CCO"), and other resources reasonably necessary to provide the Trust
53
Victory Portfolios | | Notes to Financial Statements — continued
December 31, 2021 | |
with compliance oversight services related to the design, administration, and oversight of a compliance program for the Trust in accordance with Rule 38a-1 under the 1940 Act. The CCO is an employee of the Adviser, which pays the compensation of the CCO and support staff. The funds in the Trust, Victory Variable Insurance Funds, Victory Portfolios II, and USAA Mutual Funds (collectively, the "Victory Funds Complex") in the aggregate, compensate the Adviser for these services. Amounts incurred for the year ended December 31, 2021, are reflected on the Statements of Operations as Compliance fees.
Transfer Agency Fees:
FIS Investor Services, LLC ("FIS") serves as the Funds' transfer agent. Under the Transfer Agent Agreement, the Trust pays FIS a fee for its services and reimburses FIS for all of their reasonable out-of-pocket expenses incurred in providing these services. Amounts incurred for the year ended December 31, 2021, are reflected on the Statements of Operations as Transfer agent fees.
Distributor/Underwriting Services:
Victory Capital Services, Inc. (the "Distributor"), an affiliate of the Adviser, serves as Distributor for the continuous offering of the shares of the Funds pursuant to a Distribution Agreement between the Distributor and the Trust. Pursuant to the Distribution and Service Plans adopted in accordance with Rule 12b-1 under the 1940 Act, the Distributor may receive a monthly distribution and service fee at the annual rate shown in the table below:
| | | Class A | | Class C | | Class R | |
RS International Fund | | | 0.25 | % | | | 1.00 | % | | | 0.50 | % | |
RS Global Fund | | | 0.25 | % | | | 1.00 | % | | | 0.50 | % | |
Sophus Emerging Markets Fund | | | 0.25 | % | | | 1.00 | % | | | 0.50 | % | |
The distribution and service fees paid to the Distributor may be used by the Distributor to pay for activities primarily intended to result in the sale of Class A, Class C, and Class R. Amounts incurred for the year ended December 31, 2021, are reflected on the Statements of Operations as 12b-1 fees.
In addition, the Distributor is entitled to receive commissions on sale of the Class A. For the year ended December 31, 2021, the Distributor received $8,858 from commissions earned on the sale of Class A.
Other Fees:
Citibank serves as the Funds' custodian. The Funds pay Citibank a fee for providing these services. Amounts incurred for the year ended December 31, 2021, are reflected on the Statements of Operations as Custodian fees.
Sidley Austin LLP provides legal services to the Trust.
The Adviser has entered into expense limitation agreements with certain Funds. Under the terms of the agreements, the Adviser has agreed to waive fees or reimburse certain expenses to the extent that ordinary operating expenses incurred by certain classes of a Fund in any fiscal year exceed the expense limit for such classes of the Fund. Such excess amounts will be the liability of the Adviser. Acquired fund fees and expense, interest, taxes, brokerage commissions, other expenditures that are capitalized in accordance with GAAP, and other extraordinary expenses not incurred in the ordinary course of a Fund's business are excluded from the expense limits. As of December 31, 2021, the expense limits (excluding voluntary waivers) are as follows:
| | | In Effect Until April 30, 2022 | |
| | | Class A | | Class C | | Class R | | Class R6 | | Class Y | |
RS International Fund | | | 1.13 | % | | | 1.88 | % | | | 1.38 | % | | | 0.83 | % | | | 0.88 | % | |
RS Global Fund | | | 0.85 | % | | | 1.60 | % | | | 1.10 | % | | | 0.55 | % | | | 0.60 | % | |
Sophus Emerging Markets Fund | | | 1.34 | % | | | 2.14 | % | | | 1.58 | % | | | 0.89 | % | | | 0.99 | % | |
Under the terms of the expense limitation agreements, amended May 1, 2021, the Funds have agreed to repay fees and expenses that were waived or reimbursed by the Adviser for a period of up to
54
Victory Portfolios | | Notes to Financial Statements — continued
December 31, 2021 | |
three years (thirty six (36) months) after the waiver or reimbursement took place, subject to the lesser of any operating expense limits in effect at the time of: (a) the original waiver or expense reimbursement; or (b) the recoupment, after giving effect to the recoupment amount. Prior to May 1, 2021, the Funds were permitted to recoup fees waived and expenses reimbursed for up to three years after the fiscal year in which the waiver or reimbursement took place, subject to the limitations above. This change did not have any effect on the amounts previously reported for recoupment.
As of December 31, 2021, the following amounts are available to be repaid to the Adviser. The Funds have not recorded any amounts available to be repaid as a liability due to an assessment that repayments are not probable at December 31, 2021.
| | | Expires
2022 | | Expires
2023 | | Expires
2024 | | Total | |
RS International Fund | | $ | 266,869 | | | $ | 491,864 | | | $ | 478,133 | | | $ | 1,236,866 | | |
RS Global Fund | | | 359,812 | | | | 690,062 | | | | 1,055,677 | | | | 2,105,551 | | |
Sophus Emerging Markets Fund | | | 1,124,230 | | | | 1,137,721 | | | | 1,536,446 | | | | 3,798,397 | | |
The Adviser may voluntarily waive or reimburse additional fees to assist the Funds in maintaining competitive expense ratios. Voluntary waivers and reimbursements applicable to the Funds are not available to be recouped at a future time. There were no voluntary waivers or reimbursements for the year ended December 31, 2021.
Certain officers and/or interested trustees of the Funds are also officers and/or employees of the Adviser, administrator, fund accountant, sub-administrator, sub-fund accountant, custodian, legal counsel, and Distributor.
6. Risks:
The Funds may be subject to other risks in addition to these identified risks.
Equity Risk — The value of the equity securities in which the Fund invests may decline in response to developments affecting individual companies and/or general economic conditions in the United States or abroad. A company's earnings or dividends may not increase as expected (or may decline) because of poor management, competitive pressures, reliance on particular suppliers or geographical regions, labor problems or shortages, corporate restructurings, fraudulent disclosures, man-made or natural disasters, military confrontations or wars, terrorism, public health crises, or other events, conditions and factors. Price changes may be temporary or last for extended periods.
Foreign Securities Risk — The RS International Fund, RS Global Fund and Sophus Emerging Markets Fund invest in securities of foreign issuers in various countries. Investing on an international basis involves certain risks not involved in domestic investments including the risk of nationalization or expropriation of assets, imposition of currency exchange controls or restrictions on the repatriation of foreign currency, confiscatory taxation, political or financial instability and diplomatic developments, which could affect the value of a Fund's investments in certain foreign countries. Governments of many countries have exercised, and continue to exercise, substantial influence over many aspects of the private sector through the ownership or control of many companies, including some of the largest in these countries. As a result, government actions in the future could have a significant effect on economic conditions which may adversely affect prices of certain portfolio securities. There is also generally less government supervision and regulation of stock exchanges, brokers and listed companies than in the U.S. Dividends or interest on, or proceeds from the sale of, foreign securities may be subject to foreign withholding taxes, and special U.S. tax considerations may apply. Moreover, foreign economies may differ favorably or unfavorably from the U.S. economy in such respects as growth of gross national product, rate of inflation, capital reinvestment, resource self-sufficiency and balance of payments position. The Schedule of Portfolio Investments includes information on each Fund's holdings, including industry and/or geographic composition, as relevant.
Emerging Markets Risk — The risks related to investing in foreign securities are generally greater with respect to securities of companies that conduct their business activities in emerging markets or
55
Victory Portfolios | | Notes to Financial Statements — continued
December 31, 2021 | |
whose securities are traded principally in emerging markets. The risks of investing in emerging markets include the risks of illiquidity, increased price volatility, smaller market capitalizations, less government regulation, less extensive and less frequent accounting, financial and other reporting requirements, risk of loss resulting from problems in share registration and custody, substantial economic and political disruptions and the nationalization of foreign deposits or assets.
7. Borrowing and Interfund Lending:
Line of Credit:
The Victory Funds Complex participates in a short-term demand note "Line of Credit" agreement with Citibank. The Line of Credit agreement with Citibank was renewed on June 28, 2021, with a termination date of June 27, 2022. Under the agreement with Citibank, the Victory Funds Complex may borrow up to $600 million, of which $300 million is committed and $300 million is uncommitted. $40 million of the Line of Credit is reserved for use by the Victory Floating Rate Fund, another series of the Victory Funds Complex, with Victory Floating Rate Fund paying the related commitment fees for that amount. The purpose of the Line of Credit is to meet temporary or emergency cash needs. For the year ended December 31, 2021, Citibank received an annual commitment fee of 0.15% on $300 million for providing the Line of Credit. Each fund in the Victory Funds Complex pays a pro-rata portion of the commitment fees plus any interest (one-month London Interbank Offered Rate ("LIBOR") plus one percent, with LIBOR to be replaced by a different benchmark rate in accordance with the terms of the agreement) on amounts borrowed. Prior to June 28, 2021, the Victory Funds Complex paid an annual commitment fee of 0.15% and an upfront fee of 0.10%. Each fund in the Victory Funds Complex paid a pro-rata portion of the upfront fee. Interest charged to each fund during the period, if applicable, is reflected on the Statements of Operations under Line of credit fees.
The Funds had no borrowings under the Line of Credit agreement during the year ended December 31, 2021.
Interfund Lending:
The Trust and Adviser rely on an exemptive order granted by the SEC in March 2017 (the "Order"), permitting the establishment and operation of an Interfund Lending Facility (the "Facility"). The Facility allows each Fund to directly lend and borrow money to or from any other fund in the Victory Funds Complex that is permitted to participate in the Facility, relying upon the Order at rates beneficial to both the borrowing and lending funds. Advances under the Facility are allowed for temporary or emergency purposes, including the meeting of redemption requests that otherwise might require the untimely disposition of securities, and are subject to each Fund's borrowing restrictions. The interfund loan rate is determined, as specified in the Order, by averaging the current repurchase agreement rate and the current bank loan rate. As a Borrower, interest charged to each Fund, if any, during the period, is reflected on the Statements of Operations under Interfund lending fees. As a Lender, interest earned by each Fund, if any, during the period, is reflected on the Statements of Operations under Interfund lending.
The average borrowing or lending for the days outstanding and average interest rate for the Funds that utilized this Facility during the year ended December 31, 2021, were as follows:
| | | Borrower or
Lender | | Amount
Outstanding at
December 31,
2021 | | Average
Borrowing* | | Days
Borrowing
Outstanding | | Average
Interest
Rate | | Maximum
Borrowing
During the
Period | |
Sophus Emerging
Markets Fund | | Borrower | | $ | — | | | $ | 2,518,000 | | | | 5 | | | | 0.57 | % | | $ | 4,142,000 | | |
* For the year ended December 31, 2021, based on the number of days borrowings were outstanding.
56
Victory Portfolios | | Notes to Financial Statements — continued
December 31, 2021 | |
8. Federal Income Tax Information:
Dividends from net investment income, if any, are declared and paid as noted in the table below. Distributable net realized gains, if any, are declared and distributed at least annually from each Fund.
| | | Declared | | Paid | |
RS International Fund | | Annually | | Annually | |
RS Global Fund | | Annually | | Annually | |
Sophus Emerging Markets Fund | | Annually | | Annually | |
The amounts of dividends from net investment income and distributions from net realized gains (collectively, distributions to shareholders) are determined in accordance with federal income tax regulations, which may differ from GAAP. To the extent these "book/tax" differences are permanent in nature (e.g., net operating loss and distribution reclassification), such amounts are reclassified within the components of net assets based on their federal tax-basis treatment; temporary differences (e.g., wash sales) do not require reclassification. To the extent dividends and distributions exceed net investment income and net realized gains for tax purposes, they are reported as distributions of capital. Net investment losses incurred by the Funds may be reclassified as an offset to capital on the accompanying Statements of Assets and Liabilities.
As of December 31, 2021, on the Statements of Assets and Liabilities, as a result of permanent book-to-tax differences, reclassification adjustments were as follows:
| | Total
Accumulated
Earnings/(Loss) | | Capital | |
RS International Fund | | $ | (995,468 | ) | | $ | 995,468 | | |
| RS Global Fund | | | (619,114 | ) | | | 619,114 | | |
The tax character of distributions paid during the tax years ended as noted below, were as follows (total distributions paid may differ from the Statements of Changes in Net Assets because, for tax purposes, dividends are recognized when actually paid).
| | Year Ended December 31, 2021 | |
| | Distributions Paid From: | | | | | | | |
| | Ordinary
Income | | Net
Long-Term
Capital Gains | | Total
Taxable
Distributions | | Return of
Capital | | Total
Distributions
Paid | |
RS International Fund | | $ | 11,266,524 | | | $ | 10,268,011 | | | $ | 21,534,535 | | | $ | — | | | $ | 21,534,535 | | |
RS Global Fund | | | 8,707,700 | | | | 3,659,424 | | | | 12,367,124 | | | | — | | | | 12,367,124 | | |
| Sophus Emerging Markets Fund | | | 9,828,717 | | | | 11,506,626 | | | | 21,335,343 | | | | 319,013 | | | | 21,654,356 | | |
| | | Year Ended December 31, 2020 | |
| | | Distributions Paid From: | | | |
| | | Ordinary
Income | | Net
Long-Term
Capital Gains | | Total
Distributions
Paid | |
RS International Fund | | $ | 4,899,261 | | | $ | 909,323 | | | $ | 5,808,584 | | |
RS Global Fund | | | 1,560,318 | | | | 96,155 | | | | 1,656,473 | | |
Sophus Emerging Markets Fund | | | 5,284,371 | | | | — | | | | 5,284,371 | | |
57
Victory Portfolios | | Notes to Financial Statements — continued
December 31, 2021 | |
As of December 31, 2021, the components of accumulated earnings/(loss) on a tax basis were as follows:
| | Undistributed
Ordinary
Income | | Undistributed
Long-Term
Capital Gains | | Accumulated
Earnings | | Qualified
Late Year
Losses* | | Unrealized
Appreciation
(Depreciation)** | | Total
Accumulated
Earnings/
(Loss) | |
| RS International Fund | | $ | 2,870,216 | | | $ | 777,246 | | | $ | 3,647,462 | | | $ | — | | | $ | 69,357,174 | | | $ | 73,004,636 | | |
| RS Global Fund | | | — | | | | — | | | | — | | | | (611,648 | ) | | | 88,570,968 | | | | 87,959,320 | | |
Sophus Emerging Markets
Fund | | | — | | | | — | | | | — | | | | (135,645 | ) | | | 53,849,326 | | | | 53,713,681 | | |
* Qualified late-year losses are comprised of post-October capital losses incurred after October 31 and certain late-year ordinary losses. Late-year ordinary losses represent ordinary losses incurred after December 31 and specified losses incurred after October 31. These losses are deemed to arise on the first day of the Fund's next taxable year.
** The difference between the book-basis and tax-basis unrealized appreciation (depreciation) is attributable primarily to tax deferral of losses on wash sales and passive foreign investment companies.
During the tax year ended December 31, 2021, the following Funds utilized capital loss carryforwards:
RS International Fund | | $ | 2,778,208 | | |
Sophus Emerging Markets Fund | | | 26,270,363 | | |
As of the tax year ended December 31, 2021, the Funds had no capital loss carryforwards for federal income tax purposes.
As of December 31, 2021, the cost basis for federal income tax purposes, gross unrealized appreciation, gross unrealized depreciation, and net unrealized appreciation (depreciation) for investments were as follows:
| | | Cost of
Investments
for Federal
Tax Purposes | | Gross
Unrealized
Appreciation | | Gross
Unrealized
Depreciation | | Net
Unrealized
Appreciation
(Depreciation) | |
| RS International Fund | | $ | 357,841,103 | | | $ | 84,424,098 | | | $ | (15,081,758 | ) | | $ | 69,342,340 | | |
| RS Global Fund | | | 256,282,622 | | | | 94,562,573 | | | | (5,992,247 | ) | | | 88,570,326 | | |
| Sophus Emerging Markets Fund | | | 444,044,455 | | | | 88,486,413 | | | | (33,929,945 | ) | | | 54,556,468 | | |
58
REPORT OF INDEPENDENT REGISTERED PUBLIC ACCOUNTING FIRM
To the Shareholders and Board of Trustees of Victory Portfolios
Opinion on the Financial Statements
We have audited the accompanying statements of assets and liabilities, including the schedules of portfolio investments, of Victory RS International Fund, Victory RS Global Fund, and Victory Sophus Emerging Markets Fund (the "Funds"), each a series of Victory Portfolios, as of December 31, 2021, the related statements of operations for the year then ended, the statements of changes in net assets for each of the two years in the period then ended, the related notes, and the financial highlights for each of the three years in the period then ended (collectively referred to as the "financial statements"). In our opinion, the financial statements present fairly, in all material respects, the financial position of each of the Funds as of December 31, 2021, the results of their operations for the year then ended, the changes in net assets for each of the two years in the period then ended and the financial highlights for each of the three years in the period then ended, in conformity with accounting principles generally accepted in the United States of America.
The Funds' financial highlights for the years ended December 31, 2018 and prior, were audited by other auditors whose report dated February 26, 2019, expressed an unqualified opinion on those financial highlights.
Basis for Opinion
These financial statements are the responsibility of the Funds' management. Our responsibility is to express an opinion on the Funds' financial statements based on our audits. We are a public accounting firm registered with the Public Company Accounting Oversight Board (United States) ("PCAOB") and are required to be independent with respect to the Funds in accordance with the U.S. federal securities laws and the applicable rules and regulations of the Securities and Exchange Commission and the PCAOB.
We conducted our audits in accordance with the standards of the PCAOB. Those standards require that we plan and perform the audit to obtain reasonable assurance about whether the financial statements are free of material misstatement whether due to error or fraud.
Our audits included performing procedures to assess the risks of material misstatement of the financial statements, whether due to error or fraud, and performing procedures that respond to those risks. Such procedures included examining, on a test basis, evidence regarding the amounts and disclosures in the financial statements. Our procedures included confirmation of securities owned as of December 31, 2021, by correspondence with the custodian and brokers; when replies were not received from brokers, we performed other auditing procedures. Our audits also included evaluating the accounting principles used and significant estimates made by management, as well as evaluating the overall presentation of the financial statements. We believe that our audits provide a reasonable basis for our opinion.
We have served as the auditor of one or more of the investment companies advised by Victory Capital Management, Inc. since 2015.

COHEN & COMPANY, LTD.
Cleveland, Ohio
February 23, 2022
59
Victory Portfolios | | Supplemental Information
December 31, 2021 | |
(Unaudited)
Trustee and Officer Information
Board of Trustees:
Overall responsibility for management of the Trust rests with the Board. The Trust is managed by the Board in accordance with the laws of the State of Delaware. There are currently nine Trustees, eight of whom are not "interested persons" of the Trust within the meaning of that term under the 1940 Act ("Independent Trustees") and one of whom is an "interested person" of the Trust within the meaning of that term under the 1940 Act ("Interested Trustee"). The Trustees, in turn, elect the officers of the Trust to actively supervise its day-to-day operations.
The following tables list the Trustees, their date of birth, their position with the Trust, their commencement of service, their principal occupations during the past five years, and any directorships of other investment companies or companies whose securities are registered under the Securities Exchange Act of 1934, as amended, or who file reports under that Act. Each Trustee oversees 41 portfolios in the Trust, eight portfolios in Victory Variable Insurance Funds, and 25 portfolios in Victory Portfolios II, each a registered investment company that, together with the Trust, comprise the Victory Funds Complex. David C. Brown is a Trustee of USAA Mutual Funds and oversees 46 portfolios of the USAA Mutual Funds Trust. Each Trustee's address is c/o Victory Portfolios, 4900 Tiedeman Road, 4th Floor, Brooklyn, Ohio 44144. Each Trustee has an indefinite term.
| Name and Date of Birth | | Position
Held with
the Trust | | Date
Commenced
Service | | Principal Occupation
During Past 5 Years | | Other
Directorships
Held During
Past 5 Years | |
Independent Trustees. | |
David Brooks Adcock,
Born October 1951 | | Trustee | | May 2005 | | Consultant (since 2006). | | Chair and Trustee, Turner Funds (December 2016-December 2017). | |
Nigel D. T. Andrews,
Born April 1947 | | Trustee | | August 2002 | | Retired. | | Director, TCG BDC II, Inc. (since 2017); Director, TCG BDC I, Inc. (formerly Carlyle GMS Finance, Inc.) (since 2012); Trustee, Carlyle Secured Lending III (since 2021). | |
E. Lee Beard,*
Born August 1951 | | Trustee | | May 2005 | | Retired (since 2015) | | None. | |
Dennis M. Bushe,
Born January 1944 | | Trustee | | July 2016 | | Retired. | | None. | |
60
Victory Portfolios | | Supplemental Information — continued
December 31, 2021 | |
(Unaudited)
| Name and Date of Birth | | Position
Held with
the Trust | | Date
Commenced
Service | | Principal Occupation
During Past 5 Years | | Other
Directorships
Held During
Past 5 Years | |
John L. Kelly,
Born April 1953 | | Vice Chair and Trustee | | February 2015 | | Partner, McCarvill Capital Partners (September 2016- September 2017). | | Director, Caledonia Mining Corporation (since May 2012). | |
David L. Meyer,*
Born April 1957 | | Trustee | | December 2008 | | Retired. | | None. | |
Gloria S. Nelund,
Born May 1961 | | Trustee | | July 2016 | | Chair, CEO and Co-Founder of TriLinc Global, LLC, an investment firm. | | TriLinc Global Impact Fund, LLC (since 2012). | |
Leigh A. Wilson,
Born December 1944 | | Chair and Trustee | | November 1994 | | Private Investor. | | Chair (since 2013), Caledonia Mining Corporation. | |
Interested Trustee. | |
David C. Brown,**
Born May 1972 | | Trustee | | May 2008 | | Chairman and Chief Executive Officer (since 2013), the Adviser; Chairman and Chief Executive Officer (since 2013), Victory Capital Holdings, Inc.; Chairman and Chief Executive Officer (since 2019), Victory Capital Transfer Agency, Inc. | | Trustee, USAA Mutual Funds Trust; Board Member, Victory Capital Services, Inc. | |
* The Board has designated Ms. Beard and Mr. Meyer as its Audit Committee Financial Experts.
** Mr. Brown is an "Interested Person" by reason of his relationship with the Adviser.
The Statement of Additional Information includes additional information about the Trustees of the Trust and is available, without charge, by calling 800-539-3863.
61
Victory Portfolios | | Supplemental Information — continued
December 31, 2021 | |
(Unaudited)
Officers:
The officers of the Trust, their date of birth, their commencement of service, and their principal occupations during the past five years, are detailed in the following table. Each officer serves until the earlier of his or her resignation, removal, retirement, death, or the election of a successor. The mailing address of each officer of the Trust is 4900 Tiedeman Road, 4th Floor, Brooklyn, Ohio 44144. The officers of the Trust receive no compensation directly from the Trust for performing the duties of their offices.
| Name and Date of Birth | | Position with
the Trust | | Date
Commenced
Service | | Principal Occupation During Past 5 Years | |
Christopher K. Dyer,
Born February 1962 | | President | | February 2006* | | Director of Mutual Fund Administration, the Adviser; Chief Operating Officer, Victory Capital Services, Inc. (since 2020); Vice President, Victory Capital Transfer Agency, Inc. (since 2019). | |
Scott A. Stahorsky,
Born July 1969 | | Vice President | | December 2014 | | Manager, Fund Administration, the Adviser. | |
Erin G. Wagner,
Born February 1974 | | Secretary | | December 2014 | | Associate General Counsel, the Adviser (since 2013). | |
Allan Shaer,
Born March 1965 | | Treasurer | | May 2017 | | Senior Vice President, Financial Administration, Citi Fund Services Ohio, Inc. (since 2016); Vice President, Mutual Fund Administration, JP Morgan Chase (2011-2016). | |
Christopher A. Ponte,
Born March 1984 | | Assistant Treasurer | | December 2017 | | Manager, Fund Administration, the Adviser (since 2017); Senior Analyst, Fund Administration, the Adviser (prior to 2017); Chief Financial Officer, Victory Capital Services, Inc. (since 2018). | |
Colin Kinney,
Born October 1973 | | Chief Compliance Officer | | July 2017 | | Chief Compliance Officer (since 2013) and Chief Risk Officer (2009-2017), the Adviser. | |
Sean Fox,
Born September 1976 | | Deputy Chief Compliance
Officer | | July 2021 | | Sr. Compliance Officer, the Adviser (2019-2021); Compliance Officer, the Adviser (2015-2019). | |
Chuck Booth,
Born April 1960 | | Anti-Money Laundering Compliance Officer and Identity Theft Officer | | May 2015 | | Director, Regulatory Administration and CCO Support Services, Citi Fund Services Ohio, Inc. | |
Jay G. Baris,
Born January 1954 | | Assistant Secretary | | December 1997 | | Partner, Sidley Austin LLP (since April 2020); Partner, Shearman & Sterling LLP (January 2018-April 2020); Partner, Morrison & Foerster LLP (2011-January 2018). | |
* On December 3, 2014, Mr. Dyer resigned as Secretary of the Trust and accepted the position of President.
62
Victory Portfolios | | Supplemental Information — continued
December 31, 2021 | |
(Unaudited)
Proxy Voting and Portfolio Holdings Information
Proxy Voting:
Information regarding the policies and procedures each Fund uses to determine how to vote proxies relating to portfolio securities is available without charge, upon request, by calling 800-539-3863. The information is also included in the Funds' Statement of Additional Information, which is available on the SEC's website at www.sec.gov.
Information relating to how the Funds voted proxies relating to portfolio securities held during the most recent 12 months ended June 30 is available on the SEC's website at www.sec.gov.
Availability of Schedules of Portfolio Investments:
The Trust files a complete list of Schedules of Portfolio Investments with the SEC for the first and third quarter of each fiscal year on Form N-PORT. Forms N-PORT are available on the SEC's website at www.sec.gov.
Expense Examples
As a shareholder of the Fund, you may incur two types of costs: (1) transaction costs, including sales charges (loads) on purchases; and (2) ongoing costs, including management fees and other Fund expenses. These examples are intended to help you understand your ongoing costs (in dollars) of investing in the Fund and to compare these costs with the ongoing costs of investing in other mutual funds.
These examples are based on an investment of $1,000 invested at the beginning of the period and held for the entire period from July 1, 2021, through December 31, 2021.
The Actual Expense figures in the table below provide information about actual account values and actual expenses. You may use the information below, together with the amount you invested, to estimate the expenses that you paid over the period. Simply divide your account value by $1,000 (for example, an $8,600 account value divided by $1,000 = 8.6), then multiply the result by the number in the table under the heading entitled "Actual Expenses Paid During Period" to estimate the expenses you paid on your account during this period.
The Hypothetical Expense figures in the table below provide information about hypothetical account values and hypothetical expenses based on the Fund's actual expense ratio and an assumed rate of return of 5% per year before expenses, which is not the Fund's actual return. The hypothetical account values and expenses may not be used to estimate the actual ending account balance or expenses you paid for the period. You may use this information to compare this 5% hypothetical example with the 5% hypothetical examples that appear in shareholder reports of other funds.
Please note the expenses shown in the table below are meant to highlight your ongoing costs only and do not reflect any transactional costs. Therefore, the hypothetical expenses in the table are useful in comparing ongoing costs only and will not help you determine the relative total costs of owning different funds. In addition, if these transactional costs were included, your costs would have been higher.
| | | Beginning
Account
Value
7/1/21 | | Actual
Ending
Account
Value
12/31/21 | | Hypothetical
Ending
Account
Value
12/31/21 | | Actual
Expenses Paid
During Period
7/1/21-12/31/21* | | Hypothetical
Expenses Paid
During Period
7/1/21-12/31/21* | | Annualized
Expense Ratio
During Period
7/1/21-12/31/21 | |
RS International Fund | |
Class A | | $ | 1,000.00 | | | $ | 1,025.70 | | | $ | 1,019.51 | | | $ | 5.77 | | | $ | 5.75 | | | | 1.13 | % | |
Class C | | | 1,000.00 | | | | 1,022.00 | | | | 1,015.73 | | | | 9.58 | | | | 9.55 | | | | 1.88 | | |
Class R | | | 1,000.00 | | | | 1,024.50 | | | | 1,018.25 | | | | 7.04 | | | | 7.02 | | | | 1.38 | | |
Class R6 | | | 1,000.00 | | | | 1,026.30 | | | | 1,021.02 | | | | 4.24 | | | | 4.23 | | | | 0.83 | | |
Class Y | | | 1,000.00 | | | | 1,026.40 | | | | 1,020.77 | | | | 4.49 | | | | 4.48 | | | | 0.88 | | |
63
Victory Portfolios | | Supplemental Information — continued
December 31, 2021 | |
(Unaudited)
| | | Beginning
Account
Value
7/1/21 | | Actual
Ending
Account
Value
12/31/21 | | Hypothetical
Ending
Account
Value
12/31/21 | | Actual
Expenses Paid
During Period
7/1/21-12/31/21* | | Hypothetical
Expenses Paid
During Period
7/1/21-12/31/21* | | Annualized
Expense Ratio
During Period
7/1/21-12/31/21 | |
RS Global Fund | |
Class A | | $ | 1,000.00 | | | $ | 1,085.60 | | | $ | 1,020.92 | | | $ | 4.47 | | | $ | 4.33 | | | | 0.85 | % | |
Class C | | | 1,000.00 | | | | 1,081.70 | | | | 1,017.14 | | | | 8.40 | | | | 8.13 | | | | 1.60 | | |
Class R | | | 1,000.00 | | | | 1,084.40 | | | | 1,019.66 | | | | 5.78 | | | | 5.60 | | | | 1.10 | | |
Class R6 | | | 1,000.00 | | | | 1,088.10 | | | | 1,022.43 | | | | 2.89 | | | | 2.80 | | | | 0.55 | | |
Class Y | | | 1,000.00 | | | | 1,087.40 | | | | 1,022.18 | | | | 3.16 | | | | 3.06 | | | | 0.60 | | |
Sophus Emerging Markets Fund | |
Class A | | | 1,000.00 | | | | 865.70 | | | | 1,018.45 | | | | 6.30 | | | | 6.82 | | | | 1.34 | | |
Class C | | | 1,000.00 | | | | 862.10 | | | | 1,014.42 | | | | 10.04 | | | | 10.87 | | | | 2.14 | | |
Class R | | | 1,000.00 | | | | 865.00 | | | | 1,017.24 | | | | 7.43 | | | | 8.03 | | | | 1.58 | | |
Class R6 | | | 1,000.00 | | | | 868.00 | | | | 1,020.72 | | | | 4.19 | | | | 4.53 | | | | 0.89 | | |
Class Y | | | 1,000.00 | | | | 867.40 | | | | 1,020.21 | | | | 4.66 | | | | 5.04 | | | | 0.99 | | |
* Expenses are equal to the average account value multiplied by the Fund's annualized expense ratio multiplied by 184/365 (the number of days in the most recent fiscal half-year divided by the number of days in the fiscal year).
64
Victory Portfolios | | Supplemental Information — continued
December 31, 2021 | |
(Unaudited)
Additional Federal Income Tax Information
For the year ended December 31, 2021, the following Funds paid qualified dividend income for the purposes of reduced individual federal income tax rates of:
| | Percent | |
RS International Fund | | | 95 | % | |
RS Global Fund | | | 59 | % | |
Sophus Emerging Markets Fund | | | 93 | % | |
Dividends qualified for corporate dividends received deductions of:
| | Percent | |
RS Global Fund | | | 23 | % | |
For the year ended December 31, 2021, the following Funds designated short-term capital gain distributions:
| | Amount | |
RS International Fund | | $ | 1,861,153 | | |
RS Global Fund | | | 5,194,804 | | |
Sophus Emerging Markets Fund | | | 2,665,689 | | |
For the year ended December 31, 2021, the following Funds designated long-term capital gain distributions:
| | Amount | |
RS International Fund | | $ | 11,113,311 | | |
| RS Global Fund | | | 3,910,715 | | |
Sophus Emerging Markets Fund | | | 11,506,626 | | |
The following Funds intend to elect to pass through to shareholders the income tax credit for taxes paid to foreign countries. Foreign source income and foreign tax expense per outstanding share on December 31, 2021, were as follows:
| | Foreign
Source
Income | | Foreign
Tax
Expense | |
RS International Fund | | $ | 0.35 | | | $ | 0.04 | | |
Sophus Emerging Markets Fund | | | 0.57 | | | | 0.08 | | |
65
Victory Portfolios | | Supplemental Information — continued
December 31, 2021 | |
(Unaudited)
Considerations of the Board in Continuing the Investment Advisory Agreement (the "Agreement")
The Board approved the Agreement on behalf of each of the Funds at a meeting, which was called for that purpose, on December 2, 2020. The Board also considered information relating to the Funds and the Agreement provided throughout the year and, more specifically, at the meetings on October 19, 2021 and November 30, 2021. In considering whether to approve the Agreement, the Board requested, and the Adviser provided, information that the Board believed to be reasonably necessary to reach its conclusions.
The Board, including the Independent Trustees, evaluated this information along with other information obtained throughout the year and was advised by legal counsel to the Funds and independent legal counsel to the Independent Trustees. In addition, the Independent Trustees considered a past review of their overall process for conducting the annual review of the Funds' advisory arrangements by a consultant retained through their counsel.
The Board took into consideration regular reports from the Adviser throughout the COVID-19 pandemic public health crisis concerning how the ongoing pandemic has affected market volatility, investment risk, liquidity and valuation of portfolio securities, and the implementation and effectiveness of business continuity plans. These reports also had confirmed that the pandemic had no material impact on the Adviser's operations.
The Board considered each Fund's advisory fee, expense ratio and investment performance as significant factors in determining whether the Agreement should be continued. In considering whether the compensation paid to the Adviser was fair and reasonable, the Board also evaluated, among other things, the following factors:
• The requirements of the Funds for the services provided by the Adviser;
• The nature, quality and extent of the services provided and expected to be provided;
• The performance of the Funds as compared to comparable funds;
• The fees payable for the services and whether the fee arrangements provided for economies of scale that would benefit Fund shareholders as the Funds grow (acknowledging that economies of scale can be complex to assess and typically are not directly measurable);
• Whether the fee would be sufficient to enable the Adviser to attract and retain experienced personnel and continue to provide quality services to the Funds;
• The fees paid by other clients of the Adviser whose accounts are managed in a similar investment style and any differences in the services provided to the other clients compared to those provided to the Funds;
• The total expenses of each Fund;
• Management's commitment to operating the Funds at competitive expense levels;
• The profitability of the Adviser (as reflected by comparing fees earned against an estimate of the Adviser's costs) with respect to the Adviser's relationship with the Funds;
• Research and other service benefits received by the Adviser obtained through payment of client commissions for securities transactions;
• Other benefits received by the Adviser, and its affiliates, including revenues paid to the Adviser, or its affiliates, by the Funds for administration and fund accounting services, and distribution;
• The capabilities and financial condition of the Adviser;
• Current economic and industry trends; and
• The historical relationship between each Fund and the Adviser.
The Board reviewed each Fund's current management fee, comprised of the advisory fee plus the administrative services fee paid to the Adviser, in the context of the Adviser's profitability with respect to each Fund individually. The Board retained a consultant to provide comparative information about fees and performance. The Board met with the consultant to review its inputs and methodologies, among other things. The Board compared each Fund's gross management fee and total operating expense ratio on a net and gross basis with the median gross management fee and median expense ratio of a universe of comparable mutual funds compiled by the consultant and a peer group of funds with similar investment strategies selected by that consultant from the universe. The
66
Victory Portfolios | | Supplemental Information — continued
December 31, 2021 | |
(Unaudited)
Board reviewed the factors and methodology used by the consultant in the selection of each Fund's peer group, including the consultant's selection of a broad universe of funds, the more specific universe of comparable funds, and peer groups of funds with comparable investment strategies and asset levels, among other factors. The Board also reviewed any changes to the consultant's methodology as compared to the prior year, including those resulting from the Adviser's input, if any. With respect to certain Funds, the Board also reviewed fees and other information related to the Adviser's management of similarly managed institutional or private accounts, and the differences in the services provided to the other accounts. The Board noted that none of the advisory fee arrangements for the Funds included breakpoints, which would be a structure that results in reduced fees as a fund grows. The Board also considered the Adviser's commitment to limit expenses as discussed in more detail below.
The Board also reviewed the compliance and administrative services provided to the Funds by the Adviser and its affiliates, including the Adviser's oversight of the Funds' day-to-day operations and oversight of Fund accounting, assistance in meeting legal and regulatory requirements, and other services necessary for the operation of the Funds and the Trust.
The Board found that the gross annual management fee paid by each Fund was within the range of management fees paid by each Fund's respective peer group. The Board also found that each Fund's Class A net annual expense ratio, taking into account any shareholder servicing or distribution fees, was reasonable as compared with each Fund's respective peer group. The Board considered the Adviser's contractual agreement with each Fund to waive its fees and reimburse expenses of certain classes for a specified period of time, as described in the Fund's prospectus.
The Board reviewed each Fund's performance over one-, three-, five- and ten-year periods (as applicable) against the performance of the Fund's selected peer group and benchmark index. The Board recognized that the performance of the Fund and the peer group funds are net of expenses, while the performance of the benchmark index reflects gross returns.
The Board reviewed various other specific factors with respect to each Fund, as described below. In their deliberations, the Trustees did not rank the importance of any particular information or factor considered and each Trustee may have attributed different weights to various factors.
RS International Fund:
The Board compared the Fund's Class A performance for the one-, three-, five- and ten-year periods ended June 30, 2021, to that of the median performance of the Fund's peer group and benchmark index for the same periods and considered the fact that the Fund underperformed both the benchmark index and peer group median for the one- and ten-year periods, and outperformed both the benchmark index and the peer group median for the three- and five-year periods.
Having considered, among other things: (1) the Fund's management fee compared to comparable mutual funds; (2) the Fund's total expense ratio compared to comparable mutual funds; (3) that the Adviser's willingness to limit the expenses of certain classes for a period of time would provide stability to the Fund's expenses for those share classes during that period; and (4) the Fund's performance during the periods reviewed, the Board concluded that the Agreement continued to be in the best interests of the Fund's shareholders.
RS Global Fund:
The Board compared the Fund's Class A performance for the one-, three- and five-year periods ended June 30, 2021, to that of the median performance of the Fund's peer group and benchmark index for the same periods and considered the fact that the Fund underperformed the benchmark index for the one-year period, outperformed the benchmark index for the three-, five- and ten-year periods, and outperformed the peer group median for all periods reviewed.
Having considered, among other things: (1) the Fund's management compared to comparable mutual funds; (2) the Fund's total expense ratio compared to comparable mutual funds; (3) that the Adviser's willingness to limit the expenses of certain classes for a period of time would provide stability to the Fund's expenses for those share classes during that period; and (4) the Fund's performance during the periods reviewed, the Board concluded that the Agreement continued to be in the best interests of the Fund's shareholders.
67
Victory Portfolios | | Supplemental Information — continued
December 31, 2021 | |
(Unaudited)
Sophus Emerging Markets Fund:
The Board compared the Fund's Class A performance for the one-, three-, five- and ten-year periods ended June 30, 2021, to that of the median performance of the Fund's peer group and benchmark index for the same periods and considered the fact that the Fund outperformed both the benchmark index and the peer group median for the one-and five-year periods, and underperformed both the benchmark index and the peer group median for the three- and ten-year periods.
Having considered, among other things: (1) the Fund's management fee compared to comparable mutual funds; (2) the Fund's total expense ratio compared to comparable mutual funds; (3) that the Adviser's willingness to limit the expenses of certain classes for a period of time would provide stability to the Fund's expenses for those share classes during that period; and (4) the Fund's performance during the periods reviewed, the Board concluded that the Agreement continued to be in the best interests of the Fund's shareholders.
Conclusion:
Based on its review of the information requested and provided, and following extended discussions, the Board determined that the Agreement, on behalf of the Funds discussed above, was consistent with the best interests of each Fund and its shareholders, and the Board unanimously approved the Agreement, on behalf of each Fund, for an additional annual period on the basis of the foregoing review and discussions and the following considerations, among others:
• The fairness and reasonableness of the investment advisory fee payable to the Adviser under the Agreement in light of the investment advisory services provided, the costs of these services, the profitability of the Adviser's relationship with the Fund and the comparability of the fee paid to the fees paid by other investment companies;
• The nature, quality and extent of the investment advisory services provided by the Adviser;
• The Adviser's entrepreneurial commitment to the management of the Funds and the creation of a broad-based family of funds, which could entail a substantial commitment of the Adviser's resources to the successful operation of the Funds;
• The Adviser's representations regarding its staffing and capabilities to manage the Funds, including the retention of personnel with relevant portfolio management experience;
• The Adviser's efforts to enhance investment results by, among other things, developing quality portfolio management teams; and
• The overall high quality of the personnel, operations, financial condition, investment management capabilities, methodologies and performance of the Adviser.
68
Privacy Policy
Protecting the Privacy of Information
The Trust respects your right to privacy. We also know that you expect us to conduct and process your business in an accurate and efficient manner. To do so, we must collect and maintain certain personal information about you. This is the information we collect from you on applications or other forms, and from the transactions you make with us or third parties. It may include your name, address, social security number, account transactions and balances, and information about investment goals and risk tolerance.
We do not disclose any information about you or about former customers to anyone except as permitted or required by law. Specifically, we may disclose the information we collect to companies that perform services on our behalf, such as the transfer agent that processes shareholder accounts and printers and mailers that assist us in the distribution of investor materials. We may also disclose this information to companies that perform marketing services on our behalf. This allows us to continue to offer you Victory investment products and services that meet your investing needs, and to effect transactions that you request or authorize. These companies will use this information only in connection with the services for which we hired them. They are not permitted to use or share this information for any other purpose.
To protect your personal information internally, we permit access only by authorized employees and maintain physical, electronic, and procedural safeguards to guard your personal information.*
* You may have received communications regarding information about privacy policies from other financial institutions which gave you the opportunity to "opt-out" of certain information sharing with companies which are not affiliated with that financial institution. The Trust does not share information with other companies for purposes of marketing solicitations for products other than the Trust. Therefore, the Trust does not provide opt-out options to their shareholders.
Victory Funds
P.O. Box 182593
Columbus, Ohio 43218-2593

Visit our website at: | | Call Victory at: | |
www.vcm.com | | 800-539-FUND (800-539-3863) | |

December 31, 2021
Annual Report
Victory RS Partners Fund
Victory RS Value Fund
Victory RS Large Cap Alpha Fund
Victory RS Investors Fund
Victory Global Energy Transition Fund
(Formerly Victory Global Natural Resources Fund)
www.vcm.com
News, Information And Education 24 Hours A Day, 7 Days A Week
The Victory Capital website gives fund shareholders, prospective shareholders, and investment professionals a convenient way to access fund information, get guidance, and track fund performance anywhere they can access the Internet. The site includes:
• Detailed performance records
• Daily share prices
• The latest fund news
• Investment resources to help you become a better investor
• A section dedicated to investment professionals
Whether you're a potential investor searching for the fund that matches your investment philosophy, a seasoned investor interested in planning tools, or an investment professional, www.vcm.com has what you seek. Visit us anytime. We're always open.
TABLE OF CONTENTS
Shareholder Letter (Unaudited) | | | 3 | | |
Managers' Commentary / Investment Overview
(Unaudited) | | | 5 | | |
Investment Objective and Portfolio
Holdings (Unaudited) | | | 19 | | |
Schedules of Portfolio Investments | |
Victory RS Partners Fund | | | 24 | | |
Victory RS Value Fund | | | 27 | | |
Victory RS Large Cap Alpha Fund | | | 30 | | |
Victory RS Investors Fund | | | 32 | | |
Victory Global Energy Transition Fund
(Formerly Victory Global Natural Resources Fund) | | | 34 | | |
Financial Statements | |
Statements of Assets and Liabilities | | | 36 | | |
Statements of Operations | | | 38 | | |
Statements of Changes in Net Assets | | | 40 | | |
Financial Highlights | | | 46 | | |
Notes to Financial Statements | | | 56 | | |
Report of Independent Registered Public
Accounting Firm | | | 68 | | |
Supplemental Information (Unaudited) | | | 69 | | |
Trustee and Officer Information | | | 69 | | |
Proxy Voting and Portfolio Holdings Information | | | 72 | | |
Expense Examples | | | 72 | | |
Additional Federal Income Tax Information | | | 74 | | |
Advisory Contract Approval | | | 75 | | |
Privacy Policy (inside back cover) | | | |
1
IRA DISTRIBUTION WITHHOLDING DISCLOSURE
We generally must withhold federal income tax at a rate of 10% of the taxable portion of your distribution and, if you live in a state that requires state income tax withholding, at your state's tax rate. However, you may elect not to have withholding apply or to have income tax withheld at a higher rate. Any withholding election that you make will apply to any subsequent distribution unless and until you change or revoke the election. If you wish to make a withholding election, or change or revoke a prior withholding election, call 800-539-3863 (800-235-8396 for Member Class) and form W-4P (OMB No. 1545-0074 withholding certificate for pension or annuity payments) will be electronically sent.
If you do not have a withholding election in place by the date of a distribution, federal income tax will be withheld from the taxable portion of your distribution at a rate of 10%. If you must pay estimated taxes, you may be subject to estimated tax penalties if your estimated tax payments are not sufficient and sufficient tax is not withheld from your distribution.
For more specific information, please consult your tax adviser.
The Funds are distributed by Victory Capital Services, Inc. Victory Capital Management Inc. is the investment adviser to the Funds and receives fees from the Funds for performing services for the Funds.
This report is not authorized for distribution to prospective investors unless preceded or accompanied by a current prospectus of the Victory Funds.
For additional information about any Victory Fund, including fees, expenses, and risks, view our prospectus online at vcm.com or call 800-539-3863 (800-235-8396 for Member Class). Read it carefully before you invest or send money.
The information in this report is based on data obtained from recognized services and sources and is believed to be reliable. Any opinions, projections, or recommendations in this report are subject to change without notice and are not intended as individual investment advice. Past investment performance of the Funds, markets or securities mentioned herein should not be considered to be indicative of future results.
• NOT FDIC INSURED • NO BANK GUARANTEE • MAY LOSE VALUE

Call Victory at:
800-539-FUND (800-539-3863)
800-235-8396 for Member Class
Visit our website at:
www.vcm.com
2
Victory Funds Letter to Shareholders
(Unaudited)
Dear Shareholder,
Another year has passed, but unfortunately the pandemic endures. Yet, looking back on the year ended 2021, it is evident that financial markets have endured as well, despite stiff headwinds — including new COVID-19 variants; disruption among global supply chains; uncomfortable inflation readings; and the fear of rising interest rates.
Through it all, the S&P 500® Index, the bell-weather proxy for our domestic stock market, once again registered a positive annual total return (that makes it 12 out of the past 13 years). This was largely driven by a U.S. economy that bounced back quickly after what was effectively a global economic shutdown in 2020, and we witnessed robust earnings growth across many sectors thanks in no small part to continued fiscal stimulus and accommodative monetary policy. Underlying this positive performance were interesting differences among investment styles and market capitalizations. For example, growth-oriented investments outperformed value within large-caps but underperformed within both mid-caps and small-caps (as measured by the Russell family of indices). Perhaps this reflects investors' expectations for higher interest rates next year?
There were other notable subplots to 2021. Early in the year we watched in disbelief as "meme stocks" — a few names that gained massive notoriety on social media platforms — went on stomach-churning roller coaster rides. Also, intriguing was how the biotech sector struggled mightily despite the success and fanfare surrounding the COVID-19 vaccines. Meanwhile, rising oil prices fueled impressive gains across the energy landscape, while crypto assets captivated investors. Now we're all watching how crypto's underlying blockchain technologies might disrupt business-as-usual across industries in the years ahead. These were just a few of the highlights of the past year.
Through all the twists and turns, the S&P 500® Index registered an impressive annual total return of nearly 29% for the 12-month period ended December 31, 2021. Over this same annual period, the yield on the 10-Year U.S. Treasury jumped 59 basis points (a basis point is 1/100th of a percentage point), reflecting substantial fiscal stimuli and the U.S. Federal Reserve's (the "Fed") accommodative monetary stance (recently). At the end of our reporting period, the yield on the 10-Year U.S. Treasury was trending higher and finished at 1.52%.
Despite the resiliency of financial markets, we fully acknowledge that the volatility and unusual events of recent years may have made investors uneasy at times. However, this simply underscores why it's important for investors to remain calm and unemotional in the face of market turmoil. A long-term perspective, a well-diversified portfolio across asset classes and investment types, and a clear understanding of individual risk tolerance are some of the key ingredients for staying the course and progressing on your investment goals.
Of course, no one knows for certain what 2022 will bring. We are already facing a potential end to the Fed's accommodative monetary policies and the various forms of fiscal stimuli that helped revive the economy from the depths of the pandemic-
3
induced market downturn. By all accounts, the Fed appears ready to raise short-term interest rates, perhaps as early as the end of the first quarter, though any move will certainly be data dependent, and some are expressing concerns about labor shortages, disrupted supply chains, rising commodity prices, and the potential for lasting inflation. There will likely be new headwinds, some yet to be identified.
Thus, we cannot tell you with any certainty what markets will do in the future, but we can assure you that the investment professionals at our investment franchises continually monitor the market environment and work hard to position portfolios opportunistically no matter what the markets bring.
On the following pages, you will find information relating to your Victory Funds investment, brought to you by Victory Capital. If you have any questions, we encourage you to contact your financial advisor. Or, if you invest with us directly, you may call 800-539-3863 (800-235-8396 for Member Class) or visit our website at www.vcm.com.
From all of us here at Victory Capital, thank you for your ongoing confidence and for letting us help you work toward your investment goals.

Christopher K. Dyer, CFA
President,
Victory Funds
4
Managers' Commentary
(Unaudited)
What were the market conditions during the reporting period?
Is the global economy approaching an important inflection point? Perhaps. U.S. equity markets certainly appear to be acting as if this is a possibility, vacillating and turning in mixed results during the fourth quarter of 2021. However, the optimists seemed to be winning this latest tug-of-war, and upbeat investor sentiment helped push several areas of the equities market to new all-time highs as we approached year-end.
In general, we have continued to see a normalization of economic activity following the rollout of COVID-19 vaccinations, though investors have lingering concerns over elevated inflation readings — evidenced by some of the highest year-over-year Consumer Price Index readings in decades — as well as the pending expiration of emergency fiscal and monetary measures. On top of that, we are experiencing another surge in COVID-19 cases due to the Delta and worrisome Omicron variants, which in turn is raising questions about whether corporate operations (and earnings) will be disrupted in the new calendar year.
Will the economy continue to normalize and grow, or are we poised to pull back in 2022? This ongoing uncertainty suggests that there will be a continued push and pull among investors in the year ahead. We expect that periods of elevated volatility may continue, especially for risk assets. Yet this type of ambiguity can also create attractive opportunities for patient, long-term investors. In fact, security selection looks to become more important than ever as some sectors of the economy are being discounted by investors, while other pockets of the market may be quite vulnerable given that investors have bid up some stocks well past what fundamentals appear to warrant.
An underlying theme for U.S. equity markets at the start of 2021 was that value-oriented cyclical stocks (defined as those with fundamentals that are closely tied to short-term economic output) had materially outperformed growth-oriented secular stocks (defined as stocks that are taking market share from legacy companies, and thus are less sensitive to short-term economic output). This theme reversed course to a large extent within the large-cap space, as large growth was the best performing style within U.S. equity markets during the fourth quarter of 2021. However, a similar reversal has not yet been seen in the small-cap space. In fact, small-cap secular growth has continued to struggle, whereas small-cap value was the best-performing investment style group for the entire year.
This cyclical versus secular tug-of-war was evident within indices. For example, earlier in the year, the Energy, Producer Durables, Materials & Processing, and Consumer Staples sectors led the market higher. Later in the year, however, market leadership (particularly within large-cap stocks) shifted back to growth-oriented technology. Perhaps even more telling was the tug-of-war between small and large companies during 2021. While investors embraced small-cap stocks early in the year, it became clear that higher inflation might be more than just "transitory." As a result, the U.S. Federal Reserve (the "Fed") adopted a more hawkish stance, which helped push investor preferences away from small-caps and toward larger companies in the second half of the year.
In terms of the overall numbers, the Russell 3000® Value Index gained 7.54% during the fourth quarter of 2021 and was up 25.37% for the full year. In terms of market capitalizations, small was mighty when it came to value stocks in 2021. The Russell 2000® Value Index (the
5
Manager's Commentary (continued)
"Index") returned 28.27% for the year, while the Russell Midcap® Value Index returned 28.34% and the Russell 1000® Value Index posted an annual gain of 25.16%.
Looking ahead, the outlook remains mostly constructive for equities, though caveats always apply. The most obvious of these is the trajectory of the pandemic and the potential emergence of any new variants. Will we continue to cope adequately with these societal challenges, or will we revert to lockdowns? For the moment, investors remain relatively optimistic. Labor shortages and supply chain disruptions also pose risks, as does the potential for higher inflation. The Fed seems committed to addressing rising inflation and has all but banned the word "transitory" from its analysis. What remains to be seen is how far and how fast interest rates rise, and whether the alarming inflation readings of late 2021 subside. Despite the risks and inevitable bouts of volatility, we continue to see companies across the capitalization spectrum — including many in traditional value-oriented sectors — with solid fundamentals and encouraging earnings growth potential.
How did Victory RS Partners (the "Fund") perform during the reporting period?
The Fund returned 29.58% (Class A at net asset value) for the fiscal year ended December 31, 2021, outperforming the Index, which returned 28.27% during the reporting period.
What strategies did you employ during the reporting period?
The year was best characterized as a year of transition, as the reopening of the economy coupled with strong monetary and fiscal stimulus led to strong economic growth and higher inflation. Throughout the year, the markets debated the duration of inflation, but this did not keep markets from moving materially higher as strong earnings outweighed any angst caused by inflation fears. The Fund outperformed the Index primarily through stock selection in the Industrials and Energy sectors. Our focus on businesses that have the potential for long-term value creation while limiting our downside paid off during 2021. For the year, the stocks that provided positive contribution tended to be cyclical, but also held a competitive advantage. Within Industrials, a cyclical sector, Atkore, Inc., GMS, Inc., and ArcBest Corp. were significant positive contributors to performance. The Energy sector provided other names that benefited the portfolio. Magnolia Oil & Gas Corp. and PDC Energy, Inc. benefited from more disciplined capital allocation decision-making and higher energy prices. Where we struggled was in a couple of our names in the Technology sector. Euronet Worldwide, Inc. saw its ATM operations negatively affected by lower tourism in its geographies. Cognyte Software Ltd. saw sales of its cybersecurity software delayed as a result of the pandemic. Also negatively impacting the portfolio has been the activity of the "meme" stocks, several of which are in the Index. At the end of the day, we managed to outperform the Index in 2021 and we remain confident in our process and feel it will provide us with the discipline which leads to longer term outperformance, which will benefit our investors over time.
6
Victory RS Partners Fund
Investment Overview
(Unaudited)
Average Annual Total Return
Year Ended December 31, 2021
| | | Class A | | Class R | | Class Y | | Member Class | | | |
INCEPTION DATE | | 7/12/95 | | 10/13/06 | | 5/1/07 | | 11/2/20 | | | |
| | | Net Asset
Value | | Maximum
Offering
Price | | Net Asset
Value | | Net Asset
Value | | Net Asset
Value | | Russell
2000® Value
Index1 | |
One Year | | | 29.58 | % | | | 22.12 | % | | | 29.15 | % | | | 30.03 | % | | | 29.90 | % | | | 28.27 | % | |
Five Year | | | 11.32 | % | | | 10.00 | % | | | 10.91 | % | | | 11.69 | % | | | NA | | | | 9.07 | % | |
Ten Year | | | 11.93 | % | | | 11.27 | % | | | 11.52 | % | | | 12.30 | % | | | NA | | | | 12.03 | % | |
Since Inception | | | NA | | | | NA | | | | NA | | | | NA | | | | 52.01 | % | | | NA | | |
The performance data quoted represents past performance and current returns may be lower or higher. The investment return and principal value will fluctuate so that an investor's shares, when redeemed, may be worth more or less than the original cost. To obtain performance information current to the most recent month's end, please visit www.vcm.com.
The maximum offering price ("MOP") figures reflect a maximum sales charge of 5.75% for Class A. Net Asset Value ("NAV") does not reflect sales charges.
Total return measures the price change in a share assuming the reinvestment of all net investment income and realized capital gain distributions, if any. The total returns quoted do not reflect adjustments made to the enclosed financial statements in accordance with U.S. Generally Accepted Accounting Principles or the deduction of taxes that a shareholder would pay on net investment income and realized capital gain distributions, including reinvested distributions, or redemptions of shares. The total return figures set forth above include all waivers of fees. Without such fee waivers, the total returns would have been lower.
Victory RS Partners Fund — Growth of $10,000
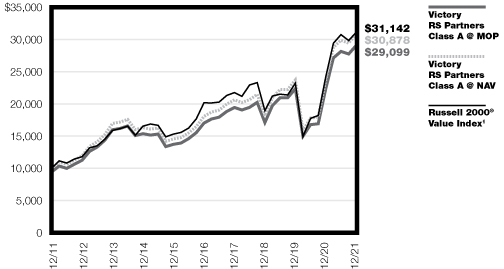
1The Russell 2000® Value Index is an unmanaged market-capitalization-weighted index that measures the performance of those companies in the Russell 2000® Index with lower price-to-book ratios and lower forecasted growth values. (The Russell 2000® Index measures the performance of the 2,000 smallest companies in the Russell 3000® Index, which consists of the 3,000 largest U.S. companies based on total market capitalization.) Index results assume the reinvestment of dividends paid on the stocks constituting the index. This index does not include the effect of sales charges, commissions, expenses or taxes, is not representative of the Fund and it is not possible to invest directly in an index.
The graph reflects investment of growth of a hypothetical $10,000 investment in the Fund.
The graph and table do not reflect the deduction of taxes that a shareholder would pay on Fund distributions or the redemption of shares.
Past performance is not indicative of future results.
7
Managers' Commentary
(Unaudited)
What were the market conditions during the reporting period?
Is the global economy approaching an important inflection point? Perhaps. U.S. equity markets certainly appear to be acting as if this is a possibility, vacillating and turning in mixed results during the fourth quarter of 2021. However, the optimists seemed to be winning this latest tug-of-war, and upbeat investor sentiment helped push several areas of the equities market to new all-time highs as we approached year-end.
In general, we have continued to see a normalization of economic activity following the rollout of COVID-19 vaccinations, though investors have lingering concerns over elevated inflation readings — evidenced by some of the highest year-over-year Consumer Price Index readings in decades — as well as the pending expiration of emergency fiscal and monetary measures. On top of that, we are experiencing another surge in COVID-19 cases due to the Delta and worrisome Omicron variants, which in turn is raising questions about whether corporate operations (and earnings) will be disrupted in the new calendar year.
Will the economy continue to normalize and grow, or are we poised to pull back in 2022? This ongoing uncertainty suggests that there will be a continued push and pull among investors in the year ahead. We expect that periods of elevated volatility may continue, especially for risk assets. Yet this type of ambiguity can also create attractive opportunities for patient, long-term investors. In fact, security selection looks to become more important than ever as some sectors of the economy are being discounted by investors, while other pockets of the market may be quite vulnerable given that investors have bid up some stocks well past what fundamentals appear to warrant.
An underlying theme for U.S. equity markets at the start of 2021 was that value-oriented cyclical stocks (defined as those with fundamentals that are closely tied to short-term economic output) had materially outperformed growth-oriented secular stocks (defined as stocks that are taking market share from legacy companies, and thus are less sensitive to short-term economic output). This theme reversed course to a large extent within the large-cap space, as large growth was the best performing style within U.S. equity markets during the fourth quarter of 2021. However, a similar reversal has not yet been seen in the small-cap space. In fact, small-cap secular growth has continued to struggle, whereas small-cap value was the best-performing investment style group for the entire year.
This cyclical versus secular tug-of-war was evident within indices. For example, earlier in the year, the Energy, Producer Durables, Materials & Processing, and Consumer Staples sectors led the market higher. Later in the year, however, market leadership (particularly within large cap stocks) shifted back to growth-oriented technology. Perhaps even more telling was the tug-of-war between small and large companies during 2021. While investors embraced small-cap stocks early in the year, it became clear that higher inflation might be more than just "transitory." As a result, the U.S. Federal Reserve (the "Fed") adopted a more hawkish stance, which helped push investor preferences away from small-cap stocks and toward larger companies in the second half of the year.
In terms of the overall numbers, the Russell 3000® Value Index gained 7.54% during the fourth quarter of 2021 and was up 25.37% for the full year. In terms of market capitalizations, small was mighty when it came to value stocks in 2021. The Russell 2000® Value Index
8
Manager's Commentary (continued)
returned 28.27% for the year, while the Russell Midcap® Value Index (the "Index") returned 28.34% and the Russell 1000® Value Index posted an annual gain of 25.16%.
Looking ahead, the outlook remains mostly constructive for equities, though caveats always apply. The most obvious of these is the trajectory of the pandemic and the potential emergence of any new variants. Will we continue to cope adequately with these societal challenges, or will we revert to lockdowns? For the moment, investors remain relatively optimistic. Labor shortages and supply chain disruptions also pose risks, as does the potential for higher inflation. The Fed seems committed to addressing rising inflation and has all but banned the word "transitory" from its analysis. What remains to be seen is how far and how fast interest rates rise, and whether the alarming inflation readings of late 2021 subside. Despite the risks and inevitable bouts of volatility, we continue to see companies across the capitalization spectrum — including many in traditional value-oriented sectors — with solid fundamentals and encouraging earnings growth potential.
How did Victory RS Value Fund (the "Fund") perform during the reporting period?
The Fund returned 27.31% (Class A at net asset value) for the fiscal year ended December 31, 2021, underperforming the Index, which returned 28.34% during the reporting period.
What strategies did you employ during the reporting period?
The Fund's relative returns were driven primarily by stock selection in the Energy, Materials, and Industrials sectors. In the Energy sector, our investments in Devon Energy Corporation and Magnolia Oil & Gas Corporation benefited from more disciplined capital allocation, strengthened balance sheets, and rising commodity prices. In the Materials sector, our investment in Summit Materials benefited from solid demand, strong pricing, and expectations for increased infrastructure spending. The Financials sector detracted from performance, as investments in insurance names underperformed as a result of continued high catastrophe losses, despite improving pricing. In the end, the Fund underperformed the Index in 2021. We feel confident in the securities that we own and are optimistic in our future performance, both absolute and relative, as interest rates normalize from generational lows over the intermediate term and deflate many of the speculative areas of the market. We believe our consistent focus on investing in quality companies with good balance sheets and durable cash flows, run by good managers, will continue to serve us well.
9
Victory RS Value Fund
Investment Overview
(Unaudited)
Average Annual Total Return
Year Ended December 31, 2021
| | | Class A | | Class C | | Class R | | Class Y | | | |
INCEPTION DATE | | 6/30/93 | | 5/1/07 | | 12/4/06 | | 5/1/07 | | | |
| | | Net Asset
Value | | Maximum
Offering
Price | | Net Asset
Value | | Contingent
Deferred
Charges | | Net Asset
Value | | Net Asset
Value | | Russell
Midcap® Value
Index1 | |
One Year | | | 27.31 | % | | | 20.01 | % | | | 26.28 | % | | | 25.28 | % | | | 26.77 | % | | | 27.57 | % | | | 28.34 | % | |
Five Year | | | 11.29 | % | | | 9.98 | % | | | 10.43 | % | | | 10.43 | % | | | 10.85 | % | | | 11.55 | % | | | 11.22 | % | |
Ten Year | | | 12.00 | % | | | 11.34 | % | | | 11.14 | % | | | 11.14 | % | | | 11.56 | % | | | 12.26 | % | | | 13.44 | % | |
The performance data quoted represents past performance and current returns may be lower or higher. The investment return and principal value will fluctuate so that an investor's shares, when redeemed, may be worth more or less than the original cost. To obtain performance information current to the most recent month's end, please visit www.vcm.com.
The maximum offering price ("MOP") figures reflect a maximum sales charge of 5.75% for Class A. Class C is not subject to an initial sales charge, but is subject to a deferred sales charge of 1.00% on shares redeemed within one year of purchase. Net Asset Value ("NAV") does not reflect sales charges.
Total return measures the price change in a share assuming the reinvestment of all net investment income and realized capital gain distributions, if any. The total returns quoted do not reflect adjustments made to the enclosed financial statements in accordance with U.S. Generally Accepted Accounting Principles or the deduction of taxes that a shareholder would pay on net investment income and realized capital gain distributions, including reinvested distributions, or redemptions of shares. The total return figures set forth above include all waivers of fees. Without such fee waivers, the total returns would have been lower.
Victory RS Value Fund — Growth of $10,000
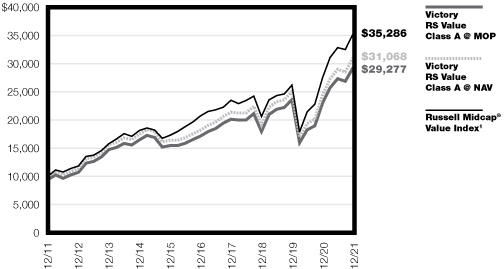
1The Russell Midcap® Value Index is an unmanaged market-capitalization-weighted index that measures the performance of those companies in the Russell Midcap® Index with lower price-to book ratios and lower forecasted growth values. (The Russell Midcap® Index measures the performance of the 800 smallest companies in the Russell 1000® Index, which consists of the 1,000 largest U.S. companies based on total market capitalization.) Index results assume the reinvestment of dividends paid on the stocks constituting the index. This index does not include the effect of sales charges, commissions, expenses or taxes, is not representative of the Fund and it is not possible to invest directly in an index.
The graph reflects investment of growth of a hypothetical $10,000 investment in the Fund.
The graph and table do not reflect the deduction of taxes that a shareholder would pay on Fund distributions or the redemption of shares.
Past performance is not indicative of future results.
10
Victory RS Large Cap Alpha Fund
Managers' Commentary
(Unaudited)
What were the market conditions during the reporting period?
Is the global economy approaching an important inflection point? Perhaps. U.S. equity markets certainly appear to be acting as if this is a possibility, vacillating and turning in mixed results during the fourth quarter of 2021. However, the optimists seemed to be winning this latest tug-of-war, and upbeat investor sentiment helped push several areas of the equities market to new all-time highs as we approached year-end.
In general, we have continued to see a normalization of economic activity following the rollout of COVID-19 vaccinations, though investors have lingering concerns over elevated inflation readings — evidenced by some of the highest year-over-year Consumer Price Index readings in decades — as well as the pending expiration of emergency fiscal and monetary measures. On top of that, we are experiencing another surge in COVID-19 cases due to the Delta and worrisome Omicron variants, which in turn is raising questions about whether corporate operations (and earnings) will be disrupted in the new calendar year.
Will the economy continue to normalize and grow, or are we poised to pull back in 2022? This ongoing uncertainty suggests that there will be a continued push and pull among investors in the year ahead. We expect that periods of elevated volatility may continue, especially for risk assets. Yet this type of ambiguity can also create attractive opportunities for patient, long-term investors. In fact, security selection looks to become more important than ever as some sectors of the economy are being discounted by investors, while other pockets of the market may be quite vulnerable given that investors have bid up some stocks well past what fundamentals appear to warrant.
An underlying theme for U.S. equity markets at the start of 2021 was that value-oriented cyclical stocks (defined as those with fundamentals that are closely tied to short-term economic output) had materially outperformed growth-oriented secular stocks (defined as stocks that are taking market share from legacy companies, and thus are less sensitive to short-term economic output). This theme reversed course to a large extent within the large-cap space, as large growth was the best performing style within U.S. equity markets during the fourth quarter of 2021. However, a similar reversal has not yet been seen in the small-cap space. In fact, small-cap secular growth has continued to struggle, whereas small-cap value was the best-performing investment style group for the entire year.
This cyclical versus secular tug-of-war was evident within indices. For example, earlier in the year, the Energy, Producer Durables, Materials & Processing, and Consumer Staples sectors led the market higher. Later in the year, however, market leadership (particularly within large-cap stocks) shifted back to growth-oriented technology. Perhaps even more telling was the tug-of-war between small and large companies during 2021. While investors embraced small-cap stocks early in the year, it became clear that higher inflation might be more than just "transitory." As a result, the U.S. Federal Reserve (the "Fed") adopted a more hawkish stance, which helped push investor preferences away from small-cap stocks and toward larger companies in the second half of the year.
In terms of the overall numbers, the Russell 3000® Value Index gained 7.54% during the fourth quarter of 2021 and was up 25.37% for the full year. In terms of market capitalizations, small was mighty when it came to value stocks in 2021. The Russell 2000® Value Index
11
Victory RS Large Cap Alpha Fund
Manager's Commentary (continued)
returned 28.27% for the year, while the Russell Midcap® Value Index returned 28.34% and the Russell 1000® Value Index (the "Index") posted an annual gain of 25.16%.
Looking ahead, the outlook remains mostly constructive for equities, though caveats always apply. The most obvious of these is the trajectory of the pandemic and the potential emergence of any new variants. Will we continue to cope adequately with these societal challenges, or will we revert to lockdowns? For the moment, investors remain relatively optimistic. Labor shortages and supply chain disruptions also pose risks, as does the potential for higher inflation. The Fed seems committed to addressing rising inflation and has all but banned the word "transitory" from its analysis. What remains to be seen is how far and how fast interest rates rise, and whether the alarming inflation readings of late 2021 subside. Despite the risks and inevitable bouts of volatility, we continue to see companies across the capitalization spectrum — including many in traditional value-oriented sectors — with solid fundamentals and encouraging earnings growth potential.
How did Victory RS Large Cap Alpha Fund (the "Fund") perform during the reporting period?
The Fund returned 23.00% (Class A at net asset value) for the fiscal year ended December 31, 2021, underperforming the Index, which returned 25.16% during the reporting period.
What strategies did you employ during the reporting period?
The Fund underperformed the Index despite strong stock selection in the Communication Services sector. Negative contributors to stock selection were in the Technology sector and to a lesser degree the Financials sector, as company-specific bets were not rewarded in 2021. However, our investments in the Communication Services sector paid off in 2021. Alphabet Inc. Class A was a significant positive contributor to performance. Sealed Air was also a positive contributor in the Materials sector, as the food packaging company continued to show positive traction. Where we struggled was in the Technology sector, where a combination of unattractive valuations in more cyclical areas of the sector (names we did not own) coupled with continued pandemic-related near-term headwinds (names we did own) led to the underperformance. Euronet Worldwide, Inc. was pressured in its ATM segment by muted tourism demand. Within the Financials sector, continued high levels of catastrophe losses from wildfires and hurricanes pressured returns, as the market focused on more cyclical names. While 2021 was a challenging year, we expect more from ourselves and strive to deliver exceptional results over the long term to our clients. Although nothing is certain, a backdrop of rising interest rates provides a tailwind to value investors and our Fund.
12
Victory RS Large Cap Alpha Fund
Investment Overview
(Unaudited)
Average Annual Total Return
Year Ended December 31, 2021
| | | Class A | | Class C | | Class R | | Class Y | | | | | |
INCEPTION DATE | | 6/1/72 | | 8/7/00 | | 5/15/01 | | 5/1/07 | | | | | |
| | | Net Asset
Value | | Maximum
Offering
Price | | Net Asset
Value | | Contingent
Deferred
Charges | | Net Asset
Value | | Net Asset
Value | | Russell 1000®
Value1 | | S&P 500®
Index2 | |
One Year | | | 23.00 | % | | | 15.92 | % | | | 22.05 | % | | | 21.05 | % | | | 22.55 | % | | | 23.28 | % | | | 25.16 | % | | | 28.71 | % | |
Five Year | | | 11.29 | % | | | 9.99 | % | | | 10.41 | % | | | 10.41 | % | | | 10.88 | % | | | 11.53 | % | | | 11.16 | % | | | 18.47 | % | |
Ten Year | | | 12.69 | % | | | 12.02 | % | | | 11.79 | % | | | 11.79 | % | | | 12.27 | % | | | 12.94 | % | | | 12.97 | % | | | 16.55 | % | |
The performance data quoted represents past performance and current returns may be lower or higher. The investment return and principal value will fluctuate so that an investor's shares, when redeemed, may be worth more or less than the original cost. To obtain performance information current to the most recent month's end, please visit www.vcm.com.
The maximum offering price ("MOP") figures reflect a maximum sales charge of 5.75% for Class A. Class C is not subject to an initial sales charge, but is subject to a deferred sales charge of 1.00% on shares redeemed within one year of purchase. Net Asset Value ("NAV") does not reflect sales charges.
Total return measures the price change in a share assuming the reinvestment of all net investment income and realized capital gain distributions, if any. The total returns quoted do not reflect adjustments made to the enclosed financial statements in accordance with U.S. Generally Accepted Accounting Principles or the deduction of taxes that a shareholder would pay on net investment income and realized capital gain distributions, including reinvested distributions, or redemptions of shares. The total return figures set forth above include all waivers of fees. Without such fee waivers, the total returns would have been lower.
Victory RS Large Cap Alpha Fund — Growth of $10,000

1The Russell 1000® Value Index measures the performance of those Russell 1000 companies with lower price-to-book ratios and lower forecasted growth values. This index does not include the effect of sales charges, commissions, expenses or taxes, is not representative of the Fund and it is not possible to invest directly in an index.
2 The S&P 500® Index is an unmanaged index comprised of 500 domestically traded common stocks, is weighted according to the market value of each common stock in the index, and includes reinvestment of dividends. This index does not include the effect of sales charges, commissions, expenses or taxes, is not representative of the Fund and it is not possible to invest directly in an index.
The graph reflects investment of growth of a hypothetical $10,000 investment in the Fund.
The graph and table do not reflect the deduction of taxes that a shareholder would pay on Fund distributions or the redemption of shares.
Past performance is not indicative of future results.
13
Victory RS Investors Fund
Managers' Commentary
(Unaudited)
What were the market conditions during the reporting period?
Is the global economy approaching an important inflection point? Perhaps. U.S. equity markets certainly appear to be acting as if this is a possibility, vacillating and turning in mixed results during the fourth quarter of 2021. However, the optimists seemed to be winning this latest tug-of-war, and upbeat investor sentiment helped push several areas of the equities market to new all-time highs as we approached year-end.
In general, we have continued to see a normalization of economic activity following the rollout of COVID-19 vaccinations, though investors have lingering concerns over elevated inflation readings — evidenced by some of the highest year-over-year Consumer Price Index readings in decades — as well as the pending expiration of emergency fiscal and monetary measures. On top of that, we are experiencing another surge in COVID-19 cases due to the Delta and worrisome Omicron variants, which in turn is raising questions about whether corporate operations (and earnings) will be disrupted in the new calendar year.
Will the economy continue to normalize and grow, or are we poised to pull back in 2022? This ongoing uncertainty suggests that there will be a continued push and pull among investors in the year ahead. We expect that periods of elevated volatility may continue, especially for risk assets. Yet this type of ambiguity can also create attractive opportunities for patient, long-term investors. In fact, security selection looks to become more important than ever as some sectors of the economy are being discounted by investors, while other pockets of the market may be quite vulnerable given that investors have bid up some stocks well past what fundamentals appear to warrant.
An underlying theme for U.S. equity markets at the start of 2021 was that value-oriented cyclical stocks (defined as those with fundamentals that are closely tied to short-term economic output) had materially outperformed growth-oriented secular stocks (defined as stocks that are taking market share from legacy companies, and thus are less sensitive to short-term economic output). This theme reversed course to a large extent within the large-cap space, as large growth was the best performing style within U.S. equity markets during the fourth quarter of 2021. However, a similar reversal has not yet been seen in the small-cap space. In fact, small-cap secular growth has continued to struggle, whereas small-cap value was the best-performing investment style group for the entire year.
This cyclical versus secular tug-of-war was evident within indices. For example, earlier in the year, the Energy, Producer Durables, Materials & Processing, and Consumer Staples sectors led the market higher. Later in the year, however, market leadership (particularly within large-cap stocks) shifted back to growth-oriented technology. Perhaps even more telling was the tug-of-war between small and large companies during 2021. While investors embraced small-cap stocks early in the year, it became clear that higher inflation might be more than just "transitory." As a result, the U.S. Federal Reserve (the "Fed") adopted a more hawkish stance, which helped push investor preferences away from small-cap stocks and toward larger companies in the second half of the year.
In terms of the overall numbers, the Russell 3000® Value Index (the "Index") gained 7.54% during the fourth quarter of 2021 and was up 25.37% for the full year. In terms of market capitalizations, small was mighty when it came to value stocks in 2021. The Russell 2000®
14
Victory RS Investors Fund
Manager's Commentary (continued)
Value Index returned 28.27% for the year, while the Russell Midcap® Value Index returned 28.34% and the Russell 1000® Value Index posted an annual gain of 25.16%.
Looking ahead, the outlook remains mostly constructive for equities, though caveats always apply. The most obvious of these is the trajectory of the pandemic and the potential emergence of any new variants. Will we continue to cope adequately with these societal challenges, or will we revert to lockdowns? For the moment, investors remain relatively optimistic. Labor shortages and supply chain disruptions also pose risks, as does the potential for higher inflation. The Fed seems committed to addressing rising inflation and has all but banned the word "transitory" from its analysis. What remains to be seen is how far and how fast interest rates rise, and whether the alarming inflation readings of late 2021 subside. Despite the risks and inevitable bouts of volatility, we continue to see companies across the capitalization spectrum — including many in traditional value-oriented sectors — with solid fundamentals and encouraging earnings growth potential.
How did Victory RS Investors Fund (the "Fund") perform during the reporting period?
The Fund returned 25.74% (Class A at net asset value) for the fiscal year ended December 31, 2021, outperforming the Index, which returned 25.37% during the reporting period.
What strategies did you employ during the reporting period?
Relative returns were driven primarily by stock selection in several sectors that beat the Index's performance for the year. In the Industrials sector, TFI International benefited from strong domestic freight demand and market pricing in its trucking operations. Atkore, Inc., an electrical conduit business, saw improved pricing and market share gains. In the Technology sector, Verint Systems, Inc. contributed to performance as the company spun out its cybersecurity business. Detracting from performance was Cognyte Software Ltd., where new contract wins have been delayed as a result of the pandemic. Euronet Worldwide, Inc. also underperformed as its ATM segment remains pressured by lower tourist activity in key regions. In the end, the Fund performed in line with the Index in 2021. We feel confident in the securities that we own and are optimistic in our future performance, both absolute and relative, as interest rates normalize from generational lows over the intermediate term and deflate many of the speculative areas of the market. We believe our consistent focus on investing in quality companies with good balance sheets and durable cash flows, run by good managers, will continue to serve us well.
15
Victory RS Investors Fund
Investment Overview
(Unaudited)
Average Annual Total Return
Year Ended December 31, 2021
| | | Class A | | Class C | | Class R | | Class Y | | | |
INCEPTION DATE | | 11/15/05 | | 7/24/07 | | 1/3/07 | | 5/1/07 | | | |
| | | Net Asset
Value | | Maximum
Offering
Price | | Net Asset
Value | | Contingent
Deferred
Charges | | Net Asset
Value | | Net Asset
Value | | Russell 3000®
Value
Index1 | |
One Year | | | 25.74 | % | | | 18.54 | % | | | 24.78 | % | | | 23.78 | % | | | 25.00 | % | | | 26.07 | % | | | 25.37 | % | |
Five Year | | | 10.77 | % | | | 9.47 | % | | | 9.95 | % | | | 9.95 | % | | | 10.09 | % | | | 11.08 | % | | | 11.00 | % | |
Ten Year | | | 12.53 | % | | | 11.86 | % | | | 11.69 | % | | | 11.69 | % | | | 11.93 | % | | | 12.85 | % | | | 12.89 | % | |
The performance data quoted represents past performance and current returns may be lower or higher. The investment return and principal value will fluctuate so that an investor's shares, when redeemed, may be worth more or less than the original cost. To obtain performance information current to the most recent month's end, please visit www.vcm.com.
The maximum offering price ("MOP") figures reflect a maximum sales charge of 5.75% for Class A. Class C is not subject to an initial sales charge, but is subject to a deferred sales charge of 1.00% on shares redeemed within one year of purchase. Net Asset Value ("NAV") does not reflect sales charges.
Total return measures the price change in a share assuming the reinvestment of all net investment income and realized capital gain distributions, if any. The total returns quoted do not reflect adjustments made to the enclosed financial statements in accordance with U.S. Generally Accepted Accounting Principles or the deduction of taxes that a shareholder would pay on net investment income and realized capital gain distributions, including reinvested distributions, or redemptions of shares. The total return figures set forth above include all waivers of fees. Without such fee waivers, the total returns would have been lower.
Victory RS Investors Fund — Growth of $10,000

1The Russell 3000® Value Index measures the performance of those Russell 3000® Index companies with lower price-to-book ratios and lower forecasted growth values. The stocks in this index are also members of either the Russell 1000® Value or the Russell 2000® Value indexes. Index results assume the reinvestment of dividends paid on the stocks constituting the index. This index does not include the effect of sales charges, commissions, expenses or taxes, is not representative of the Fund and it is not possible to invest directly in an index.
The graph reflects investment of growth of a hypothetical $10,000 investment in the Fund.
The graph and table do not reflect the deduction of taxes that a shareholder would pay on Fund distributions or the redemption of shares.
Past performance is not indicative of future results.
16
Victory Global Energy Transition Fund
Managers' Commentary
(Unaudited)
What were the market conditions during the reporting period?
2021 has been a remarkable year for all things Energy Transition, which refers to efforts designed to develop energy systems with zero carbon emissions and expand access to affordable, sustainable energy services around the world. There has been a litany of promising advancements in areas such as grid-scale energy storage systems and electric vehicle penetration rates which are running well ahead of even the most aggressive forecasts. Conversely, troubling developments in Europe and the United Kingdom are stark reminder of the limitations of renewables and the unintended consequences of misplaced policy decisions. Regulators and investors are being forced to reconsider some long-held fundamental assumptions while consumers and the broader economy suffer from spiraling energy and heating costs.
Commodity markets are healing as the world ramps up to address one of its most pressing concerns — climate change — with one of the most complex, capital-intensive, resource-intensive endeavors ever undertaken. We remain steadfast in our belief that efforts to decarbonize our energy systems while at the same time addressing the cold reality of energy poverty must be driven by relative economics and cost/benefit analysis. If not, the Energy Transition will fail, and tens of trillions of dollars will be spent for naught.
More broadly, inflation concerns are rising, and rightly so from the perspective of the commodity markets. Capital constraints and resource exhaustion should drive prices higher, not lower, over the coming years. This runs counter to the experience of the past decade, and as a result, many investors still are reluctant to embrace this potential outcome.
This skepticism shows up in the public equity markets, as valuations in many resource-related areas are still extraordinarily attractive, in our opinion. Over time, we expect the Fund to reflect the realities of the Energy Transition, with the appropriate level of scarcity value ascribed to the building blocks of decarbonization. Until then, we remain excited to deploy capital into what we believe to be one of the most fundamentally attractive set-ups in recent memory.
How did Victory Global Energy Transition Fund (the "Fund") perform during the reporting period?
The Fund returned 83.01% (Class A at net asset value) for the fiscal year ended December 31, 2021, outperforming the MSCI World Commodity Producers Index (the "Index"), which returned 31.78% during the reporting period.
What strategies did you employ during the reporting period?
Fund performance was aided by strong returns in North American Natural Oil and Gas, Base Metals and a lack of exposure to Precious Metals. Stock selection in North American Natural Gas drove most of the relative outperformance versus the Index, assisted by investments in Base Metals and a lack of exposure to Precious Metals. Commodity mix was also a net positive contributor to relative returns, aided by exposure to Base Metals and North American Natural Gas. Not owning integrated oil companies and cash drag negatively impacted relative performance.
17
Victory Global Energy Transition Fund
Investment Overview
(Unaudited)
Average Annual Total Return
Year Ended December 31, 2021
| | | Class A | | Class C | | Class R | | Class Y | | | | | | | |
INCEPTION DATE | | 11/15/95 | | 5/1/07 | | 12/4/06 | | 5/1/07 | | | | | | | |
| | | Net Asset
Value | | Maximum
Offering
Price | | Net Asset
Value | | Contingent
Deferred
Charges | | Net Asset
Value | | Net Asset
Value | | MSCI
World
Commodity
Producers
Index1 | | S&P North
American
Natural
Resources
Sector
Index2 | | S&P 500®
Index3 | |
One Year | | | 83.01 | % | | | 72.54 | % | | | 81.64 | % | | | 80.64 | % | | | 82.44 | % | | | 83.62 | % | | | 31.78 | % | | | 39.94 | % | | | 28.71 | % | |
Five Year | | | –0.74 | % | | | –1.91 | % | | | –1.54 | % | | | –1.54 | % | | | –1.11 | % | | | –0.42 | % | | | 3.88 | % | | | 1.27 | % | | | 18.47 | % | |
Ten Year | | | –2.94 | % | | | –3.51 | % | | | –3.69 | % | | | –3.69 | % | | | –3.28 | % | | | –2.61 | % | | | 1.19 | % | | | 1.27 | % | | | 16.55 | % | |
The performance data quoted represents past performance and current returns may be lower or higher. The investment return and principal value will fluctuate so that an investor's shares, when redeemed, may be worth more or less than the original cost. To obtain performance information current to the most recent month's end, please visit www.vcm.com.
The maximum offering price ("MOP") figures reflect a maximum sales charge of 5.75% for Class A. Class C is not subject to an initial sales charge, but is subject to a deferred sales charge of 1.00% on shares redeemed within one year of purchase. Net Asset Value ("NAV") does not reflect sales charges.
Total return measures the price change in a share assuming the reinvestment of all net investment income and realized capital gain distributions, if any. The total returns quoted do not reflect adjustments made to the enclosed financial statements in accordance with U.S. Generally Accepted Accounting Principles or the deduction of taxes that a shareholder would pay on net investment income and realized capital gain distributions, including reinvested distributions, or redemptions of shares. The total return figures set forth above include all waivers of fees. Without such fee waivers, the total returns would have been lower.
Victory Global Energy Transition Fund — Growth of $10,000
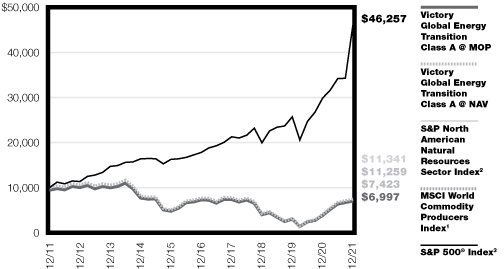
1The MSCI World Commodity Producers Index is an equity-based index designed to reflect the performance related to commodity producers stocks. The index is a free float-adjusted market-capitalization-weighted index composed of commodity producer companies based on the Global Industry Classification Standard (GICS®). The index reflects the reinvestment of dividends paid on the stocks constituting the index net of withholding taxes. This index does not include the effect of sales charges, commissions, expenses or taxes, is not representative of the Fund and it is not possible to invest directly in an index.
2The S&P North American Natural Resources Sector IndexTM is a modified capitalization-weighted index designed as a benchmark for U.S.-traded securities in the natural resources sector. The index includes companies involved in the following categories: extractive industries, energy companies, owners and operators of timber tracts, forestry services, producers of pulp and paper, and owners of plantations. Index results assume the reinvestment of dividends paid on the stocks constituting the index. This index does not include the effect of sales charges, commissions, expenses or taxes, is not representative of the Fund and it is not possible to invest directly in an index.
3The S&P 500® Index is an unmanaged index comprised of 500 domestically traded common stocks, is weighted according to the market value of each common stock in the index, and includes reinvestment of dividends. This index does not include the effect of sales charges, commissions, expenses or taxes, is not representative of the Fund and it is not possible to invest directly in an index.
The graph reflects investment of growth of a hypothetical $10,000 investment in the Fund.
The graph and table do not reflect the deduction of taxes that a shareholder would pay on Fund distributions or the redemption of shares.
Past performance is not indicative of future results.
18
Victory Portfolios
Victory RS Partners Fund | | December 31, 2021 | |
(Unaudited)
Investment Objective and Portfolio Holdings:
The Fund seeks to provide long-term capital appreciation.
Top 10 Holdings*:
December 31, 2021
(% of Net Assets)
First BanCorp/Puerto Rico | | | 3.0 | % | |
Federated Hermes, Inc. | | | 3.0 | % | |
Graphic Packaging Holding Co. | | | 2.8 | % | |
Eastern Bankshares, Inc. | | | 2.5 | % | |
NCR Corp. | | | 2.5 | % | |
Verint Systems, Inc. | | | 2.3 | % | |
Euronet Worldwide, Inc. | | | 2.3 | % | |
Carter's, Inc. | | | 2.2 | % | |
California Resources Corp. | | | 2.2 | % | |
GrafTech International Ltd. | | | 2.2 | % | |
Sector Allocation*:
December 31, 2021
(% of Net Assets)
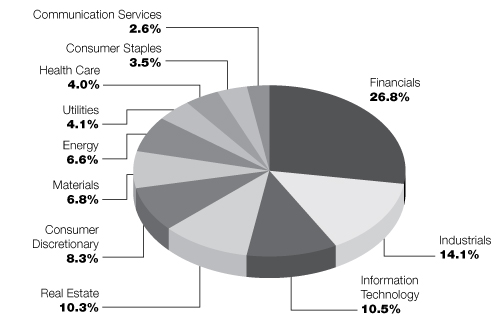
* Does not include futures contracts, money market instruments, and short-term investments purchased with cash collateral from securities loaned.
Percentages are of the net assets of the Fund and may not equal 100%.
Refer to the Schedule of Portfolio Investments for a complete list of securities.
19
Victory Portfolios
Victory RS Value Fund | | December 31, 2021 | |
(Unaudited)
Investment Objective and Portfolio Holdings:
The Fund seeks to provide long-term capital appreciation.
Top 10 Holdings*:
December 31, 2021
(% of Net Assets)
Vistra Corp. | | | 3.6 | % | |
Willis Towers Watson PLC | | | 3.3 | % | |
Sealed Air Corp. | | | 3.2 | % | |
Sotera Health Co. | | | 3.1 | % | |
Globe Life, Inc. | | | 3.1 | % | |
Graphic Packaging Holding Co. | | | 3.0 | % | |
Humana, Inc. | | | 2.8 | % | |
Olin Corp. | | | 2.8 | % | |
Federated Hermes, Inc. | | | 2.6 | % | |
Carter's, Inc. | | | 2.2 | % | |
Sector Allocation*:
December 31, 2021
(% of Net Assets)
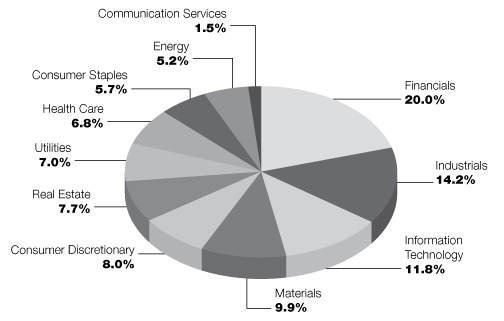
* Does not include futures contracts, money market instruments, and short-term investments purchased with cash collateral from securities loaned.
Percentages are of the net assets of the Fund and may not equal 100%.
Refer to the Schedule of Portfolio Investments for a complete list of securities.
20
Victory Portfolios
Victory RS Large Cap Alpha Fund | | December 31, 2021 | |
(Unaudited)
Investment Objective and Portfolio Holdings:
The Fund seeks to provide long-term capital appreciation.
Top 10 Holdings*:
December 31, 2021
(% of Net Assets)
Comerica, Inc. | | | 4.1 | % | |
Vistra Corp. | | | 3.7 | % | |
The Progressive Corp. | | | 3.7 | % | |
Keurig Dr Pepper, Inc. | | | 3.7 | % | |
Humana, Inc. | | | 3.7 | % | |
Willis Towers Watson PLC | | | 3.4 | % | |
Sealed Air Corp. | | | 3.2 | % | |
Mondelez International, Inc., Class A | | | 3.2 | % | |
Global Payments, Inc. | | | 3.1 | % | |
Meta Platforms, Inc., Class A | | | 3.1 | % | |
Sector Allocation*:
December 31, 2021
(% of Net Assets)
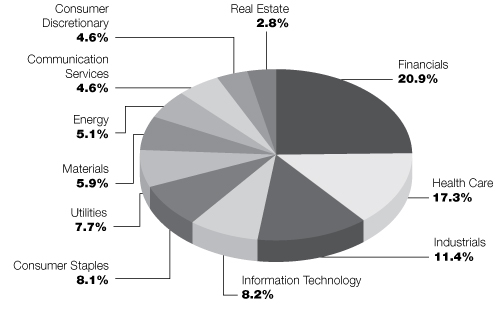
* Does not include futures contracts, money market instruments, and short-term investments purchased with cash collateral from securities loaned.
Percentages are of the net assets of the Fund and may not equal 100%.
Refer to the Schedule of Portfolio Investments for a complete list of securities.
21
Victory Portfolios
Victory RS Investors Fund | | December 31, 2021 | |
(Unaudited)
Investment Objective and Portfolio Holdings:
The Fund seeks to provide long-term capital appreciation.
Top 10 Holdings*:
December 31, 2021
(% of Net Assets)
Vistra Corp. | | | 6.6 | % | |
Olin Corp. | | | 5.9 | % | |
Keurig Dr Pepper, Inc. | | | 5.0 | % | |
Comerica, Inc. | | | 4.8 | % | |
Willis Towers Watson PLC | | | 4.8 | % | |
Graphic Packaging Holding Co. | | | 4.3 | % | |
Sealed Air Corp. | | | 4.2 | % | |
Humana, Inc. | | | 4.0 | % | |
Meta Platforms, Inc., Class A | | | 3.7 | % | |
Alleghany Corp. | | | 3.7 | % | |
Sector Allocation*:
December 31, 2021
(% of Net Assets)
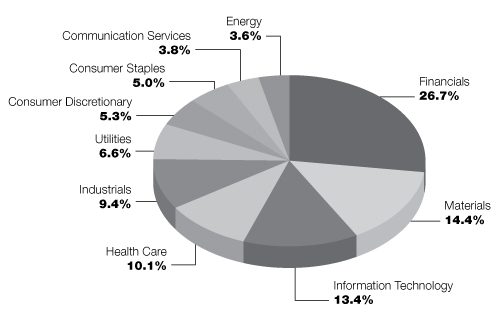
* Does not include futures contracts, money market instruments, and short-term investments purchased with cash collateral from securities loaned.
Percentages are of the net assets of the Fund and may not equal 100%.
Refer to the Schedule of Portfolio Investments for a complete list of securities.
22
Victory Portfolios
Victory Global Energy Transition Fund | | December 31, 2021 | |
(Unaudited)
Investment Objective and Portfolio Holdings:
The Fund seeks to provide long-term capital appreciation.
Top 10 Holdings*:
December 31, 2021
(% of Net Assets)
Turquoise Hill Resources Ltd. | | | 14.6 | % | |
Whitecap Resources, Inc. | | | 8.6 | % | |
First Quantum Minerals Ltd. | | | 8.2 | % | |
Antero Resources Corp. | | | 6.7 | % | |
Range Resources Corp. | | | 5.6 | % | |
Cameco Corp. | | | 5.6 | % | |
Tourmaline Oil Corp. | | | 4.7 | % | |
Peyto Exploration & Development Corp. | | | 4.7 | % | |
NextEra Energy, Inc. | | | 4.3 | % | |
Linde PLC | | | 4.2 | % | |
Sector Allocation*:
December 31, 2021
(% of Net Assets)
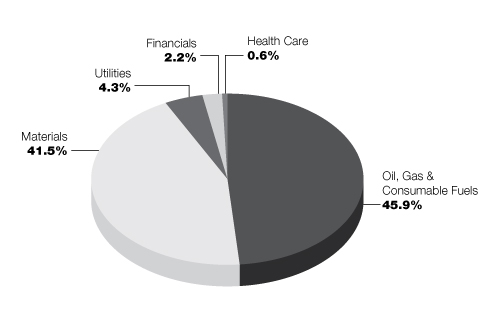
* Does not include futures contracts, money market instruments, and short-term investments purchased with cash collateral from securities loaned.
Percentages are of the net assets of the Fund and may not equal 100%.
Refer to the Schedule of Portfolio Investments for a complete list of securities.
23
Victory Portfolios
Victory RS Partners Fund | | Schedule of Portfolio Investments
December 31, 2021 | |
Security Description | | Shares | | Value | |
Common Stocks (97.5%) | |
Banks (17.2%): | |
Ameris Bancorp | | | 57,220 | | | $ | 2,842,690 | | |
Associated Bancorp | | | 133,460 | | | | 3,014,861 | | |
Banner Corp. | | | 109,480 | | | | 6,642,151 | | |
Columbia Banking System, Inc. | | | 85,276 | | | | 2,790,231 | | |
Eastern Bankshares, Inc. | | | 468,610 | | | | 9,451,864 | | |
First BanCorp/Puerto Rico | | | 823,160 | | | | 11,343,145 | | |
Pacific Premier Bancorp, Inc. | | | 43,960 | | | | 1,759,719 | | |
Pinnacle Financial Partners, Inc. | | | 56,180 | | | | 5,365,190 | | |
SouthState Corp. | | | 50,350 | | | | 4,033,538 | | |
Synovus Financial Corp. | | | 101,180 | | | | 4,843,487 | | |
The Bank of NT Butterfield & Son Ltd. | | | 174,040 | | | | 6,632,664 | | |
UMB Financial Corp. | | | 56,542 | | | | 5,999,672 | | |
| | | | 64,719,212 | | |
Capital Markets (3.0%): | |
Federated Hermes, Inc. | | | 298,410 | | | | 11,214,248 | | |
Communication Services (2.6%): | |
Madison Square Garden Sports Corp. (a) | | | 21,730 | | | | 3,775,153 | | |
World Wrestling Entertainment, Inc., Class A (b) | | | 123,210 | | | | 6,079,181 | | |
| | | | 9,854,334 | | |
Consumer Discretionary (8.3%): | |
Adient PLC (a) | | | 44,260 | | | | 2,119,169 | | |
Carter's, Inc. | | | 83,260 | | | | 8,427,577 | | |
Dana, Inc. | | | 251,680 | | | | 5,743,338 | | |
Dine Brands Global, Inc. | | | 50,360 | | | | 3,817,792 | | |
Taylor Morrison Home Corp. (a) | | | 189,520 | | | | 6,625,619 | | |
Wolverine World Wide, Inc. | | | 153,130 | | | | 4,411,675 | | |
| | | | 31,145,170 | | |
Consumer Staples (3.5%): | |
Herbalife Nutrition Ltd. (a) | | | 92,170 | | | | 3,772,518 | | |
Hostess Brands, Inc. (a) | | | 150,111 | | | | 3,065,267 | | |
Nomad Foods Ltd. (a) | | | 251,440 | | | | 6,384,061 | | |
| | | | 13,221,846 | | |
Energy (6.6%): | |
California Resources Corp. | | | 195,150 | | | | 8,334,857 | | |
Comstock Resources, Inc. (a) | | | 439,510 | | | | 3,555,636 | | |
Magnolia Oil & Gas Corp., Class A (b) | | | 247,860 | | | | 4,677,118 | | |
National Energy Services Reunited Corp. (a) | | | 123,040 | | | | 1,162,728 | | |
PDC Energy, Inc. | | | 146,030 | | | | 7,123,343 | | |
| | | | 24,853,682 | | |
Health Care (3.9%): | |
The Ensign Group, Inc. | | | 94,290 | | | | 7,916,588 | | |
Tivity Health, Inc. (a) (b) | | | 255,990 | | | | 6,768,376 | | |
| | | | 14,684,964 | | |
See notes to financial statements.
24
Victory Portfolios
Victory RS Partners Fund | | Schedule of Portfolio Investments — continued
December 31, 2021 | |
Security Description | | Shares | | Value | |
Industrials (14.1%): | |
Altra Industrial Motion Corp. | | | 72,890 | | | $ | 3,758,937 | | |
American Woodmark Corp. (a) (b) | | | 33,560 | | | | 2,188,112 | | |
ArcBest Corp. | | | 30,590 | | | | 3,666,212 | | |
Atkore, Inc. (a) | | | 34,970 | | | | 3,888,314 | | |
Finning International, Inc. | | | 123,130 | | | | 3,103,561 | | |
GMS, Inc. (a) | | | 63,270 | | | | 3,803,160 | | |
GrafTech International Ltd. | | | 690,100 | | | | 8,163,883 | | |
H&E Equipment Services, Inc. | | | 81,070 | | | | 3,588,969 | | |
McGrath RentCorp | | | 39,870 | | | | 3,199,966 | | |
Meritor, Inc. (a) | | | 286,850 | | | | 7,108,143 | | |
Primoris Services Corp. | | | 230,280 | | | | 5,522,115 | | |
SkyWest, Inc. (a) | | | 132,150 | | | | 5,193,495 | | |
| | | | 53,184,867 | | |
Information Technology (10.5%): | |
Cognyte Software Ltd. (a) | | | 447,420 | | | | 7,011,071 | | |
Euronet Worldwide, Inc. (a) | | | 72,050 | | | | 8,586,199 | | |
NCR Corp. (a) | | | 233,930 | | | | 9,403,986 | | |
Verint Systems, Inc. (a) | | | 165,110 | | | | 8,669,926 | | |
Verra Mobility Corp. (a) | | | 392,200 | | | | 6,051,646 | | |
| | | | 39,722,828 | | |
Insurance (6.6%): | |
Alleghany Corp. (a) | | | 10,540 | | | | 7,036,399 | | |
Globe Life, Inc. | | | 80,260 | | | | 7,521,967 | | |
Kemper Corp. | | | 78,630 | | | | 4,622,658 | | |
Primerica, Inc. | | | 36,793 | | | | 5,639,263 | | |
| | | | 24,820,287 | | |
Materials (6.8%): | |
Constellium SE (a) | | | 209,070 | | | | 3,744,444 | | |
Graphic Packaging Holding Co. | | | 539,230 | | | | 10,514,985 | | |
Olin Corp. | | | 133,430 | | | | 7,674,893 | | |
Summit Materials, Inc., Class A (a) | | | 91,157 | | | | 3,659,042 | | |
| | | | 25,593,364 | | |
Real Estate (10.3%): | |
Apple Hospitality REIT, Inc. | | | 428,090 | | | | 6,913,653 | | |
Cushman & Wakefield PLC (a) | | | 286,420 | | | | 6,369,981 | | |
Equity Commonwealth (a) | | | 250,180 | | | | 6,479,662 | | |
Four Corners Property Trust, Inc. | | | 245,770 | | | | 7,228,095 | | |
Jones Lang LaSalle, Inc. (a) | | | 24,170 | | | | 6,509,948 | | |
Kennedy-Wilson Holdings, Inc. | | | 231,860 | | | | 5,536,817 | | |
| | | | 39,038,156 | | |
See notes to financial statements.
25
Victory Portfolios
Victory RS Partners Fund | | Schedule of Portfolio Investments — continued
December 31, 2021 | |
Security Description | | Shares | | Value | |
Utilities (4.1%): | |
Black Hills Corp. | | | 73,935 | | | $ | 5,217,593 | | |
NorthWestern Corp. | | | 79,200 | | | | 4,527,072 | | |
South Jersey Industries, Inc. | | | 219,500 | | | | 5,733,340 | | |
| | | | 15,478,005 | | |
Total Common Stocks (Cost $277,039,047) | | | 367,530,963 | | |
Preferred Stocks (0.1%) | |
Health Care (0.1%): | |
WellDoc, Inc. Series B (a) (c) (d) | | | 1,587,483 | | | | 587,369 | | |
Total Preferred Stocks (Cost $1,942,920) | | | 587,369 | | |
Collateral for Securities Loaned (2.1%)^ | |
BlackRock Liquidity Funds TempFund Portfolio, Institutional Shares, 0.04% (e) | | | 183,146 | | | | 183,146 | | |
Fidelity Investments Money Market Government Portfolio, Institutional Shares,
0.01% (e) | | | 3,597,002 | | | | 3,597,002 | | |
Goldman Sachs Financial Square Prime Obligations Fund, Institutional Shares,
0.02% (e) | | | 91,399 | | | | 91,399 | | |
JPMorgan Prime Money Market Fund, Capital Shares, 0.07% (e) | | | 728,785 | | | | 728,785 | | |
Morgan Stanley Institutional Liquidity Prime Portfolio, Institutional Shares,
0.06% (e) | | | 3,276,757 | | | | 3,276,757 | | |
Total Collateral for Securities Loaned (Cost $7,877,089) | | | 7,877,089 | | |
Total Investments (Cost $286,859,056) — 99.7% | | | 375,995,421 | | |
Other assets in excess of liabilities — 0.3% | | | 982,127 | | |
NET ASSETS — 100.00% | | $ | 376,977,548 | | |
^ Purchased with cash collateral from securities on loan.
(a) Non-income producing security.
(b) All or a portion of this security is on loan.
(c) Security was fair valued based upon procedures approved by the Board of Trustees and represents 0.1% of net assets as of December 31, 2021. This security is classified as Level 3 within the fair value hierarchy. (See Note 2 in the Notes to Financial Statements)
(d) The Fund's Adviser has deemed this security to be illiquid based upon procedures approved by the Board. As of December 31, 2021, illiquid securities were 0.1% of net assets.
(e) Rate disclosed is the daily yield on December 31, 2021.
PLC — Public Limited Company
REIT — Real Estate Investment Trust
See notes to financial statements.
26
Victory Portfolios
Victory RS Value Fund | | Schedule of Portfolio Investments
December 31, 2021 | |
Security Description | | Shares | | Value | |
Common Stocks (97.8%) | |
Communication Services (1.5%): | |
World Wrestling Entertainment, Inc., Class A (a) | | | 104,690 | | | $ | 5,165,405 | | |
Consumer Discretionary (8.0%): | |
Adient PLC (b) | | | 131,420 | | | | 6,292,390 | | |
Carter's, Inc. | | | 71,990 | | | | 7,286,828 | | |
LKQ Corp. | | | 97,320 | | | | 5,842,120 | | |
Taylor Morrison Home Corp. (b) | | | 141,020 | | | | 4,930,059 | | |
The Wendy's Co. | | | 102,370 | | | | 2,441,524 | | |
| | | | 26,792,921 | | |
Consumer Staples (5.7%): | |
Herbalife Nutrition Ltd. (b) | | | 81,310 | | | | 3,328,018 | | |
Keurig Dr Pepper, Inc. | | | 185,965 | | | | 6,854,670 | | |
Nomad Foods Ltd. (b) | | | 212,870 | | | | 5,404,769 | | |
U.S. Foods Holding Corp. (a) (b) | | | 103,680 | | | | 3,611,175 | | |
| | | | 19,198,632 | | |
Energy (5.2%): | |
Baker Hughes Co. | | | 187,110 | | | | 4,501,867 | | |
Chesapeake Energy Corp. (a) | | | 89,610 | | | | 5,781,637 | | |
Devon Energy Corp. | | | 158,150 | | | | 6,966,507 | | |
| | | | 17,250,011 | | |
Financials (20.0%): | |
Alleghany Corp. (b) | | | 8,740 | | | | 5,834,737 | | |
Cboe Global Markets, Inc. | | | 45,260 | | | | 5,901,904 | | |
Citizens Financial Group, Inc. | | | 109,300 | | | | 5,164,425 | | |
Federated Hermes, Inc. | | | 228,980 | | | | 8,605,068 | | |
First Horizon Corp. | | | 211,650 | | | | 3,456,244 | | |
Globe Life, Inc. | | | 111,240 | | | | 10,425,413 | | |
Interactive Brokers Group, Inc. | | | 69,400 | | | | 5,511,748 | | |
KeyCorp | | | 217,840 | | | | 5,038,639 | | |
The Progressive Corp. | | | 57,890 | | | | 5,942,409 | | |
Willis Towers Watson PLC | | | 46,420 | | | | 11,024,286 | | |
| | | | 66,904,873 | | |
Health Care (6.8%): | |
Humana, Inc. | | | 20,380 | | | | 9,453,467 | | |
Sotera Health Co. (a) (b) | | | 445,050 | | | | 10,480,927 | | |
Zimmer Biomet Holdings, Inc. | | | 21,550 | | | | 2,737,712 | | |
| | | | 22,672,106 | | |
Industrials (14.2%): | |
Crane Co. (a) | | | 30,030 | | | | 3,054,952 | | |
Curtiss-Wright Corp. | | | 25,090 | | | | 3,479,230 | | |
Fluor Corp. (b) | | | 236,720 | | | | 5,863,554 | | |
GrafTech International Ltd. | | | 530,070 | | | | 6,270,728 | | |
See notes to financial statements.
27
Victory Portfolios
Victory RS Value Fund | | Schedule of Portfolio Investments — continued
December 31, 2021 | |
Security Description | | Shares | | Value | |
Leidos Holdings, Inc. | | | 56,360 | | | $ | 5,010,404 | | |
nVent Electric PLC | | | 67,890 | | | | 2,579,820 | | |
Regal Rexnord Corp. | | | 22,750 | | | | 3,871,595 | | |
Sensata Technologies Holding PLC (b) | | | 88,690 | | | | 5,471,286 | | |
TFI International, Inc. | | | 20,460 | | | | 2,293,771 | | |
The Timken Co. | | | 60,720 | | | | 4,207,289 | | |
Triton International Ltd. | | | 62,530 | | | | 3,766,182 | | |
United Rentals, Inc. (b) | | | 4,940 | | | | 1,641,513 | | |
| | | | 47,510,324 | | |
Information Technology (11.8%): | |
Cognyte Software Ltd. (b) | | | 383,620 | | | | 6,011,326 | | |
Euronet Worldwide, Inc. (b) | | | 58,813 | | | | 7,008,745 | | |
Fiserv, Inc. (b) | | | 59,170 | | | | 6,141,254 | | |
Global Payments, Inc. | | | 46,860 | | | | 6,334,535 | | |
NCR Corp. (b) | | | 180,580 | | | | 7,259,316 | | |
Verint Systems, Inc. (b) | | | 131,090 | | | | 6,883,536 | | |
| | | | 39,638,712 | | |
Materials (9.9%): | |
Graphic Packaging Holding Co. | | | 511,460 | | | | 9,973,470 | | |
Olin Corp. | | | 160,080 | | | | 9,207,802 | | |
Sealed Air Corp. | | | 157,060 | | | | 10,596,838 | | |
Summit Materials, Inc., Class A (b) | | | 82,860 | | | | 3,326,000 | | |
| | | | 33,104,110 | | |
Real Estate (7.7%): | |
Americold Realty Trust | | | 139,930 | | | | 4,588,305 | | |
Apple Hospitality REIT, Inc. | | | 260,940 | | | | 4,214,181 | | |
Cushman & Wakefield PLC (b) | | | 189,020 | | | | 4,203,805 | | |
Equity Commonwealth (b) | | | 207,430 | | | | 5,372,437 | | |
Healthcare Trust of America, Inc., Class A | | | 109,160 | | | | 3,644,852 | | |
Highwoods Properties, Inc. | | | 81,040 | | | | 3,613,573 | | |
| | | | 25,637,153 | | |
Utilities (7.0%): | |
Evergy, Inc. | | | 52,230 | | | | 3,583,500 | | |
FirstEnergy Corp. | | | 89,650 | | | | 3,728,543 | | |
The AES Corp. | | | 181,180 | | | | 4,402,674 | | |
Vistra Corp. | | | 522,240 | | | | 11,891,405 | | |
| | | | 23,606,122 | | |
Total Common Stocks (Cost $262,095,697) | | | 327,480,369 | | |
Collateral for Securities Loaned (2.6%)^ | |
BlackRock Liquidity Funds TempFund Portfolio, Institutional Shares, 0.04% (c) | | | 200,105 | | | | 200,105 | | |
Fidelity Investments Money Market Government Portfolio, Institutional Shares,
0.01% (c) | | | 3,930,098 | | | | 3,930,098 | | |
Goldman Sachs Financial Square Prime Obligations Fund, Institutional Shares,
0.02% (c) | | | 99,863 | | | | 99,863 | | |
See notes to financial statements.
28
Victory Portfolios
Victory RS Value Fund | | Schedule of Portfolio Investments — continued
December 31, 2021 | |
Security Description | | Shares | | Value | |
JPMorgan Prime Money Market Fund, Capital Shares, 0.07% (c) | | | 796,273 | | | $ | 796,273 | | |
Morgan Stanley Institutional Liquidity Prime Portfolio, Institutional Shares,
0.06% (c) | | | 3,580,197 | | | | 3,580,197 | | |
Total Collateral for Securities Loaned (Cost $8,606,536) | | | 8,606,536 | | |
Total Investments (Cost $270,702,233) — 100.4% | | | 336,086,905 | | |
Liabilities in excess of other assets — (0.4)% | | | (1,387,789 | ) | |
NET ASSETS — 100.00% | | $ | 334,699,116 | | |
^ Purchased with cash collateral from securities on loan.
(a) All or a portion of this security is on loan.
(b) Non-income producing security.
(c) Rate disclosed is the daily yield on December 31, 2021.
PLC — Public Limited Company
REIT — Real Estate Investment Trust
See notes to financial statements.
29
Victory Portfolios
Victory RS Large Cap Alpha Fund | | Schedule of Portfolio Investments
December 31, 2021 | |
Security Description | | Shares | | Value | |
Common Stocks (96.6%) | |
Communication Services (4.6%): | |
Alphabet, Inc., Class A (a) | | | 2,750 | | | $ | 7,966,860 | | |
Meta Platforms, Inc., Class A (a) | | | 48,350 | | | | 16,262,523 | | |
| | | | 24,229,383 | | |
Consumer Discretionary (4.6%): | |
General Motors Co. (a) | | | 136,480 | | | | 8,001,823 | | |
LKQ Corp. | | | 161,680 | | | | 9,705,650 | | |
Target Corp. | | | 29,150 | | | | 6,746,476 | | |
| | | | 24,453,949 | | |
Consumer Staples (8.1%): | |
Keurig Dr Pepper, Inc. | | | 529,440 | | | | 19,515,158 | | |
Lamb Weston Holdings, Inc. | | | 96,280 | | | | 6,102,226 | | |
Mondelez International, Inc., Class A | | | 256,560 | | | | 17,012,494 | | |
| | | | 42,629,878 | | |
Energy (5.1%): | |
Enterprise Products Partners LP | | | 422,830 | | | | 9,285,347 | | |
Hess Corp. | | | 93,830 | | | | 6,946,235 | | |
Pioneer Natural Resources Co. | | | 41,970 | | | | 7,633,504 | | |
Valero Energy Corp. | | | 38,250 | | | | 2,872,957 | | |
| | | | 26,738,043 | | |
Financials (20.9%): | |
Cboe Global Markets, Inc. | | | 103,830 | | | | 13,539,432 | | |
Comerica, Inc. | | | 249,410 | | | | 21,698,670 | | |
Interactive Brokers Group, Inc. | | | 131,120 | | | | 10,413,550 | | |
JPMorgan Chase & Co. | | | 66,430 | | | | 10,519,191 | | |
KeyCorp | | | 280,870 | | | | 6,496,523 | | |
The Progressive Corp. | | | 190,260 | | | | 19,530,189 | | |
U.S. Bancorp | | | 184,860 | | | | 10,383,586 | | |
Willis Towers Watson PLC | | | 76,550 | | | | 18,179,860 | | |
| | | | 110,761,001 | | |
Health Care (17.3%): | |
AbbVie, Inc. | | | 98,890 | | | | 13,389,706 | | |
Cigna Corp. | | | 61,430 | | | | 14,106,171 | | |
Humana, Inc. | | | 41,910 | | | | 19,440,373 | | |
Johnson & Johnson | | | 47,520 | | | | 8,129,246 | | |
Medtronic PLC | | | 136,530 | | | | 14,124,028 | | |
Sotera Health Co. (a) | | | 466,510 | | | | 10,986,311 | | |
UnitedHealth Group, Inc. | | | 22,525 | | | | 11,310,703 | | |
| | | | 91,486,538 | | |
Industrials (11.4%): | |
Eaton Corp. PLC | | | 30,810 | | | | 5,324,584 | | |
Johnson Controls International PLC | | | 33,810 | | | | 2,749,091 | | |
L3Harris Technologies, Inc. | | | 23,790 | | | | 5,072,980 | | |
Leidos Holdings, Inc. | | | 95,050 | | | | 8,449,945 | | |
PACCAR, Inc. | | | 81,130 | | | | 7,160,534 | | |
See notes to financial statements.
30
Victory Portfolios
Victory RS Large Cap Alpha Fund | | Schedule of Portfolio Investments — continued
December 31, 2021 | |
Security Description | | Shares | | Value | |
Parker-Hannifin Corp. | | | 20,220 | | | $ | 6,432,386 | | |
Raytheon Technologies Corp. | | | 58,852 | | | | 5,064,803 | | |
Sensata Technologies Holding PLC (a) | | | 136,320 | | | | 8,409,581 | | |
Union Pacific Corp. | | | 46,530 | | | | 11,722,303 | | |
| | | | 60,386,207 | | |
Information Technology (8.2%): | |
Euronet Worldwide, Inc. (a) | | | 85,390 | | | | 10,175,926 | | |
Fidelity National Information Services, Inc. | | | 89,330 | | | | 9,750,369 | | |
FleetCor Technologies, Inc. (a) | | | 32,840 | | | | 7,350,906 | | |
Global Payments, Inc. | | | 120,650 | | | | 16,309,467 | | |
| | | | 43,586,668 | | |
Materials (5.9%): | |
Freeport-McMoRan, Inc. | | | 154,750 | | | | 6,457,718 | | |
PPG Industries, Inc. | | | 43,250 | | | | 7,458,030 | | |
Sealed Air Corp. | | | 254,002 | | | | 17,137,515 | | |
| | | | 31,053,263 | | |
Real Estate (2.8%): | |
Host Hotels & Resorts, Inc. (a) | | | 850,190 | | | | 14,784,804 | | |
Utilities (7.7%): | |
Exelon Corp. | | | 252,760 | | | | 14,599,418 | | |
FirstEnergy Corp. | | | 157,850 | | | | 6,564,981 | | |
Vistra Corp. | | | 861,600 | | | | 19,618,632 | | |
| | | | 40,783,031 | | |
Total Common Stocks (Cost $393,641,086) | | | 510,892,765 | | |
Total Investments (Cost $393,641,086) — 96.6% | | | 510,892,765 | | |
Other assets in excess of liabilities — 3.4% | | | 17,824,478 | | |
NET ASSETS — 100.00% | | $ | 528,717,243 | | |
(a) Non-income producing security.
LP — Limited Partnership
PLC — Public Limited Company
See notes to financial statements.
31
Victory Portfolios
Victory RS Investors Fund | | Schedule of Portfolio Investments
December 31, 2021 | |
Security Description | | Shares | | Value | |
Common Stocks (98.3%) | |
Banks (9.7%): | |
Citizens Financial Group, Inc. | | | 19,630 | | | $ | 927,517 | | |
Comerica, Inc. | | | 17,040 | | | | 1,482,480 | | |
First Horizon Corp. | | | 38,120 | | | | 622,500 | | |
| | | | 3,032,497 | | |
Capital Markets (5.4%): | |
Cboe Global Markets, Inc. | | | 7,090 | | | | 924,536 | | |
Federated Hermes, Inc. | | | 20,000 | | | | 751,600 | | |
| | | | 1,676,136 | | |
Communication Services (3.8%): | |
Meta Platforms, Inc., Class A (a) | | | 3,470 | | | | 1,167,135 | | |
Consumer Discretionary (5.3%): | |
Carter's, Inc. | | | 8,740 | | | | 884,663 | | |
LKQ Corp. | | | 12,570 | | | | 754,577 | | |
| | | | 1,639,240 | | |
Consumer Staples (5.0%): | |
Keurig Dr Pepper, Inc. | | | 41,900 | | | | 1,544,434 | | |
Energy (3.6%): | |
PDC Energy, Inc. | | | 23,030 | | | | 1,123,403 | | |
Health Care (10.1%): | |
Cigna Corp. | | | 4,460 | | | | 1,024,150 | | |
Humana, Inc. | | | 2,700 | | | | 1,252,422 | | |
Sotera Health Co. (a) | | | 37,280 | | | | 877,944 | | |
| | | | 3,154,516 | | |
Industrials (9.4%): | |
Fluor Corp. (a) | | | 41,480 | | | | 1,027,460 | | |
GrafTech International Ltd. | | | 96,080 | | | | 1,136,626 | | |
Meritor, Inc. (a) | | | 30,890 | | | | 765,454 | | |
| | | | 2,929,540 | | |
Information Technology (13.4%): | |
Cognyte Software Ltd. (a) | | | 48,900 | | | | 766,263 | | |
Euronet Worldwide, Inc. (a) | | | 7,620 | | | | 908,075 | | |
Fidelity National Information Services, Inc. | | | 8,730 | | | | 952,880 | | |
NCR Corp. (a) | | | 17,000 | | | | 683,400 | | |
Verint Systems, Inc. (a) | | | 16,660 | | | | 874,817 | | |
| | | | 4,185,435 | | |
Insurance (11.6%): | |
Alleghany Corp. (a) | | | 1,730 | | | | 1,154,931 | | |
The Progressive Corp. | | | 9,500 | | | | 975,175 | | |
Willis Towers Watson PLC | | | 6,240 | | | | 1,481,937 | | |
| | | | 3,612,043 | | |
See notes to financial statements.
32
Victory Portfolios
Victory RS Investors Fund | | Schedule of Portfolio Investments — continued
December 31, 2021 | |
Security Description | | Shares | | Value | |
Materials (14.4%): | |
Graphic Packaging Holding Co. | | | 68,510 | | | $ | 1,335,945 | | |
Olin Corp. | | | 31,750 | | | | 1,826,260 | | |
Sealed Air Corp. | | | 19,350 | | | | 1,305,545 | | |
| | | | 4,467,750 | | |
Utilities (6.6%): | |
Vistra Corp. | | | 89,920 | | | | 2,047,478 | | |
Total Common Stocks (Cost $24,862,039) | | | 30,579,607 | | |
Total Investments (Cost $24,862,039) — 98.3% | | | 30,579,607 | | |
Other assets in excess of liabilities — 1.7% | | | 544,078 | | |
NET ASSETS — 100.00% | | $ | 31,123,685 | | |
(a) Non-income producing security.
PLC — Public Limited Company
See notes to financial statements.
33
Victory Portfolios
Victory Global Energy Transition Fund | | Schedule of Portfolio Investments
December 31, 2021 | |
Security Description | | Shares or
Principal
Amount | | Value | |
Common Stocks (92.0%) | |
Chemicals (8.3%): | |
Linde PLC | | | 35,872 | | | $ | 12,427,137 | | |
Sociedad Quimica y Minera de Chile SA, ADR | | | 231,922 | | | | 11,695,826 | | |
| | | | 24,122,963 | | |
Financials (0.3%): | |
Ivanhoe (a) (b) (c) | | | 969,000 | | | | 804,270 | | |
Health Care (0.6%): | |
Novus PIPE (a) (b) (e) (f) (g) (h) (k) | | | 179,725 | | | | 1,728,089 | | |
Metals & Mining (33.2%): | |
First Quantum Minerals Ltd. | | | 1,002,606 | | | | 23,995,006 | | |
HudBay Minerals, Inc. (d) | | | 422,265 | | | | 3,058,149 | | |
Lundin Mining Corp. | | | 944,011 | | | | 7,374,153 | | |
Newmont Corp. | | | 158,101 | | | | 9,805,424 | | |
Norsk Hydro ASA | | | 977,725 | | | | 7,721,483 | | |
Rio Tinto PLC, ADR (d) | | | 40,319 | | | | 2,698,954 | | |
Turquoise Hill Resources Ltd. (a) | | | 2,608,571 | | | | 42,910,993 | | |
| | | | 97,564,162 | | |
Oil, Gas & Consumable Fuels (45.3%): | |
Antero Resources Corp. (a) | | | 1,116,185 | | | | 19,533,237 | | |
ARC Resources Ltd. | | | 962,123 | | | | 8,747,956 | | |
Cameco Corp. (d) | | | 748,755 | | | | 16,327,216 | | |
Cheniere Energy, Inc. | | | 119,966 | | | | 12,166,952 | | |
PDC Energy, Inc. | | | 158,896 | | | | 7,750,947 | | |
Peyto Exploration & Development Corp. | | | 1,836,652 | | | | 13,722,613 | | |
Range Resources Corp. (a) | | | 928,837 | | | | 16,561,164 | | |
Tourmaline Oil Corp. | | | 425,030 | | | | 13,724,087 | | |
Whitecap Resources, Inc. | | | 4,092,082 | | | | 24,232,839 | | |
| | | 132,767,011 | | |
Utilities (4.3%): | |
NextEra Energy, Inc. (i) | | | 135,351 | | | | 12,636,369 | | |
Total Common Stocks (Cost $163,064,922) | | | 269,622,864 | | |
Preferred Stocks (0.6%) | |
Energy (0.6%): | |
Energy Vault SA (a) (b) (c) | | | 36,659 | | | | 1,797,237 | | |
Total Preferred Stocks (Cost $1,797,237) | | | 1,797,237 | | |
Convertible Corporate Bonds (1.9%) | |
Financials (1.9%): | |
Ipulse, 2.00%, 7/31/23 (PIK Exchange Right) (a) (b) (c) | | $ | 1,608,540 | | | | 1,608,540 | | |
| Ivanhoe, 2.00%, 7/31/23 (a) (b) (c) | | | 4,021,350 | | | | 4,021,350 | | |
Total Convertible Corporate Bonds (Cost $5,629,890) | | | 5,629,890 | | |
See notes to financial statements.
34
Victory Portfolios
Victory Global Energy Transition Fund | | Schedule of Portfolio Investments — continued
December 31, 2021 | |
Security Description | | Shares | | Value | |
Collateral for Securities Loaned (1.4%)^ | |
BlackRock Liquidity Funds TempFund Portfolio, Institutional Shares, 0.04% (j) | | | 96,917 | | | $ | 96,917 | | |
Fidelity Investments Money Market Government Portfolio, Institutional Shares,
0.01% (j) | | | 1,903,460 | | | | 1,903,460 | | |
Goldman Sachs Financial Square Prime Obligations Fund, Institutional Shares,
0.02% (j) | | | 48,366 | | | | 48,366 | | |
JPMorgan Prime Money Market Fund, Capital Shares, 0.07% (j) | | | 385,658 | | | | 385,658 | | |
Morgan Stanley Institutional Liquidity Prime Portfolio, Institutional Shares,
0.06% (j) | | | 1,733,993 | | | | 1,733,993 | | |
Total Collateral for Securities Loaned (Cost $4,168,394) | | | 4,168,394 | | |
Total Investments (Cost $174,660,443) — 95.9% | | | 281,218,385 | | |
Other assets in excess of liabilities — 4.1% | | | 11,950,438 | | |
NET ASSETS — 100.00% | | $ | 293,168,823 | | |
^ Purchased with cash collateral from securities on loan.
(a) Non-income producing security.
(b) The Fund's Adviser has deemed this security to be illiquid based upon procedures approved by the Board of Trustees. As of December 31, 2021, illiquid securities were 3.4% of net assets.
(c) Security was fair valued based upon procedures approved by the Board of Trustees and represents 2.8% of net assets as of December 31, 2021. This security is classified as Level 3 within the fair value hierarchy. (See Note 2 in the Notes to Financial Statements)
(d) All or a portion of this security is on loan.
(e) This security is held in connection with special purpose acquisition company transactions.
(f) Restricted security that is not registered under the Securities Act of 1933.
(g) The following table details the acquisition date and cost of the Fund's restricted securities at December 31, 2021:
Security Name | | Acquisition Date | | Cost | |
Novus | | 9/9/2021 | | $ | 1,797,250 | | |
(h) Security or portion of security purchased on a forward settlement basis.
(i) All or a portion of this security has been segregated as collateral for securities purchases on a forward settlement basis.
(j) Rate disclosed is the daily yield on December 31, 2021.
(k) Security was fair valued based upon procedures approved by the Board of Trustees and represents 0.6% of net assets as of December 31, 2021. (See Note 2 in the Notes to Financial Statements)
ADR — American Depositary Receipt
PIK — Payment-in-Kind
PIPE — Private Investment in Public Equity
PLC — Public Limited Company
See notes to financial statements.
35
Victory Portfolios | | Statements of Assets and Liabilities
December 31, 2021 | |
| | | Victory
RS Partners
Fund | | Victory
RS Value
Fund | | Victory
RS Large
Cap Alpha
Fund | |
Assets: | |
Investments, at value (Cost $286,859,056,
$270,702,233 and $393,641,086) | | $ | 375,995,421 | (a) | | $ | 336,086,905 | (b) | | $ | 510,892,765 | | |
Cash | | | 10,944,680 | | | | 7,583,599 | | | | 19,071,660 | | |
Receivables: | |
Interest and dividends | | | 306,413 | | | | 178,977 | | | | 671,283 | | |
Capital shares issued | | | 639,985 | | | | 62,140 | | | | 82,885 | | |
Investments sold | | | 1,955,622 | | | | — | | | | — | | |
From Adviser | | | 24,645 | | | | 4,615 | | | | 24,961 | | |
Prepaid expenses | | | 31,706 | | | | 25,837 | | | | 22,006 | | |
Total Assets | | | 389,898,472 | | | | 343,942,073 | | | | 530,765,560 | | |
Liabilities: | |
Payables: | |
Collateral received on loaned securities | | | 7,877,089 | | | | 8,606,536 | | | | — | | |
Investments purchased | | | 3,590,241 | | | | — | | | | 1,227,957 | | |
Capital shares redeemed | | | 983,175 | | | | 249,914 | | | | 404,448 | | |
Accrued expenses and other payables: | |
Investment advisory fees | | | 318,831 | | | | 237,339 | | | | 217,972 | | |
Administration fees | | | 19,423 | | | | 17,126 | | | | 26,833 | | |
Custodian fees | | | 3,275 | | | | 6,260 | | | | 4,014 | | |
Transfer agent fees | | | 65,249 | | | | 64,406 | | | | 80,111 | | |
Compliance fees | | | 225 | | | | 194 | | | | 299 | | |
| 12b-1 fees | | | 21,314 | | | | 20,968 | | | | 56,994 | | |
Other accrued expenses | | | 42,102 | | | | 40,214 | | | | 29,689 | | |
Total Liabilities | | | 12,920,924 | | | | 9,242,957 | | | | 2,048,317 | | |
Net Assets: | |
| Capital | | | 281,400,371 | | | | 259,208,484 | | | | 386,241,051 | | |
Total accumulated earnings/(loss) | | | 95,577,177 | | | | 75,490,632 | | | | 142,476,192 | | |
Net Assets | | $ | 376,977,548 | | | $ | 334,699,116 | | | $ | 528,717,243 | | |
Net Assets | |
Class A | | $ | 195,053,234 | | | $ | 188,880,540 | | | $ | 495,890,209 | | |
Class C | | | — | | | | 1,397,714 | | | | 6,229,941 | | |
Class R | | | 1,651,831 | | | | 637,771 | | | | 6,428,443 | | |
Class Y | | | 177,278,485 | | | | 143,783,091 | | | | 20,168,650 | | |
Member Class | | | 2,993,998 | | | | — | | | | — | | |
Total | | $ | 376,977,548 | | | $ | 334,699,116 | | | $ | 528,717,243 | | |
Shares (unlimited number of shares authorized
with a par value of $0.001 per share): | |
Class A | | | 7,272,016 | | | | 7,174,403 | | | | 8,989,482 | | |
Class C | | | — | | | | 62,441 | | | | 139,319 | | |
Class R | | | 70,557 | | | | 25,993 | | | | 117,428 | | |
Class Y | | | 6,069,637 | | | | 5,279,884 | | | | 367,372 | | |
Member Class | | | 111,446 | | | | — | | | | — | | |
Total | | | 13,523,656 | | | | 12,542,721 | | | | 9,613,601 | | |
Net asset value, offering (except Class A) and
redemption price per share: | |
Class A | | $ | 26.82 | | | $ | 26.33 | | | $ | 55.16 | | |
Class C (c) | | | — | | | | 22.38 | | | | 44.72 | | |
Class R | | | 23.41 | | | | 24.54 | | | | 54.74 | | |
Class Y | | | 29.21 | | | | 27.23 | | | | 54.90 | | |
Member Class | | | 26.87 | | | | — | | | | — | | |
Maximum Sales Charge — Class A | | | 5.75 | % | | | 5.75 | % | | | 5.75 | % | |
Maximum offering price
(100%/(100%-maximum sales charge) of
net asset value adjusted to the nearest cent)
per share — Class A | | $ | 28.46 | | | $ | 27.94 | | | $ | 58.53 | | |
(a) Includes $7,757,416 of securities on loan.
(b) Includes $8,438,631 of securities on loan.
(c) Redemption price per share varies by the length of time shares are held.
See notes to financial statements.
36
Victory Portfolios | | Statements of Assets and Liabilities
December 31, 2021 | |
| | | Victory
RS Investors
Fund | | Victory
Global Energy
Transition
Fund | |
Assets: | |
Investments, at value (Cost $24,862,039 and $174,660,443) | | $ | 30,579,607 | | | $ | 281,218,385 | (a) | |
Foreign currency, at value (Cost $— and $58,863) | | | — | | | | 51,057 | | |
Cash | | | 523,820 | | | | 18,867,921 | | |
Receivables: | |
Interest and dividends | | | 31,548 | | | | 442,747 | | |
Capital shares issued | | | 2,289 | | | | 308,846 | | |
Investments sold | | | — | | | | 2,398,199 | | |
From Adviser | | | 14,527 | | | | 36,209 | | |
Prepaid expenses | | | 23,832 | | | | 39,935 | | |
Total Assets | | | 31,175,623 | | | | 303,363,299 | | |
Liabilities: | |
Payables: | |
Collateral received on loaned securities | | | — | | | | 4,168,394 | | |
Investments purchased | | | — | | | | 3,713,388 | | |
Investments purchased-PIPE settlements | | | — | | | | 1,797,250 | | |
Capital shares redeemed | | | 1,514 | | | | 165,479 | | |
Accrued expenses and other payables: | |
Investment advisory fees | | | 25,930 | | | | 241,322 | | |
Administration fees | | | 1,576 | | | | 13,801 | | |
Custodian fees | | | 628 | | | | 4,255 | | |
Transfer agent fees | | | 6,775 | | | | 52,702 | | |
Compliance fees | | | 18 | | | | 164 | | |
| 12b-1 fees | | | 2,935 | | | | 10,030 | | |
Other accrued expenses | | | 12,562 | | | | 27,691 | | |
Total Liabilities | | | 51,938 | | | | 10,194,476 | | |
Net Assets: | |
| Capital | | | 25,325,275 | | | | 2,086,961,754 | | |
Total accumulated earnings/(loss) | | | 5,798,410 | | | | (1,793,792,931 | ) | |
Net Assets | | $ | 31,123,685 | | | $ | 293,168,823 | | |
Net Assets | |
Class A | | $ | 15,038,878 | | | $ | 78,316,580 | | |
Class C | | | 2,701,587 | | | | 3,240,252 | | |
Class R | | | 805,827 | | | | 1,026,034 | | |
Class Y | | | 12,577,393 | | | | 210,585,957 | | |
Total | | $ | 31,123,685 | | | $ | 293,168,823 | | |
Shares (unlimited number of shares authorized with a
par value of $0.001 per share): | |
Class A | | | 1,082,184 | | | | 3,461,876 | | |
Class C | | | 229,659 | | | | 162,161 | | |
Class R | | | 67,061 | | | | 48,410 | | |
Class Y | | | 872,826 | | | | 8,908,293 | | |
Total | | | 2,251,730 | | | | 12,580,740 | | |
Net asset value, offering (except Class A) and
redemption price per share: | |
Class A | | $ | 13.90 | | | $ | 22.62 | | |
Class C (b) | | | 11.76 | | | | 19.98 | | |
Class R | | | 12.02 | | | | 21.19 | | |
Class Y | | | 14.41 | | | | 23.64 | | |
Maximum Sales Charge — Class A | | | 5.75 | % | | | 5.75 | % | |
Maximum offering price
(100%/(100%-maximum sales charge) of net asset
value adjusted to the nearest cent) per share — Class A | | $ | 14.75 | | | $ | 24.00 | | |
(a) Includes $4,057,601 of securities on loan.
(b) Redemption price per share varies by the length of time shares are held.
See notes to financial statements.
37
Victory Portfolios | | Statements of Operations
For the Year Ended December 31, 2021 | |
| | �� | Victory
RS Partners
Fund | | Victory
RS Value
Fund | | Victory
RS Large
Cap Alpha
Fund | |
Investment Income: | | | |
Dividends | | $ | 4,405,801 | | | $ | 4,739,656 | | | $ | 10,415,655 | | |
Interest | | | 1,825 | | | | 1,378 | | | | 2,250 | | |
Securities lending (net of fees) | | | 10,577 | | | | 7,646 | | | | 832 | | |
Foreign tax withholding | | | (31,838 | ) | | | (10,110 | ) | | | (11,170 | ) | |
Total Income | | | 4,386,365 | | | | 4,738,570 | | | | 10,407,567 | | |
Expenses: | | | |
Investment advisory fees | | | 3,756,423 | | | | 2,839,080 | | | | 2,576,693 | | |
Administration fees | | | 207,177 | | | | 184,262 | | | | 284,251 | | |
Sub-Administration fees | | | 17,000 | | | | 16,792 | | | | 16,792 | | |
| 12b-1 fees — Class A | | | 464,994 | | | | 450,225 | | | | 1,208,245 | | |
| 12b-1 fees — Class C | | | — | | | | 16,261 | | | | 80,145 | | |
| 12b-1 fees — Class R | | | 8,075 | | | | 3,587 | | | | 31,820 | | |
Custodian fees | | | 18,893 | | | | 20,291 | | | | 24,299 | | |
Transfer agent fees — Class A | | | 252,040 | | | | 231,006 | | | | 438,993 | | |
Transfer agent fees — Class C | | | — | | | | 3,147 | | | | 3,989 | | |
Transfer agent fees — Class R | | | 3,044 | | | | 1,857 | | | | 11,044 | | |
Transfer agent fees — Class Y | | | 157,004 | | | | 153,236 | | | | 16,700 | | |
Transfer agent fees — Member Class | | | 2,634 | | | | — | | | | — | | |
Trustees' fees | | | 24,636 | | | | 22,478 | | | | 33,556 | | |
Compliance fees | | | 2,705 | | | | 2,421 | | | | 3,735 | | |
Legal and audit fees | | | 29,215 | | | | 22,591 | | | | 30,663 | | |
State registration and filing fees | | | 59,083 | | | | 33,116 | | | | 45,159 | | |
Other expenses | | | 62,195 | | | | 59,590 | | | | 43,897 | | |
Total Expenses | | | 5,065,118 | | | | 4,059,940 | | | | 4,849,981 | | |
Expenses waived/reimbursed by Adviser | | | (229,651 | ) | | | (70,218 | ) | | | (211,774 | ) | |
Net Expenses | | | 4,835,467 | | | | 3,989,722 | | | | 4,638,207 | | |
Net Investment Income (Loss) | | | (449,102 | ) | | | 748,848 | | | | 5,769,360 | | |
Realized/Unrealized Gains (Losses) from
Investments: | | | |
Net realized gains (losses) from investment
securities and foreign currency transactions | | | 80,047,267 | | | | 67,085,450 | | | | 79,181,305 | | |
Net change in unrealized appreciation/depreciation
on investment securities and foreign currency
translations | | | 13,032,470 | | | | 11,836,881 | | | | 20,032,914 | | |
Net realized/unrealized gains (losses) on
investments | | | 93,079,737 | | | | 78,922,331 | | | | 99,214,219 | | |
Change in net assets resulting from operations | | $ | 92,630,635 | | | $ | 79,671,179 | | | $ | 104,983,579 | | |
See notes to financial statements.
38
Victory Portfolios | | Statements of Operations
For the Year Ended December 31, 2021 | |
| | | Victory RS
Investors
Fund | | Victory
Global Energy
Transition
Fund | |
Investment Income: | | | |
Dividends | | $ | 444,004 | | | $ | 3,486,824 | | |
Interest | | | 205 | | | | 49,446 | | |
Securities lending (net of fees) | | | 841 | | | | 11,367 | | |
Foreign tax withholding | | | (476 | ) | | | (293,818 | ) | |
Total Income | | | 444,574 | | | | 3,253,819 | | |
Expenses: | | | |
Investment advisory fees | | | 305,703 | | | | 2,591,991 | | |
Administration fees | | | 16,862 | | | | 142,658 | | |
Sub-Administration fees | | | 13,500 | | | | 13,500 | | |
| 12b-1 fees — Class A | | | 36,056 | | | | 161,696 | | |
| 12b-1 fees — Class C | | | 30,298 | | | | 28,153 | | |
| 12b-1 fees — Class R | | | 3,713 | | | | 7,385 | | |
Custodian fees | | | 3,911 | | | | 25,618 | | |
Transfer agent fees — Class A | | | 17,015 | | | | 125,270 | | |
Transfer agent fees — Class C | | | 4,411 | | | | 4,068 | | |
Transfer agent fees — Class R | | | 1,294 | | | | 3,491 | | |
Transfer agent fees — Class Y | | | 14,075 | | | | 189,612 | | |
Trustees' fees | | | 3,547 | | | | 15,279 | | |
Compliance fees | | | 221 | | | | 1,634 | | |
Legal and audit fees | | | 8,770 | | | | 42,630 | | |
State registration and filing fees | | | 18,310 | | | | 29,119 | | |
Interfund lending fees | | | — | | | | 302 | | |
Other expenses | | | 11,801 | | | | 45,163 | | |
Total Expenses | | | 489,487 | | | | 3,427,569 | | |
Expenses waived/reimbursed by Adviser | | | (90,433 | ) | | | (186,151 | ) | |
Net Expenses | | | 399,054 | | | | 3,241,418 | | |
Net Investment Income (Loss) | | | 45,520 | | | | 12,401 | | |
Realized/Unrealized Gains (Losses) from Investments: | | | |
Net realized gains (losses) from investment securities and
foreign currency transactions | | | 6,937,784 | | | | 8,906,170 | | |
Net change in unrealized appreciation/depreciation on
investment securities and foreign currency translations | | | (144,539 | ) | | | 121,511,876 | | |
Net realized/unrealized gains (losses) on investments | | | 6,793,245 | | | | 130,418,046 | | |
Change in net assets resulting from operations | | $ | 6,838,765 | | | $ | 130,430,447 | | |
See notes to financial statements.
39
Victory Portfolios | | Statements of Changes in Net Assets | |
| | | Victory RS Partners
Fund | | Victory RS Value
Fund | | Victory RS Large Cap Alpha
Fund | |
| | | Year
Ended
December 31,
2021 | | Year
Ended
December 31,
2020 | | Year
Ended
December 31,
2021 | | Year
Ended
December 31,
2020 | | Year
Ended
December 31,
2021 | | Year
Ended
December 31,
2020 | |
From Investment Activities: | |
Operations: | |
Net investment
income (loss) | | $ | (449,102 | ) | | $ | 1,240,556 | | | $ | 748,848 | | | $ | 718,636 | | | $ | 5,769,360 | | | $ | 5,054,970 | | |
Net realized gains
(losses) from
investments | | | 80,047,267 | | | | (11,698,940 | ) | | | 67,085,450 | | | | (12,229,730 | ) | | | 79,181,305 | | | | (4,201,598 | ) | |
Net change in
unrealized
appreciation/
depreciation
on investments | | | 13,032,470 | | | | (4,653,083 | ) | | | 11,836,881 | | | | (9,051,390 | ) | | | 20,032,914 | | | | (17,104,453 | ) | |
Change in net assets
resulting from
operations | | | 92,630,635 | | | | (15,111,467 | ) | | | 79,671,179 | | | | (20,562,484 | ) | | | 104,983,579 | | | | (16,251,081 | ) | |
Distributions to
Shareholders: | |
Class A | | | (28,047,422 | ) | | | (2,382,023 | ) | | | (23,751,997 | ) | | | (3,101,649 | ) | | | (55,880,468 | ) | | | (16,466,861 | ) | |
Class C | | | — | | | | — | | | | (199,127 | ) | | | (57,388 | ) | | | (812,225 | ) | | | (464,103 | ) | |
Class R | | | (261,917 | ) | | | (24,191 | ) | | | (83,609 | ) | | | (13,629 | ) | | | (699,959 | ) | | | (206,060 | ) | |
Class Y | | | (24,006,515 | ) | | | (2,572,869 | ) | | | (17,934,828 | ) | | | (2,641,513 | ) | | | (2,330,388 | ) | | | (617,022 | ) | |
Member Class (a) | | | (434,976 | ) | | | (1,246 | ) | | | — | | | | — | | | | — | | | | — | | |
Change in net assets
resulting from
distributions to
shareholders | | | (52,750,830 | ) | | | (4,980,329 | ) | | | (41,969,561 | ) | | | (5,814,179 | ) | | | (59,723,040 | ) | | | (17,754,046 | ) | |
Change in net assets
resulting from
capital transactions | | | 10,857,122 | | | | (81,239,459 | ) | | | (10,957,822 | ) | | | (55,511,801 | ) | | | 5,894,424 | | | | (52,872,803 | ) | |
Change in net assets | | | 50,736,927 | | | | (101,331,255 | ) | | | 26,743,796 | | | | (81,888,464 | ) | | | 51,154,963 | | | | (86,877,930 | ) | |
Net Assets: | |
Beginning of period | | | 326,240,621 | | | | 427,571,876 | | | | 307,955,320 | | | | 389,843,784 | | | | 477,562,280 | | | | 564,440,210 | | |
End of period | | $ | 376,977,548 | | | $ | 326,240,621 | | | $ | 334,699,116 | | | $ | 307,955,320 | | | $ | 528,717,243 | | | $ | 477,562,280 | | |
(a) Victory RS Partners Fund Member Class commenced operations on November 3, 2020.
(continues on next page)
See notes to financial statements.
40
Victory Portfolios | | Statements of Changes in Net Assets | |
(continued)
| | | Victory RS Partners
Fund | | Victory RS Value
Fund | | Victory RS Large Cap Alpha
Fund | |
| | | Year
Ended
December 31,
2021 | | Year
Ended
December 31,
2020 | | Year
Ended
December 31,
2021 | | Year
Ended
December 31,
2020 | | Year
Ended
December 31,
2021 | | Year
Ended
December 31,
2020 | |
Capital Transactions: | |
Class A | |
Proceeds from
shares issued | | $ | 32,378,102 | | | $ | 8,056,549 | | | $ | 12,582,595 | | | $ | 10,671,316 | | | $ | 18,537,698 | | | $ | 15,044,197 | | |
Distributions
reinvested | | | 27,357,527 | | | | 2,346,101 | | | | 23,208,972 | | | | 3,021,005 | | | | 54,292,632 | | | | 16,006,543 | | |
Cost of shares
redeemed | | | (38,380,359 | ) | | | (38,903,637 | ) | | | (27,845,087 | ) | | | (43,963,514 | ) | | | (63,635,769 | ) | | | (76,615,653 | ) | |
Total Class A | | $ | 21,355,270 | | | $ | (28,500,987 | ) | | $ | 7,946,480 | | | $ | (30,271,193 | ) | | $ | 9,194,561 | | | $ | (45,564,913 | ) | |
Class C | |
Proceeds from
shares issued | | $ | — | | | $ | — | | | $ | 93,397 | | | $ | 111,055 | | | $ | 183,579 | | | $ | 228,965 | | |
Distributions
reinvested | | | — | | | | — | | | | 199,127 | | | | 57,388 | | | | 784,649 | | | | 464,103 | | |
Cost of shares
redeemed | | | — | | | | — | | | | (1,731,042 | ) | | | (1,886,466 | ) | | | (6,904,121 | ) | | | (4,905,429 | ) | |
Total Class C | | $ | — | | | $ | — | | | $ | (1,438,518 | ) | | $ | (1,718,023 | ) | | $ | (5,935,893 | ) | | $ | (4,212,361 | ) | |
Class R | |
Proceeds from
shares issued | | $ | 102,925 | | | $ | 336,137 | | | $ | 79,653 | | | $ | 58,505 | | | $ | 569,839 | | | $ | 908,104 | | |
Distributions
reinvested | | | 261,917 | | | | 24,191 | | | | 78,836 | | | | 13,629 | | | | 695,951 | | | | 206,047 | | |
Cost of shares
redeemed | | | (278,653 | ) | | | (421,656 | ) | | | (280,742 | ) | | | (319,314 | ) | | | (1,527,178 | ) | | | (1,850,065 | ) | |
Total Class R | | $ | 86,189 | | | $ | (61,328 | ) | | $ | (122,253 | ) | | $ | (247,180 | ) | | $ | (261,388 | ) | | $ | (735,914 | ) | |
Class Y | |
Proceeds from
shares issued | | $ | 64,038,117 | | | $ | 28,022,881 | | | $ | 12,404,934 | | | $ | 18,473,898 | | | $ | 4,827,781 | | | $ | 2,949,615 | | |
Distributions
reinvested | | | 23,949,470 | | | | 2,567,572 | | | | 17,722,595 | | | | 2,604,139 | | | | 2,275,335 | | | | 596,266 | | |
Cost of shares
redeemed | | | (101,782,209 | ) | | | (83,363,101 | ) | | | (47,471,060 | ) | | | (44,353,442 | ) | | | (4,205,972 | ) | | | (5,905,496 | ) | |
Total Class Y | | $ | (13,794,622 | ) | | $ | (52,772,648 | ) | | $ | (17,343,531 | ) | | $ | (23,275,405 | ) | | $ | 2,897,144 | | | $ | (2,359,615 | ) | |
Member Class (a) | |
Proceeds from
shares issued | | $ | 4,042,884 | | | $ | 94,259 | | | $ | — | | | $ | — | | | $ | — | | | $ | — | | |
Distributions
reinvested | | | 434,976 | | | | 1,245 | | | | — | | | | — | | | | — | | | | — | | |
Cost of shares
redeemed | | | (1,267,575 | ) | | | — | | | | — | | | | — | | | | — | | | | — | | |
Total Member Class | | $ | 3,210,285 | | | $ | 95,504 | | | $ | — | | | $ | — | | | $ | — | | | $ | — | | |
Change in net assets
resulting from
capital transactions | | $ | 10,857,122 | | | $ | (81,239,459 | ) | | $ | (10,957,822 | ) | | $ | (55,511,801 | ) | | $ | 5,894,424 | | | $ | (52,872,803 | ) | |
(a) Victory RS Partners Fund Member Class commenced operations on November 3, 2020.
(continues on next page)
See notes to financial statements.
41
Victory Portfolios | | Statements of Changes in Net Assets | |
(continued)
| | | Victory RS Partners
Fund | | Victory RS Value
Fund | | Victory RS Large Cap Alpha
Fund | |
| | | Year
Ended
December 31,
2021 | | Year
Ended
December 31,
2020 | | Year
Ended
December 31,
2021 | | Year
Ended
December 31,
2020 | | Year
Ended
December 31,
2021 | | Year
Ended
December 31,
2020 | |
Share Transactions: | |
Class A | |
Issued | | | 1,071,551 | | | | 411,941 | | | | 459,952 | | | | 545,133 | | | | 327,763 | | | | 327,242 | | |
Reinvested | | | 1,045,777 | | | | 98,163 | | | | 900,018 | | | | 130,384 | | | | 1,000,925 | | | | 321,465 | | |
Redeemed | | | (1,316,022 | ) | | | (1,952,159 | ) | | | (1,031,826 | ) | | | (2,185,810 | ) | | | (1,117,937 | ) | | | (1,663,736 | ) | |
Total Class A | | | 801,306 | | | | (1,442,055 | ) | | | 328,144 | | | | (1,510,293 | ) | | | 210,751 | | | | (1,015,029 | ) | |
Class C | |
Issued | | | — | | | | — | | | | 3,951 | | | | 6,149 | | | | 3,697 | | | | 6,096 | | |
Reinvested | | | — | | | | — | | | | 9,118 | | | | 2,840 | | | | 17,967 | | | | 11,226 | | |
Redeemed | | | — | | | | — | | | | (77,404 | ) | | | (105,185 | ) | | | (151,544 | ) | | | (129,105 | ) | |
Total Class C | | | — | | | | — | | | | (64,335 | ) | | | (96,196 | ) | | | (129,880 | ) | | | (111,783 | ) | |
Class R | |
Issued | | | 3,946 | | | | 19,278 | | | | 3,060 | | | | 3,076 | | | | 10,041 | | | | 19,865 | | |
Reinvested | | | 11,467 | | | | 1,131 | | | | 3,293 | | | | 625 | | | | 12,969 | | | | 4,172 | | |
Redeemed | | | (10,507 | ) | | | (23,375 | ) | | | (10,767 | ) | | | (16,873 | ) | | | (26,224 | ) | | | (40,294 | ) | |
Total Class R | | | 4,906 | | | | (2,966 | ) | | | (4,414 | ) | | | (13,172 | ) | | | (3,214 | ) | | | (16,257 | ) | |
Class Y | |
Issued | | | 1,974,973 | | | | 1,326,866 | | | | 451,850 | | | | 931,019 | | | | 81,687 | | | | 60,906 | | |
Reinvested | | | 839,425 | | | | 100,022 | | | | 663,195 | | | | 109,188 | | | | 42,077 | | | | 12,016 | | |
Redeemed | | | (3,210,913 | ) | | | (3,844,005 | ) | | | (1,681,077 | ) | | | (2,139,626 | ) | | | (74,261 | ) | | | (133,707 | ) | |
Total Class Y | | | (396,515 | ) | | | (2,417,117 | ) | | | (566,032 | ) | | | (1,099,419 | ) | | | 49,503 | | | | (60,785 | ) | |
Member Class (a) | |
Issued | | | 132,546 | | | | 4,173 | | | | — | | | | — | | | | — | | | | — | | |
Reinvested | | | 16,583 | | | | 52 | | | | — | | | | — | | | | — | | | | — | | |
Redeemed | | | (41,908 | ) | | | — | | | | — | | | | — | | | | — | | | | — | | |
Total Member Class | | | 107,221 | | | | 4,225 | | | | — | | | | — | | | | — | | | | — | | |
Change in Shares | | | 516,918 | | | | (3,857,913 | ) | | | (306,637 | ) | | | (2,719,080 | ) | | | 127,160 | | | | (1,203,854 | ) | |
(a) Victory RS Partners Fund Member Class commenced operations on November 3, 2020.
See notes to financial statements.
42
Victory Portfolios | | Statements of Changes in Net Assets | |
| | | Victory RS
Investors Fund | | Victory Global Energy
Transition Fund | |
| | | Year
Ended
December 31,
2021 | | Year
Ended
December 31,
2020 | | Year
Ended
December 31,
2021 | | Year
Ended
December 31,
2020 | |
From Investment Activities: | |
Operations: | |
Net investment income (loss) | | $ | 45,520 | | | $ | (32,101 | ) | | $ | 12,401 | | | $ | 95,179 | | |
Net realized gains (losses) from
investments | | | 6,937,784 | | | | (2,049,123 | ) | | | 8,906,170 | | | | (156,274,442 | ) | |
Net change in unrealized
appreciation/depreciation
on investments | | | (144,539 | ) | | | (1,336,814 | ) | | | 121,511,876 | | | | 185,771,622 | | |
Change in net assets resulting
from operations | | | 6,838,765 | | | | (3,418,038 | ) | | | 130,430,447 | | | | 29,592,359 | | |
Distributions to Shareholders: | |
Class A | | | (2,084,214 | ) | | | (38,891 | ) | | | — | | | | (17,431 | ) | |
Class C | | | (430,072 | ) | | | (11,599 | ) | | | — | | | | — | | |
Class R | | | (124,797 | ) | | | (2,189 | ) | | | — | | | | — | | |
Class Y | | | (1,716,122 | ) | | | (33,498 | ) | | | (86,748 | ) | | | (307,837 | ) | |
Change in net assets resulting
from distributions to shareholders | | | (4,355,205 | ) | | | (86,177 | ) | | | (86,748 | ) | | | (325,268 | ) | |
Change in net assets resulting
from capital transactions | | | 762,677 | | | | (12,411,650 | ) | | | 3,720,084 | | | | (21,333,904 | ) | |
Change in net assets | | | 3,246,237 | | | | (15,915,865 | ) | | | 134,063,783 | | | | 7,933,187 | | |
Net Assets: | |
Beginning of period | | | 27,877,448 | | | | 43,793,313 | | | | 159,105,040 | | | | 151,171,853 | | |
End of period | | $ | 31,123,685 | | | $ | 27,877,448 | | | $ | 293,168,823 | | | $ | 159,105,040 | | |
(continues on next page)
See notes to financial statements.
43
Victory Portfolios | | Statements of Changes in Net Assets | |
(continued)
| | | Victory RS
Investors Fund | | Victory Global Energy
Transition Fund | |
| | | Year
Ended
December 31,
2021 | | Year
Ended
December 31,
2020 | | Year
Ended
December 31,
2021 | | Year
Ended
December 31,
2020 | |
Capital Transactions: | |
Class A | |
Proceeds from shares issued | | $ | 1,456,481 | | | $ | 1,680,515 | | | $ | 45,428,214 | | | $ | 5,505,577 | | |
Distributions reinvested | | | 1,959,510 | | | | 36,157 | | | | — | | | | 16,618 | | |
Cost of shares redeemed | | | (2,154,752 | ) | | | (4,654,377 | ) | | | (36,106,014 | ) | | | (8,758,422 | ) | |
Total Class A | | $ | 1,261,239 | | | $ | (2,937,705 | ) | | $ | 9,322,200 | | | $ | (3,236,227 | ) | |
Class C | |
Proceeds from shares issued | | $ | 115,128 | | | $ | 64,083 | | | $ | 1,198,233 | | | $ | 496,242 | | |
Distributions reinvested | | | 430,072 | | | | 11,513 | | | | — | | | | — | | |
Cost of shares redeemed | | | (1,412,389 | ) | | | (2,978,451 | ) | | | (1,858,895 | ) | | | (1,312,505 | ) | |
Total Class C | | $ | (867,189 | ) | | $ | (2,902,855 | ) | | $ | (660,662 | ) | | $ | (816,263 | ) | |
Class R | |
Proceeds from shares issued | | $ | 37,764 | | | $ | 46,519 | | | $ | 1,274,162 | | | $ | 263,387 | | |
Distributions reinvested | | | 124,797 | | | | 2,189 | | | | — | | | | — | | |
Cost of shares redeemed | | | (47,693 | ) | | | (195,450 | ) | | | (1,575,801 | ) | | | (294,240 | ) | |
Total Class R | | $ | 114,868 | | | $ | (146,742 | ) | | $ | (301,639 | ) | | $ | (30,853 | ) | |
Class Y | |
Proceeds from shares issued | | $ | 1,797,156 | | | $ | 1,952,154 | | | $ | 102,421,824 | | | $ | 22,164,045 | | |
Distributions reinvested | | | 1,711,171 | | | | 33,328 | | | | 81,976 | | | | 288,040 | | |
Cost of shares redeemed | | | (3,254,568 | ) | | | (8,409,830 | ) | | | (107,143,615 | ) | | | (39,702,646 | ) | |
Total Class Y | | $ | 253,759 | | | $ | (6,424,348 | ) | | $ | (4,639,815 | ) | | $ | (17,250,561 | ) | |
Change in net assets resulting from
capital transactions | | $ | 762,677 | | | $ | (12,411,650 | ) | | $ | 3,720,084 | | | $ | (21,333,904 | ) | |
(continues on next page)
See notes to financial statements.
44
Victory Portfolios | | Statements of Changes in Net Assets | |
(continued)
| | | Victory RS
Investors Fund | | Victory Global Energy
Transition Fund | |
| | | Year
Ended
December 31,
2021 | | Year
Ended
December 31,
2020 | | Year
Ended
December 31,
2021 | | Year
Ended
December 31,
2020 | |
Share Transactions: | |
Class A | |
Issued | | | 99,952 | | | | 153,026 | | | | 2,394,815 | | | | 690,679 | | |
Reinvested | | | 143,240 | | | | 2,876 | | | | — | | | | 1,375 | | |
Redeemed | | | (147,295 | ) | | | (460,596 | ) | | | (1,910,846 | ) | | | (1,073,725 | ) | |
Total Class A | | | 95,897 | | | | (304,694 | ) | | | 483,969 | | | | (381,671 | ) | |
Class C | |
Issued | | | 9,121 | | | | 7,008 | | | | 78,427 | | | | 58,179 | | |
Reinvested | | | 37,139 | | | | 1,048 | | | | — | | | | — | | |
Redeemed | | | (111,183 | ) | | | (311,413 | ) | | | (133,023 | ) | | | (179,802 | ) | |
Total Class C | | | (64,923 | ) | | | (303,357 | ) | | | (54,596 | ) | | | (121,623 | ) | |
Class R | |
Issued | | | 2,913 | | | | 4,704 | | | | 83,535 | | | | 32,115 | | |
Reinvested | | | 10,549 | | | | 196 | | | | — | | | | — | | |
Redeemed | | | (3,805 | ) | | | (19,506 | ) | | | (93,632 | ) | | | (41,381 | ) | |
Total Class R | | | 9,657 | | | | (14,606 | ) | | | (10,097 | ) | | | (9,266 | ) | |
Class Y | |
Issued | | | 117,213 | | | | 176,376 | | | | 5,277,694 | | | | 2,643,842 | | |
Reinvested | | | 120,357 | | | | 2,572 | | | | 3,515 | | | | 22,860 | | |
Redeemed | | | (214,659 | ) | | | (750,912 | ) | | | (5,630,485 | ) | | | (4,779,989 | ) | |
Total Class Y | | | 22,911 | | | | (571,964 | ) | | | (349,276 | ) | | | (2,113,287 | ) | |
Change in Shares | | | 63,542 | | | | (1,194,621 | ) | | | 70,000 | | | | (2,625,847 | ) | |
See notes to financial statements.
45
Victory Portfolios | | Financial Highlights | |
For a Share Outstanding Throughout Each Period
| | | | | Investment Activities | | Distributions to
Shareholders From | |
| | | Net Asset
Value,
Beginning of
Period | | Net
Investment
Income
(Loss)(a) | | Net Realized
and Unrealized
Gains (Losses)
on Investments | | Total from
Investment
Activities | | Net
Investment
Income | | Net Realized
Gains from
Investments | |
Victory RS Partners Fund | | | |
Class A | | | |
Year Ended December 31: | |
2021 | | $ | 24.21 | | | | (0.09 | ) | | | 7.14 | | | | 7.05 | | | | — | | | | (4.44 | ) | |
2020 | | $ | 24.47 | | | | 0.04 | | | | 0.07 | (e) | | | 0.11 | | | | — | | | | (0.37 | ) | |
2019 | | $ | 20.66 | | | | 0.12 | | | | 6.12 | | | | 6.24 | | | | (0.21 | ) | | | (2.22 | ) | |
2018 | | $ | 29.21 | | | | 0.04 | | | | (3.52 | ) | | | (3.48 | ) | | | (0.08 | ) | | | (4.99 | ) | |
2017 | | $ | 31.58 | | | | (0.25 | ) | | | 4.78 | | | | 4.53 | | | | — | | | | (6.90 | ) | |
Class R | | | |
Year Ended December 31: | |
2021 | | $ | 21.65 | | | | (0.17 | ) | | | 6.37 | | | | 6.20 | | | | — | | | | (4.44 | ) | |
2020 | | $ | 22.01 | | | | (0.03 | ) | | | 0.04 | (e) | | | 0.01 | | | | — | | | | (0.37 | ) | |
2019 | | $ | 18.79 | | | | 0.03 | | | | 5.55 | | | | 5.58 | | | | (0.14 | ) | | | (2.22 | ) | |
2018 | | $ | 27.09 | | | | (0.04 | ) | | | (3.27 | ) | | | (3.31 | ) | | | — | | | | (4.99 | ) | |
2017 | | $ | 29.84 | | | | (0.44 | ) | | | 4.59 | | | | 4.15 | | | | — | | | | (6.90 | ) | |
Class Y | | | |
Year Ended December 31: | |
2021 | | $ | 25.99 | | | | 0.02 | | | | 7.69 | | | | 7.71 | | | | (0.05 | ) | | | (4.44 | ) | |
2020 | | $ | 26.17 | | | | 0.12 | | | | 0.07 | (e) | | | 0.19 | | | | — | | | | (0.37 | ) | |
2019 | | $ | 21.94 | | | | 0.21 | | | | 6.52 | | | | 6.73 | | | | (0.28 | ) | | | (2.22 | ) | |
2018 | | $ | 30.67 | | | | 0.14 | | | | (3.71 | ) | | | (3.57 | ) | | | (0.17 | ) | | | (4.99 | ) | |
2017 | | $ | 32.75 | | | | (0.04 | ) | | | 4.86 | | | | 4.82 | | | | — | | | | (6.90 | ) | |
Member Class | | | |
Year Ended: | |
December 31, 2021 | | $ | 24.22 | | | | (0.04 | ) | | | 7.17 | | | | 7.13 | | | | (0.04 | ) | | | (4.44 | ) | |
November 3, 2020(g)
through
December 31, 2020 | | $ | 19.64 | | | | 0.01 | | | | 4.94 | (e) | | | 4.95 | | | | — | | | | (0.37 | ) | |
(a) Per share net investment income (loss) has been calculated using the average daily shares method.
(b) Not annualized for periods less than one year.
(c) Annualized for periods less than one year.
(d) Portfolio turnover is calculated on the basis of the Fund as a whole without distinguishing between the classes of shares issued.
(e) The amount shown for a share outstanding throughout the period does not accord with the change in net assets resulting from operations during the period because of the timing of sales and purchases of fund shares in relation to fluctuating market values during the period.
(f) Reflects an increase in trading activity due to asset allocation shifts.
(g) Commencement of operations.
See notes to financial statements.
46
Victory Portfolios | | Financial Highlights — continued | |
For a Share Outstanding Throughout Each Period
| | | | | Ratios to Average Net Assets | | Supplemental Data | |
| | | Total
Distributions | | Net Asset
Value,
End of
Period | | Total
Return
(Excludes
Sales
Charge)(b) | | Net
Expenses(c) | | Net
Investment
Income
(Loss)(c) | | Gross
Expenses(c) | | Net Assets,
End of
Period
(000's) | | Portfolio
Turnover(b)(d) | |
Victory RS Partners Fund | |
Class A | |
Year Ended December 31: | |
2021 | | | (4.44 | ) | | $ | 26.82 | | | | 29.58 | % | | | 1.45 | % | | | (0.29 | )% | | | 1.49 | % | | $ | 195,053 | | | | 64 | % | |
2020 | | | (0.37 | ) | | $ | 24.21 | | | | 0.46 | % | | | 1.45 | % | | | 0.20 | % | | | 1.53 | % | | $ | 156,629 | | | | 108 | %(f) | |
2019 | | | (2.43 | ) | | $ | 24.47 | | | | 30.69 | % | | | 1.45 | % | | | 0.49 | % | | | 1.52 | % | | $ | 193,630 | | | | 57 | % | |
2018 | | | (5.07 | ) | | $ | 20.66 | | | | (12.04 | )% | | | 1.45 | % | | | 0.14 | % | | | 1.52 | % | | $ | 175,723 | | | | 62 | % | |
2017 | | | (6.90 | ) | | $ | 29.21 | | | | 14.21 | % | | | 1.45 | % | | | (0.75 | )% | | | 1.50 | % | | $ | 259,050 | | | | 38 | % | |
Class R | |
Year Ended December 31: | |
2021 | | | (4.44 | ) | | $ | 23.41 | | | | 29.15 | % | | | 1.81 | % | | | (0.65 | )% | | | 2.48 | % | | $ | 1,652 | | | | 64 | % | |
2020 | | | (0.37 | ) | | $ | 21.65 | | | | 0.06 | % | | | 1.81 | % | | | (0.15 | )% | | | 2.87 | % | | $ | 1,421 | | | | 108 | %(f) | |
2019 | | | (2.36 | ) | | $ | 22.01 | | | | 30.26 | % | | | 1.81 | % | | | 0.12 | % | | | 2.63 | % | | $ | 1,510 | | | | 57 | % | |
2018 | | | (4.99 | ) | | $ | 18.79 | | | | (12.39 | )% | | | 1.81 | % | | | (0.16 | )% | | | 2.37 | % | | $ | 1,207 | | | | 62 | % | |
2017 | | | (6.90 | ) | | $ | 27.09 | | | | 13.81 | % | | | 1.81 | % | | | (1.40 | )% | | | 2.28 | % | | $ | 2,168 | | | | 38 | % | |
Class Y | |
Year Ended December 31: | |
2021 | | | (4.49 | ) | | $ | 29.21 | | | | 30.03 | % | | | 1.12 | % | | | 0.05 | % | | | 1.19 | % | | $ | 177,278 | | | | 64 | % | |
2020 | | | (0.37 | ) | | $ | 25.99 | | | | 0.77 | % | | | 1.12 | % | | | 0.54 | % | | | 1.23 | % | | $ | 168,087 | | | | 108 | %(f) | |
2019 | | | (2.50 | ) | | $ | 26.17 | | | | 31.18 | % | | | 1.12 | % | | | 0.82 | % | | | 1.21 | % | | $ | 232,432 | | | | 57 | % | |
2018 | | | (5.16 | ) | | $ | 21.94 | | | | (11.77 | )% | | | 1.12 | % | | | 0.48 | % | | | 1.19 | % | | $ | 250,709 | | | | 62 | % | |
2017 | | | (6.90 | ) | | $ | 30.67 | | | | 14.59 | % | | | 1.12 | % | | | (0.11 | )% | | | 1.21 | % | | $ | 349,022 | | | | 38 | % | |
Member Class | |
Year Ended: | |
December 31, 2021 | | | (4.48 | ) | | $ | 26.87 | | | | 29.90 | % | | | 1.25 | % | | | (0.14 | )% | | | 3.05 | % | | $ | 2,994 | | | | 64 | % | |
November 3, 2020(g)
through
December 31, 2020 | | | (0.37 | ) | | $ | 24.22 | | | | 25.22 | % | | | 1.25 | % | | | 0.36 | % | | | 33.63 | % | | $ | 102 | | | | 108 | % | |
(continues on next page)
See notes to financial statements.
47
Victory Portfolios | | Financial Highlights | |
For a Share Outstanding Throughout Each Period
| | | | | Investment Activities | | Distributions to
Shareholders From | |
| | | Net Asset
Value,
Beginning of
Period | | Net
Investment
Income
(Loss)(a) | | Net Realized
and Unrealized
Gains (Losses)
on Investments | | Total from
Investment
Activities | | Net
Investment
Income | | Net Realized
Gains from
Investments | |
Victory RS Value Fund | | | |
Class A | | | |
Year Ended December 31: | |
2021 | | $ | 23.68 | | | | 0.03 | | | | 6.34 | | | | 6.37 | | | | (0.11 | ) | | | (3.61 | ) | |
2020 | | $ | 24.79 | | | | 0.03 | | | | (0.68 | ) | | | (0.65 | ) | | | — | | | | (0.46 | ) | |
2019 | | $ | 20.28 | | | | 0.07 | | | | 6.28 | | | | 6.35 | | | | (0.14 | ) | | | (1.70 | ) | |
2018 | | $ | 26.21 | | | | 0.06 | | | | (2.85 | ) | | | (2.79 | ) | | | (0.14 | ) | | | (3.00 | ) | |
2017 | | $ | 27.94 | | | | 0.03 | | | | 4.80 | | | | 4.83 | | | | (0.04 | ) | | | (6.52 | ) | |
Class C | | | |
Year Ended December 31: | |
2021 | | $ | 20.65 | | | | (0.16 | ) | | | 5.50 | | | | 5.34 | | | | — | | | | (3.61 | ) | |
2020 | | $ | 21.85 | | | | (0.11 | ) | | | (0.63 | ) | | | (0.74 | ) | | | — | | | | (0.46 | ) | |
2019 | | $ | 18.08 | | | | (0.11 | ) | | | 5.58 | | | | 5.47 | | | | — | | | | (1.70 | ) | |
2018 | | $ | 23.76 | | | | (0.13 | ) | | | (2.55 | ) | | | (2.68 | ) | | | — | | | | (3.00 | ) | |
2017 | | $ | 26.01 | | | | (0.08 | ) | | | 4.35 | | | | 4.27 | | | | — | | | | (6.52 | ) | |
Class R | | | |
Year Ended December 31: | |
2021 | | $ | 22.27 | | | | (0.07 | ) | | | 5.95 | | | | 5.88 | | | | — | (c) | | | (3.61 | ) | |
2020 | | $ | 23.44 | | | | (0.05 | ) | | | (0.66 | ) | | | (0.71 | ) | | | — | | | | (0.46 | ) | |
2019 | | $ | 19.26 | | | | (0.03 | ) | | | 5.95 | | | | 5.92 | | | | (0.04 | ) | | | (1.70 | ) | |
2018 | | $ | 25.06 | | | | (0.03 | ) | | | (2.72 | ) | | | (2.75 | ) | | | (0.05 | ) | | | (3.00 | ) | |
2017 | | $ | 27.03 | | | | (0.03 | ) | | | 4.58 | | | | 4.55 | | | | — | | | | (6.52 | ) | |
Class Y | | | |
Year Ended December 31: | |
2021 | | $ | 24.38 | | | | 0.10 | | | | 6.53 | | | | 6.63 | | | | (0.17 | ) | | | (3.61 | ) | |
2020 | | $ | 25.45 | | | | 0.08 | | | | (0.69 | ) | | | (0.61 | ) | | | — | | | | (0.46 | ) | |
2019 | | $ | 20.77 | | | | 0.13 | | | | 6.44 | | | | 6.57 | | | | (0.19 | ) | | | (1.70 | ) | |
2018 | | $ | 26.77 | | | | 0.13 | | | | (2.92 | ) | | | (2.79 | ) | | | (0.21 | ) | | | (3.00 | ) | |
2017 | | $ | 28.40 | | | | 0.06 | | | | 4.94 | | | | 5.00 | | | | (0.11 | ) | | | (6.52 | ) | |
(a) Per share net investment income (loss) has been calculated using the average daily shares method.
(b) Portfolio turnover is calculated on the basis of the Fund as a whole without distinguishing between the classes of shares issued.
(c) Amount is less than $0.005 per share.
See notes to financial statements.
48
Victory Portfolios | | Financial Highlights — continued | |
For a Share Outstanding Throughout Each Period
| | | | | Ratios to Average Net Assets | | Supplemental Data | |
| | | Total
Distributions | | Net Asset
Value,
End of
Period | | Total
Return
(Excludes
Sales
Charge) | | Net
Expenses | | Net
Investment
Income
(Loss) | | Gross
Expenses | | Net Assets,
End of
Period
(000's) | | Portfolio
Turnover(b) | |
Victory RS Value Fund | |
Class A | |
Year Ended December 31: | |
2021 | | | (3.72 | ) | | $ | 26.33 | | | | 27.31 | % | | | 1.30 | % | | | 0.12 | % | | | 1.34 | % | | $ | 188,881 | | | | 69 | % | |
2020 | | | (0.46 | ) | | $ | 23.68 | | | | (2.59 | )% | | | 1.30 | % | | | 0.14 | % | | | 1.37 | % | | $ | 162,145 | | | | 73 | % | |
2019 | | | (1.84 | ) | | $ | 24.79 | | | | 31.35 | % | | | 1.30 | % | | | 0.28 | % | | | 1.35 | % | | $ | 207,200 | | | | 54 | % | |
2018 | | | (3.14 | ) | | $ | 20.28 | | | | (10.75 | )% | | | 1.30 | % | | | 0.24 | % | | | 1.34 | % | | $ | 179,535 | | | | 65 | % | |
2017 | | | (6.56 | ) | | $ | 26.21 | | | | 17.41 | % | | | 1.30 | % | | | 0.09 | % | | | 1.33 | % | | $ | 239,994 | | | | 64 | % | |
Class C | |
Year Ended December 31: | |
2021 | | | (3.61 | ) | | $ | 22.38 | | | | 26.28 | % | | | 2.07 | % | | | (0.67 | )% | | | 2.33 | % | | $ | 1,398 | | | | 69 | % | |
2020 | | | (0.46 | ) | | $ | 20.65 | | | | (3.35 | )% | | | 2.07 | % | | | (0.62 | )% | | | 2.60 | % | | $ | 2,618 | | | | 73 | % | |
2019 | | | (1.70 | ) | | $ | 21.85 | | | | 30.32 | % | | | 2.07 | % | | | (0.50 | )% | | | 2.29 | % | | $ | 4,872 | | | | 54 | % | |
2018 | | | (3.00 | ) | | $ | 18.08 | | | | (11.41 | )% | | | 2.07 | % | | | (0.54 | )% | | | 2.14 | % | | $ | 9,428 | | | | 65 | % | |
2017 | | | (6.52 | ) | | $ | 23.76 | | | | 16.53 | % | | | 2.07 | % | | | (0.30 | )% | | | 2.08 | % | | $ | 16,916 | | | | 64 | % | |
Class R | |
Year Ended December 31: | |
2021 | | | (3.61 | ) | | $ | 24.54 | | | | 26.77 | % | | | 1.69 | % | | | (0.27 | )% | | | 1.80 | % | | $ | 638 | | | | 69 | % | |
2020 | | | (0.46 | ) | | $ | 22.27 | | | | (2.95 | )% | | | 1.69 | % | | | (0.23 | )% | | | 4.03 | % | | $ | 677 | | | | 73 | % | |
2019 | | | (1.74 | ) | | $ | 23.44 | | | | 30.89 | % | | | 1.69 | % | | | (0.13 | )% | | | 3.47 | % | | $ | 1,022 | | | | 54 | % | |
2018 | | | (3.05 | ) | | $ | 19.26 | | | | (11.12 | )% | | | 1.69 | % | | | (0.11 | )% | | | 2.82 | % | | $ | 1,019 | | | | 65 | % | |
2017 | | | (6.52 | ) | | $ | 25.06 | | | | 16.95 | % | | | 1.69 | % | | | (0.11 | )% | | | 2.29 | % | | $ | 1,625 | | | | 64 | % | |
Class Y | |
Year Ended December 31: | |
2021 | | | (3.78 | ) | | $ | 27.23 | | | | 27.57 | % | | | 1.06 | % | | | 0.36 | % | | | 1.06 | % | | $ | 143,783 | | | | 69 | % | |
2020 | | | (0.46 | ) | | $ | 24.38 | | | | (2.37 | )% | | | 1.06 | % | | | 0.38 | % | | | 1.10 | % | | $ | 142,515 | | | | 73 | % | |
2019 | | | (1.89 | ) | | $ | 25.45 | | | | 31.69 | % | | | 1.06 | % | | | 0.51 | % | | | 1.07 | % | | $ | 176,749 | | | | 54 | % | |
2018 | | | (3.21 | ) | | $ | 20.77 | | | | (10.54 | )% | | | 1.06 | % | | | 0.49 | % | | | 1.06 | % | | $ | 166,538 | | | | 65 | % | |
2017 | | | (6.63 | ) | | $ | 26.77 | | | | 17.71 | % | | | 1.06 | % | | | 0.20 | % | | | 1.06 | % | | $ | 247,528 | | | | 64 | % | |
(continues on next page)
See notes to financial statements.
49
Victory Portfolios | | Financial Highlights | |
For a Share Outstanding Throughout Each Period
| | | | | Investment Activities | | Distributions to
Shareholders From | |
| | | Net Asset
Value,
Beginning of
Period | | Net
Investment
Income
(Loss)(a) | | Net Realized
and Unrealized
Gains (Losses)
on Investments | | Total from
Investment
Activities | | Net
Investment
Income | | Net Realized
Gains from
Investments | |
Victory RS Large Cap Alpha Fund | | | |
Class A | | | |
Year Ended December 31: | |
2021 | | $ | 50.59 | | | | 0.65 | | | | 10.81 | | | | 11.46 | | | | (0.57 | ) | | | (6.32 | ) | |
2020 | | $ | 53.11 | | | | 0.52 | | | | (1.12 | ) | | | (0.60 | ) | | | (0.15 | ) | | | (1.77 | ) | |
2019 | | $ | 42.20 | | | | 0.51 | | | | 12.44 | | | | 12.95 | | | | (0.37 | ) | | | (1.67 | ) | |
2018 | | $ | 56.61 | | | | 0.44 | | | | (5.67 | ) | | | (5.23 | ) | | | (0.38 | ) | | | (8.80 | ) | |
2017 | | $ | 51.86 | | | | 0.38 | | | | 9.10 | | | | 9.48 | | | | — | (c) | | | (4.73 | ) | |
Class C | | | |
Year Ended December 31: | |
2021 | | $ | 42.07 | | | | 0.13 | | | | 8.97 | | | | 9.10 | | | | (0.13 | ) | | | (6.32 | ) | |
2020 | | $ | 44.70 | | | | 0.14 | | | | (1.00 | ) | | | (0.86 | ) | | | — | | | | (1.77 | ) | |
2019 | | $ | 35.78 | | | | 0.10 | | | | 10.50 | | | | 10.60 | | | | (0.01 | ) | | | (1.67 | ) | |
2018 | | $ | 49.50 | | | | (0.03 | ) | | | (4.89 | ) | | | (4.92 | ) | | | — | (c) | | | (8.80 | ) | |
2017 | | $ | 46.22 | | | | (0.04 | ) | | | 8.05 | | | | 8.01 | | | | — | | | | (4.73 | ) | |
Class R | | | |
Year Ended December 31: | |
2021 | | $ | 50.28 | | | | 0.43 | | | | 10.73 | | | | 11.16 | | | | (0.38 | ) | | | (6.32 | ) | |
2020 | | $ | 52.83 | | | | 0.35 | | | | (1.13 | ) | | | (0.78 | ) | | | — | | | | (1.77 | ) | |
2019 | | $ | 42.01 | | | | 0.32 | | | | 12.36 | | | | 12.68 | | | | (0.19 | ) | | | (1.67 | ) | |
2018 | | $ | 56.35 | | | | 0.22 | | | | (5.61 | ) | | | (5.39 | ) | | | (0.15 | ) | | | (8.80 | ) | |
2017 | | $ | 51.83 | | | | 0.18 | | | | 9.07 | | | | 9.25 | | | | — | | | | (4.73 | ) | |
Class Y | | | |
Year Ended December 31: | |
2021 | | $ | 50.37 | | | | 0.78 | | | | 10.76 | | | | 11.54 | | | | (0.69 | ) | | | (6.32 | ) | |
2020 | | $ | 52.87 | | | | 0.62 | | | | (1.10 | ) | | | (0.48 | ) | | | (0.25 | ) | | | (1.77 | ) | |
2019 | | $ | 42.01 | | | | 0.61 | | | | 12.38 | | | | 12.99 | | | | (0.46 | ) | | | (1.67 | ) | |
2018 | | $ | 56.38 | | | | 0.55 | | | | (5.64 | ) | | | (5.09 | ) | | | (0.48 | ) | | | (8.80 | ) | |
2017 | | $ | 51.66 | | | | 0.49 | | | | 9.07 | | | | 9.56 | | | | (0.11 | ) | | | (4.73 | ) | |
(a) Per share net investment income (loss) has been calculated using the average daily shares method.
(b) Portfolio turnover is calculated on the basis of the Fund as a whole without distinguishing between the classes of shares issued.
(c) Amount is less than $0.005 per share.
See notes to financial statements.
50
Victory Portfolios | | Financial Highlights — continued | |
For a Share Outstanding Throughout Each Period
| | | | | Ratios to Average Net Assets | | Supplemental Data | |
| | | Total
Distributions | | Net Asset
Value,
End of
Period | | Total
Return
(Excludes
Sales
Charge) | | Net
Expenses | | Net
Investment
Income
(Loss) | | Gross
Expenses | | Net Assets,
End of
Period
(000's) | | Portfolio
Turnover(b) | |
Victory RS Large Cap Alpha Fund | |
Class A | |
Year Ended December 31: | |
2021 | | | (6.89 | ) | | $ | 55.16 | | | | 23.00 | % | | | 0.89 | % | | | 1.13 | % | | | 0.93 | % | | $ | 495,890 | | | | 52 | % | |
2020 | | | (1.92 | ) | | $ | 50.59 | | | | (1.03 | )% | | | 0.89 | % | | | 1.13 | % | | | 0.95 | % | | $ | 444,160 | | | | 95 | % | |
2019 | | | (2.04 | ) | | $ | 53.11 | | | | 30.73 | % | | | 0.89 | % | | | 1.03 | % | | | 0.95 | % | | $ | 520,159 | | | | 51 | % | |
2018 | | | (9.18 | ) | | $ | 42.20 | | | | (9.31 | )% | | | 0.89 | % | | | 0.77 | % | | | 0.93 | % | | $ | 439,035 | | | | 59 | % | |
2017 | | | (4.73 | ) | | $ | 56.61 | | | | 18.32 | % | | | 0.89 | % | | | 0.68 | % | | | 0.94 | % | | $ | 540,762 | | | | 55 | % | |
Class C | |
Year Ended December 31: | |
2021 | | | (6.45 | ) | | $ | 44.72 | | | | 22.05 | % | | | 1.69 | % | | | 0.27 | % | | | 1.80 | % | | $ | 6,230 | | | | 52 | % | |
2020 | | | (1.77 | ) | | $ | 42.07 | | | | (1.85 | )% | | | 1.69 | % | | | 0.37 | % | | | 1.79 | % | | $ | 11,326 | | | | 95 | % | |
2019 | | | (1.68 | ) | | $ | 44.70 | | | | 29.70 | % | | | 1.69 | % | | | 0.24 | % | | | 1.74 | % | | $ | 17,028 | | | | 51 | % | |
2018 | | | (8.80 | ) | | $ | 35.78 | | | | (10.03 | )% | | | 1.69 | % | | | (0.06 | )% | | | 1.75 | % | | $ | 18,227 | | | | 59 | % | |
2017 | | | (4.73 | ) | | $ | 49.50 | | | | 17.36 | % | | | 1.69 | % | | | (0.08 | )% | | | 1.71 | % | | $ | 29,771 | | | | 55 | % | |
Class R | |
Year Ended December 31: | |
2021 | | | (6.70 | ) | | $ | 54.74 | | | | 22.55 | % | | | 1.26 | % | | | 0.75 | % | | | 1.44 | % | | $ | 6,428 | | | | 52 | % | |
2020 | | | (1.77 | ) | | $ | 50.28 | | | | (1.41 | )% | | | 1.26 | % | | | 0.77 | % | | | 1.50 | % | | $ | 6,066 | | | | 95 | % | |
2019 | | | (1.86 | ) | | $ | 52.83 | | | | 30.23 | % | | | 1.26 | % | | | 0.66 | % | | | 1.48 | % | | $ | 7,232 | | | | 51 | % | |
2018 | | | (8.95 | ) | | $ | 42.01 | | | | (9.63 | )% | | | 1.26 | % | | | 0.38 | % | | | 1.40 | % | | $ | 6,348 | | | | 59 | % | |
2017 | | | (4.73 | ) | | $ | 56.35 | | | | 17.87 | % | | | 1.26 | % | | | 0.33 | % | | | 1.42 | % | | $ | 10,229 | | | | 55 | % | |
Class Y | |
Year Ended December 31: | |
2021 | | | (7.01 | ) | | $ | 54.90 | | | | 23.28 | % | | | 0.68 | % | | | 1.35 | % | | | 0.68 | % | | $ | 20,169 | | | | 52 | % | |
2020 | | | (2.02 | ) | | $ | 50.37 | | | | (0.83 | )% | | | 0.68 | % | | | 1.34 | % | | | 0.82 | % | | $ | 16,011 | | | | 95 | % | |
2019 | | | (2.13 | ) | | $ | 52.87 | | | | 30.99 | % | | | 0.68 | % | | | 1.24 | % | | | 0.78 | % | | $ | 20,021 | | | | 51 | % | |
2018 | | | (9.28 | ) | | $ | 42.01 | | | | (9.11 | )% | | | 0.68 | % | | | 0.96 | % | | | 0.75 | % | | $ | 21,827 | | | | 59 | % | |
2017 | | | (4.84 | ) | | $ | 56.38 | | | | 18.56 | % | | | 0.68 | % | | | 0.88 | % | | | 0.72 | % | | $ | 33,638 | | | | 55 | % | |
(continues on next page)
See notes to financial statements.
51
Victory Portfolios | | Financial Highlights | |
For a Share Outstanding Throughout Each Period
| | | | | Investment Activities | | Distributions to
Shareholders From | |
| | | Net Asset
Value,
Beginning of
Period | | Net
Investment
Income
(Loss)(a) | | Net Realized
and Unrealized
Gains (Losses)
on Investments | | Total from
Investment
Activities | | Net
Investment
Income | | Net Realized
Gains from
Investments | |
Victory RS Investors Fund | | | |
Class A | | | |
Year Ended December 31: | |
2021 | | $ | 12.84 | | | | 0.02 | | | | 3.25 | | | | 3.27 | | | | — | (c) | | | (2.21 | ) | |
2020 | | $ | 13.10 | | | | (0.01 | ) | | | (0.21 | ) | | | (0.22 | ) | | | — | | | | (0.04 | ) | |
2019 | | $ | 10.68 | | | | — | (c) | | | 2.99 | | | | 2.99 | | | | — | | | | (0.57 | ) | |
2018 | | $ | 13.86 | | | | — | (c) | | | (1.27 | ) | | | (1.27 | ) | | | — | | | | (1.91 | ) | |
2017 | | $ | 13.65 | | | | (0.03 | ) | | | 2.23 | | | | 2.20 | | | | — | | | | (1.99 | ) | |
Class C | | | |
Year Ended December 31: | |
2021 | | $ | 11.22 | | | | (0.08 | ) | | | 2.83 | | | | 2.75 | | | | — | | | | (2.21 | ) | |
2020 | | $ | 11.54 | | | | (0.08 | ) | | | (0.20 | ) | | | (0.28 | ) | | | — | | | | (0.04 | ) | |
2019 | | $ | 9.53 | | | | (0.08 | ) | | | 2.66 | | | | 2.58 | | | | — | | | | (0.57 | ) | |
2018 | | $ | 12.68 | | | | (0.10 | ) | | | (1.14 | ) | | | (1.24 | ) | | | — | | | | (1.91 | ) | |
2017 | | $ | 12.73 | | | | (0.19 | ) | | | 2.13 | | | | 1.94 | | | | — | | | | (1.99 | ) | |
Class R | | | |
Year Ended December 31: | |
2021 | | $ | 11.41 | | | | (0.06 | ) | | | 2.88 | | | | 2.82 | | | | — | | | | (2.21 | ) | |
2020 | | $ | 11.72 | | | | (0.07 | ) | | | (0.20 | ) | | | (0.27 | ) | | | — | | | | (0.04 | ) | |
2019 | | $ | 9.66 | | | | (0.07 | ) | | | 2.70 | | | | 2.63 | | | | — | | | | (0.57 | ) | |
2018 | | $ | 12.81 | | | | (0.08 | ) | | | (1.16 | ) | | | (1.24 | ) | | | — | | | | (1.91 | ) | |
2017 | | $ | 12.83 | | | | (0.17 | ) | | | 2.14 | | | | 1.97 | | | | — | | | | (1.99 | ) | |
Class Y | | | |
Year Ended December 31: | |
2021 | | $ | 13.24 | | | | 0.06 | | | | 3.36 | | | | 3.42 | | | | (0.04 | ) | | | (2.21 | ) | |
2020 | | $ | 13.47 | | | | 0.02 | | | | (0.21 | ) | | | (0.19 | ) | | | — | | | | (0.04 | ) | |
2019 | | $ | 10.94 | | | | 0.03 | | | | 3.07 | | | | 3.10 | | | | — | | | | (0.57 | ) | |
2018 | | $ | 14.10 | | | | 0.03 | | | | (1.28 | ) | | | (1.25 | ) | | | — | | | | (1.91 | ) | |
2017 | | $ | 13.82 | | | | 0.03 | | | | 2.24 | | | | 2.27 | | | | — | | | | (1.99 | ) | |
(a) Per share net investment income (loss) has been calculated using the average daily shares method.
(b) Portfolio turnover is calculated on the basis of the Fund as a whole without distinguishing between the classes of shares issued.
(c) Amount is less than $0.005 per share.
See notes to financial statements.
52
Victory Portfolios | | Financial Highlights — continued | |
For a Share Outstanding Throughout Each Period
| | | | | Ratios to Average Net Assets | | Supplemental Data | |
| | | Total
Distributions | | Net Asset
Value,
End of
Period | | Total
Return
(Excludes
Sales
Charge) | | Net
Expenses | | Net
Investment
Income
(Loss) | | Gross
Expenses | | Net Assets,
End of
Period
(000's) | | Portfolio
Turnover(b) | |
Victory RS Investors Fund | |
Class A | |
Year Ended December 31: | |
2021 | | | (2.21 | ) | | $ | 13.90 | | | | 25.74 | % | | | 1.33 | % | | | 0.13 | % | | | 1.66 | % | | $ | 15,039 | | | | 68 | % | |
2020 | | | (0.04 | ) | | $ | 12.84 | | | | (1.68 | )% | | | 1.33 | % | | | (0.08 | )% | | | 1.71 | % | | $ | 12,663 | | | | 66 | % | |
2019 | | | (0.57 | ) | | $ | 13.10 | | | | 28.01 | % | | | 1.33 | % | | | 0.03 | % | | | 1.62 | % | | $ | 16,906 | | | | 64 | % | |
2018 | | | (1.91 | ) | | $ | 10.68 | | | | (9.36 | )% | | | 1.33 | % | | | (0.03 | )% | | | 1.58 | % | | $ | 15,682 | | | | 56 | % | |
2017 | | | (1.99 | ) | | $ | 13.86 | | | | 16.28 | % | | | 1.33 | % | | | (0.24 | )% | | | 1.54 | % | | $ | 20,419 | | | | 80 | % | |
Class C | |
Year Ended December 31: | |
2021 | | | (2.21 | ) | | $ | 11.76 | | | | 24.78 | % | | | 2.07 | % | | | (0.64 | )% | | | 2.42 | % | | $ | 2,702 | | | | 68 | % | |
2020 | | | (0.04 | ) | | $ | 11.22 | | | | (2.43 | )% | | | 2.07 | % | | | (0.85 | )% | | | 2.75 | % | | $ | 3,306 | | | | 66 | % | |
2019 | | | (0.57 | ) | | $ | 11.54 | | | | 27.08 | % | | | 2.07 | % | | | (0.73 | )% | | | 2.54 | % | | $ | 6,898 | | | | 64 | % | |
2018 | | | (1.91 | ) | | $ | 9.53 | | | | (10.08 | )% | | | 2.07 | % | | | (0.82 | )% | | | 2.44 | % | | $ | 7,282 | | | | 56 | % | |
2017 | | | (1.99 | ) | | $ | 12.68 | | | | 15.48 | % | | | 2.07 | % | | | (1.42 | )% | | | 2.35 | % | | $ | 11,149 | | | | 80 | % | |
Class R | |
Year Ended December 31: | |
2021 | | | (2.21 | ) | | $ | 12.02 | | | | 25.00 | % | | | 1.95 | % | | | (0.49 | )% | | | 1.96 | % | | $ | 806 | | | | 68 | % | |
2020 | | | (0.04 | ) | | $ | 11.41 | | | | (2.30 | )% | | | 1.95 | % | | | (0.71 | )% | | | 4.41 | % | | $ | 655 | | | | 66 | % | |
2019 | | | (0.57 | ) | | $ | 11.72 | | | | 27.24 | % | | | 1.95 | % | | | (0.59 | )% | | | 3.85 | % | | $ | 844 | | | | 64 | % | |
2018 | | | (1.91 | ) | | $ | 9.66 | | | | (9.91 | )% | | | 1.95 | % | | | (0.64 | )% | | | 3.15 | % | | $ | 831 | | | | 56 | % | |
2017 | | | (1.99 | ) | | $ | 12.81 | | | | 15.50 | % | | | 1.95 | % | | | (1.27 | )% | | | 2.72 | % | | $ | 1,379 | | | | 80 | % | |
Class Y | |
Year Ended December 31: | |
2021 | | | (2.25 | ) | | $ | 14.41 | | | | 26.07 | % | | | 1.05 | % | | | 0.40 | % | | | 1.32 | % | | $ | 12,577 | | | | 68 | % | |
2020 | | | (0.04 | ) | | $ | 13.24 | | | | (1.41 | )% | | | 1.05 | % | | | 0.17 | % | | | 1.50 | % | | $ | 11,253 | | | | 66 | % | |
2019 | | | (0.57 | ) | | $ | 13.47 | | | | 28.35 | % | | | 1.05 | % | | | 0.27 | % | | | 1.43 | % | | $ | 19,146 | | | | 64 | % | |
2018 | | | (1.91 | ) | | $ | 10.94 | | | | (9.06 | )% | | | 1.05 | % | | | 0.18 | % | | | 1.37 | % | | $ | 14,669 | | | | 56 | % | |
2017 | | | (1.99 | ) | | $ | 14.10 | | | | 16.59 | % | | | 1.05 | % | | | 0.19 | % | | | 1.25 | % | | $ | 27,131 | | | | 80 | % | |
(continues on next page)
See notes to financial statements.
53
Victory Portfolios | | Financial Highlights | |
For a Share Outstanding Throughout Each Period
| | | | | Investment Activities | | Distributions to
Shareholders From | |
| | | Net Asset
Value,
Beginning of
Period | | Net
Investment
Income
(Loss)(a) | | Net Realized
and Unrealized
Gains (Losses)
on Investments | | Total from
Investment
Activities | | Net
Investment
Income | | Total
Distributions | |
Victory Global Energy Transition Fund | | | |
Class A | | | |
Year Ended December 31: | |
2021 | | $ | 12.36 | | | | (0.04 | ) | | | 10.30 | | | | 10.26 | | | | — | | | | — | | |
2020 | | $ | 9.71 | | | | (0.01 | ) | | | 2.67 | | | | 2.66 | | | | (0.01 | ) | | | (0.01 | ) | |
2019 | | $ | 12.86 | | | | — | (c) | | | (3.15 | ) | | | (3.15 | ) | | | — | | | | — | | |
2018 | | $ | 23.73 | | | | (0.14 | ) | | | (10.73 | ) | | | (10.87 | ) | | | — | | | | — | | |
2017 | | $ | 23.49 | | | | (0.22 | ) | | | 0.46 | | | | 0.24 | | | | — | | | | — | | |
Class C | | | |
Year Ended December 31: | |
2021 | | $ | 11.00 | | | | (0.17 | ) | | | 9.15 | | | | 8.98 | | | | — | | | | — | | |
2020 | | $ | 8.71 | | | | (0.07 | ) | | | 2.36 | | | | 2.29 | | | | — | | | | — | | |
2019 | | $ | 11.63 | | | | (0.08 | ) | | | (2.84 | ) | | | (2.92 | ) | | | — | | | | — | | |
2018 | | $ | 21.63 | | | | (0.28 | ) | | | (9.72 | ) | | | (10.00 | ) | | | — | | | | — | | |
2017 | | $ | 21.59 | | | | (0.36 | ) | | | 0.40 | | | | 0.04 | | | | — | | | | — | | |
Class R | | | |
Year Ended December 31: | |
2021 | | $ | 11.62 | | | | (0.12 | ) | | | 9.69 | | | | 9.57 | | | | — | | | | — | | |
2020 | | $ | 9.16 | | | | (0.04 | ) | | | 2.50 | | | | 2.46 | | | | — | | | | — | | |
2019 | | $ | 12.18 | | | | (0.04 | ) | | | (2.98 | ) | | | (3.02 | ) | | | — | | | | — | | |
2018 | | $ | 22.56 | | | | (0.20 | ) | | | (10.18 | ) | | | (10.38 | ) | | | — | | | | — | | |
2017 | | $ | 22.42 | | | | (0.29 | ) | | | 0.43 | | | | 0.14 | | | | — | | | | — | | |
Class Y | | | |
Year Ended December 31: | |
2021 | | $ | 12.88 | | | | 0.02 | | | | 10.75 | | | | 10.77 | | | | (0.01 | ) | | | (0.01 | ) | |
2020 | | $ | 10.11 | | | | 0.02 | | | | 2.78 | | | | 2.80 | | | | (0.03 | ) | | | (0.03 | ) | |
2019 | | $ | 13.38 | | | | 0.03 | | | | (3.27 | ) | | | (3.24 | ) | | | (0.03 | ) | | | (0.03 | ) | |
2018 | | $ | 24.60 | | | | (0.06 | ) | | | (11.16 | ) | | | (11.22 | ) | | | — | | | | — | | |
2017 | | $ | 24.28 | | | | (0.14 | ) | | | 0.46 | | | | 0.32 | | | | — | | | | — | | |
* Includes adjustments in accordance with U.S. Generally Accepted Accounting Principles.
(a) Per share net investment income (loss) has been calculated using the average daily shares method.
(b) Portfolio turnover is calculated on the basis of the Fund as a whole without distinguishing between the classes of shares issued.
(c) Amount is less than $0.005 per share.
(d) Amount is less than 0.005%.
(e) Portfolio turnover increased due to change within the portfolio holdings during the year.
See notes to financial statements.
54
Victory Portfolios | | Financial Highlights — continued | |
For a Share Outstanding Throughout Each Period
| | | | | Ratios to Average Net Assets | | Supplemental Data | |
| | | Net Asset
Value,
End of
Period | | Total
Return
(Excludes
Sales
Charge)* | | Net
Expenses | | Net
Investment
Income
(Loss) | | Gross
Expenses | | Net Assets,
End of
Period
(000's) | | Portfolio
Turnover(b) | |
Victory Global Energy Transition Fund | |
Class A | |
Year Ended December 31: | |
2021 | | $ | 22.62 | | | | 83.01 | % | | | 1.48 | % | | | (0.21 | )% | | | 1.58 | % | | $ | 78,317 | | | | 79 | % | |
2020 | | $ | 12.36 | | | | 27.35 | % | | | 1.48 | % | | | (0.15 | )% | | | 1.79 | % | | $ | 36,803 | | | | 46 | % | |
2019 | | $ | 9.71 | | | | (24.49 | )% | | | 1.48 | % | | | — | %(d) | | | 1.69 | % | | $ | 32,630 | | | | 24 | % | |
2018 | | $ | 12.86 | | | | (45.81 | )% | | | 1.48 | % | | | (0.65 | )% | | | 1.54 | % | | $ | 64,001 | | | | 26 | % | |
2017 | | $ | 23.73 | | | | 1.02 | % | | | 1.48 | % | | | (0.93 | )% | | | 1.55 | % | | $ | 262,455 | | | | 57 | %(e) | |
Class C | |
Year Ended December 31: | |
2021 | | $ | 19.98 | | | | 81.64 | % | | | 2.28 | % | | | (1.02 | )% | | | 2.41 | % | | $ | 3,240 | | | | 79 | % | |
2020 | | $ | 11.00 | | | | 26.29 | % | | | 2.28 | % | | | (0.92 | )% | | | 3.32 | % | | $ | 2,385 | | | | 46 | % | |
2019 | | $ | 8.71 | | | | (25.11 | )% | | | 2.28 | % | | | (0.81 | )% | | | 2.75 | % | | $ | 2,949 | | | | 24 | % | |
2018 | | $ | 11.63 | | | | (46.26 | )% | | | 2.28 | % | | | (1.42 | )% | | | 2.38 | % | | $ | 6,939 | | | | 26 | % | |
2017 | | $ | 21.63 | | | | 0.23 | % | | | 2.28 | % | | | (1.72 | )% | | | 2.35 | % | | $ | 20,428 | | | | 57 | %(e) | |
Class R | |
Year Ended December 31: | |
2021 | | $ | 21.19 | | | | 82.36 | % | | | 1.86 | % | | | (0.70 | )% | | | 1.89 | % | | $ | 1,026 | | | | 79 | % | |
2020 | | $ | 11.62 | | | | 26.86 | % | | | 1.86 | % | | | (0.51 | )% | | | 5.74 | % | | $ | 680 | | | | 46 | % | |
2019 | | $ | 9.16 | | | | (24.79 | )% | | | 1.86 | % | | | (0.37 | )% | | | 4.31 | % | | $ | 621 | | | | 24 | % | |
2018 | | $ | 12.18 | | | | (46.01 | )% | | | 1.86 | % | | | (0.99 | )% | | | 2.50 | % | | $ | 920 | | | | 26 | % | |
2017 | | $ | 22.56 | | | | 0.62 | % | | | 1.86 | % | | | (1.31 | )% | | | 2.20 | % | | $ | 2,442 | | | | 57 | %(e) | |
Class Y | |
Year Ended December 31: | |
2021 | | $ | 23.64 | | | | 83.62 | % | | | 1.15 | % | | | 0.10 | % | | | 1.21 | % | | $ | 210,586 | | | | 79 | % | |
2020 | | $ | 12.88 | | | | 27.73 | % | | | 1.15 | % | | | 0.18 | % | | | 1.28 | % | | $ | 119,237 | | | | 46 | % | |
2019 | | $ | 10.11 | | | | (24.25 | )% | | | 1.15 | % | | | 0.27 | % | | | 1.26 | % | | $ | 114,972 | | | | 24 | % | |
2018 | | $ | 13.38 | | | | (45.63 | )% | | | 1.15 | % | | | (0.29 | )% | | | 1.20 | % | | $ | 393,581 | | | | 26 | % | |
2017 | | $ | 24.60 | | | | 1.36 | % | | | 1.15 | % | | | (0.58 | )% | | | 1.19 | % | | $ | 1,126,533 | | | | 57 | %(e) | |
See notes to financial statements.
55
Victory Portfolios | | Notes to Financial Statements
December 31, 2021 | |
1. Organization:
Victory Portfolios (the "Trust") is organized as a Delaware statutory trust and the Trust is registered under the Investment Company Act of 1940, as amended (the "1940 Act"), as an open-end investment company. The Trust is comprised of 41 funds and is authorized to issue an unlimited number of shares, which are units of beneficial interest with a par value of $0.001 per share.
The accompanying financial statements are those of the following five Funds (collectively, the "Funds" and individually, a "Fund"). Each Fund, with the exception of RS Investors Fund and Global Energy Transition Fund (formerly, Global Natural Resources Fund), is classified as diversified under the 1940 Act.
Funds (Legal Name) | | Funds (Short Name) | | Investment Share
Classes Offered | |
Victory RS Partners Fund | | RS Partners Fund | | A, R, Y, and
Member Class | |
Victory RS Value Fund | | RS Value Fund | | A, C, R, and Y | |
Victory RS Large Cap Alpha Fund | | RS Large Cap Alpha Fund | | A, C, R, and Y | |
Victory RS Investors Fund | | RS Investors Fund | | A, C, R, and Y | |
Victory Global Energy Transition Fund
(Formerly Victory Global Natural
Resources Fund) | | Global Energy Transition Fund | | A, C, R, and Y | |
Each class of shares of a Fund has substantially identical rights and privileges except with respect to sales charges, fees paid under distribution plans, expenses allocable exclusively to each class of shares, voting rights on matters solely affecting a single class of shares, and the exchange privilege of each class of shares.
Under the Trust's organizational documents, its officers and trustees are indemnified against certain liabilities arising out of the performance of their duties to the Funds. In addition, in the normal course of business, the Funds enter into contracts with their vendors and others that provide for general indemnifications. The Funds' maximum exposure under these arrangements is unknown, as this would involve future claims that may be made against the Fund. However, based on experience, the Funds expect that risk of loss to be remote.
2. Significant Accounting Policies:
The following is a summary of significant accounting policies followed by the Trust in the preparation of its financial statements. The policies are in conformity with U.S. Generally Accepted Accounting Principles ("GAAP"). The preparation of financial statements in accordance with GAAP requires management to make estimates and assumptions that affect the reported amounts of assets and liabilities and disclosure of contingent assets and liabilities at the date of the financial statements and the reported amounts of income and expenses for the period. Actual results could differ from those estimates. The Funds follow the specialized accounting and reporting requirements under GAAP that are applicable to investment companies under Accounting Standards Codification Topic 946.
Investment Valuation:
The Funds record investments at fair value. Fair value is defined as the price that would be received to sell an asset or paid to transfer a liability in an orderly transaction between market participants at the measurement date.
The valuation techniques described below maximize the use of observable inputs and minimize the use of unobservable inputs in determining fair value. The inputs used for valuing the Funds' investments are summarized in the three broad levels listed below:
• Level 1 — quoted prices in active markets for identical securities
• Level 2 — other significant observable inputs (including quoted prices for similar securities or interest rates applicable to those securities, etc.)
56
Victory Portfolios | | Notes to Financial Statements — continued
December 31, 2021 | |
• Level 3 — significant unobservable inputs (including the Funds' own assumptions in determining the fair value of investments)
Changes in valuation techniques may result in transfers in or out of an assigned level within the disclosure hierarchy. The inputs or methodologies used for valuation techniques are not necessarily an indication of the risk associated with entering into those investments.
Victory Capital Management Inc. ("VCM" or the "Adviser") has established the Pricing and Liquidity Committee (the "Committee"), and subject to the Trust's Board of Trustees' (the "Board") oversight, the Committee administers and oversees the Funds' valuation policies and procedures, which are approved by the Board.
Portfolio securities listed or traded on securities exchanges, including exchange-traded funds ("ETFs") American Depositary Receipts ("ADRs"), and Private Investments in Public Equities, are valued at the closing price on the exchange or system where the security is principally traded, if available, or at the Nasdaq Official Closing Price. If there have been no sales for that day on the exchange or system, then a security is valued at the last available bid quotation on the exchange or system where the security is principally traded. In each of these situations, valuations are typically categorized as Level 1 in the fair value hierarchy.
Investments in open-end investment companies are valued at net asset value ("NAV"). These valuations are typically categorized as Level 1 in the fair value hierarchy.
In the event that price quotations or valuations are not readily available, investments are valued at fair value in accordance with procedures established by and under the general supervision and responsibility of the Board. These valuations are typically categorized as Level 2 or Level 3 in the fair value hierarchy, based on the observability of inputs used to determine the fair value. The effect of fair value pricing is that securities may not be priced on the basis of quotations from the primary market in which they are traded and the actual price realized from the sale of a security may differ materially from the fair value price. Valuing these securities at fair value is intended to cause a Fund's NAV to be more reliable than it otherwise would be.
A summary of the valuations as of December 31, 2021, is included in the table below while the breakdown, by category, of investments is disclosed on the Schedules of Portfolio Investments:
| | | Level 1 | | Level 2 | | Level 3 | | Total | |
RS Partners Fund | |
Common Stocks | | $ | 367,530,963 | | | $ | — | | | $ | — | | | $ | 367,530,963 | | |
Preferred Stocks | | | — | | | | — | | | | 587,369 | | | | 587,369 | | |
Collateral for Securities Loaned | | | 7,877,089 | | | | — | | | | — | | | | 7,877,089 | | |
Total | | $ | 375,408,052 | | | $ | — | | | $ | 587,369 | | | $ | 375,995,421 | | |
RS Value Fund | |
Common Stocks | | $ | 327,480,369 | | | $ | — | | | $ | — | | | $ | 327,480,369 | | |
Collateral for Securities Loaned | | | 8,606,536 | | | | — | | | | — | | | | 8,606,536 | | |
Total | | $ | 336,086,905 | | | $ | — | | | $ | — | | | $ | 336,086,905 | | |
RS Large Cap Alpha Fund | |
Common Stocks | | $ | 510,892,765 | | | $ | — | | | $ | — | | | $ | 510,892,765 | | |
Total | | $ | 510,892,765 | | | $ | — | | | $ | — | | | $ | 510,892,765 | | |
RS Investors Fund | |
Common Stocks | | $ | 30,579,607 | | | $ | — | | | $ | — | | | $ | 30,579,607 | | |
Total | | $ | 30,579,607 | | | $ | — | | | $ | — | | | $ | 30,579,607 | | |
Global Energy Transition Fund | |
Common Stocks | | $ | 267,090,505 | | | $ | 1,728,089 | | | $ | 804,270 | | | $ | 269,622,864 | | |
Preferred Stocks | | | — | | | | — | | | | 1,797,237 | | | | 1,797,237 | | |
Convertible Corporate Bonds | | | — | | | | — | | | | 5,629,890 | | | | 5,629,890 | | |
Collateral for Securities Loaned | | | 4,168,394 | | | | — | | | | — | | | | 4,168,394 | | |
Total | | $ | 271,258,899 | | | $ | 1,728,089 | | | $ | 8,231,397 | | | $ | 281,218,385 | | |
57
Victory Portfolios | | Notes to Financial Statements — continued
December 31, 2021 | |
For the year ended December 31, 2021, there were no transfers in or out of Level 3.
As of December 31, 2021, there were no significant Level 3 holdings for RS Partners Fund, RS Value Fund, and RS Large Cap Alpha Fund.
The following is a reconciliation of assets in which significant unobservable inputs (Level 3) were used in determining fair value (amounts in thousands):
Global Energy Transition Fund | |
Balance as of December 31, 2020 | | $ | — | | |
Accrued discount (premium) | | | — | | |
Realized Gain (Loss) | | | — | | |
Change in Unrealized Appreciation/Depreciation | | | — | | |
Purchases | | | 8,231 | | |
Sales Proceeds | | | — | | |
Transfers into Level 3 | | | — | | |
Transfers out of Level 3 | | | — | | |
Balance as of December 31, 2021 | | $ | 8,231 | | |
Global Energy Transition Fund
QUANTITATIVE INFORMATION ABOUT LEVEL 3 FAIR VALUE MEASUREMENTS | |
| Assets | | Fair Value at
December 31, 2021
($ in 000's) | | Valuation
Technique(s) | | Significant
Unobservable
Input(s) | | Input Value | |
Equity Securities: | |
Common Stocks | | $ | 804 | | | Last Transaction Price | | Transaction Price(a) | | $ | 0.83 | | |
Preferred Stocks | | $ | 1,797 | | | Last Transaction Price | | Transaction Price(a) | | $ | 49.03 | | |
Bonds: | |
Convertible Securities | | $ | 5,630 | | | Last Transaction Price | | Transaction Price(a) | | $ | 1,000.00 | | |
(a) Represents amounts used when the reporting entity has determined that market participants would use such multiples when pricing the security.
Significant increases (decreases) to transaction price would result in a significantly higher (lower) fair value measurements.
Real Estate Investment Trusts ("REITs"):
The Funds may invest in REITs, which report information on the source of their distributions annually. REITs are pooled investment vehicles that invest primarily in income-producing real estate or real-estate related loans or interests (such as mortgages). Certain distributions received from REITs during the year are recorded as realized gains or return of capital as estimated by the Funds or when such information becomes known.
Investment Companies:
Open-End Funds:
The Funds may invest in portfolios of open-end investment companies. These investment companies value securities in their portfolios for which market quotations are readily available at their market values (generally the last reported sale price) and all other securities and assets at their fair value by the methods established by the board of directors of the underlying funds.
Special Purpose Acquisition Companies ("SPAC"):
The Funds may invest in stock, warrants and other securities of special purpose acquisition companies ("SPACs"). A SPAC typically is a publicly traded company that raises funds through an initial public offering ("IPO") for the purpose of acquiring or merging with another company to be identified subsequent to the SPAC's IPO. If a Fund purchases shares of a SPAC in an IPO it generally will bear a sales commission, which may be significant. The securities of a SPAC are often issued in "units" that include one share of common stock and one right or warrant (or partial right or warrant) conveying
58
Victory Portfolios | | Notes to Financial Statements — continued
December 31, 2021 | |
the right to purchase additional shares or partial shares. Unless and until a transaction is completed, a SPAC generally invests its assets (less a portion retained to cover expenses) in U.S. government securities, money market funds and similar investments whose returns or yields may be significantly lower than those of the Fund's other investments. If an acquisition or merger that meets the requirements for the SPAC is not completed within a pre-established period of time, the invested funds are returned to the SPAC's shareholders, less certain permitted expenses, and any rights or warrants issued by the SPAC will expire worthless.
Private Investments in Public Equities:
The Funds may acquire common stock or a security convertible into common stock, such as a warrant or convertible preferred stock, directly from an issuer seeking to raise capital in a private placement pursuant to Regulation D under the 1933 Act. These transactions are commonly referred to as a private placement in a publicly-held company, or "PIPE." The issuer's common stock is usually publicly traded on a U.S. securities exchange or in the over-the-counter market, but the securities acquired will be subject to restrictions on resale imposed by U.S. securities laws absent an effective registration statement. In recognition of the illiquid nature of the securities being acquired, the purchase price paid in a PIPE transaction (or the conversion price of the convertible securities being acquired) will typically be fixed at a discount to the prevailing market price of the issuer's common stock at the time of the transaction. As part of a PIPE transaction, the issuer usually will be contractually obligated to seek to register, within an agreed upon period of time for public resale under the U.S. securities laws, the common stock or the shares of common stock issuable upon conversion of the convertible securities. PIPE transactions typically involve the purchase of securities directly from a publicly traded company or its affiliates in a private placement transaction, including through a SPAC, typically at a discount to the market price of the issuer's securities. If the issuer fails to so register the shares within that period, the buyer may be entitled to additional consideration from the issuer (e.g. warrants to acquire additional shares of common stock), but the buyer may not be able to sell its shares unless and until the registration process is successfully completed. Thus PIPE transactions present certain risks not associated with open market purchases of equities.
Investment Transactions and Related Income:
Changes in holdings of investments are accounted for no later than one business day following the trade date. For financial reporting purposes, however, investment transactions are accounted for on trade date or the last business day of the reporting period. Interest income is determined on the basis of coupon interest accrued using the effective interest method which adjusts, where applicable, the amortization of premiums or accretion of discounts. Dividend income is recorded on the ex-dividend date. Gains or losses realized on sales of securities are recorded on the identified cost basis.
Withholding taxes on interest, dividends, and gains as a result of certain investments in ADRs by the Funds have been provided for in accordance with each investment's applicable country's tax rules and rates.
Securities Lending:
The Funds, through a Securities Lending Agreement with Citibank, N.A. ("Citibank"), may lend their securities to qualified financial institutions, such as certain broker-dealers and banks, to earn additional income, net of income retained by Citibank. Borrowers are required to initially secure their loans for collateral in the amount of at least 102% of the value of U.S. securities loaned or at least 105% of the value of non-U.S. securities loaned, marked-to-market daily. Any collateral shortfalls associated with increases in the valuation of the securities loaned are generally cured the next business day. The collateral can be received in the form of cash collateral and/or non-cash collateral. Non-cash collateral can include U.S. Government Securities and other securities as permitted by Securities and Exchange Commission ("SEC") guidelines. The cash collateral is invested in short-term instruments or cash equivalents, primarily open-end investment companies, as noted on the Funds' Schedules of Portfolio Investments. The Funds effectively do not have control of the non-cash collateral and therefore it is not disclosed on the Funds' Schedules of Portfolio Investments. Collateral requirements are determined daily based on the value of the Funds' securities on loan as of the end of the prior business day. During
59
Victory Portfolios | | Notes to Financial Statements — continued
December 31, 2021 | |
the time portfolio securities are on loan, the borrower will pay the Funds any dividends or interest paid on such securities plus any fee negotiated between the parties to the lending agreement. The Funds also earn a return from the collateral. The Funds pay Citibank various fees in connection with the investment of cash collateral and fees based on the investment income received from securities lending activities. Securities lending income (net of these fees) is disclosed on the Statements of Operations. Loans are terminable upon demand and the borrower must return the loaned securities within the lesser of one standard settlement period or five business days. Although risk is mitigated by the collateral, a Fund could experience a delay in recovering its securities and possible loss of income or value if the borrower fails to return them. In addition, there is a risk that the value of the short-term investments will be less than the amount of cash collateral required to be returned to the borrower.
The Funds' agreement with Citibank does not include master netting provisions. Non-cash collateral received by the Funds may not be sold or repledged, except to satisfy borrower default.
The following table is a summary of the Funds' securities lending transactions as of December 31, 2021.
| | | Value of
Securities on Loan | | Non-Cash Collateral | | Cash Collateral | |
RS Partners Fund | | $ | 7,757,416 | | | $ | — | | | $ | 7,877,089 | | |
RS Value Fund | | | 8,438,631 | | | | — | | | | 8,606,536 | | |
Global Energy Transition Fund | | | 4,057,601 | | | | — | | | | 4,168,394 | | |
Foreign Currency Translations:
The accounting records of the Funds are maintained in U.S. dollars. Investment securities and other assets and liabilities of a Fund denominated in a foreign currency are translated into U.S. dollars at current exchange rates. Purchases and sales of securities, income receipts and expense payments are translated into U.S. dollars at the exchange rates on the date of the transactions. The Funds do not isolate the portion of the results of operations resulting from changes in foreign exchange rates on investments from fluctuations arising from changes in market prices of securities held. Such fluctuations are disclosed as Net change in unrealized appreciation/depreciation on investment securities and foreign currency translations on the Statements of Operations. Any realized gains or losses from these fluctuations are disclosed as Net realized gains (losses) from investment securities and foreign currency transactions on the Statements of Operations.
Federal Income Taxes:
It is each Fund's policy to continue to qualify as a regulated investment company by complying with the provisions available to certain investment companies, as defined in applicable sections of the Internal Revenue Code, and to make distributions of net investment income and net realized gains sufficient to relieve it from all, or substantially all, federal income taxes. Accordingly, no provision for federal income taxes is required in the financial statements. The Funds have a tax year end of December 31.
For the year ended December 31, 2021, the Funds did not incur any income tax, interest, or penalties, and has recorded no liability for net unrecognized tax benefits relating to uncertain income tax positions.
Management of the Funds has reviewed tax positions taken in tax years that remain subject to examination by all major tax jurisdictions, including federal (i.e., the last four tax years, which includes the current fiscal tax year end). Management believes that there is no tax liability resulting from unrecognized tax benefits related to uncertain tax positions taken.
Allocations:
Expenses directly attributable to a Fund are charged to that Fund, while expenses that are attributable to more than one fund in the Trust, or jointly with an affiliated trust, are allocated among the respective funds in the Trust and/or an affiliated trust based upon net assets or another appropriate basis.
Income, expenses (other than class-specific expenses such as transfer agent fees, state registration fees, 12b-1 fees, and printing fees), and realized and unrealized gains or losses on investments are
60
Victory Portfolios | | Notes to Financial Statements — continued
December 31, 2021 | |
allocated to each class of shares based on its relative net assets on the date income is earned or expenses and realized and unrealized gains and losses are incurred.
3. Purchases and Sales:
Purchases and sales of securities (excluding securities maturing less than one year from acquisition) for the year ended December 31, 2021, were as follows:
| | | Excluding
U.S. Government Securities | |
| | | Purchases | | Sales | |
RS Partners Fund | | $ | 232,077,728 | | | $ | 283,502,815 | | |
RS Value Fund | | | 222,781,077 | | | | 279,334,428 | | |
RS Large Cap Alpha Fund | | | 260,193,081 | | | | 323,460,383 | | |
RS Investors Funds | | | 20,003,197 | | | | 23,987,688 | | |
| Global Energy Transition Fund | | | 188,279,882 | | | | 189,920,431 | | |
4. Fees and Transactions with Affiliates and Related Parties:
Investment Advisory Fees:
Investment advisory services are provided to the Funds by the Adviser, which is a New York corporation registered as an investment adviser with the SEC. The Adviser is an indirect wholly owned subsidiary of Victory Capital Holdings, Inc., a publicly traded Delaware corporation, and a wholly owned direct subsidiary of Victory Capital Operating, LLC.
VCM has entered into a Sub-Advisory Agreement with SailingStone Capital Partners LLC ("SailingStone"). SailingStone is responsible for providing day-to-day investment advisory services to the Global Energy Transition Fund, subject to the oversight of the Board. Sub-investment advisory fees paid by VCM to SailingStone do not represent a separate or additional expense to the Funds.
Under the terms of the Investment Advisory Agreement, the Adviser is entitled to receive fees based on a percentage of the average daily net assets of each Fund. The rates at which the Adviser is paid by each Fund are included in the table below.
| | | Flat Rate | |
RS Partners Fund | | | 1.00 | % | |
RS Value Fund | | | 0.85 | % | |
RS Large Cap Alpha Fund | | | 0.50 | % | |
RS Investors Fund | | | 1.00 | % | |
Global Energy Transition Fund | | | 1.00 | % | |
Amounts incurred and paid to VCM for the year ended December 31, 2021, are reflected on the Statements of Operations as Investment advisory fees.
Administration and Servicing Fees:
VCM also serves as the Funds' administrator and fund accountant. Under the Administration and Fund Accounting Agreement, VCM is entitled to receive fees based on a percentage of the average daily net assets of the Trust, Victory Variable Insurance Funds and Victory Portfolios II. The tiered rates at which VCM is paid by the Funds are shown in the table below:
| Net Assets | |
| Up to $15 billion | | $15 billion – $30 billion | | Over $30 billion | |
| 0.08 %, plus | | 0.05 %, plus | | 0.04 % | |
Amounts incurred for the year ended December 31, 2021, are reflected on the Statements of Operations as Administration fees.
61
Victory Portfolios | | Notes to Financial Statements — continued
December 31, 2021 | |
Citi Fund Services Ohio, Inc. ("Citi"), an affiliate of Citibank, acts as sub-administrator and sub-fund accountant to the Funds pursuant to the Sub-Administration and Sub-Fund Accounting Services Agreement between VCM and Citi. VCM pays Citi a fee for providing these services. The Trust reimburses VCM and Citi for out-of-pocket expenses incurred in providing these services and certain other expenses specifically allocated to the Funds. Amounts incurred for the year ended December 31, 2021, are reflected on the Statements of Operations as Sub-Administration fees.
The Funds (as part of the Trust) have entered into an agreement with the Adviser to provide compliance services, pursuant to which the Adviser furnishes its compliance personnel, including the services of the Chief Compliance Officer ("CCO"), and other resources reasonably necessary to provide the Trust with compliance oversight services related to the design, administration, and oversight of a compliance program for the Trust in accordance with Rule 38a-1 under the 1940 Act. The CCO is an employee of the Adviser, which pays the compensation of the CCO and support staff. The funds in the Trust, Victory Variable Insurance Funds, Victory Portfolios II, and USAA Mutual Funds (collectively, the "Victory Funds Complex") in the aggregate, compensate the Adviser for these services. Amounts incurred for the year ended December 31, 2021, are reflected on the Statements of Operations as Compliance fees.
Transfer Agency Fees:
FIS Investor Services, LLC ("FIS") serves as the Funds' transfer agent. Under the Transfer Agent Agreement, the Trust pays FIS a fee for its services and reimburses FIS for all of their reasonable out-of-pocket expenses incurred in providing these services. Amounts incurred for the year ended December 31, 2021, are reflected on the Statements of Operations as Transfer agent fees.
Victory Capital Transfer Agency, Inc., an affiliate of the Adviser, serves as sub-transfer agent for the Member Class. Victory Capital Transfer Agency, Inc. receives no fee or other compensation for these services.
Distributor/Underwriting Services:
Victory Capital Services, Inc. (the "Distributor"), an affiliate of the Adviser, serves as Distributor for the continuous offering of the shares of the Funds pursuant to a Distribution Agreement between the Distributor and the Trust.
Pursuant to the Distribution and Service Plans adopted in accordance with Rule 12b-1 under the 1940 Act, the Distributor may receive a monthly distribution and service fee up to the annual rate shown in the table below:
| | | Class A | | Class C | | Class R | |
RS Partners Fund | | | 0.25 | % | | | N/A | | | | 0.50 | % | |
RS Value Fund | | | 0.25 | % | | | 1.00 | % | | | 0.50 | % | |
RS Large Cap Alpha Fund | | | 0.25 | % | | | 1.00 | % | | | 0.50 | % | |
RS Investors Fund | | | 0.25 | % | | | 1.00 | % | | | 0.50 | % | |
Global Energy Transition Fund | | | 0.25 | % | | | 1.00 | % | | | 0.50 | % | |
The distribution and service fees paid to the Distributor may be used by the Distributor to pay for activities primarily intended to result in the sale of Class A, Class C, and Class R. Amounts incurred for the year ended December 31, 2021, are reflected on the Statements of Operations as 12b-1 fees.
In addition, the Distributor is entitled to receive commissions on sale of the Class A. For the year ended December 31, 2021, the Distributor received $20,172 from commissions earned on the sale of Class A.
Other Fees:
Citibank serves as the Funds' custodian. The Funds pay Citibank a fee for providing these services. Amounts incurred for the year ended December 31, 2021, are reflected on the Statements of Operations as Custodian fees.
Sidley Austin LLP provides legal services to the Trust.
The Adviser has entered into expense limitation agreements with certain Funds. Under the terms of the agreements, the Adviser has agreed to waive fees or reimburse certain expenses to the extent that
62
Victory Portfolios | | Notes to Financial Statements — continued
December 31, 2021 | |
ordinary operating expenses incurred by certain classes of a Fund in any fiscal year exceed the expense limit for such classes of the Fund. Such excess amounts will be the liability of the Adviser. Acquired fund fees and expenses, interest, taxes, brokerage commissions, other expenditures that are capitalized in accordance with GAAP, and other extraordinary expenses not incurred in the ordinary course of a Fund's business are excluded from the expense limits. As of December 31, 2021, the expense limits (excluding voluntary waivers) are as follows:
| | | In effect until April 30, 2022 | |
| | | Class A | | Class C | | Class R | | Class Y | | Member Class | |
RS Partners Fund | | | 1.45 | % | | | N/A | | | | 1.81 | % | | | 1.12 | % | | | 1.25 | % | |
RS Value Fund | | | 1.30 | % | | | 2.07 | % | | | 1.69 | % | | | 1.06 | % | | | N/A | | |
RS Large Cap Alpha Fund | | | 0.89 | % | | | 1.69 | % | | | 1.26 | % | | | 0.68 | % | | | N/A | | |
RS Investors Fund | | | 1.33 | % | | | 2.07 | % | | | 1.95 | % | | | 1.05 | % | | | N/A | | |
Global Energy Transition Fund | | | 1.48 | % | | | 2.28 | % | | | 1.86 | % | | | 1.15 | % | | | N/A | | |
Under the terms of the expense limitation agreements, amended May 1, 2021, the Funds have agreed to repay fees and expenses that were waived or reimbursed by the Adviser for a period of up to three years (thirty six (36) months) after the waiver or reimbursement took place, subject to the lesser of any operating expense limits in effect at the time of: (a) the original waiver or expense reimbursement; or (b) the recoupment, after giving effect to the recoupment amount. Prior to May 1, 2021, the Funds were permitted to recoup fees waived and expenses reimbursed for up to three years after the fiscal year in which the waiver or reimbursement took place, subject to the limitations above. This change did not have any effect on the amounts previously reported for recoupment.
As of December 31, 2021, the following amounts are available to be repaid to the Adviser. The Funds have not recorded any amounts available to be repaid as a liability due to an assessment that repayments are not probable at December 31, 2021.
| | | Expires
2022 | | Expires
2023 | | Expires
2024 | | Total | |
RS Partners Fund | | $ | 344,191 | | | $ | 316,786 | | | $ | 229,651 | | | $ | 890,628 | | |
RS Value Fund | | | 154,554 | | | | 199,071 | | | | 70,218 | | | | 423,843 | | |
RS Large Cap Alpha Fund | | | 327,684 | | | | 314,607 | | | | 211,774 | | | | 854,065 | | |
RS Investors Fund | | | 162,310 | | | | 146,600 | | | | 90,433 | | | | 399,343 | | |
Global Energy Transition Fund | | | 429,505 | | | | 234,015 | | | | 186,151 | | | | 849,671 | | |
The Adviser may voluntarily waive or reimburse additional fees to assist the Funds in maintaining competitive expense ratios. Voluntary waivers and reimbursements applicable to the Funds are not available to be recouped at a future time. There were no voluntary waivers or reimbursements for the year ended December 31, 2021.
Certain officers and/or interested trustees of the Funds are also officers and/or employees of the Adviser, administrator, fund accountant, sub-administrator, sub-fund accountant, custodian, legal counsel, and Distributor.
5. Risks:
The Funds may be subject to other risks in addition to these identified risks.
Equity Risk — An investment in the Funds' shares represents an indirect investment in the securities owned by the Funds, some of which will be traded on a national securities exchange or in the over-the-counter markets. The value of the securities in which the Funds invest, like other market investments, may move up or down, sometimes rapidly and unpredictably. The value of the securities in which the Funds invest may affect the value of the Funds' shares. An investment in the Funds' shares at any point in time may be worth less than the original investment, even after taking into account the reinvestment of the Funds' distributions.
Private Investments in Public Equities Risk — The risks associated with PIPE transactions that a Fund invests is that the issuer may be unable to register the shares for public resale in a timely manner or
63
Victory Portfolios | | Notes to Financial Statements — continued
December 31, 2021 | |
at all, in which case the shares may be sold only in a privately negotiated transaction, typically at a price less than that paid, assuming a suitable buyer can be found. Disposing of the securities may involve time-consuming negotiation and legal expenses, and selling them promptly at an acceptable price may be difficult or impossible. Even if the shares are registered for public resale, the market for the issuer's securities may nevertheless be "thin" or illiquid, making the sale of securities at desired prices or in desired quantities difficult or impossible. While private placements may offer attractive opportunities not otherwise available in the open market, the securities purchased are usually "restricted securities" or are "not readily marketable." Restricted securities cannot be sold without being registered under the 1933 Act, unless they are sold pursuant to an exemption from registration (such as Rules 144 or 144A under the 1933 Act). Securities that are not readily marketable are subject to other legal or contractual restrictions on resale.
Special Purpose Acquisition Company Risk — An investment in a SPAC is subject to a variety of risks, including that (1) a portion of the monies raised by the SPAC for the purpose of effecting an acquisition or merger may be expended prior to the transaction for payment of taxes and other expenses; (2) the Fund generally will not receive significant income from its investments in SPACs (both prior to and after any acquisition or merger) and, therefore, the Fund's investments in SPACs will not significantly contribute to the Fund's distributions to shareholders; (3) an attractive acquisition or merger target may not be identified at all or a proposed merger or acquisition may be unable to obtain the requisite approval, if any, of SPAC shareholders and/or antitrust and securities regulators; (4) the warrants or other rights with respect to the SPAC held by the Fund may expire worthless or may be redeemed by the SPAC at an unfavorable price; (5) the Fund may be subject to opportunity costs to the extent that alternative investments would have produced higher returns; (6) an acquisition or merger once effected may prove unsuccessful and an investment in the SPAC may lose value; (7) while a SPAC is seeking a transaction target, its stock may be thinly traded and/or illiquid and there can be no assurance that a market will develop, leaving the Fund unable to sell its interest in a SPAC or to sell its interest only at a price below what the Fund believes is the SPAC interest's intrinsic value, (8) an investment in a SPAC may be diluted by additional later offerings of interests in the SPAC or by other investors exercising existing rights to purchase shares of the SPAC; and (9) the values of investments in SPACs may be highly volatile and may depreciate significantly over time. The proceeds of a SPAC IPO that are placed in trust are subject to risks, including the risk of insolvency of the custodian of the funds, fraud by the trustee, interest rate risk and credit and liquidity risk relating to the securities and money market funds in which the proceeds are invested.
Sector Risk — To the extent the Funds focus in one or more sectors, market or economic factors impacting those sectors could have a significant effect on the value of the Funds' investments and could make the Funds' performance more volatile. For example, the values of companies in the Information Technology sector are particularly vulnerable to economic downturns, short product cycles and aggressive pricing, market competition and changes in government regulation.
Concentration Risk — The Global Energy Transition Fund (herein, the "Fund") may concentrate its investments in a particular industry, as the term "concentration is used in the 1940 Act. Concentrating investments in the Natural Resources sector increases the risk of loss because the stocks of many or all of the companies in the sector may decline in value due to developments adversely affecting the sector. In addition, investors may buy or sell substantial amounts of the Fund's shares in response to factors affecting or expected to affect the natural resources sector, resulting in extreme inflows and outflows of cash into and out of the Fund. Such inflows or outflows might affect management of the Fund adversely to the extent they cause the Fund's cash position or cash requirements to exceed normal levels.
Natural Resources Investment Risk — Investment in companies in natural resources industries (including those in the energy sector) can be significantly affected by (often rapid) changes in supply of, or demand for, various natural resources. They may also be affected by changes in energy prices, international political and economic developments, environmental incidents, energy conservation, the success of exploration projects, changes in commodity prices, and tax and other government regulations. For example, the COVID-19 pandemic has drastically reduced the demand for various natural resources and has drastically increased the price volatility of natural resources and companies within the natural resources industry. An extended period of reduced (or negative) prices may significantly lengthen the
64
Victory Portfolios | | Notes to Financial Statements — continued
December 31, 2021 | |
time that companies within the natural resources industries would need to recover after a stabilization of prices. Investments in interests in gas or mineral exploration or development programs, including pipelines, may be held through master limited partnerships, which are generally subject to many of the risks that apply to partnerships and may also be subject to certain tax risks.
6. Borrowing and Interfund Lending:
Line of Credit:
The Victory Funds Complex participates in a short-term demand note "Line of Credit" agreement with Citibank. The Line of Credit agreement with Citibank was renewed on June 28, 2021, with a termination date of June 27, 2022. Under the agreement with Citibank, the Victory Funds Complex may borrow up to $600 million, of which $300 million is committed and $300 million is uncommitted. $40 million of the Line of Credit is reserved for use by the Victory Floating Rate Fund, another series of the Victory Funds Complex, with Victory Floating Rate Fund paying the related commitment fees for that amount. The purpose of the Line of Credit is to meet temporary or emergency cash needs. For the year ended December 31, 2021, Citibank received an annual commitment fee of 0.15% on $300 million for providing the Line of Credit. Each fund in the Victory Funds Complex pays a pro-rata portion of the commitment fees plus any interest (one-month London Interbank Offered Rate ("LIBOR") plus one percent, with LIBOR to be replaced by a different benchmark rate in accordance with the terms of the agreement) on amounts borrowed. Prior to June 28, 2021, the Victory Funds Complex paid an annual commitment fee of 0.15% and an upfront fee of 0.10%. Each fund in the Victory Funds Complex paid a pro-rata portion of the upfront fee. Interest charged to each fund during the period, if applicable, is reflected on the Statements of Operations under Line of credit fees.
The Funds had no borrowings under the Line of Credit agreement during the year ended December 31, 2021.
Interfund Lending:
The Trust and Adviser rely on an exemptive order granted by the SEC in March 2017 (the "Order"), permitting the establishment and operation of an Interfund Lending Facility (the "Facility"). The Facility allows each Fund to directly lend and borrow money to or from any other fund in the Victory Funds Complex that is permitted to participate in the Facility, relying upon the Order at rates beneficial to both the borrowing and lending funds. Advances under the Facility are allowed for temporary or emergency purposes, including the meeting of redemption requests that otherwise might require the untimely disposition of securities, and are subject to each Fund's borrowing restrictions. The interfund loan rate is determined, as specified in the Order, by averaging the current repurchase agreement rate and the current bank loan rate. As a Borrower, interest charged to each Fund, if any, during the period, is reflected on the Statements of Operations under Interfund lending fees. As a Lender, interest earned by each Fund, if any, during the period, is reflected on the Statements of Operations under Interfund lending.
The average borrowing or lending for the days outstanding and average interest rate for the Funds that utilized this Facility during the year ended December 31, 2021, were as follows:
| | | Borrower
or
Lender | | Amount
Outstanding
at
December 31,
2021 | | Average
Borrowing* | | Days
Borrowing
Outstanding | | Average
Interest
Rate | | Maximum
Borrowing
During
the Period | |
Global Energy
Transition Fund | | Borrower | | $ | — | | | $ | 6,334,000 | | | | 3 | | | | 0.58 | % | | $ | 6,334,000 | | |
* For the year ended December 31, 2021, based on the number of days borrowings were outstanding.
65
Victory Portfolios | | Notes to Financial Statements — continued
December 31, 2021 | |
7. Federal Income Tax Information:
Dividends from net investment income, if any, are declared and paid as noted in the table below. Distributable net realized gains, if any, are declared and distributed at least annually from each Fund.
| | | Declared | | Paid | |
RS Partners Fund | | Annually | | Annually | |
RS Value Fund | | Annually | | Annually | |
RS Large Cap Alpha Fund | | Annually | | Annually | |
RS Investors Fund | | Annually | | Annually | |
Global Energy Transition Fund | | Annually | | Annually | |
The amounts of dividends from net investment income and distributions from net realized gains (collectively, distributions to shareholders) are determined in accordance with federal income tax regulations, which may differ from GAAP. To the extent these "book/tax" differences are permanent in nature (e.g., net operating loss and distribution reclassification), such amounts are reclassified within the components of net assets based on their federal tax-basis treatment; temporary differences (e.g., wash sales) do not require reclassification. To the extent dividends and distributions exceed net investment income and net realized gains for tax purposes, they are reported as distributions of capital. Net investment losses incurred by the Funds may be reclassified as an offset to capital on the accompanying Statements of Assets and Liabilities.
As of December 31, 2021, on the Statements of Assets and Liabilities, as a result of permanent book-to-tax differences, reclassification adjustments were as follows:
| | Total
Accumulated
Earnings/(Loss) | | Capital | |
RS Partners Fund | | $ | (9,706,847 | ) | | $ | 9,706,847 | | |
| RS Value Fund | | | (4,124,475 | ) | | | 4,124,475 | | |
| RS Large Cap Alpha Fund | | | (3,482,070 | ) | | | 3,482,070 | | |
RS Investors Fund | | | (357,640 | ) | | | 357,640 | | |
| Global Energy Transition Fund | | | 5,906 | | | | (5,906 | ) | |
The tax character of distributions paid during the tax years ended as noted below, were as follows (total distributions paid may differ from the Statements of Changes in Net Assets because, for tax purposes, dividends are recognized when actually paid).
| | | Year Ended December 31, 2021 | |
| | | Distributions Paid From: | | | |
| | Ordinary
Income | | Net
Long-Term
Capital Gains | | Total
Distributions
Paid | |
RS Partners Fund | | $ | 21,530,003 | | | $ | 31,220,827 | | | $ | 52,750,830 | | |
RS Value Fund | | | 10,573,513 | | | | 31,396,048 | | | | 41,969,561 | | |
RS Large Cap Alpha Fund | | | 27,811,743 | | | | 31,911,297 | | | | 59,723,040 | | |
RS Investors Fund | | | 1,283,871 | | | | 3,071,334 | | | | 4,355,205 | | |
Global Energy Transition Fund | | | 86,748 | | | | — | | | | 86,748 | | |
| | | Year Ended December 31, 2020 | |
| | | Distributions Paid From: | | | |
| | | Ordinary
Income | | Net
Long-Term
Capital Gains | | Total
Distributions
Paid | |
RS Partners Fund | | $ | 11 | | | $ | 4,980,318 | | | $ | 4,980,329 | | |
RS Value Fund | | | 5 | | | | 5,814,174 | | | | 5,814,179 | | |
RS Large Cap Alpha Fund | | | 1,415,308 | | | | 16,338,738 | | | | 17,754,046 | | |
RS Investors Fund | | | — | | | | 86,177 | | | | 86,177 | | |
| Global Energy Transition Fund | | | 325,268 | | | | — | | | | 325,268 | | |
66
Victory Portfolios | | Notes to Financial Statements — continued
December 31, 2021 | |
As of December 31, 2021, the components of accumulated earnings/(loss) on a tax basis were as follows:
| | Undistributed
Ordinary
Income | | Undistributed
Long-Term
Capital Gains | | Accumulated
Earnings | | Accumulated
Capital and
Other Losses | | Qualified
Late
Year
Losses* | | Unrealized
Appreciation
(Depreciation)** | | Total
Accumulated
Earnings
(Loss) | |
RS Partners
Fund | | $ | — | | | $ | 8,390,677 | | | $ | 8,390,677 | | | $ | — | | | $ | — | | | $ | 87,186,500 | | | $ | 95,577,177 | | |
RS Value
Fund | | | 1,674,095 | | | | 8,969,328 | | | | 10,643,423 | | | | — | | | | — | | | | 64,847,209 | | | | 75,490,632 | | |
RS Large
Cap Alpha
Fund | | | 8,766,492 | | | | 16,449,490 | | | | 25,215,982 | | | | — | | | | — | | | | 117,260,210 | | | | 142,476,192 | | |
RS Investors
Fund | | | 31,223 | | | | 81,649 | | | | 112,872 | | | | — | | | | — | | | | 5,685,538 | | | | 5,798,410 | | |
Global Energy
Transition
Fund | | | — | | | | — | | | | — | | | | (1,823,189,805 | ) | | | (6,381 | ) | | | 29,403,255 | | | | (1,793,792,931 | ) | |
* Qualified late-year losses are comprised of post-October capital losses incurred after October 31and certain late-year ordinary losses. Late-year ordinary losses represent ordinary losses incurred after December 31 and specified losses incurred after October 31. These losses are deemed to arise on the first day of the Fund's next taxable year.
** The difference between the book-basis and tax-basis unrealized appreciation (depreciation) is attributable primarily to tax deferral of losses on wash sales and partnership basis adjustments.
At December 31, 2021, the Funds had net capital loss carryforwards as shown in the table below, which are not subject to expiration. It is unlikely that the Board will authorize a distribution of capital gains realized in the future until the capital loss carryforwards have been used.
| | Short Term
Amount | | Long Term
Amount | | Total | |
Global Energy Transition Fund | | $ | — | | | $ | 1,823,189,805 | | | $ | 1,823,189,805 | | |
During the tax year ended December 31, 2021, the following Funds utilized capital loss carryforwards:
RS Partners Fund | | $ | 9,264,242 | | |
| RS Value Fund | | | 11,866,659 | | |
| RS Large Cap Alpha Fund | | | 574,294 | | |
| RS Investors Fund | | | 2,106,442 | | |
| Global Energy Transition Fund | | | 5,099,724 | | |
As of December 31, 2021, the cost basis for federal income tax purposes, gross unrealized appreciation, gross unrealized depreciation, and net unrealized appreciation (depreciation) for investments were as follows:
| | Cost of
Investments
for Federal
Tax Purposes | | Gross
Unrealized
Appreciation | | Gross
Unrealized
Depreciation | | Net
Unrealized
Appreciation
(Depreciation) | |
RS Partners Fund | | $ | 288,808,921 | | | $ | 96,427,241 | | | $ | (9,240,741 | ) | | $ | 87,186,500 | | |
| RS Value Fund | | | 271,239,696 | | | | 69,656,045 | | | | (4,808,836 | ) | | | 64,847,209 | | |
| RS Large Cap Alpha Fund | | | 393,632,555 | | | | 123,711,490 | | | | (6,451,280 | ) | | | 117,260,210 | | |
RS Investors Fund | | | 24,894,069 | | | | 6,357,977 | | | | (672,439 | ) | | | 5,685,538 | | |
| Global Energy Transition Fund | | | 251,816,606 | | | | 107,047,219 | | | | (77,645,440 | ) | | | 29,401,779 | | |
67
REPORT OF INDEPENDENT REGISTERED PUBLIC ACCOUNTING FIRM
To the Shareholders and Board of Trustees of Victory Portfolios
Opinion on the Financial Statements
We have audited the accompanying statements of assets and liabilities, including the schedules of portfolio investments, of Victory RS Partners Fund, Victory RS Value Fund, Victory RS Large Cap Alpha Fund, Victory RS Investors Fund, and Victory Global Energy Transition Fund (formerly Victory Global Natural Resources Fund) (the "Funds"), each a series of Victory Portfolios, as of December 31, 2021, the related statements of operations for the year then ended, the statements of changes in net assets for each of the two years in the period then ended, the related notes, and the financial highlights for each of the three years in the period then ended (collectively referred to as the "financial statements"). In our opinion, the financial statements present fairly, in all material respects, the financial position of each of the Funds as of December 31, 2021, the results of their operations for the year then ended, the changes in net assets for each of the two years in the period then ended and the financial highlights for each of the three years in the period then ended, in conformity with accounting principles generally accepted in the United States of America.
The Funds' financial highlights for the years ended December 31, 2018 and prior, were audited by other auditors whose report dated February 26, 2019, expressed an unqualified opinion on those financial highlights.
Basis for Opinion
These financial statements are the responsibility of the Funds' management. Our responsibility is to express an opinion on the Funds' financial statements based on our audits. We are a public accounting firm registered with the Public Company Accounting Oversight Board (United States) ("PCAOB") and are required to be independent with respect to the Funds in accordance with the U.S. federal securities laws and the applicable rules and regulations of the Securities and Exchange Commission and the PCAOB.
We conducted our audits in accordance with the standards of the PCAOB. Those standards require that we plan and perform the audit to obtain reasonable assurance about whether the financial statements are free of material misstatement whether due to error or fraud.
Our audits included performing procedures to assess the risks of material misstatement of the financial statements, whether due to error or fraud, and performing procedures that respond to those risks. Such procedures included examining, on a test basis, evidence regarding the amounts and disclosures in the financial statements. Our procedures included confirmation of securities owned as of December 31, 2021, by correspondence with the custodian and brokers; when replies were not received from brokers, we performed other auditing procedures. Our audits also included evaluating the accounting principles used and significant estimates made by management, as well as evaluating the overall presentation of the financial statements. We believe that our audits provide a reasonable basis for our opinion.
We have served as the auditor of one or more of the investment companies advised by Victory Capital Management, Inc. since 2015.
COHEN & COMPANY, LTD.
Cleveland, Ohio
February 23, 2022
68
Victory Portfolios | | Supplemental Information
December 31, 2021 | |
(Unaudited)
Trustee and Officer Information
Board of Trustees:
Overall responsibility for management of the Trust rests with the Board. The Trust is managed by the Board in accordance with the laws of the State of Delaware. There are currently nine Trustees, eight of whom are not "interested persons" of the Trust within the meaning of that term under the 1940 Act ("Independent Trustees") and one of whom is an "interested person" of the Trust within the meaning of that term under the 1940 Act ("Interested Trustee"). The Trustees, in turn, elect the officers of the Trust to actively supervise its day-to-day operations.
The following tables list the Trustees, their date of birth, their position with the Trust, their commencement of service, their principal occupations during the past five years, and any directorships of other investment companies or companies whose securities are registered under the Securities Exchange Act of 1934, as amended, or who file reports under that Act. Each Trustee oversees 41 portfolios in the Trust, eight portfolios in Victory Variable Insurance Funds, and 25 portfolios in Victory Portfolios II, each a registered investment company that, together with the Trust, comprise the Victory Funds Complex. David C. Brown is a Trustee of USAA Mutual Funds and oversees 46 portfolios of the USAA Mutual Funds Trust. Each Trustee's address is c/o Victory Portfolios, 4900 Tiedeman Road, 4th Floor, Brooklyn, Ohio 44144. Each Trustee has an indefinite term.
Name and Date of Birth | | Position
Held with
the Trust | | Date
Commenced
Service | | Principal Occupation
During Past 5 Years | | Other
Directorships
Held During
Past 5 Years | |
Independent Trustees. | |
David Brooks Adcock,
Born October 1951 | | Trustee | | May 2005 | | Consultant (since 2006). | | Chair and Trustee, Turner Funds (December 2016-December 2017). | |
Nigel D. T. Andrews,
Born April 1947 | | Trustee | | August 2002 | | Retired. | | Director, TCG BDC II, Inc. (since 2017); Director, TCG BDC I, Inc. (formerly Carlyle GMS Finance, Inc.) (since 2012); Trustee, Carlyle Secured Lending III (since 2021). | |
E. Lee Beard,*
Born August 1951 | | Trustee | | May 2005 | | Retired (since 2015) | | None. | |
Dennis M. Bushe,
Born January 1944 | | Trustee | | July 2016 | | Retired. | | None. | |
69
Victory Portfolios | | Supplemental Information — continued
December 31, 2021 | |
(Unaudited)
Name and Date of Birth | | Position
Held with
the Trust | | Date
Commenced
Service | | Principal Occupation
During Past 5 Years | | Other
Directorships
Held During
Past 5 Years | |
John L. Kelly,
Born April 1953 | | Vice Chair and Trustee | | February 2015 | | Partner, McCarvill Capital Partners (September 2016- September 2017). | | Director, Caledonia Mining Corporation (since May 2012). | |
David L. Meyer,*
Born April 1957 | | Trustee | | December 2008 | | Retired. | | None. | |
Gloria S. Nelund,
Born May 1961 | | Trustee | | July 2016 | | Chair, CEO and Co-Founder of TriLinc Global, LLC, an investment firm. | | TriLinc Global Impact Fund, LLC (since 2012). | |
Leigh A. Wilson,
Born December 1944 | | Chair and Trustee | | November 1994 | | Private Investor. | | Chair (since 2013), Caledonia Mining Corporation. | |
Interested Trustee. | |
David C. Brown,**
Born May 1972 | | Trustee | | May 2008 | | Chairman and Chief Executive Officer (since 2013), the Adviser; Chairman and Chief Executive Officer (since 2013), Victory Capital Holdings, Inc.; Chairman and Chief Executive Officer (since 2019), Victory Capital Transfer Agency, Inc. | | Trustee, USAA Mutual Funds Trust; Board Member, Victory Capital Services, Inc. | |
* The Board has designated Ms. Beard and Mr. Meyer as its Audit Committee Financial Experts.
** Mr. Brown is an "Interested Person" by reason of his relationship with the Adviser.
The Statement of Additional Information includes additional information about the Trustees of the Trust and is available, without charge, by calling 800-539-3863.
70
Victory Portfolios | | Supplemental Information — continued
December 31, 2021 | |
(Unaudited)
Officers:
The officers of the Trust, their date of birth, their commencement of service, and their principal occupations during the past five years, are detailed in the following table. Each officer serves until the earlier of his or her resignation, removal, retirement, death, or the election of a successor. The mailing address of each officer of the Trust is 4900 Tiedeman Road, 4th Floor, Brooklyn, Ohio 44144. The officers of the Trust receive no compensation directly from the Trust for performing the duties of their offices.
Name and Date of Birth | | Position with
the Trust | | Date
Commenced
Service | | Principal Occupation During Past 5 Years | |
Christopher K. Dyer,
Born February 1962 | | President | | February 2006* | | Director of Mutual Fund Administration, the Adviser; Chief Operating Officer, Victory Capital Services, Inc. (since 2020); Vice President, Victory Capital Transfer Agency, Inc. (since 2019). | |
Scott A. Stahorsky,
Born July 1969 | | Vice President | | December 2014 | | Manager, Fund Administration, the Adviser. | |
Erin G. Wagner,
Born February 1974 | | Secretary | | December 2014 | | Associate General Counsel, the Adviser (since 2013). | |
Allan Shaer,
Born March 1965 | | Treasurer | | May 2017 | | Senior Vice President, Financial Administration, Citi Fund Services Ohio, Inc. (since 2016); Vice President, Mutual Fund Administration, JP Morgan Chase (2011-2016). | |
Christopher A. Ponte,
Born March 1984 | | Assistant Treasurer | | December 2017 | | Manager, Fund Administration, the Adviser (since 2017); Senior Analyst, Fund Administration, the Adviser (prior to 2017); Chief Financial Officer, Victory Capital Services, Inc. (since 2018). | |
Colin Kinney,
Born October 1973 | | Chief Compliance Officer | | July 2017 | | Chief Compliance Officer (since 2013) and Chief Risk Officer (2009-2017), the Adviser. | |
Sean Fox,
Born September 1976 | | Deputy Chief Compliance
Officer | | July 2021 | | Sr. Compliance Officer, the Adviser (2019-2021); Compliance Officer, the Adviser (2015-2019). | |
Chuck Booth,
Born April 1960 | | Anti-Money Laundering Compliance Officer and Identity Theft Officer | | May 2015 | | Director, Regulatory Administration and CCO Support Services, Citi Fund Services Ohio, Inc. | |
Jay G. Baris,
Born January 1954 | | Assistant Secretary | | December 1997 | | Partner, Sidley Austin LLP (since April 2020); Partner, Shearman & Sterling LLP (January 2018-April 2020); Partner, Morrison & Foerster LLP (2011-January 2018). | |
* On December 3, 2014, Mr. Dyer resigned as Secretary of the Trust and accepted the position of President.
71
Victory Portfolios | | Supplemental Information — continued
December 31, 2021 | |
(Unaudited)
Proxy Voting and Portfolio Holdings Information
Proxy Voting:
Information regarding the policies and procedures each Fund uses to determine how to vote proxies relating to portfolio securities is available without charge, upon request, by calling 800-539-3863. The information is also included in the Funds' Statement of Additional Information, which is available on the SEC's website at www.sec.gov.
Information relating to how the Funds voted proxies relating to portfolio securities held during the most recent 12 months ended June 30 is available on the SEC's website at www.sec.gov.
Availability of Schedules of Portfolio Investments:
The Trust files a complete list of Schedules of Portfolio Investments with the SEC for the first and third quarter of each fiscal year on Form N-PORT. Forms N-PORT are available on the SEC's website at www.sec.gov.
Expense Examples
As a shareholder of the Fund, you may incur two types of costs: (1) transaction costs, including sales charges (loads) on purchases; and (2) ongoing costs, including management fees and other Fund expenses. These examples are intended to help you understand your ongoing costs (in dollars) of investing in the Fund and to compare these costs with the ongoing costs of investing in other mutual funds.
These examples are based on an investment of $1,000 invested at the beginning of the period and held for the entire period from July 1, 2021, through December 31, 2021.
The Actual Expense figures in the table below provide information about actual account values and actual expenses. You may use the information below, together with the amount you invested, to estimate the expenses that you paid over the period. Simply divide your account value by $1,000 (for example, an $8,600 account value divided by $1,000 = 8.6), then multiply the result by the number in the table under the heading entitled "Actual Expenses Paid During Period" to estimate the expenses you paid on your account during this period.
The Hypothetical Expense figures in the table below provide information about hypothetical account values and hypothetical expenses based on the Fund's actual expense ratio and an assumed rate of return of 5% per year before expenses, which is not the Fund's actual return. The hypothetical account values and expenses may not be used to estimate the actual ending account balance or expenses you paid for the period. You may use this information to compare this 5% hypothetical example with the 5% hypothetical examples that appear in shareholder reports of other funds.
Please note the expenses shown in the table below are meant to highlight your ongoing costs only and do not reflect any transactional costs. Therefore, the hypothetical expenses in the table are useful in comparing ongoing costs only and will not help you determine the relative total costs of owning different funds. In addition, if these transactional costs were included, your costs would have been higher.
| | | Beginning
Account
Value
7/1/21 | | Actual
Ending
Account
Value
12/31/21 | | Hypothetical
Ending
Account
Value
12/31/21 | | Actual
Expenses Paid
During Period
7/1/21-12/31/21* | | Hypothetical
Expenses Paid
During Period
7/1/21-12/31/21* | | Annualized
Expense Ratio
During Period
7/1/21-12/31/21 | |
RS Partners Fund | |
Class A | | $ | 1,000.00 | | | $ | 1,033.70 | | | $ | 1,017.90 | | | $ | 7.43 | | | $ | 7.38 | | | | 1.45 | % | |
Class R | | | 1,000.00 | | | | 1,031.80 | | | | 1,016.08 | | | | 9.27 | | | | 9.20 | | | | 1.81 | % | |
Class Y | | | 1,000.00 | | | | 1,035.50 | | | | 1,019.56 | | | | 5.75 | | | | 5.70 | | | | 1.12 | % | |
Member Class | | | 1,000.00 | | | | 1,034.90 | | | | 1,018.90 | | | | 6.41 | | | | 6.36 | | | | 1.25 | % | |
RS Value Fund | |
Class A | | | 1,000.00 | | | | 1,071.30 | | | | 1,018.65 | | | | 6.79 | | | | 6.61 | | | | 1.30 | % | |
Class C | | | 1,000.00 | | | | 1,066.60 | | | | 1,014.77 | | | | 10.78 | | | | 10.51 | | | | 2.07 | % | |
Class R | | | 1,000.00 | | | | 1,069.10 | | | | 1,016.69 | | | | 8.81 | | | | 8.59 | | | | 1.69 | % | |
Class Y | | | 1,000.00 | | | | 1,072.10 | | | | 1,019.86 | | | | 5.54 | | | | 5.40 | | | | 1.06 | % | |
72
Victory Portfolios | | Supplemental Information — continued
December 31, 2021 | |
(Unaudited)
| | | Beginning
Account
Value
7/1/21 | | Actual
Ending
Account
Value
12/31/21 | | Hypothetical
Ending
Account
Value
12/31/21 | | Actual
Expenses Paid
During Period
7/1/21-12/31/21* | | Hypothetical
Expenses Paid
During Period
7/1/21-12/31/21* | | Annualized
Expense Ratio
During Period
7/1/21-12/31/21 | |
RS Large Cap Alpha Fund | |
Class A | | $ | 1,000.00 | | | $ | 1,053.10 | | | $ | 1,020.72 | | | $ | 4.61 | | | $ | 4.53 | | | | 0.89 | % | |
Class C | | | 1,000.00 | | | | 1,049.00 | | | | 1,016.69 | | | | 8.73 | | | | 8.59 | | | | 1.69 | % | |
Class R | | | 1,000.00 | | | | 1,051.20 | | | | 1,018.85 | | | | 6.51 | | | | 6.41 | | | | 1.26 | % | |
Class Y | | | 1,000.00 | | | | 1,054.30 | | | | 1,021.78 | | | | 3.52 | | | | 3.47 | | | | 0.68 | % | |
RS Investors Fund | |
Class A | | | 1,000.00 | | | | 1,066.40 | | | | 1,018.50 | | | | 6.93 | | | | 6.77 | | | | 1.33 | % | |
Class C | | | 1,000.00 | | | | 1,062.30 | | | | 1,014.77 | | | | 10.76 | | | | 10.51 | | | | 2.07 | % | |
Class R | | | 1,000.00 | | | | 1,063.50 | | | | 1,015.38 | | | | 10.14 | | | | 9.91 | | | | 1.95 | % | |
Class Y | | | 1,000.00 | | | | 1,067.90 | | | | 1,019.91 | | | | 5.47 | | | | 5.35 | | | | 1.05 | % | |
Global Energy Transition Fund | |
Class A | | | 1,000.00 | | | | 1,105.60 | | | | 1,017.74 | | | | 7.85 | | | | 7.53 | | | | 1.48 | % | |
Class C | | | 1,000.00 | | | | 1,100.80 | | | | 1,013.71 | | | | 12.07 | | | | 11.57 | | | | 2.28 | % | |
Class R | | | 1,000.00 | | | | 1,103.10 | | | | 1,015.83 | | | | 9.86 | | | | 9.45 | | | | 1.86 | % | |
Class Y | | | 1,000.00 | | | | 1,107.70 | | | | 1,019.41 | | | | 6.11 | | | | 5.85 | | | | 1.15 | % | |
* Expenses are equal to the average account value multiplied by the Fund's annualized expense ratio multiplied by 184/365 (the number of days in the most recent fiscal half-year divided by the number of days in the fiscal year).
73
Victory Portfolios | | Supplemental Information — continued
December 31, 2021 | |
(Unaudited)
Additional Federal Income Tax Information
For the year ended December 31, 2021, the following Funds paid qualified dividend income for the purposes of reduced individual federal income tax rates of:
| | Percent | |
RS Partners Fund | | | 18 | % | |
| RS Value Fund | | | 30 | % | |
RS Large Cap Alpha Fund | | | 40 | % | |
RS Investors Fund | | | 31 | % | |
Global Energy Transition Fund | | | 100 | % | |
Dividends qualified for corporate dividends received deductions of:
| | Percent | |
RS Partners Fund | | | 16 | % | |
RS Value Fund | | | 28 | % | |
RS Large Cap Alpha Fund | | | 36 | % | |
RS Investors Fund | | | 30 | % | |
Global Energy Transition Fund | | | 100 | % | |
For the year ended December 31, 2021, the following Funds designated short-term capital gain distributions:
| | Amount | |
RS Partners Fund | | $ | 23,718,479 | | |
| RS Value Fund | | | 9,996,921 | | |
| RS Large Cap Alpha Fund | | | 23,626,563 | | |
RS Investors Fund | | | 1,349,946 | | |
For the year ended December 31, 2021, the following Funds designated long-term capital gain distributions:
| | Amount | |
RS Partners Fund | | $ | 37,702,000 | | |
| RS Value Fund | | | 34,649,902 | | |
| RS Large Cap Alpha Fund | | | 34,167,241 | | |
RS Investors Fund | | | 3,326,346 | | |
The following Funds intend to elect to pass through to shareholders the income tax credit for taxes paid to foreign countries. Foreign source income and foreign tax expense per outstanding share on December 31, 2021, were as follows:
| | Foreign
Source
Income | | Foreign
Tax
Expense | |
Global Energy Transition Fund | | $ | 0.19 | | | $ | 0.02 | | |
74
Victory Portfolios | | Supplemental Information — continued
December 31, 2021 | |
(Unaudited)
Considerations of the Board in Continuing the Investment Advisory Agreements
The Board approved the advisory agreement with the Adviser, on behalf of each of the Funds (the "Advisory Agreement"), and the sub-advisory agreement between SailingStone Capital Partners LLC (the "Sub-Adviser") and the Adviser, on behalf of the Global Energy Transition Fund (the "Sub-Advisory Agreement" and together with the Advisory Agreement, the "Agreements"), at a meeting, which was called for that purpose, on November 30, 2021. The Board also considered information relating to the Funds and the Agreements provided throughout the year and, more specifically, at the meetings on October 19, 2021 and November 30, 2021. In considering whether to approve the Agreement, the Board requested, and the Adviser and Sub-Adviser provided, information that the Board believed to be reasonably necessary to reach its conclusions.
The Board, including the Independent Trustees, evaluated this information along with other information obtained throughout the year and was advised by legal counsel to the Funds and independent legal counsel to the Independent Trustees. In addition, the Independent Trustees considered a past review of their overall process for conducting the annual review of the Funds' advisory arrangements by a consultant retained through their counsel.
The Board took into consideration regular reports from the Adviser and Sub-Adviser throughout the COVID-19 pandemic public health crisis concerning how the ongoing pandemic has affected market volatility, investment risk, liquidity and valuation of portfolio securities, and the implementation and effectiveness of business continuity plans. These reports also had confirmed that the pandemic had no material impact on the Adviser's (or the Sub-Adviser's) operations.
The Board considered each Fund's advisory fee, expense ratio and investment performance as significant factors in determining whether the Agreements should be continued. The Board reviewed numbers factors with respect to each Fund, including the services to be provided by the Sub-Adviser. In considering whether the compensation paid to the Adviser was fair and reasonable, the Board also evaluated, among other things, the following factors:
• The requirements of the Funds for the services provided by the Adviser;
• The nature, quality and extent of the services provided and expected to be provided;
• The performance of the Funds as compared to comparable funds;
• The fees payable for the services and whether the fee arrangements provided for economies of scale that would benefit Fund shareholders as the Funds grow (acknowledging that economies of scale can be complex to assess and typically are not directly measurable);
• Whether the fee would be sufficient to enable the Adviser to attract and retain experienced personnel and continue to provide quality services to the Funds;
• The fees paid by other clients of the Adviser whose accounts are managed in a similar investment style and any differences in the services provided to the other clients compared to those provided to the Funds;
• The total expenses of each Fund;
• Management's commitment to operating the Funds at competitive expense levels;
• The profitability of the Adviser (as reflected by comparing fees earned against an estimate of the Adviser's costs) with respect to the Adviser's relationship with the Funds;
• Research and other service benefits received by the Adviser obtained through payment of client commissions for securities transactions;
• Other benefits received by the Adviser, and its affiliates, including revenues paid to the Adviser, or its affiliates, by the Funds for administration and fund accounting services, and distribution;
• The capabilities and financial condition of the Adviser;
• Current economic and industry trends; and
• The historical relationship between each Fund and the Adviser.
75
Victory Portfolios | | Supplemental Information — continued
December 31, 2021 | |
(Unaudited)
For Funds with total net expense ratios that ranked within the fourth quartile (most expensive) in relation to their peers as evaluated by a consultant, the Board also considered a memorandum that it requested the Adviser to prepare. The Adviser reviewed additional relevant circumstances, which included, among other things, specialized strategies, small or decreasing assets, or rapid or recent changes in peer expense ratios.
In considering whether the compensation paid to the Sub-Adviser was fair and reasonable, the Board also evaluated, among other things, the following factors:
• The requirements of the Fund for the services provided by the Sub-Adviser;
• The nature, quality and extent of the services provided and expected to be provided;
• The fees payable for the services;
• Representations by the Adviser that the sub-advisory fee for the Fund is within the range of fees agreed to in the market for similar services;
• Whether the fee would be sufficient to enable the Sub-Adviser to attract and retain experienced personnel and continue to provide quality services to the Fund;
• Management's commitment to operating the Fund at competitive expense levels;
• Research and other service benefits received by the Sub-Adviser obtained through payment of client commissions for securities transactions;
• Other benefits received by the Sub-Adviser as a result of its sub-advisory relationship with the Fund;
• The capabilities and financial condition of the Sub-Adviser;
• The nature, quality and extent of the oversight and compliance services provided by the Adviser;
• The historical relationship between the Fund and the Sub-Adviser; and
• Current economic and industry trends.
The Board reviewed each Fund's current management fee, comprised of the advisory fee plus the administrative services fee paid to the Adviser, in the context of the Adviser's profitability with respect to each Fund individually. The Board retained a consultant to provide comparative information about fees and performance. The Board met with the consultant to review its inputs and methodologies, among other things. The Board compared each Fund's gross management fee and total operating expense ratio on a net and gross basis with the median gross management fee and median expense ratio of a universe of comparable mutual funds compiled by the consultant, and a peer group of funds with similar investment strategies selected by that consultant from the universe of comparable funds. The Board reviewed the factors and methodology used by the consultant in the selection of each Fund's peer group, including the consultant's selection of a broad universe of funds, the more specific universe of comparable funds, and peer groups of funds with comparable investment strategies and asset levels, among other factors. The Board also reviewed any changes to the consultant's methodology as compared to the prior year, including those resulting from the Adviser's input, if any. With respect to certain Funds, the Board also reviewed fees and other information related to the Adviser's management of similarly managed institutional or private accounts, and the differences in the services provided to the other accounts. The Board noted that none of the advisory fee arrangements for the Funds included breakpoints, which would be a structure that results in reduced fees as a fund grows. The Board also considered the Adviser's commitment to limit expenses as discussed in more detail below.
The Board also reviewed the compliance and administrative services provided to the Funds by the Adviser and its affiliates, including the Adviser's oversight of the Funds' day-to-day operations and oversight of Fund accounting, assistance in meeting legal and regulatory requirements, and other services necessary for the operation of the Funds and the Trust.
With respect to the Global Energy Transition Fund, the Board also considered information concerning the fee paid to the Sub-Adviser under the Sub-Advisory Agreement. The Board considered the relative roles and responsibilities of the Adviser and Sub-Adviser with respect to the Fund and noted that, among other things: (1) the sub-advisory fees for the Fund are paid by the Adviser and, therefore, are not a direct expense of the Fund; and (2) the Adviser supervises the Sub-Adviser. The Board also considered the Adviser's representation
76
Victory Portfolios | | Supplemental Information — continued
December 31, 2021 | |
(Unaudited)
that the fees to be paid to the Sub-Adviser are within the range of sub-advisory fees paid to other sub-advisers for similar services. The Board reviewed fees and other information related to the Sub-Adviser's management of similarly managed institutional or private accounts, and the differences in the services provided to the other accounts. The Board recognized that because the sub-advisory fees are paid by the Adviser, any arrangement by the Sub-Adviser to either increase or reduce its fee would have no direct impact on the Fund or its shareholders.
The Board found that the gross annual management fee paid by each Fund was within the range of management fees paid by each Fund's respective peer group. The Board also found that each Fund's Class A net annual expense ratio, taking into account any shareholder servicing or distribution fees, was reasonable as compared with each Fund's respective peer group. The Board considered the Adviser's contractual agreement with each Fund to waive its fees and reimburse expenses of certain classes for a specified period of time, as described in the Fund's prospectus.
The Board reviewed each Fund's performance over one-, three-, five- and ten-year periods (as applicable) against the performance of the Fund's selected peer group and benchmark index. The Board recognized that the performance of the Fund and the peer group funds are net of expenses, while the performance of the benchmark index reflects gross returns.
The Board reviewed various other specific factors with respect to each Fund, as described below. In their deliberations, the Trustees did not rank the importance of any particular information or factor considered and each Trustee may have attributed different weights to various factors.
RS Partners Fund
The Board compared the Fund's Class A performance for the one-, three-, five- and ten-year periods ended June 30, 2021, to that of the median performance of the Fund's peer group and benchmark index for the same periods and considered the fact that the Fund underperformed the benchmark index for the one- and ten-year periods, outperformed the benchmark index for the three- and five-year periods, underperformed the peer group median for the one-year period, and outperformed the peer group median for the three-, five- and ten-year periods.
Having considered, among other things: (1) the Fund's management fee compared to comparable mutual funds; (2) the Fund's total expense ratio compared to comparable mutual funds; (3) that the Adviser's willingness to limit the expenses of certain classes for a period of time would provide stability to the Fund's expenses for those share classes during that period; and (4) the Fund's performance during the periods reviewed, the Board concluded that the Agreement continued to be in the best interests of the Fund's shareholders.
RS Value Fund
The Board compared the Fund's Class A performance for the one-, three-, five- and ten-year periods ended June 30, 2021, to that of the median performance of the Fund's peer group and benchmark index for the same periods and considered the fact that the Fund underperformed the benchmark index for all of the periods reviewed, underperformed the peer group median for the one- and ten-year periods, and outperformed the peer group median for the three- and five-year periods.
Having considered, among other things: (1) the Fund's management fee compared to comparable mutual funds; (2) the Fund's total expense ratio compared to comparable mutual funds; (3) that the Adviser's willingness to limit the expenses of certain classes for a period of time would provide stability to the Fund's expenses for those share classes during that period; and (4) the Fund's performance during the periods reviewed, the Board concluded that the Agreement continued to be in the best interests of the Fund's shareholders.
RS Large Cap Alpha Fund
The Board compared the Fund's Class A performance for the one-, three-, five- and ten-year periods ended June 30, 2021, to that of the median performance of the Fund's peer group and benchmark index for the same periods and considered the fact that the Fund underperformed the benchmark index for one-, three- and ten-year periods, outperformed the benchmark index for the five-year period, and underperformed the peer group median for all periods reviewed. The Board brought the Fund's underperformance to management's attention and discussed with the Adviser any steps that had been or could be taken to enhance performance in the future.
77
Victory Portfolios | | Supplemental Information — continued
December 31, 2021 | |
(Unaudited)
Having considered, among other things: (1) the Fund's management fee compared to comparable mutual funds; (2) the Fund's total expense ratio compared to comparable mutual fund; (3) that the Adviser's willingness to limit the expenses of certain classes for a period of time would provide stability to the Fund's expenses for those share classes during that period; and (4) the Fund's performance during the periods reviewed, the Board concluded that the Agreement continued to be in the best interests of the Fund's shareholders.
RS Investors Fund
The Board compared the Fund's Class A performance for the one-, three-, five- and ten-year periods ended June 30, 2021, to that of the median performance of the Fund's peer group and benchmark index for the same periods and considered the fact that the Fund outperformed the benchmark index for the one-year period, underperformed the benchmark index for the three-, five- and ten-year periods, outperformed the peer group median for the one- and ten-year periods, and underperformed the peer group median for the three- and five-year periods.
Having considered, among other things: (1) the Fund's management fee compared to comparable mutual funds; (2) the Fund's total expense ratio compared to comparable mutual fund; (3) that the Adviser's willingness to limit the expenses of certain classes for a period of time would provide stability to the Fund's expenses for those share classes during that period; and (4) the Fund's performance during the periods reviewed, the Board concluded that the Agreement continued to be in the best interests of the Fund's shareholders.
Global Energy Transition Fund
The Board noted that effective May 1, 2021, the Fund changed its principal investment strategy and name. The Board compared the Fund's Class A performance for the one-, three-, five- and ten-year periods ended June 30, 2021, to that of the median performance of the Fund's peer group and benchmark index for the same periods and considered the fact that the Fund outperformed the benchmark index for the one-year period, underperformed the benchmark index for the three-, five- and ten-year periods, outperformed the peer group median for the one-year period and unperformed the peer group median for the three-, five- and ten-year periods. The Board noted its numerous discussions with the Adviser and Sub-Adviser throughout the year, and in prior years, about, among other things, the Fund's investment strategy, the Adviser's and Sub-Adviser's implementation of the strategy, and related market conditions, together with relevant fee and expense considerations. The Board also discussed the steps taken by the Adviser and Sub-Adviser to enhance performance in the future, and the Board's continued monitoring of the Fund's performance.
Having considered, among other things: (1) the Fund's management fee compared to comparable mutual funds; (2) the Fund's total expense ratio compared to comparable mutual funds; (3) that the Adviser's willingness to limit the expenses of certain classes for a period of time would provide stability to the Fund's expenses for those share classes during that period; and (4) the Fund's performance during the periods reviewed, the Board concluded that the Agreement continued to be in the best interests of the Fund's shareholders.
Conclusion
Based on its review of the information requested and provided, and following extended discussions, the Board determined that the Agreement, on behalf of the Funds discussed above, was consistent with the best interests of each Fund and its shareholders, and the Board unanimously approved the Agreement, on behalf of each Fund, for an additional annual period on the basis of the foregoing review and discussions and the following considerations, among others:
• The fairness and reasonableness of the investment advisory fee payable to the Adviser under the Agreement in light of the investment advisory services provided, the costs of these services, the profitability of the Adviser's relationship with the Fund and the comparability of the fee paid to the fees paid by other investment companies;
• The nature, quality and extent of the investment advisory services provided by the Adviser;
• The Adviser's entrepreneurial commitment to the management of the Funds and the creation of a broad-based family of funds, which could entail a substantial commitment of the Adviser's resources to the successful operation of the Funds;
78
Victory Portfolios | | Supplemental Information — continued
December 31, 2021 | |
(Unaudited)
• The Adviser's representations regarding its staffing and capabilities to manage the Funds, including the retention of personnel with relevant portfolio management experience;
• The Adviser's efforts to enhance investment results by, among other things, developing quality portfolio management teams; and
• The overall high quality of the personnel, operations, financial condition, investment management capabilities, methodologies and performance of the Adviser.
Based on its review of the information requested and provided, and following extended discussions, the Board concluded, among other things, that the Sub-Advisory Agreement, with respect to the Global Energy Transition Fund, was consistent with the best interests of the Fund and its shareholders and unanimously approved the Sub-Advisory Agreement (including the fees to be charged for services thereunder), on the basis of the foregoing review and discussions and the following considerations, among others:
• The fairness and reasonableness of the investment advisory fee payable to the Sub-Adviser under the Sub-Advisory Agreement in light of the investment advisory services provided, the costs of these services and the estimated profitability of the Sub-Adviser's relationship with the Fund;
• The nature, quality and extent of the investment advisory services provided by the portfolio management team of the Sub-Adviser, which have resulted in the Fund achieving its stated investment objective;
• The Sub-Adviser's representations regarding its staffing and capabilities to manage the Fund; and
• The overall high quality of the personnel, operations, financial condition, investment management capabilities, methodologies and performance of the Sub-Adviser.
79
Privacy Policy
Protecting the Privacy of Information
The Trust respects your right to privacy. We also know that you expect us to conduct and process your business in an accurate and efficient manner. To do so, we must collect and maintain certain personal information about you. This is the information we collect from you on applications or other forms, and from the transactions you make with us or third parties. It may include your name, address, social security number, account transactions and balances, and information about investment goals and risk tolerance.
We do not disclose any information about you or about former customers to anyone except as permitted or required by law. Specifically, we may disclose the information we collect to companies that perform services on our behalf, such as the transfer agent that processes shareholder accounts and printers and mailers that assist us in the distribution of investor materials. We may also disclose this information to companies that perform marketing services on our behalf. This allows us to continue to offer you Victory investment products and services that meet your investing needs, and to effect transactions that you request or authorize. These companies will use this information only in connection with the services for which we hired them. They are not permitted to use or share this information for any other purpose.
To protect your personal information internally, we permit access only by authorized employees and maintain physical, electronic, and procedural safeguards to guard your personal information.*
* You may have received communications regarding information about privacy policies from other financial institutions which gave you the opportunity to "opt-out" of certain information sharing with companies which are not affiliated with that financial institution. The Trust does not share information with other companies for purposes of marketing solicitations for products other than the Trust. Therefore, the Trust does not provide opt-out options to their shareholders.
Victory Funds
P.O. Box 182593
Columbus, Ohio 43218-2593

Visit our website at: | | Call Victory at: | |
www.vcm.com | | 800-539-FUND (800-539-3863) | |
| | | 800-235-8396 for Member Class | |
Item 2. Code of Ethics.
| (a) | The registrant has adopted a code of ethics that applies to the registrant’s principal executive officer, principal financial officer, principal accounting officer or controller, or persons performing similar functions. This code of ethics in included as an Exhibit. |
| (b) | During the period covered by the report, with respect to the registrant’s code of ethics that applies to its principal executive officer, principal financial officer, principal accounting officer or controller, or persons performing similar functions; there have been no amendments to, nor any waivers granted from, a provision that relates to any element of the code of ethics definition enumerated in paragraph (b) of this Item 2. |
Item 3. Audit Committee Financial Expert.
(a)(1) The registrant’s board of directors has determined that the registrant has at least one audit committee financial expert serving on its audit committee.
(a)(2) The audit committee financial experts are David L. Meyer and E. Lee Beard, who are “independent” for purposes of this Item 3 of Form N-CSR.
Item 4. Principal Accountant Fees and Services.
| | | 2021 | | | 2020 | |
| (a) Audit Fees (1) | | $ | 284,000 | | | $ | 297,500 | |
| (b) Audit-Related Fees (2) | | | 0 | | | | 0 | |
| (c) Tax Fees (3) | | | 83,250 | | | | 87,750 | |
| (d) All Other Fees (4) | | | 0 | | | | 3,327 | |
(1) Audit fees include amounts related to the audit of the Registrant’s annual financial statements and services normally provided by the accountant in connection with statutory and regulatory filings. Audit fees billed were for professional services provided by Cohen & Company, Ltd. for audit compliance, audit advice and audit planning.
(2) Represents the fee for assurance and related services by Cohen & Company, Ltd. reasonably related to the performance of the audit of the Registrant’s financial statements that was not reported under (a) of this item.
(3) Represents the aggregate tax fee billed for professional services rendered by Cohen & Company, Ltd. for tax compliance, tax advice, international tax fee transactions and tax planning. Such tax services included the review of income and excise tax returns for the Registrant.
(4) For the fiscal year ended December 31, 2021, there were no fees billed for professional services rendered by The Funds’ independent registered public accounting firm to the Registrant, other than the services reported in (a) through (c) of this item. For the fiscal year ended December 31, 2020, fees represent the consent related to Member Class Registration Statements as of June 10, 2020, and Review and Consent of the Registration Statements for six portfolios as of August 21, 2020.
Tax fees for 2021 and 2020 are for recurring tax fees for the preparation of the federal and state tax returns and procedures performed relating to the Registrant’s analysis of complex securities.
(e)(1) The Registrant’s Audit Committee must pre-approve non-audit services to be provided by the principal accountant and the fees charged with these services. The Committee may delegate authority to one or more Committee members to pre-approve these services, subject to subsequent review and approval by the Committee.
(e)(2) There were no services performed under Rule 2.01 (c)(7)(i)(C).
(f) Not applicable.
(g)
(h) The Registrant’s Audit Committee has evaluated the non-audit services that the principal accountant provided to the Registrant’s investment adviser (and the adviser’s relevant affiliated), which services the Committee did not pre-approve, and has concluded that the provision of those services was compatible with maintaining the accountant’s independence.
Item 5. Audit Committee of Listed Registrants.
Not applicable.
Item 6. Investments.
(a) Not applicable.
(b) Not applicable.
Item 7. Disclosure of Proxy Voting Policies and Procedures for Closed-End Management Investment Companies.
Not applicable.
Item 8. Portfolio Managers of Closed-End Management Investment Companies.
Not applicable.
Item 9. Purchases of Equity Securities by Closed-End Management Investment Company and Affiliated Purchasers.
Not applicable.
Item 10. Submission of Matters to a Vote of Security Holders.
Not applicable.
Item 11. Controls and Procedures.
(a)The registrant’s principal executive officer and principal financial officer have concluded, based on their evaluation of the registrant's disclosure controls and procedures as conducted within 90 days of the filing date of this report, that these disclosure controls and procedures are adequately designed and are operating effectively to ensure that information required to be disclosed by the registrant on Form N-CSR is recorded, processed, summarized and reported within the time periods specified in the Securities and Exchange Commission's rules and forms.
(b)There were no changes in the registrant’s internal control over financial reporting (as defined in Rule 30a-3(d) under the Investment Company Act of 1940 (17 CFR 270.30a-3(d)) that occurred during the period covered by this report that have materially affected or are reasonably likely to materially affect, the registrant’s internal control over financial reporting.
Item 12. Disclosure of Securities Lending Activities for Closed-End Management Investment Companies.
(a)(1) Not applicable.
(a)(2) Not applicable.
(a)(3) Not applicable.
(a)(4) Not applicable.
Item 13. Exhibits.
(a)(1) The code of ethics that is the subject of the disclosure required by Item 2 is attached hereto.
(a)(2) Certifications pursuant to Rule 30a-2(a) are attached hereto.
(a)(3) Not applicable.
SIGNATURES
Pursuant to the requirements of the Securities Exchange Act of 1934 and the Investment Company Act of 1940, the registrant has duly caused this report to be signed on its behalf by the undersigned, thereunto duly authorized.
| (Registrant) | Victory Portfolios | |
| | |
| By (Signature and Title)* | /s/ Allan Shaer | |
| Allan Shaer, Principal Financial Officer | |
| |
| Date__February 24, 2022_________________ | |
Pursuant to the requirements of the Securities Exchange Act of 1934 and the Investment Company Act of 1940, this report has been signed below by the following persons on behalf of the registrant and in the capacities and on the dates indicated.
| By (Signature and Title)* | /s/ Christopher K. Dyer | |
| | Christopher K. Dyer, Principal Executive Officer | |
| Date_Feburuary 24, 2022__________________ | | |
| | | |
| By (Signature and Title)* | /s/ Allan Shaer | |
| | Allan Shaer, Principal Financial Officer | |
| Date_February 24, 2022________________________ | | |