UNITED STATES
SECURITIES AND EXCHANGE COMMISSION
Washington, D.C. 20549
FORM N-CSR
CERTIFIED SHAREHOLDER REPORT OF REGISTERED
MANAGEMENT INVESTMENT COMPANIES
Investment Company Act file number: 811-04852
Victory Portfolios
(Exact name of registrant as specified in charter)
| 4900 Tiedeman Road, 4th Floor, Brooklyn, Ohio | 44144 |
| (Address of principal executive offices) | (Zip code) |
Citi Fund Services Ohio, Inc., 4400 Easton Commons, Suite 200, Columbus, OH 43219
(Name and address of agent for service)
Registrant’s telephone number, including area code: 800-539-3863
Date of fiscal year end: June 30
Date of reporting period: June 30, 2022
Item 1. Reports to Stockholders.

June 30, 2022
Annual Report
Victory Integrity Discovery Fund
Victory Integrity Mid-Cap Value Fund
Victory Integrity Small-Cap Value Fund
Victory Integrity Small/Mid-Cap Value Fund
Victory Munder Multi-Cap Fund
Victory S&P 500 Index Fund
Victory Munder Mid-Cap Core Growth Fund
Victory Munder Small Cap Growth Fund
Victory Trivalent International Fund-Core Equity
Victory Trivalent International Small-Cap Fund
Victory INCORE Total Return Bond Fund
www.vcm.com
News, Information And Education 24 Hours A Day, 7 Days A Week
The Victory Capital website gives fund shareholders, prospective shareholders, and investment professionals a convenient way to access fund information, get guidance, and track fund performance anywhere they can access the Internet. The site includes:
• Detailed performance records
• Daily share prices
• The latest fund news
• Investment resources to help you become a better investor
• A section dedicated to investment professionals
Whether you're a potential investor searching for the fund that matches your investment philosophy, a seasoned investor interested in planning tools, or an investment professional, www.vcm.com has what you seek. Visit us anytime. We're always open.
TABLE OF CONTENTS
Shareholder Letter (Unaudited) | | | 4 | | |
Managers' Commentary / Investment Overview (Unaudited) | | | 6 | | |
Investment Objective and Portfolio
Holdings (Unaudited) | | | 32 | | |
Schedules of Portfolio Investments | |
Victory Integrity Discovery Fund | | | 43 | | |
Victory Integrity Mid-Cap Value Fund | | | 47 | | |
Victory Integrity Small-Cap Value Fund | | | 51 | | |
Victory Integrity Small/Mid-Cap Value Fund | | | 56 | | |
Victory Munder Multi-Cap Fund | | | 60 | | |
Victory S&P 500 Index Fund | | | 63 | | |
Victory Munder Mid-Cap Core Growth Fund | | | 75 | | |
Victory Munder Small Cap Growth Fund | | | 78 | | |
Victory Trivalent International Fund — Core Equity | | | 83 | | |
Victory Trivalent International Small-Cap Fund | | | 95 | | |
Victory INCORE Total Return Bond Fund | | | 106 | | |
Financial Statements | |
Statements of Assets and Liabilities | | | 116 | | |
Statements of Operations | | | 120 | | |
Statements of Changes in Net Assets | | | 124 | | |
Financial Highlights | | | 136 | | |
Notes to Financial Statements | | | 158 | | |
Report of Independent Registered Public
Accounting Firm | | | 178 | | |
Supplemental Information (Unaudited) | | | 179 | | |
Trustee and Officer Information | | | 179 | | |
Proxy Voting and Portfolio Holdings Information | | | 183 | | |
Expense Examples | | | 183 | | |
Additional Federal Income Tax Information | | | 185 | | |
Liquidity Risk Management Program | | | 187 | | |
Privacy Policy (inside back cover) | | | |
1
IRA DISTRIBUTION WITHHOLDING DISCLOSURE
We generally must withhold federal income tax at a rate of 10% of the taxable portion of your distribution and, if you live in a state that requires state income tax withholding, at your state's tax rate. However, you may elect not to have withholding apply or to have income tax withheld at a higher rate. Any withholding election that you make will apply to any subsequent distribution unless and until you change or revoke the election. If you wish to make a withholding election, or change or revoke a prior withholding election, call 800-539-3863 (800-235-8396 for Member Class) and form W-4P (OMB No. 1545-0074 withholding certificate for pension or annuity payments) will be electronically sent.
If you do not have a withholding election in place by the date of a distribution, federal income tax will be withheld from the taxable portion of your distribution at a rate of 10%. If you must pay estimated taxes, you may be subject to estimated tax penalties if your estimated tax payments are not sufficient and sufficient tax is not withheld from your distribution.
For more specific information, please consult your tax adviser.
The Funds are distributed by Victory Capital Services, Inc. Victory Capital Management Inc. is the investment adviser to the Funds and receives fees from the Funds for performing services for the Funds.
This report is not authorized for distribution to prospective investors unless preceded or accompanied by a current prospectus of the Victory Funds.
For additional information about any Victory Fund, including fees, expenses, and risks, view our prospectus online at vcm.com or call 800-539-3863 (800-235-8396 for Member Class). Read it carefully before you invest or send money.
The information in this report is based on data obtained from recognized services and sources and is believed to be reliable. Any opinions, projections, or recommendations in this report are subject to change without notice and are not intended as individual investment advice. Past investment performance of the Funds, markets or securities mentioned herein should not be considered to be indicative of future results.
• NOT FDIC INSURED • NO BANK GUARANTEE • MAY LOSE VALUE

Call Victory at:
800-539-FUND (800-539-3863)
800-235-8396 for Member Class
Visit our website at:
www.vcm.com
2
This page is intentionally left blank.
3
Victory Funds Letter to Shareholders
(Unaudited)
Dear Shareholder,
Looking back over our most recent annual reporting period offers us a stark reminder that markets go up and down, and that investor sentiment can shift quickly.
Although most of 2021 was constructive for financial markets, the script flipped as we entered the new calendar year. More recently, investors have been focused on a host of worries. Inflation data has been running hotter than expected. The U.S. Federal Reserve (the "Fed") has embarked on a new rate-hike cycle and a terrible war is raging in Eastern Europe. All these issues, among other factors, have ratcheted up market volatility in both stock and bond markets. Many broad-market stock indices have pulled back substantially during the first half of 2022 and even entered "bear market" territory, which is typically considered a 20% pullback from the most recent highs. Meanwhile, fixed income investors are also dealing with elevated volatility, and wide swaths of the bond market have struggled in the face of rising interest rates.
Throughout the ups and downs of the past reporting period, there have been interesting differences playing out within the broader market. In general, large-cap stocks outperformed smaller-capitalization companies for the full annual reporting period. Meanwhile, growth-oriented styles led value-oriented investments during the earlier part of our annual reporting period, while the reverse was true during the latter segment of the reporting period (as measured by the Russell family of indices). Perhaps this reflects investors' realization and expectations for future higher interest rates and corresponding higher borrowing costs.
There were other notable subplots, too. During much of 2021 we watched crypto assets captivate investors, only to see them fall out of favor as sentiment soured. This year we've seen oil prices surge, which helped fuel gains across the energy landscape while many other sectors lagged. The Energy and Utilities sectors (and yes, Cash) have been the lone bright spots for many investor portfolios. If anything, this underscores the importance of diversification.
Looking at the numbers, we see that the S&P 500® Index, the bell-weather proxy for our domestic stock market, declined by 10.62% for the 12-month period ended June 30, 2022. Over this same annual period, the yield on the 10-Year U.S. Treasury jumped 1.53%, thanks largely to the Fed's shift toward a less accommodative monetary policy and the first rate hike in three years. At the end of our reporting period, the yield on the 10-Year U.S. Treasury finished at 2.98%.
Given the market environment of the past few months, it's no surprise that investors have become more focused on risk management and downside protection. Remember, our experience managing portfolios through various economic cycles has taught us to remain calm in the face of market turmoil. It is our view that a long-term perspective, a well-diversified portfolio across asset classes and investment types, and a clear understanding of individual risk tolerances are some of the key ingredients for staying the course and progressing on investment goals.
4
As ever, there will be challenges ahead. The Fed has declared its intent to continue raising rates until the recent elevated inflation readings decline. Labor shortages, ongoing supply chain issues, high energy prices, and the Russia-Ukraine war are among the performance detractors investors continue to navigate. There's even some chatter about a possible recession.
Although we cannot tell you with any certainty what markets will do in the future, we can assure you that the investment professionals at all our independent franchises continually monitor the environment and work hard to position portfolios opportunistically no matter what the markets bring.
On the following pages you will find information relating to your Victory Funds investment. If you have any questions regarding the current market dynamics or your specific portfolio or investment plan, we encourage you to contact your financial advisor. If you invest with us directly, you may call 800-539-3863 (800-235-8396 for Member Class) or visit our website at www.vcm.com.
From all of us here at Victory Capital, thank you for letting us help you work toward your investment goals.

Christopher K. Dyer, CFA
President,
Victory Funds
5
Victory Integrity Discovery Fund
Managers' Commentary
(Unaudited)
What were the market conditions during the reporting period?
It was a tale of two different markets during this reporting period. Emergence of new COVID-19 variants in the second half of 2021 were temporary setbacks for the market recovery. Ultimately, Gross Domestic Product growth completed the transition from recovery to expansion and eventually surpassed its pre-pandemic peak. Equities ended the year near all-time highs. As we turned the calendar to 2022, the markets had no shortage of information to process. Russia invaded Ukraine, the U.S. Federal Reserve started to signal (and ultimately implemented) interest rate increases, mortgage rates rapidly rose, and markets started to price in fears of a recession. The first-half performance for the S&P 500® Index was one of the worst on record. The second quarter performance for the Russell 2000® Value Index was the worst ever. From a market capitalization perspective, small-cap equities underperformed their mid- and large-cap peers.
The top-performing sectors within the Russell Microcap® Value Index (the "Index") were Energy and Utilities, while Consumer Discretionary, Health Care, and Communication Services were the weakest-performing sectors. Micro-cap value stocks outperformed micro-cap growth stocks.
How did Victory Integrity Discovery Fund (the "Fund") perform during the reporting period?
The Fund returned -15.27% (Class A at net asset value) for the fiscal year ended June 30, 2022, outperforming the Index, which returned -20.19% during the period.
What strategies did you employ during the reporting period?
Stock selection in the Health Care sector was the prominent contributor to Fund performance. Stock selection in the Consumer Discretionary and Energy sectors also helped Fund performance. Stock selection in the Financials and Communication Services sectors hurt Fund performance. Sector weights were a positive on Fund performance relative to the Index largely due to our underweight position in the Health Care sector. From a style perspective, the Fund holdings on average had higher beta relative to the Index, and this was a detractor from performance. The Fund holdings on average had a larger market capitalization and lower volatility than the Index, and both were contributors to performance.
The Fund continued to benefit from our return to value positioning in the aftermath of the pandemic as value continued to outperform growth. Now that we are in a rising interest rate environment, we believe that rates will have an impact on the economy. In the last month or so, the Fund began incrementally adding companies with better balance sheets, more stable business models and higher returns on invested capital. Given the many uncertainties in the market, we think it makes sense to continue to move to the more stable, less cyclical side of the benchmark. We realize that a lot of bad news is already priced in. However, we don't necessarily see a "rebound" opportunity in the deeper cyclical names in our benchmarks. Moreover, the Russell indices had their annual rebalance. The Russell Value benchmarks have become less cyclical and more "growth-like." There is a significant style difference post rebalance. The Fund has become less cyclical. However, we are underexposed to growth relative to the rebalanced benchmark. Potentially, these recently added, "growthy" benchmark names could snap back, which would be negative for our relative performance.
6
Victory Integrity Discovery Fund
Managers' Commentary (continued)
We believe most of the increased growth exposure in the benchmark came from the inclusion of biotechnology stocks as well as unprofitable technology companies. We will explore our growth underweight on a company-by-company basis, looking for opportunities to buy stocks that meet our Right Company, Right Price, Right Time framework. Unprofitable, cash-burning technology and biotechnology companies are unlikely to meet those criteria.
7
Victory Integrity Discovery Fund
Investment Overview
(Unaudited)
Average Annual Total Return
Year Ended June 30, 2022
| | | Class A | | Class C | | Class R | | Class Y | | Member Class | | | |
INCEPTION DATE | | 12/26/96 | | 3/31/97 | | 7/29/04 | | 12/26/96 | | 11/2/20 | | | |
| | | Net Asset
Value | | Maximum
Offering
Price | | Net Asset
Value | | Contingent
Deferred
Charges | | Net Asset
Value | | Net Asset
Value | | Net Asset
Value | | Russell
Microcap®
Value Index1 | |
One Year | | | –15.27 | % | | | –20.14 | % | | | –15.98 | % | | | –16.76 | % | | | –15.68 | % | | | –15.11 | % | | | –15.17 | % | | | –20.19 | % | |
Five Year | | | 4.51 | % | | | 3.28 | % | | | 3.65 | % | | | 3.65 | % | | | 3.99 | % | | | 4.75 | % | | | NA | | | | 6.03 | % | |
Ten Year | | | 10.02 | % | | | 9.37 | % | | | 9.15 | % | | | 9.15 | % | | | 9.55 | % | | | 10.29 | % | | | NA | | | | 10.12 | % | |
Since Inception | | | NA | | | | NA | | | | NA | | | | NA | | | | NA | | | | NA | | | | 25.98 | % | | | NA | | |
The performance data quoted represents past performance and current returns may be lower or higher. The investment return and principal value will fluctuate so that an investor's shares, when redeemed, may be worth more or less than the original cost. To obtain performance information current to the most recent month's end, please visit www.vcm.com.
The maximum offering price ("MOP") figures reflect a maximum sales charge of 5.75% for Class A. Class C is not subject to an initial sales charge, but is subject to a deferred sales charge of 1.00% on shares redeemed within one year of purchase. Net Asset Value does not reflect sales charges.
Total return measures the price change in a share assuming the reinvestment of all net investment income and realized capital gain distributions, if any. The total returns quoted do not reflect adjustments made to the enclosed financial statements in accordance with U.S. Generally Accepted Accounting Principles or the deduction of taxes that a shareholder would pay on net investment income and realized capital gain distributions, including reinvested distributions, or redemptions of shares. The total return figures set forth above include all waivers of fees. Without such fee waivers, the total returns would have been lower.
Victory Integrity Discovery Fund — Growth of $10,000
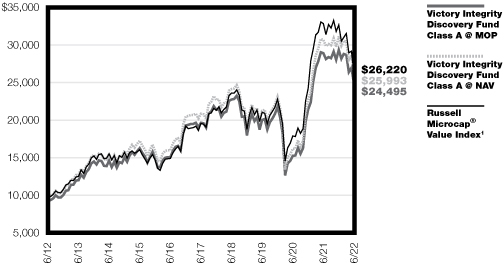
1The Russell Microcap® Value Index is a capitalization–weighted index that measures the performance of the smallest 1,000 securities in the Russell 2000® Index, plus the next 1,000 smallest eligible securities by market cap. (The Russell 2000® Index is a capitalization-weighted index that measures the performance of approximately 2,000 of the smallest companies in the Russell 3000® Index, an index representing approximately 98% of the investable U.S. equity market.) This index does not include the effect of sales charges, commissions, expenses, or taxes, is not representative of the Fund, and it is not possible to invest directly in an index.
The graph reflects investment of growth of a hypothetical $10,000 investment in the Fund.
The graph and table do not reflect the deduction of taxes that a shareholder would pay on Fund distributions or the redemption of shares.
Past performance is not indicative of future results.
8
Victory Integrity Mid-Cap Value Fund
Managers' Commentary
(Unaudited)
What were the market conditions during the reporting period?
It was a tale of two different markets during this reporting period. Emergence of new COVID-19 variants in the second half of 2021 were temporary setbacks for the market recovery. Ultimately, Gross Domestic Product growth completed the transition from recovery to expansion and eventually surpassed its pre-pandemic peak. Equities ended the year near all-time highs. As we turned the calendar to 2022, the markets had no shortage of information to process. Russia invaded Ukraine, the U.S. Federal Reserve started to signal (and ultimately implemented) interest rate increases, mortgage rates rapidly rose, and markets started to price in fears of a recession. The first-half performance for the S&P 500® Index was one of the worst on record. The second quarter performance for the Russell 2000® Value Index was the worst ever. From a market capitalization perspective, small-cap equities underperformed their mid- and large-cap peers.
The top-performing sectors within the Russell Midcap® Value Index (the "Index") were Energy, Utilities, and Consumer Staples, while Communication Services, Consumer Discretionary, and Technology were the weakest-performing sectors. Mid-cap value stocks outperformed mid-cap growth stocks.
How did Victory Integrity Mid-Cap Value Fund (the "Fund") perform during the reporting period?
The Fund returned -6.56% (Class A at net asset value) for the fiscal year ended June 30, 2022, outperforming the Index, which returned -10.00% for the period.
What strategies did you employ during the reporting period?
Stock selection in the Financials, Technology, and Materials sectors were the main contributors that resulted in Fund outperformance. Stock selection in the Consumer Discretionary sector hurt Fund performance. Sector weights were neutral. The Fund holdings on average had higher beta and higher volatility relative to the Index, and both were detractors from performance.
The Fund continued to benefit from our return to value positioning in the aftermath of the pandemic as value continued to outperform growth. Now that we are in a rising interest rate environment, we believe that rates will have an impact on the economy. In the last month or so, the Fund began incrementally adding companies with better balance sheets, more stable business models and higher returns on invested capital. Given the many uncertainties in the market, we think it makes sense to continue to move to the more stable, less cyclical side of the benchmark. We realize that a lot of bad news is already priced in. However, we don't necessarily see a "rebound" opportunity in the deeper cyclical names in our benchmarks. Moreover, the Russell indices had their annual rebalance. The Russell Value benchmarks have become less cyclical and more "growth-like." There is a significant style difference post rebalance. The Fund has become less cyclical. However, we are underexposed to growth relative to the rebalanced benchmark. Potentially, these recently added, "growthy" benchmark names could snap back, which would be negative for our relative performance. We believe most of the increased growth exposure in the benchmark came from the inclusion of biotechnology stocks as well as unprofitable technology companies. We will explore our growth underweight on a company-by-company basis, looking for opportunities to buy stocks that meet our Right Company, Right Price, Right Time framework. Unprofitable, cash-burning technology and biotechnology companies are unlikely to meet those criteria.
9
Victory Integrity Mid-Cap Value Fund
Investment Overview
(Unaudited)
Average Annual Total Return
Year Ended June 30, 2022
| | | Class A | | Class C | | Class R6 | | Class Y | | Member Class | | | |
INCEPTION DATE | | 7/1/11 | | 11/4/19 | | 12/14/15 | | 7/1/11 | | 11/2/20 | | | |
| | | Net Asset
Value | | Maximum
Offering
Price | | Net Asset
Value | | Contingent
Deferred
Charges | | Net Asset
Value | | Net Asset
Value | | Net Asset
Value | | Russell
Midcap®
Value Index1 | |
One Year | | | –6.56 | % | | | –11.94 | % | | | –7.26 | % | | | –8.15 | % | | | –6.21 | % | | | –6.35 | % | | | –6.46 | % | | | –10.00 | % | |
Five Year | | | 7.36 | % | | | 6.10 | % | | | NA | | | | NA | | | | 7.76 | % | | | 7.61 | % | | | NA | | | | 6.27 | % | |
Ten Year | | | 10.68 | % | | | 10.02 | % | | | NA | | | | NA | | | | NA | | | | 10.97 | % | | | NA | | | | 10.62 | % | |
Since Inception | | | NA | | | | NA | | | | 7.21 | % | | | 7.21 | % | | | 9.88 | % | | | NA | | | | 19.42 | % | | | NA | | |
The performance data quoted represents past performance and current returns may be lower or higher. The investment return and principal value will fluctuate so that an investor's shares, when redeemed, may be worth more or less than the original cost. To obtain performance information current to the most recent month's end, please visit www.vcm.com.
The maximum offering price ("MOP") figures reflect a maximum sales charge of 5.75% for Class A. Class C is not subject to an initial sales charge, but is subject to a deferred sales charge of 1.00% on shares redeemed within one year of purchase. Net Asset Value does not reflect sales charges.
Total return measures the price change in a share assuming the reinvestment of all net investment income and realized capital gain distributions, if any. The total returns quoted do not reflect adjustments made to the enclosed financial statements in accordance with U.S. Generally Accepted Accounting Principles or the deduction of taxes that a shareholder would pay on net investment income and realized capital gain distributions, including reinvested distributions, or redemptions of shares. The total return figures set forth above include all waivers of fees. Without such fee waivers, the total returns would have been lower.
Victory Integrity Mid-Cap Value Fund — Growth of $10,000
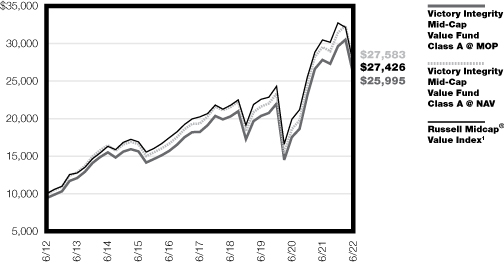
1The Russell Midcap® Value Index is an unmanaged market-capitalization-weighted index that measures the performance of those companies in the Russell Midcap® Index with lower price-to-book ratios and lower forecasted growth values. (The Russell Midcap® Index measures the performance of the 800 smallest companies in the Russell 1000® Index, which consists of the 1,000 largest U.S. companies based on total market capitalization.) Index results assume the reinvestment of dividends paid on the stocks constituting the index. This index does not include the effect of sales charges, commissions, expenses or taxes, is not representative of the Fund and it is not possible to invest directly in an index.
The graph reflects investment of growth of a hypothetical $10,000 investment in the Fund.
The graph and table do not reflect the deduction of taxes that a shareholder would pay on Fund distributions or the redemption of shares.
Past performance is not indicative of future results.
10
Victory Integrity Small-Cap Value Fund
Managers' Commentary
(Unaudited)
What were the market conditions during the reporting period?
It was a tale of two different markets during this reporting period. Emergence of new COVID-19 variants in the second half of 2021 were temporary setbacks for the market recovery. Ultimately, Gross Domestic Product growth completed the transition from recovery to expansion and eventually surpassed its pre-pandemic peak. Equities ended the year near all-time highs. As we turned the calendar to 2022, the markets had no shortage of information to process. Russia invaded Ukraine, the U.S. Federal Reserve started to signal (and ultimately implemented) interest rate increases, mortgage rates rapidly rose, and markets started to price in fears of a recession. The first-half performance for the S&P 500® Index was one of the worst on record. The second quarter performance for the Russell 2000® Value Index (the "Index") was the worst ever. From a market capitalization perspective, small-cap equities underperformed their mid- and large-cap peers.
The top-performing sectors within the Index were Energy, Utilities, and Consumer Staples while Communication Services, Health Care, and Consumer Discretionary were the weakest-performing sectors relative to the Index. Small-cap value stocks outperformed small-cap growth stocks.
How did Victory Integrity Small-Cap Value Fund (the "Fund") perform during the reporting period?
The Fund returned -12.13% (Class A at net asset value) for the fiscal year ended June 30, 2022, outperforming the Index, which returned -16.28% for the period.
What strategies did you employ during the reporting period?
Stock selection in the Health Care, Industrials, Communication Services, and Energy sectors were the largest positive contributors to Fund performance, while stock selection in the Consumer Discretionary and Materials sectors were the largest detractors. Sector weights were a positive on the Fund's performance relative to the Index largely due to underweights in the Health Care and Communication Services sectors and our overweight to the Energy sector. From a style perspective, the Fund holdings on average had higher liquidity and higher beta relative to the Index and both were detractors from performance. The Fund holdings on average had lower volatility than the Index, and this was a contributor to performance.
The Fund continued to benefit from our return to value positioning in the aftermath of the pandemic as value continued to outperform growth. Now that we are in a rising interest rate environment, we believe that rates will have an impact on the economy. In the last month or so, the Fund began incrementally adding companies with better balance sheets, more stable business models and higher returns on invested capital. Given the many uncertainties in the market, we think it makes sense to continue to move to the more stable, less cyclical side of the benchmark. We realize that a lot of bad news is already priced in. However, we don't necessarily see a "rebound" opportunity in the deeper cyclical names in our benchmarks. Moreover, the Russell indices had their annual rebalance. The Russell Value benchmarks have become less cyclical and more "growth-like." There is a significant style difference post rebalance. The Fund has become less cyclical. However, we are underexposed to growth relative to the rebalanced benchmark. Potentially, these recently added, "growthy" benchmark names could snap back, which would be negative for our relative performance.
11
Victory Integrity Small-Cap Value Fund
Managers' Commentary (continued)
We believe most of the increased growth exposure in the benchmark came from the inclusion of biotechnology stocks as well as unprofitable technology companies. We will explore our growth underweight on a company-by-company basis, looking for opportunities to buy stocks that meet our Right Company, Right Price, Right Time framework. Unprofitable, cash-burning technology and biotechnology companies are unlikely to meet those criteria.
12
Victory Integrity Small-Cap Value Fund
Investment Overview
(Unaudited)
Average Annual Total Return
Year Ended June 30, 2022
| | | Class A | | Class C | | Class R | | Class R6 | | Class Y | | | |
INCEPTION DATE | | 3/30/04 | | 7/7/05 | | 7/7/12 | | 6/1/12 | | 7/7/05 | | | |
| | | Net Asset
Value | | Maximum
Offering
Price | | Net Asset
Value | | Contingent
Deferred
Charges | | Net Asset
Value | | Net Asset
Value | | Net Asset
Value | |
Russell 2000®
Value Index1 | |
One Year | | | –12.13 | % | | | –17.18 | % | | | –12.77 | % | | | –13.48 | % | | | –12.32 | % | | | –11.63 | % | | | –11.72 | % | | | –16.28 | % | |
Five Year | | | 4.62 | % | | | 3.39 | % | | | 3.86 | % | | | 3.86 | % | | | 4.36 | % | | | 5.19 | % | | | 5.04 | % | | | 4.89 | % | |
Ten Year | | | 9.06 | % | | | 8.41 | % | | | 8.26 | % | | | 8.26 | % | | | 8.78 | % | | | 9.60 | % | | | 9.44 | % | | | 9.05 | % | |
The performance data quoted represents past performance and current returns may be lower or higher. The investment return and principal value will fluctuate so that an investor's shares, when redeemed, may be worth more or less than the original cost. To obtain performance information current to the most recent month's end, please visit www.vcm.com.
The maximum offering price ("MOP") figures reflect a maximum sales charge of 5.75% for Class A. Class C is not subject to an initial sales charge, but is subject to a deferred sales charge of 1.00% on shares redeemed within one year of purchase. Net Asset Value does not reflect sales charges.
Total return measures the price change in a share assuming the reinvestment of all net investment income and realized capital gain distributions, if any. The total returns quoted do not reflect adjustments made to the enclosed financial statements in accordance with U.S. Generally Accepted Accounting Principles or the deduction of taxes that a shareholder would pay on net investment income and realized capital gain distributions, including reinvested distributions, or redemptions of shares. The total return figures set forth above include all waivers of fees. Without such fee waivers, the total returns would have been lower.
Victory Integrity Small-Cap Value Fund — Growth of $10,000
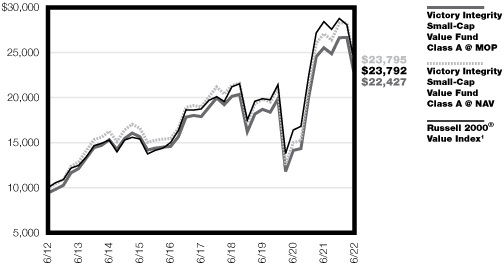
1The Russell 2000® Value Index is an unmanaged market-capitalization-weighted index that measures the performance of those companies in the Russell 2000® Index with lower price-to-book ratios and lower forecasted growth values. (The Russell 2000® Index measures the performance of the 2,000 smallest companies in the Russell 3000® Index, which consists of the 3,000 largest U.S. companies based on total market capitalization.) Index results assume the reinvestment of dividends paid on the stocks constituting the index. This index does not include the effect of sales charges, commissions, expenses, or taxes, is not representative of the Fund and it is not possible to invest directly in an index.
The graph reflects investment of growth of a hypothetical $10,000 investment in the Fund.
The graph and table do not reflect the deduction of taxes that a shareholder would pay on Fund distributions or the redemption of shares.
Past performance is not indicative of future results.
13
Victory Integrity Small/Mid-Cap Value Fund
Managers' Commentary
(Unaudited)
What were the market conditions during the reporting period?
It was a tale of two different markets during this reporting period. Emergence of new COVID-19 variants in the second half of 2021 were temporary setbacks for the market recovery. Ultimately, Gross Domestic Product growth completed the transition from recovery to expansion and eventually surpassed its pre-pandemic peak. Equities ended the year near all-time highs. As we turned the calendar to 2022, the markets had no shortage of information to process. Russia invaded Ukraine, the U.S. Federal Reserve started to signal (and ultimately implemented) interest rate increases, mortgage rates rapidly rose, and markets started to price in fears of a recession. The first-half performance for the S&P 500® Index was one of the worst on record. The second quarter performance for the Russell 2000® Value Index was the worst ever. From a market capitalization perspective, small-cap equities underperformed their mid- and large-cap peers.
The top-performing sectors within the Russell 2500TM Value Index (the "Index") were Energy, Utilities, and Consumer Staples, while Communication Services, Consumer Discretionary, and Health Care were the weakest-performing sectors relative to the Index. Small/mid-cap value stocks outperformed small/mid-cap growth stocks.
How did Victory Integrity Small/Mid-Cap Value Fund (the "Fund") perform during the reporting period?
The Fund returned -8.64% (Class A at net asset value) for the fiscal year ended June 30, 2022, outperforming the Index, which returned -13.19% for the period.
What strategies did you employ during the reporting period?
Stock selection in the Industrials, Financials, Materials, Communication Services, and Health Care sectors led to Fund outperformance, while security selection in the Consumer Discretionary and Real Estate detracted. Sector weights were a positive due to our overweight in the Energy sector and our underweight in the Health Care sector. The Fund holdings on average had higher beta relative to the Index, and this was a detractor from performance.
The Fund continued to benefit from our return to value positioning in the aftermath of the pandemic as value continued to outperform growth. Now that we are in a rising interest rate environment, we believe that rates will have an impact on the economy. In the last month or so, the Fund began incrementally adding companies with better balance sheets, more stable business models and higher returns on invested capital. Given the many uncertainties in the market, we think it makes sense to continue to move to the more stable, less cyclical side of the benchmark. We realize that a lot of bad news is already priced in. However, we don't necessarily see a "rebound" opportunity in the deeper cyclical names in our benchmarks. Moreover, the Russell indices had their annual rebalance. The Russell Value benchmarks have become less cyclical and more "growth-like." There is a significant style difference post rebalance. The Fund has become less cyclical. However, we are underexposed to growth relative to the rebalanced benchmark. Potentially, these recently added, "growthy" benchmark names could snap back, which would be negative for our relative performance. We believe most of the increased growth exposure in the benchmark came from the inclusion of biotechnology stocks as well as unprofitable technology companies. We will explore our growth underweight on a company-by-company basis, looking for opportunities to buy stocks that meet our Right Company, Right Price, Right Time framework. Unprofitable, cash-burning technology and biotechnology companies are unlikely to meet those criteria.
14
Victory Integrity Small/Mid-Cap Value Fund
Investment Overview
(Unaudited)
Average Annual Total Return
Year Ended June 30, 2022
| | | Class A | | Class R6 | | Class Y | | Member Class | | | |
INCEPTION DATE | | 7/1/11 | | 3/3/15 | | 7/1/11 | | 11/2/20 | | | |
| | | Net Asset
Value | | Maximum
Offering
Price | | Net Asset
Value | | Net Asset
Value | | Net Asset
Value | | Russell 2500TM
Value Index1 | |
One Year | | | –8.64 | % | | | –13.89 | % | | | –8.38 | % | | | –8.45 | % | | | –8.55 | % | | | –13.19 | % | |
Five Year | | | 7.18 | % | | | 5.91 | % | | | 7.50 | % | | | 7.45 | % | | | NA | | | | 5.54 | % | |
Ten Year | | | 9.62 | % | | | 8.97 | % | | | NA | | | | 9.88 | % | | | NA | | | | 9.54 | % | |
Since Inception | | | NA | | | | NA | | | | 6.82 | % | | | NA | | | | 24.47 | % | | | NA | | |
The performance data quoted represents past performance and current returns may be lower or higher. The investment return and principal value will fluctuate so that an investor's shares, when redeemed, may be worth more or less than the original cost. To obtain performance information current to the most recent month's end, please visit www.vcm.com.
The maximum offering price ("MOP") figures reflect a maximum sales charge of 5.75% for Class A. Net Asset Value does not reflect sales charges.
Total return measures the price change in a share assuming the reinvestment of all net investment income and realized capital gain distributions, if any. The total returns quoted do not reflect adjustments made to the enclosed financial statements in accordance with U.S. Generally Accepted Accounting Principles or the deduction of taxes that a shareholder would pay on net investment income and realized capital gain distributions, including reinvested distributions, or redemptions of shares. The total return figures set forth above include all waivers of fees. Without such fee waivers, the total returns would have been lower.
Victory Integrity Small/Mid-Cap Value Fund — Growth of $10,000

1The Russell 2500TM Value Index measures the performance of those Russell 2500TM companies (approximately 2,500 of the smallest securities in the Russell 3000® Index, an index representing approximately 98% of the investable U.S. equity market) with lower price-to-book ratios and lower forecasted growth values. This index does not include the effect of sales charges, commissions, expenses, or taxes, is not representative of the Fund, and it is not possible to invest directly in an index.
The graph reflects investment of growth of a hypothetical $10,000 investment in the Fund.
The graph and table do not reflect the deduction of taxes that a shareholder would pay on Fund distributions or the redemption of shares.
Past performance is not indicative of future results.
15
Victory Munder Multi-Cap Fund
Managers' Commentary
(Unaudited)
What were the market conditions during the reporting period?
The Russell 3000® Index (the "Index") declined by approximately 14% over the 12 months ended June 30, 2022. The decline was broad-based across most sectors except Utilities, which increased by 13%, and Energy, which increased 37.8% on strength of rising oil prices from pandemic lows. Value stocks outperformed growth by approximately 12% as investors focused on an economic recovery as well as rising interest rates, which generally negatively impact growth stock valuation metrics. The spread between value and growth was even wider in the small-cap spectrum at approximately 17%. The returns of the small-cap segment of the market lagged the Index by an additional 11%.
More recently, we have seen inflation and interest rate expectations rise significantly in the past year, the result of U.S Federal Reserve commentary and recent inflation data released by the U.S. government. As a result of rising inflation and interest rate expectations, traditional growth sectors (e.g., Consumer Discretionary, Communication Services and Technology) all lagged Index returns.
How did Victory Munder Multi-Cap Fund (the "Fund") perform during the reporting period?
The Fund returned -8.71% (Class A at net asset value) for the fiscal year ended June 30, 2022, outperforming the Index, which returned -13.87% for the period.
What strategies did you employ during the reporting period?
The Fund looks to invest in stocks with market capitalizations of $1 billion and above that we believe are of high quality with the potential for above-average earnings growth as well as earnings momentum.
Using this framework, the Fund generated the strongest relative returns within the Health Care, Technology, and Communication Services sectors.
On an individual security basis, two of the Fund's top-performing stocks for the year were drug/medical supply distributor McKesson Corp. and homebuilding supply retailer/wholesaler Builders FirstSource, Inc. McKesson Corp. benefitted from strong demand for COVID-19-related supplies, including vaccine distribution and storage, as well as demand for its core drug distribution unit. Builders FirstSource, Inc. benefitted from integrating several acquisitions for the past few years along with strong demand for homebuilding supplies and ability to pass on high inflation through price increases.
Two of the Fund's weakest-performing stocks for the year were Trex Co., Inc. ("Trex"), a wood composite decking company and Signature Bank, a regional bank operator. Trex came under pressure this year on concerns over homebuilding deceleration combined with additional manufacturing capacity being added in 2022. We believe concerns are overblown as we believe a majority of sales are via home remodeling projects, not new home construction sales. We continued to hold Trex at June 30, 2022. Signature Bank lagged the portfolio later in the fiscal year on concerns over its crypto deposit and lending segment. We believe the decline is an overreaction to news of general decline in cryptocurrency prices, and we continued to own the security at June 30, 2022.
16
Victory Munder Multi-Cap Fund
Investment Overview
(Unaudited)
Average Annual Total Return
Year Ended June 30, 2022
| | | Class A | | Class C | | Class Y | | | | | |
INCEPTION DATE | | 8/19/96 | | 11/3/98 | | 6/1/98 | | | | | |
| | | Net Asset
Value | | Maximum
Offering
Price | | Net Asset
Value | | Contingent
Deferred
Charges | | Net Asset
Value | | Russell 3000®
Index1 | | S&P 500®
Index2 | |
One Year | | | –8.71 | % | | | –13.97 | % | | | –9.53 | % | | | –10.31 | % | | | –8.42 | % | | | –13.87 | % | | | –10.62 | % | |
Five Year | | | 8.64 | % | | | 7.36 | % | | | 7.78 | % | | | 7.78 | % | | | 9.03 | % | | | 10.60 | % | | | 11.31 | % | |
Ten Year | | | 10.71 | % | | | 10.05 | % | | | 9.83 | % | | | 9.83 | % | | | 11.09 | % | | | 12.57 | % | | | 12.96 | % | |
The performance data quoted represents past performance and current returns may be lower or higher. The investment return and principal value will fluctuate so that an investor's shares, when redeemed, may be worth more or less than the original cost. To obtain performance information current to the most recent month's end, please visit www.vcm.com.
The maximum offering price ("MOP") figures reflect a maximum sales charge of 5.75% for Class A. Class C is not subject to an initial sales charge, but is subject to a deferred sales charge of 1.00% on shares redeemed within one year of purchase. Net Asset Value does not reflect sales charges.
Total return measures the price change in a share assuming the reinvestment of all net investment income and realized capital gain distributions, if any. The total returns quoted do not reflect adjustments made to the enclosed financial statements in accordance with U.S. Generally Accepted Accounting Principles or the deduction of taxes that a shareholder would pay on net investment income and realized capital gain distributions, including reinvested distributions, or redemptions of shares. The total return figures set forth above include all waivers of fees. Without such fee waivers, the total returns would have been lower.
Victory Munder Multi-Cap Fund — Growth of $10,000
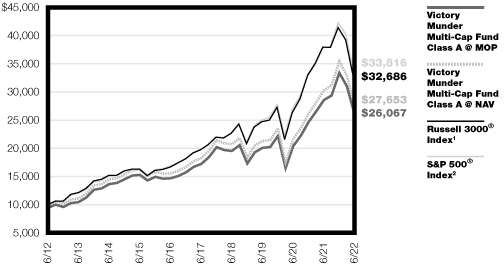
1The Russell 3000® Index measures the performance of the 3,000 largest U.S. companies based on total market capitalization, which represents approximately 98% of the investable U.S. equity market. This index does not include the effect of sales charges, commissions, expenses, or taxes, is not representative of the Fund, and it is not possible to invest directly in an index.
2The S&P 500® Index is an unmanaged index comprised of 500 domestically traded common stocks, is weighted according to the market value of each common stock in the index, and includes reinvestment of dividends. This index does not include the effect of sales charges, commissions, expenses, or taxes, is not representative of the Fund, and it is not possible to invest directly in an index.
The graph reflects investment of growth of a hypothetical $10,000 investment in the Fund.
The graph and table do not reflect the deduction of taxes that a shareholder would pay on Fund distributions or the redemption of shares.
Past performance is not indicative of future results.
17
Victory S&P 500 Index Fund
Managers' Commentary
(Unaudited)
Investment Considerations
Equity Securities ("stocks") are more volatile and carry more risk than other forms of investments in high-grade, fixed-income securities. The net asset value per share of Victory S&P 500 Index Fund (the "Fund") will fluctuate as the value of the securities in the portfolio changes. The securities of foreign companies acquired by the Fund tend to experience more volatility than their domestic counterparts in part because of higher political and economic risks, lack of reliable information, fluctuations in currency exchange rates and the risks that a foreign government may take over assets, restrict the ability to exchange currency, or restrict the delivery of securities.
Commentary
The Fund seeks to provide performance and income that is comparable to the performance of the S&P 500® Index (the "Index") before fees and expenses.
The Fund returned -11.11% (Class A at net asset value) for the fiscal year ended June 30, 2022, underperforming the Index, which returned -10.62%. The difference in performance of the Fund and the Index was primarily due to the Fund's fees and expenses. The Index is not an investable product; therefore, fees and expenses do not apply.
During the reporting period, the Fund saw positive contributions from the Energy, Health Care and Utilities sectors. The Consumer Discretionary, Communication Services, and Financials sectors were negative contributors to overall performance.
18
Victory S&P 500 Index Fund
Investment Overview
(Unaudited)
Average Annual Total Return
Year Ended June 30, 2022
| | | Class A | | Class R | | Class Y | | | |
INCEPTION DATE | | 12/9/92 | | 7/29/04 | | 12/1/91 | | | |
| | | Net Asset
Value | | Maximum
Offering
Price | | Net Asset
Value | | Net Asset
Value | | S&P 500®
Index1 | |
One Year | | | –11.11 | % | | | –13.10 | % | | | –11.46 | % | | | –11.06 | % | | | –10.62 | % | |
Five Year | | | 10.70 | % | | | 10.19 | % | | | 10.26 | % | | | 10.83 | % | | | 11.31 | % | |
Ten Year | | | 12.29 | % | | | 12.04 | % | | | 11.85 | % | | | 12.45 | % | | | 12.96 | % | |
The performance data quoted represents past performance and current returns may be lower or higher. The investment return and principal value will fluctuate so that an investor's shares, when redeemed, may be worth more or less than the original cost. To obtain performance information current to the most recent month's end, please visit www.vcm.com.
The maximum offering price ("MOP") figures reflect a maximum sales charge of 2.25% for Class A. Net Asset Value does not reflect sales charges.
Total return measures the price change in a share assuming the reinvestment of all net investment income and realized capital gain distributions, if any. The total returns quoted do not reflect adjustments made to the enclosed financial statements in accordance with U.S. Generally Accepted Accounting Principles or the deduction of taxes that a shareholder would pay on net investment income and realized capital gain distributions, including reinvested distributions, or redemptions of shares. The total return figures set forth above include all waivers of fees. Without such fee waivers, the total returns would have been lower.
Victory S&P 500 Index Fund — Growth of $10,000
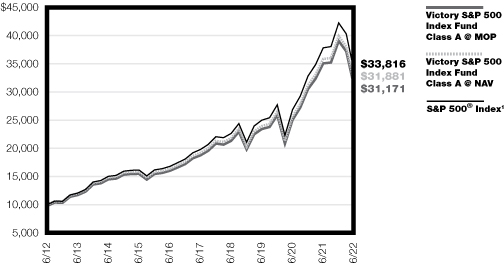
1The S&P 500® Index is an unmanaged index comprised of 500 domestically traded common stocks, is weighted according to the market value of each common stock in the index, and includes reinvestment of dividends. This index does not include the effect of sales charges, commissions, expenses, or taxes, is not representative of the Fund, and it is not possible to invest directly in an index.
The graph reflects investment of growth of a hypothetical $10,000 investment in the Fund.
The graph and table do not reflect the deduction of taxes that a shareholder would pay on Fund distributions or the redemption of shares.
Past performance is not indicative of future results.
19
Victory Munder Mid-Cap Core Growth Fund
Managers' Commentary
(Unaudited)
What were the market conditions during the reporting period?
The Russell Midcap® Index (the "Index") declined over 17% over the 12 months ended June 30, 2022. The decline was broad-based across most sectors except Utilities, which increased by 10% and Energy, which increased 39% on the strength of rising oil prices from pandemic lows. Value stocks outperformed growth stocks as investors focused on an economic recovery as well as rising interest rates, which generally negatively impact growth stock valuation metrics. The returns of the small-cap segment of the market lagged the Index during this environment where investors seek to reduce their exposure to risk.
More recently, we have seen inflation and interest rate expectations rise significantly in the past year, the result of U.S Federal Reserve commentary and recent inflation data released by the U.S. government. As a result of rising inflation and interest rate expectations, traditional growth sectors (e.g., Consumer Discretionary, Communication Services, and Technology) all lagged Index returns.
How did Victory Munder Mid-Cap Core Growth Fund (the "Fund") perform during the reporting period?
The Fund returned -16.84% (Class A at net asset value) for the fiscal year ended June 30, 2022, outperforming the Index, which returned -17.30% for the period.
What strategies did you employ during the reporting period?
The Fund looks to invest in stocks with market capitalizations within the range of the Index that we believe are of high quality with the potential for above-average earnings growth as well as earnings momentum.
Using this framework, the Fund generated the strongest relative returns within the Communication Services, Information Technology, and Consumer Discretionary sectors. These were the weakest-performing sectors within the Index, and our focus on quality and reasonable valuations helped us within these sectors.
On an individual security basis, two of the Fund's top-performing stock for the year were Cheniere Energy, Inc. ("Cheniere") and Autozone, Inc. Cheniere performed well, as there has been a resurgence in liquefied natural gas (LNG) projects. Autozone, Inc. posted positive earnings surprises in each of the last four quarters, as the auto parts industry typically has performed well in periods of consumer weakness.
Two of the Fund's weakest-performing stocks for the year were Trex Co., Inc. ("Trex"), a wood composite decking company and CRISPR Therapeutics AG ("CRISPR"), a biotech company. Trex came under pressure this year on concerns over homebuilding deceleration combined with additional manufacturing capacity being added in 2022. We believe concerns are overblown as we believe a majority of sales are via home remodeling projects, not new home construction sales. We continued to hold Trex at June 30, 2022. CRISPR underperformed, as did many biotech stocks in this risk-off environment. We have sold this stock.
20
Victory Munder Mid-Cap Core Growth Fund
Investment Overview
(Unaudited)
Average Annual Total Return
Year Ended June 30, 2022
| | | Class A | | Class C | | Class R | | Class R6 | | Class Y | | | | | |
INCEPTION DATE | | 6/30/00 | | 7/14/00 | | 7/29/04 | | 6/1/12 | | 6/24/98 | | | | | |
| | | Net Asset
Value | | Maximum
Offering
Price | | Net Asset
Value | | Contingent
Deferred
Charges | | Net Asset
Value | | Net Asset
Value | | Net Asset
Value | | Russell
Midcap®
Index1 | | Russell
Midcap®
Growth
Index2 | |
One Year | | | –16.84 | % | | | –21.62 | % | | | –17.53 | % | | | –17.73 | % | | | –17.10 | % | | | –16.53 | % | | | –16.64 | % | | | –17.30 | % | | | –29.57 | % | |
Five Year | | | 6.79 | % | | | 5.53 | % | | | 6.00 | % | | | 6.00 | % | | | 6.49 | % | | | 7.24 | % | | | 7.09 | % | | | 7.96 | % | | | 8.88 | % | |
Ten Year | | | 9.42 | % | | | 8.77 | % | | | 8.63 | % | | | 8.63 | % | | | 9.12 | % | | | 9.89 | % | | | 9.71 | % | | | 11.29 | % | | | 11.50 | % | |
The performance data quoted represents past performance and current returns may be lower or higher. The investment return and principal value will fluctuate so that an investor's shares, when redeemed, may be worth more or less than the original cost. To obtain performance information current to the most recent month's end, please visit www.vcm.com.
The maximum offering price ("MOP") figures reflect a maximum sales charge of 5.75% for Class A. Class C is not subject to an initial sales charge, but is subject to a deferred sales charge of 1.00% on shares redeemed within one year of purchase. Net Asset Value does not reflect sales charges.
Total return measures the price change in a share assuming the reinvestment of all net investment income and realized capital gain distributions, if any. The total returns quoted do not reflect adjustments made to the enclosed financial statements in accordance with U.S. Generally Accepted Accounting Principles or the deduction of taxes that a shareholder would pay on net investment income and realized capital gain distributions, including reinvested distributions, or redemptions of shares. The total return figures set forth above include all waivers of fees. Without such fee waivers, the total returns would have been lower.
Victory Munder Mid-Cap Core Growth Fund — Growth of $10,000

1The Russell Midcap® Index is an unmanaged index measuring the performance of medium capitalization domestically traded common stocks. This index does not include the effect of sales charges, commissions, expenses, or taxes, is not representative of the Fund, and it is not possible to invest directly in an index.
2The Russell Midcap® Growth Index is an unmanaged market capitalization-weighted index that measures the performance of those companies in the Russell Midcap® Index with higher price-to-book ratios and higher forecasted growth values. Index results assume the reinvestment of dividends paid on the stocks constituting the index. This index does not include the effect of sales charges, commissions, expenses or taxes, is not representative of the Fund, and it is not possible to invest directly in an index.
The graph reflects investment of growth of a hypothetical $10,000 investment in the Fund.
The graph and table do not reflect the deduction of taxes that a shareholder would pay on Fund distributions or the redemption of shares.
Past performance is not indicative of future results.
21
Victory Munder Small Cap Growth Fund
Managers' Commentary
(Unaudited)
What were the market conditions during the reporting period?
All major equity indexes were down double digits for the 12 months ended June 30, 2022. After a strong post-COVID-19 rally in the proceeding twelve months, investors have a new set of worries. Supply chains have yet to be restored to normal while the world faces multiple simultaneous crises. The Russian invasion of Ukraine complicates the global situation, and we see increasing concerns about food and energy security. Europe faces the prospects of gas rationing this winter, which could force their economy into a deeper recession. The combination of stubbornly high inflation, war in Ukraine, and growth concerns puts the U.S. Federal Reserve (the "Fed") in a tricky situation. Financial conditions tightened considerably in recent months with thirty-year fixed mortgage rates soaring to over 6%, which we expect will slow housing activity. Consumer confidence has declined, and recession fears have grown. These effects impact the economy with a lag, so they mitigate the need for the Fed to tighten much further. The biggest risk we see is that the Fed overtightens and slows the economy too much.
How did Victory Munder Small Cap Growth Fund (the "Fund") perform during the reporting period?
The Fund returned -33.53% (Class A at net asset value) for the fiscal year ended June 30, 2022, narrowly underperforming the Russell 2000® Growth Index, which returned -33.43% for the period.
What strategies did you employ during the reporting period?
The Fund looks to invest in small-cap stocks that have superior growth prospects, strong profitability, sustainable competitive advantages, and reasonable valuations.
Using this framework, the Fund generated the strongest contributions within the Financials, Energy, and Consumer Staples sectors, while Health Care lagged. In the Financials sector, the Fund's overweight in bank stocks contributed, with Coastal Financial Corp. being our top performer. In the Energy sector, Magnolia Oil & Gas Corp. was our top performer. In the Consumer Staples sector, all of our holdings were strong, led by Sovos Brands, Inc. and Albertsons Cos., Inc. The Technology sector had some notable contributors, such as ON Semiconductor Corp., Cloudflare, Inc., Datto Holding Corp., and Napco Security Technologies, Inc., but also a notable detractor in Avaya Holdings Corp. Within the Health Care sector, the Fund's biotech holdings were weak, lead down by LianBio ADR, Natera, Inc., and NanoString Technologies, Inc.
22
Victory Munder Small Cap Growth Fund
Investment Overview
(Unaudited)
Average Annual Total Return
Year Ended June 30, 2022
| | | Class A | | Class I | | Class Y | | | |
INCEPTION DATE | | 4/30/15 | | 4/30/15 | | 4/30/15 | | | |
| | | Net Asset
Value | | Maximum
Offering
Price | | Net Asset
Value | | Net Asset
Value | | Russell
2000® Growth
Index1 | |
One Year | | | –33.53 | % | | | –37.34 | % | | | –33.41 | % | | | –33.46 | % | | | –33.43 | % | |
Five Year | | | 10.14 | % | | | 8.84 | % | | | 10.39 | % | | | 10.21 | % | | | 4.80 | % | |
Since Inception | | | 8.59 | % | | | 7.70 | % | | | 8.86 | % | | | 8.70 | % | | | NA | | |
The performance data quoted represents past performance and current returns may be lower or higher. The investment return and principal value will fluctuate so that an investor's shares, when redeemed, may be worth more or less than the original cost. To obtain performance information current to the most recent month's end, please visit www.vcm.com.
The maximum offering price ("MOP") figures reflect a maximum sales charge of 5.75% for Class A. Net Asset Value does not reflect sales charges.
Total return measures the price change in a share assuming the reinvestment of all net investment income and realized capital gain distributions, if any. The total returns quoted do not reflect adjustments made to the enclosed financial statements in accordance with U.S. Generally Accepted Accounting Principles or the deduction of taxes that a shareholder would pay on net investment income and realized capital gain distributions, including reinvested distributions, or redemptions of shares. The total return figures set forth above include all waivers of fees. Without such fee waivers, the total returns would have been lower.
Victory Munder Small Cap Growth Fund — Growth of $10,000
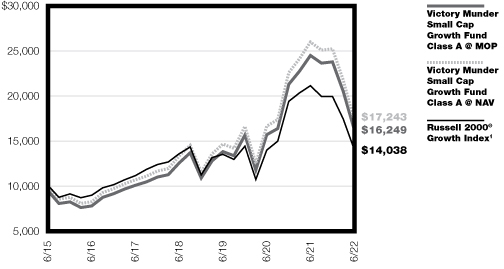
1The Russell 2000® Growth Index is an unmanaged market-capitalization-weighted index that measures the performance of those companies in the Russell 2000® Index with higher price-to-book ratios and higher forecasted growth values. Index results assume the reinvestment of dividends paid on the stocks constituting the index. This index does not include the effect of sales charges, commissions, expenses, or taxes, is not representative of the Fund, and it is not possible to invest directly in an index.
The graph reflects investment of growth of a hypothetical $10,000 investment in the Fund.
The graph and table do not reflect the deduction of taxes that a shareholder would pay on Fund distributions or the redemption of shares.
Past performance is not indicative of future results.
23
Victory Trivalent International Fund — Core Equity
Managers' Commentary
(Unaudited)
What were the market conditions during the reporting period?
International equities retreated on concerns of surging inflation, Russia's full-scale invasion of Ukraine, and ongoing supply chain disruptions from the pandemic. For the fiscal year ended June 30, 2022, the MSCI ACWI ex USA Index (the "Index") fell 19.42%. There was wide dispersion among country returns in the Index, with emerging markets trailing their developed markets peers. Russia was cut from MSCI indices following the invasion of Ukraine and was the worst-performing country prior to its removal. China dropped 31.8% as investors remain concerned over regulatory crackdowns and real estate debt levels. Within developed markets, Germany was down 31.2% on growing recession fears in the event Russia cuts off energy supplies to Europe. Japan, the largest-weighted country in the Index, fell 19.9% as the yen, traditionally considered a safe-haven currency, depreciated 18.3% relative to the U.S. dollar on expectations of monetary policy divergence between the Bank of Japan and the U.S. Federal Reserve. On the upside, Saudi Arabia gained 10.3% and was supported by strength in the Energy sector.
All but one of the 11 sectors were down during the period as long-duration growth stocks were hit the hardest on demand concerns and the impact of higher rates on valuations. The Information Technology and Consumer Discretionary sectors sold off 31.5% and 31.3%, respectively. The Communication Services sector fell 26.6% and was driven down by weakness among interactive media and entertainment stocks. On the other end of the spectrum, Energy stocks advanced 8.1% as Brent crude oil prices jumped 52.8% and topped $100 per barrel for the first time since 2014 as the Russia/Ukraine conflict has caused major supply disruptions.
How did the Victory Trivalent International Fund — Core Equity (the "Fund") perform during the reporting period?
The Fund returned -19.33% (Class A at net asset value) for the fiscal year ended June 30, 2022, outperforming the Index, which returned -19.42% for the period.
What strategies did you employ during the reporting period?
Overall security selection was positive as excess returns were generated in four of six geographic regions and eight of the eleven economic sectors. From a style perspective, the Fund's overall exposure to value, business momentum and quality factors contributed to relative performance. While quality was a detractor from performance, value worked well, and business momentum was neutral. At the sector level, notable outperformance was generated in the Information Technology, Consumer Discretionary, and Industrials sectors. LG Innotek Co. Ltd., a Korean supplier to Apple, rose on upbeat guidance for smartphone camera modules and optimism for the use of its optical products in virtual/augmented reality applications. Within Consumer Discretionary, Chinese auto and battery manufacturer BYD Co. Ltd. gained as the outlook for its battery production and electric vehicle sales rose ahead of expectations. In Industrials, Japanese ocean shipping company Nippon Yusen Kabushiki Kaisha rose on an improved profit outlook with higher container and bulk shipping rates.
On the downside, security selection was weakest in the Financials sector, with the largest impact coming from banks. Raiffeisen Bank International AG in Austria dropped on concerns sanctions imposed on Russia will have a material impact on earnings with Russia and
24
Victory Trivalent International Fund — Core Equity
Managers' Commentary (continued)
Ukraine accounting for nearly 25% of company revenues. Sberbank of Russia PJSC plunged as major indexes and foreign investors demoted Russian securities to uninvestable status following the invasion of Ukraine. Relative performance also lagged in the Consumer Staples sector. Brazilian food retailer Sendas Distribuidora SA fell after announcing the acquisition of 71 stores. The debt-financed deal worried some investors as interest costs are expected to rise in 2022.
25
Victory Trivalent International Fund — Core Equity
Investment Overview
(Unaudited)
Average Annual Total Return
Year Ended June 30, 2022
| | | Class A | | Class C | | Class I | | Class R6 | | Class Y | | | |
INCEPTION DATE | | 8/16/07 | | 8/16/07 | | 8/16/07 | | 3/3/15 | | 8/16/07 | | | |
| | | Net Asset
Value | | Maximum
Offering
Price | | Net Asset
Value | | Contingent
Deferred
Charges | | Net Asset
Value | | Net Asset
Value | | Net Asset
Value | | MSCI ACWI
ex USA
Index1 | |
One Year | | | –19.33 | % | | | –23.98 | % | | | –19.77 | % | | | –20.55 | % | | | –19.03 | % | | | –18.93 | % | | | –19.04 | % | | | –19.42 | % | |
Five Year | | | 1.18 | % | | | –0.01 | % | | | 0.45 | % | | | 0.45 | % | | | 1.56 | % | | | 1.60 | % | | | 1.46 | % | | | 2.50 | % | |
Ten Year | | | 5.14 | % | | | 4.52 | % | | | 4.36 | % | | | 4.36 | % | | | 5.60 | % | | | NA | | | | 5.40 | % | | | 4.83 | % | |
Since Inception | | | NA | | | | NA | | | | NA | | | | NA | | | | NA | | | | 2.29 | % | | | NA | | | | NA | | |
The performance data quoted represents past performance and current returns may be lower or higher. The investment return and principal value will fluctuate so that an investor's shares, when redeemed, may be worth more or less than the original cost. To obtain performance information current to the most recent month's end, please visit www.vcm.com.
The maximum offering price ("MOP") figures reflect a maximum sales charge of 5.75% for Class A. Class C is not subject to an initial sales charge, but is subject to a deferred sales charge of 1.00% on shares redeemed within one year of purchase. Net Asset Value does not reflect sales charges.
Total return measures the price change in a share assuming the reinvestment of all net investment income and realized capital gain distributions, if any. The total returns quoted do not reflect adjustments made to the enclosed financial statements in accordance with U.S. Generally Accepted Accounting Principles or the deduction of taxes that a shareholder would pay on net investment income and realized capital gain distributions, including reinvested distributions, or redemptions of shares. The total return figures set forth above include all waivers of fees. Without such fee waivers, the total returns would have been lower.
Victory Trivalent International Fund-Core Equity — Growth of $10,000
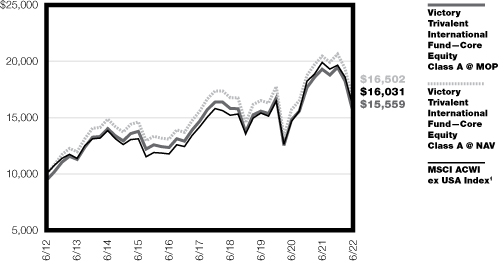
1The MSCI ACWI ex USA Index is a free float-adjusted market capitalization-weighted index that is designed to measure the equity market performance of developed and emerging markets. The index consists of 46 country indices, comprising 22 developed and 24 emerging market county indices. The index is unmanaged and its results include reinvested dividends and/or distributions, but do not reflect the effect of sales charges, commissions, expenses or taxes. It is not possible to invest directly in an index.
The graph reflects investment of growth of a hypothetical $10,000 investment in the Fund.
The graph and table do not reflect the deduction of taxes that a shareholder would pay on Fund distributions or the redemption of shares.
Past performance is not indicative of future results.
26
Victory Trivalent International Small-Cap Fund
Managers' Commentary
(Unaudited)
What were the market conditions during the reporting period?
International small-cap equities retreated on concerns of surging inflation, Russia's full-scale invasion of Ukraine, and ongoing supply chain disruptions from the pandemic. For the fiscal year ended June 30, 2022, the S&P® Developed Ex-U.S. SmallCap Index (the "Index") fell 25.26%. Almost all countries in the Index ended in negative territory as a strong U.S. dollar further weakened local returns across global markets. Within Europe, non-NATO countries Sweden and Finland fell 40.9% and 38.8%, respectively. While both countries are applying for NATO membership, Russia's war against Ukraine is weighing on sentiment and has pushed inflation to its highest rate in more than three decades. Japan, the largest weighted country in the Index, fell 21.9% as the Japanese yen, traditionally considered a safe-haven currency, depreciated 18.3% relative to the U.S. dollar on expectations of monetary policy divergence between the Bank of Japan and the U.S. Federal Reserve. On the upside, Portugal advanced 9% as the government pledged to reduce debt levels amid rising borrowing costs.
All 11 sectors were down during the period as long-duration growth stocks were hit the hardest on demand concerns and the impact of higher rates on valuations. The Health Care, Consumer Discretionary, and Information Technology sectors sold off 38.6%, 34.2%, and 33.3%, respectively. The Materials sector fell 22.8% and was driven down by declining metals prices. The more defensive Utilities sector, down 1.7%, outperformed the broader Index, and was supported by relative strength in renewables stocks.
How did the Victory Trivalent International Small-Cap Fund (the "Fund") perform during the reporting period?
The Fund returned -25.22% (Class A at net asset value) for the fiscal year ended June 30, 2022, outperforming the Index, which returned -25.26% for the period.
What strategies did you employ during the reporting period?
Overall security selection was modestly positive and accounted for the Fund's relative outperformance. Excess returns were generated in four of five geographic regions and five of the 11 economic sectors. From a style perspective, the Fund's overall exposure to value, business momentum and quality factors contributed to relative performance. While quality was a detractor from performance, value and business momentum factors worked well. At the sector level, notable relative outperformance was generated in Information Technology, Health Care, and Industrials. A position in ASM International NV boosted performance within the Information Technology sector. The Dutch semiconductor company rose on increased revenue guidance and bullish industry commentary from market leaders TSMC and Intel Corp. Within the Health Care sector, Swiss pharmacy operator Galenica AG rose on strong sales growth in its online channel and solid demand for specialty pharmaceutical products. Industrial holding Rheinmetall was the top contributor over the one-year period. The German defense contractor gained as the Russia-Ukraine war has led to proposals for significant increases in defense spending.
On the downside, security selection was weakest in the Materials sector, with the largest impact coming from Soulbrain Co. Ltd. The Korean chemical company dropped as earnings results fell short of expectations due to higher raw material costs. Performance was also
27
Victory Trivalent International Small-Cap Fund
Managers' Commentary (continued)
weak in the Consumer Discretionary sector, as acquisitions weighed on sentiment for two holdings. French auto parts manufacturer Faurecia SE declined after acquiring German peer Hella. While the acquisition is expected to be highly earnings-accretive, the current industry environment remains challenging due to supply chain constraints made worse by the conflict in Ukraine. United Kingdom online gaming company 888 Holdings PLC declined on pressure from an expected equity raise in early 2022 to fund the acquisition of William Hill's non-U.S. assets.
28
Victory Trivalent International Small-Cap Fund
Investment Overview
(Unaudited)
Average Annual Total Return
Year Ended June 30, 2022
| | | Class A | | Class C | | Class I | | Class R6 | | Class Y | | | |
INCEPTION DATE | | 8/17/07 | | 8/17/07 | | 8/17/07 | | 6/1/12 | | 8/17/07 | | | |
| | | Net Asset
Value | | Maximum
Offering
Price | | Net Asset
Value | | Contingent
Deferred
Charges | | Net Asset
Value | | Net Asset
Value | | Net Asset
Value | | S&P Developed
Ex-U.S. SmallCap
Index1 | |
One Year | | | –25.22 | % | | | –29.52 | % | | | –25.84 | % | | | –26.53 | % | | | –24.96 | % | | | –25.06 | % | | | –25.07 | % | | | –25.26 | % | |
Five Year | | | 2.22 | % | | | 1.01 | % | | | 1.44 | % | | | 1.44 | % | | | 2.64 | % | | | 2.51 | % | | | 2.48 | % | | | 1.39 | % | |
Ten Year | | | 7.97 | % | | | 7.33 | % | | | 7.16 | % | | | 7.16 | % | | | 8.41 | % | | | 8.28 | % | | | 8.25 | % | | | 6.44 | % | |
The performance data quoted represents past performance and current returns may be lower or higher. The investment return and principal value will fluctuate so that an investor's shares, when redeemed, may be worth more or less than the original cost. To obtain performance information current to the most recent month's end, please visit www.vcm.com.
The maximum offering price ("MOP") figures reflect a maximum sales charge of 5.75% for Class A. Class C is not subject to an initial sales charge, but is subject to a deferred sales charge of 1.00% on shares redeemed within one year of purchase. Net Asset Value does not reflect sales charges.
Total return measures the price change in a share assuming the reinvestment of all net investment income and realized capital gain distributions, if any. The total returns quoted do not reflect adjustments made to the enclosed financial statements in accordance with U.S. Generally Accepted Accounting Principles or the deduction of taxes that a shareholder would pay on net investment income and realized capital gain distributions, including reinvested distributions, or redemptions of shares. The total return figures set forth above include all waivers of fees. Without such fee waivers, the total returns would have been lower.
Victory Trivalent International Small-Cap Fund — Growth of $10,000
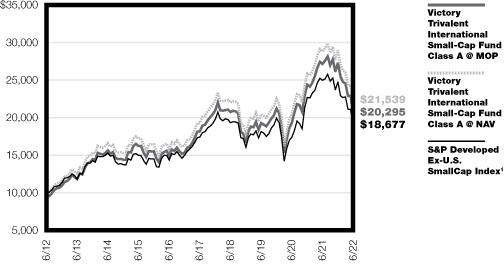
1The S&P Developed Ex-U.S. SmallCap Index consists of the stocks representing the lowest 15% of float-adjusted market capitalization in each country, other than the United States, represented in the S&P Developed Broad Market Index (BMI). The S&P Developed BMI includes all listed shares of companies from 25 developed countries with float-adjusted market capitalizations of at least US$100 million and annual trading value of at least US$50 million. This index does not include the effect of sales charges, commissions, expenses, or taxes, is not representative of the Fund, and it is not possible to invest directly in an index.
The graph reflects investment of growth of a hypothetical $10,000 investment in the Fund.
The graph and table do not reflect the deduction of taxes that a shareholder would pay on Fund distributions or the redemption of shares.
Past performance is not indicative of future results.
29
Victory INCORE Total Return Bond Fund
Managers' Commentary
(Unaudited)
What were the market conditions during the reporting period?
Rising and persistent inflation, driven by supply chain disruptions, labor scarcity, inefficient regulatory policy, and war in Ukraine continued to push financial markets further into negative return territory as the U.S. Federal Reserve (the "Fed") belatedly pivoted to fighting inflation in the second quarter. U.S. interest rates increased by 60 — 80 basis points (a basis point is 1/100th of a percentage point) across the yield curve, while corporate bond spreads moved wider by 40 basis points and high yield bonds moved wider by 240 basis points on fears of a Fed-induced recession. The U.S. Dollar Index strengthened by nearly 7% during the second quarter.
For the one-year period, U.S. interest rates increased by 270 basis points in the short end of the yield curve and 100 — 150 basis points in the long end. Corporate bond spreads moved wider by 75 basis points and high yield bonds moved wider by 300 basis points. Investment-grade convertible bonds returned -9.74%, while the U.S. Dollar Index strengthened nearly 14% over the past year.
How did Victory INCORE Total Return Bond Fund (the "Fund") perform during the reporting period?
The Fund returned -10.48% (Class A at net asset value) for the fiscal year ended June 30, 2022, underperforming its benchmark, the Bloomberg US Aggregate Bond Index, which returned -10.29% for the period.
What strategies did you employ during the reporting period?
The strategy's shorter relative duration position, as well as long U.S. dollar versus other developed market currencies contributed positively to relative performance, while an overweight to convertible bonds, high yield bonds, and investment-grade corporate bonds detracted from relative performance.
In addition, the Fund's small allocation to derivatives during the period did not have a material impact on performance.
30
Victory INCORE Total Return Bond Fund
Investment Overview
(Unaudited)
Average Annual Total Return
Year Ended June 30, 2022
| | | Class A | | Class C | | Class R6 | | Class Y | | | |
INCEPTION DATE | | 12/9/92 | | 3/25/96 | | 3/3/15 | | 12/1/91 | | | |
| | | Net Asset
Value | | Maximum
Offering
Price | | Net Asset
Value | | Contingent
Deferred
Charges | | Net Asset
Value | | Net Asset
Value | | Bloomberg
US Aggregate
Bond Index1 | |
One Year | | | –10.48 | % | | | –12.52 | % | | | –11.23 | % | | | –12.10 | % | | | –10.30 | % | | | –10.32 | % | | | –10.29 | % | |
Five Year | | | 0.60 | % | | | 0.15 | % | | | –0.13 | % | | | –0.13 | % | | | 0.89 | % | | | 0.87 | % | | | 0.88 | % | |
Ten Year | | | 1.52 | % | | | 1.29 | % | | | 0.76 | % | | | 0.76 | % | | | NA | | | | 1.77 | % | | | 1.54 | % | |
Since Inception | | | NA | | | | NA | | | | NA | | | | NA | | | | 1.10 | % | | | NA | | | | NA | | |
The performance data quoted represents past performance and current returns may be lower or higher. The investment return and principal value will fluctuate so that an investor's shares, when redeemed, may be worth more or less than the original cost. To obtain performance information current to the most recent month's end, please visit www.vcm.com.
The maximum offering price ("MOP") figures reflect a maximum sales charge of 2.25% for Class A. Class C is not subject to an initial sales charge, but is subject to a deferred sales charge of 1.00% on shares redeemed within one year of purchase. Net Asset Value does not reflect sales charges.
Total return measures the price change in a share assuming the reinvestment of all net investment income and realized capital gain distributions, if any. The total returns quoted do not reflect adjustments made to the enclosed financial statements in accordance with U.S. Generally Accepted Accounting Principles or the deduction of taxes that a shareholder would pay on net investment income and realized capital gain distributions, including reinvested distributions, or redemptions of shares. The total return figures set forth above include all waivers of fees. Without such fee waivers, the total returns would have been lower.
Victory INCORE Total Return Bond Fund — Growth of $10,000
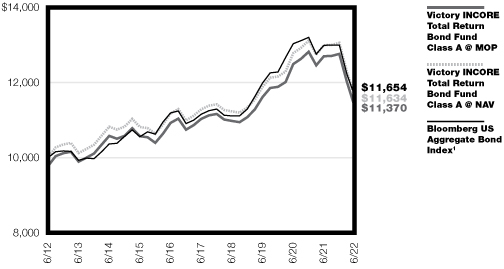
1The Bloomberg US Aggregate Bond Index covers the U.S. investment-grade-rated bond market, including government and credit securities, agency mortgage pass-through securities, asset-backed securities, and commercial mortgage-backed securities that have remaining maturities of more than one year. This index does not include the effect of sales charges, commissions, expenses, or taxes, is not representative of the Fund, and it is not possible to invest directly in an index. As of August 24, 2021, Bloomberg rebranded the Bloomberg Barclays fixed income indices as "Bloomberg Indices."
The graph reflects investment of growth of a hypothetical $10,000 investment in the Fund.
The graph and table do not reflect the deduction of taxes that a shareholder would pay on Fund distributions or the redemption of shares.
Past performance is not indicative of future results.
31
Victory Portfolios
Victory Integrity Discovery Fund | | June 30, 2022 | |
(Unaudited)
Investment Objective and Portfolio Holdings:
The Fund seeks to provide capital appreciation.
Top 10 Holdings*:
June 30, 2022
(% of Net Assets)
AngioDynamics, Inc. | | | 1.3 | % | |
First Mid Bancshares, Inc. | | | 1.1 | % | |
Univest Financial Corp. | | | 1.1 | % | |
Origin Bancorp, Inc. | | | 1.1 | % | |
Digi International, Inc. | | | 1.1 | % | |
Harmonic, Inc. | | | 1.1 | % | |
First Foundation, Inc. | | | 1.1 | % | |
EZCORP, Inc., Class A | | | 1.1 | % | |
Premier Financial Corp. | | | 1.1 | % | |
Kimball Electronics, Inc. | | | 1.1 | % | |
Sector Allocation*:
June 30, 2022
(% of Net Assets)
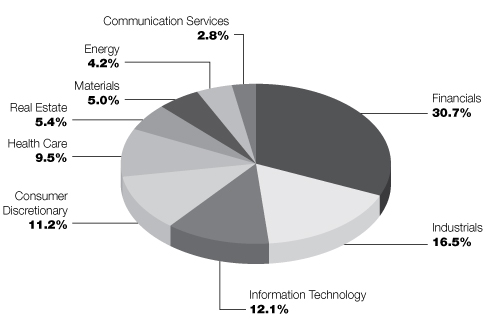
* Does not include futures contracts, money market instruments, and short-term investments purchased with cash collateral from securities loaned.
Percentages are of the net assets of the Fund and may not equal 100%.
Refer to the Schedule of Portfolio Investments for a complete list of securities.
32
Victory Portfolios
Victory Integrity Mid-Cap Value Fund | | June 30, 2022 | |
(Unaudited)
Investment Objective and Portfolio Holdings:
The Fund seeks to provide capital appreciation.
Top 10 Holdings*:
June 30, 2022
(% of Net Assets)
Realty Income Corp. | | | 1.5 | % | |
Arthur J. Gallagher & Co. | | | 1.4 | % | |
Welltower, Inc. | | | 1.4 | % | |
Motorola Solutions, Inc. | | | 1.4 | % | |
Fifth Third Bancorp | | | 1.3 | % | |
Republic Services, Inc. | | | 1.3 | % | |
M&T Bank Corp. | | | 1.3 | % | |
Essex Property Trust, Inc. | | | 1.2 | % | |
Vistra Corp. | | | 1.2 | % | |
Xcel Energy, Inc. | | | 1.1 | % | |
Sector Allocation*:
June 30, 2022
(% of Net Assets)
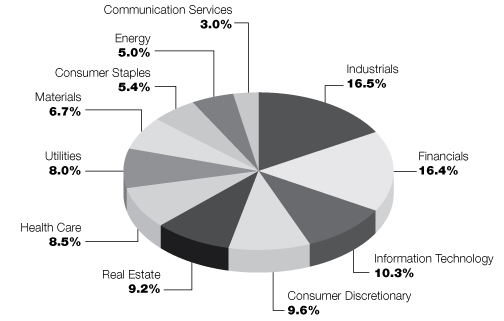
* Does not include futures contracts, money market instruments, and short-term investments purchased with cash collateral from securities loaned.
Percentages are of the net assets of the Fund and may not equal 100%.
Refer to the Schedule of Portfolio Investments for a complete list of securities.
33
Victory Portfolios
Victory Integrity Small-Cap Value Fund | | June 30, 2022 | |
(Unaudited)
Investment Objective and Portfolio Holdings:
The Fund seeks to provide long-term capital growth.
Top 10 Holdings*:
June 30, 2022
(% of Net Assets)
SouthState Corp. | | | 1.4 | % | |
Black Hills Corp. | | | 1.3 | % | |
United Community Banks, Inc. | | | 1.2 | % | |
ONE Gas, Inc. | | | 1.2 | % | |
FTI Consulting, Inc. | | | 1.1 | % | |
ABM Industries, Inc. | | | 1.1 | % | |
Belden, Inc. | | | 1.0 | % | |
Ameris Bancorp | | | 1.0 | % | |
Visteon Corp. | | | 1.0 | % | |
Synovus Financial Corp. | | | 1.0 | % | |
Sector Allocation*:
June 30, 2022
(% of Net Assets)
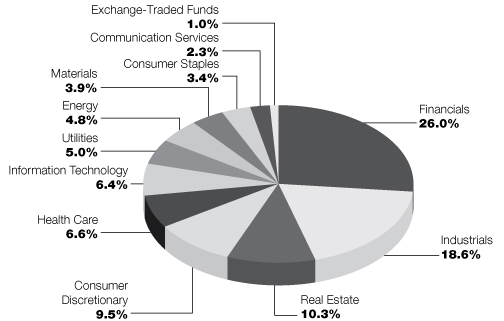
* Does not include futures contracts, money market instruments, and short-term investments purchased with cash collateral from securities loaned.
Percentages are of the net assets of the Fund and may not equal 100%.
Refer to the Schedule of Portfolio Investments for a complete list of securities.
34
Victory Portfolios
Victory Integrity Small/Mid-Cap Value Fund | | June 30, 2022 | |
(Unaudited)
Investment Objective and Portfolio Holdings:
The Fund seeks to provide capital appreciation.
Top 10 Holdings*:
June 30, 2022
(% of Net Assets)
FTI Consulting, Inc. | | | 1.2 | % | |
SouthState Corp. | | | 1.2 | % | |
Perrigo Co. PLC | | | 1.2 | % | |
Gaming and Leisure Properties, Inc. | | | 1.1 | % | |
Apartment Income REIT Corp. | | | 1.1 | % | |
Synovus Financial Corp. | | | 1.1 | % | |
Prosperity Bancshares, Inc. | | | 1.1 | % | |
Curtiss-Wright Corp. | | | 1.1 | % | |
Wintrust Financial Corp. | | | 1.1 | % | |
Organon & Co. | | | 1.0 | % | |
Sector Allocation*:
June 30, 2022
(% of Net Assets)
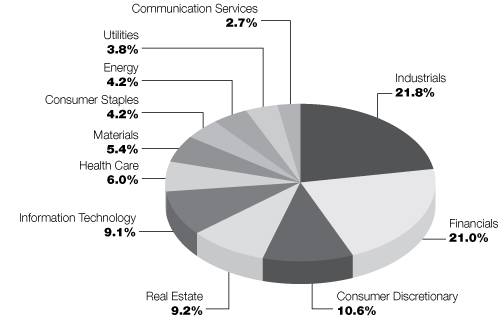
* Does not include futures contracts, money market instruments, and short-term investments purchased with cash collateral from securities loaned.
Percentages are of the net assets of the Fund and may not equal 100%.
Refer to the Schedule of Portfolio Investments for a complete list of securities.
35
Victory Portfolios
Victory Munder Multi-Cap Fund | | June 30, 2022 | |
(Unaudited)
Investment Objective and Portfolio Holdings:
The Fund seeks to provide long-term capital appreciation.
Top 10 Holdings*:
June 30, 2022
(% of Net Assets)
Apple, Inc. | | | 6.1 | % | |
Microsoft Corp. | | | 5.1 | % | |
Alphabet, Inc., Class A | | | 4.6 | % | |
UnitedHealth Group, Inc. | | | 2.2 | % | |
Chevron Corp. | | | 2.1 | % | |
iShares Russell 3000 ETF | | | 2.0 | % | |
NVIDIA Corp. | | | 2.0 | % | |
Broadcom, Inc. | | | 1.9 | % | |
McKesson Corp. | | | 1.8 | % | |
Chubb Ltd. | | | 1.7 | % | |
Sector Allocation*:
June 30, 2022
(% of Net Assets)

* Does not include futures contracts, money market instruments, and short-term investments purchased with cash collateral from securities loaned.
Percentages are of the net assets of the Fund and may not equal 100%.
Refer to the Schedule of Portfolio Investments for a complete list of securities.
36
Victory Portfolios
Victory S&P 500 Index Fund | | June 30, 2022 | |
(Unaudited)
Investment Objective and Portfolio Holdings:
The Fund seeks to provide performance and income that is comparable to the S&P 500® Index.
Top 10 Holdings*:
June 30, 2022
(% of Net Assets)
Apple, Inc. | | | 6.5 | % | |
Microsoft Corp. | | | 6.0 | % | |
Amazon.com, Inc. | | | 2.9 | % | |
Alphabet, Inc., Class A | | | 2.0 | % | |
Alphabet, Inc., Class C | | | 1.9 | % | |
Tesla, Inc. | | | 1.8 | % | |
Berkshire Hathaway, Inc., Class B | | | 1.5 | % | |
UnitedHealth Group, Inc. | | | 1.5 | % | |
Johnson & Johnson | | | 1.5 | % | |
NVIDIA Corp. | | | 1.2 | % | |
Sector Allocation*:
June 30, 2022
(% of Net Assets)
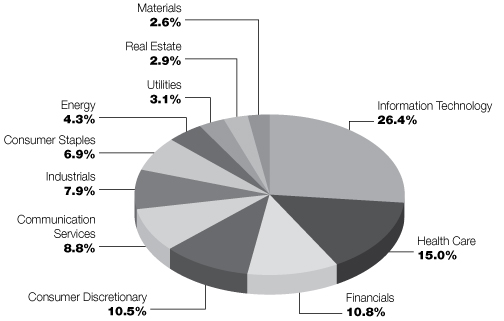
* Does not include futures contracts, money market instruments, and short-term investments purchased with cash collateral from securities loaned.
Percentages are of the net assets of the Fund and may not equal 100%.
Refer to the Schedule of Portfolio Investments for a complete list of securities.
37
Victory Portfolios
Victory Munder Mid-Cap Core Growth Fund | | June 30, 2022 | |
(Unaudited)
Investment Objective and Portfolio Holdings:
The Fund seeks to provide long-term capital appreciation.
Top 10 Holdings*:
June 30, 2022
(% of Net Assets)
Cheniere Energy, Inc. | | | 2.3 | % | |
SPDR S&P MidCap 400 ETF | | | 2.2 | % | |
W.R. Berkley Corp. | | | 2.1 | % | |
Brown & Brown, Inc. | | | 2.1 | % | |
Atmos Energy Corp. | | | 2.1 | % | |
Synopsys, Inc. | | | 2.1 | % | |
AutoZone, Inc. | | | 2.0 | % | |
Sempra Energy | | | 1.9 | % | |
Avery Dennison Corp. | | | 1.9 | % | |
CDW Corp. | | | 1.8 | % | |
Sector Allocation*:
June 30, 2022
(% of Net Assets)
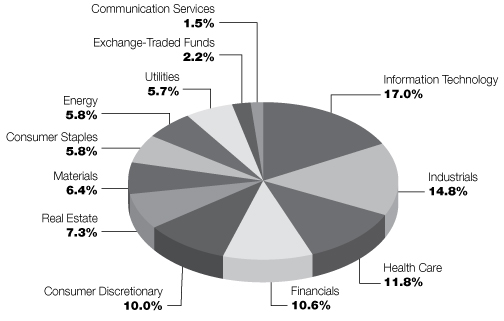
* Does not include futures contracts, money market instruments, and short-term investments purchased with cash collateral from securities loaned.
Percentages are of the net assets of the Fund and may not equal 100%.
Refer to the Schedule of Portfolio Investments for a complete list of securities.
38
Victory Portfolios
Victory Munder Small Cap Growth Fund | | June 30, 2022 | |
(Unaudited)
Investment Objective and Portfolio Holdings:
The Fund seeks to provide long-term capital appreciation.
Top 10 Holdings*:
June 30, 2022
(% of Net Assets)
Magnolia Oil & Gas Corp., Class A | | | 2.3 | % | |
Napco Security Technologies, Inc. | | | 2.1 | % | |
Talos Energy, Inc. | | | 2.0 | % | |
Coastal Financial Corp. | | | 1.9 | % | |
WNS Holdings Ltd. | | | 1.9 | % | |
Elastic NV | | | 1.8 | % | |
Performance Food Group Co. | | | 1.8 | % | |
Chart Industries, Inc. | | | 1.7 | % | |
Sovos Brands, Inc. | | | 1.7 | % | |
Silvercrest Asset Management Group, Inc., Class A | | | 1.7 | % | |
Sector Allocation*:
June 30, 2022
(% of Net Assets)
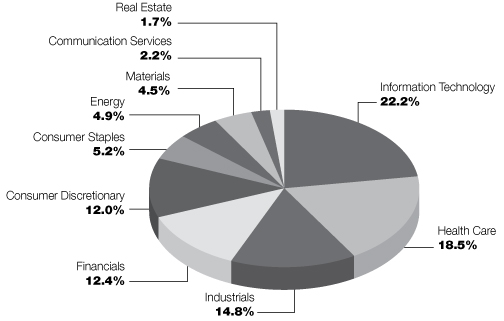
* Does not include futures contracts, money market instruments, and short-term investments purchased with cash collateral from securities loaned.
Percentages are of the net assets of the Fund and may not equal 100%.
Refer to the Schedule of Portfolio Investments for a complete list of securities.
39
Victory Portfolios
Victory Trivalent International Fund-Core Equity | | June 30, 2022 | |
(Unaudited)
Investment Objective and Portfolio Holdings:
The Fund seeks to provide long-term growth of capital.
Top 10 Holdings*:
June 30, 2022
(% of Net Assets)
Taiwan Semiconductor Manufacturing Co. Ltd. | | | 1.6 | % | |
Roche Holding AG | | | 1.4 | % | |
Nestle SA, Registered Shares | | | 1.4 | % | |
LVMH Moet Hennessy Louis Vuitton SE | | | 1.4 | % | |
Novo Nordisk A/S, Class B | | | 1.4 | % | |
Tencent Holdings Ltd. | | | 1.3 | % | |
iShares Core MSCI EAFE ETF | | | 1.2 | % | |
Novartis AG, Registered Shares | | | 1.1 | % | |
Sony Group Corp. | | | 1.1 | % | |
AstraZeneca PLC | | | 1.1 | % | |
Sector Allocation*:
June 30, 2022
(% of Net Assets)
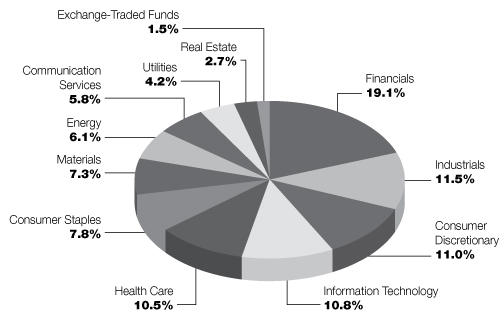
* Does not include futures contracts, money market instruments, and short-term investments purchased with cash collateral from securities loaned.
Percentages are of the net assets of the Fund and may not equal 100%.
Refer to the Schedule of Portfolio Investments for a complete list of securities.
40
Victory Portfolios
Victory Trivalent International Small-Cap Fund | | June 30, 2022 | |
(Unaudited)
Investment Objective and Portfolio Holdings:
The Fund seeks to provide long-term growth of capital.
Top 10 Holdings*:
June 30, 2022
(% of Net Assets)
Rheinmetall AG | | | 1.2 | % | |
ARC Resources Ltd. | | | 1.1 | % | |
Allkem, Ltd. | | | 0.9 | % | |
Internet Initiative Japan, Inc. | | | 0.9 | % | |
Eiffage SA | | | 0.9 | % | |
Shinko Electric Industries Co. Ltd. | | | 0.8 | % | |
BRP, Inc. | | | 0.8 | % | |
Bank of Ireland Group PLC | | | 0.8 | % | |
Bankinter SA | | | 0.8 | % | |
PSP Swiss Property AG, Registered Shares | | | 0.8 | % | |
Sector Allocation*:
June 30, 2022
(% of Net Assets)
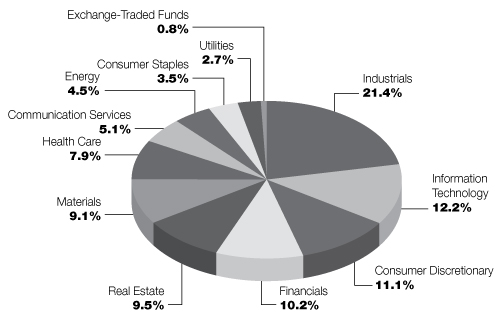
* Does not include futures contracts, money market instruments, and short-term investments purchased with cash collateral from securities loaned.
Percentages are of the net assets of the Fund and may not equal 100%.
Refer to the Schedule of Portfolio Investments for a complete list of securities.
41
Victory Portfolios
Victory INCORE Total Return Bond Fund | | June 30, 2022 | |
(Unaudited)
Investment Objective and Portfolio Holdings:
The Fund seeks to provide a high level of current income. Its secondary objective is capital appreciation.
Asset Allocation*:
June 30, 2022
(% of Net Assets)
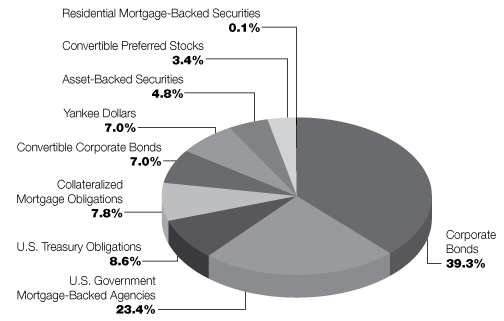
* Does not include futures contracts, money market instruments, and short-term investments purchased with cash collateral from securities loaned.
Percentages are of the net assets of the Fund and may not equal 100%.
Refer to the Schedule of Portfolio Investments for a complete list of securities.
42
Victory Portfolios
Victory Integrity Discovery Fund | | Schedule of Portfolio Investments
June 30, 2022 | |
(Amounts in Thousands, Except for Shares)
Security Description | | Shares | | Value | |
Common Stocks (97.4%) | |
Banks (21.4%): | |
Business First Bancshares, Inc. | | | 24,800 | | | $ | 528 | | |
Central Pacific Financial Corp. | | | 16,900 | | | | 363 | | |
Civista Bancshares, Inc. | | | 21,700 | | | | 461 | | |
ConnectOne Bancorp, Inc. | | | 27,300 | | | | 667 | | |
Dime Community Bancshares, Inc. | | | 18,400 | | | | 546 | | |
Financial Institutions, Inc. | | | 19,500 | | | | 507 | | |
First Foundation, Inc. | | | 33,600 | | | | 688 | | |
First Internet Bancorp | | | 16,200 | | | | 596 | | |
First Mid Bancshares, Inc. | | | 19,900 | | | | 710 | | |
German American Bancorp, Inc. | | | 18,000 | | | | 615 | | |
HarborOne Bancorp, Inc. | | | 43,000 | | | | 593 | | |
Heritage Commerce Corp. | | | 62,300 | | | | 666 | | |
Heritage Financial Corp. | | | 7,900 | | | | 199 | | |
Hometrust Bancshares, Inc. | | | 19,300 | | | | 483 | | |
Independent Bank Corp. | | | 28,850 | | | | 556 | | |
Mercantile Bank Corp. | | | 17,700 | | | | 566 | | |
Origin Bancorp, Inc. | | | 18,035 | | | | 700 | | |
Peoples Bancorp, Inc. | | | 23,700 | | | | 630 | | |
Primis Financial Corp. | | | 41,500 | | | | 566 | | |
QCR Holdings, Inc. | | | 12,500 | | | | 675 | | |
SmartFinancial, Inc. | | | 19,000 | | | | 459 | | |
The First Bancshares, Inc. | | | 21,000 | | | | 601 | | |
Third Coast Bancshares, Inc. (a) | | | 10,200 | | | | 223 | | |
Univest Financial Corp. | | | 27,581 | | | | 702 | | |
Washington Trust Bancorp, Inc. | | | 12,205 | | | | 590 | | |
| | | | 13,890 | | |
Capital Markets (1.9%): | |
Cowen, Inc., Class A | | | 28,500 | | | | 675 | | |
Diamond Hill Investment Group, Inc. | | | 3,300 | | | | 573 | | |
| | | | 1,248 | | |
Communication Services (2.8%): | |
Clear Channel Outdoor Holdings, Inc. (a) | | | 338,813 | | | | 362 | | |
Emerald Holding, Inc. (a) (b) | | | 94,000 | | | | 383 | | |
The EW Scripps Co., Class A (a) | | | 32,900 | | | | 410 | | |
The Marcus Corp. (a) (b) | | | 45,620 | | | | 674 | | |
| | | | 1,829 | | |
Consumer Discretionary (11.2%): | |
Chico's FAS, Inc. (a) | | | 109,000 | | | | 542 | | |
Chuy's Holdings, Inc. (a) | | | 20,600 | | | | 410 | | |
Designer Brands, Inc., Class A | | | 28,000 | | | | 366 | | |
Express, Inc. (a) | | | 147,000 | | | | 288 | | |
Funko, Inc., Class A (a) | | | 27,200 | | | | 607 | | |
Genesco, Inc. (a) (b) | | | 11,665 | | | | 582 | | |
Inspired Entertainment, Inc. (a) | | | 36,550 | | | | 315 | | |
Lindblad Expeditions Holdings, Inc. (a) (b) | | | 39,890 | | | | 323 | | |
Malibu Boats, Inc., Class A (a) | | | 6,500 | | | | 343 | | |
See notes to financial statements.
43
Victory Portfolios
Victory Integrity Discovery Fund | | Schedule of Portfolio Investments — continued
June 30, 2022 | |
(Amounts in Thousands, Except for Shares)
Security Description | | Shares | | Value | |
Modine Manufacturing Co. (a) | | | 57,000 | | | $ | 600 | | |
Motorcar Parts of America, Inc. (a) | | | 36,400 | | | | 478 | | |
OneWater Marine, Inc. (a) | | | 9,420 | | | | 311 | | |
Potbelly Corp. (a) | | | 59,300 | | | | 335 | | |
Red Robin Gourmet Burgers, Inc. (a) (b) | | | 39,000 | | | | 313 | | |
Ruth's Hospitality Group, Inc. | | | 29,900 | | | | 486 | | |
The Children's Place, Inc. (a) | | | 7,650 | | | | 298 | | |
Universal Electronics, Inc. (a) | | | 12,300 | | | | 315 | | |
Zumiez, Inc. (a) | | | 14,850 | | | | 386 | | |
| | | | 7,298 | | |
Consumer Finance (1.1%): | |
EZCORP, Inc., Class A (a) | | | 91,200 | | | | 685 | | |
Energy (4.2%): | |
Berry Corp. | | | 68,900 | | | | 525 | | |
International Seaways, Inc. | | | 23,556 | | | | 499 | | |
ProPetro Holding Corp. (a) | | | 34,400 | | | | 344 | | |
Solaris Oilfield Infrastructure, Inc., Class A | | | 44,500 | | | | 484 | | |
Talos Energy, Inc. (a) | | | 33,515 | | | | 519 | | |
Tidewater, Inc. (a) | | | 16,200 | | | | 342 | | |
| | | | 2,713 | | |
Health Care (9.5%): | |
AngioDynamics, Inc. (a) | | | 43,608 | | | | 844 | | |
Brookdale Senior Living, Inc. (a) | | | 97,400 | | | | 442 | | |
Collegium Pharmaceutical, Inc. (a) | | | 33,000 | | | | 585 | | |
Community Health Systems, Inc. (a) | | | 59,600 | | | | 223 | | |
Cross Country Healthcare, Inc. (a) | | | 20,200 | | | | 421 | | |
Hanger, Inc. (a) | | | 37,400 | | | | 535 | | |
HealthStream, Inc. (a) | | | 27,900 | | | | 606 | | |
Natus Medical, Inc. (a) | | | 17,000 | | | | 557 | | |
Orthofix Medical, Inc. (a) (b) | | | 26,621 | | | | 627 | | |
RadNet, Inc. (a) | | | 33,000 | | | | 570 | | |
Vanda Pharmaceuticals, Inc. (a) | | | 37,300 | | | | 407 | | |
Zimvie, Inc. (a) | | | 22,250 | | | | 356 | | |
| | | | 6,173 | | |
Industrials (16.5%): | |
CIRCOR International, Inc. (a) (b) | | | 24,960 | | | | 409 | | |
Columbus McKinnon Corp. | | | 19,500 | | | | 553 | | |
Covenant Logistics Group, Inc., Class A | | | 23,700 | | | | 595 | | |
CRA International, Inc. | | | 5,400 | | | | 482 | | |
Ducommun, Inc. (a) | | | 13,630 | | | | 587 | | |
DXP Enterprises, Inc. (a) | | | 19,750 | | | | 605 | | |
Eagle Bulk Shipping, Inc. (b) | | | 8,525 | | | | 442 | | |
Great Lakes Dredge & Dock Corp. (a) | | | 51,000 | | | | 669 | | |
Hawaiian Holdings, Inc. (a) | | | 22,100 | | | | 316 | | |
Heritage-Crystal Clean, Inc. (a) | | | 21,350 | | | | 576 | | |
Interface, Inc. | | | 44,800 | | | | 562 | | |
Kelly Services, Inc., Class A | | | 33,000 | | | | 654 | | |
Kimball International, Inc., Class B | | | 61,345 | | | | 470 | | |
See notes to financial statements.
44
Victory Portfolios
Victory Integrity Discovery Fund | | Schedule of Portfolio Investments — continued
June 30, 2022 | |
(Amounts in Thousands, Except for Shares)
Security Description | | Shares | | Value | |
Matrix Service Co. (a) | | | 38,000 | | | $ | 192 | | |
NN, Inc. (a) (b) | | | 93,000 | | | | 235 | | |
Park Aerospace Corp. | | | 38,800 | | | | 495 | | |
Park-Ohio Holdings Corp. | | | 18,800 | | | | 298 | | |
SP Plus Corp. (a) | | | 18,750 | | | | 576 | | |
Titan Machinery, Inc. (a) | | | 26,600 | | | | 596 | | |
Triumph Group, Inc. (a) | | | 29,175 | | | | 388 | | |
VSE Corp. | | | 12,950 | | | | 487 | | |
Willdan Group, Inc. (a) | | | 19,859 | | | | 548 | | |
| | | | 10,735 | | |
Information Technology (12.1%): | |
American Software, Inc., Class A | | | 25,800 | | | | 417 | | |
Benchmark Electronics, Inc. | | | 19,095 | | | | 431 | | |
Comtech Telecommunications Corp. | | | 30,500 | | | | 277 | | |
CTS Corp. | | | 9,900 | | | | 337 | | |
Digi International, Inc. (a) | | | 28,750 | | | | 696 | | |
EMCORE Corp. (a) | | | 73,000 | | | | 224 | | |
Extreme Networks, Inc. (a) | | | 45,300 | | | | 404 | | |
Harmonic, Inc. (a) | | | 79,565 | | | | 690 | | |
I3 Verticals, Inc., Class A (a) | | | 16,450 | | | | 412 | | |
Ichor Holdings Ltd. (a) | | | 18,400 | | | | 478 | | |
Impinj, Inc. (a) | | | 7,550 | | | | 443 | | |
Kimball Electronics, Inc. (a) | | | 34,000 | | | | 683 | | |
Lantronix, Inc. (a) (b) | | | 79,600 | | | | 428 | | |
PDF Solutions, Inc. (a) | | | 25,550 | | | | 550 | | |
ScanSource, Inc. (a) | | | 14,900 | | | | 464 | | |
Veeco Instruments, Inc. (a) | | | 21,550 | | | | 418 | | |
Vishay Precision Group, Inc. (a) | | | 16,730 | | | | 487 | | |
| | | | 7,839 | | |
Insurance (1.1%): | |
HCI Group, Inc. (b) | | | 7,500 | | | | 508 | | |
Heritage Insurance Holdings, Inc. | | | 69,000 | | | | 182 | | |
| | | | 690 | | |
Materials (5.0%): | |
AdvanSix, Inc. | | | 16,800 | | | | 562 | | |
Clearwater Paper Corp. (a) | | | 17,200 | | | | 579 | | |
Haynes International, Inc. | | | 15,950 | | | | 523 | | |
Koppers Holdings, Inc. | | | 22,545 | | | | 510 | | |
Schnitzer Steel Industries, Inc. | | | 15,450 | | | | 507 | | |
SunCoke Energy, Inc. | | | 84,000 | | | | 572 | | |
| | | | 3,253 | | |
Mortgage Real Estate Investment Trusts (1.8%): | |
Ares Commercial Real Estate Corp. | | | 28,500 | | | | 349 | | |
Dynex Capital, Inc. | | | 41,900 | | | | 667 | | |
Western Asset Mortgage Capital Corp. | | | 144,000 | | | | 174 | | |
| | | | 1,190 | | |
See notes to financial statements.
45
Victory Portfolios
Victory Integrity Discovery Fund | | Schedule of Portfolio Investments — continued
June 30, 2022 | |
(Amounts in Thousands, Except for Shares)
Security Description | | Shares | | Value | |
Real Estate (5.4%): | |
CatchMark Timber Trust, Inc., Class A | | | 30,000 | | | $ | 302 | | |
City Office REIT, Inc. | | | 48,000 | | | | 622 | | |
Global Medical REIT, Inc. | | | 46,800 | | | | 525 | | |
NETSTREIT Corp. (b) | | | 30,100 | | | | 568 | | |
NexPoint Residential Trust, Inc. | | | 5,650 | | | | 353 | | |
Plymouth Industrial REIT, Inc. | | | 27,900 | | | | 489 | | |
Urstadt Biddle Properties, Inc., Class A | | | 38,200 | | | | 619 | | |
| | | | 3,478 | | |
Thrifts & Mortgage Finance (3.4%): | |
Bridgewater Bancshares, Inc. (a) | | | 36,500 | | | | 589 | | |
HomeStreet, Inc. | | | 15,500 | | | | 537 | | |
Premier Financial Corp. | | | 27,000 | | | | 685 | | |
Southern Missouri Bancorp, Inc. | | | 9,050 | | | | 410 | | |
| | | | 2,221 | | |
Total Common Stocks (Cost $60,402) | | | 63,242 | | |
Collateral for Securities Loaned (4.0%)^ | |
BlackRock Liquidity Funds TempFund, Institutional Shares, 1.47% (c) | | | 81,399 | | | | 81 | | |
Goldman Sachs Financial Square Prime Obligations Fund, Institutional Shares,
1.42% (c) | | | 40,622 | | | | 41 | | |
HSBC U.S. Government Money Market Fund, I Shares, 1.46% (c) | | | 506,643 | | | | 507 | | |
JPMorgan Prime Money Market Fund, Capital Shares, 1.50% (c) | | | 323,910 | | | | 324 | | |
Morgan Stanley Institutional Liquidity Government Portfolio, Institutional Shares,
1.39% (c) | | | 216,011 | | | | 216 | | |
Morgan Stanley Institutional Liquidity Prime Portfolio, Institutional Shares,
1.53% (c) | | | 1,456,363 | | | | 1,456 | | |
Total Collateral for Securities Loaned (Cost $2,625) | | | 2,625 | | |
Total Investments (Cost $63,027) — 101.4% | | | 65,867 | | |
Liabilities in excess of other assets — (1.4)% | | | (933 | ) | |
NET ASSETS — 100.00% | | $ | 64,934 | | |
^ Purchased with cash collateral from securities on loan.
(a) Non-income producing security.
(b) All or a portion of this security is on loan.
(c) Rate disclosed is the daily yield on June 30, 2022.
REIT — Real Estate Investment Trust
See notes to financial statements.
46
Victory Portfolios
Victory Integrity Mid-Cap Value Fund | | Schedule of Portfolio Investments
June 30, 2022 | |
(Amounts in Thousands, Except for Shares)
Security Description | | Shares | | Value | |
Common Stocks (98.6%) | |
Communication Services (3.0%): | |
Liberty Media Corp.-Liberty Formula One, Class C (a) | | | 31,980 | | | $ | 2,030 | | |
Lions Gate Entertainment Corp., Class B (a) | | | 160,600 | | | | 1,418 | | |
Nexstar Media Group, Inc., Class A | | | 17,538 | | | | 2,856 | | |
Paramount Global, Class B | | | 76,000 | | | | 1,876 | | |
| | | | 8,180 | | |
Consumer Discretionary (9.6%): | |
Advance Auto Parts, Inc. | | | 11,180 | | | | 1,935 | | |
Aptiv PLC (a) | | | 20,300 | | | | 1,808 | | |
Aramark | | | 65,197 | | | | 1,997 | | |
Brunswick Corp. | | | 24,200 | | | | 1,582 | | |
Caesars Entertainment, Inc. (a) | | | 35,282 | | | | 1,351 | | |
Dollar Tree, Inc. (a) | | | 15,000 | | | | 2,338 | | |
Hilton Worldwide Holdings, Inc. | | | 14,300 | | | | 1,594 | | |
Newell Brands, Inc. | | | 93,302 | | | | 1,776 | | |
Norwegian Cruise Line Holdings Ltd. (a) (b) | | | 106,796 | | | | 1,188 | | |
Ralph Lauren Corp. | | | 22,700 | | | | 2,035 | | |
Ross Stores, Inc. | | | 18,648 | | | | 1,310 | | |
Tapestry, Inc. | | | 67,924 | | | | 2,073 | | |
Travel + Leisure Co. | | | 44,000 | | | | 1,708 | | |
Victoria's Secret & Co. (a) | | | 42,967 | | | | 1,202 | | |
Yum! Brands, Inc. | | | 23,700 | | | | 2,690 | | |
| | | | 26,587 | | |
Consumer Staples (5.4%): | |
Archer-Daniels-Midland Co. | | | 34,000 | | | | 2,638 | | |
BJ's Wholesale Club Holdings, Inc. (a) | | | 38,459 | | | | 2,397 | | |
Coty, Inc., Class A (a) | | | 278,707 | | | | 2,232 | | |
Molson Coors Beverage Co., Class B | | | 50,500 | | | | 2,753 | | |
Performance Food Group Co. (a) | | | 42,800 | | | | 1,968 | | |
Tyson Foods, Inc., Class A | | | 34,127 | | | | 2,937 | | |
| | | | 14,925 | | |
Energy (5.0%): | |
APA Corp. | | | 57,108 | | | | 1,993 | | |
Devon Energy Corp. | | | 50,368 | | | | 2,776 | | |
Diamondback Energy, Inc. | | | 17,342 | | | | 2,101 | | |
Halliburton Co. | | | 82,778 | | | | 2,596 | | |
Hess Corp. | | | 19,229 | | | | 2,037 | | |
Phillips 66 | | | 28,928 | | | | 2,372 | | |
| | | | 13,875 | | |
Financials (16.4%): | |
American Financial Group, Inc. | | | 21,458 | | | | 2,979 | | |
Arthur J. Gallagher & Co. | | | 24,000 | | | | 3,913 | | |
Artisan Partners Asset Management, Inc., Class A | | | 59,200 | | | | 2,106 | | |
Assurant, Inc. | | | 14,071 | | | | 2,432 | | |
Cincinnati Financial Corp. | | | 20,900 | | | | 2,487 | | |
Fifth Third Bancorp | | | 106,258 | | | | 3,570 | | |
See notes to financial statements.
47
Victory Portfolios
Victory Integrity Mid-Cap Value Fund | | Schedule of Portfolio Investments — continued
June 30, 2022 | |
(Amounts in Thousands, Except for Shares)
Security Description | | Shares | | Value | |
Huntington Bancshares, Inc. | | | 240,825 | | | $ | 2,897 | | |
Invesco Ltd. | | | 70,000 | | | | 1,129 | | |
LPL Financial Holdings, Inc. | | | 13,900 | | | | 2,565 | | |
M&T Bank Corp. | | | 21,953 | | | | 3,499 | | |
Northern Trust Corp. | | | 29,260 | | | | 2,823 | | |
Regions Financial Corp. | | | 130,028 | | | | 2,438 | | |
Reinsurance Group of America, Inc. | | | 23,439 | | | | 2,749 | | |
State Street Corp. | | | 38,250 | | | | 2,358 | | |
The Hartford Financial Services Group Inc. | | | 38,900 | | | | 2,545 | | |
Unum Group | | | 66,200 | | | | 2,252 | | |
Western Alliance Bancorp | | | 35,241 | | | | 2,488 | | |
| | | | 45,230 | | |
Health Care (8.5%): | |
Centene Corp. (a) | | | 25,584 | | | | 2,165 | | |
Elanco Animal Health, Inc. (a) | | | 105,268 | | | | 2,066 | | |
Encompass Health Corp. | | | 41,183 | | | | 2,308 | | |
Jazz Pharmaceuticals PLC (a) | | | 16,111 | | | | 2,514 | | |
Laboratory Corp. of America Holdings | | | 8,870 | | | | 2,079 | | |
McKesson Corp. | | | 6,509 | | | | 2,123 | | |
Organon & Co. | | | 66,500 | | | | 2,244 | | |
Perrigo Co. PLC | | | 55,188 | | | | 2,239 | | |
STERIS PLC | | | 10,611 | | | | 2,187 | | |
Tenet Healthcare Corp. (a) | | | 31,032 | | | | 1,631 | | |
Zimmer Biomet Holdings, Inc. | | | 18,300 | | | | 1,923 | | |
| | | | 23,479 | | |
Industrials (16.5%): | |
AGCO Corp. | | | 17,500 | | | | 1,727 | | |
Booz Allen Hamilton Holding Corp. | | | 27,900 | | | | 2,521 | | |
BWX Technologies, Inc. | | | 49,312 | | | | 2,717 | | |
Carlisle Cos., Inc. | | | 9,500 | | | | 2,267 | | |
Crane Holdings Co. | | | 25,500 | | | | 2,233 | | |
Cummins, Inc. | | | 9,908 | | | | 1,917 | | |
Curtiss-Wright Corp. | | | 17,348 | | | | 2,291 | | |
Delta Air Lines, Inc. (a) | | | 80,550 | | | | 2,334 | | |
Dover Corp. | | | 20,302 | | | | 2,463 | | |
Hertz Global Holdings, Inc. (a) (b) | | | 108,982 | | | | 1,726 | | |
Howmet Aerospace, Inc. | | | 81,953 | | | | 2,577 | | |
ITT, Inc. | | | 32,000 | | | | 2,152 | | |
Nordson Corp. | | | 6,841 | | | | 1,385 | | |
Old Dominion Freight Line, Inc. | | | 10,317 | | | | 2,644 | | |
Oshkosh Corp. | | | 22,449 | | | | 1,844 | | |
Parker-Hannifin Corp. | | | 12,133 | | | | 2,985 | | |
Regal Rexnord Corp. | | | 16,050 | | | | 1,822 | | |
Republic Services, Inc. | | | 26,988 | | | | 3,532 | | |
WESCO International, Inc. (a) | | | 17,711 | | | | 1,897 | | |
Westinghouse Air Brake Technologies Corp. | | | 28,750 | | | | 2,360 | | |
| | | | 45,394 | | |
See notes to financial statements.
48
Victory Portfolios
Victory Integrity Mid-Cap Value Fund | | Schedule of Portfolio Investments — continued
June 30, 2022 | |
(Amounts in Thousands, Except for Shares)
Security Description | | Shares | | Value | |
Information Technology (10.3%): | |
Ciena Corp. (a) | | | 45,900 | | | $ | 2,098 | | |
DXC Technology Co. (a) | | | 82,861 | | | | 2,511 | | |
Flex Ltd. (a) | | | 140,900 | | | | 2,039 | | |
Global Payments, Inc. | | | 25,285 | | | | 2,797 | | |
Jabil, Inc. | | | 42,586 | | | | 2,181 | | |
Juniper Networks, Inc. | | | 78,167 | | | | 2,228 | | |
MKS Instruments, Inc. | | | 21,190 | | | | 2,175 | | |
Motorola Solutions, Inc. | | | 17,951 | | | | 3,762 | | |
ON Semiconductor Corp. (a) | | | 38,200 | | | | 1,922 | | |
Teledyne Technologies, Inc. (a) | | | 7,068 | | | | 2,651 | | |
Verint Systems, Inc. (a) | | | 34,000 | | | | 1,440 | | |
Western Digital Corp. (a) | | | 55,500 | | | | 2,488 | | |
| | | | 28,292 | | |
Materials (6.7%): | |
Ashland Global Holdings, Inc. | | | 19,889 | | | | 2,050 | | |
Avery Dennison Corp. | | | 12,960 | | | | 2,098 | | |
Berry Global Group, Inc. (a) | | | 38,418 | | | | 2,099 | | |
Corteva, Inc. | | | 40,602 | | | | 2,198 | | |
DuPont de Nemours, Inc. | | | 37,359 | | | | 2,076 | | |
Olin Corp. | | | 43,500 | | | | 2,013 | | |
Packaging Corp. of America | | | 15,227 | | | | 2,094 | | |
Reliance Steel & Aluminum Co. | | | 10,457 | | | | 1,776 | | |
Westlake Corp. | | | 21,806 | | | | 2,138 | | |
| | | | 18,542 | | |
Real Estate (9.2%): | |
Apartment Income REIT Corp. | | | 70,500 | | | | 2,933 | | |
Duke Realty Corp. | | | 39,000 | | | | 2,143 | | |
Essex Property Trust, Inc. | | | 12,475 | | | | 3,262 | | |
Federal Realty Investment Trust | | | 20,800 | | | | 1,991 | | |
Host Hotels & Resorts, Inc. | | | 159,903 | | | | 2,507 | | |
Realty Income Corp. | | | 62,900 | | | | 4,294 | | |
VICI Properties, Inc. | | | 103,783 | | | | 3,092 | | |
Welltower, Inc. | | | 46,000 | | | | 3,788 | | |
Weyerhaeuser Co. | | | 44,000 | | | | 1,457 | | |
| | | | 25,467 | | |
Utilities (8.0%): | |
CenterPoint Energy, Inc. | | | 102,000 | | | | 3,017 | | |
Constellation Energy Corp. | | | 40,275 | | | | 2,306 | | |
DTE Energy Co. | | | 20,591 | | | | 2,610 | | |
Evergy, Inc. | | | 40,605 | | | | 2,650 | | |
PPL Corp. | | | 84,000 | | | | 2,279 | | |
UGI Corp. | | | 71,501 | | | | 2,761 | | |
Vistra Corp. | | | 139,476 | | | | 3,187 | | |
Xcel Energy, Inc. | | | 44,000 | | | | 3,113 | | |
| | | | 21,923 | | |
Total Common Stocks (Cost $259,762) | | | 271,894 | | |
See notes to financial statements.
49
Victory Portfolios
Victory Integrity Mid-Cap Value Fund | | Schedule of Portfolio Investments — continued
June 30, 2022 | |
(Amounts in Thousands, Except for Shares)
Security Description | | Shares | | Value | |
Collateral for Securities Loaned (1.1%)^ | |
BlackRock Liquidity Funds TempFund, Institutional Shares, 1.47% (c) | | | 97,705 | | | $ | 98 | | |
Goldman Sachs Financial Square Prime Obligations Fund, Institutional Shares,
1.42% (c) | | | 48,760 | | | | 49 | | |
HSBC U.S. Government Money Market Fund, I Shares, 1.46% (c) | | | 608,132 | | | | 608 | | |
JPMorgan Prime Money Market Fund, Capital Shares, 1.50% (c) | | | 388,795 | | | | 389 | | |
Morgan Stanley Institutional Liquidity Government Portfolio, Institutional Shares,
1.39% (c) | | | 259,282 | | | | 259 | | |
Morgan Stanley Institutional Liquidity Prime Portfolio, Institutional Shares,
1.53% (c) | | | 1,748,098 | | | | 1,748 | | |
Total Collateral for Securities Loaned (Cost $3,151) | | | 3,151 | | |
Total Investments (Cost $262,913) — 99.7% | | | 275,045 | | |
Other assets in excess of liabilities — 0.3% | | | 815 | | |
NET ASSETS — 100.00% | | $ | 275,860 | | |
^ Purchased with cash collateral from securities on loan.
(a) Non-income producing security.
(b) All or a portion of this security is on loan.
(c) Rate disclosed is the daily yield on June 30, 2022.
PLC — Public Limited Company
REIT — Real Estate Investment Trust
See notes to financial statements.
50
Victory Portfolios
Victory Integrity Small-Cap Value Fund | | Schedule of Portfolio Investments
June 30, 2022 | |
(Amounts in Thousands, Except for Shares)
Security Description | | Shares | | Value | |
Common Stocks (96.8%) | |
Banks (15.3%): | |
Ameris Bancorp | | | 356,570 | | | $ | 14,327 | | |
Atlantic Union Bankshares Corp. | | | 394,059 | | | | 13,367 | | |
Banc of California, Inc. | | | 646,141 | | | | 11,385 | | |
Bank of Hawaii Corp. | | | 166,900 | | | | 12,417 | | |
Banner Corp. | | | 237,700 | | | | 13,361 | | |
FB Financial Corp. | | | 312,305 | | | | 12,249 | | |
First Bancorp/Southern Pines NC | | | 219,120 | | | | 7,647 | | |
First Merchants Corp. | | | 376,800 | | | | 13,422 | | |
Hancock Whitney Corp. | | | 208,300 | | | | 9,234 | | |
Heritage Financial Corp. | | | 282,690 | | | | 7,112 | | |
Pacific Premier Bancorp, Inc. | | | 460,000 | | | | 13,450 | | |
Prosperity Bancshares, Inc. | | | 194,000 | | | | 13,244 | | |
Sandy Spring Bancorp, Inc. (a) | | | 289,800 | | | | 11,323 | | |
SouthState Corp. | | | 253,540 | | | | 19,561 | | |
Synovus Financial Corp. | | | 394,723 | | | | 14,230 | | |
United Community Banks, Inc. | | | 551,188 | | | | 16,640 | | |
Wintrust Financial Corp. | | | 152,500 | | | | 12,223 | | |
| | | | 215,192 | | |
Capital Markets (2.3%): | |
Artisan Partners Asset Management, Inc., Class A | | | 297,015 | | | | 10,565 | | |
Federated Hermes, Inc. | | | 414,370 | | | | 13,173 | | |
Stifel Financial Corp. | | | 153,600 | | | | 8,604 | | |
| | | | 32,342 | | |
Communication Services (2.3%): | |
Cinemark Holdings, Inc. (a) (b) | | | 646,778 | | | | 9,714 | | |
Gray Television, Inc. | | | 613,065 | | | | 10,355 | | |
Lions Gate Entertainment Corp., Class B (b) | | | 704,514 | | | | 6,221 | | |
The Marcus Corp. (a) (b) | | | 373,000 | | | | 5,509 | | |
| | | | 31,799 | | |
Consumer Discretionary (9.5%): | |
Abercrombie & Fitch Co. (b) | | | 432,400 | | | | 7,316 | | |
Asbury Automotive Group, Inc. (b) | | | 64,982 | | | | 11,004 | | |
Bloomin' Brands, Inc. | | | 649,569 | | | | 10,796 | | |
Brinker International, Inc. (b) | | | 249,124 | | | | 5,488 | | |
Brunswick Corp. | | | 95,133 | | | | 6,220 | | |
Dave & Buster's Entertainment, Inc. (b) | | | 190,080 | | | | 6,231 | | |
Light & Wonder, Inc. (b) | | | 190,400 | | | | 8,947 | | |
Macy's, Inc. | | | 605,459 | | | | 11,092 | | |
Marriott Vacations Worldwide Corp. | | | 76,046 | | | | 8,837 | | |
Signet Jewelers Ltd. | | | 177,300 | | | | 9,478 | | |
Steven Madden Ltd. | | | 342,716 | | | | 11,039 | | |
The Goodyear Tire & Rubber Co. (b) | | | 947,729 | | | | 10,150 | | |
Victoria's Secret & Co. (b) | | | 210,081 | | | | 5,876 | | |
Visteon Corp. (b) | | | 138,173 | | | | 14,312 | | |
Wolverine World Wide, Inc. | | | 328,465 | | | | 6,622 | | |
| | | | 133,408 | | |
See notes to financial statements.
51
Victory Portfolios
Victory Integrity Small-Cap Value Fund | | Schedule of Portfolio Investments — continued
June 30, 2022 | |
(Amounts in Thousands, Except for Shares)
Security Description | | Shares | | Value | |
Consumer Staples (3.4%): | |
Coty, Inc., Class A (b) | | | 1,480,920 | | | $ | 11,862 | | |
MGP Ingredients, Inc. | | | 75,900 | | | | 7,597 | | |
Performance Food Group Co. (b) | | | 265,589 | | | | 12,212 | | |
The Andersons, Inc. | | | 180,500 | | | | 5,954 | | |
The Simply Good Foods Co. (b) | | | 272,778 | | | | 10,303 | | |
| | | | 47,928 | | |
Energy (4.8%): | |
Cactus, Inc., Class A | | | 311,913 | | | | 12,561 | | |
Civitas Resources, Inc. | | | 204,300 | | | | 10,683 | | |
CONSOL Energy, Inc. (b) | | | 234,626 | | | | 11,586 | | |
CVR Energy, Inc. | | | 341,200 | | | | 11,430 | | |
Green Plains, Inc. (a) (b) | | | 393,051 | | | | 10,679 | | |
Whiting Petroleum Corp. | | | 154,350 | | | | 10,500 | | |
| | | | 67,439 | | |
Health Care (6.6%): | |
Brookdale Senior Living, Inc. (b) | | | 1,460,040 | | | | 6,629 | | |
Encompass Health Corp. | | | 151,700 | | | | 8,503 | | |
Haemonetics Corp. (b) | | | 189,450 | | | | 12,349 | | |
NuVasive, Inc. (b) | | | 206,000 | | | | 10,127 | | |
Patterson Cos., Inc. | | | 353,000 | | | | 10,696 | | |
Perrigo Co. PLC | | | 258,400 | | | | 10,483 | | |
Select Medical Holdings Corp. | | | 528,295 | | | | 12,478 | | |
Supernus Pharmaceuticals, Inc. (b) | | | 385,135 | | | | 11,138 | | |
Tenet Healthcare Corp. (b) | | | 203,353 | | | | 10,688 | | |
| | | | 93,091 | | |
Industrials (18.6%): | |
AAR Corp. (b) | | | 223,200 | | | | 9,339 | | |
ABM Industries, Inc. | | | 358,800 | | | | 15,579 | | |
Arcosa, Inc. | | | 202,704 | | | | 9,412 | | |
Atkore, Inc. (b) | | | 104,100 | | | | 8,641 | | |
BWX Technologies, Inc. | | | 236,806 | | | | 13,046 | | |
CACI International, Inc., Class A (b) | | | 39,085 | | | | 11,013 | | |
Clean Harbors, Inc. (b) | | | 133,097 | | | | 11,669 | | |
Crane Holdings Co. | | | 135,281 | | | | 11,845 | | |
Curtiss-Wright Corp. | | | 97,536 | | | | 12,881 | | |
EMCOR Group, Inc. | | | 122,993 | | | | 12,663 | | |
EnPro Industries, Inc. | | | 82,538 | | | | 6,762 | | |
ESCO Technologies, Inc. | | | 109,200 | | | | 7,466 | | |
Federal Signal Corp. | | | 246,400 | | | | 8,772 | | |
Fluor Corp. (b) | | | 285,000 | | | | 6,937 | | |
FTI Consulting, Inc. (b) | | | 87,300 | | | | 15,788 | | |
Hawaiian Holdings, Inc. (b) | | | 520,431 | | | | 7,447 | | |
Helios Technologies, Inc. | | | 110,200 | | | | 7,301 | | |
Hub Group, Inc., Class A (b) | | | 156,901 | | | | 11,131 | | |
Kirby Corp. (b) | | | 148,887 | | | | 9,058 | | |
Maxar Technologies, Inc. | | | 423,000 | | | | 11,036 | | |
Saia, Inc. (b) | | | 42,778 | | | | 8,042 | | |
See notes to financial statements.
52
Victory Portfolios
Victory Integrity Small-Cap Value Fund | | Schedule of Portfolio Investments — continued
June 30, 2022 | |
(Amounts in Thousands, Except for Shares)
Security Description | | Shares | | Value | |
The Greenbrier Cos., Inc. | | | 216,453 | | | $ | 7,790 | | |
Univar Solutions, Inc. (b) | | | 371,288 | | | | 9,234 | | |
Wabash National Corp. | | | 631,300 | | | | 8,573 | | |
Werner Enterprises, Inc. | | | 236,565 | | | | 9,117 | | |
WESCO International, Inc. (b) | | | 90,005 | | | | 9,640 | | |
| | | | 260,182 | | |
Information Technology (6.4%): | |
Belden, Inc. | | | 270,500 | | | | 14,409 | | |
Conduent, Inc. (b) | | | 1,390,000 | | | | 6,005 | | |
FormFactor, Inc. (b) | | | 228,241 | | | | 8,840 | | |
Harmonic, Inc. (b) | | | 993,000 | | | | 8,609 | | |
Infinera Corp. (a) (b) | | | 1,179,889 | | | | 6,324 | | |
Plexus Corp. (b) | | | 135,500 | | | | 10,637 | | |
Progress Software Corp. | | | 179,350 | | | | 8,124 | | |
Sanmina Corp. (b) | | | 261,700 | | | | 10,659 | | |
Veeco Instruments, Inc. (b) | | | 360,400 | | | | 6,992 | | |
Verint Systems, Inc. (b) | | | 215,436 | | | | 9,124 | | |
| | | | 89,723 | | |
Insurance (4.8%): | |
Assured Guaranty Ltd. | | | 170,719 | | | | 9,524 | | |
Brighthouse Financial, Inc. (b) | | | 168,129 | | | | 6,897 | | |
Horace Mann Educators Corp. | | | 218,808 | | | | 8,398 | | |
Kinsale Capital Group, Inc. | | | 43,791 | | | | 10,056 | | |
Primerica, Inc. | | | 59,282 | | | | 7,095 | | |
ProAssurance Corp. | | | 359,637 | | | | 8,498 | | |
RLI Corp. | | | 80,800 | | | | 9,421 | | |
The Hanover Insurance Group, Inc. | | | 54,400 | | | | 7,956 | | |
| | | | 67,845 | | |
Materials (3.9%): | |
AdvanSix, Inc. | | | 253,300 | | | | 8,470 | | |
Allegheny Technologies, Inc. (b) | | | 315,000 | | | | 7,154 | | |
Avient Corp. | | | 257,100 | | | | 10,304 | | |
Commercial Metals Co. | | | 279,000 | | | | 9,235 | | |
Methanex Corp. (a) | | | 202,998 | | | | 7,761 | | |
O-I Glass, Inc. (b) | | | 882,500 | | | | 12,355 | | |
| | | | 55,279 | | |
Mortgage Real Estate Investment Trusts (2.2%): | |
Blackstone Mortgage Trust, Inc., Class A | | | 490,000 | | | | 13,558 | | |
Ladder Capital Corp. | | | 788,000 | | | | 8,306 | | |
Starwood Property Trust, Inc. | | | 402,700 | | | | 8,412 | | |
| | | | 30,276 | | |
Real Estate (10.3%): | |
Alexander & Baldwin, Inc. | | | 376,306 | | | | 6,755 | | |
CareTrust REIT, Inc. | | | 530,530 | | | | 9,783 | | |
DiamondRock Hospitality Co. (b) | | | 1,372,000 | | | | 11,264 | | |
Easterly Government Properties, Inc. | | | 566,416 | | | | 10,784 | | |
Essential Properties Realty Trust, Inc. | | | 449,729 | | | | 9,665 | | |
See notes to financial statements.
53
Victory Portfolios
Victory Integrity Small-Cap Value Fund | | Schedule of Portfolio Investments — continued
June 30, 2022 | |
(Amounts in Thousands, Except for Shares)
Security Description | | Shares | | Value | |
Hudson Pacific Properties, Inc. | | | 449,745 | | | $ | 6,674 | | |
LXP Industrial Trust | | | 1,200,000 | | | | 12,888 | | |
Physicians Realty Trust | | | 538,000 | | | | 9,388 | | |
Sabra Health Care REIT, Inc. | | | 921,395 | | | | 12,872 | | |
SITE Centers Corp. | | | 965,781 | | | | 13,009 | | |
STAG Industrial, Inc. | | | 454,408 | | | | 14,032 | | |
Summit Hotel Properties, Inc. (b) | | | 1,064,357 | | | | 7,738 | | |
Sunstone Hotel Investors, Inc. (b) | | | 1,066,400 | | | | 10,579 | | |
Veris Residential, Inc. (b) | | | 626,706 | | | | 8,298 | | |
| | | | 143,729 | | |
Thrifts & Mortgage Finance (1.4%): | |
MGIC Investment Corp. | | | 805,399 | | | | 10,148 | | |
Northwest Bancshares, Inc. | | | 691,000 | | | | 8,845 | | |
| | | | 18,993 | | |
Utilities (5.0%): | |
ALLETE, Inc. | | | 200,800 | | | | 11,803 | | |
Black Hills Corp. | | | 248,545 | | | | 18,087 | | |
NorthWestern Corp. | | | 194,237 | | | | 11,446 | | |
ONE Gas, Inc. | | | 203,306 | | | | 16,506 | | |
Portland General Electric Co. | | | 265,333 | | | | 12,824 | | |
| | | | 70,666 | | |
Total Common Stocks (Cost $1,275,980) | | | 1,357,892 | | |
Exchange-Traded Funds (1.0%) | |
iShares Russell 2000 Value ETF | | | 100,000 | | | | 13,615 | | |
Total Exchange-Traded Funds (Cost $15,698) | | | 13,615 | | |
Collateral for Securities Loaned (1.7%)^ | |
BlackRock Liquidity Funds TempFund, Institutional Shares, 1.47% (c) | | | 745,838 | | | | 746 | | |
Goldman Sachs Financial Square Prime Obligations Fund, Institutional Shares,
1.42% (c) | | | 372,210 | | | | 372 | | |
HSBC U.S. Government Money Market Fund, I Shares, 1.46% (c) | | | 4,642,210 | | | | 4,642 | | |
JPMorgan Prime Money Market Fund, Capital Shares, 1.50% (c) | | | 2,967,888 | | | | 2,968 | | |
Morgan Stanley Institutional Liquidity Government Portfolio, Institutional Shares,
1.39% (c) | | | 1,979,247 | | | | 1,980 | | |
Morgan Stanley Institutional Liquidity Prime Portfolio, Institutional Shares,
1.53% (c) | | | 13,344,205 | | | | 13,344 | | |
Total Collateral for Securities Loaned (Cost $24,052) | | | 24,052 | | |
Total Investments (Cost $1,315,730) — 99.5% | | | 1,395,559 | | |
Other assets in excess of liabilities — 0.5% | | | 6,948 | | |
NET ASSETS — 100.00% | | $ | 1,402,507 | | |
See notes to financial statements.
54
Victory Portfolios
Victory Integrity Small-Cap Value Fund | | Schedule of Portfolio Investments — continued
June 30, 2022 | |
^ Purchased with cash collateral from securities on loan.
(a) All or a portion of this security is on loan.
(b) Non-income producing security.
(c) Rate disclosed is the daily yield on June 30, 2022.
ETF — Exchange-Traded Fund
PLC — Public Limited Company
REIT — Real Estate Investment Trust
See notes to financial statements.
55
Victory Portfolios
Victory Integrity Small/Mid-Cap Value Fund | | Schedule of Portfolio Investments
June 30, 2022 | |
(Amounts in Thousands, Except for Shares)
Security Description | | Shares | | Value | |
Common Stocks (98.0%) | |
Communication Services (2.7%): | |
Cinemark Holdings, Inc. (a) | | | 82,300 | | | $ | 1,236 | | |
Liberty Media Corp.-Liberty Formula One, Class C (a) | | | 24,794 | | | | 1,574 | | |
Lions Gate Entertainment Corp., Class B (a) | | | 92,700 | | | | 819 | | |
Nexstar Media Group, Inc., Class A | | | 12,900 | | | | 2,101 | | |
| | | | 5,730 | | |
Consumer Discretionary (10.6%): | |
Aramark | | | 55,500 | | | | 1,700 | | |
Asbury Automotive Group, Inc. (a) | | | 9,995 | | | | 1,693 | | |
Bloomin' Brands, Inc. | | | 100,000 | | | | 1,662 | | |
Brunswick Corp. | | | 19,150 | | | | 1,252 | | |
Caesars Entertainment, Inc. (a) | | | 21,793 | | | | 835 | | |
Lear Corp. | | | 10,647 | | | | 1,340 | | |
Macy's, Inc. | | | 56,025 | | | | 1,026 | | |
Newell Brands, Inc. | | | 82,839 | | | | 1,577 | | |
Norwegian Cruise Line Holdings Ltd. (a) (b) | | | 89,000 | | | | 990 | | |
Ralph Lauren Corp. | | | 18,800 | | | | 1,685 | | |
Signet Jewelers Ltd. | | | 27,100 | | | | 1,449 | | |
Steven Madden Ltd. | | | 48,300 | | | | 1,556 | | |
Tapestry, Inc. | | | 54,655 | | | | 1,668 | | |
Travel + Leisure Co. | | | 33,000 | | | | 1,281 | | |
Victoria's Secret & Co. (a) | | | 32,493 | | | | 909 | | |
Visteon Corp. (a) | | | 16,267 | | | | 1,685 | | |
| | | | 22,308 | | |
Consumer Staples (4.2%): | |
BJ's Wholesale Club Holdings, Inc. (a) | | | 23,653 | | | | 1,474 | | |
Coty, Inc., Class A (a) | | | 220,353 | | | | 1,765 | | |
MGP Ingredients, Inc. | | | 21,600 | | | | 2,162 | | |
Molson Coors Beverage Co., Class B | | | 33,076 | | | | 1,803 | | |
Performance Food Group Co. (a) | | | 34,500 | | | | 1,586 | | |
| | | | 8,790 | | |
Energy (4.2%): | |
APA Corp. | | | 34,457 | | | | 1,203 | | |
Cactus, Inc., Class A | | | 33,432 | | | | 1,346 | | |
CONSOL Energy, Inc. (a) | | | 26,451 | | | | 1,306 | | |
CVR Energy, Inc. | | | 38,461 | | | | 1,288 | | |
Green Plains, Inc. (a) (b) | | | 44,307 | | | | 1,204 | | |
PDC Energy, Inc. | | | 21,122 | | | | 1,301 | | |
Whiting Petroleum Corp. | | | 17,396 | | | | 1,184 | | |
| | | | 8,832 | | |
Financials (21.0%): | |
American Financial Group, Inc. | | | 14,748 | | | | 2,047 | | |
Artisan Partners Asset Management, Inc., Class A | | | 46,200 | | | | 1,643 | | |
Assurant, Inc. | | | 12,000 | | | | 2,074 | | |
Assured Guaranty Ltd. | | | 24,300 | | | | 1,356 | | |
Atlantic Union Bankshares Corp. | | | 57,000 | | | | 1,933 | | |
See notes to financial statements.
56
Victory Portfolios
Victory Integrity Small/Mid-Cap Value Fund | | Schedule of Portfolio Investments — continued
June 30, 2022 | |
(Amounts in Thousands, Except for Shares)
Security Description | | Shares | | Value | |
Bank of Hawaii Corp. | | | 27,942 | | | $ | 2,079 | | |
Blackstone Mortgage Trust, Inc., Class A | | | 71,880 | | | | 1,989 | | |
East West Bancorp, Inc. | | | 27,200 | | | | 1,763 | | |
Federated Hermes, Inc. | | | 47,000 | | | | 1,494 | | |
Hancock Whitney Corp. | | | 31,370 | | | | 1,391 | | |
Invesco Ltd. | | | 54,300 | | | | 876 | | |
Kinsale Capital Group, Inc. | | | 6,335 | | | | 1,455 | | |
Lincoln National Corp. | | | 23,036 | | | | 1,077 | | |
LPL Financial Holdings, Inc. | | | 10,410 | | | | 1,920 | | |
MGIC Investment Corp. | | | 107,500 | | | | 1,354 | | |
Prosperity Bancshares, Inc. | | | 34,182 | | | | 2,334 | | |
Reinsurance Group of America, Inc. | | | 13,380 | | | | 1,569 | | |
SouthState Corp. | | | 33,000 | | | | 2,546 | | |
Stifel Financial Corp. | | | 27,085 | | | | 1,517 | | |
Synovus Financial Corp. | | | 65,000 | | | | 2,343 | | |
The Hanover Insurance Group, Inc. | | | 10,720 | | | | 1,568 | | |
Unum Group | | | 54,400 | | | | 1,851 | | |
Voya Financial, Inc. | | | 28,000 | | | | 1,667 | | |
Western Alliance Bancorp | | | 31,000 | | | | 2,189 | | |
Wintrust Financial Corp. | | | 27,594 | | | | 2,212 | | |
| | | | 44,247 | | |
Health Care (6.0%): | |
Encompass Health Corp. | | | 28,830 | | | | 1,616 | | |
Jazz Pharmaceuticals PLC (a) | | | 11,700 | | | | 1,825 | | |
NuVasive, Inc. (a) | | | 31,035 | | | | 1,526 | | |
Organon & Co. | | | 65,000 | | | | 2,194 | | |
Perrigo Co. PLC | | | 61,203 | | | | 2,483 | | |
Select Medical Holdings Corp. | | | 77,665 | | | | 1,835 | | |
Tenet Healthcare Corp. (a) | | | 22,800 | | | | 1,198 | | |
| | | | 12,677 | | |
Industrials (21.8%): | |
ABM Industries, Inc. | | | 49,690 | | | | 2,158 | | |
AGCO Corp. | | | 14,500 | | | | 1,431 | | |
Alaska Air Group, Inc. (a) | | | 33,782 | | | | 1,353 | | |
Arcosa, Inc. | | | 31,400 | | | | 1,458 | | |
Atkore, Inc. (a) | | | 15,824 | | | | 1,314 | | |
BWX Technologies, Inc. | | | 38,800 | | | | 2,138 | | |
CACI International, Inc., Class A (a) | | | 5,766 | | | | 1,625 | | |
Carlisle Cos., Inc. | | | 7,684 | | | | 1,833 | | |
Clean Harbors, Inc. (a) | | | 23,019 | | | | 2,018 | | |
Crane Holdings Co. | | | 22,791 | | | | 1,996 | | |
Curtiss-Wright Corp. | | | 16,963 | | | | 2,240 | | |
EMCOR Group, Inc. | | | 16,142 | | | | 1,662 | | |
EnPro Industries, Inc. | | | 12,383 | | | | 1,015 | | |
Fluor Corp. (a) | | | 45,660 | | | | 1,111 | | |
FTI Consulting, Inc. (a) (b) | | | 14,135 | | | | 2,556 | | |
Hertz Global Holdings, Inc. (a) (b) | | | 78,959 | | | | 1,251 | | |
Howmet Aerospace, Inc. | | | 69,538 | | | | 2,187 | | |
ITT, Inc. | | | 25,570 | | | | 1,719 | | |
See notes to financial statements.
57
Victory Portfolios
Victory Integrity Small/Mid-Cap Value Fund | | Schedule of Portfolio Investments — continued
June 30, 2022 | |
(Amounts in Thousands, Except for Shares)
Security Description | | Shares | | Value | |
Kirby Corp. (a) | | | 25,730 | | | $ | 1,565 | | |
Knight-Swift Transportation Holdings, Inc. | | | 31,150 | | | | 1,442 | | |
Nordson Corp. | | | 9,395 | | | | 1,902 | | |
Oshkosh Corp. | | | 14,000 | | | | 1,150 | | |
Regal Rexnord Corp. | | | 13,366 | | | | 1,517 | | |
Saia, Inc. (a) | | | 7,030 | | | | 1,322 | | |
The Greenbrier Cos., Inc. | | | 35,021 | | | | 1,260 | | |
Univar Solutions, Inc. (a) | | | 64,581 | | | | 1,606 | | |
WESCO International, Inc. (a) | | | 16,397 | | | | 1,756 | | |
Westinghouse Air Brake Technologies Corp. | | | 16,960 | | | | 1,392 | | |
| | | | 45,977 | | |
Information Technology (9.1%): | |
Belden, Inc. | | | 37,700 | | | | 2,008 | | |
Ciena Corp. (a) | | | 41,500 | | | | 1,896 | | |
DXC Technology Co. (a) | | | 68,678 | | | | 2,082 | | |
Euronet Worldwide, Inc. (a) | | | 17,600 | | | | 1,770 | | |
Flex Ltd. (a) | | | 103,990 | | | | 1,505 | | |
FormFactor, Inc. (a) | | | 41,215 | | | | 1,596 | | |
Jabil, Inc. | | | 32,859 | | | | 1,683 | | |
Juniper Networks, Inc. | | | 58,948 | | | | 1,680 | | |
MKS Instruments, Inc. | | | 17,340 | | | | 1,780 | | |
Progress Software Corp. | | | 34,455 | | | | 1,561 | | |
Verint Systems, Inc. (a) | | | 35,360 | | | | 1,497 | | |
| | | | 19,058 | | |
Materials (5.4%): | |
Berry Global Group, Inc. (a) | | | 38,608 | | | | 2,110 | | |
O-I Glass, Inc. (a) | | | 132,114 | | | | 1,850 | | |
Olin Corp. | | | 41,313 | | | | 1,912 | | |
Packaging Corp. of America | | | 15,312 | | | | 2,105 | | |
Reliance Steel & Aluminum Co. | | | 9,413 | | | | 1,599 | | |
Westlake Corp. | | | 19,000 | | | | 1,862 | | |
| | | | 11,438 | | |
Real Estate (9.2%): | |
Apartment Income REIT Corp. | | | 56,500 | | | | 2,350 | | |
DiamondRock Hospitality Co. (a) | | | 169,000 | | | | 1,387 | | |
Federal Realty Investment Trust | | | 21,050 | | | | 2,015 | | |
First Industrial Realty Trust, Inc. | | | 44,410 | | | | 2,109 | | |
Gaming and Leisure Properties, Inc. | | | 51,350 | | | | 2,355 | | |
Highwoods Properties, Inc. | | | 52,300 | | | | 1,788 | | |
Host Hotels & Resorts, Inc. | | | 88,000 | | | | 1,380 | | |
Hudson Pacific Properties, Inc. | | | 76,900 | | | | 1,141 | | |
Medical Properties Trust, Inc. | | | 123,000 | | | | 1,878 | | |
SITE Centers Corp. | | | 121,200 | | | | 1,633 | | |
Veris Residential, Inc. (a) | | | 93,250 | | | | 1,235 | | |
| | | | 19,271 | | |
See notes to financial statements.
58
Victory Portfolios
Victory Integrity Small/Mid-Cap Value Fund | | Schedule of Portfolio Investments — continued
June 30, 2022 | |
(Amounts in Thousands, Except for Shares)
Security Description | | Shares | | Value | |
Utilities (3.8%): | |
ALLETE, Inc. | | | 30,100 | | | $ | 1,769 | | |
Black Hills Corp. | | | 28,100 | | | | 2,045 | | |
UGI Corp. | | | 51,630 | | | | 1,993 | | |
Vistra Corp. | | | 92,600 | | | | 2,116 | | |
| | | | 7,923 | | |
Total Common Stocks (Cost $201,973) | | | 206,251 | | |
Collateral for Securities Loaned (1.8%)^ | |
BlackRock Liquidity Funds TempFund, Institutional Shares, 1.47% (c) | | | 120,700 | | | | 121 | | |
Goldman Sachs Financial Square Prime Obligations Fund, Institutional Shares,
1.42% (c) | | | 60,235 | | | | 60 | | |
HSBC U.S. Government Money Market Fund, I Shares, 1.46% (c) | | | 751,253 | | | | 751 | | |
JPMorgan Prime Money Market Fund, Capital Shares, 1.50% (c) | | | 480,296 | | | | 480 | | |
Morgan Stanley Institutional Liquidity Government Portfolio, Institutional Shares,
1.39% (c) | | | 320,303 | | | | 320 | | |
Morgan Stanley Institutional Liquidity Prime Portfolio, Institutional Shares,
1.53% (c) | | | 2,159,506 | | | | 2,160 | | |
Total Collateral for Securities Loaned (Cost $3,892) | | | 3,892 | | |
Total Investments (Cost $205,865) — 99.8% | | | 210,143 | | |
Other assets in excess of liabilities — 0.2% | | | 391 | | |
NET ASSETS — 100.00% | | $ | 210,534 | | |
^ Purchased with cash collateral from securities on loan.
(a) Non-income producing security.
(b) All or a portion of this security is on loan.
(c) Rate disclosed is the daily yield on June 30, 2022.
PLC — Public Limited Company
REIT — Real Estate Investment Trust
See notes to financial statements.
59
Victory Portfolios
Victory Munder Multi-Cap Fund | | Schedule of Portfolio Investments
June 30, 2022 | |
(Amounts in Thousands, Except for Shares)
Security Description | | Shares | | Value | |
Common Stocks (97.1%) | |
Communication Services (7.2%): | |
Alphabet, Inc., Class A (a) | | | 7,793 | | | $ | 16,983 | | |
Nexstar Media Group, Inc., Class A | | | 38,700 | | | | 6,304 | | |
World Wrestling Entertainment, Inc., Class A (b) | | | 56,000 | | | | 3,499 | | |
| | | | 26,786 | | |
Communications Equipment (1.3%): | |
Lumentum Holdings, Inc. (a) (b) | | | 60,700 | | | | 4,821 | | |
Consumer Discretionary (10.3%): | |
Amazon.com, Inc. (a) | | | 38,200 | | | | 4,057 | | |
Asbury Automotive Group, Inc. (a) | | | 23,100 | | | | 3,912 | | |
Brunswick Corp. | | | 47,500 | | | | 3,106 | | |
Crocs, Inc. (a) | | | 41,900 | | | | 2,039 | | |
D.R. Horton, Inc. | | | 39,000 | | | | 2,581 | | |
Group 1 Automotive, Inc. | | | 22,200 | | | | 3,770 | | |
Lithia Motors, Inc. | | | 15,300 | | | | 4,205 | | |
MarineMax, Inc. (a) | | | 98,800 | | | | 3,569 | | |
Meritage Homes Corp. (a) | | | 25,000 | | | | 1,812 | | |
Skyline Champion Corp. (a) | | | 46,500 | | | | 2,205 | | |
Tesla, Inc. (a) | | | 7,900 | | | | 5,320 | | |
Vista Outdoor, Inc. (a) | | | 59,500 | | | | 1,660 | | |
| | | | 38,236 | | |
Consumer Staples (6.3%): | |
BJ's Wholesale Club Holdings, Inc. (a) | | | 59,000 | | | | 3,677 | | |
Darling Ingredients, Inc. (a) | | | 83,300 | | | | 4,981 | | |
Grocery Outlet Holding Corp. (a) | | | 53,900 | | | | 2,298 | | |
Medifast, Inc. | | | 12,900 | | | | 2,328 | | |
PepsiCo, Inc. | | | 23,100 | | | | 3,850 | | |
Philip Morris International, Inc. | | | 44,400 | | | | 4,384 | | |
Walmart, Inc. | | | 15,200 | | | | 1,848 | | |
| | | | 23,366 | | |
Electronic Equipment, Instruments & Components (2.8%): | |
Fabrinet (a) | | | 60,900 | | | | 4,939 | | |
Jabil, Inc. | | | 105,200 | | | | 5,387 | | |
| | | | 10,326 | | |
Energy (8.3%): | |
Chevron Corp. | | | 54,710 | | | | 7,921 | | |
Diamondback Energy, Inc. | | | 43,300 | | | | 5,246 | | |
EOG Resources, Inc. | | | 41,100 | | | | 4,539 | | |
Matador Resources Co. | | | 67,000 | | | | 3,122 | | |
Pioneer Natural Resources Co. | | | 19,300 | | | | 4,305 | | |
Schlumberger NV | | | 153,600 | | | | 5,493 | | |
| | | | 30,626 | | |
Financials (10.5%): | |
Ameriprise Financial, Inc. | | | 20,200 | | | | 4,801 | | |
Bank of America Corp. | | | 142,400 | | | | 4,433 | | |
See notes to financial statements.
60
Victory Portfolios
Victory Munder Multi-Cap Fund | | Schedule of Portfolio Investments — continued
June 30, 2022 | |
(Amounts in Thousands, Except for Shares)
Security Description | | Shares | | Value | |
Chubb Ltd. | | | 32,400 | | | $ | 6,369 | | |
Customers Bancorp, Inc. (a) | | | 51,000 | | | | 1,729 | | |
JPMorgan Chase & Co. | | | 42,400 | | | | 4,775 | | |
Morgan Stanley | | | 54,700 | | | | 4,160 | | |
ServisFirst Bancshares, Inc. | | | 67,500 | | | | 5,327 | | |
Signature Bank | | | 18,700 | | | | 3,351 | | |
Western Alliance Bancorp | | | 59,600 | | | | 4,208 | | |
| | | | 39,153 | | |
Health Care (12.2%): | |
AbbVie, Inc. | | | 15,650 | | | | 2,397 | | |
AmerisourceBergen Corp. | | | 39,800 | | | | 5,631 | | |
AMN Healthcare Services, Inc. (a) | | | 40,900 | | | | 4,487 | | |
Cigna Corp. | | | 20,100 | | | | 5,297 | | |
ICON PLC (a) | | | 20,400 | | | | 4,421 | | |
McKesson Corp. | | | 20,700 | | | | 6,753 | | |
Pfizer, Inc. | | | 44,500 | | | | 2,333 | | |
Regeneron Pharmaceuticals, Inc. (a) | | | 3,900 | | | | 2,305 | | |
Stryker Corp. | | | 8,400 | | | | 1,671 | | |
Thermo Fisher Scientific, Inc. | | | 3,800 | | | | 2,064 | | |
UnitedHealth Group, Inc. | | | 15,525 | | | | 7,974 | | |
| | | | 45,333 | | |
Industrials (9.6%): | |
Builders FirstSource, Inc. (a) | | | 40,200 | | | | 2,159 | | |
Chart Industries, Inc. (a) | | | 37,100 | | | | 6,210 | | |
GXO Logistics, Inc. (a) | | | 34,900 | | | | 1,510 | | |
Huntington Ingalls Industries, Inc. | | | 9,369 | | | | 2,041 | | |
Marten Transport Ltd. | | | 293,400 | | | | 4,935 | | |
Old Dominion Freight Line, Inc. | | | 12,800 | | | | 3,280 | | |
Parker-Hannifin Corp. | | | 13,500 | | | | 3,322 | | |
Raytheon Technologies Corp. | | | 21,100 | | | | 2,028 | | |
Saia, Inc. (a) | | | 16,900 | | | | 3,177 | | |
Trex Co., Inc. (a) | | | 63,500 | | | | 3,455 | | |
UFP Industries, Inc. | | | 52,200 | | | | 3,557 | | |
| | | | 35,674 | | |
Materials (4.1%): | |
Commercial Metals Co. | | | 60,200 | | | | 1,992 | | |
Graphic Packaging Holding Co. | | | 109,300 | | | | 2,241 | | |
Greif, Inc., Class A | | | 34,600 | | | | 2,158 | | |
Materion Corp. | | | 30,200 | | | | 2,227 | | |
Summit Materials, Inc., Class A (a) | | | 113,900 | | | | 2,653 | | |
Valvoline, Inc. | | | 134,400 | | | | 3,875 | | |
| | | | 15,146 | | |
Real Estate (2.1%): | |
American Tower Corp. | | | 11,800 | | | | 3,016 | | |
CBRE Group, Inc., Class A (a) | | | 25,300 | | | | 1,862 | | |
Simon Property Group, Inc. | | | 29,200 | | | | 2,772 | | |
| | | | 7,650 | | |
See notes to financial statements.
61
Victory Portfolios
Victory Munder Multi-Cap Fund | | Schedule of Portfolio Investments — continued
June 30, 2022 | |
(Amounts in Thousands, Except for Shares)
Security Description | | Shares | | Value | |
Semiconductors & Semiconductor Equipment (8.3%): | |
Advanced Micro Devices, Inc. (a) | | | 65,400 | | | $ | 5,001 | | |
Alpha & Omega Semiconductor Ltd. (a) | | | 63,300 | | | | 2,110 | | |
Applied Materials, Inc. | | | 37,200 | | | | 3,385 | | |
Broadcom, Inc. | | | 14,500 | | | | 7,044 | | |
NVIDIA Corp. | | | 49,200 | | | | 7,458 | | |
QUALCOMM, Inc. | | | 44,400 | | | | 5,672 | | |
| | | | 30,670 | | |
Software (6.7%): | |
Cadence Design Systems, Inc. (a) | | | 39,100 | | | | 5,866 | | |
Microsoft Corp. | | | 74,160 | | | | 19,047 | | |
| | | | 24,913 | | |
Technology Hardware, Storage & Peripherals (7.4%): | |
Apple, Inc. | | | 165,480 | | | | 22,624 | | |
HP, Inc. | | | 146,700 | | | | 4,809 | | |
| | | | 27,433 | | |
Total Common Stocks (Cost $299,054) | | | 360,133 | | |
Exchange-Traded Funds (2.7%) | |
iShares Russell 3000 ETF (b) | | | 34,600 | | | | 7,522 | | |
SPDR S&P Biotech ETF (a) (b) | | | 34,100 | | | | 2,532 | | |
Total Exchange-Traded Funds (Cost $10,406) | | | | | 10,054 | | |
Collateral for Securities Loaned (1.8%)^ | |
BlackRock Liquidity Funds TempFund, Institutional Shares, 1.47% (c) | | | 209,085 | | | | 209 | | |
Goldman Sachs Financial Square Prime Obligations Fund, Institutional Shares,
1.42% (c) | | | 104,344 | | | | 104 | | |
HSBC U.S. Government Money Market Fund, I Shares, 1.46% (c) | | | 1,301,378 | | | | 1,301 | | |
JPMorgan Prime Money Market Fund, Capital Shares, 1.50% (c) | | | 832,006 | | | | 833 | | |
Morgan Stanley Institutional Liquidity Government Portfolio, Institutional Shares,
1.39% (c) | | | 554,854 | | | | 555 | | |
Morgan Stanley Institutional Liquidity Prime Portfolio, Institutional Shares,
1.53% (c) | | | 3,740,859 | | | | 3,741 | | |
Total Collateral for Securities Loaned (Cost $6,743) | | | | | 6,743 | | |
Total Investments (Cost $316,203) — 101.6% | | | | | 376,930 | | |
Liabilities in excess of other assets — (1.6)% | | | | | (6,047 | ) | |
NET ASSETS — 100.00% | | | | $ | 370,883 | | |
^ Purchased with cash collateral from securities on loan.
(a) Non-income producing security.
(b) All or a portion of this security is on loan.
(c) Rate disclosed is the daily yield on June 30, 2022.
ETF — Exchange-Traded Fund
PLC — Public Limited Company
See notes to financial statements.
62
Victory Portfolios
Victory S&P 500 Index Fund | | Schedule of Portfolio Investments
June 30, 2022 | |
(Amounts in Thousands, Except for Shares)
Security Description | | Shares | | Value | |
Common Stocks (99.2%) | |
Communication Services (8.8%): | |
Activision Blizzard, Inc. | | | 5,428 | | | $ | 423 | | |
Alphabet, Inc., Class A (a) | | | 2,088 | | | | 4,550 | | |
Alphabet, Inc., Class C (a) | | | 1,914 | | | | 4,187 | | |
AT&T, Inc. | | | 49,695 | | | | 1,042 | | |
Charter Communications, Inc., Class A (a) | | | 804 | | | | 377 | | |
Comcast Corp., Class A | | | 31,033 | | | | 1,218 | | |
DISH Network Corp., Class A (a) | | | 1,741 | | | | 31 | | |
Electronic Arts, Inc. | | | 1,952 | | | | 237 | | |
Fox Corp., Class A | | | 2,164 | | | | 70 | | |
Fox Corp., Class B | | | 1,004 | | | | 30 | | |
Live Nation Entertainment, Inc. (a) | | | 951 | | | | 79 | | |
Lumen Technologies, Inc. | | | 6,454 | | | | 70 | | |
Match Group, Inc. (a) | | | 1,982 | | | | 138 | | |
Meta Platforms, Inc., Class A (a) | | | 15,921 | | | | 2,567 | | |
Netflix, Inc. (a) | | | 3,084 | | | | 539 | | |
News Corp., Class A | | | 2,697 | | | | 42 | | |
News Corp., Class B | | | 835 | | | | 13 | | |
Omnicom Group, Inc. | | | 1,428 | | | | 91 | | |
Paramount Global, Class B | | | 4,223 | | | | 104 | | |
Take-Two Interactive Software, Inc. (a) | | | 1,097 | | | | 134 | | |
The Interpublic Group of Cos., Inc. | | | 2,733 | | | | 75 | | |
The Walt Disney Co. (a) | | | 12,644 | | | | 1,194 | | |
T-Mobile U.S., Inc. (a) | | | 4,090 | | | | 550 | | |
Twitter, Inc. (a) | | | 5,295 | | | | 198 | | |
Verizon Communications, Inc. | | | 29,152 | | | | 1,479 | | |
Warner Bros. Discovery, Inc. (a) (b) | | | 15,330 | | | | 206 | | |
| | | | 19,644 | | |
Communications Equipment (0.8%): | |
Arista Networks, Inc. (a) | | | 1,562 | | | | 147 | | |
Cisco Systems, Inc. | | | 28,837 | | | | 1,230 | | |
F5, Inc. (a) | | | 420 | | | | 64 | | |
Juniper Networks, Inc. | | | 2,243 | | | | 64 | | |
Motorola Solutions, Inc. | | | 1,161 | | | | 243 | | |
| | | | 1,748 | | |
Consumer Discretionary (10.5%): | |
Advance Auto Parts, Inc. | | | 424 | | | | 73 | | |
Amazon.com, Inc. (a) | | | 60,739 | | | | 6,451 | | |
Aptiv PLC (a) | | | 1,881 | | | | 168 | | |
AutoZone, Inc. (a) | | | 138 | | | | 297 | | |
Bath & Body Works, Inc. | | | 1,656 | | | | 45 | | |
Best Buy Co., Inc. | | | 1,405 | | | | 92 | | |
Booking Holdings, Inc. (a) | | | 282 | | | | 493 | | |
BorgWarner, Inc. | | | 1,663 | | | | 55 | | |
Caesars Entertainment, Inc. (a) | | | 1,488 | | | | 57 | | |
CarMax, Inc. (a) | | | 1,114 | | | | 101 | | |
Carnival Corp. (a) (c) | | | 5,634 | | | | 49 | | |
See notes to financial statements.
63
Victory Portfolios
Victory S&P 500 Index Fund | | Schedule of Portfolio Investments — continued
June 30, 2022 | |
(Amounts in Thousands, Except for Shares)
Security Description | | Shares | | Value | |
Chipotle Mexican Grill, Inc. (a) | | | 194 | | | $ | 254 | | |
D.R. Horton, Inc. | | | 2,224 | | | | 147 | | |
Darden Restaurants, Inc. | | | 866 | | | | 98 | | |
Dollar General Corp. | | | 1,588 | | | | 390 | | |
Dollar Tree, Inc. (a) | | | 1,563 | | | | 244 | | |
Domino's Pizza, Inc. | | | 250 | | | | 97 | | |
eBay, Inc. | | | 3,886 | | | | 162 | | |
Etsy, Inc. (a) (b) | | | 882 | | | | 65 | | |
Expedia Group, Inc. (a) | | | 1,052 | | | | 100 | | |
Ford Motor Co. | | | 27,412 | | | | 305 | | |
Garmin Ltd. | | | 1,059 | | | | 104 | | |
General Motors Co. (a) | | | 10,121 | | | | 321 | | |
Genuine Parts Co. | | | 983 | | | | 131 | | |
Hasbro, Inc. | | | 910 | | | | 74 | | |
Hilton Worldwide Holdings, Inc. | | | 1,932 | | | | 215 | | |
Las Vegas Sands Corp. (a) (b) | | | 2,387 | | | | 80 | | |
Lennar Corp., Class A | | | 1,795 | | | | 127 | | |
LKQ Corp. | | | 1,806 | | | | 89 | | |
Lowe's Cos., Inc. | | | 4,589 | | | | 802 | | |
Marriott International, Inc., Class A | | | 1,908 | | | | 259 | | |
McDonald's Corp. | | | 5,134 | | | | 1,267 | | |
MGM Resorts International | | | 2,455 | | | | 71 | | |
Mohawk Industries, Inc. (a) | | | 357 | | | | 44 | | |
Newell Brands, Inc. | | | 2,555 | | | | 49 | | |
NIKE, Inc., Class B | | | 8,807 | | | | 900 | | |
Norwegian Cruise Line Holdings Ltd. (a) (c) | | | 2,909 | | | | 32 | | |
NVR, Inc. (a) | | | 21 | | | | 84 | | |
O'Reilly Automotive, Inc. (a) | | | 456 | | | | 288 | | |
Penn National Gaming, Inc. (a) | | | 1,135 | | | | 35 | | |
Pool Corp. | | | 278 | | | | 98 | | |
PulteGroup, Inc. | | | 1,650 | | | | 65 | | |
PVH Corp. | | | 469 | | | | 27 | | |
Ralph Lauren Corp. | | | 321 | | | | 29 | | |
Ross Stores, Inc. | | | 2,439 | | | | 171 | | |
Royal Caribbean Cruises Ltd. (a) | | | 1,557 | | | | 54 | | |
Starbucks Corp. | | | 7,961 | | | | 608 | | |
Tapestry, Inc. | | | 1,748 | | | | 53 | | |
Target Corp. (b) | | | 3,210 | | | | 453 | | |
Tesla, Inc. (a) | | | 5,825 | | | | 3,923 | | |
The Home Depot, Inc. | | | 7,173 | | | | 1,967 | | |
The TJX Cos., Inc. | | | 8,152 | | | | 455 | | |
Tractor Supply Co. | | | 777 | | | | 151 | | |
Ulta Beauty, Inc. (a) | | | 363 | | | | 140 | | |
VF Corp. | | | 2,241 | | | | 99 | | |
Whirlpool Corp. | | | 390 | | | | 60 | | |
Wynn Resorts Ltd. (a) | | | 733 | | | | 42 | | |
Yum! Brands, Inc. | | | 1,980 | | | | 225 | | |
| | | | 23,335 | | |
See notes to financial statements.
64
Victory Portfolios
Victory S&P 500 Index Fund | | Schedule of Portfolio Investments — continued
June 30, 2022 | |
(Amounts in Thousands, Except for Shares)
Security Description | | Shares | | Value | |
Consumer Staples (6.9%): | |
Altria Group, Inc. | | | 12,568 | | | $ | 525 | | |
Archer-Daniels-Midland Co. | | | 3,906 | | | | 303 | | |
Brown-Forman Corp., Class B | | | 1,269 | | | | 89 | | |
Campbell Soup Co. | | | 1,403 | | | | 67 | | |
Church & Dwight Co., Inc. | | | 1,685 | | | | 156 | | |
Colgate-Palmolive Co. | | | 5,817 | | | | 466 | | |
Conagra Brands, Inc. | | | 3,331 | | | | 114 | | |
Constellation Brands, Inc., Class A | | | 1,130 | | | | 263 | | |
Costco Wholesale Corp. | | | 3,077 | | | | 1,475 | | |
General Mills, Inc. | | | 4,180 | | | | 315 | | |
Hormel Foods Corp. (c) | | | 1,967 | | | | 93 | | |
Kellogg Co. | | | 1,759 | | | | 125 | | |
Keurig Dr Pepper, Inc. | | | 5,120 | | | | 181 | | |
Kimberly-Clark Corp. | | | 2,339 | | | | 316 | | |
Lamb Weston Holdings, Inc. | | | 1,003 | | | | 72 | | |
McCormick & Co., Inc. | | | 1,737 | | | | 145 | | |
Molson Coors Beverage Co., Class B | | | 1,307 | | | | 71 | | |
Mondelez International, Inc., Class A | | | 9,607 | | | | 597 | | |
Monster Beverage Corp. (a) | | | 2,611 | | | | 242 | | |
PepsiCo, Inc. | | | 9,598 | | | | 1,600 | | |
Philip Morris International, Inc. | | | 10,760 | | | | 1,062 | | |
Sysco Corp. | | | 3,537 | | | | 300 | | |
The Clorox Co. | | | 854 | | | | 120 | | |
The Coca-Cola Co. | | | 27,083 | | | | 1,704 | | |
The Estee Lauder Cos., Inc. | | | 1,609 | | | | 410 | | |
The Hershey Co. | | | 1,013 | | | | 218 | | |
The J.M. Smucker Co. | | | 753 | | | | 96 | | |
The Kraft Heinz Co. | | | 4,928 | | | | 188 | | |
The Kroger Co. | | | 4,554 | | | | 216 | | |
The Procter & Gamble Co. | | | 16,655 | | | | 2,395 | | |
Tyson Foods, Inc., Class A | | | 2,024 | | | | 174 | | |
Walgreens Boots Alliance, Inc. | | | 4,977 | | | | 189 | | |
Walmart, Inc. | | | 9,745 | | | | 1,185 | | |
| | | | 15,472 | | |
Electronic Equipment, Instruments & Components (0.6%): | |
Amphenol Corp., Class A | | | 4,145 | | | | 267 | | |
CDW Corp. | | | 938 | | | | 148 | | |
Corning, Inc. | | | 5,277 | | | | 166 | | |
Keysight Technologies, Inc. (a) | | | 1,263 | | | | 174 | | |
TE Connectivity Ltd. | | | 2,236 | | | | 253 | | |
Teledyne Technologies, Inc. (a) | | | 325 | | | | 122 | | |
Trimble, Inc. (a) | | | 1,736 | | | | 101 | | |
Zebra Technologies Corp. (a) | | | 365 | | | | 107 | | |
| | | | 1,338 | | |
Energy (4.3%): | |
APA Corp. | | | 2,348 | | | | 82 | | |
Baker Hughes Co. | | | 6,493 | | | | 188 | | |
Chevron Corp. | | | 13,639 | | | | 1,975 | | |
See notes to financial statements.
65
Victory Portfolios
Victory S&P 500 Index Fund | | Schedule of Portfolio Investments — continued
June 30, 2022 | |
(Amounts in Thousands, Except for Shares)
Security Description | | Shares | | Value | |
ConocoPhillips | | | 8,979 | | | $ | 806 | | |
Coterra Energy, Inc. | | | 5,594 | | | | 144 | | |
Devon Energy Corp. | | | 4,261 | | | | 235 | | |
Diamondback Energy, Inc. | | | 1,158 | | | | 140 | | |
EOG Resources, Inc. | | | 4,066 | | | | 449 | | |
Exxon Mobil Corp. | | | 29,242 | | | | 2,504 | | |
Halliburton Co. | | | 6,261 | | | | 196 | | |
Hess Corp. | | | 1,923 | | | | 204 | | |
Kinder Morgan, Inc. | | | 13,536 | | | | 227 | | |
Marathon Oil Corp. | | | 4,913 | | | | 110 | | |
Marathon Petroleum Corp. | | | 3,755 | | | | 309 | | |
Occidental Petroleum Corp. | | | 6,180 | | | | 364 | | |
ONEOK, Inc. | | | 3,100 | | | | 172 | | |
Phillips 66 | | | 3,340 | | | | 274 | | |
Pioneer Natural Resources Co. | | | 1,562 | | | | 348 | | |
Schlumberger NV | | | 9,812 | | | | 351 | | |
The Williams Cos., Inc. | | | 8,455 | | | | 264 | | |
Valero Energy Corp. | | | 2,833 | | | | 301 | | |
| | | | 9,643 | | |
Financials (10.8%): | |
Aflac, Inc. | | | 4,114 | | | | 228 | | |
American Express Co. | | | 4,234 | | | | 587 | | |
American International Group, Inc. | | | 5,499 | | | | 281 | | |
Ameriprise Financial, Inc. | | | 763 | | | | 181 | | |
Aon PLC, Class A | | | 1,474 | | | | 398 | | |
Arthur J. Gallagher & Co. | | | 1,458 | | | | 238 | | |
Assurant, Inc. | | | 375 | | | | 65 | | |
Bank of America Corp. | | | 49,216 | | | | 1,532 | | |
Berkshire Hathaway, Inc., Class B (a) | | | 12,559 | | | | 3,429 | | |
BlackRock, Inc. | | | 989 | | | | 602 | | |
Brown & Brown, Inc. | | | 1,626 | | | | 95 | | |
Capital One Financial Corp. | | | 2,728 | | | | 284 | | |
Cboe Global Markets, Inc. | | | 737 | | | | 83 | | |
Chubb Ltd. | | | 2,941 | | | | 578 | | |
Cincinnati Financial Corp. | | | 1,035 | | | | 123 | | |
Citigroup, Inc. | | | 13,480 | | | | 620 | | |
Citizens Financial Group, Inc. | | | 3,405 | | | | 122 | | |
CME Group, Inc. | | | 2,495 | | | | 511 | | |
Comerica, Inc. | | | 908 | | | | 67 | | |
Discover Financial Services | | | 1,950 | | | | 184 | | |
Everest Re Group Ltd. | | | 274 | | | | 77 | | |
FactSet Research Systems, Inc. | | | 263 | | | | 101 | | |
Fifth Third Bancorp | | | 4,763 | | | | 160 | | |
First Republic Bank | | | 1,246 | | | | 180 | | |
Franklin Resources, Inc. | | | 1,943 | | | | 45 | | |
Globe Life, Inc. | | | 630 | | | | 61 | | |
Huntington Bancshares, Inc. | | | 9,990 | | | | 120 | | |
Intercontinental Exchange, Inc. | | | 3,875 | | | | 364 | | |
Invesco Ltd. | | | 2,337 | | | | 38 | | |
JPMorgan Chase & Co. | | | 20,388 | | | | 2,296 | | |
See notes to financial statements.
66
Victory Portfolios
Victory S&P 500 Index Fund | | Schedule of Portfolio Investments — continued
June 30, 2022 | |
(Amounts in Thousands, Except for Shares)
Security Description | | Shares | | Value | |
KeyCorp | | | 6,473 | | | $ | 112 | | |
Lincoln National Corp. | | | 1,122 | | | | 52 | | |
Loews Corp. | | | 1,350 | | | | 80 | | |
M&T Bank Corp. | | | 1,245 | | | | 198 | | |
MarketAxess Holdings, Inc. | | | 262 | | | | 67 | | |
Marsh & McLennan Cos., Inc. | | | 3,484 | | | | 541 | | |
MetLife, Inc. | | | 4,798 | | | | 301 | | |
Moody's Corp. | | | 1,114 | | | | 303 | | |
Morgan Stanley | | | 9,714 | | | | 739 | | |
MSCI, Inc. | | | 563 | | | | 232 | | |
Nasdaq, Inc. | | | 800 | | | | 122 | | |
Northern Trust Corp. | | | 1,446 | | | | 140 | | |
Principal Financial Group, Inc. | | | 1,631 | | | | 109 | | |
Prudential Financial, Inc. | | | 2,603 | | | | 249 | | |
Raymond James Financial, Inc. | | | 1,349 | | | | 121 | | |
Regions Financial Corp. | | | 6,487 | | | | 122 | | |
S&P Global, Inc. | | | 2,409 | | | | 812 | | |
Signature Bank | | | 437 | | | | 78 | | |
State Street Corp. | | | 2,548 | | | | 157 | | |
SVB Financial Group (a) | | | 409 | | | | 162 | | |
Synchrony Financial | | | 3,481 | | | | 96 | | |
T. Rowe Price Group, Inc. | | | 1,578 | | | | 179 | | |
The Allstate Corp. | | | 1,909 | | | | 242 | | |
The Bank of New York Mellon Corp. | | | 5,159 | | | | 215 | | |
The Charles Schwab Corp. | | | 10,469 | | | | 661 | | |
The Goldman Sachs Group, Inc. | | | 2,384 | | | | 708 | | |
The Hartford Financial Services Group Inc. | | | 2,283 | | | | 149 | | |
The PNC Financial Services Group, Inc. | | | 2,871 | | | | 453 | | |
The Progressive Corp. | | | 4,060 | | | | 472 | | |
The Travelers Cos., Inc. | | | 1,666 | | | | 282 | | |
Truist Financial Corp. | | | 9,242 | | | | 438 | | |
U.S. Bancorp | | | 9,385 | | | | 432 | | |
W.R. Berkley Corp. | | | 1,454 | | | | 99 | | |
Wells Fargo & Co. | | | 26,311 | | | | 1,031 | | |
Willis Towers Watson PLC | | | 774 | | | | 153 | | |
Zions Bancorp NA | | | 1,051 | | | | 54 | | |
| | | | 24,011 | | |
Health Care (15.0%): | |
Abbott Laboratories | | | 12,154 | | | | 1,321 | | |
AbbVie, Inc. | | | 12,267 | | | | 1,879 | | |
ABIOMED, Inc. (a) | | | 316 | | | | 78 | | |
Agilent Technologies, Inc. | | | 2,083 | | | | 247 | | |
Align Technology, Inc. (a) | | | 509 | | | | 121 | | |
AmerisourceBergen Corp. | | | 1,047 | | | | 148 | | |
Amgen, Inc. | | | 3,708 | | | | 902 | | |
Baxter International, Inc. | | | 3,495 | | | | 225 | | |
Becton Dickinson & Co. | | | 1,979 | | | | 488 | | |
Biogen, Inc. (a) | | | 1,017 | | | | 207 | | |
Bio-Rad Laboratories, Inc., Class A (a) | | | 150 | | | | 74 | | |
Bio-Techne Corp. | | | 272 | | | | 94 | | |
See notes to financial statements.
67
Victory Portfolios
Victory S&P 500 Index Fund | | Schedule of Portfolio Investments — continued
June 30, 2022 | |
(Amounts in Thousands, Except for Shares)
Security Description | | Shares | | Value | |
Boston Scientific Corp. (a) | | | 9,924 | | | $ | 370 | | |
Bristol-Myers Squibb Co. | | | 14,779 | | | | 1,138 | | |
Cardinal Health, Inc. | | | 1,891 | | | | 99 | | |
Catalent, Inc. (a) | | | 1,244 | | | | 134 | | |
Centene Corp. (a) | | | 4,060 | | | | 344 | | |
Charles River Laboratories International, Inc. (a) | | | 353 | | | | 76 | | |
Cigna Corp. | | | 2,202 | | | | 580 | | |
CVS Health Corp. | | | 9,103 | | | | 844 | | |
Danaher Corp. | | | 4,492 | | | | 1,139 | | |
DaVita, Inc. (a) | | | 420 | | | | 34 | | |
DENTSPLY SIRONA, Inc. | | | 1,496 | | | | 53 | | |
Dexcom, Inc. (a) | | | 2,725 | | | | 203 | | |
Edwards Lifesciences Corp. (a) | | | 4,316 | | | | 410 | | |
Elevance Health, Inc. | | | 1,674 | | | | 808 | | |
Eli Lilly & Co. | | | 5,474 | | | | 1,775 | | |
Gilead Sciences, Inc. (b) | | | 8,707 | | | | 538 | | |
HCA Healthcare, Inc. | | | 1,579 | | | | 265 | | |
Henry Schein, Inc. (a) | | | 958 | | | | 74 | | |
Hologic, Inc. (a) | | | 1,731 | | | | 120 | | |
Humana, Inc. | | | 878 | | | | 411 | | |
IDEXX Laboratories, Inc. (a) | | | 583 | | | | 205 | | |
Illumina, Inc. (a) | | | 1,091 | | | | 201 | | |
Incyte Corp. (a) | | | 1,307 | | | | 99 | | |
Intuitive Surgical, Inc. (a) | | | 2,492 | | | | 500 | | |
IQVIA Holdings, Inc. (a) | | | 1,314 | | | | 285 | | |
Johnson & Johnson (b) | | | 18,266 | | | | 3,242 | | |
Laboratory Corp. of America Holdings | | | 643 | | | | 151 | | |
McKesson Corp. | | | 1,009 | | | | 329 | | |
Medtronic PLC | | | 9,312 | | | | 836 | | |
Merck & Co., Inc. | | | 17,554 | | | | 1,600 | | |
Mettler-Toledo International, Inc. (a) | | | 157 | | | | 180 | | |
Moderna, Inc. (a) | | | 2,402 | | | | 343 | | |
Molina Healthcare, Inc. (a) | | | 407 | | | | 114 | | |
Organon & Co. | | | 1,761 | | | | 59 | | |
PerkinElmer, Inc. | | | 876 | | | | 125 | | |
Pfizer, Inc. | | | 38,949 | | | | 2,042 | | |
Quest Diagnostics, Inc. | | | 815 | | | | 108 | | |
Regeneron Pharmaceuticals, Inc. (a) | | | 750 | | | | 443 | | |
ResMed, Inc. | | | 1,015 | | | | 213 | | |
STERIS PLC | | | 695 | | | | 143 | | |
Stryker Corp. | | | 2,336 | | | | 465 | | |
Teleflex, Inc. | | | 326 | | | | 80 | | |
The Cooper Cos., Inc. | | | 342 | | | | 107 | | |
Thermo Fisher Scientific, Inc. | | | 2,717 | | | | 1,476 | | |
UnitedHealth Group, Inc. | | | 6,512 | | | | 3,345 | | |
Universal Health Services, Inc., Class B | | | 466 | | | | 47 | | |
Vertex Pharmaceuticals, Inc. (a) | | | 1,775 | | | | 500 | | |
Viatris, Inc. | | | 8,416 | | | | 88 | | |
Waters Corp. (a) | | | 418 | | | | 138 | | |
West Pharmaceutical Services, Inc. | | | 514 | | | | 155 | | |
See notes to financial statements.
68
Victory Portfolios
Victory S&P 500 Index Fund | | Schedule of Portfolio Investments — continued
June 30, 2022 | |
(Amounts in Thousands, Except for Shares)
Security Description | | Shares | | Value | |
Zimmer Biomet Holdings, Inc. | | | 1,455 | | | $ | 153 | | |
Zoetis, Inc. | | | 3,267 | | | | 562 | | |
| | | | 33,533 | | |
Industrials (7.9%): | |
3M Co. | | | 3,950 | | | | 511 | | |
A O Smith Corp. | | | 903 | | | | 49 | | |
Alaska Air Group, Inc. (a) | | | 875 | | | | 35 | | |
Allegion PLC | | | 610 | | | | 60 | | |
American Airlines Group, Inc. (a) | | | 4,509 | | | | 57 | | |
AMETEK, Inc. | | | 1,603 | | | | 176 | | |
C.H. Robinson Worldwide, Inc. | | | 883 | | | | 90 | | |
Carrier Global Corp. | | | 5,888 | | | | 210 | | |
Caterpillar, Inc. | | | 3,702 | | | | 662 | | |
Cintas Corp. | | | 604 | | | | 226 | | |
Copart, Inc. (a) | | | 1,484 | | | | 161 | | |
CSX Corp. | | | 15,093 | | | | 439 | | |
Cummins, Inc. | | | 979 | | | | 189 | | |
Deere & Co. | | | 1,938 | | | | 580 | | |
Delta Air Lines, Inc. (a) | | | 4,450 | | | | 129 | | |
Dover Corp. | | | 1,001 | | | | 121 | | |
Eaton Corp. PLC | | | 2,770 | | | | 349 | | |
Emerson Electric Co. | | | 4,123 | | | | 328 | | |
Equifax, Inc. | | | 849 | | | | 155 | | |
Expeditors International of Washington, Inc. | | | 1,164 | | | | 113 | | |
Fastenal Co. | | | 3,996 | | | | 199 | | |
FedEx Corp. | | | 1,655 | | | | 375 | | |
Fortive Corp. | | | 2,488 | | | | 135 | | |
Fortune Brands Home & Security, Inc. | | | 908 | | | | 54 | | |
Generac Holdings, Inc. (a) | | | 443 | | | | 93 | | |
General Dynamics Corp. | | | 1,600 | | | | 354 | | |
General Electric Co. | | | 7,640 | | | | 486 | | |
Honeywell International, Inc. | | | 4,725 | | | | 821 | | |
Howmet Aerospace, Inc. | | | 2,611 | | | | 82 | | |
Huntington Ingalls Industries, Inc. | | | 278 | | | | 61 | | |
IDEX Corp. | | | 528 | | | | 96 | | |
Illinois Tool Works, Inc. | | | 1,967 | | | | 359 | | |
Ingersoll Rand, Inc. (b) | | | 2,818 | | | | 119 | | |
J.B. Hunt Transport Services, Inc. | | | 582 | | | | 92 | | |
Jacobs Engineering Group, Inc. | | | 893 | | | | 114 | | |
Johnson Controls International PLC | | | 4,829 | | | | 231 | | |
L3Harris Technologies, Inc. | | | 1,339 | | | | 324 | | |
Leidos Holdings, Inc. | | | 949 | | | | 96 | | |
Lockheed Martin Corp. | | | 1,644 | | | | 707 | | |
Masco Corp. | | | 1,638 | | | | 83 | | |
Nielsen Holdings PLC | | | 2,497 | | | | 58 | | |
Nordson Corp. | | | 374 | | | | 76 | | |
Norfolk Southern Corp. | | | 1,654 | | | | 376 | | |
Northrop Grumman Corp. | | | 1,014 | | | | 485 | | |
Old Dominion Freight Line, Inc. | | | 637 | | | | 163 | | |
Otis Worldwide Corp. | | | 2,935 | | | | 207 | | |
See notes to financial statements.
69
Victory Portfolios
Victory S&P 500 Index Fund | | Schedule of Portfolio Investments — continued
June 30, 2022 | |
(Amounts in Thousands, Except for Shares)
Security Description | | Shares | | Value | |
PACCAR, Inc. | | | 2,413 | | | $ | 199 | | |
Parker-Hannifin Corp. | | | 891 | | | | 219 | | |
Pentair PLC | | | 1,148 | | | | 53 | | |
Quanta Services, Inc. | | | 998 | | | | 125 | | |
Raytheon Technologies Corp. | | | 10,324 | | | | 992 | | |
Republic Services, Inc. (b) | | | 1,447 | | | | 189 | | |
Robert Half International, Inc. | | | 767 | | | | 57 | | |
Rockwell Automation, Inc. | | | 807 | | | | 161 | | |
Rollins, Inc. | | | 1,573 | | | | 55 | | |
Roper Technologies, Inc. | | | 735 | | | | 290 | | |
Snap-on, Inc. | | | 371 | | | | 73 | | |
Southwest Airlines Co. (a) | | | 4,116 | | | | 149 | | |
Stanley Black & Decker, Inc. | | | 1,048 | | | | 110 | | |
Textron, Inc. | | | 1,493 | | | | 91 | | |
The Boeing Co. (a) | | | 3,860 | | | | 528 | | |
Trane Technologies PLC | | | 1,623 | | | | 211 | | |
TransDigm Group, Inc. (a) | | | 360 | | | | 193 | | |
Union Pacific Corp. | | | 4,360 | | | | 930 | | |
United Airlines Holdings, Inc. (a) | | | 2,268 | | | | 80 | | |
United Parcel Service, Inc., Class B | | | 5,098 | | | | 931 | | |
United Rentals, Inc. (a) | | | 497 | | | | 121 | | |
Verisk Analytics, Inc. | | | 1,096 | | | | 190 | | |
W.W. Grainger, Inc. | | | 298 | | | | 135 | | |
Waste Management, Inc. | | | 2,652 | | | | 406 | | |
Westinghouse Air Brake Technologies Corp. | | | 1,268 | | | | 104 | | |
Xylem, Inc. | | | 1,250 | | | | 98 | | |
| | | | 17,576 | | |
IT Services (4.3%): | |
Accenture PLC, Class A | | | 4,397 | | | | 1,221 | | |
Akamai Technologies, Inc. (a) | | | 1,113 | | | | 102 | | |
Automatic Data Processing, Inc. | | | 2,900 | | | | 609 | | |
Broadridge Financial Solutions, Inc. | | | 814 | | | | 116 | | |
Cognizant Technology Solutions Corp., Class A | | | 3,618 | | | | 244 | | |
DXC Technology Co. (a) | | | 1,697 | | | | 51 | | |
EPAM Systems, Inc. (a) | | | 397 | | | | 117 | | |
Fidelity National Information Services, Inc. | | | 4,240 | | | | 389 | | |
Fiserv, Inc. (a) | | | 4,038 | | | | 359 | | |
FleetCor Technologies, Inc. (a) | | | 537 | | | | 113 | | |
Gartner, Inc. (a) | | | 559 | | | | 135 | | |
Global Payments, Inc. | | | 1,954 | | | | 216 | | |
International Business Machines Corp. | | | 6,244 | | | | 882 | | |
Jack Henry & Associates, Inc. | | | 506 | | | | 91 | | |
Mastercard, Inc., Class A | | | 5,961 | | | | 1,881 | | |
Paychex, Inc. | | | 2,230 | | | | 254 | | |
PayPal Holdings, Inc. (a) | | | 8,039 | | | | 561 | | |
VeriSign, Inc. (a) | | | 662 | | | | 111 | | |
Visa, Inc., Class A | | | 11,424 | | | | 2,249 | | |
| | | | 9,701 | | |
See notes to financial statements.
70
Victory Portfolios
Victory S&P 500 Index Fund | | Schedule of Portfolio Investments — continued
June 30, 2022 | |
(Amounts in Thousands, Except for Shares)
Security Description | | Shares | | Value | |
Materials (2.6%): | |
Air Products and Chemicals, Inc. | | | 1,539 | | | $ | 370 | | |
Albemarle Corp. | | | 813 | | | | 170 | | |
Amcor PLC | | | 10,432 | | | | 130 | | |
Avery Dennison Corp. | | | 567 | | | | 92 | | |
Ball Corp. | | | 2,220 | | | | 153 | | |
Celanese Corp. | | | 752 | | | | 88 | | |
CF Industries Holdings, Inc. | | | 1,448 | | | | 124 | | |
Corteva, Inc. | | | 5,024 | | | | 272 | | |
Dow, Inc. | | | 5,054 | | | | 261 | | |
DuPont de Nemours, Inc. | | | 3,530 | | | | 196 | | |
Eastman Chemical Co. | | | 895 | | | | 80 | | |
Ecolab, Inc. | | | 1,725 | | | | 265 | | |
FMC Corp. | | | 874 | | | | 93 | | |
Freeport-McMoRan, Inc. | | | 10,060 | | | | 294 | | |
International Flavors & Fragrances, Inc. | | | 1,769 | | | | 211 | | |
International Paper Co. | | | 2,573 | | | | 108 | | |
Linde PLC | | | 3,494 | | | | 1,005 | | |
LyondellBasell Industries NV, Class A | | | 1,797 | | | | 157 | | |
Martin Marietta Materials, Inc. | | | 433 | | | | 130 | | |
Newmont Corp. | | | 5,509 | | | | 329 | | |
Nucor Corp. | | | 1,847 | | | | 193 | | |
Packaging Corp. of America | | | 650 | | | | 89 | | |
PPG Industries, Inc. | | | 1,640 | | | | 187 | | |
Sealed Air Corp. | | | 1,014 | | | | 59 | | |
The Mosaic Co. | | | 2,513 | | | | 119 | | |
The Sherwin-Williams Co. | | | 1,661 | | | | 372 | | |
Vulcan Materials Co. | | | 923 | | | | 131 | | |
Westrock Co. | | | 1,769 | | | | 70 | | |
| | | | 5,748 | | |
Real Estate (2.9%): | |
Alexandria Real Estate Equities, Inc. | | | 1,031 | | | | 149 | | |
American Tower Corp. | | | 3,226 | | | | 825 | | |
AvalonBay Communities, Inc. | | | 971 | | | | 189 | | |
Boston Properties, Inc. | | | 990 | | | | 88 | | |
Camden Property Trust | | | 739 | | | | 99 | | |
CBRE Group, Inc., Class A (a) | | | 2,269 | | | | 167 | | |
Crown Castle International Corp. | | | 3,006 | | | | 506 | | |
Digital Realty Trust, Inc. | | | 1,976 | | | | 257 | | |
Duke Realty Corp. | | | 2,669 | | | | 147 | | |
Equinix, Inc. | | | 632 | | | | 415 | | |
Equity Residential | | | 2,375 | | | | 171 | | |
Essex Property Trust, Inc. | | | 454 | | | | 119 | | |
Extra Space Storage, Inc. | | | 932 | | | | 159 | | |
Federal Realty Investment Trust | | | 496 | | | | 47 | | |
Healthpeak Properties, Inc. | | | 3,745 | | | | 97 | | |
Host Hotels & Resorts, Inc. | | | 4,962 | | | | 78 | | |
Iron Mountain, Inc. | | | 2,017 | | | | 98 | | |
Kimco Realty Corp. | | | 4,290 | | | | 85 | | |
Mid-America Apartment Communities, Inc. | | | 801 | | | | 140 | | |
See notes to financial statements.
71
Victory Portfolios
Victory S&P 500 Index Fund | | Schedule of Portfolio Investments — continued
June 30, 2022 | |
(Amounts in Thousands, Except for Shares)
Security Description | | Shares | | Value | |
Prologis, Inc. | | | 5,139 | | | $ | 605 | | |
Public Storage | | | 1,060 | | | | 331 | | |
Realty Income Corp. | | | 4,176 | | | | 285 | | |
Regency Centers Corp. | | | 1,077 | | | | 64 | | |
SBA Communications Corp. | | | 749 | | | | 240 | | |
Simon Property Group, Inc. | | | 2,279 | | | | 216 | | |
UDR, Inc. | | | 2,078 | | | | 96 | | |
Ventas, Inc. | | | 2,775 | | | | 143 | | |
VICI Properties, Inc. | | | 6,685 | | | | 199 | | |
Vornado Realty Trust | | | 1,105 | | | | 32 | | |
Welltower, Inc. | | | 3,151 | | | | 259 | | |
Weyerhaeuser Co. | | | 5,168 | | | | 171 | | |
| | | | 6,477 | | |
Semiconductors & Semiconductor Equipment (5.1%): | |
Advanced Micro Devices, Inc. (a) | | | 11,249 | | | | 860 | | |
Analog Devices, Inc. | | | 3,633 | | | | 531 | | |
Applied Materials, Inc. | | | 6,132 | | | | 558 | | |
Broadcom, Inc. | | | 2,834 | | | | 1,377 | | |
Enphase Energy, Inc. (a) | | | 937 | | | | 183 | | |
Intel Corp. | | | 28,384 | | | | 1,062 | | |
KLA Corp. | | | 1,036 | | | | 331 | | |
Lam Research Corp. | | | 963 | | | | 410 | | |
Microchip Technology, Inc. | | | 3,859 | | | | 224 | | |
Micron Technology, Inc. | | | 7,751 | | | | 428 | | |
Monolithic Power Systems, Inc. | | | 304 | | | | 117 | | |
NVIDIA Corp. | | | 17,382 | | | | 2,635 | | |
NXP Semiconductors NV | | | 1,823 | | | | 270 | | |
ON Semiconductor Corp. (a) | | | 3,016 | | | | 152 | | |
Qorvo, Inc. (a) | | | 753 | | | | 71 | | |
QUALCOMM, Inc. | | | 7,775 | | | | 993 | | |
Skyworks Solutions, Inc. | | | 1,117 | | | | 103 | | |
SolarEdge Technologies, Inc. (a) | | | 384 | | | | 105 | | |
Teradyne, Inc. | | | 1,112 | | | | 100 | | |
Texas Instruments, Inc. | | | 6,401 | | | | 983 | | |
| | | | 11,493 | | |
Software (8.8%): | |
Adobe, Inc. (a) | | | 3,280 | | | | 1,201 | | |
ANSYS, Inc. (a) | | | 604 | | | | 144 | | |
Autodesk, Inc. (a) | | | 1,510 | | | | 260 | | |
Cadence Design Systems, Inc. (a) | | | 1,914 | | | | 287 | | |
Ceridian HCM Holding, Inc. (a) | | | 954 | | | | 45 | | |
Citrix Systems, Inc. | | | 866 | | | | 84 | | |
Fortinet, Inc. (a) | | | 4,625 | | | | 262 | | |
Intuit, Inc. | | | 1,963 | | | | 757 | | |
Microsoft Corp. (b) | | | 51,917 | | | | 13,334 | | |
NortonLifeLock, Inc. | | | 4,039 | | | | 89 | | |
Oracle Corp. | | | 10,928 | | | | 763 | | |
Paycom Software, Inc. (a) | | | 334 | | | | 93 | | |
PTC, Inc. (a) | | | 731 | | | | 78 | | |
See notes to financial statements.
72
Victory Portfolios
Victory S&P 500 Index Fund | | Schedule of Portfolio Investments — continued
June 30, 2022 | |
(Amounts in Thousands, Except for Shares)
Security Description | | Shares | | Value | |
Salesforce, Inc. (a) | | | 6,897 | | | $ | 1,138 | | |
ServiceNow, Inc. (a) (b) | | | 1,392 | | | | 662 | | |
Synopsys, Inc. (a) | | | 1,063 | | | | 323 | | |
Tyler Technologies, Inc. (a) | | | 288 | | | | 96 | | |
| | | | 19,616 | | |
Technology Hardware, Storage & Peripherals (6.8%): | |
Apple, Inc. | | | 106,734 | | | | 14,593 | | |
Hewlett Packard Enterprise Co. | | | 9,025 | | | | 119 | | |
HP, Inc. | | | 7,312 | | | | 240 | | |
NetApp, Inc. | | | 1,545 | | | | 101 | | |
Seagate Technology Holdings PLC | | | 1,372 | | | | 98 | | |
Western Digital Corp. (a) | | | 2,174 | | | | 97 | | |
| | | | 15,248 | | |
Utilities (3.1%): | |
Alliant Energy Corp. | | | 1,741 | | | | 102 | | |
Ameren Corp. | | | 1,793 | | | | 162 | | |
American Electric Power Co., Inc. (b) | | | 3,565 | | | | 342 | | |
American Water Works Co., Inc. | | | 1,262 | | | | 188 | | |
Atmos Energy Corp. | | | 965 | | | | 108 | | |
CenterPoint Energy, Inc. | | | 4,369 | | | | 129 | | |
CMS Energy Corp. | | | 2,014 | | | | 136 | | |
Consolidated Edison, Inc. (b) | | | 2,459 | | | | 234 | | |
Constellation Energy Corp. | | | 2,268 | | | | 130 | | |
Dominion Energy, Inc. | | | 5,632 | | | | 450 | | |
DTE Energy Co. | | | 1,345 | | | | 171 | | |
Duke Energy Corp. (b) | | | 5,344 | | | | 573 | | |
Edison International | | | 2,646 | | | | 167 | | |
Entergy Corp. | | | 1,412 | | | | 159 | | |
Evergy, Inc. (b) | | | 1,593 | | | | 104 | | |
Eversource Energy (b) | | | 2,394 | | | | 202 | | |
Exelon Corp. | | | 6,804 | | | | 308 | | |
FirstEnergy Corp. | | | 3,963 | | | | 152 | | |
NextEra Energy, Inc. (b) | | | 13,637 | | | | 1,056 | | |
NiSource, Inc. | | | 2,817 | | | | 83 | | |
NRG Energy, Inc. | | | 1,647 | | | | 63 | | |
Pinnacle West Capital Corp. | | | 784 | | | | 57 | | |
PPL Corp. | | | 5,108 | | | | 139 | | |
Public Service Enterprise Group, Inc. | | | 3,466 | | | | 219 | | |
Sempra Energy | | | 2,182 | | | | 328 | | |
The AES Corp. | | | 4,636 | | | | 98 | | |
The Southern Co. (b) | | | 7,376 | | | | 526 | | |
WEC Energy Group, Inc. (b) | | | 2,190 | | | | 220 | | |
Xcel Energy, Inc. (b) | | | 3,781 | | | | 268 | | |
| | | | 6,874 | | |
Total Common Stocks (Cost $47,534) | | | | | 221,457 | | |
See notes to financial statements.
73
Victory Portfolios
Victory S&P 500 Index Fund | | Schedule of Portfolio Investments — continued
June 30, 2022 | |
(Amounts in Thousands, Except for Shares)
Security Description | | Shares | | Value | |
Collateral for Securities Loaned (0.1%)^ | |
BlackRock Liquidity Funds TempFund, Institutional Shares, 1.47% (d) | | | 5,581 | | | $ | 5 | | |
Goldman Sachs Financial Square Prime Obligations Fund, Institutional Shares,
1.42% (d) | | | 2,785 | | | | 3 | | |
HSBC U.S. Government Money Market Fund, I Shares, 1.46% (d) | | | 34,739 | | | | 35 | | |
JPMorgan Prime Money Market Fund, Capital Shares, 1.50% (d) | | | 22,210 | | | | 22 | | |
Morgan Stanley Institutional Liquidity Government Portfolio, Institutional Shares,
1.39% (d) | | | 14,811 | | | | 15 | | |
Morgan Stanley Institutional Liquidity Prime Portfolio, Institutional Shares,
1.53% (d) | | | 99,858 | | | | 100 | | |
Total Collateral for Securities Loaned (Cost $180) | | | | | 180 | | |
Total Investments (Cost $47,714) — 99.3% | | | | | 221,637 | | |
Other assets in excess of liabilities — 0.7% | | | | | 1,592 | | |
NET ASSETS — 100.00% | | | | $ | 223,229 | | |
^ Purchased with cash collateral from securities on loan.
(a) Non-income producing security.
(b) All or a portion of this security has been segregated as collateral for derivative instruments.
(c) All or a portion of this security is on loan.
(d) Rate disclosed is the daily yield on June 30, 2022.
PLC — Public Limited Company
Futures Contracts Purchased | |
(Amounts not in thousands) | |
| | | Number of
Contracts | | Expiration
Date | | Notional
Amount | | Value | | Unrealized
Appreciation/
(Depreciation) | |
E-Mini S&P 500 Futures | | | 9 | | | 9/16/22 | | $ | 1,764,756 | | | $ | 1,705,275 | | | $ | (59,481 | ) | |
Total unrealized appreciation | | $ | — | | |
Total unrealized depreciation | | | (59,481 | ) | |
Total net unrealized appreciation (depreciation) | | $ | (59,481 | ) | |
See notes to financial statements.
74
Victory Portfolios
Victory Munder Mid-Cap Core Growth Fund | | Schedule of Portfolio Investments
June 30, 2022 | |
(Amounts in Thousands, Except for Shares)
Security Description | | Shares | | Value | |
Common Stocks (96.7%) | |
Communication Services (1.5%): | |
Live Nation Entertainment, Inc. (a) | | | 68,444 | | | $ | 5,652 | | |
Consumer Discretionary (10.0%): | |
Airbnb, Inc., Class A (a) | | | 21,200 | | | | 1,888 | | |
AutoZone, Inc. (a) | | | 3,300 | | | | 7,092 | | |
Choice Hotels International, Inc. | | | 45,100 | | | | 5,034 | | |
D.R. Horton, Inc. | | | 29,700 | | | | 1,966 | | |
Dollar General Corp. | | | 17,600 | | | | 4,320 | | |
Lithia Motors, Inc. | | | 9,900 | | | | 2,721 | | |
Marriott Vacations Worldwide Corp. | | | 26,421 | | | | 3,070 | | |
NVR, Inc. (a) | | | 1,200 | | | | 4,805 | | |
Pool Corp. | | | 15,300 | | | | 5,374 | | |
| | | | 36,270 | | |
Consumer Staples (5.8%): | |
Casey's General Stores, Inc. | | | 29,700 | | | | 5,494 | | |
Church & Dwight Co., Inc. | | | 59,600 | | | | 5,523 | | |
Darling Ingredients, Inc. (a) | | | 84,300 | | | | 5,041 | | |
McCormick & Co., Inc. | | | 61,600 | | | | 5,128 | | |
| | | | 21,186 | | |
Energy (5.8%): | |
Cheniere Energy, Inc. | | | 62,000 | | | | 8,248 | | |
Diamondback Energy, Inc. | | | 52,800 | | | | 6,397 | | |
EOG Resources, Inc. | | | 60,500 | | | | 6,681 | | |
| | | | 21,326 | | |
Financials (10.6%): | |
Brown & Brown, Inc. | | | 131,500 | | | | 7,672 | | |
East West Bancorp, Inc. | | | 69,000 | | | | 4,471 | | |
Evercore, Inc. | | | 26,200 | | | | 2,453 | | |
FactSet Research Systems, Inc. | | | 13,000 | | | | 4,999 | | |
Kinsale Capital Group, Inc. | | | 26,500 | | | | 6,085 | | |
MSCI, Inc. | | | 12,600 | | | | 5,193 | | |
W.R. Berkley Corp. | | | 112,550 | | | | 7,683 | | |
| | | | 38,556 | | |
Health Care (11.8%): | |
Agilent Technologies, Inc. | | | 44,693 | | | | 5,308 | | |
Edwards Lifesciences Corp. (a) | | | 53,600 | | | | 5,097 | | |
Halozyme Therapeutics, Inc. (a) | | | 101,000 | | | | 4,444 | | |
Horizon Therapeutics PLC (a) | | | 51,100 | | | | 4,076 | | |
IDEXX Laboratories, Inc. (a) | | | 8,600 | | | | 3,016 | | |
Insulet Corp. (a) | | | 12,200 | | | | 2,659 | | |
Intra-Cellular Therapies, Inc. (a) | | | 48,400 | | | | 2,763 | | |
IQVIA Holdings, Inc. (a) | | | 28,800 | | | | 6,249 | | |
Neurocrine Biosciences, Inc. (a) | | | 43,800 | | | | 4,269 | | |
Zoetis, Inc. | | | 28,930 | | | | 4,973 | | |
| | | | 42,854 | | |
See notes to financial statements.
75
Victory Portfolios
Victory Munder Mid-Cap Core Growth Fund | | Schedule of Portfolio Investments — continued
June 30, 2022 | |
(Amounts in Thousands, Except for Shares)
Security Description | | Shares | | Value | |
Industrials (14.8%): | |
Advanced Drainage Systems, Inc. | | | 45,400 | | | $ | 4,089 | | |
AMETEK, Inc. | | | 41,100 | | | | 4,517 | | |
Chart Industries, Inc. (a) (b) | | | 30,500 | | | | 5,105 | | |
Copa Holdings SA (a) | | | 65,600 | | | | 4,157 | | |
HEICO Corp. | | | 44,500 | | | | 5,835 | | |
IDEX Corp. | | | 21,500 | | | | 3,905 | | |
Masco Corp. | | | 78,300 | | | | 3,962 | | |
Old Dominion Freight Line, Inc. | | | 17,050 | | | | 4,370 | | |
TFI International, Inc. | | | 24,900 | | | | 1,999 | | |
The Middleby Corp. (a) | | | 14,300 | | | | 1,793 | | |
Trane Technologies PLC | | | 13,700 | | | | 1,779 | | |
Trex Co., Inc. (a) | | | 49,300 | | | | 2,683 | | |
Verisk Analytics, Inc. | | | 28,200 | | | | 4,881 | | |
WESCO International, Inc. (a) | | | 44,400 | | | | 4,755 | | |
| | | | 53,830 | | |
Information Technology (17.0%): | |
Advanced Micro Devices, Inc. (a) | | | 45,300 | | | | 3,464 | | |
Amphenol Corp., Class A | | | 82,920 | | | | 5,338 | | |
CDW Corp. | | | 42,559 | | | | 6,706 | | |
Crowdstrike Holdings, Inc., Class A (a) | | | 13,700 | | | | 2,309 | | |
CyberArk Software Ltd. (a) | | | 14,100 | | | | 1,804 | | |
Fair Isaac Corp. (a) | | | 12,900 | | | | 5,172 | | |
Global Payments, Inc. | | | 42,200 | | | | 4,669 | | |
KLA Corp. | | | 18,300 | | | | 5,839 | | |
Monolithic Power Systems, Inc. | | | 12,800 | | | | 4,916 | | |
Qualys, Inc. (a) | | | 15,700 | | | | 1,980 | | |
ServiceNow, Inc. (a) | | | 6,200 | | | | 2,948 | | |
Synopsys, Inc. (a) | | | 24,500 | | | | 7,441 | | |
Teledyne Technologies, Inc. (a) | | | 15,800 | | | | 5,927 | | |
The Trade Desk, Inc., Class A (a) | | | 77,400 | | | | 3,242 | | |
| | | | 61,755 | | |
Materials (6.4%): | |
Avery Dennison Corp. | | | 41,700 | | | | 6,750 | | |
FMC Corp. | | | 57,900 | | | | 6,196 | | |
Freeport-McMoRan, Inc. | | | 77,500 | | | | 2,268 | | |
Huntsman Corp. | | | 160,500 | | | | 4,550 | | |
Louisiana-Pacific Corp. | | | 69,600 | | | | 3,648 | | |
| | | | 23,412 | | |
Real Estate (7.3%): | |
Crown Castle International Corp. | | | 30,900 | | | | 5,203 | | |
Digital Realty Trust, Inc. | | | 39,946 | | | | 5,186 | | |
SBA Communications Corp. | | | 18,403 | | | | 5,890 | | |
Sun Communities, Inc. | | | 34,416 | | | | 5,484 | | |
Ventas, Inc. | | | 90,600 | | | | 4,660 | | |
| | | | 26,423 | | |
See notes to financial statements.
76
Victory Portfolios
Victory Munder Mid-Cap Core Growth Fund | | Schedule of Portfolio Investments — continued
June 30, 2022 | |
(Amounts in Thousands, Except for Shares)
Security Description | | Shares | | Value | |
Utilities (5.7%): | |
Atmos Energy Corp. | | | 67,900 | | | $ | 7,612 | | |
Essential Utilities, Inc. | | | 136,100 | | | | 6,240 | | |
Sempra Energy | | | 46,039 | | | | 6,918 | | |
| | | | 20,770 | | |
Total Common Stocks (Cost $298,171) | | | 352,034 | | |
Exchange-Traded Funds (2.2%) | |
SPDR S&P MidCap 400 ETF | | | 19,450 | | | | 8,043 | | |
Total Exchange-Traded Funds (Cost $8,459) | | | 8,043 | | |
Collateral for Securities Loaned (0.6%)^ | |
BlackRock Liquidity Funds TempFund, Institutional Shares, 1.47% (c) | | | 68,016 | | | | 68 | | |
Goldman Sachs Financial Square Prime Obligations Fund, Institutional Shares,
1.42% (c) | | | 33,944 | | | | 34 | | |
HSBC U.S. Government Money Market Fund, I Shares, 1.46% (c) | | | 423,344 | | | | 423 | | |
JPMorgan Prime Money Market Fund, Capital Shares, 1.50% (c) | | | 270,655 | | | | 271 | | |
Morgan Stanley Institutional Liquidity Government Portfolio, Institutional Shares,
1.39% (c) | | | 180,496 | | | | 180 | | |
Morgan Stanley Institutional Liquidity Prime Portfolio, Institutional Shares,
1.53% (c) | | | 1,216,917 | | | | 1,217 | | |
Total Collateral for Securities Loaned (Cost $2,193) | | | 2,193 | | |
Total Investments (Cost $308,823) — 99.5% | | | 362,270 | | |
Other assets in excess of liabilities — 0.5% | | | 1,650 | | |
NET ASSETS — 100.00% | | $ | 363,920 | | |
^ Purchased with cash collateral from securities on loan.
(a) Non-income producing security.
(b) All or a portion of this security is on loan.
(c) Rate disclosed is the daily yield on June 30, 2022.
ETF — Exchange-Traded Fund
PLC — Public Limited Company
See notes to financial statements.
77
Victory Portfolios
Victory Munder Small Cap Growth Fund | | Schedule of Portfolio Investments
June 30, 2022 | |
(Amounts in Thousands, Except for Shares)
Security Description | | Shares | | Value | |
Common Stocks (98.4%) | |
Communication Services (2.2%): | |
Cian PLC, ADR (a) (b) (f) | | | 77 | | | $ | — | (c) | |
Iridium Communications, Inc. (a) | | | 3,561 | | | | 134 | | |
Radius Global Infrastructure, Inc., Class A (a) | | | 6,300 | | | | 96 | | |
| | | | 230 | | |
Consumer Discretionary (12.0%): | |
Academy Sports & Outdoors, Inc. | | | 4,217 | | | | 150 | | |
Brunswick Corp. | | | 1,273 | | | | 83 | | |
Burlington Stores, Inc. (a) | | | 509 | | | | 69 | | |
Cavco Industries, Inc. (a) | | | 567 | | | | 111 | | |
Chegg, Inc. (a) | | | 1,378 | | | | 26 | | |
F45 Training Holdings, Inc. (a) (d) | | | 14,831 | | | | 58 | | |
Five Below, Inc. (a) | | | 616 | | | | 70 | | |
Group 1 Automotive, Inc. | | | 882 | | | | 150 | | |
Kohl's Corp. | | | 2,352 | | | | 84 | | |
Kura Sushi USA, Inc., Class A (a) | | | 2,130 | | | | 105 | | |
Legacy Housing Corp. (a) | | | 5,799 | | | | 76 | | |
Polaris, Inc. | | | 866 | | | | 86 | | |
Skyline Champion Corp. (a) | | | 3,307 | | | | 157 | | |
Sweetgreen, Inc., Class A (a) | | | 2,488 | | | | 29 | | |
Torrid Holdings, Inc. (a) (d) | | | 9,039 | | | | 39 | | |
| | | | 1,293 | | |
Consumer Staples (5.2%): | |
Albertsons Cos., Inc., Class A | | | 2,824 | | | | 75 | | |
Celsius Holdings, Inc. (a) (d) | | | 1,710 | | | | 112 | | |
Performance Food Group Co. (a) | | | 4,200 | | | | 193 | | |
Sovos Brands, Inc. (a) | | | 11,486 | | | | 182 | | |
| | | | 562 | | |
Energy (4.9%): | |
Magnolia Oil & Gas Corp., Class A | | | 11,674 | | | | 245 | | |
New Fortress Energy, Inc. | | | 1,580 | | | | 62 | | |
Talos Energy, Inc. (a) | | | 14,134 | | | | 219 | | |
| | | | 526 | | |
Financials (12.4%): | |
American Business Bank (a) | | | 1,652 | | | | 66 | | |
Coastal Financial Corp. (a) | | | 5,370 | | | | 205 | | |
Colony Bankcorp, Inc. | | | 2,215 | | | | 33 | | |
Customers Bancorp, Inc. (a) | | | 3,942 | | | | 134 | | |
First Western Financial, Inc. (a) | | | 2,768 | | | | 75 | | |
Morningstar, Inc. | | | 483 | | | | 117 | | |
Radian Group, Inc. | | | 5,519 | | | | 108 | | |
Silvercrest Asset Management Group, Inc., Class A | | | 11,001 | | | | 181 | | |
SLM Corp. | | | 5,481 | | | | 87 | | |
South Plains Financial, Inc. | | | 5,120 | | | | 124 | | |
See notes to financial statements.
78
Victory Portfolios
Victory Munder Small Cap Growth Fund | | Schedule of Portfolio Investments — continued
June 30, 2022 | |
(Amounts in Thousands, Except for Shares)
Security Description | | Shares | | Value | |
Tradeweb Markets, Inc., Class A | | | 1,226 | | | $ | 84 | | |
WTB Financial Corp., Class B | | | 360 | | | | 122 | | |
| | | | 1,336 | | |
Health Care (18.5%): | |
4D Molecular Therapeutics, Inc. (a) | | | 662 | | | | 5 | | |
Akero Therapeutics, Inc. (a) | | | 1,608 | | | | 15 | | |
Alpha Teknova, Inc. (a) | | | 2,306 | | | | 19 | | |
Arrowhead Pharmaceuticals, Inc. (a) | | | 1,813 | | | | 64 | | |
Aurinia Pharmaceuticals, Inc. (a) | | | 6,904 | | | | 69 | | |
Avidity Biosciences, Inc. (a) (d) | | | 1,205 | | | | 17 | | |
Beam Therapeutics, Inc. (a) | | | 1,233 | | | | 48 | | |
Bicycle Therapeutics PLC, ADR (a) (d) | | | 2,928 | | | | 49 | | |
BioMarin Pharmaceutical, Inc. (a) | | | 283 | | | | 23 | | |
C4 Therapeutics, Inc. (a) (d) | | | 249 | | | | 2 | | |
Cabaletta Bio, Inc. (a) | | | 2,967 | | | | 3 | | |
Castle Biosciences, Inc. (a) | | | 2,000 | | | | 44 | | |
Cerus Corp. (a) | | | 6,712 | | | | 35 | | |
Codiak Biosciences, Inc. (a) | | | 6,305 | | | | 18 | | |
Collegium Pharmaceutical, Inc. (a) | | | 1,187 | | | | 21 | | |
CRISPR Therapeutics AG (a) (d) | | | 410 | | | | 25 | | |
CryoPort, Inc. (a) | | | 1,655 | | | | 51 | | |
Dynavax Technologies Corp. (a) | | | 6,261 | | | | 79 | | |
Fusion Pharmaceuticals, Inc. (a) | | | 4,261 | | | | 11 | | |
Gamida Cell Ltd. (a) | | | 9,195 | | | | 16 | | |
Generation Bio Co. (a) | | | 1,180 | | | | 8 | | |
Genetron Holdings Ltd., ADR (a) (d) | | | 5,361 | | | | 9 | | |
Henry Schein, Inc. (a) | | | 1,145 | | | | 88 | | |
Horizon Therapeutics PLC (a) | | | 987 | | | | 79 | | |
IGM Biosciences, Inc. (a) (d) | | | 796 | | | | 14 | | |
Immunocore Holdings PLC, ADR (a) (d) | | | 699 | | | | 26 | | |
Inari Medical, Inc. (a) | | | 2,605 | | | | 177 | | |
Instil Bio, Inc. (a) (d) | | | 1,072 | | | | 5 | | |
Insulet Corp. (a) | | | 546 | | | | 119 | | |
Intellia Therapeutics, Inc. (a) | | | 1,502 | | | | 78 | | |
IO Biotech, Inc. (a) | | | 77 | | | | — | (c) | |
Iovance Biotherapeutics, Inc. (a) | | | 2,461 | | | | 27 | | |
LianBio, ADR (a) | | | 13,402 | | | | 29 | | |
Maravai LifeSciences Holdings, Inc., Class A (a) | | | 1,150 | | | | 33 | | |
Merit Medical Systems, Inc. (a) | | | 1,525 | | | | 83 | | |
NanoString Technologies, Inc. (a) | | | 3,309 | | | | 42 | | |
Natera, Inc. (a) | | | 1,954 | | | | 69 | | |
NeoGenomics, Inc. (a) | | | 3,529 | | | | 29 | | |
Neurocrine Biosciences, Inc. (a) | | | 336 | | | | 33 | | |
Nurix Therapeutics, Inc. (a) | | | 439 | | | | 6 | | |
ORIC Pharmaceuticals, Inc. (a) | | | 3,909 | | | | 17 | | |
Oyster Point Pharma, Inc. (a) (d) | | | 396 | | | | 2 | | |
PMV Pharmaceuticals, Inc. (a) (d) | | | 280 | | | | 4 | | |
PolyPid Ltd. (a) | | | 7,333 | | | | 34 | | |
Pulmonx Corp. (a) (d) | | | 1,906 | | | | 28 | | |
See notes to financial statements.
79
Victory Portfolios
Victory Munder Small Cap Growth Fund | | Schedule of Portfolio Investments — continued
June 30, 2022 | |
(Amounts in Thousands, Except for Shares)
Security Description | | Shares | | Value | |
RadNet, Inc. (a) | | | 3,159 | | | $ | 55 | | |
Reata Pharmaceuticals, Inc., Class A (a) | | | 645 | | | | 20 | | |
Recursion Pharmaceuticals, Inc., Class A (a) | | | 218 | | | | 2 | | |
Repligen Corp. (a) | | | 370 | | | | 60 | | |
Singular Genomics Systems, Inc. (a) (d) | | | 5,036 | | | | 19 | | |
Stoke Therapeutics, Inc. (a) | | | 1,486 | | | | 20 | | |
Sutro Biopharma, Inc. (a) | | | 3,661 | | | | 19 | | |
TCR2 Therapeutics, Inc. (a) | | | 8,824 | | | | 26 | | |
TG Therapeutics, Inc. (a) | | | 2,119 | | | | 9 | | |
Veracyte, Inc. (a) | | | 3,428 | | | | 68 | | |
Xencor, Inc. (a) | | | 822 | | | | 22 | | |
Zai Lab Ltd., ADR (a) | | | 598 | | | | 21 | | |
| | | | 1,994 | | |
Industrials (14.8%): | |
AGCO Corp. | | | 1,000 | | | | 99 | | |
ASGN, Inc. (a) | | | 1,743 | | | | 157 | | |
BWX Technologies, Inc. | | | 1,070 | | | | 59 | | |
Casella Waste Systems, Inc. (a) | | | 2,176 | | | | 158 | | |
Chart Industries, Inc. (a) | | | 1,114 | | | | 186 | | |
Construction Partners, Inc., Class A (a) | | | 1,877 | | | | 39 | | |
ESCO Technologies, Inc. | | | 571 | | | | 39 | | |
Kaman Corp. | | | 1,610 | | | | 50 | | |
Kratos Defense & Security Solutions, Inc. (a) | | | 6,093 | | | | 85 | | |
McGrath RentCorp | | | 1,522 | | | | 116 | | |
Owens Corning | | | 2,069 | | | | 154 | | |
PGT Innovations, Inc. (a) | | | 3,825 | | | | 64 | | |
Regal Rexnord Corp. | | | 340 | | | | 39 | | |
Sensata Technologies Holding PLC | | | 1,965 | | | | 81 | | |
Shoals Technologies Group, Inc., Class A (a) | | | 8,596 | | | | 142 | | |
The AZEK Co., Inc. (a) | | | 2,561 | | | | 43 | | |
Zurn Water Solutions Corp. | | | 2,954 | | | | 80 | | |
| | | | 1,591 | | |
Information Technology (22.2%): | |
ACV Auctions, Inc., Class A (a) | | | 357 | | | | 2 | | |
Alteryx, Inc., Class A (a) | | | 441 | | | | 21 | | |
Avaya Holdings Corp. (a) (d) | | | 12,599 | | | | 28 | | |
Blackline, Inc. (a) | | | 2,235 | | | | 149 | | |
BM Technologies, Inc. (a) (d) | | | 606 | | | | 4 | | |
C3.ai, Inc., Class A (a) (d) | | | 848 | | | | 16 | | |
Couchbase, Inc. (a) | | | 377 | | | | 6 | | |
CS Disco, Inc. (a) | | | 4,343 | | | | 78 | | |
Digital Turbine, Inc. (a) | | | 1,163 | | | | 20 | | |
DoubleVerify Holdings, Inc. (a) | | | 363 | | | | 8 | | |
Dropbox, Inc., Class A (a) | | | 1,247 | | | | 26 | | |
Elastic NV (a) | | | 2,867 | | | | 194 | | |
Endava PLC, ADR (a) | | | 1,637 | | | | 145 | | |
Expensify, Inc., Class A (a) | | | 5,375 | | | | 96 | | |
Flywire Corp. (a) | | | 1,122 | | | | 20 | | |
See notes to financial statements.
80
Victory Portfolios
Victory Munder Small Cap Growth Fund | | Schedule of Portfolio Investments — continued
June 30, 2022 | |
(Amounts in Thousands, Except for Shares)
Security Description | | Shares | | Value | |
ForgeRock, Inc., Class A (a) (d) | | | 383 | | | $ | 8 | | |
Freshworks, Inc., Class A (a) (d) | | | 3,873 | | | | 51 | | |
Globant SA (a) | | | 841 | | | | 146 | | |
Intapp, Inc. (a) | | | 75 | | | | 1 | | |
JFrog Ltd. (a) | | | 6,700 | | | | 141 | | |
Mitek Systems, Inc. (a) | | | 9,134 | | | | 84 | | |
Monday.com Ltd. (a) (d) | | | 37 | | | | 4 | | |
Napco Security Technologies, Inc. (a) | | | 10,722 | | | | 221 | | |
PagerDuty, Inc. (a) | | | 4,305 | | | | 107 | | |
Ping Identity Holding Corp. (a) | | | 3,255 | | | | 59 | | |
SentinelOne, Inc., Class A (a) | | | 3,720 | | | | 87 | | |
Shift4 Payments, Inc., Class A (a) | | | 1,480 | | | | 49 | | |
SiTime Corp. (a) | | | 1,041 | | | | 170 | | |
Smartsheet, Inc., Class A (a) | | | 2,908 | | | | 91 | | |
TaskUS, Inc., Class A (a) | | | 6,682 | | | | 113 | | |
Vizio Holding Corp., Class A (a) | | | 6,005 | | | | 41 | | |
WNS Holdings Ltd., ADR (a) | | | 2,735 | | | | 204 | | |
| | | | 2,390 | | |
Materials (4.5%): | |
CF Industries Holdings, Inc. | | | 720 | | | | 62 | | |
Compass Minerals International, Inc. | | | 1,115 | | | | 39 | | |
FMC Corp. | | | 795 | | | | 85 | | |
Franco-Nevada Corp. | | | 824 | | | | 108 | | |
Intrepid Potash, Inc. (a) | | | 1,715 | | | | 78 | | |
Summit Materials, Inc., Class A (a) | | | 4,929 | | | | 115 | | |
| | | | 487 | | |
Real Estate (1.7%): | |
Rexford Industrial Realty, Inc. | | | 1,252 | | | | 72 | | |
UMH Properties, Inc. | | | 6,434 | | | | 114 | | |
| | | | 186 | | |
Total Common Stocks (Cost $11,307) | | | 10,595 | | |
Warrants (0.0%) (e) | |
Health Care (0.0%): (e) | |
BioNano Genomics, Inc. (a) (f) | | | 8,136 | | | | 2 | | |
Total Warrants (Cost $—) | | | 2 | | |
Collateral for Securities Loaned (4.8%)^ | |
BlackRock Liquidity Funds TempFund Portfolio, Institutional Shares,
1.47% (g) | | | 16,022 | | | | 16 | | |
Goldman Sachs Financial Square Prime Obligations Fund, Institutional Shares,
1.42% (g) | | | 7,996 | | | | 8 | | |
HSBC U.S. Government Money Market Fund, I Shares, 1.46% (g) | | | 99,723 | | | | 100 | | |
JPMorgan Prime Money Market Fund, Capital Shares, 1.50% (g) | | | 63,756 | | | | 64 | | |
Morgan Stanley Institutional Liquidity Government Portfolio, Institutional Shares,
1.39% (g) | | | 42,518 | | | | 42 | | |
See notes to financial statements.
81
Victory Portfolios
Victory Munder Small Cap Growth Fund | | Schedule of Portfolio Investments — continued
June 30, 2022 | |
(Amounts in Thousands, Except for Shares)
Security Description | | Shares | | Value | |
Morgan Stanley Institutional Liquidity Prime Portfolio, Institutional Shares,
1.53% (g) | | | 286,659 | | | $ | 287 | | |
Total Collateral for Securities Loaned (Cost $517) | | | 517 | | |
Total Investments (Cost $11,824) — 103.2% | | | 11,114 | | |
Liabilities in excess of other assets — (3.2)% | | | (348 | ) | |
NET ASSETS — 100.00% | | $ | 10,766 | | |
^ Purchased with cash collateral from securities on loan.
(a) Non-income producing security.
(b) Security was fair valued based upon procedures approved by the Board of Trustees and represents less than 0.05% of net assets as of June 30, 2022. This security is classified as Level 3 within the fair value hierarchy. (See Note 2 in the Notes to Financial Statements)
(c) Rounds to less than $1 thousand.
(d) All or a portion of this security is on loan.
(e) Amount represents less than 0.05% of net assets.
(f) The Fund's Adviser has deemed this security to be illiquid based upon procedures approved by the Board of Trustees. As of June 30, 2022, illiquid securities were less than 0.05% of net assets.
(g) Rate disclosed is the daily yield on June 30, 2022.
ADR — American Depositary Receipt
PLC — Public Limited Company
See notes to financial statements.
82
Victory Portfolios
Victory Trivalent International Fund-Core Equity | | Schedule of Portfolio Investments
June 30, 2022 | |
(Amounts in Thousands, Except for Shares)
Security Description | | Shares | | Value | |
Common Stocks (96.8%) | |
Australia (4.1%): | |
Consumer Discretionary (0.3%): | |
Aristocrat Leisure Ltd. | | | 25,881 | | | $ | 615 | | |
Energy (0.9%): | |
Santos Ltd. | | | 147,322 | | | | 747 | | |
Woodside Energy Group Ltd. | | | 40,879 | | | | 898 | | |
| | | | 1,645 | | |
Financials (1.2%): | |
Macquarie Group Ltd. | | | 6,345 | | | | 722 | | |
National Australia Bank Ltd. | | | 85,361 | | | | 1,619 | | |
| | | | 2,341 | | |
Health Care (0.5%): | |
Sonic Healthcare Ltd. | | | 37,390 | | | | 852 | | |
Materials (0.5%): | |
Rio Tinto Ltd. | | | 13,391 | | | | 955 | | |
Real Estate (0.7%): | |
Goodman Group (a) | | | 48,738 | | | | 602 | | |
Stockland | | | 273,796 | | | | 683 | | |
| | | | 1,285 | | |
| | | | 7,693 | | |
Austria (0.4%): | |
Industrials (0.4%): | |
ANDRITZ AG | | | 17,446 | | | | 704 | | |
Brazil (1.8%): | |
Energy (0.5%): | |
Petro Rio SA (b) | | | 240,600 | | | | 1,011 | | |
Financials (0.5%): | |
Banco do Brasil SA | | | 146,600 | | | | 935 | | |
Materials (0.4%): | |
Gerdau SA, Preference Shares | | | 169,700 | | | | 725 | | |
Utilities (0.4%): | |
Cia Energetica de Minas Gerais, Preference Shares | | | 323,350 | | | | 641 | | |
| | | | 3,312 | | |
Canada (6.5%): | |
Consumer Discretionary (0.4%): | |
BRP, Inc. (a) | | | 10,928 | | | | 672 | | |
Energy (1.2%): | |
Headwater Exploration, Inc. (b) | | | 125,512 | | | | 528 | | |
Parex Resources, Inc. | | | 48,148 | | | | 815 | | |
Suncor Energy, Inc. | | | 27,265 | | | | 957 | | |
| | | | 2,300 | | |
See notes to financial statements.
83
Victory Portfolios
Victory Trivalent International Fund-Core Equity | | Schedule of Portfolio Investments — continued
June 30, 2022 | |
(Amounts in Thousands, Except for Shares)
Security Description | | Shares | | Value | |
Financials (3.1%): | |
Element Fleet Management Corp. (a) | | | 89,793 | | | $ | 936 | | |
Fairfax Financial Holdings Ltd. | | | 1,404 | | | | 744 | | |
Intact Financial Corp. | | | 9,556 | | | | 1,348 | | |
National Bank of Canada (a) | | | 21,002 | | | | 1,379 | | |
The Bank of Nova Scotia | | | 22,381 | | | | 1,325 | | |
| | | | 5,732 | | |
Industrials (0.3%): | |
Finning International, Inc. | | | 27,160 | | | | 572 | | |
Materials (1.5%): | |
Nutrien Ltd. | | | 14,048 | | | | 1,119 | | |
Teck Resources Ltd., Class B | | | 28,123 | | | | 860 | | |
West Fraser Timber Co. Ltd. | | | 10,629 | | | | 816 | | |
| | | | 2,795 | | |
| | | | 12,071 | | |
Chile (0.6%): | |
Consumer Discretionary (0.3%): | |
Falabella SA | | | 245,732 | | | | 576 | | |
Consumer Staples (0.3%): | |
Cencosud SA | | | 384,409 | | | | 490 | | |
| | | | 1,066 | | |
China (7.6%): | |
Communication Services (1.3%): | |
Tencent Holdings Ltd. | | | 53,600 | | | | 2,426 | | |
Consumer Discretionary (2.6%): | |
Alibaba Group Holding Ltd. (b) | | | 84,796 | | | | 1,210 | | |
BYD Co. Ltd., Class H | | | 25,000 | | | | 1,008 | | |
Guangzhou Automobile Group Co. Ltd., Class H | | | 692,000 | | | | 671 | | |
JD.com, Inc., Class A | | | 24,613 | | | | 793 | | |
Zhongsheng Group Holdings Ltd. | | | 166,000 | | | | 1,173 | | |
| | | | 4,855 | | |
Financials (1.6%): | |
Agricultural Bank of China Ltd., Class H (b) | | | 1,600,000 | | | | 605 | | |
Bank of China Ltd., Class H (b) | | | 2,233,275 | | | | 892 | | |
China Construction Bank Corp., Class H (a) | | | 1,304,000 | | | | 879 | | |
Huatai Securities Co. Ltd., Class H (c) | | | 471,000 | | | | 701 | | |
| | | | 3,077 | | |
Health Care (0.3%): | |
Shanghai Fosun Pharmaceutical Group Co. Ltd., Class H | | | 161,500 | | | | 601 | | |
Industrials (0.8%): | |
China Railway Group Ltd., Class H | | | 1,591,000 | | | | 985 | | |
COSCO SHIPPING Holdings Co. Ltd., Class H | | | 392,650 | | | | 551 | | |
| | | | 1,536 | | |
See notes to financial statements.
84
Victory Portfolios
Victory Trivalent International Fund-Core Equity | | Schedule of Portfolio Investments — continued
June 30, 2022 | |
(Amounts in Thousands, Except for Shares)
Security Description | | Shares | | Value | |
Materials (0.6%): | |
Anhui Conch Cement Co. Ltd., Class H | | | 246,500 | | | $ | 1,070 | | |
Utilities (0.4%): | |
China Longyuan Power Group Corp. Ltd., Class H | | | 374,000 | | | | 725 | | |
| | | | 14,290 | | |
Denmark (2.2%): | |
Consumer Discretionary (0.2%): | |
Pandora A/S | | | 8,047 | | | | 511 | | |
Health Care (1.4%): | |
Novo Nordisk A/S, Class B | | | 23,256 | | | | 2,580 | | |
Industrials (0.6%): | |
AP Moller — Maersk A/S, Class B | | | 475 | | | | 1,115 | | |
| | | | 4,206 | | |
Finland (0.7%): | |
Industrials (0.3%): | |
Metso Outotec Oyj | | | 81,905 | | | | 618 | | |
Information Technology (0.4%): | |
Nokia Oyj | | | 133,433 | | | | 619 | | |
| | | | 1,237 | | |
France (6.6%): | |
Communication Services (0.8%): | |
Publicis Groupe SA | | | 18,426 | | | | 906 | | |
Vivendi SE | | | 51,517 | | | | 526 | | |
| | | | 1,432 | | |
Consumer Discretionary (1.4%): | |
LVMH Moet Hennessy Louis Vuitton SE | | | 4,248 | | | | 2,603 | | |
Consumer Staples (0.7%): | |
Pernod Ricard SA | | | 6,810 | | | | 1,259 | | |
Financials (0.8%): | |
AXA SA | | | 24,844 | | | | 568 | | |
BNP Paribas SA | | | 18,990 | | | | 908 | | |
| | | | 1,476 | | |
Industrials (1.4%): | |
Cie de Saint-Gobain | | | 19,477 | | | | 841 | | |
Eiffage SA | | | 6,593 | | | | 596 | | |
Rexel SA | | | 37,088 | | | | 573 | | |
Teleperformance | | | 1,861 | | | | 575 | | |
| | | | 2,585 | | |
Information Technology (0.9%): | |
Capgemini SE | | | 6,567 | | | | 1,132 | | |
Edenred | | | 12,740 | | | | 604 | | |
| | | | 1,736 | | |
See notes to financial statements.
85
Victory Portfolios
Victory Trivalent International Fund-Core Equity | | Schedule of Portfolio Investments — continued
June 30, 2022 | |
(Amounts in Thousands, Except for Shares)
Security Description | | Shares | | Value | |
Materials (0.3%): | |
Arkema SA | | | 7,407 | | | $ | 662 | | |
Real Estate (0.3%): | |
Klepierre SA | | | 27,268 | | | | 528 | | |
| | | | 12,281 | | |
Germany (4.9%): | |
Communication Services (1.0%): | |
Deutsche Telekom AG | | | 89,774 | | | | 1,785 | | |
Consumer Discretionary (0.5%): | |
Mercedes-Benz Group AG | | | 15,750 | | | | 915 | | |
Energy (0.3%): | |
VERBIO Vereinigte BioEnergie AG | | | 11,742 | | | | 591 | | |
Financials (0.4%): | |
Hannover Rueck SE | | | 5,263 | | | | 767 | | |
Health Care (1.4%): | |
Bayer AG, Registered Shares | | | 20,812 | | | | 1,243 | | |
Merck KGaA | | | 7,744 | | | | 1,313 | | |
| | | | 2,556 | | |
Industrials (0.5%): | |
Deutsche Post AG, Registered Shares | | | 27,036 | | | | 1,021 | | |
Information Technology (0.6%): | |
Infineon Technologies AG | | | 23,136 | | | | 563 | | |
SAP SE | | | 5,245 | | | | 478 | | |
| | | | 1,041 | | |
Real Estate (0.2%): | |
LEG Immobilien SE | | | 5,603 | | | | 466 | | |
| | | | 9,142 | | |
Hong Kong (2.0%): | |
Consumer Discretionary (0.4%): | |
Chow Tai Fook Jewellery Group Ltd. | | | 427,000 | | | | 807 | | |
Consumer Staples (0.3%): | |
WH Group Ltd. (c) | | | 824,500 | | | | 638 | | |
Information Technology (0.8%): | |
Lenovo Group Ltd. | | | 1,588,000 | | | | 1,492 | | |
Real Estate (0.5%): | |
CK Asset Holdings Ltd. | | | 121,895 | | | | 866 | | |
| | | | 3,803 | | |
India (2.9%): | |
Energy (0.7%): | |
Reliance Industries Ltd. (b) | | | 42,193 | | | | 1,394 | | |
See notes to financial statements.
86
Victory Portfolios
Victory Trivalent International Fund-Core Equity | | Schedule of Portfolio Investments — continued
June 30, 2022 | |
(Amounts in Thousands, Except for Shares)
Security Description | | Shares | | Value | |
Financials (0.7%): | |
Angel One Ltd. | | | 25,087 | | | $ | 386 | | |
Canara Bank | | | 387,198 | | | | 893 | | |
| | | | 1,279 | | |
Information Technology (0.6%): | |
Mindtree Ltd. | | | 13,525 | | | | 497 | | |
Tata Consultancy Services Ltd. | | | 13,601 | | | | 565 | | |
| | | | 1,062 | | |
Materials (0.4%): | |
UPL Ltd. | | | 102,771 | | | | 825 | | |
Utilities (0.5%): | |
Power Grid Corp. of India Ltd. | | | 318,853 | | | | 858 | | |
| | | | 5,418 | | |
Indonesia (0.8%): | |
Communication Services (0.4%): | |
PT Sarana Menara Nusantara Tbk | | | 9,781,200 | | | | 723 | | |
Consumer Staples (0.4%): | |
PT Industri Jamu Dan Farmasi Sido Muncul Tbk | | | 10,577,000 | | | | 710 | | |
| | | | 1,433 | | |
Ireland (1.0%): | |
Health Care (0.5%): | |
ICON PLC (b) | | | 4,208 | | | | 912 | | |
Industrials (0.5%): | |
DCC PLC | | | 14,259 | | | | 887 | | |
| | | | 1,799 | | |
Israel (0.7%): | |
Financials (0.3%): | |
Bank Leumi Le-Israel BM | | | 67,497 | | | | 604 | | |
Information Technology (0.4%): | |
Nice Ltd. (b) | | | 3,889 | | | | 751 | | |
| | | | 1,355 | | |
Italy (1.3%): | |
Industrials (0.4%): | |
Leonardo SpA | | | 75,301 | | | | 764 | | |
Information Technology (0.2%): | |
Nexi SpA (a) (b) (c) | | | 54,423 | | | | 452 | | |
Utilities (0.7%): | |
Enel SpA | | | 139,799 | | | | 766 | | |
Iren SpA (b) | | | 231,813 | | | | 507 | | |
| | | | 1,273 | | |
| | | | 2,489 | | |
See notes to financial statements.
87
Victory Portfolios
Victory Trivalent International Fund-Core Equity | | Schedule of Portfolio Investments — continued
June 30, 2022 | |
(Amounts in Thousands, Except for Shares)
Security Description | | Shares | | Value | |
Japan (14.1%): | |
Communication Services (1.0%): | |
Konami Holdings Corp. | | | 10,000 | | | $ | 554 | | |
Nippon Telegraph & Telephone Corp. | | | 41,800 | | | | 1,201 | | |
| | | | 1,755 | | |
Consumer Discretionary (2.2%): | |
Open House Group Co. Ltd. | | | 15,200 | | | | 605 | | |
Sony Group Corp. | | | 24,900 | | | | 2,031 | | |
Toyota Motor Corp. | | | 98,800 | | | | 1,525 | | |
| | | | 4,161 | | |
Consumer Staples (1.0%): | |
Ajinomoto Co., Inc. | | | 33,300 | | | | 812 | | |
Seven & i Holdings Co. Ltd. | | | 27,300 | | | | 1,060 | | |
| | | | 1,872 | | |
Financials (2.0%): | |
Mizuho Financial Group, Inc. | | | 72,310 | | | | 823 | | |
ORIX Corp. | | | 75,600 | | | | 1,267 | | |
Sumitomo Mitsui Financial Group, Inc. | | | 31,125 | | | | 925 | | |
Tokio Marine Holdings, Inc. | | | 12,200 | | | | 712 | | |
| | | | 3,727 | | |
Health Care (0.7%): | |
Hoya Corp. | | | 6,700 | | | | 573 | | |
Ono Pharmaceutical Co. Ltd. | | | 27,200 | | | | 699 | | |
| | | | 1,272 | | |
Industrials (4.0%): | |
AGC, Inc. | | | 19,500 | | | | 685 | | |
Fuji Electric Co. Ltd. | | | 20,500 | | | | 848 | | |
Hitachi Ltd. | | | 23,600 | | | | 1,123 | | |
ITOCHU Corp. | | | 49,700 | | | | 1,341 | | |
Komatsu Ltd. | | | 34,500 | | | | 768 | | |
Mitsui & Co. Ltd. | | | 42,100 | | | | 925 | | |
NIPPON EXPRESS HOLDINGS, Inc. | | | 13,600 | | | | 741 | | |
Nippon Yusen KK | | | 14,500 | | | | 995 | | |
| | | | 7,426 | | |
Information Technology (1.7%): | |
Canon, Inc. | | | 25,400 | | | | 576 | | |
Fujitsu Ltd. | | | 7,400 | | | | 926 | | |
Murata Manufacturing Co. Ltd. | | | 12,100 | | | | 659 | | |
Tokyo Electron Ltd. | | | 3,200 | | | | 1,044 | | |
| | | | 3,205 | | |
Materials (0.8%): | |
Shin-Etsu Chemical Co. Ltd. | | | 6,300 | | | | 708 | | |
Tosoh Corp. | | | 57,400 | | | | 714 | | |
| | | | 1,422 | | |
See notes to financial statements.
88
Victory Portfolios
Victory Trivalent International Fund-Core Equity | | Schedule of Portfolio Investments — continued
June 30, 2022 | |
(Amounts in Thousands, Except for Shares)
Security Description | | Shares | | Value | |
Real Estate (0.3%): | |
Mitsui Fudosan Co. Ltd. | | | 29,500 | | | $ | 634 | | |
Utilities (0.4%): | |
Osaka Gas Co. Ltd. | | | 42,100 | | | | 807 | | |
| | | | 26,281 | | |
Korea, Republic Of (3.6%): | |
Communication Services (0.7%): | |
Cheil Worldwide, Inc. | | | 33,988 | | | | 624 | | |
JYP Entertainment Corp. | | | 18,216 | | | | 678 | | |
| | | | 1,302 | | |
Consumer Discretionary (0.7%): | |
Kia Corp. | | | 13,272 | | | | 792 | | |
LG Electronics, Inc. | | | 8,218 | | | | 561 | | |
| | | | 1,353 | | |
Financials (0.4%): | |
Hana Financial Group, Inc. | | | 21,285 | | | | 647 | | |
Industrials (0.3%): | |
Samsung Engineering Co. Ltd. (b) | | | 37,663 | | | | 626 | | |
Information Technology (1.5%): | |
LG Innotek Co. Ltd. | | | 5,100 | | | | 1,353 | | |
Samsung Electronics Co. Ltd. | | | 31,177 | | | | 1,376 | | |
| | | | 2,729 | | |
| | | | 6,657 | | |
Luxembourg (0.7%): | |
Energy (0.4%): | |
Tenaris SA | | | 56,126 | | | | 721 | | |
Materials (0.3%): | |
ArcelorMittal SA | | | 29,487 | | | | 661 | | |
| | | | 1,382 | | |
Malaysia (0.9%): | |
Consumer Staples (0.3%): | |
Kuala Lumpur Kepong Bhd | | | 109,200 | | | | 543 | | |
Financials (0.6%): | |
RHB Bank Bhd | | | 929,500 | | | | 1,209 | | |
| | | | 1,752 | | |
Mexico (0.8%): | |
Communication Services (0.4%): | |
America Movil SAB de CV, Class L | | | 652,934 | | | | 667 | | |
Consumer Staples (0.4%): | |
Arca Continental SAB de CV | | | 114,670 | | | | 756 | | |
| | | | 1,423 | | |
See notes to financial statements.
89
Victory Portfolios
Victory Trivalent International Fund-Core Equity | | Schedule of Portfolio Investments — continued
June 30, 2022 | |
(Amounts in Thousands, Except for Shares)
Security Description | | Shares | | Value | |
Netherlands (3.5%): | |
Consumer Staples (1.1%): | |
Heineken NV | | | 8,225 | | | $ | 749 | | |
Koninklijke Ahold Delhaize NV | | | 49,154 | | | | 1,279 | | |
| | | | 2,028 | | |
Financials (0.8%): | |
ING Groep NV | | | 69,479 | | | | 684 | | |
NN Group NV | | | 17,768 | | | | 805 | | |
| | | | 1,489 | | |
Health Care (0.4%): | |
QIAGEN NV (b) | | | 15,684 | | | | 737 | | |
Industrials (0.2%): | |
Signify NV (c) | | | 14,226 | | | | 469 | | |
Information Technology (1.0%): | |
ASM International NV | | | 3,122 | | | | 777 | | |
STMicroelectronics NV | | | 32,984 | | | | 1,043 | | |
| | | | 1,820 | | |
| | | | 6,543 | | |
Norway (1.4%): | |
Consumer Staples (0.3%): | |
Mowi ASA | | | 27,580 | | | | 631 | | |
Energy (0.7%): | |
Equinor ASA | | | 18,961 | | | | 661 | | |
Var Energi ASA | | | 156,049 | | | | 609 | | |
| | | | 1,270 | | |
Materials (0.4%): | |
Yara International ASA | | | 18,166 | | | | 762 | | |
| | | | 2,663 | | |
Russian Federation (0.0%): (d) | |
Consumer Staples (0.0%): | |
Magnit PJSC, GDR (e) (h) | | | 36,370 | | | | — | (f) | |
Energy (0.0%): | |
LUKOIL PJSC, ADR (e) (h) (i) (j) | | | 8,489 | | | | 1 | | |
Financials (0.0%): | |
Sberbank of Russia PJSC (b) (e) (h) (i) (j) | | | 220,230 | | | | 1 | | |
| | | | 2 | | |
Saudi Arabia (0.8%): | |
Energy (0.3%): | |
Saudi Arabian Oil Co. (c) | | | 55,985 | | | | 579 | | |
Financials (0.5%): | |
Alinma Bank | | | 109,658 | | | | 980 | | |
| | | | 1,559 | | |
See notes to financial statements.
90
Victory Portfolios
Victory Trivalent International Fund-Core Equity | | Schedule of Portfolio Investments — continued
June 30, 2022 | |
(Amounts in Thousands, Except for Shares)
Security Description | | Shares | | Value | |
Singapore (1.6%): | |
Consumer Staples (0.6%): | |
Wilmar International Ltd. | | | 394,600 | | | $ | 1,149 | | |
Financials (0.6%): | |
DBS Group Holdings Ltd. | | | 53,000 | | | | 1,134 | | |
Utilities (0.4%): | |
Sembcorp Industries Ltd. | | | 329,800 | | | | 677 | | |
| | | | 2,960 | | |
South Africa (0.6%): | |
Financials (0.3%): | |
Absa Group Ltd. (a) | | | 60,454 | | | | 577 | | |
Materials (0.3%): | |
Impala Platinum Holdings Ltd. | | | 45,369 | | | | 504 | | |
| | | | 1,081 | | |
Spain (2.1%): | |
Financials (0.8%): | |
Banco Santander SA | | | 310,235 | | | | 878 | | |
Bankinter SA | | | 102,410 | | | | 640 | | |
| | | | 1,518 | | |
Health Care (0.3%): | |
Laboratorios Farmaceuticos Rovi SA | | | 10,671 | | | | 654 | | |
Utilities (1.0%): | |
Corp. ACCIONA Energias Renovables SA | | | 24,864 | | | | 964 | | |
Iberdrola SA | | | 83,227 | | | | 866 | | |
| | | | 1,830 | | |
| | | | 4,002 | | |
Sweden (1.1%): | |
Industrials (0.7%): | |
Sandvik AB | | | 39,912 | | | | 651 | | |
Volvo AB, Class B | | | 37,036 | | | | 577 | | |
| | | | 1,228 | | |
Materials (0.4%): | |
Boliden AB | | | 26,287 | | | | 841 | | |
| | | | 2,069 | | |
Switzerland (7.2%): | |
Consumer Discretionary (0.5%): | |
Cie Financiere Richemont SA, Registered Shares | | | 7,827 | | | | 842 | | |
Consumer Staples (1.8%): | |
Coca-Cola HBC AG | | | 35,497 | | | | 791 | | |
Nestle SA, Registered Shares | | | 22,790 | | | | 2,664 | | |
| | | | 3,455 | | |
See notes to financial statements.
91
Victory Portfolios
Victory Trivalent International Fund-Core Equity | | Schedule of Portfolio Investments — continued
June 30, 2022 | |
(Amounts in Thousands, Except for Shares)
Security Description | | Shares | | Value | |
Financials (1.6%): | |
Julius Baer Group Ltd. | | | 19,630 | | | $ | 911 | | |
Swiss Life Holding AG | | | 2,546 | | | | 1,243 | | |
UBS Group AG | | | 47,463 | | | | 767 | | |
| | | | 2,921 | | |
Health Care (2.9%): | |
Alcon, Inc. | | | 9,585 | | | | 672 | | |
Novartis AG, Registered Shares | | | 24,290 | | | | 2,060 | | |
Roche Holding AG | | | 7,997 | | | | 2,674 | | |
| | | | 5,406 | | |
Materials (0.4%): | |
Holcim AG | | | 17,247 | | | | 740 | | |
| | | | 13,364 | | |
Taiwan (4.0%): | |
Financials (0.8%): | |
Chailease Holding Co. Ltd. | | | 98,895 | | | | 694 | | |
Fubon Financial Holding Co. Ltd. | | | 397,839 | | | | 800 | | |
| | | | 1,494 | | |
Health Care (0.5%): | |
Lotus Pharmaceutical Co. Ltd. | | | 179,000 | | | | 925 | | |
Information Technology (2.7%): | |
MediaTek, Inc. | | | 34,000 | | | | 746 | | |
Realtek Semiconductor Corp. | | | 103,000 | | | | 1,260 | | |
Taiwan Semiconductor Manufacturing Co. Ltd. | | | 190,000 | | | | 3,046 | | |
| | | | 5,052 | | |
| | | | 7,471 | | |
Thailand (0.5%): | |
Health Care (0.5%): | |
Chularat Hospital PCL | | | 8,368,500 | | | | 876 | | |
United Arab Emirates (0.4%): | |
Real Estate (0.4%): | |
Emaar Development PJSC (b) | | | 636,237 | | | | 737 | | |
United Kingdom (9.4%): | |
Communication Services (0.2%): | |
WPP PLC | | | 46,586 | | | | 471 | | |
Consumer Discretionary (1.5%): | |
Barratt Developments PLC | | | 83,188 | | | | 465 | | |
JD Sports Fashion PLC (b) | | | 590,213 | | | | 832 | | |
Stellantis NV | | | 126,988 | | | | 1,576 | | |
| | | | 2,873 | | |
Consumer Staples (0.6%): | |
Tesco PLC | | | 345,462 | | | | 1,076 | | |
See notes to financial statements.
92
Victory Portfolios
Victory Trivalent International Fund-Core Equity | | Schedule of Portfolio Investments — continued
June 30, 2022 | |
(Amounts in Thousands, Except for Shares)
Security Description | | Shares | | Value | |
Energy (1.1%): | |
| BP PLC | | | 292,685 | | | $ | 1,374 | | |
Harbour Energy PLC | | | 142,991 | | | | 635 | | |
| | | | 2,009 | | |
Financials (2.1%): | |
| 3i Group PLC | | | 94,348 | | | | 1,279 | | |
Barclays PLC | | | 355,627 | | | | 665 | | |
Legal & General Group PLC | | | 201,307 | | | | 588 | | |
Standard Chartered PLC | | | 182,555 | | | | 1,378 | | |
| | | | 3,910 | | |
Health Care (1.1%): | |
AstraZeneca PLC | | | 15,133 | | | | 1,996 | | |
Industrials (1.1%): | |
Ashtead Group PLC | | | 13,728 | | | | 578 | | |
Electrocomponents PLC | | | 57,090 | | | | 607 | | |
Ferguson PLC | | | 6,991 | | | | 783 | | |
| | | | 1,968 | | |
Materials (1.0%): | |
Anglo American PLC | | | 53,198 | | | | 1,901 | | |
Real Estate (0.3%): | |
Safestore Holdings PLC | | | 46,679 | | | | 604 | | |
Utilities (0.4%): | |
Drax Group PLC | | | 92,977 | | | | 730 | | |
| | | | 17,538 | | |
Total Common Stocks (Cost $191,666) | | | 180,659 | | |
Exchange-Traded Funds (1.5%) | |
United States (1.5%): | |
iShares Core MSCI EAFE ETF | | | 38,141 | | | | 2,245 | | |
iShares Core MSCI Emerging Markets ETF | | | 11,829 | | | | 580 | | |
Total Exchange-Traded Funds (Cost $3,437) | | | 2,825 | | |
Collateral for Securities Loaned (1.9%)^ | |
United States (1.9%): | |
BlackRock Liquidity Funds TempFund, Institutional Shares, 1.47% (g) | | | 107,682 | | | | 108 | | |
Goldman Sachs Financial Square Prime Obligations Fund, Institutional Shares,
1.42% (g) | | | 53,738 | | | | 54 | | |
HSBC U.S. Government Money Market Fund, I Shares, 1.46% (g) | | | 670,226 | | | | 670 | | |
JPMorgan Prime Money Market Fund, Capital Shares, 1.50% (g) | | | 428,494 | | | | 428 | | |
Morgan Stanley Institutional Liquidity Government Portfolio, Institutional Shares,
1.39% (g) | | | 285,757 | | | | 286 | | |
See notes to financial statements.
93
Victory Portfolios
Victory Trivalent International Fund-Core Equity | | Schedule of Portfolio Investments — continued
June 30, 2022 | |
(Amounts in Thousands, Except for Shares)
Security Description | | Shares | | Value | |
Morgan Stanley Institutional Liquidity Prime Portfolio, Institutional Shares,
1.53% (g) | | | 1,926,491 | | | $ | 1,926 | | |
Total Collateral for Securities Loaned (Cost $3,472) | | | 3,472 | | |
Total Investments (Cost $198,575) — 100.2% | | | 186,956 | | |
Liabilities in excess of other assets — (0.2)% | | | (325 | ) | |
NET ASSETS — 100.00% | | $ | 186,631 | | |
^ Purchased with cash collateral from securities on loan.
(a) All or a portion of this security is on loan.
(b) Non-income producing security.
(c) Rule 144A security or other security that is restricted as to resale to institutional investors. The Fund's Adviser has deemed this security to be liquid (unless otherwise noted as illiquid) based upon procedures approved by the Board of Trustees. As of June 30, 2022, the fair value of these securities was $2,839 (thousands) and amounted to 1.5% of net assets.
(d) Amount represents less than 0.05% of net assets.
(e) Security was fair valued based upon procedures approved by the Board of Trustees and represents less than 0.05% of net assets as of June 30, 2022. This security is classified as Level 3 within the fair value hierarchy. (See Note 2 in the Notes to Financial Statements)
(f) Rounds to less than $1 thousand.
(g) Rate disclosed is the daily yield on June 30, 2022.
(h) The Fund's Adviser has deemed this security to be illiquid based upon procedures approved by the Board of Trustees. As of June 30, 2022, illiquid securities were less than 0.05% of net assets.
(i) Restricted security that is not registered under the Securities Act of 1933.
(j) The following table details the acquisition date and cost of the Fund's restricted securities at June 30, 2022 (amount in thousand):
Security Name | | Acquisition
Date | | Cost | |
LUKOIL PJSC, ADR | | 8/21/2019 | | $ | 729 | | |
Sberbank of Russia PJSC, ADR | | 12/9/2016 | | | 752 | | |
ADR — American Depositary Receipt
ETF — Exchange-Traded Fund
GDR — Global Depositary Receipt
PCL — Public Company Limited
PLC — Public Limited Company
See notes to financial statements.
94
Victory Portfolios
Victory Trivalent International Small-Cap Fund | | Schedule of Portfolio Investments
June 30, 2022 | |
(Amounts in Thousands, Except for Shares)
Security Description | | Shares | | Value | |
Common Stocks (97.2%) | |
Australia (7.2%): | |
Communication Services (0.3%): | |
Nine Entertainment Co. Holdings Ltd. | | | 7,017,220 | | | $ | 8,874 | | |
Consumer Discretionary (0.7%): | |
JB Hi-Fi Ltd. | | | 368,935 | | | | 9,810 | | |
Super Retail Group Ltd. | | | 1,200,198 | | | | 7,048 | | |
| | | | 16,858 | | |
Consumer Staples (0.7%): | |
Elders Ltd. | | | 2,006,327 | | | | 17,463 | | |
Energy (0.7%): | |
Beach Energy Ltd. | | | 16,041,275 | | | | 19,102 | | |
Financials (0.7%): | |
Bank of Queensland Ltd. | | | 2,250,398 | | | | 10,377 | | |
Pendal Group Ltd. | | | 2,451,696 | | | | 7,500 | | |
| | | | 17,877 | | |
Industrials (0.3%): | |
Seven Group Holdings Ltd. (a) | | | 771,004 | | | | 8,862 | | |
Information Technology (0.5%): | |
Technology One Ltd. | | | 1,567,348 | | | | 11,620 | | |
Materials (2.4%): | |
Allkem, Ltd. (b) | | | 3,279,539 | | | | 23,452 | | |
CSR Ltd. | | | 2,350,884 | | | | 6,607 | | |
Iluka Resources Ltd. | | | 1,863,774 | | | | 12,155 | | |
Incitec Pivot, Ltd. | | | 4,922,198 | | | | 11,325 | | |
OZ Minerals Ltd. | | | 615,026 | | | | 7,559 | | |
| | | | 61,098 | | |
Real Estate (0.9%): | |
Charter Hall Group | | | 1,417,885 | | | | 10,633 | | |
Shopping Centres Australasia Property Group | | | 6,401,780 | | | | 12,193 | | |
| | | | 22,826 | | |
| | | | 184,580 | | |
Canada (9.8%): | |
Consumer Discretionary (1.1%): | |
AutoCanada, Inc. (b) | | | 360,563 | | | | 6,881 | | |
BRP, Inc. (a) | | | 349,569 | | | | 21,517 | | |
| | | | 28,398 | | |
Energy (2.4%): | |
ARC Resources Ltd. (a) | | | 2,235,175 | | | | 28,187 | | |
Headwater Exploration, Inc. (a) (b) | | | 1,786,082 | | | | 7,508 | | |
Parex Resources, Inc. (a) | | | 967,306 | | | | 16,385 | | |
Vermilion Energy, Inc. | | | 442,004 | | | | 8,414 | | |
| | | | 60,494 | | |
See notes to financial statements.
95
Victory Portfolios
Victory Trivalent International Small-Cap Fund | | Schedule of Portfolio Investments — continued
June 30, 2022 | |
(Amounts in Thousands, Except for Shares)
Security Description | | Shares | | Value | |
Financials (0.8%): | |
Element Fleet Management Corp. | | | 1,177,448 | | | $ | 12,278 | | |
Laurentian Bank of Canada | | | 268,285 | | | | 8,063 | | |
| | | | 20,341 | | |
Industrials (1.4%): | |
ATS Automation Tooling Systems, Inc. (b) | | | 587,973 | | | | 16,150 | | |
Ballard Power Systems, Inc. (a) (b) | | | 300,676 | | | | 1,899 | | |
Finning International, Inc. | | | 846,695 | | | | 17,822 | | |
| | | | 35,871 | | |
Information Technology (0.9%): | |
Celestica, Inc. (b) | | | 1,341,380 | | | | 13,049 | | |
The Descartes Systems Group, Inc. (b) | | | 181,562 | | | | 11,284 | | |
| | | | 24,333 | | |
Materials (1.8%): | |
Aginco Eagle Mines Ltd. | | | 1 | | | | — | (c) | |
Canfor Corp. (b) | | | 487,505 | | | | 8,504 | | |
Dundee Precious Metals, Inc. | | | 1,721,287 | | | | 8,573 | | |
Methanex Corp. (a) | | | 300,208 | | | | 11,470 | | |
OceanaGold Corp. (b) | | | 1,324,358 | | | | 2,542 | | |
Stella-Jones, Inc. | | | 311,660 | | | | 7,870 | | |
Yamana Gold, Inc. | | | 1,581,632 | | | | 7,361 | | |
| | | | 46,320 | | |
Real Estate (1.2%): | |
Boardwalk Real Estate Invest (a) | | | 416,291 | | | | 13,547 | | |
Tricon Residential, Inc. | | | 1,630,331 | | | | 16,531 | | |
| | | | 30,078 | | |
Utilities (0.2%): | |
TransAlta Corp. | | | 446,560 | | | | 5,097 | | |
| | | | 250,932 | | |
Denmark (0.4%): | |
Financials (0.4%): | |
Jyske Bank A/S, Registered Shares (b) | | | 226,771 | | | | 11,179 | | |
Finland (1.1%): | |
Industrials (0.6%): | |
Valmet Oyj | | | 633,704 | | | | 15,614 | | |
Information Technology (0.5%): | |
TietoEVRY Oyj | | | 464,812 | | | | 11,519 | | |
| | | | 27,133 | | |
France (8.1%): | |
Communication Services (0.3%): | |
Criteo SA, ADR (b) | | | 337,989 | | | | 8,247 | | |
See notes to financial statements.
96
Victory Portfolios
Victory Trivalent International Small-Cap Fund | | Schedule of Portfolio Investments — continued
June 30, 2022 | |
(Amounts in Thousands, Except for Shares)
Security Description | | Shares | | Value | |
Consumer Discretionary (0.8%): | |
Faurecia SE (a) | | | 493,385 | | | $ | 9,886 | | |
La Francaise des Jeux SAEM (d) | | | 301,315 | | | | 10,462 | | |
| | | | 20,348 | | |
Energy (0.7%): | |
Vallourec SA (b) | | | 1,579,772 | | | | 18,934 | | |
Health Care (0.3%): | |
Ipsen SA | | | 71,885 | | | | 6,805 | | |
Industrials (2.9%): | |
Eiffage SA | | | 244,797 | | | | 22,141 | | |
Elis SA | | | 910,969 | | | | 12,187 | | |
Nexans SA | | | 148,672 | | | | 11,581 | | |
Rexel SA | | | 907,944 | | | | 14,028 | | |
SPIE SA | | | 653,750 | | | | 14,265 | | |
| | | | 74,202 | | |
Information Technology (1.6%): | |
Edenred | | | 220,744 | | | | 10,455 | | |
SOITEC (b) | | | 92,520 | | | | 13,288 | | |
Sopra Steria Group | | | 110,204 | | | | 16,571 | | |
| | | | 40,314 | | |
Materials (0.4%): | |
Arkema SA | | | 119,355 | | | | 10,675 | | |
Real Estate (1.1%): | |
Klepierre SA | | | 911,353 | | | | 17,634 | | |
Nexity SA | | | 391,216 | | | | 10,503 | | |
| | | | 28,137 | | |
| | | | 207,662 | | |
Germany (7.8%): | |
Communication Services (1.4%): | |
Freenet AG | | | 539,417 | | | | 13,450 | | |
ProSiebenSat.1 Media SE | | | 1,080,134 | | | | 10,045 | | |
United Internet AG, Registered Shares | | | 406,519 | | | | 11,651 | | |
| | | | 35,146 | | |
Consumer Discretionary (0.4%): | |
Hugo Boss AG | | | 192,692 | | | | 10,202 | | |
Energy (0.2%): | |
VERBIO Vereinigte BioEnergie AG | | | 120,144 | | | | 6,052 | | |
Financials (0.9%): | |
Deutsche Pfandbriefbank AG (d) | | | 1,393,259 | | | | 12,583 | | |
DWS Group GmbH & Co. KGaA (d) | | | 351,007 | | | | 9,253 | | |
| | | | 21,836 | | |
See notes to financial statements.
97
Victory Portfolios
Victory Trivalent International Small-Cap Fund | | Schedule of Portfolio Investments — continued
June 30, 2022 | |
(Amounts in Thousands, Except for Shares)
Security Description | | Shares | | Value | |
Health Care (0.7%): | |
Dermapharm Holding SE | | | 140,411 | | | $ | 6,996 | | |
Gerresheimer AG (a) | | | 182,284 | | | | 11,906 | | |
| | | | 18,902 | | |
Industrials (1.7%): | |
GEA Group AG | | | 344,397 | | | | 11,938 | | |
Rheinmetall AG | | | 134,261 | | | | 30,978 | | |
| | | | 42,916 | | |
Information Technology (0.9%): | |
AIXTRON SE | | | 462,308 | | | | 11,807 | | |
Bechtle AG | | | 278,670 | | | | 11,445 | | |
| | | | 23,252 | | |
Materials (1.3%): | |
Aurubis AG | | | 150,499 | | | | 10,268 | | |
K+S AG, Registered Shares | | | 559,078 | | | | 13,605 | | |
LANXESS AG | | | 250,831 | | | | 9,052 | | |
| | | | 32,925 | | |
Real Estate (0.3%): | |
TAG Immobilien AG | | | 650,266 | | | | 7,444 | | |
| | | | 198,675 | | |
Gibraltar (0.4%): | |
Consumer Discretionary (0.4%): | |
| 888 Holdings PLC (a) | | | 4,369,668 | | | | 8,920 | | |
Hong Kong (2.0%): | |
Health Care (0.2%): | |
The United Laboratories International Holdings Ltd. | | | 8,992,000 | | | | 5,350 | | |
Industrials (1.0%): | |
LK Technology Holdings Ltd. | | | 8,270,000 | | | | 15,876 | | |
Pacific Basin Shipping Ltd. | | | 28,275,000 | | | | 10,871 | | |
| | | | 26,747 | | |
Information Technology (0.4%): | |
ASM Pacific Technology Ltd. | | | 1,131,300 | | | | 9,629 | | |
Real Estate (0.4%): | |
Hysan Development Co. Ltd. | | | 3,316,000 | | | | 10,004 | | |
| | | | 51,730 | | |
Ireland (1.6%): | |
Consumer Discretionary (0.4%): | |
Dalata Hotel Group PLC (b) | | | 2,609,879 | | | | 9,518 | | |
Consumer Staples (0.4%): | |
Glanbia PLC | | | 1,063,739 | | | | 11,548 | | |
Financials (0.8%): | |
Bank of Ireland Group PLC | | | 3,153,743 | | | | 19,931 | | |
| | | | 40,997 | | |
See notes to financial statements.
98
Victory Portfolios
Victory Trivalent International Small-Cap Fund | | Schedule of Portfolio Investments — continued
June 30, 2022 | |
(Amounts in Thousands, Except for Shares)
Security Description | | Shares | | Value | |
Israel (1.2%): | |
Communication Services (0.6%): | |
Perion Network Ltd. (a) (b) | | | 816,600 | | | $ | 14,846 | | |
Health Care (0.3%): | |
Inmode Ltd. (b) | | | 394,667 | | | | 8,844 | | |
Information Technology (0.3%): | |
Radware Ltd. (b) | | | 330,816 | | | | 7,169 | | |
| | | | 30,859 | | |
Italy (1.9%): | |
Financials (0.4%): | |
Banco Bpm SpA | | | 3,314,321 | | | | 9,460 | | |
Information Technology (0.7%): | |
Reply SpA | | | 136,175 | | | | 16,563 | | |
Materials (0.4%): | |
Buzzi Unicem SpA (a) | | | 605,988 | | | | 9,946 | | |
Utilities (0.4%): | |
Iren SpA (b) | | | 5,053,825 | | | | 11,056 | | |
| | | | 47,025 | | |
Japan (19.6%): | |
Communication Services (1.3%): | |
Gungho Online Entertainment, Inc. | | | 564,800 | | | | 10,022 | | |
Internet Initiative Japan, Inc. | | | 660,100 | | | | 23,137 | | |
| | | | 33,159 | | |
Consumer Discretionary (3.8%): | |
ASKUL Corp. | | | 694,000 | | | | 8,296 | | |
Komeri Co. Ltd. | | | 422,800 | | | | 8,223 | | |
Open House Group Co. Ltd. | | | 486,100 | | | | 19,352 | | |
Resorttrust, Inc. | | | 620,400 | | | | 10,162 | | |
Sankyo Co. Ltd. | | | 308,500 | | | | 9,334 | | |
Shimamura Co. Ltd. | | | 129,700 | | | | 11,398 | | |
Sumitomo Forestry Co. Ltd. | | | 771,000 | | | | 10,967 | | |
Tokyotokeiba Co. Ltd. | | | 203,200 | | | | 5,889 | | |
Toyo Tire Corp. | | | 1,013,000 | | | | 12,664 | | |
| | | | 96,285 | | |
Consumer Staples (1.0%): | |
Morinaga Milk Industry Co. Ltd. | | | 206,300 | | | | 7,389 | | |
Nippon Suisan Kaisha Ltd. | | | 2,587,500 | | | | 10,941 | | |
Valor Holdings Co. Ltd. | | | 484,700 | | | | 6,528 | | |
| | | | 24,858 | | |
Financials (0.6%): | |
North Pacific Bank Ltd. | | | 3,723,300 | | | | 6,131 | | |
Zenkoku Hosho Co. Ltd. | | | 341,700 | | | | 10,734 | | |
| | | | 16,865 | | |
See notes to financial statements.
99
Victory Portfolios
Victory Trivalent International Small-Cap Fund | | Schedule of Portfolio Investments — continued
June 30, 2022 | |
(Amounts in Thousands, Except for Shares)
Security Description | | Shares | | Value | |
Health Care (1.8%): | |
Eiken Chemical Co. Ltd. | | | 651,200 | | | $ | 8,587 | | |
Jeol Ltd. | | | 176,500 | | | | 6,832 | | |
Miraca Holdings, Inc. | | | 569,400 | | | | 12,383 | | |
Sawai Group Holdings Co. Ltd. | | | 270,800 | | | | 8,214 | | |
Suzuken Co. Ltd. | | | 341,600 | | | | 9,630 | | |
| | | | 45,646 | | |
Industrials (5.1%): | |
BayCurrent Consulting, Inc. | | | 51,800 | | | | 13,851 | | |
CKD Corp. | | | 694,300 | | | | 8,873 | | |
Daihen Corp. | | | 285,800 | | | | 8,868 | | |
Dmg Mori Co. Ltd. (a) | | | 585,300 | | | | 7,281 | | |
Ebara Corp. | | | 200,600 | | | | 7,497 | | |
Fujikura Ltd. | | | 1,389,400 | | | | 7,871 | | |
FULLCAST Holdings Co. Ltd. | | | 479,800 | | | | 7,687 | | |
Infroneer Holdings, Inc. | | | 1,187,500 | | | | 8,441 | | |
Kumagai Gumi Co. Ltd. | | | 401,200 | | | | 8,125 | | |
Outsourcing, Inc. | | | 885,700 | | | | 6,775 | | |
Sankyu, Inc. | | | 257,700 | | | | 7,420 | | |
Sanwa Holdings Corp. | | | 991,900 | | | | 9,500 | | |
Takeuchi Manufacturing Co. Ltd. | | | 500,600 | | | | 8,592 | | |
TechnoPro Holdings, Inc. | | | 431,200 | | | | 8,657 | | |
Ushio, Inc. | | | 821,600 | | | | 10,177 | | |
| | | | 129,615 | | |
Information Technology (3.1%): | |
Fuji Soft, Inc. | | | 192,200 | | | | 11,041 | | |
NEC Networks & System Integration Corp. | | | 756,600 | | | | 10,249 | | |
Nippon Electric Glass Co. Ltd. (a) | | | 771,000 | | | | 14,769 | | |
Shinko Electric Industries Co. Ltd. | | | 833,000 | | | | 21,518 | | |
Taiyo Yuden Co. Ltd. | | | 342,100 | | | | 11,659 | | |
Tokyo Seimitsu Co. Ltd. | | | 276,900 | | | | 9,129 | | |
| | | | 78,365 | | |
Materials (1.3%): | |
Kaneka Corp. | | | 354,000 | | | | 8,720 | | |
Rengo Co. Ltd. | | | 1,893,500 | | | | 10,290 | | |
Tokyo Ohka Kogyo Co. Ltd. | | | 148,800 | | | | 7,284 | | |
Zeon Corp. | | | 667,600 | | | | 6,477 | | |
| | | | 32,771 | | |
Real Estate (1.3%): | |
Invincible Investment Corp. | | | 25,966 | | | | 7,650 | | |
Kenedix Office Investment Corp. | | | 1,623 | | | | 8,164 | | |
Nippon Accommodations Fund, Inc. | | | 2,010 | | | | 10,114 | | |
Starts Corp., Inc. | | | 373,100 | | | | 7,652 | | |
| | | | 33,580 | | |
Utilities (0.3%): | |
West Holdings Corp. (a) | | | 295,100 | | | | 7,914 | | |
| | | | 499,058 | | |
See notes to financial statements.
100
Victory Portfolios
Victory Trivalent International Small-Cap Fund | | Schedule of Portfolio Investments — continued
June 30, 2022 | |
(Amounts in Thousands, Except for Shares)
Security Description | | Shares | | Value | |
Korea, Republic Of (5.1%): | |
Communication Services (0.4%): | |
JYP Entertainment Corp. | | | 267,119 | | | $ | 9,943 | | |
Consumer Discretionary (0.5%): | |
Coway Co. Ltd. | | | 149,049 | | | | 7,376 | | |
Youngone Corp. | | | 220,380 | | | | 6,544 | | |
| | | | 13,920 | | |
Consumer Staples (0.6%): | |
Cosmax, Inc. | | | 86,746 | | | | 3,782 | | |
Lotte Chilsung Beverage Co., Ltd. | | | 83,269 | | | | 11,267 | | |
| | | | 15,049 | | |
Health Care (0.8%): | |
Dentium Co. Ltd. | | | 52,743 | | | | 3,480 | | |
Osstem Implant Co. Ltd. | | | 116,286 | | | | 8,997 | | |
PharmaResearch Co. Ltd. | | | 138,311 | | | | 7,194 | | |
| | | | 19,671 | | |
Industrials (0.8%): | |
KCC Corp. | | | 31,277 | | | | 6,941 | | |
Samsung Engineering Co. Ltd. (b) | | | 811,194 | | | | 13,486 | | |
| | | | 20,427 | | |
Information Technology (1.6%): | |
Daeduck Electronics Co. Ltd. | | | 152,137 | | | | 3,075 | | |
LEENO Industrial, Inc. | | | 82,026 | | | | 8,230 | | |
LG Innotek Co. Ltd. | | | 53,677 | | | | 14,241 | | |
LX Semicon Co. Ltd. | | | 122,601 | | | | 9,101 | | |
Partron Co. Ltd. | | | 1,080,299 | | | | 7,060 | | |
| | | | 41,707 | | |
Materials (0.4%): | |
LOTTE Fine Chemical Co. Ltd. | | | 174,975 | | | | 8,863 | | |
| | | | 129,580 | | |
Netherlands (4.0%): | |
Financials (1.2%): | |
| ASR Nederland NV | | | 454,546 | | | | 18,323 | | |
Euronext NV (d) | | | 139,385 | | | | 11,430 | | |
| | | | 29,753 | | |
Health Care (0.8%): | |
Argenx SE, ADR (b) | | | 51,601 | | | | 19,550 | | |
Industrials (1.7%): | |
Aalberts NV | | | 278,269 | | | | 10,805 | | |
Fugro NV (b) | | | 1,235,097 | | | | 15,544 | | |
Signify NV (d) | | | 509,901 | | | | 16,819 | | |
| | | | 43,168 | | |
See notes to financial statements.
101
Victory Portfolios
Victory Trivalent International Small-Cap Fund | | Schedule of Portfolio Investments — continued
June 30, 2022 | |
(Amounts in Thousands, Except for Shares)
Security Description | | Shares | | Value | |
Information Technology (0.3%): | |
BE Semiconductor Industries NV | | | 172,542 | | | $ | 8,244 | | |
| | | | 100,715 | | |
Norway (0.3%): | |
Financials (0.3%): | |
Sparebanken Vest | | | 891,977 | | | | 7,972 | | |
Singapore (1.2%): | |
Real Estate (0.6%): | |
Frasers Logistics & Commercial Trust | | | 14,328,800 | | | | 13,729 | | |
Utilities (0.6%): | |
Sembcorp Industries Ltd. | | | 7,902,500 | | | | 16,224 | | |
| | | | 29,953 | | |
Spain (3.6%): | |
Financials (0.8%): | |
Bankinter SA | | | 3,145,294 | | | | 19,671 | | |
Health Care (0.7%): | |
Laboratorios Farmaceuticos Rovi SA | | | 296,829 | | | | 18,177 | | |
Industrials (0.8%): | |
Applus Services SA | | | 1,125,751 | | | | 7,799 | | |
Cia de Distribucion Integral Logista Holdings SA | | | 636,621 | | | | 12,473 | | |
| | | | 20,272 | | |
Materials (0.5%): | |
Acerinox SA (b) | | | 1,290,284 | | | | 12,526 | | |
Real Estate (0.4%): | |
Merlin Properties Socimi SA | | | 1,057,985 | | | | 10,244 | | |
Utilities (0.4%): | |
Acciona SA | | | — | | | | — | | |
Corp. ACCIONA Energias Renovables SA (a) | | | 274,825 | | | | 10,655 | | |
| | | | 10,655 | | |
| | | | 91,545 | | |
Sweden (2.1%): | |
Consumer Discretionary (0.2%): | |
Dometic Group AB (a) (d) | | | 1,025,590 | | | | 6,053 | | |
Industrials (1.2%): | |
Intrum AB (a) | | | 507,505 | | | | 9,713 | | |
Saab AB, Class B | | | 218,145 | | | | 9,026 | | |
Trelleborg AB, Class B | | | 523,275 | | | | 10,593 | | |
| | | | 29,332 | | |
See notes to financial statements.
102
Victory Portfolios
Victory Trivalent International Small-Cap Fund | | Schedule of Portfolio Investments — continued
June 30, 2022 | |
(Amounts in Thousands, Except for Shares)
Security Description | | Shares | | Value | |
Real Estate (0.7%): | |
Cibus Nordic Real Estate AB | | | 473,125 | | | $ | 7,326 | | |
Wihlborgs Fastigheter AB | | | 1,585,111 | | | | 11,095 | | |
| | | | 18,421 | | |
| | | | 53,806 | | |
Switzerland (5.4%): | |
Consumer Discretionary (0.3%): | |
Forbo Holding AG, Registered Shares | | | 6,629 | | | | 8,859 | | |
Financials (1.6%): | |
Julius Baer Group Ltd. | | | 292,831 | | | | 13,587 | | |
Swissquote Group Holding SA, Registered Shares | | | 85,165 | | | | 8,688 | | |
Vontobel Holding AG, Class R | | | 259,758 | | | | 18,254 | | |
| | | | 40,529 | | |
Health Care (1.5%): | |
Galenica AG (d) | | | 227,425 | | | | 17,498 | | |
Siegfried Holding AG | | | 14,318 | | | | 9,171 | | |
Tecan Group AG, Class R | | | 36,715 | | | | 10,692 | | |
| | | | 37,361 | | |
Industrials (1.2%): | |
Adecco Group AG | | | 221,217 | | | | 7,541 | | |
Bucher Industries AG, Registered Shares | | | 40,632 | | | | 14,185 | | |
Sulzer AG, Registered Shares | | | 167,522 | | | | 10,444 | | |
| | | | 32,170 | | |
Real Estate (0.8%): | |
PSP Swiss Property AG, Registered Shares | | | 176,374 | | | | 19,640 | | |
| | | | 138,559 | | |
United Kingdom (13.4%): | |
Communication Services (0.8%): | |
Airtel Africa PLC (d) | | | 6,061,483 | | | | 10,068 | | |
Future PLC | | | 551,159 | | | | 11,661 | | |
| | | | 21,729 | | |
Consumer Discretionary (2.1%): | |
Inchcape PLC | | | 1,568,705 | | | | 13,329 | | |
Marks & Spencer Group PLC (b) | | | 6,142,049 | | | | 10,188 | | |
Pets at Home Group PLC | | | 2,220,263 | | | | 8,355 | | |
Redrow PLC | | | 2,091,674 | | | | 12,486 | | |
Vistry Group PLC | | | 1,027,700 | | | | 10,466 | | |
| | | | 54,824 | | |
Consumer Staples (0.8%): | |
Cranswick PLC | | | 275,217 | | | | 10,305 | | |
Tate Lyle PLC | | | 1,070,792 | | | | 9,811 | | |
| | | | 20,116 | | |
Energy (0.5%): | |
Capricorn Energy PLC (b) | | | 4,765,808 | | | | 12,667 | | |
See notes to financial statements.
103
Victory Portfolios
Victory Trivalent International Small-Cap Fund | | Schedule of Portfolio Investments — continued
June 30, 2022 | |
(Amounts in Thousands, Except for Shares)
Security Description | | Shares | | Value | |
Financials (1.7%): | |
IG Group Holdings PLC | | | 1,243,623 | | | $ | 10,495 | | |
Man Group PLC | | | 3,604,341 | | | | 11,001 | | |
OSB Group PLC | | | 2,468,392 | | | | 14,504 | | |
Virgin Money UK PLC | | | 3,919,612 | | | | 6,279 | | |
| | | | 42,279 | | |
Health Care (0.8%): | |
Abcam PLC (b) | | | 722,796 | | | | 10,387 | | |
CVS Group PLC | | | 477,516 | | | | 9,651 | | |
| | | | 20,038 | | |
Industrials (2.4%): | |
easyJet PLC (b) | | | 2,221,862 | | | | 9,978 | | |
Electrocomponents PLC | | | 1,154,784 | | | | 12,281 | | |
IMI PLC | | | 1,011,292 | | | | 14,502 | | |
Serco Group PLC | | | 7,797,384 | | | | 16,535 | | |
Travis Perkins PLC | | | 606,174 | | | | 7,184 | | |
| | | | 60,480 | | |
Information Technology (1.4%): | |
Computacenter PLC | | | 645,913 | | | | 18,494 | | |
Micro Focus International PLC | | | 2,085,069 | | | | 7,094 | | |
Spirent Communications PLC | | | 3,535,258 | | | | 10,619 | | |
| | | | 36,207 | | |
Materials (0.3%): | |
Endeavour Mining PLC (a) | | | 366,976 | | | | 7,593 | | |
Real Estate (1.8%): | |
LondonMetric Property PLC | | | 4,480,581 | | | | 12,450 | | |
Safestore Holdings PLC | | | 1,387,201 | | | | 17,959 | | |
Savills PLC | | | 713,599 | | | | 8,797 | | |
Tritax Big Box REIT PLC | | | 3,445,343 | | | | 7,634 | | |
| | | | 46,840 | | |
Utilities (0.8%): | |
Atlantica Sustainable Infrastructure PLC | | | 306,556 | | | | 9,889 | | |
Drax Group PLC | | | 1,294,292 | | | | 10,158 | | |
| | | | 20,047 | | |
| | | | 342,820 | | |
United States (1.0%): | |
Consumer Discretionary (0.4%): | |
International Game Technology PLC (a) | | | 562,283 | | | | 10,436 | | |
Industrials (0.3%): | |
Reliance Worldwide Corp. Ltd. | | | 3,143,502 | | | | 8,783 | | |
Materials (0.3%): | |
SSR Mining, Inc. | | | 410,618 | | | | 6,859 | | |
| | | | 26,078 | | |
Total Common Stocks (Cost $2,694,613) | | | 2,479,778 | | |
See notes to financial statements.
104
Victory Portfolios
Victory Trivalent International Small-Cap Fund | | Schedule of Portfolio Investments — continued
June 30, 2022 | |
(Amounts in Thousands, Except for Shares)
Security Description | | Shares | | Value | |
Exchange-Traded Funds (0.8%) | |
United States (0.8%): | |
Vanguard FTSE Developed Markets ETF | | | 461,604 | | | $ | 18,834 | | |
Total Exchange-Traded Funds (Cost $20,015) | | | 18,834 | | |
Collateral for Securities Loaned (5.0%)^ | |
United States (5.0%): | |
BlackRock Liquidity Funds TempFund Portfolio, Institutional Shares, 1.47% (e) | | | 3,959,392 | | | | 3,959 | | |
Goldman Sachs Financial Square Prime Obligations Fund, Institutional Shares,
1.42% (e) | | | 1,975,932 | | | | 1,976 | | |
HSBC U.S. Government Money Market Fund, I Shares, 1.46% (e) | | | 24,643,852 | | | | 24,644 | | |
JPMorgan Prime Money Market Fund, Capital Shares, 1.50% (e) | | | 15,755,469 | | | | 15,755 | | |
Morgan Stanley Institutional Liquidity Government Portfolio, Institutional Shares,
1.39% (e) | | | 10,507,120 | | | | 10,507 | | |
Morgan Stanley Institutional Liquidity Prime Portfolio, Institutional Shares,
1.53% (e) | | | 70,839,664 | | | | 70,840 | | |
Total Collateral for Securities Loaned (Cost $127,681) | | | 127,681 | | |
Total Investments (Cost $2,842,309) — 103.0% | | | 2,626,293 | | |
Liabilities in excess of other assets — (3.0)% | | | (75,741 | ) | |
NET ASSETS — 100.00% | | $ | 2,550,552 | | |
^ Purchased with cash collateral from securities on loan.
(a) All or a portion of this security is on loan.
(b) Non-income producing security.
(c) Rounds to less than $1 thousand.
(d) Rule 144A security or other security that is restricted as to resale to institutional investors. The Fund's Adviser has deemed this security to be liquid (unless otherwise noted as illiquid) based upon procedures approved by the Board of Trustees. As of June 30, 2022, the fair value of these securities was $94,166 (thousands) and amounted to 3.7% of net assets.
(e) Rate disclosed is the daily yield on June 30, 2022.
ADR — American Depositary Receipt
ETF — Exchange-Traded Fund
PLC — Public Limited Company
REIT — Real Estate Investment Trust
See notes to financial statements.
105
Victory Portfolios
Victory INCORE Total Return Bond Fund | | Schedule of Portfolio Investments
June 30, 2022 | |
(Amounts in Thousands, Except for Shares)
Security Description | | Principal
Amount | | Value | |
Asset-Backed Securities (4.8%) | |
Drive Auto Receivables Trust, Series 2021-1, Class C, 1.02%, 6/15/27,
Callable 12/15/23 @ 100 (a) | | $ | 298 | | | $ | 291 | | |
GM Financial Consumer Automobile Receivables Trust, Series 2021-2, Class C,
1.28%, 1/19/27, Callable 12/16/24 @ 100 (a) | | | 245 | | | | 228 | | |
Home Equity Asset Trust, Series 2005-2, Class M5, 2.10% (LIBOR01M+110bps),
7/25/35, Callable 7/25/22 @ 100 (b) | | | 111 | | | | 111 | | |
JPMorgan Chase Bank NA, Series 2021-2, Class C, 0.97%, 12/26/28,
Callable 3/25/25 @ 100 (c) | | | 155 | | | | 150 | | |
Santander Drive Auto Receivables Trust, Series 2021-4, Class C, 1.26%, 2/16/27,
Callable 6/15/24 @ 100 (a) | | | 283 | | | | 271 | | |
Santander Retail Auto Lease Trust, Series 2021-A, Class C, 1.14%, 3/20/26,
Callable 4/20/24 @ 100 (a) (c) | | | 674 | | | | 639 | | |
United Auto Credit Securitization Trust, Series 2022-1, Class C, 2.61%, 6/10/27,
Callable 6/10/25 @ 100 (a) (c) | | | 231 | | | | 223 | | |
Westlake Automobile Receivables Trust, Series 2021-1A, Class C, 0.95%, 3/16/26,
Callable 6/15/24 @ 100 (a) (c) | | | 332 | | | | 319 | | |
Westlake Automobile Receivables Trust, Series 2021-2A, Class C, 0.89%, 7/15/26,
Callable 9/15/24 @ 100 (a) (c) | | | 337 | | | | 319 | | |
Westlake Automobile Receivables Trust, Series 2022-1A, Class C, 3.11%,
3/15/27, Callable 8/15/25 @ 100 (a) (c) | | | 310 | | | | 303 | | |
Total Asset-Backed Securities (Cost $2,972) | | | 2,854 | | |
Collateralized Mortgage Obligations (7.8%) | |
BANK, Series 2020-BN26, Class AS, 2.69%, 3/15/63, Callable 3/15/30 @ 100 (a) | | | 290 | | | | 251 | | |
CFCRE Commercial Mortgage Trust, Series 2016-C3, Class A2, 3.60%, 1/10/48,
Callable 11/10/25 @ 100 | | | 158 | | | | 153 | | |
CFCRE Commercial Mortgage Trust, Series 2016-C4, Class A2,
3.28%, 5/10/58 | | | 163 | | | | 157 | | |
Citigroup Commercial Mortgage Trust, Series 2020-GC46, Class AS, 2.92%,
2/15/53, Callable 2/15/30 @ 100 (a) | | | 257 | | | | 225 | | |
Citigroup Commercial Mortgage Trust, Series 2016-P4, Class A4, 2.90%,
7/10/49, Callable 7/10/26 @ 100 (a) | | | 244 | | | | 232 | | |
Citigroup Commercial Mortgage Trust, Series 2015-GC33, Class A4, 3.78%,
9/10/58, Callable 9/10/25 @ 100 | | | 143 | | | | 142 | | |
Citigroup Commercial Mortgage Trust, Series 2015-P1, Class A5, 3.72%, 9/15/48,
Callable 7/15/25 @ 100 (a) | | | 158 | | | | 156 | | |
COMM Mortgage Trust, Series 2015-CR25, Class A4, 3.76%, 8/10/48,
Callable 8/10/25 @ 100 (a) | | | 186 | | | | 183 | | |
CSAIL Commercial Mortgage Trust, Series 2015-C2, Class A4, 3.50%, 6/15/57,
Callable 4/15/25 @ 100 (a) | | | 212 | | | | 208 | | |
CSAIL Commercial Mortgage Trust, Series 2015-C3, Class A4, 3.72%, 8/15/48,
Callable 7/15/25 @ 100 (a) | | | 348 | | | | 342 | | |
CSAIL Commercial Mortgage Trust, Series 2015-C4, Class A4, 3.81%,
11/15/48 (a) | | | 158 | | | | 155 | | |
CSAIL Commercial Mortgage Trust, Series 2016-C7, Class A5, 3.50%, 11/15/49,
Callable 10/15/26 @ 100 | | | 137 | | | | 133 | | |
GS Mortgage Securities Trust, Series 2015-GC30, Class A4, 3.38%, 5/10/50,
Callable 5/10/25 @ 100 (a) | | | 162 | | | | 159 | | |
See notes to financial statements.
106
Victory Portfolios
Victory INCORE Total Return Bond Fund | | Schedule of Portfolio Investments — continued
June 30, 2022 | |
(Amounts in Thousands, Except for Shares)
Security Description | | Principal
Amount | | Value | |
GS Mortgage Securities Trust, Series 2016-GS2, Class A4, 3.05%, 5/10/49,
Callable 2/10/26 @ 100 (a) | | $ | 162 | | | $ | 155 | | |
JP Morgan Chase Commercial Mortgage Securities Trust, Series 2016-JP2,
Class A4, 2.82%, 8/15/49, Callable 7/15/26 @ 100 (a) | | | 376 | | | | 356 | | |
JPMBB Commercial Mortgage Securities Trust, Series 2015-C28, Class A4, 3.23%,
10/15/48, Callable 3/15/25 @ 100 (a) | | | 453 | | | | 417 | | |
JPMBB Commercial Mortgage Securities Trust, Series 2015-C31, Class A3, 3.80%,
8/15/48, Callable 8/15/25 @ 100 (a) | | | 152 | | | | 150 | | |
Morgan Stanley Bank of America Merrill Lynch Trust, Series 2016-C32, Class A4,
3.72%, 12/15/49, Callable 12/15/26 @ 100 (a) | | | 158 | | | | 154 | | |
Wells Fargo Commercial Mortgage Trust, Series 2016-NXS6, Class A4, 2.92%,
11/15/49, Callable 9/15/26 @ 100 | | | 149 | | | | 142 | | |
Wells Fargo Commercial Mortgage Trust, Series 2015-C28, Class A4, 3.54%,
5/15/48, Callable 4/15/25 @ 100 (a) | | | 193 | | | | 189 | | |
Wells Fargo Commercial Mortgage Trust, Series 2015-P2, Class A4, 3.81%,
12/15/48, Callable 11/15/25 @ 100 (a) | | | 163 | | | | 161 | | |
Wells Fargo Commercial Mortgage Trust, Series 2015-C30, Class A4, 3.66%,
9/15/58, Callable 7/15/25 @ 100 (a) | | | 181 | | | | 178 | | |
WFRBS Commercial Mortgage Trust, Series 2012-C10, Class A5, 3.24%, 12/15/45,
Callable 12/15/22 @ 100 | | | 270 | | | | 266 | | |
Total Collateralized Mortgage Obligations (Cost $4,953) | | | 4,664 | | |
Convertible Corporate Bonds (7.0%) | |
Consumer Discretionary (1.2%): | |
Booking Holdings, Inc., 0.75%, 5/1/25 (a) (d) | | | 305 | | | | 362 | | |
Expedia Group, Inc., 2/15/26 (a) (d) (e) | | | 300 | | | | 271 | | |
Ford Motor Co., 3/15/26 (e) | | | 95 | | | | 87 | | |
| | | | 720 | | |
Energy (0.6%): | |
Pioneer Natural Resources Co., 0.25%, 5/15/25 (a) | | | 185 | | | | 400 | | |
Financials (1.6%): | |
Ares Capital Corp., 4.63%, 3/1/24 (a) | | | 345 | | | | 359 | | |
Barclays Bank PLC
2/4/25 (a) (e) | | | 110 | | | | 150 | | |
2/18/25 (e) | | | 65 | | | | 68 | | |
JPMorgan Chase Financial Co. LLC, 0.25%, 5/1/23 (a) (c) | | | 265 | | | | 276 | | |
Sixth Street Specialty Lending, Inc., 4.50%, 8/1/22 | | | 90 | | | | 94 | | |
| | | | 947 | | |
Health Care (1.0%): | |
Anthem, Inc., 2.75%, 10/15/42 (a) | | | 53 | | | | 363 | | |
Illumina, Inc., 8/15/23 (a) (e) | | | 280 | | | | 268 | | |
| | | | 631 | | |
Industrials (0.6%): | |
Southwest Airlines Co., 1.25%, 5/1/25 (a) | | | 300 | | | | 355 | | |
Information Technology (1.7%): | |
Akamai Technologies, Inc., 0.13%, 5/1/25 (a) | | | 130 | | | | 143 | | |
Block, Inc., 0.25%, 11/1/27 | | | 55 | | | | 41 | | |
See notes to financial statements.
107
Victory Portfolios
Victory INCORE Total Return Bond Fund | | Schedule of Portfolio Investments — continued
June 30, 2022 | |
(Amounts in Thousands, Except for Shares)
Security Description | | Shares or
Principal
Amount | | Value | |
Euronet Worldwide, Inc., 0.75%, 3/15/49, Callable 3/20/25 @ 100 (a) (d) | | $ | 315 | | | $ | 323 | | |
Vishay Intertechnology, Inc., 2.25%, 6/15/25 | | | 105 | | | | 99 | | |
Western Digital Corp., 1.50%, 2/1/24 (a) | | | 430 | | | | 409 | | |
| | | | 1,015 | | |
Real Estate (0.3%): | |
Kite Realty Group LP, 0.75%, 4/1/27 (a) (c) | | | 185 | | | | 167 | | |
Total Convertible Corporate Bonds (Cost $4,219) | | | 4,235 | | |
Convertible Preferred Stocks (3.4%) | |
Financials (1.4%): | |
Bank of America Corp., Series L, 7.25% (a) (f) | | | 280 | | | | 337 | | |
KKR & Co., Inc., Series C, 6.00%, 9/15/23 (a) | | | 2,570 | | | | 150 | | |
Wells Fargo & Co., Series L, 7.50% (a) (f) | | | 245 | | | | 298 | | |
| | | | 785 | | |
Health Care (0.1%): | |
Danaher Corp., Series B, 5.00%, 4/15/23 | | | 39 | | | | 52 | | |
Industrials (0.3%): | |
Stanley Black & Decker, Inc., 5.25%, 11/15/22 (a) | | | 3,047 | | | | 205 | | |
Utilities (1.6%): | |
American Electric Power Co., Inc., 6.13%, 8/15/23 | | | 1,615 | | | | 88 | | |
CenterPoint Energy, Inc., 4.57%, 9/15/29 | | | 1,045 | | | | 48 | | |
DTE Energy Co., 6.25%, 11/1/22 (a) | | | 4,475 | | | | 230 | | |
NextEra Energy, Inc., 5.28%, 3/1/23 (a) | | | 7,295 | | | | 362 | | |
NiSource, Inc., 7.75%, 3/1/24 | | | 210 | | | | 24 | | |
The Southern Co., Series 2019, 6.75%, 8/1/22 (a) | | | 5,037 | | | | 267 | | |
| | | | 1,019 | | |
Total Convertible Preferred Stocks (Cost $2,326) | | | 2,061 | | |
Corporate Bonds (39.3%) | |
Communication Services (1.7%): | |
AT&T, Inc.
4.25%, 3/1/27, Callable 12/1/26 @ 100 (a) | | $ | 129 | | | | 129 | | |
5.15%, 11/15/46, Callable 5/15/46 @ 100 (a) | | | 312 | | | | 308 | | |
CenturyLink, Inc., 6.75%, 12/1/23 | | | 115 | | | | 114 | | |
Comcast Corp., 3.45%, 2/1/50, Callable 8/1/49 @ 100 (a) | | | 150 | | | | 120 | | |
Sirius XM Radio, Inc., 4.13%, 7/1/30, Callable 7/1/25 @ 102.06 (a) (c) | | | 143 | | | | 119 | | |
Verizon Communications, Inc.
3.38%, 2/15/25 (a) | | | 116 | | | | 115 | | |
3.55%, 3/22/51, Callable 9/22/50 @ 100 (a) | | | 125 | | | | 100 | | |
| | | | 1,005 | | |
Consumer Discretionary (5.3%): | |
D.R. Horton, Inc., 2.50%, 10/15/24, Callable 9/15/24 @ 100 (a) | | | 670 | | | | 640 | | |
Dana, Inc., 5.63%, 6/15/28, Callable 6/15/23 @ 102.81 | | | 110 | | | | 95 | | |
General Motors Co., 4.88%, 10/2/23 (a) | | | 229 | | | | 231 | | |
Lennar Corp., 5.00%, 6/15/27, Callable 12/15/26 @ 100 (a) | | | 212 | | | | 210 | | |
See notes to financial statements.
108
Victory Portfolios
Victory INCORE Total Return Bond Fund | | Schedule of Portfolio Investments — continued
June 30, 2022 | |
(Amounts in Thousands, Except for Shares)
Security Description | | Principal
Amount | | Value | |
Marriott International, Inc., 3.60%, 4/15/24, Callable 3/15/24 @ 100 (a) | | $ | 326 | | | $ | 323 | | |
Meritage Homes Corp., 6.00%, 6/1/25, Callable 3/1/25 @ 100 | | | 63 | | | | 61 | | |
Murphy Oil USA, Inc., 3.75%, 2/15/31, Callable 2/15/26 @ 101.88 (a) (c) | | | 201 | | | | 171 | | |
NIKE, Inc., 3.88%, 11/1/45, Callable 5/1/45 @ 100 (a) | | | 198 | | | | 182 | | |
NVR, Inc., 3.00%, 5/15/30, Callable 11/15/29 @ 100 (a) | | | 267 | | | | 229 | | |
O'Reilly Automotive, Inc., 4.70%, 6/15/32, Callable 3/15/32 @ 100 (d) | | | 199 | | | | 198 | | |
PulteGroup, Inc., 5.00%, 1/15/27, Callable 10/15/26 @ 100 (a) (d) | | | 240 | | | | 240 | | |
Ross Stores, Inc., 3.38%, 9/15/24, Callable 6/15/24 @ 100 (a) | | | 160 | | | | 158 | | |
The Goodyear Tire Rubber Co., 5.25%, 4/30/31, Callable 1/30/31 @ 100 (a) (d) | | | 188 | | | | 153 | | |
Whirlpool Corp., 2.40%, 5/15/31, Callable 2/15/31 @ 100 (a) | | | 185 | | | | 154 | | |
Yum! Brands, Inc., 3.63%, 3/15/31, Callable 12/15/30 @ 100 (a) | | | 171 | | | | 145 | | |
| | | | 3,190 | | |
Consumer Staples (1.8%): | |
7-Eleven, Inc., 0.80%, 2/10/24, Callable 8/8/22 @ 100 (a) (c) | | | 368 | | | | 349 | | |
Altria Group, Inc., 4.40%, 2/14/26, Callable 12/14/25 @ 100 (a) | | | 105 | | | | 103 | | |
BAT Capital Corp., 5.28%, 4/2/50, Callable 10/2/49 @ 100 (a) | | | 167 | | | | 138 | | |
Church & Dwight Co., Inc., 2.30%, 12/15/31, Callable 9/15/31 @ 100 | | | 139 | | | | 117 | | |
Estee Lauder Cos., Inc., 4.15%, 3/15/47, Callable 9/15/46 @ 100 (a) | | | 105 | | | | 98 | | |
Reynolds American, Inc., 6.15%, 9/15/43 (a) | | | 175 | | | | 159 | | |
Tyson Foods, Inc., 5.10%, 9/28/48, Callable 3/28/48 @ 100 | | | 135 | | | | 136 | | |
| | | | 1,100 | | |
Energy (2.9%): | |
Continental Resources, Inc.
4.50%, 4/15/23, Callable 1/15/23 @ 100 (a) | | | 234 | | | | 235 | | |
2.27%, 11/15/26, Callable 11/15/23 @ 100 (a) (c) | | | 267 | | | | 237 | | |
EOG Resources, Inc., 4.95%, 4/15/50, Callable 10/15/49 @ 100 (a) | | | 135 | | | | 140 | | |
HollyFrontier Corp., 2.63%, 10/1/23 (a) | | | 265 | | | | 257 | | |
Marathon Oil Corp., 6.60%, 10/1/37 (a) | | | 255 | | | | 270 | | |
Pioneer Natural Resources Co., 1.90%, 8/15/30, Callable 5/15/30 @ 100 (a) | | | 251 | | | | 205 | | |
Plains All American Pipeline LP/PAA Finance Corp., 2.85%, 1/31/23,
Callable 10/31/22 @ 100 (a) | | | 245 | | | | 243 | | |
Western Midstream Operating LP, 4.55%, 2/1/30, Callable 11/1/29 @ 100 (a) | | | 188 | | | | 163 | | |
| | | | 1,750 | | |
Financials (11.4%): | |
Aflac, Inc., 4.75%, 1/15/49, Callable 7/15/48 @ 100 | | | 35 | | | | 34 | | |
Alleghany Corp., 3.63%, 5/15/30, Callable 2/15/30 @ 100 (a) | | | 130 | | | | 122 | | |
American Express Co., 4.99% (SOFR+226bps), 5/26/33,
Callable 2/26/32 @ 100 (b) | | | 299 | | | | 299 | | |
Bank of America Corp.
4.20%, 8/26/24 (a) | | | 160 | | | | 160 | | |
3.25%, 10/21/27, Callable 10/21/26 @ 100 (a) | | | 205 | | | | 193 | | |
2.57% (SOFR+121bps), 10/20/32, Callable 10/20/31 @ 100 (a) (b) | | | 340 | | | | 281 | | |
Capital One Financial Corp.
4.93% (SOFR+206bps), 5/10/28, Callable 5/10/27 @ 100 (b) | | | 174 | | | | 172 | | |
2.36% (SOFR+134bps), 7/29/32, Callable 7/29/31 @ 100 (a) (b) | | | 395 | | | | 301 | | |
Cincinnati Financial Corp., 6.13%, 11/1/34 (a) | | | 230 | | | | 261 | | |
See notes to financial statements.
109
Victory Portfolios
Victory INCORE Total Return Bond Fund | | Schedule of Portfolio Investments — continued
June 30, 2022 | |
(Amounts in Thousands, Except for Shares)
Security Description | | Principal
Amount | | Value | |
Citigroup, Inc.
3.88%, 3/26/25 | | $ | 108 | | | $ | 107 | | |
4.60%, 3/9/26 (a) | | | 232 | | | | 233 | | |
4.45%, 9/29/27 (a) | | | 108 | | | | 106 | | |
Fifth Third Bancorp
1.63%, 5/5/23, Callable 4/5/23 @ 100 | | | 130 | | | | 128 | | |
3.65%, 1/25/24, Callable 12/25/23 @ 100 (a) | | | 584 | | | | 582 | | |
Ford Motor Credit Co. LLC, 4.06%, 11/1/24, Callable 10/1/24 @ 100 (a) | | | 290 | | | | 276 | | |
General Motors Financial Co., Inc., 4.15%, 6/19/23, Callable 5/19/23 @ 100 | | | 110 | | | | 110 | | |
Globe Life, Inc., 2.15%, 8/15/30, Callable 5/15/30 @ 100 (a) | | | 250 | | | | 205 | | |
JPMorgan Chase & Co.
2.95%, 10/1/26, Callable 7/1/26 @ 100 (a) | | | 425 | | | | 406 | | |
2.55% (SOFR+118bps), 11/8/32, Callable 11/8/31 @ 100 (a) (b) | | | 376 | | | | 312 | | |
5.60%, 7/15/41 | | | 87 | | | | 91 | | |
Morgan Stanley
4.88%, 11/1/22 (a) | | | 303 | | | | 306 | | |
3.13%, 7/27/26, MTN (a) | | | 545 | | | | 520 | | |
Old Republic International Corp., 3.85%, 6/11/51, Callable 12/11/50 @ 100 | | | 104 | | | | 78 | | |
Regions Financial Corp., 1.80%, 8/12/28, Callable 6/12/28 @ 100 (a) | | | 228 | | | | 194 | | |
SVB Financial Group, 3.13%, 6/5/30, Callable 3/5/30 @ 100 (a) | | | 373 | | | | 321 | | |
The Goldman Sachs Group, Inc., 3.50%, 1/23/25, Callable 10/23/24 @ 100 | | | 275 | | | | 272 | | |
Wells Fargo & Co.
4.30%, 7/22/27, MTN (a) | | | 410 | | | | 405 | | |
4.90%, 11/17/45 (a) | | | 155 | | | | 143 | | |
Zions Bancorp NA, 3.25%, 10/29/29, Callable 7/29/29 @ 100 | | | 250 | | | | 218 | | |
| | | | 6,836 | | |
Health Care (4.4%): | |
AbbVie, Inc.
3.20%, 11/21/29, Callable 8/21/29 @ 100 (a) | | | 285 | | | | 262 | | |
4.45%, 5/14/46, Callable 11/14/45 @ 100 (a) | | | 142 | | | | 129 | | |
Anthem, Inc., 2.38%, 1/15/25, Callable 12/15/24 @ 100 (a) | | | 148 | | | | 143 | | |
Baxter International, Inc.
2.54%, 2/1/32, Callable 11/1/31 @ 100 (a) (c) (d) | | | 390 | | | | 329 | | |
3.50%, 8/15/46, Callable 2/15/46 @ 100 | | | 109 | | | | 85 | | |
Centene Corp., 4.25%, 12/15/27, Callable 12/15/22 @ 102.13 (a) | | | 168 | | | | 157 | | |
HCA, Inc., 4.13%, 6/15/29, Callable 3/15/29 @ 100 (a) | | | 193 | | | | 176 | | |
Hologic, Inc., 3.25%, 2/15/29, Callable 9/28/23 @ 101.63 (a) (c) | | | 260 | | | | 222 | | |
Humana, Inc., 2.90%, 12/15/22, Callable 11/15/22 @ 100 (a) | | | 135 | | | | 135 | | |
Mylan, Inc., 4.55%, 4/15/28, Callable 1/15/28 @ 100 (a) | | | 262 | | | | 250 | | |
Regeneron Pharmaceuticals, Inc., 2.80%, 9/15/50, Callable 3/15/50 @ 100 | | | 146 | | | | 99 | | |
Universal Health Services, Inc.
1.65%, 9/1/26, Callable 8/1/26 @ 100 (a) (c) | | | 394 | | | | 341 | | |
2.65%, 10/15/30, Callable 7/15/30 @ 100 (c) | | | 102 | | | | 81 | | |
Viatris, Inc.
2.30%, 6/22/27, Callable 4/22/27 @ 100 | | | 95 | | | | 81 | | |
4.00%, 6/22/50, Callable 12/22/49 @ 100 (a) | | | 190 | | | | 127 | | |
| | | | 2,617 | | |
Industrials (3.4%): | |
Acuity Brands Lighting, Inc., 2.15%, 12/15/30, Callable 9/15/30 @ 100 | | | 107 | | | | 85 | | |
See notes to financial statements.
110
Victory Portfolios
Victory INCORE Total Return Bond Fund | | Schedule of Portfolio Investments — continued
June 30, 2022 | |
(Amounts in Thousands, Except for Shares)
Security Description | | Principal
Amount | | Value | |
Air Lease Corp.
0.70%, 2/15/24, Callable 1/15/24 @ 100, MTN (a) | | $ | 282 | | | $ | 266 | | |
0.80%, 8/18/24, Callable 7/18/24 @ 100 (a) | | | 146 | | | | 134 | | |
CSX Corp., 3.35%, 9/15/49, Callable 3/15/49 @ 100 (a) | | | 92 | | | | 72 | | |
Delta Air Lines, Inc., 3.80%, 4/19/23, Callable 3/19/23 @ 100 (a) | | | 275 | | | | 274 | | |
Hillenbrand, Inc., 5.00%, 9/15/26, Callable 7/15/26 @ 100 (a) | | | 420 | | | | 397 | | |
Honeywell International, Inc., 2.80%, 6/1/50, Callable 12/1/49 @ 100 | | | 82 | | | | 63 | | |
Norfolk Southern Corp.
2.30%, 5/15/31, Callable 2/15/31 @ 100 | | | 239 | | | | 204 | | |
2.90%, 8/25/51, Callable 2/25/51 @ 100 | | | 125 | | | | 90 | | |
Northrop Grumman Corp., 5.25%, 5/1/50, Callable 11/1/49 @ 100 (a) | | | 116 | | | | 122 | | |
Oshkosh Corp., 3.10%, 3/1/30, Callable 12/1/29 @ 100 (a) | | | 140 | | | | 120 | | |
Sensata Technologies, Inc., 3.75%, 2/15/31, Callable 2/15/26 @ 101.88 (c) | | | 130 | | | | 104 | | |
Snap-on, Inc., 4.10%, 3/1/48, Callable 9/1/47 @ 100 (a) | | | 115 | | | | 105 | | |
| | | | 2,036 | | |
Information Technology (3.1%): | |
Apple, Inc., 4.65%, 2/23/46, Callable 8/23/45 @ 100 (a) | | | 117 | | | | 121 | | |
Broadcom, Inc., 5.00%, 4/15/30, Callable 1/15/30 @ 100 (a) | | | 315 | | | | 310 | | |
Cadence Design Systems, Inc., 4.38%, 10/15/24, Callable 7/15/24 @ 100 (a) | | | 342 | | | | 345 | | |
Micron Technology, Inc., 5.33%, 2/6/29, Callable 11/6/28 @ 100 (a) | | | 394 | | | | 393 | | |
NCR Corp., 5.25%, 10/1/30, Callable 10/1/25 @ 102.63 (c) | | | 87 | | | | 75 | | |
NetApp, Inc., 3.25%, 12/15/22, Callable 9/15/22 @ 100 (a) | | | 150 | | | | 150 | | |
Texas Instruments, Inc., 4.15%, 5/15/48, Callable 11/15/47 @ 100 (a) | | | 160 | | | | 154 | | |
Visa, Inc., 2.00%, 8/15/50, Callable 2/15/50 @ 100 | | | 287 | | | | 190 | | |
Western Digital Corp., 2.85%, 2/1/29, Callable 12/1/28 @ 100 | | | 147 | | | | 120 | | |
| | | | 1,858 | | |
Materials (0.4%): | |
Newmont Corp., 2.60%, 7/15/32, Callable 4/15/32 @ 100 | | | 104 | | | | 86 | | |
The Scotts Miracle-Gro Co., 4.50%, 10/15/29, Callable 10/15/24 @ 102.25 (a) | | | 188 | | | | 154 | | |
| | | | 240 | | |
Real Estate (3.4%): | |
Essential Properties LP, 2.95%, 7/15/31, Callable 4/15/31 @ 100 | | | 131 | | | | 103 | | |
Highwoods Realty LP, 3.63%, 1/15/23, Callable 10/15/22 @ 100 (a) | | | 630 | | | | 630 | | |
Iron Mountain, Inc., 5.25%, 7/15/30, Callable 7/15/25 @ 102.63 (c) | | | 108 | | | | 94 | | |
Kite Realty Group Trust, 4.00%, 3/15/25, Callable 12/15/24 @ 100 (a) | | | 339 | | | | 332 | | |
Physicians Realty LP
3.95%, 1/15/28, Callable 10/15/27 @ 100 (a) | | | 138 | | | | 131 | | |
2.63%, 11/1/31, Callable 8/1/31 @ 100 | | | 128 | | | | 103 | | |
Regency Centers LP, 4.65%, 3/15/49, Callable 9/15/48 @ 100 | | | 114 | | | | 102 | | |
Sabra Health Care LP, 5.13%, 8/15/26, Callable 5/15/26 @ 100 (a) | | | 145 | | | | 141 | | |
Spirit Realty LP, 3.20%, 1/15/27, Callable 11/15/26 @ 100 (d) | | | 266 | | | | 245 | | |
STORE Capital Corp., 2.75%, 11/18/30, Callable 8/18/30 @ 100 (a) | | | 184 | | | | 151 | | |
| | | | 2,032 | | |
Utilities (1.5%): | |
Ameren Illinois Co., 1.55%, 11/15/30, Callable 8/15/30 @ 100 (a) | | | 225 | | | | 183 | | |
Consolidated Edison Co. of New York, Inc., 6.30%, 8/15/37 | | | 250 | | | | 282 | | |
Oklahoma Gas and Electric Co., 5.25%, 5/15/41, Callable 11/15/40 @ 100 (a) | | | 190 | | | | 189 | | |
See notes to financial statements.
111
Victory Portfolios
Victory INCORE Total Return Bond Fund | | Schedule of Portfolio Investments — continued
June 30, 2022 | |
(Amounts in Thousands, Except for Shares)
Security Description | | Principal
Amount | | Value | |
Public Service Electric & Gas Co., 3.95%, 5/1/42, MTN,
Callable 11/1/41 @ 100 (a) | | $ | 159 | | | $ | 144 | | |
Wisconsin Public Service Corp., 2.85%, 12/1/51, Callable 6/1/51 @ 100 | | | 174 | | | | 126 | | |
| | | | 924 | | |
Total Corporate Bonds (Cost $26,382) | | | 23,588 | | |
Residential Mortgage-Backed Securities (0.1%) | |
Credit Suisse First Boston Mortgage Securities Corp., Series 2002-HE16,
Class M1, 2.94% (LIBOR01M+132bps), 10/25/32, Callable 7/25/22 @ 100 (b) | | | 77 | | | | 77 | | |
Total Residential Mortgage-Backed Securities (Cost $76) | | | 77 | | |
Yankee Dollars (7.0%) | |
Communication Services (0.3%): | |
Vodafone Group PLC, 5.25%, 5/30/48 (a) | | | 193 | | | | 184 | | |
Consumer Staples (2.5%): | |
Barry Callebaut Services NV, 5.50%, 6/15/23 (c) | | | 638 | | | | 641 | | |
Kerry Group Financial Services Unlimited Co., 3.20%, 4/9/23,
Callable 1/9/23 @ 100 (a) (c) | | | 670 | | | | 668 | | |
Suntory Holdings Ltd., 2.25%, 10/16/24, Callable 9/16/24 @ 100 (a) (c) | | | 200 | | | | 190 | | |
| | | | 1,499 | | |
Energy (0.9%): | |
Canadian Natural Resources Ltd., 2.95%, 1/15/23, Callable 12/15/22 @ 100 | | | 140 | | | | 140 | | |
Ecopetrol SA, 5.88%, 9/18/23 (a) | | | 325 | | | | 325 | | |
Statoil ASA, 3.95%, 5/15/43 | | | 100 | | | | 89 | | |
| | | | 554 | | |
Financials (1.1%): | |
HSBC Holdings PLC, 2.87% (SOFR+141bps), 11/22/32,
Callable 11/22/31 @ 100 (a) (b) | | | 340 | | | | 279 | | |
Newcrest Finance Pty Ltd.
5.75%, 11/15/41 (c) | | | 155 | | | | 153 | | |
4.20%, 5/13/50, Callable 11/13/49 @ 100 (c) | | | 110 | | | | 90 | | |
Total Capital International SA, 2.99%, 6/29/41, Callable 12/29/40 @ 100 (a) | | | 195 | | | | 154 | | |
| | | | 676 | | |
Industrials (1.0%): | |
AerCap Ireland Capital DAC/AerCap Global Aviation Trust
6.50%, 7/15/25, Callable 6/15/25 @ 100 (a) | | | 150 | | | | 153 | | |
1.75%, 1/30/26, Callable 12/30/25 @ 100 | | | 150 | | | | 131 | | |
Canadian National Railway Co., 3.20%, 8/2/46, Callable 2/2/46 @ 100 (a) | | | 85 | | | | 66 | | |
Canadian Pacific Railway Co., 3.10%, 12/2/51, Callable 6/2/51 @ 100 | | | 92 | | | | 68 | | |
Sensata Technologies BV, 4.00%, 4/15/29, Callable 4/15/24 @ 102 (c) | | | 200 | | | | 170 | | |
| | | | 588 | | |
Materials (1.1%): | |
Anglo American Capital PLC
2.88%, 3/17/31, Callable 12/17/30 @ 100 (a) (c) | | | 300 | | | | 250 | | |
3.95%, 9/10/50, Callable 3/10/50 @ 100 (c) (d) | | | 200 | | | | 154 | | |
See notes to financial statements.
112
Victory Portfolios
Victory INCORE Total Return Bond Fund | | Schedule of Portfolio Investments — continued
June 30, 2022 | |
(Amounts in Thousands, Except for Shares)
Security Description | | Principal
Amount | | Value | |
Rio Tinto Finance USA Ltd., 5.20%, 11/2/40 (a) | | $ | 75 | | | $ | 78 | | |
Vale Overseas Ltd., 6.25%, 8/10/26 (a) (d) | | | 143 | | | | 149 | | |
| | | | 631 | | |
Utilities (0.1%): | |
Iberdrola International BV, 6.75%, 9/15/33 | | | 50 | | | | 57 | | |
Total Yankee Dollars (Cost $4,657) | | | 4,189 | | |
U.S. Government Mortgage-Backed Agencies (23.4%) | |
Federal Home Loan Bank
1.10%, 4/29/26 (a) | | | 680 | | | | 626 | | |
Federal Home Loan Mortgage Corp.
9.00%, 4/1/25 (a) | | | 6 | | | | 6 | | |
7.50%, 8/1/29 (a) | | | 8 | | | | 8 | | |
Series 4395, Class PA, 2.50%, 4/15/37 – 7/1/50 (a) | | �� | 386 | | | | 360 | | |
5.00%, 7/1/39 (a) | | | 448 | | | | 472 | | |
Series 4320, Class AP, 3.50%, 7/15/39 – 10/15/40 (a) | | | 133 | | | | 133 | | |
Series 4444, Class CH, 3.00%, 1/15/41 (a) | | | 68 | | | | 68 | | |
4.50%, 7/1/44 – 12/1/45 (a) | | | 627 | | | | 646 | | |
2.00%, 3/1/51 (a) | | | 559 | | | | 486 | | |
Federal National Mortgage Association
3.50%, 2/1/32 | | | 105 | | | | 105 | | |
Series 2005-19, Class PB, 5.50%, 3/25/35 (a) | | | 237 | | | | 251 | | |
6.00%, 2/1/37 (a) | | | 68 | | | | 75 | | |
3.50%, 8/1/39 – 12/25/50 (a) | | | 1,134 | | | | 1,111 | | |
Series 2011-21, Class PA, 4.50%, 5/25/40 (a) | | | 289 | | | | 293 | | |
3.00%, 6/1/40 – 5/1/48 (a) | | | 1,843 | | | | 1,748 | | |
Series 2013-81, Class KA, 2.75%, 9/25/42 (a) | | | 162 | | | | 159 | | |
4.00%, 11/1/43 – 10/1/48 (a) | | | 628 | | | | 630 | | |
4.00%, 3/1/47 – 6/1/49 | | | 81 | | | | 81 | | |
Series 2017-96, Class DA, 2.50%, 12/25/47 – 7/1/51 (a) | | | 2,079 | | | | 1,882 | | |
4.50%, 5/1/50 | | | 27 | | | | 27 | | |
2.00%, 3/1/51 (a) | | | 943 | | | | 821 | | |
2.00%, 7/25/52 (g) | | | 1,400 | | | | 1,214 | | |
2.50%, 7/25/52 (g) | | | 2,000 | | | | 1,798 | | |
3.00%, 7/25/52 (g) | | | 500 | | | | 465 | | |
3.50%, 7/25/52 (g) | | | 600 | | | | 577 | | |
| | | | 14,042 | | |
Total U.S. Government Mortgage-Backed Agencies (Cost $14,798) | | | 14,042 | | |
U.S. Treasury Obligations (8.6%) | |
U.S. Treasury Bonds, 1.25%, 5/15/50 (a) | | | 3,215 | | | | 2,070 | | |
U.S. Treasury Notes
0.25%, 3/15/24 (a) | | | 800 | | | | 764 | | |
0.75%, 4/30/26 (a) | | | 950 | | | | 871 | | |
1.25%, 5/31/28 (a) | | | 256 | | | | 230 | | |
1.63%, 5/15/31 (a) | | | 1,374 | | | | 1,228 | | |
Total U.S. Treasury Obligations (Cost $5,676) | | | 5,163 | | |
See notes to financial statements.
113
Victory Portfolios
Victory INCORE Total Return Bond Fund | | Schedule of Portfolio Investments — continued
June 30, 2022 | |
(Amounts in Thousands, Except for Shares)
Security Description | | Shares | | Value | |
Collateral for Securities Loaned (3.6%)^ | |
BlackRock Liquidity Funds TempFund, Institutional Shares, 1.47% (h) | | | 67,903 | | | $ | 68 | | |
Goldman Sachs Financial Square Prime Obligations Fund, Institutional Shares,
1.42% (h) | | | 33,887 | | | | 34 | | |
HSBC U.S. Government Money Market Fund I Shares, 1.46% (h) | | | 422,638 | | | | 423 | | |
JPMorgan Prime Money Market Fund, Capital Shares, 1.50% (h) | | | 270,204 | | | | 270 | | |
Morgan Stanley Institutional Liquidity Government Portfolio, Institutional Shares,
1.39% (h) | | | 180,195 | | | | 180 | | |
Morgan Stanley Institutional Liquidity Prime Portfolio, Institutional Shares,
1.53% (h) | | | 1,214,888 | | | | 1,215 | | |
Total Collateral for Securities Loaned (Cost $2,190) | | | 2,190 | | |
Total Investments (Cost $68,249) — 105.0% | | | 63,063 | | |
Liabilities in excess of other assets — (5.0)% | | | (3,000 | ) | |
NET ASSETS — 100.00% | | $ | 60,063 | | |
^ Purchased with cash collateral from securities on loan.
(a) All or a portion of this security has been segregated as collateral for derivative instruments, delayed delivered and/or when-issued securities.
(b) Variable or Floating-Rate Security. Rate disclosed is as of June 30, 2022.
(c) Rule 144A security or other security that is restricted as to resale to institutional investors. The Fund's Adviser has deemed this security to be liquid (unless otherwise noted as illiquid) based upon procedures approved by the Board of Trustees. As of June 30, 2022, the fair value of these securities was $6,834 (thousands) and amounted to 11.4% of net assets.
(d) All or a portion of this security is on loan.
(e) Zero-coupon bond.
(f) Security is perpetual and has no final maturity date but may be subject to calls at various dates in the future.
(g) Security or a portion of the security purchased on a delayed-delivery and/or when-issued basis.
(h) Rate disclosed is the daily yield on June 30, 2022.
bps — Basis points
LIBOR — London Interbank Offered Rate
LIBOR01M — 1 Month US Dollar LIBOR, rate disclosed as of June 30, 2022, based on the last reset date of the security
LLC — Limited Liability Company
LP — Limited Partnership
MTN — Medium Term Note
PLC — Public Limited Company
SOFR — Secured Overnight Financing Rate
See notes to financial statements.
114
Victory Portfolios
Victory INCORE Total Return Bond Fund | | Schedule of Portfolio Investments — continued
June 30, 2022 | |
Futures Contracts Purchased | |
(Amounts not in thousands) | |
| | | Number of
Contracts | | Expiration
Date | | Notional
Amount | | Value | | Unrealized
Appreciation/
(Depreciation) | |
2-Year U.S. Treasury Note Futures | | | 6 | | | 9/30/22 | | $ | 1,264,755 | | | $ | 1,260,094 | | | $ | (4,661 | ) | |
5-Year U.S. Treasury Note Futures | | | 45 | | | 9/30/22 | | | 4,999,738 | | | | 5,051,250 | | | | 51,512 | | |
Euro FX Futures | | | 6 | | | 9/19/22 | | | 807,800 | | | | 790,350 | | | | (17,450 | ) | |
Mexican Peso Futures | | | 30 | | | 9/19/22 | | | 747,001 | | | | 734,400 | | | | (12,601 | ) | |
Ultra Long Term U.S. Treasury
Bond Futures | | | 10 | | | 9/21/22 | | | 1,584,097 | | | | 1,543,437 | | | | (40,660 | ) | |
| | | $ | (23,860 | ) | |
Futures Contracts Sold | |
(Amounts not in thousands) | |
| | | Number of
Contracts | | Expiration
Date | | Notional
Amount | | Value | | Unrealized
Appreciation/
(Depreciation) | |
10-Year U.S. Treasury Note Futures | | | 21 | | | 9/21/22 | | $ | 2,514,513 | | | $ | 2,489,156 | | | $ | 25,357 | | |
Japanese Yen Futures | | | 14 | | | 9/19/22 | | | 1,329,999 | | | | 1,297,712 | | | | 32,287 | | |
Micro E-Mini S&P 500 Index Futures | | | 65 | | | 9/16/22 | | | 1,287,363 | | | | 1,231,587 | | | | 55,776 | | |
| | | $ | 113,420 | | |
Total unrealized appreciation | | $ | 164,932 | | |
Total unrealized depreciation | | | (75,372 | ) | |
Total net unrealized appreciation (depreciation) | | $ | 89,560 | | |
See notes to financial statements.
115
Victory Portfolios | | Statements of Assets and Liabilities
June 30, 2022 | |
(Amounts in Thousands, Except Per Share Amounts)
| | | Victory
Integrity
Discovery
Fund | | Victory
Integrity
Mid-Cap
Value
Fund | | Victory
Integrity
Small-Cap
Value
Fund | |
Assets: | |
Investments, at value (Cost $63,027, $262,913
and $1,315,730) | | $ | 65,867 | (a) | | $ | 275,045 | (b) | | $ | 1,395,559 | (c) | |
Cash | | | 1,741 | | | | 3,676 | | | | 37,984 | | |
Receivables: | |
Interest and dividends | | | 82 | | | | 487 | | | | 2,180 | | |
Capital shares issued | | | 1 | | | | 602 | | | | 828 | | |
Investments sold | | | 39 | | | | — | | | | 3,630 | | |
From Adviser | | | 7 | | | | 132 | | | | — | | |
Prepaid expenses | | | 10 | | | | 42 | | | | 33 | | |
Total Assets | | | 67,747 | | | | 279,984 | | | | 1,440,214 | | |
Liabilities: | |
Payables: | |
Collateral received on loaned securities | | | 2,625 | | | | 3,151 | | | | 24,052 | | |
Investments purchased | | | 46 | | | | 157 | | | | 11,188 | | |
Capital shares redeemed | | | 6 | | | | 569 | | | | 991 | | |
Accrued expenses and other payables: | |
Investment advisory fees | | | 56 | | | | 180 | | | | 1,054 | | |
Administration fees | | | 3 | | | | 13 | | | | 69 | | |
Custodian fees | | | 1 | | | | 2 | | | | 13 | | |
Transfer agent fees | | | 27 | | | | 20 | | | | 205 | | |
Compliance fees | | | — | (d) | | | — | (d) | | | 1 | | |
Trustees' fees | | | 28 | | | | — | (d) | | | 24 | | |
| 12b-1 fees | | | 4 | | | | 2 | | | | 11 | | |
Other accrued expenses | | | 17 | | | | 30 | | | | 99 | | |
Total Liabilities | | | 2,813 | | | | 4,124 | | | | 37,707 | | |
Net Assets: | |
| Capital | | | 57,226 | | | | 251,521 | | | | 1,155,539 | | |
Total accumulated earnings/(loss) | | | 7,708 | | | | 24,339 | | | | 246,968 | | |
Net Assets | | $ | 64,934 | | | $ | 275,860 | | | $ | 1,402,507 | | |
Net Assets | |
Class A | | $ | 35,308 | | | $ | 19,898 | | | $ | 69,687 | | |
Class C | | | 1,227 | | | | 83 | | | | 5,667 | | |
Class R | | | 688 | | | | — | | | | 4,605 | | |
Class R6 | | | — | | | | 207,959 | | | | 716,271 | | |
Class Y | | | 24,479 | | | | 45,535 | | | | 606,277 | | |
Member Class | | | 3,232 | | | | 2,385 | | | | — | | |
Total | | $ | 64,934 | | | $ | 275,860 | | | $ | 1,402,507 | | |
Shares (unlimited number of shares authorized with
a par value of $0.001 per share): | |
Class A | | | 962 | | | | 943 | | | | 2,143 | | |
Class C | | | 51 | | | | 4 | | | | 215 | | |
Class R | | | 20 | | | | — | | | | 148 | | |
Class R6 | | | — | | | | 9,716 | | | | 20,920 | | |
Class Y | | | 595 | | | | 2,132 | | | | 17,843 | | |
Member Class | | | 88 | | | | 111 | | | | — | | |
Total | | | 1,716 | | | | 12,906 | | | | 41,269 | | |
Net asset value, offering (except Class A) and
redemption price per share: (e) | |
Class A | | $ | 36.72 | | | $ | 21.11 | | | $ | 32.51 | | |
Class C (f) | | | 23.91 | | | | 21.03 | | | | 26.39 | | |
Class R | | | 33.85 | | | | — | | | | 31.04 | | |
Class R6 | | | — | | | | 21.40 | | | | 34.24 | | |
Class Y | | | 41.12 | | | | 21.36 | | | | 33.98 | | |
Member Class | | | 36.80 | | | | 21.47 | | | | — | | |
Maximum Sales Charge — Class A | | | 5.75 | % | | | 5.75 | % | | | 5.75 | % | |
Maximum offering price (100%/(100%-maximum
sales charge) of net asset value adjusted to the
nearest cent) per share — Class A | | $ | 38.96 | | | $ | 22.40 | | | $ | 34.49 | | |
(a) Includes $2,546 of securities on loan.
(b) Includes $2,885 of securities on loan.
(c) Includes $22,789 of securities on loan.
(d) Rounds to less than $1 thousand.
(e) Per share amount may not recalculate due to rounding of net assets and/or shares outstanding.
(f) Redemption price per share varies by the length of time shares are held.
See notes to financial statements.
116
Victory Portfolios | | Statements of Assets and Liabilities
June 30, 2022 | |
(Amounts in Thousands, Except Per Share Amounts)
| | | Victory
Integrity
Small/Mid-Cap
Value Fund | | Victory
Munder
Multi-Cap
Fund | | Victory
S&P 500
Index
Fund | |
Assets: | |
Investments, at value (Cost $205,865, $316,203
and $47,714) | | $ | 210,143 | (a) | | $ | 376,930 | (b) | | $ | 221,637 | (c) | |
Cash | | | 4,175 | | | | 3,977 | | | | 1,482 | | |
Deposit with broker for futures contracts | | | — | | | | — | | | | 271 | | |
Receivables: | |
Interest and dividends | | | 235 | | | | 244 | | | | 175 | | |
Capital shares issued | | | 307 | | | | 16 | | | | 29 | | |
Investments sold | | | 601 | | | | 407 | | | | — | | |
Variation margin on open futures contracts | | | — | | | | — | | | | 2 | | |
From Adviser | | | 52 | | | | 1 | | | | — | | |
Prepaid expenses | | | 31 | | | | 22 | | | | 10 | | |
Total Assets | | | 215,544 | | | | 381,597 | | | | 223,606 | | |
Liabilities: | |
Payables: | |
Collateral received on loaned securities | | | 3,892 | | | | 6,743 | | | | 180 | | |
Investments purchased | | | 747 | | | | 3,314 | | | | — | | |
Capital shares redeemed | | | 174 | | | | 63 | | | | 17 | | |
Variation margin on open futures contracts | | | — | | | | — | | | | 19 | | |
Accrued expenses and other payables: | |
Investment advisory fees | | | 146 | | | | 240 | | | | 38 | | |
Administration fees | | | 10 | | | | 17 | | | | 10 | | |
Custodian fees | | | 2 | | | | 3 | | | | 3 | | |
Transfer agent fees | | | 9 | | | | 122 | | | | 40 | | |
Compliance fees | | | — | (d) | | | — | (d) | | | — | (d) | |
Trustees' fees | | | — | | | | 139 | | | | 29 | | |
| 12b-1 fees | | | 1 | | | | 36 | | | | 13 | | |
Other accrued expenses | | | 29 | | | | 37 | | | | 28 | | |
Total Liabilities | | | 5,010 | | | | 10,714 | | | | 377 | | |
Net Assets: | |
| Capital | | | 188,708 | | | | 261,865 | | | | 41,855 | | |
Total accumulated earnings/(loss) | | | 21,826 | | | | 109,018 | | | | 181,374 | | |
Net Assets | | $ | 210,534 | | | $ | 370,883 | | | $ | 223,229 | | |
Net Assets | |
Class A | | $ | 7,149 | | | $ | 332,533 | | | $ | 156,112 | | |
Class C | | | — | | | | 3,287 | | | | — | | |
Class R | | | — | | | | — | | | | 17,735 | | |
Class R6 | | | 151,752 | | | | — | | | | — | | |
Class Y | | | 46,579 | | | | 35,063 | | | | 49,382 | | |
Member Class | | | 5,054 | | | | — | | | | — | | |
Total | | $ | 210,534 | | | $ | 370,883 | | | $ | 223,229 | | |
Shares (unlimited number of shares authorized with
a par value of $0.001 per share): | |
Class A | | | 363 | | | | 7,564 | | | | 7,349 | | |
Class C | | | — | | | | 103 | | | | — | | |
Class R | | | — | | | | — | | | | 839 | | |
Class R6 | | | 7,588 | | | | — | | | | — | | |
Class Y | | | 2,337 | | | | 716 | | | | 2,303 | | |
Member Class | | | 254 | | | | — | | | | — | | |
Total | | | 10,542 | | | | 8,383 | | | | 10,491 | | |
Net asset value, offering (except Class A) and
redemption price per share: (e) | |
Class A | | $ | 19.70 | | | $ | 43.96 | | | $ | 21.24 | | |
Class C (f) | | | — | | | | 31.96 | | | | — | | |
Class R | | | — | | | | — | | | | 21.15 | | |
Class R6 | | | 20.00 | | | | — | | | | — | | |
Class Y | | | 19.93 | | | | 48.98 | | | | 21.44 | | |
Member Class | | | 19.87 | | | | — | | | | — | | |
Maximum Sales Charge — Class A | | | 5.75 | % | | | 5.75 | % | | | 2.25 | % | |
Maximum offering price (100%/(100%-maximum
sales charge) of net asset value adjusted to the
nearest cent) per share — Class A | | $ | 20.90 | | | $ | 46.64 | | | $ | 21.73 | | |
(a) Includes $3,591 of securities on loan.
(b) Includes $6,589 of securities on loan.
(c) Includes $172 of securities on loan.
(d) Rounds to less than $1 thousand.
(e) Per share amount may not recalculate due to rounding of net assets and/or shares outstanding.
(f) Redemption price per share varies by the length of time shares are held.
See notes to financial statements.
117
Victory Portfolios | | Statements of Assets and Liabilities
June 30, 2022 | |
(Amounts in Thousands, Except Per Share Amounts)
| | | Victory
Munder
Mid-Cap
Core Growth
Fund | | Victory
Munder
Small Cap
Growth
Fund | | Victory
Trivalent
International
Fund-Core
Equity | |
Assets: | |
Investments, at value (Cost $308,823, $11,824
and $198,575) | | $ | 362,270 | (a) | | $ | 11,114 | (b) | | $ | 186,956 | (c) | |
Foreign currency, at value (Cost $—, $— and $1,024) | | | — | | | | — | | | | 1,024 | | |
Cash | | | 477 | | | | 175 | | | | 836 | | |
Receivables: | |
Interest and dividends | | | 246 | | | | 3 | | | | 565 | | |
Capital shares issued | | | 149 | | | | — | | | | 6 | | |
Investments sold | | | 3,553 | | | | — | | | | 2,664 | | |
Reclaims | | | — | | | | — | | | | 402 | | |
From Adviser | | | 3 | | | | 6 | | | | 133 | | |
Prepaid expenses | | | 27 | | | | 5 | | | | 32 | | |
Total Assets | | | 366,725 | | | | 11,303 | | | | 192,618 | | |
Liabilities: | |
Payables: | |
Collateral received on loaned securities | | | 2,193 | | | | 517 | | | | 3,472 | | |
Investments purchased | | | — | | | | — | | | | 2,260 | | |
Capital shares redeemed | | | 157 | | | | — | | | | — | (d) | |
Accrued foreign capital gains taxes | | | — | | | | — | | | | 22 | | |
Accrued expenses and other payables: | |
Investment advisory fees | | | 229 | | | | 8 | | | | 129 | | |
Administration fees | | | 17 | | | | 1 | | | | 9 | | |
Custodian fees | | | 3 | | | | — | (d) | | | 18 | | |
Transfer agent fees | | | 112 | | | | — | (d) | | | 2 | | |
Compliance fees | | | — | (d) | | | — | (d) | | | — | (d) | |
Trustees' fees | | | 34 | | | | — | (d) | | | 45 | | |
| 12b-1 fees | | | 20 | | | | — | (d) | | | — | (d) | |
Other accrued expenses | | | 40 | | | | 11 | | | | 30 | | |
Total Liabilities | | | 2,805 | | | | 537 | | | | 5,987 | | |
Net Assets: | |
| Capital | | | 275,790 | | | | 10,203 | | | | 199,633 | | |
Total accumulated earnings/(loss) | | | 88,130 | | | | 563 | | | | (13,002 | ) | |
Net Assets | | $ | 363,920 | | | $ | 10,766 | | | $ | 186,631 | | |
Net Assets | |
Class A | | $ | 157,570 | | | $ | 643 | | | $ | 4,147 | | |
Class C | | | 4,714 | | | | — | | | | 71 | | |
Class I | | | — | | | | 9,981 | | | | 2,834 | | |
Class R | | | 8,890 | | | | — | | | | — | | |
Class R6 | | | 70,577 | | | | — | | | | 172,965 | | |
Class Y | | | 122,169 | | | | 142 | | | | 6,614 | | |
Total | | $ | 363,920 | | | $ | 10,766 | | | $ | 186,631 | | |
Shares (unlimited number of shares authorized with
a par value of $0.001 per share): | |
Class A | | | 16,532 | | | | 53 | | | | 637 | | |
Class C | | | 4,449 | | | | — | | | | 11 | | |
Class I | | | — | | | | 801 | | | | 433 | | |
Class R | | | 1,220 | | | | — | | | | — | | |
Class R6 | | | 5,275 | | | | — | | | | 26,208 | | |
Class Y | | | 9,732 | | | | 12 | | | | 1,017 | | |
Total | | | 37,208 | | | | 866 | | | | 28,306 | | |
Net asset value, offering (except Class A) and
redemption price per share: (e) | |
Class A | | $ | 9.53 | | | $ | 12.18 | | | $ | 6.51 | | |
Class C (f) | | | 1.06 | | | | — | | | | 6.50 | | |
Class I | | | — | | | | 12.45 | | | | 6.55 | | |
Class R | | | 7.29 | | | | — | | | | — | | |
Class R6 | | | 13.38 | | | | — | | | | 6.60 | | |
Class Y | | | 12.55 | | | | 12.28 | | | | 6.50 | | |
Maximum Sales Charge — Class A | | | 5.75 | % | | | 5.75 | % | | | 5.75 | % | |
Maximum offering price (100%/(100%-maximum
sales charge) of net asset value adjusted to the
nearest cent) per share — Class A | | $ | 10.11 | | | $ | 12.92 | | | $ | 6.91 | | |
(a) Includes $2,243 of securities on loan.
(b) Includes $491 of securities on loan.
(c) Includes $3,302 of securities on loan.
(d) Rounds to less than $1 thousand.
(e) Per share amount may not recalculate due to rounding of net assets and/or shares outstanding.
(f) Redemption price per share varies by the length of time shares are held.
See notes to financial statements.
118
Victory Portfolios | | Statements of Assets and Liabilities
June 30, 2022 | |
(Amounts in Thousands, Except Per Share Amounts)
| | | Victory
Trivalent
International
Small-Cap
Fund | | Victory
INCORE
Total Return
Bond
Fund | |
Assets: | |
Investments, at value (Cost $2,842,309 and $68,249) | | $ | 2,626,293 | (a) | | $ | 63,063 | (b) | |
Cash | | | 30,298 | | | | 2,108 | | |
Deposit with broker for futures contracts | | | — | | | | 758 | | |
Receivables: | |
Interest and dividends | | | 5,265 | | | | 358 | | |
Capital shares issued | | | 3,586 | | | | — | | |
Investments sold | | | 33,836 | | | | 103 | | |
Variation margin on open futures contracts | | | — | | | | 72 | | |
Reclaims | | | 5,263 | | | | — | | |
From Adviser | | | 1,002 | | | | 12 | | |
Prepaid expenses | | | 95 | | | | 12 | | |
Total Assets | | | 2,705,638 | | | | 66,486 | | |
Liabilities: | |
Payables: | |
Foreign currency, at value (Cost $614 and $—) | | | 614 | | | | — | | |
Collateral received on loaned securities | | | 127,681 | | | | 2,190 | | |
Investments purchased | | | 19,442 | | | | 4,103 | | |
Capital shares redeemed | | | 4,088 | | | | 1 | | |
Variation margin on open futures contracts | | | — | | | | 30 | | |
Accrued expenses and other payables: | |
Investment advisory fees | | | 2,019 | | | | 20 | | |
Administration fees | | | 120 | | | | 3 | | |
Custodian fees | | | 106 | | | | 2 | | |
Transfer agent fees | | | 806 | | | | 5 | | |
Compliance fees | | | 2 | | | | — | (c) | |
Trustees' fees | | | 9 | | | | 51 | | |
| 12b-1 fees | | | 8 | | | | 1 | | |
Other accrued expenses | | | 191 | | | | 17 | | |
Total Liabilities | | | 155,086 | | | | 6,423 | | |
Net Assets: | |
| Capital | | | 2,802,058 | | | | 70,565 | | |
Total accumulated earnings/(loss) | | | (251,506 | ) | | | (10,502 | ) | |
Net Assets | | $ | 2,550,552 | | | $ | 60,063 | | |
Net Assets | |
Class A | | $ | 64,968 | | | $ | 7,507 | | |
Class C | | | 3,283 | | | | 163 | | |
Class I | | | 1,655,788 | | | | — | | |
Class R6 | | | 123,487 | | | | 23,854 | | |
Class Y | | | 703,026 | | | | 28,539 | | |
Total | | $ | 2,550,552 | | | $ | 60,063 | | |
Shares (unlimited number of shares authorized with
a par value of $0.001 per share): | |
Class A | | | 5,228 | | | | 871 | | |
Class C | | | 274 | | | | 19 | | |
Class I | | | 132,080 | | | | — | | |
Class R6 | | | 9,805 | | | | 2,760 | | |
Class Y | | | 56,390 | | | | 3,303 | | |
Total | | | 203,777 | | | | 6,953 | | |
Net asset value, offering (except Class A) and
redemption price per share: (d) | |
Class A | | $ | 12.43 | | | $ | 8.62 | | |
Class C (e) | | | 11.98 | | | | 8.69 | | |
Class I | | | 12.54 | | | | — | | |
Class R6 | | | 12.59 | | | | 8.64 | | |
Class Y | | | 12.47 | | | | 8.64 | | |
Maximum Sales Charge — Class A | | | 5.75 | % | | | 2.25 | % | |
Maximum offering price (100%/(100%-maximum
sales charge) of net asset value adjusted to the
nearest cent) per share — Class A | | $ | 13.19 | | | $ | 8.82 | | |
(a) Includes $112,865 of securities on loan.
(b) Includes $2,121 of securities on loan.
(c) Rounds to less than $1 thousand.
(d) Per share amount may not recalculate due to rounding of net assets and/or shares outstanding.
(e) Redemption price per share varies by the length of time shares are held.
See notes to financial statements.
119
Victory Portfolios | | Statements of Operations
For the Year Ended June 30, 2022 | |
(Amounts in Thousands)
| | | Victory
Integrity
Discovery
Fund | | Victory
Integrity
Mid-Cap
Value
Fund | | Victory
Integrity
Small-Cap
Value
Fund | |
Investment Income: | | | |
Dividends | | $ | 1,117 | | | $ | 5,149 | | | $ | 28,295 | | |
Interest | | | 2 | | | | 5 | | | | 47 | | |
Securities lending (net of fees) | | | 5 | | | | 5 | | | | 47 | | |
Foreign tax withholding | | | — | | | | — | | | | (4 | ) | |
Total Income | | | 1,124 | | | | 5,159 | | | | 28,385 | | |
Expenses: | | | |
Investment advisory fees | | | 842 | | | | 2,054 | | | | 15,507 | | |
Administration fees | | | 46 | | | | 148 | | | | 979 | | |
Sub-Administration fees | | | 17 | | | | 17 | | | | 17 | | |
| 12b-1 fees — Class A | | | 106 | | | | 42 | | | | 210 | | |
| 12b-1 fees — Class C | | | 18 | | | | 1 | | | | 70 | | |
| 12b-1 fees — Class R | | | 7 | | | | — | | | | 30 | | |
Custodian fees | | | 5 | | | | 13 | | | | 81 | | |
Transfer agent fees — Class A | | | 62 | | | | 40 | | | | 180 | | |
Transfer agent fees — Class C | | | 3 | | | | — | (a) | | | 9 | | |
Transfer agent fees — Class R | | | 5 | | | | — | | | | 17 | | |
Transfer agent fees — Class R6 | | | — | | | | 20 | | | | 90 | | |
Transfer agent fees — Class Y | | | 66 | | | | 45 | | | | 817 | | |
Transfer agent fees — Member Class | | | 8 | | | | 3 | | | | — | | |
Trustees' fees | | | 9 | | | | 17 | | | | 110 | | |
Compliance fees | | | 1 | | | | 2 | | | | 13 | | |
Legal and audit fees | | | 12 | | | | 20 | | | | 74 | | |
State registration and filing fees | | | 85 | | | | 74 | | | | 169 | | |
Other expenses | | | 23 | | | | 50 | | | | 207 | | |
Recoupment of prior expenses waived/reimbursed by Adviser | | | — | | | | — | | | | 44 | | |
Total Expenses | | | 1,315 | | | | 2,546 | | | | 18,624 | | |
Expenses waived/reimbursed by Adviser | | | (42 | ) | | | (785 | ) | | | (14 | ) | |
Net Expenses | | | 1,273 | | | | 1,761 | | | | 18,610 | | |
Net Investment Income (Loss) | | | (149 | ) | | | 3,398 | | | | 9,775 | | |
Realized/Unrealized Gains (Losses) from Investments: | | | |
Net realized gains (losses) from investment securities | | | 8,242 | | | | 26,505 | | | | 321,819 | | |
Net change in unrealized appreciation/depreciation on
investment securities | | | (20,684 | ) | | | (50,400 | ) | | | (517,182 | ) | |
Net realized/unrealized gains (losses) on investments | | | (12,442 | ) | | | (23,895 | ) | | | (195,363 | ) | |
Change in net assets resulting from operations | | $ | (12,591 | ) | | $ | (20,497 | ) | | $ | (185,588 | ) | |
(a) Rounds to less than $1 thousand.
See notes to financial statements.
120
Victory Portfolios | | Statements of Operations
For the Year Ended June 30, 2022 | |
(Amounts in Thousands)
| | | Victory
Integrity
Small/Mid-Cap
Value Fund | | Victory
Munder
Multi-Cap
Fund | | Victory
S&P 500
Index
Fund | |
Investment Income: | | | |
Dividends | | $ | 3,981 | | | $ | 5,716 | | | $ | 3,829 | | |
Interest | | | 3 | | | | 3 | | | | — | | |
Securities lending (net of fees) | | | 5 | | | | 4 | | | | 1 | | |
Foreign tax withholding | | | — | | | | — | | | | (1 | ) | |
Total Income | | | 3,989 | | | | 5,723 | | | | 3,829 | | |
Expenses: | | | |
Investment advisory fees | | | 1,771 | | | | 3,369 | | | | 522 | | |
Administration fees | | | 120 | | | | 243 | | | | 146 | | |
Sub-Administration fees | | | 17 | | | | 17 | | | | 18 | | |
| 12b-1 fees — Class A | | | 18 | | | | 1,005 | | | | 287 | | |
| 12b-1 fees — Class C | | | — | | | | 40 | | | | — | | |
| 12b-1 fees — Class R | | | — | | | | — | | | | 100 | | |
Custodian fees | | | 12 | | | | 21 | | | | 14 | | |
Transfer agent fees — Class A | | | 13 | | | | 710 | | | | 125 | | |
Transfer agent fees — Class C | | | — | | | | 9 | | | | — | | |
Transfer agent fees — Class R | | | — | | | | — | | | | 7 | | |
Transfer agent fees — Class R6 | | | 3 | | | | — | | | | — | | |
Transfer agent fees — Class Y | | | 29 | | | | 33 | | | | 66 | | |
Transfer agent fees — Member Class | | | 8 | | | | — | | | | — | | |
Trustees' fees | | | 14 | | | | 35 | | | | 19 | | |
Compliance fees | | | 2 | | | | 3 | | | | 2 | | |
Legal and audit fees | | | 18 | | | | 26 | | | | 19 | | |
State registration and filing fees | | | 74 | | | | 58 | | | | 65 | | |
Interfund lending fees | | | — | | | | — | (a) | | | — | | |
Other expenses | | | 50 | | | | 77 | | | | 60 | | |
Total Expenses | | | 2,149 | | | | 5,646 | | | | 1,450 | | |
Expenses waived/reimbursed by Adviser | | | (259 | ) | | | (8 | ) | | | — | | |
Net Expenses | | | 1,890 | | | | 5,638 | | | | 1,450 | | |
Net Investment Income (Loss) | | | 2,099 | | | | 85 | | | | 2,379 | | |
Realized/Unrealized Gains (Losses) from Investments: | | | |
Net realized gains (losses) from investment securities | | | 27,521 | | | | 52,306 | | | | 14,069 | | |
Net realized gains (losses) from futures contracts | | | — | | | | — | | | | (224 | ) | |
Net change in unrealized appreciation/depreciation on
investment securities | | | (50,052 | ) | | | (86,125 | ) | | | (44,511 | ) | |
Net change in unrealized appreciation/depreciation on
futures contracts | | | — | | | | — | | | | (108 | ) | |
Net realized/unrealized gains (losses) on investments | | | (22,531 | ) | | | (33,819 | ) | | | (30,774 | ) | |
Change in net assets resulting from operations | | $ | (20,432 | ) | | $ | (33,734 | ) | | $ | (28,395 | ) | |
(a) Rounds to less than $1 thousand.
See notes to financial statements.
121
Victory Portfolios | | Statements of Operations
For the Year Ended June 30, 2022 | |
(Amounts in Thousands)
| | | Victory
Munder
Mid-Cap
Core Growth
Fund | | Victory
Munder
Small Cap
Growth
Fund | | Victory
Trivalent
International
Fund-Core
Equity | |
Investment Income: | | | |
Dividends | | $ | 4,431 | | | $ | 65 | | | $ | 7,781 | | |
Securities lending (net of fees) | | | 7 | | | | 19 | | | | 35 | | |
Foreign tax withholding | | | (9 | ) | | | — | | | | (903 | ) | |
Total Income | | | 4,429 | | | | 84 | | | | 6,913 | | |
Expenses: | | | |
Investment advisory fees | | | 3,690 | | | | 128 | | | | 1,757 | | |
Administration fees | | | 267 | | | | 8 | | | | 119 | | |
Sub-Administration fees | | | 17 | | | | 17 | | | | 17 | | |
| 12b-1 fees — Class A | | | 507 | | | | 2 | | | | 13 | | |
| 12b-1 fees — Class C | | | 72 | | | | — | | | | 1 | | |
| 12b-1 fees — Class R | | | 59 | | | | — | | | | — | | |
Custodian fees | | | 23 | | | | 3 | | | | 96 | | |
Transfer agent fees — Class A | | | 330 | | | | 1 | | | | 11 | | |
Transfer agent fees — Class C | | | 9 | | | | — | | | | — | (a) | |
Transfer agent fees — Class I | | | — | | | | 1 | | | | — | (a) | |
Transfer agent fees — Class R | | | 32 | | | | — | | | | — | | |
Transfer agent fees — Class R6 | | | 3 | | | | — | | | | — | (a) | |
Transfer agent fees — Class Y | | | 231 | | | | — | (a) | | | 1 | | |
Trustees' fees | | | 34 | | | | 3 | | | | 16 | | |
Compliance fees | | | 4 | | | | — | (a) | | | 2 | | |
Legal and audit fees | | | 26 | | | | 9 | | | | 22 | | |
State registration and filing fees | | | 91 | | | | 14 | | | | 93 | | |
Other expenses | | | 68 | | | | 11 | | | | 53 | | |
Total Expenses | | | 5,463 | | | | 197 | | | | 2,201 | | |
Expenses waived/reimbursed by Adviser | | | (24 | ) | | | (21 | ) | | | (958 | ) | |
Net Expenses | | | 5,439 | | | | 176 | | | | 1,243 | | |
Net Investment Income (Loss) | | | (1,010 | ) | | | (92 | ) | | | 5,670 | | |
Realized/Unrealized Gains (Losses) from Investments: | | | |
Net realized gains (losses) from investment securities | | | 93,929 | | | | 2,060 | | | | 832 | | |
Foreign taxes on realized gains | | | — | | | | — | | | | (65 | ) | |
Net change in unrealized appreciation/depreciation on
investment securities | | | (163,796 | ) | | | (7,556 | ) | | | (49,844 | ) | |
Net change in accrued foreign taxes on unrealized gains | | | — | | | | — | | | | 122 | | |
Net realized/unrealized gains (losses) on investments | | | (69,867 | ) | | | (5,496 | ) | | | (48,955 | ) | |
Change in net assets resulting from operations | | $ | (70,877 | ) | | $ | (5,588 | ) | | $ | (43,285 | ) | |
(a) Rounds to less than $1 thousand.
See notes to financial statements.
122
Victory Portfolios | | Statements of Operations
For the Year Ended June 30, 2022 | |
(Amounts in Thousands)
| | | Victory
Trivalent
International
Small-Cap
Fund | | Victory
INCORE
Total Return
Bond
Fund | |
Investment Income: | |
Dividends | | $ | 93,280 | | | $ | 151 | | |
Interest | | | — | | | | 1,291 | | |
Securities lending (net of fees) | | | 435 | | | | 14 | | |
Foreign tax withholding | | | (10,403 | ) | | | — | | |
Total Income | | | 83,312 | | | | 1,456 | | |
Expenses: | |
Investment advisory fees | | | 30,677 | | | | 265 | | |
Administration fees | | | 1,817 | | | | 36 | | |
Sub-Administration fees | | | 17 | | | | 17 | | |
| 12b-1 fees — Class A | | | 215 | | | | 22 | | |
| 12b-1 fees — Class C | | | 45 | | | | 3 | | |
Custodian fees | | | 557 | | | | 11 | | |
Transfer agent fees — Class A | | | 298 | | | | 18 | | |
Transfer agent fees — Class C | | | 5 | | | | — | (a) | |
Transfer agent fees — Class I | | | 3,023 | | | | — | | |
Transfer agent fees — Class R6 | | | 4 | | | | — | (a) | |
Transfer agent fees — Class Y | | | 1,169 | | | | 7 | | |
Trustees' fees | | | 197 | | | | 8 | | |
Compliance fees | | | 24 | | | | — | (a) | |
Legal and audit fees | | | 197 | | | | 14 | | |
State registration and filing fees | | | 178 | | | | 66 | | |
Interfund lending fees | | | 6 | | | | — | | |
Line of credit fees | | | 2 | | | | — | | |
Other expenses | | | 414 | | | | 24 | | |
Total Expenses | | | 38,845 | | | | 491 | | |
Expenses waived/reimbursed by Adviser | | | (4,898 | ) | | | (73 | ) | |
Net Expenses | | | 33,947 | | | | 418 | | |
Net Investment Income (Loss) | | | 49,365 | | | | 1,038 | | |
Realized/Unrealized Gains (Losses) from Investments: | |
Net realized gains (losses) from investment securities | | | 63,147 | | | | (574 | ) | |
Net realized gains (losses) from futures contracts | | | — | | | | 54 | | |
Net realized gains (losses) from swap agreements | | | — | | | | 26 | | |
Net change in unrealized appreciation/depreciation on
investment securities | | | (1,013,226 | ) | | | (7,654 | ) | |
Net change in unrealized appreciation/depreciation on
futures contracts | | | — | | | | 66 | | |
Net change in unrealized appreciation/depreciation on
swap agreements | | | — | | | | — | (a) | |
Net realized/unrealized gains (losses) on investments | | | (950,079 | ) | | | (8,082 | ) | |
Change in net assets resulting from operations | | $ | (900,714 | ) | | $ | (7,044 | ) | |
(a) Rounds to less than $1 thousand.
See notes to financial statements.
123
Victory Portfolios | | Statements of Changes in Net Assets | |
(Amounts in Thousands)
| | | Victory Integrity
Discovery Fund | | Victory Integrity
Mid-Cap Value Fund | | Victory Integrity
Small-Cap Value Fund | |
| | | Year
Ended
June 30,
2022 | | Year
Ended
June 30,
2021 | | Year
Ended
June 30,
2022 | | Year
Ended
June 30,
2021 | | Year
Ended
June 30,
2022 | | Year
Ended
June 30,
2021 | |
From Investment Activities: | |
Operations: | |
Net Investment Income (Loss) | | $ | (149 | ) | | $ | (96 | ) | | $ | 3,398 | | | $ | 1,861 | | | $ | 9,775 | | | $ | 7,796 | | |
Net realized gains (losses) | | | 8,242 | | | | 13,282 | | | | 26,505 | | | | 18,606 | | | | 321,819 | | | | 415,788 | | |
Net change in unrealized
appreciation/depreciation | | | (20,684 | ) | | | 33,986 | | | | (50,400 | ) | | | 72,691 | | | | (517,182 | ) | | | 625,957 | | |
Change in net assets resulting
from operations | | | (12,591 | ) | | | 47,172 | | | | (20,497 | ) | | | 93,158 | | | | (185,588 | ) | | | 1,049,541 | | |
Distributions to Shareholders: | |
Class A | | | (2,076 | ) | | | — | (a) | | | (799 | ) | | | (196 | ) | | | (13,359 | ) | | | (90 | ) | |
Class C | | | (128 | ) | | | — | | | | (4 | ) | | | — | (a) | | | (1,318 | ) | | | — | | |
Class R | | | (92 | ) | | | — | | | | — | | | | — | | | | (964 | ) | | | — | | |
Class R6 | | | — | | | | — | | | | (10,936 | ) | | | (3,719 | ) | | | (165,101 | ) | | | (5,456 | ) | |
Class Y | | | (1,641 | ) | | | — | | | | (1,255 | ) | | | (247 | ) | | | (110,577 | ) | | | (1,954 | ) | |
Member Class | | | (150 | ) | | | — | | | | (63 | ) | | | (1 | ) | | | — | | | | — | | |
From return of capital: | |
Class A | | | — | | | | — | | | | — | | | | (44 | ) | | | — | | | | — | | |
Class C | | | — | | | | — | | | | — | | | | — | (a) | | | — | | | | — | | |
Class R6 | | | — | | | | — | | | | — | | | | (844 | ) | | | — | | | | — | | |
Class Y | | | — | | | | — | | | | — | | | | (56 | ) | | | — | | | | — | | |
Member Class | | | — | | | | — | | | | — | | | | (1 | ) | | | — | | | | — | | |
Change in net assets resulting from
distributions to shareholders | | | (4,087 | ) | | | — | | | | (13,057 | ) | | | (5,108 | ) | | | (291,319 | ) | | | (7,500 | ) | |
Change in net assets resulting from
capital transactions | | | (10,268 | ) | | | (17,609 | ) | | | 44,294 | | | | (25,403 | ) | | | (138,370 | ) | | | (591,559 | ) | |
Change in net assets | | | (26,946 | ) | | | 29,563 | | | | 10,740 | | | | 62,647 | | | | (615,277 | ) | | | 450,482 | | |
Net Assets: | |
Beginning of period | | | 91,880 | | | | 62,317 | | | | 265,120 | | | | 202,473 | | | | 2,017,784 | | | | 1,567,302 | | |
End of period | | $ | 64,934 | | | $ | 91,880 | | | $ | 275,860 | | | $ | 265,120 | | | $ | 1,402,507 | | | $ | 2,017,784 | | |
(a) Rounds to less than $1 thousand.
(continues on next page)
See notes to financial statements.
124
Victory Portfolios | | Statements of Changes in Net Assets | |
(Amounts in Thousands) (continued)
| | | Victory Integrity
Discovery Fund | | Victory Integrity
Mid-Cap Value Fund | | Victory Integrity
Small-Cap Value Fund | |
| | | Year
Ended
June 30,
2022 | | Year
Ended
June 30,
2021 | | Year
Ended
June 30,
2022 | | Year
Ended
June 30,
2021 | | Year
Ended
June 30,
2022 | | Year
Ended
June 30,
2021 | |
Capital Transactions: | |
Class A | |
Proceeds from shares issued | | $ | 3,420 | | | $ | 4,616 | | | $ | 12,746 | | | $ | 2,340 | | | $ | 14,735 | | | $ | 24,763 | | |
Distributions reinvested | | | 1,787 | | | | — | | | | 783 | | | | 234 | | | | 12,062 | | | | 81 | | |
Cost of shares redeemed | | | (6,514 | ) | | | (14,397 | ) | | | (3,660 | ) | | | (3,212 | ) | | | (25,143 | ) | | | (66,313 | ) | |
Total Class A | | $ | (1,307 | ) | | $ | (9,781 | ) | | $ | 9,869 | | | $ | (638 | ) | | $ | 1,654 | | | $ | (41,469 | ) | |
Class C | |
Proceeds from shares issued | | $ | 187 | | | $ | 69 | | | $ | 12 | | | $ | 17 | | | $ | 498 | | | $ | 913 | | |
Distributions reinvested | | | 117 | | | | — | | | | 4 | | | | 1 | | | | 1,284 | | | | — | | |
Cost of shares redeemed | | | (773 | ) | | | (1,491 | ) | | | — | | | | (11 | ) | | | (1,545 | ) | | | (2,746 | ) | |
Total Class C | | $ | (469 | ) | | $ | (1,422 | ) | | $ | 16 | | | $ | 7 | | | $ | 237 | | | $ | (1,833 | ) | |
Class R | |
Proceeds from shares issued | | $ | 125 | | | $ | 632 | | | $ | — | | | $ | — | | | $ | 1,408 | | | $ | 2,845 | | |
Distributions reinvested | | | 91 | | | | — | | | | — | | | | — | | | | 953 | | | | — | | |
Cost of shares redeemed | | | (1,216 | ) | | | (2,274 | ) | | | — | | | | — | | | | (3,241 | ) | | | (4,587 | ) | |
Total Class R | | $ | (1,000 | ) | | $ | (1,642 | ) | | $ | — | | | $ | — | | | $ | (880 | ) | | $ | (1,742 | ) | |
Class R6 | |
Proceeds from shares issued | | $ | — | | | $ | — | | | $ | 52,815 | | | $ | 32,650 | | | $ | 228,375 | | | $ | 239,858 | | |
Distributions reinvested | | | — | | | | — | | | | 10,920 | | | | 4,555 | | | | 159,634 | | | | 5,356 | | |
Cost of shares redeemed | | | — | | | | — | | | | (57,099 | ) | | | (72,923 | ) | | | (560,687 | ) | | | (724,545 | ) | |
Total Class R6 | | $ | — | | | $ | — | | | $ | 6,636 | | | $ | (35,718 | ) | | $ | (172,678 | ) | | $ | (479,331 | ) | |
Class Y | |
Proceeds from shares issued | | $ | 10,055 | | | $ | 14,515 | | | $ | 34,224 | | | $ | 12,767 | | | $ | 135,984 | | | $ | 180,087 | | |
Distributions reinvested | | | 1,337 | | | | — | | | | 1,242 | | | | 299 | | | | 105,215 | | | | 1,797 | | |
Cost of shares redeemed | | | (20,693 | ) | | | (21,292 | ) | | | (9,552 | ) | | | (2,904 | ) | | | (207,902 | ) | | | (249,068 | ) | |
Total Class Y | | $ | (9,301 | ) | | $ | (6,777 | ) | | $ | 25,914 | | | $ | 10,162 | | | $ | 33,297 | | | $ | (67,184 | ) | |
Member Class | |
Proceeds from shares issued | | $ | 3,436 | | | $ | 2,476 | | | $ | 2,225 | | | $ | 985 | | | $ | — | | | $ | — | | |
Distributions reinvested | | | 150 | | | | — | | | | 63 | | | | 1 | | | | — | | | | — | | |
Cost of shares redeemed | | | (1,777 | ) | | | (463 | ) | | | (429 | ) | | | (202 | ) | | | — | | | | — | | |
Total Member Class | | $ | 1,809 | | | $ | 2,013 | | | $ | 1,859 | | | $ | 784 | | | $ | — | | | $ | — | | |
Change in net assets resulting from
capital transactions | | $ | (10,268 | ) | | $ | (17,609 | ) | | $ | 44,294 | | | $ | (25,403 | ) | | $ | (138,370 | ) | | $ | (591,559 | ) | |
(continues on next page)
See notes to financial statements.
125
Victory Portfolios | | Statements of Changes in Net Assets | |
(Amounts in Thousands) (continued)
| | | Victory Integrity
Discovery Fund | | Victory Integrity
Mid-Cap Value Fund | | Victory Integrity
Small-Cap Value Fund | |
| | | Year
Ended
June 30,
2022 | | Year
Ended
June 30,
2021 | | Year
Ended
June 30,
2022 | | Year
Ended
June 30,
2021 | | Year
Ended
June 30,
2022 | | Year
Ended
June 30,
2021 | |
Share Transactions: | |
Class A | |
Issued | | | 82 | | | | 123 | | | | 536 | | | | 112 | | | | 375 | | | | 734 | | |
Reinvested | | | 42 | | | | — | | | | 34 | | | | 12 | | | | 326 | | | | 2 | | |
Redeemed | | | (152 | ) | | | (407 | ) | | | (156 | ) | | | (155 | ) | | | (632 | ) | | | (1,918 | ) | |
Total Class A | | | (28 | ) | | | (284 | ) | | | 414 | | | | (31 | ) | | | 69 | | | | (1,182 | ) | |
Class C | |
Issued | | | 6 | | | | 3 | | | | 1 | | | | 1 | | | | 15 | | | | 27 | | |
Reinvested | | | 4 | | | | — | | | | — | (a) | | | — | (a) | | | 43 | | | | — | | |
Redeemed | | | (27 | ) | | | (69 | ) | | | — | | | | (1 | ) | | | (47 | ) | | | (102 | ) | |
Total Class C | | | (17 | ) | | | (66 | ) | | | 1 | | | | — | (a) | | | 11 | | | | (75 | ) | |
Class R | |
Issued | | | 3 | | | | 21 | | | | — | | | | — | | | | 36 | | | | 79 | | |
Reinvested | | | 2 | | | | — | | | | — | | | | — | | | | 27 | | | | — | | |
Redeemed | | | (31 | ) | | | (64 | ) | | | — | | | | — | | | | (83 | ) | | | (136 | ) | |
Total Class R | | | (26 | ) | | | (43 | ) | | | — | | | | — | | | | (20 | ) | | | (57 | ) | |
Class R6 | |
Issued | | | — | | | | — | | | | 2,197 | | | | 1,550 | | | | 5,526 | | | | 6,278 | | |
Reinvested | | | — | | | | — | | | | 465 | | | | 235 | | | | 4,086 | | | | 152 | | |
Redeemed | | | — | | | | — | | | | (2,393 | ) | | | (4,266 | ) | | | (13,655 | ) | | | (20,196 | ) | |
Total Class R6 | | | — | | | | — | | | | 269 | | | | (2,481 | ) | | | (4,043 | ) | | | (13,766 | ) | |
Class Y | |
Issued | | | 203 | | | | 354 | | | | 1,451 | | | | 561 | | | | 3,317 | | | | 4,710 | | |
Reinvested | | | 28 | | | | — | | | | 53 | | | | 15 | | | | 2,715 | | | | 51 | | |
Redeemed | | | (438 | ) | | | (585 | ) | | | (416 | ) | | | (138 | ) | | | (4,980 | ) | | | (7,435 | ) | |
Total Class Y | | | (207 | ) | | | (231 | ) | | | 1,088 | | | | 438 | | | | 1,052 | | | | (2,674 | ) | |
Member Class | |
Issued | | | 77 | | | | 59 | | | | 91 | | | | 43 | | | | — | | | | — | | |
Reinvested | | | 4 | | | | — | | | | 3 | | | | — | (a) | | | — | | | | — | | |
Redeemed | | | (41 | ) | | | (11 | ) | | | (18 | ) | | | (8 | ) | | | — | | | | — | | |
Total Member Class | | | 40 | | | | 48 | | | | 76 | | | | 35 | | | | — | | | | — | | |
Change in Shares | | | (238 | ) | | | (576 | ) | | | 1,848 | | | | (2,039 | ) | | | (2,931 | ) | | | (17,754 | ) | |
(a) Rounds to less than 1 thousand.
See notes to financial statements.
126
Victory Portfolios | | Statements of Changes in Net Assets | |
(Amounts in Thousands)
| | | Victory Integrity
Small/Mid-Cap
Value Fund | | Victory Munder
Multi-Cap Fund | | Victory
S&P 500 Index Fund | |
| | | Year
Ended
June 30,
2022 | | Year
Ended
June 30,
2021 | | Year
Ended
June 30,
2022 | | Year
Ended
June 30,
2021 | | Year
Ended
June 30,
2022 | | Year
Ended
June 30,
2021 | |
From Investment Activities: | |
Operations: | |
Net Investment Income (Loss) | | $ | 2,099 | | | $ | 1,061 | | | $ | 85 | | | $ | (713 | ) | | $ | 2,379 | | | $ | 2,343 | | |
Net realized gains (losses) | | | 27,521 | | | | 19,368 | | | | 52,306 | | | | 59,602 | | | | 13,845 | | | | 22,456 | | |
Net change in unrealized
appreciation/depreciation | | | (50,052 | ) | | | 60,800 | | | | (86,125 | ) | | | 73,487 | | | | (44,619 | ) | | | 56,130 | | |
Change in net assets resulting
from operations | | | (20,432 | ) | | | 81,229 | | | | (33,734 | ) | | | 132,376 | | | | (28,395 | ) | | | 80,929 | | |
Distributions to Shareholders: | |
Class A | | | (414 | ) | | | (59 | ) | | | (43,776 | ) | | | (244 | ) | | | (15,195 | ) | | | (11,972 | ) | |
Class C | | | — | | | | — | | | | (566 | ) | | | — | | | | — | | | | — | | |
Class R | | | — | | | | — | | | | — | | | | — | | | | (1,626 | ) | | | (993 | ) | |
Class R6 | | | (9,521 | ) | | | (1,692 | ) | | | — | | | | — | | | | — | | | | — | | |
Class Y | | | (3,472 | ) | | | (644 | ) | | | (4,126 | ) | | | (124 | ) | | | (4,702 | ) | | | (3,648 | ) | |
Member Class | | | (201 | ) | | | (2 | ) | | | — | | | | — | | | | — | | | | — | | |
Change in net assets resulting from
distributions to shareholders | | | (13,608 | ) | | | (2,397 | ) | | | (48,468 | ) | | | (368 | ) | | | (21,523 | ) | | | (16,613 | ) | |
Change in net assets resulting from
capital transactions | | | 35,787 | | | | 13,858 | | | | 14,603 | | | | (41,195 | ) | | | 3,815 | | | | (8,496 | ) | |
Change in net assets | | | 1,747 | | | | 92,690 | | | | (67,599 | ) | | | 90,813 | | | | (46,103 | ) | | | 55,820 | | |
Net Assets: | |
Beginning of period | | | 208,787 | | | | 116,097 | | | | 438,482 | | | | 347,669 | | | | 269,332 | | | | 213,512 | | |
End of period | | $ | 210,534 | | | $ | 208,787 | | | $ | 370,883 | | | $ | 438,482 | | | $ | 223,229 | | | $ | 269,332 | | |
(continues on next page)
See notes to financial statements.
127
Victory Portfolios | | Statements of Changes in Net Assets | |
(Amounts in Thousands) (continued)
| | | Victory Integrity
Small/Mid-Cap
Value Fund | | Victory Munder
Multi-Cap Fund | | Victory
S&P 500 Index Fund | |
| | | Year
Ended
June 30,
2022 | | Year
Ended
June 30,
2021 | | Year
Ended
June 30,
2022 | | Year
Ended
June 30,
2021 | | Year
Ended
June 30,
2022 | | Year
Ended
June 30,
2021 | |
Capital Transactions: | |
Class A | |
Proceeds from shares issued | | $ | 2,555 | | | $ | 3,876 | | | $ | 8,884 | | | $ | 5,765 | | | $ | 13,350 | | | $ | 8,080 | | |
Distributions reinvested | | | 414 | | | | 59 | | | | 37,870 | | | | 211 | | | | 13,199 | | | | 10,439 | | |
Cost of shares redeemed | | | (1,285 | ) | | | (2,792 | ) | | | (34,441 | ) | | | (42,345 | ) | | | (30,162 | ) | | | (23,902 | ) | |
Total Class A | | $ | 1,684 | | | $ | 1,143 | | | $ | 12,313 | | | $ | (36,369 | ) | | $ | (3,613 | ) | | $ | (5,383 | ) | |
Class C | |
Proceeds from shares issued | | $ | — | | | $ | — | | | $ | 343 | | | $ | 254 | | | $ | — | | | $ | — | | |
Distributions reinvested | | | — | | | | — | | | | 516 | | | | — | | | | — | | | | — | | |
Cost of shares redeemed | | | — | | | | — | | | | (1,035 | ) | | | (3,268 | ) | | | — | | | | — | | |
Total Class C | | $ | — | | | $ | — | | | $ | (176 | ) | | $ | (3,014 | ) | | $ | — | | | $ | — | | |
Class R | |
Proceeds from shares issued | | $ | — | | | $ | — | | | $ | — | | | $ | — | | | $ | 9,850 | | | $ | 3,501 | | |
Distributions reinvested | | | — | | | | — | | | | — | | | | — | | | | 1,626 | | | | 993 | | |
Cost of shares redeemed | | | — | | | | — | | | | — | | | | — | | | | (7,673 | ) | | | (4,476 | ) | |
Total Class R | | $ | — | | | $ | — | | | $ | — | | | $ | — | | | $ | 3,803 | | | $ | 18 | | |
Class R6 | |
Proceeds from shares issued | | $ | 63,291 | | | $ | 35,979 | | | $ | — | | | $ | — | | | $ | — | | | $ | — | | |
Distributions reinvested | | | 9,495 | | | | 1,689 | | | | — | | | | — | | | | — | | | | — | | |
Cost of shares redeemed | | | (40,006 | ) | | | (29,451 | ) | | | — | | | | — | | | | — | | | | — | | |
Total Class R6 | | $ | 32,780 | | | $ | 8,217 | | | $ | — | | | $ | — | | | $ | — | | | $ | — | | |
Class Y | |
Proceeds from shares issued | | $ | 14,743 | | | $ | 14,072 | | | $ | 10,503 | | | $ | 3,433 | | | $ | 7,977 | | | $ | 9,028 | | |
Distributions reinvested | | | 2,460 | | | | 511 | | | | 2,786 | | | | 82 | | | | 4,647 | | | | 3,454 | | |
Cost of shares redeemed | | | (19,405 | ) | | | (12,315 | ) | | | (10,823 | ) | | | (5,327 | ) | | | (8,999 | ) | | | (15,613 | ) | |
Total Class Y | | $ | (2,202 | ) | | $ | 2,268 | | | $ | 2,466 | | | $ | (1,812 | ) | | $ | 3,625 | | | $ | (3,131 | ) | |
Member Class | |
Proceeds from shares issued | | $ | 4,507 | | | $ | 2,616 | | | $ | — | | | $ | — | | | $ | — | | | $ | — | | |
Distributions reinvested | | | 201 | | | | 2 | | | | — | | | | — | | | | — | | | | — | | |
Cost of shares redeemed | | | (1,183 | ) | | | (388 | ) | | | — | | | | — | | | | — | | | | — | | |
Total Member Class | | $ | 3,525 | | | $ | 2,230 | | | $ | — | | | $ | — | | | $ | — | | | $ | — | | |
Change in net assets resulting from
capital transactions | | $ | 35,787 | | | $ | 13,858 | | | $ | 14,603 | | | $ | (41,195 | ) | | $ | 3,815 | | | $ | (8,496 | ) | |
(continues on next page)
See notes to financial statements.
128
Victory Portfolios | | Statements of Changes in Net Assets | |
(Amounts in Thousands) (continued)
| | | Victory Integrity
Small/Mid-Cap
Value Fund | | Victory Munder
Multi-Cap Fund | | Victory
S&P 500 Index Fund | |
| | | Year
Ended
June 30,
2022 | | Year
Ended
June 30,
2021 | | Year
Ended
June 30,
2022 | | Year
Ended
June 30,
2021 | | Year
Ended
June 30,
2022 | | Year
Ended
June 30,
2021 | |
Share Transactions: | |
Class A | |
Issued | | | 114 | | | | 180 | | | | 163 | | | | 129 | | | | 521 | | | | 352 | | |
Reinvested | | | 19 | | | | 3 | | | | 695 | | | | 5 | | | | 506 | | | | 466 | | |
Redeemed | | | (57 | ) | | | (137 | ) | | | (645 | ) | | | (923 | ) | | | (1,217 | ) | | | (1,042 | ) | |
Total Class A | | | 76 | | | | 46 | | | | 213 | | | | (789 | ) | | | (190 | ) | | | (224 | ) | |
Class C | |
Issued | | | — | | | | — | | | | 9 | | | | 7 | | | | — | | | | — | | |
Reinvested | | | — | | | | — | | | | 13 | | | | — | | | | — | | | | — | | |
Redeemed | | | — | | | | — | | | | (25 | ) | | | (98 | ) | | | — | | | | — | | |
Total Class C | | | — | | | | — | | | | (3 | ) | | | (91 | ) | | | — | | | | — | | |
Class R | |
Issued | | | — | | | | — | | | | — | | | | — | | | | 383 | | | | 153 | | |
Reinvested | | | — | | | | — | | | | — | | | | — | | | | 62 | | | | 45 | | |
Redeemed | | | — | | | | — | | | | — | | | | — | | | | (302 | ) | | | (197 | ) | |
Total Class R | | | — | | | | — | | | | — | | | | — | | | | 143 | | | | 1 | | |
Class R6 | |
Issued | | | 2,764 | | | | 1,756 | | | | — | | | | — | | | | — | | | | — | | |
Reinvested | | | 426 | | | | 93 | | | | — | | | | — | | | | — | | | | — | | |
Redeemed | | | (1,751 | ) | | | (1,586 | ) | | | — | | | | — | | | | — | | | | — | | |
Total Class R6 | | | 1,439 | | | | 263 | | | | — | | | | — | | | | — | | | | — | | |
Class Y | |
Issued | | | 632 | | | | 686 | | | | 180 | | | | 68 | | | | 308 | | | | 385 | | |
Reinvested | | | 111 | | | | 28 | | | | 46 | | | | 2 | | | | 177 | | | | 153 | | |
Redeemed | | | (840 | ) | | | (675 | ) | | | (196 | ) | | | (104 | ) | | | (354 | ) | | | (674 | ) | |
Total Class Y | | | (97 | ) | | | 39 | | | | 30 | | | | (34 | ) | | | 131 | | | | (136 | ) | |
Member Class | |
Issued | | | 195 | | | | 120 | | | | — | | | | — | | | | — | | | | — | | |
Reinvested | | | 9 | | | | — | (a) | | | — | | | | — | | | | — | | | | — | | |
Redeemed | | | (53 | ) | | | (17 | ) | | | — | | | | — | | | | — | | | | — | | |
Total Member Class | | | 151 | | | | 103 | | | | — | | | | — | | | | — | | | | — | | |
Change in Shares | | | 1,569 | | | | 451 | | | | 240 | | | | (914 | ) | | | 84 | | | | (359 | ) | |
(a) Rounds to less than 1 thousand.
See notes to financial statements.
129
Victory Portfolios | | Statements of Changes in Net Assets | |
(Amounts in Thousands)
| | | Victory Munder
Mid-Cap Core
Growth Fund | | Victory Munder
Small Cap
Growth Fund | | Victory
Trivalent International
Fund-Core Equity | |
| | | Year
Ended
June 30,
2022 | | Year
Ended
June 30,
2021 | | Year
Ended
June 30,
2022 | | Year
Ended
June 30,
2021 | | Year
Ended
June 30,
2022 | | Year
Ended
June 30,
2021 | |
From Investment Activities: | |
Operations: | |
Net Investment Income (Loss) | | $ | (1,010 | ) | | $ | (2,599 | ) | | $ | (92 | ) | | $ | (91 | ) | | $ | 5,670 | | | $ | 5,148 | | |
Net realized gains (losses) | | | 93,929 | | | | 159,032 | | | | 2,060 | | | | 1,315 | | | | 767 | | | | 5,843 | | |
Net change in unrealized
appreciation/depreciation | | | (163,796 | ) | | | 70,979 | | | | (7,556 | ) | | | 4,924 | | | | (49,722 | ) | | | 37,361 | | |
Change in net assets resulting
from operations | | | (70,877 | ) | | | 227,412 | | | | (5,588 | ) | | | 6,148 | | | | (43,285 | ) | | | 48,352 | | |
Distributions to Shareholders: | |
Class A | | | (55,097 | ) | | | (23,341 | ) | | | (85 | ) | | | (36 | ) | | | (177 | ) | | | (62 | ) | |
Class C | | | (5,636 | ) | | | (3,462 | ) | | | — | | | | — | | | | (2 | ) | | | — | (a) | |
Class I | | | — | | | | — | | | | (1,494 | ) | | | (1,071 | ) | | | (103 | ) | | | (46 | ) | |
Class R | | | (3,821 | ) | | | (1,885 | ) | | | — | | | | — | | | | — | | | | — | | |
Class R6 | | | (19,676 | ) | | | (8,673 | ) | | | — | | | | — | | | | (7,901 | ) | | | (2,687 | ) | |
Class Y | | | (39,212 | ) | | | (23,441 | ) | | | (14 | ) | | | (9 | ) | | | (303 | ) | | | (110 | ) | |
Change in net assets resulting from
distributions to shareholders | | | (123,442 | ) | | | (60,802 | ) | | | (1,593 | ) | | | (1,116 | ) | | | (8,486 | ) | | | (2,905 | ) | |
Change in net assets resulting from
capital transactions | | | (23,195 | ) | | | (169,539 | ) | | | 847 | | | | 1,252 | | | | 16,347 | | | | 43,468 | | |
Change in net assets | | | (217,514 | ) | | | (2,929 | ) | | | (6,334 | ) | | | 6,284 | | | | (35,424 | ) | | | 88,915 | | |
Net Assets: | |
Beginning of period | | | 581,434 | | | | 584,363 | | | | 17,100 | | | | 10,816 | | | | 222,055 | | | | 133,140 | | |
End of period | | $ | 363,920 | | | $ | 581,434 | | | $ | 10,766 | | | $ | 17,100 | | | $ | 186,631 | | | $ | 222,055 | | |
(a) Rounds to less than $1 thousand.
(continues on next page)
See notes to financial statements.
130
Victory Portfolios | | Statements of Changes in Net Assets | |
(Amounts in Thousands) (continued)
| | | Victory Munder
Mid-Cap Core
Growth Fund | | Victory Munder
Small Cap
Growth Fund | | Victory
Trivalent International
Fund-Core Equity | |
| | | Year
Ended
June 30,
2022 | | Year
Ended
June 30,
2021 | | Year
Ended
June 30,
2022 | | Year
Ended
June 30,
2021 | | Year
Ended
June 30,
2022 | | Year
Ended
June 30,
2021 | |
Capital Transactions: | |
Class A | |
Proceeds from shares issued | | $ | 14,606 | | | $ | 15,937 | | | $ | 368 | | | $ | 135 | | | $ | 174 | | | $ | 616 | | |
Distributions reinvested | | | 50,743 | | | | 21,270 | | | | 84 | | | | 35 | | | | 152 | | | | 53 | | |
Cost of shares redeemed | | | (37,415 | ) | | | (62,892 | ) | | | (30 | ) | | | (80 | ) | | | (388 | ) | | | (1,104 | ) | |
Total Class A | | $ | 27,934 | | | $ | (25,685 | ) | | $ | 422 | | | $ | 90 | | | $ | (62 | ) | | $ | (435 | ) | |
Class C | |
Proceeds from shares issued | | $ | 153 | | | $ | 128 | | | $ | — | | | $ | — | | | $ | 2 | | | $ | 3 | | |
Distributions reinvested | | | 5,595 | | | | 3,445 | | | | — | | | | — | | | | 2 | | | | — | (a) | |
Cost of shares redeemed | | | (4,259 | ) | | | (9,106 | ) | | | — | | | | — | | | | (21 | ) | | | (134 | ) | |
Total Class C | | $ | 1,489 | | | $ | (5,533 | ) | | $ | — | | | $ | — | | | $ | (17 | ) | | $ | (131 | ) | |
Class I | |
Proceeds from shares issued | | $ | — | | | $ | — | | | $ | 80 | | | $ | 175 | | | $ | 611 | | | $ | — | | |
Distributions reinvested | | | — | | | | — | | | | 1,494 | | | | 1,071 | | | | 103 | | | | 46 | | |
Cost of shares redeemed | | | — | | | | — | | | | (1,218 | ) | | | (114 | ) | | | (518 | ) | | | (66 | ) | |
Total Class I | | $ | — | | | $ | — | | | $ | 356 | | | $ | 1,132 | | | $ | 196 | | | $ | (20 | ) | |
Class R | |
Proceeds from shares issued | | $ | 1,542 | | | $ | 1,783 | | | $ | — | | | $ | — | | | $ | — | | | $ | — | | |
Distributions reinvested | | | 3,814 | | | | 1,882 | | | | — | | | | — | | | | — | | | | — | | |
Cost of shares redeemed | | | (4,335 | ) | | | (6,595 | ) | | | — | | | | — | | | | — | | | | — | | |
Total Class R | | $ | 1,021 | | | $ | (2,930 | ) | | $ | — | | | $ | — | | | $ | — | | | $ | — | | |
Class R6 | |
Proceeds from shares issued | | $ | 18,046 | | | $ | 13,910 | | | $ | — | | | $ | — | | | $ | 15,317 | | | $ | 44,300 | | |
Distributions reinvested | | | 19,626 | | | | 8,636 | | | | — | | | | — | | | | 7,901 | | | | 2,687 | | |
Cost of shares redeemed | | | (31,822 | ) | | | (67,516 | ) | | | — | | | | — | | | | (6,910 | ) | | | (3,122 | ) | |
Total Class R6 | | $ | 5,850 | | | $ | (44,970 | ) | | $ | — | | | $ | — | | | $ | 16,308 | | | $ | 43,865 | | |
Class Y | |
Proceeds from shares issued | | $ | 7,440 | | | $ | 13,776 | | | $ | 68 | | | $ | 21 | | | $ | 26 | | | $ | 401 | | |
Distributions reinvested | | | 38,340 | | | | 22,365 | | | | 14 | | | | 9 | | | | 266 | | | | 97 | | |
Cost of shares redeemed | | | (105,269 | ) | | | (126,562 | ) | | | (13 | ) | | | — | | | | (370 | ) | | | (309 | ) | |
Total Class Y | | $ | (59,489 | ) | | $ | (90,421 | ) | | $ | 69 | | | $ | 30 | | | $ | (78 | ) | | $ | 189 | | |
Change in net assets resulting from capital
transactions | | $ | (23,195 | ) | | $ | (169,539 | ) | | $ | 847 | | | $ | 1,252 | | | $ | 16,347 | | | $ | 43,468 | | |
(a) Rounds to less than $1 thousand.
(continues on next page)
See notes to financial statements.
131
Victory Portfolios | | Statements of Changes in Net Assets | |
(Amounts in Thousands) (continued)
| | | Victory Munder
Mid-Cap Core
Growth Fund | | Victory Munder
Small Cap
Growth Fund | | Victory
Trivalent International
Fund-Core Equity | |
| | | Year
Ended
June 30,
2022 | | Year
Ended
June 30,
2021 | | Year
Ended
June 30,
2022 | | Year
Ended
June 30,
2021 | | Year
Ended
June 30,
2022 | | Year
Ended
June 30,
2021 | |
Share Transactions: | |
Class A | |
Issued | | | 1,132 | | | | 1,167 | | | | 20 | | | | 8 | | | | 22 | | | | 89 | | |
Reinvested | | | 4,208 | | | | 1,611 | | | | 5 | | | | 2 | | | | 19 | | | | 7 | | |
Redeemed | | | (2,853 | ) | | | (4,603 | ) | | | (2 | ) | | | (5 | ) | | | (49 | ) | | | (152 | ) | |
Total Class A | | | 2,487 | | | | (1,825 | ) | | | 23 | | | | 5 | | | | (8 | ) | | | (56 | ) | |
Class C | |
Issued | | | 86 | | | | 25 | | | | — | | | | — | | | | — | (a) | | | — | | |
Reinvested | | | 4,144 | | | | 762 | | | | — | | | | — | | | | — | (a) | | | — | | |
Redeemed | | | (1,649 | ) | | | (1,785 | ) | | | — | | | | — | | | | (2 | ) | | | (19 | ) | |
Total Class C | | | 2,581 | | | | (998 | ) | | | — | | | | — | | | | (2 | ) | | | (19 | ) | |
Class I | |
Issued | | | — | | | | — | | | | 4 | | | | 9 | | | | 91 | | | | — | | |
Reinvested | | | — | | | | — | | | | 87 | | | | 61 | | | | 13 | | | | 6 | | |
Redeemed | | | — | | | | — | | | | (77 | ) | | | (6 | ) | | | (64 | ) | | | (8 | ) | |
Total Class I | | | — | | | | — | | | | 14 | | | | 64 | | | | 40 | | | | (2 | ) | |
Class R | |
Issued | | | 153 | | | | 154 | | | | — | | | | — | | | | — | | | | — | | |
Reinvested | | | 413 | | | | 172 | | | | — | | | | — | | | | — | | | | — | | |
Redeemed | | | (402 | ) | | | (567 | ) | | | — | | | | — | | | | — | | | | — | | |
Total Class R | | | 164 | | | | (241 | ) | | | — | | | | — | | | | — | | | | — | | |
Class R6 | |
Issued | | | 1,017 | | | | 786 | | | | — | | | | — | | | | 1,876 | | | | 6,110 | | |
Reinvested | | | 1,160 | | | | 505 | | | | — | | | | — | | | | 974 | | | | 357 | | |
Redeemed | | | (1,848 | ) | | | (3,988 | ) | | | — | | | | — | | | | (863 | ) | | | (413 | ) | |
Total Class R6 | | | 329 | | | | (2,697 | ) | | | — | | | | — | | | | 1,987 | | | | 6,054 | | |
Class Y | |
Issued | | | 458 | | | | 823 | | | | 4 | | | | 1 | | | | 3 | | | | 52 | | |
Reinvested | | | 2,417 | | | | 1,376 | | | | 1 | | | | 1 | | | | 33 | | | | 13 | | |
Redeemed | | | (5,925 | ) | | | (7,632 | ) | | | (1 | ) | | | — | | | | (48 | ) | | | (43 | ) | |
Total Class Y | | | (3,050 | ) | | | (5,433 | ) | | | 4 | | | | 2 | | | | (12 | ) | | | 22 | | |
Change in Shares | | | 2,511 | | | | (11,194 | ) | | | 41 | | | | 71 | | | | 2,005 | | | | 5,999 | | |
(a) Rounds to less than 1 thousand.
See notes to financial statements.
132
Victory Portfolios | | Statements of Changes in Net Assets | |
(Amounts in Thousands)
| | | Victory
Trivalent International
Small-Cap Fund | | Victory
INCORE Total Return
Bond Fund | |
| | | Year
Ended
June 30,
2022 | | Year
Ended
June 30,
2021 | | Year
Ended
June 30,
2022 | | Year
Ended
June 30,
2021 | |
From Investment Activities: | |
Operations: | |
Net Investment Income (Loss) | | $ | 49,365 | | | $ | 38,085 | | | $ | 1,038 | | | $ | 1,176 | | |
Net realized gains (losses) | | | 63,147 | | | | 315,377 | | | | (494 | ) | | | 548 | | |
Net change in unrealized appreciation/
depreciation | | | (1,013,226 | ) | | | 497,274 | | | | (7,588 | ) | | | (407 | ) | |
Change in net assets resulting
from operations | | | (900,714 | ) | | | 850,736 | | | | (7,044 | ) | | | 1,317 | | |
Distributions to Shareholders: | |
Class A | | | (7,089 | ) | | | — | (a) | | | (189 | ) | | | (249 | ) | |
Class C | | | (363 | ) | | | — | | | | (4 | ) | | | (8 | ) | |
Class I | | | (175,425 | ) | | | (6,561 | ) | | | — | | | | — | | |
Class R6 | | | (11,807 | ) | | | (355 | ) | | | (630 | ) | | | (680 | ) | |
Class Y | | | (93,356 | ) | | | (2,549 | ) | | | (744 | ) | | | (843 | ) | |
Change in net assets resulting from
distributions to shareholders | | | (288,040 | ) | | | (9,465 | ) | | | (1,567 | ) | | | (1,780 | ) | |
Change in net assets resulting from capital
transactions | | | 403,816 | | | | 630,234 | | | | 841 | | | | (3,357 | ) | |
Change in net assets | | | (784,938 | ) | | | 1,471,505 | | | | (7,770 | ) | | | (3,820 | ) | |
Net Assets: | |
Beginning of period | | | 3,335,490 | | | | 1,863,985 | | | | 67,833 | | | | 71,653 | | |
End of period | | $ | 2,550,552 | | | $ | 3,335,490 | | | $ | 60,063 | | | $ | 67,833 | | |
(a) Rounds to less than $1 thousand.
(continues on next page)
See notes to financial statements.
133
Victory Portfolios | | Statements of Changes in Net Assets | |
(Amounts in Thousands) (continued)
| | | Victory
Trivalent International
Small-Cap Fund | | Victory
INCORE Total Return
Bond Fund | |
| | | Year
Ended
June 30,
2022 | | Year
Ended
June 30,
2021 | | Year
Ended
June 30,
2022 | | Year
Ended
June 30,
2021 | |
Capital Transactions: | |
Class A | |
Proceeds from shares issued | | $ | 22,529 | | | $ | 39,592 | | | $ | 369 | | | $ | 604 | | |
Distributions reinvested | | | 5,380 | | | | — | | | | 164 | | | | 219 | | |
Cost of shares redeemed | | | (27,265 | ) | | | (86,919 | ) | | | (1,281 | ) | | | (2,844 | ) | |
Total Class A | | $ | 644 | | | $ | (47,327 | ) | | $ | (748 | ) | | $ | (2,021 | ) | |
Class C | |
Proceeds from shares issued | | $ | 545 | | | $ | 656 | | | $ | 6 | | | $ | 76 | | |
Distributions reinvested | | | 331 | | | | — | | | | 4 | | | | 9 | | |
Cost of shares redeemed | | | (974 | ) | | | (1,560 | ) | | | (262 | ) | | | (357 | ) | |
Total Class C | | $ | (98 | ) | | $ | (904 | ) | | $ | (252 | ) | | $ | (272 | ) | |
Class I | |
Proceeds from shares issued | | $ | 1,113,552 | | | $ | 843,443 | | | $ | — | | | $ | — | | |
Distributions reinvested | | | 127,349 | | | | 5,005 | | | | — | | | | — | | |
Cost of shares redeemed | | | (851,599 | ) | | | (353,920 | ) | | | — | | | | — | | |
Total Class I | | $ | 389,302 | | | $ | 494,528 | | | $ | — | | | $ | — | | |
Class R6 | |
Proceeds from shares issued | | $ | 53,561 | | | $ | 57,389 | | | $ | 1,106 | | | $ | 2,005 | | |
Distributions reinvested | | | 11,804 | | | | 354 | | | | 630 | | | | 680 | | |
Cost of shares redeemed | | | (24,452 | ) | | | (31,825 | ) | | | (1,463 | ) | | | (1,558 | ) | |
Total Class R6 | | $ | 40,913 | | | $ | 25,918 | | | $ | 273 | | | $ | 1,127 | | |
Class Y | |
Proceeds from shares issued | | $ | 369,071 | | | $ | 415,535 | | | $ | 2,069 | | | $ | 243 | | |
Distributions reinvested | | | 90,858 | | | | 2,460 | | | | 551 | | | | 603 | | |
Cost of shares redeemed | | | (486,874 | ) | | | (259,976 | ) | | | (1,052 | ) | | | (3,037 | ) | |
Total Class Y | | $ | (26,945 | ) | | $ | 158,019 | | | $ | 1,568 | | | $ | (2,191 | ) | |
Change in net assets resulting from
capital transactions | | $ | 403,816 | | | $ | 630,234 | | | $ | 841 | | | $ | (3,357 | ) | |
(continues on next page)
See notes to financial statements.
134
Victory Portfolios | | Statements of Changes in Net Assets | |
(Amounts in Thousands) (continued)
| | | Victory
Trivalent International
Small-Cap Fund | | Victory
INCORE Total Return
Bond Fund | |
| | | Year
Ended
June 30,
2022 | | Year
Ended
June 30,
2021 | | Year
Ended
June 30,
2022 | | Year
Ended
June 30,
2021 | |
Share Transactions: | |
Class A | |
Issued | | | 1,380 | | | | 2,538 | | | | 39 | | | | 61 | | |
Reinvested | | | 327 | | | | — | | | | 17 | | | | 22 | | |
Redeemed | | | (1,680 | ) | | | (5,762 | ) | | | (138 | ) | | | (287 | ) | |
Total Class A | | | 27 | | | | (3,224 | ) | | | (82 | ) | | | (204 | ) | |
Class C | |
Issued | | | 33 | | | | 41 | | | | — | (a) | | | 8 | | |
Reinvested | | | 21 | | | | — | | | | — | (a) | | | 1 | | |
Redeemed | | | (63 | ) | | | (104 | ) | | | (27 | ) | | | (36 | ) | |
Total Class C | | | (9 | ) | | | (63 | ) | | | (27 | ) | | | (27 | ) | |
Class I | |
Issued | | | 70,352 | | | | 53,324 | | | | — | | | | — | | |
Reinvested | | | 7,672 | | | | 316 | | | | — | | | | — | | |
Redeemed | | | (56,109 | ) | | | (21,878 | ) | | | — | | | | — | | |
Total Class I | | | 21,915 | | | | 31,762 | | | | — | | | | — | | |
Class R6 | |
Issued | | | 3,304 | | | | 3,632 | | | | 118 | | | | 204 | | |
Reinvested | | | 708 | | | | 22 | | | | 67 | | | | 68 | | |
Redeemed | | | (1,515 | ) | | | (2,000 | ) | | | (157 | ) | | | (156 | ) | |
Total Class R6 | | | 2,497 | | | | 1,654 | | | | 28 | | | | 116 | | |
Class Y | |
Issued | | | 23,293 | | | | 25,779 | | | | 211 | | | | 24 | | |
Reinvested | | | 5,504 | | | | 156 | | | | 59 | | | | 61 | | |
Redeemed | | | (33,189 | ) | | | (16,681 | ) | | | (112 | ) | | | (307 | ) | |
Total Class Y | | | (4,392 | ) | | | 9,254 | | | | 158 | | | | (222 | ) | |
Change in Shares | | | 20,038 | | | | 39,383 | | | | 77 | | | | (337 | ) | |
(a) Rounds to less than 1 thousand.
See notes to financial statements.
135
Victory Portfolios | | Financial Highlights | |
For a Share Outstanding Throughout Each Period
| | | | | Investment Activities | | Distributions to
Shareholders From | |
| | | Net Asset
Value,
Beginning of
Period | | Net
Investment
Income
(Loss)(a) | | Net Realized
and Unrealized
Gains (Losses) | | Total from
Investment
Activities | | Net Realized
Gains from
Investments | | Total
Distributions | |
Victory Integrity Discovery Fund | | | |
Class A | | | |
Year Ended June 30: | |
2022 | | $ | 45.53 | | | | (0.10 | ) | | | (6.57 | ) | | | (6.67 | ) | | | (2.14 | ) | | | (2.14 | ) | |
2021 | | $ | 24.03 | | | | (0.07 | ) | | | 21.57 | | | | 21.50 | | | | — | | | | — | | |
2020 | | $ | 32.28 | | | | (0.05 | ) | | | (7.38 | ) | | | (7.43 | ) | | | (0.82 | ) | | | (0.82 | ) | |
2019 | | $ | 42.75 | | | | (0.11 | ) | | | (5.61 | ) | | | (5.72 | ) | | | (4.75 | ) | | | (4.75 | ) | |
2018 | | $ | 41.01 | | | | (0.16 | ) | | | 6.40 | | | | 6.24 | | | | (4.50 | ) | | | (4.50 | ) | |
Class C | | | |
Year Ended June 30: | |
2022 | | $ | 30.67 | | | | (0.32 | ) | | | (4.30 | ) | | | (4.62 | ) | | | (2.14 | ) | | | (2.14 | ) | |
2021 | | $ | 16.32 | | | | (0.21 | ) | | | 14.56 | | | | 14.35 | | | | — | | | | — | | |
2020 | | $ | 22.36 | | | | (0.22 | ) | | | (5.00 | ) | | | (5.22 | ) | | | (0.82 | ) | | | (0.82 | ) | |
2019 | | $ | 31.69 | | | | (0.28 | ) | | | (4.30 | ) | | | (4.58 | ) | | | (4.75 | ) | | | (4.75 | ) | |
2018 | | $ | 31.69 | | | | (0.34 | ) | | | 4.84 | | | | 4.50 | | | | (4.50 | ) | | | (4.50 | ) | |
Class R | | | |
Year Ended June 30: | |
2022 | | $ | 42.35 | | | | (0.31 | ) | | | (6.05 | ) | | | (6.36 | ) | | | (2.14 | ) | | | (2.14 | ) | |
2021 | | $ | 22.45 | | | | (0.18 | ) | | | 20.08 | | | | 19.90 | | | | — | | | | — | | |
2020 | | $ | 30.36 | | | | (0.18 | ) | | | (6.91 | ) | | | (7.09 | ) | | | (0.82 | ) | | | (0.82 | ) | |
2019 | | $ | 40.76 | | | | (0.28 | ) | | | (5.37 | ) | | | (5.65 | ) | | | (4.75 | ) | | | (4.75 | ) | |
2018 | | $ | 39.49 | | | | (0.28 | ) | | | 6.05 | | | | 5.77 | | | | (4.50 | ) | | | (4.50 | ) | |
Class Y | | | |
Year Ended June 30: | |
2022 | | $ | 50.63 | | | | (0.03 | ) | | | (7.34 | ) | | | (7.37 | ) | | | (2.14 | ) | | | (2.14 | ) | |
2021 | | $ | 26.64 | | | | 0.03 | | | | 23.96 | | | | 23.99 | | | | — | | | | — | | |
2020 | | $ | 35.65 | | | | — | (f) | | | (8.19 | ) | | | (8.19 | ) | | | (0.82 | ) | | | (0.82 | ) | |
2019 | | $ | 46.47 | | | | (0.03 | ) | | | (6.04 | ) | | | (6.07 | ) | | | (4.75 | ) | | | (4.75 | ) | |
2018 | | $ | 44.11 | | | | (0.05 | ) | | | 6.91 | | | | 6.86 | | | | (4.50 | ) | | | (4.50 | ) | |
Member Class | | | |
Year Ended
June 30, 2022 | | $ | 45.58 | | | | (0.04 | ) | | | (6.60 | ) | | | (6.64 | ) | | | (2.14 | ) | | | (2.14 | ) | |
November 3, 2020 (g)
through
June 30, 2021 | | $ | 26.37 | | | | (0.30 | ) | | | 19.51 | | | | 19.21 | | | | — | | | | — | | |
(a) Per share net investment income (loss) has been calculated using the average daily shares method.
(b) Not annualized for periods less than one year.
(c) Annualized for periods less than one year.
(d) Does not include acquired fund fees and expenses, if any.
(e) Portfolio turnover is calculated on the basis of the Fund as a whole without distinguishing between the classes of shares issued.
(f) Amount is less than $0.005 per share.
(g) Commencement of operations.
(h) Amount is less than 0.005%.
(i) Includes adjustments in accordance with U.S. Generally Accepted Accounting Principles.
See notes to financial statements.
136
Victory Portfolios | | Financial Highlights — continued | |
For a Share Outstanding Throughout Each Period
| | | | | Ratios to Average Net Assets | | Supplemental Data | |
| | | Net Asset
Value, End
of Period | | Total
Return
(Excludes
Sales
Charge)(b)(i) | | Net
Expenses(c)(d) | | Net
Investment
Income
(Loss)(c) | | Gross
Expenses(c)(d) | | Net Assets,
End of
Period
(000's) | | Portfolio
Turnover(b)(e) | |
Victory Integrity Discovery Fund | |
Class A | |
Year Ended June 30: | |
2022 | | $ | 36.72 | | | | (15.25 | )% | | | 1.57 | % | | | (0.23 | )% | | | 1.57 | % | | $ | 35,308 | | | | 36 | % | |
2021 | | $ | 45.53 | | | | 89.47 | % | | | 1.62 | % | | | (0.20 | )% | | | 1.62 | % | | $ | 45,073 | | | | 41 | % | |
2020 | | $ | 24.03 | | | | (23.78 | )% | | | 1.59 | % | | | (0.18 | )% | | | 1.59 | % | | $ | 30,614 | | | | 40 | % | |
2019 | | $ | 32.28 | | | | (12.02 | )% | | | 1.55 | % | | | (0.29 | )% | | | 1.55 | % | | $ | 50,963 | | | | 40 | % | |
2018 | | $ | 42.75 | | | | 15.76 | % | | | 1.54 | % | | | (0.39 | )% | | | 1.54 | % | | $ | 67,840 | | | | 45 | % | |
Class C | |
Year Ended June 30: | |
2022 | | $ | 23.91 | | | | (15.98 | )% | | | 2.45 | % | | | (1.11 | )% | | | 3.02 | % | | $ | 1,227 | | | | 36 | % | |
2021 | | $ | 30.67 | | | | 87.93 | % | | | 2.45 | % | | | (0.95 | )% | | | 2.87 | % | | $ | 2,079 | | | | 41 | % | |
2020 | | $ | 16.32 | | | | (24.42 | )% | | | 2.46 | % | | | (1.09 | )% | | | 2.52 | % | | $ | 2,194 | | | | 40 | % | |
2019 | | $ | 22.36 | | | | (12.74 | )% | | | 2.34 | % | | | (1.07 | )% | | | 2.34 | % | | $ | 6,633 | | | | 40 | % | |
2018 | | $ | 31.69 | | | | 14.88 | % | | | 2.32 | % | | | (1.10 | )% | | | 2.32 | % | | $ | 9,871 | | | | 45 | % | |
Class R | |
Year Ended June 30: | |
2022 | | $ | 33.85 | | | | (15.68 | )% | | | 2.08 | % | | | (0.76 | )% | | | 3.14 | % | | $ | 688 | | | | 36 | % | |
2021 | | $ | 42.35 | | | | 88.56 | % | | | 2.08 | % | | | (0.58 | )% | | | 2.43 | % | | $ | 1,955 | | | | 41 | % | |
2020 | | $ | 22.45 | | | | (24.10 | )% | | | 2.08 | % | | | (0.65 | )% | | | 2.33 | % | | $ | 1,990 | | | | 40 | % | |
2019 | | $ | 30.36 | | | | (12.49 | )% | | | 2.08 | % | | | (0.84 | )% | | | 2.41 | % | | $ | 3,038 | | | | 40 | % | |
2018 | | $ | 40.76 | | | | 15.15 | % | | | 2.08 | % | | | (0.70 | )% | | | 2.27 | % | | $ | 3,465 | | | | 45 | % | |
Class Y | |
Year Ended June 30: | |
2022 | | $ | 41.12 | | | | (15.09 | )% | | | 1.38 | % | | | (0.05 | )% | | | 1.38 | % | | $ | 24,479 | | | | 36 | % | |
2021 | | $ | 50.63 | | | | 90.05 | % | | | 1.31 | % | | | 0.07 | % | | | 1.31 | % | | $ | 40,600 | | | | 41 | % | |
2020 | | $ | 26.64 | | | | (23.64 | )% | | | 1.38 | % | | | — | %(h) | | | 1.38 | % | | $ | 27,519 | | | | 40 | % | |
2019 | | $ | 35.65 | | | | (11.81 | )% | | | 1.30 | % | | | (0.06 | )% | | | 1.30 | % | | $ | 71,708 | | | | 40 | % | |
2018 | | $ | 46.47 | | | | 16.08 | % | | | 1.28 | % | | | (0.12 | )% | | | 1.28 | % | | $ | 78,079 | | | | 45 | % | |
Member Class | |
Year Ended
June 30, 2022 | | $ | 36.80 | | | | (15.17 | )% | | | 1.50 | % | | | (0.10 | )% | | | 1.99 | % | | $ | 3,232 | | | | 36 | % | |
November 3, 2020 (g)
through
June 30, 2021 | | $ | 45.58 | | | | 72.85 | % | | | 1.50 | % | | | (1.04 | )% | | | 5.05 | % | | $ | 2,172 | | | | 41 | % | |
See notes to financial statements.
137
Victory Portfolios | | Financial Highlights | |
For a Share Outstanding Throughout Each Period
| | | | | Investment Activities | | Distributions to
Shareholders From | |
| | | Net Asset
Value,
Beginning of
Period | | Net
Investment
Income
(Loss)(a) | | Net
Realized and
Unrealized
Gains (Losses) | | Total from
Investment
Activities | | Net
Investment
Income | | Net Realized
Gains from
Investments | | Return
of
Capital | |
Victory Integrity Mid-Cap Value Fund | | | |
Class A | | | |
Year Ended June 30: | |
2022 | | $ | 23.72 | | | | 0.21 | | | | (1.66 | ) | | | (1.45 | ) | | | — | | | | (1.16 | ) | | | — | | |
2021 | | $ | 15.30 | | | | 0.13 | | | | 8.74 | | | | 8.87 | | | | (0.37 | ) | | | — | | | | (0.08 | ) | |
2020 | | $ | 17.86 | | | | 0.24 | | | | (2.70 | ) | | | (2.46 | ) | | | (0.10 | ) | | | — | | | | — | | |
2019 | | $ | 19.17 | | | | 0.19 | | | | (0.32 | ) | | | (0.13 | ) | | | (0.19 | ) | | | (0.99 | ) | | | — | | |
2018 | | $ | 17.91 | | | | 0.19 | | | | 1.84 | | | | 2.03 | | | | (0.15 | ) | | | (0.62 | ) | | | — | | |
Class C | | | |
Year Ended June 30: | |
2022 | | $ | 23.81 | | | | 0.03 | | | | (1.65 | ) | | | (1.62 | ) | | | — | | | | (1.16 | ) | | | — | | |
2021 | | $ | 15.37 | | | | (0.05 | ) | | | 8.82 | | | | 8.77 | | | | (0.27 | ) | | | — | | | | (0.06 | ) | |
November 4, 2019 (f)
through
June 30, 2020 | | $ | 18.75 | | | | 0.11 | | | | (3.39 | ) | | | (3.28 | ) | | | (0.10 | ) | | | — | | | | — | | |
Class R6 | | | |
Year Ended June 30: | |
2022 | | $ | 23.99 | | | | 0.31 | | | | (1.69 | ) | | | (1.38 | ) | | | (0.05 | ) | | | (1.16 | ) | | | — | | |
2021 | | $ | 15.47 | | | | 0.19 | | | | 8.85 | | | | 9.04 | | | | (0.43 | ) | | | — | | | | (0.09 | ) | |
2020 | | $ | 18.02 | | | | 0.33 | | | | (2.74 | ) | | | (2.41 | ) | | | (0.14 | ) | | | — | | | | — | | |
2019 | | $ | 19.30 | | | | 0.26 | | | | (0.32 | ) | | | (0.06 | ) | | | (0.23 | ) | | | (0.99 | ) | | | — | | |
2018 | | $ | 18.02 | | | | 0.22 | | | | 1.87 | | | | 2.09 | | | | (0.19 | ) | | | (0.62 | ) | | | — | | |
Class Y | | | |
Year Ended June 30: | |
2022 | | $ | 23.95 | | | | 0.28 | | | | (1.70 | ) | | | (1.42 | ) | | | (0.01 | ) | | | (1.16 | ) | | | — | | |
2021 | | $ | 15.44 | | | | 0.06 | | | | 8.94 | | | | 9.00 | | | | (0.41 | ) | | | — | | | | (0.08 | ) | |
2020 | | $ | 18.02 | | | | 0.25 | | | | (2.68 | ) | | | (2.43 | ) | | | (0.15 | ) | | | — | | | | — | | |
2019 | | $ | 19.34 | | | | 0.28 | | | | (0.37 | ) | | | (0.09 | ) | | | (0.24 | ) | | | (0.99 | ) | | | — | | |
2018 | | $ | 18.06 | | | | 0.24 | | | | 1.85 | | | | 2.09 | | | | (0.19 | ) | | | (0.62 | ) | | | — | | |
Member Class | | | |
Year Ended
June 30, 2022 | | $ | 24.08 | | | | 0.27 | | | | (1.72 | ) | | | (1.45 | ) | | | — | | | | (1.16 | ) | | | — | | |
November 3, 2020 (f)
through
June 30, 2021 | | $ | 16.94 | | | | (0.26 | ) | | | 7.58 | | | | 7.32 | | | | (0.17 | ) | | | — | | | | (0.01 | ) | |
(a) Per share net investment income (loss) has been calculated using the average daily shares method.
(b) Not annualized for periods less than one year.
(c) Annualized for periods less than one year.
(d) Does not include acquired fund fees and expenses, if any.
(e) Portfolio turnover is calculated on the basis of the Fund as a whole without distinguishing between the classes of shares issued.
(f) Commencement of operations.
See notes to financial statements.
138
Victory Portfolios | | Financial Highlights — continued | |
For a Share Outstanding Throughout Each Period
| | | | | Ratios to Average Net Assets | | Supplemental Data | |
| | | Total
Distributions | | Net Asset
Value,
End of
Period | | Total
Return
(Excludes
Sales
Charge)(b) | | Net
Expenses(c)(d) | | Net
Investment
Income
(Loss)(c) | | Gross
Expenses(c)(d) | | Net Assets,
End of
Period
(000's) | | Portfolio
Turnover(b)(e) | |
Victory Integrity Mid-Cap Value Fund | |
Class A | |
Year Ended June 30: | |
2022 | | | (1.16 | ) | | $ | 21.11 | | | | (6.56 | )% | | | 1.00 | % | | | 0.90 | % | | | 1.42 | % | | $ | 19,898 | | | | 70 | % | |
2021 | | | (0.45 | ) | | $ | 23.72 | | | | 58.66 | % | | | 1.00 | % | | | 0.64 | % | | | 1.37 | % | | $ | 12,542 | | | | 67 | % | |
2020 | | | (0.10 | ) | | $ | 15.30 | | | | (13.90 | )% | | | 1.00 | % | | | 1.40 | % | | | 1.43 | % | | $ | 8,574 | | | | 82 | % | |
2019 | | | (1.18 | ) | | $ | 17.86 | | | | 0.36 | % | | | 1.00 | % | | | 1.05 | % | | | 1.51 | % | | $ | 7,567 | | | | 73 | % | |
2018 | | | (0.77 | ) | | $ | 19.17 | | | | 11.32 | % | | | 1.09 | % | | | 1.01 | % | | | 1.67 | % | | $ | 4,255 | | | | 73 | % | |
Class C | |
Year Ended June 30: | |
2022 | | | (1.16 | ) | | $ | 21.03 | | | | (7.26 | )% | | | 1.75 | % | | | 0.14 | % | | | 2.82 | % | | $ | 83 | | | | 70 | % | |
2021 | | | (0.33 | ) | | $ | 23.81 | | | | 57.43 | % | | | 1.75 | % | | | (0.25 | )% | | | 16.27 | % | | $ | 78 | | | | 67 | % | |
November 4, 2019 (f)
through
June 30, 2020 | | | (0.10 | ) | | $ | 15.37 | | | | (17.55 | )% | | | 1.75 | % | | | 1.02 | % | | | 43.95 | % | | $ | 44 | | | | 82 | % | |
Class R6 | |
Year Ended June 30: | |
2022 | | | (1.21 | ) | | $ | 21.40 | | | | (6.21 | )% | | | 0.60 | % | | | 1.28 | % | | | 0.87 | % | | $ | 207,959 | | | | 70 | % | |
2021 | | | (0.52 | ) | | $ | 23.99 | | | | 59.24 | % | | | 0.60 | % | | | 0.94 | % | | | 0.88 | % | | $ | 226,652 | | | | 67 | % | |
2020 | | | (0.14 | ) | | $ | 15.47 | | | | (13.53 | )% | | | 0.60 | % | | | 1.93 | % | | | 0.88 | % | | $ | 184,503 | | | | 82 | % | |
2019 | | | (1.22 | ) | | $ | 18.02 | | | | 0.72 | % | | | 0.60 | % | | | 1.43 | % | | | 0.94 | % | | $ | 56,232 | | | | 73 | % | |
2018 | | | (0.81 | ) | | $ | 19.30 | | | | 11.68 | % | | | 0.77 | % | | | 1.14 | % | | | 1.17 | % | | $ | 6,750 | | | | 73 | % | |
Class Y | |
Year Ended June 30: | |
2022 | | | (1.17 | ) | | $ | 21.36 | | | | (6.35 | )% | | | 0.75 | % | | | 1.18 | % | | | 1.03 | % | | $ | 45,535 | | | | 70 | % | |
2021 | | | (0.49 | ) | | $ | 23.95 | | | | 59.03 | % | | | 0.75 | % | | | 0.29 | % | | | 1.08 | % | | $ | 25,003 | | | | 67 | % | |
2020 | | | (0.15 | ) | | $ | 15.44 | | | | (13.67 | )% | | | 0.75 | % | | | 1.46 | % | | | 1.21 | % | | $ | 9,352 | | | | 82 | % | |
2019 | | | (1.23 | ) | | $ | 18.02 | | | | 0.58 | % | | | 0.75 | % | | | 1.52 | % | | | 1.17 | % | | $ | 21,486 | | | | 73 | % | |
2018 | | | (0.81 | ) | | $ | 19.34 | | | | 11.58 | % | | | 0.84 | % | | | 1.25 | % | | | 1.13 | % | | $ | 59,866 | | | | 73 | % | |
Member Class | |
Year Ended
June 30, 2022 | | | (1.16 | ) | | $ | 21.47 | | | | (6.46 | )% | | | 0.85 | % | | | 1.11 | % | | | 1.97 | % | | $ | 2,385 | | | | 70 | % | |
November 3, 2020 (f)
through
June 30, 2021 | | | (0.18 | ) | | $ | 24.08 | | | | 43.46 | % | | | 0.85 | % | | | (1.69 | )% | | | 8.67 | % | | $ | 845 | | | | 67 | % | |
See notes to financial statements.
139
Victory Portfolios | | Financial Highlights | |
For a Share Outstanding Throughout Each Period
| | | | | Investment Activities | | Distributions to
Shareholders From | |
| | | Net Asset
Value,
Beginning of
Period | | Net
Investment
Income
(Loss)(a) | | Net Realized
and Unrealized
Gains (Losses) | | Total from
Investment
Activities | | Net
Investment
Income | | Net Realized
Gains from
Investments | |
Victory Integrity Small-Cap Value Fund | | | |
Class A | | | |
Year Ended June 30:
2022 | | $ | 43.97 | | | | 0.03 | | | | (4.51 | ) | | | (4.48 | ) | | | (0.04 | ) | | | (6.94 | ) | |
2021 | | $ | 24.40 | | | | (0.01 | ) | | | 19.61 | | | | 19.60 | | | | (0.03 | ) | | | — | | |
2020 | | $ | 32.37 | | | | 0.03 | | | | (7.86 | ) | | | (7.83 | ) | | | — | | | | (0.14 | ) | |
2019 | | $ | 40.06 | | | | 0.09 | | | | (3.59 | ) | | | (3.50 | ) | | | — | | | | (4.19 | ) | |
2018 | | $ | 37.70 | | | | (0.04 | ) | | | 4.76 | | | | 4.72 | | | | — | | | | (2.36 | ) | |
Class C | | | |
Year Ended June 30:
2022 | | $ | 37.22 | | | | (0.22 | ) | | | (3.67 | ) | | | (3.89 | ) | | | — | | | | (6.94 | ) | |
2021 | | $ | 20.81 | | | | (0.26 | ) | | | 16.67 | | | | 16.41 | | | | — | | | | — | | |
2020 | | $ | 27.85 | | | | (0.17 | ) | | | (6.73 | ) | | | (6.90 | ) | | | — | | | | (0.14 | ) | |
2019 | | $ | 35.40 | | | | (0.13 | ) | | | (3.23 | ) | | | (3.36 | ) | | | — | | | | (4.19 | ) | |
2018 | | $ | 33.76 | | | | (0.24 | ) | | | 4.24 | | | | 4.00 | | | | — | | | | (2.36 | ) | |
Class R | | | |
Year Ended June 30:
2022 | | $ | 42.35 | | | | (0.07 | ) | | | (4.30 | ) | | | (4.37 | ) | | | — | | | | (6.94 | ) | |
2021 | | $ | 23.53 | | | | (0.10 | ) | | | 18.92 | | | | 18.82 | | | | — | | | | — | | |
2020 | | $ | 31.32 | | | | (0.05 | ) | | | (7.60 | ) | | | (7.65 | ) | | | — | | | | (0.14 | ) | |
2019 | | $ | 39.02 | | | | (0.01 | ) | | | (3.50 | ) | | | (3.51 | ) | | | — | | | | (4.19 | ) | |
2018 | | $ | 36.86 | | | | (0.13 | ) | | | 4.65 | | | | 4.52 | | | | — | | | | (2.36 | ) | |
Class R6 | | | |
Year Ended June 30:
2022 | | $ | 45.91 | | | | 0.26 | | | | (4.75 | ) | | | (4.49 | ) | | | (0.24 | ) | | | (6.94 | ) | |
2021 | | $ | 25.43 | | | | 0.18 | | | | 20.47 | | | | 20.65 | | | | (0.17 | ) | | | — | | |
2020 | | $ | 33.70 | | | | 0.19 | | | | (8.18 | ) | | | (7.99 | ) | | | (0.14 | ) | | | (0.14 | ) | |
2019 | | $ | 41.51 | | | | 0.24 | | | | (3.67 | ) | | | (3.43 | ) | | | (0.19 | ) | | | (4.19 | ) | |
2018 | | $ | 38.86 | | | | 0.18 | | | | 4.92 | | | | 5.10 | | | | (0.09 | ) | | | (2.36 | ) | |
Class Y | | | |
Year Ended June 30:
2022 | | $ | 45.62 | | | | 0.21 | | | | (4.71 | ) | | | (4.50 | ) | | | (0.20 | ) | | | (6.94 | ) | |
2021 | | $ | 25.27 | | | | 0.13 | | | | 20.34 | | | | 20.47 | | | | (0.12 | ) | | | — | | |
2020 | | $ | 33.49 | | | | 0.14 | | | | (8.13 | ) | | | (7.99 | ) | | | (0.09 | ) | | | (0.14 | ) | |
2019 | | $ | 41.25 | | | | 0.21 | | | | (3.67 | ) | | | (3.46 | ) | | | (0.11 | ) | | | (4.19 | ) | |
2018 | | $ | 38.63 | | | | 0.11 | | | | 4.89 | | | | 5.00 | | | | (0.02 | ) | | | (2.36 | ) | |
(a) Per share net investment income (loss) has been calculated using the average daily shares method.
(b) Does not include acquired fund fees and expenses, if any.
(c) Portfolio turnover is calculated on the basis of the Fund as a whole without distinguishing between the classes of shares issued.
(d) Includes adjustments in accordance with U.S. Generally Accepted Accounting Principles.
See notes to financial statements.
140
Victory Portfolios | | Financial Highlights — continued | |
For a Share Outstanding Throughout Each Period
| | | | | Ratios to Average Net Assets | | Supplemental Data | |
| | | Total
Distributions | | Net Asset
Value,
End of
Period | | Total
Return
(Excludes
Sales
Charge)(d) | | Net
Expenses(b) | | Net
Investment
Income
(Loss) | | Gross
Expenses(b) | | Net Assets,
End of
Period
(000's) | | Portfolio
Turnover(c) | |
Victory Integrity Small-Cap Value Fund | |
Class A | |
Year Ended June 30:
2022 | | | (6.98 | ) | | $ | 32.51 | | | | (12.11 | )% | | | 1.50 | % | | | 0.08 | % | | | 1.50 | % | | $ | 69,687 | | | | 58 | % | |
2021 | | | (0.03 | ) | | $ | 43.97 | | | | 80.37 | % | | | 1.50 | % | | | (0.02 | )% | | | 1.50 | % | | $ | 91,203 | | | | 56 | % | |
2020 | | | (0.14 | ) | | $ | 24.40 | | | | (24.33 | )% | | | 1.48 | % | | | 0.10 | % | | | 1.48 | % | | $ | 79,429 | | | | 80 | % | |
2019 | | | (4.19 | ) | | $ | 32.37 | | | | (7.16 | )% | | | 1.50 | % | | | 0.25 | % | | | 1.58 | % | | $ | 140,439 | | | | 72 | % | |
2018 | | | (2.36 | ) | | $ | 40.06 | | | | 12.55 | % | | | 1.50 | % | | | (0.10 | )% | | | 1.54 | % | | $ | 221,775 | | | | 70 | % | |
Class C | |
Year Ended June 30:
2022 | | | (6.94 | ) | | $ | 26.39 | | | | (12.77 | )% | | | 2.25 | % | | | (0.67 | )% | | | 2.25 | % | | $ | 5,667 | | | | 58 | % | |
2021 | | | — | | | $ | 37.22 | | | | 78.86 | % | | | 2.34 | % | | | (0.89 | )% | | | 2.34 | % | | $ | 7,578 | | | | 56 | % | |
2020 | | | (0.14 | ) | | $ | 20.81 | | | | (24.91 | )% | | | 2.25 | % | | | (0.69 | )% | | | 2.25 | % | | $ | 5,796 | | | | 80 | % | |
2019 | | | (4.19 | ) | | $ | 27.85 | | | | (7.79 | )% | | | 2.16 | % | | | (0.42 | )% | | | 2.16 | % | | $ | 11,083 | | | | 72 | % | |
2018 | | | (2.36 | ) | | $ | 35.40 | | | | 11.86 | % | | | 2.13 | % | | | (0.70 | )% | | | 2.13 | % | | $ | 16,746 | | | | 70 | % | |
Class R | |
Year Ended June 30:
2022 | | | (6.94 | ) | | $ | 31.04 | | | | (12.32 | )% | | | 1.75 | % | | | (0.18 | )% | | | 1.99 | % | | $ | 4,605 | | | | 58 | % | |
2021 | | | — | | | $ | 42.35 | | | | 79.91 | % | | | 1.75 | % | | | (0.29 | )% | | | 1.95 | % | | $ | 7,099 | | | | 56 | % | |
2020 | | | (0.14 | ) | | $ | 23.53 | | | | (24.54 | )% | | | 1.75 | % | | | (0.19 | )% | | | 1.86 | % | | $ | 5,303 | | | | 80 | % | |
2019 | | | (4.19 | ) | | $ | 31.32 | | | | (7.39 | )% | | | 1.75 | % | | | (0.03 | )% | | | 1.99 | % | | $ | 10,451 | | | | 72 | % | |
2018 | | | (2.36 | ) | | $ | 39.02 | | | | 12.29 | % | | | 1.75 | % | | | (0.35 | )% | | | 1.89 | % | | $ | 14,952 | | | | 70 | % | |
Class R6 | |
Year Ended June 30:
2022 | | | (7.18 | ) | | $ | 34.24 | | | | (11.63 | )% | | | 0.95 | % | | | 0.61 | % | | | 0.95 | % | | $ | 716,271 | | | | 58 | % | |
2021 | | | (0.17 | ) | | $ | 45.91 | | | | 81.42 | % | | | 0.96 | % | | | 0.52 | % | | | 0.96 | % | | $ | 1,145,953 | | | | 56 | % | |
2020 | | | (0.28 | ) | | $ | 25.43 | | | | (23.95 | )% | | | 0.97 | % | | | 0.64 | % | | | 0.97 | % | | $ | 984,938 | | | | 80 | % | |
2019 | | | (4.38 | ) | | $ | 33.70 | | | | (6.67 | )% | | | 0.96 | % | | | 0.65 | % | | | 0.96 | % | | $ | 1,179,915 | | | | 72 | % | |
2018 | | | (2.45 | ) | | $ | 41.51 | | | | 13.17 | % | | | 0.95 | % | | | 0.45 | % | | | 0.95 | % | | $ | 938,831 | | | | 70 | % | |
Class Y | |
Year Ended June 30:
2022 | | | (7.14 | ) | | $ | 33.98 | | | | (11.72 | )% | | | 1.07 | % | | | 0.51 | % | | | 1.07 | % | | $ | 606,277 | | | | 58 | % | |
2021 | | | (0.12 | ) | | $ | 45.62 | | | | 81.13 | % | | | 1.08 | % | | | 0.36 | % | | | 1.08 | % | | $ | 765,951 | | | | 56 | % | |
2020 | | | (0.23 | ) | | $ | 25.27 | | | | (24.04 | )% | | | 1.11 | % | | | 0.47 | % | | | 1.11 | % | | $ | 491,836 | | | | 80 | % | |
2019 | | | (4.30 | ) | | $ | 33.49 | | | | (6.83 | )% | | | 1.12 | % | | | 0.58 | % | | | 1.12 | % | | $ | 981,688 | | | | 72 | % | |
2018 | | | (2.38 | ) | | $ | 41.25 | | | | 13.01 | % | | | 1.12 | % | | | 0.28 | % | | | 1.12 | % | | $ | 1,467,901 | | | | 70 | % | |
See notes to financial statements.
141
Victory Portfolios | | Financial Highlights | |
For a Share Outstanding Throughout Each Period
| | | | | Investment Activities | | Distributions to
Shareholders From | |
| | | Net Asset
Value,
Beginning of
Period | | Net
Investment
Income
(Loss)(a) | | Net Realized
and Unrealized
Gains (Losses) | | Total from
Investment
Activities | | Net
Investment
Income | | Net Realized
Gains from
Investments | |
Victory Integrity Small/Mid-Cap Value Fund | | | |
Class A | | | |
Year Ended June 30:
2022 | | $ | 22.98 | | | | 0.15 | | | | (1.99 | ) | | | (1.84 | ) | | | (0.05 | ) | | | (1.39 | ) | |
2021 | | $ | 13.46 | | | | 0.05 | | | | 9.73 | | | | 9.78 | | | | (0.26 | ) | | | — | | |
2020 | | $ | 16.70 | | | | 0.10 | | | | (3.24 | ) | | | (3.14 | ) | | | (0.10 | ) | | | — | | |
2019 | | $ | 17.75 | | | | 0.12 | | | | (0.53 | ) | | | (0.41 | ) | | | (0.12 | ) | | | (0.52 | ) | |
2018 | | $ | 16.04 | | | | 0.07 | | | | 1.89 | | | | 1.96 | | | | (0.05 | ) | | | (0.20 | ) | |
Class R6 | | | |
Year Ended June 30:
2022 | | $ | 23.30 | | | | 0.22 | | | | (2.02 | ) | | | (1.80 | ) | | | (0.11 | ) | | | (1.39 | ) | |
2021 | | $ | 13.64 | | | | 0.14 | | | | 9.82 | | | | 9.96 | | | | (0.30 | ) | | | — | | |
2020 | | $ | 16.91 | | | | 0.15 | | | | (3.28 | ) | | | (3.13 | ) | | | (0.14 | ) | | | — | | |
2019 | | $ | 17.96 | | | | 0.14 | | | | (0.51 | ) | | | (0.37 | ) | | | (0.16 | ) | | | (0.52 | ) | |
2018 | | $ | 16.20 | | | | 0.05 | | | | 1.99 | | | | 2.04 | | | | (0.08 | ) | | | (0.20 | ) | |
Class Y | | | |
Year Ended June 30:
2022 | | $ | 23.23 | | | | 0.21 | | | | (2.02 | ) | | | (1.81 | ) | | | (0.10 | ) | | | (1.39 | ) | |
2021 | | $ | 13.60 | | | | 0.12 | | | | 9.81 | | | | 9.93 | | | | (0.30 | ) | | | — | | |
2020 | | $ | 16.86 | | | | 0.14 | | | | (3.27 | ) | | | (3.13 | ) | | | (0.13 | ) | | | — | | |
2019 | | $ | 17.92 | | | | 0.22 | | | | (0.60 | ) | | | (0.38 | ) | | | (0.16 | ) | | | (0.52 | ) | |
2018 | | $ | 16.17 | | | | 0.12 | | | | 1.91 | | | | 2.03 | | | | (0.08 | ) | | | (0.20 | ) | |
Member Class | | | |
Year Ended June 30,
2022 | | $ | 23.18 | | | | 0.21 | | | | (2.04 | ) | | | (1.83 | ) | | | (0.09 | ) | | | (1.39 | ) | |
November 3, 2020 (f)
through
June 30, 2021 | | $ | 14.86 | | | | (0.27 | ) | | | 8.73 | | | | 8.46 | | | | (0.14 | ) | | | — | | |
(a) Per share net investment income (loss) has been calculated using the average daily shares method.
(b) Not annualized for periods less than one year.
(c) Annualized for periods less than one year.
(d) Does not include acquired fund fees and expenses, if any.
(e) Portfolio turnover is calculated on the basis of the Fund as a whole without distinguishing between the classes of shares issued.
(f) Commencement of operations.
See notes to financial statements.
142
Victory Portfolios | | Financial Highlights — continued | |
For a Share Outstanding Throughout Each Period
| | | | | Ratios to Average Net Assets | | Supplemental Data | |
| | | Total
Distributions | | Net Asset
Value,
End of
Period | | Total
Return
(Excludes
Sales
Charge)(b) | | Net
Expenses(c)(d) | | Net
Investment
Income
(Loss)(c) | | Gross
Expenses(c)(d) | | Net Assets,
End of
Period
(000's) | | Portfolio
Turnover(b)(e) | |
Victory Integrity Small/Mid-Cap Value Fund | |
Class A | |
Year Ended June 30:
2022 | | | (1.44 | ) | | $ | 19.70 | | | | (8.64 | )% | | | 1.13 | % | | | 0.67 | % | | | 1.50 | % | | $ | 7,149 | | | | 63 | % | |
2021 | | | (0.26 | ) | | $ | 22.98 | | | | 73.21 | % | | | 1.13 | % | | | 0.27 | % | | | 1.68 | % | | $ | 6,589 | | | | 61 | % | |
2020 | | | (0.10 | ) | | $ | 13.46 | | | | (18.97 | )% | | | 1.13 | % | | | 0.67 | % | | | 1.65 | % | | $ | 3,241 | | | | 72 | % | |
2019 | | | (0.64 | ) | | $ | 16.70 | | | | (1.66 | )% | | | 1.13 | % | | | 0.70 | % | | | 1.71 | % | | $ | 3,626 | | | | 67 | % | |
2018 | | | (0.25 | ) | | $ | 17.75 | | | | 12.16 | % | | | 1.13 | % | | | 0.42 | % | | | 1.74 | % | | $ | 2,996 | | | | 77 | % | |
Class R6 | |
Year Ended June 30:
2022 | | | (1.50 | ) | | $ | 20.00 | | | | (8.38 | )% | | | 0.83 | % | | | 0.97 | % | | | 0.93 | % | | $ | 151,752 | | | | 63 | % | |
2021 | | | (0.30 | ) | | $ | 23.30 | | | | 73.68 | % | | | 0.83 | % | | | 0.72 | % | | | 0.94 | % | | $ | 143,273 | | | | 61 | % | |
2020 | | | (0.14 | ) | | $ | 13.64 | | | | (18.70 | )% | | | 0.83 | % | | | 0.97 | % | | | 0.97 | % | | $ | 80,284 | | | | 72 | % | |
2019 | | | (0.68 | ) | | $ | 16.91 | | | | (1.39 | )% | | | 0.83 | % | | | 0.86 | % | | | 0.96 | % | | $ | 95,286 | | | | 67 | % | |
2018 | | | (0.28 | ) | | $ | 17.96 | | | | 12.54 | % | | | 0.83 | % | | | 0.28 | % | | | 1.26 | % | | $ | 24,926 | | | | 77 | % | |
Class Y | |
Year Ended June 30:
2022 | | | (1.49 | ) | | $ | 19.93 | | | | (8.45 | )% | | | 0.88 | % | | | 0.91 | % | | | 0.97 | % | | $ | 46,579 | | | | 63 | % | |
2021 | | | (0.30 | ) | | $ | 23.23 | | | | 73.61 | % | | | 0.88 | % | | | 0.66 | % | | | 0.98 | % | | $ | 56,537 | | | | 61 | % | |
2020 | | | (0.13 | ) | | $ | 13.60 | | | | (18.73 | )% | | | 0.88 | % | | | 0.92 | % | | | 1.01 | % | | $ | 32,572 | | | | 72 | % | |
2019 | | | (0.68 | ) | | $ | 16.86 | | | | (1.45 | )% | | | 0.88 | % | | | 1.30 | % | | | 1.03 | % | | $ | 35,927 | | | | 67 | % | |
2018 | | | (0.28 | ) | | $ | 17.92 | | | | 12.51 | % | | | 0.88 | % | | | 0.67 | % | | | 1.13 | % | | $ | 92,019 | | | | 77 | % | |
Member Class | |
Year Ended June 30,
2022 | | | (1.48 | ) | | $ | 19.87 | | | | (8.50 | )% | | | 0.95 | % | | | 0.90 | % | | | 1.59 | % | | $ | 5,054 | | | | 63 | % | |
November 3, 2020 (f)
through
June 30, 2021 | | | (0.14 | ) | | $ | 23.18 | | | | 57.17 | % | | | 0.95 | % | | | (1.84 | )% | | | 4.39 | % | | $ | 2,388 | | | | 61 | % | |
See notes to financial statements.
143
Victory Portfolios | | Financial Highlights | |
For a Share Outstanding Throughout Each Period
| | | | | Investment Activities | | Distributions to
Shareholders From | |
| | | Net Asset
Value,
Beginning of
Period | | Net
Investment
Income
(Loss)(a) | | Net Realized
and Unrealized
Gains (Losses) | | Total from
Investment
Activities | | Net
Investment
Income | | Net Realized
Gains from
Investments | |
Victory Munder Multi-Cap Fund | | | |
Class A | | | |
Year Ended June 30:
2022 | | $ | 53.57 | | | | — | (d) | | | (3.48 | ) | | | (3.48 | ) | | | — | | | | (6.13 | ) | |
2021 | | $ | 38.28 | | | | (0.09 | ) | | | 15.41 | | | | 15.32 | | | | (0.03 | ) | | | — | | |
2020 | | $ | 38.75 | | | | 0.03 | | | | 0.65 | | | | 0.68 | | | | (0.10 | ) | | | (1.05 | ) | |
2019 | | $ | 44.99 | | | | 0.10 | | | | 0.08 | | | | 0.18 | | | | — | | | | (6.42 | ) | |
2018 | | $ | 41.77 | | | | (0.03 | ) | | | 5.71 | | | | 5.68 | | | | — | (d) | | | (2.46 | ) | |
Class C | | | |
Year Ended June 30:
2022 | | $ | 40.76 | | | | (0.35 | ) | | | (2.32 | ) | | | (2.67 | ) | | | — | | | | (6.13 | ) | |
2021 | | $ | 29.35 | | | | (0.35 | ) | | | 11.76 | | | | 11.41 | | | | — | | | | — | | |
2020 | | $ | 30.10 | | | | (0.22 | ) | | | 0.52 | | | | 0.30 | | | | — | | | | (1.05 | ) | |
2019 | | $ | 36.81 | | | | (0.16 | ) | | | (0.13 | ) | | | (0.29 | ) | | | — | | | | (6.42 | ) | |
2018 | | $ | 34.82 | | | | (0.34 | ) | | | 4.79 | | | | 4.45 | | | | — | | | | (2.46 | ) | |
Class Y | | | |
Year Ended June 30:
2022 | | $ | 58.88 | | | | 0.19 | | | | (3.96 | ) | | | (3.77 | ) | | | — | | | | (6.13 | ) | |
2021 | | $ | 42.05 | | | | 0.08 | | | | 16.93 | | | | 17.01 | | | | (0.18 | ) | | | — | | |
2020 | | $ | 42.42 | | | | 0.19 | | | | 0.72 | | | | 0.91 | | | | (0.23 | ) | | | (1.05 | ) | |
2019 | | $ | 48.41 | | | | 0.27 | | | | 0.16 | | | | 0.43 | | | | — | | | | (6.42 | ) | |
2018 | | $ | 44.62 | | | | 0.14 | | | | 6.11 | | | | 6.25 | | | | — | | | | (2.46 | ) | |
(a) Per share net investment income (loss) has been calculated using the average daily shares method.
(b) Does not include acquired fund fees and expenses, if any.
(c) Portfolio turnover is calculated on the basis of the Fund as a whole without distinguishing between the classes of shares issued.
(d) Amount is less than $0.005 per share.
(e) Includes adjustments in accordance with U.S. Generally Accepted Accounting Principles.
(f) During the year ended June 30, 2018, the Fund received monies related to certain nonrecurring litigation settlements. The corresponding impact to the total return was an increase of 0.22%.
See notes to financial statements.
144
Victory Portfolios | | Financial Highlights — continued | |
For a Share Outstanding Throughout Each Period
| | | | | Ratios to Average Net Assets | | Supplemental Data | |
| | | Total
Distributions | | Net Asset
Value,
End of
Period | | Total
Return
(Excludes
Sales
Charge)(e) | | Net
Expenses(b) | | Net
Investment
Income
(Loss) | | Gross
Expenses(b) | | Net Assets,
End of
Period
(000's) | | Portfolio
Turnover(c) | |
Victory Munder Multi-Cap Fund | |
Class A | |
Year Ended June 30:
2022 | | | (6.13 | ) | | $ | 43.96 | | | | (8.71 | )% | | | 1.28 | % | | | 0.00 | % | | | 1.28 | % | | $ | 332,533 | | | | 64 | % | |
2021 | | | (0.03 | ) | | $ | 53.57 | | | | 40.04 | % | | | 1.35 | % | | | (0.20 | )% | | | 1.35 | % | | $ | 393,769 | | | | 70 | % | |
2020 | | | (1.15 | ) | | $ | 38.28 | | | | 1.53 | % | | | 1.35 | % | | | 0.09 | % | | | 1.35 | % | | $ | 311,642 | | | | 100 | % | |
2019 | | | (6.42 | ) | | $ | 38.75 | | | | 2.86 | % | | | 1.36 | % | | | 0.25 | % | | | 1.36 | % | | $ | 346,180 | | | | 107 | % | |
2018 | | | (2.46 | ) | | $ | 44.99 | | | | 13.37 | %(f) | | | 1.36 | % | | | (0.07 | )% | | | 1.36 | % | | $ | 374,259 | | | | 123 | % | |
Class C | |
Year Ended June 30:
2022 | | | (6.13 | ) | | $ | 31.96 | | | | (9.53 | )% | | | 2.16 | % | | | (0.88 | )% | | | 2.37 | % | | $ | 3,287 | | | | 64 | % | |
2021 | | | — | | | $ | 40.76 | | | | 38.88 | % | | | 2.16 | % | | | (1.00 | )% | | | 2.32 | % | | $ | 4,339 | | | | 70 | % | |
2020 | | | (1.05 | ) | | $ | 29.35 | | | | 0.69 | % | | | 2.18 | % | | | (0.73 | )% | | | 2.20 | % | | $ | 5,769 | | | | 100 | % | |
2019 | | | (6.42 | ) | | $ | 30.10 | | | | 2.21 | % | | | 2.07 | % | | | (0.48 | )% | | | 2.07 | % | | $ | 10,056 | | | | 107 | % | |
2018 | | | (2.46 | ) | | $ | 36.81 | | | | 12.48 | %(f) | | | 2.16 | % | | | (0.91 | )% | | | 2.16 | % | | $ | 18,383 | | | | 123 | % | |
Class Y | |
Year Ended June 30:
2022 | | | (6.13 | ) | | $ | 48.98 | | | | (8.41 | )% | | | 0.96 | % | | | 0.32 | % | | | 0.96 | % | | $ | 35,063 | | | | 64 | % | |
2021 | | | (0.18 | ) | | $ | 58.88 | | | | 40.51 | % | | | 0.99 | % | | | 0.16 | % | | | 0.99 | % | | $ | 40,374 | | | | 70 | % | |
2020 | | | (1.28 | ) | | $ | 42.05 | | | | 1.92 | % | | | 0.99 | % | | | 0.46 | % | | | 0.99 | % | | $ | 30,258 | | | | 100 | % | |
2019 | | | (6.42 | ) | | $ | 42.42 | | | | 3.21 | % | | | 1.00 | % | | | 0.61 | % | | | 1.00 | % | | $ | 30,776 | | | | 107 | % | |
2018 | | | (2.46 | ) | | $ | 48.41 | | | | 13.81 | %(f) | | | 1.00 | % | | | 0.29 | % | | | 1.00 | % | | $ | 33,503 | | | | 123 | % | |
See notes to financial statements.
145
Victory Portfolios | | Financial Highlights | |
For a Share Outstanding Throughout Each Period
| | | | | Investment Activities | | Distributions to
Shareholders From | |
| | | Net Asset
Value,
Beginning of
Period | | Net
Investment
Income
(Loss)(a) | | Net Realized
and Unrealized
Gains (Losses) | | Total from
Investment
Activities | | Net
Investment
Income | | Net Realized
Gains from
Investments | |
Victory S&P 500 Index Fund | | | |
Class A | | | |
Year Ended June 30:
2022 | | $ | 25.84 | | | | 0.23 | | | | (2.72 | ) | | | (2.49 | ) | | | (0.21 | ) | | | (1.90 | ) | |
2021 | | $ | 19.80 | | | | 0.22 | | | | 7.43 | | | | 7.65 | | | | (0.24 | ) | | | (1.37 | ) | |
2020 | | $ | 21.07 | | | | 0.29 | | | | 1.20 | | | | 1.49 | | | | (0.28 | ) | | | (2.48 | ) | |
2019 | | $ | 21.52 | | | | 0.31 | | | | 1.43 | | | | 1.74 | | | | (0.33 | ) | | | (1.86 | ) | |
2018 | | $ | 22.20 | | | | 0.31 | | | | 2.65 | | | | 2.96 | | | | (0.31 | ) | | | (3.33 | ) | |
Class R | | | |
Year Ended June 30:
2022 | | $ | 25.74 | | | | 0.13 | | | | (2.70 | ) | | | (2.57 | ) | | | (0.12 | ) | | | (1.90 | ) | |
2021 | | $ | 19.74 | | | | 0.13 | | | | 7.39 | | | | 7.52 | | | | (0.15 | ) | | | (1.37 | ) | |
2020 | | $ | 21.01 | | | | 0.21 | | | | 1.21 | | | | 1.42 | | | | (0.21 | ) | | | (2.48 | ) | |
2019 | | $ | 21.47 | | | | 0.22 | | | | 1.43 | | | | 1.65 | | | | (0.25 | ) | | | (1.86 | ) | |
2018 | | $ | 22.15 | | | | 0.21 | | | | 2.66 | | | | 2.87 | | | | (0.22 | ) | | | (3.33 | ) | |
Class Y | | | |
Year Ended June 30:
2022 | | $ | 26.07 | | | | 0.25 | | | | (2.75 | ) | | | (2.50 | ) | | | (0.23 | ) | | | (1.90 | ) | |
2021 | | $ | 19.96 | | | | 0.25 | | | | 7.49 | | | | 7.74 | | | | (0.26 | ) | | | (1.37 | ) | |
2020 | | $ | 21.22 | | | | 0.32 | | | | 1.21 | | | | 1.53 | | | | (0.31 | ) | | | (2.48 | ) | |
2019 | | $ | 21.66 | | | | 0.33 | | | | 1.45 | | | | 1.78 | | | | (0.36 | ) | | | (1.86 | ) | |
2018 | | $ | 22.31 | | | | 0.35 | | | | 2.67 | | | | 3.02 | | | | (0.34 | ) | | | (3.33 | ) | |
(a) Per share net investment income (loss) has been calculated using the average daily shares method.
(b) Does not include acquired fund fees and expenses, if any.
(c) Portfolio turnover is calculated on the basis of the Fund as a whole without distinguishing between the classes of shares issued.
(d) Includes adjustments in accordance with U.S. Generally Accepted Accounting Principles.
See notes to financial statements.
146
Victory Portfolios | | Financial Highlights — continued | |
For a Share Outstanding Throughout Each Period
| | | | | Ratios to Average Net Assets | | Supplemental Data | |
| | | Total
Distributions | | Net Asset
Value,
End of
Period | | Total
Return
(Excludes
Sales
Charge)(d) | | Net
Expenses(b) | | Net
Investment
Income
(Loss) | | Gross
Expenses(b) | | Net Assets,
End of
Period
(000's) | | Portfolio
Turnover(c) | |
Victory S&P 500 Index Fund | |
Class A | |
Year Ended June 30:
2022 | | | (2.11 | ) | | $ | 21.24 | | | | (11.11 | )% | | | 0.53 | % | | | 0.89 | % | | | 0.53 | % | | $ | 156,112 | | | | 5 | % | |
2021 | | | (1.61 | ) | | $ | 25.84 | | | | 40.00 | % | | | 0.55 | % | | | 0.97 | % | | | 0.55 | % | | $ | 194,818 | | | | 3 | % | |
2020 | | | (2.76 | ) | | $ | 19.80 | | | | 6.96 | % | | | 0.55 | % | | | 1.42 | % | | | 0.55 | % | | $ | 153,714 | | | | 4 | % | |
2019 | | | (2.19 | ) | | $ | 21.07 | | | | 9.80 | % | | | 0.53 | % | | | 1.46 | % | | | 0.53 | % | | $ | 188,004 | | | | 3 | % | |
2018 | | | (3.64 | ) | | $ | 21.52 | | | | 13.73 | % | | | 0.55 | % | | | 1.38 | % | | | 0.55 | % | | $ | 192,530 | | | | 2 | % | |
Class R | |
Year Ended June 30:
2022 | | | (2.02 | ) | | $ | 21.15 | | | | (11.43 | )% | | | 0.92 | % | | | 0.50 | % | | | 0.92 | % | | $ | 17,735 | | | | 5 | % | |
2021 | | | (1.52 | ) | | $ | 25.74 | | | | 39.38 | % | | | 0.95 | % | | | 0.57 | % | | | 0.95 | % | | $ | 17,907 | | | | 3 | % | |
2020 | | | (2.69 | ) | | $ | 19.74 | | | | 6.57 | % | | | 0.95 | % | | | 1.02 | % | | | 0.95 | % | | $ | 13,726 | | | | 4 | % | |
2019 | | | (2.11 | ) | | $ | 21.01 | | | | 9.31 | % | | | 0.96 | % | | | 1.04 | % | | | 0.96 | % | | $ | 14,501 | | | | 3 | % | |
2018 | | | (3.55 | ) | | $ | 21.47 | | | | 13.31 | % | | | 0.97 | % | | | 0.97 | % | | | 0.97 | % | | $ | 17,052 | | | | 2 | % | |
Class Y | |
Year Ended June 30:
2022 | | | (2.13 | ) | | $ | 21.44 | | | | (11.06 | )% | | | 0.44 | % | | | 0.98 | % | | | 0.44 | % | | $ | 49,382 | | | | 5 | % | |
2021 | | | (1.63 | ) | | $ | 26.07 | | | | 40.16 | % | | | 0.45 | % | | | 1.07 | % | | | 0.45 | % | | $ | 56,607 | | | | 3 | % | |
2020 | | | (2.79 | ) | | $ | 19.96 | | | | 7.07 | % | | | 0.43 | % | | | 1.56 | % | | | 0.43 | % | | $ | 46,072 | | | | 4 | % | |
2019 | | | (2.22 | ) | | $ | 21.22 | | | | 9.93 | % | | | 0.43 | % | | | 1.57 | % | | | 0.43 | % | | $ | 32,146 | | | | 3 | % | |
2018 | | | (3.67 | ) | | $ | 21.66 | | | | 13.96 | % | | | 0.39 | % | | | 1.57 | % | | | 0.39 | % | | $ | 19,932 | | | | 2 | % | |
See notes to financial statements.
147
Victory Portfolios | | Financial Highlights | |
For a Share Outstanding Throughout Each Period
| | | | | Investment Activities | | Distributions to
Shareholders From | |
| | | Net Asset
Value,
Beginning of
Period | | Net
Investment
Income
(Loss)(a) | | Net Realized
and Unrealized
Gains (Losses) | | Total from
Investment
Activities | | Net
Investment
Income | | Net Realized
Gains from
Investments | |
Victory Munder Mid-Cap Core Growth Fund | | | |
Class A | | | |
Year Ended June 30:
2022 | | $ | 15.41 | | | | (0.05 | ) | | | (1.67 | ) | | | (1.72 | ) | | | — | | | | (4.16 | ) | |
2021 | | $ | 11.76 | | | | (0.09 | ) | | | 5.40 | | | | 5.31 | | | | — | | | | (1.66 | ) | |
2020 | | $ | 22.95 | | | | (0.07 | ) | | | 0.01 | | | | (0.06 | ) | | | — | | | | (11.13 | ) | |
2019 | | $ | 34.56 | | | | (0.13 | ) | | | (0.72 | ) | | | (0.85 | ) | | | — | | | | (10.76 | ) | |
2018 | | $ | 37.21 | | | | (0.11 | ) | | | 4.55 | | | | 4.44 | | | | — | | | | (7.09 | ) | |
Class C | | | |
Year Ended June 30:
2022 | | $ | 5.25 | | | | (0.03 | ) | | | — | | | | (0.03 | ) | | | — | (d) | | | (4.16 | ) | |
2021 | | $ | 4.90 | | | | (0.07 | ) | | | 2.08 | | | | 2.01 | | | | — | | | | (1.66 | ) | |
2020 | | $ | 15.96 | | | | (0.10 | ) | | | 0.17 | | | | 0.07 | | | | — | | | | (11.13 | ) | |
2019 | | $ | 27.98 | | | | (0.23 | ) | | | (1.03 | ) | | | (1.26 | ) | | | — | | | | (10.76 | ) | |
2018 | | $ | 31.54 | | | | (0.29 | ) | | | 3.82 | | | | 3.53 | | | | — | | | | (7.09 | ) | |
Class R | | | |
Year Ended June 30:
2022 | | $ | 12.75 | | | | (0.07 | ) | | | (1.23 | ) | | | (1.30 | ) | | | — | | | | (4.16 | ) | |
2021 | | $ | 9.98 | | | | (0.11 | ) | | | 4.54 | | | | 4.43 | | | | — | | | | (1.66 | ) | |
2020 | | $ | 21.16 | | | | (0.09 | ) | | | 0.04 | | | | (0.05 | ) | | | — | | | | (11.13 | ) | |
2019 | | $ | 32.91 | | | | (0.20 | ) | | | (0.79 | ) | | | (0.99 | ) | | | — | | | | (10.76 | ) | |
2018 | | $ | 35.82 | | | | (0.20 | ) | | | 4.38 | | | | 4.18 | | | | — | | | | (7.09 | ) | |
Class R6 | | | |
Year Ended June 30:
2022 | | $ | 19.99 | | | | 0.01 | | | | (2.44 | ) | | | (2.43 | ) | | | (0.02 | ) | | | (4.16 | ) | |
2021 | | $ | 14.80 | | | | (0.04 | ) | | | 6.89 | | | | 6.85 | | | | — | | | | (1.66 | ) | |
2020 | | $ | 26.00 | | | | — | (d) | | | (0.07 | ) | | | (0.07 | ) | | | — | | | | (11.13 | ) | |
2019 | | $ | 37.36 | | | | — | (d) | | | (0.60 | ) | | | (0.60 | ) | | | — | | | | (10.76 | ) | |
2018 | | $ | 39.55 | | | | 0.06 | | | | 4.84 | | | | 4.90 | | | | — | | | | (7.09 | ) | |
Class Y | | | |
Year Ended June 30:
2022 | | $ | 19.00 | | | | (0.02 | ) | | | (2.27 | ) | | | (2.29 | ) | | | — | | | | (4.16 | ) | |
2021 | | $ | 14.15 | | | | (0.05 | ) | | | 6.56 | | | | 6.51 | | | | — | | | | (1.66 | ) | |
2020 | | $ | 25.37 | | | | (0.04 | ) | | | (0.05 | ) | | | (0.09 | ) | | | — | | | | (11.13 | ) | |
2019 | | $ | 36.79 | | | | (0.07 | ) | | | (0.59 | ) | | | (0.66 | ) | | | — | | | | (10.76 | ) | |
2018 | | $ | 39.10 | | | | (0.01 | ) | | | 4.79 | | | | 4.78 | | | | — | | | | (7.09 | ) | |
(a) Per share net investment income (loss) has been calculated using the average daily shares method.
(b) Does not include acquired fund fees and expenses, if any.
(c) Portfolio turnover is calculated on the basis of the Fund as a whole without distinguishing between the classes of shares issued.
(d) Amount is less than $0.005 per share.
See notes to financial statements.
148
Victory Portfolios | | Financial Highlights — continued | |
For a Share Outstanding Throughout Each Period
| | | | | Ratios to Average Net Assets | | Supplemental Data | |
| | | Total
Distributions | | Net Asset
Value,
End of
Period | | Total
Return
(Excludes
Sales
Charge) | | Net
Expenses(b) | | Net
Investment
Income
(Loss) | | Gross
Expenses(b) | | Net Assets,
End of
Period
(000's) | | Portfolio
Turnover(c) | |
Victory Munder Mid-Cap Core Growth Fund | |
Class A | |
Year Ended June 30:
2022 | | | (4.16 | ) | | $ | 9.53 | | | | (16.84 | )% | | | 1.26 | % | | | (0.35 | )% | | | 1.26 | % | | $ | 157,570 | | | | 80 | % | |
2021 | | | (1.66 | ) | | $ | 15.41 | | | | 47.52 | % | | | 1.27 | % | | | (0.62 | )% | | | 1.27 | % | | $ | 216,453 | | | | 103 | % | |
2020 | | | (11.13 | ) | | $ | 11.76 | | | | (3.04 | )% | | | 1.29 | % | | | (0.40 | )% | | | 1.29 | % | | $ | 186,571 | | | | 86 | % | |
2019 | | | (10.76 | ) | | $ | 22.95 | | | | 4.18 | % | | | 1.28 | % | | | (0.49 | )% | | | 1.28 | % | | $ | 292,120 | | | | 82 | % | |
2018 | | | (7.09 | ) | | $ | 34.56 | | | | 12.08 | % | | | 1.28 | % | | | (0.29 | )% | | | 1.28 | % | | $ | 575,926 | | | | 50 | % | |
Class C | |
Year Ended June 30:
2022 | | | (4.16 | ) | | $ | 1.06 | | | | (17.53 | )% | | | 2.12 | % | | | (1.23 | )% | | | 2.15 | % | | $ | 4,714 | | | | 80 | % | |
2021 | | | (1.66 | ) | | $ | 5.25 | | | | 46.51 | % | | | 2.06 | % | | | (1.40 | )% | | | 2.06 | % | | $ | 9,806 | | | | 103 | % | |
2020 | | | (11.13 | ) | | $ | 4.90 | | | | (3.82 | )% | | | 2.03 | % | | | (1.15 | )% | | | 2.03 | % | | $ | 14,053 | | | | 86 | % | |
2019 | | | (10.76 | ) | | $ | 15.96 | | | | 3.51 | % | | | 1.94 | % | | | (1.14 | )% | | | 1.94 | % | | $ | 26,825 | | | | 82 | % | |
2018 | | | (7.09 | ) | | $ | 27.98 | | | | 11.28 | % | | | 1.96 | % | | | (0.94 | )% | | | 1.96 | % | | $ | 52,210 | | | | 50 | % | |
Class R | |
Year Ended June 30:
2022 | | | (4.16 | ) | | $ | 7.29 | | | | (17.10 | )% | | | 1.57 | % | | | (0.66 | )% | | | 1.75 | % | | $ | 8,890 | | | | 80 | % | |
2021 | | | (1.66 | ) | | $ | 12.75 | | | | 47.15 | % | | | 1.57 | % | | | (0.92 | )% | | | 1.69 | % | | $ | 13,463 | | | | 103 | % | |
2020 | | | (11.13 | ) | | $ | 9.98 | | | | (3.28 | )% | | | 1.57 | % | | | (0.68 | )% | | | 1.67 | % | | $ | 12,943 | | | | 86 | % | |
2019 | | | (10.76 | ) | | $ | 21.16 | | | | 3.85 | % | | | 1.57 | % | | | (0.79 | )% | | | 1.69 | % | | $ | 18,438 | | | | 82 | % | |
2018 | | | (7.09 | ) | | $ | 32.91 | | | | 11.79 | % | | | 1.57 | % | | | (0.58 | )% | | | 1.65 | % | | $ | 25,939 | | | | 50 | % | |
Class R6 | |
Year Ended June 30:
2022 | | | (4.18 | ) | | $ | 13.38 | | | | (16.53 | )% | | | 0.87 | % | | | 0.04 | % | | | 0.87 | % | | $ | 70,577 | | | | 80 | % | |
2021 | | | (1.66 | ) | | $ | 19.99 | | | | 48.19 | % | | | 0.87 | % | | | (0.21 | )% | | | 0.87 | % | | $ | 98,852 | | | | 103 | % | |
2020 | | | (11.13 | ) | | $ | 14.80 | | | | (2.60 | )% | | | 0.86 | % | | | 0.01 | % | | | 0.86 | % | | $ | 113,104 | | | | 86 | % | |
2019 | | | (10.76 | ) | | $ | 26.00 | | | | 4.57 | % | | | 0.87 | % | | | (0.01 | )% | | | 0.87 | % | | $ | 310,949 | | | | 82 | % | |
2018 | | | (7.09 | ) | | $ | 37.36 | | | | 12.56 | % | | | 0.84 | % | | | 0.15 | % | | | 0.84 | % | | $ | 685,568 | | | | 50 | % | |
Class Y | |
Year Ended June 30:
2022 | | | (4.16 | ) | | $ | 12.55 | | | | (16.64 | )% | | | 0.98 | % | | | (0.10 | )% | | | 0.98 | % | | $ | 122,169 | | | | 80 | % | |
2021 | | | (1.66 | ) | | $ | 19.00 | | | | 48.00 | % | | | 0.98 | % | | | (0.33 | )% | | | 0.98 | % | | $ | 242,860 | | | | 103 | % | |
2020 | | | (11.13 | ) | | $ | 14.15 | | | | (2.76 | )% | | | 1.04 | % | | | (0.18 | )% | | | 1.04 | % | | $ | 257,692 | | | | 86 | % | |
2019 | | | (10.76 | ) | | $ | 25.37 | | | | 4.47 | % | | | 1.02 | % | | | (0.22 | )% | | | 1.02 | % | | $ | 810,261 | | | | 82 | % | |
2018 | | | (7.09 | ) | | $ | 36.79 | | | | 12.38 | % | | | 1.01 | % | | | (0.02 | )% | | | 1.01 | % | | $ | 2,240,305 | | | | 50 | % | |
See notes to financial statements.
149
Victory Portfolios | | Financial Highlights | |
For a Share Outstanding Throughout Each Period
| | | | | Investment Activities | | Distributions to
Shareholders From | |
| | | Net Asset
Value,
Beginning of
Period | | Net
Investment
Income
(Loss)(a) | | Net Realized
and Unrealized
Gains (Losses) | | Total from
Investment
Activities | | Net
Investment
Income | | Net Realized
Gains from
Investments | |
Victory Munder Small Cap Growth Fund | | | |
Class A | | | |
Year Ended June 30:
2022 | | $ | 20.38 | | | | (0.14 | ) | | | (6.16 | ) | | | (6.30 | ) | | | — | | | | (1.90 | ) | |
2021 | | $ | 14.13 | | | | (0.16 | ) | | | 7.85 | | | | 7.69 | | | | (0.02 | ) | | | (1.42 | ) | |
2020 | | $ | 13.39 | | | | (0.09 | ) | | | 1.88 | | | | 1.79 | | | | — | | | | (1.05 | ) | |
2019 | | $ | 13.81 | | | | (0.12 | ) | | | 1.12 | | | | 1.00 | | | | — | | | | (1.42 | ) | |
2018 | | $ | 11.14 | | | | (0.10 | ) | | | 2.84 | | | | 2.74 | | | | — | | | | (0.07 | ) | |
Class I | | | |
Year Ended June 30:
2022 | | $ | 20.75 | | | | (0.10 | ) | | | (6.30 | ) | | | (6.40 | ) | | | — | | | | (1.90 | ) | |
2021 | | $ | 14.35 | | | | (0.11 | ) | | | 7.98 | | | | 7.87 | | | | (0.05 | ) | | | (1.42 | ) | |
2020 | | $ | 13.56 | | | | (0.05 | ) | | | 1.89 | | | | 1.84 | | | | — | | | | (1.05 | ) | |
2019 | | $ | 13.92 | | | | (0.09 | ) | | | 1.15 | | | | 1.06 | | | | — | | | | (1.42 | ) | |
2018 | | $ | 11.21 | | | | (0.07 | ) | | | 2.85 | | | | 2.78 | | | | — | | | | (0.07 | ) | |
Class Y | | | |
Year Ended June 30:
2022 | | $ | 20.51 | | | | (0.11 | ) | | | (6.22 | ) | | | (6.33 | ) | | | — | | | | (1.90 | ) | |
2021 | | $ | 14.20 | | | | (0.13 | ) | | | 7.89 | | | | 7.76 | | | | (0.03 | ) | | | (1.42 | ) | |
2020 | | $ | 13.44 | | | | (0.06 | ) | | | 1.87 | | | | 1.81 | | | | — | | | | (1.05 | ) | |
2019 | | $ | 13.88 | | | | (0.11 | ) | | | 1.09 | | | | 0.98 | | | | — | | | | (1.42 | ) | |
2018 | | $ | 11.18 | | | | (0.09 | ) | | | 2.86 | | | | 2.77 | | | | — | | | | (0.07 | ) | |
(a) Per share net investment income (loss) has been calculated using the average daily shares method.
(b) Does not include acquired fund fees and expenses, if any.
(c) Portfolio turnover is calculated on the basis of the Fund as a whole without distinguishing between the classes of shares issued.
See notes to financial statements.
150
Victory Portfolios | | Financial Highlights — continued | |
For a Share Outstanding Throughout Each Period
| | | | | Ratios to Average Net Assets | | Supplemental Data | |
| | | Total
Distributions | | Net Asset
Value,
End of
Period | | Total
Return
(Excludes
Sales
Charge) | | Net
Expenses(b) | | Net
Investment
Income
(Loss) | | Gross
Expenses(b) | | Net Assets,
End of
Period
(000's) | | Portfolio
Turnover(c) | |
Victory Munder Small Cap Growth Fund | |
Class A | |
Year Ended June 30:
2022 | | | (1.90 | ) | | $ | 12.18 | | | | (33.53 | )% | | | 1.40 | % | | | (0.82 | )% | | | 2.39 | % | | $ | 643 | | | | 36 | % | |
2021 | | | (1.44 | ) | | $ | 20.38 | | | | 56.27 | % | | | 1.40 | % | | | (0.89 | )% | | | 2.09 | % | | $ | 614 | | | | 28 | % | |
2020 | | | (1.05 | ) | | $ | 14.13 | | | | 13.64 | % | | | 1.40 | % | | | (0.67 | )% | | | 2.26 | % | | $ | 359 | | | | 56 | % | |
2019 | | | (1.42 | ) | | $ | 13.39 | | | | 10.06 | % | | | 1.40 | % | | | (0.90 | )% | | | 2.31 | % | | $ | 189 | | | | 108 | % | |
2018 | | | (0.07 | ) | | $ | 13.81 | | | | 24.73 | % | | | 1.40 | % | | | (0.86 | )% | | | 2.69 | % | | $ | 174 | | | | 62 | % | |
Class I | |
Year Ended June 30:
2022 | | | (1.90 | ) | | $ | 12.45 | | | | (33.41 | )% | | | 1.15 | % | | | (0.60 | )% | | | 1.24 | % | | $ | 9,981 | | | | 36 | % | |
2021 | | | (1.47 | ) | | $ | 20.75 | | | | 56.71 | % | | | 1.15 | % | | | (0.64 | )% | | | 1.22 | % | | $ | 16,328 | | | | 28 | % | |
2020 | | | (1.05 | ) | | $ | 14.35 | | | | 13.85 | % | | | 1.15 | % | | | (0.39 | )% | | | 1.32 | % | | $ | 10,370 | | | | 56 | % | |
2019 | | | (1.42 | ) | | $ | 13.56 | | | | 10.44 | % | | | 1.15 | % | | | (0.65 | )% | | | 1.17 | % | | $ | 9,034 | | | | 108 | % | |
2018 | | | (0.07 | ) | | $ | 13.92 | | | | 24.94 | % | | | 1.15 | % | | | (0.61 | )% | | | 1.31 | % | | $ | 7,518 | | | | 62 | % | |
Class Y | |
Year Ended June 30:
2022 | | | (1.90 | ) | | $ | 12.28 | | | | (33.46 | )% | | | 1.25 | % | | | (0.67 | )% | | | 1.33 | % | | $ | 142 | | | | 36 | % | |
2021 | | | (1.45 | ) | | $ | 20.51 | | | | 56.57 | % | | | 1.25 | % | | | (0.74 | )% | | | 1.85 | % | | $ | 158 | | | | 28 | % | |
2020 | | | (1.05 | ) | | $ | 14.20 | | | | 13.74 | % | | | 1.25 | % | | | (0.49 | )% | | | 2.84 | % | | $ | 87 | | | | 56 | % | |
2019 | | | (1.42 | ) | | $ | 13.44 | | | | 9.84 | % | | | 1.25 | % | | | (0.77 | )% | | | 1.45 | % | | $ | 77 | | | | 108 | % | |
2018 | | | (0.07 | ) | | $ | 13.88 | | | | 24.92 | % | | | 1.25 | % | | | (0.71 | )% | | | 2.98 | % | | $ | 70 | | | | 62 | % | |
See notes to financial statements.
151
Victory Portfolios | | Financial Highlights | |
For a Share Outstanding Throughout Each Period
| | | | | Investment Activities | | Distributions to
Shareholders From | |
| | | Net Asset
Value,
Beginning of
Period | | Net
Investment
Income
(Loss)(a) | | Net Realized
and Unrealized
Gains (Losses) | | Total from
Investment
Activities | | Net
Investment
Income | | Net Realized
Gains from
Investments | |
Victory Trivalent International Fund-Core Equity | | | |
Class A | | | |
Year Ended June 30:
2022 | | $ | 8.35 | | | | 0.17 | | | | (1.73 | ) | | | (1.56 | ) | | | (0.28 | ) | | | — | | |
2021 | | $ | 6.49 | | | | 0.18 | | | | 1.77 | | | | 1.95 | | | | (0.09 | ) | | | — | | |
2020 | | $ | 6.87 | | | | 0.12 | | | | (0.44 | ) | | | (0.32 | ) | | | (0.06 | ) | | | — | | |
2019 | | $ | 7.28 | | | | 0.14 | | | | (0.30 | ) | | | (0.16 | ) | | | (0.13 | ) | | | (0.12 | ) | |
2018 | | $ | 7.21 | | | | 0.13 | | | | 0.44 | | | | 0.57 | | | | (0.13 | ) | | | (0.37 | ) | |
Class C | | | |
Year Ended June 30:
2022 | | $ | 8.33 | | | | 0.11 | | | | (1.73 | ) | | | (1.62 | ) | | | (0.21 | ) | | | — | | |
2021 | | $ | 6.46 | | | | 0.12 | | | | 1.76 | | | | 1.88 | | | | (0.01 | ) | | | — | | |
2020 | | $ | 6.84 | | | | 0.06 | | | | (0.43 | ) | | | (0.37 | ) | | | (0.01 | ) | | | — | | |
2019 | | $ | 7.22 | | | | 0.08 | | | | (0.27 | ) | | | (0.19 | ) | | | (0.07 | ) | | | (0.12 | ) | |
2018 | | $ | 7.16 | | | | 0.05 | | | | 0.45 | | | | 0.50 | | | | (0.07 | ) | | | (0.37 | ) | |
Class I | | | |
Year Ended June 30:
2022 | | $ | 8.40 | | | | 0.20 | | | | (1.74 | ) | | | (1.54 | ) | | | (0.31 | ) | | | — | | |
2021 | | $ | 6.53 | | | | 0.21 | | | | 1.78 | | | | 1.99 | | | | (0.12 | ) | | | — | | |
2020 | | $ | 6.90 | | | | 0.14 | | | | (0.43 | ) | | | (0.29 | ) | | | (0.08 | ) | | | — | | |
2019 | | $ | 7.29 | | | | 0.17 | | | | (0.30 | ) | | | (0.13 | ) | | | (0.14 | ) | | | (0.12 | ) | |
2018 | | $ | 7.23 | | | | 0.24 | | | | 0.34 | | | | 0.58 | | | | (0.15 | ) | | | (0.37 | ) | |
Class R6 | | | |
Year Ended June 30:
2022 | | $ | 8.45 | | | | 0.21 | | | | (1.75 | ) | | | (1.54 | ) | | | (0.31 | ) | | | — | | |
2021 | | $ | 6.57 | | | | 0.21 | | | | 1.78 | | | | 1.99 | | | | (0.11 | ) | | | — | | |
2020 | | $ | 6.92 | | | | 0.14 | | | | (0.43 | ) | | | (0.29 | ) | | | (0.06 | ) | | | — | | |
2019 | | $ | 7.31 | | | | 0.17 | | | | (0.29 | ) | | | (0.12 | ) | | | (0.15 | ) | | | (0.12 | ) | |
2018 | | $ | 7.23 | | | | 0.21 | | | | 0.39 | | | | 0.60 | | | | (0.15 | ) | | | (0.37 | ) | |
Class Y | | | |
Year Ended June 30:
2022 | | $ | 8.34 | | | | 0.19 | | | | (1.73 | ) | | | (1.54 | ) | | | (0.30 | ) | | | — | | |
2021 | | $ | 6.48 | | | | 0.20 | | | | 1.77 | | | | 1.97 | | | | (0.11 | ) | | | — | | |
2020 | | $ | 6.87 | | | | 0.13 | | | | (0.44 | ) | | | (0.31 | ) | | | (0.08 | ) | | | — | | |
2019 | | $ | 7.26 | | | | 0.15 | | | | (0.28 | ) | | | (0.13 | ) | | | (0.14 | ) | | | (0.12 | ) | |
2018 | | $ | 7.20 | | | | 0.12 | | | | 0.46 | | | | 0.58 | | | | (0.15 | ) | | | (0.37 | ) | |
(a) Per share net investment income (loss) has been calculated using the average daily shares method.
(b) Does not include acquired fund fees and expenses, if any.
(c) Portfolio turnover is calculated on the basis of the Fund as a whole without distinguishing between the classes of shares issued.
(d) Includes adjustments in accordance with U.S. Generally Accepted Accounting Principles.
See notes to financial statements.
152
Victory Portfolios | | Financial Highlights — continued | |
For a Share Outstanding Throughout Each Period
| | | | | Ratios to Average Net Assets | | Supplemental Data | |
| | | Total
Distributions | | Net Asset
Value,
End of
Period | | Total
Return
(Excludes
Sales
Charge)(d) | | Net
Expenses(b) | | Net
Investment
Income
(Loss) | | Gross
Expenses(b) | | Net Assets,
End of
Period
(000's) | | Portfolio
Turnover(c) | |
Victory Trivalent International Fund-Core Equity | |
Class A | |
Year Ended June 30:
2022 | | | (0.28 | ) | | $ | 6.51 | | | | (19.33 | )% | | | 0.95 | % | | | 2.18 | % | | | 1.77 | % | | $ | 4,147 | | | | 55 | % | |
2021 | | | (0.09 | ) | | $ | 8.35 | | | | 30.28 | % | | | 0.95 | % | | | 2.32 | % | | | 1.76 | % | | $ | 5,379 | | | | 47 | % | |
2020 | | | (0.06 | ) | | $ | 6.49 | | | | (4.72 | )% | | | 0.95 | % | | | 1.73 | % | | | 1.84 | % | | $ | 4,550 | | | | 49 | % | |
2019 | | | (0.25 | ) | | $ | 6.87 | | | | (1.69 | )% | | | 0.95 | % | | | 2.08 | % | | | 1.96 | % | | $ | 5,347 | | | | 56 | % | |
2018 | | | (0.50 | ) | | $ | 7.28 | | | | 7.74 | % | | | 1.11 | % | | | 1.71 | % | | | 1.91 | % | | $ | 8,620 | | | | 51 | % | |
Class C | |
Year Ended June 30:
2022 | | | (0.21 | ) | | $ | 6.50 | | | | (19.89 | )% | | | 1.70 | % | | | 1.40 | % | | | 20.36 | % | | $ | 71 | | | | 55 | % | |
2021 | | | (0.01 | ) | | $ | 8.33 | | | | 29.09 | % | | | 1.70 | % | | | 1.59 | % | | | 12.66 | % | | $ | 108 | | | | 47 | % | |
2020 | | | (0.01 | ) | | $ | 6.46 | | | | (5.48 | )% | | | 1.70 | % | | | 0.87 | % | | | 6.44 | % | | $ | 204 | | | | 49 | % | |
2019 | | | (0.19 | ) | | $ | 6.84 | | | | (2.19 | )% | | | 1.70 | % | | | 1.22 | % | | | 5.22 | % | | $ | 335 | | | | 56 | % | |
2018 | | | (0.44 | ) | | $ | 7.22 | | | | 6.81 | % | | | 1.87 | % | | | 0.64 | % | | | 3.61 | % | | $ | 449 | | | | 51 | % | |
Class I | |
Year Ended June 30:
2022 | | | (0.31 | ) | | $ | 6.55 | | | | (19.03 | )% | | | 0.60 | % | | | 2.57 | % | | | 1.62 | % | | $ | 2,834 | | | | 55 | % | |
2021 | | | (0.12 | ) | | $ | 8.40 | | | | 30.65 | % | | | 0.60 | % | | | 2.69 | % | | | 1.42 | % | | $ | 3,303 | | | | 47 | % | |
2020 | | | (0.08 | ) | | $ | 6.53 | | | | (4.36 | )% | | | 0.60 | % | | | 2.12 | % | | | 1.54 | % | | $ | 2,579 | | | | 49 | % | |
2019 | | | (0.26 | ) | | $ | 6.90 | | | | (1.19 | )% | | | 0.60 | % | | | 2.48 | % | | | 1.76 | % | | $ | 2,268 | | | | 56 | % | |
2018 | | | (0.52 | ) | | $ | 7.29 | | | | 8.07 | % | | | 0.72 | % | | | 3.17 | % | | | 2.67 | % | | $ | 2,575 | | | | 51 | % | |
Class R6 | |
Year Ended June 30:
2022 | | | (0.31 | ) | | $ | 6.60 | | | | (18.93 | )% | | | 0.55 | % | | | 2.60 | % | | | 0.96 | % | | $ | 172,965 | | | | 55 | % | |
2021 | | | (0.11 | ) | | $ | 8.45 | | | | 30.57 | % | | | 0.55 | % | | | 2.75 | % | | | 1.00 | % | | $ | 204,691 | | | | 47 | % | |
2020 | | | (0.06 | ) | | $ | 6.57 | | | | (4.34 | )% | | | 0.55 | % | | | 2.06 | % | | | 1.01 | % | | $ | 119,275 | | | | 49 | % | |
2019 | | | (0.27 | ) | | $ | 6.92 | | | | (1.12 | )% | | | 0.55 | % | | | 2.53 | % | | | 1.45 | % | | $ | 5,661 | | | | 56 | % | |
2018 | | | (0.52 | ) | | $ | 7.31 | | | | 8.14 | % | | | 0.71 | % | | | 2.71 | % | | | 1.71 | % | | $ | 5,975 | | | | 51 | % | |
Class Y | |
Year Ended June 30:
2022 | | | (0.30 | ) | | $ | 6.50 | | | | (19.16 | )% | | | 0.70 | % | | | 2.42 | % | | | 1.21 | % | | $ | 6,614 | | | | 55 | % | |
2021 | | | (0.11 | ) | | $ | 8.34 | | | | 30.62 | % | | | 0.70 | % | | | 2.59 | % | | | 1.19 | % | | $ | 8,574 | | | | 47 | % | |
2020 | | | (0.08 | ) | | $ | 6.48 | | | | (4.60 | )% | | | 0.70 | % | | | 1.95 | % | | | 1.32 | % | | $ | 6,532 | | | | 49 | % | |
2019 | | | (0.26 | ) | | $ | 6.87 | | | | (1.34 | )% | | | 0.70 | % | | | 2.26 | % | | | 1.40 | % | | $ | 8,482 | | | | 56 | % | |
2018 | | | (0.52 | ) | | $ | 7.26 | | | | 8.01 | % | | | 0.87 | % | | | 1.62 | % | | | 1.49 | % | | $ | 9,712 | | | | 51 | % | |
See notes to financial statements.
153
Victory Portfolios | | Financial Highlights | |
For a Share Outstanding Throughout Each Period
| | | | | Investment Activities | | Distributions to
Shareholders From | |
| | | Net Asset
Value,
Beginning of
Period | | Net
Investment
Income
(Loss)(a) | | Net Realized
and Unrealized
Gains (Losses) | | Total from
Investment
Activities | | Net
Investment
Income | | Net Realized
Gains from
Investments | |
Victory Trivalent International Small-Cap Fund | | | |
Class A | | | |
Year Ended June 30:
2022 | | $ | 18.04 | | | | 0.18 | | | | (4.40 | ) | | | (4.22 | ) | | | (0.23 | ) | | | (1.16 | ) | |
2021 | | $ | 12.83 | | | | 0.14 | | | | 5.07 | | | | 5.21 | | | | — | | | | — | | |
2020 | | $ | 13.02 | | | | 0.06 | | | | (0.02 | ) | | | 0.04 | | | | (0.23 | ) | | | — | | |
2019 | | $ | 14.46 | | | | 0.13 | | | | (1.22 | ) | | | (1.09 | ) | | | (0.09 | ) | | | (0.26 | ) | |
2018 | | $ | 12.87 | | | | 0.10 | | | | 1.72 | | | | 1.82 | | | | (0.15 | ) | | | (0.08 | ) | |
Class C | | | |
Year Ended June 30:
2022 | | $ | 17.46 | | | | 0.05 | | | | (4.26 | ) | | | (4.21 | ) | | | (0.11 | ) | | | (1.16 | ) | |
2021 | | $ | 12.51 | | | | 0.04 | | | | 4.91 | | | | 4.95 | | | | — | | | | — | | |
2020 | | $ | 12.71 | | | | (0.03 | ) | | | (0.03 | ) | | | (0.06 | ) | | | (0.14 | ) | | | — | | |
2019 | | $ | 14.12 | | | | 0.02 | | | | (1.17 | ) | | | (1.15 | ) | | | — | | | | (0.26 | ) | |
2018 | | $ | 12.58 | | | | — | (d) | | | 1.67 | | | | 1.67 | | | | (0.05 | ) | | | (0.08 | ) | |
Class I | | | |
Year Ended June 30:
2022 | | $ | 18.19 | | | | 0.26 | | | | (4.46 | ) | | | (4.20 | ) | | | (0.29 | ) | | | (1.16 | ) | |
2021 | | $ | 12.94 | | | | 0.25 | | | | 5.07 | | | | 5.32 | | | | (0.07 | ) | | | — | | |
2020 | | $ | 13.13 | | | | 0.11 | | | | (0.02 | ) | | | 0.09 | | | | (0.28 | ) | | | — | | |
2019 | | $ | 14.58 | | | | 0.18 | | | | (1.23 | ) | | | (1.05 | ) | | | (0.14 | ) | | | (0.26 | ) | |
2018 | | $ | 12.96 | | | | 0.18 | | | | 1.71 | | | | 1.89 | | | | (0.19 | ) | | | (0.08 | ) | |
Class R6 | | | |
Year Ended June 30:
2022 | | $ | 18.26 | | | | 0.25 | | | | (4.48 | ) | | | (4.23 | ) | | | (0.28 | ) | | | (1.16 | ) | |
2021 | | $ | 13.00 | | | | 0.23 | | | | 5.09 | | | | 5.32 | | | | (0.06 | ) | | | — | | |
2020 | | $ | 13.19 | | | | 0.12 | | | | (0.04 | ) | | | 0.08 | | | | (0.27 | ) | | | — | | |
2019 | | $ | 14.65 | | | | 0.17 | | | | (1.24 | ) | | | (1.07 | ) | | | (0.13 | ) | | | (0.26 | ) | |
2018 | | $ | 13.02 | | | | 0.15 | | | | 1.73 | | | | 1.88 | | | | (0.17 | ) | | | (0.08 | ) | |
Class Y | | | |
Year Ended June 30:
2022 | | $ | 18.10 | | | | 0.22 | | | | (4.42 | ) | | | (4.20 | ) | | | (0.27 | ) | | | (1.16 | ) | |
2021 | | $ | 12.88 | | | | 0.22 | | | | 5.05 | | | | 5.27 | | | | (0.05 | ) | | | — | | |
2020 | | $ | 13.07 | | | | 0.10 | | | | (0.03 | ) | | | 0.07 | | | | (0.26 | ) | | | — | | |
2019 | | $ | 14.52 | | | | 0.16 | | | | (1.22 | ) | | | (1.06 | ) | | | (0.13 | ) | | | (0.26 | ) | |
2018 | | $ | 12.91 | | | | 0.15 | | | | 1.71 | | | | 1.86 | | | | (0.17 | ) | | | (0.08 | ) | |
(a) Per share net investment income (loss) has been calculated using the average daily shares method.
(b) Does not include acquired fund fees and expenses, if any.
(c) Portfolio turnover is calculated on the basis of the Fund as a whole without distinguishing between the classes of shares issued.
(d) Amount is less than $0.005 per share.
(e) Includes adjustments in accordance with U.S. Generally Accepted Accounting Principles.
See notes to financial statements.
154
Victory Portfolios | | Financial Highlights — continued | |
For a Share Outstanding Throughout Each Period
| | | | | Ratios to Average Net Assets | | Supplemental Data | |
| | | Total
Distributions | | Net Asset
Value,
End of
Period | | Total
Return
(Excludes
Sales
Charge)(e) | | Net
Expenses(b) | | Net
Investment
Income
(Loss) | | Gross
Expenses(b) | | Net Assets,
End of
Period
(000's) | | Portfolio
Turnover(c) | |
Victory Trivalent International Small-Cap Fund | |
Class A | |
Year Ended June 30:
2022 | | | (1.39 | ) | | $ | 12.43 | | | | (25.22 | )% | | | 1.35 | % | | | 1.09 | % | | | 1.63 | % | | $ | 64,968 | | | | 68 | % | |
2021 | | | — | | | $ | 18.04 | | | | 40.61 | % | | | 1.35 | % | | | 0.91 | % | | | 1.63 | % | | $ | 93,832 | | | | 64 | % | |
2020 | | | (0.23 | ) | | $ | 12.83 | | | | 0.15 | % | | | 1.35 | % | | | 0.47 | % | | | 1.63 | % | | $ | 108,115 | | | | 52 | % | |
2019 | | | (0.35 | ) | | $ | 13.02 | | | | (7.12 | )% | | | 1.35 | % | | | 1.02 | % | | | 1.59 | % | | $ | 137,665 | | | | 54 | % | |
2018 | | | (0.23 | ) | | $ | 14.46 | | | | 14.14 | % | | | 1.35 | % | | | 0.68 | % | | | 1.56 | % | | $ | 122,933 | | | | 62 | % | |
Class C | |
Year Ended June 30:
2022 | | | (1.27 | ) | | $ | 11.98 | | | | (25.84 | )% | | | 2.10 | % | | | 0.30 | % | | | 2.49 | % | | $ | 3,283 | | | | 68 | % | |
2021 | | | — | | | $ | 17.46 | | | | 39.57 | % | | | 2.10 | % | | | 0.26 | % | | | 2.41 | % | | $ | 4,945 | | | | 64 | % | |
2020 | | | (0.14 | ) | | $ | 12.51 | | | | (0.65 | )% | | | 2.10 | % | | | (0.28 | )% | | | 2.42 | % | | $ | 4,327 | | | | 52 | % | |
2019 | | | (0.26 | ) | | $ | 12.71 | | | | (7.78 | )% | | | 2.10 | % | | | 0.15 | % | | | 2.42 | % | | $ | 4,909 | | | | 54 | % | |
2018 | | | (0.13 | ) | | $ | 14.12 | | | | 13.28 | % | | | 2.10 | % | | | (0.03 | )% | | | 2.36 | % | | $ | 6,211 | | | | 62 | % | |
Class I | |
Year Ended June 30:
2022 | | | (1.45 | ) | | $ | 12.54 | | | | (24.96 | )% | | | 0.95 | % | | | 1.56 | % | | | 1.16 | % | | $ | 1,655,788 | | | | 68 | % | |
2021 | | | (0.07 | ) | | $ | 18.19 | | | | 41.16 | % | | | 0.95 | % | | | 1.52 | % | | | 1.17 | % | | $ | 2,003,337 | | | | 64 | % | |
2020 | | | (0.28 | ) | | $ | 12.94 | | | | 0.54 | % | | | 0.95 | % | | | 0.88 | % | | | 1.18 | % | | $ | 1,014,425 | | | | 52 | % | |
2019 | | | (0.40 | ) | | $ | 13.13 | | | | (6.69 | )% | | | 0.95 | % | | | 1.41 | % | | | 1.16 | % | | $ | 955,568 | | | | 54 | % | |
2018 | | | (0.27 | ) | | $ | 14.58 | | | | 14.60 | % | | | 0.95 | % | | | 1.22 | % | | | 1.14 | % | | $ | 866,643 | | | | 62 | % | |
Class R6 | |
Year Ended June 30:
2022 | | | (1.44 | ) | | $ | 12.59 | | | | (25.02 | )% | | | 1.03 | % | | | 1.52 | % | | | 1.03 | % | | $ | 123,487 | | | | 68 | % | |
2021 | | | (0.06 | ) | | $ | 18.26 | | | | 41.06 | % | | | 1.03 | % | | | 1.43 | % | | | 1.03 | % | | $ | 133,486 | | | | 64 | % | |
2020 | | | (0.27 | ) | | $ | 13.00 | | | | 0.36 | % | | | 1.06 | % | | | 0.94 | % | | | 1.06 | % | | $ | 73,480 | | | | 52 | % | |
2019 | | | (0.39 | ) | | $ | 13.19 | | | | (6.86 | )% | | | 1.08 | % | | | 1.31 | % | | | 1.08 | % | | $ | 42,975 | | | | 54 | % | |
2018 | | | (0.25 | ) | | $ | 14.65 | | | | 14.49 | % | | | 1.08 | % | | | 1.01 | % | | | 1.08 | % | | $ | 39,497 | | | | 62 | % | |
Class Y | |
Year Ended June 30:
2022 | | | (1.43 | ) | | $ | 12.47 | | | | (25.07 | )% | | | 1.10 | % | | | 1.33 | % | | | 1.12 | % | | $ | 703,026 | | | | 68 | % | |
2021 | | | (0.05 | ) | | $ | 18.10 | | | | 40.96 | % | | | 1.10 | % | | | 1.35 | % | | | 1.13 | % | | $ | 1,099,890 | | | | 64 | % | |
2020 | | | (0.26 | ) | | $ | 12.88 | | | | 0.41 | % | | | 1.10 | % | | | 0.75 | % | | | 1.19 | % | | $ | 663,638 | | | | 52 | % | |
2019 | | | (0.39 | ) | | $ | 13.07 | | | | (6.88 | )% | | | 1.10 | % | | | 1.21 | % | | | 1.18 | % | | $ | 666,547 | | | | 54 | % | |
2018 | | | (0.25 | ) | | $ | 14.52 | | | | 14.45 | % | | | 1.10 | % | | | 1.05 | % | | | 1.19 | % | | $ | 756,933 | | | | 62 | % | |
See notes to financial statements.
155
Victory Portfolios | | Financial Highlights | |
For a Share Outstanding Throughout Each Period
| | | | | Investment Activities | | Distributions to
Shareholders From | |
| | | Net Asset
Value,
Beginning of
Period | | Net
Investment
Income
(Loss)(a) | | Net Realized
and Unrealized
Gains (Losses) | | Total from
Investment
Activities | | Net
Investment
Income | | Total
Distributions | |
Victory INCORE Total Return Bond Fund | | | |
Class A | | | |
Year Ended June 30:
2022 | | $ | 9.84 | | | | 0.13 | | | | (1.15 | ) | | | (1.02 | ) | | | (0.20 | ) | | | (0.20 | ) | |
2021 | | $ | 9.91 | | | | 0.15 | | | | 0.01 | | | | 0.16 | | | | (0.23 | ) | | | (0.23 | ) | |
2020 | | $ | 9.46 | | | | 0.20 | | | | 0.50 | | | | 0.70 | | | | (0.25 | ) | | | (0.25 | ) | |
2019 | | $ | 9.21 | | | | 0.21 | | | | 0.32 | | | | 0.53 | | | | (0.28 | ) | | | (0.28 | ) | |
2018 | | $ | 9.54 | | | | 0.20 | | | | (0.24 | ) | | | (0.04 | ) | | | (0.29 | ) | | | (0.29 | ) | |
Class C | | | |
Year Ended June 30:
2022 | | $ | 9.92 | | | | 0.05 | | | | (1.15 | ) | | | (1.10 | ) | | | (0.13 | ) | | | (0.13 | ) | |
2021 | | $ | 9.99 | | | | 0.08 | | | | 0.01 | | | | 0.09 | | | | (0.16 | ) | | | (0.16 | ) | |
2020 | | $ | 9.53 | | | | 0.12 | | | | 0.52 | | | | 0.64 | | | | (0.18 | ) | | | (0.18 | ) | |
2019 | | $ | 9.28 | | | | 0.15 | | | | 0.31 | | | | 0.46 | | | | (0.21 | ) | | | (0.21 | ) | |
2018 | | $ | 9.60 | | | | 0.14 | | | | (0.25 | ) | | | (0.11 | ) | | | (0.21 | ) | | | (0.21 | ) | |
Class R6 | | | |
Year Ended June 30:
2022 | | $ | 9.87 | | | | 0.15 | | | | (1.15 | ) | | | (1.00 | ) | | | (0.23 | ) | | | (0.23 | ) | |
2021 | | $ | 9.94 | | | | 0.17 | | | | 0.02 | | | | 0.19 | | | | (0.26 | ) | | | (0.26 | ) | |
2020 | | $ | 9.48 | | | | 0.22 | | | | 0.51 | | | | 0.73 | | | | (0.27 | ) | | | (0.27 | ) | |
2019 | | $ | 9.23 | | | | 0.24 | | | | 0.31 | | | | 0.55 | | | | (0.30 | ) | | | (0.30 | ) | |
2018 | | $ | 9.55 | | | | 0.22 | | | | (0.23 | ) | | | (0.01 | ) | | | (0.31 | ) | | | (0.31 | ) | |
Class Y | | | |
Year Ended June 30:
2022 | | $ | 9.87 | | | | 0.15 | | | | (1.15 | ) | | | (1.00 | ) | | | (0.23 | ) | | | (0.23 | ) | |
2021 | | $ | 9.94 | | | | 0.17 | | | | 0.02 | | | | 0.19 | | | | (0.26 | ) | | | (0.26 | ) | |
2020 | | $ | 9.47 | | | | 0.22 | | | | 0.52 | | | | 0.74 | | | | (0.27 | ) | | | (0.27 | ) | |
2019 | | $ | 9.23 | | | | 0.24 | | | | 0.30 | | | | 0.54 | | | | (0.30 | ) | | | (0.30 | ) | |
2018 | | $ | 9.55 | | | | 0.23 | | | | (0.24 | ) | | | (0.01 | ) | | | (0.31 | ) | | | (0.31 | ) | |
(a) Per share net investment income (loss) has been calculated using the average daily shares method.
(b) Does not include acquired fund fees and expenses, if any.
(c) Portfolio turnover is calculated on the basis of the Fund as a whole without distinguishing between the classes of shares issued.
(d) Portfolio turnover rate excluding mortgage dollar roll transactions was 103% for the year ended June 30, 2018.
See notes to financial statements.
156
Victory Portfolios | | Financial Highlights — continued | |
| | | | | Ratios to Average Net Assets | | Supplemental Data | |
| | | Net Asset
Value, End
of Period | | Total
Return
(Excludes
Sales
Charge) | | Net
Expenses(b) | | Net
Investment
Income
(Loss) | | Gross
Expenses(b) | | Net Assets,
End of
Period
(000's) | | Portfolio
Turnover(c)(d) | |
Victory INCORE Total Return Bond Fund | |
Class A | |
Year Ended June 30:
2022 | | $ | 8.62 | | | | (10.48 | )% | | | 0.85 | % | | | 1.34 | % | | | 1.20 | % | | $ | 7,507 | | | | 55 | % | |
2021 | | $ | 9.84 | | | | 1.67 | % | | | 0.85 | % | | | 1.51 | % | | | 1.16 | % | | $ | 9,380 | | | | 79 | % | |
2020 | | $ | 9.91 | | | | 7.57 | % | | | 0.85 | % | | | 2.03 | % | | | 1.11 | % | | $ | 11,472 | | | | 74 | % | |
2019 | | $ | 9.46 | | | | 5.77 | % | | | 0.85 | % | | | 2.32 | % | | | 1.09 | % | | $ | 12,248 | | | | 150 | % | |
2018 | | $ | 9.21 | | | | (0.49 | )% | | | 0.85 | % | | | 2.15 | % | | | 1.11 | % | | $ | 12,592 | | | | 110 | % | |
Class C | |
Year Ended June 30:
2022 | | $ | 8.69 | | | | (11.23 | )% | | | 1.60 | % | | | 0.56 | % | | | 5.81 | % | | $ | 163 | | | | 55 | % | |
2021 | | $ | 9.92 | | | | 0.91 | % | | | 1.60 | % | | | 0.80 | % | | | 3.68 | % | | $ | 451 | | | | 79 | % | |
2020 | | $ | 9.99 | | | | 6.76 | % | | | 1.60 | % | | | 1.27 | % | | | 3.54 | % | | $ | 727 | | | | 74 | % | |
2019 | | $ | 9.53 | | | | 5.05 | % | | | 1.60 | % | | | 1.67 | % | | | 3.12 | % | | $ | 574 | | | | 150 | % | |
2018 | | $ | 9.28 | | | | (1.12 | )% | | | 1.60 | % | | | 1.43 | % | | | 2.31 | % | | $ | 973 | | | | 110 | % | |
Class R6 | |
Year Ended June 30:
2022 | | $ | 8.64 | | | | (10.30 | )% | | | 0.58 | % | | | 1.62 | % | | | 0.63 | % | | $ | 23,854 | | | | 55 | % | |
2021 | | $ | 9.87 | | | | 1.93 | % | | | 0.58 | % | | | 1.73 | % | | | 0.61 | % | | $ | 26,970 | | | | 79 | % | |
2020 | | $ | 9.94 | | | | 7.94 | % | | | 0.58 | % | | | 2.30 | % | | | 0.59 | % | | $ | 25,999 | | | | 74 | % | |
2019 | | $ | 9.48 | | | | 6.05 | % | | | 0.57 | % | | | 2.61 | % | | | 0.57 | % | | $ | 24,929 | | | | 150 | % | |
2018 | | $ | 9.23 | | | | (0.12 | )% | | | 0.58 | % | | | 2.37 | % | | | 0.62 | % | | $ | 25,438 | | | | 110 | % | |
Class Y | |
Year Ended June 30:
2022 | | $ | 8.64 | | | | (10.32 | )% | | | 0.60 | % | | | 1.60 | % | | | 0.65 | % | | $ | 28,539 | | | | 55 | % | |
2021 | | $ | 9.87 | | | | 1.91 | % | | | 0.60 | % | | | 1.74 | % | | | 0.64 | % | | $ | 31,032 | | | | 79 | % | |
2020 | | $ | 9.94 | | | | 7.92 | % | | | 0.60 | % | | | 2.28 | % | | | 0.62 | % | | $ | 33,455 | | | | 74 | % | |
2019 | | $ | 9.47 | | | | 5.99 | % | | | 0.60 | % | | | 2.63 | % | | | 0.63 | % | | $ | 31,026 | | | | 150 | % | |
2018 | | $ | 9.23 | | | | (0.13 | )% | | | 0.59 | % | | | 2.43 | % | | | 0.59 | % | | $ | 52,633 | | | | 110 | % | |
For a Share Outstanding Throughout Each Period
See notes to financial statements.
157
Victory Portfolios | | Notes to Financial Statements
June 30, 2022 | |
1. Organization:
Victory Portfolios (the "Trust") is organized as a Delaware statutory trust and the Trust is registered under the Investment Company Act of 1940, as amended (the "1940 Act"), as an open-end investment company. The Trust is comprised of 40 funds and is authorized to issue an unlimited number of shares, which are units of beneficial interest with a par value of $0.001 per share.
The accompanying financial statements are those of the following 11 Funds (collectively, the "Funds" and individually, a "Fund"). Each Fund is classified as diversified under the 1940 Act.
Funds (Legal Name) | | Funds (Short Name) | | Investment Share
Classes Offered | |
Victory Integrity Discovery Fund | | Integrity Discovery Fund | | A, C, R, Y, and Member Class | |
Victory Integrity Mid-Cap
Value Fund | | Integrity Mid-Cap Value Fund
| | A, C, R6, Y, and Member Class
| |
Victory Integrity Small-Cap
Value Fund | | Integrity Small-Cap Value Fund
| | A, C, R, R6, and Y
| |
Victory Integrity Small/Mid-Cap
Value Fund | | Integrity Small/Mid-Cap
Value Fund | | A, R6, Y, and Member Class
| |
Victory Munder Multi-Cap Fund | | Munder Multi-Cap Fund | | A, C, and Y | |
Victory S&P 500 Index Fund | | S&P 500 Index Fund | | A, R, and Y | |
Victory Munder Mid-Cap Core
Growth Fund | | Munder Mid-Cap Core
Growth Fund | | A, C, R, R6, and Y
| |
Victory Munder Small Cap
Growth Fund | | Munder Small Cap
Growth Fund | | A, I and Y
| |
Victory Trivalent International
Fund — Core Equity | | Trivalent International
Fund — Core Equity | | A, C, R6, Y, and I
| |
Victory Trivalent International
Small-Cap Fund | | Trivalent International
Small-Cap Fund | | A, C, R6, Y, and I
| |
Victory INCORE Total Return
Bond Fund | | INCORE Total Return
Bond Fund | | A, C, R6, and Y
| |
Each class of shares of a Fund has substantially identical rights and privileges except with respect to sales charges, fees paid under distribution plans, expenses allocable exclusively to each class of shares, voting rights on matters solely affecting a single class of shares, and the exchange privilege of each class of shares.
Under the Trust's organizational documents, its officers and trustees are indemnified against certain liabilities arising out of the performance of their duties to the Funds. In addition, in the normal course of business, the Funds enter into contracts with their vendors and others that provide for general indemnifications. The Funds' maximum exposure under these arrangements is unknown, as this would involve future claims that may be made against the Funds. However, based on experience, the Funds expect that risk of loss to be remote.
2. Significant Accounting Policies:
The following is a summary of significant accounting policies followed by the Trust in the preparation of its financial statements. The policies are in conformity with U.S. Generally Accepted Accounting Principles ("GAAP"). The preparation of financial statements in accordance with GAAP requires management to make estimates and assumptions that affect the reported amounts of assets and liabilities and disclosure of contingent assets and liabilities at the date of the financial statements and the reported amounts of income and expenses for the period. Actual results could differ from those estimates. The Funds follow the specialized accounting and reporting requirements under GAAP that are applicable to investment companies under Accounting Standards Codification Topic 946.
158
Victory Portfolios | | Notes to Financial Statements — continued
June 30, 2022 | |
Investment Valuation:
The Funds record investments at fair value. Fair value is defined as the price that would be received to sell an asset or paid to transfer a liability in an orderly transaction between market participants at the measurement date.
The valuation techniques described below maximize the use of observable inputs and minimize the use of unobservable inputs in determining fair value. The inputs used for valuing the Funds' investments are summarized in the three broad levels listed below:
• Level 1 — quoted prices in active markets for identical securities
• Level 2 — other significant observable inputs (including quoted prices for similar securities or interest rates applicable to those securities, etc.)
• Level 3 — significant unobservable inputs (including the Funds' own assumptions in determining the fair value of investments)
Changes in valuation techniques may result in transfers in or out of an assigned level within the disclosure hierarchy. The inputs or methodologies used for valuation techniques are not necessarily an indication of the risk associated with entering into those investments.
Victory Capital Management Inc. ("VCM" or the "Adviser") has established the Pricing and Liquidity Committee (the "Committee"), and subject to the Trust's Board of Trustees' (the "Board") oversight, the Committee administers and oversees the Funds' valuation policies and procedures, which are approved by the Board.
Portfolio securities listed or traded on securities exchanges, including Exchange-Traded Funds ("ETFs"), and American Depositary Receipts ("ADRs"), are valued at the closing price on the exchange or system where the security is principally traded, if available, or at the Nasdaq Official Closing Price. If there have been no sales for that day on the exchange or system, then a security is valued at the last available bid quotation on the exchange or system where the security is principally traded. In each of these situations, valuations are typically categorized as Level 1 in the fair value hierarchy.
Investments in open-end investment companies, other than ETFs, are valued at their net asset value ("NAV"). These valuations are typically categorized as Level 1 in the fair value hierarchy.
Debt securities are valued each business day by a pricing service approved by the Board. The approved pricing service uses the evaluated bid or the last sale price to value securities. Debt obligations maturing within 60 days may be valued at amortized cost, provided that the amortized cost represents the fair value of such securities. These valuations are typically categorized as Level 2 in the fair value hierarchy.
Swap agreements are valued at the mean between the current bid and ask prices. To the extent this model is utilized, these valuations are considered as Level 2 in the fair value hierarchy.
Futures contracts are valued at the settlement price established each day by the board of trade or an exchange on which they are traded. These valuations are typically categorized as Level 1 in the fair value hierarchy.
In the event that price quotations or valuations are not readily available, investments are valued at fair value in accordance with procedures established by and under the general supervision and responsibility of the Board. These valuations are typically categorized as Level 2 or Level 3 in the fair value hierarchy, based on the observability of inputs used to determine the fair value. The effect of fair value pricing is that securities may not be priced on the basis of quotations from the primary market in which they are traded and the actual price realized from the sale of a security may differ materially from the fair value price. Valuing these securities at fair value is intended to cause the Fund's NAV to be more reliable than it otherwise would be.
In accordance with procedures adopted by the Board, fair value pricing may be used if events materially affecting the value of foreign securities occur between the time the exchange on which they are traded closes and the time a Fund's NAV is calculated. The Funds use a systematic valuation model, provided
159
Victory Portfolios | | Notes to Financial Statements — continued
June 30, 2022 | |
daily by an independent third party to fair value its international equity securities. The valuations are categorized as Level 2 in the fair value hierarchy.
A summary of the valuations as of June 30, 2022, based upon the three levels defined above, is included in the table below while the breakdown, by category, of investments is disclosed on the Schedules of Portfolio Investments (amounts in thousands):
| | | Level 1 | | Level 2 | | Level 3 | | Total | |
Integrity Discovery Fund | |
Common Stocks | | $ | 63,242 | | | $ | — | | | $ | — | | | $ | 63,242 | | |
Collateral for Securities Loaned | | | 2,625 | | | | — | | | | — | | | | 2,625 | | |
Total | | $ | 65,867 | | | $ | — | | | $ | — | | | $ | 65,867 | | |
Integrity Mid-Cap Value Fund | |
Common Stocks | | $ | 271,894 | | | $ | — | | | $ | — | | | $ | 271,894 | | |
Collateral for Securities Loaned | | | 3,151 | | | | — | | | | — | | | | 3,151 | | |
Total | | $ | 275,045 | | | $ | — | | | $ | — | | | $ | 275,045 | | |
Integrity Small-Cap Value Fund | |
Common Stocks | | $ | 1,357,892 | | | $ | — | | | $ | — | | | $ | 1,357,892 | | |
Exchange-Traded Funds | | | 13,615 | | | | — | | | | — | | | | 13,615 | | |
Collateral for Securities Loaned | | | 24,052 | | | | — | | | | — | | | | 24,052 | | |
Total | | $ | 1,395,559 | | | $ | — | | | $ | — | | | $ | 1,395,559 | | |
Integrity Small/Mid-Cap Value Fund | |
Common Stocks | | $ | 206,251 | | | $ | — | | | $ | — | | | $ | 206,251 | | |
Collateral for Securities Loaned | | | 3,892 | | | | — | | | | — | | | | 3,892 | | |
Total | | $ | 210,143 | | | $ | — | | | $ | — | | | $ | 210,143 | | |
Munder Multi-Cap Fund | |
Common Stocks | | $ | 360,133 | | | $ | — | | | $ | — | | | $ | 360,133 | | |
Exchange-Traded Funds | | | 10,054 | | | | — | | | | — | | | | 10,054 | | |
Collateral for Securities Loaned | | | 6,743 | | | | — | | | | — | | | | 6,743 | | |
Total | | $ | 376,930 | | | $ | — | | | $ | — | | | $ | 376,930 | | |
S&P 500 Index Fund | |
Common Stocks | | $ | 221,457 | | | $ | — | | | $ | — | | | $ | 221,457 | | |
Collateral for Securities Loaned | | | 180 | | | | — | | | | — | | | | 180 | | |
Total | | $ | 221,637 | | | $ | — | | | $ | — | | | $ | 221,637 | | |
Other Financial Investments* | |
Liabilities: | |
Futures Contracts | | $ | (59 | ) | | $ | — | | | $ | — | | | $ | (59 | ) | |
Total | | $ | (59 | ) | | $ | — | | | $ | — | | | $ | (59 | ) | |
Munder Mid-Cap Core Growth Fund | |
Common Stocks | | $ | 352,034 | | | $ | — | | | $ | — | | | $ | 352,034 | | |
Exchange-Traded Funds | | | 8,043 | | | | — | | | | — | | | | 8,043 | | |
Collateral for Securities Loaned | | | 2,193 | | | | — | | | | — | | | | 2,193 | | |
Total | | $ | 362,270 | | | $ | — | | | $ | — | | | $ | 362,270 | | |
Munder Small Cap Growth Fund | |
Common Stocks | | $ | 10,595 | | | $ | — | | | $ | — | (a) | | $ | 10,595 | | |
Warrants | | | 2 | | | | — | | | | — | | | | 2 | | |
Collateral for Securities Loaned | | | 517 | | | | — | | | | — | | | | 517 | | |
Total | | $ | 11,114 | | | $ | — | | | $ | — | | | $ | 11,114 | | |
160
Victory Portfolios | | Notes to Financial Statements — continued
June 30, 2022 | |
| | | Level 1 | | Level 2 | | Level 3 | | Total | |
Trivalent International Fund — Core Equity | |
Common Stocks | | $ | 18,784 | | | $ | 161,873 | | | $ | 2 | | | $ | 180,659 | | |
Exchange-Traded Funds | | | 2,825 | | | | — | | | | — | | | | 2,825 | | |
Collateral for Securities Loaned | | | 3,472 | | | | — | | | | — | | | | 3,472 | | |
Total | | $ | 25,081 | | | $ | 161,873 | | | $ | 2 | | | $ | 186,956 | | |
Trivalent International Small-Cap Fund | |
Common Stocks | | $ | 334,232 | | | $ | 2,145,546 | | | $ | — | | | $ | 2,479,778 | | |
Exchange-Traded Funds | | | 18,834 | | | | — | | | | — | | | | 18,834 | | |
Collateral for Securities Loaned | | | 127,681 | | | | — | | | | — | | | | 127,681 | | |
Total | | $ | 480,747 | | | $ | 2,145,546 | | | $ | — | | | $ | 2,626,293 | | |
INCORE Total Return Bond Fund | |
Asset-Backed Securities | | $ | — | | | $ | 2,854 | | | $ | — | | | $ | 2,854 | | |
Collateralized Mortgage Obligations | | | — | | | | 4,664 | | | | — | | | | 4,664 | | |
Convertible Corporate Bonds | | | — | | | | 4,235 | | | | — | | | | 4,235 | | |
Convertible Preferred Stocks | | | 2,013 | | | | 48 | | | | — | | | | 2,061 | | |
Corporate Bonds | | | — | | | | 23,588 | | | | — | | | | 23,588 | | |
Residential Mortgage-Backed Securities | | | — | | | | 77 | | | | — | | | | 77 | | |
Yankee Dollars | | | — | | | | 4,189 | | | | — | | | | 4,189 | | |
U.S. Government Mortgage-Backed Agencies | | | — | | | | 14,042 | | | | — | | | | 14,042 | | |
U.S. Treasury Obligations | | | — | | | | 5,163 | | | | — | | | | 5,163 | | |
Collateral for Securities Loaned | | | 2,190 | | | | — | | | | — | | | | 2,190 | | |
Total | | $ | 4,203 | | | $ | 58,860 | | | $ | — | | | $ | 63,063 | | |
Other Financial Investments* | |
Assets: | |
Futures Contracts | | $ | 165 | | | $ | — | | | $ | — | | | $ | 165 | | |
Liabilities: | |
Futures Contracts | | | (75 | ) | | | — | | | | — | | | | (75 | ) | |
Total | | $ | 90 | | | $ | — | | | $ | — | | | $ | 90 | | |
* Futures contracts are valued at the unrealized appreciation (depreciation) on the investment.
(a) Rounds to less than $1 thousand.
For the year ended June 30, 2022, there were no significant changes into/out of Level 3.
Real Estate Investment Trusts ("REITs"):
The Funds may invest in REITs, which report information on the source of their distributions annually. REITs are pooled investment vehicles that invest primarily in income-producing real estate or real-estate related loans or interests (such as mortgages). Certain distributions received from REITs during the year are recorded as realized gains or return of capital as estimated by the Funds or when such information becomes known.
Investment Companies:
Exchange-Traded Funds:
The Funds may invest in ETFs, the shares of which are bought and sold on a securities exchange. An ETF trades like common stock and represents a fixed portfolio of securities often designed to track the performance and dividend yield of a particular domestic or foreign market index. The Funds may purchase shares of an ETF to temporarily gain exposure to a portion of the U.S. or a foreign market while awaiting purchase of underlying securities. The risks of owning an ETF generally reflect the risks of owning the underlying securities they are designed to track, although the lack of liquidity of an ETF could result in it being more volatile. Additionally, ETFs have fees and expenses that reduce their value.
161
Victory Portfolios | | Notes to Financial Statements — continued
June 30, 2022 | |
Open-End Funds:
The Funds may invest in portfolios of open-end investment companies. These investment companies value securities in their portfolios for which market quotations are readily available at their market values (generally the last reported sale price) and all other securities and assets at their fair value by the methods established by the board of directors of the underlying funds.
Mortgage- and Asset-Backed Securities:
The values of some mortgage-related or asset-backed securities may be particularly sensitive to changes in prevailing interest rates. Early repayment of principal on some mortgage-related securities may expose the Fund to a lower rate of return upon reinvestment of principal. The values of mortgage- and asset-backed securities depend in part on the credit quality and adequacy of the underlying assets or collateral and may fluctuate in response to the market's perception of these factors as well as current and future repayment rates. Some mortgage-backed securities are backed by the full faith and credit of the U.S. government (e.g., mortgage-backed securities issued by the Government National Mortgage Association, commonly known as "Ginnie Mae"), while other mortgage-backed securities (e.g., mortgage-backed securities issued by the Federal National Mortgage Association and the Federal Home Loan Mortgage Corporation, commonly known as "Fannie Mae" and "Freddie Mac," respectively), are backed only by the credit of the government entity issuing them. In addition, some mortgage-backed securities are issued by private entities and, as such, are not guaranteed by the U.S. government or any agency or instrumentality of the U.S. government.
Derivative Instruments:
Foreign Exchange Currency Contracts:
The Funds may enter into foreign exchange currency contracts to convert U.S. dollars to and from various foreign currencies. A foreign exchange currency contract is an obligation by a Fund to purchase or sell a specific currency at a future date at a price (in U.S. dollars) set at the time of the contract. The Funds do not engage in "cross-currency" foreign exchange contracts (i.e., contracts to purchase or sell one foreign currency in exchange for another foreign currency). The Funds' foreign exchange currency contracts might be considered spot contracts (typically a contract of one week or less) or forward contracts (typically a contract term over one week). A spot contract is entered into for purposes of hedging against foreign currency fluctuations relating to a specific portfolio transaction, such as the delay between a security transaction trade date and settlement date. Forward contracts are entered into for purposes of hedging portfolio holdings or concentrations of such holdings. The Funds enter into foreign exchange currency contracts solely for spot or forward hedging purposes, and not for speculative purposes (i.e., the Funds do not enter into such contracts solely for the purpose of earning foreign currency gains). Each foreign exchange currency contract is adjusted daily by the prevailing spot or forward rate of the underlying currency, and any appreciation or depreciation is recorded for financial statement purposes as unrealized until the contract settlement date, at which time the Funds record realized gains or losses equal to the difference between the value of a contract at the time it was opened and the value at the time it was closed. The Funds could be exposed to risk if a counterparty is unable to meet the terms of a foreign exchange currency contract or if the value of the foreign currency changes unfavorably. In addition, the use of foreign exchange currency contracts does not eliminate fluctuations in the underlying prices of the securities. For the year ended June 30, 2022, the Funds had no open forward foreign exchange currency contracts.
Futures Contracts:
The Funds may enter into contracts for the future delivery of securities or foreign currencies and futures contracts based on a specific security, class of securities, foreign currency or an index, and
162
Victory Portfolios | | Notes to Financial Statements — continued
June 30, 2022 | |
purchase or sell options on any such futures contracts. A futures contract on a securities index is an agreement obligating either party to pay, and entitling the other party to receive, while the contract is outstanding, cash payments based on the level of a specified securities index. No physical delivery of the underlying asset is made. The Funds may enter into futures contracts in an effort to hedge against market risks. The acquisition of put and call options on futures contracts will give the Funds the right (but not the obligation), for a specified price, to sell or to purchase the underlying futures contract, upon exercise of the option, at any time during the option period. Futures transactions involve brokerage costs and require the Funds to segregate assets to cover contracts that would require it to purchase securities or currencies. A good faith margin deposit, known as initial margin, of cash or government securities with a broker or custodian is required to initiate and maintain open positions in futures contracts. Subsequent payments, known as variation margin, are made or received by the Funds based on the change in the market value of the position and are recorded as unrealized appreciation or depreciation until the contract is closed out, at which time the gain or loss is realized. The Funds may lose the expected benefit of futures transactions if interest rates, exchange rates or securities prices change in an unanticipated manner. Such unanticipated changes may also result in lower overall performance than if the Funds had not entered into any futures transactions. In addition, the value of the Funds' futures positions may not prove to be perfectly or even highly correlated with the value of its portfolio securities or foreign currencies, limiting the Funds' ability to hedge effectively against interest rate, exchange rate and/or market risk and giving rise to additional risks. There is no assurance of liquidity in the secondary market for purposes of closing out futures positions. The collateral held by the Funds is reflected on the Statements of Assets and Liabilities under Deposit with broker for futures contracts.
Management has determined that no offsetting requirements exist as a result of their conclusion that the Funds are not subject to master netting agreements for futures contracts.
As of June 30, 2022, the S&P 500 Index Fund and INCORE Total Return Bond Fund entered into futures contracts primarily for the strategy of hedging or other purposes, including but not limited to, providing liquidity and equitizing cash.
Credit Derivatives:
The INCORE Total Return Bond Fund may enter into credit derivatives, including centrally cleared credit default swaps on individual obligations or credit indices. The Fund may use these investments (i) as alternatives to direct long or short investment in a particular security or securities, (ii) to adjust the Fund's asset allocation or risk exposure, or (iii) for hedging purposes. The use by the Fund of centrally cleared credit default swaps may have the effect of creating a short position in a security. Credit derivatives can create investment leverage and may create additional investment risks that may subject the Fund to greater volatility than investments in more traditional securities, as described in the Fund's Statement of Additional Information.
Centrally cleared credit default swap ("CDS") agreements on credit indices involve one party making a stream of payments (referred to as the buyer of protection) to another party (the seller of protection) in exchange for the right to receive a specified return in the event of a write-down, principal shortfall, interest shortfall or default of all or part of the referenced entities comprising the credit index. A credit index is a basket of credit instruments or exposures designed to be representative of a specific sector of the credit market as a whole. These indices are made up of reference credits that are judged by a poll of dealers to be the most liquid entities in the CDS.
The counterparty risk for cleared swap agreements is generally lower than uncleared over-the-counter swap agreements because generally a clearing organization becomes substituted for each counterparty to a centrally cleared swap agreement and, in effect, guarantees each party's performance under the contract as each party to a trade looks only to the clearing organization for performance of financial obligations. However, there can be no assurance that the clearing organization, or its members, will satisfy its obligations to the Fund.
The Fund may enter into CDS agreements either as a buyer or seller. The Fund may buy protection under a CDS to attempt to mitigate the risk of default or credit quality deterioration in one or more
163
Victory Portfolios | | Notes to Financial Statements — continued
June 30, 2022 | |
individual holdings or in a segment of the fixed income securities market. The Fund may sell protection under a CDS in an attempt to gain exposure to an underlying issuer's credit quality characteristics without investing directly in that issuer.
For swaps entered with an individual counterparty, the Fund bears the risk of loss of the uncollateralized amount expected to be received under a CDS agreement in the event of the default or bankruptcy of the counterparty. CDS agreements are generally valued at a price at which the counterparty to such agreement would terminate the agreement. The Fund may also enter into centrally cleared swaps.
Upon entering into a cleared CDS, the Fund may be required to deposit with the broker an amount of cash or cash equivalents in the range of approximately 3% to 6% of the notional amount for CDS on high yield debt issuers (this amount is subject to change by the clearing organization that clears the trade). This amount, known as "initial margin," is in the nature of a performance bond or good faith deposit on the CDS and is returned to a Fund upon termination of the CDS, assuming all contractual obligations have been satisfied. Subsequent payments, known as "variation margin," to and from the broker will be made daily as the price of the CDS fluctuates, making the long and short positions in the CDS contract more or less valuable, a process known as "marking-to-market". The premium (discount) payments are built into the daily price of the CDS and thus are amortized through the variation margin. The variation margin payment also includes the daily portion of the periodic payment stream.
The maximum potential amount of future payments (undiscounted) that the Fund as a seller of protection could be required to make under a CDS agreement equals the notional amount of the agreement. Notional amounts of each individual CDS agreement outstanding as of period end for which the Fund is the seller of protection are disclosed on the Schedule of Portfolio Investments. These potential amounts would be partially offset by any recovery values of the respective referenced obligations, upfront payments received upon entering into the agreement, periodic interest payments, or net amounts received from the settlement of buy protection CDS agreements entered into by the Fund for the same referenced entity or entities. The collateral held by the Funds is reflected on the Statements of Assets and Liabilities under Deposit with brokers for swap agreements. As of June 30, 2022, the INCORE Total Return Bond Fund had no open swap agreements.
Management has determined that no offsetting requirements exist as a result of their conclusion that the Fund is not subject to master netting agreements for futures contracts. The INCORE Total Return Bond Fund entered into centrally cleared CDS agreements primarily for the strategy of asset allocation and risk exposure management during the period.
Summary of Derivative Instruments:
The following table summarizes the fair values of derivative instruments on the Statements of Assets and Liabilities, categorized by risk exposure, as of June 30, 2022 (amounts in thousands):
| | | Assets | | Liabilities | |
| | | Variation Margin
Receivable on Open
Futures Contracts* | | Variation Margin
Payable on Open
Futures Contracts* | |
Equity Risk Exposure: | |
Victory S&P 500 Index Fund | | $ | — | | | $ | 59 | | |
| INCORE Total Return Bond Fund | | | 56 | | | | — | | |
Interest Rate Risk Exposure: | |
| INCORE Total Return Bond Fund | | | 77 | | | | 45 | | |
Currency Risk Exposure: | |
| INCORE Total Return Bond Fund | | | 32 | | | | 30 | | |
* Includes cumulative appreciation/depreciation of futures contracts as reported on the Schedules of Portfolio Investments. Only current day's variation margin for futures contracts is reported within the Statements of Assets and Liabilities.
164
Victory Portfolios | | Notes to Financial Statements — continued
June 30, 2022 | |
The following table presents the effect of derivative instruments on the Statements of Operations, categorized by risk exposure, for the year ended June 30, 2022 (amounts in thousands):
| | | Net Realized Gains (Losses)
on Derivatives
Recognized as a
Result from Operations | | Net Change in Unrealized
Appreciation/Depreciation
on Derivatives Recognized
as a Result of Operations | |
| | | Net Realized
Gains (Losses)
from Futures
Contracts | | Net Realized
Gains (Losses)
from Swap
Agreements | | Net Change in
Unrealized
Appreciation/
Depreciation
on Futures
Contracts | | Net Change in
Unrealized
Appreciation/
Depreciation
on Swap
Agreements | |
Equity Risk Exposure: | |
S&P 500 Index Fund | | $ | (224 | ) | | $ | — | | | $ | (108 | ) | | $ | — | | |
| INCORE Total Return Bond Fund | | | 90 | | | | — | | | | 56 | | | | — | | |
Credit Risk Exposure: | |
INCORE Total Return Bond Fund | | | — | | | | 26 | | | | — | | | | — | (a) | |
Interest Rate Risk Exposure: | |
| INCORE Total Return Bond Fund | | | (334 | ) | | | — | | | | 4 | | | | — | | |
Currency Risk Exposure: | |
| INCORE Total Return Bond Fund | | | 298 | | | | — | | | | 6 | | | | — | | |
(a) Amount is less than $1 thousand.
All open derivative positions at year end are reflected on each respective Fund's Schedule of Portfolio Investments. The underlying face value of open derivative positions relative to each Fund's net assets at year end is generally representative of the notional amount of open positions to net assets throughout the year.
Investment Transactions and Related Income:
Changes in holdings of investments are accounted for no later than one business day following the trade date. For financial reporting purposes, however, investment transactions are accounted for on trade date or the last business day of the reporting period. Interest income is determined on the basis of coupon interest accrued using the effective interest method which adjusts, where applicable, the amortization of premiums or accretion of discounts. Dividend income is recorded on the ex-dividend date. Gains or losses realized on sales of securities are recorded on the identified cost basis. Paydown gains or losses on applicable securities, if any, are recorded as a component of Interest income on the Statements of Operations.
Withholding taxes on interest, dividends, and gains as a result of certain investments by the Funds have been provided for in accordance with each investment's applicable country's tax rules and rates.
Securities Lending:
The Funds, through a Securities Lending Agreement with Citibank, N.A. ("Citibank"), may lend their securities to qualified financial institutions, such as certain broker-dealers and banks, to earn additional income, net of income retained by Citibank. Borrowers are required to initially secure their loans for collateral in the amount of at least 102% of the value of U.S. securities loaned or at least 105% of the value of non-U.S. securities loaned, marked-to-market daily. Any collateral shortfalls associated with increases in the valuation of the securities loaned are generally cured the next business day. The collateral can be received in the form of cash collateral and/or non-cash collateral. Non-cash collateral can include U.S. Government Securities and other securities as permitted by Securities and Exchange Commission ("SEC") guidelines. The cash collateral is invested in short-term instruments or cash equivalents, primarily open-end investment companies, as noted on the Funds' Schedules of Portfolio Investments. The Funds effectively do not have control of the non-cash collateral and therefore it is not
165
Victory Portfolios | | Notes to Financial Statements — continued
June 30, 2022 | |
disclosed on the Funds' Schedules of Portfolio Investments. Collateral requirements are determined daily based on the value of the Funds' securities on loan as of the end of the prior business day. During the time portfolio securities are on loan, the borrower will pay the Funds any dividends or interest paid on such securities plus any fee negotiated between the parties to the lending agreement. The Funds also earn a return from the collateral. The Funds pay Citibank various fees in connection with the investment of cash collateral and fees based on the investment income received from securities lending activities. Securities lending income (net of these fees) is disclosed on the Statements of Operations. Loans are terminable upon demand and the borrower must return the loaned securities within the lesser of one standard settlement period or five business days. Although risk is mitigated by the collateral, a Fund could experience a delay in recovering its securities and possible loss of income or value if the borrower fails to return them. In addition, there is a risk that the value of the short-term investments will be less than the amount of cash collateral required to be returned to the borrower.
The Funds' agreement with Citibank does not include master netting provisions. Non-cash collateral received by the Funds may not be sold or repledged, except to satisfy borrower default.
The following table (amounts in thousands) is a summary of the Funds' securities lending transactions as of June 30, 2022.
| | | Value of
Securities on Loan | | Non-Cash
Collateral | | Cash
Collateral | |
Integrity Discovery Fund | | $ | 2,546 | | | $ | — | | | $ | 2,625 | | |
Integrity Mid-Cap Value Fund | | | 2,885 | | | | — | | | | 3,151 | | |
Integrity Small-Cap Value Fund | | | 22,789 | | | | — | | | | 24,052 | | |
Integrity Small/Mid-Cap Value Fund | | | 3,591 | | | | — | | | | 3,892 | | |
Munder Multi-Cap Fund | | | 6,589 | | | | — | | | | 6,743 | | |
S&P 500 Index Fund | | | 172 | | | | — | | | | 180 | | |
Munder Mid-Cap Core Growth Fund | | | 2,243 | | | | — | | | | 2,193 | | |
Munder Small Cap Growth Fund | | | 491 | | | | — | | | | 517 | | |
Trivalent International Fund — Core Equity | | | 3,302 | | | | — | | | | 3,472 | | |
Trivalent International Small-Cap Fund | | | 112,865 | | | | — | | | | 127,681 | | |
INCORE Total Return Bond Fund | | | 2,121 | | | | — | | | | 2,190 | | |
Foreign Currency Translations:
The accounting records of the Funds are maintained in U.S. dollars. Investment securities and other assets and liabilities of a Fund denominated in a foreign currency are translated into U.S. dollars at current exchange rates. Purchases and sales of securities, income receipts and expense payments are translated into U.S. dollars at the exchange rates on the date of the transactions. The Funds do not isolate the portion of the results of operations resulting from changes in foreign exchange rates on investments from fluctuations arising from changes in market prices of securities held. Such fluctuations are disclosed as Net change in unrealized appreciation/depreciation on investment securities and foreign currency translations on the Statements of Operations. Any realized gains or losses from these fluctuations are disclosed as Net realized gains (losses) from investment securities and foreign currency transactions on the Statements of Operations.
Mortgage Dollar Rolls:
The INCORE Total Return Bond Fund may enter into mortgage dollar roll transactions in which the Fund sells a mortgage-backed security to a counterparty to buy back similar, but not identical, securities on a specific future date at a predetermined price. Mortgage dollar rolls may be renewed by a new sale and repurchased with a cash settlement at each renewal without physical delivery of the securities. Certain risks may arise upon entering into mortgage dollar rolls from the potential inability of counterparties to meet the terms of their commitments. Additionally, the value of such securities may change adversely before the Fund is able to repurchase them. Mortgage dollar rolls are treated as financing transactions unless the sale and repurchase are determined to involve securities that are not
166
Victory Portfolios | | Notes to Financial Statements — continued
June 30, 2022 | |
substantially the same. Therefore, any gain or loss is considered unrealized until the roll reaches ultimate disposition or the sale and repurchase are determined to involve securities that are not substantially the same. Income is generated as consideration for entering into these transactions and is included in mortgage dollar roll income on the Fund's Statement of Operations. For the year ended June 30, 2022, there were no mortgage dollar roll transactions.
Foreign Taxes:
The Funds may be subject to foreign taxes related to foreign income received (a portion of which may be reclaimable), capital gains on the sale of securities, and certain foreign currency transactions. All foreign taxes are recorded in accordance with the applicable regulations and rates that exist in the foreign jurisdictions in which the Funds invest.
The Trivalent International Small-Cap Fund filed for additional European Union reclaims related to prior years. These reclaims are recorded when the amount is known and there are no significant uncertainties on collectability. For the year ended June 30, 2022, the Trivalent International Small-Cap Fund recognized $71 thousand in reclaims (net of less than $1 thousand realized gain or loss from currency translations) and $2 thousand related in interest on the filed reclaims. These reclaims are reflected on the Statements of Operations as Dividends and Interest, respectively.
Federal Income Taxes:
Each Fund intends to continue to qualify as a regulated investment company by complying with the provisions available to certain investment companies, as defined in applicable sections of the Internal Revenue Code, and to make distributions of net investment income and net realized gains sufficient to relieve it from all, or substantially all, federal income taxes. Accordingly, no provision for federal income taxes is required in the financial statements. The Funds have a tax year end of June 30.
For the year ended June 30, 2022, the Funds did not incur any income tax, interest, or penalties, and have recorded no liability for net unrecognized tax benefits relating to uncertain tax positions.
Management of the Funds has reviewed tax positions taken in tax years that remain subject to examination by all major tax jurisdictions, including federal (i.e., the last four tax years, which includes the current fiscal tax year end). Management believes that there is no tax liability resulting from unrecognized tax benefits related to uncertain tax positions taken.
Allocations:
Expenses directly attributable to a Fund are charged to that Fund, while expenses that are attributable to more than one fund in the Trust, or jointly with an affiliated trust, are allocated among the respective funds in the Trust and/or an affiliated trust based upon net assets or another appropriate basis.
Income, expenses (other than class-specific expenses such as transfer agent fees, state registration fees, printing fees, and 12b-1 fees), and realized and unrealized gains or losses on investments are allocated to each class of shares based on its relative net assets on the date income is earned or expenses and realized and unrealized gains and losses are incurred.
3. Purchases and Sales:
Purchases and sales of securities (excluding securities maturing less than one year from acquisition) for the year ended June 30, 2022, were as follows (amounts in thousands):
| | | Excluding
U.S. Government Securities | | U.S. Government
Securities | |
| | | Purchases | | Sales | | Purchases | | Sales | |
Integrity Discovery Fund | | $ | 29,744 | | | $ | 44,290 | | | $ | — | | | $ | — | | |
Integrity Mid-Cap Value Fund | | | 221,741 | | | | 188,135 | | | | — | | | | — | | |
Integrity Small-Cap Value Fund | | | 1,024,642 | | | | 1,435,174 | | | | — | | | | — | | |
167
Victory Portfolios | | Notes to Financial Statements — continued
June 30, 2022 | |
| | | Excluding
U.S. Government Securities | | U.S. Government
Securities | |
| | | Purchases | | Sales | | Purchases | | Sales | |
Integrity Small/Mid-Cap Value Fund | | $ | 159,460 | | | $ | 136,189 | | | $ | — | | | $ | — | | |
Munder Multi-Cap Fund | | | 281,805 | | | | 312,361 | | | | — | | | | — | | |
S&P 500 Index Fund | | | 12,355 | | | | 27,025 | | | | — | | | | — | | |
Munder Mid-Cap Core Growth Fund | | | 394,190 | | | | 541,509 | | | | — | | | | — | | |
Munder Small Cap Growth Fund | | | 5,343 | | | | 6,291 | | | | — | | | | — | | |
Trivalent International Fund — Core
Equity Fund | | | 131,172 | | | | 117,492 | | | | — | | | | — | | |
Trivalent International Small-Cap Fund | | | 2,379,554 | | | | 2,230,201 | | | | — | | | | — | | |
INCORE Total Return Bond Fund | | | 12,638 | | | | 13,203 | | | | 22,550 | | | | 21,596 | | |
4. Affiliated Fund Ownership:
The Funds offer shares for investment by other funds. The fund-of-funds do not invest in the underlying funds for the purpose of exercising management or control, and the affiliated fund-of-funds' annual and semi-annual reports may be viewed at vcm.com. As of June 30, 2022, certain fund-of-funds owned total outstanding shares of the Funds as follows:
Integrity Discovery Fund | | Ownership % | |
Victory Strategic Allocation Fund | | | 1.3 | | |
Integrity Mid-Cap Value Fund | | Ownership % | |
USAA Target Retirement Income Fund | | | 2.3 | | |
USAA Target Retirement 2030 Fund | | | 9.3 | | |
USAA Target Retirement 2040 Fund | | | 14.2 | | |
USAA Target Retirement 2050 Fund | | | 9.6 | | |
USAA Target Retirement 2060 Fund | | | 1.4 | | |
Trivalent International Fund — Core Equity | | Ownership % | |
USAA Target Retirement Income Fund | | | 8.0 | | |
USAA Target Retirement 2030 Fund | | | 22.6 | | |
USAA Target Retirement 2040 Fund | | | 32.7 | | |
USAA Target Retirement 2050 Fund | | | 22.3 | | |
USAA Target Retirement 2060 Fund | | | 3.2 | | |
Trivalent International Small-Cap Fund | | Ownership % | |
Victory Strategic Allocation Fund | | | 0.1 | | |
INCORE Total Return Bond Fund | |
Victory Strategic Allocation Fund | | | 4.3 | | |
5. Fees and Transactions with Affiliates and Related Parties:
Investment Advisory Fees:
Investment advisory services are provided to the Fund by the Adviser, which is a New York corporation registered as an investment adviser with the SEC. The Adviser is an indirect wholly owned subsidiary of Victory Capital Holdings, Inc., a publicly traded Delaware corporation, and a wholly owned direct subsidiary of Victory Capital Operating, LLC.
168
Victory Portfolios | | Notes to Financial Statements — continued
June 30, 2022 | |
Under the terms of the Investment Advisory Agreement, the Adviser is entitled to receive fees based on a percentage of the average daily net assets of each Fund. The rates at which the Adviser is paid by each Fund are included in the table below.
| | | Adviser Fee Tier Rates | |
| | | Flat Rate | | | | | |
Integrity Discovery Fund | | | 1.00 | % | | | | | | | | | |
| | | Up to $500 million | | | | Over $500 million | |
Integrity Mid-Cap Value Fund | | | 0.75 | % | | | | | | | 0.70 | % | |
| | | Up to $300 million | | | | Over $300 million | |
Integrity Small-Cap Value Fund | | | 0.90 | % | | | | | | | 0.85 | % | |
| | | Up to $300 million | | | | Over $300 million | |
Integrity Small/Mid-Cap Value Fund | | | 0.80 | % | | | | | | | 0.75 | % | |
| | | Up to $1 billion | | $1 billion – $2 billion | | Over $2 billion | |
Munder Multi-Cap Fund | | | 0.75 | % | | | 0.72 | % | | | 0.70 | % | |
| | | Up to $250 million | | $250 million –
$500 million | | Over $500 million | |
S&P 500 Index Fund | | | 0.20 | % | | | 0.12 | % | | | 0.07 | % | |
| | | Up to $6 billion | | $6 billion – $8 billion | | Over $8 billion | |
Munder Mid-Cap Core Growth Fund | | | 0.75 | % | | | 0.70 | % | | | 0.65 | % | |
| | | Flat Rate | | | | | |
Munder Small Cap Growth Fund | | | 0.85 | % | | | | | | | | | |
| | | Up to $1 billion | | | | Over $1 billion | |
Trivalent International Fund — Core
Equity | | | 0.80 | % | | | | | | | 0.75 | % | |
| | | Up to $1 billion | | | | Over $1 billion | |
Trivalent International Small-Cap Fund | | | 0.95 | % | | | | | | | 0.90 | % | |
| | | Flat Rate | | | | | |
INCORE Total Return Bond Fund | | | 0.40 | % | | | | | | | | | |
Amounts incurred and paid to VCM for the year ended June 30, 2022, are reflected on the Statements of Operations as Investment advisory fees.
Administration and Servicing Fees:
VCM also serves as the Funds' administrator and fund accountant. Under the Administration and Fund Accounting Agreement, VCM is entitled to receive fees based on a percentage of the average daily net assets of the Trust, Victory Variable Insurance Funds and Victory Portfolios II. The tiered rates at which VCM is paid by the Funds are shown in the table below:
Net Assets | |
Up to $15 billion | | $15 billion – $30 billion | | Over $30 billion | |
| | 0.08 | %, plus | | | 0.05 | %, plus | | | 0.04 | % | |
Amounts incurred for the year ended June 30, 2022, are reflected on the Statements of Operations as Administration fees.
169
Victory Portfolios | | Notes to Financial Statements — continued
June 30, 2022 | |
Citi Fund Services Ohio, Inc. ("Citi"), an affiliate of Citibank, acts as sub-administrator and sub-fund accountant to the Funds pursuant to the Sub-Administration and Sub-Fund Accounting Services Agreement between VCM and Citi. VCM pays Citi a fee for providing these services. The Trust reimburses VCM and Citi for out-of-pocket expenses incurred in providing these services and certain other expenses specifically allocated to the Funds. Amounts incurred for the year ended June 30, 2022, are reflected on the Statements of Operations as Sub-Administration fees.
The Funds (as part of the Trust) have entered into an agreement with the Adviser to provide compliance services, pursuant to which the Adviser furnishes its compliance personnel, including the services of the Chief Compliance Officer ("CCO"), and other resources reasonably necessary to provide the Trust with compliance oversight services related to the design, administration, and oversight of a compliance program for the Trust in accordance with Rule 38a-1 under the 1940 Act. The CCO is an employee of the Adviser, which pays the compensation of the CCO and support staff. The funds in the Trust, Victory Variable Insurance Funds, Victory Portfolios II and USAA Mutual Funds (collectively, the "Victory Funds Complex"), in aggregate, compensate the Adviser for these services. Amounts incurred for the year ended June 30, 2022, are reflected on the Statements of Operations as Compliance fees.
Transfer Agency Fees:
FIS Investor Services, LLC ("FIS") serves as the Funds' transfer agent. Under the Transfer Agent Agreement, the Trust pays FIS a fee for its services and reimburses FIS for all of their reasonable out-of-pocket expenses incurred in providing these services. Amounts incurred for the year ended June 30, 2022, are reflected on the Statements of Operations as Transfer agent fees.
Victory Capital Transfer Agency, Inc., an affiliate of the Adviser, serves as sub-transfer agent for the Member Class. Victory Capital Transfer Agency, Inc. receives no fee or other compensation for these services.
Distributor/Underwriting Services:
Victory Capital Services, Inc. (the "Distributor"), an affiliate of the Adviser, serves as Distributor for the continuous offering of the shares of the Funds pursuant to a Distribution Agreement between the Distributor and the Trust.
Pursuant to the Distribution and Service Plans adopted in accordance with Rule 12b-1 under the 1940 Act, the Distributor may receive a monthly distribution and service fee up to the annual rate shown in the table below:
| | | Class A | | Class C | | Class R | |
Integrity Discovery Fund | | | 0.25 | % | | | 1.00 | % | | | 0.50 | % | |
Integrity Mid-Cap Value Fund | | | 0.25 | % | | | 1.00 | % | | | N/A | | |
Integrity Small-Cap Value Fund | | | 0.25 | % | | | 1.00 | % | | | 0.50 | % | |
Integrity Small/Mid-Cap Value Fund | | | 0.25 | % | | | N/A | | | | N/A | | |
Munder Multi-Cap Fund | | | 0.25 | % | | | 1.00 | % | | | N/A | | |
S&P 500 Index Fund | | | 0.15 | % | | | N/A | | | | 0.50 | % | |
Munder Mid-Cap Core Growth Fund | | | 0.25 | % | | | 1.00 | % | | | 0.50 | % | |
Munder Small Cap Growth Fund | | | 0.25 | % | | | N/A | | | | N/A | | |
Trivalent International Fund — Core Equity | | | 0.25 | % | | | 1.00 | % | | | N/A | | |
Trivalent International Small-Cap Fund | | | 0.25 | % | | | 1.00 | % | | | N/A | | |
INCORE Total Return Bond Fund | | | 0.25 | % | | | 1.00 | % | | | N/A | | |
The distribution and service fees paid to the Distributor may be used by the Distributor to pay for activities primarily intended to result in the sale of Class A, Class C, and Class R. Amounts incurred for the year ended June 30, 2022, are reflected on the Statements of Operations as 12b-1 fees.
In addition, the Distributor is entitled to receive commissions in connection with sales of Class A. For the year ended June 30, 2022, the Distributor received approximately $43 thousand from commissions earned in connection with sales of Class A.
170
Victory Portfolios | | Notes to Financial Statements — continued
June 30, 2022 | |
Other Fees:
Citibank serves as the Funds' custodian. The Funds pay Citibank a fee for providing these services. Amounts incurred for the year ended June 30, 2022, are reflected on the Statements of Operations as Custodian fees.
Sidley Austin LLP provides legal services to the Trust.
The Adviser has entered into expense limitation agreements with certain Funds. Under the terms of the agreements, the Adviser has agreed to waive fees or reimburse certain expenses to the extent that ordinary operating expenses incurred by certain classes of a Fund in any fiscal year exceed the expense limit for such classes of the Fund. Such excess amounts will be the liability of the Adviser. Acquired fund fees and expenses, interest, taxes, brokerage commissions, other expenditures which are capitalized in accordance with GAAP, and other extraordinary expenses not incurred in the ordinary course of a Fund's business are excluded from the expense limits. As of June 30, 2022, the expense limits (excluding voluntary waivers) are as follows:
| | | In effect until April 30, 2022 | |
| | | Class A | | Class C | | Class I | | Class R | | Class R6 | | Class Y | | Member
Class | |
Integrity Discovery Fund | | | 1.66 | % | | | 2.45 | % | | | N/A | | | | 2.08 | % | | | N/A | | | | 1.44 | % | | | 1.50 | % | |
Integrity Mid-Cap Value Fund | | | 1.00 | % | | | 1.75 | % | | | N/A | | | | N/A | | | | 0.60 | % | | | 0.75 | % | | | 0.85 | % | |
Integrity Small-Cap Value Fund | | | 1.50 | % | | | 2.35 | % | | | N/A | | | | 1.75 | % | | | N/A | | | | N/A | | | | N/A | | |
Integrity Small/Mid-Cap Value Fund | | | 1.13 | % | | | N/A | | | | N/A | | | | N/A | | | | 0.83 | % | | | 0.88 | % | | | 0.95 | % | |
Munder Multi-Cap Fund | | | N/A | | | | 2.16 | % | | | N/A | | | | N/A | | | | N/A | | | | N/A | | | | N/A | | |
S&P 500 Index Fund | | | N/A | | | | N/A | | | | N/A | | | | N/A | | | | N/A | | | | N/A | | | | N/A | | |
Munder Mid-Cap Core Growth Fund | | | 1.32 | % | | | 2.12 | % | | | N/A | | | | 1.57 | % | | | N/A | | | | N/A | | | | N/A | | |
Munder Small Cap Growth Fund | | | 1.40 | % | | | N/A | | | | 1.15 | % | | | N/A | | | | N/A | | | | 1.25 | % | | | N/A | | |
Trivalent International Fund — Core Equity | | | 0.95 | % | | | 1.70 | % | | | 0.60 | % | | | N/A | | | | 0.55 | % | | | 0.70 | % | | | N/A | | |
Trivalent International Small-Cap Fund | | | 1.35 | % | | | 2.10 | % | | | 0.95 | % | | | N/A | | | | 1.10 | % | | | 1.10 | % | | | N/A | | |
INCORE Total Return Bond Fund | | | 0.85 | % | | | 1.60 | % | | | N/A | | | | N/A | | | | 0.58 | % | | | 0.60 | % | | | N/A | | |
Under the terms of the expense limitation agreements, as amended May 1, 2022, the Funds have agreed to repay fees and expenses that were waived or reimbursed by the Adviser for a period of up to three years (thirty-six (36) months) after the waiver or reimbursement took place, subject to the lesser of any operating expense limits in effect at the time of: (a) the original waiver or expense reimbursement; or (b) the recoupment, after giving effect to the recoupment amount.
As of June 30, 2022, the following amounts are available to be repaid to the Adviser. The Funds have not recorded any amounts available to be repaid as a liability due to an assessment that such repayments are not probable at June 30, 2022.
| | | Expires
2023 | | Expires
2024 | | Expires
2025 | | Total | |
Integrity Discovery Fund | | $ | 9 | | | $ | 35 | | | $ | 42 | | | $ | 86 | | |
Integrity Mid-Cap Value Fund | | | 615 | | | | 639 | | | | 785 | | | | 2,039 | | |
Integrity Small-Cap Value Fund | | | 8 | | | | 13 | | | | 14 | | | | 35 | | |
Integrity Small/Mid-Cap Value Fund | | | 185 | | | | 213 | | | | 259 | | | | 657 | | |
Munder Multi-Cap Fund | | | 2 | | | | 8 | | | | 8 | | | | 18 | | |
Munder Mid-Cap Core Growth Fund | | | 16 | | | | 18 | | | | 24 | | | | 58 | | |
Munder Small Cap Growth Fund | | | 19 | | | | 14 | | | | 21 | | | | 54 | | |
Trivalent International Fund — Core Equity | | | 522 | | | | 896 | | | | 958 | | | | 2,376 | | |
Trivalent International Small-Cap Fund | | | 3,170 | | | | 4,069 | | | | 4,898 | | | | 12,137 | | |
INCORE Total Return Bond Fund | | | 52 | | | | 97 | | | | 73 | | | | 222 | | |
The Adviser may voluntarily waive or reimburse additional fees to assist the Funds in maintaining competitive expense ratios. Voluntary waivers and reimbursements applicable to the Funds are not available to be recouped at a future time. There were no voluntary waivers or reimbursements for the year ended June 30, 2022.
171
Victory Portfolios | | Notes to Financial Statements — continued
June 30, 2022 | |
Certain officers and/or interested trustees of the Funds are also officers and/or employees of the Adviser, administrator, fund accountant, sub-administrator, sub-fund accountant, custodian, legal counsel, and Distributor.
6. Risks:
The Funds may be subject to other risks in addition to these identified risks.
Equity Risk — The value of the equity securities in which the Fund invests may decline in response to developments affecting individual companies and/or general economic conditions. A company's earnings or dividends may not increase as expected due to poor management decisions, competitive pressures, breakthroughs in technology, reliance on suppliers, labor problems or shortages, corporate restructurings, fraudulent disclosures, natural disasters, military confrontations, war, terrorism, public health crises, or other events, conditions, and factors. Price changes may be temporary or last for extended periods.
Foreign Investments Risk — The Trivalent International Fund — Core Equity and Trivalent International Small-Cap Fund invest in securities of foreign issuers in various countries. Investing on an international basis involves certain risks not involved in domestic investments including the risk of nationalization or expropriation of assets, imposition of currency exchange controls or restrictions on the repatriation of foreign currency, confiscatory taxation, political or financial instability and diplomatic developments, which could affect the value of a Fund's investments in certain foreign countries. Governments of many countries have exercised and continue to exercise substantial influence over many aspects of the private sector through the ownership or control of many companies, including some of the largest in these countries. As a result, government actions in the future could have a significant effect on economic conditions which may adversely affect prices of certain portfolio securities. There is also generally less government supervision and regulation of stock exchanges, brokers and listed companies than in the United States. Dividends or interest on, or proceeds from the sale of, foreign securities may be subject to foreign withholding taxes, and special U.S. tax considerations may apply. Moreover, foreign economies may differ favorably or unfavorably from the U.S. economy in such respects as growth of gross national product, rate of inflation, capital reinvestment, resource self-sufficiency and balance of payments position. The Schedules of Portfolio Investments includes information on each Fund's holdings, including industry and/or geographic composition, as relevant.
Interest Rate Risk — The INCORE Total Return Bond Fund is subject to credit and interest rate risk with respect to fixed income securities. Credit risk refers to the ability of an issuer to make timely payments of interest and principal. Interest rates may rise, or the rate of inflation may increase, impacting the value if investments in fixed income securities. A debt issuer's credit quality may be downgraded, or an issuer may default. Interest rates may fluctuate due to changes in governmental fiscal policy initiatives and resulting market reaction to those initiatives.
Credit Risk — The Funds will be subject to credit risk with respect to the amount each expects to receive from counterparties for financial instruments entered into by the Funds. The Funds may be negatively impacted if a counterparty becomes bankrupt or otherwise fails to perform its obligations due to financial difficulties. The Funds may experience significant delays in obtaining any recovery in bankruptcy or other reorganization proceeding and the Funds may obtain only limited recovery or may obtain no recovery in such circumstances. The Funds typically enter into transactions with counterparties whose credit ratings are investment grade, as determined by a nationally recognized statistical rating organization or, if unrated, judged by the Adviser to be of comparable quality.
Sector Risk — To the extent the Funds focus in one or more sectors, market or economic factors impacting those sectors could have a significant effect on the value of the Funds' investments and could make the Funds' performance more volatile. For example, the values of companies in the Information Technology sector are particularly vulnerable to economic downturns, short product cycles and aggressive pricing, market competition and changes in government regulation.
172
Victory Portfolios | | Notes to Financial Statements — continued
June 30, 2022 | |
LIBOR Discontinuation Risk — The London Interbank Offered Rate ("LIBOR") discontinuation may adversely affect the financial markets generally and the Funds' operations, finances and investments specifically. LIBOR has been the principal floating-rate benchmark in the financial markets. However, LIBOR has been or will be discontinued as a floating rate benchmark. The date of discontinuation depends on the LIBOR currency and tenor. With limited exceptions, no new LIBOR obligations will be entered into after December 31, 2021. Existing LIBOR obligations have transitioned or will transition to another benchmark, depending on the LIBOR currency and tenor. For some existing LIBOR-based obligations, the contractual consequences of the discontinuation of LIBOR may not be clear.
Non-LIBOR floating-rate obligations, including Secured Overnight Financing Rate ("SOFR")-based obligations, may have returns and values that fluctuate more than those of floating-rate debt obligations that are based on LIBOR or other rates. Also, because SOFR and some alternative floating rates are relatively new market indexes, markets for certain non-LIBOR obligations may never develop or may not be liquid. Market terms for non-LIBOR floating rate obligations, such as the spread over the index reflected in interest-rate provisions, may evolve over time, and prices of non-LIBOR floating rate obligations may be different depending on when they are issued and changing views about correct spread levels.
Various SOFR-based rates, including SOFR-based term rates, and various non-SOFR-based rates are expected to develop in response to the discontinuation of U.S. dollar LIBOR, which may create various risks for the Funds and the financial markets more generally. There are non-LIBOR forward-looking floating rates that are not based on SOFR and that may be considered by participants in the financial markets as LIBOR alternatives. Such rates include AMERIBOR (American Interbank Offered Rate), BSBY (Bloomberg Short-Term Bank Yield Index) and BYI (Bank Yield Index). Unlike forward-looking SOFR-based term rates, such rates are intended to reflect a bank credit spread component.
It is not clear how replacement rates for LIBOR — including SOFR-based rates and non-SOFR-based rates — will develop and to what extent they will be used. There is no assurance that these replacement rates will be suitable substitutes for LIBOR, and thus the substitution of such rates for LIBOR could have an adverse effect on the Funds and the financial markets more generally. Concerns about market depth and stability could affect the development of non-SOFR-based term rates, and such rates may create various risks, which may or may not be similar to the risks relating to SOFR.
Market Risk — Overall market risks may affect the value of the Fund. Domestic and international factors such as political events, war, terrorism, trade disputes, inflation rates, interest rate levels and other fiscal and monetary policy changes, cybersecurity incidents, pandemics and other public health crises, sanctions against a particular foreign country, its nationals, businesses or industries and related geopolitical events, as well as environmental disasters such as earthquakes, fires, and floods or other catastrophes, may add to instability in global economies and markets generally, and may lead to increased market volatility. Global economies and financial markets are highly interconnected, which increases the possibility that conditions in one country or region might adversely affect issuers in another country or region. The impact of these and other factors may be short-term or may last for extended periods.
7. Borrowing and Interfund Lending:
Line of Credit:
The Victory Funds Complex participates in a short-term demand note "Line of Credit" agreement with Citibank. The Line of Credit agreement with Citibank was renewed on June 27, 2022, with a termination date of June 26, 2023. Under the agreement with Citibank, the Victory Funds Complex may borrow up to $600 million, of which $300 million is committed and $300 million is uncommitted. $40 million of the Line of Credit is reserved for use by the Victory Floating Rate Fund, another series of the Victory Funds Complex, with Victory Floating Rate Fund paying the related commitment fees for that amount. The purpose of the Line of Credit is to meet temporary or emergency cash needs. For the year ended
173
Victory Portfolios | | Notes to Financial Statements — continued
June 30, 2022 | |
June 30, 2022, Citibank received an annual commitment fee of 0.15% on $300 million for providing the Line of Credit. Each fund in the Victory Funds Complex paid a pro-rata portion of the commitment fees plus any interest on amounts borrowed. For the period from July 1, 2021, through June 27, 2022, interest was based on the one-month LIBOR plus one percent. Effective with the renewal, for the period June 28, 2022, through June 30, 2022, interest was based on the one-month SOFR plus 1.10 percent. Interest charged to each fund during the period, if applicable, is reflected on the Statements of Operations under Line of credit fees.
The average borrowing for the days outstanding and average interest rate for each Fund that utilized the Line of Credit during the year ended June 30, 2022, were as follows (amounts in thousands):
| | | Amount
Outstanding
at
June 30,
2022 | | Average
Borrowing* | | Days
Borrowing
Outstanding | | Average
Interest
Rate* | | Maximum
Borrowing
During
the Period | |
Trivalent International
Small-Cap Fund | | $ | — | | | $ | 30,900 | | | | 2 | | | | 1.22 | % | | $ | 30,900 | | |
* Based on the number of days borrowings were outstanding for the year ended June 30, 2022.
Interfund Lending:
The Trust and the Adviser rely on an exemptive order granted by the SEC in March 2017 (the "Order"), permitting the establishment and operation of an Interfund Lending Facility (the "Facility"). The Facility allows each Fund to directly lend and borrow money to or from any other fund in the Victory Funds Complex that is permitted to participate in the Facility, relying upon the Order at rates beneficial to both the borrowing and lending funds. Advances under the Facility are allowed for temporary or emergency purposes, including the meeting of redemption requests that otherwise might require the untimely disposition of securities, and are subject to each Fund's borrowing restrictions. The interfund loan rate is determined, as specified in the Order, by averaging the current repurchase agreement rate and the current bank loan rate. As a Borrower, interest charged to each Fund, if any, during the period, is reflected on the Statements of Operations under Interfund lending fees. As a Lender, interest earned by each Fund, if any, during the period, is reflected on the Statements of Operations under Interfund lending.
The average borrowing or lending for the days outstanding and average interest rate for each Fund during the year ended June 30, 2022, were as follows (amounts in thousands):
| | |
Borrower
or
Lender | | Amount
Outstanding
at
June 30,
2022 | | Average
Borrowing* | | Days
Borrowing
Outstanding | | Average
Interest
Rate* | | Maximum
Borrowing
During
the Period | |
Munder Multi-Cap
Fund | | Borrower | | $ | — | | | $ | 2,658 | | | | 4 | | | | 0.79 | % | | $ | 2,982 | | |
Trivalent International
Small-Cap Fund | | Borrower | | | — | | | | 22,420 | | | | 12 | | | | 0.74 | % | | | 34,798 | | |
* Based on the number of days borrowings were outstanding for the year ended June 30, 2022.
174
Victory Portfolios | | Notes to Financial Statements — continued
June 30, 2022 | |
8. Federal Income Tax Information:
Dividends from net investment income, if any, are declared and paid as noted in the table below. Distributable net realized gains, if any, are declared and distributed at least annually from each Fund.
| | | Declared | | Paid | |
Integrity Discovery Fund | | Annually | | Annually | |
Integrity Mid-Cap Value Fund | | Annually | | Annually | |
Integrity Small-Cap Value Fund | | Annually | | Annually | |
Integrity Small/Mid-Cap Value Fund | | Annually | | Annually | |
Munder Multi-Cap Fund | | Annually | | Annually | |
S&P 500 Index Fund | | Quarterly | | Quarterly | |
Munder Mid-Cap Core Growth Fund | | Annually | | Annually | |
Munder Small Cap Growth Fund | | Annually | | Annually | |
Trivalent International Fund — Core Equity | | Annually | | Annually | |
Trivalent International Small-Cap Fund | | Annually | | Annually | |
INCORE Total Return Bond Fund | | Monthly | | Monthly | |
The amounts of dividends from net investment income and distributions from net realized gains (collectively, distributions to shareholders) are determined in accordance with federal income tax regulations, which may differ from GAAP. To the extent these "book/tax" differences are permanent in nature (e.g., net operating loss and distribution reclassification), such amounts are reclassified within the components of net assets based on their federal tax-basis treatment; temporary differences (e.g., wash sales) do not require reclassification. To the extent dividends and distributions exceed net investment income and net realized gains for tax purposes, they are reported as distributions of capital. Net investment losses incurred by the Funds may be reclassified as an offset to capital on the accompanying Statements of Assets and Liabilities.
As of June 30, 2022, on the Statements of Assets and Liabilities, as a result of permanent book-to-tax differences, reclassification adjustments were as follows (amounts in thousands):
| | Total
Accumulated
Earnings/(Loss) | | Capital | |
Integrity Discovery Fund | | $ | (936 | ) | | $ | 936 | | |
Integrity Mid-Cap Value Fund | | | (1,894 | ) | | | 1,894 | | |
Integrity Small-Cap Value Fund | | | (28,051 | ) | | | 28,051 | | |
Integrity Small/Mid-Cap Value Fund | | | (1,635 | ) | | | 1,635 | | |
Munder Multi-Cap Fund | | | (3,005 | ) | | | 3,005 | | |
S&P 500 Index Fund | | | (687 | ) | | | 687 | | |
Munder Mid-Cap Core Growth Fund | | | (7,036 | ) | | | 7,036 | | |
Trivalent International Small-Cap Fund | | | (19,900 | ) | | | 19,900 | | |
The tax character of distributions paid during the tax years ended, as noted below, were as follows (total distributions paid may differ from the Statements of Changes in Net Assets because, for tax purposes, dividends are recognized when actually paid (amounts in thousands)).
| | | Year Ended June 30, 2022 | |
| | Distributions paid from: | | | |
| | Ordinary
Income | | Net
Long-Term
Capital Gains | | Total
Distributions
Paid | |
Integrity Discovery Fund | | $ | — | | | $ | 4,087 | | | $ | 4,087 | | |
Integrity Mid-Cap Value Fund | | | 3,218 | | | | 9,839 | | | | 13,057 | | |
Integrity Small-Cap Value Fund | | | 92,940 | | | | 198,379 | | | | 291,319 | | |
Integrity Small/Mid-Cap Value Fund | | | 2,614 | | | | 10,994 | | | | 13,608 | | |
Munder Multi-Cap Fund | | | 13,197 | | | | 35,271 | | | | 48,468 | | |
S&P 500 Index Fund | | | 2,576 | | | | 18,947 | | | | 21,523 | | |
Munder Mid-Cap Core Growth Fund | | | 21,732 | | | | 101,710 | | | | 123,442 | | |
Munder Small Cap Growth Fund | | | 408 | | | | 1,185 | | | | 1,593 | | |
175
Victory Portfolios | | Notes to Financial Statements — continued
June 30, 2022 | |
| | Year Ended June 30, 2022 | |
| | Distributions paid from: | | | |
| | Ordinary
Income | | Net
Long-Term
Capital Gains | | Total
Distributions
Paid | |
Trivalent International Fund — Core Equity Fund | | $ | 8,486 | | | $ | — | | | $ | 8,486 | | |
Trivalent International Small-Cap Fund | | | 58,936 | | | | 229,104 | | | | 288,040 | | |
INCORE Total Return Bond Fund | | | 1,567 | | | | — | | | | 1,567 | | |
| | Year Ended June 30, 2021 | |
| | Distributions paid from | | | | | | | |
| | Ordinary
Income | | Net
Long-Term
Capital Gains | | Total
Taxable
Distributions | | Return of
Capital | | Total
Distributions
Paid | |
Integrity Mid-Cap Value Fund | | $ | 4,163 | | | $ | — | | | $ | 4,163 | | | $ | 945 | | | $ | 5,108 | | |
Integrity Small-Cap Value Fund | | | 7,500 | | | | — | | | | 7,500 | | | | — | | | | 7,500 | | |
Integrity Small/Mid-Cap Value Fund | | | 1,424 | | | | 973 | | | | 2,397 | | | | — | | | | 2,397 | | |
Munder Multi-Cap Fund | | | 368 | | | | — | | | | 368 | | | | — | | | | 368 | | |
S&P 500 Index Fund | | | 2,896 | | | | 13,717 | | | | 16,613 | | | | — | | | | 16,613 | | |
Munder Mid-Cap Core Growth Fund | | | — | | | | 60,802 | | | | 60,802 | | | | — | | | | 60,802 | | |
Munder Small Cap Growth Fund | | | 392 | | | | 724 | | | | 1,116 | | | | — | | | | 1,116 | | |
Trivalent International Fund — Core Equity
Fund | | | 2,905 | | | | — | | | | 2,905 | | | | — | | | | 2,905 | | |
Trivalent International Small-Cap Fund | | | 9,465 | | | | — | | | | 9,465 | | | | — | | | | 9,465 | | |
INCORE Total Return Bond Fund | | | 1,780 | | | | — | | | | 1,780 | | | | — | | | | 1,780 | | |
As of June 30, 2022, the components of accumulated earnings/(loss) on a tax basis were as follows (amounts in thousands):
| | Undistributed
Ordinary
Income | | Undistributed
Long-Term
Capital Gains | | Accumulated
Earnings | | Accumulated
Capital and
Other Losses | | Qualified
Late-Year
Losses* | | Unrealized
Appreciation
(Depreciation)** | | Total
Accumulated
Earnings
(Loss) | |
Integrity Discovery
Fund | | $ | 1,668 | | | $ | 3,909 | | | $ | 5,577 | | | $ | — | | | $ | — | | | $ | 2,131 | | | $ | 7,708 | | |
Integrity Mid-Cap Value
Fund | | | 2,683 | | | | 11,515 | | | | 14,198 | | | | — | | | | — | | | | 10,141 | | | | 24,339 | | |
Integrity Small-Cap
Value Fund | | | 30,449 | | | | 151,639 | | | | 182,088 | | | | — | | | | — | | | | 64,880 | | | | 246,968 | | |
Integrity Small/Mid-Cap
Value Fund | | | 1,574 | | | | 16,454 | | | | 18,028 | | | | — | | | | — | | | | 3,798 | | | | 21,826 | | |
Munder Multi-Cap
Fund | | | 87 | | | | 49,518 | | | | 49,605 | | | | — | | | | — | | | | 59,413 | | | | 109,018 | | |
S&P 500 Index Fund | | | 94 | | | | 8,322 | | | | 8,416 | | | | — | | | | — | | | | 172,958 | | | | 181,374 | | |
Munder Mid-Cap Core
Growth Fund | | | — | | | | 44,088 | | | | 44,088 | | | | — | | | | (7,020 | ) | | | 51,062 | | | | 88,130 | | |
Munder Small Cap
Growth Fund | | | — | | | | 1,335 | | | | 1,335 | | | | — | | | | (53 | ) | | | (719 | ) | | | 563 | | |
Trivalent International
Fund — Core
Equity Fund | | | 1,034 | | | | — | | | | 1,034 | | | | (1,524 | ) | | | — | | | | (12,512 | ) | | | (13,002 | ) | |
Trivalent International
Small-Cap Fund | | | 19,938 | | | | — | | | | 19,938 | | | | — | | | | (13,155 | ) | | | (258,289 | ) | | | (251,506 | ) | |
INCORE Total Return
Bond Fund | | | 70 | | | | — | | | | 70 | | | | (4,214 | ) | | | — | | | | (6,358 | ) | | | (10,502 | ) | |
* Qualified late-year losses are comprised of post-October capital losses incurred after October 31 and certain late-year ordinary losses. Late-year ordinary losses represent ordinary losses incurred
176
Victory Portfolios | | Notes to Financial Statements — continued
June 30, 2022 | |
after December 31 and specified losses incurred after October 31. These losses are deemed to arise on the first day of the Fund's next taxable year.
** The difference between the book-basis and tax-basis unrealized appreciation (depreciation) is attributable primarily to tax deferral of losses on wash sales, futures, passive foreign investment company adjustments, hybrid accruals interest purchased, and deemed dividends on Convertible Debt under Sec. 305(c).
As of June 30, 2022, the Funds had net capital loss carryforwards as shown in the table below (amounts in thousands). It is unlikely that the Board will authorize a distribution of capital gains realized in the future until the capital loss carryforwards have been used (amounts in thousands).
| | | Short-Term
Amount | | Long-Term
Amount | | Total | |
Trivalent International Fund — Core Equity Fund | | $ | (1,524 | ) | | $ | — | | | $ | (1,524 | ) | |
INCORE Total Return Bond Fund | | | (912 | ) | | | (3,302 | ) | | | (4,214 | ) | |
During the tax year ended June 30, 2022, the following Fund utilized capital loss carryforwards (amounts in thousands):
| | Amount | |
Trivalent International Fund — Core Equity Fund | | $ | 679 | | |
Integrity Mid-Cap Value Fund | | | 930 | | |
As of June 30, 2022, the cost basis for federal income tax purposes, gross unrealized appreciation, gross unrealized depreciation, and net unrealized appreciation (depreciation) for investments were as follows (amounts in thousands):
| | Cost of
Investments
for Federal
Tax Purposes | | Net Gross
Unrealized
Appreciation | | Gross
Unrealized
Depreciation | | Net
Unrealized
Appreciation
(Depreciation) | |
Integrity Discovery Fund | | $ | 63,736 | | | $ | 10,091 | | | $ | (7,960 | ) | | $ | 2,131 | | |
Integrity Mid-Cap Value Fund | | | 264,904 | | | | 29,406 | | | | (19,265 | ) | | | 10,141 | | |
Integrity Small-Cap Value Fund | | | 1,330,679 | | | | 180,986 | | | | (116,106 | ) | | | 64,880 | | |
Integrity Small/Mid-Cap Value Fund | | | 206,345 | | | | 20,592 | | | | (16,794 | ) | | | 3,798 | | |
Munder Multi-Cap Fund | | | 317,517 | | | | 88,386 | | | | (28,973 | ) | | | 59,413 | | |
S&P 500 Index Fund | | | 48,679 | | | | 176,162 | | | | (3,204 | ) | | | 172,958 | | |
Munder Mid-Cap Core Growth Fund | | | 311,208 | | | | 79,022 | | | | (27,960 | ) | | | 51,062 | | |
Munder Small Cap Growth Fund | | | 11,833 | | | | 2,472 | | | | (3,191 | ) | | | (719 | ) | |
Trivalent International Fund — Core
Equity Fund | | | 199,424 | | | | 10,621 | | | | (23,089 | ) | | | (12,468 | ) | |
Trivalent International Small-Cap
Fund | | | 2,884,276 | | | | 250,211 | | | | (508,194 | ) | | | (257,983 | ) | |
INCORE Total Return Bond Fund | | | 69,421 | | | | 349 | | | | (6,707 | ) | | | (6,358 | ) | |
9. Fund Ownership:
Ownership of more than 25% of voting securities of a fund creates presumptions of control of the fund, under section 2(a)(9) of the 1940 Act. As of June 30, 2022, the shareholders listed below held more than 25% of the shares outstanding of the Funds and may be deemed to control those Funds. Shareholders of record may hold Funds shares for the benefit of their customers.
| | Shareholder | | Percent | |
| Munder Small Cap Growth Fund | | Brian S. Matuszak | | | 36.1 | % | |
| Munder Small Cap Growth Fund | | Tony Y. Dong | | | 51.1 | % | |
177
REPORT OF INDEPENDENT REGISTERED PUBLIC ACCOUNTING FIRM
To the Shareholders and Board of Trustees of Victory Portfolios
Opinion on the Financial Statements
We have audited the accompanying statements of assets and liabilities, including the schedules of portfolio investments, of Victory Integrity Discovery Fund, Victory Integrity Mid-Cap Value Fund, Victory Integrity Small-Cap Value Fund, Victory Integrity Small/Mid-Cap Value Fund, Victory Munder Multi-Cap Fund, Victory S&P 500 Index Fund, Victory Munder Mid-Cap Core Growth Fund, Victory Munder Small Cap Growth Fund, Victory Trivalent International Fund-Core Equity, Victory Trivalent International Small-Cap Fund, and Victory INCORE Total Return Bond Fund (the "Funds"), each a series of Victory Portfolios, as of June 30, 2022, the related statements of operations for the year then ended, the statements of changes in net assets for each of the two years in the period then ended, the related notes, and the financial highlights for each of the four years in the period then ended (collectively referred to as the "financial statements"). In our opinion, the financial statements present fairly, in all material respects, the financial position the Funds as of June 30, 2022, the results of their operations for the year then ended, the changes in net assets for each of the two years in the period then ended, and the financial highlights for each of the four years in the period then ended, in conformity with accounting principles generally accepted in the United States of America.
The Funds' financial highlights for the year ended June 30, 2018, were audited by other auditors whose report dated August 24, 2018, expressed an unqualified opinion on those financial highlights.
Basis for Opinion
These financial statements are the responsibility of the Funds' management. Our responsibility is to express an opinion on the Funds' financial statements based on our audits. We are a public accounting firm registered with the Public Company Accounting Oversight Board (United States) ("PCAOB") and are required to be independent with respect to the Funds in accordance with the U.S. federal securities laws and the applicable rules and regulations of the Securities and Exchange Commission and the PCAOB.
We conducted our audits in accordance with the standards of the PCAOB. Those standards require that we plan and perform the audit to obtain reasonable assurance about whether the financial statements are free of material misstatement whether due to error or fraud.
Our audits included performing procedures to assess the risks of material misstatement of the financial statements, whether due to error or fraud, and performing procedures that respond to those risks. Such procedures included examining, on a test basis, evidence regarding the amounts and disclosures in the financial statements. Our procedures included confirmation of securities owned as of June 30, 2022, by correspondence with the custodian and brokers; when replies were not received from brokers, we performed other auditing procedures. Our audits also included evaluating the accounting principles used and significant estimates made by management, as well as evaluating the overall presentation of the financial statements. We believe that our audits provide a reasonable basis for our opinion.
We have served as the auditor of one or more investment companies advised by Victory Capital Management, Inc. since 2015.

COHEN & COMPANY, LTD.
Cleveland, Ohio
August 26, 2022
178
Victory Portfolios | | Supplemental Information
June 30, 2022 | |
(Unaudited)
Trustee and Officer Information
Board of Trustees:
Overall responsibility for management of the Trust rests with the Board. The Trust is managed by the Board in accordance with the laws of the State of Delaware. There are currently nine Trustees, eight of whom are not "interested persons" of the Trust within the meaning of that term under the 1940 Act ("Independent Trustees") and one of whom is an "interested person" of the Trust within the meaning of that term under the 1940 Act ("Interested Trustee"). The Trustees, in turn, elect the officers of the Trust to actively supervise its day-to-day operations.
The following tables list the Trustees, their date of birth, their position with the Trust, their commencement of service, their principal occupations during the past five years, and any directorships of other investment companies or companies whose securities are registered under the Securities Exchange Act of 1934, as amended, or who file reports under that Act. Each Trustee oversees 40 portfolios in the Trust, six portfolios in Victory Variable Insurance Funds, and 25 portfolios in Victory Portfolios II, each a registered investment company that, together with the Trust, comprise the Victory Fund Complex. David C. Brown is a Trustee of USAA Mutual Funds and oversees 45 portfolios of the USAA Mutual Funds Trust. Each Trustee's address is c/o Victory Portfolios, 4900 Tiedeman Road, 4th Floor, Brooklyn, Ohio 44144. Each Trustee has an indefinite term.
Name and Date of Birth | | Position
Held with
the Trust | | Date
Commenced
Service | | Principal Occupation
During Past 5 Years | | Other
Directorships
Held During
Past 5 Years | |
Independent Trustees. | |
David Brooks Adcock,
Born October 1951 | | Trustee | | May 2005 | | Consultant (since 2006). | | Chair and Trustee, Turner Funds (December 2016-December 2017). | |
Nigel D. T. Andrews,
Born April 1947 | | Trustee | | August 2002 | | Retired. | | Director, Carlyle Secured Lending, Inc. (formerly TCG BDC I, Inc.) (since 2012); Director, Carlyle Credit Solutions, Inc. (formerly TCG BDC II, Inc.) (since 2017); Trustee, Carlyle Secured Lending III (since 2021). | |
E. Lee Beard,*
Born August 1951 | | Trustee | | May 2005 | | Retired. | | None. | |
Dennis M. Bushe,
Born January 1944 | | Trustee | | July 2016 | | Retired. | | None. | |
179
Victory Portfolios | | Supplemental Information — continued
June 30, 2022 | |
(Unaudited)
Name and Date of Birth | | Position
Held with
the Trust | | Date
Commenced
Service | | Principal Occupation
During Past 5 Years | | Other
Directorships
Held During
Past 5 Years | |
John L. Kelly,
Born April 1953 | | Chair and Trustee | | February 2015 | | Partner, McCarvill Capital Partners (September 2016- September 2017). | | Director, Caledonia Mining Corporation (since May 2012). | |
David L. Meyer,
Born April 1957 | | Trustee | | December 2008 | | Retired. | | None. | |
Gloria S. Nelund,
Born May 1961 | | Trustee | | July 2016 | | Chair, CEO and Co-Founder of TriLinc Global, LLC, an investment firm. | | TriLinc Global Impact Fund, LLC (since 2012). | |
Leigh A. Wilson,
Born December 1944 | | Trustee | | November 1994 | | Private Investor. | | Chair (since 2013), Caledonia Mining Corporation. | |
Interested Trustee. | |
David C. Brown,**
Born May 1972 | | Trustee | | May 2008 | | Chairman and Chief Executive Officer (since 2013), the Adviser; Chairman and Chief Executive Officer (since 2013), Victory Capital Holdings, Inc.; Chairman and Chief Executive Officer (since 2019), Victory Capital Transfer Agency, Inc. | | Trustee, USAA Mutual Funds Trust; Board Member, Victory Capital Services, Inc. | |
* The Board has designated Ms. Beard as its Audit Committee Financial Expert.
** Mr. Brown is an "Interested Person" by reason of his relationship with the Adviser.
The Statement of Additional Information includes additional information about the Trustees of the Trust and is available, without charge, by calling 800-539-3863.
180
Victory Portfolios | | Supplemental Information — continued
June 30, 2022 | |
(Unaudited)
Officers:
The officers of the Trust, their date of birth, their commencement of service, and their principal occupations during the past five years, are detailed in the following table. Each officer serves until the earlier of his or her resignation, removal, retirement, death, or the election of a successor. The mailing address of each officer of the Trust is 4900 Tiedeman Road, 4th Floor, Brooklyn, Ohio 44144. The officers of the Trust receive no compensation directly from the Trust for performing the duties of their offices.
Name and Date of Birth | | Position with
the Trust | | Date
Commenced
Service | | Principal Occupation During Past 5 Years | |
Christopher K. Dyer,
Born February 1962 | | President | | February 2006 | | Director of Mutual Fund Administration, the Adviser (since 2004); Chief Operating Officer, Victory Capital Services, Inc. (since 2020); Vice President, Victory Capital Transfer Agency, Inc. (since 2019). | |
Scott A. Stahorsky,
Born July 1969 | | Vice President | | December 2014 | | Manager, Fund Administration, the Adviser. (since 2015) | |
Erin G. Wagner,
Born February 1974 | | Secretary* | | December 2014-
April 2022 | | Associate General Counsel, the Adviser (2013-2022). | |
Thomas Dusenberry,
Born July 1977 | | Secretary | | May 2022 | | Manager, Fund Administration, the Adviser (since 2022); Treasurer and Principal Financial Officer (2020-2022), Assistant Treasurer (2019), Salient MF Trust, Salient Midstream, MLP Fund and Forward Funds; Principal Financial Officer (2018-2021) and Treasurer (2020-2021), Salient Private Access Funds and Endowment PMF Funds; Senior Vice President of Fund Accounting and Operations, Salient Partners (2020-2022); Director of Fund Operations, Salient Partners (2016-2019). | |
Allan Shaer,
Born March 1965 | | Treasurer | | May 2017 | | Senior Vice President, Financial Administration, Citi Fund Services Ohio, Inc. (since 2016); Vice President, Mutual Fund Administration, JP Morgan Chase (2011-2016). | |
Christopher A. Ponte,
Born March 1984 | | Assistant Treasurer | | December 2017 | | Manager, Fund Administration, the Adviser (since 2017); Senior Analyst, Fund Administration, the Adviser (prior to 2017); Chief Financial Officer, Victory Capital Services, Inc. (since 2018). | |
Colin Kinney,
Born October 1973 | | Chief Compliance Officer** | | July 2017-
June 2022 | | Chief Compliance Officer (2013-2022) and Chief Risk Officer (2009-2017), the Adviser. | |
181
Victory Portfolios | | Supplemental Information — continued
June 30, 2022 | |
(Unaudited)
Name and Date of Birth | | Position with
the Trust | | Date
Commenced
Service | | Principal Occupation During Past 5 Years | |
Sean Fox,
Born September 1976 | | Chief Compliance
Officer | | June 2022 | | Sr. Compliance Officer, the Adviser (since 2019); Compliance Officer, the Adviser (2015-2019). | |
Chuck Booth,
Born April 1960 | | Anti-Money Laundering Compliance Officer and Identity Theft Officer | | May 2015 | | Director, Regulatory Administration and CCO Support Services, Citi Fund Services Ohio, Inc. | |
Jay G. Baris,
Born January 1954 | | Assistant Secretary | | December 1997 | | Partner, Sidley Austin LLP (since 2020); Partner, Shearman & Sterling LLP (2018-2020); Partner, Morrison & Foerster LLP (2011-2018). | |
* On April 27, 2022, Ms. Wagner resigned her position with the Trust.
** On June 10, 2022, Mr. Kinney resigned his position with the Trust.
182
Victory Portfolios | | Supplemental Information — continued
June 30, 2022 | |
(Unaudited)
Proxy Voting and Portfolio Holdings Information
Proxy Voting:
Information regarding the policies and procedures each Fund uses to determine how to vote proxies relating to portfolio securities is available without charge, upon request, by calling 800-539-3863. The information is also included in the Funds' Statement of Additional Information, which is available on the SEC's website at www.sec.gov.
Information relating to how the Funds voted proxies relating to portfolio securities held during the most recent 12 months ended June 30 is available on the SEC's website at www.sec.gov.
Availability of Schedules of Portfolio Investments:
The Trust files a complete list of Schedules of Portfolio Investments with the SEC for the first and third quarter of each fiscal year on Form N-PORT. Forms N-PORT are available on the SEC's website at www.sec.gov.
Expense Examples
As a shareholder of a Fund, you may incur two types of costs: (1) transaction costs, including sales charges (loads) on purchases; and (2) ongoing costs, including management fees and other Fund expenses. These examples are intended to help you understand your ongoing costs (in dollars) of investing in a Fund and to compare these costs with the ongoing costs of investing in other mutual funds.
These examples are based on an investment of $1,000 invested at the beginning of the period and held for the entire period from January 1, 2022, through June 30, 2022.
The Actual Expense figures in the table below provide information about actual account values and actual expenses. You may use the information below, together with the amount you invested, to estimate the expenses that you paid over the period. Simply divide your account value by $1,000 (for example, an $8,600 account value divided by $1,000 = 8.6), then multiply the result by the number in the table under the heading entitled "Actual Expenses Paid During Period" to estimate the expenses you paid on your account during this period.
The Hypothetical Expense figures in the table below provide information about hypothetical account values and hypothetical expenses based on the Fund's actual expense ratio and an assumed rate of return of 5% per year before expenses, which is not the Fund's actual return. The hypothetical account values and expenses may not be used to estimate the actual ending account balance or expenses you paid for the period. You may use this information to compare this 5% hypothetical example with the 5% hypothetical examples that appear in shareholder reports of other funds.
Please note the expenses shown in the table below are meant to highlight your ongoing costs only and do not reflect any transactional costs. Therefore, the hypothetical expenses in the table are useful in comparing ongoing costs only and will not help you determine the relative total costs of owning different funds. In addition, if these transactional costs were included, your costs would have been higher.
| | | Beginning
Account
Value
1/1/22 | | Actual
Ending
Account
Value
6/30/22 | | Hypothetical
Ending
Account
Value
6/30/22 | | Actual
Expenses Paid
During Period
1/1/22-6/30/22* | | Hypothetical
Expenses Paid
During Period
1/1/22-6/30/22* | | Annualized
Expense Ratio
During Period
1/1/22-6/30/22 | |
Integrity Discovery Fund | |
Class A | | $ | 1,000.00 | | | $ | 834.70 | | | $ | 1,017.01 | | | $ | 7.14 | | | $ | 7.85 | | | | 1.57 | % | |
Class C | | | 1,000.00 | | | | 831.10 | | | | 1,012.65 | | | | 11.12 | | | | 12.23 | | | | 2.45 | % | |
Class R | | | 1,000.00 | | | | 832.50 | | | | 1,014.48 | | | | 9.45 | | | | 10.39 | | | | 2.08 | % | |
Class Y | | | 1,000.00 | | | | 835.30 | | | | 1,017.75 | | | | 6.46 | | | | 7.10 | | | | 1.42 | % | |
Member Class | | | 1,000.00 | | | | 835.20 | | | | 1,017.36 | | | | 6.83 | | | | 7.50 | | | | 1.50 | % | |
Integrity Mid-Cap Value Fund | |
Class A | | | 1,000.00 | | | | 877.40 | | | | 1,019.84 | | | | 4.65 | | | | 5.01 | | | | 1.00 | % | |
Class C | | | 1,000.00 | | | | 874.10 | | | | 1,016.12 | | | | 8.13 | | | | 8.75 | | | | 1.75 | % | |
Class R6 | | | 1,000.00 | | | | 878.90 | | | | 1,021.82 | | | | 2.80 | | | | 3.01 | | | | 0.60 | % | |
Class Y | | | 1,000.00 | | | | 878.30 | | | | 1,021.08 | | | | 3.49 | | | | 3.76 | | | | 0.75 | % | |
Member Class | | | 1,000.00 | | | | 877.40 | | | | 1,020.58 | | | | 3.96 | | | | 4.26 | | | | 0.85 | % | |
183
Victory Portfolios | | Supplemental Information — continued
June 30, 2022 | |
(Unaudited)
| | | Beginning
Account
Value
1/1/22 | | Actual
Ending
Account
Value
6/30/22 | | Hypothetical
Ending
Account
Value
6/30/22 | | Actual
Expenses Paid
During Period
1/1/22-6/30/22* | | Hypothetical
Expenses Paid
During Period
1/1/22-6/30/22* | | Annualized
Expense Ratio
During Period
1/1/22-6/30/22 | |
Integrity Small-Cap Value Fund | |
Class A | | $ | 1,000.00 | | | $ | 841.80 | | | $ | 1,017.50 | | | $ | 6.71 | | | $ | 7.35 | | | | 1.47 | % | |
Class C | | | 1,000.00 | | | | 838.60 | | | | 1,013.64 | | | | 10.26 | | | | 11.23 | | | | 2.25 | % | |
Class R | | | 1,000.00 | | | | 841.00 | | | | 1,016.12 | | | | 7.99 | | | | 8.75 | | | | 1.75 | % | |
Class R6 | | | 1,000.00 | | | | 844.20 | | | | 1,020.03 | | | | 4.39 | | | | 4.81 | | | | 0.96 | % | |
Class Y | | | 1,000.00 | | | | 843.80 | | | | 1,019.49 | | | | 4.89 | | | | 5.36 | | | | 1.07 | % | |
Integrity Small-Mid Value Fund | |
Class A | | | 1,000.00 | | | | 863.70 | | | | 1,019.19 | | | | 5.22 | | | | 5.66 | | | | 1.13 | % | |
Class R6 | | | 1,000.00 | | | | 864.70 | | | | 1,020.68 | | | | 3.84 | | | | 4.16 | | | | 0.83 | % | |
Class Y | | | 1,000.00 | | | | 864.60 | | | | 1,020.43 | | | | 4.07 | | | | 4.41 | | | | 0.88 | % | |
Member Class | | | 1,000.00 | | | | 864.30 | | | | 1,020.08 | | | | 4.39 | | | | 4.76 | | | | 0.95 | % | |
Munder Multi-Cap Fund | |
Class A | | | 1,000.00 | | | | 780.70 | | | | 1,018.45 | | | | 5.65 | | | | 6.41 | | | | 1.28 | % | |
Class C | | | 1,000.00 | | | | 777.20 | | | | 1,014.08 | | | | 9.52 | | | | 10.79 | | | | 2.16 | % | |
Class Y | | | 1,000.00 | | | | 782.10 | | | | 1,019.98 | | | | 4.29 | | | | 4.86 | | | | 0.97 | % | |
S&P 500 Index Fund | |
Class A | | | 1,000.00 | | | | 798.20 | | | | 1,022.12 | | | | 2.41 | | | | 2.71 | | | | 0.54 | % | |
Class R | | | 1,000.00 | | | | 796.90 | | | | 1,020.13 | | | | 4.19 | | | | 4.71 | | | | 0.94 | % | |
Class Y | | | 1,000.00 | | | | 798.50 | | | | 1,022.46 | | | | 2.10 | | | | 2.36 | | | | 0.47 | % | |
Munder Mid-Cap Core Growth Fund | |
Class A | | | 1,000.00 | | | | 757.60 | | | | 1,018.50 | | | | 5.53 | | | | 6.36 | | | | 1.27 | % | |
Class C | | | 1,000.00 | | | | 757.10 | | | | 1,014.28 | | | | 9.24 | | | | 10.59 | | | | 2.12 | % | |
Class R | | | 1,000.00 | | | | 757.00 | | | | 1,017.01 | | | | 6.84 | | | | 7.85 | | | | 1.57 | % | |
Class R6 | | | 1,000.00 | | | | 758.90 | | | | 1,020.48 | | | | 3.79 | | | | 4.36 | | | | 0.87 | % | |
Class Y | | | 1,000.00 | | | | 758.80 | | | | 1,020.13 | | | | 4.10 | | | | 4.71 | | | | 0.94 | % | |
Munder Small Cap Growth Fund | |
Class A | | | 1,000.00 | | | | 684.70 | | | | 1,017.85 | | | | 5.85 | | | | 7.00 | | | | 1.40 | % | |
Class I | | | 1,000.00 | | | | 685.20 | | | | 1,019.09 | | | | 4.81 | | | | 5.76 | | | | 1.15 | % | |
Class Y | | | 1,000.00 | | | | 684.90 | | | | 1,018.60 | | | | 5.22 | | | | 6.26 | | | | 1.25 | % | |
Trivalent International Core Equity | |
Class A | | | 1,000.00 | | | | 799.80 | | | | 1,020.08 | | | | 4.24 | | | | 4.76 | | | | 0.95 | % | |
Class C | | | 1,000.00 | | | | 796.60 | | | | 1,016.36 | | | | 7.57 | | | | 8.50 | | | | 1.70 | % | |
Class I | | | 1,000.00 | | | | 801.70 | | | | 1,021.82 | | | | 2.68 | | | | 3.01 | | | | 0.60 | % | |
Class R6 | | | 1,000.00 | | | | 801.90 | | | | 1,022.07 | | | | 2.46 | | | | 2.76 | | | | 0.55 | % | |
Class Y | | | 1,000.00 | | | | 800.50 | | | | 1,021.32 | | | | 3.12 | | | | 3.51 | | | | 0.70 | % | |
Trivalent International Small-Cap Fund | |
Class A | | | 1,000.00 | | | | 743.40 | | | | 1,018.10 | | | | 5.84 | | | | 6.76 | | | | 1.35 | % | |
Class C | | | 1,000.00 | | | | 740.40 | | | | 1,014.38 | | | | 9.06 | | | | 10.49 | | | | 2.10 | % | |
Class I | | | 1,000.00 | | | | 744.70 | | | | 1,020.08 | | | | 4.11 | | | | 4.76 | | | | 0.95 | % | |
Class R6 | | | 1,000.00 | | | | 744.10 | | | | 1,019.64 | | | | 4.50 | | | | 5.21 | | | | 1.04 | % | |
Class Y | | | 1,000.00 | | | | 744.00 | | | | 1,019.34 | | | | 4.76 | | | | 5.51 | | | | 1.10 | % | |
INCORE Total Return Bond Fund | |
Class A | | | 1,000.00 | | | | 890.90 | | | | 1,020.58 | | | | 3.99 | | | | 4.26 | | | | 0.85 | % | |
Class C | | | 1,000.00 | | | | 887.80 | | | | 1,016.86 | | | | 7.49 | | | | 8.00 | | | | 1.60 | % | |
Class R6 | | | 1,000.00 | | | | 892.30 | | | | 1,021.92 | | | | 2.72 | | | | 2.91 | | | | 0.58 | % | |
Class Y | | | 1,000.00 | | | | 892.20 | | | | 1,021.82 | | | | 2.81 | | | | 3.01 | | | | 0.60 | % | |
* Expenses are equal to the average account value multiplied by the Fund's annualized expense ratio multiplied by 181/365 (the number of days in the most recent fiscal half-year divided by the number of days in the fiscal year).
184
Victory Portfolios | | Supplemental Information — continued
June 30, 2022 | |
(Unaudited)
Additional Federal Income Tax Information
For the year ended June 30, 2022, the following Funds paid qualified dividend income for the purposes of reduced individual federal income tax rates of:
| | | Percent | |
Integrity Mid-Cap Value Fund | | | 75 | % | |
Integrity Small-Cap Value Fund | | | 24 | % | |
Integrity Small/Mid-Cap Value Fund | | | 72 | % | |
Munder Multi-Cap Fund | | | 31 | % | |
S&P 500 Index Fund | | | 100 | % | |
Munder Mid-Cap Core Growth Fund | | | 79 | % | |
Munder Small Cap Growth Fund | | | 19 | % | |
Trivalent International Fund — Core Equity Fund | | | 81 | % | |
Trivalent International Small-Cap Fund | | | 87 | % | |
INCORE Total Return Bond Fund | | | 4 | % | |
Dividends qualified for corporate dividends received deductions of:
| | | Percent | |
Integrity Mid-Cap Value Fund | | | 74 | % | |
Integrity Small-Cap Value Fund | | | 22 | % | |
Integrity Small/Mid-Cap Value Fund | | | 70 | % | |
Munder Multi-Cap Fund | | | 31 | % | |
S&P 500 Index Fund | | | 100 | % | |
Munder Mid-Cap Core Growth Fund | | | 73 | % | |
Munder Small Cap Growth Fund | | | 19 | % | |
INCORE Total Return Bond Fund | | | 4 | % | |
For the year ended June 30, 2022, the following Funds designated short-term capital gain distributions (amounts in thousands):
| | | Amount | |
Integrity Discovery Fund | | $ | 229 | | |
Integrity Mid-Cap Value Fund | | | 2,503 | | |
Integrity Small-Cap Value Fund | | | 85,034 | | |
Integrity Small/Mid-Cap Value Fund | | | 1,754 | | |
Munder Multi-Cap Fund | | | 13,198 | | |
S&P 500 Index Fund | | | 291 | | |
Munder Mid-Cap Core Growth Fund | | | 21,732 | | |
Munder Small Cap Growth Fund | | | 408 | | |
For the year ended June 30, 2022, the following Funds designated long-term capital gain distributions (amounts in thousands):
| | | Amount | |
Integrity Discovery Fund | | $ | 4,794 | | |
Integrity Mid-Cap Value Fund | | | 11,733 | | |
Integrity Small-Cap Value Fund | | | 224,160 | | |
Integrity Small/Mid-Cap Value Fund | | | 12,495 | | |
Munder Multi-Cap Fund | | | 38,276 | | |
S&P 500 Index Fund | | | 19,634 | | |
Munder Mid-Cap Core Growth Fund | | | 108,747 | | |
Munder Small Cap Growth Fund | | | 1,185 | | |
Trivalent International Small-Cap Fund | | | 235,803 | | |
185
Victory Portfolios | | Supplemental Information — continued
June 30, 2022 | |
(Unaudited)
The following Funds intend to elect to pass through to shareholders the income tax credit for taxes paid to foreign countries. Foreign source income and foreign tax expense per outstanding share on June 30, 2022, were as follows:
| | | Foreign
Source
Income | | Foreign
Tax
Expense | |
Trivalent International Fund — Core Equity Fund | | | 0.23 | | | | 0.03 | | |
Trivalent International Small-Cap Fund | | | 0.39 | | | | 0.04 | | |
186
Victory Portfolios | | Supplemental Information — continued
June 30, 2022 | |
(Unaudited)
Liquidity Risk Management Program:
The Victory Funds have adopted and implemented a written liquidity risk management program (the "LRMP") as required by Rule 22e-4 under the Investment Company Act of 1940, as amended. The LRMP is reasonably designed to assess and manage each Fund's liquidity risk, taking into consideration each Fund's investment strategy and the liquidity of its portfolio investments during normal and reasonably foreseeable stressed market conditions; its short- and long-term cash flow projections; and its cash holdings and access to other liquidity management tools such as available funding sources including the Victory Funds Complex Interfund Lending Facility and Line of Credit (discussed in the Notes to Financial Statements). The Victory Funds' Board of Trustees approved the appointment of the Funds' investment adviser, Victory Capital Management Inc. ("Victory Capital"), as the administrator of the LRMP.
Victory Capital manages liquidity risks associated with the Funds' investments by monitoring, among other things, cash and cash equivalents, any use of derivatives, the concentration of investments, the appropriateness of each Fund's investment strategy, and by classifying every Fund investment as either highly liquid, moderately liquid, less liquid, or illiquid on at least a monthly basis. To assist with the classification of Fund investments, Victory Capital has retained a third-party provider of liquidity evaluation services. This provider determines preliminary liquidity classifications for all portfolio holdings based upon portfolio-level data and certain assumptions provided by Victory Capital. Victory Capital reviews the preliminary liquidity classifications and, when appropriate, considers other information including input from the Funds' portfolio managers (including the portfolio managers employed by any investment sub-advisers) in determining final liquidity classifications.
At a meeting held on February 24, 2022, Victory Capital provided an oral and written report to the Trustees on the operation and effectiveness of the LRMP during the previous year. The report from Victory Capital concluded that the Funds did not experience any significant liquidity challenges during the covered period, and the Funds' LRMP is reasonably designed to assess and manage its liquidity risk. The report also concluded that the LRMP continues to operate adequately and effectively to enable Victory Capital to oversee and manage liquidity risk and ensure each Fund is able to meet redemption requests without significant dilution to the remaining investors' interest in each Fund. During the review period, each Fund's portfolio consisted primarily of highly liquid investments, which are defined as cash and any investments that each Fund reasonably expects to be converted to cash in current market conditions in three business days or less without significantly changing the market value of the investment. Therefore, the Funds have not adopted a highly liquid investment minimum. The Funds' investments were below the limitation on illiquid investments during the review period. Additionally, Victory Capital indicated that no events occurred that would require the filing of Form N-LIQUID and recommended no material changes to the LRMP.
187
Privacy Policy
Protecting the Privacy of Information
The Trust respects your right to privacy. We also know that you expect us to conduct and process your business in an accurate and efficient manner. To do so, we must collect and maintain certain personal information about you. This is the information we collect from you on applications or other forms, and from the transactions you make with us or third parties. It may include your name, address, social security number, account transactions and balances, and information about investment goals and risk tolerance.
We do not disclose any information about you or about former customers to anyone except as permitted or required by law. Specifically, we may disclose the information we collect to companies that perform services on our behalf, such as the transfer agent that processes shareholder accounts and printers and mailers that assist us in the distribution of investor materials. We may also disclose this information to companies that perform marketing services on our behalf. This allows us to continue to offer you Victory investment products and services that meet your investing needs, and to effect transactions that you request or authorize. These companies will use this information only in connection with the services for which we hired them. They are not permitted to use or share this information for any other purpose.
To protect your personal information internally, we permit access only by authorized employees and maintain physical, electronic, and procedural safeguards to guard your personal information.*
* You may have received communications regarding information about privacy policies from other financial institutions which gave you the opportunity to "opt-out" of certain information sharing with companies which are not affiliated with that financial institution. The Trust does not share information with other companies for purposes of marketing solicitations for products other than the Trust. Therefore, the Trust does not provide opt-out options to their shareholders.
Victory Funds
P.O. Box 182593
Columbus, Ohio 43218-2593

Visit our website at: | | Call Victory at: | |
www.vcm.com | | 800-539-FUND (800-539-3863) | |
| | | 800-235-8396 for Member Class | |

June 30, 2022
Annual Report
Victory Diversified Stock Fund
Victory NewBridge Large Cap Growth Fund
Victory Special Value Fund
Victory THB US Small Opportunities Fund
Victory Strategic Allocation Fund
Victory INCORE Fund for Income
Victory INCORE Investment Grade Convertible Fund
www.vcm.com
News, Information And Education 24 Hours A Day, 7 Days A Week
The Victory Capital website gives fund shareholders, prospective shareholders, and investment professionals a convenient way to access fund information, get guidance, and track fund performance anywhere they can access the Internet. The site includes:
• Detailed performance records
• Daily share prices
• The latest fund news
• Investment resources to help you become a better investor
• A section dedicated to investment professionals
Whether you're a potential investor searching for the fund that matches your investment philosophy, a seasoned investor interested in planning tools, or an investment professional, www.vcm.com has what you seek. Visit us anytime. We're always open.
TABLE OF CONTENTS
Shareholder Letter (Unaudited) | | | 3 | | |
Managers' Commentary/Investment
Overview (Unaudited) | | | 5 | | |
Investment Objectives and Portfolio
Holdings (Unaudited) | | | 22 | | |
Schedules of Portfolio Investments | |
Victory Diversified Stock Fund | | | 29 | | |
Victory NewBridge Large Cap Growth Fund | | | 32 | | |
Victory Special Value Fund | | | 34 | | |
Victory THB US Small Opportunities Fund | | | 37 | | |
Victory Strategic Allocation Fund | | | 40 | | |
Victory INCORE Fund for Income | | | 41 | | |
Victory INCORE Investment Grade Convertible Fund | | | 43 | | |
Financial Statements | | | |
Statements of Assets and Liabilities | | | 46 | | |
Statements of Operations | | | 52 | | |
Statements of Changes in Net Assets | | | 56 | | |
Financial Highlights | | | 74 | | |
Notes to Financial Statements | | | 94 | | |
Report of Independent Registered
Public Accounting Firm | | | 110 | | |
Supplemental Information (Unaudited) | | | 112 | | |
Trustee and Officer Information | | | 112 | | |
Proxy Voting and Portfolio Holdings Information | | | 116 | | |
Expense Examples | | | 116 | | |
Additional Federal Income Tax Information | | | 118 | | |
Privacy Policy (inside back cover) | | | |
1
IRA DISTRIBUTION WITHHOLDING DISCLOSURE
We generally must withhold federal income tax at a rate of 10% of the taxable portion of your distribution and, if you live in a state that requires state income tax withholding, at your state's tax rate. However, you may elect not to have withholding apply or to have income tax withheld at a higher rate. Any withholding election that you make will apply to any subsequent distribution unless and until you change or revoke the election. If you wish to make a withholding election, or change or revoke a prior withholding election, call 800-539-3863 (800-235-8396 for Member Class) and form W-4P (OMB No. 1545-0074 withholding certificate for pension or annuity payments) will be electronically sent.
If you do not have a withholding election in place by the date of a distribution, federal income tax will be withheld from the taxable portion of your distribution at a rate of 10%. If you must pay estimated taxes, you may be subject to estimated tax penalties if your estimated tax payments are not sufficient and sufficient tax is not withheld from your distribution.
For more specific information, please consult your tax adviser.
The Funds are distributed by Victory Capital Services, Inc. Victory Capital Management Inc. is the investment adviser to the Funds and receives fees from the Funds for performing services for the Funds.
This report is not authorized for distribution to prospective investors unless preceded or accompanied by a current prospectus of the Victory Funds.
For additional information about any Victory Fund, including fees, expenses, and risks, view our prospectus online at vcm.com or call 800-539-3863 (800-235-8396 for Member Class). Read it carefully before you invest or send money.
The information in this report is based on data obtained from recognized services and sources and is believed to be reliable. Any opinions, projections, or recommendations in this report are subject to change without notice and are not intended as individual investment advice. Past investment performance of the Funds, markets or securities mentioned herein should not be considered to be indicative of future results.
• NOT FDIC INSURED • NO BANK GUARANTEE • MAY LOSE VALUE

Call Victory at:
800-539-FUND (800-539-3863)
800-235-8396 for Member Class
Visit our website at:
www.vcm.com
2
Victory Funds Letter to Shareholders
(Unaudited)
Dear Shareholder,
If you are reading this letter but double-checking your calendar, be assured there's no mistake. The annual reporting period for the Victory Funds contained in this report has changed from a fiscal year ended October 31st to a fiscal year ended June 30th. This change has no material impact on any of your investments. This change aims to help us improve efficiencies and reduce auditing and other operational costs. Therefore, this letter covers an abbreviated eight-month "annual" period from November 1, 2021, through June 30, 2022. Future shareholder letters will now be on a June 30th fiscal year cycle going forward.
With that said, looking back on our most recent reporting period offers us a stark reminder that financial markets are dynamic, and that investor sentiment can shift quickly.
After a mostly constructive 2021, the script flipped as we entered the new calendar year, and investors were suddenly more focused on a host of challenges. Inflation data has been running hotter than expected. The U.S. Federal Reserve (the "Fed") has embarked on a new rate-hike cycle and a terrible war began in Eastern Europe. All these issues, among other factors, have ratcheted up market volatility in both stock and bond markets. Many broad-market stock indices have pulled back substantially during the first half of 2022 and even entered "bear market" territory, which is typically considered a 20% pullback from the most recent highs. Meanwhile, fixed income investors are also dealing with elevated volatility, and wide swaths of the bond market have struggled in the face of rising interest rates.
Throughout the ups and downs of the past reporting period, there have been interesting differences playing out within the broader market. In general, large-cap stocks outperformed smaller-capitalization companies, while value-oriented investments fared better than their growth counterparts (generally speaking, as measured by the Russell family of indices). Perhaps this reflects investors' realization and expectations for future higher interest rates and corresponding higher borrowing costs.
There were other notable subplots, too. Crypto assets, which had captivated investors for a spell, reversed course as sentiment soured and investors became more risk averse. We've also seen oil prices surge, which in turn helped fuel gains across the energy landscape. In fact, the Energy and Utilities sectors (and yes, Cash) have been some of the lone bright spots for many investor portfolios in recent months.
Looking at the numbers, the S&P 500® Index, the bell-weather proxy for our domestic stock market, declined by 16.95% for the eight-month period ended June 30, 2022. Over this same time frame, the yield on the 10-Year U.S. Treasury jumped 1.43%, thanks largely to the Fed's shift toward a less accommodative monetary policy and several aggressive rate hikes. At the end of our reporting period, the yield on the 10-Year U.S. Treasury finished at 2.98%.
3
Given the market environment of the past few months, it's no surprise that investors have become more focused on risk management and downside protection. Remember, our experience managing portfolios through various economic cycles has taught us to remain calm in the face of market turmoil. It is our view that a long-term perspective, a well-diversified portfolio across asset classes and investment types, and a clear understanding of individual risk tolerances are some of the key ingredients for staying the course and progressing on investment goals.
Although we cannot tell you with any certainty what markets will do in the future, we can assure you that the investment professionals at all our independent franchises continually monitor the environment and work hard to position portfolios opportunistically no matter what the markets bring.
On the following pages you will find information relating to your Victory Funds investment. If you have any questions regarding the current market dynamics or your specific portfolio or investment plan, we encourage you to contact your financial advisor. If you invest with us directly, you may call 800-539-3863 (800-235-8396 for Member Class) or visit our website at www.vcm.com.
From all of us here at Victory Capital, thank you for letting us help you work toward your investment goals.

Christopher K. Dyer, CFA
President,
Victory Funds
4
Victory Diversified Stock Fund
Managers' Commentary
(Unaudited)
What were the market conditions during the reporting period?
The S&P 500® Index (the "Index") declined by nearly 17% over the eight months ended June 30, 2022. The decline was broad-based across most sectors except Utilities, Consumer Staples, and Energy, which increased on the strength of rising oil prices from pandemic lows. Value stocks outperformed growth stocks by a significant margin as investors focused on an economic recovery as well as rising interest rates, which generally negatively impact growth stock valuation metrics. The spread between value and growth was even wider in the small-cap spectrum. The returns of the small-cap segment of the market lagged the Index.
More recently, we have seen inflation and interest rate expectations rise significantly in the past year, the result of U.S Federal Reserve commentary and recent inflation data released by the U.S. government. As a result of rising inflation and interest rate expectations, traditional growth sectors (e.g., Consumer Discretionary, Communication Services, and Technology) all lagged Index returns.
How did Victory Diversified Stock Fund (the "Fund") perform during the reporting period?
The Fund returned -17.22% (Class A at net asset value) for the eight-month period ended June 30, 2022, underperforming the Index, which returned -16.95% for the period.
What strategies did you employ during the reporting period?
The Fund looks to invest in stocks with market capitalizations of $1 billion and above that we believe are of high quality with potential for above-average earnings growth as well as earnings momentum.
Using this framework, the Fund generated the strongest relative returns within the Health Care, Technology, and Industrials sectors.
On an individual security basis, two of the Fund's top-performing stocks for the year were drug/medical supply distributor McKesson Corp. and homebuilding supply retailer/wholesaler Builders FirstSource, Inc. McKesson Corp. benefitted from strong demand for COVID-19-related supplies, including vaccine distribution and storage, as well as demand for its core drug distribution unit. Builders FirstSource, Inc. benefitted from integrating several acquisitions for the past few years along with strong demand for homebuilding supplies and ability to pass on high inflation through price increases.
Two of the Fund's weakest-performing stocks for the year were Trex Co. ("Trex"), a wood composite decking company and Crocs, Inc., a global shoe company. Trex came under pressure this year on concerns over homebuilding deceleration combined with additional manufacturing capacity being added in 2022. We believe concerns are overblown as we believe a majority of sales are via home remodeling projects, not new home construction sales. We continued to hold Trex at June 30, 2022. Crocs, Inc. lagged the market on concerns over COVID-19 disrupting its supply chain. We continued to hold the security at June 30, 2022, as we believe any disruption will be short-term in nature as global demand continues to be strong for their product line.
5
Victory Diversified Stock Fund
Investment Overview
(Unaudited)
Average Annual Total Return
Year Ended June 30, 2022
| | | Class A | | Class C | | Class I | | Class R | | Class R6 | | Class Y | | | |
INCEPTION DATE | | 10/28/89 | | 3/1/02 | | 8/31/07 | | 3/26/99 | | 3/3/14 | | 1/28/13 | | | |
| | | Net Asset
Value | | Maximum
Offering
Price | | Net Asset
Value | | Contingent
Deferred
Charges | | Net Asset
Value | | Net Asset
Value | | Net Asset
Value | | Net Asset
Value | | S&P 500®
Index1 | |
One Year | | | –8.43 | % | | | –13.69 | % | | | –9.29 | % | | | –10.07 | % | | | –8.20 | % | | | –8.68 | % | | | –8.16 | % | | | –8.20 | % | | | –10.62 | % | |
Five Year | | | 9.76 | % | | | 8.46 | % | | | 8.76 | % | | | 8.76 | % | | | 10.04 | % | | | 9.45 | % | | | 10.09 | % | | | 10.00 | % | | | 11.31 | % | |
Ten Year | | | 10.82 | % | | | 10.17 | % | | | 9.86 | % | | | 9.86 | % | | | 11.11 | % | | | 10.51 | % | | | N/A | | | | N/A | | | | 12.96 | % | |
Since
Inception | | | N/A | | | | N/A | | | | N/A | | | | N/A | | | | N/A | | | | N/A | | | | 8.62 | % | | | 10.08 | % | | | N/A | | |
The performance data quoted represents past performance and current returns may be lower or higher. The investment return and principal value will fluctuate so that an investor's shares, when redeemed, may be worth more or less than the original cost. To obtain performance information current to the most recent month's end, please visit www.vcm.com.
The maximum offering price ("MOP") figures reflect a maximum sales charge of 5.75% for Class A. Class C is not subject to an initial sales charge, but is subject to a deferred sales charge of 1.00% on shares redeemed within one year of purchase. Net Asset Value does not reflect sales charges.
Total return measures the price change in a share assuming the reinvestment of all net investment income and realized capital gain distributions, if any. The total returns quoted do not reflect adjustments made to the enclosed financial statements in accordance with U.S. Generally Accepted Accounting Principles or the deduction of taxes that a shareholder would pay on net investment income and realized capital gain distributions, including reinvested distributions, or redemptions of shares. The total return figures set forth above include all waivers of fees. Without such fee waivers, the total returns would have been lower.
Victory Diversified Stock Fund — Growth of $10,000
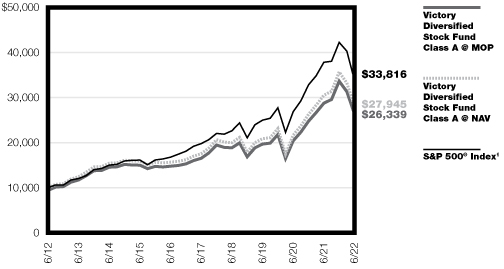
1The S&P 500® Index is an unmanaged index comprised of 500 domestically traded common stocks, is weighted according to the market value of each common stock in the index, and includes reinvestment of dividends. This index does not include the effect of sales charges, commissions, expenses, or taxes, is not representative of the Fund, and it is not possible to invest directly in an index.
The graph reflects investment of growth of a hypothetical $10,000 investment in the Fund.
The graph and table do not reflect the deduction of taxes that a shareholder would pay on Fund distributions or the redemption of shares.
Past performance is not indicative of future results.
6
Victory NewBridge Large Cap Growth Fund
Managers' Commentary
(Unaudited)
What were the market conditions during the reporting period?
Market conditions during the reporting period were not favorable for Victory NewBridge Large Cap Growth Fund (the "Fund"), as they coincided with a significant shift from growth stocks to value stocks. Despite three earlier rotations out of growth in favor of value stocks in 2021 (from mid-February to early March, late April to mid-May, and a one-week slide in late July), the Russell 1000® Growth Index (the "Index") and the Fund recovered in each instance. It wasn't until mid-November that growth stocks failed to rally back. The difference from that point forward was that the U.S. Federal Reserve (the "Fed") acknowledged inflation was more persistent than transitory and as a result was well behind in raising rates. It became increasingly clear that the Fed was embracing a decidedly more hawkish stance which became more pronounced in the ensuing months with incoming economic data continuing to reflect worrisome higher levels of inflation.
Factors such as growth, high beta, and market sensitivity were sold in favor of value factors to which the Fund had no exposure. Within the context of growth, the Fund has had a greater percentage of its holdings in the two most growth-oriented quintiles of the Index; emerging growth and established growth. Over the long-term, and when monetary policy is accommodative, that has been an advantage. However, when quantitative easing shifts to quantitative tightening, the advantage turns to disadvantage. High growth stocks are long-duration assets that react to interest rates in a matter similar to zero-coupon bonds. Both high growth stocks and zero-coupon bonds benefit from declining or stable interest rates but face significant challenges when interest rates begin to rise; especially when the magnitude and velocity is as significant as what we've seen during the reporting period in which the 10-Year U.S. Treasury yield rocketed from 1.58% to a mid-June high of 3.48% before ending the period at 2.99%
Not owning Apple and Tesla or as much Microsoft as the Index cost the Fund relative performance, as did owning shares of EPAM Systems ("EPAM"), which had an exceptional record of beating expectations and contributing to performance throughout most of the time the Fund held shares. Most of its market share was lost when Russia invaded Ukraine because the company has more than 50% of its employees in Ukraine and Russia.
The combination of the Fed significantly raising rates quickly to contend with inflation at a 41-year high, persistent supply chain disruptions, and geo-political risk not seen in decades resulting from Russia's invasion of Ukraine created an untenable environment for most equities; especially for the highest growth companies that generally have commensurately high valuations.
How did the Fund perform during the reporting period?
The Fund returned -39.44% (Class A at net asset value) for the eight-month period ended June 30, 2022, underperforming the Index, which returned -26.10% for the period.
What strategies did you employ during the reporting period?
We relentlessly focus on companies we believe have inherent advantages that propel their growth. While it's natural for companies to experience setbacks, and such situations often provide an opportunity for management to demonstrate how well they deal with adversity,
7
Victory NewBridge Large Cap Growth Fund
Managers' Commentary (continued)
the environment that unfolded in November and continued through the reporting period was quite unforgiving. In any given year, the Fund has its share of disappointments. The key is to have many more winners than losers. During the reporting period, most of the Fund's holdings executed well, but still suffered from valuation compression. As if fighting the trend of valuation compression wasn't enough and eerily reminiscent of 2000, we have 41-year highs in inflation, supply chain disruptions and Russia invading Ukraine!
Even though growth rallied back after losing ground to value in the three earlier episodes in 2021, it became apparent that what began to unfold in mid-November was likely to be longer-lasting as the Fed indicated that it would begin to quickly increase interest rates to curb inflationary pressures. As such, the first company added to the Fund that has a sufficiently high growth rate along with a more modest valuation was Motorola Solutions, a manufacturer of radio systems for first responders based in Chicago. Subsequently, other companies with solid growth and less expensive valuations were added to the Fund. Another notable characteristic of those additions is less international exposure as China went into lockdown and Russia invaded Ukraine. Those companies include O'Reilly Automotive, Tractor Supply Company, CDW Corp., and Broadcom. At the same time, the Fund sold companies deemed to be well positioned longer term but too risky in the near term due to valuation and business visibility. Those sales include Twilio and EPAM. Finally, the Fund sold Shopify and PayPal. Despite stellar performance since adding them to the portfolio, each company experienced challenges against demanding valuations and recently communicated changes in corporate strategy that require time to judge whether or not they should have been pursued.
As long-term fundamental investors, the current investment environment is almost completely driven by macro factors, technical analysis, volatility measures and fund flows. It's not the first time anything but fundamentals drive near-term performance, but we believe that fundamentals, math, and responsible management win over the long term. Furthermore, there is a price for everything no matter how challenging the environment. While it's difficult to say when the bottom will be reached, especially as the Fed still has much work to do, valuations for many stocks have declined to pre-pandemic levels, if not lower. Even the stalwarts that may have appeared insulated by the widespread carnage have been marked down. The list of opportunities grows by the day and while we are not yet ready to meaningfully add any higher-growth companies in the Fund above those we already invest in, it's crucial to do the work now in preparation for the next wave of growth once negative macro influences have subsided. In our view, growth companies should prosper once again as the combination of higher rates and declining consumer demand tempers inflation, the economy grows at a slower pace, and the need for productivity improvements once again becomes a higher priority.
The Technology sector, which represented an average weight of 41% of the Fund, experienced the greatest relative sector underperformance; -5.83% vs. the Index. Not owning Apple detracted 1.79% of performance and an underweight of Microsoft cost the Fund 0.28%. Owning EPAM, Shopify and PayPal detracted 1.32%, 0.94%, and 0.94%, respectively. During the period, the Fund sold its shares of each.
8
Victory NewBridge Large Cap Growth Fund
Managers' Commentary (continued)
Industrials was the second biggest underperforming sector, recording relative underperformance of -2.95%. The Fund's investments in Generac, Kornit Digital and Uber detracted 1.13%, 0.78%, and 0.69%, respectively. The Fund still owned Generac and Uber at June 30, 2022, but sold Kornit Digital, as the company is expected to experience a difficult year due to slower order growth from customers working through supply chain issues and bloated inventory.
Despite generally being a defensive sector, the Fund's underperformance in Health Care was due to a combination of owning higher growth companies and no exposure to the more defensive pharmaceutical industry. The Fund's positions in Align Technology and Dexcom detracted 0.97% and 0.36%, respectively, while not owning Abbvie and Eli Lilly cost the Fund 0.48% and 0.36%, respectively. The Fund maintains a position in Align Technology and Dexcom due to strong competitive positions and attractive growth prospects.
Consumer Discretionary underperformance stemmed primarily from the Fund's positions in Burlington Stores, Aptiv PLC and Airbnb, which detracted 0.61%, 0.47%, and 0.46%, respectively. The Fund remained invested in all three companies at June 30, 2022.
Overall, the reporting period has been among the most difficult performance stretches the Fund has experienced since the beginning of the pandemic in March of 2020 (quickly reversed by trillions of stimulus) and the fourth quarter of 2019. Performance has been disappointing on both an absolute and relative basis. However, given the significant valuation compression experienced, the companies that continue to execute against plan have become much more attractive and should be well-positioned as the Fed addresses inflation with higher interest rates and the market begins to discount a more stable future environment.
9
Victory NewBridge Large Cap Growth Fund
Investment Overview
(Unaudited)
Average Annual Total Return
Year Ended June 30, 2022
| | | Class A | | Class C | | Class I | | Class Y | | | |
INCEPTION DATE | | 12/31/03 | | 12/31/03 | | 3/1/11 | | 1/28/13 | | | |
| | | Net Asset
Value | | Maximum
Offering
Price | | Net Asset
Value | | Contingent
Deferred
Charges | | Net Asset
Value | | Net Asset
Value | | Russell 1000®
Growth Index1 | |
One Year | | | –36.43 | % | | | –40.08 | % | | | –36.99 | % | | | –37.47 | % | | | –36.19 | % | | | –36.30 | % | | | –18.77 | % | |
Five Year | | | 6.24 | % | | | 4.99 | % | | | 5.43 | % | | | 5.43 | % | | | 6.67 | % | | | 6.57 | % | | | 14.29 | % | |
Ten Year | | | 8.64 | % | | | 8.00 | % | | | 7.78 | % | | | 7.78 | % | | | 9.05 | % | | | N/A | | | | 14.80 | % | |
Since Inception | | | N/A | | | | N/A | | | | N/A | | | | N/A | | | | N/A | | | | 8.82 | % | | | N/A | | |
The performance data quoted represents past performance and current returns may be lower or higher. The investment return and principal value will fluctuate so that an investor's shares, when redeemed, may be worth more or less than the original cost. To obtain performance information current to the most recent month's end, please visit www.vcm.com.
The maximum offering price ("MOP") figures reflect a maximum sales charge of 5.75% for Class A. Class C is not subject to an initial sales charge, but is subject to a deferred sales charge of 1.00% on shares redeemed within one year of purchase. Net Asset Value does not reflect sales charges.
Total return measures the price change in a share assuming the reinvestment of all net investment income and realized capital gain distributions, if any. The total returns quoted do not reflect adjustments made to the enclosed financial statements in accordance with U.S. Generally Accepted Accounting Principles or the deduction of taxes that a shareholder would pay on net investment income and realized capital gain distributions, including reinvested distributions, or redemptions of shares. The total return figures set forth above include all waivers of fees. Without such fee waivers, the total returns would have been lower.
Victory NewBridge Large Cap Growth Fund — Growth of $10,000
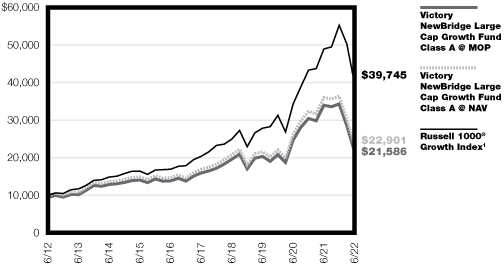
1The Russell 1000® Growth Index is an unmanaged index that measures the performance of those Russell 1000 companies with higher price-to-book ratios and higher forecasted growth values. This index does not include the effect of sales charges, commissions, expenses or taxes, is not representative of the Fund, and it is not possible to invest directly in an index.
The graph reflects investment of growth of a hypothetical $10,000 investment in the Fund.
The graph and table do not reflect the deduction of taxes that a shareholder would pay on Fund distributions or the redemption of shares.
Past performance is not indicative of future results.
10
Victory Special Value Fund
Managers' Commentary
(Unaudited)
What were the market conditions during the reporting period?
The S&P 500® Index (the "Index") declined by nearly 17% over the eight months ended June 30, 2022. The decline was broad-based across most sectors except Utilities, Consumer Staples, and Energy, which increased on the strength of rising oil prices from pandemic lows. Value stocks outperformed growth stocks by a significant margin as investors focused on an economic recovery as well as rising interest rates, which generally negatively impact growth stock valuation metrics. The spread between value and growth was even wider in the small-cap spectrum. The returns of the small-cap segment of the market lagged the Index.
More recently, we have seen inflation and interest rate expectations rise significantly in the past year, the result of U.S Federal Reserve commentary and recent inflation data released by the U.S. government. As a result of rising inflation and interest rate expectations, traditional growth sectors (e.g., Consumer Discretionary, Communication Services, and Technology) all lagged Index returns.
How did Victory Special Value Fund (the "Fund") perform during the reporting period?
The Fund returned -17.03% (Class A at net asset value) for the eight-month period ended June 30, 2022, underperforming the Index, which returned -16.95% for the period.
What strategies did you employ during the reporting period?
The Fund looks to invest in stocks with market capitalizations of $1 billion and above that we believe are of high quality with potential for above-average earnings growth as well as earnings momentum.
Using this framework, the Fund generated the strongest relative returns within the Health Care, Technology, and Industrials sectors.
On an individual security basis, two of the Fund's top-performing stocks for the year were drug/medical supply distributor McKesson Corp. and homebuilding supply retailer/wholesaler Builders FirstSource, Inc. McKesson Corp. benefitted from strong demand for COVID-19-related supplies, including vaccine distribution and storage, as well as demand for its core drug distribution unit. Builders FirstSource, Inc. benefitted from integrating several acquisitions for the past few years along with strong demand for homebuilding supplies and ability to pass on high inflation through price increases.
Two of the Fund's weakest-performing stocks for the year were Trex Co. ("Trex"), a wood composite decking company and Crocs, Inc., a global shoe company. Trex came under pressure this year on concerns over homebuilding deceleration combined with additional manufacturing capacity being added in 2022. We believe concerns are overblown as we believe a majority of sales are via home remodeling projects, not new home construction sales. We continued to hold Trex at June 30, 2022. Crocs, Inc. lagged the market on concerns over COVID-19 disrupting its supply chain. We continued to hold the security at June 30, 2022, as we believe any disruption will be short-term in nature as global demand continues to be strong for their product line.
11
Victory Special Value Fund
Investment Overview
(Unaudited)
Average Annual Total Return
Year Ended June 30, 2022
| | | Class A | | Class C | | Class I | | Class R | | Class Y | | | |
INCEPTION DATE | | 12/3/93 | | 3/1/03 | | 8/31/07 | | 12/21/99 | | 1/28/213 | | | |
| | | Net Asset
Value | | Maximum
Offering
Price | | Net Asset
Value | | Contingent
Deferred
Charges | | Net Asset
Value | | Net Asset
Value | | Net Asset
Value | | S&P 500®
Index1 | |
One Year | | | –8.25 | % | | | –13.52 | % | | | –9.04 | % | | | –9.79 | % | | | –8.10 | % | | | –8.59 | % | | | –8.05 | % | | | –10.62 | % | |
Five Year | | | 9.43 | % | | | 8.15 | % | | | 8.46 | % | | | 8.46 | % | | | 9.59 | % | | | 9.09 | % | | | 9.67 | % | | | 11.31 | % | |
Ten Year | | | 9.41 | % | | | 8.77 | % | | | 8.44 | % | | | 8.44 | % | | | 9.61 | % | | | 9.09 | % | | | N/A | | | | 12.96 | % | |
Since Inception | | | N/A | | | | N/A | | | | N/A | | | | N/A | | | | N/A | | | | N/A | | | | 9.01 | % | | | N/A | | |
The performance data quoted represents past performance and current returns may be lower or higher. The investment return and principal value will fluctuate so that an investor's shares, when redeemed, may be worth more or less than the original cost. To obtain performance information current to the most recent month's end, please visit www.vcm.com.
The maximum offering price ("MOP") figures reflect a maximum sales charge of 5.75% for Class A. Class C is not subject to an initial sales charge, but is subject to a deferred sales charge of 1.00% on shares redeemed within one year of purchase. Net Asset Value does not reflect sales charges.
Total return measures the price change in a share assuming the reinvestment of all net investment income and realized capital gain distributions, if any. The total returns quoted do not reflect adjustments made to the enclosed financial statements in accordance with U.S. Generally Accepted Accounting Principles or the deduction of taxes that a shareholder would pay on net investment income and realized capital gain distributions, including reinvested distributions, or redemptions of shares. The total return figures set forth above include all waivers of fees. Without such fee waivers, the total returns would have been lower.
Victory Special Value Fund — Growth of $10,000
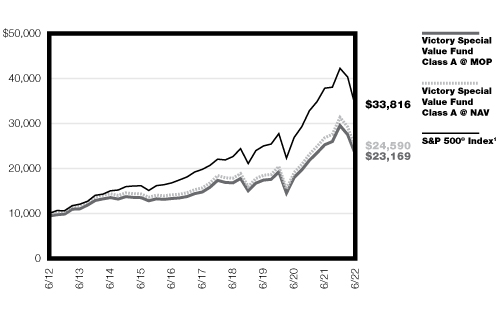
1The S&P 500® Index is an unmanaged index comprised of 500 domestically traded common stocks, is weighted according to the market value of each common stock in the index, and includes reinvestment of dividends. This index does not include the effect of sales charges, commissions, expenses, or taxes, is not representative of the Fund, and it is not possible to invest directly in an index.
The graph reflects investment of growth of a hypothetical $10,000 investment in the Fund.
The graph and table do not reflect the deduction of taxes that a shareholder would pay on Fund distributions or the redemption of shares.
Past performance is not indicative of future results.
12
Victory THB US Small Opportunities Fund
Managers' Commentary
(Unaudited)
What were the market conditions during the reporting period?
U.S. equities were broadly lower during the period as a series of events kept investors concerns elevated. The COVID-19 Omicron variant outbreak in the November — December period last year was followed by geopolitical tensions culminating with Russia's invasion of Ukraine in February. The war in Ukraine and new China lockdowns in the spring served to amplify preexisting inflationary drivers such as energy prices and supply chain disruptions. In response, the U.S. Federal Reserve raised interest rates and struck a more hawkish tone, intending to bring inflation under control. The direction of interest rates and of inflation have been widely discussed and appear to have impacted a large swath of assets. Accurately predicting the future levels of interest rates is notoriously difficult, but anomalies appear to be reversing and may indicate that the extended period of ultra-low interest rates is ending.
How did THB US Small Opportunities Fund (the "Fund") perform during the reporting period?
The Fund returned -24.83% (Class A at net asset value) for the eight-month period ended June 30, 2022, outperforming the Russell Microcap® Index, which returned -28.68% for the period.
What strategies did you employ during the reporting period?
The Fund utilizes a bottom-up, fundamental approach to find mispriced securities within the investment universe. The Fund selects investments based on an active fundamental process that combines financial analysis and proprietary research to evaluate potential investments' management and long-term outlook and business strategy. Using this process, the Fund generated the highest contribution to the return from the Utilities, Real Estate, and Consumer Staples sectors over the trailing eight months, while the Industrials, Consumer Discretionary and Information Technology sectors were the primary detractors. The Fund's top five-performing stocks (from a contribution standpoint) were Lantheus Holdings, Inc. (Health Care), RPC, Inc. (Energy), TETRA Technologies, Inc. (Energy), Meridian Bioscience, Inc. (Health Care), and Bassett Furniture Industries, Inc. (Consumer Discretionary). The bottom five-performing stocks (from a contribution standpoint) were BioLife Solutions, Inc. (Health Care), The Joint Corp. (Health Care), Transcat, Inc. (Industrials), Clean Energy Fuels, Corp. (Energy), and Ichor Holdings, Ltd. (Information Technology).
13
Victory THB US Small Opportunities Fund
Investment Overview
(Unaudited)
Average Annual Total Return
Year Ended June 30, 2022
| | | Class A | | Class I | | | |
INCEPTION DATE | | 3/30/12 | | 3/30/12 | | | |
| | | Net Asset Value | | Maximum
Offering
Price | | Net Asset Value | | Russell Microcap®
Index1 | |
One Year | | | –27.63 | % | | | –31.79 | % | | | –27.30 | % | | | –30.73 | % | |
Five Year | | | 5.05 | % | | | 3.81 | % | | | 5.50 | % | | | 4.55 | % | |
Ten Year | | | 9.02 | % | | | 8.38 | % | | | 9.52 | % | | | 9.04 | % | |
The performance data quoted represents past performance and current returns may be lower or higher. The investment return and principal value will fluctuate so that an investor's shares, when redeemed, may be worth more or less than the original cost. To obtain performance information current to the most recent month's end, please visit www.vcm.com. The performance figures for Class A and Class I reflect the historical performance of, respectively, the Investor Class and Institutional Class of the THB Asset Management Microcap Fund (the "Predecessor Fund"), a series of Advisors' Inner Circle Fund. The Fund's performance has not been restated to reflect any difference in the expenses of the Predecessor Fund prior to its reorganization into the Fund on May 3, 2021.
The maximum offering price ("MOP") figures reflect a maximum sales charge of 5.75% for Class A. Net Asset Value does not reflect sales charges.
Total return measures the price change in a share assuming the reinvestment of all net investment income and realized capital gain distributions, if any. The total returns quoted do not reflect adjustments made to the enclosed financial statements in accordance with U.S. Generally Accepted Accounting Principles or the deduction of taxes that a shareholder would pay on net investment income and realized capital gain distributions, including reinvested distributions, or redemptions of shares. The total return figures set forth above include all waivers of fees. Without such fee waivers, the total returns would have been lower.
Victory THB US Small Opportunities Fund — Growth of $10,000
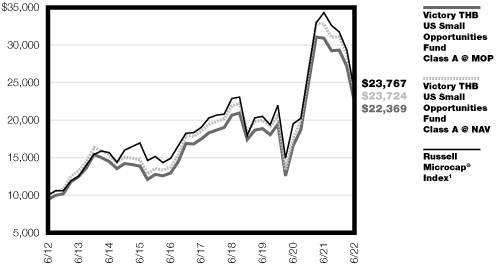
1The Russell Microcap® Index is a capitalization weighted index of 2,000 small-cap and micro-cap stocks that captures the smallest 1,000 companies in the Russell 2000® Index, plus the next 1,000 smallest eligible securities by market capitalization. This index does not include the effect of sales charges, commissions, expenses, or taxes, is not representative of the Fund, and it is not possible to invest directly in an index.
The graph reflects investment of growth of a hypothetical $10,000 investment in the Fund.
The graph and table do not reflect the deduction of taxes that a shareholder would pay on Fund distributions or the redemption of shares.
Past performance is not indicative of future results.
14
Victory Strategic Allocation Fund
Managers' Commentary
(Unaudited)
What were the market conditions during the reporting period?
Over the period, the global capital markets were generally weak except for commodity-oriented stocks as represented by the MSCI World Commodity Producers Index. The U.S. equity markets were relatively stronger leading the broad non-U.S. developed and emerging market equity markets. Commodity-oriented stocks were the strongest subcomponent of the broad global equity markets, with rising inflation and continuing global supply chain challenges. Fixed income markets' lackluster returns were driven by rising interest rates.
How did Victory Strategic Allocation Fund (the "Fund") perform during the reporting period?
The Fund returned -12.57% (Class A at net asset value) for the eight-month period ended June 30, 2022, outperforming the MSCI All Country World Index (ACWI), which returned -18.98% for the period, and outperforming the "Custom Index" (60% MSCI ACWI/40% Bloomberg US Aggregate Bond Index), which returned -15.50% for the period.
What strategies did you employ during the reporting period?
The Fund exceeded its Custom Index primarily due to the strong relative performance of the underlying Victory Mutual Funds in which it invests. The Fund had nine out of 10 underlying Victory Mutual Funds outperform their respective benchmarks. The best-performing underlying Victory Mutual Funds were the Victory Global Energy Transition Fund and the Victory Market Neutral Income Fund.
15
Victory Strategic Allocation Fund
Investment Overview
(Unaudited)
Average Annual Total Return
Year Ended June 30, 2022
| | | Class A | | Class C | | Class I | | Class R | | | | | | | |
INCEPTION DATE | | 12/10/93 | | 3/1/03 | | 8/31/07 | | 12/15/99 | | | | | | | |
| | | Net Asset
Value | | Maximum
Offering
Price | | Net Asset
Value | | Contingent
Deferred
Charges | | Net Asset
Value | | Net Asset
Value | | MSCI
All Country
World Index1 | | Bloomberg
US
Aggregate
Bond
Index2 | | 60% MSCI
All Country
World
Index/40%
Bloomberg
US
Aggregate
Bond Index1,2 | |
One Year | | | –11.25 | % | | | –13.23 | % | | | –11.96 | % | | | –12.82 | % | | | –11.06 | % | | | –11.50 | % | | | –15.75 | % | | | –10.29 | % | | | –13.43 | % | |
Five Year | | | 5.00 | % | | | 4.52 | % | | | 4.21 | % | | | 4.21 | % | | | 5.26 | % | | | 4.74 | % | | | 7.00 | % | | | 0.88 | % | | | 4.83 | % | |
Ten Year | | | 6.93 | % | | | 6.68 | % | | | 6.15 | % | | | 6.15 | % | | | 7.19 | % | | | 6.64 | % | | | 8.76 | % | | | 1.54 | % | | | 6.04 | % | |
The performance data quoted represents past performance and current returns may be lower or higher. The investment return and principal value will fluctuate so that an investor's shares, when redeemed, may be worth more or less than the original cost. To obtain performance information current to the most recent month's end, please visit www.vcm.com.
The maximum offering price ("MOP") figures reflect a maximum sales charge of 2.25% for Class A. Class C is not subject to an initial sales charge, but is subject to a deferred sales charge of 1.00% on shares redeemed within one year of purchase. Net Asset Value does not reflect sales charges.
Total return measures the price change in a share assuming the reinvestment of all net investment income and realized capital gain distributions, if any. The total returns quoted do not reflect adjustments made to the enclosed financial statements in accordance with U.S. Generally Accepted Accounting Principles or the deduction of taxes that a shareholder would pay on net investment income and realized capital gain distributions, including reinvested distributions, or redemptions of shares. The total return figures set forth above include all waivers of fees. Without such fee waivers, the total returns would have been lower.
Victory Strategic Allocation Fund — Growth of $10,000
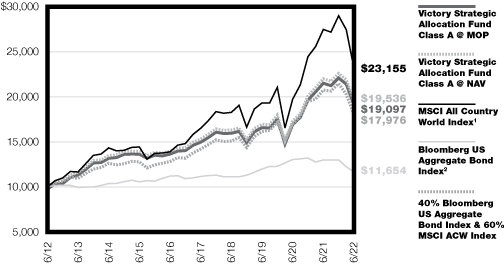
1The MSCI All Country World Index is a market capitalization-weighted index designed to provide a broad measure of equity-market performance throughout the world. This index does not include the effect of sales charges, commissions, expenses or taxes, is not representative of the Fund and it is not possible to invest directly in an index.
2The Bloomberg US Aggregate Bond Index is a broad-based flagship benchmark that measures the investment grade, U.S. dollar-denominated, fixed-rate taxable bond market. The index includes U.S. Treasurys, government-related and corporate securities, MBS (agency fixed-rate and hybrid ARM pass-throughs), ABS and CMBS (agency and nonagency). This index does not include the effect of sales charges, commissions, expenses or taxes, is not representative of the Fund and it is not possible to invest directly in an index.
The graph reflects investment of growth of a hypothetical $10,000 investment in the Fund.
The graph and table do not reflect the deduction of taxes that a shareholder would pay on Fund distributions or the redemption of shares.
Past performance is not indicative of future results.
16
Victory INCORE Fund for Income
Managers' Commentary
(Unaudited)
What were the market conditions during the reporting period?
Risk markets continued to struggle over the last eight months with the Dow Jones Industrial Average down 14.1%, the S&P 500® Index down 16.95%, and Nasdaq down 28.8%, as inflation surged, and the U.S. Federal Reserve (the "Fed") raised interest rates in what is likely to be a swift and steep climb to try to begin to tame the highest inflation readings in decades. The bond market swooned in response. The U.S. Treasury yield curve flattened as short rates rose to match Fed hiking expectations and longer-dated tenors rose, but less so reflecting potential growth concerns as the Fed removes accommodation to combat inflation. U.S. Treasury bonds maturing in two years' time rose +2.46%, five years +1.85%, ten years +1.46%, and the 30-year long bond rose +1.25%. Bond prices move opposite yields.
All fixed income sectors had negative total return and excess return versus duration neutral U.S. Treasury bonds. Asset-backed and agency debt underperformed modestly on an excess return basis. Commercial mortgage-backed and mortgage-backed debt moderately underperformed. Corporate bonds underperformed the most versus duration-neutral U.S. Treasury bonds. Within the mortgage market, GNMA, Fannie, and Freddie all moderately underperformed, with moderate differences between them.
How did Victory INCORE Fund for Income (the "Fund") perform during the reporting period?
The Fund returned -4.48% (Class A at net asset value) for the eight-month period ended June 30, 2022, underperforming the Bloomberg 1-5 Year U.S. Government Bond Index, which returned -4.41% for the period.
What strategies did you employ during the reporting period?
The Fund's GNMA structured bonds, GNMA pass-through bonds, and U.S. Treasury bonds all underperformed moderately, with GNMA structure ahead of GNMA pass-through and U.S. Treasury bonds. We continue to selectively buy or create high-coupon GNMA platinum pools as opportunities arise.
Unfortunately, we think risk markets have further to fall relative to expectations. We think the risks of a deeper and more protracted slowdown (recession) have increased. We think more pain lies ahead as inflation has become more widespread. We may not yet have reached peak inflation. This would keep the Fed on the back foot, forced into tightening both farther and faster than originally anticipated. The ultimate path of the U.S. and global economies rely on external variables, such as: the war in Ukraine and zero-COVID-19 policy in China and related ongoing supply chain disruptions, as well as U.S.-based inflation expectations, which are becoming more entrenched. No matter the weather, the goal of our strategy remains consistent as we seek to deliver high, reliable income and preservation of capital.
17
Victory INCORE Fund for Income
Investment Overview
(Unaudited)
Average Annual Total Return
Year Ended June 30, 2022
| | | Class A | | Class C | | Class I | | Class R | | Class R6 | | Class Y | | Member
Class | | | |
INCEPTION DATE | | 3/26/99 | | 3/1/02 | | 3/1/11 | | 9/16/87 | | 3/4/15 | | 1/28/13 | | 11/3/20 | | | |
| | | Net Asset
Value | | Maximum
Offering
Price | | Net Asset
Value | | Contingent
Deferred
Charges | | Net Asset
Value | | Net Asset
Value | | Net Asset
Value | | Net Asset
Value | | Net Asset
Value | | Bloomberg
1-5 Year U.S.
Government
Bond
Index1 | |
One Year | | | –5.02 | % | | | –7.20 | % | | | –5.82 | % | | | –6.73 | % | | | –4.90 | % | | | –5.02 | % | | | –4.90 | % | | | –4.93 | % | | | –4.98 | % | | | –4.87 | % | |
Five Year | | | 0.30 | % | | | –0.15 | % | | | –0.53 | % | | | –0.53 | % | | | 0.54 | % | | | 0.30 | % | | | 0.55 | % | | | 0.48 | % | | | N/A | | | | 0.87 | % | |
Ten Year | | | 0.60 | % | | | 0.37 | % | | | –0.19 | % | | | –0.19 | % | | | 0.87 | % | | | 0.60 | % | | | N/A | | | | N/A | | | | N/A | | | | 0.87 | % | |
Since
Inception | | | N/A | | | | N/A | | | | N/A | | | | N/A | | | | N/A | | | | N/A | | | | 0.67 | % | | | 0.74 | % | | | –3.37 | % | | | N/A | | |
The performance data quoted represents past performance and current returns may be lower or higher. The investment return and principal value will fluctuate so that an investor's shares, when redeemed, may be worth more or less than the original cost. To obtain performance information current to the most recent month's end, please visit www.vcm.com.
The maximum offering price ("MOP") figures reflect a maximum sales charge of 2.25% for Class A. Class C is not subject to an initial sales charge, but is subject to a deferred sales charge of 1.00% on shares redeemed within one year of purchase. Net Asset Value does not reflect sales charges.
Total return measures the price change in a share assuming the reinvestment of all net investment income and realized capital gain distributions, if any. The total returns quoted do not reflect adjustments made to the enclosed financial statements in accordance with U.S. Generally Accepted Accounting Principles or the deduction of taxes that a shareholder would pay on net investment income and realized capital gain distributions, including reinvested distributions, or redemptions of shares. The total return figures set forth above include all waivers of fees. Without such fee waivers, the total returns would have been lower.
Victory INCORE Fund for Income — Growth of $10,000
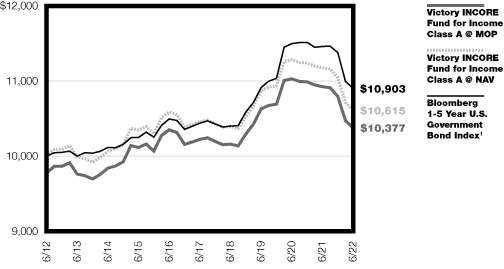
1The Bloomberg 1-5 Year U.S. Government Bond Index is a market-weighted index measuring the performance of Treasury and Agency securities issued by the United States government with maturities of one to five years. The index does not include the effect of sales charges, commissions, expenses, or taxes is not representative of the Fund and it is not possible to invest directly in an index.
The graph reflects investment of growth of a hypothetical $10,000 investment in the Fund.
The graph and table do not reflect the deduction of taxes that a shareholder would pay on Fund distributions or the redemption of shares.
Past performance is not indicative of future results.
18
Victory INCORE Investment Grade Convertible Fund
Managers' Commentary
(Unaudited)
What were the market conditions during the reporting period?
After a year of very positive returns, stock and convertible markets experienced negative returns during the eight-month period ended June 30, 2022. Over this period, stocks, as measured by the S&P 500® Index, returned -16.95%, while investment-grade convertibles, as measured by the ICE BofA Investment Grade U.S. Convertible 5% Constrained Index (the "Index") returned -6.26%. Straight bonds, as measured by the Bloomberg US Aggregate Bond Index returned -10.31%. Convertible securities are either bonds or preferred stock that can be converted into the common stock of the issuing company. Because of this ability to convert to common stock, convertibles participate in the upward and downward movement of the stock market. But because they are part fixed income, they tend to move up and down at a reduced rate. Convertible returns have historically ended up in between stock and bond returns; however, during the period, they outperformed both stocks and bonds.
The stock market began 2022 with a continuation of gains experienced throughout calendar year 2021. Volatility in November, however, brought on by rising inflation and the beginnings of the fast-spreading COVID-19 Omicron variant, foreshadowed the difficult environment that lay ahead. After a strong December, the S&P 500® Index fell in excess of 5% in January, and at one point was down 9.2% month-to-date. Stocks fell again in February as worries of higher interest rates and inflation preceded turbulence caused by the Russian invasion of Ukraine. Surging oil prices early in March contributed to further declines. Markets continued to suffer in the second quarter as the investment environment turned increasingly sour. Stocks were driven lower in April as disappointing earnings, rising rates, spreading COVID-19, economic woes in China, and continuing war in Ukraine combined to push the S&P 500® Index down 8.72% for the month. Technology stocks were particularly punished in April as the Nasdaq fell 13.24%. Stock averages were mostly flat in May, yet they were quite volatile and included both a 933-point up day in the Dow Jones Industrial Average Index followed immediately by a 1064-point down day. May was notable in that the U.S. Federal Reserve (the "Fed") announced a long-awaited half-point increase in the federal-funds rate. It was also notable for the beginnings of the crypto-currency collapse. Markets were hit hard again in June as stocks were pushed into bear market territory. Stocks were flattish during the first part of month before falling sharply midway through June coinciding with the May Consumer Price Index report showing 8.6% inflation. Stocks fell further in reaction to a three-quarter point Fed rate hike one month after the previous rate increase. Fears of slowing economic growth with increasing likelihood of recession also weighed on investors' minds. The S&P 500® Index hit its closing low of 3,666.77 on June 16, down 22.5% on the year, firmly pushing it beyond the negative 20% bear market definition. Stocks recovered from that low point but were pressured again during the final week of the quarter by a drop in consumer confidence and the report of a decrease in May real consumer spending. Ending on a downward tilt, the S&P 500® Index finished June down 8.26%, resulting in a quarterly loss of 16.10%, and a period loss of 16.95%. Investment-grade convertibles, as measured by the Index, returned -6.26% during the period, participating in only 37% of the S&P 500® Index decline, thus providing a lower level of descent than stocks.
19
Victory INCORE Investment Grade Convertible Fund
Managers' Commentary (continued)
How did Victory INCORE Investment Grade Convertible Fund (the "Fund") perform during the reporting period?
The Fund returned -10.32% (Class A at net asset value) for the eight-month period ended June 30, 2022, underperforming the Index, which returned -6.25% for the period.
What strategies did you employ during the reporting period?
In managing the Fund, we strive to invest in high-quality convertibles with attractive underlying common stocks. We structure the Fund by spreading out our holdings across the three types of convertibles: 1) equity-sensitive, high-delta convertibles; 2) total return, middle-of-the-road convertibles; and 3) defensive, fixed-income oriented convertibles. With this structure, we seek to provide a favorable balance between upside potential and downside exposure to equities. As of June 30, 2022, the Fund is overweight compared to the Index in the Information Technology sector. It is underweighted in the Energy and Utilities sectors. It is approximately equal weighted in the Consumer Discretionary, Health Care, Financials, and Industrials sectors. The Fund is broadly diversified among individual issues, economic sectors, credits, and convertible types. Performance during the period was aided by positive security selection in the Financials, Health Care, and Industrials sectors. Performance was hurt by underweights in the Energy and Utilities sectors, and negative security selection in the Information Technology sector.
20
Victory INCORE Investment Grade Convertible Fund
Investment Overview
(Unaudited)
Average Annual Total Return
Year Ended June 30, 2022
| | | Class A | | Class I | | Member Class | | | |
INCEPTION DATE | | 4/14/88 | | 8/31/07 | | 11/3/20 | | | |
| | | Net Asset
Value | | Maximum
Offering Price | | Net Asset
Value | | Net Asset
Value | | ICE BofAML
Investment
Grade U.S. Conv
5% Constrained
Index1 | |
One Year | | | –8.92 | % | | | –10.95 | % | | | –8.58 | % | | | –8.76 | % | | | –3.16 | % | |
Five Year | | | 7.21 | % | | | 6.72 | % | | | 7.67 | % | | | N/A | | | | 8.37 | % | |
Ten Year | | | 8.51 | % | | | 8.26 | % | | | 8.97 | % | | | N/A | | | | 10.00 | % | |
Since Inception | | | N/A | | | | N/A | | | | N/A | | | | 4.93 | % | | | N/A | | |
The performance data quoted represents past performance and current returns may be lower or higher. The investment return and principal value will fluctuate so that an investor's shares, when redeemed, may be worth more or less than the original cost. To obtain performance information current to the most recent month's end, please visit www.vcm.com.
The maximum offering price ("MOP") figures reflect a maximum sales charge of 2.25% for Class A. Net Asset Value does not reflect sales charges.
Total return measures the price change in a share assuming the reinvestment of all net investment income and realized capital gain distributions, if any. The total returns quoted do not reflect adjustments made to the enclosed financial statements in accordance with U.S. Generally Accepted Accounting Principles or the deduction of taxes that a shareholder would pay on net investment income and realized capital gain distributions, including reinvested distributions, or redemptions of shares. The total return figures set forth above include all waivers of fees. Without such fee waivers, the total returns would have been lower.
Victory INCORE Investment Grade Convertible Fund — Growth of $10,000
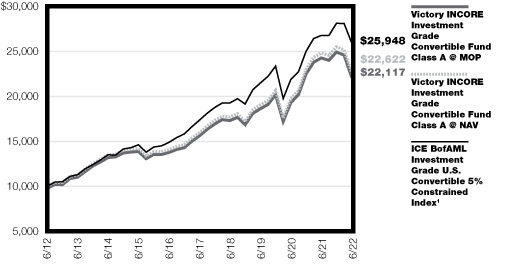
1The ICE BofAML Investment Grade U.S. Convertible 5% Constrained Index is a market capitalization-weighted index of domestic corporate convertible securities. Bonds and preferred stocks must be convertible only to common stock, ADR's or cash equivalent and have a market value of at least $50 million. Composed of Coupon, OID, or zero coupon convertible bonds rated by Moody's and/or S&P with an average rating of Baa3/BBB- or higher. This Index does not include the effect of sales charges, commissions, expenses, or taxes, is not representative of the Fund and it is not possible to invest directly in an index.
The graph reflects investment of growth of a hypothetical $10,000 investment in the Fund.
The graph and table do not reflect the deduction of taxes that a shareholder would pay on Fund distributions or the redemption of shares.
Past performance is not indicative of future results.
21
Victory Portfolios
Victory Diversified Stock Fund | | June 30, 2022 | |
(Unaudited)
Investment Objective and Portfolio Holdings:
The Fund seeks to provide long-term growth of capital.
Top 10 Holdings*:
June 30, 2022
(% of Net Assets)
Apple, Inc. | | | 6.1 | % | |
Microsoft Corp. | | | 5.1 | % | |
Alphabet, Inc., Class C | | | 4.6 | % | |
SPDR S&P 500 ETF Trust | | | 3.0 | % | |
Chevron Corp. | | | 2.1 | % | |
UnitedHealth Group, Inc. | | | 2.1 | % | |
NVIDIA Corp. | | | 2.0 | % | |
Broadcom, Inc. | | | 1.9 | % | |
McKesson Corp. | | | 1.8 | % | |
Nexstar Media Group, Inc., Class A | | | 1.7 | % | |
Sector Allocation*:
June 30, 2022
(% of Net Assets)
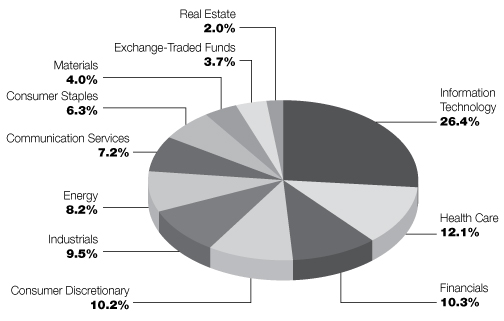
* Does not include futures contracts, money market instruments, and short-term investments purchased with cash collateral from securities loaned.
Percentages are of the net assets of the Fund and may not equal 100%.
Refer to the Schedule of Portfolio Investments for a complete list of securities.
22
Victory Portfolios
Victory NewBridge Large Cap Growth Fund | | June 30, 2022 | |
(Unaudited)
Investment Objective and Portfolio Holdings:
The Fund seeks to provide long-term capital appreciation.
Top 10 Holdings*:
June 30, 2022
(% of Net Assets)
Alphabet, Inc., Class C | | | 7.1 | % | |
Amazon.com, Inc. | | | 5.7 | % | |
Visa, Inc., Class A | | | 5.5 | % | |
NVIDIA Corp. | | | 5.2 | % | |
ServiceNow, Inc. | | | 4.6 | % | |
Zoetis, Inc. | | | 4.3 | % | |
Cadence Design Systems, Inc. | | | 4.3 | % | |
Thermo Fisher Scientific, Inc. | | | 3.9 | % | |
Microsoft Corp. | | | 3.7 | % | |
O'Reilly Automotive, Inc. | | | 3.2 | % | |
Sector Allocation*:
June 30, 2022
(% of Net Assets)
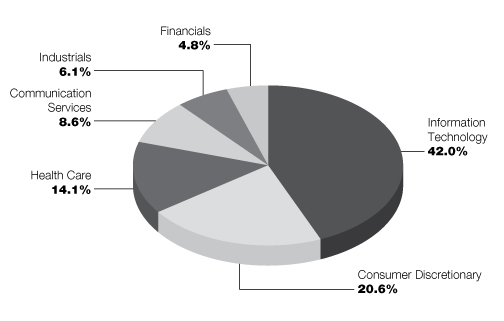
* Does not include futures contracts, money market instruments, and short-term investments purchased with cash collateral from securities loaned.
Percentages are of the net assets of the Fund and may not equal 100%.
Refer to the Schedule of Portfolio Investments for a complete list of securities.
23
Victory Portfolios
Victory Special Value Fund | | June 30, 2022 | |
(Unaudited)
Investment Objective and Portfolio Holdings:
The Fund seeks to provide long-term growth of capital and dividend income.
Top 10 Holdings*:
June 30, 2022
(% of Net Assets)
Apple, Inc. | | | 5.6 | % | |
Microsoft Corp. | | | 5.2 | % | |
Alphabet, Inc., Class C | | | 4.6 | % | |
SPDR S&P 500 ETF Trust | | | 3.0 | % | |
UnitedHealth Group, Inc. | | | 2.2 | % | |
Chevron Corp. | | | 2.1 | % | |
NVIDIA Corp. | | | 2.0 | % | |
Broadcom, Inc. | | | 1.9 | % | |
McKesson Corp. | | | 1.8 | % | |
Chart Industries, Inc. | | | 1.7 | % | |
Sector Allocation*:
June 30, 2022
(% of Net Assets)
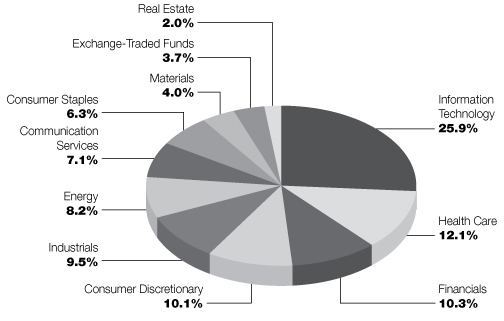
* Does not include futures contracts, money market instruments, and short-term investments purchased with cash collateral from securities loaned.
Percentages are of the net assets of the Fund and may not equal 100%.
Refer to the Schedule of Portfolio Investments for a complete list of securities.
24
Victory Portfolios
Victory THB US Small Opportunities Fund | | June 30, 2022 | |
(Unaudited)
Investment Objective and Portfolio Holdings:
The Fund seeks to provide capital appreciation.
Top 10 Holdings*:
June 30, 2022
(% of Net Assets)
TETRA Technologies, Inc. | | | 3.2 | % | |
First Busey Corp. | | | 3.0 | % | |
ePlus, Inc. | | | 2.8 | % | |
Transcat, Inc. | | | 2.6 | % | |
RPC, Inc. | | | 2.4 | % | |
LeMaitre Vascular, Inc. | | | 2.4 | % | |
Heritage Financial Corp. | | | 2.2 | % | |
Old Second Bancorp, Inc. | | | 2.2 | % | |
Movado Group, Inc. | | | 2.2 | % | |
Grid Dynamics Holdings, Inc. | | | 2.1 | % | |
Sector Allocation*:
June 30, 2022
(% of Net Assets)
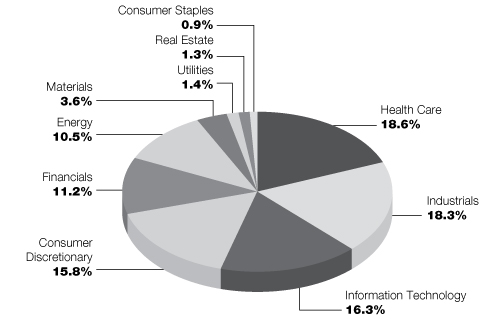
* Does not include futures contracts, money market instruments, and short-term investments purchased with cash collateral from securities loaned.
Percentages are of the net assets of the Fund and may not equal 100%.
Refer to the Schedule of Portfolio Investments for a complete list of securities.
25
Victory Portfolios
Victory Strategic Allocation Fund | | June 30, 2022 | |
(Unaudited)
Investment Objective and Portfolio Holdings:
The Fund seeks to provide income and long-term growth of capital.
Top 10 Holdings*:
June 30, 2022
(% of Net Assets)
Victory RS Global Fund, Class Y | | | 26.3 | % | |
Victory Market Neutral Income Fund, Class I | | | 21.5 | % | |
Victory INCORE Total Return Bond Fund, Class R6 | | | 10.6 | % | |
Victory Sophus Emerging Markets Fund, Class R6 | | | 8.8 | % | |
VictoryShares U.S. Multi-Factor Minimum Volatility ETF | | | 7.2 | % | |
Victory INCORE Investment Grade Convertible Fund, Class I | | | 6.2 | % | |
Victory Global Energy Transition Fund, Class Y | | | 5.8 | % | |
Victory Trivalent International Small-Cap Fund, Class I | | | 5.6 | % | |
Victory RS Partners Fund, Class Y | | | 3.8 | % | |
Victory Integrity Discovery Fund, Class Y | | | 3.7 | % | |
Asset Allocation*:
June 30, 2022
(% of Net Assets)
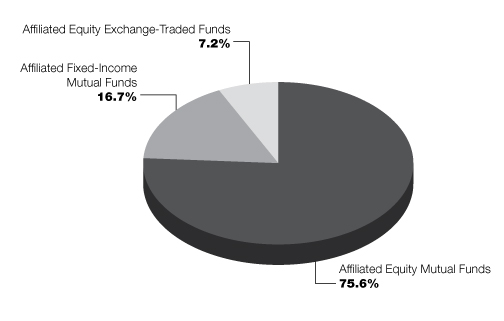
* Does not include futures contracts, money market instruments, and short-term investments purchased with cash collateral from securities loaned.
Percentages are of the net assets of the Fund and may not equal 100%.
Refer to the Schedule of Portfolio Investments for a complete list of securities.
26
Victory Portfolios
Victory INCORE Fund for Income | | June 30, 2022 | |
(Unaudited)
Investment Objective and Portfolio Holdings:
The Fund seeks to provide a high level of current income consistent with preservation of shareholders' capital.
Asset Allocation*:
June 30, 2022
(% of Net Assets)
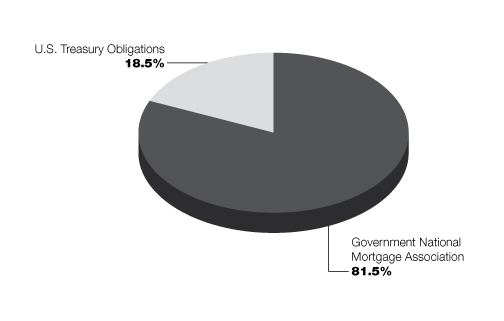
* Does not include futures contracts, money market instruments, and short-term investments purchased with cash collateral from securities loaned.
Percentages are of the net assets of the Fund and may not equal 100%.
Refer to the Schedule of Portfolio Investments for a complete list of securities.
27
Victory Portfolios
Victory INCORE Investment Grade Convertible Fund | | June 30, 2022 | |
(Unaudited)
Investment Objective and Portfolio Holdings:
The Fund seeks to provide a high level of current income together with long-term capital appreciation.
Top 10 Holdings*:
June 30, 2022
(% of Net Assets)
Western Digital Corp. | | | 5.1 | % | |
Anthem, Inc. | | | 4.9 | % | |
Pioneer Natural Resources Co. | | | 4.9 | % | |
Southwest Airlines Co. | | | 4.7 | % | |
Euronet Worldwide, Inc. | | | 4.7 | % | |
Booking Holdings, Inc. | | | 4.6 | % | |
Illumina, Inc. | | | 4.2 | % | |
Wells Fargo & Co. | | | 4.2 | % | |
Bank of America Corp. | | | 4.1 | % | |
Expedia Group, Inc. | | | 4.1 | % | |
Sector Allocation*:
June 30, 2022
(% of Net Assets)
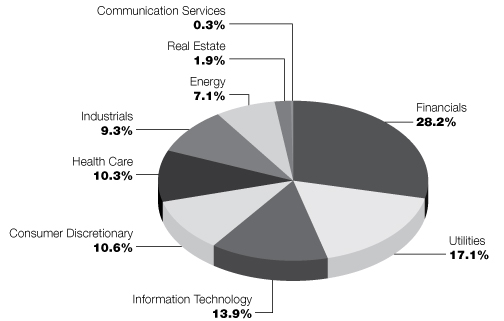
* Does not include futures contracts, money market instruments, and short-term investments purchased with cash collateral from securities loaned.
Percentages are of the net assets of the Fund and may not equal 100%.
Refer to the Schedule of Portfolio Investments for a complete list of securities.
28
Victory Portfolios
Victory Diversified Stock Fund | | Schedule of Portfolio Investments
June 30, 2022 | |
(Amounts in Thousands, Except for Shares)
Security Description | | Shares | | Value | |
Common Stocks (96.2%) | |
Communication Services (7.2%): | |
Alphabet, Inc., Class C (a) | | | 5,371 | | | $ | 11,749 | | |
Nexstar Media Group, Inc., Class A | | | 26,338 | | | | 4,290 | | |
World Wrestling Entertainment, Inc., Class A (b) | | | 38,660 | | | | 2,416 | | |
| | | | 18,455 | | |
Communications Equipment (1.3%): | |
Lumentum Holdings, Inc. (a) | | | 41,318 | | | | 3,282 | | |
Consumer Discretionary (10.2%): | |
Amazon.com, Inc. (a) | | | 25,320 | | | | 2,689 | | |
Asbury Automotive Group, Inc. (a) | | | 15,966 | | | | 2,704 | | |
Brunswick Corp. | | | 32,580 | | | | 2,130 | | |
Crocs, Inc. (a) | | | 28,674 | | | | 1,396 | | |
D.R. Horton, Inc. | | | 26,749 | | | | 1,771 | | |
Group 1 Automotive, Inc. | | | 14,886 | | | | 2,528 | | |
Lithia Motors, Inc. | | | 10,382 | | | | 2,853 | | |
MarineMax, Inc. (a) | | | 67,896 | | | | 2,452 | | |
Meritage Homes Corp. (a) | | | 17,129 | | | | 1,242 | | |
Skyline Champion Corp. (a) | | | 32,099 | | | | 1,522 | | |
Tesla, Inc. (a) | | | 5,404 | | | | 3,639 | | |
Vista Outdoor, Inc. (a) | | | 40,152 | | | | 1,120 | | |
| | | | 26,046 | | |
Consumer Staples (6.3%): | |
BJ's Wholesale Club Holdings, Inc. (a) | | | 40,721 | | | | 2,538 | | |
Darling Ingredients, Inc. (a) | | | 57,530 | | | | 3,440 | | |
Grocery Outlet Holding Corp. (a) | | | 37,200 | | | | 1,586 | | |
Medifast, Inc. | | | 8,793 | | | | 1,587 | | |
PepsiCo, Inc. | | | 15,958 | | | | 2,659 | | |
Philip Morris International, Inc. | | | 30,624 | | | | 3,024 | | |
Walmart, Inc. | | | 10,371 | | | | 1,261 | | |
| | | | 16,095 | | |
Electronic Equipment, Instruments & Components (2.8%): | |
Fabrinet (a) | | | 41,726 | | | | 3,384 | | |
Jabil, Inc. | | | 72,078 | | | | 3,691 | | |
| | | | 7,075 | | |
Energy (8.2%): | |
Chevron Corp. | | | 37,776 | | | | 5,469 | | |
Diamondback Energy, Inc. | | | 29,877 | | | | 3,620 | | |
EOG Resources, Inc. | | | 28,497 | | | | 3,147 | | |
Matador Resources Co. | | | 44,700 | | | | 2,082 | | |
Pioneer Natural Resources Co. | | | 13,259 | | | | 2,958 | | |
Schlumberger NV | | | 105,138 | | | | 3,760 | | |
| | | | 21,036 | | |
Financials (10.3%): | |
Ameriprise Financial, Inc. | | | 13,854 | | | | 3,293 | | |
Bank of America Corp. | | | 94,616 | | | | 2,945 | | |
See notes to financial statements.
29
Victory Portfolios
Victory Diversified Stock Fund | | Schedule of Portfolio Investments — continued
June 30, 2022 | |
(Amounts in Thousands, Except for Shares)
Security Description | | Shares | | Value | |
Chubb Ltd. | | | 21,600 | | | $ | 4,246 | | |
Customers Bancorp, Inc. (a) | | | 34,997 | | | | 1,186 | | |
JPMorgan Chase & Co. | | | 29,025 | | | | 3,269 | | |
Morgan Stanley | | | 36,551 | | | | 2,780 | | |
ServisFirst Bancshares, Inc. | | | 46,280 | | | | 3,652 | | |
Signature Bank | | | 12,833 | | | | 2,300 | | |
Western Alliance Bancorp | | | 40,509 | | | | 2,860 | | |
| | | | 26,531 | | |
Health Care (12.1%): | |
AbbVie, Inc. | | | 10,704 | | | | 1,639 | | |
AmerisourceBergen Corp. | | | 27,230 | | | | 3,852 | | |
AMN Healthcare Services, Inc. (a) | | | 27,975 | | | | 3,069 | | |
Cigna Corp. | | | 13,873 | | | | 3,656 | | |
ICON PLC (a) | | | 13,373 | | | | 2,898 | | |
McKesson Corp. | | | 14,166 | | | | 4,621 | | |
Pfizer, Inc. | | | 30,701 | | | | 1,610 | | |
Regeneron Pharmaceuticals, Inc. (a) | | | 2,720 | | | | 1,608 | | |
Stryker Corp. | | | 5,754 | | | | 1,145 | | |
Thermo Fisher Scientific, Inc. | | | 2,573 | | | | 1,398 | | |
UnitedHealth Group, Inc. | | | 10,590 | | | | 5,439 | | |
| | | | 30,935 | | |
Industrials (9.5%): | |
Builders FirstSource, Inc. (a) | | | 27,569 | | | | 1,480 | | |
Chart Industries, Inc. (a) | | | 25,462 | | | | 4,262 | | |
GXO Logistics, Inc. (a) | | | 23,159 | | | | 1,002 | | |
Huntington Ingalls Industries, Inc. | | | 6,316 | | | | 1,376 | | |
Marten Transport Ltd. | | | 201,259 | | | | 3,385 | | |
Old Dominion Freight Line, Inc. | | | 8,585 | | | | 2,200 | | |
Parker-Hannifin Corp. | | | 9,285 | | | | 2,285 | | |
Raytheon Technologies Corp. | | | 14,347 | | | | 1,379 | | |
Saia, Inc. (a) | | | 11,433 | | | | 2,149 | | |
Trex Co., Inc. (a) | | | 44,028 | | | | 2,396 | | |
UFP Industries, Inc. | | | 35,808 | | | | 2,440 | | |
| | | | 24,354 | | |
Materials (4.0%): | |
Commercial Metals Co. | | | 41,717 | | | | 1,381 | | |
Graphic Packaging Holding Co. | | | 75,000 | | | | 1,537 | | |
Greif, Inc., Class A | | | 23,783 | | | | 1,484 | | |
Materion Corp. | | | 20,748 | | | | 1,530 | | |
Summit Materials, Inc., Class A (a) | | | 76,806 | | | | 1,789 | | |
Valvoline, Inc. | | | 92,002 | | | | 2,652 | | |
| | | | 10,373 | | |
Real Estate (2.0%): | |
American Tower Corp. | | | 7,923 | | | | 2,025 | | |
CBRE Group, Inc., Class A (a) | | | 16,826 | | | | 1,238 | | |
Simon Property Group, Inc. | | | 19,981 | | | | 1,897 | | |
| | | | 5,160 | | |
See notes to financial statements.
30
Victory Portfolios
Victory Diversified Stock Fund | | Schedule of Portfolio Investments — continued
June 30, 2022 | |
(Amounts in Thousands, Except for Shares)
Security Description | | Shares | | Value | |
Semiconductors & Semiconductor Equipment (8.2%): | |
Advanced Micro Devices, Inc. (a) | | | 44,831 | | | $ | 3,428 | | |
Alpha & Omega Semiconductor Ltd. (a) | | | 43,485 | | | | 1,450 | | |
Applied Materials, Inc. | | | 25,255 | | | | 2,298 | | |
Broadcom, Inc. | | | 9,991 | | | | 4,854 | | |
NVIDIA Corp. | | | 33,653 | | | | 5,101 | | |
QUALCOMM, Inc. | | | 30,415 | | | | 3,885 | | |
| | | | 21,016 | | |
Software (6.7%): | |
Cadence Design Systems, Inc. (a) | | | 26,661 | | | | 4,000 | | |
Microsoft Corp. | | | 51,239 | | | | 13,160 | | |
| | | | 17,160 | | |
Technology Hardware, Storage & Peripherals (7.4%): | |
Apple, Inc. | | | 114,498 | | | | 15,654 | | |
HP, Inc. | | | 101,749 | | | | 3,336 | | |
| | | | 18,990 | | |
Total Common Stocks (Cost $202,453) | | | 246,508 | | |
Exchange-Traded Funds (3.7%) | |
SPDR S&P 500 ETF Trust | | | 20,783 | | | | 7,840 | | |
SPDR S&P Biotech ETF (a) (b) | | | 23,522 | | | | 1,747 | | |
Total Exchange-Traded Funds (Cost $9,243) | | | 9,587 | | |
Collateral for Securities Loaned (1.1%)^ | |
BlackRock Liquidity Funds TempFund, Institutional Shares, 1.47% (c) | | | 86,249 | | | | 86 | | |
Goldman Sachs Financial Square Prime Obligations Fund,
Institutional Shares, 1.42% (c) | | | 43,043 | | | | 43 | | |
HSBC U.S. Government Money Market Fund I Shares, 1.46% (c) | | | 536,828 | | | | 537 | | |
JPMorgan Prime Money Market Fund, Capital Shares, 1.50% (c) | | | 343,208 | | | | 343 | | |
Morgan Stanley Institutional Liquidity Government Portfolio,
Institutional Shares, 1.39% (c) | | | 228,881 | | | | 229 | | |
Morgan Stanley Institutional Liquidity Prime Portfolio,
Institutional Shares, 1.53% (c) | | | 1,543,132 | | | | 1,543 | | |
Total Collateral for Securities Loaned (Cost $2,781) | | | 2,781 | | |
Total Investments (Cost $214,477) — 101.0% | | | 258,876 | | |
Liabilities in excess of other assets — (1.0)% | | | (2,681 | ) | |
NET ASSETS — 100.00% | | $ | 256,195 | | |
^ Purchased with cash collateral from securities on loan.
(a) Non-income producing security.
(b) All or a portion of this security is on loan.
(c) Rate disclosed is the daily yield on June 30, 2022.
ETF — Exchange-Traded Fund
PLC — Public Limited Company
See notes to financial statements.
31
Victory Portfolios
Victory NewBridge Large Cap Growth Fund | | Schedule of Portfolio Investments
June 30, 2022 | |
(Amounts in Thousands, Except for Shares)
Security Description | | Shares | | Value | |
Common Stocks (96.2%) | |
Communication Services (8.6%): | |
Alphabet, Inc., Class C (a) | | | 279 | | | $ | 610 | | |
Meta Platforms, Inc., Class A (a) | | | 775 | | | | 125 | | |
| | | | 735 | | |
Communications Equipment (4.9%): | |
Arista Networks, Inc. (a) | | | 2,439 | | | | 229 | | |
Motorola Solutions, Inc. | | | 917 | | | | 192 | | |
| | | | 421 | | |
Consumer Discretionary (20.6%): | |
Airbnb, Inc., Class A (a) | | | 1,666 | | | | 148 | | |
Amazon.com, Inc. (a) | | | 4,605 | | | | 489 | | |
Aptiv PLC (a) | | | 1,626 | | | | 145 | | |
Burlington Stores, Inc. (a) | | | 576 | | | | 79 | | |
Lululemon Athletica, Inc. (a) | | | 845 | | | | 230 | | |
NIKE, Inc., Class B | | | 2,075 | | | | 212 | | |
O'Reilly Automotive, Inc. (a) | | | 436 | | | | 276 | | |
Tractor Supply Co. | | | 945 | | | | 183 | | |
| | | | 1,762 | | |
Electronic Equipment, Instruments & Components (2.7%): | |
CDW Corp. | | | 1,490 | | | | 235 | | |
Financials (4.8%): | |
Blackstone, Inc. | | | 2,186 | | | | 199 | | |
MSCI, Inc. | | | 524 | | | | 216 | | |
| | | | 415 | | |
Health Care (14.1%): | |
Align Technology, Inc. (a) | | | 356 | | | | 84 | | |
Dexcom, Inc. (a) | | | 2,594 | | | | 194 | | |
Thermo Fisher Scientific, Inc. | | | 620 | | | | 337 | | |
Veeva Systems, Inc., Class A (a) | | | 1,151 | | | | 228 | | |
Zoetis, Inc. | | | 2,137 | | | | 367 | | |
| | | | 1,210 | | |
Industrials (6.1%): | |
CoStar Group, Inc. (a) | | | 2,979 | | | | 180 | | |
Generac Holdings, Inc. (a) | | | 811 | | | | 171 | | |
Uber Technologies, Inc. (a) | | | 8,556 | | | | 175 | | |
| | | | 526 | | |
IT Services (5.5%): | |
Visa, Inc., Class A | | | 2,382 | | | | 469 | | |
Semiconductors & Semiconductor Equipment (7.9%): | |
Broadcom, Inc. | | | 484 | | | | 235 | | |
NVIDIA Corp. | | | 2,921 | | | | 443 | | |
| | | | 678 | | |
See notes to financial statements.
32
Victory Portfolios
Victory NewBridge Large Cap Growth Fund | | Schedule of Portfolio Investments — continued
June 30, 2022 | |
(Amounts in Thousands, Except for Shares)
Security Description | | Shares | | Value | |
Software (21.0%): | |
Adobe, Inc. (a) | | | 729 | | | $ | 267 | | |
Cadence Design Systems, Inc. (a) | | | 2,443 | | | | 366 | | |
Crowdstrike Holdings, Inc., Class A (a) | | | 793 | | | | 134 | | |
Microsoft Corp. | | | 1,224 | | | | 314 | | |
Palo Alto Networks, Inc. (a) | | | 366 | | | | 181 | | |
ServiceNow, Inc. (a) | | | 827 | | | | 393 | | |
The Trade Desk, Inc., Class A (a) | | | 3,388 | | | | 142 | | |
| | | | 1,797 | | |
Total Common Stocks (Cost $6,525) | | | 8,248 | | |
Total Investments (Cost $6,525) — 96.2% | | | 8,248 | | |
Other assets in excess of liabilities — 3.8% | | | 327 | | |
NET ASSETS — 100.00% | | $ | 8,575 | | |
(a) Non-income producing security.
PLC — Public Limited Company
See notes to financial statements.
33
Victory Portfolios
Victory Special Value Fund | | Schedule of Portfolio Investments
June 30, 2022 | |
(Amounts in Thousands, Except for Shares)
Security Description | | Shares | | Value | |
Common Stocks (95.5%) | |
Communication Services (7.1%): | |
Alphabet, Inc., Class C (a) | | | 809 | | | $ | 1,770 | | |
Nexstar Media Group, Inc., Class A | | | 3,911 | | | | 637 | | |
World Wrestling Entertainment, Inc., Class A | | | 5,850 | | | | 365 | | |
| | | | 2,772 | | |
Communications Equipment (1.3%): | |
Lumentum Holdings, Inc. (a) | | | 6,282 | | | | 499 | | |
Consumer Discretionary (10.1%): | |
Amazon.com, Inc. (a) | | | 3,760 | | | | 399 | | |
Asbury Automotive Group, Inc. (a) | | | 2,416 | | | | 409 | | |
Brunswick Corp. | | | 5,059 | | | | 331 | | |
Crocs, Inc. (a) | | | 4,357 | | | | 212 | | |
D.R. Horton, Inc. | | | 4,023 | | | | 266 | | |
Group 1 Automotive, Inc. | | | 2,182 | | | | 371 | | |
Lithia Motors, Inc. | | | 1,512 | | | | 416 | | |
MarineMax, Inc. (a) | | | 10,543 | | | | 381 | | |
Meritage Homes Corp. (a) | | | 2,577 | | | | 187 | | |
Skyline Champion Corp. (a) | | | 4,865 | | | | 231 | | |
Tesla, Inc. (a) | | | 813 | | | | 547 | | |
Vista Outdoor, Inc. (a) | | | 5,847 | | | | 163 | | |
| | | | 3,913 | | |
Consumer Staples (6.3%): | |
BJ's Wholesale Club Holdings, Inc. (a) | | | 6,172 | | | | 385 | | |
Darling Ingredients, Inc. (a) | | | 8,720 | | | | 521 | | |
Grocery Outlet Holding Corp. (a) | | | 5,629 | | | | 240 | | |
Medifast, Inc. | | | 1,343 | | | | 242 | | |
PepsiCo, Inc. | | | 2,419 | | | | 403 | | |
Philip Morris International, Inc. | | | 4,634 | | | | 458 | | |
Walmart, Inc. | | | 1,585 | | | | 193 | | |
| | | | 2,442 | | |
Electronic Equipment, Instruments & Components (2.8%): | |
Fabrinet (a) | | | 6,300 | | | | 511 | | |
Jabil, Inc. | | | 10,967 | | | | 562 | | |
| | | | 1,073 | | |
Energy (8.2%): | |
Chevron Corp. | | | 5,726 | | | | 829 | | |
Diamondback Energy, Inc. | | | 4,529 | | | | 549 | | |
EOG Resources, Inc. | | | 4,292 | | | | 474 | | |
Matador Resources Co. | | | 6,579 | | | | 307 | | |
Pioneer Natural Resources Co. | | | 1,996 | | | | 445 | | |
Schlumberger NV | | | 15,969 | | | | 571 | | |
| | | | 3,175 | | |
Financials (10.3%): | |
Ameriprise Financial, Inc. | | | 2,086 | | | | 496 | | |
Bank of America Corp. | | | 14,581 | | | | 454 | | |
See notes to financial statements.
34
Victory Portfolios
Victory Special Value Fund | | Schedule of Portfolio Investments — continued
June 30, 2022 | |
(Amounts in Thousands, Except for Shares)
Security Description | | Shares | | Value | |
Chubb Ltd. | | | 3,211 | | | $ | 631 | | |
Customers Bancorp, Inc. (a) | | | 5,268 | | | | 179 | | |
JPMorgan Chase & Co. | | | 4,388 | | | | 494 | | |
Morgan Stanley | | | 5,423 | | | | 412 | | |
ServisFirst Bancshares, Inc. | | | 6,977 | | | | 551 | | |
Signature Bank | | | 1,994 | | | | 357 | | |
Western Alliance Bancorp | | | 5,946 | | | | 420 | | |
| | | | 3,994 | | |
Health Care (12.1%): | |
AbbVie, Inc. | | | 1,629 | | | | 250 | | |
AmerisourceBergen Corp. | | | 4,138 | | | | 585 | | |
AMN Healthcare Services, Inc. (a) | | | 4,251 | | | | 466 | | |
Cigna Corp. | | | 2,103 | | | | 554 | | |
ICON PLC (a) | | | 1,991 | | | | 432 | | |
McKesson Corp. | | | 2,153 | | | | 702 | | |
Pfizer, Inc. | | | 4,654 | | | | 244 | | |
Regeneron Pharmaceuticals, Inc. (a) | | | 410 | | | | 242 | | |
Stryker Corp. | | | 874 | | | | 174 | | |
Thermo Fisher Scientific, Inc. | | | 392 | | | | 213 | | |
UnitedHealth Group, Inc. | | | 1,645 | | | | 845 | | |
| | | | 4,707 | | |
Industrials (9.5%): | |
Builders FirstSource, Inc. (a) | | | 4,253 | | | | 228 | | |
Chart Industries, Inc. (a) | | | 3,833 | | | | 642 | | |
GXO Logistics, Inc. (a) | | | 3,466 | | | | 150 | | |
Huntington Ingalls Industries, Inc. | | | 947 | | | | 206 | | |
Marten Transport Ltd. | | | 30,570 | | | | 514 | | |
Old Dominion Freight Line, Inc. | | | 1,272 | | | | 326 | | |
Parker-Hannifin Corp. | | | 1,442 | | | | 355 | | |
Raytheon Technologies Corp. | | | 2,192 | | | | 211 | | |
Saia, Inc. (a) | | | 1,676 | | | | 315 | | |
Trex Co., Inc. (a) | | | 6,619 | | | | 360 | | |
UFP Industries, Inc. | | | 5,390 | | | | 367 | | |
| | | | 3,674 | | |
Materials (4.0%): | |
Commercial Metals Co. | | | 6,288 | | | | 208 | | |
Graphic Packaging Holding Co. | | | 11,290 | | | | 231 | | |
Greif, Inc., Class A | | | 3,580 | | | | 223 | | |
Materion Corp. | | | 3,143 | | | | 232 | | |
Summit Materials, Inc., Class A (a) | | | 11,187 | | | | 261 | | |
Valvoline, Inc. | | | 13,910 | | | | 401 | | |
| | | | 1,556 | | |
Real Estate (2.0%): | |
American Tower Corp. | | | 1,190 | | | | 304 | | |
CBRE Group, Inc., Class A (a) | | | 2,507 | | | | 184 | | |
Simon Property Group, Inc. | | | 3,021 | | | | 287 | | |
| | | | 775 | | |
See notes to financial statements.
35
Victory Portfolios
Victory Special Value Fund | | Schedule of Portfolio Investments — continued
June 30, 2022 | |
(Amounts in Thousands, Except for Shares)
Security Description | | Shares | | Value | |
Semiconductors & Semiconductor Equipment (8.2%): | |
Advanced Micro Devices, Inc. (a) | | | 6,774 | | | $ | 518 | | |
Alpha & Omega Semiconductor Ltd. (a) | | | 6,564 | | | | 219 | | |
Applied Materials, Inc. | | | 3,706 | | | | 337 | | |
Broadcom, Inc. | | | 1,508 | | | | 733 | | |
NVIDIA Corp. | | | 5,088 | | | | 771 | | |
QUALCOMM, Inc. | | | 4,599 | | | | 587 | | |
| | | | 3,165 | | |
Software (6.7%): | |
Cadence Design Systems, Inc. (a) | | | 4,053 | | | | 608 | | |
Microsoft Corp. | | | 7,813 | | | | 2,007 | | |
| | | | 2,615 | | |
Technology Hardware, Storage & Peripherals (6.9%): | |
Apple, Inc. | | | 16,042 | | | | 2,193 | | |
HP, Inc. | | | 15,337 | | | | 503 | | |
| | | | 2,696 | | |
Total Common Stocks (Cost $30,891) | | | 37,056 | | |
Exchange-Traded Funds (3.7%) | |
SPDR S&P 500 ETF Trust | | | 3,124 | | | | 1,179 | | |
SPDR S&P Biotech ETF (a) | | | 3,559 | | | | 264 | | |
Total Exchange-Traded Funds (Cost $1,559) | | | 1,443 | | |
Total Investments (Cost $32,450) — 99.2% | | | 38,499 | | |
Other assets in excess of liabilities — 0.8% | | | 329 | | |
NET ASSETS — 100.00% | | $ | 38,828 | | |
(a) Non-income producing security.
ETF — Exchange-Traded Fund
PLC — Public Limited Company
See notes to financial statements.
36
Victory Portfolios
Victory THB US Small Opportunities Fund | | Schedule of Portfolio Investments
June 30, 2022 | |
(Amounts in Thousands, Except for Shares)
Security Description | | Shares | | Value | |
Common Stocks (97.9%) | |
Consumer Discretionary (15.8%): | |
America's Car-Mart, Inc. (a) | | | 6,210 | | | $ | 625 | | |
Bassett Furniture Industries, Inc. | | | 81,180 | | | | 1,471 | | |
BJ's Restaurants, Inc. (a) | | | 32,474 | | | | 704 | | |
Century Communities, Inc. | | | 15,640 | | | | 703 | | |
Charles & Colvard Ltd. (a) | | | 113,330 | | | | 141 | | |
Chuy's Holdings, Inc. (a) | | | 14,844 | | | | 296 | | |
Holley, Inc. (a) | | | 68,420 | | | | 718 | | |
Johnson Outdoors, Inc., Class A | | | 8,670 | | | | 530 | | |
Latham Group, Inc. (a) | | | 76,810 | | | | 532 | | |
Lazydays Holdings, Inc. (a) | | | 5,500 | | | | 65 | | |
M/I Homes, Inc. (a) | | | 17,445 | | | | 692 | | |
MasterCraft Boat Holdings, Inc. (a) | | | 22,680 | | | | 477 | | |
Movado Group, Inc. | | | 49,780 | | | | 1,540 | | |
Overstock.com, Inc. (a) (b) | | | 20,730 | | | | 519 | | |
Ruth's Hospitality Group, Inc. | | | 63,110 | | | | 1,026 | | |
Universal Technical Institute, Inc. (a) | | | 171,930 | | | | 1,226 | | |
| | | | 11,265 | | |
Consumer Staples (0.9%): | |
Vital Farms, Inc. (a) | | | 70,780 | | | | 619 | | |
Energy (10.5%): | |
Clean Energy Fuels Corp. (a) | | | 155,720 | | | | 698 | | |
Expro Group Holdings NV (a) | | | 53,136 | | | | 612 | | |
Geospace Technologies Corp. (a) | | | 49,200 | | | | 233 | | |
Natural Gas Services Group, Inc. (a) | | | 11,768 | | | | 129 | | |
Profire Energy, Inc. | | | 552,220 | | | | 795 | | |
RPC, Inc. (a) | | | 249,850 | | | | 1,727 | | |
Select Energy Services, Inc., Class A (a) | | | 89,180 | | | | 608 | | |
Solaris Oilfield Infrastructure, Inc., Class A | | | 38,590 | | | | 420 | | |
TETRA Technologies, Inc. (a) | | | 556,600 | | | | 2,260 | | |
| | | | 7,482 | | |
Financials (11.2%): | |
BayCom Corp. | | | 40,606 | | | | 840 | | |
Coastal Financial Corp. (a) | | | 12,190 | | | | 465 | | |
Colony Bankcorp, Inc. | | | 29,920 | | | | 451 | | |
First Busey Corp. | | | 92,411 | | | | 2,111 | | |
Heritage Financial Corp. | | | 62,995 | | | | 1,585 | | |
Old Second Bancorp, Inc. | | | 116,242 | | | | 1,555 | | |
P10, Inc., Class A | | | 36,050 | | | | 401 | | |
The First Bancshares, Inc. | | | 20,617 | | | | 590 | | |
| | | | 7,998 | | |
Health Care (18.6%): | |
Addus HomeCare Corp. (a) | | | 11,661 | | | | 971 | | |
Amneal Pharmaceuticals, Inc. (a) | | | 22,048 | | | | 70 | | |
Apollo Medical Holdings, Inc. (a) | | | 19,220 | | | | 742 | | |
Artivion, Inc. (a) | | | 31,965 | | | | 604 | | |
See notes to financial statements.
37
Victory Portfolios
Victory THB US Small Opportunities Fund | | Schedule of Portfolio Investments — continued
June 30, 2022 | |
(Amounts in Thousands, Except for Shares)
Security Description | | Shares | | Value | |
Atrion Corp. | | | 1,194 | | | $ | 751 | | |
BioLife Solutions, Inc. (a) | | | 58,964 | | | | 814 | | |
Catalyst Pharmaceuticals, Inc. (a) | | | 40,330 | | | | 283 | | |
CryoPort, Inc. (a) | | | 29,690 | | | | 920 | | |
Dynavax Technologies Corp. (a) | | | 52,210 | | | | 657 | | |
Lantheus Holdings, Inc. (a) | | | 14,721 | | | | 972 | | |
LeMaitre Vascular, Inc. | | | 37,766 | | | | 1,720 | | |
Meridian Bioscience, Inc. (a) | | | 21,800 | | | | 663 | | |
Mesa Laboratories, Inc. | | | 2,723 | | | | 555 | | |
OptimizeRx Corp. (a) | | | 25,490 | | | | 698 | | |
Organogenesis Holdings, Inc. (a) | | | 13,690 | | | | 67 | | |
Orthofix Medical, Inc. (a) | | | 36,626 | | | | 862 | | |
Retractable Technologies, Inc. (a) (b) | | | 17,950 | | | | 69 | | |
The Joint Corp. (a) | | | 24,587 | | | | 377 | | |
U.S. Physical Therapy, Inc. | | | 4,330 | | | | 473 | | |
Vanda Pharmaceuticals, Inc. (a) | | | 24,930 | | | | 272 | | |
Vericel Corp. (a) | | | 28,570 | | | | 719 | | |
| | | | 13,259 | | |
Industrials (18.3%): | |
Allied Motion Technologies, Inc. | | | 33,337 | | | | 762 | | |
ARC Document Solutions, Inc. | | | 233,850 | | | | 615 | | |
Argan, Inc. | | | 9,560 | | | | 357 | | |
Bowman Consulting Group Ltd. (a) | | | 44,030 | | | | 543 | | |
CIRCOR International, Inc. (a) (b) | | | 4,510 | | | | 74 | | |
Concrete Pumping Holdings, Inc. (a) | | | 92,450 | | | | 560 | | |
Energy Recovery, Inc. (a) | | | 20,500 | | | | 398 | | |
Graham Corp. | | | 23,570 | | | | 163 | | |
Great Lakes Dredge & Dock Corp. (a) | | | 27,380 | | | | 359 | | |
Harsco Corp. (a) | | | 19,250 | | | | 137 | | |
Hyster-Yale Materials Handling, Inc. | | | 2,120 | | | | 68 | | |
IES Holdings, Inc. (a) | | | 6,600 | | | | 199 | | |
Insteel Industries, Inc. | | | 39,915 | | | | 1,344 | | |
Karat Packaging, Inc. (a) | | | 34,000 | | | | 580 | | |
Limbach Holdings, Inc. (a) | | | 53,160 | | | | 284 | | |
MYR Group, Inc. (a) | | | 4,851 | | | | 428 | | |
NN, Inc. (a) | | | 26,660 | | | | 68 | | |
Northwest Pipe Co. (a) | | | 25,970 | | | | 778 | | |
Preformed Line Products Co. | | | 11,290 | | | | 694 | | |
Quest Resource Holding Corp. (a) | | | 65,050 | | | | 266 | | |
The Greenbrier Cos., Inc. | | | 38,180 | | | | 1,374 | | |
The Shyft Group, Inc. | | | 17,216 | | | | 320 | | |
Transcat, Inc. (a) | | | 32,271 | | | | 1,833 | | |
Twin Disc, Inc. (a) | | | 44,300 | | | | 401 | | |
Willdan Group, Inc. (a) | | | 16,780 | | | | 463 | | |
| | | | 13,068 | | |
Information Technology (16.3%): | |
CEVA, Inc. (a) | | | 22,710 | | | | 762 | | |
ePlus, Inc. (a) | | | 37,722 | | | | 2,004 | | |
Grid Dynamics Holdings, Inc. (a) | | | 91,370 | | | | 1,537 | | |
See notes to financial statements.
38
Victory Portfolios
Victory THB US Small Opportunities Fund | | Schedule of Portfolio Investments — continued
June 30, 2022 | |
(Amounts in Thousands, Except for Shares)
Security Description | | Shares | | Value | |
Ichor Holdings Ltd. (a) | | | 46,140 | | | $ | 1,199 | | |
Immersion Corp. (a) | | | 148,540 | | | | 793 | | |
Luna Innovations, Inc. (a) | | | 14,180 | | | | 83 | | |
Napco Security Technologies, Inc. (a) | | | 65,790 | | | | 1,355 | | |
NVE Corp. | | | 7,450 | | | | 347 | | |
PAR Technology Corp. (a) (b) | | | 29,726 | | | | 1,114 | | |
Perficient, Inc. (a) | | | 9,240 | | | | 847 | | |
Ultra Clean Holdings, Inc. (a) | | | 32,963 | | | | 981 | | |
Wayside Technology Group, Inc. | | | 18,010 | | | | 599 | | |
| | | | 11,621 | | |
Materials (3.6%): | |
Hawkins, Inc. | | | 14,570 | | | | 525 | | |
Koppers Holdings, Inc. | | | 45,237 | | | | 1,024 | | |
UFP Technologies, Inc. (a) | | | 12,900 | | | | 1,027 | | |
| | | | 2,576 | | |
Real Estate (1.3%): | |
Gladstone Land Corp. | | | 28,080 | | | | 622 | | |
Postal Realty Trust, Inc., Class A | | | 21,350 | | | | 318 | | |
| | | | 940 | | |
Utilities (1.4%): | |
The York Water Co. | | | 23,950 | | | | 967 | | |
Total Common Stocks (Cost $64,319) | | | 69,795 | | |
Collateral for Securities Loaned (1.6%)^ | |
BlackRock Liquidity Funds TempFund, Institutional Shares, 1.47% (c) | | | 34,308 | | | | 34 | | |
Goldman Sachs Financial Square Prime Obligations Fund,
Institutional Shares, 1.42% (c) | | | 17,122 | | | | 17 | | |
HSBC U.S. Government Money Market Fund I Shares, 1.46% (c) | | | 213,541 | | | | 214 | | |
JPMorgan Prime Money Market Fund, Capital Shares, 1.50% (c) | | | 136,523 | | | | 137 | | |
Morgan Stanley Institutional Liquidity Government Portfolio,
Institutional Shares, 1.39% (c) | | | 91,045 | | | | 91 | | |
Morgan Stanley Institutional Liquidity Prime Portfolio,
Institutional Shares, 1.53% (c) | | | 613,832 | | | | 613 | | |
Total Collateral for Securities Loaned (Cost $1,106) | | | 1,106 | | |
Total Investments (Cost $65,425) — 99.5% | | | 70,901 | | |
Other assets in excess of liabilities — 0.5% | | | 375 | | |
NET ASSETS — 100.00% | �� | $ | 71,276 | | |
^ Purchased with cash collateral from securities on loan.
(a) Non-income producing security.
(b) All or a portion of this security is on loan.
(c) Rate disclosed is the daily yield on June 30, 2022.
See notes to financial statements.
39
Victory Portfolios
Victory Strategic Allocation Fund | | Schedule of Portfolio Investments
June 30, 2022 | |
(Amounts in Thousands, Except for Shares)
Security Description | | Shares | | Value | |
Affiliated Exchange-Traded Funds (7.2%) | |
VictoryShares U.S. Multi-Factor Minimum Volatility ETF | | | 48,490 | | | $ | 1,779 | | |
Total Affiliated Exchange-Traded Funds (Cost $1,231) | | | 1,779 | | |
Affiliated Mutual Funds (92.3%) | |
Victory Global Energy Transition Fund, Class Y | | | 49,394 | | | | 1,440 | | |
Victory INCORE Investment Grade Convertible Fund, Class I | | | 93,486 | | | | 1,524 | | |
Victory INCORE Total Return Bond Fund, Class R6 | | | 300,962 | | | | 2,600 | | |
Victory Integrity Discovery Fund, Class Y | | | 22,352 | | | | 919 | | |
Victory Market Neutral Income Fund Class I | | | 564,317 | | | | 5,288 | | |
Victory RS Global Fund, Class Y | | | 409,071 | | | | 6,484 | | |
Victory RS Partners Fund, Class Y | | | 35,142 | | | | 926 | | |
Victory Sophus Emerging Markets Fund Class R6 | | | 115,473 | | | | 2,166 | | |
Victory Trivalent International Small-Cap Fund, Class I | | | 110,274 | | | | 1,383 | | |
Total Affiliated Mutual Funds (Cost $22,090) | | | 22,730 | | |
Total Investments (Cost $23,321) — 99.5% | | | 24,509 | | |
Other assets in excess of liabilities — 0.5% | | | 125 | | |
NET ASSETS — 100.00% | | $ | 24,634 | | |
ETF — Exchange-Traded Fund
See notes to financial statements.
40
Victory Portfolios
Victory INCORE Fund for Income | | Schedule of Portfolio Investments
June 30, 2022 | |
(Amounts in Thousands, Except for Shares)
Security Description | | Principal
Amount | | Value | |
Government National Mortgage Association (81.5%) | |
Multi-family (0.3%): | |
Pass-throughs (0.3%): | |
Government National Mortgage Assoc.
7.92%, 7/1/23 | | $ | 82 | | | $ | 82 | | |
8.00%, 1/15/31 – 11/15/33 | | | 990 | | | | 991 | | |
7.75%, 9/15/33 | | | 368 | | | | 368 | | |
| | | | 1,441 | | |
Collateralized Mortgage Obligations (3.2%): | |
Government National Mortgage Assoc.
Series 1999-4, Class ZB, 6.00%, 2/20/29 | | | 122 | | | | 122 | | |
Series 2001-10, Class PE, 6.50%, 3/16/31 | | | 102 | | | | 102 | | |
Series 2005-74, Class HB, 7.50%, 9/16/35 | | | 6 | | | | 7 | | |
Series 2005-74, Class HC, 7.50%, 9/16/35 | | | 40 | | | | 43 | | |
Series 2011-166, Class NT, 7.73%, 11/20/31 (a) | | | 610 | | | | 657 | | |
Series 2012-106, Class JM, 7.34%, 10/20/34 (a) | | | 447 | | | | 488 | | |
Series 2012-30, Class WB, 7.00%, 11/20/39 (a) | | | 1,573 | | | | 1,692 | | |
Series 2013-190, Class KT, 8.10%, 9/20/30 (a) | | | 181 | | | | 197 | | |
Series 2013-51, Class BL, 6.07%, 4/20/34 (a) | | | 1,261 | | | | 1,356 | | |
Series 2013-64, Class KY, 6.72%, 12/20/38 (a) | | | 681 | | | | 729 | | |
Series 2013-70, Class KP, 7.02%, 2/20/39 (a) | | | 650 | | | | 708 | | |
Series 2014-69, Class W, 7.21%, 11/20/34 (a) | | | 88 | | | | 95 | | |
Series 2014-74, Class PT, 7.87%, 5/16/44 (a) | | | 120 | | | | 128 | | |
Series 2015-77, Class PT, 7.23%, 6/20/39 (a) | | | 244 | | | | 266 | | |
Series 2019-22, Class PT, 7.93%, 2/20/49 (a) | | | 4,374 | | | | 4,740 | | |
Series 2021-1, Class WT, 7.82%, 1/20/51 (a) | | | 4,712 | | | | 5,140 | | |
| | | | 16,470 | | |
Single Family (78.0%): | |
Pass-throughs (78.0%): | |
Government National Mortgage Assoc.
7.50%, 9/15/22 – 5/15/49 | | | 44,902 | | | | 48,362 | | |
8.00%, 9/15/22 – 5/15/49 | | | 26,784 | | | | 29,213 | | |
7.00%, 12/20/22 – 9/20/50 | | | 69,837 | | | | 75,767 | | |
8.50%, 2/15/23 – 7/15/32 | | | 3,513 | | | | 3,779 | | |
7.13%, 3/15/23 – 7/15/25 | | | 36 | | | | 36 | | |
6.50%, 6/15/23 – 2/20/41 | | | 107,672 | | | | 115,871 | | |
5.50%, 7/15/23 – 11/15/45 | | | 23,745 | | | | 25,796 | | |
6.00%, 9/20/23 – 9/20/50 | | | 67,137 | | | | 73,468 | | |
9.00%, 4/15/25 – 9/15/30 | | | 980 | | | | 1,051 | | |
10.00%, 4/15/25 | | | — | (b) | | | — | (b) | |
6.13%, 6/20/28 – 11/20/28 | | | 227 | | | | 228 | | |
6.28%, 10/20/28 – 9/20/29 | | | 459 | | | | 475 | | |
6.10%, 5/20/29 – 7/20/31 | | | 388 | | | | 401 | | |
7.30%, 4/20/30 – 2/20/31 | | | 167 | | | | 170 | | |
6.49%, 5/20/31 – 3/20/32 | | | 684 | | | | 708 | | |
4.50%, 12/15/33 – 5/15/41 | | | 8,340 | | | | 8,789 | | |
See notes to financial statements.
41
Victory Portfolios
Victory INCORE Fund for Income | | Schedule of Portfolio Investments — continued
June 30, 2022 | |
(Amounts in Thousands, Except for Shares)
Security Description | | Shares or
Principal
Amount | | Value | |
5.00%, 1/20/34 – 2/20/42 | | $ | 19,372 | | | $ | 20,266 | | |
4.00%, 8/15/41 | | | 544 | | | | 564 | | |
| | | | 404,944 | | |
Total Government National Mortgage Association (Cost $446,318) | | | 422,855 | | |
U.S. Treasury Obligations (18.5%) | |
U.S. Treasury Bills,
0.64%, 8/11/22 (c) | | | 10,096 | | | | 10,081 | | |
U.S. Treasury Bonds,
7.50%, 11/15/24 | | | 77,858 | | | | 85,823 | | |
Total U.S. Treasury Obligations (Cost $99,019) | | | 95,904 | | |
Investment Companies (0.0%) (d) | |
BlackRock Liquidity Funds Fedfund Portfolio, 0.91% (c) | | | 99,926 | | | | 100 | | |
Total Investment Companies (Cost $100) | | | 100 | | |
Total Investments (Cost $545,437) — 100.0% | | | 518,859 | | |
Other assets in excess of liabilities — 0.0% | | | 255 | | |
NET ASSETS — 100.00% | | $ | 519,114 | | |
(a) The rate for certain asset-backed and mortgage-backed securities may vary based on factors relating to the pool of assets underlying the security. The rate disclosed is the rate in effect at June 30, 2022.
(b) Rounds to less than $1 thousand.
(c) Rate disclosed is the daily yield on June 30, 2022.
(d) Amount represents less than 0.05% of net assets.
See notes to financial statements.
42
Victory Portfolios
Victory INCORE Investment Grade Convertible Fund | | Schedule of Portfolio Investments
June 30, 2022 | |
(Amounts in Thousands, Except for Shares)
Security Description | | Principal
Amount | | Value | |
Convertible Corporate Bonds (65.7%) | |
Communication Services (0.3%): | |
Snap, Inc., 0.75%, 8/1/26 | | $ | 1,595 | | | $ | 1,530 | | |
Consumer Discretionary (10.6%): | |
Booking Holdings, Inc., 0.75%, 5/1/25 (a) | | | 17,300 | | | | 20,541 | | |
Expedia Group, Inc., 2/15/26 (a) (b) | | | 20,141 | | | | 18,191 | | |
Ford Motor Co., 3/15/26 (a) (b) | | | 9,175 | | | | 8,402 | | |
| | | | 47,134 | | |
Energy (7.1%): | |
EQT Corp., 1.75%, 5/1/26 | | | 3,995 | | | | 9,598 | | |
Pioneer Natural Resources Co., 0.25%, 5/15/25 | | | 10,101 | | | | 21,852 | | |
| | | | 31,450 | | |
Financials (15.6%): | |
Ares Capital Corp., 4.63%, 3/1/24 | | | 13,313 | | | | 13,894 | | |
Barclays Bank PLC
2/4/25 (b) | | | 7,120 | | | | 9,682 | | |
2/18/25 (b) | | | 4,330 | | | | 4,533 | | |
Blackstone Mortgage TR, 5.50%, 3/15/27 | | | 6,105 | | | | 5,555 | | |
GSK Finance NO 3 PLC, 4.51%, 6/22/23 (c) | | | 5,153 | | | | 4,935 | | |
Hannon Armstrong Sustainable Infrastructure Capital, Inc., 1.30%, 8/15/23 | | | 2,435 | | | | 2,400 | | |
JPMorgan Chase Financial Co. LLC, 0.25%, 5/1/23 (c) | | | 12,505 | | | | 13,014 | | |
MGIC Investment Corp., Convertible Subordinated Notes, 9.00%, 4/1/63 | | | 4,342 | | | | 5,748 | | |
TPG Specialty Lending, Inc., 4.50%, 8/1/22 | | | 9,261 | | | | 9,643 | | |
| | | | 69,404 | | |
Health Care (10.3%): | |
Anthem, Inc., 2.75%, 10/15/42 | | | 3,215 | | | | 22,050 | | |
Bristol-Myers Squibb Co., 1.33% (LIBOR03M-50bps), 9/15/23,
Callable 8/8/22 @ 100 (d) | | | 2,466 | | | | 5,233 | | |
Illumina, Inc., 8/15/23 (a) (b) | | | 19,617 | | | | 18,750 | | |
| | | | 46,033 | | |
Industrials (6.0%): | |
Parsons Corp., 0.25%, 8/15/25 | | | 5,520 | | | | 5,834 | | |
Southwest Airlines Co., 1.25%, 5/1/25 | | | 17,865 | | | | 21,123 | | |
| | | | 26,957 | | |
Information Technology (13.9%): | |
Akamai Technologies, Inc., 0.13%, 5/1/25 (a) | | | 3,399 | | | | 3,727 | | |
Block, Inc.
0.13%, 3/1/25 | | | 1,125 | | | | 1,061 | | |
0.25%, 11/1/27 | | | 7,625 | | | | 5,615 | | |
Euronet Worldwide, Inc., 0.75%, 3/15/49, Callable 3/20/25 @ 100 (a) | | | 20,305 | | | | 20,833 | | |
Vishay Intertechnology, Inc., 2.25%, 6/15/25 | | | 8,530 | | | | 8,082 | | |
Western Digital Corp., 1.50%, 2/1/24 | | | 24,003 | | | | 22,826 | | |
| | | | 62,144 | | |
See notes to financial statements.
43
Victory Portfolios
Victory INCORE Investment Grade Convertible Fund | | Schedule of Portfolio Investments — continued
June 30, 2022 | |
(Amounts in Thousands, Except for Shares)
Security Description | | Shares or
Principal
Amount | | Value | |
Real Estate (1.9%): | |
Kite Realty Group LP, 0.75%, 4/1/27 (c) | | $ | 9,280 | | | $ | 8,368 | | |
Total Convertible Corporate Bonds (Cost $294,613) | | | 293,020 | | |
Convertible Preferred Stocks (33.0%) | |
Financials (12.6%): | |
Bank of America Corp., Series L, 7.25% (e) | | | 15,205 | | | | 18,314 | | |
KKR & Co., Inc., Series C, 6.00%, 9/15/23 | | | 282,910 | | | | 16,542 | | |
New York Community Capital Trust, 6.49%, 11/1/51 | | | 53,619 | | | | 2,477 | | |
Wells Fargo & Co., Series L, 7.50% (e) | | | 15,384 | | | | 18,699 | | |
| | | | 56,032 | | |
Industrials (3.3%): | |
Stanley Black & Decker, Inc., 5.25%, 11/15/22 | | | 217,390 | | | | 14,650 | | |
Utilities (17.1%): | |
American Electric Power Co., Inc., 6.13%, 8/15/23 (a) | | | 239,620 | | | | 13,007 | | |
CenterPoint Energy, Inc., 4.57%, 9/15/29 | | | 55,000 | | | | 2,545 | | |
DTE Energy Co., 6.25%, 11/1/22 | | | 314,998 | | | | 16,197 | | |
NextEra Energy, Inc.
0.62%, 9/1/22 | | | 127,545 | | | | 7,182 | | |
5.28%, 3/1/23 | | | 274,805 | | | | 13,644 | | |
3.30%, 9/1/23 | | | 48,900 | | | | 2,404 | | |
NiSource, Inc., 7.75%, 3/1/24 | | | 135,990 | | | | 15,465 | | |
The Southern Co., Series 2019, 6.75%, 8/1/22 | | | 114,070 | | | | 6,043 | | |
| | | | 76,487 | | |
Total Convertible Preferred Stocks (Cost $161,142) | | | 147,169 | | |
Collateral for Securities Loaned (13.5%)^ | |
BlackRock Liquidity Funds TempFund, Institutional Shares, 1.47% (f) | | | 1,872,638 | | | | 1,873 | | |
Goldman Sachs Financial Square Prime Obligations Fund,
Institutional Shares, 1.42% (f) | | | 934,539 | | | | 935 | | |
HSBC U.S. Government Money Market Fund, I Shares, 1.46% (f) | | | 11,655,579 | | | | 11,655 | | |
JPMorgan Prime Money Market Fund, Capital Shares, 1.50% (f) | | | 7,451,721 | | | | 7,452 | | |
Morgan Stanley Institutional Liquidity Government Portfolio,
Institutional Shares, 1.39% (f) | | | 4,969,457 | | | | 4,969 | | |
Morgan Stanley Institutional Liquidity Prime Portfolio,
Institutional Shares, 1.53% (f) | | | 33,504,393 | | | | 33,504 | | |
Total Collateral for Securities Loaned (Cost $60,388) | | | 60,388 | | |
Total Investments (Cost $516,143) — 112.2% | | | 500,577 | | |
Liabilities in excess of other assets — (12.2)% | | | (54,584 | ) | |
NET ASSETS — 100.00% | | $ | 445,993 | | |
^ Purchased with cash collateral from securities on loan.
(a) All or a portion of this security is on loan.
(b) Zero-coupon bond.
See notes to financial statements.
44
Victory Portfolios
Victory INCORE Investment Grade Convertible Fund | | Schedule of Portfolio Investments — continued
June 30, 2022 | |
(c) Rule 144A security or other security that is restricted as to resale to institutional investors. The Fund's Adviser has deemed this security to be liquid (unless otherwise noted as illiquid) based upon procedures approved by the Board of Trustees. As of June 30, 2022, the fair value of these securities was $26,317 (thousands) and amounted to 5.9% of net assets.
(d) Variable or Floating-Rate Security. Rate disclosed is as of June 30, 2022.
(e) Security is perpetual and has no final maturity date but may be subject to calls at various dates in the future.
(f) Rate disclosed is the daily yield on June 30, 2022.
bps — Basis points
LIBOR — London Interbank Offered Rate
LIBOR03M — 3 Month US Dollar LIBOR, rate disclosed as of June 30, 2022, based on the last reset date of the security
LLC — Limited Liability Company
LP — Limited Partnership
PLC — Public Limited Company
See notes to financial statements.
45
Victory Portfolios | | Statements of Assets and Liabilities
June 30, 2022 | |
(Amounts in Thousands, Except Per Share Amounts)
| | | Victory
Diversified
Stock Fund | | Victory
NewBridge
Large Cap
Growth Fund | | Victory
Special
Value Fund | |
Assets: | |
Investments, at value (Cost $214,477, $6,525 and
$32,450) | | $ | 258,876 | (a) | | $ | 8,248 | | | $ | 38,499 | | |
Cash | | | 2,253 | | | | 199 | | | | 622 | | |
Receivables: | |
Interest and dividends | | | 200 | | | | 2 | | | | 30 | | |
Capital shares issued | | | 32 | | | | — | (b) | | | 10 | | |
Investments sold | | | 274 | | | | 113 | | | | 42 | | |
From Adviser | | | 7 | | | | 19 | | | | 8 | | |
Prepaid expenses | | | 35 | | | | 17 | | | | 25 | | |
Total Assets | | | 261,677 | | | | 8,598 | | | | 39,236 | | |
Liabilities: | |
Payables: | |
Collateral received on loaned securities | | | 2,781 | | | | — | | | | — | | |
Investments purchased | | | 2,300 | | | | — | | | | 347 | | |
Capital shares redeemed | | | 144 | | | | — | | | | — | (b) | |
Accrued expenses and other payables: | |
Investment advisory fees | | | 144 | | | | 6 | | | | 25 | | |
Administration fees | | | 12 | | | | — | (b) | | | 2 | | |
Custodian fees | | | 2 | | | | — | (b) | | | 1 | | |
Transfer agent fees | | | 36 | | | | 3 | | | | 11 | | |
Compliance fees | | | — | (b) | | | — | (b) | | | — | (b) | |
Trustees' fees | | | 3 | | | | — | (b) | | | — | (b) | |
| 12b-1 fees | | | 28 | | | | 1 | | | | 5 | | |
Other accrued expenses | | | 32 | | | | 13 | | | | 17 | | |
Total Liabilities | | | 5,482 | | | | 23 | | | | 408 | | |
Net Assets: | |
Capital | | | 189,681 | | | | 5,270 | | | | 29,050 | | |
Total accumulated earnings/(loss) | | | 66,514 | | | | 3,305 | | | | 9,778 | | |
Net Assets | | $ | 256,195 | | | $ | 8,575 | | | $ | 38,828 | | |
Net Assets | |
Class A | | $ | 191,392 | | | $ | 4,524 | | | $ | 22,188 | | |
Class C | | | 1,545 | | | | 354 | | | | 802 | | |
Class I | | | 21,933 | | | | 3,142 | | | | 2,769 | | |
Class R | | | 36,360 | | | | — | | | | 12,401 | | |
Class R6 | | | 863 | | | | — | | | | — | | |
Class Y | | | 4,102 | | | | 555 | | | | 668 | | |
Total | | $ | 256,195 | | | $ | 8,575 | | | $ | 38,828 | | |
Shares (unlimited number of shares authorized with
a par value of $0.001 per share): | |
Class A | | | 10,717 | | | | 1,376 | | | | 852 | | |
Class C | | | 97 | | | | 91 | | | | 37 | | |
Class I | | | 1,229 | | | | 782 | | | | 104 | | |
Class R | | | 2,099 | | | | — | | | | 510 | | |
Class R6 | | | 48 | | | | — | | | | — | | |
Class Y | | | 229 | | | | 150 | | | | 25 | | |
Total | | | 14,419 | | | | 2,399 | | | | 1,528 | | |
(continues on next page)
See notes to financial statements.
46
Victory Portfolios | | Statements of Assets and Liabilities
June 30, 2022 | |
(Amounts in Thousands, Except Per Share Amounts) (continued)
| | | Victory
Diversified
Stock Fund | | Victory
NewBridge
Large Cap
Growth Fund | | Victory
Special
Value Fund | |
Net asset value, offering (except Class A) and
redemption price per share: (c) | |
Class A | | $ | 17.86 | | | $ | 3.29 | | | $ | 26.07 | | |
Class C (d) | | | 15.97 | | | | 3.88 | | | | 21.46 | | |
Class I | | | 17.85 | | | | 4.02 | | | | 26.55 | | |
Class R | | | 17.32 | | | | — | | | | 24.34 | | |
Class R6 | | | 17.87 | | | | — | | | | — | | |
Class Y | | | 17.89 | | | | 3.70 | | | | 26.37 | | |
Maximum Sales Charge — Class A | | | 5.75 | % | | | 5.75 | % | | | 5.75 | % | |
Maximum offering price
(100%/(100%-maximum sales charge) of net asset
value adjusted to the nearest cent) per share —
Class A | | $ | 18.95 | | | $ | 3.49 | | | $ | 27.66 | | |
(a) Includes $2,737 of securities on loan.
(b) Rounds to less than $1 thousand.
(c) Per share amount may not recalculate due to rounding of net assets and/or shares outstanding.
(d) Redemption price per share varies by the length of time shares are held.
See notes to financial statements.
47
Victory Portfolios | | Statements of Assets and Liabilities
June 30, 2022 | |
(Amounts in Thousands, Except Per Share Amounts)
| | | Victory
THB US
Small
Opportunities
Fund | | Victory
Strategic
Allocation
Fund | | Victory
INCORE
Fund for
Income | |
Assets: | |
Affiliated investments, at value (Cost $—,
$23,321 and $—) | | $ | — | | | $ | 24,509 | | | $ | — | | |
Unaffiliated investments, at value (Cost $65,425,
$— and $545,437) | | | 70,901 | (a) | | | — | | | | 518,859 | | |
Cash | | | 1,539 | | | | 103 | | | | — | | |
Receivables: | |
Interest and dividends | | | 9 | | | | — | | | | 2,901 | | |
Capital shares issued | | | 53 | | | | — | (b) | | | 205 | | |
From Adviser | | | 38 | | | | 26 | | | | 30 | | |
Prepaid expenses | | | 17 | | | | 23 | | | | 43 | | |
Total Assets | | | 72,557 | | | | 24,661 | | | | 522,038 | | |
Liabilities: | |
Payables: | |
Collateral received on loaned securities | | | 1,106 | | | | — | | | | — | | |
Capital shares redeemed | | | 74 | | | | — | (b) | | | 2,479 | | |
Accrued expenses and other payables: | |
Investment advisory fees | | | 69 | | | | 2 | | | | 212 | | |
Administration fees | | | 3 | | | | 1 | | | | 25 | | |
Custodian fees | | | 1 | | | | — | (b) | | | 5 | | |
Transfer agent fees | | | 12 | | | | 6 | | | | 100 | | |
Compliance fees | | | — | (b) | | | — | (b) | | | — | (b) | |
Trustees' fees | | | 1 | | | | — | (b) | | | 5 | | |
| 12b-1 fees | | | — | (b) | | | 2 | | | | 15 | | |
Other accrued expenses | | | 15 | | | | 16 | | | | 83 | | |
Total Liabilities | | | 1,281 | | | | 27 | | | | 2,924 | | |
Net Assets: | |
| Capital | | | 66,773 | | | | 22,873 | | | | 939,301 | | |
Total accumulated earnings/(loss) | | | 4,503 | | | | 1,761 | | | | (420,187 | ) | |
Net Assets | | $ | 71,276 | | | $ | 24,634 | | | $ | 519,114 | | |
Net Assets | |
Class A | | $ | 1,185 | | | $ | 13,575 | | | $ | 99,353 | | |
Class C | | | — | | | | 1,978 | | | | 6,978 | | |
Class I | | | 70,091 | | | | 8,020 | | | | 284,230 | | |
Class R | | | — | | | | 1,061 | | | | 17,973 | | |
Class R6 | | | — | | | | — | | | | 27,174 | | |
Class Y | | | — | | | | — | | | | 82,168 | | |
Member Class | | | — | | | | — | | | | 1,238 | | |
Total | | $ | 71,276 | | | $ | 24,634 | | | $ | 519,114 | | |
(continues on next page)
See notes to financial statements.
48
Victory Portfolios | | Statements of Assets and Liabilities
June 30, 2022 | |
(Amounts in Thousands, Except Per Share Amounts) (continued)
| | | Victory
THB US
Small
Opportunities
Fund | | Victory
Strategic
Allocation
Fund | | Victory
INCORE
Fund for
Income | |
Shares (unlimited number of shares authorized with
a par value of $0.001 per share): | |
Class A | | | 72 | | | | 796 | | | | 13,580 | | |
Class C | | | — | | | | 118 | | | | 965 | | |
Class I | | | 4,061 | | | | 468 | | | | 38,857 | | |
Class R | | | — | | | | 62 | | | | 2,454 | | |
Class R6 | | | — | | | | — | | | | 3,721 | | |
Class Y | | | — | | | | — | | | | 11,237 | | |
Member Class | | | — | | | | — | | | | 169 | | |
Total | | | 4,133 | | | | 1,444 | | | | 70,983 | | |
Net asset value, offering (except Class A)
and redemption price per share: (c) | |
Class A | | $ | 16.36 | | | $ | 17.05 | | | $ | 7.32 | | |
Class C (d) | | | — | | | | 16.73 | | | | 7.23 | | |
Class I | | | 17.26 | | | | 17.15 | | | | 7.31 | | |
Class R | | | — | | | | 17.01 | | | | 7.33 | | |
Class R6 | | | — | | | | — | | | | 7.30 | | |
Class Y | | | — | | | | — | | | | 7.31 | | |
Member Class | | | — | | | | — | | | | 7.34 | | |
Maximum Sales Charge — Class A | | | 5.75 | % | | | 2.25 | % | | | 2.25 | % | |
Maximum offering price
(100%/(100%-maximum sales charge) of net asset
value adjusted to the nearest cent) per share —
Class A | | $ | 17.36 | | | $ | 17.44 | | | $ | 7.49 | | |
(a) Includes $1,082 of securities on loan.
(b) Rounds to less than $1 thousand.
(c) Per share amount may not recalculate due to rounding of net assets and/or shares outstanding.
(d) Redemption price per share varies by the length of time shares are held.
See notes to financial statements.
49
Victory Portfolios | | Statements of Assets and Liabilities
June 30, 2022 | |
(Amounts in Thousands, Except Per Share Amounts)
| | | Victory INCORE
Investment Grade
Convertible Fund | |
Assets: | |
Investments, at value (Cost $516,143) | | $ | 500,577 | (a) | |
Cash | | | 3,496 | | |
Receivables: | |
Interest and dividends | | | 1,273 | | |
Capital shares issued | | | 319 | | |
Investments sold | | | 3,588 | | |
From Adviser | | | 4 | | |
Prepaid expenses | | | 24 | | |
Total Assets | | | 509,281 | | |
Liabilities: | |
Payables: | |
Collateral received on loaned securities | | | 60,388 | | |
Investments purchased | | | 2,253 | | |
Capital shares redeemed | | | 220 | | |
Accrued expenses and other payables: | |
Investment advisory fees | | | 279 | | |
Administration fees | | | 21 | | |
Custodian fees | | | 3 | | |
Transfer agent fees | | | 69 | | |
Compliance fees | | | — | (b) | |
Trustees' fees | | | 5 | | |
| 12b-1 fees | | | 2 | | |
Other accrued expenses | | | 48 | | |
Total Liabilities | | | 63,288 | | |
Net Assets: | |
Capital | | | 459,742 | | |
Total accumulated earnings/(loss) | | | (13,749 | ) | |
Net Assets | | $ | 445,993 | | |
Net Assets | |
Class A | | $ | 18,981 | | |
Class I | | | 425,954 | | |
Member Class | | | 1,058 | | |
Total | | $ | 445,993 | | |
Shares (unlimited number of shares authorized with a par value of $0.001 per share): | |
Class A | | | 1,165 | | |
Class I | | | 26,148 | | |
Member Class | | | 62 | | |
Total | | | 27,375 | | |
(continues on next page)
See notes to financial statements.
50
Victory Portfolios | | Statements of Assets and Liabilities
June 30, 2022 | |
(Amounts in Thousands, Except Per Share Amounts) (continued)
| | | Victory INCORE
Investment Grade
Convertible Fund | |
Net asset value, offering (except Class A)
and redemption price per share: (c) | |
Class A | | $ | 16.30 | | |
Class I | | | 16.29 | | |
Member Class | | | 16.95 | | |
Maximum Sales Charge — Class A | | | 2.25 | % | |
Maximum offering price
(100%/(100%-maximum sales charge) of net asset
value adjusted to the nearest cent) per share —
Class A | | $ | 16.68 | | |
(a) Includes $58,950 of securities on loan.
(b) Rounds to less than $1 thousand.
(c) Per share amount may not recalculate due to rounding of net assets and/or shares outstanding.
See notes to financial statements.
51
Victory Portfolios | | Statements of Operations | |
(Amounts in Thousands)
| | | Victory Diversified
Stock Fund | | Victory NewBridge
Large Cap Growth Fund | |
| | | Eight
Months
Ended
June 30,
2022 | | Year
Ended
October 31,
2021 | | Eight
Months
Ended
June 30,
2022 | | Year
Ended
October 31,
2021 | |
Investment Income: | | | |
Dividends | | $ | 2,896 | | | $ | 3,241 | | | $ | 22 | | | $ | 28 | | |
Interest | | | 1 | | | | 1 | | | | — | (a) | | | — | (a) | |
Securities lending (net of fees) | | | 3 | | | | 5 | | | | — | | | | — | (a) | |
Total Income | | | 2,900 | | | | 3,247 | | | | 22 | | | | 28 | | |
Expenses: | | | |
Investment advisory fees | | | 1,342 | | | | 1,965 | | | | 63 | | | | 132 | | |
Administration fees | | | 111 | | | | 169 | | | | 5 | | | | 10 | | |
Sub-Administration fees | | | 11 | | | | 17 | | | | 9 | | | | 14 | | |
| 12b-1 fees — Class A | | | 383 | | | | 552 | | | | 11 | | | | 21 | | |
| 12b-1 fees — Class C | | | 14 | | | | 26 | | | | 3 | | | | 9 | | |
| 12b-1 fees — Class R | | | 148 | | | | 229 | | | | — | | | | — | | |
Custodian fees | | | 10 | | | | 14 | | | | 1 | | | | 2 | | |
Transfer agent fees — Class A | | | 102 | | | | 154 | | | | 5 | | | | 9 | | |
Transfer agent fees — Class C | | | 2 | | | | 4 | | | | — | | | | 1 | | |
Transfer agent fees — Class I | | | 10 | | | | 14 | | | | 3 | | | | 5 | | |
Transfer agent fees — Class R | | | 22 | | | | 35 | | | | — | | | | — | | |
Transfer agent fees — Class R6 | | | — | (a) | | | — | (a) | | | — | | | | — | | |
Transfer agent fees — Class Y | | | 4 | | | | 5 | | | | 1 | | | | 1 | | |
Trustees' fees | | | 13 | | | | 21 | | | | 2 | | | | 3 | | |
Compliance fees | | | 2 | | | | 2 | | | | — | (a) | | | — | (a) | |
Legal and audit fees | | | 17 | | | | 19 | | | | 10 | | | | 8 | | |
State registration and filing fees | | | 52 | | | | 81 | | | | 34 | | | | 52 | | |
Other expenses | | | 38 | | | | 34 | | | | 10 | | | | 9 | | |
Total Expenses | | | 2,281 | | | | 3,341 | | | | 157 | | | | 276 | | |
Expenses waived/reimbursed by Adviser | | | (21 | ) | | | (28 | ) | | | (56 | ) | | | (63 | ) | |
Net Expenses | | | 2,260 | | | | 3,313 | | | | 101 | | | | 213 | | |
Net Investment Income (Loss) | | | 640 | | | | (66 | ) | | | (79 | ) | | | (185 | ) | |
Realized/Unrealized Gains (Losses) from
Investments: | | | |
Net realized gains (losses) from investment
securities | | | 24,238 | | | | 48,095 | | | | 2,027 | | | | 4,481 | | |
Net change in unrealized appreciation/
depreciation on investment securities | | | (78,869 | ) | | | 64,146 | | | | (8,015 | ) | | | 660 | | |
Net realized/unrealized gains (losses) on
investments | | | (54,631 | ) | | | 112,241 | | | | (5,988 | ) | | | 5,141 | | |
Change in net assets resulting from operations | | $ | (53,991 | ) | | $ | 112,175 | | | $ | (6,067 | ) | | $ | 4,956 | | |
(a) Rounds to less than $1 thousand.
See notes to financial statements.
52
Victory Portfolios | | Statements of Operations | |
(Amounts in Thousands)
| | | Victory Special
Value Fund | | Victory THB US Small
Opportunities Fund | |
| | | Eight
Months
Ended
June 30,
2022 | | Year
Ended
October 31,
2021 | | Eight
Months
Ended
June 30,
2022 | | Year
Ended
October 31,
2021(a) | |
Investment Income: | | | |
Dividends | | $ | 439 | | | $ | 521 | | | $ | 580 | | | $ | 429 | | |
Interest | | | — | (b) | | | — | (b) | | | — | | | | — | (b) | |
Securities lending (net of fees) | | | — | | | | — | (b) | | | 3 | | | | 1 | | |
Total Income | | | 439 | | | | 521 | | | | 583 | | | | 430 | | |
Expenses: | | | |
Investment advisory fees | | | 235 | | | | 364 | | | | 600 | | | | 998 | | |
Administration fees | | | 17 | | | | 27 | | | | 28 | | | | 94 | | |
Sub-Administration fees | | | 11 | | | | 17 | | | | 10 | | | | 8 | | |
Shareholder servicing fees — Class A | | | — | | | | — | | | | — | | | | 2 | | |
| 12b-1 fees — Class A | | | 45 | | | | 69 | | | | 3 | | | | 7 | | |
| 12b-1 fees — Class C | | | 6 | | | | 9 | | | | — | | | | — | | |
| 12b-1 fees — Class R | | | 50 | | | | 79 | | | | — | | | | — | | |
Custodian fees | | | 2 | | | | 3 | | | | 3 | | | | 6 | | |
Transfer agent fees | | | — | | | | — | | | | — | | | | 58 | | |
Transfer agent fees — Class A | | | 20 | | | | 31 | | | | 3 | | | | 3 | | |
Transfer agent fees — Class C | | | — | (b) | | | 1 | | | | — | | | | — | | |
Transfer agent fees — Class I | | | 1 | | | | 3 | | | | 45 | | | | 34 | | |
Transfer agent fees — Class R | | | 17 | | | | 23 | | | | — | | | | — | | |
Transfer agent fees — Class Y | | | 1 | | | | 1 | | | | — | | | | — | | |
Trustees' fees | | | 3 | | | | 5 | | | | 4 | | | | 15 | | |
Compliance fees | | | — | (b) | | | — | (b) | | | — | (b) | | | 5 | | |
Legal and audit fees | | | 11 | | | | 9 | | | | 12 | | | | 74 | | |
State registration and filing fees | | | 41 | | | | 65 | | | | 38 | | | | 79 | | |
Line of credit fees | | | — | | | | — | | | | 1 | | | | — | | |
Other expenses | | | 14 | | | | 12 | | | | 19 | | | | 33 | | |
Total Expenses | | | 474 | | | | 718 | | | | 766 | | | | 1,416 | | |
Expenses waived/reimbursed by Adviser | | | (45 | ) | | | (72 | ) | | | (109 | ) | | | (362 | ) | |
Net Expenses | | | 429 | | | | 646 | | | | 657 | | | | 1,054 | | |
Net Investment Income (Loss) | | | 10 | | | | (125 | ) | | | (74 | ) | | | (624 | ) | |
Realized/Unrealized Gains (Losses) from
Investments: | | | |
Net realized gains (losses) from investment
securities | | | 4,295 | | | | 9,190 | | | | (669 | ) | | | 12,921 | | |
Net change in unrealized appreciation/
depreciation on investment securities | | | (12,389 | ) | | | 8,963 | | | | (20,891 | ) | | | 17,176 | | |
Net realized/unrealized gains (losses) on
investments | | | (8,094 | ) | | | 18,153 | | | | (21,560 | ) | | | 30,097 | | |
Change in net assets resulting from operations | | $ | (8,084 | ) | | $ | 18,028 | | | $ | (21,634 | ) | | $ | 29,473 | | |
(a) On May 3, 2021, the THB Asset Management Microcap Fund (the "Predecessor Fund") was reorganized into the Victory THB US Small Opportunities Fund (the "Victory THB Fund"). Investor Class and Institutional Class shares of the Predecessor Fund were exchanged on a tax-free basis for Class A and Class I shares, respectively, of the Victory THB Fund. Information presented prior to May 3, 2021, is that of the Predecessor Fund. See Note 1 in the Notes to Financial Statements.
(b) Rounds to less than $1 thousand.
See notes to financial statements.
53
Victory Portfolios | | Statements of Operations | |
(Amounts in Thousands)
| | | Victory Strategic
Allocation Fund | | Victory INCORE Fund
for Income | |
| | | Eight
Months
Ended
June 30,
2022 | | Year
Ended
October 31,
2021 | | Eight
Months
Ended
June 30,
2022 | | Year
Ended
October 31,
2021 | |
Investment Income: | | | |
Dividends from affiliated investments | | $ | 691 | | | $ | 936 | | | $ | — | | | $ | — | | |
Interest from unaffiliated investments | | | — | | | | — | (a) | | | 5,753 | | | | 9,513 | | |
Total Income | | | 691 | | | | 936 | | | | 5,753 | | | | 9,513 | | |
Expenses: | | | |
Investment advisory fees | | | 18 | | | | 28 | | | | 1,933 | | | | 3,979 | | |
Administration fees | | | 10 | | | | 16 | | | | 216 | | | | 478 | | |
Sub-Administration fees | | | 8 | | | | 13 | | | | 14 | | | | 22 | | |
| 12b-1 fees — Class A | | | 26 | | | | 41 | | | | 191 | | | | 345 | | |
| 12b-1 fees — Class C | | | 15 | | | | 23 | | | | 56 | | | | 136 | | |
| 12b-1 fees — Class R | | | 4 | | | | 7 | | | | 34 | | | | 93 | | |
Custodian fees | | | 2 | | | | 2 | | | | 21 | | | | 54 | | |
Transfer agent fees — Class A | | | 11 | | | | 22 | | | | 72 | | | | 117 | | |
Transfer agent fees — Class C | | | 2 | | | | 3 | | | | 7 | | | | 16 | | |
Transfer agent fees — Class I | | | 6 | | | | 8 | | | | 202 | | | | 435 | | |
Transfer agent fees — Class R | | | 1 | | | | 1 | | | | 10 | | | | 27 | | |
Transfer agent fees — Class R6 | | | — | | | | — | | | | 1 | | | | 3 | | |
Transfer agent fees — Class Y | | | — | | | | — | | | | 68 | | | | 164 | | |
Transfer agent fees — Member Class (b) | | | — | | | | — | | | | 1 | | | | 1 | | |
Trustees' fees | | | 2 | | | | 4 | | | | 24 | | | | 58 | | |
Compliance fees | | | — | (a) | | | — | (a) | | | 3 | | | | 7 | | |
Legal and audit fees | | | 9 | | | | 8 | | | | 13 | | | | 54 | | |
State registration and filing fees | | | 39 | | | | 61 | | | | 85 | | | | 151 | | |
Interfund lending fees | | | — | | | | — | | | | — | (a) | | | — | (a) | |
Other expenses | | | 14 | | | | 11 | | | | 112 | | | | 174 | | |
Recoupment of prior expenses waived/reimbursed
by Adviser | | | — | | | | — | | | | 1 | | | | 34 | | |
Total Expenses | | | 167 | | | | 248 | | | | 3,064 | | | | 6,348 | | |
Expenses waived/reimbursed by Adviser | | | (95 | ) | | | (135 | ) | | | (160 | ) | | | (197 | ) | |
Net Expenses | | | 72 | | | | 113 | | | | 2,904 | | | | 6,151 | | |
Net Investment Income (Loss) | | | 619 | | | | 823 | | | | 2,849 | | | | 3,362 | | |
Realized/Unrealized Gains (Losses) from
Investments: | | | |
Net realized gains (losses) from affiliated
investment securities | | | 313 | | | | (162 | ) | | | — | | | | — | | |
Net realized gains (losses) from unaffiliated
investment securities | | | 15 | | | | 2 | | | | (1,232 | ) | | | (1,300 | ) | |
Capital gain distributions received from affiliated funds | | | 447 | | | | 288 | | | | — | | | | — | | |
Net change in unrealized appreciation/depreciation
on affiliated investment securities | | | (4,992 | ) | | | 5,000 | | | | — | | | | — | | |
Net change in unrealized appreciation/depreciation
on unaffiliated investment securities | | | — | | | | — | | | | (29,251 | ) | | | (8,573 | ) | |
Net realized/unrealized gains (losses) on
investments | | | (4,217 | ) | | | 5,128 | | | | (30,483 | ) | | | (9,873 | ) | |
Change in net assets resulting from operations | | $ | (3,598 | ) | | $ | 5,951 | | | $ | (27,634 | ) | | $ | (6,511 | ) | |
(a) Rounds to less than $1 thousand.
(b) Member Class commenced operations on November 3, 2020.
See notes to financial statements.
54
Victory Portfolios | | Statements of Operations | |
(Amounts in Thousands)
| | | Victory INCORE Investment
Grade Convertible Fund | |
| | | Eight
Months
Ended
June 30,
2022 | | Year
Ended
October 31,
2021 | |
Investment Income: | |
Dividends | | $ | 5,768 | | | $ | 6,102 | | |
Interest | | | 1,824 | | | | 2,675 | | |
Securities lending (net of fees) | | | 612 | | | | 205 | | |
Total Income | | | 8,204 | | | | 8,982 | | |
Expenses: | |
Investment advisory fees | | | 2,218 | | | | 2,675 | | |
Administration fees | | | 162 | | | | 200 | | |
Sub-Administration fees | | | 11 | | | | 16 | | |
| 12b-1 fees — Class A | | | 34 | | | | 51 | | |
Custodian fees | | | 13 | | | | 16 | | |
Transfer agent fees — Class A | | | 8 | | | | 40 | | |
Transfer agent fees — Class I | | | 217 | | | | 255 | | |
Transfer agent fees — Member Class (a) | | | 2 | | | | 1 | | |
Trustees' fees | | | 18 | | | | 24 | | |
Compliance fees | | | 2 | | | | 3 | | |
Legal and audit fees | | | 22 | | | | 27 | | |
State registration and filing fees | | | 46 | | | | 77 | | |
Interfund lending fees | | | — | (b) | | | — | (b) | |
Other expenses | | | 45 | | | | 46 | | |
Recoupment of prior expenses waived/reimbursed by Adviser | | | 5 | | | | — | | |
Total Expenses | | | 2,803 | | | | 3,431 | | |
Expenses waived/reimbursed by Adviser | | | (15 | ) | | | (28 | ) | |
Net Expenses | | | 2,788 | | | | 3,403 | | |
Net Investment Income (Loss) | | | 5,416 | | | | 5,579 | | |
Realized/Unrealized Gains (Losses) from Investments: | |
Net realized gains (losses) from investment securities | | | 5,530 | | | | 35,138 | | |
Net change in unrealized appreciation/depreciation on investment
securities | | | (61,562 | ) | | | 21,029 | | |
Net realized/unrealized gains (losses) on investments | | | (56,032 | ) | | | 56,167 | | |
Change in net assets resulting from operations | | $ | (50,616 | ) | | $ | 61,746 | | |
(a) Member Class commenced operations on November 3, 2020.
(b) Rounds to less than $1 thousand.
See notes to financial statements.
55
Victory Portfolios | | Statements of Changes in Net Assets | |
(Amounts in Thousands)
| | | Victory Diversified Stock Fund | |
| | | Eight
Months
Ended
June 30,
2022 | | Year
Ended
October 31,
2021 | | Year
Ended
October 31,
2020 | |
From Investment Activities: | |
Operations: | |
Net Investment Income (Loss) | | $ | 640 | | | $ | (66 | ) | | $ | 701 | | |
Net realized gains (losses) | | | 24,238 | | | | 48,095 | | | | 6,025 | | |
Net change in unrealized appreciation/depreciation | | | (78,869 | ) | | | 64,146 | | | | 6,403 | | |
Change in net assets resulting from operations | | | (53,991 | ) | | | 112,175 | | | | 13,129 | | |
Distributions to Shareholders: | |
Class A | | | (33,326 | ) | | | (4,846 | ) | | | (13,665 | ) | |
Class C | | | (349 | ) | | | (83 | ) | | | (369 | ) | |
Class I | | | (4,120 | ) | | | (570 | ) | | | (1,940 | ) | |
Class R | | | (6,603 | ) | | | (1,037 | ) | | | (3,072 | ) | |
Class R6 | | | (553 | ) | | | (85 | ) | | | (57 | ) | |
Class Y | | | (684 | ) | | | (99 | ) | | | (287 | ) | |
Change in net assets resulting from distributions to shareholders | | | (45,635 | ) | | | (6,720 | ) | | | (19,390 | ) | |
Change in net assets resulting from capital transactions | | | 21,482 | | | | (25,722 | ) | | | (36,149 | ) | |
Change in net assets | | | (78,144 | ) | | | 79,733 | | | | (42,410 | ) | |
Net Assets: | |
Beginning of period | | | 334,339 | | | | 254,606 | | | | 297,016 | | |
End of period | | $ | 256,195 | | | $ | 334,339 | | | $ | 254,606 | | |
(continues on next page)
See notes to financial statements.
56
Victory Portfolios | | Statements of Changes in Net Assets | |
(Amounts in Thousands) (continued)
| | | Victory Diversified Stock Fund | |
| | | Eight
Months
Ended
June 30,
2022 | | Year
Ended
October 31,
2021 | | Year
Ended
October 31,
2020 | |
Capital Transactions: | |
Class A | |
Proceeds from shares issued | | $ | 6,377 | | | $ | 7,876 | | | $ | 7,727 | | |
Distributions reinvested | | | 30,676 | | | | 4,436 | | | | 12,429 | | |
Cost of shares redeemed | | | (18,160 | ) | | | (27,454 | ) | | | (36,795 | ) | |
Total Class A | | $ | 18,893 | | | $ | (15,142 | ) | | $ | (16,639 | ) | |
Class C | |
Proceeds from shares issued | | $ | 98 | | | $ | 80 | | | $ | 169 | | |
Distributions reinvested | | | 349 | | | | 82 | | | | 311 | | |
Cost of shares redeemed | | | (560 | ) | | | (1,782 | ) | | | (3,132 | ) | |
Total Class C | | $ | (113 | ) | | $ | (1,620 | ) | | $ | (2,652 | ) | |
Class I | |
Proceeds from shares issued | | $ | 4,219 | | | $ | 1,886 | | | $ | 2,816 | | |
Distributions reinvested | | | 3,953 | | | | 537 | | | | 1,805 | | |
Cost of shares redeemed | | | (5,236 | ) | | | (4,406 | ) | | | (14,222 | ) | |
Total Class I | | $ | 2,936 | | | $ | (1,983 | ) | | $ | (9,601 | ) | |
Class R | |
Proceeds from shares issued | | $ | 649 | | | $ | 721 | | | $ | 1,667 | | |
Distributions reinvested | | | 6,442 | | | | 1,016 | | | | 2,947 | | |
Cost of shares redeemed | | | (5,365 | ) | | | (8,082 | ) | | | (12,020 | ) | |
Total Class R | | $ | 1,726 | | | $ | (6,345 | ) | | $ | (7,406 | ) | |
Class R6 | |
Proceeds from shares issued | | $ | 162 | | | $ | 183 | | | $ | 2,494 | | |
Distributions reinvested | | | 553 | | | | 85 | | | | 57 | | |
Cost of shares redeemed | | | (3,272 | ) | | | (618 | ) | | | (1,945 | ) | |
Total Class R6 | | $ | (2,557 | ) | | $ | (350 | ) | | $ | 606 | | |
Class Y | |
Proceeds from shares issued | | $ | 305 | | | $ | 284 | | | $ | 188 | | |
Distributions reinvested | | | 574 | | | | 83 | | | | 244 | | |
Cost of shares redeemed | | | (282 | ) | | | (649 | ) | | | (889 | ) | |
Total Class Y | | $ | 597 | | | $ | (282 | ) | | $ | (457 | ) | |
Change in net assets resulting from capital transactions | | $ | 21,482 | | | $ | (25,722 | ) | | $ | (36,149 | ) | |
(continues on next page)
See notes to financial statements.
57
Victory Portfolios | | Statements of Changes in Net Assets | |
(Amounts in Thousands) (continued)
| | | Victory Diversified Stock Fund | |
| | | Eight
Months
Ended
June 30,
2022 | | Year
Ended
October 31,
2021 | | Year
Ended
October 31,
2020 | |
Share Transactions: | |
Class A | |
Issued | | | 289 | | | | 378 | | | | 473 | | |
Reinvested | | | 1,387 | | | | 231 | | | | 719 | | |
Redeemed | | | (844 | ) | | | (1,303 | ) | | | (2,225 | ) | |
Total Class A | | | 832 | | | | (694 | ) | | | (1,033 | ) | |
Class C | |
Issued | | | 5 | | | | 3 | | | | 11 | | |
Reinvested | | | 18 | | | | 5 | | | | 19 | | |
Redeemed | | | (30 | ) | | | (94 | ) | | | (199 | ) | |
Total Class C | | | (7 | ) | | | (86 | ) | | | (169 | ) | |
Class I | |
Issued | | | 180 | | | | 86 | | | | 169 | | |
Reinvested | | | 179 | | | | 28 | | | | 105 | | |
Redeemed | | | (249 | ) | | | (208 | ) | | | (856 | ) | |
Total Class I | | | 110 | | | | (94 | ) | | | (582 | ) | |
Class R | |
Issued | | | 30 | | | | 35 | | | | 102 | | |
Reinvested | | | 300 | | | | 54 | | | | 174 | | |
Redeemed | | | (251 | ) | | | (387 | ) | | | (734 | ) | |
Total Class R | | | 79 | | | | (298 | ) | | | (458 | ) | |
Class R6 | |
Issued | | | 8 | | | | 8 | | | | 154 | | |
Reinvested | | | 25 | | | | 4 | | | | 3 | | |
Redeemed | | | (147 | ) | | | (29 | ) | | | (109 | ) | |
Total Class R6 | | | (114 | ) | | | (17 | ) | | | 48 | | |
Class Y | |
Issued | | | 14 | | | | 14 | | | | 12 | | |
Reinvested | | | 26 | | | | 4 | | | | 14 | | |
Redeemed | | | (13 | ) | | | (31 | ) | | | (52 | ) | |
Total Class Y | | | 27 | | | | (13 | ) | | | (26 | ) | |
Change in Shares | | | 927 | | | | (1,202 | ) | | | (2,220 | ) | |
See notes to financial statements.
58
Victory Portfolios | | Statements of Changes in Net Assets | |
(Amounts in Thousands)
| | | Victory NewBridge Large Cap Growth Fund | |
| | | Eight
Months
Ended
June 30,
2022 | | Year
Ended
October 31,
2021 | | Year
Ended
October 31,
2020 | |
From Investment Activities: | |
Operations: | |
Net Investment Income (Loss) | | $ | (79 | ) | | $ | (185 | ) | | $ | (153 | ) | |
Net realized gains (losses) | | | 2,027 | | | | 4,481 | | | | 2,698 | | |
Net change in unrealized appreciation/depreciation | | | (8,015 | ) | | | 660 | | | | 2,842 | | |
Change in net assets resulting from operations | | | (6,067 | ) | | | 4,956 | | | | 5,387 | | |
Distributions to Shareholders: | |
Class A | | | (2,162 | ) | | | (924 | ) | | | (1,005 | ) | |
Class C | | | (149 | ) | | | (429 | ) | | | (746 | ) | |
Class I | | | (1,267 | ) | | | (641 | ) | | | (987 | ) | |
Class Y | | | (277 | ) | | | (148 | ) | | | (385 | ) | |
Change in net assets resulting from distributions to
shareholders | | | (3,855 | ) | | | (2,142 | ) | | | (3,123 | ) | |
Change in net assets resulting from capital transactions | | | 655 | | | | (1,834 | ) | | | (1,443 | ) | |
Change in net assets | | | (9,267 | ) | | | 980 | | | | 821 | | |
Net Assets: | |
Beginning of period | | | 17,842 | | | | 16,862 | | | | 16,041 | | |
End of period | | $ | 8,575 | | | $ | 17,842 | | | $ | 16,862 | | |
(continues on next page)
See notes to financial statements.
59
Victory Portfolios | | Statements of Changes in Net Assets | |
(Amounts in Thousands) (continued)
| | | Victory NewBridge Large Cap Growth Fund | |
| | | Eight
Months
Ended
June 30,
2022 | | Year
Ended
October 31,
2021 | | Year
Ended
October 31,
2020 | |
Capital Transactions: | |
Class A | |
Proceeds from shares issued | | $ | 391 | | | $ | 701 | | | $ | 1,914 | | |
Distributions reinvested | | | 1,813 | | | | 740 | | | | 817 | | |
Cost of shares redeemed | | | (1,107 | ) | | | (1,851 | ) | | | (1,714 | ) | |
Total Class A | | $ | 1,097 | | | $ | (410 | ) | | $ | 1,017 | | |
Class C | |
Proceeds from shares issued | | $ | 45 | | | $ | 93 | | | $ | 286 | | |
Distributions reinvested | | | 106 | | | | 338 | | | | 569 | | |
Cost of shares redeemed | | | (87 | ) | | | (752 | ) | | | (1,193 | ) | |
Total Class C | | $ | 64 | | | $ | (321 | ) | | $ | (338 | ) | |
Class I | |
Proceeds from shares issued | | $ | 206 | | | $ | 1,047 | | | $ | 522 | | |
Distributions reinvested | | | 1,213 | | | | 624 | | | | 927 | | |
Cost of shares redeemed | | | (1,898 | ) | | | (2,047 | ) | | | (2,375 | ) | |
Total Class I | | $ | (479 | ) | | $ | (376 | ) | | $ | (926 | ) | |
Class Y | |
Proceeds from shares issued | | $ | 38 | | | $ | 266 | | | $ | 310 | | |
Distributions reinvested | | | 251 | | | | 131 | | | | 184 | | |
Cost of shares redeemed | | | (316 | ) | | | (1,124 | ) | | | (1,690 | ) | |
Total Class Y | | $ | (27 | ) | | $ | (727 | ) | | $ | (1,196 | ) | |
Change in net assets resulting from capital transactions | | $ | 655 | | | $ | (1,834 | ) | | $ | (1,443 | ) | |
Share Transactions: | |
Class A | |
Issued | | | 80 | | | | 110 | | | | 336 | | |
Reinvested | | | 356 | | | | 118 | | | | 171 | | |
Redeemed | | | (241 | ) | | | (277 | ) | | | (314 | ) | |
Total Class A | | | 195 | | | | (49 | ) | | | 193 | | |
Class C (a) | |
Issued | | | 8 | | | | 13 | | | | 176 | | |
Reinvested | | | 17 | | | | 47 | | | | 377 | | |
Redeemed | | | (16 | ) | | | (99 | ) | | | (678 | ) | |
Total Class C | | | 9 | | | | (39 | ) | | | (125 | ) | |
Class I | |
Issued | | | 39 | | | | 139 | | | | 86 | | |
Reinvested | | | 195 | | | | 86 | | | | 170 | | |
Redeemed | | | (276 | ) | | | (260 | ) | | | (383 | ) | |
Total Class I | | | (42 | ) | | | (35 | ) | | | (127 | ) | |
Class Y | |
Issued | | | 8 | | | | 38 | | | | 59 | | |
Reinvested | | | 44 | | | | 19 | | | | 36 | | |
Redeemed | | | (64 | ) | | | (152 | ) | | | (264 | ) | |
Total Class Y | | | (12 | ) | | | (95 | ) | | | (169 | ) | |
Change in Shares | | | 150 | | | | (218 | ) | | | (228 | ) | |
(a) As described in Note 10 in the Notes to Financial Statements, Victory NewBridge Large Cap Growth Fund Class C share amounts have been adjusted for a 1:5 reverse stock split.
See notes to financial statements.
60
Victory Portfolios | | Statements of Changes in Net Assets | |
(Amounts in Thousands)
| | | Victory Special Value Fund | |
| | | Eight
Months
Ended
June 30,
2022 | | Year
Ended
October 31,
2021 | | Year
Ended
October 31,
2020 | |
From Investment Activities: | |
Operations: | |
Net Investment Income (Loss) | | $ | 10 | | | $ | (125 | ) | | $ | 12 | | |
Net realized gains (losses) | | | 4,295 | | | | 9,190 | | | | 1,501 | | |
Net change in unrealized appreciation/depreciation | | | (12,389 | ) | | | 8,963 | | | | 855 | | |
Change in net assets resulting from operations | | | (8,084 | ) | | | 18,028 | | | | 2,368 | | |
Distributions to Shareholders: | |
Class A | | | (4,420 | ) | | | (913 | ) | | | (912 | ) | |
Class C | | | (178 | ) | | | (36 | ) | | | (40 | ) | |
Class I | | | (565 | ) | | | (121 | ) | | | (114 | ) | |
Class R | | | (2,680 | ) | | | (543 | ) | | | (660 | ) | |
Class Y | | | (126 | ) | | | (23 | ) | | | (19 | ) | |
Change in net assets resulting from distributions to shareholders | | | (7,969 | ) | | | (1,636 | ) | | | (1,745 | ) | |
Change in net assets resulting from capital transactions | | | 3,676 | | | | (8,094 | ) | | | (11,653 | ) | |
Change in net assets | | | (12,377 | ) | | | 8,298 | | | | (11,030 | ) | |
Net Assets: | |
Beginning of period | | | 51,205 | | | | 42,907 | | | | 53,937 | | |
End of period | | $ | 38,828 | | | $ | 51,205 | | | $ | 42,907 | | |
(continues on next page)
See notes to financial statements.
61
Victory Portfolios | | Statements of Changes in Net Assets | |
(Amounts in Thousands) (continued)
| | | Victory Special Value Fund | |
| | | Eight
Months
Ended
June 30,
2022 | | Year
Ended
October 31,
2021 | | Year
Ended
October 31,
2020 | |
Capital Transactions: | |
Class A | |
Proceeds from shares issued | | $ | 2,647 | | | $ | 1,518 | | | $ | 2,733 | | |
Distributions reinvested | | | 4,022 | | | | 831 | | | | 818 | | |
Cost of shares redeemed | | | (4,347 | ) | | | (7,055 | ) | | | (7,356 | ) | |
Total Class A | | $ | 2,322 | | | $ | (4,706 | ) | | $ | (3,805 | ) | |
Class C | |
Proceeds from shares issued | | $ | 2 | | | $ | 36 | | | $ | 446 | | |
Distributions reinvested | | | 178 | | | | 36 | | | | 29 | | |
Cost of shares redeemed | | | (9 | ) | | | (249 | ) | | | (870 | ) | |
Total Class C | | $ | 171 | | | $ | (177 | ) | | $ | (395 | ) | |
Class I | |
Proceeds from shares issued | | $ | 2 | | | $ | 406 | | | $ | 436 | | |
Distributions reinvested | | | 503 | | | | 101 | | | | 98 | | |
Cost of shares redeemed | | | (470 | ) | | | (1,187 | ) | | | (601 | ) | |
Total Class I | | $ | 35 | | | $ | (680 | ) | | $ | (67 | ) | |
Class R | |
Proceeds from shares issued | | $ | 1,497 | | | $ | 1,962 | | | $ | 2,086 | | |
Distributions reinvested | | | 2,661 | | | | 530 | | | | 613 | | |
Cost of shares redeemed | | | (3,118 | ) | | | (5,022 | ) | | | (10,132 | ) | |
Total Class R | | $ | 1,040 | | | $ | (2,530 | ) | | $ | (7,433 | ) | |
Class Y | |
Proceeds from shares issued | | $ | 43 | | | $ | 82 | | | $ | 105 | | |
Distributions reinvested | | | 99 | | | | 18 | | | | 14 | | |
Cost of shares redeemed | | | (34 | ) | | | (101 | ) | | | (72 | ) | |
Total Class Y | | $ | 108 | | | $ | (1 | ) | | $ | 47 | | |
Change in net assets resulting from capital transactions | | $ | 3,676 | | | $ | (8,094 | ) | | $ | (11,653 | ) | |
(continues on next page)
See notes to financial statements.
62
Victory Portfolios | | Statements of Changes in Net Assets | |
(Amounts in Thousands) (continued)
| | | Victory Special Value Fund | |
| | | Eight
Months
Ended
June 30,
2022 | | Year
Ended
October 31,
2021 | | Year
Ended
October 31,
2020 | |
Share Transactions: | |
Class A | |
Issued | | | 85 | | | | 48 | | | | 111 | | |
Reinvested | | | 125 | | | | 29 | | | | 31 | | |
Redeemed | | | (140 | ) | | | (222 | ) | | | (294 | ) | |
Total Class A | | | 70 | | | | (145 | ) | | | (152 | ) | |
Class C | |
Issued | | | — | (a) | | | 2 | | | | 21 | | |
Reinvested | | | 6 | | | | 1 | | | | 1 | | |
Redeemed | | | — | (a) | | | (10 | ) | | | (39 | ) | |
Total Class C | | | 6 | | | | (7 | ) | | | (17 | ) | |
Class I | |
Issued | | | — | (a) | | | 13 | | | | 18 | | |
Reinvested | | | 15 | | | | 3 | | | | 4 | | |
Redeemed | | | (13 | ) | | | (37 | ) | | | (24 | ) | |
Total Class I | | | 2 | | | | (21 | ) | | | (2 | ) | |
Class R | |
Issued | | | 52 | | | | 65 | | | | 95 | | |
Reinvested | | | 88 | | | | 20 | | | | 25 | | |
Redeemed | | | (105 | ) | | | (167 | ) | | | (422 | ) | |
Total Class R | | | 35 | | | | (82 | ) | | | (302 | ) | |
Class Y | |
Issued | | | 1 | | | | 2 | | | | 4 | | |
Reinvested | | | 3 | | | | 1 | | | | 1 | | |
Redeemed | | | (1 | ) | | | (3 | ) | | | (3 | ) | |
Total Class Y | | | 3 | | | | — | (a) | | | 2 | | |
Change in Shares | | | 116 | | | | (255 | ) | | | (471 | ) | |
(a) Rounds to less than 1 thousand.
See notes to financial statements.
63
Victory Portfolios | | Statements of Changes in Net Assets | |
(Amounts in Thousands)
| | | Victory THB US Small
Opportunities Fund(a) | |
| | | Eight
Months
Ended
June 30,
2022 | | Year
Ended
October 31,
2021 | | Year
Ended
October 31,
2020 | |
From Investment Activities: | |
Operations: | |
Net Investment Income (Loss) | | $ | (74 | ) | | $ | (624 | ) | | $ | (393 | ) | |
Net realized gains (losses) | | | (669 | ) | | | 12,921 | | | | (3,264 | ) | |
Net change in unrealized appreciation/depreciation | | | (20,891 | ) | | | 17,176 | | | | 1,848 | | |
Change in net assets resulting from operations | | | (21,634 | ) | | | 29,473 | | | | (1,809 | ) | |
Distributions to Shareholders: | |
Class A | | | (183 | ) | | | — | | | | (4 | ) | |
Class I | | | (7,893 | ) | | | — | | | | (417 | ) | |
From return of capital: | |
Class A | | | (8 | ) | | | — | | | | — | | |
Class I | | | (361 | ) | | | — | | | | — | | |
Change in net assets resulting from distributions to shareholders | | | (8,445 | ) | | | — | | | | (421 | ) | |
Change in net assets resulting from capital transactions | | | 11,971 | | | | 9,212 | | | | (21,101 | ) | |
Change in net assets | | | (18,108 | ) | | | 38,685 | | | | (23,331 | ) | |
Net Assets: | |
Beginning of period | | | 89,384 | | | | 50,699 | | | | 74,030 | | |
End of period | | $ | 71,276 | | | $ | 89,384 | | | $ | 50,699 | | |
(a) On May 3, 2021, the THB Asset Management Microcap Fund (the "Predecessor Fund") was reorganized into the Victory THB US Small Opportunities Fund (the "Victory THB Fund"). Investor Class and Institutional Class shares of the Predecessor Fund were exchanged on a tax-free basis for Class A and Class I shares, respectively, of the Victory THB Fund. Information presented prior to May 3, 2021, is that of the Predecessor Fund. See Note 1 in the Notes to Financial Statements.
(continues on next page)
See notes to financial statements.
64
Victory Portfolios | | Statements of Changes in Net Assets | |
(Amounts in Thousands) (continued)
| | | Victory THB US Small
Opportunities Fund(a) | |
| | | Eight
Months
Ended
June 30,
2022 | | Year
Ended
October 31,
2021 | | Year
Ended
October 31,
2020 | |
Capital Transactions: | |
Class A | |
Proceeds from shares issued | | $ | 173 | | | $ | 5,749 | | | $ | 92 | | |
Distributions reinvested | | | 190 | | | | — | | | | 4 | | |
Cost of shares redeemed | | | (1,035 | ) | | | (3,959 | ) | | | (241 | ) | |
Redemption fees | | | — | | | | 1 | | | | — | | |
Total Class A | | $ | (672 | ) | | $ | 1,791 | | | $ | (145 | ) | |
Class I | |
Proceeds from shares issued | | $ | 15,585 | | | $ | 15,429 | | | $ | 6,642 | | |
Distributions reinvested | | | 7,418 | | | | — | | | | 360 | | |
Cost of shares redeemed | | | (10,360 | ) | | | (8,010 | ) | | | (27,958 | ) | |
Redemption fees (b) | | | — | | | | 2 | | | | — | | |
Total Class I | | $ | 12,643 | | | $ | 7,421 | | | $ | (20,956 | ) | |
Change in net assets resulting from capital transactions | | $ | 11,971 | | | $ | 9,212 | | | $ | (21,101 | ) | |
Share Transactions: | |
Class A | |
Issued | | | 7 | | | | 227 | | | | 7 | | |
Reinvested | | | 9 | | | | — | | | | — | (c) | |
Redeemed | | | (44 | ) | | | (159 | ) | | | (18 | ) | |
Total Class A | | | (28 | ) | | | 68 | | | | (10 | ) | |
Class I | |
Issued | | | 781 | | | | 639 | | | | 465 | | |
Reinvested | | | 342 | | | | — | | | | 22 | | |
Redeemed | | | (482 | ) | | | (319 | ) | | | (2,105 | ) | |
Total Class I | | | 641 | | | | 320 | | | | (1,618 | ) | |
Change in Shares | | | 613 | | | | 388 | | | | (1,628 | ) | |
(a) On May 3, 2021, the THB Asset Management Microcap Fund (the "Predecessor Fund") was reorganized into the Victory THB US Small Opportunities Fund (the "Victory THB Fund"). Investor Class and Institutional Class shares of the Predecessor Fund were exchanged on a tax-free basis for Class A and Class I shares, respectively, of the Victory THB Fund. Information presented prior to May 3, 2021, is that of the Predecessor Fund. See Note 1 in the Notes to Financial Statements.
(b) Redemptions Fees — see Note 2 in the Notes to Financial Statements.
(c) Rounds to less than 1 thousand.
See notes to financial statements.
65
Victory Portfolios | | Statements of Changes in Net Assets | |
(Amounts in Thousands)
| | | Victory Strategic Allocation Fund | |
| | | Eight
Months
Ended
June 30,
2022 | | Year
Ended
October 31,
2021 | | Year
Ended
October 31,
2020 | |
From Investment Activities: | |
Operations: | |
Net Investment Income (Loss) | | $ | 619 | | | $ | 823 | | | $ | 347 | | |
Net realized gains (losses) | | | 775 | | | | 128 | | | | (96 | ) | |
Net change in unrealized appreciation/depreciation | | | (4,992 | ) | | | 5,000 | | | | 644 | | |
Change in net assets resulting from operations | | | (3,598 | ) | | | 5,951 | | | | 895 | | |
Distributions to Shareholders: | |
Class A | | | (350 | ) | | | (464 | ) | | | (582 | ) | |
Class C | | | (40 | ) | | | (54 | ) | | | (99 | ) | |
Class I | | | (218 | ) | | | (264 | ) | | | (239 | ) | |
Class R | | | (25 | ) | | | (34 | ) | | | (45 | ) | |
Change in net assets resulting from distributions to shareholders | | | (633 | ) | | | (816 | ) | | | (965 | ) | |
Change in net assets resulting from capital transactions | | | (567 | ) | | | (341 | ) | | | (901 | ) | |
Change in net assets | | | (4,798 | ) | | | 4,794 | | | | (971 | ) | |
Net Assets: | |
Beginning of period | | | 29,432 | | | | 24,638 | | | | 25,609 | | |
End of period | | $ | 24,634 | | | $ | 29,432 | | | $ | 24,638 | | |
(continues on next page)
See notes to financial statements.
66
Victory Portfolios | | Statements of Changes in Net Assets | |
(Amounts in Thousands) (continued)
| | | Victory Strategic Allocation Fund | |
| | | Eight
Months
Ended
June 30,
2022 | | Year
Ended
October 31,
2021 | | Year
Ended
October 31,
2020 | |
Capital Transactions: | |
Class A | |
Proceeds from shares issued | | $ | 969 | | | $ | 1,793 | | | $ | 2,364 | | |
Distributions reinvested | | | 338 | | | | 448 | | | | 557 | | |
Cost of shares redeemed | | | (1,761 | ) | | | (3,213 | ) | | | (3,895 | ) | |
Total Class A | | $ | (454 | ) | | $ | (972 | ) | | $ | (974 | ) | |
Class C | |
Proceeds from shares issued | | $ | 296 | | | $ | 650 | | | $ | 574 | | |
Distributions reinvested | | | 40 | | | | 53 | | | | 98 | | |
Cost of shares redeemed | | | (522 | ) | | | (623 | ) | | | (1,845 | ) | |
Total Class C | | $ | (186 | ) | | $ | 80 | | | $ | (1,173 | ) | |
Class I | |
Proceeds from shares issued | | $ | 942 | | | $ | 1,842 | | | $ | 2,267 | | |
Distributions reinvested | | | 215 | | | | 261 | | | | 233 | | |
Cost of shares redeemed | | | (1,062 | ) | | | (1,305 | ) | | | (1,204 | ) | |
Total Class I | | $ | 95 | | | $ | 798 | | | $ | 1,296 | | |
Class R | |
Proceeds from shares issued | | $ | 11 | | | $ | 93 | | | $ | 30 | | |
Distributions reinvested | | | 25 | | | | 34 | | | | 45 | | |
Cost of shares redeemed | | | (58 | ) | | | (374 | ) | | | (125 | ) | |
Total Class R | | $ | (22 | ) | | $ | (247 | ) | | $ | (50 | ) | |
Change in net assets resulting from capital transactions | | $ | (567 | ) | | $ | (341 | ) | | $ | (901 | ) | |
Share Transactions: | |
Class A | |
Issued | | | 51 | | | | 95 | | | | 146 | | |
Reinvested | | | 17 | | | | 23 | | | | 34 | | |
Redeemed | | | (93 | ) | | | (168 | ) | | | (242 | ) | |
Total Class A | | | (25 | ) | | | (50 | ) | | | (62 | ) | |
Class C | |
Issued | | | 16 | | | | 35 | | | | 36 | | |
Reinvested | | | 2 | | | | 3 | | | | 6 | | |
Redeemed | | | (28 | ) | | | (34 | ) | | | (115 | ) | |
Total Class C | | | (10 | ) | | | 4 | | | | (73 | ) | |
Class I | |
Issued | | | 49 | | | | 96 | | | | 140 | | |
Reinvested | | | 11 | | | | 13 | | | | 14 | | |
Redeemed | | | (55 | ) | | | (69 | ) | | | (78 | ) | |
Total Class I | | | 5 | | | | 40 | | | | 76 | | |
Class R | |
Issued | | | 1 | | | | 5 | | | | 2 | | |
Reinvested | | | 1 | | | | 2 | | | | 3 | | |
Redeemed | | | (4 | ) | | | (20 | ) | | | (8 | ) | |
Total Class R | | | (2 | ) | | | (13 | ) | | | (3 | ) | |
Change in Shares | | | (32 | ) | | | (19 | ) | | | (62 | ) | |
See notes to financial statements.
67
Victory Portfolios | | Statements of Changes in Net Assets | |
(Amounts in Thousands)
| | | Victory INCORE Fund for Income | |
| | | Eight
Months
Ended
June 30,
2022 | | Year
Ended
October 31,
2021 | | Year
Ended
October 31,
2020 | |
From Investment Activities: | |
Operations: | |
Net Investment Income (Loss) | | $ | 2,849 | | | $ | 3,362 | | | $ | 7,347 | | |
Net realized gains (losses) | | | (1,232 | ) | | | (1,300 | ) | | | 877 | | |
Net change in unrealized appreciation/depreciation | | | (29,251 | ) | | | (8,573 | ) | | | 12,254 | | |
Change in net assets resulting from operations | | | (27,634 | ) | | | (6,511 | ) | | | 20,478 | | |
Distributions to Shareholders: | |
Class A | | | (3,754 | ) | | | (6,501 | ) | | | (6,067 | ) | |
Class C | | | (234 | ) | | | (542 | ) | | | (809 | ) | |
Class I | | | (11,344 | ) | | | (23,178 | ) | | | (25,543 | ) | |
Class R | | | (661 | ) | | | (1,747 | ) | | | (1,831 | ) | |
Class R6 | | | (988 | ) | | | (1,851 | ) | | | (1,832 | ) | |
Class Y | | | (3,403 | ) | | | (7,361 | ) | | | (5,074 | ) | |
Member Class | | | (35 | ) | | | (33 | )(a) | | | — | | |
Change in net assets resulting from distributions to
shareholders | | | (20,419 | ) | | | (41,213 | ) | | | (41,156 | ) | |
Change in net assets resulting from capital transactions | | | (131,802 | ) | | | (295,207 | ) | | | 346,322 | | |
Change in net assets | | | (179,855 | ) | | | (342,931 | ) | | | 325,644 | | |
Net Assets: | |
Beginning of period | | | 698,969 | | | | 1,041,900 | | | | 716,256 | | |
End of period | | $ | 519,114 | | | $ | 698,969 | | | $ | 1,041,900 | | |
(a) Member Class activity is for the period November 3, 2020 (commencement of operations) to October 31, 2021.
(continues on next page)
See notes to financial statements.
68
Victory Portfolios | | Statements of Changes in Net Assets | |
(Amounts in Thousands) (continued)
| | | Victory INCORE Fund for Income | |
| | | Eight
Months
Ended
June 30,
2022 | | Year
Ended
October 31,
2021 | | Year
Ended
October 31,
2020 | |
Capital Transactions: | |
Class A | |
Proceeds from shares issued | | $ | 11,500 | | | $ | 43,381 | | | $ | 73,304 | | |
Distributions reinvested | | | 3,347 | | | | 5,738 | | | | 5,164 | | |
Cost of shares redeemed | | | (35,105 | ) | | | (63,627 | ) | | | (60,933 | ) | |
Total Class A | | $ | (20,258 | ) | | $ | (14,508 | ) | | $ | 17,535 | | |
Class C | |
Proceeds from shares issued | | $ | 330 | | | $ | 1,685 | | | $ | 6,690 | | |
Distributions reinvested | | | 222 | | | | 505 | | | | 690 | | |
Cost of shares redeemed | | | (2,959 | ) | | | (12,166 | ) | | | (8,697 | ) | |
Total Class C | | $ | (2,407 | ) | | $ | (9,976 | ) | | $ | (1,317 | ) | |
Class I | |
Proceeds from shares issued | | $ | 51,698 | | | $ | 163,315 | | | $ | 410,936 | | |
Distributions reinvested | | | 9,623 | | | | 20,000 | | | | 21,645 | | |
Cost of shares redeemed | | | (136,152 | ) | | | (362,435 | ) | | | (277,267 | ) | |
Total Class I | | $ | (74,831 | ) | | $ | (179,120 | ) | | $ | 155,314 | | |
Class R | |
Proceeds from shares issued | | $ | 883 | | | $ | 4,576 | | | $ | 18,508 | | |
Distributions reinvested | | | 644 | | | | 1,705 | | | | 1,753 | | |
Cost of shares redeemed | | | (5,556 | ) | | | (24,238 | ) | | | (14,365 | ) | |
Total Class R | | $ | (4,029 | ) | | $ | (17,957 | ) | | $ | 5,896 | | |
Class R6 | |
Proceeds from shares issued | | $ | 6,503 | | | $ | 11,111 | | | $ | 49,482 | | |
Distributions reinvested | | | 976 | | | | 1,831 | | | | 1,818 | | |
Cost of shares redeemed | | | (7,714 | ) | | | (30,159 | ) | | | (17,319 | ) | |
Total Class R6 | | $ | (235 | ) | | $ | (17,217 | ) | | $ | 33,981 | | |
Class Y | |
Proceeds from shares issued | | $ | 21,390 | | | $ | 94,608 | | | $ | 189,431 | | |
Distributions reinvested | | | 3,399 | | | | 7,353 | | | | 3,546 | | |
Cost of shares redeemed | | | (55,272 | ) | | | (159,309 | ) | | | (58,064 | ) | |
Total Class Y | | $ | (30,483 | ) | | $ | (57,348 | ) | | $ | 134,913 | | |
Member Class | |
Proceeds from shares issued | | $ | 820 | | | $ | 1,372 | (a) | | $ | — | | |
Distributions reinvested | | | 35 | | | | 33 | (a) | | | — | | |
Cost of shares redeemed | | | (414 | ) | | | (486 | )(a) | | | — | | |
Total Member Class | | $ | 441 | | | $ | 919 | | | $ | — | | |
Change in net assets resulting from capital transactions | | $ | (131,802 | ) | | $ | (295,207 | ) | | $ | 346,322 | | |
(a) Member Class activity is for the period November 3, 2020 (commencement of operations) to October 31, 2021.
(continues on next page)
See notes to financial statements.
69
Victory Portfolios | | Statements of Changes in Net Assets | |
(Amounts in Thousands) (continued)
| | | Victory INCORE Fund for Income | |
| | | Eight
Months
Ended
June 30,
2022 | | Year
Ended
October 31,
2021 | | Year
Ended
October 31,
2020 | |
Share Transactions: | |
Class A | |
Issued | | | 1,506 | | | | 5,258 | | | | 8,586 | | |
Reinvested | | | 441 | | | | 703 | | | | 608 | | |
Redeemed | | | (4,621 | ) | | | (7,717 | ) | | | (7,145 | ) | |
Total Class A | | | (2,674 | ) | | | (1,756 | ) | | | 2,049 | | |
Class C | |
Issued | | | 43 | | | | 206 | | | | 789 | | |
Reinvested | | | 30 | | | | 62 | | | | 82 | | |
Redeemed | | | (392 | ) | | | (1,486 | ) | | | (1,028 | ) | |
Total Class C | | | (319 | ) | | | (1,218 | ) | | | (157 | ) | |
Class I | |
Issued | | | 6,775 | | | | 19,802 | | | | 48,019 | | |
Reinvested | | | 1,268 | | | | 2,447 | | | | 2,546 | | |
Redeemed | | | (17,829 | ) | | | (43,989 | ) | | | (32,536 | ) | |
Total Class I | | | (9,786 | ) | | | (21,740 | ) | | | 18,029 | | |
Class R | |
Issued | | | 115 | | | | 552 | | | | 2,167 | | |
Reinvested | | | 85 | | | | 208 | | | | 206 | | |
Redeemed | | | (723 | ) | | | (2,981 | ) | | | (1,682 | ) | |
Total Class R | | | (523 | ) | | | (2,221 | ) | | | 691 | | |
Class R6 | |
Issued | | | 852 | | | | 1,349 | | | | 5,802 | | |
Reinvested | | | 129 | | | | 224 | | | | 214 | | |
Redeemed | | | (1,014 | ) | | | (3,665 | ) | | | (2,027 | ) | |
Total Class R6 | | | (33 | ) | | | (2,092 | ) | | | 3,989 | | |
Class Y | |
Issued | | | 2,806 | | | | 11,518 | | | | 22,159 | | |
Reinvested | | | 448 | | | | 900 | | | | 418 | | |
Redeemed | | | (7,238 | ) | | | (19,398 | ) | | | (6,797 | ) | |
Total Class Y | | | (3,984 | ) | | | (6,980 | ) | | | 15,780 | | |
Member Class | |
Issued | | | 107 | | | | 166 | (a) | | | — | | |
Reinvested | | | 5 | | | | 4 | (a) | | | — | | |
Redeemed | | | (53 | ) | | | (60 | )(a) | | | — | | |
Total Member Class | | | 59 | | | | 110 | | | | — | | |
Change in Shares | | | (17,260 | ) | | | (35,897 | ) | | | 40,381 | | |
(a) Member Class activity is for the period November 3, 2020 (commencement of operations) to October 31, 2021.
See notes to financial statements.
70
Victory Portfolios | | Statements of Changes in Net Assets | |
(Amounts in Thousands)
| | | Victory INCORE
Investment Grade Convertible Fund | |
| | | Eight
Months
Ended
June 30,
2022 | | Year
Ended
October 31,
2021 | | Year
Ended
October 31,
2020 | |
From Investment Activities: | |
Operations: | |
Net Investment Income (Loss) | | $ | 5,416 | | | $ | 5,579 | | | $ | 5,803 | | |
Net realized gains (losses) | | | 5,530 | | | | 35,138 | | | | 8,565 | | |
Net change in unrealized appreciation/depreciation | | | (61,562 | ) | | | 21,029 | | | | 1,342 | | |
Change in net assets resulting from operations | | | (50,616 | ) | | | 61,746 | | | | 15,710 | | |
Distributions to Shareholders: | |
Class A | | | (1,950 | ) | | | (820 | ) | | | (1,183 | ) | |
Class I | | | (37,138 | ) | | | (14,821 | ) | | | (15,554 | ) | |
Member Class | | | (57 | ) | | | (3 | )(a) | | | — | | |
Change in net assets resulting from distributions to
shareholders | | | (39,145 | ) | | | (15,644 | ) | | | (16,737 | ) | |
Change in net assets resulting from capital transactions | | | 110,476 | | | | 85,682 | | | | 14,191 | | |
Change in net assets | | | 20,715 | | | | 131,784 | | | | 13,164 | | |
Net Assets: | |
Beginning of period | | | 425,278 | | | | 293,494 | | | | 280,330 | | |
End of period | | $ | 445,993 | | | $ | 425,278 | | | $ | 293,494 | | |
(a) Member Class activity is for the period November 3, 2020 (commencement of operations) to October 31, 2021.
(continues on next page)
See notes to financial statements.
71
Victory Portfolios | | Statements of Changes in Net Assets | |
(Amounts in Thousands) (continued)
| | | Victory INCORE
Investment Grade Convertible Fund | |
| | | Eight
Months
Ended
June 30,
2022 | | Year
Ended
October 31,
2021 | | Year
Ended
October 31,
2020 | |
Capital Transactions: | |
Class A | |
Proceeds from shares issued | | $ | 3,129 | | | $ | 8,473 | | | $ | 26,469 | | |
Distributions reinvested | | | 1,697 | | | | 711 | | | | 1,032 | | |
Cost of shares redeemed | | | (3,353 | ) | | | (6,798 | ) | | | (29,802 | ) | |
Total Class A | | $ | 1,473 | | | $ | 2,386 | | | $ | (2,301 | ) | |
Class I | |
Proceeds from shares issued | | $ | 223,089 | | | $ | 174,838 | | | $ | 181,653 | | |
Distributions reinvested | | | 35,733 | | | | 14,661 | | | | 15,054 | | |
Cost of shares redeemed | | | (150,529 | ) | | | (106,697 | ) | | | (180,215 | ) | |
Total Class I | | $ | 108,293 | | | $ | 82,802 | | | $ | 16,492 | | |
Member Class | |
Proceeds from shares issued | | $ | 910 | | | $ | 657 | (a) | | $ | — | | |
Distributions reinvested | | | 57 | | | | 3 | (a) | | | — | | |
Cost of shares redeemed | | | (257 | ) | | | (166 | )(a) | | | — | | |
Total Member Class | | $ | 710 | | | $ | 494 | | | $ | — | | |
Change in net assets resulting from capital transactions | | $ | 110,476 | | | $ | 85,682 | | | $ | 14,191 | | |
Share Transactions: | |
Class A | |
Issued | | | 175 | | | | 441 | | | | 1,717 | | |
Reinvested | | | 92 | | | | 39 | | | | 62 | | |
Redeemed | | | (186 | ) | | | (353 | ) | | | (1,755 | ) | |
Total Class A | | | 81 | | | | 127 | | | | 24 | | |
Class I | |
Issued | | | 12,314 | | | | 8,995 | | | | 11,013 | | |
Reinvested | | | 1,946 | | | | 797 | | | | 889 | | |
Redeemed | | | (8,292 | ) | | | (5,604 | ) | | | (10,994 | ) | |
Total Class I | | | 5,968 | | | | 4,188 | | | | 908 | | |
Member Class | |
Issued | | | 47 | | | | 33 | (a) | | | — | | |
Reinvested | | | 3 | | | | — | (a)(b) | | | — | | |
Redeemed | | | (13 | ) | | | (8 | )(a) | | | — | | |
Total Member Class | | | 37 | | | | 25 | | | | — | | |
Change in Shares | | | 6,086 | | | | 4,340 | | | | 932 | | |
(a) Member Class activity is for the period November 3, 2020 (commencement of operations) to October 31, 2021.
(b) Rounds to less than 1 thousand.
See notes to financial statements.
72
This page is intentionally left blank.
73
Victory Portfolios | | Financial Highlights | |
For a Share Outstanding Throughout Each Period
| | | | | Investment Activities | | Distributions to
Shareholders From | |
| | | Net Asset
Value,
Beginning of
Period | | Net
Investment
Income
(Loss)(a) | | Net Realized
and Unrealized
Gains (Losses) | | Total from
Investment
Activities | | Net
Investment
Income | | Net Realized
Gains from
Investments | |
Victory Diversified Stock Fund | | | |
Class A | | | |
Eight Months Ended
June 30, 2022 (h) | | $ | 24.89 | | | | 0.05 | | | | (3.68 | ) | | | (3.63 | ) | | | (0.04 | ) | | | (3.36 | ) | |
Year Ended October 31: | |
2021 | | $ | 17.41 | | | | — | (f) | | | 7.95 | | | | 7.95 | | | | (0.01 | ) | | | (0.46 | ) | |
2020 | | $ | 17.65 | | | | 0.05 | | | | 0.90 | | | | 0.95 | | | | (0.04 | ) | | | (1.15 | ) | |
2019 | | $ | 17.90 | | | | 0.09 | | | | 1.65 | | | | 1.74 | | | | (0.08 | ) | | | (1.91 | ) | |
2018 | | $ | 22.03 | | | | 0.06 | | | | 0.17 | | | | 0.23 | | | | (0.06 | ) | | | (4.30 | ) | |
2017 | | $ | 18.01 | | | | 0.13 | | | | 4.28 | | | | 4.41 | | | | (0.17 | ) | | | (0.22 | ) | |
Class C | | | |
Eight Months Ended
June 30, 2022 (h) | | $ | 22.70 | | | | (0.08 | ) | | | (3.29 | ) | | | (3.37 | ) | | | — | | | | (3.36 | ) | |
Year Ended October 31: | |
2021 | | $ | 16.05 | | | | (0.18 | ) | | | 7.29 | | | | 7.11 | | | | — | | | | (0.46 | ) | |
2020 | | $ | 16.46 | | | | (0.10 | ) | | | 0.84 | | | | 0.74 | | | | — | | | | (1.15 | ) | |
2019 | | $ | 16.90 | | | | (0.05 | ) | | | 1.52 | | | | 1.47 | | | | — | | | | (1.91 | ) | |
2018 | | $ | 21.12 | | | | (0.10 | ) | | | 0.18 | | | | 0.08 | | | | — | | | | (4.30 | ) | |
2017 | | $ | 17.30 | | | | (0.02 | ) | | | 4.10 | | | | 4.08 | | | | (0.04 | ) | | | (0.22 | ) | |
Class I | | | |
Eight Months Ended
June 30, 2022 (h) | | $ | 24.88 | | | | 0.08 | | | | (3.67 | ) | | | (3.59 | ) | | | (0.08 | ) | | | (3.36 | ) | |
Year Ended October 31: | |
2021 | | $ | 17.37 | | | | 0.05 | | | | 7.94 | | | | 7.99 | | | | (0.02 | ) | | | (0.46 | ) | |
2020 | | $ | 17.61 | | | | 0.09 | | | | 0.90 | | | | 0.99 | | | | (0.08 | ) | | | (1.15 | ) | |
2019 | | $ | 17.87 | | | | 0.13 | | | | 1.65 | | | | 1.78 | | | | (0.13 | ) | | | (1.91 | ) | |
2018 | | $ | 22.00 | | | | 0.11 | | | | 0.16 | | | | 0.27 | | | | (0.10 | ) | | | (4.30 | ) | |
2017 | | $ | 17.98 | | | | 0.19 | | | | 4.27 | | | | 4.46 | | | | (0.22 | ) | | | (0.22 | ) | |
(a) Per share net investment income (loss) has been calculated using the average daily shares method.
(b) Not annualized for periods less than one year.
(c) Annualized for periods less than one year.
(d) Does not include acquired fund fees and expenses, if any.
(e) Portfolio turnover is calculated on the basis of the Fund as a whole without distinguishing between the classes of shares issued.
(f) Amount is less than $0.005 per share.
(g) Amount is less than 0.005%.
(h) The Fund's fiscal year-end changed from October 31 to June 30. See Note 1 in the Notes to Financial Statements.
See notes to financial statements.
74
Victory Portfolios | | Financial Highlights — continued | |
For a Share Outstanding Throughout Each Period
| | | | | Ratios to Average Net Assets | | Supplemental Data | |
| | | Total
Distributions | | Net Asset
Value,
End of
Period | | Total
Return
(Excludes
Sales
Charge)(b) | | Net
Expenses(c)(d) | | Net
Investment
Income
(Loss)(c) | | Gross
Expenses(c)(d) | | Net Assets,
End of
Period
(000's) | | Portfolio
Turnover(b)(e) | |
Victory Diversified Stock Fund | |
Class A | |
Eight Months Ended
June 30, 2022 (h) | | | (3.40 | ) | | $ | 17.86 | | | | (17.22 | )% | | | 1.08 | % | | | 0.33 | % | | | 1.08 | % | | $ | 191,392 | | | | 49 | % | |
Year Ended October 31: | |
2021 | | | (0.47 | ) | | $ | 24.89 | | | | 46.50 | % | | | 1.07 | % | | | 0.00 | %(g) | | | 1.07 | % | | $ | 246,063 | | | | 61 | % | |
2020 | | | (1.19 | ) | | $ | 17.41 | | | | 5.47 | % | | | 1.09 | % | | | 0.29 | % | | | 1.09 | % | | $ | 184,217 | | | | 95 | % | |
2019 | | | (1.99 | ) | | $ | 17.65 | | | | 12.27 | % | | | 1.08 | % | | | 0.55 | % | | | 1.08 | % | | $ | 204,945 | | | | 132 | % | |
2018 | | | (4.36 | ) | | $ | 17.90 | | | | (0.20 | )% | | | 1.05 | % | | | 0.32 | % | | | 1.05 | % | | $ | 264,297 | | | | 112 | % | |
2017 | | | (0.39 | ) | | $ | 22.03 | | | | 24.85 | % | | | 1.05 | % | | | 0.66 | % | | | 1.05 | % | | $ | 311,255 | | | | 133 | % | |
Class C | |
Eight Months Ended
June 30, 2022 (h) | | | (3.36 | ) | | $ | 15.97 | | | | (17.72 | )% | | | 2.02 | % | | | (0.62 | )% | | | 2.46 | % | | $ | 1,545 | | | | 49 | % | |
Year Ended October 31: | |
2021 | | | (0.46 | ) | | $ | 22.70 | | | | 45.01 | % | | | 2.02 | % | | | (0.93 | )% | | | 2.32 | % | | $ | 2,371 | | | | 61 | % | |
2020 | | | (1.15 | ) | | $ | 16.05 | | | | 4.53 | % | | | 2.05 | % | | | (0.64 | )% | | | 2.14 | % | | $ | 3,046 | | | | 95 | % | |
2019 | | | (1.91 | ) | | $ | 16.46 | | | | 11.19 | % | | | 2.02 | % | | | (0.35 | )% | | | 2.02 | % | | $ | 5,909 | | | | 132 | % | |
2018 | | | (4.30 | ) | | $ | 16.90 | | | | (1.02 | )% | | | 1.89 | % | | | (0.53 | )% | | | 1.89 | % | | $ | 11,586 | | | | 112 | % | |
2017 | | | (0.26 | ) | | $ | 21.12 | | | | 23.82 | % | | | 1.87 | % | | | (0.12 | )% | | | 1.87 | % | | $ | 36,001 | | | | 133 | % | |
Class I | |
Eight Months Ended
June 30, 2022 (h) | | | (3.44 | ) | | $ | 17.85 | | | | (17.09 | )% | | | 0.83 | % | | | 0.57 | % | | | 0.85 | % | | $ | 21,933 | | | | 49 | % | |
Year Ended October 31: | |
2021 | | | (0.48 | ) | | $ | 24.88 | | | | 46.79 | % | | | 0.83 | % | | | 0.24 | % | | | 0.85 | % | | $ | 27,856 | | | | 61 | % | |
2020 | | | (1.23 | ) | | $ | 17.37 | | | | 5.81 | % | | | 0.84 | % | | | 0.56 | % | | | 0.86 | % | | $ | 21,071 | | | | 95 | % | |
2019 | | | (2.04 | ) | | $ | 17.61 | | | | 12.52 | % | | | 0.84 | % | | | 0.81 | % | | | 0.84 | % | | $ | 31,619 | | | | 132 | % | |
2018 | | | (4.40 | ) | | $ | 17.87 | | | | 0.05 | % | | | 0.79 | % | | | 0.58 | % | | | 0.79 | % | | $ | 46,122 | | | | 112 | % | |
2017 | | | (0.44 | ) | | $ | 22.00 | | | | 25.21 | % | | | 0.80 | % | | | 0.99 | % | | | 0.80 | % | | $ | 74,466 | | | | 133 | % | |
See notes to financial statements.
75
Victory Portfolios | | Financial Highlights | |
For a Share Outstanding Throughout Each Period
| | | | | Investment Activities | | Distributions to
Shareholders From | |
| | | Net Asset
Value,
Beginning of
Period | | Net
Investment
Income
(Loss)(a) | | Net Realized
and Unrealized
Gains (Losses) | | Total from
Investment
Activities | | Net
Investment
Income | | Net Realized
Gains from
Investments | |
Victory Diversified Stock Fund | | | |
Class R | | | |
Eight Months Ended
June 30, 2022 (g) | | $ | 24.25 | | | | 0.01 | | | | (3.57 | ) | | | (3.56 | ) | | | (0.01 | ) | | | (3.36 | ) | |
Year Ended October 31: | |
2021 | | $ | 17.01 | | | | (0.06 | ) | | | 7.76 | | | | 7.70 | | | | — | | | | (0.46 | ) | |
2020 | | $ | 17.29 | | | | — | (f) | | | 0.88 | | | | 0.88 | | | | (0.01 | ) | | | (1.15 | ) | |
2019 | | $ | 17.58 | | | | 0.04 | | | | 1.62 | | | | 1.66 | | | | (0.04 | ) | | | (1.91 | ) | |
2018 | | $ | 21.71 | | | | 0.01 | | | | 0.16 | | | | 0.17 | | | | — | (f) | | | (4.30 | ) | |
2017 | | $ | 17.75 | | | | 0.07 | | | | 4.23 | | | | 4.30 | | | | (0.12 | ) | | | (0.22 | ) | |
Class R6 | | | |
Eight Months Ended
June 30, 2022 (g) | | $ | 24.91 | | | | 0.09 | | | | (3.69 | ) | | | (3.60 | ) | | | (0.08 | ) | | | (3.36 | ) | |
Year Ended October 31: | |
2021 | | $ | 17.38 | | | | 0.06 | | | | 7.95 | | | | 8.01 | | | | (0.02 | ) | | | (0.46 | ) | |
2020 | | $ | 17.62 | | | | 0.08 | | | | 0.92 | | | | 1.00 | | | | (0.09 | ) | | | (1.15 | ) | |
2019 | | $ | 17.88 | | | | 0.14 | | | | 1.64 | | | | 1.78 | | | | (0.13 | ) | | | (1.91 | ) | |
2018 | | $ | 22.00 | | | | 0.11 | | | | 0.17 | | | | 0.28 | | | | (0.10 | ) | | | (4.30 | ) | |
2017 | | $ | 17.98 | | | | 0.18 | | | | 4.29 | | | | 4.47 | | | | (0.23 | ) | | | (0.22 | ) | |
Class Y | | | |
Eight Months Ended
June 30, 2022 (g) | | $ | 24.93 | | | | 0.08 | | | | (3.69 | ) | | | (3.61 | ) | | | (0.07 | ) | | | (3.36 | ) | |
Year Ended October 31: | |
2021 | | $ | 17.41 | | | | 0.05 | | | | 7.95 | | | | 8.00 | | | | (0.02 | ) | | | (0.46 | ) | |
2020 | | $ | 17.65 | | | | 0.09 | | | | 0.90 | | | | 0.99 | | | | (0.08 | ) | | | (1.15 | ) | |
2019 | | $ | 17.90 | | | | 0.12 | | | | 1.66 | | | | 1.78 | | | | (0.12 | ) | | | (1.91 | ) | |
2018 | | $ | 22.02 | | | | 0.11 | | | | 0.16 | | | | 0.27 | | | | (0.09 | ) | | | (4.30 | ) | |
2017 | | $ | 18.00 | | | | 0.17 | | | | 4.28 | | | | 4.45 | | | | (0.21 | ) | | | (0.22 | ) | |
(a) Per share net investment income (loss) has been calculated using the average daily shares method.
(b) Not annualized for periods less than one year.
(c) Annualized for periods less than one year.
(d) Does not include acquired fund fees and expenses, if any.
(e) Portfolio turnover is calculated on the basis of the Fund as a whole without distinguishing between the classes of shares issued.
(f) Amount is less than $0.005 per share.
(g) The Fund's fiscal year-end changed from October 31 to June 30. See Note 1 in the Notes to Financial Statements.
See notes to financial statements.
76
Victory Portfolios | | Financial Highlights — continued | |
For a Share Outstanding Throughout Each Period
| | | | | Ratios to Average Net Assets | | Supplemental Data | |
| | | Total
Distributions | | Net Asset
Value,
End of
Period | | Total
Return
(Excludes
Sales
Charge)(b) | | Net
Expenses(c)(d) | | Net
Investment
Income
(Loss)(c) | | Gross
Expenses(c)(d) | | Net Assets,
End of
Period
(000's) | | Portfolio
Turnover(b)(e) | |
Victory Diversified Stock Fund | |
Class R | |
Eight Months Ended
June 30, 2022 (g) | | | (3.37 | ) | | $ | 17.32 | | | | (17.38 | )% | | | 1.36 | % | | | 0.05 | % | | | 1.36 | % | | $ | 36,360 | | | | 49 | % | |
Year Ended October 31: | |
2021 | | | (0.46 | ) | | $ | 24.25 | | | | 46.02 | % | | | 1.35 | % | | | (0.28 | )% | | | 1.35 | % | | $ | 48,980 | | | | 61 | % | |
2020 | | | (1.16 | ) | | $ | 17.01 | | | | 5.25 | % | | | 1.37 | % | | | 0.01 | % | | | 1.37 | % | | $ | 39,432 | | | | 95 | % | |
2019 | | | (1.95 | ) | | $ | 17.29 | | | | 11.90 | % | | | 1.37 | % | | | 0.26 | % | | | 1.37 | % | | $ | 47,981 | | | | 132 | % | |
2018 | | | (4.30 | ) | | $ | 17.58 | | | | (0.47 | )% | | | 1.34 | % | | | 0.03 | % | | | 1.34 | % | | $ | 54,776 | | | | 112 | % | |
2017 | | | (0.34 | ) | | $ | 21.71 | | | | 24.56 | % | | | 1.33 | % | | | 0.38 | % | | | 1.33 | % | | $ | 66,310 | | | | 133 | % | |
Class R6 | |
Eight Months Ended
June 30, 2022 (g) | | | (3.44 | ) | | $ | 17.87 | | | | (17.08 | )% | | | 0.78 | % | | | 0.63 | % | | | 1.36 | % | | $ | 863 | | | | 49 | % | |
Year Ended October 31: | |
2021 | | | (0.48 | ) | | $ | 24.91 | | | | 46.89 | % | | | 0.78 | % | | | 0.29 | % | | | 1.10 | % | | $ | 4,040 | | | | 61 | % | |
2020 | | | (1.24 | ) | | $ | 17.38 | | | | 5.86 | % | | | 0.78 | % | | | 0.49 | % | | | 1.34 | % | | $ | 3,103 | | | | 95 | % | |
2019 | | | (2.04 | ) | | $ | 17.62 | | | | 12.58 | % | | | 0.78 | % | | | 0.83 | % | | | 1.24 | % | | $ | 2,313 | | | | 132 | % | |
2018 | | | (4.40 | ) | | $ | 17.88 | | | | 0.10 | % | | | 0.78 | % | | | 0.58 | % | | | 1.21 | % | | $ | 2,189 | | | | 112 | % | |
2017 | | | (0.45 | ) | | $ | 22.00 | | | | 25.24 | % | | | 0.78 | % | | | 0.94 | % | | | 1.29 | % | | $ | 2,427 | | | | 133 | % | |
Class Y | |
Eight Months Ended
June 30, 2022 (g) | | | (3.43 | ) | | $ | 17.89 | | | | (17.07 | )% | | | 0.86 | % | | | 0.55 | % | | | 0.96 | % | | $ | 4,102 | | | | 49 | % | |
Year Ended October 31: | |
2021 | | | (0.48 | ) | | $ | 24.93 | | | | 46.75 | % | | | 0.86 | % | | | 0.21 | % | | | 0.96 | % | | $ | 5,029 | | | | 61 | % | |
2020 | | | (1.23 | ) | | $ | 17.41 | | | | 5.72 | % | | | 0.86 | % | | | 0.52 | % | | | 1.31 | % | | $ | 3,737 | | | | 95 | % | |
2019 | | | (2.03 | ) | | $ | 17.65 | | | | 12.53 | % | | | 0.86 | % | | | 0.76 | % | | | 1.33 | % | | $ | 4,249 | | | | 132 | % | |
2018 | | | (4.39 | ) | | $ | 17.90 | | | | 0.01 | % | | | 0.86 | % | | | 0.54 | % | | | 1.13 | % | | $ | 4,373 | | | | 112 | % | |
2017 | | | (0.43 | ) | | $ | 22.02 | | | | 25.11 | % | | | 0.86 | % | | | 0.88 | % | | | 0.94 | % | | $ | 8,843 | | | | 133 | % | |
See notes to financial statements.
77
Victory Portfolios | | Financial Highlights | |
For a Share Outstanding Throughout Each Period
| | | | | Investment Activities | | Distributions to
Shareholders From | |
| | | Net Asset
Value,
Beginning of
Period | | Net
Investment
Income
(Loss)(a) | | Net Realized
and Unrealized
Gains (Losses) | | Total from
Investment
Activities | | Net Realized
Gains from
Investments | | Total
Distributions | |
Victory NewBridge Large Cap Growth Fund | | | |
Class A | | | |
Eight Months Ended
June 30, 2022 (h) | | $ | 7.41 | | | | (0.03 | ) | | | (2.24 | ) | | | (2.27 | ) | | | (1.85 | ) | | | (1.85 | ) | |
Year Ended October 31: | |
2021 | | $ | 6.31 | | | | (0.08 | ) | | | 1.94 | | | | 1.86 | | | | (0.76 | ) | | | (0.76 | ) | |
2020 | | $ | 5.52 | | | | (0.06 | ) | | | 1.91 | | | | 1.85 | | | | (1.06 | ) | | | (1.06 | ) | |
2019 | | $ | 7.94 | | | | (0.05 | ) | | | 0.05 | | | | — | (f) | | | (2.42 | ) | | | (2.42 | ) | |
2018 | | $ | 10.23 | | | | (0.09 | ) | | | 0.85 | | | | 0.76 | | | | (3.05 | ) | | | (3.05 | ) | |
2017 | | $ | 12.79 | | | | (0.09 | ) | | | 1.82 | | | | 1.73 | | | | (4.29 | ) | | | (4.29 | ) | |
Class C | | | |
Eight Months Ended
June 30, 2022 (g) (h) | | $ | 8.43 | | | | (0.04 | ) | | | (2.66 | ) | | | (2.70 | ) | | | (1.85 | ) | | | (1.85 | ) | |
Year Ended October 31: | |
| 2021 (g) | | $ | 9.87 | | | | (0.15 | ) | | | 2.51 | | | | 2.36 | | | | (3.80 | ) | | | (3.80 | ) | |
| 2020 (g) | | $ | 12.15 | | | | (0.15 | ) | | | 3.17 | | | | 3.02 | | | | (5.30 | ) | | | (5.30 | ) | |
| 2019 (g) | | $ | 25.00 | | | | (0.30 | ) | | | (0.45 | ) | | | (0.75 | ) | | | (12.10 | ) | | | (12.10 | ) | |
| 2018 (g) | | $ | 37.93 | | | | (0.50 | ) | | | 2.82 | | | | 2.32 | | | | (15.25 | ) | | | (15.25 | ) | |
| 2017 (g) | | $ | 53.25 | | | | (0.60 | ) | | | 6.73 | | | | 6.13 | | | | (21.45 | ) | | | (21.45 | ) | |
Class I | | | |
Eight Months Ended
June 30, 2022 (h) | | $ | 8.60 | | | | (0.03 | ) | | | (2.70 | ) | | | (2.73 | ) | | | (1.85 | ) | | | (1.85 | ) | |
Year Ended October 31: | |
2021 | | $ | 7.18 | | | | (0.06 | ) | | | 2.24 | | | | 2.18 | | | | (0.76 | ) | | | (0.76 | ) | |
2020 | | $ | 6.13 | | | | (0.04 | ) | | | 2.15 | | | | 2.11 | | | | (1.06 | ) | | | (1.06 | ) | |
2019 | | $ | 8.49 | | | | (0.04 | ) | | | 0.10 | | | | 0.06 | | | | (2.42 | ) | | | (2.42 | ) | |
2018 | | $ | 10.71 | | | | (0.06 | ) | | | 0.89 | | | | 0.83 | | | | (3.05 | ) | | | (3.05 | ) | |
2017 | | $ | 13.13 | | | | (0.05 | ) | | | 1.92 | | | | 1.87 | | | | (4.29 | ) | | | (4.29 | ) | |
Class Y | | | |
Eight Months Ended
June 30, 2022 (h) | | $ | 8.08 | | | | (0.03 | ) | | | (2.50 | ) | | | (2.53 | ) | | | (1.85 | ) | | | (1.85 | ) | |
Year Ended October 31: | |
2021 | | $ | 6.79 | | | | (0.06 | ) | | | 2.11 | | | | 2.05 | | | | (0.76 | ) | | | (0.76 | ) | |
2020 | | $ | 5.86 | | | | (0.04 | ) | | | 2.03 | | | | 1.99 | | | | (1.06 | ) | | | (1.06 | ) | |
2019 | | $ | 8.24 | | | | (0.04 | ) | | | 0.08 | | | | 0.04 | | | | (2.42 | ) | | | (2.42 | ) | |
2018 | | $ | 10.48 | | | | (0.06 | ) | | | 0.87 | | | | 0.81 | | | | (3.05 | ) | | | (3.05 | ) | |
2017 | | $ | 12.96 | | | | (0.06 | ) | | | 1.87 | | | | 1.81 | | | | (4.29 | ) | | | (4.29 | ) | |
(a) Per share net investment income (loss) has been calculated using the average daily shares method.
(b) Not annualized for periods less than one year.
(c) Annualized for periods less than one year.
(d) Does not include acquired fund fees and expenses, if any.
(e) Portfolio turnover is calculated on the basis of the Fund as a whole without distinguishing between the classes of shares issued.
(f) Amount is less than $0.005 per share.
(g) As described in Note 10 in the Notes to Financial Statements, per share amounts adjusted for a 1:5 reverse stock split.
See notes to financial statements.
78
Victory Portfolios | | Financial Highlights — continued | |
For a Share Outstanding Throughout Each Period
| | | | | Ratios to Average Net Assets | | Supplemental Data | |
| | | Net Asset
Value,
End of
Period | | Total
Return
(Excludes
Sales
Charge)(b) | | Net
Expenses(c)(d) | | Net
Investment
Income
(Loss)(c) | | Gross
Expenses(c)(d) | | Net Assets,
End of
Period
(000's) | | Portfolio
Turnover(b)(e) | |
Victory NewBridge Large Cap Growth Fund | |
Class A | |
Eight Months Ended
June 30, 2022 (h) | | $ | 3.29 | | | | (39.44 | )% | | | 1.36 | % | | | (1.09 | )% | | | 1.84 | % | | $ | 4,524 | | | | 28 | % | |
Year Ended October 31: | |
2021 | | $ | 7.41 | | | | 31.73 | % | | | 1.36 | % | | | (1.20 | )% | | | 1.56 | % | | $ | 8,749 | | | | 39 | % | |
2020 | | $ | 6.31 | | | | 39.61 | % | | | 1.36 | % | | | (1.08 | )% | | | 1.52 | % | | $ | 7,757 | | | | 39 | % | |
2019 | | $ | 5.52 | | | | 4.56 | % | | | 1.36 | % | | | (0.97 | )% | | | 1.60 | % | | $ | 5,732 | | | | 62 | % | |
2018 | | $ | 7.94 | | | | 9.41 | % | | | 1.36 | % | | | (1.05 | )% | | | 1.47 | % | | $ | 5,546 | | | | 41 | % | |
2017 | | $ | 10.23 | | | | 20.84 | % | | | 1.40 | % | | | (0.94 | )% | | | 1.40 | % | | $ | 7,639 | | | | 60 | % | |
Class C | |
Eight Months Ended
June 30, 2022 (g) (h) | | $ | 3.88 | | | | (39.97 | )% | | | 2.10 | % | | | (1.84 | )% | | | 4.75 | % | | $ | 354 | | | | 28 | % | |
Year Ended October 31: | |
| 2021 (g) | | $ | 8.43 | | | | 31.44 | % | | | 2.10 | % | | | (1.93 | )% | | | 3.58 | % | | $ | 695 | | | | 39 | % | |
| 2020 (g) | | $ | 9.87 | | | | 37.97 | % | | | 2.10 | % | | | (1.79 | )% | | | 2.67 | % | | $ | 1,190 | | | | 39 | % | |
| 2019 (g) | | $ | 12.15 | | | | 3.92 | % | | | 2.10 | % | | | (1.71 | )% | | | 2.70 | % | | $ | 1,768 | | | | 62 | % | |
| 2018 (g) | | $ | 25.00 | | | | 8.47 | % | | | 2.10 | % | | | (1.78 | )% | | | 2.40 | % | | $ | 3,042 | | | | 41 | % | |
| 2017 (g) | | $ | 37.93 | | | | 20.06 | % | | | 2.10 | % | | | (1.64 | )% | | | 2.27 | % | | $ | 4,201 | | | | 60 | % | |
Class I | |
Eight Months Ended
June 30, 2022 (h) | | $ | 4.02 | | | | (39.31 | )% | | | 0.95 | % | | | (0.68 | )% | | | 1.60 | % | | $ | 3,142 | | | | 28 | % | |
Year Ended October 31: | |
2021 | | $ | 8.60 | | | | 32.38 | % | | | 0.95 | % | | | (0.79 | )% | | | 1.34 | % | | $ | 7,085 | | | | 39 | % | |
2020 | | $ | 7.18 | | | | 39.95 | % | | | 0.95 | % | | | (0.66 | )% | | | 1.31 | % | | $ | 6,171 | | | | 39 | % | |
2019 | | $ | 6.13 | | | | 5.11 | % | | | 0.95 | % | | | (0.56 | )% | | | 1.26 | % | | $ | 6,043 | | | | 62 | % | |
2018 | | $ | 8.49 | | | | 9.74 | % | | | 0.95 | % | | | (0.63 | )% | | | 1.09 | % | | $ | 10,633 | | | | 41 | % | |
2017 | | $ | 10.71 | | | | 21.52 | % | | | 0.95 | % | | | (0.47 | )% | | | 1.01 | % | | $ | 16,103 | | | | 60 | % | |
Class Y | |
Eight Months Ended
June 30, 2022 (h) | | $ | 3.70 | | | | (39.37 | )% | | | 1.02 | % | | | (0.76 | )% | | | 1.93 | % | | $ | 555 | | | | 28 | % | |
Year Ended October 31: | |
2021 | | $ | 8.08 | | | | 32.32 | % | | | 1.02 | % | | | (0.86 | )% | | | 1.49 | % | | $ | 1,313 | | | | 39 | % | |
2020 | | $ | 6.79 | | | | 39.72 | % | | | 1.02 | % | | | (0.73 | )% | | | 1.78 | % | | $ | 1,744 | | | | 39 | % | |
2019 | | $ | 5.86 | | | | 5.06 | % | | | 1.02 | % | | | (0.63 | )% | | | 1.69 | % | | $ | 2,498 | | | | 62 | % | |
2018 | | $ | 8.24 | | | | 9.75 | % | | | 1.02 | % | | | (0.72 | )% | | | 1.48 | % | | $ | 3,411 | | | | 41 | % | |
2017 | | $ | 10.48 | | | | 21.30 | % | | | 1.02 | % | | | (0.55 | )% | | | 1.42 | % | | $ | 2,128 | | | | 60 | % | |
(h) The Fund's fiscal year-end changed from October 31 to June 30. See Note 1 in the Notes to Financial Statements.
See notes to financial statements.
79
Victory Portfolios | | Financial Highlights | |
For a Share Outstanding Throughout Each Period
| | | | | Investment Activities | | Distributions to
Shareholders From | |
| | | Net Asset
Value,
Beginning of
Period | | Net
Investment
Income
(Loss)(a) | | Net Realized
and Unrealized
Gains (Losses) | | Total from
Investment
Activities | | Net
Investment
Income | | Net Realized
Gains from
Investments | |
Victory Special Value Fund | | | |
Class A | | | |
Eight Months Ended
June 30, 2022 (h) | | $ | 37.00 | | | | 0.03 | | | | (5.24 | ) | | | (5.21 | ) | | | — | | | | (5.72 | ) | |
Year Ended October 31: | |
2021 | | $ | 26.23 | | | | (0.05 | ) | | | 11.82 | | | | 11.77 | | | | — | (f) | | | (1.00 | ) | |
2020 | | $ | 25.78 | | | | 0.04 | | | | 1.29 | | | | 1.33 | | | | (0.09 | ) | | | (0.79 | ) | |
2019 | | $ | 26.10 | | | | 0.10 | | | | 2.26 | | | | 2.36 | | | | (0.03 | ) | | | (2.65 | ) | |
2018 | | $ | 26.31 | | | | 0.05 | | | | (0.15 | ) | | | (0.10 | ) | | | (0.11 | ) | | | — | | |
2017 | | $ | 21.48 | | | | 0.13 | | | | 4.95 | | | | 5.08 | | | | (0.25 | ) | | | — | | |
Class C | | | |
Eight Months Ended
June 30, 2022 (h) | | $ | 31.59 | | | | (0.12 | ) | | | (4.29 | ) | | | (4.41 | ) | | | — | | | | (5.72 | ) | |
Year Ended October 31: | |
2021 | | $ | 22.72 | | | | (0.28 | ) | | | 10.15 | | | | 9.87 | | | | — | | | | (1.00 | ) | |
2020 | | $ | 22.54 | | | | (0.16 | ) | | | 1.13 | | | | 0.97 | | | | — | | | | (0.79 | ) | |
2019 | | $ | 23.34 | | | | (0.09 | ) | | | 1.94 | | | | 1.85 | | | | — | | | | (2.65 | ) | |
2018 | | $ | 23.66 | | | | (0.18 | ) | | | (0.14 | ) | | | (0.32 | ) | | | — | | | | — | | |
2017 | | $ | 19.34 | | | | (0.08 | ) | | | 4.45 | | | | 4.37 | | | | (0.05 | ) | | | — | | |
Class I | | | |
Eight Months Ended
June 30, 2022 (h) | | $ | 37.54 | | | | 0.08 | | | | (5.35 | ) | | | (5.27 | ) | | | — | | | | (5.72 | ) | |
Year Ended October 31: | |
2021 | | $ | 26.59 | | | | 0.01 | | | | 11.99 | | | | 12.00 | | | | (0.05 | ) | | | (1.00 | ) | |
2020 | | $ | 26.13 | | | | 0.08 | | | | 1.31 | | | | 1.39 | | | | (0.14 | ) | | | (0.79 | ) | |
2019 | | $ | 26.39 | | | | 0.14 | | | | 2.30 | | | | 2.44 | | | | (0.05 | ) | | | (2.65 | ) | |
2018 | | $ | 26.62 | | | | 0.09 | | | | (0.15 | ) | | | (0.06 | ) | | | (0.17 | ) | | | — | | |
2017 | | $ | 21.76 | | | | 0.13 | | | | 5.01 | | | | 5.14 | | | | (0.28 | ) | | | — | | |
(a) Per share net investment income (loss) has been calculated using the average daily shares method.
(b) Not annualized for periods less than one year.
(c) Annualized for periods less than one year.
(d) Does not include acquired fund fees and expenses, if any.
(e) Portfolio turnover is calculated on the basis of the Fund as a whole without distinguishing between the classes of shares issued.
(f) Amount is less than $0.005 per share.
(g) During the year, additional fees were voluntarily waived or reimbursed. Had these fees not been waived or reimbursed, the net expense ratio for each class would have been 0.10% higher.
(h) The Fund's fiscal year-end changed from October 31 to June 30. See Note 1 in the Notes to Financial Statements.
See notes to financial statements.
80
Victory Portfolios | | Financial Highlights — continued | |
For a Share Outstanding Throughout Each Period
| | | | | Ratios to Average Net Assets | | Supplemental Data | |
| | | Total
Distributions | | Net Asset
Value,
End of
Period | | Total
Return
(Excludes
Sales
Charge)(b) | | Net
Expenses(c)(d) | | Net
Investment
Income
(Loss)(c) | | Gross
Expenses(c)(d) | | Net Assets,
End of
Period
(000's) | | Portfolio
Turnover(b)(e) | |
Victory Special Value Fund | |
Class A | |
Eight Months Ended
June 30, 2022 (h) | | | (5.72 | ) | | $ | 26.07 | | | | (17.03 | )% | | | 1.27 | %(g) | | | 0.13 | % | | | 1.37 | % | | $ | 22,188 | | | | 53 | % | |
Year Ended October 31: | |
2021 | | | (1.00 | ) | | $ | 37.00 | | | | 46.06 | % | | | 1.23 | %(g) | | | (0.16 | )% | | | 1.33 | % | | $ | 28,945 | | | | 70 | % | |
2020 | | | (0.88 | ) | | $ | 26.23 | | | | 5.15 | % | | | 1.23 | %(g) | | | 0.14 | % | | | 1.33 | % | | $ | 24,302 | | | | 102 | % | |
2019 | | | (2.68 | ) | | $ | 25.78 | | | | 11.32 | % | | | 1.21 | % | | | 0.41 | % | | | 1.31 | % | | $ | 27,818 | | | | 126 | % | |
2018 | | | (0.11 | ) | | $ | 26.10 | | | | (0.42 | )% | | | 1.17 | % | | | 0.19 | % | | | 1.27 | % | | $ | 32,565 | | | | 113 | % | |
2017 | | | (0.25 | ) | | $ | 26.31 | | | | 23.84 | % | | | 1.17 | % | | | 0.53 | % | | | 1.27 | % | | $ | 35,223 | | | | 135 | % | |
Class C | |
Eight Months Ended
June 30, 2022 (h) | | | (5.72 | ) | | $ | 21.46 | | | | (17.50 | )% | | | 2.10 | %(g) | | | (0.70 | )% | | | 3.23 | % | | $ | 802 | | | | 53 | % | |
Year Ended October 31: | |
2021 | | | (1.00 | ) | | $ | 31.59 | | | | 44.81 | % | | | 2.10 | %(g) | | | (1.02 | )% | | | 3.53 | % | | $ | 978 | | | | 70 | % | |
2020 | | | (0.79 | ) | | $ | 22.72 | | | | 4.26 | % | | | 2.10 | %(g) | | | (0.72 | )% | | | 2.99 | % | | $ | 863 | | | | 102 | % | |
2019 | | | (2.65 | ) | | $ | 22.54 | | | | 10.34 | % | | | 2.10 | % | | | (0.44 | )% | | | 2.79 | % | | $ | 1,241 | | | | 126 | % | |
2018 | | | — | | | $ | 23.34 | | | | (1.35 | )% | | | 2.10 | % | | | (0.75 | )% | | | 2.27 | % | | $ | 2,145 | | | | 113 | % | |
2017 | | | (0.05 | ) | | $ | 23.66 | | | | 22.65 | % | | | 2.10 | % | | | (0.38 | )% | | | 2.21 | % | | $ | 7,296 | | | | 135 | % | |
Class I | |
Eight Months Ended
June 30, 2022 (h) | | | (5.72 | ) | | $ | 26.55 | | | | (16.93 | )% | | | 1.05 | %(g) | | | 0.35 | % | | | 1.37 | % | | $ | 2,769 | | | | 53 | % | |
Year Ended October 31: | |
2021 | | | (1.05 | ) | | $ | 37.54 | | | | 46.29 | % | | | 1.05 | %(g) | | | 0.02 | % | | | 1.33 | % | | $ | 3,861 | | | | 70 | % | |
2020 | | | (0.93 | ) | | $ | 26.59 | | | | 5.35 | % | | | 1.05 | %(g) | | | 0.32 | % | | | 1.31 | % | | $ | 3,283 | | | | 102 | % | |
2019 | | | (2.70 | ) | | $ | 26.13 | | | | 11.52 | % | | | 1.05 | % | | | 0.58 | % | | | 1.34 | % | | $ | 3,274 | | | | 126 | % | |
2018 | | | (0.17 | ) | | $ | 26.39 | | | | (0.28 | )% | | | 1.02 | % | | | 0.31 | % | | | 1.16 | % | | $ | 3,678 | | | | 113 | % | |
2017 | | | (0.28 | ) | | $ | 26.62 | | | | 23.86 | % | | | 1.15 | % | | | 0.56 | % | | | 1.25 | % | | $ | 3,703 | | | | 135 | % | |
See notes to financial statements.
81
Victory Portfolios | | Financial Highlights | |
For a Share Outstanding Throughout Each Period
| | | | | Investment Activities | | Distributions to
Shareholders From | |
| | | Net Asset
Value,
Beginning of
Period | | Net
Investment
Income
(Loss)(a) | | Net Realized
and Unrealized
Gains (Losses) | | Total from
Investment
Activities | | Net
Investment
Income | | Net Realized
Gains from
Investments | |
Victory Special Value Fund | | | |
Class R | | | |
Eight Months Ended
June 30, 2022 (h) | | $ | 34.99 | | | | (0.04 | ) | | | (4.89 | ) | | | (4.93 | ) | | | — | | | | (5.72 | ) | |
Year Ended October 31: | |
2021 | | $ | 24.93 | | | | (0.14 | ) | | | 11.20 | | | | 11.06 | | | | — | | | | (1.00 | ) | |
2020 | | $ | 24.55 | | | | (0.04 | ) | | | 1.23 | | | | 1.19 | | | | (0.02 | ) | | | (0.79 | ) | |
2019 | | $ | 25.02 | | | | 0.03 | | | | 2.15 | | | | 2.18 | | | | — | | | | (2.65 | ) | |
2018 | | $ | 25.24 | | | | (0.03 | ) | | | (0.15 | ) | | | (0.18 | ) | | | (0.04 | ) | | | — | | |
2017 | | $ | 20.63 | | | | 0.05 | | | | 4.75 | | | | 4.80 | | | | (0.19 | ) | | | — | | |
Class Y | | | |
Eight Months Ended
June 30, 2022 (h) | | $ | 37.31 | | | | 0.09 | | | | (5.31 | ) | | | (5.22 | ) | | | — | | | | (5.72 | ) | |
Year Ended October 31: | |
2021 | | $ | 26.44 | | | | 0.02 | | | | 11.92 | | | | 11.94 | | | | (0.07 | ) | | | (1.00 | ) | |
2020 | | $ | 25.98 | | | | 0.09 | | | | 1.32 | | | | 1.41 | | | | (0.16 | ) | | | (0.79 | ) | |
2019 | | $ | 26.25 | | | | 0.15 | | | | 2.28 | | | | 2.43 | | | | (0.05 | ) | | | (2.65 | ) | |
2018 | | $ | 26.47 | | | | 0.12 | | | | (0.17 | ) | | | (0.05 | ) | | | (0.17 | ) | | | — | | |
2017 | | $ | 21.62 | | | | 0.18 | | | | 4.98 | | | | 5.16 | | | | (0.31 | ) | | | — | | |
(a) Per share net investment income (loss) has been calculated using the average daily shares method.
(b) Not annualized for periods less than one year.
(c) Annualized for periods less than one year.
(d) Does not include acquired fund fees and expenses, if any.
(e) Portfolio turnover is calculated on the basis of the Fund as a whole without distinguishing between the classes of shares issued.
(g) During the year, additional fees were voluntarily waived or reimbursed. Had these fees not been waived or reimbursed, the net expense ratio for each class would have been 0.10% higher.
(h) The Fund's fiscal year-end changed from October 31 to June 30. See Note 1 in the Notes to Financial Statements.
See notes to financial statements.
82
Victory Portfolios | | Financial Highlights — continued | |
For a Share Outstanding Throughout Each Period
| | | | | Ratios to Average Net Assets | | Supplemental Data | |
| | | Total
Distributions | | Net Asset
Value,
End of
Period | | Total
Return
(Excludes
Sales
Charge)(b) | | Net
Expenses(c)(d) | | Net
Investment
Income
(Loss)(c) | | Gross
Expenses(c)(d) | | Net Assets,
End of
Period
(000's) | | Portfolio
Turnover(b)(e) | |
Victory Special Value Fund | |
Class R | |
Eight Months Ended
June 30, 2022 (h) | | | (5.72 | ) | | $ | 24.34 | | | | (17.24 | )% | | | 1.60 | %(g) | | | (0.19 | )% | | | 1.70 | % | | $ | 12,401 | | | | 53 | % | |
Year Ended October 31: | |
2021 | | | (1.00 | ) | | $ | 34.99 | | | | 45.59 | % | | | 1.54 | %(g) | | | (0.47 | )% | | | 1.64 | % | | $ | 16,605 | | | | 70 | % | |
2020 | | | (0.81 | ) | | $ | 24.93 | | | | 4.82 | % | | | 1.54 | %(g) | | | (0.16 | )% | | | 1.64 | % | | $ | 13,875 | | | | 102 | % | |
2019 | | | (2.65 | ) | | $ | 24.55 | | | | 11.03 | % | | | 1.50 | % | | | 0.13 | % | | | 1.60 | % | | $ | 21,084 | | | | 126 | % | |
2018 | | | (0.04 | ) | | $ | 25.02 | | | | (0.71 | )% | | | 1.46 | % | | | (0.10 | )% | | | 1.56 | % | | $ | 26,532 | | | | 113 | % | |
2017 | | | (0.19 | ) | | $ | 25.24 | | | | 23.43 | % | | | 1.47 | % | | | 0.24 | % | | | 1.57 | % | | $ | 36,688 | | | | 135 | % | |
Class Y | |
Eight Months Ended
June 30, 2022 (h) | | | (5.72 | ) | | $ | 26.37 | | | | (16.90 | )% | | | 1.00 | %(g) | | | 0.41 | % | | | 1.61 | % | | $ | 668 | | | | 53 | % | |
Year Ended October 31: | |
2021 | | | (1.07 | ) | | $ | 37.31 | | | | 46.39 | % | | | 1.00 | %(g) | | | 0.07 | % | | | 1.77 | % | | $ | 816 | | | | 70 | % | |
2020 | | | (0.95 | ) | | $ | 26.44 | | | | 5.40 | % | | | 1.00 | %(g) | | | 0.36 | % | | | 3.68 | % | | $ | 584 | | | | 102 | % | |
2019 | | | (2.70 | ) | | $ | 25.98 | | | | 11.57 | % | | | 1.00 | % | | | 0.60 | % | | | 4.50 | % | | $ | 520 | | | | 126 | % | |
2018 | | | (0.17 | ) | | $ | 26.25 | | | | (0.21 | )% | | | 0.97 | % | | | 0.42 | % | | | 2.82 | % | | $ | 436 | | | | 113 | % | |
2017 | | | (0.31 | ) | | $ | 26.47 | | | | 24.12 | % | | | 0.93 | % | | | 0.77 | % | | | 2.07 | % | | $ | 1,219 | | | | 135 | % | |
See notes to financial statements.
83
Victory Portfolios | | Financial Highlights | |
For a Share Outstanding Throughout Each Period
| | | | | Investment Activities | | Distributions to
Shareholders From | |
| | | Net Asset
Value,
Beginning of
Period | | Net
Investment
Income
(Loss)(a) | | Net
Realized
and
Unrealized
Gains
(Losses) | | Total from
Investment
Activities | | Net
Realized
Gains
from
Investments | | Return
of
Capital | | Total
Distributions | |
Victory THB US Small Opportunities Fund (f) | | | |
Class A | | | |
Eight Months Ended
June 30, 2022 (i) | | $ | 24.30 | | | | (0.08 | ) | | | (5.46 | ) | | | (5.54 | ) | | | (2.30 | ) | | | (0.10 | ) | | | (2.40 | ) | |
Year Ended October 31: | |
2021 | | $ | 15.55 | | | | (0.20 | ) | | | 8.95 | | | | 8.75 | | | | — | | | | — | | | | — | | |
2020 | | $ | 15.00 | | | | (0.17 | ) | | | 0.81 | (g) | | | 0.64 | | | | (0.09 | ) | | | — | | | | (0.09 | ) | |
2019 | | $ | 16.08 | | | | (0.14 | ) | | | (0.44 | ) | | | (0.58 | ) | | | (0.50 | ) | | | — | | | | (0.50 | ) | |
2018 | | $ | 18.14 | | | | (0.15 | ) | | | 0.24 | | | | 0.09 | | | | (2.15 | ) | | | — | | | | (2.15 | ) | |
2017 | | $ | 13.49 | | | | (0.16 | ) | | | 4.81 | | | | 4.65 | | | | — | | | | — | | | | — | | |
Class I | | | |
Eight Months Ended
June 30, 2022 (i) | | $ | 25.42 | | | | (0.02 | ) | | | (5.74 | ) | | | (5.76 | ) | | | (2.30 | ) | | | (0.10 | ) | | | (2.40 | ) | |
Year Ended October 31: | |
2021 | | $ | 16.20 | | | | (0.18 | ) | | | 9.40 | | | | 9.22 | | | | — | | | | — | | | | — | | |
2020 | | $ | 15.56 | | | | (0.10 | ) | | | 0.83 | (g) | | | 0.73 | | | | (0.09 | ) | | | — | | | | (0.09 | ) | |
2019 | | $ | 16.58 | | | | (0.08 | ) | | | (0.44 | ) | | | (0.52 | ) | | | (0.50 | ) | | | — | | | | (0.50 | ) | |
2018 | | $ | 18.59 | | | | (0.10 | ) | | | 0.24 | | | | 0.14 | | | | (2.15 | ) | | | — | | | | (2.15 | ) | |
2017 | | $ | 13.75 | | | | (0.08 | ) | | | 4.92 | | | | 4.84 | | | | — | | | | — | | | | — | | |
(a) Per share net investment income (loss) has been calculated using the average daily shares method.
(b) Not annualized for periods less than one year.
(c) Annualized for periods less than one year.
(d) Does not include acquired fund fees and expenses, if any.
(e) Portfolio turnover is calculated on the basis of the Fund as a whole without distinguishing between the classes of shares issued.
(f) On May 3, 2021, the THB Asset Management Microcap Fund (the "Predecessor Fund") was reorganized into the Victory THB US Small Opportunities Fund (the "Victory THB Fund"). Investor Class and Institutional Class shares of the Predecessor Fund were exchanged on a tax-free basis for Class A and Class I shares, respectively, of the Victory THB Fund. Information presented prior to May 3, 2021, is that of the Predecessor Fund. See Note 1 in the Notes to Financial Statements.
(g) The amount shown for a share outstanding throughout the period does not accord with the change in net assets resulting from operations during the period because of the timing of sales and purchases of fund shares in relation to fluctuating market values during the period.
(h) Amount is less than 0.005%.
(i) The Fund's fiscal year-end changed from October 31 to June 30. See Note 1 in the Notes to Financial Statements.
See notes to financial statements.
84
Victory Portfolios | | Financial Highlights — continued | |
For a Share Outstanding Throughout Each Period
| | | | | Ratios to Average Net Assets | | Supplemental Data | |
| | | Redemption
Fees | | Net Asset
Value,
End of
Period | | Total
Return
(Excludes
Sales
Charge)(b) | | Net
Expenses(c)(d) | | Net
Investment
Income
(Loss)(c) | | Gross
Expenses(c)(d) | | Net Assets,
End of
Period
(000's) | | Portfolio
Turnover(b)(e) | |
Victory THB US Small Opportunities Fund (f) | |
Class A | |
Eight Months Ended
June 30, 2022 (i) | | | — | | | $ | 16.36 | | | | (24.83 | )% | | | 1.70 | % | | | (0.59 | )% | | | 2.85 | % | | $ | 1,185 | | | | 43 | % | |
Year Ended October 31: | |
2021 | | | — | | | $ | 24.30 | | | | 56.27 | % | | | 1.70 | % | | | (1.20 | )% | | | 2.45 | % | | $ | 2,437 | | | | 50 | % | |
2020 | | | — | | | $ | 15.55 | | | | 4.25 | % | | | 1.70 | % | | | (1.17 | )% | | | 2.45 | % | | $ | 493 | | | | 62 | % | |
2019 | | | — | | | $ | 15.00 | | | | (3.34 | )% | | | 1.70 | % | | | (0.92 | )% | | | 2.20 | % | | $ | 627 | | | | 31 | % | |
2018 | | | — | | | $ | 16.08 | | | | 0.45 | % | | | 1.55 | % | | | (0.86 | )% | | | 2.00 | % | | $ | 1,041 | | | | 35 | % | |
2017 | | | — | | | $ | 18.14 | | | | 34.47 | % | | | 1.75 | % | | | (0.97 | )% | | | 2.29 | % | | $ | 679 | | | | 58 | % | |
Class I | |
Eight Months Ended
June 30, 2022 (i) | | | — | | | $ | 17.26 | | | | (24.61 | )% | | | 1.25 | % | | | (0.13 | )% | | | 1.44 | % | | $ | 70,091 | | | | 43 | % | |
Year Ended October 31: | |
2021 | | | — | (h) | | $ | 25.42 | | | | 56.98 | % | | | 1.25 | % | | | (0.73 | )% | | | 1.67 | % | | $ | 86,947 | | | | 50 | % | |
2020 | | | — | | | $ | 16.20 | | | | 4.68 | % | | | 1.25 | % | | | (0.70 | )% | | | 1.98 | % | | $ | 50,206 | | | | 62 | % | |
2019 | | | — | | | $ | 15.56 | | | | (2.86 | )% | | | 1.25 | % | | | (0.48 | )% | | | 1.75 | % | | $ | 73,403 | | | | 31 | % | |
2018 | | | — | | | $ | 16.58 | | | | 0.73 | % | | | 1.25 | % | | | (0.55 | )% | | | 1.70 | % | | $ | 89,159 | | | | 35 | % | |
2017 | | | — | | | $ | 18.59 | | | | 35.20 | % | | | 1.25 | % | | | (0.48 | )% | | | 1.78 | % | | $ | 81,076 | | | | 58 | % | |
See notes to financial statements.
85
Victory Portfolios | | Financial Highlights | |
For a Share Outstanding Throughout Each Period
| | | | | Investment Activities | | Distributions to
Shareholders From | |
| | | Net Asset
Value,
Beginning of
Period | | Net
Investment
Income
(Loss)(a) | | Net Realized
and Unrealized
Gains (Losses) | | Total from
Investment
Activities | | Net
Investment
Income | | Net Realized
Gains from
Investments | |
Victory Strategic Allocation Fund | | | |
Class A | | | |
Eight Months Ended
June 30, 2022 (g) | | $ | 19.94 | | | | 0.42 | | | | (2.88 | ) | | | (2.46 | ) | | | (0.43 | ) | | | — | | |
Year Ended October 31: | |
2021 | | $ | 16.48 | | | | 0.56 | | | | 3.46 | | | | 4.02 | | | | (0.56 | ) | | | — | | |
2020 | | $ | 16.47 | | | | 0.23 | | | | 0.41 | | | | 0.64 | | | | (0.23 | ) | | | (0.40 | ) | |
2019 | | $ | 15.44 | | | | 0.43 | | | | 1.12 | | | | 1.55 | | | | (0.39 | ) | | | (0.13 | ) | |
2018 | | $ | 16.41 | | | | 0.29 | | | | (0.68 | ) | | | (0.39 | ) | | | (0.39 | ) | | | (0.19 | ) | |
2017 | | $ | 14.80 | | | | 0.50 | | | | 1.51 | | | | 2.01 | | | | (0.40 | ) | | | — | | |
Class C | | | |
Eight Months Ended
June 30, 2022 (g) | | $ | 19.56 | | | | 0.32 | | | | (2.82 | ) | | | (2.50 | ) | | | (0.33 | ) | | | — | | |
Year Ended October 31: | |
2021 | | $ | 16.19 | | | | 0.40 | | | | 3.40 | | | | 3.80 | | | | (0.43 | ) | | | — | | |
2020 | | $ | 16.18 | | | | 0.13 | | | | 0.39 | | | | 0.52 | | | | (0.11 | ) | | | (0.40 | ) | |
2019 | | $ | 15.19 | | | | 0.30 | | | | 1.10 | | | | 1.40 | | | | (0.28 | ) | | | (0.13 | ) | |
2018 | | $ | 16.19 | | | | 0.21 | | | | (0.71 | ) | | | (0.50 | ) | | | (0.31 | ) | | | (0.19 | ) | |
2017 | | $ | 14.65 | | | | 0.43 | | | | 1.44 | | | | 1.87 | | | | (0.33 | ) | | | — | | |
Class I | | | |
Eight Months Ended
June 30, 2022 (g) | | $ | 20.06 | | | | 0.45 | | | | (2.89 | ) | | | (2.44 | ) | | | (0.47 | ) | | | — | | |
Year Ended October 31: | |
2021 | | $ | 16.57 | | | | 0.61 | | | | 3.48 | | | | 4.09 | | | | (0.60 | ) | | | — | | |
2020 | | $ | 16.56 | | | | 0.27 | | | | 0.41 | | | | 0.68 | | | | (0.27 | ) | | | (0.40 | ) | |
2019 | | $ | 15.52 | | | | 0.46 | | | | 1.13 | | | | 1.59 | | | | (0.42 | ) | | | (0.13 | ) | |
2018 | | $ | 16.48 | | | | 0.35 | | | | (0.70 | ) | | | (0.35 | ) | | | (0.42 | ) | | | (0.19 | ) | |
2017 | | $ | 14.86 | | | | 0.55 | | | | 1.50 | | | | 2.05 | | | | (0.43 | ) | | | — | | |
Class R | | | |
Eight Months Ended
June 30, 2022 (g) | | $ | 19.89 | | | | 0.39 | | | | (2.87 | ) | | | (2.48 | ) | | | (0.40 | ) | | | — | | |
Year Ended October 31: | |
2021 | | $ | 16.44 | | | | 0.51 | | | | 3.45 | | | | 3.96 | | | | (0.51 | ) | | | — | | |
2020 | | $ | 16.43 | | | | 0.19 | | | | 0.42 | | | | 0.61 | | | | (0.20 | ) | | | (0.40 | ) | |
2019 | | $ | 15.41 | | | | 0.36 | | | | 1.14 | | | | 1.50 | | | | (0.35 | ) | | | (0.13 | ) | |
2018 | | $ | 16.38 | | | | 0.27 | | | | (0.70 | ) | | | (0.43 | ) | | | (0.35 | ) | | | (0.19 | ) | |
2017 | | $ | 14.79 | | | | 0.46 | | | | 1.49 | | | | 1.95 | | | | (0.36 | ) | | | — | | |
(a) Per share net investment income (loss) has been calculated using the average daily shares method.
(b) Not annualized for periods less than one year.
(c) Annualized for periods less than one year.
(d) Does not include acquired fund fees and expenses, if any.
(e) Portfolio turnover is calculated on the basis of the Fund as a whole without distinguishing between the classes of shares issued.
(f) The amount includes a change in accounting estimate. Without this change in accounting estimate, the gross expense ratio would have been 0.67%, 1.54%, 0.42% and 1.43% for Class A, C, I and R, respectively.
See notes to financial statements.
86
Victory Portfolios | | Financial Highlights — continued | |
For a Share Outstanding Throughout Each Period
| | | | | Ratios to Average Net Assets | | Supplemental Data | |
| | | Total
Distributions | | Net Asset
Value,
End of
Period | | Total
Return
(Excludes
Sales
Charge)(b) | | Net
Expenses(c)(d) | | Net
Investment
Income
(Loss)(c) | | Gross
Expenses(c)(d) | | Net Assets,
End of
Period
(000's) | | Portfolio
Turnover(b)(e) | |
Victory Strategic Allocation Fund | |
Class A | |
Eight Months Ended
June 30, 2022 (g) | | | (0.43 | ) | | $ | 17.05 | | | | (12.57 | )% | | | 0.40 | % | | | 3.34 | % | | | 0.82 | % | | $ | 13,575 | | | | 9 | % | |
Year Ended October 31: | |
2021 | | | (0.56 | ) | | $ | 19.94 | | | | 24.51 | % | | | 0.40 | % | | | 2.92 | % | | | 0.80 | % | | $ | 16,378 | | | | 22 | % | |
2020 | | | (0.63 | ) | | $ | 16.48 | | | | 3.99 | % | | | 0.40 | % | | | 1.45 | % | | | 0.81 | % | | $ | 14,364 | | | | 13 | % | |
2019 | | | (0.52 | ) | | $ | 16.47 | | | | 10.37 | % | | | 0.40 | % | | | 2.69 | % | | | 0.77 | % | | $ | 15,365 | | | | 5 | % | |
2018 | | | (0.58 | ) | | $ | 15.44 | | | | (2.56 | )% | | | 0.40 | % | | | 1.77 | % | | | 0.28 | %(f) | | $ | 18,747 | | | | 40 | % | |
2017 | | | (0.40 | ) | | $ | 16.41 | | | | 13.72 | % | | | 0.30 | % | | | 3.19 | % | | | 0.79 | % | | $ | 14,820 | | | | 51 | % | |
Class C | |
Eight Months Ended
June 30, 2022 (g) | | | (0.33 | ) | | $ | 16.73 | | | | (13.01 | )% | | | 1.15 | % | | | 2.59 | % | | | 2.02 | % | | $ | 1,978 | | | | 9 | % | |
Year Ended October 31: | |
2021 | | | (0.43 | ) | | $ | 19.56 | | | | 23.57 | % | | | 1.15 | % | | | 2.10 | % | | | 2.02 | % | | $ | 2,507 | | | | 22 | % | |
2020 | | | (0.51 | ) | | $ | 16.19 | | | | 3.23 | % | | | 1.15 | % | | | 0.82 | % | | | 1.90 | % | | $ | 2,009 | | | | 13 | % | |
2019 | | | (0.41 | ) | | $ | 16.18 | | | | 9.53 | % | | | 1.15 | % | | | 1.94 | % | | | 1.72 | % | | $ | 3,193 | | | | 5 | % | |
2018 | | | (0.50 | ) | | $ | 15.19 | | | | (3.26 | )% | | | 1.15 | % | | | 1.30 | % | | | 1.08 | %(f) | | $ | 4,445 | | | | 40 | % | |
2017 | | | (0.33 | ) | | $ | 16.19 | | | | 12.88 | % | | | 1.03 | % | | | 2.78 | % | | | 1.58 | % | | $ | 8,814 | | | | 51 | % | |
Class I | |
Eight Months Ended
June 30, 2022 (g) | | | (0.47 | ) | | $ | 17.15 | | | | (12.43 | )% | | | 0.15 | % | | | 3.59 | % | | | 0.63 | % | | $ | 8,020 | | | | 9 | % | |
Year Ended October 31: | |
2021 | | | (0.60 | ) | | $ | 20.06 | | | | 24.86 | % | | | 0.15 | % | | | 3.13 | % | | | 0.56 | % | | $ | 9,283 | | | | 22 | % | |
2020 | | | (0.67 | ) | | $ | 16.57 | | | | 4.22 | % | | | 0.15 | % | | | 1.66 | % | | | 0.59 | % | | $ | 7,006 | | | | 13 | % | |
2019 | | | (0.55 | ) | | $ | 16.56 | | | | 10.63 | % | | | 0.15 | % | | | 2.90 | % | | | 0.59 | % | | $ | 5,743 | | | | 5 | % | |
2018 | | | (0.61 | ) | | $ | 15.52 | | | | (2.29 | )% | | | 0.15 | % | | | 2.11 | % | | | 0.01 | %(f) | | $ | 8,811 | | | | 40 | % | |
2017 | | | (0.43 | ) | | $ | 16.48 | | | | 13.95 | % | | | 0.10 | % | | | 3.48 | % | | | 0.61 | % | | $ | 9,153 | | | | 51 | % | |
Class R | |
Eight Months Ended
June 30, 2022 (g) | | | (0.40 | ) | | $ | 17.01 | | | | (12.72 | )% | | | 0.65 | % | | | 3.10 | % | | | 1.95 | % | | $ | 1,061 | | | | 9 | % | |
Year Ended October 31: | |
2021 | | | (0.51 | ) | | $ | 19.89 | | | | 24.20 | % | | | 0.65 | % | | | 2.69 | % | | | 1.82 | % | | $ | 1,264 | | | | 22 | % | |
2020 | | | (0.60 | ) | | $ | 16.44 | | | | 3.74 | % | | | 0.65 | % | | | 1.18 | % | | | 1.76 | % | | $ | 1,259 | | | | 13 | % | |
2019 | | | (0.48 | ) | | $ | 16.43 | | | | 10.08 | % | | | 0.65 | % | | | 2.30 | % | | | 1.87 | % | | $ | 1,308 | | | | 5 | % | |
2018 | | | (0.54 | ) | | $ | 15.41 | | | | (2.77 | )% | | | 0.65 | % | | | 1.63 | % | | | 1.01 | %(f) | | $ | 1,529 | | | | 40 | % | |
2017 | | | (0.36 | ) | | $ | 16.38 | | | | 13.36 | % | | | 0.56 | % | | | 2.96 | % | | | 1.80 | % | | $ | 1,892 | | | | 51 | % | |
(g) The Fund's fiscal year-end changed from October 31 to June 30. See Note 1 in the Notes to Financial Statements.
See notes to financial statements.
87
Victory Portfolios | | Financial Highlights | |
For a Share Outstanding Throughout Each Period
| | | | | Investment Activities | | Distributions to
Shareholders From | |
| | | Net Asset
Value,
Beginning of
Period | | Net
Investment
Income
(Loss)(a) | | Net Realized
and Unrealized
Gains (Losses) | | Total from
Investment
Activities | | Net
Investment
Income | | Total
Distributions | |
Victory INCORE Fund for Income | | | |
Class A | | | |
Eight Months Ended
June 30, 2022 (h) | | $ | 7.92 | | | | 0.03 | | | | (0.38 | ) | | | (0.35 | ) | | | (0.25 | ) | | | (0.25 | ) | |
Year Ended October 31: | |
2021 | | $ | 8.40 | | | | 0.02 | | | | (0.11 | ) | | | (0.09 | ) | | | (0.39 | ) | | | (0.39 | ) | |
2020 | | $ | 8.56 | | | | 0.06 | | | | 0.17 | | | | 0.23 | | | | (0.39 | ) | | | (0.39 | ) | |
2019 | | $ | 8.56 | | | | 0.18 | | | | 0.28 | | | | 0.46 | | | | (0.46 | ) | | | (0.46 | ) | |
2018 | | $ | 9.09 | | | | 0.15 | (f) | | | (0.23 | )(f) | | | (0.08 | ) | | | (0.45 | ) | | | (0.45 | ) | |
2017 | | $ | 9.63 | | | | 0.10 | | | | (0.15 | ) | | | (0.05 | ) | | | (0.49 | ) | | | (0.49 | ) | |
Class C | | | |
Eight Months Ended
June 30, 2022 (h) | | $ | 7.84 | | | | (0.01 | ) | | | (0.39 | ) | | | (0.40 | ) | | | (0.21 | ) | | | (0.21 | ) | |
Year Ended October 31: | |
2021 | | $ | 8.31 | | | | (0.05 | ) | | | (0.10 | ) | | | (0.15 | ) | | | (0.32 | ) | | | (0.32 | ) | |
2020 | | $ | 8.48 | | | | — | (g) | | | 0.16 | | | | 0.16 | | | | (0.33 | ) | | | (0.33 | ) | |
2019 | | $ | 8.48 | | | | 0.13 | | | | 0.26 | | | | 0.39 | | | | (0.39 | ) | | | (0.39 | ) | |
2018 | | $ | 9.01 | | | | 0.08 | (f) | | | (0.23 | )(f) | | | (0.15 | ) | | | (0.38 | ) | | | (0.38 | ) | |
2017 | | $ | 9.56 | | | | 0.03 | | | | (0.16 | ) | | | (0.13 | ) | | | (0.42 | ) | | | (0.42 | ) | |
Class I | | | |
Eight Months Ended
June 30, 2022 (h) | | $ | 7.92 | | | | 0.04 | | | | (0.39 | ) | | | (0.35 | ) | | | (0.26 | ) | | | (0.26 | ) | |
Year Ended October 31: | |
2021 | | $ | 8.39 | | | | 0.04 | | | | (0.10 | ) | | | (0.06 | ) | | | (0.41 | ) | | | (0.41 | ) | |
2020 | | $ | 8.55 | | | | 0.08 | | | | 0.17 | | | | 0.25 | | | | (0.41 | ) | | | (0.41 | ) | |
2019 | | $ | 8.55 | | | | 0.16 | | | | 0.32 | | | | 0.48 | | | | (0.48 | ) | | | (0.48 | ) | |
2018 | | $ | 9.08 | | | | 0.15 | (f) | | | (0.21 | )(f) | | | (0.06 | ) | | | (0.47 | ) | | | (0.47 | ) | |
2017 | | $ | 9.63 | | | | 0.13 | | | | (0.16 | ) | | | (0.03 | ) | | | (0.52 | ) | | | (0.52 | ) | |
(a) Per share net investment income (loss) has been calculated using the average daily shares method.
(b) Not annualized for periods less than one year.
(c) Annualized for periods less than one year.
(d) Does not include acquired fund fees and expenses, if any.
(e) Portfolio turnover is calculated on the basis of the Fund as a whole without distinguishing between the classes of shares issued.
(f) The Fund restated certain elements of its 2018 financial statements resulting from the identification of a GAAP reclassification error for the Fund's paydown gain (loss) transactions. However, this reclassification had no impact on the Fund's net assets, NAV, performance, or taxable distributions paid and reported to shareholders for the fiscal and tax years ended 2018.
(g) Amount is less than $0.005 per share.
(h) The Fund's fiscal year-end changed from October 31 to June 30. See Note 1 in the Notes to Financial Statements.
See notes to financial statements.
88
Victory Portfolios | | Financial Highlights — continued | |
For a Share Outstanding Throughout Each Period
| | | | | Ratios to Average Net Assets | | Supplemental Data | |
| | | Net Asset
Value,
End of
Period | | Total
Return
(Excludes
Sales
Charge)(b) | | Net
Expenses(c)(d) | | Net
Investment
Income
(Loss)(c) | | Gross
Expenses(c)(d) | | Net Assets,
End of
Period
(000's) | | Portfolio
Turnover(b)(e) | |
Victory INCORE Fund for Income | |
Class A | |
Eight Months Ended
June 30, 2022 (h) | | $ | 7.32 | | | | (4.48 | )% | | | 0.91 | % | | | 0.53 | % | | | 0.95 | % | | $ | 99,353 | | | | 20 | % | |
Year Ended October 31: | |
2021 | | $ | 7.92 | | | | (1.14 | )% | | | 0.91 | % | | | 0.25 | % | | | 0.92 | % | | $ | 128,802 | | | | 27 | % | |
2020 | | $ | 8.40 | | | | 2.75 | % | | | 0.91 | % | | | 0.75 | % | | | 0.92 | % | | $ | 151,236 | | | | 55 | % | |
2019 | | $ | 8.56 | | | | 5.50 | % | | | 0.92 | % | | | 2.12 | % | | | 0.94 | % | | $ | 136,570 | | | | 29 | % | |
2018 | | $ | 8.56 | | | | (0.91 | )% | | | 0.92 | % | | | 1.64 | %(f) | | | 0.93 | % | | $ | 153,574 | | | | 27 | % | |
2017 | | $ | 9.09 | | | | (0.51 | )% | | | 0.88 | % | | | 1.08 | % | | | 0.88 | % | | $ | 224,822 | | | | 30 | % | |
Class C | |
Eight Months Ended
June 30, 2022 (h) | | $ | 7.23 | | | | (5.15 | )% | | | 1.71 | % | | | (0.27 | )% | | | 1.84 | % | | $ | 6,978 | | | | 20 | % | |
Year Ended October 31: | |
2021 | | $ | 7.84 | | | | (1.81 | )% | | | 1.71 | % | | | (0.62 | )% | | | 1.79 | % | | $ | 10,066 | | | | 27 | % | |
2020 | | $ | 8.31 | | | | 1.85 | % | | | 1.71 | % | | | (0.01 | )% | | | 1.74 | % | | $ | 20,801 | | | | 55 | % | |
2019 | | $ | 8.48 | | | | 4.72 | % | | | 1.72 | % | | | 1.53 | % | | | 1.73 | % | | $ | 22,541 | | | | 29 | % | |
2018 | | $ | 8.48 | | | | (1.69 | )% | | | 1.70 | % | | | 0.94 | %(f) | | | 1.71 | % | | $ | 31,976 | | | | 27 | % | |
2017 | | $ | 9.01 | | | | (1.41 | )% | | | 1.67 | % | | | 0.29 | % | | | 1.67 | % | | $ | 50,316 | | | | 30 | % | |
Class I | |
Eight Months Ended
June 30, 2022 (h) | | $ | 7.31 | | | | (4.45 | )% | | | 0.64 | % | | | 0.80 | % | | | 0.68 | % | | $ | 284,230 | | | | 20 | % | |
Year Ended October 31: | |
2021 | | $ | 7.92 | | | | (0.77 | )% | | | 0.64 | % | | | 0.48 | % | | | 0.67 | % | | $ | 385,332 | | | | 27 | % | |
2020 | | $ | 8.39 | | | | 3.01 | % | | | 0.64 | % | | | 0.95 | % | | | 0.66 | % | | $ | 590,749 | | | | 55 | % | |
2019 | | $ | 8.55 | | | | 5.79 | % | | | 0.64 | % | | | 1.84 | % | | | 0.65 | % | | $ | 447,735 | | | | 29 | % | |
2018 | | $ | 8.55 | | | | (0.64 | )% | | | 0.63 | % | | | 1.69 | %(f) | | | 0.63 | % | | $ | 331,338 | | | | 27 | % | |
2017 | | $ | 9.08 | | | | (0.34 | )% | | | 0.61 | % | | | 1.34 | % | | | 0.61 | % | | $ | 520,056 | | | | 30 | % | |
See notes to financial statements.
89
Victory Portfolios | | Financial Highlights | |
For a Share Outstanding Throughout Each Period
| | | | | Investment Activities | | Distributions to
Shareholders From | |
| | | Net Asset
Value,
Beginning of
Period | | Net
Investment
Income
(Loss)(a) | | Net Realized
and Unrealized
Gains (Losses) | | Total from
Investment
Activities | | Net
Investment
Income | | Total
Distributions | |
Victory INCORE Fund for Income | | | |
Class R | | | |
Eight Months Ended
June 30, 2022 (i) | | $ | 7.93 | | | | 0.03 | | | | (0.38 | ) | | | (0.35 | ) | | | (0.25 | ) | | | (0.25 | ) | |
Year Ended October 31: | |
2021 | | $ | 8.40 | | | | 0.02 | | | | (0.10 | ) | | | (0.08 | ) | | | (0.39 | ) | | | (0.39 | ) | |
2020 | | $ | 8.56 | | | | 0.06 | | | | 0.17 | | | | 0.23 | | | | (0.39 | ) | | | (0.39 | ) | |
2019 | | $ | 8.57 | | | | 0.18 | | | | 0.27 | | | | 0.45 | | | | (0.46 | ) | | | (0.46 | ) | |
2018 | | $ | 9.09 | | | | 0.15 | (f) | | | (0.22 | )(f) | | | (0.07 | ) | | | (0.45 | ) | | | (0.45 | ) | |
2017 | | $ | 9.64 | | | | 0.10 | | | | (0.16 | ) | | | (0.06 | ) | | | (0.49 | ) | | | (0.49 | ) | |
Class R6 | | | |
Eight Months Ended
June 30, 2022 (i) | | $ | 7.91 | | | | 0.04 | | | | (0.39 | ) | | | (0.35 | ) | | | (0.26 | ) | | | (0.26 | ) | |
Year Ended October 31: | |
2021 | | $ | 8.38 | | | | 0.04 | | | | (0.10 | ) | | | (0.06 | ) | | | (0.41 | ) | | | (0.41 | ) | |
2020 | | $ | 8.54 | | | | 0.08 | | | | 0.18 | | | | 0.26 | | | | (0.42 | ) | | | (0.42 | ) | |
2019 | | $ | 8.55 | | | | 0.17 | | | | 0.30 | | | | 0.47 | | | | (0.48 | ) | | | (0.48 | ) | |
2018 | | $ | 9.07 | | | | 0.13 | (f) | | | (0.18 | )(f) | | | (0.05 | ) | | | (0.47 | ) | | | (0.47 | ) | |
2017 | | $ | 9.62 | | | | 0.12 | | | | (0.16 | ) | | | (0.04 | ) | | | (0.51 | ) | | | (0.51 | ) | |
Class Y | | | |
Eight Months Ended
June 30, 2022 (i) | | $ | 7.92 | | | | 0.04 | | | | (0.39 | ) | | | (0.35 | ) | | | (0.26 | ) | | | (0.26 | ) | |
Year Ended October 31: | |
2021 | | $ | 8.40 | | | | 0.03 | | | | (0.11 | ) | | | (0.08 | ) | | | (0.40 | ) | | | (0.40 | ) | |
2020 | | $ | 8.56 | | | | 0.06 | | | | 0.19 | | | | 0.25 | | | | (0.41 | ) | | | (0.41 | ) | |
2019 | | $ | 8.56 | | | | 0.13 | | | | 0.35 | | | | 0.48 | | | | (0.48 | ) | | | (0.48 | ) | |
2018 | | $ | 9.08 | | | | 0.19 | (f) | | | (0.25 | )(f) | | | (0.06 | ) | | | (0.46 | ) | | | (0.46 | ) | |
2017 | | $ | 9.64 | | | | 0.10 | | | | (0.15 | ) | | | (0.05 | ) | | | (0.51 | ) | | | (0.51 | ) | |
Member Class | | | |
Eight Months Ended
June 30, 2022 (i) | | $ | 7.95 | | | | 0.04 | | | | (0.39 | ) | | | (0.35 | ) | | | (0.26 | ) | | | (0.26 | ) | |
November 3, 2020 (h)
through
October 31, 2021 | | $ | 8.41 | | | | 0.04 | | | | (0.13 | ) | | | (0.09 | ) | | | (0.37 | ) | | | (0.37 | ) | |
(a) Per share net investment income (loss) has been calculated using the average daily shares method.
(b) Not annualized for periods less than one year.
(c) Annualized for periods less than one year.
(d) Does not include acquired fund fees and expenses, if any.
(e) Portfolio turnover is calculated on the basis of the Fund as a whole without distinguishing between the classes of shares issued.
(f) The Fund restated certain elements of its 2018 financial statements resulting from the identification of a GAAP reclassification error for the Fund's paydown gain (loss) transactions. However, this reclassification had no impact on the Fund's net assets, NAV, performance, or taxable distributions paid and reported to shareholders for the fiscal and tax years ended 2018.
(h) Commencement of operations.
See notes to financial statements.
90
Victory Portfolios | | Financial Highlights — continued | |
For a Share Outstanding Throughout Each Period
| | | | | Ratios to Average Net Assets | | Supplemental Data | |
| | | Net Asset
Value,
End of
Period | | Total
Return
(Excludes
Sales
Charge)(b) | | Net
Expenses(c)(d) | | Net
Investment
Income
(Loss)(c) | | Gross
Expenses(c)(d) | | Net Assets,
End of
Period
(000's) | | Portfolio
Turnover(b)(e) | |
Victory INCORE Fund for Income | |
Class R | |
Eight Months Ended
June 30, 2022 (i) | | $ | 7.33 | | | | (4.48 | )% | | | 0.91 | % | | | 0.54 | % | | | 0.98 | % | | $ | 17,973 | | | | 20 | % | |
Year Ended October 31: | |
2021 | | $ | 7.93 | | | | (1.03 | )% | | | 0.91 | % | | | 0.23 | % | | | 0.93 | % | | $ | 23,613 | | | | 27 | % | |
2020 | | $ | 8.40 | | | | 2.74 | % | | | 0.91 | % | | | 0.76 | % | | | 0.92 | % | | $ | 43,684 | | | | 55 | % | |
2019 | | $ | 8.56 | | | | 5.37 | % | | | 0.92 | % | | | 2.04 | % | | | 0.94 | % | | $ | 38,596 | | | | 29 | % | |
2018 | | $ | 8.57 | | | | (0.79 | )% | | | 0.91 | % | | | 1.67 | %(f) | | | 0.91 | % | | $ | 43,405 | | | | 27 | % | |
2017 | | $ | 9.09 | | | | (0.62 | )% | | | 0.88 | % | | | 1.08 | % | | | 0.88 | % | | $ | 58,783 | | | | 30 | % | |
Class R6 | |
Eight Months Ended
June 30, 2022 (i) | | $ | 7.30 | | | | (4.44 | )% | | | 0.63 | % | | | 0.83 | % | | | 0.63 | % | | $ | 27,174 | | | | 20 | % | |
Year Ended October 31: | |
2021 | | $ | 7.91 | | | | (0.77 | )% | | | 0.63 | % | | | 0.46 | % | | | 0.64 | % | | $ | 29,691 | | | | 27 | % | |
2020 | | $ | 8.38 | | | | 3.06 | % | | | 0.63 | % | | | 0.88 | % | | | 0.64 | % | | $ | 49,009 | | | | 55 | % | |
2019 | | $ | 8.54 | | | | 5.68 | % | | | 0.63 | % | | | 2.00 | % | | | 0.66 | % | | $ | 15,864 | | | | 29 | % | |
2018 | | $ | 8.55 | | | | (0.52 | )% | | | 0.63 | % | | | 1.43 | %(f) | | | 0.69 | % | | $ | 13,741 | | | | 27 | % | |
2017 | | $ | 9.07 | | | | (0.36 | )% | | | 0.63 | % | | | 1.31 | % | | | 0.73 | % | | $ | 9,407 | | | | 30 | % | |
Class Y | |
Eight Months Ended
June 30, 2022 (i) | | $ | 7.31 | | | | (4.46 | )% | | | 0.71 | % | | | 0.72 | % | | | 0.72 | % | | $ | 82,168 | | | | 20 | % | |
Year Ended October 31: | |
2021 | | $ | 7.92 | | | | (0.94 | )% | | | 0.71 | % | | | 0.40 | % | | | 0.71 | % | | $ | 120,588 | | | | 27 | % | |
2020 | | $ | 8.40 | | | | 2.95 | % | | | 0.71 | % | | | 0.67 | % | | | 0.74 | % | | $ | 186,421 | | | | 55 | % | |
2019 | | $ | 8.56 | | | | 5.72 | % | | | 0.71 | % | | | 1.48 | % | | | 0.79 | % | | $ | 54,950 | | | | 29 | % | |
2018 | | $ | 8.56 | | | | (0.61 | )% | | | 0.71 | % | | | 2.14 | %(f) | | | 0.79 | % | | $ | 31,975 | | | | 27 | % | |
2017 | | $ | 9.08 | | | | (0.53 | )% | | | 0.68 | % | | | 1.09 | % | | | 0.68 | % | | $ | 62,408 | | | | 30 | % | |
Member Class | |
Eight Months Ended
June 30, 2022 (i) | | $ | 7.34 | | | | (4.49 | )% | | | 0.75 | % | | | 0.73 | % | | | 2.85 | % | | $ | 1,238 | | | | 20 | % | |
November 3, 2020 (h)
through
October 31, 2021 | | $ | 7.95 | | | | (1.08 | )% | | | 0.75 | % | | | 0.52 | % | | | 4.45 | % | | $ | 877 | | | | 27 | % | |
(i) The Fund's fiscal year-end changed from October 31 to June 30. See Note 1 in the Notes to Financial Statements.
See notes to financial statements.
91
Victory Portfolios | | Financial Highlights | |
For a Share Outstanding Throughout Each Period
| | | | | Investment Activities | | Distributions to
Shareholders From | |
| | | Net Asset
Value,
Beginning of
Period | | Net
Investment
Income
(Loss)(a) | | Net Realized
and Unrealized
Gains (Losses) | | Total from
Investment
Activities | | Net
Investment
Income | | Net Realized
Gains from
Investments | |
Victory INCORE Investment Grade Convertible Fund | | | |
Class A | | | |
Eight Months Ended
June 30, 2022 (g) | | $ | 19.97 | | | | 0.18 | | | | (2.07 | ) | | | (1.89 | ) | | | (1.45 | ) | | | (0.33 | ) | |
Year Ended October 31: | |
2021 | | $ | 17.31 | | | | 0.22 | | | | 3.27 | | | | 3.49 | | | | (0.83 | ) | | | — | | |
2020 | | $ | 17.51 | | | | 0.27 | | | | 0.47 | | | | 0.74 | | | | (0.35 | ) | | | (0.59 | ) | |
2019 | | $ | 16.22 | | | | 0.21 | | | | 1.84 | | | | 2.05 | | | | (0.28 | ) | | | (0.48 | ) | |
2018 | | $ | 16.53 | | | | 0.30 | | | | 0.01 | | | | 0.31 | | | | (0.53 | ) | | | (0.09 | ) | |
2017 | | $ | 13.72 | | | | 0.17 | | | | 2.89 | | | | 3.06 | | | | (0.25 | ) | | | — | | |
Class I | | | |
Eight Months Ended
June 30, 2022 (g) | | $ | 19.98 | | | | 0.22 | | | | (2.08 | ) | | | (1.86 | ) | | | (1.50 | ) | | | (0.33 | ) | |
Year Ended October 31: | |
2021 | | $ | 17.32 | | | | 0.31 | | | | 3.27 | | | | 3.58 | | | | (0.92 | ) | | | — | | |
2020 | | $ | 17.50 | | | | 0.33 | | | | 0.49 | | | | 0.82 | | | | (0.41 | ) | | | (0.59 | ) | |
2019 | | $ | 16.21 | | | | 0.31 | | | | 1.83 | | | | 2.14 | | | | (0.37 | ) | | | (0.48 | ) | |
2018 | | $ | 16.53 | | | | 0.36 | | | | (0.01 | ) | | | 0.35 | | | | (0.58 | ) | | | (0.09 | ) | |
2017 | | $ | 13.71 | | | | 0.22 | | | | 2.90 | | | | 3.12 | | | | (0.30 | ) | | | — | | |
Member Class | | | |
Eight Months Ended
June 30, 2022 (g) | | $ | 20.71 | | | | 0.21 | | | | (2.16 | ) | | | (1.95 | ) | | | (1.48 | ) | | | (0.33 | ) | |
November 3, 2020 (f)
through
October 31, 2021 | | $ | 17.36 | | | | 0.26 | | | | 3.31 | | | | 3.57 | | | | (0.22 | ) | | | — | | |
(a) Per share net investment income (loss) has been calculated using the average daily shares method.
(b) Not annualized for periods less than one year.
(c) Annualized for periods less than one year.
(d) Does not include acquired fund fees and expenses, if any.
(e) Portfolio turnover is calculated on the basis of the Fund as a whole without distinguishing between the classes of shares issued.
(f) Commencement of operations.
(g) The Fund's fiscal year-end changed from October 31 to June 30. See Note 1 in the Notes to Financial Statements.
See notes to financial statements.
92
Victory Portfolios | | Financial Highlights — continued | |
For a Share Outstanding Throughout Each Period
| | | | | Ratios to Average Net Assets | | Supplemental Data | |
| | | Total
Distributions | | Net Asset
Value,
End of
Period | | Total
Return
(Excludes
Sales
Charge)(b) | | Net
Expenses(c)(d) | | Net
Investment
Income
(Loss)(c) | | Gross
Expenses(c)(d) | | Net Assets,
End of
Period
(000's) | | Portfolio
Turnover(b)(e) | |
Victory INCORE Investment Grade Convertible Fund | |
Class A | |
Eight Months Ended
June 30, 2022 (g) | | | (1.78 | ) | | $ | 16.30 | | | | (10.32 | )% | | | 1.22 | % | | | 1.48 | % | | | 1.22 | % | | $ | 18,981 | | | | 17 | % | |
Year Ended October 31: | |
2021 | | | (0.83 | ) | | $ | 19.97 | | | | 20.62 | % | | | 1.39 | % | | | 1.12 | % | | | 1.41 | % | | $ | 21,644 | | | | 28 | % | |
2020 | | | (0.94 | ) | | $ | 17.31 | | | | 4.43 | % | | | 1.38 | % | | | 1.63 | % | | | 1.38 | % | | $ | 16,571 | | | | 34 | % | |
2019 | | | (0.76 | ) | | $ | 17.51 | | | | 13.35 | % | | | 1.49 | % | | | 1.31 | % | | | 1.49 | % | | $ | 16,349 | | | | 35 | % | |
2018 | | | (0.62 | ) | | $ | 16.22 | | | | 1.87 | % | | | 1.27 | % | | | 1.79 | % | | | 1.27 | % | | $ | 14,268 | | | | 41 | % | |
2017 | | | (0.25 | ) | | $ | 16.53 | | | | 22.57 | % | | | 1.30 | % | | | 1.12 | % | | | 1.30 | % | | $ | 33,040 | | | | 39 | % | |
Class I | |
Eight Months Ended
June 30, 2022 (g) | | | (1.83 | ) | | $ | 16.29 | | | | (10.20 | )% | | | 0.91 | % | | | 1.82 | % | | | 0.91 | % | | $ | 425,954 | | | | 17 | % | |
Year Ended October 31: | |
2021 | | | (0.92 | ) | | $ | 19.98 | | | | 21.19 | % | | | 0.93 | % | | | 1.59 | % | | | 0.93 | % | | $ | 403,122 | | | | 28 | % | |
2020 | | | (1.00 | ) | | $ | 17.32 | | | | 4.91 | % | | | 0.96 | % | | | 1.98 | % | | | 0.96 | % | | $ | 276,923 | | | | 34 | % | |
2019 | | | (0.85 | ) | | $ | 17.50 | | | | 13.99 | % | | | 0.96 | % | | | 1.87 | % | | | 0.96 | % | | $ | 263,981 | | | | 35 | % | |
2018 | | | (0.67 | ) | | $ | 16.21 | | | | 2.16 | % | | | 0.94 | % | | | 2.17 | % | | | 0.94 | % | | $ | 126,871 | | | | 41 | % | |
2017 | | | (0.30 | ) | | $ | 16.53 | | | | 23.07 | % | | | 0.94 | % | | | 1.47 | % | | | 0.94 | % | | $ | 78,879 | | | | 39 | % | |
Member Class | |
Eight Months Ended
June 30, 2022 (g) | | | (1.81 | ) | | $ | 16.95 | | | | (10.28 | )% | | | 1.10 | % | | | 1.67 | % | | | 3.79 | % | | $ | 1,058 | | | | 17 | % | |
November 3, 2020 (f)
through
October 31, 2021 | | | (0.22 | ) | | $ | 20.71 | | | | 20.63 | % | | | 1.10 | % | | | 1.30 | % | | | 9.99 | % | | $ | 512 | | | | 28 | % | |
See notes to financial statements.
93
Victory Portfolios | | Notes to Financial Statements
June 30, 2022 | |
1. Organization:
Victory Portfolios (the "Trust") is organized as a Delaware statutory trust and the Trust is registered under the Investment Company Act of 1940, as amended (the "1940 Act"), as an open-end investment company. The Trust is comprised of 40 funds and is authorized to issue an unlimited number of shares, which are units of beneficial interest with a par value of $0.001 per share.
The accompanying financial statements are those of the following seven Funds (collectively, the "Funds" and individually, a "Fund"). Each Fund is classified as diversified under the 1940 Act.
Funds (Legal Name) | | Funds (Short Name) | | Investment Share
Classes Offered | |
Victory Diversified Stock Fund | | Diversified Stock Fund | | A, C, I, R, R6, and Y | |
Victory NewBridge Large Cap
Growth Fund | | NewBridge Large Cap
Growth Fund | | A, C, I, and Y
| |
Victory Special Value Fund | | Special Value Fund | | A, C, I, R, and Y | |
Victory THB US Small
Opportunities Fund | | THB US Small Opportunities Fund
| | A and I | |
Victory Strategic Allocation Fund | | Strategic Allocation Fund | | A, C, I, and R | |
Victory INCORE Fund for Income
| | INCORE Fund for Income
| | A, C, I, R, R6, Y, and
Member Class | |
Victory INCORE Investment Grade
Convertible Fund | | INCORE Investment Grade
Convertible Fund | | A, I, and
Member Class | |
On February 2, 2021, the Board of Trustees (the "Board") of the Trust approved an Agreement and Plan of Reorganization ("Reorganization"), dated February 26, 2021, which provided for the newly formed Victory THB US Small Opportunities Fund ("Acquiring Fund") and its tax-free exchange of shares of the THB Asset Management Microcap Fund's ("Predecessor Fund") shares, valued at the Predecessor Fund's net assets for the exact same shares and value of the Acquiring Fund's shares. Investor Class and Institutional Class shares of the Predecessor Fund were exchanged for Class A and Class I shares, respectively, of the Acquiring Fund. The Acquiring Fund commenced operations on May 3, 2021, upon the completion of the Reorganization as of the close of business on April 30, 2021.
Each class of shares of a Fund has substantially identical rights and privileges except with respect to sales charges, fees paid under distribution plans, expenses allocable exclusively to each class of shares, voting rights on matters solely affecting a single class of shares, and the exchange privilege of each class of shares.
Strategic Allocation Fund is a "fund of funds" in that it invests in a selection of affiliated mutual funds and exchange-traded funds ("ETFs") managed by Victory Capital Management Inc. ("VCM" or the Adviser), an affiliate of the Fund.
Strategic Allocation Fund may rely on various exemptions contained in the 1940 Act and in exemptive rules or orders thereunder issued by the Securities and Exchange Commission ("SEC") that permit funds, subject to certain conditions, to invest in one or more ETFs and certain other types of investment companies in amounts that exceed limits set forth in the 1940 Act that would otherwise be applicable.
On May 19, 2022, the Board approved the fiscal year-end change for the Funds from October 31 to June 30. The accompanying financial statements reflect this change in fiscal year-end.
Under the Trust's organizational documents, its officers and trustees are indemnified against certain liabilities arising out of the performance of their duties to the Funds. In addition, in the normal course of business, the Funds enter into contracts with their vendors and others that provide for general indemnifications. The Funds' maximum exposure under these arrangements is unknown, as this would involve future claims that may be made against the Funds. However, based on experience, the Funds expect that risk of loss to be remote.
94
Victory Portfolios | | Notes to Financial Statements — continued
June 30, 2022 | |
2. Significant Accounting Policies:
The following is a summary of significant accounting policies followed by the Trust in the preparation of its financial statements. The policies are in conformity with U.S. Generally Accepted Accounting Principles ("GAAP"). The preparation of financial statements in accordance with GAAP requires management to make estimates and assumptions that affect the reported amounts of assets and liabilities and disclosure of contingent assets and liabilities at the date of the financial statements and the reported amounts of income and expenses for the period. Actual results could differ from those estimates. The Funds follow the specialized accounting and reporting requirements under GAAP that are applicable to investment companies under Accounting Standards Codification Topic 946.
Investment Valuation:
The Funds record investments at fair value. Fair value is defined as the price that would be received to sell an asset or paid to transfer a liability in an orderly transaction between market participants at the measurement date.
The valuation techniques described below maximize the use of observable inputs and minimize the use of unobservable inputs in determining fair value. The inputs used for valuing the Funds' investments are summarized in the three broad levels listed below:
• Level 1 — quoted prices in active markets for identical securities
• Level 2 — other significant observable inputs (including quoted prices for similar securities or interest rates applicable to those securities, etc.)
• Level 3 — significant unobservable inputs (including the Funds' own assumptions in determining the fair value of investments)
Changes in valuation techniques may result in transfers in or out of an assigned level within the disclosure hierarchy. The inputs or methodologies used for valuation techniques are not necessarily an indication of the risk associated with entering into those investments.
The Adviser has established the Pricing and Liquidity Committee (the "Committee"), and subject to the Board's oversight, the Committee administers and oversees the Funds' valuation policies and procedures, which are approved by the Board.
Portfolio securities listed or traded on securities exchanges, including ETFs, are valued at the closing price on the exchange or system where the security is principally traded, if available, or at the Nasdaq Official Closing Price. If there have been no sales for that day on the exchange or system, then a security is valued at the last available bid quotation on the exchange or system where the security is principally traded. In each of these situations, valuations are typically categorized as Level 1 in the fair value hierarchy.
Investments in open-end investment companies, including underlying funds, are valued at their net asset value ("NAV"). These valuations are typically categorized as Level 1 in the fair value hierarchy.
Investments in the underlying affiliated Funds of the Strategic Allocation Fund and other open-end investment companies, other than ETFs, are valued at their NAV at the end of each business day and are typically categorized in Level 1 of the fair value hierarchy.
The underlying affiliated Funds of the Strategic Allocation Fund have specific valuation procedures. In the event that price quotations or valuations are not readily available, are not reflective of market value, or a significant event has been recognized in relation to a security or class of securities, the securities are valued in good faith by the Committee in accordance with valuation procedures approved by the Board. The effect of fair value pricing is that securities may not be priced on the basis of quotations from the primary market in which they are traded and the actual price realized from the sale of a security may differ materially from the fair value price. Valuing these securities at fair value is intended to cause the Fund's NAV to be more reliable than it otherwise would be.
95
Victory Portfolios | | Notes to Financial Statements — continued
June 30, 2022 | |
Debt securities are valued each business day by a pricing service approved by the Board. The approved pricing service uses the evaluated bid or the last sale price to value securities. Debt obligations maturing within 60 days may be valued at amortized cost, provided that the amortized cost represents the fair value of such securities. These valuations are typically categorized as Level 2 in the fair value hierarchy.
In the event that price quotations or valuations are not readily available, investments are valued at fair value in accordance with procedures established by and under the general supervision and responsibility of the Board. These valuations are typically categorized as Level 2 or Level 3 in the fair value hierarchy, based on the observability of inputs used to determine the fair value. The effect of fair value pricing is that securities may not be priced on the basis of quotations from the primary market in which they are traded and the actual price realized from the sale of a security may differ materially from the fair value price. Valuing these securities at fair value is intended to cause the Fund's NAV to be more reliable than it otherwise would be.
A summary of the valuations as of June 30, 2022, based upon the three levels defined above, is included in the table below while the breakdown, by category, of investments is disclosed on the Schedules of Portfolio Investments (amounts in thousands):
| | | Level 1 | | Level 2 | | Level 3 | | Total | |
Diversified Stock Fund | |
Common Stocks | | $ | 246,508 | | | $ | — | | | $ | — | | | $ | 246,508 | | |
Exchange-Traded Funds | | | 9,587 | | | | — | | | | — | | | | 9,587 | | |
Collateral for Securities Loaned | | | 2,781 | | | | — | | | | — | | | | 2,781 | | |
Total | | $ | 258,876 | | | $ | — | | | $ | — | | | $ | 258,876 | | |
NewBridge Large Cap Growth Fund | |
Common Stocks | | $ | 8,248 | | | $ | — | | | $ | — | | | $ | 8,248 | | |
Total | | $ | 8,248 | | | $ | — | | | $ | — | | | $ | 8,248 | | |
Special Value Fund | |
Common Stocks | | $ | 37,056 | | | $ | — | | | $ | — | | | $ | 37,056 | | |
Exchange-Traded Funds | | | 1,443 | | | | — | | | | — | | | | 1,443 | | |
Total | | $ | 38,499 | | | $ | — | | | $ | — | | | $ | 38,499 | | |
THB US Small Opportunities Fund | |
Common Stocks | | $ | 69,795 | | | $ | — | | | $ | — | | | $ | 69,795 | | |
Collateral for Securities Loaned | | | 1,106 | | | | — | | | | — | | | | 1,106 | | |
Total | | $ | 70,901 | | | $ | — | | | $ | — | | | $ | 70,901 | | |
Strategic Allocation Fund | |
Affiliated Exchange-Traded Funds | | $ | 1,779 | | | $ | — | | | $ | — | | | $ | 1,779 | | |
Affiliated Mutual Funds | | | 22,730 | | | | — | | | | — | | | | 22,730 | | |
Total | | $ | 24,509 | | | $ | — | | | $ | — | | | $ | 24,509 | | |
INCORE Fund for Income | |
Government National Mortgage Association | | $ | — | | | $ | 422,855 | | | $ | — | | | $ | 422,855 | | |
U.S. Treasury Obligations | | | — | | | | 95,904 | | | | — | | | | 95,904 | | |
Investment Companies | | | 100 | | | | — | | | | — | | | | 100 | | |
Total | | $ | 100 | | | $ | 518,759 | | | $ | — | | | $ | 518,859 | | |
INCORE Investment Grade Convertible Fund | |
Convertible Corporate Bonds | | $ | — | | | $ | 293,020 | | | $ | — | | | $ | 293,020 | | |
| Convertible Preferred Stocks | | | 60,944 | | | | 86,225 | | | | — | | | | 147,169 | | |
Collateral for Securities Loaned | | | 60,388 | | | | — | | | | — | | | | 60,388 | | |
Total | | $ | 121,332 | | | $ | 379,245 | | | $ | — | | | $ | 500,577 | | |
For the eight months ended June 30, 2022, there were no transfers in or out of Level 3 in the fair value hierarchy.
96
Victory Portfolios | | Notes to Financial Statements — continued
June 30, 2022 | |
Real Estate Investment Trusts ("REITs"):
The Funds may invest in REITs, which report information on the source of their distributions annually. REITs are pooled investment vehicles that invest primarily in income-producing real estate or real-estate related loans or interests (such as mortgages). Certain distributions received from REITs during the year are recorded as realized gains or return of capital as estimated by the Funds or when such information becomes known.
Investment Companies:
Exchange-Traded Funds:
The Funds may invest in ETFs, the shares of which are bought and sold on a securities exchange. An ETF trades like common stock and represents a fixed portfolio of securities often designed to track the performance and dividend yield of a particular domestic or foreign market index. The Funds may purchase shares of an ETF to temporarily gain exposure to a portion of the U.S. or a foreign market while awaiting purchase of underlying securities. The risks of owning an ETF generally reflect the risks of owning the underlying securities they are designed to track, although the lack of liquidity of an ETF could result in it being more volatile. Additionally, ETFs have fees and expenses that reduce their value.
Open-End Funds:
The Funds may invest in portfolios of open-end investment companies. These investment companies value securities in their portfolios for which market quotations are readily available at their market values (generally the last reported sale price) and all other securities and assets at their fair value by the methods established by the board of directors of the underlying funds.
Investment Transactions and Related Income:
Changes in holdings of investments are accounted for no later than one business day following the trade date. For financial reporting purposes, however, investment transactions are accounted for on trade date or the last business day of the reporting period. Interest income is determined on the basis of coupon interest accrued using the effective interest method which adjusts, where applicable, the amortization of premiums or accretion of discounts. Dividend income is recorded on the ex-dividend date. Gains or losses realized on sales of securities are recorded on the identified cost basis. Paydown gains or losses on applicable securities, if any, are recorded as components of Interest income on the Statements of Operations.
Securities Lending:
The Funds, through a Securities Lending Agreement with Citibank, N.A. ("Citibank"), may lend their securities to qualified financial institutions, such as certain broker-dealers and banks, to earn additional income, net of income retained by Citibank. Borrowers are required to initially secure their loans for collateral in the amount of at least 102% of the value of U.S. securities loaned or at least 105% of the value of non-U.S. securities loaned, marked-to-market daily. Any collateral shortfalls associated with increases in the valuation of the securities loaned are generally cured the next business day. The collateral can be received in the form of cash collateral and/or non-cash collateral. Non-cash collateral can include U.S. Government Securities and other securities as permitted by SEC guidelines. The cash collateral is invested in short-term instruments or cash equivalents, primarily open-end investment companies, as noted on the Funds' Schedules of Portfolio Investments. The Funds effectively do not have control of the non-cash collateral and therefore it is not disclosed on the Funds' Schedules of Portfolio Investments. Collateral requirements are determined daily based on the value of the Funds' securities on loan as of the end of the prior business day. During the time portfolio securities are on loan, the borrower will pay the Funds any dividends or interest paid on such securities plus any fee negotiated between the parties to the lending agreement. The Funds also earn a return from the collateral. The Funds pay Citibank various fees in connection with the investment of cash collateral
97
Victory Portfolios | | Notes to Financial Statements — continued
June 30, 2022 | |
and fees based on the investment income received from securities lending activities. Securities lending income (net of these fees) is disclosed on the Statements of Operations. Loans are terminable upon demand and the borrower must return the loaned securities within the lesser of one standard settlement period or five business days. Although risk is mitigated by the collateral, a Fund could experience a delay in recovering its securities and possible loss of income or value if the borrower fails to return them. In addition, there is a risk that the value of the short-term investments will be less than the amount of cash collateral required to be returned to the borrower.
The Funds' agreement with Citibank does not include master netting provisions. Non-cash collateral received by the Funds may not be sold or repledged, except to satisfy borrower default.
The following table (amounts in thousands) is a summary of the Funds' securities lending transactions as of June 30, 2022.
| | | Value of
Securities on Loan | | Non-Cash Collateral | | Cash Collateral | |
Diversified Stock Fund | | $ | 2,737 | | | $ | — | | | $ | 2,781 | | |
THB US Small Opportunities Fund | | | 1,082 | | | | — | | | | 1,106 | | |
INCORE Investment Grade
Convertible Fund | | | 58,950 | | | | — | | | | 60,388 | | |
Federal Income Taxes:
Each Fund intends to continue to qualify as a regulated investment company by complying with the provisions available to certain investment companies, as defined in applicable sections of the Internal Revenue Code, and to make distributions of net investment income and net realized gains sufficient to relieve it from all, or substantially all, federal income taxes. Accordingly, no provision for federal income taxes is required in the financial statements. The Funds have a tax year end of June 30.
For the eight months ended June 30, 2022, the Funds did not incur any income tax, interest, or penalties, and have recorded no liability for net unrecognized tax benefits relating to uncertain tax positions.
Management of the Funds has reviewed tax positions taken in tax years that remain subject to examination by all major tax jurisdictions, including federal (i.e., the last four tax years, which includes the current fiscal tax year end). Management believes that there is no tax liability resulting from unrecognized tax benefits related to uncertain tax positions taken.
Allocations:
Expenses directly attributable to a Fund are charged to that Fund, while expenses that are attributable to more than one fund in the Trust, or jointly with an affiliated trust, are allocated among the respective funds in the Trust and/or an affiliated trust based upon net assets or another appropriate basis.
Income, expenses (other than class-specific expenses such as transfer agent fees, state registration fees, printing fees, and 12b-1 fees), and realized and unrealized gains or losses on investments are allocated to each class of shares based on its relative net assets on the date income is earned or expenses and realized and unrealized gains and losses are incurred.
Redemption Fees:
The Funds do not receive a redemption fee. Prior to the Reorganization, the Predecessor Fund retained redemption fees of 2.00% on redemptions of fund shares held for less than 30 days. For the year ended October 31, 2021, Class I (formerly Institutional Class shares) and Class A (formerly Investor Class shares) had approximately $2 thousand and $1 thousand in redemptions fees, respectively, as presented on the Statements of Changes in Net Assets.
98
Victory Portfolios | | Notes to Financial Statements — continued
June 30, 2022 | |
3. Purchases and Sales:
Purchases and sales of securities (excluding securities maturing less than one year from acquisition) for the eight months ended June 30, 2022, were as follows (amounts in thousands):
| | | Excluding
U.S. Government Securities | | U.S. Government Securities | |
| | | Purchases | | Sales | | Purchases | | Sales | |
Diversified Stock Fund | | $ | 150,493 | | | $ | 168,419 | | | $ | — | | | $ | — | | |
NewBridge Large Cap Growth Fund | | | 3,514 | | | | 6,965 | | | | — | | | | — | | |
Special Value Fund | | | 24,502 | | | | 28,369 | | | | — | | | | — | | |
THB US Small Opportunities Fund | | | 36,605 | | | | 33,553 | | | | — | | | | — | | |
Strategic Allocation Fund | | | 2,454 | | | | 2,622 | | | | — | | | | — | | |
INCORE Fund for Income | | | — | | | | — | | | | 117,011 | | | | 247,985 | | |
INCORE Investment Grade
Convertible Fund | | | 162,839 | | | | 75,932 | | | | — | | | | — | | |
4. Affiliated Fund Ownership:
The Funds offer shares for investment by other funds. The fund-of-funds do not invest in the underlying funds for the purpose of exercising management or control, and the affiliated fund-of-funds annual and semi-annual reports may be viewed at www.vcm.com. As of June 30, 2022, certain fund-of-funds owned total outstanding shares of the Funds as follows:
INCORE Investment Grade Convertible Fund | | Ownership % | |
Victory Strategic Allocation Fund | | | 0.3 | | |
5. Fees and Transactions with Affiliates and Related Parties:
Investment Advisory Fees:
Investment advisory services are provided to the Fund by the Adviser, which is a New York corporation registered as an investment adviser with the SEC. The Adviser is an indirect wholly owned subsidiary of Victory Capital Holdings, Inc., a publicly traded Delaware corporation, and a wholly owned direct subsidiary of Victory Capital Operating, LLC.
Under the terms of the Investment Advisory Agreement, the Adviser is entitled to receive fees based on a percentage of the average daily net assets of each Fund. The rates at which the Adviser is paid by each Fund are included in the table below.
| | | Adviser Fee Tier Rates | |
| | | Up to $800 million | | $800 million – $2.4 billion | | Over $2.4 billion | |
Diversified Stock Fund | | | 0.65 | % | | | 0.60 | % | | | 0.55 | % | |
| | | Up to $400 million | | $400 million – $800 million | | Over $800 million | |
NewBridge Large Cap
Growth Fund | | | 0.75 | % | | | 0.65 | % | | | 0.60 | % | |
Special Value Fund | | | 0.75 | % | | | 0.65 | % | | | 0.60 | % | |
| | | Flat Rate | | | | | |
THB US Small Opportunities Fund | | | 1.15 | % | | | | | | | | | |
Strategic Allocation Fund | | | 0.10 | % | | | | | | | | | |
| | | Up to $400 million | | $400 million – $800 million | | Over $800 million | |
INCORE Fund for Income | | | 0.50 | % | | | 0.45 | % | | | 0.40 | % | |
INCORE Investment Grade
Convertible Fund | | | 0.75 | % | | | 0.65 | % | | | 0.60 | % | |
Amounts incurred and paid to VCM for the eight months ended June 30, 2022, and the year ended October 31, 2021, are reflected on the Statements of Operations as Investment advisory fees.
99
Victory Portfolios | | Notes to Financial Statements — continued
June 30, 2022 | |
Administration and Servicing Fees:
VCM also serves as the Funds' administrator and fund accountant. Under the Administration and Fund Accounting Agreement, VCM is entitled to receive fees based on a percentage of the average daily net assets of the Trust, Victory Variable Insurance Funds and Victory Portfolios II. The tiered rates at which VCM is paid by the Funds are shown in the table below:
Net Assets | |
| Up to $15 billion | | $15 billion – $30 billion | | Over $30 billion | |
| | 0.08 | %, plus | | | 0.05 | %, plus | | | 0.04 | % | |
Amounts incurred for the eight months ended June 30, 2022, and the year ended October 31, 2021, are reflected on the Statements of Operations as Administration fees.
Citi Fund Services Ohio, Inc. ("Citi"), an affiliate of Citibank, acts as sub-administrator and sub-fund accountant to the Funds pursuant to the Sub-Administration and Sub-Fund Accounting Services Agreement between VCM and Citi. VCM pays Citi a fee for providing these services. The Trust reimburses VCM and Citi for out-of-pocket expenses incurred in providing these services and certain other expenses specifically allocated to the Funds. Amounts incurred for the eight months ended June 30, 2022, and the year ended October 31, 2021, are reflected on the Statements of Operations as Sub-Administration fees.
The Funds (as part of the Trust) have entered into an agreement with the Adviser to provide compliance services, pursuant to which the Adviser furnishes its compliance personnel, including the services of the Chief Compliance Officer ("CCO"), and other resources reasonably necessary to provide the Trust with compliance oversight services related to the design, administration, and oversight of a compliance program for the Trust in accordance with Rule 38a-1 under the 1940 Act. The CCO is an employee of the Adviser, which pays the compensation of the CCO and support staff. The funds in the Trust, Victory Variable Insurance Funds, Victory Portfolios II and USAA Mutual Funds (collectively, the "Victory Funds Complex"), in aggregate, compensate the Adviser for these services. Amounts incurred for the eight months ended June 30, 2022, and the year ended October 31, 2021, are reflected on the Statements of Operations as Compliance fees.
Transfer Agency Fees:
FIS Investor Services, LLC ("FIS") serves as the Funds' transfer agent. Under the Transfer Agent Agreement, the Trust pays FIS a fee for its services and reimburses FIS for all of their reasonable out-of-pocket expenses incurred in providing these services. Victory Capital Transfer Agency, Inc., an affiliate of the Adviser, serves as sub-transfer agent for the Member Class. Victory Capital Transfer Agency, Inc. receives no fee or other compensation for these services. Amounts incurred for the eight months ended June 30, 2022, and the year ended October 31, 2021, are reflected on the Statements of Operations as Transfer agent fees.
Distributor/Underwriting Services:
Victory Capital Services, Inc. (the "Distributor"), an affiliate of the Adviser, serves as Distributor for the continuous offering of the shares of the Funds pursuant to a Distribution Agreement between the Distributor and the Trust. Pursuant to the Distribution and Service Plans adopted in accordance with Rule 12b-1 under the 1940 Act, the Distributor may receive a monthly distribution and service fee up to the annual rate shown in the table below:
| | | Class A | | Class C | | Class R | |
Diversified Stock Fund | | | 0.25 | % | | | 1.00 | % | | | 0.50 | % | |
NewBridge Large Cap Growth Fund | | | 0.25 | % | | | 1.00 | % | | | N/A | | |
Special Value Fund | | | 0.25 | % | | | 1.00 | % | | | 0.50 | % | |
THB US Small Opportunities Fund | | | 0.25 | % | | | N/A | | | | N/A | | |
Strategic Allocation Fund | | | 0.25 | % | | | 1.00 | % | | | 0.50 | % | |
INCORE Fund for Income | | | 0.25 | % | | | 1.00 | % | | | 0.25 | % | |
INCORE Investment Grade Convertible Fund | | | 0.25 | % | | | N/A | | | | N/A | | |
100
Victory Portfolios | | Notes to Financial Statements — continued
June 30, 2022 | |
The distribution and service fees paid to the Distributor may be used by the Distributor to pay for activities primarily intended to result in the sale of Class A, Class C, and Class R. Amounts incurred for the eight months ended June 30, 2022, and the year ended October 31, 2021, are reflected on the Statements of Operations as 12b-1 fees.
In addition, the Distributor is entitled to receive commissions in connection with sales of Class A. For the eight months ended June 30, 2022, the Distributor received approximately $11 thousand from commissions earned in connection with sales of Class A. For the year ended October 31, 2021, the Distributor received approximately $22 thousand from commissions earned in connection with sales of Class A.
Prior to the Reorganization, the Predecessor Fund had entered into shareholder servicing agreements with third-party service providers pursuant to which the service providers provided certain shareholder services to Predecessor Fund shareholders (the "Service Plan"). Under the Service Plan, the Fund may have paid service providers a fee at a rate of up to 0.25% annually of the average daily net assets attributable to the former Investor Class (currently Class A), subject to the arrangement for provision of shareholder and administrative services. The Predecessor Fund's former Investor Class (currently Class A) incurred approximately $2 thousand of shareholder servicing fees, an effective rate of 0.20%. These fees are disclosed as Shareholder servicing fees on the Statements of Operations.
Other Fees:
Citibank serves as the Funds' custodian. The Funds pay Citibank a fee for providing these services. Amounts incurred for the eight months ended June 30, 2022, and the year ended October 31, 2021, are reflected on the Statements of Operations as Custodian fees.
Sidley Austin LLP provides legal services to the Trust.
The Adviser has entered into expense limitation agreements with certain Funds. Under the terms of the agreements, the Adviser has agreed to waive fees or reimburse certain expenses to the extent that ordinary operating expenses incurred by certain classes of a Fund in any fiscal year exceed the expense limit for such classes of the Fund. Such excess amounts will be the liability of the Adviser. Acquired fund fees and expenses, interest, taxes, brokerage commissions, other expenditures which are capitalized in accordance with GAAP, and other extraordinary expenses not incurred in the ordinary course of a Fund's business are excluded from the expense limits. As of June 30, 2022, the expense limits (excluding voluntary waivers) are as follows:
| | | In effect until February 28, 2023 | |
| | | Class A | | Class C | | Class I | | Class R | | Class R6 | | Class Y | | Member
Class | |
Diversified Stock Fund | | | N/A | | | | 2.02 | % | | | 0.83 | % | | | N/A | | | | 0.78 | % | | | 0.86 | % | | | N/A | | |
NewBridge Large Cap
Growth Fund | | | 1.36 | % | | | 2.10 | % | | | 0.95 | % | | | N/A | | | | N/A | | | | 1.02 | % | | | N/A | | |
Special Value Fund | | | N/A | | | | 2.20 | % | | | 1.15 | % | | | N/A | | | | N/A | | | | 1.10 | % | | | N/A | | |
THB US Small
Opportunities Fund | | | 1.70 | %(a) | | | N/A | | | | 1.25 | %(a) | | | N/A | | | | N/A | | | | N/A | | | | N/A | | |
Strategic Allocation Fund | | | 0.40 | % | | | 1.15 | % | | | 0.15 | % | | | 0.65 | % | | | N/A | | | | N/A | | | | N/A | | |
INCORE Fund for Income | | | 0.91 | % | | | 1.71 | % | | | 0.64 | % | | | 0.91 | % | | | 0.63 | % | | | 0.71 | % | | | 0.75 | % | |
INCORE Investment Grade
Convertible Fund | | | 1.39 | % | | | N/A | | | | N/A | | | | N/A | | | | N/A | | | | N/A | | | | 1.10 | % | |
(a) In effect until May 3, 2023.
Under the terms of the expense limitation agreements, as amended May 1, 2022, the Funds (except Strategic Allocation Fund)have agreed to repay fees and expenses that were waived or reimbursed by the Adviser for a period of up to three years (thirty-six (36) months) after the waiver or reimbursement took place, subject to the lesser of any operating expense limits in effect at the time of: (a) the original waiver or expense reimbursement; or (b) the recoupment, after giving effect to the recoupment amount.
101
Victory Portfolios | | Notes to Financial Statements — continued
June 30, 2022 | |
For the eight months ended June 30, 2022, the following amounts are available to be repaid to the Adviser (amounts in thousands). The Funds have not recorded any amounts available to be repaid as a liability due to an assessment that such repayments are not probable at June 30, 2022.
| | Expires
10/31/2022 | | Expires
10/31/2023 | | Expires
10/31/2024 | | Expires
6/30/2025 | | Total | |
Diversified Stock Fund | | $ | 10 | | | $ | 36 | | | $ | 28 | | | $ | 21 | | | $ | 95 | | |
NewBridge Large Cap Growth Fund | | | 28 | | | | 58 | | | | 63 | | | | 56 | | | | 205 | | |
Special Value Fund | | | 11 | | | | 28 | | | | 23 | | | | 14 | | | | 76 | | |
THB US Small Opportunities Fund | | | — | | | | — | | | | 13 | | | | 109 | | | | 122 | | |
INCORE Fund for Income | | | 25 | | | | 105 | | | | 197 | | | | 160 | | | | 487 | | |
INCORE Investment Grade
Convertible Fund | | | — | | | | — | | | | 23 | | | | 15 | | | | 38 | | |
As of October 31, 2021, the following amounts were available to be repaid to the Adviser (amounts in thousands). The Funds have not recorded any amounts available to be repaid as a liability due to an assessment that such repayments are not probable at June 30, 2022.
| | | Expires
2022 | | Expires
2023 | | Expires
2024 | | Total | |
Diversified Stock Fund | | $ | 30 | | | $ | 36 | | | $ | 28 | | | $ | 94 | | |
NewBridge Large Cap Growth Fund | | | 72 | | | | 58 | | | | 63 | | | | 193 | | |
Special Value Fund | | | 33 | | | | 28 | | | | 23 | | | | 84 | | |
THB US Small Opportunities Fund | | | — | | | | — | | | | 13 | | | | 13 | | |
INCORE Fund for Income | | | 78 | | | | 105 | | | | 197 | | | | 380 | | |
INCORE Investment Grade Convertible Fund | | | — | | | | — | | | | 28 | | | | 28 | | |
The Adviser may voluntarily waive or reimburse additional fees to assist the Funds in maintaining competitive expense ratios. Voluntary waivers and reimbursements applicable to the Funds are not available to be recouped at a future time. For the eight months ended June 30, 2022, the Adviser voluntarily waived the following amounts (amounts in thousands):
For the year ended October 31, 2021, the Adviser voluntarily waived the following amounts (amounts in thousands):
Certain officers and/or interested trustees of the Funds are also officers and/or employees of the Adviser, administrator, fund accountant, sub-administrator, sub-fund accountant, custodian, legal counsel, and Distributor.
6. Risks:
The Funds may be subject to other risks in addition to these identified risks.
Convertible Securities Risk — Convertible securities rank senior to the issuer's common stock, but may be subordinate to senior debt obligations. In part, the total return for a convertible security may depend upon the performance of the underlying stock into which it can be converted. Synthetic convertibles may respond differently to market fluctuations than traditional convertible securities. They are also subject to counterparty risk.
Equity Risk — The value of the equity securities in which a Fund invests may decline in response to developments affecting individual companies and/or general economic conditions in the United States or abroad. A company's earnings or dividends may not increase as expected (or may decline) because of poor management, competitive pressures, reliance on particular suppliers or geographical regions, labor problems or shortages, corporate restructurings, fraudulent disclosures, man-made or natural disasters, military confrontations or wars, terrorism, public health crises, or other events, conditions and factors. Price changes may be temporary or last for extended periods.
102
Victory Portfolios | | Notes to Financial Statements — continued
June 30, 2022 | |
Market Risk — Overall market risks may affect the value of the Funds. Domestic and international factors such as political events, war, terrorism, trade disputes, inflation rates, interest rate levels and other fiscal and monetary policy changes, cybersecurity incidents, pandemics and other public health crises, sanctions against a particular foreign country, its nationals, businesses or industries and related geopolitical events, as well as environmental disasters such as earthquakes, fires, and floods or other catastrophes, may add to instability in global economies and markets generally, and may lead to increased market volatility. Global economies and financial markets are highly interconnected, which increases the possibility that conditions in one country or region might adversely affect issuers in another country or region. The impact of these and other factors may be short-term or may last for extended periods.
Micro-Capitalization Stock Risk — Micro-capitalization companies tend to be less seasoned and may lose market share or profits to a greater extent than larger, more established companies. Since micro-capitalization company stocks typically have narrower markets and are traded in lower volumes than larger company stocks, they may be more difficult to purchase and sell. Micro-capitalization companies may have limited markets, product lines, or financial resources and lack management experience and may experience higher failure rates than larger companies.
Debt Securities and Interest Rate Risk — The INCORE Fund for Income and the INCORE Investment Grade Convertible Bond Fund are subject to debt securities and interest rate risk. The value of a debt security or other income-producing security changes in response to various factors including, for example, market-related factors (such as changes in interest rates or changes in the risk appetite of investors generally) and changes in the actual or perceived ability of the issuer (or of issuers generally) to meet its (or their) obligations. Interest rates may rise or the rate of inflation may increase, impacting the value of investments in fixed income securities. A debt issuer's credit quality may be downgraded or an issuer may default. Interest rates may fluctuate due to changes in governmental fiscal policy initiatives and resulting market reaction to those initiatives.
High-Yield/Junk Bond Risk — Lower-quality debt securities can involve a substantially greater risk of default than higher quality debt securities, and their values can decline significantly over short and longer periods of time. Lower-quality debt securities tend to be more sensitive to adverse news about the issuer, or the market or economy in general.
LIBOR Discontinuation Risk — The London Interbank Offered Rate ("LIBOR") discontinuation may adversely affect the financial markets generally and the Funds' operations, finances and investments specifically. LIBOR has been the principal floating-rate benchmark in the financial markets. However, LIBOR has been or will be discontinued as a floating rate benchmark. The date of discontinuation depends on the LIBOR currency and tenor. With limited exceptions, no new LIBOR obligations will be entered into after December 31, 2021. Existing LIBOR obligations have transitioned or will transition to another benchmark, depending on the LIBOR currency and tenor. For some existing LIBOR-based obligations, the contractual consequences of the discontinuation of LIBOR may not be clear.
Non-LIBOR floating-rate obligations, including Secured Overnight Financing Rate ("SOFR")-based obligations, may have returns and values that fluctuate more than those of floating-rate debt obligations that are based on LIBOR or other rates. Also, because SOFR and some alternative floating rates are relatively new market indexes, markets for certain non-LIBOR obligations may never develop or may not be liquid. Market terms for non-LIBOR floating rate obligations, such as the spread over the index reflected in interest-rate provisions, may evolve over time, and prices of non-LIBOR floating rate obligations may be different depending on when they are issued and changing views about correct spread levels.
Various SOFR-based rates, including SOFR-based term rates, and various non-SOFR-based rates are expected to develop in response to the discontinuation of U.S. dollar LIBOR, which may create various risks for the Funds and the financial markets more generally. There are non-LIBOR forward-looking floating rates that are not based on SOFR and that may be considered by participants in the financial markets as LIBOR alternatives. Such rates include AMERIBOR (American Interbank Offered Rate), BSBY (Bloomberg Short-Term Bank Yield Index) and BYI (Bank Yield Index). Unlike forward-looking SOFR-based term rates, such rates are intended to reflect a bank credit spread component.
103
Victory Portfolios | | Notes to Financial Statements — continued
June 30, 2022 | |
It is not clear how replacement rates for LIBOR — including SOFR-based rates and non-SOFR-based rates — will develop and to what extent they will be used. There is no assurance that these replacement rates will be suitable substitutes for LIBOR, and thus the substitution of such rates for LIBOR could have an adverse effect on the Funds and the financial markets more generally. Concerns about market depth and stability could affect the development of non-SOFR-based term rates, and such rates may create various risks, which may or may not be similar to the risks relating to SOFR.
7. Borrowing and Interfund Lending:
Line of Credit:
The Victory Funds Complex participates in a short-term demand note "Line of Credit" agreement with Citibank. The Line of Credit agreement with Citibank was renewed on June 27, 2022, with a termination date of June 26, 2023. Under the agreement with Citibank, the Victory Funds Complex may borrow up to $600 million, of which $300 million is committed and $300 million is uncommitted. $40 million of the Line of Credit is reserved for use by the Victory Floating Rate Fund, another series of the Victory Funds Complex, with Victory Floating Rate Fund paying the related commitment fees for that amount. The purpose of the Line of Credit is to meet temporary or emergency cash needs. For the eight months ended June 30, 2022, Citibank received an annual commitment fee of 0.15% on $300 million for providing the Line of Credit. Each fund in the Victory Funds Complex paid a pro-rata portion of the commitment fees plus any interest on amounts borrowed. For the period from November 1, 2021, through June 27, 2022, interest was based on the one-month LIBOR plus one percent. Effective with the renewal, for the period June 28, 2022, through June 30, 2022, interest was based on the one-month SOFR plus 1.10 percent. Interest charged to each fund during the period, if applicable, is reflected on the Statements of Operations under Line of credit fees.
The average borrowing for the days outstanding and average interest rate for each Fund that utilized the Line of Credit during the eight months ended June 30, 2022, were as follows (amounts in thousands):
| | | Amount
Outstanding at
June 30, 2022 | | Average
Borrowing* | | Days
Borrowings
Outstanding | | Average
Interest
Rate | | Maximum
Borrowing
During
the Period | |
THB US Small
Opportunities Fund | | $ | — | | | $ | 4,486 | | | | 7 | | | | 1.21 | % | | $ | 5,600 | | |
* Based on the number of days borrowings were outstanding for the eight months ended June 30, 2022.
Interfund Lending:
The Trust and the Adviser rely on an exemptive order granted by the SEC in March 2017 (the "Order"), permitting the establishment and operation of an Interfund Lending Facility (the "Facility"). The Facility allows each Fund to directly lend and borrow money to or from any other fund in the Victory Funds Complex that is permitted to participate in the Facility, relying upon the Order at rates beneficial to both the borrowing and lending funds. Advances under the Facility are allowed for temporary or emergency purposes, including the meeting of redemption requests that otherwise might require the untimely disposition of securities, and are subject to each Fund's borrowing restrictions. The interfund loan rate is determined, as specified in the Order, by averaging the current repurchase agreement rate and the current bank loan rate. As a Borrower, interest charged to each Fund, if any, during the period, is reflected on the Statements of Operations under Interfund lending fees. As a Lender, interest earned by each Fund, if any, during the period, is reflected on the Statements of Operations under Interfund lending.
104
Victory Portfolios | | Notes to Financial Statements — continued
June 30, 2022 | |
The average borrowing or lending for the days outstanding and average interest rate for the Funds that utilized this Facility during the eight months ended June 30, 2022, were as follows (amounts in thousands):
| | |
Borrower
or
Lender | | Amount
Outstanding
at
June 30, 2022 | | Average
Borrowing* | | Days
Borrowing
Outstanding | | Average
Interest
Rate* | | Maximum
Borrowing
During
the Period | |
INCORE Fund for
Income | | Borrower | | $ | — | | | $ | 4,065 | | | | 4 | | | | 0.83 | % | | $ | 10,000 | | |
INCORE Investment
Grade Convertible
Fund | | Borrower | | | — | | | | 1,670 | | | | 4 | | | | 0.58 | % | | | 1,670 | | |
* Based on the number of days borrowings were outstanding for the eight months ended June 30, 2022.
The average borrowing or lending for the days outstanding and average interest rate for the Funds that utilized this Facility during the year ended October 31, 2021, were as follows (amounts in thousands):
| | | Borrower
or
Lender | | Amount
Outstanding
at
October 31, 2021 | | Average
Borrowing* | | Days
Borrowing
Outstanding | | Average
Interest
Rate* | | Maximum
Borrowing
During
the Period | |
INCORE Fund for
Income | | Borrower | | $ | — | | | $ | 825 | | | | 3 | | | | 0.57 | % | | $ | 825 | | |
INCORE Investment
Grade Convertible
Fund | | Borrower | | | — | | | | 946 | | | | 1 | | | | 0.61 | % | | | 946 | | |
* Based on the number of days borrowings were outstanding for the year ended October 31, 2021.
8. Federal Income Tax Information:
Dividends from net investment income, if any, are declared and paid as noted in the table below. Distributable net realized gains, if any, are declared and distributed at least annually from each Fund.
| | | Declared | | Paid | |
Diversified Stock Fund | | Quarterly | | Quarterly | |
Newbridge Large Cap Growth Fund | | Annually | | Annually | |
Special Value Fund | | Annually | | Annually | |
THB US Small Opportunities Fund | | Quarterly | | Quarterly | |
Strategic Allocation Fund | | Quarterly | | Quarterly | |
INCORE Fund for Income | | Monthly | | Monthly | |
INCORE Investment Grade Convertible Fund | | Quarterly | | Quarterly | |
The amounts of dividends from net investment income and distributions from net realized gains (collectively, distributions to shareholders) are determined in accordance with federal income tax regulations, which may differ from GAAP. To the extent these "book/tax" differences are permanent in nature (e.g., net operating loss and distribution reclassification), such amounts are reclassified within the components of net assets based on their federal tax-basis treatment; temporary differences (e.g., wash sales) do not require reclassification. To the extent dividends and distributions exceed net investment income and net realized gains for tax purposes, they are reported as distributions of capital. Net investment losses incurred by the Funds may be reclassified as an offset to capital on the accompanying Statements of Assets and Liabilities.
105
Victory Portfolios | | Notes to Financial Statements — continued
June 30, 2022 | |
As of June 30, 2022, on the Statements of Assets and Liabilities, as a result of permanent book-to-tax differences, reclassification adjustments were as follows (amounts in thousands):
| | Total
Accumulated
Earnings/(Loss) | | Capital | |
Diversified Stock Fund | | $ | (1,445 | ) | | $ | 1,445 | | |
NewBridge Large Cap Growth Fund | | | (171 | ) | | | 171 | | |
Special Value Fund | | | (421 | ) | | | 421 | | |
THB US Small Opportunities Fund | | | 37 | | | | (37 | ) | |
Strategic Allocation Fund | | | 2 | | | | (2 | ) | |
INCORE Investment Grade Convertible Fund | | | (482 | ) | | | 482 | | |
The tax character of distributions paid during the tax years ended, as noted below, were as follows (total distributions paid may differ from the Statements of Changes in Net Assets because, for tax purposes, dividends are recognized when actually paid) (amounts in thousands):
| | Eight Months Ended June 30, 2022 | |
| | Distributions paid from: | | | |
| | | Ordinary
Income | | Net
Long-Term
Capital Gains | | Return
of
Capital | | Total
Distributions
Paid | |
Diversified Stock Fund | | $ | 13,127 | | | $ | 32,508 | | | $ | | | | $ | 45,635 | | |
NewBridge Large Cap Growth Fund | | | — | | | | 3,855 | | | | — | | | | 3,855 | | |
Special Value Fund | | | 2,140 | | | | 5,829 | | | | — | | | | 7,969 | | |
THB US Small Opportunities Fund | | | 3,014 | | | | 5,062 | | | | 369 | | | | 8,445 | | |
Strategic Allocation Fund | | | 627 | | | | 6 | | | | — | | | | 633 | | |
INCORE Fund for Income | | | 20,419 | | | | — | | | | — | | | | 20,419 | | |
INCORE Investment Grade Convertible Fund | | | 33,136 | | | | 6,009 | | | | — | | | | 39,145 | | |
| | | Year Ended October 31, 2021 | |
| | | Distributions Paid From: | | | |
| | | Ordinary
Income | | Net
Long-Term
Capital Gains | | Total
Distributions
Paid | |
Diversified Stock Fund | | $ | 121 | | | $ | 6,599 | | | $ | 6,720 | | |
Newbridge Large Cap Growth Fund | | | — | | | | 2,142 | | | | 2,142 | | |
Special Value Fund | | | 8 | | | | 1,628 | | | | 1,636 | | |
THB US Small Opportunities Fund | | | — | | | | — | | | | — | | |
Strategic Allocation Fund | | | 816 | | | | — | | | | 816 | | |
INCORE Fund for Income | | | 41,213 | | | | — | | | | 41,213 | | |
INCORE Investment Grade Convertible Fund | | | 15,644 | | | | — | | | | 15,644 | | |
| | | Year Ended October 31, 2020 | |
| | | Distributions Paid From: | | | |
| | | Ordinary
Income | | Net
Long-Term
Capital Gains | | Total
Distributions
Paid | |
Diversified Stock Fund | | $ | 665 | | | $ | 18,725 | | | $ | 19,390 | | |
Newbridge Large Cap Growth Fund | | | — | | | | 3,123 | | | | 3,123 | | |
Special Value Fund | | | 134 | | | | 1,611 | | | | 1,745 | | |
THB US Small Opportunities Fund | | | — | | | | 421 | | | | 421 | | |
Strategic Allocation Fund | | | 462 | | | | 503 | | | | 965 | | |
INCORE Fund for Income | | | 41,156 | | | | — | | | | 41,156 | | |
INCORE Investment Grade Convertible Fund | | | 9,063 | | | | 7,674 | | | | 16,737 | | |
106
Victory Portfolios | | Notes to Financial Statements — continued
June 30, 2022 | |
As of June 30, 2022, the components of accumulated earnings/(loss) on a tax basis were as follows (amounts in thousands):
| | Undistributed
Ordinary
Income | | Undistributed
Long-Term
Capital Gains | | Other
Earnings
(Deficit) | | Accumulated
Earnings | | Accumulated
Capital and
Other
Losses | | Qualified
Late-Year
Losses* | | Unrealized
Appreciation
(Depreciation)** | | Total
Accumulated
Earnings
(Loss) | |
Diversified
Stock Fund | | $ | 29 | | | $ | 23,373 | | | $ | (8 | ) | | $ | 23,394 | | | $ | — | | | $ | — | | | $ | 43,120 | | | $ | 66,514 | | |
NewBridge
Large Cap
Growth Fund | | | — | | | | 1,836 | | | | — | *** | | | 1,836 | | | | — | | | | (210 | ) | | | 1,679 | | | | 3,305 | | |
Special
Value Fund | | | 30 | | | | 3,925 | | | | (2 | ) | | | 3,953 | | | | — | | | | — | | | | 5,825 | | | | 9,778 | | |
THB US Small
Opportunities
Fund | | | — | | | | — | | | | — | | | | — | | | | (610 | ) | | | (26 | ) | | | 5,139 | | | | 4,503 | | |
Strategic
Allocation
Fund | | | — | | | | 651 | | | | — | *** | | | 651 | | | | — | | | | — | | | | 1,110 | | | | 1,761 | | |
INCORE Fund for
Income | | | 1,473 | | | | — | | | | (2 | ) | | | 1,471 | | | | (379,003 | ) | | | — | | | | (42,655 | ) | | | (420,187 | ) | |
INCORE Investment
Grade
Convertible
Fund | | | 1,613 | | | | 3,401 | | | | — | *** | | | 5,014 | | | | — | | | | — | | | | (18,763 | ) | | | (13,749 | ) | |
* Qualified late-year losses are comprised of post-October capital losses incurred after October 31 and certain late-year ordinary losses. Late-year ordinary losses represent ordinary losses incurred after December 31 and specified losses incurred after October 31. These losses are deemed to arise on the first day of the Fund's next taxable year.
** The difference between the book-basis and tax-basis unrealized appreciation (depreciation) is attributable primarily to tax deferral of losses on wash sales, hybrid accruals interest purchased, and deemed dividends on Convertible Debt under Sec. 305(c).
*** Rounds to less than $1 thousand.
At June 30, 2022, the Funds had net capital loss carryforwards as shown in the table below (amounts in thousands). It is unlikely that the Board will authorize a distribution of capital gains realized in the future until the capital loss carryforwards have been used.
| | Short-Term
Amount | | Long-Term
Amount | | Total | |
THB US Small Opportunities Fund | | $ | (610 | ) | | $ | — | | | $ | (610 | ) | |
INCORE Fund for Income | | | (130,175 | ) | | | (248,828 | ) | | | (379,003 | ) | |
During the eight months ended June 30, 2022, the following Fund utilized capital loss carryforwards (amounts in thousands):
| | | Amount | |
| Strategic Allocation Fund | | $ | 113 | | |
As of June 30, 2022, the cost basis for federal income tax purposes, gross unrealized appreciation, gross unrealized depreciation, and net unrealized appreciation (depreciation) for investments were as follows (amounts in thousands):
| | Cost of
Investments
for Federal
Tax Purposes | | Net
Gross
Unrealized
Appreciation | | Gross
Unrealized
Depreciation | | Net
Unrealized
Appreciation
(Depreciation) | |
Diversified Stock Fund | | $ | 215,756 | | | $ | 62,765 | | | $ | (19,645 | ) | | $ | 43,120 | | |
NewBridge Large Cap Growth Fund | | | 6,569 | | | | 2,939 | | | | (1,260 | ) | | | 1,679 | | |
107
Victory Portfolios | | Notes to Financial Statements — continued
June 30, 2022 | |
| | Cost of
Investments
for Federal
Tax Purposes | | Net
Gross
Unrealized
Appreciation | | Gross
Unrealized
Depreciation | | Net
Unrealized
Appreciation
(Depreciation) | |
Special Value Fund | | $ | 32,674 | | | $ | 8,956 | | | $ | (3,131 | ) | | $ | 5,825 | | |
THB US Small Opportunities Fund | | | 65,762 | | | | 11,180 | | | | (6,041 | ) | | | 5,139 | | |
Strategic Allocation Fund | | | 23,399 | | | | 2,847 | | | | (1,737 | ) | | | 1,110 | | |
INCORE Fund for Income | | | 561,514 | | | | 293 | | | | (42,948 | ) | | | (42,655 | ) | |
INCORE Investment Grade Convertible
Fund | | | 519,340 | | | | 25,891 | | | | (44,654 | ) | | | (18,763 | ) | |
9. Affiliated Securities:
An affiliated security is a security in which a Fund has ownership of at least 5% of the security's outstanding voting shares, an investment company managed by VCM or an issuer under common control with a Fund or VCM. The Funds do not invest in affiliated securities for the purpose of exercising management or control. These securities are noted as affiliated on the Fund's Schedule of Portfolio Investments. The financial statements of the underlying funds can be found in shareholder reports filed with the SEC by each such underlying fund semi-annually on Form N-CSR and are available for download from both the SEC's as well as each respective underlying fund's website. Transactions in affiliated securities during the eight months ended June 30, 2022, were as follows (amounts in thousands):
| | | Fair
Value
10/31/2021 | | Purchases
at Cost | | Proceeds
from
Sales | | Realized
Gains
(Losses) | | Capital
Gain
Distribution | | Net
Change in
Unrealized
Appreciation/
Depreciation | | Fair Value
6/30/2022 | | Dividend
Income | |
Strategic Allocation Fund | |
Victory INCORE Total Return
Bond Fund Class R6 | | $ | 3,201 | | | $ | 49 | | | $ | (277 | ) | | $ | (16 | ) | | $ | — | | | $ | (357 | ) | | $ | 2,600 | | | $ | 49 | | |
Victory Integrity Discovery
Fund Class Y | | | 1,178 | | | | 48 | | | | (77 | ) | | | 2 | | | | 48 | | | | (232 | ) | | | 919 | | | | — | | |
Victory Market Neutral Income
Fund Class I | | | 5,661 | | | | 114 | | | | (435 | ) | | | (5 | ) | | | — | | | | (47 | ) | | | 5,288 | | | | 114 | | |
Victory RS Global Fund
Class Y | | | 9,197 | | | | 302 | | | | (1,076 | ) | | | 274 | | | | 88 | | | | (2,213 | ) | | | 6,484 | | | | 204 | | |
Victory RS Partners Fund
Class Y | | | 1,130 | | | | 151 | | | | (107 | ) | | | (1 | ) | | | 89 | | | | (247 | ) | | | 926 | | | | 62 | | |
Victory INCORE Investment
Grade Convertible Fund
Class I | | | 1,849 | | | | 172 | | | | (145 | ) | | | (22 | ) | | | 26 | | | | (330 | ) | | | 1,524 | | | | 146 | | |
Victory Sophus Emerging
Markets Fund Class R6 | | | 2,770 | | | | 114 | | | | — | | | | — | | | | 59 | | | | (718 | ) | | | 2,166 | | | | 55 | | |
Victory Global Energy
Transition Fund Class Y | | | — | | | | 1,330 | | | | — | | | | — | | | | — | | | | 110 | | | | 1,440 | | | | — | | |
Victory Trivalent International
Small-Cap Fund Class I | | | 2,200 | | | | 174 | | | | (275 | ) | | | 19 | | | | 137 | | | | (735 | ) | | | 1,383 | | | | 37 | | |
VictoryShares U.S. Multi-Factor
Minimum Volatility ETF | | | 2,171 | | | | — | | | | (231 | ) | | | 62 | | | | — | | | | (223 | ) | | | 1,779 | | | | 24 | | |
| | | $ | 29,357 | | | $ | 2,454 | | | $ | (2,623 | ) | | $ | 313 | | | $ | 447 | | | $ | (4,992 | ) | | $ | 24,509 | | | $ | 691 | | |
108
Victory Portfolios | | Notes to Financial Statements — continued
June 30, 2022 | |
Transactions in affiliated securities during the year ended October 31, 2021, were as follows (amounts in thousands):
| | | Fair
Value
10/31/2020 | | Purchases
at Cost | | Proceeds
from
Sales | | Realized
Gains
(Losses) | | Capital
Gain
Distribution | | Net
Change in
Unrealized
Appreciation/
Depreciation | | Fair Value
10/31/2021 | | Dividend
Income | |
Strategic Allocation Fund | |
Victory INCORE Total Return
Bond Fund Class R6 | | $ | 3,081 | | | $ | 147 | | | $ | — | | | $ | — | | | $ | — | | | $ | (27 | ) | | $ | 3,201 | | | $ | 77 | | |
Victory Integrity Discovery
Fund Class Y | | | 820 | | | | — | | | | (248 | ) | | | 10 | | | | — | | | | 596 | | | | 1,178 | | | | — | | |
Victory Market Neutral Income
Fund Class I | | | 5,412 | | | | 384 | | | | — | | | | — | | | | 101 | | | | (135 | ) | | | 5,661 | | | | 212 | | |
Victory RS Global Fund
Class Y | | | 7,049 | | | | 64 | | | | (526 | ) | | | 136 | | | | 3 | | | | 2,474 | | | | 9,197 | | | | 61 | | |
Victory RS Partners Fund
Class Y | | | 830 | | | | 14 | | | | (219 | ) | | | 68 | | | | 14 | | | | 437 | | | | 1,130 | | | | — | * | |
Victory INCORE Investment
Grade Convertible Fund
Class I | | | — | | | | 1,838 | | | | — | | | | — | | | | — | | | | 11 | | | | 1,849 | | | | 13 | | |
Victory Sophus Emerging
Markets Fund Class R6 | | | — | | | | 2,990 | | | | — | | | | — | | | | — | | | | (220 | ) | | | 2,770 | | | | — | * | |
Victory Sophus Emerging
Markets Small Cap Fund
Class Y | | | 1,916 | | | | 682 | | | | (2,579 | ) | | | (682 | ) | | | 170 | | | | 663 | | | | — | | | | 513 | | |
Victory Trivalent Emerging
Markets Small-Cap Fund
Class Y | | | 1,987 | | | | 19 | | | | (2,454 | ) | | | 281 | | | | — | | | | 167 | | | | — | | | | 19 | | |
Victory Trivalent International
Small-Cap Fund Class I | | | 1,710 | | | | 8 | | | | (78 | ) | | | 25 | | | | — | | | | 535 | | | | 2,200 | | | | 8 | | |
VictoryShares U.S. Multi-Factor
Minimum Volatility ETF | | | 1,629 | | | | 43 | | | | — | | | | — | | | | — | | | | 499 | | | | 2,171 | | | | 33 | | |
| | | $ | 24,434 | | | $ | 6,189 | | | $ | (6,104 | ) | | $ | (162 | ) | | $ | 288 | | | $ | 5,000 | | | $ | 29,357 | | | $ | 936 | | |
* Rounds to less than $1 thousand.
10. Stock Split:
Effective December 3, 2021, the NewBridge Large Cap Growth Fund underwent a 1-for-5 reverse stock split of the issued and outstanding Class C shares of the Fund. The reverse stock split was not a taxable event, nor did it have an impact on the Fund's holdings or performance. No changes are contemplated at this time for the other share classes offered by the Fund.
109
REPORT OF INDEPENDENT REGISTERED PUBLIC ACCOUNTING FIRM
To the Shareholders and Board of Trustees of Victory Portfolios
Opinion on the Financial Statements
We have audited the accompanying statements of assets and liabilities, including the schedules of portfolio investments, of Victory Portfolios comprising the funds listed below (the "Funds"), as of June 30, 2022, the related statements of operations, the statements of changes in net assets, the related notes, and the financial highlights for each of the periods indicated below (collectively referred to as the "financial statements"). In our opinion, the financial statements present fairly, in all material respects, the financial position of the Funds as of June 30, 2022, the results of their operations, the changes in net assets, and the financial highlights for each of the periods indicated below, in conformity with accounting principles generally accepted in the United States of America.
| Fund Name | | Statements of
Operations | | Statements of Changes
in Net Assets | | Financial Highlights | |
Victory Diversified Stock Fund, Victory NewBridge Large Cap Growth Fund, Victory Special Value Fund, Victory Strategic Allocation Fund, Victory INCORE Fund for Income, and Victory INCORE Investment Grade Convertible Fund | | For the eight months ended June 30, 2022, and the year ended October 31, 2021 | | For the eight months ended June 30, 2022, and the two years ended October 31, 2021, and 2020 | | For the eight months ended June 30, 2022, and the three years ended October 31, 2021, 2020, and 2019 | |
Victory THB US Small Opportunities Fund | | For the eight months ended June 30, 2022, and the year ended October 31, 2021 | |
The Funds' financial highlights for the year ended October 31, 2018 and prior, were audited by other auditors whose report dated December 21, 2018, expressed an unqualified opinion on those financial highlights for all Funds other than Victory THB US Small Opportunities Fund.
The Victory THB US Small Opportunities Fund's financial statements and financial highlights for the years ended October 31, 2020 and prior, were audited by other auditors whose report dated December 29, 2020, expressed an unqualified opinion on those financial statements and financial highlights.
Basis for Opinion
These financial statements are the responsibility of the Funds' management. Our responsibility is to express an opinion on the Funds' financial statements based on our audits. We are a public accounting firm registered with the Public Company Accounting Oversight Board (United States) ("PCAOB") and are required to be independent with respect to the Funds in accordance with the U.S. federal securities laws and the applicable rules and regulations of the Securities and Exchange Commission and the PCAOB.
We conducted our audits in accordance with the standards of the PCAOB. Those standards require that we plan and perform the audit to obtain reasonable assurance about whether the financial statements are free of material misstatement whether due to error or fraud.
110
Our audits included performing procedures to assess the risks of material misstatement of the financial statements, whether due to error or fraud, and performing procedures that respond to those risks. Such procedures included examining, on a test basis, evidence regarding the amounts and disclosures in the financial statements. Our procedures included confirmation of securities owned as of June 30, 2022, by correspondence with the custodians and brokers; when replies were not received from brokers, we performed other auditing procedures. Our audits also included evaluating the accounting principles used and significant estimates made by management, as well as evaluating the overall presentation of the financial statements. We believe that our audits provide a reasonable basis for our opinion.
We have served as the auditor of one or more investment companies advised by Victory Capital Management, Inc. since 2015.
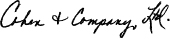
COHEN & COMPANY, LTD.
Cleveland, Ohio
August 26, 2022
111
Victory Portfolios | | Supplemental Information
June 30, 2022 | |
(Unaudited)
Trustee and Officer Information
Board of Trustees:
Overall responsibility for management of the Trust rests with the Board. The Trust is managed by the Board in accordance with the laws of the State of Delaware. There are currently nine Trustees, eight of whom are not "interested persons" of the Trust within the meaning of that term under the 1940 Act ("Independent Trustees") and one of whom is an "interested person" of the Trust within the meaning of that term under the 1940 Act ("Interested Trustee"). The Trustees, in turn, elect the officers of the Trust to actively supervise its day-to-day operations.
The following tables list the Trustees, their date of birth, their position with the Trust, their commencement of service, their principal occupations during the past five years, and any directorships of other investment companies or companies whose securities are registered under the Securities Exchange Act of 1934, as amended, or who file reports under that Act. Each Trustee oversees 40 portfolios in the Trust, six portfolios in Victory Variable Insurance Funds, and 25 portfolios in Victory Portfolios II, each a registered investment company that, together with the Trust, comprise the Victory Funds Complex. David C. Brown is a Trustee of USAA Mutual Funds and oversees 45 portfolios of the USAA Mutual Funds Trust. Each Trustee's address is c/o Victory Portfolios, 4900 Tiedeman Road, 4th Floor, Brooklyn, Ohio 44144. Each Trustee has an indefinite term.
Name and Date of Birth | | Position
Held with
the Trust | | Date
Commenced
Service | | Principal Occupation
During Past 5 Years | | Other
Directorships
Held During
Past 5 Years | |
Independent Trustees. | |
David Brooks Adcock,
Born October 1951 | | Trustee | | May 2005 | | Consultant (since 2006). | | Chair and Trustee, Turner Funds (December 2016-December 2017). | |
Nigel D. T. Andrews,
Born April 1947 | | Trustee | | August 2002 | | Retired. | | Director, Carlyle Secured Lending, Inc. (formerly TCG BDC I, Inc.) (since 2012); Director, Carlyle Credit Solutions, Inc. (formerly TCG BDC II, Inc.) (since 2017); Trustee, Carlyle Secured Lending III (since 2021). | |
E. Lee Beard,*
Born August 1951 | | Trustee | | May 2005 | | Retired. | | None. | |
Dennis M. Bushe,
Born January 1944 | | Trustee | | July 2016 | | Retired. | | None. | |
112
Victory Portfolios | | Supplemental Information — continued
June 30, 2022 | |
(Unaudited)
Name and Date of Birth | | Position
Held with
the Trust | | Date
Commenced
Service | | Principal Occupation
During Past 5 Years | | Other
Directorships
Held During
Past 5 Years | |
John L. Kelly,
Born April 1953 | | Chair and Trustee | | February 2015 | | Partner, McCarvill Capital Partners (September 2016- September 2017). | | Director, Caledonia Mining Corporation (since May 2012). | |
David L. Meyer,
Born April 1957 | | Trustee | | December 2008 | | Retired. | | None. | |
Gloria S. Nelund,
Born May 1961 | | Trustee | | July 2016 | | Chair, CEO and Co-Founder of TriLinc Global, LLC, an investment firm. | | TriLinc Global Impact Fund, LLC (since 2012). | |
Leigh A. Wilson,
Born December 1944 | | Trustee | | November 1994 | | Private Investor. | | Chair (since 2013), Caledonia Mining Corporation. | |
Interested Trustee. | |
David C. Brown,**
Born May 1972 | | Trustee | | May 2008 | | Chairman and Chief Executive Officer (since 2013), the Adviser; Chairman and Chief Executive Officer (since 2013), Victory Capital Holdings, Inc.; Chairman and Chief Executive Officer (since 2019), Victory Capital Transfer Agency, Inc. | | Trustee, USAA Mutual Funds Trust; Board Member, Victory Capital Services, Inc. | |
* The Board has designated Ms. Beard as its Audit Committee Financial Expert.
** Mr. Brown is an "Interested Person" by reason of his relationship with the Adviser.
The Statement of Additional Information includes additional information about the Trustees of the Trust and is available, without charge, by calling 800-539-3863.
113
Victory Portfolios | | Supplemental Information — continued
June 30, 2022 | |
(Unaudited)
Officers:
The officers of the Trust, their date of birth, their commencement of service, and their principal occupations during the past five years, are detailed in the following table. Each officer serves until the earlier of his or her resignation, removal, retirement, death, or the election of a successor. The mailing address of each officer of the Trust is 4900 Tiedeman Road, 4th Floor, Brooklyn, Ohio 44144. The officers of the Trust receive no compensation directly from the Trust for performing the duties of their offices.
Name and Date of Birth | | Position with
the Trust | | Date
Commenced
Service | | Principal Occupation During Past 5 Years | |
Christopher K. Dyer,
Born February 1962 | | President | | February 2006 | | Director of Mutual Fund Administration, the Adviser (since 2004); Chief Operating Officer, Victory Capital Services, Inc. (since 2020); Vice President, Victory Capital Transfer Agency, Inc. (since 2019). | |
Scott A. Stahorsky,
Born July 1969 | | Vice President | | December 2014 | | Manager, Fund Administration, the Adviser (since 2015). | |
Erin G. Wagner,
Born February 1974 | | Secretary* | | December 2014-April 2022 | | Associate General Counsel, the Adviser (2013-2022). | |
Thomas Dusenberry,
Born July 1977 | | Secretary | | May 2022 | | Manager, Fund Administration, the Adviser (since 2022); Treasurer and Principal Financial Officer (2020-2022), Assistant Treasurer (2019), Salient MF Trust, Salient Midstream, MLP Fund and Forward Funds; Principal Financial Officer (2018-2021) and Treasurer (2020-2021), Salient Private Access Funds and Endowment PMF Funds; Senior Vice President of Fund Accounting and Operations, Salient Partners (2020-2022); Director of Fund Operations, Salient Partners (2016-2019). | |
Allan Shaer,
Born March 1965 | | Treasurer | | May 2017 | | Senior Vice President, Financial Administration, Citi Fund Services Ohio, Inc. (since 2016); Vice President, Mutual Fund Administration, JP Morgan Chase (2011-2016). | |
Christopher A. Ponte,
Born March 1984 | | Assistant Treasurer | | December 2017 | | Manager, Fund Administration, the Adviser (since 2017); Senior Analyst, Fund Administration, the Adviser (prior to 2017); Chief Financial Officer, Victory Capital Services, Inc. (since 2018). | |
Colin Kinney,
Born October 1973 | | Chief Compliance Officer** | | July 2017-June 2022 | | Chief Compliance Officer (2013-2022) and Chief Risk Officer (2009-2017), the Adviser. | |
Sean Fox,
Born September 1976 | | Chief Compliance
Officer | | June 2022 | | Sr. Compliance Officer, the Adviser (since 2019); Compliance Officer, the Adviser (2015-2019). | |
Chuck Booth,
Born April 1960 | | Anti-Money Laundering Compliance Officer and Identity Theft Officer | | May 2015 | | Director, Regulatory Administration and CCO Support Services, Citi Fund Services Ohio, Inc. | |
114
Victory Portfolios | | Supplemental Information — continued
June 30, 2022 | |
(Unaudited)
Name and Date of Birth | | Position with
the Trust | | Date
Commenced
Service | | Principal Occupation During Past 5 Years | |
Jay G. Baris,
Born January 1954 | | Assistant Secretary | | December 1997 | | Partner, Sidley Austin LLP (since 2020); Partner, Shearman & Sterling LLP (2018-2020); Partner, Morrison & Foerster LLP (2011-2018). | |
* On April 27, 2022, Ms. Wagner resigned her position with the Trust.
** On June 10, 2022, Mr. Kinney resigned his position with the Trust.
115
Victory Portfolios | | Supplemental Information — continued
June 30, 2022 | |
(Unaudited)
Proxy Voting and Portfolio Holdings Information
Proxy Voting:
Information regarding the policies and procedures each Fund uses to determine how to vote proxies relating to portfolio securities is available without charge, upon request, by calling 800-539-3863. The information is also included in the Funds' Statement of Additional Information, which is available on the SEC's website at www.sec.gov.
Information relating to how the Funds voted proxies relating to portfolio securities held during the most recent 12 months ended June 30 is available on the SEC's website at www.sec.gov.
Availability of Schedules of Portfolio Investments:
The Trust files a complete list of Schedules of Portfolio Investments with the SEC for the first and third quarter of each fiscal year on Form N-PORT. Forms N-PORT are available on the SEC's website at www.sec.gov.
Expense Examples
As a shareholder of a Fund, you may incur two types of costs: (1) transaction costs, including sales charges (loads) on purchases; and (2) ongoing costs, including management fees and other Fund expenses. These examples are intended to help you understand your ongoing costs (in dollars) of investing in a Fund and to compare these costs with the ongoing costs of investing in other mutual funds.
These examples are based on an investment of $1,000 invested at the beginning of the period and held for the entire period from January 1, 2022, through June 30, 2022.
The Actual Expense figures in the table below provide information about actual account values and actual expenses. You may use the information below, together with the amount you invested, to estimate the expenses that you paid over the period. Simply divide your account value by $1,000 (for example, an $8,600 account value divided by $1,000 = 8.6), then multiply the result by the number in the table under the heading entitled "Actual Expenses Paid During Period" to estimate the expenses you paid on your account during this period.
The Hypothetical Expense figures in the table below provide information about hypothetical account values and hypothetical expenses based on the Fund's actual expense ratio and an assumed rate of return of 5% per year before expenses, which is not the Fund's actual return. The hypothetical account values and expenses may not be used to estimate the actual ending account balance or expenses you paid for the period. You may use this information to compare this 5% hypothetical example with the 5% hypothetical examples that appear in shareholder reports of other funds.
Please note the expenses shown in the table below are meant to highlight your ongoing costs only and do not reflect any transactional costs. Therefore, the hypothetical expenses in the table are useful in comparing ongoing costs only and will not help you determine the relative total costs of owning different funds. In addition, if these transactional costs were included, your costs would have been higher.
116
Victory Portfolios | | Supplemental Information — continued
June 30, 2022 | |
(Unaudited)
| | | Beginning
Account
Value
1/1/22 | | Actual
Ending
Account
Value
6/30/22 | | Hypothetical
Ending
Account
Value
6/30/22 | | Actual
Expenses
Paid
During
Period
1/1/22-
6/30/22* | | Hypothetical
Expenses
Paid
During
Period
1/1/22-
6/30/22* | | Annualized
Expense
Ratio
During
Period
1/1/22-
6/30/22 | |
Diversified Stock Fund | |
Class A | | $ | 1,000.00 | | | $ | 782.80 | | | $ | 1,019.44 | | | $ | 4.77 | | | $ | 5.41 | | | | 1.08 | % | |
Class C | | | 1,000.00 | | | | 779.00 | | | | 1,014.78 | | | | 8.91 | | | | 10.09 | | | | 2.02 | % | |
Class I | | | 1,000.00 | | | | 783.70 | | | | 1,020.68 | | | | 3.67 | | | | 4.16 | | | | 0.83 | % | |
Class R | | | 1,000.00 | | | | 781.60 | | | | 1,018.00 | | | | 6.05 | | | | 6.85 | | | | 1.37 | % | |
Class R6 | | | 1,000.00 | | | | 783.70 | | | | 1,020.93 | | | | 3.45 | | | | 3.91 | | | | 0.78 | % | |
Class Y | | | 1,000.00 | | | | 783.60 | | | | 1,020.53 | | | | 3.80 | | | | 4.31 | | | | 0.86 | % | |
NewBridge Large Cap Growth Fund | |
Class A | | $ | 1,000.00 | | | $ | 629.10 | | | $ | 1,018.05 | | | $ | 5.49 | | | $ | 6.80 | | | | 1.36 | % | |
Class C | | | 1,000.00 | | | | 626.80 | | | | 1,014.38 | | | | 8.47 | | | | 10.49 | | | | 2.10 | % | |
Class I | | | 1,000.00 | | | | 630.10 | | | | 1,020.08 | | | | 3.84 | | | | 4.76 | | | | 0.95 | % | |
Class Y | | | 1,000.00 | | | | 630.30 | | | | 1,019.74 | | | | 4.12 | | | | 5.11 | | | | 1.02 | % | |
Special Value Fund | |
Class A | | $ | 1,000.00 | | | $ | 784.80 | | | $ | 1,018.35 | | | $ | 5.75 | | | $ | 6.51 | | | | 1.30 | % | |
Class C | | | 1,000.00 | | | | 781.80 | | | | 1,014.38 | | | | 9.28 | | | | 10.49 | | | | 2.10 | % | |
Class I | | | 1,000.00 | | | | 785.50 | | | | 1,019.59 | | | | 4.65 | | | | 5.26 | | | | 1.05 | % | |
Class R | | | 1,000.00 | | | | 783.10 | | | | 1,016.71 | | | | 7.21 | | | | 8.15 | | | | 1.63 | % | |
Class Y | | | 1,000.00 | | | | 786.00 | | | | 1,019.84 | | | | 4.43 | | | | 5.01 | | | | 1.00 | % | |
THB US Small Opportunities Fund | |
Class A | | $ | 1,000.00 | | | $ | 762.70 | | | $ | 1,016.36 | | | $ | 7.43 | | | $ | 8.50 | | | | 1.70 | % | |
Class I | | | 1,000.00 | | | | 764.40 | | | | 1,018.60 | | | | 5.47 | | | | 6.26 | | | | 1.25 | % | |
Strategic Allocation Fund | |
Class A | | $ | 1,000.00 | | | $ | 864.40 | | | $ | 1,022.81 | | | $ | 1.85 | | | $ | 2.01 | | | | 0.40 | % | |
Class C | | | 1,000.00 | | | | 860.90 | | | | 1,019.09 | | | | 5.31 | | | | 5.76 | | | | 1.15 | % | |
Class I | | | 1,000.00 | | | | 865.20 | | | | 1,024.05 | | | | 0.69 | | | | 0.75 | | | | 0.15 | % | |
Class R | | | 1,000.00 | | | | 863.00 | | | | 1,021.57 | | | | 3.00 | | | | 3.26 | | | | 0.65 | % | |
INCORE Fund For Income | |
Class A | | $ | 1,000.00 | | | $ | 961.10 | | | $ | 1,020.28 | | | $ | 4.42 | | | $ | 4.56 | | | | 0.91 | % | |
Class C | | | 1,000.00 | | | | 955.90 | | | | 1,016.31 | | | | 8.29 | | | | 8.55 | | | | 1.71 | % | |
Class I | | | 1,000.00 | | | | 961.00 | | | | 1,021.62 | | | | 3.11 | | | | 3.21 | | | | 0.64 | % | |
Class R | | | 1,000.00 | | | | 961.20 | | | | 1,020.28 | | | | 4.43 | | | | 4.56 | | | | 0.91 | % | |
Class R6 | | | 1,000.00 | | | | 961.00 | | | | 1,021.67 | | | | 3.06 | | | | 3.16 | | | | 0.63 | % | |
Class Y | | | 1,000.00 | | | | 961.00 | | | | 1,021.57 | | | | 3.16 | | | | 3.26 | | | | 0.65 | % | |
Member Class | | | 1,000.00 | | | | 960.70 | | | | 1,021.08 | | | | 3.65 | | | | 3.76 | | | | 0.75 | % | |
INCORE Investment Grade Convertible Fund | |
Class A | | $ | 1,000.00 | | | $ | 886.80 | | | $ | 1,018.89 | | | $ | 5.57 | | | $ | 5.96 | | | | 1.19 | % | |
Class I | | | 1,000.00 | | | | 887.90 | | | | 1,020.23 | | | | 4.31 | | | | 4.61 | | | | 0.92 | % | |
Member Class | | | 1,000.00 | | | | 887.00 | | | | 1,019.34 | | | | 5.15 | | | | 5.51 | | | | 1.10 | % | |
* Expenses are equal to the average account value multiplied by the Fund's annualized expense ratio multiplied by 181/365 (the number of days in the most recent fiscal half-year divided by the number of days in the fiscal year).
117
Victory Portfolios | | Supplemental Information — continued
June 30, 2022 | |
(Unaudited)
Additional Federal Income Tax Information
For the eight months ended June 30, 2022, the following Funds paid qualified dividend income for the purposes of reduced individual federal income tax rates of:
| | | Percent | |
Diversified Stock Fund | | | 26 | % | |
Special Value Fund | | | 20 | % | |
THB US Small Opportunities Fund | | | 12 | % | |
Strategic Allocation Fund | | | 47 | % | |
INCORE Investment Grade Convertible Fund | | | 15 | % | |
Dividends qualified for corporate dividends received deductions of:
| | | Percent | |
Diversified Stock Fund | | | 26 | % | |
Special Value Fund | | | 20 | % | |
THB US Small Opportunities Fund | | | 13 | % | |
Strategic Allocation Fund | | | 18 | % | |
INCORE Investment Grade Convertible Fund | | | 12 | % | |
For the eight months ended June 30, 2022, the following Funds designated short-term capital gain distributions (in thousands):
| | | Amount | |
Diversified Stock Fund | | $ | 12,564 | | |
Special Value Fund | | | 2,143 | | |
THB US Small Opportunities Fund | | | 3,014 | | |
INCORE Investment Grade Convertible Fund | | | 1,133 | | |
For the eight months ended June 30, 2022, the following Funds designated long-term capital gain distributions (in thousands):
| | | Amount | |
Diversified Stock Fund | | $ | 33,954 | | |
NewBridge Large Cap Growth Fund | | | 4,055 | | |
Special Value Fund | | | 6,247 | | |
THB US Small Opportunities Fund | | | 5,062 | | |
Strategic Allocation Fund | | | 6 | | |
INCORE Investment Grade Convertible Fund | | | 6,429 | | |
The following Fund intends to elect to pass through to shareholders the income tax credit for taxes paid to foreign countries. Foreign source income and foreign tax expense per outstanding share on June 30, 2022, were as follows:
| | | Foreign
Source
Income | | Foreign
Tax
Expense | |
Strategic Allocation Fund | | $ | 0.02 | | | $ | 0.03 | | |
118
Privacy Policy
Protecting the Privacy of Information
The Trust respects your right to privacy. We also know that you expect us to conduct and process your business in an accurate and efficient manner. To do so, we must collect and maintain certain personal information about you. This is the information we collect from you on applications or other forms, and from the transactions you make with us or third parties. It may include your name, address, social security number, account transactions and balances, and information about investment goals and risk tolerance.
We do not disclose any information about you or about former customers to anyone except as permitted or required by law. Specifically, we may disclose the information we collect to companies that perform services on our behalf, such as the transfer agent that processes shareholder accounts and printers and mailers that assist us in the distribution of investor materials. We may also disclose this information to companies that perform marketing services on our behalf. This allows us to continue to offer you Victory investment products and services that meet your investing needs, and to effect transactions that you request or authorize. These companies will use this information only in connection with the services for which we hired them. They are not permitted to use or share this information for any other purpose.
To protect your personal information internally, we permit access only by authorized employees and maintain physical, electronic, and procedural safeguards to guard your personal information.*
* You may have received communications regarding information about privacy policies from other financial institutions which gave you the opportunity to "opt-out" of certain information sharing with companies which are not affiliated with that financial institution. The Trust does not share information with other companies for purposes of marketing solicitations for products other than the Trust. Therefore, the Trust does not provide opt-out options to their shareholders.
Victory Funds
P.O. Box 182593
Columbus, Ohio 43218-2593

Visit our website at: | | Call Victory at: | |
www.vcm.com | | 800-539-FUND (800-539-3863) | |
| | | 800-235-8396 for Member Class | |

June 30, 2022
Annual Report
Victory Sycamore Established Value Fund
Victory Sycamore Small Company Opportunity Fund
www.vcm.com
News, Information And Education 24 Hours A Day, 7 Days A Week
The Victory Capital website gives fund shareholders, prospective shareholders, and investment professionals a convenient way to access fund information, get guidance, and track fund performance anywhere they can access the Internet. The site includes:
• Detailed performance records
• Daily share prices
• The latest fund news
• Investment resources to help you become a better investor
• A section dedicated to investment professionals
Whether you're a potential investor searching for the fund that matches your investment philosophy, a seasoned investor interested in planning tools, or an investment professional, www.vcm.com has what you seek. Visit us anytime. We're always open.
TABLE OF CONTENTS
Shareholder Letter (Unaudited) | | | 3 | | |
Managers' Commentary / Investment
Overview (Unaudited) | | | 5 | | |
Investment Objective and Portfolio
Holdings (Unaudited) | | | 7 | | |
Schedules of Portfolio Investments | |
Victory Sycamore Established Value Fund | | | 13 | | |
Victory Sycamore Small Company Opportunity Fund | | | 16 | | |
Financial Statements | |
Statements of Assets and Liabilities | | | 20 | | |
Statements of Operations | | | 22 | | |
Statements of Changes in Net Assets | | | 23 | | |
Financial Highlights | | | 26 | | |
Notes to Financial Statements | | | 34 | | |
Report of Independent Registered Public
Accounting Firm | | | 45 | | |
Supplemental Information (Unaudited) | | | 47 | | |
Trustee and Officer Information | | | 47 | | |
Proxy Voting and Portfolio Holdings Information | | | 51 | | |
Expense Examples | | | 51 | | |
Additional Federal Income Tax Information | | | 53 | | |
Privacy Policy (inside back cover) | | | |
1
IRA DISTRIBUTION WITHHOLDING DISCLOSURE
We generally must withhold federal income tax at a rate of 10% of the taxable portion of your distribution and, if you live in a state that requires state income tax withholding, at your state's tax rate. However, you may elect not to have withholding apply or to have income tax withheld at a higher rate. Any withholding election that you make will apply to any subsequent distribution unless and until you change or revoke the election. If you wish to make a withholding election, or change or revoke a prior withholding election, call 800-539-3863 and form W-4P (OMB No. 1545-0074 withholding certificate for pension or annuity payments) will be electronically sent.
If you do not have a withholding election in place by the date of a distribution, federal income tax will be withheld from the taxable portion of your distribution at a rate of 10%. If you must pay estimated taxes, you may be subject to estimated tax penalties if your estimated tax payments are not sufficient and sufficient tax is not withheld from your distribution.
For more specific information, please consult your tax adviser.
The Funds are distributed by Victory Capital Services, Inc. Victory Capital Management Inc. is the investment adviser to the Funds and receives fees from the Funds for performing services for the Funds.
This report is not authorized for distribution to prospective investors unless preceded or accompanied by a current prospectus of the Victory Funds.
For additional information about any Victory Fund, including fees, expenses, and risks, view our prospectus online at vcm.com or call 800-539-3863. Read it carefully before you invest or send money.
The information in this annual report is based on data obtained from recognized services and sources and is believed to be reliable. Any opinions, projections, or recommendations in this report are subject to change without notice and are not intended as individual investment advice. Past investment performance of the Funds, markets or securities mentioned herein should not be considered to be indicative of future results.
• NOT FDIC INSURED • NO BANK GUARANTEE • MAY LOSE VALUE

Call Victory at:
800-539-FUND (800-539-3863)
Visit our website at:
www.vcm.com
2
Victory Funds Letter to Shareholders
(Unaudited)
Dear Shareholder,
If you are reading this letter but double-checking your calendar, be assured there's no mistake. The annual reporting period for the Victory Funds contained in this report has changed from a fiscal year ended October 31st to a fiscal year ended June 30th. This change has no material impact on any of your investments. This change aims to help us improve efficiencies and reduce auditing and other operational costs. Therefore, this letter covers an abbreviated eight-month "annual" period from November 1, 2021, through June 30, 2022. Future shareholder letters will now be on a June 30th fiscal year cycle going forward.
With that said, looking back on our most recent reporting period offers us a stark reminder that financial markets are dynamic, and that investor sentiment can shift quickly.
After a mostly constructive 2021, the script flipped as we entered the new calendar year, and investors were suddenly more focused on a host of challenges. Inflation data has been running hotter than expected. The U.S. Federal Reserve (the "Fed") has embarked on a new rate-hike cycle and a terrible war began in Eastern Europe. All these issues, among other factors, have ratcheted up market volatility in both stock and bond markets. Many broad-market stock indices have pulled back substantially during the first half of 2022 and even entered "bear market" territory, which is typically considered a 20% pullback from the most recent highs. Meanwhile, fixed income investors are also dealing with elevated volatility, and wide swaths of the bond market have struggled in the face of rising interest rates.
Throughout the ups and downs of the past reporting period, there have been interesting differences playing out within the broader market. In general, large-cap stocks outperformed smaller-capitalization companies, while value-oriented investments fared better than their growth counterparts (generally speaking, as measured by the Russell family of indices). Perhaps this reflects investors' realization and expectations for future higher interest rates and corresponding higher borrowing costs.
There were other notable subplots, too. Crypto assets, which had captivated investors for a spell, reversed course as sentiment soured and investors became more risk averse. We've also seen oil prices surge, which in turn helped fuel gains across the energy landscape. In fact, the Energy and Utilities sectors (and yes, Cash) have been some of the lone bright spots for many investor portfolios in recent months.
Looking at the numbers, the S&P 500® Index, the bell-weather proxy for our domestic stock market, declined by 16.95% for the eight-month period ended June 30, 2022. Over this same time frame, the yield on the 10-Year U.S. Treasury jumped 1.43%, thanks largely to the Fed's shift toward a less accommodative monetary policy and several aggressive rate hikes. At the end of our reporting period, the yield on the 10-Year U.S. Treasury finished at 2.98%.
Given the market environment of the past few months, it's no surprise that investors have become more focused on risk management and downside protection. Remember,
3
our experience managing portfolios through various economic cycles has taught us to remain calm in the face of market turmoil. It is our view that a long-term perspective, a well-diversified portfolio across asset classes and investment types, and a clear understanding of individual risk tolerances are some of the key ingredients for staying the course and progressing on investment goals.
Although we cannot tell you with any certainty what markets will do in the future, we can assure you that the investment professionals at all our independent franchises continually monitor the environment and work hard to position portfolios opportunistically no matter what the markets bring.
On the following pages you will find information relating to your Victory Funds investment. If you have any questions regarding the current market dynamics or your specific portfolio or investment plan, we encourage you to contact your financial advisor. If you invest with us directly, you may call 800-539-3863 or visit our website at www.vcm.com.
From all of us here at Victory Capital, thank you for letting us help you work toward your investment goals.

Christopher K. Dyer, CFA
President,
Victory Funds
4
Victory Sycamore Established Value Fund
Managers' Commentary
(Unaudited)
What were the market conditions during the reporting period?
The underlying concerns plaguing the economic backdrop became more prevalent in late 2021. Supply chain issues, which resulted in wide-spread shortages, exerted an upward pressure on the price of goods. The rapid spread of the COVID-19 Omicron variant exacerbated the supply chain challenges given China's zero-tolerance approach to the pandemic and more restrictions in the United States. In early 2022, the U.S. Federal Reserve's (the "Fed") messaging that inflation was transitory began to unravel as monthly inflation prints pointed to the highest figures in decades. Russia's invasion of Ukraine in late February, which resulted in a global oil shock, also fueled inflation higher. With inflation proving to be less fleeting than originally anticipated, the Fed moved to aggressively hike rates and tighten financial conditions. Consequently, recession fears have intensified given the Fed's path to a soft landing has narrowed.
The equity market selloff during the first half of 2022 and elevated recession fears are undoubtably unsettling for many market participants. However, it is worth reflecting over the past two years and acknowledging how the unprecedented level of liquidity injected into the economy impacted equity market returns. The market recovered much faster from the pandemic-induced market bottom relative to past drawdowns. While it was necessary for Fed officials to intervene at the onset of the pandemic to stabilize the economy, it is also important to recognize that there were unintended consequences as a result of the historic level of liquidity that was ultimately released into the system. Persistent inflation is a key consequence which the Fed admittedly underestimated, and it was further exacerbated by an accommodative fiscal policy response. Arguably, the "sticky" inflation has multiple root causes that cannot entirely be addressed with monetary policy (e.g., supply chain challenges and geopolitical risks). Nevertheless, the Fed is at a point where it has few avenues — even if it risks a recession — to tame decades-high inflation.
With recession fears elevated, the key question is whether the Fed will once again come to the rescue. After all, that has been the pattern since the global financial crisis of 2008. However, the recent selloff may suggest that the market is convinced that a Fed pivot is not in the playbook unless inflation moderates. Until there is further evidence that inflation is under control and recession fears are receding, equity market volatility is likely to remain elevated.
How did Victory Sycamore Established Value Fund (the "Fund") perform during the reporting period?
The Fund returned -7.99% (Class A at net asset value) for the eight-month period ended June 30, 2022, outperforming the Russell Midcap® Value Index (the "Index"), which returned -13.67% for the period.
What strategies did you employ during the reporting period?
The investment team employs a disciplined, bottom-up, fundamental process to invest in better businesses that trade at a discount to the team's estimate of intrinsic value and possess fundamental drivers that will narrow the valuation gap. By investing in businesses that exhibit these attributes, we seek to minimize downside risk without sacrificing the upside potential.
5
Victory Sycamore Established Value Fund
Managers' Commentary (continued)
During the eight-month period, both stock selection and sector allocation were favorable, with stock selection having a larger impact on relative outperformance. Sector weighting is a by-product of the bottom-up security selection process and not a result of top-down tactical decisions. Index returns were negative across eight of the 11 major economic sectors and varied widely, with five sectors outpacing the broader Russell 2000® Index. Energy was the top-performing sector, posting a return of 27.13%. By contrast, Communication Services was the worst-performing sector for the period, returning -29.40%.
Specifically, for the Fund, stock selection in the Financials sector was the largest contributor to relative outperformance. Stock selection in the Materials, Information Technology, Consumer Staples, and Energy sectors also contributed to relative return for the period. An underweight in the Communication Services sector — the worst-performing sector — as well as an overweight in the Consumer Staples and Materials sectors were also favorable. Additionally, the Fund's cash position during the period augmented performance. Conversely, an underweight in the Utilities sector, as well as an overweight in the Industrials sector, detracted from the Fund's relative performance for the period.
6
Victory Sycamore Established Value Fund
Investment Overview
(Unaudited)
Average Annual Total Return
Year Ended June 30, 2022
| | | Class A | | Class C | | Class I | | Class R | | Class R6 | | Class Y | | | |
INCEPTION DATE | | 5/5/20 | | 3/1/16 | | 3/1/10 | | 8/16/83 | | 3/4/14 | | 1/28/13 | | | |
| | | Net Asset
Value | | Maximum
Offering
Price | | Net Asset
Value | | Contingent
Deferred
Charges | | Net Asset
Value | | Net Asset
Value | | Net Asset
Value | | Net Asset
Value | | Russell
Midcap®
Value Index1 | |
One Year | | | –4.51 | % | | | –10.00 | % | | | –5.22 | % | | | –6.10 | % | | | –4.21 | % | | | –4.71 | % | | | –4.16 | % | | | –4.24 | % | | | –10.00 | % | |
Five Year | | | 9.82 | % | | | 8.52 | % | | | 8.98 | % | | | 8.98 | % | | | 10.16 | % | | | 9.60 | % | | | 10.21 | % | | | 10.14 | % | | | 6.27 | % | |
Ten Year | | | 12.59 | % | | | 11.93 | % | | | N/A | | | | N/A | | | | 12.96 | % | | | 12.37 | % | | | N/A | | | | N/A | | | | 10.62 | % | |
Since Inception | | | N/A | | | | N/A | | | | 11.55 | % | | | 11.55 | % | | | N/A | | | | N/A | | | | 10.73 | % | | | 12.12 | % | | | N/A | | |
The performance data quoted represents past performance and current returns may be lower or higher. The investment return and principal value will fluctuate so that an investor's shares, when redeemed, may be worth more or less than the original cost. To obtain performance information current to the most recent month's end, please visit www.vcm.com. | |
The maximum offering price ("MOP") figures reflect a maximum sales charge of 5.75% for Class A. Class C is not subject to an initial sales charge, but is subject to a deferred sales charge of 1.00% on shares redeemed within one year of purchase. Net Asset Value does not reflect sales charges.
Total return measures the price change in a share assuming the reinvestment of all net investment income and realized capital gain distributions, if any. The total returns quoted do not reflect adjustments made to the enclosed financial statements in accordance with U.S. Generally Accepted Accounting Principles or the deduction of taxes that a shareholder would pay on net investment income and realized capital gain distributions, including reinvested distributions, or redemptions of shares. The total return figures set forth above include all waivers of fees. Without such fee waivers, the total returns would have been lower.
Victory Sycamore Established Value Fund — Growth of $10,000
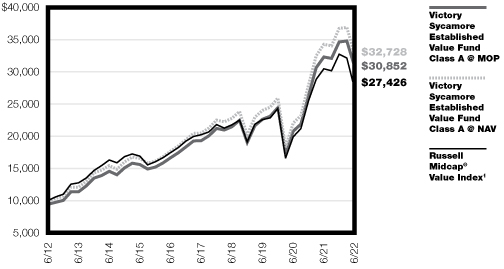
1The Russell Midcap® Value Index is an unmanaged Index that measures the performance of the mid-cap value segment of the U.S. equity universe. It includes those Russell Midcap® Index companies with relatively lower price-to-book ratios and lower forecasted growth values. This Index does not include the effect of sales charges, commissions, expenses or taxes, is not representative of the Fund and it is not possible to invest directly in an index.
The graph reflects investment of growth of a hypothetical $10,000 investment in the Fund.
The graph and table do not reflect the deduction of taxes that a shareholder would pay on Fund distributions or the redemption of shares.
Past performance is not indicative of future results.
7
Victory Sycamore Small Company Opportunity Fund
Managers' Commentary
(Unaudited)
What were the market conditions during the reporting period?
The underlying concerns plaguing the economic backdrop became more prevalent in late 2021. Supply chain issues, which resulted in wide-spread shortages, exerted an upward pressure on the price of goods. The rapid spread of the COVID-19 Omicron variant exacerbated the supply chain challenges given China's zero-tolerance approach to the pandemic and more restrictions in the United States. In early 2022, the U.S. Federal Reserve's (the "Fed") messaging that inflation was transitory began to unravel as monthly inflation prints pointed to the highest figures in decades. Russia's invasion of Ukraine in late February, which resulted in a global oil shock, also fueled inflation higher. With inflation proving to be less fleeting than originally anticipated, the Fed moved to aggressively hike rates and tighten financial conditions. Consequently, recession fears have intensified given the Fed's path to a soft landing has narrowed.
The equity market selloff during the first half of 2022 and elevated recession fears are undoubtably unsettling for many market participants. However, it is worth reflecting over the past two years and acknowledging how the unprecedented level of liquidity injected into the economy impacted equity market returns. The market recovered much faster from the pandemic-induced market bottom relative to past drawdowns. While it was necessary for Fed officials to intervene at the onset of the pandemic to stabilize the economy, it is also important to recognize that there were unintended consequences as a result of the historic level of liquidity that was ultimately released into the system. Persistent inflation is a key consequence which the Fed admittedly underestimated, and it was further exacerbated by an accommodative fiscal policy response. Arguably, the "sticky" inflation has multiple root causes that cannot entirely be addressed with monetary policy (e.g., supply chain challenges and geopolitical risks). Nevertheless, the Fed is at a point where it has few avenues — even if it risks a recession — to tame decades-high inflation.
With recession fears elevated, the key question is whether the Fed will once again come to the rescue. After all, that has been the pattern since the global financial crisis of 2008. However, the recent selloff may suggest that the market is convinced that a Fed pivot is not in the playbook unless inflation moderates. Until there is further evidence that inflation is under control and recession fears are receding, equity market volatility is likely to remain elevated.
How did Victory Sycamore Small Company Opportunity Fund (the "Fund") perform during the reporting period?
The Fund returned -10.95% (Class A at net asset value) for the eight-month period ended June 30, 2022, outperforming the Russell 2000® Value Index (the "Index"), which returned -16.88% for the period.
What strategies did you employ during the reporting period?
The investment team employs a disciplined, bottom-up, fundamental process to invest in better businesses that trade at a discount to the team's estimate of intrinsic value and possess fundamental drivers that will narrow the valuation gap. By investing in businesses that exhibit these attributes, we seek to minimize downside risk without sacrificing the upside potential.
8
Victory Sycamore Small Company Opportunity Fund
Managers' Commentary (continued)
During the eight-month period, both stock selection and sector allocation were favorable, with stock selection having a larger impact on relative outperformance. Sector weighting is a by-product of the bottom-up security selection process and not a result of top-down tactical decisions. Index returns were negative across eight of the 11 major economic sectors and varied widely, with five sectors outpacing the broader Russell 2000® Value Index. Energy was the top-performing sector, posting a return of 11.11%. By contrast, Communication Services was the worst-performing sector and significantly lagged the Index, returning -38.20%.
Specifically, for the Fund, stock selection in the Consumer Discretionary, Materials, Financials, Information Technology, Real Estate, Health Care, and Industrials sectors contributed to relative outperformance. However, an overweight in the Information Technology sector partially offset the favorable impact of selection in the sector. An underweight in the two worst-performing sectors, Health Care and Communication Services, also contributed to relative return. Additionally, the Fund's cash position during the period was favorable. Conversely, an underweight in the two top-performing sectors, Energy and Utilities, detracted from relative return for the period. Stock selection in the Consumer Staples sector was also unfavorable; however, an overweight in the sector partially offset the impact from stock selection.
9
Victory Sycamore Small Company Opportunity Fund
Investment Overview
(Unaudited)
Average Annual Total Return
Year Ended June 30, 2022
| | | Class A | | Class I | | Class R | | Class R6 | | Class Y | | | |
INCEPTION DATE | | 3/26/99 | | 8/31/07 | | 8/16/83 | | 12/14/15 | | 1/28/13 | | | |
| | | Net Asset
Value | | Maximum
Offering
Price | | Net Asset
Value | | Net Asset
Value | | Net Asset
Value | | Net Asset
Value | | Russell 2000®
Value Index1 | |
One Year | | | –9.11 | % | | | –14.33 | % | | | –8.78 | % | | | –9.25 | % | | | –8.73 | % | | | –8.81 | % | | | –16.28 | % | |
Five Year | | | 7.45 | % | | | 6.19 | % | | | 7.82 | % | | | 7.25 | % | | | 7.86 | % | | | 7.68 | % | | | 4.89 | % | |
Ten Year | | | 10.86 | % | | | 10.21 | % | | | 11.23 | % | | | 10.63 | % | | | N/A | | | | N/A | | | | 9.05 | % | |
Since Inception | | | N/A | | | | N/A | | | | N/A | | | | N/A | | | | 10.64 | % | | | 10.29 | % | | | N/A | | |
The performance data quoted represents past performance and current returns may be lower or higher. The investment return and principal value will fluctuate so that an investor's shares, when redeemed, may be worth more or less than the original cost. To obtain performance information current to the most recent month's end, please visit www.vcm.com.
The maximum offering price ("MOP") figures reflect a maximum sales charge of 5.75% for Class A. Net Asset Value does not reflect sales charges.
Total return measures the price change in a share assuming the reinvestment of all net investment income and realized capital gain distributions, if any. The total returns quoted do not reflect adjustments made to the enclosed financial statements in accordance with U.S. Generally Accepted Accounting Principles or the deduction of taxes that a shareholder would pay on net investment income and realized capital gain distributions, including reinvested distributions, or redemptions of shares. The total return figures set forth above include all waivers of fees. Without such fee waivers, the total returns would have been lower.
Victory Sycamore Small Company Opportunity Fund — Growth of $10,000
1The Russell 2000® Value Index is an unmanaged index that measures the performance of those Russell 2000® companies with lower price-to-book ratios and lower forecasted growth values. This index does not include the effect of sales charges, commissions, expenses, or taxes, is not representative of the Fund, and it is not possible to invest directly in an index.
The graph reflects investment of growth of a hypothetical $10,000 investment in the Fund.
The graph and table do not reflect the deduction of taxes that a shareholder would pay on Fund distributions or the redemption of shares.
Past performance is not indicative of future results.
10
Victory Portfolios
Victory Sycamore Established Value Fund | | June 30, 2022 | |
(Unaudited)
Investment Objective and Portfolio Holdings:
The Fund seeks to provide long-term capital growth by investing primarily in common stocks.
Top 10 Holdings*:
June 30, 2022
(% of Net Assets)
Alleghany Corp. | | | 2.7 | % | |
Sysco Corp. | | | 2.5 | % | |
Xcel Energy, Inc. | | | 1.8 | % | |
Alliant Energy Corp. | | | 1.8 | % | |
Quest Diagnostics, Inc. | | | 1.8 | % | |
The Progressive Corp. | | | 1.8 | % | |
Tyson Foods, Inc., Class A | | | 1.7 | % | |
American Financial Group, Inc. | | | 1.7 | % | |
Zions Bancorp NA | | | 1.7 | % | |
Genpact Ltd. | | | 1.7 | % | |
Sector Allocation*:
June 30, 2022
(% of Net Assets)
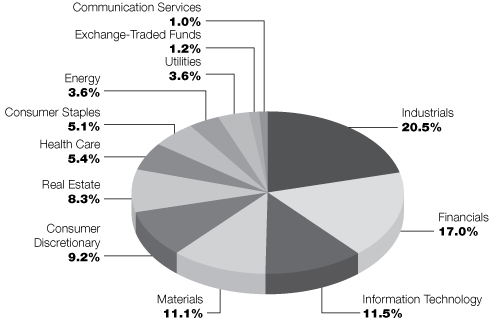
* Does not include futures contracts, money market instruments, and short-term investments purchased with cash collateral from securities loaned.
Percentages are of the net assets of the Fund and may not equal 100%.
Refer to the Schedule of Portfolio Investments for a complete list of securities.
11
Victory Portfolios
Victory Sycamore Small Company Opportunity Fund | | June 30, 2022 | |
(Unaudited)
Investment Objective and Portfolio Holdings:
The Fund seeks to provide capital appreciation.
Top 10 Holdings*:
June 30, 2022
(% of Net Assets)
Independent Bank Corp. | | | 1.8 | % | |
SouthState Corp. | | | 1.7 | % | |
UMB Financial Corp. | | | 1.6 | % | |
Bank of Hawaii Corp. | | | 1.6 | % | |
EMCOR Group, Inc. | | | 1.5 | % | |
Applied Industrial Technologies, Inc. | | | 1.5 | % | |
PDC Energy, Inc. | | | 1.4 | % | |
Performance Food Group Co. | | | 1.4 | % | |
Corporate Office Properties Trust | | | 1.4 | % | |
Werner Enterprises, Inc. | | | 1.4 | % | |
Sector Allocation*:
June 30, 2022
(% of Net Assets)
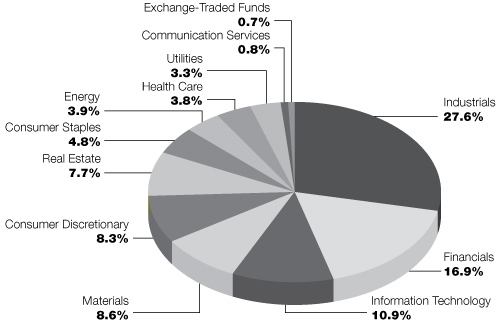
* Does not include futures contracts, money market instruments, and short-term investments purchased with cash collateral from securities loaned.
Percentages are of the net assets of the Fund and may not equal 100%.
Refer to the Schedule of Portfolio Investments for a complete list of securities.
12
Victory Portfolios
Victory Sycamore Established Value Fund | | Schedule of Portfolio Investments
June 30, 2022 | |
(Amounts in Thousands, Except for Shares)
Security Description | | Shares | | Value | |
Common Stocks (96.3%) | |
Communication Services (1.0%): | |
Live Nation Entertainment, Inc. (a) | | | 1,840,000 | | | $ | 151,947 | | |
Consumer Discretionary (9.2%): | |
Aptiv PLC (a) | | | 1,695,000 | | | | 150,974 | | |
BorgWarner, Inc. | | | 7,115,000 | | | | 237,428 | | |
Hilton Worldwide Holdings, Inc. | | | 1,658,600 | | | | 184,834 | | |
Newell Brands, Inc. | | | 9,847,200 | | | | 187,491 | | |
Ross Stores, Inc. | | | 3,153,000 | | | | 221,435 | | |
VF Corp. | | | 3,485,000 | | | | 153,932 | | |
Yum! Brands, Inc. | | | 2,210,000 | | | | 250,857 | | |
| | | | 1,386,951 | | |
Consumer Staples (5.1%): | |
Archer-Daniels-Midland Co. | | | 1,850,000 | | | | 143,560 | | |
Sysco Corp. | | | 4,407,000 | | | | 373,317 | | |
Tyson Foods, Inc., Class A | | | 3,037,600 | | | | 261,416 | | |
| | | | 778,293 | | |
Energy (3.6%): | |
Coterra Energy, Inc. | | | 8,942,400 | | | | 230,624 | | |
Devon Energy Corp. | | | 3,250,000 | | | | 179,108 | | |
Valero Energy Corp. | | | 1,295,000 | | | | 137,633 | | |
| | | | 547,365 | | |
Financials (17.0%): | |
Alleghany Corp. (a) | | | 494,000 | | | | 411,551 | | |
American Financial Group, Inc. | | | 1,880,000 | | | | 260,963 | | |
Everest Re Group Ltd. | | | 615,000 | | | | 172,372 | | |
Huntington Bancshares, Inc. | | | 12,400,000 | | | | 149,172 | | |
Old Republic International Corp. | | | 7,666,600 | | | | 171,425 | | |
Prosperity Bancshares, Inc. | | | 3,095,000 | | | | 211,296 | | |
The Allstate Corp. | | | 1,336,200 | | | | 169,336 | | |
The Bank of New York Mellon Corp. | | | 5,735,000 | | | | 239,207 | | |
The Progressive Corp. | | | 2,301,700 | | | | 267,619 | | |
W.R. Berkley Corp. | | | 3,670,000 | | | | 250,514 | | |
Zions Bancorp NA | | | 5,100,000 | | | | 259,590 | | |
| | | | 2,563,045 | | |
Health Care (5.4%): | |
Hologic, Inc. (a) | | | 2,455,500 | | | | 170,166 | | |
Molina Healthcare, Inc. (a) | | | 561,900 | | | | 157,113 | | |
Quest Diagnostics, Inc. | | | 2,015,000 | | | | 267,955 | | |
The Cooper Cos., Inc. | | | 720,000 | | | | 225,446 | | |
| | | | 820,680 | | |
Industrials (20.5%): | |
AGCO Corp. | | | 1,860,000 | | | | 183,582 | | |
Alaska Air Group, Inc. (a) | | | 4,370,000 | | | | 175,019 | | |
See notes to financial statements.
13
Victory Portfolios
Victory Sycamore Established Value Fund | | Schedule of Portfolio Investments — continued
June 30, 2022 | |
(Amounts in Thousands, Except for Shares)
Security Description | | Shares | | Value | |
Hubbell, Inc. | | | 1,400,000 | | | $ | 250,012 | | |
J.B. Hunt Transport Services, Inc. | | | 845,000 | | | | 133,062 | | |
Landstar System, Inc. | | | 1,130,000 | | | | 164,325 | | |
Leidos Holdings, Inc. | | | 2,450,000 | | | | 246,739 | | |
Lincoln Electric Holdings, Inc. | | | 1,230,000 | | | | 151,733 | | |
ManpowerGroup, Inc. | | | 1,730,000 | | | | 132,189 | | |
Oshkosh Corp. | | | 1,910,000 | | | | 156,887 | | |
Owens Corning | | | 1,845,000 | | | | 137,102 | | |
Parker-Hannifin Corp. | | | 903,600 | | | | 222,331 | | |
Republic Services, Inc. | | | 1,195,000 | | | | 156,390 | | |
Textron, Inc. | | | 4,120,000 | | | | 251,608 | | |
The Middleby Corp. (a) | | | 1,695,000 | | | | 212,485 | | |
The Toro Co. | | | 3,055,000 | | | | 231,538 | | |
United Rentals, Inc. (a) | | | 560,000 | | | | 136,030 | | |
Xylem, Inc. | | | 1,963,900 | | | | 153,538 | | |
| | | | 3,094,570 | | |
Information Technology (11.5%): | |
Amphenol Corp., Class A | | | 3,300,000 | | | | 212,454 | | |
DXC Technology Co. (a) | | | 5,520,000 | | | | 167,311 | | |
Flex Ltd. (a) | | | 14,750,000 | | | | 213,433 | | |
Genpact Ltd. | | | 6,038,900 | | | | 255,808 | | |
Global Payments, Inc. | | | 1,850,000 | | | | 204,684 | | |
Hewlett Packard Enterprise Co. | | | 11,195,600 | | | | 148,454 | | |
Maximus, Inc. (b) | | | 3,500,000 | | | | 218,785 | | |
MKS Instruments, Inc. | | | 1,770,900 | | | | 181,747 | | |
Motorola Solutions, Inc. | | | 669,500 | | | | 140,327 | | |
| | | | 1,743,003 | | |
Materials (11.1%): | |
AptarGroup, Inc. | | | 1,684,900 | | | | 173,899 | | |
Avery Dennison Corp. | | | 1,490,000 | | | | 241,186 | | |
Corteva, Inc. | | | 2,930,000 | | | | 158,630 | | |
International Flavors & Fragrances, Inc. | | | 1,005,000 | | | | 119,716 | | |
Packaging Corp. of America | | | 1,825,000 | | | | 250,937 | | |
Reliance Steel & Aluminum Co. | | | 1,220,000 | | | | 207,229 | | |
RPM International, Inc. | | | 2,035,000 | | | | 160,195 | | |
Steel Dynamics, Inc. | | | 2,585,000 | | | | 170,998 | | |
Westlake Corp. | | | 1,937,000 | | | | 189,865 | | |
| | | | 1,672,655 | | |
Real Estate (8.3%): | |
Alexandria Real Estate Equities, Inc. | | | 1,745,000 | | | | 253,077 | | |
American Homes 4 Rent, Class A | | | 4,730,000 | | | | 167,631 | | |
Camden Property Trust | | | 994,700 | | | | 133,767 | | |
Equity LifeStyle Properties, Inc. | | | 3,265,000 | | | | 230,085 | | |
Lamar Advertising Co., Class A | | | 2,609,600 | | | | 229,567 | | |
National Retail Properties, Inc. | | | 5,570,000 | | | | 239,510 | | |
| | | | 1,253,637 | | |
See notes to financial statements.
14
Victory Portfolios
Victory Sycamore Established Value Fund | | Schedule of Portfolio Investments — continued
June 30, 2022 | |
(Amounts in Thousands, Except for Shares)
Security Description | | Shares | | Value | |
Utilities (3.6%): | |
Alliant Energy Corp. | | | 4,625,000 | | | $ | 271,071 | | |
Xcel Energy, Inc. | | | 3,925,000 | | | | 277,733 | | |
| | | | 548,804 | | |
Total Common Stocks (Cost $12,583,680) | | | 14,560,950 | | |
Exchange-Traded Funds (1.2%) | |
iShares Russell Mid-Cap Value ETF (c) | | | 1,800,000 | | | | 182,826 | | |
Total Exchange-Traded Funds (Cost $140,770) | | | 182,826 | | |
Collateral for Securities Loaned (0.0%)^(d) | |
BlackRock Liquidity Funds TempFund, Institutional Shares, 1.47% (e) | | | 6,484 | | | | 7 | | |
Goldman Sachs Financial Square Prime Obligations Fund, Institutional
Shares, 1.42% (e) | | | 3,236 | | | | 3 | | |
HSBC U.S. Government Money Market Fund, I Shares, 1.46% (e) | | | 40,358 | | | | 40 | | |
JPMorgan Prime Money Market Fund, Capital Shares, 1.50% (e) | | | 25,802 | | | | 26 | | |
Morgan Stanley Institutional Liquidity Government Portfolio, Institutional
Shares, 1.39% (e) | | | 17,207 | | | | 17 | | |
Morgan Stanley Institutional Liquidity Prime Portfolio, Institutional
Shares, 1.53% (e) | | | 116,010 | | | | 116 | | |
Total Collateral for Securities Loaned (Cost $209) | | | 209 | | |
Total Investments (Cost $12,724,659) — 97.5% | | | 14,743,985 | | |
Other assets in excess of liabilities — 2.5% | | | 379,436 | | |
NET ASSETS — 100.00% | | $ | 15,123,421 | | |
^ Purchased with cash collateral from securities on loan.
(a) Non-income producing security.
(b) Affiliated security (See Note 9 in the Notes to Financial Statements).
(c) All or a portion of this security is on loan.
(d) Amount represents less than 0.05% of net assets.
(e) Rate disclosed is the daily yield on June 30, 2022.
ETF — Exchange-Traded Fund
PLC — Public Limited Company
See notes to financial statements.
15
Victory Portfolios
Victory Sycamore Small Company Opportunity Fund | | Schedule of Portfolio Investments
June 30, 2022 | |
(Amounts in Thousands, Except for Shares)
Security Description | | Shares | | Value | |
Common Stocks (96.6%) | |
Aerospace & Defense (1.9%): | |
Hexcel Corp. | | | 1,438,000 | | | $ | 75,222 | | |
Mercury Systems, Inc. (a) | | | 570,000 | | | | 36,668 | | |
| | | | 111,890 | | |
Air Freight & Logistics (1.6%): | |
Forward Air Corp. | | | 445,100 | | | | 40,932 | | |
Hub Group, Inc., Class A (a) | | | 780,000 | | | | 55,333 | | |
| | | | 96,265 | | |
Building Products (1.9%): | |
Gibraltar Industries, Inc. (a) | | | 930,000 | | | | 36,038 | | |
UFP Industries, Inc. | | | 1,130,000 | | | | 76,998 | | |
| | | | 113,036 | | |
Commercial Services & Supplies (3.7%): | |
ABM Industries, Inc. | | | 1,220,000 | | | | 52,972 | | |
McGrath RentCorp | | | 805,000 | | | | 61,180 | | |
UniFirst Corp. | | | 305,000 | | | | 52,515 | | |
Viad Corp. (a) (b) | | | 1,770,763 | | | | 48,891 | | |
| | | | 215,558 | | |
Communication Services (0.8%): | |
The EW Scripps Co., Class A (a) (b) | | | 3,948,000 | | | | 49,232 | | |
Construction & Engineering (3.2%): | |
Comfort Systems USA, Inc. | | | 540,000 | | | | 44,901 | | |
EMCOR Group, Inc. | | | 885,000 | | | | 91,120 | | |
MYR Group, Inc. (a) | | | 366,000 | | | | 32,255 | | |
Valmont Industries, Inc. | | | 92,000 | | | | 20,666 | | |
| | | | 188,942 | | |
Consumer Discretionary (8.3%): | |
Carter's, Inc. | | | 690,200 | | | | 48,645 | | |
Choice Hotels International, Inc. | | | 273,800 | | | | 30,564 | | |
Citi Trends, Inc. (a) (b) (c) | | | 720,000 | | | | 17,028 | | |
Columbia Sportswear Co. | | | 719,300 | | | | 51,488 | | |
Helen of Troy Ltd. (a) | | | 210,000 | | | | 34,106 | | |
Hyatt Hotels Corp., Class A (a) | | | 620,000 | | | | 45,824 | | |
LCI Industries | | | 380,000 | | | | 42,514 | | |
Mattel, Inc. (a) | | | 3,535,000 | | | | 78,937 | | |
Murphy USA, Inc. | | | 167,000 | | | | 38,889 | | |
Signet Jewelers Ltd. (c) | | | 664,900 | | | | 35,546 | | |
Visteon Corp. (a) | | | 656,000 | | | | 67,949 | | |
| | | | 491,490 | | |
Consumer Staples (4.8%): | |
Central Garden & Pet Co., Class A (a) | | | 904,600 | | | | 36,193 | | |
Ingredion, Inc. | | | 825,000 | | | | 72,732 | | |
Lancaster Colony Corp. | | | 302,100 | | | | 38,904 | | |
See notes to financial statements.
16
Victory Portfolios
Victory Sycamore Small Company Opportunity Fund | | Schedule of Portfolio Investments — continued
June 30, 2022 | |
(Amounts in Thousands, Except for Shares)
Security Description | | Shares | | Value | |
Performance Food Group Co. (a) | | | 1,810,000 | | | $ | 83,224 | | |
Spectrum Brands Holdings, Inc. | | | 635,000 | | | | 52,083 | | |
| | | | 283,136 | | |
Energy (3.9%): | |
Delek U.S. Holdings, Inc. (a) | | | 2,535,000 | | | | 65,505 | | |
Helix Energy Solutions Group, Inc. (a) | | | 5,030,000 | | | | 15,593 | | |
Magnolia Oil & Gas Corp., Class A | | | 2,995,000 | | | | 62,865 | | |
PDC Energy, Inc. | | | 1,357,300 | | | | 83,623 | | |
| | | | 227,586 | | |
Financials (16.9%): | |
AMERISAFE, Inc. (b) | | | 985,000 | | | | 51,230 | | |
Bank of Hawaii Corp. | | | 1,230,300 | | | | 91,534 | | |
Cohen & Steers, Inc. | | | 785,400 | | | | 49,944 | | |
Eagle Bancorp, Inc. | | | 985,000 | | | | 46,699 | | |
First American Financial Corp. | | | 871,400 | | | | 46,114 | | |
Independent Bank Corp. | | | 1,350,000 | | | | 107,231 | | |
Lakeland Financial Corp. | | | 671,900 | | | | 44,628 | | |
Pinnacle Financial Partners, Inc. | | | 505,000 | | | | 36,517 | | |
Renasant Corp. | | | 1,515,000 | | | | 43,647 | | |
Ryan Specialty Holdings, Inc., Class A (a) (c) | | | 1,160,000 | | | | 45,460 | | |
Safety Insurance Group, Inc. | | | 316,059 | | | | 30,689 | | |
Selective Insurance Group, Inc. | | | 725,000 | | | | 63,031 | | |
SouthState Corp. | | | 1,270,000 | | | | 97,981 | | |
Stewart Information Services Corp. | | | 715,000 | | | | 35,571 | | |
The Hanover Insurance Group, Inc. | | | 345,000 | | | | 50,456 | | |
UMB Financial Corp. | | | 1,067,100 | | | | 91,877 | | |
Wintrust Financial Corp. | | | 805,800 | | | | 64,585 | | |
| | | | 997,194 | | |
Health Care (3.8%): | |
AngioDynamics, Inc. (a) (b) | | | 2,085,000 | | | | 40,345 | | |
Chemed Corp. | | | 127,000 | | | | 59,613 | | |
Hanger, Inc. (a) (b) | | | 2,570,000 | | | | 36,802 | | |
Integer Holdings Corp. (a) | | | 601,304 | | | | 42,488 | | |
Natus Medical, Inc. (a) | | | 1,350,000 | | | | 44,239 | | |
| | | | 223,487 | | |
Information Technology (10.9%): | |
Advanced Energy Industries, Inc. | | | 695,000 | | | | 50,721 | | |
Avnet, Inc. | | | 1,510,000 | | | | 64,749 | | |
Belden, Inc. | | | 1,127,300 | | | | 60,051 | | |
Cognyte Software Ltd. (a) | | | 3,179,800 | | | | 13,514 | | |
Cohu, Inc. (a) | | | 2,071,300 | | | | 57,479 | | |
Fabrinet (a) | | | 631,000 | | | | 51,174 | | |
Kulicke & Soffa Industries, Inc. (c) | | | 1,172,100 | | | | 50,178 | | |
Littelfuse, Inc. | | | 218,800 | | | | 55,584 | | |
Maximus, Inc. | | | 660,000 | | | | 41,257 | | |
NETGEAR, Inc. (a) (b) | | | 2,120,000 | | | | 39,262 | | |
Plexus Corp. (a) | | | 585,000 | | | | 45,922 | | |
See notes to financial statements.
17
Victory Portfolios
Victory Sycamore Small Company Opportunity Fund | | Schedule of Portfolio Investments — continued
June 30, 2022 | |
(Amounts in Thousands, Except for Shares)
Security Description | | Shares | | Value | |
ScanSource, Inc. (a) (b) | | | 1,400,000 | | | $ | 43,596 | | |
Verint Systems, Inc. (a) | | | 1,640,000 | | | | 69,454 | | |
| | | | 642,941 | | |
Machinery (7.1%): | |
Alamo Group, Inc. | | | 485,000 | | | | 56,468 | | |
Altra Industrial Motion Corp. | | | 1,290,000 | | | | 45,472 | | |
Astec Industries, Inc. | | | 1,065,000 | | | | 43,431 | | |
Columbus McKinnon Corp. | | | 940,000 | | | | 26,668 | | |
Crane Holdings Co. | | | 570,000 | | | | 49,909 | | |
Hillenbrand, Inc. | | | 1,010,000 | | | | 41,370 | | |
Kennametal, Inc. | | | 1,614,000 | | | | 37,493 | | |
Mueller Industries, Inc. | | | 985,000 | | | | 52,491 | | |
The Manitowoc Co., Inc. (a) | | | 1,185,000 | | | | 12,478 | | |
Watts Water Technologies, Inc., Class A | | | 419,000 | | | | 51,470 | | |
| | | | 417,250 | | |
Materials (8.6%): | |
Cabot Corp. | | | 550,000 | | | | 35,084 | | |
Eagle Materials, Inc. | | | 385,000 | | | | 42,327 | | |
Innospec, Inc. | | | 692,000 | | | | 66,287 | | |
Kaiser Aluminum Corp. | | | 720,000 | | | | 56,945 | | |
Minerals Technologies, Inc. | | | 780,000 | | | | 47,845 | | |
Silgan Holdings, Inc. | | | 1,830,000 | | | | 75,670 | | |
Sonoco Products Co. | | | 1,370,000 | | | | 78,145 | | |
TriMas Corp. (b) | | | 2,235,000 | | | | 61,887 | | |
Worthington Industries, Inc. | | | 950,000 | | | | 41,895 | | |
| | | | 506,085 | | |
Professional Services (3.4%): | |
CBIZ, Inc. (a) | | | 1,370,000 | | | | 54,745 | | |
ICF International, Inc. | | | 725,000 | | | | 68,875 | | |
Korn Ferry | | | 487,600 | | | | 28,290 | | |
ManTech International Corp., Class A | | | 475,000 | | | | 45,339 | | |
| | | | 197,249 | | |
Real Estate (7.7%): | |
Apple Hospitality REIT, Inc. | | | 5,029,600 | | | | 73,784 | | |
Colliers International Group, Inc. | | | 425,000 | | | | 46,627 | | |
Corporate Office Properties Trust | | | 3,110,000 | | | | 81,451 | | |
Cushman & Wakefield PLC (a) | | | 3,125,000 | | | | 47,625 | | |
First Industrial Realty Trust, Inc. | | | 1,045,000 | | | | 49,616 | | |
Four Corners Property Trust, Inc. | | | 2,914,700 | | | | 77,502 | | |
Rayonier, Inc. | | | 2,000,000 | | | | 74,760 | | |
| | | | 451,365 | | |
Road & Rail (2.5%): | |
Marten Transport Ltd. | | | 4,000,000 | | | | 67,280 | | |
Werner Enterprises, Inc. | | | 2,055,000 | | | | 79,200 | | |
| | | | 146,480 | | |
See notes to financial statements.
18
Victory Portfolios
Victory Sycamore Small Company Opportunity Fund | | Schedule of Portfolio Investments — continued
June 30, 2022 | |
(Amounts in Thousands, Except for Shares)
Security Description | | Shares | | Value | |
Trading Companies & Distributors (2.3%): | |
Applied Industrial Technologies, Inc. | | | 910,000 | | | $ | 87,515 | | |
Core & Main, Inc., Class A (a) (c) | | | 2,240,000 | | | | 49,952 | | |
| | | | 137,467 | | |
Utilities (3.3%): | |
ALLETE, Inc. | | | 785,000 | | | | 46,142 | | |
MGE Energy, Inc. | | | 601,700 | | | | 46,831 | | |
NorthWestern Corp. | | | 885,000 | | | | 52,153 | | |
ONE Gas, Inc. | | | 590,000 | | | | 47,902 | | |
| | | | 193,028 | | |
Total Common Stocks (Cost $5,148,800) | | | 5,689,681 | | |
Exchange-Traded Funds (0.7%) | |
iShares Russell 2000 Value ETF (c) | | | 320,000 | | | | 43,568 | | |
Total Exchange-Traded Funds (Cost $36,379) | | | 43,568 | | |
Collateral for Securities Loaned (0.9%)^ | |
BlackRock Liquidity Funds TempFund, Institutional Shares, 1.47% (d) | | | 1,616,478 | | | | 1,617 | | |
Goldman Sachs Financial Square Prime Obligations Fund, Institutional
Shares, 1.42% (d) | | | 806,702 | | | | 807 | | |
HSBC U.S. Government Money Market Fund, I Shares, 1.46% (d) | | | 10,061,203 | | | | 10,061 | | |
JPMorgan Prime Money Market Fund, Capital Shares, 1.50% (d) | | | 6,432,395 | | | | 6,432 | | |
Morgan Stanley Institutional Liquidity Government Portfolio, Institutional
Shares, 1.39% (d) | | | 4,289,681 | | | | 4,290 | | |
Morgan Stanley Institutional Liquidity Prime Portfolio, Institutional
Shares, 1.53% (d) | | | 28,921,301 | | | | 28,921 | | |
Total Collateral for Securities Loaned (Cost $52,128) | | | 52,128 | | |
Total Investments (Cost $5,237,307) — 98.2% | | | 5,785,377 | | |
Other assets in excess of liabilities — 1.8% | | | 104,571 | | |
NET ASSETS — 100.00% | | $ | 5,889,948 | | |
^ Purchased with cash collateral from securities on loan.
(a) Non-income producing security.
(b) Affiliated security (See Note 9 in the Notes to Financial Statements).
(c) All or a portion of this security is on loan.
(d) Rate disclosed is the daily yield on June 30, 2022.
ETF — Exchange-Traded Fund
PLC — Public Limited Company
REIT — Real Estate Investment Trust
See notes to financial statements.
19
Victory Portfolios | | Statements of Assets and Liabilities
June 30, 2022 | |
(Amounts in Thousands, Except Per Share Amounts)
| | | Victory
Sycamore
Established
Value Fund | | Victory
Sycamore
Small Company
Opportunity
Fund | |
Assets: | |
Affiliated investments, at value (Cost $225,368 and $466,081) | | $ | 218,785 | | | $ | 388,273 | | |
Unaffiliated investments, at value (Cost $12,499,291
and $4,771,226) | | | 14,525,200 | (a) | | | 5,397,104 | (b) | |
Cash | | | 339,085 | | | | 169,372 | | |
Receivables: | |
Interest and dividends | | | 23,304 | | | | 4,549 | | |
From affiliate on interfund lending | | | 18,261 | | | | — | | |
Capital shares issued | | | 19,904 | | | | 15,322 | | |
Investments sold | | | 145,712 | | | | 16,207 | | |
From Adviser | | | — | (c) | | | — | | |
Prepaid expenses | | | 268 | | | | 89 | | |
Total Assets | | | 15,290,519 | | | | 5,990,916 | | |
Liabilities: | |
Payables: | |
Collateral received on loaned securities | | | 209 | | | | 52,128 | | |
Investments purchased | | | 142,068 | | | | 35,778 | | |
Capital shares redeemed | | | 15,516 | | | | 7,823 | | |
Accrued expenses and other payables: | |
Investment advisory fees | | | 5,846 | | | | 3,785 | | |
Administration fees | | | 710 | | | | 273 | | |
Custodian fees | | | 117 | | | | 47 | | |
Transfer agent fees | | | 1,189 | | | | 399 | | |
Compliance fees | | | 10 | | | | 4 | | |
Trustees' fees | | | 161 | | | | 62 | | |
| 12b-1 fees | | | 342 | | | | 76 | | |
Other accrued expenses | | | 930 | | | | 593 | | |
Total Liabilities | | | 167,098 | | | | 100,968 | | |
Net Assets: | |
| Capital | | | 12,360,252 | | | | 5,081,376 | | |
Total accumulated earnings/(loss) | | | 2,763,169 | | | | 808,572 | | |
Net Assets | | $ | 15,123,421 | | | $ | 5,889,948 | | |
Net Assets | |
Class A | | $ | 1,538,933 | | | $ | 329,556 | | |
Class C | | | 55,720 | | | | — | | |
Class I | | | 4,801,212 | | | | 3,211,022 | | |
Class R | | | 780,556 | | | | 209,007 | | |
Class R6 | | | 7,357,481 | | | | 2,116,606 | | |
Class Y | | | 589,519 | | | | 23,757 | | |
Total | | $ | 15,123,421 | | | $ | 5,889,948 | | |
Shares (unlimited number of shares authorized with a
par value of $0.001 per share): | |
Class A | | | 35,045 | | | | 7,394 | | |
Class C | | | 1,305 | | | | — | | |
Class I | | | 109,258 | | | | 71,002 | | |
Class R | | | 18,078 | | | | 5,114 | | |
Class R6 | | | 167,355 | | | | 46,882 | | |
Class Y | | | 13,416 | | | | 530 | | |
Total | | | 344,457 | | | | 130,922 | | |
(continues on next page)
See notes to financial statements.
20
Victory Portfolios | | Statements of Assets and Liabilities
June 30, 2022 | |
(Amounts in Thousands, Except Per Share Amounts) (continued)
| | | Victory
Sycamore
Established
Value Fund | | Victory
Sycamore
Small Company
Opportunity
Fund | |
Net asset value, offering (except Class A)
and redemption price per share: (d) | |
Class A | | $ | 43.91 | | | $ | 44.57 | | |
Class C | | | 42.71 | | | | — | | |
Class I | | | 43.94 | | | | 45.22 | | |
Class R | | | 43.18 | | | | 40.87 | | |
Class R6 | | | 43.96 | | | | 45.15 | | |
Class Y | | | 43.94 | | | | 44.86 | | |
Maximum Sales Charge — Class A | | | 5.75 | % | | | 5.75 | % | |
Maximum offering price
(100%/(100%-maximum sales charge) of net asset value
adjusted to the nearest cent) per share — Class A | | $ | 46.59 | | | $ | 47.29 | | |
(a) Includes $203 of securities on loan.
(b) Includes $50,555 of securities on loan.
(c) Rounds to less than $1 thousand.
(d) Per share amount may not recalculate due to rounding of net assets and/or shares outstanding.
See notes to financial statements.
21
Victory Portfolios | | Statements of Operations | |
(Amounts in Thousands, Except Per Share Amounts)
| | | Victory Sycamore
Established Value Fund | | Victory Sycamore
Small Company
Opportunity Fund | |
| | | Eight
Months
Ended
June 30,
2022 | | Year
Ended
October 31,
2021 | | Eight
Months
Ended
June 30,
2022 | | Year
Ended
October 31,
2021 | |
Investment Income: | | | |
Dividends from affiliated investments | | $ | 2,713 | | | $ | — | | | $ | 5,193 | | | $ | 8,599 | | |
Dividends from unaffiliated investments | | | 263,557 | | | | 323,284 | | | | 58,872 | | | | 77,696 | | |
Interest from unaffiliated investments | | | 188 | | | | 89 | | | | 82 | | | | 31 | | |
Interfund lending | | | 25 | | | | 21 | | | | — | | | | — | | |
Securities lending (net of fees) | | | 1 | | | | 629 | | | | 115 | | | | 55 | | |
Foreign tax withholding | | | — | | | | — | | | | (18 | ) | | | — | | |
Total Income | | | 266,484 | | | | 324,023 | | | | 64,244 | | | | 86,381 | | |
Expenses: | | | |
Investment advisory fees | | | 49,720 | | | | 65,951 | | | | 34,114 | | | | 50,300 | | |
Administration fees | | | 5,944 | | | | 8,152 | | | | 2,433 | | | | 3,715 | | |
Sub-Administration fees | | | 11 | | | | 17 | | | | 11 | | | | 17 | | |
| 12b-1 fees — Class A | | | 2,875 | | | | 4,347 | | | | 646 | | | | 1,057 | | |
| 12b-1 fees — Class C | | | 428 | | | | 671 | | | | — | | | | — | | |
| 12b-1 fees — Class R | | | 2,962 | | | | 4,338 | | | | 807 | | | | 1,274 | | |
Custodian fees | | | 467 | | | | 615 | | | | 195 | | | | 282 | | |
Transfer agent fees — Class A | | | 1,313 | | | | 2,029 | | | | 402 | | | | 657 | | |
Transfer agent fees — Class C | | | 46 | | | | 72 | | | | — | | | | — | | |
Transfer agent fees — Class I | | | 1,862 | | | | 2,542 | | | | 1,305 | | | | 1,970 | | |
Transfer agent fees — Class R | | | 456 | | | | 719 | | | | 135 | | | | 199 | | |
Transfer agent fees — Class R6 | | | 155 | | | | 253 | | | | 30 | | | | 39 | | |
Transfer agent fees — Class Y | | | 459 | | | | 628 | | | | 17 | | | | 31 | | |
Trustees' fees | | | 605 | | | | 903 | | | | 251 | | | | 413 | | |
Compliance fees | | | 79 | | | | 106 | | | | 33 | | | | 49 | | |
Legal and audit fees | | | 405 | | | | 519 | | | | 170 | | | | 240 | | |
State registration and filing fees | | | 222 | | | | 299 | | | | 119 | | | | 150 | | |
Other expenses | | | 1,261 | | | | 1,165 | | | | 736 | | | | 708 | | |
Total Expenses | | | 69,270 | | | | 93,326 | | | | 41,404 | | | | 61,101 | | |
Net Investment Income (Loss) | | | 197,214 | | | | 230,697 | | | | 22,840 | | | | 25,280 | | |
Realized/Unrealized Gains (Losses) from
Investments: | | | |
Net realized gains (losses) from affiliated
investment securities | | | — | | | | — | | | | (2,139 | ) | | | 4,984 | | |
Net realized gains (losses) from unaffiliated
investment securities | | | 807,625 | | | | 1,200,711 | | | | 298,888 | | | | 861,108 | | |
Net realized gains (losses) from in-kind
redemptions | | | — | | | | — | | | | — | | | | 25,718 | | |
Net change in unrealized appreciation/
depreciation on affiliated investment
securities | | | (72,994 | ) | | | — | | | | (150,998 | ) | | | 60,210 | | |
Net change in unrealized appreciation/
depreciation on unaffiliated investment
securities | | | (2,219,306 | ) | | | 4,048,780 | | | | (899,011 | ) | | | 1,441,199 | | |
Net realized/unrealized gains (losses) on
investments | | | (1,484,675 | ) | | | 5,249,491 | | | | (753,260 | ) | | | 2,393,219 | | |
Change in net assets resulting from
operations | | $ | (1,287,461 | ) | | $ | 5,480,188 | | | $ | (730,420 | ) | | $ | 2,418,499 | | |
See notes to financial statements.
22
Victory Portfolios | | Statements of Change in Net Assets | |
(Amounts in Thousands)
| | | Victory Sycamore Established Value Fund | | Victory Sycamore
Small Company Opportunity Fund | |
| | | Eight
Months
Ended
June 30,
2022 | | Year
Ended
October 31,
2021 | | Year
Ended
October 31,
2020 | | Eight
Months
Ended
June 30,
2022 | | Year
Ended
October 31,
2021 | | Year
Ended
October 31,
2020 | |
From Investment Activities: | |
Operations: | |
Net Investment
Income (Loss) | | $ | 197,214 | | | $ | 230,697 | | | $ | 168,869 | | | $ | 22,840 | | | $ | 25,280 | | | $ | 35,573 | | |
Net realized gains (losses) | | | 807,625 | | | | 1,200,711 | | | | 591,933 | | | | 296,749 | | | | 891,810 | | | | 31,757 | | |
Net change in unrealized
appreciation/depreciation | | | (2,292,300 | ) | | | 4,048,780 | | | | (1,316,124 | ) | | | (1,050,009 | ) | | | 1,501,409 | | | | (680,021 | ) | |
Change in net assets resulting
from operations | | | (1,287,461 | ) | | | 5,480,188 | | | | (555,322 | ) | | | (730,420 | ) | | | 2,418,499 | | | | (612,691 | ) | |
Distributions to Shareholders: | |
Class A | | | (133,887 | ) | | | (82,155 | ) | | | (103,792 | ) | | | (47,738 | ) | | | (2,698 | ) | | | (22,491 | ) | |
Class C | | | (4,853 | ) | | | (2,825 | ) | | | (4,182 | ) | | | — | | | | — | | | | — | | |
Class I | | | (417,771 | ) | | | (215,656 | ) | | | (218,171 | ) | | | (441,801 | ) | | | (30,516 | ) | | | (243,950 | ) | |
Class R | | | (70,658 | ) | | | (38,781 | ) | | | (46,556 | ) | | | (31,189 | ) | | | (1,442 | ) | | | (14,387 | ) | |
Class R6 | | | (605,531 | ) | | | (304,092 | ) | | | (308,392 | ) | | | (301,383 | ) | | | (20,349 | ) | | | (15,900 | ) | |
Class Y | | | (65,807 | ) | | | (38,108 | ) | | | (42,591 | ) | | | (3,832 | ) | | | (228 | ) | | | (1,835 | ) | |
Change in net assets resulting from
distributions to shareholders | | | (1,298,507 | ) | | | (681,617 | ) | | | (723,684 | ) | | | (825,943 | ) | | | (55,233 | ) | | | (298,563 | ) | |
Change in net assets resulting from
capital transactions | | | 1,178,947 | | | | 1,258,292 | | | | 124,104 | | | | 372,862 | | | | (135,276 | ) | | | 133,993 | | |
Change in net assets | | | (1,407,021 | ) | | | 6,056,863 | | | | (1,154,902 | ) | | | (1,183,501 | ) | | | 2,227,990 | | | | (777,261 | ) | |
Net Assets: | |
Beginning of period | | | 16,530,442 | | | | 10,473,579 | | | | 11,628,481 | | | | 7,073,449 | | | | 4,845,459 | | | | 5,622,720 | | |
End of period | | $ | 15,123,421 | | | $ | 16,530,442 | | | $ | 10,473,579 | | | $ | 5,889,948 | | | $ | 7,073,449 | | | $ | 4,845,459 | | |
(continues on next page)
See notes to financial statements.
23
Victory Portfolios | | Statements of Change in Net Assets | |
(Amounts in Thousands) (continued)
| | | Victory Sycamore Established Value Fund | | Victory Sycamore
Small Company Opportunity Fund | |
| | | Eight
Months
Ended
June 30,
2022 | | Year
Ended
October 31,
2021 | | Year
Ended
October 31,
2020 | | Eight
Months
Ended
June 30,
2022 | | Year
Ended
October 31,
2021 | | Year
Ended
October 31,
2020 | |
Capital Transactions: | |
Class A | |
Proceeds from shares issued | | $ | 245,246 | | | $ | 316,369 | | | $ | 323,380 | | | $ | 44,532 | | | $ | 91,245 | | | $ | 93,340 | | |
Distributions reinvested | | | 113,795 | | | | 69,394 | | | | 87,261 | | | | 39,941 | | | | 2,255 | | | | 18,989 | | |
Cost of shares redeemed | | | (340,316 | ) | | | (578,155 | ) | | | (638,669 | ) | | | (90,673 | ) | | | (161,535 | ) | | | (155,298 | ) | |
Total Class A | | $ | 18,725 | | | $ | (192,392 | ) | | $ | (228,028 | ) | | $ | (6,200 | ) | | $ | (68,035 | ) | | $ | (42,969 | ) | |
Class C | |
Proceeds from shares issued | | $ | 592 | | | $ | 1,691 | | | $ | 1,281 | | | $ | — | | | $ | — | | | $ | — | | |
Distributions reinvested | | | 4,723 | | | | 2,735 | | | | 3,900 | | | | — | | | | — | | | | — | | |
Cost of shares redeemed | | | (7,323 | ) | | | (14,289 | ) | | | (20,288 | ) | | | — | | | | — | | | | — | | |
Total Class C | | $ | (2,008 | ) | | $ | (9,863 | ) | | $ | (15,107 | ) | | $ | — | | | $ | — | | | $ | — | | |
Class I | |
Proceeds from shares issued | | $ | 766,087 | | | $ | 1,448,698 | | | $ | 1,126,708 | | | $ | 369,880 | | | $ | 753,269 | | | $ | 1,115,785 | | |
Distributions reinvested | | | 353,839 | | | | 184,882 | | | | 186,353 | | | | 415,540 | | | | 28,267 | | | | 227,267 | | |
Cost of shares redeemed | | | (808,277 | ) | | | (1,151,120 | ) | | | (1,094,095 | ) | | | (579,228 | ) | | | (917,576 | ) | | | (2,509,736 | ) | |
Total Class I | | $ | 311,649 | | | $ | 482,460 | | | $ | 218,966 | | | $ | 206,192 | | | $ | (136,040 | ) | | $ | (1,166,684 | ) | |
Class R | |
Proceeds from shares issued | | $ | 111,462 | | | $ | 184,333 | | | $ | 102,944 | | | $ | 23,918 | | | $ | 45,316 | | | $ | 43,209 | | |
Distributions reinvested | | | 69,760 | | | | 38,246 | | | | 45,322 | | | | 30,913 | | | | 1,426 | | | | 13,958 | | |
Cost of shares redeemed | | | (197,799 | ) | | | (206,480 | ) | | | (246,422 | ) | | | (45,240 | ) | | | (83,973 | ) | | | (89,785 | ) | |
Total Class R | | $ | (16,577 | ) | | $ | 16,099 | | | $ | (98,156 | ) | | $ | 9,591 | | | $ | (37,231 | ) | | $ | (32,618 | ) | |
Class R6 | |
Proceeds from shares issued | | $ | 1,550,645 | | | $ | 2,058,418 | | | $ | 1,467,343 | | | $ | 470,668 | | | $ | 696,838 | | | $ | 1,529,209 | | |
Distributions reinvested | | | 593,853 | | | | 298,880 | | | | 301,095 | | | | 289,072 | | | | 19,320 | | | | 15,321 | | |
Cost of shares redeemed | | | (1,107,054 | ) | | | (1,400,472 | ) | | | (1,544,569 | ) | | | (593,800 | ) | | | (617,635 | ) | | | (158,934 | ) | |
Total Class R6 | | $ | 1,037,444 | | | $ | 956,826 | | | $ | 223,869 | | | $ | 165,940 | | | $ | 98,523 | | | $ | 1,385,596 | | |
Class Y | |
Proceeds from shares issued | | $ | 179,349 | | | $ | 367,701 | | | $ | 286,306 | | | $ | 3,483 | | | $ | 15,804 | | | $ | 10,492 | | |
Distributions reinvested | | | 61,791 | | | | 36,208 | | | | 38,649 | | | | 3,515 | | | | 207 | | | | 831 | | |
Cost of shares redeemed | | | (411,426 | ) | | | (398,747 | ) | | | (302,395 | ) | | | (9,659 | ) | | | (8,504 | ) | | | (20,655 | ) | |
Total Class Y | | $ | (170,286 | ) | | $ | 5,162 | | | $ | 22,560 | | | $ | (2,661 | ) | | $ | 7,507 | | | $ | (9,332 | ) | |
Change in net assets resulting from
capital transactions | | $ | 1,178,947 | | | $ | 1,258,292 | | | $ | 124,104 | | | $ | 372,862 | | | $ | (135,276 | ) | | $ | 133,993 | | |
(continues on next page)
See notes to financial statements.
24
Victory Portfolios | | Statements of Change in Net Assets | |
(Amounts in Thousands) (continued)
| | | Victory Sycamore Established Value Fund | | Victory Sycamore
Small Company Opportunity Fund | |
| | | Eight
Months
Ended
June 30,
2022 | | Year
Ended
October 31,
2021 | | Year
Ended
October 31,
2020 | | Eight
Months
Ended
June 30,
2022 | | Year
Ended
October 31,
2021 | | Year
Ended
October 31,
2020 | |
Share Transactions: | |
Class A | |
Issued | | | 5,021 | | | | 6,696 | | | | 9,415 | | | | 885 | | | | 1,750 | | | | 2,491 | | |
Reinvested | | | 2,352 | | | | 1,666 | | | | 2,275 | | | | 797 | | | | 49 | | | | 420 | | |
Redeemed | | | (6,968 | ) | | | (12,340 | ) | | | (18,025 | ) | | | (1,799 | ) | | | (3,154 | ) | | | (4,039 | ) | |
Total Class A | | | 405 | | | | (3,978 | ) | | | (6,335 | ) | | | (117 | ) | | | (1,355 | ) | | | (1,128 | ) | |
Class C | |
Issued | | | 13 | | | | 37 | | | | 37 | | | | — | | | | — | | | | — | | |
Reinvested | | | 100 | | | | 69 | | | | 102 | | | | — | | | | — | | | | — | | |
Redeemed | | | (155 | ) | | | (315 | ) | | | (602 | ) | | | — | | | | — | | | | — | | |
Total Class C | | | (42 | ) | | | (209 | ) | | | (463 | ) | | | — | | | | — | | | | — | | |
Class I | |
Issued | | | 15,699 | | | | 30,624 | | | | 32,071 | | | | 7,249 | | | | 14,282 | | | | 29,815 | | |
Reinvested | | | 7,313 | | | | 4,393 | | | | 4,896 | | | | 8,163 | | | | 605 | | | | 4,969 | | |
Redeemed | | | (16,639 | ) | | | (24,567 | ) | | | (31,823 | ) | | | (11,418 | ) | | | (17,329 | ) | | | (65,620 | ) | |
Total Class I | | | 6,373 | | | | 10,450 | | | | 5,144 | | | | 3,994 | | | | (2,442 | ) | | | (30,836 | ) | |
Class R | |
Issued | | | 2,308 | | | | 4,046 | | | | 3,001 | | | | 517 | | | | 918 | | | | 1,236 | | |
Reinvested | | | 1,466 | | | | 935 | | | | 1,194 | | | | 673 | | | | 33 | | | | 333 | | |
Redeemed | | | (4,128 | ) | | | (4,524 | ) | | | (7,057 | ) | | | (982 | ) | | | (1,751 | ) | | | (2,499 | ) | |
Total Class R | | | (354 | ) | | | 457 | | | | (2,862 | ) | | | 208 | | | | (800 | ) | | | (930 | ) | |
Class R6 | |
Issued | | | 31,742 | | | | 43,452 | | | | 42,781 | | | | 9,073 | | | | 12,955 | | | | 40,067 | | |
Reinvested | | | 12,274 | | | | 7,091 | | | | 7,945 | | | | 5,687 | | | | 414 | | | | 335 | | |
Redeemed | | | (22,709 | ) | | | (30,224 | ) | | | (43,689 | ) | | | (11,893 | ) | | | (11,730 | ) | | | (4,097 | ) | |
Total Class R6 | | | 21,307 | | | | 20,319 | | | | 7,037 | | | | 2,867 | | | | 1,639 | | | | 36,305 | | |
Class Y | |
Issued | | | 3,648 | | | | 7,724 | | | | 8,117 | | | | 69 | | | | 320 | | | | 256 | | |
Reinvested | | | 1,275 | | | | 861 | | | | 1,018 | | | | 70 | | | | 4 | | | | 18 | | |
Redeemed | | | (8,422 | ) | | | (8,452 | ) | | | (8,786 | ) | | | (194 | ) | | | (160 | ) | | | (536 | ) | |
Total Class Y | | | (3,499 | ) | | | 133 | | | | 349 | | | | (55 | ) | | | 164 | | | | (262 | ) | |
Change in Shares | | | 24,190 | | | | 27,172 | | | | 2,870 | | | | 6,897 | | | | (2,794 | ) | | | 3,149 | | |
See notes to financial statements.
25
Victory Portfolios | | Financial Highlights | |
For a Share Outstanding Throughout Each Period
| | | | | Investment Activities | | Distributions to
Shareholders From | |
| | | Net Asset
Value,
Beginning of
Period | | Net
Investment
Income
(Loss)(a) | | Net Realized
and Unrealized
Gains (Losses) | | Total from
Investment
Activities | | Net
Investment
Income | | Net Realized
Gains from
Investments | |
Victory Sycamore Established Value Fund | | | |
Class A | | | |
Eight Months Ended
June 30, 2022 (f) | | $ | 51.62 | | | | 0.49 | | | | (4.29 | ) | | | (3.80 | ) | | | (0.60 | ) | | | (3.31 | ) | |
Year Ended October 31:
2021 | | $ | 35.75 | | | | 0.62 | | | | 17.44 | | | | 18.06 | | | | (0.52 | ) | | | (1.67 | ) | |
2020 | | $ | 40.09 | | | | 0.48 | | | | (2.44 | ) | | | (1.96 | ) | | | (0.48 | ) | | | (1.90 | ) | |
2019 | | $ | 39.52 | | | | 0.40 | | | | 3.61 | | | | 4.01 | | | | (0.39 | ) | | | (3.05 | ) | |
2018 | | $ | 40.01 | | | | 0.35 | | | | 0.48 | | | | 0.83 | | | | (0.33 | ) | | | (0.99 | ) | |
2017 | | $ | 33.82 | | | | 0.22 | | | | 6.53 | | | | 6.75 | | | | (0.21 | ) | | | (0.35 | ) | |
Class C | | | |
Eight Months Ended
June 30, 2022 (f) | | $ | 50.28 | | | | 0.24 | | | | (4.16 | ) | | | (3.92 | ) | | | (0.34 | ) | | | (3.31 | ) | |
Year Ended October 31:
2021 | | $ | 34.89 | | | | 0.26 | | | | 17.00 | | | | 17.26 | | | | (0.20 | ) | | | (1.67 | ) | |
2020 | | $ | 39.16 | | | | 0.20 | | | | (2.35 | ) | | | (2.15 | ) | | | (0.22 | ) | | | (1.90 | ) | |
2019 | | $ | 38.69 | | | | 0.11 | | | | 3.53 | | | | 3.64 | | | | (0.12 | ) | | | (3.05 | ) | |
2018 | | $ | 39.22 | | | | 0.03 | | | | 0.46 | | | | 0.49 | | | | (0.03 | ) | | | (0.99 | ) | |
2017 | | $ | 33.26 | | | | (0.09 | ) | | | 6.44 | | | | 6.35 | | | | (0.04 | ) | | | (0.35 | ) | |
Class I | | | |
Eight Months Ended
June 30, 2022 (f) | | $ | 51.66 | | | | 0.60 | | | | (4.30 | ) | | | (3.70 | ) | | | (0.71 | ) | | | (3.31 | ) | |
Year Ended October 31:
2021 | | $ | 35.77 | | | | 0.77 | | | | 17.44 | | | | 18.21 | | | | (0.65 | ) | | | (1.67 | ) | |
2020 | | $ | 40.12 | | | | 0.59 | | | | (2.45 | ) | | | (1.86 | ) | | | (0.59 | ) | | | (1.90 | ) | |
2019 | | $ | 39.55 | | | | 0.52 | | | | 3.62 | | | | 4.14 | | | | (0.52 | ) | | | (3.05 | ) | |
2018 | | $ | 40.04 | | | | 0.47 | | | | 0.48 | | | | 0.95 | | | | (0.45 | ) | | | (0.99 | ) | |
2017 | | $ | 33.83 | | | | 0.32 | | | | 6.56 | | | | 6.88 | | | | (0.32 | ) | | | (0.35 | ) | |
Class R | | | |
Eight Months Ended
June 30, 2022 (f) | | $ | 50.81 | | | | 0.42 | | | | (4.21 | ) | | | (3.79 | ) | | | (0.53 | ) | | | (3.31 | ) | |
Year Ended October 31:
2021 | | $ | 35.23 | | | | 0.52 | | | | 17.16 | | | | 17.68 | | | | (0.43 | ) | | | (1.67 | ) | |
2020 | | $ | 39.54 | | | | 0.40 | | | | (2.40 | ) | | | (2.00 | ) | | | (0.41 | ) | | | (1.90 | ) | |
2019 | | $ | 39.03 | | | | 0.31 | | | | 3.57 | | | | 3.88 | | | | (0.32 | ) | | | (3.05 | ) | |
2018 | | $ | 39.54 | | | | 0.26 | | | | 0.48 | | | | 0.74 | | | | (0.26 | ) | | | (0.99 | ) | |
2017 | | $ | 33.43 | | | | 0.14 | | | | 6.46 | | | | 6.60 | | | | (0.14 | ) | | | (0.35 | ) | |
(a) Per share net investment income (loss) has been calculated using the average daily shares method.
(b) Not annualized for periods less than one year.
(c) Annualized for periods less than one year.
(d) Does not include acquired fund fees and expenses, if any.
(e) Portfolio turnover is calculated on the basis of the Fund as a whole without distinguishing between the classes of shares issued.
(f) The Fund's fiscal year-end changed from October 31 to June 30. See Note 1 in the Notes to Financial Statements.
See notes to financial statements.
26
Victory Portfolios | | Financial Highlights — continued | |
For a Share Outstanding Throughout Each Period
| | | | | Ratios to Average Net Assets | | Supplemental Data | |
| | | Total
Distributions | | Net Asset
Value,
End of
Period | | Total
Return
(Excludes
Sales
Charge)(b) | | Net
Expenses(c)(d) | | Net
Investment
Income
(Loss)(c) | | Gross
Expenses(c)(d) | | Net Assets,
End of
Period
(000's) | | Portfolio
Turnover(b)(e) | |
Victory Sycamore Established Value Fund | |
Class A | |
Eight Months Ended
June 30, 2022 (f) | | | (3.91 | ) | | $ | 43.91 | | | | (7.99 | )% | | | 0.90 | % | | | 1.52 | % | | | 0.90 | % | | $ | 1,538,933 | | | | 24 | % | |
Year Ended October 31:
2021 | | | (2.19 | ) | | $ | 51.62 | | | | 52.05 | % | | | 0.90 | % | | | 1.32 | % | | | 0.90 | % | | $ | 1,788,115 | | | | 32 | % | |
2020 | | | (2.38 | ) | | $ | 35.75 | | | | (5.22 | )% | | | 0.92 | % | | | 1.34 | % | | | 0.92 | % | | $ | 1,380,509 | | | | 44 | % | |
2019 | | | (3.44 | ) | | $ | 40.09 | | | | 11.96 | % | | | 0.92 | % | | | 1.06 | % | | | 0.92 | % | | $ | 1,802,034 | | | | 34 | % | |
2018 | | | (1.32 | ) | | $ | 39.52 | | | | 2.01 | % | | | 0.89 | % | | | 0.85 | % | | | 0.89 | % | | $ | 2,008,143 | | | | 36 | % | |
2017 | | | (0.56 | ) | | $ | 40.01 | | | | 20.12 | % | | | 0.90 | % | | | 0.58 | % | | | 0.90 | % | | $ | 2,386,049 | | | | 32 | % | |
Class C | |
Eight Months Ended
June 30, 2022 (f) | | | (3.65 | ) | | $ | 42.71 | | | | (8.44 | )% | | | 1.66 | % | | | 0.75 | % | | | 1.66 | % | | $ | 55,720 | | | | 24 | % | |
Year Ended October 31:
2021 | | | (1.87 | ) | | $ | 50.28 | | | | 50.91 | % | | | 1.66 | % | | | 0.56 | % | | | 1.66 | % | | $ | 67,718 | | | | 32 | % | |
2020 | | | (2.12 | ) | | $ | 34.89 | | | | (5.93 | )% | | | 1.69 | % | | | 0.58 | % | | | 1.69 | % | | $ | 54,271 | | | | 44 | % | |
2019 | | | (3.17 | ) | | $ | 39.16 | | | | 11.10 | % | | | 1.68 | % | | | 0.30 | % | | | 1.68 | % | | $ | 79,066 | | | | 34 | % | |
2018 | | | (1.02 | ) | | $ | 38.69 | | | | 1.19 | % | | | 1.68 | % | | | 0.07 | % | | | 1.68 | % | | $ | 90,128 | | | | 36 | % | |
2017 | | | (0.39 | ) | | $ | 39.22 | | | | 19.20 | % | | | 1.70 | % | | | (0.24 | )% | | | 1.70 | % | | $ | 101,506 | | | | 32 | % | |
Class I | |
Eight Months Ended
June 30, 2022 (f) | | | (4.02 | ) | | $ | 43.94 | | | | (7.80 | )% | | | 0.58 | % | | | 1.84 | % | | | 0.58 | % | | $ | 4,801,212 | | | | 24 | % | |
Year Ended October 31:
2021 | | | (2.32 | ) | | $ | 51.66 | | | | 52.54 | % | | | 0.58 | % | | | 1.63 | % | | | 0.58 | % | | $ | 5,315,482 | | | | 32 | % | |
2020 | | | (2.49 | ) | | $ | 35.77 | | | | (4.92 | )% | | | 0.60 | % | | | 1.64 | % | | | 0.60 | % | | $ | 3,306,226 | | | | 44 | % | |
2019 | | | (3.57 | ) | | $ | 40.12 | | | | 12.31 | % | | | 0.60 | % | | | 1.37 | % | | | 0.60 | % | | $ | 3,501,630 | | | | 34 | % | |
2018 | | | (1.44 | ) | | $ | 39.55 | | | | 2.30 | % | | | 0.59 | % | | | 1.14 | % | | | 0.59 | % | | $ | 3,509,093 | | | | 36 | % | |
2017 | | | (0.67 | ) | | $ | 40.04 | | | | 20.50 | % | | | 0.62 | % | | | 0.85 | % | | | 0.62 | % | | $ | 5,263,053 | | | | 32 | % | |
Class R | |
Eight Months Ended
June 30, 2022 (f) | | | (3.84 | ) | | $ | 43.18 | | | | (8.11 | )% | | | 1.11 | % | | | 1.31 | % | | | 1.11 | % | | $ | 780,556 | | | | 24 | % | |
Year Ended October 31:
2021 | | | (2.10 | ) | | $ | 50.81 | | | | 51.74 | % | | | 1.11 | % | | | 1.11 | % | | | 1.11 | % | | $ | 936,593 | | | | 32 | % | |
2020 | | | (2.31 | ) | | $ | 35.23 | | | | (5.41 | )% | | | 1.12 | % | | | 1.14 | % | | | 1.12 | % | | $ | 633,244 | | | | 44 | % | |
2019 | | | (3.37 | ) | | $ | 39.54 | | | | 11.72 | % | | | 1.13 | % | | | 0.84 | % | | | 1.13 | % | | $ | 823,796 | | | | 34 | % | |
2018 | | | (1.25 | ) | | $ | 39.03 | | | | 1.80 | % | | | 1.10 | % | | | 0.65 | % | | | 1.10 | % | | $ | 897,277 | | | | 36 | % | |
2017 | | | (0.49 | ) | | $ | 39.54 | | | | 19.89 | % | | | 1.10 | % | | | 0.38 | % | | | 1.10 | % | | $ | 1,005,561 | | | | 32 | % | |
See notes to financial statements.
27
Victory Portfolios | | Financial Highlights | |
For a Share Outstanding Throughout Each Period
| | | | | Investment Activities | | Distributions to
Shareholders From | |
| | | Net Asset
Value,
Beginning of
Period | | Net
Investment
Income
(Loss)(a) | | Net Realized
and Unrealized
Gains (Losses) | | Total from
Investment
Activities | | Net
Investment
Income | | Net Realized
Gains from
Investments | |
Victory Sycamore Established Value Fund | | | |
Class R6 | | | |
Eight Months Ended
June 30, 2022 (f) | | $ | 51.69 | | | | 0.61 | | | | (4.31 | ) | | | (3.70 | ) | | | (0.72 | ) | | | (3.31 | ) | |
Year Ended October 31:
2021 | | $ | 35.78 | | | | 0.80 | | | | 17.45 | | | | 18.25 | | | | (0.67 | ) | | | (1.67 | ) | |
2020 | | $ | 40.13 | | | | 0.60 | | | | (2.45 | ) | | | (1.85 | ) | | | (0.60 | ) | | | (1.90 | ) | |
2019 | | $ | 39.55 | | | | 0.52 | | | | 3.63 | | | | 4.15 | | | | (0.52 | ) | | | (3.05 | ) | |
2018 | | $ | 40.05 | | | | 0.49 | | | | 0.48 | | | | 0.97 | | | | (0.48 | ) | | | (0.99 | ) | |
2017 | | $ | 33.85 | | | | 0.35 | | | | 6.54 | | | | 6.89 | | | | (0.34 | ) | | | (0.35 | ) | |
Class Y | | | |
Eight Months Ended
June 30, 2022 (f) | | $ | 51.66 | | | | 0.58 | | | | (4.30 | ) | | | (3.72 | ) | | | (0.69 | ) | | | (3.31 | ) | |
Year Ended October 31:
2021 | | $ | 35.76 | | | | 0.77 | | | | 17.45 | | | | 18.22 | | | | (0.65 | ) | | | (1.67 | ) | |
2020 | | $ | 40.11 | | | | 0.58 | | | | (2.45 | ) | | | (1.87 | ) | | | (0.58 | ) | | | (1.90 | ) | |
2019 | | $ | 39.54 | | | | 0.50 | | | | 3.63 | | | | 4.13 | | | | (0.51 | ) | | | (3.05 | ) | |
2018 | | $ | 40.04 | | | | 0.46 | | | | 0.48 | | | | 0.94 | | | | (0.45 | ) | | | (0.99 | ) | |
2017 | | $ | 33.83 | | | | 0.31 | | | | 6.57 | | | | 6.88 | | | | (0.32 | ) | | | (0.35 | ) | |
(a) Per share net investment income (loss) has been calculated using the average daily shares method.
(b) Not annualized for periods less than one year.
(c) Annualized for periods less than one year.
(d) Does not include acquired fund fees and expenses, if any.
(e) Portfolio turnover is calculated on the basis of the Fund as a whole without distinguishing between the classes of shares issued.
(f) The Fund's fiscal year-end changed from October 31 to June 30. See Note 1 in the Notes to Financial Statements.
See notes to financial statements.
28
Victory Portfolios | | Financial Highlights — continued | |
For a Share Outstanding Throughout Each Period
| | | | | Ratios to Average Net Assets | | Supplemental Data | |
| | | Total
Distributions | | Net Asset
Value,
End of
Period | | Total
Return
(Excludes
Sales
Charge)(b) | | Net
Expenses(c)(d) | | Net
Investment
Income
(Loss)(c) | | Gross
Expenses(c)(d) | | Net Assets,
End of
Period
(000's) | | Portfolio
Turnover(b)(e) | |
Victory Sycamore Established Value Fund | |
Class R6 | |
Eight Months Ended
June 30, 2022 (f) | | | (4.03 | ) | | $ | 43.96 | | | | (7.77 | )% | | | 0.54 | % | | | 1.88 | % | | | 0.54 | % | | $ | 7,357,481 | | | | 24 | % | |
Year Ended October 31:
2021 | | | (2.34 | ) | | $ | 51.69 | | | | 52.62 | % | | | 0.54 | % | | | 1.68 | % | | | 0.54 | % | | $ | 7,548,781 | | | | 32 | % | |
2020 | | | (2.50 | ) | | $ | 35.78 | | | | (4.89 | )% | | | 0.57 | % | | | 1.68 | % | | | 0.57 | % | | $ | 4,499,129 | | | | 44 | % | |
2019 | | | (3.57 | ) | | $ | 40.13 | | | | 12.35 | % | | | 0.58 | % | | | 1.38 | % | | | 0.58 | % | | $ | 4,762,844 | | | | 34 | % | |
2018 | | | (1.47 | ) | | $ | 39.55 | | | | 2.34 | % | | | 0.57 | % | | | 1.19 | % | | | 0.57 | % | | $ | 3,822,378 | | | | 36 | % | |
2017 | | | (0.69 | ) | | $ | 40.05 | | | | 20.54 | % | | | 0.54 | % | | | 0.91 | % | | | 0.54 | % | | $ | 1,314,843 | | | | 32 | % | |
Class Y | |
Eight Months Ended
June 30, 2022 (f) | | | (4.00 | ) | | $ | 43.94 | | | | (7.82 | )% | | | 0.61 | % | | | 1.77 | % | | | 0.61 | % | | $ | 589,519 | | | | 24 | % | |
Year Ended October 31:
2021 | | | (2.32 | ) | | $ | 51.66 | | | | 52.49 | % | | | 0.61 | % | | | 1.62 | % | | | 0.61 | % | | $ | 873,753 | | | | 32 | % | |
2020 | | | (2.48 | ) | | $ | 35.76 | | | | (4.92 | )% | | | 0.63 | % | | | 1.63 | % | | | 0.63 | % | | $ | 600,200 | | | | 44 | % | |
2019 | | | (3.56 | ) | | $ | 40.11 | | | | 12.28 | % | | | 0.63 | % | | | 1.32 | % | | | 0.63 | % | | $ | 659,111 | | | | 34 | % | |
2018 | | | (1.44 | ) | | $ | 39.54 | | | | 2.27 | % | | | 0.62 | % | | | 1.13 | % | | | 0.62 | % | | $ | 448,543 | | | | 36 | % | |
2017 | | | (0.67 | ) | | $ | 40.04 | | | | 20.51 | % | | | 0.60 | % | | | 0.81 | % | | | 0.60 | % | | $ | 487,044 | | | | 32 | % | |
See notes to financial statements.
29
Victory Portfolios | | Financial Highlights | |
For a Share Outstanding Throughout Each Period
| | | | | Investment Activities | | Distributions to
Shareholders From | |
| | | Net Asset
Value,
Beginning of
Period | | Net
Investment
Income
(Loss)(a) | | Net Realized
and Unrealized
Gains (Losses) | | Total from
Investment
Activities | | Net
Investment
Income | | Net Realized
Gains from
Investments | |
Victory Sycamore Small Company Opportunity Fund | | | |
Class A | | | |
Eight Months Ended
June 30, 2022 (g) | | $ | 56.52 | | | | 0.06 | | | | (5.54 | ) | | | (5.48 | ) | | | (0.05 | ) | | | (6.42 | ) | |
Year Ended October 31:
2021 | | $ | 37.91 | | | | 0.04 | | | | 18.89 | | | | 18.93 | | | | (0.17 | ) | | | (0.15 | ) | |
2020 | | $ | 45.16 | | | | 0.17 | | | | (5.14 | ) | | | (4.97 | ) | | | (0.20 | ) | | | (2.08 | ) | |
2019 | | $ | 45.91 | | | | 0.22 | | | | 4.22 | | | | 4.44 | | | | (0.10 | ) | | | (5.09 | ) | |
2018 | | $ | 48.23 | | | | 0.22 | | | | (0.09 | ) | | | 0.13 | | | | (0.21 | ) | | | (2.24 | ) | |
2017 | | $ | 39.74 | | | | 0.11 | | | | 10.44 | | | | 10.55 | | | | (0.12 | ) | | | (1.94 | ) | |
Class I | | | |
Eight Months Ended
June 30, 2022 (g) | | $ | 57.31 | | | | 0.18 | | | | (5.63 | ) | | | (5.45 | ) | | | (0.23 | ) | | | (6.41 | ) | |
Year Ended October 31:
2021 | | $ | 38.40 | | | | 0.22 | | | | 19.13 | | | | 19.35 | | | | (0.29 | ) | | | (0.15 | ) | |
2020 | | $ | 45.71 | | | | 0.31 | | | | (5.20 | ) | | | (4.89 | ) | | | (0.34 | ) | | | (2.08 | ) | |
2019 | | $ | 46.43 | | | | 0.35 | | | | 4.28 | | | | 4.63 | | | | (0.26 | ) | | | (5.09 | ) | |
2018 | | $ | 48.75 | | | | 0.37 | | | | (0.09 | ) | | | 0.28 | | | | (0.36 | ) | | | (2.24 | ) | |
2017 | | $ | 40.12 | | | | 0.25 | | | | 10.55 | | | | 10.80 | | | | (0.23 | ) | | | (1.94 | ) | |
Class R | | | |
Eight Months Ended
June 30, 2022 (g) | | $ | 52.37 | | | | — | (f) | | | (5.08 | ) | | | (5.08 | ) | | | — | | | | (6.42 | ) | |
Year Ended October 31:
2021 | | $ | 35.16 | | | | (0.05 | ) | | | 17.52 | | | | 17.47 | | | | (0.11 | ) | | | (0.15 | ) | |
2020 | | $ | 42.05 | | | | 0.09 | | | | (4.76 | ) | | | (4.67 | ) | | | (0.14 | ) | | | (2.08 | ) | |
2019 | | $ | 43.13 | | | | 0.13 | | | | 3.91 | | | | 4.04 | | | | (0.03 | ) | | | (5.09 | ) | |
2018 | | $ | 45.47 | | | | 0.10 | | | | (0.08 | ) | | | 0.02 | | | | (0.12 | ) | | | (2.24 | ) | |
2017 | | $ | 37.59 | | | | 0.01 | | | | 9.86 | | | | 9.87 | | | | (0.05 | ) | | | (1.94 | ) | |
Class R6 | | | |
Eight Months Ended
June 30, 2022 (g) | | $ | 57.22 | | | | 0.19 | | | | (5.60 | ) | | | (5.41 | ) | | | (0.24 | ) | | | (6.42 | ) | |
Year Ended October 31:
2021 | | $ | 38.37 | | | | 0.24 | | | | 19.10 | | | | 19.34 | | | | (0.34 | ) | | | (0.15 | ) | |
2020 | | $ | 45.66 | | | | 0.19 | | | | (5.03 | ) | | | (4.84 | ) | | | (0.37 | ) | | | (2.08 | ) | |
2019 | | $ | 46.38 | | | | 0.36 | | | | 4.28 | | | | 4.64 | | | | (0.27 | ) | | | (5.09 | ) | |
2018 | | $ | 48.69 | | | | 0.30 | | | | — | (f) | | | 0.30 | | | | (0.37 | ) | | | (2.24 | ) | |
2017 | | $ | 40.08 | | | | 0.21 | | | | 10.58 | | | | 10.79 | | | | (0.24 | ) | | | (1.94 | ) | |
(a) Per share net investment income (loss) has been calculated using the average daily shares method.
(b) Not annualized for periods less than one year.
(c) Annualized for periods less than one year.
(d) Does not include acquired fund fees and expenses, if any.
(e) Portfolio turnover is calculated on the basis of the Fund as a whole without distinguishing between the classes of shares issued.
(f) Amount is less than $0.005 per share.
(g) The Fund's fiscal year-end changed from October 31 to June 30. See Note 1 in the Notes to Financial Statements.
See notes to financial statements.
30
Victory Portfolios | | Financial Highlights — continued | |
For a Share Outstanding Throughout Each Period
| | | | | Ratios to Average Net Assets | | Supplemental Data | |
| | | Total
Distributions | | Net Asset
Value,
End of
Period | | Total
Return
(Excludes
Sales
Charge)(b) | | Net
Expenses(c)(d) | | Net
Investment
Income
(Loss)(c) | | Gross
Expenses(c)(d) | | Net Assets,
End of
Period
(000's) | | Portfolio
Turnover(b)(e) | |
Victory Sycamore Small Company Opportunity Fund | |
Class A | |
Eight Months Ended
June 30, 2022 (g) | | | (6.47 | ) | | $ | 44.57 | | | | (10.95 | )% | | | 1.25 | % | | | 0.18 | % | | | 1.25 | % | | $ | 329,556 | | | | 22 | % | |
Year Ended October 31:
2021 | | | (0.32 | ) | | $ | 56.52 | | | | 50.11 | % | | | 1.24 | % | | | 0.07 | % | | | 1.24 | % | | $ | 424,496 | | | | 41 | % | |
2020 | | | (2.28 | ) | | $ | 37.91 | | | | (11.80 | )% | | | 1.26 | % | | | 0.43 | % | | | 1.26 | % | | $ | 336,083 | | | | 37 | % | |
2019 | | | (5.19 | ) | | $ | 45.16 | | | | 12.10 | % | | | 1.25 | % | | | 0.51 | % | | | 1.25 | % | | $ | 451,310 | | | | 34 | % | |
2018 | | | (2.45 | ) | | $ | 45.91 | | | | 0.17 | % | | | 1.22 | % | | | 0.46 | % | | | 1.22 | % | | $ | 486,622 | | | | 43 | % | |
2017 | | | (2.06 | ) | | $ | 48.23 | | | | 27.02 | % | | | 1.23 | % | | | 0.25 | % | | | 1.23 | % | | $ | 603,851 | | | | 36 | % | |
Class I | |
Eight Months Ended
June 30, 2022 (g) | | | (6.64 | ) | | $ | 45.22 | | | | (10.75 | )% | | | 0.89 | % | | | 0.53 | % | | | 0.89 | % | | $ | 3,211,022 | | | | 22 | % | |
Year Ended October 31:
2021 | | | (0.44 | ) | | $ | 57.31 | | | | 50.66 | % | | | 0.89 | % | | | 0.41 | % | | | 0.89 | % | | $ | 3,840,013 | | | | 41 | % | |
2020 | | | (2.42 | ) | | $ | 38.40 | | | | (11.51 | )% | | | 0.93 | % | | | 0.78 | % | | | 0.93 | % | | $ | 2,666,852 | | | | 37 | % | |
2019 | | | (5.35 | ) | | $ | 45.71 | | | | 12.49 | % | | | 0.92 | % | | | 0.82 | % | | | 0.92 | % | | $ | 4,584,086 | | | | 34 | % | |
2018 | | | (2.60 | ) | | $ | 46.43 | | | | 0.49 | % | | | 0.88 | % | | | 0.76 | % | | | 0.88 | % | | $ | 4,127,411 | | | | 43 | % | |
2017 | | | (2.17 | ) | | $ | 48.75 | | | | 27.44 | % | | | 0.90 | % | | | 0.56 | % | | | 0.90 | % | | $ | 4,003,419 | | | | 36 | % | |
Class R | |
Eight Months Ended
June 30, 2022 (g) | | | (6.42 | ) | | $ | 40.87 | | | | (11.05 | )% | | | 1.42 | % | | | 0.00 | % | | | 1.42 | % | | $ | 209,007 | | | | 22 | % | |
Year Ended October 31:
2021 | | | (0.26 | ) | | $ | 52.37 | | | | 49.85 | % | | | 1.42 | % | | | (0.11 | )% | | | 1.42 | % | | $ | 256,938 | | | | 41 | % | |
2020 | | | (2.22 | ) | | $ | 35.16 | | | | (11.94 | )% | | | 1.44 | % | | | 0.25 | % | | | 1.44 | % | | $ | 200,617 | | | | 37 | % | |
2019 | | | (5.12 | ) | | $ | 42.05 | | | | 11.89 | % | | | 1.44 | % | | | 0.32 | % | | | 1.44 | % | | $ | 279,090 | | | | 34 | % | |
2018 | | | (2.36 | ) | | $ | 43.13 | | | | (0.06 | )% | | | 1.44 | % | | | 0.23 | % | | | 1.44 | % | | $ | 286,480 | | | | 43 | % | |
2017 | | | (1.99 | ) | | $ | 45.47 | | | | 26.73 | % | | | 1.45 | % | | | 0.03 | % | | | 1.45 | % | | $ | 333,944 | | | | 36 | % | |
Class R6 | |
Eight Months Ended
June 30, 2022 (g) | | | (6.66 | ) | | $ | 45.15 | | | | (10.72 | )% | | | 0.86 | % | | | 0.57 | % | | | 0.86 | % | | $ | 2,116,606 | | | | 22 | % | |
Year Ended October 31:
2021 | | | (0.49 | ) | | $ | 57.22 | | | | 50.71 | % | | | 0.85 | % | | | 0.44 | % | | | 0.85 | % | | $ | 2,518,726 | | | | 41 | % | |
2020 | | | (2.45 | ) | | $ | 38.37 | | | | (11.43 | )% | | | 0.86 | % | | | 0.48 | % | | | 0.86 | % | | $ | 1,625,853 | | | | 37 | % | |
2019 | | | (5.36 | ) | | $ | 45.66 | | | | 12.52 | % | | | 0.87 | % | | | 0.84 | % | | | 0.87 | % | | $ | 277,218 | | | | 34 | % | |
2018 | | | (2.61 | ) | | $ | 46.38 | | | | 0.52 | % | | | 0.87 | % | | | 0.62 | % | | | 0.87 | % | | $ | 195,360 | | | | 43 | % | |
2017 | | | (2.18 | ) | | $ | 48.69 | | | | 27.44 | % | | | 0.90 | % | | | 0.46 | % | | | 0.90 | % | | $ | 85,307 | | | | 36 | % | |
(continues on next page)
See notes to financial statements.
31
Victory Portfolios | | Financial Highlights | |
For a Share Outstanding Throughout Each Period
| | | | | Investment Activities | | Distributions to
Shareholders From | |
| | | Net Asset
Value,
Beginning of
Period | | Net
Investment
Income
(Loss)(a) | | Net Realized
and Unrealized
Gains (Losses) | | Total from
Investment
Activities | | Net
Investment
Income | | Net Realized
Gains from
Investments | |
Victory Sycamore Small Company Opportunity Fund | | | |
Class Y | | | |
Eight Months Ended
June 30, 2022 (f) | | $ | 56.88 | | | | 0.17 | | | | (5.58 | ) | | | (5.41 | ) | | | (0.19 | ) | | | (6.42 | ) | |
Year Ended October 31:
2021 | | $ | 38.10 | | | | 0.16 | | | | 19.00 | | | | 19.16 | | | | (0.23 | ) | | | (0.15 | ) | |
2020 | | $ | 45.39 | | | | 0.24 | | | | (5.16 | ) | | | (4.92 | ) | | | (0.29 | ) | | | (2.08 | ) | |
2019 | | $ | 46.13 | | | | 0.30 | | | | 4.24 | | | | 4.54 | | | | (0.19 | ) | | | (5.09 | ) | |
2018 | | $ | 48.33 | | | | 0.29 | | | | (0.09 | ) | | | 0.20 | | | | (0.16 | ) | | | (2.24 | ) | |
2017 | | $ | 39.84 | | | | 0.20 | | | | 10.40 | | | | 10.60 | | | | (0.17 | ) | | | (1.94 | ) | |
(a) Per share net investment income (loss) has been calculated using the average daily shares method.
(b) Not annualized for periods less than one year.
(c) Annualized for periods less than one year.
(d) Does not include acquired fund fees and expenses, if any.
(e) Portfolio turnover is calculated on the basis of the Fund as a whole without distinguishing between the classes of shares issued.
(f) The Fund's fiscal year-end changed from October 31 to June 30. See Note 1 in the Notes to Financial Statements.
See notes to financial statements.
32
Victory Portfolios | | Financial Highlights — continued | |
For a Share Outstanding Throughout Each Period
| | | | | Ratios to Average Net Assets | | Supplemental Data | |
| | | Total
Distributions | | Net Asset
Value,
End of
Period | | Total
Return
(Excludes
Sales
Charge)(b) | | Net
Expenses(c)(d) | | Net
Investment
Income
(Loss)(c) | | Gross
Expenses(c)(d) | | Net Assets,
End of
Period
(000's) | | Portfolio
Turnover(b)(e) | |
Victory Sycamore Small Company Opportunity Fund | |
Class Y | |
Eight Months Ended
June 30, 2022 (f) | | | (6.61 | ) | | $ | 44.86 | | | | (10.78 | )% | | | 0.95 | % | | | 0.50 | % | | | 0.95 | % | | $ | 23,757 | | | | 22 | % | |
Year Ended October 31:
2021 | | | (0.38 | ) | | $ | 56.88 | | | | 50.55 | % | | | 0.95 | % | | | 0.31 | % | | | 0.95 | % | | $ | 33,276 | | | | 41 | % | |
2020 | | | (2.37 | ) | | $ | 38.10 | | | | (11.65 | )% | | | 1.08 | % | | | 0.62 | % | | | 1.08 | % | | $ | 16,054 | | | | 37 | % | |
2019 | | | (5.28 | ) | | $ | 45.39 | | | | 12.31 | % | | | 1.07 | % | | | 0.69 | % | | | 1.07 | % | | $ | 31,016 | | | | 34 | % | |
2018 | | | (2.40 | ) | | $ | 46.13 | | | | 0.33 | % | | | 1.06 | % | | | 0.61 | % | | | 1.06 | % | | $ | 32,592 | | | | 43 | % | |
2017 | | | (2.11 | ) | | $ | 48.33 | | | | 27.10 | % | | | 1.15 | % | | | 0.45 | % | | | 1.25 | % | | $ | 35,416 | | | | 36 | % | |
See notes to financial statements.
33
Victory Portfolios | | Notes to Financial Statements
June 30, 2022 | |
1. Organization:
Victory Portfolios (the "Trust") is organized as a Delaware statutory trust and the Trust is registered under the Investment Company Act of 1940, as amended (the "1940 Act"), as an open-end investment company. The Trust is comprised of 40 funds and is authorized to issue an unlimited number of shares, which are units of beneficial interest with a par value of $0.001 per share.
The accompanying financial statements are those of the following two Funds (collectively, the "Funds" and individually, a "Fund"). Each Fund is classified as diversified under the 1940 Act.
Funds (Legal Name)* | | Funds (Short Name) | | Investment Share
Classes Offered | |
Victory Sycamore Established
Value Fund | | Sycamore Established Value Fund | | A, C, I, R, R6, and Y | |
Victory Sycamore Small Company
Opportunity Fund | | Sycamore Small Company
Opportunity Fund | | A, I, R, R6, and Y | |
* The Funds are generally closed to new investors. The Funds will continue to be available for investment (by direct purchase or exchange) by the following: existing shareholders, investors that purchase shares through certain intermediaries, retirement plans that purchase shares through certain record keepers, and current and retired Fund trustees, officers, employees of Victory Capital Management Inc. ("VCM" or the "Adviser") and affiliated providers, and their family members.
Each class of shares of a Fund has substantially identical rights and privileges except with respect to sales charges, fees paid under distribution plans, expenses allocable exclusively to each class of shares, voting rights on matters solely affecting a single class of shares, and the exchange privilege of each class of shares.
On May 19, 2022, the Board of Trustees (the "Board") of the Trust approved the fiscal year-end change for the Funds from October 31 to June 30. The accompanying financial statements reflect this change in fiscal year-end.
Under the Trust's organizational documents, its officers and trustees are indemnified against certain liabilities arising out of the performance of their duties to the Funds. In addition, in the normal course of business, the Funds enter into contracts with their vendors and others that provide for general indemnifications. The Funds' maximum exposure under these arrangements is unknown, as this would involve future claims that may be made against the Funds. However, based on experience, the Funds expect that risk of loss to be remote.
2. Significant Accounting Policies:
The following is a summary of significant accounting policies followed by the Trust in the preparation of its financial statements. The policies are in conformity with U.S. Generally Accepted Accounting Principles ("GAAP"). The preparation of financial statements in accordance with GAAP requires management to make estimates and assumptions that affect the reported amounts of assets and liabilities and disclosure of contingent assets and liabilities at the date of the financial statements and the reported amounts of income and expenses for the period. Actual results could differ from those estimates. The Funds follow the specialized accounting and reporting requirements under GAAP that are applicable to investment companies under Accounting Standards Codification Topic 946.
Investment Valuation:
The Funds record investments at fair value. Fair value is defined as the price that would be received to sell an asset or paid to transfer a liability in an orderly transaction between market participants at the measurement date.
34
Victory Portfolios | | Notes to Financial Statements — continued
June 30, 2022 | |
The valuation techniques described below maximize the use of observable inputs and minimize the use of unobservable inputs in determining fair value. The inputs used for valuing the Funds' investments are summarized in the three broad levels listed below:
• Level 1 — quoted prices in active markets for identical securities
• Level 2 — other significant observable inputs (including quoted prices for similar securities or interest rates applicable to those securities, etc.)
• Level 3 — significant unobservable inputs (including the Funds' own assumptions in determining the fair value of investments)
Changes in valuation techniques may result in transfers in or out of an assigned level within the disclosure hierarchy. The inputs or methodologies used for valuation techniques are not necessarily an indication of the risk associated with entering into those investments.
The Adviser has established the Pricing and Liquidity Committee (the "Committee"), and subject to the Board's oversight, the Committee administers and oversees the Funds' valuation policies and procedures, which are approved by the Board.
Portfolio securities listed or traded on securities exchanges, including Exchange-Traded Funds ("ETFs"), and American Depositary Receipts ("ADRs"), are valued at the closing price on the exchange or system where the security is principally traded, if available, or at the Nasdaq Official Closing Price. If there have been no sales for that day on the exchange or system, then a security is valued at the last available bid quotation on the exchange or system where the security is principally traded. In each of these situations, valuations are typically categorized as Level 1 in the fair value hierarchy.
Investments in open-end investment companies, other than ETFs, are valued at their net asset value ("NAV"). These valuations are typically categorized as Level 1 in the fair value hierarchy.
In the event that price quotations or valuations are not readily available, investments are valued at fair value in accordance with procedures established by and under the general supervision and responsibility of the Board. These valuations are typically categorized as Level 2 or Level 3 in the fair value hierarchy, based on the observability of inputs used to determine the fair value. The effect of fair value pricing is that securities may not be priced on the basis of quotations from the primary market in which they are traded and the actual price realized from the sale of a security may differ materially from the fair value price. Valuing these securities at fair value is intended to cause the Fund's NAV to be more reliable than it otherwise would be.
A summary of the valuations as of June 30, 2022, based upon the three levels defined above, is included in the table below while the breakdown, by category, of investments is disclosed on the Schedules of Portfolio Investments (amounts in thousands):
| | | Level 1 | | Level 2 | | Level 3 | | Total | |
Sycamore Established Value Fund | |
Common Stocks | | $ | 14,560,950 | | | $ | — | | | $ | — | | | $ | 14,560,950 | | |
Exchange-Traded Funds | | | 182,826 | | | | — | | | | — | | | | 182,826 | | |
Collateral for Securities Loaned | | | 209 | | | | — | | | | — | | | | 209 | | |
Total | | $ | 14,743,985 | | | $ | — | | | $ | — | | | $ | 14,743,985 | | |
Sycamore Small Company Opportunity Fund | |
Common Stocks | | $ | 5,689,681 | | | $ | — | | | $ | — | | | $ | 5,689,681 | | |
Exchange-Traded Funds | | | 43,568 | | | | — | | | | — | | | | 43,568 | | |
Collateral for Securities Loaned | | | 52,128 | | | | — | | | | — | | | | 52,128 | | |
Total | | $ | 5,785,377 | | | $ | — | | | $ | — | | | $ | 5,785,377 | | |
For the eight months ended June 30, 2022, there were no transfers in or out of Level 3 in the fair value hierarchy.
35
Victory Portfolios | | Notes to Financial Statements — continued
June 30, 2022 | |
Real Estate Investment Trusts ("REITs"):
The Funds may invest in REITs, which report information on the source of their distributions annually. REITs are pooled investment vehicles that invest primarily in income-producing real estate or real-estate related loans or interests (such as mortgages). Certain distributions received from REITs during the year are recorded as realized gains or return of capital as estimated by the Funds or when such information becomes known.
Investment Companies:
Exchange-Traded Funds:
The Funds may invest in ETFs, the shares of which are bought and sold on a securities exchange. An ETF trades like common stock and represents a fixed portfolio of securities often designed to track the performance and dividend yield of a particular domestic or foreign market index. The Funds may purchase shares of an ETF to temporarily gain exposure to a portion of the U.S. or a foreign market while awaiting purchase of underlying securities. The risks of owning an ETF generally reflect the risks of owning the underlying securities they are designed to track, although the lack of liquidity of an ETF could result in it being more volatile. Additionally, ETFs have fees and expenses that reduce their value.
Open-End Funds:
The Funds may invest in portfolios of open-end investment companies. These investment companies value securities in their portfolios for which market quotations are readily available at their market values (generally the last reported sale price) and all other securities and assets at their fair value by the methods established by the board of directors of the underlying funds.
Investment Transactions and Related Income:
Changes in holdings of investments are accounted for no later than one business day following the trade date. For financial reporting purposes, however, investment transactions are accounted for on trade date or the last business day of the reporting period. Interest income is determined on the basis of coupon interest accrued using the effective interest method which adjusts, where applicable, the amortization of premiums or accretion of discounts. Dividend income is recorded on the ex-dividend date. Gains or losses realized on sales of securities are recorded on the identified cost basis.
Withholding taxes on interest, dividends, and gains as a result of certain investments by the Funds have been provided for in accordance with each investment's applicable country's tax rules and rates.
Securities Lending:
The Funds, through a Securities Lending Agreement with Citibank, N.A. ("Citibank"), may lend their securities to qualified financial institutions, such as certain broker-dealers and banks, to earn additional income, net of income retained by Citibank. Borrowers are required to initially secure their loans for collateral in the amount of at least 102% of the value of U.S. securities loaned or at least 105% of the value of non-U.S. securities loaned, marked-to-market daily. Any collateral shortfalls associated with increases in the valuation of the securities loaned are generally cured the next business day. The collateral can be received in the form of cash collateral and/or non-cash collateral. Non-cash collateral can include U.S. Government Securities and other securities as permitted by Securities and Exchange Commission ("SEC") guidelines. The cash collateral is invested in short-term instruments or cash equivalents, primarily open-end investment companies, as noted on the Funds' Schedules of Portfolio Investments. The Funds effectively do not have control of the non-cash collateral and therefore it is not disclosed on the Funds' Schedules of Portfolio Investments. Collateral requirements are determined daily based on the value of the Funds' securities on loan as of the end of the prior business day. During the time portfolio securities are on loan, the borrower will pay the Funds any dividends or interest
36
Victory Portfolios | | Notes to Financial Statements — continued
June 30, 2022 | |
paid on such securities plus any fee negotiated between the parties to the lending agreement. The Funds also earn a return from the collateral. The Funds pay Citibank various fees in connection with the investment of cash collateral and fees based on the investment income received from securities lending activities. Securities lending income (net of these fees) is disclosed on the Statements of Operations. Loans are terminable upon demand and the borrower must return the loaned securities within the lesser of one standard settlement period or five business days. Although risk is mitigated by the collateral, a Fund could experience a delay in recovering its securities and possible loss of income or value if the borrower fails to return them. In addition, there is a risk that the value of the short-term investments will be less than the amount of cash collateral required to be returned to the borrower.
The Funds' agreement with Citibank does not include master netting provisions. Non-cash collateral received by the Funds may not be sold or repledged, except to satisfy borrower default.
The following table (amounts in thousands) is a summary of the Funds' securities lending transactions as of June 30, 2022.
| | | Value of
Securities on Loan | | Non-Cash
Collateral | | Cash
Collateral | |
Sycamore Established Value Fund | | $ | 203 | | | $ | — | | | $ | 209 | | |
| Sycamore Small Company Opportunity Fund | | | 50,935 | (a) | | | — | | | | 52,128 | | |
(a) Includes $380 thousand of securities on loan that were sold prior to June 30, 2022.
Federal Income Taxes:
Each Fund intends to continue to qualify as a regulated investment company by complying with the provisions available to certain investment companies, as defined in applicable sections of the Internal Revenue Code, and to make distributions of net investment income and net realized gains sufficient to relieve it from all, or substantially all, federal income taxes. Accordingly, no provision for federal income taxes is required in the financial statements. The Funds have a tax year end of June 30.
For the eight months ended June 30, 2022, the Funds did not incur any income tax, interest, or penalties, and have recorded no liability for net unrecognized tax benefits relating to uncertain tax positions.
Management of the Funds has reviewed tax positions taken in tax years that remain subject to examination by all major tax jurisdictions, including federal (i.e., the last four tax years, which includes the current fiscal tax year end). Management believes that there is no tax liability resulting from unrecognized tax benefits related to uncertain tax positions taken.
Allocations:
Expenses directly attributable to a Fund are charged to that Fund, while expenses that are attributable to more than one fund in the Trust, or jointly with an affiliated trust, are allocated among the respective funds in the Trust and/or an affiliated trust based upon net assets or another appropriate basis.
Income, expenses (other than class-specific expenses such as transfer agent fees, state registration fees, printing fees, and 12b-1 fees), and realized and unrealized gains or losses on investments are allocated to each class of shares based on its relative net assets on the date income is earned or expenses and realized and unrealized gains and losses are incurred.
3. Purchases and Sales:
Purchases and sales of securities (excluding securities maturing less than one year from acquisition) for the eight months ended June 30, 2022, were as follows (amounts in thousands):
| | | Excluding
U.S. Government Securities | |
| | | Purchases | | Sales | |
Sycamore Established Value Fund | | $ | 3,800,924 | | | $ | 3,850,670 | | |
Sycamore Small Company Opportunity Fund | | | 1,441,413 | | | | 1,907,892 | | |
37
Victory Portfolios | | Notes to Financial Statements — continued
June 30, 2022 | |
4. Fees and Transactions with Affiliates and Related Parties:
Investment Advisory Fees:
Investment advisory services are provided to the Fund by the Adviser, which is a New York corporation registered as an investment adviser with the SEC. The Adviser is an indirect wholly owned subsidiary of Victory Capital Holdings, Inc., a publicly traded Delaware corporation, and a wholly owned direct subsidiary of Victory Capital Operating, LLC.
Under the terms of the Investment Advisory Agreement, the Adviser is entitled to receive fees based on a percentage of the average daily net assets of each Fund. The rates at which the Adviser is paid by each Fund are included in the table below.
| | | Adviser Fee Tier Rates | |
| | | Up to $100 million | | $100 million — $200 million | | Over $200 million | |
Sycamore Established Value Fund | | | 0.65 | % | | | 0.55 | % | | | 0.45 | % | |
| | | Up to $500 million | | | | Over $500 million | |
Sycamore Small Company
Opportunity Fund | | | 0.85 | % | | | | | | | 0.75 | % | |
Amounts incurred and paid to VCM for the eight months ended June 30, 2022, and the year ended October 31, 2021, are reflected on the Statements of Operations as Investment advisory fees.
Administration and Servicing Fees:
VCM also serves as the Funds' administrator and fund accountant. Under the Administration and Fund Accounting Agreement, VCM is entitled to receive fees based on a percentage of the average daily net assets of the Trust, Victory Variable Insurance Funds and Victory Portfolios II. The tiered rates at which VCM is paid by the Funds are shown in the table below:
Net Assets | |
Up to $15 billion | | $15 billion — $30 billion | | Over $30 billion | |
| | 0.08 | %, plus | | | 0.05 | %, plus | | | 0.04 | % | |
Amounts incurred for the eight months ended June 30, 2022, and the year ended October 31, 2021, are reflected on the Statements of Operations as Administration fees.
Citi Fund Services Ohio, Inc. ("Citi"), an affiliate of Citibank, acts as sub-administrator and sub-fund accountant to the Funds pursuant to the Sub-Administration and Sub-Fund Accounting Services Agreement between VCM and Citi. VCM pays Citi a fee for providing these services. The Trust reimburses VCM and Citi for out-of-pocket expenses incurred in providing these services and certain other expenses specifically allocated to the Funds. Amounts incurred for the eight months ended June 30, 2022, and the year ended October 31, 2021, are reflected on the Statements of Operations as Sub-Administration fees.
The Funds (as part of the Trust) have entered into an agreement with the Adviser to provide compliance services, pursuant to which the Adviser furnishes its compliance personnel, including the services of the Chief Compliance Officer ("CCO"), and other resources reasonably necessary to provide the Trust with compliance oversight services related to the design, administration, and oversight of a compliance program for the Trust in accordance with Rule 38a-1 under the 1940 Act. The CCO is an employee of the Adviser, which pays the compensation of the CCO and support staff. The funds in the Trust, Victory Variable Insurance Funds, Victory Portfolios II and USAA Mutual Funds (collectively, the "Victory Funds Complex"), in aggregate, compensate the Adviser for these services. Amounts incurred for the eight months ended June 30, 2022, and the year ended October 31, 2021, are reflected on the Statements of Operations as Compliance fees.
38
Victory Portfolios | | Notes to Financial Statements — continued
June 30, 2022 | |
Transfer Agency Fees:
FIS Investor Services, LLC ("FIS") serves as the Funds' transfer agent. Under the Transfer Agent Agreement, the Trust pays FIS a fee for its services and reimburses FIS for all of their reasonable out-of-pocket expenses incurred in providing these services. Amounts incurred for the eight months ended June 30, 2022, and the year ended October 31, 2021, are reflected on the Statements of Operations as Transfer agent fees.
Distributor/Underwriting Services:
Victory Capital Services, Inc. (the "Distributor"), an affiliate of the Adviser, serves as Distributor for the continuous offering of the shares of the Funds pursuant to a Distribution Agreement between the Distributor and the Trust.
Pursuant to the Distribution and Service Plans adopted in accordance with Rule 12b-1 under the 1940 Act, the Distributor may receive a monthly distribution and service fee up to the annual rate shown in the table below:
| | | Class A | | Class C | | Class R | |
Sycamore Established Value Fund | | | 0.25 | % | | | 1.00 | % | | | 0.50 | % | |
Sycamore Small Company Opportunity Fund | | | 0.25 | % | | | N/A | | | | 0.50 | % | |
The distribution and service fees paid to the Distributor may be used by the Distributor to pay for activities primarily intended to result in the sale of Class A, Class C, and Class R. Amounts incurred for the eight months ended June 30, 2022, and the year ended October 31, 2021, are reflected on the Statements of Operations as 12b-1 fees.
In addition, the Distributor is entitled to receive commissions in connection with sales of Class A. For the eight months ended June 30, 2022, the Distributor received approximately $12 thousand from commissions earned in connection with sales of Class A. For the year ended October 31, 2021, the Distributor received approximately $19 thousand from commissions earned in connection with sales of Class A.
Other Fees:
Citibank serves as the Funds' custodian. The Funds pay Citibank a fee for providing these services. Amounts incurred for the eight months ended June 30, 2022, and the year ended October 31, 2021, are reflected on the Statements of Operations as Custodian fees.
Sidley Austin LLP provides legal services to the Trust.
The Adviser has entered into expense limitation agreements with the Funds. Under the terms of the agreements, the Adviser has agreed to waive fees or reimburse certain expenses to the extent that ordinary operating expenses incurred by certain classes of a Fund in any fiscal year exceed the expense limit for such classes of the Fund. Such excess amounts will be the liability of the Adviser. Acquired fund fees and expenses, interest, taxes, brokerage commissions, other expenditures which are capitalized in accordance with GAAP, and other extraordinary expenses not incurred in the ordinary course of a Fund's business are excluded from the expense limits. As of June 30, 2022, the expense limits (excluding voluntary waivers) are as follows:
| | | In effect until February 28, 2023 | |
| | | Class C | | Class Y | |
Sycamore Established Value Fund | | | 1.84 | % | | | N/A | | |
Sycamore Small Company Opportunity Fund | | | N/A | | | | 1.15 | % | |
Under the terms of the expense limitation agreements, as amended May 1, 2022, the Funds have agreed to repay fees and expenses that were waived or reimbursed by the Adviser for a period of up to three years (thirty-six (36) months) after the waiver or reimbursement took place, subject to the lesser
39
Victory Portfolios | | Notes to Financial Statements — continued
June 30, 2022 | |
of any operating expense limits in effect at the time of: (a) the original waiver or expense reimbursement; or (b) the recoupment, after giving effect to the recoupment amount.
As of June 30, 2022, and October 31, 2021, the Funds had no amounts available to be repaid to the Adviser. The Funds have not recorded any amounts available to be repaid as a liability due to an assessment that such repayments are not probable at June 30, 2022, or at October 31, 2021.
The Adviser may voluntarily waive or reimburse additional fees to assist the Funds in maintaining competitive expense ratios. Voluntary waivers and reimbursements applicable to the Funds are not available to be recouped at a future time. There were no voluntary waivers or reimbursements for the eight months ended June 30, 2022, or for the year ended October 31, 2021.
Certain officers and/or interested trustees of the Funds are also officers and/or employees of the Adviser, administrator, fund accountant, sub-administrator, sub-fund accountant, custodian, legal counsel, and Distributor.
5. Risks:
The Funds may be subject to other risks in addition to these identified risks.
Equity Risk — The value of the equity securities in which the Fund invests may decline in response to developments affecting individual companies and/or general economic conditions in the United States or abroad. A company's earnings or dividends may not increase as expected (or may decline) because of poor management, competitive pressures, reliance on particular suppliers or geographical regions, labor problems or shortages, corporate restructurings, fraudulent disclosures, man-made or natural disasters, military confrontations or wars, terrorism, public health crises, or other events, conditions and factors. Price changes may be temporary or last for extended periods.
Market Risk — Overall market risks may affect the value of the Fund. Domestic and international factors such as political events, war, terrorism, trade disputes, inflation rates, interest rate levels and other fiscal and monetary policy changes, cybersecurity incidents, pandemics and other public health crises, sanctions against a particular foreign country, its nationals, businesses or industries and related geopolitical events, as well as environmental disasters such as earthquakes, fires, and floods or other catastrophes, may add to instability in global economies and markets generally, and may lead to increased market volatility. Global economies and financial markets are highly interconnected, which increases the possibility that conditions in one country or region might adversely affect issuers in another country or region. The impact of these and other factors may be short-term or may last for extended periods.
Small-Capitalization Stock Risk — Small-capitalization companies are subject to a number of risks not associated with larger, more established companies, potentially making their stock prices more volatile and increasing the risk of loss. Smaller companies may have limited markets, product lines, or financial resources and lack management experience and may experience higher failure rates than larger companies.
Mid-Capitalization Stock Risk — Mid-sized companies may be subject to a number of risks not associated with larger, more established companies, potentially making their stock prices more volatile and increasing the risk of loss.
6. Borrowing and Interfund Lending:
Line of Credit:
The Victory Funds Complex participates in a short-term demand note "Line of Credit" agreement with Citibank. The Line of Credit agreement with Citibank was renewed on June 27, 2022, with a termination date of June 26, 2023. Under the agreement with Citibank, the Victory Funds Complex may borrow up
40
Victory Portfolios | | Notes to Financial Statements — continued
June 30, 2022 | |
to $600 million, of which $300 million is committed and $300 million is uncommitted. $40 million of the Line of Credit is reserved for use by the Victory Floating Rate Fund, another series of the Victory Funds Complex, with Victory Floating Rate Fund paying the related commitment fees for that amount. The purpose of the Line of Credit is to meet temporary or emergency cash needs. For the eight months ended June 30, 2022, Citibank received an annual commitment fee of 0.15% on $300 million for providing the Line of Credit. Each fund in the Victory Funds Complex paid a pro-rata portion of the commitment fees plus any interest on amounts borrowed. For the period from November 1, 2021, through June 27, 2022, interest was based on the one-month London Interbank Offered Rate ("LIBOR") plus one percent. Effective with the renewal, for the period June 28, 2022, through June 30, 2022, interest was based on the one-month Secured Overnight Financing Rate (SOFR) plus 1.10 percent. Interest charged to each fund during the period, if applicable, is reflected on the Statements of Operations under Line of credit fees.
The Funds had no borrowings under the Line of Credit agreement during the eight months ended June 30, 2022, or during the year ended October 31, 2021.
Interfund Lending:
The Trust and the Adviser rely on an exemptive order granted by the SEC in March 2017 (the "Order"), permitting the establishment and operation of an Interfund Lending Facility (the "Facility"). The Facility allows each Fund to directly lend and borrow money to or from any other fund in the Victory Funds Complex that is permitted to participate in the Facility, relying upon the Order at rates beneficial to both the borrowing and lending funds. Advances under the Facility are allowed for temporary or emergency purposes, including the meeting of redemption requests that otherwise might require the untimely disposition of securities, and are subject to each Fund's borrowing restrictions. The interfund loan rate is determined, as specified in the Order, by averaging the current repurchase agreement rate and the current bank loan rate. As a Borrower, interest charged to each Fund, if any, during the period, is reflected on the Statements of Operations under Interfund lending fees. As a Lender, interest earned by each Fund, if any, during the period, is reflected on the Statements of Operations under Interfund lending.
The average borrowing or lending for the days outstanding and average interest rate for the Funds that utilized this Facility during the eight months ended June 30, 2022, were as follows (amounts in thousands):
| | | Borrower or
Lender | | Amount
Outstanding at
June 30, 2022 | | Average
Borrowing* | | Days
Borrowing
Outstanding | | Average
Interest
Rate* | | Maximum
Borrowing
During
the Period | |
Sycamore Established
Value Fund | | Lender | | $ | 18,261 | | | $ | 12,581 | | | | 78 | | | | 0.97 | % | | $ | 59,082 | | |
* Based on the number of days borrowings were outstanding for the eight months ended June 30, 2022.
The average borrowing or lending for the days outstanding and average interest rate for the Funds that utilized this Facility during the year ended October 31, 2021, were as follows (amounts in thousands):
| | Borrower
or
Lender | | Amount
Outstanding
at
October 31,
2021 | | Average
Borrowing* | | Days
Borrowing
Outstanding | | Average
Interest
Rate* | | Maximum
Borrowing
During
the Period | |
Sycamore Established
Value Fund | | Lender | | $ | — | | | $ | 8,775 | | | | 151 | | | | 0.28 | % | | $ | 64,000 | | |
* Based on the number of days borrowings were outstanding for the year ended October 31, 2021.
41
Victory Portfolios | | Notes to Financial Statements — continued
June 30, 2022 | |
7. Federal Income Tax Information:
Dividends from net investment income, if any, are declared and paid as noted in the table below. Distributable net realized gains, if any, are declared and distributed at least annually from each Fund.
| | | Declared | | Paid | |
Sycamore Established Value Fund | | Quarterly | | Quarterly | |
Sycamore Small Company Opportunity Fund | | Annually | | Annually | |
The amounts of dividends from net investment income and distributions from net realized gains (collectively, distributions to shareholders) are determined in accordance with federal income tax regulations, which may differ from GAAP. To the extent these "book/tax" differences are permanent in nature (e.g., net operating loss and distribution reclassification), such amounts are reclassified within the components of net assets based on their federal tax-basis treatment; temporary differences (e.g., wash sales) do not require reclassification. To the extent dividends and distributions exceed net investment income and net realized gains for tax purposes, they are reported as distributions of capital. Net investment losses incurred by the Funds may be reclassified as an offset to capital on the accompanying Statements of Assets and Liabilities.
As of June 30, 2022, on the Statements of Assets and Liabilities, as a result of permanent book-to-tax differences, reclassification adjustments were as follows (amounts in thousands):
| | Total
Accumulated
Earnings/(Loss) | | Capital | |
Sycamore Established Value Fund | | $ | (50,616 | ) | | $ | 50,616 | | |
| Sycamore Small Company Opportunity Fund | | | (28,053 | ) | | | 28,053 | | |
The tax character of distributions paid during the tax years ended, as noted below, were as follows (total distributions paid may differ from the Statements of Changes in Net Assets because, for tax purposes, dividends are recognized when actually paid) (amounts in thousands).
| | Eight Months Ended June 30, 2022 | | Year Ended October 31, 2021 | |
| | Distributions Paid From: | | | | Distributions Paid From: | | | |
| | Ordinary
Income | | Net
Long-Term
Capital Gains | | Total
Distributions
Paid | | Ordinary
Income | | Net
Long-Term
Capital Gains | | Total
Distributions
Paid | |
Sycamore Established
Value Fund | | $ | 438,661 | | | $ | 859,846 | | | $ | 1,298,507 | | | $ | 248,269 | | | $ | 433,348 | | | $ | 681,617 | | |
Sycamore Small Company
Opportunity Fund | | | 163,598 | | | | 662,345 | | | | 825,943 | | | | 32,840 | | | | 22,393 | | | | 55,233 | | |
| | Year Ended October 31, 2020 | |
| | Distributions Paid From: | | | |
| | | Ordinary
Income | | Net
Long-Term
Capital Gains | | Total
Distributions
Paid | |
Sycamore Established
Value Fund | | $ | 206,073 | | | $ | 517,611 | | | $ | 723,684 | | |
Sycamore Small Company
Opportunity Fund | | | 73,792 | | | | 224,771 | | | | 298,563 | | |
42
Victory Portfolios | | Notes to Financial Statements — continued
June 30, 2022 | |
As of June 30, 2022, the components of accumulated earnings/(loss) on a tax basis were as follows (amounts in thousands):
| | | Undistributed
Ordinary
Income | | Undistributed
Long-Term
Capital Gains | | Other
Earnings
(Deficit) | | Accumulated
Earnings | | Unrealized
Appreciation
(Depreciation)* | | Total
Accumulated
Earnings
(Loss) | |
Sycamore Established
Value Fund | | $ | 75,811 | | | $ | 704,804 | | | $ | (5 | ) | | $ | 780,610 | | | $ | 1,982,559 | | | $ | 2,763,169 | | |
Sycamore Small Company
Opportunity Fund | | | 14,442 | | | | 259,637 | | | | (4 | ) | | | 274,075 | | | | 534,497 | | | | 808,572 | | |
* The difference between the book-basis and tax-basis unrealized appreciation (depreciation) is attributable primarily to tax deferral of losses on wash sales.
As of the eight months ended June 30, 2022, the Funds had no capital loss carryforwards for the federal income tax purposes.
As of June 30, 2022, the cost basis for federal income tax purposes, gross unrealized appreciation, gross unrealized depreciation, and net unrealized appreciation (depreciation) for investments were as follows (amounts in thousands):
| | Cost of
Investments
for Federal
Tax Purposes | | Net
Gross
Unrealized
Appreciation | | Gross
Unrealized
Depreciation | | Net
Unrealized
Appreciation
(Depreciation) | |
Sycamore Established
Value Fund | | $ | 12,761,426 | | | $ | 2,841,606 | | | $ | (859,047 | ) | | $ | 1,982,559 | | |
Sycamore Small Company
Opportunity Fund | | | 5,250,880 | | | | 949,205 | | | | (414,708 | ) | | | 534,497 | | |
8. Affiliated Securities:
An affiliated security is a security in which a Fund has ownership of at least 5% of the security's outstanding voting shares, an investment company managed by VCM, or an issuer under common control with a Fund or VCM. The Funds do not invest in affiliated securities for the purpose of exercising management or control. These securities are noted as affiliated on a Fund's Schedule of Portfolio Investments. Transactions in affiliated securities during the eight months ended June 30, 2022, were as follows (amounts in thousands):
| | | Fair
Value
10/31/2021 | | Purchases
at Cost | | Proceeds
from
Sales | | Realized
Gains
(Losses) | | Capital
Gain
Distribution | | Net
Change in
Unrealized
Appreciation/
Depreciation | | Fair Value
6/30/2022 | | Dividend
Income | |
Victory Sycamore Established
Value Fund | |
Maximus, Inc. | | $ | 251,164 | | | $ | 40,615 | | | $ | — | | | $ | — | | | $ | — | | | $ | (72,994 | ) | | $ | 218,785 | | | $ | 2,713 | | |
43
Victory Portfolios | | Notes to Financial Statements — continued
June 30, 2022 | |
| | | Fair
Value
10/31/2021 | | Purchases
at Cost | | Proceeds
from
Sales | | Realized
Gains
(Losses) | | Capital
Gain
Distribution | | Net
Change in
Unrealized
Appreciation/
Depreciation | | Fair Value
6/30/2022 | | Dividend
Income | |
Sycamore Small Company
Opportunity Fund | |
AMERISAFE, Inc. | | $ | 60,179 | | | $ | — | | | $ | (1,433 | ) | | $ | (594 | ) | | $ | — | | | $ | (6,922 | ) | | $ | 51,230 | | | $ | 4,974 | | |
AngioDynamics, Inc.* | | | 46,378 | | | | 13,108 | | | | (3,039 | ) | | | (172 | ) | | | — | | | | (15,930 | ) | | | 40,345 | | | | — | | |
Citi Trends, Inc. | | | 39,879 | | | | 4,882 | | | | — | | | | — | | | | — | | | | (27,733 | ) | | | 17,028 | | | | — | | |
Hanger, Inc. | | | 48,101 | | | | 820 | | | | (922 | ) | | | (352 | ) | | | — | | | | (10,845 | ) | | | 36,802 | | | | — | | |
NETGEAR, Inc. | | | 56,939 | | | | 4,900 | | | | (769 | ) | | | (586 | ) | | | — | | | | (21,222 | ) | | | 39,262 | | | | — | | |
ScanSource, Inc. | | | 57,248 | | | | — | | | | (7,369 | ) | | | 811 | | | | — | | | | (7,094 | ) | | | 43,596 | | | | — | | |
The E.W. Scripps Co., Class A* | | | 60,822 | | | | 14,625 | | | | (2,888 | ) | | | (159 | ) | | | — | | | | (23,168 | ) | | | 49,232 | | | | — | | |
TriMas Corp.* | | | 60,697 | | | | 13,459 | | | | (1,830 | ) | | | (154 | ) | | | — | | | | (10,285 | ) | | | 61,887 | | | | 219 | | |
Viad Corp. | | | 61,416 | | | | 17,794 | | | | (1,587 | ) | | | (933 | ) | | | — | | | | (27,799 | ) | | | 48,891 | | | | — | | |
| | | $ | 491,659 | | | $ | 69,588 | | | $ | (19,837 | ) | | $ | (2,139 | ) | | $ | — | | | $ | (150,998 | ) | | $ | 388,273 | | | $ | 5,193 | | |
* Securities noted at the beginning of the October 31, 2021, did not meet the affiliated securities definition for the year ended October 31, 2021.
Transactions in affiliated securities during the year ended October 31, 2021, were as follows (amounts in thousands):
| | | Fair
Value
10/31/2020 | | Purchases
at Cost | | Proceeds
from
Sales | | Realized
Gains
(Losses) | | Capital
Gain
Distribution | | Net
Change in
Unrealized
Appreciation/
Depreciation | | Fair
Value
10/31/2021 | | Dividend
Income | |
Sycamore Small Company
Opportunity Fund | |
AMERISAFE, Inc. | | $ | 49,538 | | | $ | 10,432 | | | $ | (482 | ) | | $ | 45 | | | $ | — | | | $ | 646 | | | $ | 60,179 | | | $ | 4,020 | | |
Astec Industries, Inc.* | | | 37,744 | | | | 28,674 | | | | (620 | ) | | | 307 | | | | — | | | | (2,049 | ) | | | 64,056 | | | | 393 | | |
Citi Trends, Inc. | | | — | | | | 26,838 | | | | (390 | ) | | | 228 | | | | — | | | | 13,203 | | | | 39,879 | | | | — | | |
Hanger, Inc. | | | 39,179 | | | | 12,428 | | | | (4,353 | ) | | | 590 | | | | — | | | | 257 | | | | 48,101 | | | | — | | |
Helix Energy Solutions
Group, Inc.* | | | 14,980 | | | | 13,527 | | | | (405 | ) | | | (126 | ) | | | — | | | | 2,755 | | | | 30,731 | | | | — | | |
Marten Transport Ltd.* | | | 46,131 | | | | 20,389 | | | | (584 | ) | | | 179 | | | | — | | | | 3,232 | | | | 69,347 | | | | 4,186 | | |
NETGEAR, Inc. | | | 54,958 | | | | 25,150 | | | | (20,979 | ) | | | 3,336 | | | | — | | | | (5,526 | ) | | | 56,939 | | | | — | | |
ScanSource, Inc. | | | 24,596 | | | | 10,972 | | | | (357 | ) | | | 27 | | | | — | | | | 22,010 | | | | 57,248 | | | | — | | |
Viad Corp. | | | 20,071 | | | | 15,835 | | | | (570 | ) | | | 398 | | | | — | | | | 25,682 | | | | 61,416 | | | | — | | |
| | | $ | 287,197 | | | $ | 164,245 | | | $ | (28,740 | ) | | $ | 4,984 | | | $ | — | | | $ | 60,210 | | | $ | 487,896 | | | $ | 8,599 | | |
* Securities noted as of the year ended October 31, 2021, did not meet the affiliated security definition for the eight months ended June 30, 2022.
44
REPORT OF INDEPENDENT REGISTERED PUBLIC ACCOUNTING FIRM
To the Shareholders and Board of Trustees of Victory Portfolios
Opinion on the Financial Statements
We have audited the accompanying statements of assets and liabilities, including the schedules of portfolio investments, of Victory Portfolios comprising the funds listed below (the "Funds"), as of June 30, 2022, the related statements of operations, the statements of changes in net assets, the related notes, and the financial highlights for each of the periods indicated below (collectively referred to as the "financial statements"). In our opinion, the financial statements present fairly, in all material respects, the financial position of the Funds as of June 30, 2022, the results of their operations, the changes in net assets, and the financial highlights for each of the periods indicated below, in conformity with accounting principles generally accepted in the United States of America.
| Fund Name | | Statements of
Operations | | Statements of Changes
in Net Assets | | Financial Highlights | |
Victory Sycamore Established Value Fund and Victory Sycamore Small Company Opportunity Fund | | For the eight months ended June 30, 2022, and the year ended October 31, 2021 | | For the eight months ended June 30, 2022, and the two years ended October 31, 2021 and 2020 | | For the eight months ended June 30, 2022, and the three years ended October 31, 2021, 2020, and 2019 | |
The Funds' financial highlights for the year ended October 31, 2018 and prior, were audited by other auditors whose report dated December 21, 2018, expressed an unqualified opinion on those financial highlights.
Basis for Opinion
These financial statements are the responsibility of the Funds' management. Our responsibility is to express an opinion on the Funds' financial statements based on our audits. We are a public accounting firm registered with the Public Company Accounting Oversight Board (United States) ("PCAOB") and are required to be independent with respect to the Funds in accordance with the U.S. federal securities laws and the applicable rules and regulations of the Securities and Exchange Commission and the PCAOB.
We conducted our audits in accordance with the standards of the PCAOB. Those standards require that we plan and perform the audit to obtain reasonable assurance about whether the financial statements are free of material misstatement whether due to error or fraud.
Our audits included performing procedures to assess the risks of material misstatement of the financial statements, whether due to error or fraud, and performing procedures that respond to those risks. Such procedures included examining, on a test basis, evidence regarding the amounts and disclosures in the financial statements. Our procedures included confirmation of securities owned as of June 30, 2022, by correspondence with the custodian and brokers; when replies were not received from brokers, we performed other auditing procedures. Our audits also included evaluating the accounting principles used and significant estimates made by management, as well as evaluating the overall presentation of the financial statements. We believe that our audits provide a reasonable basis for our opinion.
45
We have served as the auditor of one or more investment companies advised by Victory Capital Management, Inc. since 2015.

COHEN & COMPANY, LTD.
Cleveland, Ohio
August 26, 2022
46
Victory Portfolios | | Supplemental Information
June 30, 2022 | |
(Unaudited)
Trustee and Officer Information
Board of Trustees:
Overall responsibility for management of the Trust rests with the Board. The Trust is managed by the Board in accordance with the laws of the State of Delaware. There are currently nine Trustees, eight of whom are not "interested persons" of the Trust within the meaning of that term under the 1940 Act ("Independent Trustees") and one of whom is an "interested person" of the Trust within the meaning of that term under the 1940 Act ("Interested Trustee"). The Trustees, in turn, elect the officers of the Trust to actively supervise its day-to-day operations.
The following tables list the Trustees, their date of birth, their position with the Trust, their commencement of service, their principal occupations during the past five years, and any directorships of other investment companies or companies whose securities are registered under the Securities Exchange Act of 1934, as amended, or who file reports under that Act. Each Trustee oversees 40 portfolios in the Trust, six portfolios in Victory Variable Insurance Funds, and 25 portfolios in Victory Portfolios II, each a registered investment company that, together with the Trust, comprise the Victory Funds Complex. David C. Brown is a Trustee of USAA Mutual Funds and oversees 45 portfolios of the USAA Mutual Funds Trust. Each Trustee's address is c/o Victory Portfolios, 4900 Tiedeman Road, 4th Floor, Brooklyn, Ohio 44144. Each Trustee has an indefinite term.
Name and Date of Birth | | Position
Held with
the Trust | | Date
Commenced
Service | | Principal Occupation
During Past 5 Years | | Other
Directorships
Held During
Past 5 Years | |
Independent Trustees. | |
David Brooks Adcock,
Born October 1951 | | Trustee | | May 2005 | | Consultant (since 2006). | | Chair and Trustee, Turner Funds (December 2016-December 2017). | |
Nigel D. T. Andrews,
Born April 1947 | | Trustee | | August 2002 | | Retired. | | Director, Carlyle Secured Lending, Inc. (formerly TCG BDC I, Inc.) (since 2012); Director, Carlyle Credit Solutions, Inc. (formerly TCG BDC II, Inc.) (since 2017); Trustee, Carlyle Secured Lending III (since 2021). | |
E. Lee Beard,*
Born August 1951 | | Trustee | | May 2005 | | Retired. | | None. | |
Dennis M. Bushe,
Born January 1944 | | Trustee | | July 2016 | | Retired. | | None. | |
47
Victory Portfolios | | Supplemental Information — continued
June 30, 2022 | |
(Unaudited)
Name and Date of Birth | | Position
Held with
the Trust | | Date
Commenced
Service | | Principal Occupation
During Past 5 Years | | Other
Directorships
Held During
Past 5 Years | |
John L. Kelly,
Born April 1953 | | Chair and Trustee | | February 2015 | | Partner, McCarvill Capital Partners (September 2016- September 2017). | | Director, Caledonia Mining Corporation (since May 2012). | |
David L. Meyer,
Born April 1957 | | Trustee | | December 2008 | | Retired. | | None. | |
Gloria S. Nelund,
Born May 1961 | | Trustee | | July 2016 | | Chair, CEO and Co-Founder of TriLinc Global, LLC, an investment firm. | | TriLinc Global Impact Fund, LLC (since 2012). | |
Leigh A. Wilson,
Born December 1944 | | Trustee | | November 1994 | | Private Investor. | | Chair (since 2013), Caledonia Mining Corporation. | |
Interested Trustee. | |
David C. Brown,**
Born May 1972 | | Trustee | | May 2008 | | Chairman and Chief Executive Officer (since 2013), the Adviser; Chairman and Chief Executive Officer (since 2013), Victory Capital Holdings, Inc.; Chairman and Chief Executive Officer (since 2019), Victory Capital Transfer Agency, Inc. | | Trustee, USAA Mutual Funds Trust; Board Member, Victory Capital Services, Inc. | |
* The Board has designated Ms. Beard as its Audit Committee Financial Expert.
** Mr. Brown is an "Interested Person" by reason of his relationship with the Adviser.
The Statement of Additional Information includes additional information about the Trustees of the Trust and is available, without charge, by calling 800-539-3863.
48
Victory Portfolios | | Supplemental Information — continued
June 30, 2022 | |
(Unaudited)
Officers:
The officers of the Trust, their date of birth, their commencement of service, and their principal occupations during the past five years, are detailed in the following table. Each officer serves until the earlier of his or her resignation, removal, retirement, death, or the election of a successor. The mailing address of each officer of the Trust is 4900 Tiedeman Road, 4th Floor, Brooklyn, Ohio 44144. The officers of the Trust receive no compensation directly from the Trust for performing the duties of their offices.
Name and Date of Birth | | Position with
the Trust | | Date
Commenced
Service | | Principal Occupation During Past 5 Years | |
Christopher K. Dyer,
Born February 1962 | | President | | February 2006 | | Director of Mutual Fund Administration, the Adviser (since 2004); Chief Operating Officer, Victory Capital Services, Inc. (since 2020); Vice President, Victory Capital Transfer Agency, Inc. (since 2019). | |
Scott A. Stahorsky,
Born July 1969 | | Vice President | | December 2014 | | Manager, Fund Administration, the Adviser (since 2015). | |
Erin G. Wagner,
Born February 1974 | | Secretary* | | December 2014-April 2022 | | Associate General Counsel, the Adviser (2013-2022). | |
Thomas Dusenberry,
Born July 1977 | | Secretary | | May 2022 | | Manager, Fund Administration, the Adviser (since 2022); Treasurer and Principal Financial Officer (2020-2022), Assistant Treasurer (2019), Salient MF Trust, Salient Midstream, MLP Fund and Forward Funds; Principal Financial Officer (2018-2021) and Treasurer (2020-2021), Salient Private Access Funds and Endowment PMF Funds; Senior Vice President of Fund Accounting and Operations, Salient Partners (2020-2022); Director of Fund Operations, Salient Partners (2016-2019). | |
Allan Shaer,
Born March 1965 | | Treasurer | | May 2017 | | Senior Vice President, Financial Administration, Citi Fund Services Ohio, Inc. (since 2016); Vice President, Mutual Fund Administration, JP Morgan Chase (2011-2016). | |
Christopher A. Ponte,
Born March 1984 | | Assistant Treasurer | | December 2017 | | Manager, Fund Administration, the Adviser (since 2017); Senior Analyst, Fund Administration, the Adviser (prior to 2017); Chief Financial Officer, Victory Capital Services, Inc. (since 2018). | |
Colin Kinney,
Born October 1973 | | Chief Compliance Officer** | | July 2017-June 2022 | | Chief Compliance Officer (2013-2022) and Chief Risk Officer (2009-2017), the Adviser. | |
Sean Fox,
Born September 1976 | | Chief Compliance
Officer | | June 2022 | | Sr. Compliance Officer, the Adviser (since 2019); Compliance Officer, the Adviser (2015-2019). | |
Chuck Booth,
Born April 1960 | | Anti-Money Laundering Compliance Officer and Identity Theft Officer | | May 2015 | | Director, Regulatory Administration and CCO Support Services, Citi Fund Services Ohio, Inc. | |
49
Victory Portfolios | | Supplemental Information — continued
June 30, 2022 | |
(Unaudited)
Name and Date of Birth | | Position with
the Trust | | Date
Commenced
Service | | Principal Occupation During Past 5 Years | |
Jay G. Baris,
Born January 1954 | | Assistant Secretary | | December 1997 | | Partner, Sidley Austin LLP (since 2020); Partner, Shearman & Sterling LLP (2018-2020); Partner, Morrison & Foerster LLP (2011-2018). | |
* On April 27, 2022, Ms. Wagner resigned her position with the Trust.
** On June 10, 2022, Mr. Kinney resigned his position with the Trust.
50
Victory Portfolios | | Supplemental Information — continued
June 30, 2022 | |
(Unaudited)
Proxy Voting and Portfolio Holdings Information
Proxy Voting:
Information regarding the policies and procedures each Fund uses to determine how to vote proxies relating to portfolio securities is available without charge, upon request, by calling 800-539-3863. The information is also included in the Funds' Statement of Additional Information, which is available on the SEC's website at www.sec.gov.
Information relating to how the Funds voted proxies relating to portfolio securities held during the most recent 12 months ended June 30 is available on the SEC's website at www.sec.gov.
Availability of Schedules of Portfolio Investments:
The Trust files a complete list of Schedules of Portfolio Investments with the SEC for the first and third quarter of each fiscal year on Form N-PORT. Forms N-PORT are available on the SEC's website at www.sec.gov.
Expense Examples
As a shareholder of a Fund, you may incur two types of costs: (1) transaction costs, including sales charges (loads) on purchases; and (2) ongoing costs, including management fees and other Fund expenses. These examples are intended to help you understand your ongoing costs (in dollars) of investing in a Fund and to compare these costs with the ongoing costs of investing in other mutual funds.
These examples are based on an investment of $1,000 invested at the beginning of the period and held for the entire period from January 1, 2022, through June 30, 2022.
The Actual Expense figures in the table below provide information about actual account values and actual expenses. You may use the information below, together with the amount you invested, to estimate the expenses that you paid over the period. Simply divide your account value by $1,000 (for example, an $8,600 account value divided by $1,000 = 8.6), then multiply the result by the number in the table under the heading entitled "Actual Expenses Paid During Period" to estimate the expenses you paid on your account during this period.
The Hypothetical Expense figures in the table below provide information about hypothetical account values and hypothetical expenses based on the Fund's actual expense ratio and an assumed rate of return of 5% per year before expenses, which is not the Fund's actual return. The hypothetical account values and expenses may not be used to estimate the actual ending account balance or expenses you paid for the period. You may use this information to compare this 5% hypothetical example with the 5% hypothetical examples that appear in shareholder reports of other funds.
Please note the expenses shown in the table below are meant to highlight your ongoing costs only and do not reflect any transactional costs. Therefore, the hypothetical expenses in the table are useful in comparing ongoing costs only and will not help you determine the relative total costs of owning different funds. In addition, if these transactional costs were included, your costs would have been higher.
| | | Beginning
Account
Value
1/1/22 | | Actual
Ending
Account
Value
6/30/22 | | Hypothetical
Ending
Account
Value
6/30/22 | | Actual
Expenses Paid
During Period
1/1/22-6/30/22* | | Hypothetical
Expenses Paid
During Period
1/1/22-6/30/22* | | Annualized
Expense Ratio
During Period
1/1/22-6/30/22 | |
Sycamore Established Value | |
Class A | | $ | 1,000.00 | | | $ | 890.60 | | | $ | 1,020.33 | | | $ | 4.22 | | | $ | 4.51 | | | | 0.90 | % | |
Class C | | | 1,000.00 | | | | 887.30 | | | | 1,016.56 | | | | 7.77 | | | | 8.30 | | | | 1.66 | % | |
Class I | | | 1,000.00 | | | | 892.00 | | | | 1,021.92 | | | | 2.72 | | | | 2.91 | | | | 0.58 | % | |
Class R | | | 1,000.00 | | | | 889.90 | | | | 1,019.29 | | | | 5.20 | | | | 5.56 | | | | 1.11 | % | |
Class R6 | | | 1,000.00 | | | | 892.20 | | | | 1,022.12 | | | | 2.53 | | | | 2.71 | | | | 0.54 | % | |
Class Y | | | 1,000.00 | | | | 892.00 | | | | 1,021.72 | | | | 2.91 | | | | 3.11 | | | | 0.62 | % | |
51
Victory Portfolios | | Supplemental Information — continued
June 30, 2022 | |
(Unaudited)
| | | Beginning
Account
Value
1/1/22 | | Actual
Ending
Account
Value
6/30/22 | | Hypothetical
Ending
Account
Value
6/30/22 | | Actual
Expenses Paid
During Period
1/1/22-6/30/22* | | Hypothetical
Expenses Paid
During Period
1/1/22-6/30/22* | | Annualized
Expense Ratio
During Period
1/1/22-6/30/22 | |
Sycamore Small Company Opportunity | |
Class A | | $ | 1,000.00 | | | $ | 859.40 | | | $ | 1,018.60 | | | $ | 5.76 | | | $ | 6.26 | | | | 1.25 | % | |
Class I | | | 1,000.00 | | | | 861.00 | | | | 1,020.33 | | | | 4.15 | | | | 4.51 | | | | 0.90 | % | |
Class R | | | 1,000.00 | | | | 858.80 | | | | 1,017.70 | | | | 6.59 | | | | 7.15 | | | | 1.43 | % | |
Class R6 | | | 1,000.00 | | | | 861.30 | | | | 1,020.53 | | | | 3.97 | | | | 4.31 | | | | 0.86 | % | |
Class Y | | | 1,000.00 | | | | 860.90 | | | | 1,020.08 | | | | 4.38 | | | | 4.76 | | | | 0.95 | % | |
* Expenses are equal to the average account value multiplied by the Fund's annualized expense ratio multiplied by 181/365 (the number of days in the most recent fiscal half-year divided by the number of days in the fiscal year).
52
Victory Portfolios | | Supplemental Information — continued
June 30, 2022 | |
(Unaudited)
Additional Federal Income Tax Information
For the eight months ended June 30, 2022, the following Funds paid qualified dividend income for the purposes of reduced individual federal income tax rates of:
| | | Percent | |
Sycamore Established Value Fund | | | 74 | % | |
Sycamore Small Company Opportunity Fund | | | 52 | % | |
Dividends qualified for corporate dividends received deductions of:
| | | Percent | |
Sycamore Established Value Fund | | | 73 | % | |
Sycamore Small Company Opportunity Fund | | | 52 | % | |
For the eight months ended June 30, 2022, the following Funds designated short-term capital gain distributions (in thousands):
| | | Amount | |
Sycamore Established Value Fund | | $ | 210,674 | | |
Sycamore Small Company Opportunity Fund | | | 139,835 | | |
For the eight months ended June 30, 2022, the following Funds designated long-term capital gain distributions (in thousands):
| | | Amount | |
Sycamore Established Value Fund | | $ | 908,015 | | |
| Sycamore Small Company Opportunity Fund | | | 691,386 | | |
53
Privacy Policy
Protecting the Privacy of Information
The Trust respects your right to privacy. We also know that you expect us to conduct and process your business in an accurate and efficient manner. To do so, we must collect and maintain certain personal information about you. This is the information we collect from you on applications or other forms, and from the transactions you make with us or third parties. It may include your name, address, social security number, account transactions and balances, and information about investment goals and risk tolerance.
We do not disclose any information about you or about former customers to anyone except as permitted or required by law. Specifically, we may disclose the information we collect to companies that perform services on our behalf, such as the transfer agent that processes shareholder accounts and printers and mailers that assist us in the distribution of investor materials. We may also disclose this information to companies that perform marketing services on our behalf. This allows us to continue to offer you Victory investment products and services that meet your investing needs, and to effect transactions that you request or authorize. These companies will use this information only in connection with the services for which we hired them. They are not permitted to use or share this information for any other purpose.
To protect your personal information internally, we permit access only by authorized employees and maintain physical, electronic, and procedural safeguards to guard your personal information.*
* You may have received communications regarding information about privacy policies from other financial institutions which gave you the opportunity to "opt-out" of certain information sharing with companies which are not affiliated with that financial institution. The Trust does not share information with other companies for purposes of marketing solicitations for products other than the Trust. Therefore, the Trust does not provide opt-out options to their shareholders.
Victory Funds
P.O. Box 182593
Columbus, Ohio 43218-2593

Visit our website at: | | Call Victory at: | |
www.vcm.com | | 800-539-FUND (800-539-3863) | |
Item 2. Code of Ethics.
| (a) | The registrant has adopted a code of ethics that applies to the registrant’s principal executive officer, principal financial officer, principal accounting officer or controller, or persons performing similar functions. This code of ethics in included as an Exhibit. |
| (b) | During the period covered by the report, with respect to the registrant’s code of ethics that applies to its principal executive officer, principal financial officer, principal accounting officer or controller, or persons performing similar functions; there have been no amendments to, nor any waivers granted from, a provision that relates to any element of the code of ethics definition enumerated in paragraph (b) of this Item 2. |
Item 3. Audit Committee Financial Expert.
(a)(1) The registrant’s board of directors has determined that the registrant has at least one audit committee financial expert serving on its audit committee.
(a)(2) The audit committee financial expert is E. Lee Beard, who is “independent” for purposes of this Item 3 of Form N-CSR.
Item 4. Principal Accountant Fees and Services.
| | | 2022 | | | 2021 | |
| (a) Audit Fees (1) | | $ | 246,800 | | | $ | 245,500 | |
| (b) Audit-Related Fees (2) | | | 0 | | | | 0 | |
| (c) Tax Fees (3) | | | 73,000 | | | | 76,250 | |
| (d) All Other Fees (4) | | | 0 | | | | 0 | |
(1) Audit fees include amounts related to the audit of the Registrant’s annual financial statements and services normally provided by the accountant in connection with statutory and regulatory filings. Audit fees billed were for professional services provided by Cohen & Company, Ltd for audit compliance, audit advice and audit planning.
(2) Represents the fee for assurance and related services by Cohen & Company, Ltd reasonably related to the performance of the audit of the Registrant’s financial statements that was not reported under (a) of this item.
(3) Represents the aggregate tax fee billed for professional services rendered by Cohen & Company, Ltd for tax compliance, tax advice, international tax fee transactions and tax planning. Such tax services included the review of income and excise tax returns for the Registrant.
(4) For the fiscal years ended June 30, 2022 and June 30, 2021, there were no fees billed for professional services rendered by Cohen & Company, Ltd to the Registrant, other than the services reported in (a) through (c) of this item.
Tax fees for 2022 and 2021 are for recurring tax fees for the preparation of the federal and state tax returns and procedures performed relating to the Registrant’s analysis of complex securities.
(e)(1) The Registrant’s Audit Committee must pre-approve non-audit services to be provided by the principal accountant and the fees charged with these services. The Committee may delegate authority to one or more Committee members to pre-approve these services, subject to subsequent review and approval by the Committee.
(e)(2) There were no services performed under Rule 2.01 (c)(7)(i)(C).
(f) Not applicable.
(g)
| 2022 | | $ | 73,000 | |
| 2021 | | $ | 76,250 | |
(h) The Registrant’s Audit Committee has evaluated the non-audit services that the principal accountant provided to the Registrant’s investment adviser (and the adviser’s relevant affiliated), which services the Committee did not pre-approve, and has concluded that the provision of those services was compatible with maintaining the accountant’s independence.
Item 5. Audit Committee of Listed Registrants.
Not applicable.
Item 6. Investments.
(a) Not applicable.
(b) Not applicable.
Item 7. Disclosure of Proxy Voting Policies and Procedures for Closed-End Management Investment Companies.
Not applicable.
Item 8. Portfolio Managers of Closed-End Management Investment Companies.
Not applicable.
Item 9. Purchases of Equity Securities by Closed-End Management Investment Company and Affiliated Purchasers.
Not applicable.
Item 10. Submission of Matters to a Vote of Security Holders.
Not applicable.
Item 11. Controls and Procedures.
(a) The registrant’s principal executive officer and principal financial officer have concluded, based on their evaluation of the registrant's disclosure controls and procedures as conducted within 90 days of the filing date of this report, that these disclosure controls and procedures are adequately designed and are operating effectively to ensure that information required to be disclosed by the registrant on Form N-CSR is recorded, processed, summarized and reported within the time periods specified in the Securities and Exchange Commission's rules and forms.
(b) There were no changes in the registrant’s internal control over financial reporting (as defined in Rule 30a-3(d) under the Investment Company Act of 1940 (17 CFR 270.30a-3(d)) that occurred during the period covered by this report that have materially affected or are reasonably likely to materially affect, the registrant’s internal control over financial reporting.
Item 12. Disclosure of Securities Lending Activities for Closed-End Management Investment Companies.
(a)(1) Not applicable.
(a)(2) Not applicable.
(a)(3) Not applicable.
(a)(4) Not applicable.
(b) Not applicable.
Item 13. Exhibits.
(a)(1) The code of ethics that is the subject of the disclosure required by Item 2 is attached hereto.
(a)(2) Certifications pursuant to Rule 30a-2(a) are attached hereto.
(a)(3) Not applicable.
(b) Certifications pursuant to Rule 30a-2(b) are furnished herewith.
SIGNATURES
Pursuant to the requirements of the Securities Exchange Act of 1934 and the Investment Company Act of 1940, the registrant has duly caused this report to be signed on its behalf by the undersigned, thereunto duly authorized.
| (Registrant) | Victory Portfolios | |
| By (Signature and Title)* | /s/ Allan Shaer | |
| | Allan Shaer, Principal Financial Officer | |
Pursuant to the requirements of the Securities Exchange Act of 1934 and the Investment Company Act of 1940, this report has been signed below by the following persons on behalf of the registrant and in the capacities and on the dates indicated.
| By (Signature and Title)* | /s/ Christopher K. Dyer | |
| | Christopher K. Dyer, Principal Executive Officer | |
| By (Signature and Title)* | /s/ Allan Shaer | |
| | Allan Shaer, Principal Financial Officer | |