UNITED STATES
SECURITIES AND EXCHANGE COMMISSION
Washington, D.C. 20549
FORM N-CSR
CERTIFIED SHAREHOLDER REPORT OF REGISTERED
MANAGEMENT INVESTMENT COMPANIES
Investment Company Act file number: 811-04852
Victory Portfolios
(Exact name of registrant as specified in charter)
| 4900 Tiedeman Road, 4th Floor, Brooklyn, Ohio | 44144 |
| (Address of principal executive offices) | (Zip code) |
Citi Fund Services Ohio, Inc., 4400 Easton Commons, Suite 200, Columbus, OH 43219
(Name and address of agent for service)
Registrant’s telephone number, including area code: 800-539-3863
Date of fiscal year end: June 30
Date of reporting period: June 30, 2021
Item 1. Reports to Stockholders.

June 30, 2021
Annual Report
Victory Integrity Discovery Fund
Victory Integrity Mid-Cap Value Fund
Victory Integrity Small-Cap Value Fund
Victory Integrity Small/Mid-Cap Value Fund
Victory Munder Multi-Cap Fund
Victory S&P 500 Index Fund
Victory Munder Mid-Cap Core Growth Fund
Victory Munder Small Cap Growth Fund
Victory Trivalent International Fund-Core Equity
Victory Trivalent International Small-Cap Fund
Victory INCORE Total Return Bond Fund
www.vcm.com
News, Information And Education 24 Hours A Day, 7 Days A Week
The Victory Funds site gives fund shareholders, prospective shareholders, and investment professionals a convenient way to access fund information, get guidance, and track fund performance anywhere they can access the Internet. The site includes:
• Detailed performance records
• Daily share prices
• The latest fund news
• Investment resources to help you become a better investor
• A section dedicated to investment professionals
Whether you're a potential investor searching for the fund that matches your investment philosophy, a seasoned investor interested in planning tools, or an investment professional, www.vcm.com has what you seek. Visit us anytime. We're always open.
TABLE OF CONTENTS
Shareholder Letter (Unaudited) | | | 4 | | |
Managers' Commentary / Investment Overview (Unaudited) | | | 6 | | |
Investment Objective and Portfolio
Holdings (Unaudited) | | | 35 | | |
Schedules of Portfolio Investments | |
Victory Integrity Discovery Fund | | | 46 | | |
Victory Integrity Mid-Cap Value Fund | | | 51 | | |
Victory Integrity Small-Cap Value Fund | | | 55 | | |
Victory Integrity Small/Mid-Cap Value Fund | | | 60 | | |
Victory Munder Multi-Cap Fund | | | 64 | | |
Victory S&P 500 Index Fund | | | 67 | | |
Victory Munder Mid-Cap Core Growth Fund | | | 79 | | |
Victory Munder Small Cap Growth Fund | | | 82 | | |
Victory Trivalent International Fund-Core Equity | | | 87 | | |
Victory Trivalent International Small-Cap Fund | | | 99 | | |
Victory INCORE Total Return Bond Fund | | | 110 | | |
Financial Statements | |
Statements of Assets and Liabilities | | | 120 | | |
Statements of Operations | | | 124 | | |
Statements of Changes in Net Assets | | | 128 | | |
Financial Highlights | | | 140 | | |
Notes to Financial Statements | | | 162 | | |
Report of Independent Registered Public
Accounting Firm | | | 182 | | |
Supplemental Information (Unaudited) | | | 183 | | |
Trustees' and Officers' Information | | | 183 | | |
Proxy Voting and Portfolio Holdings Information | | | 186 | | |
Expense Examples | | | 186 | | |
Additional Federal Income Tax Information | | | 188 | | |
Liquidity Risk Management Program | | | 189 | | |
Privacy Policy (inside back cover) | | | |
1
IRA DISTRIBUTION WITHHOLDING DISCLOSURE
We generally must withhold federal income tax at a rate of 10% of the taxable portion of your distribution and, if you live in a state that requires state income tax withholding, at your state's tax rate. However, you may elect not to have withholding apply or to have income tax withheld at a higher rate. Any withholding election that you make will apply to any subsequent distribution unless and until you change or revoke the election. If you wish to make a withholding election, or change or revoke a prior withholding election, call 800-539-3863 (800-235-8396 for Member Class) and form W-4P (OMB No. 1545-0074 withholding certificate for pension or annuity payments) will be electronically sent.
If you do not have a withholding election in place by the date of a distribution, federal income tax will be withheld from the taxable portion of your distribution at a rate of 10%. If you must pay estimated taxes, you may be subject to estimated tax penalties if your estimated tax payments are not sufficient and sufficient tax is not withheld from your distribution.
For more specific information, please consult your tax adviser.
The Funds are distributed by Victory Capital Services, Inc. Victory Capital Management Inc. is the investment adviser to the Funds and receives fees from the Funds for performing services for the Funds.
This report is not authorized for distribution to prospective investors unless preceded or accompanied by a current prospectus of the Victory Funds.
For additional information about any Victory Fund, including fees, expenses, and risks, view our prospectus online at vcm.com or call 800-539-3863 (800-235-8396 for Member Class). Read it carefully before you invest or send money.
The information in this report is based on data obtained from recognized services and sources and is believed to be reliable. Any opinions, projections, or recommendations in this report are subject to change without notice and are not intended as individual investment advice. Past investment performance of the Funds, markets or securities mentioned herein should not be considered to be indicative of future results.
• NOT FDIC INSURED • NO BANK GUARANTEE • MAY LOSE VALUE

Call Victory at:
800-539-FUND (800-539-3863)
800-235-8396 for Member Class
Visit our website at:
www.vcm.com
2
This page is intentionally left blank.
3
Victory Funds Letter to Shareholders
(Unaudited)
Dear Shareholder,
Never a dull moment. A year ago, we were still coming to grips with a global pandemic, hoping for an effective vaccine, and wondering whether the U.S. Federal Reserve's (the "Fed") aggressive actions would continue to mollify financial markets. As it turns out, a vaccine was rolled out (domestically) faster than expectations, and a recovery that began during the second quarter of 2020 continued unabated.
Fast forward to today and investors are suddenly more concerned about labor shortages, rising commodity prices, and whether inflation will prove to be transitory or more lasting. If anything, this merely exemplifies that markets are unpredictable and the environment can and will change rapidly.
Reflecting on the past year, we must consider ourselves fortunate despite the myriad challenges. For starters, it was impressive how quickly the various forms of monetary and fiscal stimulus contributed to a rebound in GDP. Of course, it wasn't a straight line upward and there were bouts of elevated volatility in both bond and stock markets. Late in 2020, for example, financial markets were alternately fueled and roiled by a contentious election season, growing optimism for an effective vaccine, and a fluid debate regarding the need for even more stimulus. Ultimately, stocks were propelled higher in the fourth quarter of 2020 as it became clear Congress would provide another dose of stimulus in the form of direct payments, more unemployment insurance, and additional aid to businesses.
As we moved into 2021, stocks continued their upward trajectory. Meanwhile, the yield on the 10-Year U.S. Treasury continued rallying sharply as many investors began to shift their focus. Deflation was out; inflation was in. Indeed, the potential for a new era of inflation and higher interest rates seems to be the new worry du jour.
Through all the volatility and surprises, the S&P 500® Index registered an impressive annual return of 40.79% for the 12-month period ended June 30, 2021. In fact, this broad market index ended the reporting period at an all-time high. Over this same period, the yield on the 10-Year U.S. Treasury jumped 79 basis points (a basis point is 1/100th of a percentage point), reflecting a very low starting rate, substantial fiscal stimulus, and the Fed's ongoing accommodative monetary policy. At the end of the reporting period, the yield on the 10-Year U.S. Treasury was 1.45%.
No doubt, the past year is not one we will forget any time soon. There were many hardships, but we should not overlook the positives and remember our collective spirit and perseverance. Markets endured and even surprised to the upside, but perhaps the key takeaway is that investors need to remain calm in the face of adversity and focused on longer-term investment goals. That's usually the best approach no matter what the markets throw at us.
On the following pages, you will find information relating to your Victory Funds investment. If you have any questions, we encourage you to contact your financial advisor. If you invest with us directly, you may call 800-539-3863 (800-235-8396 for Member Class), or visit our website at www.vcm.com.
4
From all of us here at Victory Capital, thank you for placing your confidence in us and for letting us help you work toward your investment goals.

Christopher K. Dyer, CFA
President,
Victory Funds
5
Victory Integrity Discovery Fund
Managers' Commentary
(Unaudited)
What were the market conditions during the reporting period?
After the second wave of COVID-19 hit in June 2020, equities recovered the rest of the year and into the first half of 2021 due to unprecedented fiscal and monetary policy intervention and extraordinary progress towards vaccines and treatments. Markets also benefited from clarity around the U.S. presidential election after major media outlets called the presidential race for Joe Biden in November. Equities continued to rally into the new year as vaccination rollouts increased throughout the country. An increased rate of vaccinations and a declining rate of COVID-19 cases led to state and region reopenings throughout the country. These events aided economic activity and fueled equity markets to push higher as business and consumer sentiment started to improve. From a market capitalization viewpoint, small-cap equities outperformed their mid- and large-cap peers.
The top-performing sectors within the benchmark were Consumer Discretionary, Communication Services, Energy, and Materials while Utilities and Consumer Staples were the weakest-performing sectors. Micro-cap value stocks outperformed micro-cap growth stocks.
How did Victory Integrity Discovery Fund (the "Fund") perform during the reporting period?
The Fund returned 89.51% (Class A at net asset value) for the fiscal year ended June 30, 2021, outperforming the Russell Microcap® Value Index (the "Index"), which returned 83.62% during the period.
What strategies did you employ during the reporting period?
Stock selection in Health Care was the prominent contributor to Fund performance. Stock selection in Technology, Financials, and Consumer Staples also helped Fund performance. Security selection in Consumer Discretionary hurt Fund performance. Sector weights were a positive on Fund performance relative to the Index due to underweight positions in Consumer Staples, Health Care, Consumer Discretionary, and Financials. From a style perspective, the Fund holdings on average had higher beta and higher liquidity relative to the Index and both were tailwinds. The Fund's holdings, on average, had a larger market capitalization than the Index and this was a headwind.
We have benefited from our positioning in the aftermath of the pandemic as our portfolio has been tilted towards stocks that we believed would outperform as fears of the virus subsided. This return to value trading also has been aided by the fact that value style has outperformed growth style. Going forward, we still believe in value versus growth. Our value-rising strategy — rising economic activity, rising revenue, rising margins, rising rates, and rising taxes still holds in our view. However, investors returned to growth stocks at the end of the second quarter in 2021. There is still a lot of uncertainty surrounding tax policy. Diminishing inflation concerns, declining 10-year yields, and decreasing threats of increased taxes combined to rally growthier stocks. Despite the pullback in relative performance for value in June, we continue to believe the combination of earnings growth and cheap relative valuations looks attractive. Value stocks are forecasted to grow earnings by 32.4% compared
6
Victory Integrity Discovery Fund (continued)
to growth at 27.6% (Jeffries valuation handbook (7/6/2021)). Value has rallied relative to growth this year, but it still looks cheap on an historical basis. This fuels our belief that, despite some short-term reversals, the trend is for value to outperform. We believe the Fund is positioned to benefit from this combination of good value and good news.
7
Victory Integrity Discovery Fund (continued)
Investment Overview
(Unaudited)
Average Annual Total Return
Year Ended June 30, 2021
| | Class A | | Class C | | Class R | | Class Y | | Member Class | | | |
INCEPTION DATE | | 12/26/96 | | 3/31/97 | | 7/29/04 | | 12/26/96 | | 11/2/20 | | | |
| | Net Asset
Value | | Maximum
Offering
Price | | Net Asset
Value | | Contingent
Deferred
Charges | | Net Asset
Value | | Net Asset
Value | | Net Asset
Value | | Russell
Microcap®
Value Index1 | |
One Year | | | 89.51 | % | | | 78.59 | % | | | 87.93 | % | | | 86.93 | % | | | 88.56 | % | | | 90.09 | % | | | NA | | | | 83.62 | % | |
Five Year | | | 13.91 | % | | | 12.57 | % | | | 12.99 | % | | | 12.99 | % | | | 13.33 | % | | | 14.18 | % | | | NA | | | | 17.13 | % | |
Ten Year | | | 12.58 | % | | | 11.92 | % | | | 11.70 | % | | | 11.70 | % | | | 12.12 | % | | | 12.86 | % | | | NA | | | | 12.80 | % | |
Since Inception | | | NA | | | | NA | | | | NA | | | | NA | | | | NA | | | | NA | | | | 72.85 | % | | | NA | | |
The performance data quoted represents past performance and current returns may be lower or higher. The investment return and principal value will fluctuate so that an investor's shares, when redeemed, may be worth more or less than the original cost. To obtain performance information current to the most recent month's end, please visit www.vcm.com.
The maximum offering price ("MOP") figures reflect a maximum sales charge of 5.75% for Class A. Class C is not subject to an initial sales charge, but is subject to a deferred sales charge of 1.00% on shares redeemed within one year of purchase. Net Asset Value does not reflect sales charges.
Total return measures the price change in a share assuming the reinvestment of all net investment income and realized capital gain distributions, if any. The total returns quoted do not reflect adjustments made to the enclosed financial statements in accordance with U.S. Generally Accepted Accounting Principles or the deduction of taxes that a shareholder would pay on net investment income and realized capital gain distributions, including reinvested distributions, or redemptions of shares. The total return figures set forth above include all waivers of fees. Without such fee waivers, the total returns would have been lower.
Victory Integrity Discovery Fund — Growth of $10,000

1The Russell Microcap® Value Index is a capitalization–weighted index that measures the performance of the smallest 1,000 securities in the Russell 2000® Index, plus the next 1,000 smallest eligible securities by market cap. The Russell 2000® Index is a capitalization-weighted index that measures the performance of approximately 2,000 of the smallest companies in the Russell 3000® Index, an index representing approximately 98% of the investable U.S. equity market. This index does not include the effect of sales charges, commissions, expenses, or taxes, is not representative of the Fund, and it is not possible to invest directly in an index.
The graph reflects investment of growth of a hypothetical $10,000 investment in Class A of the Fund.
The graph and table do not reflect the deduction of taxes that a shareholder would pay on Fund distributions or the redemption of shares.
Past performance is not indicative of future results.
8
Victory Integrity Mid-Cap Value Fund
Managers' Commentary
(Unaudited)
What were the market conditions during the reporting period?
After the second wave of COVID-19 hit in June 2020, equities recovered the rest of the year and into the first half of 2021 due to unprecedented fiscal and monetary policy intervention and extraordinary progress towards vaccines and treatments. Markets also benefited from clarity around the U.S. presidential election after major media outlets called the presidential race for Joe Biden in November. Equities continued to rally into the new year as vaccination rollouts increased throughout the country. An increased rate of vaccinations and a declining rate of COVID-19 cases led to state and region reopenings throughout the country. These events aided economic activity and fueled equity markets to push higher as business and consumer sentiment started to improve. From a market capitalization viewpoint, small-cap equities outperformed their mid- and large-cap peers.
The top performing sectors within the benchmark were Material and Energy while Utilities and Consumer Staples were the weakest-performing sectors. Mid-cap value stocks outperformed mid cap growth stocks.
How did Victory Integrity Mid-Cap Value Fund (the "Fund") perform during the reporting period?
The Fund returned 58.66% (Class A at net asset value) for the fiscal year ended June 30, 2021, outperforming the Russell Midcap® Value Index (the "Index"), which returned 53.06% for the period.
What strategies did you employ during the reporting period?
Stock selection in Consumer Discretionary, Technology, and Industrials were the main contributors that resulted in Fund outperformance. Security selection in Health Care hurt Fund performance. The Fund's holdings, on average, had higher beta and higher volatility relative to the Index and both were tailwinds.
We have benefited from our positioning in the aftermath of the pandemic as our portfolio has been tilted towards stocks that we believed would outperform as fears of the virus subsided. This return to value trade has also been aided by the fact that value style has outperformed growth style. Going forward, we still believe in value versus growth. Our value-rising strategy — rising economic activity, rising revenue, rising margins, rising rates, and rising taxes still holds in our view. However, investors returned to growth stocks at the end of the second quarter in 2021. There is still a lot of uncertainty surrounding tax policy. Diminishing inflation concerns, declining 10-year yields, and decreasing threats of increased taxes combined to rally growthier stocks. Despite the pullback in relative performance for value in June, we continue to believe the combination of earnings growth and cheap relative valuations looks attractive. Value stocks are forecasted to grow earnings by 32.4% compared to growth at 27.6% (Jeffries valuation handbook (7/6/2021)). Value has rallied relative to growth this year, but it still looks cheap on an historical basis. This fuels our belief that, despite some short-term reversals, the trend is for value to outperform. We believe the Fund is positioned to benefit from this combination of good value and good news.
9
Victory Integrity Mid-Cap Value Fund (continued)
Investment Overview
(Unaudited)
Average Annual Total Return
Year Ended June 30, 2021
| | | Class A | | Class C | | Class R6 | | Class Y | | Member Class | | | |
INCEPTION DATE | | 7/1/11 | | 11/4/19 | | 12/14/15 | | 7/1/11 | | 11/2/20 | | | |
| | | Net Asset
Value | | Maximum
Offering
Price | | Net Asset
Value | | Contingent
Deferred
Charges | | Net Asset
Value | | Net Asset
Value | | Net Asset
Value | | Russell
Midcap®
Value Index1 | |
One Year | | | 58.66 | % | | | 49.56 | % | | | 57.43 | % | | | 56.43 | % | | | 59.24 | % | | | 59.03 | % | | | NA | | | | 53.06 | % | |
Five Year | | | 12.12 | % | | | 10.80 | % | | | NA | | | | NA | | | | 12.52 | % | | | 12.40 | % | | | NA | | | | 11.79 | % | |
Since Inception | | | 11.24 | % | | | 10.58 | % | | | 16.98 | % | | | 16.98 | % | | | 13.06 | % | | | 11.53 | % | | | 43.46 | % | | | NA | | |
The performance data quoted represents past performance and current returns may be lower or higher. The investment return and principal value will fluctuate so that an investor's shares, when redeemed, may be worth more or less than the original cost. To obtain performance information current to the most recent month's end, please visit www.vcm.com.
The maximum offering price ("MOP") figures reflect a maximum sales charge of 5.75% for Class A. Class C is not subject to an initial sales charge, but is subject to a deferred sales charge of 1.00% on shares redeemed within one year of purchase. Net Asset Value does not reflect sales charges.
Total return measures the price change in a share assuming the reinvestment of all net investment income and realized capital gain distributions, if any. The total returns quoted do not reflect adjustments made to the enclosed financial statements in accordance with U.S. Generally Accepted Accounting Principles or the deduction of taxes that a shareholder would pay on net investment income and realized capital gain distributions, including reinvested distributions, or redemptions of shares. The total return figures set forth above include all waivers of fees. Without such fee waivers, the total returns would have been lower.
Victory Integrity Mid-Cap Value Fund — Growth of $10,000

1The Russell Midcap® Value Index is an unmanaged index made up of medium and medium/small companies in the Russell 1000® Index chosen for their value orientation. This index does not include the effect of sales charges, commissions, expenses, or taxes, is not representative of the Fund, and it is not possible to invest directly in an index.
The graph reflects investment of growth of a hypothetical $10,000 investment in Class A of the Fund.
The graph and table do not reflect the deduction of taxes that a shareholder would pay on Fund distributions or the redemption of shares.
Past performance is not indicative of future results.
10
Victory Integrity Small-Cap Value Fund
Managers' Commentary
(Unaudited)
What were the market conditions during the reporting period?
After the second wave of COVID-19 hit in June 2020, equities recovered the rest of the year and into the first half of 2021 due to unprecedented fiscal and monetary policy intervention and extraordinary progress towards vaccines and treatments. Markets also benefited from clarity around the U.S. presidential election after major media outlets called the presidential race for Joe Biden in November. Equities continued to rally into the new year as vaccination rollouts increased throughout the country. An increased rate of vaccinations and a declining rate of COVID-19 cases led to state and region reopenings throughout the country. These events aided economic activity and fueled equity markets to push higher as business and consumer sentiment started to improve. From a market capitalization viewpoint, small-cap equities outperformed their mid- and large-cap peers.
The top-performing sectors within the benchmark were Communication Services, Consumer Discretionary, Energy, and Materials while Utilities and Real Estate were the weakest-performing sectors relative to the benchmark. Small-cap value stocks outperformed small-cap growth stocks.
How did Victory Integrity Small-Cap Value Fund (the "Fund") perform during the reporting period?
The Fund returned 80.41% (Class A at net asset value) for the fiscal year ended June 30, 2021, outperforming the Russell 2000® Value Index (the "Index"), which returned 73.28% for the period.
What strategies did you employ during the reporting period?
Security selection in Financials, Materials, Industrials, Energy, and Health Care were the largest positive contributors to Fund performance, while stock selection in Communication Services was the largest detractor. Sector weights were a positive on the Fund's performance relative to the Index largely due to our overweight in Consumer Discretionary and underweights to Financials and Health Care. From a style perspective, the Fund's holdings, on average, had higher liquidity and higher beta relative to the Index and both were tailwinds. The Fund's holdings on average had a larger market capitalization than the Index and this was a headwind.
We have benefited from our positioning in the aftermath of the pandemic as our portfolio has been tilted towards stocks that we believed would outperform as fears of the virus subsided. This return to value trading also has been aided by the fact that value style has outperformed growth style. Going forward, we still believe in value versus growth. Our value-rising strategy — rising economic activity, rising revenue, rising margins, rising rates, and rising taxes still holds in our view. However, investors returned to growth stocks at the end of the second quarter in 2021. There is still a lot of uncertainty surrounding tax policy. Diminishing inflation concerns, declining ten-year yields, and decreasing threats of increased taxes combined to rally growthier stocks. Despite the pullback in relative performance for value in June, we continue to believe the combination of earnings growth and cheap relative valuations looks attractive. Value stocks are forecasted to grow earnings by 32.4% compared
11
Victory Integrity Small-Cap Value Fund (continued)
to growth at 27.6% (Jeffries valuation handbook (7/6/2021)). Value has rallied relative to growth this year, but it still looks cheap on an historical basis. This fuels our belief that, despite some short-term reversals, the trend is for value to outperform. We believe the Fund is positioned to benefit from this combination of good value and good news.
12
Victory Integrity Small-Cap Value Fund (continued)
Investment Overview
(Unaudited)
Average Annual Total Return
Year Ended June 30, 2021
| | Class A | | Class C | | Class R | | Class R6 | | Class Y | | | |
INCEPTION DATE | | 3/30/04 | | 7/7/05 | | 7/7/05 | | 6/1/12 | | 7/7/05 | | | |
| | Net Asset
Value | | Maximum
Offering
Price | | Net Asset
Value | | Contingent
Deferred
Charges | | Net Asset
Value | | Net Asset
Value | | Net Asset
Value | | Russell 2000®
Value Index1 | |
One Year | | | 80.41 | % | | | 70.03 | % | | | 78.86 | % | | | 77.86 | % | | | 79.91 | % | | | 81.42 | % | | | 81.13 | % | | | 73.28 | % | |
Five Year | | | 11.85 | % | | | 10.54 | % | | | 11.05 | % | | | 11.05 | % | | | 11.56 | % | | | 12.45 | % | | | 12.27 | % | | | 13.62 | % | |
Ten Year | | | 10.12 | % | | | 9.47 | % | | | 9.32 | % | | | 9.32 | % | | | 9.84 | % | | | NA | | | | 10.48 | % | | | 10.85 | % | |
Since Inception | | | NA | | | | NA | | | | NA | | | | NA | | | | NA | | | | 13.08 | % | | | NA | | | | NA | | |
The performance data quoted represents past performance and current returns may be lower or higher. The investment return and principal value will fluctuate so that an investor's shares, when redeemed, may be worth more or less than the original cost. To obtain performance information current to the most recent month's end, please visit www.vcm.com.
The maximum offering price ("MOP") figures reflect a maximum sales charge of 5.75% for Class A. Class C is not subject to an initial sales charge, but is subject to a deferred sales charge of 1.00% on shares redeemed within one year of purchase. Net Asset Value does not reflect sales charges.
Total return measures the price change in a share assuming the reinvestment of all net investment income and realized capital gain distributions, if any. The total returns quoted do not reflect adjustments made to the enclosed financial statements in accordance with U.S. Generally Accepted Accounting Principles or the deduction of taxes that a shareholder would pay on net investment income and realized capital gain distributions, including reinvested distributions, or redemptions of shares. The total return figures set forth above include all waivers of fees. Without such fee waivers, the total returns would have been lower.
Victory Integrity Small-Cap Value Fund — Growth of $10,000
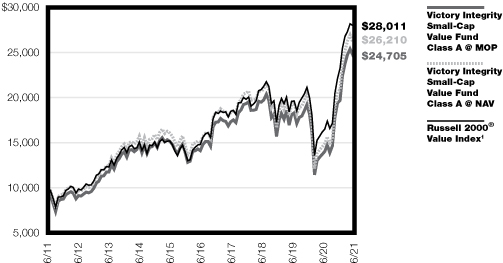
1The Russell 2000® Value Index is an unmanaged index that measures the performance of those Russell 2000® companies with lower price-to-book ratios and lower forecasted growth values. This index does not include the effect of sales charges, commissions, expenses, or taxes, is not representative of the Fund, and it is not possible to invest directly in an index.
The graph reflects investment of growth of a hypothetical $10,000 investment in Class A of the Fund.
The graph and table do not reflect the deduction of taxes that a shareholder would pay on Fund distributions or the redemption of shares.
Past performance is not indicative of future results.
13
Victory Integrity Small/Mid-Cap Value Fund
Managers' Commentary
(Unaudited)
What were the market conditions during the reporting period?
After the second wave of COVID-19 hit in June 2020, equities recovered the rest of the year and into the first half of 2021 due to unprecedented fiscal and monetary policy intervention and extraordinary progress towards vaccines and treatments. Markets also benefited from clarity around the U.S. presidential election after major media outlets called the presidential race for Joe Biden in November. Equities continued to rally into the new year as vaccination rollouts increased throughout the country. An increased rate of vaccinations and a declining rate of COVID-19 cases led to state and region reopenings throughout the country. These events aided economic activity and fueled equity markets to push higher as business and consumer sentiment started to improve. From a market capitalization viewpoint, small-cap equities outperformed their mid- and large-cap peers.
The top-performing sectors within the benchmark were Energy, Communication Services, and Consumer Discretionary while Utilities and Health Care were the weakest performing sectors relative to the benchmark. Small/mid-cap value stocks outperformed small/mid-cap growth stocks.
How did Victory Integrity Small/Mid-Cap Value Fund (the "Fund") perform during the reporting period?
The Fund returned 73.21% (Class A at net asset value) for the fiscal year ended June 30, 2021, outperforming the Russell 2500TM Value Index (the "Index"), which returned 63.23% for the period.
What strategies did you employ during the reporting period?
Stock selection in Financials, Industrials, Materials, Technology, and Consumer Discretionary, led to Fund outperformance, while security selection in Communication Services detracted from relative Fund performance. Sector weights were a positive due to our underweights in Health Care, Real Estate, and Utilities. The Fund holdings on average had higher returns as compared to the overall market and higher volatility relative to the Index and both were tailwinds.
We have benefited from our positioning in the aftermath of the pandemic as our portfolio has been tilted towards stocks that we believed would outperform as fears of the virus subsided. This return to value trading also has been aided by the fact that value style has outperformed growth style. Going forward, we still believe in value versus growth. Our value-rising strategy — rising economic activity, rising revenue, rising margins, rising rates, and rising taxes still holds in our view. However, investors returned to growth stocks at the end of the second quarter in 2021. There is still a lot of uncertainty surrounding tax policy. Diminishing inflation concerns, declining 10-year yields, and decreasing threats of increased taxes combined to rally growthier stocks. Despite the pullback in relative performance for value in June, we continue to believe the combination of earnings growth and cheap relative valuations looks attractive. Value stocks are forecasted to grow earnings by 32.4% compared to growth at 27.6% (Jeffries valuation handbook (7/6/2021)). Value has rallied relative to growth this year, but it still looks cheap on an historical basis. This fuels our belief that, despite some short-term reversals, the trend is for value to outperform. We believe the Fund is positioned to benefit from this combination of good value and good news.
14
Victory Integrity Small/Mid-Cap Value Fund (continued)
Investment Overview
(Unaudited)
Average Annual Total Return
Year Ended June 30, 2021
| | Class A | | Class R6 | | Class Y | | Member Class | | | |
INCEPTION DATE | | 7/1/11 | | 3/3/15 | | 7/1/11 | | 11/2/20 | | | |
| | Net Asset
Value | | Maximum
Offering
Price | | Net Asset
Value | | Net Asset
Value | | Net Asset
Value | | Russell 2500TM
Value Index1 | |
One Year | | | 73.21 | % | | | 63.26 | % | | | 73.68 | % | | | 73.61 | % | | | NA | | | | 63.23 | % | |
Five Year | | | 13.37 | % | | | 12.03 | % | | | 13.72 | % | | | 13.66 | % | | | NA | | | | 12.29 | % | |
Since Inception | | | 10.41 | % | | | 9.76 | % | | | 9.45 | % | | | 10.68 | % | | | 57.17 | % | | | NA | | |
The performance data quoted represents past performance and current returns may be lower or higher. The investment return and principal value will fluctuate so that an investor's shares, when redeemed, may be worth more or less than the original cost. To obtain performance information current to the most recent month's end, please visit www.vcm.com.
The maximum offering price ("MOP") figures reflect a maximum sales charge of 5.75% for Class A. Net Asset Value does not reflect sales charges.
Total return measures the price change in a share assuming the reinvestment of all net investment income and realized capital gain distributions, if any. The total returns quoted do not reflect adjustments made to the enclosed financial statements in accordance with U.S. Generally Accepted Accounting Principles or the deduction of taxes that a shareholder would pay on net investment income and realized capital gain distributions, including reinvested distributions, or redemptions of shares. The total return figures set forth above include all waivers of fees. Without such fee waivers, the total returns would have been lower.
Victory Integrity Small/Mid-Cap Value Fund — Growth of $10,000

1The Russell 2500® Value Index measures the performance of those Russell 2500® companies (approximately 2,500 of the smallest securities in the Russell 3000® Index, an index representing approximately 98% of the investable U.S. equity market) with lower price-to-book ratios and lower forecasted growth values. This index does not include the effect of sales charges, commissions, expenses, or taxes, is not representative of the Fund, and it is not possible to invest directly in an index.
The graph reflects investment of growth of a hypothetical $10,000 investment in Class A of the Fund.
The graph and table do not reflect the deduction of taxes that a shareholder would pay on Fund distributions or the redemption of shares.
Past performance is not indicative of future results.
15
Victory Munder Multi-Cap Fund
Managers' Commentary
(Unaudited)
What were the market conditions during the reporting period?
The Russell 3000® Index (the "Index") is up approximately 44% over the 12 months ended June 30, 2021, and stands roughly 30% above the pre-COVID highs it made in February 2020. This rally has seen strong participation across the spectrum, from value and reopening names to secular growth and stay-at-home winners, though leadership has changed up frequently and with great dispersion. In addition, cyclical sectors (e.g., Financials, Energy, Industrials), the sectors hit hardest during the COVID-19 selloff, garnered the highest return over this period.
More recently, however, we've seen inflation and interest rate expectations decline, largely the result of U.S. Federal Reserve commentary, which precipitated a rotation back into growth stocks in the second quarter of 2021. Traditional growth sectors (e.g., Technology, Communication Services, and Health Care) all outperformed; though, it's worth noting that value style-heavy sectors Energy and Real Estate actually posted the strongest returns in the second quarter of 2021. Energy stocks are clearly benefiting from stronger commodity prices, while Real Estate's outsized dividend income looks more attractive as rates decline, with many property types also leveraged to the economic reopening.
How did Victory Munder Multi-Cap Fund (the "Fund") perform during the reporting period?
The Fund seeks to provide long-term capital appreciation. The Fund returned 40.04% (Class A at net asset value) for the fiscal year ended June 30, 2021, underperforming the Index, which returned 44.16% during the same period.
What strategies did you employ during the reporting period?
The Fund looks to invest in stocks with market capitalizations of $1 billion and above that we believe are of high quality with the potential for above-average earnings growth, as well as current earnings momentum.
Using this framework, the Fund generated the strongest returns within the Financials, Energy, Consumer Discretionary, Materials, and Communication Services sectors, all up 50% or more over the trailing 12 months. Defensive sectors (e.g., Real Estate and Consumer Staples) lagged, but still generated positive return.
On an individual basis, two of the Fund's top-performing stocks for the year were graphics processing unit vendor and artificial intelligence enabler NVIDIA and casino owner/operator Boyd Gaming. With regards to NVIDIA, demand remains robust across all end markets, with sales up 84% year-over-year during the most recent quarter, led by gaming and datacenter. In addition, the market has turned more positive/confident on the potential Arm Holdings acquisition, and we've seen Broadcom, MediaTek, and Marvell become the first customers of Arm to publicly support a NVIDIA takeover. With regard to Boyd Gaming, this was an opportunistic purchase made during the COVID-19 selloff in Feb/March of 2020. Since that time, the company has posted solid results, especially relative to what was initially feared, with management recently confirming improving year-to-date trends.
16
Victory Munder Multi-Cap Fund (continued)
Two of the Fund's weakest-performing stocks for the year were optical and photonic communications equipment vendor Lumentum Holdings ("Lumentum") and lease-to-own/durable goods retailer Rent-A-Center Inc. Lumentum has come under pressure as near-term headwinds drive negative estimate revisions, including supply chain constraints, inventory build at certain customers, COVID-related issues hampering network deployments, and the decline in the 3D Sensing market. While we reduced our position, we continue to hold the stock, as growth looks primed to reaccelerate and the company maintains dominant market position and technological differentiation, including a strong upgrade cycle to 5G phones and the emergence of World Facing 3D modules, while strong margins and inexpensive valuations offer attractive factor exposures. With regards to Rent-A-Center Inc, this was a newer purchase, and shares sold off despite a strong beat-and-raise quarter highlighted by 75% year-over-year revenue growth (+22% proforma for acquisitions) and Earning Per Share that more than doubled year over year.
17
Victory Munder Multi-Cap Fund (continued)
Investment Overview
(Unaudited)
Average Annual Total Return
Year Ended June 30, 2021
| | Class A | | Class C | | Class Y | | | | | |
INCEPTION DATE | | 8/19/96 | | 11/3/98 | | 6/1/98 | | | | | |
| | Net Asset
Value | | Maximum
Offering
Price | | Net Asset
Value | | Contingent
Deferred
Charges | | Net Asset
Value | | S&P 500®
Index1 | | Russell 3000®
Index2 | |
One Year | | | 40.04 | % | | | 31.97 | % | | | 38.88 | % | | | 37.88 | % | | | 40.54 | % | | | 40.79 | % | | | 44.16 | % | |
Five Year | | | 14.25 | % | | | 12.90 | % | | | 13.36 | % | | | 13.36 | % | | | 14.67 | % | | | 17.65 | % | | | 17.89 | % | |
Ten Year | | | 11.65 | % | | | 10.99 | % | | | 10.78 | % | | | 10.78 | % | | | 12.03 | % | | | 14.84 | % | | | 14.70 | % | |
The performance data quoted represents past performance and current returns may be lower or higher. The investment return and principal value will fluctuate so that an investor's shares, when redeemed, may be worth more or less than the original cost. To obtain performance information current to the most recent month's end, please visit www.vcm.com.
The maximum offering price ("MOP") figures reflect a maximum sales charge of 5.75% for Class A. Class C is not subject to an initial sales charge, but is subject to a deferred sales charge of 1.00% on shares redeemed within one year of purchase. Net Asset Value does not reflect sales charges.
Total return measures the price change in a share assuming the reinvestment of all net investment income and realized capital gain distributions, if any. The total returns quoted do not reflect adjustments made to the enclosed financial statements in accordance with U.S. Generally Accepted Accounting Principles or the deduction of taxes that a shareholder would pay on net investment income and realized capital gain distributions, including reinvested distributions, or redemptions of shares. The total return figures set forth above include all waivers of fees. Without such fee waivers, the total returns would have been lower.
Victory Munder Multi-Cap Fund — Growth of $10,000

1The S&P 500® Index, an unmanaged index comprised of 500 domestically traded common stocks, is weighted according to the market value of each common stock in the index, and includes reinvestment of dividends. This index does not include the effect of sales charges, commissions, expenses, or taxes, is not representative of the Fund, and it is not possible to invest directly in an index.
2The Russell 3000® Index is an unmanaged index that measures the performance of the 3,000 largest U.S.-traded stocks, in which the underlying companies are all incorporated in the United States. This index does not include the effect of sales charges, commissions, expenses, or taxes, is not representative of the Fund, and it is not possible to invest directly in an index.
The graph reflects investment of growth of a hypothetical $10,000 investment in Class A of the Fund.
The graph and table do not reflect the deduction of taxes that a shareholder would pay on Fund distributions or the redemption of shares.
Past performance is not indicative of future results.
18
Victory S&P 500 Index Fund
Managers' Commentary
(Unaudited)
Investment Considerations
Equity Securities ("stocks") are more volatile and carry more risk than other forms of investments in high-grade, fixed-income securities. The net asset value per share of Victory S&P 500 Index Fund (the "Fund") will fluctuate as the value of the securities in the portfolio changes. The securities of foreign companies acquired by the Fund tend to experience more volatility than their domestic counterparts in part because of higher political and economic risks, lack of reliable information, fluctuations in currency exchange rates and the risks that a foreign government may take over assets, restrict the ability to exchange currency, or restrict the delivery of securities.
Commentary
The Fund seeks to provide performance and income that is comparable to the performance of the S&P 500® Index (the "Index") before fees and expenses.
The Fund returned 40.00% (Class A at net asset value) for the fiscal year ended June 30, 2021, underperforming the Index, which returned 40.79%. The difference in performance of the Fund and the Index was primarily due to the Fund's fees and expenses. The Index is not an investable product; therefore, fees and expenses do not apply.
Over the reporting period, much of the performance was driven by the largest market cap names within the Index. The well-known FAANG+M stocks, comprised of Facebook, Apple, Amazon, Netflix, Google, and Microsoft, combined to make up over 22% of the Index and contributed a positive 9.84% to the Fund's return. Penn National Gaming was down 35% during the reporting period and was a negative contributor to overall performance.
19
Victory S&P 500 Index Fund (continued)
Investment Overview
(Unaudited)
Average Annual Total Return
Year Ended June 30, 2021
| | Class A | | Class R | | Class Y | | | |
INCEPTION DATE | | 12/9/92 | | 7/29/04 | | 12/1/91 | | | |
| | Net Asset
Value | | Maximum
Offering
Price | | Net Asset
Value | | Net Asset
Value | | S&P 500®
Index1 | |
One Year | | | 40.00 | % | | | 36.82 | % | | | 39.43 | % | | | 40.16 | % | | | 40.79 | % | |
Five Year | | | 16.98 | % | | | 16.45 | % | | | 16.50 | % | | | 17.14 | % | | | 17.65 | % | |
Ten Year | | | 14.15 | % | | | 13.89 | % | | | 13.70 | % | | | 14.32 | % | | | 14.84 | % | |
The performance data quoted represents past performance and current returns may be lower or higher. The investment return and principal value will fluctuate so that an investor's shares, when redeemed, may be worth more or less than the original cost. To obtain performance information current to the most recent month's end, please visit www.vcm.com.
The maximum offering price ("MOP") figures reflect a maximum sales charge of 2.25% for Class A. Net Asset Value does not reflect sales charges.
Total return measures the price change in a share assuming the reinvestment of all net investment income and realized capital gain distributions, if any. The total returns quoted do not reflect adjustments made to the enclosed financial statements in accordance with U.S. Generally Accepted Accounting Principles or the deduction of taxes that a shareholder would pay on net investment income and realized capital gain distributions, including reinvested distributions, or redemptions of shares. The total return figures set forth above include all waivers of fees. Without such fee waivers, the total returns would have been lower.
Victory S&P 500 Index Fund — Growth of $10,000
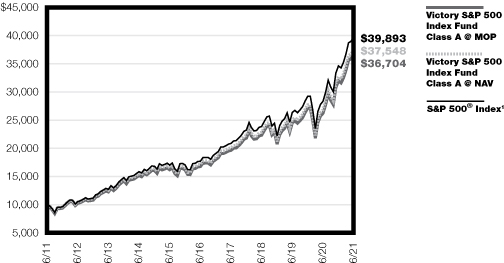
1The S&P 500® Index, an unmanaged index comprised of 500 domestically traded common stocks, is weighted according to the market value of each common stock in the index, and includes reinvestment of dividends. This index does not include the effect of sales charges, commissions, expenses, or taxes, is not representative of the Fund, and it is not possible to invest directly in an index.
The graph reflects investment of growth of a hypothetical $10,000 investment in Class A of the Fund.
The graph and table do not reflect the deduction of taxes that a shareholder would pay on Fund distributions or the redemption of shares.
Past performance is not indicative of future results.
20
Victory Munder Mid-Cap Core Growth Fund
Managers' Commentary
(Unaudited)
What were the market conditions during the reporting period?
The Russell 3000® Index (the "Index") is up approximately 44% over the 12 months ended June 30, 2021, and stands roughly 30% above the pre-COVID highs it made in February 2020. This rally has seen strong participation across the spectrum, from value and reopening names to secular growth and stay-at-home winners, though leadership has changed up frequently and with great dispersion. In addition, cyclical sectors (e.g., Financials, Energy, Industrials), the sectors hit hardest during the COVID-19 selloff, garnered the highest return over this period.
More recently, however, we've seen inflation and interest rate expectations decline, largely the result of U.S. Federal Reserve commentary, which precipitated a rotation back into growth stocks in the second quarter of 2021. Traditional growth sectors (e.g., Technology, Communication Services, and Health Care) all outperformed; though, it's worth noting that value-heavy sectors Energy and Real Estate actually posted the strongest returns in the second quarter of 2021. Energy stocks are clearly benefiting from stronger commodity prices, while Real Estate's outsized dividend income looks more attractive as rates decline, with many property types also leveraged to the economic reopening.
How did Victory Munder Mid-Cap Core Growth Fund (the "Fund") perform during the reporting period?
The Fund seeks to provide long-term capital appreciation. The Fund returned 47.52% (Class A at net asset value) for the fiscal year ended June 30, 2021, underperforming the Russell Midcap® Index, which returned 49.80% for the period.
What strategies did you employ during the reporting period?
The Fund looks to invest in mid-cap stocks that have superior growth prospects, strong profitability, below-average debt levels, and attractive valuations relative to the market and the company's growth rate.
Using this framework, the Fund generated the strongest returns within the Materials, Industrials, Financials, and Communication Services sectors, all up 60%+ over the trailing 12 months. Real Estate, Utilities, and Energy lagged, but still generated positive return.
In Materials and Industrials, we had strong stock-specific drivers of outperformance but also benefited from our tactical positioning toward the reopening/economic recovery. Specifically, to this last point, the Fund experienced strong returns from our holdings in Chart Industries, Cleveland-Cliffs, and Freeport-McMoRan, which stand to benefit from improved commodity prices. In addition, WESCO International, which distributes electrical supplies and equipment and offers integrated procurement services, drove nearly half our positive stock selection in Industrials for the period. This was an opportunistic purchase we made after shares came under extreme pressure from the pandemic. We believed the COVID-19-related selloff was an overreaction by the market, particularly as it related to the pending acquisition of a primary competitor, Anixter. Indeed, both organic trends and the Anixter integration have surprised to the upside.
21
Victory Munder Mid-Cap Core Growth Fund (continued)
In Real Estate, the Fund's cell tower and datacenter positions drove results. These properties proved resilient and even benefited from the lockdown due to greater adoption of stay-at-home and cloud-based solutions, and had contributed strongly to returns, but more recently fell out of favor as the market rotated into reopening names. Again, while we continue to view the growth/value profile of these holdings favorably, we reduced our exposure in the first quarter of 2021 with the sale of CyrusOne.
In Utilities, Southwest Gas Holdings was by far our weakest position. Southwest operates regulated natural gas utilities in Arizona, California, and Nevada. We sold our position in January due to a negative outcome in their rate case for their Arizona utility. In Energy, our underperformance was due to our lack of exposure to the sector during the strong rally in the fourth quarter of 2020 and the first quarter of 2021. We added two Energy positions at the end of the first quarter of 2021, Permian Basin-focused oil and gas exploration and production company Diamondback Energy, Inc. ("Diamondback") and U.S. Silica Holdings ("U.S. Silica"), a producer of fracturing sand for the Oil & Gas industry as well as specialized commercial silica products for a variety of end users. With regards to Diamondback, we had sold our position in the company three years ago after a long holding period of outperformance versus the Energy sector. We decided to reestablish a position, as we feel the CEO and his team are still best of breed, measured by their acquisition and execution track records. In addition, the quality of Diamondback's assets in the low-cost Permian Basin allows for profitable oilfield development in low oil price environments. As for U.S. Silica , the company has right-sized its Oil &Gas segment and is now well-positioned to benefit from the recent recovery of oil prices. The specialty products business is also producing strong earnings growth thanks to the introduction of several successful new products, including numerous ESG-friendly applications.
22
Victory Munder Mid-Cap Core Growth Fund (continued)
Investment Overview
(Unaudited)
Average Annual Total Return
Year Ended June 30, 2021
| | Class A | | Class C | | Class R | | Class R6 | | Class Y | | | | | |
INCEPTION DATE | | 6/30/00 | | 7/14/00 | | 7/29/04 | | 6/1/12 | | 6/24/98 | | | | | |
| | Net Asset
Value | | Maximum
Offering
Price | | Net Asset
Value | | Contingent
Deferred
Charges | | Net Asset
Value | | Net Asset
Value | | Net Asset
Value | | Russell
Midcap®
Index1 | | Russell
Midcap®
Growth
Index2 | |
One Year | | | 47.52 | % | | | 39.01 | % | | | 46.51 | % | | | 45.51 | % | | | 47.15 | % | | | 48.19 | % | | | 48.00 | % | | | 49.80 | % | | | 43.77 | % | |
Five Year | | | 14.37 | % | | | 13.02 | % | | | 13.57 | % | | | 13.57 | % | | | 14.07 | % | | | 14.87 | % | | | 14.70 | % | | | 15.62 | % | | | 20.52 | % | |
Ten Year | | | 11.29 | % | | | 10.63 | % | | | 10.50 | % | | | 10.50 | % | | | 11.00 | % | | | NA | | | | 11.59 | % | | | 13.24 | % | | | 15.13 | % | |
Since Inception | | | NA | | | | NA | | | | NA | | | | NA | | | | NA | | | | 13.91 | % | | | NA | | | | NA | | | | NA | | |
The performance data quoted represents past performance and current returns may be lower or higher. The investment return and principal value will fluctuate so that an investor's shares, when redeemed, may be worth more or less than the original cost. To obtain performance information current to the most recent month's end, please visit www.vcm.com.
The maximum offering price ("MOP") figures reflect a maximum sales charge of 5.75% for Class A. Class C is not subject to an initial sales charge, but is subject to a deferred sales charge of 1.00% on shares redeemed within one year of purchase. Net Asset Value does not reflect sales charges.
Total return measures the price change in a share assuming the reinvestment of all net investment income and realized capital gain distributions, if any. The total returns quoted do not reflect adjustments made to the enclosed financial statements in accordance with U.S. Generally Accepted Accounting Principles or the deduction of taxes that a shareholder would pay on net investment income and realized capital gain distributions, including reinvested distributions, or redemptions of shares. The total return figures set forth above include all waivers of fees. Without such fee waivers, the total returns would have been lower.
Victory Munder Mid-Cap Core Growth Fund — Growth of $10,000

1The Russell Midcap® Index is an unmanaged index measuring the performance of medium capitalization domestically traded common stocks. This index does not include the effect of sales charges, commissions, expenses, or taxes, is not representative of the Fund, and it is not possible to invest directly in an index.
2The Russell Midcap® Growth Index is an unmanaged index made up of medium and medium/small companies in the Russell 1000® Index chosen for their growth orientation. This index does not include the effect of sales charges, commissions, expenses, or taxes, is not representative of the Fund, and it is not possible to invest directly in an index.
The graph reflects investment of growth of a hypothetical $10,000 investment in Class A of the Fund.
The graph and table do not reflect the deduction of taxes that a shareholder would pay on Fund distributions or the redemption of shares.
Past performance is not indicative of future results.
23
Victory Munder Small Cap Growth Fund
Managers' Commentary
(Unaudited)
What were the market conditions during the reporting period?
The Russell 3000® Index (the "Index") is up approximately 44% over the 12 months ended June 30, 2021, and stands roughly 30% above the pre-COVID highs it made in February 2020. This rally has seen strong participation across the spectrum, from value and reopening names to secular growth and stay-at-home winners, though leadership has changed up frequently and with great dispersion. In addition, cyclical sectors (e.g., Financials, Energy, Industrials), the sectors hit hardest during the COVID-19 selloff, garnered the highest return over this period.
More recently, however, we've seen inflation and interest rate expectations decline, largely the result of U.S. Federal Reserve commentary, which precipitated a rotation back into growth stocks in the second quarter of 2021. Traditional growth sectors (e.g., Technology, Communication Services, and Health Care) all outperformed; though, it's worth noting that value style-heavy sectors Energy and Real Estate actually posted the strongest returns in the second quarter of 2021. Energy stocks are clearly benefiting from stronger commodity prices, while Real Estate's outsized dividend income looks more attractive as rates decline, with many property types also leveraged to the economic reopening.
How did Victory Munder Small Cap Growth Fund (the "Fund") perform during the reporting period?
The Fund seeks to provide long-term capital appreciation. The Fund returned 56.27% (Class A at net asset value) for the fiscal year ended June 30, 2021, outperforming the Russell 2000® Growth Index (the "Index"), which returned 51.36% during the period.
What strategies did you employ during the reporting period?
The Fund looks to invest in small-cap stocks that have superior growth prospects, strong profitability, sustainable competitive advantages, and reasonable valuations.
Using this framework, the Fund generated the strongest returns within the Energy, Consumer Discretionary, Real Estate, Materials, and Financials sectors, all up 75% or more over the trailing 12 months. Consumer Staples, Communication Services, and Health Care lagged, but each were still up 25% or more.
In Energy, Magnolia Oil & Gas Corp was our top performer, up nearly 160%. In Consumer Discretionary, the Fund had six different stocks that more than doubled during the year, including sporting goods retailer Academy Sports + Outdoors and cutting machine manufacturer Cricut, Inc., which together contributed approximately 175 basis points ("bps") of positive stock selection. Other top performers include retail REIT Macerich Company (Real Estate), Summit Materials (Materials), and Customers Bancorp/SLM Corp (Financials).
Within Consumer Staples and Communication Services, again, among our weakest sectors, up just 25% and 30%, respectively, we had several stocks where we experienced double-digit declines, including value grocery retailer Grocery Outlet Holdings Corp, packaged food/shell egg producer Cal-Maine Foods, and video game and e-sports developer Motorsport Games.
24
Victory Munder Small Cap Growth Fund (continued)
Investment Overview
(Unaudited)
Average Annual Total Return
Year Ended June 30, 2021
| | Class A | | Class I | | Class Y | | | |
INCEPTION DATE | | 4/30/15 | | 4/30/15 | | 4/30/15 | | | |
| | Net Asset
Value | | Maximum
Offering
Price | | Net Asset
Value | | Net Asset
Value | | Russell
2000® Growth
Index1 | |
One Year | | | 56.27 | % | | | 47.31 | % | | | 56.71 | % | | | 56.57 | % | | | 51.36 | % | |
Five Year | | | 25.89 | % | | | 24.42 | % | | | 26.20 | % | | | 25.98 | % | | | 18.76 | % | |
Since Inception | | | 17.59 | % | | | 16.46 | % | | | 17.89 | % | | | 17.70 | % | | | NA | | |
The performance data quoted represents past performance and current returns may be lower or higher. The investment return and principal value will fluctuate so that an investor's shares, when redeemed, may be worth more or less than the original cost. To obtain performance information current to the most recent month's end, please visit www.vcm.com.
The maximum offering price ("MOP") figures reflect a maximum sales charge of 5.75% for Class A. Net Asset Value does not reflect sales charges.
Total return measures the price change in a share assuming the reinvestment of all net investment income and realized capital gain distributions, if any. The total returns quoted do not reflect adjustments made to the enclosed financial statements in accordance with U.S. Generally Accepted Accounting Principles or the deduction of taxes that a shareholder would pay on net investment income and realized capital gain distributions, including reinvested distributions, or redemptions of shares. The total return figures set forth above include all waivers of fees. Without such fee waivers, the total returns would have been lower.
Victory Munder Small Cap Growth Fund — Growth of $10,000
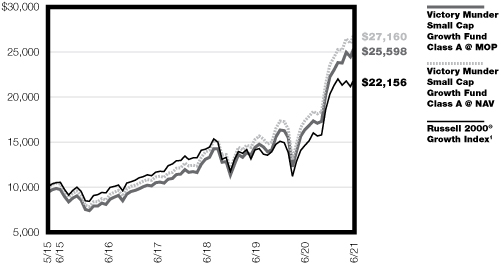
1The Russell 2000® Growth Index is an unmanaged index that measures the performance of those Russell 2000® companies with higher price-to-book ratios and higher forecasted growth values. This index does not include the effect of sales charges, commissions, expenses, or taxes, is not representative of the Fund, and it is not possible to invest directly in an index.
The graph reflects investment of growth of a hypothetical $10,000 investment in Class A of the Fund.
The graph and table do not reflect the deduction of taxes that a shareholder would pay on Fund distributions or the redemption of shares.
Past performance is not indicative of future results.
25
Victory Trivalent International Fund-Core Equity
Managers' Commentary
(Unaudited)
What were the market conditions during the reporting period?
International equities rose to new records on the back of additional stimulus measures and vaccination rollouts across the globe. Strong consumer demand has led to a substantial pickup in economic activity and has accelerated the global recovery. International returns were also boosted by a weakening dollar as the U.S. Dollar Index, which measures the U.S. dollar against six major global currencies, fell 5.1%. For the year ended June 30, 2021, the MSCI ACWI ex USA Index (the "Index") rose 35.72%. There was wide dispersion among country returns in the Index, with emerging markets outperforming their developed peers. Technology-heavy Taiwan returned 70.5% as a strong rebound in exports led to an increase in forecasted economic growth. South Korea rose 66.2% after raising its growth forecast to 4.2%, a full percentage point higher than the previous estimate. Within developed markets, Sweden gained 53.9% after avoiding a full lockdown during the height of the pandemic in Europe, resulting in a less-severe economic contraction than its European neighbors. On the other end of the spectrum, Turkey dropped 13% as President Erdogan unexpectedly fired the central bank chief following a period of aggressive rate hikes that had stabilized the Turkish Lira.
All sectors posted positive returns with the more cyclical and commodity-exposed sectors outperforming. Information Technology gained 56.5% and was driven by strength in semiconductors. Materials jumped 49.4% and were supported by rising commodity prices. Financials advanced 40.7% as the prospect of rising interest rates will improve net interest margins for the banking industry. The more defensive Utilities and Health Care stocks were the relative laggards, up 14.5% and 15.2%, respectively.
How did the Victory Trivalent International Fund — Core Equity (the "Fund") perform during the reporting period?
The Fund seeks to provide long-term capital growth. The Fund returned 30.28% (Class A at net asset value) for the fiscal year ended June 30, 2021, underperforming the Index, which returned 35.72% for the period.
What strategies did you employ during the reporting period?
Overall security selection was negative and accounted for the Fund's relative underperformance. Excess returns were generated in two of six geographic regions and five of the 11 economic sectors. The majority of the Fund's underperformance occurred in the fourth quarter of 2020, as positive vaccine news boosted sentiment for the post-pandemic recovery. From a style perspective, the portfolio's limited exposure to deep value and lower-quality stocks was a major detractor during the market's sharp reversal away from prior winners. Companies that faced the greatest struggles during the pandemic materially outperformed while beneficiaries of the pandemic era lagged despite continued strong execution and robust earnings. For the trailing one-year period, security selection was weakest in the Consumer Staples sector, with the largest impact coming from two holdings. Chinese food operator Sun Art Retail Group was the top detractor, down 39.7% on weak same-store sales growth amid the pandemic. Japanese packaged food company Toyo Suisan Kaisha dropped 30% after reporting in-line results and forecasting a slight profit decline
26
Victory Trivalent International Fund-Core Equity (continued)
due to rising costs. Relative performance was also weak within Materials, as Anhui Conch Cement Company Limited fell 17.3% on declining demand and margins.
Notable outperformance was generated in the Industrials and Real Estate sectors. Within Industrials, UK-listed construction equipment rental company Ashtead Group rose 123.7% on positive results in its North American Sunbelt operations with continued market share gains. Deutsche Post was another strong performer in the sector. The German logistics and delivery service provider rose 94% as results and outlook confirmed a strong demand environment which has led to higher earnings expectations. Within Real Estate, Australian diversified real estate investment trust Charter Hall Group advanced 78.2% after announcing strong momentum in its direct investment business and the successful closing of two commercial property acquisitions.
27
Victory Trivalent International Fund-Core Equity (continued)
Investment Overview
(Unaudited)
Average Annual Total Return
Year Ended June 30, 2021
| | Class A | | Class C | | Class I | | Class R6 | | Class Y | | | |
INCEPTION DATE | | 8/16/07 | | 8/16/07 | | 8/16/07 | | 3/3/15 | | 8/16/07 | | | |
| | Net Asset
Value | | Maximum
Offering
Price | | Net Asset
Value | | Contingent
Deferred
Charges | | Net Asset
Value | | Net Asset
Value | | Net Asset
Value | | MSCI ACWI
ex USA
Index1 | |
One Year | | | 30.28 | % | | | 22.72 | % | | | 29.09 | % | | | 28.09 | % | | | 30.65 | % | | | 30.57 | % | | | 30.62 | % | | | 35.72 | % | |
Five Year | | | 9.36 | % | | | 8.06 | % | | | 8.51 | % | | | 8.51 | % | | | 9.74 | % | | | 9.78 | % | | | 9.64 | % | | | 11.08 | % | |
Ten Year | | | 5.58 | % | | | 4.96 | % | | | 4.76 | % | | | 4.76 | % | | | 6.04 | % | | | NA | | | | 5.84 | % | | | 5.45 | % | |
Since Inception | | | NA | | | | NA | | | | NA | | | | NA | | | | NA | | | | 6.12 | % | | | NA | | | | NA | | |
The performance data quoted represents past performance and current returns may be lower or higher. The investment return and principal value will fluctuate so that an investor's shares, when redeemed, may be worth more or less than the original cost. To obtain performance information current to the most recent month's end, please visit www.vcm.com.
The maximum offering price ("MOP") figures reflect a maximum sales charge of 5.75% for Class A. Class C is not subject to an initial sales charge, but is subject to a deferred sales charge of 1.00% on shares redeemed within one year of purchase. Net Asset Value does not reflect sales charges.
Total return measures the price change in a share assuming the reinvestment of all net investment income and realized capital gain distributions, if any. The total returns quoted do not reflect adjustments made to the enclosed financial statements in accordance with U.S. Generally Accepted Accounting Principles or the deduction of taxes that a shareholder would pay on net investment income and realized capital gain distributions, including reinvested distributions, or redemptions of shares. The total return figures set forth above include all waivers of fees. Without such fee waivers, the total returns would have been lower.
Victory Trivalent International Fund-Core Equity — Growth of $10,000
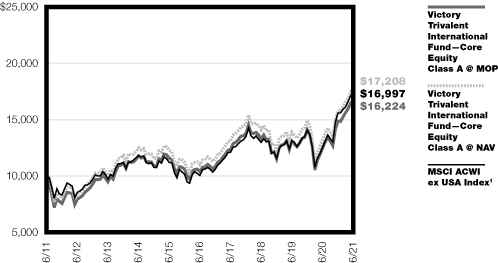
1The MSCI ACWI ex USA Index is a free float-adjusted market capitalization-weighted index that is designed to measure the equity market performance of developed and emerging markets. The index consists of 49 country indices, comprising 22 developed and 27 emerging market county indices. The index is unmanaged and its results include reinvested dividends and/or distributions, but do not reflect the effect of sales charges, commissions, expenses or taxes. It is not possible to invest directly in an index.
The graph reflects investment of growth of a hypothetical $10,000 investment in Class A of the Fund.
The graph and table do not reflect the deduction of taxes that a shareholder would pay on Fund distributions or the redemption of shares.
Past performance is not indicative of future results.
28
Victory Trivalent International Small-Cap Fund
Managers' Commentary
(Unaudited)
What were the market conditions during the reporting period?
International small-cap equities rose to new records on the back of additional stimulus measures and vaccination rollouts across the globe. Strong consumer demand has led to a substantial pickup in economic activity and has accelerated the global recovery. International returns were also boosted by a weakening dollar as the U.S. Dollar Index, which measures the U.S. dollar against six major global currencies, fell 5.1%. For the year ended June 30, 2021, the S&P® Developed Ex-U.S. SmallCap Index (the "Index") rose 43.62%. All countries in the Index advanced with European small-cap equities outpacing their AsiaPac peers. Sweden gained 64% after avoiding a full lockdown during the height of the pandemic in Europe, resulting in a less severe economic contraction than its European neighbors. Italy climbed 58.7% as former European Central Bank president, Mario Draghi, was sworn in as prime minister to lead the country out of recession. The United Kingdom advanced 55.8% as its global leadership in vaccine distribution has led to higher growth forecasts. On the other end of the spectrum, Japan trailed the broader index and was up only 18.9% after declaring its third state of emergency ahead of the Tokyo Olympics due to surging coronavirus cases.
All 11 sectors advanced, with Energy leading the way, up 61.3% as Brent Crude oil prices gained 82.6% and topped $75 a barrel for the first time since October 2018 on improved demand expectations. Cyclical sectors posted strong gains as Consumer Discretionary and Industrials rose 57.7% and 49.4%, respectively. The more defensive Consumer Staples stocks were the relative laggards, up 22.9%.
How did the Victory Trivalent International Small-Cap Fund (the "Fund") perform during the reporting period?
The Fund seeks to provide long-term capital growth. The Fund returned 40.61% (Class A at net asset value) for the fiscal year ended June 30, 2021, underperforming the Index, which returned 43.62% for the period.
What strategies did you employ during the reporting period?
Overall security selection was negative and accounted for the Fund's relative underperformance. Excess returns were generated in two of five geographic regions and four of the eleven economic sectors. Most of the Fund's underperformance occurred in the fourth quarter of 2020, as positive vaccine news boosted sentiment for the post-pandemic recovery. From a style perspective, the portfolio's limited exposure to deep value and lower quality stocks was a major detractor during the market's sharp reversal away from prior winners. Companies that faced the greatest struggles during the pandemic materially outperformed while beneficiaries of the pandemic era lagged despite continued strong execution and robust earnings. For the trailing one-year period, security selection was weakest in the Information Technology sector, with the largest impact coming from Anritsu. The Japanese telecom equipment provider fell 20.2% after guidance for the next fiscal year short of consensus. Although still expected to be strong, demand from 5G activity has not materialized as quickly as expected. Relative performance was also weak within Materials and was largely driven down by two gold miners. Silver Lake Resources in Australia and Endeavour Mining Corporation in Canada sold off 27.0% and 15.6%, respectively, on weaker
29
Victory Trivalent International Small-Cap Fund (continued)
gold prices during our holding period. Both companies remain attractive as strong producers and solid operations.
Notable outperformance was generated in the Industrials and Health Care sectors. Japanese business consultant BayCurrent Consulting rose 335.9% as demand for its digital transformation services continues to rise. TFI International ("TFI") was another strong performer within the Industrials sector. The Canadian listed trucking company rose 161.1% after announcing the acquisition of UPS Freight, which will complement TFI's existing U.S. freight business and improve margins. Within Health Care, Korean biotechnology company Seegene gained 24.4%, as its COVID-19 test kit received approval from Korean authorities and the test kits are being shipped to governments and medical facilities across the world.
30
Victory Trivalent International Small-Cap Fund (continued)
Investment Overview
(Unaudited)
Average Annual Total Return
Year Ended June 30, 2021
| | Class A | | Class C | | Class I | | Class R6 | | Class Y | | | |
INCEPTION DATE | | 8/17/07 | | 8/17/07 | | 8/17/07 | | 6/1/12 | | 8/17/07 | | | |
| | Net Asset
Value | | Maximum
Offering
Price | | Net Asset
Value | | Contingent
Deferred
Charges | | Net Asset
Value | | Net Asset
Value | | Net Asset
Value | | S&P Developed
Ex-U.S. SmallCap
Index1 | |
One Year | | | 40.61 | % | | | 32.55 | % | | | 39.57 | % | | | 38.57 | % | | | 41.16 | % | | | 41.14 | % | | | 40.96 | % | | | 43.62 | % | |
Five Year | | | 12.75 | % | | | 11.42 | % | | | 11.90 | % | | | 11.90 | % | | | 13.19 | % | | | 13.06 | % | | | 13.03 | % | | | 11.72 | % | |
Ten Year | | | 9.63 | % | | | 8.99 | % | | | 8.83 | % | | | 8.83 | % | | | 10.11 | % | | | NA | | | | 9.92 | % | | | 7.67 | % | |
Since Inception | | | NA | | | | NA | | | | NA | | | | NA | | | | NA | | | | 13.54 | % | | | NA | | | | NA | | |
The performance data quoted represents past performance and current returns may be lower or higher. The investment return and principal value will fluctuate so that an investor's shares, when redeemed, may be worth more or less than the original cost. To obtain performance information current to the most recent month's end, please visit www.vcm.com.
The maximum offering price ("MOP") figures reflect a maximum sales charge of 5.75% for Class A. Class C is not subject to an initial sales charge, but is subject to a deferred sales charge of 1.00% on shares redeemed within one year of purchase. Net Asset Value does not reflect sales charges.
Total return measures the price change in a share assuming the reinvestment of all net investment income and realized capital gain distributions, if any. The total returns quoted do not reflect adjustments made to the enclosed financial statements in accordance with U.S. Generally Accepted Accounting Principles or the deduction of taxes that a shareholder would pay on net investment income and realized capital gain distributions, including reinvested distributions, or redemptions of shares. The total return figures set forth above include all waivers of fees. Without such fee waivers, the total returns would have been lower.
Victory Trivalent International Small-Cap Fund — Growth of $10,000
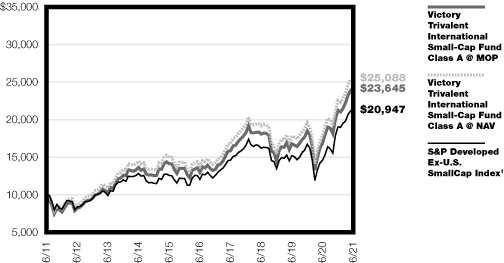
1The S&P Developed Ex-U.S. SmallCap Index consists of the stocks representing the lowest 15% of float-adjusted market capitalization in each country, other than the United States, represented in the S&P Developed Broad Market Index (BMI). The S&P Developed BMI includes all listed shares of companies from 26 developed countries with float-adjusted market capitalizations of at least US$100 million and annual trading value of at least US$50 million. This index does not include the effect of sales charges, commissions, expenses, or taxes, is not representative of the Fund, and it is not possible to invest directly in an index.
The graph reflects investment of growth of a hypothetical $10,000 investment in Class A of the Fund.
The graph and table do not reflect the deduction of taxes that a shareholder would pay on Fund distributions or the redemption of shares.
Past performance is not indicative of future results.
31
Victory INCORE Total Return Bond Fund
Managers' Commentary
(Unaudited)
What were the market conditions during the reporting period?
The economy continued to roar back in 2021, with annualized Gross Domestic Product ("GDP") growth estimated to reach nearly 7% plus for the year, a growth rate not seen since 1950, and likely marking the return of the economy, as measured by GDP, to pre-pandemic levels or better. Employment is lagging, which is not unusual in a recovery, and, in our opinion, should continue to improve throughout the year. Risk assets performed well year-to-date, with stocks continuing to set new records, led by large caps. High yield bonds, investment-grade convertible bonds, and investment-grade corporate bonds all outperformed U.S. Treasurys.
A significant change in the expected timing of future rate hikes in the Federal Open Market Committee ("FOMC") dot plot, combined with slower than expected job growth, helped U.S. Treasurys claw back some of their losses from earlier in the year, as long yields fell nearly 30 basis points, and the Bloomberg Barclays Treasury Index returned 1.75% in the second quarter of 2021. Monetary & fiscal stimulus, higher vaccination rates, and economic reopening are providing prodigious tailwinds that will likely ease later this year.
Prior to their June meeting, the FOMC seemed to be focused on the employment pillar of its dual mandate of maximizing employment and maintaining price stability, explaining away elevated inflation as transitory, which some on the committee continue to do. The dot plot from the U.S. Federal Reserve's (the "Fed") April meeting indicated the federal funds effective rate remaining near zero until 2024, while inflation would be allowed to run above target for some time. We expected this new paradigm, known as "Flexible Average Inflation Targeting" ("FAIT"), to be tested by increasing inflation. The committee's latest announcement in June indicates members are aware of higher inflation risks, are discussing tapering, and have moved expected rate hikes forward into 2023. The new dot plot estimates show that seven members expect rate increases as early as 2022, indicating a willingness to pivot if necessary. Some board members see upside risk to inflation and are advocating for tapering asset purchases as early as the fourth quarter of 2021. This, combined with lower-than-expected job growth in the second quarter of 2021, caused the yield curve to flatten significantly during the quarter. As the economy emerges from recession, the Fed must determine when and at what pace to remove accommodation. This is a delicate process, subject to Monday-morning quarterbacking, causing markets to overreact as policy evolves. Buckle up for continued interest rate volatility.
How did Victory INCORE Total Return Bond Fund (the "Fund") perform during the reporting period?
The Fund seeks to provide a high level of current income together with capital appreciation. The Fund returned 1.67% (Class A at net asset value), outperforming its benchmark, Bloomberg Barclays US Aggregate Bond Index (the "Index"), which returned -0.33% for the fiscal year ended June 30, 2020.
The Fund started 2021 underweight U.S. Treasurys and mortgage-backed securities, with corresponding overweight allocations to investment-grade corporate bonds, high yield corporate bonds, and investment-grade convertible bonds. While U.S. Treasury yields have
32
Victory INCORE Total Return Bond Fund (continued)
increased over the year, substantial spread tightening since last June has helped offset the negative impact of rising intermediate yields. We maintain a corporate credit overweight as the economy continues to rebound, benefitting the Fund.
What strategies did you employ during the reporting period?
INCORE believes the U.S. economy still has some distance before reaching full employment and will continue to perform well into 2022, with moderating growth as the effects of recent fiscal stimulus fade. Monetary stimulus will continue to support markets in the near term, but with real GDP in 2021 expected at 7-8% and 2022 forecasts between 3-4%, we look for the FOMC to begin tapering bond purchases in the fourth quarter of 2021 or the first quarter of 2022, and for real yields to move somewhat higher. It remains to be seen whether inflation is transitory or persistent, but we think the risks are skewed to the upside. An improving economy, improving consumer and corporate balance sheets, and low yields compel us to maintain a significant overweight to corporate credit, high yield, and investment-grade convertible bonds. Also, we are maintaining our strategies shorter duration relative to benchmarks in anticipation of higher yields. The overweight position to credit was additive to performance in the second quarter of 2021, outpacing the drag from the short duration position, helping the Fund outpace the Index during the quarter and the past year.
It remains to be seen how much additional infrastructure stimulus will be passed prior to the start of 2022 mid-term campaigns; time is running short. We expect a volatile interest rate environment as the Fed attempts to implement FAIT, and navigate a soft landing as it removes accommodative policy. We believe the Fund is well-positioned for this uncertain environment.
33
Victory INCORE Total Return Bond Fund (continued)
Investment Overview
(Unaudited)
Average Annual Total Return
Year Ended June 30, 2021
| | Class A | | Class C | | Class R6 | | Class Y | | | |
INCEPTION DATE | | 12/9/92 | | 3/25/96 | | 3/3/15 | | 12/1/91 | | | |
| | Net Asset
Value | | Maximum
Offering
Price | | Net Asset
Value | | Contingent
Deferred
Charges | | Net Asset
Value | | Net Asset
Value | | Bloomberg
Barclays US
Aggregate
Bond Index1 | |
One Year | | | 1.67 | % | | | –0.63 | % | | | 0.91 | % | | | –0.08 | % | | | 1.93 | % | | | 1.91 | % | | | –0.33 | % | |
Five Year | | | 3.06 | % | | | 2.58 | % | | | 2.30 | % | | | 2.30 | % | | | 3.35 | % | | | 3.33 | % | | | 3.03 | % | |
Ten Year | | | 3.40 | % | | | 3.16 | % | | | 2.64 | % | | | 2.64 | % | | | NA | | | | 3.66 | % | | | 3.39 | % | |
Since Inception | | | NA | | | | NA | | | | NA | | | | NA | | | | 3.03 | % | | | NA | | | | NA | | |
The performance data quoted represents past performance and current returns may be lower or higher. The investment return and principal value will fluctuate so that an investor's shares, when redeemed, may be worth more or less than the original cost. To obtain performance information current to the most recent month's end, please visit www.vcm.com.
The maximum offering price ("MOP") figures reflect a maximum sales charge of 2.25% for Class A. Class C is not subject to an initial sales charge, but is subject to a deferred sales charge of 1.00% on shares redeemed within one year of purchase. Net Asset Value does not reflect sales charges.
Total return measures the price change in a share assuming the reinvestment of all net investment income and realized capital gain distributions, if any. The total returns quoted do not reflect adjustments made to the enclosed financial statements in accordance with U.S. Generally Accepted Accounting Principles or the deduction of taxes that a shareholder would pay on net investment income and realized capital gain distributions, including reinvested distributions, or redemptions of shares. The total return figures set forth above include all waivers of fees. Without such fee waivers, the total returns would have been lower.
Victory INCORE Total Return Bond Fund — Growth of $10,000

1The Bloomberg Barclays US Aggregate Bond Index measures the performance of the investment grade, U.S. dollar-denominated, fixed-rate taxable bond market, including Treasuries, government-related and corporate securities, mortgage-backed securities (agency fixed-rate and hybrid adjustable-rate mortgage (ARM) pass-throughs), asset-backed securities and commercial mortgage-backed securities. This index does not include the effect of sales charges, commissions, expenses, or taxes, is not representative of the Fund, and it is not possible to invest directly in an index.
The graph reflects investment of growth of a hypothetical $10,000 investment in Class A of the Fund.
The graph and table do not reflect the deduction of taxes that a shareholder would pay on Fund distributions or the redemption of shares.
Past performance is not indicative of future results.
34
Victory Portfolios
Victory Integrity Discovery Fund | | June 30, 2021 | |
(Unaudited)
Investment Objective and Portfolio Holdings:
The Fund's investment objective seeks to provide capital appreciation.
Top 10 Holdings*:
June 30, 2021
(% of Net Assets)
Chico's FAS, Inc. | | | 1.4 | % | |
RadNet, Inc. | | | 1.2 | % | |
Genesco, Inc. | | | 1.2 | % | |
The EW Scripps Co., Class A | | | 1.1 | % | |
Atlantic Capital Bancshares, Inc. | | | 1.1 | % | |
Origin Bancorp, Inc. | | | 1.1 | % | |
AngioDynamics, Inc. | | | 1.0 | % | |
Northern Oil and Gas, Inc. | | | 1.0 | % | |
Earthstone Energy, Inc., Class A | | | 1.0 | % | |
Caleres, Inc. | | | 1.0 | % | |
Sector Allocation*:
June 30, 2021
(% of Net Assets)
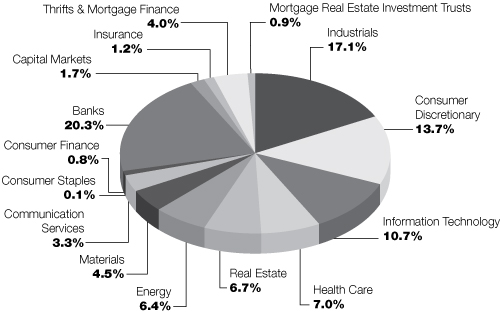
* Does not include futures contracts, money market instruments, and short-term investments purchased with cash collateral from securities loaned.
Percentages are of the net assets of the Fund and may not equal 100%.
Refer to the Schedule of Portfolio Investments for a complete list of securities.
35
Victory Portfolios
Victory Integrity Mid-Cap Value Fund | | June 30, 2021 | |
(Unaudited)
Investment Objective and Portfolio Holdings:
The Fund's investment objective seeks to provide capital appreciation.
Top 10 Holdings*:
June 30, 2021
(% of Net Assets)
Laboratory Corp. of America Holdings | | | 1.4 | % | |
Arthur J. Gallagher & Co. | | | 1.1 | % | |
McKesson Corp. | | | 1.1 | % | |
Huntington Bancshares, Inc. | | | 1.1 | % | |
PPG Industries, Inc. | | | 1.1 | % | |
Diamondback Energy, Inc. | | | 1.1 | % | |
Northern Trust Corp. | | | 1.0 | % | |
Essex Property Trust, Inc. | | | 1.0 | % | |
Pioneer Natural Resources Co. | | | 1.0 | % | |
Zimmer Biomet Holdings, Inc. | | | 1.0 | % | |
Sector Allocation*:
June 30, 2021
(% of Net Assets)

* Does not include futures contracts, money market instruments, and short-term investments purchased with cash collateral from securities loaned.
Percentages are of the net assets of the Fund and may not equal 100%.
Refer to the Schedule of Portfolio Investments for a complete list of securities.
36
Victory Portfolios
Victory Integrity Small-Cap Value Fund | | June 30, 2021 | |
(Unaudited)
Investment Objective and Portfolio Holdings:
The Fund's investment objective seeks to provide long-term capital growth.
Top 10 Holdings*:
June 30, 2021
(% of Net Assets)
Whiting Petroleum Corp. | | | 1.2 | % | |
PDC Energy, Inc. | | | 1.1 | % | |
Green Plains, Inc. | | | 1.1 | % | |
Hancock Whitney Corp. | | | 1.0 | % | |
Alcoa Corp. | | | 1.0 | % | |
Ovintiv, Inc. | | | 1.0 | % | |
Korn Ferry | | | 1.0 | % | |
STAG Industrial, Inc. | | | 1.0 | % | |
PacWest Bancorp | | | 1.0 | % | |
Synovus Financial Corp. | | | 1.0 | % | |
Sector Allocation*:
June 30, 2021
(% of Net Assets)

* Does not include futures contracts, money market instruments, and short-term investments purchased with cash collateral from securities loaned.
Percentages are of the net assets of the Fund and may not equal 100%.
Refer to the Schedule of Portfolio Investments for a complete list of securities.
37
Victory Portfolios
Victory Integrity Small/Mid-Cap Value Fund | | June 30, 2021 | |
(Unaudited)
Investment Objective and Portfolio Holdings:
The Fund's investment objective seeks to provide capital appreciation.
Top 10 Holdings*:
June 30, 2021
(% of Net Assets)
Hancock Whitney Corp. | | | 1.1 | % | |
East West Bancorp, Inc. | | | 1.1 | % | |
Comerica, Inc. | | | 1.1 | % | |
PacWest Bancorp | | | 1.1 | % | |
PDC Energy, Inc. | | | 1.1 | % | |
Alcoa Corp. | | | 1.0 | % | |
Synovus Financial Corp. | | | 1.0 | % | |
Ally Financial, Inc. | | | 1.0 | % | |
Olin Corp. | | | 1.0 | % | |
Hill-Rom Holdings, Inc. | | | 0.9 | % | |
Sector Allocation*:
June 30, 2021
(% of Net Assets)
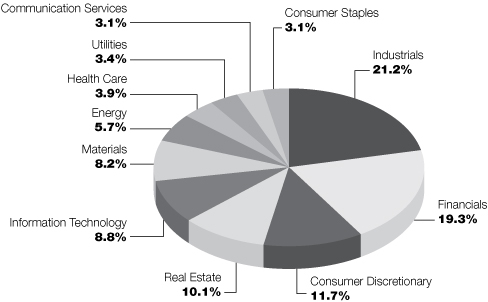
* Does not include futures contracts, money market instruments, and short-term investments purchased with cash collateral from securities loaned.
Percentages are of the net assets of the Fund and may not equal 100%.
Refer to the Schedule of Portfolio Investments for a complete list of securities.
38
Victory Portfolios
Victory Munder Multi-Cap Fund | | June 30, 2021 | |
(Unaudited)
Investment Objective and Portfolio Holdings:
The Fund's investment objective seeks to provide long-term capital appreciation.
Top 10 Holdings*:
June 30, 2021
(% of Net Assets)
Apple, Inc. | | | 5.9 | % | |
Microsoft Corp. | | | 5.8 | % | |
Amazon.com, Inc. | | | 3.5 | % | |
Alphabet, Inc., Class A | | | 3.2 | % | |
NVIDIA Corp. | | | 2.4 | % | |
Facebook, Inc., Class A | | | 2.3 | % | |
iShares Russell 3000 ETF | | | 2.1 | % | |
JPMorgan Chase & Co. | | | 2.0 | % | |
AbbVie, Inc. | | | 1.8 | % | |
Regeneron Pharmaceuticals, Inc. | | | 1.7 | % | |
Sector Allocation*:
June 30, 2021
(% of Net Assets)
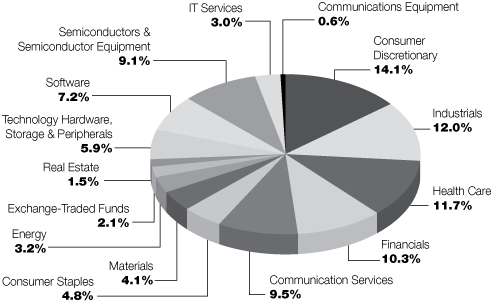
* Does not include futures contracts, money market instruments, and short-term investments purchased with cash collateral from securities loaned.
Percentages are of the net assets of the Fund and may not equal 100%.
Refer to the Schedule of Portfolio Investments for a complete list of securities.
39
Victory Portfolios
Victory S&P 500 Index Fund | | June 30, 2021 | |
(Unaudited)
Investment Objective and Portfolio Holdings:
The Fund's investment objective seeks to provide performance and income that is comparable to the S&P 500® Index.
Top 10 Holdings*:
June 30, 2021
(% of Net Assets)
Apple, Inc. | | | 5.9 | % | |
Microsoft Corp. | | | 5.6 | % | |
Amazon.com, Inc. | | | 4.0 | % | |
Facebook, Inc., Class A | | | 2.3 | % | |
Alphabet, Inc., Class A | | | 2.0 | % | |
Alphabet, Inc., Class C | | | 2.0 | % | |
Berkshire Hathaway, Inc., Class B | | | 1.4 | % | |
Tesla, Inc. | | | 1.4 | % | |
NVIDIA Corp. | | | 1.4 | % | |
JPMorgan Chase & Co. | | | 1.3 | % | |
Sector Allocation*:
June 30, 2021
(% of Net Assets)
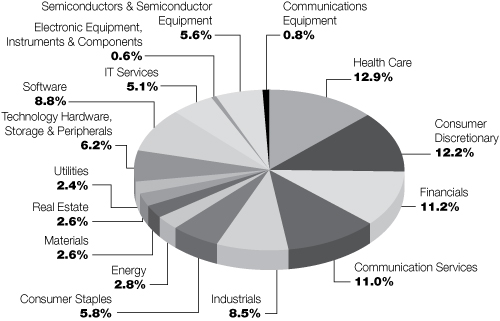
* Does not include futures contracts, money market instruments, and short-term investments purchased with cash collateral from securities loaned.
Percentages are of the net assets of the Fund and may not equal 100%.
Refer to the Schedule of Portfolio Investments for a complete list of securities.
40
Victory Portfolios
Victory Munder Mid-Cap Core Growth Fund | | June 30, 2021 | |
(Unaudited)
Investment Objective and Portfolio Holdings:
The Fund's investment objective seeks to provide long-term capital appreciation.
Top 10 Holdings*:
June 30, 2021
(% of Net Assets)
SPDR S&P MidCap 400 ETF | | | 2.6 | % | |
EPAM Systems, Inc. | | | 2.4 | % | |
Advanced Micro Devices, Inc. | | | 2.0 | % | |
MSCI, Inc. | | | 1.9 | % | |
Ally Financial, Inc. | | | 1.9 | % | |
Trane Technologies PLC | | | 1.8 | % | |
Synchrony Financial | | | 1.7 | % | |
D.R. Horton, Inc. | | | 1.6 | % | |
IQVIA Holdings, Inc. | | | 1.5 | % | |
Synopsys, Inc. | | | 1.5 | % | |
Sector Allocation*:
June 30, 2021
(% of Net Assets)
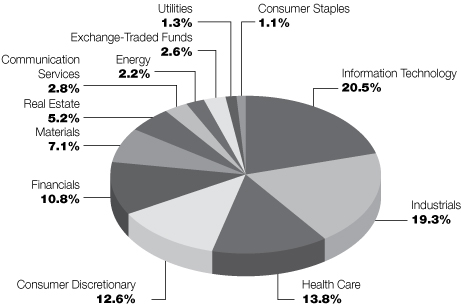
* Does not include futures contracts, money market instruments, and short-term investments purchased with cash collateral from securities loaned.
Percentages are of the net assets of the Fund and may not equal 100%.
Refer to the Schedule of Portfolio Investments for a complete list of securities.
41
Victory Portfolios
Victory Munder Small Cap Growth Fund | | June 30, 2021 | |
(Unaudited)
Investment Objective and Portfolio Holdings:
The Fund's investment objective seeks to provide long-term capital appreciation.
Top 10 Holdings*:
June 30, 2021
(% of Net Assets)
Intellia Therapeutics, Inc. | | | 1.8 | % | |
Maravai LifeSciences Holdings, Inc., Class A | | | 1.6 | % | |
Summit Materials, Inc., Class A | | | 1.6 | % | |
Natera, Inc. | | | 1.5 | % | |
Academy Sports & Outdoors, Inc. | | | 1.4 | % | |
Shoals Technologies Group, Inc., Class A | | | 1.4 | % | |
Napco Security Technologies, Inc. | | | 1.4 | % | |
Skyline Champion Corp. | | | 1.3 | % | |
Vonage Holdings Corp. | | | 1.3 | % | |
WNS Holdings Ltd. | | | 1.3 | % | |
Sector Allocation*:
June 30, 2021
(% of Net Assets)

* Does not include futures contracts, money market instruments, and short-term investments purchased with cash collateral from securities loaned.
Percentages are of the net assets of the Fund and may not equal 100%.
Refer to the Schedule of Portfolio Investments for a complete list of securities.
42
Victory Portfolios
Victory Trivalent International Fund-Core Equity | | June 30, 2021 | |
(Unaudited)
Investment Objective and Portfolio Holdings:
The Fund's investment objective seeks to provide long-term growth of capital.
Top 10 Holdings*:
June 30, 2021
(% of Net Assets)
Tencent Holdings Ltd. | | | 1.7 | % | |
Taiwan Semiconductor Manufacturing Co. Ltd. | | | 1.6 | % | |
Sony Group Corp. | | | 1.6 | % | |
Nestle SA | | | 1.1 | % | |
Volkswagen AG | | | 1.0 | % | |
Anglo American PLC | | | 1.0 | % | |
Toyota Motor Corp. | | | 1.0 | % | |
Novartis AG | | | 1.0 | % | |
Samsung Electronics Co. Ltd. | | | 0.9 | % | |
Alibaba Group Holding Ltd. | | | 0.9 | % | |
Sector Allocation*:
June 30, 2021
(% of Net Assets)

* Does not include futures contracts, money market instruments, and short-term investments purchased with cash collateral from securities loaned.
Percentages are of the net assets of the Fund and may not equal 100%.
Refer to the Schedule of Portfolio Investments for a complete list of securities.
43
Victory Portfolios
Victory Trivalent International Small-Cap Fund | | June 30, 2021 | |
(Unaudited)
Investment Objective and Portfolio Holdings:
The Fund's investment objective seeks to provide long-term growth of capital.
Top 10 Holdings*:
June 30, 2021
(% of Net Assets)
Logitech International SA | | | 1.3 | % | |
Mineral Resources Ltd. | | | 1.2 | % | |
ASM International NV | | | 1.1 | % | |
BayCurrent Consulting, Inc. | | | 1.1 | % | |
TFI International, Inc. | | | 1.1 | % | |
Shinko Electric Industries Co. Ltd. | | | 1.1 | % | |
Valmet Oyj | | | 0.9 | % | |
Soulbrain Co. Ltd. | | | 0.9 | % | |
Future PLC | | | 0.9 | % | |
Osstem Implant Co. Ltd. | | | 0.9 | % | |
Sector Allocation*:
June 30, 2021
(% of Net Assets)
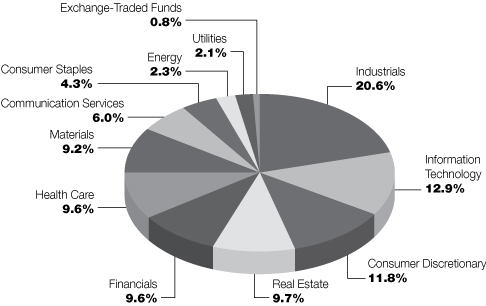
* Does not include futures contracts, money market instruments, and short-term investments purchased with cash collateral from securities loaned.
Percentages are of the net assets of the Fund and may not equal 100%.
Refer to the Schedule of Portfolio Investments for a complete list of securities.
44
Victory Portfolios
Victory INCORE Total Return Bond Fund | | June 30, 2021 | |
(Unaudited)
Investment Objective and Portfolio Holdings:
The Fund's investment objective seeks to provide a high level of current income. Its secondary objective is capital appreciation.
Asset Allocation*:
June 30, 2021
(% of Net Assets)

* Does not include futures contracts, money market instruments, and short-term investments purchased with cash collateral from securities loaned.
Percentages are of the net assets of the Fund and may not equal 100%.
Refer to the Schedule of Portfolio Investments for a complete list of securities.
45
Victory Portfolios
Victory Integrity Discovery Fund | | Schedule of Portfolio Investments
June 30, 2021 | |
(Amounts in Thousands, Except for Shares)
Security Description | | Shares | | Value | |
Common Stocks (98.4%) | |
Banks (20.3%): | |
Atlantic Capital Bancshares, Inc. (a) | | | 38,700 | | | $ | 985 | | |
Central Pacific Financial Corp. | | | 23,200 | | | | 605 | | |
Civista Bancshares, Inc. | | | 30,530 | | | | 675 | | |
ConnectOne Bancorp, Inc. | | | 32,400 | | | | 848 | | |
Dime Community Bancshares, Inc. | | | 23,000 | | | | 773 | | |
Equity Bancshares, Inc., Class A (a) | | | 23,700 | | | | 723 | | |
Financial Institutions, Inc. | | | 25,100 | | | | 753 | | |
First Bank/Hamilton NJ | | | 23,900 | | | | 324 | | |
First Foundation, Inc. | | | 23,600 | | | | 531 | | |
First Internet Bancorp | | | 15,900 | | | | 493 | | |
First Mid Bancshares, Inc. | | | 18,900 | | | | 766 | | |
FVCBankcorp, Inc. (a) (b) | | | 18,800 | | | | 324 | | |
German American Bancorp, Inc. | | | 14,800 | | | | 550 | | |
HarborOne Bancorp, Inc. | | | 47,000 | | | | 674 | | |
Heritage Commerce Corp. (b) | | | 71,800 | | | | 799 | | |
Heritage Financial Corp. | | | 8,500 | | | | 213 | | |
Hometrust Bancshares, Inc. | | | 27,200 | | | | 759 | | |
Howard Bancorp, Inc. (a) | | | 21,500 | | | | 347 | | |
Independent Bank Corp. | | | 31,500 | | | | 684 | | |
Mercantile Bank Corp. | | | 22,730 | | | | 686 | | |
Origin Bancorp, Inc. | | | 22,850 | | | | 970 | | |
Peoples Bancorp, Inc. | | | 23,900 | | | | 708 | | |
Primis Financial Corp. | | | 40,500 | | | | 618 | | |
QCR Holdings, Inc. (b) | | | 17,900 | | | | 861 | | |
SmartFinancial, Inc. | | | 29,200 | | | | 701 | | |
The First Bancshares, Inc. | | | 20,800 | | | | 778 | | |
Univest Financial Corp. | | | 26,300 | | | | 693 | | |
Washington Trust Bancorp, Inc. | | | 16,100 | | | | 827 | | |
| | | | 18,668 | | |
Capital Markets (1.7%): | |
Cowen, Inc., Class A (b) | | | 20,800 | | | | 854 | | |
Diamond Hill Investment Group, Inc. | | | 4,000 | | | | 669 | | |
| | | | 1,523 | | |
Communication Services (3.3%): | |
Emerald Holding, Inc. (a) | | | 106,000 | | | | 571 | | |
Entravision Communications Corp., Class A | | | 96,700 | | | | 646 | | |
The EW Scripps Co., Class A | | | 48,900 | | | | 997 | | |
The Marcus Corp. (a) (b) | | | 39,550 | | | | 839 | | |
| | | | 3,053 | | |
Consumer Discretionary (13.7%): | |
Caleres, Inc. | | | 33,699 | | | | 920 | | |
Chico's FAS, Inc. (a) (b) | | | 193,600 | | | | 1,274 | | |
Chuy's Holdings, Inc. (a) (b) | | | 14,450 | | | | 538 | | |
Del Taco Restaurants, Inc. | | | 46,400 | | | | 465 | | |
Funko, Inc., Class A (a) (b) | | | 27,650 | | | | 588 | | |
Genesco, Inc. (a) | | | 16,830 | | | | 1,072 | | |
See notes to financial statements.
46
Victory Portfolios
Victory Integrity Discovery Fund | | Schedule of Portfolio Investments — continued
June 30, 2021 | |
(Amounts in Thousands, Except for Shares)
Security Description | | Shares | | Value | |
Lindblad Expeditions Holdings, Inc. (a) (b) | | | 38,500 | | | $ | 616 | | |
M/I Homes, Inc. (a) | | | 7,400 | | | | 434 | | |
Malibu Boats, Inc., Class A (a) | | | 7,730 | | | | 567 | | |
Modine Manufacturing Co. (a) (b) | | | 52,700 | | | | 874 | | |
Motorcar Parts of America, Inc. (a) | | | 26,300 | | | | 590 | | |
OneWater Marine, Inc. | | | 9,680 | | | | 407 | | |
Potbelly Corp. (a) | | | 110,000 | | | | 869 | | |
Red Robin Gourmet Burgers, Inc. (a) (b) | | | 14,202 | | | | 470 | | |
Ruth's Hospitality Group, Inc. (a) | | | 15,400 | | | | 355 | | |
Shoe Carnival, Inc. (b) | | | 7,100 | | | | 508 | | |
The Aaron's Co., Inc. | | | 11,827 | | | | 378 | | |
Universal Electronics, Inc. (a) | | | 10,340 | | | | 502 | | |
Universal Technical Institute, Inc. (a) | | | 72,000 | | | | 467 | | |
Zumiez, Inc. (a) | | | 14,850 | | | | 728 | | |
| | | | 12,622 | | |
Consumer Finance (0.8%): | |
EZCORP, Inc., Class A (a) (b) | | | 116,000 | | | | 699 | | |
Consumer Staples (0.1%): | |
Rite Aid Corp. (a) (b) | | | 8,100 | | | | 132 | | |
Energy (6.4%): | |
DHT Holdings, Inc. | | | 68,000 | | | | 441 | | |
Earthstone Energy, Inc., Class A (a) | | | 85,500 | | | | 947 | | |
International Seaways, Inc. (b) | | | 19,885 | | | | 381 | | |
Matrix Service Co. (a) | | | 37,500 | | | | 394 | | |
Natural Gas Services Group, Inc. (a) | | | 31,700 | | | | 326 | | |
Newpark Resources, Inc. (a) (b) | | | 126,000 | | | | 436 | | |
Northern Oil and Gas, Inc. (b) | | | 46,050 | | | | 956 | | |
ProPetro Holding Corp. (a) | | | 47,000 | | | | 431 | | |
Solaris Oilfield Infrastructure, Inc., Class A | | | 49,000 | | | | 477 | | |
Tidewater, Inc. (a) | | | 40,000 | | | | 482 | | |
Vine Energy, Inc., Class A (a) (b) | | | 39,500 | | | | 616 | | |
| | | | 5,887 | | |
Health Care (7.0%): | |
AngioDynamics, Inc. (a) | | | 35,400 | | | | 960 | | |
Collegium Pharmaceutical, Inc. (a) | | | 21,200 | | | | 501 | | |
Community Health Systems, Inc. (a) | | | 49,838 | | | | 770 | | |
Hanger, Inc. (a) | | | 25,000 | | | | 632 | | |
Invacare Corp. (a) (b) | | | 95,800 | | | | 773 | | |
Natus Medical, Inc. (a) | | | 16,000 | | | | 416 | | |
Orthofix Medical, Inc. (a) (b) | | | 12,900 | | | | 517 | | |
RadNet, Inc. (a) | | | 33,000 | | | | 1,112 | | |
Vanda Pharmaceuticals, Inc. (a) | | | 33,400 | | | | 718 | | |
| | | | 6,399 | | |
Industrials (17.1%): | |
CIRCOR International, Inc. (a) | | | 21,250 | | | | 693 | | |
Columbus McKinnon Corp. | | | 12,000 | | | | 579 | | |
Covenant Logistics Group, Inc., Class A (a) | | | 28,800 | | | | 596 | | |
CRA International, Inc. | | | 4,850 | | | | 415 | | |
See notes to financial statements.
47
Victory Portfolios
Victory Integrity Discovery Fund | | Schedule of Portfolio Investments — continued
June 30, 2021 | |
(Amounts in Thousands, Except for Shares)
Security Description | | Shares | | Value | |
Ducommun, Inc. (a) | | | 13,650 | | | $ | 745 | | |
DXP Enterprises, Inc. (a) | | | 25,400 | | | | 846 | | |
Eagle Bulk Shipping, Inc. (a) (b) | | | 13,900 | | | | 658 | | |
Echo Global Logistics, Inc. (a) | | | 25,240 | | | | 776 | | |
Great Lakes Dredge & Dock Corp. (a) | | | 51,000 | | | | 745 | | |
Hawaiian Holdings, Inc. (a) | | | 23,000 | | | | 560 | | |
Heidrick & Struggles International, Inc. | | | 11,700 | | | | 521 | | |
Heritage-Crystal Clean, Inc. (a) | | | 26,700 | | | | 792 | | |
Kelly Services, Inc., Class A (a) | | | 22,500 | | | | 539 | | |
Kimball International, Inc., Class B | | | 47,000 | | | | 618 | | |
NN, Inc. (a) | | | 93,000 | | | | 684 | | |
Park Aerospace Corp. | | | 29,500 | | | | 440 | | |
Park-Ohio Holdings Corp. | | | 14,300 | | | | 460 | | |
SP Plus Corp. (a) | | | 25,380 | | | | 776 | | |
Team, Inc. (a) | | | 58,800 | | | | 394 | | |
The Shyft Group, Inc. | | | 14,550 | | | | 544 | | |
Titan Machinery, Inc. (a) | | | 26,650 | | | | 825 | | |
Triumph Group, Inc. (a) | | | 38,000 | | | | 788 | | |
TrueBlue, Inc. (a) | | | 20,300 | | | | 571 | | |
VSE Corp. | | | 14,550 | | | | 720 | | |
Willdan Group, Inc. (a) (b) | | | 11,700 | | | | 440 | | |
| | | | 15,725 | | |
Information Technology (10.7%): | |
ADTRAN, Inc. | | | 33,900 | | | | 700 | | |
American Software, Inc., Class A | | | 18,635 | | | | 409 | | |
Asure Software, Inc. (a) | | | 72,300 | | | | 641 | | |
Benchmark Electronics, Inc. | | | 16,200 | | | | 461 | | |
Comtech Telecommunications Corp. (b) | | | 28,000 | | | | 676 | | |
CTS Corp. | | | 24,100 | | | | 896 | | |
Diebold Nixdorf, Inc. (a) | | | 33,400 | | | | 429 | | |
Digi International, Inc. (a) (b) | | | 34,900 | | | | 702 | | |
Extreme Networks, Inc. (a) | | | 56,900 | | | | 635 | | |
Harmonic, Inc. (a) | | | 94,500 | | | | 805 | | |
I3 Verticals, Inc., Class A (a) | | | 12,500 | | | | 378 | | |
Ichor Holdings Ltd. (a) | | | 9,400 | | | | 506 | | |
Impinj, Inc. (a) (b) | | | 7,500 | | | | 387 | | |
NeoPhotonics Corp. (a) | | | 53,000 | | | | 541 | | |
PDF Solutions, Inc. (a) | | | 31,400 | | | | 571 | | |
Veeco Instruments, Inc. (a) | | | 22,100 | | | | 531 | | |
Vishay Precision Group, Inc. (a) | | | 17,700 | | | | 603 | | |
| | | | 9,871 | | |
Insurance (1.2%): | |
HCI Group, Inc. (b) | | | 6,120 | | | | 609 | | |
Heritage Insurance Holdings, Inc. | | | 54,000 | | | | 463 | | |
| | | | 1,072 | | |
Materials (4.5%): | |
Haynes International, Inc. | | | 23,100 | | | | 817 | | |
Koppers Holdings, Inc. (a) | | | 20,500 | | | | 663 | | |
See notes to financial statements.
48
Victory Portfolios
Victory Integrity Discovery Fund | | Schedule of Portfolio Investments — continued
June 30, 2021 | |
(Amounts in Thousands, Except for Shares)
Security Description | | Shares | | Value | |
Kraton Corp. (a) | | | 14,500 | | | $ | 468 | | |
Schnitzer Steel Industries, Inc. | | | 8,000 | | | | 393 | | |
SunCoke Energy, Inc. | | | 119,400 | | | | 853 | | |
Verso Corp., Class A | | | 51,300 | | | | 908 | | |
| | | | 4,102 | | |
Mortgage Real Estate Investment Trusts (0.9%): | |
Dynex Capital, Inc. | | | 33,000 | | | | 616 | | |
Western Asset Mortgage Capital Corp. (b) | | | 72,000 | | | | 234 | | |
| | | | 850 | | |
Real Estate (6.7%): | |
Bluerock Residential Growth REIT, Inc. (b) | | | 15,000 | | | | 152 | | |
CatchMark Timber Trust, Inc., Class A | | | 41,000 | | | | 480 | | |
Cedar Realty Trust, Inc. | | | 24,500 | | | | 413 | | |
City Office REIT, Inc. | | | 63,500 | | | | 789 | | |
Global Medical REIT, Inc. (b) | | | 46,600 | | | | 688 | | |
NETSTREIT Corp. | | | 25,700 | | | | 593 | | |
New Senior Investment Group, Inc. | | | 85,900 | | | | 754 | | |
NexPoint Residential Trust, Inc. | | | 11,300 | | | | 621 | | |
Plymouth Industrial REIT, Inc. | | | 31,100 | | | | 623 | | |
UMH Properties, Inc. | | | 9,881 | | | | 216 | | |
Urstadt Biddle Properties, Inc., Class A | | | 43,100 | | | | 835 | | |
| | | | 6,164 | | |
Thrifts & Mortgage Finance (4.0%): | |
Bridgewater Bancshares, Inc. (a) (b) | | | 34,500 | | | | 557 | | |
Home Bancorp, Inc. (b) | | | 8,100 | | | | 309 | | |
HomeStreet, Inc. | | | 11,900 | | | | 485 | | |
Meridian Bancorp, Inc. | | | 40,600 | | | | 831 | | |
PCSB Financial Corp. | | | 34,200 | | | | 621 | | |
Premier Financial Corp. | | | 29,200 | | | | 829 | | |
| | | | 3,632 | | |
Total Common Stocks (Cost $66,875) | | | 90,399 | | |
Collateral for Securities Loaned^ (11.0%) | |
BlackRock Liquidity Funds TempFund Portfolio, Institutional Class, 0.04% (c) | | | 200,064 | | | | 200 | | |
Fidelity Investments Money Market Government Portfolio I Shares, 0.01% (c) | | | 5,419,098 | | | | 5,419 | | |
Goldman Sachs Financial Square Prime Obligations Fund, Institutional Class,
0.02% (c) | | | 99,842 | | | | 100 | | |
JPMorgan Prime Money Market Fund, Capital Class, 0.07% (c) | | | 796,109 | | | | 796 | | |
Morgan Stanley Institutional Liquidity Prime Portfolio, Institutional Class,
0.06% (c) | | | 3,579,461 | | | | 3,580 | | |
Total Collateral for Securities Loaned (Cost $10,095) | | | 10,095 | | |
Total Investments (Cost $76,970) — 109.4% | | | 100,494 | | |
Liabilities in excess of other assets — (9.4)% | | | (8,614 | ) | |
NET ASSETS — 100.00% | | $ | 91,880 | | |
See notes to financial statements.
49
Victory Portfolios
Victory Integrity Discovery Fund | | Schedule of Portfolio Investments — continued
June 30, 2021 | |
(Amounts in Thousands, Except for Shares)
^ Purchased with cash collateral from securities on loan.
(a) Non-income producing security.
(b) All or a portion of this security is on loan.
(c) Rate disclosed is the daily yield on June 30, 2021.
REIT — Real Estate Investment Trust
See notes to financial statements.
50
Victory Portfolios
Victory Integrity Mid-Cap Value Fund | | Schedule of Portfolio Investments
June 30, 2021 | |
(Amounts in Thousands, Except for Shares)
Security Description | | Shares | | Value | |
Common Stocks (99.0%) | |
Communication Services (3.0%): | |
Cinemark Holdings, Inc. (a) | | | 55,696 | | | $ | 1,223 | | |
Liberty Media Group Corp.-Liberty Formula One, Class C (a) | | | 34,700 | | | | 1,673 | | |
Lions Gate Entertainment Corp., Class B (a) | | | 90,309 | | | | 1,653 | | |
Nexstar Media Group, Inc., Class A | | | 16,000 | | | | 2,366 | | |
ViacomCBS, Inc., Class B | | | 21,182 | | | | 957 | | |
| | | | 7,872 | | |
Consumer Discretionary (11.9%): | |
Advance Auto Parts, Inc. | | | 9,300 | | | | 1,908 | | |
Aptiv PLC (a) | | | 11,920 | | | | 1,875 | | |
Aramark | | | 59,782 | | | | 2,227 | | |
Brunswick Corp. | | | 21,600 | | | | 2,152 | | |
Caesars Entertainment, Inc. (a) | | | 19,650 | | | | 2,039 | | |
D.R. Horton, Inc. | | | 15,835 | | | | 1,431 | | |
Hilton Worldwide Holdings, Inc. (a) | | | 11,300 | | | | 1,363 | | |
Kohl's Corp. | | | 26,200 | | | | 1,444 | | |
Newell Brands, Inc. | | | 51,300 | | | | 1,409 | | |
Norwegian Cruise Line Holdings Ltd. (a) (b) | | | 77,200 | | | | 2,270 | | |
Penske Automotive Group, Inc. | | | 19,800 | | | | 1,495 | | |
Ralph Lauren Corp. | | | 19,814 | | | | 2,334 | | |
Tapestry, Inc. (a) | | | 39,700 | | | | 1,726 | | |
The Gap, Inc. | | | 47,450 | | | | 1,597 | | |
Travel + Leisure Co. | | | 39,330 | | | | 2,338 | | |
Visteon Corp. (a) | | | 15,620 | | | | 1,889 | | |
Yum! Brands, Inc. | | | 18,149 | | | | 2,088 | | |
| | | | 31,585 | | |
Consumer Staples (4.4%): | |
Archer-Daniels-Midland Co. | | | 30,511 | | | | 1,849 | | |
Coty, Inc., Class A (a) | | | 207,600 | | | | 1,939 | | |
Darling Ingredients, Inc. (a) | | | 20,259 | | | | 1,367 | | |
Lamb Weston Holdings, Inc. | | | 17,050 | | | | 1,375 | | |
Molson Coors Beverage Co., Class B (a) (b) | | | 25,400 | | | | 1,364 | | |
Performance Food Group Co. (a) | | | 37,600 | | | | 1,823 | | |
Tyson Foods, Inc., Class A | | | 27,450 | | | | 2,025 | | |
| | | | 11,742 | | |
Energy (5.5%): | |
Devon Energy Corp. | | | 81,700 | | | | 2,385 | | |
Diamondback Energy, Inc. | | | 30,164 | | | | 2,832 | | |
Halliburton Co. | | | 91,060 | | | | 2,105 | | |
Hess Corp. | | | 27,600 | | | | 2,410 | | |
Pioneer Natural Resources Co. | | | 16,205 | | | | 2,634 | | |
Valero Energy Corp. | | | 28,606 | | | | 2,234 | | |
| | | | 14,600 | | |
Financials (16.1%): | |
Ally Financial, Inc. | | | 45,600 | | | | 2,273 | | |
Arch Capital Group Ltd. (a) | | | 37,700 | | | | 1,468 | | |
See notes to financial statements.
51
Victory Portfolios
Victory Integrity Mid-Cap Value Fund | | Schedule of Portfolio Investments — continued
June 30, 2021 | |
(Amounts in Thousands, Except for Shares)
Security Description | | Shares | | Value | |
Arthur J. Gallagher & Co. | | | 21,621 | | | $ | 3,029 | | |
Assurant, Inc. | | | 12,800 | | | | 1,999 | | |
Cincinnati Financial Corp. (b) | | | 13,440 | | | | 1,567 | | |
CIT Group, Inc. | | | 32,160 | | | | 1,659 | | |
Comerica, Inc. | | | 35,990 | | | | 2,568 | | |
Huntington Bancshares, Inc. | | | 199,550 | | | | 2,848 | | |
Invesco Ltd. | | | 80,600 | | | | 2,154 | | |
Lincoln National Corp. | | | 28,100 | | | | 1,766 | | |
LPL Financial Holdings, Inc. | | | 18,125 | | | | 2,446 | | |
M&T Bank Corp. | | | 17,450 | | | | 2,536 | | |
Northern Trust Corp. | | | 23,549 | | | | 2,723 | | |
Regions Financial Corp. | | | 100,000 | | | | 2,018 | | |
Reinsurance Group of America, Inc. | | | 14,750 | | | | 1,681 | | |
State Street Corp. | | | 24,400 | | | | 2,008 | | |
Sterling Bancorp | | | 69,269 | | | | 1,717 | | |
The Hartford Financial Services Group, Inc. | | | 29,500 | | | | 1,828 | | |
Voya Financial, Inc. | | | 36,600 | | | | 2,251 | | |
W.R. Berkley Corp. | | | 29,600 | | | | 2,203 | | |
| | | | 42,742 | | |
Health Care (8.5%): | |
Cerner Corp. | | | 20,362 | | | | 1,591 | | |
Elanco Animal Health, Inc. (a) | | | 52,294 | | | | 1,814 | | |
Encompass Health Corp. | | | 30,900 | | | | 2,411 | | |
Hill-Rom Holdings, Inc. | | | 16,600 | | | | 1,886 | | |
Jazz Pharmaceuticals PLC (a) | | | 7,200 | | | | 1,279 | | |
Laboratory Corp. of America Holdings (a) | | | 13,550 | | | | 3,738 | | |
McKesson Corp. | | | 15,476 | | | | 2,960 | | |
Perrigo Co. PLC (b) | | | 35,300 | | | | 1,618 | | |
STERIS PLC | | | 6,505 | | | | 1,342 | | |
Viatris, Inc. | | | 89,400 | | | | 1,278 | | |
Zimmer Biomet Holdings, Inc. | | | 16,250 | | | | 2,613 | | |
| | | | 22,530 | | |
Industrials (17.2%): | |
Altra Industrial Motion Corp. | | | 20,212 | | | | 1,314 | | |
Avis Budget Group, Inc. (a) | | | 12,400 | | | | 966 | | |
Barnes Group, Inc. | | | 22,974 | | | | 1,178 | | |
Carlisle Cos., Inc. | | | 11,910 | | | | 2,279 | | |
Colfax Corp. (a) | | | 38,001 | | | | 1,741 | | |
Crane Co. | | | 16,391 | | | | 1,514 | | |
Cummins, Inc. | | | 6,450 | | | | 1,573 | | |
Delta Air Lines, Inc. (a) | | | 23,700 | | | | 1,025 | | |
Howmet Aerospace, Inc. (a) | | | 62,235 | | | | 2,145 | | |
ITT, Inc. | | | 19,550 | | | | 1,791 | | |
Kirby Corp. (a) | | | 23,170 | | | | 1,405 | | |
Landstar System, Inc. | | | 8,248 | | | | 1,303 | | |
ManpowerGroup, Inc. | | | 19,850 | | | | 2,360 | | |
nVent Electric PLC | | | 57,270 | | | | 1,789 | | |
Old Dominion Freight Line, Inc. | | | 5,364 | | | | 1,361 | | |
See notes to financial statements.
52
Victory Portfolios
Victory Integrity Mid-Cap Value Fund | | Schedule of Portfolio Investments — continued
June 30, 2021 | |
(Amounts in Thousands, Except for Shares)
Security Description | | Shares | | Value | |
Oshkosh Corp. | | | 16,224 | | | $ | 2,022 | | |
Parker-Hannifin Corp. | | | 8,217 | | | | 2,524 | | |
Quanta Services, Inc. | | | 24,000 | | | | 2,174 | | |
Republic Services, Inc. | | | 14,000 | | | | 1,540 | | |
Rexnord Corp. | | | 33,350 | | | | 1,669 | | |
Ryder System, Inc. | | | 23,750 | | | | 1,765 | | |
Southwest Airlines Co. (a) | | | 46,200 | | | | 2,453 | | |
Spirit AeroSystems Holdings, Inc., Class A | | | 38,404 | | | | 1,812 | | |
Textron, Inc. | | | 27,637 | | | | 1,901 | | |
Trane Technologies PLC | | | 11,450 | | | | 2,108 | | |
Westinghouse Air Brake Technologies Corp. | | | 23,135 | | | | 1,904 | | |
| | | | 45,616 | | |
Information Technology (9.5%): | |
Arrow Electronics, Inc. (a) | | | 12,600 | | | | 1,434 | | |
Booz Allen Hamilton Holding Corp. | | | 12,281 | | | | 1,046 | | |
Ciena Corp. (a) | | | 31,300 | | | | 1,781 | | |
Corning, Inc. | | | 37,100 | | | | 1,517 | | |
DXC Technology Co. (a) | | | 64,100 | | | | 2,496 | | |
Flex Ltd. (a) | | | 102,300 | | | | 1,828 | | |
Hewlett Packard Enterprise Co. | | | 91,000 | | | | 1,327 | | |
Jabil, Inc. | | | 42,800 | | | | 2,488 | | |
MKS Instruments, Inc. | | | 8,040 | | | | 1,431 | | |
Motorola Solutions, Inc. | | | 7,853 | | | | 1,703 | | |
NCR Corp. (a) | | | 40,000 | | | | 1,824 | | |
ON Semiconductor Corp. (a) | | | 45,800 | | | | 1,753 | | |
Skyworks Solutions, Inc. | | | 6,563 | | | | 1,258 | | |
Verint Systems, Inc. (a) | | | 29,100 | | | | 1,312 | | |
Western Digital Corp. (a) | | | 27,472 | | | | 1,955 | | |
| | | | 25,153 | | |
Materials (7.6%): | |
Arconic Corp. (a) | | | 57,954 | | | | 2,064 | | |
CF Industries Holdings, Inc. | | | 44,517 | | | | 2,290 | | |
Cleveland-Cliffs, Inc. (a) (b) | | | 79,651 | | | | 1,717 | | |
Freeport-McMoRan, Inc. | | | 38,982 | | | | 1,447 | | |
Martin Marietta Materials, Inc. | | | 4,702 | | | | 1,654 | | |
PPG Industries, Inc. | | | 16,700 | | | | 2,835 | | |
Reliance Steel & Aluminum Co. | | | 12,930 | | | | 1,951 | | |
Steel Dynamics, Inc. | | | 33,900 | | | | 2,021 | | |
The Mosaic Co. | | | 63,000 | | | | 2,010 | | |
Westlake Chemical Corp. | | | 22,650 | | | | 2,041 | | |
| | | | 20,030 | | |
Real Estate (8.6%): | |
Americold Realty Trust | | | 46,250 | | | | 1,751 | | |
Apartment Income REIT Corp. | | | 53,600 | | | | 2,542 | | |
Duke Realty Corp. | | | 51,077 | | | | 2,419 | | |
Essex Property Trust, Inc. | | | 8,980 | | | | 2,694 | | |
Healthpeak Properties, Inc. | | | 46,200 | | | | 1,538 | | |
Host Hotels & Resorts, Inc. (a) | | | 124,300 | | | | 2,124 | | |
See notes to financial statements.
53
Victory Portfolios
Victory Integrity Mid-Cap Value Fund | | Schedule of Portfolio Investments — continued
June 30, 2021 | |
(Amounts in Thousands, Except for Shares)
Security Description | | Shares | | Value | |
Medical Properties Trust, Inc. | | | 114,190 | | | $ | 2,295 | | |
Realty Income Corp. | | | 27,500 | | | | 1,835 | | |
STORE Capital Corp. | | | 46,000 | | | | 1,588 | | |
Welltower, Inc. | | | 30,050 | | | | 2,497 | | |
Weyerhaeuser Co. | | | 47,846 | | | | 1,647 | | |
| | | | 22,930 | | |
Utilities (6.7%): | |
CenterPoint Energy, Inc. | | | 78,000 | | | | 1,913 | | |
DTE Energy Co. | | | 18,750 | | | | 2,430 | | |
Edison International | | | 23,100 | | | | 1,336 | | |
Evergy, Inc. | | | 33,200 | | | | 2,006 | | |
Pinnacle West Capital Corp. | | | 15,350 | | | | 1,258 | | |
PPL Corp. | | | 50,200 | | | | 1,404 | | |
Spire, Inc. | | | 30,138 | | | | 2,178 | | |
UGI Corp. | | | 36,736 | | | | 1,701 | | |
Vistra Corp. | | | 87,181 | | | | 1,617 | | |
Xcel Energy, Inc. | | | 28,576 | | | | 1,883 | | |
| | | | 17,726 | | |
Total Common Stocks (Cost $199,994) | | | 262,526 | | |
Collateral for Securities Loaned^ (1.2%) | |
BlackRock Liquidity Funds TempFund Portfolio, Institutional Class, 0.04% (c) | | | 60,594 | | | | 61 | | |
Fidelity Investments Money Market Government Portfolio I Shares, 0.01% (c) | | | 1,641,303 | | | | 1,641 | | |
Goldman Sachs Financial Square Prime Obligations Fund, Institutional Class,
0.02% (c) | | | 30,240 | | | | 30 | | |
JPMorgan Prime Money Market Fund, Capital Class, 0.07% (c) | | | 241,121 | | | | 241 | | |
Morgan Stanley Institutional Liquidity Prime Portfolio, Institutional Class,
0.06% (c) | | | 1,084,125 | | | | 1,084 | | |
Total Collateral for Securities Loaned (Cost $3,057) | | | 3,057 | | |
Total Investments (Cost $203,051) — 100.2% | | | 265,583 | | |
Liabilities in excess of other assets — (0.2)% | | | (463 | ) | |
NET ASSETS — 100.00% | | $ | 265,120 | | |
^ Purchased with cash collateral from securities on loan.
(a) Non-income producing security.
(b) All or a portion of this security is on loan.
(c) Rate disclosed is the daily yield on June 30, 2021.
PLC — Public Limited Company
REIT — Real Estate Investment Trust
See notes to financial statements.
54
Victory Portfolios
Victory Integrity Small-Cap Value Fund | | Schedule of Portfolio Investments
June 30, 2021 | |
(Amounts in Thousands, Except for Shares)
Security Description | | Shares | | Value | |
Common Stocks (98.2%) | |
Communication Services (2.6%): | |
Cinemark Holdings, Inc. (a) (b) | | | 463,000 | | | $ | 10,163 | | |
Gray Television, Inc. | | | 549,700 | | | | 12,863 | | |
Lions Gate Entertainment Corp., Class B (a) | | | 664,000 | | | | 12,151 | | |
TEGNA, Inc. | | | 451,000 | | | | 8,461 | | |
The Marcus Corp. (a) (b) | | | 406,000 | | | | 8,611 | | |
| | | | 52,249 | | |
Consumer Discretionary (10.9%): | |
Abercrombie & Fitch Co. (a) | | | 231,600 | | | | 10,753 | | |
American Axle & Manufacturing Holdings, Inc. (a) | | | 856,000 | | | | 8,860 | | |
Asbury Automotive Group, Inc. (a) | | | 69,100 | | | | 11,842 | | |
Bloomin' Brands, Inc. (a) | | | 576,600 | | | | 15,649 | | |
Brinker International, Inc. (a) | | | 140,100 | | | | 8,665 | | |
Brunswick Corp. | | | 126,000 | | | | 12,552 | | |
Century Communities, Inc. | | | 114,000 | | | | 7,585 | | |
Dana, Inc. | | | 430,000 | | | | 10,217 | | |
G-III Apparel Group Ltd. (a) | | | 321,000 | | | | 10,548 | | |
Guess?, Inc. (b) | | | 404,700 | | | | 10,684 | | |
Jack in the Box, Inc. | | | 140,000 | | | | 15,602 | | |
Macy's, Inc. (a) (b) | | | 625,500 | | | | 11,859 | | |
Marriott Vacations Worldwide Corp. (a) | | | 98,900 | | | | 15,755 | | |
Steven Madden Ltd. | | | 368,250 | | | | 16,115 | | |
The ODP Corp. (a) | | | 169,200 | | | | 8,123 | | |
Tri Pointe Homes, Inc. (a) | | | 470,000 | | | | 10,072 | | |
Visteon Corp. (a) | | | 81,500 | | | | 9,857 | | |
Wolverine World Wide, Inc. | | | 403,000 | | | | 13,557 | | |
WW International, Inc. (a) | | | 295,000 | | | | 10,661 | | |
| | | | 218,956 | | |
Consumer Staples (3.2%): | |
Coty, Inc., Class A (a) | | | 1,557,900 | | | | 14,551 | | |
Edgewell Personal Care Co. | | | 243,200 | | | | 10,676 | | |
Performance Food Group Co. (a) | | | 346,600 | | | | 16,807 | | |
Sanderson Farms, Inc. | | | 52,000 | | | | 9,774 | | |
The Simply Good Foods Co. (a) (b) | | | 346,800 | | | | 12,662 | | |
| | | | 64,470 | | |
Energy (7.7%): | |
Antero Resources Corp. (a) (b) | | | 1,047,000 | | | | 15,736 | | |
Cactus, Inc., Class A | | | 185,400 | | | | 6,808 | | |
Chesapeake Energy Corp. | | | 289,500 | | | | 15,031 | | |
Delek U.S. Holdings, Inc. | | | 457,700 | | | | 9,895 | | |
Green Plains, Inc. (a) | | | 638,000 | | | | 21,450 | | |
Laredo Petroleum, Inc. (a) (b) | | | 125,000 | | | | 11,599 | | |
Ovintiv, Inc. (b) | | | 669,864 | | | | 21,081 | | |
PDC Energy, Inc. | | | 487,100 | | | | 22,304 | | |
ProPetro Holding Corp. (a) | | | 718,800 | | | | 6,584 | | |
Whiting Petroleum Corp. (a) | | | 445,100 | | | | 24,280 | | |
| | | | 154,768 | | |
See notes to financial statements.
55
Victory Portfolios
Victory Integrity Small-Cap Value Fund | | Schedule of Portfolio Investments — continued
June 30, 2021 | |
(Amounts in Thousands, Except for Shares)
Security Description | | Shares | | Value | |
Financials (21.9%): | |
Ameris Bancorp | | | 380,600 | | | $ | 19,270 | | |
Assured Guaranty Ltd. | | | 202,300 | | | | 9,605 | | |
Banc of California, Inc. (b) | | | 619,800 | | | | 10,871 | | |
Banner Corp. | | | 301,800 | | | | 16,361 | | |
Blackstone Mortgage Trust, Inc., Class A (b) | | | 468,600 | | | | 14,944 | | |
Brighthouse Financial, Inc. (a) (b) | | | 172,900 | | | | 7,874 | | |
Cathay General Bancorp | | | 439,000 | | | | 17,279 | | |
CNO Financial Group, Inc. | | | 424,500 | | | | 10,027 | | |
Federated Hermes, Inc. | | | 378,700 | | | | 12,842 | | |
First Bancorp/Southern Pines NC | | | 184,000 | | | | 7,527 | | |
First Merchants Corp. | | | 423,400 | | | | 17,643 | | |
First Midwest Bancorp, Inc. | | | 587,000 | | | | 11,640 | | |
Hancock Whitney Corp. | | | 476,700 | | | | 21,185 | | |
Heritage Financial Corp. | | | 255,000 | | | | 6,380 | | |
Horace Mann Educators Corp. | | | 191,500 | | | | 7,166 | | |
Investors Bancorp, Inc. | | | 1,302,000 | | | | 18,567 | | |
Kinsale Capital Group, Inc. | | | 48,500 | | | | 7,991 | | |
Ladder Capital Corp. | | | 916,000 | | | | 10,571 | | |
MGIC Investment Corp. | | | 1,039,000 | | | | 14,130 | | |
PacWest Bancorp | | | 496,600 | | | | 20,440 | | |
People's United Financial, Inc. | | | 797,144 | | | | 13,663 | | |
Piper Sandler Cos. | | | 98,800 | | | | 12,801 | | |
Primerica, Inc. | | | 59,400 | | | | 9,096 | | |
ProAssurance Corp. | | | 370,800 | | | | 8,436 | | |
Renasant Corp. | | | 395,500 | | | | 15,820 | | |
RLI Corp. | | | 99,000 | | | | 10,354 | | |
Starwood Property Trust, Inc. | | | 337,000 | | | | 8,819 | | |
Sterling Bancorp | | | 529,000 | | | | 13,114 | | |
Stifel Financial Corp. (b) | | | 262,200 | | | | 17,006 | | |
Synovus Financial Corp. | | | 450,700 | | | | 19,777 | | |
United Community Banks, Inc. | | | 552,900 | | | | 17,698 | | |
Veritex Holdings, Inc. | | | 486,500 | | | | 17,227 | | |
WesBanco, Inc. | | | 418,100 | | | | 14,897 | | |
| | | | 441,021 | | |
Health Care (3.7%): | |
Brookdale Senior Living, Inc. (a) | | | 1,442,200 | | | | 11,394 | | |
CONMED Corp. (b) | | | 75,600 | | | | 10,390 | | |
Patterson Cos., Inc. | | | 318,500 | | | | 9,679 | | |
Select Medical Holdings Corp. | | | 407,000 | | | | 17,200 | | |
Supernus Pharmaceuticals, Inc. (a) | | | 334,200 | | | | 10,290 | | |
Tenet Healthcare Corp. (a) (b) | | | 232,100 | | | | 15,548 | | |
| | | | 74,501 | | |
Industrials (19.9%): | |
AAR Corp. (a) | | | 400,600 | | | | 15,523 | | |
Altra Industrial Motion Corp. | | | 160,400 | | | | 10,429 | | |
Atkore, Inc. (a) | | | 122,100 | | | | 8,669 | | |
Avis Budget Group, Inc. (a) | | | 127,500 | | | | 9,931 | | |
See notes to financial statements.
56
Victory Portfolios
Victory Integrity Small-Cap Value Fund | | Schedule of Portfolio Investments — continued
June 30, 2021 | |
(Amounts in Thousands, Except for Shares)
Security Description | | Shares | | Value | |
AZZ, Inc. | | | 220,000 | | | $ | 11,392 | | |
Barnes Group, Inc. | | | 300,600 | | | | 15,406 | | |
Beacon Roofing Supply, Inc. (a) | | | 190,800 | | | | 10,160 | | |
Clean Harbors, Inc. (a) | | | 140,000 | | | | 13,040 | | |
Crane Co. | | | 140,750 | | | | 13,001 | | |
EMCOR Group, Inc. | | | 158,800 | | | | 19,563 | | |
EnPro Industries, Inc. | | | 114,000 | | | | 11,075 | | |
Granite Construction, Inc. | | | 316,100 | | | | 13,128 | | |
Hub Group, Inc., Class A (a) | | | 139,200 | | | | 9,184 | | |
Kirby Corp. (a) | | | 172,650 | | | | 10,469 | | |
Korn Ferry | | | 286,100 | | | | 20,757 | | |
Landstar System, Inc. | | | 65,000 | | | | 10,271 | | |
ManpowerGroup, Inc. | | | 79,000 | | | | 9,394 | | |
Meritor, Inc. (a) | | | 505,700 | | | | 11,843 | | |
MRC Global, Inc. (a) | | | 1,147,000 | | | | 10,782 | | |
nVent Electric PLC | | | 359,600 | | | | 11,234 | | |
Parsons Corp. (a) | | | 313,500 | | | | 12,339 | | |
Rexnord Corp. | | | 349,200 | | | | 17,474 | | |
Ryder System, Inc. | | | 160,000 | | | | 11,893 | | |
Saia, Inc. (a) | | | 62,300 | | | | 13,051 | | |
SkyWest, Inc. (a) | | | 200,000 | | | | 8,614 | | |
Spirit Airlines, Inc. (a) | | | 353,900 | | | | 10,773 | | |
Steelcase, Inc., Class A | | | 808,000 | | | | 12,209 | | |
Terex Corp. | | | 216,700 | | | | 10,319 | | |
Trinity Industries, Inc. (b) | | | 300,000 | | | | 8,067 | | |
Triumph Group, Inc. (a) | | | 574,700 | | | | 11,925 | | |
TrueBlue, Inc. (a) | | | 268,500 | | | | 7,548 | | |
Univar Solutions, Inc. (a) | | | 399,200 | | | | 9,732 | | |
Wabash National Corp. (b) | | | 595,000 | | | | 9,520 | | |
WESCO International, Inc. (a) | | | 129,700 | | | | 13,336 | | |
| | | | 402,051 | | |
Information Technology (7.5%): | |
ADTRAN, Inc. | | | 420,400 | | | | 8,681 | | |
Belden, Inc. | | | 320,800 | | | | 16,223 | | |
Cognyte Software Ltd. (a) | | | 330,000 | | | | 8,085 | | |
Cohu, Inc. (a) (b) | | | 392,000 | | | | 14,422 | | |
Conduent, Inc. (a) | | | 1,371,500 | | | | 10,286 | | |
CTS Corp. | | | 308,000 | | | | 11,445 | | |
Diebold Nixdorf, Inc. (a) | | | 780,000 | | | | 10,015 | | |
Diodes, Inc. (a) | | | 155,300 | | | | 12,388 | | |
Harmonic, Inc. (a) | | | 598,100 | | | | 5,096 | | |
Infinera Corp. (a) (b) | | | 1,134,000 | | | | 11,567 | | |
NeoPhotonics Corp. (a) | | | 554,700 | | | | 5,663 | | |
Plexus Corp. (a) (b) | | | 90,900 | | | | 8,309 | | |
TTM Technologies, Inc. (a) | | | 664,000 | | | | 9,495 | | |
Verint Systems, Inc. (a) | | | 221,800 | | | | 9,997 | | |
Vishay Intertechnology, Inc. | | | 443,000 | | | | 9,990 | | |
| | | | 151,662 | | |
See notes to financial statements.
57
Victory Portfolios
Victory Integrity Small-Cap Value Fund | | Schedule of Portfolio Investments — continued
June 30, 2021 | |
(Amounts in Thousands, Except for Shares)
Security Description | | Shares | | Value | |
Materials (6.7%): | |
Alcoa Corp. (a) | | | 574,300 | | | $ | 21,157 | | |
Allegheny Technologies, Inc. (a) (b) | | | 646,300 | | | | 13,476 | | |
Arconic Corp. (a) | | | 454,800 | | | | 16,200 | | |
Avient Corp. | | | 336,000 | | | | 16,518 | | |
Carpenter Technology Corp. | | | 255,400 | | | | 10,272 | | |
Kraton Corp. (a) | | | 320,000 | | | | 10,333 | | |
Olin Corp. | | | 372,700 | | | | 17,241 | | |
Summit Materials, Inc., Class A (a) | | | 438,200 | | | | 15,271 | | |
Tronox Holdings PLC, Class A | | | 662,100 | | | | 14,831 | | |
| | | | 135,299 | | |
Real Estate (9.7%): | |
Alexander & Baldwin, Inc. | | | 618,000 | | | | 11,322 | | |
CareTrust REIT, Inc. | | | 493,700 | | | | 11,469 | | |
City Office REIT, Inc. | | | 566,000 | | | | 7,035 | | |
DiamondRock Hospitality Co. (a) | | | 1,548,000 | | | | 15,015 | | |
Easterly Government Properties, Inc. | | | 601,900 | | | | 12,688 | | |
Essential Properties Realty Trust, Inc. | | | 590,000 | | | | 15,954 | | |
Hudson Pacific Properties, Inc. | | | 434,800 | | | | 12,096 | | |
Lexington Realty Trust (b) | | | 1,439,500 | | | | 17,202 | | |
Mack-Cali Realty Corp. | | | 751,900 | | | | 12,895 | | |
Physicians Realty Trust | | | 616,200 | | | | 11,381 | | |
Sabra Health Care REIT, Inc. | | | 699,000 | | | | 12,722 | | |
SITE Centers Corp. | | | 1,183,500 | | | | 17,823 | | |
STAG Industrial, Inc. | | | 551,200 | | | | 20,631 | | |
Summit Hotel Properties, Inc. (a) | | | 997,600 | | | | 9,308 | | |
Sunstone Hotel Investors, Inc. (a) | | | 742,000 | | | | 9,216 | | |
| | | | 196,757 | | |
Utilities (4.4%): | |
ALLETE, Inc. | | | 187,500 | | | | 13,121 | | |
Black Hills Corp. | | | 194,800 | | | | 12,785 | | |
New Jersey Resources Corp. | | | 249,500 | | | | 9,873 | | |
NorthWestern Corp. | | | 248,100 | | | | 14,940 | | |
ONE Gas, Inc. | | | 154,400 | | | | 11,444 | | |
Portland General Electric Co. | | | 254,000 | | | | 11,704 | | |
Spire, Inc. | | | 195,900 | | | | 14,158 | | |
| | | | 88,025 | | |
Total Common Stocks (Cost $1,382,748) | | | 1,979,759 | | |
See notes to financial statements.
58
Victory Portfolios
Victory Integrity Small-Cap Value Fund | | Schedule of Portfolio Investments — continued
June 30, 2021 | |
(Amounts in Thousands, Except for Shares)
Security Description | | Shares | | Value | |
Collateral for Securities Loaned^ (3.7%) | |
BlackRock Liquidity Funds TempFund Portfolio, Institutional Class, 0.04% (c) | | | 1,493,916 | | | $ | 1,494 | | |
Fidelity Investments Money Market Government Portfolio I Shares, 0.01% (c) | | | 40,465,377 | | | | 40,465 | | |
Goldman Sachs Financial Square Prime Obligations Fund, Institutional Class,
0.02% (c) | | | 745,538 | | | | 746 | | |
JPMorgan Prime Money Market Fund, Capital Class, 0.07% (c) | | | 5,944,689 | | | | 5,945 | | |
Morgan Stanley Institutional Liquidity Prime Portfolio, Institutional Class,
0.06% (c) | | | 26,728,482 | | | | 26,728 | | |
Total Collateral for Securities Loaned (Cost $75,378) | | | 75,378 | | |
Total Investments (Cost $1,458,126) — 101.9% | | | 2,055,137 | | |
Liabilities in excess of other assets — (1.9)% | | | (37,353 | ) | |
NET ASSETS — 100.00% | | $ | 2,017,784 | | |
^ Purchased with cash collateral from securities on loan.
(a) ��Non-income producing security.
(b) All or a portion of this security is on loan.
(c) Rate disclosed is the daily yield on June 30, 2021.
PLC — Public Limited Company
REIT — Real Estate Investment Trust
See notes to financial statements.
59
Victory Portfolios
Victory Integrity Small/Mid-Cap Value Fund | | Schedule of Portfolio Investments
June 30, 2021 | |
(Amounts in Thousands, Except for Shares)
Security Description | | Shares | | Value | |
Common Stocks (98.5%) | |
Communication Services (3.1%): | |
Cinemark Holdings, Inc. (a) | | | 47,200 | | | $ | 1,036 | | |
Liberty Media Group Corp.-Liberty Formula One, Class C (a) | | | 28,655 | | | | 1,381 | | |
Lions Gate Entertainment Corp., Class B (a) | | | 74,400 | | | | 1,362 | | |
Nexstar Media Group, Inc., Class A | | | 11,890 | | | | 1,758 | | |
TEGNA, Inc. | | | 54,800 | | | | 1,028 | | |
| | | | 6,565 | | |
Consumer Discretionary (11.7%): | |
Aramark | | | 41,700 | | | | 1,553 | | |
Asbury Automotive Group, Inc. (a) | | | 5,000 | | | | 857 | | |
Bloomin' Brands, Inc. (a) | | | 45,904 | | | | 1,246 | | |
Brunswick Corp. | | | 17,650 | | | | 1,758 | | |
Caesars Entertainment, Inc. (a) | | | 14,360 | | | | 1,490 | | |
Kohl's Corp. | | | 27,330 | | | | 1,506 | | |
Lear Corp. | | | 6,700 | | | | 1,174 | | |
Newell Brands, Inc. | | | 48,800 | | | | 1,341 | | |
Norwegian Cruise Line Holdings Ltd. (a) (b) | | | 56,530 | | | | 1,663 | | |
PulteGroup, Inc. | | | 20,600 | | | | 1,124 | | |
Ralph Lauren Corp. | | | 15,210 | | | | 1,792 | | |
Steven Madden Ltd. | | | 31,944 | | | | 1,398 | | |
Tapestry, Inc. (a) | | | 26,900 | | | | 1,170 | | |
The Gap, Inc. | | | 31,596 | | | | 1,063 | | |
Travel + Leisure Co. | | | 30,100 | | | | 1,789 | | |
Visteon Corp. (a) | | | 10,400 | | | | 1,258 | | |
Wolverine World Wide, Inc. | | | 38,000 | | | | 1,278 | | |
WW International, Inc. (a) | | | 28,980 | | | | 1,047 | | |
| | | | 24,507 | | |
Consumer Staples (3.1%): | |
Coty, Inc., Class A (a) | | | 161,150 | | | | 1,505 | | |
Edgewell Personal Care Co. | | | 19,300 | | | | 847 | | |
Lamb Weston Holdings, Inc. | | | 17,270 | | | | 1,393 | | |
Performance Food Group Co. (a) | | | 32,000 | | | | 1,552 | | |
Sanderson Farms, Inc. | | | 6,100 | | | | 1,147 | | |
| | | | 6,444 | | |
Energy (5.7%): | |
Cactus, Inc., Class A | | | 16,014 | | | | 588 | | |
Cimarex Energy Co. | | | 24,530 | | | | 1,777 | | |
Devon Energy Corp. | | | 64,900 | | | | 1,894 | | |
Diamondback Energy, Inc. | | | 19,850 | | | | 1,864 | | |
Green Plains, Inc. (a) | | | 56,958 | | | | 1,915 | | |
PDC Energy, Inc. | | | 48,300 | | | | 2,212 | | |
Whiting Petroleum Corp. (a) | | | 30,430 | | | | 1,660 | | |
| | | | 11,910 | | |
Financials (19.3%): | |
AGNC Investment Corp. (b) | | | 57,525 | | | | 972 | | |
Ally Financial, Inc. | | | 41,900 | | | | 2,088 | | |
See notes to financial statements.
60
Victory Portfolios
Victory Integrity Small/Mid-Cap Value Fund | | Schedule of Portfolio Investments — continued
June 30, 2021 | |
(Amounts in Thousands, Except for Shares)
Security Description | | Shares | | Value | |
American Financial Group, Inc. | | | 6,600 | | | $ | 823 | | |
Arch Capital Group Ltd. (a) | | | 17,500 | | | | 682 | | |
Assurant, Inc. | | | 10,950 | | | | 1,710 | | |
Assured Guaranty Ltd. | | | 21,900 | | | | 1,040 | | |
Blackstone Mortgage Trust, Inc., Class A (b) | | | 36,000 | | | | 1,148 | | |
CIT Group, Inc. | | | 27,110 | | | | 1,399 | | |
Comerica, Inc. | | | 31,586 | | | | 2,253 | | |
East West Bancorp, Inc. | | | 31,950 | | | | 2,291 | | |
Hancock Whitney Corp. | | | 51,810 | | | | 2,302 | | |
Invesco Ltd. | | | 57,250 | | | | 1,530 | | |
Investors Bancorp, Inc. | | | 108,000 | | | | 1,540 | | |
Kinsale Capital Group, Inc. | | | 4,850 | | | | 799 | | |
Lincoln National Corp. | | | 12,750 | | | | 801 | | |
LPL Financial Holdings, Inc. | | | 12,990 | | | | 1,753 | | |
MGIC Investment Corp. | | | 97,950 | | | | 1,332 | | |
PacWest Bancorp | | | 54,210 | | | | 2,231 | | |
People's United Financial, Inc. | | | 92,600 | | | | 1,587 | | |
Primerica, Inc. | | | 8,950 | | | | 1,371 | | |
Reinsurance Group of America, Inc. | | | 9,015 | | | | 1,028 | | |
Sterling Bancorp | | | 64,100 | | | | 1,589 | | |
Stifel Financial Corp. | | | 25,145 | | | | 1,631 | | |
Synovus Financial Corp. | | | 49,008 | | | | 2,151 | | |
The Hanover Insurance Group, Inc. | | | 9,770 | | | | 1,325 | | |
Voya Financial, Inc. | | | 25,600 | | | | 1,574 | | |
WesBanco, Inc. | | | 36,110 | | | | 1,287 | | |
| | | | 40,237 | | |
Health Care (3.9%): | |
Encompass Health Corp. | | | 21,000 | | | | 1,639 | | |
Hill-Rom Holdings, Inc. | | | 17,380 | | | | 1,974 | | |
Jazz Pharmaceuticals PLC (a) | | | 6,885 | | | | 1,223 | | |
Perrigo Co. PLC | | | 31,800 | | | | 1,458 | | |
Select Medical Holdings Corp. | | | 43,200 | | | | 1,826 | | |
| | | | 8,120 | | |
Industrials (21.2%): | |
Alaska Air Group, Inc. (a) | | | 13,119 | | | | 791 | | |
Altra Industrial Motion Corp. | | | 16,270 | | | | 1,058 | | |
Atkore, Inc. (a) | | | 12,520 | | | | 889 | | |
Avis Budget Group, Inc. (a) | | | 12,070 | | | | 940 | | |
Barnes Group, Inc. | | | 20,120 | | | | 1,031 | | |
Beacon Roofing Supply, Inc. (a) | | | 18,186 | | | | 968 | | |
Carlisle Cos., Inc. | | | 8,735 | | | | 1,672 | | |
Clean Harbors, Inc. (a) | | | 14,915 | | | | 1,389 | | |
Crane Co. | | | 15,172 | | | | 1,401 | | |
EMCOR Group, Inc. | | | 13,563 | | | | 1,671 | | |
EnPro Industries, Inc. | | | 12,280 | | | | 1,193 | | |
Flowserve Corp. | | | 31,200 | | | | 1,258 | | |
Granite Construction, Inc. (b) | | | 27,537 | | | | 1,144 | | |
Howmet Aerospace, Inc. (a) | | | 53,580 | | | | 1,847 | | |
See notes to financial statements.
61
Victory Portfolios
Victory Integrity Small/Mid-Cap Value Fund | | Schedule of Portfolio Investments — continued
June 30, 2021 | |
(Amounts in Thousands, Except for Shares)
Security Description | | Shares | | Value | |
ITT, Inc. | | | 18,142 | | | $ | 1,662 | | |
Kirby Corp. (a) | | | 20,420 | | | | 1,238 | | |
Korn Ferry | | | 25,330 | | | | 1,838 | | |
Landstar System, Inc. | | | 6,360 | | | | 1,005 | | |
ManpowerGroup, Inc. | | | 12,500 | | | | 1,486 | | |
Meritor, Inc. (a) | | | 49,500 | | | | 1,159 | | |
MRC Global, Inc. (a) | | | 100,612 | | | | 946 | | |
nVent Electric PLC | | | 42,140 | | | | 1,316 | | |
Oshkosh Corp. | | | 12,777 | | | | 1,593 | | |
Parsons Corp. (a) | | | 31,715 | | | | 1,248 | | |
Quanta Services, Inc. | | | 12,670 | | | | 1,148 | | |
Rexnord Corp. | | | 26,710 | | | | 1,337 | | |
Ryder System, Inc. | | | 17,275 | | | | 1,284 | | |
Saia, Inc. (a) | | | 6,400 | | | | 1,341 | | |
SkyWest, Inc. (a) | | | 24,900 | | | | 1,072 | | |
Spirit AeroSystems Holdings, Inc., Class A | | | 30,250 | | | | 1,427 | | |
Steelcase, Inc., Class A | | | 74,780 | | | | 1,130 | | |
Textron, Inc. | | | 22,000 | | | | 1,513 | | |
Trinity Industries, Inc. | | | 28,300 | | | | 761 | | |
Univar Solutions, Inc. (a) | | | 48,059 | | | | 1,172 | | |
Westinghouse Air Brake Technologies Corp. | | | 15,432 | | | | 1,270 | | |
| | | | 44,198 | | |
Information Technology (8.8%): | |
Arrow Electronics, Inc. (a) | | | 10,070 | | | | 1,146 | | |
Belden, Inc. | | | 30,310 | | | | 1,533 | | |
Ciena Corp. (a) | | | 26,000 | | | | 1,479 | | |
Cognyte Software Ltd. (a) | | | 33,600 | | | | 823 | | |
Conduent, Inc. (a) | | | 127,100 | | | | 953 | | |
Diodes, Inc. (a) | | | 13,208 | | | | 1,054 | | |
Euronet Worldwide, Inc. (a) | | | 10,250 | | | | 1,387 | | |
Flex Ltd. (a) | | | 71,400 | | | | 1,276 | | |
Infinera Corp. (a) (b) | | | 100,780 | | | | 1,028 | | |
Jabil, Inc. | | | 26,100 | | | | 1,517 | | |
MKS Instruments, Inc. | | | 6,250 | | | | 1,112 | | |
NCR Corp. (a) | | | 27,800 | | | | 1,268 | | |
ON Semiconductor Corp. (a) | | | 42,090 | | | | 1,611 | | |
Verint Systems, Inc. (a) | | | 26,746 | | | | 1,206 | | |
Vishay Intertechnology, Inc. | | | 40,500 | | | | 913 | | |
| | | | 18,306 | | |
Materials (8.2%): | |
Alcoa Corp. (a) | | | 59,250 | | | | 2,183 | | |
Allegheny Technologies, Inc. (a) | | | 58,700 | | | | 1,224 | | |
Arconic Corp. (a) | | | 46,680 | | | | 1,663 | | |
Carpenter Technology Corp. | | | 26,400 | | | | 1,062 | | |
CF Industries Holdings, Inc. | | | 26,959 | | | | 1,387 | | |
Cleveland-Cliffs, Inc. (a) | | | 60,167 | | | | 1,297 | | |
Kraton Corp. (a) | | | 25,630 | | | | 828 | | |
Olin Corp. | | | 42,970 | | | | 1,988 | | |
Steel Dynamics, Inc. | | | 23,210 | | | | 1,383 | | |
Summit Materials, Inc., Class A (a) | | | 33,700 | | | | 1,174 | | |
See notes to financial statements.
62
Victory Portfolios
Victory Integrity Small/Mid-Cap Value Fund | | Schedule of Portfolio Investments — continued
June 30, 2021 | |
(Amounts in Thousands, Except for Shares)
Security Description | | Shares | | Value | |
The Mosaic Co. | | | 44,800 | | | $ | 1,430 | | |
Westlake Chemical Corp. | | | 17,310 | | | | 1,559 | | |
| | | | 17,178 | | |
Real Estate (10.1%): | |
Americold Realty Trust | | | 41,820 | | | | 1,583 | | |
Apartment Income REIT Corp. | | | 41,600 | | | | 1,973 | | |
DiamondRock Hospitality Co. (a) | | | 158,000 | | | | 1,533 | | |
Federal Realty Investment Trust | | | 14,800 | | | | 1,734 | | |
First Industrial Realty Trust, Inc. | | | 25,210 | | | | 1,317 | | |
Gaming and Leisure Properties, Inc. | | | 38,979 | | | | 1,806 | | |
Highwoods Properties, Inc. | | | 42,650 | | | | 1,926 | | |
Hudson Pacific Properties, Inc. | | | 49,200 | | | | 1,369 | | |
Mack-Cali Realty Corp. | | | 64,449 | | | | 1,105 | | |
Medical Properties Trust, Inc. | | | 90,040 | | | | 1,810 | | |
SITE Centers Corp. | | | 128,160 | | | | 1,930 | | |
STORE Capital Corp. | | | 38,195 | | | | 1,318 | | |
VICI Properties, Inc. (b) | | | 54,580 | | | | 1,693 | | |
| | | | 21,097 | | |
Utilities (3.4%): | |
ALLETE, Inc. | | | 15,000 | | | | 1,050 | | |
Black Hills Corp. | | | 15,430 | | | | 1,013 | | |
Pinnacle West Capital Corp. | | | 12,200 | | | | 1,000 | | |
Spire, Inc. | | | 19,800 | | | | 1,431 | | |
UGI Corp. | | | 28,925 | | | | 1,339 | | |
Vistra Corp. | | | 73,564 | | | | 1,365 | | |
| | | | 7,198 | | |
Total Common Stocks (Cost $151,430) | | | 205,760 | | |
Collateral for Securities Loaned^ (2.3%) | |
BlackRock Liquidity Funds TempFund Portfolio, Institutional Class, 0.04% (c) | | | 94,679 | | | | 95 | | |
| Fidelity Investments Money Market Government Portfolio I Shares, 0.01% (c) | | | 2,564,553 | | | | 2,564 | | |
Goldman Sachs Financial Square Prime Obligations Fund, Institutional Class,
0.02% (c) | | | 47,250 | | | | 47 | | |
JPMorgan Prime Money Market Fund, Capital Class, 0.07% (c) | | | 376,754 | | | | 377 | | |
Morgan Stanley Institutional Liquidity Prime Portfolio, Institutional Class,
0.06% (c) | | | 1,693,957 | | | | 1,694 | | |
Total Collateral for Securities Loaned (Cost $4,777) | | | 4,777 | | |
Total Investments (Cost $156,207) — 100.8% | | | 210,537 | | |
Liabilities in excess of other assets — (0.8)% | | | (1,750 | ) | |
NET ASSETS — 100.00% | | $ | 208,787 | | |
^ Purchased with cash collateral from securities on loan.
(a) Non-income producing security.
(b) All or a portion of this security is on loan.
(c) Rate disclosed is the daily yield on June 30, 2021.
PLC — Public Limited Company
REIT — Real Estate Investment Trust
See notes to financial statements.
63
Victory Portfolios
Victory Munder Multi-Cap Fund | | Schedule of Portfolio Investments
June 30, 2021 | |
(Amounts in Thousands, Except for Shares)
Security Description | | Shares | | Value | |
Common Stocks (97.0%) | |
Communication Services (9.5%): | |
Alphabet, Inc., Class A (a) | | | 5,693 | | | $ | 13,901 | | |
Charter Communications, Inc., Class A (a) | | | 7,900 | | | | 5,699 | | |
Facebook, Inc., Class A (a) | | | 29,400 | | | | 10,223 | | |
Iridium Communications, Inc. (a) | | | 52,000 | | | | 2,080 | | |
Nexstar Media Group, Inc., Class A | | | 27,900 | | | | 4,126 | | |
Zynga, Inc., Class A (a) | | | 535,100 | | | | 5,688 | | |
| | | | 41,717 | | |
Communications Equipment (0.6%): | |
Lumentum Holdings, Inc. (a) | | | 30,800 | | | | 2,526 | | |
Consumer Discretionary (14.1%): | |
Amazon.com, Inc. (a) | | | 4,410 | | | | 15,171 | | |
Asbury Automotive Group, Inc. (a) | | | 37,600 | | | | 6,444 | | |
Boyd Gaming Corp. (a) | | | 34,800 | | | | 2,140 | | |
Brunswick Corp. | | | 57,000 | | | | 5,678 | | |
D.R. Horton, Inc. | | | 46,000 | | | | 4,157 | | |
Group 1 Automotive, Inc. | | | 25,200 | | | | 3,892 | | |
LCI Industries | | | 41,700 | | | | 5,480 | | |
LGI Homes, Inc. (a) | | | 24,100 | | | | 3,903 | | |
Lowe's Cos., Inc. | | | 11,500 | | | | 2,231 | | |
Meritage Homes Corp. (a) | | | 56,700 | | | | 5,334 | | |
Rent-A-Center, Inc. | | | 107,800 | | | | 5,721 | | |
Tesla, Inc. (a) | | | 2,800 | | | | 1,903 | | |
| | | | 62,054 | | |
Consumer Staples (4.8%): | |
BJ's Wholesale Club Holdings, Inc. (a) | | | 130,800 | | | | 6,223 | | |
PepsiCo, Inc. | | | 32,800 | | | | 4,860 | | |
Performance Food Group Co. (a) | | | 73,400 | | | | 3,559 | | |
Philip Morris International, Inc. | | | 63,100 | | | | 6,254 | | |
| | | | 20,896 | | |
Energy (3.2%): | |
Chevron Corp. | | | 41,710 | | | | 4,369 | | |
Matador Resources Co. | | | 140,200 | | | | 5,049 | | |
Pioneer Natural Resources Co. | | | 15,100 | | | | 2,454 | | |
Valero Energy Corp. | | | 29,500 | | | | 2,303 | | |
| | | | 14,175 | | |
Financials (10.3%): | |
Ameriprise Financial, Inc. | | | 11,900 | | | | 2,962 | | |
Bank of America Corp. | | | 161,700 | | | | 6,667 | | |
Flagstar Bancorp, Inc. | | | 66,500 | | | | 2,811 | | |
JPMorgan Chase & Co. | | | 56,500 | | | | 8,788 | | |
Morgan Stanley | | | 62,300 | | | | 5,712 | | |
Primerica, Inc. | | | 38,600 | | | | 5,911 | | |
ServisFirst Bancshares, Inc. | | | 51,400 | | | | 3,494 | | |
T. Rowe Price Group, Inc. | | | 24,600 | | | | 4,870 | | |
Western Alliance Bancorp | | | 42,600 | | | | 3,956 | | |
| | | | 45,171 | | |
See notes to financial statements.
64
Victory Portfolios
Victory Munder Multi-Cap Fund | | Schedule of Portfolio Investments — continued
June 30, 2021 | |
(Amounts in Thousands, Except for Shares)
Security Description | | Shares | | Value | |
Health Care (11.7%): | |
AbbVie, Inc. | | | 69,750 | | | $ | 7,857 | | |
Charles River Laboratories International, Inc. (a) | | | 18,300 | | | | 6,770 | | |
ICON PLC (a) (b) | | | 23,100 | | | | 4,775 | | |
Insulet Corp. (a) | | | 8,300 | | | | 2,278 | | |
McKesson Corp. | | | 31,600 | | | | 6,043 | | |
Regeneron Pharmaceuticals, Inc. (a) | | | 13,000 | | | | 7,261 | | |
Stryker Corp. | | | 23,900 | | | | 6,208 | | |
Thermo Fisher Scientific, Inc. | | | 12,400 | | | | 6,255 | | |
UnitedHealth Group, Inc. | | | 9,425 | | | | 3,774 | | |
| | | | 51,221 | | |
Industrials (12.0%): | |
Builders FirstSource, Inc. (a) (b) | | | 116,300 | | | | 4,961 | | |
Chart Industries, Inc. (a) | | | 17,200 | | | | 2,517 | | |
Kansas City Southern | | | 14,600 | | | | 4,137 | | |
Marten Transport Ltd. | | | 213,000 | | | | 3,512 | | |
Masco Corp. | | | 84,700 | | | | 4,990 | | |
Masonite International Corp. (a) | | | 21,400 | | | | 2,392 | | |
Old Dominion Freight Line, Inc. | | | 26,200 | | | | 6,650 | | |
Parker-Hannifin Corp. | | | 14,700 | | | | 4,515 | | |
Patrick Industries, Inc. | | | 65,200 | | | | 4,760 | | |
Trex Co., Inc. (a) | | | 42,700 | | | | 4,364 | | |
UFP Industries, Inc. | | | 56,100 | | | | 4,170 | | |
XPO Logistics, Inc. (a) | | | 39,800 | | | | 5,568 | | |
| | | | 52,536 | | |
IT Services (3.0%): | |
Akamai Technologies, Inc. (a) | | | 43,900 | | | | 5,119 | | |
CACI International, Inc., Class A (a) | | | 9,900 | | | | 2,525 | | |
EPAM Systems, Inc. (a) | | | 11,200 | | | | 5,723 | | |
| | | | 13,367 | | |
Materials (4.1%): | |
Avery Dennison Corp. | | | 22,200 | | | | 4,667 | | |
Dow, Inc. | | | 64,600 | | | | 4,088 | | |
Summit Materials, Inc., Class A (a) | | | 182,200 | | | | 6,350 | | |
Valvoline, Inc. | | | 93,800 | | | | 3,045 | | |
| | | | 18,150 | | |
Real Estate (1.5%): | |
American Tower Corp. | | | 13,500 | | | | 3,647 | | |
Simon Property Group, Inc. | | | 21,300 | | | | 2,779 | | |
| | | | 6,426 | | |
Semiconductors & Semiconductor Equipment (9.1%): | |
Advanced Micro Devices, Inc. (a) | | | 76,400 | | | | 7,176 | | |
Applied Materials, Inc. | | | 31,600 | | | | 4,500 | | |
Broadcom, Inc. | | | 15,100 | | | | 7,200 | | |
Lam Research Corp. | | | 6,700 | | | | 4,360 | | |
See notes to financial statements.
65
Victory Portfolios
Victory Munder Multi-Cap Fund | | Schedule of Portfolio Investments — continued
June 30, 2021 | |
(Amounts in Thousands, Except for Shares)
Security Description | | Shares | | Value | |
NVIDIA Corp. | | | 13,100 | | | $ | 10,481 | | |
Qorvo, Inc. (a) | | | 31,500 | | | | 6,163 | | |
| | | | 39,880 | | |
Software (7.2%): | |
Adobe, Inc. (a) | | | 3,900 | | | | 2,284 | | |
Cadence Design Systems, Inc. (a) | | | 30,600 | | | | 4,187 | | |
Microsoft Corp. | | | 93,360 | | | | 25,291 | | |
| | | | 31,762 | | |
Technology Hardware, Storage & Peripherals (5.9%): | |
Apple, Inc. | | | 187,780 | | | | 25,718 | | |
Total Common Stocks (Cost $279,590) | | | | | 425,599 | | |
Exchange-Traded Funds (2.1%) | |
iShares Russell 3000 ETF | | | 35,100 | | | | 8,982 | | |
Total Exchange-Traded Funds (Cost $8,140) | | | | | 8,982 | | |
Collateral for Securities Loaned^ (1.5%) | |
BlackRock Liquidity Funds TempFund Portfolio, Institutional Class, 0.04% (c) | | | 131,232 | | | | 131 | | |
Fidelity Investments Money Market Government Portfolio I Shares, 0.01% (c) | | | 3,554,640 | | | | 3,555 | | |
Goldman Sachs Financial Square Prime Obligations Fund, Institutional Class,
0.02% (c) | | | 65,491 | | | | 66 | | |
JPMorgan Prime Money Market Fund, Capital Class, 0.07% (c) | | | 522,205 | | | | 522 | | |
Morgan Stanley Institutional Liquidity Prime Portfolio, Institutional Class,
0.06% (c) | | | 2,347,936 | | | | 2,348 | | |
Total Collateral for Securities Loaned (Cost $6,622) | | | | | 6,622 | | |
Total Investments (Cost $294,352) — 100.6% | | | | | 441,203 | | |
Liabilities in excess of other assets — (0.6)% | | | | | (2,721 | ) | |
NET ASSETS — 100.00% | | | | $ | 438,482 | | |
^ Purchased with cash collateral from securities on loan.
(a) Non-income producing security.
(b) All or a portion of this security is on loan.
(c) Rate disclosed is the daily yield on June 30, 2021.
ETF — Exchange-Traded Fund
PLC — Public Limited Company
See notes to financial statements.
66
Victory Portfolios
Victory S&P 500 Index Fund | | Schedule of Portfolio Investments
June 30, 2021 | |
(Amounts in Thousands, Except for Shares)
Security Description | | Shares | | Value | |
Common Stocks (99.1%) | |
Communication Services (11.0%): | |
Activision Blizzard, Inc. | | | 5,706 | | | $ | 545 | | |
Alphabet, Inc., Class A (a) | | | 2,209 | | | | 5,394 | | |
Alphabet, Inc., Class C (a) | | | 2,091 | | | | 5,241 | | |
AT&T, Inc. | | | 52,434 | | | | 1,509 | | |
Charter Communications, Inc., Class A (a) | | | 1,011 | | | | 730 | | |
Comcast Corp., Class A | | | 33,670 | | | | 1,920 | | |
Discovery, Inc., Class A (a) (b) | | | 1,239 | | | | 38 | | |
Discovery, Inc., Class C (a) (b) | | | 2,206 | | | | 64 | | |
DISH Network Corp., Class A (a) | | | 1,825 | | | | 76 | | |
Electronic Arts, Inc. | | | 2,102 | | | | 302 | | |
Facebook, Inc., Class A (a) | | | 17,596 | | | | 6,118 | | |
Fox Corp., Class A | | | 2,401 | | | | 89 | | |
Fox Corp., Class B | | | 1,116 | | | | 39 | | |
Live Nation Entertainment, Inc. (a) | | | 1,061 | | | | 93 | | |
Lumen Technologies, Inc. | | | 7,305 | | | | 99 | | |
Netflix, Inc. (a) | | | 3,256 | | | | 1,720 | | |
News Corp., Class A | | | 2,873 | | | | 74 | | |
News Corp., Class B | | | 894 | | | | 22 | | |
Omnicom Group, Inc. | | | 1,579 | | | | 126 | | |
Take-Two Interactive Software, Inc. (a) | | | 849 | | | | 150 | | |
The Interpublic Group of Cos., Inc. | | | 2,889 | | | | 94 | | |
The Walt Disney Co. (a) | | | 13,343 | | | | 2,345 | | |
T-Mobile U.S., Inc. (a) | | | 4,304 | | | | 624 | | |
Twitter, Inc. (a) | | | 5,861 | | | | 403 | | |
Verizon Communications, Inc. | | | 30,403 | | | | 1,704 | | |
ViacomCBS, Inc., Class B | | | 4,447 | | | | 201 | | |
| | | | 29,720 | | |
Communications Equipment (0.8%): | |
Arista Networks, Inc. (a) | | | 404 | | | | 146 | | |
Cisco Systems, Inc. | | | 30,948 | | | | 1,640 | | |
F5 Networks, Inc. (a) | | | 438 | | | | 82 | | |
Juniper Networks, Inc. | | | 2,407 | | | | 66 | | |
Motorola Solutions, Inc. | | | 1,246 | | | | 270 | | |
| | | | 2,204 | | |
Consumer Discretionary (12.2%): | |
Advance Auto Parts, Inc. | | | 481 | | | | 99 | | |
Amazon.com, Inc. (a) | | | 3,148 | | | | 10,830 | | |
Aptiv PLC (a) | | | 1,986 | | | | 312 | | |
AutoZone, Inc. (a) | | | 159 | | | | 237 | | |
Best Buy Co., Inc. | | | 1,637 | | | | 188 | | |
Booking Holdings, Inc. (a) | | | 301 | | | | 659 | | |
BorgWarner, Inc. | | | 1,761 | | | | 85 | | |
Caesars Entertainment, Inc. (a) | | | 1,533 | | | | 159 | | |
CarMax, Inc. (a) | | | 1,198 | | | | 155 | | |
Carnival Corp. (a) (b) | | | 5,862 | | | | 155 | | |
Chipotle Mexican Grill, Inc. (a) | | | 207 | | | | 321 | | |
See notes to financial statements.
67
Victory Portfolios
Victory S&P 500 Index Fund | | Schedule of Portfolio Investments — continued
June 30, 2021 | |
(Amounts in Thousands, Except for Shares)
Security Description | | Shares | | Value | |
D.R. Horton, Inc. | | | 2,409 | | | $ | 218 | | |
Darden Restaurants, Inc. | | | 961 | | | | 140 | | |
Dollar General Corp. | | | 1,735 | | | | 375 | | |
Dollar Tree, Inc. (a) | | | 1,703 | | | | 169 | | |
Domino's Pizza, Inc. | | | 285 | | | | 133 | | |
eBay, Inc. | | | 4,753 | | | | 334 | | |
Etsy, Inc. (a) | | | 933 | | | | 192 | | |
Expedia Group, Inc. (a) | | | 1,039 | | | | 170 | | |
Ford Motor Co. (a) | | | 28,793 | | | | 428 | | |
Garmin Ltd. | | | 1,101 | | | | 159 | | |
General Motors Co. (a) | | | 9,375 | | | | 555 | | |
Genuine Parts Co. | | | 1,061 | | | | 134 | | |
Hanesbrands, Inc. | | | 2,564 | | | | 48 | | |
Hasbro, Inc. | | | 940 | | | | 89 | | |
Hilton Worldwide Holdings, Inc. (a) | | | 2,045 | | | | 247 | | |
L Brands, Inc. | | | 1,720 | | | | 124 | | |
Las Vegas Sands Corp. (a) (c) | | | 2,412 | | | | 127 | | |
Leggett & Platt, Inc. | | | 978 | | | | 51 | | |
Lennar Corp., Class A | | | 2,025 | | | | 201 | | |
LKQ Corp. (a) | | | 2,041 | | | | 100 | | |
Lowe's Cos., Inc. | | | 5,191 | | | | 1,007 | | |
Marriott International, Inc., Class A (a) | | | 1,961 | | | | 268 | | |
McDonald's Corp. | | | 5,480 | | | | 1,266 | | |
MGM Resorts International | | | 2,990 | | | | 128 | | |
Mohawk Industries, Inc. (a) | | | 430 | | | | 83 | | |
Newell Brands, Inc. | | | 2,780 | | | | 76 | | |
NIKE, Inc., Class B | | | 9,363 | | | | 1,446 | | |
Norwegian Cruise Line Holdings Ltd. (a) (b) | | | 2,717 | | | | 80 | | |
NVR, Inc. (a) | | | 25 | | | | 124 | | |
O'Reilly Automotive, Inc. (a) | | | 512 | | | | 290 | | |
Penn National Gaming, Inc. (a) | | | 1,091 | | | | 83 | | |
Pool Corp. | | | 295 | | | | 135 | | |
PulteGroup, Inc. | | | 1,942 | | | | 106 | | |
PVH Corp. (a) | | | 523 | | | | 56 | | |
Ralph Lauren Corp. | | | 354 | | | | 42 | | |
Ross Stores, Inc. | | | 2,619 | | | | 325 | | |
Royal Caribbean Cruises Ltd. (a) | | | 1,608 | | | | 137 | | |
Starbucks Corp. | | | 8,653 | | | | 968 | | |
Tapestry, Inc. (a) | | | 2,048 | | | | 89 | | |
Target Corp. (c) | | | 3,633 | | | | 878 | | |
Tesla, Inc. (a) | | | 5,660 | | | | 3,847 | | |
The Gap, Inc. | | | 1,525 | | | | 51 | | |
The Home Depot, Inc. | | | 7,808 | | | | 2,490 | | |
The TJX Cos., Inc. | | | 8,856 | | | | 597 | | |
Tractor Supply Co. | | | 846 | | | | 157 | | |
Ulta Beauty, Inc. (a) | | | 402 | | | | 139 | | |
Under Armour, Inc., Class A (a) | | | 1,385 | | | | 29 | | |
Under Armour, Inc., Class C (a) | | | 1,443 | | | | 27 | | |
VF Corp. | | | 2,361 | | | | 194 | | |
Whirlpool Corp. | | | 460 | | | | 100 | | |
See notes to financial statements.
68
Victory Portfolios
Victory S&P 500 Index Fund | | Schedule of Portfolio Investments — continued
June 30, 2021 | |
(Amounts in Thousands, Except for Shares)
Security Description | | Shares | | Value | |
Wynn Resorts Ltd. (a) | | | 773 | | | $ | 95 | | |
Yum! Brands, Inc. | | | 2,188 | | | | 252 | | |
| | | | 32,759 | | |
Consumer Staples (5.8%): | |
Altria Group, Inc. | | | 13,590 | | | | 648 | | |
Archer-Daniels-Midland Co. | | | 4,103 | | | | 249 | | |
Brown-Forman Corp., Class B | | | 1,341 | | | | 101 | | |
Campbell Soup Co. | | | 1,491 | | | | 68 | | |
Church & Dwight Co., Inc. | | | 1,801 | | | | 154 | | |
Colgate-Palmolive Co. | | | 6,213 | | | | 505 | | |
Conagra Brands, Inc. | | | 3,525 | | | | 128 | | |
Constellation Brands, Inc., Class A | | | 1,241 | | | | 290 | | |
Costco Wholesale Corp. | | | 3,246 | | | | 1,284 | | |
General Mills, Inc. | | | 4,479 | | | | 273 | | |
Hormel Foods Corp. | | | 2,070 | | | | 99 | | |
Kellogg Co. | | | 1,850 | | | | 119 | | |
Kimberly-Clark Corp. | | | 2,478 | | | | 332 | | |
Lamb Weston Holdings, Inc. | | | 1,074 | | | | 87 | | |
McCormick & Co., Inc. | | | 1,829 | | | | 162 | | |
Molson Coors Beverage Co., Class B (a) (b) | | | 1,383 | | | | 74 | | |
Mondelez International, Inc., Class A | | | 10,316 | | | | 644 | | |
Monster Beverage Corp. (a) | | | 2,717 | | | | 248 | | |
PepsiCo, Inc. | | | 10,146 | | | | 1,503 | | |
Philip Morris International, Inc. | | | 11,445 | | | | 1,134 | | |
Sysco Corp. | | | 3,757 | | | | 292 | | |
The Clorox Co. | | | 913 | | | | 164 | | |
The Coca-Cola Co. | | | 28,497 | | | | 1,542 | | |
The Estee Lauder Cos., Inc. | | | 1,703 | | | | 542 | | |
The Hershey Co. | | | 1,075 | | | | 187 | | |
The J.M. Smucker Co. (b) | | | 805 | | | | 104 | | |
The Kraft Heinz Co. | | | 4,761 | | | | 194 | | |
The Kroger Co. | | | 5,560 | | | | 213 | | |
The Procter & Gamble Co. | | | 17,979 | | | | 2,426 | | |
Tyson Foods, Inc., Class A | | | 2,165 | | | | 160 | | |
Walgreens Boots Alliance, Inc. | | | 5,269 | | | | 277 | | |
Walmart, Inc. | | | 10,083 | | | | 1,422 | | |
| | | | 15,625 | | |
Electronic Equipment, Instruments & Components (0.6%): | |
Amphenol Corp., Class A | | | 4,389 | | | | 300 | | |
CDW Corp. | | | 1,030 | | | | 180 | | |
Corning, Inc. | | | 5,689 | | | | 233 | | |
IPG Photonics Corp. (a) | | | 264 | | | | 55 | | |
Keysight Technologies, Inc. (a) | | | 1,353 | | | | 209 | | |
TE Connectivity Ltd. | | | 2,425 | | | | 328 | | |
Trimble, Inc. (a) | | | 1,843 | | | | 151 | | |
Zebra Technologies Corp. (a) | | | 393 | | | | 208 | | |
| | | | 1,664 | | |
See notes to financial statements.
69
Victory Portfolios
Victory S&P 500 Index Fund | | Schedule of Portfolio Investments — continued
June 30, 2021 | |
(Amounts in Thousands, Except for Shares)
Security Description | | Shares | | Value | |
Energy (2.8%): | |
APA Corp. | | | 2,776 | | | $ | 60 | | |
Baker Hughes Co. | | | 5,342 | | | | 122 | | |
Cabot Oil & Gas Corp. | | | 2,935 | | | | 51 | | |
Chevron Corp. | | | 14,194 | | | | 1,487 | | |
ConocoPhillips | | | 9,910 | | | | 603 | | |
Devon Energy Corp. | | | 4,374 | | | | 128 | | |
Diamondback Energy, Inc. | | | 1,329 | | | | 125 | | |
EOG Resources, Inc. | | | 4,286 | | | | 358 | | |
Exxon Mobil Corp. | | | 31,090 | | | | 1,961 | | |
Halliburton Co. | | | 6,534 | | | | 151 | | |
Hess Corp. | | | 2,016 | | | | 176 | | |
Kinder Morgan, Inc. | | | 14,302 | | | | 261 | | |
Marathon Oil Corp. | | | 5,788 | | | | 79 | | |
Marathon Petroleum Corp. | | | 4,793 | | | | 289 | | |
NOV, Inc. (a) | | | 2,869 | | | | 44 | | |
Occidental Petroleum Corp. | | | 6,169 | | | | 193 | | |
ONEOK, Inc. | | | 3,272 | | | | 182 | | |
Phillips 66 | | | 3,216 | | | | 276 | | |
Pioneer Natural Resources Co. | | | 1,702 | | | | 277 | | |
Schlumberger Ltd. | | | 10,269 | | | | 329 | | |
The Williams Cos., Inc. | | | 8,921 | | | | 237 | | |
Valero Energy Corp. | | | 3,002 | | | | 234 | | |
| | | | 7,623 | | |
Financials (11.2%): | |
Aflac, Inc. | | | 4,642 | | | | 249 | | |
American Express Co. | | | 4,778 | | | | 789 | | |
American International Group, Inc. | | | 6,302 | | | | 300 | | |
Ameriprise Financial, Inc. | | | 851 | | | | 212 | | |
Aon PLC, Class A | | | 1,657 | | | | 396 | | |
Arthur J. Gallagher & Co. | | | 1,505 | | | | 211 | | |
Assurant, Inc. | | | 445 | | | | 69 | | |
Bank of America Corp. | | | 55,379 | | | | 2,283 | | |
Berkshire Hathaway, Inc., Class B (a) | | | 13,919 | | | | 3,868 | | |
BlackRock, Inc. | | | 1,042 | | | | 912 | | |
Capital One Financial Corp. | | | 3,316 | | | | 513 | | |
Cboe Global Markets, Inc. | | | 783 | | | | 93 | | |
Chubb Ltd. | | | 3,302 | | | | 525 | | |
Cincinnati Financial Corp. (b) | | | 1,100 | | | | 128 | | |
Citigroup, Inc. | | | 15,180 | | | | 1,074 | | |
Citizens Financial Group, Inc. | | | 3,128 | | | | 143 | | |
CME Group, Inc. | | | 2,637 | | | | 561 | | |
Comerica, Inc. | | | 1,025 | | | | 73 | | |
Discover Financial Services | | | 2,239 | | | | 265 | | |
Everest Re Group Ltd. | | | 294 | | | | 74 | | |
Fifth Third Bancorp | | | 5,170 | | | | 198 | | |
First Republic Bank | | | 1,292 | | | | 242 | | |
Franklin Resources, Inc. | | | 2,000 | | | | 64 | | |
Globe Life, Inc. | | | 696 | | | | 66 | | |
Huntington Bancshares, Inc. | | | 10,836 | | | | 155 | | |
See notes to financial statements.
70
Victory Portfolios
Victory S&P 500 Index Fund | | Schedule of Portfolio Investments — continued
June 30, 2021 | |
(Amounts in Thousands, Except for Shares)
Security Description | | Shares | | Value | |
Intercontinental Exchange, Inc. | | | 4,133 | | | $ | 491 | | |
Invesco Ltd. | | | 2,779 | | | | 74 | | |
JPMorgan Chase & Co. | | | 22,230 | | | | 3,458 | | |
KeyCorp | | | 7,127 | | | | 147 | | |
Lincoln National Corp. | | | 1,314 | | | | 83 | | |
Loews Corp. | | | 1,643 | | | | 90 | | |
M&T Bank Corp. | | | 945 | | | | 137 | | |
MarketAxess Holdings, Inc. | | | 279 | | | | 129 | | |
Marsh & McLennan Cos., Inc. | | | 3,734 | | | | 525 | | |
MetLife, Inc. | | | 5,464 | | | | 327 | | |
Moody's Corp. | | | 1,182 | | | | 428 | | |
Morgan Stanley | | | 10,931 | | | | 1,002 | | |
MSCI, Inc. | | | 605 | | | | 322 | | |
Nasdaq, Inc. | | | 844 | | | | 148 | | |
Northern Trust Corp. | | | 1,529 | | | | 177 | | |
People's United Financial, Inc. | | | 3,140 | | | | 54 | | |
Principal Financial Group, Inc. | | | 1,858 | | | | 117 | | |
Prudential Financial, Inc. | | | 2,893 | | | | 296 | | |
Raymond James Financial, Inc. | | | 898 | | | | 117 | | |
Regions Financial Corp. | | | 7,059 | | | | 142 | | |
S&P Global, Inc. | | | 1,769 | | | | 726 | | |
State Street Corp. | | | 2,554 | | | | 210 | | |
SVB Financial Group (a) | | | 399 | | | | 222 | | |
Synchrony Financial | | | 3,972 | | | | 193 | | |
T. Rowe Price Group, Inc. | | | 1,666 | | | | 330 | | |
The Allstate Corp. | | | 2,198 | | | | 287 | | |
The Bank of New York Mellon Corp. | | | 5,925 | | | | 304 | | |
The Charles Schwab Corp. | | | 11,014 | | | | 802 | | |
The Goldman Sachs Group, Inc. | | | 2,498 | | | | 948 | | |
The Hartford Financial Services Group, Inc. | | | 2,623 | | | | 163 | | |
The PNC Financial Services Group, Inc. | | | 3,120 | | | | 595 | | |
The Progressive Corp. | | | 4,297 | | | | 422 | | |
The Travelers Cos., Inc. | | | 1,847 | | | | 277 | | |
Truist Financial Corp. | | | 9,876 | | | | 548 | | |
U.S. Bancorp | | | 9,955 | | | | 567 | | |
Unum Group | | | 1,500 | | | | 43 | | |
W.R. Berkley Corp. | | | 1,029 | | | | 77 | | |
Wells Fargo & Co. | | | 30,356 | | | | 1,375 | | |
Willis Towers Watson PLC | | | 947 | | | | 218 | | |
Zions Bancorp NA | | | 1,203 | | | | 64 | | |
| | | | 30,098 | | |
Health Care (12.9%): | |
Abbott Laboratories | | | 13,048 | | | | 1,513 | | |
AbbVie, Inc. | | | 12,971 | | | | 1,461 | | |
ABIOMED, Inc. (a) | | | 333 | | | | 104 | | |
Agilent Technologies, Inc. | | | 2,228 | | | | 329 | | |
Alexion Pharmaceuticals, Inc. (a) | | | 1,623 | | | | 298 | | |
Align Technology, Inc. (a) | | | 529 | | | | 323 | | |
AmerisourceBergen Corp. | | | 1,086 | | | | 124 | | |
Amgen, Inc. | | | 4,219 | | | | 1,028 | | |
See notes to financial statements.
71
Victory Portfolios
Victory S&P 500 Index Fund | | Schedule of Portfolio Investments — continued
June 30, 2021 | |
(Amounts in Thousands, Except for Shares)
Security Description | | Shares | | Value | |
Anthem, Inc. | | | 1,798 | | | $ | 687 | | |
Baxter International, Inc. | | | 3,693 | | | | 297 | | |
Becton, Dickinson & Co. | | | 2,136 | | | | 519 | | |
Biogen, Inc. (a) | | | 1,106 | | | | 383 | | |
Bio-Rad Laboratories, Inc., Class A (a) | | | 158 | | | | 102 | | |
Boston Scientific Corp. (a) | | | 10,435 | | | | 446 | | |
Bristol-Myers Squibb Co. | | | 16,405 | | | | 1,096 | | |
Cardinal Health, Inc. | | | 2,131 | | | | 122 | | |
Catalent, Inc. (a) | | | 1,251 | | | | 135 | | |
Centene Corp. (a) | | | 4,279 | | | | 312 | | |
Cerner Corp. | | | 2,213 | | | | 173 | | |
Charles River Laboratories International, Inc. (a) | | | 369 | | | | 137 | | |
Cigna Corp. | | | 2,520 | | | | 597 | | |
CVS Health Corp. | | | 9,668 | | | | 807 | | |
Danaher Corp. | | | 4,662 | | | | 1,251 | | |
DaVita, Inc. (a) | | | 515 | | | | 62 | | |
DENTSPLY SIRONA, Inc. | | | 1,603 | | | | 101 | | |
DexCom, Inc. (a) | | | 710 | | | | 303 | | |
Edwards Lifesciences Corp. (a) | | | 4,565 | | | | 473 | | |
Eli Lilly & Co. | | | 5,846 | | | | 1,342 | | |
Gilead Sciences, Inc. (c) | | | 9,210 | | | | 634 | | |
HCA Healthcare, Inc. | | | 1,930 | | | | 399 | | |
Henry Schein, Inc. (a) | | | 1,033 | | | | 77 | | |
Hologic, Inc. (a) | | | 1,882 | | | | 126 | | |
Humana, Inc. | | | 947 | | | | 419 | | |
IDEXX Laboratories, Inc. (a) | | | 626 | | | | 395 | | |
Illumina, Inc. (a) | | | 1,072 | | | | 507 | | |
Incyte Corp. (a) | | | 1,373 | | | | 116 | | |
Intuitive Surgical, Inc. (a) | | | 870 | | | | 800 | | |
IQVIA Holdings, Inc. (a) | | | 1,407 | | | | 341 | | |
Johnson & Johnson (c) | | | 19,339 | | | | 3,186 | | |
Laboratory Corp. of America Holdings (a) | | | 717 | | | | 198 | | |
McKesson Corp. | | | 1,162 | | | | 222 | | |
Medtronic PLC | | | 9,880 | | | | 1,226 | | |
Merck & Co., Inc. | | | 18,595 | | | | 1,446 | | |
Mettler-Toledo International, Inc. (a) | | | 171 | | | | 237 | | |
Organon & Co. (a) | | | 1,858 | | | | 56 | | |
PerkinElmer, Inc. | | | 823 | | | | 127 | | |
Perrigo Co. PLC | | | 981 | | | | 45 | | |
Pfizer, Inc. | | | 41,108 | | | | 1,610 | | |
Quest Diagnostics, Inc. | | | 959 | | | | 127 | | |
Regeneron Pharmaceuticals, Inc. (a) | | | 769 | | | | 430 | | |
ResMed, Inc. | | | 1,069 | | | | 264 | | |
STERIS PLC | | | 717 | | | | 148 | | |
Stryker Corp. | | | 2,407 | | | | 625 | | |
Teleflex, Inc. | | | 343 | | | | 138 | | |
The Cooper Cos., Inc. | | | 362 | | | | 143 | | |
Thermo Fisher Scientific, Inc. | | | 2,886 | | | | 1,456 | | |
UnitedHealth Group, Inc. | | | 6,930 | | | | 2,775 | | |
Universal Health Services, Inc., Class B | | | 573 | | | | 84 | | |
Vertex Pharmaceuticals, Inc. (a) | | | 1,901 | | | | 383 | | |
See notes to financial statements.
72
Victory Portfolios
Victory S&P 500 Index Fund | | Schedule of Portfolio Investments — continued
June 30, 2021 | |
(Amounts in Thousands, Except for Shares)
Security Description | | Shares | | Value | |
Viatris, Inc. | | | 8,876 | | | $ | 127 | | |
Waters Corp. (a) | | | 453 | | | | 157 | | |
West Pharmaceutical Services, Inc. | | | 542 | | | | 195 | | |
Zimmer Biomet Holdings, Inc. | | | 1,531 | | | | 246 | | |
Zoetis, Inc. | | | 3,487 | | | | 650 | | |
| | | | 34,640 | | |
Industrials (8.5%): | |
3M Co. | | | 4,257 | | | | 846 | | |
Alaska Air Group, Inc. (a) | | | 914 | | | | 55 | | |
Allegion PLC | | | 661 | | | | 92 | | |
American Airlines Group, Inc. (a) | | | 4,710 | | | | 100 | | |
AMETEK, Inc. | | | 1,696 | | | | 226 | | |
AO Smith Corp. | | | 987 | | | | 71 | | |
C.H. Robinson Worldwide, Inc. | | | 977 | | | | 91 | | |
Carrier Global Corp. | | | 5,999 | | | | 292 | | |
Caterpillar, Inc. | | | 4,023 | | | | 875 | | |
Cintas Corp. | | | 648 | | | | 248 | | |
Copart, Inc. (a) | | | 1,529 | | | | 202 | | |
CSX Corp. | | | 16,686 | | | | 535 | | |
Cummins, Inc. | | | 1,074 | | | | 262 | | |
Deere & Co. | | | 2,291 | | | | 808 | | |
Delta Air Lines, Inc. (a) | | | 4,697 | | | | 203 | | |
Dover Corp. | | | 1,057 | | | | 159 | | |
Eaton Corp. PLC | | | 2,926 | | | | 434 | | |
Emerson Electric Co. | | | 4,404 | | | | 424 | | |
Enphase Energy, Inc. (a) | | | 997 | | | | 183 | | |
Equifax, Inc. | | | 894 | | | | 214 | | |
Expeditors International of Washington, Inc. | | | 1,240 | | | | 157 | | |
Fastenal Co. | | | 4,218 | | | | 219 | | |
FedEx Corp. | | | 1,793 | | | | 535 | | |
Fortive Corp. | | | 2,486 | | | | 173 | | |
Fortune Brands Home & Security, Inc. | | | 1,017 | | | | 101 | | |
Generac Holdings, Inc. (a) | | | 462 | | | | 192 | | |
General Dynamics Corp. | | | 1,681 | | | | 316 | | |
General Electric Co. | | | 64,468 | | | | 868 | | |
Honeywell International, Inc. | | | 5,101 | | | | 1,119 | | |
Howmet Aerospace, Inc. (a) | | | 2,871 | | | | 99 | | |
Huntington Ingalls Industries, Inc. | | | 295 | | | | 62 | | |
IDEX Corp. | | | 558 | | | | 123 | | |
IHS Markit Ltd. | | | 2,751 | | | | 310 | | |
Illinois Tool Works, Inc. | | | 2,111 | | | | 472 | | |
Ingersoll Rand, Inc. (a) (c) | | | 2,741 | | | | 134 | | |
J.B. Hunt Transport Services, Inc. | | | 613 | | | | 100 | | |
Jacobs Engineering Group, Inc. | | | 956 | | | | 128 | | |
Johnson Controls International PLC | | | 5,263 | | | | 361 | | |
Kansas City Southern | | | 668 | | | | 189 | | |
L3Harris Technologies, Inc. | | | 1,505 | | | | 325 | | |
Lockheed Martin Corp. | | | 1,796 | | | | 679 | | |
Masco Corp. | | | 1,864 | | | | 110 | | |
Nielsen Holdings PLC | | | 2,633 | | | | 65 | | |
See notes to financial statements.
73
Victory Portfolios
Victory S&P 500 Index Fund | | Schedule of Portfolio Investments — continued
June 30, 2021 | |
(Amounts in Thousands, Except for Shares)
Security Description | | Shares | | Value | |
Norfolk Southern Corp. | | | 1,838 | | | $ | 488 | | |
Northrop Grumman Corp. | | | 1,099 | | | | 399 | | |
Old Dominion Freight Line, Inc. | | | 698 | | | | 177 | | |
Otis Worldwide Corp. | | | 2,962 | | | | 242 | | |
PACCAR, Inc. | | | 2,549 | | | | 227 | | |
Parker-Hannifin Corp. | | | 948 | | | | 291 | | |
Pentair PLC | | | 1,221 | | | | 82 | | |
Quanta Services, Inc. | | | 1,023 | | | | 93 | | |
Raytheon Technologies Corp. | | | 11,126 | | | | 949 | | |
Republic Services, Inc. (c) | | | 1,546 | | | | 170 | | |
Robert Half International, Inc. | | | 828 | | | | 74 | | |
Rockwell Automation, Inc. | | | 852 | | | | 244 | | |
Rollins, Inc. | | | 1,626 | | | | 56 | | |
Roper Technologies, Inc. | | | 773 | | | | 363 | | |
Snap-on, Inc. | | | 397 | | | | 89 | | |
Southwest Airlines Co. (a) | | | 4,343 | | | | 231 | | |
Stanley Black & Decker, Inc. | | | 1,186 | | | | 243 | | |
Teledyne Technologies, Inc. (a) | | | 341 | | | | 143 | | |
Textron, Inc. | | | 1,658 | | | | 114 | | |
The Boeing Co. (a) | | | 4,037 | | | | 967 | | |
Trane Technologies PLC | | | 1,756 | | | | 323 | | |
TransDigm Group, Inc. (a) | | | 403 | | | | 261 | | |
Union Pacific Corp. | | | 4,878 | | | | 1,073 | | |
United Airlines Holdings, Inc. (a) (b) | | | 2,376 | | | | 124 | | |
United Parcel Service, Inc., Class B | | | 5,312 | | | | 1,105 | | |
United Rentals, Inc. (a) | | | 532 | | | | 170 | | |
Verisk Analytics, Inc. | | | 1,190 | | | | 208 | | |
W.W. Grainger, Inc. | | | 321 | | | | 141 | | |
Waste Management, Inc. | | | 2,852 | | | | 400 | | |
Westinghouse Air Brake Technologies Corp. | | | 1,305 | | | | 107 | | |
Xylem, Inc. | | | 1,322 | | | | 159 | | |
| | | | 22,870 | | |
IT Services (5.1%): | |
Accenture PLC, Class A | | | 4,668 | | | | 1,376 | | |
Akamai Technologies, Inc. (a) | | | 1,197 | | | | 139 | | |
Automatic Data Processing, Inc. | | | 3,125 | | | | 621 | | |
Broadridge Financial Solutions, Inc. | | | 853 | | | | 138 | | |
Cognizant Technology Solutions Corp., Class A | | | 3,873 | | | | 268 | | |
DXC Technology Co. (a) | | | 1,871 | | | | 73 | | |
Fidelity National Information Services, Inc. | | | 4,554 | | | | 645 | | |
Fiserv, Inc. (a) | | | 4,374 | | | | 467 | | |
FleetCor Technologies, Inc. (a) | | | 612 | | | | 157 | | |
Gartner, Inc. (a) | | | 632 | | | | 153 | | |
Global Payments, Inc. | | | 2,168 | | | | 406 | | |
International Business Machines Corp. | | | 6,562 | | | | 962 | | |
Jack Henry & Associates, Inc. | | | 546 | | | | 89 | | |
Leidos Holdings, Inc. | | | 976 | | | | 99 | | |
Mastercard, Inc., Class A | | | 6,424 | | | | 2,345 | | |
Paychex, Inc. | | | 2,355 | | | | 253 | | |
PayPal Holdings, Inc. (a) | | | 8,627 | | | | 2,515 | | |
See notes to financial statements.
74
Victory Portfolios
Victory S&P 500 Index Fund | | Schedule of Portfolio Investments — continued
June 30, 2021 | |
(Amounts in Thousands, Except for Shares)
Security Description | | Shares | | Value | |
The Western Union Co. | | | 3,005 | | | $ | 69 | | |
VeriSign, Inc. (a) | | | 728 | | | | 166 | | |
Visa, Inc., Class A | | | 12,424 | | | | 2,905 | | |
| | | | 13,846 | | |
Materials (2.6%): | |
Air Products & Chemicals, Inc. | | | 1,625 | | | | 468 | | |
Albemarle Corp. | | | 857 | | | | 144 | | |
Amcor PLC | | | 11,322 | | | | 130 | | |
Avery Dennison Corp. | | | 610 | | | | 128 | | |
Ball Corp. | | | 2,411 | | | | 195 | | |
Celanese Corp. | | | 827 | | | | 125 | | |
CF Industries Holdings, Inc. | | | 1,575 | | | | 81 | | |
Corteva, Inc. | | | 5,413 | | | | 240 | | |
Dow, Inc. | | | 5,486 | | | | 347 | | |
DuPont de Nemours, Inc. | | | 3,908 | | | | 303 | | |
Eastman Chemical Co. | | | 1,003 | | | | 117 | | |
Ecolab, Inc. | | | 1,827 | | | | 376 | | |
FMC Corp. | | | 946 | | | | 102 | | |
Freeport-McMoRan, Inc. | | | 10,762 | | | | 399 | | |
International Flavors & Fragrances, Inc. | | | 1,828 | | | | 273 | | |
International Paper Co. | | | 2,877 | | | | 176 | | |
Linde PLC | | | 3,820 | | | | 1,104 | | |
LyondellBasell Industries NV, Class A | | | 1,891 | | | | 195 | | |
Martin Marietta Materials, Inc. | | | 458 | | | | 161 | | |
Newmont Corp. | | | 5,883 | | | | 373 | | |
Nucor Corp. | | | 2,198 | | | | 211 | | |
Packaging Corp. of America | | | 698 | | | | 95 | | |
PPG Industries, Inc. | | | 1,741 | | | | 296 | | |
Sealed Air Corp. | | | 1,116 | | | | 66 | | |
The Mosaic Co. | | | 2,538 | | | | 81 | | |
The Sherwin-Williams Co. | | | 1,758 | | | | 479 | | |
Vulcan Materials Co. | | | 974 | | | | 170 | | |
Westrock Co. | | | 1,954 | | | | 104 | | |
| | | | 6,939 | | |
Real Estate (2.6%): | |
Alexandria Real Estate Equities, Inc. | | | 1,007 | | | | 183 | | |
American Tower Corp. | | | 3,339 | | | | 902 | | |
AvalonBay Communities, Inc. | | | 1,025 | | | | 214 | | |
Boston Properties, Inc. | | | 1,043 | | | | 120 | | |
CBRE Group, Inc., Class A (a) | | | 2,465 | | | | 211 | | |
Crown Castle International Corp. | | | 3,174 | | | | 619 | | |
Digital Realty Trust, Inc. | | | 2,068 | | | | 311 | | |
Duke Realty Corp. | | | 2,754 | | | | 130 | | |
Equinix, Inc. | | | 658 | | | | 528 | | |
Equity Residential | | | 2,527 | | | | 195 | | |
Essex Property Trust, Inc. | | | 477 | | | | 143 | | |
Extra Space Storage, Inc. | | | 982 | | | | 161 | | |
Federal Realty Investment Trust | | | 520 | | | | 61 | | |
Healthpeak Properties, Inc. | | | 3,958 | | | | 132 | | |
See notes to financial statements.
75
Victory Portfolios
Victory S&P 500 Index Fund | | Schedule of Portfolio Investments — continued
June 30, 2021 | |
(Amounts in Thousands, Except for Shares)
Security Description | | Shares | | Value | |
Host Hotels & Resorts, Inc. (a) | | | 5,185 | | | $ | 89 | | |
Iron Mountain, Inc. (b) | | | 2,120 | | | | 90 | | |
Kimco Realty Corp. | | | 3,183 | | | | 66 | | |
Mid-America Apartment Communities, Inc. | | | 841 | | | | 142 | | |
Prologis, Inc. | | | 5,433 | | | | 649 | | |
Public Storage | | | 1,118 | | | | 336 | | |
Realty Income Corp. | | | 2,743 | | | | 183 | | |
Regency Centers Corp. | | | 1,160 | | | | 74 | | |
SBA Communications Corp. | | | 803 | | | | 256 | | |
Simon Property Group, Inc. | | | 2,413 | | | | 315 | | |
UDR, Inc. | | | 2,180 | | | | 107 | | |
Ventas, Inc. | | | 2,755 | | | | 157 | | |
Vornado Realty Trust | | | 1,153 | | | | 54 | | |
Welltower, Inc. | | | 3,066 | | | | 255 | | |
Weyerhaeuser Co. | | | 5,502 | | | | 189 | | |
| | | | 6,872 | | |
Semiconductors & Semiconductor Equipment (5.6%): | |
Advanced Micro Devices, Inc. (a) | | | 8,923 | | | | 838 | | |
Analog Devices, Inc. | | | 2,709 | | | | 466 | | |
Applied Materials, Inc. | | | 6,739 | | | | 960 | | |
Broadcom, Inc. | | | 2,998 | | | | 1,430 | | |
Intel Corp. | | | 29,654 | | | | 1,665 | | |
KLA Corp. | | | 1,126 | | | | 365 | | |
Lam Research Corp. | | | 1,047 | | | | 681 | | |
Maxim Integrated Products, Inc. | | | 1,971 | | | | 208 | | |
Microchip Technology, Inc. | | | 2,009 | | | | 301 | | |
Micron Technology, Inc. (a) | | | 8,235 | | | | 700 | | |
Monolithic Power Systems, Inc. | | | 316 | | | | 118 | | |
NVIDIA Corp. | | | 4,575 | | | | 3,660 | | |
NXP Semiconductors NV | | | 2,025 | | | | 417 | | |
Qorvo, Inc. (a) | | | 827 | | | | 162 | | |
QUALCOMM, Inc. | | | 8,284 | | | | 1,184 | | |
Skyworks Solutions, Inc. | | | 1,212 | | | | 232 | | |
Teradyne, Inc. | | | 1,221 | | | | 163 | | |
Texas Instruments, Inc. | | | 6,782 | | | | 1,304 | | |
Xilinx, Inc. | | | 1,805 | | | | 261 | | |
| | | | 15,115 | | |
Software (8.8%): | |
Adobe, Inc. (a) | | | 3,510 | | | | 2,056 | | |
ANSYS, Inc. (a) | | | 640 | | | | 222 | | |
Autodesk, Inc. (a) | | | 1,616 | | | | 472 | | |
Cadence Design Systems, Inc. (a) | | | 2,043 | | | | 280 | | |
Citrix Systems, Inc. | | | 912 | | | | 107 | | |
Fortinet, Inc. (a) | | | 995 | | | | 237 | | |
Intuit, Inc. | | | 2,007 | | | | 984 | | |
Microsoft Corp. (c) | | | 55,309 | | | | 14,983 | | |
NortonLifeLock, Inc. | | | 4,259 | | | | 116 | | |
Oracle Corp. | | | 13,341 | | | | 1,038 | | |
Paycom Software, Inc. (a) | | | 361 | | | | 131 | | |
See notes to financial statements.
76
Victory Portfolios
Victory S&P 500 Index Fund | | Schedule of Portfolio Investments — continued
June 30, 2021 | |
(Amounts in Thousands, Except for Shares)
Security Description | | Shares | | Value | |
PTC, Inc. (a) | | | 772 | | | $ | 109 | | |
salesforce.com, Inc. (a) | | | 6,800 | | | | 1,661 | | |
ServiceNow, Inc. (a) (c) | | | 1,450 | | | | 797 | | |
Synopsys, Inc. (a) | | | 1,120 | | | | 309 | | |
Tyler Technologies, Inc. (a) | | | 299 | | | | 135 | | |
| | | | 23,637 | | |
Technology Hardware, Storage & Peripherals (6.2%): | |
Apple, Inc. | | | 115,196 | | | | 15,777 | | |
Hewlett Packard Enterprise Co. | | | 9,590 | | | | 140 | | |
HP, Inc. | | | 8,822 | | | | 266 | | |
NetApp, Inc. | | | 1,635 | | | | 134 | | |
Seagate Technology Holdings PLC | | | 1,462 | | | | 129 | | |
Western Digital Corp. (a) | | | 2,250 | | | | 160 | | |
| | | | 16,606 | | |
Utilities (2.4%): | |
Alliant Energy Corp. | | | 1,837 | | | | 102 | | |
Ameren Corp. | | | 1,877 | | | | 150 | | |
American Electric Power Co., Inc. (c) | | | 3,670 | | | | 310 | | |
American Water Works Co., Inc. | | | 1,333 | | | | 205 | | |
Atmos Energy Corp. | | | 960 | | | | 92 | | |
CenterPoint Energy, Inc. | | | 4,263 | | | | 105 | | |
CMS Energy Corp. | | | 2,126 | | | | 126 | | |
Consolidated Edison, Inc. (c) | | | 2,518 | | | | 181 | | |
Dominion Energy, Inc. | | | 5,923 | | | | 436 | | |
DTE Energy Co. | | | 1,423 | | | | 184 | | |
Duke Energy Corp. (c) | | | 5,649 | | | | 558 | | |
Edison International | | | 2,786 | | | | 161 | | |
Entergy Corp. | | | 1,474 | | | | 147 | | |
Evergy, Inc. (c) | | | 1,684 | | | | 102 | | |
Eversource Energy (c) | | | 2,522 | | | | 202 | | |
Exelon Corp. | | | 7,176 | | | | 318 | | |
FirstEnergy Corp. | | | 3,994 | | | | 149 | | |
NextEra Energy, Inc. (c) | | | 14,404 | | | | 1,055 | | |
NiSource, Inc. | | | 2,880 | | | | 71 | | |
NRG Energy, Inc. | | | 1,797 | | | | 72 | | |
Pinnacle West Capital Corp. | | | 828 | | | | 68 | | |
PPL Corp. | | | 5,650 | | | | 158 | | |
Public Service Enterprise Group, Inc. | | | 3,709 | | | | 222 | | |
Sempra Energy | | | 2,314 | | | | 307 | | |
The AES Corp. | | | 4,893 | | | | 128 | | |
The Southern Co. (c) | | | 7,774 | | | | 470 | | |
WEC Energy Group, Inc. (c) | | | 2,316 | | | | 206 | | |
Xcel Energy, Inc. (c) | | | 3,952 | | | | 260 | | |
| | | | 6,545 | | |
Total Common Stocks (Cost $48,328) | | | | | 266,763 | | |
See notes to financial statements.
77
Victory Portfolios
Victory S&P 500 Index Fund | | Schedule of Portfolio Investments — continued
June 30, 2021 | |
(Amounts in Thousands, Except for Shares)
Security Description | | Shares | | Value | |
Collateral for Securities Loaned^ (0.3%) | |
BlackRock Liquidity Funds TempFund Portfolio, Institutional Class, 0.04% (d) | | | 17,088 | | | $ | 17 | | |
Fidelity Investments Money Market Government Portfolio I Shares, 0.01% (d) | | | 462,850 | | | | 463 | | |
Goldman Sachs Financial Square Prime Obligations Fund, Institutional Class,
0.02% (d) | | | 8,528 | | | | 8 | | |
JPMorgan Prime Money Market Fund, Capital Class, 0.07% (d) | | | 67,996 | | | | 68 | | |
Morgan Stanley Institutional Liquidity Prime Portfolio, Institutional Class,
0.06% (d) | | | 305,725 | | | | 306 | | |
Total Collateral for Securities Loaned (Cost $862) | | | | | 862 | | |
Total Investments (Cost $49,190) — 99.4% | | | | | 267,625 | | |
Other assets in excess of liabilities — 0.6% | | | | | 1,707 | | |
NET ASSETS — 100.00% | | | | $ | 269,332 | | |
^ Purchased with cash collateral from securities on loan.
(a) Non-income producing security.
(b) All or a portion of this security is on loan.
(c) All or a portion of this security has been segregated as collateral for derivative instruments.
(d) Rate disclosed is the daily yield on June 30, 2021.
PLC — Public Limited Company
Futures Contracts Purchased
(Amounts not in thousands)
| | | Number of
Contracts | | Expiration
Date | | Notional
Amount | | Value | | Unrealized
Appreciation/
(Depreciation) | |
E-Mini S&P 500 Futures | | | 12 | | | 9/17/21 | | $ | 2,524,748 | | | $ | 2,573,160 | | | $ | 48,412 | | |
Total unrealized appreciation | | $ | 48,412 | | |
Total unrealized depreciation | | | — | | |
Total net unrealized appreciation (depreciation) | | $ | 48,412 | | |
See notes to financial statements.
78
Victory Portfolios
Victory Munder Mid-Cap Core Growth Fund | | Schedule of Portfolio Investments
June 30, 2021 | |
(Amounts in Thousands, Except for Shares)
Security Description | | Shares | | Value | |
Common Stocks (96.7%) | |
Communication Services (2.8%): | |
Live Nation Entertainment, Inc. (a) | | | 75,344 | | | $ | 6,599 | | |
Take-Two Interactive Software, Inc. (a) | | | 33,300 | | | | 5,895 | | |
ViacomCBS, Inc., Class B | | | 90,000 | | | | 4,068 | | |
| | | | 16,562 | | |
Consumer Discretionary (12.6%): | |
AutoZone, Inc. (a) | | | 5,200 | | | | 7,760 | | |
Choice Hotels International, Inc. | | | 22,000 | | | | 2,615 | | |
D.R. Horton, Inc. | | | 104,500 | | | | 9,444 | | |
Etsy, Inc. (a) | | | 26,300 | | | | 5,414 | | |
Expedia Group, Inc. (a) | | | 41,800 | | | | 6,843 | | |
Five Below, Inc. (a) | | | 23,400 | | | | 4,522 | | |
LCI Industries | | | 19,500 | | | | 2,563 | | |
Lear Corp. | | | 40,500 | | | | 7,099 | | |
Lithia Motors, Inc., Class A | | | 12,700 | | | | 4,364 | | |
Marriott Vacations Worldwide Corp. (a) | | | 34,121 | | | | 5,435 | | |
NVR, Inc. (a) | | | 1,500 | | | | 7,460 | | |
Rent-A-Center, Inc. | | | 66,500 | | | | 3,529 | | |
YETI Holdings, Inc. (a) | | | 66,500 | | | | 6,106 | | |
| | | | 73,154 | | |
Consumer Staples (1.1%): | |
Darling Ingredients, Inc. (a) | | | 91,200 | | | | 6,156 | | |
| | | 6,156 | | |
Energy (2.2%): | |
Diamondback Energy, Inc. | | | 72,500 | | | | 6,807 | | |
U.S. Silica Holdings, Inc. (a) | | | 533,900 | | | | 6,172 | | |
| | | | 12,979 | | |
Financials (10.8%): | |
Ally Financial, Inc. | | | 219,500 | | | | 10,940 | | |
Brown & Brown, Inc. | | | 109,500 | | | | 5,819 | | |
East West Bancorp, Inc. | | | 89,700 | | | | 6,431 | | |
Evercore, Inc. | | | 39,900 | | | | 5,617 | | |
MSCI, Inc. | | | 20,900 | | | | 11,141 | | |
Radian Group, Inc. | | | 317,977 | | | | 7,075 | | |
Synchrony Financial | | | 201,600 | | | | 9,782 | | |
W.R. Berkley Corp. | | | 82,300 | | | | 6,125 | | |
| | | | 62,930 | | |
Health Care (13.8%): | |
Agilent Technologies, Inc. | | | 57,693 | | | | 8,528 | | |
BioCryst Pharmaceuticals, Inc. (a) (b) | | | 354,900 | | | | 5,611 | | |
Bruker Corp. | | | 96,500 | | | | 7,332 | | |
CRISPR Therapeutics AG (a) | | | 11,500 | | | | 1,862 | | |
Dynavax Technologies Corp. (a) (b) | | | 253,700 | | | | 2,499 | | |
Edwards Lifesciences Corp. (a) | | | 55,800 | | | | 5,779 | | |
Horizon Therapeutics PLC (a) | | | 50,600 | | | | 4,738 | | |
See notes to financial statements.
79
Victory Portfolios
Victory Munder Mid-Cap Core Growth Fund | | Schedule of Portfolio Investments — continued
June 30, 2021 | |
(Amounts in Thousands, Except for Shares)
Security Description | | Shares | | Value | |
IDEXX Laboratories, Inc. (a) | | | 11,100 | | | $ | 7,010 | | |
Insulet Corp. (a) | | | 15,700 | | | | 4,310 | | |
IQVIA Holdings, Inc. (a) | | | 36,900 | | | | 8,942 | | |
NanoString Technologies, Inc. (a) | | | 85,500 | | | | 5,539 | | |
Teleflex, Inc. | | | 15,100 | | | | 6,067 | | |
Veeva Systems, Inc., Class A (a) | | | 17,300 | | | | 5,379 | | |
Zoetis, Inc. | | | 37,230 | | | | 6,938 | | |
| | | | 80,534 | | |
Industrials (19.3%): | |
Advanced Drainage Systems, Inc. | | | 39,900 | | | | 4,651 | | |
Chart Industries, Inc. (a) | | | 46,100 | | | | 6,745 | | |
Clean Harbors, Inc. (a) | | | 58,100 | | | | 5,412 | | |
Copa Holdings SA (a) | | | 69,100 | | | | 5,205 | | |
CSX Corp. | | | 130,800 | | | | 4,196 | | |
Generac Holdings, Inc. (a) | | | 13,100 | | | | 5,439 | | |
Jacobs Engineering Group, Inc. | | | 18,800 | | | | 2,508 | | |
Kratos Defense & Security Solutions, Inc. (a) | | | 214,000 | | | | 6,097 | | |
Old Dominion Freight Line, Inc. | | | 24,750 | | | | 6,282 | | |
Oshkosh Corp. | | | 68,400 | | | | 8,525 | | |
Owens Corning, Inc. | | | 72,900 | | | | 7,137 | | |
Robert Half International, Inc. | | | 82,900 | | | | 7,376 | | |
Southwest Airlines Co. (a) | | | 90,600 | | | | 4,810 | | |
TFI International, Inc. | | | 84,200 | | | | 7,678 | | |
The Middleby Corp. (a) | | | 41,400 | | | | 7,173 | | |
Trane Technologies PLC | | | 56,100 | | | | 10,330 | | |
Trex Co., Inc. (a) | | | 64,300 | | | | 6,572 | | |
WESCO International, Inc. (a) | | | 57,200 | | | | 5,881 | | |
| | | | 112,017 | | |
Information Technology (20.5%): | |
Advanced Micro Devices, Inc. (a) | | | 123,400 | | | | 11,591 | | |
Amphenol Corp., Class A | | | 108,020 | | | | 7,390 | | |
CDW Corp. | | | 44,759 | | | | 7,817 | | |
Concentrix Corp. (a) | | | 26,000 | | | | 4,181 | | |
Crowdstrike Holdings, Inc., Class A (a) | | | 30,500 | | | | 7,665 | | |
EPAM Systems, Inc. (a) | | | 26,900 | | | | 13,745 | | |
Fidelity National Information Services, Inc. | | | 21,844 | | | | 3,095 | | |
Fiserv, Inc. (a) | | | 48,600 | | | | 5,195 | | |
Global Payments, Inc. | | | 22,000 | | | | 4,126 | | |
KLA Corp. | | | 23,500 | | | | 7,619 | | |
Lumentum Holdings, Inc. (a) | | | 40,600 | | | | 3,330 | | |
Microchip Technology, Inc. | | | 41,687 | | | | 6,242 | | |
Monolithic Power Systems, Inc. (b) | | | 19,600 | | | | 7,320 | | |
ServiceNow, Inc. (a) | | | 7,800 | | | | 4,286 | | |
SS&C Technologies Holdings, Inc. | | | 103,179 | | | | 7,435 | | |
SYNNEX Corp. | | | 37,600 | | | | 4,578 | | |
Synopsys, Inc. (a) | | | 31,700 | | | | 8,742 | | |
Zendesk, Inc. (a) | | | 35,000 | | | | 5,052 | | |
| | | | 119,409 | | |
See notes to financial statements.
80
Victory Portfolios
Victory Munder Mid-Cap Core Growth Fund | | Schedule of Portfolio Investments — continued
June 30, 2021 | |
(Amounts in Thousands, Except for Shares)
Security Description | | Shares | | Value | |
Materials (7.1%): | |
Avery Dennison Corp. | | | 31,100 | | | $ | 6,539 | | |
Cleveland-Cliffs, Inc. (a) (b) | | | 387,000 | | | | 8,344 | | |
Franco-Nevada Corp. (b) | | | 28,200 | | | | 4,091 | | |
Freeport-McMoRan, Inc. | | | 227,200 | | | | 8,431 | | |
Louisiana-Pacific Corp. | | | 113,300 | | | | 6,831 | | |
The Scotts Miracle-Gro Co. | | | 35,600 | | | | 6,832 | | |
| | | | 41,068 | | |
Real Estate (5.2%): | |
Digital Realty Trust, Inc. | | | 51,646 | | | | 7,771 | | |
SBA Communications Corp. | | | 23,603 | | | | 7,522 | | |
Simon Property Group, Inc. | | | 66,300 | | | | 8,651 | | |
Sun Communities, Inc. | | | 36,816 | | | | 6,310 | | |
| | | | 30,254 | | |
Utilities (1.3%): | |
Atmos Energy Corp. | | | 28,000 | | | | 2,691 | | |
Sempra Energy | | | 34,739 | | | | 4,602 | | |
| | | | 7,293 | | |
Total Common Stocks (Cost $345,271) | | | 562,356 | | |
Exchange-Traded Funds (2.6%) | |
SPDR S&P MidCap 400 ETF | | | 31,100 | | | | 15,271 | | |
Total Exchange-Traded Funds (Cost $15,113) | | | 15,271 | | |
Collateral for Securities Loaned^ (2.6%) | |
BlackRock Liquidity Funds TempFund Portfolio, Institutional Class, 0.04% (c) | | | 297,623 | | | | 298 | | |
Fidelity Investments Money Market Government Portfolio I Shares, 0.01% (c) | | | 8,061,635 | | | | 8,062 | | |
Goldman Sachs Financial Square Prime Obligations Fund, Institutional Class,
0.02% (c) | | | 148,528 | | | | 148 | | |
JPMorgan Prime Money Market Fund, Capital Class, 0.07% (c) | | | 1,184,319 | | | | 1,184 | | |
Morgan Stanley Institutional Liquidity Prime Portfolio, Institutional Class,
0.06% (c) | | | 5,324,929 | | | | 5,325 | | |
Total Collateral for Securities Loaned (Cost $15,017) | | | 15,017 | | |
Total Investments (Cost $375,401) — 101.9% | | | 592,644 | | |
Liabilities in excess of other assets — (1.9)% | | | (11,210 | ) | |
NET ASSETS — 100.00% | | $ | 581,434 | | |
^ Purchased with cash collateral from securities on loan.
(a) Non-income producing security.
(b) All or a portion of this security is on loan.
(c) Rate disclosed is the daily yield on June 30, 2021.
ETF — Exchange-Traded Fund
PLC — Public Limited Company
See notes to financial statements.
81
Victory Portfolios
Victory Munder Small Cap Growth Fund | | Schedule of Portfolio Investments
June 30, 2021 | |
(Amounts in Thousands, Except for Shares)
Security Description | | Shares | | Value | |
Common Stocks (99.5%) | |
Biotechnology (19.4%): | |
4D Molecular Therapeutics, Inc. (a) | | | 662 | | | $ | 16 | | |
Akero Therapeutics, Inc. (a) (b) | | | 1,608 | | | | 40 | | |
Alpha Teknova, Inc. (a) | | | 2,306 | | | | 55 | | |
Annexon, Inc. (a) | | | 439 | | | | 10 | | |
Arrowhead Pharmaceuticals, Inc. (a) | | | 1,813 | | | | 150 | | |
Atreca, Inc., Class A (a) | | | 1,590 | | | | 14 | | |
Aurinia Pharmaceuticals, Inc. (a) (b) | | | 6,904 | | | | 89 | | |
Avidity Biosciences, Inc. (a) | | | 1,205 | | | | 30 | | |
Beam Therapeutics, Inc. (a) (b) | | | 1,499 | | | | 193 | | |
Bicycle Therapeutics PLC, ADR (a) | | | 5,276 | | | | 160 | | |
BioAtla, Inc. (a) (b) | | | 665 | | | | 28 | | |
BioCryst Pharmaceuticals, Inc. (a) (b) | | | 11,342 | | | | 179 | | |
BioMarin Pharmaceutical, Inc. (a) | | | 283 | | | | 24 | | |
Black Diamond Therapeutics, Inc. (a) | | | 437 | | | | 5 | | |
Bolt Biotherapeutics, Inc. (a) | | | 699 | | | | 11 | | |
C4 Therapeutics, Inc. (a) (b) | | | 249 | | | | 9 | | |
Cabaletta Bio, Inc. (a) | | | 2,967 | | | | 26 | | |
Castle Biosciences, Inc. (a) | | | 2,000 | | | | 147 | | |
Codiak Biosciences, Inc. (a) | | | 6,305 | | | | 117 | | |
CRISPR Therapeutics AG (a) | | | 410 | | | | 66 | | |
Deciphera Pharmaceuticals, Inc. (a) (b) | | | 708 | | | | 26 | | |
Dicerna Pharmaceuticals, Inc. (a) | | | 2,168 | | | | 81 | | |
Dynavax Technologies Corp. (a) (b) | | | 6,261 | | | | 62 | | |
Esperion Therapeutics, Inc. (a) (b) | | | 873 | | | | 18 | | |
Fusion Pharmaceuticals, Inc. (a) | | | 4,261 | | | | 34 | | |
Gamida Cell Ltd. (a) | | | 9,195 | | | | 59 | | |
Generation Bio Co. (a) | | | 1,180 | | | | 32 | | |
Genetron Holdings Ltd., ADR (a) | | | 5,361 | | | | 108 | | |
IGM Biosciences, Inc. (a) | | | 796 | | | | 66 | | |
Immunocore Holdings PLC, ADR (a) | | | 699 | | | | 27 | | |
Instil Bio, Inc. (a) (b) | | | 1,072 | | | | 21 | | |
Intellia Therapeutics, Inc. (a) | | | 1,924 | | | | 311 | | |
Iovance Biotherapeutics, Inc. (a) | | | 2,461 | | | | 64 | | |
Natera, Inc. (a) | | | 2,234 | | | | 254 | | |
Neurocrine Biosciences, Inc. (a) | | | 336 | | | | 33 | | |
NexImmune, Inc. (a) | | | 709 | | | | 12 | | |
Nurix Therapeutics, Inc. (a) | | | 439 | | | | 12 | | |
Orchard Therapeutics PLC, ADR (a) (b) | | | 6,720 | | | | 29 | | |
Oyster Point Pharma, Inc. (a) (b) | | | 396 | | | | 7 | | |
Recursion Pharmaceuticals, Inc., Class A (a) (b) | | | 218 | | | | 8 | | |
Stoke Therapeutics, Inc. (a) (b) | | | 1,486 | | | | 50 | | |
Sutro Biopharma, Inc. (a) | | | 3,661 | | | | 68 | | |
TCR2 Therapeutics, Inc. (a) | | | 8,824 | | | | 145 | | |
TG Therapeutics, Inc. (a) | | | 2,119 | | | | 82 | | |
Veracyte, Inc. (a) | | | 3,428 | | | | 137 | | |
Xencor, Inc. (a) | | | 822 | | | | 28 | | |
Zai Lab Ltd., ADR (a) | | | 984 | | | | 174 | | |
| | | | 3,317 | | |
See notes to financial statements.
82
Victory Portfolios
Victory Munder Small Cap Growth Fund | | Schedule of Portfolio Investments — continued
June 30, 2021 | |
(Amounts in Thousands, Except for Shares)
Security Description | | Shares | | Value | |
Communication Services (2.1%): | |
Bumble, Inc., Class A (a) (b) | | | 71 | | | $ | 4 | | |
Iridium Communications, Inc. (a) | | | 2,861 | | | | 114 | | |
Motorsport Games, Inc., Class A (a) | | | 1,701 | | | | 24 | | |
Vonage Holdings Corp. (a) | | | 15,601 | | | | 225 | | |
| | | | 367 | | |
Consumer Discretionary (13.4%): | |
Academy Sports & Outdoors, Inc. (a) (b) | | | 5,840 | | | | 241 | | |
Brunswick Corp. | | | 1,273 | | | | 127 | | |
Burlington Stores, Inc. (a) | | | 509 | | | | 164 | | |
Cavco Industries, Inc. (a) | | | 567 | | | | 126 | | |
Chegg, Inc. (a) | | | 1,378 | | | | 115 | | |
Cricut, Inc., Class A (a) | | | 2,547 | | | | 108 | | |
Five Below, Inc. (a) | | | 1,001 | | | | 193 | | |
Group 1 Automotive, Inc. (b) | | | 1,287 | | | | 199 | | |
Legacy Housing Corp. (a) | | | 5,799 | | | | 98 | | |
Levi Strauss & Co., Class A | | | 6,726 | | | | 186 | | |
Nordstrom, Inc. (a) | | | 4,923 | | | | 180 | | |
Polaris, Inc. | | | 1,361 | | | | 186 | | |
Skyline Champion Corp. (a) | | | 4,307 | | | | 230 | | |
Tractor Supply Co. | | | 724 | | | | 135 | | |
| | | | 2,288 | | |
Consumer Staples (2.1%): | |
Albertsons Cos., Inc., Class A (b) | | | 4,314 | | | | 85 | | |
Grocery Outlet Holding Corp. (a) (b) | | | 2,063 | | | | 71 | | |
Performance Food Group Co. (a) | | | 4,200 | | | | 204 | | |
| | | | 360 | | |
Energy (1.7%): | |
Magnolia Oil & Gas Corp., Class A (a) (b) | | | 9,317 | | | | 146 | | |
Talos Energy, Inc. (a) | | | 8,799 | | | | 137 | | |
| | | | 283 | | |
Financials (10.0%): | |
American Business Bank (a) | | | 1,502 | | | | 63 | | |
Coastal Financial Corp. (a) | | | 6,830 | | | | 195 | | |
Colony Bankcorp, Inc. | | | 2,215 | | | | 40 | | |
Customers Bancorp, Inc. | | | 3,942 | | | | 154 | | |
First Western Financial, Inc. (a) (b) | | | 6,683 | | | | 173 | | |
Morningstar, Inc. | | | 668 | | | | 172 | | |
Radian Group, Inc. | | | 5,519 | | | | 123 | | |
Silvercrest Asset Management Group, Inc., Class A (b) | | | 13,506 | | | | 203 | | |
SLM Corp. | | | 5,481 | | | | 115 | | |
South Plains Financial, Inc. | | | 5,120 | | | | 118 | | |
Tradeweb Markets, Inc., Class A | | | 2,436 | | | | 206 | | |
WTB Financial Corp., Class B | | | 360 | | | | 140 | | |
| | | | 1,702 | | |
See notes to financial statements.
83
Victory Portfolios
Victory Munder Small Cap Growth Fund | | Schedule of Portfolio Investments — continued
June 30, 2021 | |
(Amounts in Thousands, Except for Shares)
Security Description | | Shares | | Value | |
Health Care Equipment & Supplies (4.1%): | |
Brainsway Ltd., ADR (a) | | | 11,679 | | | $ | 119 | | |
Cerus Corp. (a) | | | 6,712 | | | | 40 | | |
Inari Medical, Inc. (a) | | | 42 | | | | 4 | | |
Insulet Corp. (a) | | | 546 | | | | 150 | | |
Merit Medical Systems, Inc. (a) | | | 1,525 | | | | 99 | | |
Outset Medical, Inc. (a) (b) | | | 180 | | | | 9 | | |
PolyPid Ltd. (a) | | | 7,333 | | | | 66 | | |
Pulmonx Corp. (a) (b) | | | 1,906 | | | | 84 | | |
Silk Road Medical, Inc. (a) | | | 2,804 | | | | 134 | | |
| | | | 705 | | |
Health Care Providers & Services (1.4%): | |
Guardant Health, Inc. (a) | | | 1,011 | | | | 126 | | |
RadNet, Inc. (a) | | | 3,159 | | | | 106 | | |
| | | | 232 | | |
Health Care Technology (0.1%): | |
Schrodinger, Inc. (a) | | | 217 | | | | 16 | | |
Industrials (12.2%): | |
ASGN, Inc. (a) | | | 1,743 | | | | 169 | | |
BWX Technologies, Inc. | | | 1,070 | | | | 62 | | |
Casella Waste Systems, Inc. (a) | | | 2,586 | | | | 164 | | |
Chart Industries, Inc. (a) | | | 1,114 | | | | 163 | | |
Construction Partners, Inc., Class A (a) | | | 1,877 | | | | 59 | | |
ESCO Technologies, Inc. | | | 571 | | | | 54 | | |
Hydrofarm Holdings Group, Inc. (a) (b) | | | 1,950 | | | | 115 | | |
Kaman Corp. | | | 1,610 | | | | 81 | | |
Kratos Defense & Security Solutions, Inc. (a) | | | 6,093 | | | | 174 | | |
Marten Transport Ltd. | | | 4,300 | | | | 71 | | |
McGrath RentCorp | | | 1,522 | | | | 124 | | |
Owens Corning, Inc. | | | 1,289 | | | | 126 | | |
Parsons Corp. (a) | | | 3,000 | | | | 118 | | |
Patrick Industries, Inc. | | | 1,209 | | | | 88 | | |
PGT Innovations, Inc. (a) | | | 3,825 | | | | 89 | | |
Rexnord Corp. | | | 1,529 | | | | 77 | | |
Shoals Technologies Group, Inc., Class A (a) | | | 6,736 | | | | 239 | | |
The AZEK Co., Inc. (a) | | | 2,561 | | | | 109 | | |
TuSimple Holdings, Inc., Class A (a) (b) | | | 73 | | | | 5 | | |
| | | | 2,087 | | |
Information Technology (21.5%): | |
908 Devices, Inc. (a) | | | 482 | | | | 19 | | |
ACV Auctions, Inc., Class A (a) | | | 357 | | | | 9 | | |
Alteryx, Inc., Class A (a) | | | 441 | | | | 38 | | |
Avaya Holdings Corp. (a) | | | 6,195 | | | | 167 | | |
Blackline, Inc. (a) | | | 540 | | | | 60 | | |
BM Technologies, Inc. (a) | | | 606 | | | | 8 | | |
Brooks Automation, Inc. | | | 1,901 | | | | 181 | | |
C3.ai, Inc., Class A (a) | | | 848 | | | | 53 | | |
Cloudflare, Inc., Class A (a) | | | 1,467 | | | | 155 | | |
See notes to financial statements.
84
Victory Portfolios
Victory Munder Small Cap Growth Fund | | Schedule of Portfolio Investments — continued
June 30, 2021 | |
(Amounts in Thousands, Except for Shares)
Security Description | | Shares | | Value | |
Digital Turbine, Inc. (a) | | | 1,163 | | | $ | 88 | | |
DoubleVerify Holdings, Inc. (a) (b) | | | 363 | | | | 15 | | |
Dropbox, Inc., Class A (a) | | | 1,247 | | | | 38 | | |
Elastic NV (a) | | | 1,342 | | | | 196 | | |
Endava PLC, ADR (a) | | | 1,434 | | | | 163 | | |
Flywire Corp. (a) | | | 1,122 | | | | 41 | | |
Globant SA (a) | | | 753 | | | | 165 | | |
Intapp, Inc. (a) | | | 75 | | | | 2 | | |
Mitek Systems, Inc. (a) (b) | | | 9,134 | | | | 176 | | |
Monday.com Ltd. (a) | | | 37 | | | | 8 | | |
Napco Security Technologies, Inc. (a) | | | 6,551 | | | | 238 | | |
New Relic, Inc. (a) (b) | | | 422 | | | | 28 | | |
ON Semiconductor Corp. (a) | | | 5,499 | | | | 210 | | |
OneSpan, Inc. (a) | | | 6,297 | | | | 161 | | |
PagerDuty, Inc. (a) (b) | | | 1,680 | | | | 72 | | |
Ping Identity Holding Corp. (a) | | | 3,255 | | | | 75 | | |
Powerfleet, Inc. (a) | | | 9,414 | | | | 68 | | |
QAD, Inc., Class A | | | 1,749 | | | | 152 | | |
Sapiens International Corp. NV | | | 3,065 | | | | 81 | | |
SiTime Corp. (a) | | | 459 | | | | 58 | | |
Smartsheet, Inc., Class A (a) | | | 2,908 | | | | 210 | | |
Taskus, Inc., Class A (a) | | | 750 | | | | 26 | | |
Telos Corp. (a) | | | 1,641 | | | | 56 | | |
Vizio Holding Corp., Class A (a) | | | 2,145 | | | | 58 | | |
WNS Holdings Ltd., ADR (a) | | | 2,735 | | | | 218 | | |
Yext, Inc. (a) | | | 4,806 | | | | 69 | | |
Zeta Global Holdings Corp., Class A (a) | | | 18,751 | | | | 157 | | |
Zix Corp. (a) | | | 23,117 | | | | 163 | | |
| | | | 3,682 | | |
Life Sciences Tools & Services (4.4%): | |
Adaptive Biotechnologies Corp. (a) | | | 1,407 | | | | 58 | | |
Berkeley Lights, Inc. (a) | | | 1,468 | | | | 66 | | |
Maravai LifeSciences Holdings, Inc., Class A (a) | | | 6,479 | | | | 270 | | |
NanoString Technologies, Inc. (a) | | | 3,309 | | | | 214 | | |
Singular Genomics Systems, Inc. (a) (b) | | | 5,036 | | | | 138 | | |
| | | | 746 | | |
Materials (2.5%): | |
Franco-Nevada Corp. (b) | | | 1,104 | | | | 160 | | |
Summit Materials, Inc., Class A (a) | | | 7,713 | | | | 269 | | |
| | | | 429 | | |
Pharmaceuticals (1.3%): | |
Collegium Pharmaceutical, Inc. (a) | | | 1,187 | | | | 28 | | |
Cymabay Therapeutics, Inc. (a) (b) | | | 1,278 | | | | 6 | | |
Horizon Therapeutics PLC (a) | | | 987 | | | | 92 | | |
PMV Pharmaceuticals, Inc. (a) (b) | | | 280 | | | | 10 | | |
Reata Pharmaceuticals, Inc., Class A (a) | | | 645 | | | | 91 | | |
Terns Pharmaceuticals, Inc. (a) | | | 175 | | | | 2 | | |
| | | | 229 | | |
See notes to financial statements.
85
Victory Portfolios
Victory Munder Small Cap Growth Fund | | Schedule of Portfolio Investments — continued
June 30, 2021 | |
(Amounts in Thousands, Except for Shares)
Security Description | | Shares | | Value | |
Real Estate (3.3%): | |
FirstService Corp. | | | 868 | | | $ | 149 | | |
Rexford Industrial Realty, Inc. | | | 1,252 | | | | 71 | | |
The Macerich Co. (b) | | | 11,499 | | | | 210 | | |
UMH Properties, Inc. | | | 6,434 | | | | 140 | | |
| | | | 570 | | |
Total Common Stocks (Cost $10,202) | | | 17,013 | | |
Warrants (0.1%) | |
Health Care (0.1%): | |
BioNano Genomics, Inc. (c) | | | 8,136 | | | | 33 | | |
Total Warrants (Cost $—) | | | 33 | | |
Collateral for Securities Loaned^ (13.5%) | |
BlackRock Liquidity Funds TempFund Portfolio, Institutional Class, 0.04% (d) | | | 45,607 | | | | 46 | | |
Fidelity Investments Money Market Government Portfolio I Shares, 0.01% (d) | | | 1,235,354 | | | | 1,235 | | |
Goldman Sachs Financial Square Prime Obligations Fund, Institutional Class,
0.02% (d) | | | 22,760 | | | | 23 | | |
JPMorgan Prime Money Market Fund, Capital Class, 0.07% (d) | | | 181,483 | | | | 181 | | |
Morgan Stanley Institutional Liquidity Prime Portfolio, Institutional Class,
0.06% (d) | | | 815,985 | | | | 816 | | |
Total Collateral for Securities Loaned (Cost $2,301) | | | 2,301 | | |
Total Investments (Cost $12,503) — 113.1% | | | 19,347 | | |
Liabilities in excess of other assets — (13.1)% | | | (2,247 | ) | |
NET ASSETS — 100.00% | | $ | 17,100 | | |
^ Purchased with cash collateral from securities on loan.
(a) Non-income producing security.
(b) All or a portion of this security is on loan.
(c) The Fund's Adviser has deemed this security to be illiquid based upon procedures approved by the Board of Trustees. As of June 30, 2021, illiquid securities were 0.2% of net assets.
(d) Rate disclosed is the daily yield on June 30, 2021.
ADR — American Depositary Receipt
PLC — Public Limited Company
See notes to financial statements.
86
Victory Portfolios
Victory Trivalent International Fund-Core Equity | | Schedule of Portfolio Investments
June 30, 2021 | |
(Amounts in Thousands, Except for Shares)
Security Description | | Shares | | Value | |
Common Stocks (97.0%) | |
Australia (3.4%): | |
Consumer Discretionary (0.3%): | |
Aristocrat Leisure Ltd. | | | 24,815 | | | $ | 801 | | |
Energy (0.3%): | |
Santos Ltd. | | | 111,626 | | | | 593 | | |
Financials (0.9%): | |
Australia & New Zealand Banking Group Ltd. | | | 48,957 | | | | 1,033 | | |
Macquarie Group Ltd. | | | 8,445 | | | | 989 | | |
| | | | 2,022 | | |
Health Care (0.3%): | |
Sonic Healthcare Ltd. | | | 25,522 | | | | 735 | | |
Materials (0.9%): | |
Rio Tinto Ltd. | | | 20,546 | | | | 1,948 | | |
Real Estate (0.7%): | |
Charter Hall Group | | | 70,254 | | | | 813 | | |
Stockland | | | 196,363 | | | | 684 | | |
| | | | 1,497 | | |
| | | | 7,596 | | |
Austria (0.2%): | |
Financials (0.2%): | |
Raiffeisen Bank International AG | | | 21,162 | | | | 480 | | |
Belgium (1.1%): | |
Consumer Staples (0.4%): | |
Anheuser-Busch InBev SA | | | 10,577 | | | | 762 | | |
Financials (0.3%): | |
KBC Group NV | | | 7,946 | | | | 607 | | |
Health Care (0.4%): | |
UCB SA | | | 9,343 | | | | 978 | | |
| | | | 2,347 | | |
Brazil (1.7%): | |
Consumer Staples (0.4%): | |
Sendas Distribuidora SA | | | 54,362 | | | | 946 | | |
Energy (0.4%): | |
Petro Rio SA (a) | | | 241,000 | | | | 944 | | |
Financials (0.6%): | |
Banco Santander Brasil SA | | | 147,200 | | | | 1,199 | | |
Utilities (0.3%): | |
Cia Energetica de Minas Gerais, Preference Shares | | | 266,000 | | | | 649 | | |
| | | | 3,738 | | |
See notes to financial statements.
87
Victory Portfolios
Victory Trivalent International Fund-Core Equity | | Schedule of Portfolio Investments — continued
June 30, 2021 | |
(Amounts in Thousands, Except for Shares)
Security Description | | Shares | | Value | |
Canada (5.2%): | |
Energy (0.8%): | |
Parex Resources, Inc. (a) | | | 68,158 | | | $ | 1,138 | | |
Suncor Energy, Inc. (b) | | | 28,434 | | | | 681 | | |
| | | | 1,819 | | |
Financials (2.7%): | |
Bank of Montreal | | | 11,274 | | | | 1,156 | | |
iA Financial Corp., Inc. | | | 17,870 | | | | 973 | | |
IGM Financial, Inc. (b) | | | 30,118 | | | | 1,064 | | |
National Bank of Canada | | | 19,884 | | | | 1,488 | | |
Sun Life Financial, Inc. | | | 24,527 | | | | 1,265 | | |
| | | | 5,946 | | |
Industrials (0.7%): | |
Canadian Pacific Railway Ltd. | | | 10,672 | | | | 821 | | |
Finning International, Inc. | | | 25,434 | | | | 666 | | |
| | | | 1,487 | | |
Materials (1.0%): | |
First Quantum Minerals Ltd. | | | 39,157 | | | | 903 | | |
Nutrien Ltd. | | | 11,161 | | | | 676 | | |
West Fraser Timber Co. Ltd. | | | 10,182 | | | | 731 | | |
| | | | 2,310 | | |
| | | | 11,562 | | |
China (8.4%): | |
Communication Services (1.7%): | |
Tencent Holdings Ltd. | | | 51,400 | | | | 3,870 | | |
Consumer Discretionary (2.5%): | |
Alibaba Group Holding Ltd., ADR (a) | | | 8,938 | | | | 2,027 | | |
China Tourism Group Duty Free Corp. Ltd., Class A | | | 16,400 | | | | 761 | | |
Haier Smart Home Co. Ltd., Class H (a) | | | 206,988 | | | | 722 | | |
Vipshop Holdings Ltd., ADR (a) | | | 27,951 | | | | 561 | | |
Zhongsheng Group Holdings Ltd. | | | 184,000 | | | | 1,530 | | |
| | | | 5,601 | | |
Consumer Staples (0.4%): | |
Tingyi Cayman Islands Holding Corp. | | | 414,000 | | | | 827 | | |
Financials (1.4%): | |
Bank of China Ltd., Class H | | | 2,382,275 | | | | 855 | | |
China Construction Bank Corp., Class H | | | 921,000 | | | | 723 | | |
Huatai Securities Co. Ltd., Class H (c) | | | 565,400 | | | | 829 | | |
New China Life Insurance Co. Ltd., Class H | | | 215,800 | | | | 736 | | |
| | | | 3,143 | | |
Health Care (0.5%): | |
Shanghai Fosun Pharmaceutical Group Co. Ltd., Class H | | | 150,500 | | | | 1,215 | | |
See notes to financial statements.
88
Victory Portfolios
Victory Trivalent International Fund-Core Equity | | Schedule of Portfolio Investments — continued
June 30, 2021 | |
(Amounts in Thousands, Except for Shares)
Security Description | | Shares | | Value | |
Industrials (0.7%): | |
China Railway Group Ltd., Class H | | | 1,478,000 | | | $ | 770 | | |
COSCO SHIPPING Holdings Co. Ltd., Class H (a) | | | 280,500 | | | | 705 | | |
| | | | 1,475 | | |
Information Technology (0.3%): | |
Focus Media Information Technology Co. Ltd., Class A | | | 491,400 | | | | 715 | | |
Materials (0.6%): | |
Anhui Conch Cement Co. Ltd., Class H | | | 229,500 | | | | 1,216 | | |
Real Estate (0.3%): | |
Agile Group Holdings Ltd. | | | 526,000 | | | | 682 | | |
| | | | 18,744 | | |
Denmark (2.1%): | |
Consumer Discretionary (0.3%): | |
Pandora A/S | | | 5,419 | | | | 731 | | |
Consumer Staples (0.5%): | |
Carlsberg A/S, Class B | | | 6,389 | | | | 1,192 | | |
Health Care (0.4%): | |
GN Store Nord A/S | | | 8,802 | | | | 770 | | |
Industrials (0.6%): | |
AP Moller — Maersk A/S, Class B | | | 456 | | | | 1,313 | | |
Utilities (0.3%): | |
Orsted A/S (c) | | | 5,019 | | | | 705 | | |
| | | | 4,711 | | |
Finland (0.5%): | |
Industrials (0.5%): | |
Metso Outotec Oyj | | | 93,525 | | | | 1,087 | | |
France (5.1%): | |
Communication Services (0.5%): | |
Publicis Groupe SA | | | 17,668 | | | | 1,131 | | |
Consumer Discretionary (0.9%): | |
LVMH Moet Hennessy Louis Vuitton SE | | | 2,516 | | | | 1,979 | | |
Energy (0.6%): | |
TotalEnergies SE | | | 28,181 | | | | 1,276 | | |
Financials (1.0%): | |
Amundi SA (c) | | | 6,559 | | | | 578 | | |
AXA SA | | | 17,657 | | | | 448 | | |
BNP Paribas SA | | | 18,208 | | | | 1,143 | | |
| | | | 2,169 | | |
Health Care (0.7%): | |
Sanofi | | | 8,124 | | | | 853 | | |
Sartorius Stedim Biotech | | | 1,755 | | | | 831 | | |
| | | | 1,684 | | |
See notes to financial statements.
89
Victory Portfolios
Victory Trivalent International Fund-Core Equity | | Schedule of Portfolio Investments — continued
June 30, 2021 | |
(Amounts in Thousands, Except for Shares)
Security Description | | Shares | | Value | |
Industrials (0.9%): | |
Cie de Saint-Gobain | | | 18,676 | | | $ | 1,233 | | |
Teleperformance | | | 1,784 | | | | 724 | | |
| | | | 1,957 | | |
Information Technology (0.5%): | |
Capgemini SE (b) | | | 6,296 | | | | 1,211 | | |
| | | | 11,407 | | |
Germany (6.9%): | |
Communication Services (0.7%): | |
Deutsche Telekom AG | | | 73,562 | | | | 1,556 | | |
Consumer Discretionary (1.4%): | |
HelloFresh SE (a) (b) | | | 8,037 | | | | 781 | | |
Volkswagen AG, Preference Shares | | | 8,980 | | | | 2,251 | | |
| | | | 3,032 | | |
Financials (1.0%): | |
Allianz SE, Registered Shares | | | 4,810 | | | | 1,200 | | |
Hannover Rueck SE | | | 3,064 | | | | 513 | | |
Muenchener Rueckversicherungs-Gesellschaft AG, Class R | | | 1,839 | | | | 504 | | |
| | | | 2,217 | | |
Health Care (0.5%): | |
Merck KGaA | | | 6,155 | | | | 1,181 | | |
Industrials (1.1%): | |
Deutsche Post AG, Registered Shares | | | 25,923 | | | | 1,765 | | |
Siemens AG, Registered Shares | | | 4,479 | | | | 711 | | |
| | | | 2,476 | | |
Information Technology (0.7%): | |
Infineon Technologies AG | | | 17,430 | | | | 701 | | |
SAP SE | | | 5,873 | | | | 825 | | |
| | | | 1,526 | | |
Materials (0.5%): | |
Covestro AG (c) | | | 9,032 | | | | 584 | | |
HeidelbergCement AG | | | 5,916 | | | | 508 | | |
| | | | 1,092 | | |
Real Estate (0.6%): | |
alstria office REIT-AG | | | 27,512 | | | | 508 | | |
LEG Immobilien SE | | | 5,372 | | | | 773 | | |
| | | | 1,281 | | |
Utilities (0.4%): | |
E.ON SE | | | 89,200 | | | | 1,032 | | |
| | | | 15,393 | | |
Hong Kong (3.3%): | |
Communication Services (0.4%): | |
NetDragon Websoft Holdings Ltd. | | | 298,500 | | | | 795 | | |
See notes to financial statements.
90
Victory Portfolios
Victory Trivalent International Fund-Core Equity | | Schedule of Portfolio Investments — continued
June 30, 2021 | |
(Amounts in Thousands, Except for Shares)
Security Description | | Shares | | Value | |
Consumer Discretionary (0.4%): | |
Xinyi Glass Holdings Ltd. | | | 242,000 | | | $ | 986 | | |
Consumer Staples (0.6%): | |
Vinda International Holdings Ltd. | | | 190,000 | | | | 585 | | |
WH Group Ltd. (c) | | | 730,000 | | | | 655 | | |
| | | | 1,240 | | |
Energy (0.3%): | |
Kunlun Energy Co. Ltd. | | | 826,000 | | | | 761 | | |
Financials (0.3%): | |
BOC Hong Kong Holdings Ltd. | | | 203,500 | | | | 690 | | |
Information Technology (0.8%): | |
Lenovo Group Ltd. | | | 1,476,000 | | | | 1,695 | | |
Real Estate (0.5%): | |
CK Asset Holdings Ltd. | | | 67,895 | | | | 467 | | |
Sun Hung Kai Properties Ltd. | | | 44,000 | | | | 654 | | |
| | | | 1,121 | | |
| | | | 7,288 | | |
Hungary (0.5%): | |
Financials (0.5%): | |
OTP Bank Nyrt (a) | | | 21,008 | | | | 1,132 | | |
India (2.7%): | |
Energy (0.5%): | |
Reliance Industries Ltd. | | | 39,199 | | | | 1,115 | | |
Financials (0.7%): | |
LIC Housing Finance Ltd. | | | 134,932 | | | | 855 | | |
Muthoot Finance Ltd. | | | 42,998 | | | | 858 | | |
| | | | 1,713 | | |
Health Care (0.3%): | |
Cadila Healthcare Ltd. (a) | | | 75,892 | | | | 659 | | |
Information Technology (0.6%): | |
Infosys Ltd. | | | 60,719 | | | | 1,285 | | |
Materials (0.3%): | |
UPL Ltd. | | | 59,164 | | | | 632 | | |
Utilities (0.3%): | |
Power Grid Corp. of India Ltd. | | | 222,154 | | | | 695 | | |
| | | | 6,099 | | |
Indonesia (0.4%): | |
Communication Services (0.4%): | |
PT Sarana Menara Nusantara Tbk | | | 9,086,600 | | | | 778 | | |
Ireland (1.1%): | |
Health Care (0.6%): | |
ICON PLC (a) (b) | | | 6,523 | | | | 1,348 | | |
See notes to financial statements.
91
Victory Portfolios
Victory Trivalent International Fund-Core Equity | | Schedule of Portfolio Investments — continued
June 30, 2021 | |
(Amounts in Thousands, Except for Shares)
Security Description | | Shares | | Value | |
Industrials (0.5%): | |
DCC PLC | | | 13,672 | | | $ | 1,120 | | |
| | | | 2,468 | | |
Italy (1.5%): | |
Industrials (0.2%): | |
Leonardo SpA (a) | | | 72,198 | | | | 584 | | |
Information Technology (0.4%): | |
Nexi SpA (a) (c) | | | 38,144 | | | | 838 | | |
Utilities (0.9%): | |
ACEA SpA | | | 30,357 | | | | 702 | | |
Enel SpA | | | 134,040 | | | | 1,245 | | |
| | | | 1,947 | | |
| | | | 3,369 | | |
Japan (15.4%): | |
Communication Services (1.8%): | |
Capcom Co. Ltd. | | | 20,600 | | | | 602 | | |
KDDI Corp. | | | 31,200 | | | | 972 | | |
Nintendo Co. Ltd. | | | 2,000 | | | | 1,158 | | |
Nippon Telegraph & Telephone Corp. | | | 30,100 | | | | 787 | | |
SoftBank Group Corp. | | | 6,400 | | | | 446 | | |
| | | | 3,965 | | |
Consumer Discretionary (2.9%): | |
Sony Group Corp. | | | 36,200 | | | | 3,511 | | |
Toyo Tire Corp. (b) | | | 36,100 | | | | 764 | | |
Toyota Motor Corp. | | | 25,200 | | | | 2,203 | | |
| | | | 6,478 | | |
Consumer Staples (1.1%): | |
Ajinomoto Co., Inc. | | | 29,000 | | | | 754 | | |
Asahi Group Holdings Ltd. | | | 20,000 | | | | 935 | | |
Seven & i Holdings Co. Ltd. | | | 15,600 | | | | 747 | | |
| | | | 2,436 | | |
Financials (1.7%): | |
Mizuho Financial Group, Inc. | | | 69,410 | | | | 995 | | |
Nomura Holdings, Inc. | | | 109,100 | | | | 555 | | |
ORIX Corp. | | | 72,500 | | | | 1,226 | | |
Sumitomo Mitsui Financial Group, Inc. | | | 29,825 | | | | 1,028 | | |
| | | | 3,804 | | |
Health Care (0.8%): | |
Astellas Pharma, Inc. | | | 46,300 | | | | 807 | | |
Hoya Corp. | | | 6,400 | | | | 847 | | |
| | | | 1,654 | | |
See notes to financial statements.
92
Victory Portfolios
Victory Trivalent International Fund-Core Equity | | Schedule of Portfolio Investments — continued
June 30, 2021 | |
(Amounts in Thousands, Except for Shares)
Security Description | | Shares | | Value | |
Industrials (2.8%): | |
AGC, Inc. (b) | | | 15,600 | | | $ | 654 | | |
Fuji Electric Co. Ltd. | | | 15,000 | | | | 700 | | |
ITOCHU Corp. | | | 47,600 | | | | 1,374 | | |
Komatsu Ltd. | | | 24,300 | | | | 602 | | |
Mitsubishi Electric Corp. | | | 45,200 | | | | 656 | | |
Mitsui & Co. Ltd. | | | 40,300 | | | | 908 | | |
Nippon Yusen KK | | | 13,900 | | | | 705 | | |
Yamato Holdings Co. Ltd. | | | 24,200 | | | | 688 | | |
| | | | 6,287 | | |
Information Technology (2.6%): | |
Canon, Inc. (b) | | | 28,500 | | | | 644 | | |
Fujitsu Ltd. | | | 7,100 | | | | 1,329 | | |
Hitachi Ltd. | | | 22,600 | | | | 1,295 | | |
Murata Manufacturing Co. Ltd. | | | 9,100 | | | | 693 | | |
NTT Data Corp. | | | 40,100 | | | | 626 | | |
Tokyo Electron Ltd. | | | 2,800 | | | | 1,211 | | |
| | | | 5,798 | | |
Materials (0.8%): | |
Rengo Co. Ltd. | | | 59,100 | | | | 493 | | |
Shin-Etsu Chemical Co. Ltd. | | | 4,400 | | | | 736 | | |
Tosoh Corp. | | | 34,100 | | | | 588 | | |
| | | | 1,817 | | |
Real Estate (0.6%): | |
Daiwa House Industry Co. Ltd. | | | 19,600 | | | | 590 | | |
Open House Co. Ltd. | | | 14,600 | | | | 686 | | |
| | | | 1,276 | | |
Utilities (0.3%): | |
Osaka Gas Co. Ltd. | | | 31,300 | | | | 584 | | |
| | | | 34,099 | | |
Korea, Republic Of (4.3%): | |
Communication Services (0.3%): | |
NAVER Corp. | | | 1,882 | | | | 698 | | |
Consumer Discretionary (0.9%): | |
Kia Corp. | | | 8,840 | | | | 705 | | |
LG Electronics, Inc. | | | 8,419 | | | | 1,219 | | |
| | | | 1,924 | | |
Consumer Staples (0.3%): | |
E-MART, Inc. | | | 4,210 | | | | 598 | | |
Financials (0.3%): | |
Hana Financial Group, Inc. | | | 19,776 | | | | 810 | | |
Industrials (0.4%): | |
Samsung Engineering Co. Ltd. (a) | | | 44,225 | | | | 938 | | |
See notes to financial statements.
93
Victory Portfolios
Victory Trivalent International Fund-Core Equity | | Schedule of Portfolio Investments — continued
June 30, 2021 | |
(Amounts in Thousands, Except for Shares)
Security Description | | Shares | | Value | |
Information Technology (2.1%): | |
LG Innotek Co. Ltd. | | | 8,671 | | | $ | 1,715 | | |
Samsung Electronics Co. Ltd. | | | 28,964 | | | | 2,074 | | |
SK Hynix, Inc. | | | 7,311 | | | | 825 | | |
| | | | 4,614 | | |
| | | | 9,582 | | |
Luxembourg (1.1%): | |
Energy (0.3%): | |
Tenaris SA | | | 58,987 | | | | 645 | | |
Health Care (0.4%): | |
Eurofins Scientific SE (a) | | | 8,519 | | | | 974 | | |
Materials (0.4%): | |
ArcelorMittal SA | | | 24,536 | | | | 756 | | |
| | | | 2,375 | | |
Malaysia (0.9%): | |
Communication Services (0.4%): | |
Telekom Malaysia Bhd | | | 581,300 | | | | 851 | | |
Financials (0.5%): | |
RHB Bank Bhd | | | 863,600 | | | | 1,124 | | |
| | | | 1,975 | | |
Netherlands (3.4%): | |
Consumer Discretionary (0.5%): | |
Prosus NV | | | 10,309 | | | | 1,010 | | |
Consumer Staples (0.6%): | |
Koninklijke Ahold Delhaize NV | | | 47,131 | | | | 1,403 | | |
Financials (0.6%): | |
ING Groep NV | | | 43,948 | | | | 583 | | |
NN Group NV | | | 17,038 | | | | 805 | | |
| | | | 1,388 | | |
Health Care (0.3%): | |
QIAGEN NV (a) | | | 12,184 | | | | 589 | | |
Information Technology (1.1%): | |
| ASML Holding NV | | | 2,016 | | | | 1,392 | | |
STMicroelectronics NV | | | 31,626 | | | | 1,150 | | |
| | | | 2,542 | | |
Materials (0.3%): | |
Akzo Nobel NV | | | 5,057 | | | | 626 | | |
| | | | 7,558 | | |
Norway (0.3%): | |
Energy (0.3%): | |
Equinor ASA | | | 29,224 | | | | 619 | | |
See notes to financial statements.
94
Victory Portfolios
Victory Trivalent International Fund-Core Equity | | Schedule of Portfolio Investments — continued
June 30, 2021 | |
(Amounts in Thousands, Except for Shares)
Security Description | | Shares | | Value | |
Russian Federation (1.0%): | |
Energy (0.6%): | |
LUKOIL PJSC, ADR | | | 14,221 | | | $ | 1,320 | | |
Financials (0.4%): | |
Sberbank of Russia PJSC | | | 208,090 | | | | 870 | | |
| | | | 2,190 | | |
Saudi Arabia (0.3%): | |
Health Care (0.3%): | |
Mouwasat Medical Services Co. | | | 13,647 | | | | 656 | | |
Singapore (1.4%): | |
Consumer Discretionary (0.3%): | |
Genting Singapore Ltd. | | | 942,500 | | | | 587 | | |
Consumer Staples (0.4%): | |
Wilmar International Ltd. | | | 237,000 | | | | 795 | | |
Financials (0.7%): | |
DBS Group Holdings Ltd. | | | 36,600 | | | | 815 | | |
Singapore Exchange Ltd. | | | 98,700 | | | | 822 | | |
| | | | 1,637 | | |
| | | | 3,019 | | |
South Africa (1.5%): | |
Communication Services (0.7%): | |
Naspers Ltd., Class N | | | 7,340 | | | | 1,548 | | |
Materials (0.8%): | |
Impala Platinum Holdings Ltd. | | | 42,148 | | | | 694 | | |
Kumba Iron Ore Ltd. | | | 23,560 | | | | 1,053 | | |
| | | | 1,747 | | |
| | | | 3,295 | | |
Spain (0.9%): | |
Industrials (0.3%): | |
ACS Actividades de Construccion y Servicios SA | | | 25,777 | | | | 691 | | |
Utilities (0.6%): | |
Acciona SA | | | 3,994 | | | | 603 | | |
EDP Renovaveis SA | | | 33,341 | | | | 774 | | |
| | | | 1,377 | | |
| | | | 2,068 | | |
Sweden (3.1%): | |
Consumer Staples (0.5%): | |
Swedish Match AB | | | 119,000 | | | | 1,015 | | |
Financials (0.4%): | |
Skandinaviska Enskilda Banken AB, Class A | | | 63,581 | | | | 822 | | |
See notes to financial statements.
95
Victory Portfolios
Victory Trivalent International Fund-Core Equity | | Schedule of Portfolio Investments — continued
June 30, 2021 | |
(Amounts in Thousands, Except for Shares)
Security Description | | Shares | | Value | |
Industrials (1.1%): | |
Sandvik AB (b) | | | 26,026 | | | $ | 666 | | |
| SKF AB, B Shares | | | 32,527 | | | | 829 | | |
Volvo AB, Class B (b) | | | 39,956 | | | | 963 | | |
| | | | 2,458 | | |
Information Technology (0.4%): | |
Telefonaktiebolaget LM Ericsson, Class B | | | 64,866 | | | | 816 | | |
Materials (0.4%): | |
Boliden AB | | | 25,205 | | | | 970 | | |
Real Estate (0.3%): | |
Fastighets AB Balder, B Shares (a) | | | 11,329 | | | | 711 | | |
| | | | 6,792 | | |
Switzerland (7.1%): | |
Consumer Discretionary (0.3%): | |
Cie Financiere Richemont SA, Registered Shares | | | 5,212 | | | | 632 | | |
Consumer Staples (1.4%): | |
Coca-Cola HBC AG | | | 18,603 | | | | 673 | | |
Nestle SA, Registered Shares | | | 18,948 | | | | 2,363 | | |
| | | | 3,036 | | |
Financials (1.4%): | |
Julius Baer Group Ltd. | | | 14,755 | | | | 964 | | |
Swiss Life Holding AG | | | 3,396 | | | | 1,652 | | |
UBS Group AG | | | 41,165 | | | | 631 | | |
| | | | 3,247 | | |
Health Care (2.4%): | |
Lonza Group AG, Registered Shares | | | 1,310 | | | | 929 | | |
Novartis AG, Registered Shares | | | 23,289 | | | | 2,125 | | |
Roche Holding AG | | | 4,192 | | | | 1,580 | | |
Sonova Holding AG | | | 1,916 | | | | 722 | | |
| | | | 5,356 | | |
Industrials (0.3%): | |
Adecco Group AG | | | 10,122 | | | | 689 | | |
Information Technology (0.9%): | |
Logitech International SA, Class R | | | 16,159 | | | | 1,963 | | |
Materials (0.4%): | |
Holcim Ltd. | | | 14,242 | | | | 856 | | |
| | | | 15,779 | | |
Taiwan (3.7%): | |
Financials (0.8%): | |
Chailease Holding Co. Ltd. (a) | | | 103,935 | | | | 755 | | |
Fubon Financial Holding Co. Ltd. | | | 413,000 | | | | 1,095 | | |
| | | | 1,850 | | |
See notes to financial statements.
96
Victory Portfolios
Victory Trivalent International Fund-Core Equity | | Schedule of Portfolio Investments — continued
June 30, 2021 | |
(Amounts in Thousands, Except for Shares)
Security Description | | Shares | | Value | |
Information Technology (2.9%): | |
Radiant Opto-Electronics Corp. | | | 222,000 | | | $ | 968 | | |
Realtek Semiconductor Corp. | | | 95,000 | | | | 1,721 | | |
Taiwan Semiconductor Manufacturing Co. Ltd. | | | 168,000 | | | | 3,619 | | |
| | | | 6,308 | | |
| | | | 8,158 | | |
Thailand (0.3%): | |
Consumer Staples (0.3%): | |
Charoen Pokphand Foods PCL (b) | | | 804,100 | | | | 665 | | |
United Kingdom (8.2%): | |
Communication Services (0.3%): | |
Vodafone Group PLC | | | 448,225 | | | | 751 | | |
Consumer Discretionary (1.0%): | |
Barratt Developments PLC | | | 79,761 | | | | 768 | | |
Stellantis NV | | | 72,027 | | | | 1,417 | | |
| | | | 2,185 | | |
Consumer Staples (1.4%): | |
British American Tobacco PLC | | | 16,496 | | | | 641 | | |
Tate & Lyle PLC | | | 63,006 | | | | 644 | | |
Tesco PLC | | | 331,231 | | | | 1,023 | | |
Unilever PLC | | | 14,909 | | | | 871 | | |
| | | | 3,179 | | |
Energy (0.7%): | |
| BP PLC | | | 280,629 | | | | 1,231 | | |
Cairn Energy PLC | | | 204,682 | | | | 413 | | |
| | | | 1,644 | | |
Financials (1.6%): | |
| 3i Group PLC | | | 90,462 | | | | 1,468 | | |
Barclays PLC | | | 340,266 | | | | 807 | | |
Legal & General Group PLC | | | 193,014 | | | | 688 | | |
Standard Chartered PLC | | | 103,556 | | | | 661 | | |
| | | | 3,624 | | |
Health Care (0.7%): | |
AstraZeneca PLC | | | 6,583 | | | | 791 | | |
Hikma Pharmaceuticals PLC | | | 20,081 | | | | 679 | | |
| | | | 1,470 | | |
Industrials (1.5%): | |
Ashtead Group PLC | | | 16,086 | | | | 1,195 | | |
BAE Systems PLC | | | 98,261 | | | | 710 | | |
Ferguson PLC | | | 4,777 | | | | 665 | | |
Royal Mail PLC (a) | | | 82,068 | | | | 656 | | |
| | | | 3,226 | | |
See notes to financial statements.
97
Victory Portfolios
Victory Trivalent International Fund-Core Equity | | Schedule of Portfolio Investments — continued
June 30, 2021 | |
(Amounts in Thousands, Except for Shares)
Security Description | | Shares | | Value | |
Materials (1.0%): | |
Anglo American PLC | | | 55,947 | | | $ | 2,226 | | |
| | | | 18,305 | | |
Total Common Stocks (Cost $177,237) | | | 215,334 | | |
Rights (0.0%) (d) | |
Spain (0.0%): (d) | |
Industrials (0.0%): | |
ACS Actividades de Construccion y Servicios SA , Expires 7/7/21 (a) | | | 25,777 | | | | 36 | | |
Total Rights (Cost $39) | | | 36 | | |
Exchange-Traded Funds (1.5%) | |
United States (1.5%): | |
iShares Core MSCI EAFE ETF | | | 25,412 | | | | 1,902 | | |
iShares Core MSCI Emerging Markets ETF | | | 21,111 | | | | 1,414 | | |
| | | | 3,316 | | |
Total Exchange-Traded Funds (Cost $3,207) | | | 3,316 | | |
Collateral for Securities Loaned^ (3.9%) | |
United States (3.9%): | |
BlackRock Liquidity Funds TempFund Portfolio, Institutional Class, 0.04% (e) | | | 173,094 | | | | 173 | | |
Fidelity Investments Money Market Government Portfolio I Shares, 0.01% (e) | | | 4,688,547 | | | | 4,689 | | |
Goldman Sachs Financial Square Prime Obligations Fund, Institutional Class, 0.02% (e) | | | 86,382 | | | | 86 | | |
JPMorgan Prime Money Market Fund, Capital Class, 0.07% (e) | | | 688,785 | | | | 689 | | |
Morgan Stanley Institutional Liquidity Prime Portfolio, Institutional Class, 0.06% (e) | | | 3,096,913 | | | | 3,097 | | |
Total Collateral for Securities Loaned (Cost $8,734) | | | 8,734 | | |
Total Investments (Cost $189,217) — 102.4% | | | 227,420 | | |
Liabilities in excess of other assets — (2.4)% | | | (5,365 | ) | |
NET ASSETS — 100.00% | | $ | 222,055 | | |
^ Purchased with cash collateral from securities on loan.
(a) Non-income producing security.
(b) All or a portion of this security is on loan.
(c) Rule 144A security or other security that is restricted as to resale to institutional investors. The Fund's Adviser has deemed this security to be liquid based upon procedures approved by the Board of Trustees. As of June 30, 2021, the fair value of these securities was $4,189 (thousands) and amounted to 1.9% of net assets.
(d) Amount represents less than 0.05% of net assets.
(e) Rate disclosed is the daily yield on June 30, 2021.
ADR — American Depositary Receipt
ETF — Exchange-Traded Fund
PCL — Public Company Limited
PLC — Public Limited Company
REIT — Real Estate Investment Trust
See notes to financial statements.
98
Victory Portfolios
Victory Trivalent International Small-Cap Fund | | Schedule of Portfolio Investments
June 30, 2021 | |
(Amounts in Thousands, Except for Shares)
Security Description | | Shares | | Value | |
Common Stocks (98.1%) | |
Australia (7.2%): | |
Consumer Discretionary (0.8%): | |
Bapcor Ltd. | | | 1,910,010 | | | $ | 12,168 | | |
JB Hi-Fi Ltd. | | | 365,856 | | | | 13,863 | | |
| | | | 26,031 | | |
Consumer Staples (0.5%): | |
Elders Ltd. | | | 1,802,155 | | | | 15,609 | | |
Energy (0.4%): | |
Beach Energy Ltd. | | | 13,982,353 | | | | 12,994 | | |
Financials (0.9%): | |
Bank of Queensland Ltd. | | | 1,990,651 | | | | 13,595 | | |
Pendal Group Ltd. | | | 2,502,512 | | | | 15,115 | | |
| | | | 28,710 | | |
Health Care (0.5%): | |
Ansell Ltd. | | | 535,249 | | | | 17,457 | | |
Industrials (0.3%): | |
Seven Group Holdings Ltd. | | | 764,584 | | | | 11,661 | | |
Information Technology (0.3%): | |
Technology One Ltd. | | | 1,554,301 | | | | 10,839 | | |
Materials (2.5%): | |
CSR Ltd. | | | 2,331,307 | | | | 10,074 | | |
Mineral Resources Ltd. | | | 1,029,162 | | | | 41,329 | | |
OZ Minerals Ltd. | | | 1,280,763 | | | | 21,527 | | |
Silver Lake Resources Ltd. (a) | | | 8,218,201 | | | | 10,235 | | |
| | | | 83,165 | | |
Real Estate (1.0%): | |
Charter Hall Group | | | 2,022,751 | | | | 23,415 | | |
Shopping Centres Australasia Property Group | | | 5,412,145 | | | | 10,173 | | |
| | | | 33,588 | | |
| | | | 240,054 | | |
Canada (8.6%): | |
Communication Services (0.4%): | |
Cogeco Communications, Inc. (b) | | | 141,181 | | | | 13,807 | | |
Consumer Discretionary (0.5%): | |
BRP, Inc. (b) | | | 215,437 | | | | 16,861 | | |
Energy (1.3%): | |
ARC Resources Ltd. | | | 2,707,057 | | | | 23,043 | | |
Parex Resources, Inc. (a) | | | 1,294,740 | | | | 21,624 | | |
| | | | 44,667 | | |
Financials (0.9%): | |
Canadian Western Bank (b) | | | 568,953 | | | | 15,975 | | |
CI Financial Corp. | | | 731,183 | | | | 13,422 | | |
| | | | 29,397 | | |
See notes to financial statements.
99
Victory Portfolios
Victory Trivalent International Small-Cap Fund | | Schedule of Portfolio Investments — continued
June 30, 2021 | |
(Amounts in Thousands, Except for Shares)
Security Description | | Shares | | Value | |
Health Care (0.3%): | |
Tilray, Inc., Class 2 (a) (b) | | | 561,999 | | | $ | 10,148 | | |
Industrials (2.2%): | |
ATS Automation Tooling System (a) (b) | | | 578,320 | | | | 16,602 | | |
Ballard Power Systems, Inc. (a) (b) | | | 295,740 | | | | 5,364 | | |
Finning International, Inc. | | | 610,485 | | | | 15,984 | | |
TFI International, Inc. (b) | | | 391,161 | | | | 35,717 | | |
| | | | 73,667 | | |
Information Technology (0.3%): | |
The Descartes Systems Group, Inc. (a) (b) | | | 154,960 | | | | 10,719 | | |
Materials (1.2%): | |
Canfor Corp. (a) | | | 479,506 | | | | 10,972 | | |
Dundee Precious Metals, Inc. | | | 1,487,043 | | | | 9,011 | | |
Fortuna Silver Mines, Inc. (a) (b) | | | 1,426,999 | | | | 7,956 | | |
Kirkland Lake Gold Ltd. | | | 1 | | | | — | (c) | |
Stella-Jones, Inc. | | | 306,541 | | | | 11,038 | | |
| | | | 38,977 | | |
Real Estate (0.9%): | |
Boardwalk Real Estate Invest (b) | | | 366,935 | | | | 12,103 | | |
Tricon Residential, Inc. (b) | | | 1,603,581 | | | | 18,450 | | |
| | | | 30,553 | | |
Utilities (0.6%): | |
Northland Power, Inc. (b) | | | 581,818 | | | | 19,852 | | |
| | | | 288,648 | | |
China (0.2%): | |
Financials (0.2%): | |
Futu Holdings Ltd., ADR (a) (b) | | | 33,862 | | | | 6,064 | | |
Denmark (1.4%): | |
Consumer Discretionary (0.6%): | |
Pandora A/S | | | 139,258 | | | | 18,791 | | |
Consumer Staples (0.5%): | |
Royal Unibrew A/S | | | 124,800 | | | | 15,905 | | |
Information Technology (0.3%): | |
Netcompany Group A/S (d) | | | 96,820 | | | | 11,010 | | |
| | | | 45,706 | | |
Finland (2.1%): | |
Industrials (1.4%): | |
Metso Outotec Oyj | | | 1,378,597 | | | | 16,017 | | |
Valmet Oyj | | | 714,591 | | | | 31,202 | | |
| | | | 47,219 | | |
Information Technology (0.4%): | |
TietoEVRY Oyj | | | 412,448 | | | | 13,030 | | |
See notes to financial statements.
100
Victory Portfolios
Victory Trivalent International Small-Cap Fund | | Schedule of Portfolio Investments — continued
June 30, 2021 | |
(Amounts in Thousands, Except for Shares)
Security Description | | Shares | | Value | |
Materials (0.3%): | |
Kemira Oyj | | | 594,195 | | | $ | 9,362 | | |
| | | | 69,611 | | |
France (7.3%): | |
Communication Services (0.7%): | |
Publicis Groupe SA | | | 367,382 | | | | 23,508 | | |
Consumer Discretionary (1.4%): | |
Faurecia SE | | | 440,907 | | | | 21,673 | | |
La Francaise des Jeux SAEM (b) (d) | | | 241,044 | | | | 14,176 | | |
SEB SA | | | 60,860 | | | | 11,008 | | |
| | | | 46,857 | | |
Health Care (0.4%): | |
Korian SA | | | 399,113 | | | | 14,751 | | |
Industrials (2.1%): | |
Eiffage SA | | | 240,780 | | | | 24,522 | | |
Elis SA (a) | | | 702,692 | | | | 13,258 | | |
Nexans SA | | | 214,609 | | | | 19,581 | | |
Rexel SA | | | 545,156 | | | | 11,413 | | |
| | | | 68,774 | | |
Information Technology (1.3%): | |
Atos SE | | | 121,957 | | | | 7,425 | | |
SOITEC (a) | | | 90,962 | | | | 20,084 | | |
Sopra Steria Group | | | 84,022 | | | | 16,165 | | |
| | | | 43,674 | | |
Materials (0.3%): | |
Arkema SA | | | 81,117 | | | | 10,194 | | |
Real Estate (1.1%): | |
Klepierre SA | | | 896,394 | | | | 23,092 | | |
Nexity SA | | | 280,076 | | | | 14,014 | | |
| | | | 37,106 | | |
| | | | 244,864 | | |
Germany (7.1%): | |
Communication Services (1.3%): | |
Freenet AG | | | 695,260 | | | | 16,437 | | |
ProSiebenSat.1 Media SE | | | 867,782 | | | | 17,301 | | |
United Internet AG, Registered Shares | | | 235,038 | | | | 9,611 | | |
| | | | 43,349 | | |
Consumer Discretionary (0.4%): | |
HelloFresh SE (a) (b) | | | 159,569 | | | | 15,510 | | |
Financials (0.8%): | |
Deutsche Pfandbriefbank AG (d) | | | 1,223,517 | | | | 12,111 | | |
DWS Group GmbH & Co. KGaA (d) | | | 301,998 | | | | 13,685 | | |
| | | | 25,796 | | |
See notes to financial statements.
101
Victory Portfolios
Victory Trivalent International Small-Cap Fund | | Schedule of Portfolio Investments — continued
June 30, 2021 | |
(Amounts in Thousands, Except for Shares)
Security Description | | Shares | | Value | |
Health Care (1.0%): | |
Carl Zeiss Meditec AG | | | 85,686 | | | $ | 16,561 | | |
Gerresheimer AG | | | 147,864 | | | | 16,353 | | |
| | | | 32,914 | | |
Industrials (1.1%): | |
Brenntag SE | | | 193,144 | | | | 17,974 | | |
Rheinmetall AG | | | 182,545 | | | | 18,036 | | |
| | | | 36,010 | | |
Information Technology (0.5%): | |
Bechtle AG | | | 93,616 | | | | 17,397 | | |
Materials (0.8%): | |
Aurubis AG | | | 143,423 | | | | 13,310 | | |
Covestro AG (d) | | | 223,321 | | | | 14,438 | | |
| | | | 27,748 | | |
Real Estate (1.2%): | |
alstria office REIT-AG | | | 895,841 | | | | 16,550 | | |
TAG Immobilien AG | | | 705,548 | | | | 22,361 | | |
| | | | 38,911 | | |
| | | | 237,635 | | |
Gibraltar (0.3%): | |
Consumer Discretionary (0.3%): | |
| 888 Holdings PLC | | | 1,993,243 | | | | 10,592 | | |
Hong Kong (1.8%): | |
Health Care (0.3%): | |
The United Laboratories International Holdings Ltd. | | | 11,954,000 | | | | 9,811 | | |
Industrials (0.4%): | |
Pacific Basin Shipping Ltd. (a) | | | 28,040,000 | | | | 11,297 | | |
Information Technology (0.3%): | |
ASM Pacific Technology Ltd. | | | 756,400 | | | | 10,247 | | |
Real Estate (0.5%): | |
Hysan Development Co. Ltd. | | | 4,436,000 | | | | 17,677 | | |
Utilities (0.3%): | |
Towngas China Co. Ltd. | | | 14,497,000 | | | | 10,702 | | |
| | | | 59,734 | | |
Ireland (1.2%): | |
Consumer Discretionary (0.3%): | |
Dalata Hotel Group PLC (a) | | | 2,179,327 | | | | 9,930 | | |
Financials (0.5%): | |
Bank of Ireland Group PLC (a) | | | 3,102,000 | | | | 16,644 | | |
Health Care (0.4%): | |
UDG Healthcare PLC | | | 1,025,415 | | | | 15,172 | | |
| | | | 41,746 | | |
See notes to financial statements.
102
Victory Portfolios
Victory Trivalent International Small-Cap Fund | | Schedule of Portfolio Investments — continued
June 30, 2021 | |
(Amounts in Thousands, Except for Shares)
Security Description | | Shares | | Value | |
Isle of Man (0.4%): | |
Consumer Discretionary (0.4%): | |
Entain PLC (a) | | | 546,169 | | | $ | 13,196 | | |
Israel (0.8%): | |
Health Care (0.8%): | |
Inmode Ltd. (a) | | | 271,901 | | | | 25,744 | | |
Italy (2.4%): | |
Financials (0.4%): | |
Banca Mediolanum SpA | | | 1,433,297 | | | | 13,957 | | |
Industrials (0.4%): | |
Interpump Group SpA | | | 216,096 | | | | 12,819 | | |
Information Technology (0.6%): | |
Reply SpA | | | 133,946 | | | | 21,997 | | |
Materials (0.5%): | |
Buzzi Unicem SpA | | | 596,043 | | | | 15,833 | | |
Utilities (0.5%): | |
ACEA SpA | | | 694,079 | | | | 16,045 | | |
| | | | 80,651 | | |
Japan (19.4%): | |
Communication Services (1.2%): | |
Capcom Co. Ltd. | | | 602,800 | | | | 17,621 | | |
Internet Initiative Japan, Inc. | | | 755,200 | | | | 23,473 | | |
| | | | 41,094 | | |
Consumer Discretionary (3.2%): | |
ASKUL Corp. | | | 688,100 | | | | 10,729 | | |
Food & Life Cos Ltd. (b) | | | 378,500 | | | | 16,320 | | |
Izumi Co. Ltd. | | | 251,200 | | | | 9,450 | | |
Komeri Co. Ltd. | | | 348,000 | | | | 8,205 | | |
Resorttrust, Inc. | | | 615,300 | | | | 10,045 | | |
Starts Corp., Inc. | | | 395,100 | | | | 10,100 | | |
Sumitomo Forestry Co. Ltd. (b) | | | 617,800 | | | | 11,311 | | |
Tokyotokeiba Co. Ltd. | | | 201,800 | | | | 8,248 | | |
Toyo Tire Corp. (b) | | | 1,004,500 | | | | 21,273 | | |
| | | | 105,681 | | |
Consumer Staples (0.9%): | |
Morinaga Milk Industry Co. Ltd. | | | 236,600 | | | | 12,333 | | |
Nichirei Corp. | | | 342,300 | | | | 9,001 | | |
Valor Holdings Co. Ltd. | | | 480,800 | | | | 9,789 | | |
| | | | 31,123 | | |
Financials (0.7%): | |
North Pacific Bank Ltd. | | | 3,692,200 | | | | 7,861 | | |
Zenkoku Hosho Co. Ltd. | | | 339,100 | | | | 14,550 | | |
| | | | 22,411 | | |
See notes to financial statements.
103
Victory Portfolios
Victory Trivalent International Small-Cap Fund | | Schedule of Portfolio Investments — continued
June 30, 2021 | |
(Amounts in Thousands, Except for Shares)
Security Description | | Shares | | Value | |
Health Care (1.7%): | |
Eiken Chemical Co. Ltd. | | | 649,200 | | | $ | 12,555 | | |
Miraca Holdings, Inc. | | | 431,800 | | | | 11,144 | | |
Nikkiso Co. Ltd. | | | 812,400 | | | | 8,190 | | |
Sawai Group Holdings Co. Ltd. | | | 268,800 | | | | 11,994 | | |
Ship Healthcare Holdings, Inc. | | | 522,100 | | | | 12,201 | | |
| | | | 56,084 | | |
Industrials (4.9%): | |
BayCurrent Consulting, Inc. | | | 99,400 | | | | 35,718 | | |
Daihen Corp. | | | 283,600 | | | | 11,792 | | |
Fuji Corp. | | | 713,000 | | | | 16,334 | | |
FULLCAST Holdings Co. Ltd. | | | 475,800 | | | | 9,887 | | |
Kanamoto Co. Ltd. | | | 375,600 | | | | 8,677 | | |
Kintetsu World Express, Inc. | | | 571,200 | | | | 12,036 | | |
Kumagai Gumi Co. Ltd. | | | 397,900 | | | | 10,043 | | |
Outsourcing, Inc. | | | 577,000 | | | | 10,478 | | |
Penta-Ocean Construction Co. Ltd. | | | 1,985,900 | | | | 13,840 | | |
Sankyu, Inc. | | | 217,900 | | | | 9,470 | | |
Sanwa Holdings Corp. | | | 983,600 | | | | 12,099 | | |
Takeuchi Manufacturing Co. Ltd. | | | 496,300 | | | | 12,366 | | |
| | | | 162,740 | | |
Information Technology (3.6%): | |
Anritsu Corp. (b) | | | 590,300 | | | | 10,997 | | |
Freee KK (a) | | | 84,800 | | | | 7,743 | | |
Fuji Soft, Inc. (b) | | | 190,800 | | | | 9,554 | | |
NEC Networks & System Integration Corp. | | | 877,500 | | | | 13,857 | | |
Nippon Electric Glass Co. Ltd. | | | 623,300 | | | | 14,639 | | |
Shinko Electric Industries Co. Ltd. | | | 952,100 | | | | 34,807 | | |
Taiyo Yuden Co. Ltd. | | | 339,600 | | | | 16,758 | | |
Tokyo Seimitsu Co. Ltd. | | | 274,300 | | | | 12,385 | | |
| | | | 120,740 | | |
Materials (1.5%): | |
Denka Co. Ltd. | | | 435,800 | | | | 14,488 | | |
Kaneka Corp. | | | 263,500 | | | | 10,633 | | |
Rengo Co. Ltd. | | | 1,877,700 | | | | 15,652 | | |
Zeon Corp. | | | 661,900 | | | | 9,162 | | |
| | | | 49,935 | | |
Real Estate (1.7%): | |
Invincible Investment Corp. | | | 25,754 | | | | 9,909 | | |
Kenedix Office Investment Corp. | | | 1,614 | | | | 11,369 | | |
Nippon Accommodations Fund, Inc. | | | 2,297 | | | | 13,246 | | |
Open House Co. Ltd. | | | 482,400 | | | | 22,671 | | |
| | | | 57,195 | | |
| | | | 647,003 | | |
See notes to financial statements.
104
Victory Portfolios
Victory Trivalent International Small-Cap Fund | | Schedule of Portfolio Investments — continued
June 30, 2021 | |
(Amounts in Thousands, Except for Shares)
Security Description | | Shares | | Value | |
Korea, Republic Of (6.0%): | |
Communication Services (1.1%): | |
AfreecaTV Co. Ltd. | | | 212,244 | | | $ | 22,431 | | |
Neowiz (a) | | | 578,072 | | | | 12,973 | | |
| | | | 35,404 | | |
Consumer Discretionary (0.3%): | |
Coway Co. Ltd. | | | 147,802 | | | | 10,315 | | |
Consumer Staples (0.6%): | |
Hite Jinro Co. Ltd. | | | 306,697 | | | | 10,270 | | |
Maeil Dairies Co. Ltd. | | | 129,128 | | | | 8,858 | | |
| | | | 19,128 | | |
Health Care (1.4%): | |
Osstem Implant Co. Ltd. | | | 297,296 | | | | 30,025 | | |
PharmaResearch Co. Ltd. | | | 205,441 | | | | 16,426 | | |
| | | | 46,451 | | |
Industrials (0.5%): | |
Samsung Engineering Co. Ltd. (a) | | | 804,439 | | | | 17,054 | | |
Information Technology (1.2%): | |
Partron Co. Ltd. | | | 1,083,203 | | | | 10,013 | | |
Seoul Semiconductor Co. Ltd. | | | 583,901 | | | | 9,854 | | |
SFA Engineering Corp. | | | 284,558 | | | | 10,948 | | |
WONIK IPS Co. Ltd. | | | 225,063 | | | | 9,904 | | |
| | | | 40,719 | | |
Materials (0.9%): | |
Soulbrain Co. Ltd. | | | 105,716 | | | | 30,847 | | |
| | | | 199,918 | | |
Luxembourg (0.4%): | |
Consumer Discretionary (0.4%): | |
B&M European Value Retail SA | | | 1,804,959 | | | | 14,327 | | |
Malta (0.7%): | |
Consumer Discretionary (0.7%): | |
Kindred Group PLC | | | 1,437,130 | | | | 22,553 | | |
Netherlands (4.4%): | |
Energy (0.3%): | |
SBM Offshore NV | | | 650,598 | | | | 9,897 | | |
Financials (1.2%): | |
| ASR Nederland NV | | | 447,081 | | | | 17,309 | | |
Euronext NV (d) | | | 189,195 | | | | 20,580 | | |
| | | | 37,889 | | |
Health Care (0.3%): | |
Argenx SE (a) | | | 36,135 | | | | 10,901 | | |
See notes to financial statements.
105
Victory Portfolios
Victory Trivalent International Small-Cap Fund | | Schedule of Portfolio Investments — continued
June 30, 2021 | |
(Amounts in Thousands, Except for Shares)
Security Description | | Shares | | Value | |
Industrials (1.5%): | |
AerCap Holdings NV (a) | | | 240,895 | | | $ | 12,336 | | |
Intertrust NV (a) (d) | | | 494,360 | | | | 8,907 | | |
Signify NV (d) | | | 468,595 | | | | 29,742 | | |
| | | | 50,985 | | |
Information Technology (1.1%): | |
ASM International NV | | | 112,035 | | | | 36,948 | | |
| | | | 146,620 | | |
Norway (0.3%): | |
Financials (0.3%): | |
Sparebanken Vest | | | 936,746 | | | | 9,747 | | |
Singapore (0.4%): | |
Real Estate (0.4%): | |
Frasers Logistics & Commercial Trust | | | 12,726,100 | | | | 13,646 | | |
Spain (3.2%): | |
Consumer Staples (0.3%): | |
Viscofan SA | | | 141,288 | | | | 9,847 | | |
Financials (0.5%): | |
Bankinter SA | | | 2,976,792 | | | | 14,975 | | |
Health Care (0.5%): | |
Laboratorios Farmaceuticos Rovi SA | | | 262,071 | | | | 18,159 | | |
Industrials (0.7%): | |
Applus Services SA (a) | | | 1,107,279 | | | | 10,816 | | |
Cia de Distribucion Integral Logista Holdings SA | | | 626,174 | | | | 12,873 | | |
| | | | 23,689 | | |
Materials (0.4%): | |
Acerinox SA | | | 973,993 | | | | 11,792 | | |
Real Estate (0.4%): | |
Merlin Properties Socimi SA | | | 1,344,380 | | | | 13,909 | | |
Utilities (0.4%): | |
Acciona SA (b) | | | 90,222 | | | | 13,624 | | |
| | | | 105,995 | | |
Sweden (2.4%): | |
Communication Services (0.4%): | |
G5 Entertainment AB | | | 223,483 | | | | 13,756 | | |
Consumer Discretionary (0.5%): | |
Dometic Group AB (d) | | | 1,008,761 | | | | 17,194 | | |
Health Care (0.7%): | |
Getinge AB, Class B | | | 595,956 | | | | 22,488 | | |
Industrials (0.3%): | |
Peab AB, Class B | | | 885,067 | | | | 10,941 | | |
Real Estate (0.5%): | |
Wihlborgs Fastigheter AB | | | 658,765 | | | | 14,292 | | |
| | | | 78,671 | | |
See notes to financial statements.
106
Victory Portfolios
Victory Trivalent International Small-Cap Fund | | Schedule of Portfolio Investments — continued
June 30, 2021 | |
(Amounts in Thousands, Except for Shares)
Security Description | | Shares | | Value | |
Switzerland (6.8%): | |
Consumer Discretionary (0.3%): | |
Forbo Holding AG, Registered Shares | | | 5,689 | | | $ | 10,772 | | |
Consumer Staples (0.5%): | |
Coca-Cola HBC AG | | | 301,702 | | | | 10,919 | | |
Zur Rose Group AG (a) | | | 19,553 | | | | 7,490 | | |
| | | | 18,409 | | |
Financials (1.5%): | |
Julius Baer Group Ltd. | | | 288,019 | | | | 18,816 | | |
Swiss Life Holding AG | | | 33,076 | | | | 16,094 | | |
Vontobel Holding AG, Class R | | | 203,018 | | | | 15,849 | | |
| | | | 50,759 | | |
Health Care (0.6%): | |
Tecan Group AG, Class R | | | 37,663 | | | | 18,668 | | |
Industrials (2.0%): | |
Adecco Group AG | | | 273,304 | | | | 18,601 | | |
Bucher Industries AG, Registered Shares | | | 39,968 | | | | 20,935 | | |
Sulzer AG, Registered Shares | | | 89,575 | | | | 12,398 | | |
Wizz Air Holdings PLC (a) (d) | | | 223,728 | | | | 14,463 | | |
| | | | 66,397 | | |
Information Technology (1.3%): | |
Logitech International SA, Class R | | | 355,152 | | | | 43,142 | | |
Real Estate (0.6%): | |
PSP Swiss Property AG, Registered Shares | | | 149,384 | | | | 18,974 | | |
| | | | 227,121 | | |
United Kingdom (12.6%): | |
Communication Services (0.9%): | |
Future PLC | | | 703,590 | | | | 30,502 | | |
Consumer Discretionary (1.4%): | |
Pets at Home Group PLC | | | 2,008,099 | | | | 12,692 | | |
Redrow PLC | | | 2,057,357 | | | | 17,449 | | |
Vistry Group PLC | | | 1,010,837 | | | | 16,455 | | |
| | | | 46,596 | | |
Consumer Staples (1.0%): | |
Cranswick PLC | | | 208,155 | | | | 11,450 | | |
Stock Spirits Group PLC | | | 2,694,391 | | | | 9,750 | | |
Tate & Lyle PLC | | | 1,199,704 | | | | 12,269 | | |
| | | | 33,469 | | |
Energy (0.3%): | |
Cairn Energy PLC | | | 5,127,738 | | | | 10,356 | | |
Financials (1.7%): | |
Close Brothers Group PLC | | | 699,100 | | | | 14,649 | | |
IG Group Holdings PLC | | | 1,062,375 | | | | 12,447 | | |
See notes to financial statements.
107
Victory Portfolios
Victory Trivalent International Small-Cap Fund | | Schedule of Portfolio Investments — continued
June 30, 2021 | |
(Amounts in Thousands, Except for Shares)
Security Description | | Shares | | Value | |
Intermediate Capital Group PLC | | | 454,785 | | | $ | 13,375 | | |
OSB Group PLC | | | 2,427,895 | | | | 15,593 | | |
| | | | 56,064 | | |
Health Care (0.7%): | |
Genus PLC | | | 153,523 | | | | 10,542 | | |
Hikma Pharmaceuticals PLC | | | 338,610 | | | | 11,458 | | |
| | | | 22,000 | | |
Industrials (2.4%): | |
IMI PLC | | | 994,697 | | | | 23,670 | | |
Royal Mail PLC (a) | | | 2,212,895 | | | | 17,692 | | |
Serco Group PLC | | | 7,669,450 | | | | 14,397 | | |
Travis Perkins PLC (a) | | | 524,876 | | | | 12,279 | | |
Ultra Electronics Holdings PLC | | | 377,538 | | | | 11,964 | | |
| | | | 80,002 | | |
Information Technology (1.7%): | |
Computacenter PLC | | | 635,308 | | | | 22,639 | | |
Electrocomponents PLC | | | 777,461 | | | | 11,075 | | |
Micro Focus International PLC | | | 1,752,470 | | | | 13,267 | | |
Spirent Communications PLC | | | 2,913,413 | | | | 9,930 | | |
| | | | 56,911 | | |
Materials (0.8%): | |
Endeavour Mining PLC | | | 530,481 | | | | 11,394 | | |
Synthomer PLC | | | 2,076,357 | | | | 14,130 | | |
| | | | 25,524 | | |
Real Estate (1.4%): | |
LondonMetric Property PLC | | | 4,371,031 | | | | 13,980 | | |
Safestore Holdings PLC | | | 1,594,912 | | | | 20,890 | | |
The Unite Group PLC | | | 841,407 | | | | 12,504 | | |
| | | | 47,374 | | |
Utilities (0.3%): | |
Atlantica Sustainable Infrastructure PLC (b) | | | 301,521 | | | | 11,223 | | |
| | | | 420,021 | | |
United States (0.7%): | |
Consumer Discretionary (0.3%): | |
Nexteer Automotive Group Ltd. | | | 7,438,000 | | | | 10,336 | | |
Industrials (0.4%): | |
Reliance Worldwide Corp. Ltd. | | | 3,321,456 | | | | 13,091 | | |
| | | | 23,427 | | |
Total Common Stocks (Cost $2,477,925) | | | 3,273,294 | | |
Exchange-Traded Funds (0.8%) | |
United States (0.8%): | |
Vanguard FTSE Developed Markets ETF (b) | | | 481,772 | | | | 24,821 | | |
Total Exchange-Traded Funds (Cost $23,312) | | | 24,821 | | |
See notes to financial statements.
108
Victory Portfolios
Victory Trivalent International Small-Cap Fund | | Schedule of Portfolio Investments — continued
June 30, 2021 | |
(Amounts in Thousands, Except for Shares)
Security Description | | Shares | | Value | |
Collateral for Securities Loaned^ (2.7%) | |
United States (2.7%): | |
BlackRock Liquidity Funds TempFund Portfolio, Institutional Class, 0.04% (e) | | | 1,793,292 | | | $ | 1,793 | | |
Fidelity Investments Money Market Government Portfolio I Shares, 0.01% (e) | | | 48,574,486 | | | | 48,574 | | |
Goldman Sachs Financial Square Prime Obligations Fund, Institutional Class,
0.02% (e) | | | 894,941 | | | | 895 | | |
JPMorgan Prime Money Market Fund, Capital Class, 0.07% (e) | | | 7,135,982 | | | | 7,136 | | |
Morgan Stanley Institutional Liquidity Prime Portfolio, Institutional Class,
0.06% (e) | | | 32,084,768 | | | | 32,085 | | |
Total Collateral for Securities Loaned (Cost $90,483) | | | 90,483 | | |
Total Investments (Cost $2,591,720) — 101.6% | | | 3,388,598 | | |
Liabilities in excess of other assets — (1.6)% | | | (53,108 | ) | |
NET ASSETS — 100.00% | | $ | 3,335,490 | | |
^ Purchased with cash collateral from securities on loan.
(a) Non-income producing security.
(b) All or a portion of this security is on loan.
(c) Rounds to less than $1 thousand.
(d) Rule 144A security or other security that is restricted as to resale to institutional investors. The Fund's Adviser has deemed this security to be liquid based upon procedures approved by the Board of Trustees. As of June 30, 2021, the fair value of these securities was $156,306 (thousands) and amounted to 4.7% of net assets.
(e) Rate disclosed is the daily yield on June 30, 2021.
ADR — American Depositary Receipt
ETF — Exchange-Traded Fund
PLC — Public Limited Company
REIT — Real Estate Investment Trust
See notes to financial statements.
109
Victory Portfolios
Victory INCORE Total Return Bond Fund | | Schedule of Portfolio Investments
June 30, 2021 | |
(Amounts in Thousands, Except for Shares)
Security Description | | Shares or
Principal
Amount | | Value | |
Asset-Backed Securities (3.3%) | |
Ameriquest Mortgage Securities, Series 2004-R12, Class M1,
0.95% (LIBOR01M+86bps), 1/25/35, Callable 7/25/21 @ 100 (a) | | $ | 47 | | | $ | 47 | | |
Drive Auto Receivables Trust, Series 2021-1, Class C,
1.02%, 6/15/27, Callable 12/15/24 @ 100 | | | 298 | | | | 299 | | |
GM Financial Consumer Automobile Receivables Trust, Series 2021-2, Class C,
1.28%, 1/19/27, Callable 7/16/24 @ 100 | | | 245 | | | | 244 | | |
Home Equity Asset Trust, Series 2005-2, Class M5,
1.19% (LIBOR01M+110bps), 7/25/35, Callable 7/25/21 @ 100 (a) | | | 306 | | | | 306 | | |
Park Place Securities, Inc., Series 2004-WCW2, Class M2,
1.07% (LIBOR01M+98bps), 10/25/34, Callable 7/25/21 @ 100 (a) | | | 19 | | | | 19 | | |
Santander Retail Auto Lease Trust, Series 2021-A, Class C,
1.14%, 3/20/26, Callable 6/20/24 @ 100 (b) (c) | | | 674 | | | | 674 | | |
Westlake Automobile Receivables Trust, Series 2021-2A, Class C,
0.89%, 7/15/26, Callable 8/15/24 @ 100 (b) | | | 337 | | | | 337 | | |
Westlake Automobile Receivables Trust, Series 2021-1A, Class C,
0.95%, 3/16/26, Callable 9/15/24 @ 100 (b) | | | 332 | | | | 332 | | |
Total Asset-Backed Securities (Cost $2,246) | | | 2,258 | | |
Collateralized Mortgage Obligations (1.3%) | |
BANK, Series 2020-BN26, Class AS, 2.69%, 3/15/63, Callable 3/15/30 @ 100 | | | 290 | | | | 303 | | |
Citigroup Commercial Mortgage Trust, Series 2020-GC46, Class AS,
2.92%, 2/15/53, Callable 2/15/30 @ 100 | | | 257 | | | | 273 | | |
WFRBS Commercial Mortgage Trust, Series 2012-C10, Class A5,
3.24%, 12/15/45, Callable 12/15/22 @ 100 | | | 270 | | | | 278 | | |
Total Collateralized Mortgage Obligations (Cost $838) | | | 854 | | |
Preferred Stocks (3.5%) | |
Financials (1.4%): | |
AMG Capital Trust II, 5.15%, 10/15/37 | | | 3,640 | | | | 219 | | |
Bank of America Corp., Series L, 7.25% (d) | | | 190 | | | | 269 | | |
KKR & Co., Inc., Series C, 6.00%, 9/15/23 (e) | | | 2,125 | | | | 164 | | |
Wells Fargo & Co., Series L, 7.50% (d) | | | 185 | | | | 282 | | |
| | | | 934 | | |
Health Care (0.1%): | |
Danaher Corp., Series B, 5.00%, 4/15/23 (e) | | | 39 | | | | 57 | | |
Industrials (0.4%): | |
Stanley Black & Decker, Inc., 5.25%, 11/15/22 (e) | | | 2,482 | | | | 300 | | |
Utilities (1.6%): | |
American Electric Power Co., Inc., 6.13%, 8/15/23 | | | 1,615 | | | | 83 | | |
CenterPoint Energy, Inc., 4.57%, 9/15/29 | | | 1 | | | | 68 | | |
Dominion Energy, Inc., Series A, 7.25%, 6/1/22 | | | 2,700 | | | | 262 | | |
DTE Energy Co., 6.25%, 11/1/22 | | | 3,724 | | | | 184 | | |
NextEra Energy, Inc., 5.27%, 3/1/23 | | | 6,025 | | | | 295 | | |
The Southern Co., Series 2019, 6.75%, 8/1/22 | | | 4,227 | | | | 214 | | |
| | | | 1,106 | | |
Total Preferred Stocks (Cost $2,297) | | | 2,397 | | |
See notes to financial statements.
110
Victory Portfolios
Victory INCORE Total Return Bond Fund | | Schedule of Portfolio Investments — continued
June 30, 2021 | |
(Amounts in Thousands, Except for Shares)
Security Description | | Principal
Amount | | Value | |
Corporate Bonds (52.0%) | |
Communication Services (2.7%): | |
Alphabet, Inc., 2.05%, 8/15/50, Callable 2/15/50 @ 100 | | $ | 184 | | | $ | 163 | | |
AT&T, Inc.
4.25%, 3/1/27, Callable 12/1/26 @ 100 (c) | | | 129 | | | | 146 | | |
1.65%, 2/1/28, Callable 12/1/27 @ 100 | | | 117 | | | | 116 | | |
5.15%, 11/15/46, Callable 5/15/46 @ 100 (c) | | | 312 | | | | 400 | | |
CenturyLink, Inc., 6.75%, 12/1/23 | | | 115 | | | | 127 | | |
Comcast Corp.
3.45%, 2/1/50, Callable 8/1/49 @ 100 | | | 150 | | | | 163 | | |
2.80%, 1/15/51, Callable 7/15/50 @ 100 | | | 128 | | | | 123 | | |
Sirius XM Radio, Inc., 4.13%, 7/1/30, Callable 7/1/25 @ 102.06 (b) | | | 143 | | | | 145 | | |
Verizon Communications, Inc.
3.38%, 2/15/25 (c) | | | 116 | | | | 126 | | |
3.55%, 3/22/51, Callable 9/22/50 @ 100 (c) | | | 275 | | | | 294 | | |
| | | | 1,803 | | |
Consumer Discretionary (7.7%): | |
Booking Holdings, Inc.
0.90%, 9/15/21 | | | 30 | | | | 33 | | |
0.75%, 5/1/25 | | | 190 | | | | 269 | | |
D.R. Horton, Inc., 2.50%, 10/15/24, Callable 9/15/24 @ 100 (c) | | | 670 | | | | 703 | | |
Dana, Inc., 5.63%, 6/15/28, Callable 6/15/23 @ 102.81 | | | 110 | | | | 119 | | |
Darden Restaurants, Inc., 3.85%, 5/1/27, Callable 2/1/27 @ 100 (c) | | | 170 | | | | 189 | | |
Expedia Group, Inc.
3.60%, 12/15/23, Callable 11/15/23 @ 100 (e) | | | 201 | | | | 213 | | |
2/15/26 (b) (e) | | | 180 | | | | 195 | | |
General Motors Co., 4.88%, 10/2/23 (c) | | | 229 | | | | 249 | | |
Hasbro, Inc., 2.60%, 11/19/22 | | | 300 | | | | 308 | | |
Hilton Domestic Operating Co., Inc., 4.88%, 1/15/30, Callable 1/15/25 @ 102.44 | | | 110 | | | | 118 | | |
Hilton Worldwide Finance LLC/Hilton Worldwide Finance Corp.,
4.88%, 4/1/27, Callable 4/1/22 @ 102.44 | | | 130 | | | | 136 | | |
Lear Corp., 3.50%, 5/30/30, Callable 2/28/30 @ 100 | | | 112 | | | | 120 | | |
Lennar Corp., 5.00%, 6/15/27, Callable 12/15/26 @ 100 | | | 212 | | | | 245 | | |
Marriott International, Inc., 3.60%, 4/15/24, Callable 3/15/24 @ 100 | | | 326 | | | | 347 | | |
Meritage Homes Corp., 6.00%, 6/1/25, Callable 3/1/25 @ 100 | | | 63 | | | | 72 | | |
Murphy Oil USA, Inc., 3.75%, 2/15/31, Callable 2/15/26 @ 101.88 (b) | | | 101 | | | | 100 | | |
NIKE, Inc., 3.88%, 11/1/45, Callable 5/1/45 @ 100 | | | 198 | | | | 237 | | |
NVR, Inc.
3.95%, 9/15/22, Callable 6/15/22 @ 100 (c) | | | 268 | | | | 277 | | |
3.00%, 5/15/30, Callable 11/15/29 @ 100 | | | 267 | | | | 283 | | |
PulteGroup, Inc., 5.00%, 1/15/27, Callable 10/15/26 @ 100 (e) | | | 240 | | | | 280 | | |
Ross Stores, Inc.
3.38%, 9/15/24, Callable 6/15/24 @ 100 | | | 160 | | | | 170 | | |
0.88%, 4/15/26, Callable 3/15/26 @ 100 | | | 186 | | | | 182 | | |
Whirlpool Corp., 2.40%, 5/15/31, Callable 2/15/31 @ 100 | | | 185 | | | | 187 | | |
Yum! Brands, Inc., 3.63%, 3/15/31, Callable 12/15/30 @ 100 | | | 171 | | | | 171 | | |
| | | | 5,203 | | |
See notes to financial statements.
111
Victory Portfolios
Victory INCORE Total Return Bond Fund | | Schedule of Portfolio Investments — continued
June 30, 2021 | |
(Amounts in Thousands, Except for Shares)
Security Description | | Principal
Amount | | Value | |
Consumer Staples (2.6%): | |
7-Eleven, Inc., 0.80%, 2/10/24, Callable 2/10/22 @ 100 (b) | | $ | 368 | | | $ | 367 | | |
Altria Group, Inc., 4.40%, 2/14/26, Callable 12/14/25 @ 100 (c) | | | 105 | | | | 119 | | |
BAT Capital Corp., 5.28%, 4/2/50, Callable 10/2/49 @ 100 | | | 167 | | | | 193 | | |
Church & Dwight Co., Inc., 2.45%, 8/1/22, Callable 7/1/22 @ 100 (c) | | | 70 | | | | 72 | | |
Estee Lauder Cos., Inc., 4.15%, 3/15/47, Callable 9/15/46 @ 100 (e) | | | 105 | | | | 131 | | |
Hormel Foods Corp., 1.80%, 6/11/30, Callable 3/11/30 @ 100 | | | 363 | | | | 360 | | |
Molson Coors Beverage Co., 4.20%, 7/15/46, Callable 1/15/46 @ 100 | | | 95 | | | | 106 | | |
Reynolds American, Inc., 6.15%, 9/15/43 (c) | | | 175 | | | | 221 | | |
Tyson Foods, Inc., 5.10%, 9/28/48, Callable 3/28/48 @ 100 | | | 135 | | | | 178 | | |
| | | | 1,747 | | |
Energy (3.6%): | |
Chevron USA, Inc., 3.85%, 1/15/28, Callable 10/15/27 @ 100 | | | 320 | | | | 365 | | |
Continental Resources, Inc., 4.50%, 4/15/23, Callable 1/15/23 @ 100 (c) | | | 234 | | | | 244 | | |
EOG Resources, Inc., 4.95%, 4/15/50, Callable 10/15/49 @ 100 (e) | | | 135 | | | | 180 | | |
EQM Midstream Partners LP, 4.75%, 7/15/23, Callable 6/15/23 @ 100 (c) | | | 84 | | | | 88 | | |
HollyFrontier Corp., 2.63%, 10/1/23 | | | 265 | | | | 274 | | |
Marathon Oil Corp., 6.60%, 10/1/37 (e) | | | 125 | | | | 166 | | |
Phillips 66 Partners LP, 4.90%, 10/1/46, Callable 4/1/46 @ 100 | | | 229 | | | | 272 | | |
Pioneer Natural Resources Co.
0.25%, 5/15/25 | | | 155 | | | | 247 | | |
1.90%, 8/15/30, Callable 5/15/30 @ 100 | | | 251 | | | | 242 | | |
Plains All American Pipeline LP/PAA Finance Corp.,
2.85%, 1/31/23, Callable 10/31/22 @ 100 (c) | | | 245 | | | | 252 | | |
Valero Energy Corp., 4.00%, 4/1/29, Callable 1/1/29 @ 100 (c) | | | 102 | | | | 114 | | |
| | | | 2,444 | | |
Financials (11.7%): | |
Aflac, Inc.
2.88%, 10/15/26, Callable 7/15/26 @ 100 | | | 335 | | | | 360 | | |
4.75%, 1/15/49, Callable 7/15/48 @ 100 | | | 35 | | | | 46 | | |
Alleghany Corp., 3.63%, 5/15/30, Callable 2/15/30 @ 100 | | | 130 | | | | 143 | | |
Ares Capital Corp., 4.63%, 3/1/24 | | | 275 | | | | 302 | | |
Bank of America Corp.
4.20%, 8/26/24, MTN (c) (e) | | | 160 | | | | 176 | | |
3.25%, 10/21/27, Callable 10/21/26 @ 100, MTN | | | 205 | | | | 222 | | |
Capital One Financial Corp., 3.30%, 10/30/24, Callable 9/30/24 @ 100 (c) | | | 224 | | | | 241 | | |
Cincinnati Financial Corp., 6.13%, 11/1/34 | | | 230 | | | | 314 | | |
Citigroup, Inc.
3.88%, 3/26/25 | | | 108 | | | | 119 | | |
4.60%, 3/9/26 (c) | | | 232 | | | | 264 | | |
4.45%, 9/29/27 (c) | | | 108 | | | | 123 | | |
3.88% (LIBOR03M+117bps), 1/24/39, Callable 1/24/38 @ 100 (a) | | | 94 | | | | 108 | | |
Fifth Third Bancorp
1.63%, 5/5/23, Callable 4/5/23 @ 100 | | | 130 | | | | 133 | | |
3.65%, 1/25/24, Callable 12/25/23 @ 100 (c) | | | 584 | | | | 626 | | |
Ford Motor Credit Co. LLC, 4.06%, 11/1/24, Callable 10/1/24 @ 100 | | | 290 | | | | 308 | | |
General Motors Financial Co., Inc., 4.15%, 6/19/23, Callable 5/19/23 @ 100 | | | 110 | | | | 117 | | |
Globe Life, Inc., 2.15%, 8/15/30, Callable 5/15/30 @ 100 | | | 250 | | | | 247 | | |
See notes to financial statements.
112
Victory Portfolios
Victory INCORE Total Return Bond Fund | | Schedule of Portfolio Investments — continued
June 30, 2021 | |
(Amounts in Thousands, Except for Shares)
Security Description | | Principal
Amount | | Value | |
JPMorgan Chase & Co.
2.95%, 10/1/26, Callable 7/1/26 @ 100 (c) | | $ | 425 | | | $ | 458 | | |
5.60%, 7/15/41 | | | 87 | | | | 122 | | |
JPMorgan Chase Financial Co. LLC, 0.25%, 5/1/23 (b) | | | 165 | | | | 179 | | |
Level 3 Financing, Inc., 3.75%, 7/15/29, Callable 1/15/24 @ 101.88 (b) | | | 170 | | | | 165 | | |
Morgan Stanley
4.88%, 11/1/22 (c) (e) | | | 303 | | | | 321 | | |
3.13%, 7/27/26, MTN (c) (e) | | | 545 | | | | 590 | | |
Old Republic International Corp., 3.85%, 6/11/51, Callable 12/11/50 @ 100 | | | 104 | | | | 111 | | |
Sixth Street Specialty Lending, Inc., 4.50%, 8/1/22 | | | 90 | | | | 104 | | |
SVB Financial Group, 3.13%, 6/5/30, Callable 3/5/30 @ 100 | | | 373 | | | | 398 | | |
The Goldman Sachs Group, Inc., 3.50%, 1/23/25, Callable 10/23/24 @ 100 | | | 275 | | | | 297 | | |
Unum Group
4.00%, 6/15/29, Callable 3/15/29 @ 100 | | | 195 | | | | 219 | | |
4.13%, 6/15/51, Callable 12/15/50 @ 100 | | | 165 | | | | 167 | | |
Wells Fargo & Co.
4.30%, 7/22/27, MTN (c) | | | 410 | | | | 467 | | |
4.90%, 11/17/45 (c) | | | 155 | | | | 198 | | |
Zions Bancorp NA, 3.25%, 10/29/29, Callable 7/29/29 @ 100 | | | 250 | | | | 262 | | |
| | | | 7,907 | | |
Health Care (5.4%): | |
AbbVie, Inc.
3.20%, 11/21/29, Callable 8/21/29 @ 100 | | | 285 | | | | 309 | | |
4.45%, 5/14/46, Callable 11/14/45 @ 100 | | | 142 | | | | 172 | | |
Amgen, Inc., 4.40%, 5/1/45, Callable 11/1/44 @ 100 | | | 250 | | | | 303 | | |
Anthem, Inc.
2.38%, 1/15/25, Callable 12/15/24 @ 100 | | | 148 | | | | 155 | | |
2.75%, 10/15/42 | | | 50 | | | | 270 | | |
Baxter International, Inc., 3.50%, 8/15/46, Callable 2/15/46 @ 100 | | | 109 | | | | 122 | | |
Bristol-Myers Squibb Co., 3.40%, 7/26/29, Callable 4/26/29 @ 100 (c) | | | 455 | | | | 510 | | |
Centene Corp., 4.25%, 12/15/27, Callable 12/15/22 @ 102.13 (e) | | | 168 | | | | 177 | | |
HCA, Inc., 4.13%, 6/15/29, Callable 3/15/29 @ 100 | | | 193 | | | | 218 | | |
Hologic, Inc., 3.25%, 2/15/29, Callable 9/28/23 @ 101.63 (b) | | | 260 | | | | 259 | | |
Humana, Inc., 2.90%, 12/15/22, Callable 11/15/22 @ 100 (c) | | | 135 | | | | 139 | | |
Illumina, Inc. , 8/15/23 (e) | | | 215 | | | | 273 | | |
Merck & Co., Inc., 2.45%, 6/24/50, Callable 12/24/49 @ 100 | | | 135 | | | | 127 | | |
Mylan, Inc., 4.55%, 4/15/28, Callable 1/15/28 @ 100 | | | 262 | | | | 301 | | |
Regeneron Pharmaceuticals, Inc., 2.80%, 9/15/50, Callable 3/15/50 @ 100 | | | 146 | | | | 133 | | |
Universal Health Services, Inc., 2.65%, 10/15/30, Callable 7/15/30 @ 100 (b) | | | 102 | | | | 102 | | |
Upjohn, Inc., 2.30%, 6/22/27, Callable 4/22/27 @ 100 (b) | | | 95 | | | | 97 | | |
| | | | 3,667 | | |
Industrials (6.5%): | |
Acuity Brands Lighting, Inc., 2.15%, 12/15/30, Callable 9/15/30 @ 100 | | | 241 | | | | 239 | | |
Air Lease Corp., 0.70%, 2/15/24, MTN, Callable 1/15/24 @ 100 | | | 282 | | | | 281 | | |
Carlisle Cos., Inc., 2.75%, 3/1/30, Callable 12/1/29 @ 100 | | | 150 | | | | 157 | | |
CSX Corp., 3.35%, 9/15/49, Callable 3/15/49 @ 100 | | | 195 | | | | 207 | | |
Delta Air Lines, Inc., 3.80%, 4/19/23, Callable 3/19/23 @ 100 (c) | | | 275 | | | | 285 | | |
Fortive Corp., 0.88%, 2/15/22 | | | 295 | | | | 296 | | |
Hillenbrand, Inc., 5.00%, 9/15/26, Callable 7/15/26 @ 100 (c) | | | 420 | | | | 467 | | |
See notes to financial statements.
113
Victory Portfolios
Victory INCORE Total Return Bond Fund | | Schedule of Portfolio Investments — continued
June 30, 2021 | |
(Amounts in Thousands, Except for Shares)
Security Description | | Principal
Amount | | Value | |
Honeywell International, Inc., 2.80%, 6/1/50, Callable 12/1/49 @ 100 (e) | | $ | 82 | | | $ | 85 | | |
Norfolk Southern Corp., 2.30%, 5/15/31, Callable 2/15/31 @ 100 | | | 239 | | | | 242 | | |
Oshkosh Corp., 3.10%, 3/1/30, Callable 12/1/29 @ 100 | | | 140 | | | | 148 | | |
Rockwell Automation, Inc.
3.50%, 3/1/29, Callable 12/1/28 @ 100 | | | 165 | | | | 185 | | |
6.25%, 12/1/37 | | | 155 | | | | 219 | | |
Roper Technologies, Inc., 2.95%, 9/15/29, Callable 6/15/29 @ 100 (c) | | | 379 | | | | 405 | | |
Sensata Technologies, Inc., 3.75%, 2/15/31, Callable 2/15/26 @ 101.88 (b) | | | 130 | | | | 129 | | |
Snap-on, Inc., 4.10%, 3/1/48, Callable 9/1/47 @ 100 | | | 115 | | | | 141 | | |
Southwest Airlines Co., 1.25%, 5/1/25 | | | 190 | | | | 288 | | |
The Boeing Co., 2.20%, 2/4/26, Callable 2/4/23 @ 100 (c) | | | 470 | | | | 474 | | |
Valmont Industries, Inc., 5.00%, 10/1/44, Callable 4/1/44 @ 100 (c) | | | 146 | | | | 176 | | |
| | | | 4,424 | | |
Information Technology (5.7%): | |
Akamai Technologies, Inc., 0.13%, 5/1/25 | | | 80 | | | | 105 | | |
Apple, Inc., 4.65%, 2/23/46, Callable 8/23/45 @ 100 | | | 117 | | | | 155 | | |
Broadcom Corp./Broadcom Cayman Finance Ltd.,
3.63%, 1/15/24, Callable 11/15/23 @ 100 (c) (e) | | | 132 | | | | 141 | | |
Broadcom, Inc., 5.00%, 4/15/30, Callable 1/15/30 @ 100 | | | 315 | | | | 372 | | |
Cadence Design Systems, Inc., 4.38%, 10/15/24, Callable 7/15/24 @ 100 (c) | | | 342 | | | | 376 | | |
Citrix Systems, Inc., 1.25%, 3/1/26, Callable 2/1/26 @ 100 | | | 275 | | | | 272 | | |
Euronet Worldwide, Inc., 0.75%, 3/15/49, Callable 3/20/25 @ 100 (e) | | | 260 | | | | 299 | | |
Lam Research Corp., 4.00%, 3/15/29, Callable 12/15/28 @ 100 (c) | | | 166 | | | | 193 | | |
Micron Technology, Inc., 5.33%, 2/6/29, Callable 11/6/28 @ 100 (c) | | | 394 | | | | 477 | | |
NCR Corp., 5.25%, 10/1/30, Callable 10/1/25 @ 102.63 (b) | | | 87 | | | | 91 | | |
NetApp, Inc., 3.25%, 12/15/22, Callable 9/15/22 @ 100 | | | 150 | | | | 154 | | |
ServiceNow, Inc. , 6/1/22 | | | 5 | | | | 20 | | |
Square, Inc., 0.25%, 11/1/27 (b) (e) | | | 55 | | | | 64 | | |
Texas Instruments, Inc., 4.15%, 5/15/48, Callable 11/15/47 @ 100 | | | 160 | | | | 203 | | |
Visa, Inc., 2.00%, 8/15/50, Callable 2/15/50 @ 100 | | | 287 | | | | 254 | | |
Vishay Intertechnology, Inc., 2.25%, 6/15/25 | | | 45 | | | | 47 | | |
VMware, Inc., 2.95%, 8/21/22, Callable 7/21/22 @ 100 | | | 360 | | | | 369 | | |
Western Digital Corp., 1.50%, 2/1/24 (e) | | | 275 | | | | 294 | | |
| | | | 3,886 | | |
Materials (0.7%): | |
Celanese US Holdings LLC, 4.63%, 11/15/22 (c) | | | 210 | | | | 221 | | |
Nucor Corp., 2.00%, 6/1/25, Callable 5/1/25 @ 100 | | | 160 | | | | 166 | | |
Southern Copper Corp., 5.25%, 11/8/42 (c) | | | 95 | | | | 121 | | |
| | | | 508 | | |
Real Estate (2.8%): | |
Highwoods Realty LP, 3.63%, 1/15/23, Callable 10/15/22 @ 100 (c) | | | 630 | | | | 651 | | |
Iron Mountain, Inc., 5.25%, 7/15/30, Callable 7/15/25 @ 102.63 (b) | | | 108 | | | | 115 | | |
Kite Realty Group LP, 0.75%, 4/1/27 (b) | | | 25 | | | | 26 | | |
Physicians Realty LP, 3.95%, 1/15/28, Callable 10/15/27 @ 100 | | | 138 | | | | 152 | | |
Piedmont Operating Partnership LP, 3.15%, 8/15/30, Callable 5/15/30 @ 100 | | | 134 | | | | 136 | | |
Regency Centers LP, 4.65%, 3/15/49, Callable 9/15/48 @ 100 | | | 114 | | | | 138 | | |
Retail Properties of America, Inc., 4.00%, 3/15/25, Callable 12/15/24 @ 100 | | | 339 | | | | 361 | | |
Sabra Health Care LP, 5.13%, 8/15/26, Callable 5/15/26 @ 100 | | | 145 | | | | 163 | | |
STORE Capital Corp., 2.75%, 11/18/30, Callable 8/18/30 @ 100 | | | 184 | | | | 186 | | |
| | | | 1,928 | | |
See notes to financial statements.
114
Victory Portfolios
Victory INCORE Total Return Bond Fund | | Schedule of Portfolio Investments — continued
June 30, 2021 | |
(Amounts in Thousands, Except for Shares)
Security Description | | Principal
Amount | | Value | |
Utilities (2.6%): | |
Ameren Illinois Co., 1.55%, 11/15/30, Callable 8/15/30 @ 100 | | $ | 225 | | | $ | 216 | | |
American Water Capital Corp., 2.80%, 5/1/30, Callable 2/1/30 @ 100 | | | 135 | | | | 143 | | |
Consolidated Edison Co. of New York, Inc., 6.30%, 8/15/37 (e) | | | 250 | | | | 351 | | |
NextEra Energy Capital Holdings, Inc.,
2.80%, 1/15/23, Callable 12/15/22 @ 100 (c) | | | 310 | | | | 320 | | |
Oklahoma G&E Co., 5.25%, 5/15/41, Callable 11/15/40 @ 100 | | | 190 | | | | 245 | | |
Public Service Electric & Gas Co., 3.95%, 5/1/42, MTN, Callable 11/1/41 @ 100 (c) | | | 159 | | | | 188 | | |
Vistra Operations Co. LLC, 3.70%, 1/30/27, Callable 11/30/26 @ 100 (b) | | | 287 | | | | 307 | | |
| | | 1,770 | | |
Total Corporate Bonds (Cost $33,614) | | | 35,287 | | |
Residential Mortgage-Backed Securities (0.1%) | |
Credit Suisse First Boston Mortgage Securities Corp., Series 2002-HE16,
Class M1, 1.41% (LIBOR01M+132bps), 10/25/32, Callable 7/25/21 @ 100 (a) | | | 90 | | | | 90 | | |
Total Residential Mortgage-Backed Securities (Cost $88) | | | 90 | | |
Yankee Dollars (9.2%) | |
Communication Services (0.4%): | |
Vodafone Group PLC, 5.25%, 5/30/48 | | | 193 | | | | 253 | | |
Consumer Staples (3.2%): | |
Barry Callebaut Services NV, 5.50%, 6/15/23 (b) | | | 638 | | | | 693 | | |
Kerry Group Financial Services Unlimited Co.,
3.20%, 4/9/23, Callable 1/9/23 @ 100 (b) (c) | | | 670 | | | | 694 | | |
Suntory Holdings Ltd.
2.55%, 6/28/22, Callable 5/28/22 @ 100 (b) (c) | | | 574 | | | | 585 | | |
2.25%, 10/16/24, Callable 9/16/24 @ 100 (b) | | | 200 | | | | 208 | | |
| | | | 2,180 | | |
Energy (0.9%): | |
Canadian Natural Resources Ltd., 2.95%, 1/15/23, Callable 12/15/22 @ 100 | | | 140 | | | | 145 | | |
Ecopetrol SA, 5.88%, 9/18/23 (c) | | | 325 | | | | 352 | | |
Statoil ASA, 3.95%, 5/15/43 | | | 100 | | | | 117 | | |
| | | | 614 | | |
Financials (2.2%): | |
Barclays Bank PLC
0.00%, 2/4/25 (c) | | | 110 | | | | 158 | | |
0.00%, 2/18/25 | | | 65 | | | | 74 | | |
Enel Finance International NV, 2.88%, 5/25/22 (b) (c) | | | 415 | | | | 424 | | |
Newcrest Finance Pty Ltd.
5.75%, 11/15/41 (b) | | | 155 | | | | 207 | | |
4.20%, 5/13/50, Callable 11/13/49 @ 100 (b) | | | 110 | | | | 126 | | |
NXP BV/NXP Funding LLC, 4.63%, 6/1/23 (b) | | | 300 | | | | 323 | | |
Total Capital International SA, 2.99%, 6/29/41, Callable 12/29/40 @ 100 (e) | | | 195 | | | | 198 | | |
| | | | 1,510 | | |
See notes to financial statements.
115
Victory Portfolios
Victory INCORE Total Return Bond Fund | | Schedule of Portfolio Investments — continued
June 30, 2021 | |
(Amounts in Thousands, Except for Shares)
Security Description | | Principal
Amount | | Value | |
Industrials (0.9%): | |
Aercap Ireland Capital DAC/AerCap Global Aviation Trust,
1.75%, 1/30/26, Callable 12/30/25 @ 100 | | $ | 150 | | | $ | 148 | | |
AerCap Ireland Capital DAC/AerCap Global Aviation Trust,
6.50%, 7/15/25, Callable 6/15/25 @ 100 | | | 150 | | | | 176 | | |
Canadian National Railway Co., 3.20%, 8/2/46, Callable 2/2/46 @ 100 | | | 85 | | | | 88 | | |
Sensata Technologies BV, 4.00%, 4/15/29, Callable 4/15/24 @ 102 (b) | | | 200 | | | | 203 | | |
| | | | 615 | | |
Materials (1.2%): | |
Anglo American Capital PLC
2.88%, 3/17/31, Callable 12/17/30 @ 100 (b) | | | 300 | | | | 307 | | |
3.95%, 9/10/50, Callable 3/10/50 @ 100 (b) | | | 200 | | | | 216 | | |
Rio Tinto Finance USA Ltd., 5.20%, 11/2/40 | | | 75 | | | | 103 | | |
Vale Overseas Ltd., 6.25%, 8/10/26 | | | 143 | | | | 172 | | |
| | | | 798 | | |
Utilities (0.4%): | |
Iberdrola International BV
6.75%, 9/15/33 | | | 50 | | | | 68 | | |
6.75%, 7/15/36 | | | 152 | | | | 231 | | |
| | | | 299 | | |
Total Yankee Dollars (Cost $5,996) | | | 6,269 | | |
U.S. Government Mortgage-Backed Agencies (17.7%) | |
Federal Home Loan Mortgage Corp.
9.00%, 4/1/25 (c) | | | 12 | | | | 13 | | |
7.50%, 8/1/29 (c) | | | 8 | | | | 10 | | |
Series 4395, Class PA, 2.50%, 4/15/37 (c) | | | 233 | | | | 243 | | |
5.00%, 7/1/39 (c) | | | 538 | | | | 612 | | |
Series 4320, Class AP, 3.50%, 7/15/39 – 10/15/40 (c) | | | 359 | | | | 374 | | |
Series 4444, Class CH, 3.00%, 1/15/41 – 10/1/46 (c) | | | 714 | | | | 745 | | |
4.50%, 7/1/44 – 12/1/45 (c) | | | 836 | | | | 928 | | |
2.50%, 7/1/50 | | | 294 | | | | 304 | | |
2.00%, 3/1/51 (c) | | | 642 | | | | 649 | | |
| | | | 3,878 | | |
Federal National Mortgage Association
3.50%, 2/1/32 | | | 143 | | | | 153 | | |
6.00%, 2/1/37 (c) | | | 93 | | | | 109 | | |
3.50%, 8/1/39 – 12/25/50 (c) | | | 1,868 | | | | 1,978 | | |
Series 2011-21, Class PA, 4.50%, 5/25/40 (c) | | | 419 | | | | 444 | | |
3.00%, 6/1/40 – 2/1/47 (c) | | | 1,927 | | | | 2,045 | | |
Series 2013-81, Class KA, 2.75%, 9/25/42 (c) | | | 239 | | | | 248 | | |
3.00%, 9/1/46 – 5/1/48 | | | 500 | | | | 531 | | |
4.00%, 3/1/47 – 6/1/49 | | | 151 | | | | 162 | | |
4.00%, 7/1/47 – 10/1/48 (c) | | | 916 | | | | 989 | | |
Series 2017-96, Class DA, 2.50%, 12/25/47 (c) | | | 237 | | | | 245 | | |
4.50%, 5/1/50 | | | 50 | | | | 54 | | |
2.00%, 3/1/51 (c) | | | 1,136 | | | | 1,150 | | |
| | | | 8,108 | | |
Total U.S. Government Mortgage-Backed Agencies (Cost $11,578) | | | 11,986 | | |
See notes to financial statements.
116
Victory Portfolios
Victory INCORE Total Return Bond Fund | | Schedule of Portfolio Investments — continued
June 30, 2021 | |
(Amounts in Thousands, Except for Shares)
Security Description | | Shares or
Principal
Amount | | Value | |
U.S. Treasury Obligations (8.5%) | |
U.S. Treasury Bonds, 1.25%, 5/15/50 (c) | | $ | 2,150 | | | $ | 1,755 | | |
U.S. Treasury Notes
0.25%, 3/15/24 (c) | | | 1,247 | | | | 1,242 | | |
0.75%, 4/30/26 | | | 2,700 | | | | 2,687 | | |
1.63%, 5/15/31 | | | 50 | | | | 51 | | |
Total U.S. Treasury Obligations (Cost $5,752) | | | 5,735 | | |
Collateral for Securities Loaned^ (4.7%) | |
BlackRock Liquidity Funds TempFund Portfolio, Institutional Class, 0.04% (f) | | | 62,985 | | | | 63 | | |
Fidelity Investments Money Market Government Portfolio I Shares, 0.01% (f) | | | 1,706,058 | | | | 1,706 | | |
Goldman Sachs Financial Square Prime Obligations Fund, Institutional Class,
0.02% (f) | | | 31,433 | | | | 31 | | |
JPMorgan Prime Money Market Fund, Capital Class, 0.07% (f) | | | 250,634 | | | | 251 | | |
Morgan Stanley Institutional Liquidity Prime Portfolio, Institutional Class,
0.06% (f) | | | 1,126,898 | | | | 1,127 | | |
Total Collateral for Securities Loaned (Cost $3,178) | | | 3,178 | | |
Total Investments (Cost $65,587) — 100.3% | | | 68,054 | | |
Liabilities in excess of other assets — (0.3)% | | | (221 | ) | |
NET ASSETS — 100.00% | | $ | 67,833 | | |
^ Purchased with cash collateral from securities on loan.
(a) Variable or Floating-Rate Security. Rate disclosed is as of June 30, 2021.
(b) Rule 144A security or other security that is restricted as to resale to institutional investors. The Fund's Adviser has deemed this security to be liquid based upon procedures approved by the Board of Trustees. As of June 30, 2021, the fair value of these securities was $7,670 (thousands) and amounted to 11.3% of net assets.
(c) All or a portion of this security has been segregated as collateral for derivative instruments.
(d) Security is perpetual and has no final maturity date but may be subject to calls at various dates in the future.
(e) All or a portion of this security is on loan.
(f) Rate disclosed is the daily yield on June 30, 2021.
bps — Basis points
LIBOR — London InterBank Offered Rate
LIBOR01M — 1 Month US Dollar LIBOR, rate disclosed as of June 30, 2021, based on the last reset date of the security
LIBOR03M — 3 Month US Dollar LIBOR, rate disclosed as of June 30, 2021, based on the last reset date of the security
LLC — Limited Liability Company
LP — Limited Partnership
MTN — Medium Term Note
PLC — Public Limited Company
See notes to financial statements.
117
Victory Portfolios
Victory INCORE Total Return Bond Fund | | Schedule of Portfolio Investments — continued
June 30, 2021 | |
(Amounts in Thousands, Except for Shares)
Futures Contracts Purchased
(Amounts not in thousands)
| | | Number of
Contracts | | Expiration
Date | | Notional
Amount | | Value | | Unrealized
Appreciation/
(Depreciation) | |
2-Year U.S. Treasury Note Futures | | | 8 | | | 9/30/21 | | $ | 1,763,480 | | | $ | 1,762,562 | | | $ | (918 | ) | |
5-Year U.S. Treasury Note Futures | | | 31 | | | 9/30/21 | | | 3,831,997 | | | | 3,826,320 | | | | (5,677 | ) | |
Canadian Dollar Futures | | | 8 | | | 9/14/21 | | | 661,840 | | | | 644,960 | | | | (16,880 | ) | |
Ultra Long Term U.S. Treasury
Bond Futures | | | 6 | | | 9/21/21 | | | 1,099,911 | | | | 1,156,125 | | | | 56,214 | | |
| | | $ | 32,739 | | |
Futures Contracts Sold
(Amounts not in thousands)
| | | Number of
Contracts | | Expiration
Date | | Notional
Amount | | Value | | Unrealized
Appreciation/
(Depreciation) | |
10-Year U.S. Treasury Note Futures | | | 23 | | | 9/21/21 | | $ | 3,025,499 | | | $ | 3,047,500 | | | $ | (22,001 | ) | |
Japanese Yen Futures | | | 8 | | | 9/13/21 | | | 910,000 | | | | 900,700 | | | | 9,300 | | |
Mexican Peso Currency Futures | | | 19 | | | 9/13/21 | | | 475,950 | | | | 472,150 | | | | 3,800 | | |
| | | $ | (8,901 | ) | |
Total unrealized appreciation | | $ | 69,314 | | |
Total unrealized depreciation | | | (45,476 | ) | |
Total net unrealized appreciation (depreciation) | | $ | 23,838 | | |
Centrally Cleared Credit Default Swap Agreements
(Amounts not in thousands)
Credit Default Swap Agreements — Sell Protection (a)
Underlying
Instruments | | Fixed
Deal
Receive
Rate | | Maturity
Date | | Payment
Frequency | | Implied
Credit
Spread at
June 30,
2021 (b) | | Notional
Amount (c) | | Value | | Premiums
Paid
(Received) | | Unrealized
Appreciation
(Depreciation) | |
CDX North
America
Investment
Grade Index;
Series 36 | | | 1.00 | % | | 6/20/26 | | Quarterly | | | 0.48 | % | | $ | 3,000,000 | | | $ | 76,257 | | | $ | 76,238 | | | $ | 19 | | |
| | | $ | 76,257 | | | $ | 76,238 | | | $ | 19 | | |
(a) When a credit event occurs as defined under the terms of the swap agreement, the Fund as a seller of credit protection will either (i) pay to the buyer of protection an amount equal to the par value of the defaulted reference entity or (ii) pay a net amount equal to the par value of the defaulted reference entity less its recovery value.
(b) Implied credit spread, represented in absolute terms, utilized in determining the value of the credit default swap agreements as of period end will serve as an indicator of the current status of the
See notes to financial statements.
118
Victory Portfolios
Victory INCORE Total Return Bond Fund | | Schedule of Portfolio Investments — continued
June 30, 2021 | |
(Amounts in Thousands, Except for Shares)
payment/performance risk and represent the likelihood or risk of default for the credit derivative. The implied credit spread of a referenced entity reflects the cost of buying/selling protection and may include payments required to be made to enter into the agreement. Generally, wider credit spreads represent a perceived deterioration of the referenced entity's credit soundness and a greater likelihood or risk of default or other credit event occurring as defined under the terms of the swap agreement.
(c) The notional amount represents the maximum potential amount the Fund could be required to pay as a seller of credit protection if a credit event occurs, as defined under the terms of the swap agreement, for each security included in the CDX North America High Yield Index.
See notes to financial statements.
119
Victory Portfolios | | Statements of Assets and Liabilities
June 30, 2021 | |
(Amounts in Thousands, Except Per Share Amounts)
| | | Victory
Integrity
Discovery
Fund | | Victory
Integrity
Mid-Cap
Value
Fund | | Victory
Integrity
Small-Cap
Value
Fund | |
ASSETS: | |
Investments, at value (Cost $76,970, $203,051
and $1,458,126) | | $ | 100,494 | (a) | | $ | 265,583 | (b) | | $ | 2,055,137 | (c) | |
Cash | | | 1,573 | | | | 3,146 | | | | 30,340 | | |
Receivables: | |
Interest and dividends | | | 79 | | | | 368 | | | | 2,523 | | |
Capital shares issued | | | 39 | | | | 322 | | | | 2,009 | | |
Investments sold | | | 351 | | | | 385 | | | | 33,099 | | |
From Adviser | | | 9 | | | | 127 | | | | — | | |
Prepaid expenses | | | 26 | | | | 27 | | | | 112 | | |
Total Assets | | | 102,571 | | | | 269,958 | | | | 2,123,220 | | |
LIABILITIES: | |
Payables: | |
Collateral received on loaned securities | | | 10,095 | | | | 3,057 | | | | 75,378 | | |
Investments purchased | | | 187 | | | | 1,423 | | | | 25,901 | | |
Capital shares redeemed | | | 246 | | | | 141 | | | | 2,147 | | |
Accrued expenses and other payables: | |
Investment advisory fees | | | 77 | | | | 165 | | | | 1,506 | | |
Administration fees | | | 5 | | | | 14 | | | | 110 | | |
Custodian fees | | | 1 | | | | 2 | | | | 13 | | |
Transfer agent fees | | | 25 | | | | 11 | | | | 205 | | |
Compliance fees | | | — | (d) | | | — | (d) | | | 1 | | |
Trustees' fees | | | 35 | | | | — | | | | 30 | | |
| 12b-1 fees | | | 6 | | | | 1 | | | | 14 | | |
Other accrued expenses | | | 14 | | | | 24 | | | | 131 | | |
Total Liabilities | | | 10,691 | | | | 4,838 | | | | 105,436 | | |
NET ASSETS: | |
Capital | | | 66,558 | | | | 205,333 | | | | 1,265,858 | | |
Total accumulated earnings/(loss) | | | 25,322 | | | | 59,787 | | | | 751,926 | | |
Net Assets | | $ | 91,880 | | | $ | 265,120 | | | $ | 2,017,784 | | |
Net Assets | |
Class A | | $ | 45,074 | | | $ | 12,542 | | | $ | 91,203 | | |
Class C | | | 2,079 | | | | 78 | | | | 7,578 | | |
Class R | | | 1,955 | | | | — | | | | 7,099 | | |
Class R6 | | | — | | | | 226,652 | | | | 1,145,953 | | |
Class Y | | | 40,600 | | | | 25,003 | | | | 765,951 | | |
Member Class | | | 2,172 | | | | 845 | | | | — | | |
Total | | $ | 91,880 | | | $ | 265,120 | | | $ | 2,017,784 | | |
Shares (unlimited number of shares authorized with
a par value of $0.001 per share): | |
Class A | | | 990 | | | | 529 | | | | 2,074 | | |
Class C | | | 68 | | | | 3 | | | | 204 | | |
Class R | | | 46 | | | | — | | | | 168 | | |
Class R6 | | | — | | | | 9,447 | | | | 24,963 | | |
Class Y | | | 802 | | | | 1,044 | | | | 16,791 | | |
Member Class | | | 48 | | | | 35 | | | | — | | |
Total | | | 1,954 | | | | 11,058 | | | | 44,200 | | |
Net asset value, offering (except Class A) and
redemption price per share: (e) | |
Class A | | $ | 45.53 | | | $ | 23.72 | | | $ | 43.97 | | |
Class C (f) | | | 30.67 | | | | 23.81 | | | | 37.22 | | |
Class R | | | 42.35 | | | | — | | | | 42.35 | | |
Class R6 | | | — | | | | 23.99 | | | | 45.91 | | |
Class Y | | | 50.63 | | | | 23.95 | | | | 45.62 | | |
Member Class | | | 45.58 | | | | 24.08 | | | | — | | |
Maximum Sales Charge — Class A | | | 5.75 | % | | | 5.75 | % | | | 5.75 | % | |
Maximum offering price (100%/(100%-maximum
sales charge) of net asset value adjusted to the
nearest cent) per share — Class A | | $ | 48.31 | | | $ | 25.17 | | | $ | 46.65 | | |
(a) Includes $9,867 of securities on loan.
(b) Includes $3,034 of securities on loan.
(c) Includes $72,736 of securities on loan.
(d) Rounds to less than $1 thousand.
(e) Per share amount may not recalculate due to rounding of net assets and/or shares outstanding.
(f) Redemption price per share varies by the length of time shares are held.
See notes to financial statements.
120
Victory Portfolios | | Statements of Assets and Liabilities
June 30, 2021 | |
(Amounts in Thousands, Except Per Share Amounts)
| | | Victory
Integrity
Small/Mid-Cap
Value Fund | | Victory
Munder
Multi-Cap
Fund | | Victory
S&P 500
Index
Fund | |
ASSETS: | |
Investments, at value (Cost $156,207, $294,352
and $49,190) | | $ | 210,537 | (a) | | $ | 441,203 | (b) | | $ | 267,625 | (c) | |
Cash | | | 4,458 | | | | 2,779 | | | | 2,214 | | |
Deposit with brokers for futures contracts | | | — | | | | — | | | | 408 | | |
Receivables: | |
Interest and dividends | | | 223 | | | | 250 | | | | 155 | | |
Capital shares issued | | | 301 | | | | 6 | | | | 17 | | |
Investments sold | | | 1,219 | | | | 6,123 | | | | — | | |
Variation margin on open futures contracts | | | — | | | | — | | | | 4 | | |
From Adviser | | | 34 | | | | 2 | | | | — | | |
Prepaid expenses | | | 31 | | | | 32 | | | | 24 | | |
Total Assets | | | 216,803 | | | | 450,395 | | | | 270,447 | | |
LIABILITIES: | |
Payables: | |
Collateral received on loaned securities | | | 4,777 | | | | 6,622 | | | | 862 | | |
Investments purchased | | | 2,904 | | | | 4,520 | | | | — | | |
Capital shares redeemed | | | 156 | | | | 83 | | | | 80 | | |
Accrued expenses and other payables: | |
Investment advisory fees | | | 136 | | | | 268 | | | | 43 | | |
Administration fees | | | 10 | | | | 22 | | | | 14 | | |
Custodian fees | | | 1 | | | | 3 | | | | 2 | | |
Transfer agent fees | | | 6 | | | | 131 | | | | 37 | | |
Compliance fees | | | — | (d) | | | — | (d) | | | — | (d) | |
Trustees' fees | | | — | | | | 178 | | | | 37 | | |
| 12b-1 fees | | | 1 | | | | 42 | | | | 15 | | |
Other accrued expenses | | | 25 | | | | 44 | | | | 25 | | |
Total Liabilities | | | 8,016 | | | | 11,913 | | | | 1,115 | | |
NET ASSETS: | |
Capital | | | 151,286 | | | | 244,257 | | | | 37,353 | | |
Total accumulated earnings/(loss) | | | 57,501 | | | | 194,225 | | | | 231,979 | | |
Net Assets | | $ | 208,787 | | | $ | 438,482 | | | $ | 269,332 | | |
Net Assets | |
Class A | | $ | 6,589 | | | $ | 393,769 | | | $ | 194,818 | | |
Class C | | | — | | | | 4,339 | | | | — | | |
Class R | | | — | | | | — | | | | 17,907 | | |
Class R6 | | | 143,273 | | | | — | | | | — | | |
Class Y | | | 56,537 | | | | 40,374 | | | | 56,607 | | |
Member Class | | | 2,388 | | | | — | | | | — | | |
Total | | $ | 208,787 | | | $ | 438,482 | | | $ | 269,332 | | |
Shares (unlimited number of shares authorized with
a par value of $0.001 per share): | |
Class A | | | 287 | | | | 7,351 | | | | 7,539 | | |
Class C | | | — | | | | 106 | | | | — | | |
Class R | | | — | | | | — | | | | 696 | | |
Class R6 | | | 6,149 | | | | — | | | | — | | |
Class Y | | | 2,434 | | | | 686 | | | | 2,172 | | |
Member Class | | | 103 | | | | — | | | | — | | |
Total | | | 8,973 | | | | 8,143 | | | | 10,407 | | |
Net asset value, offering (except Class A) and
redemption price per share: (e) | |
Class A | | $ | 22.98 | | | $ | 53.57 | | | $ | 25.84 | | |
Class C (f) | | | — | | | | 40.76 | | | | — | | |
Class R | | | — | | | | — | | | | 25.74 | | |
Class R6 | | | 23.30 | | | | — | | | | — | | |
Class Y | | | 23.23 | | | | 58.88 | | | | 26.07 | | |
Member Class | | | 23.18 | | | | — | | | | — | | |
Maximum Sales Charge — Class A | | | 5.75 | % | | | 5.75 | % | | | 2.25 | % | |
Maximum offering price (100%/(100%-maximum
sales charge) of net asset value adjusted to the
nearest cent) per share — Class A | | $ | 24.38 | | | $ | 56.84 | | | $ | 26.43 | | |
(a) Includes $4,621 of securities on loan.
(b) Includes $6,321 of securities on loan.
(c) Includes $845 of securities on loan.
(d) Rounds to less than $1 thousand.
(e) Per share amount may not recalculate due to rounding of net assets and/or shares outstanding.
(f) Redemption price per share varies by the length of time shares are held.
See notes to financial statements.
121
Victory Portfolios | | Statements of Assets and Liabilities
June 30, 2021 | |
(Amounts in Thousands, Except Per Share Amounts)
| | | Victory
Munder
Mid-Cap
Core Growth
Fund | | Victory
Munder
Small Cap
Growth
Fund | | Victory
Trivalent
International
Fund-Core
Equity | |
ASSETS: | |
Investments, at value (Cost $375,401, $12,503 and $189,217) | | $ | 592,644 | (a) | | $ | 19,347 | (b) | | $ | 227,420 | (c) | |
Foreign currency, at value (Cost $—, $— and $13) | | | — | | | | — | | | | 13 | | |
Cash | | | 1,172 | | | | 86 | | | | 2,249 | | |
Receivables: | |
Interest and dividends | | | 185 | | | | 2 | | | | 968 | | |
Capital shares issued | | | 175 | | | | — | | | | 12 | | |
Investments sold | | | 7,304 | | | | — | | | | 1,049 | | |
Reclaims | | | — | | | | — | | | | 229 | | |
From Adviser | | | 5 | | | | 3 | | | | 203 | | |
Prepaid expenses | | | 49 | | | | 6 | | | | 63 | | |
Total Assets | | | 601,534 | | | | 19,444 | | | | 232,206 | | |
Liabilities: | |
Payables: | |
Collateral received on loaned securities | | | 15,017 | | | | 2,301 | | | | 8,734 | | |
Investments purchased | | | 4,016 | | | | 19 | | | | 1,008 | | |
Capital shares redeemed | | | 417 | | | | — | | | | 2 | | |
Accrued foreign capital gains taxes | | | — | | | | — | | | | 144 | | |
Accrued expenses and other payables: | |
Investment advisory fees | | | 354 | | | | 12 | | | | 148 | | |
Administration fees | | | 27 | | | | 1 | | | | 12 | | |
Custodian fees | | | 4 | | | | — | (d) | | | 16 | | |
Transfer agent fees | | | 142 | | | | — | (d) | | | 3 | | |
Compliance fees | | | — | (d) | | | — | (d) | | | — | (d) | |
Trustees' fees | | | 45 | | | | — | | | | 57 | | |
| 12b-1 fees | | | 29 | | | | — | (d) | | | 1 | | |
Other accrued expenses | | | 49 | | | | 11 | | | | 26 | | |
Total Liabilities | | | 20,100 | | | | 2,344 | | | | 10,151 | | |
NET ASSETS: | |
Capital | | | 291,949 | | | | 9,356 | | | | 183,286 | | |
Total accumulated earnings/(loss) | | | 289,485 | | | | 7,744 | | | | 38,769 | | |
Net Assets | | $ | 581,434 | | | $ | 17,100 | | | $ | 222,055 | | |
Net Assets | |
Class A | | $ | 216,453 | | | $ | 614 | | | $ | 5,379 | | |
Class C | | | 9,806 | | | | — | | | | 108 | | |
Class I | | | — | | | | 16,328 | | | | 3,303 | | |
Class R | | | 13,463 | | | | — | | | | — | | |
Class R6 | | | 98,852 | | | | — | | | | 204,691 | | |
Class Y | | | 242,860 | | | | 158 | | | | 8,574 | | |
Total | | $ | 581,434 | | | $ | 17,100 | | | $ | 222,055 | | |
Shares (unlimited number of shares authorized with
a par value of $0.001 per share): | |
Class A | | | 14,045 | | | | 30 | | | | 645 | | |
Class C | | | 1,868 | | | | — | | | | 13 | | |
Class I | | | — | | | | 787 | | | | 393 | | |
Class R | | | 1,056 | | | | — | | | | — | | |
Class R6 | | | 4,946 | | | | — | | | | 24,221 | | |
Class Y | | | 12,782 | | | | 8 | | | | 1,029 | | |
Total | | | 34,697 | | | | 825 | | | | 26,301 | | |
Net asset value, offering (except Class A) and
redemption price per share: (e) | |
Class A | | $ | 15.41 | | | $ | 20.38 | | | $ | 8.35 | | |
Class C (f) | | | 5.25 | | | | — | | | | 8.33 | | |
Class I | | | — | | | | 20.75 | | | | 8.40 | | |
Class R | | | 12.75 | | | | — | | | | — | | |
Class R6 | | | 19.99 | | | | — | | | | 8.45 | | |
Class Y | | | 19.00 | | | | 20.51 | | | | 8.34 | | |
Maximum Sales Charge — Class A | | | 5.75 | % | | | 5.75 | % | | | 5.75 | % | |
Maximum offering price (100%/(100%-maximum
sales charge) of net asset value adjusted to the
nearest cent) per share — Class A | | $ | 16.35 | | | $ | 21.62 | | | $ | 8.86 | | |
(a) Includes $14,738 of securities on loan.
(b) Includes $2,261 of securities on loan.
(c) Includes $8,250 of securities on loan.
(d) Rounds to less than $1 thousand.
(e) Per share amount may not recalculate due to rounding of net assets and/or shares outstanding.
(f) Redemption price per share varies by the length of time shares are held.
See notes to financial statements.
122
Victory Portfolios | | Statements of Assets and Liabilities
June 30, 2021 | |
(Amounts in Thousands, Except Per Share Amounts)
| | | Victory
Trivalent
International
Small-Cap
Fund | | Victory
INCORE
Total Return
Bond
Fund | |
ASSETS: | |
Investments, at value (Cost $2,591,720 and $65,587) | | $ | 3,388,598 | (a) | | $ | 68,054 | (b) | |
| Cash | | | 60,555 | | | | 1,364 | | |
Deposit with brokers for futures contracts | | | — | | | | 442 | | |
Deposit with brokers for swap agreements | | | — | | | | 656 | | |
Receivables: | |
Interest and dividends | | | 7,194 | | | | 389 | | |
Capital shares issued | | | 2,797 | | | | 1 | | |
Investments sold | | | 17,134 | | | | 199 | | |
Variation margin on open futures contracts | | | — | | | | 17 | | |
Variation margin on open swap agreements | | | — | | | | — | (c) | |
Reclaims | | | 4,213 | | | | — | | |
From Adviser | | | 924 | | | | 41 | | |
Prepaid expenses | | | 129 | | | | 23 | | |
Total Assets | | | 3,481,544 | | | | 71,186 | | |
LIABILITIES: | |
Payables: | |
Foreign currency, at value (Cost $2,461 and $—) | | | 2,461 | | | | — | | |
Collateral received on loaned securities | | | 90,483 | | | | 3,178 | | |
Investments purchased | | | 47,883 | | | | 51 | | |
Capital shares redeemed | | | 1,608 | | | | — | (c) | |
Variation margin on open futures contracts | | | — | | | | 7 | | |
Accrued expenses and other payables: | |
Investment advisory fees | | | 2,497 | | | | 22 | | |
Administration fees | | | 167 | | | | 3 | | |
Custodian fees | | | 78 | | | | 2 | | |
Transfer agent fees | | | 690 | | | | 5 | | |
Compliance fees | | | 2 | | | | — | (c) | |
Trustees' fees | | | 11 | | | | 65 | | |
| 12b-1 fees | | | 12 | | | | 1 | | |
Other accrued expenses | | | 162 | | | | 19 | | |
Total Liabilities | | | 146,054 | | | | 3,353 | | |
NET ASSETS: | |
| Capital | | | 2,378,342 | | | | 69,724 | | |
Total accumulated earnings/(loss) | | | 957,148 | | | | (1,891 | ) | |
Net Assets | | $ | 3,335,490 | | | $ | 67,833 | | |
Net Assets | |
Class A | | $ | 93,832 | | | $ | 9,380 | | |
Class C | | | 4,945 | | | | 451 | | |
Class I | | | 2,003,337 | | | | — | | |
Class R6 | | | 133,486 | | | | 26,970 | | |
Class Y | | | 1,099,890 | | | | 31,032 | | |
Total | | $ | 3,335,490 | | | $ | 67,833 | | |
Shares (unlimited number of shares authorized with
a par value of $0.001 per share): | |
Class A | | | 5,201 | | | | 953 | | |
Class C | | | 283 | | | | 46 | | |
Class I | | | 110,165 | | | | — | | |
Class R6 | | | 7,308 | | | | 2,732 | | |
Class Y | | | 60,782 | | | | 3,145 | | |
| Total | | | 183,739 | | | | 6,876 | | |
Net asset value, offering (except Class A) and
redemption price per share: (d) | |
Class A | | $ | 18.04 | | | $ | 9.84 | | |
Class C (e) | | | 17.46 | | | | 9.92 | | |
Class I | | | 18.19 | | | | — | | |
Class R6 | | | 18.26 | | | | 9.87 | | |
Class Y | | | 18.10 | | | | 9.87 | | |
Maximum Sales Charge — Class A | | | 5.75 | % | | | 2.25 | % | |
Maximum offering price (100%/(100%-maximum
sales charge) of net asset value adjusted to the
nearest cent) per share — Class A | | $ | 19.14 | | | $ | 10.07 | | |
(a) Includes $83,952 of securities on loan.
(b) Includes $3,089 of securities on loan.
(c) Rounds to less than $1 thousand.
(d) Per share amount may not recalculate due to rounding of net assets and/or shares outstanding.
(e) Redemption price per share varies by the length of time shares are held.
See notes to financial statements.
123
Victory Portfolios | | Statements of Operations
For the Year Ended June 30, 2021 | |
(Amounts in Thousands)
| | | Victory
Integrity
Discovery
Fund | | Victory
Integrity
Mid-Cap
Value
Fund | | Victory
Integrity
Small-Cap
Value
Fund | |
Investment Income: | | | |
Dividends | | $ | 1,056 | | | $ | 3,195 | | | $ | 26,390 | | |
Interest | | | — | (a) | | | 1 | | | | 5 | | |
Securities lending (net of fees) | | | 10 | | | | 4 | | | | 150 | | |
Total Income | | | 1,066 | | | | 3,200 | | | | 26,545 | | |
Expenses: | | | |
Investment advisory fees | | | 760 | | | | 1,587 | | | | 15,551 | | |
Administration fees | | | 44 | | | | 123 | | | | 1,051 | | |
Sub-Administration fees | | | 17 | | | | 17 | | | | 17 | | |
| 12b-1 fees — Class A | | | 96 | | | | 27 | | | | 222 | | |
| 12b-1 fees — Class C | | | 21 | | | | 1 | | | | 65 | | |
| 12b-1 fees — Class R | | | 12 | | | | — | | | | 31 | | |
Custodian fees | | | 4 | | | | 12 | | | | 77 | | |
Transfer agent fees — Class A | | | 69 | | | | 15 | | | | 219 | | |
Transfer agent fees — Class C | | | 3 | | | | — | (a) | | | 15 | | |
Transfer agent fees — Class R | | | 6 | | | | — | | | | 19 | | |
Transfer agent fees — Class R6 | | | — | | | | 18 | | | | 76 | | |
Transfer agent fees — Class Y | | | 35 | | | | 24 | | | | 776 | | |
Transfer agent fees — Member Class (b) | | | 1 | | | | 1 | | | | — | | |
Trustees' fees | | | 21 | | | | 16 | | | | 142 | | |
Compliance fees | | | 1 | | | | 2 | | | | 15 | | |
Legal and audit fees | | | 13 | | | | 28 | | | | 104 | | |
State registration and filing fees | | | 75 | | | | 72 | | | | 125 | | |
Interfund lending fees | | | — | | | | — | | | | — | (a) | |
Other expenses | | | 19 | | | | 35 | | | | 216 | | |
Recoupment of prior expenses waived/reimbursed by Adviser | | | — | | | | — | | | | 41 | | |
Total Expenses | | | 1,197 | | | | 1,978 | | | | 18,762 | | |
Expenses waived/reimbursed by Adviser | | | (35 | ) | | | (639 | ) | | | (13 | ) | |
Net Expenses | | | 1,162 | | | | 1,339 | | | | 18,749 | | |
Net Investment Income (Loss) | | | (96 | ) | | | 1,861 | | | | 7,796 | | |
Realized/Unrealized Gains (Losses) from Investments: | | | |
Net realized gains (losses) from investment securities | | | 13,282 | | | | 18,606 | | | | 415,788 | | |
Net change in unrealized appreciation/depreciation on
investment securities | | | 33,986 | | | | 72,691 | | | | 625,957 | | |
Net realized/unrealized gains (losses) on investments | | | 47,268 | | | | 91,297 | | | | 1,041,745 | | |
Change in net assets resulting from operations | | $ | 47,172 | | | $ | 93,158 | | | $ | 1,049,541 | | |
(a) Rounds to less than $1 thousand.
(b) Victory Integrity Discovery Fund and Victory Integrity Mid-Cap Value Fund Member Class commenced operations on November 3, 2020.
See notes to financial statements.
124
Victory Portfolios | | Statements of Operations
For the Year Ended June 30, 2021 | |
(Amounts in Thousands)
| | | Victory
Integrity
Small/Mid-Cap
Value Fund | | Victory
Munder
Multi-Cap
Fund | | Victory
S&P 500
Index
Fund | |
Investment Income: | | | |
Dividends | | $ | 2,386 | | | $ | 4,568 | | | $ | 3,693 | | |
Interest | | | 1 | | | | 1 | | | | — | (a) | |
Securities lending (net of fees) | | | 5 | | | | 4 | | | | 3 | | |
Foreign tax withholding | | | — | | | | — | | | | — | (a) | |
Total Income | | | 2,392 | | | | 4,573 | | | | 3,696 | | |
Expenses: | | | |
Investment advisory fees | | | 1,245 | | | | 2,987 | | | | 482 | | |
Administration fees | | | 90 | | | | 232 | | | | 141 | | |
Sub-Administration fees | | | 17 | | | | 17 | | | | 18 | | |
| 12b-1 fees — Class A | | | 11 | | | | 894 | | | | 263 | | |
| 12b-1 fees — Class C | | | — | | | | 47 | | | | — | | |
| 12b-1 fees — Class R | | | — | | | | — | | | | 79 | | |
Custodian fees | | | 8 | | | | 18 | | | | 12 | | |
Transfer agent fees — Class A | | | 12 | | | | 803 | | | | 127 | | |
Transfer agent fees — Class C | | | — | | | | 11 | | | | — | | |
Transfer agent fees — Class R | | | — | | | | — | | | | 7 | | |
Transfer agent fees — Class R6 | | | 2 | | | | — | | | | — | | |
Transfer agent fees — Class Y | | | 21 | | | | 32 | | | | 55 | | |
Transfer agent fees — Member Class (b) | | | 1 | | | | — | | | | — | | |
Trustees' fees | | | 11 | | | | 92 | | | | 35 | | |
Compliance fees | | | 1 | | | | 3 | | | | 2 | | |
Legal and audit fees | | | 20 | | | | 28 | | | | 22 | | |
State registration and filing fees | | | 61 | | | | 52 | | | | 58 | | |
Other expenses | | | 44 | | | | 78 | | | | 52 | | |
Total Expenses | | | 1,544 | | | | 5,294 | | | | 1,353 | | |
Expenses waived/reimbursed by Adviser | | | (213 | ) | | | (8 | ) | | | — | | |
Net Expenses | | | 1,331 | | | | 5,286 | | | | 1,353 | | |
Net Investment Income (Loss) | | | 1,061 | | | | (713 | ) | | | 2,343 | | |
Realized/Unrealized Gains (Losses) from Investments: | | | |
Net realized gains (losses) from investment securities | | | 19,368 | | | | 59,602 | | | | 21,975 | | |
Net realized gains (losses) from futures contracts | | | — | | | | — | | | | 481 | | |
Net change in unrealized appreciation/depreciation on
investment securities | | | 60,800 | | | | 73,487 | | | | 56,079 | | |
Net change in unrealized appreciation/depreciation on
futures contracts | | | — | | | | — | | | | 51 | | |
Net realized/unrealized gains (losses) on investments | | | 80,168 | | | | 133,089 | | | | 78,586 | | |
Change in net assets resulting from operations | | $ | 81,229 | | | $ | 132,376 | | | $ | 80,929 | | |
(a) Rounds to less than $1 thousand.
(b) Victory Integrity Small/Mid-Cap Value Fund Member Class commenced operations on November 3, 2020
See notes to financial statements.
125
Victory Portfolios | | Statements of Operations
For the Year Ended June 30, 2021 | |
(Amounts in Thousands)
| | | Victory
Munder
Mid-Cap
Core Growth
Fund | | Victory
Munder
Small Cap
Growth
Fund | | Victory
Trivalent
International
Fund-Core
Equity | |
Investment Income: | | | |
Dividends | | $ | 3,786 | | | $ | 54 | | | $ | 6,821 | | |
Interest | | | 1 | | | | — | (a) | | | — | (a) | |
Securities lending (net of fees) | | | 24 | | | | 19 | | | | 28 | | |
Foreign tax withholding | | | (6 | ) | | | — | (a) | | | (630 | ) | |
Total Income | | | 3,805 | | | | 73 | | | | 6,219 | | |
Expenses: | | | |
Investment advisory fees | | | 4,352 | | | | 120 | | | | 1,504 | | |
Administration fees | | | 338 | | | | 8 | | | | 109 | | |
Sub-Administration fees | | | 17 | | | | 17 | | | | 17 | | |
| 12b-1 fees — Class A | | | 512 | | | | 1 | | | | 13 | | |
| 12b-1 fees — Class C | | | 119 | | | | — | | | | 1 | | |
| 12b-1 fees — Class R | | | 69 | | | | — | | | | — | | |
Custodian fees | | | 25 | | | | 2 | | | | 101 | | |
Transfer agent fees — Class A | | | 353 | | | | 1 | | | | 12 | | |
Transfer agent fees — Class C | | | 14 | | | | — | | | | — | (a) | |
Transfer agent fees — Class I | | | — | | | | 1 | | | | — | (a) | |
Transfer agent fees — Class R | | | 36 | | | | — | | | | — | | |
Transfer agent fees — Class R6 | | | 4 | | | | — | | | | — | (a) | |
Transfer agent fees — Class Y | | | 331 | | | | — | (a) | | | 1 | | |
Trustees' fees | | | 67 | | | | 2 | | | | 39 | | |
Compliance fees | | | 5 | | | | — | (a) | | | 1 | | |
Legal and audit fees | | | 28 | | | | 8 | | | | 46 | | |
State registration and filing fees | | | 84 | | | | 11 | | | | 75 | | |
Interfund lending fees | | | — | (a) | | | — | | | | — | | |
Other expenses | | | 68 | | | | 7 | | | | 48 | | |
Total Expenses | | | 6,422 | | | | 178 | | | | 1,967 | | |
Expenses waived/reimbursed by Adviser | | | (18 | ) | | | (14 | ) | | | (896 | ) | |
Net Expenses | | | 6,404 | | | | 164 | | | | 1,071 | | |
Net Investment Income (Loss) | | | (2,599 | ) | | | (91 | ) | | | 5,148 | | |
Realized/Unrealized Gains (Losses) from Investments: | | | |
Net realized gains (losses) from investment securities and
foreign currency translations | | | 159,032 | | | | 1,315 | | | | 5,940 | | |
Foreign taxes on realized gains | | | — | | | | — | | | | (97 | ) | |
Net change in unrealized appreciation/depreciation on
investment securities and foreign currency translations | | | 70,979 | | | | 4,924 | | | | 37,461 | | |
Net change in accrued foreign taxes on unrealized gains | | | — | | | | — | | | | (100 | ) | |
Net realized/unrealized gains (losses) on investments | | | 230,011 | | | | 6,239 | | | | 43,204 | | |
Change in net assets resulting from operations | | $ | 227,412 | | | $ | 6,148 | | | $ | 48,352 | | |
(a) Rounds to less than $1 thousand.
See notes to financial statements.
126
Victory Portfolios | | Statements of Operations
For the Year Ended June 30, 2021 | |
(Amounts in Thousands)
| | | Victory
Trivalent
International
Small-Cap
Fund | | Victory
INCORE
Total Return
Bond
Fund | |
Investment Income: | |
Dividends | | $ | 72,042 | | | $ | 68 | | |
| Interest | | | 10 | | | | 1,550 | | |
Securities lending (net of fees) | | | 1,008 | | | | 2 | | |
Foreign tax withholding | | | (7,965 | ) | | | — | | |
Total Income | | | 65,095 | | | | 1,620 | | |
Expenses: | |
Investment advisory fees | | | 24,288 | | | | 278 | | |
Administration fees | | | 1,530 | | | | 41 | | |
Sub-Administration fees | | | 17 | | | | 17 | | |
| 12b-1 fees — Class A | | | 245 | | | | 26 | | |
| 12b-1 fees — Class C | | | 47 | | | | 6 | | |
Custodian fees | | | 430 | | | | 11 | | |
Transfer agent fees — Class A | | | 338 | | | | 22 | | |
Transfer agent fees — Class C | | | 6 | | | | 1 | | |
Transfer agent fees — Class I | | | 2,349 | | | | — | | |
Transfer agent fees — Class R6 | | | 4 | | | | — | (a) | |
Transfer agent fees — Class Y | | | 965 | | | | 9 | | |
Trustees' fees | | | 172 | | | | 34 | | |
Compliance fees | | | 21 | | | | 1 | | |
Legal and audit fees | | | 168 | | | | 14 | | |
State registration and filing fees | | | 149 | | | | 60 | | |
Other expenses | | | 350 | | | | 21 | | |
Total Expenses | | | 31,079 | | | | 541 | | |
Expenses waived/reimbursed by Adviser | | | (4,069 | ) | | | (97 | ) | |
Net Expenses | | | 27,010 | | | | 444 | | |
Net Investment Income (Loss) | | | 38,085 | | | | 1,176 | | |
Realized/Unrealized Gains (Losses) from Investments: | |
Net realized gains (losses) from investment securities and foreign
currency translations | | | 315,377 | | | | 678 | | |
Net realized gains (losses) from futures contracts | | | — | | | | (198 | ) | |
Net realized gains (losses) from swap agreements | | | — | | | | 68 | | |
Net change in unrealized appreciation/depreciation on investment
securities and foreign currency translations | | | 497,274 | | | | (438 | ) | |
Net change in unrealized appreciation/depreciation on futures contracts | | | — | | | | 31 | | |
Net change in unrealized appreciation/depreciation on swap agreements | | | — | | | | — | (a) | |
Net realized/unrealized gains (losses) on investments | | | 812,651 | | | | 141 | | |
Change in net assets resulting from operations | | $ | 850,736 | | | $ | 1,317 | | |
(a) Rounds to less than $1 thousand.
See notes to financial statements.
127
Victory Portfolios | | Statements of Changes in Net Assets | |
(Amounts in Thousands)
| | | Victory Integrity
Discovery Fund | | Victory Integrity
Mid-Cap Value Fund | | Victory Integrity
Small-Cap Value Fund | |
| | | Year
Ended
June 30,
2021 | | Year
Ended
June 30,
2020 | | Year
Ended
June 30,
2021 | | Year
Ended
June 30,
2020 | | Year
Ended
June 30,
2021 | | Year
Ended
June 30,
2020 | |
From Investment Activities: | |
Operations: | |
Net investment income (loss) | | $ | (96 | ) | | $ | (140 | ) | | $ | 1,861 | | | $ | 3,811 | | | $ | 7,796 | | | $ | 10,994 | | |
Net realized gains (losses) from
investments | | | 13,282 | | | | (10,099 | ) | | | 18,606 | | | | (20,430 | ) | | | 415,788 | | | | (254,708 | ) | |
Net change in unrealized
appreciation/depreciation
on investments | | | 33,986 | | | | (18,876 | ) | | | 72,691 | | | | (17,425 | ) | | | 625,957 | | | | (257,100 | ) | |
Change in net assets resulting
from operations | | | 47,172 | | | | (29,115 | ) | | | 93,158 | | | | (34,044 | ) | | | 1,049,541 | | | | (500,814 | ) | |
Distributions to Shareholders: | |
Class A | | | — | | | | (1,198 | ) | | | (196 | ) | | | (45 | ) | | | (90 | ) | | | (569 | ) | |
Class C | | | — | | | | (191 | ) | | | — | (a) | | | — | (a) | | | — | | | | (49 | ) | |
Class R | | | — | | | | (98 | ) | | | — | | | | — | | | | — | | | | (43 | ) | |
Class R6 | | | — | | | | — | | | | (3,719 | ) | | | (1,711 | ) | | | (5,456 | ) | | | (9,755 | ) | |
Class Y | | | — | | | | (1,529 | ) | | | (247 | ) | | | (108 | ) | | | (1,954 | ) | | | (6,764 | ) | |
Member Class (b) | | | — | | | | — | | | | (1 | ) | | | — | | | | — | | | | — | | |
From return of capital: | |
Class A | | | — | | | | — | | | | (44 | ) | | | — | | | | — | | | | — | | |
Class C | | | — | | | | — | | | | — | (a) | | | — | | | | — | | | | — | | |
Class R | | | — | | | | — | | | | — | | | | — | | | | — | | | | — | | |
Class R6 | | | — | | | | — | | | | (844 | ) | | | — | | | | — | | | | — | | |
Class Y | | | — | | | | — | | | | (56 | ) | | | — | | | | — | | | | — | | |
Member Class | | | — | | | | — | | | | (1 | ) | | | — | | | | — | | | | — | | |
Change in net assets resulting from
distributions to shareholders | | | — | | | | (3,016 | ) | | | (5,108 | ) | | | (1,864 | ) | | | (7,500 | ) | | | (17,180 | ) | |
Change in net assets resulting from
capital transactions | | | (17,609 | ) | | | (37,894 | ) | | | (25,403 | ) | | | 153,096 | | | | (591,559 | ) | | | (238,280 | ) | |
Change in net assets | | | 29,563 | | | | (70,025 | ) | | | 62,647 | | | | 117,188 | | | | 450,482 | | | | (756,274 | ) | |
Net Assets: | |
Beginning of period | | | 62,317 | | | | 132,342 | | | | 202,473 | | | | 85,285 | | | | 1,567,302 | | | | 2,323,576 | | |
End of period | | $ | 91,880 | | | $ | 62,317 | | | $ | 265,120 | | | $ | 202,473 | | | $ | 2,017,784 | | | $ | 1,567,302 | | |
(a) Rounds to less than $1 thousand.
(b) Victory Integrity Discovery Fund and Victory Integrity Mid-Cap Value Fund Member Class commenced operations on November 3, 2020.
(continues on next page)
See notes to financial statements.
128
Victory Portfolios | | Statements of Changes in Net Assets | |
(Amounts in Thousands) (continued)
| | | Victory Integrity
Discovery Fund | | Victory Integrity
Mid-Cap Value Fund | | Victory Integrity
Small-Cap Value Fund | |
| | | Year
Ended
June 30,
2021 | | Year
Ended
June 30,
2020 | | Year
Ended
June 30,
2021 | | Year
Ended
June 30,
2020 | | Year
Ended
June 30,
2021 | | Year
Ended
June 30,
2020 | |
Capital Transactions: | |
Class A | |
Proceeds from shares issued | | $ | 4,616 | | | $ | 4,226 | | | $ | 2,340 | | | $ | 3,987 | | | $ | 24,763 | | | $ | 23,461 | | |
Distributions reinvested | | | — | | | | 1,058 | | | | 234 | | | | 44 | | | | 81 | | | | 495 | | |
Cost of shares redeemed | | | (14,397 | ) | | | (13,704 | ) | | | (3,212 | ) | | | (1,868 | ) | | | (66,313 | ) | | | (56,674 | ) | |
Total Class A | | $ | (9,781 | ) | | $ | (8,420 | ) | | $ | (638 | ) | | $ | 2,163 | | | $ | (41,469 | ) | | $ | (32,718 | ) | |
Class C | |
Proceeds from shares issued | | $ | 69 | | | $ | 219 | | | $ | 17 | | | $ | 54 | | | $ | 913 | | | $ | 538 | | |
Distributions reinvested | | | — | | | | 168 | | | | 1 | | | | — | (a) | | | — | | | | 47 | | |
Cost of shares redeemed | | | (1,491 | ) | | | (3,625 | ) | | | (11 | ) | | | — | | | | (2,746 | ) | | | (3,569 | ) | |
Total Class C | | $ | (1,422 | ) | | $ | (3,238 | ) | | $ | 7 | | | $ | 54 | | | $ | (1,833 | ) | | $ | (2,984 | ) | |
Class R | |
Proceeds from shares issued | | $ | 632 | | | $ | 1,386 | | | $ | — | | | $ | — | | | $ | 2,845 | | | $ | 2,040 | | |
Distributions reinvested | | | — | | | | 85 | | | | — | | | | — | | | | — | | | | 35 | | |
Cost of shares redeemed | | | (2,274 | ) | | | (1,514 | ) | | | — | | | | — | | | | (4,587 | ) | | | (5,439 | ) | |
Total Class R | | $ | (1,642 | ) | | $ | (43 | ) | | $ | — | | | $ | — | | | $ | (1,742 | ) | | $ | (3,364 | ) | |
Class R6 | |
Proceeds from shares issued | | $ | — | | | $ | — | | | $ | 32,650 | | | $ | 190,734 | | | $ | 239,858 | | | $ | 354,199 | | |
Distributions reinvested | | | — | | | | — | | | | 4,555 | | | | 1,707 | | | | 5,356 | | | | 9,428 | | |
Cost of shares redeemed | | | — | | | | — | | | | (72,923 | ) | | | (31,573 | ) | | | (724,545 | ) | | | (292,721 | ) | |
Total Class R6 | | $ | — | | | $ | — | | | $ | (35,718 | ) | | $ | 160,868 | | | $ | (479,331 | ) | | $ | 70,906 | | |
Class Y | |
Proceeds from shares issued | | $ | 14,515 | | | $ | 24,172 | | | $ | 12,767 | | | $ | 4,409 | | | $ | 180,087 | | | $ | 224,939 | | |
Distributions reinvested | | | — | | | | 1,407 | | | | 299 | | | | 107 | | | | 1,797 | | | | 6,413 | | |
Cost of shares redeemed | | | (21,292 | ) | | | (51,772 | ) | | | (2,904 | ) | | | (14,505 | ) | | | (249,068 | ) | | | (501,472 | ) | |
Total Class Y | | $ | (6,777 | ) | | $ | (26,193 | ) | | $ | 10,162 | | | $ | (9,989 | ) | | $ | (67,184 | ) | | $ | (270,120 | ) | |
| Member Class (b) | |
Proceeds from shares issued | | $ | 2,476 | | | $ | — | | | $ | 985 | | | $ | — | | | $ | — | | | $ | — | | |
Distributions reinvested | | | — | | | | — | | | | 1 | | | | — | | | | — | | | | — | | |
Cost of shares redeemed | | | (463 | ) | | | — | | | | (202 | ) | | | — | | | | — | | | | — | | |
Total Member Class | | $ | 2,013 | | | $ | — | | | $ | 784 | | | $ | — | | | $ | — | | | $ | — | | |
Change in net assets resulting from
capital transactions | | $ | (17,609 | ) | | $ | (37,894 | ) | | $ | (25,403 | ) | | $ | 153,096 | | | $ | (591,559 | ) | | $ | (238,280 | ) | |
(a) Rounds to less than $1 thousand.
(b) Victory Integrity Discovery Fund and Victory Integrity Mid-Cap Value Fund Member Class commenced operations on November 3, 2020
(continues on next page)
See notes to financial statements.
129
Victory Portfolios | | Statements of Changes in Net Assets | |
(Amounts in Thousands) (continued)
| | | Victory Integrity
Discovery Fund | | Victory Integrity
Mid-Cap Value Fund | | Victory Integrity
Small-Cap Value Fund | |
| | | Year
Ended
June 30,
2021 | | Year
Ended
June 30,
2020 | | Year
Ended
June 30,
2021 | | Year
Ended
June 30,
2020 | | Year
Ended
June 30,
2021 | | Year
Ended
June 30,
2020 | |
Share Transactions: | |
Class A | |
Issued | | | 123 | | | | 159 | | | | 112 | | | | 250 | | | | 734 | | | | 846 | | |
Reinvested | | | — | | | | 31 | | | | 12 | | | | 2 | | | | 2 | | | | 15 | | |
Redeemed | | | (407 | ) | | | (495 | ) | | | (155 | ) | | | (116 | ) | | | (1,918 | ) | | | (1,943 | ) | |
Total Class A | | | (284 | ) | | | (305 | ) | | | (31 | ) | | | 136 | | | | (1,182 | ) | | | (1,082 | ) | |
Class C | |
Issued | | | 3 | | | | 12 | | | | 1 | | | | 3 | | | | 27 | | | | 22 | | |
Reinvested | | | — | | | | 7 | | | | — | (a) | | | — | (a) | | | — | | | | 2 | | |
Redeemed | | | (69 | ) | | | (182 | ) | | | (1 | ) | | | — | | | | (102 | ) | | | (143 | ) | |
Total Class C | | | (66 | ) | | | (163 | ) | | | — | (a) | | | 3 | | | | (75 | ) | | | (119 | ) | |
Class R | |
Issued | | | 21 | | | | 47 | | | | — | | | | — | | | | 79 | | | | 81 | | |
Reinvested | | | — | | | | 3 | | | | — | | | | — | | | | — | | | | 1 | | |
Redeemed | | | (64 | ) | | | (61 | ) | | | — | | | | — | | | | (136 | ) | | | (191 | ) | |
Total Class R | | | (43 | ) | | | (11 | ) | | | — | | | | — | | | | (57 | ) | | | (109 | ) | |
Class R6 | |
Issued | | | — | | | | — | | | | 1,550 | | | | 10,669 | | | | 6,278 | | | | 13,497 | | |
Reinvested | | | — | | | | — | | | | 235 | | | | 88 | | | | 152 | | | | 265 | | |
Redeemed | | | — | | | | — | | | | (4,266 | ) | | | (1,948 | ) | | | (20,196 | ) | | | (10,043 | ) | |
Total Class R6 | | | — | | | | — | | | | (2,481 | ) | | | 8,809 | | | | (13,766 | ) | | | 3,719 | | |
Class Y | |
Issued | | | 354 | | | | 815 | | | | 561 | | | | 259 | | | | 4,710 | | | | 8,217 | | |
Reinvested | | | — | | | | 37 | | | | 15 | | | | 6 | | | | 51 | | | | 182 | | |
Redeemed | | | (585 | ) | | | (1,830 | ) | | | (138 | ) | | | (852 | ) | | | (7,435 | ) | | | (18,245 | ) | |
Total Class Y | | | (231 | ) | | | (978 | ) | | | 438 | | | | (587 | ) | | | (2,674 | ) | | | (9,846 | ) | |
| Member Class (b) | |
Issued | | | 59 | | | | — | | | | 43 | | | | — | | | | — | | | | — | | |
Reinvested | | | — | | | | — | | | | — | (a) | | | — | | | | — | | | | — | | |
Redeemed | | | (11 | ) | | | — | | | | (8 | ) | | | — | | | | — | | | | — | | |
Total Member Class | | | 48 | | | | — | | | | 35 | | | | — | | | | — | | | | — | | |
Change in Shares | | | (576 | ) | | | (1,457 | ) | | | (2,039 | ) | | | 8,361 | | | | (17,754 | ) | | | (7,437 | ) | |
(a) Rounds to less than 1 thousand.
(b) Victory Integrity Discovery Fund and Victory Integrity Mid-Cap Value Fund Member Class commenced operations on November 3, 2020.
See notes to financial statements.
130
Victory Portfolios | | Statements of Changes in Net Assets | |
(Amounts in Thousands)
| | | Victory Integrity
Small/Mid-Cap
Value Fund | | Victory Munder
Multi-Cap Fund | | Victory
S&P 500 Index Fund | |
| | | Year
Ended
June 30,
2021 | | Year
Ended
June 30,
2020 | | Year
Ended
June 30,
2021 | | Year
Ended
June 30,
2020 | | Year
Ended
June 30,
2021 | | Year
Ended
June 30,
2020 | |
From Investment Activities: | |
Operations: | |
Net investment income (loss) | | $ | 1,061 | | | $ | 1,209 | | | $ | (713 | ) | | $ | 369 | | | $ | 2,343 | | | $ | 3,075 | | |
Net realized gains (losses) from
investments | | | 19,368 | | | | (13,324 | ) | | | 59,602 | | | | (9,321 | ) | | | 22,456 | | | | 27,234 | | |
Net change in unrealized
appreciation/depreciation
on investments | | | 60,800 | | | | (14,023 | ) | | | 73,487 | | | | 14,670 | | | | 56,130 | | | | (15,381 | ) | |
Change in net assets resulting
from operations | | | 81,229 | | | | (26,138 | ) | | | 132,376 | | | | 5,718 | | | | 80,929 | | | | 14,928 | | |
Distributions to Shareholders: | |
Class A | | | (59 | ) | | | (22 | ) | | | (244 | ) | | | (9,781 | ) | | | (11,972 | ) | | | (20,471 | ) | |
Class C | | | — | | | | — | | | | — | | | | (265 | ) | | | — | | | | — | | |
Class R | | | — | | | | — | | | | — | | | | — | | | | (993 | ) | | | (1,715 | ) | |
Class R6 | | | (1,692 | ) | | | (815 | ) | | | — | | | | — | | | | — | | | | — | | |
Class Y | | | (644 | ) | | | (283 | ) | | | (124 | ) | | | (917 | ) | | | (3,648 | ) | | | (5,159 | ) | |
Member Class (a) | | | (2 | ) | | | — | | | | — | | | | — | | | | — | | | | — | | |
Change in net assets resulting from
distributions to shareholders | | | (2,397 | ) | | | (1,120 | ) | | | (368 | ) | | | (10,963 | ) | | | (16,613 | ) | | | (27,345 | ) | |
Change in net assets resulting from
capital transactions | | | 13,858 | | | | 8,516 | | | | (41,195 | ) | | | (34,098 | ) | | | (8,496 | ) | | | (8,722 | ) | |
Change in net assets | | | 92,690 | | | | (18,742 | ) | | | 90,813 | | | | (39,343 | ) | | | 55,820 | | | | (21,139 | ) | |
Net Assets: | |
Beginning of period | | | 116,097 | | | | 134,839 | | | | 347,669 | | | | 387,012 | | | | 213,512 | | | | 234,651 | | |
End of period | | $ | 208,787 | | | $ | 116,097 | | | $ | 438,482 | | | $ | 347,669 | | | $ | 269,332 | | | $ | 213,512 | | |
(a) Victory Integrity Small/Mid-Cap Value Fund Member Class commenced operations on November 3, 2020.
(continues on next page)
See notes to financial statements.
131
Victory Portfolios | | Statements of Changes in Net Assets | |
(Amounts in Thousands) (continued)
| | | Victory Integrity
Small/Mid-Cap
Value Fund | | Victory Munder
Multi-Cap Fund | | Victory
S&P 500 Index Fund | |
| | | Year
Ended
June 30,
2021 | | Year
Ended
June 30,
2020 | | Year
Ended
June 30,
2021 | | Year
Ended
June 30,
2020 | | Year
Ended
June 30,
2021 | | Year
Ended
June 30,
2020 | |
Capital Transactions: | |
Class A | |
Proceeds from shares issued | | $ | 3,876 | | | $ | 1,437 | | | $ | 5,765 | | | $ | 8,491 | | | $ | 8,080 | | | $ | 12,097 | | |
Distributions reinvested | | | 59 | | | | 22 | | | | 211 | | | | 8,468 | | | | 10,439 | | | | 17,860 | | |
Cost of shares redeemed | | | (2,792 | ) | | | (1,062 | ) | | | (42,345 | ) | | | (46,249 | ) | | | (23,902 | ) | | | (54,473 | ) | |
Total Class A | | $ | 1,143 | | | $ | 397 | | | $ | (36,369 | ) | | $ | (29,290 | ) | | $ | (5,383 | ) | | $ | (24,516 | ) | |
Class C | |
Proceeds from shares issued | | $ | — | | | $ | — | | | $ | 254 | | | $ | 401 | | | $ | — | | | $ | — | | |
Distributions reinvested | | | — | | | | — | | | | — | | | | 234 | | | | — | | | | — | | |
Cost of shares redeemed | | | — | | | | — | | | | (3,268 | ) | | | (4,844 | ) | | | — | | | | — | | |
Total Class C | | $ | — | | | $ | — | | | $ | (3,014 | ) | | $ | (4,209 | ) | | $ | — | | | $ | — | | |
Class R | |
Proceeds from shares issued | | $ | — | | | $ | — | | | $ | — | | | $ | — | | | $ | 3,501 | | | $ | 4,926 | | |
Distributions reinvested | | | — | | | | — | | | | — | | | | — | | | | 993 | | | | 1,715 | | |
Cost of shares redeemed | | | — | | | | — | | | | — | | | | — | | | | (4,476 | ) | | | (6,634 | ) | |
Total Class R | | $ | — | | | $ | — | | | $ | — | | | $ | — | | | $ | 18 | | | $ | 7 | | |
Class R6 | |
Proceeds from shares issued | | $ | 35,979 | | | $ | 22,861 | | | $ | — | | | $ | — | | | $ | — | | | $ | — | | |
Distributions reinvested | | | 1,689 | | | | 813 | | | | — | | | | — | | | | — | | | | — | | |
Cost of shares redeemed | | | (29,451 | ) | | | (20,141 | ) | | | — | | | | — | | | | — | | | | — | | |
Total Class R6 | | $ | 8,217 | | | $ | 3,533 | | | $ | — | | | $ | — | | | $ | — | | | $ | — | | |
Class Y | |
Proceeds from shares issued | | $ | 14,072 | | | $ | 8,038 | | | $ | 3,433 | | | $ | 5,469 | | | $ | 9,028 | | | $ | 37,717 | | |
Distributions reinvested | | | 511 | | | | 268 | | | | 82 | | | | 645 | | | | 3,454 | | | | 4,878 | | |
Cost of shares redeemed | | | (12,315 | ) | | | (3,720 | ) | | | (5,327 | ) | | | (6,713 | ) | | | (15,613 | ) | | | (26,808 | ) | |
Total Class Y | | $ | 2,268 | | | $ | 4,586 | | | $ | (1,812 | ) | | $ | (599 | ) | | $ | (3,131 | ) | | $ | 15,787 | | |
| Member Class (a) | |
Proceeds from shares issued | | $ | 2,616 | | | $ | — | | | $ | — | | | $ | — | | | $ | — | | | $ | — | | |
Distributions reinvested | | | 2 | | | | — | | | | — | | | | — | | | | — | | | | — | | |
Cost of shares redeemed | | | (388 | ) | | | — | | | | — | | | | — | | | | — | | | | — | | |
Total Member Class | | $ | 2,230 | | | $ | — | | | $ | — | | | $ | — | | | $ | — | | | $ | — | | |
Change in net assets resulting from
capital transactions | | $ | 13,858 | | | $ | 8,516 | | | $ | (41,195 | ) | | $ | (34,098 | ) | | $ | (8,496 | ) | | $ | (8,722 | ) | |
(a) Victory Integrity Small/Mid-Cap Value Fund Member Class commenced operations on November 3, 2020.
(continues on next page)
See notes to financial statements.
132
Victory Portfolios | | Statements of Changes in Net Assets | |
(Amounts in Thousands) (continued)
| | | Victory Integrity
Small/Mid-Cap
Value Fund | | Victory Munder
Multi-Cap Fund | | Victory
S&P 500 Index Fund | |
| | | Year
Ended
June 30,
2021 | | Year
Ended
June 30,
2020 | | Year
Ended
June 30,
2021 | | Year
Ended
June 30,
2020 | | Year
Ended
June 30,
2021 | | Year
Ended
June 30,
2020 | |
Share Transactions: | |
Class A | |
Issued | | | 180 | | | | 97 | | | | 129 | | | | 214 | | | | 352 | | | | 612 | | |
Reinvested | | | 3 | | | | 1 | | | | 5 | | | | 204 | | | | 466 | | | | 880 | | |
Redeemed | | | (137 | ) | | | (74 | ) | | | (923 | ) | | | (1,212 | ) | | | (1,042 | ) | | | (2,651 | ) | |
Total Class A | | | 46 | | | | 24 | | | | (789 | ) | | | (794 | ) | | | (224 | ) | | | (1,159 | ) | |
Class C | |
Issued | | | — | | | | — | | | | 7 | | | | 13 | | | | — | | | | — | | |
Reinvested | | | — | | | | — | | | | — | | | | 7 | | | | — | | | | — | | |
Redeemed | | | — | | | | — | | | | (98 | ) | | | (157 | ) | | | — | | | | — | | |
Total Class C | | | — | | | | — | | | | (91 | ) | | | (137 | ) | | | — | | | | — | | |
Class R | |
Issued | | | — | | | | — | | | | — | | | | — | | | | 153 | | | | 246 | | |
Reinvested | | | — | | | | — | | | | — | | | | — | | | | 45 | | | | 85 | | |
Redeemed | | | — | | | | — | | | | — | | | | — | | | | (197 | ) | | | (326 | ) | |
Total Class R | | | — | | | | — | | | | — | | | | — | | | | 1 | | | | 5 | | |
Class R6 | |
Issued | | | 1,756 | | | | 1,535 | | | | — | | | | — | | | | — | | | | — | | |
Reinvested | | | 93 | | | | 46 | | | | — | | | | — | | | | — | | | | — | | |
Redeemed | | | (1,586 | ) | | | (1,330 | ) | | | — | | | | — | | | | — | | | | — | | |
Total Class R6 | | | 263 | | | | 251 | | | | — | | | | — | | | | — | | | | — | | |
Class Y | |
Issued | | | 686 | | | | 515 | | | | 68 | | | | 142 | | | | 385 | | | | 1,848 | | |
Reinvested | | | 28 | | | | 15 | | | | 2 | | | | 14 | | | | 153 | | | | 239 | | |
Redeemed | | | (675 | ) | | | (266 | ) | | | (104 | ) | | | (162 | ) | | | (674 | ) | | | (1,294 | ) | |
Total Class Y | | | 39 | | | | 264 | | | | (34 | ) | | | (6 | ) | | | (136 | ) | | | 793 | | |
| Member Class (a) | |
Issued | | | | | 120 | | | | — | | | | — | | | | — | | | | — | | |
Reinvested | | | — | (b) | | | — | | | | — | | | | — | | | | — | | | | — | | |
Redeemed | | | (17 | ) | | | — | | | | — | | | | — | | | | — | | | | — | | |
Total Member Class | | | 103 | | | | — | | | | — | | | | — | | | | — | | | | — | | |
Change in Shares | | | 451 | | | | 539 | | | | (914 | ) | | | (937 | ) | | | (359 | ) | | | (361 | ) | |
(a) Victory Integrity Small/Mid-Cap Value Fund Member Class commenced operations on November 3, 2020.
(b) Rounds to less than 1 thousand.
See notes to financial statements.
133
Victory Portfolios | | Statements of Changes in Net Assets | |
(Amounts in Thousands)
| | | Victory Munder
Mid-Cap Core
Growth Fund | | Victory Munder
Small Cap
Growth Fund | | Victory
Trivalent International
Fund-Core Equity | |
| | | Year
Ended
June 30,
2021 | | Year
Ended
June 30,
2020 | | Year
Ended
June 30,
2021 | | Year
Ended
June 30,
2020 | | Year
Ended
June 30,
2021 | | Year
Ended
June 30,
2020 | |
From Investment Activities: | |
Operations: | |
Net investment income (loss) | | $ | (2,599 | ) | | $ | (2,195 | ) | | $ | (91 | ) | | $ | (38 | ) | | $ | 5,148 | | | $ | 2,053 | | |
Net realized gains (losses) from
investments | | | 159,032 | | | | 254,589 | | | | 1,315 | | | | 1,238 | | | | 5,843 | | | | (4,895 | ) | |
Net change in unrealized
appreciation/depreciation
on investments | | | 70,979 | | | | (273,091 | ) | | | 4,924 | | | | 92 | | | | 37,361 | | | | (1,138 | ) | |
Change in net assets resulting
from operations | | | 227,412 | | | | (20,697 | ) | | | 6,148 | | | | 1,292 | | | | 48,352 | | | | (3,980 | ) | |
Distributions to Shareholders: | |
Class A | | | (23,341 | ) | | | (127,008 | ) | | | (36 | ) | | | (18 | ) | | | (62 | ) | | | (48 | ) | |
Class C | | | (3,462 | ) | | | (17,343 | ) | | | — | | | | — | | | | — | (a) | | | — | (a) | |
Class I | | | — | | | | — | | | | (1,071 | ) | | | (702 | ) | | | (46 | ) | | | (33 | ) | |
Class R | | | (1,885 | ) | | | (8,983 | ) | | | — | | | | — | | | | — | | | | — | | |
Class R6 | | | (8,673 | ) | | | (74,101 | ) | | | — | | | | — | | | | (2,687 | ) | | | (902 | ) | |
Class Y | | | (23,441 | ) | | | (283,629 | ) | | | (9 | ) | | | (6 | ) | | | (110 | ) | | | (96 | ) | |
Change in net assets resulting from
distributions to shareholders | | | (60,802 | ) | | | (511,064 | ) | | | (1,116 | ) | | | (726 | ) | | | (2,905 | ) | | | (1,079 | ) | |
Change in net assets resulting from
capital transactions | | | (169,539 | ) | | | (342,469 | ) | | | 1,252 | | �� | | 950 | | | | 43,468 | | | | 116,106 | | |
Change in net assets | | | (2,929 | ) | | | (874,230 | ) | | | 6,284 | | | | 1,516 | | | | 88,915 | | | | 111,047 | | |
Net Assets: | |
Beginning of period | | | 584,363 | | | | 1,458,593 | | | | 10,816 | | | | 9,300 | | | | 133,140 | | | | 22,093 | | |
End of period | | $ | 581,434 | | | $ | 584,363 | | | $ | 17,100 | | | $ | 10,816 | | | $ | 222,055 | | | $ | 133,140 | | |
(continues on next page)
See notes to financial statements.
134
Victory Portfolios | | Statements of Changes in Net Assets | |
(Amounts in Thousands) (continued)
| | | Victory Munder
Mid-Cap Core
Growth Fund | | Victory Munder
Small Cap
Growth Fund | | Victory
Trivalent International
Fund-Core Equity | |
| | | Year
Ended
June 30,
2021 | | Year
Ended
June 30,
2020 | | Year
Ended
June 30,
2021 | | Year
Ended
June 30,
2020 | | Year
Ended
June 30,
2021 | | Year
Ended
June 30,
2020 | |
Capital Transactions: | |
Class A | |
Proceeds from shares issued | | $ | 15,937 | | | $ | 29,605 | | | $ | 135 | | | $ | 242 | | | $ | 616 | | | $ | 337 | | |
Distributions reinvested | | | 21,270 | | | | 114,821 | | | | 35 | | | | 18 | | | | 53 | | | | 42 | | |
Cost of shares redeemed | | | (62,892 | ) | | | (115,796 | ) | | | (80 | ) | | | (98 | ) | | | (1,104 | ) | | | (892 | ) | |
Total Class A | | $ | (25,685 | ) | | $ | 28,630 | | | $ | 90 | | | $ | 162 | | | $ | (435 | ) | | $ | (513 | ) | |
Class C | |
Proceeds from shares issued | | $ | 128 | | | $ | 1,741 | | | $ | — | | | $ | — | | | $ | 3 | | | $ | 10 | | |
Distributions reinvested | | | 3,445 | | | | 15,847 | | | | — | | | | — | | | | — | (a) | | | — | (a) | |
Cost of shares redeemed | | | (9,106 | ) | | | (12,234 | ) | | | — | | | | — | | | | (134 | ) | | | (118 | ) | |
Total Class C | | $ | (5,533 | ) | | $ | 5,354 | | | $ | — | | | $ | — | | | $ | (131 | ) | | $ | (108 | ) | |
Class I | |
Proceeds from shares issued | | $ | — | | | $ | — | | | $ | 175 | | | $ | 106 | | | $ | — | (a) | | $ | 912 | | |
Distributions reinvested | | | — | | | | — | | | | 1,071 | | | | 701 | | | | 46 | | | | 32 | | |
Cost of shares redeemed | | | — | | | | — | | | | (114 | ) | | | (25 | ) | | | (66 | ) | | | (469 | ) | |
Total Class I | | $ | — | | | $ | — | | | $ | 1,132 | | | $ | 782 | | | $ | (20 | ) | | $ | 475 | | |
Class R | |
Proceeds from shares issued | | $ | 1,783 | | | $ | 2,169 | | | $ | — | | | $ | — | | | $ | — | | | $ | — | | |
Distributions reinvested | | | 1,882 | | | | 8,785 | | | | — | | | | — | | | | — | | | | — | | |
Cost of shares redeemed | | | (6,595 | ) | | | (6,902 | ) | | | — | | | | — | | | | — | | | | — | | |
Total Class R | | $ | (2,930 | ) | | $ | 4,052 | | | $ | — | | | $ | — | | | $ | — | | | $ | — | | |
Class R6 | |
Proceeds from shares issued | | $ | 13,910 | | | $ | 24,724 | | | $ | — | | | $ | — | | | $ | 44,300 | | | $ | 118,773 | | |
Distributions reinvested | | | 8,636 | | | | 73,891 | | | | — | | | | — | | | | 2,687 | | | | 902 | | |
Cost of shares redeemed | | | (67,516 | ) | | | (221,336 | ) | | | — | | | | — | | | | (3,122 | ) | | | (2,003 | ) | |
Total Class R6 | | $ | (44,970 | ) | | $ | (122,721 | ) | | $ | — | | | $ | — | | | $ | 43,865 | | | $ | 117,672 | | |
Class Y | |
Proceeds from shares issued | | $ | 13,776 | | | $ | 133,669 | | | $ | 21 | | | $ | — | | | $ | 401 | | | $ | 241 | | |
Distributions reinvested | | | 22,365 | | | | 256,344 | | | | 9 | | | | 6 | | | | 97 | | | | 87 | | |
Cost of shares redeemed | | | (126,562 | ) | | | (647,797 | ) | | | — | | | | — | | | | (309 | ) | | | (1,748 | ) | |
Total Class Y | | $ | (90,421 | ) | | $ | (257,784 | ) | | $ | 30 | | | $ | 6 | | | $ | 189 | | | $ | (1,420 | ) | |
Change in net assets resulting from capital
transactions | | $ | (169,539 | ) | | $ | (342,469 | ) | | $ | 1,252 | | | $ | 950 | | | $ | 43,468 | | | $ | 116,106 | | |
(continues on next page)
See notes to financial statements.
135
Victory Portfolios | | Statements of Changes in Net Assets | |
(Amounts in Thousands) (continued)
| | | Victory Munder
Mid-Cap Core
Growth Fund | | Victory Munder
Small Cap
Growth Fund | | Victory
Trivalent International
Fund-Core Equity | |
| | | Year
Ended
June 30,
2021 | | Year
Ended
June 30,
2020 | | Year
Ended
June 30,
2021 | | Year
Ended
June 30,
2020 | | Year
Ended
June 30,
2021 | | Year
Ended
June 30,
2020 | |
Share Transactions: | |
Class A | |
Issued | | | 1,167 | | | | 2,039 | | | | 8 | | | | 18 | | | | 89 | | | | 51 | | |
Reinvested | | | 1,611 | | | | 8,445 | | | | 2 | | | | 1 | | | | 7 | | | | 6 | | |
Redeemed | | | (4,603 | ) | | | (7,341 | ) | | | (5 | ) | | | (8 | ) | | | (152 | ) | | | (134 | ) | |
Total Class A | | | (1,825 | ) | | | 3,143 | | | | 5 | | | | 11 | | | | (56 | ) | | | (77 | ) | |
Class C | |
Issued | | | 25 | | | | 252 | | | | — | | | | — | | | | — | (a) | | | 1 | | |
Reinvested | | | 762 | | | | 2,542 | | | | — | | | | — | | | | — | (a) | | | — | (a) | |
Redeemed | | | (1,785 | ) | | | (1,609 | ) | | | — | | | | — | | | | (19 | ) | | | (18 | ) | |
Total Class C | | | (998 | ) | | | 1,185 | | | | — | | | | — | | | | (19 | ) | | | (17 | ) | |
Class I | |
Issued | | | — | | | | — | | | | 9 | | | | 8 | | | | — | (a) | | | 135 | | |
Reinvested | | | — | | | | — | | | | 61 | | | | 50 | | | | 6 | | | | 4 | | |
Redeemed | | | — | | | | — | | | | (6 | ) | | | (1 | ) | | | (8 | ) | | | (72 | ) | |
Total Class I | | | — | | | | — | | | | 64 | | | | 57 | | | | (2 | ) | | | 67 | | |
Class R | |
Issued | | | 154 | | | | 188 | | | | — | | | | — | | | | — | | | | — | | |
Reinvested | | | 172 | | | | 752 | | | | — | | | | — | | | | — | | | | — | | |
Redeemed | | | (567 | ) | | | (514 | ) | | | — | | | | — | | | | — | | | | — | | |
Total Class R | | | (241 | ) | | | 426 | | | | — | | | | — | | | | — | | | | — | | |
Class R6 | |
Issued | | | 786 | | | | 1,234 | | | | — | | | | — | | | | 6,110 | | | | 17,546 | | |
Reinvested | | | 505 | | | | 4,387 | | | | — | | | | — | | | | 357 | | | | 122 | | |
Redeemed | | | (3,988 | ) | | | (9,938 | ) | | | — | | | | — | | | | (413 | ) | | | (319 | ) | |
Total Class R6 | | | (2,697 | ) | | | (4,317 | ) | | | — | | | | — | | | | 6,054 | | | | 17,349 | | |
Class Y | |
Issued | | | 823 | | | | 6,000 | | | | 1 | | | | — | | | | 52 | | | | 35 | | |
Reinvested | | | 1,376 | | | | 15,847 | | | | 1 | | | | — | (a) | | | 13 | | | | 12 | | |
Redeemed | | | (7,632 | ) | | | (35,576 | ) | | | — | | | | — | | | | (43 | ) | | | (275 | ) | |
Total Class Y | | | (5,433 | ) | | | (13,729 | ) | | | 2 | | | | — | (a) | | | 22 | | | | (228 | ) | |
Change in Shares | | | (11,194 | ) | | | (13,292 | ) | | | 71 | | | | 68 | | | | 5,999 | | | | 17,094 | | |
(a) Rounds to less than 1 thousand.
See notes to financial statements.
136
Victory Portfolios | | Statements of Changes in Net Assets | |
(Amounts in Thousands)
| | | Victory
Trivalent International
Small-Cap Fund | | Victory
INCORE Total Return
Bond Fund | |
| | | Year
Ended
June 30,
2021 | | Year
Ended
June 30,
2020 | | Year
Ended
June 30,
2021 | | Year
Ended
June 30,
2020 | |
From Investment Activities: | |
Operations: | |
Net investment income (loss) | | $ | 38,085 | | | $ | 14,373 | | | $ | 1,176 | | | $ | 1,552 | | |
Net realized gains (losses) from
investments | | | 315,377 | | | | (70,162 | ) | | | 548 | | | | 2,336 | | |
Net change in unrealized appreciation/
depreciation on investments | | | 497,274 | | | | 41,304 | | | | (407 | ) | | | 1,323 | | |
Change in net assets resulting
from operations | | | 850,736 | | | | (14,485 | ) | | | 1,317 | | | | 5,211 | | |
Distributions to Shareholders: | |
Class A | | | — | | | | (1,886 | ) | | | (249 | ) | | | (300 | ) | |
Class C | | | — | | | | (52 | ) | | | (8 | ) | | | (10 | ) | |
Class I | | | (6,561 | ) | | | (21,459 | ) | | | — | | | | — | | |
Class R6 | | | (355 | ) | | | (989 | ) | | | (680 | ) | | | (710 | ) | |
Class Y | | | (2,549 | ) | | | (13,429 | ) | | | (843 | ) | | | (881 | ) | |
Change in net assets resulting from
distributions to shareholders | | | (9,465 | ) | | | (37,815 | ) | | | (1,780 | ) | | | (1,901 | ) | |
Change in net assets resulting from capital
transactions | | | 630,234 | | | | 108,621 | | | | (3,357 | ) | | | (434 | ) | |
Change in net assets | | | 1,471,505 | | | | 56,321 | | | | (3,820 | ) | | | 2,876 | | |
Net Assets: | |
Beginning of period | | | 1,863,985 | | | | 1,807,664 | | | | 71,653 | | | | 68,777 | | |
End of period | | $ | 3,335,490 | | | $ | 1,863,985 | | | $ | 67,833 | | | $ | 71,653 | | |
(a) Rounds to less than $1 thousand.
(continues on next page)
See notes to financial statements.
137
Victory Portfolios | | Statements of Changes in Net Assets | |
(Amounts in Thousands) (continued)
| | | Victory
Trivalent International
Small-Cap Fund | | Victory
INCORE Total Return
Bond Fund | |
| | | Year
Ended
June 30,
2021 | | Year
Ended
June 30,
2020 | | Year
Ended
June 30,
2021 | | Year
Ended
June 30,
2020 | |
Capital Transactions: | |
Class A | |
Proceeds from shares issued | | $ | 39,592 | | | $ | 35,046 | | | $ | 604 | | | $ | 1,275 | | |
Distributions reinvested | | | — | | | | 1,735 | | | | 219 | | | | 252 | | |
Cost of shares redeemed | | | (86,919 | ) | | | (62,948 | ) | | | (2,844 | ) | | | (2,846 | ) | |
Total Class A | | $ | (47,327 | ) | | $ | (26,167 | ) | | $ | (2,021 | ) | | $ | (1,319 | ) | |
Class C | |
Proceeds from shares issued | | $ | 656 | | | $ | 664 | | | $ | 76 | | | $ | 340 | | |
Distributions reinvested | | | — | | | | 42 | | | | 9 | | | | 10 | | |
Cost of shares redeemed | | | (1,560 | ) | | | (1,180 | ) | | | (357 | ) | | | (230 | ) | |
Total Class C | | $ | (904 | ) | | $ | (474 | ) | | $ | (272 | ) | | $ | 120 | | |
Class I | |
Proceeds from shares issued | | $ | 843,443 | | | $ | 350,308 | | | $ | — | | | $ | — | | |
Distributions reinvested | | | 5,005 | | | | 10,793 | | | | — | | | | — | | |
Cost of shares redeemed | | | (353,920 | ) | | | (266,728 | ) | | | — | | | | — | | |
Total Class I | | $ | 494,528 | | | $ | 94,373 | | | $ | — | | | $ | — | | |
Class R6 | |
Proceeds from shares issued | | $ | 57,389 | | | $ | 46,552 | | | $ | 2,005 | | | $ | 536 | | |
Distributions reinvested | | | 354 | | | | 989 | | | | 680 | | | | 710 | | |
Cost of shares redeemed | | | (31,825 | ) | | | (16,987 | ) | | | (1,558 | ) | | | (1,392 | ) | |
Total Class R6 | | $ | 25,918 | | | $ | 30,554 | | | $ | 1,127 | | | $ | (146 | ) | |
Class Y | |
Proceeds from shares issued | | $ | 415,535 | | | $ | 257,621 | | | $ | 243 | | | $ | 1,271 | | |
Distributions reinvested | | | 2,460 | | | | 11,950 | | | | 603 | | | | 617 | | |
Cost of shares redeemed | | | (259,976 | ) | | | (259,236 | ) | | | (3,037 | ) | | | (977 | ) | |
Total Class Y | | $ | 158,019 | | | $ | 10,335 | | | $ | (2,191 | ) | | $ | 911 | | |
Change in net assets resulting from
capital transactions | | $ | 630,234 | | | $ | 108,621 | | | $ | (3,357 | ) | | $ | (434 | ) | |
(a) Rounds to less than $1 thousand.
(continues on next page)
See notes to financial statements.
138
Victory Portfolios | | Statements of Changes in Net Assets | |
(Amounts in Thousands) (continued)
| | | Victory
Trivalent International
Small-Cap Fund | | Victory
INCORE Total Return
Bond Fund | |
| | | Year
Ended
June 30,
2021 | | Year
Ended
June 30,
2020 | | Year
Ended
June 30,
2021 | | Year
Ended
June 30,
2020 | |
Share Transactions: | |
Class A | |
Issued | | | 2,538 | | | | 2,784 | | | | 61 | | | | 133 | | |
Reinvested | | | — | | | | 124 | | | | 22 | | | | 26 | | |
Redeemed | | | (5,762 | ) | | | (5,054 | ) | | | (287 | ) | | | (297 | ) | |
Total Class A | | | (3,224 | ) | | | (2,146 | ) | | | (204 | ) | | | (138 | ) | |
Class C | |
Issued | | | 41 | | | | 54 | | | | 8 | | | | 35 | | |
Reinvested | | | — | | | | 3 | | | | 1 | | | | 1 | | |
Redeemed | | | (104 | ) | | | (97 | ) | | | (36 | ) | | | (23 | ) | |
Total Class C | | | (63 | ) | | | (40 | ) | | | (27 | ) | | | 13 | | |
Class I | |
Issued | | | 53,324 | | | | 27,996 | | | | — | | | | — | | |
Reinvested | | | 316 | | | | 769 | | | | — | | | | — | | |
Redeemed | | | (21,878 | ) | | | (23,160 | ) | | | — | | | | — | | |
Total Class I | | | 31,762 | | | | 5,605 | | | | — | | | | — | | |
Class R6 | |
Issued | | | 3,632 | | | | 3,656 | | | | 204 | | | | 55 | | |
Reinvested | | | 22 | | | | 70 | | | | 68 | | | | 74 | | |
Redeemed | | | (2,000 | ) | | | (1,331 | ) | | | (156 | ) | | | (144 | ) | |
Total Class R6 | | | 1,654 | | | | 2,395 | | | | 116 | | | | (15 | ) | |
Class Y | |
Issued | | | 25,779 | | | | 20,940 | | | | 24 | | | | 130 | | |
Reinvested | | | 156 | | | | 855 | | | | 61 | | | | 64 | | |
Redeemed | | | (16,681 | ) | | | (21,266 | ) | | | (307 | ) | | | (102 | ) | |
Total Class Y | | | 9,254 | | | | 529 | | | | (222 | ) | | | 92 | | |
Change in Shares | | | 39,383 | | | | 6,343 | | | | (337 | ) | | | (48 | ) | |
(a) Rounds to less than 1 thousand.
See notes to financial statements.
139
Victory Portfolios | | Financial Highlights | |
For a Share Outstanding Throughout Each Period
| | | | | Investment Activities | | Distributions to
Shareholders From | |
| | | Net Asset
Value,
Beginning of
Period | | Net
Investment
Income
(Loss)(a) | | Net Realized
and Unrealized
Gains (Losses)
on Investments | | Total from
Investment
Activities | | Net Realized
Gains from
Investments | | Total
Distributions | |
Victory Integrity Discovery Fund | |
Class A | |
Year Ended: | |
June 30, 2021 | | $ | 24.03 | | | | (0.07 | ) | | | 21.57 | | | | 21.50 | | | | — | | | | — | | |
June 30, 2020 | | $ | 32.28 | | | | (0.05 | ) | | | (7.38 | ) | | | (7.43 | ) | | | (0.82 | ) | | | (0.82 | ) | |
June 30, 2019 | | $ | 42.75 | | | | (0.11 | ) | | | (5.61 | ) | | | (5.72 | ) | | | (4.75 | ) | | | (4.75 | ) | |
June 30, 2018 | | $ | 41.01 | | | | (0.16 | ) | | | 6.40 | | | | 6.24 | | | | (4.50 | ) | | | (4.50 | ) | |
June 30, 2017 | | $ | 32.71 | | | | (0.19 | ) | | | 10.10 | | | | 9.91 | | | | (1.61 | ) | | | (1.61 | ) | |
Class C | |
Year Ended: | |
June 30, 2021 | | $ | 16.32 | | | | (0.21 | ) | | | 14.56 | | | | 14.35 | | | | — | | | | — | | |
June 30, 2020 | | $ | 22.36 | | | | (0.22 | ) | | | (5.00 | ) | | | (5.22 | ) | | | (0.82 | ) | | | (0.82 | ) | |
June 30, 2019 | | $ | 31.69 | | | | (0.28 | ) | | | (4.30 | ) | | | (4.58 | ) | | | (4.75 | ) | | | (4.75 | ) | |
June 30, 2018 | | $ | 31.69 | | | | (0.34 | ) | | | 4.84 | | | | 4.50 | | | | (4.50 | ) | | | (4.50 | ) | |
June 30, 2017 | | $ | 25.76 | | | | (0.38 | ) | | | 7.92 | | | | 7.54 | | | | (1.61 | ) | | | (1.61 | ) | |
Class R | |
Year Ended: | |
June 30, 2021 | | $ | 22.45 | | | | (0.18 | ) | | | 20.08 | | | | 19.90 | | | | — | | | | — | | |
June 30, 2020 | | $ | 30.36 | | | | (0.18 | ) | | | (6.91 | ) | | | (7.09 | ) | | | (0.82 | ) | | | (0.82 | ) | |
June 30, 2019 | | $ | 40.76 | | | | (0.28 | ) | | | (5.37 | ) | | | (5.65 | ) | | | (4.75 | ) | | | (4.75 | ) | |
June 30, 2018 | | $ | 39.49 | | | | (0.28 | ) | | | 6.05 | | | | 5.77 | | | | (4.50 | ) | | | (4.50 | ) | |
June 30, 2017 | | $ | 31.71 | | | | (0.37 | ) | | | 9.76 | | | | 9.39 | | | | (1.61 | ) | | | (1.61 | ) | |
Class Y | |
Year Ended: | |
June 30, 2021 | | $ | 26.64 | | | | 0.03 | | | | 23.96 | | | | 23.99 | | | | — | | | | — | | |
June 30, 2020 | | $ | 35.65 | | | | — | (e) | | | (8.19 | ) | | | (8.19 | ) | | | (0.82 | ) | | | (0.82 | ) | |
June 30, 2019 | | $ | 46.47 | | | | (0.03 | ) | | | (6.04 | ) | | | (6.07 | ) | | | (4.75 | ) | | | (4.75 | ) | |
June 30, 2018 | | $ | 44.11 | | | | (0.05 | ) | | | 6.91 | | | | 6.86 | | | | (4.50 | ) | | | (4.50 | ) | |
June 30, 2017 | | $ | 35.02 | | | | (0.13 | ) | | | 10.83 | | | | 10.70 | | | | (1.61 | ) | | | (1.61 | ) | |
Member Class | |
November 3, 2020(g)
through
June 30, 2021 | | $ | 26.37 | | | | (0.30 | ) | | | 19.51 | | | | 19.21 | | | | — | | | | — | | |
* Includes adjustments in accordance with U.S. Generally Accepted Accounting Principles.
(a) Per share net investment income (loss) has been calculated using the average daily shares method.
(b) Not annualized for periods less than one year.
(c) Annualized for periods less than one year.
(d) Portfolio turnover is calculated on the basis of the Fund as a whole without distinguishing between the classes of shares issued.
(e) Amount is less than $0.005 per share.
(f) Amount is less than 0.005%.
(g) Commencement of operations.
See notes to financial statements.
140
Victory Portfolios | | Financial Highlights — continued | |
For a Share Outstanding Throughout Each Period
| | | | | Ratios to Average Net Assets | | Supplemental Data | |
| | | Net Asset
Value, End
of Period | | Total
Return
(Excludes
Sales
Charge)(b)* | | Net
Expenses(c) | | Net
Investment
Income
(Loss)(c) | | Gross
Expenses(c) | | Net Assets,
End of
Period
(000's) | | Portfolio
Turnover(b)(d) | |
Victory Integrity Discovery Fund | |
Class A | |
Year Ended: | |
June 30, 2021 | | $ | 45.53 | | | | 89.47 | % | | | 1.62 | % | | | (0.20 | )% | | | 1.62 | % | | $ | 45,073 | | | | 41 | % | |
June 30, 2020 | | $ | 24.03 | | | | (23.78 | )% | | | 1.59 | % | | | (0.18 | )% | | | 1.59 | % | | $ | 30,614 | | | | 40 | % | |
June 30, 2019 | | $ | 32.28 | | | | (12.02 | )% | | | 1.55 | % | | | (0.29 | )% | | | 1.55 | % | | $ | 50,963 | | | | 40 | % | |
June 30, 2018 | | $ | 42.75 | | | | 15.76 | % | | | 1.54 | % | | | (0.39 | )% | | | 1.54 | % | | $ | 67,840 | | | | 45 | % | |
June 30, 2017 | | $ | 41.01 | | | | 30.36 | % | | | 1.55 | % | | | (0.50 | )% | | | 1.55 | % | | $ | 85,228 | | | | 110 | % | |
Class C | |
Year Ended: | |
June 30, 2021 | | $ | 30.67 | | | | 87.93 | % | | | 2.45 | % | | | (0.95 | )% | | | 2.87 | % | | $ | 2,079 | | | | 41 | % | |
June 30, 2020 | | $ | 16.32 | | | | (24.42 | )% | | | 2.46 | % | | | (1.09 | )% | | | 2.52 | % | | $ | 2,194 | | | | 40 | % | |
June 30, 2019 | | $ | 22.36 | | | | (12.74 | )% | | | 2.34 | % | | | (1.07 | )% | | | 2.34 | % | | $ | 6,633 | | | | 40 | % | |
June 30, 2018 | | $ | 31.69 | | | | 14.88 | % | | | 2.32 | % | | | (1.10 | )% | | | 2.32 | % | | $ | 9,871 | | | | 45 | % | |
June 30, 2017 | | $ | 31.69 | | | | 29.33 | % | | | 2.36 | % | | | (1.28 | )% | | | 2.36 | % | | $ | 15,796 | | | | 110 | % | |
Class R | |
Year Ended: | |
June 30, 2021 | | $ | 42.35 | | | | 88.56 | % | | | 2.08 | % | | | (0.58 | )% | | | 2.43 | % | | $ | 1,955 | | | | 41 | % | |
June 30, 2020 | | $ | 22.45 | | | | (24.10 | )% | | | 2.08 | % | | | (0.65 | )% | | | 2.33 | % | | $ | 1,990 | | | | 40 | % | |
June 30, 2019 | | $ | 30.36 | | | | (12.49 | )% | | | 2.08 | % | | | (0.84 | )% | | | 2.41 | % | | $ | 3,038 | | | | 40 | % | |
June 30, 2018 | | $ | 40.76 | | | | 15.15 | % | | | 2.08 | % | | | (0.70 | )% | | | 2.27 | % | | $ | 3,465 | | | | 45 | % | |
June 30, 2017 | | $ | 39.49 | | | | 29.67 | % | | | 2.08 | % | | | (0.99 | )% | | | 2.56 | % | | $ | 2,291 | | | | 110 | % | |
Class Y | |
Year Ended: | |
June 30, 2021 | | $ | 50.63 | | | | 90.05 | % | | | 1.31 | % | | | 0.07 | % | | | 1.31 | % | | $ | 40,600 | | | | 41 | % | |
June 30, 2020 | | $ | 26.64 | | | | (23.64 | )% | | | 1.38 | % | | | — | %(f) | | | 1.38 | % | | $ | 27,519 | | | | 40 | % | |
June 30, 2019 | | $ | 35.65 | | | | (11.81 | )% | | | 1.30 | % | | | (0.06 | )% | | | 1.30 | % | | $ | 71,708 | | | | 40 | % | |
June 30, 2018 | | $ | 46.47 | | | | 16.08 | % | | | 1.28 | % | | | (0.12 | )% | | | 1.28 | % | | $ | 78,079 | | | | 45 | % | |
June 30, 2017 | | $ | 44.11 | | | | 30.62 | % | | | 1.38 | % | | | (0.30 | )% | | | 1.38 | % | | $ | 49,468 | | | | 110 | % | |
Member Class | |
November 3, 2020(g)
through
June 30, 2021 | | $ | 45.58 | | | | 72.85 | % | | | 1.50 | % | | | (1.04 | )% | | | 5.05 | % | | $ | 2,172 | | | | 41 | % | |
See notes to financial statements.
141
Victory Portfolios | | Financial Highlights | |
For a Share Outstanding Throughout Each Period
| | | | | Investment Activities | | Distributions to
Shareholders From | |
| | | Net Asset
Value,
Beginning of
Period | | Net
Investment
Income
(Loss)(a) | | Net
Realized and
Unrealized
Gains
(Losses) on
Investments | | Total from
Investment
Activities | | Net
Investment
Income | | Net Realized
Gains from
Investments | | Return
of
Capital | |
Victory Integrity Mid-Cap Value Fund | |
Class A | |
Year Ended: | |
June 30, 2021 | | $ | 15.30 | | | | 0.13 | | | | 8.74 | | | | 8.87 | | | | (0.37 | ) | | | — | | | | (0.08 | ) | |
June 30, 2020 | | $ | 17.86 | | | | 0.24 | | | | (2.70 | ) | | | (2.46 | ) | | | (0.10 | ) | | | — | | | | — | | |
June 30, 2019 | | $ | 19.17 | | | | 0.19 | | | | (0.32 | ) | | | (0.13 | ) | | | (0.19 | ) | | | (0.99 | ) | | | — | | |
June 30, 2018 | | $ | 17.91 | | | | 0.19 | | | | 1.84 | | | | 2.03 | | | | (0.15 | ) | | | (0.62 | ) | | | — | | |
June 30, 2017 | | $ | 15.43 | | | | 0.03 | | | | 2.45 | | | | 2.48 | | | | — | | | | — | | | | — | | |
Class C | |
Year Ended: | |
June 30, 2021 | | $ | 15.37 | | | | (0.05 | ) | | | 8.82 | | | | 8.77 | | | | (0.27 | ) | | | — | | | | (0.06 | ) | |
November 4, 2019(e)
through
Jume 30, 2020 | | $ | 18.75 | | | | 0.11 | | | | (3.39 | ) | | | (3.28 | ) | | | (0.10 | ) | | | — | | | | — | | |
Class R6 | |
Year Ended: | |
June 30, 2021 | | $ | 15.47 | | | | 0.19 | | | | 8.85 | | | | 9.04 | | | | (0.43 | ) | | | — | | | | (0.09 | ) | |
June 30, 2020 | | $ | 18.02 | | | | 0.33 | | | | (2.74 | ) | | | (2.41 | ) | | | (0.14 | ) | | | — | | | | — | | |
June 30, 2019 | | $ | 19.30 | | | | 0.26 | | | | (0.32 | ) | | | (0.06 | ) | | | (0.23 | ) | | | (0.99 | ) | | | — | | |
June 30, 2018 | | $ | 18.02 | | | | 0.22 | | | | 1.87 | | | | 2.09 | | | | (0.19 | ) | | | (0.62 | ) | | | — | | |
June 30, 2017 | | $ | 15.53 | | | | 0.12 | | | | 2.43 | | | | 2.55 | | | | (0.06 | ) | | | — | | | | — | | |
Class Y | |
Year Ended: | |
June 30, 2021 | | $ | 15.44 | | | | 0.06 | | | | 8.94 | | | | 9.00 | | | | (0.41 | ) | | | — | | | | (0.08 | ) | |
June 30, 2020 | | $ | 18.02 | | | | 0.25 | | | | (2.68 | ) | | | (2.43 | ) | | | (0.15 | ) | | | — | | | | — | | |
June 30, 2019 | | $ | 19.34 | | | | 0.28 | | | | (0.37 | ) | | | (0.09 | ) | | | (0.24 | ) | | | (0.99 | ) | | | — | | |
June 30, 2018 | | $ | 18.06 | | | | 0.24 | | | | 1.85 | | | | 2.09 | | | | (0.19 | ) | | | (0.62 | ) | | | — | | |
June 30, 2017 | | $ | 15.58 | | | | 0.13 | | | | 2.43 | | | | 2.56 | | | | (0.08 | ) | | | — | | | | — | | |
Member Class | |
November 3, 2020(e)
through
June 30, 2021 | | $ | 16.94 | | | | (0.26 | ) | | | 7.58 | | | | 7.32 | | | | (0.17 | ) | | | — | | | | (0.01 | ) | |
(a) Per share net investment income (loss) has been calculated using the average daily shares method.
(b) Not annualized for periods less than one year.
(c) Annualized for periods less than one year.
(d) Portfolio turnover is calculated on the basis of the Fund as a whole without distinguishing between the classes of shares issued.
(e) Commencement of operations.
See notes to financial statements.
142
Victory Portfolios | | Financial Highlights — continued | |
For a Share Outstanding Throughout Each Period
| | | | | Ratios to Average Net Assets | | Supplemental Data | |
| | | Total
Distributions | | Net Asset
Value,
End of
Period | | Total
Return
(Excludes
Sales
Charge)(b) | | Net
Expenses(c) | | Net
Investment
Income
(Loss)(c) | | Gross
Expenses(c) | | Net Assets,
End of
Period
(000's) | | Portfolio
Turnover(b)(d) | |
Victory Integrity Mid-Cap Value Fund | |
Class A | |
Year Ended: | |
June 30, 2021 | | | (0.45 | ) | | $ | 23.72 | | | | 58.66 | % | | | 1.00 | % | | | 0.64 | % | | | 1.37 | % | | $ | 12,542 | | | | 67 | % | |
June 30, 2020 | | | (0.10 | ) | | $ | 15.30 | | | | (13.90 | )% | | | 1.00 | % | | | 1.40 | % | | | 1.43 | % | | $ | 8,574 | | | | 82 | % | |
June 30, 2019 | | | (1.18 | ) | | $ | 17.86 | | | | 0.36 | % | | | 1.00 | % | | | 1.05 | % | | | 1.51 | % | | $ | 7,567 | | | | 73 | % | |
June 30, 2018 | | | (0.77 | ) | | $ | 19.17 | | | | 11.32 | % | | | 1.09 | % | | | 1.01 | % | | | 1.67 | % | | $ | 4,255 | | | | 73 | % | |
June 30, 2017 | | | — | | | $ | 17.91 | | | | 16.07 | % | | | 1.35 | % | | | 0.19 | % | | | 1.94 | % | | $ | 2,864 | | | | 68 | % | |
Class C | |
Year Ended: | |
June 30, 2021 | | | (0.33 | ) | | $ | 23.81 | | | | 57.43 | % | | | 1.75 | % | | | (0.25 | )% | | | 16.27 | % | | $ | 78 | | | | 67 | % | |
November 4, 2019(e)
through
Jume 30, 2020 | | | (0.10 | ) | | $ | 15.37 | | | | (17.55 | )% | | | 1.75 | % | | | 1.02 | % | | | 43.95 | % | | $ | 44 | | | | 82 | % | |
Class R6 | |
Year Ended: | |
June 30, 2021 | | | (0.52 | ) | | $ | 23.99 | | | | 59.24 | % | | | 0.60 | % | | | 0.94 | % | | | 0.88 | % | | $ | 226,652 | | | | 67 | % | |
June 30, 2020 | | | (0.14 | ) | | $ | 15.47 | | | | (13.53 | )% | | | 0.60 | % | | | 1.93 | % | | | 0.88 | % | | $ | 184,503 | | | | 82 | % | |
June 30, 2019 | | | (1.22 | ) | | $ | 18.02 | | | | 0.72 | % | | | 0.60 | % | | | 1.43 | % | | | 0.94 | % | | $ | 56,232 | | | | 73 | % | |
June 30, 2018 | | | (0.81 | ) | | $ | 19.30 | | | | 11.68 | % | | | 0.77 | % | | | 1.14 | % | | | 1.17 | % | | $ | 6,750 | | | | 73 | % | |
June 30, 2017 | | | (0.06 | ) | | $ | 18.02 | | | | 16.42 | % | | | 0.89 | % | | | 0.71 | % | | | 3.01 | % | | $ | 1,375 | | | | 68 | % | |
Class Y | |
Year Ended: | |
June 30, 2021 | | | (0.49 | ) | | $ | 23.95 | | | | 59.03 | % | | | 0.75 | % | | | 0.29 | % | | | 1.08 | % | | $ | 25,003 | | | | 67 | % | |
June 30, 2020 | | | (0.15 | ) | | $ | 15.44 | | | | (13.67 | )% | | | 0.75 | % | | | 1.46 | % | | | 1.21 | % | | $ | 9,352 | | | | 82 | % | |
June 30, 2019 | | | (1.23 | ) | | $ | 18.02 | | | | 0.58 | % | | | 0.75 | % | | | 1.52 | % | | | 1.17 | % | | $ | 21,486 | | | | 73 | % | |
June 30, 2018 | | | (0.81 | ) | | $ | 19.34 | | | | 11.58 | % | | | 0.84 | % | | | 1.25 | % | | | 1.13 | % | | $ | 59,866 | | | | 73 | % | |
June 30, 2017 | | | (0.08 | ) | | $ | 18.06 | | | | 16.43 | % | | | 0.89 | % | | | 0.74 | % | | | 1.18 | % | | $ | 47,989 | | | | 68 | % | |
Member Class | |
November 3, 2020(e)
through
June 30, 2021 | | | (0.18 | ) | | $ | 24.08 | | | | 43.46 | % | | | 0.85 | % | | | (1.69 | )% | | | 8.67 | % | | $ | 845 | | | | 67 | % | |
See notes to financial statements.
143
Victory Portfolios | | Financial Highlights | |
For a Share Outstanding Throughout Each Period
| | | | | Investment Activities | | Distributions to
Shareholders From | |
| | | Net Asset
Value,
Beginning of
Period | | Net
Investment
Income
(Loss)(a) | | Net Realized
and Unrealized
Gains (Losses)
on Investments | | Total from
Investment
Activities | | Net
Investment
Income | | Net Realized
Gains from
Investments | |
Victory Integrity Small-Cap Value Fund | |
Class A | |
Year Ended: | |
June 30, 2021 | | $ | 24.40 | | | | (0.01 | )(c) | | | 19.61 | | | | 19.60 | | | | (0.03 | ) | | | — | | |
June 30, 2020 | | $ | 32.37 | | | | 0.03 | | | | (7.86 | ) | | | (7.83 | ) | | | — | | | | (0.14 | ) | |
June 30, 2019 | | $ | 40.06 | | | | 0.09 | | | | (3.59 | ) | | | (3.50 | ) | | | — | | | | (4.19 | ) | |
June 30, 2018 | | $ | 37.70 | | | | (0.04 | ) | | | 4.76 | | | | 4.72 | | | | — | | | | (2.36 | ) | |
June 30, 2017 | | $ | 30.72 | | | | (0.08 | ) | | | 7.06 | | | | 6.98 | | | | — | | | | — | | |
Class C | |
Year Ended: | |
June 30, 2021 | | $ | 20.81 | | | | (0.26 | ) | | | 16.67 | | | | 16.41 | | | | — | | | | — | | |
June 30, 2020 | | $ | 27.85 | | | | (0.17 | ) | | | (6.73 | ) | | | (6.90 | ) | | | — | | | | (0.14 | ) | |
June 30, 2019 | | $ | 35.40 | | | | (0.13 | ) | | | (3.23 | ) | | | (3.36 | ) | | | — | | | | (4.19 | ) | |
June 30, 2018 | | $ | 33.76 | | | | (0.24 | ) | | | 4.24 | | | | 4.00 | | | | — | | | | (2.36 | ) | |
June 30, 2017 | | $ | 27.69 | | | | (0.28 | ) | | | 6.35 | | | | 6.07 | | | | — | | | | — | | |
Class R | |
Year Ended: | |
June 30, 2021 | | $ | 23.53 | | | | (0.10 | ) | | | 18.92 | | | | 18.82 | | | | — | | | | — | | |
June 30, 2020 | | $ | 31.32 | | | | (0.05 | ) | | | (7.60 | ) | | | (7.65 | ) | | | — | | | | (0.14 | ) | |
June 30, 2019 | | $ | 39.02 | | | | (0.01 | ) | | | (3.50 | ) | | | (3.51 | ) | | | — | | | | (4.19 | ) | |
June 30, 2018 | | $ | 36.86 | | | | (0.13 | ) | | | 4.65 | | | | 4.52 | | | | — | | | | (2.36 | ) | |
June 30, 2017 | | $ | 30.11 | | | | (0.16 | ) | | | 6.91 | | | | 6.75 | | | | — | | | | — | | |
Class R6 | |
Year Ended: | |
June 30, 2021 | | $ | 25.43 | | | | 0.18 | | | | 20.47 | | | | 20.65 | | | | (0.17 | ) | | | — | | |
June 30, 2020 | | $ | 33.70 | | | | 0.19 | | | | (8.18 | ) | | | (7.99 | ) | | | (0.14 | ) | | | (0.14 | ) | |
June 30, 2019 | | $ | 41.51 | | | | 0.24 | | | | (3.67 | ) | | | (3.43 | ) | | | (0.19 | ) | | | (4.19 | ) | |
June 30, 2018 | | $ | 38.86 | | | | 0.18 | | | | 4.92 | | | | 5.10 | | | | (0.09 | ) | | | (2.36 | ) | |
June 30, 2017 | | $ | 31.60 | | | | 0.12 | | | | 7.28 | | | | 7.40 | | | | (0.14 | ) | | | — | | |
Class Y | |
Year Ended: | |
June 30, 2021 | | $ | 25.27 | | | | 0.13 | | | | 20.34 | | | | 20.47 | | | | (0.12 | ) | | | — | | |
June 30, 2020 | | $ | 33.49 | | | | 0.14 | | | | (8.13 | ) | | | (7.99 | ) | | | (0.09 | ) | | | (0.14 | ) | |
June 30, 2019 | | $ | 41.25 | | | | 0.21 | | | | (3.67 | ) | | | (3.46 | ) | | | (0.11 | ) | | | (4.19 | ) | |
June 30, 2018 | | $ | 38.63 | | | | 0.11 | | | | 4.89 | | | | 5.00 | | | | (0.02 | ) | | | (2.36 | ) | |
June 30, 2017 | | $ | 31.45 | | | | 0.05 | | | | 7.23 | | | | 7.28 | | | | (0.10 | ) | | | — | | |
* Includes adjustments in accordance with U.S. Generally Accepted Accounting Principles.
(a) Per share net investment income (loss) has been calculated using the average daily shares method.
(b) Portfolio turnover is calculated on the basis of the Fund as a whole without distinguishing between the classes of shares issued.
(c) Amount is less than $0.005 per share.
(d) Amount is less than 0.005%.
See notes to financial statements.
144
Victory Portfolios | | Financial Highlights — continued | |
For a Share Outstanding Throughout Each Period
| | | | | Ratios to Average Net Assets | | Supplemental Data | |
| | | Total
Distributions | | Net Asset
Value,
End of
Period | | Total
Return
(Excludes
Sales
Charge)* | | Net
Expenses | | Net
Investment
Income
(Loss) | | Gross
Expenses | | Net Assets,
End of
Period
(000's) | | Portfolio
Turnover(b) | |
Victory Integrity Small-Cap Value Fund | |
Class A | |
Year Ended: | |
June 30, 2021 | | | (0.03 | ) | | $ | 43.97 | | | | 80.37 | % | | | 1.50 | % | | | (0.02 | )%(d) | | | 1.50 | % | | $ | 91,203 | | | | 56 | % | |
June 30, 2020 | | | (0.14 | ) | | $ | 24.40 | | | | (24.33 | )% | | | 1.48 | % | | | 0.10 | % | | | 1.48 | % | | $ | 79,429 | | | | 80 | % | |
June 30, 2019 | | | (4.19 | ) | | $ | 32.37 | | | | (7.16 | )% | | | 1.50 | % | | | 0.25 | % | | | 1.58 | % | | $ | 140,439 | | | | 72 | % | |
June 30, 2018 | | | (2.36 | ) | | $ | 40.06 | | | | 12.55 | % | | | 1.50 | % | | | (0.10 | )% | | | 1.54 | % | | $ | 221,775 | | | | 70 | % | |
June 30, 2017 | | | — | | | $ | 37.70 | | | | 22.72 | % | | | 1.50 | % | | | (0.22 | )% | | | 1.52 | % | | $ | 219,113 | | | | 58 | % | |
Class C | |
Year Ended: | |
June 30, 2021 | | | — | | | $ | 37.22 | | | | 78.86 | % | | | 2.34 | % | | | (0.89 | )% | | | 2.34 | % | | $ | 7,578 | | | | 56 | % | |
June 30, 2020 | | | (0.14 | ) | | $ | 20.81 | | | | (24.91 | )% | | | 2.25 | % | | | (0.69 | )% | | | 2.25 | % | | $ | 5,796 | | | | 80 | % | |
June 30, 2019 | | | (4.19 | ) | | $ | 27.85 | | | | (7.79 | )% | | | 2.16 | % | | | (0.42 | )% | | | 2.16 | % | | $ | 11,083 | | | | 72 | % | |
June 30, 2018 | | | (2.36 | ) | | $ | 35.40 | | | | 11.86 | % | | | 2.13 | % | | | (0.70 | )% | | | 2.13 | % | | $ | 16,746 | | | | 70 | % | |
June 30, 2017 | | | — | | | $ | 33.76 | | | | 21.92 | % | | | 2.16 | % | | | (0.89 | )% | | | 2.16 | % | | $ | 27,015 | | | | 58 | % | |
Class R | |
Year Ended: | |
June 30, 2021 | | | — | | | $ | 42.35 | | | | 79.91 | % | | | 1.75 | % | | | (0.29 | )% | | | 1.95 | % | | $ | 7,099 | | | | 56 | % | |
June 30, 2020 | | | (0.14 | ) | | $ | 23.53 | | | | (24.54 | )% | | | 1.75 | % | | | (0.19 | )% | | | 1.86 | % | | $ | 5,303 | | | | 80 | % | |
June 30, 2019 | | | (4.19 | ) | | $ | 31.32 | | | | (7.39 | )% | | | 1.75 | % | | | (0.03 | )% | | | 1.99 | % | | $ | 10,451 | | | | 72 | % | |
June 30, 2018 | | | (2.36 | ) | | $ | 39.02 | | | | 12.29 | % | | | 1.75 | % | | | (0.35 | )% | | | 1.89 | % | | $ | 14,952 | | | | 70 | % | |
June 30, 2017 | | | — | | | $ | 36.86 | | | | 22.42 | % | | | 1.75 | % | | | (0.46 | )% | | | 2.06 | % | | $ | 15,317 | | | | 58 | % | |
Class R6 | |
Year Ended: | |
June 30, 2021 | | | (0.17 | ) | | $ | 45.91 | | | | 81.42 | % | | | 0.96 | % | | | 0.52 | % | | | 0.96 | % | | $ | 1,145,953 | | | | 56 | % | |
June 30, 2020 | | | (0.28 | ) | | $ | 25.43 | | | | (23.95 | )% | | | 0.97 | % | | | 0.64 | % | | | 0.97 | % | | $ | 984,938 | | | | 80 | % | |
June 30, 2019 | | | (4.38 | ) | | $ | 33.70 | | | | (6.67 | )% | | | 0.96 | % | | | 0.65 | % | | | 0.96 | % | | $ | 1,179,915 | | | | 72 | % | |
June 30, 2018 | | | (2.45 | ) | | $ | 41.51 | | | | 13.17 | % | | | 0.95 | % | | | 0.45 | % | | | 0.95 | % | | $ | 938,831 | | | | 70 | % | |
June 30, 2017 | | | (0.14 | ) | | $ | 38.86 | | | | 23.40 | % | | | 0.96 | % | | | 0.33 | % | | | 0.96 | % | | $ | 871,150 | | | | 58 | % | |
Class Y | |
Year Ended: | |
June 30, 2021 | | | (0.12 | ) | | $ | 45.62 | | | | 81.13 | % | | | 1.08 | % | | | 0.36 | % | | | 1.08 | % | | $ | 765,951 | | | | 56 | % | |
June 30, 2020 | | | (0.23 | ) | | $ | 25.27 | | | | (24.04 | )% | | | 1.11 | % | | | 0.47 | % | | | 1.11 | % | | $ | 491,836 | | | | 80 | % | |
June 30, 2019 | | | (4.30 | ) | | $ | 33.49 | | | | (6.83 | )% | | | 1.12 | % | | | 0.58 | % | | | 1.12 | % | | $ | 981,688 | | | | 72 | % | |
June 30, 2018 | | | (2.38 | ) | | $ | 41.25 | | | | 13.01 | % | | | 1.12 | % | | | 0.28 | % | | | 1.12 | % | | $ | 1,467,901 | | | | 70 | % | |
June 30, 2017 | | | (0.10 | ) | | $ | 38.63 | | | | 23.14 | % | | | 1.15 | % | | | 0.13 | % | | | 1.15 | % | | $ | 1,329,435 | | | | 58 | % | |
See notes to financial statements.
145
Victory Portfolios | | Financial Highlights | |
For a Share Outstanding Throughout Each Period
| | | | | Investment Activities | | Distributions to
Shareholders From | |
| | | Net Asset
Value,
Beginning of
Period | | Net
Investment
Income
(Loss)(a) | | Net Realized
and Unrealized
Gains (Losses)
on Investments | | Total from
Investment
Activities | | Net
Investment
Income | | Net Realized
Gains from
Investments | |
Victory Integrity Small/Mid-Cap Value Fund | |
Class A | |
Year Ended: | |
June 30, 2021 | | $ | 13.46 | | | | 0.05 | | | | 9.73 | | | | 9.78 | | | | (0.26 | ) | | | — | | |
June 30, 2020 | | $ | 16.70 | | | | 0.10 | | | | (3.24 | ) | | | (3.14 | ) | | | (0.10 | ) | | | — | | |
June 30, 2019 | | $ | 17.75 | | | | 0.12 | | | | (0.53 | ) | | | (0.41 | ) | | | (0.12 | ) | | | (0.52 | ) | |
June 30, 2018 | | $ | 16.04 | | | | 0.07 | | | | 1.89 | | | | 1.96 | | | | (0.05 | ) | | | (0.20 | ) | |
June 30, 2017 | | $ | 13.26 | | | | 0.02 | | | | 2.76 | | | | 2.78 | | | | — | | | | — | | |
Class R6 | |
Year Ended: | |
June 30, 2021 | | $ | 13.64 | | | | 0.14 | | | | 9.82 | | | | 9.96 | | | | (0.30 | ) | | | — | | |
June 30, 2020 | | $ | 16.91 | | | | 0.15 | | | | (3.28 | ) | | | (3.13 | ) | | | (0.14 | ) | | | — | | |
June 30, 2019 | | $ | 17.96 | | | | 0.14 | | | | (0.51 | ) | | | (0.37 | ) | | | (0.16 | ) | | | (0.52 | ) | |
June 30, 2018 | | $ | 16.20 | | | | 0.05 | | | | 1.99 | | | | 2.04 | | | | (0.08 | ) | | | (0.20 | ) | |
June 30, 2017 | | $ | 13.35 | | | | 0.03 | | | | 2.82 | | | | 2.85 | | | | — | | | | — | | |
Class Y | |
Year Ended: | |
June 30, 2021 | | $ | 13.60 | | | | 0.12 | | | | 9.81 | | | | 9.93 | | | | (0.30 | ) | | | — | | |
June 30, 2020 | | $ | 16.86 | | | | 0.14 | | | | (3.27 | ) | | | (3.13 | ) | | | (0.13 | ) | | | — | | |
June 30, 2019 | | $ | 17.92 | | | | 0.22 | | | | (0.60 | ) | | | (0.38 | ) | | | (0.16 | ) | | | (0.52 | ) | |
June 30, 2018 | | $ | 16.17 | | | | 0.12 | | | | 1.91 | | | | 2.03 | | | | (0.08 | ) | | | (0.20 | ) | |
June 30, 2017 | | $ | 13.35 | | | | 0.06 | | | | 2.78 | | | | 2.84 | | | | (0.02 | ) | | | — | | |
Member Class | |
November 3, 2020(e)
through
June 30, 2021 | | $ | 14.86 | | | | (0.27 | ) | | | 8.73 | | | | 8.46 | | | | (0.14 | ) | | | — | | |
(a) Per share net investment income (loss) has been calculated using the average daily shares method.
(b) Not annualized for periods less than one year.
(c) Annualized for periods less than one year.
(d) Portfolio turnover is calculated on the basis of the Fund as a whole without distinguishing between the classes of shares issued.
(e) Commencement of operations.
See notes to financial statements.
146
Victory Portfolios | | Financial Highlights — continued | |
For a Share Outstanding Throughout Each Period
| | | | | Ratios to Average Net Assets | | Supplemental Data | |
| | | Total
Distributions | | Net Asset
Value,
End of
Period | | Total
Return
(Excludes
Sales
Charge)(b) | | Net
Expenses(c) | | Net
Investment
Income
(Loss)(c) | | Gross
Expenses(c) | | Net Assets,
End of
Period
(000's) | | Portfolio
Turnover(b)(d) | |
Victory Integrity Small/Mid-Cap Value Fund | |
Class A | |
Year Ended: | |
June 30, 2021 | | | (0.26 | ) | | $ | 22.98 | | | | 73.21 | % | | | 1.13 | % | | | 0.27 | % | | | 1.68 | % | | $ | 6,589 | | | | 61 | % | |
June 30, 2020 | | | (0.10 | ) | | $ | 13.46 | | | | (18.97 | )% | | | 1.13 | % | | | 0.67 | % | | | 1.65 | % | | $ | 3,241 | | | | 72 | % | |
June 30, 2019 | | | (0.64 | ) | | $ | 16.70 | | | | (1.66 | )% | | | 1.13 | % | | | 0.70 | % | | | 1.71 | % | | $ | 3,626 | | | | 67 | % | |
June 30, 2018 | | | (0.25 | ) | | $ | 17.75 | | | | 12.16 | % | | | 1.13 | % | | | 0.42 | % | | | 1.74 | % | | $ | 2,996 | | | | 77 | % | |
June 30, 2017 | | | — | | | $ | 16.04 | | | | 20.97 | % | | | 1.21 | % | | | 0.13 | % | | | 2.40 | % | | $ | 2,304 | | | | 65 | % | |
Class R6 | |
Year Ended: | |
June 30, 2021 | | | (0.30 | ) | | $ | 23.30 | | | | 73.68 | % | | | 0.83 | % | | | 0.72 | % | | | 0.94 | % | | $ | 143,273 | | | | 61 | % | |
June 30, 2020 | | | (0.14 | ) | | $ | 13.64 | | | | (18.70 | )% | | | 0.83 | % | | | 0.97 | % | | | 0.97 | % | | $ | 80,284 | | | | 72 | % | |
June 30, 2019 | | | (0.68 | ) | | $ | 16.91 | | | | (1.39 | )% | | | 0.83 | % | | | 0.86 | % | | | 0.96 | % | | $ | 95,286 | | | | 67 | % | |
June 30, 2018 | | | (0.28 | ) | | $ | 17.96 | | | | 12.54 | % | | | 0.83 | % | | | 0.28 | % | | | 1.26 | % | | $ | 24,926 | | | | 77 | % | |
June 30, 2017 | | | — | | | $ | 16.20 | | | | 21.35 | % | | | 1.09 | % | | | 0.20 | % | | | 1.96 | % | | $ | 18 | | | | 65 | % | |
Class Y | |
Year Ended: | |
June 30, 2021 | | | (0.30 | ) | | $ | 23.23 | | | | 73.61 | % | | | 0.88 | % | | | 0.66 | % | | | 0.98 | % | | $ | 56,537 | | | | 61 | % | |
June 30, 2020 | | | (0.13 | ) | | $ | 13.60 | | | | (18.73 | )% | | | 0.88 | % | | | 0.92 | % | | | 1.01 | % | | $ | 32,572 | | | | 72 | % | |
June 30, 2019 | | | (0.68 | ) | | $ | 16.86 | | | | (1.45 | )% | | | 0.88 | % | | | 1.30 | % | | | 1.03 | % | | $ | 35,927 | | | | 67 | % | |
June 30, 2018 | | | (0.28 | ) | | $ | 17.92 | | | | 12.51 | % | | | 0.88 | % | | | 0.67 | % | | | 1.13 | % | | $ | 92,019 | | | | 77 | % | |
June 30, 2017 | | | (0.02 | ) | | $ | 16.17 | | | | 21.25 | % | | | 0.96 | % | | | 0.38 | % | | | 1.21 | % | | $ | 53,509 | | | | 65 | % | |
Member Class | |
November 3, 2020(e)
through
June 30, 2021 | | | (0.14 | ) | | $ | 23.18 | | | | 57.17 | % | | | 0.95 | % | | | (1.84 | )% | | | 4.39 | % | | $ | 2,388 | | | | 61 | % | |
See notes to financial statements.
147
Victory Portfolios | | Financial Highlights | |
For a Share Outstanding Throughout Each Period
| | | | | Investment Activities | | Distributions to
Shareholders From | |
| | | Net Asset
Value,
Beginning of
Period | | Net
Investment
Income
(Loss)(a) | | Net Realized
and Unrealized
Gains (Losses)
on Investments | | Total from
Investment
Activities | | Net
Investment
Income | | Net Realized
Gains from
Investments | |
Victory Munder Multi-Cap Fund | |
Class A | |
Year Ended: | |
June 30, 2021 | | $ | 38.28 | | | | (0.09 | ) | | | 15.41 | | | | 15.32 | | | | (0.03 | ) | | | — | | |
June 30, 2020 | | $ | 38.75 | | | | 0.03 | | | | 0.65 | | | | 0.68 | | | | (0.10 | ) | | | (1.05 | ) | |
June 30, 2019 | | $ | 44.99 | | | | 0.10 | | | | 0.08 | | | | 0.18 | | | | — | | | | (6.42 | ) | |
June 30, 2018 | | $ | 41.77 | | | | (0.03 | ) | | | 5.71 | | | | 5.68 | | | | — | (c) | | | (2.46 | ) | |
June 30, 2017 | | $ | 35.58 | | | | 0.02 | | | | 6.17 | | | | 6.19 | | | | — | | | | — | | |
Class C | |
Year Ended: | |
June 30, 2021 | | $ | 29.35 | | | | (0.35 | ) | | | 11.76 | | | | 11.41 | | | | — | | | | — | | |
June 30, 2020 | | $ | 30.10 | | | | (0.22 | ) | | | 0.52 | | | | 0.30 | | | | — | | | | (1.05 | ) | |
June 30, 2019 | | $ | 36.81 | | | | (0.16 | ) | | | (0.13 | ) | | | (0.29 | ) | | | — | | | | (6.42 | ) | |
June 30, 2018 | | $ | 34.82 | | | | (0.34 | ) | | | 4.79 | | | | 4.45 | | | | — | | | | (2.46 | ) | |
June 30, 2017 | | $ | 29.90 | | | | (0.26 | ) | | | 5.18 | | | | 4.92 | | | | — | | | | — | | |
Class Y | |
Year Ended: | |
June 30, 2021 | | $ | 42.05 | | | | 0.08 | | | | 16.93 | | | | 17.01 | | | | (0.18 | ) | | | — | | |
June 30, 2020 | | $ | 42.42 | | | | 0.19 | | | | 0.72 | | | | 0.91 | | | | (0.23 | ) | | | (1.05 | ) | |
June 30, 2019 | | $ | 48.41 | | | | 0.27 | | | | 0.16 | | | | 0.43 | | | | — | | | | (6.42 | ) | |
June 30, 2018 | | $ | 44.62 | | | | 0.14 | | | | 6.11 | | | | 6.25 | | | | — | | | | (2.46 | ) | |
June 30, 2017 | | $ | 37.86 | | | | 0.17 | | | | 6.59 | | | | 6.76 | | | | — | | | | — | | |
* Includes adjustments in accordance with U.S. Generally Accepted Accounting Principles.
(a) Per share net investment income (loss) has been calculated using the average daily shares method.
(b) Portfolio turnover is calculated on the basis of the Fund as a whole without distinguishing between the classes of shares issued.
(c) Amount is less than $0.005 per share.
(d) During the year ended June 30, 2018, the Fund received monies related to certain nonrecurring litigation settlements. The corresponding impact to the total return was an increase of 0.22%.
See notes to financial statements.
148
Victory Portfolios | | Financial Highlights — continued | |
For a Share Outstanding Throughout Each Period
| | | | | Ratios to Average Net Assets | | Supplemental Data | |
| | | Total
Distributions | | Net Asset
Value,
End of
Period | | Total
Return
(Excludes
Sales
Charge)* | | Net
Expenses | | Net
Investment
Income
(Loss) | | Gross
Expenses | | Net Assets,
End of
Period
(000's) | | Portfolio
Turnover(b) | |
Victory Munder Multi-Cap Fund | |
Class A | |
Year Ended: | |
June 30, 2021 | | | (0.03 | ) | | $ | 53.57 | | | | 40.04 | % | | | 1.35 | % | | | (0.20 | )% | | | 1.35 | % | | $ | 393,769 | | | | 70 | % | |
June 30, 2020 | | | (1.15 | ) | | $ | 38.28 | | | | 1.53 | % | | | 1.35 | % | | | 0.09 | % | | | 1.35 | % | | $ | 311,642 | | | | 100 | % | |
June 30, 2019 | | | (6.42 | ) | | $ | 38.75 | | | | 2.86 | % | | | 1.36 | % | | | 0.25 | % | | | 1.36 | % | | $ | 346,180 | | | | 107 | % | |
June 30, 2018 | | | (2.46 | ) | | $ | 44.99 | | | | 13.37 | %(d) | | | 1.36 | % | | | (0.07 | )% | | | 1.36 | % | | $ | 374,259 | | | | 123 | % | |
June 30, 2017 | | | — | | | $ | 41.77 | | | | 17.40 | % | | | 1.38 | % | | | 0.04 | % | | | 1.38 | % | | $ | 341,279 | | | | 109 | % | |
Class C | |
Year Ended: | |
June 30, 2021 | | | — | | | $ | 40.76 | | | | 38.88 | % | | | 2.16 | % | | | (1.00 | )% | | | 2.32 | % | | $ | 4,339 | | | | 70 | % | |
June 30, 2020 | | | (1.05 | ) | | $ | 29.35 | | | | 0.69 | % | | | 2.18 | % | | | (0.73 | )% | | | 2.20 | % | | $ | 5,769 | | | | 100 | % | |
June 30, 2019 | | | (6.42 | ) | | $ | 30.10 | | | | 2.21 | % | | | 2.07 | % | | | (0.48 | )% | | | 2.07 | % | | $ | 10,056 | | | | 107 | % | |
June 30, 2018 | | | (2.46 | ) | | $ | 36.81 | | | | 12.48 | %(d) | | | 2.16 | % | | | (0.91 | )% | | | 2.16 | % | | $ | 18,383 | | | | 123 | % | |
June 30, 2017 | | | — | | | $ | 34.82 | | | | 16.45 | % | | | 2.21 | % | | | (0.80 | )% | | | 2.21 | % | | $ | 57,690 | | | | 109 | % | |
Class Y | |
Year Ended: | |
June 30, 2021 | | | (0.18 | ) | | $ | 58.88 | | | | 40.51 | % | | | 0.99 | % | | | 0.16 | % | | | 0.99 | % | | $ | 40,374 | | | | 70 | % | |
June 30, 2020 | | | (1.28 | ) | | $ | 42.05 | | | | 1.92 | % | | | 0.99 | % | | | 0.46 | % | | | 0.99 | % | | $ | 30,258 | | | | 100 | % | |
June 30, 2019 | | | (6.42 | ) | | $ | 42.42 | | | | 3.21 | % | | | 1.00 | % | | | 0.61 | % | | | 1.00 | % | | $ | 30,776 | | | | 107 | % | |
June 30, 2018 | | | (2.46 | ) | | $ | 48.41 | | | | 13.81 | %(d) | | | 1.00 | % | | | 0.29 | % | | | 1.00 | % | | $ | 33,503 | | | | 123 | % | |
June 30, 2017 | | | — | | | $ | 44.62 | | | | 17.86 | % | | | 1.01 | % | | | 0.42 | % | | | 1.01 | % | | $ | 24,032 | | | | 109 | % | |
See notes to financial statements.
149
Victory Portfolios | | Financial Highlights | |
For a Share Outstanding Throughout Each Period
| | | | | Investment Activities | | Distributions to
Shareholders From | |
| | | Net Asset
Value,
Beginning of
Period | | Net
Investment
Income
(Loss)(a) | | Net Realized
and Unrealized
Gains (Losses)
on Investments | | Total from
Investment
Activities | | Net
Investment
Income | | Net Realized
Gains from
Investments | |
Victory S&P 500 Index Fund | |
Class A | |
Year Ended: | |
June 30, 2021 | | $ | 19.80 | | | | 0.22 | | | | 7.43 | | | | 7.65 | | | | (0.24 | ) | | | (1.37 | ) | |
June 30, 2020 | | $ | 21.07 | | | | 0.29 | | | | 1.20 | | | | 1.49 | | | | (0.28 | ) | | | (2.48 | ) | |
June 30, 2019 | | $ | 21.52 | | | | 0.31 | | | | 1.43 | | | | 1.74 | | | | (0.33 | ) | | | (1.86 | ) | |
June 30, 2018 | | $ | 22.20 | | | | 0.31 | | | | 2.65 | | | | 2.96 | | | | (0.31 | ) | | | (3.33 | ) | |
June 30, 2017 | | $ | 20.54 | | | | 0.31 | | | | 3.08 | | | | 3.39 | | | | (0.34 | ) | | | (1.39 | ) | |
Class R | |
Year Ended: | |
June 30, 2021 | | $ | 19.74 | | | | 0.13 | | | | 7.39 | | | | 7.52 | | | | (0.15 | ) | | | (1.37 | ) | |
June 30, 2020 | | $ | 21.01 | | | | 0.21 | | | | 1.21 | | | | 1.42 | | | | (0.21 | ) | | | (2.48 | ) | |
June 30, 2019 | | $ | 21.47 | | | | 0.22 | | | | 1.43 | | | | 1.65 | | | | (0.25 | ) | | | (1.86 | ) | |
June 30, 2018 | | $ | 22.15 | | | | 0.21 | | | | 2.66 | | | | 2.87 | | | | (0.22 | ) | | | (3.33 | ) | |
June 30, 2017 | | $ | 20.51 | | | | 0.22 | | | | 3.06 | | | | 3.28 | | | | (0.25 | ) | | | (1.39 | ) | |
Class Y | |
Year Ended: | |
June 30, 2021 | | $ | 19.96 | | | | 0.25 | | | | 7.49 | | | | 7.74 | | | | (0.26 | ) | | | (1.37 | ) | |
June 30, 2020 | | $ | 21.22 | | | | 0.32 | | | | 1.21 | | | | 1.53 | | | | (0.31 | ) | | | (2.48 | ) | |
June 30, 2019 | | $ | 21.66 | | | | 0.33 | | | | 1.45 | | | | 1.78 | | | | (0.36 | ) | | | (1.86 | ) | |
June 30, 2018 | | $ | 22.31 | | | | 0.35 | | | | 2.67 | | | | 3.02 | | | | (0.34 | ) | | | (3.33 | ) | |
June 30, 2017 | | $ | 20.64 | | | | 0.36 | | | | 3.08 | | | | 3.44 | | | | (0.38 | ) | | | (1.39 | ) | |
* Includes adjustments in accordance with U.S. Generally Accepted Accounting Principles.
(a) Per share net investment income (loss) has been calculated using the average daily shares method.
(b) Portfolio turnover is calculated on the basis of the Fund as a whole without distinguishing between the classes of shares issued.
See notes to financial statements.
150
Victory Portfolios | | Financial Highlights — continued | |
For a Share Outstanding Throughout Each Period
| | | | | Ratios to Average Net Assets | | Supplemental Data | |
| | | Total
Distributions | | Net Asset
Value,
End of
Period | | Total
Return
(Excludes
Sales
Charge)* | | Net
Expenses | | Net
Investment
Income
(Loss) | | Gross
Expenses | | Net Assets,
End of
Period
(000's) | | Portfolio
Turnover(b) | |
Victory S&P 500 Index Fund | |
Class A | |
Year Ended: | |
June 30, 2021 | | | (1.61 | ) | | $ | 25.84 | | | | 40.00 | % | | | 0.55 | % | | | 0.97 | % | | | 0.55 | % | | $ | 194,818 | | | | 3 | % | |
June 30, 2020 | | | (2.76 | ) | | $ | 19.80 | | | | 6.96 | % | | | 0.55 | % | | | 1.42 | % | | | 0.55 | % | | $ | 153,714 | | | | 4 | % | |
June 30, 2019 | | | (2.19 | ) | | $ | 21.07 | | | | 9.80 | % | | | 0.53 | % | | | 1.46 | % | | | 0.53 | % | | $ | 188,004 | | | | 3 | % | |
June 30, 2018 | | | (3.64 | ) | | $ | 21.52 | | | | 13.73 | % | | | 0.55 | % | | | 1.38 | % | | | 0.55 | % | | $ | 192,530 | | | | 2 | % | |
June 30, 2017 | | | (1.73 | ) | | $ | 22.20 | | | | 17.16 | % | | | 0.58 | % | | | 1.47 | % | | | 0.58 | % | | $ | 192,390 | | | | 4 | % | |
Class R | |
Year Ended: | |
June 30, 2021 | | | (1.52 | ) | | $ | 25.74 | | | | 39.38 | % | | | 0.95 | % | | | 0.57 | % | | | 0.95 | % | | $ | 17,907 | | | | 3 | % | |
June 30, 2020 | | | (2.69 | ) | | $ | 19.74 | | | | 6.57 | % | | | 0.95 | % | | | 1.02 | % | | | 0.95 | % | | $ | 13,726 | | | | 4 | % | |
June 30, 2019 | | | (2.11 | ) | | $ | 21.01 | | | | 9.31 | % | | | 0.96 | % | | | 1.04 | % | | | 0.96 | % | | $ | 14,501 | | | | 3 | % | |
June 30, 2018 | | | (3.55 | ) | | $ | 21.47 | | | | 13.31 | % | | | 0.97 | % | | | 0.97 | % | | | 0.97 | % | | $ | 17,052 | | | | 2 | % | |
June 30, 2017 | | | (1.64 | ) | | $ | 22.15 | | | | 16.59 | % | | | 1.03 | % | | | 1.02 | % | | | 1.03 | % | | $ | 15,487 | | | | 4 | % | |
Class Y | |
Year Ended: | |
June 30, 2021 | | | (1.63 | ) | | $ | 26.07 | | | | 40.16 | % | | | 0.45 | % | | | 1.07 | % | | | 0.45 | % | | $ | 56,607 | | | | 3 | % | |
June 30, 2020 | | | (2.79 | ) | | $ | 19.96 | | | | 7.07 | % | | | 0.43 | % | | | 1.56 | % | | | 0.43 | % | | $ | 46,072 | | | | 4 | % | |
June 30, 2019 | | | (2.22 | ) | | $ | 21.22 | | | | 9.93 | % | | | 0.43 | % | | | 1.57 | % | | | 0.43 | % | | $ | 32,146 | | | | 3 | % | |
June 30, 2018 | | | (3.67 | ) | | $ | 21.66 | | | | 13.96 | % | | | 0.39 | % | | | 1.57 | % | | | 0.39 | % | | $ | 19,932 | | | | 2 | % | |
June 30, 2017 | | | (1.77 | ) | | $ | 22.31 | | | | 17.33 | % | | | 0.40 | % | | | 1.66 | % | | | 0.40 | % | | $ | 28,148 | | | | 4 | % | |
See notes to financial statements.
151
Victory Portfolios | | Financial Highlights | |
For a Share Outstanding Throughout Each Period
| | | | | Investment Activities | | Distributions to
Shareholders From | |
| | | Net Asset
Value,
Beginning of
Period | | Net
Investment
Income
(Loss)(a) | | Net Realized
and Unrealized
Gains (Losses)
on Investments | | Total from
Investment
Activities | | Net Realized
Gains from
Investments | | Total
Distributions | |
Victory Munder Mid-Cap Core Growth Fund | |
Class A | |
Year Ended: | |
June 30, 2021 | | $ | 11.76 | | | | (0.09 | ) | | | 5.40 | | | | 5.31 | | | | (1.66 | ) | | | (1.66 | ) | |
June 30, 2020 | | $ | 22.95 | | | | (0.07 | ) | | | 0.01 | (c) | | | (0.06 | ) | | | (11.13 | ) | | | (11.13 | ) | |
June 30, 2019 | | $ | 34.56 | | | | (0.13 | ) | | | (0.72 | ) | | | (0.85 | ) | | | (10.76 | ) | | | (10.76 | ) | |
June 30, 2018 | | $ | 37.21 | | | | (0.11 | ) | | | 4.55 | | | | 4.44 | | | | (7.09 | ) | | | (7.09 | ) | |
June 30, 2017 | | $ | 35.99 | | | | (0.08 | ) | | | 5.79 | | | | 5.71 | | | | (4.49 | ) | | | (4.49 | ) | |
Class C | |
Year Ended: | |
June 30, 2021 | | $ | 4.90 | | | | (0.07 | ) | | | 2.08 | | | | 2.01 | | | | (1.66 | ) | | | (1.66 | ) | |
June 30, 2020 | | $ | 15.96 | | | | (0.10 | ) | | | 0.17 | (c) | | | 0.07 | | | | (11.13 | ) | | | (11.13 | ) | |
June 30, 2019 | | $ | 27.98 | | | | (0.23 | ) | | | (1.03 | ) | | | (1.26 | ) | | | (10.76 | ) | | | (10.76 | ) | |
June 30, 2018 | | $ | 31.54 | | | | (0.29 | ) | | | 3.82 | | | | 3.53 | | | | (7.09 | ) | | | (7.09 | ) | |
June 30, 2017 | | $ | 31.34 | | | | (0.27 | ) | | | 4.96 | | | | 4.69 | | | | (4.49 | ) | | | (4.49 | ) | |
Class R | |
Year Ended: | |
June 30, 2021 | | $ | 9.98 | | | | (0.11 | ) | | | 4.54 | | | | 4.43 | | | | (1.66 | ) | | | (1.66 | ) | |
June 30, 2020 | | $ | 21.16 | | | | (0.09 | ) | | | 0.04 | (c) | | | (0.05 | ) | | | (11.13 | ) | | | (11.13 | ) | |
June 30, 2019 | | $ | 32.91 | | | | (0.20 | ) | | | (0.79 | ) | | | (0.99 | ) | | | (10.76 | ) | | | (10.76 | ) | |
June 30, 2018 | | $ | 35.82 | | | | (0.20 | ) | | | 4.38 | | | | 4.18 | | | | (7.09 | ) | | | (7.09 | ) | |
June 30, 2017 | | $ | 34.89 | | | | (0.16 | ) | | | 5.58 | | | | 5.42 | | | | (4.49 | ) | | | (4.49 | ) | |
Class R6 | |
Year Ended: | |
June 30, 2021 | | $ | 14.80 | | | | (0.04 | ) | | | 6.89 | | | | 6.85 | | | | (1.66 | ) | | | (1.66 | ) | |
June 30, 2020 | | $ | 26.00 | | | | — | (d) | | | (0.07 | ) | | | (0.07 | ) | | | (11.13 | ) | | | (11.13 | ) | |
June 30, 2019 | | $ | 37.36 | | | | — | (d) | | | (0.60 | ) | | | (0.60 | ) | | | (10.76 | ) | | | (10.76 | ) | |
June 30, 2018 | | $ | 39.55 | | | | 0.06 | | | | 4.84 | | | | 4.90 | | | | (7.09 | ) | | | (7.09 | ) | |
June 30, 2017 | | $ | 37.82 | | | | 0.10 | | | | 6.12 | | | | 6.22 | | | | (4.49 | ) | | | (4.49 | ) | |
Class Y | |
Year Ended: | |
June 30, 2021 | | $ | 14.15 | | | | (0.05 | ) | | | 6.56 | | | | 6.51 | | | | (1.66 | ) | | | (1.66 | ) | |
June 30, 2020 | | $ | 25.37 | | | | (0.04 | ) | | | (0.05 | ) | | | (0.09 | ) | | | (11.13 | ) | | | (11.13 | ) | |
June 30, 2019 | | $ | 36.79 | | | | (0.07 | ) | | | (0.59 | ) | | | (0.66 | ) | | | (10.76 | ) | | | (10.76 | ) | |
June 30, 2018 | | $ | 39.10 | | | | (0.01 | ) | | | 4.79 | | | | 4.78 | | | | (7.09 | ) | | | (7.09 | ) | |
June 30, 2017 | | $ | 37.51 | | | | 0.02 | | | | 6.06 | | | | 6.08 | | | | (4.49 | ) | | | (4.49 | ) | |
(a) Per share net investment income (loss) has been calculated using the average daily shares method.
(b) Portfolio turnover is calculated on the basis of the Fund as a whole without distinguishing between the classes of shares issued.
(c) The amount shown reflects a net realized and unrealized gain per share, whereas the statement of operations reflected a net realized and unrealized loss for the period for the Fund in total. The difference in realized and unrealized gains and losses for the Fund versus the class is due to the timing of sales and repurchases of the class in relation to fluctuating market values during the period.
(d) Amount is less than $0.005 per share.
See notes to financial statements.
152
Victory Portfolios | | Financial Highlights — continued | |
For a Share Outstanding Throughout Each Period
| | | | | Ratios to Average Net Assets | | Supplemental Data | |
| | | Net Asset
Value, End
of Period | | Total
Return
(Excludes
Sales
Charge) | | Net
Expenses | | Net
Investment
Income
(Loss) | | Gross
Expenses | | Net Assets,
End of
Period
(000's) | | Portfolio
Turnover(b) | |
Victory Munder Mid-Cap Core Growth Fund | |
Class A | |
Year Ended: | |
June 30, 2021 | | $ | 15.41 | | | | 47.52 | % | | | 1.27 | % | | | (0.62 | )% | | | 1.27 | % | | $ | 216,453 | | | | 103 | % | |
June 30, 2020 | | $ | 11.76 | | | | (3.04 | )% | | | 1.29 | % | | | (0.40 | )% | | | 1.29 | % | | $ | 186,571 | | | | 86 | % | |
June 30, 2019 | | $ | 22.95 | | | | 4.18 | % | | | 1.28 | % | | | (0.49 | )% | | | 1.28 | % | | $ | 292,120 | | | | 82 | % | |
June 30, 2018 | | $ | 34.56 | | | | 12.08 | % | | | 1.28 | % | | | (0.29 | )% | | | 1.28 | % | | $ | 575,926 | | | | 50 | % | |
June 30, 2017 | | $ | 37.21 | | | | 17.18 | % | | | 1.31 | % | | | (0.21 | )% | | | 1.31 | % | | $ | 657,496 | | | | 55 | % | |
Class C | |
Year Ended: | |
June 30, 2021 | | $ | 5.25 | | | | 46.51 | % | | | 2.06 | % | | | (1.40 | )% | | | 2.06 | % | | $ | 9,806 | | | | 103 | % | |
June 30, 2020 | | $ | 4.90 | | | | (3.82 | )% | | | 2.03 | % | | | (1.15 | )% | | | 2.03 | % | | $ | 14,053 | | | | 86 | % | |
June 30, 2019 | | $ | 15.96 | | | | 3.51 | % | | | 1.94 | % | | | (1.14 | )% | | | 1.94 | % | | $ | 26,825 | | | | 82 | % | |
June 30, 2018 | | $ | 27.98 | | | | 11.28 | % | | | 1.96 | % | | | (0.94 | )% | | | 1.96 | % | | $ | 52,210 | | | | 50 | % | |
June 30, 2017 | | $ | 31.54 | | | | 16.43 | % | | | 1.97 | % | | | (0.88 | )% | | | 1.97 | % | | $ | 148,305 | | | | 55 | % | |
Class R | |
Year Ended: | |
June 30, 2021 | | $ | 12.75 | | | | 47.15 | % | | | 1.57 | % | | | (0.92 | )% | | | 1.69 | % | | $ | 13,463 | | | | 103 | % | |
June 30, 2020 | | $ | 9.98 | | | | (3.28 | )% | | | 1.57 | % | | | (0.68 | )% | | | 1.67 | % | | $ | 12,943 | | | | 86 | % | |
June 30, 2019 | | $ | 21.16 | | | | 3.85 | % | | | 1.57 | % | | | (0.79 | )% | | | 1.69 | % | | $ | 18,438 | | | | 82 | % | |
June 30, 2018 | | $ | 32.91 | | | | 11.79 | % | | | 1.57 | % | | | (0.58 | )% | | | 1.65 | % | | $ | 25,939 | | | | 50 | % | |
June 30, 2017 | | $ | 35.82 | | | | 16.87 | % | | | 1.57 | % | | | (0.47 | )% | | | 1.64 | % | | $ | 32,913 | | | | 55 | % | |
Class R6 | |
Year Ended: | |
June 30, 2021 | | $ | 19.99 | | | | 48.19 | % | | | 0.87 | % | | | (0.21 | )% | | | 0.87 | % | | $ | 98,852 | | | | 103 | % | |
June 30, 2020 | | $ | 14.80 | | | | (2.60 | )% | | | 0.86 | % | | | 0.01 | % | | | 0.86 | % | | $ | 113,104 | | | | 86 | % | |
June 30, 2019 | | $ | 26.00 | | | | 4.57 | % | | | 0.87 | % | | | (0.01 | )% | | | 0.87 | % | | $ | 310,949 | | | | 82 | % | |
June 30, 2018 | | $ | 37.36 | | | | 12.56 | % | | | 0.84 | % | | | 0.15 | % | | | 0.84 | % | | $ | 685,568 | | | | 50 | % | |
June 30, 2017 | | $ | 39.55 | | | | 17.73 | % | | | 0.85 | % | | | 0.26 | % | | | 0.85 | % | | $ | 761,607 | | | | 55 | % | |
Class Y | |
Year Ended: | |
June 30, 2021 | | $ | 19.00 | | | | 48.00 | % | | | 0.98 | % | | | (0.33 | )% | | | 0.98 | % | | $ | 242,860 | | | | 103 | % | |
June 30, 2020 | | $ | 14.15 | | | | (2.76 | )% | | | 1.04 | % | | | (0.18 | )% | | | 1.04 | % | | $ | 257,692 | | | | 86 | % | |
June 30, 2019 | | $ | 25.37 | | | | 4.47 | % | | | 1.02 | % | | | (0.22 | )% | | | 1.02 | % | | $ | 810,261 | | | | 82 | % | |
June 30, 2018 | | $ | 36.79 | | | | 12.38 | % | | | 1.01 | % | | | (0.02 | )% | | | 1.01 | % | | $ | 2,240,305 | | | | 50 | % | |
June 30, 2017 | | $ | 39.10 | | | | 17.49 | % | | | 1.04 | % | | | 0.06 | % | | | 1.05 | % | | $ | 2,345,812 | | | | 55 | % | |
See notes to financial statements.
153
Victory Portfolios | | Financial Highlights | |
For a Share Outstanding Throughout Each Period
| | | | | Investment Activities | | Distributions to
Shareholders From | |
| | | Net Asset
Value,
Beginning of
Period | | Net
Investment
Income
(Loss)(a) | | Net Realized
and Unrealized
Gains (Losses)
on Investments | | Total from
Investment
Activities | | Net
Investment
Income | | Net Realized
Gains from
Investments | |
Victory Munder Small Cap Growth Fund | |
Class A | |
Year Ended: | |
June 30, 2021 | | $ | 14.13 | | | | (0.16 | ) | | | 7.85 | | | | 7.69 | | | | (0.02 | ) | | | (1.42 | ) | |
June 30, 2020 | | $ | 13.39 | | | | (0.09 | ) | | | 1.88 | | | | 1.79 | | | | — | | | | (1.05 | ) | |
June 30, 2019 | | $ | 13.81 | | | | (0.12 | ) | | | 1.12 | | | | 1.00 | | | | — | | | | (1.42 | ) | |
June 30, 2018 | | $ | 11.14 | | | | (0.10 | ) | | | 2.84 | | | | 2.74 | | | | — | | | | (0.07 | ) | |
June 30, 2017 | | $ | 8.59 | | | | (0.05 | ) | | | 2.60 | | | | 2.55 | | | | — | | | | — | | |
Class I | |
Year Ended: | |
June 30, 2021 | | $ | 14.35 | | | | (0.11 | ) | | | 7.98 | | | | 7.87 | | | | (0.05 | ) | | | (1.42 | ) | |
June 30, 2020 | | $ | 13.56 | | | | (0.05 | ) | | | 1.89 | | | | 1.84 | | | | — | | | | (1.05 | ) | |
June 30, 2019 | | $ | 13.92 | | | | (0.09 | ) | | | 1.15 | | | | 1.06 | | | | — | | | | (1.42 | ) | |
June 30, 2018 | | $ | 11.21 | | | | (0.07 | ) | | | 2.85 | | | | 2.78 | | | | — | | | | (0.07 | ) | |
June 30, 2017 | | $ | 8.62 | | | | (0.01 | ) | | | 2.60 | | | | 2.59 | | | | — | | | | — | | |
Class Y | |
Year Ended: | |
June 30, 2021 | | $ | 14.20 | | | | (0.13 | ) | | | 7.89 | | | | 7.76 | | | | (0.03 | ) | | | (1.42 | ) | |
June 30, 2020 | | $ | 13.44 | | | | (0.06 | ) | | | 1.87 | | | | 1.81 | | | | — | | | | (1.05 | ) | |
June 30, 2019 | | $ | 13.88 | | | | (0.11 | ) | | | 1.09 | | | | 0.98 | | | | — | | | | (1.42 | ) | |
June 30, 2018 | | $ | 11.18 | | | | (0.09 | ) | | | 2.86 | | | | 2.77 | | | | — | | | | (0.07 | ) | |
June 30, 2017 | | $ | 8.61 | | | | (0.02 | ) | | | 2.59 | | | | 2.57 | | | | — | | | | — | | |
(a) Per share net investment income (loss) has been calculated using the average daily shares method.
(b) Portfolio turnover is calculated on the basis of the Fund as a whole without distinguishing between the classes of shares issued.
See notes to financial statements.
154
Victory Portfolios | | Financial Highlights — continued | |
For a Share Outstanding Throughout Each Period
| | | | | Ratios to Average Net Assets | | Supplemental Data | |
| | | Total
Distributions | | Net Asset
Value,
End of
Period | | Total
Return
(Excludes
Sales
Charge) | | Net
Expenses | | Net
Investment
Income
(Loss) | | Gross
Expenses | | Net Assets,
End of
Period
(000's) | | Portfolio
Turnover(b) | |
Victory Munder Small Cap Growth Fund | |
Class A | |
Year Ended: | |
June 30, 2021 | | | (1.44 | ) | | $ | 20.38 | | | | 56.27 | % | | | 1.40 | % | | | (0.89 | )% | | | 2.09 | % | | $ | 614 | | | | 28 | % | |
June 30, 2020 | | | (1.05 | ) | | $ | 14.13 | | | | 13.64 | % | | | 1.40 | % | | | (0.67 | )% | | | 2.26 | % | | $ | 359 | | | | 56 | % | |
June 30, 2019 | | | (1.42 | ) | | $ | 13.39 | | | | 10.06 | % | | | 1.40 | % | | | (0.90 | )% | | | 2.31 | % | | $ | 189 | | | | 108 | % | |
June 30, 2018 | | | (0.07 | ) | | $ | 13.81 | | | | 24.73 | % | | | 1.40 | % | | | (0.86 | )% | | | 2.69 | % | | $ | 174 | | | | 62 | % | |
June 30, 2017 | | | — | | | $ | 11.14 | | | | 29.69 | % | | | 1.40 | % | | | (0.52 | )% | | | 4.67 | % | | $ | 83 | | | | 56 | % | |
Class I | |
Year Ended: | |
June 30, 2021 | | | (1.47 | ) | | $ | 20.75 | | | | 56.71 | % | | | 1.15 | % | | | (0.64 | )% | | | 1.22 | % | | $ | 16,328 | | | | 28 | % | |
June 30, 2020 | | | (1.05 | ) | | $ | 14.35 | | | | 13.85 | % | | | 1.15 | % | | | (0.39 | )% | | | 1.32 | % | | $ | 10,370 | | | | 56 | % | |
June 30, 2019 | | | (1.42 | ) | | $ | 13.56 | | | | 10.44 | % | | | 1.15 | % | | | (0.65 | )% | | | 1.17 | % | | $ | 9,034 | | | | 108 | % | |
June 30, 2018 | | | (0.07 | ) | | $ | 13.92 | | | | 24.94 | % | | | 1.15 | % | | | (0.61 | )% | | | 1.31 | % | | $ | 7,518 | | | | 62 | % | |
June 30, 2017 | | | — | | | $ | 11.21 | | | | 30.05 | % | | | 1.15 | % | | | (0.12 | )% | | | 1.37 | % | | $ | 6,049 | | | | 56 | % | |
Class Y | |
Year Ended: | |
June 30, 2021 | | | (1.45 | ) | | $ | 20.51 | | | | 56.57 | % | | | 1.25 | % | | | (0.74 | )% | | | 1.85 | % | | $ | 158 | | | | 28 | % | |
June 30, 2020 | | | (1.05 | ) | | $ | 14.20 | | | | 13.74 | % | | | 1.25 | % | | | (0.49 | )% | | | 2.84 | % | | $ | 87 | | | | 56 | % | |
June 30, 2019 | | | (1.42 | ) | | $ | 13.44 | | | | 9.84 | % | | | 1.25 | % | | | (0.77 | )% | | | 1.45 | % | | $ | 77 | | | | 108 | % | |
June 30, 2018 | | | (0.07 | ) | | $ | 13.88 | | | | 24.92 | % | | | 1.25 | % | | | (0.71 | )% | | | 2.98 | % | | $ | 70 | | | | 62 | % | |
June 30, 2017 | | | — | | | $ | 11.18 | | | | 29.85 | % | | | 1.25 | % | | | (0.22 | )% | | | 3.98 | % | | $ | 56 | | | | 56 | % | |
See notes to financial statements.
155
Victory Portfolios | | Financial Highlights | |
For a Share Outstanding Throughout Each Period
| | | | | Investment Activities | | Distributions to
Shareholders From | |
| | | Net Asset
Value,
Beginning of
Period | | Net
Investment
Income
(Loss)(a) | | Net Realized
and Unrealized
Gains (Losses)
on Investments | | Total from
Investment
Activities | | Net
Investment
Income | | Net Realized
Gains from
Investments | |
Victory Trivalent International Fund-Core Equity | |
Class A | |
Year Ended: | |
June 30, 2021 | | $ | 6.49 | | | | 0.18 | | | | 1.77 | | | | 1.95 | | | | (0.09 | ) | | | — | | |
June 30, 2020 | | $ | 6.87 | | | | 0.12 | | | | (0.44 | ) | | | (0.32 | ) | | | (0.06 | ) | | | — | | |
June 30, 2019 | | $ | 7.28 | | | | 0.14 | | | | (0.30 | ) | | | (0.16 | ) | | | (0.13 | ) | | | (0.12 | ) | |
June 30, 2018 | | $ | 7.21 | | | | 0.13 | | | | 0.44 | | | | 0.57 | | | | (0.13 | ) | | | (0.37 | ) | |
June 30, 2017 | | $ | 6.18 | | | | 0.08 | | | | 1.07 | | | | 1.15 | | | | (0.12 | ) | | | — | | |
Class C | |
Year Ended: | |
June 30, 2021 | | $ | 6.46 | | | | 0.12 | | | | 1.76 | | | | 1.88 | | | | (0.01 | ) | | | — | | |
June 30, 2020 | | $ | 6.84 | | | | 0.06 | | | | (0.43 | ) | | | (0.37 | ) | | | (0.01 | ) | | | — | | |
June 30, 2019 | | $ | 7.22 | | | | 0.08 | | | | (0.27 | ) | | | (0.19 | ) | | | (0.07 | ) | | | (0.12 | ) | |
June 30, 2018 | | $ | 7.16 | | | | 0.05 | | | | 0.45 | | | | 0.50 | | | | (0.07 | ) | | | (0.37 | ) | |
June 30, 2017 | | $ | 6.14 | | | | 0.03 | | | | 1.07 | | | | 1.10 | | | | (0.08 | ) | | | — | | |
Class I | |
Year Ended: | |
June 30, 2021 | | $ | 6.53 | | | | 0.21 | | | | 1.78 | | | | 1.99 | | | | (0.12 | ) | | | — | | |
June 30, 2020 | | $ | 6.90 | | | | 0.14 | | | | (0.43 | ) | | | (0.29 | ) | | | (0.08 | ) | | | — | | |
June 30, 2019 | | $ | 7.29 | | | | 0.17 | | | | (0.30 | ) | | | (0.13 | ) | | | (0.14 | ) | | | (0.12 | ) | |
June 30, 2018 | | $ | 7.23 | | | | 0.24 | | | | 0.34 | | | | 0.58 | | | | (0.15 | ) | | | (0.37 | ) | |
June 30, 2017 | | $ | 6.20 | | | | 0.12 | | | | 1.06 | | | | 1.18 | | | | (0.15 | ) | | | — | | |
Class R6 | |
Year Ended: | |
June 30, 2021 | | $ | 6.57 | | | | 0.21 | | | | 1.78 | | | | 1.99 | | | | (0.11 | ) | | | — | | |
June 30, 2020 | | $ | 6.92 | | | | 0.14 | | | | (0.43 | ) | | | (0.29 | ) | | | (0.06 | ) | | | — | | |
June 30, 2019 | | $ | 7.31 | | | | 0.17 | | | | (0.29 | ) | | | (0.12 | ) | | | (0.15 | ) | | | (0.12 | ) | |
June 30, 2018 | | $ | 7.23 | | | | 0.21 | | | | 0.39 | | | | 0.60 | | | | (0.15 | ) | | | (0.37 | ) | |
June 30, 2017 | | $ | 6.21 | | | | 0.11 | | | | 1.07 | | | | 1.18 | | | | (0.16 | ) | | | — | | |
Class Y | |
Year Ended: | |
June 30, 2021 | | $ | 6.48 | | | | 0.20 | | | | 1.77 | | | | 1.97 | | | | (0.11 | ) | | | — | | |
June 30, 2020 | | $ | 6.87 | | | | 0.13 | | | | (0.44 | ) | | | (0.31 | ) | | | (0.08 | ) | | | — | | |
June 30, 2019 | | $ | 7.26 | | | | 0.15 | | | | (0.28 | ) | | | (0.13 | ) | | | (0.14 | ) | | | (0.12 | ) | |
June 30, 2018 | | $ | 7.20 | | | | 0.12 | | | | 0.46 | | | | 0.58 | | | | (0.15 | ) | | | (0.37 | ) | |
June 30, 2017 | | $ | 6.17 | | | | 0.09 | | | | 1.08 | | | | 1.17 | | | | (0.14 | ) | | | — | | |
* Includes adjustments in accordance with U.S. Generally Accepted Accounting Principles.
(a) Per share net investment income (loss) has been calculated using the average daily shares method.
(b) Portfolio turnover is calculated on the basis of the Fund as a whole without distinguishing between the classes of shares issued.
See notes to financial statements.
156
Victory Portfolios | | Financial Highlights — continued | |
For a Share Outstanding Throughout Each Period
| | | | | Ratios to Average Net Assets | | Supplemental Data | |
| | | Total
Distributions | | Net Asset
Value,
End of
Period | | Total
Return
(Excludes
Sales
Charge)* | | Net
Expenses | | Net
Investment
Income
(Loss) | | Gross
Expenses | | Net Assets,
End of
Period
(000's) | | Portfolio
Turnover(b) | |
Victory Trivalent International Fund-Core Equity | |
Class A | |
Year Ended: | |
June 30, 2021 | | | (0.09 | ) | | $ | 8.35 | | | | 30.28 | % | | | 0.95 | % | | | 2.32 | % | | | 1.76 | % | | $ | 5,379 | | | | 47 | % | |
June 30, 2020 | | | (0.06 | ) | | $ | 6.49 | | | | (4.72 | )% | | | 0.95 | % | | | 1.73 | % | | | 1.84 | % | | $ | 4,550 | | | | 49 | % | |
June 30, 2019 | | | (0.25 | ) | | $ | 6.87 | | | | (1.69 | )% | | | 0.95 | % | | | 2.08 | % | | | 1.96 | % | | $ | 5,347 | | | | 56 | % | |
June 30, 2018 | | | (0.50 | ) | | $ | 7.28 | | | | 7.74 | % | | | 1.11 | % | | | 1.71 | % | | | 1.91 | % | | $ | 8,620 | | | | 51 | % | |
June 30, 2017 | | | (0.12 | ) | | $ | 7.21 | | | | 18.95 | % | | | 1.38 | % | | | 1.22 | % | | | 2.27 | % | | $ | 5,658 | | | | 91 | % | |
Class C | |
Year Ended: | |
June 30, 2021 | | | (0.01 | ) | | $ | 8.33 | | | | 29.09 | % | | | 1.70 | % | | | 1.59 | % | | | 12.66 | % | | $ | 108 | | | | 47 | % | |
June 30, 2020 | | | (0.01 | ) | | $ | 6.46 | | | | (5.48 | )% | | | 1.70 | % | | | 0.87 | % | | | 6.44 | % | | $ | 204 | | | | 49 | % | |
June 30, 2019 | | | (0.19 | ) | | $ | 6.84 | | | | (2.19 | )% | | | 1.70 | % | | | 1.22 | % | | | 5.22 | % | | $ | 335 | | | | 56 | % | |
June 30, 2018 | | | (0.44 | ) | | $ | 7.22 | | | | 6.81 | % | | | 1.87 | % | | | 0.64 | % | | | 3.61 | % | | $ | 449 | | | | 51 | % | |
June 30, 2017 | | | (0.08 | ) | | $ | 7.16 | | | | 18.01 | % | | | 2.14 | % | | | 0.42 | % | | | 2.97 | % | | $ | 773 | | | | 91 | % | |
Class I | |
Year Ended: | |
June 30, 2021 | | | (0.12 | ) | | $ | 8.40 | | | | 30.65 | % | | | 0.60 | % | | | 2.69 | % | | | 1.42 | % | | $ | 3,303 | | | | 47 | % | |
June 30, 2020 | | | (0.08 | ) | | $ | 6.53 | | | | (4.36 | )% | | | 0.60 | % | | | 2.12 | % | | | 1.54 | % | | $ | 2,579 | | | | 49 | % | |
June 30, 2019 | | | (0.26 | ) | | $ | 6.90 | | | | (1.19 | )% | | | 0.60 | % | | | 2.48 | % | | | 1.76 | % | | $ | 2,268 | | | | 56 | % | |
June 30, 2018 | | | (0.52 | ) | | $ | 7.29 | | | | 8.07 | % | | | 0.72 | % | | | 3.17 | % | | | 2.67 | % | | $ | 2,575 | | | | 51 | % | |
June 30, 2017 | | | (0.15 | ) | | $ | 7.23 | | | | 19.47 | % | | | 0.90 | % | | | 1.84 | % | | | 6.48 | % | | $ | 378 | | | | 91 | % | |
Class R6 | |
Year Ended: | |
June 30, 2021 | | | (0.11 | ) | | $ | 8.45 | | | | 30.57 | % | | | 0.55 | % | | | 2.75 | % | | | 1.00 | % | | $ | 204,691 | | | | 47 | % | |
June 30, 2020 | | | (0.06 | ) | | $ | 6.57 | | | | (4.34 | )% | | | 0.55 | % | | | 2.06 | % | | | 1.01 | % | | $ | 119,275 | | | | 49 | % | |
June 30, 2019 | | | (0.27 | ) | | $ | 6.92 | | | | (1.12 | )% | | | 0.55 | % | | | 2.53 | % | | | 1.45 | % | | $ | 5,661 | | | | 56 | % | |
June 30, 2018 | | | (0.52 | ) | | $ | 7.31 | | | | 8.14 | % | | | 0.71 | % | | | 2.71 | % | | | 1.71 | % | | $ | 5,975 | | | | 51 | % | |
June 30, 2017 | | | (0.16 | ) | | $ | 7.23 | | | | 19.39 | % | | | 0.91 | % | | | 1.63 | % | | | 2.44 | % | | $ | 1,628 | | | | 91 | % | |
Class Y | |
Year Ended: | |
June 30, 2021 | | | (0.11 | ) | | $ | 8.34 | | | | 30.62 | % | | | 0.70 | % | | | 2.59 | % | | | 1.19 | % | | $ | 8,574 | | | | 47 | % | |
June 30, 2020 | | | (0.08 | ) | | $ | 6.48 | | | | (4.60 | )% | | | 0.70 | % | | | 1.95 | % | | | 1.32 | % | | $ | 6,532 | | | | 49 | % | |
June 30, 2019 | | | (0.26 | ) | | $ | 6.87 | | | | (1.34 | )% | | | 0.70 | % | | | 2.26 | % | | | 1.40 | % | | $ | 8,482 | | | | 56 | % | |
June 30, 2018 | | | (0.52 | ) | | $ | 7.26 | | | | 8.01 | % | | | 0.87 | % | | | 1.62 | % | | | 1.49 | % | | $ | 9,712 | | | | 51 | % | |
June 30, 2017 | | | (0.14 | ) | | $ | 7.20 | | | | 19.28 | % | | | 1.14 | % | | | 1.39 | % | | | 1.58 | % | | $ | 14,086 | | | | 91 | % | |
See notes to financial statements.
157
Victory Portfolios | | Financial Highlights | |
For a Share Outstanding Throughout Each Period
| | | | | Investment Activities | | Distributions to
Shareholders From | |
| | | Net Asset
Value,
Beginning of
Period | | Net
Investment
Income
(Loss)(a) | | Net Realized
and Unrealized
Gains (Losses)
on Investments | | Total from
Investment
Activities | | Net
Investment
Income | | Net Realized
Gains from
Investments | |
Victory Trivalent International Small-Cap Fund | |
Class A | |
Year Ended: | |
June 30, 2021 | | $ | 12.83 | | | | 0.14 | | | | 5.07 | | | | 5.21 | | | | — | | | | — | | |
June 30, 2020 | | $ | 13.02 | | | | 0.06 | | | | (0.02 | ) | | | 0.04 | | | | (0.23 | ) | | | — | | |
June 30, 2019 | | $ | 14.46 | | | | 0.13 | | | | (1.22 | ) | | | (1.09 | ) | | | (0.09 | ) | | | (0.26 | ) | |
June 30, 2018 | | $ | 12.87 | | | | 0.10 | | | | 1.72 | | | | 1.82 | | | | (0.15 | ) | | | (0.08 | ) | |
June 30, 2017 | | $ | 10.67 | | | | 0.11 | | | | 2.22 | | | | 2.33 | | | | (0.13 | ) | | | — | | |
Class C | |
Year Ended: | |
June 30, 2021 | | $ | 12.51 | | | | 0.04 | | | | 4.91 | | | | 4.95 | | | | — | | | | — | | |
June 30, 2020 | | $ | 12.71 | | | | (0.03 | ) | | | (0.03 | ) | | | (0.06 | ) | | | (0.14 | ) | | | — | | |
June 30, 2019 | | $ | 14.12 | | | | 0.02 | | | | (1.17 | ) | | | (1.15 | ) | | | — | | | | (0.26 | ) | |
June 30, 2018 | | $ | 12.58 | | | | — | (c) | | | 1.67 | | | | 1.67 | | | | (0.05 | ) | | | (0.08 | ) | |
June 30, 2017 | | $ | 10.42 | | | | 0.02 | | | | 2.18 | | | | 2.20 | | | | (0.04 | ) | | | — | | |
Class I | |
Year Ended: | |
June 30, 2021 | | $ | 12.94 | | | | 0.25 | | | | 5.07 | | | | 5.32 | | | | (0.07 | ) | | | — | | |
June 30, 2020 | | $ | 13.13 | | | | 0.11 | | | | (0.02 | ) | | | 0.09 | | | | (0.28 | ) | | | — | | |
June 30, 2019 | | $ | 14.58 | | | | 0.18 | | | | (1.23 | ) | | | (1.05 | ) | | | (0.14 | ) | | | (0.26 | ) | |
June 30, 2018 | | $ | 12.96 | | | | 0.18 | | | | 1.71 | | | | 1.89 | | | | (0.19 | ) | | | (0.08 | ) | |
June 30, 2017 | | $ | 10.75 | | | | 0.17 | | | | 2.21 | | | | 2.38 | | | | (0.17 | ) | | | — | | |
Class R6 | |
Year Ended: | |
June 30, 2021 | | $ | 13.00 | | | | 0.23 | | | | 5.09 | | | | 5.32 | | | | (0.06 | ) | | | — | | |
June 30, 2020 | | $ | 13.19 | | | | 0.12 | | | | (0.04 | ) | | | 0.08 | | | | (0.27 | ) | | | — | | |
June 30, 2019 | | $ | 14.65 | | | | 0.17 | | | | (1.24 | ) | | | (1.07 | ) | | | (0.13 | ) | | | (0.26 | ) | |
June 30, 2018 | | $ | 13.02 | | | | 0.15 | | | | 1.73 | | | | 1.88 | | | | (0.17 | ) | | | (0.08 | ) | |
June 30, 2017 | | $ | 10.80 | | | | 0.18 | | | | 2.20 | | | | 2.38 | | | | (0.16 | ) | | | — | | |
Class Y | |
Year Ended: | |
June 30, 2021 | | $ | 12.88 | | | | 0.22 | | | | 5.05 | | | | 5.27 | | | | (0.05 | ) | | | — | | |
June 30, 2020 | | $ | 13.07 | | | | 0.10 | | | | (0.03 | ) | | | 0.07 | | | | (0.26 | ) | | | — | | |
June 30, 2019 | | $ | 14.52 | | | | 0.16 | | | | (1.22 | ) | | | (1.06 | ) | | | (0.13 | ) | | | (0.26 | ) | |
June 30, 2018 | | $ | 12.91 | | | | 0.15 | | | | 1.71 | | | | 1.86 | | | | (0.17 | ) | | | (0.08 | ) | |
June 30, 2017 | | $ | 10.71 | | | | 0.15 | | | | 2.21 | | | | 2.36 | | | | (0.16 | ) | | | — | | |
* Includes adjustments in accordance with U.S. Generally Accepted Accounting Principles.
(a) Per share net investment income (loss) has been calculated using the average daily shares method.
(b) Portfolio turnover is calculated on the basis of the Fund as a whole without distinguishing between the classes of shares issued.
(c) Amount is less than $0.005 per share.
See notes to financial statements.
158
Victory Portfolios | | Financial Highlights — continued | |
For a Share Outstanding Throughout Each Period
| | | | | Ratios to Average Net Assets | | Supplemental Data | |
| | | Total
Distributions | | Net Asset
Value,
End of
Period | | Total
Return
(Excludes
Sales
Charge)* | | Net
Expenses | | Net
Investment
Income
(Loss) | | Gross
Expenses | | Net Assets,
End of
Period
(000's) | | Portfolio
Turnover(b) | |
Victory Trivalent International Small-Cap Fund | |
Class A | |
Year Ended: | |
June 30, 2021 | | | — | | | $ | 18.04 | | | | 40.61 | % | | | 1.35 | % | | | 0.91 | % | | | 1.63 | % | | $ | 93,832 | | | | 64 | % | |
June 30, 2020 | | | (0.23 | ) | | $ | 12.83 | | | | 0.15 | % | | | 1.35 | % | | | 0.47 | % | | | 1.63 | % | | $ | 108,115 | | | | 52 | % | |
June 30, 2019 | | | (0.35 | ) | | $ | 13.02 | | | | (7.12 | )% | | | 1.35 | % | | | 1.02 | % | | | 1.59 | % | | $ | 137,665 | | | | 54 | % | |
June 30, 2018 | | | (0.23 | ) | | $ | 14.46 | | | | 14.14 | % | | | 1.35 | % | | | 0.68 | % | | | 1.56 | % | | $ | 122,933 | | | | 62 | % | |
June 30, 2017 | | | (0.13 | ) | | $ | 12.87 | | | | 22.04 | % | | | 1.35 | % | | | 0.99 | % | | | 1.52 | % | | $ | 92,295 | | | | 55 | % | |
Class C | |
Year Ended: | |
June 30, 2021 | | | — | | | $ | 17.46 | | | | 39.57 | % | | | 2.10 | % | | | 0.26 | % | | | 2.41 | % | | $ | 4,945 | | | | 64 | % | |
June 30, 2020 | | | (0.14 | ) | | $ | 12.51 | | | | (0.65 | )% | | | 2.10 | % | | | (0.28 | )% | | | 2.42 | % | | $ | 4,327 | | | | 52 | % | |
June 30, 2019 | | | (0.26 | ) | | $ | 12.71 | | | | (7.78 | )% | | | 2.10 | % | | | 0.15 | % | | | 2.42 | % | | $ | 4,909 | | | | 54 | % | |
June 30, 2018 | | | (0.13 | ) | | $ | 14.12 | | | | 13.28 | % | | | 2.10 | % | | | (0.03 | )% | | | 2.36 | % | | $ | 6,211 | | | | 62 | % | |
June 30, 2017 | | | (0.04 | ) | | $ | 12.58 | | | | 21.14 | % | | | 2.10 | % | | | 0.17 | % | | | 2.47 | % | | $ | 5,161 | | | | 55 | % | |
Class I | |
Year Ended: | |
June 30, 2021 | | | (0.07 | ) | | $ | 18.19 | | | | 41.16 | % | | | 0.95 | % | | | 1.52 | % | | | 1.17 | % | | $ | 2,003,337 | | | | 64 | % | |
June 30, 2020 | | | (0.28 | ) | | $ | 12.94 | | | | 0.54 | % | | | 0.95 | % | | | 0.88 | % | | | 1.18 | % | | $ | 1,014,425 | | | | 52 | % | |
June 30, 2019 | | | (0.40 | ) | | $ | 13.13 | | | | (6.69 | )% | | | 0.95 | % | | | 1.41 | % | | | 1.16 | % | | $ | 955,568 | | | | 54 | % | |
June 30, 2018 | | | (0.27 | ) | | $ | 14.58 | | | | 14.60 | % | | | 0.95 | % | | | 1.22 | % | | | 1.14 | % | | $ | 866,643 | | | | 62 | % | |
June 30, 2017 | | | (0.17 | ) | | $ | 12.96 | | | | 22.45 | % | | | 0.95 | % | | | 1.45 | % | | | 1.16 | % | | $ | 539,822 | | | | 55 | % | |
Class R6 | |
Year Ended: | |
June 30, 2021 | | | (0.06 | ) | | $ | 18.26 | | | | 41.06 | % | | | 1.03 | % | | | 1.43 | % | | | 1.03 | % | | $ | 133,486 | | | | 64 | % | |
June 30, 2020 | | | (0.27 | ) | | $ | 13.00 | | | | 0.36 | % | | | 1.06 | % | | | 0.94 | % | | | 1.06 | % | | $ | 73,480 | | | | 52 | % | |
June 30, 2019 | | | (0.39 | ) | | $ | 13.19 | | | | (6.86 | )% | | | 1.08 | % | | | 1.31 | % | | | 1.08 | % | | $ | 42,975 | | | | 54 | % | |
June 30, 2018 | | | (0.25 | ) | | $ | 14.65 | | | | 14.49 | % | | | 1.08 | % | | | 1.01 | % | | | 1.08 | % | | $ | 39,497 | | | | 62 | % | |
June 30, 2017 | | | (0.16 | ) | | $ | 13.02 | | | | 22.28 | % | | | 1.10 | % | | | 1.50 | % | | | 1.16 | % | | $ | 30,033 | | | | 55 | % | |
Class Y | |
Year Ended: | |
June 30, 2021 | | | (0.05 | ) | | $ | 18.10 | | | | 40.96 | % | | | 1.10 | % | | | 1.35 | % | | | 1.13 | % | | $ | 1,099,890 | | | | 64 | % | |
June 30, 2020 | | | (0.26 | ) | | $ | 12.88 | | | | 0.41 | % | | | 1.10 | % | | | 0.75 | % | | | 1.19 | % | | $ | 663,638 | | | | 52 | % | |
June 30, 2019 | | | (0.39 | ) | | $ | 13.07 | | | | (6.88 | )% | | | 1.10 | % | | | 1.21 | % | | | 1.18 | % | | $ | 666,547 | | | | 54 | % | |
June 30, 2018 | | | (0.25 | ) | | $ | 14.52 | | | | 14.45 | % | | | 1.10 | % | | | 1.05 | % | | | 1.19 | % | | $ | 756,933 | | | | 62 | % | |
June 30, 2017 | | | (0.16 | ) | | $ | 12.91 | | | | 22.27 | % | | | 1.10 | % | | | 1.26 | % | | | 1.32 | % | | $ | 450,441 | | | | 55 | % | |
See notes to financial statements.
159
Victory Portfolios | | Financial Highlights | |
For a Share Outstanding Throughout Each Period
| | | | | Investment Activities | | Distributions to
Shareholders From | |
| | | Net Asset
Value,
Beginning of
Period | | Net
Investment
Income
(Loss)(a) | | Net
Realized
and
Unrealized
Gains
(Losses) on
Investments | | Total from
Investment
Activities | | Net
Investment
Income | | Total
Distributions | |
Victory INCORE Total Return Bond Fund | |
Class A | |
Year Ended: | |
June 30, 2021 | | $ | 9.91 | | | | 0.15 | | | | 0.01 | | | | 0.16 | | | | (0.23 | ) | | | (0.23 | ) | |
June 30, 2020 | | $ | 9.46 | | | | 0.20 | | | | 0.50 | | | | 0.70 | | | | (0.25 | ) | | | (0.25 | ) | |
June 30, 2019 | | $ | 9.21 | | | | 0.21 | | | | 0.32 | | | | 0.53 | | | | (0.28 | ) | | | (0.28 | ) | |
June 30, 2018 | | $ | 9.54 | | | | 0.20 | | | | (0.24 | ) | | | (0.04 | ) | | | (0.29 | ) | | | (0.29 | ) | |
June 30, 2017 | | $ | 9.79 | | | | 0.23 | | | | (0.14 | ) | | | 0.09 | | | | (0.34 | ) | | | (0.34 | ) | |
Class C | |
Year Ended: | |
June 30, 2021 | | $ | 9.99 | | | | 0.08 | | | | 0.01 | | | | 0.09 | | | | (0.16 | ) | | | (0.16 | ) | |
June 30, 2020 | | $ | 9.53 | | | | 0.12 | | | | 0.52 | | | | 0.64 | | | | (0.18 | ) | | | (0.18 | ) | |
June 30, 2019 | | $ | 9.28 | | | | 0.15 | | | | 0.31 | | | | 0.46 | | | | (0.21 | ) | | | (0.21 | ) | |
June 30, 2018 | | $ | 9.60 | | | | 0.14 | | | | (0.25 | ) | | | (0.11 | ) | | | (0.21 | ) | | | (0.21 | ) | |
June 30, 2017 | | $ | 9.86 | | | | 0.15 | | | | (0.14 | ) | | | 0.01 | | | | (0.27 | ) | | | (0.27 | ) | |
Class R6 | |
Year Ended: | |
June 30, 2021 | | $ | 9.94 | | | | 0.17 | | | | 0.02 | | | | 0.19 | | | | (0.26 | ) | | | (0.26 | ) | |
June 30, 2020 | | $ | 9.48 | | | | 0.22 | | | | 0.51 | | | | 0.73 | | | | (0.27 | ) | | | (0.27 | ) | |
June 30, 2019 | | $ | 9.23 | | | | 0.24 | | | | 0.31 | | | | 0.55 | | | | (0.30 | ) | | | (0.30 | ) | |
June 30, 2018 | | $ | 9.55 | | | | 0.22 | | | | (0.23 | ) | | | (0.01 | ) | | | (0.31 | ) | | | (0.31 | ) | |
June 30, 2017 | | $ | 9.81 | | | | 0.25 | | | | (0.14 | ) | | | 0.11 | | | | (0.37 | ) | | | (0.37 | ) | |
Class Y | |
Year Ended: | |
June 30, 2021 | | $ | 9.94 | | | | 0.17 | | | | 0.02 | | | | 0.19 | | | | (0.26 | ) | | | (0.26 | ) | |
June 30, 2020 | | $ | 9.47 | | | | 0.22 | | | | 0.52 | | | | 0.74 | | | | (0.27 | ) | | | (0.27 | ) | |
June 30, 2019 | | $ | 9.23 | | | | 0.24 | | | | 0.30 | | | | 0.54 | | | | (0.30 | ) | | | (0.30 | ) | |
June 30, 2018 | | $ | 9.55 | | | | 0.23 | | | | (0.24 | ) | | | (0.01 | ) | | | (0.31 | ) | | | (0.31 | ) | |
June 30, 2017 | | $ | 9.81 | | | | 0.25 | | | | (0.14 | ) | | | 0.11 | | | | (0.37 | ) | | | (0.37 | ) | |
(a) Per share net investment income (loss) has been calculated using the average daily shares method.
(b) Portfolio turnover is calculated on the basis of the Fund as a whole without distinguishing between the classes of shares issued.
(c) Portfolio turnover rates excluding mortgage dollar roll transactions were 103% and 57% for the years ended June 30, 2018 and June 30, 2017, respectively.
See notes to financial statements.
160
Victory Portfolios | | Financial Highlights — continued | |
For a Share Outstanding Throughout Each Period
| | | | | Ratios to Average Net Assets | | Supplemental Data | |
| | | Net
Asset
Value,
End of
Period | | Total
Return
(Excludes
Sales
Charge) | | Net
Expenses | | Net
Investment
Income
(Loss) | | Gross
Expenses | | Net
Assets,
End of
Period
(000's) | | Portfolio
Turnover(b)(c) | |
Victory INCORE Total Return Bond Fund | |
Class A | |
Year Ended: | |
June 30, 2021 | | $ | 9.84 | | | | 1.67 | % | | | 0.85 | % | | | 1.51 | % | | | 1.16 | % | | $ | 9,380 | | | | 79 | % | |
June 30, 2020 | | $ | 9.91 | | | | 7.57 | % | | | 0.85 | % | | | 2.03 | % | | | 1.11 | % | | $ | 11,472 | | | | 74 | % | |
June 30, 2019 | | $ | 9.46 | | | | 5.77 | % | | | 0.85 | % | | | 2.32 | % | | | 1.09 | % | | $ | 12,248 | | | | 150 | % | |
June 30, 2018 | | $ | 9.21 | | | | (0.49 | )% | | | 0.85 | % | | | 2.15 | % | | | 1.11 | % | | $ | 12,592 | | | | 110 | % | |
June 30, 2017 | | $ | 9.54 | | | | 0.97 | % | | | 0.85 | % | | | 2.35 | % | | | 1.07 | % | | $ | 14,569 | | | | 210 | % | |
Class C | |
Year Ended: | |
June 30, 2021 | | $ | 9.92 | | | | 0.91 | % | | | 1.60 | % | | | 0.80 | % | | | 3.68 | % | | $ | 451 | | | | 79 | % | |
June 30, 2020 | | $ | 9.99 | | | | 6.76 | % | | | 1.60 | % | | | 1.27 | % | | | 3.54 | % | | $ | 727 | | | | 74 | % | |
June 30, 2019 | | $ | 9.53 | | | | 5.05 | % | | | 1.60 | % | | | 1.67 | % | | | 3.12 | % | | $ | 574 | | | | 150 | % | |
June 30, 2018 | | $ | 9.28 | | | | (1.12 | )% | | | 1.60 | % | | | 1.43 | % | | | 2.31 | % | | $ | 973 | | | | 110 | % | |
June 30, 2017 | | $ | 9.60 | | | | 0.13 | % | | | 1.60 | % | | | 1.60 | % | | | 1.61 | % | | $ | 2,073 | | | | 210 | % | |
Class R6 | |
Year Ended: | |
June 30, 2021 | | $ | 9.87 | | | | 1.93 | % | | | 0.58 | % | | | 1.73 | % | | | 0.61 | % | | $ | 26,970 | | | | 79 | % | |
June 30, 2020 | | $ | 9.94 | | | | 7.94 | % | | | 0.58 | % | | | 2.30 | % | | | 0.59 | % | | $ | 25,999 | | | | 74 | % | |
June 30, 2019 | | $ | 9.48 | | | | 6.05 | % | | | 0.57 | % | | | 2.61 | % | | | 0.57 | % | | $ | 24,929 | | | | 150 | % | |
June 30, 2018 | | $ | 9.23 | | | | (0.12 | )% | | | 0.58 | % | | | 2.37 | % | | | 0.62 | % | | $ | 25,438 | | | | 110 | % | |
June 30, 2017 | | $ | 9.55 | | | | 1.19 | % | | | 0.58 | % | | | 2.63 | % | | | 0.91 | % | | $ | 6,698 | | | | 210 | % | |
Class Y | |
Year Ended: | |
June 30, 2021 | | $ | 9.87 | | | | 1.91 | % | | | 0.60 | % | | | 1.74 | % | | | 0.64 | % | | $ | 31,032 | | | | 79 | % | |
June 30, 2020 | | $ | 9.94 | | | | 7.92 | % | | | 0.60 | % | | | 2.28 | % | | | 0.62 | % | | $ | 33,455 | | | | 74 | % | |
June 30, 2019 | | $ | 9.47 | | | | 5.99 | % | | | 0.60 | % | | | 2.63 | % | | | 0.63 | % | | $ | 31,026 | | | | 150 | % | |
June 30, 2018 | | $ | 9.23 | | | | (0.13 | )% | | | 0.59 | % | | | 2.43 | % | | | 0.59 | % | | $ | 52,633 | | | | 110 | % | |
June 30, 2017 | | $ | 9.55 | | | | 1.17 | % | | | 0.60 | % | | | 2.61 | % | | | 0.62 | % | | $ | 76,263 | | | | 210 | % | |
See notes to financial statements.
161
Victory Portfolios | | Notes to Financial Statements
June 30, 2021 | |
1. Organization:
Victory Portfolios (the "Trust") is organized as a Delaware statutory trust and the Trust is registered under the Investment Company Act of 1940, as amended (the "1940 Act"), as an open-end investment company. The Trust is comprised of 41 funds and is authorized to issue an unlimited number of shares, which are units of beneficial interest with a par value of $0.001 per share.
The accompanying financial statements are those of the following 11 Funds (collectively, the "Funds" and individually, a "Fund"). Each Fund is classified as diversified under the 1940 Act.
Funds (Legal Name) | | Funds (Short Name) | | Investment Share
Classes Offered | |
Victory Integrity Discovery Fund | | Integrity Discovery Fund | | Classes A, C, R, Y and Member Class* | |
Victory Integrity Mid-Cap
Value Fund | | Integrity Mid-Cap Value Fund
| | Classes A, C, R6, Y and Member Class*
| |
Victory Integrity Small-Cap
Value Fund | | Integrity Small-Cap Value Fund
| | Classes A, C, R, R6 and Y
| |
Victory Integrity Small/Mid-Cap
Value Fund | | Integrity Small/Mid-Cap
Value Fund | | Classes A, R6, Y and Member Class*
| |
Victory Munder Multi-Cap Fund | | Munder Multi-Cap Fund | | Classes A, C and Y | |
Victory S&P 500 Index Fund | | S&P 500 Index Fund | | Classes A, R, and Y | |
Victory Munder Mid-Cap Core
Growth Fund | | Munder Mid-Cap Core
Growth Fund | | Classes A, C, R, R6, and Y
| |
Victory Munder Small Cap
Growth Fund | | Munder Small Cap
Growth Fund | | Classes A, I and Y
| |
Victory Trivalent International
Fund-Core Equity | | Trivalent International
Fund-Core Equity | | Classes A, C, R6, Y and I
| |
Victory Trivalent International
Small-Cap Fund | | Trivalent International
Small-Cap Fund | | Classes A, C, R6, Y and I
| |
Victory INCORE Total Return
Bond Fund | | INCORE Total Return
Bond Fund | | Classes A, C, R6 and Y
| |
* Member Class commenced operations on November 3, 2020
Each class of shares of a Fund has substantially identical rights and privileges except with respect to sales charges, fees paid under distribution plans, expenses allocable exclusively to each class of shares, voting rights on matters solely affecting a single class of shares, and the exchange privilege of each class of shares.
Under the Trust's organizational documents, its officers and trustees are indemnified against certain liabilities arising out of the performance of their duties to the Funds. In addition, in the normal course of business, the Funds enter into contracts with their vendors and others that provide for general indemnifications. A Fund's maximum exposure under these arrangements is unknown, as this would involve future claims that may be made against the Funds. However, based on experience, the Funds expect that risk of loss to be remote.
2. Significant Accounting Policies:
The following is a summary of significant accounting policies followed by the Trust in the preparation of its financial statements. The policies are in conformity with Generally Accepted Accounting Principles in the United States of America ("GAAP"). The preparation of financial statements in accordance with GAAP requires management to make estimates and assumptions that affect the reported amounts of assets and liabilities and disclosure of contingent assets and liabilities at the date of the financial statements and the reported amounts of income and expenses for the period. Actual results could differ from those estimates. The Funds follow the specialized accounting and reporting requirements under GAAP that are applicable to investment companies under Accounting Standards Codification Topic 946.
162
Victory Portfolios | | Notes to Financial Statements — continued
June 30, 2021 | |
Investment Valuation:
The Funds record investments at fair value. Fair value is defined as the price that would be received to sell an asset or paid to transfer a liability in an orderly transaction between market participants at the measurement date.
The valuation techniques described below maximize the use of observable inputs and minimize the use of unobservable inputs in determining fair value. The inputs used for valuing the Funds' investments are summarized in the three broad levels listed below:
• Level 1 — quoted prices in active markets for identical securities
• Level 2 — other significant observable inputs (including quoted prices for similar securities or interest rates applicable to those securities, etc.)
• Level 3 — significant unobservable inputs (including the Funds' own assumptions in determining the fair value of investments)
Changes in valuation techniques may result in transfers in or out of an assigned level within the disclosure hierarchy. The inputs or methodologies used for valuation techniques are not necessarily an indication of the risk associated with entering into those investments.
Victory Capital Management Inc. ("VCM" or the "Adviser") has established the Pricing and Liquidity Committee (the "Committee"), and subject to Trust's Board of Trustees' (the "Board") oversight, the Committee administers and oversees the Funds' valuation policies and procedures, which are approved by the Board.
Portfolio securities listed or traded on securities exchanges, including exchange-traded funds ("ETFs"), American Depositary Receipts, and Rights, are valued at the closing price on the exchange or system where the security is principally traded, if available, or at the Nasdaq Official Closing Price. If there have been no sales for that day on the exchange or system, then a security is valued at the last available bid quotation on the exchange or system where the security is principally traded. In each of these situations, valuations are typically categorized as Level 1 in the fair value hierarchy.
Investments in open-end investment companies are valued at net asset value ("NAV"). These valuations are typically categorized as Level 1 in the fair value hierarchy.
Debt securities are valued each business day by a pricing service approved by the Board. The approved pricing service uses the evaluated bid or the last sale price to value securities. Debt obligations maturing within 60 days may be valued at amortized cost, provided that the amortized cost represents the fair value of such securities. These valuations are typically categorized as Level 2 in the fair value hierarchy.
Swap agreements are valued at the mean between the current bid and ask prices. These valuations are typically categorized as Level 2 in the fair value hierarchy.
Futures contracts are valued at the settlement price established each day by the board of trade or an exchange on which they are traded. These valuations are typically categorized as Level 1 in the fair value hierarchy.
Options are generally valued at the last quoted sales price or, in the absence of a sale, at the mean between the current bid and ask prices. These valuations are typically categorized as Level 1 in the fair value hierarchy.
In the event that price quotations or valuations are not readily available, investments are valued at fair value in accordance with procedures established by and under the general supervision and responsibility of the Board. These valuations are typically categorized as Level 2 or Level 3 in the fair value hierarchy, based on the observability of inputs used to determine the fair value. The effect of fair value pricing is that securities may not be priced on the basis of quotations from the primary market in which they are traded and the actual price realized from the sale of a security may differ materially from the fair value price. Valuing these securities at fair value is intended to cause the Funds' NAV to be more reliable than it otherwise would be.
163
Victory Portfolios | | Notes to Financial Statements — continued
June 30, 2021 | |
In accordance with procedures adopted by the Board, fair value pricing may be used if events materially affecting the value of foreign securities occur between the time the exchange on which they are traded closes and the time the Fund's NAV is calculated. The Funds use a systematic valuation model, provided daily by an independent third party to fair value their international equity securities. These valuations are considered as Level 2 in the fair value hierarchy.
A summary of the valuations as of June 30, 2021, is included in the table below while the breakdown, by category, of investments is disclosed on the Schedules of Portfolio Investments (amounts in thousands):
| | | Level 1 | | Level 2 | | Level 3 | | Total | |
Integrity Discovery Fund | |
Common Stocks | | $ | 90,399 | | | $ | — | | | $ | — | | | $ | 90,399 | | |
Collateral for Securities Loaned | | | 10,095 | | | | — | | | | — | | | | 10,095 | | |
Total | | $ | 100,494 | | | $ | — | | | $ | — | | | $ | 100,494 | | |
Integrity Mid-Cap Value Fund | |
Common Stocks | | $ | 262,526 | | | $ | — | | | $ | — | | | $ | 262,526 | | |
Collateral for Securities Loaned | | | 3,057 | | | | — | | | | — | | | | 3,057 | | |
Total | | $ | 265,583 | | | $ | — | | | $ | — | | | $ | 265,583 | | |
Integrity Small-Cap Value Fund | |
Common Stocks | | $ | 1,979,759 | | | $ | — | | | $ | — | | | $ | 1,979,759 | | |
Collateral for Securities Loaned | | | 75,378 | | | | — | | | | — | | | | 75,378 | | |
Total | | $ | 2,055,137 | | | $ | — | | | $ | — | | | $ | 2,055,137 | | |
Integrity Small/Mid-Cap Value Fund | |
Common Stocks | | $ | 205,760 | | | $ | — | | | $ | — | | | $ | 205,760 | | |
Collateral for Securities Loaned | | | 4,777 | | | | — | | | | — | | | | 4,777 | | |
Total | | $ | 210,537 | | | $ | — | | | $ | — | | | $ | 210,537 | | |
Munder Multi-Cap Fund | |
Common Stocks | | $ | 425,599 | | | $ | — | | | $ | — | | | $ | 425,599 | | |
Exchange-Traded Funds | | | 8,982 | | | | — | | | | — | | | | 8,982 | | |
Collateral for Securities Loaned | | | 6,622 | | | | — | | | | — | | | | 6,622 | | |
Total | | $ | 441,203 | | | $ | — | | | $ | — | | | $ | 441,203 | | |
S&P 500 Index Fund | |
Common Stocks | | $ | 266,763 | | | $ | — | | | $ | — | | | $ | 266,763 | | |
Collateral for Securities Loaned | | | 862 | | | | — | | | | — | | | | 862 | | |
Total | | $ | 267,625 | | | $ | — | | | $ | — | | | $ | 267,625 | | |
Other Financial Investments^: | |
Assets: | |
Futures Contracts | | $ | 48 | | | $ | — | | | $ | — | | | $ | 48 | | |
Total | | $ | 48 | | | $ | — | | | $ | — | | | $ | 48 | | |
Munder Mid-Cap Core Growth Fund | |
Common Stocks | | $ | 562,356 | | | $ | — | | | $ | — | | | $ | 562,356 | | |
Exchange-Traded Funds | | | 15,271 | | | | — | | | | — | | | | 15,271 | | |
Collateral for Securities Loaned | | | 15,017 | | | | — | | | | — | | | | 15,017 | | |
Total | | $ | 592,644 | | | $ | — | | | $ | — | | | $ | 592,644 | | |
Munder Small Cap Growth Fund | |
Common Stocks | | $ | 17,013 | | | $ | — | | | $ | — | | | $ | 17,013 | | |
Warrants | | | 33 | | | | — | | | | — | | | | 33 | | |
Collateral for Securities Loaned | | | 2,301 | | | | — | | | | — | | | | 2,301 | | |
Total | | $ | 19,347 | | | $ | — | | | $ | — | | | $ | 19,347 | | |
164
Victory Portfolios | | Notes to Financial Statements — continued
June 30, 2021 | |
| | | Level 1 | | Level 2 | | Level 3 | | Total | |
Trivalent International Fund-Core Equity | |
Common Stocks | | $ | 19,236 | | | $ | 196,098 | | | $ | — | | | $ | 215,334 | | |
Rights | | | 36 | | | | — | | | | — | | | | 36 | | |
Exchange-Traded Funds | | | 3,316 | | | | — | | | | — | | | | 3,316 | | |
Collateral for Securities Loaned | | | 8,734 | | | | — | | | | — | | | | 8,734 | | |
Total | | $ | 31,322 | | | $ | 196,098 | | | $ | — | | | $ | 227,420 | | |
Trivalent International Small-Cap Fund | |
Common Stocks | | $ | 355,409 | | | $ | 2,917,885 | | | $ | — | | | $ | 3,273,294 | | |
Exchange-Traded Funds | | | 24,821 | | | | — | | | | — | | | | 24,821 | | |
Collateral for Securities Loaned | | | 90,483 | | | | — | | | | — | | | | 90,483 | | |
Total | | $ | 470,713 | | | $ | 2,917,885 | | | $ | — | | | $ | 3,388,598 | | |
INCORE Total Return Bond Fund | |
Asset-Backed Securities | | $ | — | | | $ | 2,258 | | | $ | — | | | $ | 2,258 | | |
Collateralized Mortgage Obligations | | | — | | | | 854 | | | | — | | | | 854 | | |
Preferred Stocks | | | 2,110 | | | | 287 | | | | — | | | | 2,397 | | |
Corporate Bonds | | | — | | | | 35,287 | | | | — | | | | 35,287 | | |
Residential Mortgage-Backed Securities | | | — | | | | 90 | | | | — | | | | 90 | | |
Yankee Dollars | | | — | | | | 6,269 | | | | — | | | | 6,269 | | |
U.S. Government Mortgage-
Backed Agencies | | | — | | | | 11,986 | | | | — | | | | 11,986 | | |
U.S. Treasury Obligations | | | — | | | | 5,735 | | | | — | | | | 5,735 | | |
Collateral for Securities Loaned | | | 3,178 | | | | — | | | | — | | | | 3,178 | | |
Total | | $ | 5,288 | | | $ | 62,766 | | | $ | — | | | $ | 68,054 | | |
Other Financial Investments^: | |
Assets: | |
Credit Default Swap Agreements | | | — | | | | — | (a) | | | — | | | | — | (a) | |
Futures Contracts | | | 69 | | | | — | | | | — | | | | 69 | | |
Liabilities: | |
Futures Contracts | | | (45 | ) | | | — | | | | — | | | | (45 | ) | |
Total | | $ | 24 | | | $ | — | (a) | | $ | — | | | $ | 24 | | |
^ Other Financial investments include any derivative instruments not reflected in the Schedules of Portfolio Investments as Investment Securities, such as futures contracts and swap agreements. These instruments are generally recorded in the financial statements as the unrealized gain or loss on the investment.
(a) Amount is less than $1 thousand.
For the year ended June 30, 2021, there were no transfers in or out of Level 3 in the fair value hierarchy.
As of June 30, 2021, there were no significant Level 3 holdings in the fair value hierarchy.
Real Estate Investment Trusts ("REITs"):
The Funds may invest in REITs, which report information on the source of their distributions annually. REITs are pooled investment vehicles that invest primarily in income-producing real estate or real-estate related loans or interests (such as mortgages). Certain distributions received from REITs during the year are recorded as realized gains or return of capital as estimated by the Funds or when such information becomes known.
Investment Companies:
Exchange-Traded Funds:
The Funds may invest in ETFs, the shares of which are bought and sold on a securities exchange. An ETF trades like common stock and represents a fixed portfolio of securities often designed to track the performance and dividend yield of a particular domestic or foreign market index. The Funds may
165
Victory Portfolios | | Notes to Financial Statements — continued
June 30, 2021 | |
purchase shares of an ETF to temporarily gain exposure to a portion of the U.S. or a foreign market while awaiting purchase of underlying securities. The risks of owning an ETF generally reflect the risks of owning the underlying securities they are designed to track, although the lack of liquidity of an ETF could result in it being more volatile. Additionally, ETFs have fees and expenses that reduce their value.
Open-End Funds:
The Funds may invest in portfolios of open-end investment companies. These investment companies value securities in their portfolios for which market quotations are readily available at their market values (generally the last reported sale price) and all other securities and assets at their fair value by the methods established by the board of directors of the underlying funds.
Mortgage- and Asset-Backed Securities:
The values of some mortgage-related or asset-backed securities may be particularly sensitive to changes in prevailing interest rates. Early repayment of principal on some mortgage-related securities may expose a Fund to a lower rate of return upon reinvestment of principal. The values of mortgage- and asset-backed securities depend in part on the credit quality and adequacy of the underlying assets or collateral and may fluctuate in response to the market's perception of these factors as well as current and future repayment rates. Some mortgage-backed securities are backed by the full faith and credit of the U.S. government (e.g., mortgage-backed securities issued by the Government National Mortgage Association, commonly known as "Ginnie Mae"), while other mortgage-backed securities (e.g., mortgage- backed securities issued by the Federal National Mortgage Association and the Federal Home Loan Mortgage Corporation, commonly known as "Fannie Mae" and "Freddie Mac," respectively), are backed only by the credit of the government entity issuing them. In addition, some mortgage-backed securities are issued by private entities and, as such, are not guaranteed by the U.S. government or any agency or instrumentality of the U.S. government.
Foreign Exchange Currency Contracts:
The Funds may enter into foreign exchange currency contracts to convert U.S. dollars to and from various foreign currencies. A foreign exchange currency contract is an obligation by a Fund to purchase or sell a specific currency at a future date at a price (in U.S. dollars) set at the time of the contract. The Funds do not engage in "cross-currency" foreign exchange contracts (i.e., contracts to purchase or sell one foreign currency in exchange for another foreign currency). The Funds' foreign exchange currency contracts might be considered spot contracts (typically a contract of one week or less) or forward contracts (typically a contract term over one week). A spot contract is entered into for purposes of hedging against foreign currency fluctuations relating to a specific portfolio transaction, such as the delay between a security transaction trade date and settlement date. Forward contracts are entered into for purposes of hedging portfolio holdings or concentrations of such holdings. The Funds enter into foreign exchange currency contracts solely for spot or forward hedging purposes, and not for speculative purposes (i.e., the Funds do not enter into such contracts solely for the purpose of earning foreign currency gains). Each foreign exchange currency contract is adjusted daily by the prevailing spot or forward rate of the underlying currency, and any appreciation or depreciation is recorded for financial statement purposes as unrealized until the contract settlement date, at which time the Funds record realized gains or losses equal to the difference between the value of a contract at the time it was opened and the value at the time it was closed. The Funds could be exposed to risk if a counterparty is unable to meet the terms of a foreign exchange currency contract or if the value of the foreign currency changes unfavorably. In addition, the use of foreign exchange currency contracts does not eliminate fluctuations in the underlying prices of the securities. As of June 30, 2021, the Funds had no open forward foreign exchange currency contracts.
Derivative Instruments:
Options Transactions:
The Funds may purchase or sell options to aid in hedging against equity price risk incurred in the normal course of pursuing its investment objective. When a Fund writes a call option, an amount equal
166
Victory Portfolios | | Notes to Financial Statements — continued
June 30, 2021 | |
to the premium received is included as a liability. The amount of the liability is subsequently marked-to-market to reflect the current market value of the option. If an option expires on its stipulated expiration date or if the Fund enters into a closing purchase transaction, a gain or loss is realized. If a written call option is exercised, a gain or loss is realized for the sale of the underlying security and the proceeds from the sale are increased by the premium originally received. As a writer of an option, the Fund has no control over whether the option will be exercised and, as a result, retains the market risk of an unfavorable change in the price of the security underlying the written option.
The Funds may purchase put and call options. Put options are purchased to hedge against a decline in the value of securities held in the Funds' portfolio. If such a decline occurs, the put options will permit the Funds to sell the securities underlying such options at the exercise price, or to close out the options at a profit. The premium paid for a put or call option plus any transaction costs will reduce the benefit, if any, realized by the Funds upon exercise of the option, and, unless the price of the underlying security rises or declines sufficiently, the option may expire worthless to the Funds. In addition, in the event that the price of the security in connection with which an option was purchased moves in a direction favorable to the Funds, the benefits realized by the Funds as a result of such favorable movement will be reduced by the amount of the premium paid for the option and related transaction costs. Written and purchased options are non-income producing securities. With purchased options, there is minimal counterparty risk to the Funds since these options are exchange-traded. The collateral held by the Funds, if any, is presented on the Schedules of Portfolio Investments.
Futures Contracts:
The Funds may enter into contracts for the future delivery of securities or foreign currencies and futures contracts based on a specific security, class of securities, foreign currency or an index, and purchase or sell options on any such futures contracts. A futures contract on a securities index is an agreement obligating either party to pay, and entitling the other party to receive, while the contract is outstanding, cash payments based on the level of a specified securities index. No physical delivery of the underlying asset is made. The Funds may enter into futures contracts in an effort to hedge against market risks. The acquisition of put and call options on futures contracts will give the Funds the right (but not the obligation), for a specified price, to sell or to purchase the underlying futures contract, upon exercise of the option, at any time during the option period. Futures transactions involve brokerage costs and require the Funds to segregate assets to cover contracts that would require it to purchase securities or currencies. A good faith margin deposit, known as initial margin, of cash or government securities with a broker or custodian is required to initiate and maintain open positions in futures contracts. Subsequent payments, known as variation margin, are made or received by the Funds based on the change in the market value of the position and are recorded as unrealized appreciation or depreciation until the contract is closed out, at which time the gain or loss is realized. The Funds may lose the expected benefit of futures transactions if interest rates, exchange rates or securities prices change in an unanticipated manner. Such unanticipated changes may also result in lower overall performance than if the Funds had not entered into any futures transactions. In addition, the value of the Fund's futures positions may not prove to be perfectly or even highly correlated with the value of its portfolio securities or foreign currencies, limiting the Fund's ability to hedge effectively against interest rate, exchange rate and/or market risk and giving rise to additional risks. There is no assurance of liquidity in the secondary market for purposes of closing out futures positions. The collateral held by the Funds is reflected on the Statements of Assets and Liabilities under Deposit with brokers for futures contracts. As of June 30, 2021, the S&P 500 Index Fund and INCORE Total Return Bond Fund entered into futures contracts primarily for the strategy of hedging or other purposes, including but not limited to, providing liquidity and equitizing cash.
Credit Derivatives:
The INCORE Total Return Bond Fund may enter into credit derivatives, including centrally cleared credit default swaps on individual obligations or credit indices. The Fund may use these investments (i) as alternatives to direct long or short investment in a particular security or securities, (ii) to adjust the Fund's asset allocation or risk exposure, or (iii) for hedging purposes. The use by the Fund of centrally cleared credit default swaps may have the effect of creating a short position in a security. Credit derivatives can create investment leverage and may create additional investment risks that may
167
Victory Portfolios | | Notes to Financial Statements — continued
June 30, 2021 | |
subject the Fund to greater volatility than investments in more traditional securities, as described in the Funds' Statements of Additional Information.
Centrally cleared credit default swap ("CDS") agreements on credit indices involve one party making a stream of payments (referred to as the buyer of protection) to another party (the seller of protection) in exchange for the right to receive a specified return in the event of a write-down, principal shortfall, interest shortfall or default of all or part of the referenced entities comprising the credit index. A credit index is a basket of credit instruments or exposures designed to be representative of a specific sector of the credit market as a whole. These indices are made up of reference credits that are judged by a poll of dealers to be the most liquid entities in the CDS.
The counterparty risk for cleared swap agreements is generally lower than uncleared over-the-counter swap agreements because generally a clearing organization becomes substituted for each counterparty to a centrally cleared swap agreement and, in effect, guarantees each party's performance under the contract as each party to a trade looks only to the clearing organization for performance of financial obligations. However, there can be no assurance that the clearing organization, or its members, will satisfy its obligations to the Fund.
The Fund may enter into CDS agreements either as a buyer or seller. The Fund may buy protection under a CDS to attempt to mitigate the risk of default or credit quality deterioration in one or more individual holdings or in a segment of the fixed income securities market. The Fund may sell protection under a CDS in an attempt to gain exposure to an underlying issuer's credit quality characteristics without investing directly in that issuer.
For swaps entered with an individual counterparty, the Fund bears the risk of loss of the uncollateralized amount expected to be received under a CDS agreement in the event of the default or bankruptcy of the counterparty. CDS agreements are generally valued at a price at which the counterparty to such agreement would terminate the agreement. The Fund may also enter into cleared swaps.
Upon entering into a cleared CDS, the Fund may be required to deposit with the broker an amount of cash or cash equivalents in the range of approximately 3% to 6% of the notional amount for CDS on high yield debt issuers (this amount is subject to change by the clearing organization that clears the trade). This amount, known as "initial margin," is in the nature of a performance bond or good faith deposit on the CDS and is returned to a Fund upon termination of the CDS, assuming all contractual obligations have been satisfied. Subsequent payments, known as "variation margin," to and from the broker will be made daily as the price of the CDS fluctuates, making the long and short positions in the CDS contract more or less valuable, a process known as "marking-to-market". The premium (discount) payments are built into the daily price of the CDS and thus are amortized through the variation margin. The variation margin payment also includes the daily portion of the periodic payment stream.
The maximum potential amount of future payments (undiscounted) that the Fund as a seller of protection could be required to make under a CDS agreement equals the notional amount of the agreement. Notional amounts of each individual CDS agreement outstanding as of period end for which the Fund is the seller of protection are disclosed on the Schedules of Portfolio Investments. These potential amounts would be partially offset by any recovery values of the respective referenced obligations, upfront payments received upon entering into the agreement, periodic interest payments, or net amounts received from the settlement of buy protection CDS agreements entered into by the Fund for the same referenced entity or entities. The collateral held by the Funds is presented on the Statements of Assets and Liabilities under Deposit with brokers for swap agreements.
The INCORE Total Return Bond Fund entered into centrally cleared CDS agreements primarily for the strategy of asset allocation and risk exposure management during the period.
Offsetting of Financial Assets and Derivatives Assets:
The Funds are subject to various Master Netting Arrangements, which govern the terms of certain transactions with select counterparties. The Master Netting Arrangements allow the Funds to close out and net total exposure to a counterparty in the event of a default with respect to all the transactions governed under a single agreement with a counterparty. The Master Netting Arrangements also specify collateral posting arrangements at pre-arranged exposure levels. Under the Master Netting Arrangements, collateral is routinely transferred if the total net exposure to certain transactions (net
168
Victory Portfolios | | Notes to Financial Statements — continued
June 30, 2021 | |
of existing collateral already in place) governed under the relevant Master Netting Arrangement with a counterparty in a given account exceeds a specified threshold depending on the counterparty and the type of Master Netting Arrangement.
The table below, as of June 30, 2021 (amounts in thousands), discloses both gross information and net information about instruments and transactions eligible for offset on the Statements of Assets and Liabilities and instruments and transactions that are subject to an agreement similar to a master netting agreement as well as amounts related to collateral held at clearing brokers and counterparties.
| | | Gross
Amounts of
Recognized
Assets | | Gross
Amounts
Available
for Offset | | Net Amounts
Presented in the
Statements of
Assets and
Liabilities | | Financial
Instruments
for offset | | Cash
Collateral
Received | | Net
Amount | |
S&P 500 Index Fund | |
Futures Contracts — Goldman
Sachs & Co | | $ | 4 | | | $ | — | | | $ | 4 | | | $ | — | | | $ | — | | | $ | 4 | | |
INCORE Total Return Bond Fund | |
Futures Contracts — Goldman
Sachs & Co | | | 17 | | | | — | | | | 17 | | | | (7 | ) | | | — | | | | 10 | | |
Swap Agreements — Goldman
Sachs & Co | | | — | (a) | | | — | | | | — | (a) | | | — | | | | — | | | | — | (a) | |
| | | Gross
Amounts of
Recognized
Liabilities | | Gross
Amounts
Available
for Offset | | Net Amounts
Presented in the
Statements of
Assets and
Liabilities | | Financial
Instruments
for offset | | Cash
Collateral
Pledged* | | Net
Amount | |
INCORE Total Return Bond Fund | |
Futures Contracts — Goldman
Sachs & Co | | $ | 7 | | | $ | — | | | $ | 7 | | | $ | (7 | ) | | $ | — | | | $ | — | | |
* Cash collateral pledged may be in excess of the amounts shown in the table. The total cash collateral pledged by each Fund is disclosed in the Statements of Assets and Liabilities.
(a) Amount is less than $1 thousand.
Summary of Derivative Instruments:
The following table summarizes the fair values of derivative instruments on the Statements of Assets and Liabilities, categorized by risk exposure, as of June 30, 2021 (amounts in thousands):
| | | Assets | | Liabilities | |
| | | Variation Margin
Receivable on Open
Futures Contracts* | | Variation Margin
Receivable on Open
Swap Agreements* | | Variation Margin
Payable on Open
Futures Contracts* | | Variation Margin
Payable on Open
Swap Agreements* | |
Equity Risk Exposure: | |
S&P Index 500 Fund | | $ | 48 | | | $ | — | | | $ | — | | | $ | — | | |
Credit Risk Exposure | |
INCORE Total Return
Bond Fund | | | — | | | | — | (a) | | | — | | | | — | | |
Interest Rate
Risk Exposure: | |
INCORE Total Return
Bond Fund | | | 69 | | | | — | | | | 45 | | | | — | | |
* Includes cumulative unrealized appreciation/depreciation of futures contracts and swap agreements as reported on the Schedules of Portfolio Investments. Only current day's variation margin for both futures contracts and credit default swap agreements are reported within the Statements of Assets and Liabilities.
(a) Amount is less than $1 thousand.
169
Victory Portfolios | | Notes to Financial Statements — continued
June 30, 2021 | |
The following table presents the effect of derivative instruments on the Statements of Operations, categorized by risk exposure, for the year ended June 30, 2021 (amounts in thousands):
| | | Net Realized Gains (Losses)
on Derivatives
Recognized as a
Result from Operations | | Net Change in Unrealized
Appreciation/Depreciation
on Derivatives Recognized
as a Result of Operations | |
| | | Net Realized
Gains (Losses)
from Futures
Contracts | | Net Realized
Gains (Losses)
from Swap
Agreements | | Net Change in
Unrealized
Appreciation/
Depreciation
on Futures
Contracts | | Net Change in
Unrealized
Appreciation/
Depreciation
on Swap
Agreements | |
Equity Risk Exposure: | |
S&P 500 Index Fund | | $ | 481 | | | $ | — | | | $ | 51 | | | $ | — | | |
Credit Risk Exposure: | |
INCORE Total Return Bond Fund | | | — | | | | 68 | | | | — | | | | — | (a) | |
Interest Rate Risk Exposure: | |
INCORE Total Return Bond Fund | | | (198 | ) | | | — | | | | 31 | | | | — | | |
(a) Amount is less than $1 thousand.
The underlying face value of open derivative positions relative to each Fund's net assets at year end is generally representative of the notional amount of open positions to net assets throughout the year.
Investment Transactions and Related Income:
Changes in holdings of investments are accounted for no later than one business day following the trade date. For financial reporting purposes, however, investment transactions are accounted for on trade date on the last business day of the reporting period. Interest income is determined on the basis of coupon interest accrued using the effective interest method which adjusts, where applicable, the amortization of premiums or accretion of discounts. Dividend income is recorded on the ex-dividend date. Gains or losses realized on sales of securities are recorded on the identified cost basis. Paydown gains or losses on applicable securities, if any, are recorded as components of Interest income on the Statements of Operations.
Withholding taxes on interest, dividends and gains as a result of certain investments in ADRs by the Funds have been provided for in accordance with each investment's applicable country's tax rules and rates.
Securities Lending:
The Trust has entered into a Master Securities Lending Agreement ("MSLA") with Citibank, N.A. ("Citibank"). Under the terms of the MSLA, the Funds may lend securities to certain broker-dealers, and banks, in exchange for collateral in the amount of at least 102% of the value of U.S. securities loaned or at least 105% of the value of non-U.S. securities loaned, marked-to-market daily. Any collateral shortfalls associated with increases in the valuation of the securities loaned are adjusted the next business day. The collateral can be received in the form of cash collateral and/or non-cash collateral. Non-cash collateral can include U.S. Government Securities, letters of credit and certificates of deposit. The cash collateral is invested in short-term instruments or cash equivalents, primarily open-end investment companies, as noted on the Funds' Schedules of Portfolio Investments. The Trust does not have effective control of the non-cash collateral and therefore it is not disclosed on the Funds' Schedules of Portfolio Investments. During the time portfolio securities are on loan, the borrower will pay the Funds any dividends or interest paid on such securities plus any fee negotiated between the parties to the lending agreement. The Funds also earn a return from the collateral. The Funds pay Citibank various fees in connection with the investment of cash collateral and fees based on the investment income received from securities lending activities. Securities lending income (net of these fees) is
170
Victory Portfolios | | Notes to Financial Statements — continued
June 30, 2021 | |
disclosed on the Statements of Operations. Although risk is mitigated by the collateral, the Funds could experience a delay in recovering its securities and possible loss of income or value if the borrower fails to return them.
Securities lending transactions are entered into by a Fund under the MSLA, which permits the Fund, under certain circumstances such as an event of default, to offset amounts payable by the Fund to the same counterparty against amounts receivable from the counterparty to create a net payment due to or from the Fund.
The following table (amounts in thousands) is a summary of the Funds' securities lending transactions which are subject to offset under the MSLA as of June 30, 2021. These transactions are accounted for as secured borrowings with an overnight and continuous contractual maturity for cash collateral, and greater than overnight and continuous contractual maturity for non-cash collateral.
| | | Gross Amount of
Recognized | | Value of
Cash | | Value of Non-cash Collateral
Received by Maturity | | | |
| | | Assets (Value of
Securities on Loan) | | Collateral
Received* | | <30
Days | | Between
30 & 90 Days | | >90
Days | | Net
Amount | |
Integrity Discovery Fund | | $ | 9,867 | | | $ | 9,867 | | | $ | — | | | $ | — | | | $ | — | | | $ | — | | |
Integrity Mid-Cap Value Fund | | | 3,034 | | | | 3,034 | | | | — | | | | — | | | | — | | | | — | | |
Integrity Small-Cap Value Fund | | | 72,736 | | | | 72,736 | | | | — | | | | — | | | | — | | | | — | | |
Integrity Small/Mid-Cap
Value Fund | | | 4,621 | | | | 4,621 | | | | — | | | | — | | | | — | | | | — | | |
Munder Multi-Cap Fund | | | 6,321 | | | | 6,321 | | | | — | | | | — | | | | — | | | | — | | |
S&P 500 Index Fund | | | 845 | | | | 845 | | | | — | | | | — | | | | — | | | | — | | |
Munder Mid-Cap Core
Growth Fund | | | 14,738 | | | | 14,738 | | | | — | | | | — | | | | — | | | | — | | |
Munder Small Cap
Growth Fund | | | 2,261 | | | | 2,261 | | | | — | | | | — | | | | — | | | | — | | |
Trivalent International Fund —
Core Equity | | | 8,250 | | | | 8,250 | | | | — | | | | — | | | | — | | | | — | | |
Trivalent International
Small-Cap Fund | | | 83,952 | | | | 83,952 | | | | — | | | | — | | | | — | | | | — | | |
INCORE Total Return Bond Fund | | | 3,089 | | | | 3,089 | | | | — | | | | — | | | | — | | | | — | | |
* Collateral received in excess of the market value of securities on loan is not presented in this table. The total cash collateral received by each Fund is disclosed in the Statements of Assets and Liabilities.
Foreign Currency Translations:
The accounting records of the Funds are maintained in U.S. dollars. Investment securities and other assets and liabilities of a Fund denominated in a foreign currency are translated into U.S. dollars at current exchange rates. Purchases and sales of securities, income receipts and expense payments are translated into U.S. dollars at the exchange rates on the date of the transactions. The Funds do not isolate the portion of the results of operations resulting from changes in foreign exchange rates on investments from fluctuations arising from changes in market prices of securities held. Such fluctuations are disclosed as Net change in unrealized appreciation/depreciation on investment securities and foreign currency translations on the Statements of Operations. Any realized gains or losses from these fluctuations are disclosed as Net realized gains (losses) from investment securities and foreign currency translations on the Statements of Operations.
Mortgage Dollar Rolls:
The INCORE Total Return Bond Fund may enter into mortgage dollar roll transactions in which the Fund sells a mortgage-backed security to a counterparty to buy back similar, but not identical, securities on a specific future date at a predetermined price. Mortgage dollar rolls may be renewed by a new sale
171
Victory Portfolios | | Notes to Financial Statements — continued
June 30, 2021 | |
and repurchased with a cash settlement at each renewal without physical delivery of the securities. Certain risks may arise upon entering into mortgage dollar rolls from the potential inability of counterparties to meet the terms of their commitments. Additionally, the value of such securities may change adversely before the Fund is able to repurchase them. Mortgage dollar rolls are treated as financing transactions unless the sale and repurchase are determined to involve securities that are not substantially the same. Therefore, any gain or loss is considered unrealized until the roll reaches ultimate disposition or the sale and repurchase are determined to involve securities that are not substantially the same. Income is generated as consideration for entering into these transactions and is included in mortgage dollar roll income on the Statements of Operations. For the year ended June 30, 2021, there were no mortgage dollar roll transactions.
Foreign Taxes:
The Funds may be subject to foreign taxes related to foreign income received (a portion of which may be reclaimable), capital gains on the sale of securities, and certain foreign currency transactions. All foreign taxes are recorded in accordance with the applicable regulations and rates that exist in the foreign jurisdictions in which the Funds invest.
Federal Income Taxes:
It is the policy of each Fund to continue to qualify as a regulated investment company by complying with the provisions available to certain investment companies, as defined in applicable sections of the Internal Revenue Code, and to make distributions of net investment income and net realized gains sufficient to relieve it from all, or substantially all, federal income taxes. Accordingly, no provision for federal income taxes is required in the financial statements. The Funds have a tax year end of June 30.
Management of the Funds have reviewed tax positions taken in tax years that remain subject to examination by all major tax jurisdictions, including federal (i.e., the last four tax years, which includes the current fiscal tax year end). Management believes that there is no tax liability resulting from unrecognized tax benefits related to uncertain tax positions taken.
Allocations:
Expenses directly attributable to the Funds are charged to the Funds, while expenses that are attributable to more than one fund in the Trust, or jointly with an affiliated trust, are allocated among the respective funds in the Trust and/or affiliated trust based upon net assets or another appropriate basis.
Income, expenses (other than class-specific expenses such as transfer agent fees, state registration fees, 12b-1 fees, and printing fees), and realized and unrealized gains or losses on investments are allocated to each class of shares based on its relative net assets on the date income is earned or expenses and realized and unrealized gains and losses are incurred.
3. Purchases and Sales:
Cost of purchases and proceeds from sales/maturities of securities (excluding securities maturing less than one year from acquisition) for the year ended June 30, 2021, were as follows for the Funds (amounts in thousands):
| | | Excluding
U.S. Government Securities | | U.S. Government
Securities | |
| | | Purchases | | Sales | | Purchases | | Sales | |
Integrity Discovery Fund | | $ | 30,257 | | | $ | 47,525 | | | $ | — | | | $ | — | | |
Integrity Mid-Cap Value Fund | | | 140,768 | | | | 170,174 | | | | — | | | | — | | |
Integrity Small-Cap Value Fund | | | 985,101 | | | | 1,599,374 | | | | — | | | | — | | |
Integrity Small/Mid-Cap Value Fund | | | 104,115 | | | | 93,548 | | | | — | | | | — | | |
Munder Multi-Cap Fund | | | 275,777 | | | | 320,315 | | | | — | | | | — | | |
S&P 500 Index Fund | | | 8,043 | | | | 30,893 | | | | — | | | | — | | |
Munder Mid-Cap Core Growth Fund | | | 590,719 | | | | 826,939 | | | | — | | | | — | | |
172
Victory Portfolios | | Notes to Financial Statements — continued
June 30, 2021 | |
| | | Excluding
U.S. Government Securities | | U.S. Government
Securities | |
| | | Purchases | | Sales | | Purchases | | Sales | |
Munder Small Cap Growth Fund | | $ | 3,925 | | | $ | 3,878 | | | $ | — | | | $ | — | | |
Trivalent International Fund-Core Equity | | | 129,540 | | | | 86,263 | | | | — | | | | — | | |
Trivalent International Small-Cap Fund | | | 2,307,771 | | | | 1,642,660 | | | | — | | | | — | | |
| INCORE Total Return Bond Fund | | | 26,639 | | | | 22,528 | | | | 26,662 | | | | 29,483 | | |
4. Affiliated Fund Ownership:
The Funds offer shares for investment by other funds. The fund-of-funds do not invest in the underlying funds for the purpose of exercising management or control, and the affiliated fund-of-funds annual and semi-annual reports may be viewed at vcm.com. As of June 30, 2021, certain fund-of-funds owned total outstanding shares of the Funds as follows:
Trivalent International Fund-Core Equity | |
| | Ownership % | |
USAA Target Retirement Income Fund | | | 7 | % | |
USAA Target Retirement 2030 Fund | | | 22 | % | |
USAA Target Retirement 2040 Fund | | | 32 | % | |
USAA Target Retirement 2050 Fund | | | 21 | % | |
USAA Target Retirement 2060 Fund | | | 3 | % | |
Integrity Mid-Cap Value Fund | |
| | Ownership % | |
USAA Target Retirement Income Fund | | | 2 | % | |
USAA Target Retirement 2030 Fund | | | 14 | % | |
USAA Target Retirement 2040 Fund | | | 19 | % | |
USAA Target Retirement 2050 Fund | | | 14 | % | |
USAA Target Retirement 2060 Fund | | | 2 | % | |
5. Fees and Transactions with Affiliates and Related Parties:
Investment Advisory Fees:
Investment advisory services are provided to the Funds by the Adviser, which is a New York corporation registered as an investment adviser with the Securities and Exchange Commission ("SEC"). The Adviser is an indirect wholly owned subsidiary of Victory Capital Holdings, Inc., a publicly traded Delaware corporation, and a wholly owned direct subsidiary of Victory Capital Operating, LLC.
Under the terms of the Investment Advisory Agreement, the Adviser is entitled to receive fees based on a percentage of the average daily net assets of each Fund. The rates at which the Adviser is paid by each Fund are included in the table below.
| | | Flat Rate | | | | | |
Integrity Discovery Fund | | | 1.00 | % | | | | | | | | | |
| | | Up to $500 million | | | | Over $500 million | |
Integrity Mid-Cap Value Fund | | | 0.75 | % | | | | | | | 0.70 | % | |
| | | Up to $300 million | | | | Over $300 million | |
Integrity Small-Cap Value Fund | | | 0.90 | % | | | | | | | 0.85 | % | |
| | | Up to $300 million | | | | Over $300 million | |
Integrity Small/Mid-Cap Value Fund | | | 0.80 | % | | | | | | | 0.75 | % | |
| | | Up to $1 billion | | $1 billion – $2 billion | | Over $2 billion | |
Munder Multi-Cap Fund | | | 0.75 | % | | | 0.72 | % | | | 0.70 | % | |
173
Victory Portfolios | | Notes to Financial Statements — continued
June 30, 2021 | |
| | | Up to $250 million | | $250 million –
$500 million | | Over $500 million | |
S&P 500 Index Fund | | | 0.20 | % | | | 0.12 | % | | | 0.07 | % | |
| | | Up to $6 billion | | $6 billion – $8 billion | | Over $8 billion | |
Munder Mid-Cap Core Growth Fund | | | 0.75 | % | | | 0.70 | % | | | 0.65 | % | |
| | | Flat Rate | | | | | |
| Munder Small Cap Growth Fund | | | 0.85 | % | | | | | | | | | |
| | | Up to $1 billion | | | | Over $1 billion | |
Trivalent International Fund-Core
Equity | | | 0.80 | % | | | | | | | 0.75 | % | |
| | | Up to $1 billion | | | | Over $1 billion | |
Trivalent International Small-Cap
Fund | | | 0.95 | % | | | | | | | 0.90 | % | |
| | | Flat Rate | | | | | |
| INCORE Total Return Bond Fund | | | 0.40 | % | | | | | | | | | |
Amounts incurred and paid to VCM for the year ended June 30, 2021, are reflected on the Statements of Operations as Investment advisory fees.
Administration and Servicing Fees:
VCM serves as the Funds' administrator and fund accountant. Under the Administration and Fund Accounting Agreement, VCM is entitled to receive fees based on a percentage of the average daily net assets of the Trust, Victory Variable Insurance Funds and Victory Portfolios II (collectively, the "Victory Funds Complex"). Tiered rates at which VCM is paid by the Funds are shown in the table below:
| Net Assets up to $15 billion | | Net Assets $15 billion – $30 billion | | Net Assets over $30 billion | |
| | 0.08 | %, plus | | | 0.05 | %, plus | | | 0.04 | % | |
Amounts incurred for the year ended June 30, 2021, are reflected on the Statements of Operations as Administration fees.
Citi Fund Services Ohio, Inc. ("Citi"), an affiliate of Citibank, acts as sub-administrator and sub-fund accountant to the Fund pursuant to the Sub-Administration and Sub-Fund Accounting Services Agreement between VCM and Citi. VCM pays Citi a fee for providing these services. The Trust reimburses VCM and Citi for out-of-pocket expenses incurred in providing these services and certain other expenses specifically allocated to the Funds. Amounts incurred for the year ended June 30, 2021, are reflected on the Statements of Operations as Sub-Administration fees.
The Chief Compliance Officer ("CCO") is an employee of the Adviser, which pays the compensation of the CCO and his support staff. The Trust has entered into an agreement to provide compliance services with the Adviser, pursuant to which the Adviser furnishes its compliance personnel, including the services of the CCO, and other resources reasonably necessary to provide the Trust with compliance oversight services related to the design, administration and oversight of a compliance program for the Trust in accordance with Rule 38a-1 under the 1940 Act. The funds in the Victory Funds Complex, in aggregate, compensate the Adviser for these services. Amounts incurred for the year ended June 30, 2021, are reflected on the Statements of Operations as Compliance fees.
Transfer Agency Fees:
FIS Investor Services, LLC ("FIS") serves as the Funds' transfer agent. Under the Transfer Agent Agreement, the Trust pays FIS a fee for its services and reimburses FIS for all of their reasonable out-of-pocket expenses incurred in providing these services. Amounts incurred for the year ended June 30, 2021, are reflected on the Statements of Operations as Transfer agent fees.
174
Victory Portfolios | | Notes to Financial Statements — continued
June 30, 2021 | |
Victory Capital Transfer Agency, Inc., an affiliate of the Adviser, serves as sub-transfer agent for the Member Class. Victory Capital Transfer Agency, Inc. receives no fee or other compensation for these services.
Distributor/Underwriting Services:
Victory Capital Services, Inc. (the "Distributor"), an affiliate of the Adviser, serves as distributor for the continuous offering of the shares of the Funds pursuant to a Distribution Agreement between the Distributor and the Trust. Pursuant to the Distribution and Service Plans adopted in accordance with Rule 12b-1 under the 1940 Act, the Distributor may receive a monthly distribution and service fee at the annual rate shown in the table below:
| | Class A | | Class C | | Class I | | Class R | | Class R6 | | Class Y | | Member
Class | |
Integrity Discovery Fund | | | 0.25 | % | | | 1.00 | % | | | N/A | | | | 0.50 | % | | | N/A | | | | N/A | | | | N/A | | |
Integrity Mid-Cap Value Fund | | | 0.25 | % | | | 1.00 | % | | | N/A | | | | N/A | | | | N/A | | | | N/A | | | | N/A | | |
Integrity Small-Cap Value Fund | | | 0.25 | % | | | 1.00 | % | | | N/A | | | | 0.50 | % | | | N/A | | | | N/A | | | | N/A | | |
Integrity Small/Mid-Cap Value Fund | | | 0.25 | % | | | N/A | | | | N/A | | | | N/A | | | | N/A | | | | N/A | | | | N/A | | |
Munder Multi-Cap Fund | | | 0.25 | % | | | 1.00 | % | | | N/A | | | | N/A | | | | N/A | | | | N/A | | | | N/A | | |
S&P 500 Index Fund | | | 0.15 | % | | | N/A | | | | N/A | | | | 0.50 | % | | | N/A | | | | N/A | | | | N/A | | |
Munder Mid-Cap Core Growth Fund | | | 0.25 | % | | | 1.00 | % | | | N/A | | | | 0.50 | % | | | N/A | | | | N/A | | | | N/A | | |
Munder Small Cap Growth Fund | | | 0.25 | % | | | N/A | | | | N/A | | | | N/A | | | | N/A | | | | N/A | | | | N/A | | |
Trivalent International Fund-Core Equity | | | 0.25 | % | | | 1.00 | % | | | N/A | | | | N/A | | | | N/A | | | | N/A | | | | N/A | | |
Trivalent International Small-Cap Fund | | | 0.25 | % | | | 1.00 | % | | | N/A | | | | N/A | | | | N/A | | | | N/A | | | | N/A | | |
INCORE Total Return Bond Fund | | | 0.25 | % | | | 1.00 | % | | | N/A | | | | N/A | | | | N/A | | | | N/A | | | | N/A | | |
The distribution and service fees paid to the Distributor may be used by the Distributor to pay for activities primarily intended to result in the sale of Class A, Class R or Class C. Amounts incurred for the year ended June 30, 2021, are reflected on the Statements of Operations as 12b-1 fees.
In addition, the Distributor is entitled to receive commission on sales of Class A. For the year ended June 30, 2021, the Distributor received approximately $47,473 from commissions earned on sales of Class A.
Other Fees:
Citibank serves as the Funds' custodian. The Funds pay Citibank a fee for providing these services. Amounts incurred for the year ended June 30, 2021, are reflected on the Statements of Operations as Custodian fees.
Sidley Austin LLP provides legal services to the Trust.
The Adviser has entered into expense limitation agreements with certain Funds. Under the terms of the agreements, the Adviser has agreed to waive fees or reimburse certain expenses to the extent that ordinary operating expenses incurred by certain classes of the Funds in any fiscal year exceed the expense limit for such classes of the Funds. Such excess amounts will be the liability of the Adviser. Acquired fund fees and expense, interest, taxes, brokerage commissions, other expenditures which are capitalized in accordance with GAAP, and other extraordinary expenses not incurred in the ordinary course of a Funds' business are excluded from the expense limits. As of June 30, 2021, the expense limits (excluding voluntary waivers) are as follows:
| | | In effect until October 31, 2021 | |
| | Class A | | Class C | | Class I | | Class R | | Class R6 | | Class Y | | Member
Class | |
Integrity Discovery Fund | | | 1.66 | % | | | 2.45 | % | | | N/A | | | | 2.08 | % | | | N/A | | | | 1.44 | %(a) | | | 1.50 | %(b) | |
Integrity Mid-Cap Value Fund | | | 1.00 | % | | | 1.75 | % | | | N/A | | | | N/A | | | | 0.60 | % | | | 0.75 | % | | | 0.85 | %(b) | |
Integrity Small-Cap Value Fund | | | 1.50 | % | | | 2.35 | %(a) | | | N/A | | | | 1.75 | % | | | N/A | | | | N/A | | | | N/A | | |
Integrity Small/Mid-Cap Value Fund | | | 1.13 | % | | | N/A | | | | N/A | | | | N/A | | | | 0.83 | % | | | 0.88 | % | | | 0.95 | %(b) | |
Munder Multi-Cap Fund | | | N/A | | | | 2.16 | % | | | N/A | | | | N/A | | | | N/A | | | | N/A | | | | N/A | | |
S&P 500 Index Fund | | | N/A | | | | N/A | | | | N/A | | | | N/A | | | | N/A | | | | N/A | | | | N/A | | |
Munder Mid-Cap Core Growth Fund | | | 1.32 | % | | | 2.12 | %(a) | | | N/A | | | | 1.57 | % | | | N/A | | | | N/A | | | | N/A | | |
175
Victory Portfolios | | Notes to Financial Statements — continued
June 30, 2021 | |
| | | In effect until October 31, 2021 | |
| | Class A | | Class C | | Class I | | Class R | | Class R6 | | Class Y | | Member
Class | |
Munder Small Cap Growth Fund | | | 1.40 | % | | | N/A | | | | 1.15 | % | | | N/A | | | | N/A | | | | 1.25 | % | | | N/A | | |
Trivalent International Fund-Core Equity | | | 0.95 | % | | | 1.70 | % | | | 0.60 | % | | | N/A | | | | 0.55 | % | | | 0.70 | % | | | N/A | | |
Trivalent International Small-Cap Fund | | | 1.35 | % | | | 2.10 | % | | | 0.95 | % | | | N/A | | | | 1.10 | % | | | 1.10 | % | | | N/A | | |
INCORE Total Return Bond Fund | | | 0.85 | % | | | 1.60 | % | | | N/A | | | | N/A | | | | 0.58 | % | | | 0.60 | % | | | N/A | | |
(a) In Effect November 1, 2020, until at least October 31, 2021.
(b) In Effect November 3, 2020, until at least October 31, 2021.
Under the terms of the expense limitation agreement, amended May 1, 2021, the Funds have agreed to repay fees and expenses that were waived or reimbursed by the Adviser for a period of up to three years (thirty six (36) months) after the waiver or reimbursement took place, subject to the lesser of any operating expense limits in effect at the time of: (a) the original waiver or expense reimbursement; or (b) the recoupment, after giving effect to the recoupment amount. Prior to May 1, 2021, the Funds were permitted to recoup fees waived and expenses reimbursed for up to three years after the fiscal year in which the waiver or reimbursement took place, subject to the limitations above. This change did not have any effect on the amounts previously reported for recoupment.
As of June 30, 2021, the following amounts are available to be repaid to the Adviser (amounts in thousands). The Funds have not recorded any amounts available to be repaid as a liability due to an assessment that such repayment is not probable at June 30, 2021.
| | Expires
2022 | | Expires
2023 | | Expires
2024 | | Total | |
Integrity Discovery Fund | | $ | 10 | | | $ | 9 | | | $ | 35 | | | $ | 54 | | |
Integrity Mid-Cap Value Fund | | | 292 | | | | 615 | | | | 639 | | | | 1,546 | | |
| Integrity Small-Cap Value Fund | | | 114 | | | | 8 | | | | 13 | | | | 135 | | |
Integrity Small/Mid-Cap Value Fund | | | 189 | | | | 185 | | | | 213 | | | | 587 | | |
Munder Multi-Cap Fund | | | — | | | | 2 | | | | 8 | | | | 10 | | |
Munder Mid-Cap Core Growth Fund | | | 25 | | | | 16 | | | | 18 | | | | 59 | | |
Munder Small Cap Growth Fund | | | 5 | | | | 19 | | | | 14 | | | | 38 | | |
Trivalent International Fund-Core Equity | | | 222 | | | | 522 | | | | 896 | | | | 1,640 | | |
Trivalent International Small-Cap Fund | | | 2,605 | | | | 3,170 | | | | 4,069 | | | | 9,844 | | |
INCORE Total Return Bond Fund | | | 43 | | | | 52 | | | | 97 | | | | 192 | | |
The Adviser may voluntarily waive or reimburse additional fees to assist the Funds in maintaining competitive expense ratios. Voluntary waivers and reimbursements applicable to the Funds are not available to be recouped at a future time. There were no voluntary waivers or reimbursements for the year ended June 30, 2021.
Certain officers and/or interested trustees of the Funds are also officers and/or employees of the Adviser, administrator, fund accountant, sub-administrator, sub-fund accountant, custodian, legal counsel, and Distributor.
6. Risks:
The Funds may be subject to other risks in addition to these identified risks.
Equity Risk — An investment in the Funds' shares represents an indirect investment in the securities owned by the Funds, some of which will be traded on a national securities exchange or in the over-the-counter markets. The value of the securities in which the Funds invest, like other market investments, may move up or down, sometimes rapidly and unpredictably. The value of the securities in which the Funds invest may affect the value of the Funds' shares. An investment in the Funds' shares at any point in time may be worth less than the original investment, even after taking into account the reinvestment of the Funds' distributions.
Foreign Investments Risk — The Trivalent Emerging Markets Small-Cap Fund, Trivalent International Fund-Core Equity and Trivalent International Small-Cap Fund invest in securities of foreign issuers in various countries. Investing on an international basis involves certain risks not involved in domestic investments including the risk of nationalization or expropriation of assets, imposition of currency exchange controls or restrictions on the repatriation of foreign currency, confiscatory taxation, political
176
Victory Portfolios | | Notes to Financial Statements — continued
June 30, 2021 | |
or financial instability and diplomatic developments, which could affect the value of a Fund's investments in certain foreign countries. Governments of many countries have exercised and continue to exercise substantial influence over many aspects of the private sector through the ownership or control of many companies, including some of the largest in these countries. As a result, government actions in the future could have a significant effect on economic conditions which may adversely affect prices of certain portfolio securities. There is also generally less government supervision and regulation of stock exchanges, brokers and listed companies than in the United States. Dividends or interest on, or proceeds from the sale of, foreign securities may be subject to foreign withholding taxes, and special U.S. tax considerations may apply. Moreover, foreign economies may differ favorably or unfavorably from the U.S. economy in such respects as growth of gross national product, rate of inflation, capital reinvestment, resource self-sufficiency and balance of payments position. The Schedules of Portfolio Investments includes information on each Fund's holdings, including industry and/or geographic composition, as relevant.
Interest Rate Risk — The INCORE Total Return Bond Fund is subject to credit and interest rate risk with respect to fixed income securities. Credit risk refers to the ability of an issuer to make timely payments of interest and principal. Interest rates may rise, or the rate of inflation may increase, impacting the value if investments in fixed income securities. A debt issuer's credit quality may be downgraded, or an issuer may default. Interest rates may fluctuate due to changes in governmental fiscal policy initiatives and resulting market reaction to those initiatives.
Credit Risk — The Funds will be subject to credit risk with respect to the amount each expects to receive from counterparties for financial instruments entered into by the Funds. The Funds may be negatively impacted if a counterparty becomes bankrupt or otherwise fails to perform its obligations due to financial difficulties. The Funds may experience significant delays in obtaining any recovery in bankruptcy or other reorganization proceeding and the Funds may obtain only limited recovery or may obtain no recovery in such circumstances. The Funds typically enter into transactions with counterparties whose credit ratings are investment grade, as determined by a nationally recognized statistical rating organization or, if unrated, judged by the Adviser to be of comparable quality.
Sector Risk — To the extent the Funds focus in one or more sectors, market or economic factors impacting those sectors could have a significant effect on the value of the Funds' investments and could make the Funds' performance more volatile. For example, the values of companies in the Information Technology sector are particularly vulnerable to economic downturns, short product cycles and aggressive pricing, market competition and changes in government regulation.
LIBOR Discontinuation Risk — Many debt securities, derivatives and other financial instruments, including some of the Funds' investments, use the London Interbank Offered Rate ("LIBOR") as the reference or benchmark rate for variable interest rate calculations. In June 2017, the Alternative Reference Rates Committee, a group of large U.S. banks working with the Federal Reserve, announced its selection of a new Secured Overnight Funding Rate ("SOFR"), which is intended to be a broad measure of secured overnight U.S. Treasury repo rates, as an appropriate replacement for LIBOR. The Federal Reserve Bank of New York began publishing the SOFR in 2018, expecting that it could be used on a voluntary basis in new instruments and transactions. Bank working groups and regulators in other countries have suggested other alternatives for their markets, including the Sterling Overnight Interbank Average Rate ("SONIA") in England. In July 2017, the Financial Conduct Authority (the "FCA"), the United Kingdom financial regulatory body, announced that after 2021 it will cease its active encouragement of UK banks to provide the quotations needed to sustain LIBOR. That announcement suggests that LIBOR may cease to be published after that time. For U.S. dollar LIBOR, however, the relevant date may be deferred to June 30, 2023, for the most common tenors (overnight and one, three, six and 12 months). As to those tenors, the LIBOR administrator has published a consultation regarding its intention to cease publication of U.S. dollar LIBOR as of June 30, 2023 (instead of December 31, 2021, as previously expected), apparently based on continued rate submissions from banks. It is expected that there will be enough time for market participants to transition to the use of a different benchmark for both new and existing securities and transactions. Various financial industry groups have begun planning for that transition, but there are obstacles to converting certain longer-term securities and transactions to a new benchmark. Transition planning is at an early stage, and neither the effect of the transition process nor its ultimate success can yet be known. Although the foregoing may provide some sense of timing, there is no assurance that LIBOR, nor any particular currency and tenor, will continue to be published until any particular date, and it appears highly likely that LIBOR
177
Victory Portfolios | | Notes to Financial Statements — continued
June 30, 2021 | |
will be discontinued or modified after December 31, 2021, or June 30, 2023, depending on the currency and tenor. The transition process might lead to increased volatility and illiquidity in markets that currently rely on the LIBOR to determine interest rates. It could also lead to a reduction in the value of some LIBOR-based investments and reduce the effectiveness of new hedges placed against existing LIBOR-based instruments. Since the usefulness of LIBOR as a benchmark could deteriorate during the transition period, these effects could occur before the end of 2021.
7. Borrowing and Interfund Lending:
Line of Credit:
The Victory Funds Complex participates in a short-term demand note "Line of Credit" agreement with Citibank. The Line of Credit agreement with Citibank was renewed on June 29, 2021, with a termination date of June 29, 2022. Under the agreement with Citibank, the Victory Funds Complex may borrow up to $600 million, of which $300 million is committed and $300 million is uncommitted. $40 million of the Line of Credit is reserved for use by the Victory Floating Rate Fund, another series of the Victory Funds Complex, with Victory Floating Rate Fund paying the related commitment fees for that amount. The purpose of the Line of Credit is to meet temporary or emergency cash needs. For the year ended June 30, 2021, Citibank also received an annual commitment fee of 0.15% on $300 million for providing the Line of Credit. Each fund in the Victory Funds Complex pays a pro-rata portion of the commitment fees plus any interest (one month LIBOR plus one percent) on amounts borrowed. For the period June 29, 2020, through April 30, 2021, under an amended Line of Credit agreement, Citibank received an annual upfront fee of 0.10% on the $300 million committed line of credit. Each Fund in the Victory Funds Complex paid a pro-rata portion of the upfront fee. Effective with the renewal, the annual commitment fee of 0.15% remains unchanged and the upfront fee of 0.10% was discontinued. Interest charged to each Fund during the period, if applicable, is presented on the Statements of Operations under Line of credit fees.
The Funds had no borrowings under the Line of Credit during the year ended June 30, 2021.
Interfund Lending:
The Trust and Adviser rely on an exemptive order granted by the SEC in March 2017 (the "Order"), permitting the establishment and operation of an Interfund Lending Facility (the "Facility"). The Facility allows each Fund to directly lend and borrow money to or from any other fund in the Victory Funds Complex that is permitted to participate in the Facility, relying upon the Order at rates beneficial to both the borrowing and lending funds. Advances under the Facility are allowed for temporary or emergency purposes, including the meeting of redemption requests that otherwise might require the untimely disposition of securities, and are subject to each Fund's borrowing restrictions. The interfund loan rate is determined, as specified in the Order, by averaging the current repurchase agreement rate and the current bank loan rate. As a Borrower, interest charged to each Fund during the period, if applicable, is presented on the Statements of Operations under Interfund lending fees. As a Lender, interest earned by each Fund during the period, if applicable, is presented on the Statements of Operations under Interest expense on interfund lending.
The average borrowing or lending for the days outstanding and average interest rate for the Funds during the year ended June 30, 2021, were as follows (amounts in thousands):
| | | Borrower or
Lender | | Amount
Outstanding at
June 30, 2021 | | Average
Borrowing* | | Days
Borrowing
Outstanding | | Average
Interest
Rate | | Maximum
Borrowing
During
the Period | |
Integrity Small-Cap
Value Fund | | Borrower | | $ | — | | | $ | 5,096 | | | | 5 | | | | 0.62 | % | | $ | 5,671 | | |
Munder Mid-Cap Core
Growth Fund | | Borrower | | | — | | | | 1,357 | | | | 1 | | | | 0.58 | % | | | 1,357 | | |
* For the year ended June 30, 2021, based on the number of days borrowings were outstanding.
178
Victory Portfolios | | Notes to Financial Statements — continued
June 30, 2021 | |
8. Federal Income Tax Information:
Dividends from net investment income, if any, are declared and paid as noted in the table below. Distributable net realized gains, if any, are declared and distributed at least annually from each Fund.
| | | Declared | | Paid | |
Integrity Discovery Fund | | Annually | | Annually | |
Integrity Mid-Cap Value Fund | | Annually | | Annually | |
Integrity Small-Cap Value Fund | | Annually | | Annually | |
Integrity Small/Mid-Cap Value Fund | | Annually | | Annually | |
Munder Multi-Cap Fund | | Annually | | Annually | |
S&P 500 Index Fund | | Quarterly | | Quarterly | |
Munder Mid-Cap Core Growth Fund | | Annually | | Annually | |
Munder Small Cap Growth Fund | | Annually | | Annually | |
Trivalent International Fund-Core Equity | | Annually | | Annually | |
Trivalent International Small-Cap Fund | | Annually | | Annually | |
INCORE Total Return Bond Fund | | Monthly | | Monthly | |
The amounts of dividends from net investment income and distributions from net realized gains (collectively distributions to shareholders) are determined in accordance with federal income tax regulations, which may differ from GAAP. To the extent these "book/tax" differences are permanent in nature (e.g., net operating loss and distribution reclassification), such amounts are reclassified within the components of net assets based on their federal tax-basis treatment; temporary differences (e.g., wash sales) do not require reclassification. To the extent dividends and distributions exceed net investment income and net realized gains for tax purposes, they are reported as distributions of capital. Net investment losses incurred by the Funds may be reclassified as an offset to capital on the accompanying Statements of Assets and Liabilities.
As of June 30, 2021, on the Statements of Assets and Liabilities, as a result of permanent book-to-tax differences, reclassification adjustments were as follows (amount in thousands):
| | | Total
Accumulated
Earnings/(Loss) | | Capital | |
Integrity Discovery Fund | | $ | 99 | | | $ | (99 | ) | |
Integrity Small-Cap Value Fund | | | (3,889 | ) | | | 3,889 | | |
Munder Multi-Cap Fund | | | (1,737 | ) | | | 1,737 | | |
S&P 500 Index Fund | | | (1,095 | ) | | | 1,095 | | |
Munder Mid-Cap Core Growth Fund | | | (12,055 | ) | | | 12,055 | | |
Trivalent International Small-Cap Fund | | | (11,868 | ) | | | 11,868 | | |
The tax character of distributions paid during the tax years ended as noted below, were as follows (total distributions paid may differ from the Statements of Changes in Net Assets because, for tax purposes, dividends are recognized when actually paid) (amounts in thousands):
| | | Year Ended June 30, 2021 | |
| | Distributions paid from | | | | | | | |
| | Ordinary
Income | | Net
Long-Term
Capital Gains | | Total
Taxable
Distributions | | Return of
Capital | | Total
Distributions
Paid | |
Integrity Mid-Cap Value Fund | | $ | 4,163 | | | $ | — | | | $ | 4,163 | | | $ | 945 | | | $ | 5,108 | | |
Integrity Small-Cap Value Fund | | | 7,500 | | | | — | | | | 7,500 | | | | — | | | | 7,500 | | |
Integrity Small/Mid-Cap Value Fund | | | 1,424 | | | | 973 | | | | 2,397 | | | | — | | | | 2,397 | | |
Munder Multi-Cap Fund | | | 368 | | | | — | | | | 368 | | | | — | | | | 368 | | |
S&P 500 Index Fund | | | 2,896 | | | | 13,717 | | | | 16,613 | | | | — | | | | 16,613 | | |
Munder Mid-Cap Core Growth Fund | | | — | | | | 60,802 | | | | 60,802 | | | | — | | | | 60,802 | | |
Munder Small Cap Growth Fund | | | 392 | | | | 724 | | | | 1,116 | | | | — | | | | 1,116 | | |
Trivalent International Fund-Core Equity
Fund | | | 2,905 | | | | — | | | | 2,905 | | | | — | | | | 2,905 | | |
Trivalent International Small-Cap Fund | | | 9,465 | | | | — | | | | 9,465 | | | | — | | | | 9,465 | | |
INCORE Total Return Bond Fund | | | 1,780 | | | | — | | | | 1,780 | | | | — | | | | 1,780 | | |
179
Victory Portfolios | | Notes to Financial Statements — continued
June 30, 2021 | |
| | | Year Ended June 30, 2020 | |
| | Distributions paid from | | | | | | | |
| | Ordinary
Income | | Net
Long-Term
Capital Gains | | Total
Taxable
Distributions | | Return of
Capital | | Total
Distributions
Paid | |
Integrity Discovery Fund | | $ | — | | | $ | 3,016 | | | $ | 3,016 | | | $ | — | | | $ | 3,016 | | |
Integrity Mid-Cap Value Fund | | | 1,864 | | | | — | | | | 1,864 | | | | — | | | | 1,864 | | |
Integrity Small-Cap Value Fund | | | 7,384 | | | | 9,796 | | | | 17,180 | | | | — | | | | 17,180 | | |
Integrity Small/Mid-Cap Value Fund | | | 1,120 | | | | — | | | | 1,120 | | | | — | | | | 1,120 | | |
Munder Multi-Cap Fund | | | 1,013 | | | | 9,950 | | | | 10,963 | | | | — | | | | 10,963 | | |
S&P 500 Index Fund | | | 3,010 | | | | 24,335 | | | | 27,345 | | | | — | | | | 27,345 | | |
Munder Mid-Cap Core Growth Fund | | | 8,744 | | | | 502,320 | | | | 511,064 | | | | — | | | | 511,064 | | |
Munder Small Cap Growth Fund | | | 470 | | | | 256 | | | | 726 | | | | — | | | | 726 | | |
Trivalent International Fund-Core Equity | | | 1,079 | | | | — | | | | 1,079 | | | | — | | | | 1,079 | | |
Trivalent International Small-Cap Fund | | | 37,815 | | | | — | | | | 37,815 | | | | — | | | | 37,815 | | |
INCORE Total Return Bond Fund | | | 1,901 | | | | — | | | | 1,901 | | | | — | | | | 1,901 | | |
As of June 30, 2021, the components of accumulated earnings (loss) on a tax basis were as follows (amount in thousands):
| | | Undistributed
Ordinary
Income | | Undistributed
Long-Term
Capital Gains | | Accumulated
Earnings | | Accumulated
Capital and
Other
Losses | | Qualified
Late-Year
Losses* | | Unrealized
Appreciation
(Depreciation)** | | Total
Accumulated
Earnings
(Loss) | |
Integrity Discovery
Fund | | $ | — | | | $ | 2,846 | | | $ | 2,846 | | | $ | — | | | $ | (97 | ) | | $ | 22,573 | | | $ | 25,322 | | |
Integrity Mid-Cap Value
Fund | | | — | | | | — | | | | — | | | | (931 | ) | | | — | | | | 60,718 | | | | 59,787 | | |
Integrity Small-Cap
Value Fund | | | 90,560 | | | | 88,140 | | | | 178,700 | | | | — | | | | — | | | | 573,226 | | | | 751,926 | | |
Integrity Small/Mid-Cap
Value Fund | | | — | | | | 4,048 | | | | 4,048 | | | | — | | | | — | | | | 53,453 | | | | 57,501 | | |
Munder Multi-Cap
Fund | | | 13,198 | | | | 35,272 | | | | 48,470 | | | | — | | | | — | | | | 145,755 | | | | 194,225 | | |
| S&P 500 Index Fund | | | 291 | | | | 14,188 | | | | 14,479 | | | | — | | | | — | | | | 217,500 | | | | 231,979 | | |
Munder Mid-Cap Core
Growth Fund | | | 19,951 | | | | 56,014 | | | | 75,965 | | | | — | | | | — | | | | 213,520 | | | | 289,485 | | |
Munder Small Cap
Growth Fund | | | 244 | | | | 710 | | | | 954 | | | | — | | | | — | | | | 6,790 | | | | 7,744 | | |
Trivalent International
Fund-Core
Equity Fund | | | 3,815 | | | | — | | | | 3,815 | | | | (2,216 | ) | | | — | | | | 37,170 | | | | 38,769 | | |
Trivalent International
Small-Cap Fund | | | 55,923 | | | | 143,660 | | | | 199,583 | | | | — | | | | — | | | | 757,565 | | | | 957,148 | | |
INCORE Total Return
Bond Fund | | | 49 | | | | — | | | | 49 | | | | (3,745 | ) | | | — | | | | 1,805 | | | | (1,891 | ) | |
* Qualified late-year losses are comprised of post-October capital losses incurred after October 31 and certain late-year ordinary losses. Late-year ordinary losses represent ordinary losses incurred after December 31 and specified losses incurred after October 31. These losses are deemed to arise on the first day of the Fund's next taxable year.
** The difference between the book-basis and tax-basis unrealized appreciation (depreciation) is attributable primarily to tax deferral of losses on wash sales, and passive foreign investment company adjustments.
180
Victory Portfolios | | Notes to Financial Statements — continued
June 30, 2021 | |
At June 30, 2021, the Funds had net capital loss carryforwards as shown in the table below. It is unlikely that the Board will authorize a distribution of capital gains realized in the future until the capital loss carryforwards have been used (amount in thousands).
| | | Short-Term
Amount | | Long-Term
Amount | | Total | |
| Integrity Mid-Cap Value Fund | | $ | 931 | | | $ | — | | | $ | 931 | | |
Trivalent International Fund-Core Equity Fund | | | 2,216 | | | | — | | | | 2,216 | | |
INCORE Total Return Bond Fund | | | 460 | | | | 3,285 | | | | 3,745 | | |
During the tax year ended June 30, 2021, the following Funds utilized capital loss carryforwards (amount in thousands):
| | Short-Term
Amount | | Long-Term
Amount | |
Integrity Discovery Fund | | $ | 3,937 | | | $ | 6,141 | | |
Integrity Mid-Cap Value Fund | | | 18,365 | | | | 675 | | |
Integrity Small-Cap Value Fund | | | 135,836 | | | | 94,837 | | |
Integrity Small/Mid-Cap Value Fund | | | 11,685 | | | | 1,793 | | |
Munder Multi-Cap Fund | | | 7,601 | | | | — | | |
Trivalent International Fund-Core Equity Fund | | | 5,868 | | | | — | | |
Trivalent International Small-Cap Fund | | | 138,252 | | | | 16,487 | | |
INCORE Total Return Bond Fund | | | 154 | | | | 251 | | |
As of June 30, 2021, the cost basis for federal income tax purposes, gross unrealized appreciation, gross unrealized depreciation, and net unrealized appreciation (depreciation) for investments were as follows (amount in thousands):
| | Cost of
Investments
for Federal
Tax Purposes | | Net Gross
Unrealized
Appreciation | | Gross
Unrealized
Depreciation | | Net
Unrealized
Appreciation
(Depreciation) | |
Integrity Discovery Fund | | $ | 77,921 | | | $ | 26,858 | | | $ | (4,285 | ) | | $ | 22,573 | | |
Integrity Mid-Cap Value Fund | | | 204,865 | | | | 64,855 | | | | (4,137 | ) | | | 60,718 | | |
Integrity Small-Cap Value Fund | | | 1,481,911 | | | | 611,046 | | | | (37,820 | ) | | | 573,226 | | |
Integrity Small/Mid-Cap Value Fund | | | 157,084 | | | | 55,519 | | | | (2,066 | ) | | | 53,453 | | |
Munder Multi-Cap Fund | | | 295,448 | | | | 150,154 | | | | (4,399 | ) | | | 145,755 | | |
S&P 500 Index Fund | | | 50,125 | | | | 218,933 | | | | (1,433 | ) | | | 217,500 | | |
Munder Mid-Cap Core Growth Fund | | | 379,124 | | | | 219,233 | | | | (5,713 | ) | | | 213,520 | | |
Munder Small Cap Growth Fund | | | 12,557 | | | | 7,257 | | | | (467 | ) | | | 6,790 | | |
Trivalent International Fund-Core
Equity Fund | | | 190,105 | | | | 42,066 | | | | (4,751 | ) | | | 37,315 | | |
Trivalent International Small-Cap
Fund | | | 2,631,057 | | | | 868,755 | | | | (111,214 | ) | | | 757,541 | | |
INCORE Total Return Bond Fund | | | 66,249 | | | | 2,683 | | | | (878 | ) | | | 1,805 | | |
181
REPORT OF INDEPENDENT REGISTERED PUBLIC ACCOUNTING FIRM
To the Shareholders and Board of Trustees of
Victory Portfolios
Opinion on the Financial Statements
We have audited the accompanying statements of assets and liabilities, including the schedules of portfolio investments, of Victory Integrity Discovery Fund, Victory Integrity Mid-Cap Value Fund, Victory Integrity Small-Cap Value Fund, Victory Integrity Small/Mid-Cap Value Fund, Victory Munder Multi-Cap Fund, Victory S&P 500 Index Fund, Victory Munder Mid-Cap Core Growth Fund, Victory Munder Small Cap Growth Fund, Victory Trivalent International Fund-Core Equity, Victory Trivalent International Small-Cap Fund, and Victory INCORE Total Return Bond Fund (the "Funds"), each a series of Victory Portfolios, as of June 30, 2021, the related statements of operations for the year then ended, the statements of changes in net assets for each of the two years in the period then ended, the related notes, and the financial highlights for each of the three years in the period then ended (collectively referred to as the "financial statements"). In our opinion, the financial statements present fairly, in all material respects, the financial position of the Funds as of June 30, 2021, the results of their operations for the year then ended, the changes in their net assets for each of the two years in the period then ended, and the financial highlights for each of the three years in the period then ended, in conformity with accounting principles generally accepted in the United States of America.
The Funds' financial highlights for the year ended June 30, 2018, and prior, were audited by other auditors whose report dated August 24, 2018, expressed an unqualified opinion on those financial highlights.
Basis for Opinion
These financial statements are the responsibility of the Funds' management. Our responsibility is to express an opinion on the Funds' financial statements based on our audits. We are a public accounting firm registered with the Public Company Accounting Oversight Board (United States) ("PCAOB") and are required to be independent with respect to the Funds in accordance with the U.S. federal securities laws and the applicable rules and regulations of the Securities and Exchange Commission and the PCAOB.
We conducted our audits in accordance with the standards of the PCAOB. Those standards require that we plan and perform the audit to obtain reasonable assurance about whether the financial statements are free of material misstatement whether due to error or fraud.
Our audits included performing procedures to assess the risks of material misstatement of the financial statements, whether due to error or fraud, and performing procedures that respond to those risks. Such procedures included examining, on a test basis, evidence regarding the amounts and disclosures in the financial statements. Our procedures included confirmation of securities owned as of June 30, 2021, by correspondence with the custodian and brokers; when replies were not received from brokers, we performed other auditing procedures. Our audits also included evaluating the accounting principles used and significant estimates made by management, as well as evaluating the overall presentation of the financial statements. We believe that our audits provide a reasonable basis for our opinion.
We have served as the auditor of one or more investment companies advised by Victory Capital Management, Inc. since 2015.

COHEN & COMPANY, LTD.
Cleveland, Ohio
August 27, 2021
182
Victory Portfolios | | Supplemental Information
June 30, 2021 | |
(Unaudited)
Trustee and Officer Information
Board of Trustees:
Overall responsibility for management of the Trust rests with the Board. The Trust is managed by the Board in accordance with the laws of the State of Delaware. There are currently nine Trustees, eight of whom are not "interested persons" of the Trust within the meaning of that term under the 1940 Act ("Independent Trustees") and one of whom is an "interested person" of the Trust within the meaning of that term under the 1940 Act ("Interested Trustee"). The Trustees, in turn, elect the officers of the Trust to actively supervise its day-to-day operations.
The following tables list the Trustees, their date of birth, position with the Trust, commencement of service, principal occupations during the past five years and any directorships of other investment companies or companies whose securities are registered under the Securities Exchange Act of 1934, as amended, or who file reports under that Act. Each Trustee oversees 41 portfolios in the Trust, eight portfolios in Victory Variable Insurance Funds, and 24 portfolios in Victory Portfolios II, each a registered investment company that, together with the Trust, comprise the Victory Fund Complex. David C. Brown is a Trustee of USAA Mutual Funds and oversees 46 portfolios of the USAA Mutual Funds Trust. Each Trustee's address is c/o Victory Portfolios, 4900 Tiedeman Road, 4th Floor, Brooklyn, Ohio 44144. Each Trustee has an indefinite term.
Name and Date of Birth | | Position
Held with
the Trust | | Date
Commenced
Service | | Principal Occupation
During Past 5 Years | | Other
Directorships
Held During
Past 5 Years | |
Independent Trustees. | |
David Brooks Adcock,
Born October 1951 | | Trustee | | May 2005 | | Consultant (since 2006). | | Chair and Trustee, Turner Funds (December 2016-December 2017). | |
Nigel D. T. Andrews,
Born April 1947 | | Trustee | | August 2002 | | Retired. | | Director, TCG BDC II, Inc. (since 2017); Director, TCG BDC I, Inc. (formerly Carlyle GMS Finance, Inc.) (since 2012). | |
E. Lee Beard,*
Born August 1951 | | Trustee | | May 2005 | | Retired (since 2015) | | None. | |
Dennis M. Bushe,
Born January 1944 | | Trustee | | July 2016 | | Retired. | | Trustee, RS Investment Trust and RS Variable Products Trust (November 2011-July 2016). | |
183
Victory Portfolios | | Supplemental Information — continued
June 30, 2021 | |
(Unaudited)
Name and Date of Birth | | Position
Held with
the Trust | | Date
Commenced
Service | | Principal Occupation
During Past 5 Years | | Other
Directorships
Held During
Past 5 Years | |
John L. Kelly,
Born April 1953 | | Vice Chair and Trustee | | February 2015 | | Partner, McCarvill Capital Partners (September 2016- September 2017). | | Director, Caledonia Mining Corporation (since May 2012). | |
David L. Meyer,*
Born April 1957 | | Trustee | | December 2008 | | Retired. | | | None. | | |
Gloria S. Nelund,
Born May 1961 | | Trustee | | July 2016 | | Chair, CEO and Co-Founder of TriLinc Global, LLC, an investment firm. | | TriLinc Global Impact Fund, LLC (since 2012); Trustee, RS Investment Trust and RS Variable Products Trust (November 2007-July 2016). | |
Leigh A. Wilson,
Born December 1944 | | Chair and Trustee | | November 1994 | | Private Investor. | | Chair (since 2013), Caledonia Mining Corporation. | |
Interested Trustee. | |
David C. Brown,**
Born May 1972 | | Trustee | | May 2008 | | Chairman and Chief Executive Officer (since 2013), the Adviser; Chairman and Chief Executive Officer (since 2013), Victory Capital Holdings, Inc. | | Trustee, USAA Mutual Funds Trust. | |
* The Board has designated Ms. Beard and Mr. Meyer as its Audit Committee Financial Experts.
** Mr. Brown is an "Interested Person" by reason of his relationship with the Adviser.
The Statement of Additional Information includes additional information about the Trustees of the Trust and is available, without charge, by calling 800-539-3863.
184
Victory Portfolios | | Supplemental Information — continued
June 30, 2021 | |
(Unaudited)
Officers:
The officers of the Trust, their date of birth, commencement of service and their principal occupations during the past five years, are detailed in the following table. Each officer serves until the earlier of his or her resignation, removal, retirement, death, or the election of a successor. The mailing address of each officer of the Trust is 4900 Tiedeman Road, 4th Floor, Brooklyn, Ohio 44144. The officers of the Trust receive no compensation directly from the Trust for performing the duties of their offices.
Name and Date of Birth | | Position with
the Trust | | Date
Commenced
Service | | Principal Occupation During Past 5 Years | |
Christopher K. Dyer,
Born February 1962 | | President | | February 2006* | | Director of Mutual Fund Administration, the Adviser. | |
Scott A. Stahorsky,
Born July 1969 | | Vice President | | December 2014 | | Manager, Fund Administration, the Adviser. | |
Erin G. Wagner,
Born February 1974 | | Secretary | | December 2014 | | Associate General Counsel, the Adviser (since 2013). | |
Allan Shaer,
Born March 1965 | | Treasurer | | May 2017 | | Senior Vice President, Financial Administration, Citi Fund Services Ohio, Inc. (since 2016); Vice President, Mutual Fund Administration, JP Morgan Chase (2011-2016). | |
Christopher A. Ponte,
Born March 1984 | | Assistant Treasurer | | December 2017 | | Manager, Fund Administration, the Adviser (since 2017); Senior Analyst, Fund Administration, the Adviser (prior to 2017); Chief Financial Officer, Victory Capital Services, Inc. (since 2018). | |
Colin Kinney,
Born October 1973 | | Chief Compliance Officer | | July 2017 | | Chief Compliance Officer (since 2013) and Chief Risk Officer (2009-2017), the Adviser. | |
Chuck Booth,
Born April 1960 | | Anti-Money Laundering Compliance Officer and Identity Theft Officer | | May 2015 | | Director, Regulatory Administration and CCO Support Services, Citi Fund Services Ohio, Inc. | |
Jay G. Baris,
Born January 1954 | | Assistant Secretary | | December 1997 | | Partner, Sidley Austin LLP (since April 2020); Partner, Shearman & Sterling LLP (January 2018-April 2020); Partner, Morrison & Foerster LLP (2011-January 2018). | |
* On December 3, 2014, Mr. Dyer resigned as Secretary of the Trust and accepted the position of President.
185
Victory Portfolios | | Supplemental Information — continued
June 30, 2021 | |
(Unaudited)
Proxy Voting and Portfolio Holdings Information
Proxy Voting:
Information regarding the policies and procedures the Funds use to determine how to vote proxies relating to portfolio securities is available without charge, upon request, by calling 800-539-3863. The information is also included in the Funds' Statement of Additional Information, which is available on the SEC's website at www.sec.gov.
Information relating to how the Funds voted proxies relating to portfolio securities held during the most recent 12 months ended June 30 is available on the SEC's website at www.sec.gov.
Availability of Schedules of Portfolio Investments:
The Trust files a complete list of Schedules of Portfolio Investments with the SEC for the first and third quarter of each fiscal year on Form N-PORT. Forms N-PORT is available on the SEC's website at www.sec.gov.
Expense Examples
As a shareholder of the Funds, you may incur two types of costs: (1) transaction costs, including sales charges (loads) on purchases; and (2) ongoing costs, including management fees, distribution and services (12b-1) fees and other Fund expenses. These examples are intended to help you understand your ongoing costs (in dollars) of investing in the Funds and to compare these costs with the ongoing costs of investing in other mutual funds.
These examples are based on an investment of $1,000 invested at the beginning of the period and held for the entire period from January 1, 2021, through June 30, 2021.
The Actual Expense figures in the table below provide information about actual account values and actual expenses. You may use the information below, together with the amount you invested, to estimate the expenses that you paid over the period. Simply divide your account value by $1,000 (for example, an $8,600 account value divided by $1,000 = 8.6), then multiply the result by the number in the table under the heading entitled "Actual Expenses Paid During Period" to estimate the expenses you paid on your account during this period.
The Hypothetical Expense figures in the table below provide information about hypothetical account values and hypothetical expenses based on the Fund's actual expense ratio and an assumed rate of return of 5% per year before expenses, which is not the Fund's actual return. The hypothetical account values and expenses may not be used to estimate the actual ending account balance or expenses you paid for the period. You may use this information to compare this 5% hypothetical example with the 5% hypothetical examples that appear in shareholder reports of other funds.
Please note the expenses shown in the table below are meant to highlight your ongoing costs only and do not reflect any transactional costs. If these transactional costs were included, your costs would have been higher.
| | Beginning
Account
Value
1/1/21 | | Actual
Ending
Account
Value
6/30/21 | | Hypothetical
Ending
Account
Value
6/30/21 | | Actual
Expenses Paid
During Period
1/1/21-6/30/21* | | Hypothetical
Expenses Paid
During Period
1/1/21-6/30/21* | | Annualized
Expense Ratio
During Period
1/1/21-6/30/21 | |
Integrity Discovery Fund | |
Class A | | $ | 1,000.00 | | | $ | 1,348.20 | | | $ | 1,016.81 | | | $ | 9.37 | | | $ | 8.05 | | | | 1.61 | % | |
Class C | | | 1,000.00 | | | | 1,342.20 | | | | 1,012.65 | | | | 14.23 | | | | 12.23 | | | | 2.45 | % | |
Class R | | | 1,000.00 | | | | 1,344.90 | | | | 1,014.48 | | | | 12.09 | | | | 10.39 | | | | 2.08 | % | |
Class Y | | | 1,000.00 | | | | 1,350.50 | | | | 1,018.60 | | | | 7.28 | | | | 6.26 | | | | 1.25 | % | |
Member Class | | | 1,000.00 | | | | 1,348.90 | | | | 1,017.36 | | | | 8.74 | | | | 7.50 | | | | 1.50 | % | |
Integrity Mid-Cap Value Fund | |
Class A | | | 1,000.00 | | | | 1,205.30 | | | | 1,019.84 | | | | 5.47 | | | | 5.01 | | | | 1.00 | % | |
Class C | | | 1,000.00 | | | | 1,200.70 | | | | 1,016.12 | | | | 9.55 | | | | 8.75 | | | | 1.75 | % | |
Class R6 | | | 1,000.00 | | | | 1,207.30 | | | | 1,021.82 | | | | 3.28 | | | | 3.01 | | | | 0.60 | % | |
Class Y | | | 1,000.00 | | | | 1,206.50 | | | | 1,021.08 | | | | 4.10 | | | | 3.76 | | | | 0.75 | % | |
Member Class | | | 1,000.00 | | | | 1,205.80 | | | | 1,020.58 | | | | 4.65 | | | | 4.26 | | | | 0.85 | % | |
186
Victory Portfolios | | Supplemental Information — continued
June 30, 2021 | |
(Unaudited)
| | Beginning
Account
Value
1/1/21 | | Actual
Ending
Account
Value
6/30/21 | | Hypothetical
Ending
Account
Value
6/30/21 | | Actual
Expenses Paid
During Period
1/1/21-6/30/21* | | Hypothetical
Expenses Paid
During Period
1/1/21-6/30/21* | | Annualized
Expense Ratio
During Period
1/1/21-6/30/21 | |
Integrity Small-Cap Value Fund | |
Class A | | $ | 1,000.00 | | | $ | 1,273.80 | | | $ | 1,017.21 | | | $ | 8.63 | | | $ | 7.65 | | | | 1.53 | % | |
Class C | | | 1,000.00 | | | | 1,268.60 | | | | 1,013.14 | | | | 13.22 | | | | 11.73 | | | | 2.35 | % | |
Class R | | | 1,000.00 | | | | 1,272.50 | | | | 1,016.12 | | | | 9.86 | | | | 8.75 | | | | 1.75 | % | |
Class R6 | | | 1,000.00 | | | | 1,277.80 | | | | 1,020.08 | | | | 5.37 | | | | 4.76 | | | | 0.95 | % | |
Class Y | | | 1,000.00 | | | | 1,276.80 | | | | 1,019.64 | | | | 5.87 | | | | 5.21 | | | | 1.04 | % | |
Integrity Small/Mid Value Fund | |
Class A | | | 1,000.00 | | | | 1,256.40 | | | | 1,019.19 | | | | 6.32 | | | | 5.66 | | | | 1.13 | % | |
Class R6 | | | 1,000.00 | | | | 1,258.10 | | | | 1,020.68 | | | | 4.65 | | | | 4.16 | | | | 0.83 | % | |
Class Y | | | 1,000.00 | | | | 1,258.40 | | | | 1,020.43 | | | | 4.93 | | | | 4.41 | | | | 0.88 | % | |
Member Class | | | 1,000.00 | | | | 1,257.70 | | | | 1,020.08 | | | | 5.32 | | | | 4.76 | | | | 0.95 | % | |
Munder Multi-Cap Fund | |
Class A | | | 1,000.00 | | | | 1,156.80 | | | | 1,018.10 | | | | 7.22 | | | | 6.76 | | | | 1.35 | % | |
Class C | | | 1,000.00 | | | | 1,152.10 | | | | 1,014.08 | | | | 11.53 | | | | 10.79 | | | | 2.16 | % | |
Class Y | | | 1,000.00 | | | | 1,158.80 | | | | 1,019.89 | | | | 5.30 | | | | 4.96 | | | | 0.99 | % | |
S&P 500 Index Fund | |
Class A | | | 1,000.00 | | | | 1,149.40 | | | | 1,022.07 | | | | 2.93 | | | | 2.76 | | | | 0.55 | % | |
Class R | | | 1,000.00 | | | | 1,147.10 | | | | 1,020.18 | | | | 4.95 | | | | 4.66 | | | | 0.93 | % | |
Class Y | | | 1,000.00 | | | | 1,149.90 | | | | 1,022.46 | | | | 2.51 | | | | 2.36 | | | | 0.47 | % | |
Munder Mid-Cap Core Growth Fund | |
Class A | | | 1,000.00 | | | | 1,148.30 | | | | 1,018.50 | | | | 6.76 | | | | 6.36 | | | | 1.27 | % | |
Class C | | | 1,000.00 | | | | 1,143.80 | | | | 1,014.63 | | | | 10.90 | | | | 10.24 | | | | 2.05 | % | |
Class R | | | 1,000.00 | | | | 1,147.60 | | | | 1,017.01 | | | | 8.36 | | | | 7.85 | | | | 1.57 | % | |
Class R6 | | | 1,000.00 | | | | 1,151.50 | | | | 1,020.58 | | | | 4.53 | | | | 4.26 | | | | 0.85 | % | |
Class Y | | | 1,000.00 | | | | 1,150.80 | | | | 1,020.08 | | | | 5.07 | | | | 4.76 | | | | 0.95 | % | |
Munder Small Cap Growth Fund | |
Class A | | | 1,000.00 | | | | 1,150.80 | | | | 1,017.85 | | | | 7.47 | | | | 7.00 | | | | 1.40 | % | |
Class I | | | 1,000.00 | | | | 1,152.10 | | | | 1,019.09 | | | | 6.14 | | | | 5.76 | | | | 1.15 | % | |
Class Y | | | 1,000.00 | | | | 1,151.60 | | | | 1,018.60 | | | | 6.67 | | | | 6.26 | | | | 1.25 | % | |
Trivalent International Fund-Core Equity | |
Class A | | | 1,000.00 | | | | 1,091.50 | | | | 1,020.08 | | | | 4.93 | | | | 4.76 | | | | 0.95 | % | |
Class C | | | 1,000.00 | | | | 1,086.00 | | | | 1,016.36 | | | | 8.79 | | | | 8.50 | | | | 1.70 | % | |
Class I | | | 1,000.00 | | | | 1,092.30 | | | | 1,021.82 | | | | 3.11 | | | | 3.01 | | | | 0.60 | % | |
Class R6 | | | 1,000.00 | | | | 1,093.10 | | | | 1,022.07 | | | | 2.85 | | | | 2.76 | | | | 0.55 | % | |
Class Y | | | 1,000.00 | | | | 1,091.60 | | | | 1,021.32 | | | | 3.63 | | | | 3.51 | | | | 0.70 | % | |
Trivalent International Small-Cap Fund | |
Class A | | | 1,000.00 | | | | 1,112.90 | | | | 1,018.10 | | | | 7.07 | | | | 6.76 | | | | 1.35 | % | |
Class C | | | 1,000.00 | | | | 1,109.30 | | | | 1,014.38 | | | | 10.98 | | | | 10.49 | | | | 2.10 | % | |
Class I | | | 1,000.00 | | | | 1,115.30 | | | | 1,020.08 | | | | 4.98 | | | | 4.76 | | | | 0.95 | % | |
Class R6 | | | 1,000.00 | | | | 1,114.10 | | | | 1,019.74 | | | | 5.35 | | | | 5.11 | | | | 1.02 | % | |
Class Y | | | 1,000.00 | | | | 1,114.50 | | | | 1,019.34 | | | | 5.77 | | | | 5.51 | | | | 1.10 | % | |
INCORE Total Return Bond Fund | |
Class A | | | 1,000.00 | | | | 990.80 | | | | 1,020.58 | | | | 4.20 | | | | 4.26 | | | | 0.85 | % | |
Class C | | | 1,000.00 | | | | 988.30 | | | | 1,016.86 | | | | 7.89 | | | | 8.00 | | | | 1.60 | % | |
Class R6 | | | 1,000.00 | | | | 993.00 | | | | 1,021.92 | | | | 2.87 | | | | 2.91 | | | | 0.58 | % | |
Class Y | | | 1,000.00 | | | | 992.90 | | | | 1,021.82 | | | | 2.96 | | | | 3.01 | | | | 0.60 | % | |
* Expenses are equal to the average account value multiplied by the Fund's annualized expense ratio multiplied by 181/365 (the number of days in the most recent fiscal half-year divided by the number of days in the fiscal year).
187
Victory Portfolios | | Supplemental Information — continued
June 30, 2021 | |
(Unaudited)
Additional Federal Income Tax Information
For the year ended June 30, 2021, the following Funds paid qualified dividend income for the purposes of reduced individual federal income tax rates of:
| | | Percent | |
Integrity Mid-Cap Value Fund | | | 100 | % | |
Integrity Small-Cap Value Fund | | | 100 | % | |
Integrity Small/Mid-Cap Value Fund | | | 100 | % | |
Munder Multi-Cap Fund | | | 100 | % | |
S&P 500 Index Fund | | | 100 | % | |
Munder Small Cap Growth Fund | | | 8 | % | |
Trivalent International Fund-Core Equity Fund | | | 82 | % | |
Trivalent International Small-Cap Fund | | | 94 | % | |
INCORE Total Return Bond Fund | | | 2 | % | |
Dividends qualified for corporate dividends received deductions of:
| | | Percent | |
Integrity Mid-Cap Value Fund | | | 100 | % | |
Integrity Small-Cap Value Fund | | | 100 | % | |
Integrity Small/Mid-Cap Value Fund | | | 100 | % | |
Munder Multi-Cap Fund | | | 100 | % | |
S&P 500 Index Fund | | | 100 | % | |
Munder Small Cap Growth Fund | | | 7 | % | |
INCORE Total Return Bond Fund | | | 1 | % | |
For the year ended June 30, 2021, the following Funds designated short-term capital gain distributions (amount in thousands):
| | | Amount | |
Integrity Small-Cap Value Fund | | $ | 1,883 | | |
Munder Multi-Cap Fund | | | 473 | | |
| S&P 500 Index Fund | | | 511 | | |
Munder Mid-Cap Core Growth Fund | | | 1,835 | | |
Munder Small Cap Growth Fund | | | 354 | | |
For the year ended June 30, 2021, the following Funds designated long-term capital gain distributions (amount in thousands):
| | | Amount | |
Integrity Small-Cap Value Fund | | $ | 2,005 | | |
Integrity Small/Mid-Cap Value Fund | | | 973 | | |
Munder Multi-Cap Fund | | | 1,264 | | |
S&P 500 Index Fund | | | 14,788 | | |
Munder Mid-Cap Core Growth Fund | | | 70,793 | | |
Munder Small Cap Growth Fund | | | 724 | | |
Trivalent International Small-Cap Fund | | | 11,868 | | |
The following Funds intend to elect to pass through to shareholders the income tax credit for taxes paid to foreign countries. Foreign source income and foreign tax expense per outstanding share on June 30, 2021, were as follows:
| | | Foreign
Source
Income | | Foreign
Tax
Expense | |
Trivalent International Fund-Core Equity Fund | | | 0.23 | | | | 0.02 | | |
Trivalent International Small-Cap Fund | | | 0.32 | | | | 0.03 | | |
188
Victory Portfolios | | Supplemental Information — continued
June 30, 2021 | |
(Unaudited)
Liquidity Risk Management Program:
The Victory Funds have adopted and implemented a written liquidity risk management program (the "LRMP") as required by Rule 22e-4 under the Investment Company Act of 1940, as amended. The LRMP is reasonably designed to assess and manage each Fund's liquidity risk, taking into consideration each Fund's investment strategy and the liquidity of its portfolio investments during normal and reasonably foreseeable stressed market conditions; its short- and long-term cash flow projections; and its cash holdings and access to other liquidity management tools such as available funding sources including the Victory Funds Complex Interfund Lending Facility and Line of Credit (discussed in the Notes to Financial Statements). The Victory Funds' Board of Trustees approved the appointment of the Funds' investment adviser, Victory Capital Management Inc. ("Victory Capital"), as the administrator of the LRMP.
Victory Capital manages liquidity risks associated with the Funds' investments by monitoring, among other things, cash and cash equivalents, any use of derivatives, the concentration of investments, the appropriateness of each Fund's investment strategy, and by classifying every Fund investment as either highly liquid, moderately liquid, less liquid or illiquid on at least a monthly basis. To assist with the classification of Fund investments, Victory Capital has retained a third-party provider of liquidity evaluation services. This provider determines preliminary liquidity classifications for all portfolio holdings based upon portfolio-level data and certain assumptions provided by Victory Capital. Victory Capital reviews the preliminary liquidity classifications and, when appropriate, considers other information including input from the Funds' portfolio managers (including the portfolio managers employed by any investment sub-advisers) in determining final liquidity classifications.
At a meeting held on February 18, 2021, Victory Capital provided an oral and written report to the Trustees on the operation and effectiveness of the LRMP during the previous year. The report from Victory Capital concluded that the Funds did not experience any significant liquidity challenges during the covered period, and the Funds' LRMP is reasonably designed to assess and manage its liquidity risk. The report also concluded that the LRMP continues to operate adequately and effectively to enable Victory Capital to oversee and manage liquidity risk and ensure the Funds are able to meet redemption requests without significant dilution to the remaining investors' interest in the Funds. During the review period, the Funds' portfolio consisted primarily of highly liquid investments, which are defined as cash and any investments that the Funds reasonably expects to be converted to cash in current market conditions in three business days or less without significantly changing the market value of the investment. Therefore, the Funds have not adopted a highly liquid investment minimum. The Funds' investments were below the limitation on illiquid investments during the review period. Additionally, Victory Capital indicated that no events occurred that would require the filing of Form N-LIQUID and recommended no material changes to the LRMP.
189
Privacy Policy
Protecting the Privacy of Information
The Trust respects your right to privacy. We also know that you expect us to conduct and process your business in an accurate and efficient manner. To do so, we must collect and maintain certain personal information about you. This is the information we collect from you on applications or other forms, and from the transactions you make with us or third parties. It may include your name, address, social security number, account transactions and balances, and information about investment goals and risk tolerance.
We do not disclose any information about you or about former customers to anyone except as permitted or required by law. Specifically, we may disclose the information we collect to companies that perform services on our behalf, such as the transfer agent that processes shareholder accounts and printers and mailers that assist us in the distribution of investor materials. We may also disclose this information to companies that perform marketing services on our behalf. This allows us to continue to offer you Victory investment products and services that meet your investing needs, and to effect transactions that you request or authorize. These companies will use this information only in connection with the services for which we hired them. They are not permitted to use or share this information for any other purpose.
To protect your personal information internally, we permit access only by authorized employees and maintain physical, electronic, and procedural safeguards to guard your personal information.*
* You may have received communications regarding information about privacy policies from other financial institutions which gave you the opportunity to "opt-out" of certain information sharing with companies which are not affiliated with that financial institution. The Trust does not share information with other companies for purposes of marketing solicitations for products other than the Trust. Therefore, the Trust does not provide opt-out options to their shareholders.
Victory Funds
P.O. Box 182593
Columbus, Ohio 43218-2593

Visit our website at: | | Call Victory at: | |
www.vcm.com | | 800-539-FUND (800-539-3863) | |
| | | 800-235-8396 for Member Class | |
Item 2. Code of Ethics.
| (a) | The registrant has adopted a code of ethics that applies to the registrant’s principal executive officer, principal financial officer, principal accounting officer or controller, or persons performing similar functions. This code of ethics in included as an Exhibit. |
| (b) | During the period covered by the report, with respect to the registrant’s code of ethics that applies to its principal executive officer, principal financial officer, principal accounting officer or controller, or persons performing similar functions; there have been no amendments to, nor any waivers granted from, a provision that relates to any element of the code of ethics definition enumerated in paragraph (b) of this Item 2. |
Item 3. Audit Committee Financial Expert.
(a)(1) The registrant’s board of directors has determined that the registrant has at least one audit committee financial expert serving on its audit committee.
(a)(2) The audit committee financial experts are David L. Meyer and E. Lee Beard, who are “independent” for purposes of this Item 3 of Form N-CSR.
Item 4. Principal Accountant Fees and Services.
| | | 2021 | | | 2020 | |
| (a) Audit Fees (1) | | $ | 135,000 | | | $ | 152,500 | |
| (b) Audit-Related Fees (2) | | | 0 | | | | 0 | |
| (c) Tax Fees (3) | | | 44,500 | | | | 44,500 | |
| (d) All Other Fees (4) | | | 0 | | | | 0 | |
(1) Audit fees include amounts related to the audit of the Registrant’s annual financial statements and services normally provided by the accountant in connection with statutory and regulatory filings. Audit fees billed were for professional services provided by Cohen & Company, Ltd for audit compliance, audit advice and audit planning.
(2) Represents the fee for assurance and related services by Cohen & Company, Ltd reasonably related to the performance of the audit of the Registrant’s financial statements that was not reported under (a) of this item.
(3) Represents the aggregate tax fee billed for professional services rendered by Cohen & Company, Ltd for tax compliance, tax advice, international tax fee transactions and tax planning. Such tax services included the review of income and excise tax returns for the Registrant.
(4) For the fiscal years ended June 30, 2021 and June 30, 2020, there were no fees billed for professional services rendered by Cohen & Company, Ltd to the Registrant, other than the services reported in (a) through (c) of this item.
Tax fees for 2021 and 2020 are for recurring tax fees for the preparation of the federal and state tax returns and procedures performed relating to the Registrant’s analysis of complex securities.
(e)(1) The Registrant’s Audit Committee must pre-approve non-audit services to be provided by the principal accountant and the fees charged with these services. The Committee may delegate authority to one or more Committee members to pre-approve these services, subject to subsequent review and approval by the Committee.
(e)(2) There were no services performed under Rule 2.01 (c)(7)(i)(C).
(f) Not applicable.
(g)
(h) The Registrant’s Audit Committee has evaluated the non-audit services that the principal accountant provided to the Registrant’s investment adviser (and the adviser’s relevant affiliated), which services the Committee did not pre-approve, and has concluded that the provision of those services was compatible with maintaining the accountant’s independence.
Item 5. Audit Committee of Listed Registrants.
Not applicable.
Item 6. Investments.
Item 7. Disclosure of Proxy Voting Policies and Procedures for Closed-End Management Investment Companies.
Not applicable.
Item 8. Portfolio Managers of Closed-End Management Investment Companies.
Not applicable.
Item 9. Purchases of Equity Securities by Closed-End Management Investment Company and Affiliated Purchasers.
Not applicable.
Item 10. Submission of Matters to a Vote of Security Holders.
Not applicable.
Item 11. Controls and Procedures.
(a)The registrant’s principal executive officer and principal financial officer have concluded, based on their evaluation of the registrant's disclosure controls and procedures as conducted within 90 days of the filing date of this report, that these disclosure controls and procedures are adequately designed and are operating effectively to ensure that information required to be disclosed by the registrant on Form N-CSR is recorded, processed, summarized and reported within the time periods specified in the Securities and Exchange Commission's rules and forms.
(b)There were no changes in the registrant’s internal control over financial reporting (as defined in Rule 30a-3(d) under the Investment Company Act of 1940 (17 CFR 270.30a-3(d)) that occurred during the period covered by this report that have materially affected or are reasonably likely to materially affect, the registrant’s internal control over financial reporting.
Item 12. Disclosure of Securities Lending Activities for Closed-End Management Investment Companies.
(a)(1) Not applicable.
(a)(2) Not applicable.
(a)(3) Not applicable.
(a)(4) Not applicable.
(b) Not applicable.
Item 13. Exhibits.
(a)(1) The code of ethics that is the subject of the disclosure required by Item 2 is attached hereto.
(a)(2) Certifications pursuant to Rule 30a-2(a) are attached hereto.
(a)(3) Not applicable.
(b) Certifications pursuant to Rule 30a-2(b) are furnished herewith.
SIGNATURES
Pursuant to the requirements of the Securities Exchange Act of 1934 and the Investment Company Act of 1940, the registrant has duly caused this report to be signed on its behalf by the undersigned, thereunto duly authorized.
| (Registrant) | Victory Portfolios | |
| By (Signature and Title)* | /s/ Allan Shaer | |
| | Allan Shaer, Principal Financial Officer | |
Pursuant to the requirements of the Securities Exchange Act of 1934 and the Investment Company Act of 1940, this report has been signed below by the following persons on behalf of the registrant and in the capacities and on the dates indicated.
| By (Signature and Title)* | /s/ Christopher K. Dyer | |
| | Christopher K. Dyer, Principal Executive Officer | |
| By (Signature and Title)* | /s/ Allan Shaer | |
| | Allan Shaer, Principal Financial Officer | |