UNITED STATES
SECURITIES AND EXCHANGE COMMISSION
Washington, D.C. 20549
FORM N-CSR
CERTIFIED SHAREHOLDER REPORT OF REGISTERED
MANAGEMENT INVESTMENT COMPANIES
Investment Company Act file number: 811-04852
Victory Portfolios
(Exact name of registrant as specified in charter)
4900 Tiedeman Road, 4th Floor, Brooklyn, Ohio 44144
(Address of principal executive offices) (Zip code)
Citi Fund Services Ohio, Inc., 4400 Easton Commons, Suite 200, Columbus, Ohio 43219
(Name and address of agent for service)
Registrant’s telephone number, including area code: 800-539-3863
Date of fiscal year end: December 31
Date of reporting period: December 31, 2020
Item 1. Reports to Stockholders.

December 31, 2020
Annual Report
Victory INCORE Investment Quality Bond Fund
Victory INCORE Low Duration Bond Fund
Victory High Yield Fund
Victory Tax-Exempt Fund
Victory High Income Municipal Bond Fund
Victory Floating Rate Fund
Victory Strategic Income Fund
As permitted by regulations adopted by the Securities and Exchange Commission, paper copies of the Victory Funds' shareholder reports may no longer be sent by mail, unless you specifically request paper copies of the reports from the Victory Funds or from your financial intermediary, such as a broker-dealer or bank. Instead, the reports will be made available on www.VictoryFunds.com, and you will be notified by mail each time a report is posted and provided with a website link to access the report. If you already elected to receive shareholder reports electronically, you will not be affected by this change, and you need not take any action.
You may elect to receive all future reports in paper free of charge. If you invest through a financial intermediary, you can contact your financial intermediary to request that you continue to receive paper copies of your reports. If you invest directly with the Victory Funds, you can call 800-539-3863 (800-235-8396 for Member Class) or send an e-mail request to TA.Processing@FISGlobal.com. Your election to receive reports in paper will apply to all Victory Funds you hold directly or through your financial intermediary.
www.vcm.com
News, Information And Education 24 Hours A Day, 7 Days A Week
The Victory Funds site gives fund shareholders, prospective shareholders, and investment professionals a convenient way to access fund information, get guidance, and track fund performance anywhere they can access the Internet. The site includes:
• Detailed performance records
• Daily share prices
• The latest fund news
• Investment resources to help you become a better investor
• A section dedicated to investment professionals
Whether you're a potential investor searching for the fund that matches your investment philosophy, a seasoned investor interested in planning tools, or an investment professional, www.vcm.com has what you seek. Visit us anytime. We're always open.
Victory Portfolios
Table of Contents
Shareholder Letter (Unaudited) | | | 5 | | |
Managers' Commentary and Investment
Overview (Unaudited) | | | 7 | | |
Investment Objective and Portfolio
Holdings (Unaudited) | | | 26 | | |
Financial Statements | |
The Victory Fixed Income Funds | |
Victory INCORE Investment Quality Bond Fund | |
Schedule of Portfolio Investments | | | 33 | | |
Statement of Assets and Liabilities | | | 76 | | |
Statement of Operations | | | 79 | | |
Statements of Changes in Net Assets | | | 82-84 | | |
Financial Highlights | | | 90-91 | | |
Victory INCORE Low Duration Bond Fund | |
Schedule of Portfolio Investments | | | 42 | | |
Statement of Assets and Liabilities | | | 76 | | |
Statement of Operations | | | 79 | | |
Statements of Changes in Net Assets | | | 82-84 | | |
Financial Highlights | | | 92-93 | | |
Victory High Yield Fund | |
Schedule of Portfolio Investments | | | 49 | | |
Statement of Assets and Liabilities | | | 76 | | |
Statement of Operations | | | 79 | | |
Statements of Changes in Net Assets | | | 82-84 | | |
Financial Highlights | | | 94-95 | | |
Victory Tax-Exempt Fund | |
Schedule of Portfolio Investments | | | 55 | | |
Statement of Assets and Liabilities | | | 77 | | |
Statement of Operations | | | 80 | | |
Statements of Changes in Net Assets | | | 85-87 | | |
Financial Highlights | | | 96-97 | | |
Victory High Income Municipal Bond Fund | |
Schedule of Portfolio Investments | | | 59 | | |
Statement of Assets and Liabilities | | | 77 | | |
Statement of Operations | | | 80 | | |
Statements of Changes in Net Assets | | | 85-87 | | |
Financial Highlights | | | 98-99 | | |
Victory Floating Rate Fund | |
Schedule of Portfolio Investments | | | 63 | | |
Statement of Assets and Liabilities | | | 77 | | |
Statement of Operations | | | 80 | | |
Statements of Changes in Net Assets | | | 85-87 | | |
Financial Highlights | | | 100-101 | | |
1
Table of Contents (continued)
Victory Strategic Income Fund | |
Schedule of Portfolio Investments | | | 70 | | |
Statement of Assets and Liabilities | | | 78 | | |
Statement of Operations | | | 81 | | |
Statements of Changes in Net Assets | | | 88-89 | | |
Financial Highlights | | | 102-103 | | |
Notes to Financial Statements | | | 104 | | |
Report of Independent Registered Public
Accounting Firm | | | 122 | | |
Supplemental Information (Unaudited) | | | 123 | | |
Trustee and Officer Information | | | 123 | | |
Proxy Voting and Form Portfolio Holdings
Information | | | 126 | | |
Expense Examples | | | 126 | | |
Additional Federal Income Tax Information | | | 128 | | |
Advisory Contract Approval | | | 129 | | |
Privacy Policy (inside back cover) | | | |
IRA DISTRIBUTION WITHHOLDING DISCLOSURE
We generally must withhold federal income tax at a rate of 10% of the taxable portion of your distribution and, if you live in a state that requires state income tax withholding, at your state's tax rate. However, you may elect not to have withholding apply or to have income tax withheld at a higher rate. Any withholding election that you make will apply to any subsequent distribution unless and until you change or revoke the election. If you wish to make a withholding election, or change or revoke a prior withholding election, call 800-539-3863 (800-235-8396 for Member Class) and form W-4P (OMB No. 1545-0074 withholding certificate for pension or annuity payments) will be electronically sent.
If you do not have a withholding election in place by the date of a distribution, federal income tax will be withheld from the taxable portion of your distribution at a rate of 10%. If you must pay estimated taxes, you may be subject to estimated tax penalties if your estimated tax payments are not sufficient and sufficient tax is not withheld from your distribution.
For more specific information, please consult your tax adviser.
2
The Funds are distributed by Victory Capital Services, Inc. Victory Capital Management Inc. is the investment adviser to the Funds and receives fees from the Funds for performing services for the Funds.
This report is not authorized for distribution to prospective investors unless preceded or accompanied by a current prospectus of the Victory Funds.
For additional information about any Victory Fund, including fees, expenses, and risks, view our prospectus online at www.vcm.com or call 800-539-3863 (800-235-8396 for Member Class). Read it carefully before you invest or send money.
The information in this annual report is based on data obtained from recognized services and sources and is believed to be reliable. Any opinions, projections, or recommendations in this report are subject to change without notice and are not intended as individual investment advice. Past investment performance of the Funds, markets or securities mentioned herein should not be considered to be indicative of future results.
• NOT FDIC INSURED • NO BANK GUARANTEE • MAY LOSE VALUE

Call Victory at:
800-539-FUND (800-539-3863)
800-235-8396 for Member Class
Visit our website at:
www.vcm.com
3
This page is intentionally left blank.
4
Victory Funds Letter to Shareholders
(Unaudited)
Dear Shareholder,
When we look back on 2020, we will undoubtedly remember it as an extraordinary year. A year ago, no one could have imagined the unusual events that would challenge us personally, professionally, and collectively as a nation. But in retrospect, the trajectory of financial markets over the past year was nothing short of extraordinary.
The year began with rudimentary worries, such as economic growth rates, trade deals, and interest rates. But a novel coronavirus and the subsequent worldwide spread of COVID-19 became an unprecedented event. To combat the pandemic, governments everywhere issued austere shelter-in-place orders, and the global economy slowed markedly. Equity markets sold off sharply in March and April, and second quarter U.S. GDP contracted by an alarming annual rate of 31.4%.
It's no surprise that so many investors flocked to the perceived safety of U.S. Treasurys. Meanwhile, liquidity evaporated (for a short spell) in many other segments of the fixed income market, including higher-yielding credits and municipal bonds. The outlook was tenuous, and credit spreads widened while prices declined for most securities perceived to be higher risk.
A response, however, came swiftly. The U.S. Federal Reserve (the "Fed") and other monetary authorities worldwide leapt into action — cutting interest rates, (re)starting quantitative easing and, in the case of the Fed, launching an array of programs to provide liquidity to stabilize fixed-income markets. The U.S. government also stepped up to provide fiscal stimulus in the form of the Coronavirus Aid, Relief, and Economic Security Act (CARES Act).
It was impressive how quickly those actions helped end the stock market's freefall and restore order across much of the fixed-income universe. The rebound was almost as robust as the drawdown, and third-quarter GDP (the most recent finalized data available) grew at a 33.4% annualized rate.
Late in the year, markets were alternately fueled and roiled by a contentious election season, growing optimism for an effective vaccine, and a fluid debate regarding the need for additional fiscal stimulus. Ultimately, stocks were propelled higher in the fourth quarter when it became clear the United States Congress would provide another dose of fiscal stimulus in the form of direct payments, more unemployment insurance, and additional aid to businesses.
Through all the unprecedented events and extreme volatility, the S&P 500® Index registered an impressive annual return of 18.40% for the 12-month period ended December 31, 2020. Meanwhile, the yield on 10-year U.S. Treasurys declined 95 basis points over the same period, reflecting both the Fed's interest rate cuts and its pledge to keep rates low longer. The yield on 10-Year U.S. Treasurys was 0.93% as of December 31, 2020.
While markets endured and performed admirably during 2020, perhaps the key takeaway is that the unexpected can and will happen. That's why it's important to
5
remain focused on your long-term investment goals and avoid making emotional decisions. Moreover, we continue to have confidence in all of Victory Capital's autonomous Investment Franchises and their ability to navigate the ups and downs.
On the following pages, you will find information relating to your Victory Funds investment. If you have any questions, we encourage you to contact your financial advisor. Or, if you invest with us directly, you may call 800-539-3863 (800-235-8396 for Member Class), or visit our website at www.vcm.com.
My colleagues and I sincerely appreciate the confidence you have placed in the Victory Funds, and we value the opportunity to help meet your investment goals.

Christopher K. Dyer, CFA
President,
Victory Funds
6
Victory Fixed Income Funds
Victory INCORE Investment Quality Bond Fund
Managers' Commentary
(Unaudited)
What were the market conditions during the reporting period?
As we end one of the most turbulent years in economic history, markets remain near all-time highs, driven by unprecedented levels of monetary and fiscal stimulus. The U.S. economy experienced its single largest economic loss in the nation's history, contracting by 31.4% during the second quarter of 2020. The dramatic second-quarter collapse in economic activity has been followed by consecutive quarters of robust economic growth. Specifically, third-quarter U.S. gross domestic product ("GDP") rebounded by a robust 33.4%, and the Atlanta Fed's GDPNow forecasting model predicts fourth-quarter growth to print around 8.6%. While the GDPNow forecast will likely vary from the final U.S. GDP growth figure, what we can take away from the estimate is that the recovery has been quicker than anticipated.
Despite a better-than-expected economic recovery, much has hinged on the overwhelming amount of fiscal and monetary stimulus injected into the economy. Since March, the U.S. Federal Reserve (the "Fed") has provided trillions in monetary stimulus. Monetary policy has helped stabilize and buoy financial markets, but it is the fiscal stimulus that has supported the rebound in actual economic activity. The U.S. Congress has passed three rounds of fiscal stimulus since March totaling an additional $4 trillion, which is equivalent to nearly 20% of U.S. GDP in 2019.
It is difficult to estimate the long-term consequences of unprecedented fiscal and monetary stimulus. The Fed, U.S. Treasury, and the U.S. Congress are embarking upon a grand experiment in Modern Monetary Theory ("MMT"), where massive fiscal deficits purportedly do not matter for countries that control their own currency. In the short run, we believe monetary and fiscal stimulus is likely to be supportive of economic growth and market valuations. We worry that early success with MMT may lead to long-term unintended economic consequences later in the decade.
We remain concerned about the possible long-term inflationary effects of continued MMT, but thus far the Fed's preferred measure of inflation, core personal consumption expenditures (PCE), remains below their long-term 2% objective. Furthermore, the Fed seems intent on anchoring front-end interest rates near zero for the foreseeable future in order to meet, or exceed, their target. As a result, we do not expect much movement in short-term interest rates; however, we remain concerned about the impact continued stimulus combined with the Fed's newly announced inflation-targeting policy could have on intermediate- and long-end interest rates. These concerns are motivating us to position accounts relatively short duration versus benchmarks going into 2021.
How did Victory INCORE Investment Quality Bond Fund (the "Fund") perform during the reporting period?
The Fund seeks to provide a high level of current income and capital appreciation without undue risk to principal. The Fund returned 7.94% (Class A Shares at net asset value) for the year ended December 31, 2020, outperforming the Bloomberg Barclays U.S. Aggregate Bond Index (the "Index"), which returned 7.51% during the reporting period.
7
Victory Fixed Income Funds
Victory INCORE Investment Quality Bond Fund (continued)
Managers' Commentary (continued)
What strategies did you employ during the reporting period?
The Fund came into 2020 overweight agency mortgages and relatively light corporate credit exposure, with only a modest overweight to 0-3-year BBB corporate credit. During the late part of the first quarter and beginning part of the second quarter, during the worst of the market rout, we moved to a large overweight position in corporate credit across the curve. We maintained this corporate credit overweight as we ended the year. The Fund greatly benefited from this positioning during the year.
We believe that with yields on short- and intermediate-term U.S. Treasurys near historic lows, investors have no other reasonable alternative but to invest in high-quality corporate and consumer credit. We do not believe investors are receiving enough yield or duration benefit from owning U.S. Treasurys at current levels. As a result, we added a significant overweight to corporate credit at discounted valuations late in the first quarter and beginning part of the second quarter. We maintained this overweight at year-end and continue to selectively add high-grade corporates across the curve as opportunities present themselves. This positioning has been additive to performance over the year, helping the Fund outpace the Index for 2020.
As we enter a new year, we believe massive monetary and fiscal stimulus will continue to buoy markets as both the incoming Biden administration and the Fed seem interested in continuing the MMT experiment in the near term. However, it is likely to be a volatile and uncertain time as the long-term effects of MMT are unknown. The key attributes we strive for when positioning client portfolios for an uncertain outlook are quality, balance and diversification. We believe we are well positioned across our portfolios for this uncertain environment, and we believe being overweight credit and underweight duration versus the Index should be additive to performance as we enter the coming year.
8
Victory Fixed Income Funds
Victory INCORE Investment Quality Bond Fund
Investment Overview
(Unaudited)
Average Annual Total Returns
Year Ended December 31, 2020
| | Class A | | Class C | | Class R | | Class Y | | | |
INCEPTION DATE | | 2/16/93 | | 8/7/00 | | 5/15/01 | | 5/12/09 | | | |
| | Net Asset
Value | | Maximum
Offering
Price | | Net Asset
Value | | Contingent
Deferred
Charges | | Net Asset
Value | | Net Asset
Value | | Bloomberg
Barclays U.S.
Aggregate
Bond Index1 | |
One Year | | | 7.94 | % | | | 5.55 | % | | | 6.89 | % | | | 5.89 | % | | | 7.37 | % | | | 8.21 | % | | | 7.51 | % | |
Five Year | | | 4.40 | % | | | 3.93 | % | | | 3.50 | % | | | 3.50 | % | | | 3.99 | % | | | 4.66 | % | | | 4.44 | % | |
Ten Year | | | 3.77 | % | | | 3.54 | % | | | 2.91 | % | | | 2.91 | % | | | 3.36 | % | | | 3.99 | % | | | 3.84 | % | |
The performance data quoted represents past performance and current returns may be lower or higher. The investment return and principal value will fluctuate so that an investor's shares, when redeemed, may be worth more or less than the original cost. To obtain performance information current to the most recent month's end, please visit www.vcm.com.
The maximum offering price (MOP) figures reflect a maximum sales charge of 2.25% for Class A Shares. Class C Shares are not subject to an initial sales charge, but are subject to a deferred sales charge of 1.00% on shares redeemed within one year of purchase. NAV does not reflect sales charges.
Total return measures the price change in a share assuming the reinvestment of all net investment income and realized capital gain distributions, if any. The total returns quoted do not reflect adjustments made to the enclosed financial statements in accordance with U.S. generally accepted accounting principles or the deduction of taxes that a shareholder would pay on net investment income and realized capital gain distributions, including reinvested distributions, or redemptions of shares. The total return figures set forth above include all waivers of fees. Without such fee waivers, the total returns would have been lower.
Victory INCORE Investment Quality Bond Fund — Growth of $10,000
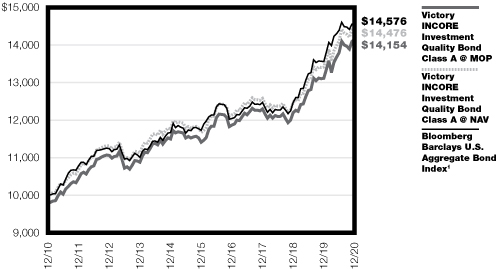
1The Bloomberg Barclays U.S. Aggregate Bond Index is generally considered to be representative of U.S. bond market activity. This index does not include the effect of sales charges, commissions, expenses or taxes, is not representative of the Fund and it is not possible to invest directly in an index.
The graph reflects investment of growth of a hypothetical $10,000 investment in the Fund.
The graph and table do not reflect the deduction of taxes that a shareholder would pay on Fund distributions or the redemption of Fund shares.
Past performance is not indicative of future results.
9
Victory Fixed Income Funds
Victory INCORE Low Duration Bond Fund
Managers' Commentary
(Unaudited)
What were the market conditions during the reporting period?
As we end one of the most turbulent years in economic history, markets remain near all-time highs, driven by unprecedented levels of monetary and fiscal stimulus. The U.S. economy experienced its single largest economic loss in the nation's history, contracting by 31.4% during the second quarter of 2020. The dramatic second-quarter collapse in economic activity has been followed by consecutive quarters of robust economic growth. Specifically, third-quarter U.S. gross domestic product ("GDP") rebounded by a robust 33.4%, and the Atlanta Fed's GDPNow forecasting model predicts fourth-quarter growth to print around 8.6%. While the GDPNow forecast will likely vary from the final U.S. GDP growth figure, what we can take away from the estimate is that the recovery has been quicker than anticipated.
Despite a better than expected economic recovery, much has hinged on the overwhelming amount of fiscal and monetary stimulus injected into the economy. Since March, the U.S. Federal Reserve (the "Fed") has provided trillions in monetary stimulus. Monetary policy has helped stabilize and buoy financial markets, but it is the fiscal stimulus that has supported the rebound in actual economic activity. The U.S. Congress has passed three rounds of fiscal stimulus since March totaling an additional $4 trillion, which is equivalent to nearly 20% of U.S. GDP in 2019.
It is difficult to estimate the long-term consequences of unprecedented fiscal and monetary stimulus. The Fed, U.S. Treasury, and the U.S. Congress are embarking upon a grand experiment in Modern Monetary Theory ("MMT"), where massive fiscal deficits purportedly do not matter for countries that control their own currency. In the short run, we believe monetary and fiscal stimulus is likely to be supportive of economic growth and market valuations. We worry that early success with MMT may lead to long-term unintended economic consequences later in the decade.
We remain concerned about the possible long-term inflationary effects of continued MMT, but thus far the Fed's preferred measure of inflation, core personal consumption expenditures (PCE), remains below their long-term 2% objective. Furthermore, the Fed seems intent on anchoring front-end interest rates near zero for the foreseeable future in order to meet, or exceed, their target. As a result, we do not expect much movement in short-term interest rates; however, we remain concerned about the impact continued stimulus combined with the Fed's newly announced inflation-targeting policy could have on intermediate- and long-end interest rates. These concerns are motivating us to position accounts relatively short duration versus benchmarks going into 2021.
How did Victory INCORE Low Duration Bond Fund (the "Fund") perform during the reporting period?
The Fund seeks to provide a high level of current income consistent with preservation of capital. The Fund returned 3.85% (Class A Shares at net asset value) for the year ended December 31, 2020, outperforming the Bloomberg Barclays U.S. 1-3 Year Government Bond Index (the "Index"), which returned 3.14% during the reporting period.
10
Victory Fixed Income Funds
Victory INCORE Low Duration Bond Fund (continued)
Managers' Commentary (continued)
What strategies did you employ during the reporting period?
The Fund came into 2020 overweight agency mortgages and relatively light corporate credit exposure. During the late part of the first quarter and beginning part of the second quarter, during the worst of the market rout, we moved to a large overweight position in corporate credit. We maintained this corporate credit overweight as we ended the year. The Fund greatly benefited from this positioning during the year.
We believe that with yields on short- and intermediate-term U.S. Treasurys near historic lows, investors have no other reasonable alternative but to invest in high-quality corporate and consumer credit. We do not believe investors are receiving enough yield or duration benefit from owning U.S. Treasurys at current levels. As a result, we added a significant overweight to corporate credit at discounted valuations late in the first quarter and beginning part of the second quarter. We maintained this overweight at year-end and continue to selectively add high-grade corporates across the curve as opportunities present themselves. This positioning has been additive to performance over the year, helping the Fund outpace the Index for 2020.
As we enter a new year, we believe massive monetary and fiscal stimulus will continue to buoy markets as both the incoming Biden administration and the Fed seem interested in continuing the MMT experiment in the near term. However, it is likely to be a volatile and uncertain time as the long-term effects of MMT are unknown. The key attributes we strive for when positioning client portfolios for an uncertain outlook are quality, balance and diversification. We believe we are well positioned across our portfolios for this uncertain environment, and we believe being overweight credit and underweight duration versus the Index should be additive to performance as we enter the coming year.
11
Victory Fixed Income Funds
Victory INCORE Low Duration Bond Fund
Investment Overview
(Unaudited)
Average Annual Total Returns
Year Ended December 31, 2020
| | Class A | | Class C | | Class R | | Class Y | | | |
INCEPTION DATE | | 7/30/03 | | 7/30/03 | | 7/30/03 | | 5/12/09 | | | |
| | Net Asset
Value | | Maximum
Offering
Price | | Net Asset
Value | | Contingent
Deferred
Charges | | Net Asset
Value | | Net Asset
Value | | Bloomberg
Barclays U.S.
Government 1-3
Year Bond Index1 | |
One Year | | | 3.85 | % | | | 1.51 | % | | | 3.05 | % | | | 2.05 | % | | | 3.41 | % | | | 4.08 | % | | | 3.14 | % | |
Five Year | | | 2.26 | % | | | 1.80 | % | | | 1.48 | % | | | 1.48 | % | | | 1.85 | % | | | 2.50 | % | | | 1.92 | % | |
Ten Year | | | 1.72 | % | | | 1.49 | % | | | 0.95 | % | | | 0.95 | % | | | 1.31 | % | | | 1.96 | % | | | 1.32 | % | |
The performance data quoted represents past performance and current returns may be lower or higher. The investment return and principal value will fluctuate so that an investor's shares, when redeemed, may be worth more or less than the original cost. To obtain performance information current to the most recent month's end, please visit www.vcm.com.
The maximum offering price (MOP) figures reflect a maximum sales charge of 2.25% for Class A Shares. Class C Shares are not subject to an initial sales charge, but are subject to a deferred sales charge of 1.00% on shares redeemed within one year of purchase. NAV does not reflect sales charges.
Total return measures the price change in a share assuming the reinvestment of all net investment income and realized capital gain distributions, if any. The total returns quoted do not reflect adjustments made to the enclosed financial statements in accordance with U.S. generally accepted accounting principles or the deduction of taxes that a shareholder would pay on net investment income and realized capital gain distributions, including reinvested distributions, or redemptions of shares. The total return figures set forth above include all waivers of fees. Without such fee waivers, the total returns would have been lower.
Victory INCORE Low Duration Bond Fund — Growth of $10,000

1The Bloomberg Barclays U.S. Government 1-3 Year Bond Index is generally considered to be representative of U.S. government bonds with maturities between one and three years. This index does not include the effect of sales charges, commissions, expenses or taxes, is not representative of the Fund and it is not possible to invest directly in an index.
The graph reflects investment of growth of a hypothetical $10,000 investment in the Fund.
The graph and table do not reflect the deduction of taxes that a shareholder would pay on Fund distributions or the redemption of Fund shares.
Past performance is not indicative of future results.
12
Victory Fixed Income Funds
Managers' Commentary
(Unaudited)
What were the market conditions during the reporting period?
After a gut-wrenching plunge as the deadly novel coronavirus and the disease it causes ("COVID-19") emerged in the first quarter of 2020, markets surged as central banks and governments fought back with unprecedented stimulus measures that supported risk-taking in the markets.
High-yield investors were rewarded for taking a bungee jump through market turmoil — even if it required closed eyes and a primal scream. At the end of the first quarter, the Bloomberg Barclays U.S. Corporate High Yield Bond Index (the "Index") had returned -12.7%, a result not seen since the financial crisis in 2008. It ended the year as the strongest performer among the major domestic fixed-income indexes. The pivotal event came in late March 2020 when the U.S. Federal Reserve announced a massive bond-buying program that included corporate debt. Markets responded with a surge that often belied grim economic and public health realities.
How did Victory High Yield Fund (the "Fund") perform during the reporting period?
The Fund seeks to provide current income. The Fund returned 7.61% (Class A Shares at net asset value) for the year ended December 31, 2020, outperforming the Index, which returned 7.11% during the reporting period.
What strategies did you employ during the reporting period?
The Fund aims to provide higher levels of income and less sensitivity to interest rate changes than most fixed-income investments by investing primarily in U.S. corporate bonds rated below investment grade. The Fund may invest in other securities and in floating rate loans. It emphasizes in-depth research and a concentrated portfolio strategy.
The Fund's management team strongly believes that the potential cost of a passive or wide-net approach to high-yield investing has never been higher or more misunderstood. We view the high-yield market in three categories:
1) Bonds yielding less than 6%: 88% of the market
2) Bonds yielding 6% to 10%: 9% of the market
3) Bonds yielding more than 10%: 3% of the market
We believe the first category offers limited upside along with interest rate risk, while the third category, with an average interest rate of 23%, is excessively speculative. The second category, a narrow segment that we believe offers a reasonable balance of risk and opportunity, cannot be exploited with broadly diversified index-like portfolios.
In addition to keeping a tight focus, we seek to use rigorous research to continually pare overpriced risk from the portfolio and uncover the idiosyncratic opportunities that have benefited returns in the past.
Prior to the fourth quarter, we culled select holdings that we did not believe would survive intact once COVID-19 had run its course. And throughout the year, we resisted cruise lines,
13
Victory Fixed Income Funds
Victory High Yield Fund (continued)
Managers' Commentary (continued)
theater operators, and several leisure companies that we believed face significant headwinds. However, confidence in our research and high-conviction strategy led us to successfully maintain our higher-risk orientation.
Security selection was the dominant factor in the Fund's outperformance of the Index in 2020. Asset allocation had a negative impact on relative performance.
Not surprisingly, given the market's embrace of risk, the Fund's positive security selection in CCC-rated bonds was the top contributor to relative performance. Although the struggling energy sector rebounded strongly in the fourth quarter, the Fund's underweight there was an important contributor to its outperformance for the year. The largest detractors were an underweight in BB-rated bonds and an overweight in the CCC-rated cohort.
14
Victory Fixed Income Funds
Investment Overview
(Unaudited)
Average Annual Total Returns
Year Ended December 31, 2020
| | Class A | | Class C | | Class R | | Class Y | | | |
INCEPTION DATE | | 9/1/98 | | 8/7/00 | | 5/15/01 | | 5/12/09 | | | |
| | Net Asset
Value | | Maximum
Offering
Price | | Net Asset
Value | | Contingent
Deferred
Charges | | Net Asset
Value | | Net Asset
Value | | Bloomberg
Barclays U.S.
Corporate High
Yield Index1 | |
One Year | | | 7.61 | % | | | 5.26 | % | | | 6.68 | % | | | 5.68 | % | | | 7.24 | % | | | 7.73 | % | | | 7.11 | % | |
Five Year | | | 9.48 | % | | | 9.00 | % | | | 8.71 | % | | | 8.71 | % | | | 9.07 | % | | | 9.75 | % | | | 8.59 | % | |
Ten Year | | | 6.65 | % | | | 6.41 | % | | | 5.88 | % | | | 5.88 | % | | | 6.26 | % | | | 6.89 | % | | | 6.80 | % | |
The performance data quoted represents past performance and current returns may be lower or higher. The investment return and principal value will fluctuate so that an investor's shares, when redeemed, may be worth more or less than the original cost. To obtain performance information current to the most recent month's end, please visit www.vcm.com.
The maximum offering price (MOP) figures reflect a maximum sales charge of 2.25% for Class A Shares. Class C Shares are not subject to an initial sales charge, but are subject to a deferred sales charge of 1.00% on shares redeemed within one year of purchase. NAV does not reflect sales charges.
Total return measures the price change in a share assuming the reinvestment of all net investment income and realized capital gain distributions, if any. The total returns quoted do not reflect adjustments made to the enclosed financial statements in accordance with U.S. generally accepted accounting principles or the deduction of taxes that a shareholder would pay on net investment income and realized capital gain distributions, including reinvested distributions, or redemptions of shares. The total return figures set forth above include all waivers of fees. Without such fee waivers, the total returns would have been lower.
Victory High Yield Fund — Growth of $10,000

1The Bloomberg Barclays U.S. Corporate High Yield Index is generally considered to be representative of the investable universe of the U.S.-dominated high-yield debt market. This index does not include the effect of sales charges, commissions, expenses or taxes, is not representative of the Fund and it is not possible to invest directly in an index.
The graph reflects investment of growth of a hypothetical $10,000 investment in the Fund.
The graph and table do not reflect the deduction of taxes that a shareholder would pay on Fund distributions or the redemption of Fund shares.
Past performance is not indicative of future results.
15
Victory Fixed Income Funds
Managers' Commentary
(Unaudited)
What were the market conditions during the reporting period?
The municipal market had an eventful 2020. The year started off well, continuing the trend we saw in 2019, as strong investor demand translated into a return of over 3% for the broad municipal index (Bloomberg Barclays Municipal Bond Index (the "Index")) just two months into the year. However, the good times were short-lived, with a sharp selloff in March, induced by the outbreak of disease called COVID-19, pushing market returns to a low of -7.6% for the year. The market remained volatile through April before embarking on a several-month recovery that pushed index returns to over +4% in early August. This recovery was heavily driven by both actual and potential government intervention to include both fiscal and monetary stimulus. The recovery lagged in late Summer and early Autumn, likely due to investors grappling with uncertainty caused by the November U.S. presidential election, the lack of an additional round of stimulus for state and local governments, as well as rising COVID-19 cases. The market recovery continued post-election and municipal market returns were strong in November and December 2020.
How did Victory Tax-Exempt Fund (the "Fund") perform during the reporting period?
The Fund seeks to maximize current income exempt from federal income taxes, consistent with the preservation of capital. The Fund returned 5.39% (Class A Shares at net asset value) for the year ended December 31, 2020, outperforming the Index, which returned 5.21% for the reporting period.
What strategies did you employ during the reporting period?
The Fund tends to be more credit-heavy than the Index, holding more BBB- rated (the lowest category of investment grade) bonds than the Index. We overweight these credits to provide additional tax-free income to our investors. These bonds tend to underperform in periods of market dislocation when credit spreads widen significantly. As a result, the Fund underperformed the Index during the market downturn in March and April 2020; however, the Fund outperformed as the year progressed and the market recovered. During the downturn, the Fund purchased additional lower rated bonds as yields were very attractive. These positions benefited the Fund during the ensuing recovery as well. Lastly, the Fund increased its number of holdings during the year to diversify its positions.
We remain committed to our core competency of evaluating, taking, and managing credit risk in the municipal market. We continue to build our portfolios bond-by-bond, relying on our assessment of fundamental credit risk and attempting to capture and distribute incremental yield that will drive higher long-term income to our investors. While there might be some volatility in the municipal market in the short term, we remain confident that the right approach is to focus on what matters in the long term.
16
Victory Fixed Income Funds
Investment Overview
(Unaudited)
Average Annual Total Returns
Year Ended December 31, 2020
| | Class A | | Class C | | Class Y | | | |
INCEPTION DATE | | 2/16/93 | | 8/7/00 | | 5/12/09 | | | |
| | Net Asset
Value | | Maximum
Offering
Price | | Net Asset
Value | | Contingent
Deferred
Charges | | Net Asset
Value | | Bloomberg
Barclays
Municipal
Bond Index1 | |
One Year | | | 5.39 | % | | | 2.99 | % | | | 4.56 | % | | | 3.56 | % | | | 5.51 | % | | | 5.21 | % | |
Five Year | | | 4.20 | % | | | 3.73 | % | | | 3.37 | % | | | 3.37 | % | | | 4.34 | % | | | 3.91 | % | |
Ten Year | | | 4.50 | % | | | 4.26 | % | | | 3.67 | % | | | 3.67 | % | | | 4.62 | % | | | 4.63 | % | |
The performance data quoted represents past performance and current returns may be lower or higher. The investment return and principal value will fluctuate so that an investor's shares, when redeemed, may be worth more or less than the original cost. To obtain performance information current to the most recent month's end, please visit www.vcm.com.
The maximum offering price (MOP) figures reflect a maximum sales charge of 2.25% for Class A Shares. Class C Shares are not subject to an initial sales charge, but are subject to a deferred sales charge of 1.00% on shares redeemed within one year of purchase. NAV does not reflect sales charges.
Total return measures the price change in a share assuming the reinvestment of all net investment income and realized capital gain distributions, if any. The total returns quoted do not reflect adjustments made to the enclosed financial statements in accordance with U.S. generally accepted accounting principles or the deduction of taxes that a shareholder would pay on net investment income and realized capital gain distributions, including reinvested distributions, or redemptions of shares. The total return figures set forth above include all waivers of fees. Without such fee waivers, the total returns would have been lower.
Victory Tax-Exempt Fund — Growth of $10,000

1The Bloomberg Barclays Municipal Bond Index is generally considered to be representative of the municipal bond market. This index does not include the effect of sales charges, commissions, expenses or taxes, is not representative of the Fund and it is not possible to invest directly in an index.
The graph reflects investment of growth of a hypothetical $10,000 investment in the Fund.
The graph and table do not reflect the deduction of taxes that a shareholder would pay on Fund distributions or the redemption of Fund shares.
Past performance is not indicative of future results.
17
Victory Fixed Income Funds
Victory High Income Municipal Bond Fund
Managers' Commentary
(Unaudited)
What were the market conditions during the reporting period?
The municipal market had an eventful 2020. The year started off well, continuing the trend we saw in 2019, as strong investor demand translated into a return of over 3% for the broad municipal index (Bloomberg Barclays Municipal Bond Index (the "Index")) just two months into the year. However, the good times were short-lived, with a sharp selloff in March, induced by the outbreak of disease called COVID-19, pushing market returns to a low of -7.6% for the year. The market remained volatile through April before embarking on a several-month recovery that pushed index returns to over +4% in early August. This recovery was heavily driven by both actual and potential government intervention to include both fiscal and monetary stimulus. The recovery lagged in late Summer and early Autumn, likely due to investors grappling with uncertainty caused by the November United States presidential election, the lack of an additional round of stimulus for state and local governments, as well as rising COVID-19 cases. The market recovery continued post-election and municipal market returns were strong in November and December 2020.
How did Victory High Income Municipal Bond Fund (the "Fund") perform during the reporting period?
The Fund seeks to provide high current income exempt from federal income taxes, with a secondary objective of capital appreciation. The Fund returned 5.52% (Class A Shares at net asset value) for the year ended December 31, 2020, outperforming the Index, which returned 5.21% during the reporting period.
What strategies did you employ during the reporting period?
The Fund tends to be more credit-heavy than the Index, holding more BBB-rated (the lowest category of investment grade) bonds than the benchmark. We overweight these credits to provide additional tax-free income to our investors. These bonds tend to underperform in periods of market dislocation when credit spreads widen significantly. As a result, the Fund underperformed the Index during the market downturn in March and April 2020; however, the Fund outperformed as the year progressed and the market recovered. During the downturn, the Fund purchased additional lower-rated bonds as yields were very attractive. These positions benefited the Fund during the ensuing recovery as well. Lastly, the Fund increased its number of holdings during the year to diversify its positions.
We remain committed to our core competency of evaluating, taking, and managing credit risk in the municipal market. We continue to build our portfolios bond-by-bond, relying on our assessment of fundamental credit risk and attempting to capture and distribute incremental yield that will drive higher long-term income to our investors. While there might be some volatility in the municipal market in the short term, we remain confident that the right approach is to focus on what matters in the long term.
18
Victory Fixed Income Funds
Victory High Income Municipal Bond Fund
Investment Overview
(Unaudited)
Average Annual Total Returns
Year Ended December 31, 2020
| | Class A | | Class C | | Class Y | | Member Class | | | | | |
INCEPTION DATE | | 12/31/09 | | 12/31/09 | | 12/31/09 | | 11/3/20 | | | | | |
| | Net Asset
Value | | Maximum
Offering
Price | | Net Asset
Value | | Contingent
Deferred
Charges | | Net Asset
Value | | Net Asset
Value | | Bloomberg
Barclays
Municipal
Bond Index1 | | Bloomberg
Barclays High
Yield Municipal
Bond Index2 | |
One Year | | | 5.52 | % | | | 3.12 | % | | | 4.72 | % | | | 3.72 | % | | | 5.76 | % | | | N/A | | | | 5.21 | % | | | 4.89 | % | |
Five Year | | | 4.26 | % | | | 3.79 | % | | | 3.47 | % | | | 3.47 | % | | | 4.51 | % | | | N/A | | | | 3.91 | % | | | 6.56 | % | |
Ten Year | | | 5.28 | % | | | 5.04 | % | | | 4.49 | % | | | 4.49 | % | | | 5.52 | % | | | N/A | | | | 4.63 | % | | | 6.86 | % | |
Since Inception | | | N/A | | | | N/A | | | | N/A | | | | N/A | | | | N/A | | | | 4.12 | % | | | N/A | | | | N/A | | |
The performance data quoted represents past performance and current returns may be lower or higher. The investment return and principal value will fluctuate so that an investor's shares, when redeemed, may be worth more or less than the original cost. To obtain performance information current to the most recent month's end, please visit www.vcm.com.
The maximum offering price (MOP) figures reflect a maximum sales charge of 2.25% for Class A Shares. Class C Shares are not subject to an initial sales charge, but are subject to a deferred sales charge of 1.00% on shares redeemed within one year of purchase. NAV does not reflect sales charges.
Total return measures the price change in a share assuming the reinvestment of all net investment income and realized capital gain distributions, if any. The total returns quoted do not reflect adjustments made to the enclosed financial statements in accordance with U.S. generally accepted accounting principles or the deduction of taxes that a shareholder would pay on net investment income and realized capital gain distributions, including reinvested distributions, or redemptions of shares. The total return figures set forth above include all waivers of fees. Without such fee waivers, the total returns would have been lower.
Victory High Income Municipal Bond Fund — Growth of $10,000
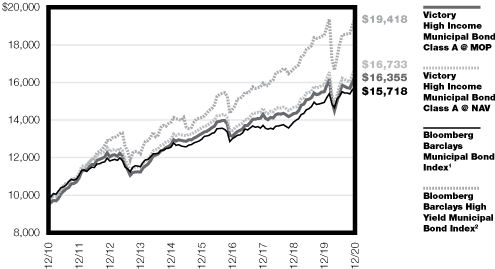
1The Bloomberg Barclays Municipal Bond Index is generally considered to be representative of the municipal bond market. This index does not include the effect of sales charges, commissions, expenses or taxes, is not representative of the Fund and it is not possible to invest directly in an index.
2The Bloomberg Barclays High Yield Municipal Bond Index is generally considered to be representative of the investable universe of the U.S high-yield municipal debt market. This index does not include the effect of sales charges, commissions, expenses or taxes, is not representative of the Fund and it is not possible to invest directly in an index.
The graph reflects investment of growth of a hypothetical $10,000 investment in the Fund.
The graph and table do not reflect the deduction of taxes that a shareholder would pay on Fund distributions or the redemption of Fund shares.
Past performance is not indicative of future results.
19
Victory Fixed Income Funds
Victory Floating Rate Fund
Managers' Commentary
(Unaudited)
What were the market conditions during the reporting period?
For most of 2020, securities markets seemed like the only things that were immune to the pandemic related to a novel coronavirus and the disease it causes ("COVID-19").
After a gut-wrenching plunge as the deadly virus emerged in the first quarter, equity and fixed-income markets surged as central banks and governments fought back with unprecedented stimulus measures that supported risk-taking in the markets. The risk-on sentiment grew stronger in the fourth quarter as optimism over a COVID-19 vaccine and an improving economic outlook brightened investors' expectations and drove stock indexes to record levels.
In fixed income, investors continued to seek higher income amid extremely low interest rates. In the below-investment-grade debt market, which includes floating rate loans, this resulted in tightening spreads and tough investor competition for new issues.
How did Victory Floating Rate Fund (the "Fund") perform during the reporting period?
The Fund seeks to provide a high level of current income. The Fund returned 4.82% (Class A Shares at net asset value) for the year ended December 31, 2020, outperforming the S&P/LSTA U.S. Leveraged Loan Index (the "Index"), which returned 3.12% during the reporting period.
What strategies did you employ during the reporting period?
In 2020, the Fund's outperformance of the Index reflected both positive security selection and effective asset allocation. The Fund's allocation to high-yield corporate bonds was the leading contributor as investors leaned into risk.
The largest contributors after bonds were an overweight and security selection in Health Care and security selection in the Air Freight and Logistics industry. The largest detractor was an underweight in Electronics. Security selection in the Aerospace and Defense industry also detracted, largely as a result of its negative impact in the first quarter.
The Fund's management team seeks to provide higher current income than most short-term investments available to retail investors, while also providing some protection from rising interest rates and inflation by investing primarily in floating-rate bank loans, whose rates adjust with market benchmarks. The Fund may also hold select bonds and other floating-rate investments of domestic or foreign issuers. The Fund's holdings are typically U.S.-based and below investment grade.
The investment team focuses on rigorous fundamental research that includes macroeconomic, company-specific and deal-specific factors.
In navigating investment challenges, the Fund follows a high-conviction strategy. It typically has 100 to 150 holdings, compared with some competitors that have several times that number. Concentration risks are mitigated by investing mostly in large, liquid loan deals and maintaining firm sell discipline. The Fund also maintains a mix of roughly 85% leveraged
20
Victory Fixed Income Funds
Victory Floating Rate Fund (continued)
Managers' Commentary (continued)
loans and 15% high yield bonds. The option of holding bonds offers liquidity and the flexibility to invest in the most attractive form of debt of companies the Fund's management team favors.
While we are optimistic about a solid economic recovery in 2021, we think there is a good chance that deficit spending and extremely easy monetary conditions could trigger inflationary trends. And while investors have been principally focused on defaults, downgrades, and other forms of credit risk, we believe that an equally serious and increasing risk has been all but dismissed: duration, or interest rate risk. Duration, a measure of a security's sensitivity to interest rate changes, is near an all-time high, meaning that big losses could be in store for many bondholders if rates rise. The adjustable rates of leveraged loans can provide some protection from rising rates.
21
Victory Fixed Income Funds
Victory Floating Rate Fund
Investment Overview
(Unaudited)
Average Annual Total Returns
Year Ended December 31, 2020
| | Class A | | Class C | | Class R | | Class Y | | Member Class | | | |
INCEPTION DATE | | 12/31/09 | | 12/31/09 | | 12/31/09 | | 12/31/09 | | 11/3/20 | | | |
| | Net Asset
Value | | Maximum
Offering
Price | | Net Asset
Value | | Contingent
Deferred
Charges | | Net Asset
Value | | Net Asset
Value | | Net Asset
Value | | S&P/LSTA U.S.
Leveraged
Loan Index1 | |
One Year | | | 4.81 | % | | | 2.41 | % | | | 3.96 | % | | | 2.97 | % | | | 4.23 | % | | | 4.92 | % | | | N/A | | | | 3.12 | % | |
Five Year | | | 6.07 | % | | | 5.59 | % | | | 5.23 | % | | | 5.23 | % | | | 5.47 | % | | | 6.30 | % | | | N/A | | | | 5.24 | % | |
Ten Year | | | 4.16 | % | | | 3.92 | % | | | 3.35 | % | | | 3.35 | % | | | 3.61 | % | | | 4.38 | % | | | N/A | | | | 4.32 | % | |
Since Inception | | | N/A | | | | N/A | | | | N/A | | | | N/A | | | | N/A | | | | N/A | | | | 4.30 | % | | | N/A | | |
The performance data quoted represents past performance and current returns may be lower or higher. The investment return and principal value will fluctuate so that an investor's shares, when redeemed, may be worth more or less than the original cost. To obtain performance information current to the most recent month's end, please visit www.vcm.com.
The maximum offering price (MOP) figures reflect a maximum sales charge of 2.25% for Class A Shares. Class C Shares are not subject to an initial sales charge, but are subject to a deferred sales charge of 1.00% on shares redeemed within one year of purchase. NAV does not reflect sales charges.
Total return measures the price change in a share assuming the reinvestment of all net investment income and realized capital gain distributions, if any. The total returns quoted do not reflect adjustments made to the enclosed financial statements in accordance with U.S. generally accepted accounting principles or the deduction of taxes that a shareholder would pay on net investment income and realized capital gain distributions, including reinvested distributions, or redemptions of shares. The total return figures set forth above include all waivers of fees. Without such fee waivers, the total returns would have been lower.
Victory Floating Rate Fund — Growth of $10,000
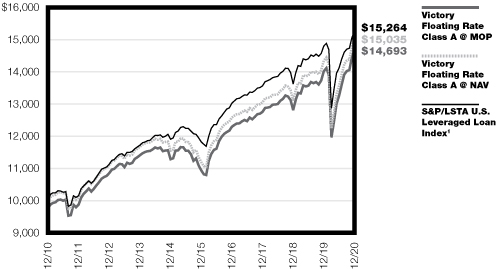
1The S&P/LSTA U.S. Leveraged Loan Index covers more than 1,100 loan facilities and reflects the market-value-weighted performance of U.S. dollar-denominated institutional leveraged loans. This index does not include the effect of sales charges, commissions, expenses or taxes, is not representative of the Fund and it is not possible to invest directly in an index.
The graph reflects investment of growth of a hypothetical $10,000 investment in the Fund.
The graph and table do not reflect the deduction of taxes that a shareholder would pay on Fund distributions or the redemption of Fund shares.
Past performance is not indicative of future results.
22
Victory Fixed Income Funds
Victory Strategic Income Fund
Managers' Commentary
(Unaudited)
What were the market conditions during the reporting period?
For most of 2020, securities markets seemed like the only things that were immune to the pandemic related to a novel coronavirus and the disease it causes (COVID-19).
After a gut-wrenching plunge as the deadly virus emerged in the first quarter, equity and fixed income markets surged even as the virus upended the global economy, killed nearly 2 million people worldwide, and threw tens of millions of people out of work.
Central banks and governments fought back with unprecedented stimulus measures that supported risk-taking in the markets. An almost willful optimism that prevailed in the markets after the first quarter gained strength late in the year as the first vaccines rolled out, a profoundly divisive U.S. election was decided, and the economic outlook, though still troubled, improved.
In fixed income, traditionally riskier assets outperformed. Investment-grade and high-yield corporate bonds led the charge, with the Bloomberg Barclays U.S. Corporate High Yield Bond Index returning 7.1% for the year. The 10-year Treasury returned 10.6%, while its yield dropped below 1.0% in the first quarter and remained there.
How did Victory Strategic Income Fund (the "Fund") perform during the reporting period?
The Fund seeks to provide high current income with a secondary objective of capital appreciation. The Fund returned 9.09% (Class A Shares at net asset value) for the year ended December 31, 2020, outperforming the Bloomberg Barclays U.S. Aggregate Bond Index (the "Index"), which returned 7.51% during the reporting period.
What strategies did you employ during the reporting period?
The investment team analyzes income and price appreciation potential based on credit fundamentals along with a broad market, economic, political, and regulatory risk assessment.
An overweight in corporate bonds has long been a mainstay of the Fund's strategy, and we added to the Fund's corporate holdings as the year progressed, both by increasing exposure to BBB-rated bonds and by reintroducing a small out-of-Index exposure to high-yield corporate debt. Accompanying these increases were reductions in U.S. Treasury holdings and corporate bonds rated AAA through A.
Corporate bonds outperformed sharply as market sentiment favored traditionally riskier sectors throughout much of the year. As a result, the Fund's substantial overweight in corporate bonds, including high-yield corporate debt, was the largest contributor to its performance relative to the Index. Overall security selection also contributed, while yield curve positioning detracted.
The Fund's overweight and positive security selection in BBB-rated corporate bonds with maturities of 3 to 10 years made them the largest single contributor to performance relative to the Index.
23
Victory Fixed Income Funds
Victory Strategic Income Fund (continued)
Managers' Commentary (continued)
Security selection in asset-backed securities was the largest detractor from relative performance. An out-of-Index allocation to credit default swaps early in the year also detracted, as did an overweight in BBB-rated corporate bonds with maturities greater than 25 years.
24
Victory Fixed Income Funds
Victory Strategic Income Fund
Investment Overview
(Unaudited)
Average Annual Total Returns
Year Ended December 31, 2020
| | Class A | | Class C | | Class R | | Class Y | | | |
INCEPTION DATE | | 12/31/09 | | 12/31/09 | | 12/31/09 | | 12/31/09 | | | |
| | Net Asset
Value | | Maximum
Offering
Price | | Net Asset
Value | | Contingent
Deferred
Charges | | Net Asset
Value | | Net Asset
Value | | Bloomberg
Barclays U.S.
Aggregate
Bond Index1 | |
One Year | | | 9.09 | % | | | 6.61 | % | | | 8.28 | % | | | 7.28 | % | | | 8.61 | % | | | 9.37 | % | | | 7.51 | % | |
Five Year | | | 5.72 | % | | | 5.25 | % | | | 4.90 | % | | | 4.90 | % | | | 5.30 | % | | | 5.96 | % | | | 4.44 | % | |
Ten Year | | | 4.44 | % | | | 4.20 | % | | | 3.63 | % | | | 3.63 | % | | | 4.02 | % | | | 4.66 | % | | | 3.84 | % | |
The performance data quoted represents past performance and current returns may be lower or higher. The investment return and principal value will fluctuate so that an investor's shares, when redeemed, may be worth more or less than the original cost. To obtain performance information current to the most recent month's end, please visit www.vcm.com.
The maximum offering price (MOP) figures reflect a maximum sales charge of 2.25% for Class A Shares. Class C Shares are not subject to an initial sales charge, but are subject to a deferred sales charge of 1.00% on shares redeemed within one year of purchase. NAV does not reflect sales charges.
Total return measures the price change in a share assuming the reinvestment of all net investment income and realized capital gain distributions, if any. The total returns quoted do not reflect adjustments made to the enclosed financial statements in accordance with U.S. generally accepted accounting principles or the deduction of taxes that a shareholder would pay on net investment income and realized capital gain distributions, including reinvested distributions, or redemptions of shares. The total return figures set forth above include all waivers of fees. Without such fee waivers, the total returns would have been lower.
Victory Strategic Income Fund — Growth of $10,000

1The Bloomberg Barclays U.S. Aggregate Bond Index is generally considered to be representative of U.S. bond market activity. This index does not include the effect of sales charges, commissions, expenses or taxes, is not representative of the Fund and it is not possible to invest directly in an index.
The graph reflects investment of growth of a hypothetical $10,000 investment in the Fund.
The graph and table do not reflect the deduction of taxes that a shareholder would pay on Fund distributions or the redemption of Fund shares.
Past performance is not indicative of future results.
25
Victory Fixed Income Funds
Victory INCORE Investment Quality Bond Fund | | December 31, 2020 | |
(Unaudited)
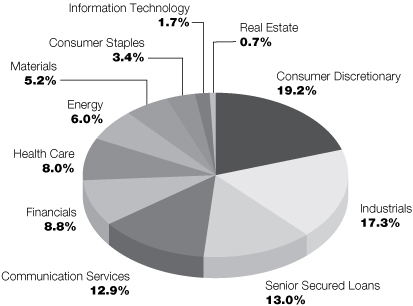
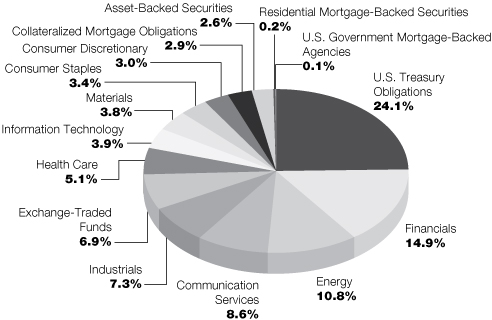
Investment Objective & Portfolio Holdings:
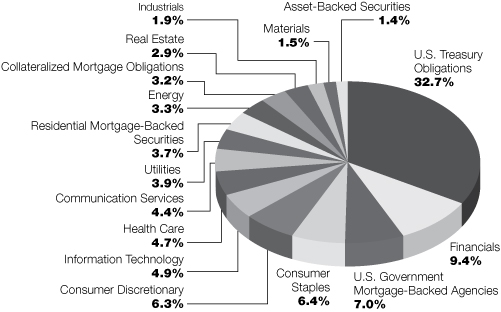
Victory INCORE Investment Quality Bond Fund seeks to provide a high level of current income and capital appreciation without undue risk to principal.
Sector Allocation*:
December 31, 2020
(% of Net Assets)

* Does not include futures, money market instruments, and short-term investments purchased with cash collateral from securities loaned.
Refer to the Schedule of Portfolio Investments for a complete list of securities.
Percentages are of the net assets of the Fund and may not equal 100%.
26
Victory Fixed Income Funds
Victory INCORE Low Duration Bond Fund | | December 31, 2020 | |
(Unaudited)
Investment Objective & Portfolio Holdings:
Victory INCORE Low Duration Bond Fund seeks to provide a high level of current income consistent with preservation of capital.
Sector Allocation*:
December 31, 2020
(% of Net Assets)
* Does not include futures, money market instruments, and short-term investments purchased with cash collateral from securities loaned.
Refer to the Schedule of Portfolio Investments for a complete list of securities.
Percentages are of the net assets of the Fund and may not equal 100%.
27
Victory Fixed Income Funds
Victory High Yield Fund | | December 31, 2020 | |
(Unaudited)
Investment Objective & Portfolio Holdings:
Victory High Yield Fund seeks to provide current income. Capital appreciation is a secondary objective.
Sector Allocation*:
December 31, 2020
(% of Net Assets)
* Does not include futures, money market instruments, and short-term investments purchased with cash collateral from securities loaned.
Refer to the Schedule of Portfolio Investments for a complete list of securities.
Percentages are of the net assets of the Fund and may not equal 100%.
28
Victory Fixed Income Funds
Victory Tax-Exempt Fund | | December 31, 2020 | |
(Unaudited)
Investment Objective & Portfolio Holdings:
Victory Tax-Exempt Fund seeks to maximize current income exempt from federal income taxes, consistent with the preservation of capital.
Portfolio Allocation*:
December 31, 2020
(% of Net Assets)
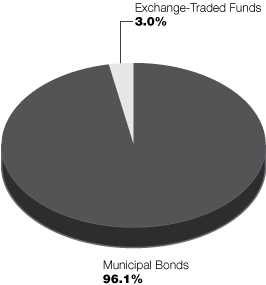
* Does not include futures, money market instruments, and short-term investments purchased with cash collateral from securities loaned.
Refer to the Schedule of Portfolio Investments for a complete list of securities.
Percentages are of the net assets of the Fund and may not equal 100%.
29
Victory Fixed Income Funds
Victory High Income Municipal Bond Fund | | December 31, 2020 | |
(Unaudited)
Investment Objective & Portfolio Holdings:
Victory High Income Municipal Bond Fund seeks to provide a high current income exempt from federal income taxes with a secondary objective of capital appreciation.
Portfolio Allocation*:
December 31, 2020
(% of Net Assets)
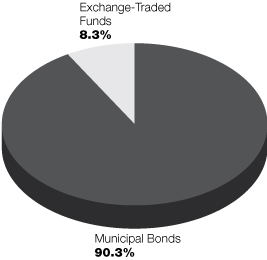
* Does not include futures, money market instruments, and short-term investments purchased with cash collateral from securities loaned.
Refer to the Schedule of Portfolio Investments for a complete list of securities.
Percentages are of the net assets of the Fund and may not equal 100%.
30
Victory Fixed Income Funds
Victory Floating Rate Fund | | December 31, 2020 | |
(Unaudited)
Investment Objective & Portfolio Holdings:
Victory Floating Rate Fund seeks to provide a high level of current income.
Sector Allocation*:
December 31, 2020
(% of Net Assets)
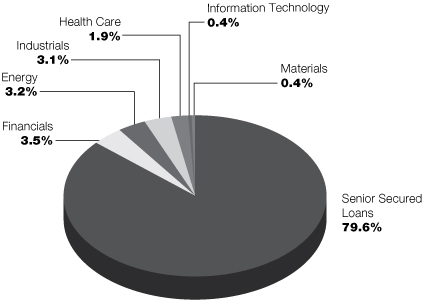
* Does not include futures, money market instruments, and short-term investments purchased with cash collateral from securities loaned.
Refer to the Schedule of Portfolio Investments for a complete list of securities.
Percentages are of the net assets of the Fund and may not equal 100%.
31
Victory Fixed Income Funds
Victory Strategic Income Fund | | December 31, 2020 | |
(Unaudited)
Investment Objective & Portfolio Holdings:
Victory Strategic Income Fund seeks to provide a high current income with a secondary objective of capital appreciation.
Sector Allocation*:
December 31, 2020
(% of Net Assets)
* Does not include futures, money market instruments, and short-term investments purchased with cash collateral from securities loaned.
Refer to the Schedule of Portfolio Investments for a complete list of securities.
Percentages are of the net assets of the Fund and may not equal 100%.
32
Victory Portfolios
Victory INCORE Investment Quality Bond Fund | | Schedule of Portfolio Investments
December 31, 2020 | |
Security Description | | Shares or
Principal
Amount | | Value | |
Asset-Backed Securities (0.6%) | |
Santander Drive Auto Receivables Trust, Series 2020-1, Class A2A, 2.07%,
1/17/23, Callable 8/15/23 @ 100 (a) | | $ | 36,336 | | | $ | 36,497 | | |
Synchrony Credit Card Master Note Trust, Series 2018-1, Class A, 2.97%,
3/15/24 | | | 130,000 | | | | 130,660 | | |
Total Asset-Backed Securities (Cost $166,700) | | | 167,157 | | |
Collateralized Mortgage Obligations (0.9%) | |
Bank, Series 2020-BN26, Class AS, 2.69%, 3/15/63, Callable 3/15/30 @ 100 | | | 130,000 | | | | 139,671 | | |
Citigroup Commercial Mortgage Trust, Series 2020-GC46, Class AS, 2.92%,
2/15/53 | | | 117,000 | | | | 128,343 | | |
Total Collateralized Mortgage Obligations (Cost $254,308) | | | 268,014 | | |
Preferred Stocks (2.0%) | |
Financials (0.7%): | |
AMG Capital Trust II, 10/15/37, 5.15% | | | 255 | | | | 12,376 | | |
Bank of America Corp., Series L, 7.25% (b) | | | 45 | | | | 68,336 | | |
KKR & Co., Inc., Series C, 9/15/23, 6.00% | | | 865 | | | | 52,143 | | |
Wells Fargo & Co., Series L, 7.50% (b) | | | 50 | | | | 75,895 | | |
| | | | 208,750 | | |
Health Care (0.2%): | |
Danaher Corp., Series B, 4/15/23, 5.00% (d) | | | 42 | | | | 54,646 | | |
Industrials (0.2%): | |
Stanley Black & Decker, Inc., 11/15/22, 5.25% | | | 635 | | | | 71,018 | | |
Utilities (0.9%): | |
American Electric Power Co., Inc., 8/15/23, 6.13% | | | 230 | | | | 11,645 | | |
CenterPoint Energy, Inc., 4.57%, 9/15/29 (g) | | | 455 | | | | 28,183 | | |
Dominion Energy, Inc., Series A, 6/1/22, 7.25% | | | 680 | | | | 68,224 | | |
DTE Energy Co., 11/1/22, 6.25% | | | 906 | | | | 43,615 | | |
NextEra Energy, Inc., 3/1/23, 5.28% | | | 1,190 | | | | 60,500 | | |
The Southern Co., Series 2019, 8/1/22, 6.75% | | | 1,057 | | | | 54,858 | | |
| | | 267,025 | | |
Total Preferred Stocks (Cost $584,456) | | | 601,439 | | |
Corporate Bonds (54.5%) | |
Communication Services (2.5%): | |
Alphabet, Inc., 2.05%, 8/15/50, Callable 2/15/50 @ 100 | | | 80,000 | | | | 76,253 | | |
AT&T, Inc.
4.25%, 3/1/27, Callable 12/1/26 @ 100 (a) | | | 76,000 | | | | 88,799 | | |
1.65%, 2/1/28, Callable 12/1/27 @ 100 (d) | | | 51,000 | | | | 52,127 | | |
5.15%, 11/15/46, Callable 5/15/46 @ 100 (a) | | | 126,000 | | | | 162,726 | | |
CenturyLink, Inc., 6.75%, 12/1/23 | | | 50,000 | | | | 55,641 | | |
Comcast Corp.
3.45%, 2/1/50, Callable 8/1/49 @ 100 | | | 70,000 | | | | 82,231 | | |
2.80%, 1/15/51, Callable 7/15/50 @ 100 | | | 56,000 | | | | 58,326 | | |
See notes to financial statements.
33
Victory Portfolios
Victory INCORE Investment Quality Bond Fund | | Schedule of Portfolio Investments — continued
December 31, 2020 | |
Security Description | | Principal
Amount | | Value | |
Sirius XM Radio, Inc., 4.13%, 7/1/30, Callable 7/1/25 @ 102.06 (e) | | $ | 62,000 | | | $ | 65,988 | | |
Verizon Communications, Inc.
5.15%, 9/15/23 (a) | | | 60,000 | | | | 67,627 | | |
3.38%, 2/15/25 (a) | | | 38,000 | | | | 42,196 | | |
| | | | 751,914 | | |
Consumer Discretionary (5.9%): | |
Booking Holdings, Inc.
0.90%, 9/15/21 | | | 10,000 | | | | 11,590 | | |
0.75%, 5/1/25 (d) (e) | | | 45,000 | | | | 65,376 | | |
D.R. Horton, Inc., 2.50%, 10/15/24, Callable 9/15/24 @ 100 | | | 315,000 | | | | 336,171 | | |
Dana, Inc., 5.63%, 6/15/28, Callable 6/15/23 @ 102.81 | | | 48,000 | | | | 51,740 | | |
Expedia Group, Inc., 3.60%, 12/15/23, Callable 11/15/23 @ 100 (e) | | | 87,000 | | | | 92,860 | | |
General Motors Co., 4.88%, 10/2/23 (a) | | | 96,000 | | | | 106,578 | | |
Hasbro, Inc., 2.60%, 11/19/22 | | | 130,000 | | | | 134,728 | | |
Hilton Domestic Operating Co., Inc., 4.88%, 1/15/30, Callable 1/15/25 @ 102.44 | | | 48,000 | | | | 52,655 | | |
Hilton Worldwide Finance LLC/Hilton Worldwide Finance Corp., 4.88%, 4/1/27,
Callable 4/1/22 @ 102.44 | | | 55,000 | | | | 58,145 | | |
Lear Corp., 3.50%, 5/30/30, Callable 2/28/30 @ 100 | | | 52,000 | | | | 56,818 | | |
Lennar Corp., 5.00%, 6/15/27, Callable 12/15/26 @ 100 | | | 93,000 | | | | 109,716 | | |
Marriott International, Inc., 3.60%, 4/15/24, Callable 3/15/24 @ 100 | | | 142,000 | | | | 151,820 | | |
NIKE, Inc., 3.88%, 11/1/45, Callable 5/1/45 @ 100 | | | 100,000 | | | | 129,689 | | |
NVR, Inc.
3.95%, 9/15/22, Callable 6/15/22 @ 100 (a) | | | 126,000 | | | | 132,534 | | |
3.00%, 5/15/30, Callable 11/15/29 @ 100 | | | 118,000 | | | | 128,659 | | |
Ross Stores, Inc.
3.38%, 9/15/24, Callable 6/15/24 @ 100 | | | 70,000 | | | | 75,152 | | |
0.88%, 4/15/26, Callable 3/15/26 @ 100 | | | 82,000 | | | | 81,907 | | |
| | | | 1,776,138 | | |
Consumer Staples (3.1%): | |
Altria Group, Inc., 4.40%, 2/14/26, Callable 12/14/25 @ 100 (a) | | | 64,000 | | | | 74,243 | | |
BAT Capital Corp., 5.28%, 4/2/50, Callable 10/2/49 @ 100 | | | 75,000 | | | | 92,521 | | |
Church & Dwight Co., Inc., 2.45%, 8/1/22, Callable 7/1/22 @ 100 (a) | | | 30,000 | | | | 30,891 | | |
Estee Lauder Cos., Inc., 4.15%, 3/15/47, Callable 9/15/46 @ 100 | | | 52,000 | | | | 68,539 | | |
Hormel Foods Corp., 1.80%, 6/11/30, Callable 3/11/30 @ 100 | | | 160,000 | | | | 165,429 | | |
Keurig Dr Pepper, Inc., 4.06%, 5/25/23, Callable 4/25/23 @ 100 (a) | | | 160,000 | | | | 173,870 | | |
Molson Coors Beverage Co., 4.20%, 7/15/46, Callable 1/15/46 @ 100 | | | 42,000 | | | | 48,051 | | |
Reynolds American, Inc., 5.70%, 8/15/35, Callable 2/15/35 @ 100 | | | 92,000 | | | | 116,746 | | |
The Coca-Cola Co., 2.95%, 3/25/25 | | | 117,000 | | | | 129,015 | | |
Tyson Foods, Inc., 5.10%, 9/28/48, Callable 3/28/48 @ 100 | | | 39,000 | | | | 55,834 | | |
| | | | 955,139 | | |
Energy (4.1%): | |
Chevron USA, Inc., 1.02%, 8/12/27, Callable 6/12/27 @ 100 | | | 140,000 | | | | 140,198 | | |
Continental Resources, Inc., 4.50%, 4/15/23, Callable 1/15/23 @ 100 (a) | | | 113,000 | | | | 116,453 | | |
EOG Resources, Inc., 4.95%, 4/15/50, Callable 10/15/49 @ 100 | | | 65,000 | | | | 88,270 | | |
EQM Midstream Partners LP, 4.75%, 7/15/23, Callable 6/15/23 @ 100 (a) | | | 113,000 | | | | 118,558 | | |
HollyFrontier Corp., 2.63%, 10/1/23 | | | 116,000 | | | | 118,566 | | |
Phillips 66 Partners LP, 4.90%, 10/1/46, Callable 4/1/46 @ 100 | | | 90,000 | | | | 101,183 | | |
See notes to financial statements.
34
Victory Portfolios
Victory INCORE Investment Quality Bond Fund | | Schedule of Portfolio Investments — continued
December 31, 2020 | |
Security Description | | Principal
Amount | | Value | |
Pioneer Natural Resources Co.
0.25%, 5/15/25 (d) (e) | | $ | 50,000 | | | $ | 66,434 | | |
1.90%, 8/15/30, Callable 5/15/30 @ 100 | | | 109,000 | | | | 108,060 | | |
Plains All American Pipeline LP/PAA Finance Corp., 2.85%, 1/31/23,
Callable 10/31/22 @ 100 (a) | | | 120,000 | | | | 124,005 | | |
Valero Energy Corp.
4.00%, 4/1/29, Callable 1/1/29 @ 100 (a) | | | 62,000 | | | | 69,771 | | |
6.63%, 6/15/37 | | | 140,000 | | | | 185,662 | | |
| | | | 1,237,160 | | |
Financials (14.0%): | |
Aflac, Inc.
2.88%, 10/15/26, Callable 7/15/26 @ 100 | | | 185,000 | | | | 204,573 | | |
4.75%, 1/15/49, Callable 7/15/48 @ 100 | | | 20,000 | | | | 27,908 | | |
Alleghany Corp.
3.63%, 5/15/30, Callable 2/15/30 @ 100 | | | 55,000 | | | | 62,249 | | |
4.90%, 9/15/44, Callable 3/15/44 @ 100 | | | 89,000 | | | | 114,798 | | |
Ares Capital Corp., 4.63%, 3/1/24 | | | 70,000 | | | | 73,676 | | |
Bank of America Corp.
2.50%, 10/21/22, Callable 10/21/21 @ 100, MTN | | | 285,000 | | | | 290,114 | | |
4.20%, 8/26/24, MTN (a) | | | 51,000 | | | | 57,159 | | |
3.25%, 10/21/27, Callable 10/21/26 @ 100, MTN | | | 100,000 | | | | 111,987 | | |
Capital One Financial Corp., 3.30%, 10/30/24, Callable 9/30/24 @ 100 (a) | | | 72,000 | | | | 79,135 | | |
Cincinnati Financial Corp., 6.13%, 11/1/34 | | | 100,000 | | | | 139,770 | | |
Citigroup, Inc.
2.75%, 4/25/22, Callable 3/25/22 @ 100 | | | 175,000 | | | | 180,192 | | |
3.88%, 3/26/25 | | | 35,000 | | | | 39,184 | | |
4.60%, 3/9/26 (a) | | | 36,000 | | | | 42,219 | | |
4.45%, 9/29/27 (a) | | | 63,000 | | | | 74,409 | | |
3.88% (LIBOR03M+117bps), 1/24/39, Callable 1/24/38 @ 100 (f) | | | 51,000 | | | | 61,053 | | |
Fifth Third Bancorp
1.63%, 5/5/23, Callable 4/5/23 @ 100 | | | 55,000 | | | | 56,594 | | |
3.65%, 1/25/24, Callable 12/25/23 @ 100 (a) | | | 261,000 | | | | 284,598 | | |
Ford Motor Credit Co. LLC, 4.06%, 11/1/24, Callable 10/1/24 @ 100 | | | 200,000 | | | | 209,894 | | |
General Motors Financial Co., Inc., 4.15%, 6/19/23, Callable 5/19/23 @ 100 | | | 49,000 | | | | 52,765 | | |
Globe Life, Inc., 2.15%, 8/15/30, Callable 5/15/30 @ 100 | | | 110,000 | | | | 111,716 | | |
JPMorgan Chase & Co.
2.95%, 10/1/26, Callable 7/1/26 @ 100 | | | 170,000 | | | | 188,746 | | |
5.60%, 7/15/41 | | | 52,000 | | | | 78,306 | | |
Morgan Stanley
4.88%, 11/1/22 (a) | | | 144,000 | | | | 155,228 | | |
3.75%, 2/25/23 (a) | | | 300,000 | | | | 321,584 | | |
3.13%, 7/27/26, MTN | | | 305,000 | | | | 340,968 | | |
Sixth Street Specialty Lending, Inc., 4.50%, 8/1/22 | | | 50,000 | | | | 53,927 | | |
SVB Financial Group, 3.13%, 6/5/30, Callable 3/5/30 @ 100 | | | 164,000 | | | | 184,708 | | |
Truist Financial Corp., 2.75%, 4/1/22, MTN, Callable 3/1/22 @ 100 | | | 260,000 | | | | 267,407 | | |
Unum Group, 4.00%, 6/15/29, Callable 3/15/29 @ 100 | | | 92,000 | | | | 103,629 | | |
See notes to financial statements.
35
Victory Portfolios
Victory INCORE Investment Quality Bond Fund | | Schedule of Portfolio Investments — continued
December 31, 2020 | |
Security Description | | Principal
Amount | | Value | |
Wells Fargo & Co.
4.30%, 7/22/27, MTN | | $ | 180,000 | | | $ | 211,090 | | |
4.90%, 11/17/45 (a) | | | 80,000 | | | | 106,483 | | |
| | | | 4,286,069 | | |
Health Care (5.8%): | |
AbbVie, Inc.
3.20%, 11/21/29, Callable 8/21/29 @ 100 | | | 135,000 | | | | 152,064 | | |
4.45%, 5/14/46, Callable 11/14/45 @ 100 | | | 62,000 | | | | 78,924 | | |
Amgen, Inc., 4.40%, 5/1/45, Callable 11/1/44 @ 100 | | | 70,000 | | | | 88,563 | | |
Anthem, Inc.
2.38%, 1/15/25, Callable 12/15/24 @ 100 | | | 65,000 | | | | 69,473 | | |
2.75%, 10/15/42 | | | 15,000 | | | | 67,199 | | |
Baxter International, Inc., 3.50%, 8/15/46, Callable 2/15/46 @ 100 | | | 48,000 | | | | 54,695 | | |
Bristol-Myers Squibb Co., 3.40%, 7/26/29, Callable 4/26/29 @ 100 | | | 220,000 | | | | 255,744 | | |
Centene Corp., 4.25%, 12/15/27, Callable 12/15/22 @ 102.13 | | | 73,000 | | | | 77,698 | | |
Gilead Sciences, Inc., 4.40%, 12/1/21, Callable 9/1/21 @ 100 (a) | | | 318,000 | | | | 326,443 | | |
HCA, Inc., 4.13%, 6/15/29, Callable 3/15/29 @ 100 | | | 91,000 | | | | 105,645 | | |
Hologic, Inc., 3.25%, 2/15/29, Callable 9/28/23 @ 101.63 (e) | | | 114,000 | | | | 116,294 | | |
Humana, Inc., 2.90%, 12/15/22, Callable 11/15/22 @ 100 (a) | | | 65,000 | | | | 67,961 | | |
Illumina, Inc.
0.50%, 6/15/21 | | | 30,000 | | | | 43,841 | | |
8/15/23 (j) | | | 25,000 | | | | 28,178 | | |
Merck & Co., Inc., 2.45%, 6/24/50, Callable 12/24/49 @ 100 | | | 59,000 | | | | 61,109 | | |
Regeneron Pharmaceuticals, Inc., 2.80%, 9/15/50, Callable 3/15/50 @ 100 | | | 63,000 | | | | 61,011 | | |
Teladoc Health, Inc., 1.25%, 6/1/27 (e) | | | 25,000 | | | | 29,943 | | |
Universal Health Services, Inc., 2.65%, 10/15/30, Callable 7/15/30 @ 100 (e) | | | 44,000 | | | | 45,700 | | |
Upjohn, Inc., 2.30%, 6/22/27, Callable 4/22/27 @ 100 (e) | | | 40,000 | | | | 42,480 | | |
| | | | 1,772,965 | | |
Industrials (5.2%): | |
Acuity Brands Lighting, Inc., 2.15%, 12/15/30, Callable 9/15/30 @ 100 | | | 105,000 | | | | 106,508 | | |
Carlisle Cos., Inc., 2.75%, 3/1/30, Callable 12/1/29 @ 100 | | | 75,000 | | | | 80,486 | | |
CSX Corp., 3.35%, 9/15/49, Callable 3/15/49 @ 100 | | | 85,000 | | | | 97,759 | | |
Delta Air Lines, Inc., 3.80%, 4/19/23, Callable 3/19/23 @ 100 (a) | | | 130,000 | | | | 133,012 | | |
Fortive Corp., 0.88%, 2/15/22 | | | 70,000 | | | | 72,008 | | |
Hillenbrand, Inc., 4.50%, 9/15/26, Callable 7/15/26 @ 100 | | | 195,000 | | | | 218,706 | | |
Oshkosh Corp., 3.10%, 3/1/30, Callable 12/1/29 @ 100 | | | 60,000 | | | | 65,318 | | |
PACCAR Financial Corp., 0.80%, 6/8/23, MTN | | | 100,000 | | | | 101,065 | | |
Rockwell Automation, Inc.
3.50%, 3/1/29, Callable 12/1/28 @ 100 | | | 65,000 | | | | 75,697 | | |
6.25%, 12/1/37 | | | 60,000 | | | | 87,345 | | |
Roper Technologies, Inc., 2.95%, 9/15/29, Callable 6/15/29 @ 100 (a) (d) | | | 167,000 | | | | 183,679 | | |
Sensata Technologies, Inc., 3.75%, 2/15/31, Callable 2/15/26 @ 101.88 (e) | | | 57,000 | | | | 59,047 | | |
Snap-on, Inc., 4.10%, 3/1/48, Callable 9/1/47 @ 100 | | | 56,000 | | | | 72,048 | | |
Southwest Airlines Co., 1.25%, 5/1/25 | | | 45,000 | | | | 65,363 | | |
Valmont Industries, Inc., 5.00%, 10/1/44, Callable 4/1/44 @ 100 (a) | | | 137,000 | | | | 160,572 | | |
| | | | 1,578,613 | | |
See notes to financial statements.
36
Victory Portfolios
Victory INCORE Investment Quality Bond Fund | | Schedule of Portfolio Investments — continued
December 31, 2020 | |
Security Description | | Principal
Amount | | Value | |
Information Technology (6.6%): | |
Akamai Technologies, Inc., 0.13%, 5/1/25 | | $ | 35,000 | | | $ | 43,318 | | |
Apple, Inc., 4.65%, 2/23/46, Callable 8/23/45 @ 100 | | | 53,000 | | | | 75,648 | | |
Broadcom Corp., 3.00%, 1/15/22, Callable 12/15/21 @ 100 (a) | | | 77,000 | | | | 78,810 | | |
Broadcom Corp./Broadcom Cayman Finance Ltd., 3.63%, 1/15/24, Callable
11/15/23 @ 100 (a) | | | 57,000 | | | | 61,658 | | |
Broadcom, Inc., 5.00%, 4/15/30, Callable 1/15/30 @ 100 | | | 140,000 | | | | 170,270 | | |
Cadence Design Systems, Inc., 4.38%, 10/15/24, Callable 7/15/24 @ 100 | | | 153,000 | | | | 171,756 | | |
Euronet Worldwide, Inc., 0.75%, 3/15/49, Callable 3/20/25 @ 100 | | | 55,000 | | | | 62,173 | | |
Intel Corp., 3.40%, 3/25/25, Callable 2/25/25 @ 100 | | | 102,000 | | | | 113,304 | | |
Lam Research Corp., 4.00%, 3/15/29, Callable 12/15/28 @ 100 (a) | | | 59,000 | | | | 70,781 | | |
Micron Technology, Inc.
4.19%, 2/15/27, Callable 12/15/26 @ 100 | | | 49,000 | | | | 57,343 | | |
5.33%, 2/6/29, Callable 11/6/28 @ 100 | | | 130,000 | | | | 162,802 | | |
3.13%, 5/1/32, Callable 5/4/21 @ 100 (g) | | | 8,000 | | | | 60,203 | | |
NCR Corp., 5.25%, 10/1/30, Callable 10/1/25 @ 102.63 (e) | | | 38,000 | | | | 40,822 | | |
NetApp, Inc., 3.25%, 12/15/22, Callable 9/15/22 @ 100 | | | 70,000 | | | | 73,119 | | |
Novellus Systems, Inc., 2.63%, 5/15/41 | | | 1,000 | | | | 14,724 | | |
NVIDIA Corp., 2.20%, 9/16/21, Callable 8/16/21 @ 100 | | | 85,000 | | | | 86,029 | | |
PayPal Holdings, Inc., 1.65%, 6/1/25, Callable 5/1/25 @ 100 | | | 184,000 | | | | 192,434 | | |
ServiceNow, Inc., 6/1/22 | | | 2,000 | | | | 8,153 | | |
Texas Instruments, Inc., 4.15%, 5/15/48, Callable 11/15/47 @ 100 | | | 66,000 | | | | 88,385 | | |
Visa, Inc., 2.00%, 8/15/50, Callable 2/15/50 @ 100 | | | 123,000 | | | | 117,002 | | |
VMware, Inc., 2.95%, 8/21/22, Callable 7/21/22 @ 100 | | | 170,000 | | | | 176,416 | | |
Western Digital Corp., 1.50%, 2/1/24 | | | 65,000 | | | | 64,606 | | |
| | | | 1,989,756 | | |
Materials (1.5%): | |
Celanese US Holdings LLC, 4.63%, 11/15/22 (a) | | | 100,000 | | | | 107,354 | | |
Domtar Corp., 6.75%, 2/15/44, Callable 8/15/43 @ 100 | | | 74,000 | | | | 93,358 | | |
Nucor Corp., 2.00%, 6/1/25, Callable 5/1/25 @ 100 | | | 71,000 | | | | 75,095 | | |
Steel Dynamics, Inc.
2.40%, 6/15/25, Callable 5/15/25 @ 100 | | | 22,000 | | | | 23,422 | | |
1.65%, 10/15/27, Callable 8/15/27 @ 100 | | | 45,000 | | | | 46,249 | | |
3.25%, 10/15/50, Callable 4/15/50 @ 100 | | | 84,000 | | | | 87,297 | | |
| | | | 432,775 | | |
Real Estate (2.8%): | |
Duke Realty LP, 3.05%, 3/1/50, Callable 9/1/49 @ 100 | | | 72,000 | | | | 78,183 | | |
Highwoods Realty LP, 3.63%, 1/15/23, Callable 10/15/22 @ 100 | | | 285,000 | | | | 296,719 | | |
Iron Mountain, Inc., 5.25%, 7/15/30, Callable 7/15/25 @ 102.63 (e) | | | 48,000 | | | | 51,949 | | |
Physicians Realty LP, 3.95%, 1/15/28, Callable 10/15/27 @ 100 | | | 60,000 | | | | 64,556 | | |
Piedmont Operating Partnership LP, 3.15%, 8/15/30, Callable 5/15/30 @ 100 | | | 58,000 | | | | 58,774 | | |
Retail Properties of America, Inc., 4.00%, 3/15/25, Callable 12/15/24 @ 100 | | | 155,000 | | | | 159,182 | | |
Sabra Health Care LP, 5.13%, 8/15/26, Callable 5/15/26 @ 100 | | | 65,000 | | | | 72,652 | | |
STORE Capital Corp., 2.75%, 11/18/30, Callable 8/18/30 @ 100 | | | 80,000 | | | | 81,302 | | |
| | | | 863,317 | | |
Utilities (3.0%): | |
Ameren Illinois Co., 1.55%, 11/15/30, Callable 8/15/30 @ 100 | | | 100,000 | | | | 100,809 | | |
Arizona Public Service Co., 2.95%, 9/15/27, Callable 6/15/27 @ 100 | | | 120,000 | | | | 132,108 | | |
See notes to financial statements.
37
Victory Portfolios
Victory INCORE Investment Quality Bond Fund | | Schedule of Portfolio Investments — continued
December 31, 2020 | |
Security Description | | Principal
Amount | | Value | |
Consolidated Edison, Inc., 6.30%, 8/15/37 | | $ | 110,000 | | | $ | 159,863 | | |
NextEra Energy Capital Holdings, Inc., 2.80%, 1/15/23, Callable
12/15/22 @ 100 (a) | | | 145,000 | | | | 151,811 | | |
Oklahoma G&E Co., 5.25%, 5/15/41, Callable 11/15/40 @ 100 | | | 105,000 | | | | 140,116 | | |
Public Service Electric & Gas Co., 4.00%, 6/1/44, Callable 12/1/43 @ 100 | | | 65,000 | | | | 79,029 | | |
Vistra Operations Co. LLC, 3.70%, 1/30/27, Callable 11/30/26 @ 100 (e) | | | 134,000 | | | | 147,551 | | |
| | | 911,287 | | |
Total Corporate Bonds (Cost $15,422,101) | | | 16,555,133 | | |
Residential Mortgage-Backed Securities (0.3%) | |
Credit Suisse First Boston Mortgage Securities Corp., Series 2002-HE16,
Class M1, 1.47% (LIBOR01M+132bps), 10/25/32, Callable 1/25/21 @ 100 (f) | | | 63,629 | | | | 63,804 | | |
JPMorgan Mortgage Trust, Series 2016-4, Class A5, 3.50%, 10/25/46,
Callable 12/25/22 @ 100 (a) (e) (h) | | | 34,309 | | | | 34,447 | | |
Total Residential Mortgage-Backed Securities (Cost $97,265) | | | 98,251 | | |
Yankee Dollars (10.8%) | |
Communication Services (0.9%): | |
Vodafone Group PLC
3.75%, 1/16/24 | | | 142,000 | | | | 155,238 | | |
5.25%, 5/30/48 | | | 89,000 | | | | 123,569 | | |
| | | | 278,807 | | |
Consumer Discretionary (0.9%): | |
Magna International, Inc., 3.63%, 6/15/24, Callable 3/15/24 @ 100 | | | 245,000 | | | | 268,250 | | |
Consumer Staples (3.9%): | |
Barry Callebaut Services NV, 5.50%, 6/15/23 (e) | | | 275,000 | | | | 301,642 | | |
Kerry Group Financial Services Unlimited Co., 3.20%, 4/9/23, Callable
1/9/23 @ 100 (a) (e) | | | 400,000 | | | | 419,531 | | |
Suntory Holdings Ltd.
2.55%, 6/28/22, Callable 5/28/22 @ 100 (a) (e) | | | 258,000 | | | | 265,273 | | |
2.25%, 10/16/24, Callable 9/16/24 @ 100 (e) | | | 200,000 | | | | 208,466 | | |
| | | | 1,194,912 | | |
Energy (0.8%): | |
Canadian Natural Resources Ltd., 2.95%, 1/15/23, Callable 12/15/22 @ 100 | | | 65,000 | | | | 68,003 | | |
Ecopetrol SA, 5.88%, 9/18/23 (a) | | | 133,000 | | | | 148,626 | | |
Statoil ASA, 3.95%, 5/15/43 | | | 20,000 | | | | 24,326 | | |
| | | | 240,955 | | |
Financials (2.6%): | |
Barclays Bank PLC
2/4/25 (a) | | | 35,000 | | | | 44,018 | | |
2/18/25 | | | 30,000 | | | | 33,212 | | |
Enel Finance International NV, 2.88%, 5/25/22 (a) (e) | | | 200,000 | | | | 206,418 | | |
Newcrest Finance Pty Ltd.
5.75%, 11/15/41 (e) | | | 95,000 | | | | 132,699 | | |
4.20%, 5/13/50, Callable 11/13/49 @ 100 (e) | | | 25,000 | | | | 30,686 | | |
See notes to financial statements.
38
Victory Portfolios
Victory INCORE Investment Quality Bond Fund | | Schedule of Portfolio Investments — continued
December 31, 2020 | |
| Security Description | | Principal
Amount | | Value | |
NXP BV/NXP Funding LLC, 4.63%, 6/1/23 (e) | | $ | 200,000 | | | $ | 218,824 | | |
Total Capital International SA, 2.99%, 6/29/41, Callable 12/29/40 @ 100 | | | 85,000 | | | | 92,455 | | |
| | | | 758,312 | | |
Industrials (0.8%): | |
AerCap Ireland Capital DAC/AerCap Global Aviation Trust, 6.50%, 7/15/25,
Callable 6/15/25 @ 100 | | | 150,000 | | | | 179,319 | | |
Canadian National Railway Co., 3.20%, 8/2/46, Callable 2/2/46 @ 100 | | | 60,000 | | | | 70,816 | | |
| | | | 250,135 | | |
Materials (0.5%): | |
Rio Tinto Finance USA Ltd.
3.75%, 6/15/25, Callable 3/15/25 @ 100 | | | 80,000 | | | | 90,361 | | |
5.20%, 11/2/40 | | | 50,000 | | | | 72,950 | | |
| | | | 163,311 | | |
Utilities (0.4%): | |
Iberdrola International BV
6.75%, 9/15/33 | | | 35,000 | | | | 47,283 | | |
6.75%, 7/15/36 | | | 47,000 | | | | 71,669 | | |
| | | | 118,952 | | |
Total Yankee Dollars (Cost $3,074,178) | | | 3,273,634 | | |
U.S. Government Mortgage-Backed Agencies (25.4%) | |
Federal Home Loan Mortgage Corp.
5.00%, 6/15/23 (a) | | | 14,033 | | | | 14,485 | | |
Series 4395, Class PA, 2.50%, 4/15/37 – 7/1/50 (a) | | | 253,128 | | | | 266,916 | | |
5.50%, 6/1/38 | | | 35,193 | | | | 41,598 | | |
7.00%, 9/1/38 (a) | | | 7,358 | | | | 9,010 | | |
Series 4320, Class AP, 3.50%, 7/15/39 – 12/15/48 (a) | | | 434,155 | | | | 463,549 | | |
4.50%, 1/1/41 – 7/1/44 (a) | | | 458,683 | | | | 512,072 | | |
Series 4444, Class CH, 3.00%, 1/15/41 (a) | | | 78,794 | | | | 79,780 | | |
Series 4049, Class AB, 2.75%, 12/15/41 (a) | | | 45,497 | | | | 46,566 | | |
Series 4494, Class JA, 3.75%, 5/15/42 (a) | | | 210,274 | | | | 218,285 | | |
| | | | 1,652,261 | | |
Federal National Mortgage Association
6.00%, 8/1/21 – 2/1/37 (a) | | | 67,620 | | | | 78,396 | | |
5.50%, 4/1/22 – 1/1/38 (a) | | | 126,367 | | | | 146,582 | | |
7.00%, 8/1/23 – 6/1/32 | | | 18,170 | | | | 21,702 | | |
7.50%, 12/1/29 – 2/1/31 (a) | | | 17,575 | | | | 20,386 | | |
8.00%, 6/1/30 – 9/1/30 | | | 12,013 | | | | 14,243 | | |
5.00%, 12/1/34 – 3/1/40 | | | 64,801 | | | | 73,815 | | |
2.16% (LIBOR12M+166bps), 12/1/36 (a) (f) | | | 26,460 | | | | 26,938 | | |
4.50%, 12/1/38 – 5/25/40 (a) | | | 276,560 | | | | 296,841 | | |
Series 2013-33, Class UD, 2.50%, 4/25/39 – 12/25/47 (a) | | | 615,776 | | | | 647,050 | | |
3.50%, 8/1/39 – 12/25/50 | | | 1,496,820 | | | | 1,580,127 | | |
3.00%, 6/1/40 – 5/1/48 | | | 2,026,673 | | | | 2,151,845 | | |
4.00%, 11/1/43 – 6/1/49 (a) | | | 792,791 | | | | 881,033 | | |
| | | | 5,938,958 | | |
See notes to financial statements.
39
Victory Portfolios
Victory INCORE Investment Quality Bond Fund | | Schedule of Portfolio Investments — continued
December 31, 2020 | |
Security Description | | Shares or
Principal
Amount | | Value | |
Government National Mortgage Association
3.00%, 8/20/50 | | $ | 98,584 | | | $ | 103,438 | | |
Multi-family (0.1%): | |
Collateralized Mortgage Obligations (0.1%): | |
Government National Mortgage Association
6.00%, 12/15/33 (a) | | | 15,986 | | | | 18,601 | | |
Total U.S. Government Mortgage-Backed Agencies (Cost $7,458,995) | | | 7,713,258 | | |
U.S. Treasury Obligations (2.7%) | |
U.S. Treasury Bonds, 1.13%, 5/15/40 (a) | | | 663,000 | | | | 629,436 | | |
U.S. Treasury Notes, 2.00%, 8/15/25 (a) | | | 170,000 | | | | 183,135 | | |
Total U.S. Treasury Obligations (Cost $820,711) | | | 812,571 | | |
Collateral for Securities Loaned^ (1.1%) | |
BlackRock Liquidity Funds TempFund Portfolio, Institutional Class, 0.08% (i) | | | 5,576 | | | | 5,576 | | |
Fidelity Investments Money Market Government Portfolio, Class I, 0.01% (i) | | | 191,570 | | | | 191,570 | | |
Goldman Sachs Financial Square Prime Obligations Fund, Institutional Class,
0.04% (i) | | | 2,783 | | | | 2,783 | | |
JPMorgan Prime Money Market Fund, Capital Class, 0.12% (i) | | | 22,189 | | | | 22,189 | | |
Morgan Stanley Institutional Liquidity Prime Portfolio, Institutional Class,
0.09% (i) | | | 99,764 | | | | 99,764 | | |
Total Collateral for Securities Loaned (Cost $321,882) | | | 321,882 | | |
Total Investments (Cost $28,200,596) — 98.3% | | | 29,811,339 | | |
Other assets in excess of liabilities — 1.7% | | | 510,197 | | |
NET ASSETS — 100.00% | | $ | 30,321,536 | | |
^ Purchased with cash collateral from securities on loan.
(a) All or a portion of this security has been segregated as collateral for derivative instruments.
(b) Security is perpetual and has no final maturity date but may be subject to calls at various dates in the future.
(d) All or a portion of this security is on loan.
(e) Rule 144A security or other security that is restricted as to resale to institutional investors. The Fund's Adviser has deemed this security to be liquid based upon procedures approved by the Board of Trustees. As of December 31, 2020, the fair value of these securities was $2,642,432 and amounted to 8.7% of net assets.
(f) Variable or Floating-Rate Security. Rate disclosed is as of December 31, 2020.
(g) Continuously callable with 30 days' notice.
(h) The rate for certain asset-backed and mortgage-backed securities may vary based on factors relating to the pool of assets underlying the security. The rate disclosed is the rate in effect at December 31, 2020.
See notes to financial statements.
40
Victory Portfolios
Victory INCORE Investment Quality Bond Fund | | Schedule of Portfolio Investments — continued
December 31, 2020 | |
(i) Rate disclosed is the daily yield on December 31, 2020.
(j) Zero coupon bond.
bps — Basis points
LIBOR — London InterBank Offered Rate
LIBOR01M — 1 Month US Dollar LIBOR, rate disclosed as of December 31, 2020, based on the last reset date of the security
LIBOR03M — 3 Month US Dollar LIBOR, rate disclosed as of December 31, 2020, based on the last reset date of the security
LIBOR12M — 12 Month US Dollar LIBOR, rate disclosed as of December 31, 2020, based on the last reset date of the security
LLC — Limited Liability Company
LP — Limited Partnership
MTN — Medium Term Note
PLC — Public Limited Company
Futures Contracts Purchased
| | | Number of
Contracts | | Expiration
Date | | Notional
Amount | | Value | | Unrealized
Appreciation
(Depreciation) | |
5-Year U.S. Treasury Note Futures | | | 14 | | | 3/31/21 | | $ | 1,762,736 | | | $ | 1,766,297 | | | $ | 3,561 | | |
Ultra Long Term U.S. Treasury Bond
Futures | | | 3 | | | 3/22/21 | | | 642,151 | | | | 640,687 | | | | (1,464 | ) | |
| | | $ | 2,097 | | |
Futures Contracts Sold
| | | Number of
Contracts | | Expiration
Date | | Notional
Amount | | Value | | Unrealized
Appreciation
(Depreciation) | |
10-Year U.S. Treasury Note Futures | | | 3 | | | 3/22/21 | | $ | 414,552 | | | $ | 414,234 | | | $ | 318 | | |
| | | Total unrealized appreciation | | | | | | | | $ | 3,879 | | |
| | | Total unrealized depreciation | | | | | | | | | (1,464 | ) | |
| | | Total net unrealized appreciation (depreciation) | | | | | | | | $ | 2,415 | | |
See notes to financial statements.
41
Victory Portfolios
Victory INCORE Low Duration Bond Fund | | Schedule of Portfolio Investments
December 31, 2020 | |
Security Description | | Shares or
Principal
Amount | | Value | |
Asset-Backed Securities (1.4%) | |
AmeriCredit Automobile Receivables Trust, Series 2016-3, Class C, 2.24%,
4/8/22, Callable 3/8/21 @ 100 (a) | | $ | 223,284 | | | $ | 223,313 | | |
AmeriCredit Automobile Receivables Trust, Series 2018-1, Class B, 3.26%,
1/18/24, Callable 10/18/22 @ 100 (a) | | | 3,200,000 | | | | 3,250,262 | | |
Santander Drive Auto Receivables Trust, Series 2020-1, Class A2A, 2.07%,
1/17/23, Callable 8/15/23 @ 100 (a) | | | 280,305 | | | | 281,546 | | |
Total Asset-Backed Securities (Cost $3,703,200) | | | 3,755,121 | | |
Collateralized Mortgage Obligations (3.2%) | |
Benefit Street Partners CLO III Ltd., Series 2013-IIIA, Class AIR, 1.47%
(LIBOR03M+125bps), 7/20/29, Callable 1/20/21 @ 100 (a) (b) (c) | | | 1,497,580 | | | | 1,497,608 | | |
Galaxy CLO Ltd., Series 2017-24A, Class A, 1.36% (LIBOR03M+112bps),
1/15/31, Callable 1/15/21 @ 100 (a) (b) (c) | | | 2,000,000 | | | | 1,991,004 | | |
Steele Creek CLO Ltd., Series 2017-1A, Class A, 1.49% (LIBOR03M+125bps),
1/15/30, Callable 1/15/21 @ 100 (a) (b) (c) | | | 2,825,000 | | | | 2,811,055 | | |
Voya CLO Ltd., Series 2017-4A, Class A1, 1.37% (LIBOR03M+113bps),
10/15/30, Callable 1/15/21 @ 100 (a) (b) (c) | | | 2,000,000 | | | | 1,996,003 | | |
Total Collateralized Mortgage Obligations (Cost $8,266,739) | | | 8,295,670 | | |
Preferred Stocks (2.0%) | |
Financials (0.7%): | |
AMG Capital Trust II, 10/15/37, 5.15% | | | 2,175 | | | | 105,564 | | |
Bank of America Corp., Series L, 7.25% (d) | | | 370 | | | | 561,874 | | |
KKR & Co., Inc., Series C, 9/15/23, 6.00% | | | 7,455 | | | | 449,387 | | |
Wells Fargo & Co., Series L, 7.50% (d) | | | 425 | | | | 645,107 | | |
| | | | 1,761,932 | | |
Health Care (0.2%): | |
Danaher Corp., Series B, 4/15/23, 5.00% (f) | | | 365 | | | | 474,902 | | |
Industrials (0.2%): | |
Stanley Black & Decker, Inc., 11/15/22, 5.25% | | | 5,290 | | | | 591,634 | | |
Utilities (0.9%): | |
American Electric Power Co., Inc., 8/15/23, 6.13% | | | 1,930 | | | | 97,716 | | |
CenterPoint Energy, Inc., 4.57%, 9/15/29 (g) | | | 3,880 | | | | 240,327 | | |
Dominion Energy, Inc., Series A, 6/1/22, 7.25% | | | 5,730 | | | | 574,891 | | |
DTE Energy Co., 11/1/22, 6.25% | | | 7,629 | | | | 367,260 | | |
NextEra Energy, Inc., 3/1/23, 5.28% | | | 9,950 | | | | 505,858 | | |
The Southern Co., Series 2019, 8/1/22, 6.75% | | | 8,901 | | | | 461,962 | | |
| | | 2,248,014 | | |
Total Preferred Stocks (Cost $4,936,343 ) | | | 5,076,482 | | |
Corporate Bonds (40.5%) | |
Communication Services (4.1%): | |
AT&T, Inc., 4.25%, 3/1/27, Callable 12/1/26 @ 100 (a) | | | 514,000 | | | | 600,563 | | |
CenturyLink, Inc., 6.75%, 12/1/23 | | | 424,000 | | | | 471,836 | | |
See notes to financial statements.
42
Victory Portfolios
Victory INCORE Low Duration Bond Fund | | Schedule of Portfolio Investments — continued
December 31, 2020 | |
Security Description | | Principal
Amount | | Value | |
Comcast Corp., 3.10%, 4/1/25, Callable 3/1/25 @ 100 (a) | | $ | 1,182,000 | | | $ | 1,299,940 | | |
Electronic Arts, Inc., 3.70%, 3/1/21, Callable 2/1/21 @ 100 (a) | | | 4,185,000 | | | | 4,195,295 | | |
Sirius XM Radio, Inc., 4.63%, 7/15/24, Callable 7/15/21 @ 102.31 (a) (c) | | | 836,000 | | | | 866,589 | | |
Verizon Communications, Inc.
5.15%, 9/15/23 (a) | | | 1,866,000 | | | | 2,103,186 | | |
3.38%, 2/15/25 (a) | | | 354,000 | | | | 393,085 | | |
1.32% (LIBOR03M+110bps), 5/15/25, Callable 3/15/25 @ 100 (a) (b) | | | 827,000 | | | | 849,470 | | |
| | | | 10,779,964 | | |
Consumer Discretionary (6.3%): | |
Best Buy Co., Inc., 4.45%, 10/1/28, Callable 7/1/28 @ 100 (a) | | | 409,000 | | | | 492,289 | | |
Booking Holdings, Inc.
0.90%, 9/15/21 | | | 105,000 | | | | 121,698 | | |
0.75%, 5/1/25 (c) (f) | | | 360,000 | | | | 523,010 | | |
D.R. Horton, Inc., 4.75%, 2/15/23, Callable 11/15/22 @ 100 (a) | | | 3,027,000 | | | | 3,258,535 | | |
Expedia Group, Inc., 3.60%, 12/15/23, Callable 11/15/23 @ 100 (c) | | | 1,020,000 | | | | 1,088,698 | | |
General Motors Co., 4.88%, 10/2/23 (a) | | | 1,297,000 | | | | 1,439,916 | | |
Hasbro, Inc., 3.15%, 5/15/21, Callable 3/15/21 @ 100 (a) | | | 3,380,000 | | | | 3,396,630 | | |
Hilton Worldwide Finance LLC/Hilton Worldwide Finance Corp., 4.88%,
4/1/27, Callable 4/1/22 @ 102.44 | | | 620,000 | | | | 655,452 | | |
LGI Homes, Inc., 6.88%, 7/15/26, Callable 7/15/21 @ 103.44 (a) (c) (f) | | | 244,000 | | | | 255,897 | | |
Marriott International, Inc., 3.60%, 4/15/24, Callable 3/15/24 @ 100 | | | 1,247,000 | | | | 1,333,242 | | |
NVR, Inc., 3.95%, 9/15/22, Callable 6/15/22 @ 100 (a) | | | 3,283,000 | | | | 3,453,257 | | |
| | | | 16,018,624 | | |
Consumer Staples (2.7%): | |
Altria Group, Inc., 4.40%, 2/14/26, Callable 12/14/25 @ 100 (a) | | | 620,000 | | | | 719,225 | | |
BAT Capital Corp., 4.70%, 4/2/27, Callable 2/2/27 @ 100 (a) | | | 1,400,000 | | | | 1,650,782 | | |
Church & Dwight Co., Inc., 2.45%, 8/1/22, Callable 7/1/22 @ 100 (a) | | | 792,000 | | | | 815,530 | | |
Keurig Dr Pepper, Inc., 4.06%, 5/25/23, Callable 4/25/23 @ 100 (a) | | | 1,385,000 | | | | 1,505,066 | | |
Tyson Foods, Inc.
2.25%, 8/23/21, Callable 7/23/21 @ 100 | | | 1,080,000 | | | | 1,091,372 | | |
3.95%, 8/15/24, Callable 5/15/24 @ 100 | | | 1,170,000 | | | | 1,300,537 | | |
| | | | 7,082,512 | | |
Energy (2.6%): | |
Continental Resources, Inc., 4.50%, 4/15/23, Callable 1/15/23 @ 100 (a) | | | 801,000 | | | | 825,479 | | |
EQM Midstream Partners LP, 4.75%, 7/15/23, Callable 6/15/23 @ 100 (a) | | | 975,000 | | | | 1,022,960 | | |
HollyFrontier Corp., 2.63%, 10/1/23 | | | 971,000 | | | | 992,479 | | |
Pioneer Natural Resources Co., 0.25%, 5/15/25 (c) | | | 410,000 | | | | 544,762 | | |
Plains All American Pipeline LP/PAA Finance Corp., 2.85%, 1/31/23, Callable
10/31/22 @ 100 (a) (f) | | | 1,010,000 | | | | 1,043,703 | | |
Valero Energy Corp.
2.70%, 4/15/23 (a) | | | 951,000 | | | | 993,082 | | |
1.20%, 3/15/24 | | | 1,020,000 | | | | 1,027,507 | | |
4.00%, 4/1/29, Callable 1/1/29 @ 100 (a) | | | 382,000 | | | | 429,880 | | |
| | | | 6,879,852 | | |
Financials (6.9%): | |
Ares Capital Corp., 4.63%, 3/1/24 (f) | | | 590,000 | | | | 620,976 | | |
Bank of America Corp., 4.20%, 8/26/24, MTN (a) | | | 458,000 | | | | 513,313 | | |
See notes to financial statements.
43
Victory Portfolios
Victory INCORE Low Duration Bond Fund | | Schedule of Portfolio Investments — continued
December 31, 2020 | |
Security Description | | Principal
Amount | | Value | |
Capital One Financial Corp.
3.45%, 4/30/21, Callable 3/30/21 @ 100 (a) | | $ | 3,500,000 | | | $ | 3,526,040 | | |
3.30%, 10/30/24, Callable 9/30/24 @ 100 (a) | | | 684,000 | | | | 751,784 | | |
Citigroup, Inc., 4.45%, 9/29/27 (a) | | | 404,000 | | | | 477,160 | | |
Dana Financing Luxembourg S.a.r.l., 5.75%, 4/15/25, Callable
2/11/21 @ 104.31 (a) (c) | | | 772,000 | | | | 801,019 | | |
Fifth Third Bancorp
1.63%, 5/5/23, Callable 4/5/23 @ 100 | | | 1,660,000 | | | | 1,708,123 | | |
3.65%, 1/25/24, Callable 12/25/23 @ 100 (a) | | | 799,000 | | | | 871,238 | | |
Ford Motor Credit Co. LLC, 3.10%, 5/4/23 (a) | | | 1,500,000 | | | | 1,513,305 | | |
JPMorgan Chase Financial Co. LLC, 0.25%, 5/1/23 (c) | | | 435,000 | | | | 466,538 | | |
Level 3 Financing, Inc., 5.38%, 1/15/24, Callable 2/11/21 @ 100 (a) | | | 637,000 | | | | 643,192 | | |
Morgan Stanley, 4.88%, 11/1/22 (a) | | | 1,004,000 | | | | 1,082,282 | | |
Sixth Street Specialty Lending, Inc., 4.50%, 8/1/22 | | | 385,000 | | | | 415,234 | | |
The Goldman Sachs Group, Inc., 1.97% (LIBOR03M+175bps), 10/28/27,
Callable 10/28/26 @ 100 (a) (b) (f) | | | 1,500,000 | | | | 1,573,274 | | |
Zions Bancorp NA
3.50%, 8/27/21 (a) | | | 1,785,000 | | | | 1,818,361 | | |
3.35%, 3/4/22, Callable 2/4/22 @ 100 (a) | | | 1,090,000 | | | | 1,120,967 | | |
| | | | 17,902,806 | | |
Health Care (4.5%): | |
AbbVie, Inc.
2.30%, 5/14/21, Callable 4/14/21 @ 100 (a) | | | 1,211,000 | | | | 1,217,794 | | |
3.85%, 6/15/24, Callable 3/15/24 @ 100 | | | 2,545,000 | | | | 2,802,935 | | |
Anthem, Inc., 2.75%, 10/15/42 (f) | | | 130,000 | | | | 582,388 | | |
Biogen, Inc., 3.63%, 9/15/22 | | | 1,025,000 | | | | 1,080,822 | | |
Bristol-Myers Squibb Co., 2.88%, 2/19/21 | | | 3,354,000 | | | | 3,364,800 | | |
Centene Corp., 4.25%, 12/15/27, Callable 12/15/22 @ 102.13 | | | 621,000 | | | | 660,961 | | |
Humana, Inc., 2.90%, 12/15/22, Callable 11/15/22 @ 100 (a) | | | 560,000 | | | | 585,508 | | |
Illumina, Inc. | |
0.50%, 6/15/21 | | | 245,000 | | | | 358,036 | | |
8/15/23 (k) | | | 195,000 | | | | 219,786 | | |
Teladoc Health, Inc., 1.25%, 6/1/27 (c) | | | 215,000 | | | | 257,507 | | |
Upjohn, Inc., 1.13%, 6/22/22 (c) | | | 525,000 | | | | 529,872 | | |
| | | | 11,660,409 | | |
Industrials (1.7%): | |
Delta Air Lines, Inc., 3.80%, 4/19/23, Callable 3/19/23 @ 100 (a) | | | 1,115,000 | | | | 1,140,834 | | |
EnPro Industries, Inc., 5.75%, 10/15/26, Callable 10/15/21 @ 104.31 (a) | | | 725,000 | | | | 774,372 | | |
Fortive Corp., 0.88%, 2/15/22 | | | 580,000 | | | | 596,637 | | |
Roper Technologies, Inc.
0.45%, 8/15/22 | | | 1,019,000 | | | | 1,020,651 | | |
2.95%, 9/15/29, Callable 6/15/29 @ 100 (a) | | | 391,000 | | | | 430,053 | | |
Southwest Airlines Co., 1.25%, 5/1/25 | | | 355,000 | | | | 515,638 | | |
| | | | 4,478,185 | | |
Information Technology (4.9%): | |
Akamai Technologies, Inc., 0.13%, 5/1/25 | | | 305,000 | | | | 377,482 | | |
Broadcom Corp., 3.00%, 1/15/22, Callable 12/15/21 @ 100 (a) (f) | | | 988,000 | | | | 1,011,218 | | |
See notes to financial statements.
44
Victory Portfolios
Victory INCORE Low Duration Bond Fund | | Schedule of Portfolio Investments — continued
December 31, 2020 | |
Security Description | | Principal
Amount | | Value | |
Broadcom Corp./Broadcom Cayman Finance Ltd., 3.63%, 1/15/24, Callable
11/15/23 @ 100 (a) | | $ | 1,425,000 | | | $ | 1,541,452 | | |
Euronet Worldwide, Inc., 0.75%, 3/15/49, Callable 3/20/25 @ 100 (f) | | | 445,000 | | | | 503,033 | | |
Lam Research Corp., 4.00%, 3/15/29, Callable 12/15/28 @ 100 (a) | | | 501,000 | | | | 601,040 | | |
Lam Research Group, 2.80%, 6/15/21, Callable 5/15/21 @ 100 (a) | | | 3,328,000 | | | | 3,358,053 | | |
Marvell Technology Group Ltd., 4.20%, 6/22/23, Callable 5/22/23 @ 100 | | | 941,000 | | | | 1,018,792 | | |
Maxim Integrated Products, Inc., 3.38%, 3/15/23, Callable 12/15/22 @ 100 | | | 901,000 | | | | 948,708 | | |
Micron Technology, Inc., 3.13%, 5/1/32, Callable 5/4/21 @ 100 (f) (g) | | | 62,000 | | | | 466,571 | | |
NCR Corp., 5.00%, 10/1/28, Callable 10/1/23 @ 102.5 (c) | | | 642,000 | | | | 676,264 | | |
Novellus Systems, Inc., 2.63%, 5/15/41 | | | 10,000 | | | | 147,239 | | |
PayPal Holdings, Inc., 2.20%, 9/26/22 (a) | | | 757,000 | | | | 782,049 | | |
Seagate HDD Cayman, 4.88%, 3/1/24, Callable 1/1/24 @ 100 | | | 1,000,000 | | | | 1,086,379 | | |
ServiceNow, Inc., 6/1/22 | | | 20,000 | | | | 81,530 | | |
Western Digital Corp., 1.50%, 2/1/24 | | | 505,000 | | | | 501,943 | | |
| | | | 13,101,753 | | |
Materials (0.9%): | |
Celanese US Holdings LLC, 4.63%, 11/15/22 (a) | | | 855,000 | | | | 917,877 | | |
Nucor Corp., 4.00%, 8/1/23, Callable 5/1/23 @ 100 | | | 1,190,000 | | | | 1,286,283 | | |
| | | | 2,204,160 | | |
Real Estate (2.9%): | |
American Tower Corp., 3.00%, 6/15/23 (a) | | | 1,000,000 | | | | 1,060,410 | | |
Duke Realty LP, 3.63%, 4/15/23, Callable 1/15/23 @ 100 (a) | | | 1,230,000 | | | | 1,300,245 | | |
Highwoods Realty LP, 3.20%, 6/15/21, Callable 4/15/21 @ 100 (a) | | | 1,019,000 | | | | 1,019,856 | | |
Host Hotels & Resorts LP, 4.00%, 6/15/25, Callable 3/15/25 @ 100 (f) | | | 754,000 | | | | 811,402 | | |
Iron Mountain, Inc., 5.25%, 7/15/30, Callable 7/15/25 @ 102.63 (c) | | | 638,000 | | | | 690,488 | | |
Piedmont Operating Partnership LP, 3.40%, 6/1/23, Callable 3/1/23 @ 100 (a) | | | 1,629,000 | | | | 1,695,007 | | |
Post Apartment Homes LP, 3.38%, 12/1/22, Callable 9/1/22 @ 100 | | | 500,000 | | | | 522,055 | | |
Weingarten Realty Investors, 3.38%, 10/15/22, Callable 7/15/22 @ 100 (a) | | | 365,000 | | | | 376,498 | | |
| | | | 7,475,961 | | |
Utilities (3.0%): | |
Eversource Energy, 2.50%, 3/15/21, Callable 2/15/21 @ 100 (a) | | | 2,900,000 | | | | 2,906,961 | | |
Exelon Corp.
3.50%, 6/1/22, Callable 5/1/22 @ 100 (a) (h) | | | 2,681,000 | | | | 2,788,589 | | |
3.95%, 6/15/25, Callable 3/15/25 @ 100 (a) | | | 591,000 | | | | 669,467 | | |
NextEra Energy Capital Holdings, Inc., 2.80%, 1/15/23, Callable
12/15/22 @ 100 (a) | | | 1,462,000 | | | | 1,530,670 | | |
| | | 7,895,687 | | |
Total Corporate Bonds (Cost $101,364,598) | | | 105,479,913 | | |
Residential Mortgage-Backed Securities (3.7%) | |
Bear Stearns Alt-A Trust, Series 2003-3, Class 2A, 2.97%, 10/25/33, Callable
1/25/21 @ 100 (a) (i) | | | 1,367,631 | | | | 1,367,631 | | |
Credit Suisse First Boston Mortgage Securities Corp., Series 2003-23,
Class 2A8, 4.50%, 12/31/49 (a) | | | 13,330 | | | | 13,946 | | |
Credit Suisse First Boston Mortgage Securities Corp., Series 2004-AR7,
Class 4A1, 2.90%, 11/25/34, Callable 1/25/21 @ 100 (a) (i) | | | 1,129,541 | | | | 1,129,541 | | |
See notes to financial statements.
45
Victory Portfolios
Victory INCORE Low Duration Bond Fund | | Schedule of Portfolio Investments — continued
December 31, 2020 | |
Security Description | | Principal
Amount | | Value | |
GSR Mortgage Loan Trust, Series 2004-15F, Class 5A1, 5.50%, 10/25/20,
Callable 5/25/31 @ 100 (a) | | $ | 16,074 | | | $ | 15,970 | | |
JPMorgan Mortgage Trust, Series 2016-4, Class A5, 3.50%, 10/25/46,
Callable 12/25/22 @ 100 (a) (c) (i) | | | 428,864 | | | | 430,587 | | |
JPMorgan Mortgage Trust, Series 2004-S1, Class 1A7, 5.00%, 9/25/34,
Callable 1/25/21 @ 100 (a) | | | 44,062 | | | | 42,467 | | |
JPMorgan Mortgage Trust, Series 2016-3, Class 1A3, 3.48%, 10/25/46,
Callable 12/25/22 @ 100 (a) (c) (i) | | | 293,445 | | | | 294,263 | | |
JPMorgan Mortgage Trust, Series 2014-5, Class A11, 2.94%, 10/25/29,
Callable 3/25/23 @ 100 (a) (c) (i) | | | 2,527,533 | | | | 2,558,382 | | |
JPMorgan Mortgage Trust, Series 2017-1, Class A5, 3.50%, 1/25/47,
Callable 2/25/23 @ 100 (a) (c) (i) | | | 184,190 | | | | 184,347 | | |
JPMorgan Mortgage Trust, Series 2017-3, Class 2A2, 2.50%, 8/25/47,
Callable 4/25/23 @ 100 (a) (c) (i) | | | 1,310,593 | | | | 1,324,464 | | |
Madison Park Funding Ltd., Series 2007-4A, Class AR, 1.41%
(LIBOR03M+120bps), 7/29/30, Callable 1/29/21 @ 100 (a) (b) (c) | | | 2,250,000 | | | | 2,246,660 | | |
Total Residential Mortgage-Backed Securities (Cost $9,609,756) | | | 9,608,258 | | |
Yankee Dollars (7.1%) | |
Communication Services (0.3%): | |
Vodafone Group PLC, 2.95%, 2/19/23 (a) | | | 631,000 | | | | 664,664 | | |
Consumer Staples (3.7%): | |
Barry Callebaut Services NV, 5.50%, 6/15/23 (c) | | | 2,346,000 | | | | 2,573,280 | | |
Heineken NV, 3.40%, 4/1/22 (c) | | | 1,570,000 | | | | 1,624,903 | | |
Kerry Group Financial Services Unlimited Co., 3.20%, 4/9/23,
Callable 1/9/23 @ 100 (a) (c) | | | 2,391,000 | | | | 2,507,753 | | |
Pernod Ricard SA, 4.25%, 7/15/22 (a) (c) | | | 833,000 | | | | 879,615 | | |
Suntory Holdings Ltd., 2.55%, 6/28/22, Callable 5/28/22 @ 100 (a) (c) | | | 2,122,000 | | | | 2,181,819 | | |
| | | | 9,767,370 | | |
Energy (0.7%): | |
Canadian Natural Resources Ltd., 2.95%, 1/15/23, Callable 12/15/22 @ 100 | | | 1,305,000 | | | | 1,365,291 | | |
Ecopetrol SA, 5.88%, 9/18/23 (a) | | | 495,000 | | | | 553,158 | | |
| | | | 1,918,449 | | |
Financials (1.8%): | |
Barclays Bank PLC
2/4/25 (a) | | | 270,000 | | | | 339,570 | | |
2/18/25 | | | 230,000 | | | | 254,622 | | |
Enel Finance International NV, 2.88%, 5/25/22 (a) (c) | | | 1,675,000 | | | | 1,728,751 | | |
Newcrest Finance Pty Ltd., 4.20%, 10/1/22 (a) (c) | | | 2,214,000 | | | | 2,334,951 | | |
| | | | 4,657,894 | | |
Materials (0.6%): | |
Anglo American Capital PLC, 4.13%, 4/15/21 (a) (c) | | | 1,524,000 | | | | 1,536,755 | | |
Total Yankee Dollars (Cost $18,175,781) | | | 18,545,132 | | |
See notes to financial statements.
46
Victory Portfolios
Victory INCORE Low Duration Bond Fund | | Schedule of Portfolio Investments — continued
December 31, 2020 | |
Security Description | | Shares or
Principal
Amount | | Value | |
U.S. Government Mortgage-Backed Agencies (7.0%) | |
Federal Home Loan Mortgage Corp.
5.00%, 6/15/23 – 8/1/40 (a) | | $ | 751,472 | | | $ | 852,759 | | |
5.50%, 10/25/23 (a) | | | 3,404 | | | | 3,566 | | |
Series 4430, Class NG, 2.50%, 2/15/38 (a) | | | 351,910 | | | | 352,481 | | |
7.00%, 9/1/38 (a) | | | 3,532 | | | | 4,325 | | |
Series 4320, Class AP, 3.50%, 7/15/39 (a) | | | 1,086,115 | | | | 1,158,523 | | |
Series 3713, Class PA, 2.00%, 2/15/40 – 3/15/40 (a) | | | 3,749,015 | | | | 3,850,491 | | |
Series 4444, Class CH, 3.00%, 1/15/41 (a) | | | 1,444,564 | | | | 1,462,626 | | |
Series 4049, Class AB, 2.75%, 12/15/41 (a) | | | 488,594 | | | | 500,068 | | |
| | | | 8,184,839 | | |
Federal National Mortgage Association
6.00%, 2/1/37 (a) | | | 1,136,733 | | | | 1,323,232 | | |
Series 2013-33, Class UD, 2.50%, 4/25/39 (a) | | | 982,916 | | | | 1,000,585 | | |
Series 2011-21, Class PA, 4.50%, 5/25/40 (a) | | | 2,505,748 | | | | 2,670,471 | | |
Series 2011-101, Class LA, 3.00%, 10/25/40 (a) | | | 695,332 | | | | 712,186 | | |
5.00%, 2/1/41 – 10/1/41 (a) | | | 2,917,193 | | | | 3,312,582 | | |
Series 2018-29, Class PA, 3.50%, 3/25/44 (a) | | | 864,615 | | | | 877,986 | | |
| | | | 9,897,042 | | |
Government National Mortgage Association
Series 2018-22, Class JA, 3.00%, 1/20/44 (a) | | | 95,212 | | | | 95,318 | | |
Total U.S. Government Mortgage-Backed Agencies (Cost $17,809,238) | | | 18,177,199 | | |
U.S. Treasury Obligations (32.7%) | |
U.S. Treasury Notes
0.13%, 4/15/22 (a) | | | 19,924,284 | | | | 20,341,490 | | |
0.13%, 6/30/22 (a) | | | 22,301,000 | | | | 22,304,485 | | |
0.13%, 7/15/23 | | | 25,755,000 | | | | 25,740,914 | | |
0.13%, 10/15/23 | | | 16,800,000 | | | | 16,786,875 | | |
Total U.S. Treasury Obligations (Cost $84,758,376) | | | 85,173,764 | | |
Collateral for Securities Loaned^ (0.8%) | |
BlackRock Liquidity Funds TempFund Portfolio, Institutional Class, 0.08% (j) | | | 36,151 | | | | 36,151 | | |
Fidelity Investments Money Market Government Portfolio, Class I, 0.01% (j) | | | 1,241,991 | | | | 1,241,991 | | |
Goldman Sachs Financial Square Prime Obligations Fund, Institutional
Class, 0.04% (j) | | | 18,041 | | | | 18,041 | | |
JPMorgan Prime Money Market Fund, Capital Class, 0.12% (j) | | | 143,854 | | | | 143,854 | | |
Morgan Stanley Institutional Liquidity Prime Portfolio, Institutional
Class, 0.09% (j) | | | 646,794 | | | | 646,794 | | |
Total Collateral for Securities Loaned (Cost $2,086,831) | | | 2,086,831 | | |
Total Investments (Cost $250,710,862) — 98.4% | | | 256,198,370 | | |
Other assets in excess of liabilities — 1.6% | | | 4,121,624 | | |
NET ASSETS — 100.00% | | $ | 260,319,994 | | |
^ Purchased with cash collateral from securities on loan.
(a) All or a portion of this security has been segregated as collateral for derivative instruments.
See notes to financial statements.
47
Victory Portfolios
Victory INCORE Low Duration Bond Fund | | Schedule of Portfolio Investments — continued
December 31, 2020 | |
(b) Variable or Floating-Rate Security. Rate disclosed is as of December 31, 2020.
(c) Rule 144A security or other security that is restricted as to resale to institutional investors. The Fund's Adviser has deemed this security to be liquid based upon procedures approved by the Board of Trustees. As of December 31, 2020, the fair value of these securities was $37,402,845 and amounted to 14.4% of net assets.
(d) Security is perpetual and has no final maturity date but may be subject to calls at various dates in the future.
(f) All or a portion of this security is on loan.
(g) Continuously callable with 30 days' notice.
(h) Variable Rate Demand Notes that provide the rights to sell the security at face value on either that day or within the rate-reset period. The interest rate is reset on the put date at a stipulated daily, weekly, monthly, quarterly, or other specified time interval to reflect current market conditions. These securities do not indicate a reference rate and spread in their description.
(i) The rate for certain asset-backed and mortgage-backed securities may vary based on factors relating to the pool of assets underlying the security. The rate disclosed is the rate in effect at December 31, 2020.
(j) Rate disclosed is the daily yield on December 31, 2020.
(k) Zero coupon bond.
bps — Basis points
LIBOR — London InterBank Offered Rate
LIBOR03M — 3 Month US Dollar LIBOR, rate disclosed as of December 31, 2020, based on the last reset date of the security
LLC — Limited Liability Company
LP — Limited Partnership
MTN — Medium Term Note
PLC — Public Limited Company
Futures Contracts Sold
| | | Number of
Contracts | | Expiration
Date | | Notional
Amount | | Value | | Unrealized
Appreciation
(Depreciation) | |
10-Year U.S. Treasury Note Futures | | | 56 | | | 3/22/21 | | $ | 7,726,056 | | | $ | 7,732,375 | | | $ | (6,319 | ) | |
5-Year U.S. Treasury Note Futures | | | 46 | | | 3/31/21 | | | 5,790,091 | | | | 5,803,547 | | | | (13,456 | ) | |
| | | $ | (19,775 | ) | |
| | | Total unrealized appreciation | | | | | | | | $ | — | | |
| | | Total unrealized depreciation | | | | | | | | $ | (19,775 | ) | |
| | | Total net unrealized appreciation (depreciation) | | | | | | | | $ | (19,775 | ) | |
See notes to financial statements.
48
Victory Portfolios
Victory High Yield Fund | | Schedule of Portfolio Investments
December 31, 2020 | |
Security Description | | Shares or
Principal
Amount | | Value | |
Common Stocks (0.7%) | |
Communication Services (0.7%): | |
AMC Networks, Inc., Class A (a) (b) | | | 12,000 | | | $ | 429,240 | | |
iHeartMedia, Inc., Class A (a) (b) | | | 30,500 | | | | 395,890 | | |
Nexstar Media Group, Inc., Class A | | | 7,250 | | | | 791,628 | | |
| | | | 1,616,758 | | |
| Consumer Discretionary (0.0%): (l) | |
New TMW TOPCO Inc | | | 31,563 | | | | 118,361 | | |
Total Common Stocks (Cost $1,747,625) | | | 1,735,119 | | |
Senior Secured Loans (13.0%) | |
Academy, Ltd., Initial Term Loan, First Lien, 5.75% (LIBOR01M+500bps),
11/6/27 (c) | | $ | 2,750,000 | | | | 2,736,938 | | |
Air Methods Corp., Initial Term Loans, First Lien, 4.50% (LIBOR03M+350bps),
4/21/24 (c) | | | 1,979,487 | | | | 1,901,297 | | |
Alphabet Holding Co., Inc., Initial Term Loan Second Lien, Second Lien, 7.90%
(LIBOR01M+775bps), 8/15/25 (c) | | | 1,500,000 | | | | 1,490,250 | | |
Bass Pro Group, LLC, Initial Term Loans, First Lien, 5.75% (LIBOR03M+500bps),
12/16/23 (c) | | | 2,949,656 | | | | 2,954,937 | | |
Caesars Resort Collection, LLC, Term B-1 Loans, First Lien, 4.65%
(LIBOR01M+450bps), 6/19/25 (c) | | | 1,995,000 | | | | 1,995,618 | | |
Dayco Products, LLC, Term Loans, First Lien, 4.48% (LIBOR03M+425bps),
5/19/24 (c) | | | 965,000 | | | | 735,330 | | |
Dynasty Acquisition Co., Inc., Term B-1 Loans, First Lien, 3.75%
(LIBOR03M+350bps), 4/6/26 (c) | | | 1,543,582 | | | | 1,466,403 | | |
Froneri International Ltd., Second Lien Term Loan, Second Lien, 5.90%
(LIBOR01M+575bps), 1/30/28 (c) | | | 500,000 | | | | 502,500 | | |
Golden Nugget, Inc., Senior Secured Term Loan, First Lien, 3.25%
(LIBOR02M+250bps), 10/4/23 (c) | | | 1,988,778 | | | | 1,915,750 | | |
Holley Purchaser, Inc., Initial Term Loan, First Lien, 5.21%
(LIBOR03M+500bps), 10/26/25 (c) | | | 2,680,291 | | | | 2,601,571 | | |
Leslie's Poolmart, Inc., Tranche B Term Loans, First Lien, 3.65%
(LIBOR01M+350bps), 8/16/23 (c) | | | 979,798 | | | | 977,760 | | |
LifeScan Global Corp., Initial Term Loan, First Lien, 6.23%
(LIBOR03M+600bps), 6/19/24 (c) | | | 1,751,192 | | | | 1,663,632 | | |
Navistar, Inc., Tranche B Term Loan, First Lien, 3.66%
(LIBOR01M+350bps), 11/2/24 (c) | | | 1,957,310 | | | | 1,952,906 | | |
Reynolds Group Holdings, Inc., 2017, Incremental US Term Loans, First Lien,
2.90% (LIBOR01M+275bps), 2/5/23 (c) | | | 671,629 | | | | 668,270 | | |
SIWF Holdings, Inc., Initial Term Loan, Second Lien, 8.65%
(LIBOR01M+850bps), 5/26/26 (c) | | | 1,000,000 | | | | 951,880 | | |
Spectacle Gary Holdings LLC, Closing Date Term Loan, First Lien, 11.00%
(LIBOR03M+900bps), 12/23/25 (c) | | | 1,864,865 | | | | 1,864,865 | | |
Spectacle Gary Holdings LLC, Delayed Draw Term Loan, First Lien, 11.25%
(PRIME+800bps), 12/23/25 (c) | | | 135,135 | | | | 135,135 | | |
Standard Aero Ltd., Term B-2 Loans, First Lien, 3.72% – 3.75%
(LIBOR03M+350bps), 4/6/26 (c) | | | 829,883 | | | | 788,389 | | |
See notes to financial statements.
49
Victory Portfolios
Victory High Yield Fund | | Schedule of Portfolio Investments — continued
December 31, 2020 | |
Security Description | | Principal
Amount | | Value | |
Stars Group Holdings BV, Term Loan, First Lien, 3.75%
(LIBOR03M+350bps), 6/27/25 (c) | | | 881,485 | | | | 884,183 | | |
Team Health Holdings, Inc., Initial Term Loans, First Lien, 3.75%
(LIBOR01M+275bps), 2/6/24 (c) | | | 1,476,982 | | | | 1,311,619 | | |
TENNECo., Inc., Tranche B Term Loan, First Lien, 3.15% (LIBOR01M+300bps),
6/18/25 (c) | | | 1,964,925 | | | | 1,912,520 | | |
The Men's Wearhouse LLC, Term Loan, First Lien, 9.00% (LIBOR01M+800bps),
12/1/25 (c) | | | 1,660,589 | | | | 1,394,895 | | |
Total Senior Secured Loans (Cost $32,715,188) | | | 32,806,648 | | |
Corporate Bonds (76.4%) | |
Communication Services (12.2%): | |
AMC Networks, Inc., 4.75%, 8/1/25, Callable 8/1/21 @ 102.38 | | | 3,000,000 | | | | 3,097,350 | | |
CCO Holdings LLC/CCO Holdings Capital Corp., 5.00%, 2/1/28,
Callable 8/1/22 @ 102.5 (d) | | | 1,000,000 | | | | 1,055,930 | | |
Cumulus Media New Holdings, Inc., 6.75%, 7/1/26, Callable 7/1/22 @ 103.38 (d) | | | 2,710,000 | | | | 2,764,688 | | |
Entercom Media Corp.
7.25%, 11/1/24, Callable 2/11/21 @ 103.63 (b) (d) | | | 1,750,000 | | | | 1,752,853 | | |
6.50%, 5/1/27, Callable 5/1/22 @ 104.88 (b) (d) | | | 2,500,000 | | | | 2,540,425 | | |
Gray Television, Inc., 4.75%, 10/15/30, Callable 10/15/25 @ 102.38 (d) | | | 2,750,000 | | | | 2,802,635 | | |
iHeartCommunications, Inc., 8.38%, 5/1/27, Callable 5/1/22 @ 104.19 | | | 1,750,000 | | | | 1,866,410 | | |
Meredith Corp., 6.88%, 2/1/26, Callable 2/11/21 @ 103.44 (b) | | | 2,500,000 | | | | 2,449,025 | | |
Nexstar Broadcasting, Inc., 5.63%, 7/15/27, Callable 7/15/22 @ 104.22 (d) | | | 3,000,000 | | | | 3,225,779 | | |
Sinclair Television Group, Inc., 5.50%, 3/1/30, Callable 12/1/24 @ 102.75 (d) | | | 3,000,000 | | | | 3,117,929 | | |
Sirius XM Radio, Inc.
4.63%, 7/15/24, Callable 7/15/21 @ 102.31 (d) (f) | | | 1,000,000 | | | | 1,036,590 | | |
5.50%, 7/1/29, Callable 7/1/24 @ 102.75 (d) (f) | | | 2,000,000 | | | | 2,204,940 | | |
Townsquare Media, Inc., 6.88%, 2/1/26, Callable 2/1/23 @ 103.44 (d) (e) | | | 450,000 | | | | 470,790 | | |
Univision Communications, Inc., 5.13%, 2/15/25, Callable
1/22/21 @ 102.56 (b) (d) | | | 2,500,000 | | | | 2,528,575 | | |
| | | | 30,913,919 | | |
Consumer Discretionary (18.4%): | |
Affinity Gaming, 6.88%, 12/15/27, Callable 12/1/23 @ 103.44 (d) | | | 2,750,000 | | | | 2,875,813 | | |
Beazer Homes USA, Inc., 5.88%, 10/15/27, Callable 10/15/22 @ 102.94 | | | 2,000,000 | | | | 2,101,820 | | |
Boyd Gaming Corp.
8.63%, 6/1/25, Callable 6/1/22 @ 104.31 (d) | | | 1,700,000 | | | | 1,888,989 | | |
6.38%, 4/1/26, Callable 4/1/21 @ 103.19 | | | 2,250,000 | | | | 2,334,060 | | |
Caesars Resort Collection LLC/CRC Finco, Inc., 5.25%, 10/15/25, Callable
1/22/21 @ 102.63 (d) | | | 2,500,000 | | | | 2,523,600 | | |
Clarios Global LP/Clarios US Finance Co., 8.50%, 5/15/27, Callable
5/15/22 @ 104.25 (d) | | | 3,000,000 | | | | 3,254,820 | | |
Diamond Sports Group LLC/Diamond Sports Finance Co., 6.63%, 8/15/27,
Callable 8/15/22 @ 103.31 (b) (d) (f) | | | 6,000,000 | | | | 3,629,519 | | |
Ford Motor Co., 9.00%, 4/22/25, Callable 3/22/25 @ 100 (f) | | | 3,000,000 | | | | 3,678,720 | | |
International Game Technology PLC, 5.25%, 1/15/29, Callable
1/15/24 @ 102.63 (d) | | | 2,000,000 | | | | 2,152,700 | | |
LBM Acquisition LLC, 6.25%, 1/15/29, Callable 1/15/24 @ 103.13 (d) | | | 1,800,000 | | | | 1,867,572 | | |
Mattel, Inc., 5.45%, 11/1/41, Callable 5/1/41 @ 100 | | | 2,000,000 | | | | 2,195,960 | | |
MGM Resorts International, 5.50%, 4/15/27, Callable 1/15/27 @ 100 | | | 2,475,000 | | | | 2,757,596 | | |
See notes to financial statements.
50
Victory Portfolios
Victory High Yield Fund | | Schedule of Portfolio Investments — continued
December 31, 2020 | |
Security Description | | Principal
Amount | | Value | |
Michaels Stores, Inc., 8.00%, 7/15/27, Callable 7/15/22 @ 104 (b) (d) | | $ | 2,750,000 | | | $ | 2,975,445 | | |
PetSmart, Inc., 8.88%, 6/1/25, Callable 1/22/21 @ 104.44 (d) | | | 2,750,000 | | | | 2,825,598 | | |
Scientific Games International, Inc., 8.25%, 3/15/26, Callable
3/15/22 @ 104.13 (d) | | | 3,000,000 | | | | 3,230,849 | | |
Specialty Building Products Holdings LLC/SBP Finance Corp., 6.38%, 9/30/26,
Callable 9/30/22 @ 103.19 (d) | | | 1,350,000 | | | | 1,426,680 | | |
Tenneco, Inc., 7.88%, 1/15/29, Callable 1/15/24 @ 103.94 (d) | | | 1,800,000 | | | | 2,021,040 | | |
The Enterprise Development Authority, 12.00%, 7/15/24, Callable
7/15/21 @ 109 (d) (f) | | | 1,200,000 | | | | 1,352,772 | | |
Yum! Brands, Inc., 5.35%, 11/1/43, Callable 5/1/43 @ 100 | | | 1,000,000 | | | | 1,120,730 | | |
| | | | 46,214,283 | | |
Consumer Staples (3.4%): | |
Albertsons Cos., Inc./Safeway, Inc./New Albertsons LP/Albertsons LLC, 5.88%,
2/15/28, Callable 8/15/22 @ 104.41 (d) | | | 2,750,000 | | | | 2,992,935 | | |
Dole Food Co., Inc., 7.25%, 6/15/25, Callable 2/11/21 @ 103.63 (d) | | | 2,250,000 | | | | 2,297,317 | | |
Simmons Foods, Inc.
7.75%, 1/15/24, Callable 2/11/21 @ 103.88 (d) | | | 1,715,000 | | | | 1,785,744 | | |
5.75%, 11/1/24, Callable 2/11/21 @ 102.88 (d) | | | 1,469,000 | | | | 1,501,259 | | |
| | | | 8,577,255 | | |
Energy (5.8%): | |
Antero Midstream Partners LP/Antero Midstream Finance Corp., 5.38%,
9/15/24, Callable 1/27/21 @ 102.69 (b) | | | 2,750,000 | | | | 2,688,208 | | |
Antero Resources Corp.
5.63%, 6/1/23, Callable 2/11/21 @ 101.41 (b) | | | 1,184,000 | | | | 1,157,774 | | |
8.38%, 7/15/26, Callable 1/15/24 @ 104.19 (d) (e) | | | 2,750,000 | | | | 2,798,153 | | |
Callon Petroleum Co., 9.00%, 4/1/25, Callable 10/1/22 @ 105 (d) | | | 1,500,000 | | | | 1,352,190 | | |
Centennial Resource Production LLC, 6.88%, 4/1/27, Callable 4/1/22 @ 103.44 (d) | | | 980,000 | | | | 702,552 | | |
Laredo Petroleum, Inc., 9.50%, 1/15/25, Callable 1/15/22 @ 104.75 | | | 650,000 | | | | 566,111 | | |
Occidental Petroleum Corp., 5.50%, 12/1/25, Callable 9/1/25 @ 100 (b) | | | 950,000 | | | | 990,052 | | |
QEP Resources, Inc.
5.25%, 5/1/23, Callable 2/1/23 @ 100 | | | 1,470,000 | | | | 1,550,409 | | |
5.63%, 3/1/26, Callable 12/1/25 @ 100 | | | 167,000 | | | | 183,192 | | |
Range Resources Corp., 5.00%, 3/15/23, Callable 12/15/22 @ 100 | | | 1,500,000 | | | | 1,470,030 | | |
SM Energy Co., 6.75%, 9/15/26, Callable 9/15/21 @ 103.38 | | | 1,500,000 | | | | 1,222,185 | | |
| | | | 14,680,856 | | |
Financials (8.2%): | |
Acrisure LLC/Acrisure Finance, Inc., 8.13%, 2/15/24, Callable
2/15/21 @ 104.06 (d) | | | 2,375,000 | | | | 2,516,930 | | |
BCPE Cycle Merger Sub II, Inc., 10.63%, 7/15/27, Callable 7/15/22 @ 105.31 (d) | | | 3,000,000 | | | | 3,305,490 | | |
Capitol Investment Merger Sub 2 LLC, 10.00%, 8/1/24, Callable 8/1/21 @ 105 (d) | | | 2,091,000 | | | | 2,281,135 | | |
Compass Group Diversified Holdings LLC, 8.00%, 5/1/26, Callable
5/1/21 @ 104 (d) (f) | | | 3,000,000 | | | | 3,150,870 | | |
Gray Television, Inc., 7.00%, 5/15/27, Callable 5/15/22 @ 105.25 (d) | | | 3,000,000 | | | | 3,284,190 | | |
LABL Escrow Issuer LLC, 10.50%, 7/15/27, Callable 7/15/22 @ 105.25 (d) (f) | | | 2,250,000 | | | | 2,535,480 | | |
Resideo Funding, Inc., 6.13%, 11/1/26, Callable 11/1/21 @ 104.59 (d) | | | 2,000,000 | | | | 2,109,320 | | |
Wolverine Escrow LLC, 13.13%, 11/15/27, Callable 11/15/22 @ 109.84 (b) (d) | | | 2,000,000 | | | | 1,609,300 | | |
| | | | 20,792,715 | | |
See notes to financial statements.
51
Victory Portfolios
Victory High Yield Fund | | Schedule of Portfolio Investments — continued
December 31, 2020 | |
Security Description | | Principal
Amount | | Value | |
Health Care (6.8%): | |
Endo Dac/Endo Finance LLC/Endo Finco, Inc., 6.00%, 6/30/28, Callable
6/30/23 @ 104.5 (d) | | $ | 1,900,000 | | | $ | 1,580,857 | | |
Ortho-Clinical Diagnostics, Inc./Ortho-Clinical Diagnostics SA, 7.25%, 2/1/28,
Callable 2/1/23 @ 103.63 (d) | | | 3,000,000 | | | | 3,164,700 | | |
Radiology Partners, Inc., 9.25%, 2/1/28, Callable 2/1/23 @ 104.63 (d) (f) | | | 2,500,000 | | | | 2,808,700 | | |
Regional Care Hospital Partners Holdings, Inc./LifePoint Health, Inc., 9.75%,
12/1/26, Callable 12/1/21 @ 104.88 (d) | | | 3,000,000 | | | | 3,282,240 | | |
Surgery Center Holdings, Inc., 10.00%, 4/15/27, Callable 4/15/22 @ 105 (b) (d) | | | 2,000,000 | | | | 2,200,940 | | |
Team Health Holdings, Inc., 6.38%, 2/1/25, Callable 1/27/21 @ 103.19 (d) | | | 1,000,000 | | | | 859,860 | | |
Tenet Healthcare Corp., 6.13%, 10/1/28, Callable 10/1/23 @ 103.06 (d) | | | 3,000,000 | | | | 3,123,660 | | |
| | | | 17,020,957 | | |
Industrials (15.4%): | |
Ahern Rentals, Inc., 7.38%, 5/15/23, Callable 2/11/21 @ 101.84 (d) | | | 2,000,000 | | | | 1,460,760 | | |
Allison Transmission, Inc., 3.75%, 1/30/31, Callable 1/30/26 @ 101.88 (d) | | | 900,000 | | | | 920,700 | | |
American Airlines, Inc., 11.75%, 7/15/25 (d) | | | 3,000,000 | | | | 3,460,860 | | |
Apex Tool Group LLC/BC Mountain Finance, Inc., 9.00%, 2/15/23,
Callable 2/11/21 @ 101 (b) (d) | | | 2,000,000 | | | | 1,953,000 | | |
Aramark Services, Inc., 6.38%, 5/1/25, Callable 5/1/22 @ 103.19 (d) | | | 3,000,000 | | | | 3,206,310 | | |
Cargo Aircraft Management, Inc., 4.75%, 2/1/28, Callable 2/1/23 @ 102.38 (d) | | | 1,800,000 | | | | 1,852,056 | | |
Delta Air Lines, Inc., 7.00%, 5/1/25 (d) | | | 3,000,000 | | | | 3,474,660 | | |
Howmet Aerospace, Inc., 6.88%, 5/1/25, Callable 4/1/25 @ 100 (f) | | | 2,000,000 | | | | 2,358,900 | | |
Mileage Plus Holdings LLC/Mileage Plus Intellectual Property Assets Ltd.,
6.50%, 6/20/27, Callable 6/30/23 @ 103.25 (d) | | | 3,000,000 | | | | 3,239,040 | | |
Pike Corp., 5.50%, 9/1/28, Callable 9/1/23 @ 102.75 (d) | | | 2,000,000 | | | | 2,106,580 | | |
Pisces Midco, Inc., 8.00%, 4/15/26, Callable 4/15/21 @ 104 (d) | | | 3,000,000 | | | | 3,151,590 | | |
SRS Distribution, Inc., 8.25%, 7/1/26, Callable 7/1/21 @ 104.13 (b) (d) (f) | | | 1,750,000 | | | | 1,859,375 | | |
TransDigm, Inc., 6.50%, 7/15/24, Callable 2/11/21 @ 101.63 | | | 4,000,000 | | | | 4,072,240 | | |
Triumph Group, Inc., 6.25%, 9/15/24, Callable 2/11/21 @ 103.13 (d) | | | 1,350,000 | | | | 1,335,326 | | |
WESCO Distribution, Inc., 7.25%, 6/15/28, Callable 6/15/23 @ 103.63 (d) | | | 2,250,000 | | | | 2,556,203 | | |
XPO Logistics, Inc., 6.25%, 5/1/25, Callable 5/1/22 @ 103.13 (d) | | | 2,000,000 | | | | 2,151,080 | | |
| | | | 39,158,680 | | |
Information Technology (1.7%): | |
Colt Merger Sub, Inc., 8.13%, 7/1/27, Callable 7/1/23 @ 104.06 (d) | | | 2,250,000 | | | | 2,490,345 | | |
Veritas U.S., Inc./Veritas Bermuda Ltd., 7.50%, 9/1/25, Callable
9/1/21 @ 103.75 (d) | | | 1,800,000 | | | | 1,846,206 | | |
| | | | 4,336,551 | | |
Materials (3.8%): | |
Ardagh Packaging Finance PLC/Ardagh Holdings USA, Inc., 5.25%, 8/15/27,
Callable 8/15/22 @ 102.63 (d) | | | 3,000,000 | | | | 3,147,240 | | |
Forterra Finance LLC/FRTA Finance Corp., 6.50%, 7/15/25, Callable
7/15/22 @ 103.25 (d) | | | 1,200,000 | | | | 1,296,624 | | |
Greif, Inc., 6.50%, 3/1/27, Callable 3/1/22 @ 103.25 (d) | | | 2,000,000 | | | | 2,115,460 | | |
Plastipak Holdings, Inc., 6.25%, 10/15/25, Callable 2/11/21 @ 103.13 (b) (d) | | | 3,000,000 | | | | 3,100,830 | | |
| | | | 9,660,154 | | |
Real Estate (0.7%): | |
Adams Homes, Inc., 7.50%, 2/15/25, Callable 2/15/22 @ 103.75 (d) | | | 1,800,000 | | | | 1,879,650 | | |
Total Corporate Bonds (Cost $182,303,927) | | | 193,235,020 | | |
See notes to financial statements.
52
Victory Portfolios
Victory High Yield Fund | | Schedule of Portfolio Investments — continued
December 31, 2020 | |
Security Description | | Shares or
Principal
Amount | | Value | |
Yankee Dollars (6.1%) | |
Consumer Discretionary (0.8%): | |
1011778 BC ULC/New Red Finance, Inc., 4.38%, 1/15/28, Callable
11/15/22 @ 102.19 (d) | | $ | 2,000,000 | | | $ | 2,060,120 | | |
Energy (0.2%): | |
Husky Holding Ltd. PIK, 13.00%, 2/15/25, Callable
2/15/21 @ 109.75 (b) (d) (f) (g) | | | 500,000 | | | | 544,090 | | |
Financials (0.6%): | |
Intelsat Jackson Holdings SA, 8.50%, 10/15/24, Callable
2/11/21 @ 106.38 (d) (h) (i) (j) | | | 2,000,000 | | | | 1,421,800 | | |
Health Care (1.2%): | |
Bausch Health Cos., Inc., 6.13%, 4/15/25, Callable 2/11/21 @ 103.06 (d) | | | 3,000,000 | | | | 3,090,990 | | |
Industrials (1.9%): | |
Algeco Global Finance 2 PLC, 10.00%, 8/15/23, Callable 1/22/21 @ 105 (d) (f) | | | 2,000,000 | | | | 2,035,000 | | |
Bombardier, Inc., 7.88%, 4/15/27, Callable 4/15/22 @ 103.94 (d) | | | 3,000,000 | | | | 2,758,320 | | |
| | | | 4,793,320 | | |
Materials (1.4%): | |
Intertape Polymer Group, Inc., 7.00%, 10/15/26, Callable 10/15/21 @ 103.5 (d) | | | 1,330,000 | | | | 1,409,468 | | |
Titan Acquisition Ltd./Titan Co-Borrower LLC, 7.75%, 4/15/26, Callable
4/15/21 @ 103.88 (d) (f) | | | 2,000,000 | | | | 2,078,920 | | |
| | | | 3,488,388 | | |
Total Yankee Dollars (Cost $15,220,936) | | | 15,398,708 | | |
Collateral for Securities Loaned^ (9.2%) | |
BlackRock Liquidity Funds TempFund Portfolio, Institutional Class, 0.08% (k) | | | 400,925 | | | | 400,925 | | |
Fidelity Investments Money Market Government Portfolio, Class I, 0.01% (k) | | | 13,774,110 | | | | 13,774,110 | | |
Goldman Sachs Financial Square Prime Obligations Fund, Institutional
Class, 0.04% (k) | | | 200,081 | | | | 200,081 | | |
JPMorgan Prime Money Market Fund, Capital Class, 0.12% (k) | | | 1,595,386 | | | | 1,595,386 | | |
Morgan Stanley Institutional Liquidity Prime Portfolio, Institutional
Class, 0.09% (k) | | | 7,173,165 | | | | 7,173,165 | | |
Total Collateral for Securities Loaned (Cost $23,143,667) | | | 23,143,667 | | |
Total Investments (Cost $255,131,343) — 105.4% | | | 266,319,162 | | |
Liabilities in excess of other assets — (5.4)% | | | (13,700,639 | ) | |
NET ASSETS — 100.00% | | $ | 252,618,523 | | |
^ Purchased with cash collateral from securities on loan.
(a) Non-income producing security.
(b) All or a portion of this security is on loan.
(c) Variable or Floating-Rate Security. Rate disclosed is as of December 31, 2020.
(d) Rule 144A security or other security that is restricted as to resale to institutional investors. The Fund's Adviser has deemed this security to be liquid based upon procedures approved by the Board of Trustees. As of December 31, 2020, the fair value of these securities was $170,772,956 and amounted to 67.6% of net assets.
See notes to financial statements.
53
Victory Portfolios
Victory High Yield Fund | | Schedule of Portfolio Investments — continued
December 31, 2020 | |
(e) Security or a portion of the security purchased on a delayed-delivery and/or when-issued basis.
(f) All or a portion of this security has been segregated as collateral for securities purchased on a when-issued basis.
(g) Cash interest 13.0%, PIK interest 13.75%.
(h) Defaulted security.
(i) Issuer filed for bankruptcy.
(j) The Fund's Adviser has deemed this security to be illiquid based upon procedures approved by the Board of Trustees. As of December 31, 2020, illiquid securities were 0.6% of the Fund's net assets.
(k) Rate disclosed is the daily yield on December 31, 2020.
(l) Amount represents less than 0.05% of net assets.
bps — Basis points
LIBOR — London InterBank Offered Rate
LIBOR01M — 1 Month US Dollar LIBOR, rate disclosed as of December 31, 2020, based on the last reset date of the security
LIBOR02M — 2 Month US Dollar LIBOR, rate disclosed as of December 31, 2020, based on the last reset date of the security
LIBOR03M — 3 Month US Dollar LIBOR, rate disclosed as of December 31, 2020, based on the last reset date of the security
LLC — Limited Liability Company
LP — Limited Partnership
PIK — Payment-in-Kind
PLC — Public Limited Company
ULC — Unlimited Liability Co.
See notes to financial statements.
54
Victory Portfolios
Victory Tax-Exempt Fund | | Schedule of Portfolio Investments
December 31, 2020 | |
Security Description | |
Principal
Amount | | Value | |
Municipal Bonds (96.1%) | |
Arkansas (1.8%): | |
Arkansas Development Finance Authority Revenue Bonds,
3.20%, 12/1/49, Continuously Callable @100 | | $ | 750,000 | | | $ | 781,373 | | |
University of Central Arkansas Revenue Bonds, Series A, 3.00%,
11/1/49, Continuously Callable @100 | | | 265,000 | | | | 278,454 | | |
| | | | 1,059,827 | | |
California (2.5%): | |
Golden State Tobacco Securitization Corp. Revenue Bonds,
Series A2, 5.00%, 6/1/47, Continuously Callable @100 | | | 1,500,000 | | | | 1,555,830 | | |
Colorado (1.3%): | |
Colorado Health Facilities Authority Revenue Bonds, 4.00%,
12/1/50, Continuously Callable @103 | | | 750,000 | | | | 825,285 | | |
Connecticut (3.9%): | |
Connecticut Health and Educational Facilities Authority Revenue Bonds,
Series 2016 CT, 5.00%, 12/1/41, Continuously Callable @100 | | | 2,000,000 | | | | 2,376,240 | | |
Florida (8.7%): | |
Capital Trust Agency, Inc. Revenue Bonds, 5.00%,
8/1/55, Continuously Callable @100 | | | 400,000 | | | | 458,892 | | |
City of Pompano Beach Revenue Bonds, 4.00%, 9/1/50, Continuously
Callable @103 | | | 500,000 | | | | 519,530 | | |
County of Escambia Revenue Bonds, 0.13%, 4/1/39, Continuously
Callable @100 (a) | | | 400,000 | | | | 400,000 | | |
Florida Development Finance Corp. Revenue Bonds, 5.00%,
6/15/55, Continuously Callable @100 | | | 500,000 | | | | 559,385 | | |
Hillsborough County Industrial Development Authority Revenue Bonds,
4.00%, 8/1/50, Continuously Callable @100 | | | 500,000 | | | | 579,960 | | |
Miami-Dade County Public Facilities Revenue Bonds, Series A, 5.00%,
6/1/33, Continuously Callable @100 | | | 2,000,000 | | | | 2,365,940 | | |
St. Johns County IDA Revenue Bonds, 4.00%, 8/1/55, Continuously
Callable @103 | | | 500,000 | | | | 537,590 | | |
| | | | 5,421,297 | | |
Guam (1.9%): | |
Port Authority of Guam Revenue Bonds, Series A, 5.00%, 7/1/48,
Continuously Callable @100 | | | 1,000,000 | | | | 1,171,260 | | |
Illinois (26.7%): | |
Chicago Board of Education Revenue Bonds, 6.00%, 4/1/46,
Continuously Callable @100 | | | 2,275,000 | | | | 2,658,610 | | |
Chicago General Obligation Refunding Bonds, Series A, 5.75%,
1/1/33, Continuously Callable @100 | | | 2,000,000 | | | | 2,295,380 | | |
Chicago Transit Authority Sales Tax Receipts Revenue Bonds,
Series 2014, 5.00%, 12/1/44, Continuously Callable @100 | | | 2,450,000 | | | | 2,769,063 | | |
City of Chicago General Obligation Bonds
Series A, 6.00%, 1/1/38, Continuously Callable @100 | | | 1,000,000 | | | | 1,167,430 | | |
Series A, 5.50%, 1/1/49, Continuously Callable @100 | | | 1,000,000 | | | | 1,174,090 | | |
See notes to financial statements.
55
Victory Portfolios
Victory Tax-Exempt Fund | | Schedule of Portfolio Investments — continued
December 31, 2020 | |
Security Description | |
Principal
Amount | | Value | |
City of Chicago Wastewater Transmission Revenue Bonds
Series A, 5.00%, 1/1/47, Continuously Callable @100 | | $ | 1,000,000 | | | $ | 1,168,930 | | |
Series C, 5.00%, 1/1/34, Continuously Callable @100 | | | 1,000,000 | | | | 1,152,120 | | |
Illinois General Obligation Bonds, Series 2013, 5.50%, 7/1/27,
Continuously Callable @100 | | | 2,000,000 | | | | 2,161,820 | | |
Sales Tax Securitization Corp. Revenue Bonds, Series 2018 C, 5.00%, 1/1/43,
Continuously Callable @100 | | | 1,500,000 | | | | 1,787,385 | | |
| | | | 16,334,828 | | |
Iowa (0.8%): | |
Iowa Finance Authority Revenue Bonds, Series A-1, 4.00%, 5/15/55,
Continuously Callable @103 | | | 500,000 | | | | 505,715 | | |
Massachusetts (1.5%): | |
University of Massachusetts Building Authority Revenue Bonds,
Series 1, 5.00%, 11/1/39, Continuously Callable @100 | | | 820,000 | | | | 944,747 | | |
Missouri (2.1%): | |
Health & Educational Facilities Authority of the State of Missouri
Revenue Bonds, 4.25%, 12/1/42,
Continuously Callable @100 (b) | | | 1,150,000 | | | | 1,291,830 | | |
New Jersey (12.6%): | |
New Jersey Economic Development Authority Biomedical Research
Facilities Revenue Bonds, Series 2016 A, 5.00%, 7/15/29,
Continuously Callable @100 | | | 885,000 | | | | 1,046,681 | | |
New Jersey Economic Development Authority School Facilities
Construction Revenue Bonds, Series 2015 WW, 5.25%,
6/15/32, Continuously Callable @100 | | | 3,000,000 | | | | 3,492,779 | | |
New Jersey Transportation Trust Fund Authority Revenue Bonds
5.00%, 6/15/28, Continuously Callable @100 | | | 1,000,000 | | | | 1,181,320 | | |
Series BB, 3.50%, 6/15/46, Continuously Callable @100 | | | 200,000 | | | | 206,672 | | |
Tobacco Settlement Financing Corp. Revenue Bonds, Series 2018 A, 5.00%,
6/1/46, Continuously Callable @100 | | | 1,500,000 | | | | 1,788,315 | | |
| | | | 7,715,767 | | |
New York (13.9%): | |
Metropolitan Transportation Authority Dedicated Tax Green Fund
Revenue Bonds, Series 2016 B1, 5.00%, 11/15/56,
Continuously Callable @100 | | | 1,545,000 | | | | 1,817,723 | | |
Metropolitan Transportation Authority Revenue Bonds, Series D-3, 4.00%,
11/15/49, Continuously Callable @100 | | | 500,000 | | | | 553,495 | | |
New York Counties Tobacco Trust II Revenue Bonds, 5.75%, 6/1/43,
Continuously Callable @100 | | | 200,000 | | | | 200,602 | | |
New York State Dormitory Authority Revenue Bonds, 6.00%, 7/1/40,
Continuously Callable @100 (b) (d) | | | 500,000 | | | | 499,910 | | |
Port Authority of New York & New Jersey Revenue Bonds
5.00%, 10/1/30, Continuously Callable @100 | | | 2,000,000 | | | | 2,110,500 | | |
5.00%, 12/1/32, Continuously Callable @100 | | | 1,000,000 | | | | 1,123,530 | | |
TSASC, Inc. Revenue Bonds, Series A, 5.00%, 6/1/41, Continuously
Callable @100 | | | 2,000,000 | | | | 2,303,200 | | |
| | | | 8,608,960 | | |
See notes to financial statements.
56
Victory Portfolios
Victory Tax-Exempt Fund | | Schedule of Portfolio Investments — continued
December 31, 2020 | |
Security Description | | Shares or
Principal
Amount | | Value | |
North Carolina (4.7%): | |
City of Charlotte Certificate of Participation, 4.00%, 6/1/49,
Continuously Callable @100 | | $ | 1,670,000 | | | $ | 1,957,591 | | |
North Carolina Medical Care Commission Revenue Bonds
Series A, 4.00%, 9/1/50, Continuously Callable @100 | | | 500,000 | | | | 524,180 | | |
Series A, 4.00%, 10/1/50, Continuously Callable @103 | | | 350,000 | | | | 385,959 | | |
| | | | 2,867,730 | | |
Ohio (6.2%): | |
Buckeye Tobacco Settlement Financing Authority Revenue Bonds,
Series B-2, 5.00%, 6/1/55, Continuously Callable @100 | | | 1,000,000 | | | | 1,130,420 | | |
County of Franklin Revenue Bonds, Series B, 5.00%, 7/1/45,
Continuously Callable @103 | | | 500,000 | | | | 571,865 | | |
County of Hardin Economic Development Facilities Revenue Bonds,
5.00%, 5/1/30, Continuously Callable @103 | | | 350,000 | | | | 367,416 | | |
Logan Elm Local School District General Obligation Bonds, 4.00%,
11/1/55, Continuously Callable @100 | | | 1,500,000 | | | | 1,693,410 | | |
| | | | 3,763,111 | | |
Oregon (0.3%): | |
Oregon State Lottery Revenue Bonds, Series A, 5.25%, 4/1/30,
Continuously Callable @100 | | | 205,000 | | | | 207,460 | | |
Pennsylvania (4.4%): | |
Philadelphia School District General Obligation Bonds
Series A, 5.00%, 9/1/38, Continuously Callable @100 | | | 1,200,000 | | | | 1,462,584 | | |
Series A, 5.00%, 9/1/44, Continuously Callable @100 | | | 1,000,000 | | | | 1,225,260 | | |
| | | | 2,687,844 | | |
Texas (1.0%): | |
New Hope Cultural Education Facilities Finance Corp. Revenue Bonds,
5.00%, 7/1/47, Continuously Callable @102 | | | 500,000 | | | | 450,635 | | |
Port of Port Arthur Navigation District Revenue Bonds, Series C,
0.18%, 4/1/40, Continuously Callable @100 (a) | | | 200,000 | | | | 200,000 | | |
| | | | 650,635 | | |
Utah (1.8%): | |
Utah Infrastructure Agency Revenue Bonds, Series A, 5.00%, 10/15/40,
Continuously Callable @100 | | | 1,000,000 | | | | 1,107,800 | | |
Total Municipal Bonds (Cost $53,977,871) | | | 59,096,166 | | |
Exchange-Traded Funds (3.0%) | |
VanEck Vectors High-Yield Municipal Index ETF (c) | | | 30,000 | | | | 1,846,200 | | |
Total Exchange-Traded Funds (Cost $1,789,152) | | | 1,846,200 | | |
See notes to financial statements.
57
Victory Portfolios
Victory Tax-Exempt Fund | | Schedule of Portfolio Investments — continued
December 31, 2020 | |
Security Description | |
Shares | | Value | |
Collateral for Securities Loaned^ (3.0%) | |
BlackRock Liquidity Funds TempFund Portfolio, Institutional
Class, 0.08% (e) | | | 32,351 | | | $ | 32,351 | | |
Fidelity Investments Money Market Government Portfolio,
Class I, 0.01% (e) | | | 1,111,458 | | | | 1,111,458 | | |
Goldman Sachs Financial Square Prime Obligations Fund,
Institutional Class, 0.04% (e) | | | 16,145 | | | | 16,145 | | |
JPMorgan Prime Money Market Fund, Capital Class, 0.12% (e) | | | 128,735 | | | | 128,735 | | |
Morgan Stanley Institutional Liquidity Prime Portfolio, Institutional
Class, 0.09% (e) | | | 578,816 | | | | 578,816 | | |
Total Collateral for Securities Loaned (Cost $1,867,505) | | | 1,867,505 | | |
Total Investments (Cost $57,634,528) — 102.1% | | | 62,809,871 | | |
Liabilities in excess of other assets — (2.1)% | | | (1,313,781 | ) | |
NET ASSETS — 100.00% | | $ | 61,496,090 | | |
^ Purchased with cash collateral from securities on loan.
(a) Variable Rate Demand Notes that provide the rights to sell the security at face value on either that day or within the rate-reset period. The interest rate is reset on the put date at a stipulated daily, weekly, monthly, quarterly, or other specified time interval to reflect current market conditions. These securities do not indicate a reference rate and spread in their description.
(b) Rule 144A security or other security that is restricted as to resale to institutional investors. The Fund's Adviser has deemed this security to be liquid based upon procedures approved by the Board of Trustees. As of December 31, 2020, the fair value of these securities was $1,791,740 and amounted to 2.9% of net assets.
(c) All or a portion of this security is on loan.
(d) The Fund's Adviser has deemed this security to be illiquid based upon procedures approved by the Board of Trustees. As of December 31, 2020, illiquid securities were 0.8% of the Fund's net assets.
(e) Rate disclosed is the daily yield on December 31, 2020.
Continuously Callable — Investment is continuously callable or will be continuously callable on any date after the first call date until its maturity
ETF — Exchange-Traded Fund
IDA — Industrial Development Authority
See notes to financial statements.
58
Victory Portfolios
Victory High Income Municipal Bond Fund | | Schedule of Portfolio Investments
December 31, 2020 | |
Security Description | | Principal
Amount | | Value | |
Municipal Bonds (90.3%) | |
California (3.0%): | |
California County Tobacco Securitization Agency Revenue Bonds,
Series B-1, 5.00%, 6/1/49, Continuously Callable @100 | | $ | 250,000 | | | $ | 304,880 | | |
Golden State Tobacco Securitization Corp. Revenue Bonds,
Series A2, 5.00%, 6/1/47, Continuously Callable @100 | | | 1,000,000 | | | | 1,037,220 | | |
| | | | 1,342,100 | | |
District of Columbia (1.7%): | |
District of Columbia Tobacco Settlement Financing Corp.
Revenue Bonds, 6.50%, 5/15/33 | | | 715,000 | | | | 790,018 | | |
Florida (5.9%): | |
County of St. Lucie Revenue Bonds, 0.12%, 9/1/28, Continuously
Callable @100 (a) | | | 300,000 | | | | 300,000 | | |
Escambia County Health Facilities Authority Revenue Bonds, 3.00%,
8/15/50, Continuously Callable @100 | | | 1,000,000 | | | | 1,035,730 | | |
Sumter County Village Community Development District No. 10 Special
Assessment Revenue Bonds, Series 2014, 5.75%, 5/1/31, Continuously
Callable @100 | | | 1,225,000 | | | | 1,330,558 | | |
| | | | 2,666,288 | | |
Georgia (1.7%): | |
Appling County Development Authority Revenue Bonds, 0.14%, 9/1/41,
Continuously Callable @100 (a) | | | 800,000 | | | | 800,000 | | |
Illinois (17.8%): | |
Chicago Board of Education Revenue Bonds, 6.00%, 4/1/46,
Continuously Callable @100 | | | 1,500,000 | | | | 1,752,929 | | |
Chicago General Obligation Refunding Bonds, Series 2015 C, 5.00%,
1/1/38, Continuously Callable @100 | | | 1,000,000 | | | | 1,067,620 | | |
City of Chicago General Obligation Bonds | |
Series A, 6.00%, 1/1/38, Continuously Callable @100 | | | 1,000,000 | | | | 1,167,430 | | |
Series A, 5.50%, 1/1/49, Continuously Callable @100 | | | 1,000,000 | | | | 1,174,090 | | |
Illinois Finance Authority Revenue Bonds, 4.75%, 10/15/40,
(Put Date 8/01/30) (b) (c) | | | 500,000 | | | | 532,445 | | |
Illinois General Obligation Bonds | |
5.50%, 7/1/33, Continuously Callable @100 | | | 1,000,000 | | | | 1,078,260 | | |
5.50%, 7/1/38, Continuously Callable @100 | | | 1,250,000 | | | | 1,337,125 | | |
| | | | 8,109,899 | | |
Indiana (1.2%): | |
Indiana Finance Authority Revenue Bonds, Series A, 5.00%, 7/1/55,
Continuously Callable @100 | | | 500,000 | | | | 544,125 | | |
Iowa (1.1%): | |
Iowa Finance Authority Revenue Bonds, Series A-1, 4.00%, 5/15/55,
Continuously Callable @103 | | | 500,000 | | | | 505,715 | | |
Maryland (0.5%): | |
Maryland Economic Development Corp. Revenue Bonds, 4.25%, 7/1/50,
Continuously Callable @100 | | | 200,000 | | | | 206,410 | | |
See notes to financial statements.
59
Victory Portfolios
Victory High Income Municipal Bond Fund | | Schedule of Portfolio Investments — continued
December 31, 2020 | |
Security Description | | Principal
Amount | | Value | |
Massachusetts (3.2%): | |
Massachusetts Development Finance Agency Revenue Bonds, 4.00%,
10/1/32, Continuously Callable @105 (b) | | $ | 300,000 | | | $ | 319,197 | | |
Massachusetts Educational Financing Authority, Education Loan
Revenue Bonds, Issue J | |
Series 2011, 5.63%, 7/1/28, Continuously Callable @100 | | | 320,000 | | | | 325,248 | | |
Series 2011, 5.63%, 7/1/29, Continuously Callable @100 | | | 645,000 | | | | 655,565 | | |
Series 2011, 5.63%, 7/1/33, Continuously Callable @100 | | | 160,000 | | | | 162,592 | | |
| | | | 1,462,602 | | |
Missouri (1.2%): | |
Health & Educational Facilities Authority of the State of Missouri Revenue
Bonds, 4.25%, 12/1/42, Continuously Callable @100 (b) | | | 500,000 | | | | 561,665 | | |
New Hampshire (1.7%): | |
New Hampshire Business Finance Authority Revenue Bonds, Series B, 3.75%,
7/1/45, (Put Date 7/02/40) (b) (c) | | | 750,000 | | | | 755,985 | | |
New Jersey (6.3%): | |
New Jersey Economic Development Authority School Facilities Construction
Revenue Bonds, Series 2015 WW, 5.25%, 6/15/32, Continuously
Callable @100 | | | 1,000,000 | | | | 1,164,260 | | |
New Jersey Economic Development Motor Vehicle Surcharges
Subordinate Revenue Bonds, Series A, 5.00%, 7/1/33, Continuously
Callable @100 | | | 500,000 | | | | 573,535 | | |
New Jersey Higher Education Student Assistance Authority, Student
Loan Revenue Bonds, Series 2011-1, 5.75%, 12/1/28, Continuously
Callable @100 | | | 575,000 | | | | 594,504 | | |
New Jersey Transportation Trust Fund Authority Revenue Bonds,
Series BB, 3.50%, 6/15/46, Continuously Callable @100 | | | 500,000 | | | | 516,680 | | |
| | | | 2,848,979 | | |
New Mexico (1.2%): | |
New Mexico Hospital Equipment Loan Council Revenue Bonds,
Series A, 5.00%, 7/1/49, Continuously Callable @102 | | | 500,000 | | | | 530,910 | | |
New York (7.0%): | |
Metropolitan Transportation Authority Revenue Bonds | |
Series A-2, 5.00%, 11/15/45, (Put Date 5/15/30) (c) | | | 365,000 | | | | 450,509 | | |
Series D-3, 4.00%, 11/15/49, Continuously Callable @100 | | | 500,000 | | | | 553,495 | | |
New York State Dormitory Authority Revenue Bonds, 6.00%, 7/1/40,
Continuously Callable @100 (b) (f) | | | 1,000,000 | | | | 999,820 | | |
New York Transportation Development Corp. Revenue Bonds, 5.00%,
10/1/40, Continuously Callable @100 | | | 750,000 | | | | 921,270 | | |
Onondaga Civic Development Corp. Revenue Bonds, 5.00%, 10/1/40,
Continuously Callable @100 | | | 250,000 | | | | 251,733 | | |
| | | | 3,176,827 | | |
North Carolina (4.1%): | |
North Carolina Medical Care Commission Revenue Bonds, 5.00%, 10/1/50,
Continuously Callable @103 | | | 250,000 | | | | 272,380 | | |
University of North Carolina Hill Revenue Bonds, 5.00%, 2/1/49 | | | 1,000,000 | | | | 1,592,020 | | |
| | | | 1,864,400 | | |
See notes to financial statements.
60
Victory Portfolios
Victory High Income Municipal Bond Fund | | Schedule of Portfolio Investments — continued
December 31, 2020 | |
Security Description | | Principal
Amount | | Value | |
North Dakota (2.2%): | |
Grand Forks, North Dakota Senior Housing and Nursing Facility
Revenue Bonds, 5.00%, 12/1/36, Continuously Callable @100 | | $ | 1,000,000 | | | $ | 1,023,750 | | |
Ohio (3.6%): | |
Buckeye Tobacco Settlement Financing Authority Revenue Bonds,
Series B-2, 5.00%, 6/1/55, Continuously Callable @100 | | | 1,000,000 | | | | 1,130,420 | | |
County of Hardin Revenue Bonds, 5.50%, 5/1/50, Continuously
Callable @103 | | | 500,000 | | | | 520,395 | | |
| | | | 1,650,815 | | |
Oklahoma (0.0%):(d) | |
Oklahoma Development Finance Authority Continuing Care Retirement
Community Revenue Bonds, Series 2012, 6.00%, 1/1/32, Continuously
Callable @100 (e) (f) | | | 1,885,000 | | | | 20,939 | | |
Oregon (1.4%): | |
Clackamas County Hospital Facility Authority Revenue Bonds | |
Series A, 5.00%, 11/15/52, Continuously Callable @102 | | | 500,000 | | | | 531,600 | | |
Series A, 5.38%, 11/15/55, Continuously Callable @102 | | | 100,000 | | | | 107,051 | | |
| | | | 638,651 | | |
South Carolina (3.8%): | |
Lancaster County, Walnut Creek Improvement District Assessment
Refunding Revenue Bonds, Series 2016 A-1, 5.00%, 12/1/37,
Continuously Callable @100 | | | 1,675,000 | | | | 1,743,691 | | |
South Dakota (1.2%): | |
Oglala Sioux Tribe, Series 2012, 5.00%, 10/1/22, Callable 2/11/21 @ 100 (b) | | | 545,000 | | | | 545,507 | | |
Texas (7.5%): | |
New Hope Cultural Education Facilities Finance Corp. Revenue
Bonds, 5.00%, 7/1/47, Continuously Callable @102 | | | 1,000,000 | | | | 688,120 | | |
Port of Port Arthur Navigation District Revenue, Series B, 0.17%,
4/1/40, Continuously Callable @100 (a) | | | 900,000 | | | | 900,000 | | |
Port of Port Arthur Navigation District Revenue Bonds, Series C, 0.18%,
4/1/40, Continuously Callable @100 (a) | | | 700,000 | | | | 700,000 | | |
Texas Private Activity Bond Surface Transportation Corp. Revenue Bonds,
NTE Mobility Partners Segments 3 LLC — Segments 3A & 3B Facility,
Series 2013, 7.00%, 12/31/38, Continuously Callable @100 | | | 1,000,000 | | | | 1,140,530 | | |
| | | | 3,428,650 | | |
Utah (7.8%): | |
Tender Option Bond Trust Receipts/Certificates Revenue Bonds,
Series 2019-XF1081, 0.42%, 3/1/62, Callable 2/1/31 @ 100 (a) (b) | | | 1,700,000 | | | | 1,700,000 | | |
Utah Charter School Finance Authority Revenue Bonds, 2.75%,
4/15/50, Continuously Callable @100 | | | 525,000 | | | | 530,061 | | |
Utah Infrastructure Agency Revenue Bonds, Series A, 5.38%,
10/15/40, Continuously Callable @100 | | | 1,150,000 | | | | 1,301,467 | | |
| | | | 3,531,528 | | |
Vermont (0.6%): | |
Vermont Educational & Health Buildings Financing Agency Revenue Bonds,
5.00%, 10/15/46, Continuously Callable @100 | | | 250,000 | | | | 270,600 | | |
See notes to financial statements.
61
Victory Portfolios
Victory High Income Municipal Bond Fund | | Schedule of Portfolio Investments — continued
December 31, 2020 | |
Security Description | | Shares or
Principal
Amount | | Value | |
West Virginia (2.3%): | |
The County Commission of Monongalia County, WV Special District Excise
Tax Revenue Bonds, Series 2017 A, 5.75%, 6/1/43,
Continuously Callable @100 (b) | | $ | 1,000,000 | | | $ | 1,029,100 | | |
Wisconsin (2.3%): | |
Public Finance Authority Revenue Bonds | |
Series A, 5.25%, 3/1/55, Continuously Callable @100 (b) | | | 500,000 | | | | 533,370 | | |
Series A, 5.00%, 7/1/55, Continuously Callable @100 (b) | | | 500,000 | | | | 518,880 | | |
| | | | 1,052,250 | | |
Total Municipal Bonds (Cost $38,992,578) | | | 41,101,404 | | |
Exchange-Traded Funds (8.3%) | |
SPDR Nuveen Bloomberg Barclays High Yield Municipal Bond ETF | | | 32,000 | | | | 1,887,680 | | |
VanEck Vectors High-Yield Municipal Index ETF | | | 31,000 | | | | 1,907,740 | | |
Total Exchange-Traded Funds (Cost $3,720,222) | | | 3,795,420 | | |
Total Investments (Cost $42,712,800) — 98.6% | | | 44,896,824 | | |
Other assets in excess of liabilities — 1.4% | | | 632,370 | | |
NET ASSETS — 100.00% | | $ | 45,529,194 | | |
(a) Variable Rate Demand Notes that provide the rights to sell the security at face value on either that day or within the rate-reset period. The interest rate is reset on the put date at a stipulated daily, weekly, monthly, quarterly, or other specified time interval to reflect current market conditions. These securities do not indicate a reference rate and spread in their description.
(b) Rule 144A security or other security that is restricted as to resale to institutional investors. The Fund's Adviser has deemed this security to be liquid based upon procedures approved by the Board of Trustees. As of December 31, 2020, the fair value of these securities was $7,495,969 and amounted to 16.5% of net assets.
(c) Put Bond.
(d) Amount represents less than 0.05% of net assets.
(e) Defaulted security.
(f) The Fund's Adviser has deemed this security to be illiquid based upon procedures approved by the Board of Trustees. As of December 31, 2020, illiquid securities were 2.2% of the Fund's net assets.
Continuously Callable — Investment is continuously callable or will be continuously callable on any date after the first call date until its maturity
ETF — Exchange-Traded Fund
LLC — Limited Liability Company
See notes to financial statements.
62
Victory Portfolios
Victory Floating Rate Fund | | Schedule of Portfolio Investments
December 31, 2020 | |
Security Description | | Shares or
Principal
Amount | | Value | |
Common Stocks (0.0%)(a) | |
Consumer Discretionary (0.0%): | |
New TMW TOPCO Inc | | | 51,299 | | | $ | 192,371 | | |
Total Common Stocks (Cost $192,371) | | | 192,371 | | |
Senior Secured Loans (79.6%) | |
Acrisure, LLC, Term Loan B 2020, First Lien, 3.65% (LIBOR01M+350bps),
2/15/27 (b) | | $ | 5,408,164 | | | | 5,294,377 | | |
ADMI Corp., Amendment No. 3 Term Loan, First Lien, 12/15/27 (c) | | | 3,500,000 | | | | 3,499,125 | | |
Air Medical Group Holdings, Inc., Incremental Term Loan B, First Lien,
5.25% (LIBOR06M+425bps), 3/14/25 (b) | | | 4,911,392 | | | | 4,857,023 | | |
Air Methods Corp., Initial Term Loans, First Lien, 4.50% (LIBOR03M+350bps),
4/21/24 (b) | | | 3,928,753 | | | | 3,773,567 | | |
Aldevron LLC, Initial Term Loans, First Lien, 5.25% (LIBOR01M+425bps),
9/20/26 (b) (c) | | | 7,176,000 | | | | 7,190,926 | | |
Alliance Laundry Systems LLC, 4.25% (LIBOR03M+350bps), 9/30/27 (b) | | | 6,600,000 | | | | 6,591,749 | | |
Alphabet Holding Co., Inc., Initial Term Loan Second Lien, Second Lien,
7.90% (LIBOR01M+775bps), 8/15/25 (b) | | | 4,950,000 | | | | 4,917,825 | | |
Alphabet Holding Co., Inc., Term Loan B, First Lien, 3.65%
(LIBOR01M+350bps), 8/15/24 (b) | | | 5,418,000 | | | | 5,362,303 | | |
American Axle & Manufacturing, Inc., Term Loan B, First Lien, 3.00%
(LIBOR01M+225bps), 4/6/24 (b) | | | 6,067,392 | | | | 5,960,120 | | |
American Renal Holdings, Inc., Term B Commitment, First Lien, 5.15%
(LIBOR01M+500bps), 6/15/24 (b) | | | 4,936,914 | | | | 4,921,066 | | |
Amneal Pharmaceuticals LLC, Initial Term Loans, First Lien, 3.69%
(LIBOR01M+350bps), 3/23/25 (b) | | | 7,798,151 | | | | 7,585,340 | | |
Anchor Packaging LLC, 4.15% (LIBOR01M+400bps), 7/18/26 (b) (c) | | | 7,969,932 | | | | 7,950,006 | | |
Asurion, LLC, Term B7, First Lien, 3.15% (LIBOR01M+300bps),
11/3/24 (b) | | | 6,847,784 | | | | 6,786,154 | | |
Bass Pro Group, LLC, Initial Term Loans, First Lien, 5.75%
(LIBOR03M+500bps), 12/16/23 (b) | | | 6,244,011 | | | | 6,255,188 | | |
Blount International, Inc., Initial Term Loan Repricing, First Lien, 4.75%
(LIBOR01M+375bps), 4/12/23 (b) | | | 5,835,900 | | | | 5,863,270 | | |
Boyd Gaming Corp., Refinancing Term B Loans, First Lien, 2.35%
(LIBOR01M+225bps), 9/15/23 (b) | | | 4,530,068 | | | | 4,485,220 | | |
Brand Energy and Infrastructure Services, Inc., Initial Term Loan,
First Lien, 5.25% (LIBOR03M+425bps), 6/21/24 (b) | | | 5,723,363 | | | | 5,569,862 | | |
BW NHHC HoldCo., Inc., Term Loan Lien 2, Second Lien, 9.22%
(LIBOR03M+900bps), 5/15/26 (b) | | | 3,000,000 | | | | 1,575,000 | | |
Caesars Resort Collection, LLC, Term B-1 Loans, First Lien, 4.65%
(LIBOR01M+450bps), 6/19/25 (b) | | | 4,987,500 | | | | 4,989,046 | | |
Calpine Corp., 2020 Term Loans, First Lien, 2.65% (LIBOR01M+250bps),
12/2/27 (b) | | | 2,995,119 | | | | 2,972,655 | | |
Chassix, Inc., Term Loan B, First Lien, 6.50% (LIBOR06M+550bps),
11/10/23 (b) | | | 3,865,340 | | | | 3,652,747 | | |
CIBT Holdings, Inc., Initial Term Loan, First Lien, 4.75%
(LIBOR03M+375bps), 6/1/24 (b) | | | 3,820,612 | | | | 2,808,150 | | |
Concrete Pumping Holdings, Inc., Initial Term Loan, First Lien, 6.15%
(LIBOR01M+600bps), 11/14/25 (b) | | | 5,475,000 | | | | 5,351,813 | | |
See notes to financial statements.
63
Victory Portfolios
Victory Floating Rate Fund | | Schedule of Portfolio Investments — continued
December 31, 2020 | |
Security Description | | Principal
Amount | | Value | |
Consolidated Communications, Inc., 5.75% (LIBOR01M+475bps),
10/2/27 (b) | | $ | 4,488,750 | | | $ | 4,503,024 | | |
CP Atlas Buyer, Inc., 5.25% (LIBOR03M+450bps), 11/23/27 (b) | | | 2,000,000 | | | | 2,002,500 | | |
CP Atlas Buyer, Inc., 5.25% (LIBOR03M+450bps), 11/23/27 (b) | | | 6,000,000 | | | | 6,007,500 | | |
CPM Holdings, Inc., 2nd Lien Initial Term Loans, Second Lien, 8.41%
(LIBOR01M+825bps), 11/16/26 (b) | | | 2,000,000 | | | | 1,847,500 | | |
CPM Holdings, Inc., Initial Term Loans, First Lien, 3.91%
(LIBOR01M+375bps), 11/17/25 (b) | | | 2,940,000 | | | | 2,861,914 | | |
Crown Finance US, Inc., 7.15%, 5/23/24 (c) | | | 1,107,435 | | | | 1,314,159 | | |
Dayco Products, LLC, Term Loans, First Lien, 4.48% (LIBOR03M+425bps),
5/19/24 (b) | | | 7,720,000 | | | | 5,882,640 | | |
DELTA AIR LINES, Inc. and SKYMILES IP LTD, Initial Term Loan, First Lien,
4.75% (LIBOR03M+375bps), 9/16/27 (b) | | | 7,500,000 | | | | 7,765,050 | | |
Delta Air Lines, Inc., Term Loan, First Lien, 5.75% (LIBOR03M+475bps),
4/27/23 (b) | | | 8,706,250 | | | | 8,829,095 | | |
Diamond Sports Group, LLC, Term Loan, First Lien, 3.40%
(LIBOR01M+325bps), 8/24/26 (b) | | | 3,979,849 | | | | 3,506,406 | | |
Dole Food Company, Inc., Tranche B Term Loan, First Lien, 3.75%
(LIBOR01M+275bps), 3/24/24 (b) | | | 6,839,640 | | | | 6,822,540 | | |
Dynasty Acquisition Co., Inc., 2020 Specified Refi Term B-1 Loans,
First Lien, 3.75% (LIBOR03M+350bps), 4/6/26 (b) | | | 3,596,434 | | | | 3,416,612 | | |
Endo Luxembourg Finance Company I S.a.r.l., Initial Term Loans,
First Lien, 5.00% (LIBOR03M+425bps), 4/29/24 (b) | | | 7,890,725 | | | | 7,752,637 | | |
Engineered Machinery Holdings, Inc., Initial Term Loans, First Lien, 4.00%
(LIBOR03M+300bps), 7/19/24 (b) | | | 3,742,922 | | | | 3,727,726 | | |
First Brands Group LLC, Tranche B-3 Term Loan, First Lien, 8.50%
(LIBOR03M+750bps), 2/2/24 (b) | | | 7,899,840 | | | | 7,860,341 | | |
Forterra Finance LLC, Replacement Term Loan, First Lien, 4.00%
(LIBOR01M+300bps), 10/25/23 (b) | | | 2,554,608 | | | | 2,555,144 | | |
Froneri International Ltd., Facility B2 Loan, First Lien, 2.40%
(LIBOR01M+225bps), 1/30/27 (b) (c) | | | 2,000,000 | | | | 1,978,000 | | |
Froneri International Ltd., Facility B2 Loan, First Lien, 2.40%
(LIBOR01M+225bps), 1/31/27 (b) | | | 4,975,000 | | | | 4,920,275 | | |
Gates Global, LLC, Initial B-2 Dollar Term Loan, First Lien, 3.75%
(LIBOR01M+275bps), 3/31/24 (b) | | | 6,039,312 | | | | 6,017,510 | | |
Global Medical Response, Inc., 5.75% (LIBOR06M+475bps),
10/2/25 (b) (c) | | | 5,000,000 | | | | 4,958,350 | | |
Golden Nugget, Inc., Senior Secured Term Loan, First Lien, 3.25%
(LIBOR02M+250bps), 10/4/23 (b) | | | 4,971,945 | | | | 4,789,376 | | |
Graham Packaging, Initial Term Loans, First Lien, 4.50%
(LIBOR01M+375bps), 7/28/27 (b) | | | 6,857,627 | | | | 6,873,948 | | |
GTT Communications, Inc., U.S. Term Loan, First Lien, 3.00%
(LIBOR03M+275bps), 5/31/25 (b) (h) | | | 2,638,487 | | | | 2,053,851 | | |
Gulf Finance, LLC, Term Loan B, First Lien, 6.25% (LIBOR01M+525bps),
8/25/23 (b) | | | 3,994,581 | | | | 3,003,086 | | |
Hillman Group, Inc., Term Loan B, First Lien, 4.15% (LIBOR01M+400bps),
5/31/25 (b) (c) | | | 5,969,543 | | | | 5,936,890 | | |
See notes to financial statements.
64
Victory Portfolios
Victory Floating Rate Fund | | Schedule of Portfolio Investments — continued
December 31, 2020 | |
Security Description | | Principal
Amount | | Value | |
Holley Purchaser, Inc., Initial Term Loan, First Lien, 5.21%
(LIBOR03M+500bps), 10/26/25 (b) | | $ | 4,312,000 | | | $ | 4,185,357 | | |
Hub International Ltd., Term Loan B, First Lien, 2.96%
(LIBOR03M+275bps), 4/25/25 (b) | | | 7,312,500 | | | | 7,173,124 | | |
iHeartCommunications, Inc., Second Amendment, Incremental Term Loan,
First Lien (LIBOR01M+400bps), 5/1/26 (b) (c) | | | 2,000,000 | | | | 1,998,340 | | |
iHeartCommunications, Inc., Term Loans, First Lien, 3.15%
(LIBOR01M+300bps), 5/1/26 (b) | | | 4,950,000 | | | | 4,863,375 | | |
Innio North America Holding, Inc., Facility B USD, First Lien, 3.23%
(LIBOR06M+300bps), 11/6/25 (b) | | | 5,939,394 | | | | 5,568,182 | | |
Intelsat Jackson Holdings S.A., DIP Term Loan Commitment, First Lien, 6.50%
(LIBOR06M+550bps), 7/13/21 (b) | | | 4,172,613 | | | | 4,249,807 | | |
Intelsat Jackson Holdings S.A., Term B-3, First Lien, 8.00% (PRIME+475bps),
11/27/23 (b) | | | 6,750,000 | | | | 6,834,375 | | |
Janus International Group, LLC, Initial Term Loan, First Lien, 4.75%
(LIBOR03M+375bps), 2/9/25 (b) | | | 5,886,919 | | | | 5,828,050 | | |
Kindred Healthcare LLC., Term Loan New, First Lien, 5.19%
(LIBOR01M+500bps), 7/2/25 (b) | | | 5,880,000 | | | | 5,865,300 | | |
LABL, Inc., Initial Dollar Term Loan, First Lien, 4.65% (LIBOR01M+450bps),
7/2/26 (b) | | | 6,442,255 | | | | 6,436,199 | | |
LBM Acquisition LLC, Delayed Draw Term Loan, First Lien, 12/8/27 (c) (g) | | | 1,212,121 | | | | 1,210,861 | | |
LBM Acquisition LLC, Initial Term Loan, First Lien, 12/8/27 (c) | | | 5,454,545 | | | | 5,448,872 | | |
Leslie's Poolmart, Inc., Tranche B Term Loans, First Lien, 3.65%
(LIBOR01M+350bps), 8/16/23 (b) | | | 5,593,109 | | | | 5,581,475 | | |
Lifepoint Health, Inc., Term B Loans, First Lien, 3.90%
(LIBOR01M+375bps), 11/16/25 (b) | | | 4,934,991 | | | | 4,915,893 | | |
LifeScan Global Corp., Initial Term Loan, First Lien, 6.23%
(LIBOR03M+600bps), 6/19/24 (b) | | | 3,096,000 | | | | 2,941,200 | | |
LifeScan Global Corp., Initial Term Loan, Second Lien, 9.73%
(LIBOR03M+950bps), 6/19/25 (b) | | | 2,250,000 | | | | 1,949,063 | | |
Meredith Corp., Tranche B-3 Term Loans, First Lien, 5.25%
(LIBOR03M+425bps), 1/31/25 (b) | | | 5,972,494 | | | | 5,999,370 | | |
MHI Holdings, LLC, Initial Term Loans, First Lien, 5.15%
(LIBOR01M+500bps), 9/20/26 (b) | | | 8,924,952 | | | | 8,880,327 | | |
Mileage Plus Holdings LLC, Initial Term Loan, First Lien, 6.25%
(LIBOR03M+525bps), 6/20/27 (b) | | | 6,000,000 | | | | 6,236,280 | | |
Navistar, Inc., Tranche B Term Loan, First Lien, 3.66%
(LIBOR01M+350bps), 11/2/24 (b) | | | 4,316,709 | | | | 4,306,997 | | |
Ortho-Clinical Diagnostics, Inc., Term Loan B New, First Lien, 3.40%
(LIBOR01M+325bps), 6/30/25 (b) (c) | | | 2,000,000 | | | | 1,969,000 | | |
Ortho-Clinical Diagnostics, Inc., Term Loan B New, First Lien, 3.40%
(LIBOR01M+325bps), 5/22/25 (b) | | | 3,552,683 | | | | 3,497,616 | | |
Packaging Coordinators Midco, Inc., 4.50% (LIBOR06M+375bps),
12/1/27 (b) | | | 4,500,000 | | | | 4,500,000 | | |
Panther BF Aggregator 2 L P, Initial Dollar Term Loan, First Lien, 3.65%
(LIBOR01M+350bps), 4/30/26 (b) | | | 6,787,500 | | | | 6,752,137 | | |
PG&E CORP, TL, First Lien, 5.50% (LIBOR03M+450bps), 6/23/25 (b) | | | 7,960,000 | | | | 8,041,590 | | |
See notes to financial statements.
65
Victory Portfolios
Victory Floating Rate Fund | | Schedule of Portfolio Investments — continued
December 31, 2020 | |
Security Description | | Principal
Amount | | Value | |
Pluto Acquisition I, Inc., 2020, Incremental Term Loans, First Lien,
6/20/26 (c) | | $ | 1,000,000 | | | $ | 1,000,000 | | |
Pluto Acquisition I, Inc., Initial Term Loans, First Lien, 5.15%
(LIBOR01M+500bps), 6/18/26 (b) | | | 5,417,500 | | | | 5,390,413 | | |
Ply Gem Midco, Inc., Term Loan, First Lien, 3.90% (LIBOR01M+375bps),
4/14/25 (b) | | | 5,835,091 | | | | 5,820,503 | | |
Precyse Acquisition Corp., Term Loan, First Lien, 5.50% (LIBOR01M+450bps),
10/20/22 (b) | | | 6,619,054 | | | | 6,563,189 | | |
Radiology Partners, Inc., Term Loan New, First Lien, 4.40%
(LIBOR01M+425bps), 7/9/25 (b) | | | 2,862,832 | | | | 2,810,957 | | |
Radiology Partners, Inc., Term Loan New, First Lien, 5.29%
(LIBOR12M+425bps), 7/9/25 (b) | | | 3,338,971 | | | | 3,278,468 | | |
Revint Intermediate II LLC, 5.75% (LIBOR01M+500bps), 10/15/27 (b) | | | 6,500,000 | | | | 6,413,355 | | |
Reynolds Group Holdings, Inc., 2017, Incremental US Term Loans,
First Lien, 2.90% (LIBOR01M+275bps), 2/5/23 (b) | | | 1,122,333 | | | | 1,116,722 | | |
Robertshaw US Holding Corp., 2nd Lien Initial Term Loans, Second Lien,
9.00% (LIBOR01M+800bps), 2/15/26 (b) | | | 4,000,000 | | | | 3,120,000 | | |
Robertshaw US Holding Corp., Term Loan B, First Lien, 4.50%
(LIBOR01M+350bps), 2/15/25 (b) | | | 1,945,000 | | | | 1,813,713 | | |
Ryan Specialty Group LLC, TL, First Lien, 4.00% (LIBOR01M+325bps),
9/1/27 (b) | | | 4,987,500 | | | | 4,968,797 | | |
Sabert Corp., Initial Term Loans, First Lien, 5.50% (LIBOR01M+450bps),
12/10/26 (b) | | | 5,802,331 | | | | 5,778,136 | | |
SIWF Holdings, Inc., Initial Term Loan, First Lien, 4.40%
(LIBOR01M+425bps), 6/15/25 (b) | | | 6,877,099 | | | | 6,811,217 | | |
SIWF Holdings, Inc., Initial Term Loan, Second Lien, 8.65%
(LIBOR01M+850bps), 5/26/26 (b) | | | 1,500,000 | | | | 1,427,820 | | |
Spectacle Gary Holdings LLC, Closing Date Term Loan, First Lien,
11.00% (LIBOR03M+900bps), 12/23/25 (b) | | | 5,594,595 | | | | 5,594,595 | | |
Spectacle Gary Holdings LLC, Delayed Draw Term Loan Commitment,
First Lien, 11.25% (PRIME+800bps), 12/23/25 (b) | | | 405,405 | | | | 405,405 | | |
SRS Distribution, Inc., First Amendment, Incremental Term Loans,
First Lien, 4.40% (LIBOR01M+425bps), 5/23/25 (b) | | | 2,475,000 | | | | 2,465,719 | | |
SRS Distribution, Inc., Initial Term Loans, First Lien, 3.15%
(LIBOR01M+300bps), 5/19/25 (b) | | | 3,910,000 | | | | 3,842,983 | | |
Standard Aero Ltd., 2020 SPCFD Refi Term B-2 Loans, First Lien,
3.72% — 3.75% (LIBOR03M+350bps), 4/6/26 (b) | | | 1,933,566 | | | | 1,836,888 | | |
Station Casinos LLC, Term B-1 Facility Loans, First Lien, 2.50%
(LIBOR01M+225bps), 2/8/27 (b) | | | 4,468,918 | | | | 4,394,599 | | |
Surgery Center Holdings, Inc., Initial Term Loans, First Lien, 4.25%
(LIBOR01M+325bps), 8/31/24 (b) | | | 4,068,207 | | | | 3,993,068 | | |
Tailwind Smith Cooper Intermediate Corp., 2nd Lien Initial Term Loans,
Second Lien, 9.15% (LIBOR01M+900bps), 5/28/27 (b) | | | 3,000,000 | | | | 2,487,510 | | |
Tailwind Smith Cooper Intermediate Corp., Initial Term Loans,
First Lien, 5.15% (LIBOR01M+500bps), 5/28/26 (b) | | | 4,937,500 | | | | 4,652,359 | | |
Team Health Holdings, Inc., Initial Term Loans, First Lien, 3.75%
(LIBOR01M+275bps), 2/6/24 (b) | | | 6,658,474 | | | | 5,912,991 | | |
TENNECo., Inc., Tranche B Term Loan, First Lien, 3.15%
(LIBOR01M+300bps), 6/18/25 (b) | | | 3,377,634 | | | | 3,287,552 | | |
See notes to financial statements.
66
Victory Portfolios
Victory Floating Rate Fund | | Schedule of Portfolio Investments — continued
December 31, 2020 | |
Security Description | | Principal
Amount | | Value | |
The Men's Wearhouse LLC, Term Loan, First Lien, 9.00%
(LIBOR01M+800bps), 12/1/25 (b) | | $ | 2,698,999 | | | $ | 2,267,159 | | |
Thor Industries, Inc., Term Loan B, First Lien, 3.94%
(LIBOR01M+375bps), 2/1/26 (b) | | | 5,753,496 | | | | 5,739,112 | | |
Titan Acquisition Ltd., Initial Term Loan, First Lien, 3.27%
(LIBOR06M+300bps), 3/28/25 (b) | | | 4,842,841 | | | | 4,712,423 | | |
U.S. Renal Care, Inc., Initial Term Loan, First Lien, 5.15%
(LIBOR01M+500bps), 6/26/26 (b) | | | 5,937,424 | | | | 5,900,316 | | |
Univision Communications, Inc., 2020 Replacement New First-Lien
Term Loans, First Lien, 4.75% (LIBOR01M+375bps), 3/24/26 (b) | | | 6,000,767 | | | | 5,998,247 | | |
USI, Inc., 2017 New Term Loans, First Lien, 3.22% — 3.25%
(LIBOR03M+300bps), 5/16/24 (b) | | | 5,753,302 | | | | 5,665,794 | | |
Utz Quality Foods, LLC, Initial Term Loan, First Lien, 3.65%
(LIBOR01M+350bps), 11/14/24 (b) | | | 4,966,167 | | | | 4,946,501 | | |
Verscend Holding Corp, Term B Loans, First Lien, 4.65%
(LIBOR01M+450bps), 8/10/25 (b) | | | 2,895,366 | | | | 2,889,575 | | |
Vertex Aerospace Services Corp, Term Loan B, First Lien, 4.65%
(LIBOR01M+450bps), 6/16/25 (b) | | | 2,925,000 | | | | 2,910,375 | | |
Waystar Technologies, Inc., 4.75% (LIBOR01M+400bps), 10/22/26 (b) | | | 6,483,750 | | | | 6,467,541 | | |
Weber-Stephen Products LLC, 4.00% (LIBOR01M+325bps), 10/20/27 (b) | | | 6,000,000 | | | | 6,003,000 | | |
White Capital Buyer LLC, 4.50% (LIBOR06M+400bps), 10/19/27 (b) | | | 7,500,000 | | | | 7,490,625 | | |
WP CPP Holdings, LLC, Term Loan Second Lien, Second Lien, 8.75%
(LIBOR03M+775bps), 4/30/26 (b) | | | 2,000,000 | | | | 1,657,500 | | |
WP CPP Holdings, LLC, Term Loans, First Lien, 4.75% (LIBOR03M+375bps),
4/30/25 (b) | | | 3,912,183 | | | | 3,646,702 | | |
Zaxby's Operating Company LLC, Second Lien Initial Loans, Second Lien,
12/9/28 (c) | | | 6,000,000 | | | | 6,060,000 | | |
Total Senior Secured Loans (Cost $532,790,358) | | | 528,173,225 | | |
Corporate Bonds (16.3%) | |
Consumer Discretionary (5.5%): | |
Affinity Gaming, 6.88%, 12/15/27, Callable 12/1/23 @ 103.44 (e) | | | 5,000,000 | | | | 5,228,750 | | |
Diamond Sports Group LLC/Diamond Sports Finance Co., 6.63%,
8/15/27, Callable 8/15/22 @ 103.31 (d) (e) | | | 5,000,000 | | | | 3,024,600 | | |
Michaels Stores, Inc., 8.00%, 7/15/27, Callable 7/15/22 @ 104 (e) | | | 5,000,000 | | | | 5,409,900 | | |
PetSmart, Inc., 8.88%, 6/1/25, Callable 1/22/21 @ 104.44 (e) | | | 3,000,000 | | | | 3,082,470 | | |
Scientific Games International, Inc. | |
8.63%, 7/1/25, Callable 7/1/22 @ 104.31 (e) | | | 1,000,000 | | | | 1,095,400 | | |
8.25%, 3/15/26, Callable 3/15/22 @ 104.13 (e) | | | 6,000,000 | | | | 6,461,700 | | |
Tenneco, Inc., 7.88%, 1/15/29, Callable 1/15/24 @ 103.94 (e) | | | 6,000,000 | | | | 6,736,800 | | |
The Enterprise Development Authority, 12.00%, 7/15/24,
Callable 7/15/21 @ 109 (d) (e) | | | 5,000,000 | | | | 5,636,550 | | |
| | | | 36,676,170 | | |
Energy (2.5%): | |
Antero Midstream Partners LP/Antero Midstream Finance Corp.,
5.38%, 9/15/24, Callable 1/27/21 @ 102.69 | | | 3,000,000 | | | | 2,932,590 | | |
Antero Resources Corp. | |
5.63%, 6/1/23, Callable 2/11/21 @ 101.41 | | | 1,000,000 | | | | 977,850 | | |
8.38%, 7/15/26, Callable 1/15/24 @ 104.19 (c) (e) | | | 5,000,000 | | | | 5,087,550 | | |
See notes to financial statements.
67
Victory Portfolios
Victory Floating Rate Fund | | Schedule of Portfolio Investments — continued
December 31, 2020 | |
Security Description | | Principal
Amount | | Value | |
Callon Petroleum Co., 9.00%, 4/1/25, Callable 10/1/22 @ 105 (e) | | $ | 2,000,000 | | | $ | 1,802,920 | | |
Occidental Petroleum Corp., 5.50%, 12/1/25, Callable 9/1/25 @ 100 | | | 1,500,000 | | | | 1,563,240 | | |
QEP Resources, Inc., 5.25%, 5/1/23, Callable 2/1/23 @ 100 | | | 500,000 | | | | 527,350 | | |
Range Resources Corp., 5.00%, 3/15/23, Callable 12/15/22 @ 100 | | | 2,000,000 | | | | 1,960,040 | | |
SM Energy Co., 6.75%, 9/15/26, Callable 9/15/21 @ 103.38 | | | 2,000,000 | | | | 1,629,580 | | |
| | | | 16,481,120 | | |
Financials (3.5%): | |
Capitol Investment Merger Sub 2 LLC, 10.00%, 8/1/24, Callable
8/1/21 @ 105 (e) | | | 2,500,000 | | | | 2,727,325 | | |
Compass Group Diversified Holdings LLC, 8.00%, 5/1/26, Callable
5/1/21 @ 104 (d) (e) | | | 5,000,000 | | | | 5,251,450 | | |
LABL Escrow Issuer LLC, 10.50%, 7/15/27, Callable
7/15/22 @ 105.25 (d) (e) | | | 6,500,000 | | | | 7,324,720 | | |
Wolverine Escrow LLC | |
9.00%, 11/15/26, Callable 11/15/22 @ 106.75 (e) | | | 4,500,000 | | | | 4,258,620 | | |
13.13%, 11/15/27, Callable 11/15/22 @ 109.84 (e) | | | 4,750,000 | | | | 3,822,088 | | |
| | | | 23,384,203 | | |
Health Care (1.9%): | |
Ortho-Clinical Diagnostics, Inc./Ortho-Clinical Diagnostics SA, 7.38%,
6/1/25, Callable 6/1/22 @ 103.69 (d) (e) | | | 2,000,000 | | | | 2,123,680 | | |
Radiology Partners, Inc., 9.25%, 2/1/28, Callable 2/1/23 @ 104.63 (d) (e) | | | 2,500,000 | | | | 2,808,700 | | |
Surgery Center Holdings, Inc., 10.00%, 4/15/27, Callable
4/15/22 @ 105 (e) | | | 500,000 | | | | 550,235 | | |
Tenet Healthcare Corp., 6.13%, 10/1/28, Callable 10/1/23 @ 103.06 (e) | | | 7,000,000 | | | | 7,288,540 | | |
| | | | 12,771,155 | | |
Industrials (2.5%): | |
American Airlines, Inc., 11.75%, 7/15/25 (e) | | | 3,000,000 | | | | 3,460,860 | | |
Apex Tool Group LLC/BC Mountain Finance, Inc., 9.00%, 2/15/23,
Callable 2/11/21 @ 101 (e) | | | 4,000,000 | | | | 3,906,000 | | |
Mileage Plus Holdings LLC/Mileage Plus Intellectual Property Assets Ltd.,
6.50%, 6/20/27, Callable 6/30/23 @ 103.25 (e) | | | 4,000,000 | | | | 4,318,720 | | |
Picasso Finance Sub, Inc., 6.13%, 6/15/25,
Callable 6/15/22 @ 103.06 (d) (e) | | | 1,000,000 | | | | 1,070,040 | | |
SRS Distribution, Inc., 8.25%, 7/1/26, Callable 7/1/21 @ 104.13 (d) (e) | | | 3,000,000 | | | | 3,187,500 | | |
| | | | 15,943,120 | | |
Information Technology (0.4%): | |
Colt Merger Sub, Inc., 8.13%, 7/1/27, Callable 7/1/23 @ 104.06 (e) | | | 2,500,000 | | | | 2,767,050 | | |
Total Corporate Bonds (Cost $103,300,412) | | | 108,022,818 | | |
Yankee Dollars (1.7%) | |
Energy (0.7%): | |
Husky Holding Ltd. PIK, 13.00%, 2/15/25,
Callable 2/15/21 @ 109.75 (d) (e) (f) | | | 4,500,000 | | | | 4,896,810 | | |
Industrials (0.6%): | |
Algeco Global Finance 2 PLC, 10.00%, 8/15/23,
Callable 1/22/21 @ 105 (d) (e) | | | 4,000,000 | | | | 4,070,000 | | |
See notes to financial statements.
68
Victory Portfolios
Victory Floating Rate Fund | | Schedule of Portfolio Investments — continued
December 31, 2020 | |
Security Description | | Principal
Amount | | Value | |
Materials (0.4%): | |
Titan Acquisition Ltd./Titan Co-Borrower LLC, 7.75%, 4/15/26,
Callable 4/15/21 @ 103.88 (d) (e) | | $ | 2,500,000 | | | $ | 2,598,650 | | |
Total Yankee Dollars (Cost $10,894,649) | | | 11,565,460 | | |
Total Investments (Cost $647,177,790) — 97.6% | | | 647,953,874 | | |
Other assets in excess of liabilities — 2.4% | | | 16,008,197 | | |
NET ASSETS — 100.00% | | $ | 663,962,071 | | |
(a) Amount represents less than 0.05% of net assets.
(b) Variable or Floating-Rate Security. Rate disclosed is as of December 31, 2020.
(c) Security or a portion of the security purchased on a delayed-delivery and/or when-issued basis.
(d) All or a portion of this security has been segregated as collateral for securities purchased on a when-issued basis.
(e) Rule 144A security or other security that is restricted as to resale to institutional investors. The Fund's Adviser has deemed this security to be liquid based upon procedures approved by the Board of Trustees. As of December 31, 2020, the fair value of these securities was $109,997,628 and amounted to 16.6% of net assets.
(f) Cash interest 13.0%, PIK interest 13.75%.
(g) The Fund may enter into certain credit agreements all or a portion of which may be unfunded. The Fund is obligated to fund these commitments at the borrower's discretion. At December 31, 2020, the Fund held unfunded or partially unfunded loan commitments of $1,210,861, which included a $2,679 unrealized gain.
(h) Defaulted security.
bps — Basis points
LIBOR — London InterBank Offered Rate
LIBOR01M — 1 Month US Dollar LIBOR, rate disclosed as of December 31, 2020, based on the last reset date of the security
LIBOR02M — 2 Month US Dollar LIBOR, rate disclosed as of December 31, 2020, based on the last reset date of the security
LIBOR03M — 3 Month US Dollar LIBOR, rate disclosed as of December 31, 2020, based on the last reset date of the security
LIBOR06M — 6 Month US Dollar LIBOR, rate disclosed as of December 31, 2020, based on the last reset date of the security
LIBOR12M — 12 Month US Dollar LIBOR, rate disclosed as of December 31, 2020, based on the last reset date of the security
LLC — Limited Liability Company
LP — Limited Partnership
PIK — Payment-in-Kind
PLC — Public Limited Company
See notes to financial statements.
69
Victory Portfolios
Victory Strategic Income Fund | | Schedule of Portfolio Investments
December 31, 2020 | |
Security Description | | Principal
Amount | | Value | |
Asset-Backed Securities (2.6%) | |
CarMax Auto Owner Trust, Series 2018-4, Class A3, 3.36%, 9/15/23,
Callable 12/15/22 @ 100 | | $ | 268,738 | | | $ | 274,669 | | |
Enterprise Fleet Financing LLC, Series 2019-1, Class A2, 2.98%,
10/22/24 (a) | | | 105,978 | | | | 107,750 | | |
Hyundai Auto Receivables Trust, Series 2019-B, Class A4, 2.00%, 4/15/25,
Callable 9/15/23 @ 100 (b) | | | 400,000 | | | | 415,196 | | |
Taco Bell Funding LLC, Series 2018-1A, Class A2I, 4.32%, 11/25/48,
Callable 5/25/21 @ 100 (a) | | | 294,000 | | | | 298,657 | | |
Verizon Owner Trust, Series 2017-3A, Class B, 2.38%, 4/20/22,
Callable 2/20/21 @ 100 (a) (b) | | | 320,721 | | | | 321,272 | | |
Verizon Owner Trust, Series 2019-C, Class A1A, 1.94%, 4/22/24,
Callable 12/20/22 @ 100 (b) | | | 1,296,000 | | | | 1,323,532 | | |
Total Asset-Backed Securities (Cost $2,742,670) | | | 2,741,076 | | |
Collateralized Mortgage Obligations (2.9%) | |
CGMS Commercial Mortgage Trust, Series 2017-B1, Class A4, 3.46%,
8/15/50 (b) | | | 590,000 | | | | 668,647 | | |
COMM Mortgage Trust, Series 2015-PC1, Class A5, 3.90%, 7/10/50,
Callable 5/10/25 @ 100 (b) | | | 250,000 | | | | 279,692 | | |
GS Mortgage Securities Trust, Series 2013-GC12, Class AS, 3.38%,
6/10/46, Callable 5/10/23 @ 100 | | | 300,000 | | | | 313,198 | | |
GS Mortgage Securities Trust, Series 2012-GCJ7, Class A4, 3.38%,
5/10/45, Callable 2/10/22 @ 100 (b) | | | 499,213 | | | | 506,072 | | |
GS Mortgage Securities Trust, Series 2019-GC42, Class A4, 3.00%,
9/1/52 (b) | | | 690,000 | | | | 770,139 | | |
Hilton USA Trust, Series 2016-SFP, Class A, 2.83%, 11/5/35 (a) (b) | | | 500,000 | | | | 501,352 | | |
Total Collateralized Mortgage Obligations (Cost $2,937,232) | | | 3,039,100 | | |
Corporate Bonds (51.5%) | |
Communication Services (7.1%): | |
AT&T, Inc. | |
4.30%, 2/15/30, Callable 11/15/29 @ 100 (b) | | | 1,000,000 | | | | 1,193,570 | | |
3.50%, 9/15/53, Callable 3/15/53 @ 100 (a) (b) | | | 900,000 | | | | 904,995 | | |
Charter Communications Operating LLC/Charter Communications
Operating Capital, 2.30%, 2/1/32, Callable 11/1/31 @ 100 | | | 1,700,000 | | | | 1,697,756 | | |
T-Mobile USA, Inc. | |
3.88%, 4/15/30, Callable 1/15/30 @ 100 (a) (b) | | | 1,300,000 | | | | 1,502,917 | | |
4.50%, 4/15/50, Callable 10/15/49 @ 100 (a) | | | 170,000 | | | | 210,662 | | |
3.30%, 2/15/51, Callable 8/15/50 @ 100 (a) | | | 300,000 | | | | 308,250 | | |
ViacomCBS, Inc. | |
4.20%, 5/19/32, Callable 2/19/32 @ 100 (b) | | | 950,000 | | | | 1,141,957 | | |
4.38%, 3/15/43 | | | 150,000 | | | | 177,120 | | |
4.95%, 5/19/50, Callable 11/19/49 @ 100 (c) | | | 250,000 | | | | 324,578 | | |
| | | | 7,461,805 | | |
See notes to financial statements.
70
Victory Portfolios
Victory Strategic Income Fund | | Schedule of Portfolio Investments — continued
December 31, 2020 | |
Security Description | | Principal
Amount | | Value | |
Consumer Discretionary (3.0%): | |
General Motors Co., 6.80%, 10/1/27, Callable 8/1/27 @ 100 (b) | | $ | 1,420,000 | | | $ | 1,826,603 | | |
Hasbro, Inc., 3.90%, 11/19/29, Callable 8/19/29 @ 100 (b) (c) | | | 1,250,000 | | | | 1,419,088 | | |
| | | | 3,245,691 | | |
Consumer Staples (3.4%): | |
BAT Capital Corp. | |
3.46%, 9/6/29, Callable 6/6/29 @ 100 (b) | | | 1,500,000 | | | | 1,653,150 | | |
2.73%, 3/25/31, Callable 12/25/30 @ 100 | | | 300,000 | | | | 310,569 | | |
Campbell Soup Co., 3.13%, 4/24/50, Callable 10/24/49 @ 100 | | | 300,000 | | | | 317,409 | | |
Kraft Heinz Foods Co., 4.25%, 3/1/31, Callable 12/1/30 @ 100 (a) | | | 1,200,000 | | | | 1,340,220 | | |
| | | | 3,621,348 | | |
Energy (10.8%): | |
Devon Energy Corp., 5.00%, 6/15/45, Callable 12/15/44 @ 100 (c) | | | 500,000 | | | | 586,230 | | |
Halliburton Co., 2.92%, 3/1/30, Callable 12/1/29 @ 100 | | | 1,300,000 | | | | 1,377,779 | | |
Hess Corp., 4.30%, 4/1/27, Callable 1/1/27 @ 100 (b) | | | 1,400,000 | | | | 1,543,010 | | |
Marathon Oil Corp., 4.40%, 7/15/27, Callable 4/15/27 @ 100 (b) | | | 1,550,000 | | | | 1,721,491 | | |
Marathon Petroleum Corp., 4.50%, 4/1/48, Callable 10/1/47 @ 100 | | | 250,000 | | | | 278,543 | | |
| MPLX LP | |
4.80%, 2/15/29, Callable 11/15/28 @ 100 (b) (c) | | | 1,500,000 | | | | 1,802,084 | | |
5.50%, 2/15/49, Callable 8/15/48 @ 100 | | | 100,000 | | | | 131,817 | | |
ONEOK, Inc., 3.40%, 9/1/29, Callable 6/1/29 @ 100 (b) | | | 1,400,000 | | | | 1,502,214 | | |
The Williams Companies, Inc., 3.50%, 11/15/30, Callable
8/15/30 @ 100 (c) | | | 1,000,000 | | | | 1,134,040 | | |
Transcontinental Gas Pipe Line Co. LLC, 3.95%, 5/15/50, Callable
11/15/49 @ 100 | | | 500,000 | | | | 565,541 | | |
Valero Energy Corp., 4.00%, 4/1/29, Callable 1/1/29 @ 100 (b) | | | 900,000 | | | | 1,012,806 | | |
| | | | 11,655,555 | | |
Financials (10.4%): | |
Apollo Management Holdings LP, 4.87%, 2/15/29, Callable
11/15/28 @ 100 (a) | | | 1,000,000 | | | | 1,187,920 | | |
Arch Capital Group Ltd., 3.64%, 6/30/50, Callable 12/30/49 @ 100 (c) | | | 900,000 | | | | 1,044,053 | | |
Bank of America Corp., 2.83%, 10/24/51, MTN, Callable
10/24/50 @ 100 (d) | | | 1,000,000 | | | | 1,039,560 | | |
CNA Financial Corp., 2.05%, 8/15/30, Callable 5/15/30 @ 100 (b) (c) | | | 2,010,000 | | | | 2,071,003 | | |
Ford Motor Credit Co. LLC, 4.00%, 11/13/30, Callable 8/13/30 @ 100 | | | 900,000 | | | | 945,603 | | |
General Motors Financial Co., Inc., 3.60%, 6/21/30, Callable
3/21/30 @ 100 (b) (c) | | | 900,000 | | | | 1,001,430 | | |
Huntington Bancshares, Inc., 2.55%, 2/4/30, Callable
11/4/29 @ 100 (b) | | | 600,000 | | | | 644,640 | | |
Jefferies Group LLC, 2.75%, 10/15/32, Callable 7/15/32 @ 100 (b) | | | 1,200,000 | | | | 1,258,308 | | |
Wells Fargo & Co. | |
3.07% (SOFR+253bps), 4/30/41, Callable 4/30/40 @ 100 (d) | | | 250,000 | | | | 271,063 | | |
3.90%, 5/1/45 (b) | | | 500,000 | | | | 622,300 | | |
Willis North America, Inc., 3.88%, 9/15/49, Callable 3/15/49 @ 100 | | | 850,000 | | | | 1,040,630 | | |
| | | | 11,126,510 | | |
See notes to financial statements.
71
Victory Portfolios
Victory Strategic Income Fund | | Schedule of Portfolio Investments — continued
December 31, 2020 | |
Security Description | | Principal
Amount | | Value | |
Health Care (5.1%): | |
AbbVie, Inc. | |
3.20%, 11/21/29, Callable 8/21/29 @ 100 | | $ | 1,000,000 | | | $ | 1,126,400 | | |
4.25%, 11/21/49, Callable 5/21/49 @ 100 | | | 800,000 | | | | 1,006,240 | | |
Becton Dickinson & Co. | |
2.82%, 5/20/30, Callable 2/20/30 @ 100 (b) (c) | | | 1,000,000 | | | | 1,099,730 | | |
3.79%, 5/20/50, Callable 11/20/49 @ 100 | | | 600,000 | | | | 713,028 | | |
CVS Health Corp. | |
3.25%, 8/15/29, Callable 5/15/29 @ 100 (b) | | | 750,000 | | | | 844,583 | | |
4.25%, 4/1/50, Callable 10/1/49 @ 100 (b) | | | 500,000 | | | | 625,375 | | |
| | | | 5,415,356 | | |
Industrials (5.8%): | |
General Electric Co. | |
3.63%, 5/1/30, Callable 2/1/30 @ 100 | | | 1,700,000 | | | | 1,937,779 | | |
4.35%, 5/1/50, Callable 11/1/49 @ 100 | | | 300,000 | | | | 362,904 | | |
Northrop Grumman Corp., 5.25%, 5/1/50, Callable
11/1/49 @ 100 (b) | | | 400,000 | | | | 594,272 | | |
The Boeing Co. | |
5.04%, 5/1/27, Callable 3/1/27 @ 100 (b) | | | 1,300,000 | | | | 1,521,065 | | |
5.15%, 5/1/30, Callable 2/1/30 @ 100 | | | 1,400,000 | | | | 1,694,546 | | |
| | | | 6,110,566 | | |
Information Technology (3.9%): | |
Broadcom, Inc. | |
4.11%, 9/15/28, Callable 6/15/28 @ 100 (b) | | | 736,000 | | | | 841,807 | | |
4.75%, 4/15/29, Callable 1/15/29 @ 100 (b) | | | 1,300,000 | | | | 1,550,900 | | |
KLA Corp. | |
4.10%, 3/15/29, Callable 12/15/28 @ 100 (b) | | | 750,000 | | | | 898,860 | | |
3.30%, 3/1/50, Callable 8/28/49 @ 100 | | | 750,000 | | | | 846,233 | | |
| | | | 4,137,800 | | |
Materials (2.0%): | |
Steel Dynamics, Inc., 3.45%, 4/15/30, Callable 1/15/30 @ 100 (b) | | | 1,900,000 | | | | 2,150,724 | | |
Total Corporate Bonds (Cost $52,673,222) | | | 54,925,355 | | |
Residential Mortgage-Backed Securities (0.2%) | |
Bank of America Funding Corp., Series 2004-2, Class 1CB1, 5.75%,
9/20/34, Callable 3/20/28 @ 100 (b) | | | 58,841 | | | | 61,411 | | |
Countrywide Home Loans, Inc., Series 2004-5, Class 2A9, 5.25%,
5/25/34, Callable 1/25/21 @ 100 (b) | | | 83,018 | | | | 88,528 | | |
GSR Mortgage Loan Trust, Series 2004-15F, Class 5A1, 5.50%,
10/25/20, Callable 5/25/31 @ 100 (b) | | | 1,665 | | | | 1,654 | | |
JPMorgan Mortgage Trust, Series 2005-A1, Class 6T1, 3.34%,
2/25/35, Callable 1/25/21 @ 100 (b) (e) | | | 18,470 | | | | 18,470 | | |
Total Residential Mortgage-Backed Securities (Cost $164,855) | | | 170,063 | | |
See notes to financial statements.
72
Victory Portfolios
Victory Strategic Income Fund | | Schedule of Portfolio Investments — continued
December 31, 2020 | |
| Security Description | | Principal
Amount | | Value | |
Yankee Dollars (9.3%) | |
Communication Services (1.5%): | |
Rogers Communications, Inc., 3.70%, 11/15/49,
Callable 5/15/49 @ 100 | | $ | 400,000 | | | $ | 471,752 | | |
Vodafone Group PLC | |
4.38%, 2/19/43 (b) | | | 650,000 | | | | 806,566 | | |
5.25%, 5/30/48 | | | 250,000 | | | | 347,105 | | |
| | | | 1,625,423 | | |
Financials (4.5%): | |
Credit Suisse Group AG, 3.87% (LIBOR03M+141bps), 1/12/29,
Callable 1/12/28 @ 100 (a) (b) (d) | | | 1,750,000 | | | | 1,981,613 | | |
NXP BV/NXP Funding LLC/NXP USA, Inc., 3.40%, 5/1/30,
Callable 2/1/30 @ 100 (a) (b) | | | 1,650,000 | | | | 1,874,499 | | |
Sumitomo Mitsui Financial Group, Inc., 3.20%, 9/17/29 (b) | | | 750,000 | | | | 818,798 | | |
| | | | 4,674,910 | | |
Industrials (1.5%): | |
AerCap Ireland Capital DAC/AerCap Global Aviation Trust, 3.65%,
7/21/27, Callable 4/21/27 @ 100 (b) | | | 1,500,000 | | | | 1,624,335 | | |
Materials (1.8%): | |
Vale Overseas Ltd., 3.75%, 7/8/30, Callable 4/8/30 @ 100 (b) (c) | | | 1,800,000 | | | | 2,008,151 | | |
Total Yankee Dollars (Cost $9,409,145) | | | 9,932,819 | | |
U.S. Government Mortgage-Backed Agencies (0.1%) | |
Federal National Mortgage Association | |
Series 2018-M1, Class A2, 2.98%, 12/25/27 (e) | | | 65,000 | | | | 73,964 | | |
3.50%, 7/1/43 (b) | | | 65,690 | | | | 71,216 | | |
| | | | 145,180 | | |
Total U.S. Government Mortgage-Backed Agencies (Cost $129,775) | | | 145,180 | | |
U.S. Treasury Obligations (24.1%) | |
U.S. Treasury Bonds | |
2.25%, 8/15/49 | | | 175,000 | | | | 200,402 | | |
2.38%, 11/15/49 | | | 190,000 | | | | 223,339 | | |
1.38%, 8/15/50 | | | 500,000 | | | | 468,281 | | |
U.S. Treasury Notes | |
0.13%, 4/30/22 (b) | | | 11,960,000 | | | | 11,962,336 | | |
0.13%, 6/30/22 (b) | | | 6,300,000 | | | | 6,300,984 | | |
0.13%, 9/30/22 (b) | | | 850,000 | | | | 850,033 | | |
0.13%, 11/30/22 | | | 1,100,000 | | | | 1,100,086 | | |
1.75%, 7/31/24 (b) | | | 850,000 | | | | 896,551 | | |
1.25%, 8/31/24 | | | 100,000 | | | | 103,727 | | |
0.25%, 6/30/25 (b) | | | 3,550,000 | | | | 3,540,848 | | |
Total U.S. Treasury Obligations (Cost $25,577,468) | | | 25,646,587 | | |
See notes to financial statements.
73
Victory Portfolios
Victory Strategic Income Fund | | Schedule of Portfolio Investments — continued
December 31, 2020 | |
Security Description | | Shares or
Principal
Amount | | Value | |
Exchange-Traded Funds (6.9%) | |
iShares iBoxx High Yield Corporate Bond ETF (b) | | $ | 30,000 | | | $ | 2,619,000 | | |
SPDR Bloomberg Barclays High Yield Bond ETF (b) | | | 25,000 | | | | 2,723,500 | | |
VanEck Vectors Fallen Angel High Yield Bond ETF (b) | | | 63,000 | | | | 2,022,300 | | |
Total Exchange-Traded Funds (Cost $7,016,024) | | | 7,364,800 | | |
Collateral for Securities Loaned^ (4.2%) | |
BlackRock Liquidity Funds TempFund Portfolio,
Institutional Class, 0.08% (f) | | | 77,643 | | | | 77,643 | | |
Fidelity Investments Money Market Government Portfolio,
Class I, 0.01% (f) | | | 2,667,491 | | | | 2,667,491 | | |
Goldman Sachs Financial Square Prime Obligations Fund,
Institutional Class, 0.04% (f) | | | 38,748 | | | | 38,748 | | |
JPMorgan Prime Money Market Fund, Capital Class, 0.12% (f) | | | 308,962 | | | | 308,962 | | |
Morgan Stanley Institutional Liquidity Prime Portfolio,
Institutional Class, 0.09% (f) | | | 1,389,153 | | | | 1,389,153 | | |
Total Collateral for Securities Loaned (Cost $4,481,997) | | | 4,481,997 | | |
Total Investments (Cost $105,132,388) — 101.8% | | | 108,446,977 | | |
Liabilities in excess of other assets — (1.8)% | | | (1,927,644 | ) | |
NET ASSETS — 100.00% | | $ | 106,519,333 | | |
^ Purchased with cash collateral from securities on loan.
(a) Rule 144A security or other security that is restricted as to resale to institutional investors. The Fund's Adviser has deemed this security to be liquid based upon procedures approved by the Board of Trustees. As of December 31, 2020, the fair value of these securities was $10,540,107 and amounted to 9.9% of net assets.
(b) All or a portion of this security has been segregated as collateral for derivative instruments.
(c) All or a portion of this security is on loan.
(d) Variable or Floating-Rate Security. Rate disclosed is as of December 31, 2020.
(e) The rate for certain asset-backed and mortgage-backed securities may vary based on factors relating to the pool of assets underlying the security. The rate disclosed is the rate in effect at December 31, 2020.
(f) Rate disclosed is the daily yield on December 31, 2020.
bps — Basis points
ETF — Exchange-Traded Fund
LIBOR — London InterBank Offered Rate
LIBOR03M — 3 Month US Dollar LIBOR, rate disclosed as of December 31, 2020, based on the last reset date of the security
LLC — Limited Liability Company
LP — Limited Partnership
MTN — Medium Term Note
PLC — Public Limited Company
SOFR — Secured Overnight Financing Rate
See notes to financial statements.
74
Victory Portfolios
Victory Strategic Income Fund | | Schedule of Portfolio Investments — continued
December 31, 2020 | |
Futures Contracts Purchased
| | | Number of
Contracts | | Expiration
Date | | Notional
Amount | | Value | | Unrealized
Appreciation
(Depreciation) | |
2-Year U.S. Treasury Note Futures | | | 35 | | | 3/31/21 | | $ | 7,727,370 | | | $ | 7,734,180 | | | $ | 6,810 | | |
30-Year U.S. Treasury Bond Futures | | | 75 | | | 3/22/21 | | | 13,078,961 | | | | 12,989,062 | | | | (89,899 | ) | |
| | | | | | | | | | | $ | (83,089 | ) | |
Futures Contracts Sold
| | | Number of
Contracts | | Expiration
Date | | Notional
Amount | | Value | | Unrealized
Appreciation
(Depreciation) | |
10-Year U.S. Treasury Note Futures | | | 161 | | | 3/22/21 | | $ | 25,238,544 | | | $ | 25,173,860 | | | $ | 64,684 | | |
10-Year U.S. Treasury Note Future | | | 1 | | | 3/22/21 | | | 137,294 | | | | 138,078 | | | | (784 | ) | |
Ultra Long Term U.S. Treasury Bond Futures | | | 9 | | | 3/22/21 | | | 1,913,283 | | | | 1,922,062 | | | | (8,779 | ) | |
| | | | | | | | | | | $ | 55,121 | | |
| | | Total unrealized appreciation | | | | | | | | $ | 71,494 | | |
| | | Total unrealized depreciation | | | | | | | | | (99,462 | ) | |
| | | Total net unrealized appreciation (depreciation) | | | | | | | | $ | (27,968 | ) | |
See notes to financial statements.
75
Victory Portfolios | | Statements of Assets and Liabilities
December 31, 2020 | |
| | | Victory INCORE
Investment Quality
Bond Fund | | Victory INCORE
Low Duration
Bond Fund | | Victory High
Yield Fund | |
ASSETS: | |
Investments, at value (Cost $28,200,596,
$250,710,862 and $255,131,343) | | $ | 29,811,339 | (a) | | $ | 256,198,370 | (b) | | $ | 266,319,162 | (c) | |
Cash and cash equivalents | | | 240,065 | | | | 1,228,450 | | | | 8,940,427 | | |
Deposit with brokers for futures contracts | | | 160,693 | | | | 999,536 | | | | — | | |
Deposit with brokers for swap agreements | | | 251,831 | | | | 1,847,277 | | | | — | | |
Receivables: | |
Interest and dividends | | | 192,793 | | | | 1,189,363 | | | | 3,966,692 | | |
Capital shares issued | | | 52,954 | | | | 179,637 | | | | 841,052 | | |
Investments sold | | | 56,713 | | | | 2,000,951 | | | | 1,221,697 | | |
Variation margin on open futures contracts | | | 2,906 | | | | — | | | | — | | |
From Adviser | | | 23,178 | | | | 21,150 | | | | 46,445 | | |
Prepaid expenses | | | 14,298 | | | | 19,299 | | | | 12,891 | | |
Total Assets | | | 30,806,770 | | | | 263,684,033 | | | | 281,348,366 | | |
LIABILITIES: | |
Payables: | |
Collateral received on loaned securities | | | 321,882 | | | | 2,086,831 | | | | 23,143,667 | | |
Distributions | | | 1,284 | | | | 37,959 | | | | 215,028 | | |
Investments purchased | | | 106,281 | | | | 864,753 | | | | 4,794,364 | | |
Capital shares redeemed | | | 11,931 | | | | 163,066 | | | | 344,721 | | |
Variation margin on open futures contracts | | | 328 | | | | 8,281 | | | | — | | |
Accrued expenses and other payables: | |
Investment advisory fees | | | 12,890 | | | | 97,781 | | | | 124,910 | | |
Administration fees | | | 1,587 | | | | 13,284 | | | | 13,043 | | |
Custodian fees | | | 1,264 | | | | 3,045 | | | | 4,816 | | |
Transfer agent fees | | | 8,034 | | | | 39,077 | | | | 39,044 | | |
Compliance fees | | | 21 | | | | 175 | | | | 168 | | |
Trustees' fees | | | 1 | | | | 10 | | | | 3 | | |
| 12b-1 fees | | | 4,213 | | | | 18,244 | | | | 19,542 | | |
Other accrued expenses | | | 15,518 | | | | 31,533 | | | | 30,537 | | |
Total Liabilities | | | 485,234 | | | | 3,364,039 | | | | 28,729,843 | | |
NET ASSETS: | |
Capital | | | 28,519,028 | | | | 285,708,012 | | | | 248,869,810 | | |
Total accumulated earnings/(loss) | | | 1,802,508 | | | | (25,388,018 | ) | | | 3,748,713 | | |
Net Assets | | $ | 30,321,536 | | | $ | 260,319,994 | | | $ | 252,618,523 | | |
Net Assets | |
Class A Shares | | $ | 21,422,701 | | | $ | 70,357,238 | | | $ | 38,735,454 | | |
Class C Shares | | | 2,526,134 | | | | 23,504,391 | | | | 25,957,459 | | |
Class R Shares | | | 3,602,712 | | | | 1,128,526 | | | | 19,248,274 | | |
Class Y Shares | | | 2,769,989 | | | | 165,329,839 | | | | 168,677,336 | | |
Total | | $ | 30,321,536 | | | $ | 260,319,994 | | | $ | 252,618,523 | | |
Shares (unlimited number of shares authorized
with a par value of $0.001 per share): | |
Class A Shares | | | 2,084,173 | | | | 6,896,953 | | | | 5,669,833 | | |
Class C Shares | | | 245,876 | | | | 2,304,939 | | | | 3,791,432 | | |
Class R Shares | | | 349,629 | | | | 110,650 | | | | 2,810,107 | | |
Class Y Shares | | | 269,807 | | | | 16,201,081 | | | | 24,812,779 | | |
Total | | | 2,949,485 | | | | 25,513,623 | | | | 37,084,151 | | |
Net asset value, offering (except Class A Shares)
and redemption price per share: | |
Class A Shares | | $ | 10.28 | | | $ | 10.20 | | | $ | 6.83 | | |
Class C Shares (d) | | | 10.27 | | | | 10.20 | | | | 6.85 | | |
Class R Shares | | | 10.30 | | | | 10.20 | | | | 6.85 | | |
Class Y Shares | | | 10.27 | | | | 10.20 | | | | 6.80 | | |
Maximum Sales Charge — Class A Shares | | | 2.25 | % | | | 2.25 | % | | | 2.25 | % | |
Maximum offering price
(100%/(100%-maximum sales charge) of
net asset value adjusted to the nearest
cent) per share — Class A Shares | | $ | 10.52 | | | $ | 10.43 | | | $ | 6.99 | | |
(a) Includes $314,857 of securities on loan.
(b) Includes $2,032,604 of securities on loan.
(c) Includes $22,083,156 of securities on loan.
(d) Redemption price per share varies by the length of time shares are held.
See notes to financial statements.
76
Victory Portfolios | | Statements of Assets and Liabilities
December 31, 2020 | |
| | | Victory
Tax-Exempt
Fund | | Victory
High Income
Municipal Bond
Fund | | Victory
Floating Rate
Fund | |
ASSETS: | |
Investments, at value (Cost $57,634,528,
$42,712,800 and $647,177,790) | | $ | 62,809,871 | (a) | | $ | 44,896,824 | | | $ | 647,953,874 | | |
Cash and cash equivalents | | | 53,106 | | | | 118,406 | | | | 44,050,340 | | |
Receivables: | |
Interest and dividends | | | 589,479 | | | | 454,311 | | | | 4,252,165 | | |
Capital shares issued | | | 4,791 | | | | 126,535 | | | | 1,529,320 | | |
Investments sold | | | — | | | | — | | | | 12,098,668 | | |
From Adviser | | | 21,057 | | | | 25,344 | | | | 133,500 | | |
Prepaid expenses | | | 14,111 | | | | 26,918 | | | | 49,610 | | |
Total Assets | | | 63,492,415 | | | | 45,648,338 | | | | 710,067,477 | | |
LIABILITIES: | |
Payables: | |
Collateral received on loaned securities | | | 1,867,505 | | | | — | | | | — | | |
Distributions | | | 10,717 | | | | 8,783 | | | | 319,730 | | |
Investments purchased | | | — | | | | — | | | | 43,788,160 | | |
Capital shares redeemed | | | 55,317 | | | | 62,367 | | | | 1,369,215 | | |
Accrued expenses and other payables: | |
Investment advisory fees | | | 26,183 | | | | 17,868 | | | | 353,021 | | |
Administration fees | | | 3,214 | | | | 2,180 | | | | 32,997 | | |
Custodian fees | | | 1,284 | | | | 1,203 | | | | 40,676 | | |
Transfer agent fees | | | 10,239 | | | | 5,985 | | | | 79,428 | | |
Compliance fees | | | 43 | | | | 28 | | | | 435 | | |
Trustees' fees | | | 2 | | | | 2 | | | | 427 | | |
| 12b-1 fees | | | 6,356 | | | | 6,850 | | | | 59,372 | | |
Other accrued expenses | | | 15,465 | | | | 13,878 | | | | 61,945 | | |
Total Liabilities | | | 1,996,325 | | | | 119,144 | | | | 46,105,406 | | |
NET ASSETS: | |
Capital | | | 56,584,262 | | | | 43,439,822 | | | | 846,913,445 | | |
Total accumulated earnings/(loss) | | | 4,911,828 | | | | 2,089,372 | | | | (182,951,374 | ) | |
Net Assets | | $ | 61,496,090 | | | $ | 45,529,194 | | | $ | 663,962,071 | | |
Net Assets | |
Class A Shares | | $ | 32,001,358 | | | $ | 26,330,042 | | | $ | 164,863,850 | | |
Class C Shares | | | 6,496,664 | | | | 9,377,811 | | | | 94,884,537 | | |
Class R Shares | | | — | | | | — | | | | 299,667 | | |
Class Y Shares | | | 22,998,068 | | | | 9,681,538 | | | | 403,851,643 | | |
Member Class | | | — | | | | 139,803 | | | | 62,374 | | |
Total | | $ | 61,496,090 | | | $ | 45,529,194 | | | $ | 663,962,071 | | |
Shares (unlimited number of shares authorized
with a par value of $0.001 per share): | |
Class A Shares | | | 3,219,448 | | | | 2,429,836 | | | | 17,654,463 | | |
Class C Shares | | | 653,891 | | | | 865,502 | | | | 10,157,617 | | |
Class R Shares | | | — | | | | — | | | | 32,104 | | |
Class Y Shares | | | 2,314,678 | | | | 893,408 | | | | 43,215,368 | | |
Member Class | | | — | | | | 12,898 | | | | 6,681 | | |
Total | | | 6,188,017 | | | | 4,201,644 | | | | 71,066,233 | | |
Net asset value, offering (except Class A Shares)
and redemption price per share: | |
Class A Shares | | $ | 9.94 | | | $ | 10.84 | | | $ | 9.34 | | |
Class C Shares (b) | | | 9.94 | | | | 10.84 | | | | 9.34 | | |
Class R Shares | | | — | | | | — | | | | 9.33 | | |
Class Y Shares | | | 9.94 | | | | 10.84 | | | | 9.35 | | |
Member Class | | | — | | | | 10.84 | | | | 9.34 | | |
Maximum Sales Charge — Class A Shares | | | 2.25 | % | | | 2.25 | % | | | 2.25 | % | |
Maximum offering price
(100%/(100%-maximum sales charge) of
net asset value adjusted to the nearest cent)
per share — Class A Shares | | $ | 10.17 | | | $ | 11.09 | | | $ | 9.55 | | |
(a) Includes $1,827,738 of securities on loan.
(b) Redemption price per share varies by the length of time shares are held.
See notes to financial statements.
77
Victory Portfolios | | Statement of Assets and Liabilities
December 31, 2020 | |
| | | Victory
Strategic
Income Fund | |
ASSETS: | |
Investments, at value (Cost $105,132,388) | | $ | 108,446,977 | (a) | |
Cash and cash equivalents | | | 1,319,299 | | |
Deposit with brokers for futures contracts | | | 389,393 | | |
Receivables: | |
Interest and dividends | | | 593,296 | | |
Capital shares issued | | | 887,179 | | |
Investments sold | | | 2,327 | | |
Variation margin on open futures contracts | | | 26,602 | | |
From Adviser | | | 38,451 | | |
Prepaid expenses | | | 19,437 | | |
Total Assets | | | 111,722,961 | | |
LIABILITIES: | |
Payables: | |
Collateral received on loaned securities | | | 4,481,997 | | |
Distributions | | | 47,577 | | |
Investments purchased | | | 500,099 | | |
Capital shares redeemed | | | 28,817 | | |
Variation margin on open futures contracts | | | 42,078 | | |
Accrued expenses and other payables: | |
Investment advisory fees | | | 53,268 | | |
Administration fees | | | 5,504 | | |
Custodian fees | | | 2,348 | | |
Transfer agent fees | | | 13,493 | | |
Compliance fees | | | 72 | | |
Trustees' fees | | | 2 | | |
| 12b-1 fees | | | 9,130 | | |
Other accrued expenses | | | 19,243 | | |
Total Liabilities | | | 5,203,628 | | |
NET ASSETS: | |
Capital | | | 102,349,480 | | |
Total accumulated earnings/(loss) | | | 4,169,853 | | |
Net Assets | | $ | 106,519,333 | | |
Net Assets | |
Class A Shares | | $ | 40,993,244 | | |
Class C Shares | | | 9,476,559 | | |
Class R Shares | | | 2,989,106 | | |
Class Y Shares | | | 53,060,424 | | |
Total | | $ | 106,519,333 | | |
Shares (unlimited number of shares authorized with a par value of $0.001 per share): | |
Class A Shares | | | 3,742,089 | | |
Class C Shares | | | 860,980 | | |
Class R Shares | | | 271,382 | | |
Class Y Shares | | | 4,870,757 | | |
Total | | | 9,745,208 | | |
Net asset value, offering (except Class A Shares) and redemption price per share: | |
Class A Shares | | $ | 10.95 | | |
Class C Shares (b) | | | 11.01 | | |
Class R Shares | | | 11.01 | | |
Class Y Shares | | | 10.89 | | |
Maximum Sales Charge — Class A Shares | | | 2.25 | % | |
Maximum offering price
(100%/(100%-maximum
sales charge) of net asset value adjusted to the
nearest cent) per share — Class A Shares | | $ | 11.20 | | |
(a) Includes $4,381,534 of securities on loan.
(b) Redemption price per share varies by the length of time shares are held.
See notes to financial statements.
78
Victory Portfolios | | Statements of Operations
For the Year Ended December 31, 2020 | |
| | | Victory INCORE
Investment Quality
Bond Fund | | Victory INCORE
Low Duration
Bond Fund | | Victory High
Yield Fund | |
Investment Income: | |
Dividends | | $ | 11,210 | | | $ | 92,222 | | | $ | 19,840 | | |
Interest | | | 766,093 | | | | 5,703,257 | | | | 13,804,040 | | |
Securities lending (net of fees) | | | 1,356 | | | | 4,918 | | | | 99,641 | | |
Total Income | | | 778,659 | | | | 5,800,397 | | | | 13,923,521 | | |
Expenses: | |
Investment advisory fees | | | 155,528 | | | | 1,149,333 | | | | 1,216,833 | | |
Administration fees | | | 18,952 | | | | 155,505 | | | | 123,363 | | |
Sub-Administration fees | | | 14,132 | | | | 14,132 | | | | 14,132 | | |
12b-1 fees — Class A Shares | | | 54,247 | | | | 162,183 | | | | 80,682 | | |
12b-1 fees — Class C Shares | | | 26,939 | | | | 311,301 | | | | 214,521 | | |
12b-1 fees — Class R Shares | | | 17,312 | | | | 5,458 | | | | 89,746 | | |
Custodian fees | | | 9,038 | | | | 17,456 | | | | 31,524 | | |
Transfer agent fees — Class A Shares | | | 35,772 | | | | 69,124 | | | | 28,131 | | |
Transfer agent fees — Class C Shares | | | 3,340 | | | | 31,277 | | | | 6,833 | | |
Transfer agent fees — Class R Shares | | | 6,638 | | | | 1,486 | | | | 4,091 | | |
Transfer agent fees — Class Y Shares | | | 4,145 | | | | 166,591 | | | | 197,488 | | |
Trustees' fees | | | 3,944 | | | | 22,001 | | | | 16,168 | | |
Compliance fees | | | 275 | | | | 2,257 | | | | 1,744 | | |
Legal and audit fees | | | 12,715 | | | | 28,818 | | | | 27,260 | | |
State registration and filing fees | | | 62,830 | | | | 72,000 | | | | 77,925 | | |
Interfund lending fees | | | — | | | | 64 | | | | — | | |
Other expenses | | | 19,889 | | | | 50,257 | | | | 45,619 | | |
Recoupment of prior expenses
waived/reimbursed by Adviser | | | — | | | | — | | | | 1,279 | | |
Total Expenses | | | 445,696 | | | | 2,259,243 | | | | 2,177,339 | | |
Expenses waived/reimbursed by Adviser | | | (136,293 | ) | | | (208,566 | ) | | | (253,784 | ) | |
Net Expenses | | | 309,403 | | | | 2,050,677 | | | | 1,923,555 | | |
Net Investment Income (Loss) | | | 469,256 | | | | 3,749,720 | | | | 11,999,966 | | |
Realized/Unrealized Gains (Losses) from
Investments: | |
Net realized gains (losses) from
investment securities | | | 789,843 | | | | 901,300 | | | | (286,139 | ) | |
Net realized gains (losses) from futures contracts | | | 248,381 | | | | 1,052,349 | | | | — | | |
Net realized gains (losses) from swap agreements | | | (82,185 | ) | | | (401,936 | ) | | | — | | |
Net change in unrealized appreciation/depreciation
on investment securities | | | 891,004 | | | | 4,239,328 | | | | 6,963,613 | | |
Net change in unrealized appreciation/depreciation
on futures contracts | | | 7,308 | | | | (23,960 | ) | | | — | | |
Net change in unrealized appreciation/depreciation
on swap agreements | | | (14,094 | ) | | | (120,813 | ) | | | — | | |
Net realized/unrealized gains (losses)
on investments | | | 1,840,257 | | | | 5,646,268 | | | | 6,677,474 | | |
Change in net assets resulting from operations | | $ | 2,309,513 | | | $ | 9,395,988 | | | $ | 18,677,440 | | |
See notes to financial statements.
79
Victory Portfolios | | Statements of Operations
For the Year Ended December 31, 2020 | |
| | | Victory
Tax-Exempt
Fund | | Victory
High Income
Municipal Bond
Fund | | Victory
Floating Rate
Fund | |
Investment Income: | |
Dividends | | $ | 22,998 | | | $ | 37,301 | | | $ | 2,555 | | |
| Interest | | | 2,327,743 | | | | 1,851,365 | | | | 35,099,847 | | |
Securities lending (net of fees) | | | 4,409 | | | | — | | | | — | | |
Total Income | | | 2,355,150 | | | | 1,888,666 | | | | 35,102,402 | | |
Expenses: | |
Investment advisory fees | | | 308,758 | | | | 199,920 | | | | 3,489,758 | | |
Administration fees | | | 37,581 | | | | 24,326 | | | | 326,207 | | |
Sub-Administration fees | | | 13,300 | | | | 13,049 | | | | 14,132 | | |
12b-1 fees — Class A Shares | | | 75,952 | | | | 48,778 | | | | 340,656 | | |
12b-1 fees — Class C Shares | | | 86,282 | | | | 114,506 | | | | 1,150,692 | | |
12b-1 fees — Class R Shares | | | — | | | | — | | | | 1,396 | | |
Custodian fees | | | 7,208 | | | | 6,610 | | | | 239,479 | | |
Transfer agent fees — Class A Shares | | | 23,970 | | | | 14,946 | | | | 118,904 | | |
Transfer agent fees — Class C Shares | | | 7,438 | | | | 8,193 | | | | 114,397 | | |
Transfer agent fees — Class R Shares | | | — | | | | — | | | | 424 | | |
Transfer agent fees — Class Y Shares | | | 28,466 | | | | 7,468 | | | | 279,291 | | |
Transfer agent fees — Member Class (a) | | | — | | | | 581 | | | | 580 | | |
Trustees' fees | | | 6,455 | | | | 4,701 | | | | 44,369 | | |
Compliance fees | | | 545 | | | | 352 | | | | 4,671 | | |
Legal and audit fees | | | 13,515 | | | | 12,635 | | | | 93,219 | | |
State registration and filing fees | | | 48,325 | | | | 50,917 | | | | 89,574 | | |
Interfund lending fees | | | 275 | | | | — | | | | — | | |
Other expenses | | | 15,238 | | | | 11,972 | | | | 183,774 | | |
Total Expenses | | | 673,308 | | | | 518,954 | | | | 6,491,523 | | |
Expenses waived/reimbursed by Adviser | | | (135,204 | ) | | | (131,713 | ) | | | (827,922 | ) | |
Net Expenses | | | 538,104 | | | | 387,241 | | | | 5,663,601 | | |
Net Investment Income (Loss) | | | 1,817,046 | | | | 1,501,425 | | | | 29,438,801 | | |
Realized/Unrealized Gains (Losses) from Investments: | |
Net realized gains (losses) from investment securities | | | 799,972 | | | | 894,229 | | | | (12,797,385 | ) | |
Net change in unrealized appreciation/depreciation
on investment securities | | | 651,008 | | | | (455,689 | ) | | | 6,115,431 | | |
Net realized/unrealized gains (losses) on investments | | | 1,450,980 | | | | 438,540 | | | | (6,681,954 | ) | |
Change in net assets resulting from operations | | $ | 3,268,026 | | | $ | 1,939,965 | | | $ | 22,756,847 | | |
(a) Victory High Income Municipal Bond Fund and Victory Floating Rate Fund Member Class commenced operations on November 3, 2020.
See notes to financial statements.
80
Victory Portfolios | | Statement of Operations
For the Year Ended December 31, 2020 | |
| | | Victory
Strategic Income
Fund | |
Investment Income: | |
Dividends | | $ | 146,503 | | |
Interest | | | 1,735,922 | | |
Securities lending (net of fees) | | | 6,810 | | |
Total Income | | | 1,889,235 | | |
Expenses: | |
Investment advisory fees | | | 490,164 | | |
Administration fees | | | 49,794 | | |
Sub-Administration fees | | | 14,132 | | |
12b-1 fees — Class A Shares | | | 91,508 | | |
12b-1 fees — Class C Shares | | | 93,279 | | |
12b-1 fees — Class R Shares | | | 14,700 | | |
Custodian fees | | | 13,881 | | |
Transfer agent fees — Class A Shares | | | 10,107 | | |
Transfer agent fees — Class C Shares | | | 5,668 | | |
Transfer agent fees — Class R Shares | | | 570 | | |
Transfer agent fees — Class Y Shares | | | 34,024 | | |
Trustees' fees | | | 6,825 | | |
Compliance fees | | | 694 | | |
Legal and audit fees | | | 17,956 | | |
State registration and filing fees | | | 66,036 | | |
Other expenses | | | 18,387 | | |
Total Expenses | | | 927,725 | | |
Expenses waived/reimbursed by Adviser | | | (134,256 | ) | |
Net Expenses | | | 793,469 | | |
Net Investment Income (Loss) | | | 1,095,766 | | |
Realized/Unrealized Gains (Losses) from Investments: | |
Net realized gains (losses) from investment securities | | | 3,924,638 | | |
Net realized gains (losses) from futures contracts | | | (267,319 | ) | |
Net realized gains (losses) from swap agreements | | | (126,520 | ) | |
Net change in unrealized appreciation/depreciation on investment securities | | | 1,631,194 | | |
Net change in unrealized appreciation/depreciation on futures contracts | | | 42,119 | | |
Net change in unrealized appreciation/depreciation on swap agreements | | | 20,150 | | |
Net realized/unrealized gains (losses) on investments | | | 5,224,262 | | |
Change in net assets resulting from operations | | $ | 6,320,028 | | |
See notes to financial statements.
81
Victory Portfolios | | Statements of Changes in Net Assets | |
| | | Victory
INCORE Investment
Quality Bond Fund | | Victory
INCORE Low Duration
Bond Fund | | Victory
High Yield Fund | |
| | | Year
Ended
December 31,
2020 | | Year
Ended
December 31,
2019 | | Year
Ended
December 31,
2020 | | Year
Ended
December 31,
2019 | | Year
Ended
December 31,
2020 | | Year
Ended
December 31,
2019 | |
From Investment Activities: | |
Operations: | |
Net investment
income (loss) | | $ | 469,256 | | | $ | 668,632 | | | $ | 3,749,720 | | | $ | 5,596,772 | | | $ | 11,999,966 | | | $ | 8,072,654 | | |
Net realized gains
(losses) from
investments | | | 956,039 | | | | 458,868 | | | | 1,551,713 | | | | (1,554,338 | ) | | | (286,139 | ) | | | 928,393 | | |
Net change in
unrealized
appreciation/
depreciation on
investments | | | 884,218 | | | | 1,246,028 | | | | 4,094,555 | | | | 6,190,500 | | | | 6,963,613 | | | | 8,834,338 | | |
Change in net assets resulting
from operations | | | 2,309,513 | | | | 2,373,528 | | | | 9,395,988 | | | | 10,232,934 | | | | 18,677,440 | | | | 17,835,385 | | |
Distributions to Shareholders: | |
Class A Shares | | | (443,929 | ) | | | (553,387 | ) | | | (868,824 | ) | | | (1,562,354 | ) | | | (1,891,442 | ) | | | (1,707,779 | ) | |
Class C Shares | | | (31,603 | ) | | | (48,455 | ) | | | (238,443 | ) | | | (645,910 | ) | | | (1,103,322 | ) | | | (1,017,743 | ) | |
Class R Shares | | | (56,460 | ) | | | (64,516 | ) | | | (10,980 | ) | | | (22,128 | ) | | | (990,013 | ) | | | (991,828 | ) | |
Class Y Shares | | | (74,664 | ) | | | (85,405 | ) | | | (2,422,766 | ) | | | (3,852,275 | ) | | | (8,004,170 | ) | | | (4,352,666 | ) | |
From return of capital: | |
Class A Shares | | | — | | | | — | | | | (220,729 | ) | | | (54,402 | ) | | | — | | | | — | | |
Class C Shares | | | — | | | | — | | | | (60,578 | ) | | | (22,491 | ) | | | — | | | | — | | |
Class R Shares | | | — | | | | — | | | | (2,790 | ) | | | (770 | ) | | | — | | | | — | | |
Class Y Shares | | | — | | | | — | | | | (615,514 | ) | | | (134,138 | ) | | | — | | | | — | | |
Change in net assets resulting
from distributions to
shareholders | | | (606,656 | ) | | | (751,763 | ) | | | (4,440,624 | ) | | | (6,294,468 | ) | | | (11,988,947 | ) | | | (8,070,016 | ) | |
Change in net assets resulting
from capital transactions | | | (2,983,450 | ) | | | (4,159,816 | ) | | | (11,232,054 | ) | | | (77,242,799 | ) | | | 66,176,609 | | | | 88,103,596 | | |
Change in net assets | | | (1,280,593 | ) | | | (2,538,051 | ) | | | (6,276,690 | ) | | | (73,304,333 | ) | | | 72,865,102 | | | | 97,868,965 | | |
Net Assets: | |
Beginning of period | | | 31,602,129 | | | | 34,140,180 | | | | 266,596,684 | | | | 339,901,017 | | | | 179,753,421 | | | | 81,884,456 | | |
End of period | | $ | 30,321,536 | | | $ | 31,602,129 | | | $ | 260,319,994 | | | $ | 266,596,684 | | | $ | 252,618,523 | | | $ | 179,753,421 | | |
(continues on next page)
See notes to financial statements.
82
Victory Portfolios | | Statements of Changes in Net Assets | |
(continued)
| | | Victory
INCORE Investment
Quality Bond Fund | | Victory
INCORE Low Duration
Bond Fund | | Victory
High Yield Fund | |
| | | Year
Ended
December 31,
2020 | | Year
Ended
December 31,
2019 | | Year
Ended
December 31,
2020 | | Year
Ended
December 31,
2019 | | Year
Ended
December 31,
2020 | | Year
Ended
December 31,
2019 | |
Capital Transactions: | |
Class A Shares | |
Proceeds from shares
issued | | $ | 3,741,042 | | | $ | 2,390,006 | | | $ | 26,390,247 | | | $ | 26,923,927 | | | $ | 11,313,136 | | | $ | 14,316,080 | | |
Distributions reinvested | | | 432,981 | | | | 541,439 | | | | 998,870 | | | | 1,496,239 | | | | 1,207,222 | | | | 1,089,701 | | |
Cost of shares redeemed | | | (5,934,340 | ) | | | (6,120,937 | ) | | | (20,255,290 | ) | | | (63,661,715 | ) | | | (6,047,019 | ) | | | (9,825,415 | ) | |
Total Class A Shares | | $ | (1,760,317 | ) | | $ | (3,189,492 | ) | | $ | 7,133,827 | | | $ | (35,241,549 | ) | | $ | 6,473,339 | | | $ | 5,580,366 | | |
Class C Shares | |
Proceeds from shares
issued | | $ | 371,418 | | | $ | 143,899 | | | $ | 1,293,466 | | | $ | 1,733,369 | | | $ | 6,325,319 | | | $ | 2,217,726 | | |
Distributions reinvested | | | 28,275 | | | | 40,736 | | | | 255,292 | | | | 555,049 | | | | 363,233 | | | | 243,448 | | |
Cost of shares redeemed | | | (853,248 | ) | | | (1,154,650 | ) | | | (17,694,441 | ) | | | (26,142,779 | ) | | | (2,370,736 | ) | | | (2,392,678 | ) | |
Total Class C Shares | | $ | (453,555 | ) | | $ | (970,015 | ) | | $ | (16,145,683 | ) | | $ | (23,854,361 | ) | | $ | 4,317,816 | | | $ | 68,496 | | |
Class R Shares | |
Proceeds from shares
issued | | $ | 520,871 | | | $ | 254,810 | | | $ | 440,750 | | | $ | 166,661 | | | $ | 573,952 | | | $ | 201,511 | | |
Distributions reinvested | | | 56,322 | | | | 64,470 | | | | 13,406 | | | | 21,886 | | | | 101,913 | | | | 104,219 | | |
Cost of shares redeemed | | | (529,270 | ) | | | (310,418 | ) | | | (494,683 | ) | | | (614,563 | ) | | | (503,868 | ) | | | (584,834 | ) | |
Total Class R Shares | | $ | 47,923 | | | $ | 8,862 | | | $ | (40,527 | ) | | $ | (426,016 | ) | | $ | 171,997 | | | $ | (279,104 | ) | |
Class Y Shares | |
Proceeds from shares
issued | | $ | 1,142,128 | | | $ | 1,073,428 | | | $ | 84,768,131 | | | $ | 79,871,959 | | | $ | 169,162,794 | | | $ | 109,042,788 | | |
Distributions reinvested | | | 73,672 | | | | 83,285 | | | | 2,450,105 | | | | 3,209,388 | | | | 7,507,572 | | | | 3,905,005 | | |
Cost of shares redeemed | | | (2,033,301 | ) | | | (1,165,884 | ) | | | (89,397,907 | ) | | | (100,802,220 | ) | | | (121,456,909 | ) | | | (30,213,955 | ) | |
Total Class Y Shares | | $ | (817,501 | ) | | $ | (9,171 | ) | | $ | (2,179,671 | ) | | $ | (17,720,873 | ) | | $ | 55,213,457 | | | $ | 82,733,838 | | |
Change in net assets resulting
from capital transactions | | $ | (2,983,450 | ) | | $ | (4,159,816 | ) | | $ | (11,232,054 | ) | | $ | (77,242,799 | ) | | $ | 66,176,609 | | | $ | 88,103,596 | | |
(continues on next page)
See notes to financial statements.
83
Victory Portfolios | | Statements of Changes in Net Assets | |
(continued)
| | | Victory
INCORE Investment
Quality Bond Fund | | Victory
INCORE Low Duration
Bond Fund | | Victory
High Yield Fund | |
| | | Year
Ended
December 31,
2020 | | Year
Ended
December 31,
2019 | | Year
Ended
December 31,
2020 | | Year
Ended
December 31,
2019 | | Year
Ended
December 31,
2020 | | Year
Ended
December 31,
2019 | |
Share Transactions: | |
Class A Shares | |
Issued | | | 374,189 | | | | 250,126 | | | | 2,611,845 | | | | 2,713,126 | | | | 1,750,643 | | | | 2,178,302 | | |
Reinvested | | | 42,958 | | | | 56,710 | | | | 99,098 | | | | 150,473 | | | | 188,872 | | | | 165,464 | | |
Redeemed | | | (596,219 | ) | | | (642,094 | ) | | | (2,017,103 | ) | | | (6,419,997 | ) | | | (962,364 | ) | | | (1,488,742 | ) | |
Total Class A Shares | | | (179,072 | ) | | | (335,258 | ) | | | 693,840 | | | | (3,556,398 | ) | | | 977,151 | | | | 855,024 | | |
Class C Shares | |
Issued | | | 37,380 | | | | 14,963 | | | | 128,943 | | | | 174,135 | | | | 971,560 | | | | 336,209 | | |
Reinvested | | | 2,808 | | | | 4,274 | | | | 25,402 | | | | 55,850 | | | | 56,460 | | | | 36,921 | | |
Redeemed | | | (84,915 | ) | | | (121,567 | ) | | | (1,751,574 | ) | | | (2,631,589 | ) | | | (372,697 | ) | | | (364,090 | ) | |
Total Class C Shares | | | (44,727 | ) | | | (102,330 | ) | | | (1,597,229 | ) | | | (2,401,604 | ) | | | 655,323 | | | | 9,040 | | |
Class R Shares | |
Issued | | | 51,521 | | | | 26,637 | | | | 43,544 | | | | 16,756 | | | | 87,110 | | | | 30,796 | | |
Reinvested | | | 5,574 | | | | 6,730 | | | | 1,331 | | | | 2,201 | | | | 15,967 | | | | 15,810 | | |
Redeemed | | | (52,365 | ) | | | (32,531 | ) | | | (49,038 | ) | | | (61,801 | ) | | | (80,100 | ) | | | (89,390 | ) | |
Total Class R Shares | | | 4,730 | | | | 836 | | | | (4,163 | ) | | | (42,844 | ) | | | 22,977 | | | | (42,784 | ) | |
Class Y Shares | |
Issued | | | 114,222 | | | | 111,553 | | | | 8,403,448 | | | | 8,030,344 | | | | 27,361,536 | | | | 16,745,403 | | |
Reinvested | | | 7,320 | | | | 8,725 | | | | 242,992 | | | | 322,449 | | | | 1,177,131 | | | | 594,277 | | |
Redeemed | | | (203,029 | ) | | | (122,068 | ) | | | (8,905,756 | ) | | | (10,149,972 | ) | | | (19,870,790 | ) | | | (4,607,680 | ) | |
Total Class Y Shares | | | (81,487 | ) | | | (1,790 | ) | | | (259,316 | ) | | | (1,797,179 | ) | | | 8,667,877 | | | | 12,732,000 | | |
Change in Shares | | | (300,556 | ) | | | (438,542 | ) | | | (1,166,868 | ) | | | (7,798,025 | ) | | | 10,323,328 | | | | 13,553,280 | | |
See notes to financial statements.
84
Victory Portfolios | | Statements of Changes in Net Assets | |
| | | Victory
Tax-Exempt Fund | | Victory
High Income
Municipal Bond Fund | | Victory
Floating Rate Fund | |
| | | Year
Ended
December 31,
2020 | | Year
Ended
December 31,
2019 | | Year
Ended
December 31,
2020 | | Year
Ended
December 31,
2019 | | Year
Ended
December 31,
2020 | | Year
Ended
December 31,
2019 | |
From Investment Activities: | |
Operations: | |
Net investment
income (loss) | | $ | 1,817,046 | | | $ | 1,965,191 | | | $ | 1,501,425 | | | $ | 1,405,189 | | | $ | 29,438,801 | | | $ | 34,566,694 | | |
Net realized gains
(losses) from
investments | | | 799,972 | | | | 930,963 | | | | 894,229 | | | | (123,953 | ) | | | (12,797,385 | ) | | | (3,969,624 | ) | |
Net change in
unrealized
appreciation/
depreciation on
investments | | | 651,008 | | | | 2,797,481 | | | | (455,689 | ) | | | 2,151,260 | | | | 6,115,431 | | | | 23,471,885 | | |
Change in net assets
resulting from operations | | | 3,268,026 | | | | 5,693,635 | | | | 1,939,965 | | | | 3,432,496 | | | | 22,756,847 | | | | 54,068,955 | | |
Distributions to Shareholders: | |
Class A Shares | | | (1,310,488 | ) | | | (1,464,845 | ) | | | (900,322 | ) | | | (787,699 | ) | | | (7,509,760 | ) | | | (8,004,025 | ) | |
Class C Shares | | | (275,865 | ) | | | (531,783 | ) | | | (416,434 | ) | | | (562,857 | ) | | | (5,483,129 | ) | | | (9,318,078 | ) | |
Class R Shares | | | — | | | | — | | | | — | | | | — | | | | (13,890 | ) | | | (30,409 | ) | |
Class Y Shares | | | (993,693 | ) | | | (1,054,293 | ) | | | (434,615 | ) | | | (507,091 | ) | | | (16,288,620 | ) | | | (17,355,800 | ) | |
Member Class (a) | | | — | | | | — | | | | (633 | ) | | | — | | | | (293 | ) | | | — | | |
Change in net assets resulting
from distributions to
shareholders | | | (2,580,046 | ) | | | (3,050,921 | ) | | | (1,752,004 | ) | | | (1,857,647 | ) | | | (29,295,692 | ) | | | (34,708,312 | ) | |
Change in net assets resulting
from capital transactions | | | (5,160,426 | ) | | | (4,913,162 | ) | | | 1,573,250 | | | | (5,254,452 | ) | | | 84,613,158 | | | | (45,868,103 | ) | |
Change in net assets | | | (4,472,446 | ) | | | (2,270,448 | ) | | | 1,761,211 | | | | (3,679,603 | ) | | | 78,074,313 | | | | (26,507,460 | ) | |
Net Assets: | |
Beginning of period | | | 65,968,536 | | | | 68,238,984 | | | | 43,767,983 | | | | 47,447,586 | | | | 585,887,758 | | | | 612,395,218 | | |
End of period | | $ | 61,496,090 | | | $ | 65,968,536 | | | $ | 45,529,194 | | | $ | 43,767,983 | | | $ | 663,962,071 | | | $ | 585,887,758 | | |
(b) Victory High Income Municipal Bond Fund and Victory Floating Rate Fund Member Class commenced operations on November 3, 2020.
(continues on next page)
See notes to financial statements.
85
Victory Portfolios | | Statements of Changes in Net Assets | |
(continued)
| | | Victory
Tax-Exempt Fund | | Victory
High Income
Municipal Bond Fund | | Victory
Floating Rate Fund | |
| | | Year
Ended
December 31,
2020 | | Year
Ended
December 31,
2019 | | Year
Ended
December 31,
2020 | | Year
Ended
December 31,
2019 | | Year
Ended
December 31,
2020 | | Year
Ended
December 31,
2019 | |
Capital Transactions: | |
Class A Shares | |
Proceeds from shares
issued | | $ | 5,775,996 | | | $ | 4,695,710 | | | $ | 9,315,877 | | | $ | 4,547,178 | | | $ | 79,846,398 | | | $ | 70,076,253 | | |
Distributions reinvested | | | 1,202,398 | | | | 1,392,860 | | | | 818,111 | | | | 711,497 | | | | 6,658,816 | | | | 7,183,990 | | |
Cost of shares redeemed | | | (5,606,292 | ) | | | (7,042,732 | ) | | | (3,158,508 | ) | | | (3,153,534 | ) | | | (66,492,431 | ) | | | (53,129,272 | ) | |
Total Class A Shares | | $ | 1,372,102 | | | $ | (954,162 | ) | | $ | 6,975,480 | | | $ | 2,105,141 | | | $ | 20,012,783 | | | $ | 24,130,971 | | |
Class C Shares | |
Proceeds from shares
issued | | $ | 658,815 | | | $ | 452,375 | | | $ | 382,792 | | | $ | 641,769 | | | $ | 8,695,794 | | | $ | 7,693,670 | | |
Distributions reinvested | | | 245,751 | | | | 442,740 | | | | 379,132 | | | | 493,333 | | | | 4,727,020 | | | | 7,766,719 | | |
Cost of shares redeemed | | | (5,678,979 | ) | | | (8,300,227 | ) | | | (5,351,211 | ) | | | (7,042,158 | ) | | | (63,036,997 | ) | | | (84,302,278 | ) | |
Total Class C Shares | | $ | (4,774,413 | ) | | $ | (7,405,112 | ) | | $ | (4,589,287 | ) | | $ | (5,907,056 | ) | | $ | (49,614,183 | ) | | $ | (68,841,889 | ) | |
Class R Shares | |
Proceeds from shares
issued | | $ | — | | | $ | — | | | $ | — | | | $ | — | | | $ | 81,023 | | | $ | 111,430 | | |
Distributions reinvested | | | — | | | | — | | | | — | | | | — | | | | 13,070 | | | | 22,324 | | |
Cost of shares redeemed | | | — | | | | — | | | | — | | | | — | | | | (245,870 | ) | | | (414,932 | ) | |
Total Class R Shares | | $ | — | | | $ | — | | | $ | — | | | $ | — | | | $ | (151,777 | ) | | $ | (281,178 | ) | |
Class Y Shares | |
Proceeds from shares
issued | | $ | 4,408,153 | | | $ | 6,261,814 | | | $ | 2,332,661 | | | $ | 1,046,792 | | | $ | 286,860,980 | | | $ | 127,457,843 | | |
Distributions reinvested | | | 974,393 | | | | 1,026,770 | | | | 417,909 | | | | 489,689 | | | | 14,104,888 | | | | 14,917,921 | | |
Cost of shares redeemed | | | (7,140,661 | ) | | | (3,842,472 | ) | | | (3,702,429 | ) | | | (2,989,018 | ) | | | (186,660,948 | ) | | | (143,251,771 | ) | |
Total Class Y Shares | | $ | (1,758,115 | ) | | $ | 3,446,112 | | | $ | (951,859 | ) | | $ | (1,452,537 | ) | | $ | 114,304,920 | | | $ | (876,007 | ) | |
Member Class (a) | |
Proceeds from shares
issued | | $ | — | | | $ | — | | | $ | 138,283 | | | $ | — | | | $ | 69,505 | | | $ | — | | |
Distributions reinvested | | | — | | | | — | | | | 633 | | | | — | | | | 290 | | | | — | | |
Cost of shares redeemed | | | — | | | | — | | | | — | | | | — | | | | (8,380 | ) | | | — | | |
Total Member Class | | $ | — | | | $ | — | | | $ | 138,916 | | | $ | — | | | $ | 61,415 | | | $ | — | | |
Change in net assets resulting
from capital transactions | | $ | (5,160,426 | ) | | $ | (4,913,162 | ) | | $ | 1,573,250 | | | $ | (5,254,452 | ) | | $ | 84,613,158 | | | $ | (45,868,103 | ) | |
(a) Victory High Income Municipal Bond Fund and Victory Floating Rate Fund Member Class commenced operations on November 3, 2020.
(continues on next page)
See notes to financial statements.
86
Victory Portfolios | | Statements of Changes in Net Assets | |
(continued)
| | | Victory
Tax-Exempt Fund | | Victory
High Income
Municipal Bond Fund | | Victory
Floating Rate Fund | |
| | | Year
Ended
December 31,
2020 | | Year
Ended
December 31,
2019 | | Year
Ended
December 31,
2020 | | Year
Ended
December 31,
2019 | | Year
Ended
December 31,
2020 | | Year
Ended
December 31,
2019 | |
Share Transactions: | |
Class A Shares | |
Issued | | | 591,255 | | | | 478,144 | | | | 869,235 | | | | 425,557 | | | | 8,856,174 | | | | 7,475,434 | | |
Reinvested | | | 122,799 | | | | 141,785 | | | | 76,906 | | | | 66,390 | | | | 752,843 | | | | 767,211 | | |
Redeemed | | | (568,616 | ) | | | (713,456 | ) | | | (297,732 | ) | | | (296,773 | ) | | | (7,516,037 | ) | | | (5,679,746 | ) | |
Total Class A Shares | | | 145,438 | | | | (93,527 | ) | | | 648,409 | | | | 195,174 | | | | 2,092,980 | | | | 2,562,899 | | |
Class C Shares | |
Issued | | | 67,589 | | | | 45,850 | | | | 35,772 | | | | 59,871 | | | | 966,114 | | | | 821,505 | | |
Reinvested | | | 25,122 | | | | 45,183 | | | | 35,679 | | | | 46,148 | | | | 535,700 | | | | 828,359 | | |
Redeemed | | | (583,439 | ) | | | (846,526 | ) | | | (507,680 | ) | | | (659,895 | ) | | | (7,162,986 | ) | | | (8,978,146 | ) | |
Total Class C Shares | | | (490,728 | ) | | | (755,493 | ) | | | (436,229 | ) | | | (553,876 | ) | | | (5,661,172 | ) | | | (7,328,282 | ) | |
Class R Shares | |
Issued | | | — | | | | — | | | | — | | | | — | | | | 8,818 | | | | 11,901 | | |
Reinvested | | | — | | | | — | | | | — | | | | — | | | | 1,480 | | | | 2,385 | | |
Redeemed | | | — | | | | — | | | | — | | | | — | | | | (26,479 | ) | | | (44,380 | ) | |
Total Class R Shares | | | — | | | | — | | | | — | | | | — | | | | (16,181 | ) | | | (30,094 | ) | |
Class Y Shares | |
Issued | | | 454,324 | | | | 633,656 | | | | 219,079 | | | | 98,269 | | | | 32,140,981 | | | | 13,621,991 | | |
Reinvested | | | 99,525 | | | | 104,534 | | | | 39,262 | | | | 45,760 | | | | 1,588,219 | | | | 1,591,749 | | |
Redeemed | | | (725,840 | ) | | | (392,165 | ) | | | (352,658 | ) | | | (280,476 | ) | | | (21,256,634 | ) | | | (15,289,018 | ) | |
Total Class Y Shares | | | (171,991 | ) | | | 346,025 | | | | (94,317 | ) | | | (136,447 | ) | | | 12,472,566 | | | | (75,278 | ) | |
Member Class (a) | |
Issued | | | — | | | | — | | | | 12,839 | | | | — | | | | 7,549 | | | | — | | |
Reinvested | | | — | | | | — | | | | 59 | | | | — | | | | 31 | | | | — | | |
Redeemed | | | — | | | | — | | | | — | | | | — | | | | (899 | ) | | | — | | |
Total Member Class | | | — | | | | — | | | | 12,898 | | | | — | | | | 6,681 | | | | — | | |
Change in Shares | | | (517,281 | ) | | | (502,995 | ) | | | 130,761 | | | | (495,149 | ) | | | 8,894,874 | | | | (4,870,755 | ) | |
(a) Victory High Income Municipal Bond Fund and Victory Floating Rate Fund Member Class commenced operations on November 3, 2020.
See notes to financial statements.
87
Victory Portfolios | | Statements of Changes in Net Assets | |
| | | Victory
Strategic Income Fund | |
| | | Year
Ended
December 31,
2020 | | Year
Ended
December 31,
2019 | |
From Investment Activities: | |
Operations: | |
Net investment income (loss) | | $ | 1,095,766 | | | $ | 1,251,164 | | |
Net realized gains (losses) from investments | | | 3,530,799 | | | | 1,161,066 | | |
Net change in unrealized appreciation/depreciation on investments | | | 1,693,463 | | | | 1,949,178 | | |
Change in net assets resulting from operations | | | 6,320,028 | | | | 4,361,408 | | |
Distributions to Shareholders: | |
Class A Shares | | | (1,174,119 | ) | | | (852,988 | ) | |
Class C Shares | | | (212,356 | ) | | | (173,876 | ) | |
Class R Shares | | | (78,861 | ) | | | (60,881 | ) | |
Class Y Shares | | | (1,372,240 | ) | | | (136,515 | ) | |
From return of capital: | |
Class A Shares | | | — | | | | (50,329 | ) | |
Class C Shares | | | — | | | | (10,259 | ) | |
Class R Shares | | | — | | | | (3,592 | ) | |
Class Y Shares | | | — | | | | (8,055 | ) | |
Change in net assets resulting from distributions to shareholders | | | (2,837,576 | ) | | | (1,296,495 | ) | |
Change in net assets resulting from capital transactions | | | 52,004,480 | | | | (1,865,822 | ) | |
Change in net assets | | | 55,486,932 | | | | 1,199,091 | | |
Net Assets: | |
Beginning of period | | | 51,032,401 | | | | 49,833,310 | | |
End of period | | $ | 106,519,333 | | | $ | 51,032,401 | | |
(continues on next page)
See notes to financial statements.
88
Victory Portfolios | | Statements of Changes in Net Assets | |
(continued)
| | | Victory
Strategic Income Fund | |
| | | Year
Ended
December 31,
2020 | | Year
Ended
December 31,
2019 | |
Capital Transactions: | |
Class A Shares | |
Proceeds from shares issued | | $ | 6,584,986 | | | $ | 1,094,391 | | |
Distributions reinvested | | | 249,590 | | | | 139,804 | | |
Cost of shares redeemed | | | (1,612,948 | ) | | | (1,529,524 | ) | |
Total Class A Shares | | $ | 5,221,628 | | | $ | (295,329 | ) | |
Class C Shares | |
Proceeds from shares issued | | $ | 1,041,663 | | | $ | 332,247 | | |
Distributions reinvested | | | 153,572 | | | | 137,629 | | |
Cost of shares redeemed | | | (1,365,907 | ) | | | (2,160,161 | ) | |
Total Class C Shares | | $ | (170,672 | ) | | $ | (1,690,285 | ) | |
Class R Shares | |
Proceeds from shares issued | | $ | 119,388 | | | $ | 8,929 | | |
Distributions reinvested | | | 9,184 | | | | 8,376 | | |
Cost of shares redeemed | | | (169,583 | ) | | | (82,802 | ) | |
Total Class R Shares | | $ | (41,011 | ) | | $ | (65,497 | ) | |
Class Y Shares | |
Proceeds from shares issued | | $ | 82,375,402 | | | $ | 638,486 | | |
Distributions reinvested | | | 1,284,394 | | | | 71,237 | | |
Cost of shares redeemed | | | (36,665,261 | ) | | | (524,434 | ) | |
Total Class Y Shares | | $ | 46,994,535 | | | $ | 185,289 | | |
Change in net assets resulting from capital transactions | | $ | 52,004,480 | | | $ | (1,865,822 | ) | |
Share Transactions: | |
Class A Shares | |
Issued | | | 608,160 | | | | 107,366 | | |
Reinvested | | | 23,022 | | | | 13,743 | | |
Redeemed | | | (150,322 | ) | | | (149,880 | ) | |
Total Class A Shares | | | 480,860 | | | | (28,771 | ) | |
Class C Shares | |
Issued | | | 98,031 | | | | 32,731 | | |
Reinvested | | | 14,102 | | | | 13,502 | | |
Redeemed | | | (128,480 | ) | | | (213,151 | ) | |
Total Class C Shares | | | (16,347 | ) | | | (166,918 | ) | |
Class R Shares | |
Issued | | | 10,816 | | | | 880 | | |
Reinvested | | | 845 | | | | 820 | | |
Redeemed | | | (15,565 | ) | | | (8,345 | ) | |
Total Class R Shares | | | (3,904 | ) | | | (6,645 | ) | |
Class Y Shares | |
Issued | | | 7,730,049 | | | | 62,449 | | |
Reinvested | | | 118,940 | | | | 7,040 | | |
Redeemed | | | (3,490,501 | ) | | | (52,459 | ) | |
Total Class Y Shares | | | 4,358,488 | | | | 17,030 | | |
Change in Shares | | | 4,819,097 | | | | (185,304 | ) | |
See notes to financial statements.
89
Victory Portfolios | | Financial Highlights | |
For a Share Outstanding Throughout Each Period
| | | | Investment Activities | | Distributions to
Shareholders From | |
| | | Net Asset
Value,
Beginning of
Period | | Net
Investment
Income
(Loss)(a) | | Net
Realized and
Unrealized
Gains
(Losses) on
Investments | | Total from
Investment
Activities | | Net
Investment
Income | | Net Realized
Gains from
Investments | |
Victory INCORE Investment Quality Bond Fund | |
Class A | |
Year Ended 12/31/20 | | $ | 9.72 | | | | 0.16 | | | | 0.61 | | | | 0.77 | | | | (0.21 | ) | | | — | | |
Year Ended 12/31/19 | | $ | 9.26 | | | | 0.20 | | | | 0.49 | | | | 0.69 | | | | (0.23 | ) | | | — | | |
Year Ended 12/31/18 | | $ | 9.59 | | | | 0.21 | | | | (0.29 | ) | | | (0.08 | ) | | | (0.25 | ) | | | — | | |
Year Ended 12/31/17 | | $ | 9.48 | | | | 0.18 | | | | 0.16 | | | | 0.34 | | | | (0.23 | ) | | | — | | |
Year Ended 12/31/16 | | $ | 9.57 | | | | 0.22 | | | | 0.16 | | | | 0.38 | | | | (0.23 | ) | | | (0.24 | ) | |
Class C | |
Year Ended 12/31/20 | | $ | 9.72 | | | | 0.08 | | | | 0.59 | | | | 0.67 | | | | (0.12 | ) | | | — | | |
Year Ended 12/31/19 | | $ | 9.25 | | | | 0.12 | | | | 0.49 | | | | 0.61 | | | | (0.14 | ) | | | — | | |
Year Ended 12/31/18 | | $ | 9.58 | | | | 0.13 | | | | (0.29 | ) | | | (0.16 | ) | | | (0.17 | ) | | | — | | |
Year Ended 12/31/17 | | $ | 9.47 | | | | 0.10 | | | | 0.16 | | | | 0.26 | | | | (0.15 | ) | | | — | | |
Year Ended 12/31/16 | | $ | 9.56 | | | | 0.14 | | | | 0.16 | | | | 0.30 | | | | (0.15 | ) | | | (0.24 | ) | |
Class R | |
Year Ended 12/31/20 | | $ | 9.75 | | | | 0.12 | | | | 0.59 | | | | 0.71 | | | | (0.16 | ) | | | — | | |
Year Ended 12/31/19 | | $ | 9.28 | | | | 0.16 | | | | 0.50 | | | | 0.66 | | | | (0.19 | ) | | | — | | |
Year Ended 12/31/18 | | $ | 9.61 | | | | 0.18 | | | | (0.30 | ) | | | (0.12 | ) | | | (0.21 | ) | | | — | | |
Year Ended 12/31/17 | | $ | 9.50 | | | | 0.14 | | | | 0.16 | | | | 0.30 | | | | (0.19 | ) | | | — | | |
Year Ended 12/31/16 | | $ | 9.58 | | | | 0.19 | | | | 0.17 | | | | 0.36 | | | | (0.20 | ) | | | (0.24 | ) | |
Class Y | |
Year Ended 12/31/20 | | $ | 9.71 | | | | 0.19 | | | | 0.60 | | | | 0.79 | | | | (0.23 | ) | | | — | | |
Year Ended 12/31/19 | | $ | 9.25 | | | | 0.22 | | | | 0.49 | | | | 0.71 | | | | (0.25 | ) | | | — | | |
Year Ended 12/31/18 | | $ | 9.58 | | | | 0.23 | | | | (0.29 | ) | | | (0.06 | ) | | | (0.27 | ) | | | — | | |
Year Ended 12/31/17 | | $ | 9.47 | | | | 0.20 | | | | 0.16 | | | | 0.36 | | | | (0.25 | ) | | | — | | |
Year Ended 12/31/16 | | $ | 9.56 | | | | 0.25 | | | | 0.16 | | | | 0.41 | | | | (0.26 | ) | | | (0.24 | ) | |
(a) Per share net investment income (loss) has been calculated using the average daily shares method.
(b) Portfolio turnover is calculated on the basis of the Fund as a whole without distinguishing between the classes of shares issued.
See notes to financial statements.
90
Victory Portfolios | | Financial Highlights — continued | |
For a Share Outstanding Throughout Each Period
| | | | | Ratios to Average Net Assets | | Supplemental Data | |
| | | Total
Distributions | | Net Asset
Value,
End of
Period | | Total
Return
(Excludes
Sales
Charge) | | Net
Expenses | | Net
Investment
Income
(Loss) | | Gross
Expenses | | Net Assets,
End of
Period
(000's) | | Portfolio
Turnover(b) | |
Victory INCORE Investment Quality Bond Fund | |
Class A | |
Year Ended 12/31/20 | | | (0.21 | ) | | $ | 10.28 | | | | 7.94 | % | | | 0.90 | % | | | 1.60 | % | | | 1.27 | % | | $ | 21,423 | | | | 80 | % | |
Year Ended 12/31/19 | | | (0.23 | ) | | $ | 9.72 | | | | 7.49 | % | | | 0.90 | % | | | 2.13 | % | | | 1.23 | % | | $ | 22,004 | | | | 92 | % | |
Year Ended 12/31/18 | | | (0.25 | ) | | $ | 9.26 | | | | (0.80 | )% | | | 0.90 | % | | | 2.27 | % | | | 1.13 | % | | $ | 24,049 | | | | 115 | % | |
Year Ended 12/31/17 | | | (0.23 | ) | | $ | 9.59 | | | | 3.62 | % | | | 0.90 | % | | | 1.86 | % | | | 1.07 | % | | $ | 31,306 | | | | 70 | % | |
Year Ended 12/31/16 | | | (0.47 | ) | | $ | 9.48 | | | | 4.01 | % | | | 0.90 | % | | | 2.29 | % | | | 1.14 | % | | $ | 40,510 | | | | 148 | % | |
Class C | |
Year Ended 12/31/20 | | | (0.12 | ) | | $ | 10.27 | | | | 6.89 | % | | | 1.77 | % | | | 0.76 | % | | | 2.39 | % | | $ | 2,526 | | | | 80 | % | |
Year Ended 12/31/19 | | | (0.14 | ) | | $ | 9.72 | | | | 6.65 | % | | | 1.77 | % | | | 1.28 | % | | | 2.23 | % | | $ | 2,824 | | | | 92 | % | |
Year Ended 12/31/18 | | | (0.17 | ) | | $ | 9.25 | | | | (1.66 | )% | | | 1.77 | % | | | 1.42 | % | | | 2.10 | % | | $ | 3,634 | | | | 115 | % | |
Year Ended 12/31/17 | | | (0.15 | ) | | $ | 9.58 | | | | 2.74 | % | | | 1.77 | % | | | 0.99 | % | | | 1.91 | % | | $ | 6,127 | | | | 70 | % | |
Year Ended 12/31/16 | | | (0.39 | ) | | $ | 9.47 | | | | 3.11 | % | | | 1.77 | % | | | 1.42 | % | | | 1.92 | % | | $ | 8,915 | | | | 148 | % | |
Class R | |
Year Ended 12/31/20 | | | (0.16 | ) | | $ | 10.30 | | | | 7.37 | % | | | 1.30 | % | | | 1.16 | % | | | 1.84 | % | | $ | 3,603 | | | | 80 | % | |
Year Ended 12/31/19 | | | (0.19 | ) | | $ | 9.75 | | | | 7.14 | % | | | 1.30 | % | | | 1.71 | % | | | 1.83 | % | | $ | 3,362 | | | | 92 | % | |
Year Ended 12/31/18 | | | (0.21 | ) | | $ | 9.28 | | | | (1.20 | )% | | | 1.30 | % | | | 1.88 | % | | | 1.69 | % | | $ | 3,192 | | | | 115 | % | |
Year Ended 12/31/17 | | | (0.19 | ) | | $ | 9.61 | | | | 3.16 | % | | | 1.30 | % | | | 1.44 | % | | | 1.65 | % | | $ | 3,940 | | | | 70 | % | |
Year Ended 12/31/16 | | | (0.44 | ) | | $ | 9.50 | | | | 3.71 | % | | | 1.30 | % | | | 1.90 | % | | | 1.44 | % | | $ | 4,477 | | | | 148 | % | |
Class Y | |
Year Ended 12/31/20 | | | (0.23 | ) | | $ | 10.27 | | | | 8.21 | % | | | 0.66 | % | | | 1.91 | % | | | 1.31 | % | | $ | 2,770 | | | | 80 | % | |
Year Ended 12/31/19 | | | (0.25 | ) | | $ | 9.71 | | | | 7.76 | % | | | 0.66 | % | | | 2.35 | % | | | 1.24 | % | | $ | 3,412 | | | | 92 | % | |
Year Ended 12/31/18 | | | (0.27 | ) | | $ | 9.25 | | | | (0.56 | )% | | | 0.66 | % | | | 2.51 | % | | | 1.12 | % | | $ | 3,265 | | | | 115 | % | |
Year Ended 12/31/17 | | | (0.25 | ) | | $ | 9.58 | | | | 3.87 | % | | | 0.66 | % | | | 2.09 | % | | | 0.98 | % | | $ | 4,421 | | | | 70 | % | |
Year Ended 12/31/16 | | | (0.50 | ) | | $ | 9.47 | | | | 4.26 | % | | | 0.66 | % | | | 2.53 | % | | | 0.94 | % | | $ | 6,133 | | | | 148 | % | |
See notes to financial statements.
91
Victory Portfolios | | Financial Highlights | |
For a Share Outstanding Throughout Each Period
| | | | | Investment Activities | | Distributions to
Shareholders From | |
| | | Net Asset
Value,
Beginning of
Period | | Net
Investment
Income
(Loss)(a) | | Net
Realized and
Unrealized
Gains
(Losses) on
Investments | | Total from
Investment
Activities | | Net
Investment
Income | | Return of
Capital | | Total
Distributions | |
Victory INCORE Low Duration Bond Fund | |
Class A | |
Year Ended 12/31/20 | | $ | 9.99 | | | | 0.14 | | | | 0.24 | | | | 0.38 | | | | (0.14 | ) | | | (0.03 | ) | | | (0.17 | ) | |
Year Ended 12/31/19 | | $ | 9.86 | | | | 0.19 | | | | 0.15 | | | | 0.34 | | | | (0.20 | ) | | | (0.01 | ) | | | (0.21 | ) | |
Year Ended 12/31/18 | | $ | 9.99 | | | | 0.16 | | | | (0.08 | ) | | | 0.08 | | | | (0.21 | ) | | | — | | | | (0.21 | ) | |
Year Ended 12/31/17 | | $ | 10.03 | | | | 0.12 | | | | 0.02 | | | | 0.14 | | | | (0.18 | ) | | | — | | | | (0.18 | ) | |
Year Ended 12/31/16 | | $ | 9.95 | | | | 0.12 | | | | 0.06 | | | | 0.18 | | | | (0.10 | ) | | | — | | | | (0.10 | ) | |
Class C | |
Year Ended 12/31/20 | | $ | 9.99 | | | | 0.08 | | | | 0.22 | | | | 0.30 | | | | (0.07 | ) | | | (0.02 | ) | | | (0.09 | ) | |
Year Ended 12/31/19 | | $ | 9.85 | | | | 0.12 | | | | 0.16 | | | | 0.28 | | | | (0.14 | ) | | | — | (c) | | | (0.14 | ) | |
Year Ended 12/31/18 | | $ | 9.99 | | | | 0.09 | | | | (0.09 | ) | | | — | (c) | | | (0.14 | ) | | | — | | | | (0.14 | ) | |
Year Ended 12/31/17 | | $ | 10.02 | | | | 0.04 | | | | 0.03 | | | | 0.07 | | | | (0.10 | ) | | | — | | | | (0.10 | ) | |
Year Ended 12/31/16 | | $ | 9.95 | | | | 0.04 | | | | 0.05 | | | | 0.09 | | | | (0.02 | ) | | | — | | | | (0.02 | ) | |
Class R | |
Year Ended 12/31/20 | | $ | 9.99 | | | | 0.10 | | | | 0.24 | | | | 0.34 | | | | (0.10 | ) | | | (0.03 | ) | | | (0.13 | ) | |
Year Ended 12/31/19 | | $ | 9.86 | | | | 0.15 | | | | 0.15 | | | | 0.30 | | | | (0.16 | ) | | | (0.01 | ) | | | (0.17 | ) | |
Year Ended 12/31/18 | | $ | 9.99 | | | | 0.12 | | | | (0.08 | ) | | | 0.04 | | | | (0.17 | ) | | | — | | | | (0.17 | ) | |
Year Ended 12/31/17 | | $ | 10.02 | | | | 0.08 | | | | 0.03 | | | | 0.11 | | | | (0.14 | ) | | | — | | | | (0.14 | ) | |
Year Ended 12/31/16 | | $ | 9.95 | | | | 0.08 | | | | 0.05 | | | | 0.13 | | | | (0.06 | ) | | | — | | | | (0.06 | ) | |
Class Y | |
Year Ended 12/31/20 | | $ | 9.99 | | | | 0.17 | | | | 0.23 | | | | 0.40 | | | | (0.15 | ) | | | (0.04 | ) | | | (0.19 | ) | |
Year Ended 12/31/19 | | $ | 9.86 | | | | 0.21 | | | | 0.16 | | | | 0.37 | | | | (0.23 | ) | | | (0.01 | ) | | | (0.24 | ) | |
Year Ended 12/31/18 | | $ | 10.00 | | | | 0.19 | | | | (0.10 | ) | | | 0.09 | | | | (0.23 | ) | | | — | | | | (0.23 | ) | |
Year Ended 12/31/17 | | $ | 10.03 | | | | 0.15 | | | | 0.02 | | | | 0.17 | | | | (0.20 | ) | | | — | | | | (0.20 | ) | |
Year Ended 12/31/16 | | $ | 9.95 | | | | 0.14 | | | | 0.06 | | | | 0.20 | | | | (0.12 | ) | | | — | | | | (0.12 | ) | |
(a) Per share net investment income (loss) has been calculated using the average daily shares method.
(b) Portfolio turnover is calculated on the basis of the Fund as a whole without distinguishing between the classes of shares issued.
(c) Amount is less than $0.005 per share.
(d) The Fund received monies related to a nonrecurring refund from the prior Custodian. The corresponding impact to the total return was less than 0.005% for the period shown. (See Note 8)
See notes to financial statements.
92
Victory Portfolios | | Financial Highlights — continued | |
For a Share Outstanding Throughout Each Period
| | | | | Ratios to Average Net Assets | | Supplemental Data | |
| | | Capital
Contribution
from Prior
Custodian,
Net (See
Note 8) | | Net Asset
Value,
End of
Period | | Total
Return
(Excludes
Sales
Charge) | | Net
Expenses | | Net
Investment
Income
(Loss) | | Gross
Expenses | | Net Assets,
End of
Period
(000's) | | Portfolio
Turnover(b) | |
Victory INCORE Low Duration Bond Fund | |
Class A | |
Year Ended 12/31/20 | | | — | | | $ | 10.20 | | | | 3.85 | % | | | 0.85 | % | | | 1.39 | % | | | 0.95 | % | | $ | 70,357 | | | | 85 | % | |
Year Ended 12/31/19 | | | — | | | $ | 9.99 | | | | 3.51 | % | | | 0.85 | % | | | 1.93 | % | | | 0.95 | % | | $ | 61,972 | | | | 50 | % | |
Year Ended 12/31/18 | | | — | | | $ | 9.86 | | | | 0.73 | % | | | 0.85 | % | | | 1.66 | % | | | 0.90 | % | | $ | 96,210 | | | | 45 | % | |
Year Ended 12/31/17 | | | — | | | $ | 9.99 | | | | 1.47 | % | | | 0.85 | % | | | 1.21 | % | | | 0.90 | % | | $ | 149,287 | | | | 62 | % | |
Year Ended 12/31/16 | | | — | (c) | | $ | 10.03 | | | | 1.80 | %(d) | | | 0.85 | % | | | 1.21 | % | | | 0.89 | % | | $ | 214,825 | | | | 49 | % | |
Class C | |
Year Ended 12/31/20 | | | — | | | $ | 10.20 | | | | 3.05 | % | | | 1.62 | % | | | 0.76 | % | | | 1.72 | % | | $ | 23,504 | | | | 85 | % | |
Year Ended 12/31/19 | | | — | | | $ | 9.99 | | | | 2.81 | % | | | 1.62 | % | | | 1.17 | % | | | 1.70 | % | | $ | 38,969 | | | | 50 | % | |
Year Ended 12/31/18 | | | — | | | $ | 9.85 | | | | (0.04 | )% | | | 1.62 | % | | | 0.88 | % | | | 1.68 | % | | $ | 62,103 | | | | 45 | % | |
Year Ended 12/31/17 | | | — | | | $ | 9.99 | | | | 0.70 | % | | | 1.62 | % | | | 0.44 | % | | | 1.65 | % | | $ | 82,847 | | | | 62 | % | |
Year Ended 12/31/16 | | | — | (c) | | $ | 10.02 | | | | 0.94 | %(d) | | | 1.62 | % | | | 0.44 | % | | | 1.65 | % | | $ | 117,544 | | | | 49 | % | |
Class R | |
Year Ended 12/31/20 | | | — | | | $ | 10.20 | | | | 3.41 | % | | | 1.27 | % | | | 0.99 | % | | | 2.38 | % | | $ | 1,129 | | | | 85 | % | |
Year Ended 12/31/19 | | | — | | | $ | 9.99 | | | | 3.17 | % | | | 1.27 | % | | | 1.50 | % | | | 2.13 | % | | $ | 1,147 | | | | 50 | % | |
Year Ended 12/31/18 | | | — | | | $ | 9.86 | | | | 0.31 | % | | | 1.27 | % | | | 1.20 | % | | | 1.87 | % | | $ | 1,554 | | | | 45 | % | |
Year Ended 12/31/17 | | | — | | | $ | 9.99 | | | | 1.05 | % | | | 1.27 | % | | | 0.79 | % | | | 1.68 | % | | $ | 2,078 | | | | 62 | % | |
Year Ended 12/31/16 | | | — | (c) | | $ | 10.02 | | | | 1.33 | %(d) | | | 1.23 | % | | | 0.83 | % | | | 1.25 | % | | $ | 2,583 | | | | 49 | % | |
Class Y | |
Year Ended 12/31/20 | | | — | | | $ | 10.20 | | | | 4.08 | % | | | 0.62 | % | | | 1.64 | % | | | 0.68 | % | | $ | 165,330 | | | | 85 | % | |
Year Ended 12/31/19 | | | — | | | $ | 9.99 | | | | 3.76 | % | | | 0.62 | % | | | 2.12 | % | | | 0.69 | % | | $ | 164,509 | | | | 50 | % | |
Year Ended 12/31/18 | | | — | | | $ | 9.86 | | | | 0.96 | % | | | 0.62 | % | | | 1.87 | % | | | 0.68 | % | | $ | 180,034 | | | | 45 | % | |
Year Ended 12/31/17 | | | — | | | $ | 10.00 | | | | 1.71 | % | | | 0.62 | % | | | 1.44 | % | | | 0.65 | % | | $ | 271,294 | | | | 62 | % | |
Year Ended 12/31/16 | | | — | (c) | | $ | 10.03 | | | | 2.04 | %(d) | | | 0.60 | % | | | 1.42 | % | | | 0.63 | % | | $ | 334,841 | | | | 49 | % | |
See notes to financial statements.
93
Victory Portfolios | | Financial Highlights | |
For a Share Outstanding Throughout Each Period
| | | | Investment Activities | | Distributions to
Shareholders From | |
| | | Net Asset
Value,
Beginning of
Period | | Net
Investment
Income
(Loss)(a) | | Net Realized
and Unrealized
Gains (Losses)
on Investments | | Total from
Investment
Activities | | Net
Investment
Income | | Total
Distributions | |
Victory High Yield Fund | |
Class A | |
Year Ended 12/31/20 | | $ | 6.73 | | | | 0.37 | | | | 0.10 | | | | 0.47 | | | | (0.37 | ) | | | (0.37 | ) | |
Year Ended 12/31/19 | | $ | 6.20 | | | | 0.37 | | | | 0.54 | | | | 0.91 | | | | (0.38 | ) | | | (0.38 | ) | |
Year Ended 12/31/18 | | $ | 6.57 | | | | 0.39 | | | | (0.37 | ) | | | 0.02 | | | | (0.39 | ) | | | (0.39 | ) | |
Year Ended 12/31/17 | | $ | 6.34 | | | | 0.39 | | | | 0.22 | | | | 0.61 | | | | (0.38 | ) | | | (0.38 | ) | |
Year Ended 12/31/16 | | $ | 5.85 | | | | 0.38 | | | | 0.49 | | | | 0.87 | | | | (0.38 | ) | | | (0.38 | ) | |
Class C | |
Year Ended 12/31/20 | | $ | 6.75 | | | | 0.33 | | | | 0.10 | | | | 0.43 | | | | (0.33 | ) | | | (0.33 | ) | |
Year Ended 12/31/19 | | $ | 6.21 | | | | 0.33 | | | | 0.54 | | | | 0.87 | | | | (0.33 | ) | | | (0.33 | ) | |
Year Ended 12/31/18 | | $ | 6.58 | | | | 0.34 | | | | (0.36 | ) | | | (0.02 | ) | | | (0.35 | ) | | | (0.35 | ) | |
Year Ended 12/31/17 | | $ | 6.35 | | | | 0.34 | | | | 0.23 | | | | 0.57 | | | | (0.34 | ) | | | (0.34 | ) | |
Year Ended 12/31/16 | | $ | 5.86 | | | | 0.34 | | | | 0.49 | | | | 0.83 | | | | (0.34 | ) | | | (0.34 | ) | |
Class R | |
Year Ended 12/31/20 | | $ | 6.75 | | | | 0.35 | | | | 0.10 | | | | 0.45 | | | | (0.35 | ) | | | (0.35 | ) | |
Year Ended 12/31/19 | | $ | 6.22 | | | | 0.35 | | | | 0.53 | | | | 0.88 | | | | (0.35 | ) | | | (0.35 | ) | |
Year Ended 12/31/18 | | $ | 6.59 | | | | 0.37 | | | | (0.37 | ) | | | — | (c) | | | (0.37 | ) | | | (0.37 | ) | |
Year Ended 12/31/17 | | $ | 6.35 | | | | 0.37 | | | | 0.23 | | | | 0.60 | | | | (0.36 | ) | | | (0.36 | ) | |
Year Ended 12/31/16 | | $ | 5.87 | | | | 0.36 | | | | 0.48 | | | | 0.84 | | | | (0.36 | ) | | | (0.36 | ) | |
Class Y | |
Year Ended 12/31/20 | | $ | 6.70 | | | | 0.39 | | | | 0.10 | | | | 0.49 | | | | (0.39 | ) | | | (0.39 | ) | |
Year Ended 12/31/19 | | $ | 6.17 | | | | 0.39 | | | | 0.53 | | | | 0.92 | | | | (0.39 | ) | | | (0.39 | ) | |
Year Ended 12/31/18 | | $ | 6.54 | | | | 0.41 | | | | (0.37 | ) | | | 0.04 | | | | (0.41 | ) | | | (0.41 | ) | |
Year Ended 12/31/17 | | $ | 6.31 | | | | 0.40 | | | | 0.23 | | | | 0.63 | | | | (0.40 | ) | | | (0.40 | ) | |
Year Ended 12/31/16 | | $ | 5.82 | | | | 0.39 | | | | 0.49 | | | | 0.88 | | | | (0.39 | ) | | | (0.39 | ) | |
* Includes adjustments in accordance with U.S. generally accepted accounting principles.
(a) Per share net investment income (loss) has been calculated using the average daily shares method.
(b) Portfolio turnover is calculated on the basis of the Fund as a whole without distinguishing between the classes of shares issued.
(c) Amount is less than $0.005 per share.
See notes to financial statements.
94
Victory Portfolios | | Financial Highlights — continued | |
For a Share Outstanding Throughout Each Period
| | | | | Ratios to Average Net Assets | | Supplemental Data | |
| | | Net Asset
Value, End
of Period | | Total
Return
(Excludes
Sales
Charge)* | | Net
Expenses | | Net
Investment
Income
(Loss) | | Gross
Expenses | | Net Assets,
End of
Period
(000's) | | Portfolio
Turnover(b) | |
Victory High Yield Fund | |
Class A | |
Year Ended 12/31/20 | | $ | 6.83 | | | | 7.61 | % | | | 1.00 | % | | | 5.85 | % | | | 1.12 | % | | $ | 38,735 | | | | 124 | % | |
Year Ended 12/31/19 | | $ | 6.73 | | | | 14.90 | % | | | 1.00 | % | | | 5.70 | % | | | 1.12 | % | | $ | 31,602 | | | | 87 | % | |
Year Ended 12/31/18 | | $ | 6.20 | | | | 0.28 | % | | | 1.00 | % | | | 6.01 | % | | | 1.12 | % | | $ | 23,797 | | | | 87 | % | |
Year Ended 12/31/17 | | $ | 6.57 | | | | 9.93 | % | | | 1.00 | % | | | 5.99 | % | | | 1.13 | % | | $ | 21,882 | | | | 174 | % | |
Year Ended 12/31/16 | | $ | 6.34 | | | | 15.40 | % | | | 1.00 | % | | | 6.32 | % | | | 1.18 | % | | $ | 25,530 | | | | 165 | % | |
Class C | |
Year Ended 12/31/20 | | $ | 6.85 | | | | 6.84 | % | | | 1.70 | % | | | 5.14 | % | | | 1.81 | % | | $ | 25,957 | | | | 124 | % | |
Year Ended 12/31/19 | | $ | 6.75 | | | | 14.24 | % | | | 1.70 | % | | | 5.00 | % | | | 1.82 | % | | $ | 21,163 | | | | 87 | % | |
Year Ended 12/31/18 | | $ | 6.21 | | | | (0.43 | )% | | | 1.70 | % | | | 5.29 | % | | | 1.84 | % | | $ | 19,432 | | | | 87 | % | |
Year Ended 12/31/17 | | $ | 6.58 | | | | 9.19 | % | | | 1.70 | % | | | 5.27 | % | | | 1.84 | % | | $ | 22,283 | | | | 174 | % | |
Year Ended 12/31/16 | | $ | 6.35 | | | | 14.58 | % | | | 1.70 | % | | | 5.61 | % | | | 1.91 | % | | $ | 22,498 | | | | 165 | % | |
Class R | |
Year Ended 12/31/20 | | $ | 6.85 | | | | 7.24 | % | | | 1.33 | % | | | 5.51 | % | | | 1.33 | % | | $ | 19,248 | | | | 124 | % | |
Year Ended 12/31/19 | | $ | 6.75 | | | | 14.48 | % | | | 1.33 | % | | | 5.37 | % | | | 1.33 | % | | $ | 18,818 | | | | 87 | % | |
Year Ended 12/31/18 | | $ | 6.22 | | | | (0.07 | )% | | | 1.35 | % | | | 5.64 | % | | | 1.35 | % | | $ | 17,595 | | | | 87 | % | |
Year Ended 12/31/17 | | $ | 6.59 | | | | 9.64 | % | | | 1.35 | % | | | 5.61 | % | | | 1.36 | % | | $ | 19,217 | | | | 174 | % | |
Year Ended 12/31/16 | | $ | 6.35 | | | | 14.78 | % | | | 1.35 | % | | | 5.96 | % | | | 1.45 | % | | $ | 18,742 | | | | 165 | % | |
Class Y | |
Year Ended 12/31/20 | | $ | 6.80 | | | | 7.88 | % | | | 0.76 | % | | | 6.11 | % | | | 0.90 | % | | $ | 168,677 | | | | 124 | % | |
Year Ended 12/31/19 | | $ | 6.70 | | | | 15.25 | % | | | 0.76 | % | | | 5.96 | % | | | 0.92 | % | | $ | 108,171 | | | | 87 | % | |
Year Ended 12/31/18 | | $ | 6.17 | | | | 0.52 | % | | | 0.76 | % | | | 6.32 | % | | | 0.97 | % | | $ | 21,060 | | | | 87 | % | |
Year Ended 12/31/17 | | $ | 6.54 | | | | 10.24 | % | | | 0.76 | % | | | 6.27 | % | | | 1.04 | % | | $ | 5,213 | | | | 174 | % | |
Year Ended 12/31/16 | | $ | 6.31 | | | | 15.72 | % | | | 0.76 | % | | | 6.54 | % | | | 1.00 | % | | $ | 6,938 | | | | 165 | % | |
See notes to financial statements.
95
Victory Portfolios | | Financial Highlights | |
For a Share Outstanding Throughout Each Period
| | | | | Investment Activities | | Distributions to
Shareholders From | |
| | | Net Asset
Value,
Beginning of
Period | | Net
Investment
Income
(Loss)(a) | | Net
Realized and
Unrealized
Gains
(Losses) on
Investments | | Total from
Investment
Activities | | Net
Investment
Income | | Net Realized
Gains from
Investments | |
Victory Tax-Exempt Fund | |
Class A | |
Year Ended 12/31/20 | | $ | 9.84 | | | | 0.29 | | | | 0.23 | | | | 0.52 | | | | (0.32 | ) | | | (0.10 | ) | |
Year Ended 12/31/19 | | $ | 9.47 | | | | 0.30 | | | | 0.53 | | | | 0.83 | | | | (0.34 | ) | | | (0.12 | ) | |
Year Ended 12/31/18 | | $ | 9.91 | | | | 0.36 | | | | (0.30 | ) | | | 0.06 | | | | (0.36 | ) | | | (0.14 | ) | |
Year Ended 12/31/17 | | $ | 9.65 | | | | 0.36 | | | | 0.39 | | | | 0.75 | | | | (0.37 | ) | | | (0.12 | ) | |
Year Ended 12/31/16 | | $ | 10.53 | | | | 0.35 | | | | (0.49 | ) | | | (0.14 | ) | | | (0.35 | ) | | | (0.39 | ) | |
Class C | |
Year Ended 12/31/20 | | $ | 9.84 | | | | 0.22 | | | | 0.22 | | | | 0.44 | | | | (0.24 | ) | | | (0.10 | ) | |
Year Ended 12/31/19 | | $ | 9.47 | | | | 0.23 | | | | 0.52 | | | | 0.75 | | | | (0.26 | ) | | | (0.12 | ) | |
Year Ended 12/31/18 | | $ | 9.90 | | | | 0.28 | | | | (0.29 | ) | | | (0.01 | ) | | | (0.28 | ) | | | (0.14 | ) | |
Year Ended 12/31/17 | | $ | 9.65 | | | | 0.29 | | | | 0.37 | | | | 0.66 | | | | (0.29 | ) | | | (0.12 | ) | |
Year Ended 12/31/16 | | $ | 10.53 | | | | 0.26 | | | | (0.48 | ) | | | (0.22 | ) | | | (0.27 | ) | | | (0.39 | ) | |
Class Y | |
Year Ended 12/31/20 | | $ | 9.84 | | | | 0.30 | | | | 0.23 | | | | 0.53 | | | | (0.33 | ) | | | (0.10 | ) | |
Year Ended 12/31/19 | | $ | 9.46 | | | | 0.30 | | | | 0.55 | | | | 0.85 | | | | (0.35 | ) | | | (0.12 | ) | |
Year Ended 12/31/18 | | $ | 9.90 | | | | 0.37 | | | | (0.30 | ) | | | 0.07 | | | | (0.37 | ) | | | (0.14 | ) | |
Year Ended 12/31/17 | | $ | 9.65 | | | | 0.37 | | | | 0.38 | | �� | | 0.75 | | | | (0.38 | ) | | | (0.12 | ) | |
Year Ended 12/31/16 | | $ | 10.52 | | | | 0.36 | | | | (0.48 | ) | | | (0.12 | ) | | | (0.36 | ) | | | (0.39 | ) | |
(a) Per share net investment income (loss) has been calculated using the average daily shares method.
(b) Portfolio turnover is calculated on the basis of the Fund as a whole without distinguishing between the classes of shares issued.
See notes to financial statements.
96
Victory Portfolios | | Financial Highlights — continued | |
For a Share Outstanding Throughout Each Period
| | | | | Ratios to Average Net Assets | | Supplemental Data | |
| | | Total
Distributions | | Net Asset
Value,
End of
Period | | Total
Return
(Excludes
Sales
Charge) | | Net
Expenses | | Net
Investment
Income
(Loss) | | Gross
Expenses | | Net Assets,
End of
Period
(000's) | | Portfolio
Turnover(b) | |
Victory Tax-Exempt Fund | |
Class A | |
Year Ended 12/31/20 | | | (0.42 | ) | | $ | 9.94 | | | | 5.39 | % | | | 0.80 | % | | | 3.00 | % | | | 1.04 | % | | $ | 32,001 | | | | 44 | % | |
Year Ended 12/31/19 | | | (0.46 | ) | | $ | 9.84 | | | | 8.82 | % | | | 0.80 | % | | | 3.04 | % | | | 1.02 | % | | $ | 30,251 | | | | 64 | % | |
Year Ended 12/31/18 | | | (0.50 | ) | | $ | 9.47 | | | | 0.69 | % | | | 0.80 | % | | | 3.68 | % | | | 0.97 | % | | $ | 29,993 | | | | 42 | % | |
Year Ended 12/31/17 | | | (0.49 | ) | | $ | 9.91 | | | | 7.89 | % | | | 0.80 | % | | | 3.70 | % | | | 0.96 | % | | $ | 37,570 | | | | 84 | % | |
Year Ended 12/31/16 | | | (0.74 | ) | | $ | 9.65 | | | | (1.40 | )% | | | 0.80 | % | | | 3.30 | % | | | 0.95 | % | | $ | 54,658 | | | | 39 | % | |
Class C | |
Year Ended 12/31/20 | | | (0.34 | ) | | $ | 9.94 | | | | 4.56 | % | | | 1.60 | % | | | 2.28 | % | | | 1.91 | % | | $ | 6,497 | | | | 44 | % | |
Year Ended 12/31/19 | | | (0.38 | ) | | $ | 9.84 | | | | 7.97 | % | | | 1.60 | % | | | 2.34 | % | | | 1.82 | % | | $ | 11,259 | | | | 64 | % | |
Year Ended 12/31/18 | | | (0.42 | ) | | $ | 9.47 | | | | (0.01 | )% | | | 1.60 | % | | | 2.88 | % | | | 1.78 | % | | $ | 17,986 | | | | 42 | % | |
Year Ended 12/31/17 | | | (0.41 | ) | | $ | 9.90 | | | | 6.92 | % | | | 1.60 | % | | | 2.89 | % | | | 1.74 | % | | $ | 26,520 | | | | 84 | % | |
Year Ended 12/31/16 | | | (0.66 | ) | | $ | 9.65 | | | | (2.19 | )% | | | 1.60 | % | | | 2.51 | % | | | 1.71 | % | | $ | 33,369 | | | | 39 | % | |
Class Y | |
Year Ended 12/31/20 | | | (0.43 | ) | | $ | 9.94 | | | | 5.51 | % | | | 0.69 | % | | | 3.12 | % | | | 0.85 | % | | $ | 22,998 | | | | 44 | % | |
Year Ended 12/31/19 | | | (0.47 | ) | | $ | 9.84 | | | | 9.06 | % | | | 0.69 | % | | | 3.07 | % | | | 0.83 | % | | $ | 24,459 | | | | 64 | % | |
Year Ended 12/31/18 | | | (0.51 | ) | | $ | 9.46 | | | | 0.80 | % | | | 0.69 | % | | | 3.79 | % | | | 0.77 | % | | $ | 20,260 | | | | 42 | % | |
Year Ended 12/31/17 | | | (0.50 | ) | | $ | 9.90 | | | | 7.90 | % | | | 0.69 | % | | | 3.80 | % | | | 0.73 | % | | $ | 27,420 | | | | 84 | % | |
Year Ended 12/31/16 | | | (0.75 | ) | | $ | 9.65 | | | | (1.20 | )% | | | 0.69 | % | | | 3.41 | % | | | 0.71 | % | | $ | 31,762 | | | | 39 | % | |
See notes to financial statements.
97
Victory Portfolios | | Financial Highlights | |
For a Share Outstanding Throughout Each Period
| | | | | Investment Activities | | Distributions to
Shareholders From | |
| | | Net Asset
Value,
Beginning of
Period | | Net
Investment
Income
(Loss)(a) | | Net Realized
and Unrealized
Gains (Losses)
on Investments | | Total from
Investment
Activities | | Net
Investment
Income | | Net Realized
Gains from
Investments | |
Victory High Income Municipal Bond Fund | |
Class A | |
Year Ended 12/31/20 | | $ | 10.75 | | | | 0.42 | | | | 0.15 | | | | 0.57 | | | | (0.39 | ) | | | (0.09 | ) | |
Year Ended 12/31/19 | | $ | 10.39 | | | | 0.35 | | | | 0.47 | | | | 0.82 | | | | (0.40 | ) | | | (0.06 | ) | |
Year Ended 12/31/18 | | $ | 10.79 | | | | 0.43 | | | | (0.40 | ) | | | 0.03 | | | | (0.43 | ) | | | — | | |
Year Ended 12/31/17 | | $ | 10.35 | | | | 0.46 | | | | 0.44 | | | | 0.90 | | | | (0.46 | ) | | | — | | |
Year Ended 12/31/16 | | $ | 10.89 | | | | 0.44 | | | | (0.54 | ) | | | (0.10 | ) | | | (0.44 | ) | | | — | | |
Class C | |
Year Ended 12/31/20 | | $ | 10.75 | | | | 0.33 | | | | 0.16 | | | | 0.49 | | | | (0.31 | ) | | | (0.09 | ) | |
Year Ended 12/31/19 | | $ | 10.39 | | | | 0.28 | | | | 0.46 | | | | 0.74 | | | | (0.32 | ) | | | (0.06 | ) | |
Year Ended 12/31/18 | | $ | 10.79 | | | | 0.35 | | | | (0.40 | ) | | | (0.05 | ) | | | (0.35 | ) | | | — | | |
Year Ended 12/31/17 | | $ | 10.35 | | | | 0.38 | | | | 0.44 | | | | 0.82 | | | | (0.38 | ) | | | — | | |
Year Ended 12/31/16 | | $ | 10.89 | | | | 0.36 | | | | (0.54 | ) | | | (0.18 | ) | | | (0.36 | ) | | | — | | |
Class Y | |
Year Ended 12/31/20 | | $ | 10.75 | | | | 0.44 | | | | 0.16 | | | | 0.60 | | | | (0.42 | ) | | | (0.09 | ) | |
Year Ended 12/31/19 | | $ | 10.39 | | | | 0.38 | | | | 0.47 | | | | 0.85 | | | | (0.43 | ) | | | (0.06 | ) | |
Year Ended 12/31/18 | | $ | 10.79 | | | | 0.46 | | | | (0.40 | ) | | | 0.06 | | | | (0.46 | ) | | | — | | |
Year Ended 12/31/17 | | $ | 10.35 | | | | 0.48 | | | | 0.44 | | | | 0.92 | | | | (0.48 | ) | | | — | | |
Year Ended 12/31/16 | | $ | 10.89 | | | | 0.47 | | | | (0.54 | ) | | | (0.07 | ) | | | (0.47 | ) | | | — | | |
Member Class | |
11/3/20(e) through
12/31/20 | | $ | 10.56 | | | | 0.12 | | | | 0.31 | | | | 0.43 | | | | (0.06 | ) | | | (0.09 | ) | |
(a) Per share net investment income (loss) has been calculated using the average daily shares method.
(b) Not annualized for periods less than one year.
(c) Annualized for periods less than one year.
(d) Portfolio turnover is calculated on the basis of the Fund as a whole without distinguishing between the classes of shares issued.
(e) Commencement of operations.
See notes to financial statements.
98
Victory Portfolios | | Financial Highlights — continued | |
For a Share Outstanding Throughout Each Period
| | | | | Ratios to Average Net Assets | | Supplemental Data | |
| | | Total
Distributions | | Net Asset
Value,
End of
Period | | Total
Return
(Excludes
Sales
Charge)(b) | | Net
Expenses(c) | | Net
Investment
Income
(Loss)(c) | | Gross
Expenses(c) | | Net Assets,
End of
Period
(000's) | | Portfolio
Turnover(b)(d) | |
Victory High Income Municipal Bond Fund | |
Class A | |
Year Ended 12/31/20 | | | (0.48 | ) | | $ | 10.84 | | | | 5.52 | % | | | 0.80 | % | | | 3.95 | % | | | 1.10 | % | | $ | 26,330 | | | | 74 | % | |
Year Ended 12/31/19 | | | (0.46 | ) | | $ | 10.75 | | | | 8.04 | % | | | 0.80 | % | | | 3.27 | % | | | 1.09 | % | | $ | 19,153 | | | | 49 | % | |
Year Ended 12/31/18 | | | (0.43 | ) | | $ | 10.39 | | | | 0.34 | % | | | 0.80 | % | | | 4.13 | % | | | 1.02 | % | | $ | 16,483 | | | | 48 | % | |
Year Ended 12/31/17 | | | (0.46 | ) | | $ | 10.79 | | | | 8.85 | % | | | 0.80 | % | | | 4.31 | % | | | 0.96 | % | | $ | 25,831 | | | | 66 | % | |
Year Ended 12/31/16 | | | (0.44 | ) | | $ | 10.35 | | | | (1.04 | )% | | | 0.80 | % | | | 4.02 | % | | | 0.96 | % | | $ | 32,943 | | | | 49 | % | |
Class C | |
Year Ended 12/31/20 | | | (0.40 | ) | | $ | 10.84 | | | | 4.72 | % | | | 1.57 | % | | | 3.11 | % | | | 1.90 | % | | $ | 9,378 | | | | 74 | % | |
Year Ended 12/31/19 | | | (0.38 | ) | | $ | 10.75 | | | | 7.22 | % | | | 1.57 | % | | | 2.61 | % | | | 1.85 | % | | $ | 13,995 | | | | 49 | % | |
Year Ended 12/31/18 | | | (0.35 | ) | | $ | 10.39 | | | | (0.43 | )% | | | 1.57 | % | | | 3.35 | % | | | 1.78 | % | | $ | 19,282 | | | | 48 | % | |
Year Ended 12/31/17 | | | (0.38 | ) | | $ | 10.79 | | | | 8.01 | % | | | 1.57 | % | | | 3.54 | % | | | 1.73 | % | | $ | 25,175 | | | | 66 | % | |
Year Ended 12/31/16 | | | (0.36 | ) | | $ | 10.35 | | | | (1.79 | )% | | | 1.57 | % | | | 3.26 | % | | | 1.73 | % | | $ | 29,563 | | | | 49 | % | |
Class Y | |
Year Ended 12/31/20 | | | (0.51 | ) | | $ | 10.84 | | | | 5.76 | % | | | 0.57 | % | | | 4.14 | % | | | 0.93 | % | | $ | 9,682 | | | | 74 | % | |
Year Ended 12/31/19 | | | (0.49 | ) | | $ | 10.75 | | | | 8.29 | % | | | 0.57 | % | | | 3.56 | % | | | 0.88 | % | | $ | 10,620 | | | | 49 | % | |
Year Ended 12/31/18 | | | (0.46 | ) | | $ | 10.39 | | | | 0.57 | % | | | 0.57 | % | | | 4.36 | % | | | 0.78 | % | | $ | 11,683 | | | | 48 | % | |
Year Ended 12/31/17 | | | (0.48 | ) | | $ | 10.79 | | | | 9.10 | % | | | 0.57 | % | | | 4.55 | % | | | 0.73 | % | | $ | 26,864 | | | | 66 | % | |
Year Ended 12/31/16 | | | (0.47 | ) | | $ | 10.35 | | | | (0.81 | )% | | | 0.57 | % | | | 4.26 | % | | | 0.72 | % | | $ | 36,603 | | | | 49 | % | |
Member Class | |
11/3/20(e) through
12/31/20 | | | (0.15 | ) | | $ | 10.84 | | | | 4.12 | % | | | 0.65 | % | | | 6.78 | % | | | 42.32 | % | | $ | 140 | | | | 74 | % | |
See notes to financial statements.
99
Victory Portfolios | | Financial Highlights | |
For a Share Outstanding Throughout Each Period
| | | | | Investment Activities | | Distributions to
Shareholders From | |
| | | Net Asset
Value,
Beginning of
Period | | Net
Investment
Income
(Loss)(a) | | Net Realized
and Unrealized
Gains (Losses)
on Investments | | Total from
Investment
Activities | | Net
Investment
Income | | Total
Distributions | |
Victory Floating Rate Fund | |
Class A | |
Year Ended 12/31/20 | | $ | 9.42 | | | | 0.49 | | | | (0.08 | ) | | | 0.41 | | | | (0.49 | ) | | | (0.49 | ) | |
Year Ended 12/31/19 | | $ | 9.13 | | | | 0.55 | | | | 0.29 | | | | 0.84 | | | | (0.55 | ) | | | (0.55 | ) | |
Year Ended 12/31/18 | | $ | 9.60 | | | | 0.52 | | | | (0.47 | ) | | | 0.05 | | | | (0.52 | ) | | | (0.52 | ) | |
Year Ended 12/31/17 | | $ | 9.71 | | | | 0.46 | | | | (0.10 | ) | | | 0.36 | | | | (0.47 | ) | | | (0.47 | ) | |
Year Ended 12/31/16 | | $ | 9.08 | | | | 0.46 | | | | 0.63 | | | | 1.09 | | | | (0.46 | ) | | | (0.46 | ) | |
Class C | |
Year Ended 12/31/20 | | $ | 9.42 | | | | 0.43 | | | | (0.09 | ) | | | 0.34 | | | | (0.42 | ) | | | (0.42 | ) | |
Year Ended 12/31/19 | | $ | 9.14 | | | | 0.48 | | | | 0.28 | | | | 0.76 | | | | (0.48 | ) | | | (0.48 | ) | |
Year Ended 12/31/18 | | $ | 9.61 | | | | 0.44 | | | | (0.47 | ) | | | (0.03 | ) | | | (0.44 | ) | | | (0.44 | ) | |
Year Ended 12/31/17 | | $ | 9.72 | | | | 0.38 | | | | (0.10 | ) | | | 0.28 | | | | (0.39 | ) | | | (0.39 | ) | |
Year Ended 12/31/16 | | $ | 9.08 | | | | 0.39 | | | | 0.64 | | | | 1.03 | | | | (0.39 | ) | | | (0.39 | ) | |
Class R | |
Year Ended 12/31/20 | | $ | 9.41 | | | | 0.45 | | | | (0.09 | ) | | | 0.36 | | | | (0.44 | ) | | | (0.44 | ) | |
Year Ended 12/31/19 | | $ | 9.13 | | | | 0.50 | | | | 0.28 | | | | 0.78 | | | | (0.50 | ) | | | (0.50 | ) | |
Year Ended 12/31/18 | | $ | 9.60 | | | | 0.46 | | | | (0.46 | ) | | | — | (e) | | | (0.47 | ) | | | (0.47 | ) | |
Year Ended 12/31/17 | | $ | 9.72 | | | | 0.41 | | | | (0.12 | ) | | | 0.29 | | | | (0.41 | ) | | | (0.41 | ) | |
Year Ended 12/31/16 | | $ | 9.08 | | | | 0.42 | | | | 0.63 | | | | 1.05 | | | | (0.41 | ) | | | (0.41 | ) | |
Class Y | |
Year Ended 12/31/20 | | $ | 9.43 | | | | 0.51 | | | | (0.08 | ) | | | 0.43 | | | | (0.51 | ) | | | (0.51 | ) | |
Year Ended 12/31/19 | | $ | 9.14 | | | | 0.57 | | | | 0.29 | | | | 0.86 | | | | (0.57 | ) | | | (0.57 | ) | |
Year Ended 12/31/18 | | $ | 9.61 | | | | 0.54 | | | | (0.47 | ) | | | 0.07 | | | | (0.54 | ) | | | (0.54 | ) | |
Year Ended 12/31/17 | | $ | 9.72 | | | | 0.48 | | | | (0.10 | ) | | | 0.38 | | | | (0.49 | ) | | | (0.49 | ) | |
Year Ended 12/31/16 | | $ | 9.08 | | | | 0.49 | | | | 0.63 | | | | 1.12 | | | | (0.48 | ) | | | (0.48 | ) | |
Member Class | |
11/3/20(f) through
12/31/20 | | $ | 9.02 | | | | 0.08 | | | | 0.32 | (g) | | | 0.40 | | | | (0.08 | ) | | | (0.08 | ) | |
* Includes adjustments in accordance with U.S. generally accepted accounting principles.
(a) Per share net investment income (loss) has been calculated using the average daily shares method.
(b) Not annualized for periods less than one year.
(c) Annualized for periods less than one year.
(d) Portfolio turnover is calculated on the basis of the Fund as a whole without distinguishing between the classes of shares issued.
(e) Amount is less than $0.005 per share.
(f) Commencement of operations.
(g) The amount shown for a share outstanding throughout the period does not accord with the change in net assets resulting from operations during the period because of the timing of sales and purchases of fund shares in relation to fluctuating market values during the period.
See notes to financial statements.
100
Victory Portfolios | | Financial Highlights — continued | |
For a Share Outstanding Throughout Each Period
| | | | | Ratios to Average Net Assets | | Supplemental Data | |
| | | Net Asset
Value, End
of Period | | Total
Return
(Excludes
Sales
Charge)(b)* | | Net
Expenses(c) | | Net
Investment
Income
(Loss)(c) | | Gross
Expenses(c) | | Net Assets,
End of
Period
(000's) | | Portfolio
Turnover(b)(d) | |
Victory Floating Rate Fund | |
Class A | |
Year Ended 12/31/20 | | $ | 9.34 | | | | 4.81 | % | | | 1.00 | % | | | 5.54 | % | | | 1.17 | % | | $ | 164,864 | | | | 54 | % | |
Year Ended 12/31/19 | | $ | 9.42 | | | | 9.43 | % | | | 1.00 | % | | | 5.89 | % | | | 1.17 | % | | $ | 146,584 | | | | 35 | % | |
Year Ended 12/31/18 | | $ | 9.13 | | | | 0.43 | % | | | 1.00 | % | | | 5.41 | % | | | 1.14 | % | | $ | 118,672 | | | | 48 | % | |
Year Ended 12/31/17 | | $ | 9.60 | | | | 3.76 | % | | | 1.00 | % | | | 4.76 | % | | | 1.10 | % | | $ | 148,060 | | | | 57 | % | |
Year Ended 12/31/16 | | $ | 9.71 | | | | 12.35 | % | | | 1.00 | % | | | 4.95 | % | | | 1.11 | % | | $ | 221,022 | | | | 56 | % | |
Class C | |
Year Ended 12/31/20 | | $ | 9.34 | | | | 3.96 | % | | | 1.80 | % | | | 4.81 | % | | | 1.94 | % | | $ | 94,885 | | | | 54 | % | |
Year Ended 12/31/19 | | $ | 9.42 | | | | 8.49 | % | | | 1.80 | % | | | 5.08 | % | | | 1.92 | % | | $ | 149,054 | | | | 35 | % | |
Year Ended 12/31/18 | | $ | 9.14 | | | | (0.38 | )% | | | 1.80 | % | | | 4.60 | % | | | 1.90 | % | | $ | 211,462 | | | | 48 | % | |
Year Ended 12/31/17 | | $ | 9.61 | | | | 2.93 | % | | | 1.80 | % | | | 3.97 | % | | | 1.87 | % | | $ | 265,486 | | | | 57 | % | |
Year Ended 12/31/16 | | $ | 9.72 | | | | 11.57 | % | | | 1.80 | % | | | 4.18 | % | | | 1.89 | % | | $ | 341,169 | | | | 56 | % | |
Class R | |
Year Ended 12/31/20 | | $ | 9.33 | | | | 4.23 | % | | | 1.56 | % | | | 5.01 | % | | | 6.20 | % | | $ | 300 | | | | 54 | % | |
Year Ended 12/31/19 | | $ | 9.41 | | | | 8.75 | % | | | 1.56 | % | | | 5.34 | % | | | 3.73 | % | | $ | 455 | | | | 35 | % | |
Year Ended 12/31/18 | | $ | 9.13 | | | | (0.13 | )% | | | 1.56 | % | | | 4.84 | % | | | 2.99 | % | | $ | 716 | | | | 48 | % | |
Year Ended 12/31/17 | | $ | 9.60 | | | | 3.07 | % | | | 1.56 | % | | | 4.20 | % | | | 2.26 | % | | $ | 916 | | | | 57 | % | |
Year Ended 12/31/16 | | $ | 9.72 | | | | 11.88 | % | | | 1.53 | % | | | 4.48 | % | | | 1.53 | % | | $ | 1,319 | | | | 56 | % | |
Class Y | |
Year Ended 12/31/20 | | $ | 9.35 | | | | 5.03 | % | | | 0.78 | % | | | 5.73 | % | | | 0.93 | % | | $ | 403,852 | | | | 54 | % | |
Year Ended 12/31/19 | | $ | 9.43 | | | | 9.65 | % | | | 0.78 | % | | | 6.10 | % | | | 0.92 | % | | $ | 289,796 | | | | 35 | % | |
Year Ended 12/31/18 | | $ | 9.14 | | | | 0.64 | % | | | 0.78 | % | | | 5.64 | % | | | 0.89 | % | | $ | 281,545 | | | | 48 | % | |
Year Ended 12/31/17 | | $ | 9.61 | | | | 3.98 | % | | | 0.78 | % | | | 4.99 | % | | | 0.88 | % | | $ | 276,195 | | | | 57 | % | |
Year Ended 12/31/16 | | $ | 9.72 | | | | 12.71 | % | | | 0.78 | % | | | 5.21 | % | | | 0.88 | % | | $ | 370,035 | | | | 56 | % | |
Member Class | |
11/3/20(f) through
12/31/20 | | $ | 9.34 | | | | 4.41 | % | | | 0.85 | % | | | 5.46 | % | | | 56.41 | % | | $ | 62 | | | | 54 | % | |
See notes to financial statements.
101
Victory Portfolios | | Financial Highlights | |
For a Share Outstanding Throughout Each Period
| | | | Investment Activities | | Distributions to
Shareholders From | |
| | | Net Asset
Value,
Beginning of
Period | | Net
Investment
Income
(Loss)(a) | | Net
Realized and
Unrealized
Gains
(Losses) on
Investments | | Total from
Investment
Activities | | Net
Investment
Income | | Net Realized
Gains from
Investments | | Return of
Capital | |
Victory Strategic Income Fund | |
Class A | |
Year Ended
12/31/20 | | $ | 10.35 | | | | 0.15 | | | | 0.78 | | | | 0.93 | | | | (0.15 | ) | | | (0.18 | ) | | | — | | |
Year Ended
12/31/19 | | $ | 9.74 | | | | 0.27 | | | | 0.61 | | | | 0.88 | | | | (0.25 | ) | | | — | | | | (0.02 | ) | |
Year Ended
12/31/18 | | $ | 10.14 | | | | 0.34 | | | | (0.41 | ) | | | (0.07 | ) | | | (0.33 | ) | | | — | | | | — | | |
Year Ended
12/31/17 | | $ | 9.99 | | | | 0.33 | | | | 0.17 | | | | 0.50 | | | | (0.35 | ) | | | — | | | | — | | |
Year Ended
12/31/16 | | $ | 9.68 | | | | 0.23 | | | | 0.36 | | | | 0.59 | | | | (0.27 | ) | | | — | | | | (0.01 | ) | |
Class C | |
Year Ended
12/31/20 | | $ | 10.40 | | | | 0.06 | | | | 0.80 | | | | 0.86 | | | | (0.07 | ) | | | (0.18 | ) | | | — | | |
Year Ended
12/31/19 | | $ | 9.79 | | | | 0.19 | | | | 0.61 | | | | 0.80 | | | | (0.18 | ) | | | — | | | | (0.01 | ) | |
Year Ended
12/31/18 | | $ | 10.19 | | | | 0.26 | | | | (0.41 | ) | | | (0.15 | ) | | | (0.25 | ) | | | — | | | | — | | |
Year Ended
12/31/17 | | $ | 10.04 | | | | 0.25 | | | | 0.17 | | | | 0.42 | | | | (0.27 | ) | | | — | | | | — | | |
Year Ended
12/31/16 | | $ | 9.72 | | | | 0.15 | | | | 0.38 | | | | 0.53 | | | | (0.20 | ) | | | — | | | | (0.01 | ) | |
Class R | |
Year Ended
12/31/20 | | $ | 10.41 | | | | 0.11 | | | | 0.78 | | | | 0.89 | | | | (0.11 | ) | | | (0.18 | ) | | | — | | |
Year Ended
12/31/19 | | $ | 9.79 | | | | 0.23 | | | | 0.62 | | | | 0.85 | | | | (0.22 | ) | | | — | | | | (0.01 | ) | |
Year Ended
12/31/18 | | $ | 10.20 | | | | 0.30 | | | | (0.42 | ) | | | (0.12 | ) | | | (0.29 | ) | | | — | | | | — | | |
Year Ended
12/31/17 | | $ | 10.04 | | | | 0.29 | | | | 0.18 | | | | 0.47 | | | | (0.31 | ) | | | — | | | | — | | |
Year Ended
12/31/16 | | $ | 9.73 | | | | 0.19 | | | | 0.37 | | | | 0.56 | | | | (0.24 | ) | | | — | | | | (0.01 | ) | |
Class Y | |
Year Ended
12/31/20 | | $ | 10.29 | | | | 0.16 | | | | 0.80 | | | | 0.96 | | | | (0.18 | ) | | | (0.18 | ) | | | — | | |
Year Ended
12/31/19 | | $ | 9.69 | | | | 0.29 | | | | 0.61 | | | | 0.90 | | | | (0.28 | ) | | | — | | | | (0.02 | ) | |
Year Ended
12/31/18 | | $ | 10.09 | | | | 0.36 | | | | (0.41 | ) | | | (0.05 | ) | | | (0.35 | ) | | | — | | | | — | | |
Year Ended
12/31/17 | | $ | 9.94 | | | | 0.35 | | | | 0.18 | | | | 0.53 | | | | (0.38 | ) | | | — | | | | — | | |
Year Ended
12/31/16 | | $ | 9.63 | | | | 0.25 | | | | 0.36 | | | | 0.61 | | | | (0.29 | ) | | | — | | | | (0.01 | ) | |
(a) Per share net investment income (loss) has been calculated using the average daily shares method.
See notes to financial statements.
102
Victory Portfolios | | Financial Highlights — continued | |
For a Share Outstanding Throughout Each Period
| | | | | Ratios to Average Net Assets | | Supplemental Data | |
| | | Total
Distributions | | Net Asset
Value,
End of
Period | | Total
Return
(Excludes
Sales
charge) | | Net
Expenses | | Net
Investment
Income
(Loss) | | Gross
Expenses | | Net Assets,
End of
Period
(000's) | | Portfolio
Turnover(b) | |
Victory Strategic Income Fund | |
Class A | |
Year Ended
12/31/20 | | | (0.33 | ) | | $ | 10.95 | | | | 9.09 | % | | | 0.95 | % | | | 1.39 | % | | | 1.08 | % | | $ | 40,993 | | | | 194 | % | |
Year Ended
12/31/19 | | | (0.27 | ) | | $ | 10.35 | | | | 9.17 | % | | | 0.95 | % | | | 2.61 | % | | | 1.11 | % | | $ | 33,767 | | | | 106 | % | |
Year Ended
12/31/18 | | | (0.33 | ) | | $ | 9.74 | | | | (0.66 | )% | | | 0.95 | % | | | 3.46 | % | | | 1.09 | % | | $ | 32,053 | | | | 115 | % | |
Year Ended
12/31/17 | | | (0.35 | ) | | $ | 10.14 | | | | 5.12 | % | | | 0.95 | % | | | 3.24 | % | | | 1.07 | % | | $ | 34,957 | | | | 138 | % | |
Year Ended
12/31/16 | | | (0.28 | ) | | $ | 9.99 | | | | 6.20 | % | | | 0.95 | % | | | 2.28 | % | | | 1.17 | % | | $ | 37,121 | | | | 79 | % | |
Class C | |
Year Ended
12/31/20 | | | (0.25 | ) | | $ | 11.01 | | | | 8.28 | % | | | 1.74 | % | | | 0.59 | % | | | 1.96 | % | | $ | 9,477 | | | | 194 | % | |
Year Ended
12/31/19 | | | (0.19 | ) | | $ | 10.40 | | | | 8.26 | % | | | 1.74 | % | | | 1.83 | % | | | 2.00 | % | | $ | 9,126 | | | | 106 | % | |
Year Ended
12/31/18 | | | (0.25 | ) | | $ | 9.79 | | | | (1.45 | )% | | | 1.74 | % | | | 2.65 | % | | | 1.97 | % | | $ | 10,221 | | | | 115 | % | |
Year Ended
12/31/17 | | | (0.27 | ) | | $ | 10.19 | | | | 4.27 | % | | | 1.74 | % | | | 2.44 | % | | | 1.89 | % | | $ | 11,671 | | | | 138 | % | |
Year Ended
12/31/16 | | | (0.21 | ) | | $ | 10.04 | | | | 5.46 | % | | | 1.74 | % | | | 1.49 | % | | | 2.00 | % | | $ | 11,547 | | | | 79 | % | |
Class R | |
Year Ended
12/31/20 | | | (0.29 | ) | | $ | 11.01 | | | | 8.61 | % | | | 1.34 | % | | | 0.99 | % | | | 1.72 | % | | $ | 2,989 | | | | 194 | % | |
Year Ended
12/31/19 | | | (0.23 | ) | | $ | 10.41 | | | | 8.79 | % | | | 1.34 | % | | | 2.21 | % | | | 1.77 | % | | $ | 2,866 | | | | 106 | % | |
Year Ended
12/31/18 | | | (0.29 | ) | | $ | 9.79 | | | | (1.15 | )% | | | 1.34 | % | | | 3.05 | % | | | 1.70 | % | | $ | 2,761 | | | | 115 | % | |
Year Ended
12/31/17 | | | (0.31 | ) | | $ | 10.20 | | | | 4.78 | % | | | 1.34 | % | | | 2.83 | % | | | 1.61 | % | | $ | 2,927 | | | | 138 | % | |
Year Ended
12/31/16 | | | (0.25 | ) | | $ | 10.04 | | | | 5.77 | % | | | 1.34 | % | | | 1.89 | % | | | 1.53 | % | | $ | 2,979 | | | | 79 | % | |
Class Y | |
Year Ended
12/31/20 | | | (0.36 | ) | | $ | 10.89 | | | | 9.37 | % | | | 0.74 | % | | | 1.53 | % | | | 0.91 | % | | $ | 53,060 | | | | 194 | % | |
Year Ended
12/31/19 | | | (0.30 | ) | | $ | 10.29 | | | | 9.35 | % | | | 0.74 | % | | | 2.83 | % | | | 1.11 | % | | $ | 5,274 | | | | 106 | % | |
Year Ended
12/31/18 | | | (0.35 | ) | | $ | 9.69 | | | | (0.45 | )% | | | 0.74 | % | | | 3.72 | % | | | 1.06 | % | | $ | 4,798 | | | | 115 | % | |
Year Ended
12/31/17 | | | (0.38 | ) | | $ | 10.09 | | | | 5.38 | % | | | 0.74 | % | | | 3.46 | % | | | 0.95 | % | | $ | 10,180 | | | | 138 | % | |
Year Ended
12/31/16 | | | (0.30 | ) | | $ | 9.94 | | | | 6.45 | % | | | 0.74 | % | | | 2.50 | % | | | 0.99 | % | | $ | 11,768 | | | | 79 | % | |
(b) Portfolio turnover is calculated on the basis of the Fund as a whole without distinguishing between the classes of shares issued.
See notes to financial statements.
103
Victory Portfolios | | Notes to Financial Statements
December 31, 2020 | |
1. Organization:
Victory Portfolios (the "Trust") was organized on December 6, 1995 as a Delaware statutory trust as a successor to a company named "The Victory Portfolios," which was organized as a Massachusetts business trust on February 5, 1986. The Trust is registered under the Investment Company Act of 1940, as amended (the "1940 Act"), as an open-end investment company. The Trust is comprised of 42 funds and is authorized to issue an unlimited number of shares, which are units of beneficial interest with a par value of $0.001 per share. Each Fund is classified as diversified under the 1940 Act.
The accompanying financial statements are those of the following seven Funds (collectively, the "Funds" and individually, a "Fund").
Funds (Legal Name) | | Funds (Short Name) | | Investment Share
Classes Offered | |
Victory INCORE Investment
Quality Bond Fund | | INCORE Investment
Quality Bond Fund | | Classes A, C, R and Y
| |
Victory INCORE Low Duration
Bond Fund | | INCORE Low Duration
Bond Fund | | Classes A, C, R and Y
| |
Victory High Yield Fund | | High Yield Fund | | Classes A, C, R and Y | |
Victory Tax-Exempt Fund | | Tax-Exempt Fund | | Classes A, C and Y | |
Victory High Income Municipal
Bond Fund | | High Income Municipal
Bond Fund | | Classes A, C, Y and
Member Class* | |
Victory Floating Rate Fund
| | Floating Rate Fund
| | Classes A, C, R, Y and
Member Class* | |
Victory Strategic Income Fund | | Strategic Income Fund | | Classes A, C, R and Y | |
* Member Class commenced operations on November 3, 2020.
Each class of shares of a Fund has substantially identical rights and privileges except with respect to sales charges, fees paid under distribution plans, expenses allocable exclusively to each class of shares, voting rights on matters solely affecting a single class of shares, and the exchange privilege of each class of shares.
Under the Trust's organizational documents, its officers and trustees are indemnified against certain liabilities arising out of the performance of their duties to the Funds. In addition, in the normal course of business, the Funds enter into contracts with their vendors and others that provide for general indemnifications. The Funds' maximum exposure under these arrangements is unknown, as this would involve future claims that may be made against the Funds. However, based on experience, the Funds expect that risk of loss to be remote.
2. Significant Accounting Policies:
The following is a summary of significant accounting policies followed by the Trust in the preparation of its financial statements. The policies are in conformity with Generally Accepted Accounting Principles in the United States of America ("GAAP"). The preparation of financial statements in accordance with GAAP requires management to make estimates and assumptions that affect the reported amounts of assets and liabilities and disclosure of contingent assets and liabilities at the date of the financial statements and the reported amounts of income and expenses for the period. Actual results could differ from those estimates. The Funds follow the specialized accounting and reporting requirements under GAAP that are applicable to investment companies.
Investment Valuation:
The Funds record investments at fair value. Fair value is defined as the price that would be received to sell an asset or paid to transfer a liability in an orderly transaction between market participants at the measurement date.
104
Victory Portfolios | | Notes to Financial Statements — continued
December 31, 2020 | |
The valuation techniques described below maximize the use of observable inputs and minimize the use of unobservable inputs in determining fair value. The inputs used for valuing the Funds' investments are summarized in the three broad levels listed below:
• Level 1 — quoted prices in active markets for identical securities
• Level 2 — other significant observable inputs (including quoted prices for similar securities or interest rates applicable to those securities, etc.)
• Level 3 — significant unobservable inputs (including the Funds' own assumptions in determining the fair value of investments)
Changes in valuation techniques may result in transfers in or out of an assigned level within the disclosure hierarchy. The inputs or methodologies used for valuation techniques are not necessarily an indication of the risk associated with entering into those investments.
Portfolio securities listed or traded on securities exchanges, including Exchange-Traded Funds ("ETFs"), American Depositary Receipts ("ADRs") and Rights, are valued at the closing price on the exchange or system where the security is principally traded, if available, or at the Nasdaq Official Closing Price. If there have been no sales for that day on the exchange or system, then a security is valued at the last available bid quotation on the exchange or system where the security is principally traded. In each of these situations, valuations are typically categorized as Level 1 in the fair value hierarchy.
Investments in open-end investment companies are valued at net asset value ("NAV"). These valuations are typically categorized as Level 1 in the fair value hierarchy.
Futures contracts are valued at the settlement price established each day by the board of trade or an exchange on which they are traded. These valuations are typically categorized as Level 1 in the fair value hierarchy.
Swap agreements are valued at the mean between the current bid and ask prices. To the extent this model is utilized, these valuations are considered as Level 2 in the fair value hierarchy.
Debt securities of United States ("U.S.") issuers (other than short-term investments maturing in 60 days or less), including corporate and municipal securities, are valued on the basis of bid valuations provided by dealers or an independent pricing service approved by the Trust's Board of Trustees (the "Board"). Short-term investments maturing in 60 days or less may be valued at amortized cost, which approximates market value. Under the amortized cost method, premium or discount, if any, is amortized or accreted, respectively, on a constant basis to the maturity of the security. In each of these situations, valuations are typically categorized as Level 2 in the fair value hierarchy.
Investments for which there are no such quotations, or for which quotations do not appear reliable, are valued at fair value in accordance with procedures established by and under the general supervision and responsibility of the Trust's Board. These valuations are typically categorized as Level 2 or Level 3 in the fair value hierarchy, based on the observability of inputs used to determine the fair value.
A summary of the valuations as of December 31, 2020, based upon the three levels defined above, is included in the table below while the breakdown, by category, of investments is disclosed on the Schedules of Portfolio Investments.
| | | Level 1 | | Level 2 | | Level 3 | | Total | |
INCORE Investment Quality Bond Fund | |
Asset-Backed Securities | | $ | — | | | $ | 167,157 | | | $ | — | | | $ | 167,157 | | |
Collateralized Mortgage Obligations | | | — | | | | 268,014 | | | | — | | | | 268,014 | | |
| Preferred Stocks | | | 601,439 | | | | — | | | | — | | | | 601,439 | | |
Corporate Bonds | | | — | | | | 16,555,133 | | | | — | | | | 16,555,133 | | |
Residential Mortgage-Backed
Securities | | | — | | | | 98,251 | | | | — | | | | 98,251 | | |
Yankee Dollars | | | — | | | | 3,273,634 | | | | — | | | | 3,273,634 | | |
U.S. Government Mortgage-Backed
Agencies | | | — | | | | 7,713,258 | | | | — | | | | 7,713,258 | | |
U.S. Treasury Obligations | | | — | | | | 812,571 | | | | — | | | | 812,571 | | |
Collateral for Securities Loaned | | | 321,882 | | | | — | | | | — | | | | 321,882 | | |
Total | | $ | 923,321 | | | $ | 28,888,018 | | | $ | — | | | $ | 29,811,339 | | |
105
Victory Portfolios | | Notes to Financial Statements — continued
December 31, 2020 | |
| | | Level 1 | | Level 2 | | Level 3 | | Total | |
Other Financial Investments^: | |
Assets: | |
Futures | | $ | 3,879 | | | $ | — | | | $ | — | | | $ | 3,879 | | |
Liabilities: | |
Futures | | | (1,464 | ) | | | — | | | | — | | | | (1,464 | ) | |
Total | | $ | 2,415 | | | $ | — | | | $ | — | | | $ | 2,415 | | |
INCORE Low Duration Bond Fund | |
Asset-Backed Securities | | $ | — | | | $ | 3,755,121 | | | $ | — | | | $ | 3,755,121 | | |
Collateralized Mortgage Obligations | | | — | | | | 8,295,670 | | | | — | | | | 8,295,670 | | |
| Preferred Stocks | | | 5,076,482 | | | | — | | | | — | | | | 5,076,482 | | |
Corporate Bonds | | | — | | | | 105,479,913 | | | | — | | | | 105,479,913 | | |
Residential Mortgage-Backed
Securities | | | — | | | | 9,608,258 | | | | — | | | | 9,608,258 | | |
Yankee Dollars | | | — | | | | 18,545,132 | | | | — | | | | 18,545,132 | | |
U.S. Government Mortgage-Backed
Agencies | | | — | | | | 18,177,199 | | | | — | | | | 18,177,199 | | |
U.S. Treasury Obligations | | | — | | | | 85,173,764 | | | | — | | | | 85,173,764 | | |
Collateral for Securities Loaned | | | 2,086,831 | | | | — | | | | — | | | | 2,086,831 | | |
Total | | $ | 7,163,313 | | | $ | 249,035,057 | | | $ | — | | | $ | 256,198,370 | | |
Other Financial Investments^: | |
Liabilities: | |
Futures | | $ | (19,775 | ) | | $ | — | | | $ | — | | | $ | (19,775 | ) | |
Total | | $ | (19,775 | ) | | $ | — | | | $ | — | | | $ | (19,775 | ) | |
High Yield Fund | |
Common Stocks | | $ | 1,735,119 | | | $ | — | | | $ | — | | | $ | 1,735,119 | | |
Senior Secured Loans | | | — | | | | 32,806,648 | | | | — | | | | 32,806,648 | | |
Corporate Bonds | | | — | | | | 193,235,020 | | | | — | | | | 193,235,020 | | |
Yankee Dollars | | | — | | | | 15,398,708 | | | | — | | | | 15,398,708 | | |
Collateral for Securities Loaned | | | 23,143,667 | | | | — | | | | — | | | | 23,143,667 | | |
Total | | $ | 24,878,786 | | | $ | 241,440,376 | | | $ | — | | | $ | 266,319,162 | | |
Tax-Exempt Fund | |
Municipal Bonds | | $ | — | | | $ | 59,096,166 | | | $ | — | | | $ | 59,096,166 | | |
Exchange-Traded Funds | | | 1,846,200 | | | | — | | | | — | | | | 1,846,200 | | |
Collateral for Securities Loaned | | | 1,867,505 | | | | — | | | | — | | | | 1,867,505 | | |
Total | | $ | 3,713,705 | | | $ | 59,096,166 | | | $ | — | | | $ | 62,809,871 | | |
High Income Municipal Bond Fund | |
Municipal Bonds | | $ | — | | | $ | 41,101,404 | | | $ | — | | | $ | 41,101,404 | | |
Exchange-Traded Funds | | | 3,795,420 | | | | — | | | | — | | | | 3,795,420 | | |
Total | | $ | 3,795,420 | | | $ | 41,101,404 | | | $ | — | | | $ | 44,896,824 | | |
Floating Rate Fund | |
Common Stocks | | $ | 192,371 | | | $ | — | | | $ | — | | | $ | 192,371 | | |
Senior Secured Loans | | | — | | | | 528,173,225 | | | | — | | | | 528,173,225 | | |
Corporate Bonds | | | — | | | | 108,022,818 | | | | — | | | | 108,022,818 | | |
Yankee Dollars | | | — | | | | 11,565,460 | | | | — | | | | 11,565,460 | | |
Total | | $ | 192,371 | | | $ | 647,761,503 | | | $ | — | | | $ | 647,953,874 | | |
106
Victory Portfolios | | Notes to Financial Statements — continued
December 31, 2020 | |
| | | Level 1 | | Level 2 | | Level 3 | | Total | |
Strategic Income Fund | |
Asset-Backed Securities | | $ | — | | | $ | 2,741,076 | | | $ | — | | | $ | 2,741,076 | | |
Collateralized Mortgage Obligations | | | — | | | | 3,039,100 | | | | — | | | | 3,039,100 | | |
Corporate Bonds | | | — | | | | 54,925,355 | | | | — | | | | 54,925,355 | | |
Residential Mortgage-Backed
Securities | | | — | | | | 170,063 | | | | — | | | | 170,063 | | |
Yankee Dollars | | | — | | | | 9,932,819 | | | | — | | | | 9,932,819 | | |
U.S. Government Mortgage-Backed
Agencies | | | — | | | | 145,180 | | | | — | | | | 145,180 | | |
U.S. Treasury Obligations | | | — | | | | 25,646,587 | | | | — | | | | 25,646,587 | | |
Exchange-Traded Funds | | | 7,364,800 | | | | — | | | | — | | | | 7,364,800 | | |
Collateral for Securities Loaned | | | 4,481,997 | | | | — | | | | — | | | | 4,481,997 | | |
Total | | $ | 11,846,797 | | | $ | 96,600,180 | | | $ | — | | | $ | 108,446,977 | | |
Other Financial Investments^: | |
Assets: | |
Futures | | $ | 71,494 | | | $ | — | | | $ | — | | | $ | 71,494 | | |
Liabilities: | |
Futures | | | (99,462 | ) | | | — | | | | — | | | | (99,462 | ) | |
Total | | $ | (27,968 | ) | | $ | — | | | $ | — | | | $ | (27,968 | ) | |
^ Futures contracts are valued at the unrealized appreciation (depreciation) on the investment.
For the year ended December 31, 2020, there were no transfers in or out of the Level 3 fair value hierarchy.
Securities Purchased on a When-Issued Basis:
The Funds may purchase securities on a when-issued basis. When-issued securities are securities purchased for delivery beyond normal settlement periods at a stated price and/or yield, thereby involving the risk that the price and/or yield obtained may be more or less than those available in the market when delivery takes place. At the time a Fund makes the commitment to purchase a security on a when-issued basis, the Fund records the transaction and reflects the value of the security in determining NAV. No interest accrues to the Fund until the transaction settles and payment takes place. Normally, the settlement date occurs within one month of the purchase. A segregated account is established and the Fund maintains cash and/or marketable securities at least equal in value to commitments for when-issued securities. If a Fund owns when-issued securities, these values are included in Payable for investments purchased on the accompanying Statements of Assets and Liabilities and the segregated assets are identified on the Schedules of Portfolio Investments.
Municipal Obligations:
The values of municipal obligations can fluctuate and may be affected by adverse tax, legislative, or political changes, and by financial developments affecting municipal issuers. Payment of municipal obligations may depend on a relatively limited source of revenue, resulting in greater credit risk. Future changes in federal tax laws or the activity of an issuer may adversely affect the tax-exempt status of municipal obligations.
Mortgage-Related and Asset-Backed Securities:
The values of some mortgage-related or asset-backed securities may be particularly sensitive to changes in prevailing interest rates. Early repayment of principal on some mortgage-related securities may expose a Fund to a lower rate of return upon reinvestment of principal. The values of mortgage- and asset-backed securities depend in part on the credit quality and adequacy of the underlying assets or collateral and may fluctuate in response to the market's perception of these factors as well as current and future repayment rates. Some mortgage-backed securities are backed by the full faith and credit
107
Victory Portfolios | | Notes to Financial Statements — continued
December 31, 2020 | |
of the U.S. government (e.g., mortgage-backed securities issued by the Government National Mortgage Association, commonly known as "Ginnie Mae"), while other mortgage-backed securities (e.g., mortgage- backed securities issued by the Federal National Mortgage Association and the Federal Home Loan Mortgage Corporation, commonly known as "Fannie Mae" and "Freddie Mac, respectively"), are backed only by the credit of the government entity issuing them. In addition, some mortgage-backed securities are issued by private entities and, as such, are not guaranteed by the U.S. government or any agency or instrumentality of the U.S. government.
Loans:
Floating rate loans in which a Fund invests are primarily "senior" loans. Senior floating rate loans typically hold a senior position in the capital structure of the borrower, are typically secured by specific collateral, and have a claim on the assets and/or stock of the borrower that is senior to that held by subordinated debtholders and stockholders of the borrower. While these protections may reduce risk, these investments still present significant credit risk. A significant portion of a Fund's floating rate investments may be issued in connection with highly leveraged transactions such as leveraged buyouts, leveraged recapitalization loans, and other types of acquisition financing. Obligations in these types of transactions are subject to greater credit risk (including default and bankruptcy) than many other investments and may be, or become, illiquid. See the note below regarding below-investment-grade securities.
A Fund may purchase second lien loans (secured loans with a claim on collateral subordinate to a senior lender's claim on such collateral), fixed rate loans, unsecured loans, and other debt obligations.
Transactions in loans often settle on a delayed basis, and a Fund may not receive the proceeds from the sale of a loan or pay for a loan purchase for a substantial period of time after entering into the transactions.
Below-Investment-Grade Securities:
Certain Funds may invest in below-investment-grade securities (i.e., lower-quality, "junk" debt), which are subject to various risks. Lower-quality debt is considered to be speculative because it is less certain that the issuer will be able to pay interest or repay the principal than in the case of investment grade debt. These securities can involve a substantially greater risk of default than higher-rated securities, and their values can decline significantly over short periods of time. Lower-quality debt securities tend to be more sensitive to adverse news about their issuers, the market and the economy in general, than higher-quality debt securities. The market for these securities can be less liquid, especially during periods of recession or general market decline.
Real Estate Investment Trusts ("REITs"):
The Funds may invest in REITs, which report information on the source of their distributions annually. REITs are pooled investment vehicles that invest primarily in income-producing real estate or real-estate related loans or interests (such as mortgages). Certain distributions received from REITs during the year are recorded as realized gains or return of capital as estimated by the Funds or when such information becomes known.
Investment Companies:
Exchange-Traded Funds:
The Funds may invest in ETFs, the shares of which are bought and sold on a securities exchange. An ETF trades like common stock and represents a fixed portfolio of securities often designed to track the performance and dividend yield of a particular domestic or foreign market index. A Fund may purchase shares of an ETF to temporarily gain exposure to a portion of the U.S. or a foreign market while awaiting purchase of underlying securities. The risks of owning an ETF generally reflect the risks of owning the underlying securities they are designed to track, although the lack of liquidity of an ETF could result in it being more volatile. Additionally, ETFs have fees and expenses that reduce their value.
108
Victory Portfolios | | Notes to Financial Statements — continued
December 31, 2020 | |
Open-End Funds:
The Funds may invest in portfolios of open-end investment companies. These investment companies value securities in their portfolios for which market quotations are readily available at their market values (generally the last reported sale price) and all other securities and assets at their fair value by the methods established by the board of directors of the underlying funds.
Derivative Instruments:
Futures Contracts:
The Funds may enter into contracts for the future delivery of securities or foreign currencies and futures contracts based on a specific security, class of securities, foreign currency or an index, and purchase or sell options on any such futures contracts. A futures contract on a securities index is an agreement obligating either party to pay, and entitling the other party to receive, while the contract is outstanding, cash payments based on the level of a specified securities index. No physical delivery of the underlying asset is made. A Fund may enter into futures contracts in an effort to hedge against market risks. The acquisition of put and call options on futures contracts will give the Fund the right (but not the obligation), for a specified price, to sell or to purchase the underlying futures contract, upon exercise of the option, at any time during the option period. Futures transactions involve brokerage costs and require the Fund to segregate assets to cover contracts that would require it to purchase securities or currencies. A good faith margin deposit, known as initial margin, of cash or government securities with a broker or custodian is required to initiate and maintain open positions in futures contracts. Subsequent payments, known as variation margin, are made or received by the Fund based on the change in the market value of the position and are recorded as unrealized appreciation or depreciation until the contract is closed out, at which time the gain or loss is realized. A Fund may lose the expected benefit of futures transactions if interest rates, exchange rates or securities prices change in an unanticipated manner. Such unanticipated changes may also result in lower overall performance than if the Fund had not entered into any futures transactions. In addition, the value of a Fund's futures positions may not prove to be perfectly or even highly correlated with the value of its portfolio securities or foreign currencies, limiting a Fund's ability to hedge effectively against interest rate, exchange rate and/or market risk and giving rise to additional risks. There is no assurance of liquidity in the secondary market for purposes of closing out futures positions. The collateral held by the Funds is presented on the Statements of Assets and Liabilities under Deposit with broker for futures contracts.
During the year ended December 31, 2020, the Funds entered into futures contracts primarily for the strategy of hedging or other purposes, including but not limited to, providing liquidity and equitizing cash.
Credit Derivatives:
The Funds may enter into credit derivatives, including centrally cleared credit default swaps on individual obligations or credit indices. The Funds may use these investments (i) as alternatives to direct long or short investment in a particular security or securities, (ii) to adjust a Fund's asset allocation or risk exposure, or (iii) for hedging purposes. The use by a Fund of credit default swaps may have the effect of creating a short position in a security. Credit derivatives can create investment leverage and may create additional investment risks that may subject a Fund to greater volatility than investments in more traditional securities, as described in the Funds' Statement of Additional Information.
Centrally cleared credit default swap ("CDS") agreements on credit indices involve one party making a stream of payments (referred to as the buyer of protection) to another party (the seller of protection) in exchange for the right to receive a specified return in the event of a write-down, principal shortfall, interest shortfall or default of all or part of the referenced entities comprising the credit index. A credit index is a basket of credit instruments or exposures designed to be representative of a specific sector of the credit market as a whole. These indices are made up of reference credits that are judged by a poll of dealers to be the most liquid entities in the CDS.
109
Victory Portfolios | | Notes to Financial Statements — continued
December 31, 2020 | |
The counterparty risk for cleared swap agreements is generally lower than uncleared over-the-counter swap agreements because generally a clearing organization becomes substituted for each counterparty to a cleared swap agreement and, in effect, guarantees each party's performance under the contract as each party to a trade looks only to the clearing organization for performance of financial obligations. However, there can be no assurance that the clearing organization, or its members, will satisfy its obligations to the Funds.
The Funds may enter into CDS agreements either as a buyer or seller. The Funds may buy protection under a CDS to attempt to mitigate the risk of default or credit quality deterioration in one or more individual holdings or in a segment of the fixed income securities market. The Funds may sell protection under a CDS in an attempt to gain exposure to an underlying issuer's credit quality characteristics without investing directly in that issuer. For swaps entered with an individual counterparty, the Funds bear the risk of loss of the uncollateralized amount expected to be received under a CDS agreement in the event of the default or bankruptcy of the counterparty. CDS agreements are generally valued at a price at which the counterparty to such agreement would terminate the agreement. The Funds may also enter into cleared swaps.
Upon entering into a cleared CDS, the Funds may be required to deposit with the broker an amount of cash or cash equivalents in the range of approximately 3% to 6% of the notional amount for CDS on high yield debt issuers (this amount is subject to change by the clearing organization that clears the trade). This amount, known as "initial margin," is in the nature of a performance bond or good faith deposit on the CDS and is returned to the Funds upon termination of the CDS, assuming all contractual obligations have been satisfied. Subsequent payments, known as "variation margin," to and from the broker will be made daily as the price of the CDS fluctuates, making the long and short positions in the CDS contract more or less valuable, a process known as "marking-to-market." The premium (discount) payments are built into the daily price of the CDS and thus are amortized through the variation margin. The variation margin payment also includes the daily portion of the periodic payment stream.
The maximum potential amount of future payments (undiscounted) that the Fund as a seller of protection could be required to make under a CDS agreement equals the notional amount of the agreement. Notional amounts of each individual CDS agreement outstanding as of period end for which a Fund is the seller of protection are disclosed on the Schedule of Portfolio Investments. These potential amounts would be partially offset by any recovery values of the respective referenced obligations, upfront payments received upon entering into the agreement, periodic interest payments, or net amounts received from the settlement of buy protection CDS agreements entered into by the Funds for the same referenced entity or entities. The collateral held by the Funds is presented on the Statements of Assets and Liabilities under Deposit with brokers for swap agreements.
For the year ended December 31, 2020, the INCORE Investment Quality Bond Fund, INCORE Low Duration Bond Fund and Strategic Income Fund entered into centrally cleared CDS agreements primarily for the strategy of asset allocation and risk exposure management.
Offsetting of Financial Assets and Derivatives Assets:
The Funds are subject to various Master Netting Arrangements, which govern the terms of certain transactions with select counterparties. The Master Netting Arrangements allow the Funds to close out and net total exposure to a counterparty in the event of a default with respect to all the transactions governed under a single agreement with a counterparty. The Master Netting Arrangements also specify collateral posting arrangements at pre-arranged exposure levels. Under the Master Netting Arrangements, collateral is routinely transferred if the total net exposure to certain transactions (net of existing collateral already in place) governed under the relevant Master Netting Arrangement with a counterparty in a given account exceeds a specified threshold depending on the counterparty and the type of Master Netting Arrangement.
The table below, as of December 31, 2020, discloses both gross information and net information about instruments and transactions eligible for offset on the Statements of Assets and Liabilities and instruments and transactions that are subject to an agreement similar to a master netting agreement as well as amounts related to collateral held at clearing brokers and counterparties.
110
Victory Portfolios | | Notes to Financial Statements — continued
December 31, 2020 | |
| | | | | | | Net Amounts
Presented in the | | Gross Amounts not offset in the
Statements of Assets and Liabilities | |
| | | Gross Amounts
of Recognized
Assets | | Gross Amounts
Available for
Offset | | Statements of
Assets and
Liabilities | | Financial
Instruments
for offset | | Cash
Collateral
Received | | Net
Amount | |
INCORE Investment Quality Bond Fund | |
Futures Contracts — Goldman
Sachs & Co. | | $ | 2,906 | | | $ | — | | | $ | 2,906 | | | $ | (328 | ) | | $ | — | | | $ | 2,578 | | |
Strategic Income Fund | |
Futures Contracts — Goldman
Sachs & Co. | | | 26,602 | | | | — | | | | 26,602 | | | | (26,602 | ) | | | — | | | | — | | |
| | | | | | Net Amounts
Presented in the | | Gross Amounts not offset in the
Statements of Assets and Liabilities | |
| | | Gross Amounts
of Recognized
Liabilities | | Gross Amounts
Available for
Offset | | Statements of
Assets and
Liabilities | | Financial
Instruments
for offset | | Cash
Collateral
Pledged* | | Net
Amount | |
INCORE Investment Quality Bond Fund | |
Futures Contracts — Goldman
Sachs & Co. | | $ | 328 | | | $ | — | | | $ | 328 | | | $ | (328 | ) | | $ | — | | | $ | — | | |
INCORE Low Duration Bond Fund | |
Futures Contracts — Goldman
Sachs & Co. | | | 8,281 | | | | — | | | | 8,281 | | | | — | | | | (8,281 | ) | | | — | | |
Strategic Income Fund | |
Futures Contracts — Goldman
Sachs & Co. | | | 42,078 | | | | — | | | | 42,078 | | | | (26,602 | ) | | | (15,476 | ) | | | — | | |
* Cash collateral pledged may be in excess of the amounts shown in the table. The total cash collateral pledged by each Fund is disclosed on the Statements of Assets and Liabilities.
Summary of Derivative Instruments:
The following table summarizes the fair values of derivative instruments on the Statements of Assets and Liabilities, categorized by risk exposure, as of December 31, 2020:
| | | Assets | | Liabilities | |
| | | Variation
Margin
Receivable on
Open Futures
Contracts* | | Variation
Margin
Payable on
Open Futures
Contracts* | |
Interest Rate Risk Exposure: | |
INCORE Investment Quality Bond Fund | | $ | 3,879 | | | $ | 1,464 | | |
INCORE Low Duration Bond Fund | | | — | | | | 19,775 | | |
Strategic Income Fund | | | 71,494 | | | | 99,462 | | |
* Includes cumulative appreciation/depreciation of futures contracts and credit default swap agreements as reported on the Schedules of Portfolio Investments. Only current day's variation margin for futures contracts are reported within the Statements of Assets and Liabilities.
111
Victory Portfolios | | Notes to Financial Statements — continued
December 31, 2020 | |
The following table presents the effect of derivative instruments on the Statements of Operations, categorized by risk exposure, for the year ended December 31, 2020:
| | | Net Realized Gains (Losses)
on Derivatives
Recognized as a
Result from Operations | | Net Change in Unrealized
Appreciation/Depreciation
on Derivatives Recognized
as a Result of Operations | |
| | Net Realized
Gains (Losses)
on Futures
Contracts | | Net Realized
Gains (Losses)
on Swap
Agreements | | Net Change in
Unrealized
Appreciation/
Depreciation
on Futures
Contracts | | Net Change in
Unrealized
Appreciation/
Depreciation
on Swap
Agreements | |
Credit Risk Exposure: | |
INCORE Investment Quality Bond Fund | | $ | — | | | $ | (82,185 | ) | | $ | — | | | $ | (14,094 | ) | |
INCORE Low Duration Bond Fund | | | — | | | | (401,936 | ) | | | — | | | | (120,813 | ) | |
Strategic Income Fund | | | — | | | | (126,520 | ) | | | — | | | | 20,150 | | |
Interest Rate Risk Exposure: | |
INCORE Investment Quality Bond Fund | | $ | 248,381 | | | $ | — | | | $ | 7,308 | | | $ | — | | |
INCORE Low Duration Bond Fund | | | 1,052,349 | | | | — | | | | (23,960 | ) | | | — | | |
Strategic Income Fund | | | (267,319 | ) | | | — | | | | 42,119 | | | | — | | |
All open derivative positions at year end are reflected in each respective Fund's Schedule of Portfolio Investments. The underlying face value of open derivative positions relative to each Fund's net assets at year end is generally representative of the notional amount of open positions to net assets throughout the year, except for the INCORE Low Duration Bond Fund. The volume associated with derivative positions in the INCORE Low Duration Bond Fund was 24% and 3% for futures contracts and swap agreements, respectively, based on average monthly notional amounts in comparison to net assets during the year.
Investment Transactions and Related Income:
Changes in holdings of investments are accounted for no later than one business day following the trade date. For financial reporting purposes, however, investment transactions are accounted for on trade date on the last business day of the reporting period. Interest income is determined on the basis of coupon interest accrued using the effective interest method which adjusts, where applicable, the amortization of premiums or accretion of discounts. Dividend income is recorded on the ex-dividend date. Gains or losses realized on sales of securities are recorded on the identified cost basis. Paydown gains or losses on applicable securities, if any, are recorded as components of Interest income on the Statements of Operations.
Certain Funds may receive other income from investment in loan assignments and/or unfunded commitments, including amendment fees, consent fees, and commitment fees. These fees are recorded as income when received by the Fund. These amounts are included in Interest Income on the Statements of Operations.
Withholding taxes on interest, dividends and gains as a result of certain investments in ADRs by the Funds have been provided for in accordance with each investment's applicable country's tax rules and rates.
Securities Lending:
The Trust has entered into a Master Securities Lending Agreement ("MSLA") with Citibank, N.A. ("Citibank" or the "Agent"). Under the terms of the MSLA, the Funds may lend securities to certain broker-dealers and banks in exchange for collateral in the amount of at least 102% of the value of U.S. securities loaned or at least 105% of the value of non-U.S. securities loaned, marked-to-market daily. Any collateral shortfalls associated with increases in the valuation of the securities loaned are adjusted
112
Victory Portfolios | | Notes to Financial Statements — continued
December 31, 2020 | |
the next business day. The collateral can be received in the form of cash collateral and/or non-cash collateral. Non-cash collateral can include U.S. Government Securities, letters of credit and certificates of deposit. The cash collateral is invested in short-term instruments or cash equivalents, primarily open-end investment companies, as noted on the Funds' Schedules of Portfolio Investments. The Trust does not have effective control of the non-cash collateral and therefore it is not disclosed on the Funds' Schedules of Portfolio Investments. During the time portfolio securities are on loan, the borrower will pay the Funds any dividends or interest paid on such securities plus any fee negotiated between the parties to the lending agreement. The Funds also earn a return from the collateral. The Funds pay the Agent various fees in connection with the investment of cash collateral and fees based on the investment income received from securities lending activities. Securities lending income (net of these fees) is disclosed on the Statements of Operations. Although risk is mitigated by the collateral, the Funds could experience a delay in recovering their securities and possible loss of income or value if the borrower fails to return them.
Securities lending transactions are entered into by a Fund under the MSLA, which permits the Fund, under certain circumstances such as an event of default, to offset amounts payable by the Fund to the same counterparty against amounts receivable from the counterparty to create a net payment due to or from the Fund.
The following table is a summary of the Funds' securities lending transactions which are subject to offset under the MSLA as of December 31, 2020. These transactions are accounted for as secured borrowings with an overnight and continuous contractual maturity for cash collateral and greater than overnight and continuous contractual maturity for non-cash collateral.
| | | Gross
Amount of
Recognized
Assets
(Value of | | Value of
Cash | | Value of Non-cash Collateral
Received by Maturity | | | |
| | | Securities
on Loan) | | Collateral
Received* | | <30 | | Between
30 & 90 days | | 90 days | | Net
Amount | |
INCORE Investment Quality
Bond Fund | | $ | 314,857 | | | $ | 314,857 | | | $ | — | | | $ | — | | | $ | — | | | $ | — | | |
INCORE Low Duration
Bond Fund | | | 2,032,604 | | | | 2,032,604 | | | | — | | | | — | | | | — | | | | — | | |
High Yield Fund | | | 22,083,156 | | | | 22,083,156 | | | | — | | | | — | | | | — | | | | — | | |
Tax-Exempt Fund | | | 1,827,738 | | | | 1,827,738 | | | | — | | | | — | | | | — | | | | — | | |
Strategic Income Fund | | | 4,381,534 | | | | 4,381,534 | | | | — | | | | — | | | | — | | | | — | | |
* Collateral received in excess of the market value of securities on loan is not presented in this table. The total cash collateral received by each Fund is disclosed in the Statements of Assets and Liabilities.
Foreign Currency Translations:
The accounting records of the Funds are maintained in U.S. dollars. Investment securities and other assets and liabilities of a Fund denominated in a foreign currency are translated into U.S. dollars at current exchange rates. Purchases and sales of securities, income receipts and expense payments are translated into U.S. dollars at the exchange rates on the date of the transactions. The Funds do not isolate the portion of the results of operations resulting from changes in foreign exchange rates on investments from fluctuations arising from changes in market prices of securities held. Such fluctuations are disclosed as Net change in unrealized appreciation/depreciation on investment securities and foreign currency translations on the Statements of Operations. Any realized gains or losses from these fluctuations are disclosed as Net realized gains (losses) from investment securities and foreign currency translations on the Statements of Operations.
113
Victory Portfolios | | Notes to Financial Statements — continued
December 31, 2020 | |
Foreign Taxes:
The Funds may be subject to foreign taxes related to foreign income received (a portion of which may be reclaimable), capital gains on the sale of securities, and certain foreign currency transactions. All foreign taxes are recorded in accordance with the applicable regulations and rates that exist in the foreign jurisdictions in which the Funds invest.
Federal Income Taxes:
It is the policy of each Fund to continue to qualify as a regulated investment company by complying with the provisions available to certain investment companies, as defined in applicable sections of the Internal Revenue Code, and to make distributions of net investment income and net realized gains sufficient to relieve it from all, or substantially all, federal income taxes. Accordingly, no provision for federal income taxes is required in the financial statements. The Funds have a tax year end of December 31.
Management of the Funds has reviewed tax positions taken in tax years that remain subject to examination by all major tax jurisdictions, including federal (i.e., the last four tax years, which includes the current fiscal tax year end). Management believes that there is no tax liability resulting from unrecognized tax benefits related to uncertain tax positions taken.
Allocations:
Expenses directly attributable to a Fund are charged to the Fund, while expenses which are attributable to more than one fund in the Trust, or jointly with an affiliated trust, are allocated among the respective funds in the Trust and/or affiliated trust based upon net assets or another appropriate basis.
Income, expenses (other than class-specific expenses such as transfer agent fees, state registration fees, printing fees and 12b-1 fees), and realized and unrealized gains or losses on investments are allocated to each class of shares based on its relative net assets on the date income is earned or expenses and realized and unrealized gains and losses are incurred.
Cross-Trade Transactions:
Pursuant to Rule 17a-7 under the 1940 Act, the Funds may engage in cross-trades, which are securities transactions with affiliated investment companies and advisory accounts managed by the Adviser and any applicable sub-adviser. Any such purchase or sale transaction must be effected without brokerage commission or other remuneration, except for customary transfer fees. The transaction must be effected at the current market price, which is either the security's last sale price on an exchange or, if there are no transactions in the security that day, at the average of the highest bid and lowest asked price. For the year ended December 31, 2020, the Funds engaged in the following securities transactions with affiliated funds, which resulted in the following net realized gains (losses):
| | | Purchases | | Sales | | Net Realized
Gains (Losses) | |
Tax-Exempt Fund | | $ | 1,600,000 | | | $ | 2,700,000 | | | $ | — | | |
High Income Municipal Bond Fund | | | 3,100,000 | | | | 2,400,000 | | | | — | | |
114
Victory Portfolios | | Notes to Financial Statements — continued
December 31, 2020 | |
3. Purchases and Sales of Securities:
Purchases and sales of securities (excluding securities maturing less than one year from acquisition) for the year ended December 31, 2020, were as follows:
| | | Purchases
(excluding U.S.
Government
Securities) | | Sales
(excluding U.S.
Government
Securities) | | Purchases
of U.S.
Government
Securities | | Sales
of U.S.
Government
Securities | |
INCORE Investment Quality
Bond Fund | | $ | 12,722,821 | | | $ | 7,397,741 | | | $ | 10,591,814 | | | $ | 17,621,538 | | |
INCORE Low Duration
Bond Fund | | | 81,484,784 | | | | 102,589,411 | | | | 124,854,059 | | | | 109,226,401 | | |
| High Yield Fund | | | 306,727,443 | | | | 240,124,573 | | | | — | | | | — | | |
| Tax-Exempt Fund | | | 27,018,082 | | | | 30,946,941 | | | | — | | | | — | | |
High Income Municipal
Bond Fund | | | 32,021,790 | | | | 29,519,121 | | | | — | | | | — | | |
| Floating Rate Fund | | | 370,025,777 | | | | 288,147,313 | | | | — | | | | — | | |
| Strategic Income Fund | | | 114,771,176 | | | | 74,378,756 | | | | 83,488,293 | | | | 74,844,753 | | |
4. Fees and Transactions with Affiliates and Related Parties:
Investment advisory services are provided to the Funds by Victory Capital Management Inc. ("VCM" or the "Adviser"), a New York corporation registered as an investment adviser with the Securities and Exchange Commission ("SEC"). The Adviser is a wholly owned indirect subsidiary of Victory Capital Holdings, Inc., a publicly traded Delaware corporation and a wholly owned direct subsidiary of Victory Capital Operating, LLC. Amounts incurred and paid to VCM for the year ended December 31, 2020, are reflected on the Statements of Operations as Investment advisory fees.
VCM has entered into a Sub-Advisory Agreement with Park Avenue Institutional Advisers LLC ("Park Avenue"). Park Avenue is responsible for providing day-to-day investment advisory services to the High Yield Fund, the Floating Rate Fund and the Strategic Income Fund, subject to the oversight of the Board. Prior to April 2020, Park Avenue provided investment advisory services to the Tax-Exempt Fund and the High Income Municipal Bond Fund.
Under the terms of the Investment Advisory Agreement, the Adviser is entitled to receive fees based on a percentage of the average daily net assets of each Fund. The rates at which the Adviser is paid by each Fund are included in the table below. The Adviser may use its resources to assist with the Funds' distribution and marketing expenses.
| | | Flat Rate | |
INCORE Investment Quality Bond Fund | | | 0.50 | % | |
INCORE Low Duration Bond Fund | | | 0.45 | % | |
High Yield Fund | | | 0.60 | % | |
Tax-Exempt Fund | | | 0.50 | % | |
High Income Municipal Bond Fund | | | 0.50 | % | |
Floating Rate Fund | | | 0.65 | % | |
Strategic Income Fund | | | 0.60 | % | |
VCM also serves as the Funds' administrator and fund accountant. Under the Administration and Fund Accounting Agreement, VCM is paid for its services an annual fee at a rate of 0.08% of the first $15 billion in average daily net assets of the Trust, Victory Variable Insurance Funds and Victory Portfolios II (collectively, the "Victory Funds Complex"), 0.05% of the average daily net assets above $15 billion to $30 billion of the Victory Funds Complex and 0.04% of the average daily net assets over $30 billion of the Victory Funds Complex. Amounts incurred for the year ended December 31, 2020, are reflected on the Statements of Operations as Administration fees.
Citi Fund Services Ohio, Inc. ("Citi"), an affiliate of Citibank, acts as sub-administrator and sub-fund accountant to the Funds pursuant to the Sub-Administration and Sub-Fund Accounting Services Agreement between VCM and Citi. VCM pays Citi a fee for providing these services. The Funds reimburse VCM and Citi for out-of-pocket expenses incurred in providing these services and certain other expenses
115
Victory Portfolios | | Notes to Financial Statements — continued
December 31, 2020 | |
specifically allocated to the Funds. Amounts incurred for the year ended December 31, 2020, are reflected on the Statements of Operations as Sub-Administration fees.
Citibank serves as the Funds' custodian. The Funds pay Citibank a fee for providing these services. Amounts incurred for the year ended December 31, 2020, are reflected on the Statements of Operations as Custodian fees.
FIS Investor Services, LLC ("FIS") serves as the Funds' transfer agent. Under the Transfer Agent Agreement, the Trust pays FIS a fee for its services and reimburses FIS for all of their reasonable out- of-pocket expenses incurred in providing these services. Amounts incurred for the year ended December 31, 2020, are reflected on the Statements of Operations as Transfer agent fees.
Victory Capital Transfer Agency, Inc., an affiliate of the Adviser, serves as sub-transfer agent for the Member Class shares of the Funds and receives no fee or other compensation for these services.
The Chief Compliance Officer ("CCO") is an employee of the Adviser, which pays the compensation of the CCO and his support staff. The Trust has entered into an agreement to provide compliance services with the Adviser, pursuant to which the Adviser furnishes its compliance personnel, including the services of the CCO, and other resources reasonably necessary to provide the Trust with compliance oversight services related to the design, administration and oversight of a compliance program for the Trust in accordance with Rule 38a-1 under the 1940 Act. The Funds in the Victory Funds Complex, in aggregate, compensate the Adviser for these services. Amounts incurred for the year ended December 31, 2020, are reflected on the Statements of Operations as Compliance fees.
Sidley Austin LLP provides legal services to the Trust.
Victory Capital Services, Inc. (the "Distributor"), an affiliate of the Adviser, serves as distributor for the continuous offering of the shares of the Funds pursuant to a Distribution Agreement between the Distributor and the Trust, and receives no fee or other compensation for these services. Effective June 30, 2020, the Distributor's name was changed from Victory Capital Advisers, Inc. Amounts incurred for the year ended December 31, 2020, are reflected on the Statements of Operations as 12b-1 fees.
Pursuant to the Distribution and Service Plans adopted in accordance with Rule 12b-1 under the 1940 Act, the Distributor may receive a monthly distribution and service fee, at an annual rate of up to 0.25% of the average daily net assets of Class A Shares, at an annual rate of up to 0.50% of the average daily net assets of Class R Shares and 1.00% of the average daily net assets of Class C Shares of the Funds. The distribution and service fees paid to the Distributor may be used by the Distributor to pay for activities primarily intended to result in the sale of Class A, Class R or Class C Shares of the Funds.
In addition, the Distributor is entitled to receive commissions on sales of the Class A Shares of the Funds. For the year ended December 31, 2020, the Distributor received approximately $21,158 from commissions earned on sales of Class A Shares of the Funds.
The Adviser has entered into expense limitation agreements with certain Funds. Under the terms of the agreements, the Adviser has agreed to waive fees or reimburse certain expenses to the extent that ordinary operating expenses incurred by certain classes of a Fund in any fiscal year exceed the expense limit for such classes of the Fund. Such excess amounts will be the liability of the Adviser. Interest, taxes, brokerage commissions, other expenditures which are capitalized in accordance with GAAP, and other extraordinary expenses not incurred in the ordinary course of a Fund's business are excluded from the expense limits. As of December 31, 2020, the expense limits (excluding voluntary waivers) are as follows:
| | | In effect until April 30, 2021 | |
| | | Class A
Shares | | Class C
Shares | | Class R
Shares | | Class Y
Shares | | Member
Class | |
INCORE Investment Quality Bond Fund | | | 0.90 | % | | | 1.77 | % | | | 1.30 | % | | | 0.66 | % | | | N/A | | |
INCORE Low Duration Bond Fund | | | 0.85 | % | | | 1.62 | % | | | 1.27 | % | | | 0.62 | % | | | N/A | | |
High Yield Fund | | | 1.00 | % | | | 1.70 | % | | | 1.35 | % | | | 0.76 | % | | | N/A | | |
Tax-Exempt Fund | | | 0.80 | % | | | 1.60 | % | | | N/A | | | | 0.69 | % | | | N/A | | |
High Income Municipal Bond Fund | | | 0.80 | % | | | 1.57 | % | | | N/A | | | | 0.57 | % | | | 0.65 | %(a) | |
Floating Rate Fund | | | 1.00 | % | | | 1.80 | % | | | 1.56 | % | | | 0.78 | % | | | 0.85 | %(a) | |
Strategic Income Fund | | | 0.95 | % | | | 1.74 | % | | | 1.34 | % | | | 0.74 | % | | | N/A | | |
116
Victory Portfolios | | Notes to Financial Statements — continued
December 31, 2020 | |
(a) In effect from November 3, 2020, until at least April 30, 2022.
The Funds have agreed to repay fees and expenses that were waived or reimbursed by the Adviser for a period up to three fiscal years after such waiver or reimbursement was made to the extent such payments or repayments would not cause the expenses of a class to exceed the original expense limitation in place at the time of the waiver or reimbursement or any expense limitation agreement in place at the time of repayment. Amounts repaid to the Adviser during the year, if any, are reflected on the Statements of Operations as Recoupment of prior expenses waived/reimbursed by Adviser.
As of December 31, 2020, the following amounts are available to be repaid to the Adviser. The Funds have not recorded any amounts available to be repaid as a liability due to an assessment that such repayment is not probable at December 31, 2020.
| | | Expires
December 30,
2021 | | Expires
December 30,
2022 | | Expires
December 31,
2023 | | Total | |
INCORE Investment Quality Bond Fund | | $ | 107,641 | | | $ | 127,606 | | | $ | 136,293 | | | $ | 371,540 | | |
INCORE Low Duration Bond Fund | | | 110,273 | | | | 163,391 | | | | 131,941 | | | | 405,605 | | |
High Yield Fund | | | 76,868 | | | | 181,413 | | | | 253,784 | | | | 512,065 | | |
Tax-Exempt Fund | | | 114,539 | | | | 132,065 | | | | 135,204 | | | | 381,808 | | |
High Income Municipal Bond Fund | | | 121,563 | | | | 132,417 | | | | 131,713 | | | | 385,693 | | |
Floating Rate Fund | | | 765,491 | | | | 841,458 | | | | 827,922 | | | | 2,434,871 | | |
Strategic Income Fund | | | 98,810 | | | | 110,089 | | | | 134,256 | | | | 343,155 | | |
The Adviser may voluntarily waive or reimburse additional fees to assist the Funds in maintaining competitive expense ratios. Voluntary waivers and reimbursements applicable to the Funds are not available to be recouped at a future time. The Adviser voluntarily waived $ 76,625 for the year ended December 31, 2020 for the INCORE Low Duration Bond Fund.
Certain officers and/or interested trustees of the Funds are also officers and/or employees of the Adviser, Administrator, Fund Accountant, Sub-Administrator, Sub-Fund Accountant, Custodian, Distributor, and Legal Counsel.
5. Risks:
Each Fund may be subject to other risks in addition to these identified risks.
Debt Securities Risk — The value of a debt security or other income-producing security changes in response to various factors, including, for example, market-related factors (such as changes in interest rates or changes in the risk appetite of investors generally) and changes in the actual or perceived ability of the issuer (or of issuers generally) to meet its (or their) obligations. Other factors that may affect the value of debt securities, include, among others, public health crises and responses by governments and companies to such crises. These and other events may affect the creditworthiness of the issuer of a debt security and may impair an issuers ability to timely meet its debt obligations as they come due.
Credit Risk — The Funds will be subject to credit risk with respect to the amount each expects to receive from counterparties for financial instruments entered into by the Funds. The Funds may be negatively impacted if a counterparty becomes bankrupt or otherwise fails to perform its obligations due to financial difficulties. The Funds may experience significant delays in obtaining any recovery in bankruptcy or other reorganization proceeding and the Funds may obtain only limited recovery or may obtain no recovery in such circumstances. The Funds typically enter into transactions with counterparties whose credit ratings are investment grade, as determined by a nationally recognized statistical rating organization or, if unrated, judged by the Adviser to be of comparable quality.
Geopolitical/Natural Disaster Risk — An outbreak of disease called COVID-19 has spread internationally. The transmission of COVID-19 and efforts to contain its spread have resulted in international, national and local border closings and other significant travel restrictions and disruptions, significant disruptions to business operations, supply chains and consumer activity, significant challenges in healthcare service preparation and delivery, quarantines and general concern and uncertainty. These
117
Victory Portfolios | | Notes to Financial Statements — continued
December 31, 2020 | |
negative impacts have caused significant volatility and declines in global financial markets, which have caused losses for Fund investors during and subsequent to period end. The impact of the COVID-19 pandemic may last for an extended period of time, and could result in a substantial economic downturn or recession. Public health crises may exacerbate other pre-existing political, social, economic, market and financial risks. The extent of the impact to the financial performance of the Funds' investments will depend on future developments, including (i) the duration and spread of the outbreak, (ii) the restrictions and advisories, (iii) the effects on the financial markets, and (iv) the effects on the economy overall, all of which are highly uncertain and cannot be predicted.
LIBOR Discontinuation Risk — Many debt securities, derivatives and other financial instruments, including some of the Funds' investments, use the London Interbank Offered Rate ("LIBOR") as the reference or benchmark rate for variable interest rate calculations. In June 2017, the Alternative Reference Rates Committee, a group of large U.S. banks working with the Federal Reserve, announced its selection of a new Secured Overnight Funding Rate ("SOFR"), which is intended to be a broad measure of secured overnight U.S. Treasury repo rates, as an appropriate replacement for LIBOR. The Federal Reserve Bank of New York began publishing the SOFR in 2018, expecting that it could be used on a voluntary basis in new instruments and transactions. Bank working groups and regulators in other countries have suggested other alternatives for their markets, including the Sterling Overnight Interbank Average Rate ("SONIA") in England. In July 2017, the Financial Conduct Authority (the "FCA"), the United Kingdom financial regulatory body, announced that after 2021 it will cease its active encouragement of UK banks to provide the quotations needed to sustain LIBOR. That announcement suggests that LIBOR may cease to be published after that time. For U.S. dollar LIBOR, however, the relevant date may be deferred to June 30, 2023, for the most common tenors (overnight and one, three, six and 12 months). As to those tenors, the LIBOR administrator has published a consultation regarding its intention to cease publication of U.S. dollar LIBOR as of June 30, 2023 (instead of December 31, 2021, as previously expected), apparently based on continued rate submissions from banks. It is expected that there will be enough time for market participants to transition to the use of a different benchmark for both new and existing securities and transactions. Various financial industry groups have begun planning for that transition, but there are obstacles to converting certain longer-term securities and transactions to a new benchmark. Transition planning is at an early stage, and neither the effect of the transition process nor its ultimate success can yet be known. Although the foregoing may provide some sense of timing, there is no assurance that LIBOR, nor any particular currency and tenor, will continue to be published until any particular date, and it appears highly likely that LIBOR will be discontinued or modified after December 31, 2021, or June 30, 2023, depending on the currency and tenor. The transition process might lead to increased volatility and illiquidity in markets that currently rely on the LIBOR to determine interest rates. It could also lead to a reduction in the value of some LIBOR-based investments and reduce the effectiveness of new hedges placed against existing LIBOR-based instruments. Since the usefulness of LIBOR as a benchmark could deteriorate during the transition period, these effects could occur before the end of 2021.
6. Borrowing and Interfund Lending:
Line of Credit:
For the year ended December 31, 2020, the Victory Funds Complex and the USAA Mutual Funds Complex (another series of mutual funds managed by the Adviser) participated in a short-term demand note "Line of Credit" agreement with Citibank. The Line of Credit agreement with Citibank was renewed on June 29, 2020, with a termination date of June 28, 2021. Under the agreement with Citibank, the Victory Funds Complex and USAA Mutual Funds Complex, combined, may borrow up to $600 million, of which $300 million is committed and $300 million is uncommitted. $40 million of the Line of Credit is reserved for use by the Victory Floating Rate Fund (herein, the "Fund"), another series of the Victory Funds Complex, with that Fund paying the related commitment fees for that amount. The purpose of the agreement is to meet temporary or emergency cash needs. For the year ended December 31, 2020, Citibank received an annual commitment fee of 0.15% on $300 million for providing the Line of Credit. Each fund in the Victory Funds Complex pays a pro-rata portion of the commitment fees plus any interest (one month LIBOR plus one percent) on amounts borrowed. Effective June 29, 2020, under an amended Line of Credit agreement, Citibank will also receive an annual upfront fee of 0.10% on the
118
Victory Portfolios | | Notes to Financial Statements — continued
December 31, 2020 | |
$300 million committed line of credit. Each fund in the Victory Funds Complex will pay a pro-rata portion of the upfront fee. Interest charged to each Fund during the period, if applicable, is presented on the Statements of Operations under Line of credit fees.
The Funds did not utilize the Line of Credit during the year ended December 31, 2020.
Interfund Lending:
The Trust and Adviser rely on an exemptive order granted by the SEC in March 2017 (the "Order"), permitting the establishment and operation of an Interfund Lending Facility (the "Facility"). The Facility allows each Fund to directly lend money to and borrow money from any other Victory Fund, that is permitted to participate in the Facility, relying upon the Order at rates beneficial to both the borrowing and lending funds. Advances under the Facility are allowed for temporary or emergency purposes, including the meeting of redemption requests that otherwise might require the untimely disposition of securities, and are subject to each Fund's borrowing restrictions. The interfund loan rate is determined, as specified in the Order, by averaging the current repurchase agreement rate and the current bank loan rate. As a Borrower, interest charged to each Fund during the period, if applicable, is presented on the Statements of Operations under Interest expense on interfund lending. As a Lender, interest earned by each Fund during the period, if applicable, is presented on the Statements of Operations under Interfund lending income.
The average borrowing and lending for the days outstanding and average interest rate for each Fund during the year ended December 31, 2020, were as follows:
| | | Borrower or
Lender | | Amount
Outstanding at
December 31,
2020 | | Average
Borrowing* | | Days
Borrowing
Outstanding | | Average
Interest
Rate* | | Maximum
Borrowing
During the
Period | |
INCORE Low Duration
Bond Fund | | Borrower | | $ | — | | | $ | 2,282,000 | | | | 1 | | | | 1.02 | % | | $ | 2,282,000 | | |
Tax-Exempt Fund | | Borrower | | | — | | | | 1,721,667 | | | | 3 | | | | 1.92 | % | | | 2,077,000 | | |
* For the year ended December 31, 2020, based on the number of days borrowings were outstanding.
7. Federal Income Tax Information:
Dividends from net investment income, if any, are declared and paid monthly for the Funds. Distributable net realized gains, if any, are declared and distributed at least annually from each Fund.
The amounts of dividends from net investment income and distributions from net realized gains (collectively, distributions to shareholders) are determined in accordance with federal income tax regulations, which may differ from GAAP. To the extent these "book/tax" differences are permanent in nature (e.g., net operating loss and distribution reclassification), such amounts are reclassified within the components of net assets based on their federal tax-basis treatment; temporary differences (e.g., wash sales) do not require reclassification. To the extent dividends and distributions exceed net investment income and net realized gains for tax purposes, they are reported as distributions of capital. Net investment losses incurred by a Fund may be reclassified as an offset to capital on the accompanying Statements of Assets and Liabilities.
As of December 31, 2020, on the Statements of Assets and Liabilities, as a result of permanent book-to-tax differences, reclassification adjustments were as follows:
| | Total
Accumulated
Earnings/(Loss) | | Capital | |
| INCORE Low Duration Bond Fund | | $ | 3 | | | $ | (3 | ) | |
High Yield Fund | | | (1,599 | ) | | | 1,599 | | |
Tax-Exempt Fund | | | 4 | | | | (4 | ) | |
Floating Rate Fund | | | 2 | | | | (2 | ) | |
Strategic Income Fund | | | (1 | ) | | | 1 | | |
119
Victory Portfolios | | Notes to Financial Statements — continued
December 31, 2020 | |
The tax character of distributions paid during the tax years ended, as noted below, were as follows (total distributions paid may differ from the Statements of Changes in Net Assets because, for tax purposes, dividends are recognized when actually paid):
| | | Year Ended December 31, 2020 | |
| | | Distributions paid from | | | | | | | | | |
| | | Ordinary
Income | | Net
Long-Term
Capital Gains | | Total
Taxable
Distributions | | Return of
Capital | | Tax-Exempt
Distributions | | Total
Distributions
Paid | |
INCORE Investment Quality
Bond Fund | | $ | 628,534 | | | $ | — | | | $ | 628,534 | | | $ | — | | | $ | — | | | $ | 628,534 | | |
INCORE Low Duration Bond Fund | | | 3,852,115 | | | | — | | | | 3,852,115 | | | | 899,611 | | | | — | | | | 4,751,726 | | |
High Yield Fund | | | 11,988,947 | | | | — | | | | 11,988,947 | | | | — | | | | — | | | | 11,988,947 | | |
| Tax-Exempt Fund | | | 16,565 | | | | 582,047 | | | | 598,612 | | | | — | | | | 1,981,434 | | | | 2,580,046 | | |
High Income Municipal Bond Fund | | | 152,651 | | | | 185,634 | | | | 338,285 | | | | — | | | | 1,413,719 | | | | 1,752,004 | | |
Floating Rate Fund | | | 29,295,692 | | | | — | | | | 29,295,692 | | | | — | | | | — | | | | 29,295,692 | | |
Strategic Income Fund | | | 2,008,446 | | | | 903,103 | | | | 2,911,549 | | | | — | | | | — | | | | 2,911,549 | | |
| | | Year Ended December 31, 2019 | |
| | | Distributions paid from | | | | | | | | | |
| | | Ordinary
Income | | Net
Long-Term
Capital Gains | | Total
Taxable
Distributions | | Return of
Capital | | Tax-Exempt
Distributions | | Total
Distributions
Paid | |
INCORE Investment Quality
Bond Fund | | $ | 729,886 | | | $ | — | | | $ | 729,886 | | | $ | — | | | $ | — | | | $ | 729,886 | | |
INCORE Low Duration Bond Fund | | | 5,542,176 | | | | — | | | | 5,542,176 | | | | 211,801 | | | | — | | | | 5,753,977 | | |
High Yield Fund | | | 8,070,016 | | | | — | | | | 8,070,016 | | | | — | | | | — | | | | 8,070,016 | | |
Tax-Exempt Fund | | | 423,874 | | | | 390,747 | | | | 814,621 | | | | — | | | | 2,236,300 | | | | 3,050,921 | | |
High Income Municipal Bond Fund | | | 2,711 | | | | 253,174 | | | | 255,885 | | | | — | | | | 1,601,762 | | | | 1,857,647 | | |
Floating Rate Fund | | | 34,708,312 | | | | — | | | | 34,708,312 | | | | — | | | | — | | | | 34,708,312 | | |
Strategic Income Fund | | | 1,237,315 | | | | — | | | | 1,237,315 | | | | 72,235 | | | | — | | | | 1,309,550 | | |
As of December 31, 2020, the components of accumulated earnings/(loss) on a tax basis were as follows:
| | | Undistributed
Ordinary
Income | | Undistributed
Tax-Exempt
Income | | Undistributed
Long-Term
Capital Gains | | Distributions
Payable | | Accumulated
Earnings | | Accumulated
Capital and
Other
Losses | | Qualified
Late-Year
Losses* | | Unrealized
Appreciation
(Depreciation)** | | Other
Temporary
Differences | | Total
Accumulated
Earnings
(Loss) | |
INCORE Investment
Quality Bond
Fund | | $ | 195,682 | | | $ | — | | | $ | — | | | $ | — | | | $ | 195,682 | | | $ | — | | | $ | — | | | $ | 1,606,826 | | | $ | — | | | $ | 1,802,508 | | |
INCORE Low
Duration Bond
Fund | | | — | | | | — | | | | — | | | | (229,387 | ) | | | (229,387 | ) | | | (30,612,155 | ) | | | — | | | | 5,453,524 | | | | — | | | | (25,388,018 | ) | |
High Yield Fund | | | 22,888 | | | | — | | | | — | | | | — | | | | 22,888 | | | | (6,751,308 | ) | | | — | | | | 10,477,133 | | | | — | | | | 3,748,713 | | |
| Tax-Exempt Fund | | | — | | | | 10,812 | | | | 217,910 | | | | — | | | | 228,722 | | | | — | | | | — | | | | 4,683,106 | | | | — | | | | 4,911,828 | | |
High Income
Municipal Bond
Fund | | | — | | | | 150,543 | | | | — | | | | — | | | | 150,543 | | | | — | | | | (82,165 | ) | | | 2,036,464 | | | | (15,470 | ) | | | 2,089,372 | | |
Floating Rate Fund | | | 278,667 | | | | — | | | | — | | | | — | | | | 278,667 | | | | (183,325,919 | ) | | | — | | | | 111,685 | | | | (15,807 | ) | | | (182,951,374 | ) | |
Strategic Income
Fund | | | 492,941 | | | | — | | | | 381,677 | | | | — | | | | 874,618 | | | | — | | | | — | | | | 3,295,235 | | | | — | | | | 4,169,853 | | |
* Qualified late-year losses are comprised of post-October capital losses incurred after October 31 and certain late-year ordinary losses. Late-year ordinary losses represent ordinary losses incurred after December 31 and specified losses incurred after October 31. These losses are deemed to arise on the first day of the Fund's next taxable year.
** The difference between the book-basis and tax-basis unrealized appreciation (depreciation) is attributable primarily to tax deferral of losses on wash sales, contingent payment debt instruments, and deemed dividends on Convertible Debt Under Sec. 305(c).
120
Victory Portfolios | | Notes to Financial Statements — continued
December 31, 2020 | |
As of the tax year ended December 31, 2020, the following Funds had net capital loss carryforwards ("CLCFs") as summarized in the table below, which are not subject to expiration.
| | | Short-Term
Amount | | Long-Term
Amount | | Total | |
INCORE Low Duration Bond Fund | | $ | 11,509,008 | | | $ | 19,103,147 | | | $ | 30,612,155 | | |
High Yield Fund | | | — | | | | 6,751,308 | | | | 6,751,308 | | |
Floating Rate Fund | | | 28,124,571 | | | | 155,201,348 | | | | 183,325,919 | | |
During the most recent tax year ended December 31, 2020, the INCORE Investment Quality Bond Fund, INCORE Low Duration Bond Fund, High Yield Fund and Strategic Income Fund utilized $577,889, $1,327,229, $420,316 and $902,515, respectively, of CLCFs.
As of December 31, 2020, the cost basis for federal income tax purposes, gross unrealized appreciation, gross unrealized depreciation and net unrealized appreciation (depreciation) for investments and derivatives were as follows:
| | Cost of
Investments
for Federal
Tax Purposes | | Gross
Unrealized
Appreciation | | Gross
Unrealized
Depreciation | | Net
Unrealized
Appreciation
(Depreciation) | |
INCORE Investment Quality Bond Fund | | $ | 28,204,513 | | | $ | 1,639,714 | | | $ | (32,888 | ) | | $ | 1,606,826 | | |
INCORE Low Duration Bond Fund | | | 250,744,846 | | | | 5,600,369 | | | | (146,845 | ) | | | 5,453,524 | | |
High Yield Fund | | | 255,842,029 | | | | 13,195,861 | | | | (2,718,728 | ) | | | 10,477,133 | | |
Tax-Exempt Fund | | | 58,126,765 | | | | 4,756,817 | | | | (73,711 | ) | | | 4,683,106 | | |
High Income Municipal Bond Fund | | | 42,860,360 | | | | 2,361,526 | | | | (325,062 | ) | | | 2,036,464 | | |
Floating Rate Fund | | | 647,842,189 | | | | 12,459,462 | | | | (12,347,777 | ) | | | 111,685 | | |
Strategic Income Fund | | | 105,151,742 | | | | 3,336,495 | | | | (41,260 | ) | | | 3,295,235 | | |
8. Capital Contribution from Prior Custodian:
During 2016, certain Funds received notification from their prior custodian, State Street Bank and Trust ("State Street"), concerning issues related to billing on certain categories of expenses during the approximately 16-year period from 1998 through October 31, 2014. The over-billing primarily related to categories of expenses that involved an allocation of general costs among multiple clients.
State Street paid the refunded amounts during January 2017. Based on billing information received during 2016 from State Street and an analysis of any expense limitation agreements that were in place during the period of the activities in question, including the application of any recoupment provisions in such agreements, the Adviser received a portion of the refund.
The portion of the refund retained by the Funds was accounted for as a capital contribution and is reflected on the Financial Highlights as Capital Contribution from Prior Custodian, Net.
9. Fund Ownership:
Ownership of more than 25% of the voting securities of a fund creates presumptions of control of the fund, under section 2(a)(9) of the 1940 Act. As of December 31, 2020, the shareholder listed below held more than 25% of the shares outstanding of the Funds and may be deemed to control those Funds. Shareholders of record may hold Fund shares for the benefit of their customers.
| | | Shareholder | | Percent | |
High Income Municipal Bond Fund | | Wells Fargo | | | 29.1 | % | |
Strategic Income Fund | | Guardian Life Insurance | | | 36.3 | % | |
121
REPORT OF INDEPENDENT REGISTERED PUBLIC ACCOUNTING FIRM
To the Shareholders and Board of Trustees of Victory Portfolios
Opinion on the Financial Statements
We have audited the accompanying statements of assets and liabilities, including the schedules of portfolio investments, of Victory INCORE Investment Quality Bond Fund, Victory INCORE Low Duration Bond Fund, Victory High Yield Fund, Victory Tax-Exempt Fund, Victory High Income Municipal Bond Fund, Victory Floating Rate Fund and Victory Strategic Income Fund (the "Funds"), each a series of Victory Portfolios, as of December 31, 2020, the related statements of operations for the year then ended and the statements of changes in net assets, the related notes, and the financial highlights for each of the two years in the period then ended (collectively referred to as the "financial statements"). In our opinion, the financial statements present fairly, in all material respects, the financial position of each of the Funds as of December 31, 2020, the results of their operations for the year then ended and the changes in their net assets and the financial highlights for each of the two years in the period then ended, in conformity with accounting principles generally accepted in the United States of America.
The Funds' financial highlights for the years ended December 31, 2018 and prior, were audited by other auditors whose report dated February 26, 2019, expressed an unqualified opinion on those financial highlights.
Basis for Opinion
These financial statements are the responsibility of the Funds' management. Our responsibility is to express an opinion on the Funds' financial statements based on our audits. We are a public accounting firm registered with the Public Company Accounting Oversight Board (United States) ("PCAOB") and are required to be independent with respect to the Funds in accordance with the U.S. federal securities laws and the applicable rules and regulations of the Securities and Exchange Commission and the PCAOB.
We conducted our audits in accordance with the standards of the PCAOB. Those standards require that we plan and perform the audit to obtain reasonable assurance about whether the financial statements are free of material misstatement whether due to error or fraud.
Our audits included performing procedures to assess the risks of material misstatement of the financial statements, whether due to error or fraud, and performing procedures that respond to those risks. Such procedures included examining, on a test basis, evidence regarding the amounts and disclosures in the financial statements. Our procedures included confirmation of securities owned as of December 31, 2020, by correspondence with the custodian, counterparties and brokers or by other appropriate auditing procedures where replies from brokers and counterparties were not received. Our audits also included evaluating the accounting principles used and significant estimates made by management, as well as evaluating the overall presentation of the financial statements. We believe that our audits provide a reasonable basis for our opinion.
We have served as the auditor of one or more of the investment companies advised by Victory Capital Management, Inc. since 2015.

COHEN & COMPANY, LTD.
Cleveland, Ohio
February 23, 2021
122
Victory Portfolios | | Supplemental Information
December 31, 2020 | |
(Unaudited)
Trustee and Officer Information
Board of Trustees:
Overall responsibility for management of the Trust rests with the Board. The Trust is managed by the Board in accordance with the laws of the State of Delaware. There are currently nine Trustees, eight of whom are not "interested persons" of the Trust within the meaning of that term under the 1940 Act ("Independent Trustees") and one of whom is an "interested person" of the Trust within the meaning of that term under the 1940 Act ("Interested Trustee"). The Trustees, in turn, elect the officers of the Trust to actively supervise its day-to-day operations.
The following tables list the Trustees, their date of birth, position with the Trust, commencement of service, principal occupations during the past five years and any directorships of other investment companies or companies whose securities are registered under the Securities Exchange Act of 1934, as amended, or who file reports under that Act. Each Trustee oversees 42 portfolios in the Trust, 8 portfolios in Victory Variable Insurance Funds, and 25 portfolios in Victory Portfolios II, each a registered investment company that, together with the Trust, comprise the Victory Fund Complex. David C. Brown is a Trustee of USAA Mutual Funds and oversees 46 portfolios of the USAA Mutual Funds Trust. Each Trustee's address is c/o Victory Portfolios, 4900 Tiedeman Road, 4th Floor, Brooklyn, Ohio 44144. Each Trustee has an indefinite term.
Name and Date of Birth | | Position
Held with
the Trust | | Date
Commenced
Service | | Principal Occupation
During Past 5 Years | | Other
Directorships
Held During
Past 5 Years | |
Independent Trustees. | |
David Brooks Adcock, Born October 1951 | | Trustee | | May 2005 | | Consultant (since 2006). | | Chair and Trustee, Turner Funds (December 2016-December 2017). | |
Nigel D. T. Andrews, Born April 1947 | | Vice Chair and Trustee | | August 2002 | | Retired. | | Director, TCG BDC II, Inc. (since 2017); Director, TCG BDC I, Inc. (formerly Carlyle GMS Finance, Inc.) (since 2012). | |
E. Lee Beard,* Born August 1951 | | Trustee | | May 2005 | | Retired (since 2015) | | None. | |
Dennis M. Bushe, Born January 1944 | | Trustee | | July 2016 | | Retired. | | Trustee, RS Investment Trust and RS Variable Products Trust (November 2011-July 2016). | |
123
Victory Portfolios | | Supplemental Information — continued
December 31, 2020 | |
(Unaudited)
Name and Date of Birth | | Position
Held with
the Trust | | Date
Commenced
Service | | Principal Occupation
During Past 5 Years | | Other
Directorships
Held During
Past 5 Years | |
John L. Kelly,
Born April 1953 | | Trustee | | February 2015 | | Partner, McCarvill Capital Partners (September 2016- September 2017); Advisor, (January 2016-April 2016) and Managing Partner (August 2014-January 2016) Endgate Commodities LLC. | | Director, Caledonia Mining Corporation (since May 2012). | |
David L. Meyer,* Born April 1957 | | Trustee | | December 2008 | | Retired. | | None. | |
Gloria S. Nelund, Born May 1961 | | Trustee | | July 2016 | | Chair, CEO and Co-Founder of TriLinc Global, LLC, an investment firm. | | TriLinc Global Impact Fund, LLC (since 2012); Trustee, RS Investment Trust and RS Variable Products Trust (November 2007-July 2016). | |
Leigh A. Wilson, Born December 1944 | | Chair and Trustee | | November 1994 | | Private Investor. | | Chair (since 2013), Caledonia Mining Corporation. | |
Interested Trustee. | |
David C. Brown,** Born May 1972 | | Trustee | | May 2008 | | Chairman and Chief Executive Officer (since 2013), the Adviser; Chairman and Chief Executive Officer (since 2013), Victory Capital Holdings, Inc. | | Trustee, USAA Mutual Funds Trust. | |
* The Board has designated Ms. Beard and Mr. Meyer as its Audit Committee Financial Experts.
** Mr. Brown is an "Interested Person" by reason of his relationship with the Adviser.
The Statement of Additional Information includes additional information about the Trustees of the Trust and is available, without charge, by calling 800-539-3863.
124
Victory Portfolios | | Supplemental Information — continued
December 31, 2020 | |
(Unaudited)
Officers:
The officers of the Trust, their date of birth, commencement of service and their principal occupations during the past five years, are detailed in the following table. Each officer serves until the earlier of his or her resignation, removal, retirement, death, or the election of a successor. The mailing address of each officer of the Trust is 4900 Tiedeman Road, 4th Floor, Brooklyn, Ohio 44144. The officers of the Trust receive no compensation directly from the Trust for performing the duties of their offices.
Name and Date of Birth | | Position with
the Trust | | Date
Commenced
Service | | Principal Occupation During Past 5 Years | |
Christopher K. Dyer, Born February 1962 | | President | | February 2006* | | Director of Mutual Fund Administration, the Adviser. | |
Scott A. Stahorsky, Born July 1969 | | Vice President | | December 2014 | | Manager, Fund Administration, the Adviser. | |
Erin G. Wagner, Born February 1974 | | Secretary | | December 2014 | | Associate General Counsel, the Adviser (since 2013). | |
Allan Shaer, Born March 1965 | | Treasurer | | May 2017 | | Senior Vice President, Financial Administration, Citi Fund Services Ohio, Inc. (since 2016); Vice President, Mutual Fund Administration, JP Morgan Chase (2011-2016). | |
Christopher A. Ponte, Born March 1984 | | Assistant Treasurer | | December 2017 | | Manager, Fund Administration, the Adviser (since 2017); Senior Analyst, Fund Administration, the Adviser (prior to 2017); Chief Financial Officer, Victory Capital Services, Inc. (since 2018). | |
Colin Kinney, Born October 1973 | | Chief Compliance Officer | | July 2017 | | Chief Compliance Officer (since 2013) and Chief Risk Officer (2009-2017), the Adviser. | |
Chuck Booth,
Born April 1960 | | Anti-Money Laundering Compliance Officer and Identity Theft Officer | | May 2015 | | Director, Regulatory Administration and CCO Support Services, Citi Fund Services Ohio, Inc. | |
Jay G. Baris, Born January 1954 | | Assistant Secretary | | December 1997 | | Partner, Sidley Austin LLP (since April 2020); Partner, Shearman & Sterling LLP (January 2018-April 2020); Partner, Morrison & Foerster LLP (2011-January 2018). | |
* On December 3, 2014, Mr. Dyer resigned as Secretary of the Trust and accepted the position of President.
125
Victory Portfolios | | Supplemental Information — continued
December 31, 2020 | |
(Unaudited)
Proxy Voting and Portfolio Holdings Information
Proxy Voting:
Information regarding the policies and procedures each Fund uses to determine how to vote proxies relating to portfolio securities is available without charge, upon request, by calling 800-539-3863. The information is also included in the Funds' Statement of Additional Information, which is available on the SEC's website at www.sec.gov.
Information relating to how the Funds voted proxies relating to portfolio securities held during the most recent twelve months ended December 31 is available on the SEC's website at www.sec.gov.
Availability of Schedules of Portfolio Investments:
The Trust files a complete list of Schedules of Portfolio Investments with the SEC for the first and third quarter of each fiscal year on Form N-PORT. Forms N-PORT are available on the SEC's web site at www.sec.gov.
Expense Examples
As a shareholder of the Funds, you may incur two types of costs: (1) transaction costs, including sales charges (loads) on purchases; and (2) ongoing costs, including management fees, distribution and service (12b-1) fees and other Fund expenses. These examples are intended to help you understand your ongoing costs (in dollars) of investing in the Funds and to compare these costs with the ongoing costs of investing in other mutual funds.
These examples are based on an investment of $1,000 invested at the beginning of the period and held for the entire period from July 1, 2020, through December 31, 2020.
The Actual Expense figures in the table below provide information about actual account values and actual expenses. You may use the information below, together with the amount you invested, to estimate the expenses that you paid over the period. Simply divide your account value by $1,000 (for example, an $8,600 account value divided by $1,000 = 8.6), then multiply the result by the number in the table under the heading entitled "Actual Expenses Paid During Period" to estimate the expenses you paid on your account during this period.
The Hypothetical Expense figures in the table below provide information about hypothetical account values and hypothetical expenses based on each Fund's actual expense ratio and an assumed rate of return of 5% per year before expenses, which is not the Fund's actual return. The hypothetical account values and expenses may not be used to estimate the actual ending account balance or expenses you paid for the period. You may use this information to compare this 5% hypothetical example with the 5% hypothetical examples that appear in shareholder reports of other funds.
Please note the expenses shown in the table are meant to highlight your ongoing costs only and do not reflect any transactional costs. Therefore, the table is useful in comparing ongoing costs only, and will not help you determine the relative total costs of owning different funds. In addition, if these transactional costs were included, your costs would have been higher.
| | | Beginning
Account
Value
7/1/20 | | Actual
Ending
Account
Value
12/31/20 | | Hypothetical
Ending
Account
Value
12/31/20 | | Actual
Expenses
Paid
During
Period
7/1/20-
12/31/20 | | Hypothetical
Expenses
Paid
During
Period
7/1/20-
12/31/20* | | Annualized
Expense
Ratio
During
Period
7/1/20-
12/31/20 | |
INCORE Investment Quality Bond Fund | |
Class A Shares | | $ | 1,000.00 | | | $ | 1,026.20 | | | $ | 1,020.61 | | | $ | 4.58 | | | $ | 4.57 | | | | 0.90 | % | |
Class C Shares | | | 1,000.00 | | | | 1,020.70 | | | | 1,016.24 | | | | 8.99 | | | | 8.97 | | | | 1.77 | % | |
Class R Shares | | | 1,000.00 | | | | 1,023.10 | | | | 1,018.60 | | | | 6.61 | | | | 6.60 | | | | 1.30 | % | |
Class Y Shares | | | 1,000.00 | | | | 1,027.50 | | | | 1,021.82 | | | | 3.36 | | | | 3.35 | | | | 0.66 | % | |
126
Victory Portfolios | | Supplemental Information — continued
December 31, 2020 | |
(Unaudited)
| | | Beginning
Account
Value
7/1/20 | | Actual
Ending
Account
Value
12/31/20 | | Hypothetical
Ending
Account
Value
12/31/20 | | Actual
Expenses
Paid
During
Period
7/1/20-
12/31/20 | | Hypothetical
Expenses
Paid
During
Period
7/1/20-
12/31/20* | | Annualized
Expense
Ratio
During
Period
7/1/20-
12/31/20 | |
INCORE Low Duration Bond Fund | |
Class A Shares | | $ | 1,000.00 | | | $ | 1,014.50 | | | $ | 1,020.86 | | | $ | 4.30 | | | $ | 4.32 | | | | 0.85 | % | |
Class C Shares | | | 1,000.00 | | | | 1,010.60 | | | | 1,016.99 | | | | 8.19 | | | | 8.21 | | | | 1.62 | % | |
Class R Shares | | | 1,000.00 | | | | 1,012.40 | | | | 1,018.75 | | | | 6.42 | | | | 6.44 | | | | 1.27 | % | |
Class Y Shares | | | 1,000.00 | | | | 1,014.70 | | | | 1,022.02 | | | | 3.14 | | | | 3.15 | | | | 0.62 | % | |
High Yield Fund | |
Class A Shares | | | 1,000.00 | | | | 1,143.30 | | | | 1,020.11 | | | | 5.39 | | | | 5.08 | | | | 1.00 | % | |
Class C Shares | | | 1,000.00 | | | | 1,140.70 | | | | 1,016.59 | | | | 9.15 | | | | 8.62 | | | | 1.70 | % | |
Class R Shares | | | 1,000.00 | | | | 1,142.80 | | | | 1,018.50 | | | | 7.11 | | | | 6.70 | | | | 1.32 | % | |
Class Y Shares | | | 1,000.00 | | | | 1,145.10 | | | | 1,021.32 | | | | 4.10 | | | | 3.86 | | | | 0.76 | % | |
Tax-Exempt Fund | |
Class A Shares | | | 1,000.00 | | | | 1,055.00 | | | | 1,021.11 | | | | 4.13 | | | | 4.06 | | | | 0.80 | % | |
Class C Shares | | | 1,000.00 | | | | 1,050.90 | | | | 1,017.09 | | | | 8.25 | | | | 8.11 | | | | 1.60 | % | |
Class Y Shares | | | 1,000.00 | | | | 1,055.60 | | | | 1,021.67 | | | | 3.57 | | | | 3.51 | | | | 0.69 | % | |
High Income Municipal Bond Fund | |
Class A Shares | | | 1,000.00 | | | | 1,057.00 | | | | 1,021.11 | | | | 4.14 | | | | 4.06 | | | | 0.80 | % | |
Class C Shares | | | 1,000.00 | | | | 1,053.00 | | | | 1,017.24 | | | | 8.10 | | | | 7.96 | | | | 1.57 | % | |
Class Y Shares | | | 1,000.00 | | | | 1,058.20 | | | | 1,022.27 | | | | 2.95 | | | | 2.90 | | | | 0.57 | % | |
Member Class** | | | 1,000.00 | | | | 1,041.20 | | | | 1,021.87 | | | | 1.07 | | | | 3.30 | | | | 0.65 | % | |
Floating Rate Fund | |
Class A Shares | | | 1,000.00 | | | | 1,108.40 | | | | 1,020.11 | | | | 5.30 | | | | 5.08 | | | | 1.00 | % | |
Class C Shares | | | 1,000.00 | | | | 1,102.70 | | | | 1,016.09 | | | | 9.51 | | | | 9.12 | | | | 1.80 | % | |
Class R Shares | | | 1,000.00 | | | | 1,104.10 | | | | 1,017.29 | | | | 8.25 | | | | 7.91 | | | | 1.56 | % | |
Class Y Shares | | | 1,000.00 | | | | 1,109.50 | | | | 1,021.22 | | | | 4.14 | | | | 3.96 | | | | 0.78 | % | |
Member Class** | | | 1,000.00 | | | | 1,044.10 | | | | 1,020.86 | | | | 1.40 | | | | 4.32 | | | | 0.85 | % | |
Strategic Income Fund | |
Class A Shares | | | 1,000.00 | | | | 1,044.20 | | | | 1,020.36 | | | | 4.88 | | | | 4.82 | | | | 0.95 | % | |
Class C Shares | | | 1,000.00 | | | | 1,040.90 | | | | 1,016.39 | | | | 8.93 | | | | 8.82 | | | | 1.74 | % | |
Class R Shares | | | 1,000.00 | | | | 1,042.90 | | | | 1,018.40 | | | | 6.88 | | | | 6.80 | | | | 1.34 | % | |
Class Y Shares | | | 1,000.00 | | | | 1,045.60 | | | | 1,021.42 | | | | 3.81 | | | | 3.76 | | | | 0.74 | % | |
* Expenses are equal to the average account value multiplied by the Fund's annualized expense ratio multiplied by 184/366 (the number of days in the most recent fiscal half-year divided by the number of days in the fiscal year).
** Actual Expenses Paid are equal to the average account value multiplied by the Fund's annualized expense ratio multiplied by 59/366 to reflect the stub period from commencement of operations November 3, 2020, through December 31, 2020.
127
Victory Portfolios | | Supplemental Information — continued
December 31, 2020 | |
(Unaudited)
Additional Federal Income Tax Information
For the year ended December 31, 2020, the following Funds designated tax-exempt income distributions:
| | | Amount | |
Tax-Exempt Fund | | $ | 1,981,434 | | |
High Income Municipal Bond Fund | | | 1,413,719 | | |
For the year ended December 31, 2020, the following Funds designated short-term capital gain distributions:
| | | Amount | |
INCORE Investment Quality Bond Fund | | $ | 86,815 | | |
Tax-Exempt Fund | | | 12,443 | | |
High Income Municipal Bond Fund | | | 150,197 | | |
Strategic Income Fund | | | 912,770 | | |
For the year ended December 31, 2020, the following Funds designated long-term capital gain distributions:
| | | Amount | |
Tax-Exempt Fund | | $ | 582,047 | | |
High Income Municipal Bond Fund | | | 185,634 | | |
Strategic Income Fund | | | 903,103 | | |
128
Victory Portfolios | | Supplemental Information — continued
December 31, 2020 | |
(Unaudited)
Considerations of the Board in Continuing the Investment Advisory Agreements
The Board approved the advisory agreement with the Adviser, on behalf of each of the Funds (the "Advisory Agreement"), and the sub-advisory agreement between the Adviser and Park Avenue Institutional Advisers LLC (the "Sub-Adviser"), on behalf of each of the High Yield Fund, Floating Rate Fund and Strategic Income Fund (the "Sub-Advisory Agreement" and together with the Advisory Agreement, the "Agreements"), at a meeting, which was called for that purpose, on December 2, 2020. The Board also considered information relating to the Funds and the Agreements provided throughout the year and, more specifically, at a meeting on October 27, 2020, called for the purpose of reviewing the Agreements. In considering whether to approve the Agreement, the Board requested, and the Adviser and Sub-Adviser provided, information that the Board believed to be reasonably necessary to reach its conclusions.
The Board, including the Independent Trustees, evaluated this information along with other information obtained throughout the year and was advised by legal counsel to the Funds, which also serves as independent legal counsel to the Independent Trustees. In addition, the Independent Trustees considered a past review of their overall process for conducting the annual review of the Funds' advisory arrangements by an independent consultant retained through their counsel.
The Board took into consideration regular reports from the Adviser and Sub-Adviser throughout the COVID-19 pandemic public health crisis concerning how the ongoing pandemic has affected market volatility, investment risk and the implementation and effectiveness of business continuity plans. These reports also had confirmed that the pandemic had no material impact on the Adviser's (or the Sub-Adviser's) operations.
The Board considered each Fund's advisory fee, expense ratio and investment performance as significant factors in determining whether the Agreements should be continued. The Board reviewed numerous factors with respect to each Fund, including the services to be provided by the Sub-Adviser. In considering whether the compensation paid to the Adviser was fair and reasonable, the Board also evaluated, among other things, the following factors:
• The requirements of the Funds for the services provided by the Adviser;
• The nature, quality and extent of the services provided and expected to be provided;
• The performance of the Funds as compared to comparable funds;
• The fees payable for the services and whether the fee arrangements provided for economies of scale that would benefit Fund shareholders as the Funds grow;
• Whether the fee would be sufficient to enable the Adviser to attract and retain experienced personnel and continue to provide quality services to the Funds;
• The fees paid by other clients of the Adviser whose accounts are managed in a similar investment style and any differences in the services provided to the other clients compared to those provided to the Funds;
• The total expenses of each Fund;
• Management's commitment to operating the Funds at competitive expense levels;
• The profitability of the Adviser (as reflected by comparing fees earned against an estimate of the Adviser's costs) with respect to the Adviser's relationship with the Funds;
• Research and other service benefits received by the Adviser obtained through payment of client commissions for securities transactions;
• Other benefits received by the Adviser, and its affiliates, including revenues paid to the Adviser, or its affiliates, by the Funds for administration and fund accounting services, and distribution;
• The capabilities and financial condition of the Adviser;
• Current economic and industry trends; and
• The historical relationship between each Fund and the Adviser.
129
Victory Portfolios | | Supplemental Information — continued
December 31, 2020 | |
(Unaudited)
In considering whether the compensation paid to the Sub-Adviser was fair and reasonable, the Board also evaluated, among other things, the following factors:
• The requirements of each Fund for the services provided by the Sub-Adviser;
• The nature, quality and extent of the services provided and expected to be provided;
• The fees payable for the services;
• Representations by the Adviser that the sub-advisory fee for each Fund is within the range of fees agreed to in the market for similar services;
• Whether the fee would be sufficient to enable the Sub-Adviser to attract and retain experienced personnel and continue to provide quality services to the Funds;
• Management's commitment to operating the Fund at competitive expense levels;
• Research and other service benefits received by the Sub-Adviser obtained through payment of client commissions for securities transactions;
• Other benefits received by the Sub-Adviser as a result of its sub-advisory relationship with the Funds;
• The capabilities and financial condition of the Sub-Adviser;
• The nature, quality and extent of the oversight and compliance services provided by the Adviser;
• The historical relationship between the predecessor funds and the Sub-Adviser; and
• Current economic and industry trends.
The Board reviewed each Fund's current management fee, comprised of the advisory fee plus the administrative services fee paid to the Adviser, in the context of the Adviser's profitability with respect to each Fund individually. In addition, the Board compared each Fund's gross management fee and total operating expense ratio on a net and gross basis with the median gross management fee and median expense ratio of a universe of comparable mutual funds compiled by an independent consultant, and a peer group of funds with similar investment strategies selected by that independent consultant from the universe of comparable funds. The Board reviewed the factors and methodology used by the independent consultant in the selection of each Fund's peer group, including the independent consultant's selection of a broad universe of funds, the more specific universe of comparable funds, and peer groups of funds with comparable investment strategies and asset levels, among other factors. The Board also reviewed any changes to the independent consultant's methodology as compared to the prior year, including those resulting from the Adviser's input, if any. With respect to certain Funds, the Board also reviewed fees and other information related to the Adviser's management of similarly managed institutional or private accounts, and the differences in the services provided to the other accounts. The Board noted that none of the advisory fee arrangements for the Funds included breakpoints, which are generally viewed as a method by which an investment adviser shares any economies of scale with a fund as a fund grows. The Board also considered the Adviser's commitment to limit expenses as discussed in more detail below, and would consider breakpoints at a future time if a Fund's assets were to grow significantly.
The Board also reviewed the compliance and administrative services provided to the Funds by the Adviser and its affiliates, including the Adviser's oversight of the Funds' day-to-day operations and oversight of Fund accounting, assistance in meeting legal and regulatory requirements, and other services necessary for the operation of the Funds and the Trust.
With respect to the High Yield Fund, Floating Rate Fund and Strategic Income Fund, the Board also considered information concerning the fee paid to the Sub-Adviser under the Sub-Advisory Agreement. The Board considered the relative roles and responsibilities of the Adviser and Sub-Adviser with respect to the applicable Funds and noted that, among other things: (1) the sub-advisory fees for these Funds are paid by the Adviser and, therefore, are not a direct expense of the Funds; and (2) the Adviser supervises the Sub-Adviser. The Board also considered the Adviser's representation that the fees to be paid to the Sub-Adviser are within the range of sub-advisory fees paid to other sub-advisers for similar services. The Board reviewed fees and other information related to the Sub-Adviser's management of similarly managed institutional or private accounts, and the differences in the services provided to the other accounts. The Board recognized that because the sub-advisory fees are paid by the Adviser, any arrangement by the Sub-Adviser to reduce its fee as a Fund grows would have no direct impact on the Fund or its shareholders.
130
Victory Portfolios | | Supplemental Information — continued
December 31, 2020 | |
(Unaudited)
The Board found that the gross annual management fee paid by each Fund was within the range of management fees paid by each Fund's respective peer group. The Board also found that each Fund's Class A net annual expense ratio was reasonable as compared with each Fund's respective peer group. The Board considered the Adviser's contractual agreement with each Fund to waive its fees and reimburse expenses of certain classes for a specified period of time, as described in the Fund's prospectus.
The Board reviewed each Fund's performance over one-, three-, five- and ten-year periods (as applicable) against the performance of the Fund's selected peer group and benchmark index. The Board recognized that the performance of the Fund and the peer group funds are net of expenses, while the performance of the benchmark index reflects gross returns. .
The Board reviewed various other specific factors with respect to each Fund, as described below. In their deliberations, the Trustees did not rank the importance of any particular information or factor considered and each Trustee may have attributed different weights to various factors.
INCORE Investment Quality Bond Fund
The Board compared the Fund's Class A performance for the one-, three-, five- and ten-year periods ended June 30, 2020, to that of the median performance of the Fund's peer group and benchmark index for the same periods and considered the fact that the Fund underperformed the benchmark index for all of the periods reviewed, outperformed the peer group median for the one-, three- and ten-year periods, and matched the peer group median for the five-year period.
Having considered, among other things: (1) the Fund's management fee compared to comparable mutual funds; (2) the Fund's total expense ratio compared to comparable mutual funds; (3) that the Adviser's willingness to limit the expenses of certain classes for a period of time would provide stability to the Fund's expenses for those share classes during that period; and (4) the Fund's performance during the periods reviewed, the Board concluded that the Agreement continued to be in the best interests of the Fund's shareholders.
INCORE Low Duration Bond Fund
The Board compared the Fund's Class A performance for the one-, three-, five- and ten-year periods ended June 30, 2020, to that of the median performance of the Fund's peer group and benchmark index for the same periods and considered the fact that the Fund underperformed the benchmark index for all of the periods reviewed, with the exception of the ten-year period, and outperformed the peer group median for the one-year period, underperformed the peer group median for the three- and five-year periods, and matched the peer group median for the ten-year period. The Board discussed with the Adviser how market conditions affected the Fund during periods of underperformance given the Fund's investment strategy and fee and expense profile.
Having considered, among other things: (1) the Fund's management fee compared to comparable mutual funds; (2) the Fund's total expense ratio compared to comparable mutual funds; (3) that the Adviser's willingness to limit the expenses of certain classes for a period of time would provide stability to the Fund's expenses for those share classes during that period; and (4) the Fund's performance during the periods reviewed, the Board concluded that the Agreement continued to be in the best interests of the Fund's shareholders.
High Yield Fund
The Board compared the Fund's Class A performance for the one-, three-, five- and ten-year periods ended June 30, 2020, to that of the median performance of the Fund's peer group and benchmark index for the same periods and considered the fact that the Fund outperformed the benchmark index for the three- and five-year periods, underperformed the benchmark index for the one- and ten-year periods, and outperformed the peer group median for all of the periods reviewed, with the exception of the one-year period.
Having considered, among other things: (1) the Fund's management fee compared to comparable mutual funds; (2) the Fund's total expense ratio compared to comparable mutual funds; (3) that the Adviser's willingness to limit the expenses of certain classes for a period of time would provide stability to the Fund's expenses for those share classes during that period; and (4) the Fund's performance during the periods reviewed, the Board concluded that the Agreement continued to be in the best interests of the Fund's shareholders.
131
Victory Portfolios | | Supplemental Information — continued
December 31, 2020 | |
(Unaudited)
Tax-Exempt Fund
Noting that as of April 1, 2020, the Sub-Adviser no longer served as sub-adviser to the Fund, the Board compared the Fund's Class A performance for the one-, three-, five- and ten-year periods ended June 30, 2020, to that of the median performance of the Fund's peer group and benchmark index for the same periods and considered the fact that the Fund underperformed both the benchmark index and the peer group median for all of the periods reviewed, with the exception of the three-year period. The Board discussed with the Adviser how market conditions affected the Fund during periods of underperformance given the Fund's investment strategy and fee and expense profile.
Having considered, among other things: (1) the Fund's management fee compared to comparable mutual funds; (2) the Fund's total expense ratio compared to comparable mutual funds; (3) that the Adviser's willingness to limit the expenses of certain classes for a period of time would provide stability to the Fund's expenses for those share classes during that period; and (4) the Fund's performance during the recent periods reviewed, the Board concluded that the Agreement continued to be in the best interests of the Fund's shareholders.
High Income Municipal Bond Fund
Noting that as of April 1, 2020, the Sub-Adviser no longer served as sub-adviser to the Fund, the Board compared the Fund's Class A performance for the one-, three-, five- and ten-year periods ended June 30, 2020, to that of the median performance of the Fund's peer group and benchmark index for the same periods and considered the fact that the Fund underperformed the benchmark index for all of the periods reviewed, with the exception of the ten-year period, outperformed the peer group median for the one- and three-year periods, and underperformed the peer group median for the five- and ten-year periods.
Having considered, among other things: (1) the Fund's management fee compared to comparable mutual funds; (2) the Fund's total expense ratio compared to comparable mutual funds; (3) that the Adviser's willingness to limit the expenses of certain classes for a period of time would provide stability to the Fund's expenses for those share classes during that period; and (4) the Fund's performance during the periods reviewed, the Board concluded that the Agreement continued to be in the best interests of the Fund's shareholders.
Floating Rate Fund
The Board compared the Fund's Class A performance for the one-, three-, five- and ten-year periods ended June 30, 2020, to that of the median performance of the Fund's peer group and benchmark index for the same periods and considered the fact that the Fund underperformed the benchmark index for all of the periods reviewed, and outperformed the peer group median for all of the periods reviewed.
Having considered, among other things: (1) the Fund's management fee compared to comparable mutual funds; (2) the Fund's total expense ratio compared to comparable mutual funds; (3) that the Adviser's willingness to limit the expenses of certain classes for a period of time would provide stability to the Fund's expenses for those share classes during that period; and (4) the Fund's performance during the periods reviewed, the Board concluded that the Agreement continued to be in the best interests of the Fund's shareholders.
Strategic Income Fund
The Board compared the Fund's Class A performance for the one-, three-, five- and ten-year periods ended June 30, 2020, to that of the median performance of the Fund's peer group and benchmark index for the same periods and considered the fact that the Fund outperformed the benchmark index for the five- and ten-year periods, underperformed the benchmark index for the one- and three-year periods, and outperformed the peer group median for all of the periods reviewed, with the exception of the ten-year period.
Having considered, among other things: (1) the Fund's management fee compared to comparable mutual funds; (2) the Fund's total expense ratio compared to comparable mutual funds; (3) that the Adviser's willingness to limit the expenses of certain classes for a period of time would provide stability to the Fund's expenses for those share classes during that period; and (4) the Fund's performance during the periods reviewed, the Board concluded that the Agreement continued to be in the best interests of the Fund's shareholders.
132
Victory Portfolios | | Supplemental Information — continued
December 31, 2020 | |
(Unaudited)
Conclusion
Based on its review of the information requested and provided, and following extended discussions, the Board determined that the Agreement, on behalf of the Funds discussed above, was consistent with the best interests of each Fund and its shareholders, and the Board unanimously approved the Agreement, on behalf of each Fund, for an additional annual period on the basis of the foregoing review and discussions and the following considerations, among others:
• The fairness and reasonableness of the investment advisory fee payable to the Adviser under the Agreement in light of the investment advisory services provided, the costs of these services, the profitability of the Adviser's relationship with the Fund and the comparability of the fee paid to the fees paid by other investment companies;
• The nature, quality and extent of the investment advisory services provided by the Adviser;
• The Adviser's entrepreneurial commitment to the management of the Funds and the creation of a broad-based family of funds, which could entail a substantial commitment of the Adviser's resources to the successful operation of the Funds;
• The Adviser's representations regarding its staffing and capabilities to manage the Funds, including the retention of personnel with relevant portfolio management experience;
• The Adviser's efforts to enhance investment results by, among other things, developing quality portfolio management teams; and
• The overall high quality of the personnel, operations, financial condition, investment management capabilities, methodologies and performance of the Adviser.
Based on its review of the information requested and provided, and following extended discussions, the Board concluded, among other things, that the Sub-Advisory Agreement, with respect to each of the High Yield Fund, Floating Rate Fund and Strategic Income Fund, was consistent with the best interests of each Fund and its shareholders and unanimously approved the Sub-Advisory Agreement (including the fees to be charged for services thereunder), on the basis of the foregoing review and discussions and the following considerations, among others:
• The fairness and reasonableness of the investment advisory fee payable to the Sub-Adviser under the Sub-Advisory Agreement in light of the investment advisory services provided, the costs of these services and the estimated profitability of the Sub-Adviser's relationship with each Fund;
• The nature, quality and extent of the investment advisory services provided by the portfolio management team of the Sub-Adviser, which have resulted in each Fund achieving its stated investment objective;
• The Sub-Adviser's representations regarding its staffing and capabilities to manage the Funds; and
• The overall high quality of the personnel, operations, financial condition, investment management capabilities, methodologies and performance of the Sub-Adviser.
133
Privacy Policy
Protecting the Privacy of Information
The Trust respects your right to privacy. We also know that you expect us to conduct and process your business in an accurate and efficient manner. To do so, we must collect and maintain certain personal information about you. This is the information we collect from you on applications or other forms, and from the transactions you make with us or third parties. It may include your name, address, social security number, account transactions and balances, and information about investment goals and risk tolerance.
We do not disclose any information about you or about former customers to anyone except as permitted or required by law. Specifically, we may disclose the information we collect to companies that perform services on our behalf, such as the transfer agent that processes shareholder accounts and printers and mailers that assist us in the distribution of investor materials. We may also disclose this information to companies that perform marketing services on our behalf. This allows us to continue to offer you Victory investment products and services that meet your investing needs, and to effect transactions that you request or authorize. These companies will use this information only in connection with the services for which we hired them. They are not permitted to use or share this information for any other purpose.
To protect your personal information internally, we permit access only by authorized employees and maintain physical, electronic and procedural safeguards to guard your personal information.*
* You may have received communications regarding information about privacy policies from other financial institutions which gave you the opportunity to "opt-out" of certain information sharing with companies which are not affiliated with that financial institution. The Trust does not share information with other companies for purposes of marketing solicitations for products other than the Trust. Therefore, the Trust does not provide opt-out options to their shareholders.
Victory Funds
P.O. Box 182593
Columbus, Ohio 43218-2593

Visit our website at: | | Call Victory at: | |
www.vcm.com | | 800-539-FUND (800-539-3863) | |
| | 800-235-8396 for Member Class | |

December 31, 2020
Annual Report
Victory RS Small Cap Growth Fund
Victory RS Select Growth Fund
Victory RS Mid Cap Growth Fund
Victory RS Growth Fund
Victory RS Science and Technology Fund
Victory RS Small Cap Equity Fund
As permitted by regulations adopted by the Securities and Exchange Commission, paper copies of the Victory Funds' shareholder reports may no longer be sent by mail, unless you specifically request paper copies of the reports from the Victory Funds or from your financial intermediary, such as a broker-dealer or bank. Instead, the reports will be made available on www.VictoryFunds.com, and you will be notified by mail each time a report is posted and provided with a website link to access the report. If you already elected to receive shareholder reports electronically, you will not be affected by this change, and you need not take any action.
You may elect to receive all future reports in paper free of charge. If you invest through a financial intermediary, you can contact your financial intermediary to request that you continue to receive paper copies of your reports. If you invest directly with the Victory Funds, you can call 800-539-3863 (800-235-8396 for Member Class) or send an e-mail request to TA.Processing@FISGlobal.com. Your election to receive reports in paper will apply to all Victory Funds you hold directly or through your financial intermediary.
www.vcm.com
News, Information And Education 24 Hours A Day, 7 Days A Week
The Victory Funds site gives fund shareholders, prospective shareholders, and investment professionals a convenient way to access fund information, get guidance, and track fund performance anywhere they can access the Internet. The site includes:
• Detailed performance records
• Daily share prices
• The latest fund news
• Investment resources to help you become a better investor
• A section dedicated to investment professionals
Whether you're a potential investor searching for the fund that matches your investment philosophy, a seasoned investor interested in planning tools, or an investment professional, www.vcm.com has what you seek. Visit us anytime. We're always open.
Table of Contents
Shareholder Letter (Unaudited) | | | 3 | | |
Managers' Commentary and Investment Overview (Unaudited) | | | 5 | | |
Investment Objective and Portfolio Holdings (Unaudited) | | | 35 | | |
Financial Statements | |
The Victory Growth Funds | |
Victory RS Small Cap Growth Fund | |
Schedule of Portfolio Investments | | | 41 | | |
Statement of Assets and Liabilities | | | 61 | | |
Statement of Operations | | | 63 | | |
Statements of Changes in Net Assets | | | 65-67 | | |
Financial Highlights | | | 72-73 | | |
Victory RS Select Growth Fund | |
Schedule of Portfolio Investments | | | 45 | | |
Statement of Assets and Liabilities | | | 61 | | |
Statement of Operations | | | 63 | | |
Statements of Changes in Net Assets | | | 65-67 | | |
Financial Highlights | | | 74-75 | | |
Victory RS Mid Cap Growth Fund | |
Schedule of Portfolio Investments | | | 48 | | |
Statement of Assets and Liabilities | | | 61 | | |
Statement of Operations | | | 63 | | |
Statements of Changes in Net Assets | | | 65-67 | | |
Financial Highlights | | | 76-77 | | |
Victory RS Growth Fund | |
Schedule of Portfolio Investments | | | 51 | | |
Statement of Assets and Liabilities | | | 62 | | |
Statement of Operations | | | 64 | | |
Statements of Changes in Net Assets | | | 68-70 | | |
Financial Highlights | | | 78-79 | | |
Victory RS Science and Technology Fund | |
Schedule of Portfolio Investments | | | 54 | | |
Statement of Assets and Liabilities | | | 62 | | |
Statement of Operations | | | 64 | | |
Statements of Changes in Net Assets | | | 68-70 | | |
Financial Highlights | | | 80-81 | | |
Victory RS Small Cap Equity Fund | |
Schedule of Portfolio Investments | | | 59 | | |
Statement of Assets and Liabilities | | | 62 | | |
Statement of Operations | | | 64 | | |
Statements of Changes in Net Assets | | | 68-70 | | |
Financial Highlights | | | 82-83 | | |
Notes to Financial Statements | | | 84 | | |
Report of Independent Registered Public
Accounting Firm | | | 95 | | |
1
Table of Contents (continued)
Supplemental Information (Unaudited) | | | 96 | | |
Trustee and Officer Information | | | 96 | | |
Proxy Voting and Portfolio Holdings Information | | | 99 | | |
Expense Examples | | | 99 | | |
Additional Federal Income Tax Information | | | 101 | | |
Advisory Contract Approval | | | 102 | | |
Privacy Policy (inside back cover) | | | |
IRA DISTRIBUTION WITHHOLDING DISCLOSURE
We generally must withhold federal income tax at a rate of 10% of the taxable portion of your distribution and, if you live in a state that requires state income tax withholding, at your state's tax rate. However, you may elect not to have withholding apply or to have income tax withheld at a higher rate. Any withholding election that you make will apply to any subsequent distribution unless and until you change or revoke the election. If you wish to make a withholding election, or change or revoke a prior withholding election, call 800-539-3863 (800-235-8396 for Member Class) and form W-4P (OMB No. 1545-0074 withholding certificate for pension or annuity payments) will be electronically sent.
If you do not have a withholding election in place by the date of a distribution, federal income tax will be withheld from the taxable portion of your distribution at a rate of 10%. If you must pay estimated taxes, you may be subject to estimated tax penalties if your estimated tax payments are not sufficient and sufficient tax is not withheld from your distribution.
For more specific information, please consult your tax adviser.
The Funds are distributed by Victory Capital Services, Inc. Victory Capital Management Inc. is the investment adviser to the Funds and receives fees from the Funds for performing services for the Funds.
This report is not authorized for distribution to prospective investors unless preceded or accompanied by a current prospectus of the Victory Funds.
For additional information about any Victory Fund, including fees, expenses, and risks, view our prospectus online at www.vcm.com or call 800-539-3863 (800-235-8396 for Member Class). Read it carefully before you invest or send money.
The information in this annual report is based on data obtained from recognized services and sources and is believed to be reliable. Any opinions, projections, or recommendations in this report are subject to change without notice and are not intended as individual investment advice. Past investment performance of the Funds, markets or securities mentioned herein should not be considered to be indicative of future results.
• NOT FDIC INSURED • NO BANK GUARANTEE • MAY LOSE VALUE

Call Victory at:
800-539-FUND (800-539-3863)
800-235-8396 for Member Class
Visit our website at:
www.vcm.com
2
Victory Funds Letter to Shareholders
(Unaudited)
Dear Shareholder,
When we look back on 2020, we will undoubtedly remember it as an extraordinary year. A year ago, no one could have imagined the unusual events that would challenge us personally, professionally, and collectively as a nation. But in retrospect, the trajectory of financial markets over the past year was nothing short of extraordinary.
The year began with rudimentary worries, such as economic growth rates, trade deals, and interest rates. But a novel coronavirus and the subsequent worldwide spread of COVID-19 became an unprecedented event. To combat the pandemic, governments everywhere issued austere shelter-in-place orders, and the global economy slowed markedly. Equity markets sold off sharply in March and April, and second quarter U.S. GDP contracted by an alarming annual rate of 31.4%.
It's no surprise that so many investors flocked to the perceived safety of U.S. Treasurys. Meanwhile, liquidity evaporated (for a short spell) in many other segments of the fixed income market, including higher-yielding credits and municipal bonds. The outlook was tenuous, and credit spreads widened while prices declined for most securities perceived to be higher risk.
A response, however, came swiftly. The U.S. Federal Reserve (the "Fed") and other monetary authorities worldwide leapt into action — cutting interest rates, (re)starting quantitative easing and, in the case of the Fed, launching an array of programs to provide liquidity to stabilize fixed-income markets. The U.S. government also stepped up to provide fiscal stimulus in the form of the Coronavirus Aid, Relief, and Economic Security Act (CARES Act).
It was impressive how quickly those actions helped end the stock market's freefall and restore order across much of the fixed-income universe. The rebound was almost as robust as the drawdown, and third-quarter GDP (the most recent finalized data available) grew at a 33.4% annualized rate.
Late in the year, markets were alternately fueled and roiled by a contentious election season, growing optimism for an effective vaccine, and a fluid debate regarding the need for additional fiscal stimulus. Ultimately, stocks were propelled higher in the fourth quarter when it became clear the United States Congress would provide another dose of fiscal stimulus in the form of direct payments, more unemployment insurance, and additional aid to businesses.
Through all the unprecedented events and extreme volatility, the S&P 500® Index registered an impressive annual return of 18.40% for the 12-month period ended December 31, 2020. Meanwhile, the yield on 10-year U.S. Treasurys declined 95 basis points over the same period, reflecting both the Fed's interest rate cuts and its pledge to keep rates low longer. The yield on 10-Year U.S. Treasurys was 0.93% as of December 31, 2020.
While markets endured and performed admirably during 2020, perhaps the key takeaway is that the unexpected can and will happen. That's why it's important to
3
remain focused on your long-term investment goals and avoid making emotional decisions. Moreover, we continue to have confidence in all of Victory Capital's autonomous Investment Franchises and their ability to navigate the ups and downs.
On the following pages, you will find information relating to your Victory Funds investment. If you have any questions, we encourage you to contact your financial advisor. Or, if you invest with us directly, you may call 800-539-3863 (800-235-8396 for Member Class), or visit our website at www.vcm.com.
My colleagues and I sincerely appreciate the confidence you have placed in the Victory Funds, and we value the opportunity to help meet your investment goals.

Christopher K. Dyer, CFA
President,
Victory Funds
4
Victory RS Small Cap Growth Fund
Managers' Commentary
(Unaudited)
What were the market conditions during the reporting period?
U.S. equity markets delivered solid performance across styles in 2020, as the S&P 500® Index delivered its 11th year of positive returns in the last 12 years. U.S. stocks continued to perform well following a strong 2019, driven by a resilient U.S. economy following what was effectively a global economic shutdown in the first quarter and renewed risk-taking among investors, supported by record fiscal stimulus and highly accommodative monetary policy.
After a solid start to the 2020 calendar year in January, U.S. equity markets moved abruptly lower as worst-case fears of SARS-CoV-2 (severe acute respiratory syndrome coronavirus 2) — the virus responsible for COVID-19 (coronavirus disease 2019) — became a reality. While investors started to show concern regarding the potential impact of the virus in February, with the broad Russell 3000® Index declining 8.19%, investors fled risk assets in March en masse as the virus hit home in the United States and the broad index declined another 13.75%. This panic pushed investors to shift away from risk assets and caused credit markets to seize up, while volatility, as measured by the CBOE Market Volatility Index, hit an all-time record high.
The U.S. Federal Reserve (the "Fed") subsequently adjusted forecasts for second quarter economic output to contract by levels not seen since the Great Depression. Given the unprecedented impact to short-term economic growth, the U.S. government implemented record levels of fiscal stimulus to keep businesses open, people in their homes, and important services funded. Meanwhile, the Fed implemented the largest scale monetary stimulus on record, which provided ample liquidity to credit markets, businesses, and important infrastructure. The Fed also lowered interest rates by 150 basis points to 0%, with the goal of helping the economy bounce back quickly.
U.S. equity markets roared back during the second quarter as fiscal and monetary measures convinced investors who had fled risk assets to re-enter. It also became clear that the economic and business impact of the coronavirus would not affect all companies similarly and that there would be "haves" and "have-nots" in the aftermath. While all U.S. equity styles performed well, the disparity between innovative growth and legacy value companies became increasingly pronounced before rising markets took a breather in September.
Strong sentiment turned into exuberance as we approached year-end, as record-setting market performance in the fourth quarter, driven by news that COVID-19 vaccines developed in record time were more effective than most could have hoped for and by the more-certain outlook a victory by Joe Biden in the U.S. presidential election brings, pushed record inflows into equities. The light at the end of the tunnel that the vaccines bring to corporations and to individuals that have struggled created a sharp reversal among equity market leadership and many companies that were left for dead came roaring back. U.S. government action and corporate innovation appear to have bridged the pre-pandemic economy to what will be a new "normal" economic environment, with initial signs that the economy could fully rebound in 2021, despite the severe wave of COVID-19 in winter.
For the year, U.S. stocks performed well across market caps, with large-cap stocks slightly outperforming small- and mid-cap stocks during the year, as measured by the Russell family of indices, while growth-oriented investments sharply outperformed value as investors favored the strong fundamentals and execution of growth companies. Growth stocks as
5
Victory RS Small Cap Growth Fund (continued)
measured by the Russell 3000® Growth Index have now outperformed value stocks as measured by the Russell 3000® Value Index over 1, 3, 5, 10, 15, and even 30 years.
How did Victory RS Small Cap Growth Fund (the "Fund") perform during the reporting period?
The Fund seeks to provide long-term capital appreciation. The Fund returned 37.84% (Class A Shares at net asset value) for the year ended December 31, 2020, outperforming the Russell 2000® Growth Index, which returned 34.63% during the reporting period.
What strategies did you employ during the reporting period?
The Fund seeks long-term capital growth by investing primarily in small-cap companies that we believe have the potential to produce sustainable earnings growth over a multi-year horizon. The Fund outperformed due to outsized outperformance in the Technology, Health Care, and Producer Durables sectors. Stock selection in Financial Services and Consumer Discretionary sectors offset some of the Fund's positive relative performance.
Within the Technology sector, contributors included Bandwidth Inc. ("Bandwidth"), a strong contributor to performance in 2020. Bandwidth is a communications platform-as-a-service solution focused on communications for enterprises. Some popular applications that use Bandwidth on the market today include Google, Skype and RingCentral. The software allows businesses to easily enhance their products and services with advanced text and voice capabilities offering enterprises end-to-end communications. We owned shares of Bandwidth given its large and growing market that we felt was still in the early days, as well as its best-in-class nationwide all-IP network that provides a unique competitive moat in the communications platform market. The stock performed exceptionally well during the year given strong execution and the unexpected tailwind the work-from-home environment provided for their customer base, including Zoom and Webex.
Another top contributor within Technology was Wix.com ("Wix"), a developer and marketer of a cloud-based platform that enables anyone to create a website or web application. Wix showed its resilience to COVID-19 at the beginning of the year as it reported a solid first quarter with collections and revenue up 24% year-over-year, in line with prior guidance. At the time, they did highlight a few negative trends due to the virus, including a slight increase in cancellations, but those trends reversed sharply for the remainder of the year as the demand for the company's tools accelerated the migration of small businesses to having an online presence by years, as well as producing a spike in new online business formation following a rise in unemployment. We believe the tailwind from this trend will continue.
Health Care sector holding Fate Therapeutics ("Fate") was another strong contributor in 2020. Fate is a biotechnology company that engages in the development of programmed cellular immunotherapies for cancer and immune disorders. We own shares of Fate given the view that it has the most disruptive technology in the cell therapy space and the best opportunity to achieve a true off-the-shelf therapeutic with drug-like properties in line with broadly used antibody therapeutics. The stock performed exceptionally well during the year, driven in part by strong Phase 1 data for their FT516 in combination with rituximab for patients with relapsed / refractory B-cell lymphoma that showed responses to the treatment and suggests there may be a clinical benefit allowing the body's cells to recognize, bind, and kill antibody-coated cancer cells.
6
Victory RS Small Cap Growth Fund (continued)
Within the Financial Services sector, a material driver of underperformance was holding EVO Payments Inc. ("EVO"). EVO is a global merchant acquirer and payment processor with exclusive global financial institution referral partnerships. We initially purchased shares of EVO given the long-term secular tailwinds supporting their business given the shift toward electronic payments, while exclusive bank partnerships present a significant moat and efficient customer acquisition strategy given these relationships extend multiple years. The stock struggled during the year as investors became concerned with the ability of the company to service its debt should the impact of the coronavirus be more prolonged than expected. The company reacted to these concerns by raising $150 million in perpetual convertible notes to pay down its debt, which we believed would allow investors to focus on the strong long-term fundamentals.
Within the Health Care sector, the largest detractor to performance was biotechnology holding bluebird bio, Inc. ("bluebird"). bluebird is a biotechnology company that uses an HIV-1 virus, lentivirus, as a means to modify genes and correct a patient's abnormal stem cells. Late in 2019, bluebird shared strong results in a number of trials, including their phase 2 registrational study of the treatment of late-stage relapsed multiple myeloma, which provided us with confidence that the company may only be at the early stage of their potential. Unfortunately, bluebird underwhelmed at the start of the year given expectations that the COVID-19 pandemic will shift the timing of enrollment and completion of a number of their other clinical studies primarily designed to expand the market opportunity once products are approved. The stock struggled to regain the confidence of investors as the company shared that their market expansion studies will be delayed or in some cases halted, though we believe these actions will reduce their cash burn and that the net impact to bluebird will be less than the impact to competitors that do not have pivotal trials that are already fully enrolled, which we feel will widen first mover advantages over competition.
Within the Consumer Discretionary sector, a material driver of relative underperformance was within Consumer Services, driven in part by Education holding Strategic Education, Inc. ("Strategic Education"). Strategic Education is an education company that offers its programs both online and on-site, with 74 campuses across 16 states and the District of Columbia, with 83% of program seats online. We purchased shares of the company given the company's new campus growth, technology, and favorable regulatory environment. The company was under pressure given weaker than expected earnings as well as reduced guidance, given the sensitivity of their undergraduate population to employment rates. We continue to hold the position given favorable longer-term trends for online education, and the uptick in inquiries, visits, and information requests given the shifting value proposal of their offering relative to traditional campuses.
Given the outsized impact of the virus globally, we believe investors should continue to expect all companies to feel some level of direct and secondary economic effects and markets to experience higher levels of volatility despite the outsized market performance to close out the year. As a result, we feel there will continue to be an abundance of opportunities across sectors in coming quarters and years as the economy transitions and new companies take leadership positions. We do not have a clear view or projection as to how large or prolonged the impact from the coronavirus (both direct and indirect) will be given the uncertainty regarding its continued spread, economic impact, politicization, the potential scale of incremental fiscal and monetary stimulus not yet announced, or even the potential transformation of industries and consumer and social norms, but we believe there are clear
7
Victory RS Small Cap Growth Fund (continued)
pockets of the economy that remain better positioned than others given the ability of workers to remain productive (remotely or on-site) and end-customer demand to remain steady, irrespective of the forward economic environment.
In this specific environment, we will focus further on companies with flexible business models that offer innovative products and services that we expect will take market share from legacy companies that will be more strained by the challenging economic conditions. Specifically, our "farm team" approach identifies and monitors premier companies within each relative index, but then waits for a favorable price. This should allow us to upgrade the portfolio to our very best ideas as relative valuations shift. We are confident that our process will allow us to take advantage of this dynamic environment.
8
Victory RS Small Cap Growth Fund
Investment Overview
(Unaudited)
Average Annual Total Returns
Year Ended December 31, 2020
| | Class A | | Class C | | Class R | | Class R6 | | Class Y | | | |
INCEPTION DATE | | 11/30/87 | | 9/6/07 | | 1/22/07 | | 7/12/17 | | 5/1/07 | | | |
| | Net Asset
Value | | Maximum
Offering
Price | | Net Asset
Value | | Contingent
Deferred
Charges | | Net Asset
Value | | Net Asset
Value | | Net Asset
Value | | Russell 2000®
Growth
Index1 | |
One Year | | | 37.84 | % | | | 29.91 | % | | | 36.78 | % | | | 35.78 | % | | | 37.20 | % | | | 38.32 | % | | | 38.21 | % | | | 34.63 | % | |
Five Year | | | 19.03 | % | | | 17.63 | % | | | 18.13 | % | | | 18.13 | % | | | 18.52 | % | | | N/A | | | | 19.35 | % | | | 16.36 | % | |
Ten Year | | | 15.90 | % | | | 15.22 | % | | | 14.92 | % | | | 14.92 | % | | | 15.37 | % | | | N/A | | | | 16.23 | % | | | 13.48 | % | |
Since Inception | | | N/A | | | | N/A | | | | N/A | | | | N/A | | | | N/A | | | | 22.64 | % | | | N/A | | | | N/A | | |
The performance data quoted represents past performance and current returns may be lower or higher. The investment return and principal value will fluctuate so that an investor's shares, when redeemed, may be worth more or less than the original cost. To obtain performance information current to the most recent month's end, please visit www.vcm.com.
The maximum offering price (MOP) reflects a maximum sales charge of 5.75% for Class A Shares. Class C Shares are not subject to an initial sales charge, but are subject to a deferred sales charge of 1.00% on shares redeemed within one year of purchase. NAV does not reflect sales charges.
Total return measures the price change in a share assuming the reinvestment of all net investment income and realized capital gain distributions, if any. The total returns quoted do not reflect adjustments made to the enclosed financial statements in accordance with U.S. generally accepted accounting principles or the deduction of taxes that a shareholder would pay on net investment income and realized capital gain distributions, including reinvested distributions, or redemptions of shares. The total return figures set forth above include all waivers of fees. Without such fee waivers, the total returns would have been lower.
Victory RS Small Cap Growth Fund — Growth of $10,000
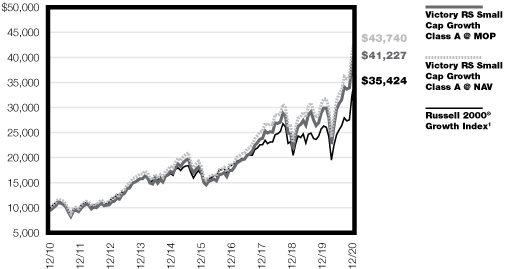
1The Russell 2000® Growth Index is an unmanaged market capitalization-weighted index that measures the performance of those companies in the Russell 2000® Index with higher price-to-book ratios and higher forecasted growth values. (The Russell 2000® Index measures the performance of the 2,000 smallest companies in the Russell 3000® Index, which consists of the 3,000 largest U.S. companies based on total market capitalization.) Index results assume the reinvestment of dividends paid on the stocks constituting the index. This index does not include the effect of sales charges, commissions, expenses or taxes, is not representative of the Fund and it is not possible to invest directly in an index.
The graph reflects investment of growth of a hypothetical $10,000 investment in the Fund.
The graph and table do not reflect the deduction of taxes that a shareholder would pay on Fund distributions or the redemption of Fund shares.
Past performance is not indicative of future results.
9
Victory RS Select Growth Fund
Managers' Commentary
(Unaudited)
What were the market conditions during the reporting period?
U.S. equity markets delivered solid performance across styles in 2020, as the S&P 500® Index delivered its 11th year of positive returns in the last 12 years. U.S. stocks continued to perform well following a strong 2019, driven by a resilient U.S. economy following what was effectively a global economic shutdown in the first quarter and renewed risk-taking among investors, supported by record fiscal stimulus and highly accommodative monetary policy.
After a solid start to the 2020 calendar year in January, U.S. equity markets moved abruptly lower as worst-case fears of SARS-CoV-2 (severe acute respiratory syndrome coronavirus 2) — the virus responsible for COVID-19 (coronavirus disease 2019) — became a reality. While investors started to show concern regarding the potential impact of the virus in February, with the broad Russell 3000® Index declining 8.19%, investors fled risk assets in March en masse as the virus hit home in the United States and the broad index declined another 13.75%. This panic pushed investors to shift away from risk assets and caused credit markets to seize up, while volatility, as measured by the CBOE Market Volatility Index, hit an all-time record high.
The U.S. Federal Reserve (the "Fed") subsequently adjusted forecasts for second quarter economic output to contract by levels not seen since the Great Depression. Given the unprecedented impact to short-term economic growth, the U.S. government implemented record levels of fiscal stimulus to keep businesses open, people in their homes, and important services funded. Meanwhile, the Fed implemented the largest-scale monetary stimulus on record, which provided ample liquidity to credit markets, businesses, and important infrastructure. The Fed also lowered interest rates by 150 basis points to 0%, with the goal of helping the economy bounce back quickly.
U.S. equity markets roared back during the second quarter as fiscal and monetary measures convinced investors that fled risk assets to re-enter. It also became clear that the economic and business impact of the coronavirus would not affect all companies similarly and that there would be "haves" and "have-nots" in the aftermath. While all U.S. equity styles performed well, the disparity between innovative growth and legacy value companies became increasingly pronounced before rising markets took a breather in September.
Strong sentiment turned into exuberance as we approached year-end, as record-setting market performance in the fourth quarter, driven by news that COVID-19 vaccines developed in record time were more effective than most could have hoped for and by the more-certain outlook a victory by Joe Biden in the U.S. presidential election brings, pushed record inflows into equities. The light at the end of the tunnel that the vaccines bring to corporations and to individuals that have struggled created a sharp reversal among equity market leadership and many companies that were left for dead came roaring back. U.S. government action and corporate innovation appear to have bridged the pre-pandemic economy to what will be a new "normal" economic environment, with initial signs that the economy could fully rebound in 2021, despite the prospect of a severe wave of COVID-19 in winter.
For the year, U.S. stocks performed well across market caps, with large-cap stocks slightly outperforming small- and mid-cap stocks during the year, as measured by the Russell family of indices, while growth-oriented investments sharply outperformed value as investors
10
Victory RS Select Growth Fund (continued)
favored the strong fundamentals and execution of growth companies. Growth stocks as measured by the Russell 3000® Growth Index have now outperformed value stocks as measured by the Russell 3000® Value Index over 1, 3, 5, 10, 15, and even 30 years.
How did Victory RS Select Growth Fund (the "Fund") perform during the reporting period?
The Fund seeks to provide long-term capital appreciation. The Fund returned 33.22% for the year ended December 31, 2020, underperforming the Russell 2500TM Growth Index, which returned 40.47% during the reporting period.
What strategies did you employ during the reporting period?
The Fund seeks long-term capital growth by investing primarily in small- and mid-cap companies that we believe have the potential to produce sustainable earnings growth over a multi-year horizon. The Fund's underperformance for the year ended December 31, 2020, was driven by stock selection within the Health Care, Financial Services, and Consumer Discretionary sectors. Stock selection in Technology and Materials & Processing sectors offset a portion of the Fund's negative relative performance.
Within the Technology sector, contributors included RingCentral, a provider of software-as-a-service solutions for businesses to support modern communications. We initially purchased the stock in early 2014 given the thesis that RingCentral operates in a huge ~$50 billion global market (with approximately $15 billion in the United States alone) that was only 10% penetrated by cloud offerings. The company has executed very well due to their industry-leading technology driven by a large research and development budget which, combined with aggressive marketing, has allowed the company to take market share. In late 2019 RingCentral announced a commercial agreement with Avaya Holdings Corp., a global leader in communications, whereby RingCentral would become the exclusive provider of unified communications-as-a-service solutions to Avaya in a strategic partnership that would provide RingCentral access to Avaya's installed base of 100 million customers in exchange for a new RingCentral product on Avaya's Cloud Office. This deal helped to accelerate RingCentral's global expansion, as well as establishing Avaya as an important channel for RingCentral for years to come.
The largest contributor to outperformance within the Materials & Processing sector was building company Advanced Drainage Systems, Inc. ("Advanced Drainage"). Advanced Drainage is a leading solutions provider of high-performance thermoplastic corrugated pipe and related stormwater management and drainage products. We initially purchased shares of Advanced Drainage given its significant size and scale advantage attributable to its leadership position built over 50+ years that has led to its sole ability to provide a comprehensive array of water management and drainage solutions. We believe there are still underpenetrated markets that will allow them to take market share with superior products that are high quality and cost effective. The company performed well in the last quarter of the year and shared a favorable outlook for 2021 given their strong order book, book-to-bill ratio, and backlog.
Within the Health Care sector, the largest driver of relative outperformance was within Biotechnology, driven in part by Horizon Therapeutics Public Limited Company ("Horizon"). Horizon is a specialty pharmaceutical company with products in the areas of rheumatoid arthritis, osteoarthritis, and several different orphan areas. We purchased shares of Horizon
11
Victory RS Select Growth Fund (continued)
given its portfolio of rare disease assets and the success it has had in evolving into a wide-scope pharmaceuticals company given its solid execution over the past 5+ years of 30%+ revenue growth. The company's portfolio includes Tepezza, which we believe will be the standard care for treatment of thyroid eye disease, and Krystexxa, which is the only FDA-approved biologic for chronic refractory gout (a common type of inflammatory arthritis).
Within the Consumer Discretionary sector, the largest driver of relative underperformance was within Consumer Services, driven in part by education holding Strategic Education, Inc. ("Strategic Education"). Strategic Education is an education company that offers its programs both online and on-site, with 74 campuses across 16 states and the District of Columbia, with 83% of program seats online. We own shares of the company given the company's new campus growth, technology, and favorable regulatory environment. The company was under pressure given weaker-than-expected earnings as the year progressed, as well as lower guidance, given the sensitivity of their undergraduate population to employment rates. Despite the view that the company has a favorable longer-term opportunity given trends for online education, we decided to move on from the name and will keep an eye on their ability to repair their fundamental momentum going forward.
Within the Financial Services sector, the largest driver of relative underperformance was within the Consumer Finance and Credit Services industry, led by Euronet Worldwide ("Euronet"). Euronet is a payment and transaction processing company that provides distribution solutions to financial institutions, retailers, service providers, and individual consumers worldwide. Euronet owns and operates the largest ATM network in Europe and has a large presence in Asia, operating almost 20,000 ATMs in total, and had been an outsized positive performer in 2019, driven by a 29% increase in operating income as the company continued to execute. Euronet reported mixed results to start the year, with better-than-expected earnings growth, but lower-than-expected top-line sales, and reduced guidance despite a partnership with Walmart being rolled out globally. The larger issue turned out to be the impact of the coronavirus on global demand for their products and services, as global travel and cash needs were and are expected to remain sluggish given the economic slowdown and sheltering.
Within the Health Care sector, a driver of relative underperformance was Pharmaceuticals & Biotechnology holding Royalty Pharma Plc ("Royalty Pharma"). Royalty Pharma is involved in the identification, evaluation, and acquisition of royalties and royalty-related assets on various biopharmaceutical therapies through the collaboration with innovators from academic institutions, research hospitals, small and mid-cap biotechnology companies, and pharmaceutical companies. Its portfolio includes royalties on approximately 45 commercial products and three development-stage product candidates. We added Royalty Pharma through its IPO given the unique business model that does no manufacturing, does no sales, and has no marketing spend. Royalty Pharma owns a portfolio of intellectual property that has provided consistent, predictable returns, and has a strong management team that we believe can continue to add value in the future. Despite generating a positive return in the calendar year, the stock was unable to keep up with the outsized performance of peers in the biopharma industry.
Given the outsized impact of the virus globally, we believe investors should continue to expect all companies to feel some level of direct and secondary economic effects and markets to experience higher levels of volatility despite the outsized market performance to close out
12
Victory RS Select Growth Fund (continued)
the year. As a result, we feel there will continue to be an abundance of opportunities across sectors in coming quarters and years as the economy transitions and new companies take leadership positions. We do not have a clear view or projection as to how large or prolonged the impact from the coronavirus (both direct and indirect) will be, given the uncertainty regarding its continued spread, economic impact, politicization, the potential scale of incremental fiscal and monetary stimulus not yet announced, or even the potential transformation of industries and consumer and social norms, but we believe there are clear pockets of the economy that remain better positioned than others given the ability of workers to remain productive (remotely or on-site) and end-customer demand to remain steady irrespective of the forward economic environment.
In this specific environment, we will focus further on companies with flexible business models that offer innovative products and services that we expect will take market share from legacy companies that will be more strained by the challenging economic conditions. Specifically, our "farm team" approach identifies and monitors premier companies within each relative index, but then waits for a favorable price. This should allow us to upgrade the portfolio to our very best ideas as relative valuations shift. We are confident that our process will allow us to take advantage of this dynamic environment.
13
Victory RS Select Growth Fund
Investment Overview
(Unaudited)
Average Annual Total Returns
Year Ended December 31, 2020
| | Class A | | Class C | | Class R | | Class R6 | | Class Y | | | | | |
INCEPTION DATE | | 8/1/96 | | 11/15/07 | | 2/12/07 | | 11/15/16 | | 5/1/09 | | | | | |
| | Net Asset
Value | | Maximum
Offering
Price | | Net Asset
Value | | Contingent
Deferred
Charges | | Net Asset
Value | | Net Asset
Value | | Net Asset
Value | | Russell 2500®
Growth
Index1 | | Russell 2000TM
Growth
Index2 | |
One Year | | | 33.22 | % | | | 25.56 | % | | | 32.20 | % | | | 31.20 | % | | | 32.57 | % | | | 33.65 | % | | | 33.57 | % | | | 40.47 | % | | | 34.63 | % | |
Five Year | | | 15.39 | % | | | 14.03 | % | | | 14.49 | % | | | 14.49 | % | | | 14.83 | % | | | N/A | | | | 15.69 | % | | | 18.68 | % | | | 16.36 | % | |
Ten Year | | | 13.50 | % | | | 12.83 | % | | | 12.59 | % | | | 12.59 | % | | | 12.87 | % | | | N/A | | | | 13.81 | % | | | 15.00 | % | | | 13.48 | % | |
Since Inception | | | N/A | | | | N/A | | | | N/A | | | | N/A | | | | N/A | | | | 18.02 | % | | | N/A | | | | N/A | | | | N/A | | |
The performance data quoted represents past performance and current returns may be lower or higher. The investment return and principal value will fluctuate so that an investor's shares, when redeemed, may be worth more or less than the original cost. To obtain performance information current to the most recent month's end, please visit www.vcm.com.
The maximum offering price (MOP) reflects a maximum sales charge of 5.75% for Class A Shares. Class C Shares are not subject to an initial sales charge, but are subject to a deferred sales charge of 1.00% on shares redeemed within one year of purchase. NAV does not reflect sales charges.
Total return measures the price change in a share assuming the reinvestment of all net investment income and realized capital gain distributions, if any. The total returns quoted do not reflect adjustments made to the enclosed financial statements in accordance with U.S. generally accepted accounting principles or the deduction of taxes that a shareholder would pay on net investment income and realized capital gain distributions, including reinvested distributions, or redemptions of shares. The total return figures set forth above include all waivers of fees. Without such fee waivers, the total returns would have been lower.
Victory RS Select Growth Fund — Growth of $10,000

1The Russell 2500TM Growth Index is an unmanaged market capitalization-weighted index that measures the performance of those companies in the Russell 2500TM Index with higher price-to-book ratios and higher forecasted growth values. (The Russell 2500TM Index measures the performance of the 2,500 smallest companies in the Russell 3000® Index, which consists of the 3,000 largest U.S. companies based on total market capitalization.) Index results assume the reinvestment of dividends paid on the stocks constituting the index. This index does not include the effect of sales charges, commissions, expenses or taxes, is not representative of the Fund and it is not possible to invest directly in an index.
2The Russell 2000® Growth Index is an unmanaged market capitalization-weighted index that measures the performance of those companies in the Russell 2000® Index with higher price-to-book ratios and higher forecasted growth values. (The Russell 2000® Index measures the performance of the 2,000 smallest companies in the Russell 3000® Index, which consists of the 3,000 largest U.S. companies based on total market capitalization.) Index results assume the reinvestment of dividends paid on the stocks constituting the index. This index does not include the effect of sales charges, commissions, expenses or taxes, is not representative of the Fund and it is not possible to invest directly in an index.
The graph reflects investment of growth of a hypothetical $10,000 investment in the Fund.
The graph and table do not reflect the deduction of taxes that a shareholder would pay on Fund distributions or the redemption of Fund shares.
Past performance is not indicative of future results.
14
Victory RS Mid Cap Growth Fund
Managers' Commentary
(Unaudited)
What were the market conditions during the reporting period?
U.S. equity markets delivered solid performance across styles in 2020, as the S&P 500® Index delivered its 11th year of positive returns in the last 12 years. U.S. stocks continued to perform well following a strong 2019, driven by a resilient U.S. economy following what was effectively a global economic shutdown in the first quarter and renewed risk-taking among investors, supported by record fiscal stimulus and highly accommodative monetary policy.
After a solid start to the 2020 calendar year in January, U.S. equity markets moved abruptly lower as worst-case fears of SARS-CoV-2 (severe acute respiratory syndrome coronavirus 2) — the virus responsible for COVID-19 (coronavirus disease 2019) — became a reality. While investors started to show concern regarding the potential impact of the virus in February, with the broad Russell 3000® Index declining 8.19%, investors fled risk assets in March en masse as the virus hit home in the United States and the broad index declined another 13.75%. This panic pushed investors to shift away from risk assets and caused credit markets to seize up, while volatility, as measured by the CBOE Market Volatility Index, hit an all-time record high.
The U.S. Federal Reserve (the "Fed") subsequently adjusted forecasts for second-quarter economic output to contract by levels not seen since the Great Depression. Given the unprecedented impact to short-term economic growth, the U.S. government implemented record levels of fiscal stimulus to keep businesses open, people in their homes, and important services funded. Meanwhile, the Fed implemented the largest-scale monetary stimulus on record, which provided ample liquidity to credit markets, businesses, and important infrastructure. The Fed also lowered interest rates by 150 basis points to 0%, with the goal of helping the economy bounce back quickly.
U.S. equity markets roared back during the second quarter as fiscal and monetary measures convinced investors that fled risk assets to re-enter. It also became clear that the economic and business impact of the coronavirus would not affect all companies similarly and that there would be "haves" and "have-nots" in the aftermath. While all U.S. equity styles performed well, the disparity between innovative growth and legacy value companies became increasingly pronounced before rising markets took a breather in September.
Strong sentiment turned into exuberance as we approached year-end, as record-setting market performance in the fourth quarter, driven by news that COVID-19 vaccines developed in record time were more effective than most could have hoped for and by the more certain outlook a victory by Joe Biden in the U.S. presidential election brings, pushed record inflows into equities. The light at the end of the tunnel that the vaccines bring to corporations and to individuals that have struggled created a sharp reversal among equity market leadership and many companies that were left for dead came roaring back. U.S. government action and corporate innovation appear to have bridged the pre-pandemic economy to what will be a new "normal" economic environment, with initial signs that the economy could fully rebound in 2021, despite the prospect of a severe wave of COVID-19 in winter.
For the year, U.S. stocks performed well across market caps, with large-cap stocks slightly outperforming small- and mid-cap stocks during the year, as measured by the Russell family of indices, while growth-oriented investments sharply outperformed value as investors
15
Victory RS Mid Cap Growth Fund (continued)
favored the strong fundamentals and execution of growth companies. Growth stocks as measured by the Russell 3000® Growth Index have now outperformed value stocks as measured by the Russell 3000® Value Index over 1, 3, 5, 10, 15, and even 30 years.
How did Victory RS Mid Cap Growth Fund (the "Fund") perform during the reporting period?
The Fund seeks to provide long-term capital appreciation. The Fund returned 34.47% (Class A Shares at net asset value) for the year ended December 31, 2020, underperforming the Russell Midcap® Growth Index, which returned 35.59% during the reporting period.
What strategies did you employ during the reporting period?
The Fund seeks long-term capital growth by investing primarily in mid-cap companies that we believe have the potential to produce sustainable earnings growth over a multi-year horizon. The Fund's relative underperformance for the year ended December 31, 2020, was driven by stock selection within the Health Care, Consumer Discretionary, Financial Services, and Consumer Staples sectors. Stock selection in Technology and Materials & Processing sectors offset a portion of the Fund's negative relative performance.
Within the Technology sector, contributors included RingCentral, a provider of software-as-a-service solutions for businesses to support modern communications. We initially purchased the stock in early 2014 given the thesis that RingCentral operates in a huge ~$50 billion global market (with approximately $15 billion in the United States alone) that was only 10% penetrated by cloud offerings. The company has executed very well due to their industry-leading technology driven by a large research and development budget which, combined with aggressive marketing, has allowed the company to take market share. In late 2019 RingCentral announced a commercial agreement with Avaya Holdings Corp., a global leader in communications, whereby RingCentral would become the exclusive provider of unified communications-as-a-service solutions to Avaya in a strategic partnership that would provide RingCentral access to Avaya's installed base of 100 million customers in exchange for a new RingCentral product on Avaya's Cloud Office. This deal helped to accelerate RingCentral's global expansion, as well as establishing Avaya as an important channel for RingCentral for years to come.
A strong performer within the Materials & Processing sectors was fertilizer holding Scotts Miracle-Gro Company ("Scotts"). Scotts is the leading manufacturer and marketer of branded lawn care products in North America, including grass seed, fertilizers, soil, mulch, herbicides, pesticides, and rodent control products. We initially purchased shares of Scotts given the company's steady growth in their consumer business (70% of sales) and optionality of their Hawthorne business given exposure to the emerging cannabis market, where we model sales growth of 40%+ per year through 2022. The company had a very strong year and gave favorable 2021 guidance.
Health Care sector holding Fate Therapeutics ("Fate") was another strong contributor in 2020. Fate is a biotechnology company that engages in the development of programmed cellular immunotherapies for cancer and immune disorders. We own shares of Fate given the view that it has the most disruptive technology in the cell therapy space and the best opportunity to achieve a true off-the-shelf therapeutic with drug-like properties in line with broadly used antibody therapeutics. The stock performed exceptionally well during the year,
16
Victory RS Mid Cap Growth Fund (continued)
driven in part by strong Phase 1 data for their FT516 in combination with rituximab for patients with relapsed / refractory B-cell lymphoma that showed responses to the treatment and suggests there may be a clinical benefit allowing the body's cells to recognize, bind, and kill antibody-coated cancer cells.
Within the Consumer Discretionary sector, one of the largest relative underperformers was Entertainment holding Live Nation Entertainment, Inc. ("Live Nation"). Live Nation operates as a live entertainment company through Concerts, Ticketing, and Sponsorship & Advertising segments. We owned shares of Live Nation given the continued trend toward experiences, which created strong demand for concerts, as well as the perception that supply was firmly in place as touring is a primary source of annual income for major artists. In addition, the shift toward digital ticketing has improved the company's ability to communicate directly to fans, while eliminating paper tickets as they migrate to a completely digital system which will reduce costs and drive margin expansion. The company struggled given significantly reduced expectations due to the impact of COVID-19 that resulted in Live Nation offering refunds on all canceled and rescheduled shows. While we believe their business will bounce back sharply as the economy opens up, the lack of clarity around timing caused us to move on from the position.
Within the Financial Services sector, the largest driver of relative underperformance was within the Consumer Finance and Credit Services industry, led by Euronet Worldwide ("Euronet"). Euronet is a payment and transaction processing company that provides distribution solutions to financial institutions, retailers, service providers, and individual consumers worldwide. Euronet owns and operates the largest ATM network in Europe and has a large presence in Asia, operating almost 20,000 ATMs in total, and had been an outsized positive performer in 2019, driven by a 29% increase in operating income as the company continued to execute. Euronet reported mixed results to start the year, with better-than-expected earnings growth, but lower-than-expected top-line sales, and reduced guidance despite a partnership with Walmart being rolled out globally. The bigger issue was the impact of the coronavirus on global demand for their products and services, as global travel and cash needs are expected to remain sluggish given the economic slowdown and sheltering.
Within the Health Care sector, a driver of relative underperformance was Pharmaceuticals & Biotechnology holding Royalty Pharma Plc ("Royalty Pharma"). Royalty Pharma is involved in the identification, evaluation, and acquisition of royalties and royalty-related assets on various biopharmaceutical therapies through the collaboration with innovators from academic institutions, research hospitals, small and mid-cap biotechnology companies, and pharmaceutical companies. Its portfolio includes royalties on approximately 45 commercial products and three development-stage product candidates. We added shares of Royalty Pharma through its IPO given the unique business model that does no manufacturing, does no sales, and has no marketing spend. Royalty Pharma owns a portfolio of intellectual property that has provided consistent, predictable returns, and has a strong management team that we believe can continue to add value in the future. Despite generating a positive return in the calendar year, the stock was unable to keep up with the outsized performance of peers in the biopharma industry.
Given the outsized impact of the virus globally, we believe investors should continue to expect all companies to feel some level of direct and secondary economic effects and markets to experience higher levels of volatility despite the outsized market performance to close out
17
Victory RS Mid Cap Growth Fund (continued)
the year. As a result, we feel there will continue to be an abundance of opportunities across sectors in coming quarters and years as the economy transitions and new companies take leadership positions. We do not have a clear view or projection as to how large or prolonged the impact from the coronavirus (both direct and indirect) will be, given the uncertainty regarding its continued spread, economic impact, politicization, the potential scale of incremental fiscal and monetary stimulus not yet announced, or even the potential transformation of industries and consumer and social norms, but we believe there are clear pockets of the economy that remain better positioned than others given the ability of workers to remain productive (remotely or on-site) and end-customer demand to remain steady irrespective of the forward economic environment.
In this specific environment, we will focus further on companies with flexible business models that offer innovative products and services that will take market share from legacy companies that will be more strained by the challenging economic conditions. Specifically, our "farm team" approach identifies and monitors premier companies within each relative index, but then waits for a favorable price. This should allow us to upgrade the portfolio to our very best ideas as relative valuations shift. We are confident that our process will allow us to take advantage of this dynamic environment.
18
Victory RS Mid Cap Growth Fund
Investment Overview
(Unaudited)
Average Annual Total Returns
Year Ended December 31, 2020
| | Class A | | Class C | | Class R | | Class R6 | | Class Y | | Member
Class | | | |
INCEPTION DATE | | 7/12/95 | | 5/21/07 | | 12/4/06 | | 11/15/16 | | 5/1/07 | | 11/3/20 | | | |
| | Net Asset
Value | | Maximum
Offering
Price | | Net Asset
Value | | Contingent
Deferred
Charges | | Net Asset
Value | | Net Asset
Value | | Net Asset
Value | | Net Asset
Value | | Russell Midcap®
Growth
Index1 | |
One Year | | | 34.47 | % | | | 26.74 | % | | | 33.30 | % | | | 32.30 | % | | | 33.67 | % | | | 34.86 | % | | | 34.84 | % | | | N/A | | | | 35.59 | % | |
Five Year | | | 15.17 | % | | | 13.81 | % | | | 14.14 | % | | | 14.14 | % | | | 14.50 | % | | | N/A | | | | 15.46 | % | | | N/A | | | | 18.66 | % | |
Ten Year | | | 13.83 | % | | | 13.15 | % | | | 12.82 | % | | | 12.82 | % | | | 13.21 | % | | | N/A | | | | 14.12 | % | | | N/A | | | | 15.04 | % | |
Since Inception | | | N/A | | | | N/A | | | | N/A | | | | N/A | | | | N/A | | | | 18.34 | % | | | N/A | | | | 17.94 | % | | | N/A | | |
The performance data quoted represents past performance and current returns may be lower or higher. The investment return and principal value will fluctuate so that an investor's shares, when redeemed, may be worth more or less than the original cost. To obtain performance information current to the most recent month's end, please visit www.vcm.com.
The maximum offering price (MOP) figures reflect a maximum sales charge of 5.75% for Class A Shares. Class C Shares are not subject to an initial sales charge, but are subject to a deferred sales charge of 1.00% on shares redeemed within one year of purchase. NAV does not reflect sales charges.
Total return measures the price change in a share assuming the reinvestment of all net investment income and realized capital gain distributions, if any. The total returns quoted do not reflect adjustments made to the enclosed financial statements in accordance with U.S. generally accepted accounting principles or the deduction of taxes that a shareholder would pay on net investment income and realized capital gain distributions, including reinvested distributions, or redemptions of shares. The total return figures set forth above include all waivers of fees. Without such fee waivers, the total returns would have been lower.
Victory RS Mid Cap Growth Fund — Growth of $10,000

1The Russell Midcap® Growth Index is an unmanaged market capitalization-weighted index that measures the performance of those companies in the Russell Midcap® Index with higher price-to-book ratios and higher forecasted growth values. (The Russell Midcap® Index measures the performance of the 800 smallest companies in the Russell 1000® Index, which consists of the 1,000 largest U.S. companies based on total market capitalization.) Index results assume the reinvestment of dividends paid on the stocks constituting the index. This index does not include the effect of sales charges, commissions, expenses or taxes, is not representative of the Fund and it is not possible to invest directly in an index.
The graph reflects investment of growth of a hypothetical $10,000 investment in the Fund.
The graph and table do not reflect the deduction of taxes that a shareholder would pay on Fund distributions or the redemption of Fund shares.
Past performance is not indicative of future results.
19
Victory RS Growth Fund
Managers' Commentary
(Unaudited)
What were the market conditions during the reporting period?
U.S. equity markets delivered solid performance across styles in 2020, as the S&P 500® Index delivered its 11th year of positive returns in the last 12 years. U.S. stocks continued to perform well following a strong 2019, driven by a resilient U.S. economy following what was effectively a global economic shutdown in the first quarter and renewed risk-taking among investors, supported by record fiscal stimulus and highly accommodative monetary policy.
After a solid start to the 2020 calendar year in January, U.S. equity markets moved abruptly lower as worst-case fears of SARS-CoV-2 (severe acute respiratory syndrome coronavirus 2) — the virus responsible for COVID-19 (coronavirus disease 2019) — became a reality. While investors started to show concern regarding the potential impact of the virus in February, with the broad Russell 3000® Index declining 8.19%, investors fled risk assets in March en masse as the virus hit home in the United States and the broad index declined another 13.75%. This panic pushed investors to shift away from risk assets and caused credit markets to seize up, while volatility, as measured by the CBOE Market Volatility Index, hit an all-time record high.
The U.S. Federal Reserve (the "Fed") subsequently adjusted forecasts for second-quarter economic output to contract by levels not seen since the Great Depression. Given the unprecedented impact to short-term economic growth, the U.S. government implemented record levels of fiscal stimulus to keep businesses open, people in their homes, and important services funded. Meanwhile, the Fed implemented the largest-scale monetary stimulus on record, which provided ample liquidity to credit markets, businesses, and important infrastructure. The Fed also lowered interest rates by 150 basis points to 0%, with the goal of helping the economy bounce back quickly.
U.S. equity markets roared back during the second quarter as fiscal and monetary measures convinced investors that fled risk assets to re-enter. It also became clear that the economic and business impact of the coronavirus would not affect all companies similarly and that there would be "haves" and "have-nots" in the aftermath. While all U.S. equity styles performed well, the disparity between innovative growth and legacy value companies became increasingly pronounced before rising markets took a breather in September.
Strong sentiment turned into exuberance as we approached year-end, as record-setting market performance in the fourth quarter, driven by news that COVID-19 vaccines developed in record time were more effective than most could have hoped for and by the more certain outlook a victory by Joe Biden in the U.S. presidential election brings, pushed record inflows into equities. The light at the end of the tunnel that the vaccines bring to corporations and to individuals that have struggled created a sharp reversal among equity market leadership and many companies that were left for dead came roaring back. U.S. government action and corporate innovation appear to have bridged the pre-pandemic economy to what will be a new "normal" economic environment, with initial signs that the economy could fully rebound in 2021, despite the prospect of a severe wave of COVID-19 in winter.
For the year, U.S. stocks performed well across market caps, with large-cap stocks slightly outperforming small- and mid-cap stocks during the year, as measured by the Russell family of indices, while growth-oriented investments sharply outperformed value as investors
20
Victory RS Growth Fund (continued)
favored the strong fundamentals and execution of growth companies. Growth stocks as measured by the Russell 3000® Growth Index have now outperformed value stocks as measured by the Russell 3000® Value Index over 1, 3, 5, 10, 15, and even 30 years.
How did Victory RS Growth Fund (the "Fund") perform during the reporting period?
The Fund seeks to provide long-term capital growth. The Fund returned 35.64% (Class A Shares at net asset value) for the year ended December 31, 2020, underperforming the Russell 1000® Growth Index, which returned 38.49% during the reporting period.
What strategies did you employ during the reporting period?
The Fund seeks long-term capital growth by investing primarily in large-cap companies that we believe have the potential to produce sustainable earnings growth over a multi-year horizon. The Fund's underperformance for the year ended December 31, 2020, was driven by stock selection within the Health Care, Financial Services, and Consumer Discretionary sectors. Stock selection in Technology and Producer Durables sectors offset a portion of the Fund's negative relative performance.
Within the Technology sector, contributors included RingCentral, a provider of software-as-a-service solutions for businesses to support modern communications. We initially purchased the stock in early 2014 given the thesis that RingCentral operates in a huge ~$50 billion global market (with approximately $15 billion in the United States alone) that was only 10% penetrated by cloud offerings. The company has executed very well due to their industry-leading technology driven by a large research and development budget which, combined with aggressive marketing, has allowed the company to take market share. In late 2019, RingCentral announced a commercial agreement with Avaya Holdings Corp., a global leader in communications, whereby RingCentral would become the exclusive provider of unified communications- as-a-service solutions to Avaya in a strategic partnership that would provide RingCentral access to Avaya's installed base of 100 million customers in exchange for a new RingCentral product on Avaya's Cloud Office. This deal helped to accelerate RingCentral's global expansion, as well as establishing Avaya as an important channel for RingCentral for years to come.
Within the Technology sector, a material driver of relative outperformance was Information Technology holding Twilio, Inc. ("Twilio"). Twilio provides a cloud communications platform that enables developers to build, scale, and operate communications within software applications. We own shares of Twilio given their leading position in a rapidly growing market, driven by the company's broad and deep functionality, strong developer focus, and comprehensive documentation. In addition, the company has a compelling model for top-line growth, driven by its high net expansion rate among existing customers and rapid customer growth. The company did exceptionally well during the year, especially following a bullish analyst day and its $3.2 billion acquisition of Segment. In typical Twilio style, the company has underplayed their strong performance, but the momentum was clearly strong in its messaging business and we expect any weakness to be used as a buying opportunity in the years to come.
A strong performer within the Materials & Processing sector was fertilizer holding Scotts Miracle-Gro Company ("Scotts"). Scotts is the leading manufacturer and marketer of branded lawn care products in North America, including grass seed, fertilizers, soil, mulch, herbicides,
21
Victory RS Growth Fund (continued)
pesticides, and rodent control products. We initially purchased shares of Scotts given the company's steady growth in their consumer business (70% of sales) and optionality of their Hawthorne business given exposure to the emerging cannabis market, where we model sales growth of 40%+ per year through 2022. The company had a very strong year and gave favorable 2021 guidance.
Within the Financial Services sector, the largest driver of relative underperformance was within the Consumer Finance and Credit Services industry, led by Euronet Worldwide ("Euronet"). Euronet is a payment and transaction processing company that provides distribution solutions to financial institutions, retailers, service providers, and individual consumers worldwide. Euronet owns and operates the largest ATM network in Europe and has a large presence in Asia, operating almost 20,000 ATMs in total, and had been an outsized positive performer in 2019, driven by a 29% increase in operating income as the company continued to execute. Euronet reported mixed results to start the year, with better-than-expected earnings growth, but lower-than-expected top-line sales, and reduced guidance despite a partnership with Walmart being rolled out globally. The bigger issue was the impact of the coronavirus on global demand for their products and services, as global travel and cash needs are expected to remain sluggish given the economic slowdown and sheltering.
Within the Health Care sector, the largest detractor to performance was Biotechnology holding bluebird bio, Inc. ("bluebird"). bluebird is a biotechnology company that uses an HIV-1 virus, lentivirus, as a means to modify genes and correct a patient's abnormal stem cells. Late in 2019, bluebird shared strong results in a number of trials, including their phase 2 registrational study of the treatment of late-stage relapsed multiple myeloma, which provided us with confidence that the company may only be at the early stage of their potential. Unfortunately, bluebird underwhelmed at the start of the year given expectations that the COVID-19 pandemic will shift the timing of enrollment and completion of a number of their other clinical studies primarily designed to expand the market opportunity once products are approved. The stock struggled to regain the confidence of investors as the company shared that their market expansion studies will be delayed or in some cases halted, though we believe these actions will reduce their cash burn and that the net impact to bluebird will be less than the impact to competitors that do not have pivotal trials that are already fully enrolled, which we feel will widen first mover advantages over competition.
Within the Producer Durables sector, the largest relative underperformer was back-office-support holding FTI Consulting, Inc. ("FTI"). FTI is the largest U.S. provider of turnaround, restructuring, bankruptcy, and related services, organized into five practice groups: Corporate Finance/ Restructuring, Forensic and Litigation Consulting, Economic Consulting, Technology Consulting and Services, and Strategic Communications Consulting and Services. We own the stock given the business diversification organized to withstand economic cyclicality and our view that the company would benefit from increasingly complex global regulations and legislation. After a strong start to the year, the stock gave up most of its gains in the second half of the year given concerns that mergers and acquisitions activity and in-person litigation could slump given the economic slowdown and impact from COVID-19. We remain confident in the company and believe their specialty consulting and advisory businesses are well-positioned as cyber threats, antitrust issues, and global disputes abound.
22
Victory RS Growth Fund (continued)
Given the outsized impact of the virus globally, we believe investors should continue to expect all companies to feel some level of direct and secondary economic effects and markets to experience higher levels of volatility despite the outsized market performance to close out the year. As a result, we feel there will continue to be an abundance of opportunities across sectors in coming quarters and years as the economy transitions and new companies take leadership positions. We do not have a clear view or projection as to how large or prolonged the impact from the coronavirus (both direct and indirect) will be, given the uncertainty regarding its continued spread, economic impact, politicization, the potential scale of incremental fiscal and monetary stimulus not yet announced, or even the potential transformation of industries and consumer and social norms, but we believe there are clear pockets of the economy that remain better positioned than others given the ability of workers to remain productive (remotely or on-site) and end-customer demand to remain steady irrespective of the forward economic environment.
In this specific environment, we will focus further on companies with flexible business models that offer innovative products and services that will take market share from legacy companies that will be more strained by the challenging economic conditions. Specifically, our "farm team" approach identifies and monitors premier companies within each relative index, but then waits for a favorable price. This should allow us to upgrade the portfolio to our very best ideas as relative valuations shift. We are confident that our process will allow us to take advantage of this dynamic environment.
23
Investment Overview
(Unaudited)
Average Annual Total Returns
Year Ended December 31, 2020
| | Class A | | Class C | | Class R | | Class Y | | | |
INCEPTION DATE | | 5/12/92 | | 6/30/07 | | 11/27/06 | | 5/1/07 | | | |
| | Net Asset
Value | | Maximum
Offering
Price | | Net Asset
Value | | Contingent
Deferred
Charges | | Net Asset
Value | | Net Asset
Value | | Russell 1000®
Growth
Index1 | |
One Year | | | 35.64 | % | | | 27.86 | % | | | 34.55 | % | | | 33.55 | % | | | 34.87 | % | | | 36.06 | % | | | 38.49 | % | |
Five Year | | | 17.11 | % | | | 15.72 | % | | | 16.13 | % | | | 16.13 | % | | | 16.41 | % | | | 17.42 | % | | | 21.00 | % | |
Ten Year | | | 15.17 | % | | | 14.50 | % | | | 14.13 | % | | | 14.13 | % | | | 14.49 | % | | | 15.47 | % | | | 17.21 | % | |
The performance data quoted represents past performance and current returns may be lower or higher. The investment return and principal value will fluctuate so that an investor's shares, when redeemed, may be worth more or less than the original cost. To obtain performance information current to the most recent month's end, please visit www.vcm.com.
The maximum offering price (MOP) figures reflect a maximum sales charge of 5.75% for Class A Shares. Class C Shares are not subject to an initial sales charge, but are subject to a deferred sales charge of 1.00% on shares redeemed within one year of purchase. NAV does not reflect sales charges.
Total return measures the price change in a share assuming the reinvestment of all net investment income and realized capital gain distributions, if any. The total returns quoted do not reflect adjustments made to the enclosed financial statements in accordance with U.S. generally accepted accounting principles or the deduction of taxes that a shareholder would pay on net investment income and realized capital gain distributions, including reinvested distributions, or redemptions of shares. The total return figures set forth above include all waivers of fees. Without such fee waivers, the total returns would have been lower.
Victory RS Growth Fund — Growth of $10,000

1The Russell 1000® Growth Index is a market capitalization-weighted index, meaning that the largest companies constitute the largest percentages in the index and will affect performance more than the smallest index members. This index does not include the effect of sales charges, commissions, expenses or taxes, is not representative of the Fund and it is not possible to invest directly in an index.
The graph reflects investment of growth of a hypothetical $10,000 investment in the Fund.
The graph and table do not reflect the deduction of taxes that a shareholder would pay on Fund distributions or the redemption of Fund shares.
Past performance is not indicative of future results.
24
Victory RS Science and Technology Fund
Managers' Commentary
(Unaudited)
What were the market conditions during the reporting period?
U.S. equity markets delivered solid performance across styles in 2020, as the S&P 500® Index delivered its 11th year of positive returns in the last 12 years. U.S. stocks continued to perform well following a strong 2019, driven by a resilient U.S. economy following what was effectively a global economic shutdown in the first quarter and renewed risk-taking among investors, supported by record fiscal stimulus and highly accommodative monetary policy.
After a solid start to the 2020 calendar year in January, U.S. equity markets moved abruptly lower as worst-case fears of SARS-CoV-2 (severe acute respiratory syndrome coronavirus 2) — the virus responsible for COVID-19 (coronavirus disease 2019) — became a reality. While investors started to show concern regarding the potential impact of the virus in February, with the broad Russell 3000® Index declining 8.19%, investors fled risk assets in March en masse as the virus hit home in the United States and the broad index declined another 13.75%. This panic pushed investors to shift away from risk assets and caused credit markets to seize up, while volatility, as measured by the CBOE Market Volatility Index, hit an all-time record high.
The U.S. Federal Reserve (the "Fed") subsequently adjusted forecasts for second quarter economic output to contract by levels not seen since the Great Depression. Given the unprecedented impact to short-term economic growth, the U.S. government implemented record levels of fiscal stimulus to keep businesses open, people in their homes, and important services funded. Meanwhile, the Fed implemented the largest scale monetary stimulus on record, which provided ample liquidity to credit markets, businesses, and important infrastructure. The Fed also lowered interest rates by 150 basis points to 0%, with the goal of helping the economy bounce back quickly.
U.S. equity markets roared back during the second quarter as fiscal and monetary measures convinced investors who had fled risk assets to re-enter. It also became clear that the economic and business impact of the coronavirus would not affect all companies similarly and that there would be "haves" and "have-nots" in the aftermath. While all U.S. equity styles performed well, the disparity between innovative growth and legacy value companies became increasingly pronounced before rising markets took a breather in September.
Strong sentiment turned into exuberance as we approached year-end, as record-setting market performance in the fourth quarter, driven by news that COVID-19 vaccines developed in record time were more effective than most could have hoped for and by the more certain outlook a victory by Joe Biden in the U.S. presidential election brings, pushed record inflows into equities. The light at the end of the tunnel that the vaccines bring to corporations and to individuals that have struggled created a sharp reversal among equity market leadership and many companies that were left for dead came roaring back. U.S. government action and corporate innovation appear to have bridged the pre-pandemic economy to what will be a new "normal" economic environment, with initial signs that the economy could fully rebound in 2021, despite the prospect of a severe wave of COVID-19 in winter.
For the year, U.S. stocks performed well across market caps, with large-cap stocks slightly outperforming small- and mid-cap stocks during the year, as measured by the Russell family of indices, while growth-oriented investments sharply outperformed value as investors
25
Victory RS Science and Technology Fund (continued)
favored the strong fundamentals and execution of growth companies. Growth stocks as measured by the Russell 3000® Growth Index have now outperformed value stocks as measured by the Russell 3000® Value Index over 1, 3, 5, 10, 15, and even 30 years.
How did Victory RS Science and Technology Fund (the "Fund") perform during the reporting period?
The Fund seeks to provide long-term capital growth. The Fund returned 65.03% (Class A Shares at net asset value) for the year ended December 31, 2020, outperforming the S&P North American Technology Sector Index (the "Index"), which returned 45.15% during the period and the broader S&P 500® Index, which returned 18.40% during the reporting period.
What strategies did you employ during the reporting period?
The Fund seeks long-term capital growth by investing in technology-oriented companies across market capitalizations and sectors that we believe have greater earnings potential relative to market expectations. The Fund's outsized performance for the year ended December 31, 2020, in absolute and relative terms, was aided by exposure to innovative companies within the Health Care sector, as well as a tilt toward smaller-cap companies relative to the Index. Stock selection in the Technology sector helped add incrementally to performance.
Within the Technology sector, contributors included RingCentral, a provider of software-as-a-service solutions for businesses to support modern communications. We initially purchased the stock in early 2014 given the thesis that RingCentral operates in a huge ~$50 billion global market (with approximately $15 billion in the United States alone) that was only 10% penetrated by cloud offerings. The company has executed very well due to their industry-leading technology driven by a large research and development budget which, combined with aggressive marketing, has allowed the company to take market share. In late 2019, RingCentral announced a commercial agreement with Avaya Holdings Corp. ("Avaya"), a global leader in communications, whereby RingCentral would become the exclusive provider of unified communications-as-a-service solutions to Avaya in a strategic partnership that would provide RingCentral access to Avaya's installed base of 100 million customers in exchange for a new RingCentral product on Avaya's Cloud Office. This deal helped to accelerate RingCentral's global expansion, as well as establishing Avaya as an important channel for RingCentral for years to come.
Health Care sector holding Fate Therapeutics ("Fate") was another strong contributor in 2020. Fate is a biotechnology company that engages in the development of programmed cellular immunotherapies for cancer and immune disorders. We own shares of Fate given the view that it has the most disruptive technology in the cell therapy space and the best opportunity to achieve a true off-the-shelf therapeutic with drug-like properties in line with broadly used antibody therapeutics. The stock performed exceptionally well during the year, driven in part by strong Phase 1 data for their FT516 in combination with rituximab for patients with relapsed / refractory B-cell lymphoma that showed responses to the treatment and suggests there may be a clinical benefit allowing the body's cells to recognize, bind, and kill antibody-coated cancer cells.
Within the Technology sector, a material driver of relative outperformance was Information Technology holding Twilio, Inc. ("Twilio"). Twilio provides a cloud communications platform
26
Victory RS Science and Technology Fund (continued)
that enables developers to build, scale, and operate communications within software applications. We own shares of Twilio given their leading position in a rapidly growing market, driven by the company's broad and deep functionality, strong developer focus, and comprehensive documentation. In addition, the company has a compelling model for top-line growth, driven by its high net expansion rate among existing customers and rapid customer growth. The company did exceptionally well during the year, especially following a bullish analyst day and its $3.2 billion acquisition of Segment. In typical Twilio style, the company has underplayed their strong performance, but the momentum was clearly strong in its messaging business and we expect any weakness to be used as a buying opportunity in the years to come.
Within the Health Care sector, the largest detractor to performance was biotechnology holding bluebird bio, Inc. ("bluebird"). bluebird is a biotechnology company that uses an HIV-1 virus, lentivirus, as a means to modify genes and correct a patient's abnormal stem cells. Late in 2019, bluebird shared strong results in a number of trials, including their phase 2 registrational study of the treatment of late-stage relapsed multiple myeloma, which provided us with confidence that the company may only be at the early stage of their potential. Unfortunately, bluebird underwhelmed at the start of the year given expectations that the COVID-19 pandemic will shift the timing of enrollment and completion of a number of their other clinical studies primarily designed to expand the market opportunity once products are approved. The stock struggled to regain the confidence of investors as the company shared that their market expansion studies will be delayed or in some cases halted, though we believe these actions will reduce their cash burn and that the net impact to bluebird will be less than the impact to competitors that do not have pivotal trials that are already fully enrolled, which we feel will widen first mover advantages over competition.
Within the Financial Services sector, the largest driver of relative underperformance was within the Consumer Finance and Credit Services industry, led by Euronet Worldwide ("Euronet"). Euronet is a payment and transaction processing company that provides distribution solutions to financial institutions, retailers, service providers, and individual consumers worldwide. Euronet owns and operates the largest ATM network in Europe and has a large presence in Asia, operating almost 20,000 ATMs in total, and had been an outsized positive performer in 2019, driven by a 29% increase in operating income as the company continued to execute. Euronet reported mixed results to start the year, with better-than-expected earnings growth, but lower-than-expected top-line sales, and reduced guidance despite a partnership with Walmart being rolled out globally. The larger issue turned out to be the impact of the coronavirus on global demand for their products and services, as global travel and cash needs were and are expected to remain sluggish given the economic slowdown and sheltering.
Given the outsized impact of the virus globally, we believe investors should continue to expect all companies to feel some level of direct and secondary economic effects and markets to experience higher levels of volatility despite the outsized market performance to close out the year. As a result, we feel there will continue to be an abundance of opportunities across sectors in coming quarters and years as the economy transitions and new companies take leadership positions. We do not have a clear view or projection as to how large or prolonged the impact from the coronavirus (both direct and indirect) will be, given the uncertainty regarding its continued spread, economic impact, politicization, the potential scale of
27
Victory RS Science and Technology Fund (continued)
incremental fiscal and monetary stimulus not yet announced, or even the potential transformation of industries and consumer and social norms, but we believe there are clear pockets of the economy that remain better positioned than others given the ability of workers to remain productive (remotely or on-site) and end-customer demand to remain steady irrespective of the forward economic environment.
In this specific environment, we will focus further on companies with flexible business models that offer innovative products and services that will take market share from legacy companies that will be more strained by the challenging economic conditions. Specifically, our "farm team" approach identifies and monitors premier companies within each relative index, but then waits for a favorable price. This should allow us to upgrade the portfolio to our very best ideas as relative valuations shift. We are confident that our process will allow us to take advantage of this dynamic environment.
28
Victory RS Science and Technology Fund
Investment Overview
(Unaudited)
Average Annual Total Returns
Year Ended December 31, 2020
| | Class A | | Class C | | Class R | | Class Y | | | | | |
INCEPTION DATE | | 11/15/95 | | 5/2/07 | | 1/19/07 | | 5/1/07 | | | | | |
| | Net Asset
Value | | Maximum
Offering
Price | | Net Asset
Value | | Contingent
Deferred
Charges | | Net Asset
Value | | Net Asset
Value | | S&P North
American
Technology
Sector IndexTM1 | | S&P 500®
Index2 | |
One Year | | | 65.03 | % | | | 55.51 | % | | | 63.71 | % | | | 62.71 | % | | | 64.32 | % | | | 65.40 | % | | | 45.15 | % | | | 18.40 | % | |
Five Year | | | 30.32 | % | | | 28.79 | % | | | 29.30 | % | | | 29.30 | % | | | 29.76 | % | | | 30.63 | % | | | 27.23 | % | | | 15.22 | % | |
Ten Year | | | 19.26 | % | | | 18.55 | % | | | 18.32 | % | | | 18.32 | % | | | 18.69 | % | | | 19.58 | % | | | 20.57 | % | | | 13.88 | % | |
The performance data quoted represents past performance and current returns may be lower or higher. The investment return and principal value will fluctuate so that an investor's shares, when redeemed, may be worth more or less than the original cost. To obtain performance information current to the most recent month's end, please visit www.vcm.com.
The maximum offering price (MOP) figures reflect a maximum sales charge of 5.75% for Class A Shares. Class C Shares are not subject to an initial sales charge, but are subject to a deferred sales charge of 1.00% on shares redeemed within one year of purchase. NAV does not reflect sales charges.
Total return measures the price change in a share assuming the reinvestment of all net investment income and realized capital gain distributions, if any. The total returns quoted do not reflect adjustments made to the enclosed financial statements in accordance with U.S. generally accepted accounting principles or the deduction of taxes that a shareholder would pay on net investment income and realized capital gain distributions, including reinvested distributions, or redemptions of shares. The total return figures set forth above include all waivers of fees. Without such fee waivers, the total returns would have been lower.
Victory RS Science and Technology Fund — Growth of $10,000
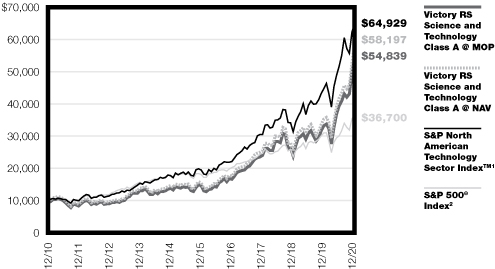
1The S&P North American Technology Sector Index is a modified capitalization-weighted index based on a universe of technology-related stocks. This index does not include the effect of sales charges, commissions, expenses or taxes, is not representative of the Fund and it is not possible to invest directly in an index.
2The S&P 500® Index is an unmanaged index comprised of 500 domestically traded common stocks, is weighted according to the market value of each common stock in the index, and includes reinvestment of dividends. This index does not include the effect of sales charges, commissions, expenses or taxes, is not representative of the Fund and it is not possible to invest directly in an index.
The graph reflects investment of growth of a hypothetical $10,000 investment in the Fund.
The graph and table do not reflect the deduction of taxes that a shareholder would pay on Fund distributions or the redemption of Fund shares.
Past performance is not indicative of future results.
29
Victory RS Small Cap Equity Fund
Managers' Commentary
(Unaudited)
What were the market conditions during the reporting period?
U.S. equity markets delivered solid performance across styles in 2020, as the S&P 500® Index delivered its 11th year of positive returns in the last 12 years. U.S. stocks continued to perform well following a strong 2019, driven by a resilient U.S. economy following what was effectively a global economic shutdown in the first quarter and renewed risk-taking among investors, supported by record fiscal stimulus and highly accommodative monetary policy.
After a solid start to the 2020 calendar year in January, U.S. equity markets moved abruptly lower as worst-case fears of SARS-CoV-2 (severe acute respiratory syndrome coronavirus 2) — the virus responsible for COVID-19 (coronavirus disease 2019) — became a reality. While investors started to show concern regarding the potential impact of the virus in February, with the broad Russell 3000® Index declining 8.19%, investors fled risk assets in March en masse as the virus hit home in the United States and the broad index declined another 13.75%. This panic pushed investors to shift away from risk assets and caused credit markets to seize up, while volatility, as measured by the CBOE Market Volatility Index, hit an all-time record high.
The U.S. Federal Reserve (the "Fed") subsequently adjusted forecasts for second quarter economic output to contract by levels not seen since the Great Depression. Given the unprecedented impact to short-term economic growth, the U.S. government implemented record levels of fiscal stimulus to keep businesses open, people in their homes, and important services funded. Meanwhile, the Fed implemented the largest scale monetary stimulus on record, which provided ample liquidity to credit markets, businesses, and important infrastructure. The Fed also lowered interest rates by 150 basis points to 0%, with the goal of helping the economy bounce back quickly.
U.S. equity markets roared back during the second quarter as fiscal and monetary measures convinced investors who had fled risk assets to re-enter. It also became clear that the economic and business impact of the coronavirus would not affect all companies similarly and that there would be "haves" and "have-nots" in the aftermath. While all U.S. equity styles performed well, the disparity between innovative growth and legacy value companies became increasingly pronounced before rising markets took a breather in September.
Strong sentiment turned into exuberance as we approached year-end, as record-setting market performance in the fourth quarter, driven by news that COVID-19 vaccines developed in record time were more effective than most could have hoped for and by the more certain outlook a victory by Joe Biden in the U.S. presidential election brings, pushed record inflows into equities. The light at the end of the tunnel that the vaccines bring to corporations and to individuals that have struggled created a sharp reversal among equity market leadership and many companies that were left for dead came roaring back. U.S. government action and corporate innovation appear to have bridged the pre-pandemic economy to what will be a new "normal" economic environment, with initial signs that the economy could fully rebound in 2021, despite the prospect of a severe wave of COVID-19 in winter.
For the year, U.S. stocks performed well across market caps, with large-cap stocks slightly outperforming small- and mid-cap stocks during the year, as measured by the Russell family of indices, while growth-oriented investments sharply outperformed value as investors
30
Victory RS Small Cap Equity Fund (continued)
favored the strong fundamentals and execution of growth companies. Growth stocks as measured by the Russell 3000® Growth Index have now outperformed value stocks as measured by the Russell 3000® Value Index over 1, 3, 5, 10, 15, and even 30 years.
How did Victory RS Small Cap Equity Fund (the "Fund") perform during the reporting period?
The Fund seeks to provide long-term capital appreciation. The Fund returned 37.99% (Class A Shares at net asset value) for the year ended December 31, 2020, outperforming the Russell 2000® Growth Index, which returned 34.63% during the reporting period.
What strategies did you employ during the reporting period?
The Fund seeks long-term capital growth by investing primarily in small-cap companies that we believe have the potential to produce sustainable earnings growth over a multi-year horizon. The Fund's outperformance for the year ended December 31, 2020 was driven outsized outperformance in the Technology, Health Care, and Producer Durables sectors. Stock selection in the Consumer Discretionary, Energy, and Financial Services sectors offset some of the Fund's positive relative performance.
Within the Technology sector, contributors included Bandwidth Inc. ("Bandwidth"), a strong contributor to performance in 2020. Bandwidth is a communications platform-as-a-service solution focused on communications for enterprises. Some popular applications that use Bandwidth on the market today include Google, Skype and RingCentral. The software allows businesses to easily enhance their products and services with advanced text and voice capabilities offering enterprises with end-to-end communications. We owned shares of Bandwidth given its large and growing market that we felt was still in the early days, as well as its best-in-class nationwide all-IP network that provides a unique competitive moat in the communications platform market. The stock performed exceptionally well in the calendar year given strong execution and the unexpected tailwind the work-from-home environment provided for their customer base, including Zoom and Webex.
Another top contributor within Technology was Wix.com ("Wix"), a developer and marketer of a cloud-based platform that enables anyone to create a website or web application. Wix showed its resilience to COVID-19 at the beginning of the year as it reported a solid first quarter with collections and revenue up 24% year-over-year, in line with prior guidance. At the time they did highlight a few negative trends due to the virus, including a slight increase in cancellations, but those trends reversed sharply for the remainder of the year as the demand for the company's tools accelerated the migration of small businesses to having an online presence by years, as well as producing a spike in new online business formation following a rise in unemployment. We believe the tailwind from this trend will continue.
Health Care sector holding Fate Therapeutics ("Fate") was another strong contributor in 2020. Fate is a biotechnology company that engages in the development of programmed cellular immunotherapies for cancer and immune disorders. We own shares of Fate given the view that it has the most disruptive technology in the cell therapy space and the best opportunity to achieve a true off-the-shelf therapeutic with drug-like properties in line with broadly used antibody therapeutics. The stock performed exceptionally well during the year, driven in part by strong Phase 1 data for their FT516 in combination with rituximab for patients with relapsed / refractory B-cell lymphoma that showed responses to the treatment
31
Victory RS Small Cap Equity Fund (continued)
and suggests there may be a clinical benefit allowing the body's cells to recognize, bind, and kill antibody-coated cancer cells.
Within the Financial Services sector, a material driver of underperformance was holding EVO Payments Inc. ("EVO"). EVO is a global merchant acquirer and payment processor with exclusive global financial institution referral partnerships. We initially purchased shares of EVO given the long-term secular tailwinds supporting their business given the shift toward electronic payments, while exclusive bank partnerships present a significant moat and efficient customer acquisition strategy given these relationships extend multiple years. The stock struggled during the year as investors became concerned with the ability of the company to service its debt should the impact of the coronavirus be more prolonged than expected. The company reacted to these concerns by raising $150 million in perpetual convertible notes to pay down its debt, which we believed would allow investors to focus on the strong long-term fundamentals.
Within the Health Care sector, the largest detractor to performance was biotechnology holding bluebird bio, Inc. ("bluebird"). bluebird is a biotechnology company that uses an HIV-1 virus, lentivirus, as a means to modify genes and correct a patient's abnormal stem cells. Late in 2019, bluebird shared strong results in a number of trials, including their phase 2 registrational study of the treatment of late-stage relapsed multiple myeloma, which provided us with confidence that the company may only be at the early stage of their potential. Unfortunately, bluebird underwhelmed at the start of the year given expectations that the COVID-19 pandemic will shift the timing of enrollment and completion of a number of their other clinical studies primarily designed to expand the market opportunity once products are approved. The stock struggled to regain the confidence of investors as the company shared that their market expansion studies will be delayed or in some cases halted, though we believe these actions will reduce their cash burn and that the net impact to bluebird will be less than the impact to competitors that do not have pivotal trials that are already fully enrolled, which we feel will widen first mover advantages over competition.
Within the Consumer Discretionary sector, a material driver of relative underperformance was within Consumer Services, driven in part by Education holding Strategic Education, Inc. ("Strategic Education"). Strategic Education is an education company that offers its programs both online and on-site, with 74 campuses across 16 states and the District of Columbia, with 83% of program seats online. We purchased shares of the company given the company's new campus growth, technology, and favorable regulatory environment. The company was under pressure given weaker than expected earnings as well as reduced guidance, given the sensitivity of their undergraduate population to employment rates. We continue to hold the position given favorable longer-term trends for online education, and the uptick in inquiries, visits, and information requests given the shifting value proposal of their offering relative to traditional campuses.
Given the outsized impact of the virus globally, we believe investors should continue to expect all companies to feel some level of direct and secondary economic effects and markets to experience higher levels of volatility despite the outsized market performance to close out the year. As a result, we feel there will continue to be an abundance of opportunities across sectors in coming quarters and years as the economy transitions and new companies take leadership positions. We do not have a clear view or projection as to how large or prolonged the impact from the coronavirus (both direct and indirect) will be, given the uncertainty
32
Victory RS Small Cap Equity Fund (continued)
regarding its continued spread, economic impact, politicization, the potential scale of incremental fiscal and monetary stimulus not yet announced, or even the potential transformation of industries and consumer and social norms, but we believe there are clear pockets of the economy that remain better positioned than others given the ability of workers to remain productive (remotely or on-site) and end-customer demand to remain steady irrespective of the forward economic environment.
In this specific environment, we will focus further on companies with flexible business models that offer innovative products and services that will take market share from legacy companies that will be more strained by the challenging economic conditions. Specifically, our "farm team" approach identifies and monitors premier companies within each relative index, but then waits for a favorable price. This should allow us to upgrade the portfolio to our very best ideas as relative valuations shift. We are confident that our process will allow us to take advantage of this dynamic environment.
33
Victory RS Small Cap Equity Fund
Investment Overview
(Unaudited)
Average Annual Total Returns
Year Ended December 31, 2020
| | Class A | | Class C | | Class R | | Class Y | | Member
Class | | | |
INCEPTION DATE | | 5/1/97 | | 8/7/00 | | 5/15/01 | | 5/1/07 | | 11/3/20 | | | |
| | Net Asset
Value | | Maximum
Offering
Price | | Net Asset
Value | | Contingent
Deferred
Charges | | Net Asset
Value | | Net Asset
Value | | Net Asset
Value | | Russell 2000®
Growth
Index1 | |
One Year | | | 37.99 | % | | | 30.05 | % | | | 36.75 | % | | | 36.38 | % | | | 37.31 | % | | | 38.24 | % | | | N/A | | | | 34.63 | % | |
Five Year | | | 19.50 | % | | | 18.09 | % | | | 18.45 | % | | | 18.45 | % | | | 18.95 | % | | | 19.75 | % | | | N/A | | | | 16.36 | % | |
Ten Year | | | 16.27 | % | | | 15.59 | % | | | 15.27 | % | | | 15.27 | % | | | 15.80 | % | | | 16.47 | % | | | N/A | | | | 13.48 | % | |
Since Inception | | | N/A | | | | N/A | | | | N/A | | | | N/A | | | | N/A | | | | N/A | | | | 25.09 | % | | | N/A | | |
The performance data quoted represents past performance and current returns may be lower or higher. The investment return and principal value will fluctuate so that an investor's shares, when redeemed, may be worth more or less than the original cost. To obtain performance information current to the most recent month's end, please visit www.vcm.com.
The maximum offering price (MOP) figures reflect a maximum sales charge of 5.75% for Class A Shares. Class C Shares are not subject to an initial sales charge, but are subject to a deferred sales charge of 1.00% on shares redeemed within one year of purchase. NAV does not reflect sales charges.
Total return measures the price change in a share assuming the reinvestment of all net investment income and realized capital gain distributions, if any. The total returns quoted do not reflect adjustments made to the enclosed financial statements in accordance with U.S. generally accepted accounting principles or the deduction of taxes that a shareholder would pay on net investment income and realized capital gain distributions, including reinvested distributions, or redemptions of shares. The total return figures set forth above include all waivers of fees. Without such fee waivers, the total returns would have been lower.
Victory RS Small Cap Equity Fund — Growth of $10,000

1The Russell 2000® Growth Index is an unmanaged market capitalization-weighted index that measures the performance of those companies in the Russell 2000® Index with higher price-to-book ratios and higher forecasted growth values. (The Russell 2000® Index measures the performance of the 2,000 smallest companies in the Russell 3000® Index, which consists of the 3,000 largest U.S. companies based on total market capitalization.) Index results assume the reinvestment of dividends paid on the stocks constituting the index. This index does not include the effect of sales charges, commissions, expenses or taxes, is not representative of the Fund and it is not possible to invest directly in an index.
The graph reflects investment of growth of a hypothetical $10,000 investment in the Fund.
The graph and table do not reflect the deduction of taxes that a shareholder would pay on Fund distributions or the redemption of Fund shares.
Past performance is not indicative of future results.
34
Victory Fixed Income Funds
Victory RS Small Cap Growth Fund | | December 31, 2020 | |
(Unaudited)
Investment Objective & Portfolio Holdings:
Victory RS Small Cap Growth Fund seeks to provide long-term capital growth.
Sector Allocation*:
December 31, 2020
(% of Net Assets)
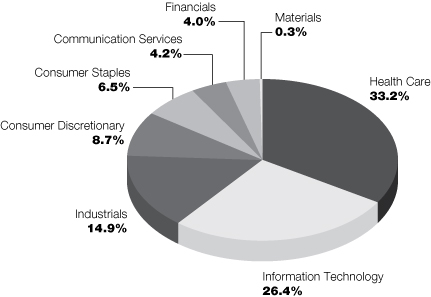
* Does not include futures, money market instruments, and short-term investments purchased with cash collateral from securities loaned.
Refer to the Schedule of Portfolio Investments for a complete list of securities.
Percentages are of the net assets of the Fund and may not equal 100%.
35
Victory Fixed Income Funds
Victory RS Select Growth Fund | | December 31, 2020 | |
(Unaudited)
Investment Objective & Portfolio Holdings:
Victory RS Select Growth Fund seeks to provide long-term capital growth.
Sector Allocation*:
December 31, 2020
(% of Net Assets)

* Does not include futures, money market instruments, and short-term investments purchased with cash collateral from securities loaned.
Refer to the Schedule of Portfolio Investments for a complete list of securities.
Percentages are of the net assets of the Fund and may not equal 100%.
36
Victory Fixed Income Funds
Victory RS Mid Cap Growth Fund | | December 31, 2020 | |
(Unaudited)
Investment Objective & Portfolio Holdings:
Victory RS Mid Cap Growth Fund seeks to provide long-term capital growth.
Sector Allocation*:
December 31, 2020
(% of Net Assets)

* Does not include futures, money market instruments, and short-term investments purchased with cash collateral from securities loaned.
Refer to the Schedule of Portfolio Investments for a complete list of securities.
Percentages are of the net assets of the Fund and may not equal 100%.
37
Victory Fixed Income Funds
Victory RS Growth Fund | | December 31, 2020 | |
(Unaudited)
Investment Objective & Portfolio Holdings:
Victory RS Growth Fund seeks to provide long-term capital growth.
Sector Allocation*:
December 31, 2020
(% of Net Assets)

* Does not include futures, money market instruments, and short-term investments purchased with cash collateral from securities loaned.
Refer to the Schedule of Portfolio Investments for a complete list of securities.
Percentages are of the net assets of the Fund and may not equal 100%.
38
Victory Fixed Income Funds
Victory RS Science and Technology Fund | | December 31, 2020 | |
(Unaudited)
Investment Objective & Portfolio Holdings:
Victory RS Science and Technology Fund seeks to provide long-term capital growth.
Sector Allocation*:
December 31, 2020
(% of Net Assets)

* Does not include futures, money market instruments, and short-term investments purchased with cash collateral from securities loaned.
Refer to the Schedule of Portfolio Investments for a complete list of securities.
Percentages are of the net assets of the Fund and may not equal 100%.
39
Victory Fixed Income Funds
Victory RS Small Cap Equity Fund | | December 31, 2020 | |
(Unaudited)
Investment Objective & Portfolio Holdings:
Victory RS Small Cap Equity Fund seeks to provide long-term capital growth.
Sector Allocation*:
December 31, 2020
(% of Net Assets)
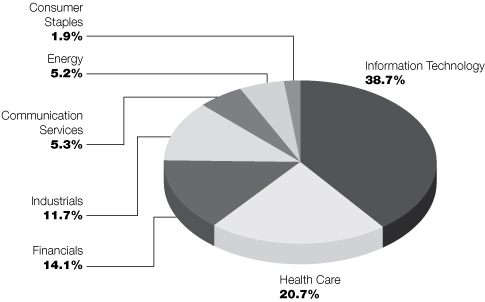
* Does not include futures, money market instruments, and short-term investments purchased with cash collateral from securities loaned.
Refer to the Schedule of Portfolio Investments for a complete list of securities.
Percentages are of the net assets of the Fund and may not equal 100%.
40
Victory Portfolios
Victory RS Small Cap Growth Fund | | Schedule of Portfolio Investments
December 31, 2020 | |
Security Description | | Shares | | Value | |
Common Stocks (98.2%) | |
Biotechnology (21.3%): | |
Allogene Therapeutics, Inc. (a) (b) | | | 539,540 | | | $ | 13,617,990 | | |
Amicus Therapeutics, Inc. (a) | | | 1,619,795 | | | | 37,401,067 | | |
Apellis Pharmaceuticals, Inc. (a) | | | 740,650 | | | | 42,365,180 | | |
Arcus Biosciences, Inc. (a) | | | 593,300 | | | | 15,402,068 | | |
Arena Pharmaceuticals, Inc. (a) | | | 265,430 | | | | 20,392,987 | | |
Ascendis Pharma A/S, ADR (a) | | | 127,340 | | | | 21,237,765 | | |
Avidity Biosciences, Inc. (a) (b) | | | 421,860 | | | | 10,765,867 | | |
Bioxcel Therapeutics, Inc. (a) (b) | | | 349,610 | | | | 16,151,982 | | |
bluebird bio, Inc. (a) (b) | | | 400,669 | | | | 17,336,948 | | |
Blueprint Medicines Corp. (a) | | | 250,128 | | | | 28,051,855 | | |
Celyad SA, ADR (a) (b) | | | 415,831 | | | | 3,243,482 | | |
Constellation Pharmaceuticals, Inc. (a) (b) | | | 597,490 | | | | 17,207,712 | | |
CytomX Therapeutics, Inc. (a) | | | 1,198,820 | | | | 7,852,271 | | |
Epizyme, Inc. (a) (b) | | | 1,310,850 | | | | 14,235,831 | | |
Equillium, Inc. (a) (b) | | | 1,087,760 | | | | 5,819,516 | | |
Fate Therapeutics, Inc. (a) | | | 653,090 | | | | 59,385,473 | | |
Five Prime Therapeutics, Inc. (a) | | | 434,640 | | | | 7,393,226 | | |
Generation Bio Co. (a) (b) | | | 361,960 | | | | 10,261,566 | | |
Invitae Corp. (a) (b) | | | 563,540 | | | | 23,561,607 | | |
Iovance Biotherapeutics, Inc. (a) (b) | | | 673,775 | | | | 31,263,160 | | |
Kura Oncology, Inc. (a) | | | 780,090 | | | | 25,477,739 | | |
Mirati Therapeutics, Inc. (a) | | | 159,330 | | | | 34,995,241 | | |
Myovant Sciences Ltd. (a) (b) | | | 909,370 | | | | 25,116,799 | | |
Opthea Ltd., ADR (a) (c) | | | 754,110 | | | | 8,566,690 | | |
ORIC Pharmaceuticals, Inc. (a) (b) | | | 573,910 | | | | 19,426,854 | | |
Replimune Group, Inc. (a) (b) | | | 487,360 | | | | 18,592,784 | | |
Sage Therapeutics, Inc. (a) | | | 248,020 | | | | 21,456,210 | | |
SpringWorks Therapeutics, Inc. (a) | | | 310,700 | | | | 22,531,964 | | |
Turning Point Therapeutics, Inc. (a) | | | 20,380 | | | | 2,483,303 | | |
Twist Bioscience Corp. (a) | | | 277,320 | | | | 39,182,543 | | |
| | | | 620,777,680 | | |
Communication Services (4.2%): | |
Bandwidth, Inc., Class A (a) (b) | | | 535,480 | | | | 82,287,211 | | |
EverQuote, Inc., Class A (a) (b) | | | 455,050 | | | | 16,996,118 | | |
Vonage Holdings Corp. (a) | | | 1,804,010 | | | | 23,226,629 | | |
| | | | 122,509,958 | | |
Communications Equipment (1.0%): | |
Viavi Solutions, Inc. (a) | | | 1,943,300 | | | | 29,100,918 | | |
Consumer Discretionary (8.7%): | |
Arco Platform Ltd., Class A (a) (b) | | | 854,130 | | | | 30,313,074 | | |
Brinker International, Inc. (b) | | | 272,930 | | | | 15,439,650 | | |
Canada Goose Holdings, Inc. (a) (b) | | | 457,580 | | | | 13,622,157 | | |
Churchill Downs, Inc. | | | 197,000 | | | | 38,373,630 | | |
Fox Factory Holding Corp. (a) | | | 240,750 | | | | 25,449,683 | | |
Lithia Motors, Inc., Class A | | | 95,160 | | | | 27,850,477 | | |
See notes to financial statements.
41
Victory Portfolios
Victory RS Small Cap Growth Fund | | Schedule of Portfolio Investments — continued
December 31, 2020 | |
Security Description | | Shares | | Value | |
Meritage Homes Corp. (a) | | | 215,720 | | | $ | 17,865,931 | | |
Ollie's Bargain Outlet Holdings, Inc. (a) (b) | | | 200,890 | | | | 16,426,775 | | |
Skyline Champion Corp. (a) | | | 463,180 | | | | 14,330,789 | | |
Wingstop, Inc. (b) | | | 118,400 | | | | 15,693,920 | | |
YETI Holdings, Inc. (a) | | | 553,090 | | | | 37,870,072 | | |
| | | | 253,236,158 | | |
Consumer Staples (6.5%): | |
BellRing Brands, Inc., Class A (a) | | | 1,380,850 | | | | 33,568,464 | | |
BJ's Wholesale Club Holdings, Inc. (a) (b) | | | 814,020 | | | | 30,346,666 | | |
elf Beauty, Inc. (a) | | | 1,701,120 | | | | 42,851,212 | | |
Freshpet, Inc. (a) | | | 405,610 | | | | 57,592,564 | | |
Hostess Brands, Inc. (a) (b) | | | 1,878,420 | | | | 27,500,069 | | |
| | | | 191,858,975 | | |
Electronic Equipment, Instruments & Components (1.0%): | |
Itron, Inc. (a) (b) | | | 306,860 | | | | 29,427,874 | | |
Financials (4.0%): | |
Green Dot Corp., Class A (a) | | | 335,580 | | | | 18,725,364 | | |
LendingTree, Inc. (a) | | | 41,780 | | | | 11,438,946 | | |
PRA Group, Inc. (a) | | | 971,770 | | | | 38,540,398 | | |
Walker & Dunlop, Inc. | | | 535,040 | | | | 49,234,381 | | |
| | | | 117,939,089 | | |
Health Care Equipment & Supplies (4.9%): | |
CryoPort, Inc. (a) (b) | | | 386,670 | | | | 16,967,080 | | |
Eargo, Inc. (a) (b) | | | 197,000 | | | | 8,829,540 | | |
iRhythm Technologies, Inc. (a) (b) | | | 140,300 | | | | 33,280,563 | | |
Nevro Corp. (a) (b) | | | 230,760 | | | | 39,944,556 | | |
Silk Road Medical, Inc. (a) | | | 431,440 | | | | 27,172,091 | | |
SmileDirectClub, Inc. (a) (b) | | | 1,458,020 | | | | 17,408,759 | | |
| | | | 143,602,589 | | |
Health Care Providers & Services (3.0%): | |
Hanger, Inc. (a) | | | 624,880 | | | | 13,741,111 | | |
HealthEquity, Inc. (a) | | | 348,190 | | | | 24,272,325 | | |
LHC Group, Inc. (a) | | | 234,350 | | | | 49,991,542 | | |
| | | | 88,004,978 | | |
Health Care Technology (2.3%): | |
Health Catalyst, Inc. (a) (b) | | | 638,070 | | | | 27,775,187 | | |
Inspire Medical System, Inc. (a) | | | 213,170 | | | | 40,095,145 | | |
| | | | 67,870,332 | | |
Industrials (14.9%): | |
Advanced Drainage Systems, Inc. | | | 560,800 | | | | 46,871,664 | | |
Builders FirstSource, Inc. (a) | | | 599,640 | | | | 24,471,308 | | |
Chart Industries, Inc. (a) | | | 227,260 | | | | 26,768,955 | | |
ESCO Technologies, Inc. | | | 165,910 | | | | 17,125,230 | | |
Evoqua Water Technologies Corp. (a) | | | 1,354,990 | | | | 36,557,631 | | |
See notes to financial statements.
42
Victory Portfolios
Victory RS Small Cap Growth Fund | | Schedule of Portfolio Investments — continued
December 31, 2020 | |
Security Description | | Shares | | Value | |
FTI Consulting, Inc. (a) | | | 281,760 | | | $ | 31,478,227 | | |
Kornit Digital Ltd. (a) (b) | | | 240,480 | | | | 21,433,982 | | |
Mercury Systems, Inc. (a) | | | 543,120 | | | | 47,827,147 | | |
Plug Power, Inc. (a) (b) | | | 873,030 | | | | 29,604,448 | | |
Saia, Inc. (a) | | | 211,840 | | | | 38,300,672 | | |
Simpson Manufacturing Co., Inc. | | | 407,600 | | | | 38,090,220 | | |
SiteOne Landscape Supply, Inc. (a) | | | 286,090 | | | | 45,382,457 | | |
Sunrun, Inc. (a) (b) | | | 207,540 | | | | 14,399,125 | | |
Watts Water Technologies, Inc., Class A | | | 192,920 | | | | 23,478,364 | | |
| | | | 441,789,430 | | |
IT Services (6.4%): | |
Evo Payments, Inc., Class A (a) | | | 499,280 | | | | 13,485,553 | | |
LiveRamp Holdings, Inc. (a) | | | 562,940 | | | | 41,201,578 | | |
Repay Holdings Corp. (a) | | | 958,900 | | | | 26,130,025 | | |
Shift4 Payments, Inc., Class A (a) | | | 363,280 | | | | 27,391,312 | | |
Wix.com Ltd. (a) | | | 201,650 | | | | 50,404,434 | | |
WNS Holdings Ltd., ADR (a) | | | 401,297 | | | | 28,913,449 | | |
| | | | 187,526,351 | | |
Materials (0.3%): | |
Kronos Bio, Inc. (a) (b) | | | 338,870 | | | | 10,122,047 | | |
Pharmaceuticals (1.7%): | |
Compass Pathways PLC, ADR (a) (b) | | | 259,910 | | | | 12,382,112 | | |
GW Pharmaceuticals PLC, ADR (a) (b) | | | 152,727 | | | | 17,626,224 | | |
PMV Pharmaceuticals, Inc. (a) | | | 329,420 | | | | 20,262,624 | | |
| | | | 50,270,960 | | |
Semiconductors & Semiconductor Equipment (7.1%): | |
Advanced Energy Industries, Inc. (a) | | | 393,970 | | | | 38,203,271 | | |
CMC Materials, Inc. | | | 179,840 | | | | 27,209,792 | | |
Lattice Semiconductor Corp. (a) | | | 1,296,260 | | | | 59,394,632 | | |
MACOM Technology Solutions Holdings, Inc. (a) | | | 980,243 | | | | 53,952,575 | | |
Silicon Laboratories, Inc. (a) | | | 243,490 | | | | 31,006,017 | | |
| | | | 209,766,287 | | |
Software (10.9%): | |
ACI Worldwide, Inc. (a) (b) | | | 891,250 | | | | 34,250,738 | | |
Avaya Holdings Corp. (a) (b) | | | 2,877,310 | | | | 55,100,486 | | |
Envestnet, Inc. (a) | | | 374,966 | | | | 30,855,952 | | |
Everbridge, Inc. (a) (b) | | | 346,380 | | | | 51,634,867 | | |
Five9, Inc. (a) | | | 85,820 | | | | 14,967,008 | | |
Q2 Holdings, Inc. (a) | | | 215,070 | | | | 27,212,807 | | |
Telos Corp. (a) (b) | | | 713,110 | | | | 23,518,368 | | |
Varonis Systems, Inc. (a) | | | 509,360 | | | | 83,336,389 | | |
| | | | 320,876,615 | | |
Total Common Stocks (Cost $1,825,326,026) | | | 2,884,680,241 | | |
See notes to financial statements.
43
Victory Portfolios
Victory RS Small Cap Growth Fund | | Schedule of Portfolio Investments — continued
December 31, 2020 | |
Security Description | | Shares | | Value | |
Collateral for Securities Loaned^ (10.5%) | |
BlackRock Liquidity Funds TempFund Portfolio, Institutional
Class, 0.08% (d) | | | 5,354,296 | | | $ | 5,354,296 | | |
Fidelity Investments Money Market Government Portfolio,
Class I, 0.01% (d) | | | 183,951,421 | | | | 183,951,421 | | |
Goldman Sachs Financial Square Prime Obligations Fund, Institutional
Class, 0.04% (d) | | | 2,672,058 | | | | 2,672,058 | | |
JPMorgan Prime Money Market Fund, Capital Class, 0.12% (d) | | | 21,306,164 | | | | 21,306,164 | | |
Morgan Stanley Institutional Liquidity Prime Portfolio, Institutional
Class, 0.09% (d) | | | 95,796,670 | | | | 95,796,670 | | |
Total Collateral for Securities Loaned (Cost $309,080,609) | | | 309,080,609 | | |
Total Investments (Cost $2,134,406,635) — 108.7% | | | 3,193,760,850 | | |
Liabilities in excess of other assets — (8.7)% | | | (256,475,941 | ) | |
NET ASSETS — 100.00% | | $ | 2,937,284,909 | | |
^ Purchased with cash collateral from securities on loan.
(a) Non-income producing security.
(b) All or a portion of this security is on loan.
(c) The Fund's Adviser has deemed this security to be illiquid based upon procedures approved by the Board of Trustees. As of December 31, 2020, illiquid securities were 0.3% of the Fund's net assets.
(d) Rate disclosed is the daily yield on December 31, 2020.
ADR — American Depositary Receipt
PLC — Public Limited Company
See notes to financial statements.
44
Victory Portfolios
Victory RS Select Growth Fund | | Schedule of Portfolio Investments
December 31, 2020 | |
Security Description | | Shares | | Value | |
Common Stocks (98.2%) | |
Biotechnology (6.4%): | |
Castle Biosciences, Inc. (a) | | | 56,720 | | | $ | 3,808,748 | | |
Halozyme Therapeutics, Inc. (a) | | | 158,830 | | | | 6,783,629 | | |
Neurocrine Biosciences, Inc. (a) | | | 47,340 | | | | 4,537,539 | | |
| | | | 15,129,916 | | |
Communication Services (4.7%): | |
Bandwidth, Inc., Class A (a) (b) | | | 28,890 | | | | 4,439,526 | | |
Boingo Wireless, Inc. (a) | | | 138,990 | | | | 1,767,953 | | |
IAC/InterActiveCorp. (a) | | | 24,220 | | | | 4,586,057 | | |
| | | | 10,793,536 | | |
Communications Equipment (1.3%): | |
Viavi Solutions, Inc. (a) | | | 200,030 | | | | 2,995,449 | | |
Consumer Discretionary (11.7%): | |
Bright Horizons Family Solutions, Inc. (a) | | | 22,760 | | | | 3,937,252 | | |
Chegg, Inc. (a) | | | 55,960 | | | | 5,054,867 | | |
Churchill Downs, Inc. | | | 13,430 | | | | 2,616,029 | | |
Ollie's Bargain Outlet Holdings, Inc. (a) (b) | | | 27,510 | | | | 2,249,493 | | |
Planet Fitness, Inc., Class A (a) | | | 30,030 | | | | 2,331,229 | | |
Pool Corp. | | | 10,470 | | | | 3,900,075 | | |
Tempur Sealy International, Inc. (a) (b) | | | 178,550 | | | | 4,820,850 | | |
The Wendy's Co. | | | 101,440 | | | | 2,223,565 | | |
| | | | 27,133,360 | | |
Consumer Staples (3.6%): | |
Beyond Meat, Inc. (a) (b) | | | 16,710 | | | | 2,088,750 | | |
Freshpet, Inc. (a) | | | 30,190 | | | | 4,286,678 | | |
Hostess Brands, Inc. (a) | | | 133,030 | | | | 1,947,559 | | |
| | | | 8,322,987 | | |
Electronic Equipment, Instruments & Components (1.2%): | |
Dolby Laboratories, Inc., Class A | | | 29,500 | | | | 2,865,335 | | |
Financials (2.7%): | |
Focus Financial Partners, Inc., Class A (a) | | | 102,760 | | | | 4,470,060 | | |
Western Alliance Bancorp | | | 30,620 | | | | 1,835,669 | | |
| | | | 6,305,729 | | |
Health Care Equipment & Supplies (7.6%): | |
Masimo Corp. (a) (b) | | | 9,990 | | | | 2,681,116 | | |
Novocure Ltd. (a) (b) | | | 38,860 | | | | 6,724,334 | | |
SmileDirectClub, Inc. (a) (b) | | | 136,260 | | | | 1,626,944 | | |
Tandem Diabetes Care, Inc. (a) | | | 26,580 | | | | 2,543,174 | | |
West Pharmaceutical Services, Inc. | | | 14,466 | | | | 4,098,363 | | |
| | | | 17,673,931 | | |
Health Care Providers & Services (4.1%): | |
Encompass Health Corp. | | | 34,260 | | | | 2,832,959 | | |
See notes to financial statements.
45
Victory Portfolios
Victory RS Select Growth Fund | | Schedule of Portfolio Investments — continued
December 31, 2020 | |
Security Description | | Shares | | Value | |
HealthEquity, Inc. (a) | | | 34,130 | | | $ | 2,379,202 | | |
LHC Group, Inc. (a) | | | 20,720 | | | | 4,419,991 | | |
| | | | 9,632,152 | | |
Industrials (17.5%): | |
Advanced Drainage Systems, Inc. | | | 70,610 | | | | 5,901,583 | | |
Enphase Energy, Inc. (a) | | | 15,910 | | | | 2,791,728 | | |
Evoqua Water Technologies Corp. (a) | | | 113,480 | | | | 3,061,690 | | |
FTI Consulting, Inc. (a) | | | 26,380 | | | | 2,947,174 | | |
Generac Holdings, Inc. (a) | | | 13,530 | | | | 3,076,857 | | |
Mercury Systems, Inc. (a) | | | 62,010 | | | | 5,460,601 | | |
MSA Safety, Inc. | | | 20,530 | | | | 3,066,977 | | |
Nordson Corp. | | | 13,870 | | | | 2,787,177 | | |
Pentair PLC | | | 77,040 | | | | 4,090,054 | | |
SiteOne Landscape Supply, Inc. (a) | | | 30,870 | | | | 4,896,908 | | |
Trex Co., Inc. (a) | | | 36,630 | | | | 3,066,664 | | |
| | | | 41,147,413 | | |
IT Services (3.6%): | |
Black Knight, Inc. (a) | | | 54,109 | | | | 4,780,530 | | |
GoDaddy, Inc., Class A (a) | | | 33,727 | | | | 2,797,655 | | |
Wix.com Ltd. (a) | | | 4,010 | | | | 1,002,340 | | |
| | | | 8,580,525 | | |
Life Sciences Tools & Services (1.4%): | |
Charles River Laboratories International, Inc. (a) | | | 12,750 | | | | 3,185,715 | | |
Pharmaceuticals (8.4%): | |
GW Pharmaceuticals PLC, ADR (a) (b) | | | 28,410 | | | | 3,278,798 | | |
Horizon Therapeutics PLC (a) | | | 81,560 | | | | 5,966,114 | | |
Ocular Therapeutix, Inc. (a) | | | 185,880 | | | | 3,847,716 | | |
Royalty Pharma PLC, Class A (b) | | | 130,210 | | | | 6,517,011 | | |
| | | | 19,609,639 | | |
Semiconductors & Semiconductor Equipment (6.4%): | |
Entegris, Inc. | | | 46,330 | | | | 4,452,312 | | |
Lattice Semiconductor Corp. (a) | | | 76,650 | | | | 3,512,103 | | |
MKS Instruments, Inc. | | | 27,750 | | | | 4,174,988 | | |
Monolithic Power Systems, Inc. | | | 7,885 | | | | 2,887,724 | | |
| | | | 15,027,127 | | |
Software (17.6%): | |
ACI Worldwide, Inc. (a) | | | 97,610 | | | | 3,751,152 | | |
Coupa Software, Inc. (a) | | | 15,630 | | | | 5,297,163 | | |
Dynatrace, Inc. (a) | | | 128,260 | | | | 5,549,810 | | |
Fair Isaac Corp. (a) | | | 8,060 | | | | 4,118,982 | | |
Five9, Inc. (a) | | | 31,380 | | | | 5,472,672 | | |
Proofpoint, Inc. (a) | | | 19,670 | | | | 2,683,185 | | |
RingCentral, Inc., Class A (a) | | | 20,150 | | | | 7,636,246 | | |
Zendesk, Inc. (a) | | | 47,840 | | | | 6,846,861 | | |
| | | | 41,356,071 | | |
Total Common Stocks (Cost $152,742,957) | | | 229,758,885 | | |
See notes to financial statements.
46
Victory Portfolios
Victory RS Select Growth Fund | | Schedule of Portfolio Investments — continued
December 31, 2020 | |
Security Description | | Shares | | Value | |
Collateral for Securities Loaned^ (7.3%) | |
BlackRock Liquidity Funds TempFund Portfolio, Institutional
Class, 0.08% (c) | | | 296,596 | | | $ | 296,596 | | |
Fidelity Investments Money Market Government Portfolio I
Shares, 0.01% (c) | | | 10,189,812 | | | | 10,189,812 | | |
Goldman Sachs Financial Square Prime Obligations Fund, Institutional
Class, 0.04% (c) | | | 148,016 | | | | 148,016 | | |
JPMorgan Prime Money Market Fund, Capital Class, 0.12% (c) | | | 1,180,235 | | | | 1,180,235 | | |
Morgan Stanley Institutional Liquidity Prime Portfolio, Institutional
Class, 0.09% (c) | | | 5,306,565 | | | | 5,306,565 | | |
Total Collateral for Securities Loaned (Cost $17,121,224) | | | 17,121,224 | | |
Total Investments (Cost $169,864,181) — 105.5% | | | 246,880,109 | | |
Liabilities in excess of other assets — (5.5)% | | | (12,976,246 | ) | |
NET ASSETS — 100.00% | | $ | 233,903,863 | | |
^ Purchased with cash collateral from securities on loan.
(a) Non-income producing security.
(b) All or a portion of this security is on loan.
(c) Rate disclosed is the daily yield on December 31, 2020.
ADR — American Depositary Receipt
PLC — Public Limited Company
See notes to financial statements.
47
Victory Portfolios
Victory RS Mid Cap Growth Fund | | Schedule of Portfolio Investments
December 31, 2020 | |
Security Description | | Shares | | Value | |
Common Stocks (99.3%) | |
Communication Services (7.0%): | |
IAC/InterActiveCorp. (a) | | | 70,190 | | | $ | 13,290,476 | | |
Match Group, Inc. (a) | | | 80,924 | | | | 12,234,900 | | |
Take-Two Interactive Software, Inc. (a) | | | 35,780 | | | | 7,434,726 | | |
Twitter, Inc. (a) | | | 180,580 | | | | 9,778,407 | | |
| | | | 42,738,509 | | |
Communications Equipment (1.0%): | |
Palo Alto Networks, Inc. (a) | | | 17,290 | | | | 6,144,693 | | |
Consumer Discretionary (11.0%): | |
Bright Horizons Family Solutions, Inc. (a) | | | 31,470 | | | | 5,443,995 | | |
Burlington Stores, Inc. (a) | | | 30,050 | | | | 7,859,578 | | |
CarMax, Inc. (a) | | | 28,790 | | | | 2,719,503 | | |
Chewy, Inc., Class A (a) (b) | | | 70,746 | | | | 6,359,358 | | |
Chipotle Mexican Grill, Inc. (a) | | | 8,510 | | | | 11,800,902 | | |
Dollar General Corp. | | | 27,840 | | | | 5,854,752 | | |
Lululemon Athletica, Inc. (a) | | | 30,070 | | | | 10,465,262 | | |
Meritage Homes Corp. (a) | | | 29,250 | | | | 2,422,485 | | |
Pool Corp. | | | 25,110 | | | | 9,353,475 | | |
The Wendy's Co. | | | 214,910 | | | | 4,710,827 | | |
| | | | 66,990,137 | | |
Consumer Staples (3.0%): | |
Beyond Meat, Inc. (a) (b) | | | 37,880 | | | | 4,735,000 | | |
Freshpet, Inc. (a) | | | 38,790 | | | | 5,507,792 | | |
The Boston Beer Co., Inc., Class A (a) | | | 8,190 | | | | 8,143,235 | | |
| | | | 18,386,027 | | |
Electronic Equipment, Instruments & Components (4.9%): | |
Amphenol Corp., Class A | | | 67,600 | | | | 8,840,051 | | |
Dolby Laboratories, Inc., Class A | | | 74,490 | | | | 7,235,214 | | |
Keysight Technologies, Inc. (a) | | | 49,850 | | | | 6,584,687 | | |
Trimble, Inc. (a) | | | 102,010 | | | | 6,811,208 | | |
| | | | 29,471,160 | | |
Financials (3.5%): | |
FactSet Research Systems, Inc. | | | 14,120 | | | | 4,694,900 | | |
MarketAxess Holdings, Inc. | | | 11,940 | | | | 6,812,486 | | |
MSCI, Inc. | | | 22,050 | | | | 9,845,987 | | |
| | | | 21,353,373 | | |
Health Care (22.3%): | |
10X Genomics, Inc., Class A (a) | | | 24,070 | | | | 3,408,312 | | |
Align Technology, Inc. (a) | | | 16,450 | | | | 8,790,551 | | |
AmerisourceBergen Corp. | | | 58,080 | | | | 5,677,901 | | |
Apellis Pharmaceuticals, Inc. (a) (b) | | | 74,880 | | | | 4,283,136 | | |
Ascendis Pharma A/S, ADR (a) | | | 16,610 | | | | 2,770,216 | | |
Berkeley Lights, Inc. (a) (b) | | | 42,210 | | | | 3,773,996 | | |
bluebird bio, Inc. (a) | | | 43,400 | | | | 1,877,918 | | |
Centene Corp. (a) | | | 73,141 | | | | 4,390,654 | | |
See notes to financial statements.
48
Victory Portfolios
Victory RS Mid Cap Growth Fund | | Schedule of Portfolio Investments — continued
December 31, 2020 | |
Security Description | | Shares | | Value | |
Charles River Laboratories International, Inc. (a) | | | 32,450 | | | $ | 8,107,957 | | |
DexCom, Inc. (a) | | | 18,890 | | | | 6,984,011 | | |
Encompass Health Corp. | | | 71,920 | | | | 5,947,065 | | |
Exact Sciences Corp. (a) | | | 49,520 | | | | 6,560,905 | | |
Fate Therapeutics, Inc. (a) | | | 68,720 | | | | 6,248,710 | | |
Horizon Therapeutics PLC (a) | | | 67,880 | | | | 4,965,422 | | |
Insulet Corp. (a) | | | 28,230 | | | | 7,216,435 | | |
Iovance Biotherapeutics, Inc. (a) | | | 114,000 | | | | 5,289,600 | | |
Masimo Corp. (a) | | | 19,440 | | | | 5,217,307 | | |
Mirati Therapeutics, Inc. (a) | | | 15,210 | | | | 3,340,724 | | |
Novocure Ltd. (a) | | | 37,340 | | | | 6,461,314 | | |
Royalty Pharma PLC, Class A (b) | | | 206,450 | | | | 10,332,823 | | |
Sage Therapeutics, Inc. (a) | | | 44,640 | | | | 3,861,806 | | |
SmileDirectClub, Inc. (a) (b) | | | 300,860 | | | | 3,592,268 | | |
Veeva Systems, Inc., Class A (a) | | | 31,700 | | | | 8,630,325 | | |
West Pharmaceutical Services, Inc. | | | 27,170 | | | | 7,697,533 | | |
| | | | 135,426,889 | | |
Industrials (12.5%): | |
Advanced Drainage Systems, Inc. | | | 30,480 | | | | 2,547,518 | | |
Builders FirstSource, Inc. (a) | | | 106,520 | | | | 4,347,081 | | |
Carrier Global Corp. | | | 102,620 | | | | 3,870,826 | | |
CoStar Group, Inc. (a) | | | 8,260 | | | | 7,634,553 | | |
FTI Consulting, Inc. (a) | | | 31,960 | | | | 3,570,571 | | |
Generac Holdings, Inc. (a) | | | 24,890 | | | | 5,660,235 | | |
IDEX Corp. | | | 35,850 | | | | 7,141,320 | | |
Nordson Corp. | | | 32,280 | | | | 6,486,666 | | |
Old Dominion Freight Line, Inc. | | | 19,570 | | | | 3,819,673 | | |
Pentair PLC | | | 144,080 | | | | 7,649,207 | | |
Ritchie Bros. Auctioneers, Inc. | | | 44,760 | | | | 3,113,058 | | |
TransUnion | | | 56,030 | | | | 5,559,297 | | |
Trex Co., Inc. (a) | | | 73,950 | | | | 6,191,095 | | |
Verisk Analytics, Inc. | | | 37,360 | | | | 7,755,562 | | |
| | | | 75,346,662 | | |
IT Services (10.7%): | |
Black Knight, Inc. (a) | | | 55,814 | | | | 4,931,167 | | |
GoDaddy, Inc., Class A (a) | | | 124,660 | | | | 10,340,547 | | |
Jack Henry & Associates, Inc. | | | 32,990 | | | | 5,344,050 | | |
Okta, Inc. (a) | | | 11,880 | | | | 3,020,609 | | |
Square, Inc., Class A (a) | | | 14,400 | | | | 3,134,016 | | |
Twilio, Inc., Class A (a) | | | 59,020 | | | | 19,978,270 | | |
Wix.com Ltd. (a) | | | 69,550 | | | | 17,384,718 | | |
| | | | 64,133,377 | | |
Materials (1.1%): | |
The Scotts Miracle-Gro Co. | | | 32,920 | | | | 6,555,689 | | |
Semiconductors & Semiconductor Equipment (6.3%): | |
Entegris, Inc. | | | 87,200 | | | | 8,379,920 | | |
KLA Corp. | | | 29,810 | | | | 7,718,107 | | |
Marvell Technology Group Ltd. (b) | | | 167,340 | | | | 7,955,344 | | |
See notes to financial statements.
49
Victory Portfolios
Victory RS Mid Cap Growth Fund | | Schedule of Portfolio Investments — continued
December 31, 2020 | |
Security Description | | Shares | | Value | |
Microchip Technology, Inc. | | | 63,860 | | | $ | 8,819,704 | | |
Monolithic Power Systems, Inc. | | | 14,950 | | | | 5,475,139 | | |
| | | | 38,348,214 | | |
Software (16.0%): | |
Coupa Software, Inc. (a) | | | 26,460 | | | | 8,967,559 | | |
DocuSign, Inc. (a) | | | 30,980 | | | | 6,886,854 | | |
Dropbox, Inc., Class A (a) | | | 241,500 | | | | 5,358,885 | | |
Fair Isaac Corp. (a) | | | 9,880 | | | | 5,049,075 | | |
Paycom Software, Inc. (a) | | | 20,480 | | | | 9,262,080 | | |
Proofpoint, Inc. (a) | | | 37,910 | | | | 5,171,303 | | |
RingCentral, Inc., Class A (a) | | | 78,960 | | | | 29,923,471 | | |
Synopsys, Inc. (a) | | | 58,380 | | | | 15,134,431 | | |
Zendesk, Inc. (a) | | | 72,910 | | | | 10,434,879 | | |
| | | | 96,188,537 | | |
Total Common Stocks (Cost $387,460,217) | | | 601,083,267 | | |
Collateral for Securities Loaned^ (3.5%) | |
BlackRock Liquidity Funds TempFund Portfolio, Institutional Class, 0.08% (c) | | | 365,613 | | | | 365,613 | | |
Fidelity Investments Money Market Government Portfolio, Class I, 0.01% (c) | | | 12,560,954 | | | | 12,560,954 | | |
Goldman Sachs Financial Square Prime Obligations Fund, Institutional
Class, 0.04% (c) | | | 182,459 | | | | 182,459 | | |
JPMorgan Prime Money Market Fund, Capital Class, 0.12% (c) | | | 1,454,872 | | | | 1,454,872 | | |
Morgan Stanley Institutional Liquidity Prime Portfolio, Institutional
Class, 0.09% (c) | | | 6,541,388 | | | | 6,541,388 | | |
Total Collateral for Securities Loaned (Cost $21,105,286) | | | 21,105,286 | | |
Total Investments (Cost $408,565,503) — 102.8% | | | 622,188,553 | | |
Liabilities in excess of other assets — (2.8)% | | | (16,883,921 | ) | |
NET ASSETS — 100.00% | | $ | 605,304,632 | | |
^ Purchased with cash collateral from securities on loan.
(a) Non-income producing security.
(b) All or a portion of this security is on loan.
(c) Rate disclosed is the daily yield on December 31, 2020.
ADR — American Depositary Receipt
PLC — Public Limited Company
See notes to financial statements.
50
Victory Portfolios
Victory RS Growth Fund | | Schedule of Portfolio Investments
December 31, 2020 | |
Security Description | | Shares | | Value | |
Common Stocks (99.1%) | |
Communication Services (11.7%): | |
Activision Blizzard, Inc. | | | 47,330 | | | $ | 4,394,591 | | |
Alphabet, Inc., Class C (a) | | | 7,281 | | | | 12,755,438 | | |
Facebook, Inc., Class A (a) | | | 38,580 | | | | 10,538,513 | | |
Netflix, Inc. (a) | | | 2,910 | | | | 1,573,524 | | |
Twitter, Inc. (a) | | | 126,510 | | | | 6,850,517 | | |
| | | | 36,112,583 | | |
Communications Equipment (0.6%): | |
Palo Alto Networks, Inc. (a) | | | 5,020 | | | | 1,784,058 | | |
Consumer Discretionary (17.3%): | |
Amazon.com, Inc. (a) | | | 6,250 | | | | 20,355,812 | | |
Booking Holdings, Inc. (a) | | | 1,640 | | | | 3,652,723 | | |
Chipotle Mexican Grill, Inc. (a) | | | 2,970 | | | | 4,118,529 | | |
Dollar General Corp. | | | 14,550 | | | | 3,059,865 | | |
NIKE, Inc., Class B | | | 41,960 | | | | 5,936,081 | | |
Target Corp. | | | 12,580 | | | | 2,220,747 | | |
Tesla, Inc. (a) | | | 8,030 | | | | 5,666,530 | | |
The Home Depot, Inc. | | | 16,595 | | | | 4,407,964 | | |
The TJX Cos., Inc. | | | 62,990 | | | | 4,301,587 | | |
| | | | 53,719,838 | | |
Consumer Staples (2.8%): | |
Constellation Brands, Inc., Class A | | | 17,370 | | | | 3,804,899 | | |
The Boston Beer Co., Inc., Class A (a) | | | 4,800 | | | | 4,772,592 | | |
| | | | 8,577,491 | | |
Electronic Equipment, Instruments & Components (1.0%): | |
Amphenol Corp., Class A | | | 22,470 | | | | 2,938,402 | | |
Health Care (13.7%): | |
Align Technology, Inc. (a) | | | 8,130 | | | | 4,344,510 | | |
Ascendis Pharma A/S, ADR (a) | | | 13,590 | | | | 2,266,540 | | |
bluebird bio, Inc. (a) | | | 27,200 | | | | 1,176,944 | | |
Charles River Laboratories International, Inc. (a) | | | 18,490 | | | | 4,619,911 | | |
DexCom, Inc. (a) | | | 6,360 | | | | 2,351,419 | | |
Exact Sciences Corp. (a) | | | 17,150 | | | | 2,272,204 | | |
Masimo Corp. (a) | | | 10,600 | | | | 2,844,828 | | |
Royalty Pharma PLC, Class A (b) | | | 148,920 | | | | 7,453,446 | | |
UnitedHealth Group, Inc. | | | 14,600 | | | | 5,119,928 | | |
Vertex Pharmaceuticals, Inc. (a) | | | 27,220 | | | | 6,433,174 | | |
West Pharmaceutical Services, Inc. | | | 11,990 | | | | 3,396,887 | | |
| | | | 42,279,791 | | |
Industrials (5.6%): | |
FTI Consulting, Inc. (a) | | | 19,250 | | | | 2,150,610 | | |
IDEX Corp. | | | 22,220 | | | | 4,426,224 | | |
See notes to financial statements.
51
Victory Portfolios
Victory RS Growth Fund | | Schedule of Portfolio Investments — continued
December 31, 2020 | |
Security Description | | Shares | | Value | |
IHS Markit Ltd. | | | 26,120 | | | $ | 2,346,360 | | |
Old Dominion Freight Line, Inc. | | | 14,240 | | | | 2,779,363 | | |
United Parcel Service, Inc., Class B | | | 33,760 | | | | 5,685,184 | | |
| | | | 17,387,741 | | |
IT Services (11.5%): | |
Fiserv, Inc. (a) | | | 56,890 | | | | 6,477,495 | | |
PayPal Holdings, Inc. (a) | | | 26,070 | | | | 6,105,594 | | |
Twilio, Inc., Class A (a) | | | 36,580 | | | | 12,382,330 | | |
Visa, Inc., Class A | | | 47,727 | | | | 10,439,327 | | |
| | | | 35,404,746 | | |
Materials (1.3%): | |
The Scotts Miracle-Gro Co. | | | 19,780 | | | | 3,938,989 | | |
Real Estate (0.8%): | |
SBA Communications Corp. | | | 8,450 | | | | 2,383,999 | | |
Semiconductors & Semiconductor Equipment (7.9%): | |
Advanced Micro Devices, Inc. (a) | | | 17,930 | | | | 1,644,360 | | |
Lam Research Corp. | | | 9,280 | | | | 4,382,666 | | |
Marvell Technology Group Ltd. | | | 69,320 | | | | 3,295,472 | | |
NVIDIA Corp. | | | 8,420 | | | | 4,396,924 | | |
QUALCOMM, Inc. | | | 50,320 | | | | 7,665,749 | | |
STMicroelectronics NV, NYS (b) | | | 85,010 | | | | 3,155,571 | | |
| | | | 24,540,742 | | |
Software (17.0%): | |
Fair Isaac Corp. (a) | | | 7,230 | | | | 3,694,819 | | |
Microsoft Corp. | | | 127,710 | | | | 28,405,258 | | |
RingCentral, Inc., Class A (a) | | | 22,540 | | | | 8,541,984 | | |
salesforce.com, Inc. (a) | | | 16,350 | | | | 3,638,366 | | |
Synopsys, Inc. (a) | | | 11,960 | | | | 3,100,510 | | |
Workday, Inc., Class A (a) | | | 20,150 | | | | 4,828,142 | | |
| | | | 52,209,079 | | |
Technology Hardware, Storage & Peripherals (7.9%): | |
Apple, Inc. | | | 184,258 | | | | 24,449,194 | | |
Total Common Stocks (Cost $168,569,672) | | | 305,726,653 | | |
Collateral for Securities Loaned^ (3.5%) | |
BlackRock Liquidity Funds TempFund Portfolio, Institutional
Class, 0.08% (c) | | | 184,609 | | | | 184,609 | | |
Fidelity Investments Money Market Government Portfolio I
Shares, 0.01% (c) | | | 6,342,393 | | | | 6,342,393 | | |
Goldman Sachs Financial Square Prime Obligations Fund, Institutional
Class, 0.04% (c) | | | 92,129 | | | | 92,129 | | |
See notes to financial statements.
52
Victory Portfolios
Victory RS Growth Fund | | Schedule of Portfolio Investments — continued
December 31, 2020 | |
Security Description | | Shares | | Value | |
JPMorgan Prime Money Market Fund, Capital Class, 0.12% (c) | | | 734,607 | | | $ | 734,607 | | |
Morgan Stanley Institutional Liquidity Prime Portfolio, Institutional
Class, 0.09% (c) | | | 3,302,938 | | | | 3,302,938 | | |
Total Collateral for Securities Loaned (Cost $10,656,676) | | | 10,656,676 | | |
Total Investments (Cost $179,226,348) — 102.6% | | | 316,383,329 | | |
Liabilities in excess of other assets — (2.6)% | | | (7,969,653 | ) | |
NET ASSETS — 100.00% | | $ | 308,413,676 | | |
^ Purchased with cash collateral from securities on loan.
(a) Non-income producing security.
(b) All or a portion of this security is on loan.
(c) Rate disclosed is the daily yield on December 31, 2020.
ADR — American Depositary Receipt
NYS — New York Registered Shares
PLC — Public Limited Company
See notes to financial statements.
53
Victory Portfolios
Victory RS Science and Technology Fund | | Schedule of Portfolio Investments
December 31, 2020 | |
Security Description | | Shares | | Value | |
Common Stocks (97.8%) | |
Biotechnology (27.8%): | |
Adverum Biotechnologies, Inc. (a) | | | 62,190 | | | $ | 674,140 | | |
Akouos, Inc. (a) (b) | | | 32,980 | | | | 653,993 | | |
Albireo Pharma, Inc. (a) | | | 23,490 | | | | 881,110 | | |
Allogene Therapeutics, Inc. (a) | | | 32,900 | | | | 830,396 | | |
Amicus Therapeutics, Inc. (a) | | | 90,010 | | | | 2,078,331 | | |
Apellis Pharmaceuticals, Inc. (a) | | | 69,363 | | | | 3,967,563 | | |
Arcus Biosciences, Inc. (a) | | | 46,950 | | | | 1,218,822 | | |
Arena Pharmaceuticals, Inc. (a) | | | 17,370 | | | | 1,334,537 | | |
Ascendis Pharma A/S, ADR (a) | | | 12,430 | | | | 2,073,075 | | |
Athenex, Inc. (a) (b) | | | 74,150 | | | | 820,099 | | |
Atreca, Inc., Class A (a) (b) | | | 85,585 | | | | 1,382,198 | | |
Autolus Therapeutics PLC, ADR (a) (b) | | | 54,280 | | | | 485,263 | | |
Avidity Biosciences, Inc. (a) | | | 50,840 | | | | 1,297,437 | | |
Avrobio, Inc. (a) | | | 62,490 | | | | 871,111 | | |
Beam Therapeutics, Inc. (a) (b) | | | 34,200 | | | | 2,792,088 | | |
Bicycle Therapeutics PLC, ADR (a) | | | 60,119 | | | | 1,079,136 | | |
Bioxcel Therapeutics, Inc. (a) (b) | | | 33,860 | | | | 1,564,332 | | |
bluebird bio, Inc. (a) | | | 77,560 | | | | 3,356,021 | | |
Blueprint Medicines Corp. (a) | | | 10,280 | | | | 1,152,902 | | |
Celyad SA, ADR (a) (b) | | | 47,690 | | | | 371,982 | | |
Centogene NV (a) | | | 68,620 | | | | 739,724 | | |
Constellation Pharmaceuticals, Inc. (a) | | | 66,110 | | | | 1,903,968 | | |
Crinetics Pharmaceuticals, Inc. (a) | | | 34,148 | | | | 481,828 | | |
CytomX Therapeutics, Inc. (a) | | | 119,920 | | | | 785,476 | | |
Dermtech, Inc. (a) | | | 307,693 | | | | 9,981,544 | | |
Editas Medicine, Inc. (a) (b) | | | 31,220 | | | | 2,188,834 | | |
Epizyme, Inc. (a) (b) | | | 120,380 | | | | 1,307,327 | | |
Equillium, Inc. (a) | | | 219,750 | | | | 1,175,663 | | |
Exact Sciences Corp. (a) | | | 19,630 | | | | 2,600,779 | | |
Fate Therapeutics, Inc. (a) | | | 102,520 | | | | 9,322,143 | | |
Five Prime Therapeutics, Inc. (a) | | | 44,810 | | | | 762,218 | | |
Fusion Pharmaceuticals, Inc. (a) (b) | | | 72,760 | | | | 854,930 | | |
Generation Bio Co. (a) (b) | | | 35,910 | | | | 1,018,049 | | |
Halozyme Therapeutics, Inc. (a) | | | 34,660 | | | | 1,480,329 | | |
Homology Medicines, Inc. (a) (b) | | | 49,540 | | | | 559,307 | | |
IGM Biosciences, Inc. (a) (b) | | | 13,140 | | | | 1,160,131 | | |
Inhibrx, Inc. (a) (b) | | | 74,240 | | | | 2,447,693 | | |
Invitae Corp. (a) (b) | | | 34,815 | | | | 1,455,615 | | |
Iovance Biotherapeutics, Inc. (a) | | | 57,970 | | | | 2,689,808 | | |
Kezar Life Sciences, Inc. (a) | | | 313,286 | | | | 1,635,353 | | |
Kinnate BioPharma, Inc. (a) | | | 74,810 | | | | 2,975,942 | | |
Kura Oncology, Inc. (a) | | | 91,830 | | | | 2,999,168 | | |
MacroGenics, Inc. (a) | | | 41,630 | | | | 951,662 | | |
Matinas BioPharma Holdings, Inc. (a) (b) | | | 671,450 | | | | 913,172 | | |
Mirati Therapeutics, Inc. (a) | | | 11,270 | | | | 2,475,343 | | |
Myovant Sciences Ltd. (a) | | | 59,340 | | | | 1,638,971 | | |
Opthea Ltd., ADR (a) (c) | | | 102,420 | | | | 1,163,491 | | |
ORIC Pharmaceuticals, Inc. (a) | | | 56,160 | | | | 1,901,016 | | |
See notes to financial statements.
54
Victory Portfolios
Victory RS Science and Technology Fund | | Schedule of Portfolio Investments — continued
December 31, 2020 | |
Security Description | | Shares | | Value | |
Passage Bio, Inc. (a) (b) | | | 47,540 | | | $ | 1,215,598 | | |
Regulus Therapeutics, Inc. PIPE (a) (c) (d) | | | 1,768,489 | | | | 2,192,926 | | |
Replimune Group, Inc. (a) | | | 66,780 | | | | 2,547,657 | | |
REVOLUTION Medicines, Inc. (a) | | | 27,870 | | | | 1,103,373 | | |
Sage Therapeutics, Inc. (a) | | | 19,190 | | | | 1,660,127 | | |
Scholar Rock Holding Corp. (a) | | | 26,450 | | | | 1,283,619 | | |
Shattuck Labs, Inc. (a) (b) | | | 46,410 | | | | 2,432,348 | | |
Sigilon Therapeutics, Inc. (a) | | | 45,610 | | | | 2,190,648 | | |
Silverback Therapeutics, Inc. (a) | | | 29,910 | | | | 1,386,029 | | |
SpringWorks Therapeutics, Inc. (a) | | | 42,650 | | | | 3,092,978 | | |
Stoke Therapeutics, Inc. (a) (b) | | | 37,090 | | | | 2,296,984 | | |
Surface Oncology, Inc. (a) (b) | | | 245,420 | | | | 2,267,681 | | |
Sutro Biopharma, Inc. (a) | | | 71,880 | | | | 1,560,515 | | |
TCR2 Therapeutics, Inc. (a) (b) | | | 69,280 | | | | 2,142,830 | | |
Turning Point Therapeutics, Inc. (a) | | | 16,180 | | | | 1,971,533 | | |
Twist Bioscience Corp. (a) | | | 34,820 | | | | 4,919,717 | | |
Zymeworks, Inc. (a) (b) | | | 27,630 | | | | 1,305,794 | | |
| | | | 124,024,377 | | |
Communication Services (6.5%): | |
Boingo Wireless, Inc. (a) (b) | | | 280,870 | | | | 3,572,666 | | |
Facebook, Inc., Class A (a) | | | 20,750 | | | | 5,668,070 | | |
IAC/InterActiveCorp. (a) | | | 16,430 | | | | 3,111,021 | | |
Match Group, Inc. (a) | | | 40,066 | | | | 6,057,579 | | |
Take-Two Interactive Software, Inc. (a) | | | 20,270 | | | | 4,211,903 | | |
Twitter, Inc. (a) | | | 120,780 | | | | 6,540,236 | | |
| | | | 29,161,475 | | |
Communications Equipment (1.6%): | |
Lumentum Holdings, Inc. (a) | | | 45,570 | | | | 4,320,036 | | |
Viavi Solutions, Inc. (a) | | | 200,980 | | | | 3,009,676 | | |
| | | | 7,329,712 | | |
Consumer Discretionary (4.3%): | |
Amazon.com, Inc. (a) | | | 3,500 | | | | 11,399,255 | | |
Arco Platform Ltd., Class A (a) (b) | | | 49,910 | | | | 1,771,306 | | |
Booking Holdings, Inc. (a) | | | 1,220 | | | | 2,717,269 | | |
Sonos, Inc. (a) | | | 151,490 | | | | 3,543,351 | | |
| | | | 19,431,181 | | |
Electronic Equipment, Instruments & Components (2.5%): | |
908 Devices, Inc. (a) (b) | | | 15,130 | | | | 861,654 | | |
Dolby Laboratories, Inc., Class A | | | 51,650 | | | | 5,016,764 | | |
Fabrinet (a) | | | 28,590 | | | | 2,218,298 | | |
Keysight Technologies, Inc. (a) | | | 23,780 | | | | 3,141,100 | | |
| | | | 11,237,816 | | |
Financials (0.4%): | |
Panacea Acquisition Corp. (a) (c) | | | 145,710 | | | | 1,859,420 | | |
See notes to financial statements.
55
Victory Portfolios
Victory RS Science and Technology Fund | | Schedule of Portfolio Investments — continued
December 31, 2020 | |
Security Description | | Shares | | Value | |
Health Care Equipment & Supplies (1.3%): | |
BioLife Solutions, Inc. (a) | | | 56,820 | | | $ | 2,266,550 | | |
CryoPort, Inc. (a) (b) | | | 73,463 | | | | 3,223,556 | | |
Quotient Ltd. (a) (b) | | | 105,190 | | | | 548,040 | | |
| | | | 6,038,146 | | |
Health Care Providers & Services (0.2%): | |
Exagen, Inc. (a) (b) | | | 73,102 | | | | 964,946 | | |
Health Care Technology (0.8%): | |
iCAD, Inc. (a) | | | 17,280 | | | | 228,096 | | |
Veeva Systems, Inc., Class A (a) | | | 12,240 | | | | 3,332,340 | | |
| | | | 3,560,436 | | |
IT Services (8.3%): | |
Global Payments, Inc. | | | 15,680 | | | | 3,377,786 | | |
GoDaddy, Inc., Class A (a) | | | 44,870 | | | | 3,721,967 | | |
Twilio, Inc., Class A (a) | | | 41,150 | | | | 13,929,274 | | |
Visa, Inc., Class A | | | 29,550 | | | | 6,463,472 | | |
Wix.com Ltd. (a) | | | 39,120 | | | | 9,778,435 | | |
| | | | 37,270,934 | | |
Life Sciences Tools & Services (3.2%): | |
10X Genomics, Inc., Class A (a) | | | 24,400 | | | | 3,455,040 | | |
Adaptive Biotechnologies Corp. (a) | | | 18,060 | | | | 1,067,888 | | |
Berkeley Lights, Inc. (a) (b) | | | 46,240 | | | | 4,134,318 | | |
NeoGenomics, Inc. (a) (b) | | | 59,870 | | | | 3,223,401 | | |
Quanterix Corp. (a) | | | 56,900 | | | | 2,645,850 | | |
| | | | 14,526,497 | | |
Materials (0.3%): | |
Kronos Bio, Inc. (a) (b) | | | 46,170 | | | | 1,379,098 | | |
Pharmaceuticals (2.4%): | |
Compass Pathways PLC, ADR (a) (b) | | | 45,310 | | | | 2,158,568 | | |
Foghorn Therapeutics, Inc. (a) | | | 64,720 | | | | 1,311,874 | | |
GW Pharmaceuticals PLC, ADR (a) (b) | | | 22,160 | | | | 2,557,486 | | |
Marinus Pharmaceuticals, Inc. (a) (b) | | | 58,864 | | | | 718,141 | | |
PMV Pharmaceuticals, Inc. (a) | | | 45,210 | | | | 2,780,867 | | |
Provention Bio, Inc. (a) (b) | | | 64,450 | | | | 1,091,783 | | |
| | | | 10,618,719 | | |
Semiconductors & Semiconductor Equipment (15.3%): | |
Ambarella, Inc. (a) | | | 43,230 | | | | 3,969,379 | | |
Cohu, Inc. | | | 213,740 | | | | 8,160,593 | | |
Ichor Holdings Ltd. (a) | | | 100,470 | | | | 3,028,668 | | |
Lam Research Corp. | | | 18,220 | | | | 8,604,759 | | |
Lattice Semiconductor Corp. (a) | | | 184,760 | | | | 8,465,703 | | |
MACOM Technology Solutions Holdings, Inc. (a) | | | 227,830 | | | | 12,539,763 | | |
See notes to financial statements.
56
Victory Portfolios
Victory RS Science and Technology Fund | | Schedule of Portfolio Investments — continued
December 31, 2020 | |
Security Description | | Shares | | Value | |
Marvell Technology Group Ltd. | | | 102,130 | | | $ | 4,855,260 | | |
MKS Instruments, Inc. | | | 34,530 | | | | 5,195,039 | | |
Monolithic Power Systems, Inc. | | | 10,620 | | | | 3,889,363 | | |
NVIDIA Corp. | | | 10,480 | | | | 5,472,656 | | |
STMicroelectronics NV, NYS (b) | | | 123,860 | | | | 4,597,683 | | |
| | | | 68,778,866 | | |
Software (22.9%): | |
Avaya Holdings Corp. (a) | | | 172,460 | | | | 3,302,609 | | |
Coupa Software, Inc. (a) | | | 24,860 | | | | 8,425,303 | | |
DocuSign, Inc. (a) | | | 43,340 | | | | 9,634,482 | | |
Domo, Inc., Class B (a) (b) | | | 65,070 | | | | 4,149,514 | | |
Dropbox, Inc., Class A (a) | | | 145,070 | | | | 3,219,103 | | |
Fair Isaac Corp. (a) | | | 7,560 | | | | 3,863,462 | | |
Microsoft Corp. | | | 75,810 | | | | 16,861,660 | | |
Paycom Software, Inc. (a) | | | 13,740 | | | | 6,213,915 | | |
Proofpoint, Inc. (a) | | | 28,029 | | | | 3,823,436 | | |
RingCentral, Inc., Class A (a) | | | 64,060 | | | | 24,276,819 | | |
ServiceNow, Inc. (a) | | | 12,770 | | | | 7,028,991 | | |
Triterras, Inc., Class A (a) (b) | | | 169,960 | | | | 1,874,659 | | |
Varonis Systems, Inc. (a) | | | 40,500 | | | | 6,626,205 | | |
Zendesk, Inc. (a) | | | 26,810 | | | | 3,837,047 | | |
| | | | 103,137,205 | | |
Total Common Stocks (Cost $209,588,053) | | | 439,318,828 | | |
Warrants (0.1%) | |
Health Care (0.1%): | |
Regulus Therapeutics, Inc. PIPE (a) (c) (d) | | | 1,326,367 | | | | 663,184 | | |
Total Warrants (Cost $165,796) | | | 663,184 | | |
Collateral for Securities Loaned^ (9.2%) | |
BlackRock Liquidity Funds TempFund Portfolio, Institutional
Class, 0.08% (e) | | | 719,287 | | | | 719,287 | | |
Fidelity Investments Money Market Government Portfolio,
Class I, 0.01% (e) | | | 24,711,717 | | | | 24,711,717 | | |
Goldman Sachs Financial Square Prime Obligations Fund, Institutional
Class, 0.04% (e) | | | 358,960 | | | | 358,960 | | |
JPMorgan Prime Money Market Fund, Capital Class, 0.12% (e) | | | 2,862,233 | | | | 2,862,233 | | |
Morgan Stanley Institutional Liquidity Prime Portfolio, Institutional
Class, 0.09% (e) | | | 12,869,160 | | | | 12,869,160 | | |
Total Collateral for Securities Loaned (Cost $41,521,357) | | | 41,521,357 | | |
Total Investments (Cost $251,275,206) — 107.1% | | | 481,503,369 | | |
Liabilities in excess of other assets — (7.1)% | | | (31,952,808 | ) | |
NET ASSETS — 100.00% | | $ | 449,550,561 | | |
See notes to financial statements.
57
Victory Portfolios
Victory RS Science and Technology Fund | | Schedule of Portfolio Investments — continued
December 31, 2020 | |
^ Purchased with cash collateral from securities on loan.
(a) Non-income producing security.
(b) All or a portion of this security is on loan.
(c) The Fund's Adviser has deemed this security to be illiquid based upon procedures approved by the Board of Trustees. As of December 31, 2020, illiquid securities were 1.3% of the Fund's net assets.
(d) Security was fair valued based upon procedures approved by the Board of Trustees and represents 0.6% of the Fund's net assets as of December 31, 2020. (See Note 2)
(e) Rate disclosed is the daily yield on December 31, 2020.
ADR — American Depositary Receipt
NYS — New York Registered Shares
PIPE — Private Investment in Public Equity
PLC — Public Limited Company
See notes to financial statements.
58
Victory Portfolios
Victory RS Small Cap Equity Fund | | Schedule of Portfolio Investments
December 31, 2020 | |
Security Description | | Shares | | Value | |
Common Stocks (97.6%) | |
Communication Services (5.3%): | |
Bandwidth, Inc., Class A (a) (b) | | | 13,970 | | | $ | 2,146,770 | | |
EverQuote, Inc., Class A (a) (b) | | | 63,230 | | | | 2,361,641 | | |
| | | | 4,508,411 | | |
Consumer Staples (1.9%): | |
BellRing Brands, Inc., Class A (a) | | | 65,670 | | | | 1,596,438 | | |
Electronic Equipment, Instruments & Components (3.0%): | |
Itron, Inc. (a) | | | 26,470 | | | | 2,538,473 | | |
Energy (5.2%): | |
Amyris, Inc. (a) (b) | | | 184,020 | | | | 1,136,324 | | |
Renewable Energy Group, Inc. (a) | | | 46,520 | | | | 3,294,546 | | |
| | | | 4,430,870 | | |
Financials (14.1%): | |
Green Dot Corp., Class A (a) | | | 40,500 | | | | 2,259,900 | | |
LendingTree, Inc. (a) | | | 7,670 | | | | 2,099,969 | | |
PRA Group, Inc. (a) | | | 90,420 | | | | 3,586,057 | | |
PROG Holdings, Inc. | | | 54,930 | | | | 2,959,079 | | |
Trupanion, Inc. (a) (b) | | | 9,290 | | | | 1,112,106 | | |
| | | | 12,017,111 | | |
Health Care (20.7%): | |
Amicus Therapeutics, Inc. (a) | | | 68,984 | | | | 1,592,840 | | |
Apellis Pharmaceuticals, Inc. (a) (b) | | | 28,370 | | | | 1,622,763 | | |
bluebird bio, Inc. (a) | | | 25,277 | | | | 1,093,736 | | |
Blueprint Medicines Corp. (a) | | | 8,470 | | | | 949,911 | | |
CryoPort, Inc. (a) (b) | | | 45,050 | | | | 1,976,794 | | |
Epizyme, Inc. (a) | | | 75,480 | | | | 819,713 | | |
Fate Therapeutics, Inc. (a) | | | 12,850 | | | | 1,168,451 | | |
Inspire Medical System, Inc. (a) | | | 13,000 | | | | 2,445,170 | | |
Invitae Corp. (a) (b) | | | 20,690 | | | | 865,049 | | |
Iovance Biotherapeutics, Inc. (a) (b) | | | 20,071 | | | | 931,294 | | |
iRhythm Technologies, Inc. (a) (b) | | | 6,970 | | | | 1,653,354 | | |
SpringWorks Therapeutics, Inc. (a) (b) | | | 14,180 | | | | 1,028,334 | | |
Twist Bioscience Corp. (a) | | | 9,760 | | | | 1,378,990 | | |
| | | | 17,526,399 | | |
Industrials (11.7%): | |
Chart Industries, Inc. (a) | | | 19,850 | | | | 2,338,131 | | |
Evoqua Water Technologies Corp. (a) | | | 82,960 | | | | 2,238,261 | | |
Mercury Systems, Inc. (a) | | | 36,230 | | | | 3,190,414 | | |
SiteOne Landscape Supply, Inc. (a) | | | 14,140 | | | | 2,243,028 | | |
| | | | 10,009,834 | | |
See notes to financial statements.
59
Victory Portfolios
Victory RS Small Cap Equity Fund | | Schedule of Portfolio Investments — continued
December 31, 2020 | |
Security Description | | Shares | | Value | |
IT Services (5.4%): | |
Evo Payments, Inc., Class A (a) | | | 41,120 | | | $ | 1,110,651 | | |
Repay Holdings Corp. (a) | | | 69,144 | | | | 1,884,174 | | |
Shift4 Payments, Inc., Class A (a) | | | 21,490 | | | | 1,620,346 | | |
| | | | 4,615,171 | | |
Semiconductors & Semiconductor Equipment (8.3%): | |
Lattice Semiconductor Corp. (a) | | | 73,420 | | | | 3,364,104 | | |
MACOM Technology Solutions Holdings, Inc. (a) | | | 67,160 | | | | 3,696,487 | | |
| | | | 7,060,591 | | |
Software (22.0%): | |
ACI Worldwide, Inc. (a) (b) | | | 95,550 | | | | 3,671,987 | | |
Avaya Holdings Corp. (a) | | | 151,460 | | | | 2,900,459 | | |
Envestnet, Inc. (a) | | | 20,420 | | | | 1,680,362 | | |
Everbridge, Inc. (a) | | | 14,640 | | | | 2,182,385 | | |
Q2 Holdings, Inc. (a) | | | 14,550 | | | | 1,841,012 | | |
The Descartes Systems Group, Inc. (a) | | | 43,680 | | | | 2,554,406 | | |
Varonis Systems, Inc. (a) | | | 24,230 | | | | 3,964,269 | | |
| | | | 18,794,880 | | |
Total Common Stocks (Cost $64,472,411) | | | 83,098,178 | | |
Collateral for Securities Loaned^ (14.6%) | |
BlackRock Liquidity Funds TempFund Portfolio, Institutional
Class, 0.08% (c) | | | 215,011 | | | | 215,011 | | |
Fidelity Investments Money Market Government Portfolio I
Shares, 0.01% (c) | | | 7,386,895 | | | | 7,386,895 | | |
Goldman Sachs Financial Square Prime Obligations Fund, Institutional
Class, 0.04% (c) | | | 107,301 | | | | 107,301 | | |
JPMorgan Prime Money Market Fund, Capital Class, 0.12% (c) | | | 855,587 | | | | 855,587 | | |
Morgan Stanley Institutional Liquidity Prime Portfolio, Institutional
Class, 0.09% (c) | | | 3,846,885 | | | | 3,846,885 | | |
Total Collateral for Securities Loaned (Cost $12,411,679) | | | 12,411,679 | | |
Total Investments (Cost $76,884,090) — 112.2% | | | 95,509,857 | | |
Liabilities in excess of other assets — (12.2)% | | | (10,391,720 | ) | |
NET ASSETS — 100.00% | | $ | 85,118,137 | | |
^ Purchased with cash collateral from securities on loan.
(a) Non-income producing security.
(b) All or a portion of this security is on loan.
(c) Rate disclosed is the daily yield on December 31, 2020.
See notes to financial statements.
60
Victory Portfolios | | Statements of Assets and Liabilities
December 31, 2020 | |
| | | Victory
RS Small Cap
Growth Fund | | Victory
RS Select
Growth Fund | | Victory
RS Mid Cap
Growth Fund | |
ASSETS: | |
Investments, at value (Cost $2,134,406,635,
$169,864,181 and $408,565,503) | | $ | 3,193,760,850 | (a) | | $ | 246,880,109 | (b) | | $ | 622,188,553 | (c) | |
Cash and cash equivalents | | | 56,546,218 | | | | 5,814,300 | | | | 6,568,804 | | |
Receivables: | |
Interest and dividends | | | 293,004 | | | | 28,707 | | | | 85,913 | | |
Capital shares issued | | | 2,371,451 | | | | 7,976 | | | | 175,589 | | |
Investments sold | | | 7,925,563 | | | | — | | | | — | | |
From Adviser | | | — | | | | 27,116 | | | | 145,751 | | |
Prepaid expenses | | | 35,884 | | | | 3,063 | | | | 11,275 | | |
Total Assets | | | 3,260,932,970 | | | | 252,761,271 | | | | 629,175,885 | | |
LIABILITIES: | |
Payables: | |
Collateral received on loaned securities | | | 309,080,609 | | | | 17,121,224 | | | | 21,105,286 | | |
Investments purchased | | | 7,811,538 | | | | 503,019 | | | | 2,040,967 | | |
Capital shares redeemed | | | 3,660,852 | | | | 927,005 | | | | 124,259 | | |
Accrued expenses and other payables: | |
Investment advisory fees | | | 2,357,231 | | | | 193,591 | | | | 434,185 | | |
Administration fees | | | 152,241 | | | | 11,740 | | | | 31,564 | | |
Custodian fees | | | 19,709 | | | | 1,837 | | | | 4,620 | | |
Transfer agent fees | | | 306,639 | | | | 35,161 | | | | 66,005 | | |
Compliance fees | | | 2,000 | | | | 155 | | | | 415 | | |
Trustees' fees | | | 120 | | | | 9 | | | | 410 | | |
| 12b-1 fees | | | 101,408 | | | | 23,038 | | | | 17,988 | | |
Other accrued expenses | | | 155,714 | | | | 40,629 | | | | 45,554 | | |
Total Liabilities | | | 323,648,061 | | | | 18,857,408 | | | | 23,871,253 | | |
NET ASSETS: | |
Capital | | | 1,824,352,693 | | | | 121,639,857 | | | | 374,540,403 | | |
Total accumulated earnings/(loss) | | | 1,112,932,216 | | | | 112,264,006 | | | | 230,764,229 | | |
Net Assets | | $ | 2,937,284,909 | | | $ | 233,903,863 | | | $ | 605,304,632 | | |
Net Assets | |
Class A Shares | | $ | 820,005,518 | | | $ | 115,014,289 | | | $ | 93,072,257 | | |
Class C Shares | | | 20,322,865 | | | | 23,830,687 | | | | 17,324,846 | | |
Class R Shares | | | 8,512,762 | | | | 504,235 | | | | 595,803 | | |
Class R6 Shares | | | 677,128,148 | | | | 710,493 | | | | 27,861,030 | | |
Class Y Shares | | | 1,411,315,616 | | | | 93,844,159 | | | | 466,341,720 | | |
Member Class | | | — | | | | — | | | | 108,976 | | |
Total | | $ | 2,937,284,909 | | | $ | 233,903,863 | | | $ | 605,304,632 | | |
Shares (unlimited number of shares authorized
with a par value of $0.001 per share): | |
Class A Shares | | | 8,414,683 | | | | 3,011,309 | | | | 2,820,923 | | |
Class C Shares | | | 257,010 | | | | 834,983 | | | | 617,725 | | |
Class R Shares | | | 98,340 | | | | 17,188 | | | | 20,000 | | |
Class R6 Shares | | | 6,547,327 | | | | 17,224 | | | | 806,824 | | |
Class Y Shares | | | 13,689,191 | | | | 2,287,788 | | | | 13,517,143 | | |
Member Class | | | — | | | | — | | | | 3,302 | | |
Total | | | 29,006,551 | | | | 6,168,492 | | | | 17,785,917 | | |
Net asset value, offering (except Class A Shares)
and redemption price per share: | |
Class A Shares | | $ | 97.45 | | | $ | 38.19 | | | $ | 32.99 | | |
Class C Shares (d) | | | 79.07 | | | | 28.54 | | | | 28.05 | | |
Class R Shares | | | 86.56 | | | | 29.34 | | | | 29.79 | | |
Class R6 Shares | | | 103.42 | | | | 41.25 | | | | 34.53 | | |
Class Y Shares | | | 103.10 | | | | 41.02 | | | | 34.50 | | |
Member Class | | | — | | | | — | | | | 33.00 | | |
Maximum Sales Charge — Class A Shares | | | 5.75 | % | | | 5.75 | % | | | 5.75 | % | |
Maximum offering price
(100%/(100%-maximum sales charge) of
net asset value adjusted to the nearest cent)
per share — Class A Shares | | $ | 103.40 | | | $ | 40.52 | | | $ | 35.00 | | |
(a) Includes $295,379,460 of securities on loan.
(b) Includes $16,583,572 of securities on loan.
(c) Includes $20,268,130 of securities on loan.
(d) Redemption price per share varies by the length of time shares are held.
See notes to financial statements.
61
Victory Portfolios | | Statements of Assets and Liabilities
December 31, 2020 | |
| | | Victory
RS Growth Fund | | Victory
RS Science and
Technology Fund | | Victory
RS Small Cap
Equity Fund | |
ASSETS: | |
Investments, at value (Cost $179,226,348,
$251,275,206 and $76,884,090) | | $ | 316,383,329 | (a) | | $ | 481,503,369 | (b) | | $ | 95,509,857 | (c) | |
Cash and cash equivalents | | | 2,941,166 | | | | 11,680,661 | | | | 2,056,584 | | |
Receivables: | |
Interest and dividends | | | 46,780 | | | | 53,475 | | | | 997 | | |
Capital shares issued | | | 4,937 | | | | 170,600 | | | | 19,598 | | |
Investments sold | | | — | | | | — | | | | 268,294 | | |
From Adviser | | | 55,238 | | | | 3,003 | | | | 9,007 | | |
Prepaid expenses | | | 4,174 | | | | 5,107 | | | | 7, 586 | | |
Total Assets | | | 319,435,624 | | | | 493,416,215 | | | | 97,871,923 | | |
LIABILITIES: | |
Payables: | |
Collateral received on loaned securities | | | 10,656,676 | | | | 41,521,357 | | | | 12,411,679 | | |
Investments purchased | | | — | | | | 132,874 | | | | — | | |
Capital shares redeemed | | | 29,919 | | | | 1,657,964 | | | | 252,163 | | |
Accrued expenses and other payables: | |
Investment advisory fees | | | 192,278 | | | | 371,333 | | | | 52,468 | | |
Administration fees | | | 15,868 | | | | 22,961 | | | | 4,316 | | |
Custodian fees | | | 2,270 | | | | 3,199 | | | | 742 | | |
Transfer agent fees | | | 32,418 | | | | 52,256 | | | | 10,177 | | |
Compliance fees | | | 209 | | | | 301 | | | | 56 | | |
Trustees' fees | | | 7 | | | | 55 | | | | 2 | | |
| 12b-1 fees | | | 31,429 | | | | 43,739 | | | | 9,287 | | |
Other accrued expenses | | | 60,874 | | | | 59,615 | | | | 12,896 | | |
Total Liabilities | | | 11,021,948 | | | | 43,865,654 | | | | 12,753,786 | | |
NET ASSETS: | |
| Capital | | | 170,387,436 | | | | 220,023,439 | | | | 60,159,253 | | |
Total accumulated earnings/(loss) | | | 138,026,240 | | | | 229,527,122 | | | | 24,958,884 | | |
Net Assets | | $ | 308,413,676 | | | $ | 449,550,561 | | | $ | 85,118,137 | | |
Net Assets | |
Class A Shares | | $ | 274,387,986 | | | $ | 320,604,505 | | | $ | 76,611,091 | | |
Class C Shares | | | 3,731,101 | | | | 18,397,982 | | | | 514,940 | | |
Class R Shares | | | 420,060 | | | | 1,273,365 | | | | 3,325,155 | | |
Class Y Shares | | | 29,874,529 | | | | 109,274,709 | | | | 4,448,518 | | |
Member Class | | | — | | | | — | | | | 218,433 | | |
Total | | $ | 308,413,676 | | | $ | 449,550,561 | | | $ | 85,118,137 | | |
Shares (unlimited number of shares authorized
with a par value of $0.001 per share): | |
Class A Shares | | | 11,507,262 | | | | 8,819,822 | | | | 4,251,916 | | |
Class C Shares | | | 198,426 | | | | 686,363 | | | | 336,017 | | |
Class R Shares | | | 19,920 | | | | 42,465 | | | | 260,008 | | |
Class Y Shares | | | 1,188,868 | | | | 2,750,413 | | | | 237,798 | | |
Member Class | | | — | | | | — | | | | 12,111 | | |
Total | | | 12,914,476 | | | | 12,299,063 | | | | 5,097,850 | | |
Net asset value, offering (except Class A Shares)
and redemption price per share: | |
Class A Shares | | $ | 23.84 | | | $ | 36.35 | | | $ | 18.02 | | |
Class C Shares (d) | | | 18.80 | | | | 26.81 | | | | 1.53 | | |
Class R Shares | | | 21.09 | | | | 29.99 | | | | 12.79 | | |
Class Y Shares | | | 25.13 | | | | 39.73 | | | | 18.71 | | |
Member Class | | | — | | | | — | | | | 18.04 | | |
Maximum Sales Charge — Class A Shares | | | 5.75 | % | | | 5.75 | % | | | 5.75 | % | |
Maximum offering price
(100%/(100%-maximum sales charge) of
net asset value adjusted to the nearest cent)
per share — Class A Shares | | $ | 25.29 | | | $ | 38.57 | | | $ | 19.12 | | |
(a) Includes $10,470,625 of securities on loan.
(b) Includes $39,281,641 of securities on loan.
(c) Includes $11,847,423 of securities on loan.
(d) Redemption price per share varies by the length of time shares are held.
See notes to financial statements.
62
Victory Portfolios | | Statements of Operations
For the Year Ended December 31, 2020 | |
| | | Victory
RS Small Cap
Growth Fund | | Victory
RS Select
Growth Fund | | Victory
RS Mid Cap
Growth Fund | |
Investment Income: | |
Dividends | | $ | 3,388,513 | | | $ | 479,591 | | | $ | 2,112,753 | | |
Interest | | | 204,733 | | | | 12,689 | | | | 28,558 | | |
Interfund lending | | | 63 | | | | — | | | | — | | |
Securities lending (net of fees) | | | 1,089,703 | | | | 44,047 | | | | 239,728 | | |
Total Income | | | 4,683,012 | | | | 536,327 | | | | 2,381,039 | | |
Expenses: | |
Investment advisory fees | | | 21,922,056 | | | | 2,050,569 | | | | 4,466,941 | | |
Administration fees | | | 1,401,883 | | | | 124,649 | | | | 319,537 | | |
Sub-Administration fees | | | 14,132 | | | | 14,132 | | | | 14,132 | | |
12b-1 fees — Class A Shares | | | 1,664,164 | | | | 243,953 | | | | 205,970 | | |
12b-1 fees — Class C Shares | | | 174,592 | | | | 233,305 | | | | 170,561 | | |
12b-1 fees — Class R Shares | | | 33,601 | | | | 2,633 | | | | 3,497 | | |
Custodian fees | | | 125,925 | | | | 14,238 | | | | 26,190 | | |
Transfer agent fees — Class A Shares | | | 888,733 | | | | 113,456 | | | | 111,741 | | |
Transfer agent fees — Class C Shares | | | 19,414 | | | | 22,838 | | | | 15,869 | | |
Transfer agent fees — Class R Shares | | | 11,343 | | | | 2,734 | | | | 1,724 | | |
Transfer agent fees — Class R6 Shares | | | 24,244 | | | | 147 | | | | 930 | | |
Transfer agent fees — Class Y Shares | | | 1,169,273 | | | | 86,560 | | | | 544,665 | | |
Transfer agent fees — Member Class (a) | | | — | | | | — | | | | 580 | | |
Trustees' fees | | | 177,633 | | | | 18,185 | | | | 42,639 | | |
Compliance fees | | | 19,777 | | | | 1,792 | | | | 4,554 | | |
Legal and audit fees | | | 188,892 | | | | 22,577 | | | | 57,842 | | |
State registration and filing fees | | | 143,576 | | | | 84,825 | | | | 98,382 | | |
Interfund lending fees | | | — | | | | — | | | | 893 | | |
Other expenses | | | 230,411 | | | | 29,205 | | | | 75,833 | | |
Recoupment of prior expenses waived/reimbursed
by Adviser | | | 42,194 | | | | — | | | | — | | |
Total Expenses | | | 28,251,843 | | | | 3,065,798 | | | | 6,162,480 | | |
Expenses waived/reimbursed by Adviser | | | (489,756 | ) | | | (227,571 | ) | | | (759,444 | ) | |
Net Expenses | | | 27,762,087 | | | | 2,838,227 | | | | 5,403,036 | | |
Net Investment Income (Loss) | | | (23,079,075 | ) | | | (2,301,900 | ) | | | (3,021,997 | ) | |
Realized/Unrealized Gains (Losses) from
Investments: | |
Net realized gains (losses) from investment
securities | | | 162,042,534 | | | | 43,552,171 | | | | 51,251,043 | | |
Net change in unrealized appreciation/depreciation
on investment securities | | | 661,220,255 | | | | 17,335,883 | | | | 117,050,286 | | |
Net realized/unrealized gains (losses) on
investments | | | 823,262,789 | | | | 60,888,054 | | | | 168,301,329 | | |
Change in net assets resulting from operations | | $ | 800,183,714 | | | $ | 58,586,154 | | | $ | 165,279,332 | | |
(a) Victory RS Mid Cap Growth Fund Member Class commenced operations on November 3, 2020.
See notes to financial statements.
63
Victory Portfolios | | Statements of Operations
For the Year Ended December 31, 2020 | |
| | | Victory
RS Growth Fund | | Victory
RS Science and
Technology Fund | | Victory
RS Small Cap
Equity Fund | |
Investment Income: | |
Dividends | | $ | 1,891,259 | | | $ | 471,320 | | | $ | 66,835 | | |
Interest | | | 7,892 | | | | 16,781 | | | | 5,909 | | |
Securities lending (net of fees) | | | 30,515 | | | | 336,806 | | | | 32,419 | | |
Total Income | | | 1,929,666 | | | | 824,907 | | | | 105,163 | | |
Expenses: | |
Investment advisory fees | | | 1,983,793 | | | | 3,270,940 | | | | 509,667 | | |
Administration fees | | | 160,822 | | | | 198,812 | | | | 41,293 | | |
Sub-Administration fees | | | 11,222 | | | | 14,132 | | | | 14,132 | | |
12b-1 fees — Class A Shares | | | 580,838 | | | | 574,720 | | | | 153,219 | | |
12b-1 fees — Class C Shares | | | 36,322 | | | | 143,887 | | | | 4,033 | | |
12b-1 fees — Class R Shares | | | 1,877 | | | | 4,485 | | | | 14,413 | | |
Custodian fees | | | 12,817 | | | | 21,971 | | | | 5,804 | | |
Transfer agent fees — Class A Shares | | | 187,514 | | | | 247,605 | | | | 59,628 | | |
Transfer agent fees — Class C Shares | | | 3,820 | | | | 14,011 | | | | 533 | | |
Transfer agent fees — Class R Shares | | | 801 | | | | 1,843 | | | | 5,282 | | |
Transfer agent fees — Class Y Shares | | | 20,240 | | | | 103,733 | | | | 4,047 | | |
Transfer agent fees — Member Class (a) | | | — | | | | — | | | | 581 | | |
Trustees' fees | | | 21,944 | | | | 25,461 | | | | 6,794 | | |
Compliance fees | | | 2,291 | | | | 2,794 | | | | 586 | | |
Legal and audit fees | | | 27,486 | | | | 33,421 | | | | 24,633 | | |
State registration and filing fees | | | 77,218 | | | | 83,941 | | | | 72,126 | | |
Other expenses | | | 33,351 | | | | 56,744 | | | | 11,985 | | |
Total Expenses | | | 3,162,356 | | | | 4,798,500 | | | | 928,756 | | |
Expenses waived/reimbursed by Adviser | | | (294,950 | ) | | | (37,306 | ) | | | (40,673 | ) | |
Net Expenses | | | 2,867,406 | | | | 4,761,194 | | | | 888,083 | | |
Net Investment Income (Loss) | | | (937,740 | ) | | | (3,936,287 | ) | | | (782,920 | ) | |
Realized/Unrealized Gains (Losses) from
Investments: | |
Net realized gains (losses) from investment
securities and foreign currency translations | | | 24,256,089 | | | | 28,360,305 | | | | 16,158,866 | | |
Net change in unrealized appreciation/depreciation
on investment securities | | | 59,111,905 | | | | 150,652,970 | | | | 7,993,132 | | |
Net realized/unrealized gains (losses) on
investments | | | 83,367,994 | | | | 179,013,275 | | | | 24,151,998 | | |
Change in net assets resulting from operations | | $ | 82,430,254 | | | $ | 175,076,988 | | | $ | 23,369,078 | | |
(a) Victory RS Small Cap Equity Fund Member Class commenced operations on November 3, 2020.
See notes to financial statements.
64
Victory Portfolios | | Statements of Changes in Net Assets | |
| | | Victory
RS Small Cap Growth Fund | | Victory
RS Select Growth Fund | | Victory
RS Mid Cap Growth Fund | |
| | | Year
Ended
December 31,
2020 | | Year
Ended
December 31,
2019 | | Year
Ended
December 31,
2020 | | Year
Ended
December 31,
2019 | | Year
Ended
December 31,
2020 | | Year
Ended
December 31,
2019 | |
From Investment Activities: | |
Operations: | |
Net investment
income (loss) | | $ | (23,079,075 | ) | | $ | (18,309,524 | ) | | $ | (2,301,900 | ) | | $ | (2,580,310 | ) | | $ | (3,021,997 | ) | | $ | (2,481,501 | ) | |
Net realized gains
(losses) from
investments | | | 162,042,534 | | | | 374,740,043 | | | | 43,552,171 | | | | 54,394,565 | | | | 51,251,043 | | | | 5,937,106 | | |
Net change in
unrealized
appreciation/
depreciation
on investments | | | 661,220,255 | | | | 272,638,580 | | | | 17,335,883 | | | | 19,783,471 | | | | 117,050,286 | | | | 95,247,594 | | |
Change in net assets
resulting from
operations | | | 800,183,714 | | | | 629,069,099 | | | | 58,586,154 | | | | 71,597,726 | | | | 165,279,332 | | | | 98,703,199 | | |
Distributions to
Shareholders: | |
Class A Shares | | | (68,841,797 | ) | | | (57,940,117 | ) | | | (17,578,995 | ) | | | (11,607,770 | ) | | | (3,686,081 | ) | | | — | | |
Class C Shares | | | (2,041,419 | ) | | | (1,811,529 | ) | | | (4,596,824 | ) | | | (3,987,456 | ) | | | (808,992 | ) | | | — | | |
Class R Shares | | | (815,880 | ) | | | (725,922 | ) | | | (91,912 | ) | | | (83,853 | ) | | | (25,936 | ) | | | — | | |
Class R6 Shares | | | (54,388,578 | ) | | | (35,271,765 | ) | | | (97,926 | ) | | | (33,206 | ) | | | (1,071,652 | ) | | | — | | |
Class Y Shares | | | (112,328,839 | ) | | | (91,533,905 | ) | | | (13,684,054 | ) | | | (10,834,909 | ) | | | (18,217,120 | ) | | | — | | |
Member Class (a) | | | — | | | | — | | | | — | | | | — | | | | (3,963 | ) | | | — | | |
Change in net assets
resulting from
distributions to
shareholders | | | (238,416,513 | ) | | | (187,283,238 | ) | | | (36,049,711 | ) | | | (26,547,194 | ) | | | (23,813,744 | ) | | | — | | |
Change in net assets
resulting from
capital transactions | | | 88,379,490 | | | | 244,715,312 | | | | (8,797,091 | ) | | | (72,669,141 | ) | | | (56,148,955 | ) | | | 79,815,678 | | |
Change in net assets | | | 650,146,691 | | | | 686,501,173 | | | | 13,739,352 | | | | (27,618,609 | ) | | | 85,316,633 | | | | 178,518,877 | | |
Net Assets: | |
Beginning of period | | | 2,287,138,218 | | | | 1,600,637,045 | | | | 220,164,511 | | | | 247,783,120 | | | | 519,987,999 | | | | 341,469,122 | | |
End of period | | $ | 2,937,284,909 | | | $ | 2,287,138,218 | | | $ | 233,903,863 | | | $ | 220,164,511 | | | $ | 605,304,632 | | | $ | 519,987,999 | | |
(a) Victory RS Mid Cap Growth Fund Member Class commenced operations on November 3, 2020.
(continues on next page)
See notes to financial statements.
65
Victory Portfolios | | Statements of Changes in Net Assets | |
(continued)
| | | Victory
RS Small Cap Growth Fund | | Victory
RS Select Growth Fund | | Victory
RS Mid Cap Growth Fund | |
| | | Year
Ended
December 31,
2020 | | Year
Ended
December 31,
2019 | | Year
Ended
December 31,
2020 | | Year
Ended
December 31,
2019 | | Year
Ended
December 31,
2020 | | Year
Ended
December 31,
2019 | |
Capital Transactions: | |
Class A Shares | |
Proceeds from
shares issued | | $ | 77,354,531 | | | $ | 142,955,975 | | | $ | 9,681,283 | | | $ | 8,995,981 | | | $ | 5,412,915 | | | $ | 7,679,624 | | |
Distributions
reinvested | | | 66,397,165 | | | | 56,001,065 | | | | 16,848,625 | | | | 11,220,690 | | | | 3,428,512 | | | | — | | |
Cost of shares
redeemed | | | (169,500,751 | ) | | | (144,757,608 | ) | | | (20,693,842 | ) | | | (34,103,074 | ) | | | (20,027,246 | ) | | | (20,994,420 | ) | |
Total Class A
Shares | | $ | (25,749,055 | ) | | $ | 54,199,432 | | | $ | 5,836,066 | | | $ | (13,886,403 | ) | | $ | (11,185,819 | ) | | $ | (13,314,796 | ) | |
Class C Shares | |
Proceeds from
shares issued | | $ | 3,029,369 | | | $ | 4,638,000 | | | $ | 376,083 | | | $ | 1,172,611 | | | $ | 424,825 | | | $ | 1,091,058 | | |
Distributions
reinvested | | | 1,949,346 | | | | 1,567,471 | | | | 4,562,487 | | | | 3,691,152 | | | | 777,691 | | | | — | | |
Cost of shares
redeemed | | | (6,820,282 | ) | | | (4,534,786 | ) | | | (9,757,197 | ) | | | (14,429,238 | ) | | | (7,717,057 | ) | | | (3,720,853 | ) | |
Total Class C
Shares | | $ | (1,841,567 | ) | | $ | 1,670,685 | | | $ | (4,818,627 | ) | | $ | (9,565,475 | ) | | $ | (6,514,541 | ) | | $ | (2,629,795 | ) | |
Class R Shares | |
Proceeds from
shares issued | | $ | 2,753,580 | | | $ | 3,104,717 | | | $ | 176,233 | | | $ | 229,179 | | | $ | 172,986 | | | $ | 109,581 | | |
Distributions
reinvested | | | 815,880 | | | | 725,922 | | | | 71,719 | | | | 43,116 | | | | 25,936 | | | | — | | |
Cost of shares
redeemed | | | (4,331,623 | ) | | | (4,973,375 | ) | | | (403,650 | ) | | | (503,698 | ) | | | (691,488 | ) | | | (621,978 | ) | |
Total Class R
Shares | | $ | (762,163 | ) | | $ | (1,142,736 | ) | | $ | (155,698 | ) | | $ | (231,403 | ) | | $ | (492,566 | ) | | $ | (512,397 | ) | |
Class R6 Shares | |
Proceeds from
shares issued | | $ | 212,153,078 | | | $ | 329,155,802 | | | $ | 313,429 | | | $ | 16,248 | | | $ | 8,791,051 | | | $ | 16,219,140 | | |
Distributions
reinvested | | | 38,383,633 | | | | 24,270,509 | | | | 77,795 | | | | 33,206 | | | | 341,886 | | | | — | | |
Cost of shares
redeemed | | | (146,162,351 | ) | | | (61,983,716 | ) | | | (20,684 | ) | | | (27,077 | ) | | | (8,265,488 | ) | | | (1,352,556 | ) | |
Total Class R6
Shares | | $ | 104,374,360 | | | $ | 291,442,595 | | | $ | 370,540 | | | $ | 22,377 | | | $ | 867,449 | | | $ | 14,866,584 | | |
Class Y Shares | |
Proceeds from
shares issued | | $ | 320,717,460 | | | $ | 289,704,953 | | | $ | 19,406,953 | | | $ | 18,878,964 | | | $ | 81,010,960 | | | $ | 205,621,682 | | |
Distributions
reinvested | | | 101,937,080 | | | | 84,364,967 | | | | 12,776,316 | | | | 9,975,034 | | | | 17,755,174 | | | | — | | |
Cost of shares
redeemed | | | (410,296,625 | ) | | | (475,524,584 | ) | | | (42,212,641 | ) | | | (77,862,235 | ) | | | (137,693,578 | ) | | | (124,215,600 | ) | |
Total Class Y
Shares | | $ | 12,357,915 | | | $ | (101,454,664 | ) | | $ | (10,029,372 | ) | | $ | (49,008,237 | ) | | $ | (38,927,444 | ) | | $ | 81,406,082 | | |
Member Class (a) | |
Proceeds from
shares issued | | $ | — | | | $ | — | | | $ | — | | | $ | — | | | $ | 100,003 | | | $ | — | | |
Distributions
reinvested | | | — | | | | — | | | | — | | | | — | | | | 3,963 | | | | — | | |
Total Member
Class | | $ | — | | | $ | — | | | $ | — | | | $ | — | | | $ | 103,966 | | | $ | — | | |
Change in net
assets resulting
from capital
transactions | | $ | 88,379,490 | | | $ | 244,715,312 | | | $ | (8,797,091 | ) | | $ | (72,669,141 | ) | | $ | (56,148,955 | ) | | $ | 79,815,678 | | |
(a) Victory RS Mid Cap Growth Fund Member Class commenced operations on November 3, 2020.
(continues on next page)
See notes to financial statements.
66
Victory Portfolios | | Statements of Changes in Net Assets | |
(continued)
| | | Victory
RS Small Cap Growth Fund | | Victory
RS Select Growth Fund | | Victory
RS Mid Cap Growth Fund | |
| | | Year
Ended
December 31,
2020 | | Year
Ended
December 31,
2019 | | Year
Ended
December 31,
2020 | | Year
Ended
December 31,
2019 | | Year
Ended
December 31,
2020 | | Year
Ended
December 31,
2019 | |
Share Transactions: | |
Class A Shares | |
Issued | | | 954,550 | | | | 1,896,687 | | | | 266,397 | | | | 262,448 | | | | 195,313 | | | | 313,448 | | |
Reinvested | | | 691,709 | | | | 739,093 | | | | 454,141 | | | | 334,946 | | | | 106,113 | | | | — | | |
Redeemed | | | (2,137,356 | ) | | | (1,900,975 | ) | | | (587,787 | ) | | | (978,442 | ) | | | (723,305 | ) | | | (851,382 | ) | |
Total Class A
Shares | | | (491,097 | ) | | | 734,805 | | | | 132,751 | | | | (381,048 | ) | | | (421,879 | ) | | | (537,934 | ) | |
Class C Shares | |
Issued | | | 48,086 | | | | 73,386 | | | | 14,337 | | | | 42,508 | | | | 19,661 | | | | 52,282 | | |
Reinvested | | | 25,020 | | | | 24,810 | | | | 164,533 | | | | 139,131 | | | | 28,311 | | | | — | | |
Redeemed | | | (104,879 | ) | | | (70,038 | ) | | | (351,862 | ) | | | (506,621 | ) | | | (348,027 | ) | | | (173,253 | ) | |
Total Class C
Shares | | | (31,773 | ) | | | 28,158 | | | | (172,992 | ) | | | (324,982 | ) | | | (300,055 | ) | | | (120,971 | ) | |
Class R Shares | |
Issued | | | 35,926 | | | | 44,878 | | | | 6,241 | | | | 8,420 | | | | 8,775 | | | | 4,976 | | |
Reinvested | | | 9,567 | | | | 10,621 | | | | 2,516 | | | | 1,594 | | | | 889 | | | | — | | |
Redeemed | | | (62,256 | ) | | | (70,784 | ) | | | (13,699 | ) | | | (16,917 | ) | | | (29,410 | ) | | | (27,710 | ) | |
Total Class R
Shares | | | (16,763 | ) | | | (15,285 | ) | | | (4,942 | ) | | | (6,903 | ) | | | (19,746 | ) | | | (22,734 | ) | |
Class R6 Shares | |
Issued | | | 2,557,025 | | | | 4,132,995 | | | | 7,416 | | | | 430 | | | | 336,247 | | | | 631,514 | | |
Reinvested | | | 376,827 | | | | 304,371 | | | | 1,942 | | | | 931 | | | | 10,112 | | | | — | | |
Redeemed | | | (1,820,549 | ) | | | (778,119 | ) | | | (532 | ) | | | (787 | ) | | | (302,470 | ) | | | (51,468 | ) | |
Total Class R6
Shares | | | 1,113,303 | | | | 3,659,247 | | | | 8,826 | | | | 574 | | | | 43,889 | | | | 580,046 | | |
Class Y Shares | |
Issued | | | 3,896,904 | | | | 3,695,019 | | | | 488,847 | | | | 523,309 | | | | 3,062,234 | | | | 8,112,643 | | |
Reinvested | | | 1,003,911 | | | | 1,060,261 | | | | 320,691 | | | | 280,987 | | | | 525,612 | | | | — | | |
Redeemed | | | (5,171,416 | ) | | | (5,965,460 | ) | | | (1,170,335 | ) | | | (2,124,164 | ) | | | (4,935,082 | ) | | | (4,972,460 | ) | |
Total Class Y
Shares | | | (270,601 | ) | | | (1,210,180 | ) | | | (360,797 | ) | | | (1,319,868 | ) | | | (1,347,236 | ) | | | 3,140,183 | | |
Member Class (a) | |
Issued | | | — | | | | — | | | | — | | | | — | | | | 3,179 | | | | — | | |
Reinvested | | | — | | | | — | | | | — | | | | — | | | | 123 | | | | — | | |
Total Member
Class | | | — | | | | — | | | | — | | | | — | | | | 3,302 | | | | — | | |
Change in Shares | | | 303,069 | | | | 3,196,745 | | | | (397,154 | ) | | | (2,032,227 | ) | | | (2,041,725 | ) | | | 3,038,590 | | |
(a) Victory RS Mid Cap Growth Fund Member Class commenced operations on November 3, 2020.
See notes to financial statements.
67
Victory Portfolios | | Statements of Changes in Net Assets | |
| | | Victory
RS Growth Fund | | Victory
RS Science and
Technology Fund | | Victory
RS Small Cap Equity Fund | |
| | | Year
Ended
December 31,
2020 | | Year
Ended
December 31,
2019 | | Year
Ended
December 31,
2020 | | Year
Ended
December 31,
2019 | | Year
Ended
December 31,
2020 | | Year
Ended
December 31,
2019 | |
From Investment Activities: | |
Operations: | |
Net investment
income (loss) | | $ | (937,740 | ) | | $ | (368,637 | ) | | $ | (3,936,287 | ) | | $ | (2,964,010 | ) | | $ | (782,920 | ) | | $ | (643,046 | ) | |
Net realized gains
(losses) from
investments | | | 24,256,089 | | | | 32,101,114 | | | | 28,360,305 | | | | 36,408,035 | | | | 16,158,866 | | | | 12,548,237 | | |
Net change in
unrealized
appreciation/
depreciation on
investments | | | 59,111,905 | | | | 32,008,409 | | | | 150,652,970 | | | | 48,008,708 | | | | 7,993,132 | | | | 9,277,446 | | |
Change in net assets resulting
from operations | | | 82,430,254 | | | | 63,740,886 | | | | 175,076,988 | | | | 81,452,733 | | | | 23,369,078 | | | | 21,182,637 | | |
Distributions to
Shareholders: | |
Class A Shares | | | (23,219,855 | ) | | | (21,706,016 | ) | | | (18,144,054 | ) | | | (16,847,930 | ) | | | (14,114,946 | ) | | | (6,685,748 | ) | |
Class C Shares | | | (395,459 | ) | | | (511,609 | ) | | | (1,381,276 | ) | | | (1,507,003 | ) | | | (349,747 | ) | | | (183,966 | ) | |
Class R Shares | | | (39,454 | ) | | | (45,536 | ) | | | (84,683 | ) | | | (65,870 | ) | | | (788,226 | ) | | | (383,511 | ) | |
Class Y Shares | | | (2,406,716 | ) | | | (2,901,012 | ) | | | (5,656,725 | ) | | | (6,017,832 | ) | | | (770,522 | ) | | | (338,729 | ) | |
Member Class (a) | | | — | | | | — | | | | — | | | | — | | | | (19,278 | ) | | | — | | |
Change in net assets resulting
from distributions to
shareholders | | | (26,061,484 | ) | | | (25,164,173 | ) | | | (25,266,738 | ) | | | (24,438,635 | ) | | | (16,042,719 | ) | | | (7,591,954 | ) | |
Change in net assets resulting
from capital transactions | | | (7,609,479 | ) | | | 1,476,091 | | | | 7,415,321 | | | | 28,962,815 | | | | 7,918,374 | | | | (1,004,760 | ) | |
Change in net assets | | | 48,759,291 | | | | 40,052,804 | | | | 157,225,571 | | | | 85,976,913 | | | | 15,244,733 | | | | 12,585,923 | | |
Net Assets: | |
Beginning of period | | | 259,654,385 | | | | 219,601,581 | | | | 292,324,990 | | | | 206,348,077 | | | | 69,873,404 | | | | 57,287,481 | | |
End of period | | $ | 308,413,676 | | | $ | 259,654,385 | | | $ | 449,550,561 | | | $ | 292,324,990 | | | $ | 85,118,137 | | | $ | 69,873,404 | | |
(a) Victory RS Small Cap Equity Fund Member Class commenced operations on November 3, 2020.
(continues on next page)
See notes to financial statements.
68
Victory Portfolios | | Statements of Changes in Net Assets | |
(continued)
| | | Victory
RS Growth Fund | | Victory RS Science and
Technology Fund | | Victory
RS Small Cap Equity Fund | |
| | | Year
Ended
December 31,
2020 | | Year
Ended
December 31,
2019 | | Year
Ended
December 31,
2020 | | Year
Ended
December 31,
2019 | | Year
Ended
December 31,
2020 | | Year
Ended
December 31,
2019 | |
Capital Transactions: | |
Class A Shares | |
Proceeds from shares
issued | | $ | 6,628,865 | | | $ | 5,052,289 | | | $ | 50,371,770 | | | $ | 37,207,174 | | | $ | 3,788,883 | | | $ | 2,379,117 | | |
Distributions reinvested | | | 22,517,933 | | | | 21,131,656 | | | | 17,377,233 | | | | 16,058,001 | | | | 13,882,892 | | | | 6,575,672 | | |
Cost of shares redeemed | | | (28,523,565 | ) | | | (23,856,360 | ) | | | (52,685,540 | ) | | | (32,975,335 | ) | | | (11,228,707 | ) | | | (9,742,633 | ) | |
Total Class A Shares | | $ | 623,233 | | | $ | 2,327,585 | | | $ | 15,063,463 | | | $ | 20,289,840 | | | $ | 6,443,068 | | | $ | (787,844 | ) | |
Class C Shares | |
Proceeds from shares
issued | | $ | 364,542 | | | $ | 279,641 | | | $ | 2,622,340 | | | $ | 2,713,477 | | | $ | 86,888 | | | $ | 68,990 | | |
Distributions reinvested | | | 391,789 | | | | 421,834 | | | | 1,369,319 | | | | 1,377,592 | | | | 349,747 | | | | 183,966 | | |
Cost of shares redeemed | | | (1,944,758 | ) | | | (1,524,992 | ) | | | (5,505,843 | ) | | | (4,658,036 | ) | | | (175,402 | ) | | | (411,685 | ) | |
Total Class C Shares | | $ | (1,188,427 | ) | | $ | (823,517 | ) | | $ | (1,514,184 | ) | | $ | (566,967 | ) | | $ | 261,233 | | | $ | (158,729 | ) | |
Class R Shares | |
Proceeds from shares
issued | | $ | 42,253 | | | $ | 55,535 | | | $ | 481,852 | | | $ | 178,010 | | | $ | 296,464 | | | $ | 211,495 | | |
Distributions reinvested | | | 39,454 | | | | 45,536 | | | | 84,683 | | | | 65,870 | | | | 788,226 | | | | 383,511 | | |
Cost of shares redeemed | | | (162,227 | ) | | | (255,531 | ) | | | (378,781 | ) | | | (447,000 | ) | | | (812,095 | ) | | | (468,593 | ) | |
Total Class R Shares | | $ | (80,520 | ) | | $ | (154,460 | ) | | $ | 187,754 | | | $ | (203,120 | ) | | $ | 272,595 | | | $ | 126,413 | | |
Class Y Shares | |
Proceeds from shares
issued | | $ | 2,195,308 | | | $ | 3,050,227 | | | $ | 29,550,096 | | | $ | 38,822,411 | | | $ | 537,133 | | | $ | 1,004,953 | | |
Distributions reinvested | | | 2,295,343 | | | | 2,783,706 | | | | 5,344,192 | | | | 5,687,567 | | | | 768,918 | | | | 338,056 | | |
Cost of shares redeemed | | | (11,454,416 | ) | | | (5,707,450 | ) | | | (41,216,000 | ) | | | (35,066,916 | ) | | | (589,970 | ) | | | (1,527,609 | ) | |
Total Class Y Shares | | $ | (6,963,765 | ) | | $ | 126,483 | | | $ | (6,321,712 | ) | | $ | 9,443,062 | | | $ | 716,081 | | | $ | (184,600 | ) | |
Member Class (a) | |
Proceeds from shares
issued | | $ | — | | | $ | — | | | $ | — | | | $ | — | | | $ | 241,917 | | | $ | — | | |
Distributions reinvested | | | — | | | | — | | | | — | | | | — | | | | 19,278 | | | | — | | |
Cost of shares redeemed | | | — | | | | — | | | | — | | | | — | | | | (35,798 | ) | | | — | | |
Total Member Class | | $ | — | | | $ | — | | | $ | — | | | $ | — | | | $ | 225,397 | | | $ | — | | |
Change in net assets resulting
from capital transactions | | $ | (7,609,479 | ) | | $ | 1,476,091 | | | $ | 7,415,321 | | | $ | 28,962,815 | | | $ | 7,918,374 | | | $ | (1,004,760 | ) | |
(a) Victory RS Small Cap Equity Fund Member Class commenced operations on November 3, 2020.
(continues on next page)
See notes to financial statements.
69
Victory Portfolios | | Statements of Changes in Net Assets | |
(continued)
| | | Victory
RS Growth Fund | | Victory RS Science and
Technology Fund | | Victory
RS Small Cap Equity Fund | |
| | | Year
Ended
December 31,
2020 | | Year
Ended
December 31,
2019 | | Year
Ended
December 31,
2020 | | Year
Ended
December 31,
2019 | | Year
Ended
December 31,
2020 | | Year
Ended
December 31,
2019 | |
Share Transactions: | |
Class A Shares | |
Issued | | | 304,224 | | | | 255,580 | | | | 1,824,265 | | | | 1,623,445 | | | | 210,814 | | | | 147,134 | | |
Reinvested | | | 961,073 | | | | 1,113,364 | | | | 489,775 | | | | 701,529 | | | | 792,855 | | | | 417,238 | | |
Redeemed | | | (1,386,023 | ) | | | (1,218,205 | ) | | | (2,033,344 | ) | | | (1,441,083 | ) | | | (691,975 | ) | | | (603,671 | ) | |
Total Class A Shares | | | (120,726 | ) | | | 150,739 | | | | 280,696 | | | | 883,891 | | | | 311,694 | | | | (39,299 | ) | |
Class C Shares | |
Issued | | | 21,225 | | | | 17,290 | | | | 134,359 | | | | 150,655 | | | | 27,881 | | | | 12,495 | | |
Reinvested | | | 21,201 | | | | 27,321 | | | | 52,324 | | | | 79,309 | | | | 234,729 | | | | 45,312 | | |
Redeemed | | | (115,239 | ) | | | (94,041 | ) | | | (293,019 | ) | | | (260,527 | ) | | | (42,161 | ) | | | (82,079 | ) | |
Total Class C Shares | | | (72,813 | ) | | | (49,430 | ) | | | (106,336 | ) | | | (30,563 | ) | | | 220,449 | | | | (24,272 | ) | |
Class R Shares | |
Issued | | | 2,271 | | | | 3,130 | | | | 21,258 | | | | 9,259 | | | | 25,117 | | | | 16,640 | | |
Reinvested | | | 1,903 | | | | 2,666 | | | | 2,892 | | | | 3,431 | | | | 63,413 | | | | 31,721 | | |
Redeemed | | | (9,571 | ) | | | (14,840 | ) | | | (16,429 | ) | | | (22,942 | ) | | | (61,871 | ) | | | (38,038 | ) | |
Total Class R Shares | | | (5,397 | ) | | | (9,044 | ) | | | 7,721 | | | | (10,252 | ) | | | 26,659 | | | | 10,323 | | |
Class Y Shares | |
Issued | | | 101,213 | | | | 148,829 | | | | 1,024,327 | | | | 1,584,545 | | | | 33,437 | | | | 60,144 | | |
Reinvested | | | 92,966 | | | | 140,237 | | | | 137,808 | | | | 229,060 | | | | 42,295 | | | | 20,842 | | |
Redeemed | | | (570,117 | ) | | | (276,822 | ) | | | (1,487,210 | ) | | | (1,445,941 | ) | | | (36,200 | ) | | | (89,723 | ) | |
Total Class Y Shares | | | (375,938 | ) | | | 12,244 | | | | (325,075 | ) | | | 367,664 | | | | 39,532 | | | | (8,737 | ) | |
Member Class (a) | |
Issued | | | — | | | | — | | | | — | | | | — | | | | 12,775 | | | | — | | |
Reinvested | | | — | | | | — | | | | — | | | | — | | | | 1,100 | | | | — | | |
Redeemed | | | — | | | | — | | | | — | | | | — | | | | (1,764 | ) | | | — | | |
Total Member Class | | | — | | | | — | | | | — | | | | — | | | | 12,111 | | | | — | | |
Change in Shares | | | (574,874 | ) | | | 104,509 | | | | (142,994 | ) | | | 1,210,740 | | | | 610,445 | | | | (61,985 | ) | |
(a) Victory RS Small Cap Equity Fund Member Class commenced operations on November 3, 2020.
See notes to financial statements.
70
This page is intentionally left blank.
71
Victory Portfolios | | Financial Highlights | |
For a Share Outstanding Throughout Each Period
| | | | | Investment Activities | | Distributions to
Shareholders From | |
| | | Net Asset
Value,
Beginning of
Period | | Net
Investment
Income
(Loss)(a) | | Net Realized
and Unrealized
Gains (Losses)
on Investments | | Total from
Investment
Activities | | Net
Investment
Income | | Net Realized
Gains from
Investments | |
Victory RS Small Cap Growth Fund | |
Class A | |
Year Ended 12/31/20 | | $ | 77.19 | | | | (0.97 | ) | | | 30.04 | | | | 29.07 | | | | — | | | | (8.81 | ) | |
Year Ended 12/31/19 | | $ | 61.11 | | | | (0.80 | ) | | | 23.84 | | | | 23.04 | | | | — | | | | (6.96 | ) | |
Year Ended 12/31/18 | | $ | 80.96 | | | | (0.83 | ) | | | (6.54 | ) | | | (7.37 | ) | | | — | | | | (12.48 | ) | |
Year Ended 12/31/17 | | $ | 65.31 | | | | (0.75 | ) | | | 24.13 | | | | 23.38 | | | | — | | | | (7.73 | ) | |
Year Ended 12/31/16 | | $ | 64.73 | | | | (0.55 | ) | | | 1.13 | | | | 0.58 | | | | — | | | | — | | |
Class C | |
Year Ended 12/31/20 | | $ | 64.34 | | | | (1.30 | ) | | | 24.84 | | | | 23.54 | | | | — | | | | (8.81 | ) | |
Year Ended 12/31/19 | | $ | 52.19 | | | | (1.17 | ) | | | 20.28 | | | | 19.11 | | | | — | | | | (6.96 | ) | |
Year Ended 12/31/18 | | $ | 71.70 | | | | (1.31 | ) | | | (5.72 | ) | | | (7.03 | ) | | | — | | | | (12.48 | ) | |
Year Ended 12/31/17 | | $ | 58.97 | | | | (1.18 | ) | | | 21.64 | | | | 20.46 | | | | — | | | | (7.73 | ) | |
Year Ended 12/31/16 | | $ | 58.90 | | | | (0.90 | ) | | | 0.97 | | | | 0.07 | | | | — | | | | — | | |
Class R | |
Year Ended 12/31/20 | | $ | 69.61 | | | | (1.20 | ) | | | 26.96 | | | | 25.76 | | | | — | | | | (8.81 | ) | |
Year Ended 12/31/19 | | $ | 55.87 | | | | (1.05 | ) | | | 21.75 | | | | 20.70 | | | | — | | | | (6.96 | ) | |
Year Ended 12/31/18 | | $ | 75.55 | | | | (1.15 | ) | | | (6.05 | ) | | | (7.20 | ) | | | — | | | | (12.48 | ) | |
Year Ended 12/31/17 | | $ | 61.63 | | | | (1.04 | ) | | | 22.69 | | | | 21.65 | | | | — | | | | (7.73 | ) | |
Year Ended 12/31/16 | | $ | 61.27 | | | | (0.68 | ) | | | 1.04 | | | | 0.36 | | | | — | | | | — | | |
Class R6 | |
Year Ended 12/31/20 | | $ | 81.24 | | | | (0.73 | ) | | | 31.72 | | | | 30.99 | | | | — | | | | (8.81 | ) | |
Year Ended 12/31/19 | | $ | 63.83 | | | | (0.58 | ) | | | 24.95 | | | | 24.37 | | | | — | | | | (6.96 | ) | |
Year Ended 12/31/18 | | $ | 83.67 | | | | (0.58 | ) | | | (6.78 | ) | | | (7.36 | ) | | | — | | | | (12.48 | ) | |
7/12/17(e) through
12/31/17 | | $ | 79.23 | | | | (0.41 | ) | | | 12.58 | | | | 12.17 | | | | — | | | | (7.73 | ) | |
Class Y | |
Year Ended 12/31/20 | | $ | 81.06 | | | | (0.79 | ) | | | 31.64 | | | | 30.85 | | | | — | | | | (8.81 | ) | |
Year Ended 12/31/19 | | $ | 63.75 | | | | (0.62 | ) | | | 24.89 | | | | 24.27 | | | | — | | | | (6.96 | ) | |
Year Ended 12/31/18 | | $ | 83.64 | | | | (0.61 | ) | | | (6.80 | ) | | | (7.41 | ) | | | — | | | | (12.48 | ) | |
Year Ended 12/31/17 | | $ | 67.08 | | | | (0.53 | ) | | | 24.82 | | | | 24.29 | | | | — | | | | (7.73 | ) | |
Year Ended 12/31/16 | | $ | 66.32 | | | | (0.39 | ) | | | 1.16 | | | | 0.77 | | | | (0.01 | ) | | | — | | |
(a) Per share net investment income (loss) has been calculated using the average daily shares method.
(b) Not annualized for periods less than one year.
(c) Annualized for periods less than one year.
(d) Portfolio turnover is calculated on the basis of the Fund as a whole without distinguishing between the classes of shares issued.
(e) Commencement of operations.
See notes to financial statements.
72
Victory Portfolios | | Financial Highlights — continued | |
For a Share Outstanding Throughout Each Period
| | | | | Ratios to Average Net Assets | | Supplemental Data | |
| | | Total
Distributions | | Net Asset
Value,
End of
Period | | Total
Return
(Excludes
Sales
Charge)(b) | | Net
Expenses(c) | | Net
Investment
Income
(Loss)(c) | | Gross
Expenses(c) | | Net Assets,
End of
Period
(000's) | | Portfolio
Turnover(b)(d) | �� |
Victory RS Small Cap Growth Fund | |
Class A | |
Year Ended 12/31/20 | | | (8.81 | ) | | $ | 97.45 | | | | 37.84 | % | | | 1.40 | % | | | (1.20 | )% | | | 1.43 | % | | $ | 820,006 | | | | 72 | % | |
Year Ended 12/31/19 | | | (6.96 | ) | | $ | 77.19 | | | | 37.91 | % | | | 1.40 | % | | | (1.06 | )% | | | 1.44 | % | | $ | 687,425 | | | | 100 | % | |
Year Ended 12/31/18 | | | (12.48 | ) | | $ | 61.11 | | | | (8.97 | )% | | | 1.40 | % | | | (0.94 | )% | | | 1.45 | % | | $ | 499,350 | | | | 86 | % | |
Year Ended 12/31/17 | | | (7.73 | ) | | $ | 80.96 | | | | 36.86 | % | | | 1.40 | % | | | (1.00 | )% | | | 1.44 | % | | $ | 575,227 | | | | 107 | % | |
Year Ended 12/31/16 | | | — | | | $ | 65.31 | | | | 0.90 | % | | | 1.40 | % | | | (0.92 | )% | | | 1.45 | % | | $ | 481,125 | | | | 91 | % | |
Class C | |
Year Ended 12/31/20 | | | (8.81 | ) | | $ | 79.07 | | | | 36.78 | % | | | 2.16 | % | | | (1.96 | )% | | | 2.26 | % | | $ | 20,323 | | | | 72 | % | |
Year Ended 12/31/19 | | | (6.96 | ) | | $ | 64.34 | | | | 36.88 | % | | | 2.16 | % | | | (1.82 | )% | | | 2.27 | % | | $ | 18,581 | | | | 100 | % | |
Year Ended 12/31/18 | | | (12.48 | ) | | $ | 52.19 | | | | (9.66 | )% | | | 2.16 | % | | | (1.71 | )% | | | 2.26 | % | | $ | 13,602 | | | | 86 | % | |
Year Ended 12/31/17 | | | (7.73 | ) | | $ | 71.70 | | | | 35.84 | % | | | 2.16 | % | | | (1.75 | )% | | | 2.23 | % | | $ | 13,633 | | | | 107 | % | |
Year Ended 12/31/16 | | | — | | | $ | 58.97 | | | | 0.12 | % | | | 2.16 | % | | | (1.67 | )% | | | 2.22 | % | | $ | 13,035 | | | | 91 | % | |
Class R | |
Year Ended 12/31/20 | | | (8.81 | ) | | $ | 86.56 | | | | 37.20 | % | | | 1.86 | % | | | (1.66 | )% | | | 1.97 | % | | $ | 8,513 | | | | 72 | % | |
Year Ended 12/31/19 | | | (6.96 | ) | | $ | 69.61 | | | | 37.28 | % | | | 1.86 | % | | | (1.52 | )% | | | 1.93 | % | | $ | 8,012 | | | | 100 | % | |
Year Ended 12/31/18 | | | (12.48 | ) | | $ | 55.87 | | | | (9.39 | )% | | | 1.86 | % | | | (1.40 | )% | | | 1.87 | % | | $ | 7,285 | | | | 86 | % | |
Year Ended 12/31/17 | | | (7.73 | ) | | $ | 75.55 | | | | 36.24 | % | | | 1.86 | % | | | (1.46 | )% | | | 1.94 | % | | $ | 7,698 | | | | 107 | % | |
Year Ended 12/31/16 | | | — | | | $ | 61.63 | | | | 0.59 | % | | | 1.70 | % | | | (1.20 | )% | | | 1.70 | % | | $ | 5,371 | | | | 91 | % | |
Class R6 | |
Year Ended 12/31/20 | | | (8.81 | ) | | $ | 103.42 | | | | 38.32 | % | | | 1.06 | % | | | (0.86 | )% | | | 1.06 | % | | $ | 677,128 | | | | 72 | % | |
Year Ended 12/31/19 | | | (6.96 | ) | | $ | 81.24 | | | | 38.38 | % | | | 1.06 | % | | | (0.72 | )% | | | 1.06 | % | | $ | 441,471 | | | | 100 | % | |
Year Ended 12/31/18 | | | (12.48 | ) | | $ | 63.83 | | | | (8.66 | )% | | | 1.06 | % | | | (0.64 | )% | | | 1.10 | % | | $ | 113,288 | | | | 86 | % | |
7/12/17(e) through
12/31/17 | | | (7.73 | ) | | $ | 83.67 | | | | 16.23 | % | | | 1.06 | % | | | (1.03 | )% | | | 1.41 | % | | $ | 25,551 | | | | 107 | % | |
Class Y | |
Year Ended 12/31/20 | | | (8.81 | ) | | $ | 103.10 | | | | 38.21 | % | | | 1.13 | % | | | (0.93 | )% | | | 1.15 | % | | $ | 1,411,316 | | | | 72 | % | |
Year Ended 12/31/19 | | | (6.96 | ) | | $ | 81.06 | | | | 38.29 | % | | | 1.13 | % | | | (0.79 | )% | | | 1.15 | % | | $ | 1,131,648 | | | | 100 | % | |
Year Ended 12/31/18 | | | (12.48 | ) | | $ | 63.75 | | | | (8.72 | )% | | | 1.13 | % | | | (0.67 | )% | | | 1.15 | % | | $ | 967,112 | | | | 86 | % | |
Year Ended 12/31/17 | | | (7.73 | ) | | $ | 83.64 | | | | 37.23 | % | | | 1.13 | % | | | (0.68 | )% | | | 1.17 | % | | $ | 1,081,427 | | | | 107 | % | |
Year Ended 12/31/16 | | | (0.01 | ) | | $ | 67.08 | | | | 1.16 | % | | | 1.13 | % | | | (0.64 | )% | | | 1.21 | % | | $ | 1,379,669 | | | | 91 | % | |
See notes to financial statements.
73
Victory Portfolios | | Financial Highlights | |
For a Share Outstanding Throughout Each Period
| | | | Investment Activities | | Distributions to
Shareholders From | |
| | | Net Asset
Value,
Beginning of
Period | | Net
Investment
Income
(Loss)(a) | | Net Realized
and Unrealized
Gains (Losses)
on Investments | | Total from
Investment
Activities | | Net Realized
Gains from
Investments | | Total
Distributions | |
Victory RS Select Growth Fund | |
Class A | |
Year Ended 12/31/20 | | $ | 33.81 | | | | (0.40 | ) | | | 11.43 | | | | 11.03 | | | | (6.65 | ) | | | (6.65 | ) | |
Year Ended 12/31/19 | | $ | 28.96 | | | | (0.37 | ) | | | 9.68 | | | | 9.31 | | | | (4.46 | ) | | | (4.46 | ) | |
Year Ended 12/31/18 | | $ | 46.03 | | | | (0.42 | ) | | | (3.12 | ) | | | (3.54 | ) | | | (13.53 | ) | | | (13.53 | ) | |
Year Ended 12/31/17 | | $ | 45.04 | | | | (0.43 | ) | | | 8.16 | | | | 7.73 | | | | (6.74 | ) | | | (6.74 | ) | |
Year Ended 12/31/16 | | $ | 43.54 | | | | (0.32 | ) | | | 3.30 | | | | 2.98 | | | | (1.48 | ) | | | (1.48 | ) | |
Class C | |
Year Ended 12/31/20 | | $ | 26.77 | | | | (0.53 | ) | | | 8.95 | | | | 8.42 | | | | (6.65 | ) | | | (6.65 | ) | |
Year Ended 12/31/19 | | $ | 23.82 | | | | (0.53 | ) | | | 7.94 | | | | 7.41 | | | | (4.46 | ) | | | (4.46 | ) | |
Year Ended 12/31/18 | | $ | 40.80 | | | | (0.70 | ) | | | (2.75 | ) | | | (3.45 | ) | | | (13.53 | ) | | | (13.53 | ) | |
Year Ended 12/31/17 | | $ | 40.89 | | | | (0.73 | ) | | | 7.38 | | | | 6.65 | | | | (6.74 | ) | | | (6.74 | ) | |
Year Ended 12/31/16 | | $ | 39.97 | | | | (0.60 | ) | | | 3.00 | | | | 2.40 | | | | (1.48 | ) | | | (1.48 | ) | |
Class R | |
Year Ended 12/31/20 | | $ | 27.30 | | | | (0.46 | ) | | | 9.15 | | | | 8.69 | | | | (6.65 | ) | | | (6.65 | ) | |
Year Ended 12/31/19 | | $ | 24.16 | | | | (0.45 | ) | | | 8.05 | | | | 7.60 | | | | (4.46 | ) | | | (4.46 | ) | |
Year Ended 12/31/18 | | $ | 41.06 | | | | (0.59 | ) | | | (2.78 | ) | | | (3.37 | ) | | | (13.53 | ) | | | (13.53 | ) | |
Year Ended 12/31/17 | | $ | 41.00 | | | | (0.61 | ) | | | 7.41 | | | | 6.80 | | | | (6.74 | ) | | | (6.74 | ) | |
Year Ended 12/31/16 | | $ | 39.93 | | | | (0.46 | ) | | | 3.01 | | | | 2.55 | | | | (1.48 | ) | | | (1.48 | ) | |
Class R6 | |
Year Ended 12/31/20 | | $ | 35.99 | | | | (0.31 | ) | | | 12.22 | | | | 11.91 | | | | (6.65 | ) | | | (6.65 | ) | |
Year Ended 12/31/19 | | $ | 30.50 | | | | (0.27 | ) | | | 10.22 | | | | 9.95 | | | | (4.46 | ) | | | (4.46 | ) | |
Year Ended 12/31/18 | | $ | 47.53 | | | | (0.29 | ) | | | (3.21 | ) | | | (3.50 | ) | | | (13.53 | ) | | | (13.53 | ) | |
Year Ended 12/31/17 | | $ | 46.16 | | | | (0.28 | ) | | | 8.39 | | | | 8.11 | | | | (6.74 | ) | | | (6.74 | ) | |
11/15/16(e) through
12/31/16 | | $ | 46.65 | | | | (0.03 | ) | | | 1.02 | | | | 0.99 | | | | (1.48 | ) | | | (1.48 | ) | |
Class Y | |
Year Ended 12/31/20 | | $ | 35.84 | | | | (0.33 | ) | | | 12.16 | | | | 11.83 | | | | (6.65 | ) | | | (6.65 | ) | |
Year Ended 12/31/19 | | $ | 30.41 | | | | (0.29 | ) | | | 10.18 | | | | 9.89 | | | | (4.46 | ) | | | (4.46 | ) | |
Year Ended 12/31/18 | | $ | 47.47 | | | | (0.30 | ) | | | (3.23 | ) | | | (3.53 | ) | | | (13.53 | ) | | | (13.53 | ) | |
Year Ended 12/31/17 | | $ | 46.15 | | | | (0.31 | ) | | | 8.37 | | | | 8.06 | | | | (6.74 | ) | | | (6.74 | ) | |
Year Ended 12/31/16 | | $ | 44.47 | | | | (0.21 | ) | | | 3.37 | | | | 3.16 | | | | (1.48 | ) | | | (1.48 | ) | |
(a) Per share net investment income (loss) has been calculated using the average daily shares method.
(b) Not annualized for periods less than one year.
(c) Annualized for periods less than one year.
(d) Portfolio turnover is calculated on the basis of the Fund as a whole without distinguishing between the classes of shares issued.
(e) Commencement of operations
See notes to financial statements.
74
Victory Portfolios | | Financial Highlights — continued | |
For a Share Outstanding Throughout Each Period
| | | | | Ratios to Average Net Assets | | Supplemental Data | |
| | | Net Asset
Value,
End of
Period | | Total
Return
(Excludes
Sales
Charge)(b) | | Net
Expenses(c) | | Net
Investment
Income
(Loss)(c) | | Gross
Expenses(c) | | Net Assets,
End of
Period
(000's) | | Portfolio
Turnover(b)(d) | |
Victory RS Select Growth Fund | |
Class A | |
Year Ended 12/31/20 | | $ | 38.19 | | | | 33.22 | % | | | 1.40 | % | | | (1.14 | )% | | | 1.49 | % | | $ | 115,014 | | | | 73 | % | |
Year Ended 12/31/19 | | $ | 33.81 | | | | 32.29 | % | | | 1.40 | % | | | (1.06 | )% | | | 1.52 | % | | $ | 97,337 | | | | 74 | % | |
Year Ended 12/31/18 | | $ | 28.96 | | | | (7.23 | )% | | | 1.40 | % | | | (0.86 | )% | | | 1.50 | % | | $ | 94,393 | | | | 79 | % | |
Year Ended 12/31/17 | | $ | 46.03 | | | | 17.10 | % | | | 1.40 | % | | | (0.88 | )% | | | 1.49 | % | | $ | 147,531 | | | | 69 | % | |
Year Ended 12/31/16 | | $ | 45.04 | | | | 6.85 | % | | | 1.40 | % | | | (0.74 | )% | | | 1.47 | % | | $ | 170,825 | | | | 89 | % | |
Class C | |
Year Ended 12/31/20 | | $ | 28.54 | | | | 32.20 | % | | | 2.18 | % | | | (1.92 | )% | | | 2.29 | % | | $ | 23,831 | | | | 73 | % | |
Year Ended 12/31/19 | | $ | 26.77 | | | | 31.28 | % | | | 2.18 | % | | | (1.84 | )% | | | 2.30 | % | | $ | 26,988 | | | | 74 | % | |
Year Ended 12/31/18 | | $ | 23.82 | | | | (7.98 | )% | | | 2.18 | % | | | (1.64 | )% | | | 2.25 | % | | $ | 31,754 | | | | 79 | % | |
Year Ended 12/31/17 | | $ | 40.80 | | | | 16.19 | % | | | 2.18 | % | | | (1.66 | )% | | | 2.24 | % | | $ | 51,208 | | | | 69 | % | |
Year Ended 12/31/16 | | $ | 40.89 | | | | 6.04 | % | | | 2.18 | % | | | (1.52 | )% | | | 2.23 | % | | $ | 63,841 | | | | 89 | % | |
Class R | |
Year Ended 12/31/20 | | $ | 29.34 | | | | 32.57 | % | | | 1.91 | % | | | (1.64 | )% | | | 5.35 | % | | $ | 504 | | | | 73 | % | |
Year Ended 12/31/19 | | $ | 27.30 | | | | 31.63 | % | | | 1.91 | % | | | (1.57 | )% | | | 4.35 | % | | $ | 604 | | | | 74 | % | |
Year Ended 12/31/18 | | $ | 24.16 | | | | (7.70 | )% | | | 1.91 | % | | | (1.38 | )% | | | 3.60 | % | | $ | 701 | | | | 79 | % | |
Year Ended 12/31/17 | | $ | 41.06 | | | | 16.51 | % | | | 1.91 | % | | | (1.39 | )% | | | 2.90 | % | | $ | 1,014 | | | | 69 | % | |
Year Ended 12/31/16 | | $ | 41.00 | | | | 6.39 | % | | | 1.82 | % | | | (1.17 | )% | | | 1.82 | % | | $ | 1,440 | | | | 89 | % | |
Class R6 | |
Year Ended 12/31/20 | | $ | 41.25 | | | | 33.65 | % | | | 1.06 | % | | | (0.80 | )% | | | 4.52 | % | | $ | 710 | | | | 73 | % | |
Year Ended 12/31/19 | | $ | 35.99 | | | | 32.76 | % | | | 1.06 | % | | | (0.72 | )% | | | 5.46 | % | | $ | 302 | | | | 74 | % | |
Year Ended 12/31/18 | | $ | 30.50 | | | | (6.92 | )% | | | 1.06 | % | | | (0.59 | )% | | | 6.33 | % | | $ | 239 | | | | 79 | % | |
Year Ended 12/31/17 | | $ | 47.53 | | | | 17.48 | % | | | 1.06 | % | | | (0.55 | )% | | | 27.47 | % | | $ | 151 | | | | 69 | % | |
11/15/16(e) through
12/31/16 | | $ | 46.16 | | | | 2.15 | % | | | 1.06 | % | | | (0.43 | )% | | | 26.37 | % | | $ | 51 | | | | 89 | % | |
Class Y | |
Year Ended 12/31/20 | | $ | 41.02 | | | | 33.57 | % | | | 1.14 | % | | | (0.88 | )% | | | 1.24 | % | | $ | 93,844 | | | | 73 | % | |
Year Ended 12/31/19 | | $ | 35.84 | | | | 32.66 | % | | | 1.14 | % | | | (0.80 | )% | | | 1.23 | % | | $ | 94,933 | | | | 74 | % | |
Year Ended 12/31/18 | | $ | 30.41 | | | | (7.02 | )% | | | 1.14 | % | | | (0.59 | )% | | | 1.21 | % | | $ | 120,696 | | | | 79 | % | |
Year Ended 12/31/17 | | $ | 47.47 | | | | 17.40 | % | | | 1.14 | % | | | (0.62 | )% | | | 1.20 | % | | $ | 244,689 | | | | 69 | % | |
Year Ended 12/31/16 | | $ | 46.15 | | | | 7.13 | % | | | 1.14 | % | | | (0.49 | )% | | | 1.20 | % | | $ | 287,970 | | | | 89 | % | |
See notes to financial statements.
75
Victory Portfolios | | Financial Highlights | |
For a Share Outstanding Throughout Each Period
| | | | Investment Activities | | Distributions to
Shareholders From | |
| | | Net Asset
Value,
Beginning of
Period | | Net
Investment
Income
(Loss)(a) | | Net Realized
and Unrealized
Gains (Losses)
on Investments | | Total from
Investment
Activities | | Net Realized
Gains from
Investments | | Return of
Capital | |
Victory RS Mid Cap Growth Fund | |
Class A | |
Year Ended 12/31/20 | | $ | 25.56 | | | | (0.20 | ) | | | 8.98 | | | | 8.78 | | | | (1.35 | ) | | | — | | |
Year Ended 12/31/19 | | $ | 19.96 | | | | (0.17 | ) | | | 5.77 | | | | 5.60 | | | | — | | | | — | | |
Year Ended 12/31/18 | | $ | 25.77 | | | | (0.14 | ) | | | (1.79 | ) | | | (1.93 | ) | | | (3.00 | ) | | | (0.88 | ) | |
Year Ended 12/31/17 | | $ | 21.32 | | | | (0.10 | ) | | | 4.55 | | | | 4.45 | | | | — | | | | — | | |
Year Ended 12/31/16 | | $ | 20.29 | | | | (0.07 | ) | | | 1.10 | | | | 1.03 | | | | — | | | | — | | |
Class C | |
Year Ended 12/31/20 | | $ | 22.08 | | | | (0.38 | ) | | | 7.70 | | | | 7.32 | | | | (1.35 | ) | | | — | | |
Year Ended 12/31/19 | | $ | 17.40 | | | | (0.34 | ) | | | 5.02 | | | | 4.68 | | | | — | | | | — | | |
Year Ended 12/31/18 | | $ | 23.22 | | | | (0.35 | ) | | | (1.59 | ) | | | (1.94 | ) | | | (3.65 | ) | | | (0.23 | ) | |
Year Ended 12/31/17 | | $ | 19.38 | | | | (0.28 | ) | | | 4.12 | | | | 3.84 | | | | — | | | | — | | |
Year Ended 12/31/16 | | $ | 18.61 | | | | (0.23 | ) | | | 1.00 | | | | 0.77 | | | | — | | | | — | | |
Class R | |
Year Ended 12/31/20 | | $ | 23.32 | | | | (0.33 | ) | | | 8.15 | | | | 7.82 | | | | (1.35 | ) | | | — | | |
Year Ended 12/31/19 | | $ | 18.31 | | | | (0.28 | ) | | | 5.29 | | | | 5.01 | | | | — | | | | — | | |
Year Ended 12/31/18 | | $ | 24.14 | | | | (0.29 | ) | | | (1.66 | ) | | | (1.95 | ) | | | (3.86 | ) | | | (0.02 | ) | |
Year Ended 12/31/17 | | $ | 20.09 | | | | (0.23 | ) | | | 4.28 | | | | 4.05 | | | | — | | | | — | | |
Year Ended 12/31/16 | | $ | 19.22 | | | | (0.16 | ) | | | 1.03 | | | | 0.87 | | | | — | | | | — | | |
Class R6 | |
Year Ended 12/31/20 | | $ | 26.63 | | | | (0.14 | ) | | | 9.39 | | | | 9.25 | | | | (1.35 | ) | | | — | | |
Year Ended 12/31/19 | | $ | 20.74 | | | | (0.11 | ) | | | 6.00 | | | | 5.89 | | | | — | | | | — | | |
Year Ended 12/31/18 | | $ | 26.55 | | | | (0.07 | ) | | | (1.86 | ) | | | (1.93 | ) | | | (3.84 | ) | | | (0.04 | ) | |
Year Ended 12/31/17 | | $ | 21.90 | | | | (0.04 | ) | | | 4.69 | | | | 4.65 | | | | — | | | | — | | |
11/15/16(e) through
12/31/16 | | $ | 21.30 | | | | — | (f) | | | 0.60 | | | | 0.60 | | | | — | | | | — | | |
Class Y | |
Year Ended 12/31/20 | | $ | 26.61 | | | | (0.14 | ) | | | 9.38 | | | | 9.24 | | | | (1.35 | ) | | | — | | |
Year Ended 12/31/19 | | $ | 20.73 | | | | (0.11 | ) | | | 5.99 | | | | 5.88 | | | | — | | | | — | | |
Year Ended 12/31/18 | | $ | 26.54 | | | | (0.08 | ) | | | (1.85 | ) | | | (1.93 | ) | | | (1.17 | ) | | | (2.71 | ) | |
Year Ended 12/31/17 | | $ | 21.90 | | | | (0.04 | ) | | | 4.68 | | | | 4.64 | | | | — | | | | — | | |
Year Ended 12/31/16 | | $ | 20.79 | | | | (0.02 | ) | | | 1.13 | | | | 1.11 | | | | — | | | | — | | |
Member Class | |
11/3/20(e) through
12/31/20 | | $ | 29.16 | | | | (0.04 | ) | | | 5.23 | | | | 5.19 | | | | (1.35 | ) | | | — | | |
(a) Per share net investment income (loss) has been calculated using the average daily shares method.
(b) Not annualized for periods less than one year.
(c) Annualized for periods less than one year.
(d) Portfolio turnover is calculated on the basis of the Fund as a whole without distinguishing between the classes of shares issued.
(e) Commencement of operations
(f) Amount is less than $0.005 per share.
See notes to financial statements.
76
Victory Portfolios | | Financial Highlights — continued | |
For a Share Outstanding Throughout Each Period
| | | | | Ratios to Average Net Assets | | Supplemental Data | |
| | | Total
Distributions | | Net Asset
Value,
End of
Period | | Total
Return
(Excludes
Sales
Charge)(b) | | Net
Expenses(c) | | Net
Investment
Income
(Loss)(c) | | Gross
Expenses(c) | | Net Assets,
End of
Period
(000's) | | Portfolio
Turnover(b)(d) | |
Victory RS Mid Cap Growth Fund | |
Class A | |
Year Ended 12/31/20 | | | (1.35 | ) | | $ | 32.99 | | | | 34.47 | % | | | 1.20 | % | | | (0.75 | )% | | | 1.35 | % | | $ | 93,072 | | | | 92 | % | |
Year Ended 12/31/19 | | | — | | | $ | 25.56 | | | | 28.06 | % | | | 1.20 | % | | | (0.67 | )% | | | 1.35 | % | | $ | 82,888 | | | | 86 | % | |
Year Ended 12/31/18 | | | (3.88 | ) | | $ | 19.96 | | | | (7.37 | )% | | | 1.20 | % | | | (0.53 | )% | | | 1.34 | % | | $ | 75,451 | | | | 126 | % | |
Year Ended 12/31/17 | | | — | | | $ | 25.77 | | | | 20.87 | % | | | 1.20 | % | | | (0.44 | )% | | | 1.29 | % | | $ | 108,271 | | | | 86 | % | |
Year Ended 12/31/16 | | | — | | | $ | 21.32 | | | | 5.08 | % | | | 1.20 | % | | | (0.35 | )% | | | 1.27 | % | | $ | 231,056 | | | | 138 | % | |
Class C | |
Year Ended 12/31/20 | | | (1.35 | ) | | $ | 28.05 | | | | 33.30 | % | | | 2.11 | % | | | (1.65 | )% | | | 2.14 | % | | $ | 17,325 | | | | 92 | % | |
Year Ended 12/31/19 | | | — | | | $ | 22.08 | | | | 26.90 | % | | | 2.11 | % | | | (1.58 | )% | | | 2.12 | % | | $ | 20,266 | | | | 86 | % | |
Year Ended 12/31/18 | | | (3.88 | ) | | $ | 17.40 | | | | (8.23 | )% | | | 2.11 | % | | | (1.44 | )% | | | 2.12 | % | | $ | 18,072 | | | | 126 | % | |
Year Ended 12/31/17 | | | — | | | $ | 23.22 | | | | 19.81 | % | | | 2.10 | % | | | (1.33 | )% | | | 2.10 | % | | $ | 23,264 | | | | 86 | % | |
Year Ended 12/31/16 | | | — | | | $ | 19.38 | | | | 4.14 | % | | | 2.11 | % | | | (1.25 | )% | | | 2.11 | % | | $ | 24,618 | | | | 138 | % | |
Class R | |
Year Ended 12/31/20 | | | (1.35 | ) | | $ | 29.79 | | | | 33.67 | % | | | 1.80 | % | | | (1.34 | )% | | | 4.13 | % | | $ | 596 | | | | 92 | % | |
Year Ended 12/31/19 | | | — | | | $ | 23.32 | | | | 27.36 | % | | | 1.80 | % | | | (1.26 | )% | | | 3.41 | % | | $ | 927 | | | | 86 | % | |
Year Ended 12/31/18 | | | (3.88 | ) | | $ | 18.31 | | | | (7.99 | )% | | | 1.80 | % | | | (1.13 | )% | | | 2.68 | % | | $ | 1,144 | | | | 126 | % | |
Year Ended 12/31/17 | | | — | | | $ | 24.14 | | | | 20.21 | % | | | 1.80 | % | | | (1.03 | )% | | | 2.43 | % | | $ | 1,685 | | | | 86 | % | |
Year Ended 12/31/16 | | | — | | | $ | 20.09 | | | | 4.53 | % | | | 1.69 | % | | | (0.84 | )% | | | 1.69 | % | | $ | 1,486 | | | | 138 | % | |
Class R6 | |
Year Ended 12/31/20 | | | (1.35 | ) | | $ | 34.53 | | | | 34.86 | % | | | 0.94 | % | | | (0.49 | )% | | | 1.01 | % | | $ | 27,861 | | | | 92 | % | |
Year Ended 12/31/19 | | | — | | | $ | 26.63 | | | | 28.40 | % | | | 0.94 | % | | | (0.44 | )% | | | 1.05 | % | | $ | 20,321 | | | | 86 | % | |
Year Ended 12/31/18 | | | (3.88 | ) | | $ | 20.74 | | | | (7.15 | )% | | | 0.94 | % | | | (0.26 | )% | | | 1.32 | % | | $ | 3,793 | | | | 126 | % | |
Year Ended 12/31/17 | | | — | | | $ | 26.55 | | | | 21.23 | % | | | 0.94 | % | | | (0.17 | )% | | | 2.26 | % | | $ | 2,132 | | | | 86 | % | |
11/15/16(e) through
12/31/16 | | | — | | | $ | 21.90 | | | | 2.82 | % | | | 0.94 | % | | | (0.02 | )% | | | 25.90 | % | | $ | 60 | | | | 138 | % | |
Class Y | |
Year Ended 12/31/20 | | | (1.35 | ) | | $ | 34.50 | | | | 34.84 | % | | | 0.95 | % | | | (0.50 | )% | | | 1.10 | % | | $ | 466,342 | | | | 92 | % | |
Year Ended 12/31/19 | | | — | | | $ | 26.61 | | | | 28.36 | % | | | 0.95 | % | | | (0.43 | )% | | | 1.10 | % | | $ | 395,586 | | | | 86 | % | |
Year Ended 12/31/18 | | | (3.88 | ) | | $ | 20.73 | | | | (7.15 | )% | | | 0.95 | % | | | (0.27 | )% | | | 1.05 | % | | $ | 243,009 | | | | 126 | % | |
Year Ended 12/31/17 | | | — | | | $ | 26.54 | | | | 21.19 | % | | | 0.95 | % | | | (0.18 | )% | | | 1.06 | % | | $ | 310,050 | | | | 86 | % | |
Year Ended 12/31/16 | | | — | | | $ | 21.90 | | | | 5.34 | % | | | 0.95 | % | | | (0.10 | )% | | | 1.05 | % | | $ | 168,936 | | | | 138 | % | |
Member Class | |
11/3/20(e) through
12/31/20 | | | (1.35 | ) | | $ | 33.00 | | | | 17.94 | % | | | 1.05 | % | | | (0.71 | )% | | | 31.23 | % | | $ | 109 | | | | 92 | % | |
See notes to financial statements.
77
Victory Portfolios | | Financial Highlights | |
For a Share Outstanding Throughout Each Period
| | | | Investment Activities | | Distributions to
Shareholders From | |
| | | Net Asset
Value,
Beginning of
Period | | Net
Investment
Income
(Loss)(a) | | Net Realized
and Unrealized
Gains (Losses)
on Investments | | Total from
Investment
Activities | | Net Realized
Gains from
Investments | | Total
Distributions | |
Victory RS Growth Fund | |
Class A | |
Year Ended 12/31/20 | | $ | 19.22 | | | | (0.08 | ) | | | 6.89 | | | | 6.81 | | | | (2.19 | ) | | | (2.19 | ) | |
Year Ended 12/31/19 | | $ | 16.40 | | | | (0.03 | ) | | | 4.90 | | | | 4.87 | | | | (2.05 | ) | | | (2.05 | ) | |
Year Ended 12/31/18 | | $ | 20.60 | | | | (0.06 | ) | | | (1.36 | ) | | | (1.42 | ) | | | (2.78 | ) | | | (2.78 | ) | |
Year Ended 12/31/17 | | $ | 16.44 | | | | (0.02 | ) | | | 5.24 | | | | 5.22 | | | | (1.06 | ) | | | (1.06 | ) | |
Year Ended 12/31/16 | | $ | 17.49 | | | | (0.02 | ) | | | 0.36 | | | | 0.34 | | | | (1.39 | ) | | | (1.39 | ) | |
Class C | |
Year Ended 12/31/20 | | $ | 15.63 | | | | (0.20 | ) | | | 5.56 | | | | 5.36 | | | | (2.19 | ) | | | (2.19 | ) | |
Year Ended 12/31/19 | | $ | 13.75 | | | | (0.16 | ) | | | 4.09 | | | | 3.93 | | | | (2.05 | ) | | | (2.05 | ) | |
Year Ended 12/31/18 | | $ | 17.90 | | | | (0.21 | ) | | | (1.16 | ) | | | (1.37 | ) | | | (2.78 | ) | | | (2.78 | ) | |
Year Ended 12/31/17 | | $ | 14.51 | | | | (0.15 | ) | | | 4.60 | | | | 4.45 | | | | (1.06 | ) | | | (1.06 | ) | |
Year Ended 12/31/16 | | $ | 15.73 | | | | (0.14 | ) | | | 0.31 | | | | 0.17 | | | | (1.39 | ) | | | (1.39 | ) | |
Class R | |
Year Ended 12/31/20 | | $ | 17.29 | | | | (0.19 | ) | | | 6.18 | | | | 5.99 | | | | (2.19 | ) | | | (2.19 | ) | |
Year Ended 12/31/19 | | $ | 15.00 | | | | (0.14 | ) | | | 4.48 | | | | 4.34 | | | | (2.05 | ) | | | (2.05 | ) | |
Year Ended 12/31/18 | | $ | 19.22 | | | | (0.18 | ) | | | (1.26 | ) | | | (1.44 | ) | | | (2.78 | ) | | | (2.78 | ) | |
Year Ended 12/31/17 | | $ | 15.49 | | | | (0.13 | ) | | | 4.92 | | | | 4.79 | | | | (1.06 | ) | | | (1.06 | ) | |
Year Ended 12/31/16 | | $ | 16.65 | | | | (0.11 | ) | | | 0.34 | | | | 0.23 | | | | (1.39 | ) | | | (1.39 | ) | |
Class Y | |
Year Ended 12/31/20 | | $ | 20.11 | | | | (0.02 | ) | | | 7.23 | | | | 7.21 | | | | (2.19 | ) | | | (2.19 | ) | |
Year Ended 12/31/19 | | $ | 17.04 | | | | 0.02 | | | | 5.10 | | | | 5.12 | | | | (2.05 | ) | | | (2.05 | ) | |
Year Ended 12/31/18 | | $ | 21.23 | | | | — | (c) | | | (1.41 | ) | | | (1.41 | ) | | | (2.78 | ) | | | (2.78 | ) | |
Year Ended 12/31/17 | | $ | 16.88 | | | | 0.03 | | | | 5.38 | | | | 5.41 | | | | (1.06 | ) | | | (1.06 | ) | |
Year Ended 12/31/16 | | $ | 17.87 | | | | 0.03 | | | | 0.37 | | | | 0.40 | | | | (1.39 | ) | | | (1.39 | ) | |
(a) Per share net investment income (loss) has been calculated using the average daily shares method.
(b) Portfolio turnover is calculated on the basis of the Fund as a whole without distinguishing between the classes of shares issued.
(c) Amount is less than $0.005 per share.
See notes to financial statements.
78
Victory Portfolios | | Financial Highlights — continued | |
For a Share Outstanding Throughout Each Period
| | | | | Ratios to Average Net Assets | | Supplemental Data | |
| | | Net Asset
Value,
End of
Period | | Total
Return
(Excludes
Sales
Charge) | | Net
Expenses | | Net
Investment
Income
(Loss) | | Gross
Expenses | | Net Assets,
End of
Period
(000's) | | Portfolio
Turnover(b) | |
Victory RS Growth Fund | |
Class A | |
Year Ended 12/31/20 | | $ | 23.84 | | | | 35.64 | % | | | 1.10 | % | | | (0.37 | )% | | | 1.19 | % | | $ | 274,388 | | | | 73 | % | |
Year Ended 12/31/19 | | $ | 19.22 | | | | 29.83 | % | | | 1.10 | % | | | (0.16 | )% | | | 1.19 | % | | $ | 223,503 | | | | 95 | % | |
Year Ended 12/31/18 | | $ | 16.40 | | | | (6.81 | )% | | | 1.10 | % | | | (0.28 | )% | | | 1.19 | % | | $ | 188,220 | | | | 87 | % | |
Year Ended 12/31/17 | | $ | 20.60 | | | | 31.75 | % | | | 1.10 | % | | | (0.09 | )% | | | 1.20 | % | | $ | 218,238 | | | | 74 | % | |
Year Ended 12/31/16 | | $ | 16.44 | | | | 1.86 | % | | | 1.10 | % | | | (0.09 | )% | | | 1.20 | % | | $ | 189,921 | | | | 123 | % | |
Class C | |
Year Ended 12/31/20 | | $ | 18.80 | | | | 34.55 | % | | | 1.93 | % | | | (1.20 | )% | | | 2.43 | % | | $ | 3,731 | | | | 73 | % | |
Year Ended 12/31/19 | | $ | 15.63 | | | | 28.74 | % | | | 1.93 | % | | | (0.99 | )% | | | 2.33 | % | | $ | 4,240 | | | | 95 | % | |
Year Ended 12/31/18 | | $ | 13.75 | | | | (7.56 | )% | | | 1.93 | % | | | (1.10 | )% | | | 2.20 | % | | $ | 4,409 | | | | 87 | % | |
Year Ended 12/31/17 | | $ | 17.90 | | | | 30.57 | % | | | 1.93 | % | | | (0.92 | )% | | | 2.10 | % | | $ | 6,974 | | | | 74 | % | |
Year Ended 12/31/16 | | $ | 14.51 | | | | 1.05 | % | | | 1.93 | % | | | (0.93 | )% | | | 2.06 | % | | $ | 8,487 | | | | 123 | % | |
Class R | |
Year Ended 12/31/20 | | $ | 21.09 | | | | 34.87 | % | | | 1.71 | % | | | (0.98 | )% | | | 6.08 | % | | $ | 420 | | | | 73 | % | |
Year Ended 12/31/19 | | $ | 17.29 | | | | 29.08 | % | | | 1.71 | % | | | (0.77 | )% | | | 5.41 | % | | $ | 438 | | | | 95 | % | |
Year Ended 12/31/18 | | $ | 15.00 | | | | (7.41 | )% | | | 1.71 | % | | | (0.88 | )% | | | 3.49 | % | | $ | 516 | | | | 87 | % | |
Year Ended 12/31/17 | | $ | 19.22 | | | | 30.92 | % | | | 1.71 | % | | | (0.70 | )% | | | 2.72 | % | | $ | 830 | | | | 74 | % | |
Year Ended 12/31/16 | | $ | 15.49 | | | | 1.29 | % | | | 1.71 | % | | | (0.69 | )% | | | 1.77 | % | | $ | 1,054 | | | | 123 | % | |
Class Y | |
Year Ended 12/31/20 | | $ | 25.13 | | | | 36.06 | % | | | 0.83 | % | | | (0.09 | )% | | | 0.99 | % | | $ | 29,875 | | | | 73 | % | |
Year Ended 12/31/19 | | $ | 20.11 | | | | 30.18 | % | | | 0.83 | % | | | 0.11 | % | | | 0.98 | % | | $ | 31,473 | | | | 95 | % | |
Year Ended 12/31/18 | | $ | 17.04 | | | | (6.56 | )% | | | 0.83 | % | | | (0.01 | )% | | | 0.97 | % | | $ | 26,457 | | | | 87 | % | |
Year Ended 12/31/17 | | $ | 21.23 | | | | 32.05 | % | | | 0.83 | % | | | 0.17 | % | | | 0.97 | % | | $ | 30,309 | | | | 74 | % | |
Year Ended 12/31/16 | | $ | 16.88 | | | | 2.16 | % | | | 0.83 | % | | | 0.17 | % | | | 0.95 | % | | $ | 25,107 | | | | 123 | % | |
See notes to financial statements.
79
Victory Portfolios | | Financial Highlights | |
For a Share Outstanding Throughout Each Period
| | | | | Investment Activities | | Distributions to
Shareholders From | |
| | | Net Asset
Value,
Beginning of
Period | | Net
Investment
Income
(Loss)(a) | | Net Realized
and Unrealized
Gains (Losses)
on Investments | | Total from
Investment
Activities | | Net Realized
Gains from
Investments | | Total
Distributions | |
Victory RS Science and Technology Fund | |
Class A | |
Year Ended 12/31/20 | | $ | 23.37 | | | | (0.34 | ) | | | 15.48 | | | | 15.14 | | | | (2.16 | ) | | | (2.16 | ) | |
Year Ended 12/31/19 | | $ | 18.34 | | | | (0.26 | ) | | | 7.43 | | | | 7.17 | | | | (2.14 | ) | | | (2.14 | ) | |
Year Ended 12/31/18 | | $ | 21.56 | | | | (0.27 | ) | | | 0.06 | | | | (0.21 | ) | | | (3.01 | ) | | | (3.01 | ) | |
Year Ended 12/31/17 | | $ | 17.49 | | | | (0.25 | ) | | | 8.04 | | | | 7.79 | | | | (3.72 | ) | | | (3.72 | ) | |
Year Ended 12/31/16 | | $ | 17.35 | | | | (0.22 | ) | | | 2.64 | | | | 2.42 | | | | (2.28 | ) | | | (2.28 | ) | |
Class C | |
Year Ended 12/31/20 | | $ | 17.73 | | | | (0.41 | ) | | | 11.65 | | | | 11.24 | | | | (2.16 | ) | | | (2.16 | ) | |
Year Ended 12/31/19 | | $ | 14.40 | | | | (0.35 | ) | | | 5.82 | | | | 5.47 | | | | (2.14 | ) | | | (2.14 | ) | |
Year Ended 12/31/18 | | $ | 17.73 | | | | (0.38 | ) | | | 0.06 | | | | (0.32 | ) | | | (3.01 | ) | | | (3.01 | ) | |
Year Ended 12/31/17 | | $ | 14.96 | | | | (0.36 | ) | | | 6.85 | | | | 6.49 | | | | (3.72 | ) | | | (3.72 | ) | |
Year Ended 12/31/16 | | $ | 15.25 | | | | (0.31 | ) | | | 2.30 | | | | 1.99 | | | | (2.28 | ) | | | (2.28 | ) | |
Class R | |
Year Ended 12/31/20 | | $ | 19.60 | | | | (0.39 | ) | | | 12.94 | | | | 12.55 | | | | (2.16 | ) | | | (2.16 | ) | |
Year Ended 12/31/19 | | $ | 15.70 | | | | (0.31 | ) | | | 6.35 | | | | 6.04 | | | | (2.14 | ) | | | (2.14 | ) | |
Year Ended 12/31/18 | | $ | 18.99 | | | | (0.33 | ) | | | 0.05 | | | | (0.28 | ) | | | (3.01 | ) | | | (3.01 | ) | |
Year Ended 12/31/17 | | $ | 15.78 | | | | (0.31 | ) | | | 7.24 | | | | 6.93 | | | | (3.72 | ) | | | (3.72 | ) | |
Year Ended 12/31/16 | | $ | 15.91 | | | | (0.26 | ) | | | 2.41 | | | | 2.15 | | | | (2.28 | ) | | | (2.28 | ) | |
Class Y | |
Year Ended 12/31/20 | | $ | 25.36 | | | | (0.29 | ) | | | 16.82 | | | | 16.53 | | | | (2.16 | ) | | | (2.16 | ) | |
Year Ended 12/31/19 | | $ | 19.72 | | | | (0.22 | ) | | | 8.00 | | | | 7.78 | | | | (2.14 | ) | | | (2.14 | ) | |
Year Ended 12/31/18 | | $ | 22.90 | | | | (0.22 | ) | | | 0.05 | | | | (0.17 | ) | | | (3.01 | ) | | | (3.01 | ) | |
Year Ended 12/31/17 | | $ | 18.37 | | | | (0.21 | ) | | | 8.46 | | | | 8.25 | | | | (3.72 | ) | | | (3.72 | ) | |
Year Ended 12/31/16 | | $ | 18.08 | | | | (0.18 | ) | | | 2.75 | | | | 2.57 | | | | (2.28 | ) | | | (2.28 | ) | |
(a) Per share net investment income (loss) has been calculated using the average daily shares method.
(b) Portfolio turnover is calculated on the basis of the Fund as a whole without distinguishing between the classes of shares issued.
(c) Amount is less than $0.005 per share.
(d) The Fund received monies related to a nonrecurring refund from the prior Custodian. The corresponding impact to the total return was less than 0.005% for the period shown. (See Note 8)
See notes to financial statements.
80
Victory Portfolios | | Financial Highlights — continued | |
For a Share Outstanding Throughout Each Period
| | | | | Ratios to Average Net Assets | | Supplemental Data | |
| | | Capital
Contribution
from Prior
Custodian,
Net (See
Note 8) | | Net Asset
Value,
End of
Period | | Total
Return
(Excludes
Sales
Charge) | | Net
Expenses | | Net
Investment
Income
(Loss) | | Gross
Expenses | | Net Assets,
End of
Period
(000's) | | Portfolio
Turnover(b) | |
Victory RS Science and Technology Fund | |
Class A | |
Year Ended 12/31/20 | | | — | | | $ | 36.35 | | | | 65.03 | % | | | 1.48 | % | | | (1.22 | )% | | | 1.48 | % | | $ | 320,605 | | | | 30 | % | |
Year Ended 12/31/19 | | | — | | | $ | 23.37 | | | | 39.32 | % | | | 1.48 | % | | | (1.14 | )% | | | 1.48 | % | | $ | 199,591 | | | | 88 | % | |
Year Ended 12/31/18 | | | — | | | $ | 18.34 | | | | (0.73 | )% | | | 1.47 | % | | | (1.10 | )% | | | 1.47 | % | | $ | 140,389 | | | | 83 | % | |
Year Ended 12/31/17 | | | — | | | $ | 21.56 | | | | 44.74 | % | | | 1.49 | % | | | (1.18 | )% | | | 1.49 | % | | $ | 146,002 | | | | 89 | % | |
Year Ended 12/31/16 | | | — | (c) | | $ | 17.49 | | | | 13.80 | %(d) | | | 1.51 | % | | | (1.24 | )% | | | 1.52 | % | | $ | 105,041 | | | | 114 | % | |
Class C | |
Year Ended 12/31/20 | | | — | | | $ | 26.81 | | | | 63.71 | % | | | 2.28 | % | | | (2.03 | )% | | | 2.32 | % | | $ | 18,398 | | | | 30 | % | |
Year Ended 12/31/19 | | | — | | | $ | 17.73 | | | | 38.27 | % | | | 2.28 | % | | | (1.94 | )% | | | 2.34 | % | | $ | 14,054 | | | | 88 | % | |
Year Ended 12/31/18 | | | — | | | $ | 14.40 | | | | (1.58 | )% | | | 2.28 | % | | | (1.91 | )% | | | 2.31 | % | | $ | 11,857 | | | | 83 | % | |
Year Ended 12/31/17 | | | — | | | $ | 17.73 | | | | 43.70 | % | | | 2.28 | % | | | (1.97 | )% | | | 2.31 | % | | $ | 11,831 | | | | 89 | % | |
Year Ended 12/31/16 | | | — | (c) | | $ | 14.96 | | | | 12.87 | %(d) | | | 2.32 | % | | | (2.05 | )% | | | 2.32 | % | | $ | 10,332 | | | | 114 | % | |
Class R | |
Year Ended 12/31/20 | | | — | | | $ | 29.99 | | | | 64.32 | % | | | 1.93 | % | | | (1.68 | )% | | | 3.69 | % | | $ | 1,273 | | | | 30 | % | |
Year Ended 12/31/19 | | | — | | | $ | 19.60 | | | | 38.73 | % | | | 1.93 | % | | | (1.59 | )% | | | 4.28 | % | | $ | 681 | | | | 88 | % | |
Year Ended 12/31/18 | | | — | | | $ | 15.70 | | | | (1.20 | )% | | | 1.93 | % | | | (1.56 | )% | | | 2.75 | % | | $ | 707 | | | | 83 | % | |
Year Ended 12/31/17 | | | — | | | $ | 18.99 | | | | 44.05 | % | | | 1.93 | % | | | (1.62 | )% | | | 2.54 | % | | $ | 1,705 | | | | 89 | % | |
Year Ended 12/31/16 | | | — | (c) | | $ | 15.78 | | | | 13.41 | %(d) | | | 1.91 | % | | | (1.63 | )% | | | 1.91 | % | | $ | 1,394 | | | | 114 | % | |
Class Y | |
Year Ended 12/31/20 | | | — | | | $ | 39.73 | | | | 65.40 | % | | | 1.24 | % | | | (0.99 | )% | | | 1.26 | % | | $ | 109,275 | | | | 30 | % | |
Year Ended 12/31/19 | | | — | | | $ | 25.36 | | | | 39.66 | % | | | 1.24 | % | | | (0.89 | )% | | | 1.26 | % | | $ | 77,998 | | | | 88 | % | |
Year Ended 12/31/18 | | | — | | | $ | 19.72 | | | | (0.51 | )% | | | 1.24 | % | | | (0.85 | )% | | | 1.25 | % | | $ | 53,395 | | | | 83 | % | |
Year Ended 12/31/17 | | | — | | | $ | 22.90 | | | | 45.11 | % | | | 1.24 | % | | | (0.92 | )% | | | 1.26 | % | | $ | 32,047 | | | | 89 | % | |
Year Ended 12/31/16 | | | — | (c) | | $ | 18.37 | | | | 14.07 | %(d) | | | 1.28 | % | | | (1.01 | )% | | | 1.29 | % | | $ | 19,335 | | | | 114 | % | |
See notes to financial statements.
81
Victory Portfolios | | Financial Highlights | |
For a Share Outstanding Throughout Each Period
| | | | | Investment Activities | | Distributions to
Shareholders From | |
| | | Net Asset
Value,
Beginning of
Period | | Net
Investment
Income
(Loss)(a) | | Net Realized
and Unrealized
Gains (Losses)
on Investments | | Total from
Investment
Activities | | Net Realized
Gains from
Investments | | Total
Distributions | |
Victory RS Small Cap Equity Fund | |
Class A | |
Year Ended 12/31/20 | | $ | 16.05 | | | | (0.19 | ) | | | 6.17 | | | | 5.98 | | | | (4.01 | ) | | | (4.01 | ) | |
Year Ended 12/31/19 | | $ | 12.97 | | | | (0.15 | ) | | | 5.11 | | | | 4.96 | | | | (1.88 | ) | | | (1.88 | ) | |
Year Ended 12/31/18 | | $ | 18.88 | | | | (0.16 | ) | | | (1.47 | ) | | | (1.63 | ) | | | (4.28 | ) | | | (4.28 | ) | |
Year Ended 12/31/17 | | $ | 14.41 | | | | (0.14 | ) | | | 5.55 | | | | 5.41 | | | | (0.94 | ) | | | (0.94 | ) | |
Year Ended 12/31/16 | | $ | 14.24 | | | | (0.12 | ) | | | 0.28 | | | | 0.16 | | | | — | | | | — | | |
Class C | |
Year Ended 12/31/20 | | $ | 4.13 | | | | (0.07 | ) | | | 1.48 | | | | 1.41 | | | | (4.01 | ) | | | (4.01 | ) | |
Year Ended 12/31/19 | | $ | 4.40 | | | | (0.09 | ) | | | 1.70 | | | | 1.61 | | | | (1.88 | ) | | | (1.88 | ) | |
Year Ended 12/31/18 | | $ | 9.61 | | | | (0.17 | ) | | | (0.76 | ) | | | (0.93 | ) | | | (4.28 | ) | | | (4.28 | ) | |
Year Ended 12/31/17 | | $ | 7.74 | | | | (0.15 | ) | | | 2.96 | | | | 2.81 | | | | (0.94 | ) | | | (0.94 | ) | |
Year Ended 12/31/16 | | $ | 7.71 | | | | (0.12 | ) | | | 0.14 | | | | 0.02 | | | | — | | | | — | | |
Class R | |
Year Ended 12/31/20 | | $ | 12.32 | | | | (0.20 | ) | | | 4.68 | | | | 4.48 | | | | (4.01 | ) | | | (4.01 | ) | |
Year Ended 12/31/19 | | $ | 10.32 | | | | (0.18 | ) | | | 4.06 | | | | 3.88 | | | | (1.88 | ) | | | (1.88 | ) | |
Year Ended 12/31/18 | | $ | 16.08 | | | | (0.23 | ) | | | (1.25 | ) | | | (1.48 | ) | | | (4.28 | ) | | | (4.28 | ) | |
Year Ended 12/31/17 | | $ | 12.44 | | | | (0.20 | ) | | | 4.78 | | | | 4.58 | | | | (0.94 | ) | | | (0.94 | ) | |
Year Ended 12/31/16 | | $ | 12.33 | | | | (0.14 | ) | | | 0.24 | | | | 0.10 | | | | — | | | | — | | |
Class Y | |
Year Ended 12/31/20 | | $ | 16.52 | | | | (0.16 | ) | | | 6.36 | | | | 6.20 | | | | (4.01 | ) | | | (4.01 | ) | |
Year Ended 12/31/19 | | $ | 13.29 | | | | (0.13 | ) | | | 5.24 | | | | 5.11 | | | | (1.88 | ) | | | (1.88 | ) | |
Year Ended 12/31/18 | | $ | 19.20 | | | | (0.14 | ) | | | (1.49 | ) | | | (1.63 | ) | | | (4.28 | ) | | | (4.28 | ) | |
Year Ended 12/31/17 | | $ | 14.62 | | | | (0.14 | ) | | | 5.66 | | | | 5.52 | | | | (0.94 | ) | | | (0.94 | ) | |
Year Ended 12/31/16 | | $ | 14.39 | | | | (0.08 | ) | | | 0.30 | | | | 0.22 | | | | — | | | | — | | |
Member Class | |
11/3/20(f) through
12/31/20 | | $ | 17.72 | | | | (0.04 | ) | | | 4.37 | | | | 4.33 | | | | (4.01 | ) | | | (4.01 | ) | |
(a) Per share net investment income (loss) has been calculated using the average daily shares method.
(b) Not annualized for periods less than one year.
(c) Annualized for periods less than one year.
(d) Portfolio turnover is calculated on the basis of the Fund as a whole without distinguishing between the classes of shares issued.
(e) The Fund received monies related to a nonrecurring refund from the prior Custodian. The corresponding impact to the total return was less than 0.05% for the period shown. (See Note 8)
(f) Commencement of operations.
See notes to financial statements.
82
Victory Portfolios | | Financial Highlights — continued | |
For a Share Outstanding Throughout Each Period
| | | | | Ratios to Average Net Assets | | Supplemental Data | |
| | | Capital
Contribution
from Prior
Custodian,
Net (See
Note 8) | | Net Asset
Value,
End of
Period | | Total
Return
(Excludes
Sales
Charge)(b) | | Net
Expenses(c) | | Net
Investment
Income
(Loss)(c) | | Gross
Expenses(c) | | Net Assets,
End of
Period
(000's) | | Portfolio
Turnover(b)(d) | |
Victory RS Small Cap Equity Fund | |
Class A | |
Year Ended 12/31/20 | | | — | | | $ | 18.02 | | | | 37.99 | % | | | 1.29 | % | | | (1.14 | )% | | | 1.29 | % | | $ | 76,611 | | | | 157 | % | |
Year Ended 12/31/19 | | | — | | | $ | 16.05 | | | | 38.49 | % | | | 1.26 | % | | | (0.93 | )% | | | 1.26 | % | | $ | 63,247 | | | | 89 | % | |
Year Ended 12/31/18 | | | — | | | $ | 12.97 | | | | (8.39 | )% | | | 1.22 | % | | | (0.78 | )% | | | 1.22 | % | | $ | 51,619 | | | | 77 | % | |
Year Ended 12/31/17 | | | — | | | $ | 18.88 | | | | 37.57 | % | | | 1.25 | % | | | (0.84 | )% | | | 1.25 | % | | $ | 65,514 | | | | 79 | % | |
Year Ended 12/31/16 | | | 0.01 | | | $ | 14.41 | | | | 1.19 | %(e) | | | 1.35 | % | | | (0.88 | )% | | | 1.36 | % | | $ | 52,075 | | | | 86 | % | |
Class C | |
Year Ended 12/31/20 | | | — | | | $ | 1.53 | | | | 36.75 | % | | | 2.10 | % | | | (1.94 | )% | | | 5.26 | % | | $ | 515 | | | | 157 | % | |
Year Ended 12/31/19 | | | — | | | $ | 4.13 | | | | 37.26 | % | | | 2.10 | % | | | (1.76 | )% | | | 3.86 | % | | $ | 478 | | | | 89 | % | |
Year Ended 12/31/18 | | | — | | | $ | 4.40 | | | | (9.23 | )% | | | 2.10 | % | | | (1.71 | )% | | | 4.24 | % | | $ | 616 | | | | 77 | % | |
Year Ended 12/31/17 | | | — | | | $ | 9.61 | | | | 36.34 | % | | | 2.10 | % | | | (1.69 | )% | | | 3.87 | % | | $ | 533 | | | | 79 | % | |
Year Ended 12/31/16 | | | 0.01 | | | $ | 7.74 | | | | 0.39 | %(e) | | | 2.10 | % | | | (1.64 | )% | | | 3.14 | % | | $ | 410 | | | | 86 | % | |
Class R | |
Year Ended 12/31/20 | | | — | | | $ | 12.79 | | | | 37.31 | % | | | 1.75 | % | | | (1.59 | )% | | | 2.05 | % | | $ | 3,325 | | | | 157 | % | |
Year Ended 12/31/19 | | | — | | | $ | 12.32 | | | | 37.91 | % | | | 1.75 | % | | | (1.42 | )% | | | 2.05 | % | | $ | 2,874 | | | | 89 | % | |
Year Ended 12/31/18 | | | — | | | $ | 10.32 | | | | (8.92 | )% | | | 1.75 | % | | | (1.30 | )% | | | 1.88 | % | | $ | 2,303 | | | | 77 | % | |
Year Ended 12/31/17 | | | — | | | $ | 16.08 | | | | 36.84 | % | | | 1.75 | % | | | (1.34 | )% | | | 1.97 | % | | $ | 3,381 | | | | 79 | % | |
Year Ended 12/31/16 | | | 0.01 | | | $ | 12.44 | | | | 0.89 | %(e) | | | 1.70 | % | | | (1.24 | )% | | | 1.70 | % | | $ | 2,954 | | | | 86 | % | |
Class Y | |
Year Ended 12/31/20 | | | — | | | $ | 18.71 | | | | 38.24 | % | | | 1.10 | % | | | (0.95 | )% | | | 1.58 | % | | $ | 4,449 | | | | 157 | % | |
Year Ended 12/31/19 | | | — | | | $ | 16.52 | | | | 38.69 | % | | | 1.10 | % | | | (0.77 | )% | | | 1.43 | % | | $ | 3,275 | | | | 89 | % | |
Year Ended 12/31/18 | | | — | | | $ | 13.29 | | | | (8.23 | )% | | | 1.10 | % | | | (0.69 | )% | | | 1.68 | % | | $ | 2,750 | | | | 77 | % | |
Year Ended 12/31/17 | | | — | | | $ | 19.20 | | | | 37.78 | % | | | 1.10 | % | | | (0.78 | )% | | | 1.34 | % | | $ | 6,398 | | | | 79 | % | |
Year Ended 12/31/16 | | | 0.01 | | | $ | 14.62 | | | | 1.60 | %(e) | | | 1.10 | % | | | (0.64 | )% | | | 1.24 | % | | $ | 1,834 | | | | 86 | % | |
Member Class | |
11/3/20(f) through
12/31/20 | | | — | | | $ | 18.04 | | | | 25.09 | % | | | 1.15 | % | | | (1.14 | )% | | | 23.73 | % | | $ | 218 | | | | 157 | % | |
See notes to financial statements.
83
Victory Portfolios | | Notes to Financial Statements
December 31, 2020 | |
1. Organization:
Victory Portfolios (the "Trust") was organized on December 6, 1995 as a Delaware statutory trust as a successor to a company named "The Victory Portfolios," which was organized as a Massachusetts business trust on February 5, 1986. The Trust is registered under the Investment Company Act of 1940, as amended (the "1940 Act"), as an open-end investment company. The Trust is comprised of 42 funds and is authorized to issue an unlimited number of shares, which are units of beneficial interest with a par value of $0.001 per share. Each Fund is classified as diversified under the 1940 Act.
The accompanying financial statements are those of the following six Funds (collectively, the "Funds" and individually, a "Fund").
Funds (Legal Name) | | Funds (Short Name) | | Investment Share
Classes Offered | |
Victory RS Small Cap Growth Fund | | RS Small Cap Growth Fund | | Classes A, C, R, R6 and Y | |
Victory RS Select Growth Fund | | RS Select Growth Fund | | Classes A, C, R, R6 and Y | |
Victory RS Mid Cap Growth Fund
| | RS Mid Cap Growth Fund
| | Classes A, C, R, R6, Y and
Member Class* | |
Victory RS Growth Fund | | RS Growth Fund | | Classes A, C, R and Y | |
Victory RS Science and
Technology Fund | | RS Science and
Technology Fund | | Classes A, C, R and Y
| |
Victory RS Small Cap Equity Fund
| | RS Small Cap Equity Fund
| | Classes A, C, R, Y and
Member Class* | |
* Member Class commenced operations on November 3, 2020.
Each class of shares of a Fund has substantially identical rights and privileges except with respect to sales charges, fees paid under distribution plans, expenses allocable exclusively to each class of shares, voting rights on matters solely affecting a single class of shares, and the exchange privilege of each class of shares.
Under the Trust's organizational documents, its officers and trustees are indemnified against certain liabilities arising out of the performance of their duties to the Funds. In addition, in the normal course of business, the Funds enter into contracts with their vendors and others that provide for general indemnifications. The Funds' maximum exposure under these arrangements is unknown, as this would involve future claims that may be made against the Funds. However, based on experience, the Funds expect that risk of loss to be remote.
2. Significant Accounting Policies:
The following is a summary of significant accounting policies followed by the Trust in the preparation of its financial statements. The policies are in conformity with Generally Accepted Accounting Principles in the United States of America ("GAAP"). The preparation of financial statements in accordance with GAAP requires management to make estimates and assumptions that affect the reported amounts of assets and liabilities and disclosure of contingent assets and liabilities at the date of the financial statements and the reported amounts of income and expenses for the period. Actual results could differ from those estimates. The Funds follow the specialized accounting and reporting requirements under GAAP that are applicable to investment companies.
Investment Valuation:
The Funds record investments at fair value. Fair value is defined as the price that would be received to sell an asset or paid to transfer a liability in an orderly transaction between market participants at the measurement date.
The valuation techniques described below maximize the use of observable inputs and minimize the use of unobservable inputs in determining fair value. The inputs used for valuing the Funds' investments are summarized in the three broad levels listed below:
• Level 1 — quoted prices in active markets for identical securities
84
Victory Portfolios | | Notes to Financial Statements — continued
December 31, 2020 | |
• Level 2 — other significant observable inputs (including quoted prices for similar securities or interest rates applicable to those securities, etc.)
• Level 3 — significant unobservable inputs (including the Funds' own assumptions in determining the fair value of investments)
Changes in valuation techniques may result in transfers in or out of an assigned level within the disclosure hierarchy. The inputs or methodologies used for valuation techniques are not necessarily an indication of the risk associated with entering into those investments.
Portfolio securities listed or traded on securities exchanges, including Exchange-Traded Funds ("ETFs"), American Depositary Receipts ("ADRs") and Rights, are valued at the closing price on the exchange or system where the security is principally traded, if available, or at the Nasdaq Official Closing Price. If there have been no sales for that day on the exchange or system, then a security is valued at the last available bid quotation on the exchange or system where the security is principally traded. In each of these situations, valuations are typically categorized as Level 1 in the fair value hierarchy.
Investments in open-end investment companies are valued at net asset value. These valuations are typically categorized as Level 1 in the fair value hierarchy.
Investments for which there are no such quotations, or for which quotations do not appear reliable, are valued at fair value in accordance with procedures established by and under the general supervision and responsibility of the Trust's Board of Trustees (the "Board"). These valuations are typically categorized as Level 2 or Level 3 in the fair value hierarchy, based on the observability of inputs used to determine the fair value.
A summary of the valuations as of December 31, 2020, based upon the three levels defined above, is included in the table below while the breakdown, by category, of investments is disclosed on the Schedules of Portfolio Investments.
| | | Level 1 | | Level 2 | | Level 3 | | Total | |
RS Small Cap Growth Fund | |
Common Stocks | | $ | 2,884,680,241 | | | $ | — | | | $ | — | | | $ | 2,884,680,241 | | |
Collateral for Securities Loaned | | | 309,080,609 | | | | — | | | | — | | | | 309,080,609 | | |
Total | | $ | 3,193,760,850 | | | $ | — | | | $ | — | | | $ | 3,193,760,850 | | |
RS Select Growth Fund | |
Common Stocks | | $ | 229,758,885 | | | $ | — | | | $ | — | | | $ | 229,758,885 | | |
Collateral for Securities Loaned | | | 17,121,224 | | | | — | | | | — | | | | 17,121,224 | | |
Total | | $ | 246,880,109 | | | $ | — | | | $ | — | | | $ | 246,880,109 | | |
RS Mid Cap Growth Fund | |
Common Stocks | | $ | 601,083,267 | | | $ | — | | | $ | — | | | $ | 601,083,267 | | |
Collateral for Securities Loaned | | | 21,105,286 | | | | — | | | | — | | | | 21,105,286 | | |
Total | | $ | 622,188,553 | | | $ | — | | | $ | — | | | $ | 622,188,553 | | |
RS Growth Fund | |
Common Stocks | | $ | 305,726,653 | | | $ | — | | | $ | — | | | $ | 305,726,653 | | |
Collateral for Securities Loaned | | | 10,656,676 | | | | — | | | | — | | | | 10,656,676 | | |
Total | | $ | 316,383,329 | | | $ | — | | | $ | — | | | $ | 316,383,329 | | |
RS Science and Technology Fund | |
Common Stocks | | $ | 437,125,902 | | | $ | 2,192,926 | | | $ | — | | | $ | 439,318,828 | | |
Warrants | | | — | | | | 663,184 | | | | — | | | | 663,184 | | |
Collateral for Securities Loaned | | | 41,521,357 | | | | — | | | | — | | | | 41,521,357 | | |
Total | | $ | 478,647,259 | | | $ | 2,856,110 | | | $ | — | | | $ | 481,503,369 | | |
85
Victory Portfolios | | Notes to Financial Statements — continued
December 31, 2020 | |
| | | Level 1 | | Level 2 | | Level 3 | | Total | |
RS Small Cap Equity Fund | |
Common Stocks | | $ | 83,098,178 | | | $ | — | | | $ | — | | | $ | 83,098,178 | | |
Collateral for Securities Loaned | | | 12,411,679 | | | | — | | | | — | | | | 12,411,679 | | |
Total | | $ | 95,509,857 | | | $ | — | | | $ | — | | | $ | 95,509,857 | | |
For the year ended December 31, 2020, there were no transfers in or out of the Level 3 fair value hierarchy.
Real Estate Investment Trusts ("REITs"):
The Funds may invest in REITs, which report information on the source of their distributions annually. REITs are pooled investment vehicles that invest primarily in income-producing real estate or real- estate related loans or interests (such as mortgages). Certain distributions received from REITs during the year are recorded as realized gains or return of capital as estimated by the Funds or when such information becomes known.
Investment Companies:
Open-End Funds:
The Funds may invest in portfolios of open-end investment companies. These investment companies value securities in their portfolios for which market quotations are readily available at their market values (generally the last reported sale price) and all other securities and assets at their fair value by the methods established by the board of directors of the underlying funds.
Investment Transactions and Related Income:
Changes in holdings of investments are accounted for no later than one business day following the trade date. For financial reporting purposes, however, investment transactions are accounted for on trade date on the last business day of the reporting period. Interest income is determined on the basis of coupon interest accrued using the effective interest method which adjusts, where applicable, the amortization of premiums or accretion of discounts. Dividend income is recorded on the ex-dividend date. Gains or losses realized on sales of securities are recorded on the identified cost basis.
Withholding taxes on interest, dividends and gains as a result of certain investments in ADRs by the Funds have been provided for in accordance with each investment's applicable country's tax rules and rates.
Securities Lending:
The Trust has entered into a Master Securities Lending Agreement ("MSLA") with Citibank, N.A. ("Citibank" or the "Agent"). Under the terms of the MSLA, the Funds may lend securities to certain broker-dealers and banks in exchange for collateral in the amount of at least 102% of the value of U.S. securities loaned or at least 105% of the value of non-U.S. securities loaned, marked-to-market daily. Any collateral shortfalls associated with increases in the valuation of the securities loaned are adjusted the next business day. The collateral can be received in the form of cash collateral and/or non-cash collateral. Non-cash collateral can include U.S. Government Securities, letters of credit and certificates of deposit. The cash collateral is invested in short-term instruments or cash equivalents, primarily open-end investment companies, as noted on the Funds' Schedules of Portfolio Investments. The Trust does not have effective control of the non-cash collateral and therefore it is not disclosed on the Funds' Schedules of Portfolio Investments. During the time portfolio securities are on loan, the borrower will pay the Funds any dividends or interest paid on such securities plus any fee negotiated between the parties to the lending agreement. The Funds also earn a return from the collateral. The Funds pay the Agent various fees in connection with the investment of cash collateral and fees based on the investment income received from securities lending activities. Securities lending income (net of these fees) is disclosed on the Statements of Operations. Although risk is mitigated by the collateral, the Funds could
86
Victory Portfolios | | Notes to Financial Statements — continued
December 31, 2020 | |
experience a delay in recovering their securities and possible loss of income or value if the borrower fails to return them.
Securities lending transactions are entered into by a Fund under the MSLA, which permits the Fund, under certain circumstances such as an event of default, to offset amounts payable by the Fund to the same counterparty against amounts receivable from the counterparty to create a net payment due to or from the Fund.
The following table is a summary of the Funds' securities lending transactions which are subject to offset under the MSLA as of December 31, 2020. These transactions are accounted for as secured borrowings with an overnight and continuous contractual maturity for cash collateral and greater than overnight and continuous contractual maturity for non-cash collateral.
| | | Gross
Amount of
Recognized
Assets
(Value of | | Value of
Cash | | Value of Non-cash Collateral
Received by Maturity | | | |
| | | Securities
on Loan) | | Collateral
Received | | <30 | | Between
30 & 90 days | | 90 days | | Net Amount | |
RS Small Cap Growth
Fund | | $ | 295,379,460 | | | $ | 295,379,460 | | | $ | — | | | $ | — | | | $ | — | | | $ | — | | |
RS Select Growth Fund | | | 16,583,572 | | | | 16,583,572 | | | | — | | | | — | | | | — | | | | — | | |
RS Mid Cap Growth
Fund | | | 20,268,130 | | | | 20,268,130 | | | | — | | | | — | | | | — | | | | — | | |
RS Growth Fund | | | 10,470,625 | | | | 10,470,625 | | | | — | | | | — | | | | — | | | | — | | |
RS Science and
Technology Fund | | | 39,281,641 | | | | 39,281,641 | | | | — | | | | — | | | | — | | | | — | | |
RS Small Cap Equity
Fund | | | 11,847,423 | | | | 11,847,423 | | | | — | | | | — | | | | — | | | | — | | |
* Collateral received in excess of the market value of securities on loan is not presented in this table. The total cash collateral received by each Fund is disclosed on the Statements of Assets and Liabilities.
Federal Income Taxes:
It is the policy of each Fund to continue to qualify as a regulated investment company by complying with the provisions available to certain investment companies, as defined in applicable sections of the Internal Revenue Code, and to make distributions of net investment income and net realized gains sufficient to relieve it from all, or substantially all, federal income taxes. Accordingly, no provision for federal income taxes is required in the financial statements. The Funds have a tax year end of December 31.
Management of the Funds has reviewed tax positions taken in tax years that remain subject to examination by all major tax jurisdictions, including federal (i.e., the last four tax years, which includes the current fiscal tax year end). Management believes that there is no tax liability resulting from unrecognized tax benefits related to uncertain tax positions taken.
Allocations:
Expenses directly attributable to a Fund are charged to the Fund, while expenses which are attributable to more than one fund in the Trust, or jointly with an affiliated trust, are allocated among the respective funds in the Trust and/or affiliated trust based upon net assets or another appropriate basis.
Income, expenses (other than class-specific expenses such as transfer agent fees, state registration fees, printing fees and 12b-1 fees), and realized and unrealized gains or losses on investments are allocated to each class of shares based on its relative net assets on the date income is earned or expenses and realized and unrealized gains and losses are incurred.
87
Victory Portfolios | | Notes to Financial Statements — continued
December 31, 2020 | |
3. Purchases and Sales of Securities:
Purchases and sales of securities (excluding securities maturing less than one year from acquisition) for the year ended December 31, 2020, were as follows:
| | | Purchases
(excluding U.S.
Government
Securities | | Sales
(excluding U.S.
Government
Securities) | |
RS Small Cap Growth Fund | | $ | 1,634,249,768 | | | $ | 1,819,271,443 | | |
RS Select Growth Fund | | | 147,799,757 | | | | 197,689,128 | | |
RS Mid Cap Growth Fund | | | 479,775,181 | | | | 560,536,902 | | |
RS Growth Fund | | | 191,406,479 | | | | 228,581,573 | | |
| RS Science and Technology Fund | | | 95,333,488 | | | | 123,632,818 | | |
RS Small Cap Equity Fund | | | 104,929,936 | | | | 114,452,144 | | |
For the year ended December 31, 2020, there were no purchases or sales of U.S. Government Securities.
4. Fees and Transactions with Affiliates and Related Parties:
Investment advisory services are provided to the Funds by Victory Capital Management Inc. ("VCM" or the "Adviser"), a New York corporation registered as an investment adviser with the Securities and Exchange Commission ("SEC"). The Adviser is a wholly owned indirect subsidiary of Victory Capital Holdings, Inc., a publicly traded Delaware corporation and a wholly owned direct subsidiary of Victory Capital Operating, LLC. Amounts incurred and paid to VCM for the year ended December 31, 2020, are reflected on the Statements of Operations as Investment advisory fees.
Under the terms of the Investment Advisory Agreement, the Adviser is entitled to receive fees based on a percentage of the average daily net assets of each Fund. The rates at which the Adviser is paid by each Fund are included in the table below. The Adviser may use its resources to assist with the Funds' distribution and marketing expenses.
| | | Flat Rate | |
RS Small Cap Growth Fund | | | 0.95 | % | |
RS Select Growth Fund | | | 1.00 | % | |
RS Mid Cap Growth Fund | | | 0.85 | % | |
RS Growth Fund | | | 0.75 | % | |
RS Science and Technology Fund | | | 1.00 | % | |
RS Small Cap Equity Fund | | | 0.75 | % | |
VCM also serves as the Funds' administrator and fund accountant. Under the Administration and Fund Accounting Agreement, VCM is paid for its services an annual fee at a rate of 0.08% of the first $15 billion in average daily net assets of the Trust, Victory Variable Insurance Funds and Victory Portfolios II (collectively, the "Victory Funds Complex"), 0.05% of the average daily net assets above $15 billion to $30 billion of the Victory Funds Complex and 0.04% of the average daily net assets over $30 billion of the Victory Funds Complex. Amounts incurred for the year ended December 31, 2020, are reflected on the Statements of Operations as Administration fees.
Citi Fund Services Ohio, Inc. ("Citi"), an affiliate of Citibank, acts as sub-administrator and sub-fund accountant to the Funds pursuant to the Sub-Administration and Sub-Fund Accounting Services Agreement between VCM and Citi. VCM pays Citi a fee for providing these services. The Funds reimburse VCM and Citi for out-of-pocket expenses incurred in providing these services and certain other expenses specifically allocated to the Funds. Amounts incurred for the year ended December 31, 2020, are reflected on the Statements of Operations as Sub-Administration fees.
Citibank serves as the Funds' custodian. The Funds pay Citibank a fee for providing these services. Amounts incurred for the year ended December 31, 2020, are reflected on the Statements of Operations as Custodian fees.
88
Victory Portfolios | | Notes to Financial Statements — continued
December 31, 2020 | |
FIS Investor Services, LLC ("FIS") serves as the Funds' transfer agent. Under the Transfer Agent Agreement, the Trust pays FIS a fee for its services and reimburses FIS for all of their reasonable out-of-pocket expenses incurred in providing these services. Amounts incurred for the year ended December 31, 2020, are reflected on the Statements of Operations as Transfer agent fees.
Victory Capital Transfer Agency, Inc., an affiliate of the Adviser, serves as sub-transfer agent for the Member Class shares of the Funds and receives no fee or other compensation for these services.
The Chief Compliance Officer ("CCO") is an employee of the Adviser, which pays the compensation of the CCO and his support staff. The Trust has entered into an agreement to provide compliance services with the Adviser, pursuant to which the Adviser furnishes its compliance personnel, including the services of the CCO, and other resources reasonably necessary to provide the Trust with compliance oversight services related to the design, administration and oversight of a compliance program for the Trust in accordance with Rule 38a-1 under the 1940 Act. The Funds in the Victory Funds Complex, in aggregate, compensate the Adviser for these services. Amounts incurred for the year ended December 31, 2020, are reflected on the Statements of Operations as Compliance fees.
Sidley Austin LLP provides legal services to the Trust.
Victory Capital Services, Inc. (the "Distributor"), an affiliate of the Adviser, serves as distributor for the continuous offering of the shares of the Funds pursuant to a Distribution Agreement between the Distributor and the Trust, and receives no fee or other compensation for these services. Effective June 30, 2020, the Distributor's name was changed from Victory Capital Advisers, Inc. Amounts incurred for the year ended December 31, 2020, are reflected on the Statements of Operations as 12b-1 fees.
Pursuant to the Distribution and Service Plans adopted in accordance with Rule 12b-1 under the 1940 Act, the Distributor may receive a monthly distribution and service fee, at an annual rate of up to 0.25% of the average daily net assets of Class A Shares, at an annual rate of up to 0.50% of the average daily net assets of Class R Shares and 1.00% of the average daily net assets of Class C Shares of the Funds. The distribution and service fees paid to the Distributor may be used by the Distributor to pay for activities primarily intended to result in the sale of Class A, Class R or Class C Shares of the Funds.
In addition, the Distributor is entitled to receive commissions on sales of the Class A Shares of the Funds. For the year ended December 31, 2020, the Distributor received approximately $40,281 from commissions earned on sales of Class A Shares of the Funds.
The Adviser has entered into expense limitation agreements with certain Funds. Under the terms of the agreements, the Adviser has agreed to waive fees or reimburse certain expenses to the extent that ordinary operating expenses incurred by certain classes of a Fund in any fiscal year exceed the expense limit for such classes of the Fund. Such excess amounts will be the liability of the Adviser. Interest, taxes, brokerage commissions, other expenditures which are capitalized in accordance with GAAP, and other extraordinary expenses not incurred in the ordinary course of a Fund's business are excluded from the expense limits. As of December 31, 2020, the expense limits (excluding voluntary waivers) are as follows:
| | | In effect until April 30, 2021 | |
| | | Class A
Shares | | Class C
Shares | | Class R
Shares | | Class R6
Shares | | Class Y
Shares | | Member
Class | |
RS Small Cap Growth
Fund | | | 1.40 | % | | | 2.16 | % | | | 1.86 | % | | | 1.06 | % | | | 1.13 | % | | | N/A | | |
RS Select Growth Fund | | | 1.40 | % | | | 2.18 | % | | | 1.91 | % | | | 1.06 | % | | | 1.14 | % | | | N/A | | |
RS Mid Cap Growth Fund | | | 1.20 | % | | | 2.11 | % | | | 1.80 | % | | | 0.94 | % | | | 0.95 | % | | | 1.05 | %(a) | |
RS Growth Fund | | | 1.10 | % | | | 1.93 | % | | | 1.71 | % | | | N/A | | | | 0.83 | % | | | N/A | | |
RS Science and Technology
Fund | | | 1.49 | % | | | 2.28 | % | | | 1.93 | % | | | N/A | | | | 1.24 | % | | | N/A | | |
RS Small Cap Equity
Fund | | | 1.35 | % | | | 2.10 | % | | | 1.75 | % | | | N/A | | | | 1.10 | % | | | 1.15 | %(a) | |
(a) In effect from November 3, 2020, until at least April 30, 2022.
The Funds have agreed to repay fees and expenses that were waived or reimbursed by the Adviser for a period up to three fiscal years after such waiver or reimbursement was made to the extent such
89
Victory Portfolios | | Notes to Financial Statements — continued
December 31, 2020 | |
payments or repayments would not cause the expenses of a class to exceed the original expense limitation in place at the time of the waiver or reimbursement or any expense limitation agreement in place at the time of repayment. Amounts repaid to the Adviser during the year, if any, are reflected on the Statements of Operations as Recoupment of prior expenses waived/reimbursed by Adviser.
As of December 31, 2020, the following amounts are available to be repaid to the Adviser. The Funds have not recorded any amounts available to be repaid as a liability due to an assessment that such repayment is not probable at December 31, 2020.
| | | Expires
December 30,
2021 | | Expires
December 30,
2022 | | Expires
December 31,
2023 | | Total | |
RS Small Cap Growth Fund | | $ | 578,670 | | | $ | 506,151 | | | $ | 489,756 | | | $ | 1,574,577 | | |
RS Select Growth Fund | | | 334,454 | | | | 285,457 | | | | 227,571 | | | | 847,482 | | |
RS Mid Cap Growth Fund | | | 394,372 | | | | 681,628 | | | | 759,444 | | | | 1,835,444 | | |
RS Growth Fund | | | 283,325 | | | | 288,176 | | | | 294,950 | | | | 866,451 | | |
RS Science and Technology Fund | | | 25,649 | | | | 41,114 | | | | 37,306 | | | | 104,069 | | |
RS Small Cap Equity Fund | | | 28,246 | | | | 30,362 | | | | 40,673 | | | | 99,281 | | |
The Adviser may voluntarily waive or reimburse additional fees to assist the Funds in maintaining competitive expense ratios. Voluntary waivers and reimbursements applicable to the Funds are not available to be recouped at a future time. There were no voluntary waivers or reimbursements for the year ended December 31, 2020.
Certain officers and/or interested trustees of the Funds are also officers and/or employees of the Adviser, Administrator, Fund Accountant, Sub-Administrator, Sub-Fund Accountant, Custodian, Distributor, and Legal Counsel.
5. Risks:
Each Fund may be subject to other risks in addition to these identified risks.
Equity Risk — An investment in the Funds' shares represents an indirect investment in the securities owned by the Funds, some of which will be traded on a national securities exchange or in the over-the-counter markets. The value of the securities in which the Funds invest, like other market investments, may move up or down, sometimes rapidly and unpredictably. The value of the securities in which the Funds invest may affect the value of the Funds' shares. An investment in the Funds' shares at any point in time may be worth less than the original investment, even after taking into account the reinvestment of the Funds' distributions.
Stock Market Risk — Overall stock market risks may affect the value of the Fund. Domestic and international factors such as political events, war, trade disputes, interest rate levels and other fiscal and monetary policy changes, pandemics and other public health crises and related geopolitical events, as well as environmental disasters such as earthquakes, fire and floods, may add to instability in world economies and markets generally. The impact of these and other factors may be short-term or may last for extended periods.
Sector Risk — To the extent the Funds focus in one or more sectors, market or economic factors impacting those sectors could have a significant effect on the value of the Funds' investments and could make the Funds' performance more volatile. For example, the values of companies in the Information Technology sector are particularly vulnerable to economic downturns, short product cycles and aggressive pricing, market competition and changes in government regulation.
Concentration Risk — The RS Science and Technology Fund (herein, the "Fund") may concentrate its investments in a particular industry, as the term "concentration" is used in the 1940 Act. Concentrating investments in the Science and Technology-related sectors increases the risk of loss because the stocks of many or all of the companies in the sectors may decline in value due to developments adversely affecting the sectors. In addition, investors may buy or sell substantial amounts of the Fund's shares in response to factors affecting or expected to affect the sectors, resulting in extreme inflows and outflows
90
Victory Portfolios | | Notes to Financial Statements — continued
December 31, 2020 | |
of cash into and out of the Fund. Such inflows or outflows might affect management of the Fund adversely to the extent they cause the Fund's cash position or cash requirements to exceed normal levels.
Geopolitical/Natural Disaster Risk — An outbreak of disease called COVID-19 has spread internationally. The transmission of COVID-19 and efforts to contain its spread have resulted in international, national and local border closings and other significant travel restrictions and disruptions, significant disruptions to business operations, supply chains and consumer activity, significant challenges in healthcare service preparation and delivery, quarantines and general concern and uncertainty. These negative impacts have caused significant volatility and declines in global financial markets, which have caused losses for Fund investors during and subsequent to period end. The impact of the COVID-19 pandemic may last for an extended period of time, and could result in a substantial economic downturn or recession. Public health crises may exacerbate other pre-existing political, social, economic, market and financial risks. The extent of the impact to the financial performance of the Funds' investments will depend on future developments, including (i) the duration and spread of the outbreak, (ii) the restrictions and advisories, (iii) the effects on the financial markets, and (iv) the effects on the economy overall, all of which are highly uncertain and cannot be predicted.
6. Borrowing and Interfund Lending:
Line of Credit:
For the year ended December 31, 2020, the Victory Funds Complex and the USAA Mutual Funds Complex (another series of mutual funds managed by the Adviser) participated in a short-term demand note "Line of Credit" agreement with Citibank. The Line of Credit agreement with Citibank was renewed on June 29, 2020, with a termination date of June 28, 2021. Under the agreement with Citibank, the Victory Funds Complex and USAA Mutual Funds Complex, combined, may borrow up to $600 million, of which $300 million is committed and $300 million is uncommitted. $40 million of the Line of Credit is reserved for use by the Victory Floating Rate Fund (herein, the "Fund"), another series of the Victory Funds Complex, with that Fund paying the related commitment fees for that amount. The purpose of the agreement is to meet temporary or emergency cash needs. For the year ended December 31, 2020, Citibank received an annual commitment fee of 0.15% on $300 million for providing the Line of Credit. Each fund in the Victory Funds Complex pays a pro-rata portion of the commitment fees plus any interest (one month LIBOR plus one percent) on amounts borrowed. Effective June 29, 2020, under an amended Line of Credit agreement, Citibank will also receive an annual upfront fee of 0.10% on the $300 million committed line of credit. Each fund in the Victory Funds Complex will pay a pro-rata portion of the upfront fee. Interest charged to each Fund during the period, if applicable, is presented on the Statements of Operations under Line of credit fees.
The Funds did not utilize the Line of Credit during the year ended December 31, 2020.
Interfund Lending:
The Trust and Adviser rely on an exemptive order granted by the SEC in March 2017 (the "Order"), permitting the establishment and operation of an Interfund Lending Facility (the "Facility"). The Facility allows each Fund to directly lend money to and borrow money from any other Victory Fund, that is permitted to participate in the Facility, relying upon the Order at rates beneficial to both the borrowing and lending funds. Advances under the Facility are allowed for temporary or emergency purposes, including the meeting of redemption requests that otherwise might require the untimely disposition of securities, and are subject to each Fund's borrowing restrictions. The interfund loan rate is determined, as specified in the Order, by averaging the current repurchase agreement rate and the current bank loan rate. As a Borrower, interest charged to each Fund during the period, if applicable, is presented on the Statements of Operations under Interfund lending fees. As a Lender, interest earned by each Fund during the period, if applicable, is presented on the Statements of Operations under Interfund lending income.
91
Victory Portfolios | | Notes to Financial Statements — continued
December 31, 2020 | |
The average borrowing and lending for the days outstanding and average interest rate for each Fund during the year ended December 31, 2020, were as follows:
| | | Borrower or
Lender | | Amount
Outstanding at
December 31, 2020 | | Average
Borrowing* | | Days
Borrowing
Outstanding | | Average
Interest
Rate* | | Maximum
Borrowing
During the
Period | |
RS Small Cap
Growth Fund | | Lender | | $ | — | | | $ | 3,715,000 | | | | 1 | | | | 0.62 | % | | $ | 3,715,000 | | |
RS Mid Cap
Growth Fund | | Borrower | | | — | | | | 7,203,571 | | | | 7 | | | | 0.78 | % | | | 13,290,000 | | |
* For the year ended December 31, 2020, based on the number of days borrowings were outstanding.
7. Federal Income Tax Information:
Dividends from net investment income, if any, are declared and paid annually for the Funds. Distributable net realized gains, if any, are declared and distributed at least annually from each Fund.
The amounts of dividends from net investment income and distributions from net realized gains (collectively, distributions to shareholders) are determined in accordance with federal income tax regulations, which may differ from GAAP. To the extent these "book/tax" differences are permanent in nature (e.g., net operating loss and distribution reclassification), such amounts are reclassified within the components of net assets based on their federal tax-basis treatment; temporary differences (e.g., wash sales) do not require reclassification. To the extent dividends and distributions exceed net investment income and net realized gains for tax purposes, they are reported as distributions of capital. Net investment losses incurred by a Fund may be reclassified as an offset to capital on the accompanying Statements of Assets and Liabilities.
As of December 31, 2020, on the Statements of Assets and Liabilities, as a result of permanent book-to-tax differences, reclassification adjustments were as follows:
| | Total
Accumulated
Earnings/(Loss) | | Capital | |
RS Small Cap Growth Fund | | $ | 15,875,438 | | | $ | (15,875,438 | ) | |
RS Select Growth Fund | | | (4,361,146 | ) | | | 4,361,146 | | |
RS Mid Cap Growth Fund | | | 374,102 | | | | (374,102 | ) | |
RS Growth Fund | | | (1,116,684 | ) | | | 1,116,684 | | |
RS Science and Technology Fund | | | (1,778,636 | ) | | | 1,778,636 | | |
RS Small Cap Equity Fund | | | (631,058 | ) | | | 631,058 | | |
The tax character of distributions paid during the tax years ended, as noted below, were as follows (total distributions paid may differ from the Statements of Changes in Net Assets because, for tax purposes, dividends are recognized when actually paid):
| | Year Ended December 31, 2020 | |
| | | Distributions paid from: | | | |
| | | Ordinary
Income | | Net
Long-Term
Capital Gains | | Total
Distributions
Paid | |
RS Small Cap Growth Fund | | $ | — | | | $ | 238,416,513 | | | $ | 238,416,513 | | |
RS Select Growth Fund | | | — | | | | 36,049,711 | | | | 36,049,711 | | |
RS Mid Cap Growth Fund | | | — | | | | 23,813,744 | | | | 23,813,744 | | |
RS Growth Fund | | | 735,571 | | | | 25,325,913 | | | | 26,061,484 | | |
RS Science and Technology Fund | | | 1,369,369 | | | | 23,897,369 | | | | 25,266,738 | | |
RS Small Cap Equity Fund | | | 125,322 | | | | 15,917,397 | | | | 16,042,719 | | |
92
Victory Portfolios | | Notes to Financial Statements — continued
December 31, 2020 | |
| | | Year Ended December 31, 2019 | |
| | | Distributions paid from | | | |
| | | Ordinary
Income | | Net
Long-Term
Capital Gains | | Total
Distributions
Paid | |
RS Small Cap Growth Fund | | $ | — | | | $ | 187,283,238 | | | $ | 187,283,238 | | |
RS Select Growth Fund | | | — | | | | 26,547,194 | | | | 26,547,194 | | |
RS Growth Fund | | | 671,178 | | | | 24,492,995 | | | | 25,164,173 | | |
RS Science and Technology Fund | | | 2,573,472 | | | | 21,865,163 | | | | 24,438,635 | | |
RS Small Cap Equity Fund | | | — | | | | 7,591,954 | | | | 7,591,954 | | |
As of December 31, 2020, the components of accumulated earnings/(loss) on a tax basis were as follows:
| | | Undistributed
Ordinary
Income | | Undistributed
Long-Term
Capital Gains | | Accumulated
Earnings | | Unrealized
Appreciation
(Depreciation)* | | Total
Accumulated
Earnings
(Loss) | |
RS Small Cap Growth Fund | | $ | — | | | $ | 83,667,611 | | | $ | 83,667,611 | | | $ | 1,029,264,605 | | | $ | 1,112,932,216 | | |
RS Select Growth Fund | | | — | | | | 37,894,206 | | | | 37,894,206 | | | | 74,369,800 | | | | 112,264,006 | | |
RS Mid Cap Growth Fund | | | — | | | | 24,589,419 | | | | 24,589,419 | | | | 206,174,810 | | | | 230,764,229 | | |
RS Growth Fund | | | 4,025,561 | | | | — | | | | 4,025,561 | | | | 134,000,679 | | | | 138,026,240 | | |
RS Science and Technology Fund | | | — | | | | 2,499,668 | | | | 2,499,668 | | | | 227,027,454 | | | | 229,527,122 | | |
RS Small Cap Equity Fund | | | 2,583,177 | | | | 4,585,326 | | | | 7,168,503 | | | | 17,790,381 | | | | 24,958,884 | | |
* The difference between the book-basis and tax-basis unrealized appreciation (depreciation) is attributable primarily to tax deferral of losses on wash sales and passive foreign investment companies.
As of the tax year ended December 31, 2020, the Funds had no net capital loss carryforwards ("CLCFs").
During the most recent tax year ended December 31, 2020, the RS Mid Cap Growth Fund utilized $2,653,428 of CLCFs.
As of December 31, 2020, the cost basis for federal income tax purposes, gross unrealized appreciation, gross unrealized depreciation and net unrealized appreciation (depreciation) for investments and derivatives were as follows:
| | Cost of
Investments
for Federal
Tax Purposes | | Gross
Unrealized
Appreciation | | Gross
Unrealized
Depreciation | | Net
Unrealized
Appreciation
(Depreciation) | |
RS Small Cap Growth Fund | | $ | 2,164,496,245 | | | $ | 1,114,205,009 | | | $ | (84,940,404 | ) | | $ | 1,029,264,605 | | |
RS Select Growth Fund | | | 172,510,309 | | | | 80,427,862 | | | | (6,058,062 | ) | | | 74,369,800 | | |
RS Mid Cap Growth Fund | | | 416,013,743 | | | | 218,031,381 | | | | (11,856,571 | ) | | | 206,174,810 | | |
RS Growth Fund | | | 182,382,650 | | | | 137,838,922 | | | | (3,838,243 | ) | | | 134,000,679 | | |
RS Science and Technology Fund | | | 254,475,915 | | | | 243,114,284 | | | | (16,086,830 | ) | | | 227,027,454 | | |
RS Small Cap Equity Fund | | | 77,719,476 | | | | 19,667,340 | | | | (1,876,959 | ) | | | 17,790,381 | | |
8. Capital Contribution from Prior Custodian:
During 2016, certain Funds received notification from their prior custodian, State Street Bank and Trust ("State Street"), concerning issues related to billing on certain categories of expenses during the approximately 16-year period from 1998 through October 31, 2014. The over-billing primarily related to categories of expenses that involved an allocation of general costs among multiple clients.
State Street paid the refunded amounts during January 2017. Based on billing information received during 2016 from State Street and an analysis of any expense limitation agreements that were in place
93
Victory Portfolios | | Notes to Financial Statements — continued
December 31, 2020 | |
during the period of the activities in question, including the application of any recoupment provisions in such agreements, the Adviser received a portion of the refund.
The portion of the refund retained by the Funds was accounted for as a capital contribution and is reflected on the Financial Highlights as Capital Contribution from Prior Custodian, Net.
9. Fund Ownership:
Ownership of more than 25% of the voting securities of a fund creates presumptions of control of the fund, under section 2(a)(9) of the 1940 Act. As of December 31, 2020, the shareholder listed below held more than 25% of the shares outstanding of the Fund and may be deemed to control those Funds. Shareholders of record may hold Fund shares for the benefit of their customers.
| | | Shareholder | | Percent | |
RS Mid Cap Growth Fund | | Pershing LLC | | | 58.3 | % | |
94
REPORT OF INDEPENDENT REGISTERED PUBLIC ACCOUNTING FIRM
To the Shareholders and Board of Trustees of Victory Portfolios
Opinion on the Financial Statements
We have audited the accompanying statements of assets and liabilities, including the schedules of portfolio investments, of Victory RS Small Cap Growth Fund, Victory RS Select Growth Fund, Victory RS Mid Cap Growth Fund, Victory RS Growth Fund, Victory RS Science and Technology Fund and Victory RS Small Cap Equity Fund (the "Funds"), each a series of Victory Portfolios, as of December 31, 2020, the related statements of operations for the year then ended and the statements of changes in net assets, the related notes, and the financial highlights for each of the two years in the period then ended (collectively referred to as the "financial statements"). In our opinion, the financial statements present fairly, in all material respects, the financial position of each of the Funds as of December 31, 2020, the results of their operations for the year then ended and the changes in their net assets and the financial highlights for each of the two years in the period then ended, in conformity with accounting principles generally accepted in the United States of America.
The Funds' financial highlights for the years ended December 31, 2018 and prior, were audited by other auditors whose report dated February 26, 2019, expressed an unqualified opinion on those financial highlights.
Basis for Opinion
These financial statements are the responsibility of the Funds' management. Our responsibility is to express an opinion on the Funds' financial statements based on our audits. We are a public accounting firm registered with the Public Company Accounting Oversight Board (United States) ("PCAOB") and are required to be independent with respect to the Funds in accordance with the U.S. federal securities laws and the applicable rules and regulations of the Securities and Exchange Commission and the PCAOB.
We conducted our audits in accordance with the standards of the PCAOB. Those standards require that we plan and perform the audit to obtain reasonable assurance about whether the financial statements are free of material misstatement whether due to error or fraud.
Our audits included performing procedures to assess the risks of material misstatement of the financial statements, whether due to error or fraud, and performing procedures that respond to those risks. Such procedures included examining, on a test basis, evidence regarding the amounts and disclosures in the financial statements. Our procedures included confirmation of securities owned as of December 31, 2020, by correspondence with the custodian, counterparties and brokers or by other appropriate auditing procedures where replies from brokers and counterparties were not received. Our audits also included evaluating the accounting principles used and significant estimates made by management, as well as evaluating the overall presentation of the financial statements. We believe that our audits provide a reasonable basis for our opinion.
We have served as the auditor of one or more of the investment companies advised by Victory Capital Management, Inc. since 2015.

COHEN & COMPANY, LTD.
Cleveland, Ohio
February 23, 2021
95
Victory Portfolios | | Supplemental Information
December 31, 2020 | |
(Unaudited)
Trustee and Officer Information
Board of Trustees:
Overall responsibility for management of the Trust rests with the Board. The Trust is managed by the Board in accordance with the laws of the State of Delaware. There are currently nine Trustees, eight of whom are not "interested persons" of the Trust within the meaning of that term under the 1940 Act ("Independent Trustees") and one of whom is an "interested person" of the Trust within the meaning of that term under the 1940 Act ("Interested Trustee"). The Trustees, in turn, elect the officers of the Trust to actively supervise its day-to-day operations.
The following tables list the Trustees, their date of birth, position with the Trust, commencement of service, principal occupations during the past five years and any directorships of other investment companies or companies whose securities are registered under the Securities Exchange Act of 1934, as amended, or who file reports under that Act. Each Trustee oversees 42 portfolios in the Trust, 8 portfolios in Victory Variable Insurance Funds, and 25 portfolios in Victory Portfolios II, each a registered investment company that, together with the Trust, comprise the Victory Fund Complex. David C. Brown is a Trustee of USAA Mutual Funds Trust and oversees 46 portfolios of the USAA Mutual Funds Trust. Each Trustee's address is c/o Victory Portfolios, 4900 Tiedeman Road, 4th Floor, Brooklyn, Ohio 44144. Each Trustee has an indefinite term.
Name and Date of Birth | | Position
Held with
the Trust | | Date
Commenced
Service | | Principal Occupation
During Past 5 Years | | Other
Directorships
Held During
Past 5 Years | |
Independent Trustees. | |
David Brooks Adcock, Born October 1951 | | Trustee | | May 2005 | | Consultant (since 2006). | | Chair and Trustee, Turner Funds (December 2016-December 2017). | |
Nigel D. T. Andrews, Born April 1947 | | Vice Chair and Trustee | | August 2002 | | Retired. | | Director, TCG BDC II, Inc. (since 2017); Director, TCG BDC I, Inc. (formerly Carlyle GMS Finance, Inc.) (since 2012). | |
E. Lee Beard,* Born August 1951 | | Trustee | | May 2005 | | Retired (since 2015) | | None. | |
Dennis M. Bushe, Born January 1944 | | Trustee | | July 2016 | | Retired. | | Trustee, RS Investment Trust and RS Variable Products Trust (November 2011-July 2016). | |
96
Victory Portfolios | | Supplemental Information — continued
December 31, 2020 | |
(Unaudited)
Name and Date of Birth | | Position
Held with
the Trust | | Date
Commenced
Service | | Principal Occupation
During Past 5 Years | | Other
Directorships
Held During
Past 5 Years | |
John L. Kelly,
Born April 1953 | | Trustee | | February 2015 | | Partner, McCarvill Capital Partners (September 2016- September 2017); Advisor, (January 2016-April 2016) and Managing Partner (August 2014-January 2016) Endgate Commodities LLC. | | Director, Caledonia Mining Corporation (since May 2012). | |
David L. Meyer,* Born April 1957 | | Trustee | | December 2008 | | Retired. | | None. | |
Gloria S. Nelund, Born May 1961 | | Trustee | | July 2016 | | Chair, CEO and Co-Founder of TriLinc Global, LLC, an investment firm. | | TriLinc Global Impact Fund, LLC (since 2012); Trustee, RS Investment Trust and RS Variable Products Trust (November 2007-July 2016). | |
Leigh A. Wilson, Born December 1944 | | Chair and Trustee | | November 1994 | | Private Investor. | | Chair (since 2013), Caledonia Mining Corporation. | |
Interested Trustee. | |
David C. Brown,** Born May 1972 | | Trustee | | May 2008 | | Chairman and Chief Executive Officer (since 2013), the Adviser; Chairman and Chief Executive Officer (since 2013), Victory Capital Holdings, Inc. | | Trustee, USAA Mutual Funds Trust. | |
* The Board has designated Ms. Beard and Mr. Meyer as its Audit Committee Financial Experts.
** Mr. Brown is an "Interested Person" by reason of his relationship with the Adviser.
The Statement of Additional Information includes additional information about the Trustees of the Trust and is available, without charge, by calling 800-539-3863.
97
Victory Portfolios | | Supplemental Information — continued
December 31, 2020 | |
(Unaudited)
Officers:
The officers of the Trust, their date of birth, commencement of service and their principal occupations during the past five years, are detailed in the following table. Each officer serves until the earlier of his or her resignation, removal, retirement, death, or the election of a successor. The mailing address of each officer of the Trust is 4900 Tiedeman Road, 4th Floor, Brooklyn, Ohio 44144. The officers of the Trust receive no compensation directly from the Trust for performing the duties of their offices.
Name and Date of Birth | | Position with
the Trust | | Date
Commenced
Service | | Principal Occupation During Past 5 Years | |
Christopher K. Dyer, Born February 1962 | | President | | February 2006* | | Director of Mutual Fund Administration, the Adviser. | |
Scott A. Stahorsky, Born July 1969 | | Vice President | | December 2014 | | Manager, Fund Administration, the Adviser. | |
Erin G. Wagner, Born February 1974 | | Secretary | | December 2014 | | Associate General Counsel, the Adviser (since 2013). | |
Allan Shaer, Born March 1965 | | Treasurer | | May 2017 | | Senior Vice President, Financial Administration, Citi Fund Services Ohio, Inc. (since 2016); Vice President, Mutual Fund Administration, JP Morgan Chase (2011-2016). | |
Christopher A. Ponte, Born March 1984 | | Assistant Treasurer | | December 2017 | | Manager, Fund Administration, the Adviser (since 2017); Senior Analyst, Fund Administration, the Adviser (prior to 2017); Chief Financial Officer, Victory Capital Services, Inc. (since 2018). | |
Colin Kinney, Born October 1973 | | Chief Compliance Officer | | July 2017 | | Chief Compliance Officer (since 2013) and Chief Risk Officer (2009-2017), the Adviser. | |
Chuck Booth,
Born April 1960 | | Anti-Money Laundering Compliance Officer and Identity Theft Officer | | May 2015 | | Director, Regulatory Administration and CCO Support Services, Citi Fund Services Ohio, Inc. | |
Jay G. Baris, Born January 1954 | | Assistant Secretary | | December 1997 | | Partner, Sidley Austin LLP (since April 2020); Partner, Shearman & Sterling LLP (January 2018-April 2020); Partner, Morrison & Foerster LLP (2011-January 2018). | |
* On December 3, 2014, Mr. Dyer resigned as Secretary of the Trust and accepted the position of President.
98
Victory Portfolios | | Supplemental Information — continued
December 31, 2020 | |
(Unaudited)
Proxy Voting and Portfolio Holdings Information
Proxy Voting:
Information regarding the policies and procedures each Fund uses to determine how to vote proxies relating to portfolio securities is available without charge, upon request, by calling 800-539-3863. The information is also included in the Funds' Statement of Additional Information, which is available on the SEC's website at www.sec.gov.
Information relating to how the Funds voted proxies relating to portfolio securities held during the most recent twelve months ended December 31 is available on the SEC's website at www.sec.gov.
Availability of Schedules of Portfolio Investments:
The Trust files a complete list of Schedules of Portfolio Investments with the SEC for the first and third quarter of each fiscal year on Form N-PORT. Forms N-PORT are available on the SEC's web site at www.sec.gov.
Expense Examples
As a shareholder of the Funds, you may incur two types of costs: (1) transaction costs, including sales charges (loads) on purchases; and (2) ongoing costs, including management fees, distribution and service (12b-1) fees and other Fund expenses. These examples are intended to help you understand your ongoing costs (in dollars) of investing in the Funds and to compare these costs with the ongoing costs of investing in other mutual funds.
These examples are based on an investment of $1,000 invested at the beginning of the period and held for the entire period from July 1, 2020, through December 31, 2020.
The Actual Expense figures in the table below provide information about actual account values and actual expenses. You may use the information below, together with the amount you invested, to estimate the expenses that you paid over the period. Simply divide your account value by $1,000 (for example, an $8,600 account value divided by $1,000 = 8.6), then multiply the result by the number in the table under the heading entitled "Actual Expenses Paid During Period" to estimate the expenses you paid on your account during this period.
The Hypothetical Expense figures in the table below provide information about hypothetical account values and hypothetical expenses based on each Fund's actual expense ratio and an assumed rate of return of 5% per year before expenses, which is not the Fund's actual return. The hypothetical account values and expenses may not be used to estimate the actual ending account balance or expenses you paid for the period. You may use this information to compare this 5% hypothetical example with the 5% hypothetical examples that appear in shareholder reports of other funds.
Please note the expenses shown in the table are meant to highlight your ongoing costs only and do not reflect any transactional costs. Therefore, the table is useful in comparing ongoing costs only, and will not help you determine the relative total costs of owning different funds. In addition, if these transactional costs were included, your costs would have been higher.
Fund | | Beginning
Account
Value
7/1/20 | | Actual
Ending
Account
Value
12/31/20 | | Hypothetical
Ending
Account
Value
12/31/20 | | Actual
Expenses
Paid
During
Period
7/1/20-
12/31/20* | | Hypothetical
Expenses
Paid
During
Period
7/1/20-
12/31/20* | | Annualized
Expense
Ratio
During
Period
7/1/20-
12/31/20 | |
RS Small Cap Growth Fund | |
Class A Shares | | $ | 1,000.00 | | | $ | 1,339.90 | | | $ | 1,018.10 | | | $ | 8.23 | | | $ | 7.10 | | | | 1.40 | % | |
Class C Shares | | | 1,000.00 | | | | 1,334.80 | | | | 1,014.28 | | | | 12.68 | | | | 10.94 | | | | 2.16 | % | |
Class R Shares | | | 1,000.00 | | | | 1,336.70 | | | | 1,015.79 | | | | 10.93 | | | | 9.42 | | | | 1.86 | % | |
Class R6 Shares | | | 1,000.00 | | | | 1,342.20 | | | | 1,019.81 | | | | 6.24 | | | | 5.38 | | | | 1.06 | % | |
Class Y Shares | | | 1,000.00 | | | | 1,341.80 | | | | 1,019.46 | | | | 6.65 | | | | 5.74 | | | | 1.13 | % | |
99
Victory Portfolios | | Supplemental Information — continued
December 31, 2020 | |
(Unaudited)
Fund | | Beginning
Account
Value
7/1/20 | | Actual
Ending
Account
Value
12/31/20 | | Hypothetical
Ending
Account
Value
12/31/20 | | Actual
Expenses
Paid
During
Period
7/1/20-
12/31/20* | | Hypothetical
Expenses
Paid
During
Period
7/1/20-
12/31/20* | | Annualized
Expense
Ratio
During
Period
7/1/20-
12/31/20 | |
RS Select Growth Fund | |
Class A Shares | | $ | 1,000.00 | | | $ | 1,256.70 | | | $ | 1,018.10 | | | $ | 7.94 | | | $ | 7.10 | | | | 1.40 | % | |
Class C Shares | | | 1,000.00 | | | | 1,251.80 | | | | 1,014.18 | | | | 12.34 | | | | 11.04 | | | | 2.18 | % | |
Class R Shares | | | 1,000.00 | | | | 1,254.00 | | | | 1,015.53 | | | | 10.82 | | | | 9.68 | | | | 1.91 | % | |
Class R6 Shares | | | 1,000.00 | | | | 1,258.90 | | | | 1,019.81 | | | | 6.02 | | | | 5.38 | | | | 1.06 | % | |
Class Y Shares | | | 1,000.00 | | | | 1,258.50 | | | | 1,019.41 | | | | 6.47 | | | | 5.79 | | | | 1.14 | % | |
RS Mid Cap Growth Fund | |
Class A Shares | | | 1,000.00 | | | | 1,282.00 | | | | 1,019.10 | | | | 6.88 | | | | 6.09 | | | | 1.20 | % | |
Class C Shares | | | 1,000.00 | | | | 1,276.30 | | | | 1,014.53 | | | | 12.07 | | | | 10.68 | | | | 2.11 | % | |
Class R Shares | | | 1,000.00 | | | | 1,278.00 | | | | 1,016.09 | | | | 10.31 | | | | 9.12 | | | | 1.80 | % | |
Class R6 Shares | | | 1,000.00 | | | | 1,283.90 | | | | 1,020.41 | | | | 5.40 | | | | 4.77 | | | | 0.94 | % | |
Class Y Shares | | | 1,000.00 | | | | 1,283.80 | | | | 1,020.36 | | | | 5.45 | | | | 4.82 | | | | 0.95 | % | |
Member Class** | | | 1,000.00 | | | | 1,179.40 | | | | 1,019.86 | | | | 1.84 | | | | 5.33 | | | | 1.05 | % | |
RS Growth Fund | |
Class A Shares | | | 1,000.00 | | | | 1,258.80 | | | | 1,019.61 | | | | 6.25 | | | | 5.58 | | | | 1.10 | % | |
Class C Shares | | | 1,000.00 | | | | 1,254.00 | | | | 1,015.43 | | | | 10.93 | | | | 9.78 | | | | 1.93 | % | |
Class R Shares | | | 1,000.00 | | | | 1,255.80 | | | | 1,016.54 | | | | 9.70 | | | | 8.67 | | | | 1.71 | % | |
Class Y Shares | | | 1,000.00 | | | | 1,260.90 | | | | 1,020.96 | | | | 4.72 | | | | 4.22 | | | | 0.83 | % | |
RS Science and Technology Fund | |
Class A Shares | | | 1,000.00 | | | | 1,393.30 | | | | 1,017.75 | | | | 8.84 | | | | 7.46 | | | | 1.47 | % | |
Class C Shares | | | 1,000.00 | | | | 1,388.20 | | | | 1,013.67 | | | | 13.69 | | | | 11.54 | | | | 2.28 | % | |
Class R Shares | | | 1,000.00 | | | | 1,390.60 | | | | 1,015.43 | | | | 11.60 | | | | 9.78 | | | | 1.93 | % | |
Class Y Shares | | | 1,000.00 | | | | 1,395.00 | | | | 1,018.90 | | | | 7.47 | | | | 6.29 | | | | 1.24 | % | |
RS Small Cap Equity Fund | |
Class A Shares | | | 1,000.00 | | | | 1,343.90 | | | | 1,018.65 | | | | 7.60 | | | | 6.55 | | | | 1.29 | % | |
Class C Shares | | | 1,000.00 | | | | 1,335.20 | | | | 1,014.58 | | | | 12.33 | | | | 10.63 | | | | 2.10 | % | |
Class R Shares | | | 1,000.00 | | | | 1,340.40 | | | | 1,016.34 | | | | 10.30 | | | | 8.87 | | | | 1.75 | % | |
Class Y Shares | | | 1,000.00 | | | | 1,344.90 | | | | 1,019.61 | | | | 6.48 | | | | 5.58 | | | | 1.10 | % | |
Member Class** | | | 1,000.00 | | | | 1,250.90 | | | | 1,019.36 | | | | 2.09 | | | | 5.84 | | | | 1.15 | % | |
* Expenses are equal to the average account value multiplied by the Fund's annualized expense ratio multiplied by 184/366 (the number of days in the most recent fiscal half-year divided by the number of days in the fiscal year).
** Actual Expenses Paid are equal to the average account value multiplied by the Fund's annualized expense ratio multiplied by 59/366 to reflect the stub period from commencement of operations November 3, 2020, through December 31, 2020.
100
Victory Portfolios | | Supplemental Information — continued
December 31, 2020 | |
(Unaudited)
Additional Federal Income Tax Information
For the year ended December 31, 2020, the following Funds paid qualified dividend income for the purposes of reduced individual federal income tax rates of:
| | | Percent | |
| RS Growth Fund | | | 66 | % | |
| RS Science and Technology Fund | | | 10 | % | |
| RS Small Cap Equity Fund | | | 1 | % | |
Dividends qualified for corporate dividends received deductions of:
| | | Percent | |
| RS Growth Fund | | | 65 | % | |
| RS Science and Technology Fund | | | 9 | % | |
| RS Small Cap Equity Fund | | | 1 | % | |
For the year ended December 31, 2020, the following Funds designated short-term capital gain distributions:
| | | Amount | |
| RS Growth Fund | | $ | 1,618,021 | | |
| RS Science and Technology Fund | | | 1,369,369 | | |
| RS Small Cap Equity Fund | | | 233,413 | | |
For the year ended December 31, 2020, the following Funds designated long-term capital gain distributions:
| | | Amount | |
| RS Small Cap Growth Fund | | $ | 238,416,513 | | |
| RS Select Growth Fund | | | 39,636,257 | | |
| RS Mid Cap Growth Fund | | | 23,813,744 | | |
| RS Growth Fund | | | 25,560,147 | | |
| RS Science and Technology Fund | | | 26,015,637 | | |
| RS Small Cap Equity Fund | | | 16,440,364 | | |
101
Victory Portfolios | | Supplemental Information — continued
December 31, 2020 | |
(Unaudited)
Considerations of the Board in Continuing the Investment Advisory Agreement (the "Agreement")
The Board approved the Agreement on behalf of each of the Funds at a meeting, which was called for that purpose, on December 2, 2020. The Board also considered information relating to the Funds and the Agreement provided throughout the year and, more specifically, at a meeting on October 27, 2020 called for the purpose of reviewing the Agreement. In considering whether to approve the Agreement, the Board requested, and the Adviser provided, information that the Board believed to be reasonably necessary to reach its conclusions.
The Board, including the Independent Trustees, evaluated this information along with other information obtained throughout the year and was advised by legal counsel to the Funds, which also serves as independent legal counsel to the Independent Trustees. In addition, the Independent Trustees considered a past review of their overall process for conducting the annual review of the Funds' advisory arrangements by an independent consultant retained through their counsel.
The Board took into consideration regular reports from the Adviser throughout the COVID-19 pandemic public health crisis concerning how the ongoing pandemic has affected market volatility, investment risk and the implementation and effectiveness of business continuity plans. These reports also had confirmed that the pandemic had no material impact on the Adviser's operations.
The Board considered each Fund's advisory fee, expense ratio and investment performance as significant factors in determining whether the Agreement should be continued. In considering whether the compensation paid to the Adviser was fair and reasonable, the Board also evaluated, among other things, the following factors:
• The requirements of the Funds for the services provided by the Adviser;
• The nature, quality and extent of the services provided and expected to be provided;
• The performance of the Funds as compared to comparable funds;
• The fees payable for the services and whether the fee arrangements provided for economies of scale that would benefit Fund shareholders as the Funds grow
• Whether the fee would be sufficient to enable the Adviser to attract and retain experienced personnel and continue to provide quality services to the Funds;
• The fees paid by other clients of the Adviser whose accounts are managed in a similar investment style and any differences in the services provided to the other clients compared to those provided to the Funds;
• The total expenses of each Fund;
• Management's commitment to operating the Funds at competitive expense levels;
• The profitability of the Adviser (as reflected by comparing fees earned against an estimate of the Adviser's costs) with respect to the Adviser's relationship with the Funds;
• Research and other service benefits received by the Adviser obtained through payment of client commissions for securities transactions;
• Other benefits received by the Adviser, and its affiliates, including revenues paid to the Adviser, or its affiliates, by the Funds for administration and fund accounting services, and distribution;
• The capabilities and financial condition of the Adviser;
• Current economic and industry trends; and
• The historical relationship between each Fund and the Adviser.
The Board reviewed each Fund's current management fee, comprised of the advisory fee plus the administrative services fee paid to the Adviser, in the context of the Adviser's profitability with respect to each Fund individually. In addition, the Board compared each Fund's gross management fee and total operating expense ratio on a net and gross basis with the median gross management fee and median expense ratio of a universe of comparable mutual funds compiled by an independent consultant, and a peer group of funds with similar investment strategies selected by that independent consultant from the universe. The Board reviewed the factors and methodology used by the independent consultant in the selection of each Fund's peer group, including the independent consultant's selection of a broad universe of funds, the more specific universe of comparable funds,
102
Victory Portfolios | | Supplemental Information — continued
December 31, 2020 | |
(Unaudited)
and peer groups of funds with comparable investment strategies and asset levels, among other factors. The Board also reviewed any changes to the independent consultant's methodology as compared to the prior year, including those resulting from the Adviser's input, if any. With respect to certain Funds, the Board also reviewed fees and other information related to the Adviser's management of similarly managed institutional or private accounts, and the differences in the services provided to the other accounts. The Board noted that none of the advisory fee arrangements for the Funds included breakpoints, which are generally viewed as a method by which an investment adviser shares any economies of scale with a fund as a fund grows. The Board also considered the Adviser's commitment to limit expenses as discussed in more detail below, and would consider breakpoints at a future time if a Fund's assets were to grow significantly.
The Board also reviewed the compliance and administrative services provided to the Funds by the Adviser and its affiliates, including the Adviser's oversight of the Funds' day-to-day operations and oversight of Fund accounting, assistance in meeting legal and regulatory requirements, and other services necessary for the operation of the Funds and the Trust.
The Board found that the gross annual management fee paid by each Fund was within the range of management fees paid by each Fund's respective peer group. The Board also found that each Fund's Class A net annual expense ratio, taking into account any shareholder servicing or distribution fees, was reasonable as compared with each Fund's respective peer group. The Board considered the Adviser's contractual agreement with each Fund to waive its fees and reimburse expenses of certain classes for a specified period of time, as described in the Fund's prospectus.
The Board reviewed each Fund's performance over one-, three-, five- and ten-year periods (as applicable) against the performance of the Fund's selected peer group and benchmark index. The Board recognized that the performance of the Fund and the peer group funds are net of expenses, while the performance of the benchmark index reflects gross returns.
The Board reviewed various other specific factors with respect to each Fund, as described below. In their deliberations, the Trustees did not rank the importance of any particular information or factor considered and each Trustee may have attributed different weights to various factors.
RS Small Cap Growth Fund
The Board compared the Fund's Class A performance for the one-, three-, five- and ten-year periods ended June 30, 2020, to that of the median performance of the Fund's peer group and benchmark index for the same periods and considered the fact that the Fund outperformed both the benchmark index and the peer group median for all of the periods reviewed.
Having considered, among other things: (1) the Fund's management fee compared to comparable mutual funds; (2) the Fund's total expense ratio compared to comparable mutual funds; (3) that the Adviser's willingness to limit the expenses of certain classes for a period of time would provide stability to the Fund's expenses for those share classes during that period; and (4) the Fund's performance during the periods reviewed, the Board concluded that the Agreement continued to be in the best interests of the Fund's shareholders.
RS Select Growth Fund
The Board compared the Fund's Class A performance for the one-, three-, five- and ten-year periods ended June 30, 2020, to that of the median performance of the Fund's peer group and benchmark index for the same periods and considered the fact that the Fund underperformed the benchmark index for all of the periods reviewed, with the exception of the one-year period, outperformed the peer group median for the one- and ten-year periods, and underperformed the peer group median for the three- and five-year periods.
Having considered, among other things: (1) the Fund's management fee compared to comparable mutual funds; (2) the Fund's total expense ratio compared to comparable mutual funds; (3) that the Adviser's willingness to limit the expenses of certain classes for a period of time would provide stability to the Fund's expenses for those share classes during that period; and (4) the Fund's performance during the periods reviewed, the Board concluded that the Agreement continued to be in the best interests of the Fund's shareholders.
103
Victory Portfolios | | Supplemental Information — continued
December 31, 2020 | |
(Unaudited)
RS Mid Cap Growth Fund
The Board compared the Fund's Class A performance for the one-, three-, five- and ten-year periods ended June 30, 2020, to that of the median performance of the Fund's peer group and benchmark index for the same periods and considered the fact that the Fund underperformed the benchmark index for all of the periods reviewed, and underperformed the peer group median for all of the periods reviewed, with the exception of the ten-year period. The Board brought the Fund's underperformance to management's attention and discussed with the Adviser any steps that had been or could be taken to enhance performance in the future.
Having considered, among other things: (1) the Fund's management fee compared to comparable mutual funds; (2) the Fund's total expense ratio compared to comparable mutual funds; (3) that the Adviser's willingness to limit the expenses of certain classes for a period of time would provide stability to the Fund's expenses for those share classes during that period; and (4) the Fund's performance during the periods reviewed, the Board concluded that the Agreement continued to be in the best interests of the Fund's shareholders.
RS Growth Fund
The Board compared the Fund's Class A performance for the one-, three-, five- and ten-year periods ended June 30, 2020, to that of the median performance of the Fund's peer group and benchmark index for the same periods and considered the fact that the Fund underperformed both the benchmark index and the peer group median for all of the periods reviewed. The Board brought the Fund's underperformance to management's attention and discussed with the Adviser any steps that had been or could be taken to enhance performance in the future.
Having considered, among other things: (1) the Fund's management fee compared to comparable mutual funds; (2) the Fund's total expense ratio compared to comparable mutual funds; (3) that the Adviser's willingness to limit the expenses of certain classes for a period of time would provide stability to the Fund's expenses for those share classes during that period; and (4) the Fund's performance during the periods reviewed, the Board concluded that the Agreement continued to be in the best interests of the Fund's shareholders.
RS Science and Technology Fund
The Board compared the Fund's Class A performance for the one-, three-, five- and ten-year periods ended June 30, 2020, to that of the median performance of the Fund's peer group and benchmark index for the same periods and considered the fact that the Fund underperformed the benchmark index for all of the periods reviewed, and outperformed the peer group median for all of the periods reviewed, with the exception of the one-year period.
Having considered, among other things: (1) the Fund's management fee compared to comparable mutual funds; (2) the Fund's total expense ratio compared to comparable mutual funds; (3) that the Adviser's willingness to limit the expenses of certain classes for a period of time would provide stability to the Fund's expenses for those share classes during that period; and (4) the Fund's performance during the periods reviewed, the Board concluded that the Agreement continued to be in the best interests of the Fund's shareholders.
RS Small Cap Equity Fund
The Board compared the Fund's Class A performance for the one-, three-, five- and ten-year periods ended June 30, 2020, to that of the median performance of the Fund's peer group and benchmark index for the same periods and considered the fact that the Fund outperformed the benchmark index for all of the periods reviewed, outperformed the peer group median for the five- and ten-year periods, underperformed the peer group median for the one-year period, and matched the peer group median for the three-year period.
Having considered, among other things: (1) the Fund's management fee compared to comparable mutual funds; (2) the Fund's total expense ratio compared to comparable mutual funds; (3) that the Adviser's willingness to limit the expenses of certain classes for a period of time would provide stability to the Fund's expenses for those share classes during that period; and (4) the Fund's performance during the periods reviewed, the Board concluded that the Agreement continued to be in the best interests of the Fund's shareholders.
104
Victory Portfolios | | Supplemental Information — continued
December 31, 2020 | |
(Unaudited)
Conclusion
Based on its review of the information requested and provided, and following extended discussions, the Board determined that the Agreement, on behalf of the Funds discussed above, was consistent with the best interests of each Fund and its shareholders, and the Board unanimously approved the Agreement, on behalf of each Fund, for an additional annual period on the basis of the foregoing review and discussions and the following considerations, among others:
• The fairness and reasonableness of the investment advisory fee payable to the Adviser under the Agreement in light of the investment advisory services provided, the costs of these services, the profitability of the Adviser's relationship with the Fund and the comparability of the fee paid to the fees paid by other investment companies;
• The nature, quality and extent of the investment advisory services provided by the Adviser;
• The Adviser's entrepreneurial commitment to the management of the Funds and the creation of a broad-based family of funds, which could entail a substantial commitment of the Adviser's resources to the successful operation of the Funds;
• The Adviser's representations regarding its staffing and capabilities to manage the Funds, including the retention of personnel with relevant portfolio management experience;
• The Adviser's efforts to enhance investment results by, among other things, developing quality portfolio management teams; and
• The overall high quality of the personnel, operations, financial condition, investment management capabilities, methodologies and performance of the Adviser.
105
Privacy Policy
Protecting the Privacy of Information
The Trust respects your right to privacy. We also know that you expect us to conduct and process your business in an accurate and efficient manner. To do so, we must collect and maintain certain personal information about you. This is the information we collect from you on applications or other forms, and from the transactions you make with us or third parties. It may include your name, address, social security number, account transactions and balances, and information about investment goals and risk tolerance.
We do not disclose any information about you or about former customers to anyone except as permitted or required by law. Specifically, we may disclose the information we collect to companies that perform services on our behalf, such as the transfer agent that processes shareholder accounts and printers and mailers that assist us in the distribution of investor materials. We may also disclose this information to companies that perform marketing services on our behalf. This allows us to continue to offer you Victory investment products and services that meet your investing needs, and to effect transactions that you request or authorize. These companies will use this information only in connection with the services for which we hired them. They are not permitted to use or share this information for any other purpose.
To protect your personal information internally, we permit access only by authorized employees and maintain physical, electronic and procedural safeguards to guard your personal information.*
* You may have received communications regarding information about privacy policies from other financial institutions which gave you the opportunity to "opt-out" of certain information sharing with companies which are not affiliated with that financial institution. The Trust does not share information with other companies for purposes of marketing solicitations for products other than the Trust. Therefore, the Trust does not provide opt-out options to their shareholders.
Victory Funds
P.O. Box 182593
Columbus, Ohio 43218-2593

Visit our website at: | | Call Victory at: | |
www.vcm.com | | 800-539-FUND (800-539-3863) | |
| | | 800-235-8396 for Member Class | |

December 31, 2020
Annual Report
Victory RS International Fund
Victory RS Global Fund
Victory Sophus Emerging Markets Fund
Victory Sophus Emerging Markets Small Cap Fund
As permitted by regulations adopted by the Securities and Exchange Commission, paper copies of the Victory Funds' shareholder reports may no longer be sent by mail, unless you specifically request paper copies of the reports from the Victory Funds or from your financial intermediary, such as a broker-dealer or bank. Instead, the reports will be made available on www.VictoryFunds.com, and you will be notified by mail each time a report is posted and provided with a website link to access the report. If you already elected to receive shareholder reports electronically, you will not be affected by this change, and you need not take any action.
You may elect to receive all future reports in paper free of charge. If you invest through a financial intermediary, you can contact your financial intermediary to request that you continue to receive paper copies of your reports. If you invest directly with the Victory Funds, you can call 800-539-3863 or send an e-mail request to TA.Processing@FISGlobal.com. Your election to receive reports in paper will apply to all Victory Funds you hold directly or through your financial intermediary.
www.vcm.com
News, Information And Education 24 Hours A Day, 7 Days A Week
The Victory Funds site gives fund shareholders, prospective shareholders, and investment professionals a convenient way to access fund information, get guidance, and track fund performance anywhere they can access the Internet. The site includes:
• Detailed performance records
• Daily share prices
• The latest fund news
• Investment resources to help you become a better investor
• A section dedicated to investment professionals
Whether you're a potential investor searching for the fund that matches your investment philosophy, a seasoned investor interested in planning tools, or an investment professional, www.vcm.com has what you seek. Visit us anytime. We're always open.
Table of Contents
Shareholder Letter (Unaudited) | | | 3 | | |
Managers' Commentary and Investment Overview (Unaudited) | | | 5 | | |
Investment Objective and Portfolio Holdings
(Unaudited) | | | 19 | | |
Financial Statements | |
The Victory International Funds | |
Victory RS International Fund | |
Schedule of Portfolio Investments | | | 23 | | |
Statement of Assets and Liabilities | | | 48 | | |
Statement of Operations | | | 50 | | |
Statements of Changes in Net Assets | | | 52-54 | | |
Financial Highlights | | | 58-59 | | |
Victory RS Global Fund | |
Schedule of Portfolio Investments | | | 28 | | |
Statement of Assets and Liabilities | | | 48 | | |
Statement of Operations | | | 50 | | |
Statements of Changes in Net Assets | | | 52-54 | | |
Financial Highlights | | | 60-61 | | |
Victory Sophus Emerging Markets Fund | |
Schedule of Portfolio Investments | | | 34 | | |
Statement of Assets and Liabilities | | | 49 | | |
Statement of Operations | | | 51 | | |
Statements of Changes in Net Assets | | | 55-57 | | |
Financial Highlights | | | 62-63 | | |
Victory Sophus Emerging Markets Small Cap Fund | |
Schedule of Portfolio Investments | | | 41 | | |
Statement of Assets and Liabilities | | | 49 | | |
Statement of Operations | | | 51 | | |
Statements of Changes in Net Assets | | | 55-57 | | |
Financial Highlights | | | 64-65 | | |
Notes to Financial Statements | | | 66 | | |
Report of Independent
Registered Public Accounting Firm | | | 78 | | |
Supplemental Information (Unaudited) | | | 79 | | |
Trustee and Officer Information | | | 79 | | |
Proxy Voting and Portfolio Holdings Information | | | 82 | | |
Expense Examples | | | 82 | | |
Additional Federal Income Tax Information | | | 84 | | |
Advisory Contract Approval | | | 85 | | |
Privacy Policy (inside back cover) | |
1
IRA DISTRIBUTION WITHHOLDING DISCLOSURE
We generally must withhold federal income tax at a rate of 10% of the taxable portion of your distribution and, if you live in a state that requires state income tax withholding, at your state's tax rate. However, you may elect not to have withholding apply or to have income tax withheld at a higher rate. Any withholding election that you make will apply to any subsequent distribution unless and until you change or revoke the election. If you wish to make a withholding election, or change or revoke a prior withholding election, call (800) 539-3863 and form W-4P (OMB No. 1545-0074 withholding certificate for pension or annuity payments) will be electronically sent.
If you do not have a withholding election in place by the date of a distribution, federal income tax will be withheld from the taxable portion of your distribution at a rate of 10%. If you must pay estimated taxes, you may be subject to estimated tax penalties if your estimated tax payments are not sufficient and sufficient tax is not withheld from your distribution.
For more specific information, please consult your tax adviser.
The Funds are distributed by Victory Capital Services, Inc. Victory Capital Management Inc. is the investment adviser to the Funds and receives fees from the Funds for performing services for the Funds.
This report is not authorized for distribution to prospective investors unless preceded or accompanied by a current prospectus of the Victory Funds.
For additional information about any Victory Fund, including fees, expenses, and risks, view our prospectus online at www.vcm.com or call 800-539-3863. Read it carefully before you invest or send money.
The information in this annual report is based on data obtained from recognized services and sources and is believed to be reliable. Any opinions, projections, or recommendations in this report are subject to change without notice and are not intended as individual investment advice. Past investment performance of the Funds, markets or securities mentioned herein should not be considered to be indicative of future results.
• NOT FDIC INSURED • NO BANK GUARANTEE • MAY LOSE VALUE

Call Victory at:
800-539-FUND (800-539-3863)
Visit our website at:
www.vcm.com
2
Victory Funds Letter to Shareholders
(Unaudited)
Dear Shareholder,
When we look back on 2020, we will undoubtedly remember it as an extraordinary year. A year ago, no one could have imagined the unusual events that would challenge us personally, professionally, and collectively as a nation. But in retrospect, the trajectory of financial markets over the past year was nothing short of extraordinary.
The year began with rudimentary worries, such as economic growth rates, trade deals, and interest rates. But a novel coronavirus and the subsequent worldwide spread of COVID-19 became an unprecedented event. To combat the pandemic, governments everywhere issued austere shelter-in-place orders, and the global economy slowed markedly. Equity markets sold off sharply in March and April, and second quarter U.S. GDP contracted by an alarming annual rate of 31.4%.
It's no surprise that so many investors flocked to the perceived safety of U.S. Treasurys. Meanwhile, liquidity evaporated (for a short spell) in many other segments of the fixed income market, including higher-yielding credits and municipal bonds. The outlook was tenuous, and credit spreads widened while prices declined for most securities perceived to be higher risk.
A response, however, came swiftly. The U.S. Federal Reserve (the "Fed") and other monetary authorities worldwide leapt into action — cutting interest rates, (re)starting quantitative easing and, in the case of the Fed, launching an array of programs to provide liquidity to stabilize fixed-income markets. The U.S. government also stepped up to provide fiscal stimulus in the form of the Coronavirus Aid, Relief, and Economic Security Act (CARES Act).
It was impressive how quickly those actions helped end the stock market's freefall and restore order across much of the fixed-income universe. The rebound was almost as robust as the drawdown, and third-quarter GDP (the most recent finalized data available) grew at a 33.4% annualized rate.
Late in the year, markets were alternately fueled and roiled by a contentious election season, growing optimism for an effective vaccine, and a fluid debate regarding the need for additional fiscal stimulus. Ultimately, stocks were propelled higher in the fourth quarter when it became clear the United States Congress would provide another dose of fiscal stimulus in the form of direct payments, more unemployment insurance, and additional aid to businesses.
Through all the unprecedented events and extreme volatility, the S&P 500® Index registered an impressive annual return of 18.40% for the 12-month period ended December 31, 2020. Meanwhile, the yield on 10-year U.S. Treasurys declined 95 basis points over the same period, reflecting both the Fed's interest rate cuts and its pledge to keep rates low longer. The yield on 10-Year U.S. Treasurys was 0.93% as of December 31, 2020.
While markets endured and performed admirably during 2020, perhaps the key takeaway is that the unexpected can and will happen. That's why it's important to
3
remain focused on your long-term investment goals and avoid making emotional decisions. Moreover, we continue to have confidence in all of Victory Capital's autonomous Investment Franchises and their ability to navigate the ups and downs.
On the following pages, you will find information relating to your Victory Funds investment. If you have any questions, we encourage you to contact your financial advisor. Or, if you invest with us directly, you may call 800-539-3863, or visit our website at www.vcm.com.
My colleagues and I sincerely appreciate the confidence you have placed in the Victory Funds, and we value the opportunity to help meet your investment goals.

Christopher K. Dyer, CFA
President,
Victory Funds
4
Victory RS International Funds
Victory RS International Fund
Managers' Commentary
(Unaudited)
What were the market conditions during the reporting period?
International equities (as measured by the MSCI EAFE Index (the "Index")) returned 7.82% over the year ended December 31, 2020, finishing a volatile year with three consecutive quarters of positive returns. Broad recognition of the pandemic related to the novel coronavirus and the disease it causes (COVID-19) in the first quarter led to steep market losses and economic contraction as virus prevention measures kept businesses closed and people at home. The ensuing government relief efforts and central bank stimulus ignited a multi-month equity market recovery led by a narrow group of U.S. large-cap equities and those companies best suited to operate in a "remote" economy. Positive vaccine news and the conclusion of the U.S. elections in early November further strengthened the stimulus driven rally, bolstering value-oriented market segments and shifting capital toward sectors that would benefit from economic growth.
How did Victory RS International Fund (the "Fund") perform during the reporting period?
The Fund seeks to provide long-term capital appreciation. The Fund returned 5.55% (Class A Shares at net asset value) for the year ended December 31, 2020, underperforming the Index, which returned 7.82% during the reporting period.
What strategies did you employ during the reporting period?
We employ a blended investment approach that relies on both rigorous quantitative techniques and experienced analyst judgement. At the heart of the investment process is our proprietary QVS (Quality, Value and Sentiment) Model (the "Model"), which is designed to identify companies that have the potential to consistently create shareholder value, are reasonably valued, and exhibit favorable market sentiment. The Model helps us focus our resources, as we conduct additional research only on companies with the strongest Model recommendations. Making correct macro allocation calls can be immensely challenging, therefore we do not forecast regional performance and seek to remain sector- and region-neutral in constructing our portfolios. In our view, stock selection can be far more impactful to strategy performance than allocation.
The Fund's active return to the Index was negatively impacted by stock selection in the Consumer Discretionary and Information Technology sectors. Underweights to the Consumer Discretionary and Consumer Staples sectors also detracted, as did the Fund's small allocation to cash. Stock selection in the Financials, Materials and Industrials sectors aided relative performance. From a regional perspective, stock selection in Japan and Europe detracted from relative results, while Fund investments in the United Kingdom and Asia/Pacific ex Japan supported relative performance. Country-level detractors included the Netherlands and Spain, while positive contributors included Italy and France.
5
Victory RS International Funds
Victory RS International Fund (continued)
Managers' Commentary (continued)
Individual detractors from relative performance included Telefonica SA, a telecommunications and network provider based in Spain, and En-Japan Inc., a Japanese online job recruitment and employee training firm. The Fund also lost relative performance from not owning ASML Holding NV, a semiconductor equipment provider based in the Netherlands that performed well within the Index. Positive contributors included Chinese technology multinational Tencent Holdings Ltd., United Kingdom- based mining and resources corporation Rio Tinto Plc, and Atlas Copco AB, an industrial equipment supplier based in Sweden.
6
Victory RS International Funds
Victory RS International Fund
Investment Overview
(Unaudited)
Average Annual Total Returns
Year Ended December 31, 2020
| | Class A | | Class C | | Class R | | Class R6 | | Class Y | | | |
INCEPTION DATE | | 2/16/93 | | 8/7/00 | | 5/15/01 | | 5/2/19 | | 3/10/09 | | | |
| | Net Asset
Value | | Maximum
Offering
Price | | Net Asset
Value | | Contingent
Deferred
Charges | | Net Asset
Value | | Net Asset
Value | | Net Asset
Value | | MSCI EAFE
Index1 | |
One Year | | | 5.55 | % | | | –0.53 | % | | | 4.76 | % | | | 3.76 | % | | | 5.21 | % | | | 5.90 | % | | | 5.80 | % | | | 7.82 | % | |
Five Year | | | 8.05 | % | | | 6.77 | % | | | 7.25 | % | | | 7.25 | % | | | 7.72 | % | | | N/A | | | | 8.31 | % | | | 7.45 | % | |
Ten Year | | | 5.12 | % | | | 4.50 | % | | | 4.24 | % | | | 4.24 | % | | | 4.71 | % | | | N/A | | | | 5.43 | % | | | 5.51 | % | |
Since Inception | | | N/A | | | | N/A | | | | N/A | | | | N/A | | | | N/A | | | | 7.92 | % | | | N/A | | | | N/A | | |
The performance data quoted represents past performance and current returns may be lower or higher. The investment return and principal value will fluctuate so that an investor's shares, when redeemed, may be worth more or less than the original cost. To obtain performance information current to the most recent month's end, please visit www.vcm.com.
The maximum offering price (MOP) figures reflect a maximum sales charge of 5.75% for Class A Shares. Class C Shares are not subject to an initial sales charge, but are subject to a deferred sales charge of 1.00% on shares redeemed within one year of purchase. NAV does not reflect sales charges.
Total return measures the price change in a share assuming the reinvestment of all net investment income and realized capital gain distributions, if any. The total returns quoted do not reflect adjustments made to the enclosed financial statements in accordance with U.S. generally accepted accounting principles or the deduction of taxes that a shareholder would pay on net investment income and realized capital gain distributions, including reinvested distributions, or redemptions of shares. The total return figures set forth above include all waivers of fees. Without such fee waivers, the total returns would have been lower.
Victory RS International Fund — Growth of $10,000

1The MSCI EAFE Index (Europe, Australasia, and Far East) is a free float-adjusted market capitalization index that is designed to measure the equity market performance of developed markets, excluding the U.S. and Canada. The index reflects the reinvestment of dividends paid on the stocks constituting the index net of withholding taxes. This index does not include the effect of sales charges, commissions, expenses or taxes, is not representative of the Fund and it is not possible to invest directly in an index.
The graph reflects investment of growth of a hypothetical $10,000 investment in the Fund.
The graph and table do not reflect the deduction of taxes that a shareholder would pay on Fund distributions or the redemption of Fund shares.
Past performance is not indicative of future results.
7
Victory RS International Funds
Managers' Commentary
(Unaudited)
What were the market conditions during the reporting period?
Global equities (as measured by the MSCI All Country World Index (the "Index")) returned 16.25% over the year ended December 31, 2020, finishing a volatile year with three consecutive quarters of positive returns. Broad recognition of the pandemic related to the novel coronavirus and the disease it causes (COVID-19) in the first quarter led to steep market losses and economic contraction as virus prevention measures kept businesses closed and people at home. The ensuing government relief efforts and central bank stimulus ignited a multi-month equity market recovery led by a narrow group of U.S. large caps and those companies best suited to operate in a "remote" economy. Positive vaccine news and the conclusion of the U.S. elections in early November further strengthened the stimulus driven rally, bolstering value-oriented market segments and shifting capital toward sectors that would benefit from economic growth
How did Victory RS Global Fund (the "Fund") perform during the reporting period?
The Fund seeks to provide long-term capital appreciation. The Fund returned 17.00% (Class A Shares at net asset value) for the year ended December 31, 2020, outperforming the Index, which returned 16.25% during the reporting period.
What strategies did you employ during the reporting period?
We employ a blended investment approach that relies on both rigorous quantitative techniques and experienced analyst judgement. At the heart of the investment process is our proprietary QVS (Quality, Value and Sentiment) Model (the "Model"), which is designed to identify companies that have the potential to consistently create shareholder value, are reasonably valued, and exhibit favorable market sentiment. The Model helps us focus our resources, as we conduct additional research only on companies with the strongest Model recommendations. Making correct macro allocation calls can be immensely challenging, therefore we do not forecast regional performance and seek to remain sector- and region-neutral in constructing our portfolios. In our view, stock selection can be far more impactful to strategy performance than allocation.
The Fund's active return to the Index was aided by positive stock selection in several economic sectors, including Financials, Consumer Staples and Industrials. Stock selection in the Consumer Discretionary sector detracted from relative performance, as did an underweight to the Information Technology sector and the Fund's allocation to cash. From a regional perspective, Fund investments in the United Kingdom and North American benefitted relative results, while stock selection in Japan and Asia/Pacific ex Japan hampered relative returns. Country-level contributors included the United States and China, while detractors included Hong Kong and France.
MSCI, Inc., a U.S. company that provides investment tools and data was the Fund's top contributor to relative performance for the year. Other key contributors included Chinese condiment maker Foshan Haitian Flavouring & Food Co., Ltd., and U.S. software and services leader Microsoft Corporation.
8
Victory RS International Funds
Victory RS Global Fund (continued)
Managers' Commentary (continued)
Individual detractors from relative performance included Hong Kong-based oil and gas producer CNOOC Ltd., and Phillips 66, a diversified energy company based in the United States. The Fund also lost relative performance from not owning Tesla, Inc., a U.S. provider of electric vehicles and energy storage systems that had strong returns within the Index.
9
Victory RS International Funds
Investment Overview
(Unaudited)
Average Annual Total Returns
Year Ended December 31, 2020
| | | Class A | | Class C | | Class R | | Class R6 | | Class Y | | | |
INCEPTION DATE | | 5/16/11 | | 5/16/11 | | 5/16/11 | | 5/2/19 | | 5/16/11 | | | |
| | Net Asset
Value | | Maximum
Offering
Price | | Net Asset
Value | | Contingent
Deferred
Charges | | Net Asset
Value | | Net Asset
Value | | Net Asset
Value | | MSCI All
Country
World Index1 | |
One Year | | | 17.00 | % | | | 10.25 | % | | | 16.06 | % | | | 15.06 | % | | | 16.70 | % | | | 17.27 | % | | | 17.27 | % | | | 16.25 | % | |
Five Year | | | 13.88 | % | | | 12.53 | % | | | 13.02 | % | | | 13.02 | % | | | 18.33 | % | | | N/A | | | | 14.18 | % | | | 12.26 | % | |
Since Inception | | | 11.19 | % | | | 10.51 | % | | | 10.36 | % | | | 10.36 | % | | | 13.23 | % | | | 18.04 | % | | | 11.53 | % | | | N/A | | |
The performance data quoted represents past performance and current returns may be lower or higher. The investment return and principal value will fluctuate so that an investor's shares, when redeemed, may be worth more or less than the original cost. To obtain performance information current to the most recent month's end, please visit www.vcm.com.
The maximum offering price (MOP) figures reflect a maximum sales charge of 5.75% for Class A Shares. Class C Shares are not subject to an initial sales charge, but are subject to a deferred sales charge of 1.00% on shares redeemed within one year of purchase. NAV does not reflect sales charges.
Total return measures the price change in a share assuming the reinvestment of all net investment income and realized capital gain distributions, if any. The total returns quoted do not reflect adjustments made to the enclosed financial statements in accordance with U.S. generally accepted accounting principles or the deduction of taxes that a shareholder would pay on net investment income and realized capital gain distributions, including reinvested distributions, or redemptions of shares. The total return figures set forth above include all waivers of fees. Without such fee waivers, the total returns would have been lower.
Victory RS Global Fund — Growth of $10,000
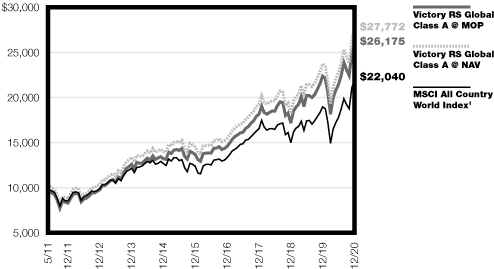
1A market capitalization weighted index designed to provide a broad measure of equity-market performance throughout the world. The MSCI All Country World Index (ACWI) is maintained by Morgan Stanley Capital International, and is comprised of stocks from both developed and emerging markets. The index reflects the reinvestment of dividends paid on the stocks constituting the index net of withholding taxes. This index does not include the effect of sales charges, commissions, expenses or taxes, is not representative of the Fund and it is not possible to invest directly in an index.
The graph reflects investment of growth of a hypothetical $10,000 investment in the Fund.
The graph and table do not reflect the deduction of taxes that a shareholder would pay on Fund distributions or the redemption of Fund shares.
Past performance is not indicative of future results.
10
Victory RS International Funds
Victory Sophus Emerging Markets Fund
Managers' Commentary
(Unaudited)
What were the market conditions during the reporting period?
The year 2020 was intense, to say the least. The incredible pace at which the pandemic spread, and the subsequent widespread lockdowns caused a steep and rapid selloff in global markets in the first quarter. This was followed by massive monetary and fiscal stimulus measures from central banks across the globe to help prop up economies, translating to a global equity market recovery. The fourth quarter brought news of therapeutics and an effective vaccine for the disease caused by a novel coronavirus ("COVID-19"), causing a strong cyclical rally as investors began to invest for a post-pandemic world. For the year ended December 31, 2020, emerging markets equities returned 18.31%, supported for much of the year by strength in Chinese equities and a weakening U.S. dollar.
In the first quarter, emerging markets declined 23.60% as global markets tumbled on recession fears triggered by the COVID-19 pandemic. Adding fuel to the fire was an oil price war following a breakdown in the OPEC+ alliance. In the second half of the quarter, as the coronavirus shifted from East Asia to the rest of the world, we witnessed an unprecedented collapse in economic activity resulting from countries' attempts to slow the spread of the virus. In response, central banks took action, implementing monetary and fiscal stimulus measures. In the first quarter, the U.S. dollar advanced 2.8% and oil collapsed, down 65.6%. China led all countries, declining 10.2% as it witnessed a gradual restoration of economic activity in the first quarter. After the dramatic selloff of the first quarter, emerging markets equities rose 18.1% in the second quarter. This was driven by the swift and novel actions of central banks in the first quarter, and a flattening of COVID-19 cases globally. Asia was particularly strong in the second quarter where COVID-19 cases appeared to be contained, while concerns remained in certain Latin American, European, Middle Eastern, and African countries around rising COVID-19 cases. As the lockdowns continued to ease, economies showed encouraging signs for a recovery with several countries reporting positive high-frequency data. Further monetary stimulus measures from central banks across the globe also added to the recovery.
Emerging markets equities continued to recover in the third quarter following the dramatic sell-down in the first quarter from the shocks related to the pandemic. Emerging markets advanced 9.6% for the three-month period ended September 30, 2020, with the bulk of that performance coming in July, when the benchmark advanced 8.9%. Monetary and fiscal stimulus measures, as well as a weakening U.S. dollar, pushed Emerging markets equities higher during the quarter. Commodities also rallied on continued optimism for a global growth recovery. However, the rally stalled late in the third quarter as rising COVID-19 cases in Europe, rising political uncertainty in the United States, and concerns over the ability/willingness for further stimulus from central banks across the globe called into question the pace and sustainability of the economic recovery. The fourth quarter brought news of effective vaccines and therapeutics, which led to a risk on rally as investors started looking forward to a post-pandemic world. This helped to propel emerging markets equities, which advanced 19.7%. A weaker U.S. dollar also contributed to the gains as the U.S. Dollar Index closed below 90. As part of this post-pandemic view, we witnessed a strong cyclical rally, with value equities outperforming growth and small-cap equities (which tend to be more economically sensitive/tied to their local economies) outperforming large-cap equities.
11
Victory RS International Funds
Victory Sophus Emerging Markets Fund (continued)
Managers' Commentary (continued)
How did Victory Sophus Emerging Markets Fund (the "Fund") perform during the reporting period?
The Fund seeks to provide long-term capital appreciation. The Fund returned 16.73% (Class A Shares at net asset value) underperforming the MSCI Emerging Markets Index, which returned 18.31% during the reporting period.
What strategies did you employ during the reporting period?
We employ a disciplined, bottom-up approach utilizing both quantitative and fundamental processes to invest in businesses that we believe have superior and sustainable earnings growth at attractive valuations, with revisions as the catalyst. By investing in companies with these characteristics, coupled with our risk-managed approach, we seek to provide a more consistent return pattern over time.
By sectors, the largest contributor to relative performance was Information Technology and Industrials. The largest detractor from relative performance was stock selection in Consumer Discretionary. By country, the largest contributor was stock selection in China. The largest detractor was stock selection in Brazil.
The economic shutdowns in 2020 due to the pandemic led to the worst recession since the Great Depression. As a result, central banks across the globe pumped liquidity into the markets, and financial markets proved rather resilient. Emerging markets equities achieved strong returns, outperforming developed markets with a strong second half of the year. With the development and rollout out of a COVID-19 vaccine and therapeutics, the world is turning the page toward recovery. Looking forward to 2021, we are optimistic on the asset class. A Joe Biden presidency potentially reduces the risk premia that has weighed on emerging markets equities for some time. The potential for easing trade restrictions and more normalized sovereign relations could go a long way to help in that regard. Emerging markets, excluding parts of Asia, have a strong value tilt, and a more reflationary backdrop could drive value for much of 2021. Small-cap equities, particularly, are more levered to the cyclical rally as economies recover. The continuation of the weakening of the U.S. dollar and favorable monetary policy through much of the emerging markets and globally, should also provide meaningful tailwinds to the asset class.
We anticipate a resurgence in global growth in 2021. The Chinese economy will continue to build on its recovery, and we expect the globe to benefit from China's strong growth outlook. In its October World Economic Order report, the International Monetary Fund projected 2021 emerging markets growth to be 6.0%, led by an 8.2% growth projection for China and an 8.8% growth rate for India. Longer term, ongoing urbanization and the growth of the middle class (and hence, consumption) should lead to higher emerging markets spending power that is expected to propel U.S. gross domestic product (GDP) growth well ahead of developed economies for the foreseeable future. The buildout of infrastructure across emerging markets, both physical and in technology, should also enhance the growth trajectory.
12
Victory RS International Funds
Victory Sophus Emerging Markets Fund (continued)
Managers' Commentary (continued)
After the uncharacteristic easing of emerging markets policy rates in the immediate aftermath of the pandemic, the firming of goods price inflation and financial stability concerns forced central banks of several emerging markets to slow or halt their rate-cutting cycles. Given the consensus view that emerging markets inflation will soften into early 2021 and developed markets growth will slow, central banks of emerging markets may be under pressure to deliver further easing.
After the strong fourth-quarter rally, emerging markets valuations appear somewhat stretched, but not when compared to developed markets, particularly versus the United States. Further, the decrease in the emerging markets risk premia potential as a result of the new Biden administration could help to narrow the discount gap between emerging markets and developed markets. We believe that with the reasonably wide growth outlook and interest rate differentials, along with the easing of the U.S. dollar into 2021, we see a strong backdrop for emerging markets equities.
13
Victory RS International Funds
Victory Sophus Emerging Markets Fund
Investment Overview
(Unaudited)
Average Annual Total Returns
Year Ended December 31, 2020
| | Class A | | Class C | | Class R | | Class R6 | | Class Y | | | |
INCEPTION DATE | | 5/1/97 | | 8/7/00 | | 5/15/01 | | 11/15/16 | | 3/10/09 | | | |
| | Net Asset
Value | | Maximum
Offering
Price | | Net Asset
Value | | Contingent
Deferred
Charges | | Net Asset
Value | | Net Asset
Value | | Net Asset
Value | | MSCI
Emerging
Markets
Index1 | |
One Year | | | 16.73 | % | | | 10.03 | % | | | 15.79 | % | | | 14.79 | % | | | 16.46 | % | | | 17.28 | % | | | 17.10 | % | | | 18.31 | % | |
Five Year | | | 12.77 | % | | | 11.44 | % | | | 11.88 | % | | | 11.88 | % | | | 12.50 | % | | | N/A | | | | 13.16 | % | | | 12.81 | % | |
Ten Year | | | 2.70 | % | | | 2.10 | % | | | 1.89 | % | | | 1.89 | % | | | 2.42 | % | | | N/A | | | | 3.03 | % | | | 3.63 | % | |
Since Inception | | | N/A | | | | N/A | | | | N/A | | | | N/A | | | | N/A | | | | 13.90 | % | | | N/A | | | | N/A | | |
The performance data quoted represents past performance and current returns may be lower or higher. The investment return and principal value will fluctuate so that an investor's shares, when redeemed, may be worth more or less than the original cost. To obtain performance information current to the most recent month's end, please visit www.vcm.com.
The maximum offering price (MOP) figures reflect a maximum sales charge of 5.75% for Class A Shares. Class C Shares are not subject to an initial sales charge, but are subject to a deferred sales charge of 1.00% on shares redeemed within one year of purchase. NAV does not reflect sales charges.
Total return measures the price change in a share assuming the reinvestment of all net investment income and realized capital gain distributions, if any. The total returns quoted do not reflect adjustments made to the enclosed financial statements in accordance with U.S. generally accepted accounting principles or the deduction of taxes that a shareholder would pay on net investment income and realized capital gain distributions, including reinvested distributions, or redemptions of shares. The total return figures set forth above include all waivers of fees. Without such fee waivers, the total returns would have been lower.
Victory Sophus Emerging Markets Fund — Growth of $10,000

1The MSCI Emerging Markets Index is a free float-adjusted market capitalization index that is designed to measure equity performance of emerging markets. The index reflects the reinvestment of dividends paid on the stocks constituting the index net of withholding taxes. This index does not include the effect of sales charges, commissions, expenses or taxes, is not representative of the Fund and it is not possible to invest directly in an index.
The graph reflects investment of growth of a hypothetical $10,000 investment in the Fund.
The graph and table do not reflect the deduction of taxes that a shareholder would pay on Fund distributions or the redemption of Fund shares.
Past performance is not indicative of future results.
14
Victory RS International Funds
Victory Sophus Emerging Markets Small Cap Fund
Managers' Commentary
(Unaudited)
What were the market conditions during the reporting period?
The year 2020 was intense, to say the least. The incredible pace at which the pandemic spread, and the subsequent widespread lockdowns caused a steep and rapid sell-off in global markets in the first quarter. This was followed by massive monetary and fiscal stimulus measures from central banks across the globe to help prop up economies, translating to a global equity market recovery. The fourth quarter brought news of therapeutics and an effective vaccine, causing a strong cyclical rally as investors began to invest for a post-pandemic world. For the year ended December 31, 2020, emerging markets small-cap equities returned 19.29%, supported for much of the year by strength in Asia and a weakening U.S. dollar.
Emerging market small-cap equities declined 31.37% in the first quarter. Global markets tumbled in March on recession fears triggered by the pandemic related to a novel coronavirus and the disease it causes ("COVID-19"). Adding fuel to the fire was an oil price war following a breakdown in the OPEC+ alliance. In the second half of the quarter, as the coronavirus shifted from East Asia to the rest of the world, we witnessed an unprecedented collapse in economic activity resulting from countries' attempts to slow the spread of the virus. In response, central banks took action, implementing monetary and fiscal stimulus measures. In the first quarter, the US dollar advanced 2.8% and oil collapsed, down 65.6%. After the dramatic selloff in the first quarter, emerging markets small-cap equities rallied 27.14% in the second quarter. This was driven by the swift and novel actions of central banks in the first quarter, and a flattening of COVID-19 cases globally. Asia was particularly strong in the second quarter where COVID-19 cases appeared to be contained, while concerns remained in certain Latin American, European, Middle Eastern, and African countries around rising COVID-19 cases. As the lockdowns continued to ease, economies showed encouraging signs for a recovery with several countries reporting positive high-frequency data. Further monetary stimulus measures from central banks across the globe also added to the recovery.
Emerging markets small-cap equities continued to recover in the third quarter following the dramatic sell-down in the first quarter from the shocks related to the pandemic. Emerging markets small-cap equities advanced 11.9% for the three-month period ended September 30, 2020. Monetary and fiscal stimulus measures, as well as a weakening U.S. dollar, served to push emerging markets small-cap equities higher. Commodities also rallied on continued optimism for a global growth recovery. The rally in equities stalled in September as rising COVID-19 cases in Europe, rising political uncertainty in the United States, and concerns over the ability/willingness for further stimulus from central banks across the globe called into question the pace and sustainability of the economic recovery. The fourth quarter brought news of effective vaccines and therapeutics, which led to a risk-on rally as investors started looking forward to a post-pandemic world. This helped to propel emerging markets small-cap equities, which advanced 22.22% for the quarter. A weaker U.S. dollar also contributed to the gains as the U.S. Dollar Index closed below 90. As part of this post-pandemic view, we witnessed a strong cyclical rally, with value equities outperforming growth and small-cap equities (which tend to be more economically sensitive/tied to their local economies) outperforming large-cap equities.
15
Victory RS International Funds
Victory Sophus Emerging Markets Small Cap Fund (continued)
Managers' Commentary (continued)
How did Victory Sophus Emerging Markets Small Cap Fund (the "Fund") perform during the reporting period?
The Fund seeks to provide long-term capital appreciation. The Fund returned 10.27% (Class A Shares at net asset value), underperforming the MSCI Emerging Market Small Cap Index, which returned 19.29% during the reporting period.
What strategies did you employ during the reporting period?
On a sector basis, the largest detractor from relative performance was Health Care, with the bulk of the underperformance coming from stock selection in South Korea. Not surprisingly, given the cyclical rally in the quarter, the largest contributor was Financials. On a country basis, the largest detractor was India, driven by many stocks that were not owned given the broad-based rally in that country. The largest contributor to relative performance was Mexico driven by stock selection in industrials.
The economic shutdowns in 2020 due to the pandemic led to the worst recession since the Great Depression. As a result, central banks across the globe pumped liquidity into the markets, and financial markets proved rather resilient. Emerging markets equities achieved strong returns, outperforming developed markets with a strong second half of the year. With the development and rollout out of a COVID-19 vaccine and therapeutics, the world is turning the page toward recovery. Looking forward to 2021, we are optimistic on the asset class. A Joe Biden presidency potentially reduces the risk premia that has weighed on emerging markets equities for some time. The potential for easing trade restrictions and more normalized sovereign relations, , could go a long way to help in that regard. Emerging markets, excluding parts of Asia, have a strong value tilt, and a more reflationary backdrop could drive value for much of 2021. Small-cap equities, particularly, are more levered to the cyclical rally as economies recover. The continuation of the weakening of the U.S. dollar and favorable monetary policy through much of the emerging markets and globally, should also provide meaningful tailwinds to the asset class.
We anticipate a resurgence in global growth in 2021. The Chinese economy will continue to build on its recovery, and we expect the globe to benefit from China's strong growth outlook. In its October World Economic Order report, the International Monetary Fund projected 2021 emerging markets growth to be 6.0%, led by an 8.2% growth projection for China and an 8.8% growth rate for India. Longer term, ongoing urbanization and the growth of the middle class (and hence, consumption) should lead to higher emerging markets spending power that is expected to propel U.S. gross domestic product (GDP) growth well ahead of developed economies for the foreseeable future. The buildout of infrastructure across emerging markets, both physical and in technology, should also enhance the growth trajectory.
After the uncharacteristic easing of emerging markets policy rates in the immediate aftermath of the pandemic, the firming of goods price inflation and financial stability concerns forced central bank of several emerging markets to slow or halt their rate-cutting cycles. Given the consensus view that emerging markets inflation will soften into early 2021
16
Victory RS International Funds
Victory Sophus Emerging Markets Small Cap Fund (continued)
Managers' Commentary (continued)
and developed markets growth will slow, central banks of emerging markets may be under pressure to deliver further easing.
Despite the strong fourth-quarter rally, emerging markets small-cap valuations still trade at a significant discount to developed market small caps, particularly versus the United States. Further, the decrease in the emerging markets risk premia potential as a result of the new Biden administration could help to narrow the discount gap between emerging markets and developed markets. We believe that with the reasonably wide growth outlook and interest rate differentials, along with the easing of the U.S. dollar into 2021, we see a strong backdrop for emerging markets small-cap equities.
17
Victory RS International Funds
Victory Sophus Emerging Markets Small Cap Fund
Investment Overview
(Unaudited)
Average Annual Total Returns
Year Ended December 31, 2020
| | Class A | | Class C | | Class Y | | | |
INCEPTION DATE | | 1/31/14 | | 1/31/14 | | 1/31/14 | | | |
| | Net Asset
Value | | Maximum
Offering
Price | | Net Asset
Value | | Contingent
Deferred
Charges | | Net Asset
Value | | MSCI
Emerging
Markets
Small Cap
Index1 | |
One Year | | | 10.27 | % | | | 3.88 | % | | | 9.47 | % | | | 8.47 | % | | | 10.61 | % | | | 19.29 | % | |
Five Year | | | 8.49 | % | | | 7.21 | % | | | 7.25 | % | | | 7.25 | % | | | 8.77 | % | | | 8.19 | % | |
Since Inception | | | 5.59 | % | | | 4.69 | % | | | 4.51 | % | | | 4.51 | % | | | 5.90 | % | | | N/A | | |
The performance data quoted represents past performance and current returns may be lower or higher. The investment return and principal value will fluctuate so that an investor's shares, when redeemed, may be worth more or less than the original cost. To obtain performance information current to the most recent month's end, please visit www.vcm.com.
The maximum offering price (MOP) figures reflect a maximum sales charge of 5.75% for Class A Shares. Class C Shares are not subject to an initial sales charge, but are subject to a deferred sales charge of 1.00% on shares redeemed within one year of purchase. NAV does not reflect sales charges.
Total return measures the price change in a share assuming the reinvestment of all net investment income and realized capital gain distributions, if any. The total returns quoted do not reflect adjustments made to the enclosed financial statements in accordance with U.S. generally accepted accounting principles or the deduction of taxes that a shareholder would pay on net investment income and realized capital gain distributions, including reinvested distributions, or redemptions of shares. The total return figures set forth above include all waivers of fees. Without such fee waivers, the total returns would have been lower.
Victory Sophus Emerging Markets Small Cap Fund — Growth of $10,000
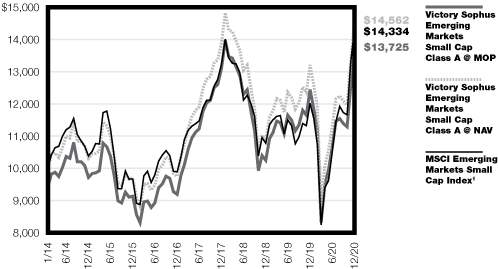
1The MSCI Emerging Markets Small Cap Index is a free float-adjusted market capitalization index that is designed to measure equity performance of small-capitalization companies in emerging markets countries. The index reflects the reinvestment of dividends paid on the stocks constituting the index net of withholding taxes. This index does not include the effect of sales charges, commissions, expenses or taxes, is not representative of the Fund and it is not possible to invest directly in an index.
The graph reflects investment of growth of a hypothetical $10,000 investment in the Fund.
The graph and table do not reflect the deduction of taxes that a shareholder would pay on Fund distributions or the redemption of Fund shares.
Past performance is not indicative of future results.
18
Victory RS International Funds (Unaudited)
Victory RS International Fund | | December 31, 2020 | |
(Unaudited)
Investment Objective & Portfolio Holdings:
Victory RS International Fund seeks to provide long-term capital appreciation.
Sector Allocation*:
December 31, 2020
(% of Net Assets)

* Does not include futures, money market instruments, and short-term investments purchased with cash collateral from securities loaned.
Refer to the Schedule of Portfolio Investments for a complete list of securities.
Percentages are of the net assets of the Fund and may not equal 100%.
19
Victory RS International Funds (Unaudited)
Victory RS Global Fund | | December 31, 2020 | |
(Unaudited)
Investment Objective & Portfolio Holdings:
Victory RS Global Fund seeks to provide long-term capital appreciation.
Sector Allocation*:
December 31, 2020
(% of Net Assets)

* Does not include futures, money market instruments, and short-term investments purchased with cash collateral from securities loaned.
Refer to the Schedule of Portfolio Investments for a complete list of securities.
Percentages are of the net assets of the Fund and may not equal 100%.
20
Victory RS International Funds (Unaudited)
Victory Sophus Emerging Markets Fund | | December 31, 2020 | |
(Unaudited)
Investment Objective & Portfolio Holdings:
Victory Sophus Emerging Markets Fund seeks to provide long-term capital appreciation.
Sector Allocation*:
December 31, 2020
(% of Net Assets)
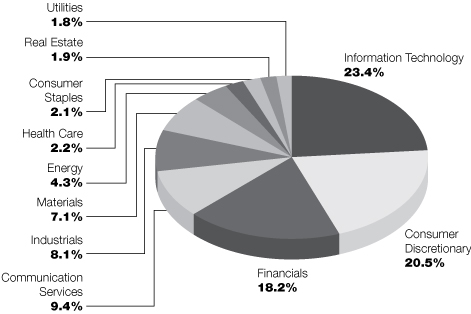
* Does not include futures, money market instruments, and short-term investments purchased with cash collateral from securities loaned.
Refer to the Schedule of Portfolio Investments for a complete list of securities.
Percentages are of the net assets of the Fund and may not equal 100%.
21
Victory RS International Funds (Unaudited)
Victory Sophus Emerging Markets Small Cap Fund | | December 31, 2020 | |
(Unaudited)
Investment Objective & Portfolio Holdings:
Victory Sophus Emerging Markets Small Cap Fund seeks to provide long-term capital appreciation.
Sector Allocation*:
December 31, 2020
(% of Net Assets)

* Does not include futures, money market instruments, and short-term investments purchased with cash collateral from securities loaned.
Refer to the Schedule of Portfolio Investments for a complete list of securities.
Percentages are of the net assets of the Fund and may not equal 100%.
22
Victory Portfolios
Victory RS International Fund | | Schedule of Portfolio Investments
December 31, 2020 | |
Security Description | | Shares | | Value | |
Common Stocks (95.6%) | |
Australia (5.4%): | |
Financials (1.1%): | |
Macquarie Group Ltd. | | | 39,513 | | | $ | 4,216,784 | | |
Health Care (1.3%): | |
CSL Ltd. | | | 23,151 | | | | 5,057,350 | | |
Materials (2.0%): | |
BHP Group Ltd. | | | 227,129 | | | | 7,419,917 | | |
Real Estate (1.0%): | |
Scentre Group | | | 1,821,745 | | | | 3,912,337 | | |
| | | | 20,606,388 | | |
Belgium (1.0%): | |
Information Technology (1.0%): | |
Melexis NV | | | 39,939 | | | | 3,892,334 | | |
China (2.6%): | |
Communication Services (0.8%): | |
Tencent Holdings Ltd. | | | 42,600 | | | | 3,065,331 | | |
Consumer Discretionary (0.8%): | |
China Meidong Auto Holdings Ltd. | | | 738,000 | | | | 3,004,188 | | |
Financials (1.0%): | |
China Merchants Bank Co. Ltd., Class H | | | 623,500 | | | | 3,944,416 | | |
| | | | 10,013,935 | | |
Denmark (1.2%): | |
Consumer Staples (1.2%): | |
Royal Unibrew A/S | | | 40,690 | | | | 4,712,631 | | |
France (8.6%): | |
Consumer Discretionary (4.0%): | |
Cie Generale des Etablissements Michelin SCA | | | 33,342 | | | | 4,292,460 | | |
Faurecia SE (a) | | | 71,739 | | | | 3,675,194 | | |
LVMH Moet Hennessy Louis Vuitton SE | | | 11,468 | | | | 7,178,064 | | |
| | | | 15,145,718 | | |
Energy (1.2%): | |
Gaztransport Et Technigaz SA | | | 11,810 | | | | 1,143,989 | | |
TOTAL SE (b) | | | 83,263 | | | | 3,593,357 | | |
| | | | 4,737,346 | | |
Industrials (1.0%): | |
Safran SA (a) | | | 25,871 | | | | 3,666,327 | | |
Information Technology (1.3%): | |
Capgemini SE | | | 33,369 | | | | 5,189,962 | | |
Materials (1.1%): | |
Arkema SA | | | 35,936 | | | | 4,111,339 | | |
| | | | 32,850,692 | | |
See notes to financial statements.
23
Victory Portfolios
Victory RS International Fund | | Schedule of Portfolio Investments — continued
December 31, 2020 | |
Security Description | | Shares | | Value | |
Germany (5.6%): | |
Financials (1.6%): | |
Allianz SE | | | 25,622 | | | $ | 6,293,826 | | |
Industrials (1.3%): | |
Siemens AG, Registered Shares | | | 34,328 | | | | 4,944,194 | | |
Information Technology (1.6%): | |
SAP SE | | | 47,889 | | | | 6,201,730 | | |
Real Estate (1.1%): | |
Vonovia SE | | | 55,142 | | | | 4,026,729 | | |
| | | | 21,466,479 | | |
Hong Kong (2.6%): | |
Financials (1.5%): | |
AIA Group Ltd. | | | 474,400 | | | | 5,781,283 | | |
Real Estate (1.1%): | |
CK Asset Holdings Ltd. | | | 841,000 | | | | 4,303,451 | | |
| | | | 10,084,734 | | |
Ireland (0.8%): | |
Industrials (0.8%): | |
Experian PLC | | | 77,118 | | | | 2,929,173 | | |
Italy (5.1%): | |
Energy (0.9%): | |
Snam SpA | | | 629,282 | | | | 3,553,474 | | |
Financials (0.9%): | |
Banca Generali SpA (a) | | | 104,497 | | | | 3,494,537 | | |
Health Care (1.1%): | |
Recordati Industria Chimica e Farmaceutica SpA | | | 72,726 | | | | 4,043,688 | | |
Utilities (2.2%): | |
Enel SpA | | | 810,494 | | | | 8,245,506 | | |
| | | | 19,337,205 | | |
Japan (21.9%): | |
Communication Services (1.8%): | |
Capcom Co. Ltd. | | | 54,800 | | | | 3,554,443 | | |
Kakaku.com, Inc. | | | 120,300 | | | | 3,293,493 | | |
| | | | 6,847,936 | | |
Consumer Discretionary (3.7%): | |
Hikari Tsushin, Inc. | | | 12,600 | | | | 2,956,819 | | |
Toyota Motor Corp. | | | 143,900 | | | | 11,106,394 | | |
| | | | 14,063,213 | | |
Consumer Staples (1.6%): | |
Kobe Bussan Co. Ltd. (b) | | | 90,100 | | | | 2,768,725 | | |
Toyo Suisan Kaisha Ltd. | | | 68,500 | | | | 3,334,173 | | |
| | | | 6,102,898 | | |
See notes to financial statements.
24
Victory Portfolios
Victory RS International Fund | | Schedule of Portfolio Investments — continued
December 31, 2020 | |
Security Description | | Shares | | Value | |
Financials (2.0%): | |
JAFCO Group Co. Ltd. | | | 41,300 | | | $ | 2,064,133 | | |
Mitsubishi UFJ Financial Group, Inc. | | | 585,100 | | | | 2,590,977 | | |
Tokio Marine Holdings, Inc. | | | 56,800 | | | | 2,926,849 | | |
| | | | 7,581,959 | | |
Health Care (3.1%): | |
Hoya Corp. | | | 56,600 | | | | 7,839,946 | | |
Shionogi & Co. Ltd. | | | 77,400 | | | | 4,232,193 | | |
| | | | 12,072,139 | | |
Industrials (4.4%): | |
en-japan, Inc. | | | 99,300 | | | | 2,983,355 | | |
Fuji Electric Co. Ltd. | | | 36,800 | | | | 1,328,528 | | |
ITOCHU Corp. | | | 93,300 | | | | 2,683,709 | | |
Nippon Yusen KK | | | 108,900 | | | | 2,541,090 | | |
OKUMA Corp. | | | 58,400 | | | | 3,276,089 | | |
Sanwa Holdings Corp. | | | 334,200 | | | | 3,903,249 | | |
| | | | 16,716,020 | | |
Information Technology (3.6%): | |
Fujitsu Ltd. | | | 47,900 | | | | 6,924,254 | | |
Oracle Corp. | | | 32,800 | | | | 4,276,252 | | |
Ulvac, Inc. | | | 60,100 | | | | 2,576,990 | | |
| | | | 13,777,496 | | |
Real Estate (0.7%): | |
Sumitomo Realty & Development Co. Ltd. | | | 82,400 | | | | 2,544,289 | | |
Utilities (1.0%): | |
Chubu Electric Power Co., Inc. | | | 307,300 | | | | 3,709,029 | | |
| | | | 83,414,979 | | |
Netherlands (4.0%): | |
Communication Services (1.1%): | |
Koninklijke KPN NV | | | 1,409,192 | | | | 4,282,399 | | |
Financials (1.2%): | |
ING Groep NV (a) | | | 477,053 | | | | 4,434,997 | | |
Industrials (1.1%): | |
Wolters Kluwer NV | | | 49,342 | | | | 4,157,788 | | |
Information Technology (0.6%): | |
ASM International NV | | | 10,848 | | | | 2,366,960 | | |
| | | | 15,242,144 | | |
New Zealand (0.9%): | |
Health Care (0.9%): | |
Fisher & Paykel Healthcare Corp. Ltd. | | | 145,834 | | | | 3,462,412 | | |
Norway (1.3%): | |
Energy (0.4%): | |
Aker BP ASA | | | 52,526 | | | | 1,327,507 | | |
See notes to financial statements.
25
Victory Portfolios
Victory RS International Fund | | Schedule of Portfolio Investments — continued
December 31, 2020 | |
Security Description | | Shares | | Value | |
Financials (0.9%): | |
SpareBank 1 SMN | | | 304,653 | | | $ | 3,472,813 | | |
| | | | 4,800,320 | | |
Spain (1.0%): | |
Communication Services (1.0%): | |
Telefonica SA | | | 946,006 | | | | 3,762,381 | | |
Sweden (2.1%): | |
Industrials (2.1%): | |
Atlas Copco AB, Class B | | | 115,251 | | | | 5,175,718 | | |
Epiroc AB, Class B | | | 157,323 | | | | 2,657,108 | | |
| | | | 7,832,826 | | |
Switzerland (15.2%): | |
Consumer Staples (4.8%): | |
Coca-Cola HBC AG | | | 81,098 | | | | 2,625,810 | | |
Nestle SA, Registered Shares | | | 131,121 | | | | 15,505,240 | | |
| | | | 18,131,050 | | |
Financials (2.9%): | |
Cembra Money Bank AG | | | 24,194 | | | | 2,931,394 | | |
Partners Group Holding AG | | | 3,118 | | | | 3,665,023 | | |
UBS Group AG | | | 322,997 | | | | 4,549,287 | | |
| | | | 11,145,704 | | |
Health Care (6.0%): | |
Novartis AG, Registered Shares | | | 112,007 | | | | 10,549,925 | | |
Roche Holding AG | | | 35,572 | | | | 12,393,876 | | |
| | | | 22,943,801 | | |
Industrials (1.5%): | |
Adecco Group AG | | | 87,594 | | | | 5,836,033 | | |
| | | | 58,056,588 | | |
United Kingdom (16.3%): | |
Communication Services (0.8%): | |
ITV PLC (a) | | | 2,190,981 | | | | 3,192,196 | | |
Consumer Discretionary (1.5%): | |
Next PLC (a) | | | 60,323 | | | | 5,815,855 | | |
Consumer Staples (4.6%): | |
Diageo PLC | | | 191,091 | | | | 7,560,112 | | |
Imperial Brands PLC | | | 291,090 | | | | 6,104,585 | | |
Unilever PLC | | | 61,364 | | | | 3,679,678 | | |
| | | | 17,344,375 | | |
Energy (2.0%): | |
| BP PLC | | | 920,171 | | | | 3,174,802 | | |
Royal Dutch Shell PLC, Class A | | | 260,554 | | | | 4,568,499 | | |
| | | | 7,743,301 | | |
See notes to financial statements.
26
Victory Portfolios
Victory RS International Fund | | Schedule of Portfolio Investments — continued
December 31, 2020 | |
Security Description | | Shares | | Value | |
Financials (2.9%): | |
Close Brothers Group PLC | | | 176,212 | | | $ | 3,322,688 | | |
HSBC Holdings PLC | | | 458,414 | | | | 2,367,467 | | |
Legal & General Group PLC | | | 1,462,591 | | | | 5,329,495 | | |
| | | | 11,019,650 | | |
Health Care (0.4%): | |
Smith & Nephew PLC | | | 75,885 | | | | 1,576,085 | | |
Materials (4.1%): | |
Croda International PLC | | | 29,940 | | | | 2,692,103 | | |
Evraz PLC | | | 592,424 | | | | 3,785,573 | | |
Rio Tinto PLC | | | 121,917 | | | | 9,175,705 | | |
| | | | 15,653,381 | | |
| | | | | | 62,344,843 | | |
Total Common Stocks (Cost $316,488,912) | | | 364,810,064 | | |
Exchange-Traded Funds (1.4%) | |
United States (1.4%): | |
iShares MSCI EAFE ETF | | | 76,110 | | | | 5,552,986 | | |
Total Exchange-Traded Funds (Cost $4,988,751) | | | 5,552,986 | | |
Collateral for Securities Loaned^ (1.2%) | |
United States (1.2%): | |
BlackRock Liquidity Funds TempFund Portfolio, Institutional Class, 0.08% (c) | | | 78,960 | | | | 78,960 | | |
Fidelity Investments Money Market Government Portfolio, Class I, 0.01% (c) | | | 2,712,732 | | | | 2,712,732 | | |
Goldman Sachs Financial Square Prime Obligations Fund,
Institutional Class, 0.04% (c) | | | 39,405 | | | | 39,405 | | |
JPMorgan Prime Money Market Fund, Capital Class, 0.12% (c) | | | 314,202 | | | | 314,202 | | |
Morgan Stanley Institutional Liquidity Prime Portfolio,
Institutional Class, 0.09% (c) | | | 1,412,714 | | | | 1,412,714 | | |
Total Collateral for Securities Loaned (Cost $4,558,013) | | | 4,558,013 | | |
Total Investments (Cost $326,035,676) — 98.2% | | | 374,921,063 | | |
Other assets in excess of liabilities — 1.8% | | | 6,716,329 | | |
NET ASSETS — 100.00% | | $ | 381,637,392 | | |
^ Purchased with cash collateral from securities on loan.
(a) Non-income producing security.
(b) All or a portion of this security is on loan.
(c) Rate disclosed is the daily yield on December 31, 2020.
ETF — Exchange-Traded Fund
PLC — Public Limited Company
See notes to financial statements.
27
Victory Portfolios
Victory RS Global Fund | | Schedule of Portfolio Investments
December 31, 2020 | |
Security Description | | Shares | | Value | |
Common Stocks (97.3%) | |
Australia (1.3%): | |
Financials (0.5%): | |
Macquarie Group Ltd. | | | 9,140 | | | $ | 975,411 | | |
Health Care (0.8%): | |
CSL Ltd. | | | 8,401 | | | | 1,835,203 | | |
| | | | 2,810,614 | | |
Belgium (0.7%): | |
Information Technology (0.7%): | |
Melexis NV | | | 14,966 | | | | 1,458,541 | | |
Bermuda (1.0%): | |
Industrials (1.0%): | |
Triton International Ltd. | | | 44,516 | | | | 2,159,471 | | |
Brazil (0.5%): | |
Financials (0.5%): | |
Itau Unibanco Holding SA, Preference Shares | | | 197,715 | | | | 1,210,129 | | |
Canada (2.3%): | |
Energy (0.5%): | |
Parex Resources, Inc. (a) | | | 82,038 | | | | 1,129,336 | | |
Industrials (1.0%): | |
Canadian Pacific Railway Ltd. (b) | | | 6,159 | | | | 2,136,704 | | |
Materials (0.8%): | |
Kirkland Lake Gold Ltd. (b) | | | 41,691 | | | | 1,723,066 | | |
| | | | 4,989,106 | | |
China (4.2%): | |
Communication Services (1.5%): | |
Tencent Holdings Ltd. | | | 47,100 | | | | 3,389,133 | | |
Consumer Discretionary (0.5%): | |
China Meidong Auto Holdings Ltd. | | | 262,000 | | | | 1,066,528 | | |
Consumer Staples (1.0%): | |
Foshan Haitan Flavouring & Food Co. Ltd., Class A | | | 68,749 | | | | 2,110,957 | | |
Financials (1.2%): | |
Industrial & Commercial Bank of China Ltd., Class H | | | 4,188,000 | | | | 2,690,834 | | |
| | | | 9,257,452 | | |
Denmark (0.7%): | |
Consumer Staples (0.7%): | |
Royal Unibrew A/S | | | 13,345 | | | | 1,545,590 | | |
See notes to financial statements.
28
Victory Portfolios
Victory RS Global Fund | | Schedule of Portfolio Investments — continued
December 31, 2020 | |
Security Description | | Shares | | Value | |
France (4.3%): | |
Consumer Discretionary (1.4%): | |
Faurecia SE (a) | | | 33,217 | | | $ | 1,701,709 | | |
LVMH Moet Hennessy Louis Vuitton SE | | | 2,085 | | | | 1,305,046 | | |
| | | | 3,006,755 | | |
Energy (0.9%): | |
Gaztransport Et Technigaz SA | | | 11,408 | | | | 1,105,049 | | |
TOTAL SE (b) | | | 18,997 | | | | 819,848 | | |
| | | | 1,924,897 | | |
Financials (0.7%): | |
BNP Paribas SA (a) | | | 29,690 | | | | 1,567,199 | | |
Industrials (0.6%): | |
Safran SA (a) | | | 10,255 | | | | 1,453,295 | | |
Materials (0.7%): | |
Arkema SA | | | 14,002 | | | | 1,601,930 | | |
| | | | 9,554,076 | | |
Hong Kong (0.4%): | |
Energy (0.4%): | |
CNOOC Ltd. | | | 1,014,957 | | | | 931,174 | | |
India (0.6%): | |
Consumer Staples (0.6%): | |
Nestle India Ltd. | | | 5,537 | | | | 1,395,563 | | |
Indonesia (1.2%): | |
Communication Services (1.2%): | |
PT Telkom Indonesia Persero Tbk | | | 11,380,500 | | | | 2,685,035 | | |
Ireland (1.6%): | |
Industrials (1.6%): | |
Eaton Corp. PLC | | | 28,772 | | | | 3,456,668 | | |
Italy (2.8%): | |
Energy (0.8%): | |
Snam SpA | | | 314,748 | | | | 1,777,341 | | |
Financials (0.3%): | |
Banca Generali SpA (a) | | | 20,667 | | | | 691,136 | | |
Health Care (0.8%): | |
Recordati Industria Chimica e Farmaceutica SpA | | | 31,448 | | | | 1,748,562 | | |
Utilities (0.9%): | |
Enel SpA | | | 184,984 | | | | 1,881,922 | | |
| | | | 6,098,961 | | |
See notes to financial statements.
29
Victory Portfolios
Victory RS Global Fund | | Schedule of Portfolio Investments — continued
December 31, 2020 | |
Security Description | | Shares | | Value | |
Japan (7.6%): | |
Communication Services (1.1%): | |
Capcom Co. Ltd. | | | 20,500 | | | $ | 1,329,673 | | |
Kakaku.com, Inc. | | | 39,800 | | | | 1,089,618 | | |
| | | | 2,419,291 | | |
Consumer Discretionary (1.4%): | |
Hikari Tsushin, Inc. | | | 4,000 | | | | 938,673 | | |
Toyota Motor Corp. | | | 28,600 | | | | 2,207,386 | | |
| | | | 3,146,059 | | |
Consumer Staples (1.0%): | |
Kobe Bussan Co. Ltd. (b) | | | 37,300 | | | | 1,146,209 | | |
Toyo Suisan Kaisha Ltd. | | | 22,900 | | | | 1,114,636 | | |
| | | | 2,260,845 | | |
Financials (1.1%): | |
JAFCO Group Co. Ltd. | | | 24,200 | | | | 1,209,492 | | |
Mitsubishi UFJ Financial Group, Inc. | | | 291,800 | | | | 1,292,167 | | |
| | | | 2,501,659 | | |
Health Care (1.2%): | |
As One Corp. | | | 5,379 | | | | 920,149 | | |
Hoya Corp. | | | 12,200 | | | | 1,689,882 | | |
| | | | 2,610,031 | | |
Industrials (1.2%): | |
Nippon Yusen KK | | | 58,500 | | | | 1,365,048 | | |
OKUMA Corp. | | | 20,700 | | | | 1,161,216 | | |
| | | | 2,526,264 | | |
Information Technology (0.6%): | |
Ulvac, Inc. | | | 30,600 | | | | 1,312,078 | | |
| | | | 16,776,227 | | |
Korea, Republic Of (2.0%): | |
Information Technology (2.0%): | |
Samsung Electronics Co. Ltd. | | | 59,672 | | | | 4,456,448 | | |
Mexico (0.7%): | |
Industrials (0.7%): | |
Promotora y Operadora de Infraestructura SAB de CV | | | 168,568 | | | | 1,488,145 | | |
Netherlands (0.5%): | |
Information Technology (0.5%): | |
ASM International NV | | | 5,176 | | | | 1,129,368 | | |
New Zealand (0.8%): | |
Health Care (0.8%): | |
Fisher & Paykel Healthcare Corp. Ltd. | | | 72,161 | | | | 1,713,257 | | |
Norway (1.0%): | |
Energy (0.4%): | |
Aker BP ASA | | | 35,869 | | | | 906,529 | | |
See notes to financial statements.
30
Victory Portfolios
Victory RS Global Fund | | Schedule of Portfolio Investments — continued
December 31, 2020 | |
Security Description | | Shares | | Value | |
Financials (0.6%): | |
SpareBank 1 SMN | | | 106,162 | | | $ | 1,210,166 | | |
| | | | 2,116,695 | | |
Singapore (0.6%): | |
Financials (0.6%): | |
Singapore Exchange Ltd. | | | 205,900 | | | | 1,446,569 | | |
Sweden (0.8%): | |
Industrials (0.8%): | |
Atlas Copco AB, Class B | | | 41,385 | | | | 1,858,527 | | |
Switzerland (3.1%): | |
Financials (0.7%): | |
Partners Group Holding AG | | | 1,306 | | | | 1,535,125 | | |
Health Care (1.4%): | |
Roche Holding AG | | | 8,926 | | | | 3,109,967 | | |
Industrials (1.0%): | |
Adecco Group AG | | | 33,189 | | | | 2,211,248 | | |
| | | | 6,856,340 | | |
Taiwan (1.0%): | |
Financials (1.0%): | |
Cathay Financial Holding Co. Ltd. | | | 1,533,000 | | | | 2,308,445 | | |
United Kingdom (5.8%): | |
Communication Services (0.8%): | |
ITV PLC (a) | | | 1,245,888 | | | | 1,815,223 | | |
Consumer Discretionary (0.6%): | |
Next PLC (a) | | | 13,951 | | | | 1,345,042 | | |
Consumer Staples (0.7%): | |
Imperial Brands PLC | | | 75,899 | | | | 1,591,714 | | |
Financials (0.9%): | |
Close Brothers Group PLC | | | 103,702 | | | | 1,955,425 | | |
Materials (2.8%): | |
Croda International PLC | | | 15,463 | | | | 1,390,380 | | |
Evraz PLC | | | 265,588 | | | | 1,697,100 | | |
Rio Tinto PLC | | | 38,947 | | | | 2,931,226 | | |
| | | | 6,018,706 | | |
| | | | 12,726,110 | | |
United States (51.8%): | |
Communication Services (5.1%): | |
Alphabet, Inc., Class C (a) | | | 2,604 | | | | 4,561,896 | | |
Facebook, Inc., Class A (a) | | | 15,046 | | | | 4,109,965 | | |
Verizon Communications, Inc. | | | 44,027 | | | | 2,586,586 | | |
| | | | 11,258,447 | | |
See notes to financial statements.
31
Victory Portfolios
Victory RS Global Fund | | Schedule of Portfolio Investments — continued
December 31, 2020 | |
Security Description | | Shares | | Value | |
Consumer Discretionary (7.1%): | |
Amazon.com, Inc. (a) | | | 2,013 | | | $ | 6,556,200 | | |
McDonald's Corp. | | | 17,027 | | | | 3,653,654 | | |
Ross Stores, Inc. | | | 22,819 | | | | 2,802,401 | | |
The TJX Cos., Inc. | | | 39,240 | | | | 2,679,700 | | |
| | | | 15,691,955 | | |
Consumer Staples (4.6%): | |
Colgate-Palmolive Co. | | | 41,389 | | | | 3,539,173 | | |
PepsiCo, Inc. | | | 23,765 | | | | 3,524,350 | | |
The Estee Lauder Cos., Inc., Class A | | | 11,579 | | | | 3,082,214 | | |
| | | | 10,145,737 | | |
Energy (0.9%): | |
ConocoPhillips | | | 31,094 | | | | 1,243,449 | | |
Phillips 66 | | | 11,960 | | | | 836,483 | | |
| | | | 2,079,932 | | |
Financials (7.1%): | |
Bank of America Corp. | | | 112,185 | | | | 3,400,327 | | |
JPMorgan Chase & Co. | | | 31,337 | | | | 3,981,993 | | |
MSCI, Inc. | | | 5,000 | | | | 2,232,650 | | |
S&P Global, Inc. | | | 8,164 | | | | 2,683,752 | | |
The PNC Financial Services Group, Inc. | | | 14,707 | | | | 2,191,343 | | |
The Progressive Corp. | | | 10,675 | | | | 1,055,544 | | |
| | | | 15,545,609 | | |
Health Care (7.4%): | |
Amedisys, Inc. (a) | | | 4,908 | | | | 1,439,664 | | |
Amgen, Inc. | | | 10,786 | | | | 2,479,917 | | |
CVS Health Corp. | | | 28,795 | | | | 1,966,698 | | |
Eli Lilly & Co. | | | 18,479 | | | | 3,119,994 | | |
IDEXX Laboratories, Inc. (a) | | | 6,087 | | | | 3,042,709 | | |
Johnson & Johnson | | | 26,779 | | | | 4,214,479 | | |
| | | | 16,263,461 | | |
Industrials (1.7%): | |
3M Co. | | | 7,618 | | | | 1,331,550 | | |
Honeywell International, Inc. | | | 11,537 | | | | 2,453,920 | | |
| | | | 3,785,470 | | |
Information Technology (16.2%): | |
Apple, Inc. | | | 83,173 | | | | 11,036,225 | | |
Cisco Systems, Inc. | | | 81,611 | | | | 3,652,092 | | |
Mastercard, Inc., Class A | | | 14,760 | | | | 5,268,434 | | |
Microsoft Corp. | | | 41,710 | | | | 9,277,138 | | |
NVIDIA Corp. | | | 5,243 | | | | 2,737,895 | | |
Texas Instruments, Inc. | | | 22,974 | | | | 3,770,723 | | |
| | | | 35,742,507 | | |
Real Estate (0.7%): | |
Prologis, Inc. | | | 16,440 | | | | 1,638,410 | | |
See notes to financial statements.
32
Victory Portfolios
Victory RS Global Fund | | Schedule of Portfolio Investments — continued
December 31, 2020 | |
Security Description | | Shares | | Value | |
Utilities (1.0%): | |
MGE Energy, Inc. | | | 31,106 | | | $ | 2,178,353 | | |
| | | | 114,329,881 | | |
Total Common Stocks (Cost $166,784,706) | | | 214,758,392 | | |
Exchange-Traded Funds (0.3%) | |
United States (0.3%): | |
iShares MSCI ACWI ETF (b) | | | 7,169 | | | | 650,372 | | |
Total Exchange-Traded Funds (Cost $548,885) | | | 650,372 | | |
Collateral for Securities Loaned^ (2.4%) | |
United States (2.4%): | |
BlackRock Liquidity Funds TempFund Portfolio, Institutional Class, 0.08% (c) | | | 90,363 | | | | 90,363 | | |
Fidelity Investments Money Market Government Portfolio, Class I, 0.01% (c) | | | 3,104,502 | | | | 3,104,502 | | |
Goldman Sachs Financial Square Prime Obligations Fund,
Institutional Class, 0.04% (c) | | | 45,096 | | | | 45,096 | | |
JPMorgan Prime Money Market Fund, Capital Class, 0.12% (c) | | | 359,579 | | | | 359,579 | | |
Morgan Stanley Institutional Liquidity Prime Portfolio,
Institutional Class, 0.09% (c) | | | 1,616,736 | | | | 1,616,736 | | |
Total Collateral for Securities Loaned (Cost $5,216,276) | | | 5,216,276 | | |
Total Investments (Cost $172,549,867) — 100.0% | | | 220,625,040 | | |
Other assets in excess of liabilities — 0.0% | | | 86,040 | | |
NET ASSETS — 100.00% | | $ | 220,711,080 | | |
^ Purchased with cash collateral from securities on loan.
(a) Non-income producing security.
(b) All or a portion of this security is on loan.
(c) Rate disclosed is the daily yield on December 31, 2020.
ETF — Exchange-Traded Fund
PLC — Public Limited Company
See notes to financial statements.
33
Victory Portfolios
Victory Sophus Emerging Markets Fund | | Schedule of Portfolio Investments
December 31, 2020 | |
Security Description | | Shares | | Value | |
Common Stocks (99.0%) | |
Brazil (7.7%): | |
Communication Services (0.7%): | |
TIM SA | | | 1,133,343 | | | $ | 3,211,986 | | |
Consumer Discretionary (1.3%): | |
Afya Ltd., Class A (a) | | | 100,547 | | | | 2,543,839 | | |
Lojas Americanas SA, Preference Shares | | | 364,100 | | | | 1,843,138 | | |
Petrobras Distribuidora SA | | | 437,000 | | | | 1,865,042 | | |
| | | | 6,252,019 | | |
Energy (1.6%): | |
Petroleo Brasileiro SA, ADR | | | 671,480 | | | | 7,540,720 | | |
Financials (1.6%): | |
Banco Bradesco SA, ADR | | | 705,205 | | | | 3,709,378 | | |
Banco do Brasil SA | | | 544,200 | | | | 4,091,439 | | |
| | | | 7,800,817 | | |
Industrials (0.9%): | |
Randon SA Implementos e Participacoes, Preference Shares | | | 763,900 | | | | 2,376,757 | | |
SIMPAR SA | | | 249,794 | | | | 1,710,336 | | |
| | | | 4,087,093 | | |
Materials (1.1%): | |
Vale SA | | | 310,400 | | | | 5,224,823 | | |
Utilities (0.5%): | |
Neoenergia SA | | | 635,400 | | | | 2,169,381 | | |
| | | | 36,286,839 | | |
Chile (0.0%): (b) | |
Financials (0.0%): | |
Banco de Credito e Inversiones SA | | | 1 | | | | 39 | | |
China (35.1%): | |
Communication Services (6.4%): | |
Baidu, Inc., ADR (a) | | | 14,754 | | | | 3,190,405 | | |
Tencent Holdings Ltd. | | | 379,215 | | | | 27,286,838 | | |
| | | | 30,477,243 | | |
Consumer Discretionary (12.7%): | |
Alibaba Group Holding Ltd., ADR (a) | | | 110,623 | | | | 25,745,291 | | |
China East Education Holdings Ltd. (c) | | | 832,500 | | | | 2,003,517 | | |
China Yongda Automobiles Services Holdings Ltd. | | | 1,832,000 | | | | 3,037,983 | | |
Hisense Home Appliances Group Co. Ltd., Class A | | | 1,250,600 | | | | 2,756,828 | | |
JD.com, Inc., ADR (a) | | | 80,328 | | | | 7,060,831 | | |
Jiumaojiu International Holdings Ltd. (a)(c) | | | 766,000 | | | | 2,334,160 | | |
Meituan Dianping, Class B (a) | | | 269,800 | | | | 10,156,532 | | |
Minth Group Ltd. | | | 312,000 | | | | 1,650,745 | | |
See notes to financial statements.
34
Victory Portfolios
Victory Sophus Emerging Markets Fund | | Schedule of Portfolio Investments — continued
December 31, 2020 | |
Security Description | | Shares | | Value | |
Tongcheng-Elong Holdings Ltd. (a) | | | 1,625,600 | | | $ | 3,150,739 | | |
Topsports International Holdings Ltd. (c) | | | 1,516,000 | | | | 2,270,383 | | |
| | | | 60,167,009 | | |
Consumer Staples (0.8%): | |
China Feihe Ltd. (c) | | | 1,553,000 | | | | 3,644,116 | | |
Energy (0.7%): | |
China Oilfield Services Ltd., Class H | | | 3,818,000 | | | | 3,236,392 | | |
Financials (3.9%): | |
China Merchants Bank Co. Ltd., Class H | | | 1,110,500 | | | | 7,025,299 | | |
CSC Financial Co. Ltd., Class H (c)(d) | | | 2,630,000 | | | | 3,499,178 | | |
Ping An Insurance Group Co. of China Ltd. | | | 639,000 | | | | 7,776,636 | | |
| | | | 18,301,113 | | |
Health Care (1.2%): | |
Wuxi Biologics Cayman, Inc. (a)(c) | | | 417,000 | | | | 5,530,159 | | |
Industrials (3.0%): | |
COSCO SHIPPING Holdings Co. Ltd., Class H (a)(d) | | | 2,844,000 | | | | 3,409,741 | | |
Hangcha Group Co. Ltd., Class A | | | 625,360 | | | | 2,011,274 | | |
Sany Heavy Industry Co. Ltd., Class A | | | 741,300 | | | | 3,973,384 | | |
Zoomlion Heavy Industry Science and Technology Co. Ltd., Class H | | | 4,174,800 | | | | 5,009,613 | | |
| | | | 14,404,012 | | |
Information Technology (4.3%): | |
Chinasoft International Ltd. | | | 2,290,000 | | | | 2,559,420 | | |
GDS Holdings Ltd., ADR (a)(d) | | | 22,668 | | | | 2,122,631 | | |
Kingdee International Software Group Co. Ltd. | | | 577,000 | | | | 2,355,712 | | |
Shengyi Technology Co. Ltd., Class A | | | 681,200 | | | | 2,939,441 | | |
Weimob, Inc. (a)(c) | | | 2,357,000 | | | | 4,249,110 | | |
Xinyi Solar Holdings Ltd. | | | 2,316,000 | | | | 6,073,232 | | |
| | | | 20,299,546 | | |
Materials (0.8%): | |
China Hongqiao Group Ltd. | | | 4,242,500 | | | | 3,889,687 | | |
Real Estate (0.5%): | |
China SCE Group Holdings Ltd. | | | 1,026,000 | | | | 423,344 | | |
Shimao Services Holdings Ltd. (a)(c) | | | 1,383,854 | | | | 2,134,993 | | |
| | | | 2,558,337 | | |
Utilities (0.8%): | |
China Longyuan Power Group Corp. Ltd., Class H | | | 3,638,000 | | | | 3,658,137 | | |
| | | | 166,165,751 | | |
Colombia (0.7%): | |
Financials (0.7%): | |
Bancolombia SA, ADR | | | 85,207 | | | | 3,423,617 | | |
Greece (1.3%): | |
Financials (0.9%): | |
National Bank of Greece SA (a) | | | 1,525,895 | | | | 4,176,928 | | |
See notes to financial statements.
35
Victory Portfolios
Victory Sophus Emerging Markets Fund | | Schedule of Portfolio Investments — continued
December 31, 2020 | |
Security Description | | Shares | | Value | |
Industrials (0.4%): | |
Mytilineos SA | | | 142,632 | | | $ | 2,070,261 | | |
| | | | 6,247,189 | | |
Hong Kong (3.1%): | |
Consumer Discretionary (0.9%): | |
Geely Automobile Holdings Ltd. | | | 1,265,000 | | | | 4,331,631 | | |
Energy (0.7%): | |
Kunlun Energy Co. Ltd. | | | 3,864,000 | | | | 3,348,977 | | |
Information Technology (0.9%): | |
Lenovo Group Ltd. (d) | | | 4,186,000 | | | | 3,957,534 | | |
Real Estate (0.6%): | |
Shimao Group Holdings Ltd. | | | 858,500 | | | | 2,734,676 | | |
| | | | 14,372,818 | | |
India (8.2%): | |
Energy (0.6%): | |
Petronet LNG Ltd. | | | 861,620 | | | | 2,921,968 | | |
Financials (3.9%): | |
Bandhan Bank Ltd. (a)(c) | | | 612,150 | | | | 3,378,926 | | |
Cholamandalam Investment and Finance Co. Ltd. | | | 554,429 | | | | 2,945,087 | | |
HDFC Bank Ltd., ADR (a)(d) | | | 43,779 | | | | 3,163,470 | | |
Housing Development Finance Corp. Ltd. | | | 190,057 | | | | 6,659,284 | | |
Multi Commodity Exchange of India Ltd. | | | 85,091 | | | | 2,016,771 | | |
| | | | 18,163,538 | | |
Health Care (0.6%): | |
Dr. Reddy's Laboratories Ltd. | | | 42,168 | | | | 3,002,460 | | |
Information Technology (1.6%): | |
Infosys Technologies Ltd., ADR | | | 437,482 | | | | 7,415,320 | | |
Materials (1.5%): | |
Asian Paints Ltd. | | | 62,129 | | | | 2,353,503 | | |
Hindalco Industries Ltd. | | | 1,461,503 | | | | 4,828,663 | | |
| | | | 7,182,166 | | |
| | | | 38,685,452 | | |
Indonesia (1.3%): | |
Consumer Discretionary (0.5%): | |
PT Astra International Tbk | | | 5,316,500 | | | | 2,286,771 | | |
Financials (0.8%): | |
PT Bank Negara Indonesia Persero Tbk | | | 8,776,700 | | | | 3,867,457 | | |
| | | | 6,154,228 | | |
Korea, Republic Of (16.0%): | |
Communication Services (0.9%): | |
NAVER Corp. | | | 15,203 | | | | 4,098,639 | | |
See notes to financial statements.
36
Victory Portfolios
Victory Sophus Emerging Markets Fund | | Schedule of Portfolio Investments — continued
December 31, 2020 | |
Security Description | | Shares | | Value | |
Consumer Discretionary (3.0%): | |
Hankook Tire & Technology Co. Ltd. | | | 85,657 | | | $ | 3,112,229 | | |
Kia Motors Corp. | | | 117,364 | | | | 6,762,758 | | |
LG Electronics, Inc. | | | 35,777 | | | | 4,455,422 | | |
| | | | 14,330,409 | | |
Consumer Staples (0.8%): | |
Cosmax, Inc. (a) | | | 21,556 | | | | 1,978,347 | | |
Orion Corp. | | | 16,078 | | | | 1,836,319 | | |
| | | | 3,814,666 | | |
Financials (1.8%): | |
DB Insurance Co. Ltd. | | | 51,898 | | | | 2,091,718 | | |
Hana Financial Group, Inc. | | | 95,651 | | | | 3,046,894 | | |
Samsung Securities Co. Ltd. | | | 85,695 | | | | 3,197,519 | | |
| | | | 8,336,131 | | |
Health Care (0.4%): | |
Hugel, Inc. (a) | | | 9,609 | | | | 1,662,564 | | |
Industrials (1.4%): | |
CJ Logistics Corp. (a) | | | 9,488 | | | | 1,447,381 | | |
Hanwha Aerospace Co. Ltd. (a) | | | 95,590 | | | | 2,512,348 | | |
LG Corp. | | | 34,400 | | | | 2,776,091 | | |
| | | | 6,735,820 | | |
Information Technology (7.1%): | |
LG Innotek Co. Ltd. | | | 17,571 | | | | 2,959,940 | | |
Samsung Electronics Co. Ltd. | | | 296,470 | | | | 22,141,090 | | |
| Samsung Electronics Co. Ltd., Preference Shares | | | 42,343 | | | | 2,872,684 | | |
SK Hynix, Inc. | | | 53,575 | | | | 5,852,456 | | |
| | | | 33,826,170 | | |
Materials (0.6%): | |
LG Chem Ltd. | | | 3,661 | | | | 2,784,143 | | |
| | | | 75,588,542 | | |
Luxembourg (0.6%): | |
Materials (0.6%): | |
Ternium SA, ADR (a) | | | 90,737 | | | | 2,638,632 | | |
Mexico (1.3%): | |
Industrials (0.9%): | |
Controladora Vuela Cia de Aviacion SAB de CV, ADR (a)(d) | | | 137,122 | | | | 1,703,055 | | |
Grupo Aeroportuario del Centro Norte SAB de CV, ADR (a) | | | 49,750 | | | | 2,571,080 | | |
| | | | 4,274,135 | | |
Real Estate (0.4%): | |
Corp Inmobiliaria Vesta SAB de CV | | | 1,045,972 | | | | 2,039,441 | | |
| | | | 6,313,576 | | |
Philippines (0.6%): | |
Financials (0.6%): | |
BDO Unibank, Inc. | | | 1,258,930 | | | | 2,803,161 | | |
See notes to financial statements.
37
Victory Portfolios
Victory Sophus Emerging Markets Fund | | Schedule of Portfolio Investments — continued
December 31, 2020 | |
Security Description | | Shares | | Value | |
Poland (0.5%): | |
Financials (0.5%): | |
Bank Polska Kasa Opieki SA (a) | | | 151,413 | | | $ | 2,491,163 | | |
Russian Federation (2.4%): | |
Consumer Discretionary (0.6%): | |
Detsky Mir PJSC (c) | | | 1,538,620 | | | | 2,833,316 | | |
Energy (0.7%): | |
Rosneft Oil Co. PJSC, GDR | | | 611,783 | | | | 3,449,629 | | |
Financials (1.1%): | |
Sberbank of Russia PJSC, ADR | | | 362,433 | | | | 5,240,139 | | |
| | | | 11,523,084 | | |
Saudi Arabia (0.5%): | |
Industrials (0.5%): | |
Saudi Industrial Services Co. | | | 289,538 | | | | 2,503,645 | | |
Singapore (0.7%): | |
Communication Services (0.7%): | |
Sea Ltd., ADR (a) | | | 16,318 | | | | 3,248,098 | | |
South Africa (2.5%): | |
Communication Services (0.6%): | |
MTN Group Ltd. | | | 674,665 | | | | 2,785,882 | | |
Consumer Discretionary (0.6%): | |
Mr. Price Group Ltd. | | | 244,658 | | | | 2,840,729 | | |
Financials (0.5%): | |
Absa Group Ltd. | | | 306,126 | | | | 2,503,901 | | |
Materials (0.8%): | |
Impala Platinum Holdings Ltd. | | | 280,183 | | | | 3,858,443 | | |
| | | | 11,988,955 | | |
Taiwan (12.2%): | |
Consumer Discretionary (0.9%): | |
Makalot Industrial Co. Ltd. | | | 352,000 | | | | 2,404,134 | | |
Topkey Corp. | | | 302,000 | | | | 1,681,137 | | |
| | | | 4,085,271 | | |
Financials (1.6%): | |
Chailease Holding Co. Ltd. | | | 638,608 | | | | 3,822,537 | | |
Yuanta Financial Holding Co. Ltd. | | | 5,306,760 | | | | 3,887,817 | | |
| | | | 7,710,354 | | |
Industrials (0.3%): | |
Sunonwealth Electric Machine Industry Co. Ltd. | | | 749,000 | | | | 1,439,248 | | |
Information Technology (9.4%): | |
Globalwafers Co. Ltd. | | | 183,000 | | | | 4,623,078 | | |
MediaTek, Inc. | | | 220,000 | | | | 5,867,010 | | |
See notes to financial statements.
38
Victory Portfolios
Victory Sophus Emerging Markets Fund | | Schedule of Portfolio Investments — continued
December 31, 2020 | |
Security Description | | Shares | | Value | |
Nanya Technology Corp. | | | 1,840,000 | | | $ | 5,704,750 | | |
Taiwan Semiconductor Manufacturing Co. Ltd. | | | 1,374,998 | | | | 26,012,414 | | |
Zhen Ding Technology Holding Ltd. | | | 564,000 | | | | 2,295,196 | | |
| | | | 44,502,448 | | |
| | | | 57,737,321 | | |
Thailand (1.5%): | |
Consumer Staples (0.5%): | |
Carabao Group PCL | | | 611,400 | | | | 2,338,805 | | |
Financials (0.6%): | |
The Siam Commercial Bank PCL | | | 1,010,900 | | | | 2,950,512 | | |
Real Estate (0.4%): | |
AP Thailand PCL | | | 7,600,800 | | | | 1,836,204 | | |
| | | | 7,125,521 | | |
Turkey (0.5%): | |
Utilities (0.5%): | |
Enerjisa Enerji A/S (c) | | | 1,286,836 | | | | 2,169,402 | | |
United Kingdom (1.7%): | |
Materials (1.7%): | |
Anglo American PLC | | | 117,172 | | | | 3,868,707 | | |
Antofagasta PLC | | | 212,669 | | | | 4,171,768 | | |
| | | | 8,040,475 | | |
United States (0.6%): | |
Industrials (0.6%): | |
Bizlink Holding, Inc. | | | 309,000 | | | | 2,686,528 | | |
Total Common Stocks (Cost $339,573,203) | | | 468,194,036 | | |
Collateral for Securities Loaned^ (1.0%) | |
United States (1.0%): | |
BlackRock Liquidity Funds TempFund Portfolio, Institutional Class, 0.08% (e) | | | 81,177 | | | | 81,177 | | |
Fidelity Investments Money Market Government Portfolio, Class I, 0.01% (e) | | | 2,788,893 | | | | 2,788,893 | | |
Goldman Sachs Financial Square Prime Obligations Fund, Institutional
Class, 0.04% (e) | | | 40,511 | | | | 40,511 | | |
JPMorgan Prime Money Market Fund, Capital Class, 0.12% (e) | | | 323,023 | | | | 323,023 | | |
Morgan Stanley Institutional Liquidity Prime Portfolio, Institutional
Class, 0.09% (e) | | | 1,452,376 | | | | 1,452,376 | | |
Total Collateral for Securities Loaned (Cost $4,685,980) | | | 4,685,980 | | |
Total Investments (Cost $344,259,183) — 100.0% | | | 472,880,016 | | |
Other assets in excess of liabilities — 0.0% | | | 119,243 | | |
NET ASSETS — 100.00% | | $ | 472,999,259 | | |
^ Purchased with cash collateral from securities on loan.
(a) Non-income producing security.
(b) Amount represents less than 0.05% of net assets.
See notes to financial statements.
39
Victory Portfolios
Victory Sophus Emerging Markets Fund | | Schedule of Portfolio Investments — continued
December 31, 2020 | |
(c) Rule 144A security or other security that is restricted as to resale to institutional investors. The Fund's Adviser has deemed this security to be liquid based upon procedures approved by the Board of Trustees. As of December 31, 2020, the fair value of these securities was $34,047,260 and amounted to 7.2% of net assets.
(d) All or a portion of this security is on loan.
(e) Rate disclosed is the daily yield on December 31, 2020.
ADR — American Depositary Receipt
GDR — Global Depositary Receipt
PCL — Public Company Limited
PLC — Public Limited Company
See notes to financial statements.
40
Victory Portfolios
Victory Sophus Emerging Markets Small Cap Fund | | Schedule of Portfolio Investments
December 31, 2020 | |
Security Description | | Shares | | Value | |
Common Stocks (104.3%) | |
Belgium (1.0%): | |
Materials (1.0%): | |
Titan Cement International SA | | | 2,337 | | | $ | 39,258 | | |
Bermuda (1.3%): | |
Industrials (1.3%): | |
Johnson Electric Holdings Ltd. | | | 10,500 | | | | 26,002 | | |
Orient Overseas International Ltd. | | | 2,500 | | | | 24,990 | | |
| | | | 50,992 | | |
Brazil (5.6%): | |
Consumer Discretionary (2.2%): | |
Afya Ltd., Class A (a) | | | 1,140 | | | | 28,842 | | |
Petrobras Distribuidora SA | | | 6,300 | | | | 26,887 | | |
Tupy SA (a) | | | 8,300 | | | | 33,617 | | |
| | | | 89,346 | | |
Financials (0.8%): | |
Banco do Estado do Rio Grande do Sul SA, Preference Shares | | | 11,300 | | | | 31,876 | | |
Industrials (2.0%): | |
Randon SA Implementos e Participacoes, Preference Shares | | | 12,300 | | | | 38,270 | | |
SIMPAR SA | | | 6,324 | | | | 43,300 | | |
| | | | 81,570 | | |
Utilities (0.6%): | |
Neoenergia SA | | | 7,300 | | | | 24,924 | | |
| | | | 227,716 | | |
Canada (1.3%): | |
Energy (1.3%): | |
Canacol Energy Ltd. | | | 7,986 | | | | 23,531 | | |
Parex Resources, Inc. (a) | | | 2,257 | | | | 31,070 | | |
| | | | 54,601 | | |
China (14.8%): | |
Communication Services (0.8%): | |
Cathay Media & Education Group, Inc. (a)(b) | | | 33,036 | | | | 35,020 | | |
Consumer Discretionary (5.4%): | |
China East Education Holdings Ltd. (b) | | | 11,000 | | | | 26,473 | | |
China Kepei Education Group Ltd. | | | 40,000 | | | | 27,886 | | |
China Yongda Automobiles Services Holdings Ltd. | | | 24,000 | | | | 39,799 | | |
Hisense Home Appliances Group Co. Ltd., Class A | | | 13,600 | | | | 29,980 | | |
Jiumaojiu International Holdings Ltd. (a)(b) | | | 13,000 | | | | 39,613 | | |
Minth Group Ltd. | | | 6,000 | | | | 31,745 | | |
Tongcheng-Elong Holdings Ltd. (a) | | | 14,000 | | | | 27,135 | | |
| | | | 222,631 | | |
See notes to financial statements.
41
Victory Portfolios
Victory Sophus Emerging Markets Small Cap Fund | | Schedule of Portfolio Investments — continued
December 31, 2020 | |
Security Description | | Shares | | Value | |
Health Care (0.5%): | |
Tonghua Dongbao Pharmaceutical Co. Ltd., Class A | | | 9,400 | | | $ | 19,232 | | |
Industrials (2.1%): | |
Binjiang Service Group Co. Ltd. | | | 12,000 | | | | 22,187 | | |
Hangcha Group Co. Ltd., Class A | | | 7,700 | | | | 24,765 | | |
Zoomlion Heavy Industry Science and Technology Co. Ltd., Class H | | | 31,200 | | | | 37,439 | | |
| | | | 84,391 | | |
Information Technology (4.3%): | |
21vianet Group, Inc., ADR (a) | | | 1,257 | | | | 43,605 | | |
Chinasoft International Ltd. | | | 30,000 | | | | 33,529 | | |
Flat Glass Group Co. Ltd., Class H | | | 8,000 | | | | 33,748 | | |
Foshan Nationstar Optoelectronics Co. Ltd., Class A | | | 16,100 | | | | 25,134 | | |
Weimob, Inc. (a)(b) | | | 21,000 | | | | 37,858 | | |
| | | | 173,874 | | |
Real Estate (1.7%): | |
China SCE Group Holdings Ltd. | | | 62,000 | | | | 25,582 | | |
Powerlong Real Estate Holdings Ltd. | | | 36,000 | | | | 24,892 | | |
Yuzhou Group Holdings Co. Ltd. | | | 54,000 | | | | 19,515 | | |
| | | | 69,989 | | |
| | | | 605,137 | | |
Greece (3.6%): | |
Financials (1.7%): | |
National Bank of Greece SA (a) | | | 25,740 | | | | 70,460 | | |
Industrials (1.0%): | |
Mytilineos SA | | | 2,724 | | | | 39,538 | | |
Utilities (0.9%): | |
Terna Energy SA | | | 2,252 | | | | 36,318 | | |
| | | | 146,316 | | |
India (13.4%): | |
Consumer Discretionary (0.7%): | |
Garware Technical Fibres Ltd. | | | 871 | | | | 27,053 | | |
Energy (0.7%): | |
Petronet LNG Ltd. | | | 7,994 | | | | 27,110 | | |
Financials (2.2%): | |
Cholamandalam Investment and Finance Co. Ltd. | | | 9,997 | | | | 53,103 | | |
Multi Commodity Exchange of India Ltd. | | | 1,629 | | | | 38,610 | | |
| | | | 91,713 | | |
Health Care (1.7%): | |
Alkem Laboratories Ltd. | | | 678 | | | | 27,177 | | |
Sequent Scientific Ltd. (a) | | | 19,078 | | | | 44,211 | | |
| | | | 71,388 | | |
See notes to financial statements.
42
Victory Portfolios
Victory Sophus Emerging Markets Small Cap Fund | | Schedule of Portfolio Investments — continued
December 31, 2020 | |
Security Description | | Shares | | Value | |
Industrials (2.7%): | |
Ashoka Buildcon Ltd. (a) | | | 17,866 | | | $ | 22,737 | | |
Engineers India Ltd. | | | 37,235 | | | | 39,952 | | |
Polycab India Ltd. | | | 1,834 | | | | 26,096 | | |
RITES Ltd. (a) | | | 5,293 | | | | 19,709 | | |
| | | | 108,494 | | |
Information Technology (1.6%): | |
Mphasis Ltd. | | | 3,130 | | | | 66,091 | | |
Materials (2.9%): | |
APL Apollo Tubes Ltd. (a) | | | 2,887 | | | | 34,939 | | |
EPL Ltd. | | | 7,109 | | | | 24,544 | | |
JK Lakshmi Cement Ltd. | | | 7,475 | | | | 34,828 | | |
Mishra Dhatu Nigam Ltd. (b) | | | 8,638 | | | | 23,748 | | |
| | | | 118,059 | | |
Utilities (0.9%): | |
CESC Ltd. | | | 4,506 | | | | 37,893 | | |
| | | | 547,801 | | |
Indonesia (3.0%): | |
Financials (1.0%): | |
PT Bank Danamon Indonesia Tbk | | | 182,600 | | | | 40,867 | | |
Industrials (0.8%): | |
PT Buana Lintas Lautan Tbk (a) | | | 1,369,800 | | | | 34,151 | | |
Materials (1.2%): | |
PT Merdeka Copper Gold Tbk (a) | | | 283,500 | | | | 49,105 | | |
| | | | 124,123 | | |
Korea, Republic Of (23.2%): | |
Communication Services (0.8%): | |
AfreecaTV Co. Ltd. | | | 604 | | | | 33,685 | | |
Consumer Discretionary (1.6%): | |
Danawa Co. Ltd. (a) | | | 1,069 | | | | 30,305 | | |
Hankook Tire & Technology Co. Ltd. | | | 985 | | | | 35,788 | | |
| | | | 66,093 | | |
Consumer Staples (2.2%): | |
Cosmax, Inc. (a) | | | 350 | | | | 32,122 | | |
Newtree Co. Ltd. (a) | | | 1,295 | | | | 29,730 | | |
Orion Corp. | | | 240 | | | | 27,411 | | |
| | | | 89,263 | | |
Financials (1.7%): | |
DB Insurance Co. Ltd. | | | 754 | | | | 30,389 | | |
KIWOOM Securities Co. Ltd. | | | 344 | | | | 40,190 | | |
| | | | 70,579 | | |
See notes to financial statements.
43
Victory Portfolios
Victory Sophus Emerging Markets Small Cap Fund | | Schedule of Portfolio Investments — continued
December 31, 2020 | |
Security Description | | Shares | | Value | |
Health Care (4.2%): | |
Classys, Inc. | | | 2,132 | | | $ | 30,277 | | |
Daewon Pharmaceutical Co. Ltd. (a) | | | 1,675 | | | | 29,961 | | |
Genexine, Inc. (a) | | | 153 | | | | 17,565 | | |
Hugel, Inc. (a) | | | 146 | | | | 25,261 | | |
Huons Co. Ltd. | | | 235 | | | | 13,432 | | |
I-Sens, Inc. | | | 895 | | | | 24,756 | | |
Samjin Pharmaceutical Co. Ltd. (a) | | | 1,145 | | | | 28,761 | | |
| | | | 170,013 | | |
Industrials (4.7%): | |
CJ Logistics Corp. (a) | | | 230 | | | | 35,086 | | |
CS Wind Corp. | | | 209 | | | | 34,172 | | |
Dongbu Corp. (a) | | | 3,105 | | | | 38,770 | | |
Hanwha Aerospace Co. Ltd. (a) | | | 1,487 | | | | 39,082 | | |
NICE Information Service Co. Ltd. (a) | | | 1,869 | | | | 42,754 | | |
| | | | 189,864 | | |
Information Technology (4.3%): | |
HyVision System, Inc. | | | 4,361 | | | | 59,566 | | |
LG Innotek Co. Ltd. | | | 203 | | | | 34,196 | | |
TES Co. Ltd. | | | 1,645 | | | | 44,994 | | |
WONIK IPS Co. Ltd. (a) | | | 924 | | | | 37,709 | | |
| | | | 176,465 | | |
Materials (3.7%): | |
Hansol Chemical Co. Ltd. | | | 312 | | | | 56,573 | | |
SK Materials Co. Ltd. (a) | | | 166 | | | | 54,725 | | |
Soulbrain Holdings Co. Ltd. | | | 945 | | | | 39,343 | | |
| | | | 150,641 | | |
| | | | 946,603 | | |
Luxembourg (0.9%): | |
Materials (0.9%): | |
Ternium SA, ADR (a) | | | 1,313 | | | | 38,182 | | |
Malaysia (1.8%): | |
Financials (0.9%): | |
Hong Leong Financial Group Bhd | | | 8,600 | | | | 38,719 | | |
Industrials (0.9%): | |
MMC Corp. Bhd | | | 163,300 | | | | 36,667 | | |
| | | | 75,386 | | |
Mexico (4.3%): | |
Financials (1.1%): | |
Banco del Bajio SA (a)(b) | | | 33,213 | | | | 45,543 | | |
See notes to financial statements.
44
Victory Portfolios
Victory Sophus Emerging Markets Small Cap Fund | | Schedule of Portfolio Investments — continued
December 31, 2020 | |
Security Description | | Shares | | Value | |
Industrials (2.3%): | |
Controladora Vuela Cia de Aviacion SAB de CV, ADR (a) | | | 2,386 | | | $ | 29,634 | | |
Grupo Aeroportuario del Centro Norte SAB de CV, ADR (a) | | | 640 | | | | 33,075 | | |
Grupo Traxion SAB de CV (a)(b) | | | 34,523 | | | | 30,178 | | |
| | | | 92,887 | | |
Real Estate (0.9%): | |
Concentradora Fibra Danhos SA de CV | | | 28,598 | | | | 34,960 | | |
| | | | 173,390 | | |
Philippines (1.2%): | |
Financials (1.2%): | |
Metropolitan Bank & Trust Co. | | | 48,020 | | | | 49,063 | | |
Poland (1.5%): | |
Financials (0.9%): | |
Bank Polska Kasa Opieki SA (a) | | | 2,114 | | | | 34,781 | | |
Industrials (0.6%): | |
Famur SA (a) | | | 41,951 | | | | 25,403 | | |
| | | | 60,184 | | |
Russian Federation (0.7%): | |
Consumer Discretionary (0.7%): | |
Detsky Mir PJSC (b) | | | 14,800 | | | | 27,254 | | |
Saudi Arabia (1.6%): | |
Consumer Discretionary (0.7%): | |
Leejam Sports Co. JSC (a) | | | 1,469 | | | | 30,252 | | |
Industrials (0.9%): | |
Saudi Industrial Services Co. | | | 4,212 | | | | 36,422 | | |
| | | | 66,674 | | |
Singapore (0.7%): | |
Real Estate (0.7%): | |
Ascendas India Trust | | | 27,900 | | | | 29,134 | | |
South Africa (2.7%): | |
Consumer Discretionary (0.7%): | |
Mr. Price Group Ltd. | | | 2,502 | | | | 29,050 | | |
Financials (0.8%): | |
Transaction Capital Ltd. (a) | | | 20,066 | | | | 34,180 | | |
Materials (1.2%): | |
Impala Platinum Holdings Ltd. | | | 3,396 | | | | 46,767 | | |
| | | | 109,997 | | |
Taiwan (17.2%): | |
Communication Services (1.3%): | |
International Games System Co. Ltd. | | | 2,000 | | | | 54,104 | | |
See notes to financial statements.
45
Victory Portfolios
Victory Sophus Emerging Markets Small Cap Fund | | Schedule of Portfolio Investments — continued
December 31, 2020 | |
Security Description | | Shares | | Value | |
Consumer Discretionary (1.5%): | |
Makalot Industrial Co. Ltd. | | | 5,000 | | | $ | 34,150 | | |
Topkey Corp. | | | 5,000 | | | | 27,833 | | |
| | | | 61,983 | | |
Financials (0.9%): | |
Chailease Holding Co. Ltd. | | | 5,743 | | | | 34,376 | | |
Industrials (1.5%): | |
Chicony Power Technology Co. Ltd. | | | 12,000 | | | | 30,199 | | |
Sunonwealth Electric Machine Industry Co. Ltd. | | | 17,000 | | | | 32,667 | | |
| | | | 62,866 | | |
Information Technology (10.3%): | |
Chipbond Technology Corp. | | | 14,000 | | | | 33,147 | | |
Ennoconn Corp. | | | 2,196 | | | | 19,697 | | |
FLEXium Interconnect, Inc. | | | 11,000 | | | | 47,559 | | |
Foxsemicon Integrated Technology, Inc. | | | 5,000 | | | | 37,511 | | |
General Interface Solution Holding Ltd. | | | 7,000 | | | | 28,612 | | |
Lelon Electronics Corp. | | | 19,000 | | | | 43,282 | | |
Lotes Co. Ltd. | | | 2,000 | | | | 33,891 | | |
Powertech Technology, Inc. | | | 7,000 | | | | 23,713 | | |
Sigurd Microelectronics Corp. | | | 20,000 | | | | 32,291 | | |
Sino-American Silicon Products, Inc. | | | 10,000 | | | | 63,325 | | |
Tripod Technology Corp. | | | 8,000 | | | | 33,833 | | |
Zhen Ding Technology Holding Ltd. | | | 6,000 | | | | 24,417 | | |
| | | | 421,278 | | |
Materials (1.7%): | |
Taiwan Hon Chuan Enterprise Co. Ltd. | | | 13,000 | | | | 27,940 | | |
Tung Ho Steel Enterprise Corp. | | | 32,000 | | | | 41,622 | | |
| | | | 69,562 | | |
| | | | 704,169 | | |
Thailand (1.6%): | |
Consumer Staples (0.8%): | |
Carabao Group PCL | | | 8,400 | | | | 32,133 | | |
Real Estate (0.8%): | |
AP Thailand PCL | | | 142,700 | | | | 34,473 | | |
| | | | 66,606 | | |
Turkey (2.0%): | |
Financials (1.1%): | |
AvivaSA Emeklilik ve Hayat A/S (a) | | | 18,523 | | | | 45,766 | | |
Utilities (0.9%): | |
Enerjisa Enerji A/S (b) | | | 21,989 | | | | 37,070 | | |
| | | | 82,836 | | |
See notes to financial statements.
46
Victory Portfolios
Victory Sophus Emerging Markets Small Cap Fund | | Schedule of Portfolio Investments — continued
December 31, 2020 | |
Security Description | | Shares | | Value | |
United States (0.9%): | |
Industrials (0.9%): | |
Bizlink Holding, Inc. | | | 4,000 | | | $ | 34,777 | | |
Total Common Stocks (Cost $3,411,918) | | | 4,260,199 | | |
Rights (0.1%) | |
Korea, Republic Of (0.1%): | |
Industrials (0.1%): | |
CS Wind Corp., Expires 2/1/21 (a)(c)(d) | | | 45 | | | | 2,237 | | |
Total Rights (Cost $—) | | | 2,237 | | |
Total Investments (Cost $3,411,918) — 104.4% | | | 4,262,436 | | |
Liabilities in excess of other assets — (4.4)% | | | (179,193 | ) | |
NET ASSETS — 100.00% | | $ | 4,083,243 | | |
(a) Non-income producing security.
(b) Rule 144A security or other security that is restricted as to resale to institutional investors. The Fund's Adviser has deemed this security to be liquid based upon procedures approved by the Board of Trustees. As of December 31, 2020, the fair value of these securities was $302,757 and amounted to 7.4% of net assets.
(c) The Fund's Adviser has deemed this security to be illiquid based upon procedures approved by the Board of Trustees. As of December 31, 2020, illiquid securities were 0.1% of the Fund's net assets.
(d) Security was fair valued based upon procedures approved by the Board of Trustees and represents 0.1% of the Fund's net assets as of December 31, 2020. (See Note 2)
ADR — American Depositary Receipt
PCL — Public Company Limited
See notes to financial statements.
47
Victory Portfolios | | Statements of Assets and Liabilities
December 31, 2020 | |
| | | Victory RS
International
Fund | | Victory
RS Global
Fund | |
ASSETS: | |
Investments, at value (Cost $326,035,676 and $172,549,867) | | $ | 374,921,063 | (a) | | $ | 220,625,040 | (b) | |
Foreign currency, at value (Cost $406,485 and $36,308) | | | 405,963 | | | | 36,308 | | |
Cash and cash equivalents | | | 9,619,949 | | | | 5,089,015 | | |
Receivables: | |
Interest and dividends | | | 26,923 | | | | 59,617 | | |
Capital shares issued | | | 1,272,662 | | | | 339,068 | | |
Reclaims | | | 396,895 | | | | 46,285 | | |
From Adviser | | | 95,250 | | | | 175,782 | | |
Prepaid expenses | | | 11,247 | | | | 19,616 | | |
Total Assets | | | 386,749,952 | | | | 226,390,731 | | |
LIABILITIES: | |
Payables: | |
Collateral received on loaned securities | | | 4,558,013 | | | | 5,216,276 | | |
Capital shares redeemed | | | 206,361 | | | | 196,564 | | |
Accrued foreign capital gains taxes | | | — | | | | 42,924 | | |
Accrued expenses and other payables: | |
Investment advisory fees | | | 250,967 | | | | 143,392 | | |
Administration fees | | | 19,859 | | | | 11,066 | | |
Custodian fees | | | 9,508 | | | | 8,431 | | |
Transfer agent fees | | | 32,404 | | | | 26,217 | | |
Compliance fees | | | 252 | | | | 144 | | |
Trustees' fees | | | 1 | | | | 1 | | |
| 12b-1 fees | | | 3,586 | | | | 7,869 | | |
Other accrued expenses | | | 31,609 | | | | 26,767 | | |
Total Liabilities | | | 5,112,560 | | | | 5,679,651 | | |
NET ASSETS: | |
Capital | | | 340,138,209 | | | | 175,169,571 | | |
Total accumulated earnings/(loss) | | | 41,499,183 | | | | 45,541,509 | | |
Net Assets | | $ | 381,637,392 | | | $ | 220,711,080 | | |
Net Assets | |
Class A Shares | | $ | 24,009,531 | | | $ | 51,065,706 | | |
Class C Shares | | | 1,241,204 | | | | 3,490,514 | | |
Class R Shares | | | 1,997,933 | | | | 4,454,043 | | |
Class R6 Shares | | | 251,586,064 | | | | 46,776,098 | | |
Class Y Shares | | | 102,802,660 | | | | 114,924,719 | | |
Total | | $ | 381,637,392 | | | $ | 220,711,080 | | |
Shares (unlimited number of shares authorized with a par
value of $0.001 per share): | |
Class A Shares | | | 1,780,230 | | | | 2,956,906 | | |
Class C Shares | | | 127,684 | | | | 209,213 | | |
Class R Shares | | | 158,758 | | | | 206,465 | | |
Class R6 Shares | | | 22,592,885 | | | | 3,633,624 | | |
Class Y Shares | | | 7,734,984 | | | | 6,711,827 | | |
Total | | | 32,394,541 | | | | 13,718,035 | | |
Net asset value, offering (except Class A Shares) and redemption
price per share: | |
Class A Shares | | $ | 13.49 | | | $ | 17.27 | | |
Class C Shares (c) | | | 9.72 | | | | 16.68 | | |
Class R Shares | | | 12.58 | | | | 21.57 | | |
Class R6 Shares | | | 11.14 | | | | 12.87 | | |
Class Y Shares | | | 13.29 | | | | 17.12 | | |
Maximum Sales Charge — Class A Shares | | | 5.75 | % | | | 5.75 | % | |
Maximum offering price
(100%/(100%-maximum sales charge) of net asset value
adjusted to the nearest cent) per share — Class A Shares | | $ | 14.31 | | | $ | 18.32 | | |
(a) Includes $4,295,333 of securities on loan.
(b) Includes $4,934,538 of securities on loan.
(c) Redemption price per share varies by the length of time shares are held.
See notes to financial statements.
48
Victory Portfolios | | Statements of Assets and Liabilities
December 31, 2020 | |
| | | Victory Sophus
Emerging
Markets Fund | | Victory Sophus
Emerging
Markets Small
Cap Fund | |
ASSETS: | |
Investments, at value (Cost $344,259,183 and $3,411,918) | | $ | 472,880,016 | (a) | | $ | 4,262,436 | | |
Foreign currency, at value (Cost $10,420 and $12,534) | | | 11,266 | | | | 12,913 | | |
Cash and cash equivalents | | | 3,725,513 | | | | — | | |
Receivables: | |
Interest and dividends | | | 1,181,204 | | | | 11,974 | | |
Capital shares issued | | | 1,409,007 | | | | — | | |
Investments sold | | | 1,456,911 | | | | 351,711 | | |
Reclaims | | | 4,987 | | | | 215 | | |
From Adviser | | | 202,236 | | | | 26,673 | | |
Prepaid expenses | | | 8,512 | | | | 22,708 | | |
Total Assets | | | 480,879,652 | | | | 4,688,630 | | |
LIABILITIES: | |
Payables: | |
Collateral received on loaned securities | | | 4,685,980 | | | | — | | |
Payable to custodian | | | — | | | | 404,332 | | |
Investments purchased | | | 1,591,774 | | | | 21,843 | | |
Capital shares redeemed | | | 698,412 | | | | 143,380 | | |
Accrued foreign capital gains taxes | | | 331,881 | | | | 28 | | |
Accrued expenses and other payables: | |
Investment advisory fees | | | 387,477 | | | | 4,709 | | |
Administration fees | | | 23,863 | | | | 234 | | |
Custodian fees | | | 45,831 | | | | 8,371 | | |
Transfer agent fees | | | 44,895 | | | | 404 | | |
Compliance fees | | | 315 | | | | 3 | | |
Trustees' fees | | | 117 | | | | — | (b) | |
| 12b-1 fees | | | 10,676 | | | | 73 | | |
Other accrued expenses | | | 59,172 | | | | 22,010 | | |
Total Liabilities | | | 7,880,393 | | | | 605,387 | | |
NET ASSETS: | |
Capital | | | 372,046,218 | | | | 3,432,830 | | |
Total accumulated earnings/(loss) | | | 100,953,041 | | | | 650,413 | | |
Net Assets | | $ | 472,999,259 | | | $ | 4,083,243 | | |
Net Assets | |
Class A Shares | | $ | 60,206,290 | | | $ | 223,969 | | |
Class C Shares | | | 3,261,022 | | | | 87,713 | | |
Class R Shares | | | 13,531,311 | | | | — | | |
Class R6 Shares | | | 115,636,607 | | | | — | | |
Class Y Shares | | | 280,364,029 | | | | 3,771,561 | | |
Total | | $ | 472,999,259 | | | $ | 4,083,243 | | |
Shares (unlimited number of shares authorized with a par
value of $0.001 per share): | |
Class A Shares | | | 2,437,157 | | | | 27,888 | | |
Class C Shares | | | 177,443 | | | | 12,062 | | |
Class R Shares | | | 585,010 | | | | — | | |
Class R6 Shares | | | 4,607,695 | | | | — | | |
Class Y Shares | | | 11,281,650 | | | | 472,197 | | |
Total | | | 19,088,955 | | | | 512,147 | | |
Net asset value, offering (except Class A Shares) and redemption
price per share: | |
Class A Shares | | $ | 24.70 | | | $ | 8.03 | | |
Class C Shares (c) | | | 18.38 | | | | 7.27 | | |
Class R Shares | | | 23.13 | | | | — | | |
Class R6 Shares | | | 25.10 | | | | — | | |
Class Y Shares | | | 24.85 | | | | 7.99 | | |
Maximum Sales Charge — Class A Shares | | | 5.75 | % | | | 5.75 | % | |
Maximum offering price
(100%/(100%-maximum sales charge) of net asset value
adjusted to the nearest cent) per share — Class A Shares | | $ | 26.21 | | | $ | 8.52 | | |
(a) Includes $4,513,824 of securities on loan.
(b) Rounds to less than $1.
(c) Redemption price per share varies by the length of time shares are held.
See notes to financial statements.
49
Victory Portfolios | | Statements of Operations
For the Year Ended December 31, 2020 | |
| | | Victory RS
International
Fund | | Victory RS
Global Fund | |
Investment Income: | |
Dividends | | $ | 9,106,884 | | | $ | 2,627,515 | | |
Non-cash dividends | | | 709,031 | | | | — | | |
Interest | | | 31,207 | | | | 11,569 | | |
Securities lending (net of fees) | | | 48,673 | | | | 11,820 | | |
Foreign tax withholding | | | (977,482 | ) | | | (152,673 | ) | |
Total Income | | | 8,918,313 | | | | 2,498,231 | | |
Expenses: | |
Investment advisory fees | | | 2,450,489 | | | | 1,013,702 | | |
Administration fees | | | 186,254 | | | | 76,884 | | |
Sub-Administration fees | | | 14,132 | | | | 14,132 | | |
12b-1 fees — Class A Shares | | | 55,130 | | | | 93,292 | | |
12b-1 fees — Class C Shares | | | 13,187 | | | | 29,672 | | |
12b-1 fees — Class R Shares | | | 11,106 | | | | 18,369 | | |
Accounting fees | | | 29,233 | | | | 10,333 | | |
Custodian fees | | | 53,366 | | | | 38,658 | | |
Transfer agent fees — Class A Shares | | | 44,008 | | | | 59,869 | | |
Transfer agent fees — Class C Shares | | | 2,005 | | | | 3,708 | | |
Transfer agent fees — Class R Shares | | | 4,764 | | | | 4,307 | | |
Transfer agent fees — Class R6 Shares | | | 331 | | | | 238 | | |
Transfer agent fees — Class Y Shares | | | 122,335 | | | | 90,710 | | |
Trustees' fees | | | 23,403 | | | | 9,486 | | |
Compliance fees | | | 2,593 | | | | 1,025 | | |
Legal and audit fees | | | 33,106 | | | | 23,142 | | |
State registration and filing fees | | | 91,105 | | | | 80,424 | | |
Interfund lending fees | | | 23 | | | | 32 | | |
Other expenses | | | 39,681 | | | | 22,507 | | |
Total Expenses | | | 3,176,251 | | | | 1,590,490 | | |
Expenses waived/reimbursed by Adviser | | | (491,864 | ) | | | (690,062 | ) | |
Net Expenses | | | 2,684,387 | | | | 900,428 | | |
Net Investment Income (Loss) | | | 6,233,926 | | | | 1,597,803 | | |
Realized/Unrealized Gains (Losses) from Investments: | |
Net realized gains (losses) from investment securities and
foreign currency translations | | | (8,724,622 | ) | | | (1,384,009 | ) | |
Foreign taxes on realized gains | | | — | | | | (9,838 | ) | |
Net change in unrealized appreciation/depreciation on
investment securities and foreign currency translations | | | 28,956,558 | | | | 29,611,926 | | |
Net change in accrued foreign taxes on unrealized gains | | | — | | | | (18,369 | ) | |
Net realized/unrealized gains (losses) on investments | | | 20,231,936 | | | | 28,199,710 | | |
Change in net assets resulting from operations | | $ | 26,465,862 | | | $ | 29,797,513 | | |
See notes to financial statements.
50
Victory Portfolios | | Statements of Operations
For the Year Ended December 31, 2020 | |
| | | Victory Sophus
Emerging
Markets Fund | | Victory Sophus
Emerging
Markets Small
Cap Fund | |
Investment Income: | |
Dividends | | $ | 7,255,576 | | | $ | 114,736 | | |
Interest | | | 9,668 | | | | 309 | | |
Securities lending (net of fees) | | | 20,582 | | | | 861 | | |
Foreign tax withholding | | | (835,463 | ) | | | (13,486 | ) | |
Total Income | | | 6,450,363 | | | | 102,420 | | |
Expenses: | |
Investment advisory fees | | | 3,581,765 | | | | 55,117 | | |
Administration fees | | | 217,411 | | | | 2,684 | | |
Sub-Administration fees | | | 14,132 | | | | 14,132 | | |
12b-1 fees — Class A Shares | | | 130,095 | | | | 713 | | |
12b-1 fees — Class C Shares | | | 35,127 | | | | 981 | | |
12b-1 fees — Class R Shares | | | 59,592 | | | | — | | |
Accounting fees | | | 25,220 | | | | 17,061 | | |
Custodian fees | | | 244,309 | | | | 54,801 | | |
Transfer agent fees — Class A Shares | | | 86,097 | | | | 587 | | |
Transfer agent fees — Class C Shares | | | 4,771 | | | | 240 | | |
Transfer agent fees — Class R Shares | | | 19,282 | | | | — | | |
Transfer agent fees — Class R6 Shares | | | 1,744 | | | | — | | |
Transfer agent fees — Class Y Shares | | | 232,907 | | | | 514 | | |
Trustees' fees | | | 29,301 | | | | 1,847 | | |
Compliance fees | | | 3,088 | | | | 39 | | |
Legal and audit fees | | | 53,208 | | | | 24,889 | | |
State registration and filing fees | | | 87,039 | | | | 44,399 | | |
Line of credit fees | | | — | | | | — | (a) | |
Interfund lending fees | | | 572 | | | | — | | |
Other expenses | | | 79,890 | | | | 8,642 | | |
Total Expenses | | | 4,905,550 | | | | 226,646 | | |
Expenses waived/reimbursed by Adviser | | | (1,137,721 | ) | | | (158,858 | ) | |
Net Expenses | | | 3,767,829 | | | | 67,788 | | |
Net Investment Income (Loss) | | | 2,682,534 | | | | 34,632 | | |
Realized/Unrealized Gains (Losses) from Investments: | |
Net realized gains (losses) from investment securities and
foreign currency translations | | | (8,580,529 | ) | | | (147,646 | ) | |
Foreign tax (paid) refunds on realized gains | | | (33,003 | ) | | | 6,357 | | |
Net change in unrealized appreciation/depreciation on investment
securities and foreign currency translations | | | 61,176,294 | | | | 257,520 | | |
Net change in accrued foreign taxes on unrealized gains | | | (221,455 | ) | | | 2,277 | | |
Net realized/unrealized gains (losses) on investments | | | 52,341,307 | | | | 118,508 | | |
Change in net assets resulting from operations | | $ | 55,023,841 | | | $ | 153,140 | | |
(a) Amount is less than $1.
See notes to financial statements.
51
Victory Portfolios | | Statements of Changes in Net Assets | |
| | | Victory
RS International Fund | | Victory RS Global Fund | |
| | | Year
Ended
December 31,
2020 | | Year
Ended
December 31,
2019 | | Year
Ended
December 31,
2020 | | Year
Ended
December 31,
2019 | |
From Investment Activities: | |
Operations: | |
Net investment income (loss) | | $ | 6,233,926 | | | $ | 1,446,540 | | | $ | 1,597,803 | | | $ | 998,312 | | |
Net realized gains (losses) from
investments | | | (8,724,622 | ) | | | (113,975 | ) | | | (1,393,847 | ) | | | (626,741 | ) | |
Net change in unrealized
appreciation/depreciation
on investments | | | 28,956,558 | | | | 19,916,509 | | | | 29,593,557 | | | | 13,988,831 | | |
Change in net assets resulting
from operations | | | 26,465,862 | | | | 21,249,074 | | | | 29,797,513 | | | | 14,360,402 | | |
Distributions to Shareholders: | |
Class A Shares | | | (274,567 | ) | | | (14,432 | ) | | | (331,988 | ) | | | (298,099 | ) | |
Class C Shares | | | (10,582 | ) | | | (963 | ) | | | (1,968 | ) | | | (18,415 | ) | |
Class R Shares | | | (18,299 | ) | | | (1,332 | ) | | | (15,302 | ) | | | (18,008 | ) | |
Class R6 Shares (a) | | | (4,128,368 | ) | | | (400,310 | ) | | | (385,647 | ) | | | (1,870 | ) | |
Class Y Shares | | | (1,376,768 | ) | | | (155,010 | ) | | | (921,568 | ) | | | (719,354 | ) | |
Change in net assets resulting from
distributions to shareholders | | | (5,808,584 | ) | | | (572,047 | ) | | | (1,656,473 | ) | | | (1,055,746 | ) | |
Change in net assets resulting from
capital transactions | | | 80,166,899 | | | | 235,953,255 | | | | 107,968,352 | | | | 35,779,871 | | |
Change in net assets | | | 100,824,177 | | | | 256,630,282 | | | | 136,109,392 | | | | 49,084,527 | | |
Net Assets: | |
Beginning of period | | | 280,813,215 | | | | 24,182,933 | | | | 84,601,688 | | | | 35,517,161 | | |
End of period | | $ | 381,637,392 | | | $ | 280,813,215 | | | $ | 220,711,080 | | | $ | 84,601,688 | | |
(a) Victory RS International Fund and Victory RS Global Fund Class R6 Shares commenced operations on May 2, 2019.
(continues on next page)
See notes to financial statements.
52
Victory Portfolios | | Statements of Changes in Net Assets | |
(continued)
| | | Victory
RS International Fund | | Victory RS Global Fund | |
| | | Year
Ended
December 31,
2020 | | Year
Ended
December 31,
2019 | | Year
Ended
December 31,
2020 | | Year
Ended
December 31,
2019 | |
Capital Transactions: | |
Class A Shares | |
Proceeds from shares issued | | $ | 5,891,859 | | | $ | 6,373,842 | | | $ | 27,939,328 | | | $ | 20,850,831 | | |
Distributions reinvested | | | 269,013 | | | | 14,244 | | | | 331,945 | | | | 297,840 | | |
Cost of shares redeemed | | | (6,074,845 | ) | | | (3,048,817 | ) | | | (9,924,361 | ) | | | (2,936,045 | ) | |
Total Class A Shares | | $ | 86,027 | | | $ | 3,339,269 | | | $ | 18,346,912 | | | $ | 18,212,626 | | |
Class C Shares | |
Proceeds from shares issued | | $ | 214,019 | | | $ | 819,811 | | | $ | 1,659,100 | | | $ | 795,903 | | |
Distributions reinvested | | | 10,582 | | | | 960 | | | | 1,968 | | | | 17,374 | | |
Cost of shares redeemed | | | (487,454 | ) | | | (247,174 | ) | | | (1,700,108 | ) | | | (737,389 | ) | |
Total Class C Shares | | $ | (262,853 | ) | | $ | 573,597 | | | $ | (39,040 | ) | | $ | 75,888 | | |
Class R Shares | |
Proceeds from shares issued | | $ | 518,709 | | | $ | 927,579 | | | $ | 1,990,563 | | | $ | 771,536 | | |
Distributions reinvested | | | 18,299 | | | | 1,332 | | | | 15,299 | | | | 18,002 | | |
Cost of shares redeemed | | | (1,230,005 | ) | | | (477,688 | ) | | | (602,183 | ) | | | (869,410 | ) | |
Total Class R Shares | | $ | (692,997 | ) | | $ | 451,223 | | | $ | 1,403,679 | | | $ | (79,872 | ) | |
Class R6 Shares (a) | |
Proceeds from shares issued | | $ | 73,968,309 | | | $ | 173,919,837 | | | $ | 41,962,795 | | | $ | 116,672 | | |
Distributions reinvested | | | 4,107,091 | | | | 397,374 | | | | 385,647 | | | | 1,870 | | |
Cost of shares redeemed | | | (19,424,029 | ) | | | (6,233,457 | ) | | | (752,758 | ) | | | — | | |
Total Class R6 Shares | | $ | 58,651,371 | | | $ | 168,083,754 | | | $ | 41,595,684 | | | $ | 118,542 | | |
Class Y Shares | |
Proceeds from shares issued | | $ | 71,266,377 | | | $ | 67,946,711 | | | $ | 68,083,654 | | | $ | 28,548,290 | | |
Distributions reinvested | | | 1,374,919 | | | | 154,814 | | | | 915,332 | | | | 711,835 | | |
Cost of shares redeemed | | | (50,255,945 | ) | | | (4,596,113 | ) | | | (22,337,869 | ) | | | (11,807,438 | ) | |
Total Class Y Shares | | $ | 22,385,351 | | | $ | 63,505,412 | | | $ | 46,661,117 | | | $ | 17,452,687 | | |
Change in net assets resulting from
capital transactions | | $ | 80,166,899 | | | $ | 235,953,255 | | | $ | 107,968,352 | | | $ | 35,779,871 | | |
(continues on next page)
See notes to financial statements.
53
Victory Portfolios | | Statements of Changes in Net Assets | |
(continued)
| | | Victory
RS International Fund | | Victory RS Global Fund | |
| | | Year
Ended
December 31,
2020 | | Year
Ended
December 31,
2019 | | Year
Ended
December 31,
2020 | | Year
Ended
December 31,
2019 | |
Share Transactions: | |
Class A Shares | |
Issued | | | 520,901 | | | | 523,906 | | | | 1,818,428 | | | | 1,487,189 | | |
Reinvested | | | 20,398 | | | | 1,104 | | | | 19,660 | | | | 20,145 | | |
Redeemed | | | (510,652 | ) | | | (253,679 | ) | | | (662,112 | ) | | | (220,393 | ) | |
Total Class A Shares | | | 30,647 | | | | 271,331 | | | | 1,175,976 | | | | 1,286,941 | | |
Class C Shares | |
Issued | | | 24,911 | | | | 95,902 | | | | 114,694 | | | | 59,708 | | |
Reinvested | | | 1,110 | | | | 103 | | | | 120 | | | | 1,215 | | |
Redeemed | | | (56,413 | ) | | | (28,453 | ) | | | (121,250 | ) | | | (56,283 | ) | |
Total Class C Shares | | | (30,392 | ) | | | 67,552 | | | | (6,436 | ) | | | 4,640 | | |
Class R Shares | |
Issued | | | 47,273 | | | | 83,638 | | | | 112,039 | | | | 45,802 | | |
Reinvested | | | 1,485 | | | | 111 | | | | 725 | | | | 976 | | |
Redeemed | | | (109,795 | ) | | | (43,472 | ) | | | (33,773 | ) | | | (52,905 | ) | |
Total Class R Shares | | | (61,037 | ) | | | 40,277 | | | | 78,991 | | | | (6,127 | ) | |
Class R6 Shares (a) | |
Issued | | | 7,441,337 | | | | 17,284,970 | | | | 3,654,266 | | | | 10,988 | | |
Reinvested | | | 377,160 | | | | 37,199 | | | | 30,626 | | | | 170 | | |
Redeemed | | | (1,925,957 | ) | | | (621,824 | ) | | | (62,426 | ) | | | — | | |
Total Class R6 Shares | | | 5,892,540 | | | | 16,700,345 | | | | 3,622,466 | | | | 11,158 | | |
Class Y Shares | |
Issued | | | 6,057,992 | | | | 5,719,982 | | | | 4,700,411 | | | | 2,167,090 | | |
Reinvested | | | 105,805 | | | | 12,169 | | | | 54,670 | | | | 48,603 | | |
Redeemed | | | (4,344,365 | ) | | | (387,903 | ) | | | (1,611,862 | ) | | | (884,579 | ) | |
Total Class Y Shares | | | 1,819,432 | | | | 5,344,248 | | | | 3,143,219 | | | | 1,331,114 | | |
Change in Shares | | | 7,651,190 | | | | 22,423,753 | | | | 8,014,216 | | | | 2,627,726 | | |
(a) Victory RS International Fund and Victory RS Global Fund Class R6 Shares commenced operations on May 2, 2019.
See notes to financial statements.
54
Victory Portfolios | | Statements of Changes in Net Assets | |
| | | Victory Sophus
Emerging Markets Fund | | Victory Sophus Emerging
Markets Small Cap Fund | |
| | | Year
Ended
December 31,
2020 | | Year
Ended
December 31,
2019 | | Year
Ended
December 31,
2020 | | Year
Ended
December 31,
2019 | |
From Investment Activities: | |
Operations: | |
Net investment income (loss) | | $ | 2,682,534 | | | $ | 8,164,402 | | | $ | 34,632 | | | $ | 61,545 | | |
Net realized gains (losses) from
investments | | | (8,613,532 | ) | | | (6,776,933 | ) | | | (141,289 | ) | | | 118,618 | | |
Net change in unrealized
appreciation/depreciation
on investments | | | 60,954,839 | | | | 72,555,651 | | | | 259,797 | | | | 785,941 | | |
Change in net assets resulting
from operations | | | 55,023,841 | | | | 73,943,120 | | | | 153,140 | | | | 966,104 | | |
Distributions to Shareholders: | |
Class A Shares | | | (535,962 | ) | | | (277,823 | ) | | | (1,226 | ) | | | (2,782 | ) | |
Class C Shares | | | (13,061 | ) | | | — | | | | — | | | | (314 | ) | |
Class R Shares | | | (104,197 | ) | | | (39,217 | ) | | | — | | | | — | | |
Class R6 Shares | | | (1,356,685 | ) | | | (562,165 | ) | | | — | | | | — | | |
Class Y Shares | | | (3,274,466 | ) | | | (1,923,302 | ) | | | (31,403 | ) | | | (56,360 | ) | |
Change in net assets resulting from
distributions to shareholders | | | (5,284,371 | ) | | | (2,802,507 | ) | | | (32,629 | ) | | | (59,456 | ) | |
Change in net assets resulting from
capital transactions | | | 13,691,046 | | | | 51,599,325 | | | | (1,352,607 | ) | | | 72,811 | | |
Change in net assets | | | 63,430,516 | | | | 122,739,938 | | | | (1,232,096 | ) | | | 979,459 | | |
Net Assets: | |
Beginning of period | | | 409,568,743 | | | | 286,828,805 | | | | 5,315,339 | | | | 4,335,880 | | |
End of period | | $ | 472,999,259 | | | $ | 409,568,743 | | | $ | 4,083,243 | | | $ | 5,315,339 | | |
(continues on next page)
See notes to financial statements.
55
Victory Portfolios | | Statements of Changes in Net Assets | |
(continued)
| | | Victory Sophus
Emerging Markets Fund | | Victory Sophus Emerging
Markets Small Cap Fund | |
| | | Year
Ended
December 31,
2020 | | Year
Ended
December 31,
2019 | | Year
Ended
December 31,
2020 | | Year
Ended
December 31,
2019 | |
Capital Transactions: | |
Class A Shares | |
Proceeds from shares issued | | $ | 6,957,366 | | | $ | 9,482,029 | | | $ | 7,780 | | | $ | 32,131 | | |
Distributions reinvested | | | 522,611 | | | | 271,641 | | | | 1,226 | | | | 2,782 | | |
Cost of shares redeemed | | | (16,658,257 | ) | | | (16,188,808 | ) | | | (147,652 | ) | | | (93,194 | ) | |
Total Class A Shares | | $ | (9,178,280 | ) | | $ | (6,435,138 | ) | | $ | (138,646 | ) | | $ | (58,281 | ) | |
Class C Shares | |
Proceeds from shares issued | | $ | 127,024 | | | $ | 530,542 | | | $ | — | | | $ | 18,900 | | |
Distributions reinvested | | | 13,061 | | | | — | | | | — | | | | 314 | | |
Cost of shares redeemed | | | (2,713,128 | ) | | | (6,342,404 | ) | | | (51,798 | ) | | | (16,359 | ) | |
Total Class C Shares | | $ | (2,573,043 | ) | | $ | (5,811,862 | ) | | $ | (51,798 | ) | | $ | 2,855 | | |
Class R Shares | |
Proceeds from shares issued | | $ | 1,471,645 | | | $ | 1,606,429 | | | $ | — | | | $ | — | | |
Distributions reinvested | | | 104,042 | | | | 39,076 | | | | — | | | | — | | |
Cost of shares redeemed | | | (3,568,641 | ) | | | (3,009,268 | ) | | | — | | | | — | | |
Total Class R Shares | | $ | (1,992,954 | ) | | $ | (1,363,763 | ) | | $ | — | | | $ | — | | |
Class R6 Shares | |
Proceeds from shares issued | | $ | 46,226,922 | | | $ | 44,467,648 | | | $ | — | | | $ | — | | |
Distributions reinvested | | | 1,298,132 | | | | 562,165 | | | | — | | | | — | | |
Cost of shares redeemed | | | (19,463,001 | ) | | | (12,538,852 | ) | | | — | | | | — | | |
Total Class R6 Shares | | $ | 28,062,053 | | | $ | 32,490,961 | | | $ | — | | | $ | — | | |
Class Y Shares | |
Proceeds from shares issued | | $ | 107,294,571 | | | $ | 111,480,099 | | | $ | 1,579,841 | | | $ | 944,047 | | |
Distributions reinvested | | | 3,263,776 | | | | 1,893,634 | | | | 31,403 | | | | 56,360 | | |
Cost of shares redeemed | | | (111,185,077 | ) | | | (80,654,606 | ) | | | (2,773,407 | ) | | | (872,170 | ) | |
Total Class Y Shares | | $ | (626,730 | ) | | $ | 32,719,127 | | | $ | (1,162,163 | ) | | $ | 128,237 | | |
Change in net assets resulting from
capital transactions | | $ | 13,691,046 | | | $ | 51,599,325 | | | $ | (1,352,607 | ) | | $ | 72,811 | | |
(continues on next page)
See notes to financial statements.
56
Victory Portfolios | | Statements of Changes in Net Assets | |
(continued)
| | | Victory Sophus
Emerging Markets Fund | | Victory Sophus Emerging
Markets Small Cap Fund | |
| | | Year
Ended
December 31,
2020 | | Year
Ended
December 31,
2019 | | Year
Ended
December 31,
2020 | | Year
Ended
December 31,
2019 | |
Share Transactions: | |
Class A Shares | |
Issued | | | 341,798 | | | | 497,792 | | | | 1,617 | | | | 4,925 | | |
Reinvested | | | 22,091 | | | | 12,862 | | | | 162 | | | | 384 | | |
Redeemed | | | (843,984 | ) | | | (849,774 | ) | | | (19,778 | ) | | | (14,442 | ) | |
Total Class A Shares | | | (480,095 | ) | | | (339,120 | ) | | | (17,999 | ) | | | (9,133 | ) | |
Class C Shares | |
Issued | | | 7,996 | | | | 37,273 | | | | — | | | | 3,242 | | |
Reinvested | | | 742 | | | | — | | | | — | | | | 48 | | |
Redeemed | | | (194,273 | ) | | | (450,593 | ) | | | (8,954 | ) | | | (2,616 | ) | |
Total Class C Shares | | | (185,535 | ) | | | (413,320 | ) | | | (8,954 | ) | | | 674 | | |
Class R Shares | |
Issued | | | 80,371 | | | | 89,819 | | | | — | | | | — | | |
Reinvested | | | 4,697 | | | | 1,974 | | | | — | | | | — | | |
Redeemed | | | (189,786 | ) | | | (166,112 | ) | | | — | | | | — | | |
Total Class R Shares | | | (104,718 | ) | | | (74,319 | ) | | | — | | | | — | | |
Class R6 Shares | |
Issued | | | 2,177,920 | | | | 2,305,144 | | | | — | | | | — | | |
Reinvested | | | 54,021 | | | | 26,252 | | | | — | | | | — | | |
Redeemed | | | (954,262 | ) | | | (654,118 | ) | | | — | | | | — | | |
Total Class R6 Shares | | | 1,277,679 | | | | 1,677,278 | | | | — | | | | — | | |
Class Y Shares | |
Issued | | | 5,108,144 | | | | 5,878,564 | | | | 221,024 | | | | 142,497 | | |
Reinvested | | | 137,133 | | | | 89,198 | | | | 4,170 | | | | 7,798 | | |
Redeemed | | | (5,852,490 | ) | | | (4,237,322 | ) | | | (416,509 | ) | | | (129,332 | ) | |
Total Class Y Shares | | | (607,213 | ) | | | 1,730,440 | | | | (191,315 | ) | | | 20,963 | | |
Change in Shares | | | (99,882 | ) | | | 2,580,959 | | | | (218,268 | ) | | | 12,504 | | |
See notes to financial statements.
57
Victory Portfolios | | Financial Highlights | |
For a Share Outstanding Throughout Each Period
| | | | | Investment Activities | | Distributions to
Shareholders From | |
| | | Net Asset
Value,
Beginning of
Period | | Net
Investment
Income
(Loss)(a) | | Net
Realized and
Unrealized
Gains
(Losses) on
Investments | | Total from
Investment
Activities | | Net
Investment
Income | | Net Realized
Gains from
Investments | | Total
Distributions | |
Victory RS International Fund | |
Class A | |
Year Ended
12/31/20 | | $ | 12.93 | | | | 0.21 | | | | 0.51 | | | | 0.72 | | | | (0.13 | ) | | | (0.03 | ) | | | (0.16 | ) | |
Year Ended
12/31/19 | | $ | 10.63 | | | | 0.26 | | | | 2.05 | | | | 2.31 | | | | — | (e) | | | (0.01 | ) | | | (0.01 | ) | |
Year Ended
12/31/18 | | $ | 12.12 | | | | 0.23 | | | | (1.52 | ) | | | (1.29 | ) | | | (0.20 | ) | | | — | | | | (0.20 | ) | |
Year Ended
12/31/17 | | $ | 9.84 | | | | 0.19 | | | | 2.29 | | | | 2.48 | | | | (0.20 | ) | | | — | | | | (0.20 | ) | |
Year Ended
12/31/16 | | $ | 9.78 | | | | 0.16 | | | | (0.07 | ) | | | 0.09 | | | | (0.17 | ) | | | — | | | | (0.17 | ) | |
Class C | |
Year Ended
12/31/20 | | $ | 9.36 | | | | 0.10 | | | | 0.34 | | | | 0.44 | | | | (0.05 | ) | | | (0.03 | ) | | | (0.08 | ) | |
Year Ended
12/31/19 | | $ | 7.76 | | | | 0.12 | | | | 1.49 | | | | 1.61 | | | | — | | | | (0.01 | ) | | | (0.01 | ) | |
Year Ended
12/31/18 | | $ | 8.89 | | | | 0.11 | | | | (1.11 | ) | | | (1.00 | ) | | | (0.13 | ) | | | — | | | | (0.13 | ) | |
Year Ended
12/31/17 | | $ | 7.26 | | | | 0.08 | | | | 1.68 | | | | 1.76 | | | | (0.13 | ) | | | — | | | | (0.13 | ) | |
Year Ended
12/31/16 | | $ | 7.26 | | | | 0.07 | | | | (0.08 | ) | | | (0.01 | ) | | | (0.13 | ) | | | — | | | | (0.13 | ) | |
Class R | |
Year Ended
12/31/20 | | $ | 12.07 | | | | 0.18 | | | | 0.45 | | | | 0.63 | | | | (0.09 | ) | | | (0.03 | ) | | | (0.12 | ) | |
Year Ended
12/31/19 | | $ | 9.95 | | | | 0.21 | | | | 1.92 | | | | 2.13 | | | | — | | | | (0.01 | ) | | | (0.01 | ) | |
Year Ended
12/31/18 | | $ | 11.35 | | | | 0.19 | | | | (1.42 | ) | | | (1.23 | ) | | | (0.17 | ) | | | — | | | | (0.17 | ) | |
Year Ended
12/31/17 | | $ | 9.23 | | | | 0.15 | | | | 2.14 | | | | 2.29 | | | | (0.17 | ) | | | — | | | | (0.17 | ) | |
Year Ended
12/31/16 | | $ | 9.18 | | | | 0.11 | | | | (0.06 | ) | | | 0.05 | | | | (0.14 | ) | | | — | | | | (0.14 | ) | |
Class R6 | |
Year Ended
12/31/20 | | $ | 10.70 | | | | 0.20 | | | | 0.43 | | | | 0.63 | | | | (0.16 | ) | | | (0.03 | ) | | | (0.19 | ) | |
5/2/2019(g)
through
12/31/19 | | $ | 10.00 | | | | 0.06 | | | | 0.67 | | | | 0.73 | | | | (0.02 | ) | | | (0.01 | ) | | | (0.03 | ) | |
Class Y | |
Year Ended
12/31/20 | | $ | 12.74 | | | | 0.25 | | | | 0.49 | | | | 0.74 | | | | (0.16 | ) | | | (0.03 | ) | | | (0.19 | ) | |
Year Ended
12/31/19 | | $ | 10.47 | | | | 0.22 | | | | 2.08 | | | | 2.30 | | | | (0.02 | ) | | | (0.01 | ) | | | (0.03 | ) | |
Year Ended
12/31/18 | | $ | 11.93 | | | | 0.23 | | | | (1.47 | ) | | | (1.24 | ) | | | (0.22 | ) | | | — | | | | (0.22 | ) | |
Year Ended
12/31/17 | | $ | 9.69 | | | | 0.22 | | | | 2.26 | | | | 2.48 | | | | (0.24 | ) | | | — | | | | (0.24 | ) | |
Year Ended
12/31/16 | | $ | 9.62 | | | | 0.18 | | | | (0.06 | ) | | | 0.12 | | | | (0.19 | ) | | | — | | | | (0.19 | ) | |
(a) Per share net investment income (loss) has been calculated using the average daily shares method.
(b) Not annualized for periods less than one year.
(c) Annualized for periods less than one year.
(d) Portfolio turnover is calculated on the basis of the Fund as a whole without distinguishing between the classes of shares issued.
See notes to financial statements.
58
Victory Portfolios | | Financial Highlights — continued | |
For a Share Outstanding Throughout Each Period
| | | | | Ratios to Average Net Assets | | Supplemental Data | |
| | | Capital
Contribution
from Prior
Custodian,
Net (See
Note 8) | | Net Asset
Value,
End of
Period | | Total
Return
(Excludes
Sales
Charge)(b) | | Net
Expenses(c) | | Net
Investment
Income
(Loss)(c) | | Gross
Expenses(c) | | Net Assets,
End of
Period
(000's) | | Portfolio
Turnover(b)(d) | |
Victory RS International Fund | |
Class A | |
Year Ended
12/31/20 | | | — | | | $ | 13.49 | | | | 5.55 | % | | | 1.13 | % | | | 1.79 | % | | | 1.47 | % | | $ | 24,010 | | | | 52 | % | |
Year Ended
12/31/19 | | | — | | | $ | 12.93 | | | | 21.72 | % | | | 1.13 | % | | | 2.18 | % | | | 1.55 | % | | $ | 22,620 | | | | 20 | % | |
Year Ended
12/31/18 | | | — | | | $ | 10.63 | | | | (10.65 | )% | | | 1.13 | % | | | 1.97 | % | | | 1.61 | % | | $ | 15,716 | | | | 52 | % | |
Year Ended
12/31/17 | | | — | | | $ | 12.12 | | | | 25.26 | % | | | 1.20 | % | | | 1.66 | % | | | 1.81 | % | | $ | 18,512 | | | | 60 | % | |
Year Ended
12/31/16 | | | 0.14 | | | $ | 9.84 | | | | 2.41 | %(f) | | | 1.40 | % | | | 1.64 | % | | | 1.95 | % | | $ | 16,799 | | | | 103 | % | |
Class C | |
Year Ended
12/31/20 | | | — | | | $ | 9.72 | | | | 4.76 | % | | | 1.88 | % | | | 1.14 | % | | | 3.07 | % | | $ | 1,241 | | | | 52 | % | |
Year Ended
12/31/19 | | | — | | | $ | 9.36 | | | | 20.70 | % | | | 1.88 | % | | | 1.39 | % | | | 3.14 | % | | $ | 1,480 | | | | 20 | % | |
Year Ended
12/31/18 | | | — | | | $ | 7.76 | | | | (11.24 | )% | | | 1.88 | % | | | 1.23 | % | | | 3.52 | % | | $ | 702 | | | | 52 | % | |
Year Ended
12/31/17 | | | — | | | $ | 8.89 | | | | 24.25 | % | | | 1.95 | % | | | 0.92 | % | | | 3.26 | % | | $ | 1,066 | | | | 60 | % | |
Year Ended
12/31/16 | | | 0.14 | | | $ | 7.26 | | | | 1.77 | %(f) | | | 2.15 | % | | | 0.97 | % | | | 3.05 | % | | $ | 1,228 | | | | 103 | % | |
Class R | |
Year Ended
12/31/20 | | | — | | | $ | 12.58 | | | | 5.21 | % | | | 1.38 | % | | | 1.60 | % | | | 2.24 | % | | $ | 1,998 | | | | 52 | % | |
Year Ended
12/31/19 | | | — | | | $ | 12.07 | | | | 21.37 | % | | | 1.38 | % | | | 1.87 | % | | | 2.32 | % | | $ | 2,652 | | | | 20 | % | |
Year Ended
12/31/18 | | | — | | | $ | 9.95 | | | | (10.85 | )% | | | 1.38 | % | | | 1.73 | % | | | 2.31 | % | | $ | 1,786 | | | | 52 | % | |
Year Ended
12/31/17 | | | — | | | $ | 11.35 | | | | 24.85 | % | | | 1.48 | % | | | 1.39 | % | | | 2.48 | % | | $ | 2,522 | | | | 60 | % | |
Year Ended
12/31/16 | | | 0.14 | | | $ | 9.23 | | | | 2.06 | %(f) | | | 1.80 | % | | | 1.26 | % | | | 2.29 | % | | $ | 2,279 | | | | 103 | % | |
Class R6 | |
Year Ended
12/31/20 | | | — | | | $ | 11.14 | | | | 5.90 | % | | | 0.83 | % | | | 2.03 | % | | | 0.93 | % | | $ | 251,586 | | | | 52 | % | |
5/2/2019(g)
through
12/31/19 | | | — | | | $ | 10.70 | | | | 7.24 | % | | | 0.83 | % | | | 0.92 | % | | | 0.97 | % | | $ | 178,695 | | | | 20 | % | |
Class Y | |
Year Ended
12/31/20 | | | — | | | $ | 13.29 | | | | 5.80 | % | | | 0.88 | % | | | 2.11 | % | | | 1.09 | % | | $ | 102,803 | | | | 52 | % | |
Year Ended
12/31/19 | | | — | | | $ | 12.74 | | | | 21.94 | % | | | 0.88 | % | | | 1.80 | % | | | 1.16 | % | | $ | 75,366 | | | | 20 | % | |
Year Ended
12/31/18 | | | — | | | $ | 10.47 | | | | (10.38 | )% | | | 0.88 | % | | | 1.97 | % | | | 1.62 | % | | $ | 5,979 | | | | 52 | % | |
Year Ended
12/31/17 | | | — | | | $ | 11.93 | | | | 25.56 | % | | | 0.94 | % | | | 1.98 | % | | | 1.85 | % | | $ | 3,122 | | | | 60 | % | |
Year Ended
12/31/16 | | | 0.14 | | | $ | 9.69 | | | | 2.69 | %(f) | | | 1.15 | % | | | 1.93 | % | | | 1.80 | % | | $ | 2,626 | | | | 103 | % | |
(e) Amount is less than $0.005 per share.
(f) The Fund received monies related to a nonrecurring refund from the prior Custodian. The corresponding impact to the total return was 1.45% for the period shown. (See Note 8)
(g) Commencement of operations.
See notes to financial statements.
59
Victory Portfolios | | Financial Highlights | |
For a Share Outstanding Throughout Each Period
| | | | | Investment Activities | | Distributions to
Shareholders From | |
| | | Net Asset
Value,
Beginning of
Period | | Net
Investment
Income
(Loss)(a) | | Net
Realized and
Unrealized
Gains
(Losses) on
Investments | | Total from
Investment
Activities | | Net
Investment
Income | | Net Realized
Gains from
Investments | | Return of
Capital | |
Victory RS Global Fund | |
Class A | |
Year Ended
12/31/20 | | $ | 14.86 | | | | 0.18 | | | | 2.35 | | | | 2.53 | | | | (0.11 | ) | | | (0.01 | ) | | | — | | |
Year Ended
12/31/19 | | $ | 11.53 | | | | 0.21 | | | | 3.29 | | | | 3.50 | | | | (0.16 | ) | | | (0.01 | ) | | | — | | |
Year Ended
12/31/18 | | $ | 12.75 | | | | 0.20 | | | | (0.90 | ) | | | (0.70 | ) | | | (0.16 | ) | | | (0.36 | ) | | | — | | |
Year Ended
12/31/17 | | $ | 11.16 | | | | 0.15 | | | | 2.53 | | | | 2.68 | | | | — | | | | (1.00 | ) | | | (0.09 | ) | |
Year Ended
12/31/16 | | $ | 11.56 | | | | 0.13 | | | | 0.65 | | | | 0.78 | | | | (0.03 | ) | | | (1.15 | ) | | | — | | |
Class C | |
Year Ended
12/31/20 | | $ | 14.38 | | | | 0.07 | | | | 2.24 | | | | 2.31 | | | | — | (e) | | | (0.01 | ) | | | — | | |
Year Ended
12/31/19 | | $ | 11.17 | | | | 0.14 | | | | 3.16 | | | | 3.30 | | | | (0.08 | ) | | | (0.01 | ) | | | — | | |
Year Ended
12/31/18 | | $ | 12.38 | | | | 0.10 | | | | (0.87 | ) | | | (0.77 | ) | | | (0.08 | ) | | | (0.36 | ) | | | — | | |
Year Ended
12/31/17 | | $ | 10.95 | | | | 0.05 | | | | 2.47 | | | | 2.52 | | | | — | | | | (1.00 | ) | | | (0.09 | ) | |
Year Ended
12/31/16 | | $ | 11.42 | | | | 0.05 | | | | 0.63 | | | | 0.68 | | | | — | | | | (1.15 | ) | | | — | | |
Class R | |
Year Ended
12/31/20 | | $ | 18.55 | | | | 0.18 | | | | 2.92 | | | | 3.10 | | | | (0.07 | ) | | | (0.01 | ) | | | — | | |
Year Ended
12/31/19 | | $ | 14.37 | | | | 0.25 | | | | 4.07 | | | | 4.32 | | | | (0.13 | ) | | | (0.01 | ) | | | — | | |
Year Ended
12/31/18 | | $ | 15.76 | | | | 0.20 | | | | (1.10 | ) | | | (0.90 | ) | | | (0.13 | ) | | | (0.36 | ) | | | — | | |
Year Ended
12/31/17 | | $ | 13.62 | | | | 0.05 | | | | 3.18 | | | | 3.23 | | | | — | | | | (1.00 | ) | | | (0.09 | ) | |
Year Ended
12/31/16 | | $ | 11.50 | | | | 0.09 | | | | 3.43 | | | | 3.52 | | | | (0.25 | ) | | | (1.15 | ) | | | — | | |
Class R6 | |
Year Ended
12/31/20 | | $ | 11.07 | | | | 0.08 | | | | 1.83 | | | | 1.91 | | | | (0.10 | ) | | | (0.01 | ) | | | — | | |
5/2/19(g)
through
12/31/19 | | $ | 10.00 | | | | 0.13 | | | | 1.12 | | | | 1.25 | | | | (0.17 | ) | | | (0.01 | ) | | | — | | |
Class Y | |
Year Ended
12/31/20 | | $ | 14.72 | | | | 0.20 | | | | 2.34 | | | | 2.54 | | | | (0.13 | ) | | | (0.01 | ) | | | — | | |
Year Ended
12/31/19 | | $ | 11.42 | | | | 0.26 | | | | 3.24 | | | | 3.50 | | | | (0.19 | ) | | | (0.01 | ) | | | — | | |
Year Ended
12/31/18 | | $ | 12.63 | | | | 0.23 | | | | (0.89 | ) | | | (0.66 | ) | | | (0.19 | ) | | | (0.36 | ) | | | — | | |
Year Ended
12/31/17 | | $ | 11.04 | | | | 0.18 | | | | 2.50 | | | | 2.68 | | | | — | | | | (1.00 | ) | | | (0.09 | ) | |
Year Ended
12/31/16 | | $ | 11.60 | | | | 0.15 | | | | 0.67 | | | | 0.82 | | | | (0.23 | ) | | | (1.15 | ) | | | — | | |
(a) Per share net investment income (loss) has been calculated using the average daily shares method.
(b) Not annualized for periods less than one year.
(c) Annualized for periods less than one year.
(d) Portfolio turnover is calculated on the basis of the Fund as a whole without distinguishing between the classes of shares issued.
See notes to financial statements.
60
Victory Portfolios | | Financial Highlights — continued | |
For a Share Outstanding Throughout Each Period
| | | | | Ratios to Average Net Assets | | Supplemental Data | |
| | |
Total
Distributions | | Net Asset
Value,
End of
Period | | Total
Return
(Excludes
Sales
Charge)(b) | | Net
Expenses(c) | | Net
Investment
Income
(Loss)(c) | | Gross
Expenses(c) | | Net Assets,
End of
Period
(000's) | | Portfolio
Turnover(b)(d) | |
Victory RS Global Fund | |
Class A | |
Year Ended
12/31/20 | | | (0.12 | ) | | $ | 17.27 | | | | 17.00 | % | | | 0.85 | % | | | 1.22 | % | | | 1.40 | % | | $ | 51,066 | | | | 71 | % | |
Year Ended
12/31/19 | | | (0.17 | ) | | $ | 14.86 | | | | 30.36 | % | | | 0.85 | % | | | 1.51 | % | | | 1.53 | % | | $ | 26,471 | | | | 46 | % | |
Year Ended
12/31/18 | | | (0.52 | ) | | $ | 11.53 | | | | (5.45 | )% | | | 0.94 | % | | | 1.51 | % | | | 1.75 | % | | $ | 5,695 | | | | 58 | % | |
Year Ended
12/31/17 | | | (1.09 | ) | | $ | 12.75 | | | | 24.48 | % | | | 1.17 | % | | | 1.24 | % | | | 1.90 | % | | $ | 3,456 | | | | 187 | % | |
Year Ended
12/31/16 | | | (1.18 | ) | | $ | 11.16 | | | | 6.67 | % | | | 1.40 | % | | | 1.12 | % | | | 1.71 | % | | $ | 5,366 | | | | 184 | % | |
Class C | |
Year Ended
12/31/20 | | | (0.01 | ) | | $ | 16.68 | | | | 16.06 | % | | | 1.60 | % | | | 0.48 | % | | | 2.53 | % | | $ | 3,491 | | | | 71 | % | |
Year Ended
12/31/19 | | | (0.09 | ) | | $ | 14.38 | | | | 29.52 | % | | | 1.60 | % | | | 1.07 | % | | | 2.59 | % | | $ | 3,101 | | | | 46 | % | |
Year Ended
12/31/18 | | | (0.44 | ) | | $ | 11.17 | | | | (6.20 | )% | | | 1.70 | % | | | 0.79 | % | | | 2.59 | % | | $ | 2,358 | | | | 58 | % | |
Year Ended
12/31/17 | | | (1.09 | ) | | $ | 12.38 | | | | 23.47 | % | | | 1.91 | % | | | 0.41 | % | | | 3.00 | % | | $ | 2,167 | | | | 187 | % | |
Year Ended
12/31/16 | | | (1.15 | ) | | $ | 10.95 | | | | 5.92 | % | | | 2.16 | % | | | 0.41 | % | | | 2.44 | % | | $ | 1,270 | | | | 184 | % | |
Class R | |
Year Ended
12/31/20 | | | (0.08 | ) | | $ | 21.57 | | | | 16.70 | % | | | 1.10 | % | | | 0.98 | % | | | 1.93 | % | | $ | 4,454 | | | | 71 | % | |
Year Ended
12/31/19 | | | (0.14 | ) | | $ | 18.55 | | | | 30.10 | % | | | 1.10 | % | | | 1.53 | % | | | 2.34 | % | | $ | 2,365 | | | | 46 | % | |
Year Ended
12/31/18 | | | (0.49 | ) | | $ | 14.37 | | | | (5.68 | )% | | | 1.20 | % | | | 1.25 | % | | | 2.34 | % | | $ | 1,920 | | | | 58 | % | |
Year Ended
12/31/17 | | | (1.09 | ) | | $ | 15.76 | | | | 24.09 | % | | | 1.61 | % | | | 0.38 | % | | | 2.76 | % | | $ | 2,281 | | | | 187 | % | |
Year Ended
12/31/16 | | | (1.40 | ) | | $ | 13.62 | | | | 30.57 | %(f) | | | 1.68 | % | | | 0.74 | % | | | 1.81 | % | | $ | 9,213 | | | | 184 | % | |
Class R6 | |
Year Ended
12/31/20 | | | (0.11 | ) | | $ | 12.87 | | | | 17.27 | % | | | 0.55 | % | | | 0.64 | % | | | 1.16 | % | | $ | 46,776 | | | | 71 | % | |
5/2/19(g)
through
12/31/19 | | | (0.18 | ) | | $ | 11.07 | | | | 12.47 | % | | | 0.55 | % | | | 1.85 | % | | | 28.85 | % | | $ | 124 | | | | 46 | % | |
Class Y | |
Year Ended
12/31/20 | | | (0.14 | ) | | $ | 17.12 | | | | 17.27 | % | | | 0.60 | % | | | 1.38 | % | | | 1.10 | % | | $ | 114,925 | | | | 71 | % | |
Year Ended
12/31/19 | | | (0.20 | ) | | $ | 14.72 | | | | 30.69 | % | | | 0.60 | % | | | 1.95 | % | | | 1.17 | % | | $ | 52,541 | | | | 46 | % | |
Year Ended
12/31/18 | | | (0.55 | ) | | $ | 11.42 | | | | (5.17 | )% | | | 0.70 | % | | | 1.80 | % | | | 1.20 | % | | $ | 25,544 | | | | 58 | % | |
Year Ended
12/31/17 | | | (1.09 | ) | | $ | 12.63 | | | | 24.75 | % | | | 0.88 | % | | | 1.44 | % | | | 1.32 | % | | $ | 24,657 | | | | 187 | % | |
Year Ended
12/31/16 | | | (1.38 | ) | | $ | 11.04 | | | | 7.01 | % | | | 1.09 | % | | | 1.30 | % | | | 1.36 | % | | $ | 13,430 | | | | 184 | % | |
(e) Amount is less than $0.005.
(f) During the period, the share class recognized certain expense reimbursements and due to the fluctuation in average net assets during the same period the total return reflected is significantly higher than the other share classes of the Fund. The total return would have been 6.39% had the expense reimbursements not occurred.
(g) Commencement of operations.
See notes to financial statements.
61
Victory Portfolios | | Financial Highlights | |
For a Share Outstanding Throughout Each Period
| | | | | Investment Activities | | Distributions to
Shareholders From | |
| | | Net Asset
Value,
Beginning of
Period | | Net
Investment
Income
(Loss)(a) | | Net
Realized and
Unrealized
Gains
(Losses) on
Investments | | Total from
Investment
Activities | | Net
Investment
Income | | Net Realized
Gains from
Investments | | Total
Distributions | |
Victory Sophus Emerging Markets Fund | |
Class A | |
Year Ended
12/31/20 | | $ | 21.37 | | | | 0.10 | | | | 3.45 | | | | 3.55 | | | | (0.22 | ) | | | — | | | | (0.22 | ) | |
Year Ended
12/31/19 | | $ | 17.45 | | | | 0.37 | | | | 3.65 | | | | 4.02 | | | | (0.10 | ) | | | — | | | | (0.10 | ) | |
Year Ended
12/31/18 | | $ | 22.52 | | | | 0.24 | | | | (4.54 | ) | | | (4.30 | ) | | | (0.13 | ) | | | (0.64 | ) | | | (0.77 | ) | |
Year Ended
12/31/17 | | $ | 15.98 | | | | 0.16 | | | | 6.55 | | | | 6.71 | | | | (0.17 | ) | | | — | | | | (0.17 | ) | |
Year Ended
12/31/16 | | $ | 14.60 | | | | 0.11 | | | | 1.38 | | | | 1.49 | | | | (0.15 | ) | | | — | | | | (0.15 | ) | |
Class C | |
Year Ended
12/31/20 | | $ | 15.94 | | | | (0.07 | ) | | | 2.58 | | | | 2.51 | | | | (0.07 | ) | | | — | | | | (0.07 | ) | |
Year Ended
12/31/19 | | $ | 13.06 | | | | 0.14 | | | | 2.74 | | | | 2.88 | | | | — | | | | — | | | | — | | |
Year Ended
12/31/18 | | $ | 17.07 | | | | 0.05 | | | | (3.42 | ) | | | (3.37 | ) | | | — | (f) | | | (0.64 | ) | | | (0.64 | ) | |
Year Ended
12/31/17 | | $ | 12.17 | | | | — | (f) | | | 4.97 | | | | 4.97 | | | | (0.07 | ) | | | — | | | | (0.07 | ) | |
Year Ended
12/31/16 | | $ | 11.20 | | | | (0.01 | ) | | | 1.05 | | | | 1.04 | | | | (0.11 | ) | | | — | | | | (0.11 | ) | |
Class R | |
Year Ended
12/31/20 | | $ | 20.03 | | | | 0.05 | | | | 3.23 | | | | 3.28 | | | | (0.18 | ) | | | — | | | | (0.18 | ) | |
Year Ended
12/31/19 | | $ | 16.37 | | | | 0.31 | | | | 3.41 | | | | 3.72 | | | | (0.06 | ) | | | — | | | | (0.06 | ) | |
Year Ended
12/31/18 | | $ | 21.18 | | | | 0.18 | | | | (4.26 | ) | | | (4.08 | ) | | | (0.09 | ) | | | (0.64 | ) | | | (0.73 | ) | |
Year Ended
12/31/17 | | $ | 15.03 | | | | 0.09 | | | | 6.17 | | | | 6.26 | | | | (0.11 | ) | | | — | | | | (0.11 | ) | |
Year Ended
12/31/16 | | $ | 13.76 | | | | 0.07 | | | | 1.30 | | | | 1.37 | | | | (0.14 | ) | | | — | | | | (0.14 | ) | |
Class R6 | |
Year Ended
12/31/20 | | $ | 21.68 | | | | 0.20 | | | | 3.52 | | | | 3.72 | | | | (0.30 | ) | | | — | | | | (0.30 | ) | |
Year Ended
12/31/19 | | $ | 17.68 | | | | 0.52 | | | | 3.65 | | | | 4.17 | | | | (0.17 | ) | | | — | | | | (0.17 | ) | |
Year Ended
12/31/18 | | $ | 22.81 | | | | 0.34 | | | | (4.62 | ) | | | (4.28 | ) | | | (0.21 | ) | | | (0.64 | ) | | | (0.85 | ) | |
Year Ended
12/31/17 | | $ | 16.16 | | | | 0.34 | | | | 6.57 | | | | 6.91 | | | | (0.26 | ) | | | — | | | | (0.26 | ) | |
11/15/16(h)
through
12/31/16 | | $ | 15.91 | | | | 0.04 | | | | 0.25 | | | | 0.29 | | | | (0.04 | ) | | | — | | | | (0.04 | ) | |
Class Y | |
Year Ended
12/31/20 | | $ | 21.48 | | | | 0.16 | | | | 3.50 | | | | 3.66 | | | | (0.29 | ) | | | — | | | | (0.29 | ) | |
Year Ended
12/31/19 | | $ | 17.54 | | | | 0.45 | | | | 3.65 | | | | 4.10 | | | | (0.16 | ) | | | — | | | | (0.16 | ) | |
Year Ended
12/31/18 | | $ | 22.64 | | | | 0.35 | | | | (4.61 | ) | | | (4.26 | ) | | | (0.20 | ) | | | (0.64 | ) | | | (0.84 | ) | |
Year Ended
12/31/17 | | $ | 16.05 | | | | 0.21 | | | | 6.62 | | | | 6.83 | | | | (0.24 | ) | | | — | | | | (0.24 | ) | |
Year Ended
12/31/16 | | $ | 14.61 | | | | 0.18 | | | | 1.37 | | | | 1.55 | | | | (0.15 | ) | | | — | | | | (0.15 | ) | |
(a) Per share net investment income (loss) has been calculated using the average daily shares method.
(b) Not annualized for periods less than one year.
(c) Annualized for periods less than one year.
(d) Portfolio turnover is calculated on the basis of the Fund as a whole without distinguishing between the classes of shares issued.
See notes to financial statements.
62
Victory Portfolios | | Financial Highlights — continued | |
For a Share Outstanding Throughout Each Period
| | | | | Ratios to Average Net Assets | | Supplemental Data | |
| | | Capital
Contribution
from Prior
Custodian,
Net (See
Note 8) | | Net Asset
Value,
End of
Period | | Total
Return
(Excludes
Sales
Charge)(b) | | Net
Expenses(c) | | Net
Investment
Income
(Loss)(c) | | Gross
Expenses(c) | | Net Assets,
End of
Period
(000's) | | Portfolio
Turnover(b)(d) | |
Victory Sophus Emerging Markets Fund | |
Class A | |
Year Ended
12/31/20 | | | — | | | $ | 24.70 | | | | 16.73 | % | | | 1.34 | % | | | 0.47 | % | | | 1.64 | % | | $ | 60,206 | | | | 109 | % | |
Year Ended
12/31/19 | | | — | | | $ | 21.37 | | | | 22.96 | % | | | 1.34 | % | | | 1.95 | % | | | 1.62 | % | | $ | 62,346 | | | | 96 | % | |
Year Ended
12/31/18 | | | — | | | $ | 17.45 | | | | (19.08 | )% | | | 1.34 | % | | | 1.11 | % | | | 1.61 | % | | $ | 56,823 | | | | 118 | % | |
Year Ended
12/31/17 | | | — | | | $ | 22.52 | | | | 42.08 | % | | | 1.54 | % | | | 0.80 | % | | | 1.66 | % | | $ | 76,485 | | | | 113 | % | |
Year Ended
12/31/16 | | | 0.04 | | | $ | 15.98 | | | | 10.50 | %(e) | | | 1.65 | % | | | 0.73 | % | | | 1.67 | % | | $ | 61,767 | | | | 120 | % | |
Class C | |
Year Ended
12/31/20 | | | — | | | $ | 18.38 | | | | 15.79 | % | | | 2.14 | % | | | (0.45 | )% | | | 2.69 | % | | $ | 3,261 | | | | 109 | % | |
Year Ended
12/31/19 | | | — | | | $ | 15.94 | | | | 22.05 | % | | | 2.14 | % | | | 0.99 | % | | | 2.48 | % | | $ | 5,787 | | | | 96 | % | |
Year Ended
12/31/18 | | | — | | | $ | 13.06 | | | | (19.75 | )% | | | 2.14 | % | | | 0.31 | % | | | 2.40 | % | | $ | 10,141 | | | | 118 | % | |
Year Ended
12/31/17 | | | — | | | $ | 17.07 | | | | 40.96 | % | | | 2.34 | % | | | — | %(g) | | | 2.46 | % | | $ | 15,854 | | | | 113 | % | |
Year Ended
12/31/16 | | | 0.04 | | | $ | 12.17 | | | | 9.62 | %(e) | | | 2.45 | % | | | (0.09 | )% | | | 2.48 | % | | $ | 12,273 | | | | 120 | % | |
Class R | |
Year Ended
12/31/20 | | | — | | | $ | 23.13 | | | | 16.46 | % | | | 1.58 | % | | | 0.25 | % | | | 1.95 | % | | $ | 13,531 | | | | 109 | % | |
Year Ended
12/31/19 | | | — | | | $ | 20.03 | | | | 22.64 | % | | | 1.58 | % | | | 1.71 | % | | | 1.94 | % | | $ | 13,817 | | | | 96 | % | |
Year Ended
12/31/18 | | | — | | | $ | 16.37 | | | | (19.24 | )% | | | 1.58 | % | | | 0.89 | % | | | 1.91 | % | | $ | 12,505 | | | | 118 | % | |
Year Ended
12/31/17 | | | — | | | $ | 21.18 | | | | 41.69 | % | | | 1.83 | % | | | 0.50 | % | | | 2.00 | % | | $ | 17,875 | | | | 113 | % | |
Year Ended
12/31/16 | | | 0.04 | | | $ | 15.03 | | | | 10.26 | %(e) | | | 1.87 | % | | | 0.50 | % | | | 1.87 | % | | $ | 15,923 | | | | 120 | % | |
Class R6 | |
Year Ended
12/31/20 | | | — | | | $ | 25.10 | | | | 17.28 | % | | | 0.89 | % | | | 0.95 | % | | | 1.21 | % | | $ | 115,637 | | | | 109 | % | |
Year Ended
12/31/19 | | | — | | | $ | 21.68 | | | | 23.55 | % | | | 0.89 | % | | | 2.69 | % | | | 1.22 | % | | $ | 72,196 | | | | 96 | % | |
Year Ended
12/31/18 | | | — | | | $ | 17.68 | | | | (18.73 | )% | | | 0.89 | % | | | 1.59 | % | | | 1.24 | % | | $ | 29,228 | | | | 118 | % | |
Year Ended
12/31/17 | | | — | | | $ | 22.81 | | | | 42.77 | % | | | 1.03 | % | | | 1.66 | % | | | 1.39 | % | | $ | 18,762 | | | | 113 | % | |
11/15/16(h)
through
12/31/16 | | | — | | | $ | 16.16 | | | | 1.81 | % | | | 1.16 | % | | | 1.79 | % | | | 21.70 | % | | $ | 64 | | | | 120 | % | |
Class Y | |
Year Ended
12/31/20 | | | — | | | $ | 24.85 | | | | 17.10 | % | | | 0.99 | % | | | 0.79 | % | | | 1.31 | % | | $ | 280,364 | | | | 109 | % | |
Year Ended
12/31/19 | | | — | | | $ | 21.48 | | | | 23.40 | % | | | 0.99 | % | | | 2.32 | % | | | 1.30 | % | | $ | 255,423 | | | | 96 | % | |
Year Ended
12/31/18 | | | — | | | $ | 17.54 | | | | (18.77 | )% | | | 0.99 | % | | | 1.64 | % | | | 1.30 | % | | $ | 178,132 | | | | 118 | % | |
Year Ended
12/31/17 | | | — | | | $ | 22.64 | | | | 42.59 | % | | | 1.18 | % | | | 1.07 | % | | | 1.33 | % | | $ | 100,902 | | | | 113 | % | |
Year Ended
12/31/16 | | | 0.04 | | | $ | 16.05 | | | | 10.86 | %(e) | | | 1.32 | % | | | 1.17 | % | | | 1.38 | % | | $ | 60,277 | | | | 120 | % | |
(e) The Fund received monies related to a nonrecurring refund from the prior Custodian. The corresponding impact to the total return was 1.45% for the period shown. (See Note 8)
(f) Amount is less than $0.005 per share.
(g) Amount is less than $0.005%.
(h) Commencement of operations.
See notes to financial statements.
63
Victory Portfolios | | Financial Highlights | |
For a Share Outstanding Throughout Each Period
| | | | Investment Activities | | Distributions to
Shareholders From | |
| | | Net Asset
Value,
Beginning of
Period | | Net
Investment
Income
(Loss)(a) | | Net
Realized and
Unrealized
Gains
(Losses) on
Investments | | Total from
Investment
Activities | | Net
Investment
Income | | Net Realized
Gains from
Investments | |
Victory Sophus Emerging Markets Small Cap Fund | |
Class A | |
Year Ended 12/31/20 | | $ | 7.32 | | | | 0.03 | | | | 0.71 | | | | 0.74 | | | | (0.03 | ) | | | — | | |
Year Ended 12/31/19 | | $ | 6.07 | | | | 0.06 | | | | 1.25 | | | | 1.31 | | | | (0.05 | ) | | | (0.01 | ) | |
Year Ended 12/31/18 | | $ | 10.13 | | | | 0.04 | | | | (2.27 | ) | | | (2.23 | ) | | | — | | | | (1.83 | ) | |
Year Ended 12/31/17 | | $ | 9.75 | | | | 0.12 | | | | 3.86 | | | | 3.98 | | | | (0.12 | ) | | | (3.48 | ) | |
Year Ended 12/31/16 | | $ | 9.69 | | | | 0.04 | | | | 0.02 | | | | 0.06 | | | | — | | | | — | | |
Class C | |
Year Ended 12/31/20 | | $ | 6.66 | | | | (0.01 | ) | | | 0.62 | | | | 0.61 | | | | — | | | | — | | |
Year Ended 12/31/19 | | $ | 5.53 | | | | 0.02 | | | | 1.12 | | | | 1.14 | | | | — | | | | (0.01 | ) | |
Year Ended 12/31/18 | | $ | 9.51 | | | | 0.01 | | | | (2.16 | ) | | | (2.15 | ) | | | — | | | | (1.83 | ) | |
Year Ended 12/31/17 | | $ | 9.34 | | | | (0.02 | ) | | | 3.75 | | | | 3.73 | | | | (0.08 | ) | | | (3.48 | ) | |
Year Ended 12/31/16 | | $ | 9.56 | | | | (0.02 | ) | | | (0.20 | ) | | | (0.22 | ) | | | — | | | | — | | |
Class Y | |
Year Ended 12/31/20 | | $ | 7.29 | | | | 0.05 | | | | 0.71 | | | | 0.76 | | | | (0.06 | ) | | | — | | |
Year Ended 12/31/19 | | $ | 6.05 | | | | 0.08 | | | | 1.24 | | | | 1.32 | | | | (0.07 | ) | | | (0.01 | ) | |
Year Ended 12/31/18 | | $ | 10.08 | | | | 0.09 | | | | (2.29 | ) | | | (2.20 | ) | | | — | | | | (1.83 | ) | |
Year Ended 12/31/17 | | $ | 9.75 | | | | 0.15 | | | | 3.87 | | | | 4.02 | | | | (0.21 | ) | | | (3.48 | ) | |
Year Ended 12/31/16 | | $ | 9.74 | | | | 0.06 | | | | 0.02 | | | | 0.08 | | | | (0.07 | ) | | | — | | |
(a) Per share net investment income (loss) has been calculated using the average daily shares method.
(b) Portfolio turnover is calculated on the basis of the Fund as a whole without distinguishing between the classes of shares issued.
(c) Portfolio turnover increased due to change within portfolio holdings during the year.
See notes to financial statements.
64
Victory Portfolios | | Financial Highlights — continued | |
For a Share Outstanding Throughout Each Period
| | | | | Ratios to Average Net Assets | | Supplemental Data | |
| | | Total
Distributions | | Net Asset
Value,
End of
Period | | Total
Return
(Excludes
Sales
Charge) | | Net
Expenses | | Net
Investment
Income
(Loss) | | Gross
Expenses | | Net Assets,
End of
Period
(000's) | | Portfolio
Turnover(b) | |
Victory Sophus Emerging Markets Small Cap Fund | |
Class A | |
Year Ended 12/31/20 | | | (0.03 | ) | | $ | 8.03 | | | | 10.27 | % | | | 1.75 | % | | | 0.49 | % | | | 9.12 | % | | $ | 224 | | | | 149 | % | |
Year Ended 12/31/19 | | | (0.06 | ) | | $ | 7.32 | | | | 21.44 | % | | | 1.75 | % | | | 0.94 | % | | | 8.02 | % | | $ | 336 | | | | 112 | % | |
Year Ended 12/31/18 | | | (1.83 | ) | | $ | 6.07 | | | | (21.76 | )% | | | 1.75 | % | | | 0.39 | % | | | 5.77 | % | | $ | 334 | | | | 200 | % | |
Year Ended 12/31/17 | | | (3.60 | ) | | $ | 10.13 | | | | 42.55 | % | | | 1.75 | % | | | 1.07 | % | | | 2.94 | % | | $ | 1,456 | | | | 227 | %(c) | |
Year Ended 12/31/16 | | | — | | | $ | 9.75 | | | | 0.62 | % | | | 1.75 | % | | | 0.44 | % | | | 2.29 | % | | $ | 2,552 | | | | 141 | % | |
Class C | |
Year Ended 12/31/20 | | | — | | | $ | 7.27 | | | | 9.32 | % | | | 2.50 | % | | | (0.23 | )% | | | 18.25 | % | | $ | 88 | | | | 149 | % | |
Year Ended 12/31/19 | | | (0.01 | ) | | $ | 6.66 | | | | 20.53 | % | | | 2.50 | % | | | 0.25 | % | | | 13.26 | % | | $ | 140 | | | | 112 | % | |
Year Ended 12/31/18 | | | (1.83 | ) | | $ | 5.53 | | | | (22.31 | )% | | | 2.51 | % | | | 0.11 | % | | | 13.96 | % | | $ | 112 | | | | 200 | % | |
Year Ended 12/31/17 | | | (3.56 | ) | | $ | 9.51 | | | | 41.68 | % | | | 2.50 | % | | | (0.21 | )% | | | 32.34 | % | | $ | 99 | | | | 227 | %(c) | |
Year Ended 12/31/16 | | | — | | | $ | 9.34 | | | | (2.30 | )% | | | 2.50 | % | | | (0.18 | )% | | | 3.12 | % | | $ | 24 | | | | 141 | % | |
Class Y | |
Year Ended 12/31/20 | | | (0.06 | ) | | $ | 7.99 | | | | 10.61 | % | | | 1.50 | % | | | 0.83 | % | | | 4.54 | % | | $ | 3,772 | | | | 149 | % | |
Year Ended 12/31/19 | | | (0.08 | ) | | $ | 7.29 | | | | 21.76 | % | | | 1.50 | % | | | 1.25 | % | | | 4.02 | % | | $ | 4,839 | | | | 112 | % | |
Year Ended 12/31/18 | | | (1.83 | ) | | $ | 6.05 | | | | (21.57 | )% | | | 1.51 | % | | | 0.94 | % | | | 3.82 | % | | $ | 3,890 | | | | 200 | % | |
Year Ended 12/31/17 | | | (3.69 | ) | | $ | 10.08 | | | | 43.02 | % | | | 1.50 | % | | | 1.32 | % | | | 2.13 | % | | $ | 5,685 | | | | 227 | %(c) | |
Year Ended 12/31/16 | | | (0.07 | ) | | $ | 9.75 | | | | 0.79 | % | | | 1.50 | % | | | 0.62 | % | | | 1.98 | % | | $ | 17,261 | | | | 141 | % | |
See notes to financial statements.
65
Victory Portfolios | | Notes to Financial Statements
December 31, 2020 | |
1. Organization:
Victory Portfolios (the "Trust") was organized on December 6, 1995 as a Delaware statutory trust as a successor to a company named "The Victory Portfolios," which was organized as a Massachusetts business trust on February 5, 1986. The Trust is registered under the Investment Company Act of 1940, as amended (the "1940 Act"), as an open-end investment company. The Trust is comprised of 42 funds and is authorized to issue an unlimited number of shares, which are units of beneficial interest with a par value of $0.001 per share. Each Fund is classified as diversified under the 1940 Act.
The accompanying financial statements are those of the following four Funds (collectively, the "Funds" and individually, a "Fund").
Funds (Legal Name) | | Funds (Short Name) | | Investment Share
Classes Offered | |
Victory RS International Fund | | RS International Fund | | Classes A, C, R, R6 and Y | |
Victory RS Global Fund | | RS Global Fund | | Classes A, C, R, R6 and Y | |
Victory Sophus Emerging
Markets Fund | | Sophus Emerging Markets Fund
| | Classes A, C, R, R6 and Y
| |
Victory Sophus Emerging
Markets Small Cap Fund | | Sophus Emerging Markets
Small Cap Fund | | Classes A, C and Y
| |
Each class of shares of a Fund has substantially identical rights and privileges except with respect to sales charges, fees paid under distribution plans, expenses allocable exclusively to each class of shares, voting rights on matters solely affecting a single class of shares, and the exchange privilege of each class of shares.
Under the Trust's organizational documents, its officers and trustees are indemnified against certain liabilities arising out of the performance of their duties to the Funds. In addition, in the normal course of business, the Funds enter into contracts with their vendors and others that provide for general indemnifications. The Funds' maximum exposure under these arrangements is unknown, as this would involve future claims that may be made against the Funds. However, based on experience, the Funds expect that risk of loss to be remote.
2. Significant Accounting Policies:
The following is a summary of significant accounting policies followed by the Trust in the preparation of its financial statements. The policies are in conformity with Generally Accepted Accounting Principles in the United States of America ("GAAP"). The preparation of financial statements in accordance with GAAP requires management to make estimates and assumptions that affect the reported amounts of assets and liabilities and disclosure of contingent assets and liabilities at the date of the financial statements and the reported amounts of income and expenses for the period. Actual results could differ from those estimates. The Funds follow the specialized accounting and reporting requirements under GAAP that are applicable to investment companies.
Investment Valuation:
The Funds record investments at fair value. Fair value is defined as the price that would be received to sell an asset or paid to transfer a liability in an orderly transaction between market participants at the measurement date.
The valuation techniques described below maximize the use of observable inputs and minimize the use of unobservable inputs in determining fair value. The inputs used for valuing the Funds' investments are summarized in the three broad levels listed below:
• Level 1 — quoted prices in active markets for identical securities
• Level 2 — other significant observable inputs (including quoted prices for similar securities or interest rates applicable to those securities, etc.)
66
Victory Portfolios | | Notes to Financial Statements — continued
December 31, 2020 | |
• Level 3 — significant unobservable inputs (including the Funds' own assumptions in determining the fair value of investments)
Changes in valuation techniques may result in transfers in or out of an assigned level within the disclosure hierarchy. The inputs or methodologies used for valuation techniques are not necessarily an indication of the risk associated with entering into those investments.
Portfolio securities listed or traded on securities exchanges, including Exchange-Traded Funds ("ETFs"), American Depositary Receipts ("ADRs") and Rights, are valued at the closing price on the exchange or system where the security is principally traded, if available, or at the Nasdaq Official Closing Price. If there have been no sales for that day on the exchange or system, then a security is valued at the last available bid quotation on the exchange or system where the security is principally traded. In each of these situations, valuations are typically categorized as Level 1 in the fair value hierarchy.
Investments in open-end investment companies are valued at net asset value. These valuations are typically categorized as Level 1 in the fair value hierarchy.
Investments for which there are no such quotations, or for which quotations do not appear reliable, are valued at fair value in accordance with procedures established by and under the general supervision and responsibility of the Trust's Board of Trustees (the "Board"). These valuations are typically categorized as Level 2 or Level 3 in the fair value hierarchy, based on the observability of inputs used to determine the fair value.
In accordance with procedures adopted by the Board, fair value pricing may be used if events materially affecting the value of foreign securities occur between the time the exchange on which they are traded closes and the time the Funds' net asset values are calculated. The Funds use a systematic valuation model, provided daily by an independent third party to fair value their international equity securities. These valuations are considered as Level 2 in the fair value hierarchy.
A summary of the valuations as of December 31, 2020, based upon the three levels defined above, is included in the table below while the breakdown, by category, of investments is disclosed on the Schedules of Portfolio Investments.
| | | Level 1 | | Level 2 | | Level 3 | | Total | |
RS International Fund | |
Common Stocks | | $ | — | | | $ | 364,810,064 | | | $ | — | | | $ | 364,810,064 | | |
Exchange-Traded Funds | | | 5,552,986 | | | | — | | | | — | | | | 5,552,986 | | |
Collateral for Securities Loaned | | | 4,558,013 | | | | — | | | | — | | | | 4,558,013 | | |
Total | | $ | 10,110,999 | | | $ | 364,810,064 | | | $ | — | | | $ | 374,921,063 | | |
RS Global Fund | |
Common Stocks | | $ | 126,423,271 | | | $ | 88,335,121 | | | $ | — | | | $ | 214,758,392 | | |
Exchange-Traded Funds | | | 650,372 | | | | — | | | | — | | | | 650,372 | | |
Collateral for Securities Loaned | | | 5,216,276 | | | | — | | | | — | | | | 5,216,276 | | |
Total | | $ | 132,289,919 | | | $ | 88,335,121 | | | $ | — | | | $ | 220,625,040 | | |
Sophus Emerging Markets Fund | |
Common Stocks | | $ | 80,250,801 | | | $ | 387,943,235 | | | $ | — | | | $ | 468,194,036 | | |
Collateral for Securities Loaned | | | 4,685,980 | | | | — | | | | — | | | | 4,685,980 | | |
Total | | $ | 84,936,781 | | | $ | 387,943,235 | | | $ | — | | | $ | 472,880,016 | | |
Sophus Emerging Markets Small Cap Fund | |
Common Stocks | | $ | 338,620 | | | $ | 3,921,579 | | | $ | — | | | $ | 4,260,199 | | |
Rights | | | — | | | | 2,237 | | | | — | | | | 2,237 | | |
Total | | $ | 338,620 | | | $ | 3,923,816 | | | $ | — | | | $ | 4,262,436 | | |
67
Victory Portfolios | | Notes to Financial Statements — continued
December 31, 2020 | |
The following is a reconciliation of assets in which significant unobservable inputs (Level 3) were used in determining fair value:
| | | Sophus Emerging
Markets Small Cap
Fund | |
Balance as of December 31, 2019 | | $ | 33,999 | | |
Accrued Discount (Premium) | | | — | | |
Realized Gain (Loss) | | | (11,243 | ) | |
| Change in Unrealized Appreciation (Depreciation) | | | 8,734 | | |
Purchases | | | — | | |
| Sales Proceeds | | | (31,490 | ) | |
Transfers into Level 3 | | | — | | |
Transfers out of Level 3 | | | — | | |
Balance as of December 31, 2020 | | $ | — | | |
Real Estate Investment Trusts ("REITs"):
The Funds may invest in REITs, which report information on the source of their distributions annually. REITs are pooled investment vehicles that invest primarily in income-producing real estate or real- estate related loans or interests (such as mortgages). Certain distributions received from REITs during the year are recorded as realized gains or return of capital as estimated by the Funds or when such information becomes known.
Investment Companies:
Exchange-Traded Funds:
The Funds may invest in ETFs, the shares of which are bought and sold on a securities exchange. An ETF trades like common stock and represents a fixed portfolio of securities often designed to track the performance and dividend yield of a particular domestic or foreign market index. A Fund may purchase shares of an ETF to temporarily gain exposure to a portion of the U.S. or a foreign market while awaiting purchase of underlying securities. The risks of owning an ETF generally reflect the risks of owning the underlying securities they are designed to track, although the lack of liquidity of an ETF could result in it being more volatile. Additionally, ETFs have fees and expenses that reduce their value.
Open-End Funds:
The Funds may invest in portfolios of open-end investment companies. These investment companies value securities in their portfolios for which market quotations are readily available at their market values (generally the last reported sale price) and all other securities and assets at their fair value by the methods established by the board of directors of the underlying funds.
Foreign Exchange Currency Contracts:
The Funds may enter into foreign exchange currency contracts to convert U.S. dollars to and from various foreign currencies. A foreign exchange currency contract is an obligation by a Fund to purchase or sell a specific currency at a future date at a price (in U.S. dollars) set at the time of the contract. The Funds do not engage in "cross-currency" foreign exchange contracts (i.e., contracts to purchase or sell one foreign currency in exchange for another foreign currency). The Funds' foreign exchange currency contracts might be considered spot contracts (typically a contract of one week or less) or forward contracts (typically a contract term over one week). A spot contract is entered into for purposes of hedging against foreign currency fluctuations relating to a specific portfolio transaction, such as the delay between a security transaction trade date and settlement date. Forward contracts are entered into for purposes of hedging portfolio holdings or concentrations of such holdings. Each foreign exchange currency contract is adjusted daily by the prevailing spot or forward rate of the underlying
68
Victory Portfolios | | Notes to Financial Statements — continued
December 31, 2020 | |
currency, and any appreciation or depreciation is recorded for financial statement purposes as unrealized until the contract settlement date, at which time the Fund records realized gains or losses equal to the difference between the value of a contract at the time it was opened and the value at the time it was closed. A Fund could be exposed to risk if a counterparty is unable to meet the terms of a foreign exchange currency contract or if the value of the foreign currency changes unfavorably. In addition, the use of foreign exchange currency contracts does not eliminate fluctuations in the underlying prices of the securities. As of December 31, 2020, the Funds had no open forward foreign exchange currency contracts.
Investment Transactions and Related Income:
Changes in holdings of investments are accounted for no later than one business day following the trade date. For financial reporting purposes, however, investment transactions are accounted for on trade date on the last business day of the reporting period. Interest income is determined on the basis of coupon interest accrued using the effective interest method which adjusts, where applicable, the amortization of premiums or accretion of discounts. Dividend income is recorded on the ex-dividend date. Gains or losses realized on sales of securities are recorded on the identified cost basis.
Withholding taxes on interest, dividends and gains as a result of certain investments in ADRs by the Funds have been provided for in accordance with each investment's applicable country's tax rules and rates.
Securities Lending:
The Trust has entered into a Master Securities Lending Agreement ("MSLA") with Citibank, N.A. ("Citibank" or the "Agent"). Under the terms of the MSLA, the Funds may lend securities to certain broker-dealers and banks in exchange for collateral in the amount of at least 102% of the value of U.S. securities loaned or at least 105% of the value of non-U.S. securities loaned, marked-to-market daily. Any collateral shortfalls associated with increases in the valuation of the securities loaned are adjusted the next business day. The collateral can be received in the form of cash collateral and/or non-cash collateral. Non-cash collateral can include U.S. Government Securities, letters of credit and certificates of deposit. The cash collateral is invested in short-term instruments or cash equivalents, primarily open-end investment companies, as noted on the Funds' Schedules of Portfolio Investments. The Trust does not have effective control of the non-cash collateral and therefore it is not disclosed on the Funds' Schedules of Portfolio Investments. During the time portfolio securities are on loan, the borrower will pay the Funds any dividends or interest paid on such securities plus any fee negotiated between the parties to the lending agreement. The Funds also earn a return from the collateral. The Funds pay the Agent various fees in connection with the investment of cash collateral and fees based on the investment income received from securities lending activities. Securities lending income (net of these fees) is disclosed on the Statements of Operations. Although risk is mitigated by the collateral, the Funds could experience a delay in recovering their securities and possible loss of income or value if the borrower fails to return them.
Securities lending transactions are entered into by a Fund under the MSLA, which permits the Fund, under certain circumstances such as an event of default, to offset amounts payable by the Fund to the same counterparty against amounts receivable from the counterparty to create a net payment due to or from the Fund.
The following table is a summary of the Funds' securities lending transactions which are subject to offset under the MSLA as of December 31, 2020. These transactions are accounted for as secured borrowings with an overnight and continuous contractual maturity for cash collateral and greater than overnight and continuous contractual maturity for non-cash collateral.
69
Victory Portfolios | | Notes to Financial Statements — continued
December 31, 2020 | |
| | | Gross
Amount of
Recognized
Assets
(Value of | | Value of
Cash | | Value of Non-cash Collateral
Received by Maturity | | | |
| | | Securities
on Loan) | | Collateral
Received* | | <30 Days | | Between
30 & 90 Days | | >90 Days | | Net Amount | |
RS International Fund | | $ | 4,295,333 | | | $ | 4,295,333 | | | $ | — | | | $ | — | | | $ | — | | | $ | — | | |
RS Global Fund | | | 4,934,538 | | | | 4,934,538 | | | | — | | | | — | | | | — | | | | — | | |
Sophus Emerging Markets Fund | | | 4,513,824 | | | | 4,513,824 | | | | — | | | | — | | | | — | | | | — | | |
* Collateral received in excess of the market value of securities on loan is not presented in this table. The total cash collateral received by each Fund is disclosed on the Statements of Assets and Liabilities.
Foreign Currency Translations:
The accounting records of the Funds are maintained in U.S. dollars. Investment securities and other assets and liabilities of a Fund denominated in a foreign currency are translated into U.S. dollars at current exchange rates. Purchases and sales of securities, income receipts and expense payments are translated into U.S. dollars at the exchange rates on the date of the transactions. The Funds do not isolate the portion of the results of operations resulting from changes in foreign exchange rates on investments from fluctuations arising from changes in market prices of securities held. Such fluctuations are disclosed as Net change in unrealized appreciation/depreciation on investment securities and foreign currency translations on the Statements of Operations. Any realized gains or losses from these fluctuations are disclosed as Net realized gains (losses) from investment securities and foreign currency translations on the Statements of Operations.
Foreign Taxes:
The Funds may be subject to foreign taxes related to foreign income received (a portion of which may be reclaimable), capital gains on the sale of securities, and certain foreign currency transactions. All foreign taxes are recorded in accordance with the applicable regulations and rates that exist in the foreign jurisdictions in which the Funds invest.
Federal Income Taxes:
It is the policy of each Fund to continue to qualify as a regulated investment company by complying with the provisions available to certain investment companies, as defined in applicable sections of the Internal Revenue Code, and to make distributions of net investment income and net realized gains sufficient to relieve it from all, or substantially all, federal income taxes. Accordingly, no provision for federal income taxes is required in the financial statements. The Funds have a tax year end of December 31.
Management of the Funds has reviewed tax positions taken in tax years that remain subject to examination by all major tax jurisdictions, including federal (i.e., the last four tax years, which includes the current fiscal tax year end). Management believes that there is no tax liability resulting from unrecognized tax benefits related to uncertain tax positions taken.
Allocations:
Expenses directly attributable to a Fund are charged to the Fund, while expenses which are attributable to more than one fund in the Trust, or jointly with an affiliated trust, are allocated among the respective funds in the Trust and/or affiliated trust based upon net assets or another appropriate basis.
Income, expenses (other than class-specific expenses such as transfer agent fees, state registration fees, printing fees and 12b-1 fees), and realized and unrealized gains or losses on investments are
70
Victory Portfolios | | Notes to Financial Statements — continued
December 31, 2020 | |
allocated to each class of shares based on its relative net assets on the date income is earned or expenses and realized and unrealized gains and losses are incurred.
3. Purchases and Sales of Securities:
Purchases and sales of securities (excluding securities maturing less than one year from acquisition) for the year ended December 31, 2020, were as follows:
| | | Purchases
(excluding U.S.
Government
Securities) | | Sales
(excluding U.S.
Government
Securities) | |
RS International Fund | | $ | 233,988,127 | | | $ | 155,783,405 | | |
RS Global Fund | | | 192,920,129 | | | | 88,858,738 | | |
Sophus Emerging Markets Fund | | | 398,504,550 | | | | 386,097,174 | | |
Sophus Emerging Markets Small Cap Fund | | | 6,355,763 | | | | 7,436,254 | | |
For the year ended December 31, 2020, there were no purchases or sales of U.S. Government Securities.
4. Fees and Transactions with Affiliates and Related Parties:
Investment advisory services are provided to the Funds by Victory Capital Management Inc. ("VCM" or the "Adviser"), a New York corporation registered as an investment adviser with the Securities and Exchange Commission ("SEC"). The Adviser is a wholly owned indirect subsidiary of Victory Capital Holdings, Inc., a publicly traded Delaware corporation and a wholly owned direct subsidiary of Victory Capital Operating, LLC. Amounts incurred and paid to VCM for the year ended December 31, 2020, are reflected on the Statements of Operations as Investment advisory fees.
Under the terms of the Investment Advisory Agreement, the Adviser is entitled to receive fees based on a percentage of the average daily net assets of each Fund. The rates at which the Adviser is paid by each Fund are included in the table below. The Adviser may use its resources to assist with the Funds' distribution and marketing expenses.
| | | Flat Rate | |
RS International Fund | | | 0.80 | % | |
RS Global Fund | | | 0.80 | % | |
Sophus Emerging Markets Fund | | | 1.00 | % | |
Sophus Emerging Markets Small Cap Fund | | | 1.25 | % | |
VCM also serves as the Funds' administrator and fund accountant. Under the Administration and Fund Accounting Agreement, VCM is paid for its services an annual fee at a rate of 0.08% of the first $15 billion in average daily net assets of the Trust, Victory Variable Insurance Funds and Victory Portfolios II (collectively, the "Victory Funds Complex"), 0.05% of the average daily net assets above $15 billion to $30 billion of the Victory Funds Complex and 0.04% of the average daily net assets over $30 billion of the Victory Funds Complex. Amounts incurred for the year ended December 31, 2020, are reflected on the Statements of Operations as Administration fees.
Citi Fund Services Ohio, Inc. ("Citi"), an affiliate of Citibank, acts as sub-administrator and sub-fund accountant to the Funds pursuant to the Sub-Administration and Sub-Fund Accounting Services Agreement between VCM and Citi. VCM pays Citi a fee for providing these services. The Funds reimburse VCM and Citi for out-of-pocket expenses incurred in providing these services and certain other expenses specifically allocated to the Funds. Amounts incurred for the year ended December 31, 2020, are reflected on the Statements of Operations as Sub-Administration fees.
Citibank serves as the Funds' custodian. The Funds pay Citibank a fee for providing these services. Amounts incurred for the year ended December 31, 2020, are reflected on the Statements of Operations as Custodian fees.
71
Victory Portfolios | | Notes to Financial Statements — continued
December 31, 2020 | |
FIS Investor Services, LLC ("FIS") serves as the Funds' transfer agent. Under the Transfer Agent Agreement, the Trust pays FIS a fee for its services and reimburses FIS for all of their reasonable out-of-pocket expenses incurred in providing these services. Amounts incurred for the year ended December 31, 2020, are reflected on the Statements of Operations as Transfer agent fees.
The Chief Compliance Officer ("CCO") is an employee of the Adviser, which pays the compensation of the CCO and his support staff. The Trust has entered into an agreement to provide compliance services with the Adviser, pursuant to which the Adviser furnishes its compliance personnel, including the services of the CCO, and other resources reasonably necessary to provide the Trust with compliance oversight services related to the design, administration and oversight of a compliance program for the Trust in accordance with Rule 38a-1 under the 1940 Act. The Funds in the Victory Funds Complex, in aggregate, compensate the Adviser for these services. Amounts incurred for the year ended December 31, 2020, are reflected on the Statements of Operations as Compliance fees.
Sidley Austin LLP provides legal services to the Trust.
Victory Capital Services, Inc. (the "Distributor"), an affiliate of the Adviser, serves as distributor for the continuous offering of the shares of the Funds pursuant to a Distribution Agreement between the Distributor and the Trust, and receives no fee or other compensation for these services. Effective June 30, 2020, the Distributor's name was changed from Victory Capital Advisers, Inc. Amounts incurred for the year ended December 31, 2020, are reflected on the Statements of Operations as 12b-1 fees.
Pursuant to the Distribution and Service Plans adopted in accordance with Rule 12b-1 under the 1940 Act, the Distributor may receive a monthly distribution and service fee, at an annual rate of up to 0.25% of the average daily net assets of Class A Shares, at an annual rate of up to 0.50% of the average daily net assets of Class R Shares and 1.00% of the average daily net assets of Class C Shares of the Funds. The distribution and service fees paid to the Distributor may be used by the Distributor to pay for activities primarily intended to result in the sale of Class A, Class R or Class C Shares of the Funds.
In addition, the Distributor is entitled to receive commissions on sales of the Class A Shares of the Funds. For the year ended December 31, 2020, the Distributor received approximately $8,345 from commissions earned on sales of Class A Shares of the Funds.
The Adviser has entered into expense limitation agreements with certain Funds. Under the terms of the agreements, the Adviser has agreed to waive fees or reimburse certain expenses to the extent that ordinary operating expenses incurred by certain classes of a Fund in any fiscal year exceed the expense limit for such classes of the Fund. Such excess amounts will be the liability of the Adviser. Interest, taxes, brokerage commissions, other expenditures which are capitalized in accordance with GAAP, and other extraordinary expenses not incurred in the ordinary course of a Fund's business are excluded from the expense limits. As of December 31, 2020, the expense limits (excluding voluntary waivers) are as follows:
| | | In effect until April 30, 2021 | |
| | | Class A
Shares | | Class C
Shares | | Class R
Shares | | Class R6
Shares | | Class Y
Shares | |
RS International Fund | | | 1.13 | % | | | 1.88 | % | | | 1.38 | % | | | 0.83 | % | | | 0.88 | % | |
RS Global Fund | | | 0.85 | % | | | 1.60 | % | | | 1.10 | % | | | 0.55 | % | | | 0.60 | % | |
Sophus Emerging Markets Fund | | | 1.34 | % | | | 2.14 | % | | | 1.58 | % | | | 0.89 | % | | | 0.99 | % | |
Sophus Emerging Markets Small Cap Fund | | | 1.75 | % | | | 2.50 | % | | | N/A | | | | N/A | | | | 1.50 | % | |
The Funds have agreed to repay fees and expenses that were waived or reimbursed by the Adviser for a period up to three fiscal years after such waiver or reimbursement was made to the extent such payments or repayments would not cause the expenses of a class to exceed the original expense limitation in place at the time of the waiver or reimbursement or any expense limitation agreement in place at the time of repayment. Amounts repaid to the Adviser during the year, if any, are reflected on the Statements of Operations as Recoupment of prior expenses waived/reimbursed by Adviser.
72
Victory Portfolios | | Notes to Financial Statements — continued
December 31, 2020 | |
As of December 31, 2020, the following amounts are available to be repaid to the Adviser. The Funds have not recorded any amounts available to be repaid as a liability due to an assessment that such repayment is not probable at December 31, 2020.
| | | Expires
December 30,
2021 | | Expires
December 30,
2022 | | Expires
December 31,
2023 | | Total | |
RS International Fund | | $ | 152,046 | | | $ | 266,869 | | | $ | 491,864 | | | $ | 910,779 | | |
RS Global Fund | | | 205,996 | | | | 359,812 | | | | 690,062 | | | | 1,255,870 | | |
Sophus Emerging Markets Fund | | | 879,454 | | | | 1,124,230 | | | | 1,137,721 | | | | 3,141,405 | | |
Sophus Emerging Markets Small Cap Fund | | | 143,951 | | | | 151,458 | | | | 158,858 | | | | 454,267 | | |
The Adviser may voluntarily waive or reimburse additional fees to assist the Funds in maintaining competitive expense ratios. Voluntary waivers and reimbursements applicable to the Funds are not available to be recouped at a future time. There were no voluntary waivers or reimbursements for the year ended December 31, 2020.
Certain officers and/or interested trustees of the Funds are also officers and/or employees of the Adviser, Administrator, Fund Accountant, Sub-Administrator, Sub-Fund Accountant, Custodian, Distributor, and Legal Counsel.
5. Risks:
Each Fund may be subject to other risks in addition to these identified risks.
Equity Risk — An investment in the Funds' shares represents an indirect investment in the securities owned by the Funds, some of which will be traded on a national securities exchange or in the over-the-counter markets. The value of the securities in which the Funds invest, like other market investments, may move up or down, sometimes rapidly and unpredictably. The value of the securities in which the Funds invest may affect the value of the Funds' shares. An investment in the Funds' shares at any point in time may be worth less than the original investment, even after taking into account the reinvestment of the Funds' distributions.
Foreign Securities Risk — Foreign securities (including depositary receipts) are subject to political, regulatory, and economic risks not present in domestic investments. Foreign securities could be affected by factors not present in the U.S., including expropriation, confiscation of property, and difficulties in enforcing contracts. Compared to U.S. companies, there generally is less publicly available information about foreign companies and there may be less governmental regulation and supervision of foreign companies. Foreign securities generally experience more volatility than their domestic counterparts. In addition, to the extent investments are made in a limited number of countries, events in those countries will have a more significant impact on the Fund. Fluctuations in the exchange rates between the U.S. dollar and foreign currencies, currency exchange control regulations, and restrictions or prohibitions on the repatriation of foreign currencies may negatively affect an investment.
Emerging Markets Risk — The risks related to investing in foreign securities are generally greater with respect to securities of companies that conduct their business activities in emerging markets or whose securities are traded principally in emerging markets. The risks of investing in emerging markets include the risks of illiquidity, increased price volatility, smaller market capitalizations, less government regulation, less extensive and less frequent accounting, financial and other reporting requirements, risk of loss resulting from problems in share registration and custody, substantial economic and political disruptions and the nationalization of foreign deposits or assets.
Geopolitical/Natural Disaster Risk — An outbreak of disease called COVID-19 has spread internationally. The transmission of COVID-19 and efforts to contain its spread have resulted in international, national and local border closings and other significant travel restrictions and disruptions, significant disruptions to business operations, supply chains and consumer activity, significant challenges in healthcare service preparation and delivery, quarantines and general concern and uncertainty. These negative impacts
73
Victory Portfolios | | Notes to Financial Statements — continued
December 31, 2020 | |
have caused significant volatility and declines in global financial markets, which have caused losses for Fund investors during and subsequent to period end. The impact of the COVID-19 pandemic may last for an extended period of time, could result in a substantial economic downturn or recession. Public health crises may exacerbate other pre-existing political, social, economic, market and financial risks. The extent of the impact to the financial performance of the Funds' investments will depend on future developments, including (i) the duration and spread of the outbreak, (ii) the restrictions and advisories, (iii) the effects on the financial markets, and (iv) the effects on the economy overall, all of which are highly uncertain and cannot be predicted.
6. Borrowing and Interfund Lending:
Line of Credit:
For the year ended December 31, 2020, the Victory Funds Complex and the USAA Mutual Funds Complex (another series of mutual funds managed by the Adviser) participated in a short-term demand note "Line of Credit" agreement with Citibank. The Line of Credit agreement with Citibank was renewed on June 29, 2020, with a termination date of June 28, 2021. Under the agreement with Citibank, the Victory Funds Complex and USAA Mutual Funds Complex, combined, may borrow up to $600 million, of which $300 million is committed and $300 million is uncommitted. $40 million of the Line of Credit is reserved for use by the Victory Floating Rate Fund (herein, the "Fund"), another series of the Victory Funds Complex, with that Fund paying the related commitment fees for that amount. The purpose of the agreement is to meet temporary or emergency cash needs. For the year ended December 31, 2020, Citibank received an annual commitment fee of 0.15% on $300 million for providing the Line of Credit. Each fund in the Victory Funds Complex pays a pro-rata portion of the commitment fees plus any interest (one month LIBOR plus one percent) on amounts borrowed. Effective June 29, 2020, under an amended Line of Credit agreement, Citibank will also receive an annual upfront fee of 0.10% on the $300 million committed line of credit. Each fund in the Victory Funds Complex will pay a pro-rata portion of the upfront fee. Interest charged to each Fund during the period, if applicable, is presented on the Statements of Operations under Line of credit fees.
The average loans for the days outstanding and average interest rate for the Fund below during the year ended December 31, 2020, were as follows:
| | | Amount
Outstanding at
December 31, 2020 | | Average
Borrowing* | | Days
Borrowings
Outstanding | | Average
Interest
Rate* | | Maximum
Borrowing
During
the Period | |
Sophus Emerging Markets
Small Cap Fund | | $ | — | | | $ | 1,116,667 | | | | 6 | | | | 1.27 | % | | $ | 1,700,000 | | |
* For the year ended December 31, 2020, based on the number of days borrowings were outstanding.
Interfund Lending:
The Trust and Adviser rely on an exemptive order granted by the SEC in March 2017 (the "Order"), permitting the establishment and operation of an Interfund Lending Facility (the "Facility"). The Facility allows each Fund to directly lend money to and borrow money from any other Victory Fund, that is permitted to participate in the Facility, relying upon the Order at rates beneficial to both the borrowing and lending funds. Advances under the Facility are allowed for temporary or emergency purposes, including the meeting of redemption requests that otherwise might require the untimely disposition of securities, and are subject to each Fund's borrowing restrictions. The interfund loan rate is determined, as specified in the Order, by averaging the current repurchase agreement rate and the current bank loan rate. As a Borrower, interest charged to each Fund during the period, if applicable, is presented on the Statements of Operations under Interest expense on interfund lending. As a Lender, interest earned by each Fund during the period, if applicable, is presented on the Statements of Operations under Interfund lending income.
74
Victory Portfolios | | Notes to Financial Statements — continued
December 31, 2020 | |
The average borrowing and lending for the days outstanding and average interest rate for each Fund during the year ended December 31, 2020, were as follows:
| | | Borrower or
Lender | | Amount
Outstanding at
December 31,
2020 | | Average
Borrowing* | | Days
Borrowing
Outstanding | | Average
Interest
Rate* | | Maximum
Borrowing
During the
Period | |
RS International
Fund | | Borrower | | $ | — | | | $ | 1,386,000 | | | | 1 | | | | 0.61 | % | | $ | 1,386,000 | | |
RS Global Fund | | Borrower | | | — | | | | 1,001,000 | | | | 1 | | | | 1.18 | % | | | 1,001,000 | | |
Sophus Emerging
Markets Fund | | Borrower | | | — | | | | 4,152,714 | | | | 7 | | | | 0.83 | % | | | 5,431,000 | | |
* For the year ended December 31, 2020, based on the number of days borrowings were outstanding.
7. Federal Income Tax Information:
Dividends from net investment income, if any, are declared and paid annually for the Funds. Distributable net realized gains, if any, are declared and distributed at least annually from each Fund.
The amounts of dividends from net investment income and distributions from net realized gains (collectively, distributions to shareholders) are determined in accordance with federal income tax regulations, which may differ from GAAP. To the extent these "book/tax" differences are permanent in nature (e.g., net operating loss and distribution reclassification), such amounts are reclassified within the components of net assets based on their federal tax-basis treatment; temporary differences (e.g., wash sales) do not require reclassification. To the extent dividends and distributions exceed net investment income and net realized gains for tax purposes, they are reported as distributions of capital. Net investment losses incurred by a Fund may be reclassified as an offset to capital on the accompanying Statements of Assets and Liabilities.
As of December 31, 2020, on the Statements of Assets and Liabilities, as a result of permanent book-to-tax differences, reclassification adjustments were as follows:
| | | Total
Accumulated
Earnings/(Loss) | | Capital | |
Sophus Emerging Markets Small Cap Fund | | $ | 4 | | | $ | (4 | ) | |
The tax character of distributions paid during the tax years ended, as noted below, were as follows (total distributions paid may differ from the Statements of Changes in Net Assets because, for tax purposes, dividends are recognized when actually paid):
| | Year Ended December 31, 2020 | |
| | | Distributions Paid From: | | | |
| | | Ordinary
Income | | Net
Long-Term
Capital Gains | | Total
Distributions
Paid | |
RS International Fund | | $ | 4,899,261 | | | $ | 909,323 | | | $ | 5,808,584 | | |
RS Global Fund | | | 1,560,318 | | | | 96,155 | | | | 1,656,473 | | |
Sophus Emerging Markets Fund | | | 5,284,371 | | | | — | | | | 5,284,371 | | |
Sophus Emerging Markets Small Cap Fund | | | 32,629 | | | | — | | | | 32,629 | | |
75
Victory Portfolios | | Notes to Financial Statements — continued
December 31, 2020 | |
| | | Year Ended December 31, 2019 | |
| | | Distributions paid from | | | |
| | | Ordinary
Income | | Net
Long-Term
Capital Gains | | Total
Distributions
Paid | |
RS International Fund | | $ | 422,976 | | | $ | 149,071 | | | $ | 572,047 | | |
RS Global Fund | | | 997,875 | | | | 57,871 | | | | 1,055,746 | | |
Sophus Emerging Markets Fund | | | 2,802,507 | | | | — | | | | 2,802,507 | | |
Sophus Emerging Markets Small
Cap Fund | | | 48,442 | | | | 11,014 | | | | 59,456 | | |
As of December 31, 2020, the components of accumulated earnings/(loss) on a tax basis were as follows:
| | Undistributed
Ordinary
Income | | Undistributed
Long-Term
Capital Gains | | Accumulated
Earnings | | Accumulated
Capital and
Other
Losses | | Unrealized
Appreciation
(Depreciation)* | | Total
Accumulated
Earnings
(Loss) | |
RS International Fund | | $ | 3,354,617 | | | $ | — | | | $ | 3,354,617 | | | $ | (2,778,208 | ) | | $ | 40,922,774 | | | $ | 41,499,183 | | |
| RS Global Fund | | | 609,060 | | | | 381,069 | | | | 990,129 | | | | — | | | | 44,551,380 | | | | 45,541,509 | | |
Sophus Emerging
Markets Fund | | | 2,707,364 | | | | — | | | | 2,707,364 | | | | (26,270,363 | ) | | | 124,516,040 | | | | 100,953,041 | | |
Sophus Emerging Markets
Small Cap Fund | | | 12,712 | | | | — | | | | 12,712 | | | | (175,951 | ) | | | 813,652 | | | | 650,413 | | |
* The difference between the book-basis and tax-basis unrealized appreciation (depreciation) is attributable primarily to tax deferral of losses on wash sales and passive foreign investment companies.
As of the tax year ended December 31, 2020, the following Funds had net capital loss carryforwards ("CLCFs") as summarized in the table below, which are not subject to expiration.
| | | Short-Term
Amount | | Long-Term
Amount | | Total | |
RS International Fund | | $ | 2,778,208 | | | $ | — | | | $ | 2,778,208 | | |
Sophus Emerging Markets Fund | | | 26,270,363 | | | | — | | | | 26,270,363 | | |
Sophus Emerging Markets Small Cap Fund | | | 127,143 | | | | 48,808 | | | | 175,951 | | |
As of December 31, 2020, the cost basis for federal income tax purposes, gross unrealized appreciation, gross unrealized depreciation and net unrealized appreciation (depreciation) for investments and derivatives were as follows:
| | Cost of
Investments
for Federal
Tax Purposes | | Gross
Unrealized
Appreciation | | Gross
Unrealized
Depreciation | | Net
Unrealized
Appreciation
(Depreciation) | |
RS International Fund | | $ | 334,031,617 | | | $ | 55,584,325 | | | $ | (14,694,879 | ) | | $ | 40,889,446 | | |
RS Global Fund | | | 176,034,288 | | | | 48,645,210 | | | | (4,054,458 | ) | | | 44,590,752 | | |
Sophus Emerging Markets Fund | | | 347,961,317 | | | | 133,063,185 | | | | (8,144,486 | ) | | | 124,918,699 | | |
Sophus Emerging Markets Small
Cap Fund | | | 3,448,792 | | | | 903,327 | | | | (89,683 | ) | | | 813,644 | | |
76
Victory Portfolios | | Notes to Financial Statements — continued
December 31, 2020 | |
8. Capital Contribution from Prior Custodian:
During 2016, certain Funds received notification from their prior custodian, State Street Bank and Trust ("State Street"), concerning issues related to billing on certain categories of expenses during the approximately 16-year period from 1998 through October 31, 2014. The over-billing primarily related to categories of expenses that involved an allocation of general costs among multiple clients.
State Street paid the refunded amounts during January 2017. Based on billing information received during 2016 from State Street and an analysis of any expense limitation agreements that were in place during the period of the activities in question, including the application of any recoupment provisions in such agreements, the Adviser received a portion of the refund.
The portion of the refund retained by the Funds was accounted for as a capital contribution and is reflected on the Financial Highlights as Capital Contribution from Prior Custodian, Net.
9. Fund Ownership:
Ownership of more than 25% of the voting securities of a fund creates presumptions of control of the fund, under section 2(a)(9) of the 1940 Act. As of December 31, 2020, the shareholders listed below held more than 25% of the shares outstanding of the Funds and may be deemed to control those Funds. Shareholders of record may hold Fund shares for the benefit of their customers.
| | | Shareholder | | Percent | |
RS International Fund | | Gerlach Company | | | 64.9 | % | |
Sophus Emerging Markets Fund | | National Financial Services | | | 32.1 | % | |
Sophus Emerging Markets Small Cap Fund | | Gerlach Company | | | 53.4 | % | |
Sophus Emerging Markets Small Cap Fund | | Acuitas Emerging Markets Small Cap LP | | | 27.6 | % | |
77
REPORT OF INDEPENDENT REGISTERED PUBLIC ACCOUNTING FIRM
To the Shareholders and Board of Trustees of Victory Portfolios
Opinion on the Financial Statements
We have audited the accompanying statements of assets and liabilities, including the schedules of portfolio investments, of Victory RS International Fund, Victory RS Global Fund, Victory Sophus Emerging Markets Fund and Victory Sophus Emerging Markets Small Cap Fund (the "Funds"), each a series of Victory Portfolios, as of December 31, 2020, the related statements of operations for the year then ended and the statements of changes in net assets, the related notes, and the financial highlights for each of the two years in the period then ended (collectively referred to as the "financial statements"). In our opinion, the financial statements present fairly, in all material respects, the financial position of each of the Funds as of December 31, 2020, the results of their operations for the year then ended and the changes in their net assets and the financial highlights for each of the two years in the period then ended, in conformity with accounting principles generally accepted in the United States of America.
The Funds' financial highlights for the years ended December 31, 2018 and prior, were audited by other auditors whose report dated February 26, 2019, expressed an unqualified opinion on those financial highlights.
Basis for Opinion
These financial statements are the responsibility of the Funds' management. Our responsibility is to express an opinion on the Funds' financial statements based on our audits. We are a public accounting firm registered with the Public Company Accounting Oversight Board (United States) ("PCAOB") and are required to be independent with respect to the Funds in accordance with the U.S. federal securities laws and the applicable rules and regulations of the Securities and Exchange Commission and the PCAOB.
We conducted our audits in accordance with the standards of the PCAOB. Those standards require that we plan and perform the audit to obtain reasonable assurance about whether the financial statements are free of material misstatement whether due to error or fraud.
Our audits included performing procedures to assess the risks of material misstatement of the financial statements, whether due to error or fraud, and performing procedures that respond to those risks. Such procedures included examining, on a test basis, evidence regarding the amounts and disclosures in the financial statements. Our procedures included confirmation of securities owned as of December 31, 2020, by correspondence with the custodian and brokers or by other appropriate auditing procedures where replies from brokers were not received. Our audits also included evaluating the accounting principles used and significant estimates made by management, as well as evaluating the overall presentation of the financial statements. We believe that our audits provide a reasonable basis for our opinion.
We have served as the auditor of one or more of the investment companies advised by Victory Capital Management, Inc. since 2015.

COHEN & COMPANY, LTD.
Cleveland, Ohio
February 23, 2021
78
Victory Portfolios | | Supplemental Information
December 31, 2020 | |
(Unaudited)
Trustee and Officer Information
Board of Trustees:
Overall responsibility for management of the Trust rests with the Board. The Trust is managed by the Board in accordance with the laws of the State of Delaware. There are currently nine Trustees, eight of whom are not "interested persons" of the Trust within the meaning of that term under the 1940 Act ("Independent Trustees") and one of whom is an "interested person" of the Trust within the meaning of that term under the 1940 Act ("Interested Trustee"). The Trustees, in turn, elect the officers of the Trust to actively supervise its day-to-day operations.
The following tables list the Trustees, their date of birth, position with the Trust, commencement of service, principal occupations during the past five years and any directorships of other investment companies or companies whose securities are registered under the Securities Exchange Act of 1934, as amended, or who file reports under that Act. Each Trustee oversees 42 portfolios in the Trust, 8 portfolios in Victory Variable Insurance Funds, and 25 portfolios in Victory Portfolios II, each a registered investment company that, together with the Trust, comprise the Victory Fund Complex. David C. Brown is a Trustee of USAA Mutual Funds Trust and oversees 46 portfolios of the USAA Mutual Funds Trust. Each Trustee's address is c/o Victory Portfolios, 4900 Tiedeman Road, 4th Floor, Brooklyn, Ohio 44144. Each Trustee has an indefinite term.
Name and Date of Birth | | Position
Held with
the Trust | | Date
Commenced
Service | | Principal Occupation
During Past 5 Years | | Other
Directorships
Held During
Past 5 Years | |
Independent Trustees. | |
David Brooks Adcock, Born October 1951 | | Trustee | | May 2005 | | Consultant (since 2006). | | Chair and Trustee, Turner Funds (December 2016-December 2017). | |
Nigel D. T. Andrews, Born April 1947 | | Vice Chair and Trustee | | August 2002 | | Retired. | | Director, TCG BDC II, Inc. (since 2017); Director, TCG BDC I, Inc. (formerly Carlyle GMS Finance, Inc.) (since 2012). | |
E. Lee Beard,* Born August 1951 | | Trustee | | May 2005 | | Retired (since 2015) | | None. | |
Dennis M. Bushe, Born January 1944 | | Trustee | | July 2016 | | Retired. | | Trustee, RS Investment Trust and RS Variable Products Trust (November 2011-July 2016). | |
79
Victory Portfolios | | Supplemental Information — continued
December 31, 2020 | |
(Unaudited)
Name and Date of Birth | | Position
Held with
the Trust | | Date
Commenced
Service | | Principal Occupation
During Past 5 Years | | Other
Directorships
Held During
Past 5 Years | |
John L. Kelly,
Born April 1953 | | Trustee | | February 2015 | | Partner, McCarvill Capital Partners (September 2016- September 2017); Advisor, (January 2016-April 2016) and Managing Partner (August 2014-January 2016) Endgate Commodities LLC. | | Director, Caledonia Mining Corporation (since May 2012). | |
David L. Meyer,* Born April 1957 | | Trustee | | December 2008 | | Retired. | | None. | |
Gloria S. Nelund, Born May 1961 | | Trustee | | July 2016 | | Chair, CEO and Co-Founder of TriLinc Global, LLC, an investment firm. | | TriLinc Global Impact Fund, LLC (since 2012); Trustee, RS Investment Trust and RS Variable Products Trust (November 2007-July 2016). | |
Leigh A. Wilson, Born December 1944 | | Chair and Trustee | | November 1994 | | Private Investor. | | Chair (since 2013), Caledonia Mining Corporation. | |
Interested Trustee. | |
David C. Brown,** Born May 1972 | | Trustee | | May 2008 | | Chairman and Chief Executive Officer (since 2013), the Adviser; Chairman and Chief Executive Officer (since 2013), Victory Capital Holdings, Inc. | | Trustee, USAA Mutual Funds Trust. | |
* The Board has designated Ms. Beard and Mr. Meyer as its Audit Committee Financial Experts.
** Mr. Brown is an "Interested Person" by reason of his relationship with the Adviser.
The Statement of Additional Information includes additional information about the Trustees of the Trust and is available, without charge, by calling 800-539-3863.
80
Victory Portfolios | | Supplemental Information — continued
December 31, 2020 | |
(Unaudited)
Officers:
The officers of the Trust, their date of birth, commencement of service and their principal occupations during the past five years, are detailed in the following table. Each officer serves until the earlier of his or her resignation, removal, retirement, death, or the election of a successor. The mailing address of each officer of the Trust is 4900 Tiedeman Road, 4th Floor, Brooklyn, Ohio 44144. The officers of the Trust receive no compensation directly from the Trust for performing the duties of their offices.
Name and Date of Birth | | Position with
the Trust | | Date
Commenced
Service | | Principal Occupation During Past 5 Years | |
Christopher K. Dyer, Born February 1962 | | President | | February 2006* | | Director of Mutual Fund Administration, the Adviser; Chief Operations Officer, Victory Capital Services, Inc. (since 2020). | |
Scott A. Stahorsky, Born July 1969 | | Vice President | | December 2014 | | Manager, Fund Administration, the Adviser. | |
Erin G. Wagner, Born February 1974 | | Secretary | | December 2014 | | Associate General Counsel, the Adviser (since 2013). | |
Allan Shaer, Born March 1965 | | Treasurer | | May 2017 | | Senior Vice President, Financial Administration, Citi Fund Services Ohio, Inc. (since 2016); Vice President, Mutual Fund Administration, JP Morgan Chase (2011-2016). | |
Christopher A. Ponte, Born March 1984 | | Assistant Treasurer | | December 2017 | | Manager, Fund Administration, the Adviser (since 2017); Senior Analyst, Fund Administration, the Adviser (prior to 2017); Chief Financial Officer, Victory Capital Services, Inc. (since 2018). | |
Colin Kinney, Born October 1973 | | Chief Compliance Officer | | July 2017 | | Chief Compliance Officer (since 2013) and Chief Risk Officer (2009-2017), the Adviser. | |
Chuck Booth,
Born April 1960 | | Anti-Money Laundering Compliance Officer and Identity Theft Officer | | May 2015 | | Director, Regulatory Administration and CCO Support Services, Citi Fund Services Ohio, Inc. | |
Jay G. Baris, Born January 1954 | | Assistant Secretary | | December 1997 | | Partner, Sidley Austin LLP (since April 2020); Partner, Shearman & Sterling LLP (January 2018-April 2020); Partner, Morrison & Foerster LLP (2011-January 2018). | |
* On December 3, 2014, Mr. Dyer resigned as Secretary of the Trust and accepted the position of President.
81
Victory Portfolios | | Supplemental Information — continued
December 31, 2020 | |
(Unaudited)
Proxy Voting and Portfolio Holdings Information
Proxy Voting:
Information regarding the policies and procedures each Fund uses to determine how to vote proxies relating to portfolio securities is available without charge, upon request, by calling 800-539-3863. The information is also included in the Funds' Statement of Additional Information, which is available on the SEC's website at www.sec.gov.
Information relating to how the Funds voted proxies relating to portfolio securities held during the most recent twelve months ended December 31 is available on the SEC's website at www.sec.gov.
Availability of Schedules of Portfolio Investments:
The Trust files a complete list of Schedules of Portfolio Investments with the SEC for the first and third quarter of each fiscal year on Form N-PORT. Forms N-PORT are available on the SEC's web site at www.sec.gov.
Expense Examples
As a shareholder of the Funds, you may incur two types of costs: (1) transaction costs, including sales charges (loads) on purchases; and (2) ongoing costs, including management fees, distribution and service (12b-1) fees and other Fund expenses. These examples are intended to help you understand your ongoing costs (in dollars) of investing in the Funds and to compare these costs with the ongoing costs of investing in other mutual funds.
These examples are based on an investment of $1,000 invested at the beginning of the period and held for the entire period from July 1, 2020, through December 31, 2020.
The Actual Expense figures in the table below provide information about actual account values and actual expenses. You may use the information below, together with the amount you invested, to estimate the expenses that you paid over the period. Simply divide your account value by $1,000 (for example, an $8,600 account value divided by $1,000 = 8.6), then multiply the result by the number in the table under the heading entitled "Actual Expenses Paid During Period" to estimate the expenses you paid on your account during this period.
The Hypothetical Expense figures in the table below provide information about hypothetical account values and hypothetical expenses based on each Fund's actual expense ratio and an assumed rate of return of 5% per year before expenses, which is not the Fund's actual return. The hypothetical account values and expenses may not be used to estimate the actual ending account balance or expenses you paid for the period. You may use this information to compare this 5% hypothetical example with the 5% hypothetical examples that appear in shareholder reports of other funds.
Please note the expenses shown in the table are meant to highlight your ongoing costs only and do not reflect any transactional costs. Therefore, the table is useful in comparing ongoing costs only, and will not help you determine the relative total costs of owning different funds. In addition, if these transactional costs were included, your costs would have been higher.
| | | Beginning
Account
Value
7/1/20 | | Actual
Ending
Account
Value
12/31/20 | | Hypothetical
Ending
Account
Value
12/31/20 | | Actual
Expenses
Paid
During
Period
7/1/20-
12/31/20 | | Hypothetical
Expenses
Paid
During
Period
7/1/20-
12/31/20* | | Annualized
Expense
Ratio
During
Period
7/1/20-
12/31/20 | |
RS International Fund | |
Class A Shares | | $ | 1,000.00 | | | $ | 1,181.60 | | | $ | 1,019.46 | | | $ | 6.20 | | | $ | 5.74 | | | | 1.13 | % | |
Class C Shares | | | 1,000.00 | | | | 1,177.10 | | | | 1,015.69 | | | | 10.29 | | | | 9.53 | | | | 1.88 | % | |
Class R Shares | | | 1,000.00 | | | | 1,179.10 | | | | 1,018.20 | | | | 7.56 | | | | 7.00 | | | | 1.38 | % | |
Class R6 Shares | | | 1,000.00 | | | | 1,182.80 | | | | 1,020.96 | | | | 4.55 | | | | 4.22 | | | | 0.83 | % | |
Class Y Shares | | | 1,000.00 | | | | 1,182.30 | | | | 1,020.71 | | | | 4.83 | | | | 4.47 | | | | 0.88 | % | |
82
Victory Portfolios | | Supplemental Information — continued
December 31, 2020 | |
(Unaudited)
| | | Beginning
Account
Value
7/1/20 | | Actual
Ending
Account
Value
12/31/20 | | Hypothetical
Ending
Account
Value
12/31/20 | | Actual
Expenses
Paid
During
Period
7/1/20-
12/31/20 | | Hypothetical
Expenses
Paid
During
Period
7/1/20-
12/31/20* | | Annualized
Expense
Ratio
During
Period
7/1/20-
12/31/20 | |
RS Global Fund | |
Class A Shares | | $ | 1,000.00 | | | $ | 1,221.00 | | | $ | 1,020.86 | | | $ | 4.75 | | | $ | 4.32 | | | | 0.85 | % | |
Class C Shares | | | 1,000.00 | | | | 1,216.50 | | | | 1,017.09 | | | | 8.91 | | | | 8.11 | | | | 1.60 | % | |
Class R Shares | | | 1,000.00 | | | | 1,219.60 | | | | 1,019.61 | | | | 6.14 | | | | 5.58 | | | | 1.10 | % | |
Class R6 Shares | | | 1,000.00 | | | | 1,222.40 | | | | 1,022.37 | | | | 3.07 | | | | 2.80 | | | | 0.55 | % | |
Class Y Shares | | | 1,000.00 | | | | 1,222.60 | | | | 1,022.12 | | | | 3.35 | | | | 3.05 | | | | 0.60 | % | |
Sophus Emerging Markets Fund | |
Class A Shares | | | 1,000.00 | | | | 1,315.00 | | | | 1,018.40 | | | | 7.80 | | | | 6.80 | | | | 1.34 | % | |
Class C Shares | | | 1,000.00 | | | | 1,309.90 | | | | 1,014.38 | | | | 12.43 | | | | 10.84 | | | | 2.14 | % | |
Class R Shares | | | 1,000.00 | | | | 1,313.60 | | | | 1,017.19 | | | | 9.19 | | | | 8.01 | | | | 1.58 | % | |
Class R6 Shares | | | 1,000.00 | | | | 1,318.20 | | | | 1,020.66 | | | | 5.19 | | | | 4.52 | | | | 0.89 | % | |
Class Y Shares | | | 1,000.00 | | | | 1,317.60 | | | | 1,020.16 | | | | 5.77 | | | | 5.03 | | | | 0.99 | % | |
Sophus Emerging Markets Small Cap Fund | |
Class A Shares | | | 1,000.00 | | | | 1,289.70 | | | | 1,016.34 | | | | 10.07 | | | | 8.87 | | | | 1.75 | % | |
Class C Shares | | | 1,000.00 | | | | 1,284.50 | | | | 1,012.57 | | | | 14.36 | | | | 12.65 | | | | 2.50 | % | |
Class Y Shares | | | 1,000.00 | | | | 1,292.60 | | | | 1,017.60 | | | | 8.64 | | | | 7.61 | | | | 1.50 | % | |
* Expenses are equal to the average account value multiplied by the Fund's annualized expense ratio multiplied by 184/366 (the number of days in the most recent fiscal half-year divided by the number of days in the fiscal year).
83
Victory Portfolios | | Supplemental Information — continued
December 31, 2020 | |
(Unaudited)
Additional Federal Income Tax Information
For the year ended December 31, 2020, the following Funds paid qualified dividend income for the purposes of reduced individual federal income tax rates of:
| | | Percent | |
RS International Fund | | | 100 | % | |
RS Global Fund | | | 100 | % | |
Sophus Emerging Markets Fund | | | 93 | % | |
Sophus Emerging Markets Small Cap Fund | | | 100 | % | |
Dividends qualified for corporate dividends received deductions of:
| | | Percent | |
| RS Global Fund | | | 48 | % | |
For the year ended December 31, 2020, the following Funds designated long-term capital gain distributions:
| | | Amount | |
RS International Fund | | $ | 909,323 | | |
RS Global Fund | | | 96,155 | | |
The following Funds intend to elect to pass through to shareholders the income tax credit for taxes paid to foreign countries. Foreign source income and foreign tax expense per outstanding share on December 31, 2020, were as follows:
| | | Foreign
Source
Income | | Foreign
Tax
Expense | |
RS International Fund | | $ | 0.28 | | | $ | 0.03 | | |
Sophus Emerging Markets Fund | | | 0.38 | | | | 0.04 | | |
Sophus Emerging Markets Small Cap Fund | | | 0.21 | | | | 0.01 | | |
84
Victory Portfolios | | Supplemental Information — continued
December 31, 2020 | |
(Unaudited)
Considerations of the Board in Continuing the Investment Advisory Agreement (the "Agreement")
The Board approved the Agreement on behalf of each of the Funds at a meeting, which was called for that purpose, on December 2, 2020. The Board also considered information relating to the Funds and the Agreement provided throughout the year and, more specifically, at a meeting on October 27, 2020 called for the purpose of reviewing the Agreement. In considering whether to approve the Agreement, the Board requested, and the Adviser provided, information that the Board believed to be reasonably necessary to reach its conclusions.
The Board, including the Independent Trustees, evaluated this information along with other information obtained throughout the year and was advised by legal counsel to the Funds, which also serves as independent legal counsel to the Independent Trustees. In addition, the Independent Trustees considered a past review of their overall process for conducting the annual review of the Funds' advisory arrangements by an independent consultant retained through their counsel.
The Board took into consideration regular reports from the Adviser throughout the COVID-19 pandemic public health crisis concerning how the ongoing pandemic has affected market volatility, investment risk and the implementation and effectiveness of business continuity plans. These reports also had confirmed that the pandemic had no material impact on the Adviser's operations.
The Board considered each Fund's advisory fee, expense ratio and investment performance as significant factors in determining whether the Agreement should be continued. In considering whether the compensation paid to the Adviser was fair and reasonable, the Board also evaluated, among other things, the following factors:
• The requirements of the Funds for the services provided by the Adviser;
• The nature, quality and extent of the services provided and expected to be provided;
• The performance of the Funds as compared to comparable funds;
• The fees payable for the services and whether the fee arrangements provided for economies of scale that would benefit Fund shareholders as the Funds grow;
• Whether the fee would be sufficient to enable the Adviser to attract and retain experienced personnel and continue to provide quality services to the Funds;
• The fees paid by other clients of the Adviser whose accounts are managed in a similar investment style and any differences in the services provided to the other clients compared to those provided to the Funds;
• The total expenses of each Fund;
• Management's commitment to operating the Funds at competitive expense levels;
• The profitability of the Adviser (as reflected by comparing fees earned against an estimate of the Adviser's costs) with respect to the Adviser's relationship with the Funds;
• Research and other service benefits received by the Adviser obtained through payment of client commissions for securities transactions;
• Other benefits received by the Adviser, and its affiliates, including revenues paid to the Adviser, or its affiliates, by the Funds for administration and fund accounting services, and distribution;
• The capabilities and financial condition of the Adviser;
• Current economic and industry trends; and
• The historical relationship between each Fund and the Adviser.
The Board reviewed each Fund's current management fee, comprised of the advisory fee plus the administrative services fee paid to the Adviser, in the context of the Adviser's profitability with respect to each Fund individually. In addition, the Board compared each Fund's gross management fee and total operating expense ratio on a net and gross basis with the median gross management fee and median expense ratio of a universe of comparable mutual funds compiled by an independent consultant and a peer group of funds with similar investment strategies selected by that independent consultant from the universe. The Board reviewed the factors and methodology used by the independent consultant in the selection of each Fund's peer group, including the independent consultant's selection of a broad universe of funds, the more specific universe of comparable funds, and peer
85
Victory Portfolios | | Supplemental Information — continued
December 31, 2020 | |
(Unaudited)
groups of funds with comparable investment strategies and asset levels, among other factors. The Board also reviewed any changes to the independent consultant's methodology as compared to the prior year, including those resulting from the Adviser's input, if any. With respect to certain Funds, the Board also reviewed fees and other information related to the Adviser's management of similarly managed institutional or private accounts, and the differences in the services provided to the other accounts. The Board noted that none of the advisory fee arrangements for the Funds included breakpoints, which are generally viewed as a method by which an investment adviser shares any economies of scale with a fund as a fund grows. The Board also considered the Adviser's commitment to limit expenses as discussed in more detail below, and would consider breakpoints at a future time if a Fund's assets were to grow significantly.
The Board also reviewed the compliance and administrative services provided to the Funds by the Adviser and its affiliates, including the Adviser's oversight of the Funds' day-to-day operations and oversight of Fund accounting, assistance in meeting legal and regulatory requirements, and other services necessary for the operation of the Funds and the Trust.
The Board found that the gross annual management fee paid by each Fund was within the range of management fees paid by each Fund's respective peer group. The Board also found that each Fund's Class A net annual expense ratio, taking into account any shareholder servicing or distribution fees, was reasonable as compared with each Fund's respective peer group. The Board considered the Adviser's contractual agreement with each Fund to waive its fees and reimburse expenses of certain classes for a specified period of time, as described in the Fund's prospectus.
The Board reviewed each Fund's performance over one-, three-, five- and ten-year periods (as applicable) against the performance of the Fund's selected peer group and benchmark index. The Board recognized that the performance of the Fund and the peer group funds are net of expenses, while the performance of the benchmark index reflects gross returns.
The Board reviewed various other specific factors with respect to each Fund, as described below. In their deliberations, the Trustees did not rank the importance of any particular information or factor considered and each Trustee may have attributed different weights to various factors.
RS International Fund
The Board compared the Fund's Class A performance for the one-, three-, five- and ten-year periods ended June 30, 2020, to that of the median performance of the Fund's peer group and benchmark index for the same periods and considered the fact that the Fund outperformed both the benchmark index and the peer group median for all of the periods reviewed, with the exception of the one-year period.
Having considered, among other things: (1) the Fund's management fee compared to comparable mutual funds; (2) the Fund's total expense ratio compared to comparable mutual funds; (3) that the Adviser's willingness to limit the expenses of certain classes for a period of time would provide stability to the Fund's expenses for those share classes during that period; and (4) the Fund's performance during the periods reviewed, the Board concluded that the Agreement continued to be in the best interests of the Fund's shareholders.
RS Global Fund
Noting that the Fund commenced operations in 2011, the Board compared the Fund's Class A performance for the one-, three- and five-year periods ended June 30, 2020, to that of the median performance of the Fund's peer group and benchmark index for the same periods and considered the fact that the Fund outperformed the benchmark index for all of the periods reviewed, and outperformed the peer group median for all of the periods reviewed, with the exception of the one-year period.
Having considered, among other things: (1) the Fund's management compared to comparable mutual funds; (2) the Fund's total expense ratio compared to comparable mutual funds; (3) that the Adviser's willingness to limit the expenses of certain classes for a period of time would provide stability to the Fund's expenses for those share classes during that period; and (4) the Fund's performance during the periods reviewed, the Board concluded that the Agreement continued to be in the best interests of the Fund's shareholders.
86
Victory Portfolios | | Supplemental Information — continued
December 31, 2020 | |
(Unaudited)
Sophus Emerging Markets Fund
The Board compared the Fund's Class A performance for the one-, three- and five-year periods ended June 30, 2020, to that of the median performance of the Fund's peer group and benchmark index for the same periods and considered the fact that the Fund outperformed the benchmark index for the one- and five-year periods, underperformed the benchmark index for the three- and ten-year periods, outperformed the peer group median for the one-year period, underperformed the peer group median for the ten-year period, and matched the peer group median for the three- and five-year periods.
Having considered, among other things: (1) the Fund's management fee compared to comparable mutual funds; (2) the Fund's total expense ratio compared to comparable mutual funds; (3) that the Adviser's willingness to limit the expenses of certain classes for a period of time would provide stability to the Fund's expenses for those share classes during that period; and (4) the Fund's performance during the periods reviewed, the Board concluded that the Agreement continued to be in the best interests of the Fund's shareholders.
Sophus Emerging Markets Small Cap Fund
Noting that the Fund commenced operations in 2014, the Board compared the Fund's Class A performance for the one-, three- and five-year periods ended June 30, 2020, to that of the median performance of the Fund's peer group and benchmark index for the same periods and considered the fact that the Fund outperformed the benchmark index for all of the periods reviewed, and underperformed the peer group median for all of the periods reviewed. The Board discussed with the Adviser how market conditions affected the Fund during periods of underperformance given the Fund's investment strategy and fee and expense profile.
Having considered, among other things: (1) the Fund's management fee compared to comparable mutual funds; (2) the Fund's total expense ratio compared to comparable mutual funds; (3) that the Adviser's willingness to limit the expenses of certain classes for a period of time would provide stability to the Fund's expenses for those share classes during that period; and (4) the Fund's performance during the periods reviewed, the Board concluded that the Agreement continued to be in the best interests of the Fund's shareholders.
Conclusion
Based on its review of the information requested and provided, and following extended discussions, the Board determined that the Agreement, on behalf of the Funds discussed above, was consistent with the best interests of each Fund and its shareholders, and the Board unanimously approved the Agreement, on behalf of each Fund, for an additional annual period on the basis of the foregoing review and discussions and the following considerations, among others:
• The fairness and reasonableness of the investment advisory fee payable to the Adviser under the Agreement in light of the investment advisory services provided, the costs of these services, the profitability of the Adviser's relationship with the Fund and the comparability of the fee paid to the fees paid by other investment companies;
• The nature, quality and extent of the investment advisory services provided by the Adviser;
• The Adviser's entrepreneurial commitment to the management of the Funds and the creation of a broad-based family of funds, which could entail a substantial commitment of the Adviser's resources to the successful operation of the Funds;
• The Adviser's representations regarding its staffing and capabilities to manage the Funds, including the retention of personnel with relevant portfolio management experience;
• The Adviser's efforts to enhance investment results by, among other things, developing quality portfolio management teams; and
• The overall high quality of the personnel, operations, financial condition, investment management capabilities, methodologies and performance of the Adviser.
87
Privacy Policy
Protecting the Privacy of Information
The Trust respects your right to privacy. We also know that you expect us to conduct and process your business in an accurate and efficient manner. To do so, we must collect and maintain certain personal information about you. This is the information we collect from you on applications or other forms, and from the transactions you make with us or third parties. It may include your name, address, social security number, account transactions and balances, and information about investment goals and risk tolerance.
We do not disclose any information about you or about former customers to anyone except as permitted or required by law. Specifically, we may disclose the information we collect to companies that perform services on our behalf, such as the transfer agent that processes shareholder accounts and printers and mailers that assist us in the distribution of investor materials. We may also disclose this information to companies that perform marketing services on our behalf. This allows us to continue to offer you Victory investment products and services that meet your investing needs, and to effect transactions that you request or authorize. These companies will use this information only in connection with the services for which we hired them. They are not permitted to use or share this information for any other purpose.
To protect your personal information internally, we permit access only by authorized employees and maintain physical, electronic and procedural safeguards to guard your personal information.*
* You may have received communications regarding information about privacy policies from other financial institutions which gave you the opportunity to "opt-out" of certain information sharing with companies which are not affiliated with that financial institution. The Trust does not share information with other companies for purposes of marketing solicitations for products other than the Trust. Therefore, the Trust does not provide opt-out options to their shareholders.
Victory Funds
P.O. Box 182593
Columbus, Ohio 43218-2593

Visit our website at: | | Call Victory at: | |
www.vcm.com | | 800-539-FUND (800-539-3863) | |

December 31, 2020
Annual Report
Victory RS Partners Fund
Victory RS Value Fund
Victory RS Large Cap Alpha Fund
Victory RS Investors Fund
Victory Global Natural Resources Fund
As permitted by regulations adopted by the Securities and Exchange Commission, paper copies of the Victory Funds' shareholder reports may no longer be sent by mail, unless you specifically request paper copies of the reports from the Victory Funds or from your financial intermediary, such as a broker-dealer or bank. Instead, the reports will be made available on www.VictoryFunds.com, and you will be notified by mail each time a report is posted and provided with a website link to access the report. If you already elected to receive shareholder reports electronically, you will not be affected by this change, and you need not take any action.
You may elect to receive all future reports in paper free of charge. If you invest through a financial intermediary, you can contact your financial intermediary to request that you continue to receive paper copies of your reports. If you invest directly with the Victory Funds, you can call 800-539-3863 (800-235-8396 for Member Class) or send an e-mail request to TA.Processing@FISGlobal.com. Your election to receive reports in paper will apply to all Victory Funds you hold directly or through your financial intermediary.
www.vcm.com
News, Information And Education 24 Hours A Day, 7 Days A Week
The Victory Funds site gives fund shareholders, prospective shareholders, and investment professionals a convenient way to access fund information, get guidance, and track fund performance anywhere they can access the Internet. The site includes:
• Detailed performance records
• Daily share prices
• The latest fund news
• Investment resources to help you become a better investor
• A section dedicated to investment professionals
Whether you're a potential investor searching for the fund that matches your investment philosophy, a seasoned investor interested in planning tools, or an investment professional, www.vcm.com has what you seek. Visit us anytime. We're always open.
Table of Contents
Shareholder Letter (Unaudited) | | | 3 | | |
Managers' Commentary and Investment Overview (Unaudited) | | | 5 | | |
Investment Objective and Portfolio Holdings (Unaudited) | | | 22 | | |
Financial Statements | |
The Victory Value Funds | |
Victory RS Partners Fund | |
Schedule of Portfolio Investments | | | 27 | | |
Statement of Assets and Liabilities | | | 39 | | |
Statement of Operations | | | 41 | | |
Statements of Changes in Net Assets | | | 43-45 | | |
Financial Highlights | | | 50-51 | | |
Victory RS Value Fund | |
Schedule of Portfolio Investments | | | 30 | | |
Statement of Assets and Liabilities | | | 39 | | |
Statement of Operations | | | 41 | | |
Statements of Changes in Net Assets | | | 43-45 | | |
Financial Highlights | | | 52-53 | | |
Victory RS Large Cap Alpha Fund | |
Schedule of Portfolio Investments | | | 33 | | |
Statement of Assets and Liabilities | | | 39 | | |
Statement of Operations | | | 41 | | |
Statements of Changes in Net Assets | | | 43-45 | | |
Financial Highlights | | | 54-55 | | |
Victory RS Investors Fund | |
Schedule of Portfolio Investments | | | 36 | | |
Statement of Assets and Liabilities | | | 40 | | |
Statement of Operations | | | 42 | | |
Statements of Changes in Net Assets | | | 46-48 | | |
Financial Highlights | | | 56-57 | | |
Victory Global Natural Resources Fund | |
Schedule of Portfolio Investments | | | 38 | | |
Statement of Assets and Liabilities | | | 40 | | |
Statement of Operations | | | 42 | | |
Statements of Changes in Net Assets | | | 46-48 | | |
Financial Highlights | | | 58-59 | | |
Notes to Financial Statements | | | 60 | | |
Report of Independent
Registered Public Accounting Firm | | | 70 | | |
Supplemental Information (Unaudited) | | | 71 | | |
Trustee and Officer Information | | | 71 | | |
Proxy Voting and Portfolio Holdings Information | | | 74 | | |
Expense Examples | | | 74 | | |
Additional Federal Income Tax Information | | | 76 | | |
Advisory Contract Approval | | | 77 | | |
Privacy Policy (inside back cover) | | | |
1
IRA DISTRIBUTION WITHHOLDING DISCLOSURE
We generally must withhold federal income tax at a rate of 10% of the taxable portion of your distribution and, if you live in a state that requires state income tax withholding, at your state's tax rate. However, you may elect not to have withholding apply or to have income tax withheld at a higher rate. Any withholding election that you make will apply to any subsequent distribution unless and until you change or revoke the election. If you wish to make a withholding election, or change or revoke a prior withholding election, call 800-539-3863 (800-235-8396 for Member Class) and form W-4P (OMB No. 1545-0074 withholding certificate for pension or annuity payments) will be electronically sent.
If you do not have a withholding election in place by the date of a distribution, federal income tax will be withheld from the taxable portion of your distribution at a rate of 10%. If you must pay estimated taxes, you may be subject to estimated tax penalties if your estimated tax payments are not sufficient and sufficient tax is not withheld from your distribution.
For more specific information, please consult your tax adviser.
The Funds are distributed by Victory Capital Services, Inc. Victory Capital Management Inc. is the investment adviser to the Funds and receives fees from the Funds for performing services for the Funds.
This report is not authorized for distribution to prospective investors unless preceded or accompanied by a current prospectus of the Victory Funds.
For additional information about any Victory Fund, including fees, expenses, and risks, view our prospectus online at www.vcm.com or call 800-539-3863 (800-235-8396 for Member Class). Read it carefully before you invest or send money.
The information in this annual report is based on data obtained from recognized services and sources and is believed to be reliable. Any opinions, projections, or recommendations in this report are subject to change without notice and are not intended as individual investment advice. Past investment performance of the Funds, markets or securities mentioned herein should not be considered to be indicative of future results.
• NOT FDIC INSURED • NO BANK GUARANTEE • MAY LOSE VALUE

Call Victory at:
800-539-FUND (800-539-3863)
800-235-8396 for Member Class
Visit our website at:
www.vcm.com
2
Victory Funds Letter to Shareholders
(Unaudited)
Dear Shareholder,
When we look back on 2020, we will undoubtedly remember it as an extraordinary year. A year ago, no one could have imagined the unusual events that would challenge us personally, professionally, and collectively as a nation. But in retrospect, the trajectory of financial markets over the past year was nothing short of extraordinary.
The year began with rudimentary worries, such as economic growth rates, trade deals, and interest rates. But a novel coronavirus and the subsequent worldwide spread of COVID-19 became an unprecedented event. To combat the pandemic, governments everywhere issued austere shelter-in-place orders, and the global economy slowed markedly. Equity markets sold off sharply in March and April, and second quarter U.S. GDP contracted by an alarming annual rate of 31.4%.
It's no surprise that so many investors flocked to the perceived safety of U.S. Treasurys. Meanwhile, liquidity evaporated (for a short spell) in many other segments of the fixed income market, including higher-yielding credits and municipal bonds. The outlook was tenuous, and credit spreads widened while prices declined for most securities perceived to be higher risk.
A response, however, came swiftly. The U.S. Federal Reserve (the "Fed") and other monetary authorities worldwide leapt into action — cutting interest rates, (re)starting quantitative easing and, in the case of the Fed, launching an array of programs to provide liquidity to stabilize fixed-income markets. The U.S. government also stepped up to provide fiscal stimulus in the form of the Coronavirus Aid, Relief, and Economic Security Act (CARES Act).
It was impressive how quickly those actions helped end the stock market's freefall and restore order across much of the fixed-income universe. The rebound was almost as robust as the drawdown, and third-quarter GDP (the most recent finalized data available) grew at a 33.4% annualized rate.
Late in the year, markets were alternately fueled and roiled by a contentious election season, growing optimism for an effective vaccine, and a fluid debate regarding the need for additional fiscal stimulus. Ultimately, stocks were propelled higher in the fourth quarter when it became clear the United States Congress would provide another dose of fiscal stimulus in the form of direct payments, more unemployment insurance, and additional aid to businesses.
Through all the unprecedented events and extreme volatility, the S&P 500® Index registered an impressive annual return of 18.40% for the 12-month period ended December 31, 2020. Meanwhile, the yield on 10-year U.S. Treasurys declined 95 basis points over the same period, reflecting both the Fed's interest rate cuts and its pledge to keep rates low longer. The yield on 10-Year U.S. Treasurys was 0.93% as of December 31, 2020.
While markets endured and performed admirably during 2020, perhaps the key takeaway is that the unexpected can and will happen. That's why it's important to
3
remain focused on your long-term investment goals and avoid making emotional decisions. Moreover, we continue to have confidence in all of Victory Capital's autonomous Investment Franchises and their ability to navigate the ups and downs.
On the following pages, you will find information relating to your Victory Funds investment. If you have any questions, we encourage you to contact your financial advisor. Or, if you invest with us directly, you may call 800-539-3863 (800-235-8396 for Member Class), or visit our website at www.vcm.com.
My colleagues and I sincerely appreciate the confidence you have placed in the Victory Funds, and we value the opportunity to help meet your investment goals.

Christopher K. Dyer, CFA
President,
Victory Funds
4
Managers' Commentary
(Unaudited)
What were the market conditions during the reporting period?
U.S. equity markets delivered solid performance across styles in 2020, and the S&P 500® Index delivered its 11th year of positive returns in the last 12 years. U.S. stocks continued to perform well following a strong 2019 — and this despite the unprecedented pandemic. The economy and stocks proved resilient following what was effectively a virtual global economic shutdown in the first quarter. But thanks to the U.S. Federal Reserve (the "Fed") (and central banks worldwide) and the U.S. Congress, the record fiscal stimulus and highly accommodative monetary policies backstopped the markets and renewed risk-taking among investors.
After a solid start to the 2020 calendar year in January, U.S. equity markets moved abruptly lower as worst-case fears of SARS-CoV-2 (severe acute respiratory syndrome coronavirus 2) — the virus responsible for COVID-19 (coronavirus disease 2019) — became a reality. While investors started to show concern of the potential impact of the virus in February 2020, with the broad Russell 3000® Index declining 8.19%, investors fled risk assets in March 2020 en masse as the virus hit home in the United States and the broad index declined another 13.75%. This panic pushed investors to shift away from risk assets and caused credit markets to seize up, while volatility, as measured by the CBOE Market Volatility Index, hit an all-time record high.
The Fed subsequently adjusted forecasts for second-quarter economic output to contract by levels not seen since the Great Depression. Given the unprecedented shock to the economy, the U.S. government implemented record levels of fiscal stimulus to keep businesses open, people in their homes, and important services funded. Meanwhile, the Fed implemented the largest-scale monetary stimulus on record, which provided ample liquidity to credit markets, businesses, and important infrastructure. The Fed has also lowered interest rates by 150 basis points to 0%, with the goal of helping the economy bounce back quickly.
U.S. equity markets roared back during the second quarter as fiscal and monetary measures convinced investors who had fled risk assets to re-enter. It also became clear that the economic and business impact of the coronavirus would not affect all companies similarly, and that there would be "haves" and "have-nots" in the aftermath.
Strong sentiment turned into exuberance as we approached year-end, and record-setting market performance in the fourth quarter was driven by news that effective COVID-19 vaccines were developed faster than expected. In addition, a more stable outlook associated with a victory by Joe Biden in the U.S. presidential election helped push record inflows into equities. This also created a sharp reversal among equity market leadership late in the year, and many lagging companies in sectors traditionally associated with value investing came roaring back. U.S. government action and corporate innovation appears to have bridged the pre-pandemic economy to what will be a new "normal" economic environment, with initial signs that the economy could fully rebound in 2021, despite the prospect of a severe wave of COVID-19 in winter.
5
Victory RS Partners Fund (continued)
Managers' Commentary (continued)
How did Victory RS Partners Fund (the "Fund") perform during the reporting period?
The Fund seeks to provide long-term capital appreciation. The Fund returned 0.46% (Class A Shares at net asset value) for the year ended December 31, 2020, underperforming the Russell 2000® Value Index (the "Index"), which returned 4.63% during the reporting period.
What strategies did you employ during the reporting period?
The year was characterized by two extremes, a decline in the stock markets through the first quarter as investors concentrated on the negative impact and spread of the pandemic. After bottoming toward the end of March 2020, the Index started to rebound as investors digested the positive influence of fiscal and monetary stimulus. The Fund underperformed the Index primarily by not owning names in specific sectors that rebounded strongly despite having what we would consider to be riskier business models or weaker balance sheets. Overall, we continue to concentrate on businesses that have the potential for long-term value creation while limiting our downside. This may have limited our performance as the Index increased off of its low levels after March of 2020, but we remain confident in providing outperformance over a longer time period. For the Fund, we had positive stock selection in Industrials and Communication Services sectors, which was offset by negative stock selection in the Information Technology, Materials and Consumer Discretionary sectors. For the year, the stocks that provided positive contribution tended to be cyclical and with exposure to an improving economy where we added after the market bottomed in March. Within Industrials, a cyclical sector, Timken, TFI International and Regal Beloit, Inc. were significant positive contributors to performance. The Financials sector provided other names that benefitted the portfolio. PJT Partners benefitted from both restructuring activity caused by the economic slowdown and increased mergers and acquisitions activity as the economy improved, while Stewart Information Services benefited from the increase in housing activity after March. Positions that were impacted by the pandemic detracted from the Fund's performance. Within Industrials, Skywest, a regional airline, experienced large declines in passenger travel while one of our Information Technology sector positions, Euronet, saw its ATM operations negatively affected by dramatically lower tourism in its geographies. Lower-quality companies with riskier balance sheets outperformed the market dramatically since March and caused underperformance in the Consumer Discretionary and Materials sectors. The Fund underperformed the Index in 2020. However, we remain confident in our process and feel it will provide us with the discipline that leads to longer-term outperformance, which will benefit our investors over time.
The range of outcomes for 2021, while more optimistic, rests on the rollout and efficacy of recently approved vaccines to fight COVID-19. Volatility, economic activity, and the level of interest rates will be impacted by the level of success of the vaccines. In addition, the U.S. presidential election has resulted in a shift in power, which provides some uncertainty as to how policy decisions may impact the economy and markets.
Interest rates and mortgage rates continue near historically low levels, inflation is nonexistent, and the economy struggles while we await broad distribution of the vaccines. We remain very watchful of inflation, particularly as a result of the size and speed of the monetary and fiscal response to the pandemic. We continue to carefully monitor the corporate
6
Victory RS Partners Fund (continued)
Managers' Commentary (continued)
debt market, but in general, U.S. corporate balance sheets are in better shape with access to low-cost debt. The Fed has stepped in to provide liquidity to support risk assets, but there does remain some concern regarding insolvency for some businesses if the absolute level of economic activity remains weak.
Equity valuations are in the top decile compared to historical levels, in part due to depressed earnings from COVID-19, but also as a result of expansion in the six largest mega-cap stocks in the S&P 500® Index. Excluding the six largest mega-cap stocks, valuations are more reasonable, particularly if compared to the 10-year U.S. Treasury yield. Recovery in aggregate earnings will be tempered, as certain industries such as hospitality, entertainment, banking, and travel will take longer to return to pre-COVID levels. However, equities continue to look attractive when compared to U.S. Treasurys and high-grade corporate bonds after the flight to safety rally during the crisis. We feel the values inherent in the portfolio should attract other investors and acquirers over time.
7
Investment Overview
(Unaudited)
Average Annual Total Returns
Year Ended December 31, 2020
| | | Class A | | Class R | | Class Y | | Member Class | | | |
INCEPTION DATE | | 7/12/95 | | 10/13/06 | | 5/1/07 | | 11/3/20 | | | |
| | | Net Asset
Value | | Maximum
Offering
Price | | Net Asset
Value | | Net Asset
Value | | Net Asset
Value | | Russell
2000®
Value Index1 | |
One Year | | | 0.46 | % | | | –5.31 | % | | | 0.06 | % | | | 0.77 | % | | | N/A | | | | 4.63 | % | |
Five Year | | | 10.35 | % | | | 9.05 | % | | | 9.95 | % | | | 10.71 | % | | | N/A | | | | 9.65 | % | |
Ten Year | | | 8.21 | % | | | 7.57 | % | | | 7.80 | % | | | 8.56 | % | | | N/A | | | | 8.66 | % | |
Since Inception | | | N/A | | | | N/A | | | | N/A | | | | N/A | | | | 25.22 | % | | | N/A | | |
The performance data quoted represents past performance and current returns may be lower or higher. The investment return and principal value will fluctuate so that an investor's shares, when redeemed, may be worth more or less than the original cost. To obtain performance information current to the most recent month's end, please visit www.vcm.com.
The maximum offering price (MOP) figures reflect a maximum sales charge of 5.75% for Class A Shares. NAV does not reflect sales charges.
Total return measures the price change in a share assuming the reinvestment of all net investment income and realized capital gain distributions, if any. The total returns quoted do not reflect adjustments made to the enclosed financial statements in accordance with U.S. generally accepted accounting principles or the deduction of taxes that a shareholder would pay on net investment income and realized capital gain distributions, including reinvested distributions, or redemptions of shares. The total return figures set forth above include all waivers of fees. Without such fee waivers, the total returns would have been lower.
Victory RS Partners Fund — Growth of $10,000
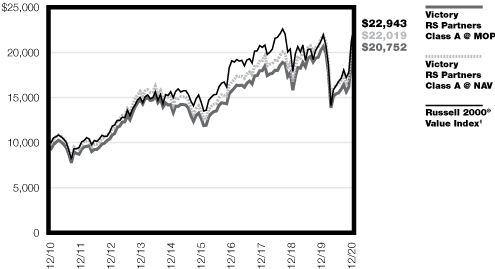
1The Russell 2000® Value Index is an unmanaged market-capitalization-weighted index that measures the performance of those companies in the Russell 2000® Index with lower price-to-book ratios and lower forecasted growth values. (The Russell 2000® Index measures the performance of the 2,000 smallest companies in the Russell 3000® Index, which consists of the 3,000 largest U.S. companies based on total market capitalization.) Index results assume the reinvestment of dividends paid on the stocks constituting the index. This index does not include the effect of sales charges, commissions, expenses or taxes, is not representative of the Fund and it is not possible to invest directly in an index.
The graph reflects investment of growth of a hypothetical $10,000 investment in the Fund.
The graph and table do not reflect the deduction of taxes that a shareholder would pay on Fund distributions or the redemption of Fund shares.
Past performance is not indicative of future results.
8
Managers' Commentary
(Unaudited)
What were the market conditions during the reporting period?
U.S. equity markets delivered solid performance across styles in 2020, and the S&P 500® Index — the most popular proxy for the overall domestic stock market — delivered its 11th year of positive returns in the last 12 years. U.S. stocks continued to perform well following a strong 2019 — and this despite the unprecedented pandemic. The economy and stocks proved resilient following what was effectively a virtual global economic shutdown in the first quarter. But thanks to the U.S. Federal Reserve (the "Fed") (and central bankers worldwide) and the U.S. Congress, the record fiscal stimulus and highly accommodative monetary policies backstopped the markets and renewed risk-taking among investors.
After a solid start to the 2020 calendar year in January, U.S. equity markets moved abruptly lower as worst-case fears of SARS-CoV-2 ("severe acute respiratory syndrome coronavirus 2") — the virus responsible for COVID-19 (coronavirus disease 2019) — became a reality. While investors started to show concern of the potential impact of the virus in February 2020, with the broad Russell 3000® Index declining 8.19%, investors fled risk assets in March 2020 en masse as the virus hit home in the United States and the broad index declined another 13.75%. This panic pushed investors to shift away from risk assets and caused credit markets to seize up, while volatility, as measured by the CBOE Market Volatility Index, hit an all-time record high.
The Fed subsequently adjusted forecasts for second-quarter economic output to contract by levels not seen since the Great Depression. Given the unprecedented shock to the economy, the U.S. government implemented record levels of fiscal stimulus to keep businesses open, people in their homes, and important services funded. Meanwhile, the Fed implemented the largest scale monetary stimulus on record, which provided ample liquidity to credit markets, businesses, and important infrastructure. The Fed has also lowered interest rates by 150 basis points to 0%, with the goal of helping the economy bounce back quickly.
U.S. equity markets roared back during the second quarter as fiscal and monetary measures convinced investors that fled risk assets to re-enter. It also became clear that the economic and business impact of the coronavirus would not affect all companies similarly, and that there would be "haves" and "have-nots" in the aftermath. While all U.S. equity styles performed well, the disparity between innovative growth and legacy value companies became increasingly pronounced before rising markets took a breather in September.
Strong sentiment turned into exuberance as we approached year-end, and record-setting market performance in the fourth quarter was driven by news that effective vaccines were developed faster than expected. In addition, a more stable outlook associated with a victory by Joe Biden in the U.S. presidential election helped push record inflows into equities. This also created a sharp reversal among equity market leadership late in the year, and many lagging companies in sectors traditionally associated with value investing came roaring back. U.S. government action and corporate innovation appears to have bridged the pre-pandemic economy to what will be a new "normal" economic environment, with initial signs that the economy could fully rebound in 2021, despite the prospect of a severe wave of COVID-19 in winter.
9
Victory RS Value Fund (continued)
Managers' Commentary (continued)
How did Victory RS Value Fund (the "Fund") perform during the reporting period?
The Fund seeks to provide long-term capital appreciation. The Fund returned -2.59% (Class A Shares at net asset value) for the year ended December 31, 2020, underperforming the Russell Midcap® Value Index (the "Index"), which returned 4.96% during the reporting period.
What strategies did you employ during the reporting period?
This was the first year of underperformance for the Fund since 2016. Relative returns were primarily driven by stock selection in several sectors that lagged the Index performance for the year. In the Financials sector, the decline in economic activity caused by the pandemic resulted in a significant decline in interest rates and increased concerns regarding credit losses. In many cases, we saw valuations fall to levels not seen since the global financial crisis, as sentiment shifted away from the sector. As we were overweight the sector, our relative performance was negatively affected; though as we look forward, we feel quite optimistic about future returns from our positions as the economy reopens in a post-COVID-19 world. In the Materials sector, our performance lagged due to an underweighting in the gold & copper mining area, which performed exceptionally well within the Index due to a market shift in sentiment for these commodity-linked businesses as people gravitated to these commodities for their perceived store of value in a negative "real" interest rate world. Within the Health Care sector, our investments performed well; however, our lack of exposure to the more speculative biotech area caused relative performance to suffer. Somewhat offsetting these negative areas of the portfolio was our performance in Real Estate, which relatively outperformed versus the Index, as our focus on quality balance sheets served us well in a very difficult year for the sector. The Fund underperformed the Index in 2020 though we feel confident in the businesses that we own and are optimistic in our future performance, both absolute and relative, as interest rates normalize from generational lows over the intermediate-term and deflate many of the speculative areas of the market. We believe our consistent focus on investing in quality businesses with good balance sheets and durable cash flows run by good managers will continue to serve us well.
The range of outcomes for 2021, while more optimistic, rests on the rollout and efficacy of recently approved vaccines to fight COVID-19. Volatility, economic activity, and the level of interest rates will be impacted by the level of success of the vaccines. In addition, the U.S. presidential election has resulted in a shift in power, which provides some uncertainty as to how policy decisions may impact the economy and markets.
Interest rates and mortgage rates continue near historically low levels, inflation is nonexistent, and the economy struggles while we await broad distribution of the vaccines. We remain very watchful of inflation, particularly as a result of the size and speed of the monetary and fiscal response to the pandemic. We continue to carefully monitor the corporate debt market, but in general, U.S. corporate balance sheets are in better shape with access to low-cost debt. The Fed has stepped in to provide liquidity to support risk assets, but there does remain some concern regarding insolvency for some businesses if the absolute level of economic activity remains weak.
10
Victory RS Value Fund (continued)
Managers' Commentary (continued)
Equity valuations are in the top decile compared to historical levels, in part due to depressed earnings from COVID-19, but also as a result of multiple expansion in the six largest mega-cap stocks in the S&P 500® Index. Excluding the six largest mega-cap stocks, valuations are more reasonable, particularly if compared to the 10-year U.S. Treasury yield. Recovery in aggregate earnings will be tempered, as certain industries such as hospitality, entertainment, banking, and travel will take longer to return to pre-COVID-19 levels. However, equities continue to look attractive when compared to U.S. Treasurys and high-grade corporate bonds after the flight to safety rally during the crisis. In any case, we feel the values inherent in the portfolio should attract other investors and acquirers over time.
11
Investment Overview
(Unaudited)
Average Annual Total Returns
Year Ended December 31, 2020
| | | Class A | | Class C | | Class R | | Class Y | | | |
INCEPTION DATE | | 6/30/93 | | 5/1/07 | | 12/4/06 | | 5/1/07 | | | |
| | | Net Asset
Value | | Maximum
Offering
Price | | Net Asset
Value | | Contingent
Deferred
Charges | | Net Asset
Value | | Net Asset
Value | | Russell
Midcap®
Value Index1 | |
One Year | | | –2.59 | % | | | –8.18 | % | | | –3.35 | % | | | –4.30 | % | | | –2.95 | % | | | –2.37 | % | | | 4.96 | % | |
Five Year | | | 8.26 | % | | | 6.98 | % | | | 7.42 | % | | | 7.42 | % | | | 7.84 | % | | | 8.51 | % | | | 9.73 | % | |
Ten Year | | | 8.06 | % | | | 7.42 | % | | | 7.23 | % | | | 7.23 | % | | | 7.63 | % | | | 8.31 | % | | | 10.49 | % | |
The performance data quoted represents past performance and current returns may be lower or higher. The investment return and principal value will fluctuate so that an investor's shares, when redeemed, may be worth more or less than the original cost. To obtain performance information current to the most recent month's end, please visit www.vcm.com.
The maximum offering price (MOP) figures reflect a maximum sales charge of 5.75% for Class A Shares. Class C Shares are not subject to an initial sales charge, but are subject to a deferred sales charge of 1.00% on shares redeemed within one year of purchase. NAV does not reflect sales charges.
Total return measures the price change in a share assuming the reinvestment of all net investment income and realized capital gain distributions, if any. The total returns quoted do not reflect adjustments made to the enclosed financial statements in accordance with U.S. generally accepted accounting principles or the deduction of taxes that a shareholder would pay on net investment income and realized capital gain distributions, including reinvested distributions, or redemptions of shares. The total return figures set forth above include all waivers of fees. Without such fee waivers, the total returns would have been lower.
Victory RS Value Fund — Growth of $10,000
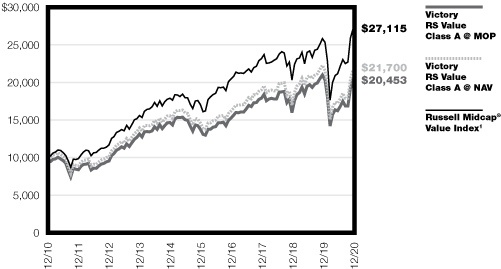
1The Russell Midcap® Value Index is an unmanaged market-capitalization-weighted index that measures the performance of those companies in the Russell Midcap® Index with lower price-to book ratios and lower forecasted growth values. (The Russell Midcap® Index measures the performance of the 800 smallest companies in the Russell 1000® Index, which consists of the 1,000 largest U.S. companies based on total market capitalization.) Index results assume the reinvestment of dividends paid on the stocks constituting the index. This index does not include the effect of sales charges, commissions, expenses or taxes, is not representative of the Fund and it is not possible to invest directly in an index.
The graph reflects investment of growth of a hypothetical $10,000 investment in the Fund.
The graph and table do not reflect the deduction of taxes that a shareholder would pay on Fund distributions or the redemption of Fund shares.
Past performance is not indicative of future results.
12
Victory RS Large Cap Alpha Fund
Managers' Commentary
(Unaudited)
What were the market conditions during the reporting period?
U.S. equity markets delivered solid performance across styles in 2020, and the S&P 500® Index — the most popular proxy for the overall domestic stock market — delivered its 11th year of positive returns in the last 12 years. U.S. stocks continued to perform well following a strong 2019 — and this despite the unprecedented pandemic. The economy and stocks proved resilient following what was effectively a virtual global economic shutdown in the first quarter. But thanks to the U.S. Federal Reserve (the "Fed") (and central bankers worldwide) and the U.S. Congress, the record fiscal stimulus and highly accommodative monetary policies backstopped the markets and renewed risk-taking among investors.
After a solid start to the 2020 calendar year in January, U.S. equity markets moved abruptly lower as worst-case fears of SARS-CoV-2 ("severe acute respiratory syndrome coronavirus 2") — the virus responsible for COVID-19 (coronavirus disease 2019) — became a reality. While investors started to show concern of the potential impact of the virus in February 2020, with the broad Russell 3000® Index declining 8.19%, investors fled risk assets in March 2020 en masse as the virus hit home in the United States and the broad index declined another 13.75%. This panic pushed investors to shift away from risk assets and caused credit markets to seize up, while volatility, as measured by the CBOE Market Volatility Index, hit an all-time record high.
The Fed subsequently adjusted forecasts for second-quarter economic output to contract by levels not seen since the Great Depression. Given the unprecedented shock to the economy, the U.S. government implemented record levels of fiscal stimulus to keep businesses open, people in their homes, and important services funded. Meanwhile, the Fed implemented the largest scale monetary stimulus on record, which provided ample liquidity to credit markets, businesses, and important infrastructure. The Fed has also lowered interest rates by 150 basis points to 0%, with the goal of helping the economy bounce back quickly.
U.S. equity markets roared back during the second-quarter as fiscal and monetary measures convinced investors that fled risk assets to re-enter. It also became clear that the economic and business impact of the coronavirus would not affect all companies similarly, and that there would be "haves" and "have-nots" in the aftermath. While all U.S. equity styles performed well, the disparity between innovative growth and legacy value companies became increasingly pronounced before rising markets took a breather in September.
Strong sentiment turned into exuberance as we approached year-end, and record-setting market performance in the fourth- quarter was driven by news that effective vaccines were developed faster than expected. In addition, a more stable outlook associated with a victory by Joe Biden in the U.S. presidential election helped push record inflows into equities. This also created a sharp reversal among equity market leadership late in the year, and many lagging companies in sectors traditionally associated with value investing came roaring back. U.S. government action and corporate innovation appears to have bridged the pre-pandemic economy to what will be a new "normal" economic environment, with initial signs that the economy could fully rebound in 2021, despite the prospect of a severe wave of COVID-19 in winter.
13
Victory RS Large Cap Alpha Fund (continued)
Managers' Commentary (continued)
How did Victory RS Large Cap Alpha Fund (the "Fund") perform during the reporting period?
The Fund seeks to provide long-term capital appreciation. The Fund returned -1.03% (Class A Shares at net asset value) for the year ended December 31, 2020, underperforming the Russell 1000® Value Index (the "Index"), which returned 2.80% during the reporting period.
What strategies did you employ during the reporting period?
The Fund underperformed the Index despite strong stock selection in Communication Services and Information Technology. Negative contributors to stock selection were in the Financials and Utilities sectors, as company-specific bets were not rewarded in 2020. However, several of our investments in the Technology and Communication Services sectors paid off in 2020. Euronet Worldwide and Broadridge, Inc. were significant positive contributors to performance. On the communication services side, Facebook, the social media company, as well as Alphabet, the internet search and online media company, performed extremely well. Where we struggled was in a couple of our Financials sector positions; two of our positions, Cincinnati Financial and CBOE Global Markets were negative contributors because of company-specific events. In the end, the Fund missed its objective of outperforming the Index in 2020.
The range of outcomes for 2021, while more optimistic, rests on the rollout and efficacy of recently approved vaccines to fight COVID-19. Volatility, economic activity, and the level of interest rates will be impacted by the level of success of the vaccines. In addition, the U.S. presidential election has resulted in a shift in power, which provides some uncertainty as to how policy decisions may impact the economy and markets.
Interest rates and mortgage rates continue near historically low levels, inflation is nonexistent, and the economy struggles while we await broad distribution of the vaccines. We remain very watchful of inflation, particularly as a result of the size and speed of the monetary and fiscal response to the pandemic. We continue to carefully monitor the corporate debt market, but in general, U.S. corporate balance sheets are in better shape with access to low-cost debt. The Fed has stepped in to provide liquidity to support risk assets, but there does remain some concern regarding insolvency for some businesses if the absolute level of economic activity remains weak.
Equity valuations are in the top decile compared to historical levels, in part due to depressed earnings from COVID-19, but also as a result of multiple expansion in the six largest mega-cap stocks in the S&P 500® Index. Excluding the six largest mega-cap stocks, valuations are more reasonable, particularly if compared to the 10-year U.S. Treasury yield. Recovery in aggregate earnings will be tempered, as certain industries such as hospitality, entertainment, banking, and travel will take longer to return to pre-COVID levels. However, equities continue to look attractive when compared to U.S. Treasurys and high-grade corporate bonds after the flight to safety rally during the crisis. We feel the values inherent in the portfolio should attract other investors and acquirers over time.
14
Victory RS Large Cap Alpha Fund
Investment Overview
(Unaudited)
Average Annual Total Returns
Year Ended December 31, 2020
| | | Class A | | Class C | | Class R | | Class Y | | | | | |
INCEPTION DATE | | 6/1/72 | | 8/7/00 | | 5/15/01 | | 5/1/07 | | | | | |
| | | Net Asset
Value | | Maximum
Offering
Price | | Net Asset
Value | | Contingent
Deferred
Charges | | Net Asset
Value | | Net Asset
Value | | Russell
1000®
Value Index1 | | S&P 500®
Index2 | |
One Year | | | –1.03 | % | | | –6.72 | % | | | –1.85 | % | | | –2.79 | % | | | –1.41 | % | | | –0.83 | % | | | 2.80 | % | | | 18.40 | % | |
Five Year | | | 8.57 | % | | | 7.29 | % | | | 7.70 | % | | | 7.70 | % | | | 8.17 | % | | | 8.79 | % | | | 9.74 | % | | | 15.22 | % | |
Ten Year | | | 9.35 | % | | | 8.71 | % | | | 8.48 | % | | | 8.48 | % | | | 8.95 | % | | | 9.61 | % | | | 10.50 | % | | | 13.88 | % | |
The performance data quoted represents past performance and current returns may be lower or higher. The investment return and principal value will fluctuate so that an investor's shares, when redeemed, may be worth more or less than the original cost. To obtain performance information current to the most recent month's end, please visit www.vcm.com.
The maximum offering price (MOP) figures reflect a maximum sales charge of 5.75% for Class A Shares. Class C Shares are not subject to an initial sales charge, but are subject to a deferred sales charge of 1.00% on shares redeemed within one year of purchase. NAV does not reflect sales charges.
Total return measures the price change in a share assuming the reinvestment of all net investment income and realized capital gain distributions, if any. The total returns quoted do not reflect adjustments made to the enclosed financial statements in accordance with U.S. generally accepted accounting principles or the deduction of taxes that a shareholder would pay on net investment income and realized capital gain distributions, including reinvested distributions, or redemptions of shares. The total return figures set forth above include all waivers of fees. Without such fee waivers, the total returns would have been lower.
Victory RS Large Cap Alpha Fund — Growth of $10,000
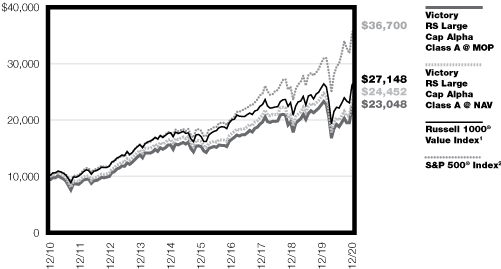
1The Russell 1000® Value Index is an unmanaged market-capitalization-weighted index that measures the performance of those companies in the Russell 1000® Index (which consists of the 1,000 largest U.S. companies based on total market capitalization) with lower price-to-book ratios and lower forecasted growth values. Index results assume the reinvestment of dividends paid on stocks constituting the index. This index does not include the effect of sales charges, commissions, expenses or taxes, is not representative of the Fund and it is not possible to invest directly in an index.
2The S&P 500® Index is an unmanaged index comprised of 500 domestically traded common stocks, is weighted according to the market value of each common stock in the index, and includes reinvestment of dividends. This index does not include the effect of sales charges, commissions, expenses or taxes, is not representative of the Fund and it is not possible to invest directly in an index.
The graph reflects investment of growth of a hypothetical $10,000 investment in the Fund.
The graph and table do not reflect the deduction of taxes that a shareholder would pay on Fund distributions or the redemption of Fund shares.
Past performance is not indicative of future results.
15
Victory RS Investors Fund
Managers' Commentary
(Unaudited)
What were the market conditions during the reporting period?
U.S. equity markets delivered solid performance across styles in 2020, and the S&P 500® Index — the most popular proxy for the overall domestic stock market — delivered its 11th year of positive returns in the last 12 years. U.S. stocks continued to perform well following a strong 2019 — and this despite the unprecedented pandemic. The economy and stocks proved resilient following what was effectively a virtual global economic shutdown in the first quarter. But thanks to the U.S. Federal Reserve (the "Fed") (and central bankers worldwide) and the U.S. Congress, the record fiscal stimulus and highly accommodative monetary policies backstopped the markets and renewed risk-taking among investors.
After a solid start to the 2020 calendar year in January, U.S. equity markets moved abruptly lower as worst-case fears of SARS-CoV-2 (severe acute respiratory syndrome coronavirus 2) — the virus responsible for COVID-19 (coronavirus disease 2019) — became a reality. While investors started to show concern of the potential impact of the virus in February 2020, with the broad Russell 3000® Index declining 8.19%, investors fled risk assets in March 2020 en masse as the virus hit home in the United States and the broad index declined another 13.75%. This panic pushed investors to shift away from risk assets and caused credit markets to seize up, while volatility, as measured by the CBOE Market Volatility Index, hit an all-time record high.
The Fed subsequently adjusted forecasts for second-quarter economic output to contract by levels not seen since the Great Depression. Given the unprecedented shock to the economy, the U.S. government implemented record levels of fiscal stimulus to keep businesses open, people in their homes, and important services funded. Meanwhile, the Fed implemented the largest-scale monetary stimulus on record, which provided ample liquidity to credit markets, businesses, and important infrastructure. The Fed has also lowered interest rates by 150 basis points to 0%, with the goal of helping the economy bounce back quickly.
U.S. equity markets roared back during the second quarter as fiscal and monetary measures convinced investors who had fled risk assets to re-enter. It also became clear that the economic and business impact of the coronavirus would not affect all companies similarly, and that there would be "haves" and "have-nots" in the aftermath.
Strong sentiment turned into exuberance as we approached year-end, and record-setting market performance in the fourth quarter was driven by news that effective COVID-19 vaccines were developed faster than expected. In addition, a more stable outlook associated with a victory by Joe Biden in the U.S. presidential election helped push record inflows into equities. This also created a sharp reversal among equity market leadership late in the year, and many lagging companies in sectors traditionally associated with value investing came roaring back. U.S. government action and corporate innovation appears to have bridged the pre-pandemic economy to what will be a new "normal" economic environment, with initial signs that the economy could fully rebound in 2021, despite the prospect of a severe wave of COVID-19 in winter.
16
Victory RS Investors Fund (continued)
Managers' Commentary (continued)
How did Victory RS Investors Fund (the "Fund") perform during the reporting period?
The Fund seeks to provide long-term capital appreciation. The Fund returned -1.68% (Class A Shares at net asset value) for the year ended December 31, 2020, underperforming the Russell 3000® Value Index (the "Index"), which returned 2.87% during the reporting period.
What strategies did you employ during the reporting period?
Relative returns were primarily driven by stock selection in several sectors which lagged the Index performance for the year. In Financials, the decline in economic activity caused by the pandemic resulted in a significant decline in interest rates and increased concerns regarding credit losses. In many cases, we saw valuations fall to levels not seen since the global financial crisis, as sentiment shifted away from the sector. As we were overweight the sector, our relative performance was negatively affected; though as we look forward, we feel quite optimistic about future returns from our positions as the economy reopens in a post-COVID-19 world. Within the Health Care sector, our investments performed well; however, our underweight exposure to the Pharmaceuticals sector, in particular the more speculative biotech area, caused relative performance to lag. Somewhat offsetting these negative areas of the portfolio was our performance in the Communication Services sector, which relatively outperformed versus the Index due to long-term positions in Google and Facebook. In the end, the Fund did not achieve its objective of outperforming the Index in 2020 though we feel confident in the businesses that we own and are optimistic in our future performance, both absolute and relative, as interest rates normalize from generational lows over the intermediate-term and deflate many of the speculative areas of the market. We believe our consistent focus on investing in quality businesses with good balance sheets and durable cash flows run by good managers will continue to serve us well.
The range of outcomes for 2021, while more optimistic, rests on the rollout and efficacy of recently approved vaccines to fight COVID-19. Volatility, economic activity, and the level of interest rates will be impacted by the level of success of the vaccines. In addition, the U.S. presidential election has resulted in a shift in power, which provides some uncertainty as to how policy decisions may impact the economy and markets.
Interest rates and mortgage rates continue near historically low levels, inflation is nonexistent, and the economy struggles while we await broad distribution of the vaccines. We remain very watchful of inflation, particularly as a result of the size and speed of the monetary and fiscal response to the pandemic. We continue to carefully monitor the corporate debt market; but in general, U.S. corporate balance sheets are in better shape with access to low-cost debt. The Fed has stepped in to provide liquidity to support risk assets, but there does remain some concern regarding insolvency for some businesses if the absolute level of economic activity remains weak.
Equity valuations are in the top decile compared to historical levels, in part due to depressed earnings from COVID-19, but also as a result of expansion in the six largest mega-cap stocks in the S&P 500® Index. Excluding the six largest mega-cap stocks, valuations are more reasonable, particularly if compared to the 10-year U.S. Treasury yield. Recovery in aggregate
17
Victory RS Investors Fund (continued)
Managers' Commentary (continued)
earnings will be tempered, as certain industries such as hospitality, entertainment, banking, and travel will take longer to return to pre-COVID-19 levels. However, equities continue to look attractive when compared to U.S. Treasurys and high-grade corporate bonds after the flight-to-safety rally during the crisis. We feel the values inherent in the portfolio should attract other investors and acquirers over time.
18
Victory RS Investors Fund
Investment Overview
(Unaudited)
Average Annual Total Returns
Year Ended December 31, 2020
| | | Class A | | Class C | | Class R | | Class Y | | | |
INCEPTION DATE | | 11/15/05 | | 7/24/07 | | 1/3/07 | | 5/1/07 | | | |
| | | Net Asset
Value | | Maximum
Offering
Price | | Net Asset
Value | | Contingent
Deferred
Charges | | Net Asset
Value | | Net Asset
Value | | Russell
3000®
Value Index1 | |
One Year | | | –1.68 | % | | | –7.34 | % | | | –2.43 | % | | | –3.40 | % | | | –2.30 | % | | | –1.41 | % | | | 2.87 | % | |
Five Year | | | 7.83 | % | | | 6.56 | % | | | 7.03 | % | | | 7.03 | % | | | 7.19 | % | | | 8.13 | % | | | 9.74 | % | |
Ten Year | | | 9.41 | % | | | 8.76 | % | | | 8.60 | % | | | 8.60 | % | | | 8.85 | % | | | 9.69 | % | | | 10.36 | % | |
The performance data quoted represents past performance and current returns may be lower or higher. The investment return and principal value will fluctuate so that an investor's shares, when redeemed, may be worth more or less than the original cost. To obtain performance information current to the most recent month's end, please visit www.vcm.com.
The maximum offering price (MOP) figures reflect a maximum sales charge of 5.75% for Class A Shares. Class C Shares are not subject to an initial sales charge, but are subject to a deferred sales charge of 1.00% on shares redeemed within one year of purchase. NAV does not reflect sales charges.
Total return measures the price change in a share assuming the reinvestment of all net investment income and realized capital gain distributions, if any. The total returns quoted do not reflect adjustments made to the enclosed financial statements in accordance with U.S. generally accepted accounting principles or the deduction of taxes that a shareholder would pay on net investment income and realized capital gain distributions, including reinvested distributions, or redemptions of shares. The total return figures set forth above include all waivers of fees. Without such fee waivers, the total returns would have been lower.
Victory RS Investors Fund — Growth of $10,000
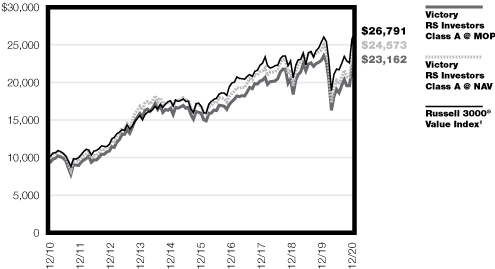
1The Russell 3000® Value Index measures the performance of those Russell 3000® Index companies with lower price-to-book ratios and lower forecasted growth values. The stocks in this index are also members of either the Russell 1000® Value or the Russell 2000® Value indexes. Index results assume the reinvestment of dividends paid on the stocks constituting the index. This index does not include the effect of sales charges, commissions, expenses or taxes, is not representative of the Fund and it is not possible to invest directly in an index.
The graph reflects investment of growth of a hypothetical $10,000 investment in the Fund.
The graph and table do not reflect the deduction of taxes that a shareholder would pay on Fund distributions or the redemption of Fund shares.
Past performance is not indicative of future results.
19
Victory Global Natural Resources Fund
Managers' Commentary
(Unaudited)
What were the market conditions during the reporting period?
Most major commodities prices increased over the course of 2020, with gold and copper being among the best performers, each up around 25%. Natural gas prices increased 16% and the average futures contract out five years rose 5%. Crude oil prices fell -20% as COVID-19 (coronavirus disease 2019) heavily impacted demand. Despite the increases in commodity prices and generally weak demand, inventories continued to correct as supply remains constrained due to a lack of capital availability combined with new-found discipline among producers. Outside of the corporate bond market, there is little access to capital for most upstream commodity producers. As Environmental, Social and Governance (ESG) became a focal point in 2020, private equity sponsors are rapidly shifting energy allocations into renewables and alternative energy. Public-equity investors have eschewed traditional energy, which represents approximately 2% of the S&P 500® Index and has been an underperforming industry segment for most of the past decade. The combination of normalizing demand, low inventories and constrained supply base is setting the stage for the next cyclical upturn in commodity prices. This phase transition became more obvious as the year progressed.
How did Victory Global Natural Resources Fund (the "Fund") perform during the reporting period?
The Fund seeks to provide long-term capital appreciation. The Fund returned 27.35% (Class A Shares at net asset value) for the year ended December 31, 2020, outperforming the MSCI World Commodity Producers Index (the "Index"), which returned -15.10% during the reporting period.
What strategies did you employ during the reporting period?
Positive performance occurred only after a severe drawdown in the first quarter as markets reacted to the COVID-19 pandemic. Above-Index weighting and security selection in the North American natural gas segment were primary drivers of relative outperformance, followed by a similar outcome in base metals. The relative overweight to North American oil companies detracted from relative returns, although our North American oil companies still outperformed those of the Index. Not owning integrated oil companies was a positive contribution to returns. The outperformance of the Fund versus the Index was due both to wise subsector allocations as well as good stock-picking.
20
Victory Global Natural Resources Fund
Investment Overview
(Unaudited)
Average Annual Total Returns
Year Ended December 31, 2020
| | | Class A | | Class C | | Class R | | Class Y | | | | | | | |
INCEPTION DATE | | 11/15/95 | | 5/1/07 | | 12/4/06 | | 5/1/07 | | | | | | | |
| | | Net Asset
Value | | Maximum
Offering
Price | | Net Asset
Value | | Contingent
Deferred
Charges | | Net Asset
Value | | Net Asset
Value | | MSCI World
Commodity
Producers
Index1 | | S&P North
American
Natural
Resources
Sector
IndexTM 2 | | S&P 500®
Index3 | |
One Year | | | 27.35 | % | | | 20.06 | % | | | 26.29 | % | | | 25.29 | % | | | 26.86 | % | | | 27.86 | % | | | –15.10 | % | | | –19.01 | % | | | 18.40 | % | |
Five Year | | | –4.22 | % | | | –5.35 | % | | | –4.99 | % | | | –4.99 | % | | | –4.57 | % | | | –3.90 | % | | | 3.69 | % | | | –0.08 | % | | | 15.22 | % | |
Ten Year | | | –9.32 | % | | | –9.85 | % | | | –10.03 | % | | | –10.03 | % | | | –9.65 | % | | | –9.02 | % | | | –2.49 | % | | | –2.83 | % | | | 13.88 | % | |
The performance data quoted represents past performance and current returns may be lower or higher. The investment return and principal value will fluctuate so that an investor's shares, when redeemed, may be worth more or less than the original cost. To obtain performance information current to the most recent month's end, please visit www.vcm.com.
The maximum offering price (MOP) figures reflect a maximum sales charge of 5.75% for Class A Shares. Class C Shares are not subject to an initial sales charge, but are subject to a deferred sales charge of 1.00% on shares redeemed within one year of purchase. NAV does not reflect sales charges.
Total return measures the price change in a share assuming the reinvestment of all net investment income and realized capital gain distributions, if any. The total returns quoted do not reflect adjustments made to the enclosed financial statements in accordance with U.S. generally accepted accounting principles or the deduction of taxes that a shareholder would pay on net investment income and realized capital gain distributions, including reinvested distributions, or redemptions of shares. The total return figures set forth above include all waivers of fees. Without such fee waivers, the total returns would have been lower.
Victory Global Natural Resources Fund — Growth of $10,000
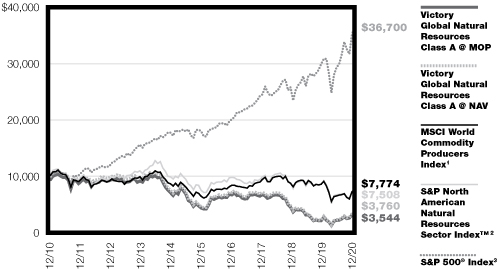
1The MSCI World Commodity Producers Index is an equity-based index designed to reflect the performance related to commodity producers stocks. The index is a free float-adjusted market-capitalization-weighted index composed of commodity producer companies based on the Global Industry Classification Standard (GICS®). The index reflects the reinvestment of dividends paid on the stocks constituting the index net of withholding taxes. This index does not include the effect of sales charges, commissions, expenses or taxes, is not representative of the Fund and it is not possible to invest directly in an index.
2The S&P North American Natural Resources Sector IndexTM is a modified capitalization-weighted index designed as a benchmark for U.S.-traded securities in the natural resources sector. The index includes companies involved in the following categories: extractive industries, energy companies, owners and operators of timber tracts, forestry services, producers of pulp and paper, and owners of plantations. Index results assume the reinvestment of dividends paid on the stocks constituting the index. This index does not include the effect of sales charges, commissions, expenses or taxes, is not representative of the Fund and it is not possible to invest directly in an index.
3The S&P 500® Index is an unmanaged index comprised of 500 domestically traded common stocks, is weighted according to the market value of each common stock in the index, and includes reinvestment of dividends. This index does not include the effect of sales charges, commissions, expenses or taxes, is not representative of the Fund and it is not possible to invest directly in an index.
The graph reflects investment of growth of a hypothetical $10,000 investment in the Fund.
The graph and table do not reflect the deduction of taxes that a shareholder would pay on Fund distributions or the redemption of Fund shares.
Past performance is not indicative of future results.
21
Victory RS Value Funds (Unaudited)
Victory RS Partners Fund | | December 31, 2020 | |
(Unaudited)
Investment Objective & Portfolio Holdings:
Victory RS Partners Fund seeks to provide long-term capital appreciation.
Sector Allocation*:
December 31, 2020
(% of Net Assets)
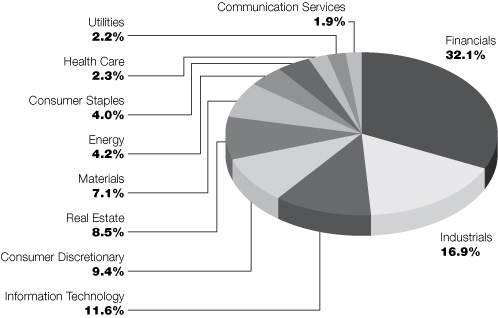
* Does not include futures, money market instruments, and short-term investments purchased with cash collateral from securities loaned.
Refer to the Schedule of Portfolio Investments for a complete list of securities.
Percentages are of the net assets of the Fund and may not equal 100%.
22
Victory RS Value Funds (Unaudited)
Victory RS Value Fund | | December 31, 2020 | |
(Unaudited)
Investment Objective & Portfolio Holdings:
Victory RS Value Fund seeks to provide long-term capital appreciation.
Sector Allocation*:
December 31, 2020
(% of Net Assets)
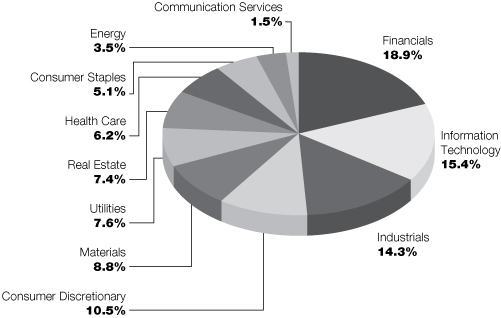
* Does not include futures, money market instruments, and short-term investments purchased with cash collateral from securities loaned.
Refer to the Schedule of Portfolio Investments for a complete list of securities.
Percentages are of the net assets of the Fund and may not equal 100%.
23
Victory RS Value Funds (Unaudited)
Victory RS Large Cap Alpha Fund | | December 31, 2020 | |
(Unaudited)
Investment Objective & Portfolio Holdings:
Victory RS Large Cap Alpha Fund seeks to provide long-term capital appreciation.
Sector Allocation*:
December 31, 2020
(% of Net Assets)

* Does not include futures, money market instruments, and short-term investments purchased with cash collateral from securities loaned.
Refer to the Schedule of Portfolio Investments for a complete list of securities.
Percentages are of the net assets of the Fund and may not equal 100%.
24
Victory RS Value Funds (Unaudited)
Victory RS Investors Fund | | December 31, 2020 | |
(Unaudited)
Investment Objective & Portfolio Holdings:
Victory RS Investors Fund seeks to provide long-term capital appreciation.
Sector Allocation*:
December 31, 2020
(% of Net Assets)
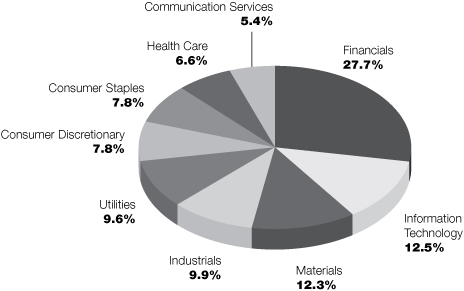
* Does not include futures, money market instruments, and short-term investments purchased with cash collateral from securities loaned.
Refer to the Schedule of Portfolio Investments for a complete list of securities.
Percentages are of the net assets of the Fund and may not equal 100%.
25
Victory RS Value Funds (Unaudited)
Victory Global Natural Resources Fund | | December 31, 2020 | |
(Unaudited)
Investment Objective & Portfolio Holdings:
Victory Global Natural Resources Fund seeks to provide long-term capital appreciation.
Sector Allocation*:
December 31, 2020
(% of Net Assets)

* Does not include futures, money market instruments, and short-term investments purchased with cash collateral from securities loaned.
Refer to the Schedule of Portfolio Investments for a complete list of securities.
Percentages are of the net assets of the Fund and may not equal 100%.
26
Victory Portfolios
Victory RS Partners Fund | | Schedule of Portfolio Investments
December 31, 2020 | |
Security Description | | Shares | | Value | |
Common Stocks (100.0%) | |
Banks (20.1%): | |
Ameris Bancorp | | | 289,970 | | | $ | 11,039,158 | | |
Associated Bancorp | | | 256,940 | | | | 4,380,827 | | |
Banner Corp. | | | 126,820 | | | | 5,908,544 | | |
Columbia Banking System, Inc. | | | 149,066 | | | | 5,351,469 | | |
Eastern Bankshares, Inc. (a) (b) | | | 308,720 | | | | 5,035,223 | | |
Independent Bank Corp. | | | 49,380 | | | | 3,606,715 | | |
Investors Bancorp, Inc. | | | 495,380 | | | | 5,231,213 | | |
Pinnacle Financial Partners, Inc. | | | 110,060 | | | | 7,087,864 | | |
South State Corp. | | | 88,790 | | | | 6,419,517 | | |
Synovus Financial Corp. | | | 156,360 | | | | 5,061,373 | | |
UMB Financial Corp. | | | 73,812 | | | | 5,092,290 | | |
Umpqua Holdings Corp. | | | 91,040 | | | | 1,378,346 | | |
| | | | 65,592,539 | | |
Capital Markets (1.0%): | |
Federated Hermes, Inc. | | | 114,990 | | | | 3,322,061 | | |
Communication Services (1.9%): | |
Madison Square Garden Sports Corp. (a) | | | 9,750 | | | | 1,794,975 | | |
World Wrestling Entertainment, Inc., Class A (b) | | | 94,090 | | | | 4,521,025 | | |
| | | | 6,316,000 | | |
Consumer Discretionary (9.4%): | |
Brinker International, Inc. (b) | | | 85,000 | | | | 4,808,450 | | |
Carter's, Inc. | | | 61,930 | | | | 5,825,755 | | |
Dana, Inc. | | | 381,740 | | | | 7,451,565 | | |
Penske Automotive Group, Inc. | | | 70,821 | | | | 4,206,059 | | |
Taylor Morrison Home Corp. (a) | | | 185,320 | | | | 4,753,458 | | |
Wolverine World Wide, Inc. | | | 106,130 | | | | 3,316,563 | | |
| | | | 30,361,850 | | |
Consumer Staples (4.0%): | |
Hostess Brands, Inc. (a) (b) | | | 512,671 | | | | 7,505,503 | | |
TreeHouse Foods, Inc. (a) (b) | | | 134,220 | | | | 5,703,008 | | |
| | | | 13,208,511 | | |
Energy (4.2%): | |
Cimarex Energy Co. | | | 93,420 | | | | 3,504,184 | | |
Magnolia Oil & Gas Corp., Class A (a) (b) | | | 871,520 | | | | 6,152,931 | | |
PDC Energy, Inc. (a) | | | 194,550 | | | | 3,994,112 | | |
| | | | 13,651,227 | | |
Health Care (2.1%): | |
The Ensign Group, Inc. | | | 22,490 | | | | 1,639,971 | | |
Tivity Health, Inc. (a) (b) | | | 270,910 | | | | 5,307,127 | | |
| | | | 6,947,098 | | |
Industrials (16.9%): | |
Altra Industrial Motion Corp. | | | 71,750 | | | | 3,977,103 | | |
American Woodmark Corp. (a) | | | 31,550 | | | | 2,960,968 | | |
See notes to financial statements.
27
Victory Portfolios
Victory RS Partners Fund | | Schedule of Portfolio Investments — continued
December 31, 2020 | |
Security Description | | Shares | | Value | |
Atkore International Group, Inc. (a) | | | 184,200 | | | $ | 7,572,462 | | |
Crane Co. | | | 55,610 | | | | 4,318,673 | | |
Evoqua Water Technologies Corp. (a) | | | 75,800 | | | | 2,045,084 | | |
Finning International, Inc. | | | 192,210 | | | | 4,082,216 | | |
GMS, Inc. (a) | | | 144,920 | | | | 4,417,161 | | |
GrafTech International Ltd. | | | 387,970 | | | | 4,135,760 | | |
H&E Equipment Services, Inc. | | | 74,860 | | | | 2,231,577 | | |
McGrath RentCorp | | | 25,760 | | | | 1,728,496 | | |
Meritor, Inc. (a) | | | 168,950 | | | | 4,715,394 | | |
Ryder System, Inc. | | | 40,090 | | | | 2,475,958 | | |
SkyWest, Inc. | | | 29,030 | | | | 1,170,199 | | |
TFI International, Inc. (b) | | | 99,200 | | | | 5,107,705 | | |
The Timken Co. | | | 53,250 | | | | 4,119,420 | | |
| | | | 55,058,176 | | |
Information Technology (11.6%): | |
Euronet Worldwide, Inc. (a) (b) | | | 58,320 | | | | 8,451,734 | | |
NCR Corp. (a) | | | 245,630 | | | | 9,228,319 | | |
Talend SA, ADR (a) (b) | | | 189,160 | | | | 7,252,394 | | |
Verint Systems, Inc. (a) | | | 194,700 | | | | 13,079,946 | | |
| | | | 38,012,393 | | |
Insurance (8.0%): | |
Alleghany Corp. | | | 13,180 | | | | 7,956,634 | | |
Axis Capital Holdings Ltd. | | | 80,110 | | | | 4,036,743 | | |
Globe Life, Inc. | | | 53,190 | | | | 5,050,922 | | |
Primerica, Inc. | | | 36,363 | | | | 4,870,097 | | |
Stewart Information Services Corp. | | | 87,370 | | | | 4,225,213 | | |
| | | | 26,139,609 | | |
Materials (7.1%): | |
Constellium SE (a) | | | 256,290 | | | | 3,585,497 | | |
Forterra, Inc. (a) | | | 171,600 | | | | 2,950,662 | | |
Graphic Packaging Holding Co. | | | 601,360 | | | | 10,187,038 | | |
Summit Materials, Inc., Class A (a) | | | 319,187 | | | | 6,409,275 | | |
| | | | 23,132,472 | | |
Real Estate (8.5%): | |
Four Corners Property Trust, Inc. | | | 171,800 | | | | 5,114,486 | | |
Jones Lang LaSalle, Inc. (a) | | | 39,940 | | | | 5,925,898 | | |
Kennedy-Wilson Holdings, Inc. | | | 230,660 | | | | 4,126,507 | | |
Spirit Realty Capital, Inc. (b) | | | 104,760 | | | | 4,208,209 | | |
Sunstone Hotel Investors, Inc. | | | 530,260 | | | | 6,007,846 | | |
Washington Real Estate Investment Trust | | | 103,830 | | | | 2,245,843 | | |
| | | | 27,628,789 | | |
Thrifts & Mortgage Finance (3.0%): | |
Essent Group Ltd. | | | 81,830 | | | | 3,535,056 | | |
PCSB Financial Corp. | | | 125,790 | | | | 2,005,093 | | |
TFS Financial Corp. | | | 246,310 | | | | 4,342,445 | | |
| | | | 9,882,594 | | |
See notes to financial statements.
28
Victory Portfolios
Victory RS Partners Fund | | Schedule of Portfolio Investments — continued
December 31, 2020 | |
Security Description | | Shares | | Value | |
Utilities (2.2%): | |
Black Hills Corp. | | | 43,665 | | | $ | 2,683,214 | | |
NorthWestern Corp. | | | 40,670 | | | | 2,371,468 | | |
South Jersey Industries, Inc. (b) | | | 98,850 | | | | 2,130,218 | | |
| | | | 7,184,900 | | |
Total Common Stocks (Cost $248,978,826) | | | 326,438,219 | | |
Preferred Stocks (0.2%) | |
Health Care (0.2%): | |
WellDoc, Inc., Series B (a) (c) (d) | | | 1,587,483 | | | | 587,369 | | |
Total Preferred Stocks (Cost $1,942,920) | | | 587,369 | | |
Collateral for Securities Loaned^ (5.6%) | |
BlackRock Liquidity Funds TempFund Portfolio, Institutional Class, 0.08% (e) | | | 315,052 | | | | 315,052 | | |
Fidelity Investments Money Market Government Portfolio, Class I, 0.01% (e) | | | 10,823,874 | | | | 10,823,874 | | |
Goldman Sachs Financial Square Prime Obligations Fund, Institutional
Class, 0.04% (e) | | | 157,226 | | | | 157,226 | | |
JPMorgan Prime Money Market Fund, Capital Class, 0.12% (e) | | | 1,253,675 | | | | 1,253,675 | | |
Morgan Stanley Institutional Liquidity Prime Portfolio, Institutional
Class, 0.09% (e) | | | 5,636,766 | | | | 5,636,766 | | |
Total Collateral for Securities Loaned (Cost $18,186,593) | | | 18,186,593 | | |
Total Investments (Cost $269,108,339) — 105.8% | | | 345,212,181 | | |
Liabilities in excess of other assets — (5.8)% | | | (18,971,560 | ) | |
NET ASSETS — 100.00% | | $ | 326,240,621 | | |
^ Purchased with cash collateral from securities on loan.
(a) Non-income producing security.
(b) All or a portion of this security is on loan.
(c) The Fund's Adviser has deemed this security to be illiquid based upon procedures approved by the Board of Trustees. As of December 31, 2020, illiquid securities were 0.2% of the Fund's net assets.
(d) Security was fair valued based upon procedures approved by the Board of Trustees and represents 0.2% of the Fund's net assets as of December 31, 2020. This security is classified as Level 3 within the fair value hierarchy. (See Note 2)
(e) Rate disclosed is the daily yield on December 31, 2020.
ADR — American Depositary Receipt
See notes to financial statements.
29
Victory Portfolios
Victory RS Value Fund | | Schedule of Portfolio Investments
December 31, 2020 | |
Security Description | | Shares | | Value | |
Common Stocks (99.2%) | |
Communication Services (1.5%): | |
World Wrestling Entertainment, Inc., Class A (a) | | | 94,200 | | | $ | 4,526,310 | | |
Consumer Discretionary (10.5%): | |
AutoZone, Inc. (b) | | | 1,510 | | | | 1,790,014 | | |
BorgWarner, Inc. | | | 92,810 | | | | 3,586,178 | | |
Carter's, Inc. (a) | | | 32,410 | | | | 3,048,809 | | |
Dollar Tree, Inc. (b) | | | 64,520 | | | | 6,970,741 | | |
LKQ Corp. (b) | | | 287,180 | | | | 10,120,223 | | |
Magna International, Inc. | | | 39,960 | | | | 2,829,168 | | |
Taylor Morrison Home Corp. (b) | | | 145,320 | | | | 3,727,458 | | |
| | | | 32,072,591 | | |
Consumer Staples (5.1%): | |
Hostess Brands, Inc. (b) | | | 359,780 | | | | 5,267,179 | | |
Keurig Dr Pepper, Inc. | | | 170,165 | | | | 5,445,280 | | |
TreeHouse Foods, Inc. (b) | | | 114,080 | | | | 4,847,259 | | |
| | | | 15,559,718 | | |
Energy (3.5%): | |
Baker Hughes Co. | | | 61,430 | | | | 1,280,816 | | |
Cabot Oil & Gas Corp. | | | 125,690 | | | | 2,046,233 | | |
Devon Energy Corp. | | | 189,220 | | | | 2,991,568 | | |
Magnolia Oil & Gas Corp., Class A (a) (b) | | | 622,980 | | | | 4,398,239 | | |
| | | | 10,716,856 | | |
Financials (18.9%): | |
Aflac, Inc. | | | 68,670 | | | | 3,053,755 | | |
Alleghany Corp. | | | 13,760 | | | | 8,306,774 | | |
Cboe Global Markets, Inc. | | | 43,910 | | | | 4,088,899 | | |
Citizens Financial Group, Inc. | | | 192,330 | | | | 6,877,721 | | |
Fidelity National Financial, Inc. | | | 117,110 | | | | 4,577,830 | | |
Hancock Whitney Corp. | | | 137,530 | | | | 4,678,771 | | |
Kearny Financial Corp. | | | 350,540 | | | | 3,701,702 | | |
KeyCorp | | | 423,170 | | | | 6,944,219 | | |
RenaissanceRe Holdings Ltd. | | | 58,980 | | | | 9,780,064 | | |
Voya Financial, Inc. | | | 107,200 | | | | 6,304,432 | | |
| | | | 58,314,167 | | |
Health Care (6.2%): | |
Hill-Rom Holdings, Inc. | | | 50,500 | | | | 4,947,485 | | |
Humana, Inc. | | | 15,390 | | | | 6,314,055 | | |
Quest Diagnostics, Inc. | | | 34,100 | | | | 4,063,697 | | |
Zimmer Biomet Holdings, Inc. | | | 24,510 | | | | 3,776,746 | | |
| | | | 19,101,983 | | |
Industrials (14.3%): | |
Allison Transmission Holdings, Inc. | | | 106,330 | | | | 4,586,013 | | |
Carrier Global Corp. | | | 55,910 | | | | 2,108,925 | | |
Crane Co. | | | 82,160 | | | | 6,380,545 | | |
Curtiss-Wright Corp. | | | 46,250 | | | | 5,381,187 | | |
See notes to financial statements.
30
Victory Portfolios
Victory RS Value Fund | | Schedule of Portfolio Investments — continued
December 31, 2020 | |
Security Description | | Shares | | Value | |
Sensata Technologies Holding PLC (b) | | | 170,480 | | | $ | 8,991,115 | | |
Textron, Inc. | | | 40,730 | | | | 1,968,481 | | |
TFI International, Inc. | | | 124,370 | | | | 6,415,005 | | |
The Timken Co. | | | 64,180 | | | | 4,964,965 | | |
United Rentals, Inc. (b) | | | 13,120 | | | | 3,042,659 | | |
| | | | 43,838,895 | | |
Information Technology (15.4%): | |
Euronet Worldwide, Inc. (b) | | | 58,153 | | | | 8,427,533 | | |
FleetCor Technologies, Inc. (b) | | | 12,130 | | | | 3,309,428 | | |
Leidos Holdings, Inc. | | | 41,100 | | | | 4,320,432 | | |
NCR Corp. (b) | | | 281,860 | | | | 10,589,480 | | |
Talend SA, ADR (a) (b) | | | 179,750 | | | | 6,891,615 | | |
Verint Systems, Inc. (b) | | | 210,120 | | | | 14,115,862 | | |
| | | | 47,654,350 | | |
Materials (8.8%): | |
Graphic Packaging Holding Co. | | | 710,290 | | | | 12,032,314 | | |
Sealed Air Corp. | | | 249,410 | | | | 11,420,484 | | |
Summit Materials, Inc., Class A (b) | | | 205,700 | | | | 4,130,456 | | |
| | | | 27,583,254 | | |
Real Estate (7.4%): | |
Healthcare Trust of America, Inc., Class A | | | 176,210 | | | | 4,852,822 | | |
Highwoods Properties, Inc. | | | 95,450 | | | | 3,782,684 | | |
MGM Growth Properties LLC, Series A | | | 141,060 | | | | 4,415,178 | | |
National Retail Properties, Inc. | | | 118,480 | | | | 4,848,202 | | |
Spirit Realty Capital, Inc. | | | 119,980 | | | | 4,819,597 | | |
| | | | 22,718,483 | | |
Utilities (7.6%): | |
FirstEnergy Corp. | | | 108,170 | | | | 3,311,084 | | |
The AES Corp. | | | 336,750 | | | | 7,913,625 | | |
Vistra Corp. | | | 618,600 | | | | 12,161,676 | | |
| | | | 23,386,385 | | |
Total Common Stocks (Cost $251,925,201) | | | 305,472,992 | | |
Collateral for Securities Loaned^ (2.9%) | |
BlackRock Liquidity Funds TempFund Portfolio, Institutional Class, 0.08% (c) | | | 156,360 | | | | 156,360 | | |
Fidelity Investments Money Market Government Portfolio, Class I, 0.01% (c) | | | 5,371,897 | | | | 5,371,897 | | |
Goldman Sachs Financial Square Prime Obligations Fund, Institutional
Class, 0.04% (c) | | | 78,032 | | | | 78,032 | | |
JPMorgan Prime Money Market Fund, Capital Class, 0.12% (c) | | | 622,200 | | | | 622,200 | | |
Morgan Stanley Institutional Liquidity Prime Portfolio, Institutional
Class, 0.09% (c) | | | 2,797,531 | | | | 2,797,531 | | |
Total Collateral for Securities Loaned (Cost $9,026,020) | | | 9,026,020 | | |
Total Investments (Cost $260,951,221) — 102.1% | | | 314,499,012 | | |
Liabilities in excess of other assets — (2.1)% | | | (6,543,692 | ) | |
NET ASSETS — 100.00% | | $ | 307,955,320 | | |
See notes to financial statements.
31
Victory Portfolios
Victory RS Value Fund | | Schedule of Portfolio Investments — continued
December 31, 2020 | |
^ Purchased with cash collateral from securities on loan.
(a) All or a portion of this security is on loan.
(b) Non-income producing security.
(c) Rate disclosed is the daily yield on December 31, 2020.
ADR — American Depositary Receipt
LLC — Limited Liability Company
PLC — Public Limited Company
See notes to financial statements.
32
Victory Portfolios
Victory RS Large Cap Alpha Fund | | Schedule of Portfolio Investments
December 31, 2020 | |
Security Description | | Shares | | Value | |
Common Stocks (99.5%) | |
Communication Services (5.4%): | |
Alphabet, Inc., Class A (a) | | | 8,140 | | | $ | 14,266,489 | | |
Facebook, Inc., Class A (a) | | | 42,680 | | | | 11,658,469 | | |
| | | | 25,924,958 | | |
Consumer Discretionary (8.3%): | |
Dollar Tree, Inc. (a) | | | 118,480 | | | | 12,800,579 | | |
General Motors Co. | | | 136,480 | | | | 5,683,027 | | |
LKQ Corp. (a) | | | 322,420 | | | | 11,362,081 | | |
Magna International, Inc. | | | 133,520 | | | | 9,453,216 | | |
| | | | 39,298,903 | | |
Consumer Staples (7.0%): | |
Keurig Dr Pepper, Inc. | | | 582,450 | | | | 18,638,400 | | |
Mondelez International, Inc., Class A | | | 256,560 | | | | 15,001,063 | | |
| | | | 33,639,463 | | |
Energy (5.1%): | |
Enterprise Products Partners LP | | | 643,210 | | | | 12,600,484 | | |
Hess Corp. | | | 88,470 | | | | 4,670,331 | | |
Pioneer Natural Resources Co. | | | 62,910 | | | | 7,164,820 | | |
| | | | 24,435,635 | | |
Financials (24.6%): | |
Aflac, Inc. | | | 158,360 | | | | 7,042,269 | | |
Bank of America Corp. | | | 413,630 | | | | 12,537,125 | | |
Cboe Global Markets, Inc. | | | 65,330 | | | | 6,083,530 | | |
Chubb Ltd. | | | 54,510 | | | | 8,390,179 | | |
Citigroup, Inc. | | | 202,240 | | | | 12,470,118 | | |
Discover Financial Services | | | 106,810 | | | | 9,669,509 | | |
Everest Re Group Ltd. | | | 20,290 | | | | 4,749,686 | | |
JPMorgan Chase & Co. | | | 109,400 | | | | 13,901,459 | | |
KeyCorp | | | 457,910 | | | | 7,514,303 | | |
RenaissanceRe Holdings Ltd. | | | 93,800 | | | | 15,553,916 | | |
U.S. Bancorp | | | 268,430 | | | | 12,506,154 | | |
Voya Financial, Inc. | | | 119,860 | | | | 7,048,967 | | |
| | | | 117,467,215 | | |
Health Care (13.2%): | |
Cigna Corp. | | | 65,060 | | | | 13,544,190 | | |
Hill-Rom Holdings, Inc. | | | 95,090 | | | | 9,315,967 | | |
Humana, Inc. | | | 23,940 | | | | 9,821,864 | | |
Johnson & Johnson | | | 42,560 | | | | 6,698,093 | | |
Medtronic PLC | | | 42,320 | | | | 4,957,365 | | |
Pfizer, Inc. | | | 103,300 | | | | 3,802,473 | | |
Quest Diagnostics, Inc. | | | 46,930 | | | | 5,592,648 | | |
UnitedHealth Group, Inc. | | | 26,195 | | | | 9,186,063 | | |
| | | | 62,918,663 | | |
See notes to financial statements.
33
Victory Portfolios
Victory RS Large Cap Alpha Fund | | Schedule of Portfolio Investments — continued
December 31, 2020 | |
Security Description | | Shares | | Value | |
Industrials (14.1%): | |
Dover Corp. | | | 43,440 | | | $ | 5,484,300 | | |
Eaton Corp. PLC | | | 79,970 | | | | 9,607,596 | | |
Johnson Controls International PLC | | | 198,400 | | | | 9,243,456 | | |
Parker-Hannifin Corp. | | | 35,260 | | | | 9,605,177 | | |
Raytheon Technologies Corp. | | | 106,432 | | | | 7,610,952 | | |
Sensata Technologies Holding PLC (a) | | | 142,910 | | | | 7,537,073 | | |
Union Pacific Corp. | | | 46,960 | | | | 9,778,011 | | |
United Rentals, Inc. (a) | | | 36,100 | | | | 8,371,951 | | |
| | | | 67,238,516 | | |
Information Technology (8.3%): | |
Euronet Worldwide, Inc. (a) (b) | | | 94,550 | | | | 13,702,185 | | |
FleetCor Technologies, Inc. (a) | | | 36,820 | | | | 10,045,601 | | |
Leidos Holdings, Inc. | | | 90,390 | | | | 9,501,797 | | |
Visa, Inc., Class A | | | 31,360 | | | | 6,859,373 | | |
| | | | 40,108,956 | | |
Materials (3.7%): | |
Sealed Air Corp. | | | 382,402 | | | | 17,510,188 | | |
Real Estate (3.4%): | |
Host Hotels & Resorts, Inc. | | | 555,320 | | | | 8,124,332 | | |
National Retail Properties, Inc. | | | 197,100 | | | | 8,065,332 | | |
| | | | 16,189,664 | | |
Utilities (6.4%): | |
Exelon Corp. | | | 222,890 | | | | 9,410,416 | | |
FirstEnergy Corp. | | | 158,180 | | | | 4,841,890 | | |
Vistra Corp. | | | 818,980 | | | | 16,101,147 | | |
| | | | 30,353,453 | | |
Total Common Stocks (Cost $377,866,849) | | | 475,085,614 | | |
Collateral for Securities Loaned^ (0.0%) (c) | |
BlackRock Liquidity Funds TempFund Portfolio, Institutional Class, 0.08% (d) | | | 1,261 | | | | 1,261 | | |
Fidelity Investments Money Market Government Portfolio, Class I, 0.01% (d) | | | 43,308 | | | | 43,308 | | |
Goldman Sachs Financial Square Prime Obligations Fund, Institutional
Class, 0.04% (d) | | | 629 | | | | 629 | | |
JPMorgan Prime Money Market Fund, Capital Class, 0.12% (d) | | | 5,016 | | | | 5,016 | | |
Morgan Stanley Institutional Liquidity Prime Portfolio, Institutional
Class, 0.09% (d) | | | 22,553 | | | | 22,553 | | |
Total Collateral for Securities Loaned (Cost $72,767) | | | 72,767 | | |
Total Investments (Cost $377,939,616) — 99.5% | | | 475,158,381 | | |
Other assets in excess of liabilities — 0.5% | | | 2,403,899 | | |
NET ASSETS — 100.00% | | $ | 477,562,280 | | |
^ Purchased with cash collateral from securities on loan.
(a) Non-income producing security.
(b) All or a portion of this security is on loan.
See notes to financial statements.
34
Victory Portfolios
Victory RS Large Cap Alpha Fund | | Schedule of Portfolio Investments — continued
December 31, 2020 | |
(c) Amount represents less than 0.05% of net assets.
(d) Rate disclosed is the daily yield on December 31, 2020.
LP — Limited Partnership
PLC — Public Limited Company
See notes to financial statements.
35
Victory Portfolios
Victory RS Investors Fund | | Schedule of Portfolio Investments
December 31, 2020 | |
Security Description | | Shares | | Value | |
Common Stocks (99.6%) | |
Banks (10.4%): | |
Citizens Financial Group, Inc. | | | 24,780 | | | $ | 886,133 | | |
JPMorgan Chase & Co. | | | 10,300 | | | | 1,308,821 | | |
KeyCorp | | | 43,670 | | | | 716,625 | | |
| | | | 2,911,579 | | |
Capital Markets (2.7%): | |
Cboe Global Markets, Inc. | | | 8,150 | | | | 758,928 | | |
Communication Services (5.4%): | |
Alphabet, Inc., Class A (a) | | | 452 | | | | 792,193 | | |
Facebook, Inc., Class A (a) | | | 2,630 | | | | 718,411 | | |
| | | | 1,510,604 | | |
Consumer Discretionary (7.8%): | |
Dollar Tree, Inc. (a) | | | 8,170 | | | | 882,687 | | |
LKQ Corp. (a) | | | 36,580 | | | | 1,289,079 | | |
| | | | 2,171,766 | | |
Consumer Staples (7.8%): | |
Keurig Dr Pepper, Inc. | | | 43,900 | | | | 1,404,800 | | |
TreeHouse Foods, Inc. (a) | | | 18,060 | | | | 767,369 | | |
| | | | 2,172,169 | | |
Health Care (6.6%): | |
Cigna Corp. | | | 4,300 | | | | 895,174 | | |
Humana, Inc. | | | 1,330 | | | | 545,659 | | |
Zimmer Biomet Holdings, Inc. | | | 2,520 | | | | 388,307 | | |
| | | | 1,829,140 | | |
Industrials (9.9%): | |
Atkore International Group, Inc. (a) | | | 17,000 | | | | 698,870 | | |
Meritor, Inc. (a) | | | 16,100 | | | | 449,351 | | |
Sensata Technologies Holding PLC (a) | | | 15,510 | | | | 817,997 | | |
TFI International, Inc. (b) | | | 15,750 | | | | 810,951 | | |
| | | | 2,777,169 | | |
Information Technology (12.5%): | |
Euronet Worldwide, Inc. (a) | | | 6,740 | | | | 976,761 | | |
Talend SA, ADR (a) (b) | | | 14,000 | | | | 536,760 | | |
Verint Systems, Inc. (a) | | | 29,480 | | | | 1,980,466 | | |
| | | | 3,493,987 | | |
Insurance (14.6%): | |
Alleghany Corp. | | | 1,730 | | | | 1,044,384 | | |
RenaissanceRe Holdings Ltd. | | | 8,370 | | | | 1,387,913 | | |
Safety Insurance Group, Inc. | | | 10,520 | | | | 819,508 | | |
Stewart Information Services Corp. | | | 16,570 | | | | 801,325 | | |
| | | | 4,053,130 | | |
See notes to financial statements.
36
Victory Portfolios
Victory RS Investors Fund | | Schedule of Portfolio Investments — continued
December 31, 2020 | |
Security Description | | Shares | | Value | |
Materials (12.3%): | |
Graphic Packaging Holding Co. | | | 106,190 | | | $ | 1,798,859 | | |
Sealed Air Corp. | | | 35,230 | | | | 1,613,182 | | |
| | | | 3,412,041 | | |
Utilities (9.6%): | |
The AES Corp. | | | 30,500 | | | | 716,750 | | |
Vistra Corp. | | | 99,920 | | | | 1,964,427 | | |
| | | | 2,681,177 | | |
Total Common Stocks (Cost $21,909,592) | | | 27,771,690 | | |
Collateral for Securities Loaned^ (2.8%) | |
BlackRock Liquidity Funds TempFund Portfolio, Institutional Class, 0.08% (c) | | | 13,576 | | | | 13,576 | | |
Fidelity Investments Money Market Government Portfolio, Class I, 0.01% (c) | | | 466,427 | | | | 466,427 | | |
Goldman Sachs Financial Square Prime Obligations Fund, Institutional
Class, 0.04% (c) | | | 6,775 | | | | 6,775 | | |
JPMorgan Prime Money Market Fund, Capital Class, 0.12% (c) | | | 54,024 | | | | 54,024 | | |
Morgan Stanley Institutional Liquidity Prime Portfolio, Institutional
Class, 0.09% (c) | | | 242,902 | | | | 242,902 | | |
Total Collateral for Securities Loaned (Cost $783,704) | | | 783,704 | | |
Total Investments (Cost $22,693,296) — 102.4% | | | 28,555,394 | | |
Liabilities in excess of other assets — (2.4)% | | | (677,946 | ) | |
NET ASSETS — 100.00% | | $ | 27,877,448 | | |
^ Purchased with cash collateral from securities on loan.
(a) Non-income producing security.
(b) All or a portion of this security is on loan.
(c) Rate disclosed is the daily yield on December 31, 2020.
ADR — American Depositary Receipt
PLC — Public Limited Company
See notes to financial statements.
37
Victory Portfolios
Victory Global Natural Resources Fund | | Schedule of Portfolio Investments
December 31, 2020 | |
Security Description | | Shares | | Value | |
Common Stocks (93.2%) | |
Chemicals (3.9%): | |
Sociedad Quimica y Minera de Chile SA, ADR (a) | | | 126,936 | | | $ | 6,231,288 | | |
Metals & Mining (35.0%): | |
Antofagasta PLC | | | 135,349 | | | | 2,667,491 | | |
First Quantum Minerals Ltd. (a) | | | 886,982 | | | | 15,924,836 | | |
Lundin Mining Corp. | | | 283,440 | | | | 2,516,596 | | |
Newmont Corp. | | | 113,853 | | | | 6,818,656 | | |
Rio Tinto PLC, ADR | | | 31,120 | | | | 2,340,846 | | |
Turquoise Hill Resources Ltd. (b) | | | 2,050,230 | | | | 25,463,857 | | |
| | | | 55,732,282 | | |
Oil, Gas & Consumable Fuels (54.3%): | |
Antero Resources Corp. (b) | | | 1,376,535 | | | | 7,502,116 | | |
ARC Resources Ltd. | | | 1,600,624 | | | | 7,545,961 | | |
Berry Petroleum Corp. | | | 385,306 | | | | 1,417,926 | | |
Cheniere Energy, Inc. (b) | | | 81,847 | | | | 4,913,275 | | |
Concho Resources, Inc. | | | 92,367 | | | | 5,389,614 | | |
PDC Energy, Inc. (b) | | | 369,967 | | | | 7,595,423 | | |
Peyto Exploration & Development Corp. | | | 3,284,714 | | | | 7,536,234 | | |
Range Resources Corp. (b) | | | 3,470,886 | | | | 23,254,937 | | |
Tourmaline Oil Corp. | | | 561,277 | | | | 7,567,780 | | |
Whitecap Resources, Inc. | | | 3,566,565 | | | | 13,619,474 | | |
| | | | 86,342,740 | | |
Total Common Stocks (Cost $163,259,095) | | | 148,306,310 | | |
Collateral for Securities Loaned^ (1.7%) | |
BlackRock Liquidity Funds TempFund Portfolio, Institutional Class, 0.08% (c) | | | 46,409 | | | | 46,409 | | |
Fidelity Investments Money Market Government Portfolio, Class I, 0.01% (c) | | | 1,594,424 | | | | 1,594,424 | | |
Goldman Sachs Financial Square Prime Obligations Fund, Institutional
Class, 0.04% (c) | | | 23,160 | | | | 23,160 | | |
JPMorgan Prime Money Market Fund, Capital Class, 0.12% (c) | | | 184,674 | | | | 184,674 | | |
Morgan Stanley Institutional Liquidity Prime Portfolio, Institutional
Class, 0.09% (c) | | | 830,331 | | | | 830,331 | | |
Total Collateral for Securities Loaned (Cost $2,678,998) | | | 2,678,998 | | |
Total Investments (Cost $165,938,093) — 94.9% | | | 150,985,308 | | |
Other assets in excess of liabilities — 5.1% | | | 8,119,732 | | |
NET ASSETS — 100.00% | | $ | 159,105,040 | | |
^ Purchased with cash collateral from securities on loan.
(a) All or a portion of this security is on loan.
(b) Non-income producing security.
(c) Rate disclosed is the daily yield on December 31, 2020.
ADR — American Depositary Receipt
PLC — Public Limited Company
See notes to financial statements.
38
Victory Portfolios | | Statements of Assets and Liabilities
December 31, 2020 | |
| | | Victory
RS Partners
Fund | | Victory
RS Value
Fund | | Victory
RS Large
Cap Alpha
Fund | |
ASSETS: | |
Investments, at value (Cost $269,108,339,
$260,951,221 and $377,939,616) | | $ | 345,212,181 | (a) | | $ | 314,499,012 | (b) | | $ | 475,158,381 | (c) | |
Cash and cash equivalents | | | 13,095,572 | | | | 2,657,025 | | | | 1,284,462 | | |
Receivables: | |
Interest and dividends | | | 412,376 | | | | 246,095 | | | | 330,966 | | |
Capital shares issued | | | 134,268 | | | | 177,856 | | | | 13,783 | | |
Investments sold | | | — | | | | 154,265 | | | | 13,304,030 | | |
From Adviser | | | 32,627 | | | | 15,758 | | | | 34,313 | | |
Prepaid expenses | | | 16,710 | | | | 4,219 | | | | 1,033 | | |
Total Assets | | | 358,903,734 | | | | 317,754,230 | | | | 490,126,968 | | |
LIABILITIES: | |
Payables: | |
Collateral received on loaned securities | | | 18,186,593 | | | | 9,026,020 | | | | 72,767 | | |
Investments purchased | | | — | | | | — | | | | 11,880,340 | | |
Capital shares redeemed | | | 14,056,613 | | | | 409,656 | | | | 232,465 | | |
Accrued expenses and other payables: | |
Investment advisory fees | | | 286,720 | | | | 219,003 | | | | 200,520 | | |
Administration fees | | | 17,403 | | | | 15,711 | | | | 24,590 | | |
Custodian fees | | | 6,176 | | | | 6,032 | | | | 3,612 | | |
Transfer agent fees | | | 53,927 | | | | 51,570 | | | | 65,422 | | |
Compliance fees | | | 234 | | | | 211 | | | | 329 | | |
Trustees' fees | | | 14 | | | | 12 | | | | 218 | | |
| 12b-1 fees | | | 17,460 | | | | 18,827 | | | | 54,128 | | |
Other accrued expenses | | | 37,973 | | | | 51,868 | | | | 30,297 | | |
Total Liabilities | | | 32,663,113 | | | | 9,798,910 | | | | 12,564,688 | | |
NET ASSETS: | |
| Capital | | | 260,836,402 | | | | 266,041,831 | | | | 376,864,557 | | |
Total accumulated earnings/(loss) | | | 65,404,219 | | | | 41,913,489 | | | | 100,697,723 | | |
Net Assets | | $ | 326,240,621 | | | $ | 307,955,320 | | | $ | 477,562,280 | | |
Net Assets | |
Class A Shares | | $ | 156,629,468 | | | $ | 162,145,013 | | | $ | 444,159,732 | | |
Class C Shares | | | — | | | | 2,618,169 | | | | 11,325,588 | | |
Class R Shares | | | 1,421,391 | | | | 677,309 | | | | 6,065,646 | | |
Class Y Shares | | | 168,087,443 | | | | 142,514,829 | | | | 16,011,314 | | |
Member Class | | | 102,319 | | | | — | | | | — | | |
Total | | $ | 326,240,621 | | | $ | 307,955,320 | | | $ | 477,562,280 | | |
Shares (unlimited number of shares authorized
with a par value of $0.001 per share): | |
Class A Shares | | | 6,470,710 | | | | 6,846,259 | | | | 8,778,731 | | |
Class C Shares | | | — | | | | 126,776 | | | | 269,199 | | |
Class R Shares | | | 65,651 | | | | 30,407 | | | | 120,642 | | |
Class Y Shares | | | 6,466,152 | | | | 5,845,916 | | | | 317,869 | | |
Member Class | | | 4,225 | | | | — | | | | — | | |
Total | | | 13,006,738 | | | | 12,849,358 | | | | 9,486,441 | | |
Net asset value, offering (except Class A Shares)
and redemption price per share: | |
Class A Shares | | $ | 24.21 | | | $ | 23.68 | | | $ | 50.59 | | |
Class C Shares (d) | | | — | | | | 20.65 | | | | 42.07 | | |
Class R Shares | | | 21.65 | | | | 22.27 | | | | 50.28 | | |
Class Y Shares | | | 25.99 | | | | 24.38 | | | | 50.37 | | |
Member Class | | | 24.22 | | | | — | | | | — | | |
Maximum Sales Charge — Class A Shares | | | 5.75 | % | | | 5.75 | % | | | 5.75 | % | |
Maximum offering price (100%/(100%-maximum
sales charge) of net asset value adjusted to the
nearest cent) per share — Class A Shares | | $ | 25.69 | | | $ | 25.12 | | | $ | 53.68 | | |
(a) Includes $17,574,751 of securities on loan.
(b) Includes $8,641,535 of securities on loan.
(c) Includes $72,460 of securities on loan.
(d) Redemption price per share varies by the length of time shares are held.
See notes to financial statements.
39
Victory Portfolios | | Statements of Assets and Liabilities
December 31, 2020 | |
| | | Victory
RS Investors
Fund | | Victory
Global Natural
Resources
Fund | |
ASSETS: | |
Investments, at value (Cost $22,693,296 and $165,938,093) | | $ | 28,555,394 | (a) | | $ | 150,985,308 | (b) | |
Foreign currency, at value (Cost $— and $47,776) | | | — | | | | 47,504 | | |
Cash and cash equivalents | | | 154,129 | | | | 9,947,689 | | |
Receivables: | |
Interest and dividends | | | 13,181 | | | | 119,356 | | |
Capital shares issued | | | 2,454 | | | | 141,528 | | |
Investments sold | | | — | | | | 1,428,373 | | |
From Adviser | | | 20,339 | | | | 19,685 | | |
Prepaid expenses | | | 382 | | | | 1,887 | | |
Total Assets | | | 28,745,879 | | | | 162,691,330 | | |
LIABILITIES: | |
Payables: | |
Collateral received on loaned securities | | | 783,704 | | | | 2,678,998 | | |
Investments purchased | | | — | | | | 573,269 | | |
Capital shares redeemed | | | 7,321 | | | | 99,999 | | |
Accrued expenses and other payables: | |
Investment advisory fees | | | 23,274 | | | | 131,796 | | |
Administration fees | | | 1,409 | | | | 7,528 | | |
Custodian fees | | | 724 | | | | 3,536 | | |
Transfer agent fees | | | 6,207 | | | | 29,818 | | |
Compliance fees | | | 19 | | | | 103 | | |
Trustees' fees | | | 1 | | | | 17 | | |
| 12b-1 fees | | | 2,938 | | | | 5,188 | | |
Other accrued expenses | | | 42,834 | | | | 56,038 | | |
Total Liabilities | | | 868,431 | | | | 3,586,290 | | |
NET ASSETS: | |
Capital | | | 24,204,958 | | | | 2,083,247,576 | | |
Total accumulated earnings/(loss) | | | 3,672,490 | | | | (1,924,142,536 | ) | |
Net Assets | | $ | 27,877,448 | | | $ | 159,105,040 | | |
Net Assets | |
Class A Shares | | $ | 12,663,281 | | | $ | 36,802,698 | | |
Class C Shares | | | 3,305,992 | | | | 2,385,333 | | |
Class R Shares | | | 655,071 | | | | 680,063 | | |
Class Y Shares | | | 11,253,104 | | | | 119,236,946 | | |
Total | | $ | 27,877,448 | | | $ | 159,105,040 | | |
Shares (unlimited number of shares authorized with a
par value of $0.001 per share): | |
Class A Shares | | | 986,287 | | | | 2,977,907 | | |
Class C Shares | | | 294,582 | | | | 216,757 | | |
Class R Shares | | | 57,404 | | | | 58,507 | | |
Class Y Shares | | | 849,915 | | | | 9,257,569 | | |
Total | | | 2,188,188 | | | | 12,510,740 | | |
Net asset value, offering (except Class A Shares) and
redemption price per share: | |
Class A Shares | | $ | 12.84 | | | $ | 12.36 | | |
Class C Shares (c) | | | 11.22 | | | | 11.00 | | |
Class R Shares | | | 11.41 | | | | 11.62 | | |
Class Y Shares | | | 13.24 | | | | 12.88 | | |
Maximum Sales Charge — Class A Shares | | | 5.75 | % | | | 5.75 | % | |
Maximum offering price (100%/(100%-maximum
sales charge) of net asset value adjusted to the
nearest cent) per share — Class A Shares | | $ | 13.62 | | | $ | 13.11 | | |
(a) Includes $764,600 of securities on loan.
(b) Includes $2,480,716 of securities on loan.
(c) Redemption price per share varies by the length of time shares are held.
See notes to financial statements.
40
Victory Portfolios | | Statements of Operations
For the Year Ended December 31, 2020 | |
| | | Victory
RS Partners
Fund | | Victory
RS Value
Fund | | Victory
RS Large
Cap Alpha
Fund | |
Investment Income: | |
Dividends | | $ | 5,232,234 | | | $ | 4,209,717 | | | $ | 9,129,759 | | |
Interest | | | 55,133 | | | | 52,878 | | | | 70,796 | | |
Securities lending (net of fees) | | | 52,846 | | | | 54,856 | | | | 16,689 | | |
Foreign tax withholding | | | (31,237 | ) | | | (22,343 | ) | | | (28,840 | ) | |
Total Income | | | 5,308,976 | | | | 4,295,108 | | | | 9,188,404 | | |
Expenses: | |
Investment advisory fees | | | 3,205,189 | | | | 2,538,968 | | | | 2,273,188 | | |
Administration fees | | | 194,621 | | | | 181,455 | | | | 276,280 | | |
Sub-Administration fees | | | 14,132 | | | | 12,257 | | | | 11,222 | | |
12b-1 fees — Class A Shares | | | 358,430 | | | | 393,850 | | | | 1,051,673 | | |
12b-1 fees — Class C Shares | | | — | | | | 30,036 | | | | 124,665 | | |
12b-1 fees — Class R Shares | | | 6,195 | | | | 3,638 | | | | 30,080 | | |
Custodian fees | | | 25,787 | | | | 21,201 | | | | 22,821 | | |
Transfer agent fees — Class A Shares | | | 205,142 | | | | 212,455 | | | | 418,363 | | |
Transfer agent fees — Class C Shares | | | — | | | | 3,467 | | | | 9,812 | | |
Transfer agent fees — Class R Shares | | | 2,581 | | | | 1,627 | | | | 11,059 | | |
Transfer agent fees — Class Y Shares | | | 145,047 | | | | 162,117 | | | | 16,511 | | |
Transfer agent fees — Member Class (a) | | | 580 | | | | — | | | | — | | |
Trustees' fees | | | 29,500 | | | | 27,389 | | | | 40,104 | | |
Compliance fees | | | 2,837 | | | | 2,650 | | | | 4,009 | | |
Legal and audit fees | | | 36,744 | | | | 28,958 | | | | 40,707 | | |
State registration and filing fees | | | 66,862 | | | | 76,843 | | | | 71,567 | | |
Other expenses | | | 91,559 | | | | 78,632 | | | | 45,980 | | |
Total Expenses | | | 4,385,206 | | | | 3,775,543 | | | | 4,448,041 | | |
Expenses waived/reimbursed by Adviser | | | (316,786 | ) | | | (199,071 | ) | | | (314,607 | ) | |
Net Expenses | | | 4,068,420 | | | | 3,576,472 | | | | 4,133,434 | | |
Net Investment Income (Loss) | | | 1,240,556 | | | | 718,636 | | | | 5,054,970 | | |
Realized/Unrealized Gains (Losses) from
Investments: | |
Net realized gains (losses) from investment
securities and foreign currency translations | | | (11,698,940 | ) | | | (12,229,730 | ) | | | (4,201,598 | ) | |
Net change in unrealized appreciation/
depreciation on investment securities and
foreign currency translations | | | (4,653,083 | ) | | | (9,051,390 | ) | | | (17,104,453 | ) | |
Net realized/unrealized gains (losses)
on investments | | | (16,352,023 | ) | | | (21,281,120 | ) | | | (21,306,051 | ) | |
Change in net assets resulting from operations | | $ | (15,111,467 | ) | | $ | (20,562,484 | ) | | $ | (16,251,081 | ) | |
(a) Victory RS Partners Fund Member Class commenced operations on November 3, 2020.
See notes to financial statements.
41
Victory Portfolios | | Statements of Operations
For the Year Ended December 31, 2020 | |
| | | Victory
RS Investors
Fund | | Victory
Global Natural
Resources
Fund | |
Investment Income: | |
Dividends | | $ | 354,155 | | | $ | 1,666,115 | | |
Interest | | | 6,494 | | | | 21,741 | | |
Securities lending (net of fees) | | | 1,440 | | | | 39,971 | | |
Foreign tax withholding | | | (1,675 | ) | | | (170,527 | ) | |
Total Income | | | 360,414 | | | | 1,557,300 | | |
Expenses: | |
Investment advisory fees | | | 292,916 | | | | 1,173,199 | | |
Administration fees | | | 17,774 | | | | 71,178 | | |
Sub-Administration fees | | | 11,222 | | | | 11,222 | | |
12b-1 fees — Class A Shares | | | 30,308 | | | | 66,587 | | |
12b-1 fees — Class C Shares | | | 44,359 | | | | 19,095 | | |
12b-1 fees — Class R Shares | | | 3,440 | | | | 2,210 | | |
Custodian fees | | | 3,359 | | | | 17,060 | | |
Transfer agent fees — Class A Shares | | | 15,917 | | | | 84,411 | | |
Transfer agent fees — Class C Shares | | | 6,073 | | | | 7,112 | | |
Transfer agent fees — Class R Shares | | | 1,617 | | | | 1,188 | | |
Transfer agent fees — Class Y Shares | | | 16,173 | | | | 103,342 | | |
Trustees' fees | | | 4,104 | | | | 10,983 | | |
Compliance fees | | | 262 | | | | 1,034 | | |
Legal and audit fees | | | 9,516 | | | | 16,835 | | |
State registration and filing fees | | | 72,301 | | | | 80,057 | | |
Interfund lending fees | | | 185 | | | | — | | |
Other expenses | | | 9,589 | | | | 30,623 | | |
Total Expenses | | | 539,115 | | | | 1,696,136 | | |
Expenses waived/reimbursed by Adviser | | | (146,600 | ) | | | (234,015 | ) | |
Net Expenses | | | 392,515 | | | | 1,462,121 | | |
Net Investment Income (Loss) | | | (32,101 | ) | | | 95,179 | | |
Realized/Unrealized Gains (Losses) from Investments: | |
Net realized gains (losses) from investment securities and
foreign currency translations | | | (2,049,123 | ) | | | (156,274,442 | ) | |
Net change in unrealized appreciation/depreciation on
investment securities and foreign currency translations | | | (1,336,814 | ) | | | 185,771,622 | | |
Net realized/unrealized gains (losses) on investments | | | (3,385,937 | ) | | | 29,497,180 | | |
Change in net assets resulting from operations | | $ | (3,418,038 | ) | | $ | 29,592,359 | | |
See notes to financial statements.
42
Victory Portfolios | | Statements of Changes in Net Assets | |
| | | Victory
RS Partners
Fund | | Victory
RS Value
Fund | | Victory
RS Large Cap Alpha
Fund | |
| | | Year
Ended
December 31,
2020 | | Year
Ended
December 31,
2019 | | Year
Ended
December 31,
2020 | | Year
Ended
December 31,
2019 | | Year
Ended
December 31,
2020 | | Year
Ended
December 31,
2019 | |
From Investment Activities: | |
Operations: | |
Net investment
income (loss) | | $ | 1,240,556 | | | $ | 2,920,104 | | | $ | 718,636 | | | $ | 1,449,500 | | | $ | 5,054,970 | | | $ | 5,431,363 | | |
Net realized gains
(losses) from
investments | | | (11,698,940 | ) | | | 40,883,294 | | | | (12,229,730 | ) | | | 34,077,370 | | | | (4,201,598 | ) | | | 27,752,926 | | |
Net change in
unrealized
appreciation/
depreciation
on investments | | | (4,653,083 | ) | | | 74,331,906 | | | | (9,051,390 | ) | | | 69,785,270 | | | | (17,104,453 | ) | | | 109,044,824 | | |
Change in net assets
resulting from
operations | | | (15,111,467 | ) | | | 118,135,304 | | | | (20,562,484 | ) | | | 105,312,140 | | | | (16,251,081 | ) | | | 142,229,113 | | |
Distributions to
Shareholders: | |
Class A Shares | | | (2,382,023 | ) | | | (18,545,144 | ) | | | (3,101,649 | ) | | | (14,419,529 | ) | | | (16,466,861 | ) | | | (19,425,553 | ) | |
Class C Shares | | | — | | | | — | | | | (57,388 | ) | | | (350,766 | ) | | | (464,103 | ) | | | (621,209 | ) | |
Class R Shares | | | (24,191 | ) | | | (152,466 | ) | | | (13,629 | ) | | | (70,532 | ) | | | (206,060 | ) | | | (249,827 | ) | |
Class Y Shares | | | (2,572,869 | ) | | | (23,073,509 | ) | | | (2,641,513 | ) | | | (12,497,492 | ) | | | (617,022 | ) | | | (786,292 | ) | |
Member Class (a) | | | (1,246 | ) | | | — | | | | — | | | | — | | | | — | | | | — | | |
Change in net assets
resulting from
distributions to
shareholders | | | (4,980,329 | ) | | | (41,771,119 | ) | | | (5,814,179 | ) | | | (27,338,319 | ) | | | (17,754,046 | ) | | | (21,082,881 | ) | |
Change in net assets
resulting from
capital transactions | | | (81,239,459 | ) | | | (76,430,849 | ) | | | (55,511,801 | ) | | | (44,649,999 | ) | | | (52,872,803 | ) | | | (42,142,778 | ) | |
Change in net assets | | | (101,331,255 | ) | | | (66,664 | ) | | | (81,888,464 | ) | | | 33,323,822 | | | | (86,877,930 | ) | | | 79,003,454 | | |
Net Assets: | |
Beginning of period | | | 427,571,876 | | | | 427,638,540 | | | | 389,843,784 | | | | 356,519,962 | | | | 564,440,210 | | | | 485,436,756 | | |
End of period | | $ | 326,240,621 | | | $ | 427,571,876 | | | $ | 307,955,320 | | | $ | 389,843,784 | | | $ | 477,562,280 | | | $ | 564,440,210 | | |
(a) Victory RS Partners Fund Member Class commenced operations on November 3, 2020.
(continues on next page)
See notes to financial statements.
43
Victory Portfolios | | Statements of Changes in Net Assets | |
(continued)
| | | Victory
RS Partners
Fund | | Victory
RS Value
Fund | | Victory
RS Large Cap Alpha
Fund | |
| | | Year
Ended
December 31,
2020 | | Year
Ended
December 31,
2019 | | Year
Ended
December 31,
2020 | | Year
Ended
December 31,
2019 | | Year
Ended
December 31,
2020 | | Year
Ended
December 31,
2019 | |
Capital Transactions: | |
Class A Shares | |
Proceeds from shares
issued | | $ | 8,056,549 | | | $ | 16,579,793 | | | $ | 10,671,316 | | | $ | 13,105,632 | | | $ | 15,044,197 | | | $ | 17,052,317 | | |
Distributions reinvested | | | 2,346,101 | | | | 18,238,219 | | | | 3,021,005 | | | | 14,014,003 | | | | 16,006,543 | | | | 18,921,963 | | |
Cost of shares redeemed | | | (38,903,637 | ) | | | (48,748,054 | ) | | | (43,963,514 | ) | | | (38,839,092 | ) | | | (76,615,653 | ) | | | (65,297,079 | ) | |
Total Class A Shares | | $ | (28,500,987 | ) | | $ | (13,930,042 | ) | | $ | (30,271,193 | ) | | $ | (11,719,457 | ) | | $ | (45,564,913 | ) | | $ | (29,322,799 | ) | |
Class C Shares | |
Proceeds from shares
issued | | $ | — | | | $ | — | | | $ | 111,055 | | | $ | 576,327 | | | $ | 228,965 | | | $ | 612,718 | | |
Distributions reinvested | | | — | | | | — | | | | 57,388 | | | | 332,779 | | | | 464,103 | | | | 578,811 | | |
Cost of shares redeemed | | | — | | | | — | | | | (1,886,466 | ) | | | (7,244,004 | ) | | | (4,905,429 | ) | | | (6,481,288 | ) | |
Total Class C Shares | | $ | — | | | $ | — | | | $ | (1,718,023 | ) | | $ | (6,334,898 | ) | | $ | (4,212,361 | ) | | $ | (5,289,759 | ) | |
Class R Shares | |
Proceeds from shares
issued | | $ | 336,137 | | | $ | 150,948 | | | $ | 58,505 | | | $ | 97,915 | | | $ | 908,104 | | | $ | 546,882 | | |
Distributions reinvested | | | 24,191 | | | | 152,466 | | | | 13,629 | | | | 70,532 | | | | 206,047 | | | | 247,948 | | |
Cost of shares redeemed | | | (421,656 | ) | | | (207,402 | ) | | | (319,314 | ) | | | (380,522 | ) | | | (1,850,065 | ) | | | (1,453,937 | ) | |
Total Class R Shares | | $ | (61,328 | ) | | $ | 96,012 | | | $ | (247,180 | ) | | $ | (212,075 | ) | | $ | (735,914 | ) | | $ | (659,107 | ) | |
Class Y Shares | |
Proceeds from shares
issued | | $ | 28,022,881 | | | $ | 42,480,816 | | | $ | 18,473,898 | | | $ | 17,702,861 | | | $ | 2,949,615 | | | $ | 4,219,718 | | |
Distributions reinvested | | | 2,567,572 | | | | 22,957,985 | | | | 2,604,139 | | | | 12,251,365 | | | | 596,266 | | | | 759,111 | | |
Cost of shares redeemed | | | (83,363,101 | ) | | | (128,035,620 | ) | | | (44,353,442 | ) | | | (56,337,795 | ) | | | (5,905,496 | ) | | | (11,849,942 | ) | |
Total Class Y Shares | | $ | (52,772,648 | ) | | $ | (62,596,819 | ) | | $ | (23,275,405 | ) | | $ | (26,383,569 | ) | | $ | (2,359,615 | ) | | $ | (6,871,113 | ) | |
Member Class (a) | |
Proceeds from shares
issued | | $ | 94,259 | | | $ | — | | | $ | — | | | $ | — | | | $ | — | | | $ | — | | |
Distributions reinvested | | | 1,245 | | | | — | | | | — | | | | — | | | | — | | | | — | | |
Total Member Class | | $ | 95,504 | | | $ | — | | | $ | — | | | $ | — | | | $ | — | | | $ | — | | |
Change in net assets resulting
from capital transactions | | $ | (81,239,459 | ) | | $ | (76,430,849 | ) | | $ | (55,511,801 | ) | | $ | (44,649,999 | ) | | $ | (52,872,803 | ) | | $ | (42,142,778 | ) | |
(a) Victory RS Partners Fund Member Class commenced operations on November 3, 2020.
(continues on next page)
See notes to financial statements.
44
Victory Portfolios | | Statements of Changes in Net Assets | |
(continued)
| | | Victory
RS Partners
Fund | | Victory
RS Value
Fund | | Victory
RS Large Cap Alpha
Fund | |
| | | Year
Ended
December 31,
2020 | | Year
Ended
December 31,
2019 | | Year
Ended
December 31,
2020 | | Year
Ended
December 31,
2019 | | Year
Ended
December 31,
2020 | | Year
Ended
December 31,
2019 | |
Share Transactions: | |
Class A Shares | |
Issued | | | 411,941 | | | | 691,105 | | | | 545,133 | | | | 542,728 | | | | 327,242 | | | | 343,113 | | |
Reinvested | | | 98,163 | | | | 758,032 | | | | 130,384 | | | | 567,685 | | | | 321,465 | | | | 357,509 | | |
Redeemed | | | (1,952,159 | ) | | | (2,042,889 | ) | | | (2,185,810 | ) | | | (1,607,052 | ) | | | (1,663,736 | ) | | | (1,309,527 | ) | |
Total Class A Shares | | | (1,442,055 | ) | | | (593,752 | ) | | | (1,510,293 | ) | | | (496,639 | ) | | | (1,015,029 | ) | | | (608,905 | ) | |
Class C Shares | |
Issued | | | — | | | | — | | | | 6,149 | | | | 27,312 | | | | 6,096 | | | | 14,939 | | |
Reinvested | | | — | | | | — | | | | 2,840 | | | | 15,378 | | | | 11,226 | | | | 13,077 | | |
Redeemed | | | — | | | | — | | | | (105,185 | ) | | | (341,331 | ) | | | (129,105 | ) | | | (156,432 | ) | |
Total Class C Shares | | | — | | | | — | | | | (96,196 | ) | | | (298,641 | ) | | | (111,783 | ) | | | (128,416 | ) | |
Class R Shares | |
Issued | | | 19,278 | | | | 6,910 | | | | 3,076 | | | | 4,276 | | | | 19,865 | | | | 11,149 | | |
Reinvested | | | 1,131 | | | | 7,039 | | | | 625 | | | | 3,033 | | | | 4,172 | | | | 4,724 | | |
Redeemed | | | (23,375 | ) | | | (9,594 | ) | | | (16,873 | ) | | | (16,629 | ) | | | (40,294 | ) | | | (30,091 | ) | |
Total Class R Shares | | | (2,966 | ) | | | 4,355 | | | | (13,172 | ) | | | (9,320 | ) | | | (16,257 | ) | | | (14,218 | ) | |
Class Y Shares | |
Issued | | | 1,326,866 | | | | 1,651,373 | | | | 931,019 | | | | 717,334 | | | | 60,906 | | | | 84,116 | | |
Reinvested | | | 100,022 | | | | 895,516 | | | | 109,188 | | | | 482,657 | | | | 12,016 | | | | 14,386 | | |
Redeemed | | | (3,844,005 | ) | | | (5,089,360 | ) | | | (2,139,626 | ) | | | (2,273,518 | ) | | | (133,707 | ) | | | (239,430 | ) | |
Total Class Y Shares | | | (2,417,117 | ) | | | (2,542,471 | ) | | | (1,099,419 | ) | | | (1,073,527 | ) | | | (60,785 | ) | | | (140,928 | ) | |
Member Class (a) | |
Issued | | | 4,173 | | | | — | | | | — | | | | — | | | | — | | | | — | | |
Reinvested | | | 52 | | | | — | | | | — | | | | — | | | | — | | | | — | | |
Total Member Class | | | 4,225 | | | | — | | | | — | | | | — | | | | — | | | | — | | |
Change in Shares | | | (3,857,913 | ) | | | (3,131,868 | ) | | | (2,719,080 | ) | | | (1,878,127 | ) | | | (1,203,854 | ) | | | (892,467 | ) | |
(a) Victory RS Partners Fund Member Class commenced operations on November 3, 2020.
See notes to financial statements.
45
Victory Portfolios | | Statements of Changes in Net Assets | |
| | | Victory RS Investors
Fund | | Victory
Global Natural Resources
Fund | |
| | | Year
Ended
December 31,
2020 | | Year
Ended
December 31,
2019 | | Year
Ended
December 31,
2020 | | Year
Ended
December 31,
2019 | |
From Investment Activities: | |
Operations: | |
Net investment income (loss) | | $ | (32,101 | ) | | $ | (12,611 | ) | | $ | 95,179 | | | $ | 698,765 | | |
Net realized gains (losses) from
investments | | | (2,049,123 | ) | | | 1,944,737 | | | | (156,274,442 | ) | | | (302,104,028 | ) | |
Net change in unrealized
appreciation/depreciation
on investments | | | (1,336,814 | ) | | | 8,148,148 | | | | 185,771,622 | | | | 187,635,480 | | |
Change in net assets resulting
from operations | | | (3,418,038 | ) | | | 10,080,274 | | | | 29,592,359 | | | | (113,769,783 | ) | |
Distributions to Shareholders: | |
Class A Shares | | | (38,891 | ) | | | (721,644 | ) | | | (17,431 | ) | | | — | | |
Class C Shares | | | (11,599 | ) | | | (330,965 | ) | | | — | | | | — | | |
Class R Shares | | | (2,189 | ) | | | (38,858 | ) | | | — | | | | — | | |
Class Y Shares | | | (33,498 | ) | | | (779,678 | ) | | | (307,837 | ) | | | (294,977 | ) | |
Change in net assets resulting
from distributions to shareholders | | | (86,177 | ) | | | (1,871,145 | ) | | | (325,268 | ) | | | (294,977 | ) | |
Change in net assets resulting
from capital transactions | | | (12,411,650 | ) | | | (2,879,723 | ) | | | (21,333,904 | ) | | | (200,204,338 | ) | |
Change in net assets | | | (15,915,865 | ) | | | 5,329,406 | | | | 7,933,187 | | | | (314,269,098 | ) | |
Net Assets: | |
Beginning of period | | | 43,793,313 | | | | 38,463,907 | | | | 151,171,853 | | | | 465,440,951 | | |
End of period | | $ | 27,877,448 | | | $ | 43,793,313 | | | $ | 159,105,040 | | | $ | 151,171,853 | | |
(continues on next page)
See notes to financial statements.
46
Victory Portfolios | | Statements of Changes in Net Assets | |
(continued)
| | | Victory RS Investors
Fund | | Victory
Global Natural Resources
Fund | |
| | | Year
Ended
December 31,
2020 | | Year
Ended
December 31,
2019 | | Year
Ended
December 31,
2020 | | Year
Ended
December 31,
2019 | |
Capital Transactions: | |
Class A Shares | |
Proceeds from shares issued | | $ | 1,680,515 | | | $ | 1,270,985 | | | $ | 5,505,577 | | | $ | 9,391,402 | | |
Distributions reinvested | | | 36,157 | | | | 698,892 | | | | 16,618 | | | | — | | |
Cost of shares redeemed | | | (4,654,377 | ) | | | (4,140,546 | ) | | | (8,758,422 | ) | | | (26,068,909 | ) | |
Total Class A Shares | | $ | (2,937,705 | ) | | $ | (2,170,669 | ) | | $ | (3,236,227 | ) | | $ | (16,677,507 | ) | |
Class C Shares | |
Proceeds from shares issued | | $ | 64,083 | | | $ | 400,138 | | | $ | 496,242 | | | $ | 177,189 | | |
Distributions reinvested | | | 11,513 | | | | 279,002 | | | | — | | | | — | | |
Cost of shares redeemed | | | (2,978,451 | ) | | | (2,558,469 | ) | | | (1,312,505 | ) | | | (2,812,027 | ) | |
Total Class C Shares | | $ | (2,902,855 | ) | | $ | (1,879,329 | ) | | $ | (816,263 | ) | | $ | (2,634,838 | ) | |
Class R Shares | |
Proceeds from shares issued | | $ | 46,519 | | | $ | 47,252 | | | $ | 263,387 | | | $ | 264,804 | | |
Distributions reinvested | | | 2,189 | | | | 38,858 | | | | — | | | | — | | |
Cost of shares redeemed | | | (195,450 | ) | | | (243,184 | ) | | | (294,240 | ) | | | (350,859 | ) | |
Total Class R Shares | | $ | (146,742 | ) | | $ | (157,074 | ) | | $ | (30,853 | ) | | $ | (86,055 | ) | |
Class Y Shares | |
Proceeds from shares issued | | $ | 1,952,154 | | | $ | 7,332,552 | | | $ | 22,164,045 | | | $ | 106,594,493 | | |
Distributions reinvested | | | 33,328 | | | | 760,887 | | | | 288,040 | | | | 250,255 | | |
Cost of shares redeemed | | | (8,409,830 | ) | | | (6,766,090 | ) | | | (39,702,646 | ) | | | (287,650,686 | ) | |
Total Class Y Shares | | $ | (6,424,348 | ) | | $ | 1,327,349 | | | $ | (17,250,561 | ) | | $ | (180,805,938 | ) | |
Change in net assets resulting from
capital transactions | | $ | (12,411,650 | ) | | $ | (2,879,723 | ) | | $ | (21,333,904 | ) | | $ | (200,204,338 | ) | |
(continues on next page)
See notes to financial statements.
47
Victory Portfolios | | Statements of Changes in Net Assets | |
(continued)
| | | Victory RS Investors
Fund | | Victory
Global Natural Resources
Fund | |
| | | Year
Ended
December 31,
2020 | | Year
Ended
December 31,
2019 | | Year
Ended
December 31,
2020 | | Year
Ended
December 31,
2019 | |
Share Transactions: | |
Class A Shares | |
Issued | | | 153,026 | | | | 99,510 | | | | 690,679 | | | | 851,433 | | |
Reinvested | | | 2,876 | | | | 53,885 | | | | 1,375 | | | | — | | |
Redeemed | | | (460,596 | ) | | | (331,114 | ) | | | (1,073,725 | ) | | | (2,468,125 | ) | |
Total Class A Shares | | | (304,694 | ) | | | (177,719 | ) | | | (381,671 | ) | | | (1,616,692 | ) | |
Class C Shares | |
Issued | | | 7,008 | | | | 35,207 | | | | 58,179 | | | | 16,952 | | |
Reinvested | | | 1,048 | | | | 24,409 | | | | — | | | | — | | |
Redeemed | | | (311,413 | ) | | | (225,759 | ) | | | (179,802 | ) | | | (275,087 | ) | |
Total Class C Shares | | | (303,357 | ) | | | (166,143 | ) | | | (121,623 | ) | | | (258,135 | ) | |
Class R Shares | |
Issued | | | 4,704 | | | | 4,134 | | | | 32,115 | | | | 28,305 | | |
Reinvested | | | 196 | | | | 3,347 | | | | — | | | | — | | |
Redeemed | | | (19,506 | ) | | | (21,490 | ) | | | (41,381 | ) | | | (36,060 | ) | |
Total Class R Shares | | | (14,606 | ) | | | (14,009 | ) | | | (9,266 | ) | | | (7,755 | ) | |
Class Y Shares | |
Issued | | | 176,376 | | | | 550,472 | | | | 2,643,842 | | | | 8,945,033 | | |
Reinvested | | | 2,572 | | | | 57,038 | | | | 22,860 | | | | 25,407 | | |
Redeemed | | | (750,912 | ) | | | (526,955 | ) | | | (4,779,989 | ) | | | (27,015,945 | ) | |
Total Class Y Shares | | | (571,964 | ) | | | 80,555 | | | | (2,113,287 | ) | | | (18,045,505 | ) | |
Change in Shares | | | (1,194,621 | ) | | | (277,316 | ) | | | (2,625,847 | ) | | | (19,928,087 | ) | |
See notes to financial statements.
48
This page is intentionally left blank.
49
Victory Portfolios | | Financial Highlights | |
For a Share Outstanding Throughout Each Period
| | | | | Investment Activities | | Distributions to
Shareholders From | |
| | | Net Asset
Value,
Beginning of
Period | | Net
Investment
Income
(Loss)(a) | | Net Realized
and Unrealized
Gains (Losses)
on Investments | | Total from
Investment
Activities | | Net
Investment
Income | | Net Realized
Gains from
Investments | |
Victory RS Partners Fund | |
Class A | |
Year Ended 12/31/20 | | $ | 24.47 | | | | 0.04 | | | | 0.07 | (e) | | | 0.11 | | | | — | | | | (0.37 | ) | |
Year Ended 12/31/19 | | $ | 20.66 | | | | 0.12 | | | | 6.12 | | | | 6.24 | | | | (0.21 | ) | | | (2.22 | ) | |
Year Ended 12/31/18 | | $ | 29.21 | | | | 0.04 | | | | (3.52 | ) | | | (3.48 | ) | | | (0.08 | ) | | | (4.99 | ) | |
Year Ended 12/31/17 | | $ | 31.58 | | | | (0.25 | ) | | | 4.78 | | | | 4.53 | | | | — | | | | (6.90 | ) | |
Year Ended 12/31/16 | | $ | 26.89 | | | | (0.12 | ) | | | 6.59 | | | | 6.47 | | | | — | | | | (1.78 | ) | |
Class R | |
Year Ended 12/31/20 | | $ | 22.01 | | | | (0.03 | ) | | | 0.04 | (e) | | | 0.01 | | | | — | | | | (0.37 | ) | |
Year Ended 12/31/19 | | $ | 18.79 | | | | 0.03 | | | | 5.55 | | | | 5.58 | | | | (0.14 | ) | | | (2.22 | ) | |
Year Ended 12/31/18 | | $ | 27.09 | | | | (0.04 | ) | | | (3.27 | ) | | | (3.31 | ) | | | — | | | | (4.99 | ) | |
Year Ended 12/31/17 | | $ | 29.84 | | | | (0.44 | ) | | | 4.59 | | | | 4.15 | | | | — | | | | (6.90 | ) | |
Year Ended 12/31/16 | | $ | 25.57 | | | | (0.21 | ) | | | 6.26 | | | | 6.05 | | | | — | | | | (1.78 | ) | |
Class Y | |
Year Ended 12/31/20 | | $ | 26.17 | | | | 0.12 | | | | 0.07 | (e) | | | 0.19 | | | | — | | | | (0.37 | ) | |
Year Ended 12/31/19 | | $ | 21.94 | | | | 0.21 | | | | 6.52 | | | | 6.73 | | | | (0.28 | ) | | | (2.22 | ) | |
Year Ended 12/31/18 | | $ | 30.67 | | | | 0.14 | | | | (3.71 | ) | | | (3.57 | ) | | | (0.17 | ) | | | (4.99 | ) | |
Year Ended 12/31/17 | | $ | 32.75 | | | | (0.04 | ) | | | 4.86 | | | | 4.82 | | | | — | | | | (6.90 | ) | |
Year Ended 12/31/16 | | $ | 27.75 | | | | (0.03 | ) | | | 6.81 | | | | 6.78 | | | | — | | | | (1.78 | ) | |
Member Class | |
11/3/20(f) through
12/31/20 | | $ | 19.64 | | | | 0.01 | | | | 4.94 | (e) | | | 4.95 | | | | — | | | | (0.37 | ) | |
(a) Per share net investment income (loss) has been calculated using the average daily shares method.
(b) Not annualized for periods less than one year.
(c) Annualized for periods less than one year.
(d) Portfolio turnover is calculated on the basis of the Fund as a whole without distinguishing between the classes of shares issued.
(e) The amount shown for a share outstanding throughout the period does not accord with the change in net assets resulting from operations during the period because of the timing of sales and purchases of fund shares in relation to fluctuating market values during the period.
(f) Commencement of operations.
See notes to financial statements.
50
Victory Portfolios | | Financial Highlights — continued | |
For a Share Outstanding Throughout Each Period
| | | | | Ratios to Average Net Assets | | Supplemental Data | |
| | | Total
Distributions | | Net Asset
Value,
End of
Period | | Total
Return
(Excludes
Sales
Charge)(b) | | Net
Expenses(c) | | Net
Investment
Income
(Loss)(c) | | Gross
Expenses(c) | | Net Assets,
End of
Period
(000's) | | Portfolio
Turnover(b)(d) | |
Victory RS Partners Fund | |
Class A | |
Year Ended 12/31/20 | | | (0.37 | ) | | $ | 24.21 | | | | 0.46 | % | | | 1.45 | % | | | 0.20 | % | | | 1.53 | % | | $ | 156,629 | | | | 108 | % | |
Year Ended 12/31/19 | | | (2.43 | ) | | $ | 24.47 | | | | 30.69 | % | | | 1.45 | % | | | 0.49 | % | | | 1.52 | % | | $ | 193,630 | | | | 57 | % | |
Year Ended 12/31/18 | | | (5.07 | ) | | $ | 20.66 | | | | (12.04 | )% | | | 1.45 | % | | | 0.14 | % | | | 1.52 | % | | $ | 175,723 | | | | 62 | % | |
Year Ended 12/31/17 | | | (6.90 | ) | | $ | 29.21 | | | | 14.21 | % | | | 1.45 | % | | | (0.75 | )% | | | 1.50 | % | | $ | 259,050 | | | | 38 | % | |
Year Ended 12/31/16 | | | (1.78 | ) | | $ | 31.58 | | | | 24.04 | % | | | 1.45 | % | | | (0.44 | )% | | | 1.53 | % | | $ | 378,695 | | | | 60 | % | |
Class R | |
Year Ended 12/31/20 | | | (0.37 | ) | | $ | 21.65 | | | | 0.06 | % | | | 1.81 | % | | | (0.15 | )% | | | 2.87 | % | | $ | 1,421 | | | | 108 | % | |
Year Ended 12/31/19 | | | (2.36 | ) | | $ | 22.01 | | | | 30.26 | % | | | 1.81 | % | | | 0.12 | % | | | 2.63 | % | | $ | 1,510 | | | | 57 | % | |
Year Ended 12/31/18 | | | (4.99 | ) | | $ | 18.79 | | | | (12.39 | )% | | | 1.81 | % | | | (0.16 | )% | | | 2.37 | % | | $ | 1,207 | | | | 62 | % | |
Year Ended 12/31/17 | | | (6.90 | ) | | $ | 27.09 | | | | 13.81 | % | | | 1.81 | % | | | (1.40 | )% | | | 2.28 | % | | $ | 2,168 | | | | 38 | % | |
Year Ended 12/31/16 | | | (1.78 | ) | | $ | 29.84 | | | | 23.64 | % | | | 1.81 | % | | | (0.78 | )% | | | 1.81 | % | | $ | 2,452 | | | | 60 | % | |
Class Y | |
Year Ended 12/31/20 | | | (0.37 | ) | | $ | 25.99 | | | | 0.77 | % | | | 1.12 | % | | | 0.54 | % | | | 1.23 | % | | $ | 168,087 | | | | 108 | % | |
Year Ended 12/31/19 | | | (2.50 | ) | | $ | 26.17 | | | | 31.18 | % | | | 1.12 | % | | | 0.82 | % | | | 1.21 | % | | $ | 232,432 | | | | 57 | % | |
Year Ended 12/31/18 | | | (5.16 | ) | | $ | 21.94 | | | | (11.77 | )% | | | 1.12 | % | | | 0.48 | % | | | 1.19 | % | | $ | 250,709 | | | | 62 | % | |
Year Ended 12/31/17 | | | (6.90 | ) | | $ | 30.67 | | | | 14.59 | % | | | 1.12 | % | | | (0.11 | )% | | | 1.21 | % | | $ | 349,022 | | | | 38 | % | |
Year Ended 12/31/16 | | | (1.78 | ) | | $ | 32.75 | | | | 24.41 | % | | | 1.12 | % | | | (0.11 | )% | | | 1.22 | % | | $ | 378,271 | | | | 60 | % | |
Member Class | |
11/3/20(f) through
12/31/20 | | | (0.37 | ) | | $ | 24.22 | | | | 25.22 | % | | | 1.25 | % | | | 0.36 | % | | | 33.63 | % | | $ | 102 | | | | 108 | % | |
See notes to financial statements.
51
Victory Portfolios | | Financial Highlights | |
For a Share Outstanding Throughout Each Period
| | | | | Investment Activities | | Distributions to
Shareholders From | |
| | | Net Asset
Value,
Beginning of
Period | | Net
Investment
Income
(Loss)(a) | | Net
Realized and
Unrealized
Gains
(Losses) on
Investments | | Total from
Investment
Activities | | Net
Investment
Income | | Net Realized
Gains from
Investments | | Total
Distributions | |
Victory RS Value Fund | |
Class A | |
Year Ended
12/31/20 | | $ | 24.79 | | | | 0.03 | | | | (0.68 | ) | | | (0.65 | ) | | | — | | | | (0.46 | ) | | | (0.46 | ) | |
Year Ended
12/31/19 | | $ | 20.28 | | | | 0.07 | | | | 6.28 | | | | 6.35 | | | | (0.14 | ) | | | (1.70 | ) | | | (1.84 | ) | |
Year Ended
12/31/18 | | $ | 26.21 | | | | 0.06 | | | | (2.85 | ) | | | (2.79 | ) | | | (0.14 | ) | | | (3.00 | ) | | | (3.14 | ) | |
Year Ended
12/31/17 | | $ | 27.94 | | | | 0.03 | | | | 4.80 | | | | 4.83 | | | | (0.04 | ) | | | (6.52 | ) | | | (6.56 | ) | |
Year Ended
12/31/16 | | $ | 28.33 | | | | — | (c) | | | 3.09 | | | | 3.09 | | | | (0.13 | ) | | | (3.35 | ) | | | (3.48 | ) | |
Class C | |
Year Ended
12/31/20 | | $ | 21.85 | | | | (0.11 | ) | | | (0.63 | ) | | | (0.74 | ) | | | — | | | | (0.46 | ) | | | (0.46 | ) | |
Year Ended
12/31/19 | | $ | 18.08 | | | | (0.11 | ) | | | 5.58 | | | | 5.47 | | | | — | | | | (1.70 | ) | | | (1.70 | ) | |
Year Ended
12/31/18 | | $ | 23.76 | | | | (0.13 | ) | | | (2.55 | ) | | | (2.68 | ) | | | — | | | | (3.00 | ) | | | (3.00 | ) | |
Year Ended
12/31/17 | | $ | 26.01 | | | | (0.08 | ) | | | 4.35 | | | | 4.27 | | | | — | | | | (6.52 | ) | | | (6.52 | ) | |
Year Ended
12/31/16 | | $ | 26.69 | | | | (0.21 | ) | | | 2.88 | | | | 2.67 | | | | — | | | | (3.35 | ) | | | (3.35 | ) | |
Class R | |
Year Ended
12/31/20 | | $ | 23.44 | | | | (0.05 | ) | | | (0.66 | ) | | | (0.71 | ) | | | — | | | | (0.46 | ) | | | (0.46 | ) | |
Year Ended
12/31/19 | | $ | 19.26 | | | | (0.03 | ) | | | 5.95 | | | | 5.92 | | | | (0.04 | ) | | | (1.70 | ) | | | (1.74 | ) | |
Year Ended
12/31/18 | | $ | 25.06 | | | | (0.03 | ) | | | (2.72 | ) | | | (2.75 | ) | | | (0.05 | ) | | | (3.00 | ) | | | (3.05 | ) | |
Year Ended
12/31/17 | | $ | 27.03 | | | | (0.03 | ) | | | 4.58 | | | | 4.55 | | | | — | | | | (6.52 | ) | | | (6.52 | ) | |
Year Ended
12/31/16 | | $ | 27.51 | | | | (0.09 | ) | | | 2.96 | | | | 2.87 | | | | — | | | | (3.35 | ) | | | (3.35 | ) | |
Class Y | |
Year Ended
12/31/20 | | $ | 25.45 | | | | 0.08 | | | | (0.69 | ) | | | (0.61 | ) | | | — | | | | (0.46 | ) | | | (0.46 | ) | |
Year Ended
12/31/19 | | $ | 20.77 | | | | 0.13 | | | | 6.44 | | | | 6.57 | | | | (0.19 | ) | | | (1.70 | ) | | | (1.89 | ) | |
Year Ended
12/31/18 | | $ | 26.77 | | | | 0.13 | | | | (2.92 | ) | | | (2.79 | ) | | | (0.21 | ) | | | (3.00 | ) | | | (3.21 | ) | |
Year Ended
12/31/17 | | $ | 28.40 | | | | 0.06 | | | | 4.94 | | | | 5.00 | | | | (0.11 | ) | | | (6.52 | ) | | | (6.63 | ) | |
Year Ended
12/31/16 | | $ | 28.57 | | | | 0.08 | | | | 3.10 | | | | 3.18 | | | | — | | | | (3.35 | ) | | | (3.35 | ) | |
(a) Per share net investment income (loss) has been calculated using the average daily shares method.
(b) Portfolio turnover is calculated on the basis of the Fund as a whole without distinguishing between the classes of shares issued.
(c) Amount is less than $0.005 per share.
(d) The Fund received monies related to nonrecurring refund from the prior Custodian. The corresponding impact to the total return was less than 0.005% for the period shown. (See Note 8)
See notes to financial statements.
52
Victory Portfolios | | Financial Highlights — continued | |
For a Share Outstanding Throughout Each Period
| | | | | Ratios to Average Net Assets | | Supplemental Data | |
| | | Capital
Contributions
from Prior
Custodian,
Net (See
Note 8) | | Net Asset
Value,
End of
Period | | Total
Return
(Excludes
Sales
Charge) | | Net
Expenses | | Net
Investment
Income
(Loss) | | Gross
Expenses | | Net Assets,
End of
Period
(000's) | | Portfolio
Turnover(b) | |
Victory RS Value Fund | |
Class A | |
Year Ended
12/31/20 | | | — | | | $ | 23.68 | | | | (2.59 | )% | | | 1.30 | % | | | 0.14 | % | | | 1.37 | % | | $ | 162,145 | | | | 73 | % | |
Year Ended
12/31/19 | | | — | | | $ | 24.79 | | | | 31.35 | % | | | 1.30 | % | | | 0.28 | % | | | 1.35 | % | | $ | 207,200 | | | | 54 | % | |
Year Ended
12/31/18 | | | — | | | $ | 20.28 | | | | (10.75 | )% | | | 1.30 | % | | | 0.24 | % | | | 1.34 | % | | $ | 179,535 | | | | 65 | % | |
Year Ended
12/31/17 | | | — | | | $ | 26.21 | | | | 17.41 | % | | | 1.30 | % | | | 0.09 | % | | | 1.33 | % | | $ | 239,994 | | | | 64 | % | |
Year Ended
12/31/16 | | | — | (c) | | $ | 27.94 | | | | 10.92 | %(d) | | | 1.30 | % | | | (0.01 | )% | | | 1.35 | % | | $ | 268,979 | | | | 67 | % | |
Class C | |
Year Ended
12/31/20 | | | — | | | $ | 20.65 | | | | (3.35 | )% | | | 2.07 | % | | | (0.62 | )% | | | 2.60 | % | | $ | 2,618 | | | | 73 | % | |
Year Ended
12/31/19 | | | — | �� | | $ | 21.85 | | | | 30.32 | % | | | 2.07 | % | | | (0.50 | )% | | | 2.29 | % | | $ | 4,872 | | | | 54 | % | |
Year Ended
12/31/18 | | | — | | | $ | 18.08 | | | | (11.41 | )% | | | 2.07 | % | | | (0.54 | )% | | | 2.14 | % | | $ | 9,428 | | | | 65 | % | |
Year Ended
12/31/17 | | | — | | | $ | 23.76 | | | | 16.53 | % | | | 2.07 | % | | | (0.30 | )% | | | 2.08 | % | | $ | 16,916 | | | | 64 | % | |
Year Ended
12/31/16 | | | — | (c) | | $ | 26.01 | | | | 10.01 | %(d) | | | 2.07 | % | | | (0.78 | )% | | | 2.13 | % | | $ | 19,943 | | | | 67 | % | |
Class R | |
Year Ended
12/31/20 | | | — | | | $ | 22.27 | | | | (2.95 | )% | | | 1.69 | % | | | (0.23 | )% | | | 4.03 | % | | $ | 677 | | | | 73 | % | |
Year Ended
12/31/19 | | | — | | | $ | 23.44 | | | | 30.89 | % | | | 1.69 | % | | | (0.13 | )% | | | 3.47 | % | | $ | 1,022 | | | | 54 | % | |
Year Ended
12/31/18 | | | — | | | $ | 19.26 | | | | (11.12 | )% | | | 1.69 | % | | | (0.11 | )% | | | 2.82 | % | | $ | 1,019 | | | | 65 | % | |
Year Ended
12/31/17 | | | — | | | $ | 25.06 | | | | 16.95 | % | | | 1.69 | % | | | (0.11 | )% | | | 2.29 | % | | $ | 1,625 | | | | 64 | % | |
Year Ended
12/31/16 | | | — | (c) | | $ | 27.03 | | | | 10.45 | %(d) | | | 1.69 | % | | | (0.34 | )% | | | 1.80 | % | | $ | 1,670 | | | | 67 | % | |
Class Y | |
Year Ended
12/31/20 | | | — | | | $ | 24.38 | | | | (2.37 | )% | | | 1.06 | % | | | 0.38 | % | | | 1.10 | % | | $ | 142,515 | | | | 73 | % | |
Year Ended
12/31/19 | | | — | | | $ | 25.45 | | | | 31.69 | % | | | 1.06 | % | | | 0.51 | % | | | 1.07 | % | | $ | 176,749 | | | | 54 | % | |
Year Ended
12/31/18 | | | — | | | $ | 20.77 | | | | (10.54 | )% | | | 1.06 | % | | | 0.49 | % | | | 1.06 | % | | $ | 166,538 | | | | 65 | % | |
Year Ended
12/31/17 | | | — | | | $ | 26.77 | | | | 17.71 | % | | | 1.06 | % | | | 0.20 | % | | | 1.06 | % | | $ | 247,528 | | | | 64 | % | |
Year Ended
12/31/16 | | | — | (c) | | $ | 28.40 | | | | 11.14 | %(d) | | | 1.06 | % | | | 0.26 | % | | | 1.19 | % | | $ | 260,818 | | | | 67 | % | |
See notes to financial statements.
53
Victory Portfolios | | Financial Highlights | |
For a Share Outstanding Throughout Each Period
| | | | | Investment Activities | | Distributions to
Shareholders From | |
| | | Net Asset
Value,
Beginning of
Period | | Net
Investment
Income
(Loss)(a) | | Net
Realized and
Unrealized
Gains
(Losses) on
Investments | | Total from
Investment
Activities | | Net
Investment
Income | | Net Realized
Gains from
Investments | | Total
Distributions | |
Victory RS Large Cap Alpha Fund | |
Class A | |
Year Ended
12/31/20 | | $ | 53.11 | | | | 0.52 | | | | (1.12 | ) | | | (0.60 | ) | | | (0.15 | ) | | | (1.77 | ) | | | (1.92 | ) | |
Year Ended
12/31/19 | | $ | 42.20 | | | | 0.51 | | | | 12.44 | | | | 12.95 | | | | (0.37 | ) | | | (1.67 | ) | | | (2.04 | ) | |
Year Ended
12/31/18 | | $ | 56.61 | | | | 0.44 | | | | (5.67 | ) | | | (5.23 | ) | | | (0.38 | ) | | | (8.80 | ) | | | (9.18 | ) | |
Year Ended
12/31/17 | | $ | 51.86 | | | | 0.38 | | | | 9.10 | | | | 9.48 | | | | — | (c) | | | (4.73 | ) | | | (4.73 | ) | |
Year Ended
12/31/16 | | $ | 50.98 | | | | 0.40 | | | | 4.01 | | | | 4.41 | | | | (0.42 | ) | | | (3.12 | ) | | | (3.54 | ) | |
Class C | |
Year Ended
12/31/20 | | $ | 44.70 | | | | 0.14 | | | | (1.00 | ) | | | (0.86 | ) | | | — | | | | (1.77 | ) | | | (1.77 | ) | |
Year Ended
12/31/19 | | $ | 35.78 | | | | 0.10 | | | | 10.50 | | | | 10.60 | | | | (0.01 | ) | | | (1.67 | ) | | | (1.68 | ) | |
Year Ended
12/31/18 | | $ | 49.50 | | | | (0.03 | ) | | | (4.89 | ) | | | (4.92 | ) | | | — | (c) | | | (8.80 | ) | | | (8.80 | ) | |
Year Ended
12/31/17 | | $ | 46.22 | | | | (0.04 | ) | | | 8.05 | | | | 8.01 | | | | — | | | | (4.73 | ) | | | (4.73 | ) | |
Year Ended
12/31/16 | | $ | 45.80 | | | | — | (c) | | | 3.57 | | | | 3.57 | | | | (0.04 | ) | | | (3.12 | ) | | | (3.16 | ) | |
Class R | |
Year Ended
12/31/20 | | $ | 52.83 | | | | 0.35 | | | | (1.13 | ) | | | (0.78 | ) | | | — | | | | (1.77 | ) | | | (1.77 | ) | |
Year Ended
12/31/19 | | $ | 42.01 | | | | 0.32 | | | | 12.36 | | | | 12.68 | | | | (0.19 | ) | | | (1.67 | ) | | | (1.86 | ) | |
Year Ended
12/31/18 | | $ | 56.35 | | | | 0.22 | | | | (5.61 | ) | | | (5.39 | ) | | | (0.15 | ) | | | (8.80 | ) | | | (8.95 | ) | |
Year Ended
12/31/17 | | $ | 51.83 | | | | 0.18 | | | | 9.07 | | | | 9.25 | | | | — | | | | (4.73 | ) | | | (4.73 | ) | |
Year Ended
12/31/16 | | $ | 50.93 | | | | 0.23 | | | | 3.99 | | | | 4.22 | | | | (0.21 | ) | | | (3.12 | ) | | | (3.33 | ) | |
Class Y | |
Year Ended
12/31/20 | | $ | 52.87 | | | | 0.62 | | | | (1.10 | ) | | | (0.48 | ) | | | (0.25 | ) | | | (1.77 | ) | | | (2.02 | ) | |
Year Ended
12/31/19 | | $ | 42.01 | | | | 0.61 | | | | 12.38 | | | | 12.99 | | | | (0.46 | ) | | | (1.67 | ) | | | (2.13 | ) | |
Year Ended
12/31/18 | | $ | 56.38 | | | | 0.55 | | | | (5.64 | ) | | | (5.09 | ) | | | (0.48 | ) | | | (8.80 | ) | | | (9.28 | ) | |
Year Ended
12/31/17 | | $ | 51.66 | | | | 0.49 | | | | 9.07 | | | | 9.56 | | | | (0.11 | ) | | | (4.73 | ) | | | (4.84 | ) | |
Year Ended
12/31/16 | | $ | 50.82 | | | | 0.51 | | | | 4.00 | | | | 4.51 | | | | (0.56 | ) | | | (3.12 | ) | | | (3.68 | ) | |
(a) Per share net investment income (loss) has been calculated using the average daily shares method.
(b) Portfolio turnover is calculated on the basis of the Fund as a whole without distinguishing between the classes of shares issued.
(c) Amounts is less than $0.005.
(d) The Fund received monies related to a nonrecurring refund from the prior Custodian. The corresponding impact to the total return was 0.01% for the period shown. (See Note 8)
See notes to financial statements.
54
Victory Portfolios | | Financial Highlights — continued | |
For a Share Outstanding Throughout Each Period
| | | | | Ratios to Average Net Assets | | Supplemental Data | |
| | | Capital
Contributions
from Prior
Custodian,
Net (See
Note 8) | | Net Asset
Value,
End of
Period | | Total
Return
(Excludes
Sales
Charge) | | Net
Expenses | | Net
Investment
Income
(Loss) | | Gross
Expenses | | Net Assets,
End of
Period
(000's) | | Portfolio
Turnover(b) | |
Victory RS Large Cap Alpha Fund | |
Class A | |
Year Ended
12/31/20 | | | — | | | $ | 50.59 | | | | (1.03 | )% | | | 0.89 | % | | | 1.13 | % | | | 0.95 | % | | $ | 444,160 | | | | 95 | % | |
Year Ended
12/31/19 | | | — | | | $ | 53.11 | | | | 30.73 | % | | | 0.89 | % | | | 1.03 | % | | | 0.95 | % | | $ | 520,159 | | | | 51 | % | |
Year Ended
12/31/18 | | | — | | | $ | 42.20 | | | | (9.31 | )% | | | 0.89 | % | | | 0.77 | % | | | 0.93 | % | | $ | 439,035 | | | | 59 | % | |
Year Ended
12/31/17 | | | — | | | $ | 56.61 | | | | 18.32 | % | | | 0.89 | % | | | 0.68 | % | | | 0.94 | % | | $ | 540,762 | | | | 55 | % | |
Year Ended
12/31/16 | | | 0.01 | | | $ | 51.86 | | | | 8.67 | %(d) | | | 0.89 | % | | | 0.79 | % | | | 0.92 | % | | $ | 522,593 | | | | 79 | % | |
Class C | |
Year Ended
12/31/20 | | | — | | | $ | 42.07 | | | | (1.85 | )% | | | 1.69 | % | | | 0.37 | % | | | 1.79 | % | | $ | 11,326 | | | | 95 | % | |
Year Ended
12/31/19 | | | — | | | $ | 44.70 | | | | 29.70 | % | | | 1.69 | % | | | 0.24 | % | | | 1.74 | % | | $ | 17,028 | | | | 51 | % | |
Year Ended
12/31/18 | | | — | | | $ | 35.78 | | | | (10.03 | )% | | | 1.69 | % | | | (0.06 | )% | | | 1.75 | % | | $ | 18,227 | | | | 59 | % | |
Year Ended
12/31/17 | | | — | | | $ | 49.50 | | | | 17.36 | % | | | 1.69 | % | | | (0.08 | )% | | | 1.71 | % | | $ | 29,771 | | | | 55 | % | |
Year Ended
12/31/16 | | | 0.01 | | | $ | 46.22 | | | | 7.80 | %(d) | | | 1.69 | % | | | (0.01 | )% | | | 1.71 | % | | $ | 28,801 | | | | 79 | % | |
Class R | |
Year Ended
12/31/20 | | | — | | | $ | 50.28 | | | | (1.41 | )% | | | 1.26 | % | | | 0.77 | % | | | 1.50 | % | | $ | 6,066 | | | | 95 | % | |
Year Ended
12/31/19 | | | — | | | $ | 52.83 | | | | 30.23 | % | | | 1.26 | % | | | 0.66 | % | | | 1.48 | % | | $ | 7,232 | | | | 51 | % | |
Year Ended
12/31/18 | | | — | | | $ | 42.01 | | | | (9.63 | )% | | | 1.26 | % | | | 0.38 | % | | | 1.40 | % | | $ | 6,348 | | | | 59 | % | |
Year Ended
12/31/17 | | | — | | | $ | 56.35 | | | | 17.87 | % | | | 1.26 | % | | | 0.33 | % | | | 1.42 | % | | $ | 10,229 | | | | 55 | % | |
Year Ended
12/31/16 | | | 0.01 | | | $ | 51.83 | | | | 8.30 | %(d) | | | 1.23 | % | | | 0.45 | % | | | 1.23 | % | | $ | 10,631 | | | | 79 | % | |
Class Y | |
Year Ended
12/31/20 | | | — | | | $ | 50.37 | | | | (0.83 | )% | | | 0.68 | % | | | 1.34 | % | | | 0.82 | % | | $ | 16,011 | | | | 95 | % | |
Year Ended
12/31/19 | | | — | | | $ | 52.87 | | | | 30.99 | % | | | 0.68 | % | | | 1.24 | % | | | 0.78 | % | | $ | 20,021 | | | | 51 | % | |
Year Ended
12/31/18 | | | — | | | $ | 42.01 | | | | (9.11 | )% | | | 0.68 | % | | | 0.96 | % | | | 0.75 | % | | $ | 21,827 | | | | 59 | % | |
Year Ended
12/31/17 | | | — | | | $ | 56.38 | | | | 18.56 | % | | | 0.68 | % | | | 0.88 | % | | | 0.72 | % | | $ | 33,638 | | | | 55 | % | |
Year Ended
12/31/16 | | | 0.01 | | | $ | 51.66 | | | | 8.89 | %(d) | | | 0.68 | % | | | 1.00 | % | | | 0.69 | % | | $ | 31,840 | | | | 79 | % | |
See notes to financial statements.
55
Victory Portfolios | | Financial Highlights | |
For a Share Outstanding Throughout Each Period
| | | | Investment Activities | | Distributions to
Shareholders From | |
| | | Net Asset
Value,
Beginning of
Period | | Net
Investment
Income (Loss)(a) | | Net Realized
and Unrealized
Gains (Losses)
on Investments | | Total from
Investment
Activities | | Net
Investment
Income | | Net Realized
Gains from
Investments | |
Victory RS Investors Fund | |
Class A | |
Year Ended
12/31/20 | | $ | 13.10 | | | | (0.01 | ) | | | (0.21 | ) | | | (0.22 | ) | | | — | | | | (0.04 | ) | |
Year Ended
12/31/19 | | $ | 10.68 | | | | — | (c) | | | 2.99 | | | | 2.99 | | | | — | | | | (0.57 | ) | |
Year Ended
12/31/18 | | $ | 13.86 | | | | — | (c) | | | (1.27 | ) | | | (1.27 | ) | | | — | | | | (1.91 | ) | |
Year Ended
12/31/17 | | $ | 13.65 | | | | (0.03 | ) | | | 2.23 | | | | 2.20 | | | | — | | | | (1.99 | ) | |
Year Ended
12/31/16 | | $ | 12.42 | | | | — | (c) | | | 1.23 | | | | 1.23 | | | | — | | | | — | | |
Class C | |
Year Ended
12/31/20 | | $ | 11.54 | | | | (0.08 | ) | | | (0.20 | ) | | | (0.28 | ) | | | — | | | | (0.04 | ) | |
Year Ended
12/31/19 | | $ | 9.53 | | | | (0.08 | ) | | | 2.66 | | | | 2.58 | | | | — | | | | (0.57 | ) | |
Year Ended
12/31/18 | | $ | 12.68 | | | | (0.10 | ) | | | (1.14 | ) | | | (1.24 | ) | | | — | | | | (1.91 | ) | |
Year Ended
12/31/17 | | $ | 12.73 | | | | (0.19 | ) | | | 2.13 | | | | 1.94 | | | | — | | | | (1.99 | ) | |
Year Ended
12/31/16 | | $ | 11.67 | | | | (0.09 | ) | | | 1.15 | | | | 1.06 | | | | — | | | | — | | |
Class R | |
Year Ended
12/31/20 | | $ | 11.72 | | | | (0.07 | ) | | | (0.20 | ) | | | (0.27 | ) | | | — | | | | (0.04 | ) | |
Year Ended
12/31/19 | | $ | 9.66 | | | | (0.07 | ) | | | 2.70 | | | | 2.63 | | | | — | | | | (0.57 | ) | |
Year Ended
12/31/18 | | $ | 12.81 | | | | (0.08 | ) | | | (1.16 | ) | | | (1.24 | ) | | | — | | | | (1.91 | ) | |
Year Ended
12/31/17 | | $ | 12.83 | | | | (0.17 | ) | | | 2.14 | | | | 1.97 | | | | — | | | | (1.99 | ) | |
Year Ended
12/31/16 | | $ | 11.73 | | | | (0.06 | ) | | | 1.16 | | | | 1.10 | | | | — | | | | — | | |
Class Y | |
Year Ended
12/31/20 | | $ | 13.47 | | | | 0.02 | | | | (0.21 | ) | | | (0.19 | ) | | | — | | | | (0.04 | ) | |
Year Ended
12/31/19 | | $ | 10.94 | | | | 0.03 | | | | 3.07 | | | | 3.10 | | | | — | | | | (0.57 | ) | |
Year Ended
12/31/18 | | $ | 14.10 | | | | 0.03 | | | | (1.28 | ) | | | (1.25 | ) | | | — | | | | (1.91 | ) | |
Year Ended
12/31/17 | | $ | 13.82 | | | | 0.03 | | | | 2.24 | | | | 2.27 | | | | — | | | | (1.99 | ) | |
Year Ended
12/31/16 | | $ | 12.55 | | | | 0.04 | | | | 1.24 | | | | 1.28 | | | | (0.01 | ) | | | — | | |
(a) Per share net investment income (loss) has been calculated using the average daily shares method.
(b) Portfolio turnover is calculated on the basis of the Fund as a whole without distinguishing between the classes of shares issued.
(c) Amount is less than $0.005 per share.
See notes to financial statements.
56
Victory Portfolios | | Financial Highlights — continued | |
For a Share Outstanding Throughout Each Period
| | | | | Ratios to Average Net Assets | | Supplemental Data | |
| | | Total
Distributions | | Net Asset
Value,
End of
Period | | Total
Return
(Excludes
Sales
Charge) | | Net
Expenses | | Net
Investment
Income
(Loss) | | Gross
Expenses | | Net Assets,
End of
Period
(000's) | | Portfolio
Turnover(b) | |
Victory RS Investors Fund | |
Class A | |
Year Ended
12/31/20 | | | (0.04 | ) | | $ | 12.84 | | | | (1.68 | )% | | | 1.33 | % | | | (0.08 | )% | | | 1.71 | % | | $ | 12,663 | | | | 66 | % | |
Year Ended
12/31/19 | | | (0.57 | ) | | $ | 13.10 | | | | 28.01 | % | | | 1.33 | % | | | 0.03 | % | | | 1.62 | % | | $ | 16,906 | | | | 64 | % | |
Year Ended
12/31/18 | | | (1.91 | ) | | $ | 10.68 | | | | (9.36 | )% | | | 1.33 | % | | | (0.03 | )% | | | 1.58 | % | | $ | 15,682 | | | | 56 | % | |
Year Ended
12/31/17 | | | (1.99 | ) | | $ | 13.86 | | | | 16.28 | % | | | 1.33 | % | | | (0.24 | )% | | | 1.54 | % | | $ | 20,419 | | | | 80 | % | |
Year Ended
12/31/16 | | | — | | | $ | 13.65 | | | | 9.90 | % | | | 1.33 | % | | | 0.02 | % | | | 1.56 | % | | $ | 28,022 | | | | 92 | % | |
Class C | |
Year Ended
12/31/20 | | | (0.04 | ) | | $ | 11.22 | | | | (2.43 | )% | | | 2.07 | % | | | (0.85 | )% | | | 2.75 | % | | $ | 3,306 | | | | 66 | % | |
Year Ended
12/31/19 | | | (0.57 | ) | | $ | 11.54 | | | | 27.08 | % | | | 2.07 | % | | | (0.73 | )% | | | 2.54 | % | | $ | 6,898 | | | | 64 | % | |
Year Ended
12/31/18 | | | (1.91 | ) | | $ | 9.53 | | | | (10.08 | )% | | | 2.07 | % | | | (0.82 | )% | | | 2.44 | % | | $ | 7,282 | | | | 56 | % | |
Year Ended
12/31/17 | | | (1.99 | ) | | $ | 12.68 | | | | 15.48 | % | | | 2.07 | % | | | (1.42 | )% | | | 2.35 | % | | $ | 11,149 | | | | 80 | % | |
Year Ended
12/31/16 | | | — | | | $ | 12.73 | | | | 9.08 | % | | | 2.07 | % | | | (0.72 | )% | | | 2.35 | % | | $ | 14,517 | | | | 92 | % | |
Class R | |
Year Ended
12/31/20 | | | (0.04 | ) | | $ | 11.41 | | | | (2.30 | )% | | | 1.95 | % | | | (0.71 | )% | | | 4.41 | % | | $ | 655 | | | | 66 | % | |
Year Ended
12/31/19 | | | (0.57 | ) | | $ | 11.72 | | | | 27.24 | % | | | 1.95 | % | | | (0.59 | )% | | | 3.85 | % | | $ | 844 | | | | 64 | % | |
Year Ended
12/31/18 | | | (1.91 | ) | | $ | 9.66 | | | | (9.91 | )% | | | 1.95 | % | | | (0.64 | )% | | | 3.15 | % | | $ | 831 | | | | 56 | % | |
Year Ended
12/31/17 | | | (1.99 | ) | | $ | 12.81 | | | | 15.50 | % | | | 1.95 | % | | | (1.27 | )% | | | 2.72 | % | | $ | 1,379 | | | | 80 | % | |
Year Ended
12/31/16 | | | — | | | $ | 12.83 | | | | 9.38 | % | | | 1.92 | % | | | (0.50 | )% | | | 1.92 | % | | $ | 1,314 | | | | 92 | % | |
Class Y | |
Year Ended
12/31/20 | | | (0.04 | ) | | $ | 13.24 | | | | (1.41 | )% | | | 1.05 | % | | | 0.17 | % | | | 1.50 | % | | $ | 11,253 | | | | 66 | % | |
Year Ended
12/31/19 | | | (0.57 | ) | | $ | 13.47 | | | | 28.35 | % | | | 1.05 | % | | | 0.27 | % | | | 1.43 | % | | $ | 19,146 | | | | 64 | % | |
Year Ended
12/31/18 | | | (1.91 | ) | | $ | 10.94 | | | | (9.06 | )% | | | 1.05 | % | | | 0.18 | % | | | 1.37 | % | | $ | 14,669 | | | | 56 | % | |
Year Ended
12/31/17 | | | (1.99 | ) | | $ | 14.10 | | | | 16.59 | % | | | 1.05 | % | | | 0.19 | % | | | 1.25 | % | | $ | 27,131 | | | | 80 | % | |
Year Ended
12/31/16 | | | (0.01 | ) | | $ | 13.82 | | | | 10.17 | % | | | 1.05 | % | | | 0.28 | % | | | 1.24 | % | | $ | 50,013 | | | | 92 | % | |
See notes to financial statements.
57
Victory Portfolios | | Financial Highlights | |
For a Share Outstanding Throughout Each Period
| | | | Investment Activities | | Distributions to
Shareholders From | |
| | | Net Asset
Value,
Beginning of
Period | | Net
Investment
Income
(Loss)(a) | | Net
Realized and
Unrealized
Gains
(Losses) on
Investments | | Total from
Investment
Activities | | Net
Investment
Income | | Total
Distributions | |
Victory Global Natural Resources Fund | |
Class A | |
Year Ended
12/31/20 | | $ | 9.71 | | | | (0.01 | ) | | | 2.67 | | | | 2.66 | | | | (0.01 | ) | | | (0.01 | ) | |
Year Ended
12/31/19 | | $ | 12.86 | | | | — | (c) | | | (3.15 | ) | | | (3.15 | ) | | | — | | | | — | | |
Year Ended
12/31/18 | | $ | 23.73 | | | | (0.14 | ) | | | (10.73 | ) | | | (10.87 | ) | | | — | | | | — | | |
Year Ended
12/31/17 | | $ | 23.49 | | | | (0.22 | ) | | | 0.46 | | | | 0.24 | | | | — | | | | — | | |
Year Ended
12/31/16 | | $ | 15.34 | | | | (0.10 | ) | | | 8.25 | | | | 8.15 | | | | — | | | | — | | |
Class C | |
Year Ended
12/31/20 | | $ | 8.71 | | | | (0.07 | ) | | | 2.36 | | | | 2.29 | | | | — | | | | — | | |
Year Ended
12/31/19 | | $ | 11.63 | | | | (0.08 | ) | | | (2.84 | ) | | | (2.92 | ) | | | — | | | | — | | |
Year Ended
12/31/18 | | $ | 21.63 | | | | (0.28 | ) | | | (9.72 | ) | | | (10.00 | ) | | | — | | | | — | | |
Year Ended
12/31/17 | | $ | 21.59 | | | | (0.36 | ) | | | 0.40 | | | | 0.04 | | | | — | | | | — | | |
Year Ended
12/31/16 | | $ | 14.21 | | | | (0.24 | ) | | | 7.62 | | | | 7.38 | | | | — | | | | — | | |
Class R | |
Year Ended
12/31/20 | | $ | 9.16 | | | | (0.04 | ) | | | 2.50 | | | | 2.46 | | | | — | | | | — | | |
Year Ended
12/31/19 | | $ | 12.18 | | | | (0.04 | ) | | | (2.98 | ) | | | (3.02 | ) | | | — | | | | — | | |
Year Ended
12/31/18 | | $ | 22.56 | | | | (0.20 | ) | | | (10.18 | ) | | | (10.38 | ) | | | — | | | | — | | |
Year Ended
12/31/17 | | $ | 22.42 | | | | (0.29 | ) | | | 0.43 | | | | 0.14 | | | | — | | | | — | | |
Year Ended
12/31/16 | | $ | 14.68 | | | | (0.15 | ) | | | 7.89 | | | | 7.74 | | | | — | | | | — | | |
Class Y | |
Year Ended
12/31/20 | | $ | 10.11 | | | | 0.02 | | | | 2.78 | | | | 2.80 | | | | (0.03 | ) | | | (0.03 | ) | |
Year Ended
12/31/19 | | $ | 13.38 | | | | 0.03 | | | | (3.27 | ) | | | (3.24 | ) | | | (0.03 | ) | | | (0.03 | ) | |
Year Ended
12/31/18 | | $ | 24.60 | | | | (0.06 | ) | | | (11.16 | ) | | | (11.22 | ) | | | — | | | | — | | |
Year Ended
12/31/17 | | $ | 24.28 | | | | (0.14 | ) | | | 0.46 | | | | 0.32 | | | | — | | | | — | | |
Year Ended
12/31/16 | | $ | 15.80 | | | | (0.04 | ) | | | 8.52 | | | | 8.48 | | | | — | | | | — | | |
* Includes adjustments in accordance with U.S. generally accepted accounting principles.
(a) Per share net investment income (loss) has been calculated using the average daily shares method.
(b) Portfolio turnover is calculated on the basis of the Fund as a whole without distinguishing between the classes of shares issued.
(c) Amount is less than $0.005 per share.
See notes to financial statements.
58
Victory Portfolios | | Financial Highlights — continued | |
For a Share Outstanding Throughout Each Period
| | | | | Ratios to Average Net Assets | | Supplemental Data | |
| | | Capital
Contributions
from Prior
Custodian,
Net (See
Note 8) | | Net Asset
Value,
End of
Period | | Total
Return
(Excludes
Sales
Charge)* | | Net
Expenses | | Net
Investment
Income
(Loss) | | Gross
Expenses | | Net Assets,
End of
Period
(000's) | | Portfolio
Turnover(b) | |
Victory Global Natural Resources Fund | |
Class A | |
Year Ended
12/31/20 | | | — | | | $ | 12.36 | | | | 27.35 | % | | | 1.48 | % | | | (0.15 | )% | | | 1.79 | % | | $ | 36,803 | | | | 46 | % | |
Year Ended
12/31/19 | | | — | | | $ | 9.71 | | | | (24.49 | )% | | | 1.48 | % | | | — | %(d) | | | 1.69 | % | | $ | 32,630 | | | | 24 | % | |
Year Ended
12/31/18 | | | — | | | $ | 12.86 | | | | (45.81 | )% | | | 1.48 | % | | | (0.65 | )% | | | 1.54 | % | | $ | 64,001 | | | | 26 | % | |
Year Ended
12/31/17 | | | — | | | $ | 23.73 | | | | 1.02 | % | | | 1.48 | % | | | (0.93 | )% | | | 1.55 | % | | $ | 262,455 | | | | 57 | %(e) | |
Year Ended
12/31/16 | | | — | (c) | | $ | 23.49 | | | | 53.13 | %(f) | | | 1.48 | % | | | (0.51 | )% | | | 1.48 | % | | $ | 545,778 | | | | 29 | % | |
Class C | |
Year Ended
12/31/20 | | | — | | | $ | 11.00 | | | | 26.29 | % | | | 2.28 | % | | | (0.92 | )% | | | 3.32 | % | | $ | 2,385 | | | | 46 | % | |
Year Ended
12/31/19 | | | — | | | $ | 8.71 | | | | (25.11 | )% | | | 2.28 | % | | | (0.81 | )% | | | 2.75 | % | | $ | 2,949 | | | | 24 | % | |
Year Ended
12/31/18 | | | — | | | $ | 11.63 | | | | (46.26 | )% | | | 2.28 | % | | | (1.42 | )% | | | 2.38 | % | | $ | 6,939 | | | | 26 | % | |
Year Ended
12/31/17 | | | — | | | $ | 21.63 | | | | 0.23 | % | | | 2.28 | % | | | (1.72 | )% | | | 2.35 | % | | $ | 20,428 | | | | 57 | %(e) | |
Year Ended
12/31/16 | | | — | (c) | | $ | 21.59 | | | | 51.94 | %(f) | | | 2.28 | % | | | (1.32 | )% | | | 2.31 | % | | $ | 30,789 | | | | 29 | % | |
Class R | |
Year Ended
12/31/20 | | | — | | | $ | 11.62 | | | | 26.86 | % | | | 1.86 | % | | | (0.51 | )% | | | 5.74 | % | | $ | 680 | | | | 46 | % | |
Year Ended
12/31/19 | | | — | | | $ | 9.16 | | | | (24.79 | )% | | | 1.86 | % | | | (0.37 | )% | | | 4.31 | % | | $ | 621 | | | | 24 | % | |
Year Ended
12/31/18 | | | — | | | $ | 12.18 | | | | (46.01 | )% | | | 1.86 | % | | | (0.99 | )% | | | 2.50 | % | | $ | 920 | | | | 26 | % | |
Year Ended
12/31/17 | | | — | | | $ | 22.56 | | | | 0.62 | % | | | 1.86 | % | | | (1.31 | )% | | | 2.20 | % | | $ | 2,442 | | | | 57 | %(e) | |
Year Ended
12/31/16 | | | — | (c) | | $ | 22.42 | | | | 52.72 | %(f) | | | 1.74 | % | | | (0.80 | )% | | | 1.74 | % | | $ | 4,611 | | | | 29 | % | |
Class Y | |
Year Ended
12/31/20 | | | | $ | 12.88 | | | | 27.73 | % | | | 1.15 | % | | | 0.18 | % | | | 1.28 | % | | $ | 119,237 | | | | 46 | % | |
Year Ended
12/31/19 | | | — | | | $ | 10.11 | | | | (24.25 | )% | | | 1.15 | % | | | 0.27 | % | | | 1.26 | % | | $ | 114,972 | | | | 24 | % | |
Year Ended
12/31/18 | | | — | | | $ | 13.38 | | | | (45.63 | )% | | | 1.15 | % | | | (0.29 | )% | | | 1.20 | % | | $ | 393,581 | | | | 26 | % | |
Year Ended
12/31/17 | | | — | | | $ | 24.60 | | | | 1.36 | % | | | 1.15 | % | | | (0.58 | )% | | | 1.19 | % | | $ | 1,126,533 | | | | 57 | %(e) | |
Year Ended
12/31/16 | | | — | (c) | | $ | 24.28 | | | | 53.67 | %(f) | | | 1.15 | % | | | (0.19 | )% | | | 1.17 | % | | $ | 1,300,024 | | | | 29 | % | |
(d) Amount is less than $0.005%.
(e) Portfolio turnover increased due to change within the portfolio holdings during the year.
(f) The Fund received monies related to a nonrecurring refund from the prior Custodian. The corresponding impact to the total return was less than 0.005% for the period shown. (See Note 8)
See notes to financial statements.
59
Victory Portfolios | | Notes to Financial Statements
December 31, 2020 | |
1. Organization:
Victory Portfolios (the "Trust") was organized on December 6, 1995 as a Delaware statutory trust as a successor to a company named "The Victory Portfolios," which was organized as a Massachusetts business trust on February 5, 1986. The Trust is registered under the Investment Company Act of 1940, as amended (the "1940 Act"), as an open-end investment company. The Trust is comprised of 42 funds and is authorized to issue an unlimited number of shares, which are units of beneficial interest with a par value of $0.001 per share. Each Fund, with the exception of RS Investors Fund and Global Natural Resources Fund, is classified as diversified under the 1940 Act.
The accompanying financial statements are those of the following five Funds (collectively, the "Funds" and individually, a "Fund").
Funds (Legal Name) | | Funds (Short Name) | | Investment Share
Classes Offered | |
Victory RS Partners Fund | | RS Partners Fund | | Classes A, R, Y and
Member Class* | |
Victory RS Value Fund | | RS Value Fund | | Classes A, C, R and Y | |
Victory RS Large Cap Alpha Fund | | RS Large Cap Alpha Fund | | Classes A, C, R and Y | |
Victory RS Investors Fund | | RS Investors Fund | | Classes A, C, R and Y | |
Victory Global Natural Resources Fund | | Global Natural Resources Fund | | Classes A, C, R and Y | |
* Member Class commenced operations on November 3, 2020.
Each class of shares of a Fund has substantially identical rights and privileges except with respect to sales charges, fees paid under distribution plans, expenses allocable exclusively to each class of shares, voting rights on matters solely affecting a single class of shares, and the exchange privilege of each class of shares.
Under the Trust's organizational documents, its officers and trustees are indemnified against certain liabilities arising out of the performance of their duties to the Funds. In addition, in the normal course of business, the Funds enter into contracts with their vendors and others that provide for general indemnifications. The Funds' maximum exposure under these arrangements is unknown, as this would involve future claims that may be made against the Funds. However, based on experience, the Funds expect that risk of loss to be remote.
2. Significant Accounting Policies:
The following is a summary of significant accounting policies followed by the Trust in the preparation of its financial statements. The policies are in conformity with Generally Accepted Accounting Principles in the United States of America ("GAAP"). The preparation of financial statements in accordance with GAAP requires management to make estimates and assumptions that affect the reported amounts of assets and liabilities and disclosure of contingent assets and liabilities at the date of the financial statements and the reported amounts of income and expenses for the period. Actual results could differ from those estimates. The Funds follow the specialized accounting and reporting requirements under GAAP that are applicable to investment companies.
Investment Valuation:
The Funds record investments at fair value. Fair value is defined as the price that would be received to sell an asset or paid to transfer a liability in an orderly transaction between market participants at the measurement date.
The valuation techniques described below maximize the use of observable inputs and minimize the use of unobservable inputs in determining fair value. The inputs used for valuing the Funds' investments are summarized in the three broad levels listed below:
• Level 1 — quoted prices in active markets for identical securities
• Level 2 — other significant observable inputs (including quoted prices for similar securities or interest rates applicable to those securities, etc.)
60
Victory Portfolios | | Notes to Financial Statements — continued
December 31, 2020 | |
• Level 3 — significant unobservable inputs (including the Funds' own assumptions in determining the fair value of investments)
Changes in valuation techniques may result in transfers in or out of an assigned level within the disclosure hierarchy. The inputs or methodologies used for valuation techniques are not necessarily an indication of the risk associated with entering into those investments.
Portfolio securities listed or traded on securities exchanges, including Exchange-Traded Funds ("ETFs"), American Depositary Receipts ("ADRs") and Rights, are valued at the closing price on the exchange or system where the security is principally traded, if available, or at the Nasdaq Official Closing Price. If there have been no sales for that day on the exchange or system, then a security is valued at the last available bid quotation on the exchange or system where the security is principally traded. In each of these situations, valuations are typically categorized as Level 1 in the fair value hierarchy.
Investments in open-end investment companies are valued at net asset value. These valuations are typically categorized as Level 1 in the fair value hierarchy.
Investments for which there are no such quotations, or for which quotations do not appear reliable, are valued at fair value in accordance with procedures established by and under the general supervision and responsibility of the Trust's Board of Trustees (the "Board"). These valuations are typically categorized as Level 2 or Level 3 in the fair value hierarchy, based on the observability of inputs used to determine the fair value.
A summary of the valuations as of December 31, 2020, based upon the three levels defined above, is included in the table below while the breakdown, by category, of investments is disclosed on the Schedules of Portfolio Investments.
| | | Level 1 | | Level 2 | | Level 3 | | Total | |
RS Partners Fund | |
Common Stocks | | $ | 326,438,219 | | | $ | — | | | $ | — | | | $ | 326,438,219 | | |
Preferred Stocks | | | — | | | | — | | | | 587,369 | | | | 587,369 | | |
Collateral for Securities Loaned | | | 18,186,593 | | | | — | | | | — | | | | 18,186,593 | | |
Total | | $ | 344,624,812 | | | $ | — | | | $ | 587,369 | | | $ | 345,212,181 | | |
RS Value Fund | |
Common Stocks | | $ | 305,472,992 | | | $ | — | | | $ | — | | | $ | 305,472,992 | | |
Collateral for Securities Loaned | | | 9,026,020 | | | | — | | | | — | | | | 9,026,020 | | |
Total | | $ | 314,499,012 | | | $ | — | | | $ | — | | | $ | 314,499,012 | | |
RS Large Cap Alpha Fund | |
Common Stocks | | $ | 475,085,614 | | | $ | — | | | $ | — | | | $ | 475,085,614 | | |
Collateral for Securities Loaned | | | 72,767 | | | | — | | | | — | | | | 72,767 | | |
Total | | $ | 475,158,381 | | | $ | — | | | $ | — | | | $ | 475,158,381 | | |
RS Investors Fund | |
Common Stocks | | $ | 27,771,690 | | | $ | — | | | $ | — | | | $ | 27,771,690 | | |
Collateral for Securities Loaned | | | 783,704 | | | | — | | | | — | | | | 783,704 | | |
Total | | $ | 28,555,394 | | | $ | — | | | $ | — | | | $ | 28,555,394 | | |
Global Natural Resources Fund | |
Common Stocks | | $ | 145,638,819 | | | $ | 2,667,491 | | | $ | — | | | $ | 148,306,310 | | |
Collateral for Securities Loaned | | | 2,678,998 | | | | — | | | | — | | | | 2,678,998 | | |
Total | | $ | 148,317,817 | | | $ | 2,667,491 | | | $ | — | | | $ | 150,985,308 | | |
For the year ended December 31, 2020, there were no transfers in or out of the Level 3 fair value hierarchy.
61
Victory Portfolios | | Notes to Financial Statements — continued
December 31, 2020 | |
Real Estate Investment Trusts ("REITs"):
The Funds may invest in REITs, which report information on the source of their distributions annually. REITs are pooled investment vehicles that invest primarily in income-producing real estate or real estate-related loans or interests (such as mortgages). Certain distributions received from REITs during the year are recorded as realized gains or return of capital as estimated by the Funds or when such information becomes known.
Investment Companies:
Open-End Funds:
The Funds may invest in portfolios of open-end investment companies. These investment companies value securities in their portfolios for which market quotations are readily available at their market values (generally the last reported sale price) and all other securities and assets at their fair value by the methods established by the board of directors of the underlying funds.
Investment Transactions and Related Income:
Changes in holdings of investments are accounted for no later than one business day following the trade date. For financial reporting purposes, however, investment transactions are accounted for on trade date on the last business day of the reporting period. Interest income is determined on the basis of coupon interest accrued using the effective interest method which adjusts, where applicable, the amortization of premiums or accretion of discounts. Dividend income is recorded on the ex-dividend date. Gains or losses realized on sales of securities are recorded on the identified cost basis.
Withholding taxes on interest, dividends and gains as a result of certain investments in ADRs by the Funds have been provided for in accordance with each investment's applicable country's tax rules and rates.
Securities Lending:
The Trust has entered into a Master Securities Lending Agreement ("MSLA") with Citibank, N.A. ("Citibank" or the "Agent"). Under the terms of the MSLA, the Funds may lend securities to certain broker-dealers and banks in exchange for collateral in the amount of at least 102% of the value of U.S. securities loaned or at least 105% of the value of non-U.S. securities loaned, marked-to-market daily. Any collateral shortfalls associated with increases in the valuation of the securities loaned are adjusted the next business day. The collateral can be received in the form of cash collateral and/or non-cash collateral. Non-cash collateral can include U.S. Government Securities, letters of credit and certificates of deposit. The cash collateral is invested in short-term instruments or cash equivalents, primarily open-end investment companies, as noted on the Funds' Schedules of Portfolio Investments. The Trust does not have effective control of the non-cash collateral and therefore it is not disclosed on the Funds' Schedules of Portfolio Investments. During the time portfolio securities are on loan, the borrower will pay the Funds any dividends or interest paid on such securities plus any fee negotiated between the parties to the lending agreement. The Funds also earn a return from the collateral. The Funds pay the Agent various fees in connection with the investment of cash collateral and fees based on the investment income received from securities lending activities. Securities lending income (net of these fees) is disclosed on the Statements of Operations. Although risk is mitigated by the collateral, the Funds could experience a delay in recovering their securities and possible loss of income or value if the borrower fails to return them.
Securities lending transactions are entered into by a Fund under the MSLA, which permits the Fund, under certain circumstances such as an event of default, to offset amounts payable by the Fund to the same counterparty against amounts receivable from the counterparty to create a net payment due to or from the Fund.
The following table is a summary of the Funds' securities lending transactions which are subject to offset under the MSLA as of December 31, 2020. These transactions are accounted for as secured borrowings with an overnight and continuous contractual maturity for cash collateral and greater than overnight and continuous contractual maturity for non-cash collateral.
62
Victory Portfolios | | Notes to Financial Statements — continued
December 31, 2020 | |
| | | Gross
Amount of
Recognized
Assets
(Value of | | Value of
Cash | | Value of Non-cash Collateral
Received by Maturity | | | |
| | | Securities
on Loan) | | Collateral
Received* | | <30 Days | | Between
30 & 90 Days | | >90 Days | | Net Amount | |
RS Partners Fund | | $ | 17,574,751 | | | $ | 17,574,751 | | | $ | — | | | $ | — | | | $ | — | | | $ | — | | |
RS Value Fund | | | 8,641,535 | | | | 8,641,535 | | | | — | | | | — | | | | — | | | | — | | |
RS Large Cap Alpha Fund | | | 72,460 | | | | 72,460 | | | | — | | | | — | | | | — | | | | �� | | |
RS Investors Fund | | | 764,600 | | | | 764,600 | | | | — | | | | — | | | | — | | | | — | | |
Global Natural Resources Fund | | | 2,480,716 | | | | 2,480,716 | | | | — | | | | — | | | | — | | | | — | | |
* Collateral received in excess of the market value of securities on loan is not presented in this table. The total cash collateral received by each Fund is disclosed in the Statements of Assets and Liabilities.
Foreign Currency Translations:
The accounting records of the Funds are maintained in U.S. dollars. Investment securities and other assets and liabilities of a Fund denominated in a foreign currency are translated into U.S. dollars at current exchange rates. Purchases and sales of securities, income receipts and expense payments are translated into U.S. dollars at the exchange rates on the date of the transactions. The Funds do not isolate the portion of the results of operations resulting from changes in foreign exchange rates on investments from fluctuations arising from changes in market prices of securities held. Such fluctuations are disclosed as Net change in unrealized appreciation/depreciation on investment securities and foreign currency translations on the Statements of Operations. Any realized gains or losses from these fluctuations are disclosed as Net realized gains (losses) from investment securities and foreign currency translations on the Statements of Operations.
Federal Income Taxes:
It is the policy of each Fund to continue to qualify as a regulated investment company by complying with the provisions available to certain investment companies, as defined in applicable sections of the Internal Revenue Code, and to make distributions of net investment income and net realized gains sufficient to relieve it from all, or substantially all, federal income taxes. Accordingly, no provision for federal income taxes is required in the financial statements. The Funds have a tax year end of December 31.
Management of the Funds has reviewed tax positions taken in tax years that remain subject to examination by all major tax jurisdictions, including federal (i.e., the last four tax years, which includes the current fiscal tax year end). Management believes that there is no tax liability resulting from unrecognized tax benefits related to uncertain tax positions taken.
Allocations:
Expenses directly attributable to a Fund are charged to the Fund, while expenses which are attributable to more than one fund in the Trust, or jointly with an affiliated trust, are allocated among the respective funds in the Trust and/or affiliated trust based upon net assets or another appropriate basis.
Income, expenses (other than class-specific expenses such as transfer agent fees, state registration fees, printing fees and 12b-1 fees), and realized and unrealized gains or losses on investments are allocated to each class of shares based on its relative net assets on the date income is earned or expenses and realized and unrealized gains and losses are incurred.
63
Victory Portfolios | | Notes to Financial Statements — continued
December 31, 2020 | |
3. Purchases and Sales of Securities:
Purchases and sales of securities (excluding securities maturing less than one year from acquisition) for the year ended December 31, 2020, were as follows:
| | | Purchases
(excluding U.S.
Government
Securities) | | Sales
(excluding U.S.
Government
Securities) | |
RS Partners Fund | | $ | 339,353,592 | | | $ | 409,425,678 | | |
RS Value Fund | | | 214,548,336 | | | | 260,377,267 | | |
RS Large Cap Alpha Fund | | | 422,858,127 | | | | 469,596,849 | | |
RS Investors Fund | | | 18,844,853 | | | | 30,039,923 | | |
| Global Natural Resources Fund | | | 51,236,662 | | | | 77,108,812 | | |
For the year ended December 31, 2020, there were no purchases or sales of U.S. Government Securities.
4. Fees and Transactions with Affiliates and Related Parties:
Investment advisory services are provided to the Funds by Victory Capital Management Inc. ("VCM" or the "Adviser"), a New York corporation registered as an investment adviser with the Securities and Exchange Commission ("SEC"). The Adviser is a wholly owned indirect subsidiary of Victory Capital Holdings, Inc., a publicly traded Delaware corporation and a wholly owned direct subsidiary of Victory Capital Operating, LLC. Amounts incurred and paid to VCM for the year ended December 31, 2020, are reflected on the Statements of Operations as Investment advisory fees.
VCM has entered into a Sub-Advisory Agreement with SailingStone Capital Partners LLC ("SailingStone"). SailingStone is responsible for providing day-to-day investment advisory services to the Global Natural Resources Fund, subject to the oversight of the Board. Sub-investment advisory fees paid by VCM to SailingStone do not represent a separate or additional expense to the Funds.
Under the terms of the Investment Advisory Agreement, the Adviser is entitled to receive fees based on a percentage of the average daily net assets of each Fund. The rates at which the Adviser is paid by each Fund are included in the table below. The Adviser may use its resources to assist with the Funds' distribution and marketing expenses.
| | | Flat Rate | |
RS Partners Fund | | | 1.00 | % | |
RS Value Fund | | | 0.85 | % | |
RS Large Cap Alpha Fund | | | 0.50 | % | |
RS Investors Fund | | | 1.00 | % | |
Global Natural Resources Fund | | | 1.00 | % | |
VCM also serves as the Funds' administrator and fund accountant. Under the Administration and Fund Accounting Agreement, VCM is paid for its services an annual fee at a rate of 0.08% of the first $15 billion in average daily net assets of the Trust, Victory Variable Insurance Funds and Victory Portfolios II (collectively, the "Victory Funds Complex"), 0.05% of the average daily net assets above $15 billion to $30 billion of the Victory Funds Complex and 0.04% of the average daily net assets over $30 billion of the Victory Funds Complex. Amounts incurred for the year ended December 31, 2020, are reflected on the Statements of Operations as Administration fees.
Citi Fund Services Ohio, Inc. ("Citi"), an affiliate of Citibank, acts as sub-administrator and sub-fund accountant to the Funds pursuant to the Sub-Administration and Sub-Fund Accounting Services Agreement between VCM and Citi. VCM pays Citi a fee for providing these services. The Funds reimburse VCM and Citi for out-of-pocket expenses incurred in providing these services and certain other expenses specifically allocated to the Funds. Amounts incurred for the year ended December 31, 2020, are reflected on the Statements of Operations as Sub-Administration fees.
64
Victory Portfolios | | Notes to Financial Statements — continued
December 31, 2020 | |
Citibank serves as the Funds' custodian. The Funds pay Citibank a fee for providing these services. Amounts incurred for the year ended December 31, 2020, are reflected on the Statements of Operations as Custodian fees.
FIS Investor Services, LLC ("FIS") serves as the Funds' transfer agent. Under the Transfer Agent Agreement, the Trust pays FIS a fee for its services and reimburses FIS for all of their reasonable out-of-pocket expenses incurred in providing these services. Amounts incurred for the year ended December 31, 2020, are reflected on the Statements of Operations as Transfer agent fees.
Victory Capital Transfer Agency, Inc., an affiliate of the Adviser, serves as sub-transfer agent for the Member Class shares of the Funds and receives no fee or other compensation for these services.
The Chief Compliance Officer ("CCO") is an employee of the Adviser, which pays the compensation of the CCO and his support staff. The Trust has entered into an Agreement to provide compliance services with the Adviser, pursuant to which the Adviser furnishes its compliance personnel, including the services of the CCO, and other resources reasonably necessary to provide the Trust with compliance oversight services related to the design, administration and oversight of a compliance program for the Trust in accordance with Rule 38a-1 under the 1940 Act. The Funds in the Victory Funds Complex, in aggregate, compensate the Adviser for these services. Amounts incurred for the year ended December 31, 2020, are reflected on the Statements of Operations as Compliance fees.
Sidley Austin LLP provides legal services to the Trust.
Victory Capital Services, Inc. (the "Distributor"), an affiliate of the Adviser, serves as distributor for the continuous offering of the shares of the Funds pursuant to a Distribution Agreement between the Distributor and the Trust, and receives no fee or other compensation for these services. Effective June 30, 2020, the Distributor's name was changed from Victory Capital Advisers, Inc. Amounts incurred for the year ended December 31, 2020, are reflected on the Statements of Operations as 12b-1 fees.
Pursuant to the Distribution and Service Plans adopted in accordance with Rule 12b-1 under the 1940 Act, the Distributor may receive a monthly distribution and service fee, at an annual rate of up to 0.25% of the average daily net assets of Class A Shares, at an annual rate of up to 0.50% of the average daily net assets of Class R Shares and 1.00% of the average daily net assets of Class C Shares of the Funds. The distribution and service fees paid to the Distributor may be used by the Distributor to pay for activities primarily intended to result in the sale of Class A, Class R or Class C Shares of the Funds.
In addition, the Distributor is entitled to receive commissions on sales of the Class A Shares of the Funds. For the year ended December 31, 2020, the Distributor received approximately $ 19,237 from commissions earned on sales of Class A Shares of the Funds.
The Adviser has entered into expense limitation agreements with certain Funds. Under the terms of the agreements, the Adviser has agreed to waive fees or reimburse certain expenses to the extent that ordinary operating expenses incurred by certain classes of a Fund in any fiscal year exceed the expense limit for such classes of the Fund. Such excess amounts will be the liability of the Adviser. Interest, taxes, brokerage commissions, other expenditures which are capitalized in accordance with GAAP, and other extraordinary expenses not incurred in the ordinary course of a Fund's business are excluded from the expense limits. As of December 31, 2020, the expense limits (excluding voluntary waivers) are as follows:
| | | In effect until April 30, 2021 | |
| | | Class A
Shares | | Class C
Shares | | Class R
Shares | | Class Y
Shares | | Member Class | |
RS Partners Fund | | | 1.45 | % | | | N/A | | | | 1.81 | % | | | 1.12 | % | | | 1.25 | %(a) | |
RS Value Fund | | | 1.30 | % | | | 2.07 | % | | | 1.69 | % | | | 1.06 | % | | | N/A | | |
RS Large Cap Alpha Fund | | | 0.89 | % | | | 1.69 | % | | | 1.26 | % | | | 0.68 | % | | | N/A | | |
RS Investors Fund | | | 1.33 | % | | | 2.07 | % | | | 1.95 | % | | | 1.05 | % | | | N/A | | |
Global Natural Resources Fund | | | 1.48 | % | | | 2.28 | % | | | 1.86 | % | | | 1.15 | % | | | N/A | | |
(a) In effect from November 3, 2020, until at least April 30, 2022.
65
Victory Portfolios | | Notes to Financial Statements — continued
December 31, 2020 | |
The Funds have agreed to repay fees and expenses that were waived or reimbursed by the Adviser for a period up to three fiscal years after such waiver or reimbursement was made to the extent such payments or repayments would not cause the expenses of a class to exceed the original expense limitation in place at the time of the waiver or reimbursement or any expense limitation agreement in place at the time of repayment. Amounts repaid to the Adviser during the year, if any, are reflected on the Statements of Operations as Recoupment of prior expenses waived/reimbursed by Adviser.
As of December 31, 2020, the following amounts are available to be repaid to the Adviser. The Funds have not recorded any amounts available to be repaid as a liability due to an assessment that such repayment is not probable at December 31, 2020.
| | | Expires
December 31,
2021 | | Expires
December 31,
2022 | | Expires
December 31,
2023 | | Total | |
RS Partners Fund | | $ | 386,406 | | | $ | 344,191 | | | $ | 316,786 | | | $ | 1,047,383 | | |
RS Value Fund | | | 116,096 | | | | 154,554 | | | | 199,071 | | | | 469,721 | | |
RS Large Cap Alpha Fund | | | 236,137 | | | | 327,684 | | | | 314,607 | | | | 878,428 | | |
RS Investors Fund | | | 163,946 | | | | 162,310 | | | | 146,600 | | | | 472,856 | | |
Global Natural Resources Fund | | | 577,205 | | | | 429,505 | | | | 234,015 | | | | 1,240,725 | | |
The Adviser may voluntarily waive or reimburse additional fees to assist the Funds in maintaining competitive expense ratios. Voluntary waivers and reimbursements applicable to the Funds are not available to be recouped at a future time. There were no voluntary waivers or reimbursements for the year ended December 31, 2020.
Certain officers and/or interested trustees of the Funds are also officers and/or employees of the Adviser, Administrator, Fund Accountant, Sub-Administrator, Sub-Fund Accountant, Custodian, Distributor, and Legal Counsel.
5. Risks:
Each Fund may be subject to other risks in addition to these identified risks.
Equity Risk — An investment in the Funds' shares represents an indirect investment in the securities owned by the Funds, some of which will be traded on a national securities exchange or in the over-the-counter markets. The value of the securities in which the Funds invest, like other market investments, may move up or down, sometimes rapidly and unpredictably. The value of the securities in which the Funds invest may affect the value of the Funds' shares. An investment in the Funds' shares at any point in time may be worth less than the original investment, even after taking into account the reinvestment of the Funds' distributions.
Sector Risk — To the extent the Funds focus in one or more sectors, market or economic factors impacting those sectors could have a significant effect on the value of the Funds' investments and could make the Funds' performance more volatile. For example, the values of companies in the Information Technology sector are particularly vulnerable to economic downturns, short product cycles and aggressive pricing, market competition and changes in government regulation.
Concentration Risk — The Global Natural Resources Fund (herein, the "Fund") may concentrate its investments in a particular industry, as the term "concentration is used in the 1940 Act. Concentrating investments in the Natural Resources sector increases the risk of loss because the stocks of many or all of the companies in the sector may decline in value due to developments adversely affecting the sector. In addition, investors may buy or sell substantial amounts of the Fund's shares in response to factors affecting or expected to affect the natural resources sector, resulting in extreme inflows and outflows of cash into and out of the Fund. Such inflows or outflows might affect management of the Fund adversely to the extent they cause the Fund's cash position or cash requirements to exceed normal levels.
Geopolitical/Natural Disaster Risk — An outbreak of disease called COVID-19 has spread internationally. The transmission of COVID-19 and efforts to contain its spread have resulted in international, national and local border closings and other significant travel restrictions and disruptions, significant disruptions to business operations, supply chains and consumer activity, significant challenges in healthcare service preparation and delivery, quarantines and general concern and uncertainty. These negative impacts have caused significant volatility and declines in global financial markets, which have
66
Victory Portfolios | | Notes to Financial Statements — continued
December 31, 2020 | |
caused losses for Fund investors during and subsequent to period end. The impact of the COVID-19 pandemic may last for an extended period of time, and could result in a substantial economic downturn or recession. Public health crises may exacerbate other pre-existing political, social, economic, market and financial risks. The extent of the impact to the financial performance of the Funds' investments will depend on future developments, including (i) the duration and spread of the outbreak, (ii) the restrictions and advisories, (iii) the effects on the financial markets, and (iv) the effects on the economy overall, all of which are highly uncertain and cannot be predicted.
6. Borrowing and Interfund Lending:
Line of Credit:
For the year ended December 31, 2020, the Victory Funds Complex and the USAA Mutual Funds Complex (another series of mutual funds managed by the Adviser) participated in a short-term demand note "Line of Credit" agreement with Citibank. The Line of Credit agreement with Citibank was renewed on June 29, 2020, with a termination date of June 28, 2021. Under the agreement with Citibank, the Victory Funds Complex and USAA Mutual Funds Complex, combined, may borrow up to $600 million, of which $300 million is committed and $300 million is uncommitted. $40 million of the Line of Credit is reserved for use by the Victory Floating Rate Fund (herein, the "Fund"), another series of the Victory Funds Complex, with that Fund paying the related commitment fees for that amount. The purpose of the agreement is to meet temporary or emergency cash needs. For the year ended December 31, 2020, Citibank received an annual commitment fee of 0.15% on $300 million for providing the Line of Credit. Each fund in the Victory Funds Complex pays a pro-rata portion of the commitment fees plus any interest (one month LIBOR plus one percent) on amounts borrowed. Effective June 29, 2020, under an amended Line of Credit agreement, Citibank will also receive an annual upfront fee of 0.10% on the $300 million committed line of credit. Each fund in the Victory Funds Complex will pay a pro-rata portion of the upfront fee. Interest charged to each Fund during the period, if applicable, is presented on the Statements of Operations under Line of credit fees.
The Funds did not utilize the Line of Credit during the year ended December 31, 2020.
Interfund Lending:
The Trust and Adviser rely on an exemptive order granted by the SEC in March 2017 (the "Order"), permitting the establishment and operation of an Interfund Lending Facility (the "Facility"). The Facility allows each Fund to directly lend and borrow money to or from any other Victory Fund, that is permitted to participate in the Facility, relying upon the Order at rates beneficial to both the borrowing and lending funds. Advances under the Facility are allowed for temporary or emergency purposes, including the meeting of redemption requests that otherwise might require the untimely disposition of securities, and are subject to each fund's borrowing restrictions. The interfund loan rate is determined, as specified in the Order, by averaging the current repurchase agreement rate and the current bank loan rate. As a Borrower, interest charged to each Fund during the period, if applicable, is presented on the Statements of Operations under Interfund lending fees. As a Lender, interest earned by each Fund during the period, if applicable, is presented on the Statements of Operations under Interfund lending income.
The average borrowing and lending for the days outstanding and average interest rate for each Fund during the year ended December 31, 2020, were as follows:
| | | Borrower or
Lender | | Amount
Outstanding at
December 31,
2020 | | Average
Borrowing* | | Days
Borrowing
Outstanding | | Average
Interest
Rate* | | Maximum
Borrowing
During the
Period | |
RS Investors Fund | | Borrower | | $ | — | | | $ | 1,916,000 | | | | 2 | | | | 1.76 | % | | $ | 1,948,000 | | |
* For the year ended December 31, 2020, based on the number of days borrowings were outstanding.
7. Federal Income Tax Information:
Dividends from net investment income, if any, are declared and paid annually for the Funds. Distributable net realized gains, if any, are declared and distributed at least annually from each Fund.
The amounts of dividends from net investment income and distributions from net realized gains (collectively, distributions to shareholders) are determined in accordance with federal income tax
67
Victory Portfolios | | Notes to Financial Statements — continued
December 31, 2020 | |
regulations, which may differ from GAAP. To the extent these "book/tax" differences are permanent in nature (e.g., net operating loss and distribution reclassification), such amounts are reclassified within the components of net assets based on their federal tax-basis treatment; temporary differences (e.g., wash sales) do not require reclassification. To the extent dividends and distributions exceed net investment income and net realized gains for tax purposes, they are reported as distributions of capital. Net investment losses incurred by a Fund may be reclassified as an offset to capital on the accompanying Statements of Assets and Liabilities.
As of December 31, 2020, on the Statements of Assets and Liabilities, as a result of permanent book-to-tax differences, reclassification adjustments were as follows:
| | Total
Accumulated
Earnings/(Loss) | | Capital | |
RS Partners Fund | | $ | 180,360 | | | $ | (180,360 | ) | |
RS Value Fund | | | (9,599 | ) | | | 9,599 | | |
RS Large Cap Alpha Fund | | | 2,667 | | | | (2,667 | ) | |
RS Investors Fund | | | 32,579 | | | | (32,579 | ) | |
The tax character of distributions paid during the tax years ended, as noted below, were as follows (total distributions paid may differ from the Statements of Changes in Net Assets because, for tax purposes, dividends are recognized when actually paid):
| | Year Ended December 31, 2020 | |
| | Distributions Paid From: | | | |
| | Ordinary
Income | | Net
Long-Term
Capital Gains | | Total
Distributions
Paid | |
RS Partners Fund | | $ | 11 | | | $ | 4,980,318 | | | $ | 4,980,329 | | |
RS Value Fund | | | 5 | | | | 5,814,174 | | | | 5,814,179 | | |
RS Large Cap Alpha Fund | | | 1,415,308 | | | | 16,338,738 | | | | 17,754,046 | | |
RS Investors Fund | | | — | | | | 86,177 | | | | 86,177 | | |
RS Global Natural Resources Fund | | | 325,268 | | | | — | | | | 325,268 | | |
| | Year Ended December 31, 2019 | |
| | Distributions paid from | | | |
| | Ordinary
Income | | Net
Long-Term
Capital Gains | | Total
Distributions
Paid | |
RS Partners Fund | | $ | 2,917,501 | | | $ | 38,853,618 | | | $ | 41,771,119 | | |
RS Value Fund | | | 3,088,482 | | | | 24,249,837 | | | | 27,338,319 | | |
RS Large Cap Alpha Fund | | | 3,767,453 | | | | 17,315,428 | | | | 21,082,881 | | |
RS Investors Fund | | | — | | | | 1,871,145 | | | | 1,871,145 | | |
Global Natural Resources Fund | | | 294,977 | | | | — | | | | 294,977 | | |
As of December 31, 2020, the components of accumulated earnings/(loss) on a tax basis were as follows:
| | Undistributed
Ordinary
Income | | Accumulated
Earnings | | Accumulated
Capital and
Other
Losses | | Unrealized
Appreciation
(Depreciation)* | | Total
Accumulated
Earnings
(Loss) | |
RS Partners Fund | | $ | 1,236,517 | | | $ | 1,236,517 | | | $ | (9,328,334 | ) | | $ | 73,496,036 | | | $ | 65,404,219 | | |
| RS Value Fund | | | 698,365 | | | | 698,365 | | | | (11,867,080 | ) | | | 53,082,204 | | | | 41,913,489 | | |
| RS Large Cap Alpha Fund | | | 5,493,216 | | | | 5,493,216 | | | | (577,913 | ) | | | 95,782,420 | | | | 100,697,723 | | |
RS Investors Fund | | | — | | | | — | | | | (2,106,442 | ) | | | 5,778,932 | | | | 3,672,490 | | |
RS Global Natural Resources Fund | | | 86,746 | | | | 86,746 | | | | (1,828,289,529 | ) | | | (95,939,753 | ) | | | (1,924,142,536 | ) | |
* The difference between the book-basis and tax-basis unrealized appreciation (depreciation) is attributable primarily to tax deferral of losses on wash sales and partnership basis adjustments.
68
Victory Portfolios | | Notes to Financial Statements — continued
December 31, 2020 | |
As of the tax year ended December 31, 2020, the following Funds had net capital loss carryforwards ("CLCFs") as summarized in the table below, which are not subject to expiration.
| | Short-Term
Amount | | Long-Term
Amount | | Total | |
RS Partners Fund | | $ | 9,328,334 | | | $ | — | | | $ | 9,328,334 | | |
| RS Value Fund | | | 11,867,080 | | | | — | | | | 11,867,080 | | |
| RS Large Cap Alpha Fund | | | 577,913 | | | | — | | | | 577,913 | | |
| RS Investors Fund | | | 2,106,442 | | | | — | | | | 2,106,442 | | |
RS Global Natural Resources Fund | | | 9,316,769 | | | | 1,818,972,760 | | | | 1,828,289,529 | | |
As of December 31, 2020, the cost basis for federal income tax purposes, gross unrealized appreciation, gross unrealized depreciation and net unrealized appreciation (depreciation) for investments and derivatives were as follows:
| | Cost of
Investments
for Federal
Tax Purposes | | Gross
Unrealized
Appreciation | | Gross
Unrealized
Depreciation | | Net
Unrealized
Appreciation
(Depreciation) | |
RS Partners Fund | | $ | 271,716,198 | | | $ | 81,536,774 | | | $ | (8,040,791 | ) | | $ | 73,495,983 | | |
RS Value Fund | | | 261,416,808 | | | | 59,599,467 | | | | (6,517,263 | ) | | | 53,082,204 | | |
RS Large Cap Alpha Fund | | | 379,375,961 | | | | 105,257,738 | | | | (9,475,318 | ) | | | 95,782,420 | | |
RS Investors Fund | | | 22,776,471 | | | | 6,410,206 | | | | (631,283 | ) | | | 5,778,923 | | |
RS Global Natural Resources Fund | | | 246,925,388 | | | | 38,152,363 | | | | (134,092,443 | ) | | | (95,940,080 | ) | |
8. Capital Contribution from Prior Custodian:
During 2016, certain Funds received notification from their prior custodian, State Street Bank and Trust ("State Street"), concerning issues related to billing on certain categories of expenses during the approximately 16-year period from 1998 through October 31, 2014. The over-billing primarily related to categories of expenses that involved an allocation of general costs among multiple clients.
State Street paid the refunded amounts during January 2017. Based on billing information received during 2016 from State Street and an analysis of any expense limitation agreements that were in place during the period of the activities in question, including the application of any recoupment provisions in such agreements, the Adviser received a portion of the refund.
The portion of the refund retained by the Funds was accounted for as a capital contribution and is reflected on the Financial Highlights as Capital Contribution from Prior Custodian, Net.
9. Fund Ownership:
Ownership of more than 25% of the voting securities of a fund creates presumptions of control of the fund, under section 2(a)(9) of the 1940 Act. As of December 31, 2020, the shareholders listed below held more than 25% of the shares outstanding of the Funds and may be deemed to control those Funds. Shareholders of record may hold Fund shares for the benefit of their customers.
| | | Shareholder | | Percent | |
RS Partners Fund | | National Financial Services, LLC | | | 30.8 | % | |
Global Natural Resources Fund | | Charles Schwab & Co., Inc. | | | 36.4 | % | |
69
REPORT OF INDEPENDENT REGISTERED PUBLIC ACCOUNTING FIRM
To the Shareholders and Board of Trustees of Victory Portfolios
Opinion on the Financial Statements
We have audited the accompanying statements of assets and liabilities, including the schedules of portfolio investments, of Victory RS Partners Fund, Victory RS Value Fund, Victory RS Large Cap Alpha Fund, Victory RS Investors Fund and Victory Global Natural Resources Fund (the "Funds"), each a series of Victory Portfolios, as of December 31, 2020, the related statements of operations for the year then ended and the statements of changes in net assets, the related notes, and the financial highlights for each of the two years in the period then ended (collectively referred to as the "financial statements"). In our opinion, the financial statements present fairly, in all material respects, the financial position of each of the Funds as of December 31, 2020, the results of their operations for the year then ended and the changes in their net assets and the financial highlights for each of the two years in the period then ended, in conformity with accounting principles generally accepted in the United States of America.
The Funds' financial highlights for the years ended December 31, 2018 and prior, were audited by other auditors whose report dated February 26, 2019, expressed an unqualified opinion on those financial highlights.
Basis for Opinion
These financial statements are the responsibility of the Funds' management. Our responsibility is to express an opinion on the Funds' financial statements based on our audits. We are a public accounting firm registered with the Public Company Accounting Oversight Board (United States) ("PCAOB") and are required to be independent with respect to the Funds in accordance with the U.S. federal securities laws and the applicable rules and regulations of the Securities and Exchange Commission and the PCAOB.
We conducted our audits in accordance with the standards of the PCAOB. Those standards require that we plan and perform the audit to obtain reasonable assurance about whether the financial statements are free of material misstatement whether due to error or fraud.
Our audits included performing procedures to assess the risks of material misstatement of the financial statements, whether due to error or fraud, and performing procedures that respond to those risks. Such procedures included examining, on a test basis, evidence regarding the amounts and disclosures in the financial statements. Our procedures included confirmation of securities owned as of December 31, 2020, by correspondence with the custodian and brokers or by other appropriate auditing procedures where replies from brokers were not received. Our audits also included evaluating the accounting principles used and significant estimates made by management, as well as evaluating the overall presentation of the financial statements. We believe that our audits provide a reasonable basis for our opinion.
We have served as the auditor of one or more of the investment companies advised by Victory Capital Management, Inc. since 2015.

COHEN & COMPANY, LTD.
Cleveland, Ohio
February 23, 2021
70
Victory Portfolios | | Supplemental Information
December 31, 2020 | |
(Unaudited)
Trustee and Officer Information
Board of Trustees:
Overall responsibility for management of the Trust rests with the Board. The Trust is managed by the Board in accordance with the laws of the State of Delaware. There are currently nine Trustees, eight of whom are not "interested persons" of the Trust within the meaning of that term under the 1940 Act ("Independent Trustees") and one of whom is an "interested person" of the Trust within the meaning of that term under the 1940 Act ("Interested Trustee"). The Trustees, in turn, elect the officers of the Trust to actively supervise its day-to-day operations.
The following tables list the Trustees, their date of birth, position with the Trust, commencement of service, principal occupations during the past five years and any directorships of other investment companies or companies whose securities are registered under the Securities Exchange Act of 1934, as amended, or who file reports under that Act. Each Trustee oversees 42 portfolios in the Trust, 8 portfolios in Victory Variable Insurance Funds, and 25 portfolios in Victory Portfolios II, each a registered investment company that, together with the Trust, comprise the Victory Fund Complex. David C. Brown is a Trustee of USAA Mutual Funds Trust and oversees 46 portfolios of the USAA Mutual Funds Trust. Each Trustee's address is c/o Victory Portfolios, 4900 Tiedeman Road, 4th Floor, Brooklyn, Ohio 44144. Each Trustee has an indefinite term.
Name and Date of Birth | | Position
Held with
the Trust | | Date
Commenced
Service | | Principal Occupation
During Past 5 Years | | Other
Directorships
Held During
Past 5 Years | |
Independent Trustees. | |
David Brooks Adcock, Born October 1951 | | Trustee | | May 2005 | | Consultant (since 2006). | | Chair and Trustee, Turner Funds (December 2016-December 2017). | |
Nigel D. T. Andrews, Born April 1947 | | Vice Chair and Trustee | | August 2002 | | Retired. | | Director, TCG BDC II, Inc. (since 2017); Director, TCG BDC I, Inc. (formerly Carlyle GMS Finance, Inc.) (since 2012). | |
E. Lee Beard,* Born August 1951 | | Trustee | | May 2005 | | Retired (since 2015) | | None. | |
Dennis M. Bushe, Born January 1944 | | Trustee | | July 2016 | | Retired. | | Trustee, RS Investment Trust and RS Variable Products Trust (November 2011-July 2016). | |
71
Victory Portfolios | | Supplemental Information — continued
December 31, 2020 | |
(Unaudited)
Name and Date of Birth | | Position
Held with
the Trust | | Date
Commenced
Service | | Principal Occupation
During Past 5 Years | | Other
Directorships
Held During
Past 5 Years | |
John L. Kelly,
Born April 1953 | | Trustee | | February 2015 | | Partner, McCarvill Capital Partners (September 2016- September 2017); Advisor, (January 2016-April 2016) and Managing Partner (August 2014-January 2016) Endgate Commodities LLC. | | Director, Caledonia Mining Corporation (since May 2012). | |
David L. Meyer,* Born April 1957 | | Trustee | | December 2008 | | Retired. | | None. | |
Gloria S. Nelund, Born May 1961 | | Trustee | | July 2016 | | Chair, CEO and Co-Founder of TriLinc Global, LLC, an investment firm. | | TriLinc Global Impact Fund, LLC (since 2012); Trustee, RS Investment Trust and RS Variable Products Trust (November 2007-July 2016). | |
Leigh A. Wilson, Born December 1944 | | Chair and Trustee | | November 1994 | | Private Investor. | | Chair (since 2013), Caledonia Mining Corporation. | |
Interested Trustee. | |
David C. Brown,** Born May 1972 | | Trustee | | May 2008 | | Chairman and Chief Executive Officer (since 2013), the Adviser; Chairman and Chief Executive Officer (since 2013), Victory Capital Holdings, Inc. | | Trustee, USAA Mutual Funds Trust. | |
* The Board has designated Ms. Beard and Mr. Meyer as its Audit Committee Financial Experts.
** Mr. Brown is an "Interested Person" by reason of his relationship with the Adviser.
The Statement of Additional Information includes additional information about the Trustees of the Trust and is available, without charge, by calling 800-539-3863.
72
Victory Portfolios | | Supplemental Information — continued
December 31, 2020 | |
(Unaudited)
Officers:
The officers of the Trust, their date of birth, commencement of service and their principal occupations during the past five years, are detailed in the following table. Each officer serves until the earlier of his or her resignation, removal, retirement, death, or the election of a successor. The mailing address of each officer of the Trust is 4900 Tiedeman Road, 4th Floor, Brooklyn, Ohio 44144. The officers of the Trust receive no compensation directly from the Trust for performing the duties of their offices.
Name and Date of Birth | | Position with
the Trust | | Date
Commenced
Service | | Principal Occupation During Past 5 Years | |
Christopher K. Dyer, Born February 1962 | | President | | February 2006* | | Director of Mutual Fund Administration, the Adviser. | |
Scott A. Stahorsky, Born July 1969 | | Vice President | | December 2014 | | Manager, Fund Administration, the Adviser. | |
Erin G. Wagner, Born February 1974 | | Secretary | | December 2014 | | Associate General Counsel, the Adviser (since 2013). | |
Allan Shaer, Born March 1965 | | Treasurer | | May 2017 | | Senior Vice President, Financial Administration, Citi Fund Services Ohio, Inc. (since 2016); Vice President, Mutual Fund Administration, JP Morgan Chase (2011-2016). | |
Christopher A. Ponte, Born March 1984 | | Assistant Treasurer | | December 2017 | | Manager, Fund Administration, the Adviser (since 2017); Senior Analyst, Fund Administration, the Adviser (prior to 2017); Chief Financial Officer, Victory Capital Services, Inc. (since 2018). | |
Colin Kinney, Born October 1973 | | Chief Compliance Officer | | July 2017 | | Chief Compliance Officer (since 2013) and Chief Risk Officer (2009-2017), the Adviser. | |
Chuck Booth,
Born April 1960 | | Anti-Money Laundering Compliance Officer and Identity Theft Officer | | May 2015 | | Director, Regulatory Administration and CCO Support Services, Citi Fund Services Ohio, Inc. | |
Jay G. Baris, Born January 1954 | | Assistant Secretary | | December 1997 | | Partner, Sidley Austin LLP (since April 2020); Partner, Shearman & Sterling LLP (January 2018-April 2020); Partner, Morrison & Foerster LLP (2011-January 2018). | |
* On December 3, 2014, Mr. Dyer resigned as Secretary of the Trust and accepted the position of President.
73
Victory Portfolios | | Supplemental Information — continued
December 31, 2020 | |
Proxy Voting and Portfolio Holdings Information
Proxy Voting:
Information regarding the policies and procedures each Fund uses to determine how to vote proxies relating to portfolio securities is available without charge, upon request, by calling 800-539-3863. The information is also included in the Funds' Statement of Additional Information, which is available on the SEC's website at www.sec.gov.
Information relating to how the Funds voted proxies relating to portfolio securities held during the most recent twelve months ended December 31 is available on the SEC's website at www.sec.gov.
Availability of Schedules of Portfolio Investments:
The Trust files a complete list of Schedules of Portfolio Investments with the SEC for the first and third quarter of each fiscal year on Form N-PORT. Forms N-PORT are available on the SEC's website at www.sec.gov.
Expense Examples
As a shareholder of the Funds, you may incur two types of costs: (1) transaction costs, including sales charges (loads) on purchases; and (2) ongoing costs, including management fees, distribution and service (12b-1) fees and other Fund expenses. These examples are intended to help you understand your ongoing costs (in dollars) of investing in the Funds and to compare these costs with the ongoing costs of investing in other mutual funds.
These examples are based on an investment of $1,000 invested at the beginning of the period and held for the entire period from July 1, 2020, through December 31, 2020.
The Actual Expense figures in the table below provide information about actual account values and actual expenses. You may use the information below, together with the amount you invested, to estimate the expenses that you paid over the period. Simply divide your account value by $1,000 (for example, an $8,600 account value divided by $1,000 = 8.6), then multiply the result by the number in the table under the heading entitled "Actual Expenses Paid During Period" to estimate the expenses you paid on your account during this period.
The Hypothetical Expense figures in the table below provide information about hypothetical account values and hypothetical expenses based on each Fund's actual expense ratio and an assumed rate of return of 5% per year before expenses, which is not the Fund's actual return. The hypothetical account values and expenses may not be used to estimate the actual ending account balance or expenses you paid for the period. You may use this information to compare this 5% hypothetical example with the 5% hypothetical examples that appear in shareholder reports of other funds.
Please note the expenses shown in the table are meant to highlight your ongoing costs only and do not reflect any transactional costs. Therefore, the table is useful in comparing ongoing costs only, and will not help you determine the relative total costs of owning different funds. In addition, if these transactional costs were included, your costs would have been higher.
| | | Beginning
Account
Value
7/1/20 | | Actual
Ending
Account
Value
12/31/20 | | Hypothetical
Ending
Account
Value
12/31/20 | | Actual
Expenses
Paid
During
Period
7/1/20-
12/31/20 | | Hypothetical
Expenses
Paid
During
Period
7/1/20-
12/31/20* | | Annualized
Expense
Ratio
During
Period
7/1/20-
12/31/20 | |
RS Partners Fund | |
Class A Shares | | $ | 1,000.00 | | | $ | 1,338.20 | | | $ | 1,017.85 | | | $ | 8.52 | | | $ | 7.35 | | | | 1.45 | % | |
Class R Shares | | | 1,000.00 | | | | 1,335.50 | | | | 1,016.04 | | | | 10.63 | | | | 9.17 | | | | 1.81 | % | |
Class Y Shares | | | 1,000.00 | | | | 1,340.10 | | | | 1,019.51 | | | | 6.59 | | | | 5.69 | | | | 1.12 | % | |
Member Class** | | | 1,000.00 | | | | 1,252.20 | | | | 1,018.85 | | | | 2.27 | | | | 6.34 | | | | 1.25 | % | |
74
Victory Portfolios | | Supplemental Information — continued
December 31, 2020 | |
| | | Beginning
Account
Value
7/1/20 | | Actual
Ending
Account
Value
12/31/20 | | Hypothetical
Ending
Account
Value
12/31/20 | | Actual
Expenses
Paid
During
Period
7/1/20-
12/31/20 | | Hypothetical
Expenses
Paid
During
Period
7/1/20-
12/31/20* | | Annualized
Expense
Ratio
During
Period
7/1/20-
12/31/20 | |
RS Value Fund | |
Class A Shares | | $ | 1,000.00 | | | $ | 1,259.70 | | | $ | 1,018.60 | | | $ | 7.38 | | | $ | 6.60 | | | | 1.30 | % | |
Class C Shares | | | 1,000.00 | | | | 1,254.80 | | | | 1,014.73 | | | | 11.73 | | | | 10.48 | | | | 2.07 | % | |
Class R Shares | | | 1,000.00 | | | | 1,257.50 | | | | 1,016.64 | | | | 9.59 | | | | 8.57 | | | | 1.69 | % | |
Class Y Shares | | | 1,000.00 | | | | 1,261.30 | | | | 1,019.81 | | | | 6.03 | | | | 5.38 | | | | 1.06 | % | |
RS Large Cap Alpha Fund | |
Class A Shares | | | 1,000.00 | | | | 1,224.90 | | | | 1,020.66 | | | | 4.98 | | | | 4.52 | | | | 0.89 | % | |
Class C Shares | | | 1,000.00 | | | | 1,220.10 | | | | 1,016.64 | | | | 9.43 | | | | 8.57 | | | | 1.69 | % | |
Class R Shares | | | 1,000.00 | | | | 1,222.70 | | | | 1,018.80 | | | | 7.04 | | | | 6.39 | | | | 1.26 | % | |
Class Y Shares | | | 1,000.00 | | | | 1,226.10 | | | | 1,021.72 | | | | 3.81 | | | | 3.46 | | | | 0.68 | % | |
RS Investors Fund | |
Class A Shares | | | 1,000.00 | | | | 1,243.20 | | | | 1,018.45 | | | | 7.50 | | | | 6.75 | | | | 1.33 | % | |
Class C Shares | | | 1,000.00 | | | | 1,237.30 | | | | 1,014.73 | | | | 11.64 | | | | 10.48 | | | | 2.07 | % | |
Class R Shares | | | 1,000.00 | | | | 1,239.20 | | | | 1,015.33 | | | | 10.98 | | | | 9.88 | | | | 1.95 | % | |
Class Y Shares | | | 1,000.00 | | | | 1,244.60 | | | | 1,019.86 | | | | 5.92 | | | | 5.33 | | | | 1.05 | % | |
Global Natural Resources Fund | |
Class A Shares | | | 1,000.00 | | | | 1,599.70 | | | | 1,017.70 | | | | 9.67 | | | | 7.51 | | | | 1.48 | % | |
Class C Shares | | | 1,000.00 | | | | 1,591.90 | | | | 1,013.67 | | | | 14.85 | | | | 11.54 | | | | 2.28 | % | |
Class R Shares | | | 1,000.00 | | | | 1,596.20 | | | | 1,015.79 | | | | 12.14 | | | | 9.42 | | | | 1.86 | % | |
Class Y Shares | | | 1,000.00 | | | | 1,602.20 | | | | 1,019.36 | | | | 7.52 | | | | 5.84 | | | | 1.15 | % | |
* Expenses are equal to the average account value multiplied by the Fund's annualized expense ratio multiplied by 184/366 (the number of days in the most recent fiscal half-year divided by the number of days in the fiscal year).
** Actual Expenses Paid are equal to the average account value multiplied by the Fund's annualized expense ratio multiplied by 59/366 to reflect the stub period from commencement of operations November 3, 2020, through December 31, 2020.
75
Victory Portfolios | | Supplemental Information — continued
December 31, 2020 | |
Additional Federal Income Tax Information
For the year ended December 31, 2020, the following Funds paid qualified dividend income for the purposes of reduced individual federal income tax rates of:
| | Percent | |
RS Large Cap Alpha Fund | | | 100 | % | |
RS Global Natural Resources Fund | | | 100 | % | |
Dividends qualified for corporate dividends received deductions of:
| | Percent | |
RS Large Cap Alpha Fund | | | 100 | % | |
RS Global Natural Resources Fund | | | 100 | % | |
For the year ended December 31, 2020, the following Funds designated long-term capital gain distributions:
| | Amount | |
RS Partners Fund | | $ | 4,980,318 | | |
RS Value Fund | | | 5,814,174 | | |
RS Large Cap Alpha Fund | | | 16,338,738 | | |
RS Investors Fund | | | 86,177 | | |
The following Funds intend to elect to pass through to shareholders the income tax credit for taxes paid to foreign countries. Foreign source income and foreign tax expense per outstanding share on December 31, 2020, were as follows:
| | Foreign
Source
Income | | Foreign
Tax
Expense | |
RS Global Natural Resources Fund | | $ | 0.10 | | | $ | 0.01 | | |
76
Victory Portfolios | | Supplemental Information — continued
December 31, 2020 | |
(Unaudited)
Considerations of the Board in Continuing the Investment Advisory Agreements
The Board approved the advisory agreement with the Adviser, on behalf of each of the Funds (the "Advisory Agreement"), and the sub-advisory agreement between SailingStone Capital Partners LLC (the "Sub-Adviser") and the Adviser, on behalf of the Global Natural Resources Fund (the "Sub-Advisory Agreement" and together with the Advisory Agreement, the "Agreements"), at a meeting, which was called for that purpose, on December 2, 2020. The Board also considered information relating to the Funds and the Agreements provided throughout the year and, more specifically, at a meeting on October 27, 2020 called for the purpose of reviewing the Agreements. In considering whether to approve the Agreement, the Board requested, and the Adviser and Sub-Adviser provided, information that the Board believed to be reasonably necessary to reach its conclusions.
The Board, including the Independent Trustees, evaluated this information along with other information obtained throughout the year and was advised by legal counsel to the Funds, which also serves as independent legal counsel to the Independent Trustees. In addition, the Independent Trustees considered a past review of their overall process for conducting the annual review of the Funds' advisory arrangements by an independent consultant retained through their counsel.
The Board took into consideration regular reports from the Adviser and Sub-Adviser throughout the COVID-19 pandemic public health crisis concerning how the ongoing pandemic has affected market volatility, investment risk and the implementation and effectiveness of business continuity plans. These reports also had confirmed that the pandemic had no material impact on the Adviser's (or the Sub-Adviser's) operations.
The Board considered each Fund's advisory fee, expense ratio and investment performance as significant factors in determining whether the Agreements should be continued. The Board reviewed numbers factors with respect to each Fund, including the services to be provided by the Sub-Adviser. In considering whether the compensation paid to the Adviser was fair and reasonable, the Board also evaluated, among other things, the following factors:
• The requirements of the Funds for the services provided by the Adviser;
• The nature, quality and extent of the services provided and expected to be provided;
• The performance of the Funds as compared to comparable funds;
• The fees payable for the services and whether the fee arrangements provided for economies of scale that would benefit Fund shareholders as the Funds grow;
• Whether the fee would be sufficient to enable the Adviser to attract and retain experienced personnel and continue to provide quality services to the Funds;
• The fees paid by other clients of the Adviser whose accounts are managed in a similar investment style and any differences in the services provided to the other clients compared to those provided to the Funds;
• The total expenses of each Fund;
• Management's commitment to operating the Funds at competitive expense levels;
• The profitability of the Adviser (as reflected by comparing fees earned against an estimate of the Adviser's costs) with respect to the Adviser's relationship with the Funds;
• Research and other service benefits received by the Adviser obtained through payment of client commissions for securities transactions;
• Other benefits received by the Adviser, and its affiliates, including revenues paid to the Adviser, or its affiliates, by the Funds for administration and fund accounting services, and distribution;
• The capabilities and financial condition of the Adviser;
• Current economic and industry trends; and
• The historical relationship between each Fund and the Adviser.
In considering whether the compensation paid to the Sub-Adviser was fair and reasonable, the Board also evaluated, among other things, the following factors:
• The requirements of the Fund for the services provided by the Sub-Adviser;
• The nature, quality and extent of the services provided and expected to be provided;
77
Victory Portfolios | | Supplemental Information — continued
December 31, 2020 | |
(Unaudited)
• The fees payable for the services;
• Representations by the Adviser that the sub-advisory fee for the Fund is within the range of fees agreed to in the market for similar services;
• Whether the fee would be sufficient to enable the Sub-Adviser to attract and retain experienced personnel and continue to provide quality services to the Fund;
• Management's commitment to operating the Fund at competitive expense levels;
• Research and other service benefits received by the Sub-Adviser obtained through payment of client commissions for securities transactions;
• Other benefits received by the Sub-Adviser as a result of its sub-advisory relationship with the Fund;
• The capabilities and financial condition of the Sub-Adviser;
• The nature, quality and extent of the oversight and compliance services provided by the Adviser;
• The historical relationship between the predecessor fund and the Sub-Adviser; and
• Current economic and industry trends.
The Board reviewed each Fund's current management fee, comprised of the advisory fee plus the administrative services fee paid to the Adviser, in the context of the Adviser's profitability with respect to each Fund individually. In addition, the Board compared each Fund's gross management fee and total operating expense ratio on a net and gross basis with the median gross management fee and median expense ratio of a universe of comparable mutual funds compiled by an independent consultant, and a peer group of funds with similar investment strategies selected by that independent consultant from the universe of comparable funds. The Board reviewed the factors and methodology used by the independent consultant in the selection of each Fund's peer group, including the independent consultant's selection of a broad universe of funds, the more specific universe of comparable funds, and peer groups of funds with comparable investment strategies and asset levels, among other factors. The Board also reviewed any changes to the independent consultant's methodology as compared to the prior year, including those resulting from the Adviser's input, if any. With respect to certain Funds, the Board also reviewed fees and other information related to the Adviser's management of similarly managed institutional or private accounts, and the differences in the services provided to the other accounts. The Board noted that none of the advisory fee arrangements for the Funds included breakpoints, which are generally viewed as a method by which an investment adviser shares any economies of scale with a fund as a fund grows. The Board also considered the Adviser's commitment to limit expenses as discussed in more detail below, and would consider breakpoints at a future time if a Fund's assets were to grow significantly.
The Board also reviewed the compliance and administrative services provided to the Funds by the Adviser and its affiliates, including the Adviser's oversight of the Funds' day-to-day operations and oversight of Fund accounting, assistance in meeting legal and regulatory requirements, and other services necessary for the operation of the Funds and the Trust.
With respect to the Global Natural Resources Fund, the Board also considered information concerning the fee paid to the Sub-Adviser under the Sub-Advisory Agreement. The Board considered the relative roles and responsibilities of the Adviser and Sub-Adviser with respect to the Fund and noted that, among other things: (1) the sub-advisory fees for the Fund are paid by the Adviser and, therefore, are not a direct expense of the Fund; and (2) the Adviser supervises the Sub-Adviser. The Board also considered the Adviser's representation that the fees to be paid to the Sub-Adviser are within the range of sub-advisory fees paid to other sub-advisers for similar services. The Board reviewed fees and other information related to the Sub-Adviser's management of similarly managed institutional or private accounts, and the differences in the services provided to the other accounts. The Board recognized that because the sub-advisory fees are paid by the Adviser, any arrangement by the Sub-Adviser to reduce its fee as the Fund grows would have no direct impact on the Fund or its shareholders.
The Board found that the gross annual management fee paid by each Fund was within the range of management fees paid by each Fund's respective peer group. The Board also found that each Fund's Class A net annual expense ratio, taking into account any shareholder servicing or distribution fees, was reasonable as compared with each Fund's respective peer group. The Board considered the Adviser's contractual agreement with each
78
Victory Portfolios | | Supplemental Information — continued
December 31, 2020 | |
(Unaudited)
Fund to waive its fees and reimburse expenses of certain classes for a specified period of time, as described in the Fund's prospectus.
The Board reviewed each Fund's performance over one-, three-, five- and ten-year periods (as applicable) against the performance of the Fund's selected peer group and benchmark index. The Board recognized that the performance of the Fund and the peer group funds are net of expenses, while the performance of the benchmark index reflects gross returns.
The Board reviewed various other specific factors with respect to each Fund, as described below. In their deliberations, the Trustees did not rank the importance of any particular information or factor considered and each Trustee may have attributed different weights to various factors.
RS Partners Fund
The Board compared the Fund's Class A performance for the one-, three-, five- and ten-year periods ended June 30, 2020, to that of the median performance of the Fund's peer group and benchmark index for the same periods and considered the fact that the Fund outperformed the benchmark index for the three- and five-year periods, underperformed the benchmark index for the one- and ten-year periods, and underperformed the peer group median for all of the periods reviewed. The Board brought the Fund's underperformance to management's attention and discussed with the Adviser any steps that had been or could be taken to enhance performance in the future.
Having considered, among other things: (1) the Fund's management fee compared to comparable mutual funds; (2) the Fund's total expense ratio compared to comparable mutual funds; (3) that the Adviser's willingness to limit the expenses of certain classes for a period of time would provide stability to the Fund's expenses for those share classes during that period; and (4) the Fund's performance during the periods reviewed, the Board concluded that the Agreement continued to be in the best interests of the Fund's shareholders.
RS Value Fund
The Board compared the Fund's Class A performance for the one-, three-, five- and ten-year periods ended June 30, 2020, to that of the median performance of the Fund's peer group and benchmark index for the same periods and considered the fact that the Fund underperformed the benchmark index for all of the periods reviewed, with the exception of the three-year period, and underperformed the peer group median for all of the periods reviewed. The Board brought the Fund's underperformance to management's attention and discussed with the Adviser any steps that had been or could be taken to enhance performance in the future.
Having considered, among other things: (1) the Fund's management fee compared to comparable mutual funds; (2) the Fund's total expense ratio compared to comparable mutual funds; (3) that the Adviser's willingness to limit the expenses of certain classes for a period of time would provide stability to the Fund's expenses for those share classes during that period; and (4) the Fund's performance during the periods reviewed, the Board concluded that the Agreement continued to be in the best interests of the Fund's shareholders.
RS Large Cap Alpha Fund
The Board compared the Fund's Class A performance for the one-, three-, five- and ten-year periods ended June 30, 2020, to that of the median performance of the Fund's peer group and benchmark index for the same periods and considered the fact that the Fund underperformed the benchmark index for all of the periods reviewed, with the exception of the three-year period, and underperformed the peer group median for all of the periods reviewed. The Board brought the Fund's underperformance to management's attention and discussed with the Adviser any steps that had been or could be taken to enhance performance in the future.
Having considered, among other things: (1) the Fund's management fee compared to comparable mutual funds; (2) the Fund's total expense ratio compared to comparable mutual fund; (3) that the Adviser's willingness to limit the expenses of certain classes for a period of time would provide stability to the Fund's expenses for those share classes during that period; and (4) the Fund's performance during the periods reviewed, the Board concluded that the Agreement continued to be in the best interests of the Fund's shareholders.
79
Victory Portfolios | | Supplemental Information — continued
December 31, 2020 | |
(Unaudited)
RS Investors Fund
The Board compared the Fund's Class A performance for the one-, three-, five- and ten-year periods ended June 30, 2020, to that of the median performance of the Fund's peer group and benchmark index for the same periods and considered the fact that the Fund underperformed the benchmark index for all of the periods reviewed, and underperformed the peer group median for all of the periods reviewed, with the exception of the ten-year period. The Board brought the Fund's underperformance to management's attention and discussed with the Adviser any steps that had been or could be taken to enhance performance in the future.
Having considered, among other things: (1) the Fund's management fee compared to comparable mutual funds; (2) the Fund's total expense ratio compared to comparable mutual fund; (3) that the Adviser's willingness to limit the expenses of certain classes for a period of time would provide stability to the Fund's expenses for those share classes during that period; and (4) the Fund's performance during the periods reviewed, the Board concluded that the Agreement continued to be in the best interests of the Fund's shareholders.
Global Natural Resources Fund
The Board compared the Fund's Class A performance for the one-, three-, five- and ten-year periods ended June 30, 2020, to that of the median performance of the Fund's peer group and benchmark index for the same periods and considered the fact that the Fund underperformed both the benchmark index and the peer group median for all of the periods reviewed. The Board noted its numerous discussions with the Adviser and Sub-Adviser throughout the year, and in prior years, about, among other things, the Fund's investment strategy, the Adviser's and Sub-Adviser's implementation of the strategy, and related market conditions, together with relevant fee and expense considerations. The Board also discussed the steps taken by the Adviser and Sub-Adviser to enhance performance in the future, and the Board's continued monitoring of the Fund's performance.
Having considered, among other things: (1) the Fund's management fee compared to comparable mutual funds; (2) the Fund's total expense ratio compared to comparable mutual funds; (3) that the Adviser's willingness to limit the expenses of certain classes for a period of time would provide stability to the Fund's expenses for those share classes during that period; and (4) the Fund's performance during the periods reviewed, the Board concluded that the Agreement continued to be in the best interests of the Fund's shareholders.
Conclusion
Based on its review of the information requested and provided, and following extended discussions, the Board determined that the Agreement, on behalf of the Funds discussed above, was consistent with the best interests of each Fund and its shareholders, and the Board unanimously approved the Agreement, on behalf of each Fund, for an additional annual period on the basis of the foregoing review and discussions and the following considerations, among others:
• The fairness and reasonableness of the investment advisory fee payable to the Adviser under the Agreement in light of the investment advisory services provided, the costs of these services, the profitability of the Adviser's relationship with the Fund and the comparability of the fee paid to the fees paid by other investment companies;
• The nature, quality and extent of the investment advisory services provided by the Adviser;
• The Adviser's entrepreneurial commitment to the management of the Funds and the creation of a broad-based family of funds, which could entail a substantial commitment of the Adviser's resources to the successful operation of the Funds;
• The Adviser's representations regarding its staffing and capabilities to manage the Funds, including the retention of personnel with relevant portfolio management experience;
• The Adviser's efforts to enhance investment results by, among other things, developing quality portfolio management teams; and
• The overall high quality of the personnel, operations, financial condition, investment management capabilities, methodologies and performance of the Adviser.
Based on its review of the information requested and provided, and following extended discussions, the Board concluded, among other things, that the Sub-Advisory Agreement, with respect to the Global Natural Resources
80
Victory Portfolios | | Supplemental Information — continued
December 31, 2020 | |
(Unaudited)
Fund, was consistent with the best interests of the Fund and its shareholders and unanimously approved the Sub-Advisory Agreement (including the fees to be charged for services thereunder), on the basis of the foregoing review and discussions and the following considerations, among others:
• The fairness and reasonableness of the investment advisory fee payable to the Sub-Adviser under the Sub-Advisory Agreement in light of the investment advisory services provided, the costs of these services and the estimated profitability of the Sub-Adviser's relationship with the Fund;
• The nature, quality and extent of the investment advisory services provided by the portfolio management team of the Sub-Adviser, which have resulted in the Fund achieving its stated investment objective;
• The Sub-Adviser's representations regarding its staffing and capabilities to manage the Fund; and
• The overall high quality of the personnel, operations, financial condition, investment management capabilities, methodologies and performance of the Sub-Adviser.
81
Privacy Policy
Protecting the Privacy of Information
The Trust respects your right to privacy. We also know that you expect us to conduct and process your business in an accurate and efficient manner. To do so, we must collect and maintain certain personal information about you. This is the information we collect from you on applications or other forms, and from the transactions you make with us or third parties. It may include your name, address, social security number, account transactions and balances, and information about investment goals and risk tolerance.
We do not disclose any information about you or about former customers to anyone except as permitted or required by law. Specifically, we may disclose the information we collect to companies that perform services on our behalf, such as the transfer agent that processes shareholder accounts and printers and mailers that assist us in the distribution of investor materials. We may also disclose this information to companies that perform marketing services on our behalf. This allows us to continue to offer you Victory investment products and services that meet your investing needs, and to effect transactions that you request or authorize. These companies will use this information only in connection with the services for which we hired them. They are not permitted to use or share this information for any other purpose.
To protect your personal information internally, we permit access only by authorized employees and maintain physical, electronic and procedural safeguards to guard your personal information.*
* You may have received communications regarding information about privacy policies from other financial institutions which gave you the opportunity to "opt-out" of certain information sharing with companies which are not affiliated with that financial institution. The Trust does not share information with other companies for purposes of marketing solicitations for products other than the Trust. Therefore, the Trust does not provide opt-out options to their shareholders.
Victory Funds
P.O. Box 182593
Columbus, Ohio 43218-2593

Visit our website at: | | Call Victory at: | |
www.vcm.com | | 800-539-FUND (800-539-3863) | |
| | | 800-235-8396 for Member Class | |
Item 2. Code of Ethics.
| (a) | The registrant has adopted a code of ethics that applies to the registrant’s principal executive officer, principal financial officer, principal accounting officer or controller, or persons performing similar functions. This code of ethics in included as an Exhibit. |
| (b) | During the period covered by the report, with respect to the registrant’s code of ethics that applies to its principal executive officer, principal financial officer, principal accounting officer or controller, or persons performing similar functions; there have been no amendments to, nor any waivers granted from, a provision that relates to any element of the code of ethics definition enumerated in paragraph (b) of this Item 2. |
Item 3. Audit Committee Financial Expert.
(a)(1) The registrant’s board of directors has determined that the registrant has at least one audit committee financial expert serving on its audit committee.
(a)(2) The audit committee financial experts are David L. Meyer and E. Lee Beard, who are “independent” for purposes of this Item 3 of Form N-CSR.
Item 4. Principal Accountant Fees and Services.
| | | 2020 | | 2019 | |
| (a) Audit Fees (1) | | $ | 297,500 | | $ | 297,500 | |
| (b) Audit-Related Fees (2) | | | 0 | | | 0 | |
| (c) Tax Fees (3) | | | 87,750 | | | 87,750 | |
| (d) All Other Fees (4) | | | 3,327 | | | 0 | |
(1) Audit fees include amounts related to the audit of the Registrant’s annual financial statements and services normally provided by the accountant in connection with statutory and regulatory filings. Audit fees billed were for professional services provided by The Funds’ independent registered public accounting firm for audit compliance, audit advice and audit planning.
(2) Represents the fee for assurance and related services by The Funds’ independent registered public accounting firm reasonably related to the performance of the audit of the Registrant’s financial statements that was not reported under (a) of this item.
(3) Represents the aggregate tax fee billed for professional services rendered by The Funds’ independent registered public accounting firm for tax compliance, tax advice, international tax fee transactions and tax planning. Such tax services included the review of income and excise tax returns for the Registrant.
(4) For the fiscal year ended December 31, 2020, fees represent the consent related to Member Class Registration Statements as of June 10, 2020, and Review and Consent of the Registration Statements for six portfolios as of August 21, 2020. For the fiscal year ended December 31, 2019, there were no fees billed for professional services rendered by The Funds’ independent registered public accounting firm to the Registrant, other than the services reported in (a) through (c) of this item.
Tax fees for 2020 and 2019 are for recurring tax fees for the preparation of the federal and state tax returns and procedures performed relating to the Registrant’s analysis of complex securities.
(e)(1) The Registrant’s Audit Committee must pre-approve non-audit services to be provided by the principal accountant and the fees charged with these services. The Committee may delegate authority to one or more Committee members to pre-approve these services, subject to subsequent review and approval by the Committee.
(e)(2) There were no services performed under Rule 2.01 (c)(7)(i)(C).
(f) Not applicable.
(g)
(h) The Registrant’s Audit Committee has evaluated the non-audit services that the principal accountant provided to the Registrant’s investment adviser (and the adviser’s relevant affiliated), which services the Committee did not pre-approve, and has concluded that the provision of those services was compatible with maintaining the accountant’s independence.
| Item 5. | Audit Committee of Listed Registrants. |
Not applicable.
(a) Not applicable.
(b) Not applicable.
Item 7. Disclosure of Proxy Voting Policies and Procedures for Closed-End Management Investment Companies.
Not applicable.
Item 8. Portfolio Managers of Closed-End Management Investment Companies.
Not applicable.
Item 9. Purchases of Equity Securities by Closed-End Management Investment Company and Affiliated Purchasers.
Not applicable.
Item 10. Submission of Matters to a Vote of Security Holders.
Not applicable.
Item 11. Controls and Procedures.
(a)The registrant’s principal executive officer and principal financial officer have concluded, based on their evaluation of the registrant's disclosure controls and procedures as conducted within 90 days of the filing date of this report, that these disclosure controls and procedures are adequately designed and are operating effectively to ensure that information required to be disclosed by the registrant on Form N-CSR is recorded, processed, summarized and reported within the time periods specified in the Securities and Exchange Commission's rules and forms.
(b)There were no changes in the registrant’s internal control over financial reporting (as defined in Rule 30a-3(d) under the Investment Company Act of 1940 (17 CFR 270.30a-3(d)) that occurred during the period covered by this report that have materially affected or are reasonably likely to materially affect, the registrant’s internal control over financial reporting.
Item 12. Disclosure of Securities Lending Activities for Closed-End Management Investment Companies.
(a)(1) Not applicable.
(a)(2) Not applicable.
(a)(3) Not applicable.
(a)(4) Not applicable.
(b) Not applicable.
Item 13. Exhibits.
SIGNATURES
Pursuant to the requirements of the Securities Exchange Act of 1934 and the Investment Company Act of 1940, the registrant has duly caused this report to be signed on its behalf by the undersigned, thereunto duly authorized.
| (Registrant) | Victory Portfolios | |
| By (Signature and Title)* | /s/ Allan Shaer | |
| | Allan Shaer, Principal Financial Officer | |
Pursuant to the requirements of the Securities Exchange Act of 1934 and the Investment Company Act of 1940, this report has been signed below by the following persons on behalf of the registrant and in the capacities and on the dates indicated.
| By (Signature and Title)* | /s/ Christopher K. Dyer | |
| | Christopher K. Dyer, Principal Executive Officer | |
| By (Signature and Title)* | /s/ Allan Shaer | |
| | Allan Shaer, Principal Financial Officer | |