UNITED STATES
SECURITIES AND EXCHANGE COMMISSION
Washington, D.C. 20549
FORM N-CSR
CERTIFIED SHAREHOLDER REPORT
OF
REGISTERED MANAGEMENT INVESTMENT COMPANIES
Investment Company Act file number: 811-04875
Name of Registrant: Royce Value Trust, Inc.
Address of Registrant: 1414 Avenue of the Americas
New York, NY 10019
| Name and address of agent for service: | John E. Denneen, Esquire |
| | 1414 Avenue of the Americas |
| | New York, NY 10019 |
Registrant’s telephone number, including area code: (212) 486-1445
Date of fiscal year end: December 31
Date of reporting period: January 1, 2006 - June 30, 2006
Item 1: Reports to Shareholders
| |
|
| S E M I A N N U A L R E V I E W |
|
| |
Royce Value Trust
Royce Micro-Cap Trust
Royce Focus Trust
www.roycefunds.com
| | AND
R E P O R T T O S T O C K H O L D E R S
2006 |
| | | | TheRoyceFunds |
| | | |
VALUE INVESTING IN SMALL COMPANIES FOR MORE THAN 30 YEARS
|
A FEW WORDS ON CLOSED-END FUNDS
| |
| | Royce & Associates, LLC manages three closed-end funds: Royce Value Trust, the first small-cap value closed-end fund offering; Royce Micro-Cap Trust, the only micro-cap closed-end fund; and Royce Focus Trust, a closed-end fund that invests in a limited number of primarily small-cap companies.
A closed-end fund is an investment company whose shares are listed on a stock exchange or are traded in the over-the-counter market. Like all investment companies, including open-end mutual funds, the assets of a closed-end fund are professionally managed in accordance with the investment objectives and policies approved by the fund’s Board of Directors. A closed-end fund raises cash for investment by issuing a fixed number of shares through initial and other public offerings that may include periodic rights offerings. Proceeds from the offerings are invested in an actively managed portfolio of securities. Investors wanting to buy or sell shares of a publicly traded closed-end fund after the offerings must do so on a stock exchange or the Nasdaq market, as with any publicly traded stock. This is in contrast to open-end mutual funds, in which the fund sells and redeems its shares on a continuous basis.
| |
| | A CLOSED-END FUND OFFERS SEVERAL DISTINCT ADVANTAGES
NOT AVAILABLE FROM AN OPEN-END FUND STRUCTURE |
| |
| | • | Since a closed-end fund does not issue redeemable securities or offer its securities on a continuous basis, it does not need to liquidate securities or hold uninvested assets to meet investor demands for cash redemptions, as an open-end fund must. | |
| |
| | • | In a closed-end fund, not having to meet investor redemption requests or invest at inopportune times is ideal for value managers who attempt to buy stocks when prices are depressed and sell securities when prices are high. | |
| |
| | • | A closed-end fund may invest more freely in less liquid portfolio securities because it is not subject to potential stockholder redemption demands. This is particularly beneficial for Royce-managed closed-end funds, which invest in small- and micro-cap securities. | |
| |
| | • | The fixed capital structure allows permanent leverage to be employed as a means to enhance capital appreciation potential. | |
| |
| | • | Unlike Royce’s open-end funds, our closed-end funds are able to distribute capital gains on a quarterly basis. Each of the Funds has adopted a quarterly distribution policy for its common stock. | |
| |
| | We believe that the closed-end fund structure is very suitable for the long-term investor who understands the benefits of a stable pool of capital. | |
| | WHY DIVIDEND REINVESTMENT IS IMPORTANT | |
| |
| | A very important component of an investor’s total return comes from the reinvestment of distributions. By reinvesting distributions, our investors can maintain an undiluted investment in a Fund. To get a fair idea of the impact of reinvested distributions, please see the charts on pages 13, 15 and 17. For additional information on the Funds’ Distribution Reinvestment and Cash Purchase Options and the benefits for stockholders, please see page 19 or visit our website at www.roycefunds.com. | |
| |
| |
| THIS PAGE IS NOT PART OF THE 2006 SEMIANNUAL REPORT TO STOCKHOLDERS | | |

| Semiannual Review | | |
|
| Performance Table | | 2 |
|
| Letter to Our Stockholders | | 3 |
|
Online Update | | 10 |
|
| | |
|
| Semiannual Report to Stockholders | | 11 |
|
For more than 30 years, we have used a value approach to invest in smaller-cap securities. We focus primarily on the quality of a company’s balance sheet, its ability to generate free cash flow and other measures of profitability or sound financial condition. At times, we may also look at other factors, such as a company’s unrecognized asset values, its future growth prospects or its turnaround potential following an earnings disappointment or other business difficulties. We then use these factors to assess the company’s current worth, basing the assessment on either what we believe a knowledgeable buyer might pay to acquire the entire company, or what we think the value of the company should be in the stock market.
THIS PAGE IS NOT PART OF THE 2006 SEMIANNUAL REPORT TO STOCKHOLDERS | 1 |
| |
| |

Charles M. Royce, President
When we discuss specific security
selection criteria for many of The
Royce Funds, four qualities are
commonly listed: a strong balance
sheet, a history of earnings, high
internal rates of return and the
ability to generate free cash flow.
Each is a critical part of
determining both a company’s
current quality and the likelihood
that it will be able to maintain
that quality in the future. They
are also in many ways interrelated.
For example, previously we
discussed the importance of a low-
debt, asset-rich balance sheet in
helping to maintain or fuel
earnings, especially when a business
is experiencing earnings trouble.
Similarly, a company’s ability to
generate free cash flow is often
linked to its ability to sustain
positive earnings and to generate
high internal rates of return. We
think that it’s a positive sign
Continued on Page 4...
| | | |
| | | |
| | | | PERFORMANCE TABLE |
| | | |
|
| | | | | | | | | | | | | | | | | | | | | | | | |
| | | | AVERAGE ANNUAL NAV TOTAL RETURNS Through June 30, 2006 |
| | | |
|
| | | | | | Royce | | | Royce | | | Royce | | | Russell | |
| | | | | | Value Trust | | | Micro-Cap Trust | | | Focus Trust | | | 2000 | |
| | | |
|
| | | | Second Quarter 2006* | | | -3.86 | % | | | | -3.16 | % | | | | -4.83 | % | | | | -5.02 | % | |
| | | |
|
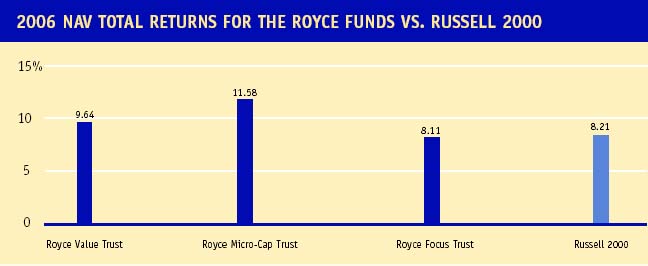
| | | | January - June 2006* | | | 9.64 | | | | | 11.58 | | | | | 8.11 | | | | | 8.21 | | |
| | | |
|
| | | | One-Year | | | 21.33 | | | | | 20.80 | | | | | 30.73 | | | | | 14.58 | | |
| | | |
|
| | | | Three-Year | | | 21.33 | | | | | 22.60 | | | | | 27.21 | | | | | 18.70 | | |
| | | |
|
| | | | Five-Year | | | 11.34 | | | | | 14.02 | | | | | 16.16 | | | | | 8.50 | | |
| | | |
|
| | | | 10-Year | | | 13.88 | | | | | 14.11 | | | | | n/a | | | | | 9.05 | | |
| | | |
|
| | | | 15-Year | | | 14.27 | | | | | n/a | | | | | n/a | | | | | 11.80 | | |
| | | |
|
| | | | Since Inception | | | 12.85 | | | | | 14.36 | | | | | 14.28 | | | | | — | | |
| | | |
|
| | | | Inception Date | | | 11/26/86 | | | | 12/14/93 | | | | | | | — | | |
| | | | * Not annualized. |
| | | | ** Date Royce & Associates, LLC assumed investment management responsibility for the Fund. |
| | | | |
| | | | |
| | | | |
| | | | |
| | | | |
| | | | |
| | | | IMPORTANT PERFORMANCE AND RISK INFORMATION |
| | | | | | | | | | | | | | | | | | | | | | | | |
| | | | All performance information in this Review and Report reflects past performance, is presented on a total return basis and reflects the reinvestment of distributions. Past performance is no guarantee of future results. Performance information does not reflect the deduction of taxes that a stockholder would pay on distributions or on the sale of Fund shares. Investment return and principal value of an investment will fluctuate, so that shares may be worth more or less than their original cost when sold. Current performance may be higher or lower than performance quoted. Current month-end performance may be obtained at www.roycefunds.com. The Royce Funds invest primarily in securities of small-cap and/or micro-cap companies, which may involve considerably more risk than investments in securities of larger-cap companies.
The thoughts expressed in this Review and Report to Stockholders concerning recent market movements and future prospects for small company stocks are solely the opinion of Royce at June 30, 2006, and, of course, historical market trends are not necessarily indicative of future market movements. Statements regarding the future prospects for particular securities held in the Funds’ portfolios and Royce’s investment intentions with respect to those securities reflect Royce’s opinions as of June 30, 2006 and are subject to change at any time without notice. There can be no assurance that securities mentioned in this Review and Report to Stockholders will be included in any Royce-managed portfolio in the future. |
| | | | |
2 | THIS PAGE IS NOT PART OF THE 2006 SEMIANNUAL
REPORT TO STOCKHOLDERS | | | |
| | | | |
LETTER TO OUR STOCKHOLDERS
|
 |
Value In Vogue?
After three full decades managing small-cap value portfolios, we thought that we had seen all of the various movements, fads and trends that periodically capture the imaginations (to say nothing of the wallets) of investors. It was always easy for us to be amused at such things. Being value investors, with that term’s inherent sense of caution and conservatism, we have always measured a comfortable distance between the work that we do and anything that smacks of trends in equity investing. With its emphasis on attributes such as patience and diligence, with its demands of long hours of detailed research, value seems by nature not simply unfashionable, but nearly impervious to the short-term mindsets that typically dominate the stock market equivalent of the runways of Paris, Milan and Manhattan. Even earlier in the current decade, when value, especially small-cap value, began scoring high returns and glowing press, it did not appear to capture the investment zeitgeist in quite the same way that large-cap or Technology investments had during the ’90s. This was more than all right with us. After all, we’re not exactly high-fashion material (there’s a reason we always look better in cartoon form), and we did not think that our approach was, either.
Yet here we are just past the halfway mark of 2006, and in our view small-cap value investing is nearing the end of its stint as domestic investment’s hottest approach. How did our style become so stylish? Its success over the last several years occurred during a period in which few alternatives in the domestic equity universe could compete with its strong results. As measured by the Russell 2000, small-cap bested large-cap (as measured by the S&P 500) for the one-, three-, five-, 10- and 15-year periods ended 6/30/06. In turn, the Russell 2000 Value index outperformed the Russell 2000 for each of these periods as well as the 20- and
|
|
The market still awaits Next Year’s Model, but small-cap value’s unexpected turn on the runway should hardly result in obsolescence.
|
|
THIS PAGE IS NOT PART OF THE 2006 SEMIANNUAL REPORT TO STOCKHOLDERS | 3 |
| |
| |
when earnings and cash flows
are closely aligned.
Cash flow is usually defined as the
amount of net cash that a company
brings in that may be used for
various company purposes, such as
to build assets or pay dividends.
(Cash flow can also be negative, in
which case there are no funds with
which to further capitalize business
activities or make payouts to
shareholders.) For most businesses,
cash flow comes from three
activities—operations, investment
and financing.
Our preference in most cases is for a
company that generates the bulk of
its net cash flow from operations,
from the day-to-day activities of its
business. Cash flow from operations
is also significant because it may
likely affect the other two activities.
Although they are similar
in that they help us to understand
a company’s profitability, cash flow
differs from earnings (the profits a
company makes) because it
also takes into account certain non-
cash accounting items, most
importantly depreciation.
Continued on Page 6...
| | |
LETTER TO OUR STOCKHOLDERS
25-year periods ended 6/30/06. These terrific results led to the plainly dressed small-cap value approach attracting speculative dollars from short-term investors, money hungry for the Next Big Thing that probably originated from those whose only experience with smaller stocks would most likely have come on the growth side. It was not long ago that this activity would have been difficult, if not impossible, without considered investments in specific small-cap stocks or astute choices in small-cap value mutual funds. However, with the advent of investment vehicles such as ETFs (Exchange Traded Funds), moving quickly in and out of virtually any equity style index has become more convenient for investors of all tastes, temperaments and time frames.
What becomes of investment approaches when they are no longer considered the most fashionable? We suspect that styles such as ours will manage just fine beyond the glare of the hot lights just as they did before they became trendy. Although the last few years have been wonderful, the rally has been top-heavy with an extended run for energy stocks (that may not be over) and shorter, less stellar bursts in other areas. This leaves ample room for potential growth in those places that have enjoyed only intermittent success or have been mostly left out. The market still awaits Next Year’s Model, but small-cap value’s unexpected turn on the runway should hardly result in obsolescence.
Is Large the New Small?
Our track record for large-scale stock market prognostication is checkered at best—we like to joke that we’ve called 10 of the last three corrections. Still, the case for emerging large-cap leadership remains compelling to us, even as it’s also important to re-assert our view that any leadership phase in the coming months is likely to be short-lived, whether for large-caps, as measured by the S&P 500, or small-caps, as measured by the Russell 2000. The 10-year period ended 12/31/05 offered an almost eerily symmetrical split between long-term periods first of large-cap, then of small-cap dominance. We do not expect anything resembling the previous 10 years in terms of the time span of asset-class leadership or the breadth in performance spreads. We continue to believe that the stock market will be characterized by frequent leadership rotation and low returns.
After narrowly outperforming small-cap stocks in 2005, large-caps took their by-now-familiar position in the back seat to small-cap during the first half of 2006. The Russell 2000 was up 8.2% for the year-to-date period ended 6/30/06, versus a gain of 2.7% for the S&P 500 (and a loss of 1.5% for the still-struggling Nasdaq Composite). Small-cap’s advantage came primarily from its considerable outperformance in the bullish first quarter, when the Russell 2000 was up 13.9% versus a gain of 4.2% for the S&P 500. When stock prices began to correct in the second quarter, large-cap outperformed (-1.4% for the S&P 500 versus -5.0% |
4 | THIS PAGE IS NOT PART OF THE 2006 SEMIANNUAL
REPORT TO STOCKHOLDERS
| | |
|
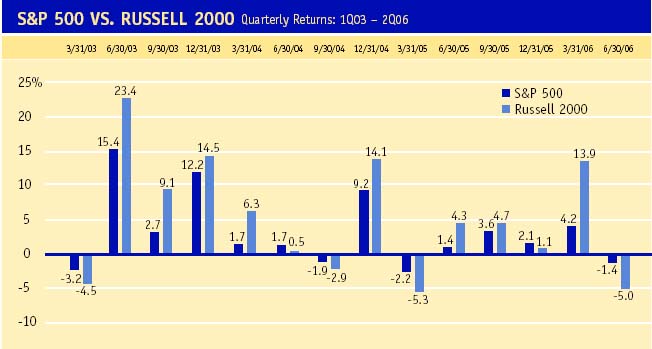 |
for the Russell 2000). The pattern of small-cap leading in brief up-market phases then ceding leadership to large-cap during equally brief downturns dates back to 2003.
The down-market resilience of large-cap stocks seems to us to be the central story of the recent decline. Our earlier contention, made in our 2005 Annual Review and Report, was that large-cap would lose less during declines, which has been the case so far in 2006. We also surmised that small-cap would have an edge in any subsequent rally, which held true in the first quarter. Yet we are no longer convinced that small-cap will lead in every subsequent bullish phase. An underreported element in the downturn was the tightening of liquidity on a worldwide level. The combination of better near-term down market results for large-cap stocks and the widespread liquidity crunch is likely to draw investors in the short run to cash, bonds and what they perceive to be stable, high-quality equities. In other words, the unfashionable nature of large-cap stocks may be exactly what helps to make them fashionable again.
|
Value—Always in Style?
Of course, no style has been more fashionable in the current decade than small-cap value. However much we may think of our work as an all-weather strategy—a fashion perennial more akin to a navy blazer or black cocktail dress than the latest creations adorning the windows of boutiques on Rodeo Drive—there’s no denying the recent attraction of small-cap value for investors burdened with what we would describe as the investment equivalent of short attention spans. And its long run in the current decade has indeed been wildly impressive. The Russell 2000 Value index outpaced its small-cap growth counterpart, as measured by the Russell 2000 Growth index, for the one-, three-, five-, 10-, 15-, 20- and 25-year periods ended 6/30/06. One notable aspect of small-cap value’s remarkable run in the current decade has been its absolute and relative strength during the most recent long-term
|
|
We do not expect anything resembling the previous 10 years in terms of the time span of asset-class leadership or the breadth in performance spreads. We continue to believe that the stock market will be characterized by frequent leadership rotation and low returns.
|
|
THIS PAGE IS NOT PART OF THE 2006 SEMIANNUAL REPORT TO STOCKHOLDERS | 5 |
| |
| |
| | |
LETTER TO OUR STOCKHOLDERS
|
| |
A company’s statement of cash
flows is crucial, because it
provides a record of how the firm
has handled cash inflows and
outflows over a given quarterly or
annual period.
It also helps to reconcile
information found on the balance
sheet (which shows a firm’s assets
and liabilities) and the income
statement (which shows all revenue,
costs, expenses and earnings).
While the balance sheet can be
used to determine the increase or
decrease in assets and the
income statement shows the
profits that have made an impact
on that growth (or lack thereof),
the statement of cash flows gives
us an idea of how that growth
was financed. It tells the story of
where the money came from and
where it went.
This is especially relevant for
capital-intensive businesses such as
industrial companies that maintain
physical plants and own stores of
equipment that will eventually
need upgrading or replacing.
Continued on Page 8...
| | |
up-market period. From the small-cap market trough on 10/9/02 through 6/30/06, the Russell 2000 Value index gained 140.1% versus 123.1% for the Russell 2000 Growth index. Small-cap value’s recent short-term returns were also strong. For the year-to-date period ended 6/30/06, the small-cap value index was up 10.4% versus 6.1% for the small-cap growth index. Although it trailed growth in the first quarter (+13.5% versus +14.4%), it moved ahead in the second, -2.7% versus -7.3%.
Investors can thus be forgiven if they’re a little anxious about small-cap value’s ongoing prospects. Our admittedly biased view is that small-cap value should be all right, even if its days of doing star turns on the most chic runways may be drawing to a close. Although returns for the approach seldom reached the same levels, its performance in the current decade is analogous to some degree to what large-cap stocks were during the mid-to-late ’90s–a fashionable area where people were putting money almost to the exclusion of the rest of the stock market. Now that the attention seems to be waning, we are finally beginning to see valuations come back to what we regard as more sensible levels throughout the small-cap world, although the number of bargains as of this writing is still not as plentiful as we would like.
Royce on the Runway
While the first six months of 2006 were terrific for the Russell 2000 (and the Russell 2000 Value index), results were slightly more mixed for our three closed-end offerings. All three Funds posted strong net asset value (NAV) results on an absolute basis, but Royce Focus Trust narrowly trailed the Russell 2000 on that basis. However, this was only a small blemish, especially in the wider context of longer-term returns for periods ended 6/30/06. Over market cycle and other long-term time periods, each Fund posted impressive absolute and relative returns on both an NAV and market price basis. These are the time spans that matter most to us in evaluating performance.
Both in our portfolios and the small-cap world as a whole, energy stocks enjoyed a strong first half, as did many Industrial Products and Services companies. However, these were not the only three areas in which Fund performance was strong in the first half. Technology companies also made a sizeable positive contribution to performance. In fact, net
 |
6 | THIS PAGE IS NOT PART OF THE 2006 SEMIANNUAL
REPORT TO STOCKHOLDERS
| |
losses on a dollar basis were hard to find at the sector level, an impressive, albeit short-term, accomplishment during a volatile six months for equities.
|
From the Catwalk to the Coal Mine?
Some investors may be concerned that small-cap’s run has been of such long duration that the asset class is poised for a long period of desultory performance, with the recent downturn a harbinger of things to come. We respectfully disagree. The recent decline has been fairly benign as corrections go and hardly catastrophic for small-cap as a whole. In the coming months, we think that micro-cap stocks will be the area to watch most closely as a potential indicator of small-cap movement. They are generally more volatile to begin with, and having enjoyed strong performance over the last few years, they are especially vulnerable to nervous investors looking for safety. For the more fatalistic among us, they are the canary in the small-cap coal mine in that any major decline for our asset class would probably begin with them. However, we’re more confident about the prospects for the entire small-cap area. We do not believe that the recent down-market period marks the beginning of a severe and/or long-term bear market for any asset class, including micro-caps. What we have been seeing lately seems to us less serious and more in line with what has happened historically following successful, speculative periods. The really interesting element in the downturn has been that several typically non-correlated asset categories–small-cap stocks, natural resources stocks and commodities, real estate and emerging markets–were coming off strong long-term performances and then began to correct at more or less the same time in the spring of this year. It’s been an odd confluence of declining performance that we believe has been making the downward move look more severe than it really is.
We define a correction as a decline of 15% or more from a previous small-cap peak. It remains too early to tell whether the current decline will reach this level (as of this writing it has not). However, like any previous decline, it has presented us with some discrete purchase opportunities, even as it has caused pain for investors. Although a market that steadily climbed year after year would make investors sleep more soundly, it is volatility that helps to create the pricing inefficiencies that attract value investors like ourselves. As any market sell-off worsens, quality companies are often lumped together with weaker ones, as short-term investors rush for the exits. This leaves many worthwhile companies trading for less than our estimate of their intrinsic value, piled among the rubble of companies walloped by the correction. The current decline has begun to create such situations, though not yet in large numbers. At least in the short run, further erosion in stock prices would not be the worst thing that could happen to small-cap stocks.
|
|
Although returns for the approach seldom reached the same stratospheric levels, small-caps performance in the current decade is analogous to some degree to what large-cap stocks were during the mid-to-late ’90s–a fashionable area where people were putting money almost to the exclusion of the rest of the stock market.
|
|
THIS PAGE IS NOT PART OF THE 2006 SEMIANNUAL REPORT TO STOCKHOLDERS | 7 |
| |
| | |
LETTER TO OUR STOCKHOLDERS
|
| |
Without positive cash flow, these
businesses are likely to have trouble
keeping up with more profitable,
cash-laden competitors. In such
businesses, we like to see cash
flows that are greater than earnings
because it means that the company’s
depreciation expenses are healthy.
In high-returning businesses, we
prefer that cash flows be reinvested
at high returns.
In all cases, regardless of the type
of business, we want to see cash
flows used intelligently. To our way
of thinking, this means reinvesting
in the business or paying dividends
to shareholders. As with most
things, we think about the longterm
picture when it comes to cash
flow. We may be willing to buy a
firm in a negative cash flow
moment if we think the firm is
capable of righting itself. However,
cash flow problems should be
temporary as few factors signal
quality more definitively than
stable, growing cash flows.
| | |
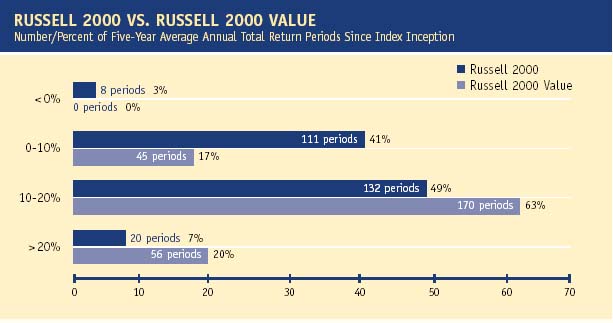
Five Years of FashionMost small-cap market cycles have been much shorter than the current cycle’s nearly six-year time span, with the average length of the eight completed cycles in the history of the Russell 2000 being 3.3 years. The shortest was little more than one-and-a-quarter years (2/8/80-6/15/81), while the longest lasted approximately six-and-a-half years (10/9/89-5/22/96). If the current cycle were to end soon, it would be the second longest on record. This is one of the reasons why we evaluate Fund performance on an absolute basis over long-term periods, such as five years, in addition to full market cycles. Examining five-year periods is especially useful because they typically include all of or most of a full market cycle, sometimes two. In addition, examining rolling five-year results gives a better picture of long-term market trends, and can also provide insight into what we might expect as the market moves forward.
There have been 269 monthly trailing five-year return periods since the Russell 2000’s inception on 12/31/78. From inception through 6/30/06, the index’s five-year return was less than zero in only 3% of these periods. The index provided positive single-digit returns more than 40% of the time and double-digit returns 56% of the time. Over the entire period, the average of all of the 269 five-year average annual total return periods was 11.6%. In the case of small-cap value, the results are even stronger. The Russell 2000 Value index did not have any negative five-year return periods since its inception and produced positive single-digit returns in 17% of the periods. In an impressive 83% of the periods, the value index produced double-digit five-year average annual total returns, averaging 14.5% for all of the 269 return periods. (Please see the following page for more details.) |
8 | THIS PAGE IS NOT PART OF THE 2006 SEMIANNUAL
REPORT TO STOCKHOLDERS
| |
|
The foregoing is in large part why we believe that small-caps continually offer the potential to produce above-average returns over long-term time horizons, and why we regard them as a necessary component in any asset allocation plan. Fashions come and go, but we believe that approaches such as ours, those that patiently strive to build wealth over the long haul, have what it takes to remain successful no matter what happens to be in (or out) of style elsewhere in the investment world.
|
| | | | | | |
| Sincerely, | | | | | |
| | | | | | |
 | |  | |  | |
| | | | | | |
| Charles M. Royce | | W. Whitney George | | Jack E. Fockler, Jr. | |
| President | | Vice President | | Vice President | |
| | | | | | |
| July 31, 2006 | | | | | |
| | | | | | |
| | | | | | |
|
The Russell 2000 Value index did not have any negative five-year return periods since its inception and produced positive single-digit returns in 17% of the periods. In an impressive 83% of the periods, the value index produced double-digit five-year average annual total returns, averaging 14.5% for all of the 269 return periods.
|
|
THIS PAGE IS NOT PART OF THE 2006 SEMIANNUAL REPORT TO STOCKHOLDERS | 9 |
| |

10 | THIS PAGE IS NOT PART OF THE 2006 SEMIANNUAL REPORT TO STOCKHOLDERS |
| |
| |
| | | |
| TABLE OF CONTENTS | | |
|
| | | |
| Semiannual Report to Stockholders | | |
|
| Managers’ Discussions of Fund Performance | | |
| | | |
Royce Value Trust | | 12 |
|
Royce Micro-Cap Trust | | 14 |
|
Royce Focus Trust | | 16 |
|
| History Since Inception | | 18 |
|
| Distribution Reinvestment and Cash Purchase Options | | 19 |
|
| Schedules of Investments and Other Financial Statements | | |
| | | |
Royce Value Trust | | 20 |
|
Royce Micro-Cap Trust | | 33 |
|
Royce Focus Trust | | 46 |
|
| Board Approval of Investment Advisory Agreements | | 54 |
|
| Other Important Information | | 56 |
|
2006 SEMIANNUAL REPORT TO STOCKHOLDERS | 11 |
| |
ROYCE VALUE TRUST
AVERAGE ANNUAL NAV TOTAL RETURNS
Through 6/30/06 | |  Manager’s Discussion The first-half results for Royce Value Trust’s (RVT) diversified portfolio of small- and micro-cap stocks fully reflected the schizoid nature of the first six months of 2006. For the year-to-date period ended 6/30/06, the Fund was up 9.6% on a net asset value (NAV) basis and 0.7% on a market price basis versus an 8.2% return for the Russell 2000 and a 7.7% result for the S&P 600. On an NAV basis, RVT stayed ahead of both of its small-cap benchmarks, although its market price return trailed by a substantial margin. Much of the Fund’s market price lag can be attributed to its relative lack of participation in the dynamic rally that characterized the first quarter, in which RVT’s market price return was 6.1%. During the same period, the Russell 2000 was up 13.9% and the S&P 600 gained 12.8%, while RVT gained 14.0% on an NAV basis. When stock prices fell in the second quarter, RVT lost 3.9% on an NAV basis and 5.1% on a market price basis. The Russell 2000 declined 5.0% and the S&P 600 lost 4.6% in the second quarter.
The Fund’s solid first-half NAV return contributed to its strong absolute and relative results over market-cycle and other long-term periods. From the small-cap market peak on 3/9/00 through 6/30/06, RVT gained 112.3% versus 29.5% for the Russell 2000 and 77.8% for the S&P 600. During the more bullish phase from the small-cap market trough on 10/9/02 through 6/30/06, the Fund was up 141.8% compared to a gain of 131.8% for the Russell 2000 and 128.0% for the S&P 600. On an NAV basis, RVT also held a performance advantage over each of its benchmarks for the one-, three-, five-, 10-, 15-year and since inception (11/26/86) periods ended 6/30/06. The Fund outperformed the Russell 2000 on a market price basis for each of these periods except the one year interval and bested the S&P 600 for all but the one-and three-year periods. RVT’s average annual NAV total return since inception was 12.9%.
Each of the Fund’s equity sectors posted positive net gains during the first half. On a dollar basis, the leading sectors were Industrial Products, Industrial Services and Natural Resources. Within Industrial Products, more than 40% of the sector’s dollar-based gains came from holdings in the machinery industry, including the portfolio’s top gainer–and top-ten position–Lincoln Electric Holdings, a security that we have owned in RVT’s portfolio since 1998. What has attracted us over the years to this welding and cutting products maker were its strong balance sheet, history of positive earnings and ability to generate positive cash flow from operating activities. Its cyclical industrial business was one that attracted quality-seeking value investors like ourselves. We were pleasantly surprised by its impressive first half, as the worldwide demand for its products continued to grow at a torrid pace. The firm announced record revenues in February for both the fiscal year and fourth quarter ended 12/31/05. Record revenues were also reported in April for the fiscal first quarter of 2006. In between, the company was added to the S&P 400 MidCap index.
We have owned shares of another Industrial Products business, Kimball International, since 1989. The firm, whose low debt and consistent dividend helped maintain our attraction, makes |
|
Second Quarter 2006* | | -3.86 | % |
|
Jan - June 2006* | | 9.64 | |
|
One-Year | | | | | | | | 21.33 | |
|
Three-Year | | | | | | | | 21.33 | |
|
Five-Year | | | | | | | | 11.34 | |
|
10-Year | | | | | | | | 13.88 | |
|
15-Year | | | | | | | | 14.27 | |
|
Since Inception (11/26/86) | | 12.85 | |
|
| | | |
CALENDAR YEAR NAV TOTAL RETURNS |
|
Year | | RVT | | | Year | | | RVT | |
|
2005 | | 8.4 | % | | 1996 | | | 15.5 | % |
|
2004 | | 21.4 | | | 1995 | | | 21.1 | |
|
2003 | | 40.8 | | | 1994 | | | 0.1 | |
|
2002 | | -15.6 | | | 1993 | | | 17.3 | |
|
2001 | | 15.2 | | | 1992 | | | 19.3 | |
|
2000 | | 16.6 | | | 1991 | | | 38.4 | |
| |
1999 | | 11.7 | | | 1990 | | | -13.8 | | All performance information in this Report reflects past performance, is presented on a total return basis and reflects the reinvestment of distributions. Past performance is no guarantee of future results. Investment return and principal value of an investment will fluctuate, so that shares may be worth more or less than their original cost when sold. Current performance may be higher or lower than performance quoted. Current month-end performance may be obtained at www.roycefunds.com. The Funds’ P/E ratio calculations exclude companies with zero or negative earnings. |
|
1998 | | 3.3 | | | 1989 | | | 18.3 | |
|
1997 | | 27.5 | | | 1988 | | | 22.7 | |
| | | | | | | | | | |
TOP 10 POSITIONS
% of Net Assets Applicable
to Common Stockholders |
|
AllianceBernstein Holding L.P. | | 1.9 | % |
|
Ritchie Bros. Auctioneers | | 1.5 | |
|
Lincoln Electric Holdings | | 1.3 | |
|
Sotheby’s | | 1.1 | |
|
SEACOR Holdings | | 1.1 | |
|
Plexus Corporation | | 1.0 | |
|
Ash Grove Cement Company Cl. B | | 0.9 | |
|
Forward Air | | 0.9 | |
|
Newport Corporation | | 0.9 | |
|
Brady Corporation Cl. A | | 0.8 | |
| | | | | | | | | | |
PORTFOLIO SECTOR BREAKDOWN
% of Net Assets Applicable
to Common Stockholders |
|
Technology | | 21.6 | % |
|
Industrial Products | | 18.0 | |
|
Industrial Services | | 14.1 | |
|
Natural Resources | | 9.8 | |
|
Financial Intermediaries | | 8.9 | |
|
Health | | 7.4 | |
|
Financial Services | | 7.4 | |
|
Consumer Services | | 5.7 | |
|
Consumer Products | | 4.6 | |
|
Utilities | | 0.2 | |
|
Diversified Investment Companies | | 0.1 | |
|
Miscellaneous | | 1.6 | |
|
Bond & Preferred Stocks | | 0.3 | |
|
Cash and Cash Equivalents | | 20.2 | |
12 | 2006 SEMIANNUAL REPORT TO STOCKHOLDERS |
| |
Performance and Portfolio Review
GOOD IDEAS THAT WORKED
Net Realized and Unrealized Gain Through 6/30/06 | | wood furniture and cabinets, as well as electronic assembly products. Better-than-expected fiscal third-quarter earnings and new opportunities for its electronics division seemed to attract more investors. Unlike many stocks in the first half, Kimball’s price climbed relatively late, not really taking off until May. Oregon Steel Mills specializes in steel plate and pipe products. A resurgent steel industry and recent earnings increases helped its stock price to climb and prompted us to trim our position in the first quarter. Outside of the Industrial Products sector, the Fund had success with two top-ten holdings. The price of fine art, antique and collectibles auction house Sotheby’s rose on news of higher profits in its fiscal fourth quarter. Steady, better-than- | | PORTFOLIO DIAGNOSTICS |
| Lincoln Electric Holdings | $4,900,103 | | |
|
| | | Average Market Capitalization | $1,055 million |
| Kimball International Cl. B | 3,971,411 | | |
|
| | | Weighted Average P/E Ratio | 20.7x |
| Sotheby’s | 3,828,228 | | |
|
| | | Weighted Average P/B Ratio | 2.2x |
| Plexus Corporation | 3,735,779 | | |
|
| | | Weighted Average Yield | 0.8% |
| Ritchie Bros. Auctioneers | 3,392,672 | | |
|
| | | | | Fund Net Assets | $1,108 million |
| expected earnings, as well as a promising outlook, seemed to create excitement for the shares of industrial equipment auctioneer Ritchie Bros. Auctioneers. | |
|
| MAXIMUS provides consulting, as well as systems and operations management, to federal, state and local government agencies and privatesector clients. Its price plummeted amidst a now-settled lawsuit, a large contract problem and some | | Turnover Rate | 8% |
| | | | management decisions that left investors scratching their heads as they were selling its shares. We held a position at the end of June, hopeful that the firm was capable of righting itself. We also held a small position in PXRE Group. Its share price collapsed in the wake of fiscal fourth-quarter losses resulting from the damage wrought by Hurricanes Katrina, Rita and Wilma. | |
|
GOOD IDEAS AT THE TIME
Net Realized and Unrealized Loss Through 6/30/06 | | | Net Leverage† | 0% |
| | |
|
| MAXIMUS | $1,731,766 | | | Symbol | |
| | | Market Price | RVT |
| PXRE Group | 1,538,931 | | | NAV | XRVTX |
| | | † Net leverage is the percentage, in excess of 100%, of the total value of equity type investments, divided by net assets, applicable to Common Stockholders. |
| HealthSouth Corporation | 1,230,400 | | |
| | | | | | |
| Foundry Networks | 1,176,210 | | | |
| | | CAPITAL STRUCTURE
Publicly Traded Securities Outstanding at 6/30/06 at
NAV or Liquidation Value |
| Fleetwood Enterprises | 1,126,983 | | |
|
| | | | | 55.9 million shares of Common Stock | $1,108 million |
| | | | |
|
| | | | | | 5.90% Cumulative Preferred Stock | $220 million |
| | | | | | | | | |
 | | RISK/RETURN COMPARISON
Three-Year Period Ended 6/30/06 |
| |
|
| | | Average Annual
Total Return | Standard Deviation | Return
Efficiency* |
| |
|
| | RVT (NAV) | 21.3% | 14.1 | 1.51 |
| |
|
| | S&P 600 | 20.5 | 13.7 | 1.50 |
| |
|
| | Russell 2000 | 18.7 | 14.6 | 1.28 |
| | * Return Efficiency is the average annual total return divided by the annualized standard deviation over a designated time period. |
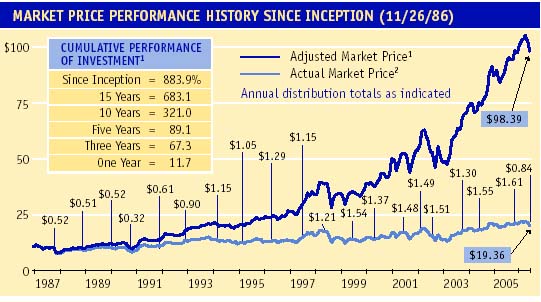
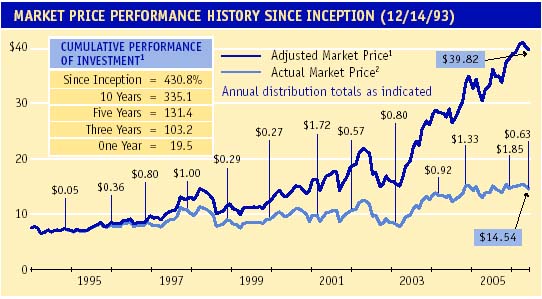
1 Reflects the cumulative total return of an investment made by a stockholder who purchased one share at inception ($10.00 IPO), reinvested all annual distributions as indicated and fully participated in primary subscriptions of the Fund’s rights offerings. | | | | | |
2 Reflects the actual market price of one share as it traded on the NYSE. | | 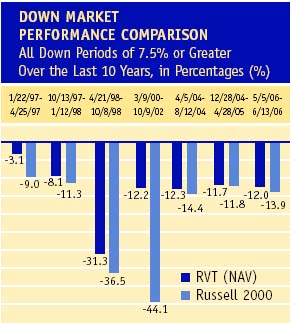 |
2006 SEMIANNUAL REPORT TO STOCKHOLDERS | 13
ROYCE MICRO-CAP TRUST
AVERAGE ANNUAL NAV TOTAL RETURNS
Through 6/30/06 | | Manager’s Discussion During the first half of 2006, the diversified portfolio of Royce Micro-Cap Trust (RMT) posted solid results on both an absolute and relative basis. For the year-to-date period ended 6/30/06, RMT gained 11.6% on a net asset value (NAV) basis and 4.5% on a market price basis versus a return of 8.2% for the Russell 2000, the Fund’s small-cap benchmark. In the bullish opening quarter, RMT’s portfolio fully participated in the dynamic up market with a gain of 15.2% versus the Russell 2000’s return of 13.9%, while on a market price basis the Fund lagged, gaining 7.0%. Even better news was the Fund’s stronger relative down-market showing in the second quarter, a more bearish time span that saw stock prices fall. From April through the end of June, RMT was down 3.2% on an NAV basis and 2.3% on a market price basis, both results ahead of the Russell 2000’s 5.0% decline. For the even shorter-term downturn from the most recent small-cap market high on 5/5/06 through 6/30/06, the Fund was down 6.1% on an NAV basis and 5.4% on a market price basis, both results again better then the small-cap index’s return of -7.1%. Although short-term performance periods are typically not of great interest or concern, we were pleased with RMT’s near-term down market results considering the volatility and vulnerability of the micro-cap asset class.
We were also pleased with the Fund’s NAV full market cycle and other long-term results on both an absolute and relative basis. These are the periods that we believe matter most in any evaluation of the portfolio’s merits. From the small-cap market peak on 3/9/00 through 6/30/06, RMT gained 125.2% on an NAV basis (+174.3% on a market price basis) versus 29.5% for the Russell 2000. Arguably even more impressive was the Fund’s gain during the more bullish phase that ran from the small-cap market trough on 10/9/02 through 6/30/06, a period in which RMT was up 160.7% on an NAV basis (+191.5% on a market price basis) compared to the Russell 2000’s gain of 131.8%. The Fund also outperformed its benchmark for the one-, three-, five, 10-year and since inception (12/14/93) periods on both an NAV and market price basis. RMT’s average annual NAV total return since inception was 14.4%.
All but one of the Fund’s equity sectors posted net gains during the first half, and losses at the individual company level were relatively small. Multi-business holding company BB Holdings spun off a subsidiary that trades in the U.S., but the prospect of its own domestic de-listing sent investors fleeing; its stock continues to trade overseas. Small pharmaceuticals companies have endured tough times recently, even conservatively capitalized businesses such as Momenta Pharmaceuticals. The firm experienced net losses as it waited for new drugs to be approved, which led many investors to go cold turkey on its stock. After selling some shares in March, we repurchased the stock in April. At the end of June, we held a position in American Bank Note Holographics, a firm that produces holograms for currency, credit card identification and document security. Its shares dropped 60% in March on news that a major credit card company |
|
Second Quarter 2006* | | -3.16 | % |
|
Jan - June 2006* | | 11.58 | |
|
One-Year | | | | | | | | 20.80 | |
|
Three-Year | | | 22.60 | |
|
Five-Year | | | | | | | | 14.02 | |
|
10-Year | | | | | | | | 14.11 | |
|
Since Inception (12/14/93) | | 14.36 | |
|
| | | |
CALENDAR YEAR NAV TOTAL RETURNS |
|
Year | | RMT | | | Year | | | RMT | |
|
2005 | | 6.8 | % | | 1999 | | | 12.7 | % |
|
2004 | | 18.7 | | | 1998 | | | -4.1 | |
|
2003 | | 55.6 | | | 1997 | | | 27.1 | |
|
2002 | | -13.8 | | | 1996 | | | 16.6 | |
|
2001 | | 23.4 | | | 1995 | | | 22.9 | |
|
2000 | | 10.9 | | | 1994 | | | 5.0 | |
| | | | | | | | | | | All performance information in this Report reflects past performance, is presented on a total return basis and reflects the reinvestment of distributions. Past performance is no guarantee of future results. Investment return and principal value of an investment will fluctuate, so that shares may be worth more or less than their original cost when sold. Current performance may be higher or lower than performance quoted. Current month-end performance may be obtained at www.roycefunds.com. The Funds’ P/E ratio calculations exclude companies with zero or negative earnings. |
TOP 10 POSITIONS
% of Net Assets Applicable
to Common Stockholders |
|
ASA Bermuda | | 1.5 | % |
|
Universal Truckload Services | | 1.4 | |
|
Transaction Systems Architects Cl. A | | 1.3 | |
|
Seneca Foods | | 1.2 | |
|
PAREXEL International | | 1.1 | |
|
Pason Systems | | 1.0 | |
|
First Acceptance | | 0.9 | |
|
Forrester Research | | 0.9 | |
|
MVC Capital | | 0.9 | |
|
Weyco Group | | 0.9 | |
| | | | | | | | | | |
PORTFOLIO SECTOR BREAKDOWN
% of Net Assets Applicable
to Common Stockholders |
|
Technology | | 22.5 | % |
|
Industrial Products | | 14.6 | |
|
Health | | 14.4 | |
|
Industrial Services | | 13.1 | |
|
Natural Resources | | 8.8 | |
|
Financial Intermediaries | | 8.4 | |
|
Consumer Services | | 6.4 | |
|
Consumer Products | | 5.0 | |
|
Financial Services | | 2.0 | |
|
Diversified Investment Companies | | 2.1 | |
|
Miscellaneous | | 4.0 | |
|
Preferred Stock | | 0.5 | |
|
Cash and Cash Equivalents | | 16.9 | |
14 | 2006 SEMIANNUAL REPORT TO STOCKHOLDERS |
| |
Performance and Portfolio Review
GOOD IDEAS THAT WORKED
Net Realized and Unrealized Gain Through 6/30/06 | | would no longer be using the firm’s security stripe.
Industrial Products made the largest positive dollar-based contribution to performance. Insteel Industries manufactures concrete reinforcing metal products. The firm reported highly improved earnings for the fiscal first quarter of 2006, as well as strong operating cash flow results, developments that helped its stock price to soar earlier in the year. Insteel then announced even stronger fiscal second-quarter results, but also said that it was giving up its well-regarded industrial-wire business and closing the plant where these operations took place, which led to a 19% decline in its stock price. The announcement of a two-for-one stock split in May helped its share price to recover a bit. We reduced our position | | PORTFOLIO DIAGNOSTICS |
| Volt Information Sciences | $1,744,138 | | |
|
| | | Average Market Capitalization | $273 million |
| Dril-Quip | 1,702,095 | | |
|
| | | Weighted Average P/E Ratio | 17.9x* |
| Universal Truckload Services | 1,493,254 | | |
|
| | | Weighted Average P/B Ratio | 2.9x |
| Insteel Industries | 1,492,665 | | |
|
| | | Weighted Average Yield | 0.7% |
| Transactions Systems Architects Cl. A | 1,433,301 | | |
|
| | | | | Fund Net Assets | $321 million |
between February and early April, then began to repurchase shares later that month.
Elsewhere in the portfolio, the share price of staffing, computer system and telephone services business Volt Information Sciences climbed on news of better-than-expected fiscal second quarter earnings in June, when we began to reduce our position. During March and April, we sold a little more than half our shares of Dril-Quip, which manufactures offshore drilling | |
|
| | Turnover Rate | 16% |
| |
|
| | | | and production equipment. Strong results for fiscal 2005 and the fiscal first quarter of 2006 helped its stock price to rise. Top-ten holding Universal Truckload Services saw its increased revenues and steady earnings drive increasing numbers of investors towards its stock. We trimmed our stake in February, but otherwise saw solid prospects for growth. | | Net Leverage† | 2% |
GOOD IDEAS AT THE TIME
Net Realized and Unrealized Loss Through 6/30/06 | | |
|
| | | Symbol | |
| BB Holdings | $1,161,864 | | | Market Price | RMT |
| | | NAV | XOTX |
| American Bank Note Holographics | 692,692 | | | * Excludes 17% of portfolio holdings with zero or negative earnings as of 6/30/06. † Net leverage is the percentage, in excess of 100%, of the total value of equity type investments, divided by net assets, applicable to Common Stockholders. |
| | |
| Momenta Pharmaceuticals | 594,939 | | |
| | | | | | |
| Herley Industries | 583,094 | | | CAPITAL STRUCTURE
Publicly Traded Securities Outstanding at 6/30/06 at
NAV or Liquidation Value |
| | |
|
| Stein Mart | 498,815 | | | 22.4 million shares of Common Stock | $321 million |
| | | | |
|
| | | | | 6.00% Cumulative Preferred Stock | $60 million |
| | | | | | | | | |
 | | RISK/RETURN COMPARISON
Three-Year Period Ended 6/30/06 |
| |
|
| | | Average Annual
Total Return | Standard Deviation | Return
Efficiency* |
| |
|
| | RMT (NAV) | 22.6% | 14.2 | 1.59 |
| |
|
| | Russell 2000 | 18.1 | 14.6 | 1.28 |
| | *Return Efficiency is the average annual total return divided by the annualized standard deviation over a designated time period. |
1 Reflects the cumulative total return of an investment made by a stockholder who purchased one share at inception ($7.50 IPO), reinvested distributions as indicated and fully participated in the primary subscription of the 1994 rights offering. | | | | | |
2 Reflects the actual market price of one share as it traded on the Nasdaq and, beginning on 12/1/03, on the NYSE. | | 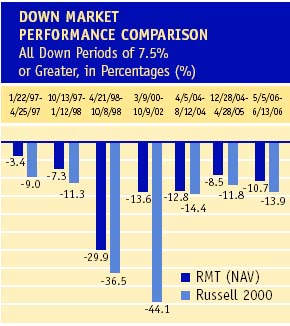 |
2006 SEMIANNUAL REPORT TO STOCKHOLDERS | 15
ROYCE FOCUS TRUST
AVERAGE ANNUAL NAV TOTAL RETURNS
Through 6/30/06 | |  Manager’s Discussion We were pleased with the first-half results for Royce Focus Trust (FUND) on an absolute basis, even if the Fund’s net asset value (NAV) returns came up short by a hair’s breadth on a relative basis. For the year-to-date period ended 6/30/06, FUND gained 8.1% on an NAV basis and 10.6% on a market price basis versus a return of 8.2% for its small-cap benchmark, the Russell 2000. In hindsight, the Fund’s NAV results in the year’s first six months went as we would expect—a solid up-market turn and better relative down-market performance. During the bullish first quarter, the Fund was up 13.6% on an NAV basis and 18.4% on a market price basis, compared to a 13.9% gain for the Russell 2000. The second quarter saw stock prices decline, and the Fund lost 4.8% on an NAV basis (-6.5% on a market price basis), while the Russell 2000 declined 5.0%.
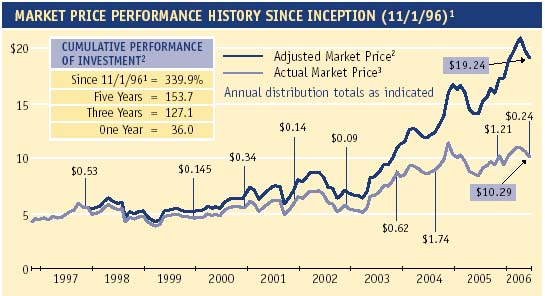
These historically characteristic performances helped FUND to post strong absolute and superior relative results over market-cycle and other long-term performance periods. From the most recent small-cap market peak on 3/9/00 through 6/30/06, the Fund gained 179.3% on an NAV basis (+233.4% on a market price basis) versus 29.5% for the Russell 2000. In the mostly up-market phase from the small-cap market trough on 10/9/02 through 6/30/06, FUND’s NAV return was 193.6% (+210.9% on a market price basis) versus a gain of 131.8% for its small-cap benchmark. On both an NAV and market price basis, FUND outperformed the Russell 2000 for the one-, three-, five-year and since inception of Royce’s management (11/1/96) periods ended 6/30/06. The Fund’s average annual NAV total return since inception was 14.3%.
Each of the Fund’s sectors posted net gains during the first half, led on a dollar basis by its three largest, Industrial Products, Natural Resources and Technology. Net losses at the individual company level were relatively minor, however disappointing. Orchid Cellmark has a dominant position in DNA testing, a promising niche business that we liked a great deal. However, it struggled with losses and meeting new regulations and the resulting accounting difficulties left us uncertain about the firm’s future prospects. Multi-business holding company BB Holdings spun off a subsidiary that trades in the U.S., but the prospect of its own domestic de-listing sent investors fleeing; its stock continues to trade overseas.
Within Industrial Products, several holdings posted impressive net gains. We have owned shares of welding and cutting products maker Lincoln Electric Holdings since shortly after we assumed management of FUND’s portfolio, drawn to its strong business, low-debt balance sheet, history of earnings and steady dividend. The firm’s business has recently undergone explosive growth, reporting record sales for the fiscal year and fiscal fourth quarter of 2005, as well as the first fiscal quarter of 2006. It was a top-ten holding at the end of June. In the metal fabrication and distribution industry, we enjoyed success with Metal Management, in which we took some gains during April and May, as well as Reliance Steel & Aluminum, Canadian steel producer and |
|
Second Quarter 2006* | | -4.83 | % |
|
Jan - June 2006* | | 8.11 | |
|
One-Year | | | | | | | | 30.73 | |
|
Three-Year | | | | | | | | 27.21 | |
|
Five-Year | | | | | | | | 16.16 | |
|
Since Inception (11/1/96)† | | | 14.28 | |
|
† Royce & Associates assumed investment management responsibility for the Fund on 11/1/96. |
| | | |
CALENDAR YEAR NAV TOTAL RETURNS |
|
Year | | RFT | | | Year | | | RFT | |
|
2005 | | 13.3 | % | | 2000 | | | 20.9 | % |
|
2004 | | 29.2 | | | 1999 | | | 8.7 | |
|
2003 | | 54.3 | | | 1998 | | | -6.8 | |
|
2002 | | -12.5 | | | 1997 | | | 20.5 | |
|
2001 | | 10.0 | | | | | | | |
| | | | | | | | | | | All performance information in this Report reflects past performance, is presented on a total return basis and reflects the reinvestment of distributions. Past performance is no guarantee of future results. Investment return and principal value of an investment will fluctuate, so that shares may be worth more or less than their original cost when sold. Current performance may be higher or lower than performance quoted. Current month-end performance may be obtained at www.roycefunds.com. The Funds’ P/E ratio calculations exclude companies with zero or negative earnings. |
TOP 10 POSITIONS*
% of Net Assets Applicable
to Common Stockholders |
|
New Zealand Government 6.00% Bond | | 3.9 | % |
|
Athena Neurosciences Finance 7.25% Bond | | 3.9 | |
|
IPSCO | | 3.7 | |
|
Canadian Government 3.00% Bond | | 3.5 | |
|
Endo Pharmaceuticals Holdings | | 3.2 | |
|
Lincoln Electric Holdings | | 3.1 | |
|
Thor Industries | | 2.8 | |
|
Simpson Manufacturing | | 2.8 | |
|
Reliance Steel & Aluminum | | 2.7 | |
|
Tesco Corporation | | 2.7 | |
* Does not include U.S. Government securities. |
| | | | | | | | | | |
PORTFOLIO SECTOR BREAKDOWN
% of Net Assets Applicable
to Common Stockholders |
|
Industrial Products | | 23.8 | % |
|
Natural Resources | | 22.9 | |
|
Technology | | 8.0 | |
|
Consumer Products | | 6.1 | |
|
Health | | 5.9 | |
|
Consumer Services | | 4.4 | |
|
Industrial Services | | 3.6 | |
|
Financial Intermediaries | | 3.4 | |
|
Financial Services | | 3.1 | |
|
Bonds | | 11.4 | |
|
Treasuries, Cash and Cash Equivalents | | 23.7 | |
16 | 2006 SEMIANNUAL REPORT TO STOCKHOLDERS |
| |
Performance and Portfolio Review
GOOD IDEAS THAT WORKED
Net Realized and Unrealized Gain Through 6/30/06 | | fabricator IPSCO, Schnitzer Steel Industries and Harris Steel Group. The once-thriving steel industry underwent a long period of consolidation and reorganization earlier in the decade after falling on tough times. It seems to us that neither the positive effects of these efforts nor the steady worldwide demand for steel products have yet been fully grasped by investors, which in turn allowed us to find what we thought were attractively valued, conservatively capitalized firms.
In the Natural Resources sector, holdings in the precious metals and mining industry posted significant net gains on a dollar basis. We began to establish positions in certain precious metals companies between 2002 and 2005 as the industry struggled to rebound. Throughout this period, we | | PORTFOLIO DIAGNOSTICS |
| Lincoln Electric Holdings | $1,724,250 | | |
|
| | | Average Market Capitalization | $1,675 million |
| Glamis Gold | 1,299,161 | | |
|
| | | Weighted Average P/E Ratio | 13.3x |
| Meridian Gold | 1,231,308 | | |
|
| | | Weighted Average P/B Ratio | 2.1x |
| Metal Management | 1,185,559 | | |
|
| | | Weighted Average Yield | 1.4% |
| Lowrance Electronics | 1,120,055 | | |
|
| | | | | Fund Net Assets | $154 million |
| remained patient, in part because of our belief that the close-to-20-year bear market for precious metals prices was likely to end, but mostly because we thought that the individual company qualities we held in such high regard would eventually be recognized by other investors. At times, we took advantage of further stock price declines by building positions. Commodity and stock prices finally began to recover during 2005. By the end of last year, the industry’s rebound was well under way, and the first half of 2006 | |
|
| | Turnover Rate | 17% |
| |
|
| | | | saw further recovery. We reduced our stake in Glamis Gold during the first half and trimmed our position in Meridian Gold. | | Net Leverage* | 0% |
GOOD IDEAS AT THE TIME
Net Realized and Unrealized Loss Through 6/30/06 | | |
|
| | | Symbol | |
| BB Holdings | $760,536 | | | Market Price | FUND |
| | | NAV | XFUNX |
| Orchid Cellmark | 721,500 | | | * Net leverage is the percentage, in excess of 100%, of the total value of equity type investments, divided by net assets applicable to Common Stockholders. |
| | |
| Trican Well Service | 559,191 | | |
| | | | | | |
| Nu Skin Enterprises Cl. A | 546,000 | | | CAPITAL STRUCTURE
Publicly Traded Securities Outstanding at 6/30/06 at
NAV or Liquidation Value |
| | |
|
| International Coal Group | 453,678 | | | 14.9 million shares of Common Stock | $154 million |
| | | | |
|
| | | | | 6.00% Cumulative Preferred Stock | $25 million |
| | | | | | | | | |
 | | RISK/RETURN COMPARISON
Three-Year Period Ended 6/30/06 |
| |
|
| | | Average Annual
Total Return | Standard Deviation | Return
Efficiency* |
| |
|
| | FUND (NAV) | 27.2% | 15.1 | 1.80 |
| |
|
| | Russell 2000 | 18.7 | 14.6 | 1.28 |
| | * Return Efficiency is the average annual total return divided by the annualized standard deviation over a designated time period. |
1 Royce & Associates assumed investment management responsibility for the Fund on 11/1/96. | | | | | |
2 Reflects the cumulative total return of a continuous common stockholder who reinvested all distributions as
indicated and fully participated in the primary subscription of the 2005 rights offering. 3 Reflects the actual market price of one share as it traded on the Nasdaq. | |  |
| | |
2006 SEMIANNUAL REPORT TO STOCKHOLDERS | 17
HISTORY SINCE INCEPTION
The following table details the share accumulations by an initial investor in the Funds who reinvested all distributions (including fractional shares) and participated fully in primary subscriptions for each of the rights offerings. Full participation in distribution reinvestments and rights offerings can maximize the returns available to a long-term investor. This table should be read in conjunction with the Performance and Portfolio Reviews of the Funds.
|
| | | | | Amount | | Purchase | | | | | NAV | | Market |
History | | Invested | | Price* | | Shares | | Value** | | Value** |
|
| Royce Value Trust | | | | | | | | | | | | | | | | | | | |
| 11/26/86 | | Initial Purchase | | $ | 10,000 | | | $ | 10.000 | | | 1,000 | | | $ | 9,280 | | | $ | 10,000 | |
| 10/15/87 | | Distribution $0.30 | | | | | | | 7.000 | | | 42 | | | | | | | | | |
| 12/31/87 | | Distribution $0.22 | | | | | | | 7.125 | | | 32 | | | | 8,578 | | | | 7,250 | |
| 12/27/88 | | Distribution $0.51 | | | | | | | 8.625 | | | 63 | | | | 10,529 | | | | 9,238 | |
| 9/22/89 | | Rights Offering | | | 405 | | | | 9.000 | | | 45 | | | | | | | | | |
| 12/29/89 | | Distribution $0.52 | | | | | | | 9.125 | | | 67 | | | | 12,942 | | | | 11,866 | |
| 9/24/90 | | Rights Offering | | | 457 | | | | 7.375 | | | 62 | | | | | | | | | |
| 12/31/90 | | Distribution $0.32 | | | | | | | 8.000 | | | 52 | | | | 11,713 | | | | 11,074 | |
| 9/23/91 | | Rights Offering | | | 638 | | | | 9.375 | | | 68 | | | | | | | | | |
| 12/31/91 | | Distribution $0.61 | | | | | | | 10.625 | | | 82 | | | | 17,919 | | | | 15,697 | |
| 9/25/92 | | Rights Offering | | | 825 | | | | 11.000 | | | 75 | | | | | | | | | |
| 12/31/92 | | Distribution $0.90 | | | | | | | 12.500 | | | 114 | | | | 21,999 | | | | 20,874 | |
| 9/27/93 | | Rights Offering | | | 1,469 | | | | 13.000 | | | 113 | | | | | | | | | |
| 12/31/93 | | Distribution $1.15 | | | | | | | 13.000 | | | 160 | | | | 26,603 | | | | 25,428 | |
| 10/28/94 | | Rights Offering | | | 1,103 | | | | 11.250 | | | 98 | | | | | | | | | |
| 12/19/94 | | Distribution $1.05 | | | | | | | 11.375 | | | 191 | | | | 27,939 | | | | 24,905 | |
| 11/3/95 | | Rights Offering | | | 1,425 | | | | 12.500 | | | 114 | | | | | | | | | |
| 12/7/95 | | Distribution $1.29 | | | | | | | 12.125 | | | 253 | | | | 35,676 | | | | 31,243 | |
| 12/6/96 | | Distribution $1.15 | | | | | | | 12.250 | | | 247 | | | | 41,213 | | | | 36,335 | |
| 1997 | | Annual distribution total $1.21 | | | | | | | 15.374 | | | 230 | | | | 52,556 | | | | 46,814 | |
| 1998 | | Annual distribution total $1.54 | | | | | | | 14.311 | | | 347 | | | | 54,313 | | | | 47,506 | |
| 1999 | | Annual distribution total $1.37 | | | | | | | 12.616 | | | 391 | | | | 60,653 | | | | 50,239 | |
| 2000 | | Annual distribution total $1.48 | | | | | | | 13.972 | | | 424 | | | | 70,711 | | | | 61,648 | |
| 2001 | | Annual distribution total $1.49 | | | | | | | 15.072 | | | 437 | | | | 81,478 | | | | 73,994 | |
| 2002 | | Annual distribution total $1.51 | | | | | | | 14.903 | | | 494 | | | | 68,770 | | | | 68,927 | |
| 1/28/03 | | Rights Offering | | | 5,600 | | | | 10.770 | | | 520 | | | | | | | | | |
| 2003 | | Annual distribution total $1.30 | | | | | | | 14.582 | | | 516 | | | | 106,216 | | | | 107,339 | |
| 2004 | | Annual distribution total $1.55 | | | | | | | 17.604 | | | 568 | | | | 128,955 | | | | 139,094 | |
| 2005 | | Annual distribution total $1.61 | | | | | | | 18.739 | | | 604 | | | | 139,808 | | | | 148,773 | |
| 2006 | | Year-to-date distribution total $0.84 | | | | | | | 19.114 | | | 329 | | | | | | | | | |
|
| 6/30/06 | | | | $ | 21,922 | | | | | | | 7,738 | | | $ | 153,290 | | | $ | 149,808 | |
|
| Royce Micro-Cap Trust | | | | | | | | | | | | | | | | | | | |
| 12/14/93 | | Initial Purchase | | $ | 7,500 | | | $ | 7.500 | | | 1,000 | | | $ | 7,250 | | | $ | 7,500 | |
| 10/28/94 | | Rights Offering | | | 1,400 | | | | 7.000 | | | 200 | | | | | | | | | |
| 12/19/94 | | Distribution $0.05 | | | | | | | 6.750 | | | 9 | | | | 9,163 | | | | 8,462 | |
| 12/7/95 | | Distribution $0.36 | | | | | | | 7.500 | | | 58 | | | | 11,264 | | | | 10,136 | |
| 12/6/96 | | Distribution $0.80 | | | | | | | 7.625 | | | 133 | | | | 13,132 | | | | 11,550 | |
| 12/5/97 | | Distribution $1.00 | | | | | | | 10.000 | | | 140 | | | | 16,694 | | | | 15,593 | |
| 12/7/98 | | Distribution $0.29 | | | | | | | 8.625 | | | 52 | | | | 16,016 | | | | 14,129 | |
| 12/6/99 | | Distribution $0.27 | | | | | | | 8.781 | | | 49 | | | | 18,051 | | | | 14,769 | |
| 12/6/00 | | Distribution $1.72 | | | | | | | 8.469 | | | 333 | | | | 20,016 | | | | 17,026 | |
| 12/6/01 | | Distribution $0.57 | | | | | | | 9.880 | | | 114 | | | | 24,701 | | | | 21,924 | |
| 2002 | | Annual distribution total $0.80 | | | | | | | 9.518 | | | 180 | | | | 21,297 | | | | 19,142 | |
| 2003 | | Annual distribution total $0.92 | | | | | | | 10.004 | | | 217 | | | | 33,125 | | | | 31,311 | |
| 2004 | | Annual distribution total $1.33 | | | | | | | 13.350 | | | 257 | | | | 39,320 | | | | 41,788 | |
| 2005 | | Annual distribution total $1.85 | | | | | | | 13.848 | | | 383 | | | | 41,969 | | | | 45,500 | |
| 2006 | | Year-to-date distribution total $0.63 | | | | | | | 13.725 | | | 145 | | | | | | | | | |
|
| 6/30/06 | | | | $ | 8,900 | | | | | | | 3,270 | | | $ | 46,826 | | | $ | 47,546 | |
|
| Royce Focus Trust | | | | | | | | | | | | | | | | | | | |
| 10/31/96 | | Initial Purchase | | $ | 4,375 | | | $ | 4.375 | | | 1,000 | | | $ | 5,280 | | | $ | 4,375 | |
| 12/31/96 | | | | | | | | | | | | | | | | 5,520 | | | | 4,594 | |
| 12/5/97 | | Distribution $0.53 | | | | | | | 5.250 | | | 101 | | | | 6,650 | | | | 5,574 | |
| 12/31/98 | | | | | | | | | | | | | | | | 6,199 | | | | 5,367 | |
| 12/6/99 | | Distribution $0.145 | | | | | | | 4.750 | | | 34 | | | | 6,742 | | | | 5,356 | |
| 12/6/00 | | Distribution $0.34 | | | | | | | 5.563 | | | 69 | | | | 8,151 | | | | 6,848 | |
| 12/6/01 | | Distribution $0.14 | | | | | | | 6.010 | | | 28 | | | | 8,969 | | | | 8,193 | |
| 12/6/02 | | Distribution $0.09 | | | | | | | 5.640 | | | 19 | | | | 7,844 | | | | 6,956 | |
| 12/8/03 | | Distribution $0.62 | | | | | | | 8.250 | | | 94 | | | | 12,105 | | | | 11,406 | |
| 2004 | | Annual distribution total $1.74 | | | | | | | 9.325 | | | 259 | | | | 15,639 | | | | 16,794 | |
| 5/6/05 | | Rights offering | | | 2,669 | | | | 8.340 | | | 320 | | | | | | | | | |
| 2005 | | Annual distribution total $1.21 | | | | | | | 9.470 | | | 249 | | | | 21,208 | | | | 20,709 | |
| 2006 | | Year-to-date distribution total $0.24 | | | | | | | 9.897 | | | 53 | | | | | | | | | |
|
| 6/30/06 | | | | $ | 7,044 | | | | | | | 2,226 | | | $ | 22,928 | | | $ | 22,906 | |
|
| * | | Beginning with the 1997 (RVT), 2002 (RMT) and 2004 (FUND) distributions, the purchase price of distributions is a weighted average of the distribution reinvestment prices for the year. |
| ** | | Other than for initial purchase and June 30, 2006, values are stated as of December 31 of the year indicated, after reinvestment of distributions. |
| 18 | 2006 SEMIANNUAL REPORT TO STOCKHOLDERS |
DISTRIBUTION REINVESTMENT AND CASH PURCHASE OPTIONS
Why should I reinvest my distributions?
By reinvesting distributions, a stockholder can maintain an undiluted investment in the Fund. The regular reinvestment of distributions has a significant impact on stockholder returns. In contrast, the stockholder who takes distributions in cash is penalized when shares are issued below net asset value to other stockholders.
How does the reinvestment of distributions from the Royce closed-end funds work?
The Funds automatically issue shares in payment of distributions unless you indicate otherwise. The shares are generally issued at the lower of the market price or net asset value on the valuation date.
How does this apply to registered stockholders?
If your shares are registered directly with a Fund, your distributions are automatically reinvested unless you have otherwise instructed the Funds’ transfer agent, Computershare, in writing. A registered stockholder also has the option to receive the distribution in the form of a stock certificate or in cash if Computershare is properly notified.
What if my shares are held by a brokerage firm or a bank?
If your shares are held by a brokerage firm, bank, or other intermediary as the stockholder of record, you should contact your brokerage firm or bank to be certain that it is automatically reinvesting distributions on your behalf. If they are unable to reinvest distributions on your behalf, you should have your shares registered in your name in order to participate.
What other features are available for registered stockholders?
The Distribution Reinvestment and Cash Purchase Plans also allow registered stockholders to make optional cash purchases of shares of a Fund’s common stock directly through Computershare on a monthly basis, and to deposit certificates representing your Fund shares with Computershare for safekeeping. The Funds’ investment adviser is absorbing all commissions on optional cash purchases under the Plans through December 31, 2006.
How do the Plans work for registered stockholders?
Computershare maintains the accounts for registered stockholders in the Plans and sends written confirmation of all transactions in the account. Shares in the account of each participant will be held by Computershare in non-certificated form in the name of the participant, and each participant will be able to vote those shares at a stockholder meeting or by proxy. A participant may also send other stock certificates held by them to Computershare to be held in non-certificated form. There is no service fee charged to participants for reinvesting distributions. If a participant elects to sell shares from a Plan account, Computershare will deduct a $2.50 fee plus brokerage commissions from the sale transaction. If a nominee is the registered owner of your shares, the nominee will maintain the accounts on your behalf.
How can I get more information on the Plans?
You can call an Investor Services Representative at (800) 221-4268 or you can request a copy of the Plan for your Fund from Computershare. All correspondence (including notifications) should be directed to: [Name of Fund] Distribution Reinvestment and Cash Purchase Plan, c/o Computershare, PO Box 43010, Providence, RI 02940-3010, telephone (800) 426-5523.
2006 SEMIANNUAL REPORT TO STOCKHOLDERS | 19
ROYCE VALUE TRUST
|
| | | | | | | | | | | | | | | | |
| | | | | | | | | | | | | | | | |
|
Schedule of Investments |
|
| | | | | | | | | | | | | | | | |
| | | SHARES | | | VALUE | | | | SHARES | | | VALUE |
| |
| COMMON STOCKS – 99.4% | | | | | | | Restaurants and Lodgings - 1.0% | | | | | |
| | | | | | | | Applebee’s International | | 63,000 | | $ | 1,210,860 |
| Consumer Products – 4.6% | | | | | | | Benihana Cl. A a | | 6,600 | | | 179,124 |
| Apparel and Shoes - 1.9% | | | | | | | CEC Entertainment a, c | | 121,400 | | | 3,899,368 |
Kenneth Cole Productions Cl. A | | 35,000 | | $ | 781,550 | | IHOP Corporation | | 93,400 | | | 4,490,672 |
Columbia Sportswear Company a, c | | 34,600 | | | 1,565,996 | | Ryan’s Restaurant Group a, c | | 7,200 | | | 85,752 |
Jones Apparel Group | | 81,500 | | | 2,590,885 | | Steak n Shake Company (The) a | | 92,600 | | | 1,401,964 |
K-Swiss Cl. A | | 105,000 | | | 2,803,500 | | | | | |
|
Oakley | | 94,900 | | | 1,599,065 | | | | | | | 11,267,740 |
Polo Ralph Lauren Cl. A | | 58,200 | | | 3,195,180 | | | | | |
|
Tandy Brands Accessories | | 16,900 | | | 175,084 | | Retail Stores - 2.0% | | | | | |
Timberland Company Cl. A a | | 60,000 | | | 1,566,000 | | Big Lots a | | 255,300 | | | 4,360,524 |
Weyco Group | | 307,992 | | | 7,151,574 | | CarMax a, c | | 84,000 | | | 2,978,640 |
| | | | |
| | Children’s Place Retail Stores a, c | | 13,670 | | | 820,883 |
| | | | | | 21,428,834 | | Claire’s Stores | | 189,800 | | | 4,841,798 |
| | | | |
| | Cost Plus a, c | | 80,500 | | | 1,180,130 |
| Collectibles - 0.1% | | | | | | | Fred’s Cl. A | | 50,000 | | | 667,500 |
Enesco Group a, c | | 174,800 | | | 92,644 | | Gander Mountain Company a, c | | 53,300 | | | 308,074 |
| | | | |
| | Hot Topic a, c | | 44,100 | | | 507,591 |
| Food/Beverage/Tobacco - 0.2% | | | | | | | Krispy Kreme Doughnuts a, c | | 85,000 | | | 691,900 |
Hain Celestial Group a, c | | 37,800 | | | 973,728 | | 99 Cents Only Stores a, c | | 95,000 | | | 993,700 |
Hershey Creamery Company | | 709 | | | 1,418,000 | | Stein Mart | | 142,800 | | | 2,113,440 |
| | | | |
| | Urban Outfitters a, c | | 27,000 | | | 472,230 |
| | | | | | 2,391,728 | | West Marine a | | 131,100 | | | 1,767,228 |
| | | | |
| | Wet Seal (The) Cl. A a | | 162,000 | | | 790,560 |
| Home Furnishing and Appliances - 0.3% | | | | | | | | | | |
|
Aaron Rents | | 4,500 | | | 120,960 | | | | | | | 22,494,198 |
Ethan Allen Interiors | | 35,800 | | | 1,308,490 | | | | | |
|
†Jacuzzi Brands a, c | | 145,000 | | | 1,276,000 | | Other Consumer Services - 2.4% | | | | | |
La-Z-Boy c | | 68,200 | | | 954,800 | | Corinthian Colleges a, c | | 106,500 | | | 1,529,340 |
| | | | |
| | ITT Educational Services a | | 106,000 | | | 6,975,860 |
| | | | | | 3,660,250 | | Laureate Education a, c | | 75,000 | | | 3,197,250 |
| | | | |
| | MoneyGram International | | 74,900 | | | 2,542,855 |
| Publishing - 0.3% | | | | | | | Sotheby’s a, c | | 485,200 | | | 12,736,500 |
Scholastic Corporation a, c | | 130,000 | | | 3,376,100 | | | | | |
|
| | | | |
| | | | | | | 26,981,805 |
| Sports and Recreation - 0.4% | | | | | | | | | | |
|
Coachmen Industries | | 47,700 | | | 569,538 | | Total (Cost $44,547,555) | | | | | 63,100,488 |
Monaco Coach | | 161,050 | | | 2,045,335 | | | | | |
|
Nautilus | | 2,000 | | | 31,420 | | Diversified Investment Companies – 0.1% | | | | | |
Thor Industries | | 26,100 | | | 1,264,545 | | Closed-End Mutual Funds - 0.1% | | | | | |
| | | | |
| | Central Fund of Canada Cl. A | | 111,500 | | | 958,900 |
| | | | | | 3,910,838 | | | | | |
|
| | | | |
| | Total (Cost $589,526) | | | | | 958,900 |
| Other Consumer Products - 1.4% | | | | | | | | | | |
|
Blyth | | 14,700 | | | 271,362 | | Financial Intermediaries – 8.9% | | | | | |
Burnham Holdings Cl. B | | 36,000 | | | 693,000 | | Banking - 3.2% | | | | | |
Fossil a, c | | 82,800 | | | 1,491,228 | | BOK Financial | | 129,327 | | | 6,423,672 |
Lazare Kaplan International a | | 103,600 | | | 854,700 | | Bank of NT Butterfield | | 62,500 | | | 3,562,500 |
Leapfrog Enterprises a, c | | 175,000 | | | 1,767,500 | | CFS Bancorp | | 260,000 | | | 3,858,400 |
Matthews International Cl. A | | 166,000 | | | 5,722,020 | | Cadence Financial | | 30,300 | | | 674,781 |
RC2 Corporation a | | 132,600 | | | 5,126,316 | | Commercial National Financial | | 44,900 | | | 865,223 |
| | | | |
| | Exchange National Bancshares | | 50,400 | | | 1,491,840 |
| | | | | | 15,926,126 | | Farmers & Merchants Bank of Long Beach | | 1,266 | | | 7,311,150 |
| | | | |
| | Heritage Financial | | 12,915 | | | 340,181 |
| Total (Cost $32,213,286) | | | | | 50,786,520 | | HopFed Bancorp | | 25,000 | | | 410,500 |
| | | | |
| | Jefferson Bancshares | | 25,000 | | | 322,500 |
| Consumer Services – 5.7% | | | | | | | Mechanics Bank | | 200 | | | 3,900,000 |
| Direct Marketing - 0.1% | | | | | | | NetBank | | 70,000 | | | 464,100 |
FTD Group a, c | | 55,000 | | | 742,500 | | Old Point Financial | | 20,000 | | | 587,400 |
| | | | |
| | Partners Trust Financial Group | | 100,000 | | | 1,141,000 |
| Leisure and Entertainment - 0.1% | | | | | | | Sun Bancorp a, c | | 44,100 | | | 716,184 |
Gemstar-TV Guide International a, c | | 201,100 | | | 707,872 | | Tompkins Trustco | | 17,545 | | | 754,435 |
Shuffle Master a, c | | 15,000 | | | 491,700 | | Whitney Holding | | 40,500 | | | 1,432,485 |
Steiner Leisure a, c | | 2,100 | | | 83,013 | | Wilber Corporation | | 31,700 | | | 332,850 |
| | | | |
| | | | | | | |
| | | | | | 1,282,585 | | | | | | | |
| | | | |
| | | | | | | |
| Media and Broadcasting - 0.1% | | | | | | | | | | | | |
Cox Radio Cl. A a | | 23,000 | | | 331,660 | | | | | | | |
| | | | |
| | | | | | | |
| 20 | 2006 SEMIANNUAL REPORT TO STOCKHOLDERS | THE ACCOMPANYING NOTES ARE AN INTEGRAL PART OF THESE FINANCIAL STATEMENTS. |
JUNE 30, 2006 (Unaudited)
|
| | | | | | | | | | | | | | | | |
| | | | | | | | | | | | | | | | |
|
| |
|
| | | | | | | | | | | | | | | | |
| | | SHARES | | | VALUE | | | | SHARES | | | VALUE |
| |
| Financial Intermediaries (continued) | | | | | | | National Financial Partners | | 22,000 | | $ | 974,820 |
| Banking (continued) | | | | | | | U.S.I. Holdings a, c | | 40,000 | | | 536,400 |
Wilmington Trust | | 31,000 | | $ | 1,307,580 | | | | | |
|
Yadkin Valley Financial | | 3,800 | | | 53,808 | | | | | | | 13,184,667 |
| | | | |
| | | | | |
|
| | | | | | 35,950,589 | | Investment Management - 3.8% | | | | | |
| | | | |
| | ADDENDA Capital | | 81,000 | | | 1,861,193 |
| Insurance - 3.6% | | | | | | | AllianceBernstein Holding L.P. | �� | 353,100 | | | 21,588,534 |
Alleghany Corporation a | | 11,097 | | | 3,066,767 | | BKF Capital Group a | | 7,500 | | | 46,875 |
Aspen Insurance Holdings | | 64,000 | | | 1,490,560 | | Eaton Vance | | 140,400 | | | 3,504,384 |
Commerce Group | | 89,000 | | | 2,629,060 | | Federated Investors Cl. B | | 121,900 | | | 3,839,850 |
Erie Indemnity Company Cl. A | | 139,900 | | | 7,274,800 | | GAMCO Investors Cl. A | | 158,600 | | | 5,830,136 |
IPC Holdings | | 27,000 | | | 665,820 | | Nuveen Investments Cl. A | | 138,600 | | | 5,966,730 |
Leucadia National | | 86,442 | | | 2,523,242 | | | | | |
|
Markel Corporation a, c | | 4,200 | | | 1,457,400 | | | | | | | 42,637,702 |
Montpelier Re Holdings | | 66,000 | | | 1,141,140 | | | | | |
|
NYMAGIC | | 85,200 | | | 2,475,060 | | Other Financial Services - 0.5% | | | | | |
Navigators Group a | | 83,200 | | | 3,645,824 | | †AmeriCredit Corporation a, c | | 18,870 | | | 526,850 |
Ohio Casualty | | 107,000 | | | 3,181,110 | | CharterMac | | 59,600 | | | 1,115,116 |
ProAssurance Corporation a, c | | 38,070 | | | 1,834,213 | | Credit Acceptance a | | 50,000 | | | 1,357,000 |
PXRE Group a | | 166,551 | | | 619,570 | | Municipal Mortgage & Equity | | 40,300 | | | 1,094,548 |
RLI | | 99,724 | | | 4,804,702 | | Van der Moolen Holding ADR | | 21,362 | | | 154,874 |
21st Century Insurance Group | | 62,000 | | | 892,800 | | World Acceptance a, c | | 21,700 | | | 770,784 |
Wesco Financial | | 4,750 | | | 1,809,750 | | | | | |
|
| | | | |
| | | | | | | 5,019,172 |
| | | | | | 39,511,818 | | | | | |
|
| | | | |
| | Total (Cost $55,307,350) | | | | | 81,673,633 |
| Real Estate Investment Trusts - 0.4% | | | | | | | | | | |
|
Gladstone Commercial | | 34,700 | | | 650,972 | | Health – 7.4% | | | | | |
Government Properties Trust | | 50,000 | | | 474,500 | | Commercial Services - 1.2% | | | | | |
Opteum Cl. A | | 347,500 | | | 3,134,450 | | First Consulting Group a | | 560,900 | | | 4,958,356 |
| | | | |
| | PAREXEL International a, c | | 313,700 | | | 9,050,245 |
| | | | | | 4,259,922 | | | | | |
|
| | | | |
| | | | | | | 14,008,601 |
| Securities Brokers - 0.8% | | | | | | | | | | |
|
Dundee Wealth Management | | 50,000 | | | 485,980 | | Drugs and Biotech - 1.8% | | | | | |
First Albany Companies a | | 350,100 | | | 1,575,450 | | Affymetrix a | | 10,000 | | | 256,000 |
Investment Technology Group a, c | | 30,400 | | | 1,546,144 | | Antigenics a, c | | 99,300 | | | 210,516 |
Knight Capital Group Cl. A a, c | | 229,700 | | | 3,498,331 | | Cerus Corporation a, c | | 21,700 | | | 154,721 |
optionsXpress Holdings | | 53,000 | | | 1,235,430 | | Connetics Corporation a, c | | 14,300 | | | 168,168 |
| | | | |
| | DUSA Pharmaceuticals a | | 79,700 | | | 450,305 |
| | | | | | 8,341,335 | | Endo Pharmaceuticals Holdings a | | 229,800 | | | 7,578,804 |
| | | | |
| | Gene Logic a, c | | 365,000 | | | 492,750 |
| Other Financial Intermediaries - 0.9% | | | | | | | Hi-Tech Pharmacal a, c | | 1,650 | | | 27,340 |
International Securities Exchange Cl. A | | 75,000 | | | 2,855,250 | | Hollis-Eden Pharmaceuticals a, c | | 44,000 | | | 210,760 |
MCG Capital | | 138,000 | | | 2,194,200 | | Human Genome Sciences a, c | | 90,000 | | | 963,000 |
MVC Capital | | 353,900 | | | 4,756,416 | | K-V Pharmaceutical Company Cl. A a, c | | 51,500 | | | 960,990 |
MarketAxess Holdings a | | 67,000 | | | 737,670 | | †Martek Biosciences a, c | | 12,500 | | | 361,875 |
| | | | |
| | Medicines Company (The) a, c | | 20,000 | | | 391,000 |
| | | | | | 10,543,536 | | Millennium Pharmaceuticals a, c | | 100,000 | | | 997,000 |
| | | | |
| | Myriad Genetics a, c | | 50,000 | | | 1,262,500 |
| Total (Cost $67,981,553) | | | | | 98,607,200 | | Perrigo Company | | 186,750 | | | 3,006,675 |
| | | | |
| | QLT a, c | | 114,070 | | | 807,616 |
| Financial Services – 7.4% | | | | | | | SFBC International a, c | | 10,000 | | | 151,600 |
| Information and Processing - 1.9% | | | | | | | Telik a | | 33,000 | | | 544,500 |
eFunds Corporation a, c | | 126,875 | | | 2,797,594 | | VIVUS a | | 163,300 | | | 628,705 |
FactSet Research Systems | | 35,350 | | | 1,672,055 | | | | | |
|
Global Payments | | 137,000 | | | 6,651,350 | | | | | | | 19,624,825 |
Interactive Data a | | 134,300 | | | 2,698,087 | | | | | |
|
PRG-Schultz International a, c | | 247,000 | | | 111,150 | | Health Services - 1.8% | | | | | |
SEI Investments Company | | 141,200 | | | 6,901,856 | | Albany Molecular Research a | | 85,000 | | | 907,800 |
| | | | |
| | Covance a, c | | 52,700 | | | 3,226,294 |
| | | | | | 20,832,092 | | Cross Country Healthcare a, c | | 30,000 | | | 545,700 |
| | | | |
| | Eclipsys Corporation a, c | | 20,000 | | | 363,200 |
| Insurance Brokers - 1.2% | | | | | | | Gentiva Health Services a | | 30,150 | | | 483,304 |
Crawford & Company Cl. A | | 289,200 | | | 1,911,612 | | HMS Holdings a | | 50,000 | | | 536,000 |
Crawford & Company Cl. B | | 162,300 | | | 1,165,314 | | | | | | | |
Gallagher (Arthur J.) & Company | | 111,200 | | | 2,817,808 | | | | | | | |
Hilb Rogal & Hobbs Company | | 155,050 | | | 5,778,713 | | | | | | | |
| THE ACCOMPANYING NOTES ARE AN INTEGRAL PART OF THESE FINANCIAL STATEMENTS. |
2006 SEMIANNUAL REPORT TO STOCKHOLDERS | 21 |
ROYCE VALUE TRUST
|
| | | | | | | | | | | | | | | | |
| | | | | | | | | | | | | | | | |
|
Schedule of Investments |
|
| | | | | | | | | | | | | | | | |
| | | SHARES | | | VALUE | | | | SHARES | | | VALUE |
| |
| Health (continued) | | | | | | | Intermagnetics General a, c | | 6,525 | | $ | 176,044 |
| Health Services (continued) | | | | | | | PerkinElmer | | 135,000 | | | 2,821,500 |
†HealthSouth Corporation a, c | | 1,000,000 | | $ | 3,830,000 | | Powell Industries a, c | | 92,400 | | | 2,211,132 |
Lincare Holdings a, c | | 52,562 | | | 1,988,946 | | II-VI a | | 13,500 | | | 247,050 |
MedQuist a, c | | 73,893 | | | 886,716 | | Woodhead Industries | | 45,400 | | | 868,956 |
National Home Health Care | | 20,000 | | | 195,000 | | | | | |
|
On Assignment a | | 425,400 | | | 3,909,426 | | | | | | | 15,064,829 |
Paramount Acquisition (Units) a | | 280,000 | | | 1,904,000 | | | | | |
|
Quovadx a | | 3,000 | | | 7,740 | | Machinery - 6.0% | | | | | |
†Res-Care a, c | | 65,460 | | | 1,309,200 | | Baldor Electric | | 62,900 | | | 1,968,141 |
| | | | |
| | Coherent a, c | | 243,500 | | | 8,213,255 |
| | | | | | 20,093,326 | | Exco Technologies | | 91,000 | | | 285,317 |
| | | | |
| | Federal Signal | | 58,600 | | | 887,204 |
| Medical Products and Devices - 2.3% | | | | | | | Franklin Electric | | 84,200 | | | 4,348,088 |
Allied Healthcare Products a | | 197,700 | | | 1,146,660 | | Graco | | 96,825 | | | 4,452,013 |
Arrow International | | 195,728 | | | 6,433,579 | | Hardinge | | 278,893 | | | 4,308,897 |
ArthroCare Corporation a, c | | 10,000 | | | 420,100 | | IDEX Corporation | | 36,000 | | | 1,699,200 |
Bruker BioSciences a | | 370,200 | | | 1,984,272 | | Intermec a, c | | 3,000 | | | 68,820 |
CONMED Corporation a, c | | 81,500 | | | 1,687,050 | | Lincoln Electric Holdings | | 228,680 | | | 14,326,802 |
IDEXX Laboratories a, c | | 79,000 | | | 5,935,270 | | Nordson Corporation | | 172,200 | | | 8,468,796 |
Invacare Corporation | | 103,100 | | | 2,565,128 | | PAXAR Corporation a, c | | 267,500 | | | 5,502,475 |
Novoste Corporation a | | 16,625 | | | 44,056 | | Rofin-Sinar Technologies a | | 128,000 | | | 7,356,160 |
STERIS Corporation | | 98,600 | | | 2,253,996 | | †Williams Controls a | | 37,500 | | | 450,000 |
Young Innovations | | 62,550 | | | 2,203,636 | | Woodward Governor Company | | 154,800 | | | 4,722,948 |
Zoll Medical a, c | | 20,200 | | | 661,752 | | | | | |
|
| | | | |
| | | | | | | 67,058,116 |
| | | | | | 25,335,499 | | | | | |
|
| | | | |
| | Metal Fabrication and Distribution - 2.5% | | | | | |
| Personal Care - 0.3% | | | | | | | Commercial Metals Company | | 36,600 | | | 940,620 |
Helen of Troy a, c | | 81,600 | | | 1,501,440 | | CompX International Cl. A | | 292,300 | | | 5,232,170 |
Nutraceutical International a | | 22,800 | | | 349,524 | | Gerdau Ameristeel | | 61,100 | | | 613,444 |
USANA Health Sciences a, c | | 38,900 | | | 1,474,310 | | Harris Steel Group | | 100,000 | | | 2,530,682 |
| | | | |
| | IPSCO | | 14,500 | | | 1,387,505 |
| | | | | | 3,325,274 | | Kaydon Corporation | | 208,700 | | | 7,786,597 |
| | | | |
| | NN | | 127,100 | | | 1,569,685 |
| Total (Cost $59,740,646) | | | | | 82,387,525 | | Novamerican Steel a | | 10,800 | | | 437,076 |
| | | | |
| | Oregon Steel Mills a | | 107,100 | | | 5,425,686 |
| Industrial Products – 18.0% | | | | | | | Reliance Steel & Aluminum | | 12,960 | | | 1,075,032 |
| Automotive - 0.6% | | | | | | | Schnitzer Steel Industries Cl. A | | 34,000 | | | 1,206,320 |
IMPCO Technologies a | | 45,000 | | | 480,150 | | | | | |
|
LKQ Corporation a, c | | 256,000 | | | 4,864,000 | | | | | | | 28,204,817 |
Quantam Fuel Systems Technologies | | | | | | | | | | |
|
Worldwide a, c | | 15,500 | | | 52,700 | | Paper and Packaging - 0.1% | | | | | |
Superior Industries International | | 52,000 | | | 951,080 | | Peak International a, c | | 408,400 | | | 1,266,040 |
| | | | |
| | | | | |
|
| | | | | | 6,347,930 | | Specialty Chemicals and Materials - 1.9% | | | | | |
| | | | |
| | Aceto Corporation | | 78,410 | | | 542,597 |
| Building Systems and Components - 1.1% | | | | | | | Bairnco Corporation | | 43,000 | | | 504,390 |
Decker Manufacturing | | 6,022 | | | 219,803 | | Balchem Corporation | | 11,250 | | | 253,125 |
Preformed Line Products Company | | 91,600 | | | 3,471,640 | | CFC International a | | 74,200 | | | 1,219,848 |
Simpson Manufacturing | | 250,800 | | | 9,041,340 | | Cabot Corporation | | 102,300 | | | 3,531,396 |
| | | | |
| | Hawkins | | 206,878 | | | 2,897,326 |
| | | | | | 12,732,783 | | Lydall a, c | | 35,500 | | | 327,310 |
| | | | |
| | MacDermid | | 264,131 | | | 7,606,973 |
| Construction Materials - 1.8% | | | | | | | Schulman (A.) | | 143,100 | | | 3,275,559 |
Ash Grove Cement Company Cl. B | | 50,518 | | | 10,002,564 | | Sensient Technologies | | 22,000 | | | 460,020 |
ElkCorp | | 2,000 | | | 55,540 | | | | | |
|
Florida Rock Industries | | 85,175 | | | 4,230,642 | | | | | | | 20,618,544 |
Heywood Williams Group a | | 958,837 | | | 1,533,716 | | | | | |
|
Synalloy Corporation a, b | | 345,000 | | | 4,443,600 | | Textiles - 0.1% | | | | | |
| | | | |
| | Unifi a, c | | 165,100 | | | 478,790 |
| | | | | | 20,266,062 | | | | | |
|
| | | | |
| | Other Industrial Products - 2.5% | | | | | |
| Industrial Components - 1.4% | | | | | | | Brady Corporation Cl. A | | 248,800 | | | 9,165,792 |
Barnes Group | | 4,000 | | | 79,800 | | Diebold | | 85,000 | | | 3,452,700 |
Bel Fuse Cl. A | | 2,000 | | | 54,300 | | Distributed Energy Systems a | | 32,000 | | | 165,440 |
C & D Technologies c | | 345,700 | | | 2,599,664 | | Kimball International Cl. B | | 437,380 | | | 8,620,760 |
CLARCOR | | 83,500 | | | 2,487,465 | | Maxwell Technologies a | | 21,500 | | | 422,045 |
Donaldson Company | | 92,800 | | | 3,143,136 | | Myers Industries | | 30,499 | | | 524,278 |
GrafTech International a | | 64,790 | | | 375,782 | | | | | | | |
| | | | | | | | | | | | | |
22 | 2006 SEMIANNUAL REPORT TO STOCKHOLDERS | THE ACCOMPANYING NOTES ARE AN INTEGRAL PART OF THESE FINANCIAL STATEMENTS. |
JUNE 30, 2006 (Unaudited)
|
| | | | | | | | | | | | | | | | |
| | | | | | | | | | | | | | | | |
|
| |
|
| | | | | | | | | | | | | | | | |
| | | SHARES | | | VALUE | | | | SHARES | | | VALUE |
| |
| Industrial Products (continued) | | | | | | | Strategic Distribution a | | 115,000 | | $ | 1,610,000 |
| Other Industrial Products (continued) | | | | | | | | | | |
|
Peerless Manufacturing a, b | | 158,600 | | $ | 3,798,470 | | | | | | | 23,895,532 |
Solar Integrated Technologies a | | 75,000 | | | 126,901 | | | | | |
|
†Waters Corporation a, c | | 25,990 | | | 1,153,956 | | Printing - 0.1% | | | | | |
| | | | |
| | Bowne & Co. | | 68,100 | | | 973,830 |
| | | | | | 27,430,342 | | | | | |
|
| | | | |
| | Transportation and Logistics - 4.6% | | | | | |
| Total (Cost $105,829,978) | | | | | 199,468,253 | | Alexander & Baldwin | | 60,000 | | | 2,656,200 |
| | | | |
| | Arkansas Best | | 1,200 | | | 60,252 |
| Industrial Services – 14.1% | | | | | | | Atlas Air Worldwide Holdings a, c | | 17,000 | | | 833,680 |
| Advertising and Publishing - 0.6% | | | | | | | C. H. Robinson Worldwide | | 80,000 | | | 4,264,000 |
Interpublic Group of Companies a, c | | 510,000 | | | 4,258,500 | | Continental Airlines Cl. B a, c | | 100,000 | | | 2,980,000 |
Lamar Advertising Company Cl. A a, c | | 24,000 | | | 1,292,640 | | EGL a, c | | 123,125 | | | 6,180,875 |
MDC Partners Cl. A a | | 60,000 | | | 491,400 | | Forward Air | | 234,750 | | | 9,561,367 |
ValueClick a, c | | 45,000 | | | 690,750 | | Frozen Food Express Industries a, c | | 286,635 | | | 3,158,718 |
| | | | |
| | Grupo Aeroportuario del Sureste ADR | | 36,900 | | | 1,239,471 |
| | | | | | 6,733,290 | | Hub Group Cl. A a | | 174,400 | | | 4,278,032 |
| | | | |
| | Landstar System | | 11,200 | | | 528,976 |
| Commercial Services - 4.5% | | | | | | | Patriot Transportation Holding a | | 96,300 | | | 8,356,914 |
ABM Industries | | 134,800 | | | 2,305,080 | | Railpower Technologies a | | 67,000 | | | 144,047 |
Allied Waste Industries a | | 188,800 | | | 2,144,768 | | UTI Worldwide | | 105,000 | | | 2,649,150 |
Anacomp Cl. A a | | 26,000 | | | 269,100 | | Universal Truckload Services a | | 115,100 | | | 3,928,363 |
BB Holdings a | | 194,900 | | | 738,839 | | | | | |
|
Bennett Environmental a | | 20,900 | | | 59,774 | | | | | | | 50,820,045 |
Central Parking | | 18,300 | | | 292,800 | | | | | |
|
Convergys Corporation a | | 121,000 | | | 2,359,500 | | Other Industrial Services - 0.5% | | | | | |
Copart a, c | | 158,100 | | | 3,882,936 | | Landauer | | 117,900 | | | 5,647,410 |
First Advantage Cl. A a, c | | 5,000 | | | 116,300 | | | | | |
|
Global Imaging Systems a, c | | 50,000 | | | 2,064,000 | | Total (Cost $85,506,325) | | | | | 155,665,543 |
Hewitt Associates Cl. A a, c | | 164,620 | | | 3,700,658 | | | | | |
|
Iron Mountain a, c | | 156,175 | | | 5,837,821 | | Natural Resources – 9.8% | | | | | |
Learning Tree International a, c | | 53,400 | | | 468,318 | | Energy Services - 3.4% | | | | | |
MPS Group a | | 564,600 | | | 8,502,876 | | Atwood Oceanics a, c | | 29,400 | | | 1,458,240 |
Manpower | | 105,800 | | | 6,834,680 | | Carbo Ceramics | | 148,400 | | | 7,290,892 |
New Horizons Worldwide a | | 228,600 | | | 160,020 | | Core Laboratories a | | 10,000 | | | 610,400 |
RHJ International a | | 157,500 | | | 3,340,048 | | Environmental Power a, c | | 326,000 | | | 2,135,300 |
RemedyTemp Cl. A a | | 160,700 | | | 2,730,293 | | Global Industries a, c | | 54,500 | | | 910,150 |
Renaissance Learning | | 15,000 | | | 203,250 | | Hanover Compressor Company a, c | | 260,000 | | | 4,882,800 |
Rollins | | 130,500 | | | 2,563,020 | | Helmerich & Payne | | 40,300 | | | 2,428,478 |
Spherion Corporation a, c | | 53,000 | | | 483,360 | | Input/Output a | | 544,100 | | | 5,141,745 |
TRC Companies a | | 3,600 | | | 37,908 | | TETRA Technologies a, c | | 68,000 | | | 2,059,720 |
Viad Corporation | | 9,025 | | | 282,482 | | Universal Compression Holdings a, c | | 105,000 | | | 6,611,850 |
Wright Express a, c | | 30,000 | | | 862,200 | | Willbros Group a, c | | 207,600 | | | 3,931,944 |
| | | | |
| | | | | |
|
| | | | | | 50,240,031 | | | | | | | 37,461,519 |
| | | | |
| | | | | |
|
| Engineering and Construction - 1.1% | | | | | | | Oil and Gas - 3.0% | | | | | |
Dycom Industries a | | 47,700 | | | 1,015,533 | | Bill Barrett a, c | | 50,000 | | | 1,480,500 |
Fleetwood Enterprises a | | 234,300 | | | 1,766,622 | | †Carrizo Oil & Gas a, c | | 41,700 | | | 1,305,627 |
Insituform Technologies Cl. A a, c | | 174,300 | | | 3,989,727 | | Cimarex Energy | | 193,990 | | | 8,341,570 |
Washington Group International a | | 100,000 | | | 5,334,000 | | †FX Energy a, c | | 20,000 | | | 92,400 |
| | | | |
| | Falcon Oil & Gas a | | 360,000 | | | 1,238,377 |
| | | | | | 12,105,882 | | †Hornbeck Offshore Services a, c | | 33,000 | | | 1,172,160 |
| | | | |
| | Particle Drilling Technologies a, c | | 61,500 | | | 216,480 |
| Food and Tobacco Processors - 0.5% | | | | | | | Penn Virginia | | 16,440 | | | 1,148,827 |
American Italian Pasta Company Cl. A a | | 10,000 | | | 85,600 | | Pioneer Drilling Company a, c | | 1,800 | | | 27,792 |
MGP Ingredients | | 127,400 | | | 2,958,228 | | Remington Oil & Gas a | | 78,500 | | | 3,451,645 |
Performance Food Group a, c | | 10,000 | | | 303,800 | | SEACOR Holdings a, c | | 153,500 | | | 12,602,350 |
Seneca Foods Cl. A a | | 69,600 | | | 1,598,712 | | †Storm Cat Energy a, c | | 330,800 | | | 744,300 |
Seneca Foods Cl. B a | | 13,251 | | | 303,183 | | W &T Offshore | | 25,000 | | | 972,250 |
| | | | |
| | | | | |
|
| | | | | | 5,249,523 | | | | | | | 32,794,278 |
| | | | |
| | | | | |
|
| Industrial Distribution - 2.2% | | | | | | | Precious Metals and Mining - 2.7% | | | | | |
Central Steel & Wire | | 7,662 | | | 4,827,060 | | Agnico-Eagle Mines | | 34,000 | | | 1,124,720 |
MSC Industrial Direct Company Cl. A | | 20,000 | | | 951,400 | | Bema Gold a, c | | 248,000 | | | 1,244,960 |
Ritchie Bros. Auctioneers | | 310,400 | | | 16,507,072 | | Cambior a | | 311,000 | | | 836,590 |
| | | | | | | | Constellation Copper a | | 186,900 | | | 425,267 |
| THE ACCOMPANYING NOTES ARE AN INTEGRAL PART OF THESE FINANCIAL STATEMENTS. |
2006 SEMIANNUAL REPORT TO STOCKHOLDERS | 23 |
ROYCE VALUE TRUST
|
| | | | | | | | | | | | | | | | |
| | | | | | | | | | | | | | | | |
|
Schedule of Investments |
|
| | | | | | | | | | | | | | | | |
| | | SHARES | | | VALUE | | | | SHARES | | | VALUE |
| |
| Natural Resources (continued) | | | | | | | Power-One a, c | | 10,000 | | $ | 66,000 |
| Precious Metals and Mining (continued) | | | | | | | REMEC a | | 143,387 | | | 157,726 |
Entree Gold a | | 90,000 | | $ | 86,400 | | Radiant Systems a, c | | 32,500 | | | 343,525 |
Etruscan Resources a | | 675,900 | | | 2,028,366 | | Richardson Electronics | | 237,700 | | | 1,747,095 |
Gammon Lake Resources a | | 188,300 | | | 2,596,657 | | SafeNet a, c | | 36,240 | | | 642,173 |
Glamis Gold a | | 212,480 | | | 8,044,493 | | Symbol Technologies | | 99,389 | | | 1,072,407 |
Golden Star Resources a | | 135,000 | | | 399,600 | | TTM Technologies a, c | | 221,400 | | | 3,203,658 |
Hecla Mining Company a, c | | 598,000 | | | 3,139,500 | | Technitrol | | 311,200 | | | 7,204,280 |
IAMGOLD Corporation | | 170,000 | | | 1,513,000 | | Tektronix | | 159,680 | | | 4,697,786 |
Ivanhoe Mines a, c | | 140,000 | | | 954,800 | | UQM Technologies a, c | | 50,000 | | | 145,000 |
Meridian Gold a, c | | 111,000 | | | 3,516,480 | | Vishay Intertechnology a, c | | 186,000 | | | 2,925,780 |
Miramar Mining a, c | | 245,000 | | | 906,500 | | Zebra Technologies Cl. A a | | 76,525 | | | 2,614,094 |
Pan American Silver a, c | | 41,000 | | | 737,590 | | | | | |
|
QGX a | | 30,000 | | | 53,211 | | | | | | | 77,070,317 |
Randgold Resources ADR a | | 53,000 | | | 1,113,000 | | | | | |
|
Stillwater Mining Company a, c | | 10,780 | | | 136,690 | | Distribution - 1.6% | | | | | |
Yamana Gold a, c | | 80,000 | | | 789,600 | | Agilysys | | 165,125 | | | 2,972,250 |
| | | | |
| | Anixter International a | | 61,795 | | | 2,932,791 |
| | | | | | 29,647,424 | | Benchmark Electronics a, c | | 208,200 | | | 5,021,784 |
| | | | |
| | Solectron Corporation a | | 1,170,100 | | | 4,001,742 |
| Real Estate - 0.6% | | | | | | | Tech Data a, c | | 86,500 | | | 3,313,815 |
Alico | | 27,000 | | | 1,487,970 | | | | | |
|
Consolidated-Tomoka Land | | 13,564 | | | 747,919 | | | | | | | 18,242,382 |
The St. Joe Company | | 53,100 | | | 2,471,274 | | | | | |
|
Trammell Crow Company a, c | | 46,500 | | | 1,635,405 | | Internet Software and Services - 1.5% | | | | | |
| | | | |
| | Arbinet-thexchange a, c | | 87,200 | | | 489,192 |
| | | | | | 6,342,568 | | CMGI a, c | | 1,305,000 | | | 1,579,050 |
| | | | |
| | CNET Networks a, c | | 155,400 | | | 1,240,092 |
| Other Natural Resources - 0.1% | | | | | | | CryptoLogic | | 137,000 | | | 3,318,140 |
PICO Holdings a | | 55,200 | | | 1,780,200 | | CyberSource Corporation a, c | | 10,000 | | | 117,000 |
| | | | |
| | EarthLink a, c | | 55,200 | | | 478,032 |
| Total (Cost $57,119,311) | | | | | 108,025,989 | | eResearch Technology a, c | | 121,000 | | | 1,101,100 |
| | | | |
| | Internap Network Services a | | 1,448,900 | | | 1,521,345 |
| Technology – 21.6% | | | | | | | Internet Security Systems a, c | | 40,000 | | | 754,000 |
| Aerospace and Defense - 0.6% | | | | | | | †j2 Global Communications a, c | | 43,420 | | | 1,355,572 |
Allied Defense Group (The) a | | 45,700 | | | 1,004,943 | | Lionbridge Technologies a | | 37,500 | | | 207,375 |
Armor Holdings a, c | | 11,410 | | | 625,610 | | RSA Security a | | 14,000 | | | 380,660 |
Astronics Corporation a | | 52,400 | | | 701,112 | | RealNetworks a, c | | 245,400 | | | 2,625,780 |
Axsys Technologies a | | 10,000 | | | 150,700 | | S1 Corporation a | | 20,000 | | | 96,000 |
Ducommun a | | 117,200 | | | 2,170,544 | | SupportSoft a | | 220,000 | | | 866,800 |
Hexcel Corporation a | | 47,500 | | | 746,225 | | | | | |
|
Integral Systems | | 49,800 | | | 1,336,134 | | | | | | | 16,130,138 |
| | | | |
| | | | | |
|
| | | | | | 6,735,268 | | IT Services - 3.8% | | | | | |
| | | | |
| | answerthink a | | 655,000 | | | 2,639,650 |
| Components and Systems - 7.0% | | | | | | | BearingPoint a, c | | 788,800 | | | 6,602,256 |
Adaptec a, c | | 167,000 | | | 724,780 | | Black Box | | 47,000 | | | 1,801,510 |
American Power Conversion | | 151,200 | | | 2,946,888 | | CACI International Cl. A a, c | | 10,000 | | | 583,300 |
Analogic Corporation | | 40,135 | | | 1,870,692 | | CIBER a, c | | 10,000 | | | 65,900 |
Belden CDT | | 57,800 | | | 1,910,290 | | Cogent Communications Group a, c | | 226,900 | | | 2,126,053 |
Checkpoint Systems a | | 56,060 | | | 1,245,092 | | Computer Task Group a | | 101,100 | | | 505,500 |
Dionex Corporation a | | 81,000 | | | 4,427,460 | | Covansys Corporation a, c | | 238,900 | | | 3,002,973 |
Electronics for Imaging a, c | | 25,000 | | | 522,000 | | DiamondCluster International a | | 80,400 | | | 636,768 |
Energy Conversion Devices a, c | | 105,500 | | | 3,843,365 | | Forrester Research a | | 40,300 | | | 1,127,594 |
Excel Technology a | | 168,500 | | | 5,041,520 | | Gartner a | | 126,000 | | | 1,789,200 |
Hutchinson Technology a, c | | 47,500 | | | 1,027,425 | | Keane a | | 468,000 | | | 5,850,000 |
Imation Corporation | | 15,700 | | | 644,485 | | MAXIMUS | | 127,900 | | | 2,960,885 |
InFocus Corporation a | | 228,100 | | | 652,366 | | Perot Systems Cl. A a, c | | 165,100 | | | 2,390,648 |
KEMET Corporation a | | 95,600 | | | 881,432 | | Sapient Corporation a, c | | 806,602 | | | 4,274,991 |
Kronos a, c | | 38,775 | | | 1,404,043 | | Syntel | | 152,679 | | | 3,123,812 |
Methode Electronics | | 50,000 | | | 525,500 | | TriZetto Group (The) a, c | | 215,200 | | | 3,182,808 |
Metrologic Instruments a, c | | 15,000 | | | 225,150 | | | | | |
|
Newport Corporation a, c | | 592,200 | | | 9,546,264 | | | | | | | 42,663,848 |
On Track Innovations a, c | | 40,000 | | | 466,800 | | | | | |
|
Perceptron a | | 397,400 | | | 3,203,044 | | Semiconductors and Equipment - 2.2% | | | | | |
Plexus Corporation a, c | | 325,700 | | | 11,142,197 | | BE Semiconductor Industries a, c | | 58,000 | | | 330,020 |
| | | | | | | | Brooks Automation a, c | | 28,500 | | | 336,300 |
24 | 2006 SEMIANNUAL REPORT TO STOCKHOLDERS | THE ACCOMPANYING NOTES ARE AN INTEGRAL PART OF THESE FINANCIAL STATEMENTS. |
JUNE 30, 2006 (Unaudited)
|
| | | | | | | | | | | | | | | | |
| | | | | | | | | | | | | | | | |
|
| |
|
| | | | | | | | | | | | | | | | |
| | | SHARES | | | VALUE | | | | SHARES | | | VALUE |
| |
| Technology (continued) | | | | | | | IDT Corporation Cl. B a, c | | 65,000 | | $ | 896,350 |
| Semiconductors and Equipment (continued) | | | | | | | Level 3 Communications a, c | | 400,000 | | | 1,776,000 |
Cabot Microelectronics a | | 131,200 | | $ | 3,976,672 | | PECO II a, c | | 93,600 | | | 173,160 |
Catalyst Semiconductor a | | 200 | | | 726 | | Time Warner Telecom Cl. A a, c | | 179,000 | | | 2,658,150 |
CEVA a | | 31,666 | | | 183,029 | | Tollgrade Communications a, c | | 20,000 | | | 194,000 |
Cognex Corporation | | 55,300 | | | 1,439,459 | | USA Mobility c | | 97,500 | | | 1,618,500 |
Conexant Systems a, c | | 11,980 | | | 29,950 | | †Vonage Holdings a, c | | 100,000 | | | 859,000 |
Credence Systems a, c | | 53,600 | | | 187,600 | | Yak Communications a | | 20,000 | | | 59,400 |
DSP Group a, c | | 115,000 | | | 2,857,750 | | | | | |
|
DTS a, c | | 64,100 | | | 1,248,668 | | | | | | | 17,214,989 |
Dolby Laboratories Cl. A a | | 83,900 | | | 1,954,870 | | | | | |
|
Exar Corporation a, c | | 181,976 | | | 2,414,821 | | Total (Cost $175,467,409) | | | | | 239,429,703 |
Fairchild Semiconductor International a, c | | 51,200 | | | 930,304 | | | | | |
|
International Rectifier a | | 20,000 | | | 781,600 | | Utilities – 0.2% | | | | | |
Intevac a, c | | 57,450 | | | 1,245,516 | | CH Energy Group | | 44,500 | | | 2,136,000 |
†IXYS Corporation a, c | | 10,000 | | | 96,000 | | Southern Union | | 11,576 | | | 313,246 |
Kulicke & Soffa Industries a, c | | 105,800 | | | 783,978 | | | | | |
|
MEMC Electronic Materials a | | 2,000 | | | 75,000 | | Total (Cost $2,127,413) | | | | | 2,449,246 |
Novellus Systems a, c | | 12,000 | | | 296,400 | | | | | |
|
Pericom Semiconductor a, c | | 58,000 | | | 481,400 | | Miscellaneous(e)– 1.6% | | | | | |
Power Integrations a, c | | 49,000 | | | 856,520 | | Total (Cost $18,109,257) | | | | | 18,222,245 |
Sanmina-SCI Corporation a | | 100,000 | | | 460,000 | | | | | |
|
Semitool a, c | | 50,000 | | | 451,000 | | TOTAL COMMON STOCKS | | | | | |
Staktek Holdings a | | 184,700 | | | 897,642 | | (Cost $704,539,609) | | | | | 1,100,775,245 |
Veeco Instruments a, c | | 65,000 | | | 1,549,600 | | | | | |
|
| | | | |
| | PREFERRED STOCKS – 0.2% | | | | | |
| | | | | | 23,864,825 | | Aristotle Corporation 11.00% Conv. | | 4,800 | | | 39,024 |
| | | | |
| | Seneca Foods Conv. a | | 300 | | | 6,300 |
| Software - 3.4% | | | | | | | Seneca Foods Conv. a, d | | 85,000 | | | 1,757,205 |
Advent Software a | | 116,800 | | | 4,212,976 | | | | | |
|
ANSYS a, c | | 20,000 | | | 956,400 | | TOTAL PREFERRED STOCKS | | | | | |
Aspen Technology a | | 27,100 | | | 355,552 | | (Cost $1,316,015) | | | | | 1,802,529 |
†Avid Technology a, c | | 20,000 | | | 666,600 | | | | | |
|
†BEA Systems a, c | | 65,610 | | | 858,835 | | | | PRINCIPAL | | | |
†Borland Software a, c | | 240,000 | | | 1,267,200 | | | | AMOUNT | | | |
†Epicor Software a, c | | 79,900 | | | 841,347 | | CORPORATE BONDS – 0.1% | | | | | |
iPass a, c | | 268,400 | | | 1,503,040 | | Dixie Group 7.00% | | | | | |
JDA Software Group a, c | | 99,900 | | | 1,401,597 | | Conv. Sub. Deb. due 5/15/12 | $ | 397,000 | | | 373,180 |
MRO Software a, c | | 46,000 | | | 923,220 | | | | | |
|
ManTech International Cl. A a, c | | 119,400 | | | 3,684,684 | | TOTAL CORPORATE BONDS | | | | | |
Manugistics Group a | | 49,200 | | | 123,000 | | (Cost $321,402) | | | | | 373,180 |
NAVTEQ Corporation a, c | | 20,000 | | | 893,600 | | | | | |
|
†NetIQ Corporation a, c | | 60,000 | | | 731,400 | | REPURCHASE AGREEMENTS – 20.6% | | | | | |
PLATO Learning a | | 149,642 | | | 930,773 | | State Street Bank & Trust Company, | | | | | |
Progress Software a, c | | 30,500 | | | 714,005 | | 5.10% dated 6/30/06, due 7/3/06, | | | | | |
SPSS a | | 179,600 | | | 5,772,344 | | maturity value $103,601,012 (collateralized | | | | | |
Sybase a, c | | 82,600 | | | 1,602,440 | | by obligations of various U.S. Government | | | | | |
†THQ a, c | | 20,000 | | | 432,000 | | Agencies, valued at $106,146,600) | | | | | |
Transaction Systems Architects Cl. A a, c | | 203,150 | | | 8,469,323 | | (Cost $103,557,000) | | | | | 103,557,000 |
Verint Systems a, c | | 40,000 | | | 1,167,600 | | | | | |
|
| | | | |
| | Lehman Brothers (Tri-Party), | | | | | |
| | | | | | 37,507,936 | | 4.85% dated 6/30/06, due 7/3/06, | | | | | |
| | | | |
| | maturity value $125,050,521 (collateralized | | | | | |
| Telecommunications - 1.5% | | | | | | | by obligations of various U.S. Government | | | | | |
ADTRAN | | 65,000 | | | 1,457,950 | | Agencies, valued at $127,555,538) | | | | | |
Broadwing Corporation a | | 1,000 | | | 10,350 | | (Cost $125,000,000) | | | | | 125,000,000 |
Catapult Communications a, c | | 87,100 | | | 949,390 | | | | | |
|
Covad Communications Group a, c | | 35,000 | | | 70,350 | | TOTAL REPURCHASE AGREEMENTS | | | | | |
Foundry Networks a, c | | 373,400 | | | 3,980,444 | | (Cost $228,557,000) | | | | | 228,557,000 |
Globecomm Systems a, c | | 233,700 | | | 1,741,065 | | | | | |
|
IDT Corporation a | | 58,400 | | | 770,880 | | | | | | | |
| THE ACCOMPANYING NOTES ARE AN INTEGRAL PART OF THESE FINANCIAL STATEMENTS. |
2006 SEMIANNUAL REPORT TO STOCKHOLDERS | 25 |
ROYCE VALUE TRUST |
JUNE 30, 2006 (Unaudited) |
|
| | | | | | | | | | | | | | | | |
| | | | | | | | | | | | | | | | |
|
Schedule of Investments |
|
| | | | | | | | | | | | | | | | |
| | | PRINCIPAL AMOUNT | | | VALUE | |
| COLLATERAL RECEIVED FOR SECURITIES | | | | | | |
LOANED – 11.3% | | | | | | |
| U.S. Treasury Bonds | | | | | | |
6.00%-7.125% | | | | | | |
due 8/15/22-2/15/26 | $ | 25,585 | | $ | 28,143 | |
| U.S. Treasury Notes | | | | | | |
4.00% due 11/15/12 | | 19,272 | | | 18,148 | |
| U.S. Treasury Strip-Interest | | | | | | |
due 11/15/18 | | 11,997 | | | 6,209 | |
| Money Market Funds | | | | | | |
State Street Navigator Securities Lending | | | | | | |
Prime Portfolio (7 day yield-5.0651%) | | | | | 125,736,199 | |
| | | | |
| |
| TOTAL COLLATERAL RECEIVED FOR | | | | | | |
SECURITIES LOANED | | | | | | |
(Cost $125,788,699) | | | | | 125,788,699 | |
| | | | |
| |
| TOTAL INVESTMENTS – 131.6% | | | | | | |
(Cost $1,060,522,725) | | | | | 1,457,296,653 | |
| | | | | | | |
| LIABILITIES LESS CASH | | | | | | |
AND OTHER ASSETS – (11.7)% | | | | | (129,709,286 | ) |
| | | | | | | |
| PREFERRED STOCK – (19.9)% | | | | | (220,000,000 | ) |
| | | | |
| |
| NET ASSETS APPLICABLE TO | | | | | | |
COMMON STOCKHOLDERS – 100.0% | | | | $ | 1,107,587,367 | |
| | | | |
| |
|
| a | | Non-income producing. |
| b | | At June 30, 2006, the Fund owned 5% or more of the Company’s outstanding voting securities thereby making the Company an Affiliated Company as that term is defined in the Investment Company Act of 1940. |
| c | | A portion of these securities were on loan at June 30, 2006. |
| d | | A security for which market quotations are no longer readily available represents 0.2% of net assets. This security has been valued at its fair value under procedures established by the Fund’s Board of Directors. |
| e | | Includes securities first acquired in 2006 and less than 1% of net assets applicable to Common Stockholders. |
| † | | New additions in 2006. |
| | | |
| | | Bold indicates the Fund’s largest 20 equity holdings in terms of June 30, 2006 market value. |
| | | |
| INCOME TAX INFORMATION: The cost of total investments for Federal income tax purposes was $1,062,163,481. At June 30, 2006, net unrealized appreciation for all securities was $395,133,172, consisting of aggregate gross unrealized appreciation of $436,662,692 and aggregate gross unrealized depreciation of $41,529,520. The primary differences in book and tax basis cost is the timing of the recognition of losses on securities sold. |
|
| 26 | 2006 SEMIANNUAL REPORT TO STOCKHOLDERS | THE ACCOMPANYING NOTES ARE AN INTEGRAL PART OF THESE FINANCIAL STATEMENTS. |
ROYCE VALUE TRUST |
JUNE 30, 2006 (Unaudited) |
|
| | | | | | | | | | | | | | | | |
| | | | | | | | | | | | | | | | |
|
Statement of Assets and Liabilities |
|
| | | | | | | | | | | | | | | | |
| ASSETS: | | | | | | | | |
| Investments at value (including collateral on loaned securities) * | | | | | | | | |
Non-Affiliates (cost $829,348,057) | | | | | | $ | 1,220,497,583 | |
Affiliated Companies (cost $2,617,668) | | | | | | | 8,242,070 | |
|
| Total investments at value | | | | | | | 1,228,739,653 | |
| Repurchase agreements (at cost and value) | | | | | | | 228,557,000 | |
| Cash | | | | | | | 11,119 | |
| Receivable for investments sold | | | | | | | 142,437 | |
| Receivable for dividends and interest | | | | | | | 975,158 | |
|
Total Assets | | | | | | | 1,458,425,367 | |
|
| LIABILITIES: | | | | | | | | |
| Payable for collateral on loaned securities | | | | | | | 125,788,699 | |
| Payable for investments purchased | | | | | | | 3,441,345 | |
| Payable for investment advisory fee | | | | | | | 932,681 | |
| Preferred dividends accrued but not yet declared | | | | | | | 288,452 | |
| Accrued expenses | | | | | | | 386,823 | |
|
Total Liabilities | | | | | | | 130,838,000 | |
|
| PREFERRED STOCK: | | | | | | | | |
| 5.90% Cumulative Preferred Stock - $0.001 par value, $25 liquidation value per share; 8,800,000 shares outstanding | | | | | | | 220,000,000 | |
|
Total Preferred Stock | | | | | | | 220,000,000 | |
|
| NET ASSETS APPLICABLE TO COMMON STOCKHOLDERS | | | | | | $ | 1,107,587,367 | |
|
| ANALYSIS OF NET ASSETS APPLICABLE TO COMMON STOCKHOLDERS: | | | | | | | | |
| Common Stock paid-in capital - $0.001 par value per share; 55,920,647 shares outstanding (150,000,000 shares authorized) | | | | | | $ | 687,492,004 | |
| Undistributed net investment income (loss) | | | | | | | 3,405,424 | |
| Accumulated net realized gain (loss) on investments | | | | | | | 72,897,346 | |
| Net unrealized appreciation (depreciation) on investments | | | | | | | 396,773,928 | |
| Quarterly and accrued distributions | | | | | | | (52,981,335 | ) |
|
Net Assets applicable to Common Stockholders (net asset value per share - $19.81) | | | | | | $ | 1,107,587,367 | |
|
| *Investments at identified cost (including $125,788,699 of collateral on loaned securities) | | | | | | $ | 831,965,725 | |
|
| Market value of loaned securities | | | | | | $ | 122,676,304 | |
|
| THE ACCOMPANYING NOTES ARE AN INTEGRAL PART OF THESE FINANCIAL STATEMENTS. |
2006 SEMIANNUAL REPORT TO STOCKHOLDERS | 27 |
ROYCE VALUE TRUST |
SIX MONTHS ENDED JUNE 30, 2006 (Unaudited) |
|
| | | | | | | | | | | | | | | | |
| | | | | | | | | | | | | | | | |
|
Statement of Opreations |
|
| | | | | | | | | | | | | | | | |
| INVESTMENT INCOME: | | | | | |
| Income: | | | | | |
Dividends | | | | | |
Non-Affiliates | | | $ | 5,051,854 | |
Interest | | | | 5,019,063 | |
Securities lending | | | | 233,214 | |
|
| Total income | | | | 10,304,131 | |
|
| Expenses: | | | | | |
Investment advisory fees | | | | 6,629,595 | |
Stockholder reports | | | | 227,291 | |
Custody and transfer agent fees | | | | 114,634 | |
Directors’ fees | | | | 63,736 | |
Administrative and office facilities expenses | | | | 51,734 | |
Professional fees | | | | 29,312 | |
Other expenses | | | | 107,647 | |
|
| Total expenses | | | | 7,223,949 | |
| Compensating balance credits | | | | (3,830 | ) |
|
| Net expenses | | | | 7,220,119 | |
|
| Net investment income (loss) | | | | 3,084,012 | |
|
| REALIZED AND UNREALIZED GAIN (LOSS) ON INVESTMENTS: | | | | | |
| Net realized gain (loss) on investments | | | | | |
Non-Affiliates | | | | 66,039,704 | |
| Net change in unrealized appreciation (depreciation) on investments | | | | 35,867,224 | |
|
| Net realized and unrealized gain (loss) on investments | | | | 101,906,928 | |
|
| NET INCREASE (DECREASE) IN NET ASSETS RESULTING FROM INVESTMENT OPERATIONS | | | | 104,990,940 | |
|
| DISTRIBUTIONS TO PREFERRED STOCKHOLDERS | | | | (6,490,000 | ) |
|
| NET INCREASE (DECREASE) IN NET ASSETS APPLICABLE TO COMMON STOCKHOLDERS | | | | | |
RESULTING FROM INVESTMENT OPERATIONS | | | $ | 98,500,940 | |
|
| 28 | 2006 SEMIANNUAL REPORT TO STOCKHOLDERS | THE ACCOMPANYING NOTES ARE AN INTEGRAL PART OF THESE FINANCIAL STATEMENTS. |
ROYCE VALUE TRUST |
|
| | | | | | | | | | | | | | | | |
| | | | | | | | | | | | | | | | |
|
Statement of Changes in Net Assets |
|
| | | | | | | | | | | | | | | | |
|
| | Six months ended
6/30/06
(unaudited) | | Year ended
12/31/05 |
|
| INVESTMENT OPERATIONS: | | | | | | | |
| Net investment income (loss) | $ | 3,084,012 | | | $ | 321,412 | |
| Net realized gain (loss) on investments | | 66,039,704 | | | | 99,178,811 | |
| Net change in unrealized appreciation (depreciation) on investments | | 35,867,224 | | | | (4,983,024 | ) |
|
| Net increase (decrease) in net assets resulting from investment operations | | 104,990,940 | | | | 94,517,199 | |
|
| DISTRIBUTIONS TO PREFERRED STOCKHOLDERS: | | | | | | | |
| Net realized gain on investments | | – | | | | (12,980,000 | ) |
| Quarterly distributions * | | (6,490,000 | ) | | | – | |
|
| Total distributions to Preferred Stockholders | | (6,490,000 | ) | | | (12,980,000 | ) |
|
| NET INCREASE (DECREASE) IN NET ASSETS APPLICABLE TO COMMON STOCKHOLDERS | | | | | | | |
RESULTING FROM INVESTMENT OPERATIONS | | 98,500,940 | | | | 81,537,199 | |
|
| DISTRIBUTIONS TO COMMON STOCKHOLDERS: | | | | | | | |
| Net realized gain on investments | | – | | | | (85,780,292 | ) |
| Quarterly distributions * | | (46,202,886 | ) | | | – | |
|
| Total distributions to Common Stockholders | | (46,202,886 | ) | | | (85,780,292 | ) |
|
| CAPITAL STOCK TRANSACTIONS: | | | | | | | |
| Reinvestment of distributions to Common Stockholders | | 23,169,227 | | | | 43,058,750 | |
|
| Total capital stock transactions | | 23,169,227 | | | | 43,058,750 | |
|
| NET INCREASE (DECREASE) IN NET ASSETS APPLICABLE TO COMMON STOCKHOLDERS | | 75,467,281 | | | | 38,815,657 | |
|
| NET ASSETS APPLICABLE TO COMMON STOCKHOLDERS: | | | | | | | |
Beginning of period | | 1,032,120,086 | | | | 993,304,429 | |
|
End of period (including undistributed net investment income of $3,405,424 at 6/30/06 | | | | | | | |
and $321,412 at 12/31/05) | $ | 1,107,587,367 | | | $ | 1,032,120,086 | |
|
| *To be allocated to net investment income and capital gains at year end. | | | | | | | |
| THE ACCOMPANYING NOTES ARE AN INTEGRAL PART OF THESE FINANCIAL STATEMENTS. |
2006 SEMIANNUAL REPORT TO STOCKHOLDERS | 29 |
ROYCE VALUE TRUST
This table is presented to show selected data for a share of Common Stock outstanding throughout each period, and to assist stockholders in evaluating the Fund’s performance for the periods presented.
| | | Six months ended | | | Years ended December 31, |
| | | June 30, 2006 | | |
|
| | | (unaudited) | | | 2005 | | | 2004 | | | 2003 | | | 2002 | | | 2001 |
|
| NET ASSET VALUE, BEGINNING OF PERIOD | | | $18.87 | | | | $18.95 | | | | $17.03 | | | | 13.22 | | | | $17.31 | | | | $16.56 | |
|
| INVESTMENT OPERATIONS: | | | | | | | | | | | | | | | | | | | | | | | | |
Net investment income (loss) | | | 0.06 | | | | 0.01 | | | | (0.08 | ) | | | (0.05 | ) | | | (0.02 | ) | | | 0.05 | |
Net realized and unrealized gain (loss) on investments | | | 1.84 | | | | 1.75 | | | | 3.81 | | | | 5.64 | | | | (2.25 | ) | | | 2.58 | |
|
Total investment operations | | | 1.90 | | | | 1.76 | | | | 3.73 | | | | 5.59 | | | | (2.27 | ) | | | 2.63 | |
|
| DISTRIBUTIONS TO PREFERRED STOCKHOLDERS: | | | | | | | | | | | | | | | | | | | | | | | | |
Net investment income | | | – | | | | – | | | | – | | | | – | | | | (0.01 | ) | | | (0.01 | ) |
Net realized gain on investments | | | – | | | | (0.24 | ) | | | (0.26 | ) | | | (0.26 | ) | | | (0.28 | ) | | | (0.30 | ) |
Quarterly distributions * | | | (0.12 | ) | | | – | | | | – | | | | – | | | | – | | | | – | |
|
Total distributions to Preferred Stockholders | | | (0.12 | ) | | | (0.24 | ) | | | (0.26 | ) | | | (0.26 | ) | | | (0.29 | ) | | | (0.31 | ) |
|
NET INCREASE (DECREASE) IN NET ASSETS APPLICABLE TO COMMON STOCKHOLDERS RESULTING FROM INVESTMENT OPERATIONS | | | 1.78 | | | | 1.52 | | | | 3.47 | | | | 5.33 | | | | (2.56 | ) | | | 2.32 | |
|
| DISTRIBUTIONS TO COMMON STOCKHOLDERS: | | | | | | | | | | | | | | | | | | | | | | | | |
Net investment income | | | – | | | | – | | | | – | | | | – | | | | (0.07 | ) | | | (0.05 | ) |
Net realized gain on investments | | | – | | | | (1.61 | ) | | | (1.55 | ) | | | (1.30 | ) | | | (1.44 | ) | | | (1.44 | ) |
Quarterly distributions * | | | (0.84 | ) | | | – | | | | – | | | | – | | | | – | | | | – | |
|
Total distributions to Common Stockholders | | | (0.84 | ) | | | (1.61 | ) | | | (1.55 | ) | | | (1.30 | ) | | | (1.51 | ) | | | (1.49 | ) |
|
| CAPITAL STOCK TRANSACTIONS: | | | | | | | | | | | | | | | | | | | | | | | | |
Effect of reinvestment of distributions by Common Stockholders | | | (0.00 | ) | | | 0.01 | | | | 0.00 | | | | (0.00 | ) | | | (0.02 | ) | | | (0.08 | ) |
Effect of rights offering and Preferred Stock offering | | | – | | | | – | | | | – | | | | (0.22 | ) | | | – | | | | – | |
|
Total capital stock transactions | | | (0.00 | ) | | | 0.01 | | | | 0.00 | | | | (0.22 | ) | | | (0.02 | ) | | | (0.08 | ) |
|
| NET ASSET VALUE, END OF PERIOD | | | $19.81 | | | | $18.87 | | | | $18.95 | | | | $17.03 | | | | $13.22 | | | | $17.31 | |
|
| MARKET VALUE, END OF PERIOD | | | $19.36 | | | | $20.08 | | | | $20.44 | | | | $17.21 | | | | $13.25 | | | | $15.72 | |
|
| TOTAL RETURN (a): | | | | | | | | | | | | | | | | | | | | | | | | |
| Market Value | | | 0.69 | % *** | | | 6.95 | % | | | 29.60 | % | | | 41.96 | % | | | (6.87 | )% | | | 20.03 | % |
| Net Asset Value | | | 9.64 | % *** | | | 8.41 | % | | | 21.42 | % | | | 40.80 | % | | | (15.61 | )% | | | 15.23 | % |
RATIOS BASED ON AVERAGE NET ASSETS APPLICABLE TO COMMON STOCKHOLDERS: | | | | | | | | | | | | | | | | | | | | | | | | |
| Total expenses ( b, c) | | | 1.30 | % ** | | | 1.49 | % | | | 1.51 | % | | | 1.49 | % | | | 1.72 | % | | | 1.61 | % |
Management fee expense (d) | | | 1.19 | % ** | | | 1.37 | % | | | 1.39 | % | | | 1.34 | % | | | 1.56 | % | | | 1.45 | % |
Other operating expenses | | | 0.11 | % ** | | | 0.12 | % | | | 0.12 | % | | | 0.15 | % | | | 0.16 | % | | | 0.16 | % |
| Net investment income (loss) | | | 0.55 | % ** | | | 0.03 | % | | | (0.50 | )% | | | (0.36 | )% | | | (0.09 | )% | | | 0.35 | % |
| SUPPLEMENTAL DATA: | | | | | | | | | | | | | | | | | | | | | | | | |
Net Assets Applicable to Common Stockholders, End of Period (in thousands) | | | $1,107,587 | | | | $1,032,120 | | | | $993,304 | | | | $850,773 | | | | $560,776 | | | | $689,141 | |
Liquidation Value of Preferred Stock, End of Period (in thousands) | | | $220,000 | | | | $220,000 | | | | $220,000 | | | | $220,000 | | | | $160,000 | | | | $160,000 | |
| Portfolio Turnover Rate | | | 8 | % | | | 31 | % | | | 30 | % | | | 23 | % | | | 35 | % | | | 30 | % |
| PREFERRED STOCK: | | | | | | | | | | | | | | | | | | | | | | | | |
| Total shares outstanding | | | 8,800,000 | | | | 8,800,000 | | | | 8,800,000 | | | | 8,800,000 | | | | 6,400,000 | | | | 6,400,000 | |
| Asset coverage per share | | | $150.86 | | | | $142.29 | | | | $137.88 | | | | $121.68 | | | | $112.62 | | | | $132.68 | |
| Liquidation preference per share | | | $25.00 | | | | $25.00 | | | | $25.00 | | | | $25.00 | | | | $25.00 | | | | $25.00 | |
| Average market value per share (e): | | | | | | | | | | | | | | | | | | | | | | | | |
5.90% Cumulative | | | $23.77 | | | | $24.75 | | | | $24.50 | | | | $25.04 | | | | – | | | | – | |
7.80% Cumulative | | | – | | | | – | | | | – | | | | $25.87 | | | | $26.37 | | | | $25.70 | |
7.30% Tax-Advantaged Cumulative | | | – | | | | – | | | | – | | | | $25.53 | | | | $25.82 | | | | $25.37 | |
|
| (a) | | The Market Value Total Return is calculated assuming a purchase of Common Stock on the opening of the first business day and a sale on the closing of the last business day of each period reported. Dividends and distributions, if any, are assumed for the purposes of this calculation to be reinvested at prices obtained under the Fund’s Distribution Reinvestment and Cash Purchase Plan. Net Asset Value Total Return is calculated on the same basis, except that the Fund’s net asset value is used on the purchase and sale dates instead of market value. |
| (b) | | Expense ratios based on total average net assets including liquidation value of Preferred Stock were 1.09%, 1.22%, 1.21%, 1.19%, 1.38% and 1.30% for the periods ended June 30, 2006 and December 31, 2005, 2004, 2003, 2002 and 2001, respectively. |
| (c) | | Expense ratios based on average net assets applicable to Common Stockholders before waiver of fees by the investment adviser would have been 1.62%, 1.82% and 1.65% for the periods ended December 31, 2003, 2002 and 2001, respectively. |
| (d) | | The management fee is calculated based on average net assets over a rolling 60-month basis, while the above ratios of Management fee expenses are based on average net assets applicable to Common Stockholders over an annualized six-month basis. |
| (e) | | The average of month-end market values during the period that the Preferred Stock was outstanding. |
| * | | To be allocated to net investment income and capital gains at year end. |
| ** | | Annualized. |
| *** | | Not annualized. |
30 | 2006 SEMIANNUAL REPORT TO STOCKHOLDERS | THE ACCOMPANYING NOTES ARE AN INTEGRAL PART OF THESE FINANCIAL STATEMENTS. |
ROYCE VALUE TRUST
|
| Notes to Financial Statements (Unaudited) |
|
Summary of Significant Accounting Policies:
Royce Value Trust, Inc. (“the Fund”) was incorporated under the laws of the State of Maryland on July 1, 1986 as a diversified closed-end investment company. The Fund commenced operations on November 26, 1986.
The preparation of financial statements in conformity with accounting principles generally accepted in the United States of America requires management to make estimates and assumptions that affect the reported amounts of assets and liabilities and the disclosure of contingent assets and liabilities at the date of the financial statements, and the reported amounts of income and expenses during the reporting period. Actual results could differ from those estimates.
Valuation of Investments:
Securities are valued as of the close of trading on the New York Stock Exchange (generally 4:00 p.m. Eastern time) on the valuation date. Securities that trade on an exchange or Nasdaq, and securities traded on Nasdaq’s Electronic Bulletin Board, are valued at their last reported sales price or Nasdaq official closing price taken from the primary market in which each security trades or, if no sale is reported for such day, at their bid price. Other over-the-counter securities for which market quotations are readily available are valued at their bid price. Securities for which market quotations are not readily available are valued at their fair value under procedures established by the Fund’s Board of Directors. Bonds and other fixed income securities may be valued by reference to other securities with comparable ratings, interest rates and maturities, using established independent pricing services. Investments in money market funds are valued at net asset value per share.
Investment Transactions and Related Investment Income:
Investment transactions are accounted for on the trade date. Dividend income is recorded on the ex-dividend date and any non-cash dividend income is recorded at the fair market value of the securities received. Interest income is recorded on an accrual basis. Realized gains and losses from investment transactions are determined on the basis of identified cost for book and tax purposes.
Expenses:
The Fund incurs direct and indirect expenses. Expenses directly attributable to the Fund are charged to the Fund’s operations, while expenses applicable to more than one of the Royce Funds are allocated in an equitable manner. Allocated personnel and occupancy costs related to The Royce Funds are included in administrative and office facilities expenses. The Fund has adopted a deferred fee agreement that allows the Fund’s Directors to defer the receipt of all or a portion of Directors’ Fees otherwise payable. The deferred fees are invested in certain Royce Funds until distributed in accordance with the agreement.
Compensating Balance Credits:
The Fund has an arrangement with its custodian bank, whereby a portion of the custodian’s fee is paid indirectly by credits earned on the Fund’s cash on deposit with the bank. This deposit arrangement is an alternative to purchasing overnight investments. | | Taxes:
As a qualified regulated investment company under Subchapter M of the Internal Revenue Code, the Fund is not subject to income taxes to the extent that it distributes substantially all of its taxable income for its fiscal year. The Schedule of Investments includes information regarding income taxes under the caption “Income Tax Information”.
Distributions:
The Fund currently has a policy of paying quarterly distributions on the Fund’s Common Stock. Distributions are currently being made at the annual rate of 9% of the rolling average of the prior four calendar quarter-end NAVs of the Fund’s Common Stock, with the fourth quarter distribution being the greater of 2.25% of the rolling average or the distribution required by IRS regulations. Distributions to Preferred Stockholders are accrued daily and paid quarterly. The Fund is required to allocate long-term capital gain distributions and other types of income proportionately to distributions made to holders of shares of Common Stock and Preferred Stock. To the extent that distributions are not paid from long-term capital gains, net investment income or net short-term capital gains, they will represent a return of capital. Distributions are determined in accordance with income tax regulations that may differ from accounting principles generally accepted in the United States of America. Permanent book and tax basis differences relating to stockholder distributions will result in reclassifications within the capital accounts. Undistributed net investment income may include temporary book and tax basis differences, which will reverse in a subsequent period. Any taxable income or gain remaining undistributed at fiscal year end is distributed in the following year.
Repurchase Agreements:
The Fund may enter into repurchase agreements with institutions that the Fund’s investment adviser has determined are creditworthy. The Fund restricts repurchase agreements to maturities of no more than seven days. Securities pledged as collateral for repurchase agreements, which are held until maturity of the repurchase agreements, are marked-to-market daily and maintained at a value at least equal to the principal amount of the repurchase agreement (including accrued interest). Repurchase agreements could involve certain risks in the event of default or insolvency of the counter-party, including possible delays or restrictions upon the ability of the Fund to dispose of the underlying securities.
Securities Lending:
The Fund loans securities to qualified institutional investors for the purpose of realizing additional income. Collateral on all securities loaned for the Fund is accepted in cash and cash equivalents and invested temporarily by the custodian. The collateral is equal to at least 100% of the current market value of the loaned securities. The market value of the loaned securities is determined at the close of business of the Fund and any additional required collateral is delivered to the Fund on the next business day. |
2006 SEMIANNUAL REPORT TO STOCKHOLDERS | 31
ROYCE VALUE TRUST
|
| Notes to Financial Statements (Unaudited) (continued) |
|
Capital Stock:
The Fund issued 1,209,849 and 2,294,908 shares of Common Stock as reinvestment of distributions by Common Stockholders for the six months ended June 30, 2006 and the year ended December 31, 2005, respectively.
At June 30, 2006, 8,800,000 shares of 5.90% Cumulative Preferred Stock were outstanding. Commencing October 9, 2008 and thereafter, the Fund, at its option, may redeem the Cumulative Preferred Stock, in whole or in part, at the redemption price. The Cumulative Preferred Stock is classified outside of permanent equity (net assets applicable to Common Stockholders) in the accompanying financial statements in accordance with Emerging Issues Task Force (EITF) Topic D-98, Classification and Measurement of Redeemable Securities, that requires preferred securities that are redeemable for cash or other assets to be classified outside of permanent equity to the extent that the redemption is at a fixed or determinable price and at the option of the holder or upon the occurrence of an event that is not solely within the control of the issuer.
The Fund is required to meet certain asset coverage tests with respect to the Cumulative Preferred Stock as required by the 1940 Act. In addition, pursuant to the Rating Agency Guidelines established by Moody’s, the Fund is required to maintain a certain discounted asset coverage. If the Fund fails to meet these requirements and does not correct such failure, the Fund may be required to redeem, in part or in full, the Cumulative Preferred Stock at a redemption price of $25.00 per share, plus an amount equal to the accumulated and unpaid dividends, whether or not declared on such shares, in order to meet these requirements. Additionally, failure to meet the foregoing asset coverage requirements could restrict the Fund’s ability to pay dividends to Common Stockholders and could lead to sales of portfolio securities at inopportune times. The Fund has met these requirements since issuing the Cumulative Preferred Stock.
Investment Advisory Agreement:
As compensation for its services under the Investment Advisory Agreement, Royce & Associates, LLC (“Royce”) receives a fee comprised of a Basic Fee (“Basic Fee”) and an adjustment to the Basic Fee based on the investment performance of the Fund in relation to the investment record of the S&P SmallCap 600 Index (“S&P 600”).
The Basic Fee is a monthly fee equal to 1/12 of 1% (1% on an annualized basis) of the average of the Fund’s month-end net assets applicable to Common Stockholders, plus the liquidation value of Preferred | | Stock, for the rolling 60-month period ending with such month (the “performance period”). The Basic Fee for each month is increased or decreased at the rate of 1/12 of .05% for each percentage point that the investment performance of the Fund exceeds, or is exceeded by, the percentage change in the investment record of the S&P 600 for the performance period by more than two percentage points. The performance period for each such month is a rolling 60-month period ending with such month. The maximum increase or decrease in the Basic Fee for any month may not exceed 1/12 of .5%. Accordingly, for each month, the maximum monthly fee rate as adjusted for performance is 1/12 of 1.5% and is payable if the investment performance of the Fund exceeds the percentage change in the investment record of the S&P 600 by 12 or more percentage points for the performance period, and the minimum monthly fee rate as adjusted for performance is 1/12 of .5% and is payable if the percentage change in the investment record of the S&P 600 exceeds the investment performance of the Fund by 12 or more percentage points for the performance period.
Notwithstanding the foregoing, Royce is not entitled to receive any fee for any month when the investment performance of the Fund for the rolling 36-month period ending with such month is negative. In the event that the Fund’s investment performance for such a performance period is less than zero, Royce will not be required to refund to the Fund any fee earned in respect of any prior performance period.
Royce has voluntarily committed to waive the portion of its investment advisory fee attributable to an issue of the Fund’s Preferred Stock for any month in which the Fund’s average annual NAV total return since issuance of the Preferred Stock fails to exceed the applicable Preferred Stock’s dividend rate.
For the six rolling 60-month periods ending June 2006, the investment performance of the Fund exceeded the investment performance of the S&P 600 by 4% to 12%. Accordingly, the investment advisory fee consisted of a Basic Fee of $4,977,939 and an upward adjustment of $1,651,656 for performance of the Fund above that of the S&P 600. For the six months ended June 30, 2006, the Fund accrued and paid Royce advisory fees totaling $6,629,595.
Purchases and Sales of Investment Securities:
For the six months ended June 30, 2006, the cost of purchases and proceeds from sales of investment securities, other than short-term securities and collateral received for securities loaned, amounted to $91,002,143 and $175,751,874, respectively. |
Transactions in Shares of Affiliated Companies:
An “Affiliated Company”, as defined in the Investment Company Act of 1940, is a company in which a Fund owns 5% or more of the company’s outstanding voting securities. The Fund effected the following transactions in shares of such companies during the six months ended June 30, 2006:
| | | Shares | | Market Value | | Cost of | | Cost of | | Realized | | Dividend | | Shares | | Market Value |
Affiliated Company | | 12/31/05 | | 12/31/05 | | Purchases | | Sales | | Gain (Loss) | | Income | | 6/30/06 | | 6/30/06 |
|
| Peerless Manufacturing | | 158,600 | | $ | 2,775,500 | | | – | | – | | – | | – | | 158,600 | | $ | 3,798,470 | |
| Synalloy Corporation | | 345,000 | | | 3,610,080 | | | – | | – | | – | | – | | 345,000 | | | 4,443,600 | |
|
| | | | | $ | 6,385,580 | | | | | | | – | | – | | | | $ | 8,242,070 | |
| | |
|
| 32 | 2006 SEMIANNUAL REPORT TO STOCKHOLDERS |
ROYCE MICRO-CAP TRUST
|
JUNE 30, 2006 (Unaudited)
|
| |
| | | SHARES | | | VALUE | | | | SHARES | | | VALUE |
| |
| COMMON STOCKS – 101.3% | | | | | | | Restaurants and Lodgings - 0.3% | | | | | |
| | | | | | | | Benihana Cl. A a | | 800 | | $ | 21,712 |
| Consumer Products – 5.0% | | | | | | | California Pizza Kitchen a, c | | 2,100 | | | 57,708 |
| Apparel and Shoes - 2.2% | | | | | | | Champps Entertainment a | | 10,000 | | | 65,600 |
Delta Apparel | | 129,300 | | $ | 2,216,202 | | †Famous Dave’s of America a, c | | 58,170 | | | 773,661 |
Hartmarx Corporation a, c | | 50,000 | | | 300,000 | | | | | |
|
Kleinert’s a, d | | 14,200 | | | 0 | | | | | | | 918,681 |
Steven Madden a | | 21,750 | | | 644,235 | | | | | |
|
Shoe Pavilion a | | 139,800 | | | 1,012,152 | | Retail Stores - 4.9% | | | | | |
Stride Rite | | 10,000 | | | 131,900 | | A.C. Moore Arts & Crafts a | | 47,600 | | | 776,356 |
Weyco Group | | 120,000 | | | 2,786,400 | | America’s Car-Mart a, c | | 113,000 | | | 2,295,030 |
| | | | |
| | Buckle (The) | | 25,500 | | | 1,067,685 |
| | | | | | 7,090,889 | | Cache a | | 3,200 | | | 55,488 |
| | | | |
| | Casual Male Retail Group a | | 2,000 | | | 20,100 |
| Collectibles - 0.4% | | | | | | | Cato Corporation Cl. A | | 71,850 | | | 1,857,322 |
Topps Company (The) | | 148,500 | | | 1,220,670 | | Cost Plus a, c | | 45,077 | | | 660,829 |
| | | | |
| | Deb Shops | | 19,900 | | | 479,789 |
| Food/Beverage/Tobacco - 0.3% | | | | | | | Fred’s Cl. A | | 7,500 | | | 100,125 |
Green Mountain Coffee Roasters a, c | | 26,600 | | | 1,068,522 | | La Senza Corporation | | 99,900 | | | 2,129,911 |
Nutrition 21 a, c | | 20,000 | | | 36,400 | | †PriceSmart a | | 90,000 | | | 901,800 |
| | | | |
| | Shoe Carnival a | | 11,000 | | | 262,460 |
| | | | | | 1,104,922 | | Stein Mart | | 148,900 | | | 2,203,720 |
| | | | |
| | United Retail Group a | | 60,600 | | | 939,906 |
| Home Furnishing and Appliances - 0.3% | | | | | | | West Marine a | | 127,000 | | | 1,711,960 |
Lifetime Brands | | 42,054 | | | 911,310 | | Wet Seal (The) Cl. A a, c | | 39,200 | | | 191,296 |
| | | | |
| | Wild Oats Markets a, c | | 3,000 | | | 58,800 |
| Publishing - 0.1% | | | | | | | | | | |
|
Educational Development | | 10,600 | | | 76,394 | | | | | | | 15,712,577 |
| | | | |
| | | | | |
|
| Sports and Recreation - 0.5% | | | | | | | Other Consumer Services - 0.3% | | | | | |
Monaco Coach | | 73,900 | | | 938,530 | | Ambassadors Group | | 15,000 | | | 433,200 |
National R.V. Holdings a | | 31,800 | | | 172,038 | | Ambassadors International | | 6,100 | | | 141,825 |
Orange 21 a | | 7,400 | | | 42,550 | | Autobytel a, c | | 20,000 | | | 70,600 |
Sturm, Ruger & Company a | | 95,000 | | | 593,750 | | Cash America International | | 5,000 | | | 160,000 |
| | | | |
| | Escala Group a, c | | 26,000 | | | 121,680 |
| | | | | | 1,746,868 | | | | | |
|
| | | | |
| | | | | | | 927,305 |
| Other Consumer Products - 1.2% | | | | | | | | | | |
|
Burnham Holdings Cl. A | | 79,500 | | | 1,530,375 | | Total (Cost $13,320,231) | | | | | 20,636,314 |
Cobra Electronics | | 10,000 | | | 94,300 | | | | | |
|
Cross (A. T.) Company Cl. A a, c | | 100,000 | | | 530,000 | | Diversified Investment Companies – 2.1% | | | | | |
JAKKS Pacific a | | 25,000 | | | 502,250 | | Closed-End Mutual Funds - 2.1% | | | | | |
Lazare Kaplan International a | | 151,700 | | | 1,251,525 | | ASA Bermuda | | 73,300 | | | 4,680,205 |
Sonic Solutions a, c | | 4,000 | | | 66,000 | | Brantley Capital a | | 56,100 | | | 120,615 |
| | | | |
| | Central Fund of Canada Cl. A | | 207,000 | | | 1,780,200 |
| | | | | | 3,974,450 | | | | | |
|
| | | | |
| | Total (Cost $3,941,581) | | | | | 6,581,020 |
| Total (Cost $10,673,077) | | | | | 16,125,503 | | | | | |
|
| | | | |
| | Financial Intermediaries – 8.4% | | | | | |
| Consumer Services – 6.4% | | | | | | | Banking - 2.8% | | | | | |
Direct Marketing - 0.3% | | | | | | | Abigail Adams National Bancorp b | | 174,400 | | | 2,441,600 |
†Dover Saddlery a, c | | 9,500 | | | 81,012 | | Arrow Financial | | 14,322 | | | 392,852 |
FTD Group a, c | | 55,000 | | | 742,500 | | Bancorp (The) a, c | | 51,380 | | | 1,285,014 |
Sportsman’s Guide (The) a, c | | 6,000 | | | 183,000 | | First National Lincoln | | 40,200 | | | 670,415 |
ValueVision Media Cl. A a, c | | 5,000 | | | 55,150 | | FirstBank NW | | 9,860 | | | 258,924 |
| | | | |
| | Lakeland Financial | | 45,000 | | | 1,093,050 |
| | | | | | 1,061,662 | | Meta Financial Group | | 44,800 | | | 963,200 |
| | | | |
| | Peapack-Gladstone Financial | | 25,800 | | | 667,962 |
| Leisure and Entertainment - 0.4% | | | | | | | Queen City Investments a | | 948 | | | 849,408 |
†FortuNet a, c | | 8,000 | | | 129,600 | | Quest Capital | | 30,000 | | | 72,292 |
IMAX Corporation a, c | | 25,000 | | | 229,000 | | Sterling Bancorp | | 22,869 | | | 445,946 |
Multimedia Games a, c | | 5,000 | | | 50,650 | | | | | |
|
New Frontier Media a | | 60,000 | | | 430,200 | | | | | | | 9,140,663 |
Progressive Gaming International a | | 9,500 | | | 74,100 | | | | | |
|
Singing Machine Company (The) a, c | | 5,000 | | | 1,600 | | | | | | | |
TiVo a, c | | 20,000 | | | 143,000 | | | | | | | |
†Youbet.com a, c | | 49,300 | | | 238,119 | | | | | | | |
| | | | |
| | | | | | | |
| | | | | | 1,296,269 | | | | | | | |
| | | | |
| | | | | | | |
| Media and Broadcasting - 0.2% | | | | | | | | | | | | |
Outdoor Channel Holdings a, c | | 69,750 | | | 719,820 | | | | | | | |
| | | | |
| | | | | | | |
| THE ACCOMPANYING NOTES ARE AN INTEGRAL PART OF THESE FINANCIAL STATEMENTS. |
2006 SEMIANNUAL REPORT TO STOCKHOLDERS | 33 |
| | | SHARES | | | VALUE | | | | SHARES | | | VALUE |
| |
| Financial Intermediaries (continued) | | | | | | | Cardiome Pharma a, c | | 29,300 | | $ | 259,012 |
| Insurance - 2.3% | | | | | | | Cell Genesys a, c | | 58,000 | | | 291,160 |
American Safety Insurance Holdings a | | 20,000 | | $ | 330,000 | | Cerus Corporation a, c | | 82,200 | | | 586,086 |
First Acceptance a | | 258,405 | | | 3,044,011 | | CollaGenex Pharmaceuticals a, c | | 25,000 | | | 299,500 |
Independence Holding | | 33,534 | | | 751,497 | | Corcept Therapeutics a, c | | 5,000 | | | 20,250 |
NYMAGIC | | 65,400 | | | 1,899,870 | | †Cytokinetics a, c | | 5,000 | | | 31,450 |
Navigators Group a, c | | 17,200 | | | 753,704 | | Dendreon Corporation a, c | | 12,700 | | | 61,468 |
Wellington Underwriting | | 444,712 | | | 717,511 | | Discovery Partners International a | | 35,000 | | | 91,000 |
| | | | |
| | Draxis Health a | | 15,000 | | | 66,600 |
| | | | | | 7,496,593 | | Durect Corporation a | | 44,100 | | | 170,667 |
| | | | |
| | DUSA Pharmaceuticals a, c | | 36,700 | | | 207,355 |
| Real Estate Investment Trusts - 0.3% | | | | | | | Dyax Corporation a, c | | 15,000 | | | 44,100 |
Opteum Cl. A | | 99,000 | | | 892,980 | | Emisphere Technologies a, c | | 163,200 | | | 1,392,096 |
| | | | |
| | †Encysive Pharmaceuticals a, c | | 10,000 | | | 69,300 |
| Securities Brokers - 1.3% | | | | | | | Gene Logic a | | 234,479 | | | 316,547 |
First Albany Companies a | | 76,000 | | | 342,000 | | Genitope Corporation a, c | | 3,000 | | | 18,960 |
International Assets Holding a | | 149,000 | | | 2,451,050 | | †Halozyme Therapeutics a, c | | 20,000 | | | 54,000 |
Sanders Morris Harris Group | | 21,000 | | | 317,310 | | Hi-Tech Pharmacal a | | 39,830 | | | 659,983 |
Stifel Financial a, c | | 21,233 | | | 749,737 | | †Idenix Pharmaceuticals a, c | | 5,000 | | | 47,000 |
TradeStation Group a, c | | 30,000 | | | 380,100 | | ImmunoGen a, c | | 44,000 | | | 137,720 |
| | | | |
| | †Lannett Company a, c | | 64,000 | | | 364,160 |
| | | | | | 4,240,197 | | Mannkind Corporation a, c | | 42,000 | | | 895,020 |
| | | | |
| | Maxygen a | | 5,000 | | | 37,400 |
| Other Financial Intermediaries - 1.7% | | | | | | | Micromet a, c | | 14,333 | | | 61,345 |
Electronic Clearing House a, c | | 20,000 | | | 269,200 | | Momenta Pharmaceuticals a, c | | 65,000 | | | 826,150 |
MVC Capital | | 211,200 | | | 2,838,528 | | Monogram Biosciences a, c | | 35,000 | | | 69,300 |
MarketAxess Holdings a, c | | 123,700 | | | 1,361,937 | | Myriad Genetics a, c | | 25,000 | | | 631,250 |
NGP Capital Resources Company | | 58,600 | | | 857,318 | | Nabi Biopharmaceuticals a, c | | 5,000 | | | 28,700 |
| | | | |
| | Nastech Pharmaceutical Company a, c | | 2,700 | | | 42,660 |
| | | | | | 5,326,983 | | Neurogen Corporation a, c | | 30,000 | | | 153,600 |
| | | | |
| | Oncolytics Biotech a, c | | 41,000 | | | 116,850 |
| Total (Cost $18,567,765) | | | | | 27,097,416 | | Orchid Cellmark a, c | | 78,000 | | | 217,620 |
| | | | |
| | †Origin Agritech a, c | | 51,000 | | | 731,340 |
| Financial Services – 2.0% | | | | | | | Pharmacyclics a | | 98,000 | | | 378,280 |
| Insurance Brokers - 0.1% | | | | | | | SFBC International a, c | | 25,000 | | | 379,000 |
Crawford & Company Cl. A | | 50,000 | | | 330,500 | | Sangamo BioSciences a, c | | 10,000 | | | 59,000 |
| | | | |
| | Senesco Technologies a | | 25,000 | | | 47,500 |
Investment Management - 1.7% | | | | | | | Tercica a, c | | 69,800 | | | 369,242 |
ADDENDA Capital | | 48,000 | | | 1,102,929 | | Theragenics Corporation a, c | | 145,800 | | | 497,178 |
Epoch Holding Corporation a | | 218,300 | | | 1,091,500 | | Trimeris a, c | | 30,000 | | | 344,700 |
Hennessy Advisors | | 16,500 | | | 470,250 | | | | | |
|
†Highbury Financial a, c | | 317,200 | | | 1,744,600 | | | | | | | 14,592,148 |
†Highbury Financial (Warrants) a | | 634,400 | | | 570,960 | | | | | |
|
Rockwater Capital a | | 50,000 | | | 318,015 | | Health Services - 2.2% | | | | | |
| | | | |
| | ATC Healthcare Cl. A a | | 35,000 | | | 14,350 |
| | | | | | 5,298,254 | | Albany Molecular Research a | | 40,000 | | | 427,200 |
| | | | |
| | Bio-Imaging Technologies a | | 42,400 | | | 174,688 |
| Other Financial Services - 0.2% | | | | | | | Covalent Group a | | 25,000 | | | 75,750 |
†Chardan North China Acquisition a, c | | 60,800 | | | 465,120 | | Gentiva Health Services a | | 23,000 | | | 368,690 |
†Chardan North China Acquisition (Warrants) a | | 93,900 | | | 261,042 | | HMS Holdings a | | 35,420 | | | 379,702 |
MicroFinancial | | 10,000 | | | 34,500 | | Healthcare Services Group | | 2,800 | | | 58,660 |
| | | | |
| | †Health Grades a, c | | 100,000 | | | 450,000 |
| | | | | | 760,662 | | Hooper Holmes a, c | | 88,600 | | | 270,230 |
| | | | |
| | Horizon Health a | | 50,000 | | | 1,044,000 |
| Total (Cost $5,646,654) | | | | | 6,389,416 | | MedCath Corporation a, c | | 18,000 | | | 339,120 |
| | | | |
| | Mediware Information Systems a | | 55,000 | | | 530,750 |
| Health – 14.4% | | | | | | | †National Medical Health Card Systems a, c | | 54,000 | | | 745,200 |
| Commercial Services - 1.9% | | | | | | | On Assignment a | | 41,100 | | | 377,709 |
First Consulting Group a | | 274,700 | | | 2,428,348 | | Quovadx a | | 5,000 | | | 12,900 |
PAREXEL International a, c | | 121,400 | | | 3,502,390 | | RehabCare Group a, c | | 22,000 | | | 382,360 |
| | | | |
| | | | | | | |
| | | | | | 5,930,738 | | | | | | | |
| | | | |
| | | | | | | |
| Drugs and Biotech - 4.5% | | | | | | | | | | | | |
Allos Therapeutics a, c | | 233,600 | | | 817,600 | | | | | | | |
Alnylam Pharmaceuticals a, c | | 3,000 | | | 45,240 | | | | | | | |
AnorMED a | | 160,600 | | | 923,450 | | | | | | | |
Antigenics a, c | | 70,000 | | | 148,400 | | | | | | | |
Axonyx a, c | | 50,000 | | | 42,500 | | | | | | | |
Barrier Therapeutics a, c | | 11,300 | | | 73,902 | | | | | | | |
Cambrex Corporation | | 16,000 | | | 333,280 | | | | | | | |
Caraco Pharmaceutical Laboratories a, c | | 123,850 | | | 1,133,227 | | | | | | | |
34 | 2006 SEMIANNUAL REPORT TO STOCKHOLDERS | THE ACCOMPANYING NOTES ARE AN INTEGRAL PART OF THESE FINANCIAL STATEMENTS. |
|
JUNE 30, 2006 (Unaudited)
|
| |
| | | SHARES | | | VALUE | | | | SHARES | | | VALUE |
| |
| Health (continued) | | | | | | | Building Systems and Components - 1.0% | | | | | |
| Health Services (continued) | | | | | | | Aaon | | 63,700 | | $ | 1,634,542 |
Res-Care a, c | | 32,000 | | $ | 640,000 | | Craftmade International | | 20,000 | | | 335,000 |
Sun Healthcare Group a, c | | 51,000 | | | 443,190 | | Flanders Corporation a, c | | 1,500 | | | 15,045 |
U.S. Physical Therapy a | | 10,000 | | | 146,400 | | LSI Industries | | 63,812 | | | 1,084,166 |
| | | | |
| | Modtech Holdings a | | 3,800 | | | 25,726 |
| | | | | | 6,880,899 | | Southern Energy Homes a | | 11,600 | | | 77,720 |
| | | | |
| | | | | |
|
| Medical Products and Devices - 5.6% | | | | | | | | | | | | 3,172,199 |
Adeza Biomedical a, c | | 23,200 | | | 325,264 | | | | | |
|
Allied Healthcare Products a | | 253,500 | | | 1,470,300 | | Construction Materials - 1.6% | | | | | |
AngioDynamics a, c | | 14,000 | | | 378,700 | | Ash Grove Cement Company | | 8,000 | | | 1,584,000 |
Anika Therapeutics a | | 24,000 | | | 232,320 | | Monarch Cement | | 50,410 | | | 1,380,226 |
Bruker BioSciences a | | 187,200 | | | 1,003,392 | | Synalloy Corporation a | | 161,000 | | | 2,073,680 |
Caliper Life Sciences a | | 52,400 | | | 261,476 | | | | | |
|
Cardiac Science a, c | | 29,947 | | | 236,282 | | | | | | | 5,037,906 |
CONMED Corporation a, c | | 3,900 | | | 80,730 | | | | | |
|
Del Global Technologies a | | 168,279 | | | 420,698 | | Industrial Components - 1.6% | | | | | |
EPIX Pharmaceuticals a, c | | 49,000 | | | 213,150 | | American Superconducter a, c | | 67,000 | | | 591,610 |
Endologix a, c | | 10,500 | | | 37,170 | | Bel Fuse Cl. A | | 55,200 | | | 1,498,680 |
Exactech a, c | | 114,100 | | | 1,568,875 | | C & D Technologies c | | 53,000 | | | 398,560 |
Kensey Nash a, c | | 25,000 | | | 737,500 | | Ladish Company a | | 10,000 | | | 374,700 |
Langer a | | 7,100 | | | 29,110 | | Plug Power a, c | | 1,370 | | | 6,398 |
Medical Action Industries a, c | | 83,500 | | | 1,844,515 | | Powell Industries a, c | | 50,300 | | | 1,203,679 |
Merit Medical Systems a, c | | 5,700 | | | 78,432 | | Scientific Technologies a, c | | 10,700 | | | 111,280 |
†Microtek Medical Holdings a, c | | 122,320 | | | 467,262 | | Tech/Ops Sevcon | | 76,200 | | | 481,584 |
†Minrad International a, c | | 12,200 | | | 50,508 | | II-VI a | | 20,000 | | | 366,000 |
Molecular Devices a, c | | 25,500 | | | 779,280 | | Woodhead Industries | | 10,000 | | | 191,400 |
NMT Medical a, c | | 10,600 | | | 106,106 | | | | | |
|
Neurometrix a, c | | 21,500 | | | 654,890 | | | | | | | 5,223,891 |
Orthofix International a | | 28,000 | | | 1,067,640 | | | | | |
|
OrthoLogic Corporation a, c | | 84,000 | | | 136,080 | | Machinery - 3.0% | | | | | |
PLC Systems a | | 105,200 | | | 109,408 | | Alamo Group | | 38,600 | | | 812,530 |
Possis Medical a, c | | 29,900 | | | 263,419 | | Ampco-Pittsburgh | | 12,900 | | | 369,585 |
Shamir Optical Industry a | | 7,500 | | | 67,500 | | Astec Industries a, c | | 40,200 | | | 1,371,624 |
Sirona Dental Systems | | 25,000 | | | 990,500 | | †Baldwin Technology Company Cl. A a, c | | 45,000 | | | 243,000 |
STAAR Surgical a | | 5,000 | | | 38,700 | | Global Power Equipment Group a | | 87,600 | | | 278,568 |
Synovis Life Technologies a, c | | 23,000 | | | 226,090 | | Gorman-Rupp Company | | 3,375 | | | 89,775 |
Urologix a, c | | 202,000 | | | 634,280 | | Hardinge | | 97,000 | | | 1,498,650 |
Utah Medical Products | | 42,300 | | | 1,269,423 | | Hurco Companies a, c | | 31,500 | | | 809,235 |
Young Innovations | | 61,450 | | | 2,164,884 | | Keithley Instruments | | 14,000 | | | 178,220 |
| | | | |
| | LeCroy Corporation a, c | | 2,000 | | | 28,700 |
| | | | | | 17,943,884 | | Lindsay Manufacturing | | 10,000 | | | 271,200 |
| | | | |
| | MTS Systems | | 10,000 | | | 395,100 |
| Personal Care - 0.2% | | | | | | | Mueller (Paul) Company | | 9,650 | | | 342,575 |
CCA Industries | | 9,040 | | | 83,349 | | Sun Hydraulics | | 38,950 | | | 809,381 |
Helen of Troy a, c | | 20,000 | | | 368,000 | | Tennant Company | | 44,100 | | | 2,217,348 |
Nature’s Sunshine Products | | 7,500 | | | 69,000 | | | | | |
|
Nutraceutical International a, c | | 15,000 | | | 229,950 | | | | | | | 9,715,491 |
| | | | |
| | | | | |
|
| | | | | | 750,299 | | Metal Fabrication and Distribution - 2.2% | | | | | |
| | | | |
| | Aleris International a, c | | 4,075 | | | 186,839 |
| Total (Cost $35,882,100) | | | | | 46,097,968 | | Castle (A.M.) & Company | | 15,890 | | | 512,453 |
| | | | |
| | Encore Wire a, c | | 15,000 | | | 539,100 |
| Industrial Products – 14.6% | | | | | | | Harris Steel Group | | 50,000 | | | 1,265,341 |
| Automotive - 1.0% | | | | | | | Haynes International a | | 39,370 | | | 1,368,108 |
IMPCO Technologies a, c | | 13,000 | | | 138,710 | | Insteel Industries | | 24,200 | | | 585,640 |
LKQ Corporation a, c | | 11,400 | | | 216,600 | | NN | | 155,600 | | | 1,921,660 |
Noble International | | 39,600 | | | 567,072 | | Novamerican Steel a | | 2,500 | | | 101,175 |
Safety Components International a, c | | 46,400 | | | 638,464 | | Universal Stainless & Alloy Products a, c | | 23,230 | | | 679,942 |
Spartan Motors | | 2,800 | | | 43,064 | | | | | |
|
Strattec Security a, c | | 28,300 | | | 1,409,623 | | | | | | | 7,160,258 |
Wescast Industries Cl. A | | 12,900 | | | 169,411 | | | | | |
|
| | | | |
| | Paper and Packaging - 0.1% | | | | | |
| | | | | | 3,182,944 | | Mod-Pac Corporation a | | 23,200 | | | 230,840 |
| | | | |
| | | | | |
|
| | | | | | | | Pumps, Valves and Bearings - 0.2% | | | | | |
| | | | | | | | CIRCOR International | | 28,000 | | | 853,720 |
| | | | | | | | | | | |
|
| THE ACCOMPANYING NOTES ARE AN INTEGRAL PART OF THESE FINANCIAL STATEMENTS. |
2006 SEMIANNUAL REPORT TO STOCKHOLDERS | 35 |
| | | SHARES | | | VALUE | | | | SHARES | | | VALUE |
| |
| Industrial Products (continued) | | | | | | | Insituform Technologies Cl. A a, c | | 75,300 | | $ | 1,723,617 |
| Specialty Chemicals and Materials - 1.9% | | | | | | | Nobility Homes | | 2,000 | | | 54,340 |
Aceto Corporation | | 384,919 | | $ | 2,663,639 | | Skyline Corporation | | 32,100 | | | 1,373,238 |
American Vanguard | | 3,333 | | | 51,595 | | | | | |
|
Balchem Corporation | | 22,500 | | | 506,250 | | | | | | | 3,654,814 |
CFC International a, c | | 30,400 | | | 499,776 | | | | | |
|
Hawkins | | 122,667 | | | 1,717,951 | | Food and Tobacco Processors - 1.2% | | | | | |
NuCo2 a, c | | 20,000 | | | 480,800 | | Cal-Maine Foods | | 50,000 | | | 343,500 |
Park Electrochemical | | 10,000 | | | 257,500 | | Galaxy Nutritional Foods a | | 176,200 | | | 61,670 |
| | | | |
| | ML Macadamia Orchards L.P. | | 120,200 | | | 653,888 |
| | | | | | 6,177,511 | | Omega Protein a, c | | 9,600 | | | 55,488 |
| | | | |
| | Seneca Foods Cl. A a | | 62,500 | | | 1,435,625 |
| Textiles - 0.1% | | | | | | | Seneca Foods Cl. B a | | 42,500 | | | 972,400 |
Unifi a | | 100,000 | | | 290,000 | | Sunopta a, c | | 42,780 | | | 396,998 |
| | | | |
| | | | | |
|
| Other Industrial Products - 1.9% | | | | | | | | | | | | 3,919,569 |
Color Kinetics a, c | | 50,000 | | | 945,500 | | | | | |
|
Distributed Energy Systems a | | 50,000 | | | 258,500 | | Industrial Distribution - 0.7% | | | | | |
Eastern Company (The) | | 26,500 | | | 547,225 | | Central Steel & Wire | | 1,088 | | | 685,440 |
Maxwell Technologies a | | 15,300 | | | 300,339 | | Elamex a | | 60,200 | | | 51,772 |
Peerless Manufacturing a | | 42,200 | | | 1,010,690 | | Lawson Products | | 19,500 | | | 768,690 |
Quixote Corporation | | 35,500 | | | 639,710 | | Strategic Distribution a | | 59,690 | | | 835,660 |
Raven Industries | | 73,000 | | | 2,299,500 | | | | | |
|
| | | | |
| | | | | | | 2,341,562 |
| | | | | | 6,001,464 | | | | | |
|
| | | | |
| | Printing - 0.9% | | | | | |
| Total (Cost $30,809,311) | | | | | 47,046,224 | | Bowne & Co. | | 66,500 | | | 950,950 |
| | | | |
| | Champion Industries | | 23,500 | | | 195,990 |
| Industrial Services – 13.1% | | | | | | | Courier Corporation | | 22,950 | | | 918,459 |
| Advertising and Publishing - 0.5% | | | | | | | Ennis | | 9,700 | | | 190,896 |
Greenfield Online a, c | | 20,000 | | | 148,200 | | Schawk | | 38,900 | | | 680,750 |
MDC Partners Cl. A a | | 84,000 | | | 687,960 | | | | | |
|
NetRatings a, c | | 50,000 | | | 694,500 | | | | | | | 2,937,045 |
| | | | |
| | | | | |
|
| | | | | | 1,530,660 | | Transportation and Logistics - 2.9% | | | | | |
| | | | |
| | †Dynamex a, c | | 42,150 | | | 919,292 |
| Commercial Services - 5.4% | | | | | | | Forward Air | | 50,700 | | | 2,065,011 |
Acacia Research-Acacia Technologies a | | 31,850 | | | 447,811 | | Frozen Food Express Industries a, c | | 92,000 | | | 1,013,840 |
American Bank Note Holographics a, c | | 242,200 | | | 808,948 | | MAIR Holdings a, c | | 8,600 | | | 53,406 |
BB Holdings a | | 390,000 | | | 1,478,436 | | Marten Transport a, c | | 4,050 | | | 88,047 |
Carlisle Group a | | 151,000 | | | 256,891 | | Pacific CMA a, c | | 200,000 | | | 122,000 |
CBIZ a, c | | 87,000 | | | 644,670 | | Patriot Transportation Holding a | | 3,000 | | | 260,340 |
Clark | | 85,900 | | | 1,133,880 | | Universal Truckload Services a | | 134,200 | | | 4,580,246 |
Collectors Universe | | 11,700 | | | 163,566 | | Vitran Corporation Cl. A a | | 8,000 | | | 187,920 |
CorVel Corporation a, c | | 31,850 | | | 796,250 | | | | | |
|
Exponent a, c | | 136,600 | | | 2,308,540 | | | | | | | 9,290,102 |
Geo Group (The) a, c | | 51,200 | | | 1,794,560 | | | | | |
|
Kforce a, c | | 55,000 | | | 851,950 | | Other Industrial Services - 0.3% | | | | | |
PDI a | | 15,200 | | | 218,728 | | Landauer | | 21,300 | | | 1,020,270 |
RCM Technologies a | | 33,200 | | | 166,664 | | Team a | | 2,200 | | | 55,110 |
Renaissance Learning | | 2,365 | | | 32,046 | | | | | |
|
SM &A a, c | | 31,300 | | | 190,930 | | | | | | | 1,075,380 |
Senomyx a, c | | 47,000 | | | 678,210 | | | | | |
|
†Services Acquisition Corporation | | | | | | | Total (Cost $23,652,978) | | | | | 42,130,725 |
International a, c | | 44,800 | | | 443,520 | | | | | |
|
†SITEL Corporation a, c | | 40,000 | | | 156,800 | | Natural Resources – 8.8% | | | | | |
StarTek | | 15,000 | | | 224,250 | | Energy Services - 3.7% | | | | | |
TRC Companies a, c | | 61,100 | | | 643,383 | | Calfrac Well Services | | 1,000 | | | 21,500 |
Volt Information Sciences a | | 51,600 | | | 2,404,560 | | Carbo Ceramics | | 18,750 | | | 921,187 |
Westaff a | | 362,500 | | | 1,537,000 | | Conrad Industries a | | 154,000 | | | 539,000 |
| | | | |
| | Dawson Geophysical a | | 2,400 | | | 73,848 |
| | | | | | 17,381,593 | | Dril-Quip a | | 27,500 | | | 2,267,100 |
| | | | |
| | Enerflex Systems | | 2,700 | | | 67,361 |
| Engineering and Construction - 1.2% | | | | | | | Gulf Island Fabrication | | 45,400 | | | 909,816 |
Comfort Systems USA | | 25,600 | | | 365,824 | | GulfMark Offshore a, c | | 65,200 | | | 1,684,116 |
Devcon International a | | 21,700 | | | 137,795 | | Input/Output a | | 43,500 | | | 411,075 |
| | | | | | | | Pason Systems | | 222,400 | | | 3,257,404 |
| | | | | | | | StealthGas | | 4,900 | | | 68,355 |
| | | | | | | | TGC Industries a | | 11,280 | | | 121,147 |
36 | 2006 SEMIANNUAL REPORT TO STOCKHOLDERS | THE ACCOMPANYING NOTES ARE AN INTEGRAL PART OF THESE FINANCIAL STATEMENTS. |
|
JUNE 30, 2006 (Unaudited)
|
| |
| | | SHARES | | | VALUE | | | | SHARES | | | VALUE |
| |
| Natural Resources (continued) | | | | | | | CSP a | | 122,581 | | $ | 876,454 |
| Energy Services (continued) | | | | | | | †DDi Corporation a | | 52,747 | | | 432,525 |
Valley National Gases a | | 30,100 | | $ | 787,115 | | Dalsa Corporation a | | 5,000 | | | 65,395 |
Willbros Group a, c | | 35,900 | | | 679,946 | | Dot Hill Systems a, c | | 2,000 | | | 6,840 |
| | | | |
| | Excel Technology a | | 92,900 | | | 2,779,568 |
| | | | | | 11,808,970 | | Giga-tronics a | | 3,200 | | | 6,112 |
| | | | |
| | Hypercom Corporation a, c | | 18,010 | | | 168,394 |
| Oil and Gas - 2.0% | | | | | | | InFocus Corporation a, c | | 54,700 | | | 156,442 |
Bonavista Energy Trust | | 69,700 | | | 2,185,344 | | International DisplayWorks a, c | | 81,560 | | | 424,112 |
CE Franklin a, c | | 56,010 | | | 811,585 | | Merix Corporation a | | 7,000 | | | 76,790 |
Contango Oil & Gas Company a, c | | 10,000 | | | 141,400 | | Metrologic Instruments a, c | | 2,900 | | | 43,529 |
Edge Petroleum a | | 2,000 | | | 39,960 | | Mobility Electronics a, c | | 1,000 | | | 7,260 |
Exploration Company of Delaware a | | 5,500 | | | 58,630 | | MOCON | | 15,600 | | | 148,044 |
Nuvista Energy a | | 121,000 | | | 1,527,269 | | Neoware a, c | | 2,600 | | | 31,954 |
Particle Drilling Technologies a, c | | 7,000 | | | 24,640 | | Performance Technologies a | | 124,550 | | | 859,395 |
Pioneer Drilling Company a | | 7,500 | | | 115,800 | | Richardson Electronics | | 202,100 | | | 1,485,435 |
Savanna Energy Services a | | 2,500 | | | 51,218 | | Rimage Corporation a, c | | 20,000 | | | 408,400 |
†Storm Cat Energy a, c | | 302,270 | | | 680,108 | | SimpleTech a, c | | 201,600 | | | 756,000 |
VAALCO Energy a, c | | 79,500 | | | 775,920 | | TTM Technologies a, c | | 120,700 | | | 1,746,529 |
| | | | |
| | TransAct Technologies a | | 78,600 | | | 809,580 |
| | | | | | 6,411,874 | | Zomax a | | 20,000 | | | 30,600 |
| | | | |
| | | | | |
|
| Precious Metals and Mining - 1.9% | | | | | | | | | | | | 12,699,637 |
Aurizon Mines a | | 237,000 | | | 663,600 | | | | | |
|
Brush Engineered Materials a, c | | 15,500 | | | 323,175 | | Distribution - 0.8% | | | | | |
Cumberland Resources a | | 220,000 | | | 1,056,000 | | Agilysys | | 90,000 | | | 1,620,000 |
Gammon Lake Resources a | | 10,600 | | | 146,174 | | Bell Industries a | | 85,700 | | | 238,246 |
Gold Reserve a | | 14,000 | | | 80,500 | | Jaco Electronics a | | 29,000 | | | 108,460 |
Golden Star Resources a | | 168,100 | | | 497,576 | | Nu Horizons Electronics a, c | | 40,000 | | | 386,000 |
Metallica Resources a, c | | 281,300 | | | 869,217 | | PC Mall a, c | | 6,000 | | | 38,100 |
Minefinders Corporation a | | 116,000 | | | 947,720 | | Pomeroy IT Solutions a | | 6,900 | | | 49,680 |
Nevsun Resources a, c | | 5,000 | | | 14,500 | | | | | |
|
Northern Orion Resources a | | 51,400 | | | 249,804 | | | | | | | 2,440,486 |
Northgate Minerals a | | 270,000 | | | 993,600 | | | | | |
|
NovaGold Resources a | | 13,400 | | | 171,788 | | Internet Software and Services - 2.0% | | | | | |
Spur Ventures a | | 44,100 | | | 37,530 | | Answers Corporation a, c | | 4,100 | | | 39,032 |
| | | | |
| | †CMGI a, c | | 552,000 | | | 667,920 |
| | | | | | 6,051,184 | | Digitas a | | 88,840 | | | 1,032,321 |
| | | | |
| | EDGAR Online a, c | | 38,700 | | | 181,890 |
| Real Estate - 0.3% | | | | | | | †eResearch Technology a, c | | 90,000 | | | 819,000 |
HomeFed Corporation | | 11,352 | | | 774,774 | | iGATE Corporation a, c | | 273,400 | | | 1,747,026 |
Kennedy-Wilson a, c | | 21,500 | | | 370,875 | | Inforte Corporation a | | 11,400 | | | 54,036 |
| | | | |
| | LookSmart a, c | | 4,000 | | | 12,960 |
| | | | | | 1,145,649 | | MIVA a, c | | 10,000 | | | 40,500 |
| | | | |
| | NIC a, c | | 26,800 | | | 193,764 |
| Other Natural Resources - 0.9% | | | | | | | †PFSweb a | | 7,242 | | | 7,314 |
PICO Holdings a | | 55,700 | | | 1,796,325 | | Stamps.com a | | 21,200 | | | 589,784 |
Pope Resources L.P. | | 33,000 | | | 1,027,950 | | Stellent | | 15,000 | | | 143,250 |
| | | | |
| | Varsity Group a, c | | 150,400 | | | 613,632 |
| | | | | | 2,824,275 | | Web.com a | | 31,800 | | | 189,846 |
| | | | |
| | | | | |
|
| Total (Cost $10,941,709) | | | | | 28,241,952 | | | | | | | 6,332,275 |
| | | | |
| | | | | |
|
| Technology – 22.5% | | | | | | | IT Services - 5.2% | | | | | |
| Aerospace and Defense - 2.3% | | | | | | | CIBER a, c | | 182,662 | | | 1,203,743 |
Allied Defense Group (The) a, c | | 78,760 | | | 1,731,932 | | †Cogent Communications Group a, c | | 32,500 | | | 304,525 |
Astronics Corporation a | | 26,400 | | | 353,232 | | Computer Task Group a, c | | 381,100 | | | 1,905,500 |
Axsys Technologies a, c | | 6,400 | | | 96,448 | | Covansys Corporation a, c | | 172,500 | | | 2,168,325 |
Ducommun a | | 72,100 | | | 1,335,292 | | DiamondCluster International a, c | | 138,100 | | | 1,093,752 |
HEICO Corporation | | 41,600 | | | 1,179,360 | | Forrester Research a | | 104,300 | | | 2,918,314 |
HEICO Corporation Cl. A | | 24,160 | | | 573,075 | | Rainmaker Systems a, c | | 2,000 | | | 10,840 |
Integral Systems | | 47,500 | | | 1,274,425 | | Sapient Corporation a, c | | 500,000 | | | 2,650,000 |
SIFCO Industries a, c | | 45,800 | | | 220,756 | | | | | | | |
TVI Corporation a, c | | 211,190 | | | 745,501 | | | | | | | |
| | | | |
| | | | | | | |
| | | | | | 7,510,021 | | | | | | | |
| | | | |
| | | | | | | |
| Components and Systems - 3.9% | | | | | | | | | | | | |
AZZ a, c | | 45,600 | | | 1,195,176 | | | | | | | |
Advanced Photonix Cl. A a | | 117,900 | | | 185,103 | | | | | | | |
| THE ACCOMPANYING NOTES ARE AN INTEGRAL PART OF THESE FINANCIAL STATEMENTS. |
2006 SEMIANNUAL REPORT TO STOCKHOLDERS | 37 |
| | | SHARES | | | VALUE | | | | SHARES | | | VALUE |
| |
| Technology (continued) | | | | | | | Telecommunications - 2.3% | | | | | |
| IT Services (continued) | | | | | | | Anaren a | | 24,300 | | $ | 497,907 |
Syntel | | 54,300 | | $ | 1,110,978 | | C-COR.net a | | 5,000 | | | 38,600 |
TechTeam Global a | | 58,100 | | | 531,615 | | Captaris a | | 67,800 | | | 315,270 |
TriZetto Group (The) a, c | | 182,300 | | | 2,696,217 | | Catapult Communications a, c | | 5,000 | | | 54,500 |
| | | | |
| | Centillium Communications a | | 11,000 | | | 30,910 |
| | | | | | 16,593,809 | | Channell Commercial a, c | | 102,825 | | | 339,322 |
| | | | |
| | Communications Systems | | 79,500 | | | 814,080 |
| Semiconductors and Equipment - 1.6% | | | | | | | Comtech Group a, c | | 31,050 | | | 345,587 |
†CalAmp Corporation a, c | | 36,200 | | | 321,818 | | †Hurray! Holding Company ADR a, c | | 10,100 | | | 55,348 |
California Micro Devices a | | 16,700 | | | 66,800 | | Intervoice a, c | | 2,900 | | | 20,648 |
Cascade Microtech a, c | | 48,000 | | | 550,080 | | North Pittsburgh Systems | | 15,700 | | | 432,692 |
Catalyst Semiconductor a | | 9,200 | | | 33,396 | | Novatel Wireless a, c | | 9,400 | | | 97,572 |
ESS Technology a | | 25,000 | | | 54,000 | | PC-Tel a, c | | 49,600 | | | 423,584 |
Electroglas a, c | | 281,700 | | | 856,368 | | Radyne ComStream a, c | | 55,720 | | | 634,094 |
Exar Corporation a, c | | 41,208 | | | 546,830 | | SpectraLink Corporation a, c | | 57,000 | | | 502,740 |
Integrated Silicon Solution a, c | | 15,000 | | | 82,650 | | Symmetricom a, c | | 24,782 | | | 175,209 |
Intevac a, c | | 40,550 | | | 879,124 | | UCN a | | 100,000 | | | 265,000 |
Jinpan International | | 57,050 | | | 447,842 | | ViaSat a, c | | 91,812 | | | 2,357,732 |
MIPS Technologies a, c | | 10,000 | | | 60,700 | | | | | |
|
PDF Solutions a, c | | 29,000 | | | 359,890 | | | | | | | 7,400,795 |
Photronics a, c | | 29,750 | | | 440,300 | | | | | |
|
QuickLogic Corporation a | | 20,000 | | | 97,800 | | Total (Cost $46,544,452) | | | | | 72,342,050 |
Semitool a, c | | 25,500 | | | 230,010 | | | | | |
|
White Electronic Designs a | | 10,000 | | | 50,800 | | Miscellaneous(e) – 4.0% | | | | | |
| | | | |
| | Total (Cost $12,139,579) | | | | | 12,853,547 |
| | | | | | 5,078,408 | | | | | |
|
| | | | |
| | TOTAL COMMON STOCKS | | | | | |
| Software - 4.4% | | | | | | | (Cost $212,119,437) | | | | | 325,542,135 |
Aladdin Knowledge Systems a | | 27,300 | | | 555,555 | | | | | |
|
Altiris a | | 3,500 | | | 63,140 | | PREFERRED STOCK – 0.5% | | | | | |
Applix a | | 20,000 | | | 147,600 | | Seneca Foods Conv. a | | 75,409 | | | 1,583,589 |
AsiaInfo Holdings a, c | | 50,000 | | | 214,500 | | | | | |
|
Descartes Systems Group (The) a, c | | 56,500 | | | 207,920 | | TOTAL PREFERRED STOCK | | | | | |
DocuCorp International a | | 100,000 | | | 747,000 | | (Cost $943,607) | | | | | 1,583,589 |
Evans & Sutherland Computer a | | 77,400 | | | 387,000 | | | | | |
|
Fundtech a | | 55,000 | | | 539,550 | | REPURCHASE AGREEMENTS – 17.2% | | | | | |
ILOG ADR a | | 35,000 | | | 460,600 | | State Street Bank & Trust Company, | | | | | |
Indus International a | | 19,200 | | | 54,912 | | 5.10% dated 6/30/06, due 7/3/06, | | | | | |
InterVideo a, c | | 24,500 | | | 239,365 | | maturity value $25,511,838 (collateralized | | | | | |
iPass a, c | | 190,000 | | | 1,064,000 | | by obligations of various U.S. Government | | | | | |
JDA Software Group a, c | | 59,500 | | | 834,785 | | Agencies, valued at $26,138,650) | | | | | |
Majesco Entertainment Company a | | 2,500 | | | 4,075 | | (Cost $25,501,000) | | | | | 25,501,000 |
MapInfo a, c | | 5,000 | | | 65,250 | | | | | |
|
McDATA Corporation Cl. A a, c | | 18,199 | | | 74,252 | | Lehman Brothers (Tri-Party), | | | | | |
MetaSolv a, c | | 5,800 | | | 16,356 | | 4.85% dated 6/30/06, due 7/3/06, | | | | | |
MIND C.T.I. | | 20,000 | | | 51,600 | | maturity value $30,012,125 (collateralized | | | | | |
Moldflow Corporation a | | 7,500 | | | 87,825 | | by obligations of various U.S. Government | | | | | |
Peerless Systems a, c | | 61,070 | | | 313,289 | | Agencies, valued at $30,615,940) | | | | | |
Pegasystems c | | 320,200 | | | 2,055,684 | | (Cost $30,000,000) | | | | | 30,000,000 |
Phase Forward a, c | | 43,000 | | | 495,360 | | | | | |
|
SPSS a | | 41,800 | | | 1,343,452 | | TOTAL REPURCHASE AGREEMENTS | | | | | |
SeaChange International a, c | | 5,000 | | | 34,800 | | (Cost $55,501,000) | | | | | 55,501,000 |
TeleCommunication Systems Cl. A a, c | | 10,000 | | | 23,900 | | | | | |
|
Transaction Systems Architects Cl. A a, c | | 100,100 | | | 4,173,169 | | | | | | | |
Unica Corporation a, c | | 3,200 | | | 31,680 | | | | | | | |
| | | | |
| | | | | | | |
| | | | | | 14,286,619 | | | | | | | |
| | | | |
| | | | | | | |
38 | 2006 SEMIANNUAL REPORT TO STOCKHOLDERS | THE ACCOMPANYING NOTES ARE AN INTEGRAL PART OF THESE FINANCIAL STATEMENTS. |
|
JUNE 30, 2006 (Unaudited)
|
| |
| | | | VALUE | |
| |
| COLLATERAL RECEIVED FOR SECURITIES LOANED – 13.1% | | | | |
| Money Market Funds | | | | |
State Street Navigator Securities Lending | | | | |
Prime Portfolio (7 day yield-5.0651%) | | | | |
(Cost $42,080,785) | | $ | 42,080,785 | |
| | |
| |
| TOTAL INVESTMENTS – 132.1% | | | | |
(Cost $310,644,829) | | | 424,707,509 | |
LIABILITIES LESS CASH
AND OTHER ASSETS – (13.4)% | | | (43,231,776 | ) |
PREFERRED STOCK – (18.7)% | | | (60,000,000 | ) |
| | |
| |
| NET ASSETS APPLICABLE TO | | | | |
COMMON STOCKHOLDERS – 100.0% | | $ | 321,475,733 | |
| | |
| |
|
| a | | Non-income producing. |
| b | | At June 30, 2006, the Fund owned 5% or more of the Company’s outstanding voting securities thereby making the Company an Affiliated Company as that term is defined in the Investment Company Act of 1940. |
| c | | A portion of these securities were on loan at June 30, 2006. |
| d | | A security for which market quotations are no longer readily available represents 0.00% of net assets. This security has been valued at its fair value under procedures established by the Fund’s Board of Directors. |
| e | | Includes securities first acquired in 2006 and less than 1% of net assets applicable to Common Stockholders. |
| † | | New additions in 2006. |
| | |
Bold indicates the Fund’s largest 20 equity holdings in terms of June 30, 2006 market value. |
| INCOME TAX INFORMATION: The cost of total investments for Federal income tax purposes was $311,447,026. At June 30, 2006, net unrealized appreciation for all securities was $113,260,483, consisting of aggregate gross unrealized appreciation of $125,806,222 and aggregate gross unrealized depreciation of $12,545,739. The primary differences in book and tax basis cost is the timing of the recognition of losses on securities sold. |
|
| THE ACCOMPANYING NOTES ARE AN INTEGRAL PART OF THESE FINANCIAL STATEMENTS. |
2006 SEMIANNUAL REPORT TO STOCKHOLDERS | 39 |
| ROYCE MICRO-CAP TRUST | | JUNE 30, 2006 (Unaudited) |
|
| | | | | |
| | | | | |
|
| Statement of Assets and Liabilities | | | | |
|
| | | | | |
| ASSETS: | | | | |
| Investments at value (including collateral on loaned securities) * | | | | |
Non-Affiliates (cost $252,353,429) | | $ | 366,764,909 | |
Affiliated Companies (cost $2,790,400) | | | 2,441,600 | |
|
| Total investments at value | | | 369,206,509 | |
| Repurchase agreements (at cost and value) | | | 55,501,000 | |
| Cash | | | 4,100 | |
| Receivable for investments sold | | | 364,950 | |
| Receivable for dividends and interest | | | 252,007 | |
|
Total Assets | | | 425,328,566 | |
|
| LIABILITIES: | | | | |
| Payable for collateral on loaned securities | | | 42,080,785 | |
| Payable for investments purchased | | | 1,120,593 | |
| Payable for investment advisory fee | | | 421,689 | |
| Preferred dividends accrued but not yet declared | | | 80,000 | |
| Accrued expenses | | | 149,766 | |
|
Total Liabilities | | | 43,852,833 | |
|
| PREFERRED STOCK: | | | | |
| 6.00% Cumulative Preferred Stock - $0.001 par value, $25 liquidation value per share; 2,400,000 shares outstanding | | | 60,000,000 | |
|
Total Preferred Stock | | | 60,000,000 | |
|
| NET ASSETS APPLICABLE TO COMMON STOCKHOLDERS | | $ | 321,475,733 | |
|
| ANALYSIS OF NET ASSETS APPLICABLE TO COMMON STOCKHOLDERS: | | | | |
| Common Stock paid-in capital - $0.001 par value per share; 22,456,527 shares outstanding (150,000,000 shares authorized) | | $ | 192,512,057 | |
| Undistributed net investment income (loss) | | | 78,015 | |
| Accumulated net realized gain (loss) on investments | | | 30,571,167 | |
| Net unrealized appreciation (depreciation) on investments | | | 114,062,680 | |
| Quarterly and accrued distributions | | | (15,748,186 | ) |
|
Net Assets applicable to Common Stockholders (net asset value per share - $14.32) | | $ | 321,475,733 | |
|
| *Investments at identified cost (including $42,080,785 of collateral on loaned securites) | | $ | 255,143,829 | |
|
| Market value of loaned securities | | $ | 41,104,418 | |
|
40 | 2006 SEMIANNUAL REPORT TO STOCKHOLDERS | THE ACCOMPANYING NOTES ARE AN INTEGRAL PART OF THESE FINANCIAL STATEMENTS. |
| ROYCE MICRO-CAP TRUST | | SIX MONTHS ENDED JUNE 30, 2006 (Unaudited) |
|
| |
| |
|
| Statement of Operations | | | | |
|
| | | | | |
| INVESTMENT INCOME: | | | | |
| Income: | | | | |
Dividends | | | | |
Non-Affiliates | | $ | 1,382,968 | |
Affiliated Companies | | | 52,350 | |
Interest | | | 1,172,517 | |
Securities lending | | | 151,655 | |
|
| Total income | | | 2,759,490 | |
|
| Expenses: | | | | |
Investment advisory fees | | | 2,442,929 | |
Stockholder reports | | | 71,008 | |
Custody and transfer agent fees | | | 69,753 | |
Directors’ fees | | | 29,954 | |
Professional fees | | | 20,665 | |
Administrative and office facilities expenses | | | 14,836 | |
Other expenses | | | 37,097 | |
|
| Total expenses | | | 2,686,242 | |
| Compensating balance credits | | | (5,871 | ) |
|
| Net expenses | | | 2,680,371 | |
|
| Net investment income (loss) | | | 79,119 | |
|
| REALIZED AND UNREALIZED GAIN (LOSS) ON INVESTMENTS: | | | | |
| Net realized gain (loss) on investments | | | | |
Non-Affiliates | | | 28,522,036 | |
Affiliated Companies | | | (208,963 | ) |
| Net change in unrealized appreciation (depreciation) on investments | | | 6,966,400 | |
|
| Net realized and unrealized gain (loss) on investments | | | 35,279,473 | |
|
| NET INCREASE (DECREASE) IN NET ASSETS RESULTING FROM INVESTMENT OPERATIONS | | | 35,358,592 | |
|
| DISTRIBUTIONS TO PREFERRED STOCKHOLDERS | | | (1,800,000 | ) |
|
NET INCREASE (DECREASE) IN NET ASSETS APPLICABLE TO COMMON STOCKHOLDERS RESULTING FROM INVESTMENT OPERATIONS | | $ | 33,558,592 | |
|
| THE ACCOMPANYING NOTES ARE AN INTEGRAL PART OF THESE FINANCIAL STATEMENTS. |
2006 SEMIANNUAL REPORT TO STOCKHOLDERS | 41 |
|
| |
| |
|
| Statement of Changes in Net Assets | | | | |
|
|
| | | Six months ended | | | | |
| | | 6/30/06 | | Year ended |
| | | (unaudited) | | 12/31/05 |
|
| | | | | | | | | |
| INVESTMENT OPERATIONS: | | | | | | | | |
| Net investment income (loss) | | $ | 79,119 | | | $ | (763,209 | ) |
| Net realized gain (loss) on investments | | | 28,313,073 | | | | 37,754,245 | |
| Net change in unrealized appreciation (depreciation) on investments | | | 6,966,400 | | | | (14,066,144 | ) |
|
| Net increase (decrease) in net assets resulting from investment operations | | | 35,358,592 | | | | 22,924,892 | |
|
| DISTRIBUTIONS TO PREFERRED STOCKHOLDERS: | | | | | | | | |
| Net realized gain on investments | | | – | | | | (3,600,000 | ) |
| Quarterly distributions * | | | (1,800,000 | ) | | | – | |
|
| Total distributions to Preferred Stockholders | | | (1,800,000 | ) | | | (3,600,000 | ) |
|
NET INCREASE (DECREASE) IN NET ASSETS APPLICABLE TO COMMON STOCKHOLDERS RESULTING FROM INVESTMENT OPERATIONS | | | 33,558,592 | | | | 19,324,892 | |
|
| DISTRIBUTIONS TO COMMON STOCKHOLDERS: | | | | | | | | |
| Net realized gain on investments | | | – | | | | (38,452,900 | ) |
| Quarterly distributions * | | | (13,868,186 | ) | | | – | |
|
| Total distributions to Common Stockholders | | | (13,868,186 | ) | | | (38,452,900 | ) |
|
| CAPITAL STOCK TRANSACTIONS: | | | | | | | | |
| Reinvestment of distributions to Common Stockholders | | | 8,066,130 | | | | 22,483,567 | |
|
| Total capital stock transactions | | | 8,066,130 | | | | 22,483,567 | |
|
| NET INCREASE (DECREASE) IN NET ASSETS APPLICABLE TO COMMON STOCKHOLDERS | | | 27,756,536 | | | | 3,355,559 | |
|
| NET ASSETS APPLICABLE TO COMMON STOCKHOLDERS: | | | | | | | | |
Beginning of period | | | 293,719,197 | | | | 290,363,638 | |
|
End of period (including undistributed net investment income (loss) of $78,015 at 6/30/06 and $(1,104) at 12/31/05) | | $ | 321,475,733 | | | $ | 293,719,197 | |
|
| *To be allocated to net investment income and capital gains at year end. | | | | | | | | |
42 | 2006 SEMIANNUAL REPORT TO STOCKHOLDERS | THE ACCOMPANYING NOTES ARE AN INTEGRAL PART OF THESE FINANCIAL STATEMENTS. |
| This table is presented to show selected data for a share of Common Stock outstanding throughout each period, and to assist stockholders in evaluating the Fund’s performance for the periods presented. |
| | | Six months ended | | | Years ended December 31, |
| | | June 30,2006 | | |
|
| | | (unaudited) | | | 2005 | | | 2004 | | | 2003 | | | 2002 | | | 2001 |
|
| NET ASSET VALUE, BEGINNING OF PERIOD | | $ | 13.43 | | | | $ | 14.34 | | | | $ | 13.33 | | | | $ | 9.39 | | | | $ | 11.83 | | | | $ | 10.14 | |
|
| INVESTMENT OPERATIONS: | | | | | | | | | | | | | | | | | | | | | | | | | | | | | |
Net investment income (loss) | | | 0.00 | | | | | (0.03 | ) | | | | (0.08 | ) | | | | (0.09 | ) | | | | (0.13 | ) | | | | (0.05 | ) |
Net realized and unrealized gain (loss) on investments | | | 1.61 | | | | | 1.14 | | | | | 2.62 | | | | | 5.28 | | | | | (1.29 | ) | | | | 2.57 | |
|
Total investment operations | | | 1.61 | | | | | 1.11 | | | | | 2.54 | | | | | 5.19 | | | | | (1.42 | ) | | | | 2.52 | |
|
| DISTRIBUTIONS TO PREFERRED STOCKHOLDERS: | | | | | | | | | | | | | | | | | | | | | | | | | | | | | |
Net investment income | | | – | | | | | – | | | | | – | | | | | – | | | | | – | | | | | – | |
Net realized gain on investments | | | – | | | | | (0.17 | ) | | | | (0.19 | ) | | | | (0.18 | ) | | | | (0.18 | ) | | | | (0.19 | ) |
Quarterly distributions * | | | (0.08 | ) | | | | – | | | | | – | | | | | – | | | | | – | | | | | – | |
|
Total distributions to Preferred Stockholders | | | (0.08 | ) | | | | (0.17 | ) | | | | (0.19 | ) | | | | (0.18 | ) | | | | (0.18 | ) | | | | (0.19 | ) |
|
NET INCREASE (DECREASE) IN NET ASSETS APPLICABLE TO COMMON | | | | | | | | | | | | | | | | | | | | | | | | | | | |
STOCKHOLDERS RESULTING FROM INVESTMENT OPERATIONS | | | 1.53 | | | | | 0.94 | | | | | 2.35 | | | | | 5.01 | | | | | (1.60 | ) | | | | 2.33 | |
|
| DISTRIBUTIONS TO COMMON STOCKHOLDERS: | | | | | | | | | | | | | | | | | | | | | | | | | | | | | |
Net investment income | | | – | | | | | – | | | | | – | | | | | – | | | | | – | | | | | – | |
Net realized gain on investments | | | – | | | | | (1.85 | ) | | | | (1.33 | ) | | | | (0.92 | ) | | | | (0.80 | ) | | | | (0.57 | ) |
Quarterly distributions * | | | (0.63 | ) | | | | – | | | | | – | | | | | – | | | | | – | | | | | – | |
|
Total distributions to Common Stockholders | | | (0.63 | ) | | | | (1.85 | ) | | | | (1.33 | ) | | | | (0.92 | ) | | | | (0.80 | ) | | | | (0.57 | ) |
|
| CAPITAL STOCK TRANSACTIONS: | | | | | | | | | | | | | | | | | | | | | | | | | | | | | |
Effect of reinvestment of distributions by Common Stockholders | | | (0.01 | ) | | | | 0.00 | | | | | (0.01 | ) | | | | (0.04 | ) | | | | (0.04 | ) | | | | (0.07 | ) |
Effect of Preferred Stock offering | | | – | | | | | – | | | | | – | | | | | (0.11 | ) | | | | – | | | | | – | |
|
Total capital stock transactions | | | (0.01 | ) | | | | 0.00 | | | | | (0.01 | ) | | | | (0.15 | ) | | | | (0.04 | ) | | | | (0.07 | ) |
|
| NET ASSET VALUE, END OF PERIOD | | $ | 14.32 | | | | $ | 13.43 | | | | $ | 14.34 | | | | $ | 13.33 | | | | $ | 9.39 | | | | $ | 11.83 | |
|
| MARKET VALUE, END OF PERIOD | | $ | 14.54 | | | | $ | 14.56 | | | | $ | 15.24 | | | | $ | 12.60 | | | | $ | 8.44 | | | | $ | 10.50 | |
|
| TOTAL RETURN (a): | | | | | | | | | | | | | | | | | | | | | | | | | | | | | |
| Market Value | | | 4.50 | % *** | | | | 8.90 | % | | | | 33.44 | % | | | | 63.58 | % | | | | (12.70 | )% | | | | 28.76 | % |
| Net Asset Value | | | 11.58 | % *** | | | | 6.75 | % | | | | 18.69 | % | | | | 55.55 | % | | | | (13.80 | )% | | | | 23.40 | % |
RATIOS BASED ON AVERAGE NET ASSETS APPLICABLE TO COMMON STOCKHOLDERS: | | | | | | | | | | | | | | | | | | | | | | | | | | | | | |
| Total expenses (b, c) | | | 1.67 | % ** | | | | 1.63 | % | | | | 1.62 | % | | | | 1.82 | % | | | | 1.96 | % | | | | 1.78 | % |
Management fee expense (d) | | | 1.52 | % ** | | | | 1.43 | % | | | | 1.43 | % | | | | 1.59 | % | | | | 1.59 | % | | | | 1.57 | % |
Other operating expenses | | | 0.15 | % ** | | | | 0.20 | % | | | | 0.19 | % | | | | 0.23 | % | | | | 0.37 | % | | | | 0.21 | % |
| Net investment income (loss) | | | 0.05 | % ** | | | | (0.27 | )% | | | | (0.56 | )% | | | | (0.82 | )% | | | | (1.23 | )% | | | | (0.43 | )% |
| SUPPLEMENTAL DATA: | | | | | | | | | | | | | | | | | | | | | | | | | | | | | |
| Net Assets Applicable to Common Stockholders, | | | | | | | | | | | | | | | | | | | | | | | | | | | | | |
End of Period (in thousands) | | $ | 321,476 | | | | $ | 293,719 | | | | $ | 290,364 | | | | $ | 253,425 | | | | $ | 167,571 | | | | $ | 200,443 | |
| Liquidation Value of Preferred Stock, | | | | | | | | | | | | | | | | | | | | | | | | | | | | | |
End of Period (in thousands) | | $ | 60,000 | | | | $ | 60,000 | | | | $ | 60,000 | | | | $ | 60,000 | | | | $ | 40,000 | | | | $ | 40,000 | |
| Portfolio Turnover Rate | | | 16 | % | | | | 46 | % | | | | 32 | % | | | | 26 | % | | | | 39 | % | | | | 27 | % |
| PREFERRED STOCK: | | | | | | | | | | | | | | | | | | | | | | | | | | | | | |
| Total shares outstanding | | | 2,400,000 | | | | | 2,400,000 | | | | | 2,400,000 | | | | | 2,400,000 | | | | | 1,600,000 | | | | | 1,600,000 | |
| Asset coverage per share | | $ | 158.95 | | | | $ | 147.38 | | | | $ | 145.98 | | | | $ | 130.59 | | | | $ | 129.73 | | | | $ | 150.28 | |
| Liquidation preference per share | | $ | 25.00 | | | | $ | 25.00 | | | | $ | 25.00 | | | | $ | 25.00 | | | | $ | 25.00 | | | | $ | 25.00 | |
| Average market value per share (e): | | | | | | | | | | | | | | | | | | | | | | | | | | | | | |
6.00% Cumulative | | $ | 23.97 | | | | $ | 24.97 | | | | $ | 24.66 | | | | $ | 25.37 | | | | | – | | | | | – | |
7.75% Cumulative | | | – | | | | | – | | | | | – | | | | $ | 25.70 | | | | $ | 25.91 | | | | $ | 25.30 | |
|
| (a) | | The Market Value Total Return is calculated assuming a purchase of Common Stock on the opening of the first business day and a sale on the closing of the last business day of each period reported. Dividends and distributions, if any, are assumed for the purposes of this calculation to be reinvested at prices obtained under the Fund’s Distribution Reinvestment and Cash Purchase Plan. Net Asset Value Total Return is calculated on the same basis, except that the Fund’s net asset value is used on the purchase and sale dates instead of market value. |
| (b) | | Expense ratios based on total average net assets including liquidation value of Preferred Stock were 1.41%, 1.35%, 1.32%, 1.49%, 1.62% and 1.46% for the periods ended June 30, 2006 and December 31, 2005, 2004, 2003, 2002 and 2001, respectively. |
| (c) | | Expense ratios based on average net assets applicable to Common Stockholders before waiver of fees by the investment adviser would have been 1.92%, 2.04% and 1.81% for the periods ended December 31, 2003, 2002 and 2001, respectively. |
| (d) | | The management fee is calculated based on average net assets over a rolling 36-month basis, while the above ratios of Management fee expenses are based on average net assets applicable to Common Stockholders over an annualized six-month basis. |
| (e) | | The average of month-end market values during the period that the Preferred Stock was outstanding. |
| * | | To be allocated to net investment income and capital gains at year end. |
| ** | | Annualized. |
| *** | | Not annualized. |
| THE ACCOMPANYING NOTES ARE AN INTEGRAL PART OF THESE FINANCIAL STATEMENTS. |
2006 SEMIANNUAL REPORT TO STOCKHOLDERS | 43 |
|
Notes to Financial Statements (Unaudited) |
|
Summary of Significant Accounting Policies:
Royce Micro-Cap Trust, Inc. (“the Fund”) was incorporated under the laws of the State of Maryland on September 9, 1993 as a diversified closed-end investment company. The Fund commenced operations on December 14, 1993.
The preparation of financial statements in conformity with accounting principles generally accepted in the United States of America requires management to make estimates and assumptions that affect the reported amounts of assets and liabilities and the disclosure of contingent assets and liabilities at the date of the financial statements, and the reported amounts of income and expenses during the reporting period. Actual results could differ from those estimates. Valuation of Investments:
Securities are valued as of the close of trading on the New York Stock Exchange (generally 4:00 p.m. Eastern time) on the valuation date. Securities that trade on an exchange or Nasdaq, and securities traded on Nasdaq’s Electronic Bulletin Board, are valued at their last reported sales price or Nasdaq official closing price taken from the primary market in which each security trades or, if no sale is reported for such day, at their bid price. Other over-the-counter securities for which market quotations are readily available are valued at their bid price. Securities for which market quotations are not readily available are valued at their fair value under procedures established by the Fund’s Board of Directors. Bonds and other fixed income securities may be valued by reference to other securities with comparable ratings, interest rates and maturities, using established independent pricing services. Investments in money market funds are valued at net asset value per share. Investment Transactions and Related Investment Income:
Investment transactions are accounted for on the trade date. Dividend income is recorded on the ex-dividend date and any non-cash dividend income is recorded at the fair market value of the securities received. Interest income is recorded on an accrual basis. Realized gains and losses from investment transactions are determined on the basis of identified cost for book and tax purposes. Expenses:
The Fund incurs direct and indirect expenses. Expenses directly attributable to the Fund are charged to the Fund’s operations, while expenses applicable to more than one of the Royce Funds are allocated in an equitable manner. Allocated personnel and occupancy costs related to The Royce Funds are included in administrative and office facilities expenses. The Fund has adopted a deferred fee agreement that allows the Fund’s Directors to defer the receipt of all or a portion of Directors’ Fees otherwise payable. The deferred fees are invested in certain Royce Funds until distributed in accordance with the agreement. Compensating Balance Credits:
The Fund has an arrangement with its custodian bank, whereby a portion of the custodian’s fee is paid indirectly by credits earned on the Fund’s cash on deposit with the bank. This deposit arrangement is an alternative to purchasing overnight investments. | | Taxes:
As a qualified regulated investment company under Subchapter M of the Internal Revenue Code, the Fund is not subject to income taxes to the extent that it distributes substantially all of its taxable income for its fiscal year. The Schedule of Investments includes information regarding income taxes under the caption “Income Tax Information”. Distributions:
The Fund currently has a policy of paying quarterly distributions on the Fund’s Common Stock. Distributions are currently being made at the annual rate of 9% of the rolling average of the prior four calendar quarter-end NAVs of the Fund’s Common Stock, with the fourth quarter distribution being the greater of 2.25% of the rolling average or the distribution required by IRS regulations. Distributions to Preferred Stockholders are accrued daily and paid quarterly. The Fund is required to allocate long-term capital gain distributions and other types of income proportionately to distributions made to holders of shares of Common Stock and Preferred Stock. To the extent that distributions are not paid from long-term capital gains, net investment income or net short-term capital gains, they will represent a return of capital. Distributions are determined in accordance with income tax regulations that may differ from accounting principles generally accepted in the United States of America. Permanent book and tax basis differences relating to stockholder distributions will result in reclassifications within the capital accounts. Undistributed net investment income may include temporary book and tax basis differences, which will reverse in a subsequent period. Any taxable income or gain remaining undistributed at fiscal year end is distributed in the following year. Repurchase Agreements:
The Fund may enter into repurchase agreements with institutions that the Fund’s investment adviser has determined are creditworthy. The Fund restricts repurchase agreements to maturities of no more than seven days. Securities pledged as collateral for repurchase agreements, which are held until maturity of the repurchase agreements, are marked-to-market daily and maintained at a value at least equal to the principal amount of the repurchase agreement (including accrued interest). Repurchase agreements could involve certain risks in the event of default or insolvency of the counter-party, including possible delays or restrictions upon the ability of the Fund to dispose of the underlying securities. Securities Lending:
The Fund loans securities to qualified institutional investors for the purpose of realizing additional income. Collateral on all securities loaned for the Fund is accepted in cash and cash equivalents and invested temporarily by the custodian. The collateral is equal to at least 100% of the current market value of the loaned securities. The market value of the loaned securities is determined at the close of business of the Fund and any additional required collateral is delivered to the Fund on the next business day. |
44 | 2006 SEMIANNUAL REPORT TO STOCKHOLDERS | |
|
Notes to Financial Statements (Unaudited) (continued) |
|
Capital Stock:
The Fund issued 587,476 and 1,625,665 shares of Common Stock as reinvestment of distributions by Common Stockholders for the six months ended June 30, 2006 and the year ended December 31, 2005, respectively.
At June 30, 2006, 2,400,000 shares of 6.00% Cumulative Preferred Stock were outstanding. Commencing October 16, 2008 and thereafter, the Fund, at its option, may redeem the Cumulative Preferred Stock, in whole or in part, at the redemption price. The Cumulative Preferred Stock is classified outside of permanent equity (net assets applicable to Common Stockholders) in the accompanying financial statements in accordance with Emerging Issues Task Force (EITF) Topic D-98, Classification and Measurement of Redeemable Securities, that requires preferred securities that are redeemable for cash or other assets to be classified outside of permanent equity to the extent that the redemption is at a fixed or determinable price and at the option of the holder or upon the occurrence of an event that is not solely within the control of the issuer.
The Fund is required to meet certain asset coverage tests with respect to the Cumulative Preferred Stock as required by the 1940 Act. In addition, pursuant to the Rating Agency Guidelines established by Moody’s, the Fund is required to maintain a certain discounted asset coverage. If the Fund fails to meet these requirements and does not correct such failure, the Fund may be required to redeem, in part or in full, the Cumulative Preferred Stock at a redemption price of $25.00 per share, plus an amount equal to the accumulated and unpaid dividends, whether or not declared on such shares, in order to meet these requirements. Additionally, failure to meet the foregoing asset coverage requirements could restrict the Fund’s ability to pay dividends to Common Stockholders and could lead to sales of portfolio securities at inopportune times. The Fund has met these requirements since issuing the Cumulative Preferred Stock. Investment Advisory Agreement:
As compensation for its services under the Investment Advisory Agreement, Royce & Associates, LLC (“Royce”) receives a fee comprised of a Basic Fee (“Basic Fee”) and an adjustment to the Basic Fee based on the investment performance of the Fund in relation to the investment record of the Russell 2000. | | The Basic Fee is a monthly fee equal to 1/12 of 1% (1% on an annualized basis) of the average of the Fund’s month-end net assets applicable to Common Stockholders, plus the liquidation value of Preferred Stock, for the rolling 36-month period ending with such month (the “performance period”). The Basic Fee for each month is increased or decreased at the rate of 1/12 of .05% for each percentage point that the investment performance of the Fund exceeds, or is exceeded by, the percentage change in the investment record of the Russell 2000 for the performance period by more than two percentage points. The performance period for each such month is a rolling 36-month period ending with such month. The maximum increase or decrease in the Basic Fee for any month may not exceed 1/12 of .5%. Accordingly, for each month, the maximum monthly fee rate as adjusted for performance is 1/12 of 1.5% and is payable if the investment performance of the Fund exceeds the percentage change in the investment record of the Russell 2000 by 12 or more percentage points for the performance period, and the minimum monthly fee rate as adjusted for performance is 1/12 of5% and is payable if the percentage change in the investment record of the Russell 2000 exceeds the investment performance of the Fund by 12 or more percentage points for the performance period.
Royce has voluntarily committed to waive the portion of its investment advisory fee attributable to an issue of the Fund’s Preferred Stock for any month in which the Fund’s average annual NAV total return since issuance of the Preferred Stock fails to exceed the applicable Preferred Stock’s dividend rate.
For the six rolling 36-month periods ending June 2006, the investment performance of the Fund exceeded the investment performance of the Russell 2000 by 18% to 29%. Accordingly, the investment advisory fee consisted of a Basic Fee of $1,628,619 and an upward adjustment of $814,310 for performance of the Fund above that of the Russell 2000. For the six months ended June 30, 2006, the Fund accrued and paid Royce advisory fees totaling $2,442,929. Purchases and Sales of Investment Securities:
For the six months ended June 30, 2006, the cost of purchases and proceeds from sales of investment securities, other than short-term securities and collateral received for securities loaned, amounted to $52,230,448 and $77,416,882, respectively. |
Transactions in Shares of Affiliated Companies:
An “Affiliated Company”, as defined in the Investment Company Act of 1940, is a company in which a Fund owns 5% or more of the company’s outstanding voting securities. The Fund effected the following transactions in shares of such companies during the six months ended June 30, 2006:
|
| | | Shares | | Market Value | | Cost of | | Cost of | | Realized | | Dividend | | Shares | | Market Value |
| Affiliated Company | | 12/31/05 | | 12/31/05 | | Purchases | | Sales | | Gain (Loss) | | Income | | 6/30/06 | | 6/30/06 |
|
| Abigail Adams National Bancorp | | | | 244,400 | | | | $ | 3,421,624 | | | – | | | $ | 1,120,000 | | | | $ | (208,963 | ) | | | $ | 52,350 | | | | | 174,400 | | | | $ | 2,441,600 | |
|
| | | | | | | | | $ | 3,421,624 | | | | | | | | | | | | | | $ | (208,963 | ) | | | $ | 52,350 | | | | | | | | | $ | 2,441,600 | |
| | |
|
| |
2006 SEMIANNUAL REPORT TO STOCKHOLDERS | 45 |
| | | SHARES | | | VALUE | | | | SHARES | | | VALUE |
| |
| COMMON STOCK – 81.2% | | | | | | | Metal Fabrication and Distribution - 13.6% | | | | | |
| | | | | | | | Harris Steel Group | | 150,000 | | $ | 3,796,023 |
| Consumer Products – 6.1% | | | | | | | IPSCO | | 60,000 | | | 5,741,400 |
| Apparel and Shoes - 1.3% | | | | | | | Metal Management | | 120,000 | | | 3,674,400 |
Timberland Company Cl. A a | | 75,000 | | $ | 1,957,500 | | Reliance Steel & Aluminum | | 50,000 | | | 4,147,500 |
| | | | |
| | Schnitzer Steel Industries Cl. A | | 100,000 | | | 3,548,000 |
| Sports and Recreation - 4.8% | | | | | | | | | | |
|
Thor Industries | | 90,000 | | | 4,360,500 | | | | | | | 20,907,323 |
Winnebago Industries | | 100,000 | | | 3,104,000 | | | | | |
|
| | | | |
| | Total (Cost $17,877,031) | | | | | 36,636,318 |
| | | | | | 7,464,500 | | | | | |
|
| | | | |
| | Industrial Services – 3.6% | | | | | |
| Total (Cost $7,013,362) | | | | | 9,422,000 | | Commercial Services - 1.0% | | | | | |
| | | | |
| | BB Holdings a | | 400,000 | | | 1,516,345 |
| Consumer Services – 4.4% | | | | | | | | | | |
|
| Direct Marketing - 1.9% | | | | | | | Transportation and Logistics - 2.6% | | | | | |
Nu Skin Enterprises Cl. A | | 200,000 | | | 2,970,000 | | Arkansas Best | | 80,000 | | | 4,016,800 |
| | | | |
| | | | | |
|
| Retail Stores - 1.4% | | | | | | | Total (Cost $4,328,352) | | | | | 5,533,145 |
†Buckle (The) | | 50,100 | | | 2,097,687 | | | | | |
|
| | | | |
| | Natural Resources – 22.9% | | | | | |
| Other Consumer Services - 1.1% | | | | | | | Energy Services - 10.3% | | | | | |
Corinthian Colleges a | | 120,000 | | | 1,723,200 | | Ensign Energy Services | | 170,000 | | | 3,493,505 |
| | | | |
| | Input/Output a, b | | 250,000 | | | 2,362,500 |
| Total (Cost $6,047,290) | | | | | 6,790,887 | | Pason Systems | | 200,000 | | | 2,929,320 |
| | | | |
| | Tesco Corporation a | | 200,000 | | | 4,144,000 |
| Financial Intermediaries – 3.4% | | | | | | | Trican Well Service b | | 140,000 | | | 2,796,739 |
| Banking - 0.9% | | | | | | | | | | |
|
†Endeavour Mining Capital | | 195,400 | | | 1,377,585 | | | | | | | 15,726,064 |
| | | | |
| | | | | |
|
Securities Brokers - 2.5% | | | | | | | Precious Metals and Mining - 12.6% | | | | | |
†Knight Capital Group Cl. A a, b | | 250,000 | | | 3,807,500 | | Gammon Lake Resources a | | 100,000 | | | 1,379,000 |
| | | | |
| | Glamis Gold a | | 100,000 | | | 3,786,000 |
Total (Cost $5,288,616) | | | | | 5,185,085 | | †International Coal Group a, b | | 310,000 | | | 2,228,900 |
| | | | |
| | Ivanhoe Mines a, b | | 400,000 | | | 2,728,000 |
| Financial Services – 3.1% | | | | | | | Meridian Gold a, b | | 100,000 | | | 3,168,000 |
| Information and Processing - 2.1% | | | | | | | Pan American Silver a, b | | 140,000 | | | 2,518,600 |
eFunds Corporation a, b | | 150,000 | | | 3,307,500 | | Silver Standard Resources a, b | | 180,000 | | | 3,600,000 |
| | | | |
| | | | | |
|
| Investment Management - 1.0% | | | | | | | | | | | | 19,408,500 |
GAMCO Investors Cl. A | | 41,500 | | | 1,525,540 | | | | | |
|
| | | | |
| | Total (Cost $19,436,521) | | | | | 35,134,564 |
| Total (Cost $3,678,413) | | | | | 4,833,040 | | | | | |
|
| | | | |
| | Technology – 8.0% | | | | | |
| Health – 5.9% | | | | | | | Internet Software and Services - 2.4% | | | | | |
| Drugs and Biotech - 4.7% | | | | | | | RealNetworks a, b | | 350,000 | | | 3,745,000 |
Endo Pharmaceuticals Holdings a | | 150,000 | | | 4,947,000 | | | | | |
|
Lexicon Genetics a, b | | 400,000 | | | 1,756,000 | | IT Services - 0.8% | | | | | |
Orchid Cellmark a | | 150,000 | | | 418,500 | | Syntel | | 60,000 | | | 1,227,600 |
| | | | |
| | | | | |
|
| | | | | | 7,121,500 | | Software - 2.7% | | | | | |
| | | | |
| | ManTech International Cl. A a, b | | 100,000 | | | 3,086,000 |
| Medical Products and Devices - 1.2% | | | | | | | PLATO Learning a, b | | 160,000 | | | 995,200 |
Caliper Life Sciences a | | 200,000 | | | 998,000 | | | | | |
|
Possis Medical a, b | | 100,000 | | | 881,000 | | | | | | | 4,081,200 |
| | | | |
| | | | | |
|
| | | | | | 1,879,000 | | Telecommunications - 2.1% | | | | | |
| | | | |
| | Foundry Networks a | | 300,000 | | | 3,198,000 |
| Total (Cost $8,234,381) | | | | | 9,000,500 | | | | | |
|
| | | | |
| | Total (Cost $8,911,099) | | | | | 12,251,800 |
| Industrial Products – 23.8% | | | | | | | | | | |
|
| Building Systems and Components - 2.8% | | | | | | | TOTAL COMMON STOCKS | | | | | |
Simpson Manufacturing | | 120,000 | | | 4,326,000 | | (Cost $80,815,065) | | | | | 124,787,339 |
| | | | |
| | | | | |
|
| Construction Materials - 2.6% | | | | | | | | | | | | |
Florida Rock Industries | | 80,000 | | | 3,973,600 | | | | | | | |
| | | | |
| | | | | | | |
| Machinery - 4.8% | | | | | | | | | | | | |
Lincoln Electric Holdings | | 75,000 | | | 4,698,750 | | | | | | | |
Woodward Governor Company | | 89,500 | | | 2,730,645 | | | | | | | |
| | | | |
| | | | | | | |
| | | | | | 7,429,395 | | | | | | | |
| | | | |
| | | | | | | |
46 | 2006 SEMIANNUAL REPORT TO STOCKHOLDERS | THE ACCOMPANYING NOTES ARE AN INTEGRAL PART OF THESE FINANCIAL STATEMENTS. |
|
JUNE 30, 2006 (Unaudited)
|
| |
| | | | PRINCIPAL | | | | | | | | |
| | | | AMOUNT | | | VALUE | | | | | VALUE |
| |
| CORPORATE BONDS – 3.9% | | | | | | | | REPURCHASE AGREEMENT – 18.3% | | | |
Athena Neurosciences Finance 7.25% | | | | | | | | State Street Bank & Trust Company, | | | |
Senior Note due 2/21/08 | | $ | 6,000,000 | | $ | 5,955,000 | | 5.10% dated 6/30/06, due 7/3/06, | | | |
| | | | | |
| | maturity value $28,156,962 (collateralized | | | |
| TOTAL CORPORATE BONDS | | | | | | | | by obligations of various U.S. Government | | | |
(Cost $5,629,442) | | | | | | 5,955,000 | | Agencies, valued at $28,850,025) | | | |
| | | | | |
| | (Cost $28,145,000) | | $ | 28,145,000 |
| GOVERNMENT BONDS – 7.5% | | | | | | | | | |
|
| (Principal Amount shown | | | | | | | | COLLATERAL RECEIVED FOR SECURITIES LOANED – 3.5% | | | |
in local currency.) | | | | | | | | Money Market Funds | | | |
Canadian Government Bond | | | | | | | | State Street Navigator Securities Lending | | | |
3.00% due 6/1/07 | | | 6,150,000 | | | 5,437,927 | | Prime Portfolio (7 day yield-5.0651%) | | | |
New Zealand Government Bond | | | | | | | | (Cost $5,412,175) | | | 5,412,175 |
6.00% due 7/18/08 | | | 10,000,000 | | | 6,043,962 | | | |
|
| | | | | |
| | TOTAL INVESTMENTS – 120.6% | | | |
| TOTAL GOVERNMENT BONDS | | | | | | | | (Cost $141,750,285) | | | 185,411,483 |
(Cost $11,357,318) | | | | | | 11,481,889 | | | | | |
| | | | | |
| | LIABILITIES LESS CASH AND OTHER ASSETS – (4.3)% | | | (6,666,366) |
| | | | | | | | | | | | |
| U.S. TREASURY OBLIGATIONS – 6.2% | | | | | | | | PREFERRED STOCK – (16.3)% | | | (25,000,000) |
U.S. Treasury Notes | | | | | | | | | |
|
Treasury Inflation Index Protection | | | | | | | | NET ASSETS APPLICABLE TO | | | |
Security 2.00% due 7/15/14 | | | 10,000,000 | | | 9,630,080 | | COMMON STOCKHOLDERS – 100.0% | | $ | 153,745,117 |
| | | | | |
| | | |
|
| TOTAL U.S. TREASURY OBLIGATIONS | | | | | | | | | | | |
(Cost $10,391,285) | | | | | | 9,630,080 | | | | | |
| | | | | |
| | | | | |
| | | | | | | | | | | | |
|
| a | | Non-income producing. |
| b | | A portion of these securities were on loan at June 30, 2006. |
| † | | New additions in 2006. |
| |
| | | Bold indicates the Fund’s largest 20 equity holdings in terms of June 30, 2006 market value. |
| INCOME TAX INFORMATION: The cost of total investments for Federal income tax purposes was $142,040,342. At June 30, 2006 net unrealized appreciation for all securities was $43,371,141, consisting of aggregate gross unrealized appreciation of $47,365,270 and aggregate gross unrealized depreciation of $3,994,129. The primary differences in book and tax basis cost is the timing of the recognition of losses on securities sold. |
|
| THE ACCOMPANYING NOTES ARE AN INTEGRAL PART OF THESE FINANCIAL STATEMENTS. |
2006 SEMIANNUAL REPORT TO STOCKHOLDERS | 47 |
ROYCE FOCUS TRUST |
JUNE 30, 2006 (Unaudited) |
|
| |
| |
|
| Statement of Assets and Liabilities | | | | |
|
| | | | | |
| ASSETS: | | | | | |
| Investments at value (including collateral on loaned securities) * | | | $ | 157,266,483 | |
| Repurchase agreement (at cost and value) | | | | 28,145,000 | |
| Cash | | | | 20,754 | |
| Receivable for dividends and interest | | | | 501,305 | |
| Prepaid expenses | | | | 12,605 | |
|
Total Assets | | | | 185,946,147 | |
|
| LIABILITIES: | | | | | |
| Payable for collateral on loaned securities | | | | 5,412,175 | |
| Payable for investments purchased | | | | 1,542,059 | |
| Payable for investment advisory fee | | | | 143,366 | |
| Preferred dividends accrued but not yet declared | | | | 33,333 | |
| Accrued expenses | | | | 70,097 | |
|
Total Liabilities | | | | 7,201,030 | |
|
| PREFERRED STOCK: | | | | | |
| 6.00% Cumulative Preferred Stock - $0.001 par value, $25 liquidation value per share; 1,000,000 shares outstanding | | | | 25,000,000 | |
|
Total Preferred Stock | | | | 25,000,000 | |
|
| NET ASSETS APPLICABLE TO COMMON STOCKHOLDERS | | | $ | 153,745,117 | |
|
| ANALYSIS OF NET ASSETS APPLICABLE TO COMMON STOCKHOLDERS: | | | | | |
| Common Stock paid-in capital - $0.001 par value per share; 14,929,414 shares outstanding (100,000,000 shares authorized) | | | $ | 94,890,325 | |
| Undistributed net investment income (loss) | | | | 511,590 | |
| Accumulated net realized gain (loss) on investments | | | | 19,002,907 | |
| Net unrealized appreciation (depreciation) on investments | | | | 43,661,198 | |
| Quarterly and accrued distributions | | | | (4,320,903 | ) |
|
Net Assets applicable to Common Stockholders (net asset value per share -$10.30) | | | $ | 153,745,117 | |
|
| *Investments at identified cost (including $5,412,175 of collateral on loaned securities) | | | $ | 113,605,285 | |
|
| Market value of loaned securities | | | $ | 5,299,032 | |
|
48 | 2006 SEMIANNUAL REPORT TO STOCKHOLDERS | THE ACCOMPANYING NOTES ARE AN INTEGRAL PART OF THESE FINANCIAL STATEMENTS. |
| ROYCE FOCUS TRUST | | SIX MONTHS ENDED JUNE 30, 2006 (Unaudited) |
|
| |
|
| Statement of Operations | | | | |
|
| | | | | |
| INVESTMENT INCOME: | | | | |
| Income: | | | | |
Interest | | $ | 1,297,273 | |
Dividends | | | 298,117 | |
Securities lending | | | 12,132 | |
|
| Total income | | | 1,607,522 | |
|
| Expenses: | | | | |
Investment advisory fees | | | 892,864 | |
Stockholder reports | | | 37,934 | |
Custody and transfer agent fees | | | 37,294 | |
Professional fees | | | 14,294 | |
Directors’ fees | | | 10,938 | |
Administrative and office facilities expenses | | | 6,780 | |
Other expenses | | | 40,727 | |
|
| Total expenses | | | 1,040,831 | |
| Compensating balance credits | | | (738 | ) |
|
| Net expenses | | | 1,040,093 | |
|
| Net investment income (loss) | | | 567,429 | |
|
| REALIZED AND UNREALIZED GAIN (LOSS) ON INVESTMENTS: | | | | |
| Net realized gain (loss) on investments | | | 15,168,081 | |
| Net change in unrealized appreciation (depreciation) on investments | | | (3,468,818 | ) |
|
| Net realized and unrealized gain (loss) on investments | | | 11,699,263 | |
|
| NET INCREASE (DECREASE) IN NET ASSETS RESULTING FROM INVESTMENT OPERATIONS | | | 12,266,692 | |
|
| DISTRIBUTIONS TO PREFERRED STOCKHOLDERS | | | (750,000 | ) |
|
NET INCREASE (DECREASE) IN NET ASSETS APPLICABLE TO COMMON STOCKHOLDERS RESULTING FROM INVESTMENT OPERATIONS | | $ | 11,516,692 | |
|
| THE ACCOMPANYING NOTES ARE AN INTEGRAL PART OF THESE FINANCIAL STATEMENTS. |
2006 SEMIANNUAL REPORT TO STOCKHOLDERS | 49 |
|
| Statement of Changes in Net Assets | | | | | | | | | | |
|
| | | | | | | | | | | |
| | | | | | | | | | | |
| | | | | | | | | | | |
|
| | | Six months ended
6/30/06
(unaudited) | | Year ended
12/31/05 |
|
| | | | | | | | | | | |
| INVESTMENT OPERATIONS: | | | | | | | | | | |
| Net investment income (loss) | | | $ | 567,429 | | | | $ | 743,582 | |
| Net realized gain (loss) on investments | | | | 15,168,081 | | | | | 19,164,839 | |
| Net change in unrealized appreciation (depreciation) on investments | | | | (3,468,818 | ) | | | | 1,922,287 | |
|
| Net increase (decrease) in net assets resulting from investment operations | | | | 12,266,692 | | | | | 21,830,708 | |
|
| DISTRIBUTIONS TO PREFERRED STOCKHOLDERS: | | | | | | | | | | |
| Net investment income | | | | – | | | | | (80,100 | ) |
| Net realized gain on investments | | | | – | | | | | (1,419,900 | ) |
| Quarterly distributions * | | | | (750,000 | ) | | | | – | |
|
| Total distributions to Preferred Stockholders | | | | (750,000 | ) | | | | (1,500,000 | ) |
|
NET INCREASE (DECREASE) IN NET ASSETS APPLICABLE TO COMMON STOCKHOLDERS RESULTING FROM INVESTMENT OPERATIONS | | | | 11,516,692 | | | | | 20,330,708 | |
|
| DISTRIBUTIONS TO COMMON STOCKHOLDERS: | | | | | | | | | | |
| Net investment income | | | | – | | | | | (853,787 | ) |
| Net realized gain on investments | | | | – | | | | | (15,134,720 | ) |
| Quarterly distributions * | | | | (3,537,570 | ) | | | | – | |
|
| Total distributions to Common Stockholders | | | | (3,537,570 | ) | | | | (15,988,507 | ) |
|
| CAPITAL STOCK TRANSACTIONS: | | | | | | | | | | |
| Reinvestment of distributions to Common Stockholders | | | | 2,522,253 | | | | | 11,288,577 | |
| Net proceeds from rights offering | | | | – | | | | | 21,760,372 | |
|
| Total capital stock transactions | | | | 2,522,253 | | | | | 33,048,949 | |
|
| NET INCREASE (DECREASE) IN NET ASSETS APPLICABLE TO COMMON STOCKHOLDERS | | | | 10,501,375 | | | | | 37,391,150 | |
|
| NET ASSETS APPLICABLE TO COMMON STOCKHOLDERS: | | | | | | | | | | |
Beginning of period | | | | 143,243,742 | | | | | 105,852,592 | |
|
End of period (including undistributed net investment income (loss) of $511,590 at 6/30/06 and $(55,839) at 12/31/05) | | | $ | 153,745,117 | | | | $ | 143,243,742 | |
|
| *To be allocated to net investment income and capital gains at year end. | | | | | | | | | | |
50 | 2006 SEMIANNUAL REPORT TO STOCKHOLDERS | THE ACCOMPANYING NOTES ARE AN INTEGRAL PART OF THESE FINANCIAL STATEMENTS. |
| This table is presented to show selected data for a share of Common Stock outstanding throughout each period, and to assist stockholders in evaluating the Fund’s performance for the periods presented. |
| | | Six months ended | | Years ended December 31, |
| | | June 30, 2006 | |
|
| | | (unaudited) | | 2005 | | | 2004 | | | 2003 | | | 2002 | | | 2001 | |
|
| NET ASSET VALUE, BEGINNING OF PERIOD | | | $ | 9.76 | | | | $ | 9.75 | | | | $ | 9.00 | | | | $ | 6.27 | | | | $ | 7.28 | | | | $ | 6.77 | |
|
| INVESTMENT OPERATIONS: | | | | | | | | | | | | | | | | | | | | | | | | | | | | | | |
Net investment income (loss) | | | | 0.04 | | | | | 0.06 | | | | | 0.02 | | | | | 0.08 | | | | | (0.01 | ) | | | | 0.05 | |
Net realized and unrealized gain (loss) on investments | | | | 0.79 | | | | | 1.44 | | | | | 2.63 | | | | | 3.57 | | | | | (0.74 | ) | | | | 0.79 | |
|
Total investment operations | | | | 0.83 | | | | | 1.50 | | | | | 2.65 | | | | | 3.65 | | | | | (0.75 | ) | | | | 0.84 | |
|
| DISTRIBUTIONS TO PREFERRED STOCKHOLDERS: | | | | | | | | | | | | | | | | | | | | | | | | | | | | | | |
Net investment income | | | | – | | | | | (0.01 | ) | | | | (0.00 | ) | | | | (0.02 | ) | | | | (0.03 | ) | | | | (0.04 | ) |
Net realized gain on investments | | | | – | | | | | (0.11 | ) | | | | (0.15 | ) | | | | (0.14 | ) | | | | (0.13 | ) | | | | (0.13 | ) |
Quarterly distributions * | | | | (0.05 | ) | | | | – | | | | | – | | | | | – | | | | | – | | | | | – | |
|
Total distributions to Preferred Stockholders | | | | (0.05 | ) | | | | (0.12 | ) | | | | (0.15 | ) | | | | (0.16 | ) | | | | (0.16 | ) | | | | (0.17 | ) |
|
NET INCREASE (DECREASE) IN NET ASSETS APPLICABLE TO COMMON STOCKHOLDERS RESULTING FROM INVESTMENT OPERATIONS | | | | 0.78 | | | | | 1.38 | | | | | 2.50 | | | | | 3.49 | | | | | (0.91 | ) | | | | 0.67 | |
|
| DISTRIBUTIONS TO COMMON STOCKHOLDERS: | | | | | | | | | | | | | | | | | | | | | | | | | | | | | | |
Net investment income | | | | – | | | | | (0.06 | ) | | | | (0.02 | ) | | | | (0.06 | ) | | | | (0.02 | ) | | | | (0.03 | ) |
Net realized gain on investments | | | | – | | | | | (1.15 | ) | | | | (1.72 | ) | | | | (0.56 | ) | | | | (0.07 | ) | | | | (0.11 | ) |
Quarterly distributions * | | | | (0.24 | ) | | | | – | | | | | – | | | | | – | | | | | – | | | | | – | |
|
Total distributions to Common Stockholders | | | | (0.24 | ) | | | | (1.21 | ) | | | | (1.74 | ) | | | | (0.62 | ) | | | | (0.09 | ) | | | | (0.14 | ) |
|
| CAPITAL STOCK TRANSACTIONS: | | | | | | | | | | | | | | | | | | | | | | | | | | | | | | |
Effect of reinvestment of distributions by Common Stockholders | | | | (0.00 | ) | | | | (0.03 | ) | | | | (0.01 | ) | | | | (0.03 | ) | | | | (0.01 | ) | | | | (0.02 | ) |
Effect of rights offering and Preferred Stock offering | | | | – | | | | | (0.13 | ) | | | | – | | | | | (0.11 | ) | | | | – | | | | | – | |
|
Total capital stock transactions | | | | (0.00 | ) | | | | (0.16 | ) | | | | (0.01 | ) | | | | (0.14 | ) | | | | (0.01 | ) | | | | (0.02 | ) |
|
| NET ASSET VALUE, END OF PERIOD | | | $ | 10.30 | | | | $ | 9.76 | | | | $ | 9.75 | | | | $ | 9.00 | | | | $ | 6.27 | | | | $ | 7.28 | |
|
| MARKET VALUE, END OF PERIOD | | | $ | 10.29 | | | | $ | 9.53 | | | | $ | 10.47 | | | | $ | 8.48 | | | | $ | 5.56 | | | | $ | 6.65 | |
|
| TOTAL RETURN (a): | | | | | | | | | | | | | | | | | | | | | | | | | | | | | | |
| Market Value | | | | 10.62 | % *** | | | | 3.03 | % | | | | 47.26 | % | | | | 63.98 | % | | | | (15.06 | )% | | | | 19.65 | % |
| Net Asset Value | | | | 8.11 | % *** | | | | 13.31 | % | | | | 29.21 | % | | | | 54.33 | % | | | | (12.50 | )% | | | | 10.04 | % |
RATIOS BASED ON AVERAGE NET ASSETS APPLICABLE TO COMMON STOCKHOLDERS: | | | | | | | | | | | | | | | | | | | | | | | | | | | | | | |
| Total expenses ( b, c) | | | | 1.35 | % ** | | | | 1.48 | % | | | | 1.53 | % | | | | 1.57 | % | | | | 1.88 | % | | | | 1.47 | % |
Management fee expense | | | | 1.16 | % ** | | | | 1.21 | % | | | | 1.27 | % | | | | 1.14 | % | | | | 1.13 | % | | | | 1.11 | % |
Other operating expenses | | | | 0.19 | % ** | | | | 0.27 | % | | | | 0.26 | % | | | | 0.43 | % | | | | 0.75 | % | | | | 0.36 | % |
| Net investment income (loss) | | | | 0.74 | % ** | | | | 0.63 | % | | | | 0.24 | % | | | | 1.07 | % | | | | (0.16 | )% | | | | 0.70 | % |
| SUPPLEMENTAL DATA: | | | | | | | | | | | | | | | | | | | | | | | | | | | | | | |
Net Assets Applicable to Common Stockholders, End of Period (in thousands) | | | $ | 153,745 | | | | $ | 143,244 | | | | $ | 105,853 | | | | $ | 87,012 | | | | $ | 57,956 | | | | $ | 66,654 | |
Liquidation Value of Preferred Stock, End of Period (in thousands) | | | $ | 25,000 | | | | $ | 25,000 | | | | $ | 25,000 | | | | $ | 25,000 | | | | $ | 20,000 | | | | $ | 20,000 | |
| Portfolio Turnover Rate | | | | 17 | % | | | | 42 | % | | | | 52 | % | | | | 49 | % | | | | 61 | % | | | | 54 | % |
| PREFERRED STOCK: | | | | | | | | | | | | | | | | | | | | | | | | | | | | | | |
| Total shares outstanding | | | | 1,000,000 | | | | | 1,000,000 | | | | | 1,000,000 | | | | | 1,000,000 | | | | | 800,000 | | | | | 800,000 | |
| Asset coverage per share | | | $ | 178.75 | | | | $ | 168.24 | | | | $ | 130.85 | | | | $ | 112.01 | | | | $ | 97.44 | | | | $ | 108.32 | |
| Liquidation preference per share | | | $ | 25.00 | | | | $ | 25.00 | | | | $ | 25.00 | | | | $ | 25.00 | | | | $ | 25.00 | | | | $ | 25.00 | |
| Average market value per share (d): | | | | | | | | | | | | | | | | | | | | | | | | | | | | | | |
6.00% Cumulative | | | $ | 24.74 | | | | $ | 25.38 | | | | $ | 24.83 | | | | $ | 25.45 | | | | | – | | | | | – | |
7.45% Cumulative | | | | – | | | | | – | | | | | – | | | | $ | 25.53 | | | | $ | 25.64 | | | | $ | 25.09 | |
|
| (a) | | The Market Value Total Return is calculated assuming a purchase of Common Stock on the opening of the first business day and a sale on the closing of the last business day of each period reported. Dividends and distributions, if any, are assumed for the purposes of this calculation to be reinvested at prices obtained under the Fund’s Distribution Reinvestment and Cash Purchase Plan. Net Asset Value Total Return is calculated on the same basis, except that the Fund’s net asset value is used on the purchase and sale dates instead of market value. |
| (b) | | Expense ratios based on total average net assets including liquidation value of Preferred Stock were 1.16%, 1.22%, 1.21%, 1.20%, 1.43% and 1.11% for the periods ended June 30, 2006 and December 31, 2005, 2004, 2003, 2002 and 2001, respectively. |
| (c) | | Expense ratios based on average net assets applicable to Common Stockholders before waiver of fees by the investment adviser would have been 1.73%, 2.06% and 1.69% for the periods ended December 31, 2003, 2002 and 2001, respectively. |
| (d) | | The average of month-end market values during the period that the Preferred Stock was outstanding. |
| * | | To be allocated to net investment income and capital gains at year end. |
| ** | | Annualized. |
| *** | | Not annualized. |
| THE ACCOMPANYING NOTES ARE AN INTEGRAL PART OF THESE FINANCIAL STATEMENTS. |
2006 SEMIANNUAL REPORT TO STOCKHOLDERS | 51 |
ROYCE FOCUS TRUST
|
Notes to Financial Statements (Unaudited) |
|
| Summary of Significant Accounting Policies: | | Taxes: |
Royce Focus Trust, Inc. (“the Fund”) is a diversified closed-end investment company. The Fund commenced operations on March 2, 1988 and Royce & Associates, LLC (“Royce”) assumed investment management responsibility for the Fund on November 1, 1996.
The preparation of financial statements in conformity with accounting principles generally accepted in the United States of America requires management to make estimates and assumptions that affect the reported amounts of assets and liabilities and the disclosure of contingent assets and liabilities at the date of the financial statements, and the reported amounts of income and expenses during the reporting period. Actual results could differ from those estimates.
Valuation of Investments:
Securities are valued as of the close of trading on the New York Stock Exchange (generally 4:00 p.m. Eastern time) on the valuation date. Securities that trade on an exchange or Nasdaq, and securities traded on Nasdaq’s Electronic Bulletin Board, are valued at their last reported sales price or Nasdaq official closing price taken from the primary market in which each security trades or, if no sale is reported for such day, at their bid price. Other over-the-counter securities for which market quotations are readily available are valued at their bid price. Securities for which market quotations are not readily available are valued at their fair value under procedures established by the Fund’s Board of Directors. Bonds and other fixed income securities may be valued by reference to other securities with comparable ratings, interest rates and maturities, using established independent pricing services. Investments in money market funds are valued at net asset value per share.
Investment Transactions and Related Investment Income:
Investment transactions are accounted for on the trade date. Dividend income is recorded on the ex-dividend date and any non-cash dividend income is recorded at the fair market value of the securities received. Interest income is recorded on an accrual basis. Realized gains and losses from investment transactions are determined on the basis of identified cost for book and tax purposes.
Expenses:
The Fund incurs direct and indirect expenses. Expenses directly attributable to the Fund are charged to the Fund’s operations, while expenses applicable to more than one of the Royce Funds are allocated in an equitable manner. Allocated personnel and occupancy costs related to The Royce Funds are included in administrative and office facilities expenses. The Fund has adopted a deferred fee agreement that allows the Fund’s Directors to defer the receipt of all or a portion of Directors’ Fees otherwise payable. The deferred fees are invested in certain Royce Funds until distributed in accordance with the agreement.
Compensating Balance Credits:
The Fund has an arrangement with its custodian bank, whereby a portion of the custodian’s fee is paid indirectly by credits earned on the Fund’s cash on deposit with the bank. This deposit arrangement is an alternative to purchasing overnight investments. | | As a qualified regulated investment company under Subchapter M of the Internal Revenue Code, the Fund is not subject to income taxes to the extent that it distributes substantially all of its taxable income for its fiscal year. The Schedule of Investments includes information regarding income taxes under the caption “Income Tax Information”.
Distributions:
The Fund currently has a policy of paying quarterly distributions on the Fund’s Common Stock. Distributions are currently being made at the annual rate of 5% of the rolling average of the prior four calendar quarter-end NAVs of the Fund’s Common Stock, with the fourth quarter distribution being the greater of 1.25% of the rolling average or the distribution required by IRS regulations. Distributions to Preferred Stockholders are accrued daily and paid quarterly. The Fund is required to allocate long-term capital gain distributions and other types of income proportionately to distributions made to holders of shares of Common Stock and Preferred Stock. To the extent that distributions are not paid from long-term capital gains, net investment income or net short-term capital gains, they will represent a return of capital. Distributions are determined in accordance with income tax regulations that may differ from accounting principles generally accepted in the United States of America. Permanent book and tax basis differences relating to stockholder distributions will result in reclassifications within the capital accounts. Undistributed net investment income may include temporary book and tax basis differences, which will reverse in a subsequent period. Any taxable income or gain remaining undistributed at fiscal year end is distributed in the following year.
Repurchase Agreements:
The Fund may enter into repurchase agreements with institutions that the Fund’s investment adviser has determined are creditworthy. The Fund restricts repurchase agreements to maturities of no more than seven days. Securities pledged as collateral for repurchase agreements, which are held until maturity of the repurchase agreements, are marked-to-market daily and maintained at a value at least equal to the principal amount of the repurchase agreement (including accrued interest). Repurchase agreements could involve certain risks in the event of default or insolvency of the counter-party, including possible delays or restrictions upon the ability of the Fund to dispose of the underlying securities.
Securities Lending:
The Fund loans securities to qualified institutional investors for the purpose of realizing additional income. Collateral on all securities loaned for the Fund is accepted in cash and cash equivalents and invested temporarily by the custodian. The collateral is equal to at least 100% of the current market value of the loaned securities. The market value of the loaned securities is determined at the close of business of the Fund and any additional required collateral is delivered to the Fund on the next business day. |
| | | |
| 52 | 2006 SEMIANNUAL REPORT TO STOCKHOLDERS | | |
ROYCE FOCUS TRUST
|
| Notes to Financial Statements (Unaudited) (continued) |
|
Capital Stock:
The Fund issued 254,747 and 1,191,399 shares of Common Stock as reinvestment of distributions by Common Stockholders for the six months ended June 30, 2006 and the year ended December 31, 2005, respectively.
On June 10, 2005, the Fund completed a rights offering of Common Stock to its stockholders at the rate of one common share for each 5 rights held by stockholders of record on May 6, 2005. The rights offering was fully subscribed, resulting in the issuance of 2,627,397 common shares at a price of $8.34, and proceeds of $21,912,491 to the Fund prior to the deduction of expenses of $152,119. The net asset value per share of the Fund’s Common Stock was reduced by approximately $0.13 per share as a result of the issuance.
At June 30, 2006, 1,000,000 shares of 6.00% Cumulative Preferred Stock were outstanding. Commencing October 17, 2008 and thereafter, the Fund, at its option, may redeem the Cumulative Preferred Stock, in whole or in part, at the redemption price. The Cumulative Preferred Stock is classified outside of permanent equity (net assets applicable to Common Stockholders) in the accompanying financial statements in accordance with Emerging Issues Task Force (EITF) Topic D-98, Classification and Measurement of Redeemable Securities, that requires preferred securities that are redeemable for cash or other assets to be classified outside of permanent equity to the extent that the redemption is at a fixed or determinable price and at the option of the holder or upon the occurrence of an event that is not solely within the control of the issuer.
The Fund is required to meet certain asset coverage tests with respect to the Cumulative Preferred Stock as required by the 1940 Act. In addition, pursuant to the Rating Agency Guidelines established by Moody’s, the Fund is required to maintain a certain discounted asset coverage. If the Fund fails to meet these requirements and does not | | correct such failure, the Fund may be required to redeem, in part or in full, the Cumulative Preferred Stock at a redemption price of $25.00 per share, plus an amount equal to the accumulated and unpaid dividends, whether or not declared on such shares, in order to meet these requirements. Additionally, failure to meet the foregoing asset coverage requirements could restrict the Fund’s ability to pay dividends to Common Stockholders and could lead to sales of portfolio securities at inopportune times. The Fund has met these requirements since issuing the Cumulative Preferred Stock.
Investment Advisory Agreement:
The Investment Advisory Agreement between Royce and the Fund provides for fees to be paid at an annual rate of 1.0% of the Fund’s average daily net assets applicable to Common Stockholders plus the liquidation value of Preferred Stock. Royce has voluntarily committed to waive the portion of its investment advisory fee attributable to an issue of the Fund’s Preferred Stock for any month in which the Fund’s average annual NAV total return since issuance of the Preferred Stock fails to exceed the applicable Preferred Stock’s dividend rate. For the six months ended June 30, 2006, the Fund accrued and paid Royce advisory fees totaling $892,864.
Purchases and Sales of Investment Securities:
For the six months ended June 30, 2006, the cost of purchases and proceeds from sales of investment securities, other than short-term securities and collateral received for securities loaned, amounted to $25,496,847 and $36,628,988, respectively. |
2006 SEMIANNUAL REPORT TO STOCKHOLDERS | 53
BOARD APPROVAL OF INVESTMENT ADVISORY AGREEMENTS
At meetings held on June 7-8, 2006, each of the Funds’ respective Board of Directors, including all of the non-interested directors, approved the continuance of the Investment Advisory Agreements between Royce & Associates, LLC (“R&A”) and each of Royce Value Trust, Royce Micro-Cap Trust and Royce Focus Trust (the “Funds”). In reaching these decisions, the Board reviewed the materials provided by R&A, which included, among other things, information prepared internally by R&A and independently by Morningstar Associates, LLC (“Morningstar”) containing detailed expense ratio and investment performance comparisons for each of the Funds with other funds in their “peer group”, information regarding the past performance of Funds managed by R&A and a memorandum outlining the legal duties of the Board prepared by independent counsel to the non-interested directors. R&A also provided the directors with an analysis of its profitability with respect to providing investment advisory services to each of the Funds. In addition, the Board took into account information furnished throughout the year at regular Board meetings, including reports on investment performance, shareholder services, regulatory compliance, brokerage commissions and research, brokerage and execution products and services provided to the Funds. The Board also considered other matters it deemed important to the approval process such as brokerage commissions paid to R&A affiliates, and other direct and indirect benefits to R&A and its affiliates, from their relationship with the Funds. The directors also met throughout the year with investment advisory personnel from R&A. The Board, in its deliberations, recognized that, for many of the Funds’ shareholders, the decision to purchase Fund shares included a decision to select R&A as the investment adviser and that there was a strong association in the minds of Fund shareholders between R&A and each Fund. In considering factors relating to the approval of the continuance of the Investment Advisory Agreements, the non-interested directors received assistance and advice from, and met separately with, their independent counsel. While the Investment Advisory Agreements for the Funds were considered at the same Board meetings, the directors dealt with each agreement separately. Among other factors, the directors considered the following:
The nature, extent and quality of services provided by R&A: The directors considered the following factors to be of fundamental importance to their consideration of whether to approve the continuance of the Funds’ Investment Advisory Agreements: (i) R&A’s more than 30 years of small-cap value investing experience and track record; (ii) the history of long-tenured R&A portfolio managers managing the Funds; (iii) R&A’s sole focus on mid-cap, small-cap and micro-cap value investing; (iv) the consistency of R&A’s approach to managing both the Funds and open-end mutual funds over more than 30 years; (v) the integrity and high ethical standards adhered to at R&A; (vi) R&A’s specialized experience in the area of trading small- and micro-cap securities; (vii) R&A’s historical ability to attract and retain portfolio management talent and (viii) R&A’s focus on shareholder interests as exemplified by its voluntary fee waiver policy on preferred stock assets in certain circumstances where the Fund’s total return performance from the issuance of the preferred does not exceed the coupon rate on the preferred, and expansive shareholder reporting and communications. The directors reviewed the services that R&A provides to the Funds, including, but not limited to, managing each Fund’s investments in accordance with the stated policies of each Fund. The directors determined that the services to be provided to each Fund by R&A would be the same as those it previously provided to the Funds. They also took into consideration the histories, reputations and backgrounds of R&A’s portfolio managers for the Funds, finding that these would likely have an impact on the continued success of the Funds. Lastly, the directors noted R&A’s ability to attract quality and experienced personnel. The directors concluded that the services provided by R&A to each Fund compared favorably to services provided by R&A to other R&A client accounts, including other funds, in both nature and quality, and that the scope of services provided by R&A would continue to be suitable for each Fund.
Investment performance of the Funds and R&A: In light of R&A’s risk-averse approach to investing, the directors believe that risk-adjusted performance continues to be an appropriate measure of each Fund’s investment performance. One measure of risk-adjusted performance the directors have historically used in their review of the Funds’ performance is the Sharpe Ratio. The Sharpe Ratio is a risk-adjusted measure of performance developed by Nobel Laureate William Sharpe. It is calculated by dividing a fund’s annualized excess returns by its annualized standard deviation to determine reward per unit of risk. The higher the Sharpe Ratio, the better a fund’s historical risk-adjusted performance. The Board attaches primary importance to risk-adjusted performance over relatively long periods of time, typically three to five years. Using Morningstar data, Royce Value Trust’s Sharpe Ratio placed in the 2nd quartile for all funds within the small blend category assigned by Morningstar for the three- and five-year periods ended December 31, 2005. Similarly, Royce Micro-Cap Trust’s Sharpe Ratio placed it in the 2nd quartile among funds within the small blend category assigned by Morningstar for the three- and five-year periods. Finally, Royce Focus Trust’s Sharpe Ratio placed it in the top quartile among all funds within the small blend category assigned by Morningstar for the three- and five-year periods. The directors noted that each of the Funds invest in small-cap and micro-cap issuers, and that each had
54 | 2006 SEMIANNUAL REPORT TO STOCKHOLDERS
BOARD APPROVAL OF INVESTMENT ADVISORY AGREEMENTS (CONTINUED)
outperformed the Russell 2000 Index over three- and five-year periods ended 12/31/05. Although the directors recognized that past performance is not necessarily an indicator of future results, they found that R&A had the necessary qualifications, experience and track record in managing small-cap and micro-cap securities to manage the Funds. The directors determined that R&A continued to be an appropriate investment adviser for the Funds and concluded that each Fund’s performance supported the renewal of its Investment Advisory Agreement.
Cost of the services provided and profits realized by R&A from its relationship with each Fund: The directors considered the cost of the services provided by R&A and profits realized by R&A from its relationship with each Fund. As part of the analysis, the Board discussed with R&A its methodology in allocating its costs to each Fund and concluded that its allocations were reasonable. The directors concluded that R&A’s profits were reasonable in relation to the nature and quality of services provided.
The extent to which economies of scale would be realized as the Funds grow and whether fee levels would reflect such economies of scale: The directors considered whether there have been economies of scale in respect of the management of the Funds, whether the Funds have appropriately benefited from any economies of scale and whether there is potential for realization of any further economies of scale. The directors noted the time and effort involved in managing portfolios of small- and micro-cap stocks and that they did not involve the same efficiencies as do portfolios of large cap stocks. The directors concluded that the current fee structure for each Fund was reasonable, and that no changes were currently necessary.
Comparison of services to be rendered and fees to be paid to those under other investment advisory contracts, such as contracts of the same and other investment advisers or other clients: The directors reviewed the investment advisory fee paid by each Fund and compared both the services to be rendered and the fees to be paid under the Investment Advisory Agreements to other contracts of R&A and to contracts of other investment advisers to registered investment companies investing in small- and micro-cap stocks, as provided by Morningstar. The directors noted that, in the case of Royce Value Trust, the 1.00% basic fee is subject to adjustment up or down (up to 50 bps in either direction) based on the Fund’s performance versus the S&P 600 SmallCap Index over a rolling period of sixty months. The fee is charged on average net assets over that rolling period. As a result, in a rising market, the fee will be smaller than a fee calculated on the current year’s average net assets, and vice versa. The directors determined that the performance adjustment feature continued to serve as an appropriate incentive to R&A to manage the Fund for the benefit of its long-term stockholders. The directors noted that R&A had also agreed to waive its management fee on Fund assets in an amount equal to the liquidation preference of the Fund’s outstanding preferred stock if the Fund’s total return from issuance of the preferred on such amount is less than the preferred’s coupon rate. The directors also noted that the fee arrangement, which also includes a provision for no fee in periods where the Fund’s performance is negative, requires R&A to measure the Fund’s performance monthly against the S&P 600, an unmanaged index. Instead of receiving a set fee regardless of its performance, R&A is penalized for poor performance.
In the case of Royce Micro-Cap Trust, the directors noted that the Fund had a 1.00% basic fee subject to adjustment up or down (up to 50 bps in either direction) based on the Fund’s performance versus the Russell 2000 Index over a rolling 36 month period. The fee is charged on average net assets over that rolling period. As a result, in a rising market, the fee will be smaller than a fee calculated on the current year’s average net assets, and vice versa. The directors determined that the performance adjustment feature continued to serve as an incentive to R&A to manage the Fund for the benefit of its long-term stockholders. The directors also noted R&A’s voluntary waiver of its fee on the liquidation value of the outstanding preferred stock in circumstances where the Fund’s total return performance from the issuance of the preferred is less than the coupon rate on the preferred for each month during the year.
Finally, in the case of Royce Focus Trust, the directors noted that if the Fund’s expense ratio were based on total average net assets including net assets applicable to Preferred Stock, it would place in the 2nd quartile of its Morningstar peer group. The directors also noted that R&A had agreed to waive its management fee on the liquidation value of the outstanding preferred stock if the Fund’s total return from the issuance of the preferred is less than its coupon rate.
The directors also considered fees charged by R&A to institutional and other clients and noted that the Funds’ advisory fees compared favorably to those other accounts.
After the non-interested directors deliberated in executive session, the entire Board, including all the non-interested directors, approved the renewal of the existing Investment Advisory Agreements, concluding that a contract renewal on the existing terms was in the best interest of the shareholders of each Fund and that each investment advisory fee rate was reasonable in relation to the services provided.
2006 SEMIANNUAL REPORT TO STOCKHOLDERS | 55
NOTES TO PERFORMANCE AND OTHER IMPORTANT INFORMATION
The thoughts expressed in this Review and Report concerning recent market movements and future prospects for small company stocks are solely the opinion of Royce at June 30, 2006, and, of course, historical market trends are not necessarily indicative of future market movements. Statements regarding the future prospects for particular securities held in the Funds’ portfolios and Royce’s investment intentions with respect to those securities reflect Royce’s opinions as of June 30, 2006 and are subject to change at any time without notice. There can be no assurance that securities mentioned in this Review and Report will be included in any Royce-managed portfolio in the future. The Funds invest primarily in securities of mid-, small- and micro-cap companies, that may involve considerably more risk than investments of larger-cap companies. All publicly released material information is always disclosed by the Funds on the website at www.roycefunds.com.
Standard deviation is a statistical measure within which a fund’s total returns have varied over time. The greater the standard deviation, the greater a fund’s volatility.
The Russell 2000, Russell 2000 Value, Russell 2000 Growth, Nasdaq Composite, S&P 500 and S&P 600 are unmanaged indices of domestic common stocks. Returns for the market indices used in this Review and Report were based on information supplied to Royce by Frank Russell and Morningstar. Royce has not independently verified the above described information. The Royce Funds is a service mark of The Royce Funds.
Forward-Looking Statements
This material contains forward-looking statements within the meaning of the Securities Exchange Act of 1934, as amended (the “Exchange Act”), that involve risks and uncertainties, including, among others, statements as to:
| • | | the Funds’ future operating results |
| • | | the prospects of the Funds’ portfolio companies |
| • | | the impact of investments that the Funds have made or may make |
| • | | the dependence of the Funds’ future success on the general economy and its impact on the companies and industries in which the Funds invest, and |
| • | | the ability of the Funds’ portfolio companies to achieve their objectives. |
| | | |
This Review and Report uses words such as “anticipates,” “believes,” “expects,” “future,” “intends,” and similar expressions to identify forward-looking statements. Actual results may differ materially from those projected in the forward-looking statements for any reason.
The Royce Funds have based the forward-looking statements included in this Review and Report on information available to us on the date of the report, and we assume no obligation to update any such forward-looking statements. Although The Royce Funds undertake no obligation to revise or update any forward-looking statements, whether as a result of new information, future events or otherwise, you are advised to consult any additional disclosures that we may make through future stockholder communications or reports.
Authorized Share Transactions
Royce Value Trust, Royce Micro-Cap Trust and Royce Focus Trust may each repurchase up to 300,000 shares of its respective common stock and up to 10% of the issued and outstanding shares of its respective preferred stock during the year ending December 31, 2006. Any such repurchases would take place at then prevailing prices in the open market or in other transactions. Common stock repurchases would be effected at a price per share that is less than the share’s then current net asset value, and preferred stock repurchases would be effected at a price per share that is less than the share’s liquidation value.
Royce Value Trust, Royce Micro-Cap Trust and Royce Focus Trust are also authorized to offer their common stockholders an opportunity to subscribe for additional shares of their common stock through rights offerings at a price per share that may be less than the share’s then current net asset value. The timing and terms of any such offerings are within each Board’s discretion.
Proxy Voting
A copy of the policies and procedures that The Royce Funds use to determine how to vote proxies relating to portfolio securities and information regarding how each of The Royce Funds voted proxies relating to portfolio securities during the most recent 12-month period ended June 30 is available, without charge, on the Royce Funds’ website at www.roycefunds.com, by calling 1-800-221-4268 (toll-free) and on the website of the Securities and Exchange Commission (“SEC”), at www.sec.gov.
Form N-Q Filing
The Funds file their complete schedules of investments with the SEC for the first and third quarters of each fiscal year on Form N-Q. The Funds’ Forms N-Q are available on The Royce Funds’ website at www.roycefunds.com and on the SEC’s website at www.sec.gov. The Funds’ Forms N-Q may also be reviewed and copied at the SEC’s Public Reference Room in Washington, D.C. To find out more about this public service, call the SEC at 1-800-732-0330. The Funds’ complete schedules of investments are updated quarterly, and are available at www.roycefunds.com.
56 | 2006 SEMIANNUAL REPORT TO STOCKHOLDERS
POSTSCRIPT
Party People
For members of our investment staff, conversations at parties or other social gatherings usually follow a familiar pattern. Introductions are made, pleasantries are exchanged and soon the talk circles around to what people do for a living. When one of our staff says, “Investment management” or “Mutual funds,” the responses generally include inquiries about which firm we work for or what sort of investments we make.
Occasionally, when we mention that we manage money for The Royce Funds, people recognize the name—some even know that we’re a small-cap value shop or mention Chuck’s ubiquitous bow ties. Often, though, a few seconds of awkward silence ensues, followed by a quick nod and an attempt at reassurance, as if we’d be crestfallen that someone might not be familiar with one of the hundreds of mutual fund companies that exist today. To puncture the silence, they’ll say something like, “Oh sure, Royce... yes, of course... no, I’ve heard of you, definitely... great company... really terrific... I think my niece owns one of your, uh, funds.” At this, we usually smile politely, nod and reach for the shrimp.
More recently, however, we were taken aback at a question from a fellow guest who was familiar with the firm: “Why do you people have so many funds if all you do is small-cap value investing?” To be honest, we seldom thought much about this, and at first we were a bit defensive. We wondered—not aloud, fortunately—if managers at Fidelity or Vanguard get these kinds of questions? Are fund managers whose firms offer multiple large-cap or fixed income portfolios ever buttonholed at parties and asked to justify the existence of half their product offerings? Didn’t the person asking this question know that small-cap represents the largest domestic equity class in the U.S., with more than 8,000 publicly traded companies totaling more than $2.7 trillion in total market capitalization?
But we stopped ourselves before slipping into a lecture on the wondrous variety of our chosen asset class. Taking a deep breath, we relaxed as soon as we realized that it wasn’t facts such as those mentioned above that we were battling; it was the perception that if you do one thing well, there must be only one way to do it. The truth is a little more complicated, and more difficult to explain in the language of light chatter that animates a party.
We have always thought of small-cap value investing as an approach that encompasses a range of possible styles. Our opportunity to see this theory work in practice came in the late ’90s. Whitney George began to manage portfolios on his own just before Buzz Zaino and Charlie Dreifus joined us early in 1998. Each of their approaches has important differences and similarities to the one Chuck Royce has been refining since 1972. The same holds true for the rest of the talented group of portfolio managers and analysts who work with us today. Each of them brings something unique to the portfolio process, while sharing our overall goal of finding high-quality, undervalued small companies.
Equally important is the enormous expansion in the number of small-cap companies available for potential investment over the last two decades. In 20 years, the number of companies has nearly doubled and the total market capitalization has increased by more than seven times: At the end of 1985, there were 4,781 companies with market caps less than $500 million (the commonly accepted definition of small-cap at the time) representing $348.7 billion in total market capitalization (Source: FactSet). We have introduced newer portfolios over the last 10 years in response to this extraordinary growth. The rapid expansion of small-cap has allowed us to bring out these new offerings.
Now maybe we can get back to cordial introductions, vacation talk and hors d’oeuvres.
THIS PAGE IS NOT PART OF THE 2006 REPORT TO STOCKHOLDERS

| |
| | | The RoyceFunds
Wealth Of Experience With approximately $25.1 billion in open- and closed-end fund assets under management, Royce & Associates is committed to the same small-company investing principles that have served us well for more than 30 years. Charles M. Royce, our Chief Investment Officer, enjoys one of the longest tenures of any active mutual fund manager. Royce’s investment staff includes six other Portfolio Managers, as well as eight assistant portfolio managers and analysts, and six traders.
Multiple Funds, Common Focus Our goal is to offer both individual and institutional investors the best available small-cap value portfolios. Unlike a lot of mutual fund groups with broad product offerings, we have chosen to concentrate on small-company value investing by providing investors with a range of funds that take full advantage of this large and diverse sector.
Consistent Discipline Our approach emphasizes paying close attention to risk and maintaining the same discipline, regardless of market movements and trends. The price we pay for a security must be significantly below our appraisal of its current worth. This requires a thorough analysis of the financial and business dynamics of an enterprise, as though we were purchasing the entire company.
Co-Ownership Of Funds It is important that our employees and shareholders share a common financial goal; our officers, employees and their families currently have approximately $111 million invested in The Royce Funds. | | |
|
| | | General Information
Additional Report Copies
and Fund Inquiries
(800) 221-4268
Computershare
Transfer Agent and Registrar
(800) 426-5523
| Broker/Dealer Services
For Fund Materials and Performance Updates,
(800) 59-ROYCE (597-6923)
Advisor Services
For Fund Materials, Performance Updates
or Account Inquiries
(800) 33-ROYCE (337-6923)
| | |
|
| | | www.roycefunds.com | | |
| | |
|
| |
CE-REP-0606
| | |
Item 2: Code(s) of Ethics – Not applicable to this semi-annual report.
Item 3: Audit Committee Financial Expert – Not applicable to this semi-annual report.
Item 4: Principal Accountant Fees and Services – Not applicable to this semi-annual report.
Item 5: Audit Committee of Listed Registrants – Not applicable to this semi-annual report.
Item 6: Schedule of Investments – See Item 1.
Item 7: Disclosure of Proxy Voting Policies and Procedures for Closed-End Management Investment Companies – Not applicable to this semi-annual report.
Item 8: Portfolio Managers of Closed-End Management Investment Companies – Not applicable to this semi-annual report.
Item 9: Purchases of Equity Securities by Closed-End Management Investment Company and Affiliated Purchasers – Not applicable.
Item 10: Submission of Matters to a Vote of Security Holders – None.
Item 11: Controls and Procedures.
(a) Disclosure Controls and Procedures. The Principal Executive and Financial Officers concluded that the registrant’s Disclosure Controls and Procedures are effective based on their evaluation of the Disclosure Controls and Procedures as of a date within 90 days of the filing date of this report.
(b) Internal Control over Financial Reporting. There were no significant changes in registrant’s internal control over financial reporting or in other factors that could significantly affect this control subsequent to the date of the evaluation, including any corrective actions with regard to significant deficiencies and material weaknesses during the second fiscal quarter of the period covered by this report.
Item 12: Exhibits attached hereto.
(a)(1) Not applicable.
(a)(2) Separate certifications by the Registrant’s Principal Executive Officer and Principal Financial Officer as required by Rule 30a-2(a) under the Investment Company Act of 1940.
(a)(3) Not Applicable
(b) Separate certifications by the Registrant’s Principal Executive Officer and Principal Financial Officer, pursuant to Section 906 of the Sarbanes-Oxley Act of 2002 and required by Rule 30a-2(b) under the Investment Company Act of 1940.
Pursuant to the requirements of the Securities Exchange Act of 1934 and the Investment Company Act of 1940, the registrant has duly caused this report to be signed on its behalf by the undersigned, thereunto duly authorized.
ROYCE VALUE TRUST, INC.
| BY: | /s/ Charles M. Royce |
| | Charles M. Royce |
| | President |
Pursuant to the requirements of the Securities Exchange Act of 1934 and the Investment Company Act of 1940, this report has been signed below by the following persons on behalf of the registrant and in the capacities and on the dates indicated.
| ROYCE VALUE TRUST, INC. | ROYCE VALUE TRUST, INC. |
| | | | | |
| BY: | /s/ Charles M. Royce | | BY: | /s/ John D. Diederich |
| | Charles M. Royce | | | John D. Diederich |
| | President | | | Chief Financial Officer |
| | | | | |
| Date: August 28, 2006 | | Date: August 28, 2006 |