UNITED STATES
SECURITIES AND EXCHANGE COMMISSION
Washington, D.C. 20549
FORM N-CSR
CERTIFIED SHAREHOLDER REPORT
OF
REGISTERED MANAGEMENT INVESTMENT COMPANIES
Investment Company Act file number: 811-04875
Name of Registrant: Royce Value Trust, Inc.
Address of Registrant: 1414 Avenue of the Americas
New York, NY 10019
| Name and address of agent for service: | John E. Denneen, Esquire |
| | 1414 Avenue of the Americas |
| | New York, NY 10019 |
Registrant’s telephone number, including area code: (212) 486-1445
Date of fiscal year end: December 31
Date of reporting period: January 1, 2007 – June 30, 2007
Item 1. Reports to Shareholders
| |
| | | |  |
| |
Royce Value Trust
Royce Micro-Cap Trust
Royce Focus Trust
| |
SEMIANNUAL
REVIEW AND REPORT
TO STOCKHOLDERS
|
| |
| | |
| |
| | |
| |
| | |
| | | |
|
| |
www.roycefunds.com | |  |
A Few Words on Closed-End Funds
| | | |
| | | |
| | Royce & Associates, LLC manages three closed-end funds: Royce Value Trust, the first small-cap value closed-end fund offering; Royce Micro-Cap Trust, the only micro-cap closed-end fund; and Royce Focus Trust, a closed-end fund that invests in a limited number of primarily small-cap companies. | |
| | | |
| | A closed-end fund is an investment company whose shares are listed and traded on a stock exchange. Like all investment companies, including open-end mutual funds, the assets of a closed-end fund are professionally managed in accordance with the investment objectives and policies approved by the fund’s Board of Directors. A closed-end fund raises cash for investment by issuing a fixed number of shares through initial and other public offerings that may include shelf offerings and periodic rights offerings. Proceeds from the offerings are invested in an actively managed portfolio of securities. Investors wanting to buy or sell shares of a publicly traded closed-end fund after the offerings must do so on a stock exchange, as with any publicly traded stock. This is in contrast to open-end mutual funds, in which the fund sells and redeems its shares on a continuous basis. | |
| | | |
| | | |
| A Closed-End Fund Offers Several Distinct Advantages Not Available From An Open-End Fund Structure |
| | | | | | |
| n | Since a closed-end fund does not issue redeemable securities or offer its securities on a continuous basis, it does not need to liquidate securities or hold uninvested assets to meet investor demands for cash redemptions, as an open-end fund must. | | | n | The fixed capital structure allows permanent leverage to be employed as a means to enhance capital appreciation potential. |
| | | | | | |
| n | In a closed-end fund, not having to meet investor redemption requests or invest at inopportune times is ideal for value managers who attempt to buy stocks when prices are depressed and sell securities when prices are high. | | | n | Unlike Royce’s open-end funds, our closed-end funds are able to distribute capital gains on a quarterly basis. Each of the Funds has adopted a quarterly distribution policy for its common stock. |
| | | | | | |
| n | A closed-end fund may invest more freely in less liquid portfolio securities because it is not subject to potential stockholder redemption demands. This is particularly beneficial for Royce-managed closed-end funds, which invest in small- and micro-cap securities. | | | We believe that the closed-end fund structure is very suitable for the long-term investor who understands the benefits of a stable pool of capital. |
| |
Why Dividend Reinvestment Is Important | |
| |
A very important component of an investor’s total return comes from the reinvestment of distributions. By reinvesting distributions, our investors can maintain an undiluted investment in a Fund. To get a fair idea of the impact of reinvested distributions, please see the charts on pages 13, 15 and 17. For additional information on the Funds’ Distribution Reinvestment and Cash Purchase Options and the benefits for stockholders, please see page 19 or visit our website at www.roycefunds.com. | |
| | | |
| | | |
| |
| This page is not part of the 2007 Semiannual Report to Stockholders | | |
| Semiannual Review | | |
|
| Performance Table | | 2 |
| |
| Letter to Our Stockholders | | 3 |
|
| Semiannual Report to Stockholders | | 10 |
For more than 30 years, we have used a value approach to invest in smaller-cap securities. We focus primarily on the quality of a company’s balance sheet, its ability to generate free cash flow and other measures of profitability or sound financial condition. At times, we may also look at other factors, such as a company’s unrecognized asset values, its future growth prospects or its turnaround potential following an earnings disappointment or other business difficulties. We then use these factors to assess the company’s current worth, basing the assessment on either what we believe a knowledgeable buyer might pay to acquire the entire company, or what we think the value of the company should be in the stock market.

| |
| This page is not part of the 2007 Semiannual Report to Stockholders | 1 |
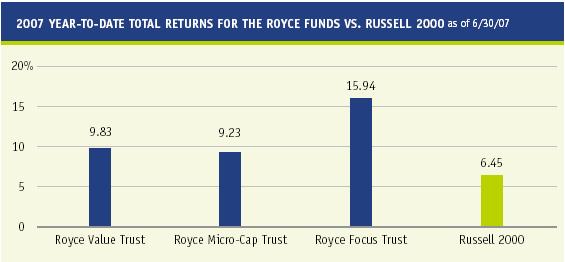
| Average Annual NAV Total Returns | | Through June 30, 2007 |
| | | | | | | Royce | | Royce | | Royce | |
| | | | | | | Value Trust | | Micro-Cap Trust | | Focus Trust | Russell 2000 |
|
| | Second Quarter 2007* | | | | | 6.30 | % | | 4.39 | % | | | | 8.24 | % | 4.41 | % |
|
| | Year-to-Date 2007* | | | | | 9.83 | | | 9.23 | | | | | 15.94 | | 6.45 | |
|
| | One-Year | | | | | 19.70 | | | 19.87 | | | | | 24.26 | | 16.43 | |
|
| | Three-Year | | | | | 16.39 | | | 16.08 | | | | | 21.31 | | 13.45 | |
|
| | Five-Year | | | | | 15.46 | | | 16.54 | | | | | 21.57 | | 13.88 | |
|
| | 10-Year | | | | | 13.63 | | | 14.34 | | | | | 14.16 | | 9.06 | |
|
| | 15-Year | | | | | 14.45 | | | n/a | | | | | n/a | | 11.92 | |
|
| | 20-Year | | | | | 13.01 | | | n/a | | | | | n/a | | 10.10 | |
|
| | Since Inception | | | | | 13.17 | | | 14.76 | | | | | 15.22 | | — | |
|
| | Inception Date | | | | | 11/26/86 | | | 12/14/93 | | | | | 11/1/96 | ** | — | |
| Important Performance and Risk Information |
All performance information in this Review and Report reflects past performance, is presented on a total return basis and reflects the reinvestment of distributions. Past performance is no guarantee of future results. Performance information does not reflect the deduction of taxes that a stockholder would pay on distributions or on the sale of Fund shares. Investment return and principal value of an investment will fluctuate, so that shares may be worth more or less than their original cost when sold. Current performance may be higher or lower than performance quoted. Current month-end performance may be obtained at www.roycefunds.com. The Royce Funds invest primarily in securities of small-cap and/or micro-cap companies, which may involve considerably more risk than investments in securities of larger-cap companies.
The thoughts expressed in this Review and Report to Stockholders concerning recent market movements and future prospects for small company stocks are solely the opinion of Royce at June 30, 2007, and, of course, historical market trends are not necessarily indicative of future market movements. Statements regarding the future prospects for particular securities held in the Funds’ portfolios and Royce’s investment intentions with respect to those securities reflect Royce’s opinions as of June 30, 2007 and are subject to change at any time without notice. There can be no assurance that securities mentioned in this Review and Report to Stockholders will be included in any Royce-managed portfolio in the future. |
|
| *Not annualized. |
| **Date Royce & Associates, LLC assumed investment management responsibility for the Fund. |
| |
| 2 | This page is not part of the 2007 Semiannual Report to Stockholders |
Letter to Our Stockholders
|
 |
| Rolling Stone Blues |
| |
At first blush, the mid-point of 2007 looked very similar to the end of 2006. The economy’s condition was mostly positive, interest rates remained low and global liquidity levels remained flush following some vexing signs of contraction earlier in the year. The stock market kept moving mostly upwards, and the long bull market for small-caps in particular showed few signs of slowing down prior to July of this year. What’s new for 2007 is that larger companies have emerged in the short run as market leaders, though the margin of outperformance versus small-cap both year-to-date and for the one-year period ended June 30 was not enormous. Within small-cap, there has been a move toward larger, arguably higher-quality companies that’s distinct from the generally better returns achieved by more speculative issues in 2006. The overall direction remained positive for smaller companies, as it did for stocks as a whole. Equity investors continued to benefit from a remarkable run that included more of the overall market than is usually thought, small-cap having long since stolen the headlines from its larger peers as “The Only Asset Class Worth Owning” in some quarters.
Like the Rolling Stones, the bull market just kept going and going and going, almost automatic in its overall upward movement, its success seemingly taken for granted, with so many investors sure that the big hits would not fade away. As value investors, prone to a cautious, if not pessimistic, temperament, this blissful confidence on the part of certain observers was the object of our skepticism. Our view for the past few years has been that the bull market is nearly out of time. Although the market has so far seen fit to prove us wrong (though July’s correction could be a sign of things to come), we remain convinced
|
|
One of the advantages of employing an all-weather strategy to select smaller company stocks is that we continue to do what we have always done regardless of the market’s behavior. When smaller company stock prices were on the rise, it was more challenging to find the compelling values that have always been our stock in trade, but the search goes on whether the overall small-cap market is moving up or down.
|
|
| |
| |
| |
| This page is not part of the 2007 Semiannual Report to Stockholders | 3 |
| | | | | | |
| | | | | Letter to Our Stockholders
|
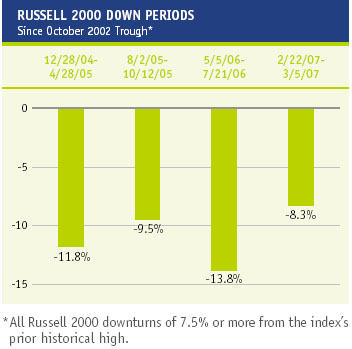
| | | | that a more historically typical correction of 15% or better is in the near future for smaller companies. The positive-performance phase that began in the fall of 2002 was interrupted by only two corrections in the 10%-14% range—one in 2004-5 and another in 2006—and a handful of others that were shy of double digits. To paraphrase the poet, the course of true market cycles never did run smooth. At least not as smooth as this current cycle. And to us, this was a warning. As we saw in July, when stock prices fell harder then they did during any other month this year, things can change very quickly. Along with our belief in regression to the mean, our conviction that markets are inherently cyclical is too firm to counter any temptation to abandon the lessons of history. | |
| | Over the past decade or so the
growth in the number and variety of
equity market indices has been
explosive. Russell, Standard & Poor’s
(“S&P”), Wilshire, and Barra have all
become accepted names in the equity
world with stables of various
indices. Considering the burgeoning
number and scope of equity market
indices, it is critical that investors
better understand the composition,
attribution and construction
methodology among similar equity
market indices.
As the Standard & Poor’s 500
index recently celebrated its 50th
anniversary, we thought that it might
be helpful to delve into the particulars
of the more prominent small-cap
indices, and how we at The Royce
Funds view them. Two of the most
prominent are the Russell 2000 and
the S&P SmallCap 600, both widely
accepted benchmarks for small-cap
equities. Yet each is different in
composition, attribution and
construction methodology.
| | | As active small-cap managers with large stakes throughout the small-cap universe, perhaps we should be more consistently happy with a market that before July had been gathering no moss and few, if any bears. Maybe we should try a little harder to relax and simply enjoy the good times. Make no mistake, we are mostly very pleased—and more than happy to reap the benefits of the robust returns that smaller stocks have been providing since the most recent small-cap market trough in October 2002. However, as the small-cap bull stampeded its way toward a fifth full year, we were also in the midst of our own 19th Nervous Breakdown (and at least as many bear market predictions) as we awaited what seemed to us an inevitable small-cap downturn. Even as the market was swaying to higher and higher levels, we could not escape the nagging and persistent reality that historically strong bull markets often give way to serious corrections, and the longer the good times last, the more likely it seems that the bear’s bite will be | | | |
| | The Russell 2000 index is the oldest—
dating back to 1979—and broadest of
the two small-cap indices. It measures
the performance of the 2,000 smallest
companies in the Russell 3000 Index
(which represents 99% of the U.S.
Continued on page 6...
| | | deep. Of course, one of the advantages of employing an all-weather strategy to select smaller company stocks is that we continue to do what we have always done regardless of the market’s behavior. When smaller company stock prices were on the rise, it was more challenging to find the compelling values that have always been our stock in trade, but the search goes on whether the overall small-cap market is moving up or down.
It’s All Over Now
If our call for overall lower returns has not yet panned out, and our prediction of a small-cap correction has thus far proved at best premature, we can take a small measure of comfort for | |
| | | | | | |
4 | This page is not part of the 2007 Semiannual Report to Stockholders | | |
| | | | | |
| |
| | |
| | our forecasting acumen in the emergence of large-cap as a market leader, a development we thought first looked likely by the beginning of 2006. As usually happens, the case for large-cap leadership took on a certain inevitability only with the gift of hindsight. In 2005, the large-cap S&P 500 and the small-cap Russell 2000 finished the year with near-identical | |
| | results—the S&P 500 was up 4.9% while the Russell 2000 gained 4.6%. The large-cap index relinquished the performance crown in 2006 (+15.8% versus 18.4%), but small-cap regained its edge mostly through the courtesy of a torrid first quarter and a strong fourth quarter. In both 2006’s bearish second quarter and flat-to-down third quarter, the S&P 500 beat the Russell 2000, events we regarded as especially telling of a shift to large-cap leadership. That third-quarter outperformance (+5.7% versus +0.4%) was the key to giving the large-cap index an edge for the second half of 2006; it also contributed to large-cap outgaining small-cap for the one-year period ended 6/30/07, up 20.6% versus 16.4%.
| |
We have been less focused on the leadership issue within small-cap than we are in the wider worlds of small- and large-cap in part because we do not limit ourselves in the broad small-cap universe by attaching labels to stocks such as “value” or “growth.” |
| | Two thousand seven has been different in terms of its first-half performance patterns, yet the end result through the end of June showed the S&P 500 ahead of its small-cap counterpart. During this year’s first quarter, a period that was positive for almost every segment of the stock market save certain small-cap growth companies and many micro-cap stocks, the S&P 500 gained a paltry 0.6% versus 2.0% for the Russell 2000. (The Nasdaq Composite, meanwhile, managed a 0.3% gain.) The second quarter saw higher returns spread more consistently throughout the market. Large-cap led small-cap, with the S&P 500 up 6.3% versus 4.4% for its small-cap sibling, while the Nasdaq Composite led both indices with a gain of 7.5%. For the year-to-date period ended 6/30/07, the Nasdaq Composite actually led, its 7.8% gain ahead of the S&P 500’s 7.0% return and the Russell 2000’s 6.5% showing.
These first-half results, as well as the large- and small-cap indices’ one-year returns, were consistent with our thought that when large-cap stocks did finally assume a leadership role, the margin of outperformance would be slight. We remain committed to the idea that large-cap’s stay at the top should be brief, as frequent leadership rotation seems likely to roll on. Considering the recent status of large-cap’s leadership, it should come as no surprise that the long-term performance edge remained with smaller companies. The Russell 2000 outpaced the S&P 500 for the three-, five-, 10- and 15-year periods ended 6/30/07. In addition, the small-cap index outgained its large-cap counterpart in two-thirds of the S&P 500’s positive quarters in each three-, five- and 10-year period ended 6/30/07.
Not Fade Away
During the first half, a similar shift in leadership arrived via a different route between value and growth within small-cap. The Russell 2000 Value index had maintained a near- | |
| This page is not part of the 2007 Semiannual Report to Stockholders | 5 |
| | | | | | |
| | equity market) and accounts for
approximately 8% of the total
market capitalization of the larger
Russell index. As of the end of June
2007, the median market cap of the
Russell 2000 was $695 million. The
largest company by market cap in the
index was $3.3 billion and the smallest
was $125 million. Companies with
market capitalizations in excess of
$2.5 billion represented 6% of the
index, while micro-caps, which Royce
defines as companies with market
capitalizations less than $500
million, comprised roughly 13% of
the index. In terms of attribution,
Financial Services represented the
largest sector weight in the index at
the end of June 2007, at 22.6%.
Industrials (autos and transportation,
materials and processing and producer
durable) and Consumer Discretionary
followed, with weightings of 21.5%
and 19.2%, respectively.
Introduced in 1994, the S&P SmallCap
600 is more concentrated than the
Russell 2000, consisting of 600 names
that cover approximately 3% of the
domestic equity market. The median
market cap of the S&P SmallCap 600
was $820 million as of the end of
June 2007. The largest company by
market cap in the index was $5.0
billion and the smallest was $70
million. Companies with more than
$2.5 billion in market cap comprised
approximately 7%, while micro-caps
represented 20% of the overall index.
Industrials (materials and processing
and producer durable) represented the
largest sector weighting in the index
at 19.1%, followed by Information
Continued on page 8...
| | | Letter to Our Stockholders
|
| | | | stranglehold on small-cap leadership until the first quarter of 2007, when it slipped under the thumb of its small-cap growth sibling. During both the first quarter (+1.5% versus +2.5%) and second quarter (+2.3% versus +6.7%), the Russell 2000 Value index lost ground to the Russell 2000 Growth index. Interestingly for us, value also underperformed growth from the interim small-cap peak on 2/22/07 through 6/30/07, down 0.8% compared to a gain of 2.9%. This consistent underperformance, even during the year’s more volatile periods, not only put small-cap value in second place for the year-to-date period ended 6/30/07 (+3.8% versus +9.3%), it also cost small-cap value the performance edge for the most recent 12-month period. For the one-year period ended 6/30/07, the Russell 2000 Value index was up 16.1% versus 16.8% for the Russell 2000 Growth index.
Paralleling the performance patterns of small-cap versus large-cap, the Russell 2000 Value index maintained its lead over the Russell 2000 Growth index for longer-term periods. It bested small-cap growth for the three-, five-, 10-,15-, 20- and 25-year periods ended 6/30/07. A critical element in this performance edge came from small-cap value’s better performance during the nearly five-year bull-market period following the small-cap market trough in October 2002, and from its superior results from the previous small-cap market peak on 3/9/00 through 6/30/07. What gives us some pause about the current period is the relative strength of small-cap growth in the more volatile period from that February 2007 interim peak. This is in stark contrast to 2006, a period in which small-cap value beat small-cap growth in up, down and more mixed quarters. However, we have been less focused on the leadership issue within small-cap than we are in the wider worlds of small- and large-cap in part because we do not limit ourselves in the broad small-cap universe by attaching labels to stocks such as “value” or “growth.”
Cool, Calm & Collected
Another reason for our bemusement is rooted in our own Funds’ recent results. While the Russell 2000 Value index was dominating small-cap performance in 2006, our closed-end portfolios were underperforming the small-cap value index. Yet during the first half of 2007, these same portfolios each outperformed the Russel 2000 Value Index on a net asset value (NAV) basis. So it would seem that the distinctions between small-cap value and growth stocks being drawn by the wider world may no longer be as significant as they were also even a few years ago. All three portfolios were also ahead of their small-cap benchmark, the Russell 2000, for the year-to-date period ended 6/30/07 on an NAV basis, and each outpaced the small-cap index on both and NAV and market price basis for the 12 months ended 6/30/07. When we turn to the long view, the news becomes even better. Each of our closed-end Funds outperformed the Russell 2000 from the previous small-cap market peak on 3/9/00 through 6/30/07 and from the small-cap market | |
| | | | | | |
6 | This page is not part of the 2007 Semiannual Report to Stockholders | | |
| | | | | |
| |
| | |
| |  trough on 10/9/02 through 6/30/07. In addition, each closed-end Royce Fund outgained the Russell 2000 for the three-, five- and 10-year periods ended 6/30/07 on both an NAV and market price basis. trough on 10/9/02 through 6/30/07. In addition, each closed-end Royce Fund outgained the Russell 2000 for the three-, five- and 10-year periods ended 6/30/07 on both an NAV and market price basis. | |
| | First-half strength came from holdings in several sectors, but the leader in each portfolio was the Industrial Products sector. It prevailed in part owing to the success of certain holdings. Synalloy Corporation was a top performer on a dollar basis in Royce Value Trust and Royce Micro-Cap Trust, while Florida Rock Industries and IPSCO dominated dollar-based gains in Royce Focus Trust. Holdings in Natural Resources and Technology were generally solid as well. Although micro-cap stocks finished the first half trailing their larger small-cap peers, any ill effects scarcely registered in the Funds’ first-half returns. We were therefore generally pleased with the Funds’ first-half returns, especially in a market climate that has made it more and more challenging to find the sort of attractive values that we like. | |
The popularity of ETFs and other index-based investments has played an important role in helping small-cap to be taken more seriously as an asset class. We also think that the related success of small-cap value approaches has been a factor in this growing esteem because a large number of investors saw that you could invest in small-cap stocks or indices with attractively low volatility scores. |
| |
You Can’t Always Get What You Want
Indeed, the reality of small-cap’s status as a permanent, professional asset class—something that we are happy to report does not seem likely to change, even in the event of a correction more severe than what we think is probable—cuts both ways for us. The popularity of ETFs and other index-based investments has played an important role in helping small-cap to be taken more seriously as an asset class. We also think that the related success of small-cap value approaches has been a factor in this growing esteem because a large number of investors saw that you could invest in small-cap stocks or indices with attractively low volatility scores. However, this has also created new tests for our purchase habits, in which we seek high-quality companies selling for bargain prices.
| |
This page is not part of the 2007 Semiannual Report to Stockholders | 7
|
| | | | | | |
| |
Technology at 17.1%, and Financial
Services at 15.8% at the end of
June 2007.
| | | Letter to Our Stockholders
|
| | | | | |
| | Another important difference between
the two indices is the respective
construction methodology. The S&P
SmallCap 600 is designed to be an
“efficient portfolio of companies that
meet specific inclusion criteria to
ensure that they are investable and
financially viable.” Inclusion in the
index is determined subjectively by
the S&P Index Committee, which adds
new stocks to the index based not
only on size, but also on financial
viability, liquidity, adequate float
size and other trading requirements.
In contrast, the Russell 2000 is
more objective in nature; it has no
committee to determine membership
and stresses the need to accurately
represent the market as it is. Kelly
Haughton, strategic director for
the Russell Indices, believes that
“the market should decide which
stocks belong in an index, especially
if the index is to provide an
unbiased benchmark for measuring
the results of money managers’
investment decisions.”
With differing composition, attribution
and construction, performance can
also vary dramatically. In fact,
examining the annual performance of
the two indices over the past 10
years shows that the spread has been
as wide as 1400 basis points in a
single calendar year. Still, we think
that the Russell 2000 and the
Standard & Poor’s SmallCap 600
Index are reasonable proxies of the
small capitalization world.
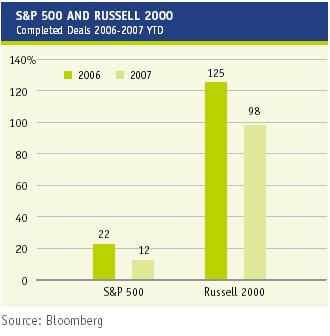
| | |  Unquestionably, in our view, the major player in the extension of the small-cap bull market has been the vast amount of global liquidity. The world has been awash with capital looking for a profitable home, and that’s been an enormous factor in keeping stock prices afloat. Many of the investment vehicles that have become increasingly better known—not just ETFs, but hedge funds, as well as merger and acquisition (M&A) and private equity activity—have been fueled to some degree by the large amounts of cash circling the globe. Global liquidity has worked to make M&As, leveraged buyouts and privatizations increasingly commonplace in the financial marketplace. The United States is in the midst of a mega-merger wave, with the number and size of the transactions exploding. During the first half of 2007, 15 companies in the S&P 500 announced takeovers, while 111 companies in the Russell 2000 Unquestionably, in our view, the major player in the extension of the small-cap bull market has been the vast amount of global liquidity. The world has been awash with capital looking for a profitable home, and that’s been an enormous factor in keeping stock prices afloat. Many of the investment vehicles that have become increasingly better known—not just ETFs, but hedge funds, as well as merger and acquisition (M&A) and private equity activity—have been fueled to some degree by the large amounts of cash circling the globe. Global liquidity has worked to make M&As, leveraged buyouts and privatizations increasingly commonplace in the financial marketplace. The United States is in the midst of a mega-merger wave, with the number and size of the transactions exploding. During the first half of 2007, 15 companies in the S&P 500 announced takeovers, while 111 companies in the Russell 2000
| |
| | | | | | | | |
| | | | | | |
8 | This page is not part of the 2007 Semiannual Report to Stockholders | | |
| | | | | |
| |
| | |
| | had deals pending. Equally important, the trend has shown no signs of slowing down within the small-cap world.
However mindful of the significance of these figures, we still do not believe that the extraordinary amount of global liquidity changes the rules of the road in the U.S. equity market, at least over the long run. Cyclicality remains the norm. Today’s small-cap market is no different than large-cap was during the ’90s. Global liquidity has extended | |
| | a wonderful bull market, but it cannot save the market from history, which means that sooner or later, the good times will end. Smaller companies have been, and will continue to be, the target of private equity funds and larger companies flush with cash. Although it’s clear that M&A activity is not the primary driver of long-term performance, it has already had a hand in the extended run for a small-cap bull market. Yet once the bull market for acquisitions ends, the softening in demand could precipitate a more widespread correction in the very market whose bullish phase it helped to extend in the first place. | |
We have never allowed our thoughts on the short- or intermediate-term forecasts for the market to cloud our stock selection process. Regardless of where we think the market may be headed next, the search for great values in smaller stocks goes on... |
| |
Time Is On Our Side
As we look forward, we almost find ourselves wishing for a serious, though short-lived, correction for smaller stocks. We are still buying mostly on short-term dips, which typically do not yield the sort of absolute value that we would ideally prefer. Our goal is to be fully invested, but with purchase decisions becoming harder and harder, it has not been easy. Yet that is the reality of the current market (at least as of this writing), so we make our adjustments and deal with what we have on a daily basis. And even as we remain highly concerned about a correction for smaller companies, we are also confident about the long-term prospects for our chosen asset class. Whether or not a decidedly bearish July marked the beginning of a correction, we are still managing our portfolios with a long-term outlook and an absolute return bias. We have never allowed our thoughts on the short- or intermediate-term forecasts for the market to cloud our stock selection process. Regardless of where we think the market may be headed next, the search for great values in smaller stocks goes on, with the thought that our Funds can provide the kind of terrific long-term absolute returns that help our shareholders to build wealth.
Sincerely,
| |

Charles M. Royce
President | 
W. Whitney George
Vice President | 
Jack E. Fockler, Jr.
Vice President | | |
July 31, 2007
This page is not part of the 2007 Semiannual Report to Stockholders | 9
|
10 | The Royce Funds 2007 Semiannual Report to Stockholders
| All Directors and Officers may be reached c/o The Royce Funds, 1414 Avenue of the Americas, New York, NY 10019 |
| |
| Charles M. Royce, Director*, President |
| Age: 67 | Number of Funds Overseen: 25 | Tenure: Since 1986 |
| Non-Royce Directorships: Director of Technology Investment Capital Corp. |
| |
| Principal Occupation(s) During Past Five Years: President, Chief Investment Officer and Member of Board of Managers of Royce & Associates, LLC (“Royce”), the Trust’s investment adviser. |
| |
| Mark R. Fetting, Director* |
| Age: 52 | Number of Funds Overseen: 41 | Tenure: Since 2001 |
| Non-Royce Directorships: Director/Trustee of registered investment companies constituting the 16 Legg Mason Funds. |
| |
| Principal Occupation(s) During Past Five Years: Senior Executive Vice President of Legg Mason, Inc.; Member of Board of Managers of Royce. Mr. Fetting’s prior business experience includes having served as Division President and Senior Officer, Prudential Financial Group, Inc. and related companies; Partner, Greenwich Associates and Vice President, T. Rowe Price Group, Inc. |
|
| Donald R. Dwight, Director |
| Age: 76 | Number of Funds Overseen: 25 | Tenure: Since 1998 |
| Non-Royce Directorships: None |
| |
| Principal Occupation(s) During Past Five Years: President of Dwight Partners, Inc., corporate communications consultant; Chairman (from 1982 to March 1998) and Chairman Emeritus (since March 1998) of Newspapers of New England, Inc. Mr. Dwight’s prior experience includes having served as Lieutenant Governor of the Commonwealth of Massachusetts, as President and Publisher of Minneapolis Star and Tribune Company and as a Trustee of the registered investment companies constituting the Eaton Vance Funds. |
| |
| Richard M. Galkin, Director |
| Age: 69 | Number of Funds Overseen: 25 | Tenure: Since 1986 |
| Non-Royce Directorships: None |
| |
| Principal Occupation(s) During Past Five Years: Private investor. Mr. Galkin’s prior business experience includes having served as President of Richard M. Galkin Associates, Inc., telecommunications consultants, President of Manhattan Cable Television (a subsidiary of Time, Inc.), President of Haverhills Inc. (another Time, Inc. subsidiary), President of Rhode Island Cable Television and Senior Vice President of Satellite Television Corp. (a subsidiary of Comsat). |
| |
| Stephen L. Isaacs, Director |
| Age: 67 | Number of Funds Overseen: 25 | Tenure: Since 1989 |
| Non-Royce Directorships: None |
| |
| Principal Occupation(s) During Past Five Years: President of The Center for Health and Social Policy (since September 1996); Attorney and President of Health Policy Associates, Inc., consultants. Mr. Isaacs’s prior business experience includes having served as Director of Columbia University Development Law and Policy Program and Professor at Columbia University (until August 1996). |
| |
| William L. Koke, Director |
| Age: 72 | Number of Funds Overseen: 25 | Tenure: Since 1996 |
| Non-Royce Directorships: None |
| |
| Principal Occupation(s) During Past Five Years: Private investor. Mr. Koke’s prior business experience includes having served as President of Shoreline Financial Consultants, Director of Financial Relations of SONAT, Inc., Treasurer of Ward Foods, Inc. and President of CFC, Inc. |
| |
| Arthur S. Mehlman, Director |
| Age: 65 | Number of Funds Overseen: 41 | Tenure: Since 2004 |
| Non-Royce Directorships: Director/Trustee of registered investment companies constituting the 16 Legg Mason Funds and Director of Municipal Mortgage & Equity, LLC. |
| |
| Principal Occupation(s) During Past Five Years: Director of The League for People with Disabilities, Inc.; Director of University of Maryland Foundation (non-profits). Formerly: Director of University of Maryland College Park Foundation (non-profit) (from 1998 to 2005); Partner, KPMG LLP (international accounting firm) (from 1972 to 2002); Director of Maryland Business Roundtable for Education (from July 1984 to June 2002). |
| David L. Meister, Director |
| Age: 67 | Number of Funds Overseen: 25 | Tenure: Since 1986 |
| Non-Royce Directorships: None |
| |
| Principal Occupation(s) During Past Five Years: Consultant. Chairman and Chief Executive Officer of The Tennis Channel (from June 2000 to March 2005). Chief Executive officer of Seniorlife.com (from December 1999 to May 2000). Mr. Meister’s prior business experience includes having served as a consultant to the communications industry, President of Financial News Network, Senior Vice President of HBO, President of Time-Life Films and Head of Broadcasting for Major League Baseball. |
| |
| G. Peter O’Brien, Director |
| Age: 61 | Number of Funds Overseen: 41 | Tenure: Since 2001 |
| Non-Royce Directorships: Director/Trustee of registered investment companies constituting the 16 Legg Mason Funds; Director of Technology Investment Capital Corp. |
| |
| Principal Occupation(s) During Past Five Years: Trustee Emeritus of Colgate University (since 2005); Board Member of Hill House, Inc. (since 1999); Formerly: Trustee of Colgate University (from 1996 to 2005), President of Hill House, Inc. (from 2001 to 2005) and Managing Director/Equity Capital Markets Group of Merrill Lynch & Co. (from 1971 to 1999). |
|
| John D. Diederich, Vice President and Treasurer |
| Age: 55 | Tenure: Since 2001 |
| |
| Principal Occupation(s) During Past Five Years: Chief Operating Officer, Managing Director and member of the Board of Managers of Royce; Chief Financial Officer of Royce; Director of Administration of the Trust; and President of RFS, having been employed by Royce since April 1993. |
| |
| Jack E. Fockler, Jr., Vice President |
| Age: 48 | Tenure: Since 1995 |
| |
| Principal Occupation(s) During Past Five Years: Managing Director and Vice President of Royce, and Vice President of RFS, having been employed by Royce since October 1989. |
| |
| W. Whitney George, Vice President |
| Age: 49 | Tenure: Since 1995 |
| |
| Principal Occupation(s) During Past Five Years: Managing Director and Vice President of Royce, having been employed by Royce since October 1991. |
| |
| Daniel A. O’Byrne, Vice President and Assistant Secretary |
| Age: 45 | Tenure: Since 1994 |
| |
| Principal Occupation(s) During Past Five Years: Principal and Vice President of Royce, having been employed by Royce since October 1986. |
| |
| John E. Denneen, Secretary and Chief Legal Officer |
| Age: 40 | Tenure: 1996-2001 and Since April 2002 |
| |
| Principal Occupation(s) During Past Five Years: General Counsel (Deputy General Counsel prior to 2003), Principal, Chief Legal and Compliance Officer and Secretary of Royce; Secretary and Chief Legal Officer of The Royce Funds. |
| |
| Lisa Curcio, Chief Compliance Officer |
| Age: 47 | Tenure: Since 2004 |
| |
| Principal Occupation(s) During Past Five Years: Chief Compliance Officer of The Royce Funds (since October 2004); Compliance Officer of Royce (since June 2004); Vice President, The Bank of New York (from February 2001 to June 2004). |
| |
|
| * Interested Director. |
| |
| |
| The Royce Funds 2007 Semiannual Report to Stockholders | 11 |
|
| | | | | | | | | | |
| | | | | | | | | | |
| | AVERAGE ANNUAL NAV TOTAL RETURNS
Through 6/30/07 | |
| |
| |
| | Second Quarter 2007* | | 6.30 | % | |
| |
| |
| | Jan - June 2007* | | 9.83 | | |
| |
| |
| | One-Year | | 19.70 | | |
| |
| |
| | Three-Year | | 16.39 | | |
| |
| |
| | Five-Year | | 15.46 | | |
| |
| |
| | 10-Year | | 13.63 | | |
| |
| |
| | 15-Year | | 14.45 | | |
| |
| |
| | 20-Year | | 13.01 | | |
| |
| |
| | Since Inception (11/26/86) | | 13.17 | | |
| |
| |
| | * Not annualized. | | | | |
| | | | | | | | | | |
| | CALENDAR YEAR NAV TOTAL RETURNS | |
| |
| |
| | Year | RVT | | Year | | RVT | |
| |
| |
| | 2006 | 19.5 | % | | 1997 | | 27.5 | % | |
| |
| |
| | 2005 | 8.4 | | | 1996 | | 15.5 | | |
| |
| |
| | 2004 | 21.4 | | | 1995 | | 21.1 | | |
| |
| |
| | 2003 | 40.8 | | | 1994 | | 0.1 | | |
| |
| |
| | 2002 | -15.6 | | | 1993 | | 17.3 | | |
| |
| |
| | 2001 | 15.2 | | | 1992 | | 19.3 | | |
| |
| |
| | 2000 | 16.6 | | | 1991 | | 38.4 | | |
| |
| |
| | 1999 | 11.7 | | | 1990 | | -13.8 | | |
| |
| |
| | 1998 | 3.3 | | | 1989 | | 18.3 | | |
| |
| |
| | | | | | | | | | |
| | TOP 10 POSITIONS
% of Net Assets Applicable
to Common Stockholders | |
| |
| |
| | AllianceBernstein Holding L.P. | | 2.3 | % | |
| |
| |
| | Ritchie Bros. Auctioneers | | 1.5 | | |
| |
| |
| | Sotheby’s Cl. A | | 1.4 | | |
| |
| |
| | Universal Compression Holdings | | 1.3 | | |
| |
| |
| | Lincoln Electric Holdings | | 1.1 | | |
| |
| |
| | SEACOR Holdings | | 1.1 | | |
| |
| |
| | PAREXEL International | | 1.0 | | |
| |
| |
| | Ash Grove Cement Cl. B | | 1.0 | | |
| |
| |
| | Brady Corporation Cl. A | | 0.9 | | |
| |
| |
| | Adaptec | | 0.8 | | |
| |
| |
| | | | | | | | | | |
| | PORTFOLIO SECTOR BREAKDOWN
% of Net Assets Applicable
to Common Stockholders | |
| |
| |
| | Technology | | 23.4 | % | |
| |
| |
| | Industrial Products | | 16.6 | | |
| |
| |
| | Industrial Services | | 11.0 | | |
| |
| |
| | Financial Intermediaries | | 10.8 | | |
| |
| |
| | Natural Resources | | 9.6 | | |
| |
| |
| | Financial Services | | 8.5 | | |
| |
| |
| | Health | | 6.8 | | |
| |
| |
| | Consumer Services | | 5.6 | | |
| |
| |
| | Consumer Products | | 4.8 | | |
| |
| |
| | Utilities | | 0.2 | | |
| |
| |
| | Diversified Investment Companies | | 0.1 | | |
| |
| |
| | Miscellaneous | | 2.2 | | |
| |
| |
| | Bonds and Preferred Stocks | | 0.2 | | |
| |
| |
| | Cash and Cash Equivalents | | 17.5 | | |
| |
| |
| | | |
| | | |
|
| |
| |
| Royce Value Trust |
|
| |
 Manager’s Discussion
Royce Value Trust’s (RVT) diversified portfolio of small- and micro-cap stocks posted solid results during the first half of 2007. For the year-to-date period ended 6/30/07, the Fund was up 9.8% on a net asset value (NAV) basis and 0.6% on a market price basis versus a 6.5% return for the Russell 2000 and 8.6% for the S&P 600. For the first quarter, the Fund returned 3.3% on an NAV basis, and 1.5% on a market price basis compared with 2.0% and 3.2% for the Russell 2000 and S&P 600, respectively. The Fund’s NAV results were also strong in the second quarter, with RVT posting a 6.3% gain compared with 4.4% and 5.3% for the Russell 2000 and S&P 600, while on a market price basis, the Fund disappointed, losing 0.8%.
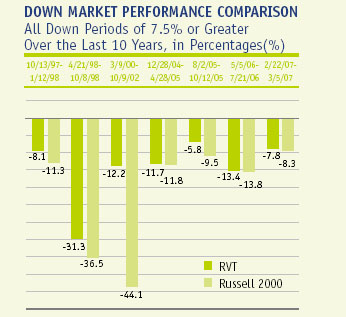
RVT demonstrated strong absolute and relative results over market-cycle and other long-term periods. From the small-cap market peak on 3/9/00 through 6/30/07, RVT gained 154.2% on an NAV basis, versus 50.8% for the Russell 2000 and 106.4% for the S&P 600. During the mostly bullish phase from the small-cap market trough on 10/9/02 through 6/30/07, the Fund was up 189.4% compared to a gain of 169.9% for the Russell 2000 and 164.7% for the S&P 600. Fortunately, market-price performance difficulties during the first half did little to hurt performance over more extended periods. On both an NAV and market price basis, RVT held a performance advantage over both benchmarks for the one-, three-, five-, 10-, 15-, 20-year, and since inception (11/26/86) periods ended 6/30/07. RVT’s average annual NAV total return since inception was 13.2%.
|
| Positive performances could be found throughout RVT’s portfolio, with the Industrial Products sector leading the way in dollar-based net gains. The worldwide boom in large-scale infrastructure construction, particularly in China, seems to be changing the business cycle. Many traditionally cyclical industries are morphing into high-growth areas with rapidly increasing demand for their shares. It’s a situation that we will continue to watch, as industrial companies have historically been well-represented in the portfolio. The Fund’s second-best performer in the first half of 2007, Synalloy, hails from | | GOOD IDEAS THAT WORKED
Net Realized and Unrealized Investment Return*
Year-to-Date Through 6/30/07 |
|
| Sotheby’s Cl. A | | $ | 6,976,529 |
|
| Synalloy Corporation | | | 6,707,090 |
|
| PAREXEL International | | | 4,106,333 |
|
| ITT Educational Services | | | 4,080,800 |
|
| AllianceBernstein Holding L.P. | | | 3,024,548 |
|
| *Includes dividends | | | |
| |
| the Industrial Products sector in the top-performing construction materials industry. This conservatively capitalized pipe and piping systems maker saw its share price climb (before cooling off a bit toward the end of June) owing to ongoing earnings strength. We began to reduce our position in May. |
| |
Important Performance and Risk Information
All performance information reflects past performance, is presented on a total return basis and reflects the reinvestment of distributions. Past performance is no guarantee of future results. Current performance may be higher or lower than performance quoted. Returns as of the recent month-end may be obtained at www.roycefunds.com. The market price of the Fund’s shares will fluctuate, so that shares may be worth more or less than their original cost when sold. The Fund invests primarily in securities of small-cap and micro-cap companies, which may involve considerably more risk than investing in a more diversified portfolio of larger-cap companies. Standard deviation is a statistical measure within which a fund’s total returns have varied over time. The greater the standard deviation, the greater a fund’s volatility. The Russell 2000 is an unmanaged index of domestic small-cap common stocks. |
12 | The Royce Funds 2007 Semiannual Report to Stockholders
| |
| |
| Performance and Portfolio Review |
|
| |
Other strong gainers in the sector included Lincoln Electric Holdings, Peerless Manufacturing Company, Kaydon Corporation and Florida Rock Industries, a takeover target that we have owned in the portfolio since 1986.
There were also notable successes outside of Industrial Products. We have held a position in Sotheby’s, the Fund’s top performing holding in the first half, since 1990. First and second quarter earnings strength helped the share price for this leading auction house to climb, and we trimmed our position in February and April. Impressive net gains also came from PAREXEL International, a company we have owned since 1998. This bio-pharmaceutical services company provides contract research, medical marketing, consulting, informatics, and advanced technology products and services to the pharmaceutical, biotechnology, and medical device industries worldwide. Its growing business and strong earnings helped its stock price stay healthy in the first half. Having recently celebrated its 25th anniversary in business, its standing as a long-term success in a volatile industry may also have helped.
|
GOOD IDEAS AT THE TIME
Net Realized and Unrealized Investment Loss*
Year-to-Date Through 6/30/07 | | Although every sector posted net gains, even the best performing periods have their blemishes. The slumping housing market and the related implosion of the subprime mortgage industry spelled trouble for real estate investment trusts such as Opteum. The departure of some of its veteran executives did little to help. Newport Corporation, which makes laser-based and photonic products, saw its price slide throughout the first half. The firm reported lower-than-expected first-quarter profits that were especially acute in its laser division. Kimball International, which manufactures wood furniture, cabinets and electronic assembly products, is a company that we have owned in RVT’s portfolio since 1986. We have long liked its low debt |
|
| Opteum Cl. A | | $ | 4,334,925 |
|
| Newport Corporation | | | 3,239,334 |
|
| Kimball International Cl. B | | | 2,893,948 |
|
| First Consulting Group | | | 2,389,434 |
|
| Adaptec | | | 2,196,485 |
|
| *Includes dividends | | | |
| |
| and consistent dividend. Although the firm was among the Fund’s top performers in 2006, its stock price slipped in the first half. We reduced our position in February. |
| |
 |
|
| | | | | | | | | | | | | | | |
| | | | | | | | | | | | | | | |
| | PORTFOLIO DIAGNOSTICS | |
| |
| |
| | Average Market Capitalization | | $1,254 million | |
| |
| |
| | Weighted Average P/E Ratio | | 21.0x | |
| |
| |
| | Weighted Average P/B Ratio | | 2.5x | |
| |
| |
| | Weighted Average Yield | | 0.9% | |
| |
| |
| | Fund Net Assets | | $1,270 million | |
| |
| |
| | Turnover Rate | | 5% | |
| |
| |
| | Net Leverage* | | 0% | |
| |
| |
| | Symbol | | | |
| | Market Price | | RVT | |
| | NAV | | XRVTX | |
| |
| |
| | *Net leverage is the percentage, in excess of 100%, of the total value of equity type investments, divided by net assets, excluding preferred stock.
| |
| | The Funds’ P/E ratio calculations exclude companies with zero or negative earnings. | |
| | | |
| | CAPITAL STRUCTURE
Publicly Traded Securities Outstanding
at 6/30/07 at NAV or Liquidation Value | |
| |
| |
| | 58.5 million shares
of Common Stock | | | | | | | | $1,270 million | |
| |
| |
| | 5.90% Cumulative
Preferred Stock | | | | | | | | $220 million | |
| |
| |
| | | |
| | RISK/RETURN COMPARISON
Five-Year Period Ended 6/30/07 | |
| |
| |
| | | | Average Annual | | Standard | | Return | |
| | | | Total Return | | Deviation | | Efficiency* | |
| |
| |
| | RVT (NAV) | | | 15.46 | % | | | 16.12 | | | | 0.96 | | |
| |
| |
| | S&P 600 | | | 14.38 | | | | 14.85 | | | | 0.97 | | |
| |
| |
| | Russell 2000 | | | 13.88 | | | | 16.47 | | | | 0.84 | | |
| |
| |
| | *Return Efficiency is the average annual total return divided by the annualized standard deviation over a designated time period. | |
| | | |
 |
| | | |
|
The Royce Funds 2007 Semiannual Report to Stockholders | 13
|
| | | | | | | | | | |
| | | | | | | | | | |
| | AVERAGE ANNUAL NAV TOTAL RETURNS
Through 6/30/07 | |
| |
| |
| | Second Quarter 2007* | | 4.39 | % | |
| |
| |
| | Jan-June 2007* | | 9.23 | | |
| |
| |
| | One-Year | | 19.87 | | |
| |
| |
| | Three-Year | | 16.08 | | |
| |
| |
| | Five-Year | | 16.54 | | |
| |
| |
| | 10-Year | | 14.34 | | |
| |
| |
| | Since Inception (12/14/93) | | 14.76 | | |
| |
| |
| | *Not annualized. | | | | |
| | | | | | | | | | |
| | CALENDAR YEAR NAV TOTAL RETURNS | |
| |
| |
| | Year | RMT | | Year | | RMT | |
| |
| |
| | 2006 | 22.5 | % | | 1999 | | 12.7 | % | |
| |
| |
| | 2005 | 6.8 | | | 1998 | | -4.1 | | |
| |
| |
| | 2004 | 18.7 | | | 1997 | | 27.1 | | |
| |
| |
| | 2003 | 55.6 | | | 1996 | | 16.6 | | |
| |
| |
| | 2002 | -13.8 | | | 1995 | | 22.9 | | |
| |
| |
| | 2001 | 23.4 | | | 1994 | | 5.0 | | |
| |
| |
| | 2000 | 10.9 | | | | | | | |
| |
| |
| | | | | | | | | | |
| | TOP 10 POSITIONS
% of Net Assets Applicable
to Common Stockholders | |
| |
| |
| | Seneca Foods | | 1.3 | % | |
| |
| |
| | Highbury Financial | | 1.2 | | |
| |
| |
| | MVC Capital | | 1.1 | | |
| |
| |
| | Sapient Corporation | | 1.1 | | |
| |
| |
| | Edge Petroleum | | 1.0 | | |
| |
| |
| | Pegasystems | | 1.0 | | |
| |
| |
| | PAREXEL International | | 0.9 | | |
| |
| |
| | Transaction Systems Architects Cl. A | | 0.9 | | |
| |
| |
| | Pason Systems | | 0.9 | | |
| |
| |
| | Weyco Group | | 0.9 | | |
| |
| |
| | | | | | | | | | |
| | PORTFOLIO SECTOR BREAKDOWN
% of Net Assets Applicable
to Common Stockholders | |
| |
| |
| | Technology | | 23.4 | % | |
| |
| |
| | Health | | 14.2 | | |
| |
| |
| | Industrial Products | | 14.2 | | |
| |
| |
| | Industrial Services | | 12.9 | | |
| |
| |
| | Financial Intermediaries | | 10.7 | | |
| |
| |
| | Natural Resources | | 10.4 | | |
| |
| |
| | Consumer Products | | 5.0 | | |
| |
| |
| | Consumer Services | | 4.6 | | |
| |
| |
| | Financial Services | | 4.2 | | |
| |
| |
| | Diversified Investment Companies | | 1.4 | | |
| |
| |
| | Miscellaneous | | 2.7 | | |
| |
| |
| | Preferred Stocks | | 1.5 | | |
| |
| |
| | Cash and Cash Equivalents | | 11.1 | | |
| |
| |
| | | |
| | | |
|
| |
| |
| Royce Micro-Cap Trust |
|
| |
 Manager’s Discussion
Royce Micro-Cap Trust’s diversified portfolio of diminutive companies fared well in the first half on both an absolute and relative basis. For the year-to-date period ended 6/30/07, the Fund gained 9.2% on a net asset value (NAV) basis, though on a market price basis it lost 2.9%, versus a return of 6.5% for its small-cap benchmark, the Russell 2000. The Fund’s strong absolute and relative NAV showing was consistent during the first half of 2007. RMT gained 4.6% in the first quarter versus 2.0% for the Russell 2000, while the Fund was down 0.7% on a market price basis. On an NAV basis, the Fund matched the gain of its benchmark in the second quarter, each up 4.4%, though its market price result was again disappointing, down 2.2%.
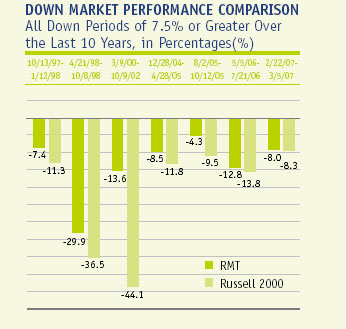
The Fund’s market price struggles during the first half represented a cooling off after a terrific performance in 2006. Its poor first half fortunately did little harm to its long-term returns. From the previous small-cap market peak on 3/9/00 through 6/30/07, RMT was up 170.0% on a net asset value basis, and 223.0% on a market price basis, compared to the Russell 2000’s 50.8% gain. During the more dynamic upswing from the small-cap market trough on 10/9/02 through 6/30/07, RMT gained 212.6% on an NAV basis and 243.3% on a market price basis, versus 169.9% for the small-cap benchmark. The Fund’s returns during these market cycle periods were equally impressive on an absolute basis, something of greater importance to us, as much as we like to beat our benchmark. On both an NAV and market price basis, RMT outperformed the Russell 2000 for the one-, three-, five-, 10-year and since inception (12/14/93) periods ended 6/30/07. The Fund’s average annual NAV total return since inception was 14.8%.
|
| One interesting development that we saw over the last several months has been a performance disparity within the micro-cap sector. Roughly coinciding with the move to higher quality that we have observed in the upper tier of the small-cap world has been better performance from larger, more established micro-cap companies. This benefited the Fund in the first half of 2007, as RMT’s average market capitalization of $290 million at the end of June leaned toward the higher range of the micro-cap world. Of course, we always seek quality in our portfolio selections even as we’re aware that the micro-cap segment is only gradually finding acceptance as an area in which quality can be reliably found. | | GOOD IDEAS THAT WORKED
Net Realized and Unrealized Investment Return*
Year-to-Date Through 6/30/07 |
|
| Synalloy Corporation | | $ | 2,353,845 |
|
| The Geo Group | | | 1,560,339 |
|
| PAREXEL International | | | 1,541,307 |
|
| Covansys Corporation | | | 1,474,748 |
|
| CMG Information Services | | | 1,457,136 |
|
| *Includes dividends | | | |
| |
| |
Important Performance and Risk Information
All performance information reflects past performance, is presented on a total return basis and reflects the reinvestment of distributions. Past performance is no guarantee of future results. Current performance may be higher or lower than performance quoted. Returns as of the recent month-end may be obtained at www.roycefunds.com. The market price of the Fund’s shares will fluctuate, so that shares may be worth more or less than their original cost when sold. The Fund normally invests in micro-cap companies, which may involve considerably more risk than investing in a more diversified portfolio of larger-cap companies. Standard deviation is a statistical measure within which a fund’s total returns have varied over time. The greater the standard deviation, the greater a fund’s volatility. The Russell 2000 is an unmanaged index of domestic small-cap common stocks. |
14 | The Royce Funds 2007 Semiannual Report to Stockholders
| | |
| |
| Performance and Portfolio Review |
|
| |
The Industrial Products sector led the way during the first half in terms of dollar-based net gains. The ongoing worldwide boom in large-scale infrastructure construction, particularly in China, has made industrial companies, historically well-represented in the portfolio, highly desirable. The Fund’s top performer came from the sector. Synalloy is a conservatively capitalized pipe and piping services business that saw its share price increase driven by ongoing earnings strength before it cooled off a bit toward the end of June. We reduced our position in February and June. Holdings in machinery and other industrial products also posted strong first-half gains.
We have owned shares of privatized correctional and detention management company Geo Group, since January 2000. Its business grew during the first half–allowing the company to reduce its debt–and its stock split early in June, which helped its share price to break out while leading us to reduce our position later that same month. We have owned bio-pharmaceutical services company PAREXEL International in RMT’s portfolio since 1999. Growing business and strong earnings helped its stock price to climb. Its standing as a long-term success in an otherwise volatile industry may also have helped. We reduced our position in June.
|
GOOD IDEAS AT THE TIME
Net Realized and Unrealized Investment Loss*
Year-to-Date Through 6/30/07 | | Even during positive performance periods, there are a few disappointments. Healthcare consultant First Consulting Group lost a customer that brought in about 10% of the firm’s business. After others had sold on this news, we increased our position based on the strength of the firm’s balance sheet, improving returns on capital and a series of promising acquisitions. Real estate investment trusts suffered from the slumping housing market and the subprime mortgage industry crisis during the first half of 2007. Opteum, which we have owned since 2005, was no exception, and the firm’s problems were exacerbated by the departure of some veteran executives. Its share price |
|
| First Consulting Group | | $ | 1,159,112 |
|
| Opteum Cl. A | | | 943,260 |
|
| CorVel Corporation | | | 859,879 |
|
| Volt Information Sciences | | | 793,760 |
|
| Allied Defense Group | | | 744,541 |
|
| *Includes dividends | | | |
| |
| dropped dramatically, and while that did not deliver positive results in the short run, we saw enough promise in the company to justify adding to our position. |
| |
 |
|
| | | | | | | | | | | | | | | |
| | | | | | | | | | | | | | | |
| | PORTFOLIO DIAGNOSTICS | |
| |
| |
| | Average Market Capitalization | | $290 million | |
| |
| |
| | Weighted Average P/E Ratio | | 20.6x* | |
| |
| |
| | Weighted Average P/B Ratio | | 2.1x | |
| |
| |
| | Weighted Average Yield | | 0.7% | |
| |
| |
| | Fund Net Assets | | $369 million | |
| |
| |
| | Turnover Rate | | 19% | |
| |
| |
| | Net Leverage† | | 5% | |
| |
| |
| | Symbol | | | |
| | Market Price | | RMT | |
| | NAV | | XOTCX | |
| |
| |
| | *Excludes 22% of portfolio holdings with zero or negative earnings as of 6/30/07. | |
| | | |
| | †Net leverage is the percentage, in excess of 100%, of the total value of equity type investments, divided by net assets, excluding preferred stock. | |
| | | |
| | CAPITAL STRUCTURE
Publicly Traded Securities Outstanding
at 6/30/07 at NAV or Liquidation Value | |
| |
| |
| | 23.8 million shares
of Common Stock | | | | $369 million | | |
| |
| |
| | 6.00% Cumulative
Preferred Stock | | | | $60 million | | |
| |
| |
| | | |
| | RISK/RETURN COMPARISON
Five-Year Period Ended 6/30/07 | |
| |
| |
| | | | Average Annual | | Standard | | Return | |
| | | | Total Return | | Deviation | | Efficiency* | |
| |
| |
| | RMT (NAV) | | | 16.54 | % | | | 17.02 | | | | 0.97 | | |
| |
| |
| | Russell 2000 | | | 13.88 | | | | 16.47 | | | | 0.84 | | |
| |
| |
| | *Return Efficiency is the average annual total return divided by the annualized standard deviation over a designated time period. | |
| | | |
 |
| | | |
|
The Royce Funds 2007 Semiannual Report to Stockholders | 15
|
| | | | | | | | | | |
| | | | | | | | | | |
| | AVERAGE ANNUAL NAV TOTAL RETURNS
Through 6/30/07 | |
| |
| |
| | Second Quarter 2007* | | 8.24 | % | |
| |
| |
| | Jan-June 2007* | | 15.94 | | |
| |
| |
| | One-Year | | 24.26 | | |
| |
| |
| | Three-Year | | 21.31 | | |
| |
| |
| | Five-Year | | 21.57 | | |
| |
| |
| | 10-Year | | 14.16 | | |
| |
| |
| | Since Inception (11/1/96)† | | 15.22 | | |
| |
| |
| | * Not annualized. | | | | |
| | † Royce & Associates assumed investment management responsibility for the Fund on 11/1/96. |
| | | | | | | | | | |
| | CALENDAR YEAR NAV TOTAL RETURNS | |
| |
| |
| | Year | | FUND | Year | | FUND | |
| |
| |
| | 2006 | | 15.9 | % | 2001 | | 10.0 | % | |
| |
| |
| | 2005 | | 13.3 | | 2000 | | 20.9 | | |
| |
| |
| | 2004 | | 29.2 | | 1999 | | 8.7 | | |
| |
| |
| | 2003 | | 54.3 | | 1998 | | -6.8 | | |
| |
| |
| | 2002 | | -12.5 | | 1997 | | 20.5 | | |
| |
| |
| | | | | | | | | | |
| | TOP 10 POSITIONS | |
| | % of Net Assets Applicable | |
| | to Common Stockholders | |
| |
| |
| | Australia Government 7.50% Bond | | 4.7 | % | |
| |
| |
| | New Zealand Government | | | | |
| | 6.00% Bond | | 4.2 | | |
| |
| |
| | Ivanhoe Mines | 3.5 | | |
| |
| |
| | Unit Corporation | | 3.5 | | |
| |
| |
| | Schnitzer Steel Industries Cl. A | | 3.3 | | |
| |
| |
| | Reliance Steel & Aluminum | | 3.1 | | |
| |
| |
| | Thor Industries | | 3.0 | | |
| |
| |
| | Knight Capital Group Cl. A | | 2.9 | | |
| |
| |
| | Lincoln Electric Holdings | | 2.9 | | |
| |
| |
| | KKR Financial Holdings | | 2.7 | | |
| |
| |
| | | | | | | | | | |
| | PORTFOLIO SECTOR BREAKDOWN
% of Net Assets Applicable
to Common Stockholders | |
| |
| |
| | Natural Resources | | 24.7 | % | |
| |
| |
| | Industrial Products | | 21.8 | | |
| |
| |
| | Technology | | 6.6 | | |
| |
| |
| | Consumer Products | | 6.6 | | |
| |
| |
| | Industrial Services | | 6.3 | | |
| |
| |
| | Financial Intermediaries | | 5.6 | | |
| |
| |
| | Health | | 5.1 | | |
| |
| |
| | Consumer Services | | 4.2 | | |
| |
| |
| | Financial Services | | 1.2 | | |
| |
| |
| | Bonds | | 8.9 | | |
| |
| |
| | Cash and Cash Equivalents | | 22.8 | | |
| |
| |
| | | |
| | | |
|
| |
| |
| Royce Focus Trust |
|
| |
 Manager’s Discussion
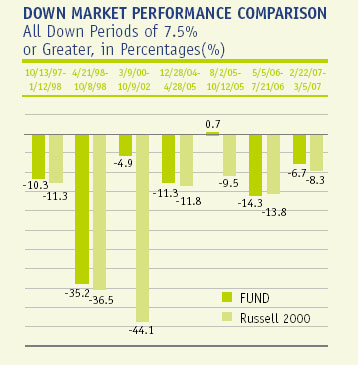
Royce Focus Trust (FUND) made its way successfully through the pleasantly buoyant waters of 2007’s first half, with notable results on both an absolute and relative basis. The Fund posted dynamic year-to-date returns, up 15.9% on a net asset value (NAV) basis and 8.6% on a market price basis, in both instances ahead of FUND’s small-cap benchmark, the Russell 2000, which was up 6.5% for the same period. Results were positive throughout the year’s first six months. In the first quarter, the Fund was up 7.1% on a net asset value (NAV) basis, and 7.4% on a market price basis, both results well out in front of the small-cap index, which was up 2.0%. During the second quarter, the Fund again outpaced the benchmark on an NAV basis, up 8.2% versus 4.4%, while its return on a market price basis was 1.2%. As gratifying as recent short-term outperformance was, it remains the case that the Fund’s market cycle and other long-term periods offer what we believe is the best gauge of its strength. We were very pleased, then, that FUND maintained its longstanding record of strong absolute performances over these time periods. From the previous small-cap market peak on 3/9/00 through 6/30/07, FUND was up 248.4% and 327.3% on NAV and market price bases, respectively, versus a 50.8% result for the small-cap index.
|
The Fund also beat the Russell 2000 during the mostly bullish phase from 10/9/02 through 6/30/07, gaining 266.3% on an NAV basis and 298.4% on a market price basis, while the Russell 2000 gained 169.9% for the same period. These strong market cycle results were a key factor in FUND’s outperformance of the benchmark over calendar-based periods. On both an NAV and market price basis, the Fund’s limited portfolio of primarily small-cap stocks outpaced the index for the one-, three-, five-, 10-year and since-inception of our management periods ended 6/30/07. FUND’s average annual NAV total return since the inception of our management (11/1/96) was 15.2%. | | GOOD IDEAS THAT WORKED
Net Realized and Unrealized Investment Return*
Year-to-Date Through 6/30/07 |
|
| IPSCO | | | $3,396,454 |
|
| Florida Rock Industries | | | 2,290,728 |
|
| Tesco Corporation | | | 1,996,506 |
|
| Ivanhoe Mines | | | 1,984,500 |
|
| Reliance Steel & Aluminum | | | 1,704,000 |
|
| *Includes dividends | | | |
| Although there were plenty of positive performances in the portfolio during the first half, the strongest dollar-based net gains came from the Industrial Products and Natural Resources sectors. The Fund’s top two performers, IPSCO and Florida Rock Industries, were Industrial Products holdings. We first began to buy shares of construction aggregates company Florida Rock Industries in other Royce-managed portfolios more than 20 years ago and have had a position in FUND’s portfolio since 1998. In February 2007, the |
| |
Important Performance and Risk Information
All performance information reflects past performance, is presented on a total return basis and reflects the reinvestment of distributions. Past performance is no guarantee of future results. Current performance may be higher or lower than performance quoted. Returns as of the recent month-end may be obtained at www.roycefunds.com. The market price of the Fund’s shares will fluctuate, so that shares may be worth more or less than their original cost when sold. The Fund normally invests primarily in small-cap companies, which may involve considerably more risk than investing in a more diversified portfolio of larger-cap companies. Standard deviation is a statistical measure within which a fund’s total returns have varied over time. The greater the standard deviation, the greater a fund’s volatility. The Russell 2000 is an unmanaged index of domestic small-cap common stocks. |
16 | The Royce Funds 2007 Semiannual Report to Stockholders
| |
| |
| Performance and Portfolio Review |
|
| |
company was acquired by a larger competitor at a substantial premium. We finished selling our stake in April. The firm was consistently attractive to us as a conservatively capitalized, well-run business in a cyclical industry that has historically garnered attention from value investors. Canadian steel production and fabrication company IPSCO first attracted our attention in 2004 with its pristine balance sheet, strong history of earnings and high returns on capital. It was also the target of the urge to merge. Earlier this year, several larger firms began looking at the firm as a potential acquisition, with Swedish business SSAB finally closing the deal in May. We sold our shares between April and May.
Within Natural Resources, Tesco Corporation, which designs and manufactures oilfield products such as drilling and hydraulic systems, reported record first-quarter earnings. This helped its already rising stock price to keep climbing. We reduced our position at increasing prices between January and May. Ivanhoe Mines is a conservatively capitalized business with extensive operations in Mongolia. It recently won permission from that nation’s government to develop what could be the world’s largest undeveloped copper and gold deposits in tandem with another firm, news that gave a healthy sheen to Ivanhoe’s stock price. Unit Corporation reaped the rewards of running a strong, well-managed business in a mostly positive market for energy stocks. We added to our stake in January and June. |
GOOD IDEAS AT THE TIME
Net Realized and Unrealized Investment Loss*
Year-to-Date Through 6/30/07 | | Even the best performing periods have their blemishes. In the otherwise-profitable precious metals and mining industry within the Natural Resources sector, Gammon Gold disappointed. In a difficult market for gold and silver commodity prices, the firm went through a change in management (that we liked) and had some issues with its Mexican mining operations. We substantially increased our stake in institutional trading and asset management company Knight Capital Group. Its stock price began to slip in January as the firm experienced slumping profits from increased compensation costs. In the second quarter, earnings were hampered by a decline in its hedge fund fees. |
|
| Gammon Gold | | | $792,108 |
|
| Knight Capital Group | | | 579,621 |
|
| The Timberland Company | | | 516,700 |
|
| KKR Financial Holdings | | | 376,960 |
|
| Nu Skin Enterprises Cl. A | | | 304,000 |
|
| *Includes dividends | | | |
| |
 |
|
| | | | | | | | | | | | | | | |
| | | | | | | | | | | | | | | |
| | PORTFOLIO DIAGNOSTICS | |
| |
| |
| | Average Market Capitalization | | $1,560 million | |
| |
| |
| | Weighted Average P/E Ratio | | 16.2x | |
| |
| |
| | Weighted Average P/B Ratio | | 2.7x | |
| |
| |
| | Weighted Average Yield | | 1.5% | |
| |
| |
| | Fund Net Assets | | $182 million | |
| |
| |
| | Turnover Rate | | 36% | |
| |
| |
| | Net Leverage† | | 0% | |
| |
| |
| | Symbol | | | |
| | Mareket Price | | FUND | |
| | NAV | | XFUNX | |
| |
| |
| | † Net leverage is the percentage, in excess of 100%, of the total value of equity type investments, divided by net assets, excluding preferred stock. | |
| |
The Funds’ P/E ratio calculations exclude companies with zero or negative earnings. | |
| | | |
| | CAPITAL STRUCTURE
Publicly Traded Securities Outstanding
at 6/30/07 at NAV or Liquidation Value | |
| |
| |
| | 16.5 million shares of Common Stock | | $182 million | |
| |
| |
| | 6.00% Cumulative Preferred Stock | | $25 million | |
| |
| |
| | | |
| | RISK/RETURN COMPARISON
Five-Year Period Ended 6/30/07 | |
| |
| |
| | | | Average Annual | | Standard | | Return | |
| | | | Total Return | | Deviation | | Efficiency* | |
| |
| |
| | FUND (NAV) | | | 21.57 | % | | | 17.04 | | | | 1.27 | | |
| |
| |
| | Russell 2000 | | | 13.88 | | | | 13.88 | | | | 0.84 | | |
| |
| |
| | *Return Efficiency is the average annual total return divided by the annualized standard deviation over a designated time period. | |
| | | |
 |
|
|
The Royce Funds 2007 Semiannual Report to Stockholders | 17
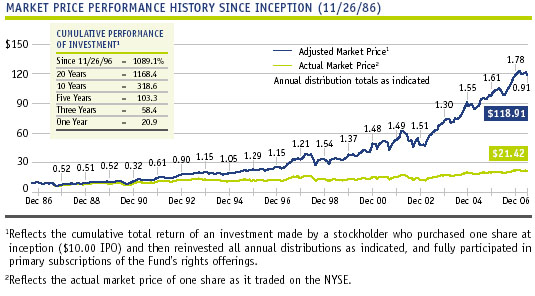
History Since Inception
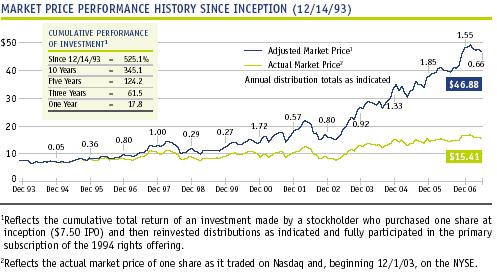
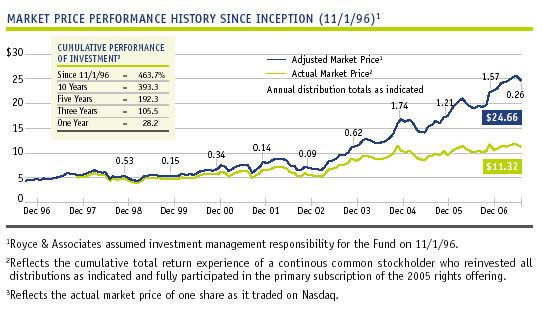
The following table details the share accumulations by an initial investor in the Funds who reinvested all distributions (including fractional shares) and participated fully in primary subscriptions for each of the rights offerings. Full participation in distribution reinvestments and rights offerings can maximize the returns available to a long-term investor. This table should be read in conjunction with the Performance and Portfolio Reviews of the Funds.
| | | | | | Amount | | | Purchase | | | | | NAV | | | Market | |
| | History | | | Invested | | | Price* | | Shares | | | Value** | | | Value** | |
| Royce Value Trust | | | | | | | | | | | | | | | | | | | |
| 11/26/86 | | Initial Purchase | | | $ | 10,000 | | | $ | 10.000 | | 1,000 | | | $ | 9,280 | | | $ | 10,000 | |
| 10/15/87 | | Distribution $0.30 | | | | | | | | 7.000 | | 42 | | | | | | | | | |
| 12/31/87 | | Distribution $0.22 | | | | | | | | 7.125 | | 32 | | | | 8,578 | | | | 7,250 | |
| 12/27/88 | | Distribution $0.51 | | | | | | | | 8.625 | | 63 | | | | 10,529 | | | | 9,238 | |
| 9/22/89 | | Rights Offering | | | | 405 | | | | 9.000 | | 45 | | | | | | | | | |
| 12/29/89 | | Distribution $0.52 | | | | | | | | 9.125 | | 67 | | | | 12,942 | | | | 11,866 | |
| 9/24/90 | | Rights Offering | | | | 457 | | | | 7.375 | | 62 | | | | | | | | | |
| 12/31/90 | | Distribution $0.32 | | | | | | | | 8.000 | | 52 | | | | 11,713 | | | | 11,074 | |
| 9/23/91 | | Rights Offering | | | | 638 | | | | 9.375 | | 68 | | | | | | | | | |
| 12/31/91 | | Distribution $0.61 | | | | | | | | 10.625 | | 82 | | | | 17,919 | | | | 15,697 | |
| 9/25/92 | | Rights Offering | | | | 825 | | | | 11.000 | | 75 | | | | | | | | | |
| 12/31/92 | | Distribution $0.90 | | | | | | | | 12.500 | | 114 | | | | 21,999 | | | | 20,874 | |
| 9/27/93 | | Rights Offering | | | | 1,469 | | | | 13.000 | | 113 | | | | | | | | | |
| 12/31/93 | | Distribution $1.15 | | | | | | | | 13.000 | | 160 | | | | 26,603 | | | | 25,428 | |
| 10/28/94 | | Rights Offering | | | | 1,103 | | | | 11.250 | | 98 | | | | | | | | | |
| 12/19/94 | | Distribution $1.05 | | | | | | | | 11.375 | | 191 | | | | 27,939 | | | | 24,905 | |
| 11/3/95 | | Rights Offering | | | | 1,425 | | | | 12.500 | | 114 | | | | | | | | | |
| 12/7/95 | | Distribution $1.29 | | | | | | | | 12.125 | | 253 | | | | 35,676 | | | | 31,243 | |
| 12/6/96 | | Distribution $1.15 | | | | | | | | 12.250 | | 247 | | | | 41,213 | | | | 36,335 | |
| 1997 | | Annual distribution total $1.21 | | | | | | | | 15.374 | | 230 | | | | 52,556 | | | | 46,814 | |
| 1998 | | Annual distribution total $1.54 | | | | | | | | 14.311 | | 347 | | | | 54,313 | | | | 47,506 | |
| 1999 | | Annual distribution total $1.37 | | | | | | | | 12.616 | | 391 | | | | 60,653 | | | | 50,239 | |
| 2000 | | Annual distribution total $1.48 | | | | | | | | 13.972 | | 424 | | | | 70,711 | | | | 61,648 | |
| 2001 | | Annual distribution total $1.49 | | | | | | | | 15.072 | | 437 | | | | 81,478 | | | | 73,994 | |
| 2002 | | Annual distribution total $1.51 | | | | | | | | 14.903 | | 494 | | | | 68,770 | | | | 68,927 | |
| 1/28/03 | | Rights Offering | | | | 5,600 | | | | 10.770 | | 520 | | | | | | | | | |
| 2003 | | Annual distribution total $1.30 | | | | | | | | 14.582 | | 516 | | | | 106,216 | | | | 107,339 | |
| 2004 | | Annual distribution total $1.55 | | | | | | | | 17.604 | | 568 | | | | 128,955 | | | | 139,094 | |
| 2005 | | Annual distribution total $1.61 | | | | | | | | 18.739 | | 604 | | | | 139,808 | | | | 148,773 | |
| 2006 | | Annual distribution total $1.78 | | | | | | | | 19.696 | | 693 | | | | 167,063 | | | | 179,945 | |
| 2007 | | Year-to-date distribution total $0.91 | | | | | | | | 21.352 | | 349 | | | | | | | | | |
|
| 6/30/07 | | | | | $ | 21,922 | | | | | | 8,451 | | | $ | 183,471 | | | $ | 181,020 | |
|
| Royce Micro-Cap Trust | | | | | | | | | | | | | | | | | | | |
| 12/14/93 | | Initial Purchase | | | $ | 7,500 | | | $ | 7.500 | | 1,000 | | | $ | 7,250 | | | $ | 7,500 | |
| 10/28/94 | | Rights Offering | | | | 1,400 | | | | 7.000 | | 200 | | | | | | | | | |
| 12/19/94 | | Distribution $0.05 | | | | | | | | 6.750 | | 9 | | | | 9,163 | | | | 8,462 | |
| 12/7/95 | | Distribution $0.36 | | | | | | | | 7.500 | | 58 | | | | 11,264 | | | | 10,136 | |
| 12/6/96 | | Distribution $0.80 | | | | | | | | 7.625 | | 133 | | | | 13,132 | | | | 11,550 | |
| 12/5/97 | | Distribution $1.00 | | | | | | | | 10.000 | | 140 | | | | 16,694 | | | | 15,593 | |
| 12/7/98 | | Distribution $0.29 | | | | | | | | 8.625 | | 52 | | | | 16,016 | | | | 14,129 | |
| 12/6/99 | | Distribution $0.27 | | | | | | | | 8.781 | | 49 | | | | 18,051 | | | | 14,769 | |
| 12/6/00 | | Distribution $1.72 | | | | | | | | 8.469 | | 333 | | | | 20,016 | | | | 17,026 | |
| 12/6/01 | | Distribution $0.57 | | | | | | | | 9.880 | | 114 | | | | 24,701 | | | | 21,924 | |
| 2002 | | Annual distribution total $0.80 | | | | | | | | 9.518 | | 180 | | | | 21,297 | | | | 19,142 | |
| 2003 | | Annual distribution total $0.92 | | | | | | | | 10.004 | | 217 | | | | 33,125 | | | | 31,311 | |
| 2004 | | Annual distribution total $1.33 | | | | | | | | 13.350 | | 257 | | | | 39,320 | | | | 41,788 | |
| 2005 | | Annual distribution total $1.85 | | | | | | | | 13.848 | | 383 | | | | 41,969 | | | | 45,500 | |
| 2006 | | Annual distribution total $1.55 | | | | | | | | 14.246 | | 354 | | | | 51,385 | | | | 57,647 | |
| 2007 | | Year-to-date distribution total $0.66 | | | | | | | | 15.075 | | 154 | | | | | | | | | |
|
| 6/30/07 | | | | | $ | 8,900 | | | | | | 3,633 | | | $ | 56,130 | | | $ | 55,985 | |
|
| Royce Focus Trust | | | | | | | | | | | | | | | | | | | |
| 10/31/96 | | Initial Purchase | | | $ | 4,375 | | | $ | 4.375 | | 1,000 | | | $ | 5,280 | | | $ | 4,375 | |
| 12/31/96 | | | | | | | | | | | | | | | | 5,520 | | | | 4,594 | |
| 12/5/97 | | Distribution $0.53 | | | | | | | | 5.250 | | 101 | | | | 6,650 | | | | 5,574 | |
| 12/31/98 | | | | | | | | | | | | | | | | 6,199 | | | | 5,367 | |
| 12/6/99 | | Distribution $0.145 | | | | | | | | 4.750 | | 34 | | | | 6,742 | | | | 5,356 | |
| 12/6/00 | | Distribution $0.34 | | | | | | | | 5.563 | | 69 | | | | 8,151 | | | | 6,848 | |
| 12/6/01 | | Distribution $0.14 | | | | | | | | 6.010 | | 28 | | | | 8,969 | | | | 8,193 | |
| 12/6/02 | | Distribution $0.09 | | | | | | | | 5.640 | | 19 | | | | 7,844 | | | | 6,956 | |
| 12/8/03 | | Distribution $0.62 | | | | | | | | 8.250 | | 94 | | | | 12,105 | | | | 11,406 | |
| 2004 | | Annual distribution total $1.74 | | | | | | | | 9.325 | | 259 | | | | 15,639 | | | | 16,794 | |
| 5/6/05 | | Rights offering | | | | 2,669 | | | | 8.340 | | 320 | | | | | | | | | |
| 2005 | | Annual distribution total $1.21 | | | | | | | | 9.470 | | 249 | | | | 21,208 | | | | 20,709 | |
| 2006 | | Annual distribution total $1.57 | | | | | | | | 9.860 | | 357 | | | | 24,668 | | | | 27,020 | |
| 2007 | | Year-to-date distribution total $0.26 | | | | | | | | 10.509 | | 63 | | | | | | | | | |
|
| 6/30/07 | | | | | $ | 7,044 | | | | | | 2,593 | | | $ | 28,601 | | | $ | 29,353 | |
|
| * | | Beginning with the 1997 (RVT), 2002 (RMT) and 2004 (FUND) distributions, the purchase price of distributions is a weighted average of the distribution reinvestment prices for the year. |
| ** | | Other than for initial purchase and June 30, 2007, values are stated as of December 31 of the year indicated, after reinvestment of distributions. |
| | | |
| 18 | | | The Royce Funds 2007 Semiannual Report to Stockholders |
Distribution Reinvestment and Cash Purchase Options |
|
Why should I reinvest my distributions?
By reinvesting distributions, a stockholder can maintain an undiluted investment in the Fund. The regular reinvestment of distributions has a significant impact on stockholder returns. In contrast, the stockholder who takes distributions in cash is penalized when shares are issued below net asset value to other stockholders. How does the reinvestment of distributions from the Royce closed-end funds work?
The Funds automatically issue shares in payment of distributions unless you indicate otherwise. The shares are generally issued at the lower of the market price or net asset value on the valuation date. How does this apply to registered stockholders?
If your shares are registered directly with a Fund, your distributions are automatically reinvested unless you have otherwise instructed the Funds’ transfer agent, Computershare, in writing. A registered stockholder also has the option to receive the distribution in the form of a stock certificate or in cash if Computershare is properly notified. What if my shares are held by a brokerage firm or a bank?
If your shares are held by a brokerage firm, bank, or other intermediary as the stockholder of record, you should contact your brokerage firm or bank to be certain that it is automatically reinvesting distributions on your behalf. If they are unable to reinvest distributions on your behalf, you should have your shares registered in your name in order to participate. What other features are available for registered stockholders?
The Distribution Reinvestment and Cash Purchase Plans also allow registered stockholders to make optional cash purchases of shares of a Fund’s common stock directly through Computershare on a monthly basis, and to deposit certificates representing your Fund shares with Computershare for safekeeping. The Funds’ investment adviser is absorbing all commissions on optional cash purchases under the Plans through December 31, 2007. | | How do the Plans work for registered stockholders?
Computershare maintains the accounts for registered stockholders in the Plans and sends written confirmation of all transactions in the account. Shares in the account of each participant will be held by Computershare in non-certificated form in the name of the participant, and each participant will be able to vote those shares at a stockholder meeting or by proxy. A participant may also send other stock certificates held by them to Computershare to be held in non-certificated form. There is no service fee charged to participants for reinvesting distributions. If a participant elects to sell shares from a Plan account, Computershare will deduct a $2.50 fee plus brokerage commissions from the sale transaction. If a nominee is the registered owner of your shares, the nominee will maintain the accounts on your behalf. How can I get more information on the Plans?
You can call an Investor Services Representative at (800) 221-4268 or you can request a copy of the Plan for your Fund from Computershare. All correspondence (including notifications) should be directed to: [Name of Fund] Distribution Reinvestment and Cash Purchase Plan, c/o Computershare, PO Box 43010, Providence, RI 02940-3010, telephone (800) 426-5523. |
| | The Royce Funds 2007 Semiannual Report to Stockholders | 19 |
| | | SHARES | | | VALUE |
COMMON STOCKS – 99.6% | | | | | |
| | | | | | |
Consumer Products – 4.8% | | | | | |
Apparel and Shoes - 1.5% | | | | | |
Kenneth Cole Productions Cl. A | | 35,000 | | $ | 864,500 |
Columbia Sportswear | | 34,600 | | | 2,376,328 |
Hugo Boss | | 19,200 | | | 1,260,072 |
K-Swiss Cl. A | | 110,000 | | | 3,116,300 |
Polo Ralph Lauren Cl. A | | 6,200 | | | 608,282 |
Tandy Brands Accessories | | 16,900 | | | 213,954 |
Van De Velde | | 40,000 | | | 2,072,943 |
Weyco Group | | 307,992 | | | 8,294,225 |
| | | | |
|
| | | | | | 18,806,604 |
| | | | |
|
Collectibles - 0.2% | | | | | |
Russ Berrie & Company a | | 150,000 | | | 2,794,500 |
| | | | |
|
Food/Beverage/Tobacco - 0.2% | | | | | |
Hain Celestial Group a,b | | 37,800 | | | 1,025,892 |
Hershey Creamery | | 709 | | | 1,559,800 |
| | | | |
|
| | | | | | 2,585,692 |
| | | | |
|
Home Furnishing and Appliances - 0.5% | | | | | |
Aaron Rents | | 4,500 | | | 131,400 |
Ekornes | | 80,000 | | | 1,824,672 |
Ethan Allen Interiors | | 45,800 | | | 1,568,650 |
La-Z-Boy b | | 68,200 | | | 781,572 |
Rational | | 9,300 | | | 1,823,238 |
| | | | |
|
| | | | | | 6,129,532 |
| | | | |
|
Publishing - 0.5% | | | | | |
†Proquest Company a,b | | 180,000 | | | 1,701,000 |
Scholastic Corporation a,b | | 130,000 | | | 4,672,200 |
| | | | |
|
| | | | | | 6,373,200 |
| | | | |
|
Sports and Recreation - 0.7% | | | | | |
Beneteau | | 12,000 | | | 1,634,534 |
Coachmen Industries | | 47,700 | | | 460,782 |
Monaco Coach | | 166,650 | | | 2,391,427 |
Sturm, Ruger & Company a,b | | 272,900 | | | 4,235,408 |
Thor Industries | | 26,100 | | | 1,178,154 |
| | | | |
|
| | | | | | 9,900,305 |
| | | | |
|
Other Consumer Products - 1.2% | | | | | |
Blyth | | 14,700 | | | 390,726 |
Burnham Holdings Cl. B | | 36,000 | | | 585,000 |
Lazare Kaplan International a | | 103,600 | | | 820,512 |
Leapfrog Enterprises a,b | | 175,000 | | | 1,793,750 |
Matthews International Cl. A | | 100,000 | | | 4,361,000 |
RC2 Corporation a | | 132,600 | | | 5,305,326 |
Sally Beauty Holdings a,b | | 194,600 | | | 1,751,400 |
| | | | |
|
| | | | | | 15,007,714 |
| | | | |
|
Total (Cost $36,850,760) | | | | | 61,597,547 |
| | | | |
|
Consumer Services – 5.6% | | | | | |
Direct Marketing - 0.2% | | | | | |
FTD Group | | 55,000 | | | 1,012,550 |
Takkt | | 95,000 | | | 1,695,940 |
| | | | |
|
| | | | | | 2,708,490 |
| | | | |
|
Leisure and Entertainment - 0.1% | | | | | |
Shuffle Master a,b | | 15,000 | | | 249,000 |
Steiner Leisure a,b | | 2,100 | | | 103,152 |
| | | | |
|
| | | | | | 352,152 |
| | | | |
|
| | | SHARES | | | VALUE |
Media and Broadcasting - 0.1% | | | | | |
Cox Radio Cl. A a,b | | 23,000 | | $ | 327,520 |
Discovery Holding Company Cl. B a | | 56,100 | | | 1,293,105 |
| | | | |
|
| | | | | | 1,620,625 |
| | | | |
|
Restaurants and Lodgings - 0.9% | | | | | |
Benihana Cl. A a,b | | 6,600 | | | 132,000 |
CEC Entertainment a | | 121,400 | | | 4,273,280 |
Morgans Hotel Group a,b | | 90,000 | | | 2,194,200 |
Steak n Shake a | | 183,000 | | | 3,054,270 |
Tim Hortons | | 50,000 | | | 1,537,500 |
| | | | |
|
| | | | | | 11,191,250 |
| | | | |
|
Retail Stores - 1.7% | | | | | |
America’s Car-Mart a,b | | 90,400 | | | 1,228,536 |
Bulgari | | 200,000 | | | 3,223,916 |
CarMax a,b | | 82,000 | | | 2,091,000 |
Children’s Place Retail Stores a | | 13,670 | | | 705,919 |
Cost Plus a,b | | 80,500 | | | 682,640 |
Fred’s Cl. A | | 50,000 | | | 669,000 |
Fielmann | | 20,000 | | | 1,266,828 |
Gander Mountain a,b | | 53,300 | | | 604,955 |
Hot Topic a,b | | 29,000 | | | 315,230 |
Krispy Kreme Doughnuts a | | 85,000 | | | 787,100 |
99 Cents Only Stores a,b | | 95,000 | | | 1,245,450 |
Stein Mart | | 142,800 | | | 1,750,728 |
Tiffany & Co. | | 75,000 | | | 3,979,500 |
Urban Outfitters a,b | | 27,000 | | | 648,810 |
West Marine a | | 131,100 | | | 1,803,936 |
Wet Seal (The) Cl. A a,b | | 162,000 | | | 973,620 |
| | | | |
|
| | | | | | 21,977,168 |
| | | | |
|
Other Consumer Services - 2.6% | | | | | |
Corinthian Colleges a,b | | 106,500 | | | 1,734,885 |
ITT Educational Services a | | 80,000 | | | 9,390,400 |
Laureate Education a | | 37,500 | | | 2,312,250 |
MoneyGram International | | 74,900 | | | 2,093,455 |
Renaissance Learning | | 15,000 | | | 197,250 |
Sotheby’s Cl. A | | 382,200 | | | 17,588,844 |
†Travelcenters of America a,b | | 2,500 | | | 101,125 |
| | | | |
|
| | | | | | 33,418,209 |
| | | | |
|
Total (Cost $41,745,500) | | | | | 71,267,894 |
| | | | |
|
Diversified Investment Companies – 0.1% | | | | | |
Closed-End Funds - 0.1% | | �� | | | |
Central Fund of Canada Cl. A | | 111,500 | | | 1,013,535 |
| | | | |
|
Total (Cost $589,526) | | | | | 1,013,535 |
| | | | |
|
Financial Intermediaries – 10.8% | | | | | |
Banking - 3.2% | | | | | |
Ameriana Bancorp | | 20,000 | | | 199,000 |
BOK Financial | | 129,327 | | | 6,908,648 |
Bank of N.T. Butterfield & Son | | 118,750 | | | 7,125,000 |
CFS Bancorp | | 260,000 | | | 3,775,200 |
Cadence Financial | | 30,300 | | | 590,244 |
Commercial National Financial | | 52,575 | | | 986,307 |
Farmers & Merchants Bank of Long Beach | | 1,266 | | | 8,418,900 |
Hawthorn Bancshares | | 44,400 | | | 1,443,000 |
Heritage Financial | | 12,915 | | | 308,023 |
HopFed Bancorp | | 25,000 | | | 402,250 |
20 | 2007 Semiannual Report to Stockholders | THE ACCOMPANYING NOTES ARE AN INTEGRAL PART OF THESE FINANCIAL STATEMENTS. |
| | | June 30, 2007 (unaudited) |
|
| |
| | | SHARES | | | VALUE |
Financial Intermediaries (continued) | | | | | |
Banking (continued) | | | | | |
Jefferson Bancshares | | 32,226 | | $ | 380,589 |
Mechanics Bank | | 200 | | | 3,900,000 |
Old Point Financial | | 20,000 | | | 510,600 |
Partners Trust Financial Group | | 100,000 | | | 1,050,000 |
Sun Bancorp a,b | | 46,305 | | | 781,165 |
Tompkins Financial | | 17,545 | | | 656,183 |
W Holding Company | | 44,700 | | | 118,008 |
Whitney Holding | | 40,500 | | | 1,219,050 |
Wilber Corporation | | 31,700 | | | 293,225 |
Wilmington Trust | | 31,000 | | | 1,286,810 |
Yadkin Valley Financial | | 3,800 | | | 69,730 |
| | | | |
|
| | | | | | 40,421,932 |
| | | | |
|
Insurance - 3.9% | | | | | |
ACA Capital Holdings a,b | | 50,000 | | | 595,000 |
Alleghany Corporation a | | 11,318 | | | 4,600,767 |
Aspen Insurance Holdings | | 64,000 | | | 1,796,480 |
Commerce Group | | 89,000 | | | 3,090,080 |
Erie Indemnity Cl. A | | 139,900 | | | 7,560,196 |
IPC Holdings | | 27,000 | | | 871,830 |
Leucadia National | | 84,940 | | | 2,994,135 |
Markel Corporation a,b | | 7,200 | | | 3,488,832 |
Montpelier Re Holdings | | 66,000 | | | 1,223,640 |
NYMAGIC | | 85,200 | | | 3,425,040 |
Ohio Casualty | | 68,502 | | | 2,966,822 |
PXRE Group a | | 166,551 | | | 772,797 |
ProAssurance Corporation a,b | | 38,070 | | | 2,119,357 |
RLI | | 99,724 | | | 5,579,558 |
Security Capital Assurance | | 30,000 | | | 926,100 |
Wesco Financial | | 4,750 | | | 1,828,750 |
White Mountains Insurance Group | | 9,000 | | | 5,454,180 |
| | | | |
|
| | | | | | 49,293,564 |
| | | | |
|
Real Estate Investment Trusts - 0.4% | | | | | |
Capstead Mortgage | | 181,100 | | | 1,756,670 |
Gladstone Commercial | | 34,700 | | | 680,120 |
Opteum Cl. A | | 897,500 | | | 2,441,200 |
| | | | |
|
| | | | | | 4,877,990 |
| | | | |
|
Securities Brokers - 1.0% | | | | | |
Cowen Group a | | 32,000 | | | 573,120 |
Dundee Wealth Management | | 100,000 | | | 1,541,422 |
Evercore Partners Cl. A | | 19,400 | | | 577,538 |
First Albany Companies a,b | | 350,100 | | | 584,667 |
Investment Technology Group a,b | | 30,400 | | | 1,317,232 |
Knight Capital Group Cl. A a,b | | 229,700 | | | 3,813,020 |
Lazard Cl. A | | 31,000 | | | 1,395,930 |
optionsXpress Holdings | | 53,000 | | | 1,359,980 |
Shinko Securities | | 464,300 | | | 2,405,875 |
| | | | |
|
| | | | | | 13,568,784 |
| | | | |
|
Other Financial Intermediaries - 2.3% | | | | | |
AP Alternative Assets L.P. | | 234,600 | | | 4,281,450 |
JAFCO | | 37,300 | | | 1,720,723 |
KKR Financial | | 171,200 | | | 4,264,592 |
KKR Private Equity Investors LLP | | 105,000 | | | 2,362,500 |
†Kohlberg Capital | | 81,800 | | | 1,517,390 |
MCG Capital | | 138,000 | | | 2,210,760 |
MVC Capital | | 397,200 | | | 7,471,332 |
MarketAxess Holdings a | | 67,000 | | | 1,205,330 |
| | | SHARES | | | VALUE |
| | | | | | |
NGP Capital Resources | | 50,000 | | $ | 836,000 |
RHJ International a | | 177,500 | | | 3,507,464 |
| | | | |
|
| | | | | | 29,377,541 |
| | | | |
|
Total (Cost $100,428,652) | | | | | 137,539,811 |
| | | | |
|
Financial Services – 8.5% | | | | | |
Information and Processing - 1.7% | | | | | |
eFunds Corporation a,b | | 126,875 | | | 4,477,419 |
FactSet Research Systems | | 35,350 | | | 2,416,172 |
Global Payments | | 68,500 | | | 2,716,025 |
Interactive Data | | 134,300 | | | 3,596,554 |
PRG-Schultz International a,b | | 14,420 | | | 229,278 |
SEI Investments | | 282,400 | | | 8,200,896 |
| | | | |
|
| | | | | | 21,636,344 |
| | | | |
|
Insurance Brokers - 1.2% | | | | | |
Crawford & Company Cl. A a | | 289,200 | | | 1,821,960 |
Crawford & Company Cl. B a | | 162,300 | | | 1,097,148 |
†eHealth a,b | | 25,000 | | | 477,250 |
Enstar Group a,b | | 7,000 | | | 844,970 |
Gallagher (Arthur J.) & Co. | | 111,200 | | | 3,100,256 |
Hilb Rogal & Hobbs | | 155,050 | | | 6,645,443 |
National Financial Partners | | 22,000 | | | 1,018,820 |
| | | | |
|
| | | | | | 15,005,847 |
| | | | |
|
Investment Management - 5.1% | | | | | |
ADDENDA Capital | | 150,900 | | | 3,208,529 |
AllianceBernstein Holding L.P. | | 333,100 | | | 29,009,679 |
BKF Capital Group a | | 227,050 | | | 522,215 |
Calamos Asset Management Cl. A | | 45,000 | | | 1,149,750 |
Eaton Vance | | 140,400 | | | 6,202,872 |
Federated Investors Cl. B | | 161,900 | | | 6,205,627 |
GAMCO Investors Cl. A | | 158,600 | | | 8,889,530 |
Nuveen Investments Cl. A | | 138,600 | | | 8,613,990 |
SPARX Group | | 2,300 | | | 1,709,239 |
| | | | |
|
| | | | | | 65,511,431 |
| | | | |
|
Other Financial Services - 0.5% | | | | | |
AmeriCredit Corporation a,b | | 18,870 | | | 500,998 |
Centerline Holding Company | | 59,600 | | | 1,072,800 |
Credit Acceptance a,b | | 86,601 | | | 2,323,505 |
Municipal Mortgage & Equity | | 40,300 | | | 982,514 |
Ocwen Financial a,b | | 50,000 | | | 666,500 |
World Acceptance a,b | | 21,700 | | | 927,241 |
| | | | |
|
| | | | | | 6,473,558 |
| | | | |
|
Total (Cost $61,728,918) | | | | | 108,627,180 |
| | | | |
|
Health – 6.8% | | | | | |
Commercial Services - 1.4% | | | | | |
First Consulting Group a,b | | 560,900 | | | 5,328,550 |
PAREXEL International a,b | | 313,700 | | | 13,194,222 |
| | | | |
|
| | | | | | 18,522,772 |
| | | | |
|
Drugs and Biotech - 1.6% | | | | | |
Affymetrix a,b | | 10,000 | | | 248,900 |
Antigenics a,b | | 99,300 | | | 283,998 |
Biovail Corporation | | 41,200 | | | 1,047,304 |
Endo Pharmaceuticals Holdings a | | 155,000 | | | 5,305,650 |
Gene Logic a | | 365,000 | | | 503,700 |
†Genitope Corporation a,b | | 100,000 | | | 386,000 |
Human Genome Sciences a,b | | 90,000 | | | 802,800 |
K-V Pharmaceutical Cl. A a,b | | 51,500 | | | 1,402,860 |
| THE ACCOMPANYING NOTES ARE AN INTEGRAL PART OF THESE FINANCIAL STATEMENTS. |
2007 Semiannual Report to Stockholders | 21 |
| | | SHARES | | | VALUE |
Health (continued) | | | | | |
Drugs and Biotech (continued) | | | | | |
Medicines Company (The) a,b | | 20,000 | | $ | 352,400 |
Millennium Pharmaceuticals a,b | | 100,000 | | | 1,057,000 |
Mylan Laboratories | | 52,200 | | | 949,518 |
Myriad Genetics a,b | | 50,000 | | | 1,859,500 |
Origin Agritech a | | 3,500 | | | 28,875 |
Perrigo Company | | 191,950 | | | 3,758,381 |
Pharmanet Development Group a | | 10,000 | | | 318,800 |
QLT a | | 114,070 | | | 844,118 |
VIVUS a,b | | 163,300 | | | 854,059 |
| | | | |
|
| | | | | | 20,003,863 |
| | | | |
|
Health Services - 1.4% | | | | | |
Albany Molecular Research a | | 85,000 | | | 1,262,250 |
Cross Country Healthcare a | | 30,000 | | | 500,400 |
Eclipsys Corporation a,b | | 20,000 | | | 396,000 |
Gentiva Health Services a | | 30,150 | | | 604,809 |
HMS Holdings a,b | | 50,000 | | | 957,000 |
HealthSouth Corporation a,b | | 200,000 | | | 3,622,000 |
Lincare Holdings a,b | | 52,562 | | | 2,094,596 |
MedQuist a | | 73,893 | | | 673,165 |
National Home Health Care | | 20,000 | | | 252,000 |
On Assignment a,b | | 375,400 | | | 4,024,288 |
Paramount Acquisition (Units) a | | 280,000 | | | 1,976,800 |
Res-Care a,b | | 65,460 | | | 1,383,824 |
| | | | |
|
| | | | | | 17,747,132 |
| | | | |
|
Medical Products and Devices - 2.2% | | | | | |
Allied Healthcare Products a | | 210,612 | | | 1,377,402 |
Arrow International | | 61,028 | | | 2,336,152 |
ArthroCare Corporation a,b | | 10,000 | | | 439,100 |
Atrion Corporation | | 15,750 | | | 1,543,500 |
Bruker BioSciences a | | 370,200 | | | 3,335,502 |
Coloplast Cl. B | | 17,000 | | | 1,383,584 |
CONMED Corporation a,b | | 81,500 | | | 2,386,320 |
IDEXX Laboratories a,b | | 79,000 | | | 7,475,770 |
Invacare Corporation | | 103,100 | | | 1,889,823 |
STERIS Corporation | | 98,600 | | | 3,017,160 |
Young Innovations | | 62,550 | | | 1,825,209 |
Zoll Medical a,b | | 40,400 | | | 901,324 |
| | | | |
|
| | | | | | 27,910,846 |
| | | | |
|
Personal Care - 0.2% | | | | | |
Nutraceutical International a | | 22,800 | | | 377,796 |
USANA Health Sciences a,b | | 38,900 | | | 1,740,386 |
| | | | |
|
| | | | | | 2,118,182 |
| | | | |
|
Total (Cost $57,167,473) | | | | | 86,302,795 |
| | | | |
|
Industrial Products – 16.6% | | | | | |
Automotive - 0.6% | | | | | |
ElringKlinger | | 16,900 | | | 1,545,091 |
Fuel Systems Solutions a,b | | 22,500 | | | 373,050 |
LKQ Corporation a,b | | 200,000 | | | 4,932,000 |
Quantam Fuel Systems Technologies Worldwide a,b | | 15,500 | | | 24,180 |
Superior Industries International | | 52,000 | | | 1,131,520 |
| | | | |
|
| | | | | | 8,005,841 |
| | | | |
|
Building Systems and Components - 1.0% | | | | | |
Decker Manufacturing | | 6,022 | | | 218,900 |
Preformed Line Products | | 91,600 | | | 4,397,716 |
| | | SHARES | | | VALUE |
| | | | | | |
Simpson Manufacturing | | 250,800 | | $ | 8,461,992 |
| | | | |
|
| | | | | | 13,078,608 |
| | | | |
|
Construction Materials - 1.8% | | | | | |
Ash Grove Cement Cl. B | | 50,518 | | | 12,124,320 |
Heywood Williams Group a | | 958,837 | | | 1,906,187 |
Synalloy Corporation | | 198,800 | | | 6,938,120 |
USG Corporation a,b | | 25,000 | | | 1,226,000 |
| | | | |
|
| | | | | | 22,194,627 |
| | | | |
|
Industrial Components - 1.3% | | | | | |
Barnes Group | | 20,000 | | | 633,600 |
C & D Technologies a | | 345,700 | | | 1,935,920 |
CLARCOR | | 83,500 | | | 3,125,405 |
Donaldson Company | | 92,800 | | | 3,299,040 |
GrafTech International a,b | | 64,790 | | | 1,091,064 |
PerkinElmer | | 135,000 | | | 3,518,100 |
Powell Industries a,b | | 92,400 | | | 2,934,624 |
II-VI a | | 13,500 | | | 366,795 |
| | | | |
|
| | | | | | 16,904,548 |
| | | | |
|
Machinery - 5.2% | | | | | |
†A.S.V. a,b | | 14,800 | | | 255,744 |
Baldor Electric | | 62,900 | | | 3,099,712 |
Coherent a,b | | 243,500 | | | 7,429,185 |
Exco Technologies | | 91,000 | | | 394,668 |
Federal Signal | | 58,600 | | | 929,396 |
Franklin Electric | | 84,200 | | | 3,972,556 |
Graco | | 101,825 | | | 4,101,511 |
Hardinge | | 26,193 | | | 891,348 |
IDEX Corporation | | 54,000 | | | 2,081,160 |
Intermec a,b | | 23,000 | | | 582,130 |
Lincoln Electric Holdings | | 188,680 | | | 14,007,603 |
Mueller Water Products Cl. A | | 50,000 | | | 853,000 |
Nordson Corporation | | 172,200 | | | 8,637,552 |
Pfeiffer Vacuum Technology | | 18,500 | | | 1,784,015 |
Rofin-Sinar Technologies a,b | | 128,000 | | | 8,832,000 |
Williams Controls a | | 37,499 | | | 655,858 |
Woodward Governor | | 144,800 | | | 7,771,416 |
| | | | |
|
| | | | | | 66,278,854 |
| | | | |
|
Metal Fabrication and Distribution - 1.8% | | | | | |
Commercial Metals | | 36,600 | | | 1,235,982 |
CompX International Cl. A | | 292,300 | | | 5,407,550 |
Gerdau Ameristeel | | 61,100 | | | 893,893 |
Kaydon Corporation | | 177,400 | | | 9,246,088 |
NN | | 197,100 | | | 2,325,780 |
Novamerican Steel a | | 10,800 | | | 575,964 |
RBC Bearings a | | 30,000 | | | 1,237,500 |
Reliance Steel & Aluminum | | 25,920 | | | 1,458,259 |
| | | | |
|
| | | | | | 22,381,016 |
| | | | |
|
Paper and Packaging - 0.2% | | | | | |
Mayr-Melnhof Karton | | 8,100 | | | 1,843,747 |
Peak International a | | 408,400 | | | 1,155,772 |
| | | | |
|
| | | | | | 2,999,519 |
| | | | |
|
Specialty Chemicals and Materials - 1.4% | | | | | |
Aceto Corporation | | 78,410 | | | 726,861 |
American Vanguard | | 26,666 | | | 381,857 |
Balchem Corporation | | 16,875 | | | 306,619 |
Cabot Corporation | | 163,500 | | | 7,795,680 |
Fuel Tech a,b | | 10,000 | | | 342,500 |
Hawkins | | 206,878 | | | 3,196,265 |
22 | 2007 Semiannual Report to Stockholders | THE ACCOMPANYING NOTES ARE AN INTEGRAL PART OF THESE FINANCIAL STATEMENTS. |
| | | June 30, 2007 (unaudited) |
|
| |
| | | SHARES | | | VALUE |
Industrial Products (continued) | | | | | |
Specialty Chemicals and Materials (continued) | | | | | |
Lydall a,b | | 35,500 | | $ | 518,655 |
Schulman (A.) | | 143,100 | | | 3,481,623 |
Sensient Technologies | | 22,000 | | | 558,580 |
| | | | |
|
| | | | | | 17,308,640 |
| | | | |
|
Textiles - 0.1% | | | | | |
Unifi a,b | | 145,100 | | | 380,162 |
| | | | |
|
Other Industrial Products - 3.2% | | | | | |
Brady Corporation Cl. A | | 293,400 | | | 10,896,876 |
Diebold | | 86,700 | | | 4,525,740 |
Distributed Energy Systems a | | 32,000 | | | 41,600 |
Kimball International Cl. B | | 286,180 | | | 4,009,382 |
Maxwell Technologies a,b | | 21,500 | | | 305,730 |
Mettler-Toledo International a | | 28,700 | | | 2,741,137 |
Munters | | 100,000 | | | 1,571,821 |
Myers Industries | | 30,499 | | | 674,333 |
Peerless Manufacturing a | | 297,200 | | | 6,131,236 |
Raven Industries | | 86,200 | | | 3,078,202 |
Solar Integrated Technologies a | | 75,000 | | | 168,680 |
Somfy | | 7,000 | | | 2,285,164 |
Waters Corporation a | | 75,990 | | | 4,510,766 |
| | | | |
|
| | | | | | 40,940,667 |
| | | | |
|
Total (Cost $103,760,088) | | | | | 210,472,482 |
| | | | |
|
Industrial Services – 11.0% | | | | | |
Advertising and Publishing - 1.0% | | | | | |
Focus Media Holding ADR a,b | | 70,000 | | | 3,535,000 |
Interpublic Group of Companies a,b | | 510,000 | | | 5,814,000 |
Lamar Advertising Cl. A | | 26,000 | | | 1,631,760 |
MDC Partners Cl. A a | | 60,000 | | | 525,000 |
ValueClick a,b | | 45,000 | | | 1,325,700 |
| | | | |
|
| | | | | | 12,831,460 |
| | | | |
|
Commercial Services - 3.2% | | | | | |
Allied Waste Industries a | | 188,800 | | | 2,541,248 |
Anacomp Cl. A a | | 26,000 | | | 191,100 |
BB Holdings a | | 289,400 | | | 1,525,504 |
†Canadian Solar a,b | | 50,000 | | | 470,000 |
Convergys Corporation a | | 121,000 | | | 2,933,040 |
Copart a,b | | 158,100 | | | 4,836,279 |
eResearch Technology a,b | | 181,000 | | | 1,721,310 |
First Advantage Cl. A a,b | | 5,000 | | | 115,050 |
Hewitt Associates Cl. A a,b | | 208,720 | | | 6,679,040 |
Iron Mountain a,b | | 234,262 | | | 6,121,266 |
Learning Tree International a,b | | 53,400 | | | 699,540 |
MPS Group a | | 564,600 | | | 7,548,702 |
Michael Page International | | 140,000 | | | 1,477,360 |
New Horizons Worldwide a | | 228,600 | | | 205,740 |
OneSource Services a | | 25,437 | | | 328,189 |
Onex Corporation | | 50,000 | | | 1,727,294 |
Spherion Corporation a,b | | 53,000 | | | 497,670 |
TRC Companies a | | 3,600 | | | 53,388 |
Viad Corporation | | 9,025 | | | 380,584 |
Wright Express a,b | | 30,000 | | | 1,028,100 |
| | | | |
|
| | | | | | 41,080,404 |
| | | | |
|
Engineering and Construction - 0.9% | | | | | |
Boskalis Westminster | | 40,200 | | | 1,605,599 |
Dycom Industries a,b | | 35,500 | | | 1,064,290 |
| | | SHARES | | | VALUE |
| | | | | | |
Fleetwood Enterprises a | | 234,300 | | $ | 2,120,415 |
Insituform Technologies Cl. A a,b | | 137,000 | | | 2,987,970 |
KBR a | | 115,000 | | | 3,016,450 |
| | | | |
|
| | | | | | 10,794,724 |
| | | | |
|
Food and Tobacco Processors - 0.4% | | | | | |
MGP Ingredients | | 127,400 | | | 2,153,060 |
Performance Food Group a,b | | 10,000 | | | 324,900 |
Seneca Foods Cl. A a | | 80,000 | | | 2,081,600 |
Seneca Foods Cl. B a | | 13,251 | | | 353,802 |
| | | | |
|
| | | | | | 4,913,362 |
| | | | |
|
Industrial Distribution - 1.9% | | | | | |
Central Steel & Wire | | 6,062 | | | 3,867,556 |
MSC Industrial Direct Cl. A | | 20,000 | | | 1,100,000 |
Ritchie Bros. Auctioneers | | 310,400 | | | 19,437,248 |
| | | | |
|
| | | | | | 24,404,804 |
| | | | |
|
Printing - 0.1% | | | | | |
Bowne & Co. | | 68,100 | | | 1,328,631 |
| | | | |
|
Transportation and Logistics - 3.0% | | | | | |
Alexander & Baldwin | | 60,000 | | | 3,186,600 |
Atlas Air Worldwide Holdings a,b | | 17,000 | | | 1,001,980 |
C. H. Robinson Worldwide | | 80,000 | | | 4,201,600 |
Forward Air | | 244,750 | | | 8,343,527 |
Frozen Food Express Industries | | 286,635 | | | 2,906,479 |
Hub Group Cl. A a,b | | 174,400 | | | 6,131,904 |
Landstar System | | 11,200 | | | 540,400 |
Patriot Transportation Holding a | | 80,300 | | | 6,962,010 |
UTI Worldwide | | 105,000 | | | 2,812,950 |
Universal Truckload Services a | | 115,100 | | | 2,287,037 |
| | | | |
|
| | | | | | 38,374,487 |
| | | | |
|
Other Industrial Services - 0.5% | | | | | |
Landauer | | 117,900 | | | 5,806,575 |
| | | | |
|
Total (Cost $73,843,574) | | | | | 139,534,447 |
| | | | |
|
Natural Resources – 9.6% | | | | | |
Energy Services - 4.3% | | | | | |
Atwood Oceanics a,b | | 29,400 | | | 2,017,428 |
†Cal Dive International a,b | | 35,000 | | | 582,050 |
Carbo Ceramics | | 158,400 | | | 6,939,504 |
Core Laboratories a,b | | 10,000 | | | 1,016,900 |
Ensign Energy Services | | 126,300 | | | 2,252,711 |
Environmental Power a,b | | 326,000 | | | 2,917,700 |
Global Industries a | | 54,500 | | | 1,461,690 |
Hanover Compressor a,b | | 208,000 | | | 4,960,800 |
Helmerich & Payne | | 80,600 | | | 2,854,852 |
Input/Output a | | 434,500 | | | 6,782,545 |
National Fuel Gas | | 47,500 | | | 2,057,225 |
TETRA Technologies a,b | | 68,000 | | | 1,917,600 |
Universal Compression Holdings a,b | | 221,300 | | | 16,037,611 |
Willbros Group a,b | | 103,800 | | | 3,080,784 |
| | | | |
|
| | | | | | 54,879,400 |
| | | | |
|
Oil and Gas - 2.3% | | | | | |
Bill Barrett a,b | | 50,000 | | | 1,841,500 |
Carrizo Oil & Gas a,b | | 41,700 | | | 1,729,299 |
Cimarex Energy | | 193,990 | | | 7,645,146 |
Falcon Oil & Gas a | | 360,000 | | | 479,887 |
Helix Energy Solutions Group a,b | | 34,226 | | | 1,365,960 |
Particle Drilling Technologies a | | 61,500 | | | 135,300 |
Penn Virginia | | 32,880 | | | 1,321,776 |
| THE ACCOMPANYING NOTES ARE AN INTEGRAL PART OF THESE FINANCIAL STATEMENTS. |
2007 Semiannual Report to Stockholders | 23 |
| | | SHARES | | | VALUE |
Natural Resources (continued) | | | | | |
Oil and Gas (continued) | | | | | |
PetroCorp a,c | | 61,400 | | $ | 0 |
SEACOR Holdings a,b | | 147,000 | | | 13,723,920 |
Storm Cat Energy a,b | | 330,800 | | | 377,112 |
W &T Offshore | | 25,000 | | | 699,750 |
| | | | |
|
| | | | | | 29,319,650 |
| | | | |
|
Precious Metals and Mining - 2.2% | | | | | |
Agnico-Eagle Mines | | 34,000 | | | 1,241,000 |
Centerra Gold a | | 30,000 | | | 297,113 |
Constellation Copper a | | 186,900 | | | 252,651 |
Etruscan Resources a | | 675,900 | | | 1,966,947 |
Gammon Gold a | | 178,300 | | | 2,250,146 |
Golden Star Resources a,b | | 175,000 | | | 649,250 |
Hecla Mining a,b | | 598,000 | | | 5,106,920 |
IAMGOLD Corporation | | 315,620 | | | 2,417,649 |
International Coal Group a,b | | 189,000 | | | 1,130,220 |
Ivanhoe Mines a,b | | 140,000 | | | 1,993,600 |
†Kinross Gold a,b | | 110,286 | | | 1,288,140 |
Meridian Gold a,b | | 111,000 | | | 3,061,380 |
Miramar Mining a | | 445,000 | | | 1,909,050 |
Northgate Minerals a | | 100,000 | | | 290,000 |
Pan American Silver a,b | | 41,000 | | | 1,079,530 |
Randgold Resources ADR | | 53,000 | | | 1,176,070 |
Royal Gold | | 34,400 | | | 817,688 |
Yamana Gold | | 80,000 | | | 889,600 |
| | | | |
|
| | | | | | 27,816,954 |
| | | | |
|
Real Estate - 0.6% | | | | | |
Alico | | 27,000 | | | 1,646,730 |
Consolidated-Tomoka Land | | 13,564 | | | 939,850 |
The St. Joe Company | | 98,900 | | | 4,583,026 |
| | | | |
|
| | | | | | 7,169,606 |
| | | | |
|
Other Natural Resources - 0.2% | | | | | |
PICO Holdings a | | 50,200 | | | 2,171,652 |
| | | | |
|
Total (Cost $67,078,639) | | | | | 121,357,262 |
| | | | |
|
Technology – 23.4% | | | | | |
Aerospace and Defense - 0.6% | | | | | |
Allied Defense Group (The) a,b | | 45,700 | | | 351,433 |
Astronics Corporation a | | 52,400 | | | 1,670,512 |
Axsys Technologies a | | 10,000 | | | 213,900 |
Ducommun a | | 117,200 | | | 3,015,556 |
Hexcel Corporation a,b | | 47,500 | | | 1,000,825 |
Integral Systems | | 49,800 | | | 1,210,638 |
| | | | |
|
| | | | | | 7,462,864 |
| | | | |
|
Components and Systems - 5.6% | | | | | |
Analogic Corporation | | 40,135 | | | 2,950,324 |
Belden CDT | | 57,800 | | | 3,199,230 |
Checkpoint Systems a | | 56,060 | | | 1,415,515 |
Dionex Corporation a | | 81,000 | | | 5,750,190 |
Electronics for Imaging a | | 25,000 | | | 705,500 |
Energy Conversion Devices a,b | | 105,500 | | | 3,251,510 |
Excel Technology a | | 168,500 | | | 4,707,890 |
Hutchinson Technology a,b | | 47,500 | | | 893,475 |
Imation Corporation | | 15,700 | | | 578,702 |
InFocus Corporation a | | 228,100 | | | 508,663 |
KEMET Corporation a | | 95,600 | | | 673,980 |
Methode Electronics | | 50,000 | | | 782,500 |
| | | SHARES | | | VALUE |
| | | | | | |
Newport Corporation a,b | | 592,200 | | $ | 9,167,256 |
On Track Innovations a,b | | 40,000 | | | 252,000 |
Perceptron a,b | | 397,400 | | | 3,930,286 |
Plexus Corporation a,b | | 325,700 | | | 7,487,843 |
Radiant Systems a,b | | 32,500 | | | 430,300 |
Richardson Electronics | | 116,700 | | | 1,079,475 |
TTM Technologies a,b | | 221,400 | | | 2,878,200 |
Technitrol | | 311,200 | | | 8,922,104 |
Tektronix | | 159,680 | | | 5,387,603 |
Vishay Intertechnology a,b | | 186,000 | | | 2,942,520 |
Zebra Technologies Cl. A a,b | | 76,525 | | | 2,964,578 |
| | | | |
|
| | | | | | 70,859,644 |
| | | | |
|
Distribution - 1.6% | | | | | |
Agilysys | | 165,125 | | | 3,715,313 |
Anixter International a | | 61,795 | | | 4,647,602 |
Benchmark Electronics a | | 208,200 | | | 4,709,484 |
Solectron Corporation a | | 1,070,100 | | | 3,937,968 |
Tech Data a,b | | 86,500 | | | 3,326,790 |
| | | | |
|
| | | | | | 20,337,157 |
| | | | |
|
Internet Software and Services - 1.4% | | | | | |
Arbinet-thexchange a | | 87,200 | | | 525,816 |
CMGI a,b | | 1,535,000 | | | 2,993,250 |
CNET Networks a,b | | 155,400 | | | 1,272,726 |
CryptoLogic | | 68,500 | | | 1,671,400 |
CyberSource Corporation a,b | | 10,000 | | | 120,600 |
EarthLink a,b | | 55,200 | | | 412,344 |
Internap Network Services a,b | | 144,890 | | | 2,089,314 |
j2 Global Communications a,b | | 43,420 | | | 1,515,358 |
Jupitermedia Corporation a,b | | 500,000 | | | 3,640,000 |
Lionbridge Technologies a | | 37,500 | | | 220,875 |
RealNetworks a,b | | 245,400 | | | 2,004,918 |
SupportSoft a | | 220,000 | | | 1,201,200 |
| | | | |
|
| | | | | | 17,667,801 |
| | | | |
|
IT Services - 4.3% | | | | | |
Alten a | | 52,000 | | | 2,049,447 |
answerthink a | | 655,000 | | | 2,371,100 |
BearingPoint a,b | | 788,800 | | | 5,766,128 |
Black Box | | 47,000 | | | 1,944,860 |
CACI International Cl. A a,b | | 10,000 | | | 488,500 |
CIBER a,b | | 10,000 | | | 81,800 |
Cogent Communications Group a,b | | 204,200 | | | 6,099,454 |
Computer Task Group a | | 101,100 | | | 451,917 |
Covansys Corporation a,b | | 188,900 | | | 6,409,377 |
Diamond Management & Technology Consultants | | 80,400 | | | 1,061,280 |
Forrester Research a | | 40,300 | | | 1,133,639 |
Gartner a | | 126,000 | | | 3,098,340 |
MAXIMUS | | 127,900 | | | 5,548,302 |
Perot Systems Cl. A a,b | | 165,100 | | | 2,813,304 |
Sapient Corporation a,b | | 806,602 | | | 6,235,033 |
Syntel | | 152,679 | | | 4,639,915 |
TriZetto Group (The) a,b | | 215,200 | | | 4,166,272 |
| | | | |
|
| | | | | | 54,358,668 |
| | | | |
|
Semiconductors and Equipment - 3.7% | | | | | |
Axcelis Technologies a,b | | 135,000 | | | 876,150 |
BE Semiconductor Industries a,b | | 58,000 | | | 377,000 |
Brooks Automation a,b | | 28,500 | | | 517,275 |
Cabot Microelectronics a | | 131,200 | | | 4,656,288 |
24 | 2007 Semiannual Report to Stockholders | THE ACCOMPANYING NOTES ARE AN INTEGRAL PART OF THESE FINANCIAL STATEMENTS. |
| | | June 30, 2007 (unaudited) |
|
| |
| | | SHARES | | | VALUE |
Technology (continued) | | | | | |
Semiconductors and Equipment (continued) | | | | | |
CEVA a | | 31,666 | | $ | 269,161 |
Cognex Corporation | | 197,700 | | | 4,450,227 |
DSP Group a,b | | 115,000 | | | 2,354,050 |
DTS a,b | | 64,100 | | | 1,395,457 |
Diodes a,b | | 167,900 | | | 7,013,183 |
Dolby Laboratories Cl. A a | | 148,900 | | | 5,272,549 |
Exar Corporation a,b | | 231,976 | | | 3,108,478 |
Fairchild Semiconductor International a,b | | 51,200 | | | 989,184 |
Himax Technologies ADR a | | 100,000 | | | 577,000 |
International Rectifier a,b | | 120,000 | | | 4,471,200 |
Intevac a,b | | 57,450 | | | 1,221,387 |
Jazz Technologies (Units) a | | 600,000 | | | 2,760,000 |
Kulicke & Soffa Industries a,b | | 105,800 | | | 1,107,726 |
Novellus Systems a,b | | 12,000 | | | 340,440 |
Pericom Semiconductor a,b | | 58,000 | | | 647,280 |
Power Integrations a | | 49,000 | | | 1,274,000 |
Sanmina-SCI Corporation a,b | | 200,000 | | | 626,000 |
Semitool a,b | | 50,000 | | | 480,500 |
Staktek Holdings a | | 184,700 | | | 725,871 |
Veeco Instruments a,b | | 65,000 | | | 1,348,100 |
†Vimicro International ADR a,b | | 160,000 | | | 928,000 |
| | | | |
|
| | | | | | 47,786,506 |
| | | | |
|
Software - 3.6% | | | | | |
Advent Software a,b | | 116,800 | | | 3,801,840 |
ANSYS a,b | | 100,000 | | | 2,650,000 |
Aspen Technology a | | 27,100 | | | 379,400 |
Avid Technology a,b | | 50,000 | | | 1,767,500 |
BEA Systems a | | 65,610 | | | 898,201 |
Borland Software a,b | | 280,000 | | | 1,663,200 |
Epicor Software a,b | | 79,900 | | | 1,188,113 |
iPass a,b | | 268,400 | | | 1,454,728 |
JDA Software Group a,b | | 99,900 | | | 1,961,037 |
MSC.Software a | | 70,000 | | | 947,800 |
ManTech International Cl. A a,b | | 119,400 | | | 3,681,102 |
NAVTEQ Corporation a,b | | 70,000 | | | 2,963,800 |
Net 1 UEPS Technologies a,b | | 50,000 | | | 1,207,500 |
PLATO Learning a | | 149,642 | | | 688,353 |
Progress Software a,b | | 30,500 | | | 969,595 |
SPSS a | | 179,600 | | | 7,927,544 |
Sybase a | | 82,600 | | | 1,973,314 |
THQ a,b | | 20,000 | | | 610,400 |
Transaction Systems Architects Cl. A a | | 228,150 | | | 7,679,529 |
Verint Systems a,b | | 40,000 | | | 1,224,000 |
| | | | |
|
| | | | | | 45,636,956 |
| | | | |
|
Telecommunications - 2.6% | | | | | |
Adaptec a,b | | 2,584,100 | | | 9,845,421 |
ADTRAN | | 65,000 | | | 1,688,050 |
Catapult Communications a,b | | 87,100 | | | 864,032 |
Covad Communications Group a,b | | 35,000 | | | 31,500 |
Foundry Networks a | | 373,400 | | | 6,220,844 |
Globalstar a,b | | 50,000 | | | 517,500 |
Globecomm Systems a | | 233,700 | | | 3,416,694 |
Golden Telecom a | | 40,000 | | | 2,200,400 |
IDT Corporation | | 108,400 | | | 1,089,420 |
IDT Corporation Cl. B b | | 65,000 | | | 670,800 |
Level 3 Communications a,b | | 401,341 | | | 2,347,845 |
| | | SHARES | | | | VALUE |
| | | | | | |
†NMS Communications a,b | | 300,000 | | | $ | 516,000 |
†Orbcomm a,b | | 30,000 | | | | 492,300 |
Sycamore Networks a,b | | 171,000 | | | | 687,420 |
Tandberg | | 70,500 | | | | 1,587,070 |
Tollgrade Communications a | | 20,000 | | | | 211,000 |
USA Mobility | | 37,500 | | | | 1,003,500 |
| | | | | |
|
| | | | | | | 33,389,796 |
| | | | | |
|
Total (Cost $206,468,593) | | | | | | 297,499,392 |
| | | | | |
|
Utilities – 0.2% | | | | | | |
CH Energy Group | | 44,500 | | | | 2,001,165 |
Southern Union | | 11,576 | | | | 377,262 |
| | | | | |
|
Total (Cost $2,127,413) | | | | | | 2,378,427 |
| | | | | |
|
Miscellaneous d – 2.2% | | | | | | |
Total (Cost $26,852,585) | | | | | | 27,740,047 |
| | | | | |
|
TOTAL COMMON STOCKS | | | | | | |
(Cost $778,641,721) | | | | | | 1,265,330,819 |
| | | | | |
|
PREFERRED STOCKS – 0.1% | | | | | | |
Aristotle Corporation 11.00% Conv. | | 4,800 | | | | 40,080 |
Seneca Foods Conv. a,c | | 85,000 | | | | 1,990,530 |
| | | | | |
|
TOTAL PREFERRED STOCKS | | | | | | |
(Cost $1,310,255) | | | | | | 2,030,610 |
| | | | | |
|
| | PRINCIPAL | | | |
| | AMOUNT | | | |
CORPORATE BONDS – 0.1% | | | | | | |
Dixie Group 7.00% | | | | | | |
Conv. Sub. Deb. due 5/15/12 | | $352,000 | | | | 337,920 |
| | | | | |
|
TOTAL CORPORATE BONDS | | | | | | |
(Cost $293,507) | | | | | | 337,920 |
| | | | | |
|
REPURCHASE AGREEMENTS – 17.0% | | | | | | |
| State Street Bank & Trust Company, | | | | | | |
5.10% dated 6/29/07, due 7/2/07, | | | | | | |
maturity value $71,123,215 (collateralized | | | | | | |
by obligations of various U.S. Government | | | | | | |
Agencies, valued at $72,870,420) | | | | | | |
(Cost $71,093,000) | | | | | | 71,093,000 |
| | | | | |
|
| Lehman Brothers (Tri-Party), | | | | | | |
5.05% dated 6/29/07, due 7/2/07, | | | | | | |
maturity value $145,061,021 (collateralized | | | | | | |
by obligations of various U.S. Government | | | | | | |
Agencies, valued at $147,966,873) | | | | | | |
(Cost $145,000,000) | | | | | | 145,000,000 |
| | | | | |
|
TOTAL REPURCHASE AGREEMENTS | | | | | | |
(Cost $216,093,000) | | | | | | 216,093,000 |
| | | | | |
|
| THE ACCOMPANYING NOTES ARE AN INTEGRAL PART OF THESE FINANCIAL STATEMENTS. |
2007 Semiannual Report to Stockholders | 25 |
| Royce Value Trust | | June 30, 2007 (unaudited) |
|
| |
| | | | | | | VALUE | |
COLLATERAL RECEIVED FOR SECURITIES LOANED – 9.6% | | | | | | | |
| Money Market Funds | | | | | | | |
State Street Navigator Securities Lending | | | | | | | |
Prime Portfolio (7 day yield-5.27%) | | | | | $ | 122,173,543 | |
| | | | | |
| |
(Cost $122,173,543) | | | | | | 122,173,543 | |
| | | | | |
| |
TOTAL INVESTMENTS – 126.4% | | | | | | | |
(Cost $1,118,512,026) | | | | | | 1,605,965,892 | |
| | | | | | | | |
LIABILITIES LESS CASH | | | | | | | |
AND OTHER ASSETS – (9.1)% | | | | | | (116,029,775 | ) |
| | | | | | | | |
PREFERRED STOCK – (17.3)% | | | | | | (220,000,000 | ) |
| | | | | |
| |
NET ASSETS APPLICABLE TO | | | | | | | |
COMMON STOCKHOLDERS – 100.0% | | | | | $ | 1,269,936,117 | |
| | | | | |
| |
| a | | Non-income producing. |
| b | | All or a portion of these securities were on loan at June 30, 2007. Total market value of loaned securities at June 30, 2007 was $118,693,269. |
| c | | Securities for which market quotations are no longer readily available represent 0.2% of net assets. These securities have been valued at their fair value under procedures established by the Fund’s Board of Directors. |
| d | | Includes securities first acquired in 2007 and less than 1% of net assets applicable to Common Stockholders. |
| † | | New additions in 2007. |
| | |
Bold indicates the Fund’s largest 20 equity holdings in terms of June 30, 2007 market value. |
| | | |
| INCOME TAX INFORMATION: The cost of total investments for Federal income tax purposes was $1,119,700,514. At June 30, 2007, net unrealized appreciation for all securities was $486,265,378, consisting of aggregate gross unrealized appreciation of $527,222,556 and aggregate gross unrealized depreciation of $40,957,178. The primary difference in book and tax basis cost is the timing of the recognition of losses on securities sold. |
26 | 2007 Semiannual Report to Stockholders | THE ACCOMPANYING NOTES ARE AN INTEGRAL PART OF THESE FINANCIAL STATEMENTS. |
Royce Value Trust | June 30, 2007 (unaudited) |
|
| |
Statement of Assets and Liabilities |
| |
ASSETS: | | | | |
Investments at value (including collateral on loaned securities)* | | $ | 1,389,872,892 | |
Repurchase agreements (at cost and value) | | | 216,093,000 | |
Receivable for investments sold | | | 9,790,553 | |
Receivable for dividends and interest | | | 768,978 | |
Prepaid expenses and other assets | | | 185,210 | |
|
Total Assets | | | 1,616,710,633 | |
|
LIABILITIES: | | | | |
Payable for collateral on loaned securities | | | 122,173,543 | |
Payable to custodian for cash overdrawn and foreign currency | | | 369,622 | |
Payable for investments purchased | | | 2,209,377 | |
Payable for investment advisory fee | | | 1,412,077 | |
Preferred dividends accrued but not yet declared | | | 288,454 | |
Accrued expenses | | | 321,443 | |
|
Total Liabilities | | | 126,774,516 | |
|
PREFERRED STOCK: | | | | |
5.90% Cumulative Preferred Stock - $0.001 par value, $25 liquidation value per share; 8,800,000 shares outstanding | | | 220,000,000 | |
|
Total Preferred Stock | | | 220,000,000 | |
|
NET ASSETS APPLICABLE TO COMMON STOCKHOLDERS | | $ | 1,269,936,117 | |
|
ANALYSIS OF NET ASSETS APPLICABLE TO COMMON STOCKHOLDERS: | | | | |
Common Stock paid-in capital - $0.001 par value per share; 58,497,690 shares outstanding (150,000,000 shares authorized) | | $ | 741,443,771 | |
Undistributed net investment income (loss) | | | 1,839,388 | |
Accumulated net realized gain (loss) on investments and foreign currency | | | 98,366,907 | |
Net unrealized appreciation (depreciation) on investments and foreign currency | | | 487,454,293 | |
Preferred dividends accrued but not yet declared | | | (59,168,242 | ) |
|
Net Assets applicable to Common Stockholders (net asset value per share - $21.71) | | $ | 1,269,936,117 | |
|
* Investments at identified cost (including $122,173,543 of collateral on loaned securities) | | $ | 902,419,026 | |
Market value of loaned securities | | | 118,693,269 | |
| THE ACCOMPANYING NOTES ARE AN INTEGRAL PART OF THESE FINANCIAL STATEMENTS. | 2007 Semiannual Report to Stockholders | 27 |
Royce Value Trust | Six Months Ended June 30, 2007 (unaudited) |
|
INVESTMENT INCOME: | | | | |
Income: | | | | |
Dividends* | | | | |
Non-Affiliates | | $ | 6,154,391 | |
Affiliated Companies | | | 51,750 | |
Interest | | | 4,614,393 | |
Securities lending | | | 229,921 | |
|
Total income | | | 11,050,455 | |
|
Expenses: | | | | |
Investment advisory fees | | | 7,095,425 | |
Stockholder reports | | | 200,162 | |
Custody and transfer agent fees | | | 98,289 | |
Directors’ fees | | | 65,041 | |
Administrative and office facilities expenses | | | 57,037 | |
Professional fees | | | 27,189 | |
Other expenses | | | 121,067 | |
|
Total expenses | | | 7,664,210 | |
Compensating balance credits | | | (58,427 | ) |
|
Net expenses | | | 7,605,783 | |
|
Net investment income (loss) | | | 3,444,672 | |
|
REALIZED AND UNREALIZED GAIN (LOSS) ON INVESTMENTS AND FOREIGN CURRENCY: | | | | |
Net realized gain (loss) on investments and foreign currency | | | | |
Non-Affiliates | | | 79,703,578 | |
Affiliated Companies | | | 5,317,318 | |
Net change in unrealized appreciation (depreciation) on investments and foreign currency | | | 33,514,490 | |
|
Net realized and unrealized gain (loss) on investments and foreign currency | | | 118,535,386 | |
|
NET INCREASE (DECREASE) IN NET ASSETS RESULTING FROM INVESTMENT OPERATIONS | | | 121,980,058 | |
|
DISTRIBUTIONS TO PREFERRED STOCKHOLDERS | | | (6,490,000 | ) |
|
NET INCREASE (DECREASE) IN NET ASSETS APPLICABLE TO COMMON STOCKHOLDERS | | | | |
RESULTING FROM INVESTMENT OPERATIONS | | $ | 115,490,058 | |
* Net of foreign withholding tax of $187,777. |
28 | 2007 Semiannual Report to Stockholders | THE ACCOMPANYING NOTES ARE AN INTEGRAL PART OF THESE FINANCIAL STATEMENTS. |
| |
Statement of Changes in Net Assets |
| |
| | | Six months ended | | | | |
| | | 6/30/07 | | Year ended |
| | | (unaudited) | | 12/31/06 |
INVESTMENT OPERATIONS: | | | | | | | | |
Net investment income (loss) | | $ | 3,444,672 | | | $ | 6,996,692 | |
Net realized gain (loss) on investments and foreign currency | | | 85,020,896 | | | | 110,169,442 | |
Net change in unrealized appreciation (depreciation) on investments and foreign currency | | | 33,514,490 | | | | 93,033,099 | |
|
Net increase (decrease) in net assets resulting from investment operations | | | 121,980,058 | | | | 210,199,233 | |
|
DISTRIBUTIONS TO PREFERRED STOCKHOLDERS: | | | | | | | | |
Net investment income | | | – | | | | (1,020,228 | ) |
Net realized gain on investments and foreign currency | | | – | | | | (11,959,772 | ) |
Quarterly distributions* | | | (6,490,000 | ) | | | – | |
|
Total distributions to Preferred Stockholders | | | (6,490,000 | ) | | | (12,980,000 | ) |
|
NET INCREASE (DECREASE) IN NET ASSETS APPLICABLE TO COMMON STOCKHOLDERS | | | | | | | | |
RESULTING FROM INVESTMENT OPERATIONS | | | 115,490,058 | | | | 197,219,233 | |
|
DISTRIBUTIONS TO COMMON STOCKHOLDERS: | | | | | | | | |
Net investment income | | | – | | | | (7,788,658 | ) |
Net realized gain on investments and foreign currency | | | – | | | | (91,303,684 | ) |
Quarterly distributions* | | | (52,389,793 | ) | | | – | |
|
Total distributions to Common Stockholders | | | (52,389,793 | ) | | | (99,092,342 | ) |
|
CAPITAL STOCK TRANSACTIONS: | | | | | | | | |
Reinvestment of distributions to Common Stockholders | | | 26,408,289 | | | | 50,180,586 | |
|
Total capital stock transactions | | | 26,408,289 | | | | 50,180,586 | |
|
NET INCREASE (DECREASE) IN NET ASSETS APPLICABLE TO COMMON STOCKHOLDERS | | | 89,508,554 | | | | 148,307,477 | |
|
NET ASSETS APPLICABLE TO COMMON STOCKHOLDERS: | | | | | | | | |
Beginning of period | | | 1,180,427,563 | | | | 1,032,120,086 | |
|
End of period (including undistributed net investment income (loss) of $1,839,388 at 6/30/07 and $(1,605,284) at 12/31/06) | | $ | 1,269,936,117 | | | $ | 1,180,427,563 | |
| | | | | | | | | |
| *To be allocated to net investment income and capital gains at year end. |
| THE ACCOMPANYING NOTES ARE AN INTEGRAL PART OF THESE FINANCIAL STATEMENTS. | 2007 Semiannual Report to Stockholders | 29 |
This table is presented to show selected data for a share of Common Stock outstanding throughout each period, and to assist stockholders in evaluating the Fund’s performance for the periods presented.
| | | Six months ended | | Years ended December 31, |
| | | June 30, 2007 | |
|
| | | (unaudited) | | 2006 | | | 2005 | | | 2004 | | | 2003 | | | 2002 | |
|
NET ASSET VALUE, BEGINNING OF PERIOD | | | $20.62 | | | | $18.87 | | | | $18.95 | | | | $17.03 | | | | $13.22 | | | | $17.31 | |
|
INVESTMENT OPERATIONS: | | | | | | | | | | | | | | | | | | | | | | | | |
Net investment income (loss) | | | 0.06 | | | | 0.13 | | | | 0.01 | | | | (0.08 | ) | | | (0.05 | ) | | | (0.02 | ) |
Net realized and unrealized gain (loss) on investments and foreign currency | | | 2.04 | | | | 3.63 | | | | 1.75 | | | | 3.81 | | | | 5.64 | | | | (2.25 | ) |
|
Total investment operations | | | 2.10 | | | | 3.76 | | | | 1.76 | | | | 3.73 | | | | 5.59 | | | | (2.27 | ) |
|
DISTRIBUTIONS TO PREFERRED STOCKHOLDERS: | | | | | | | | | | | | | | | | | | | | | | | | |
Net investment income | | | – | | | | (0.02 | ) | | | – | | | | – | | | | – | | | | (0.01 | ) |
Net realized gain on investments and foreign currency | | | – | | | | (0.21 | ) | | | (0.24 | ) | | | (0.26 | ) | | | (0.26 | ) | | | (0.28 | ) |
Quarterly distributions* | | | (0.11 | ) | | | – | | | | – | | | | – | | | | – | | | | – | |
|
Total distributions to Preferred Stockholders | | | (0.11 | ) | | | (0.23 | ) | | | (0.24 | ) | | | (0.26 | ) | | | (0.26 | ) | | �� | (0.29 | ) |
|
NET INCREASE (DECREASE) IN NET ASSETS APPLICABLE TO COMMON STOCKHOLDERS RESULTING FROM INVESTMENT OPERATIONS | | | 1.99 | | | | 3.53 | | | | 1.52 | | | | 3.47 | | | | 5.33 | | | | (2.56 | ) |
|
DISTRIBUTIONS TO COMMON STOCKHOLDERS: | | | | | | | | | | | | | | | | | | | | | | | | |
Net investment income | | | – | | | | (0.14 | ) | | | – | | | | – | | | | – | | | | (0.07 | ) |
Net realized gain on investments and foreign currency | | | – | | | | (1.64 | ) | | | (1.61 | ) | | | (1.55 | ) | | | (1.30 | ) | | | (1.44 | ) |
Quarterly distributions* | | | (0.91 | ) | | | – | | | | – | | | | – | | | | – | | | | – | |
|
Total distributions to Common Stockholders | | | (0.91 | ) | | | (1.78 | ) | | | (1.61 | ) | | | (1.55 | ) | | | (1.30 | ) | | | (1.51 | ) |
|
CAPITAL STOCK TRANSACTIONS: | | | | | | | | | | | | | | | | | | | | | | | | |
Effect of reinvestment of distributions by Common Stockholders | | | 0.01 | | | | (0.00 | ) | | | 0.01 | | | | 0.00 | | | | (0.00 | ) | | | (0.02 | ) |
Effect of rights offering and Preferred Stock offering | | | – | | | | – | | | | – | | | | – | | | | (0.22 | ) | | | – | |
|
Total capital stock transactions | | | 0.01 | | | | (0.00 | ) | | | 0.01 | | | | 0.00 | | | | (0.22 | ) | | | (0.02 | ) |
|
NET ASSET VALUE, END OF PERIOD | | | $21.71 | | | | $20.62 | | | | $18.87 | | | | $18.95 | | | | $17.03 | | | | $13.22 | |
|
MARKET VALUE, END OF PERIOD | | | $21.42 | | | | $22.21 | | | | $20.08 | | | | $20.44 | | | | $17.21 | | | | $13.25 | |
|
TOTAL RETURN (a): | | | | | | | | | | | | | | | | | | | | | | | | |
Market Value | | | 0.60 | %*** | | | 20.96 | % | | | 6.95 | % | | | 29.60 | % | | | 41.96 | % | | | (6.87 | )% |
Net Asset Value | | | 9.83 | %*** | | | 19.50 | % | | | 8.41 | % | | | 21.42 | % | | | 40.80 | % | | | (15.61 | )% |
RATIOS BASED ON AVERAGE NET ASSETS APPLICABLE TO COMMON STOCKHOLDERS: | | | | | | | | | | | | | | | | | | | | | | | | |
Total expenses (b,c) | | | 1.25 | %** | | | 1.29 | % | | | 1.49 | % | | | 1.51 | % | | | 1.49 | % | | | 1.72 | % |
Management fee expense (d) | | | 1.17 | %** | | | 1.20 | % | | | 1.37 | % | | | 1.39 | % | | | 1.34 | % | | | 1.56 | % |
Other operating expenses | | | 0.08 | %** | | | 0.09 | % | | | 0.12 | % | | | 0.12 | % | | | 0.15 | % | | | 0.16 | % |
Net investment income (loss) | | | 0.57 | %** | | | 0.62 | % | | | 0.03 | % | | | (0.50 | )% | | | (0.36 | )% | | | (0.09 | )% |
SUPPLEMENTAL DATA: | | | | | | | | | | | | | | | | | | | | | | | | |
Net Assets Applicable to Common Stockholders, | | | | | | | | | | | | | | | | | | | | | | | | |
End of Period (in thousands) | | | $1,269,936 | | | | $1,180,428 | | | | $1,032,120 | | | | $993,304 | | | | $850,773 | | | | $560,776 | |
Liquidation Value of Preferred Stock, | | | | | | | | | | | | | | | | | | | | | | | | |
End of Period (in thousands) | | | $220,000 | | | | $220,000 | | | | $220,000 | | | | $220,000 | | | | $220,000 | | | | $160,000 | |
Portfolio Turnover Rate | | | 5 | % | | | 21 | % | | | 31 | % | | | 30 | % | | | 23 | % | | | 35 | % |
PREFERRED STOCK: | | | | | | | | | | | | | | | | | | | | | | | | |
Total shares outstanding | | | 8,800,000 | | | | 8,800,000 | | | | 8,800,000 | | | | 8,800,000 | | | | 8,800,000 | | | | 6,400,000 | |
Asset coverage per share | | | $169.31 | | | | $159.14 | | | | $142.29 | | | | $137.88 | | | | $121.68 | | | | $112.62 | |
Liquidation preference per share | | | $25.00 | | | | $25.00 | | | | $25.00 | | | | $25.00 | | | | $25.00 | | | | $25.00 | |
Average market value per share (e): | | | | | | | | | | | | | | | | | | | | | | | | |
5.90% Cumulative | | | $24.35 | | | | $23.95 | | | | $24.75 | | | | $24.50 | | | | $25.04 | | | | – | |
7.80% Cumulative | | | – | | | | – | | | | – | | | | – | | | | $25.87 | | | | $26.37 | |
7.30% Tax-Advantaged Cumulative | | | – | | | | – | | | | – | | | | – | | | | $25.53 | | | | $25.82 | |
| (a) | | The Market Value Total Return is calculated assuming a purchase of Common Stock on the opening of the first business day and a sale on the closing of the last business day of each period reported. Dividends and distributions, if any, are assumed for the purposes of this calculation to be reinvested at prices obtained under the Fund’s Distribution Reinvestment and Cash Purchase Plan. Net Asset Value Total Return is calculated on the same basis, except that the Fund’s net asset value is used on the purchase and sale dates instead of market value. |
| (b) | | Expense ratios based on total average net assets including liquidation value of Preferred Stock were 1.06% 1.08%, 1.22%, 1.21%, 1.19% and 1.38% for the periods ended June 30, 2007 and December 31, 2006, 2005, 2004, 2003 and 2002, respectively. |
| (c) | | Expense ratios based on average net assets applicable to Common Stockholders before waiver of fees by the investment adviser would have been 1.62% and 1.82% for the periods ended December 31, 2003 and 2002, respectively. |
| (d) | | The management fee is calculated based on average net assets over a rolling 60-month basis, while the above ratios of management fee expenses are based on the average net assets applicable to Common Stockholders over a 12-month basis. |
| (e) | | The average of month-end market values during the period that the Preferred Stock was outstanding. |
| * | | To be allocated to net investment income and capital gains at year end. |
| ** | | Annualized. |
| *** | | Not annualized. |
30 | 2007 Semiannual Report to Stockholders | THE ACCOMPANYING NOTES ARE AN INTEGRAL PART OF THESE FINANCIAL STATEMENTS. |
| Royce Value Trust |
|
| Notes to Financial Statements (unaudited) |
| Summary of Significant Accounting Policies: |
| Royce Value Trust, Inc. (“the Fund”) was incorporated under the laws of the State of Maryland on July 1, 1986 as a diversified closed-end investment company. The Fund commenced operations on November 26, 1986. |
| The preparation of financial statements in conformity with accounting principles generally accepted in the United States of America requires management to make estimates and assumptions that affect the reported amounts of assets and liabilities and the disclosure of contingent assets and liabilities at the date of the financial statements, and the reported amounts of income and expenses during the reporting period. Actual results could differ from those estimates. |
| |
| Valuation of Investments: |
| Securities are valued as of the close of trading on the New York Stock Exchange (NYSE) (generally 4:00 p.m. Eastern time) on the valuation date. Securities that trade on an exchange, and securities traded on Nasdaq’s Electronic Bulletin Board, are valued at their last reported sales price or Nasdaq official closing price taken from the primary market in which each security trades or, if no sale is reported for such day, at their bid price. Other over-the-counter securities for which market quotations are readily available are valued at their highest bid price. Securities for which market quotations are not readily available are valued at their fair value under procedures established by the Fund’s Board of Directors. In addition, if between the time trading ends on a particular security and the close of the customary trading session on the NYSE, events occur that are significant and may make the closing price unreliable, the Fund may fair value the security. The Fund uses an independent pricing service to provide fair value estimates for relevant non-U.S. equity securities on days when the U.S. market volatility exceeds a certain threshold. This pricing service uses proprietary correlations it has developed between the movement of prices of non-U.S. equity securities and indices of U.S.-traded securities, futures contracts and other indications to estimate the fair value of relevant non-U.S. securities. Bonds and other fixed income securities may be valued by reference to other securities with comparable ratings, interest rates and maturities, using established independent pricing services. Investments in money market funds are valued at net asset value per share. |
| |
| Foreign Currency: |
| The Fund values its non-U.S. securities in U.S. dollars on the basis of foreign currency exchange rates provided to the Fund by its custodian, State Street Bank and Trust Company. The effects of changes in foreign exchange rates on investments and other assets and liabilities are included with net realized and unrealized gains and losses on investments. |
| Net realized foreign exchange gains or losses arise from sales and maturities of short-term securities, sales of foreign currencies, expiration of currency forward contracts, currency gains or losses realized between the trade and settlement dates on securities transactions, the difference between the amounts of dividends, interest, and foreign withholding taxes recorded on the Fund’s books, and the U.S. dollar equivalent of the amounts actually received or paid. Net unrealized foreign exchange gains and losses arise from changes in the value of assets and liabilities, |
| including investments in securities at the end of the reporting period, as a result of changes in foreign currency exchange rates. |
| |
| Investment Transactions and Related Investment Income: |
| Investment transactions are accounted for on the trade date. Dividend income is recorded on the ex-dividend date. Non-cash dividend income is recorded at the fair market value of the securities received. Interest income is recorded on an accrual basis. Premium and discounts on debt securities are amortized using the effective yield to maturity method. Realized gains and losses from investment transactions are determined on the basis of identified cost for book and tax purposes. |
| |
| Expenses: |
| The Fund incurs direct and indirect expenses. Expenses directly attributable to the Fund are charged to the Fund’s operations, while expenses applicable to more than one of the Royce Funds are allocated in an equitable manner. Allocated personnel and occupancy costs related to The Royce Funds are included in administrative and office facilities expenses. The Fund has adopted a deferred fee agreement that allows the Fund’s Directors to defer the receipt of all or a portion of Directors’ Fees otherwise payable. The deferred fees are invested in certain Royce Funds until distributed in accordance with the agreement. |
| |
| Compensating Balance Credits: |
| The Fund has an arrangement with its custodian bank, whereby a portion of the custodian’s fee is paid indirectly by credits earned on the Fund’s cash on deposit with the bank. This deposit arrangement is an alternative to purchasing overnight investments. |
| |
| Taxes: |
| As a qualified regulated investment company under Subchapter M of the Internal Revenue Code, the Fund is not subject to income taxes to the extent that it distributes substantially all of its taxable income for its fiscal year. The Schedule of Investments includes information regarding income taxes under the caption “Income Tax Information”. |
| |
| Distributions: |
| The Fund currently has a policy of paying quarterly distributions on the Fund’s Common Stock. Distributions are currently being made at the annual rate of 9% of the rolling average of the prior four calendar quarter-end NAVs of the Fund’s Common Stock, with the fourth quarter distribution being the greater of 2.25% of the rolling average or the distribution required by IRS regulations. Distributions to Preferred Stockholders are accrued daily and paid quarterly and distributions to Common Stockholders are recorded on ex-dividend date. The Fund is required to allocate long-term capital gain distributions and other types of income proportionately to distributions made to holders of shares of Common Stock and Preferred Stock. To the extent that distributions are not paid from long-term capital gains, net investment income or net short-term capital gains, they will represent a return of capital. Distributions are determined in accordance with income tax regulations that may differ from accounting principles generally accepted in the United States of America. Permanent book and tax basis differences relating to stockholder distributions will result in reclassifications within the capital accounts. Undistributed net investment income may include |
| | 2007 Semiannual Report to Stockholders | 31 |
| Royce Value Trust |
|
| Notes to Financial Statements (unaudited) (continued) |
| temporary book and tax basis differences, which will reverse in a subsequent period. Any taxable income or gain remaining undistributed at fiscal year end is distributed in the following year. |
| |
| Repurchase Agreements: |
| The Fund may enter into repurchase agreements with institutions that the Fund’s investment adviser has determined are creditworthy. The Fund restricts repurchase agreements to maturities of no more than seven days. Securities pledged as collateral for repurchase agreements, which are held until maturity of the repurchase agreements, are marked-to-market daily and maintained at a value at least equal to the principal amount of the repurchase agreement (including accrued interest). Repurchase agreements could involve certain risks in the event of default or insolvency of the counter-party, including possible delays or restrictions upon the ability of the Fund to dispose of the underlying securities. |
| |
| Securities Lending: |
| The Fund loans securities to qualified institutional investors for the purpose of realizing additional income. Collateral on all securities loaned for the Fund is accepted in cash and cash equivalents and invested temporarily by the custodian. The collateral is equal to at least 100% of the current market value of the loaned securities. The market value of the loaned securities is determined at the close of business of the Fund and any additional required collateral is delivered to the Fund on the next business day. |
| |
| Recent Accounting Pronouncements: |
| Financial Accounting Standards Board (“FASB”) Interpretation No. 48, “Accounting for Uncertainty in Income Taxes” (“FIN 48”) provides guidance for how uncertain tax positions should be recognized, measured, presented and disclosed in the financial statements. FIN 48 requires the evaluation of tax positions taken or expected to be taken in the course of preparing the Fund’s tax returns to determine whether the tax positions are “more-likely-than-not” of being sustained by the applicable tax authority. Tax positions not deemed to meet the more-likely-than-not threshold would be recorded as a tax benefit or expense in the current year. FIN 48 was adopted for the Fund on June 29, 2007. There was no material impact to the financial statements or disclosures thereto as a result of the adoption of this pronouncement. |
FASB Statement of Financial Accounting Standard No. 157, “Fair Value Measurement” (“FAS 157”), provides enhanced guidance for using fair value to measure assets and liabilities. The standard requires companies to provide expanded information about the assets and liabilities measured at fair value and the potential effect of these fair valuations on an entity’s financial performance. The standard does not expand the use of fair value in any new circumstances, but provides clarification on acceptable fair valuation methods and applications. Adoption of FAS 157 is required for fiscal years beginning after November 15, 2007. The standard is not expected to materially impact the Fund’s financial statements.
|
| Capital Stock: |
| The Fund issued 1,238,869 and 2,548,023 shares of Common Stock as reinvestment of distributions by Common Stockholders for the six months ended June 30, 2007 and the year ended December 31, 2006, respectively. |
| At June 30, 2007, 8,800,000 shares of 5.90% Cumulative Preferred Stock were outstanding. Commencing October 9, 2008 and thereafter, the Fund, at its option, may redeem the Cumulative Preferred Stock, in whole or in part, at the redemption price. The Cumulative Preferred Stock is classified outside of permanent equity (net assets applicable to Common Stockholders) in the accompanying financial statements in accordance with Emerging Issues Task Force (EITF) Topic D-98, Classification and Measurement of Redeemable Securities, that requires preferred securities that are redeemable for cash or other assets to be classified outside of permanent equity to the extent that the redemption is at a fixed or determinable price and at the option of the holder or upon the occurrence of an event that is not solely within the control of the issuer. |
| The Fund is required to meet certain asset coverage tests with respect to the Cumulative Preferred Stock as required by the 1940 Act. In addition, pursuant to the Rating Agency Guidelines established by Moody’s, the Fund is required to maintain a certain discounted asset coverage. If the Fund fails to meet these requirements and does not correct such failure, the Fund may be required to redeem, in part or in full, the Cumulative Preferred Stock at a redemption price of $25.00 per share, plus an amount equal to the accumulated and unpaid dividends, whether or not declared on such shares, in order to meet these requirements. Additionally, failure to meet the foregoing asset coverage requirements could restrict the Fund’s ability to pay dividends to Common Stockholders and could lead to sales of portfolio securities at inopportune times. The Fund has met these requirements since issuing the Cumulative Preferred Stock. |
| |
| Investment Advisory Agreement: |
| As compensation for its services under the Investment Advisory Agreement, Royce & Associates, LLC (“Royce”) receives a fee comprised of a Basic Fee (“Basic Fee”) and an adjustment to the Basic Fee based on the investment performance of the Fund in relation to the investment record of the S&P SmallCap 600 Index (“S&P 600”). |
| The Basic Fee is a monthly fee equal to 1/12 of 1% (1% on an annualized basis) of the average of the Fund’s month-end net assets applicable to Common Stockholders, plus the liquidation value of Preferred Stock, for the rolling 60-month period ending with such month (the “performance period”). The Basic Fee for each month is increased or decreased at the rate of 1/12 of .05% for each percentage point that the investment performance of the Fund exceeds, or is exceeded by, the percentage change in the investment record of the S&P 600 for the performance period by more than two percentage points. The performance period for each such month is a rolling 60-month period ending with such month. The maximum increase or decrease in the Basic Fee for any month may not exceed 1/12 of .5%. Accordingly, for each |
32 | 2007 Semiannual Report to Stockholders | |
| Royce Value Trust |
|
| Notes to Financial Statements (unaudited) (continued) |
month, the maximum monthly fee rate as adjusted for performance is 1/12 of 1.5% and is payable if the investment performance of the Fund exceeds the percentage change in the investment record of the S&P 600 by 12 or more percentage points for the performance period, and the minimum monthly fee rate as adjusted for performance is 1/12 of .5% and is payable if the percentage change in the investment record of the S&P 600 exceeds the investment performance of the Fund by 12 or more percentage points for the performance period.
Notwithstanding the foregoing, Royce is not entitled to receive any fee for any month when the investment performance of the Fund for the rolling 36-month period ending with such month is negative. In the event that the Fund’s investment performance for such a performance period is less than zero, Royce will not be required to refund to the Fund any fee earned in respect of any prior performance period.
Royce has voluntarily committed to waive the portion of its investment advisory fee attributable to an issue of the Fund’s Preferred Stock for any month in which the Fund’s average annual NAV total return since issuance of the Preferred Stock fails to exceed the applicable Preferred Stock’s dividend rate. | | For the six rolling 60-month periods ended June 2007, the investment performance of the Fund exceeded the investment performance of the S&P 600 by 4% to 12%. Accordingly, the investment advisory fee consisted of a Basic Fee of $5,523,766 and an upward adjustment of $1,571,659 for performance of the Fund above that of the S&P 600. For the six months ended June 30, 2007, the Fund accrued and paid Royce advisory fees totaling $7,095,425.
Purchases and Sales of Investment Securities:
For the six months ended June 30, 2007, the cost of purchases and proceeds from sales of investment securities, other than short-term securities and collateral received for securities loaned, amounted to $68,057,069 and $194,640,593, respectively. |
Transactions in Shares of Affiliated Companies: |
An “Affiliated Company,” as defined in the Investment Company Act of 1940, is a company in which a Fund owns 5% or more of the company’s outstanding voting securities at any time during the period. The Fund effected the following transactions in shares of such companies during the six months ended June 30, 2007:
|
| | | Shares | | | Market Value | | Cost of | | | Cost of | | | Realized | | | Dividend | | Shares | | Market Value |
| Affiliated Company | | 12/31/06 | | | 12/31/06 | | Purchases | | | Sales | | | Gain (Loss) | | | Income | | 6/30/07 | | 6/30/07 |
| | | | | | | | | | | | | | | | | | | | | |
| Synalloy Corporation* | | 345,000 | | | $6,361,800 | | – | | | $761,702 | | | $5,317,318 | | | $51,750 | | | | |
| | | | | | $6,361,800 | | | | | | | | $5,317,318 | | | $51,750 | | | | |
| | | | | | | | | | | | | | | | | | | | | |
| * Not an Affiliated Company at June 30, 2007. |
| | 2007 Semiannual Report to Stockholders | 33 |
| | | SHARES | | | VALUE |
COMMON STOCKS – 103.7% | | | | | |
| | | | | | |
Consumer Products – 5.0% | | | | | |
Apparel and Shoes - 1.4% | | | | | |
†dELiA*s a,c | | 33,600 | | $ | 256,368 |
Hartmarx Corporation a | | 70,000 | | | 557,900 |
Kleinert’s a,d | | 14,200 | | | 0 |
Steven Madden | | 21,750 | | | 712,530 |
True Religion Apparel a | | 24,900 | | | 506,217 |
Weyco Group | | 120,000 | | | 3,231,600 |
| | | | |
|
| | | | | | 5,264,615 |
| | | | |
|
Collectibles - 0.2% | | | | | |
Topps Company (The) | | 74,200 | | | 779,842 |
| | | | |
|
Food/Beverage/Tobacco - 0.6% | | | | | |
Green Mountain Coffee Roasters a,c | | 25,600 | | | 2,015,744 |
Nutrition 21 a,c | | 20,000 | | | 33,000 |
| | | | |
|
| | | | | | 2,048,744 |
| | | | |
|
Home Furnishing and Appliances - 0.3% | | | | | |
Lifetime Brands | | 42,054 | | | 860,004 |
†U.S. Home Systems a,c | | 10,000 | | | 99,500 |
| | | | |
|
| | | | | | 959,504 |
| | | | |
|
Publishing - 0.3% | | | | | |
Educational Development | | 7,000 | | | 54,740 |
†Proquest Company a,c | | 115,000 | | | 1,086,750 |
| | | | |
|
| | | | | | 1,141,490 |
| | | | |
|
Sports and Recreation - 1.0% | | | | | |
†Cybex International a | | 70,000 | | | 490,000 |
Monaco Coach | | 142,400 | | | 2,043,440 |
Orange 21 a | | 10,300 | | | 67,465 |
Sturm, Ruger & Company a | | 75,000 | | | 1,164,000 |
| | | | |
|
| | | | | | 3,764,905 |
| | | | |
|
Other Consumer Products - 1.2% | | | | | |
A.T. Cross Company Cl. A a | | 100,000 | | | 1,170,000 |
Burnham Holdings Cl. A | | 84,000 | | | 1,365,000 |
Cobra Electronics | | 10,000 | | | 96,400 |
Lazare Kaplan International a | | 151,700 | | | 1,201,464 |
NexCen Brands a | | 62,500 | | | 696,250 |
| | | | |
|
| | | | | | 4,529,114 |
| | | | |
|
Total (Cost $11,637,247) | | | | | 18,488,214 |
| | | | |
|
Consumer Services – 4.6% | | | | | |
Direct Marketing - 0.3% | | | | | |
Dover Saddlery a | | 9,500 | | | 67,830 |
FTD Group | | 55,000 | | | 1,012,550 |
| | | | |
|
| | | | | | 1,080,380 |
| | | | |
|
Leisure and Entertainment - 0.1% | | | | | |
FortuNet a,c | | 5,000 | | | 50,450 |
IMAX Corporation a,c | | 25,000 | | | 105,500 |
TiVo a,c | | 20,000 | | | 115,800 |
| | | | |
|
| | | | | | 271,750 |
| | | | |
|
Media and Broadcasting - 0.2% | | | | | |
Outdoor Channel Holdings a,c | | 69,750 | | | 786,083 |
| | | | |
|
Restaurants and Lodgings - 0.2% | | | | | |
Benihana Cl. A a,c | | 800 | | | 16,000 |
Champps Entertainment a | | 13,800 | | | 65,550 |
†Cosi a,c | | 85,800 | | | 391,248 |
Famous Dave’s of America a | | 18,270 | | | 407,056 |
| | | | |
|
| | | | | | 879,854 |
| | | | |
|
| | | SHARES | | | VALUE |
Retail Stores - 3.4% | | | | | |
A.C. Moore Arts & Crafts a | | 40,000 | | $ | 784,400 |
America’s Car-Mart a,c | | 200,000 | | | 2,718,000 |
†Eddie Bauer Holdings a,c | | 27,600 | | | 354,660 |
Buckle (The) | | 35,250 | | | 1,388,850 |
Cache a,c | | 9,200 | | | 122,084 |
Casual Male Retail Group a | | 25,800 | | | 260,580 |
Cato Corporation Cl. A | | 68,100 | | | 1,494,114 |
Cost Plus a,c | | 45,077 | | | 382,253 |
Deb Shops | | 19,900 | | | 550,235 |
Stein Mart | | 148,900 | | | 1,825,514 |
United Retail Group a | | 60,600 | | | 704,778 |
West Marine a,c | | 142,000 | | | 1,953,920 |
| | | | |
|
| | | | | | 12,539,388 |
| | | | |
|
Other Consumer Services - 0.4% | | | | | |
Ambassadors Group | | 15,000 | | | 532,950 |
Ambassadors International | | 6,100 | | | 202,886 |
Collectors Universe | | 23,200 | | | 354,728 |
Premier Exhibitions a,c | | 21,900 | | | 345,144 |
Renaissance Learning | | 2,365 | | | 31,100 |
| | | | |
|
| | | | | | 1,466,808 |
| | | | |
|
Total (Cost $12,692,615) | | | | | 17,024,263 |
| | | | |
|
Diversified Investment Companies – 1.4% | | | | | |
Closed-End Funds - 1.4% | | | | | |
ASA | | 48,900 | | | 3,156,984 |
Central Fund of Canada Cl. A | | 207,000 | | | 1,881,630 |
| | | | |
|
Total (Cost $2,675,077) | | | | | 5,038,614 |
| | | | |
|
| | | | | | |
Financial Intermediaries – 10.7% | | | | | |
Banking - 3.1% | | | | | |
Abigail Adams National Bancorp | | 160,500 | | | 2,214,900 |
B of I Holding a | | 100,000 | | | 721,000 |
Bancorp (The) a,c | | 51,180 | | | 1,144,385 |
First National Lincoln | | 40,200 | | | 683,400 |
Lakeland Financial | | 45,000 | | | 957,150 |
Meta Financial Group | | 44,800 | | | 1,692,992 |
Nexity Financial a | | 141,699 | | | 1,456,666 |
Peapack-Gladstone Financial | | 27,600 | | | 747,132 |
Queen City Investments a | | 948 | | | 867,420 |
Quest Capital | | 30,000 | | | 85,614 |
Sterling Bancorp | | 32,869 | | | 526,890 |
Sterling Financial | | 7,779 | | | 225,124 |
| | | | |
|
| | | | | | 11,322,673 |
| | | | |
|
Insurance - 2.2% | | | | | |
AmCOMP a | | 5,600 | | | 54,600 |
American Safety Insurance Holdings a | | 20,000 | | | 476,600 |
CRM Holdings a | | 99,000 | | | 757,350 |
First Acceptance a | | 258,405 | | | 2,625,395 |
Independence Holding | | 33,534 | | | 685,100 |
NYMAGIC | | 65,400 | | | 2,629,080 |
Navigators Group a | | 15,200 | | | 819,280 |
| | | | |
|
| | | | | | 8,047,405 |
| | | | |
|
Real Estate Investment Trusts - 0.6% | | | | | |
Capstead Mortgage | | 154,900 | | | 1,502,530 |
Opteum Cl. A | | 249,000 | | | 677,280 |
| | | | |
|
| | | | | | 2,179,810 |
| | | | |
|
34 | 2007 Semiannual Report to Stockholders | THE ACCOMPANYING NOTES ARE AN INTEGRAL PART OF THESE FINANCIAL STATEMENTS. |
| | | June 30, 2007 (unaudited) |
|
| |
| | | SHARES | | | VALUE |
Financial Intermediaries (continued) | | | | | |
Securities Brokers - 2.3% | | | | | |
Cowen Group a | | 63,800 | | $ | 1,142,658 |
First Albany Companies a | | 95,000 | | | 158,650 |
International Assets Holding a,c | | 129,400 | | | 3,008,550 |
Sanders Morris Harris Group | | 136,000 | | | 1,583,040 |
Stifel Financial a,c | | 38,733 | | | 2,280,986 |
Thomas Weisel Partners Group a,c | | 6,500 | | | 108,225 |
Tradestation Group a | | 30,000 | | | 349,500 |
| | | | |
|
| | | | | | 8,631,609 |
| | | | |
|
Other Financial Intermediaries - 2.5% | | | | | |
Kohlberg Capital | | 98,100 | | | 1,819,755 |
MVC Capital | | 216,200 | | | 4,066,722 |
MarketAxess Holdings a,c | | 123,700 | | | 2,225,363 |
NGP Capital Resources | | 68,079 | | | 1,138,283 |
| | | | |
|
| | | | | | 9,250,123 |
| | | | |
|
Total (Cost $27,404,232) | | | | | 39,431,620 |
| | | | |
|
Financial Services – 4.2% | | | | | |
Insurance Brokers - 0.2% | | | | | |
Crawford & Company Cl. A a | | 50,000 | | | 315,000 |
Health Benefits Direct a,c | | 211,100 | | | 496,085 |
| | | | |
|
| | | | | | 811,085 |
| | | | |
|
Investment Management - 3.6% | | | | | |
ADDENDA Capital | | 131,700 | | | 2,800,286 |
BKF Capital Group a,b | | 406,500 | | | 934,950 |
Epoch Holding Corporation a | | 211,500 | | | 2,831,985 |
Hennessy Advisors | | 24,750 | | | 321,750 |
Highbury Financial a,b,c | | 580,400 | | | 3,569,460 |
Highbury Financial (Warrants) a | | 533,900 | | | 822,206 |
Sceptre Investment Counsel | | 78,000 | | | 785,675 |
Westwood Holdings Group | | 31,900 | | | 1,089,704 |
| | | | |
|
| | | | | | 13,156,016 |
| | | | |
|
Other Financial Services - 0.4% | | | | | |
Chardan North China Acquisition a,c | | 149,000 | | | 1,099,620 |
Chardan North China Acquisition (Warrants) a | | 191,900 | | | 502,778 |
| | | | |
|
| | | | | | 1,602,398 |
| | | | |
|
Total (Cost $12,924,084) | | | | | 15,569,499 |
| | | | |
|
Health – 14.2% | | | | | |
Commercial Services - 1.7% | | | | | |
First Consulting Group a | | 289,800 | | | 2,753,100 |
Medifast a,c | | 10,000 | | | 89,500 |
PAREXEL International a,c | | 80,900 | | | 3,402,654 |
| | | | |
|
| | | | | | 6,245,254 |
| | | | |
|
Drugs and Biotech - 5.6% | | | | | |
Adolor Corporation a,c | | 172,000 | | | 638,120 |
Allos Therapeutics a,c | | 123,600 | | | 546,312 |
Barrier Therapeutics a,c | | 11,300 | | | 73,450 |
Cambrex Corporation | | 16,000 | | | 212,320 |
Caraco Pharmaceutical Laboratories a | | 29,850 | | | 453,123 |
Cardiome Pharma a,c | | 21,000 | | | 193,410 |
Cell Genesys a | | 58,000 | | | 194,300 |
Cerus Corporation a,c | | 166,700 | | | 1,126,892 |
†Coley Pharmaceutical Group a,c | | 210,000 | | | 760,200 |
CollaGenex Pharmaceuticals a,c | | 25,000 | | | 310,000 |
Durect Corporation a,c | | 44,100 | | | 169,785 |
| | | SHARES | | | VALUE |
| | | | | | |
DUSA Pharmaceuticals a | | 37,200 | | $ | 114,576 |
Dyax Corporation a,c | | 44,800 | | | 187,712 |
Emisphere Technologies a,c | | 163,200 | | | 789,888 |
Favrille a,c | | 271,000 | | | 999,990 |
Gene Logic a | | 224,900 | | | 310,362 |
Genitope Corporation a,c | | 294,700 | | | 1,137,542 |
Halozyme Therapeutics a,c | | 9,300 | | | 85,839 |
Hi-Tech Pharmacal a | | 50,030 | | | 597,358 |
Idenix Pharmaceuticals a | | 7,700 | | | 45,430 |
ImmunoGen a,c | | 24,000 | | | 133,200 |
Infinity Pharmaceuticals a,c | | 8,750 | | | 95,200 |
Luminex Corporation a,c | | 20,475 | | | 252,047 |
Mannkind Corporation a,c | | 42,000 | | | 517,860 |
Maxygen a | | 5,000 | | | 42,850 |
Momenta Pharmaceuticals a,c | | 69,500 | | | 700,560 |
Myriad Genetics a,c | | 25,000 | | | 929,750 |
Nastech Pharmaceutical a,c | | 2,700 | | | 29,457 |
Neurogen Corporation a,c | | 40,000 | | | 265,600 |
Nuvelo a,c | | 214,000 | | | 582,080 |
Oncolytics Biotech a,c | | 36,000 | | | 74,880 |
Orchid Cellmark a | | 78,000 | | | 361,920 |
Origin Agritech a,c | | 221,688 | | | 1,828,926 |
Pharmacyclics a | | 228,000 | | | 620,160 |
Pharmanet Development Group a,c | | 25,000 | | | 797,000 |
Sangamo BioSciences a,c | | 21,000 | | | 170,520 |
Seattle Genetics a,c | | 72,000 | | | 706,320 |
Senesco Technologies a,c | | 24,800 | | | 28,520 |
Senomyx a,c | | 47,000 | | | 634,500 |
Sinovac Biotech a,c | | 125,000 | | | 325,000 |
Strategic Diagnostics a,c | | 123,600 | | | 558,672 |
Tapestry Pharmaceuticals a,c | | 483,000 | | | 903,210 |
Theragenics Corporation a | | 145,800 | | | 607,986 |
Trimeris a,c | | 90,000 | | | 615,600 |
| | | | |
|
| | | | | | 20,728,427 |
| | | | |
|
Health Services - 1.8% | | | | | |
†Air Methods a,c | | 11,900 | | | 436,373 |
Albany Molecular Research a | | 40,000 | | | 594,000 |
†Alliance Imaging a,c | | 94,800 | | | 890,172 |
Bio-Imaging Technologies a | | 32,177 | | | 219,769 |
Gentiva Health Services a | | 23,000 | | | 461,380 |
HMS Holdings a,c | | 11,900 | | | 227,766 |
Hooper Holmes a | | 88,600 | | | 296,810 |
MedCath Corporation a,c | | 18,000 | | | 572,400 |
Mediware Information Systems a,c | | 52,600 | | | 378,720 |
Odyssey Healthcare a | | 10,000 | | | 118,600 |
On Assignment a | | 41,100 | | | 440,592 |
RehabCare Group a | | 22,000 | | | 313,280 |
Res-Care a,c | | 45,500 | | | 961,870 |
Sun Healthcare Group a,c | | 41,000 | | | 594,090 |
U.S. Physical Therapy a | | 10,000 | | | 134,700 |
| | | | |
|
| | | | | | 6,640,522 |
| | | | |
|
Medical Products and Devices - 4.9% | | | | | |
Allied Healthcare Products a | | 273,500 | | | 1,788,690 |
AngioDynamics a,c | | 14,000 | | | 252,140 |
Anika Therapeutics a,c | | 17,000 | | | 258,230 |
Atrion Corporation | | 4,000 | | | 392,000 |
†CAS Medical Systems a,c | | 91,200 | | | 644,784 |
Caliper Life Sciences a | | 50,000 | | | 234,500 |
| THE ACCOMPANYING NOTES ARE AN INTEGRAL PART OF THESE FINANCIAL STATEMENTS. |
2007 Semiannual Report to Stockholders | 35 |
| | | SHARES | | | VALUE |
Health (continued) | | | | | |
Medical Products and Devices (continued) | | | | | |
Cardiac Science a,c | | 29,947 | | $ | 328,219 |
CONMED Corporation a,c | | 3,900 | | | 114,192 |
Cutera a,c | | 15,400 | | | 383,768 |
Del Global Technologies a | | 461,301 | | | 1,176,318 |
EPIX Pharmaceuticals a | | 32,666 | | | 183,256 |
Endologix a,c | | 10,500 | | | 46,935 |
Exactech a,c | | 113,100 | | | 1,818,648 |
Golden Meditech Company a | | 24,100 | | | 13,870 |
IRIDEX Corporation a | | 30,700 | | | 160,868 |
Kensey Nash a,c | | 26,650 | | | 714,487 |
Medical Action Industries a,c | | 125,250 | | | 2,262,015 |
Merit Medical Systems a | | 8,700 | | | 104,052 |
NMT Medical a | | 13,101 | | | 155,640 |
Neurometrix a,c | | 21,500 | | | 208,765 |
Orthofix International a | | 28,000 | | | 1,259,160 |
OrthoLogic Corporation a | | 65,000 | | | 92,300 |
PLC Systems a | | 105,200 | | | 63,120 |
Possis Medical a,c | | 28,900 | | | 314,432 |
Shamir Optical Industry a | | 7,500 | | | 73,800 |
Synovis Life Technologies a | | 20,000 | | | 288,000 |
Thermage a | | 51,100 | | | 427,196 |
Urologix a,c | | 405,500 | | | 904,265 |
Utah Medical Products | | 42,300 | | | 1,342,602 |
Young Innovations | | 66,050 | | | 1,927,339 |
| | | | |
|
| | | | | | 17,933,591 |
| | | | |
|
Personal Care - 0.2% | | | | | |
Helen of Troy a,c | | 20,000 | | | 540,000 |
Nutraceutical International a | | 15,000 | | | 248,550 |
| | | | |
|
| | | | | | 788,550 |
| | | | |
|
Total (Cost $41,405,552) | | | | | 52,336,344 |
| | | | |
|
Industrial Products – 14.2% | | | | | |
Automotive - 1.0% | | | | | |
International Textile Group a | | 85,000 | | | 595,000 |
LKQ Corporation a,c | | 11,400 | | | 281,124 |
Noble International | | 30,900 | | | 631,596 |
SORL Auto Parts a,c | | 67,500 | | | 486,000 |
Spartan Motors | | 6,300 | | | 107,226 |
Strattec Security a | | 28,300 | | | 1,330,100 |
Wescast Industries Cl. A | | 12,900 | | | 193,757 |
| | | | |
|
| | | | | | 3,624,803 |
| | | | |
|
Building Systems and Components - 1.1% | | | | | |
AAON | | 63,000 | | | 2,006,550 |
LSI Industries | | 65,112 | | | 1,165,505 |
Modtech Holdings a,c | | 51,400 | | | 138,780 |
†Napco Security Systems a,c | | 111,200 | | | 700,560 |
| | | | |
|
| | | | | | 4,011,395 |
| | | | |
|
Construction Materials - 1.5% | | | | | |
Ash Grove Cement | | 8,000 | | | 1,920,000 |
Monarch Cement | | 50,410 | | | 1,572,792 |
Synalloy Corporation | | 58,200 | | | 2,031,180 |
| | | | |
|
| | | | | | 5,523,972 |
| | | | |
|
Industrial Components - 1.9% | | | | | |
American Superconducter a,c | | 32,000 | | | 617,920 |
C & D Technologies a | | 53,000 | | | 296,800 |
Deswell Industries | | 105,300 | | | 1,149,876 |
Gerber Scientific a,c | | 50,500 | | | 586,810 |
| | | SHARES | | | VALUE |
| | | | | | |
Ladish Company a | | 10,000 | | $ | 430,000 |
Planar Systems a,c | | 142,000 | | | 1,063,580 |
Powell Industries a | | 46,800 | | | 1,486,368 |
Tech/Ops Sevcon | | 76,200 | | | 723,900 |
II-VI a | | 20,000 | | | 543,400 |
| | | | |
|
| | | | | | 6,898,654 |
| | | | |
|
Machinery - 3.2% | | | | | |
Alamo Group | | 38,600 | | | 972,720 |
Astec Industries a,c | | 40,200 | | | 1,697,244 |
Capstone Turbine a,c | | 200,000 | | | 216,000 |
†Eagle Test Systems a,c | | 13,000 | | | 208,780 |
†Flow International a,c | | 26,800 | | | 337,680 |
Gorman-Rupp Company | | 4,218 | | | 134,385 |
Hurco Companies a | | 17,000 | | | 849,660 |
K-Tron International a | | 9,600 | | | 973,152 |
Keithley Instruments | | 14,000 | | | 175,700 |
LeCroy Corporation a | | 2,000 | | | 19,440 |
MTS Systems | | 10,000 | | | 446,700 |
Mueller (Paul) Company | | 9,650 | | | 605,538 |
Sun Hydraulics | | 38,950 | | | 1,918,288 |
T-3 Energy Services a | | 4,912 | | | 164,306 |
Tennant Company | | 88,200 | | | 3,219,300 |
| | | | |
|
| | | | | | 11,938,893 |
| | | | |
|
Metal Fabrication and Distribution - 1.0% | | | | | |
Encore Wire | | 15,000 | | | 441,600 |
Haynes International a,c | | 8,020 | | | 677,129 |
Insteel Industries | | 35,300 | | | 635,400 |
NN | | 114,300 | | | 1,348,740 |
Novamerican Steel a,c | | 1,900 | | | 101,327 |
Olympic Steel | | 4,600 | | | 131,836 |
Samuel Manu-Tech | | 2,500 | | | 29,031 |
Universal Stainless & Alloy Products a,c | | 7,700 | | | 271,271 |
| | | | |
|
| | | | | | 3,636,334 |
| | | | |
|
Paper and Packaging - 0.1% | | | | | |
Mod-Pac Corporation a | | 23,200 | | | 237,800 |
| | | | |
|
Pumps, Valves and Bearings - 0.3% | | | | | |
CIRCOR International | | 28,000 | | | 1,132,040 |
| | | | |
|
Specialty Chemicals and Materials - 1.8% | | | | | |
Aceto Corporation | | 329,219 | | | 3,051,860 |
American Vanguard | | 8,233 | | | 117,897 |
Balchem Corporation | | 33,750 | | | 613,237 |
Foamex International a | | 28,744 | | | 326,526 |
Hawkins | | 121,967 | | | 1,884,390 |
NuCo2 a,c | | 20,000 | | | 513,400 |
Park Electrochemical | | 10,000 | | | 281,800 |
| | | | |
|
| | | | | | 6,789,110 |
| | | | |
|
Textiles - 0.1% | | | | | |
Unifi a | | 100,000 | | | 262,000 |
| | | | |
|
Other Industrial Products - 2.2% | | | | | |
Basin Water a,c | | 11,500 | | | 100,050 |
Color Kinetics a,c | | 50,000 | | | 1,670,500 |
Eastern Company (The) | | 39,750 | | | 1,155,135 |
Maxwell Technologies a,c | | 15,300 | | | 217,566 |
Peerless Manufacturing a | | 84,400 | | | 1,741,172 |
Quixote Corporation | | 33,300 | | | 622,710 |
Raven Industries | | 73,000 | | | 2,606,830 |
| | | | |
|
| | | | | | 8,113,963 |
| | | | |
|
Total (Cost $28,547,253) | | | | | 52,168,964 |
| | | | |
|
36 | 2007 Semiannual Report to Stockholders | THE ACCOMPANYING NOTES ARE AN INTEGRAL PART OF THESE FINANCIAL STATEMENTS. |
| | | June 30, 2007 (unaudited) |
|
| |
| | | SHARES | | | VALUE |
Industrial Services – 12.9% | | | | | |
Advertising and Publishing - 0.5% | | | | | |
Greenfield Online a,c | | 20,000 | | $ | 318,200 |
Journal Register | | 80,200 | | | 359,296 |
MDC Partners Cl. A a | | 18,400 | | | 161,000 |
Traffix | | 84,700 | | | 465,850 |
†YP Corporation a,c | | 482,000 | | | 361,500 |
| | | | |
|
| | | | | | 1,665,846 |
| | | | |
|
Commercial Services - 5.0% | | | | | |
†Access Integrated Technologies Cl. A a,c | | 46,400 | | | 375,376 |
ADDvantage Technologies Group a | | 80,300 | | | 409,530 |
BB Holdings a | | 390,000 | | | 2,055,793 |
CBIZ a,c | | 87,000 | | | 639,450 |
†Canadian Solar a,c | | 25,000 | | | 235,000 |
Carlisle Group a | | 188,800 | | | 506,138 |
†ClearPoint Business Resources a,c | | 216,000 | | | 1,075,680 |
CorVel Corporation a,c | | 40,125 | | | 1,048,867 |
eResearch Technology a,c | | 185,000 | | | 1,759,350 |
GP Strategies a | | 35,000 | | | 380,800 |
Geo Group (The) a,c | | 102,400 | | | 2,979,840 |
Global Sources a,c | | 11,220 | | | 254,694 |
Intersections a | | 35,300 | | | 353,000 |
Kforce a | | 55,000 | | | 878,900 |
Metalico a,c | | 74,800 | | | 594,660 |
OneSource Services a | | 36,175 | | | 466,732 |
PDI a | | 29,708 | | | 304,804 |
PeopleSupport a,c | | 43,300 | | | 491,455 |
SM&A a | | 31,300 | | | 219,413 |
SYS a,c | | 480,000 | | | 945,600 |
Volt Information Sciences a,c | | 52,800 | | | 973,632 |
Westaff a | | 362,500 | | | 1,573,250 |
Willdan Group a | | 9,100 | | | 89,180 |
| | | | |
|
| | | | | | 18,611,144 |
| | | | |
|
Engineering and Construction - 1.6% | | | | | |
Cavco Industries a,c | | 4,400 | | | 165,088 |
Exponent a | | 130,600 | | | 2,921,522 |
Hanfeng Evergreen a | | 43,700 | | | 492,279 |
Insituform Technologies Cl. A a,c | | 56,400 | | | 1,230,084 |
Nobility Homes | | 5,800 | | | 121,974 |
Skyline Corporation | | 32,100 | | | 963,321 |
Sterling Construction a,c | | 6,300 | | | 133,245 |
| | | | |
|
| | | | | | 6,027,513 |
| | | | |
|
Food and Tobacco Processors - 1.6% | | | | | |
Cal-Maine Foods | | 50,000 | | | 819,000 |
Farmer Bros. | | 42,400 | | | 959,512 |
Galaxy Nutritional Foods a | | 432,600 | | | 233,604 |
ML Macadamia Orchards L.P. | | 120,200 | | | 615,424 |
Seneca Foods Cl. A a | | 62,500 | | | 1,626,250 |
Seneca Foods Cl. B a | | 42,500 | | | 1,134,750 |
Sunopta a | | 39,280 | | | 437,972 |
| | | | |
|
| | | | | | 5,826,512 |
| | | | |
|
Industrial Distribution - 0.4% | | | | | |
Central Steel & Wire | | 1,088 | | | 694,144 |
Elamex a | | 57,700 | | | 37,505 |
Lawson Products | | 19,500 | | | 754,650 |
| | | | |
|
| | | | | | 1,486,299 |
| | | | |
|
Printing - 1.2% | | | | | |
American Bank Note Holographics a | | 242,200 | | | 898,562 |
Bowne & Co. | | 66,500 | | | 1,297,415 |
| | | SHARES | | | VALUE |
| | | | | | |
Champion Industries | | 23,500 | | $ | 169,200 |
Courier Corporation | | 22,950 | | | 918,000 |
Ennis | | 9,700 | | | 228,144 |
Schawk | | 38,900 | | | 778,778 |
| | | | |
|
| | | | | | 4,290,099 |
| | | | |
|
Transportation and Logistics - 2.3% | | | | | |
ABX Air a | | 164,900 | | | 1,329,094 |
Dynamex a,c | | 8,300 | | | 211,899 |
†ExpressJet Holdings a,c | | 100,000 | | | 598,000 |
Forward Air | | 50,700 | | | 1,728,363 |
Frozen Food Express Industries | | 92,000 | | | 932,880 |
MAIR Holdings a | | 8,600 | | | 56,760 |
Marten Transport a,c | | 6,450 | | | 116,165 |
Midwest Air Group a,c | | 25,700 | | | 386,014 |
Patriot Transportation Holding a | | 3,000 | | | 260,100 |
Universal Truckload Services a | | 134,200 | | | 2,666,554 |
†Velocity Express a,c | | 234,816 | | | 201,942 |
| | | | |
|
| | | | | | 8,487,771 |
| | | | |
|
Other Industrial Services - 0.3% | | | | | |
Landauer | | 21,300 | | | 1,049,025 |
Team a | | 2,200 | | | 98,934 |
| | | | |
|
| | | | | | 1,147,959 |
| | | | |
|
Total (Cost $28,378,497) | | | | | 47,543,143 |
| | | | |
|
Natural Resources – 10.4% | | | | | |
Energy Services - 4.2% | | | | | |
Dril-Quip a,c | | 55,000 | | | 2,472,250 |
Environmental Power a | | 90,000 | | | 805,500 |
†Flotek Industries a,c | | 2,600 | | | 155,870 |
†Green Plains Renewable Energy a,c | | 21,600 | | | 379,512 |
Gulf Island Fabrication | | 35,400 | | | 1,228,380 |
GulfMark Offshore a,c | | 55,400 | | | 2,837,588 |
Input/Output a | | 43,500 | | | 679,035 |
Pason Systems | | 209,200 | | | 3,275,716 |
Willbros Group a,c | | 77,900 | | | 2,312,072 |
World Energy Solutions a | | 829,600 | | | 1,207,116 |
| | | | |
|
| | | | | | 15,353,039 |
| | | | |
|
Oil and Gas - 1.6% | | | | | |
Bonavista Energy Trust | | 44,600 | | | 1,281,164 |
†Bronco Drilling a | | 28,200 | | | 462,762 |
CE Franklin a | | 32,050 | | | 373,382 |
†FX Energy a,c | | 99,300 | | | 908,595 |
Houston American Energy a,c | | 82,400 | | | 444,960 |
Nuvista Energy a | | 121,000 | | | 1,647,031 |
Particle Drilling Technologies a,c | | 40,000 | | | 88,000 |
PetroCorp a,d | | 104,200 | | | 0 |
Pioneer Drilling a | | 7,500 | | | 111,825 |
Savanna Energy Services a | | 2,500 | | | 46,937 |
Storm Cat Energy a,c | | 291,200 | | | 331,968 |
TXCO Resources a,c | | 5,500 | | | 56,540 |
| | | | |
|
| | | | | | 5,753,164 |
| | | | |
|
Precious Metals and Mining - 3.2% | | | | | |
†Allied Nevada Gold a,c | | 59,700 | | | 257,307 |
Aurizon Mines a | | 197,000 | | | 650,100 |
Brush Engineered Materials a,c | | 15,500 | | | 650,845 |
Central African Gold a | | 65,800 | | | 72,012 |
Central African Gold (Warrants) a | | 119,950 | | | 24,087 |
Chesapeake Gold a,c | | 20,000 | | | 129,547 |
Duluth Metals a | | 57,600 | | | 162,215 |
| THE ACCOMPANYING NOTES ARE AN INTEGRAL PART OF THESE FINANCIAL STATEMENTS. |
2007 Semiannual Report to Stockholders | 37 |
| | | SHARES | | | VALUE |
Natural Resources (continued) | | | | | |
Precious Metals and Mining (continued) | | | | | |
Endeavour Mining Capital | | 337,000 | | $ | 3,030,706 |
Endeavour Silver a | | 50,000 | | | 225,500 |
Entree Gold a | | 177,900 | | | 435,855 |
Gammon Gold a,c | | 83,836 | | | 1,058,010 |
Golden Star Resources a | | 168,100 | | | 623,651 |
Kimber Resources a | | 540,000 | | | 691,200 |
Metallica Resources a | | 186,300 | | | 838,350 |
Midway Gold a | | 227,500 | | | 587,303 |
Minefinders Corporation a | | 36,000 | | | 413,640 |
†New Gold a,c | | 141,200 | | | 917,800 |
Northern Orion Resources a | | 39,200 | | | 223,048 |
Northgate Minerals a | | 270,000 | | | 783,000 |
Vista Gold a,c | | 50,000 | | | 215,000 |
| | | | |
|
| | | | | | 11,989,176 |
| | | | |
|
Real Estate - 0.4% | | | | | |
HomeFed Corporation a | | 11,352 | | | 715,176 |
Kennedy-Wilson a | | 21,500 | | | 811,625 |
| | | | |
|
| | | | | | 1,526,801 |
| | | | |
|
Other Natural Resources - 1.0% | | | | | |
PICO Holdings a | | 45,700 | | | 1,976,982 |
Pope Resources L.P. | | 33,000 | | | 1,605,780 |
| | | | |
|
| | | | | | 3,582,762 |
| | | | |
|
Total (Cost $19,149,143) | | | | | 38,204,942 |
| | | | |
|
Technology – 23.4% | | | | | |
Aerospace and Defense - 2.5% | | | | | |
Allied Defense Group (The) a | | 42,400 | | | 326,056 |
Astronics Corporation a | | 26,400 | | | 841,632 |
Ducommun a | | 72,100 | | | 1,855,133 |
HEICO Corporation | | 41,600 | | | 1,750,528 |
HEICO Corporation Cl. A | | 24,160 | | | 849,224 |
Integral Systems | | 99,922 | | | 2,429,104 |
LMI Aerospace a,c | | 6,100 | | | 148,169 |
SIFCO Industries a,c | | 45,800 | | | 857,376 |
TVI Corporation a | | 156,790 | | | 90,938 |
| | | | |
|
| | | | | | 9,148,160 |
| | | | |
|
Components and Systems - 3.5% | | | | | |
Acacia Research-Acacia Technologies a | | 94,450 | | | 1,526,312 |
CSP a | | 122,581 | | | 1,097,100 |
DDi Corporation a | | 54,047 | | | 431,836 |
Excel Technology a | | 91,900 | | | 2,567,686 |
Giga-tronics a | | 3,200 | | | 5,184 |
MOCON | | 15,600 | | | 179,400 |
Neoware a,c | | 103,200 | | | 1,397,328 |
Performance Technologies a | | 41,250 | | | 186,450 |
REMEC | | 143,387 | | | 217,948 |
Richardson Electronics | | 155,050 | | | 1,434,213 |
Rimage Corporation a | | 20,000 | | | 631,800 |
†SCM Microsystems a,c | | 70,300 | | | 210,900 |
Spectrum Control a | | 46,100 | | | 778,168 |
TTM Technologies a | | 123,700 | | | 1,608,100 |
TransAct Technologies a | | 78,600 | | | 470,814 |
| | | | |
|
| | | | | | 12,743,239 |
| | | | |
|
Distribution - 0.8% | | | | | |
Agilysys | | 90,000 | | | 2,025,000 |
Bell Industries a | | 39,400 | | | 143,810 |
| | | SHARES | | | VALUE |
| | | | | | |
Nu Horizons Electronics a,c | | 40,000 | | $ | 532,400 |
PC Mall a,c | | 26,000 | | | 317,980 |
| | | | |
|
| | | | | | 3,019,190 |
| | | | |
|
Internet Software and Services - 2.1% | | | | | |
Art Technology Group a,c | | 304,400 | | | 809,704 |
Convera Corporation Cl. A a,c | | 190,000 | | | 828,400 |
EDGAR Online a,c | | 27,700 | | | 74,790 |
iGATE Corporation a | | 273,400 | | | 2,192,668 |
Jupitermedia Corporation a,c | | 355,800 | | | 2,590,224 |
Lionbridge Technologies a,c | | 39,900 | | | 235,011 |
NIC | | 26,800 | | | 183,312 |
SkyTerra Communications a | | 62,200 | | | 541,140 |
Stamps.com a | | 33,200 | | | 457,496 |
| | | | |
|
| | | | | | 7,912,745 |
| | | | |
|
IT Services - 4.8% | | | | | |
CIBER a,c | | 182,662 | | | 1,494,175 |
Cogent Communications Group a,c | | 24,800 | | | 740,776 |
Computer Task Group a | | 431,100 | | | 1,927,017 |
Diamond Management & Technology | | | | | |
Consultants | | 138,100 | | | 1,822,920 |
Forrester Research a,c | | 101,500 | | | 2,855,195 |
Rainmaker Systems a | | 52,000 | | | 369,720 |
Sapient Corporation a,c | | 500,000 | | | 3,865,000 |
Syntel | | 54,300 | | | 1,650,177 |
TriZetto Group (The) a | | 145,200 | | | 2,811,072 |
†Yucheng Technologies a,c | | 20,000 | | | 154,600 |
| | | | |
|
| | | | | | 17,690,652 |
| | | | |
|
Semiconductors and Equipment - 2.6% | | | | | |
†Actions Semiconductor ADR a,c | | 50,000 | | | 307,500 |
Cascade Microtech a,c | | 50,037 | | | 599,944 |
CEVA a | | 9,800 | | | 83,300 |
Cohu | | 17,800 | | | 396,050 |
†DTS a,c | | 7,000 | | | 152,390 |
Electroglas a | | 281,700 | | | 605,655 |
Exar Corporation a,c | | 121,208 | | | 1,624,187 |
Ikanos Communications a,c | | 8,200 | | | 62,402 |
Intevac a,c | | 40,550 | | | 862,093 |
Jazz Technologies (Units) a | | 205,000 | | | 943,000 |
Jinpan International | | 25,250 | | | 484,800 |
Nanometrics a,c | | 34,000 | | | 233,240 |
NetList a | | 37,200 | | | 130,200 |
Nextest Systems a,c | | 13,000 | | | 177,710 |
PDF Solutions a,c | | 25,000 | | | 295,750 |
Photronics a,c | | 29,750 | | | 442,680 |
QuickLogic Corporation a | | 20,000 | | | 53,400 |
†Saifun Semiconductors a,c | | 25,000 | | | 297,000 |
Semitool a,c | | 25,500 | | | 245,055 |
Vimicro International ADR a,c | | 110,000 | | | 638,000 |
Virage Logic a,c | | 100,000 | | | 734,000 |
†Zarlink Semiconductor a,c | | 208,700 | | | 375,660 |
| | | | |
|
| | | | | | 9,744,016 |
| | | | |
|
Software - 4.5% | | | | | |
Aladdin Knowledge Systems a | | 27,300 | | | 566,202 |
Applix a | | 20,000 | | | 329,000 |
†Borland Software a,c | | 49,700 | | | 295,218 |
†Bottomline Technologies a,c | | 32,400 | | | 400,140 |
Descartes Systems Group (The) a | | 55,200 | | | 227,424 |
Evans & Sutherland Computer a | | 83,500 | | | 189,545 |
38 | 2007 Semiannual Report to Stockholders | THE ACCOMPANYING NOTES ARE AN INTEGRAL PART OF THESE FINANCIAL STATEMENTS. |
| | | June 30, 2007 (unaudited) |
|
| |
| | | SHARES | | | VALUE |
Technology (continued) | | | | | |
Software (continued) | | | | | |
Fundtech a | | 51,000 | | $ | 738,990 |
ILOG ADR a,c | | 35,000 | | | 423,500 |
iPass a,c | | 190,000 | | | 1,029,800 |
JDA Software Group a,c | | 59,500 | | | 1,167,985 |
OpenTV Cl. A a,c | | 373,700 | | | 792,244 |
Pegasystems | | 320,200 | | | 3,499,786 |
Phase Forward a,c | | 43,000 | | | 723,690 |
PLATO Learning a | | 100,000 | | | 460,000 |
SPSS a,c | | 41,800 | | | 1,845,052 |
SeaChange International a,c | | 10,000 | | | 77,600 |
TeleCommunication Systems Cl. A a,c | | 10,000 | | | 50,800 |
Transaction Systems Architects Cl. A a | | 97,600 | | | 3,285,216 |
Trintech Group ADR a,c | | 91,252 | | | 415,197 |
uWink a | | 23,000 | | | 27,370 |
| | | | |
|
| | | | | | 16,544,759 |
| | | | |
|
Telecommunications - 2.6% | | | | | |
Anaren a | | 30,900 | | | 544,149 |
Atlantic Tele-Network | | 5,000 | | | 143,200 |
C-COR.net a | | 5,000 | | | 70,300 |
Captaris a | | 43,300 | | | 221,696 |
Communications Systems | | 10,700 | | | 118,877 |
Hurray! Holding Company ADR a | | 4,400 | | | 19,800 |
InPhonic a,c | | 133,600 | | | 622,576 |
NMS Communications a,c | | 600,000 | | | 1,032,000 |
North Pittsburgh Systems | | 23,200 | | | 493,000 |
PC-Tel a | | 49,600 | | | 434,000 |
Radyne a | | 52,820 | | | 563,589 |
Sunrise Telecom a | | 122,350 | | | 386,626 |
Symmetricom a,c | | 24,782 | | | 208,169 |
UCN a,c | | 181,100 | | | 778,730 |
ViaSat a,c | | 76,812 | | | 2,465,665 |
WJ Communications a | | 209,300 | | | 366,275 |
Zhone Technologies a,c | | 791,600 | | | 1,135,946 |
| | | | |
|
| | | | | | 9,604,598 |
| | | | |
|
Total (Cost $54,632,678) | | | | | 86,407,359 |
| | | | |
|
Miscellaneous e – 2.7% | | | | | |
Total (Cost $10,009,923) | | | | | 10,118,939 |
| | | | |
|
TOTAL COMMON STOCKS | | | | | |
(Cost $249,456,301) | | | | | 382,331,901 |
| | | | |
|
| | | SHARES | | | VALUE | |
PREFERRED STOCKS – 1.5% | | | | | | |
†Edge Petroleum 5.75% Ser. A Conv. | | 69,000 | | $ | 3,712,200 | |
Seneca Foods Conv. a | | 75,409 | | | 1,900,307 | |
| | | | |
| |
TOTAL PREFERRED STOCKS | | | | | | |
(Cost $4,393,607) | | | | | 5,612,507 | |
| | | | |
| |
REPURCHASE AGREEMENT – 9.0% | | | | | | |
| State Street Bank & Trust Company, | | | | | | |
5.10% dated 6/29/07, due 7/2/07, | | | | | | |
maturity value $32,960,002 (collateralized | | | | | | |
by obligations of various U.S. Government | | | | | | |
Agencies, valued at $33,773,750) | | | | | | |
(Cost $32,946,000) | | | | | 32,946,000 | |
| | | | |
| |
| | PRINCIPAL | | | |
| | AMOUNT | | | |
COLLATERAL RECEIVED FOR SECURITIES LOANED – 13.4% | | | | | | |
| U.S. Treasury Bonds | | | | | | |
3.625%-6.25% due 8/15/23-4/15/28 | | $319,267 | | | 320,876 | |
| U.S. Treasury Notes | | | | | | |
3.00% due 7/15/12 | | 9 | | | 9 | |
| U.S. Treasury Strip-Principal | | | | | | |
due 11/15/09 | | 53,321 | | | 53,321 | |
| U.S. Treasury Strip-Interest | | | | | | |
due 8/15/23 | | 66 | | | 66 | |
| Money Market Funds | | | | | | |
State Street Navigator Securities Lending | | | | | | |
Prime Portfolio (7 day yield-5.27%) | | | | | 48,773,219 | |
| | | | |
| |
TOTAL COLLATERAL RECEIVED FOR SECURITIES LOANED | | | | | | |
(Cost $49,147,491) | | | | | 49,147,491 | |
| | | | |
| |
TOTAL INVESTMENTS – 127.6% | | | | | | |
(Cost $335,943,399) | | | | | 470,037,899 | |
| | | | | | | |
LIABILITIES LESS CASH | | | | | | |
AND OTHER ASSETS – (11.3)% | | | | | (41,526,812 | ) |
| | | | | | | |
PREFERRED STOCK – (16.3)% | | | | | (60,000,000 | ) |
| | | | |
| |
NET ASSETS APPLICABLE TO | | | | | | |
COMMON STOCKHOLDERS – 100.0% | | | | $ | 368,511,087 | |
| | | | |
| |
| a | | Non-income producing. |
| b | | At June 30, 2007, the Fund owned 5% or more of the Company’s outstanding voting securities thereby making the Company an Affiliated Company as that term is defined in the Investment Company Act of 1940. |
| c | | All or a portion of these securities were on loan at June 30, 2007. Total market value of loaned securities at June 30, 2007 was $47,404,281. |
| d | | Securities for which market quotations are no longer readily available represent 0.0% of net assets. These securities have been valued at their fair value under procedures established by the Fund’s Board of Directors. |
| e | | Includes securities first acquired in 2007 and less than 1% of net assets applicable to Common Stockholders. |
| † | | New additions in 2007. |
| | | |
| | | Bold indicates the Fund’s largest 20 equity holdings in terms of June 30, 2007 market value. |
| | | |
| INCOME TAX INFORMATION: The cost of total investments for Federal income tax purposes was $336,635,362. At June 30, 2007, net unrealized appreciation for all securities was $133,402,537, consisting of aggregate gross unrealized appreciation of $152,644,845 and aggregate gross unrealized depreciation of $19,242,308. The primary difference in book and tax basis cost is the timing of the recognition of losses on securities sold. |
| THE ACCOMPANYING NOTES ARE AN INTEGRAL PART OF THESE FINANCIAL STATEMENTS. |
2007 Semiannual Report to Stockholders | 39 |
| Royce Micro-Cap Trust | | June 30, 2007 (unaudited) |
|
| |
| Statement of Assets and Liabilities |
| | | | | |
| ASSETS: | | | | |
| Investments at value (including collateral on loaned securities)* | | | | |
Non-Affiliates (cost $298,071,953) | | $ | 432,587,489 | |
Affiliated Companies (cost $4,925,446) | | | 4,504,410 | |
|
| Total investments at value | | | 437,091,899 | |
| Repurchase agreement (at cost and value) | | | 32,946,000 | |
| Cash | | | 19,350 | |
| Receivable for investments sold | | | 10,592,300 | |
| Receivable for dividends and interest | | | 301,806 | |
| Prepaid expenses | | | 10,422 | |
|
Total Assets | | | 480,961,777 | |
|
| LIABILITIES: | | | | |
| Payable for collateral on loaned securities | | | 49,147,491 | |
| Payable for investments purchased | | | 2,659,400 | |
| Payable for investment advisory fee | | | 432,306 | |
| Preferred dividends accrued but not yet declared | | | 79,999 | |
| Accrued expenses | | | 131,494 | |
|
Total Liabilities | | | 52,450,690 | |
|
| PREFERRED STOCK: | | | | |
| 6.00% Cumulative Preferred Stock - $0.001 par value, $25 liquidation value per share; 2,400,000 shares outstanding | | | 60,000,000 | |
|
Total Preferred Stock | | | 60,000,000 | |
|
| NET ASSETS APPLICABLE TO COMMON STOCKHOLDERS | | $ | 368,511,087 | |
|
| ANALYSIS OF NET ASSETS APPLICABLE TO COMMON STOCKHOLDERS: | | | | |
| Common Stock paid-in capital - $0.001 par value per share; 23,848,795 shares outstanding (150,000,000 shares authorized) | | $ | 213,015,351 | |
| Undistributed net investment income (loss) | | | (2,729,655 | ) |
| Accumulated net realized gain (loss) on investments and foreign currency | | | 41,467,814 | |
| Net unrealized appreciation (depreciation) on investments and foreign currency | | | 134,094,838 | |
| Preferred dividends accrued but not yet declared | | | (17,337,261 | ) |
|
Net Assets applicable to Common Stockholders (net asset value per share - $15.45) | | $ | 368,511,087 | |
|
| *Investments at identified cost (including $49,147,491 of collateral on loaned securities) | | $ | 302,997,399 | |
| Market value of loaned securities | | | 47,404,281 | |
40 | 2007 Semiannual Report to Stockholders | THE ACCOMPANYING NOTES ARE AN INTEGRAL PART OF THESE FINANCIAL STATEMENTS. |
| Royce Micro-Cap Trust | | Six Months Ended June 30, 2007 (unaudited) |
|
| |
| | | | | |
| INVESTMENT INCOME: | | | | |
| Income: | | | | |
Dividends* | | | | |
Non-Affiliates | | $ | 1,794,854 | |
Affiliated Companies | | | – | |
Interest | | | 633,282 | |
Securities lending | | | 222,031 | |
|
| Total income | | | 2,650,167 | |
|
| Expenses: | | | | |
Investment advisory fees | | | 2,454,966 | |
Stockholder reports | | | 72,551 | |
Custody and transfer agent fees | | | 37,917 | |
Directors’ fees | | | 30,348 | |
Professional fees | | | 18,247 | |
Administrative and office facilities expenses | | | 16,359 | |
Other expenses | | | 28,535 | |
|
| Total expenses | | | 2,658,923 | |
| Compensating balance credits | | | (4,995 | ) |
|
| Net expenses | | | 2,653,928 | |
|
| Net investment income (loss) | | | (3,761 | ) |
|
| REALIZED AND UNREALIZED GAIN (LOSS) ON INVESTMENTS AND FOREIGN CURRENCY: | | | | |
| Net realized gain (loss) on investments and foreign currency | | | | |
Non-Affiliates | | | 34,201,606 | |
Affiliated Companies | | | – | |
| Net change in unrealized appreciation (depreciation) on investments and foreign currency | | | (840,996 | ) |
|
| Net realized and unrealized gain (loss) on investments and foreign currency | | | 33,360,610 | |
|
| NET INCREASE (DECREASE) IN NET ASSETS RESULTING FROM INVESTMENT OPERATIONS | | | 33,356,849 | |
|
| DISTRIBUTIONS TO PREFERRED STOCKHOLDERS | | | (1,800,000 | ) |
|
| NET INCREASE (DECREASE) IN NET ASSETS APPLICABLE TO COMMON STOCKHOLDERS | | | | |
RESULTING FROM INVESTMENT OPERATIONS | | $ | 31,556,849 | |
| *Net of foreign withholding tax of $32,263. | | | | |
| THE ACCOMPANYING NOTES ARE AN INTEGRAL PART OF THESE FINANCIAL STATEMENTS. | 2007 Semiannual Report to Stockholders | 41 |
| Statement of Changes in Net Assets |
| | | | | | | | | | |
| | | | | | | | | | |
| | | Six months ended | | | | | |
| | | 6/30/07 | | Year ended | |
| | | (unaudited) | | 12/31/06 | |
| | | | | | | | | | |
| INVESTMENT OPERATIONS: | | | | | | | | | |
| Net investment income (loss) | | $ | (3,761 | ) | | $ | 167,273 | | |
| Net realized gain (loss) on investments and foreign currency | | | 34,201,606 | | | | 40,340,273 | | |
| Net change in unrealized appreciation (depreciation) on investments and foreign currency | | | (840,996 | ) | | | 27,839,554 | | |
|
| Net increase (decrease) in net assets resulting from investment operations | | | 33,356,849 | | | | 68,347,100 | | |
|
| DISTRIBUTIONS TO PREFERRED STOCKHOLDERS: | | | | | | | | | |
| Net investment income | | | – | | | | (475,560 | ) | |
| Net realized gain on investments and foreign currency | | | – | | | | (3,124,440 | ) | |
| Quarterly distributions* | | | (1,800,000 | ) | | | – | | |
|
| Total distributions to Preferred Stockholders | | | (1,800,000 | ) | | | (3,600,000 | ) | |
|
| NET INCREASE (DECREASE) IN NET ASSETS APPLICABLE TO COMMON STOCKHOLDERS | | | | | | | | | |
RESULTING FROM INVESTMENT OPERATIONS | | | 31,556,849 | | | | 64,747,100 | | |
|
| DISTRIBUTIONS TO COMMON STOCKHOLDERS: | | | | | | | | | |
| Net investment income | | | – | | | | (4,585,208 | ) | |
| Net realized gain on investments and foreign currency | | | – | | | | (30,124,923 | ) | |
| Quarterly distributions* | | | (15,457,261 | ) | | | – | | |
|
| Total distributions to Common Stockholders | | | (15,457,261 | ) | | | (34,710,131 | ) | |
|
| CAPITAL STOCK TRANSACTIONS: | | | | | | | | | |
| Reinvestment of distributions to Common Stockholders | | | 8,729,229 | | | | 19,926,104 | | |
|
| Total capital stock transactions | | | 8,729,229 | | | | 19,926,104 | | |
|
| NET INCREASE (DECREASE) IN NET ASSETS APPLICABLE TO COMMON STOCKHOLDERS | | | 24,828,817 | | | | 49,963,073 | | |
|
| NET ASSETS APPLICABLE TO COMMON STOCKHOLDERS: | | | | | | | | | |
Beginning of period | | | 343,682,270 | | | | 293,719,197 | | |
|
End of period (including undistributed net investment income (loss) of $(2,729,655) at 6/30/07 and | | | | | | | | | |
$(2,725,894) at 12/31/06) | | $ | 368,511,087 | | | $ | 343,682,270 | | |
| | | | | | | | | | |
| *To be allocated to net investment income and capital gains at year end. | | | | | | | | | |
42 | 2007 Semiannual Report to Stockholders | THE ACCOMPANYING NOTES ARE AN INTEGRAL PART OF THESE FINANCIAL STATEMENTS. |
This table is presented to show selected data for a share of Common Stock outstanding throughout each period, and to assist stockholders in evaluating the Fund’s performance for the periods presented.
| | | Six months ended | | Years ended December 31, |
| | | June 30, 2007 | |
|
| | | (unaudited) | | 2006 | | 2005 | | 2004 | | 2003 | | 2002 |
|
NET ASSET VALUE, BEGINNING OF PERIOD | | | $14.77 | | | | $13.43 | | | | $14.34 | | | | $13.33 | | | | $9.39 | | | | $11.83 | |
|
INVESTMENT OPERATIONS: | | | | | | | | | | | | | | | | | | | | | | | | |
Net investment income (loss) | | | 0.00 | | | | 0.01 | | | | (0.03 | ) | | | (0.08 | ) | | | (0.09 | ) | | | (0.13 | ) |
Net realized and unrealized gain (loss) on investments and foreign currency | | | 1.41 | | | | 3.04 | | | | 1.14 | | | | 2.62 | | | | 5.28 | | | | (1.29 | ) |
|
Total investment operations | | | 1.41 | | | | 3.05 | | | | 1.11 | | | | 2.54 | | | | 5.19 | | | | (1.42 | ) |
|
DISTRIBUTIONS TO PREFERRED STOCKHOLDERS: | | | | | | | | | | | | | | | | | | | | | | | | |
Net investment income | | | – | | | | (0.02 | ) | | | – | | | | – | | | | – | | | | – | |
Net realized gain on investments and foreign currency | | | – | | | | (0.14 | ) | | | (0.17 | ) | | | (0.19 | ) | | | (0.18 | ) | | | (0.18 | ) |
Quarterly distributions* | | | (0.08 | ) | | | – | | | | – | | | | – | | | | – | | | | – | |
|
Total distributions to Preferred Stockholders | | | (0.08 | ) | | | (0.16 | ) | | | (0.17 | ) | | | (0.19 | ) | | | (0.18 | ) | | | (0.18 | ) |
|
NET INCREASE (DECREASE) IN NET ASSETS APPLICABLE TO COMMON STOCKHOLDERS RESULTING FROM INVESTMENT OPERATIONS | | | 1.33 | | | | 2.89 | | | | 0.94 | | | | 2.35 | | | | 5.01 | | | | (1.60 | ) |
|
DISTRIBUTIONS TO COMMON STOCKHOLDERS: | | | | | | | | | | | | | | | | | | | | | | | | |
Net investment income | | | – | | | | (0.20 | ) | | | – | | | | – | | | | – | | | | – | |
Net realized gain on investments and foreign currency | | | – | | | | (1.35 | ) | | | (1.85 | ) | | | (1.33 | ) | | | (0.92 | ) | | | (0.80 | ) |
Quarterly distributions* | | | (0.66 | ) | | | – | | | | – | | | | – | | | | – | | | | – | |
|
Total distributions to Common Stockholders | | | (0.66 | ) | | | (1.55 | ) | | | (1.85 | ) | | | (1.33 | ) | | | (0.92 | ) | | | (0.80 | ) |
|
CAPITAL STOCK TRANSACTIONS: | | | | | | | | | | | | | | | | | | | | | | | | |
Effect of reinvestment of distributions by Common Stockholders | | | 0.01 | | | | (0.00 | ) | | | 0.00 | | | | (0.01 | ) | | | (0.04 | ) | | | (0.04 | ) |
Effect of Preferred Stock offering | | | – | | | | – | | | | – | | | | – | | | | (0.11 | ) | | | – | |
|
Total capital stock transactions | | | 0.01 | | | | (0.00 | ) | | | 0.00 | | | | (0.01 | ) | | | (0.15 | ) | | | (0.04 | ) |
|
NET ASSET VALUE, END OF PERIOD | | | $15.45 | | | | $14.77 | | | | $13.43 | | | | $14.34 | | | | $13.33 | | | | $9.39 | |
|
MARKET VALUE, END OF PERIOD | | | $15.41 | | | | $16.57 | | | | $14.56 | | | | $15.24 | | | | $12.60 | | | | $8.44 | |
|
TOTAL RETURN (a): | | | | | | | | | | | | | | | | | | | | | | | | |
Market Value | | | (2.89) | %*** | | | 26.72 | % | | | 8.90 | % | | | 33.44 | % | | | 63.58 | % | | | (12.70 | )% |
Net Asset Value | | | 9.23 | %*** | | | 22.46 | % | | | 6.75 | % | | | 18.69 | % | | | 55.55 | % | | | (13.80 | )% |
RATIOS BASED ON AVERAGE NET ASSETS APPLICABLE TO COMMON STOCKHOLDERS: | | | | | | | | | | | | | | | | | | | | | | | | |
Total expenses (b,c) | | | 1.49 | %** | | | 1.64 | % | | | 1.63 | % | | | 1.62 | % | | | 1.82 | % | | | 1.96 | % |
Management fee expense (d) | | | 1.38 | %** | | | 1.49 | % | | | 1.43 | % | | | 1.43 | % | | | 1.59 | % | | | 1.59 | % |
Other operating expenses | | | 0.11 | %** | | | 0.15 | % | | | 0.20 | % | | | 0.19 | % | | | 0.23 | % | | | 0.37 | % |
Net investment income (loss) | | | (0.00 | )%** | | | 0.05 | % | | | (0.27 | )% | | | (0.56 | )% | | | (0.82 | )% | | | (1.23 | )% |
SUPPLEMENTAL DATA: | | | | | | | | | | | | | | | | | | | | | | | | |
Net Assets Applicable to Common Stockholders, | | | | | | | | | | | | | | | | | | | | | | | | |
End of Period (in thousands) | | | $368,511 | | | | $343,682 | | | | $293,719 | | | | $290,364 | | | | $253,425 | | | | $167,571 | |
Liquidation Value of Preferred Stock, | | | | | | | | | | | | | | | | | | | | | | | | |
End of Period (in thousands) | | | $60,000 | | | | $60,000 | | | | $60,000 | | | | $60,000 | | | | $60,000 | | | | $40,000 | |
Portfolio Turnover Rate | | | 19 | % | | | 34 | % | | | 46 | % | | | 32 | % | | | 26 | % | | | 39 | % |
PREFERRED STOCK: | | | | | | | | | | | | | | | | | | | | | | | | |
Total shares outstanding | | | 2,400,000 | | | | 2,400,000 | | | | 2,400,000 | | | | 2,400,000 | | | | 2,400,000 | | | | 1,600,000 | |
Asset coverage per share | | | $178.55 | | | | $168.20 | | | | $147.38 | | | | $145.98 | | | | $130.59 | | | | $129.73 | |
Liquidation preference per share | | | $25.00 | | | | $25.00 | | | | $25.00 | | | | $25.00 | | | | $25.00 | | | | $25.00 | |
Average market value per share (e): | | | | | | | | | | | | | | | | | | | | | | | | |
6.00% Cumulative | | | $24.67 | | | | $24.15 | | | | $24.97 | | | | $24.66 | | | | $25.37 | | | | – | |
7.75% Cumulative | | | – | | | | – | | | | – | | | | – | | | | $25.70 | | | | $25.91 | |
| (a) | | The Market Value Total Return is calculated assuming a purchase of Common Stock on the opening of the first business day and a sale on the closing of the last business day of each period reported. Dividends and distributions, if any, are assumed for the purposes of this calculation to be reinvested at prices obtained under the Fund’s Distribution Reinvestment and Cash Purchase Plan. Net Asset Value Total Return is calculated on the same basis, except that the Fund’s net asset value is used on the purchase and sale dates instead of market value. |
| (b) | | Expense ratios based on total average net assets including liquidation value of Preferred Stock were 1.28%, 1.38%, 1.35%, 1.32%, 1.49% and 1.62% for the periods ended June 30, 2007 and December 31, 2006, 2005, 2004, 2003 and 2002, respectively. |
| (c) | | Expense ratios based on average net assets applicable to Common Stockholders before waiver of fees by the investment adviser would have been 1.92% and 2.04% for the periods ended December 31, 2003 and 2002, respectively. |
| (d) | | The management fee is calculated based on average net assets over a rolling 36-month basis, while the above ratios of management fee expenses are based on average net assets applicable to Common Stockholders over a 12-month basis. |
| (e) | | The average of month-end market values during the period that the Preferred Stock was outstanding. |
| * | | To be allocated to net investment income and capital gains at year end. |
| ** | | Annualized. |
| *** | | Not annualized. |
| THE ACCOMPANYING NOTES ARE AN INTEGRAL PART OF THESE FINANCIAL STATEMENTS. | 2007 Semiannual Report to Stockholders | 43 |
| |
Notes to Financial Statements (unaudited) |
| |
Summary of Significant Accounting Policies:
Royce Micro-Cap Trust, Inc. (“the Fund”) was incorporated under the laws of the State of Maryland on September 9, 1993 as a diversified closed-end investment company. The Fund commenced operations on December 14, 1993.
The preparation of financial statements in conformity with accounting principles generally accepted in the United States of America requires management to make estimates and assumptions that affect the reported amounts of assets and liabilities and the disclosure of contingent assets and liabilities at the date of the financial statements, and the reported amounts of income and expenses during the reporting period. Actual results could differ from those estimates.
Valuation of Investments:
Securities are valued as of the close of trading on the New York Stock Exchange (NYSE) (generally 4:00 p.m. Eastern time) on the valuation date. Securities that trade on an exchange, and securities traded on Nasdaq’s Electronic Bulletin Board, are valued at their last reported sales price or Nasdaq official closing price taken from the primary market in which each security trades or, if no sale is reported for such day, at their bid price. Other over-the-counter securities for which market quotations are readily available are valued at their highest bid price. Securities for which market quotations are not readily available are valued at their fair value under procedures established by the Fund’s Board of Directors. In addition, if between the time trading ends on a particular security and the close of the customary trading session on the NYSE, events occur that are significant and may make the closing price unreliable, the Fund may fair value the security. The Fund uses an independent pricing service to provide fair value estimates for relevant non-U.S. equity securities on days when the U.S. market volatility exceeds a certain threshold. This pricing service uses proprietary correlations it has developed between the movement of prices of non-U.S. equity securities and indices of U.S.- traded securities, futures contracts and other indications to estimate the fair value of relevant non-U.S. securities. Bonds and other fixed income securities may be valued by reference to other securities with comparable ratings, interest rates and maturities, using established independent pricing services. Investments in money market funds are valued at net asset value per share.
Foreign Currency:
The Fund values its non-U.S. securities in U.S. dollars on the basis of foreign currency exchange rates provided to the Fund by its custodian, State Street Bank and Trust Company. The effects of changes in foreign exchange rates on investments and other assets and liabilities are included with net realized and unrealized gains and losses on investments.
Net realized foreign exchange gains or losses arise from sales and maturities of short-term securities, sales of foreign currencies, expiration of currency forward contracts, currency gains or losses realized between the trade and settlement dates on securities transactions, the difference between the amounts of dividends, interest, and foreign withholding taxes recorded on the Fund’s books, and the U.S. dollar equivalent of the amounts actually received or paid. Net unrealized foreign exchange gains and losses arise from changes in the value of | | assets and liabilities, including investments in securities at the end of the reporting period, as a result of changes in foreign currency exchange rates.
Investment Transactions and Related Investment Income:
Investment transactions are accounted for on the trade date. Dividend income is recorded on the ex-dividend date. Non-cash dividend income is recorded at the fair market value of the securities received. Interest income is recorded on an accrual basis. Premium and discounts on debt securities are amortized using the effective yield to maturity method. Realized gains and losses from investment transactions are determined on the basis of identified cost for book and tax purposes.
Expenses:
The Fund incurs direct and indirect expenses. Expenses directly attributable to the Fund are charged to the Fund’s operations, while expenses applicable to more than one of the Royce Funds are allocated in an equitable manner. Allocated personnel and occupancy costs related to The Royce Funds are included in administrative and office facilities expenses. The Fund has adopted a deferred fee agreement that allows the Fund’s Directors to defer the receipt of all or a portion of Directors’ Fees otherwise payable. The deferred fees are invested in certain Royce Funds until distributed in accordance with the agreement.
Compensating Balance Credits:
The Fund has an arrangement with its custodian bank, whereby a portion of the custodian’s fee is paid indirectly by credits earned on the Fund’s cash on deposit with the bank. This deposit arrangement is an alternative to purchasing overnight investments.
Taxes:
As a qualified regulated investment company under Subchapter M of the Internal Revenue Code, the Fund is not subject to income taxes to the extent that it distributes substantially all of its taxable income for its fiscal year. The Schedule of Investments includes information regarding income taxes under the caption “Income Tax Information”.
Distributions:
The Fund currently has a policy of paying quarterly distributions on the Fund’s Common Stock. Distributions are currently being made at the annual rate of 9% of the rolling average of the prior four calendar quarter-end NAVs of the Fund’s Common Stock, with the fourth quarter distribution being the greater of 2.25% of the rolling average or the distribution required by IRS regulations. Distributions to Preferred Stockholders are accrued daily and paid quarterly and distributions to Common Stockholders are recorded on ex-dividend date. The Fund is required to allocate long-term capital gain distributions and other types of income proportionately to distributions made to holders of shares of Common Stock and Preferred Stock. To the extent that distributions are not paid from long-term capital gains, net investment income or net short-term capital gains, they will represent a return of capital. Distributions are determined in accordance with income tax regulations that may differ from accounting principles generally accepted in the United States of America. Permanent book and tax basis differences |
44 | 2007 Semiannual Report to Stockholders | |
| |
Notes to Financial Statements (unaudited) (continued) |
| |
relating to stockholder distributions will result in reclassifications within the capital accounts. Undistributed net investment income may include temporary book and tax basis differences, which will reverse in a subsequent period. Any taxable income or gain remaining undistributed at fiscal year end is distributed in the following year.
Repurchase Agreements:
The Fund may enter into repurchase agreements with institutions that the Fund’s investment adviser has determined are creditworthy. The Fund restricts repurchase agreements to maturities of no more than seven days. Securities pledged as collateral for repurchase agreements, which are held until maturity of the repurchase agreements, are marked-to-market daily and maintained at a value at least equal to the principal amount of the repurchase agreement (including accrued interest). Repurchase agreements could involve certain risks in the event of default or insolvency of the counter-party, including possible delays or restrictions upon the ability of the Fund to dispose of the underlying securities.
Securities Lending:
The Fund loans securities to qualified institutional investors for the purpose of realizing additional income. Collateral on all securities loaned for the Fund is accepted in cash and cash equivalents and invested temporarily by the custodian. The collateral is equal to at least 100% of the current market value of the loaned securities. The market value of the loaned securities is determined at the close of business of the Fund and any additional required collateral is delivered to the Fund on the next business day.
Recent Accounting Pronouncements:
Financial Accounting Standards Board (“FASB”) Interpretation No. 48, “Accounting for Uncertainty in Income Taxes” (“FIN 48”) provides guidance for how uncertain tax positions should be recognized, measured, presented and disclosed in the financial statements. FIN 48 requires the evaluation of tax positions taken or expected to be taken in the course of preparing the Fund’s tax returns to determine whether the tax positions are “more-likely-than-not” of being sustained by the applicable tax authority. Tax positions not deemed to meet the more-likely-than-not threshold would be recorded as a tax benefit or expense in the current year. FIN 48 was adopted for the Fund on June 29, 2007. There was no material impact to the financial statements or disclosures thereto as a result of the adoption of this pronouncement. FASB Statement of Financial Accounting Standard No. 157, “Fair Value Measurement” (“FAS 157”), provides enhanced guidance for using fair value to measure assets and liabilities. The standard requires companies to provide expanded information about the assets and liabilities measured at fair value and the potential effect of these fair valuations on an entity’s financial performance. The standard does not expand the use of fair value in any new circumstances, but provides clarification on acceptable fair valuation methods and applications. Adoption of FAS 157 is required for fiscal years beginning after November 15, 2007. The standard is not expected to materially impact the Fund’s financial statements. | | Capital Stock:
The Fund issued 578,377 and 1,401,367 shares of Common Stock as reinvestment of distributions by Common Stockholders for the six months ended June 30, 2007 and the year ended December 31, 2006, respectively.
At June 30, 2007, 2,400,000 shares of 6.00% Cumulative Preferred Stock were outstanding. Commencing October 16, 2008 and thereafter, the Fund, at its option, may redeem the Cumulative Preferred Stock, in whole or in part, at the redemption price. The Cumulative Preferred Stock is classified outside of permanent equity (net assets applicable to Common Stockholders) in the accompanying financial statements in accordance with Emerging Issues Task Force (EITF) Topic D-98, Classification and Measurement of Redeemable Securities, that requires preferred securities that are redeemable for cash or other assets to be classified outside of permanent equity to the extent that the redemption is at a fixed or determinable price and at the option of the holder or upon the occurrence of an event that is not solely within the control of the issuer. The Fund is required to meet certain asset coverage tests with respect to the Cumulative Preferred Stock as required by the 1940 Act. In addition, pursuant to the Rating Agency Guidelines established by Moody’s, the Fund is required to maintain a certain discounted asset coverage. If the Fund fails to meet these requirements and does not correct such failure, the Fund may be required to redeem, in part or in full, the Cumulative Preferred Stock at a redemption price of $25.00 per share, plus an amount equal to the accumulated and unpaid dividends, whether or not declared on such shares, in order to meet these requirements. Additionally, failure to meet the foregoing asset coverage requirements could restrict the Fund’s ability to pay dividends to Common Stockholders and could lead to sales of portfolio securities at inopportune times. The Fund has met these requirements since issuing the Cumulative Preferred Stock.
Investment Advisory Agreement:
As compensation for its services under the Investment Advisory Agreement, Royce & Associates, LLC (“Royce”) receives a fee comprised of a Basic Fee (“Basic Fee”) and an adjustment to the Basic Fee based on the investment performance of the Fund in relation to the investment record of the Russell 2000. The Basic Fee is a monthly fee equal to 1/12 of 1% (1% on an annualized basis) of the average of the Fund’s month-end net assets applicable to Common Stockholders, plus the liquidation value of Preferred Stock, for the rolling 36-month period ending with such month (the “performance period”). The Basic Fee for each month is increased or decreased at the rate of 1/12 of .05% for each percentage point that the investment performance of the Fund exceeds, or is exceeded by, the percentage change in the investment record of the Russell 2000 for the performance period by more than two percentage points. The performance period for each such month is a rolling 36-month period ending with such month. The maximum increase or decrease in the Basic Fee for any month may not exceed 1/12 of .5%. Accordingly, for each month, the maximum monthly fee rate as adjusted for performance is 1/12 of 1.5% and is payable if the investment performance of the Fund exceeds the percentage change in the investment record of the Russell 2000 by 12 or more
|
| | 2007 Semiannual Report to Stockholders | 45 |
| |
Notes to Financial Statements (unaudited) (continued) |
| |
percentage points for the performance period, and the minimum monthly fee rate as adjusted for performance is 1/12 of .5% and is payable if the percentage change in the investment record of the Russell 2000 exceeds the investment performance of the Fund by 12 or more percentage points for the performance period. Royce has voluntarily committed to waive the portion of its investment advisory fee attributable to an issue of the Fund’s Preferred Stock for any month in which the Fund’s average annual NAV total return since issuance of the Preferred Stock fails to exceed the applicable Preferred Stock’s dividend rate. For the six rolling 36-month periods ending June 2007, the investment performance of the Fund exceeded the investment performance of the | | Russell 2000 by 8% to 10%. Accordingly, the investment advisory fee consisted of a Basic Fee of $1,818,265 and an upward adjustment of $636,701 for performance of the Fund above that of the Russell 2000. For the six months ended June 30, 2007, the Fund accrued and paid Royce advisory fees totaling $2,454,966.
Purchases and Sales of Investment Securities:
For the six months ended June 30, 2007, the cost of purchases and proceeds from sales of investment securities, other than short-term securities and collateral received for securities loaned, amounted to $74,142,714 and $99,563,308, respectively. |
Transactions in Shares of Affiliated Companies:
An “Affiliated Company,” as defined in the Investment Company Act of 1940, is a company in which a Fund owns 5% or more of the company’s outstanding voting securities at any time during the period. The Fund effected the following transactions in shares of such companies during the six months ended June 30, 2007:
| | | Shares | | Market Value | | Cost of | | Cost of | | Realized | | Dividend | | Shares | | Market Value |
Affiliated Company | | 12/31/06 | | 12/31/06 | | Purchases | | Sales | | Gain (Loss) | | Income | | 6/30/07 | | 6/30/07 |
BKF Capital Group | | 406,500 | | $1,361,775 | | – | | – | | – | | – | | 406,500 | | $ | 934,950 |
Highbury Financial | | 580,400 | | | 3,383,732 | | – | | – | | – | | – | | 580,400 | | | 3,569,460 |
| | | | | $4,745,507 | | | | | | – | | – | | | | $ | 4,504,410 |
46 | 2007 Semiannual Report to Stockholders | |
| Royce Focus Trust | | June 30, 2007 (unaudited) |
|
| |
| | | SHARES | | | VALUE |
COMMON STOCKS – 82.1% | | | | | |
| | | | | | |
Consumer Products – 6.5% | | | | | |
Apparel and Shoes - 1.4% | | | | | |
Timberland Company Cl. A a | | 100,000 | | $ | 2,519,000 |
| | | | |
|
Sports and Recreation - 4.2% | | | | | |
Thor Industries | | 120,000 | | | 5,416,800 |
Winnebago Industries | | 75,000 | | | 2,214,000 |
| | | | |
|
| | | | | | 7,630,800 |
| | | | |
|
Other Consumer Products - 0.9% | | | | | |
†Fossil a | | 60,000 | | | 1,769,400 |
| | | | |
|
Total (Cost $9,971,420) | | | | | 11,919,200 |
| | | | |
|
Consumer Services – 4.2% | | | | | |
Direct Marketing - 1.8% | | | | | |
Nu Skin Enterprises Cl. A | | 200,000 | | | 3,300,000 |
| | | | |
|
Other Consumer Services - 2.4% | | | | | |
Corinthian Colleges a | | 140,000 | | | 2,280,600 |
Universal Technical Institute a | | 80,100 | | | 2,033,739 |
| | | | |
|
| | | | | | 4,314,339 |
| | | | |
|
Total (Cost $5,874,584) | | | | | 7,614,339 |
| | | | |
|
Financial Intermediaries – 5.6% | | | | | |
Securities Brokers - 2.9% | | | | | |
Knight Capital Group Cl. A a | | 320,000 | | | 5,312,000 |
| | | | |
|
Other Financial Intermediaries - 2.7% | | | | | |
†KKR Financial | | 200,000 | | | 4,982,000 |
| | | | |
|
Total (Cost $10,661,560) | | | | | 10,294,000 |
| | | | |
|
Financial Services – 1.2% | | | | | |
Information and Processing - 1.2% | | | | | |
eFunds Corporation a | | 60,000 | | | 2,117,400 |
| | | | |
|
Total (Cost $652,985) | | | | | 2,117,400 |
| | | | |
|
Health – 5.1% | | | | | |
Drugs and Biotech - 3.9% | | | | | |
†Alpharma Cl. A a | | 50,000 | | | 1,300,500 |
Endo Pharmaceuticals Holdings a | | 90,000 | | | 3,080,700 |
Lexicon Pharmaceuticals a | | 499,400 | | | 1,603,074 |
ViroPharma a | | 81,900 | | | 1,130,220 |
| | | | |
|
| | | | | | 7,114,494 |
| | | | |
|
Medical Products and Devices - 1.2% | | | | | |
Caliper Life Sciences a | | 252,300 | | | 1,183,287 |
Possis Medical a | | 100,000 | | | 1,088,000 |
| | | | |
|
| | | | | | 2,271,287 |
| | | | |
|
Total (Cost $8,582,110) | | | | | 9,385,781 |
| | | | |
|
Industrial Products – 21.8% | | | | | |
Building Systems and Components - 2.2% | | | | | |
Simpson Manufacturing | | 120,000 | | | 4,048,800 |
| | | | |
|
Machinery - 6.9% | | | | | |
†Kennametal | | 40,000 | | | 3,281,200 |
Lincoln Electric Holdings | | 70,000 | | | 5,196,800 |
Woodward Governor | | 75,000 | | | 4,025,250 |
| | | | |
|
| | | | | | 12,503,250 |
| | | | |
|
| | | SHARES | | | VALUE |
Metal Fabrication and Distribution - 12.7% | | | | | |
†Chaparral Steel | | 60,100 | | $ | 4,319,387 |
†Dynamic Materials | | 75,000 | | | 2,812,500 |
Metal Management | | 100,000 | | | 4,407,000 |
Reliance Steel & Aluminum | | 100,000 | | | 5,626,000 |
Schnitzer Steel Industries Cl. A | | 125,000 | | | 5,992,500 |
| | | | |
|
| | | | | | 23,157,387 |
| | | | |
|
Total (Cost $19,997,442) | | | | | 39,709,437 |
| | | | |
|
Industrial Services – 6.3% | | | | | |
Commercial Services - 3.7% | | | | | |
BB Holdings a | | 400,000 | | | 2,108,506 |
†CRA International a | | 40,000 | | | 1,928,000 |
LECG Corporation a | | 180,000 | | | 2,719,800 |
| | | | |
|
| | | | | | 6,756,306 |
| | | | |
|
Transportation and Logistics - 2.6% | | | | | |
Arkansas Best | | 120,000 | | | 4,676,400 |
| | | | |
|
Total (Cost $10,286,023) | | | | | 11,432,706 |
| | | | |
|
Natural Resources – 24.8% | | | | | |
Energy Services - 8.3% | | | | | |
Ensign Energy Services | | 240,000 | | | 4,280,685 |
Pason Systems | | 180,000 | | | 2,818,493 |
Tesco Corporation a | | 100,000 | | | 3,155,000 |
Trican Well Service | | 240,000 | | | 4,886,740 |
| | | | |
|
| | | | | | 15,140,918 |
| | | | |
|
Oil and Gas - 3.5% | | | | | |
Unit Corporation a | | 100,000 | | | 6,291,000 |
| | | | |
|
Precious Metals and Mining - 13.0% | | | | | |
Endeavour Mining Capital | | 400,000 | | | 3,597,278 |
Gammon Gold a | | 250,000 | | | 3,155,000 |
Ivanhoe Mines a | | 450,000 | | | 6,408,000 |
Meridian Gold a | | 100,000 | | | 2,758,000 |
Pan American Silver a | | 140,000 | | | 3,686,200 |
Silver Standard Resources a,b | | 120,000 | | | 4,124,400 |
| | | | |
|
| | | | | | 23,728,878 |
| | | | |
|
Total (Cost $24,962,174) | | | | | 45,160,796 |
| | | | |
|
Technology – 6.6% | | | | | |
Semiconductors and Equipment - 1.2% | | | | | |
†MKS Instruments a | | 80,000 | | | 2,216,000 |
| | | | |
|
Software - 2.1% | | | | | |
†DivX a | | 150,000 | | | 2,250,000 |
ManTech International Cl. A a | | 50,000 | | | 1,541,500 |
| | | | |
|
| | | | | | 3,791,500 |
| | | | |
|
Telecommunications - 3.3% | | | | | |
ADTRAN | | 75,000 | | | 1,947,750 |
Foundry Networks a | | 250,100 | | | 4,166,666 |
| | | | |
|
| | | | | | 6,114,416 |
| | | | |
|
Total (Cost $9,272,651) | | | | | 12,121,916 |
| | | | |
|
TOTAL COMMON STOCKS | | | | | |
(Cost $100,260,949) | | | | | 149,755,575 |
| | | | |
|
| THE ACCOMPANYING NOTES ARE AN INTEGRAL PART OF THESE FINANCIAL STATEMENTS. |
2007 Semiannual Report to Stockholders | 47 |
| Royce Focus Trust | | June 30, 2007 (unaudited) |
|
| |
| | PRINCIPAL | | |
| | AMOUNT | | VALUE |
GOVERNMENT BONDS – 8.9% | | | | | |
| (Principal Amount shown in local currency) | | | | | |
Australia Government Bond | | | | | |
7.50% due 9/15/09 | | 10,000,000 | | $ | 8,656,703 |
New Zealand Government Bond | | | | | |
6.00% due 7/15/08 | | 10,000,000 | | | 7,596,441 |
| | | | |
|
TOTAL GOVERNMENT BONDS | | | | | |
(Cost $14,865,423) | | | | | 16,253,144 |
| | | | |
|
REPURCHASE AGREEMENTS – 23.4% | | | | | |
| State Street Bank & Trust Company, | | | | | |
5.10% dated 6/29/07, due 7/2/07, | | | | | |
maturity value $17,827,574 (collateralized | | | | | |
by obligations of various U.S. Government | | | | | |
Agencies, valued at $18,268,469) | | | | | |
(Cost $17,820,000) | | | | | 17,820,000 |
| | | | |
|
| Lehman Brothers (Tri-Party), | | | | | |
5.05% dated 6/29/07, due 7/2/07, | | | | | |
maturity value $25,010,521 (collateralized | | | | | |
by obligations of various U.S. Government | | | | | |
Agencies, valued at $25,513,364) | | | | | |
(Cost $25,000,000) | | | | | 25,000,000 |
| | | | |
|
TOTAL REPURCHASE AGREEMENTS | | | | | |
(Cost $42,820,000) | | | | | 42,820,000 |
| | | | |
|
| | | | | | VALUE | |
COLLATERAL RECEIVED FOR SECURITIES LOANED – 0.1% | | | | | | |
| Money Market Funds | | | | | | |
State Street Navigator Securities Lending | | | | | | |
Prime Portfolio (7 day yield-5.27%) | | | | | | |
(Cost $62,550) | | | | $ | 62,550 | |
| | | | |
| |
TOTAL INVESTMENTS – 114.5% | | | | | | |
(Cost $158,008,922) | | | | | 208,891,269 | |
| | | | | | | |
LIABILITIES LESS CASH | | | | | | |
AND OTHER ASSETS – (0.8)% | | | | | (1,424,233 | ) |
| | | | | | | |
PREFERRED STOCK – (13.7)% | | | | | (25,000,000 | ) |
| | | | |
| |
NET ASSETS APPLICABLE TO | | | | | | |
COMMON STOCKHOLDERS – 100.0% | | | | $ | 182,467,036 | |
| | | | |
| |
| a | | Non-income producing. |
| b | | All or a portion of these securities were on loan at June 30, 2007. Total market value of loaned securities at June 30, 2007 was $61,866. |
| † | | New additions in 2007. |
| | |
Bold indicates the Fund’s largest 20 equity holdings in terms of June 30, 2007 market value. |
| | | |
| INCOME TAX INFORMATION: The cost of total investments for Federal income tax purposes was $158,298,979. At June 30, 2007, net unrealized appreciation for all securities was $50,592,290, consisting of aggregate gross unrealized appreciation of $52,807,570 and aggregate gross unrealized depreciation of $2,215,280. The primary difference in book and tax basis cost is the timing of the recognition of losses on securities sold. |
48 | 2007 Semiannual Report to Stockholders | THE ACCOMPANYING NOTES ARE AN INTEGRAL PART OF THESE FINANCIAL STATEMENTS. |
| Royce Focus Trust | | June 30, 2007 (unaudited) |
|
| Statement of Assets and Liabilities |
| ASSETS: | | | | |
| Investments at value (including collateral on loaned securities)* | | $ | 166,071,269 | |
| Repurchase agreements (at cost and value) | | | 42,820,000 | |
| Cash | | | 19,042 | |
| Receivable for investments sold | | | 319,806 | |
| Receivable for dividends and interest | | | 477,531 | |
| Prepaid expenses | | | 21,231 | |
|
Total Assets | | | 209,728,879 | |
|
| LIABILITIES: | | | | |
| Payable for collateral on loaned securities | | | 62,550 | |
| Payable for investments purchased | | | 1,919,762 | |
| Payable for investment advisory fee | | | 172,683 | |
| Preferred dividends accrued but not yet declared | | | 33,325 | |
| Accrued expenses | | | 73,523 | |
|
Total Liabilities | | | 2,261,843 | |
|
| PREFERRED STOCK: | | | | |
| 6.00% Cumulative Preferred Stock - $0.001 par value, $25 liquidation value per share; 1,000,000 shares outstanding | | | 25,000,000 | |
|
Total Preferred Stock | | | 25,000,000 | |
|
| NET ASSETS APPLICABLE TO COMMON STOCKHOLDERS | | $ | 182,467,036 | |
|
| ANALYSIS OF NET ASSETS APPLICABLE TO COMMON STOCKHOLDERS: | | | | |
| Common Stock paid-in capital - $0.001 par value per share; 16,548,095 shares outstanding (100,000,000 shares authorized) | | $ | 111,013,537 | |
| Undistributed net investment income (loss) | | | 362,109 | |
| Accumulated net realized gain (loss) on investments and foreign currency | | | 25,225,153 | |
| Net unrealized appreciation (depreciation) on investments and foreign currency | | | 50,899,017 | |
| Preferred dividends accrued but not yet declared | | | (5,032,780 | ) |
|
Net Assets applicable to Common Stockholders (net asset value per share - $11.03) | | $ | 182,467,036 | |
|
| *Investments at identified cost (including $62,550 of collateral on loaned securities) | | $ | 115,188,922 | |
| Market value of loaned securities | | | 61,866 | |
| THE ACCOMPANYING NOTES ARE AN INTEGRAL PART OF THESE FINANCIAL STATEMENTS. | | 2007 Semiannual Report to Stockholders | 49 |
| Royce Focus Trust | | Six Months Ended June 30, 2007 (unaudited) |
|
| INVESTMENT INCOME: | | | | |
| Income: | | | | |
Interest* | | $ | 1,574,197 | |
Dividends** | | | 409,849 | |
Securities lending | | | 1,173 | |
|
| Total income | | | 1,985,219 | |
|
| Expenses: | | | | |
Investment advisory fees | | | 979,702 | |
Stockholder reports | | | 32,000 | |
Custody and transfer agent fees | | | 25,750 | |
Professional fees | | | 15,972 | |
Directors’ fees | | | 14,952 | |
Administrative and office facilities expenses | | | 7,620 | |
Other expenses | | | 31,035 | |
|
| Total expenses | | | 1,107,031 | |
| Compensating balance credits | | | (1,276 | ) |
|
| Net expenses | | | 1,105,755 | |
|
| Net investment income (loss) | | | 879,464 | |
|
| REALIZED AND UNREALIZED GAIN (LOSS) ON INVESTMENTS AND FOREIGN CURRENCY: | | | | |
| Net realized gain (loss) on investments and foreign currency | | | 23,082,886 | |
| Net change in unrealized appreciation (depreciation) on investments and foreign currency | | | 1,948,710 | |
|
| Net realized and unrealized gain (loss) on investments and foreign currency | | | 25,031,596 | |
|
| NET INCREASE (DECREASE) IN NET ASSETS RESULTING FROM INVESTMENT OPERATIONS | | | 25,911,060 | |
|
| DISTRIBUTIONS TO PREFERRED STOCKHOLDERS | | | (750,000 | ) |
|
| NET INCREASE (DECREASE) IN NET ASSETS APPLICABLE TO COMMON STOCKHOLDERS | | | | |
RESULTING FROM INVESTMENT OPERATIONS | | $ | 25,161,060 | |
| * Net of foreign withholding tax of $18,380. | | | | |
| **Net of foreign withholding tax of $22,247. | | | | |
| 50 | 2007 Semiannual Report to Stockholders | | THE ACCOMPANYING NOTES ARE AN INTEGRAL PART OF THESE FINANCIAL STATEMENTS. |
| Statement of Changes in Net Assets |
| | | Six months ended | | | | |
| | | 6/30/07 | | Year ended |
| | | (unaudited) | | 12/31/06 |
| INVESTMENT OPERATIONS: | | | | | | | | |
| Net investment income (loss) | | $ | 879,464 | | | $ | 2,368,567 | |
| Net realized gain (loss) on investments | | | 23,082,886 | | | | 20,546,074 | |
| Net change in unrealized appreciation (depreciation) on investments and foreign currency | | | 1,948,710 | | | | 1,820,291 | |
|
| Net increase (decrease) in net assets resulting from investment operations | | | 25,911,060 | | | | 24,734,932 | |
|
| DISTRIBUTIONS TO PREFERRED STOCKHOLDERS: | | | | | | | | |
| Net investment income | | | – | | | | (187,800 | ) |
| Net realized gain on investments and foreign currency | | | – | | | | (1,312,200 | ) |
| Quarterly distributions* | | | (750,000 | ) | | | – | |
|
| Total distributions to Preferred Stockholders | | | (750,000 | ) | | | (1,500,000 | ) |
|
| NET INCREASE (DECREASE) IN NET ASSETS APPLICABLE TO COMMON STOCKHOLDERS | | | | | | | | |
RESULTING FROM INVESTMENT OPERATIONS | | | 25,161,060 | | | | 23,234,932 | |
|
| DISTRIBUTIONS TO COMMON STOCKHOLDERS: | | | | | | | | |
| Net investment income | | | – | | | | (2,950,803 | ) |
| Net realized gain on investments and foreign currency | | | – | | | | (20,617,913 | ) |
| Quarterly distributions* | | | (4,249,447 | ) | | | – | |
|
| Total distributions to Common Stockholders | | | (4,249,447 | ) | | | (23,568,716 | ) |
|
| CAPITAL STOCK TRANSACTIONS: | | | | | | | | |
| Reinvestment of distributions to Common Stockholders | | | 2,988,172 | | | | 15,657,293 | |
|
| Total capital stock transactions | | | 2,988,172 | | | | 15,657,293 | |
|
| NET INCREASE (DECREASE) IN NET ASSETS APPLICABLE TO COMMON STOCKHOLDERS | | | 23,899,785 | | | | 15,323,509 | |
|
| NET ASSETS APPLICABLE TO COMMON STOCKHOLDERS: | | | | | | | | |
Beginning of period | | | 158,567,251 | | | | 143,243,742 | |
|
End of period (including undistributed net investment income (loss) of $362,109 at 06/30/07 and $(517,355) at 12/31/06) | | $ | 182,467,036 | | | $ | 158,567,251 | |
*To be allocated to net investment income and capital gains at year end. | | | | | | | | |
| THE ACCOMPANYING NOTES ARE AN INTEGRAL PART OF THESE FINANCIAL STATEMENTS. | | 2007 Semiannual Report to Stockholders | 51 |
| This table is presented to show selected data for a share of Common Stock outstanding throughout each period, and to assist stockholders in evaluating the Fund’s performance for the periods presented. |
| | | Six months ended | | Years ended December 31, |
| | | June 30, 2007 | |
|
| | | (unaudited) | | | 2006 | | | | 2005 | | | | 2004 | | | | 2003 | | | | 2002 | |
|
| NET ASSET VALUE, BEGINNING OF PERIOD | | | $9.75 | | | | $9.76 | | | | $9.75 | | | | $9.00 | | | | $6.27 | | | | $7.28 | |
|
| INVESTMENT OPERATIONS: | | | | | | | | | | | | | | | | | | | | | | | | |
Net investment income (loss) | | | 0.05 | | | | 0.16 | | | | 0.06 | | | | 0.02 | | | | 0.08 | | | | (0.01 | ) |
Net realized and unrealized gain (loss) on investments and foreign currency | | | 1.54 | | | | 1.50 | | | | 1.44 | | | | 2.63 | | | | 3.57 | | | | (0.74 | ) |
|
Total investment operations | | | 1.59 | | | | 1.66 | | | | 1.50 | | | | 2.65 | | | | 3.65 | | | | (0.75 | ) |
|
DISTRIBUTIONS TO PREFERRED STOCKHOLDERS: | | | | | | | | | | | | | | | | | | | | | | | | |
Net investment income | | | – | | | | (0.01 | ) | | | (0.01 | ) | | | (0.00 | ) | | | (0.02 | ) | | | (0.03 | ) |
Net realized gain on investments and foreign currency | | | – | | | | (0.09 | ) | | | (0.11 | ) | | | (0.15 | ) | | | (0.14 | ) | | | (0.13 | ) |
Quarterly distributions* | | | (0.05 | ) | | | – | | | | – | | | | – | | | | – | | | | – | |
|
Total distributions to Preferred Stockholders | | | (0.05 | ) | | | (0.10 | ) | | | (0.12 | ) | | | (0.15 | ) | | | (0.16 | ) | | | (0.16 | ) |
|
NET INCREASE (DECREASE) IN NET ASSETS APPLICABLE TO COMMON STOCKHOLDERS RESULTING FROM INVESTMENT OPERATIONS | | | 1.54 | | | | 1.56 | | | | 1.38 | | | | 2.50 | | | | 3.49 | | | | (0.91 | ) |
|
DISTRIBUTIONS TO COMMON STOCKHOLDERS: | | | | | | | | | | | | | | | | | | | | | | | | |
Net investment income | | | – | | | | (0.20 | ) | | | (0.06 | ) | | | (0.02 | ) | | | (0.06 | ) | | | (0.02 | ) |
Net realized gain on investments and foreign currency | | | – | | | | (1.37 | ) | | | (1.15 | ) | | | (1.72 | ) | | | (0.56 | ) | | | (0.07 | ) |
Quarterly distributions* | | | (0.26 | ) | | | – | | | | – | | | | – | | | | – | | | | – | |
|
Total distributions to Common Stockholders | | | (0.26 | ) | | | (1.57 | ) | | | (1.21 | ) | | | (1.74 | ) | | | (0.62 | ) | | | (0.09 | ) |
|
| CAPITAL STOCK TRANSACTIONS: | | | | | | | | | | | | | | | | | | | | | | | | |
Effect of reinvestment of distributions by Common Stockholders | | | 0.00 | | | | (0.00 | ) | | | (0.03 | ) | | | (0.01 | ) | | | (0.03 | ) | | | (0.01 | ) |
Effect of rights offering and Preferred Stock offering | | | – | | | | – | | | | (0.13 | ) | | | – | | | | (0.11 | ) | | | – | |
|
Total capital stock transactions | | | 0.00 | | | | (0.00 | ) | | | (0.16 | ) | | | (0.01 | ) | | | (0.14 | ) | | | (0.01 | ) |
|
| NET ASSET VALUE, END OF PERIOD | | | $11.03 | | | | $9.75 | | | | $9.76 | | | | $9.75 | | | | $9.00 | | | | $6.27 | |
|
| MARKET VALUE, END OF PERIOD | | | $11.32 | | | | $10.68 | | | | $9.53 | | | | $10.47 | | | | $8.48 | | | | $5.56 | |
|
| TOTAL RETURN (a): | | | | | | | | | | | | | | | | | | | | | | | | |
| Market Value | | | 8.63 | %*** | | | 30.50 | % | | | 3.03 | % | | | 47.26 | % | | | 63.98 | % | | | (15.06 | )% |
| Net Asset Value | | | 15.94 | %*** | | | 16.33 | % | | | 13.31 | % | | | 29.21 | % | | | 54.33 | % | | | (12.50 | )% |
RATIOS BASED ON AVERAGE NET ASSETS APPLICABLE TO COMMON STOCKHOLDERS: | | | | | | | | | | | | | | | | | | | | | | | | |
| Total expenses (b,c) | | | 1.29 | %** | | | 1.36 | % | | | 1.48 | % | | | 1.53 | % | | | 1.57 | % | | | 1.88 | % |
Management fee expense | | | 1.14 | %** | | | 1.16 | % | | | 1.21 | % | | | 1.27 | % | | | 1.14 | % | | | 1.13 | % |
Other operating expenses | | | 0.15 | %** | | | 0.20 | % | | | 0.27 | % | | | 0.26 | % | | | 0.43 | % | | | 0.75 | % |
| Net investment income (loss) | | | 1.03 | %** | | | 1.54 | % | | | 0.63 | % | | | 0.24 | % | | | 1.07 | % | | | (0.16 | )% |
| SUPPLEMENTAL DATA: | | | | | | | | | | | | | | | | | | | | | | | | |
Net Assets Applicable to Common Stockholders, End of Period (in thousands) | | | $182,467 | | | | $158,567 | | | | $143,244 | | | | $105,853 | | | | $87,012 | | | | $57,956 | |
Liquidation Value of Preferred Stock, End of Period (in thousands) | | | $25,000 | | | | $25,000 | | | | $25,000 | | | | $25,000 | | | | $25,000 | | | | $20,000 | |
| Portfolio Turnover Rate | | | 31 | % | | | 30 | % | | | 42 | % | | | 52 | % | | | 49 | % | | | 61 | % |
| PREFERRED STOCK: | | | | | | | | | | | | | | | | | | | | | | | | |
| Total shares outstanding | | | 1,000,000 | | | | 1,000,000 | | | | 1,000,000 | | | | 1,000,000 | | | | 1,000,000 | | | | 800,000 | |
| Asset coverage per share | | | $207.47 | | | | $183.57 | | | | $168.24 | | | | $130.85 | | | | $112.01 | | | | $97.44 | |
| Liquidation preference per share | | | $25.00 | | | | $25.00 | | | | $25.00 | | | | $25.00 | | | | $25.00 | | | | $25.00 | |
| Average market value per share (d): | | | | | | | | | | | | | | | | | | | | | | | | |
6.00% Cumulative | | | $25.10 | | | | $24.98 | | | | $25.38 | | | | $24.83 | | | | $25.45 | | | | – | |
7.45% Cumulative | | | – | | | | – | | | | – | | | | – | | | | $25.53 | | | | $25.64 | |
| (a) | | The Market Value Total Return is calculated assuming a purchase of Common Stock on the opening of the first business day and a sale on the closing of the last business day of each period reported. Dividends and distributions, if any, are assumed for the purposes of this calculation to be reinvested at prices obtained under the Fund’s Distribution Reinvestment and Cash Purchase Plan. Net Asset Value Total Return is calculated on the same basis, except that the Fund’s net asset value is used on the purchase and sale dates instead of market value. |
| (b) | | Expense ratios based on total average net assets including liquidation value of Preferred Stock were 1.13%, 1.17%, 1.22%, 1.21%, 1.20% and 1.43% for the periods ended June 30, 2007 and December 31, 2006, 2005, 2004, 2003 and 2002, respectively. |
| (c) | | Expense ratios based on average net assets applicable to Common Stockholders before waiver of fees by the investment adviser would have been 1.73% and 2.06% for the periods ended December 31, 2003 and 2002, respectively. |
| (d) | | The average of month-end market values during the period that the Preferred Stock was outstanding. |
| * | | To be allocated to net investment income and capital gains at year end. |
| ** | | Annualized. |
| *** | | Not annualized. |
| 52 | 2007 Semiannual Report to Stockholders | | THE ACCOMPANYING NOTES ARE AN INTEGRAL PART OF THESE FINANCIAL STATEMENTS. |
| Notes to Financial Statements (unaudited) |
Summary of Significant Accounting Policies:
Royce Focus Trust, Inc. (“the Fund”) is a diversified closed-end investment company. The Fund commenced operations on March 2, 1988 and Royce & Associates, LLC (“Royce”) assumed investment management responsibility for the Fund on November 1, 1996.
The preparation of financial statements in conformity with accounting principles generally accepted in the United States of America requires management to make estimates and assumptions that affect the reported amounts of assets and liabilities and the disclosure of contingent assets and liabilities at the date of the financial statements, and the reported amounts of income and expenses during the reporting period. Actual results could differ from those estimates.
Valuation of Investments:
Securities are valued as of the close of trading on the New York Stock Exchange (NYSE) (generally 4:00 p.m. Eastern time) on the valuation date. Securities that trade on an exchange, and securities traded on Nasdaq’s Electronic Bulletin Board, are valued at their last reported sales price or Nasdaq official closing price taken from the primary market in which each security trades or, if no sale is reported for such day, at their bid price. Other over-the-counter securities for which market quotations are readily available are valued at their highest bid price. Securities for which market quotations are not readily available are valued at their fair value under procedures established by the Fund’s Board of Directors. In addition, if between the time trading ends on a particular security and the close of the customary trading session on the NYSE, events occur that are significant and may make the closing price unreliable, the Fund may fair value the security. The Fund uses an independent pricing service to provide fair value estimates for relevant non-U.S. equity securities on days when the U.S. market volatility exceeds a certain threshold. This pricing service uses proprietary correlations it has developed between the movement of prices of non-U.S. equity securities and indices of U.S.- traded securities, futures contracts and other indications to estimate the fair value of relevant non-U.S. securities. Bonds and other fixed income securities may be valued by reference to other securities with comparable ratings, interest rates and maturities, using established independent pricing services. Investments in money market funds are valued at net asset value per share.
Foreign Currency:
The Fund values its non-U.S. securities in U.S. dollars on the basis of foreign currency exchange rates provided to the Fund by its custodian, State Street Bank and Trust Company. The effects of changes in foreign exchange rates on investments and other assets and liabilities are included with net realized and unrealized gains and losses on investments.
Net realized foreign exchange gains or losses arise from sales and maturities of short-term securities, sales of foreign currencies, expiration of currency forward contracts, currency gains or losses realized between the trade and settlement dates on securities transactions, the difference between the amounts of dividends, interest, and foreign withholding taxes recorded on the Fund’s books, and the U.S. dollar equivalent of the amounts actually received or paid. Net unrealized foreign exchange gains | | and losses arise from changes in the value of assets and liabilities, including investments in securities at the end of the reporting period, as a result of changes in foreign currency exchange rates.
Investment Transactions and Related Investment Income:
Investment transactions are accounted for on the trade date. Dividend income is recorded on the ex-dividend date. Non-cash dividend income is recorded at the fair market value of the securities received. Interest income is recorded on an accrual basis. Premium and discounts on debt securities are amortized using the effective yield to maturity method. Realized gains and losses from investment transactions are determined on the basis of identified cost for book and tax purposes.
Expenses:
The Fund incurs direct and indirect expenses. Expenses directly attributable to the Fund are charged to the Fund’s operations, while expenses applicable to more than one of the Royce Funds are allocated in an equitable manner. Allocated personnel and occupancy costs related to The Royce Funds are included in administrative and office facilities expenses. The Fund has adopted a deferred fee agreement that allows the Fund’s Directors to defer the receipt of all or a portion of Directors’ Fees otherwise payable. The deferred fees are invested in certain Royce Funds until distributed in accordance with the agreement.
Compensating Balance Credits:
The Fund has an arrangement with its custodian bank, whereby a portion of the custodian’s fee is paid indirectly by credits earned on the Fund’s cash on deposit with the bank. This deposit arrangement is an alternative to purchasing overnight investments.
Taxes:
As a qualified regulated investment company under Subchapter M of the Internal Revenue Code, the Fund is not subject to income taxes to the extent that it distributes substantially all of its taxable income for its fiscal year. The Schedule of Investments includes information regarding income taxes under the caption “Income Tax Information”.
Distributions:
The Fund currently has a policy of paying quarterly distributions on the Fund’s Common Stock. Distributions are currently being made at the annual rate of 5% of the rolling average of the prior four calendar quarter-end NAVs of the Fund’s Common Stock, with the fourth quarter distribution being the greater of 1.25% of the rolling average or the distribution required by IRS regulations. Distributions to Preferred Stockholders are accrued daily and paid quarterly and distributions to Common Stockholders are recorded on ex-dividend date. The Fund is required to allocate long-term capital gain distributions and other types of income proportionately to distributions made to holders of shares of Common Stock and Preferred Stock. To the extent that distributions are not paid from long-term capital gains, net investment income or net short-term capital gains, they will represent a return of capital. Distributions are determined in accordance with income tax regulations that may differ from accounting principles generally accepted in the United States of America. Permanent book and tax basis differences |
| 2007 Semiannual Report to Stockholders | 53 |
| Notes to Financial Statements (unaudited) (continued) |
relating to stockholder distributions will result in reclassifications within the capital accounts. Undistributed net investment income may include temporary book and tax basis differences, which will reverse in a subsequent period. Any taxable income or gain remaining undistributed at fiscal year end is distributed in the following year.
Repurchase Agreements:
The Fund may enter into repurchase agreements with institutions that the Fund’s investment adviser has determined are creditworthy. The Fund restricts repurchase agreements to maturities of no more than seven days. Securities pledged as collateral for repurchase agreements, which are held until maturity of the repurchase agreements, are marked-to-market daily and maintained at a value at least equal to the principal amount of the repurchase agreement (including accrued interest). Repurchase agreements could involve certain risks in the event of default or insolvency of the counter-party, including possible delays or restrictions upon the ability of the Fund to dispose of the underlying securities.
Securities Lending:
The Fund loans securities to qualified institutional investors for the purpose of realizing additional income. Collateral on all securities loaned for the Fund is accepted in cash and cash equivalents and invested temporarily by the custodian. The collateral is equal to at least 100% of the current market value of the loaned securities. The market value of the loaned securities is determined at the close of business of the Fund and any additional required collateral is delivered to the Fund on the next business day.
Recent Accounting Pronouncements:
Financial Accounting Standards Board (“FASB”) Interpretation No. 48, “Accounting for Uncertainty in Income Taxes” (“FIN 48”) provides guidance for how uncertain tax positions should be recognized, measured, presented and disclosed in the financial statements. FIN 48 requires the evaluation of tax positions taken or expected to be taken in the course of preparing the Fund’s tax returns to determine whether the tax positions are “more-likely-than-not” of being sustained by the applicable tax authority. Tax positions not deemed to meet the more-likely-than-not threshold would be recorded as a tax benefit or expense in the current year. FIN 48 was adopted for the Fund on June 29, 2007. There was no material impact to the financial statements or disclosures thereto as a result of the adoption of this pronouncement.
FASB Statement of Financial Accounting Standard No. 157, “Fair Value Measurement” (“FAS 157”), provides enhanced guidance for using fair value to measure assets and liabilities. The standard requires companies to provide expanded information about the assets and liabilities measured at fair value and the potential effect of these fair valuations on an entity’s financial performance. The standard does not expand the use of fair value in any new circumstances, but provides clarification on acceptable fair valuation methods and applications. Adoption of FAS 157 is required for fiscal years beginning after November 15, 2007. The standard is not expected to materially impact the Fund’s financial statements. | | Capital Stock:
The Fund issued 285,543 and 1,587,885 shares of Common Stock as reinvestment of distributions by Common Stockholders for the six months ended June 30, 2007 and the year ended December 31, 2006, respectively.
At June 30, 2007, 1,000,000 shares of 6.00% Cumulative Preferred Stock were outstanding. Commencing October 17, 2008 and thereafter, the Fund, at its option, may redeem the Cumulative Preferred Stock, in whole or in part, at the redemption price. The Cumulative Preferred Stock is classified outside of permanent equity (net assets applicable to Common Stockholders) in the accompanying financial statements in accordance with Emerging Issues Task Force (EITF) Topic D-98, Classification and Measurement of Redeemable Securities, that requires preferred securities that are redeemable for cash or other assets to be classified outside of permanent equity to the extent that the redemption is at a fixed or determinable price and at the option of the holder or upon the occurrence of an event that is not solely within the control of the issuer.
The Fund is required to meet certain asset coverage tests with respect to the Cumulative Preferred Stock as required by the 1940 Act. In addition, pursuant to the Rating Agency Guidelines established by Moody’s, the Fund is required to maintain a certain discounted asset coverage. If the Fund fails to meet these requirements and does not correct such failure, the Fund may be required to redeem, in part or in full, the Cumulative Preferred Stock at a redemption price of $25.00 per share, plus an amount equal to the accumulated and unpaid dividends, whether or not declared on such shares, in order to meet these requirements. Additionally, failure to meet the foregoing asset coverage requirements could restrict the Fund’s ability to pay dividends to Common Stockholders and could lead to sales of portfolio securities at inopportune times. The Fund has met these requirements since issuing the Cumulative Preferred Stock.
Investment Advisory Agreement:
The Investment Advisory Agreement between Royce and the Fund provides for fees to be paid at an annual rate of 1.0% of the Fund’s average daily net assets applicable to Common Stockholders plus the liquidation value of Preferred Stock. Royce has voluntarily committed to waive the portion of its investment advisory fee attributable to an issue of the Fund’s Preferred Stock for any month in which the Fund’s average annual NAV total return since issuance of the Preferred Stock fails to exceed the applicable Preferred Stock’s dividend rate. For the six months ended June 30, 2007, the Fund accrued and paid Royce advisory fees totaling $979,702.
Purchases and Sales of Investment Securities:
For the six months ended June 30, 2007, the cost of purchases and proceeds from sales of investment securities, other than short-term securities and collateral received for securities loaned, amounted to $47,667,421 and $56,178,829, respectively. |
| 54 | 2007 Semiannual Report to Stockholders |
| Board Approval of Investment Advisory Agreements |
|
At meetings held on June 6-7, 2007, each of the Funds’ respective Board of Directors, including all of the non-interested directors, approved the continuance of the Investment Advisory Agreements between Royce & Associates, LLC (“R&A”) and each of Royce Value Trust, Royce Micro-Cap Trust and Royce Focus Trust (the “Funds”). In reaching these decisions, the Board reviewed the materials provided by R&A, which included, among other things, information prepared internally by R&A and independently by Morningstar Associates, LLC (“Morningstar”) containing detailed expense ratio and investment performance comparisons for the Funds with other funds in their “peer group,” information regarding the past performance of Funds managed by R&A and a memorandum outlining the legal duties of the Board prepared by independent counsel to the non-interested directors. R&A also provided the directors with an analysis of its profitability with respect to providing investment advisory services to each of the Funds. In addition, the Board took into account information furnished throughout the year at regular Board meetings, including reports on investment performance, shareholder services, regulatory compliance, brokerage commissions and research, brokerage and execution products and services provided to the Funds. The Board also considered other matters they deemed important to the approval process such as payments made to R&A or its affiliates relating to allocation of Fund brokerage commissions, and other direct and indirect benefits to R&A and its affiliates, from their relationship with the Funds. The directors also met throughout the year with investment advisory personnel from R&A. The Board, in its deliberations, recognized that, for many of the Funds’ shareholders, the decision to purchase Fund shares included a decision to select R&A as the investment adviser and that there was a strong association in the minds of Fund shareholders between R&A and each Fund. In considering factors relating to the approval of the continuance of the Investment Advisory Agreements, the non-interested directors received assistance and advice from, and met separately with, their independent counsel. While the Investment Advisory Agreements for the Funds were considered at the same Board meetings, the directors dealt with each agreement separately. Among other factors, the directors considered the following:
The nature, extent and quality of services provided by R&A: The directors considered the following factors to be of fundamental importance to their consideration of whether to approve the continuance of the Funds’ Investment Advisory Agreements: (i) R&A’s more than 30 years of small-cap value investing experience and track record; (ii) the history of long-tenured R&A portfolio managers managing the Funds; (iii) R&A’s sole focus on mid-cap, small-cap and micro-cap value investing; (iv) the consistency of R&A’s approach to managing both the Funds and open-end mutual funds over more than 30 years; (v) the integrity and high ethical standards adhered to at R&A; (vi) R&A’s specialized experience in the area of trading small- and micro-cap securities; (vii) R&A’s historical ability to attract and retain portfolio management talent and (viii) R&A’s focus on shareholder interests as exemplified by its voluntary fee waiver policy on preferred stock assets in certain circumstances where the Funds’ total return performance from the issuance of the preferred may not exceed the coupon rate on the preferred, and expansive shareholder reporting and communications. The directors reviewed the services that R&A provides to the Funds, including, but not limited to, managing each Fund’s investments in accordance with the stated policies of each Fund. The directors determined that the services to be provided to each Fund by R&A would be the same as those it previously provided to the Funds. They also took into consideration the histories, reputations and backgrounds of R&A’s portfolio managers for the Funds, finding that these would likely have an impact on the continued success of the Funds. Lastly, the directors noted R&A’s ability to attract quality and experienced personnel. The directors concluded that the services provided by R&A to each Fund compared favorably to services provided by R&A to other R&A client accounts, including other funds, in both nature and quality, and that the scope of services provided by R&A would continue to be suitable for each Fund.
Investment performance of the Funds and R&A: In light of R&A’s risk-averse approach to investing, the directors believe that risk-adjusted performance continues to be an appropriate measure of each Fund’s investment performance. One measure of risk-adjusted performance the directors have historically used in their review of the Funds’ performance is the Sharpe Ratio. The Sharpe Ratio is a risk-adjusted measure of performance developed by Nobel Laureate William Sharpe. It is calculated by dividing a fund’s annualized excess returns by its annualized standard deviation to determine reward per unit of risk. The higher the Sharpe Ratio, the better a fund’s historical risk-adjusted performance. The Board attaches primary importance to risk-adjusted performance over relatively long periods of time, typically three to five years. Using Morningstar data, Royce Value Trust’s Sharpe Ratio placed in the 2nd quartile for all funds within the small blend category assigned by Morningstar for the three-, five- and ten-year periods ended December 31, 2006. Similarly, Royce Micro-Cap Trust’s Sharpe ratio placed it in the 2nd quartile among funds within the small blend category assigned by Morningstar for the three-, five- and ten-year periods. Finally, Royce Focus Trust’s Sharpe ratio placed it in the 1st quartile among all funds within the small growth category assigned by Morningstar for the three-year and ten-year periods ended December 31, 2006, and effectively at the median (53rd percentile) for the five-year period ended December 31, 2006.
The directors noted that R&A manages a number of funds that invest in small-cap and micro-cap issuers, many of which were outperforming the Russell 2000 Index and their competitors. Although the directors recognized that past performance is not necessarily an indicator of future results, they found that R&A had the necessary qualifications, experience and track record in managing small-cap and micro-cap securities to manage the Funds. The directors determined that R&A continued to be an appropriate investment adviser for the Funds and concluded that each Fund’s performance supported the renewal of its Investment Advisory Agreement.
Cost of the services provided and profits realized by R&A from its relationship with each Fund: The directors considered the cost of the services provided by R&A and profits realized by R&A from its relationship with each Fund. As part of the analysis, the Board discussed with R&A its methodology in allocating its costs to each Fund and concluded that its allocations were reasonable. The directors concluded that R&A’s profits were reasonable in relation to the nature and quality of services provided.
The extent to which economies of scale would be realized as the Funds grow and whether fee levels would reflect such economies of scale: The directors considered whether there have been economies of scale in respect of the management of the Funds, whether the Funds have appropriately benefited from any economies of scale and whether there is potential for realization of any further economies of scale. The directors noted the time and effort involved in managing portfolios of small- and micro-cap stocks and that they did not involve the same efficiencies as do portfolios of large-cap stocks. The directors concluded that the current fee structure for each Fund was reasonable, and that no changes were currently necessary.
| 2007 Semiannual Report to Stockholders | 55 |
| Board Approval of Investment Advisory Agreements (continued) |
|
Comparison of services to be rendered and fees to be paid to those under other investment advisory contracts, such as contracts of the same and other investment advisers or other clients: The directors reviewed the investment advisory fee paid by each Fund and compared both the services to be rendered and the fees to be paid under the Investment Advisory Agreements to other contracts of R&A and to contracts of other investment advisers to registered investment companies investing in small- and micro-cap stocks, as provided by Morningstar. The directors noted that, in the case of Royce Value Trust, the 1.00% basic fee subject to adjustment up or down (up to 0.50% in either direction) based on the Fund’s performance versus the S&P 600 SmallCap Index over a rolling period of sixty months. The fee is charged on average month-end net assets over that rolling period. As a result, in a rising market, the fee will be smaller than a fee calculated on the current year’s average net assets, and visa versa. The directors determined that the performance adjustment feature continued to serve as an appropriate incentive to R&A to manage the Fund for the benefit of its long-term common stockholders. The directors noted that R&A had also agreed to waive its management fee on Fund assets in an amount equal to the liquidation preference of the Fund’s outstanding preferred stock if the Fund’s total return from issuance of the preferred on such amount is less than the preferred’s coupon rate. The directors also noted that the fee arrangement, which also includes a provision for no fee in periods where the Fund’s trailing three-year performance is negative, requires R&A to measure the Fund’s performance monthly against the S&P 600, an unmanaged index. Instead of receiving a set fee regardless of its performance, R&A is penalized for poor performance. The directors noted that if the Fund’s expense ratio was based on total average net assets including net assets applicable to Preferred Stock, it would place in the 1st quartile of its Morningstar peer group.
In the case of Royce Micro-Cap Trust, the directors noted that the Fund had a 1.00% basic fee subject to adjustment up or down based on the Fund’s performance versus the Russell 2000 Index over a rolling 36-month period. The fee is charged on average net assets over that rolling period. As a result, in a rising market, the fee will be smaller than a fee calculated on the current year’s average net assets, and visa versa. The directors determined that the performance adjustment feature continued to serve as an incentive to R&A to manage the Fund for the benefit of its long-term stockholders. The directors also noted R&A’s voluntarily waiver of its fee on the liquidation value of the outstanding preferred stock in circumstances where the Fund’s total return performance from the issuance of the preferred is less than the coupon rate on the preferred for each month during the year. The directors noted that if the Fund’s expense ratio were based on total average net assets including net assets applicable to Preferred Stock, it would place in the 2nd quartile of its Morningstar peer group.
Finally, in the case of Royce Focus Trust, the directors noted that R&A had agreed to waive its management fee on the liquidation value of outstanding preferred stock if the Fund’s total return from issuance of the preferred is less than the preferred’s coupon rate. The directors noted that if the Fund’s expense ratio were based on total average net assets including net assets applicable to Preferred Stock, it would place in the 2ndquartile of its Morningstar peer group.
The directors also considered fees charged by R&A to institutional and other clients and noted that the Funds’ base advisory fees compared favorably to those other accounts.
After the non-interested directors deliberated in executive session, the entire Board, including all the non-interested directors, approved the renewal of the existing Investment Advisory Agreements, concluding that a contract renewal on the existing terms was in the best interest of the shareholders of each Fund and that each investment advisory fee rate was reasonable in relation to the services provided.
| 56 | 2007 Semiannual Report to Stockholders |
| Notes to Performance and Other Important Information |
|
The thoughts expressed in this Review and Report concerning recent market movements and future prospects for small company stocks are solely the opinion of Royce at June 30, 2007, and, of course, historical market trends are not necessarily indicative of future market movements. Statements regarding the future prospects for particular securities held in the Funds’ portfolios and Royce’s investment intentions with respect to those securities reflect Royce’s opinions as of June 30, 2007 and are subject to change at any time without notice. There can be no assurance that securities mentioned in this Review and Report will be included in any Royce-managed portfolio in the future. The Funds invest primarily in securities of mid-, small- and micro-cap companies, that may involve considerably more risk than investments of larger-cap companies. All publicly released material information is always disclosed by the Funds on the website at www.roycefunds.com.
Standard deviation is a statistical measure within which a fund’s total returns have varied over time. The greater the standard deviation, the greater a fund’s volatility.
The Russell 2000, Russell 2000 Value, Russell 2000 Growth, Nasdaq Composite, S&P 500 and S&P 600 are unmanaged indices of domestic common stocks. Returns for the market indices used in this Review and Report were based on information supplied to Royce by Frank Russell and Morningstar. Royce has not independently verified the above described information. The Royce Funds is a service mark of The Royce Funds.
Forward-Looking Statements
This material contains forward-looking statements within the meaning of the Securities Exchange Act of 1934, as amended (the “Exchange Act”), that involve risks and uncertainties, including, among others, statements as to: • the Funds’ future operating results
• the prospects of the Funds’ portfolio companies,
• the impact of investments that the Funds have made or may make
• the dependence of the Funds’ future success on the general economy and its impact on the companies and industries in which the Funds invest, and | | • the ability of the Funds’ portfolio companies to achieve their objectives.
This Review and Report uses words such as “anticipates,” “believes,” “expects,” “future,” “intends,” and similar expressions to identify forward-looking statements. Actual results may differ materially from those projected in the forward-looking statements for any reason.
The Royce Funds have based the forward-looking statements included in this Review and Report on information available to us on the date of the report, and we assume no obligation to update any such forward-looking statements. Although The Royce Funds undertake no obligation to revise or update any forward-looking statements, whether as a result of new information, future events or otherwise, you are advised to consult any additional disclosures that we may make through future stockholder communications or reports.
Authorized Share Transactions
Royce Value Trust, Royce Micro-Cap Trust and Royce Focus Trust may each repurchase up to 300,000 shares of its respective common stock and up to 10% of the issued and outstanding shares of its respective preferred stock during the year ending December 31, 2007. Any such repurchases would take place at then prevailing prices in the open market or in other transactions. Common stock repurchases would be effected at a price per share that is less than the share’s then current net asset value, and preferred stock repurchases would be effected at a price per share that is less than the share’s liquidation value.
Royce Value Trust, Royce Micro-Cap Trust and Royce Focus Trust are also authorized to offer their common stockholders an opportunity to subscribe for additional shares of their common stock through rights offerings at a price per share that may be less than the share’s then current net asset value. The timing and terms of any such offerings are within each Board’s discretion.
Change to Funds’ Investment Restrictions
At the June 6-7, 2007 regular meetings of the Boards of Directors of Royce Value Trust and Royce Micro-Cap Trust, the Boards approved a change in each Fund’s investment restrictions to allow Royce Value Trust and Royce Micro-Cap Trust to each invest up to 25% (increased from 10%) of its assets in the securities of foreign issuers.
|
| | | |
| | Proxy Voting
A copy of the policies and procedures that The Royce Funds use to determine how to vote proxies relating to portfolio securities and information regarding how each of The Royce Funds voted proxies relating to portfolio securities during the most recent 12-month period ended June 30 is available, without charge, on the Royce Funds’ website at www.roycefunds.com, by calling 1-800-221-4268 (toll-free) and on the website of the Securities and Exchange Commission (“SEC”), at www.sec.gov. | |
| | | |
| | Form N-Q Filing The Funds file their complete schedules of investments with the SEC for the first and third quarters of each fiscal year on Form N-Q. The Funds’ Forms N-Q are available on The Royce Funds’ website at www.roycefunds.com and on the SEC’s website at www.sec.gov. The Funds’ Forms N-Q may also be reviewed and copied at the SEC’s Public Reference Room in Washington, D.C. To find out more about this public service, call the SEC at 1-800-732-0330. The Funds’ complete schedules of investments are updated quarterly, and are available at www.roycefunds.com. | |
| | | |
| | | |
| The Royce Funds 2007 Semiannual Report to Stockholders |
| |
| |
| | |
| | |
| | |
| | |
| | |
| | |
| | |
| |
Wealth Of ExperienceWith approximately $32.7 billion in open- and closed-end fund assets under management, Royce & Associates is committed to the same small-company investing principles that have served us well for more than 30 years. Charles M. Royce, our Chief Investment Officer, enjoys one of the longest tenures of any active mutual fund manager. Royce’s investment staff includes eight Portfolio Managers, as well as 11 assistant portfolio managers and analysts, and six traders.
Multiple Funds, Common FocusOur goal is to offer both individual and institutional investors the best available small-cap value portfolios. Unlike a lot of mutual fund groups with broad product offerings, we have chosen to concentrate on small-company value investing by providing investors with a range of funds that take full advantage of this large and diverse sector.
Consistent DisciplineOur approach emphasizes paying close attention to risk and maintaining the same discipline, regardless of market movements and trends. The price we pay for a security must be significantly below our appraisal of its current worth. This requires a thorough analysis of the financial and business dynamics of an enterprise, as though we were purchasing the entire company.
Co-Ownership Of FundsIt is important that our employees and shareholders share a common financial goal; our officers, employees and their families currently have approximately $122 million invested in The Royce Funds. | | |
| | | | | | |
| | |
| | General Information | | Advisor Services | | |
| | Additional Report Copies | | For Fund Materials, Performance Updates, | | |
| | and Fund Inquiries | | Account Inquiries | | |
| | (800) 221-4268 | | (800) 33-ROYCE (337-6923) | | |
| | | | | | |
| | | | | | |
| | Computershare | | Broker/Dealer Services | | |
| | Transfer Agent and Registrar | | For Fund Materials and Performance Updates | | |
| | (800) 426-5523 | | (800) 59-ROYCE (597-6923) | | |
| | | | | | |
| |
www.roycefunds.com | | |
| | |
| | |
| | |
| | |
|
| |
| | |
| | |
| | |
| | |
| | TheRoyceFunds | CE-REP-0607 | | |
| | |
| | |
| | |
| | |
| Item 2. Code(s) of Ethics – Not applicable to this semi-annual report. |
| |
| Item 3. Audit Committee Financial Expert – Not applicable to this semi-annual report. |
| |
| Item 4. Principal Accountant Fees and Services-Not applicable to this semi-annual report. |
| |
| Item 5. Audit Committee of Listed Registrants – Not applicable to this semi-annual report. |
| |
| Item 6. Schedule of Investments – See Item 1. |
| |
| Item 7. Disclosure of Proxy Voting Policies and Procedures for Closed-End Management Investment |
| Companies – Not applicable to this semi-annual report. |
| |
| Item 8. (a)(1) Portfolio Managers of Closed-End Management Investment Companies (information as of August 29, 2007) |
| Name | Title | Length of Service | Principal Occupation(s) During Past 5 Years |
| Charles M. Royce | President and member
of the Board of
Directors of the
Registrant | Since 1986 | President, Chief Investment Officer and member of the Board of Managers of Royce & Associates, LLC (“Royce”), investment adviser to the Registrant, Royce Focus Trust, Inc., Royce Micro-Cap Trust, Inc. (“RMT”), The Royce Fund and Royce Capital Fund (collectively, “The Royce Funds”). |
| Chris Flynn | Assistant Portfolio Manager* | Since April 1, 2007 | Assistant Portfolio Manager of the Registrant (since April 1, 2007); and Principal, Assistant Portfolio Manager and Senior Analyst at Royce (since 1993). |
| Michael Hveem | Assistant Portfolio Manager* | Since April 1, 2007 | Assistant Portfolio Manager of the Registrant (since April 1, 2007); Assistant Portfolio Manager at Royce (since April 1, 2007); and Senior Analyst at Royce (since 1999). |
| David Nadel | Assistant Portfolio Manager* | Since April 1, 2007 | Assistant Portfolio Manager of the Registrant (since April 1, 2007); Portfolio Manager and Senior Analyst at Royce (since 2006); Senior Portfolio Manager at Neuberger Berman Inc. (2004-2006); and Senior Analyst at Pequot Capital Management, Inc. (2001-2003). |
* Assistant Portfolio Managers may have investment discretion over a portion of the Registrant’s portfolio subject to the supervision of Registrant’s Portfolio Manager.
(a)(2) Other Accounts Managed by Portfolio Manager and Potential Conflicts of Interest (information as of December 31, 2006 for Charles M. Royce and as of June 30, 2007 for Chris Flynn, Michael Hveem and David Nadel)
Other Accounts
Name of
Portfolio
Manager | Type of Account | Number
of
Accounts
Managed | Total
Assets
Managed | Number of
Accounts
Managed for which
Advisory Fee is
Performance-Based | Value of
Managed
Accounts for
which
Advisory Fee is
Performance
Based |
| Charles M. Royce | | | | | |
| | Registered investment companies | 11 | $17,209,849,932 | 4 | $1,829,129,329 |
| | Private pooled investment vehicles | 5 | $175,251,754 | 3 | $64,256,984 |
| | Other accounts* | 13 | $72,476,035 | - | - |
| | | | | | |
| Chris Flynn | | | | | |
| | Registered investment companies | 4 | $8,271,338,779 | 2 | $1,919,186,512 |
| | Private pooled investment vehicles | 0 | - | - | - |
| | Other accounts* | 0 | - | - | - |
| | | | | | |
| Michael Hveem | | | | | |
| | Registered investment companies | 1 | $1,490,514,905 | 1 | 1,490,514,905 |
| | Private pooled investment vehicles | 0 | - | - | - |
| | Other accounts* | 0 | - | - | - |
| | | | | | |
| David Nadel | | | | | |
| | Registered investment companies | 5 | $2,514,914,578 | 2 | $1,494,948,096 |
| | Private pooled investment vehicles | 0 | - | - | - |
| | Other accounts* | 0 | - | - | - |
| | *Other accounts include all other accounts managed by the Portfolio Manager in either a professional or personal capacity except for personal accounts subject to pre-approval and reporting requirements under the Registrant’s Rule 17j-1 Code of Ethics. |
Conflicts of Interest
The fact that a Portfolio Manager has day-to-day management responsibility for more than one client account may create actual, potential or only apparent conflicts of interest. For example, the Portfolio Manager may have an opportunity to purchase securities of limited availability. In this circumstance, the Portfolio Manager is expected to review each account’s investment guidelines, restrictions, tax considerations, cash balances, liquidity needs and other factors to determine the suitability of the investment for each account and to ensure that his managed accounts are treated equitably. The Portfolio Manager may also decide to purchase or sell the same security for multiple managed accounts at approximately the same time. To address any conflicts that this situation may create, the Portfolio Manager will generally combine managed account orders (i.e., enter a "bunched" order) in an effort to obtain best execution or a more favorable commission rate. In addition, if orders to buy or sell a security for multiple accounts managed by common Portfolio Managers on the same day are executed at different prices or commission rates, the transactions will generally
be allocated by Royce to each of such managed accounts at the weighted average execution price and commission. In circumstances where a pre-allocated bunched order is not completely filled, each account will normally receive a pro-rated portion of the securities based upon the account’s level of participation in the order. Royce may under certain circumstances allocate securities in a manner other than pro-rata if it determines that the allocation is fair and equitable under the circumstances and does not discriminate against any account.
As described below, there is a revenue-based component of each Portfolio Manager’s Performance Bonus and the Portfolio Managers also receive a “Partners Pool” participation or a Firm Bonus based on revenues (adjusted for certain imputed expenses) generated by Royce. In addition, Charles M. Royce receives a bonus based on Royce’s retained pre-tax profits from operations. As a result, the Portfolio Managers may receive a greater relative benefit from activities that increase the value to Royce of The Royce Funds and/or other Royce client accounts, including, but not limited to, increases in sales of the Registrant’s shares and assets under management.
Also, as described above, the Portfolio Managers generally manage more than one client account, including, among others, registered investment company accounts, separate accounts and private pooled accounts managed on behalf of institutions (e.g., pension funds, endowments and foundations) and for high-net-worth individuals. The appearance of a conflict of interest may arise where Royce has an incentive, such as a performance-based management fee (or any other variation in the level of fees payable by The Royce Funds or other Royce client accounts to Royce), which relates to the management of one or more of The Royce Funds or accounts with respect to which the Portfolio Manager has day-to-day management responsibilities. Except as described below, no Portfolio Manager’s compensation is tied to performance fees earned by Royce for the management of any one client account. Although bonuses and other compensation derived from Royce revenues and profits are impacted to some extent, the impact is relatively minor given the small percentage or Royce firm assets under management for which Royce received performance-measured compensation. Notwithstanding the above, the Performance Bonus paid to Charles M. Royce as Portfolio Manager of two registered investment company accounts (the Registrant and RMT) is based, in part, on performance-based fee revenues. The Registrant and RMT pay Royce a fulcrum fee that is adjusted up or down depending on the performance of that Fund relative to its benchmark index. In addition, two other registered investment company accounts managed by Mr. Royce, Royce Select Fund I and Royce Select Fund II, each pay Royce a performance-based fee.
Finally, conflicts of interest may arise when a Portfolio Manager personally buys, holds or sells securities held or to be purchased or sold for the Registrant or other Royce client account or personally buys, holds or sells the shares of one or more of The Royce Funds. To address this, Royce has adopted a written Code of Ethics designed to prevent and detect personal trading activities that may interfere or conflict with client interests (including Registrant shareholders’ interests). Royce generally does not permit its Portfolio Managers to purchase small- or micro-cap securities in their personal investment portfolios.
Royce and The Royce Funds have adopted certain compliance procedures which are designed to address the above-described types of conflicts. However, there is no guarantee that such procedures will detect each and every situation in which a conflict arises.
(a)(3) Description of Portfolio Manager Compensation Structure (information as of August 29, 2007)
Royce seeks to maintain a compensation program that is competitively positioned to attract and retain high-caliber investment professionals. All Portfolio Managers receive from Royce a base salary, a Performance Bonus (generally the largest element of each Portfolio Manager’s compensation, with the exception of Charles M. Royce), a “Partners Pool” participation based primarily on registered investment company and other client account revenues generated by Royce and a benefits package. Portfolio Manager compensation is reviewed and may be modified from time to time as appropriate to reflect changes in the market, as well as to adjust the factors used to determine bonuses. Except as described below, each Portfolio Manager’s compensation consists of the following elements:
| - | BASE SALARY. Each Portfolio Manager is paid a base salary. In setting the base salary, Royce seeks to be competitive in light of the Portfolio Manager’s experience and responsibilities. |
| | |
| - | PERFORMANCE BONUS. Each Portfolio Manager receives a quarterly Performance Bonus that is either asset-based, or revenue based and therefore in part based on the value of the accounts’ net assets, determined with reference to each of the registered investment company and other client accounts they are managing. The revenue used to determine the quarterly performance bonus received by Charles M. Royce that relates to each of the Registrant and RMT are performance-based fee revenues. For all Portfolio Managers, except as described below, the Performance Bonus applicable to the registered investment company accounts managed by the Portfolio Manager is subject to upward or downward adjustment or elimination based on a combination of 3-year and 5-year risk-adjusted pre-tax returns of such accounts relative to all small-cap objective funds with three years of history tracked by Morningstar (as of December 31, 2006 there were 373 such Funds tracked by Morningstar) and the 5-year absolute returns of such accounts relative to 5-year U.S. Treasury Notes. The Performance Bonus applicable to non-registered investment company accounts managed by a Portfolio Manager, and to Royce Select Fund I and Royce Select Fund II for Mr. Royce, is not subject to a performance-related adjustment. |
Payment of the Performance Bonus may be deferred as described below, and any amounts deferred are forfeitable, if the Portfolio Manager is terminated by Royce with or without cause or resigns. The amount of the deferred Performance Bonus will appreciate or depreciate during the deferral period, based on the total return performance of one or more Royce-managed registered investment company accounts selected by the Portfolio Manager at the beginning of the deferral period. The amount deferred will depend on the Portfolio Manager’s total direct, indirect beneficial and deferred unvested bonus investments in the Royce registered investment company account for which he or she is receiving portfolio management compensation.
| - | ROYCE “PARTNERS POOL”. Each Portfolio Manager, other than Charles M. Royce, as well as other senior firm employees, participates in a quarterly pool relating to Royce’s net operating revenues adjusted for some imputed expenses. A portion of this participation may be deferred for three years. The deferred portion is also forfeitable if the Portfolio Manager is terminated with or without cause or resigns and appreciates or depreciates during the deferral period based on the total return of a basket of registered investment company accounts managed by Royce. |
| | |
| - | FIRM BONUS. Charles M. Royce receives a quarterly bonus based on Royce’s net revenues. |
| | |
| - | BENEFIT PACKAGE. Each Portfolio Manager also receives benefits standard for all Royce employees, including health care and other insurance benefits, and participation in Royce’s 401(k) Plan and Money Purchase Pension Plan. From time to time, on a purely discretionary basis, Portfolio Managers may also receive options to acquire stock in Royce’s parent company, Legg Mason, Inc. Those options typically represent a relatively small portion of a Portfolio Manager’s overall compensation. |
Charles M. Royce, in addition to the above-described compensation, also receives a bonus based on Royce’s retained pre-tax operating profit. This bonus, along with the Performance Bonus and Firm Bonus, generally represents the most significant element of Mr. Royce’s compensation. A portion of the above-described compensation payable to Mr. Royce relates to his responsibilities as Royce’s Chief Executive Officer, Chief Investment Officer and President of The Royce Funds.
(a)(4) Dollar Range of Equity Securities in Registrant Beneficially Owned by Portfolio Manager (information as of December 31, 2006 for Charles M. Royce and as of June 30, 2007 for Chris Flynn, Michael Hveem and David Nadel)
The following table shows the dollar range of the Registrant’s shares owned beneficially and of record by the Portfolio Managers, including investments by his immediate family members sharing the same household and amounts invested through retirement and deferred compensation plans.
| Portfolio Manager | Dollar Range of Registrant’s Shares Beneficially Owned |
| Charles M. Royce | Over $1,000,000 |
| Chris Flynn | None |
| Michael Hveem | None |
| David Nadel | None |
| Item 9: Not Applicable. |
| |
| Item 10: Not Applicable. |
| |
| Item 11: Controls and Procedures. |
(a) Disclosure Controls and Procedures. The Principal Executive and Financial Officers concluded that the Registrant’s Disclosure Controls and Procedures are effective based on their evaluation of the Disclosure Controls and Procedures as of a date within 90 days of the filing date of this report.
(b) Internal Control over Financial Reporting. There were no significant changes in Registrant’s internal control over financial reporting or in other factors that could significantly affect this control subsequent to the date of the evaluation, including any corrective actions with regard to significant deficiencies and material weaknesses during the second fiscal quarter of the period covered by this report.
Item 12: Exhibits attached hereto.
(a)(1) The Registrant’s code of ethics pursuant to Item 2 of Form N-CSR.
(a)(2) Separate certifications by the Registrant’s Principal Executive Officer and Principal Financial Officer as required by Rule 30a-2(a) under the Investment Company Act of 1940.
(a)(3) Not Applicable
(b) Separate certifications by the Registrant’s Principal Executive Officer and Principal Financial Officer, pursuant to Section 906 of the Sarbanes-Oxley Act of 2002 and required by Rule 30a-2(b) under the Investment Company Act of 1940.
Pursuant to the requirements of the Securities Exchange Act of 1934 and the Investment Company Act of 1940, the registrant has duly caused this report to be signed on its behalf by the undersigned, thereunto duly authorized.
ROYCE VALUE TRUST, INC.
| BY: | | /s/Charles M. Royce | | |
| | | Charles M. Royce | | |
| | | President | | |
| | | | | |
| Date: August 29, 2007 |
Pursuant to the requirements of the Securities Exchange Act of 1934 and the Investment Company Act of 1940, this report has been signed below by the following persons on behalf of the registrant and in the capacities and on the dates indicated.
ROYCE VALUE TRUST, INC.
| BY: | | /s/Charles M. Royce | | |
| | | Charles M. Royce | | |
| | | President | | |
| | | | | |
| Date: August 29, 2007 |
ROYCE VALUE TRUST, INC.
| BY: | | /s/John D. Diederich | | |
| | | John D. Diederich | | |
| | | Chief Financial Officer | | |
| | | | | |
| Date: August 29, 2007 |
Item 12(a)(2):
CERTIFICATIONS
I, Charles M. Royce, certify that:
1. I have reviewed this report on Form N-CSR of Royce Value Trust, Inc.;
2. Based on my knowledge, this report does not contain any untrue statement of a material fact or omit to state a material fact necessary to make the statements made, in light of the circumstances under which such statements were made, not misleading with respect to the period covered by this report;
3. Based on my knowledge, the financial statements, and other financial information included in this report, fairly present in all material respects the financial condition, results of operations, changes in net assets, and cash flows (if the financial statements are required to include a statement of cash flows) of the registrant as of, and for, the periods presented in this report;
4. The registrant’s other certifying officer and I are responsible for establishing and maintaining disclosure controls and procedures (as defined in Rule 30a-3(c) under the Investment Company Act of 1940) and internal control over financial reporting (as defined in Rule 30a-3(d) under the Investment Company Act of 1940) for the registrant and have:
a) designed such disclosure controls and procedures, or caused such disclosure controls and procedures to be designed under our supervision, to ensure that material information relating to the registrant, including its consolidated subsidiaries, is made known to us by others within those entities, particularly during the period in which this report is being prepared;
b) designed such internal control over financial reporting, or caused such internal control over financial reporting to be designed under our supervision, to provide reasonable assurance regarding the reliability of financial reporting and the preparation of financial statements for external purposes in accordance with generally accepted accounting principles;
c) evaluated the effectiveness of the registrant’s disclosure controls and procedures and presented in this report our conclusions about the effectiveness of the disclosure controls and procedures, as of a date within 90 days prior to the filing date of this report based on such evaluation; and
d) disclosed in this report any change in the registrant’s internal control over financial reporting that occurred during the second fiscal quarter of the period covered by this report that has materially affected, or is reasonably likely to materially affect, the registrant’s internal control over financial reporting; and
5. The registrant’s other certifying officer and I have disclosed to the registrant’s auditors and the audit committee of the registrant’s board of directors (or persons performing the equivalent functions):
a) all significant deficiencies and material weaknesses in the design or operation of internal control over financial reporting which are reasonably likely to adversely affect the registrant’s ability to record, process, summarize, and report financial information; and
b) any fraud, whether or not material, that involves management or other employees who have a significant role in the registrant’s internal control over financial reporting.
| | | |
| Date: August 29, 2007 | | /s/ Charles M. Royce |
| | | Charles M. Royce |
| | | President |
Item 12(a)(2):
CERTIFICATIONS
I, John D. Diederich, certify that:
1. I have reviewed this report on Form N-CSR of Royce Value Trust, Inc.;
2. Based on my knowledge, this report does not contain any untrue statement of a material fact or omit to state a material fact necessary to make the statements made, in light of the circumstances under which such statements were made, not misleading with respect to the period covered by this report;
3. Based on my knowledge, the financial statements, and other financial information included in this report, fairly present in all material respects the financial condition, results of operations, changes in net assets, and cash flows (if the financial statements are required to include a statement of cash flows) of the registrant as of, and for, the periods presented in this report;
4. The registrant’s other certifying officer and I are responsible for establishing and maintaining disclosure controls and procedures (as defined in Rule 30a-3(c) under the Investment Company Act of 1940) and internal control over financial reporting (as defined in Rule 30a-3(d) under the Investment Company Act of 1940) for the registrant and have:
a) designed such disclosure controls and procedures, or caused such disclosure controls and procedures to be designed under our supervision, to ensure that material information relating to the registrant, including its consolidated subsidiaries, is made known to us by others within those entities, particularly during the period in which this report is being prepared;
b) designed such internal control over financial reporting, or caused such internal control over financial reporting to be designed under our supervision, to provide reasonable assurance regarding the reliability of financial reporting and the preparation of financial statements for external purposes in accordance with generally accepted accounting principles;
c) evaluated the effectiveness of the registrant’s disclosure controls and procedures and presented in this report our conclusions about the effectiveness of the disclosure controls and procedures, as of a date within 90 days prior to the filing date of this report based on such evaluation; and
d) disclosed in this report any change in the registrant’s internal control over financial reporting that occurred during the second fiscal quarter of the period covered by this report that has materially affected, or is reasonably likely to materially affect, the registrant’s internal control over financial reporting; and
5. The registrant’s other certifying officer and I have disclosed to the registrant’s auditors and the audit committee of the registrant’s board of directors (or persons performing the equivalent functions):
a) all significant deficiencies and material weaknesses in the design or operation of internal control over financial reporting which are reasonably likely to adversely affect the registrant’s ability to record, process, summarize, and report financial information; and
b) any fraud, whether or not material, that involves management or other employees who have a significant role in the registrant’s internal control over financial reporting.
| | | |
| Date: August 29, 2007 | | /s/John D. Diederich |
| | | John D. Diederich |
| | | Chief Financial Officer |
Item 12(b):
CERTIFICATION PURSUANT TO 18 U.S.C. SECTION 1350,
AS ADOPTED PURSUANT TO
SECTION 906 OF THE SARBANES-OXLEY ACT OF 2002
Name of Issuer: ROYCE VALUE TRUST, INC.
In connection with the Report on Form N-CSR of the above-named issuer that is accompanied by this certification, the undersigned hereby certifies, to his knowledge, that:
1. The Report fully complies with the requirements of Section 13(a) or 15 (d) of the Securities Exchange Act of 1934; and
2. The information contained in the Report fairly presents, in all materials respects, the financial condition and results of operations of the issuer.
| | | |
| Date: August 29, 2007 | | /s/ Charles M. Royce |
| | | Charles M. Royce |
| | | President |
Item 12(b):
CERTIFICATION PURSUANT TO 18 U.S.C. SECTION 1350,
AS ADOPTED PURSUANT TO
SECTION 906 OF THE SARBANES-OXLEY ACT OF 2002
Name of Issuer: ROYCE VALUE TRUST, INC.
In connection with the Report on Form N-CSR of the above-named issuer that is accompanied by this certification, the undersigned hereby certifies, to his knowledge, that:
1. The Report fully complies with the requirements of Section 13(a) or 15 (d) of the Securities Exchange Act of 1934; and
2. The information contained in the Report fairly presents, in all materials respects, the financial condition and results of operations of the issuer.
| | | |
| Date: August 29, 2007 | | /s/ John D. Diederich |
| | | John D. Diederich |
| | | Chief Financial Officer |