| UNITED STATES |
| SECURITIES AND EXCHANGE COMMISSION |
| Washington, D.C. 20549 |
| | | |
| FORM N-CSR |
| | | |
| CERTIFIED SHAREHOLDER REPORT |
| OF |
| REGISTERED MANAGEMENT INVESTMENT COMPANIES |
| | | |
| Investment Company Act file number: 811-04875 |
| | | |
| Name of Registrant: Royce Value Trust, Inc. |
| | | |
| Address of Registrant: 1414 Avenue of the Americas |
| New York, NY 10019 |
| | | |
| Name and address of agent for service: | | John E. Denneen, Esquire |
| | | 1414 Avenue of the Americas |
| | | New York, NY 10019 |
| | | |
| Registrant’s telephone number, including area code: (212) 486-1445 |
| Date of fiscal year end: December 31 |
| Date of reporting period: January 1, 2008 – June 30, 2008 |
| | | |
| | | |
| Item 1. Reports to Stockholders | | |
A Few Words on Closed-End Funds
| | | |
| | | |
| | Royce & Associates, LLC manages three closed-end funds: Royce Value Trust, the first small-cap value closed-end fund offering; Royce Micro-Cap Trust, the only micro-cap closed-end fund; and Royce Focus Trust, a closed-end fund that invests in a limited number of primarily small-cap companies. | |
| | | |
| | A closed-end fund is an investment company whose shares are listed and traded on a stock exchange. Like all investment companies, including open-end mutual funds, the assets of a closed-end fund are professionally managed in accordance with the investment objectives and policies approved by the fund’s Board of Directors. A closed-end fund raises cash for investment by issuing a fixed number of shares through initial and other public offerings that may include shelf offerings and periodic rights offerings. Proceeds from the offerings are invested in an actively managed portfolio of securities. Investors wanting to buy or sell shares of a publicly traded closed-end fund after the offerings must do so on a stock exchange, as with any publicly traded stock. This is in contrast to open-end mutual funds, in which the fund sells and redeems its shares on a continuous basis. | |
| | | |
| | | |
| A Closed-End Fund Offers Several Distinct Advantages Not Available From An Open-End Fund Structure |
| | | | | | |
| n | Since a closed-end fund does not issue redeemable securities or offer its securities on a continuous basis, it does not need to liquidate securities or hold uninvested assets to meet investor demands for cash redemptions, as an open-end fund must. | | | n | The fixed capital structure allows permanent leverage to be employed as a means to enhance capital appreciation potential. |
| | | | | | |
| n | In a closed-end fund, not having to meet investor redemption requests or invest at inopportune times is ideal for value managers who attempt to buy stocks when prices are depressed and sell securities when prices are high. | | | n | Unlike Royce’s open-end funds, our closed-end funds are able to distribute capital gains on a quarterly basis. Each of the Funds has adopted a quarterly distribution policy for its common stock. |
| | | | | | |
| n | A closed-end fund may invest more freely in less liquid portfolio securities because it is not subject to potential stockholder redemption demands. This is particularly beneficial for Royce-managed closed-end funds, which invest in small- and micro-cap securities. | | | We believe that the closed-end fund structure is very suitable for the long-term investor who understands the benefits of a stable pool of capital. |
| |
Why Dividend Reinvestment Is Important | |
| |
A very important component of an investor’s total return comes from the reinvestment of distributions. By reinvesting distributions, our investors can maintain an undiluted investment in a Fund. To get a fair idea of the impact of reinvested distributions, please see the charts on pages 13, 15 and 17. For additional information on the Funds’ Distribution Reinvestment and Cash Purchase Options and the benefits for stockholders, please see page 19 or visit our website at www.roycefunds.com. | |
| | | |
| | | |
| |
| This page is not part of the 2008 Semiannual Report to Stockholders | | |
| Semiannual Review | | |
|
| Performance Table | | 2 |
| |
| Letter to Our Stockholders | | 3 |
| |
| Small-Cap Market Cycle Performance | | 10 |
| |
| Postscript: Freeway Jam | | Inside Back Cover |
|
| Semiannual Report to Stockholders | | 11 |
| |
For more than 30 years, we have used a value approach to invest in smaller-cap securities. We focus primarily on the quality of a company’s balance sheet, its ability to generate free cash flow and other measures of profitability or sound financial condition. At times, we may also look at other factors, such as a company’s unrecognized asset values, its future growth prospects or its turnaround potential following an earnings disappointment or other business difficulties. We then use these factors to assess the company’s current worth, basing the assessment on either what we believe a knowledgeable buyer might pay to acquire the entire company, or what we think the value of the company should be in the stock market.

This page is not part of the 2008 Semiannual Report to Stockholders | 1
| NAV Average Annual Total Returns | | Through June 30, 2008 |
| | | | | | | Royce | | Royce | | Royce | |
| | | | | | | Value Trust | | Micro-Cap Trust | | Focus Trust | Russell 2000 |
|
| | Second Quarter 2008* | | | | | -1.12 | % | | -1.21 | % | | | | 8.03 | % | 0.58 | % |
|
| | Year-to-Date 2008* | | | | | -11.67 | | | -11.70 | | | | | 2.28 | | -9.37 | |
|
| | One-Year | | | | | -15.53 | | | -18.64 | | | | | -1.01 | | -16.19 | |
|
| | Three-Year | | | | | 7.05 | | | 5.62 | | | | | 17.18 | | 3.79 | |
|
| | Five-Year | | | | | 12.55 | | | 12.44 | | | | | 20.52 | | 10.29 | |
|
| | 10-Year | | | | | 9.49 | | | 9.70 | | | | | 12.83 | | 5.53 | |
|
| | 15-Year | | | | | 11.68 | | | n/a | | | | | n/a | | 8.92 | |
|
| | 20-Year | | | | | 12.06 | | | n/a | | | | | n/a | | 9.48 | |
|
| | Since Inception | | | | | 11.65 | | | 12.08 | | | | | 13.73 | | — | |
|
| | Inception Date | | | | | 11/26/86 | | 12/14/93 | | | | 11/1/96** | — | |
| Important Performance and Risk Information |
All performance information in this Review and Report reflects past performance, is presented on a total return basis and reflects the reinvestment of distributions. Past performance is no guarantee of future results. Investment return and principal value of an investment will fluctuate, so that shares may be worth more or less than their original cost when sold. Current performance may be higher or lower than performance quoted. Current month-end performance may be obtained at www.roycefunds.com. The Royce Funds invest primarily in securities of small-cap and/or micro-cap companies, which may involve considerably more risk than investments in securities of larger-cap companies.
The thoughts expressed in this Review and Report to Stockholders concerning recent market movements and future prospects for small-company stocks are solely the opinion of Royce at June 30, 2008, and, of course, historical market trends are not necessarily indicative of future market movements. Statements regarding the future prospects for particular securities held in the Funds’ portfolios and Royce’s investment intentions with respect to those securities reflect Royce’s opinions as of June 30, 2008 and are subject to change at any time without notice. There can be no assurance that securities mentioned in this Review and Report to Stockholders will be included in any Royce-managed portfolio in the future. |
|
| *Not annualized. |
| **Date Royce & Associates, LLC assumed investment management responsibility for the Fund. |
| |
| 2 | This page is not part of the 2008 Semiannual Report to Stockholders |
| Letter to Our Stockholders | | | |
| | | |
 | | | |
| Ballad of a Thin Market | | | |
| The first six months of 2008 gave even the most serene investor cause for anxiety, if not outright panic. First, a long list of worries ushered in the new year: the credit crisis, housing bubble, subprime implosion, falling dollar, stumbling equity prices, and an economy in either a full-blown recession or “merely” stalled. By the end of June, one could add to this list rapidly rising oil prices and associated energy costs. And we would be remiss if we did not also mention that smaller-company stock prices, after rallying from mid- March through early June, spent most of that latter month swooning. Indeed, share price declines throughout the market were so severe that on July 1 several media outlets were trotting out comparisons to the 1930s, since June saw the worst respective one-month losses for both the Dow Jones Industrial Average and the S&P 500 since the Great Depression. | | Both domestically and internationally, we
have seen a large number of what we believe
are superb values emerge in our asset class.
As is often the case with value investing,
patience and discipline will be critical as we
wait for the markets to rebound. | |
Each of the formidable problems besetting the economy and financial markets remained unsolved as the year crept nervously to its midpoint, with little in the way of solutions on the immediate horizon. For anyone expecting good news soon about these matters, we can offer only sympathy. It will probably take some time before genuine improvement begins. We do not mean to imply that we like being where we are, only that a measured look at the current landscape suggests that most equities will need | | | |
| | | | |
| This page is not part of the 2008 Semiannual Report to Stockholders | 3 |
| |

We are contrarians. To us, the term
has always been synonymous with
value investor. Our research screens
include searches for well-run
businesses whose stock prices have
fallen, which typically leads us to
companies, and often entire
industries, that others have recently
fled or are otherwise happy to ignore.
Searching among the neglected and
broken in the smaller-company world
for new investment ideas not only
helps us to find potential hidden
gems, it also helps to lower
portfolio risk. Companies whose stock
prices have been beaten up by
mass sell-offs often carry very low
expectations (and price risk),
especially once the smoke has cleared
and former stockholders have moved
on. Although there’s always the risk
of additional stock price erosion if a
company’s fortunes worsen or an
industry’s prospects grow dimmer,
we try to use falling stock prices to
our advantage; it is common for us
to add to positions at such times
(provided, of course, that our
long-term outlook for the company
remains positive).
While our hope is that any subsequent
drops in share prices are temporary,
it is also why we look for companies
Continued on page 6... | | | Letter to Our Stockholders
to log a few more miles of volatility and poor short-term performance prior to a sustained recovery. The fact that this is not surprising does not make the news any easier to bear. What it does mean for smaller-company bargain-hunters such as ourselves is opportunity. Both domestically and internationally, we have seen a large number of what we believe are superb values emerge in our asset class. As is often the case with value investing, patience and discipline will be critical as we wait for the markets to rebound.
While we wait, it is worth noting that many observers, including some for whom we have enormous respect, are arguing that the events of the past year—particularly the housing crisis, the credit crunch and the slowing economy—signal the end of the era of low interest rates and low-to-moderate inflation that began following the 1982 recession and ran, with some notable interruptions, through the stock market peaks in 2007. We agree in large part with this assessment. It seems plain to us that we have entered a period that will be characterized by higher inflation and rising interest rates. However, there is little agreement as to how pronounced an effect these changes will have on the U.S. economy and stock markets. So these recent travails put all of us in the position of Dylan’s Mr. Jones: there is something happening here, but we don’t know what it is. Our take is that the short term will be challenging at best, but that solid recoveries for both the economy and equities will come in the next three to five years. As is our habit, we first look at history for future direction. In a Royce Fund 1989 Annual Report, we recalled a “full-blown recession” that led to a robust economic expansion, “an epic crash in 1987 and mini-crash in 1989,” and a market that saw “speculative binges in oil, precious metals and real estate as well as stocks.” In other words, it seems to us that nothing about the ’90s or the current decade is unprecedented.
Subterranean Small-Cap Blues
As might be expected in such a tumultuous period, the current market leadership question also looks unsettled. Domestic small-caps, as measured by the Russell 2000 index, finished the year-to-date period ended 6/30/08 with a loss of 9.4%, which was better than the large-cap S&P 500 index (-11.9%), the more tech-laden Nasdaq Composite (-13.6%) and the global MSCI EAFE (Europe, Australasia and Far East) index (-11.0%). Small-cap’s performance advantage over large-cap stocks thus far in 2008 was primarily attributable to its advantage in the second quarter, in particular its strong relative showing in May, when the Russell 2000 gained 4.6% versus 1.3% for the S&P 500. (Smaller stocks finished the second quarter just barely in positive territory, up 0.6% versus -2.7% for their large-cap peers.) The strong rally from the current small-cap trough on 3/10/08 was followed by an almost equally strong decline in June that collapsed share prices across the globe. During the month, the Russell 2000 lost 7.7%, the S&P 500 fell 8.4%, the Nasdaq Composite was down 9.1% and the MSCI EAFE declined 8.2%.
The relative resilience of smaller companies during June was a welcome development. Although it did not decisively shift market leadership back to our chosen asset class, it certainly helped the Russell 2000 lose less during the highly volatile first half of 2008. |
| | | |
| | |
| | | | |
| 4 | This page is not part of the 2008 Semiannual Report to Stockholders |
| | |
| | | |
However, the S&P 500 was slightly ahead of its small-cap counterpart in the first quarter of 2008 (-9.5% versus -9.9%) and decidedly better in the second half of 2007. These outperformance periods allowed the S&P 500 to stay ahead of the Russell 2000 for both the one-year (-13.1% versus -16.2%) and three-year (+4.4% versus +3.8%) periods ended 6/30/08, while over longer-term periods, smaller stocks held serve; the Russell 2000 beat the S&P 500 for the five-, 10- and 15-year periods ended 6/30/08.
While large-cap stocks had to wait until early July to officially enter a bear market (traditionally defined as a price decline of 20% or more from a previous peak), the seeming inevitability of its arrival put the phrase ‘bear market’ on the lips of most investors before the end of June. The Dow Jones Industrial Average finished the second quarter with a price 19.9% below its 10/9/07 all-time peak. After making a cyclical high in May, the S&P 500 fell more than 10% to close the quarter within a single percentage point of its cycle low on 3/10/08. The Russell 2000 rallied to a new cyclical high in early June before it fell 9.5% by the end of the quarter. However, the small-cap index also managed to retain more of its gain, staying 7.6% above its current cycle low on 3/10/08.
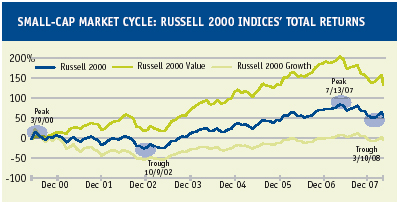
We expect more volatility and lower, possibly negative returns for much of the market in the coming months. Although we once believed that large-cap would have an advantage, we now believe that quality-oriented companies, regardless of market cap, should outperform and that smaller companies may provide an edge during short-term market upswings. We also suspect that smaller stocks should lead when share prices eventually show some sustained recovery. This, however, is likely to take some time before materializing. Putting aside for a moment the challenges that must be worked through in the economy as well as in the credit and housing markets, the Russell 2000 also enjoyed a mostly uninterrupted run from its trough on 10/9/02 through its most recent peak on 7/13/07. Nearly five years of primarily rising stock prices does not correct itself quickly or, unfortunately, without pain. (For more on recent small-cap market cycles, see page 10). | | Although we once believed that large-cap
would have an advantage, we now believe
that quality-oriented companies, regardless
of market cap, should outperform and that
smaller companies may provide an edge
during short-term market upswings. We also
suspect that smaller stocks should lead
when share prices eventually show some
sustained recovery. |
| | | |
Tangled up in Value
Small-cap value stocks, as measured by the Russell 2000 Value index, have felt more than their share of pain recently after dominating the Russell 2000 Growth index during the first seven years of the current decade. During the last full small-cap market cycle, which lasted from 3/9/00 until 7/13/07, the Russell 2000 Value index substantially outperformed the Russell 2000 Growth index (+189.5% versus -14.8%). The small-cap value index also outpaced the small-cap growth index from the small-cap market trough on 10/9/02 through 7/13/07, up 183.9% versus 169.7%. However, the small-cap growth index began to chip away at this lead during 2007, when it beat small-cap value in each of that year’s four quarters.
Small-cap growth hung on to its advantage through the year-to-date period ended 6/30/08 (-8.9% versus -9.8% for the small-cap value index), as well as from the recent small-cap peak on 7/13/07. Results for both small-cap style indices were close from | | |
| | | |
| This page is not part of the 2008 Semiannual Report to Stockholders | 5 |
| |
that have the financial strength to survive difficult times for their industry or sector. This remains a cornerstone of our approach because, despite our best intelligence, trouble sometimes lasts longer than we anticipate. Just as we attempt to be opportunistic from a purchase-price standpoint, we like companies that view opportunity through a similar prism. Businesses with strong balance sheets will at times act in a similar fashion, using their financial position to acquire lesser competitors.
Our practice of purchasing low-expectation companies often involves going against the grain of Wall Street. Five years ago, for example, oil was trading at a then-high of $30 per barrel. The Wall Street consensus was that the price of oil had reached a peak and would soon begin to decline. We began to look closely at energy services companies as well as oil and gas businesses because expectations were driving investors away to the point that share prices began to look more and more attractive to us. This, combined with many years of industry consolidation, gave us the conviction to start building positions within the sector.
We were not making a call on the prospects for oil prices or thinking that we knew better than the analysts who devote their careers to the study of energy—we simply saw an industry in which we had enjoyed success in the past once again looking attractively undervalued to us.
Continued on page 8...
| |
| |
|
| Letter to Our Stockholders |
|
| |
7/13/07 through the new small-cap trough on 3/10/08, a period in which the Russell 2000 Value index fell 25.4% and its small-cap growth sibling lost 23.0%, reversing small-cap value’s usual edge during downturns. From the small-cap market peak on 7/13/07 through 6/30/08, the small-cap growth index enjoyed a larger performance edge, falling 13.8% versus a loss of 23.1% for the small-cap value index.
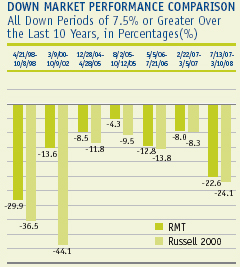
While neither index has been exempt from the market’s troubles over the past year, investors may be wondering what became of small-cap value’s typical performance edge in down-market periods. We think that the current reversal is not entirely a surprise when one considers just how thoroughly the Russell 2000 Value index prevailed over the Russell 2000 Growth index both from the previous small-cap market peak on 3/9/00 and from the small-cap market trough on 10/9/02 through the end of the last full market cycle in July 2007. That small-cap value has been struggling of late is therefore not unexpected, both in the context of reversion to the mean and in the context of an indiscriminate bear market. Of course, just as we spent much of the first several years of the decade looking for high-quality bargains in areas usually populated by smaller-company growth managers, we have spent much of the last year scrutinizing those places where value managers are thought to roam.
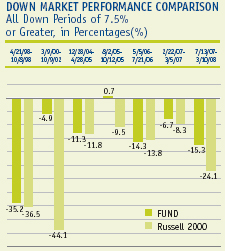
Our Back PagesPerformance during the first half of 2008 for our three closed-end portfolios was decidedly mixed on both an absolute and relative basis, with a particularly wide margin separating the terrific NAV (net asset value) results of Royce Focus Trust and the less inspiring showings for both Royce Value Trust and Royce Micro-Cap Trust (see the chart below). Each Fund looks at a slightly different area of the smaller-company universe: Royce Focus Trust typically holds fewer positions, most of which are selected from the upper tier of the smaller-company world, where market capitalizations run from $500 million to $2.5 billion. Royce Value Trust and Royce Micro-Cap Trust are more diversified and make most of their respective selections
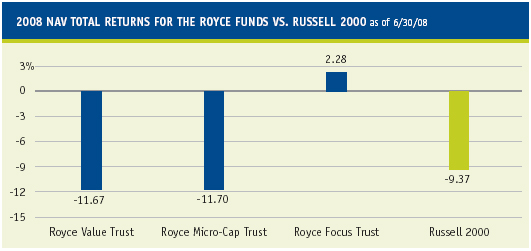
from the micro- and small-cap area (market caps up to $2.5 billion) and micro-cap area (market caps up to $500 million). Thus, we view a certain divergence as a healthy |
| 6 | This page is not part of the 2008 Semiannual Report to Stockholders |
| | |
development. Still, we were very disappointed in our two portfolios that struggled on a relative and absolute basis during both the six-month and one-year periods ended 6/30/08.
Much of the strength of Royce Focus Trust’s first-half performance came from its greater exposure to both energy and steel companies. These areas did well in all three portfolios, but both Royce Value Trust and Royce Micro-Cap Trust were comparatively underweight in their respective exposure and thus paid the price. They also suffered from having relatively larger exposures to sectors that struggled, such as consumer, technology and financial stocks. Indeed, financials continued to be a drag across the entire equity market. On average, the financial components of the Dow declined 26.6% in the second quarter, versus a 7.4% decline for the index. Within the S&P 500, banking and related industries declined 24.9% on average, versus a 2.7% decline for the index. The Financial Services sector of the Russell 2000 was that index’s worst performer, losing 13.4%, while the index gained 0.6%.
|
| | | |
| The Times They Are A-Changin’ | | |
As much as the current bearish period has convinced us that major changes are working their way through the market, it seems to us that there is a significant element to the story that has not received as much attention, namely, the shift in the status of the U.S. in the global economy. The U.S. has gone from being by far the most dominant force, perhaps the only truly dominant force, to being first among a small group of leading players, which includes the European Union, China, Japan and India. The first sign of this change can be traced back to late 2000, when the U.S. dollar first began to decline versus the Euro, a decline that has lasted more than seven years and counting. Other factors also contributed—the bursting Internet bubble, the events of 9/11, a war that has made the U.S. unpopular abroad, the surging economies of China and India, and our own recent struggles with housing, credit and an overall stalled economy. Each is a piece of a larger puzzle that shows the global economy undergoing major changes, and we believe that the shifting role of the U.S. within this system is the critical event.
We have sought to meet the challenges these changes present by exporting our investment approach over the past decade. Our initial forays into international smaller companies generally involved those with a strong domestic presence, while more recently we have been expanding our scope to include companies whose activities are more international or centered in a particular overseas region such as Western Europe. Our evolution to international investing is rooted in the Royce tradition of attempting to capitalize on market inefficiencies to generate strong absolute returns, while always keeping a close eye on managing risk. We are focusing primarily on developed economies, where we see ample inefficiencies that could translate into opportunities to find attractively priced securities. Interestingly, the degree of inefficiency that we are seeing today in many international smaller companies reminds us of the small-cap market in the United States 15 to 20 years ago. It is possible that we may be in the early phases of a long-term outperformance cycle for smaller companies on a global | |
Interestingly, the degree of inefficiency that we are seeing today in many international smaller companies reminds us of the small-cap market in the United States 15 to 20 years ago. |
| | | |
| This page is not part of the 2008 Semiannual Report to Stockholders | 7 |
| | |
| | |
Our thinking was that the industry was both significant and robust enough to eventually recover, though we set no specific time table as to when.
More recently, certain industries in the consumer sectors appear to us to have been suffering from a similar dearth of positive expectations. The slowing economy, the credit crunch, the housing bubble and, somewhat ironically, rising energy costs have all convinced many observers that the American consumer is too financially challenged for consumer stocks to do anything more than languish at best. As was the case with energy earlier in the decade, we see a traditionally cyclical area at what looks to us like a potential low point in its business cycle.
Our practice in the past several months has been to root around various consumer industries looking for smaller-cap businesses that boast sterling financial characteristics in the form of strong balance sheets, established records of earnings and the ability to generate free cash flow.
The contrarian habit of scouring beaten-down industries that others are avoiding or ignoring is a hallmark of our time-tested value approach. By closely examining industries for which expectations are at a minimum, we stay true to our goal of trying to lower risk, which is a critical part of building strong, long-term returns for The Royce Funds. | | Letter to Our Stockholders
 scale, as international smaller companies follow their U.S. peers and potentially evolve into a professional asset class.
The number of opportunities in international investing is vast. There are more companies from which to choose and greater total market capitalization. Our research indicates that there are three times as many micro-cap companies—those with market capitalizations up to $500 million—in the developed international universe, with roughly twice the total market capitalization of the U.S. micro-cap universe. Similarly, in the upper tier of the international small-cap world—market caps of $500 million to $2.5 billion—there are more total companies (2,091 versus 1,119) and greater total market capitalization ($2.4 trillion versus $1.3 trillion domestically). However, average market caps tend to be smaller in the international market. For example, according to Reuters the international micro-cap market has a weighted average market cap of $219, compared to $257 domestically. Liquidity issues, therefore, tend to increase as we move down the market-cap scale, which contributes to greater pricing inefficiencies. Independent research is difficult to come by (when it is available at all). We believe that these differences give us the opportunity to find quality businesses that are not properly priced. In addition, a counter-weight to the liquidity challenges is a marketplace with generally higher yields. As of 6/30/08, the
|
| | | |
| | | DEVELOPED UNIVERSE BY MARKET CAPITALIZATION (EXCLUDING USA) June 30, 2008 |
| | |
|
| | | Market Cap Range
(Millions) | | Number
of Companies | | Total Market Cap
(Billions) | | Percent of
Companies | | Percent of
Total Market Cap |
| | | |
| | | $0 - $500 | | 14,148 | | 1,235 | | 81 | % | | 6 | % |
| | |
|
| | | $500 - $1,000 | | 1,106 | | 798 | | 6 | | | 4 | |
| | |
|
| | | $1,000 - $2,000 | | 753 | | 1,078 | | 4 | | | 5 | |
| | |
|
| | | $2,000 - $2,500 | | 232 | | 518 | | 1 | | | 2 | |
| | |
|
| | | $2,500 - $5,000 | | 507 | | 1,810 | | 3 | | | 8 | |
| | |
|
| | | $5,000 and over | | 755 | | 16,844 | | 4 | | | 76 | |
| | |
|
| | | Total | | 17,501 | | 22,283 | | 100 | | | 100 | |
| | |
|
| | | Source: Reuters | | | | | | | | | | |
| | | |
| | |
| 8 | This page is not part of the 2008 Semiannual Report to Stockholders |
| | |
| | | |
weighted average yield of the international small-cap universe was more than a percentage point higher than its domestic equivalent, 3.5% versus 2.1%.
Most importantly, we have found that quality is a truly international concept, an idea that recognizes no borders. The same attributes that attract us to domestic companies—strong balance sheets, an established record of earnings, the ability to generate free cash flow and excellent growth prospects—are readily found in international businesses. It really is a small world after all.
Bringing It all Back Home However promising the future for global opportunities in smaller companies, we think that far too much uncertainty currently exists here at home for the equity markets to settle down and establish a consistent, forward-looking direction. Although there have been plenty of pleasant surprises, we do not think the profit picture is strong enough to outweigh the anxiety that so many investors are feeling, especially about inflation. We see the next year or so being a very volatile period as the market continues to sort out the effects of the housing and credit bubbles and adjusts to a more inflationary environment.
It seems plain to us that investors will therefore be looking for lower risk in the form of company quality, especially if the bond markets begin to struggle, as many seem to expect. We see the next year or two as a time to prepare and position our portfolios for a market and economic rebound that looks at least a year or two away. We think that three to five years from now, investors will be mostly pleased with returns because we expect the economy to recover and think that the market will see it coming first. So while smaller companies should be all right in the short term, we suspect that the real action lies further ahead. In any case, we keep doing what we have always done—buying what we think are high-quality smaller companies trading at attractive prices. A volatile stock market has historically been a boon to value investors, and the current period will hopefully be no exception. Certain areas continue to offer what look to us like compelling bargains, both here and abroad. In addition, some industries have been doing very well, so we have been taking gains in some cases, holding in others and even building positions in companies that are managing their growth most effectively. Wide divergence in sector performance is something that we anticipate will be with us for a while, so we see ample opportunity out there on a global scale. | |
We see the next year or two as a time to prepare and position our portfolios for a market and economic rebound that looks at least a year or two away. We think that three to five years from now, investors will be mostly pleased with returns because we expect the economy to recover and think that the market will see it coming first. |
| | | |
Sincerely, | | | | | | | |
| | | | | | | | |
 | |  | |  | | | |
| Charles M. Royce | | W. Whitney George | | Jack E. Fockler, Jr. | | | |
| President | | Vice President | | Vice President | | | |
| | | | | | | | |
| | | | | | | | |
| July 31, 2008 | | | | | | | |
| This page is not part of the 2008 Semiannual Report to Stockholders | 9 |
Small-Cap Market Cycle Performance
We believe strongly in the idea that a long-term investment perspective is crucial for determining the success of a particular investment approach. Flourishing in an up market is wonderful. Surviving a bear market by losing less (or not at all) is at least as good. However, the true test of a portfolio’s mettle is performance over full market cycle periods, which include both up and down market periods. We believe that providing full market cycle results is more appropriate even than showing three- to five-year standardized returns because the latter periods may not include the up and down phases that constitute a full market cycle.
Since the Russell 2000’s inception on 12/31/78, value—as measured by the Russell 2000 Value Index—outperformed growth—as measured by the Russell 2000 Growth Index—in six of the small-cap index’s eight full market cycles. The most recently concluded cycle, which ran from 3/9/00 through 7/13/07, was the longest in the index’s history, and represented what we believe was a return to more historically typical performance in that value provided a significant advantage during its downturn (3/9/00–10/9/02) and for the full cycle. In contrast, the new market cycle that began on 7/13/07 has so far favored growth over value, an unsurprising development when one considers how thoroughly value dominated growth in the previous full cycle.
Peak-to-Peak
For the full cycle, value provided a sizeable margin over growth, which finished the period with a loss. Each of our closed-end funds held a sizeable performance advantage over the Russell 2000 on both an NAV (net asset value) and market price basis. On an NAV basis, Royce Focus Trust (+264.2%) was our best performer by a wide margin, followed by Royce Micro-Cap Trust (+175.9%) and Royce Value Trust (+161.3%).
Peak-to-Trough
In the new cycle’s somewhat brief peak-to-trough period, growth was ahead of value, though its advantage was slight and neither style index managed to provide positive performance during the downdraft. All of our closed-end funds outperformed the Russell 2000 in this period, with Royce Focus Trust again providing the best (albeit negative) performance for the period, followed by Royce Value Trust.
Trough-to-Current
We would caution against reading too much into a period that has lasted only slightly longer than a calendar quarter, but it is still worth noting that growth’s return more than tripled that of the value index. Only Royce Focus Trust outpaced the Russell 2000 during this period, with Royce Value Trust and Royce Micro-Cap Trust both underperforming.
Peak-to-Current
During this nearly year-long period, both value and growth posted negative returns, though growth lost less by a comfortable margin. Once again, Royce Focus Trust distinguished itself. Both it and Royce Value Trust outperformed the Russell 2000, while Royce Micro-Cap Trust lagged the small-cap index. |
 |
| |
ROYCE FUNDS NAV TOTAL RETURNS VS. RUSSELL 2000 INDEX:
MARKET CYCLE RESULTS |
|
| | | Peak-to-
Peak
3/9/00-
7/13/07 | | Peak-to-
Trough
7/13/07-
3/10/08 | | Trough-to-
Current
3/10/08-
6/30/08 | | Peak-to-
Current
7/13/07-
6/30/08 |
| |
| Russell 2000 | | 54.9 | % | | -24.1 | % | | 7.6 | % | | -18.4 | % |
|
| Russell 2000 Value | | 189.5 | | | -25.4 | | | 3.0 | | | -23.1 | |
|
| Russell 2000 Growth | | -14.8 | | | -23.0 | | | 11.9 | | | -13.8 | |
|
| Royce Value Trust | | 161.3 | | | -20.9 | | | 3.9 | | | -17.8 | |
|
| Royce Micro-Cap Trust | | 175.9 | | | -22.6 | | | 2.8 | | | -20.4 | |
|
| Royce Focus Trust | | 264.2 | | | -15.3 | | | 11.8 | | | -5.3 | |
|
The thoughts concerning recent market movements and future prospects for smaller-company stocks are solely those of Royce & Associates and, of course, there can be no assurance with regard to future market movements. Smaller-company stocks may involve considerably more risk than larger-cap stocks. Past performance is no guarantee of future results. See page 2 for important performance information for all of the above funds.
| 10 | This page is not part of the 2008 Semiannual Report to Stockholders |
| Semiannual Report to Stockholders | |
|
| | |
| Managers’ Discussions of Fund Performance | |
| | |
| Royce Value Trust | 12 |
| | |
| Royce Micro-Cap Trust | 14 |
| | |
| Royce Focus Trust | 16 |
| | |
| History Since Inception | 18 |
| | |
| Distribution Reinvestment and Cash Purchase Options | 19 |
| | |
| Schedules of Investments and Other Financial Statements | |
| | |
| Royce Value Trust | 21 |
| | |
| Royce Micro-Cap Trust | 36 |
| | |
| Royce Focus Trust | 51 |
| | |
| Notes to Performance and Other Important Information | 60 |
| | |
| Directors and Officers | 61 |
| | |
| Board Approval of Investment Advisory Agreements | 62 |
| | |
| 2008 Semiannual Report to Stockholders | 11 |
| |
| | | | | | | | | | |
| | | | | | | | | | |
| | AVERAGE ANNUAL NAV TOTAL RETURNS
Through 6/30/08 | |
| |
| |
| | Second Quarter 2008* | | -1.12 | % | |
| |
| |
| | Year-to-Date 2008* | | -11.67 | | |
| |
| |
| | One-Year | | -15.53 | | |
| |
| |
| | Three-Year | | 7.05 | | |
| |
| |
| | Five-Year | | 12.55 | | |
| |
| |
| | 10-Year | | 9.49 | | |
| |
| |
| | 15-Year | | 11.68 | | |
| |
| |
| | 20-Year | | 12.06 | | |
| |
| |
| | Since Inception (11/26/86) | | 11.65 | | |
| |
| |
| | * Not annualized | | | | |
| | | | | | | | | | |
| | CALENDAR YEAR NAV TOTAL RETURNS | |
| |
| |
| | Year | RVT | | Year | | RVT | |
| |
| |
| | 2007 | 5.0 | % | | 1998 | | 3.3 | % | |
| |
| |
| | 2006 | 19.5 | | | 1997 | | 27.5 | | |
| |
| |
| | 2005 | 8.4 | | | 1996 | | 15.5 | | |
| |
| |
| | 2004 | 21.4 | | | 1995 | | 21.6 | | |
| |
| |
| | 2003 | 40.8 | | | 1994 | | 0.1 | | |
| |
| |
| | 2002 | -15.6 | | | 1993 | | 17.3 | | |
| |
| |
| | 2001 | 15.2 | | | 1992 | | 19.3 | | |
| |
| |
| | 2000 | 16.6 | | | 1991 | | 38.4 | | |
| |
| |
| | 1999 | 11.7 | | | 1990 | | -13.8 | | |
| |
| |
| | | | | | | | | | |
| | TOP 10 POSITIONS
% of Net Assets Applicable
to Common Stockholders | |
| |
| |
| | AllianceBernstein Holding L.P. | | 1.8 | % | |
| |
| |
| | Ritchie Bros. Auctioneers | | 1.5 | | |
| |
| |
| | Lincoln Electric Holdings | | 1.4 | | |
| |
| |
| | Ash Grove Cement Cl. B | | 1.2 | | |
| |
| |
| | Nordson Corporation | | 1.2 | | |
| |
| |
| | SEACOR Holdings | | 1.1 | | |
| |
| |
| | PAREXEL International | | 1.0 | | |
| |
| |
| | Sotheby’s | | 1.0 | | |
| |
| |
| | Woodward Governor | | 1.0 | | |
| |
| |
| | Forward Air | | 0.9 | | |
| |
| |
| | | | | | | | | | |
| | PORTFOLIO SECTOR BREAKDOWN
% of Net Assets Applicable
to Common Stockholders | |
| |
| |
| | Technology | | 21.3 | % | |
| |
| |
| | Industrial Products | | 21.0 | | |
| |
| |
| | Industrial Services | | 16.3 | | |
| |
| |
| | Financial Intermediaries | | 13.1 | | |
| |
| |
| | Financial Services | | 12.3 | | |
| |
| |
| | Natural Resources | | 10.7 | | |
| |
| |
| | Health | | 6.2 | | |
| |
| |
| | Consumer Products | | 5.8 | | |
| |
| |
| | Consumer Services | | 3.9 | | |
| |
| |
| | Diversified Investment Companies | | 0.5 | | |
| |
| |
| | Utilities | | 0.2 | | |
| |
| |
| | Miscellaneous | | 2.6 | | |
| |
| |
| | Bond and Preferred Stocks | | 0.4 | | |
| |
| |
| | Cash and Cash Equivalents | | 7.3 | | |
| |
| |
| | | |
| | | |
| |
|
| |
| |
| Royce Value Trust |
|
| |
 Manager’s Discussion
During the first half of 2008, Royce Value Trust (RVT) lagged each of its small-cap benchmarks in a bear market environment. The Fund declined 11.7% on a net asset value (NAV) basis, and 10.7% on a market price basis, for the year-to-date period ended 6/30/08, compared with losses of 9.4% for the Russell 2000 and 7.1% for the S&P SmallCap 600 for the same period. In the first quarter downturn, RVT was down 10.7% on an NAV basis while its market price fell 13.0%, versus a decline of 9.9% for the Russell 2000 and 7.5% for the S&P 600. The second quarter was equally frustrating. After establishing a market trough on 3/10/08, smaller companies enjoyed a strong short-term rally that lasted into early June, when stock prices again dropped throughout most of the market. In the thus-volatile second quarter, RVT again underperformed its benchmarks on an NAV basis, declining 1.1% versus respective gains of 0.6% and 0.4% for the Russell 2000 and for the S&P 600, while outgaining each index on a market price basis, up 2.7%.
During the short-term period from the recent small-cap market trough on 3/10/08 through 6/30/08—a span nearly coterminus with the second quarter—RVT’s market price performance was strong on a relative basis, but the Fund underperformed on an NAV basis. From 3/10/08 through 6/30/08, RVT gained 3.9% on an NAV basis and was up 9.7% on a market price basis, compared with a 7.6% gain for the Russell 2000 and a 6.3% gain for the S&P 600. The Fund’s performance pattern since the beginning of the new small-cap market cycle on 7/13/07 has been disappointing so far in that |
| we would expect the Fund to better hold its value during a down-market period. From the July 2007 peak through 6/30/08, RVT was down 17.8% on an NAV basis, and 20.0% on a market price basis, compared to the Russell 2000’s 18.4% loss and the S&P 600’s decline of 17.1% during the same period. | | | | | |
| | GOOD IDEAS THAT WORKED
Net Realized and Unrealized Investment Return*
Year-to-Date Through 6/30/08 |
|
| Energy Conversion Devices | | | $4,292,218 |
|
| Cimarex Energy | | | 3,448,987 |
|
| CARBO Ceramics | | | 3,312,445 |
|
| Nordson Corporation | | | 2,604,509 |
|
| Helmerich & Payne | | | 2,586,241 |
|
| | *Includes dividends | | | |
| |
Over full market cycle and other longer-term periods, positive performances were more common, as was strong absolute and relative performance. RVT held a large advantage over both the Russell 2000 and the S&P 600 from the previous small-cap market peak on 3/9/00 through 6/30/08, gaining 114.7% on an NAV basis and 148.2% on a market price basis, while the Russell was up 26.4%, and the S&P 600 was up 76.2%. The Fund outperformed each of its benchmarks on an NAV basis for the three-, five-, 10-, 15-, 20-year and since inception (11/26/86) periods ended 6/30/08 and on a market price basis for each period except the three- and five-year intervals. RVT’s NAV average annual total return since inception was 11.7%. |
| |
Important Performance and Risk Information
All performance information reflects past performance, is presented on a total return basis and reflects the reinvestment of distributions. Past performance is no guarantee of future results. Current performance may be higher or lower than performance quoted. Returns as of the recent month-end may be obtained at www.roycefunds.com. The market price of the Fund’s shares will fluctuate, so that shares may be worth more or less than their original cost when sold. The Fund invests primarily in securities of small- and micro-cap companies, which may involve considerably more risk than investing in a more diversified portfolio of larger-cap companies. Standard deviation is a statistical measure within which a fund’s total returns have varied over time. The greater the standard deviation, the greater a fund’s volatility. |
12 | 2008 Semiannual Report to Stockholders
| |
| |
| Performance and Portfolio Review |
|
| |
Natural Resources was not only the Fund’s best-performing sector on a dollar basis in the first half, it was the only notable positive contributor to performance. The oil and gas industry and energy services group were the sector’s strongest areas, home to three of the Fund’s best-performing stocks. Cimarex Energy is an oil and gas exploration and production company that tapped a benefit from the record-shattering price of oil and a recovery in natural gas prices. CARBO Ceramics manufactures ceramic proppants used in hydraulic fracturing of natural gas and oil wells. We have long admired its strong niche, clean balance sheet and history of profitability. We were happy to see other investors catch on in the first half. We classify the Fund’s top gainer, Energy Conversion Devices, as a Technology holding, but, as its name suggests, it does much of its business supplying products and processes for alternative energy generation and storage. The firm’s new CEO concentrated efforts on its solar-energy production segments, which helped the firm generate positive earnings.
The Financial Services sector was home to the two holdings with the largest negative impact on first-half performance. AllianceBernstein Holding remains a healthy dividend payer and, in our view, a very well-run business. Its stock disappointed after the firm revised its earnings guidance for fiscal 2007 early in 2008. It was the Fund’s largest holding at the end of June. The share price of MoneyGram International was beaten down in 2007 as the result of exposure to subprime mortgages in its investment portfolio. |
| |
GOOD IDEAS AT THE TIME
Net Realized and Unrealized Investment Loss*
Year-to-Date Through 6/30/08 | | Matters grew worse in January 2008 when the company announced, after re-valuing the portfolio, that it had experienced additional losses due to the subprime contagion. Its already-plummeting share price fell precipitously through June. We increased our stake in January and February because we think that the firm’s various money transfer businesses are strong enough to help it eventually overcome its formidable problems. We were also somewhat encouraged by a large infusion of cash that the company received in March from Thomas Lee Partners and Goldman Sachs. |
|
| AllianceBernstein Holding L.P. | | | $6,222,308 |
|
| MoneyGram International | | | 5,798,413 |
|
| Rofin-Sinar Technologies | | | 4,349,521 |
|
| Sotheby’s | | | 4,189,440 |
|
| Advent Software | | | 3,950,988 |
|
| *Net of dividends | | | |
| |
| |
 |
| |
| |
| | FUND INFORMATION AND | |
| | PORTFOLIO DIAGNOSTICS | |
| |
| |
| | Average Market Capitalization* | $1,063 million | |
| |
| |
| | Weighted Average P/E Ratio** | | 15.2x | |
| |
| |
| | Weighted Average P/B Ratio | | 1.7x | |
| |
| |
| | Weighted Average Portfolio Yield | | 1.5% | |
| |
| |
| | Fund Net Assets | $1,238 million | |
| |
| |
| | Net Leverage† | | 14% | |
| |
| |
| | Turnover Rate | | 14% | |
| |
| |
| | Symbol | | | |
| | Market Price | | RVT | |
| | NAV | | XRVTX | |
| |
| |
| | * Geometrically calculated
| |
| | **The Fund’s P/E ratio calculation excludes companies with zero or negative earnings (11% of portfolio holdings as of 6/30/08).
| |
| | †Net leverage is the percentage, in excess of 100%, of the total value of equity type investments, divided by net assets, excluding preferred stock. | |
| | | |
| | CAPITAL STRUCTURE
Publicly Traded Securities Outstanding
at 6/30/08 at NAV or Liquidation Value | |
| |
| |
| | 61.8 million shares
of Common Stock | | $1,018 million | |
| |
| |
| | 5.90% Cumulative
Preferred Stock | | $220 million | |
| |
| |
| | | |
| | RISK/RETURN COMPARISON
Five-Year Period Ended 6/30/08 | |
| |
| |
| | | | Average Annual | | Standard | | Return | |
| | | | Total Return | | Deviation | | Efficiency* | |
| |
| |
| | RVT (NAV) | | | 12.55 | % | | | 14.05 | | | | 0.89 | | |
| |
| |
| | Russell 2000 | | | 10.29 | | | | 14.38 | | | | 0.72 | | |
| |
| |
| | *Return Efficiency is the average annual total return divided by the annualized standard deviation over a designated time period. | |
| | | |
 |
| | | |
| |
|
2008 Semiannual Report to Stockholders | 13
| |
| | | | | | | | | | |
| | | | | | | | | | |
| | AVERAGE ANNUAL NAV TOTAL RETURNS
Through 6/30/08 | |
| |
| |
| | Second Quarter 2008* | | -1.21 | % | |
| |
| |
| | Year-to-Date 2008* | | -11.70 | | |
| |
| |
| | One-Year | | -18.64 | | |
| |
| |
| | Three-Year | | 5.62 | | |
| |
| |
| | Five-Year | | 12.44 | | |
| |
| |
| | 10-Year | | 9.70 | | |
| |
| |
| | Since Inception (12/14/93) | | 12.08 | | |
| |
| |
| | *Not annualized | | | | |
| | | | | | | | | | |
| | CALENDAR YEAR NAV TOTAL RETURNS | |
| |
| |
| | Year | RMT | | Year | | RMT | |
| |
| |
| | 2007 | 0.6 | % | | 2000 | | 10.9 | % | |
| |
| |
| | 2006 | 22.5 | | | 1999 | | 12.7 | | |
| |
| |
| | 2005 | 6.8 | | | 1998 | | -4.1 | | |
| |
| |
| | 2004 | 18.7 | | | 1997 | | 27.1 | | |
| |
| |
| | 2003 | 55.5 | | | 1996 | | 16.6 | | |
| |
| |
| | 2002 | -13.8 | | | 1995 | | 22.9 | | |
| |
| |
| | 2001 | 23.4 | | | 1994 | | 5.0 | | |
| |
| |
| | | | | | | | | | |
| | TOP 10 POSITIONS
% of Net Assets Applicable
to Common Stockholders | |
| |
| |
| | Pegasystems | | 1.7 | % | |
| |
| |
| | ASA | | 1.5 | | |
| |
| |
| | Peerless Manufacturing | | 1.4 | | |
| |
| |
| | Seneca Foods Cl. B | | 1.3 | | |
| |
| |
| | Exponent | | 1.3 | | |
| |
| |
| | Dril-Quip | | 1.2 | | |
| |
| |
| | Pason Systems | | 1.2 | | |
| |
| |
| | GulfMark Offshore | | 1.1 | | |
| |
| |
| | Sapient Corporation | | 1.1 | | |
| |
| |
| | Weyco Group | | 1.1 | | |
| |
| |
| | | | | | | | | | |
| | PORTFOLIO SECTOR BREAKDOWN
% of Net Assets Applicable
to Common Stockholders | |
| |
| |
| | Technology | | 22.6 | % | |
| |
| |
| | Industrial Products | | 17.4 | | |
| |
| |
| | Industrial Services | | 15.0 | | |
| |
| |
| | Health | | 14.5 | | |
| |
| |
| | Natural Resources | | 13.9 | | |
| |
| |
| | Financial Intermediaries | | 11.0 | | |
| |
| |
| | Consumer Products | | 7.6 | | |
| |
| |
| | Financial Services | | 6.4 | | |
| |
| |
| | Consumer Services | | 5.8 | | |
| |
| |
| | Diversified Investment Companies | | 2.4 | | |
| |
| |
| | Miscellaneous | | 2.6 | | |
| |
| |
| | Preferred Stock | | 0.5 | | |
| |
| |
| | Cash and Cash Equivalents | | 1.3 | | |
| |
| |
| | | |
| | | |
|
| |
| |
| Royce Micro-Cap Trust |
|
| |
 Manager’s Discussion
During the first half of 2008, Royce Micro-Cap Trust (RMT) disappointed on both an absolute and relative basis. For the year-to-date period ended 6/30/08, the Fund was down 11.7% on a net asset value (NAV) basis and lost 7.9% on a market price basis, compared with a decline of 9.4% for its small-cap benchmark, the Russell 2000. RMT did outperform the Russell Microcap index, which was down 15.5% during the first half. In the first quarter downturn, RMT fell 10.6% on an NAV basis and 8.6% on a market price basis versus a decline of 9.9% for the small-cap index and 12.4% for the Russell Microcap index. After the recent small-cap trough on 3/10/08, share prices roared back throughout the market, then swooned again in the last several weeks of June. Although the Fund enjoyed strong performance on a market price basis during this mini-rally, it could not keep pace on an NAV basis. The Fund then proceeded to endure a miserable June on both an NAV and market price basis, while also underperforming the small-cap index. The upshot was a volatile second quarter in which RMT again underperformed its benchmark on an NAV basis, declining 1.2% versus a 0.6% gain for the Russell 2000 and 3.5% decline for the Russell Microcap index. Meanwhile, the Fund was up 0.7% on a market price basis in the second quarter. |
| |
| The Fund’s performance from the beginning of the new small-cap market cycle on 7/13/07 was also disappointing. From the July 2007 peak through 6/30/08, RMT fell 20.4% on an NAV basis and 25.5% based on market price, in both cases lagging its benchmark’s 18.4% loss for the same period, while beating the Russell Microcap index’s 26.8% decline. In addition, RMT trailed its benchmark from the recent small-cap trough on 3/10/08, up 2.8% on an NAV basis and 5.6% on a market value basis, compared with a 7.6% gain for the Russell 2000 and a 2.3% gain for the Russell Microcap index. | | GOOD IDEAS THAT WORKED
Net Realized and Unrealized Investment Return*
Year-to-Date Through 6/30/08 |
|
| America’s Car-Mart | | | $995,191 |
|
| eResearch Technology | | | 984,316 |
|
| PharMerica Corporation | | | 871,000 |
|
| Trex Company | | | 805,000 |
|
| Pason Systems | | | 755,100 |
|
| *Includes dividends | | | |
Positive performances were more common over previous market cycle and other long-term periods. RMT held a large advantage over the Russell 2000 from the previous small-cap market peak on 3/9/00 through 6/30/08, gaining 119.7% on an NAV basis and 143.3% based on its market price, while its benchmark was up 26.4%. (Data for the Russell Microcap index only goes back to 2002.) While its recent performance was disappointing, we were pleased with the Fund’s longer-term record. On an NAV basis, RMT outperformed the Russell 2000 for the three-, five-, 10-year and since inception (12/14/93) periods ended 6/30/08 and beat the small-cap index in each of those time spans save the three-year period on a market price basis. The Fund’s NAV average annual total return since inception was 12.1%.
|
| |
Important Performance and Risk Information
All performance information reflects past performance, is presented on a total return basis and reflects the reinvestment of distributions. Past performance is no guarantee of future results. Current performance may be higher or lower than performance quoted. Returns as of the recent month-end may be obtained at www.roycefunds.com. The market price of the Fund’s shares will fluctuate, so that shares may be worth more or less than their original cost when sold. The Fund normally invests in micro-cap companies, which may involve considerably more risk than investing in a more diversified portfolio of larger-cap companies. Standard deviation is a statistical measure within which a fund’s total returns have varied over time. The greater the standard deviation, the greater a fund’s volatility. |
14 | 2008 Semiannual Report to Stockholders
| | |
| |
| Performance and Portfolio Review |
|
| |
Natural Resources was by far the Fund’s best performing sector on a dollar basis during the first half, led by the energy services group and the oil and gas industry. Pason Systems benefited from increased demand for its specialized oilfield drilling instrumentation systems for use on land-based drilling rigs. The Diversified Investment Companies sector also made a positive dollar-based contribution, primarily the result of strong results from holdings in closed-end funds. In the otherwise dismal Consumer Services sector, automotive retailer America’s Car-Mart was the Fund’s best performer on a dollar basis in the first half. Specializing in low-end cars drove its success in a distressed auto market especially sensitive to gas-price increases. Its earnings tripled in the second quarter, putting its stock price in the fast lane. We took gains in May and June, but still held a good-sized position at the end of June.
Making the largest dollar-based negative impact on first-half performance was TravelCenters of America, which primarily operates truck stops, gas stations and restaurants along U.S. interstates. We first purchased shares in RMT’s portfolio in February 2008. The company acquired its chief rival in May 2007, and its stock price mostly fell from around that time through the end of June 2008. Ongoing losses over the last several quarters, as well as reduced highway traffic—the result of soaring gas prices—probably also had an effect on its stalled share price during the first half of 2008. We liked the strong balance sheet and positive earnings history of Medical Action Industries, which manufactures disposable medical products primarily in the U.S.
|
GOOD IDEAS AT THE TIME
Net Realized and Unrealized Investment Loss*
Year-to-Date Through 6/30/08 | | Although still posting positive earnings, it endured manufacturing inefficiencies that the firm expected to continue through 2008, as well as the increased cost of resin (necessary in the manufacture of plastic products), and increased shipping costs for its products made in China. The Technology sector posted significant net losses on a dollar basis from the telecommunications group and the aerospace and defense industry. Sapient Corporation, which offers brand and marketing strategies, as well as business and IT services, was among the biggest disappointments for the period. In January, lower-than-expected earnings helped its stock price to plunge. |
|
| TravelCenters of America | | $ | 1,400,112 |
|
| Medical Action Industries | | | 1,312,620 |
|
| Epoch Holding Corporation | | | 1,235,160 |
|
| Tennant Company | | | 1,231,272 |
|
| Sapient Corporation | | | 1,195,000 |
|
| *Net of dividends | | | |
| |
 |
| |
| | | | | | | | | | | | | | | |
| | | | | | | | | | | | | | | |
| | FUND INFORMATION AND | |
| | PORTFOLIO DIAGNOSTICS | |
| |
| |
| | Average Market Capitalization* | | $283 million | |
| |
| |
| | Weighted Average P/E Ratio** | | 16.2x | |
| |
| |
| | Weighted Average P/B Ratio | | 1.4x | |
| |
| |
| | Weighted Average Portfolio Yield | | 1.0% | |
| |
| |
| | Fund Net Assets | | $345 million | |
| |
| |
| | Net Leverage† | | 20% | |
| |
| |
| | Turnover Rate | | 41% | |
| |
| |
| | Symbol | | | |
| | Market Price | | RMT | |
| | NAV | | XOTCX | |
| |
| |
| | *Geometrically calculated
| |
| | **The Fund’s P/E ratio calculation excludes companies with zero or negative earnings (21% of portfolio holdings as of 6/30/08).
| |
| | †Net leverage is the percentage, in excess of 100%, of the total value of equity type investments, divided by net assets, excluding preferred stock. | |
| | | |
| | CAPITAL STRUCTURE
Publicly Traded Securities Outstanding
at 6/30/08 at NAV or Liquidation Value | |
| |
| |
| | 25.4 million shares
of Common Stock | | | | $285 million | | |
| |
| |
| | 6.00% Cumulative
Preferred Stock | | | | $60 million | | |
| |
| |
| | | |
| | RISK/RETURN COMPARISON
Five-Year Period Ended 6/30/08 | |
| |
| |
| | | | Average Annual | | Standard | | Return | |
| | | | Total Return | | Deviation | | Efficiency* | |
| |
| |
| | RMT (NAV) | | | 12.44 | % | | | 14.16 | | | | 0.88 | | |
| |
| |
| | Russell 2000 | | | 10.29 | | | | 14.38 | | | | 0.72 | | |
| |
| |
| | *Return Efficiency is the average annual total return divided by the annualized standard deviation over a designated time period. | |
| | | |
 |
| | | |
| |
|
2008 Semiannual Report to Stockholders | 15
| |
| | | | | | | | | | |
| | | | | | | | | | |
| | AVERAGE ANNUAL NAV TOTAL RETURNS
Through 6/30/08 | |
| |
| |
| | Second Quarter 2008* | | 8.03 | % | |
| |
| |
| | Year-to-Date 2008* | | 2.28 | | |
| |
| |
| | One-Year | | -1.01 | | |
| |
| |
| | Three-Year | | 17.18 | | |
| |
| |
| | Five-Year | | 20.52 | | |
| |
| |
| | 10-Year | | 12.83 | | |
| |
| |
| | Since Inception (11/1/96)† | | 13.73 | | |
| |
| |
| | * Not annualized | | | | |
| | † Royce & Associates assumed investment management responsibility for the Fund on 11/1/96. |
| | | | | | | | | | |
| | CALENDAR YEAR NAV TOTAL RETURNS | |
| |
| |
| | Year | | FUND | Year | | FUND | |
| |
| |
| | 2007 | | 12.2 | % | 2001 | | 10.0 | % | |
| |
| |
| | 2006 | | 16.3 | | 2000 | | 20.9 | | |
| |
| |
| | 2005 | | 13.3 | | 1999 | | 8.7 | | |
| |
| |
| | 2004 | | 29.2 | | 1998 | | -6.8 | | |
| |
| |
| | 2003 | | 54.3 | | 1997 | | 20.5 | | |
| |
| |
| | 2002 | | -12.5 | | | | | | |
| |
| |
| | | | | | | | | | |
| | TOP 10 POSITIONS | |
| | % of Net Assets Applicable | |
| | to Common Stockholders | |
| |
| |
| | Australian Government 7.50% Bond | | 5.8 | % | |
| |
| |
| | Kennedy-Wilson Conv. | | 5.5 | | |
| |
| |
| | Reliance Steel & Aluminum | | 4.6 | | |
| |
| |
| | Unit Corporation | 4.5 | | |
| |
| |
| | Sims Group ADR | | 3.6 | | |
| |
| |
| | Ensign Energy Services | | 3.3 | | |
| |
| |
| | Knight Capital Group Cl. A | | 3.2 | | |
| |
| |
| | Trican Well Service | | 3.0 | | |
| |
| |
| | Gammon Gold | | 2.9 | | |
| |
| |
| | Lincoln Electric Holdings | | 2.8 | | |
| |
| |
| | | | | | | | | | |
| | PORTFOLIO SECTOR BREAKDOWN
% of Net Assets Applicable
to Common Stockholders | |
| |
| |
| | Natural Resources | | 29.2 | % | |
| |
| |
| | Industrial Products | | 24.3 | | |
| |
| |
| | Technology | | 11.5 | | |
| |
| |
| | Consumer Products | | 10.0 | | |
| |
| |
| | Industrial Services | | 8.5 | | |
| |
| |
| | Financial Intermediaries | | 6.2 | | |
| |
| |
| | Health | | 3.4 | | |
| |
| |
| | Financial Services | | 2.3 | | |
| |
| |
| | Bond and Preferred Stock | | 11.1 | | |
| |
| |
| | Cash and Cash Equivalents | | 6.3 | | |
| |
| |
| | | |
| | | |
| |
|
| |
| |
| Royce Focus Trust |
|
| |
 Manager’s Discussion
The first half of 2008 was a good time for the contrarian approach we use in Royce Focus Trust (FUND). For the year-to-date period ended 6/30/08, the Fund was up 2.3% on a net asset value (NAV) basis and 1.4% on a market price basis, in both cases ahead of the 9.4% loss for its small-cap benchmark, the Russell 2000, during the same period. While the Russell 2000 fell 9.9% in the difficult first quarter, the Fund held up well, down 5.3% on an NAV basis and 8.4% on a market price basis. Following the small-cap market trough on 3/10/08, equities rallied through the beginning of June. After losing less in the first quarter, FUND was also able to build on its advantage during April and May. When share prices tumbled again in June, the Fund followed suit, though its NAV performance was better than that of its benchmark (-5.0% versus -7.7%). The end result for the volatile second quarter was both significant relative outperformance and strong absolute performance—FUND gained 8.0% on an NAV basis and 10.6% on a market price basis during the second quarter, compared to a gain of 0.6% for the Russell 2000. Smaller stocks established a new peak on 7/13/07. With this new peak, the previous small-cap cycle that began with the peak on 3/9/00 came to a close and a new cycle, which has been marked by high volatility and mostly negative returns, got under way. From 7/13/07 through 6/30/08, the Fund was down 5.3% on |
| an NAV basis and fell 6.5% on a market price basis versus a loss of 18.4% for its small-cap benchmark. In the short-term period from the recent small-cap market trough on 3/10/08 through 6/30/08, FUND gained 11.8% on an NAV basis and 14.0% on a market price basis versus a 7.6% gain for the Russell 2000. We were very pleased with the Fund’s recent results, especially in the more volatile, downward-trending market that began with the new small-cap market cycle in July 2007 when the portfolio held its value well. | | GOOD IDEAS THAT WORKED
Net Realized and Unrealized Investment Return*
Year-to-Date Through 6/30/08 |
|
| Unit Corporation | | | $4,128,841 |
|
| Sims Group ADR | | | 3,298,213 |
|
| Reliance Steel & Aluminum | | | 2,309,000 |
|
| Schnitzer Steel Industries Cl. A | | | 2,241,024 |
|
| Ensign Energy Services | | | 1,633,792 |
|
| *Includes dividends | | | |
| | | | |
These results were consistent with FUND’s performance over longer-term periods, which offer a more meaningful gauge of its merits. From the previous small-cap market peak on 3/9/00 through 6/30/08, the Fund significantly outpaced its benchmark on both an NAV and market price basis. During this period, FUND gained 244.9% on an NAV basis and 310.8% on a market price basis compared to the Russell 2000’s 26.4% gain. This was a critical factor in the Fund’s outperformance of the small-cap index for the one-, three-, five, 10-year and since inception of our management (11/1/96) periods ended 6/30/08. FUND’s NAV average annual total return since inception was 13.7%.
The most significant dollar-based net losses during the first half came from the Consumer Products sector, home to RV (recreational vehicle) makers Thor Industries and Winnebago |
| |
Important Performance and Risk Information
All performance information reflects past performance, is presented on a total return basis and reflects the reinvestment of distributions. Past performance is no guarantee of future results. Current performance may be higher or lower than performance quoted. Returns as of the recent month-end may be obtained at www.roycefunds.com. The market price of the Fund’s shares will fluctuate, so that shares may be worth more or less than their original cost when sold. The Fund normally invests primarily in small-cap companies, which may involve considerably more risk than investing in a more diversified portfolio of larger-cap companies. Standard deviation is a statistical measure within which a fund’s total returns have varied over time. The greater the standard deviation, the greater a fund’s volatility. |
16 | 2008 Semiannual Report to Stockholders
| |
| |
| Performance and Portfolio Review |
|
| |
Industries. (Thor also makes small- and mid-sized buses, while Winnebago focuses solely on motor homes.) Although energy stocks were terrific performers in FUND’s portfolio, rising energy prices also contributed to each company’s dismal performance. Both have struggled in an inhospitable environment for their industry. We increased our stake in Thor Industries a bit in January and chose to hold on to Winnebago. At the end of June, we thought that both were capable of an eventual rebound. Elsewhere in the portfolio, Fronteer Development Group posted a sizeable net loss. The firm is a gold mining company with what we believe are several promising projects. Investors opted for a different point of view in the form of a mass exodus from its stock in February. At issue was the ownership of a uranium mine in which the firm holds an equity stake. We built our position in January and March before trimming it in June. At the end of the first half, we remained confident in the firm’s long-term prospects.
Unit Corporation is primarily a contract drilling company, but also runs its own oil and natural gas exploration business. The record-shattering price of oil and its own growing businesses helped its share price to climb during the first half. Although we took some gains in May, Unit was the Fund’s fourth-largest position at the end of June. Steel companies from the Industrial Products sector, such as Australian firm Sims Group, Reliance Steel & Aluminum and Schnitzer Steel Industries, continued to benefit from the weak U.S. dollar, which has made domestic steel and scrap metal attractively priced to BRIC (Brazil, Russia, India and China) and other developing countries.
|
GOOD IDEAS AT THE TIME
Net Realized and Unrealized Investment Loss*
Year-to-Date Through 6/30/08 | | After Metal Management merged with Australian scrap-metal business Sims Group in March 2008, the price of the latter moved up appreciably, no doubt reaping a benefit from its global presence in an increasingly international market. Reliance Steel & Aluminum provides metals processing services and distributor of metal products. Following a volatile 2007, the company’s stock price rose more or less steadily through the first six months of 2008 as investors took notice of its improved earnings. As with Sims, the firm’s global footprint seemed to boost its business. |
|
| Thor Industries | | | $2,436,777 |
|
| Winnebago Industries | | | 2,053,700 |
|
| Fronteer Development Group | | | 1,440,298 |
|
| LECG Corporation | | | 1,247,400 |
|
| Dynamic Materials | | | 1,166,833 |
|
| *Net of dividends | | | |
| |
 |
| |
| | | | | | | | | | | | | | | |
| | | | | | | | | | | | | | | |
| | FUND INFORMATION AND | |
| | PORTFOLIO DIAGNOSTICS | |
| |
| |
| | Average Market Capitalization* | | $1,386 million | |
| |
| |
| | Weighted Average P/E Ratio** | | 13.0x | |
| |
| |
| | Weighted Average P/B Ratio | | 2.2x | |
| |
| |
| | Weighted Average Portfolio Yield | | 1.4% | |
| |
| |
| | Fund Net Assets | | $193 million | |
| |
| |
| | Net Leverage† | | 9% | |
| |
| |
| | Turnover Rate | | 62% | |
| |
| |
| | Symbol | | | |
| | Market Price | | FUND | |
| | NAV | | XFUNX | |
| |
| |
| | *Geometrically calculated
| |
| | ** The Fund’s P/E ratio calculation excludes companies with zero or negative earnings (10% of portfolio holdings as of 6/30/08).
| |
| | †Net leverage is the percentage, in excess of 100%, of the total value of equity type investments, divided by net assets, excluding preferred stock. | |
| | | |
| | CAPITAL STRUCTURE
Publicly Traded Securities Outstanding
at 6/30/08 at NAV or Liquidation Value | |
| |
| |
| | 18.9 million shares of Common Stock | | $168 million | |
| |
| |
| | 6.00% Cumulative Preferred Stock | | $25 million | |
| |
| |
| | | |
| | RISK/RETURN COMPARISON
Five-Year Period Ended 6/30/08 | |
| |
| |
| | | | Average Annual | | Standard | | Return | |
| | | | Total Return | | Deviation | | Efficiency* | |
| |
| |
| | FUND (NAV) | | | 20.52 | % | | | 15.16 | | | | 1.35 | | |
| |
| |
| | Russell 2000 | | | 10.29 | | | | 14.38 | | | | 0.72 | | |
| |
| |
| | *Return Efficiency is the average annual total return divided by the annualized standard deviation over a designated time period. | |
| | | |
 |
| |
|
2008 Semiannual Report to Stockholders | 17
History Since Inception
The following table details the share accumulations by an initial investor in the Funds who reinvested all distributions (including fractional shares) and participated fully in primary subscriptions for each of the rights offerings. Full participation in distribution reinvestments and rights offerings can maximize the returns available to a long-term investor. This table should be read in conjunction with the Performance and Portfolio Reviews of the Funds.
| | | | | | Amount | | | Purchase | | | | | NAV | | | Market | |
| | History | | | Invested | | | Price* | | Shares | | | Value** | | | Value** | |
| Royce Value Trust | | | | | | | | | | | | | | | | | | | |
| 11/26/86 | | Initial Purchase | | | $ | 10,000 | | | $ | 10.000 | | 1,000 | | | $ | 9,280 | | | $ | 10,000 | |
| 10/15/87 | | Distribution $0.30 | | | | | | | | 7.000 | | 42 | | | | | | | | | |
| 12/31/87 | | Distribution $0.22 | | | | | | | | 7.125 | | 32 | | | | 8,578 | | | | 7,250 | |
| 12/27/88 | | Distribution $0.51 | | | | | | | | 8.625 | | 63 | | | | 10,529 | | | | 9,238 | |
| 9/22/89 | | Rights Offering | | | | 405 | | | | 9.000 | | 45 | | | | | | | | | |
| 12/29/89 | | Distribution $0.52 | | | | | | | | 9.125 | | 67 | | | | 12,942 | | | | 11,866 | |
| 9/24/90 | | Rights Offering | | | | 457 | | | | 7.375 | | 62 | | | | | | | | | |
| 12/31/90 | | Distribution $0.32 | | | | | | | | 8.000 | | 52 | | | | 11,713 | | | | 11,074 | |
| 9/23/91 | | Rights Offering | | | | 638 | | | | 9.375 | | 68 | | | | | | | | | |
| 12/31/91 | | Distribution $0.61 | | | | | | | | 10.625 | | 82 | | | | 17,919 | | | | 15,697 | |
| 9/25/92 | | Rights Offering | | | | 825 | | | | 11.000 | | 75 | | | | | | | | | |
| 12/31/92 | | Distribution $0.90 | | | | | | | | 12.500 | | 114 | | | | 21,999 | | | | 20,874 | |
| 9/27/93 | | Rights Offering | | | | 1,469 | | | | 13.000 | | 113 | | | | | | | | | |
| 12/31/93 | | Distribution $1.15 | | | | | | | | 13.000 | | 160 | | | | 26,603 | | | | 25,428 | |
| 10/28/94 | | Rights Offering | | | | 1,103 | | | | 11.250 | | 98 | | | | | | | | | |
| 12/19/94 | | Distribution $1.05 | | | | | | | | 11.375 | | 191 | | | | 27,939 | | | | 24,905 | |
| 11/3/95 | | Rights Offering | | | | 1,425 | | | | 12.500 | | 114 | | | | | | | | | |
| 12/7/95 | | Distribution $1.29 | | | | | | | | 12.125 | | 253 | | | | 35,676 | | | | 31,243 | |
| 12/6/96 | | Distribution $1.15 | | | | | | | | 12.250 | | 247 | | | | 41,213 | | | | 36,335 | |
| 1997 | | Annual distribution total $1.21 | | | | | | | | 15.374 | | 230 | | | | 52,556 | | | | 46,814 | |
| 1998 | | Annual distribution total $1.54 | | | | | | | | 14.311 | | 347 | | | | 54,313 | | | | 47,506 | |
| 1999 | | Annual distribution total $1.37 | | | | | | | | 12.616 | | 391 | | | | 60,653 | | | | 50,239 | |
| 2000 | | Annual distribution total $1.48 | | | | | | | | 13.972 | | 424 | | | | 70,711 | | | | 61,648 | |
| 2001 | | Annual distribution total $1.49 | | | | | | | | 15.072 | | 437 | | | | 81,478 | | | | 73,994 | |
| 2002 | | Annual distribution total $1.51 | | | | | | | | 14.903 | | 494 | | | | 68,770 | | | | 68,927 | |
| 1/28/03 | | Rights Offering | | | | 5,600 | | | | 10.770 | | 520 | | | | | | | | | |
| 2003 | | Annual distribution total $1.30 | | | | | | | | 14.582 | | 516 | | | | 106,216 | | | | 107,339 | |
| 2004 | | Annual distribution total $1.55 | | | | | | | | 17.604 | | 568 | | | | 128,955 | | | | 139,094 | |
| 2005 | | Annual distribution total $1.61 | | | | | | | | 18.739 | | 604 | | | | 139,808 | | | | 148,773 | |
| 2006 | | Annual distribution total $1.78 | | | | | | | | 19.696 | | 693 | | | | 167,063 | | | | 179,945 | |
| 2007 | | Annual distribution total $1.85 | | | | | | | | 19.687 | | 787 | | | | 175,469 | | | | 165,158 | |
| 2008 | | Year-to-date distribution total $0.92 | | | | | | | | 16.116 | | 515 | | | | | | | | | |
|
| 6/30/08 | | | | | $ | 21,922 | | | | | | 9,404 | | | $ | 154,978 | | | $ | 147,455 | |
|
| Royce Micro-Cap Trust |
| 12/14/93 | | Initial Purchase | | | $ | 7,500 | | | $ | 7.500 | | 1,000 | | | $ | 7,250 | | | $ | 7,500 | |
| 10/28/94 | | Rights Offering | | | | 1,400 | | | | 7.000 | | 200 | | | | | | | | | |
| 12/19/94 | | Distribution $0.05 | | | | | | | | 6.750 | | 9 | | | | 9,163 | | | | 8,462 | |
| 12/7/95 | | Distribution $0.36 | | | | | | | | 7.500 | | 58 | | | | 11,264 | | | | 10,136 | |
| 12/6/96 | | Distribution $0.80 | | | | | | | | 7.625 | | 133 | | | | 13,132 | | | | 11,550 | |
| 12/5/97 | | Distribution $1.00 | | | | | | | | 10.000 | | 140 | | | | 16,694 | | | | 15,593 | |
| 12/7/98 | | Distribution $0.29 | | | | | | | | 8.625 | | 52 | | | | 16,016 | | | | 14,129 | |
| 12/6/99 | | Distribution $0.27 | | | | | | | | 8.781 | | 49 | | | | 18,051 | | | | 14,769 | |
| 12/6/00 | | Distribution $1.72 | | | | | | | | 8.469 | | 333 | | | | 20,016 | | | | 17,026 | |
| 12/6/01 | | Distribution $0.57 | | | | | | | | 9.880 | | 114 | | | | 24,701 | | | | 21,924 | |
| 2002 | | Annual distribution total $0.80 | | | | | | | | 9.518 | | 180 | | | | 21,297 | | | | 19,142 | |
| 2003 | | Annual distribution total $0.92 | | | | | | | | 10.004 | | 217 | | | | 33,125 | | | | 31,311 | |
| 2004 | | Annual distribution total $1.33 | | | | | | | | 13.350 | | 257 | | | | 39,320 | | | | 41,788 | |
| 2005 | | Annual distribution total $1.85 | | | | | | | | 13.848 | | 383 | | | | 41,969 | | | | 45,500 | |
| 2006 | | Annual distribution total $1.55 | | | | | | | | 14.246 | | 354 | | | | 51,385 | | | | 57,647 | |
| 2007 | | Annual distribution total $1.35 | | | | | | | | 13.584 | | 357 | | | | 51,709 | | | | 45,802 | |
| 2008 | | Year-to-date distribution total $0.64 | | | | | | | | 10.837 | | 230 | | | | | | | | | |
|
| 6/30/08 | | | | | $ | 8,900 | | | | | | 4,066 | | | $ | 45,661 | | | $ | 42,164 | |
|
| Royce Focus Trust |
| 10/31/96 | | Initial Purchase | | | $ | 4,375 | | | $ | 4.375 | | 1,000 | | | $ | 5,280 | | | $ | 4,375 | |
| 12/31/96 | | | | | | | | | | | | | | | | 5,520 | | | | 4,594 | |
| 12/5/97 | | Distribution $0.53 | | | | | | | | 5.250 | | 101 | | | | 6,650 | | | | 5,574 | |
| 12/31/98 | | | | | | | | | | | | | | | | 6,199 | | | | 5,367 | |
| 12/6/99 | | Distribution $0.145 | | | | | | | | 4.750 | | 34 | | | | 6,742 | | | | 5,356 | |
| 12/6/00 | | Distribution $0.34 | | | | | | | | 5.563 | | 69 | | | | 8,151 | | | | 6,848 | |
| 12/6/01 | | Distribution $0.14 | | | | | | | | 6.010 | | 28 | | | | 8,969 | | | | 8,193 | |
| 12/6/02 | | Distribution $0.09 | | | | | | | | 5.640 | | 19 | | | | 7,844 | | | | 6,956 | |
| 12/8/03 | | Distribution $0.62 | | | | | | | | 8.250 | | 94 | | | | 12,105 | | | | 11,406 | |
| 2004 | | Annual distribution total $1.74 | | | | | | | | 9.325 | | 259 | | | | 15,639 | | | | 16,794 | |
| 5/6/05 | | Rights offering | | | | 2,669 | | | | 8.340 | | 320 | | | | | | | | | |
| 2005 | | Annual distribution total $1.21 | | | | | | | | 9.470 | | 249 | | | | 21,208 | | | | 20,709 | |
| 2006 | | Annual distribution total $1.57 | | | | | | | | 9.860 | | 357 | | | | 24,668 | | | | 27,020 | |
| 2007 | | Annual distribution total $2.01 | | | | | | | | 9.159 | | 573 | | | | 27,679 | | | | 27,834 | |
| 2008 | | Year-to-date distribution total $0.25 | | | | | | | | 8.497 | | 92 | | | | | | | | | |
|
| 6/30/08 | | | | | $ | 7,044 | | | | | | 3,195 | | | $ | 28,308 | | | $ | 28,212 | |
|
| * | | Beginning with the 1997 (RVT), 2002 (RMT) and 2004 (FUND) distributions, the purchase price of distributions is a weighted average of the distribution reinvestment prices for the year. |
| ** | | Other than for initial purchase and June 30, 2008, values are stated as of December 31 of the year indicated, after reinvestment of distributions. |
| | | |
| 18 | | | 2008 Semiannual Report to Stockholders |
Distribution Reinvestment and Cash Purchase Options |
|
Why should I reinvest my distributions?
By reinvesting distributions, a stockholder can maintain an undiluted investment in the Fund. The regular reinvestment of distributions has a significant impact on stockholder returns. In contrast, the stockholder who takes distributions in cash is penalized when shares are issued below net asset value to other stockholders. How does the reinvestment of distributions from the Royce closed-end funds work?
The Funds automatically issue shares in payment of distributions unless you indicate otherwise. The shares are generally issued at the lower of the market price or net asset value on the valuation date. How does this apply to registered stockholders?
If your shares are registered directly with a Fund, your distributions are automatically reinvested unless you have otherwise instructed the Funds’ transfer agent, Computershare, in writing. A registered stockholder also has the option to receive the distribution in the form of a stock certificate or in cash if Computershare is properly notified. What if my shares are held by a brokerage firm or a bank?
If your shares are held by a brokerage firm, bank, or other intermediary as the stockholder of record, you should contact your brokerage firm or bank to be certain that it is automatically reinvesting distributions on your behalf. If they are unable to reinvest distributions on your behalf, you should have your shares registered in your name in order to participate. What other features are available for registered stockholders?
The Distribution Reinvestment and Cash Purchase Plans also allow registered stockholders to make optional cash purchases of shares of a Fund’s common stock directly through Computershare on a monthly basis, and to deposit certificates representing your Fund shares with Computershare for safekeeping. The Funds’ investment adviser is absorbing all commissions on optional cash purchases under the Plans through December 31, 2008. | | How do the Plans work for registered stockholders?
Computershare maintains the accounts for registered stockholders in the Plans and sends written confirmation of all transactions in the account. Shares in the account of each participant will be held by Computershare in non-certificated form in the name of the participant, and each participant will be able to vote those shares at a stockholder meeting or by proxy. A participant may also send other stock certificates held by them to Computershare to be held in non-certificated form. There is no service fee charged to participants for reinvesting distributions. If a participant elects to sell shares from a Plan account, Computershare will deduct a $2.50 fee plus brokerage commissions from the sale transaction. If a nominee is the registered owner of your shares, the nominee will maintain the accounts on your behalf. How can I get more information on the Plans?
You can call an Investor Services Representative at (800) 221-4268 or you can request a copy of the Plan for your Fund from Computershare. All correspondence (including notifications) should be directed to: [Name of Fund] Distribution Reinvestment and Cash Purchase Plan, c/o Computershare, PO Box 43010, Providence, RI 02940-3010, telephone (800) 426-5523. |
| | 2008 Semiannual Report to Stockholders | 19 |
This Page Left Intentionally Blank
| Royce Value Trust | | June 30, 2008 (unaudited) |
| | | SHARES | | | VALUE |
| COMMON STOCKS – 113.9% | | | | | |
| | | | | | |
| Consumer Products – 5.8% | | | | | |
| Apparel, Shoes and Accessories - 1.8% | | | | | |
Columbia Sportswear | | 34,600 | | $ | 1,271,550 |
Delta Apparel a,b,c | | 605,560 | | | 2,228,461 |
K-Swiss Cl. A | | 160,000 | | | 2,352,000 |
Lazare Kaplan International c | | 103,600 | | | 922,040 |
Polo Ralph Lauren | | 17,500 | | | 1,098,650 |
Timberland Company (The) Cl. A b,c | | 17,500 | | | 286,125 |
Tod’s | | 35,000 | | | 1,922,641 |
Weyco Group | | 307,992 | | | 8,171,027 |
| | | | |
|
| | | | | | 18,252,494 |
| | | | |
|
| Collectibles - 0.5% | | | | | |
Leapfrog Enterprises Cl. A b,c | | 175,000 | | | 1,456,000 |
Russ Berrie & Company c | | 417,000 | | | 3,323,490 |
| | | | |
|
| | | | | | 4,779,490 |
| | | | |
|
| Consumer Electronics - 0.8% | | | | | |
Dolby Laboratories Cl. A c | | 153,900 | | | 6,202,170 |
DTS b,c | | 64,100 | | | 2,007,612 |
| | | | |
|
| | | | | | 8,209,782 |
| | | | |
|
| Food/Beverage/Tobacco - 0.6% | | | | | |
B&G Foods (Units) | | 120,100 | | | 2,041,700 |
B&G Foods Cl. A | | 51,300 | | | 479,142 |
Hershey Creamery | | 709 | | | 1,488,900 |
Seneca Foods Cl. A b,c | | 80,000 | | | 1,668,000 |
Seneca Foods Cl. B b,c | | 13,251 | | | 283,174 |
| | | | |
|
| | | | | | 5,960,916 |
| | | | |
|
| Health, Beauty and Nutrition - 0.0% | | | | | |
Nutraceutical International c | | 22,800 | | | 273,600 |
| | | | |
|
| Home Furnishing and Appliances - 1.1% | | | | | |
Aaron Rents | | 4,500 | | | 100,485 |
American Woodmark | | 123,335 | | | 2,606,069 |
Ekornes | | 110,000 | | | 1,619,807 |
Ethan Allen Interiors | | 65,800 | | | 1,618,680 |
Kimball International Cl. B | | 286,180 | | | 2,369,570 |
La-Z-Boy | | 68,200 | | | 521,730 |
†Mohawk Industries b,c | | 25,000 | | | 1,602,500 |
Nice | | 215,000 | | | 953,743 |
Universal Electronics b,c | | 10,000 | | | 209,000 |
| | | | |
|
| | | | | | 11,601,584 |
| | | | |
|
| Sports and Recreation - 1.0% | | | | | |
Beneteau | | 81,000 | | | 1,773,950 |
Coachmen Industries b,c | | 47,700 | | | 101,124 |
RC2 Corporation c | | 132,600 | | | 2,461,056 |
Sturm, Ruger & Company c | | 272,900 | | | 1,926,674 |
Thor Industries | | 110,900 | | | 2,357,734 |
Winnebago Industries | | 97,500 | | | 993,525 |
| | | | |
|
| | | | | | 9,614,063 |
| | | | |
|
| Total (Cost $57,925,364) | | | | | 58,691,929 |
| | | | |
|
| | | | | | |
| Consumer Services – 3.9% | | | | | |
| Direct Marketing - 0.3% | | | | | |
Manutan International | | 8,945 | | | 647,839 |
| | | SHARES | | | VALUE |
| Consumer Services (continued) | | | | | |
| Direct Marketing (continued) | | | | | |
Takkt | | 130,000 | | $ | 2,290,354 |
| | | | |
|
| | | | | | 2,938,193 |
| | | | |
|
| Leisure and Entertainment - 0.0% | | | | | |
Shuffle Master b,c | | 15,000 | | | 74,100 |
| | | | |
|
| Media and Broadcasting - 0.1% | | | | | |
Cox Radio Cl. A b,c | | 23,000 | | | 271,400 |
Discovery Holding Company Cl. B b,c | | 36,600 | | | 827,526 |
| | | | |
|
| | | | | | 1,098,926 |
| | | | |
|
| Online Commerce - 0.1% | | | �� | | |
CryptoLogic | | 200 | | | 2,872 |
FTD Group b | | 55,000 | | | 733,150 |
| | | | |
|
| | | | | | 736,022 |
| | | | |
|
| Restaurants and Lodgings - 0.6% | | | | | |
Benihana b,c | | 3,300 | | | 20,658 |
CEC Entertainment b,c | | 116,000 | | | 3,249,160 |
Steak n Shake c | | 198,000 | | | 1,253,340 |
Tim Hortons | | 65,000 | | | 1,864,850 |
| | | | |
|
| | | | | | 6,388,008 |
| | | | |
|
| Retail Stores - 2.8% | | | | | |
America’s Car-Mart b,c | | 65,400 | | | 1,171,968 |
AnnTaylor Stores c | | 50,000 | | | 1,198,000 |
Bulgari | | 322,000 | | | 3,252,233 |
CarMax b,c | | 120,000 | | | 1,702,800 |
Charming Shoppes b,c | | 22,800 | | | 104,652 |
Children’s Place Retail Stores c | | 13,670 | | | 493,487 |
Dress Barn (The) b,c | | 287,280 | | | 3,843,806 |
Fielmann | | 22,000 | | | 1,607,893 |
Gander Mountain c | | 53,300 | | | 196,677 |
Lewis Group | | 518,000 | | | 2,183,142 |
Pier 1 Imports c | | 626,200 | | | 2,154,128 |
Stein Mart b,c | | 182,800 | | | 824,428 |
Tiffany & Co. | | 158,700 | | | 6,467,025 |
† Tractor Supply b,c | | 21,200 | | | 615,648 |
Urban Outfitters b,c | | 27,000 | | | 842,130 |
West Marine c | | 131,100 | | | 537,510 |
Wet Seal (The) Cl. A c | | 162,000 | | | 772,740 |
| | | | |
|
| | | | | | 27,968,267 |
| | | | |
|
| Total (Cost $44,701,966) | | | | | 39,203,516 |
| | | | |
|
| | | | | | |
| Diversified Investment Companies – 0.5% | | | | | |
| Closed-End Funds - 0.5% | | | | | |
Central Fund of Canada Cl. A | | 211,500 | | | 2,738,925 |
Kohlberg Capital | | 209,884 | | | 2,098,840 |
| | | | |
|
| Total (Cost $4,642,086) | | | | | 4,837,765 |
| | | | |
|
| | | | | | |
| Financial Intermediaries – 13.1% | | | | | |
| Banking - 5.5% | | | | | |
Abigail Adams National Bancorp | | 160,500 | | | 1,500,675 |
Ameriana Bancorp | | 40,000 | | | 380,000 |
Banca Finnat Euramerica | | 500,000 | | | 577,036 |
Bank of N.T. Butterfield & Son | | 446,875 | | | 6,613,750 |
Bank Sarasin & Cie Cl. B | | 15,000 | | | 674,710 |
Banque Privee Edmond de Rothschild | | 17 | | | 632,372 |
| THE ACCOMPANYING NOTES ARE AN INTEGRAL PART OF THESE FINANCIAL STATEMENTS. | 2008 Semiannual Report to Stockholders | | | 21 |
Royce Value Trust
| | | SHARES | | | VALUE |
| Financial Intermediaries (continued) | | | | | |
| Banking (continued) | | | | | |
BB Holdings c | | 289,400 | | $ | 1,311,404 |
BOK Financial | | 164,227 | | | 8,777,933 |
Boston Private Financial Holdings | | 203,000 | | | 1,151,010 |
Cadence Financial | | 40,300 | | | 436,449 |
Center Bancorp | | 66,811 | | | 584,596 |
Centrue Financial | | 82,200 | | | 895,980 |
CFS Bancorp | | 265,000 | | | 3,124,350 |
CNB Financial | | 11,116 | | | 157,180 |
Commercial National Financial | | 54,900 | | | 818,010 |
Farmers & Merchants Bank of Long | | | | | |
Beach | | 1,200 | | | 5,760,000 |
Fauquier Bankshares | | 160,800 | | | 2,588,880 |
Hawthorn Bancshares | | 44,400 | | | 1,121,988 |
Heritage Financial | | 20,615 | | | 326,748 |
HopFed Bancorp | | 112,500 | | | 1,549,125 |
Jefferson Bancshares | | 32,226 | | | 295,835 |
Kearny Financial | | 60,862 | | | 669,482 |
Mechanics Bank (The) | | 200 | | | 3,410,000 |
Nexity Financial c | | 109,999 | | | 511,495 |
Old Point Financial | | 25,000 | | | 445,000 |
Peapack-Gladstone Financial | | 10,000 | | | 219,700 |
Peoples Community Bancorp c | | 179,310 | | | 408,827 |
Timberland Bancorp a | | 469,200 | | | 3,762,984 |
Tompkins Financial | | 17,545 | | | 652,674 |
Vontobel Holding | | 15,600 | | | 532,955 |
W Holding Company | | 935,400 | | | 795,090 |
Whitney Holding | | 41,500 | | | 759,450 |
Wilber Corporation (The) | | 103,900 | | | 880,033 |
Wilmington Trust | | 131,000 | | | 3,463,640 |
Yadkin Valley Financial | | 3,800 | | | 45,410 |
| | | | |
|
| | | | | | 55,834,771 |
| | | | |
|
| Insurance - 4.5% | | | | | |
Alleghany Corporation c | | 16,644 | | | 5,526,640 |
Argo Group International Holdings b,c | | 64,751 | | | 2,173,043 |
Aspen Insurance Holdings | | 64,000 | | | 1,514,880 |
CNA Surety b,c | | 130,600 | | | 1,650,784 |
Enstar Group b,c | | 7,000 | | | 612,500 |
Erie Indemnity Cl. A | | 91,500 | | | 4,222,725 |
First American | | 20,000 | | | 528,000 |
Greenlight Capital Re Cl. A b,c | | 87,200 | | | 1,993,392 |
† Hilltop Holdings b,c | | 230,000 | | | 2,371,300 |
Independence Holding | | 317,658 | | | 3,103,519 |
IPC Holdings | | 27,000 | | | 716,850 |
LandAmerica Financial Group | | 10,000 | | | 221,900 |
Leucadia National | | 34,940 | | | 1,640,084 |
Markel Corporation c | | 11,100 | | | 4,073,700 |
Montpelier Re Holdings | | 66,000 | | | 973,500 |
NYMAGIC | | 232,200 | | | 4,448,952 |
Old Republic International | | 20,000 | | | 236,800 |
ProAssurance Corporation c | | 33,070 | | | 1,590,998 |
RLI | | 99,724 | | | 4,933,346 |
Stewart Information Services | | 100,000 | | | 1,934,000 |
Wesco Financial | | 4,750 | | | 1,814,500 |
| | | | |
|
| | | | | | 46,281,413 |
| | | | |
|
| | | SHARES | | | VALUE |
| Financial Intermediaries (continued) | | | | | |
| Real Estate Investment Trusts - 0.1% | | | | | |
Gladstone Commercial | | 34,700 | | $ | 601,351 |
| | | | |
|
| Securities Brokers - 2.4% | | | | | |
Broadpoint Securities Group b,c | | 200,100 | | | 400,200 |
Close Brothers Group | | 33,000 | | | 363,493 |
Cowen Group b,c | | 32,000 | | | 247,040 |
DundeeWealth | | 33,300 | | | 425,516 |
E*TRADE Financial b,c | | 75,000 | | | 235,500 |
Egyptian Financial Group-Hermes Holding | | | | | |
GDR | | 28,000 | | | 504,000 |
Evercore Partners Cl. A | | 308,500 | | | 2,930,750 |
HQ | | 26,000 | | | 429,559 |
Investcorp Bank GDR c | | 22,000 | | | 561,000 |
Investment Technology Group b,c | | 30,400 | | | 1,017,184 |
KBW b,c | | 70,058 | | | 1,441,794 |
LaBranche & Co b,c | | 137,000 | | | 969,960 |
Lazard Cl. A | | 176,700 | | | 6,034,305 |
† MF Global b,c | | 145,500 | | | 918,105 |
Oppenheimer Holdings Cl. A | | 30,000 | | | 847,800 |
optionsXpress Holdings | | 53,000 | | | 1,184,020 |
Penson Worldwide b,c | | 50,000 | | | 597,500 |
Phatra Securities | | 575,000 | | | 524,525 |
Piper Jaffray b,c | | 105,700 | | | 3,100,181 |
Shinko Securities | | 464,300 | | | 1,368,611 |
| | | | |
|
| | | | | | 24,101,043 |
| | | | |
|
| Securities Exchanges - 0.0% | | | | | |
MarketAxess Holdings c | | 67,000 | | | 506,520 |
| | | | |
|
| Other Financial Intermediaries - 0.6% | | | | | |
KKR Financial Holdings | | 481,404 | | | 5,054,742 |
KKR Private Equity Investors L.P. | | 105,000 | | | 1,338,750 |
| | | | |
|
| | | | | | 6,393,492 |
| | | | |
|
| Total (Cost $140,006,502) | | | | | 133,718,590 |
| | | | |
|
| | | | | | |
| Financial Services – 12.3% | | | | | |
| Diversified Financial Services - 0.6% | | | | | |
AmeriCredit Corporation b,c | | 18,870 | | | 162,660 |
Centerline Holding Company | | 59,600 | | | 99,532 |
Discover Financial Services | | 10,000 | | | 131,700 |
Encore Capital Group b,c | | 88,000 | | | 777,040 |
Municipal Mortgage & Equityb | | 40,300 | | | 118,885 |
Ocwen Financial b,c | | 173,600 | | | 807,240 |
World Acceptance b,c | | 133,700 | | | 4,501,679 |
| | | | |
|
| | | | | | 6,598,736 |
| | | | |
|
| Information and Processing - 1.7% | | | | | |
Broadridge Financial Solutions | | 30,000 | | | 631,500 |
Global Payments | | 68,500 | | | 3,192,100 |
Interactive Data | | 134,300 | | | 3,374,959 |
MoneyGram International c | | 428,500 | | | 386,507 |
MSCI Cl. A b,c | | 30,000 | | | 1,088,700 |
Paychex | | 30,000 | | | 938,400 |
PRG-Schultz International b,c | | 14,420 | | | 135,692 |
SEI Investments | | 306,800 | | | 7,215,936 |
| | | | |
|
| | | | | | 16,963,794 |
| | | | |
|
| Insurance Brokers - 0.9% | | | | | |
Brown & Brown | | 206,800 | | | 3,596,252 |
| 22 | | | 2008 Semiannual Report to Stockholders | THE ACCOMPANYING NOTES ARE AN INTEGRAL PART OF THESE FINANCIAL STATEMENTS. |
June 30, 2008 (unaudited)
| | | SHARES | | | VALUE |
| Financial Services (continued) | | | | | |
| Insurance Brokers (continued) | | | | | |
Crawford & Company Cl. A c | | 289,200 | | $ | 1,807,500 |
Crawford & Company Cl. B b,c | | 162,300 | | | 1,296,777 |
Gallagher (Arthur J.) & Co. | | 111,200 | | | 2,679,920 |
| | | | |
|
| | | | | | 9,380,449 |
| | | | |
|
| Investment Management - 7.8% | | | | | |
A.F.P. Provida ADR | | 16,100 | | | 411,033 |
Affiliated Managers Group b,c | | 28,500 | | | 2,566,710 |
AllianceBernstein Holding L.P. | | 333,100 | | | 18,213,908 |
Anima | | 736,402 | | | 1,669,578 |
AP Alternative Assets L.P. | | 315,600 | | | 3,471,600 |
Ashmore Group | | 80,000 | | | 344,988 |
Australian Wealth Management | | 291,000 | | | 361,262 |
Azimut Holding | | 53,000 | | | 466,880 |
BKF Capital Group b,c | | 227,050 | | | 467,723 |
Calamos Asset Management Cl. A | | 45,000 | | | 766,350 |
Candover Investments | | 10,500 | | | 412,432 |
CapMan Cl. B | | 632,000 | | | 2,487,633 |
Cockleshell c | | 337,644 | | | 366,532 |
Coronation Fund Managers | | 496,000 | | | 288,225 |
Deutsche Beteiligungs | | 95,000 | | | 2,402,140 |
Eaton Vance | | 172,800 | | | 6,870,528 |
Equity Trustees | | 23,477 | | | 490,636 |
F&C Asset Management | | 210,000 | | | 615,930 |
Federated Investors Cl. B | | 145,700 | | | 5,014,994 |
Fiducian Portfolio Services | | 227,000 | | | 500,511 |
GAMCO Investors Cl. A | | 133,600 | | | 6,629,232 |
GIMV | | 20,000 | | | 1,319,390 |
GP Investments BDR c | | 15,000 | | | 181,898 |
JAFCO | | 37,300 | | | 1,275,124 |
MVC Capital | | 484,200 | | | 6,628,698 |
New Star Asset Management Group | | 126,500 | | | 255,748 |
Onex Corporation | | 50,000 | | | 1,472,492 |
Perpetual | | 11,100 | | | 455,116 |
Pzena Investment Management Cl. A | | 238,700 | | | 3,045,812 |
Rathbone Brothers | | 28,000 | | | 517,283 |
RHJ International c | | 177,500 | | | 2,235,720 |
Schroders | | 150,000 | | | 2,730,825 |
SHUAA Capital | | 320,000 | | | 659,506 |
SPARX Group | | 7,020 | | | 2,426,275 |
Tasmanian Perpetual Trustees | | 115,000 | | | 551,224 |
Trust Company | | 65,500 | | | 533,728 |
Value Partners Group | | 520,000 | | | 446,824 |
| | | | |
|
| | | | | | 79,554,488 |
| | | | |
|
| Special Purpose Acquisition Corporation - 0.4% | | | | | |
Alternative Asset Management | | | | | |
Acquisition (Units) c | | 250,000 | | | 2,425,000 |
Prospect Acquisition (Units) c | | 150,000 | | | 1,434,000 |
| | | | |
|
| | | | | | 3,859,000 |
| | | | |
|
| Specialty Finance - 0.9% | | | | | |
Credit Acceptance b,c | | 214,601 | | | 5,485,201 |
MCG Capital | | 157,715 | | | 627,706 |
NGP Capital Resources | | 50,000 | | | 770,500 |
| | | SHARES | | | VALUE |
| Financial Services (continued) | | | | | |
| Specialty Finance (continued) | | | | | |
Portfolio Recovery Associates c | | 62,100 | | $ | 2,328,750 |
| | | | |
|
| | | | | | 9,212,157 |
| | | | |
|
| Total (Cost $130,560,196) | | | | | 125,568,624 |
| | | | |
|
| | | | | | |
| Health – 6.2% | | | | | |
| Commercial Services - 1.0% | | | | | |
PAREXEL International b,c | | 384,400 | | | 10,113,564 |
| | | | |
|
| Drugs and Biotech - 1.6% | | | | | |
Affymetrix b,c | | 10,000 | | | 102,900 |
Biovail Corporation | | 41,200 | | | 397,580 |
Endo Pharmaceuticals Holdings b,c | | 155,000 | | | 3,749,450 |
Genitope Corporation b,c | | 150,000 | | | 6,660 |
Human Genome Sciences b,c | | 90,000 | | | 468,900 |
K-V Pharmaceutical Cl. A b,c | | 51,500 | | | 995,495 |
Medicines Company (The) b,c | | 20,000 | | | 396,400 |
Mylan b,c | | 52,200 | | | 630,054 |
Myriad Genetics b,c | | 50,000 | | | 2,276,000 |
Ore Pharmaceuticals b,c | | 117,980 | | | 155,734 |
Perrigo Company | | 162,950 | | | 5,176,921 |
Pharmacyclics b,c | | 383,000 | | | 677,910 |
QLT c | | 114,070 | | | 391,260 |
Sinovac Biotech b,c | | 37,400 | | | 121,550 |
Sunesis Pharmaceuticals b,c | | 582,000 | | | 838,080 |
| | | | |
|
| | | | | | 16,384,894 |
| | | | |
|
| Health Services - 1.1% | | | | | |
Albany Molecular Research c | | 85,000 | | | 1,127,950 |
Chem Rx (Units) c | | 280,000 | | | 1,416,800 |
Cross Country Healthcare c | | 30,000 | | | 432,300 |
Gentiva Health Services c | | 30,150 | | | 574,357 |
HMS Holdings b,c | | 50,000 | | | 1,073,500 |
Lincare Holdings b,c | | 52,562 | | | 1,492,761 |
MedQuist c | | 73,893 | | | 580,060 |
On Assignment b,c | | 375,400 | | | 3,010,708 |
PharmaNet Development Group b,c | | 10,000 | | | 157,700 |
Res-Care b,c | | 65,460 | | | 1,163,879 |
† WellCare Health Plans b,c | | 5,000 | | | 180,750 |
| | | | |
|
| | | | | | 11,210,765 |
| | | | |
|
| Medical Products and Devices - 2.5% | | | | | |
Allied Healthcare Products c | | 180,612 | | | 1,228,161 |
ArthroCare Corporation b,c | | 10,000 | | | 408,100 |
Atrion Corporation | | 15,750 | | | 1,509,165 |
Bruker Corporation c | | 370,200 | | | 4,757,070 |
Coloplast Cl. B | | 17,000 | | | 1,482,287 |
CONMED Corporation b,c | | 81,500 | | | 2,163,825 |
Golden Meditech c | | 200,000 | | | 67,460 |
IDEXX Laboratories c | | 158,000 | | | 7,700,920 |
STERIS Corporation | | 98,600 | | | 2,835,736 |
Straumann Holding | | 1,000 | | | 239,636 |
Urologix b,c | | 445,500 | | | 815,265 |
Young Innovations | | 62,550 | | | 1,302,291 |
| THE ACCOMPANYING NOTES ARE AN INTEGRAL PART OF THESE FINANCIAL STATEMENTS. | 2008 Semiannual Report to Stockholders | | | 23 |
Royce Value Trust
| | | SHARES | | | VALUE |
| Health (continued) | | | | | |
| Medical Products and Devices (continued) | | | | | |
Zoll Medical b,c | | 40,400 | | $ | 1,360,268 |
| | | | |
|
| | | | | | 25,870,184 |
| | | | |
|
| Total (Cost $41,943,864) | | | | | 63,579,407 |
| | | | |
|
| | | | | | |
| Industrial Products – 21.0% | | | | | |
| Automotive - 2.2% | | | | | |
Copart c | | 153,100 | | | 6,555,742 |
ElringKlinger | | 15,000 | | | 1,421,493 |
Fuel Systems Solutions b,c | | 22,500 | | | 866,250 |
International Textile Group c | | 85,000 | | | 29,750 |
LKQ Corporation b,c | | 375,000 | | | 6,776,250 |
SORL Auto Parts b,c | | 54,600 | | | 292,656 |
Superior Industries International | | 98,400 | | | 1,660,992 |
WABCO Holdings | | 98,800 | | | 4,590,248 |
† Wonder Auto Technology b,c | | 13,400 | | | 94,202 |
| | | | |
|
| | | | | | 22,287,583 |
| | | | |
|
| Building Systems and Components - 1.1% | | | | | |
Decker Manufacturing | | 6,022 | | | 216,792 |
Heywood Williams Group c | | 958,837 | | | 272,155 |
NCI Building Systems b,c | | 13,900 | | | 510,547 |
Preformed Line Products | | 91,600 | | | 3,692,396 |
Simpson Manufacturing | | 293,400 | | | 6,965,316 |
| | | | |
|
| | | | | | 11,657,206 |
| | | | |
|
| Construction Materials - 2.1% | | | | | |
Ash Grove Cement Cl. B | | 50,518 | | | 12,073,802 |
Duratex | | 45,300 | | | 834,451 |
† Owens Corning b,c | | 25,000 | | | 568,750 |
Pretoria Portland Cement | | 375,000 | | | 1,374,042 |
United Rentals b,c | | 232,500 | | | 4,559,325 |
USG Corporation b,c | | 50,000 | | | 1,478,500 |
| | | | |
|
| | | | | | 20,888,870 |
| | | | |
|
| Industrial Components - 1.9% | | | | | |
CLARCOR | | 113,500 | | | 3,983,850 |
Donaldson Company | | 92,800 | | | 4,142,592 |
GrafTech International b,c | | 64,790 | | | 1,738,316 |
II-VI c | | 13,500 | | | 471,420 |
Mueller Water Products Cl. A | | 72,500 | | | 585,075 |
PerkinElmer | | 135,800 | | | 3,782,030 |
Powell Industries c | | 92,400 | | | 4,657,884 |
| | | | |
|
| | | | | | 19,361,167 |
| | | | |
|
| Machinery - 5.5% | | | | | |
Astec Industries b,c | | 20,000 | | | 642,800 |
Baldor Electric | | 62,900 | | | 2,200,242 |
Bell Equipment | | 200,000 | | | 910,600 |
Burnham Holdings Cl. A | | 117,964 | | | 1,557,125 |
Burnham Holdings Cl. B | | 36,000 | | | 475,200 |
Franklin Electric | | 104,800 | | | 4,064,144 |
Hardinge | | 26,193 | | | 344,962 |
Intermec b,c | | 23,000 | | | 484,840 |
Lincoln Electric Holdings | | 177,980 | | | 14,007,026 |
Manitou BF | | 65,000 | | | 1,947,517 |
Nordson Corporation | | 162,200 | | | 11,822,758 |
OSG Corporation | | 20,000 | | | 226,021 |
| | | SHARES | | | VALUE |
| Industrial Products (continued) | | | | | |
| Machinery (continued) | | | | | |
Rofin-Sinar Technologies c | | 236,000 | | $ | 7,127,200 |
Takatori Corporation | | 40,000 | | | 192,118 |
Williams Controls b,c | | 37,499 | | | 475,112 |
Woodward Governor | | 274,600 | | | 9,792,236 |
| | | | |
|
| | | | | | 56,269,901 |
| | | | |
|
| Metal Fabrication and Distribution - 1.4% | | | | | |
Central Steel & Wire | | 6,062 | | | 4,000,920 |
Commercial Metals | | 36,600 | | | 1,379,820 |
CompX International | | 292,300 | | | 1,695,340 |
Gerdau Ameristeel | | 61,100 | | | 1,179,230 |
NN | | 197,100 | | | 2,747,574 |
RBC Bearings b,c | | 45,000 | | | 1,499,400 |
Reliance Steel & Aluminum | | 25,920 | | | 1,998,173 |
| | | | |
|
| | | | | | 14,500,457 |
| | | | |
|
| Miscellaneous Manufacturing - 3.5% | | | | | |
Barnes Group | | 20,000 | | | 461,800 |
Brady Corporation Cl. A | | 188,400 | | | 6,505,452 |
Matthews International Cl. A | | 100,000 | | | 4,526,000 |
Mettler-Toledo International b,c | | 28,700 | | | 2,722,482 |
Peerless Manufacturing c | | 191,600 | | | 8,980,292 |
Rational | | 15,200 | | | 3,065,645 |
Raven Industries | | 86,200 | | | 2,825,636 |
Semperit AG Holding | | 50,000 | | | 1,957,043 |
Somfy | | 5,000 | | | 1,254,444 |
Synalloy Corporation | | 198,800 | | | 3,065,496 |
| | | | |
|
| | | | | | 35,364,290 |
| | | | |
|
| Paper and Packaging - 0.4% | | | | | |
Mayr-Melnhof Karton | | 38,000 | | | 3,589,150 |
| | | | |
|
| Pumps, Valves and Bearings - 1.5% | | | | | |
Graco | | 143,625 | | | 5,467,804 |
IDEX Corporation | | 54,000 | | | 1,989,360 |
Kaydon Corporation | | 76,900 | | | 3,953,429 |
Pfeiffer Vacuum Technology | | 35,000 | | | 3,630,369 |
| | | | |
|
| | | | | | 15,040,962 |
| | | | |
|
| Specialty Chemicals and Materials - 1.2% | | | | | |
Aceto Corporation | | 119,710 | | | 914,584 |
American Vanguard | | 26,666 | | | 327,992 |
Cabot Corporation | | 181,000 | | | 4,400,110 |
Hawkins | | 206,878 | | | 3,094,895 |
Migao Corporation c | | 12,700 | | | 105,117 |
† New Oriental Energy & Chemical b,c | | 1,000 | | | 5,270 |
Schulman (A.) | | 150,100 | | | 3,456,803 |
| | | | |
|
| | | | | | 12,304,771 |
| | | | |
|
| Textiles - 0.0% | | | | | |
Unific | | 145,100 | | | 365,652 |
| | | | |
|
| Other Industrial Products - 0.2% | | | | | |
Vacon | | 45,000 | | | 1,824,395 |
| | | | |
|
| Total (Cost $117,039,891) | | | | | 213,454,404 |
| | | | |
|
| | | | | | |
| Industrial Services – 16.3% | | | | | |
| Advertising and Publishing - 0.5% | | | | | |
Focus Media Holding ADR b,c | | 71,900 | | | 1,993,068 |
Lamar Advertising Cl. A c | | 45,000 | | | 1,621,350 |
| 24 | | | 2008 Semiannual Report to Stockholders | THE ACCOMPANYING NOTES ARE AN INTEGRAL PART OF THESE FINANCIAL STATEMENTS. |
June 30, 2008 (unaudited)
| | | SHARES | | | VALUE |
| Industrial Services (continued) | | | | | |
| Advertising and Publishing (continued) | | | | | |
MDC Partners Cl. A b,c | | 60,000 | | $ | 430,800 |
Sun-Times Media Group Cl. A b,c | | 180,000 | | | 88,200 |
ValueClick b,c | | 45,000 | | | 681,750 |
Voyager Learning b,c | | 150,000 | | | 757,500 |
| | | | |
|
| | | | | | 5,572,668 |
| | | | |
|
| Commercial Services - 9.2% | | | | | |
Animal Health International b,c | | 30,000 | | | 186,900 |
Canadian Solar b,c | | 50,000 | | | 2,009,500 |
ChinaCast Education b,c | | 35,700 | | | 149,583 |
Convergys Corporation b,c | | 121,000 | | | 1,798,060 |
Corinthian Colleges b,c | | 106,500 | | | 1,236,465 |
† CRA International b,c | | 79,287 | | | 2,866,225 |
Diamond Management & Technology Consultants | | 80,400 | | | 418,884 |
Forrester Research c | | 40,300 | | | 1,244,464 |
Gartner c | | 213,000 | | | 4,413,360 |
Global Sources b,c | | 3,900 | | | 59,202 |
Hackett Group b,c | | 655,000 | | | 3,759,700 |
Hewitt Associates Cl. A b,c | | 205,720 | | | 7,885,248 |
Iron Mountain b,c | | 210,862 | | | 5,598,386 |
ITT Educational Services c | | 95,000 | | | 7,849,850 |
Landauer | | 117,900 | | | 6,630,696 |
Learning Tree International b,c | | 53,400 | | | 913,140 |
Manpower | | 3,100 | | | 180,544 |
ManTech International Cl. A b,c | | 119,400 | | | 5,745,528 |
MAXIMUS | | 127,900 | | | 4,453,478 |
Michael Page International | | 397,000 | | | 1,848,411 |
Monster Worldwide b,c | | 24,800 | | | 511,128 |
MPS Group c | | 564,600 | | | 6,001,698 |
New Horizons Worldwide b,c | | 228,600 | | | 354,330 |
Ritchie Bros. Auctioneers | | 550,200 | | | 14,926,926 |
Robert Half International | | 65,500 | | | 1,570,035 |
Sotheby’s | | 371,600 | | | 9,799,092 |
Spherion Corporation b,c | | 53,000 | | | 244,860 |
TRC Companies c | | 3,600 | | | 14,472 |
Wright Express b,c | | 30,000 | | | 744,000 |
| | | | |
|
| | | | | | 93,414,165 |
| | | | |
|
| Engineering and Construction - 1.2% | | | | | |
Desarrolladora Homex ADR b,c | | 9,800 | | | 574,084 |
Fleetwood Enterprises c | | 234,300 | | | 613,866 |
HLS Systems International b,c | | 109,120 | | | 571,789 |
Integrated Electrical Services b,c | | 355,400 | | | 6,112,880 |
KBR | | 140,000 | | | 4,887,400 |
| | | | |
|
| | | | | | 12,760,019 |
| | | | |
|
| Food, Tobacco and Agriculture - 0.4% | | | | | |
† Agria Corporation ADR b,c | | 21,900 | | | 93,732 |
Alico | | 27,000 | | | 935,820 |
Astral Foods | | 80,000 | | | 929,758 |
† HQ Sustainable Maritime Industries b,c | | 17,000 | | | 225,250 |
MGP Ingredients | | 127,400 | | | 738,920 |
Origin Agritech b,c | | 105,100 | | | 628,498 |
Zhongpin c | | 9,400 | | | 117,500 |
| | | | |
|
| | | | | | 3,669,478 |
| | | | |
|
| | | SHARES | | | VALUE |
| Industrial Services (continued) | | | | | |
| Industrial Distribution - 0.7% | | | | | |
Lawson Products | | 161,431 | | $ | 4,000,260 |
MSC Industrial Direct Cl. A | | 74,300 | | | 3,277,373 |
| | | | |
|
| | | | | | 7,277,633 |
| | | | |
|
| Printing - 0.1% | | | | | |
Bowne & Co. | | 68,100 | | | 868,275 |
| | | | |
|
| Transportation and Logistics - 4.2% | | | | | |
Alexander & Baldwin | | 60,000 | | | 2,733,000 |
Atlas Air Worldwide Holdings b,c | | 17,000 | | | 840,820 |
C.H. Robinson Worldwide | | 80,000 | | | 4,387,200 |
Forward Air | | 269,750 | | | 9,333,350 |
Frozen Food Express Industries | | 286,635 | | | 1,934,786 |
Hub Group Cl. A b,c | | 174,400 | | | 5,952,272 |
Landstar System | | 96,200 | | | 5,312,164 |
Patriot Transportation Holding c | | 72,300 | | | 5,784,000 |
Universal Truckload Services c | | 115,100 | | | 2,534,502 |
UTI Worldwide | | 175,000 | | | 3,491,250 |
| | | | |
|
| | | | | | 42,303,344 |
| | | | |
|
| Total (Cost $102,643,264) | | | | | 165,865,582 |
| | | | |
|
| | | | | | |
| Natural Resources – 10.7% | | | | | |
| Energy Services - 5.3% | | | | | |
Cal Dive International c | | 50,000 | | | 714,500 |
CARBO Ceramics | | 135,200 | | | 7,888,920 |
Core Laboratories b,c | | 10,000 | | | 1,423,500 |
Ensign Energy Services | | 126,300 | | | 2,752,168 |
Exterran Holdings b,c | | 103,600 | | | 7,406,364 |
Global Industries b,c | | 54,500 | | | 977,185 |
Helix Energy Solutions Group b,c | | 34,226 | | | 1,425,171 |
Helmerich & Payne | | 53,700 | | | 3,867,474 |
ION Geophysical b,c | | 464,500 | | | 8,105,525 |
RPC | | 25,000 | | | 420,000 |
SEACOR Holdings b,c | | 127,300 | | | 11,394,623 |
TETRA Technologies b,c | | 68,000 | | | 1,612,280 |
Willbros Group c | | 103,800 | | | 4,547,478 |
World Fuel Services | | 60,000 | | | 1,316,400 |
| | | | |
|
| | | | | | 53,851,588 |
| | | | |
|
| Oil and Gas - 2.0% | | | | | |
Bill Barrett c | | 50,000 | | | 2,970,500 |
Carrizo Oil & Gas b,c | | 41,700 | | | 2,839,353 |
Cimarex Energy | | 115,490 | | | 8,046,188 |
Edge Petroleum b,c | | 326,900 | | | 1,761,991 |
Penn Virginia | | 32,880 | | | 2,479,810 |
PetroCorp c,d | | 61,400 | | | 0 |
Storm Cat Energy b,c | | 330,800 | | | 383,728 |
W&T Offshore | | 25,000 | | | 1,462,750 |
| | | | |
|
| | | | | | 19,944,320 |
| | | | |
|
| Precious Metals and Mining - 2.3% | | | | | |
Centerra Gold c | | 30,000 | | | 140,335 |
Endeavour Mining Capital | | 150,000 | | | 1,088,555 |
Etruscan Resources c | | 745,900 | | | 1,206,958 |
Gammon Gold c | | 198,300 | | | 2,151,555 |
Golden Star Resources b,c | | 350,000 | | | 941,500 |
Harry Winston Diamond | | 10,000 | | | 287,900 |
| THE ACCOMPANYING NOTES ARE AN INTEGRAL PART OF THESE FINANCIAL STATEMENTS. | 2008 Semiannual Report to Stockholders | | | 25 |
Royce Value Trust
| | | SHARES | | | VALUE |
| Natural Resources (continued) | | | | | |
| Precious Metals and Mining (continued) | | | | | |
Hecla Mining c | | 490,500 | | $ | 4,542,030 |
IAMGOLD Corporation | | 335,620 | | | 2,030,501 |
Kimber Resources b,c | | 560,000 | | | 890,400 |
Kinross Gold | | 40,286 | | | 951,153 |
Metorex c | | 800,000 | | | 2,360,153 |
Northam Platinum | | 225,000 | | | 1,942,529 |
Northgate Minerals c | | 90,000 | | | 247,500 |
NovaGold Resources b,c | | 45,000 | | | 335,250 |
Pan American Silver b,c | | 41,000 | | | 1,417,780 |
Royal Gold | | 34,400 | | | 1,078,784 |
Yamana Gold | | 113,525 | | | 1,877,704 |
| | | | |
|
| | | | | | 23,490,587 |
| | | | |
|
| Real Estate - 1.1% | | | | | |
Consolidated-Tomoka Land | | 13,564 | | | 570,502 |
PICO Holdings b,c | | 75,200 | | | 3,267,440 |
SARE Holding Cl. B c | | 730,000 | | | 956,288 |
St. Joe Company (The) b,c | | 132,100 | | | 4,533,672 |
Tejon Ranch b,c | | 65,000 | | | 2,343,900 |
| | | | |
|
| | | | | | 11,671,802 |
| | | | |
|
| Total (Cost $58,192,473) | | | | | 108,958,297 |
| | | | |
|
| | | | | | |
| Technology – 21.3% | | | | | |
| Aerospace and Defense - 1.0% | | | | | |
AerCap Holdings b,c | | 45,000 | | | 568,350 |
Astronics Corporation c | | 52,400 | | | 728,884 |
† Ceradyne b,c | | 1,000 | | | 34,300 |
Ducommun c | | 117,200 | | | 2,690,912 |
HEICO Corporation | | 129,000 | | | 4,197,660 |
Hexcel Corporation b,c | | 47,500 | | | 916,750 |
Integral Systems c | | 39,876 | | | 1,543,201 |
| | | | |
|
| | | | | | 10,680,057 |
| | | | |
|
| Components and Systems - 6.2% | | | | | |
Analogic Corporation | | 40,135 | | | 2,531,314 |
Belden | | 57,800 | | | 1,958,264 |
Benchmark Electronics c | | 208,200 | | | 3,401,988 |
Checkpoint Systems c | | 56,060 | | | 1,170,533 |
China Security & Surveillance | | | | | |
Technology b,c | | 6,000 | | | 80,880 |
Diebold | | 73,600 | | | 2,618,688 |
Dionex Corporation c | | 81,000 | | | 5,375,970 |
Electronics for Imaging b,c | | 25,000 | | | 365,000 |
Energy Conversion Devices b,c | | 84,500 | | | 6,222,580 |
Excel Technology c | | 168,500 | | | 3,760,920 |
Hutchinson Technology b,c | | 97,500 | | | 1,310,400 |
KEMET Corporation c | | 95,600 | | | 309,744 |
† Lexmark International Cl. A b,c | | 4,000 | | | 133,720 |
Methode Electronics | | 50,000 | | | 522,500 |
Nam Tai Electronics | | 23,400 | | | 306,072 |
Newport Corporation b,c | | 592,200 | | | 6,745,158 |
Perceptron c | | 357,700 | | | 3,129,875 |
Plexus Corporation c | | 300,700 | | | 8,323,376 |
Richardson Electronics | | 520,712 | | | 3,087,822 |
Technitrol | | 261,200 | | | 4,437,788 |
Vaisala Cl. A | | 84,205 | | | 3,488,092 |
| | | SHARES | | | VALUE |
| Technology (continued) | | | | | |
| Components and Systems (continued) | | | | | |
Vishay Intertechnology b,c | | 186,000 | | $ | 1,649,820 |
Zebra Technologies Cl. A c | | 76,525 | | | 2,497,776 |
| | | | |
|
| | | | | | 63,428,280 |
| | | | |
|
| Distribution - 0.9% | | | | | |
Agilysys | | 165,125 | | | 1,872,517 |
Anixter International c | | 61,795 | | | 3,676,185 |
China 3C Group c | | 157,300 | | | 202,917 |
Tech Data b,c | | 86,500 | | | 2,931,485 |
| | | | |
|
| | | | | | 8,683,104 |
| | | | |
|
| Internet Software and Services - 0.8% | | | | | |
Arbinet-thexchange | | 21,700 | | | 84,413 |
CMGI b,c | | 173,500 | | | 1,839,100 |
CyberSource Corporation b,c | | 10,000 | | | 167,300 |
EarthLink b,c | | 55,200 | | | 477,480 |
j2 Global Communications b,c | | 43,420 | | | 998,660 |
Jupitermedia Corporation b,c | | 525,000 | | | 735,000 |
KongZhong Corporation ADR b,c | | 8,300 | | | 30,959 |
Lionbridge Technologies c | | 37,500 | | | 96,750 |
Perficient b,c | | 10,000 | | | 96,600 |
RealNetworks b,c | | 245,400 | | | 1,619,640 |
SkyTerra Communications c | | 62,200 | | | 419,850 |
SupportSoft c | | 220,000 | | | 715,000 |
VeriSign b,c | | 24,800 | | | 937,440 |
| | | | |
|
| | | | | | 8,218,192 |
| | | | |
|
| IT Services - 2.3% | | | | | |
Alten c | | 44,000 | | | 1,607,199 |
BearingPoint b,c | | 529,100 | | | 428,571 |
Black Box | | 67,300 | | | 1,829,887 |
Computer Task Group c | | 101,100 | | | 517,632 |
† DST Systems b,c | | 5,000 | | | 275,250 |
Metavante Technologies b,c | | 20,000 | | | 452,400 |
Sapient Corporation b,c | | 806,602 | | | 5,178,385 |
† SRA International Cl. A b,c | | 213,300 | | | 4,790,718 |
Syntel | | 152,679 | | | 5,148,336 |
Total System Services | | 25,000 | | | 555,500 |
TriZetto Group (The) c | | 107,600 | | | 2,300,488 |
Yucheng Technologies b,c | | 13,500 | | | 151,065 |
| | | | |
|
| | | | | | 23,235,431 |
| | | | |
|
| Semiconductors and Equipment - 3.8% | | | | | |
Actions Semiconductor ADR b,c | | 46,600 | | | 160,770 |
BE Semiconductor Industries b,c | | 58,000 | | | 281,300 |
Brooks Automation c | | 5,152 | | | 42,607 |
CEVA c | | 31,666 | | | 252,378 |
Cognex Corporation | | 236,200 | | | 5,444,410 |
Coherent c | | 243,500 | | | 7,278,215 |
Diodes c | | 297,450 | | | 8,221,518 |
DSP Group b,c | | 164,500 | | | 1,151,500 |
Exar Corporation b,c | | 232,576 | | | 1,753,623 |
Fairchild Semiconductor International c | | 51,200 | | | 600,576 |
Himax Technologies ADR | | 100,000 | | | 512,000 |
Image Sensing Systems b,c | | 8,310 | | | 106,950 |
International Rectifier b,c | | 120,000 | | | 2,304,000 |
Intevac b,c | | 57,450 | | | 648,036 |
Jazz Technologies (Units) c | | 805,000 | | | 966,000 |
| 26 | | | 2008 Semiannual Report to Stockholders | THE ACCOMPANYING NOTES ARE AN INTEGRAL PART OF THESE FINANCIAL STATEMENTS. |
June 30, 2008 (unaudited)
| | | SHARES | | | VALUE |
| Technology (continued) | | | | | |
| Semiconductors and Equipment (continued) | | | | | |
Jinpan International | | 3,700 | | $ | 136,900 |
Kulicke & Soffa Industries c | | 105,800 | | | 771,282 |
Novellus Systems b,c | | 12,000 | | | 254,280 |
Power Integrations b,c | | 49,000 | | | 1,548,890 |
Sanmina-SCI Corporation b,c | | 200,000 | | | 256,000 |
Semitool c | | 50,000 | | | 375,500 |
TTM Technologies b,c | | 221,400 | | | 2,924,694 |
Varian b,c | | 2,000 | | | 102,120 |
Veeco Instruments b,c | | 65,000 | | | 1,045,200 |
Vimicro International ADR b,c | | 270,000 | | | 766,800 |
Virage Logic b,c | | 120,000 | | | 859,200 |
| | | | |
|
| | | | | | 38,764,749 |
| | | | |
|
| Software - 3.9% | | | | | |
ACI Worldwide c | | 233,150 | | | 4,101,109 |
Advent Software b,c | | 187,900 | | | 6,779,432 |
ANSYS b,c | | 100,000 | | | 4,712,000 |
Aspen Technology c | | 42,100 | | | 589,400 |
Avid Technology b,c | | 96,000 | | | 1,631,040 |
Borland Software b,c | | 280,000 | | | 380,800 |
China Fire & Security Group c | | 16,300 | | | 131,215 |
Datasul | | 150,000 | | | 2,138,045 |
Epicor Software b,c | | 79,900 | | | 552,109 |
JDA Software Group b,c | | 99,900 | | | 1,808,190 |
MSC.Software c | | 50,000 | | | 549,000 |
National Instruments | | 72,900 | | | 2,068,173 |
Net 1 UEPS Technologies b,c | | 50,000 | | | 1,215,000 |
Pegasystems | | 44,200 | | | 594,932 |
PLATO Learning c | | 149,642 | | | 396,551 |
Radiant Systems b,c | | 32,500 | | | 348,725 |
Renaissance Learning | | 15,000 | | | 168,150 |
SPSS c | | 179,600 | | | 6,532,052 |
Sybase b,c | | 82,600 | | | 2,430,092 |
Teradata Corporation c | | 35,000 | | | 809,900 |
THQ b,c | | 20,000 | | | 405,200 |
Verint Systems b,c | | 40,000 | | | 920,800 |
| | | | |
|
| | | | | | 39,261,915 |
| | | | |
|
| Telecommunications - 2.4% | | | | | |
Adaptec b,c | | 2,584,100 | | | 8,269,120 |
ADTRAN | | 65,000 | | | 1,549,600 |
Catapult Communications c | | 87,100 | | | 620,152 |
China GrenTech ADR b,c | | 8,700 | | | 39,672 |
China Mobile Media Technology c | | 160,200 | | | 3,204 |
Cogent Communications Group b,c | | 204,200 | | | 2,736,280 |
Cogo Group b,c | | 7,900 | | | 71,969 |
Foundry Networks c | | 298,600 | | | 3,529,452 |
Globalstar b,c | | 50,000 | | | 141,500 |
Globecomm Systems c | | 233,700 | | | 1,930,362 |
IDT Corporation c | | 108,400 | | | 163,684 |
IDT Corporation Cl. B c | | 245,000 | | | 416,500 |
Level 3 Communications b,c | | 401,341 | | | 1,183,956 |
NMS Communications b,c | | 380,000 | | | 421,800 |
Sycamore Networks b,c | | 191,000 | | | 615,020 |
Tandberg | | 90,000 | | | 1,475,497 |
Tollgrade Communications c | | 20,000 | | | 89,800 |
| | | | SHARES | | | VALUE |
| Technology (continued) | | | | | | |
| Telecommunications (continued) | | | | | | |
UTStarcom c | | | 31,400 | | $ | 171,758 |
Zhone Technologies c | | | 1,090,000 | | | 850,200 |
| | | | | |
|
| | | | | | | 24,279,526 |
| | | | | |
|
| Total (Cost $206,076,638) | | | | | | 216,551,254 |
| | | | | |
|
| | | | | | | |
| Utilities – 0.2% | | | | | | |
CH Energy Group | | | 44,500 | | | 1,582,865 |
Southern Union | | | 11,576 | | | 312,784 |
| | | | | |
|
| Total (Cost $2,127,413) | | | | | | 1,895,649 |
| | | | | |
|
| | | | | | | |
| Miscellaneouse – 2.6% | | | | | | |
| Total (Cost $29,778,681) | | | | | | 26,716,887 |
| | | | | |
|
| | | | | | | |
| TOTAL COMMON STOCKS | | | | | | |
(Cost $935,638,338) | | | | | | 1,159,041,904 |
| | | | | |
|
| | | | | | | |
| PREFERRED STOCKS – 0.4% | | | | | | |
Duratex | | | 130,000 | | | 2,757,158 |
Seneca Foods Conv. c,d | | | 85,000 | | | 1,595,025 |
| | | | | |
|
| TOTAL PREFERRED STOCKS | | | | | | |
(Cost $4,182,756) | | | | | | 4,352,183 |
| | | | | |
|
| | | | | | | |
| | | | PRINCIPAL | | | |
| | | | AMOUNT | | | |
| CORPORATE BOND – 0.0% | | | | | | |
Dixie Group 7.00% | | | | | | |
Conv. Sub. Deb. due 5/15/12 | | | | | | |
(Cost $264,314) | | $ | 307,000 | | | 286,661 |
| | | | | |
|
| | | | | | | |
| REPURCHASE AGREEMENT – 6.6% | | | | | | |
| State Street Bank & Trust Company, | | | | | | |
2.05% dated 6/30/08, due 7/1/08, | | | | | | |
maturity value $67,473,842 (collateralized | | | | | | |
by obligations of various U.S. Government | | | | | | |
Agencies, valued at $69,159,350) | | | | | | |
(Cost $67,470,000) | | | | | | 67,470,000 |
| | | | | |
|
| | | | | | | |
| COLLATERAL RECEIVED FOR SECURITIES | | | | | | |
LOANED – 11.6% | | | | | | |
| U.S. Treasury Bills | | | | | | |
due 11/13/08-11/20/08 | | | 37,368 | | | 37,368 |
| U.S. Treasury Bonds | | | | | | |
5.50%-8.875% | | | | | | |
due 5/15/17-8/15/28 | | | 1,275,121 | | | 1,302,986 |
| U.S. Treasury Notes | | | | | | |
4.50%-5.00% | | | | | | |
due 4/30/09-8/15/11 | | | 146,659 | | | 149,229 |
| U.S. Treasury Notes-TIPS | | | | | | |
1.875%-2.00% | | | | | | |
due 7/15/14-7/15/15 | | | 82,587 | | | 83,209 |
| THE ACCOMPANYING NOTES ARE AN INTEGRAL PART OF THESE FINANCIAL STATEMENTS. | 2008 Semiannual Report to Stockholders | | | 27 |
| Royce Value Trust | | June 30, 2008 (unaudited) |
| | | | | | VALUE | |
| COLLATERAL RECEIVED FOR SECURITIES | | | | | | |
LOANED (continued) | | | | | | |
| Money Market Funds | | | | | | |
State Street Navigator Securities Lending | | | | | | |
Prime Portfolio (7 day yield-2.6748%) | | | | $ | 116,161,736 | |
| | | | |
| |
| | | | | | | |
| TOTAL COLLATERAL RECEIVED FOR | | | | | | |
SECURITIES LOANED | | | | | | |
(Cost $117,734,528) | | | | | 117,734,528 | |
| | | | |
| |
| | | | | | | |
| TOTAL INVESTMENTS – 132.5% | | | | | | |
(Cost $1,125,289,936) | | | | | 1,348,885,276 | |
| | | | | | | |
| LIABILITIES LESS CASH | | | | | | |
AND OTHER ASSETS – (10.9)% | | | | | (110,717,436 | ) |
| | | | | | | |
| PREFERRED STOCK – (21.6)% | | | | | (220,000,000 | ) |
| | | | |
| |
| | | | | | | |
| NET ASSETS APPLICABLE TO COMMON | | | | | | |
STOCKHOLDERS – 100.0% | | | | $ | 1,018,167,840 | |
| | | | |
| |
|
| † | | New additions in 2008. |
| | | |
| a | | At June 30, 2008, the Fund owned 5% or more of the Company’s outstanding voting securities thereby making the Company an Affiliated Company as that term is defined in the Investment Company Act of 1940. |
| | | |
| b | | All or a portion of these securities were on loan at June 30, 2008. Total market value of loaned securities at June 30, 2008 was $112,828,640. |
| | | |
| c | | Non-income producing. |
| | | |
| d | | Securities for which market quotations are not readily available represent 0.2% of net assets. These securities have been valued at their fair value under procedures established by the Fund’s Board of Directors. |
| | | |
| e | | Includes securities first acquired in 2008 and less than 1% of net assets applicable to Common Stockholders. |
| | | |
| | | Bold indicates the Fund’s 20 largest equity holdings in terms of June 30, 2008 market value. |
| | | |
TAX INFORMATION: The cost of total investments for Federal income tax purposes was $1,126,378,186. At June 30, 2008, net unrealized appreciation for all securities was $222,507,090, consisting of aggregate gross unrealized appreciation of $376,486,271 and aggregate gross unrealized depreciation of $153,979,181. The primary difference in book and tax basis cost is the timing of the recognition of losses on securities sold. |
|
| 28 | | | 2008 Semiannual Report to Stockholders | THE ACCOMPANYING NOTES ARE AN INTEGRAL PART OF THESE FINANCIAL STATEMENTS. |
| Royce Value Trust | | June 30, 2008 (unaudited) |
|
Statement of Assets and Liabilities |
|
| ASSETS: | | | | |
| Investments at value (including collateral on loaned securities)* | | | | |
Non-Affiliated Companies (cost $1,047,784,334) | | $ | 1,275,423,831 | |
Affiliated Companies (cost $10,035,602) | | | 5,991,445 | |
|
| Total investments at value | | | 1,281,415,276 | |
| Repurchase agreements (at cost and value) | | | 67,470,000 | |
| Cash and foreign currency | | | 48,083 | |
| Receivable for investments sold | | | 14,465,352 | |
| Receivable for dividends and interest | | | 1,087,014 | |
| Prepaid expenses and other assets | | | 220,593 | |
|
Total Assets | | | 1,364,706,318 | |
|
| LIABILITIES: | | | | |
| Payable for collateral on loaned securities | | | 117,734,528 | |
| Payable for investments purchased | | | 6,876,866 | |
| Payable for investment advisory fee | | | 1,356,971 | |
| Preferred dividends accrued but not yet declared | | | 288,446 | |
| Accrued expenses | | | 281,667 | |
|
Total Liabilities | | | 126,538,478 | |
|
| PREFERRED STOCK: | | | | |
| 5.90% Cumulative Preferred Stock - $0.001 par value, $25 liquidation value per share; 8,800,000 shares outstanding | | | 220,000,000 | |
|
| Total Preferred Stock | | | 220,000,000 | |
|
| NET ASSETS APPLICABLE TO COMMON STOCKHOLDERS | | $ | 1,018,167,840 | |
|
| ANALYSIS OF NET ASSETS APPLICABLE TO COMMON STOCKHOLDERS: | | | | |
| Common Stock paid-in capital - $0.001 par value per share; 61,776,913 shares outstanding (150,000,000 shares authorized) | | $ | 798,626,791 | |
| Undistributed net investment income (loss) | | | 1,438,972 | |
| Accumulated net realized gain (loss) on investments and foreign currency | | | 56,907,336 | |
| Net unrealized appreciation (depreciation) on investments and foreign currency | | | 223,598,013 | |
| Quarterly and accrued distributions | | | (62,403,272 | ) |
|
Net Assets applicable to Common Stockholders (net asset value per share - $16.48) | | $ | 1,018,167,840 | |
|
| *Investments at identified cost (including $117,734,528 of collateral on loaned securities) | | $ | 1,057,819,936 | |
| Market value of loaned securities | | | 112,828,640 | |
| THE ACCOMPANYING NOTES ARE AN INTEGRAL PART OF THESE FINANCIAL STATEMENTS. | 2008 Semiannual Report to Stockholders | | | 29 |
| Royce Value Trust | | Six Months Ended June 30, 2008 (unaudited) |
| INVESTMENT INCOME: | | | | |
| Income: | | | | |
Dividends* | | | | |
Non-Affiliated Companies | | $ | 8,931,086 | |
Affiliated Companies | | | 103,224 | |
Interest | | | 1,286,403 | |
Securities lending | | | 798,937 | |
|
| Total income | | | 11,119,650 | |
|
| Expenses: | | | | |
Investment advisory fees | | | 8,935,138 | |
Stockholder reports | | | 244,964 | |
Custody and transfer agent fees | | | 130,097 | |
Directors’ fees | | | 63,720 | |
Administrative and office facilities expenses | | | 56,362 | |
Professional fees | | | 28,628 | |
Other expenses | | | 69,227 | |
|
| Total expenses | | | 9,528,136 | |
| |
| Compensating balance credits | | | (3,514 | ) |
|
| Net expenses | | | 9,524,622 | |
|
| Net investment income (loss) | | | 1,595,028 | |
|
| REALIZED AND UNREALIZED GAIN (LOSS) ON INVESTMENTS AND FOREIGN CURRENCY: | | | | |
| Net realized gain (loss) on investments and foreign currency | | | | |
Non-Affiliated Companies | | | 39,652,598 | |
Affiliated Companies | | | – | |
| Net change in unrealized appreciation (depreciation) on investments and foreign currency | | | (174,123,794 | ) |
|
| Net realized and unrealized gain (loss) on investments and foreign currency | | | (134,471,196 | ) |
|
| NET INCREASE (DECREASE) IN NET ASSETS RESULTING FROM INVESTMENT OPERATIONS | | | (132,876,168 | ) |
|
| DISTRIBUTIONS TO PREFERRED STOCKHOLDERS | | | (6,490,000 | ) |
|
| NET INCREASE (DECREASE) IN NET ASSETS APPLICABLE TO COMMON STOCKHOLDERS | | | | |
RESULTING FROM INVESTMENT OPERATIONS | | $ | (139,366,168 | ) |
| | | | | |
| * Net of foreign withholding tax of $447,399. | | | | |
| 30 | | | 2008 Semiannual Report to Stockholders | THE ACCOMPANYING NOTES ARE AN INTEGRAL PART OF THESE FINANCIAL STATEMENTS. |
Royce Value Trust
Statement of Changes in Net Assets |
| | | Six months ended | | | | |
| | | 6/30/08 | | Year ended |
| | | (unaudited) | | 12/31/07 |
| INVESTMENT OPERATIONS: | | | | | | | | |
| Net investment income (loss) | | $ | 1,595,028 | | | $ | 5,297,518 | |
| Net realized gain (loss) on investments and foreign currency | | | 39,652,598 | | | | 121,683,331 | |
| Net change in unrealized appreciation (depreciation) on investments and foreign currency | | | (174,123,794 | ) | | | (56,217,996 | ) |
|
| Net increase (decrease) in net assets resulting from investment operations | | | (132,876,168 | ) | | | 70,762,853 | |
|
| DISTRIBUTIONS TO PREFERRED STOCKHOLDERS: | | | | | | | | |
| Net investment income | | | – | | | | (613,954 | ) |
| Net realized gain on investments and foreign currency | | | – | | | | (12,366,046 | ) |
| Quarterly distributions * | | | (6,490,000 | ) | | | – | |
|
| Total distributions to Preferred Stockholders | | | (6,490,000 | ) | | | (12,980,000 | ) |
|
NET INCREASE (DECREASE) IN NET ASSETS APPLICABLE TO COMMON STOCKHOLDERS | | | | | | | | |
RESULTING FROM INVESTMENT OPERATIONS | | | (139,366,168 | ) | | | 57,782,853 | |
|
| DISTRIBUTIONS TO COMMON STOCKHOLDERS: | | | | | | | | |
| Net investment income | | | – | | | | (5,095,420 | ) |
| Net realized gain on investments and foreign currency | | | – | | | | (102,630,144 | ) |
| Quarterly distributions * | | | (55,624,823 | ) | | | – | |
|
| Total distributions to Common Stockholders | | | (55,624,823 | ) | | | (107,725,564 | ) |
|
| CAPITAL SHARE TRANSACTIONS: | | | | | | | | |
| Reinvestment of distributions to Common Stockholders | | | 28,489,506 | | | | 54,184,473 | |
|
| Total capital stock transactions | | | 28,489,506 | | | | 54,184,473 | |
|
| NET INCREASE (DECREASE) IN NET ASSETS APPLICABLE TO COMMON STOCKHOLDERS | | | (166,501,485 | ) | | | 4,241,762 | |
|
| NET ASSETS APPLICABLE TO COMMON STOCKHOLDERS: | | | | | | | | |
Beginning of period | | | 1,184,669,325 | | | | 1,180,427,563 | |
|
End of period (including undistributed net investment income (loss) of $1,438,972 at 6/30/08 and | | | | | | | | |
$(156,056) at 12/31/07) | | $ | 1,018,167,840 | | | $ | 1,184,669,325 | |
* To be allocated to net investment income and capital gains at year end. | THE ACCOMPANYING NOTES ARE AN INTEGRAL PART OF THESE FINANCIAL STATEMENTS. | 2008 Semiannual Report to Stockholders | | | 31 |
Royce Value Trust
This table is presented to show selected data for a share of Common Stock outstanding throughout each period, and to assist stockholders in evaluating the Fund’s performance for the periods presented.
| | | Six months | | Years ended December 31, |
| | | ended | |
|
| | | June 30, 2008 | | | | | | | | | | | | | | | | | | | | |
| | | (unaudited) | | | 2007 | | | | 2006 | | | | 2005 | | | | 2004 | | | | 2003 | |
|
| NET ASSET VALUE, BEGINNING OF PERIOD | | $ | 19.74 | | | $ | 20.62 | | | $ | 18.87 | | | $ | 18.95 | | | $ | 17.03 | | | $ | 13.22 | |
|
| INVESTMENT OPERATIONS: | | | | | | | | | | | | | | | | | | | | | | | | |
| Net investment income (loss) | | | 0.03 | | | | 0.09 | | | | 0.13 | | | | 0.01 | | | | (0.08 | ) | | | (0.05 | ) |
| Net realized and unrealized gain (loss) on investments and | | | | | | | | | | | | | | | | | | | | | | | | |
| foreign currency | | | (2.22 | ) | | | 1.13 | | | | 3.63 | | | | 1.75 | | | | 3.81 | | | | 5.64 | |
|
| Total investment operations | | | (2.19 | ) | | | 1.22 | | | | 3.76 | | | | 1.76 | | | | 3.73 | | | | 5.59 | |
|
| DISTRIBUTIONS TO PREFERRED STOCKHOLDERS: | | | | | | | | | | | | | | | | | | | | | | | | |
| Net investment income | | | – | | | | (0.01 | ) | | | (0.02 | ) | | | – | | | | – | | | | – | |
| Net realized gain on investments and foreign currency | | | – | | | | (0.21 | ) | | | (0.21 | ) | | | (0.24 | ) | | | (0.26 | ) | | | (0.26 | ) |
Quarterly distributions * | | | (0.11 | ) | | | – | | | | – | | | | – | | | | – | | | | – | |
|
| Total distributions to Preferred Stockholders | | | (0.11 | ) | | | (0.22 | ) | | | (0.23 | ) | | | (0.24 | ) | | | (0.26 | ) | | | (0.26 | ) |
|
NET INCREASE (DECREASE) IN NET ASSETS APPLICABLE TO COMMON | | | | | | | | | | | | | | | | | | | | | | | | |
STOCKHOLDERS RESULTING FROM INVESTMENT OPERATIONS | | | (2.30 | ) | | | 1.00 | | | | 3.53 | | | | 1.52 | | | | 3.47 | | | | 5.33 | |
|
| DISTRIBUTIONS TO COMMON STOCKHOLDERS: | | | | | | | | | | | | | | | | | | | | | | | | |
| Net investment income | | | – | | | | (0.09 | ) | | | (0.14 | ) | | | – | | | | – | | | | – | |
| Net realized gain on investments and foreign currency | | | – | | | | (1.76 | ) | | | (1.64 | ) | | | (1.61 | ) | | | (1.55 | ) | | | 1.30 | |
Quarterly distributions * | | | (0.92 | ) | | | – | | | | – | | | | – | | | | – | | | | – | |
|
| Total distributions to Common Stockholders | | | (0.92 | ) | | | (1.85 | ) | | | (1.78 | ) | | | (1.61 | ) | | | (1.55 | ) | | | (1.30 | ) |
|
| CAPITAL STOCK TRANSACTIONS: | | | | | | | | | | | | | | | | | | | | | | | | |
| Effect of reinvestment of distributions by Common Stockholders | | | (0.04 | ) | | | (0.03 | ) | | | (0.00 | ) | | | 0.01 | | | | 0.00 | | | | (0.00 | ) |
| Effect of rights offering and Preferred Stock offering | | | – | | | | – | | | | – | | | | – | | | | – | | | | (0.22 | ) |
|
| Total capital stock transactions | | | (0.04 | ) | | | (0.03 | ) | | | (0.00 | ) | | | 0.01 | | | | 0.00 | | | | (0.22 | ) |
|
| NET ASSET VALUE, END OF PERIOD | | $ | 16.48 | | | $ | 19.74 | | | $ | 20.62 | | | $ | 18.87 | | | $ | 18.95 | | | $ | 17.03 | |
|
| MARKET VALUE, END OF PERIOD | | $ | 15.68 | | | $ | 18.58 | | | $ | 22.21 | | | $ | 20.08 | | | $ | 20.44 | | | $ | 17.21 | |
|
| TOTAL RETURN (a): | | | | | | | | | | | | | | | | | | | | | | | | |
| Market Value | | | (10.72 | )%*** | | | (8.21 | )% | | | 20.96 | % | | | 6.95 | % | | | 29.60 | % | | | 41.96 | % |
| Net Asset Value | | | (11.67 | )%*** | | | 5.04 | % | | | 19.50 | % | | | 8.41 | % | | | 21.42 | % | | | 40.80 | % |
| RATIOS BASED ON AVERAGE NET ASSETS APPLICABLE TO COMMON STOCKHOLDERS: | | | | | | | | | | | | | | | | | | | | | | | |
| Total expenses (b,c) | | | 1.79 | %** | | | 1.38 | % | | | 1.29 | % | | | 1.49 | % | | | 1.51 | % | | | 1.49 | % |
Management fee expense (d) | | | 1.68 | %** | | | 1.29 | % | | | 1.20 | % | | | 1.37 | % | | | 1.39 | % | | | 1.34 | % |
| Other operating expenses | | | 0.11 | %** | | | 0.09 | % | | | 0.09 | % | | | 0.12 | % | | | 0.12 | % | | | 0.15 | % |
| Net investment income (loss) | | | 0.30 | %** | | | 0.43 | % | | | 0.62 | % | | | 0.03 | % | | | (0.50 | )% | | | (0.36 | )% |
| SUPPLEMENTAL DATA: | | | | | | | | | | | | | | | | | | | | | | | | |
| Net Assets Applicable to Common Stockholders, | | | | | | | | | | | | | | | | | | | | | | | | |
| End of Period (in thousands) | | $ | 1,018,168 | | | $ | 1,184,669 | | | $ | 1,180,428 | | | $ | 1,032,120 | | | $ | 993,304 | | | $ | 850,773 | |
| Liquidation Value of Preferred Stock, End of Period (in thousands) | | | $220,000 | | | | $220,000 | | | | $220,000 | | | | $220,000 | | | | $220,000 | | | | $220,000 | |
| Portfolio Turnover Rate | | | 14 | % | | | 26 | % | | | 21 | % | | | 31 | % | | | 30 | % | | | 23 | % |
| PREFERRED STOCK: | | | | | | | | | | | | | | | | | | | | | | | | |
| Total shares outstanding | | | 8,800,000 | | | | 8,800,000 | | | | 8,800,000 | | | | 8,800,000 | | | | 8,800,000 | | | | 8,800,000 | |
| Asset coverage per share | | $ | 140.70 | | | $ | 159.62 | | | $ | 159.14 | | | $ | 142.29 | | | $ | 137.88 | | | $ | 121.68 | |
| Liquidation preference per share | | $ | 25.00 | | | $ | 25.00 | | | $ | 25.00 | | | $ | 25.00 | | | $ | 25.00 | | | $ | 25.00 | |
| Average market value per share (e): | | | | | | | | | | | | | | | | | | | | | | | | |
| 5.90% Cumulative | | $ | 23.35 | | | $ | 23.68 | | | $ | 23.95 | | | $ | 24.75 | | | $ | 24.50 | | | $ | 25.04 | |
| 7.80% Cumulative | | | – | | | | – | | | | – | | | | – | | | | – | | | $ | 25.87 | |
| 7.30% Tax-Advantaged Cumulative | | | – | | | | – | | | | – | | | | – | | | | – | | | $ | 25.53 | |
|
| (a) | The Market Value Total Return is calculated assuming a purchase of Common Stock on the opening of the first business day and a sale on the closing of the last business day of each period reported. Dividends and distributions are assumed for the purposes of this calculation to be reinvested at prices obtained under the Fund’s Distribution Reinvestment and Cash Purchase Plan. Net Asset Value Total Return is calculated on the same basis, except that the Fund’s net asset value is used on the purchase and sale dates instead of market value. |
| (b) | Expense ratios based on total average net assets including liquidation value of Preferred Stock were 1.48%, 1.17%, 1.08%, 1.22%, 1.21% and 1.19% for the periods ended June 30, 2008 and December 31, 2007, 2006, 2005, 2004 and 2003, respectively. |
| (c) | Expense ratios based on average net assets applicable to Common Stockholders before waiver of fees by the investment adviser would have been 1.62% for the year ended December 31, 2003; before waiver of fees and earnings credits would have been 1.79%, 1.38%, 1.29%, 1.49%, 1.51% and 1.62% for the periods ended June 30, 2008 and December 31, 2007, 2006, 2005, 2004 and 2003, respectively. |
| (d) | The management fee is calculated based on average net assets over a rolling 60-month basis, while the above ratios of management fee expenses are based on the average net assets applicable to Common Stockholders over a 12-month basis. |
| (e) | The average of month-end market values during the period that the Preferred Stock was outstanding. |
| * To be allocated to net investment income and capital gains at year end. |
| ** Annualized. *** Not annualized. |
| 32 | | | 2008 Semiannual Report to Stockholders | THE ACCOMPANYING NOTES ARE AN INTEGRAL PART OF THESE FINANCIAL STATEMENTS. |
Royce Value Trust
Notes to Financial Statements (unaudited) |
| Summary of Significant Accounting Policies: |
Royce Value Trust, Inc. (the “Fund”), was incorporated under the laws of the State of Maryland on July 1, 1986 as a diversified closed-end investment company. The Fund commenced operations on November 26, 1986.
The preparation of financial statements in conformity with accounting principles generally accepted in the United States of America requires management to make estimates and assumptions that affect the reported amounts of assets and liabilities and the disclosure of contingent assets and liabilities at the date of the financial statements, and the reported amounts of income and expenses during the reporting period. Actual results could differ from those estimates.
|
| Valuation of Investments: |
Securities are valued as of the close of trading on the New York Stock Exchange (NYSE) (generally 4:00 p.m. Eastern time) on the valuation date. Securities that trade on an exchange, and securities traded on Nasdaq’s Electronic Bulletin Board, are valued at their last reported sales price or Nasdaq official closing price taken from the primary market in which each security trades or, if no sale is reported for such day, at their bid price. Other over-the-counter securities for which market quotations are readily available are valued at their highest bid price. Securities for which market quotations are not readily available are valued at their fair value under procedures established by the Fund’s Board of Directors. In addition, if, between the time trading ends on a particular security and the close of the customary trading session on the NYSE, events occur that are significant and may make the closing price unreliable, the Fund may fair value the security. The Fund uses an independent pricing service to provide fair value estimates for relevant non-U.S. equity securities on days when the U.S. market volatility exceeds a certain threshold. This pricing service uses proprietary correlations it has developed between the movement of prices of non-U.S. equity securities and indices of U.S.-traded securities, futures contracts and other indications to estimate the fair value of relevant non-U.S. securities. When fair value pricing is employed, the price of securities used by the Fund may differ from quoted or published prices for the same security. Bonds and other fixed income securities may be valued by reference to other securities with comparable ratings, interest rates and maturities, using established independent pricing services. Investments in money market funds are valued at net asset value per share.
Various inputs are used in determining the value of the Fund’s investments. These inputs are summarized in the three broad levels below:
Level 1 – quoted prices in active markets for identical securities
Level 2 – other significant observable inputs (including quoted prices for similar securities, foreign securities that may be fair valued and repurchase agreements)
Level 3 – significant observable inputs (including the Fund’s own assumptions in determining the fair value of investments)
The inputs or methodology used for valuing securities are not necessarily an indication of the risk associated with investing in those securities.
The following is a summary of the inputs used to value the Fund’s investments as of June 30, 2008: |
| Level 1 | | Level 2 | | | | Level 3 | | Total |
|
| $1,018,972,228 | | $328,318,023 | | | | $1,595,025 | | $1,348,885,276 |
|
| Level 3 Reconciliation: | | | | | | | | |
| | | Change in unrealized appreciation | | |
| Balance as of 12/31/07 | | | | (depreciation) | | | | Balance as of 6/30/08 |
|
| $1,816,875 | | | | $(221,850) | | | | $1,595,025 |
|
| Repurchase Agreements: |
The Fund may enter into repurchase agreements with institutions that the Fund’s investment adviser has determined are creditworthy. The Fund restricts repurchase agreements to maturities of no more than seven days. Securities pledged as collateral for repurchase agreements, which are held until maturity of the repurchase agreements, are marked-to-market daily and maintained at a value at least equal to the principal amount of the repurchase agreement (including accrued interest). Repurchase agreements could involve certain risks in the event of default or insolvency of the counter-party, including possible delays or restrictions upon the ability of the Fund to dispose of its underlying securities. |
Foreign Currency: |
The Fund values its non-U.S. securities in U.S. dollars daily at the prevailing foreign currency exchange rates as quoted by a major bank. The effects of changes in foreign exchange rates on investments and other assets and liabilities are included with net realized and unrealized gains and losses on investments.
Net realized foreign exchange gains or losses arise from sales and maturities of short-term securities, sales of foreign currencies, expiration of currency forward contracts, currency gains or losses realized between the trade and settlement dates on securities transactions, and the difference between the amounts of dividends, interest, and foreign withholding taxes recorded on the Fund’s books and the U.S. dollar equivalent of the amounts actually received or paid. Net unrealized foreign exchange gains and losses arise from changes in the value of assets and liabilities, including investments in securities at the end of the reporting period, as a result of changes in foreign currency exchange rates. |
2008 Semiannual Report to Stockholders | 33
Royce Value Trust
Notes to Financial Statements (unaudited) (continued) |
| Securities Lending: |
The Fund loans securities to qualified institutional investors for the purpose of realizing additional income. Collateral on all securities loaned for the Fund is accepted in cash and cash equivalents and invested temporarily by the custodian. The collateral is equal to at least 100% of the current market value of the loaned securities. The market value of the loaned securities is determined at the close of business of the Fund and any additional required collateral is delivered to the Fund on the next business day. |
Taxes: |
As a qualified regulated investment company under Subchapter M of the Internal Revenue Code, the Fund is not subject to income taxes to the extent that it distributes substantially all of its taxable income for its fiscal year. The Schedule of Investments includes information regarding income taxes under the caption “Income Tax Information ”. |
Distributions: |
The Fund currently has a policy of paying quarterly distributions on the Fund’s Common Stock. Distributions are currently being made at the annual rate of 9% of the rolling average of the prior four calendar quarter-end NAVs of the Fund’s Common Stock, with the fourth quarter distribution being the greater of 2.25% of the rolling average or the distribution required by IRS regulations. Distributions to Preferred Stockholders are accrued daily and paid quarterly and distributions to Common Stockholders are recorded on ex-dividend date. The Fund is required to allocate long-term capital gain distributions and other types of income proportionately to distributions made to holders of shares of Common Stock and Preferred Stock. To the extent that distributions are not paid from long-term capital gains, net investment income or net short-term capital gains, they will represent a return of capital. Distributions are determined in accordance with income tax regulations that may differ from accounting principles generally accepted in the United States of America. Permanent book and tax differences relating to stockholder distributions will result in reclassifications within the capital accounts. Undistributed net investment income may include temporary book and tax basis differences, which will reverse in a subsequent period. Any taxable income or gain remaining undistributed at fiscal year end is distributed in the following year. |
Investment Transactions and Related Investment Income: |
Investment transactions are accounted for on the trade date. Dividend income is recorded on the ex-dividend date. Non-cash dividend income is recorded at the fair market value of the securities received. Interest income is recorded on an accrual basis. Premium and discounts on debt securities are amortized using the effective yield-to-maturity method. Realized gains and losses from investment transactions are determined on the basis of identified cost for book and tax purposes. |
Expenses: |
The Fund incurs direct and indirect expenses. Expenses directly attributable to the Fund are charged to the Fund’s operations, while expenses applicable to more than one of the Royce Funds are allocated equitably. Allocated personnel and occupancy costs related to The Royce Funds are included in administrative and office facilities expenses. The Fund has adopted a deferred fee agreement that allows the Directors to defer the receipt of all or a portion of Directors’ Fees otherwise payable. The deferred fees are invested in certain Royce Funds until distributed in accordance with the agreement. |
Compensating Balance Credits: |
The Fund has an arrangement with its custodian bank, whereby a portion of the custodian’s fee is paid indirectly by credits earned on the Fund’s cash on deposit with the bank. This deposit arrangement is an alternative to purchasing overnight investments. Conversely, the Fund pays interest to the custodian on any cash overdrafts, to the extent they are not offset by credits earned on positive cash balances. |
Capital Stock: |
The Fund issued 1,768,501 and 2,749,591 shares of Common Stock as reinvestment of distributions by Common Stockholders for the six months ended June 30, 2008 and the year ended December 31, 2007, respectively.
At June 30, 2008, 8,800,000 shares of 5.90% Cumulative Preferred Stock were outstanding. Commencing October 9, 2008 and thereafter, the Fund, at its option, may redeem the Cumulative Preferred Stock, in whole or in part, at the redemption price. The Cumulative Preferred Stock is classified outside of permanent equity (net assets applicable to Common Stockholders) in the accompanying financial statements in accordance with Emerging Issues Task Force (EITF) Topic D-98, Classification and Measurement of Redeemable Securities, that requires preferred securities that are redeemable for cash or other assets to be classified outside of permanent equity to the extent that the redemption is at a fixed or determinable price and at the option of the holder or upon the occurrence of an event that is not solely within the control of the issuer.
The Fund is required to meet certain asset coverage tests with respect to the Cumulative Preferred Stock as required by the 1940 Act. In addition, pursuant to the Rating Agency Guidelines established by Moody’s, the Fund is required to maintain a certain discounted asset coverage. If the Fund fails to meet these requirements and does not correct such failure, the Fund may be required to redeem, in part or in full, the Cumulative Preferred Stock at a redemption price of $25.00 per share, plus an amount equal to the accumulated and unpaid dividends, whether or not declared on such shares, in order to meet these requirements. Additionally, failure to meet the foregoing asset coverage requirements could restrict the Fund’s ability to pay dividends to Common Stockholders and could lead to sales of portfolio securities at inopportune times. The Fund has met these requirements since issuing the Cumulative Preferred Stock. |
| 34 | | | 2008 Semiannual Report to Stockholders |
Royce Value Trust
Notes to Financial Statements (unaudited) (continued) |
| Investment Advisory Agreement: |
As compensation for its services under the Investment Advisory Agreement, Royce & Associates, LLC (“Royce”) receives a fee comprised of a Basic Fee (“Basic Fee”) and an adjustment to the Basic Fee based on the investment performance of the Fund in relation to the investment record of the S&P SmallCap 600 Index (“S&P 600”).
The Basic Fee is a monthly fee equal to 1/12 of 1% (1% on an annualized basis) of the average of the Fund’s month-end net assets applicable to Common Stockholders, plus the liquidation value of Preferred Stock, for the rolling 60-month period ending with such month (the “performance period”). The Basic Fee for each month is increased or decreased at the rate of 1/12 of .05% for each percentage point that the investment performance of the Fund exceeds, or is exceeded by, the percentage change in the investment record of the S&P 600 for the performance period by more than two percentage points. The performance period for each such month is a rolling 60-month period ending with such month. The maximum increase or decrease in the Basic Fee for any month may not exceed 1/12 of .5%. Accordingly, for each month, the maximum monthly fee rate as adjusted for performance is 1/12 of 1.5% and is payable if the investment performance of the Fund exceeds the percentage change in the investment record of the S&P 600 by 12 or more percentage points for the performance period, and the minimum monthly fee rate as adjusted for performance is 1/12 of .5% and is payable if the percentage change in the investment record of the S&P 600 exceeds the investment performance of the Fund by 12 or more percentage points for the performance period.
Notwithstanding the foregoing, Royce is not entitled to receive any fee for any month when the investment performance of the Fund for the rolling 36-month period ending with such month is negative. In the event that the Fund’s investment performance for such a performance period is less than zero, Royce will not be required to refund to the Fund any fee earned in respect of any prior performance period.
Royce has voluntarily committed to waive the portion of its investment advisory fee attributable to an issue of the Fund’s Preferred Stock for any month in which the Fund’s average annual NAV total return since issuance of the Preferred Stock fails to exceed the applicable Preferred Stock’s dividend rate.
For the six rolling 60-month periods ended June 2008, the investment performance of the Fund exceeded the investment performance of the S&P 600 by 8% to 18%. Accordingly, the investment advisory fee consisted of a Basic Fee of $6,165,173 and an upward adjustment of $2,769,965 for performance of the Fund above that of the S&P 600. For the six months ended June 30, 2008, the Fund accrued and paid Royce advisory fees totaling $8,935,138. |
Purchases and Sales of Investment Securities: |
For the six months ended June 30, 2008, the cost of purchases and proceeds from sales of investment securities, other than short-term securities and collateral received for securities loaned, amounted to $166,070,505 and $214,722,026, respectively. |
Transactions in Shares of Affiliated Companies: |
An “Affiliated Company” as defined in the Investment Company Act of 1940, is a company in which a Fund owns 5% or more of the company’s outstanding voting securities at any time during the period. The Fund effected the following transactions in shares of such companies for the six months ended June 30, 2008: |
| | | | | | | | | | | | | | | | | | | | | | | | |
| | | Shares | | Market Value | | Cost of | | Cost of | | Realized | | Dividend | | Shares | | Market Value |
| Affiliated Company | | 12/31/07 | | 12/31/07 | | Purchases | | Sales | | Gain (Loss) | | Income | | 6/30/08 | | 6/30/08 |
| Delta Apparel | | 580,760 | | $4,152,434 | | | | $168,149 | | | - | | - | | | - | | | 605,560 | | | $2,228,461 | |
| Timberland Bancorp | | 469,200 | | 5,714,856 | | | | - | | | - | | - | | | $103,224 | | | 469,200 | | | 3,762,984 | |
| | | | | $9,867,290 | | | | | | | | | - | | | $103,224 | | | | | | $5,991,445 | |
2008 Semiannual Report to Stockholders | 35
Royce Micro-Cap Trust
| | | SHARES | | | VALUE |
| COMMON STOCKS – 119.2% | | | | | |
| | | | | | |
| Consumer Products – 7.6% | | | | | |
| Apparel, Shoes and Accessories - 2.2% | | | | | |
Cherokee | | 18,500 | | $ | 372,775 |
Frederick’s of Hollywood Group a | | 121,804 | | | 182,706 |
Hartmarx Corporation a | | 70,000 | | | 151,900 |
Kleinert’s a,b | | 14,200 | | | 0 |
Lazare Kaplan International a | | 151,700 | | | 1,350,130 |
†Perry Ellis Internationala,c | | 3,800 | | | 80,636 |
Steven Madden a | | 23,332 | | | 428,842 |
True Religion Apparel a,c | | 5,200 | | | 138,580 |
†Tween Brands a,c | | 13,700 | | | 225,502 |
Weyco Group | | 120,000 | | | 3,183,600 |
Yamato International | | 40,000 | | | 204,549 |
| | | | |
|
| | | | | | 6,319,220 |
| | | | |
|
| Collectibles - 0.0% | | | | | |
†Leapfrog Enterprises Cl. A a,c | | 13,000 | | | 108,160 |
| | | | |
|
| Consumer Electronics - 0.1% | | | | | |
DTS a,c | | 7,000 | | | 219,240 |
TiVo a,c | | 20,000 | | | 123,400 |
| | | | |
|
| | | | | | 342,640 |
| | | | |
|
| Food/Beverage/Tobacco - 1.9% | | | | | |
Green Mountain Coffee Roasters a,c | | 76,800 | | | 2,885,376 |
†Lifeway Foods a,c | | 20,000 | | | 237,800 |
Seneca Foods Cl. A a | | 62,500 | | | 1,303,125 |
Seneca Foods Cl. B a,c | | 42,500 | | | 908,225 |
| | | | |
|
| | | | | | 5,334,526 |
| | | | |
|
| Health, Beauty and Nutrition - 0.2% | | | | | |
Nutraceutical International a | | 15,000 | | | 180,000 |
†NutriSystem | | 24,400 | | | 345,016 |
| | | | |
|
| | | | | | 525,016 |
| | | | |
|
| Home Furnishing and Appliances - 2.3% | | | | | |
American Woodmark | | 100,000 | | | 2,113,000 |
Cobra Electronics | | 10,000 | | | 27,300 |
Flexsteel Industries | | 213,500 | | | 2,401,875 |
Helen of Troy a,c | | 20,000 | | | 322,400 |
Lifetime Brands | | 42,054 | | | 342,740 |
Natuzzi ADR a | | 387,800 | | | 1,237,082 |
Universal Electronics a,c | | 5,600 | | | 117,040 |
| | | | |
|
| | | | | | 6,561,437 |
| | | | |
|
| Household Products/Wares - 0.3% | | | | | |
A.T. Cross Company Cl. A a,c | | 100,000 | | | 833,000 |
| | | | |
|
| Sports and Recreation - 0.6% | | | | | |
Cybex International a | | 61,700 | | | 210,397 |
Monaco Coach | | 314,950 | | | 957,448 |
Steinway Musical Instruments a | | 10,000 | | | 264,000 |
Sturm, Ruger & Company a | | 45,000 | | | 317,700 |
| | | | |
|
| | | | | | 1,749,545 |
| | | | |
|
| Total (Cost $18,158,712) | | | | | 21,773,544 |
| | | | |
|
| | | | | | |
| Consumer Services – 5.8% | | | | | |
| Leisure and Entertainment - 0.4% | | | | | |
Ambassadors Group a | | 22,000 | | | 328,240 |
Ambassadors International a,c | | 6,100 | | | 26,718 |
| | | SHARES | | | VALUE |
| Consumer Services (continued) | | | | | |
| Leisure and Entertainment (continued) | | | | | |
FortuNet a,c | | 5,000 | | $ | 31,300 |
GameTech International a | | 17,500 | | | 83,125 |
IMAX Corporation a,c | | 25,000 | | | 171,000 |
Premier Exhibitions a,c | | 82,800 | | | 375,912 |
| | | | |
|
| | | | | | 1,016,295 |
| | | | |
|
| Media and Broadcasting - 0.1% | | | | | |
Ballantyne of Omaha a,c | | 100,000 | | | 445,000 |
| | | | |
|
| Online Commerce - 1.3% | | | | | |
Alloy a | | 65,702 | | | 475,026 |
CryptoLogic | | 97,200 | | | 1,395,792 |
FTD Group c | | 55,000 | | | 733,150 |
Knot (The) a,c | | 25,200 | | | 246,456 |
PC Connection a,c | | 17,100 | | | 159,201 |
PC Mall a,c | | 26,000 | | | 352,560 |
Stamps.com a | | 34,100 | | | 425,568 |
| | | | |
|
| | | | | | 3,787,753 |
| | | | |
|
| Restaurants and Lodgings - 0.2% | | | | | |
Benihana Cl. A a,c | | 39,700 | | | 251,698 |
Cosi a | | 43,800 | | | 109,938 |
Jamba a | | 67,000 | | | 123,950 |
Noble Roman’s a | | 60,200 | | | 72,240 |
| | | | |
|
| | | | | | 557,826 |
| | | | |
|
| Retail Stores - 3.6% | | | | | |
A.C. Moore Arts & Crafts a,c | | 59,000 | | | 415,950 |
America’s Car-Mart a | | 170,000 | | | 3,046,400 |
Buckle (The) | | 23,500 | | | 1,074,655 |
Build-A-Bear Workshop a,c | | 131,900 | | | 958,913 |
Cache a | | 19,200 | | | 205,440 |
Casual Male Retail Group a | | 2,000 | | | 6,100 |
Cato Corporation (The) Cl. A | | 68,100 | | | 969,744 |
Cost Plus a | | 51,100 | | | 127,750 |
dELiA*s a,c | | 67,300 | | | 135,273 |
Dover Saddlery a,c | | 20,228 | | | 79,901 |
EZCORP Cl. A a,c | | 13,900 | | | 177,225 |
Fred’s Cl. A | | 26,000 | | | 292,240 |
†Hibbett Sports a,c | | 400 | | | 8,440 |
New York & Company a | | 29,600 | | | 270,248 |
Stein Mart a,c | | 223,291 | | | 1,007,042 |
West Marine a,c | | 274,000 | | | 1,123,400 |
Wet Seal (The) Cl. A a | | 57,065 | | | 272,200 |
| | | | |
|
| | | | | | 10,170,921 |
| | | | |
|
| Other Consumer Services - 0.2% | | | | | |
Collectors Universe | | 33,200 | | | 269,252 |
First Cash Financial Services a,c | | 9,200 | | | 137,908 |
†Shutterfly a,c | | 13,000 | | | 158,730 |
| | | | |
|
| | | | | | 565,890 |
| | | | |
|
| Total (Cost $18,050,920) | | | | | 16,543,685 |
| | | | |
|
| | | | | | |
| Diversified Investment Companies – 2.4% | | | | | |
| Closed-End Funds - 2.4% | | | | | |
ASA | | 48,900 | | | 4,139,385 |
| 36 | | | 2008 Semiannual Report to Stockholders | THE ACCOMPANYING NOTES ARE AN INTEGRAL PART OF THESE FINANCIAL STATEMENTS. |
| | | June 30, 2008 (unaudited) |
| | | SHARES | | | VALUE |
| Diversified Investment Companies (continued) | | | | | |
| Closed-End Funds (continued) | | | | | |
| Central Fund of Canada Cl. A | | 207,000 | | $ | 2,680,650 |
| | | | |
|
| Total (Cost $2,675,077) | | | | | 6,820,035 |
| | | | |
|
| | | | | | |
| Financial Intermediaries – 11.0% | | | | | |
| Banking - 5.8% | | | | | |
Alliance Bancorp, Inc. of Pennsylvania | | 50,420 | | | 453,276 |
B of I Holding a,c | | 100,000 | | | 739,000 |
Bancorp (The) a | | 50,000 | | | 381,000 |
BB Holdings a | | 390,000 | | | 1,767,268 |
CFS Bancorp | | 60,000 | | | 707,400 |
Chemung Financial | | 40,000 | | | 1,030,000 |
CNB Financial | | 30,000 | | | 424,200 |
Commercial National Financial | | 20,000 | | | 298,000 |
Fauquier Bankshares | | 160,800 | | | 2,588,880 |
Financial Institutions | | 50,000 | | | 803,000 |
First Bancorp | | 40,200 | | | 548,730 |
Franklin Bank a,c | | 45,500 | | | 27,755 |
HopFed Bancorp | | 49,000 | | | 674,730 |
Lakeland Financial | | 45,000 | | | 858,600 |
LCNB Corporation | | 30,000 | | | 285,000 |
Meta Financial Group | | 44,800 | | | 1,186,304 |
Nexity Financial a | | 29,000 | | | 134,850 |
Peapack-Gladstone Financial | | 29,000 | | | 637,130 |
Queen City Investments a | | 948 | | | 1,185,000 |
Quest Capital | | 30,000 | | | 52,074 |
Sterling Bancorp | | 32,869 | | | 392,785 |
W Holding Company | | 300,000 | | | 255,000 |
Wilber Corporation(The) | | 103,150 | | | 873,680 |
WSB Financial Group a,c | | 114,200 | | | 188,430 |
| | | | |
|
| | | | | | 16,492,092 |
| | | | |
|
| Insurance - 1.8% | | | | | |
American Physicians Service Group | | 10,000 | | | 220,400 |
American Safety Insurance Holdings a | | 20,000 | | | 287,600 |
CRM Holdings a,c | | 124,000 | | | 416,640 |
First Acceptance a | | 258,405 | | | 826,896 |
Independence Holding | | 95,800 | | | 935,966 |
Navigators Group a | | 15,200 | | | 821,560 |
NYMAGIC | | 85,400 | | | 1,636,264 |
| | | | |
|
| | | | | | 5,145,326 |
| | | | |
|
| Real Estate Investment Trusts - 0.1% | | | | | |
Vestin Realty Mortgage II | | 74,230 | | | 223,432 |
| | | | |
|
| Securities Brokers - 3.0% | | | | | |
Broadpoint Securities Group a,c | | 95,000 | | | 190,000 |
CowenGroup a,c | | 123,600 | | | 954,192 |
Diamond Hill Investment Group a,c | | 5,000 | | | 417,500 |
Evercore Partners Cl. A | | 50,900 | | | 483,550 |
†FBR Capital Markets a,c | | 350,600 | | | 1,763,518 |
International Assets Holding a | | 6,400 | | | 192,384 |
Sanders Morris Harris Group | | 199,000 | | | 1,349,220 |
Stifel Financial a,c | | 53,899 | | | 1,853,587 |
Thomas Weisel Partners Group a,c | | 187,000 | | | 1,022,890 |
TradeStation Group a,c | | 30,000 | | | 304,500 |
| | | | |
|
| | | | | | 8,531,341 |
| | | | |
|
| | | SHARES | | | VALUE |
| Financial Intermediaries (continued) | | | | | |
| Securities Exchanges - 0.3% | | | | | |
MarketAxess Holdings a,c | | 123,700 | | $ | 935,172 |
| | | | |
|
| Total (Cost $33,761,587) | | | | | 31,327,363 |
| | | | |
|
| | | | | | |
| Financial Services – 6.4% | | | | | |
| Diversified Financial Services - 1.0% | | | | | |
Advanta Corporation Cl. B | | 37,500 | | | 235,875 |
†Encore Capital Group a | | 98,000 | | | 865,340 |
World Acceptance a,c | | 47,951 | | | 1,614,510 |
| | | | |
|
| | | | | | 2,715,725 |
| | | | |
|
| Insurance Brokers - 0.3% | | | | | |
Crawford & Company Cl. A a,c | | 50,000 | | | 312,500 |
Health Benefits Direct a | | 103,215 | | | 51,608 |
Western Financial Group | | 148,000 | | | 510,895 |
| | | | |
|
| | | | | | 875,003 |
| | | | |
|
| Investment Management - 3.1% | | | | | |
BKF Capital Group a | | 387,000 | | | 797,220 |
Cockleshell a | | 465,300 | | | 505,110 |
Epoch Holding Corporation | | 211,500 | | | 1,926,765 |
Hennessy Advisors | | 24,750 | | | 136,125 |
JZ Equity Partners b | | 70,000 | | | 154,766 |
MVC Capital | | 226,200 | | | 3,096,678 |
Sceptre Investment Counsel | | 78,000 | | | 611,945 |
UTEK Corporation a | | 20,100 | | | 201,000 |
Westwood Holdings Group | | 38,280 | | | 1,523,544 |
| | | | |
|
| | | | | | 8,953,153 |
| | | | |
|
| Special Purpose Acquisition Corporation - 1.5% | | | | | |
Alternative Asset Management | | | | | |
Acquisition (Units) a | | 250,000 | | | 2,425,000 |
Prospect Acquisition (Units) a | | 50,000 | | | 478,000 |
Shellshock a | | 47,200 | | | 61,580 |
Shermen WSC Acquisition a | | 220,000 | | | 1,262,800 |
| | | | |
|
| | | | | | 4,227,380 |
| | | | |
|
| Specialty Finance - 0.5% | | | | | |
ASTA Funding | | 24,100 | | | 218,346 |
MRU Holdings a | | 106,100 | | | 238,725 |
NGP Capital Resources | | 68,080 | | | 1,049,113 |
| | | | |
|
| | | | | | 1,506,184 |
| | | | |
|
| Total (Cost $15,692,368) | | | | | 18,277,445 |
| | | | |
|
| | | | | | |
| Health – 14.5% | | | | | |
| Commercial Services - 1.3% | | | | | |
Medifast a,c | | 25,700 | | | 135,182 |
PAREXEL International a,c | | 116,500 | | | 3,065,115 |
PDI a | | 66,800 | | | 581,828 |
| | | | |
|
| | | | | | 3,782,125 |
| | | | |
|
| Drugs and Biotech - 2.8% | | | | | |
Acadia Pharmaceuticals a,c | | 33,500 | | | 123,615 |
Allos Therapeutics a,c | | 53,600 | | | 370,376 |
Anadys Pharmaceuticals a,c | | 420,000 | | | 945,000 |
BioCryst Pharmaceuticals a,c | | 200,000 | | | 560,000 |
Cambrex Corporation a | | 16,000 | | | 93,920 |
Caraco Pharmaceutical Laboratories a | | 14,650 | | | 193,380 |
Cardiome Pharma a | | 21,000 | | | 184,800 |
| THE ACCOMPANYING NOTES ARE AN INTEGRAL PART OF THESE FINANCIAL STATEMENTS. | 2008 Semiannual Report to Stockholders | | | 37 |
Royce Micro-Cap Trust
| | | SHARES | | | VALUE |
| Health (continued) | | | | | |
| Drugs and Biotech (continued) | | | | | |
Cell Genesys a,c | | 78,000 | | $ | 202,800 |
Durect Corporation a,c | | 44,100 | | | 161,847 |
DUSA Pharmaceuticals a,c | | 92,600 | | | 186,126 |
Dyax Corporation a | | 47,300 | | | 146,630 |
Emisphere Technologies a,c | | 163,200 | | | 437,376 |
Favrille a,c | | 401,000 | | | 25,303 |
Genitope Corporation a,c | | 196,700 | | | 8,734 |
Genoptix a,c | | 10,000 | | | 315,500 |
GenVec a,c | | 140,000 | | | 201,600 |
Hi-Tech Pharmacal a | | 19,430 | | | 194,300 |
ImmunoGen a,c | | 24,000 | | | 73,440 |
Lexicon Pharmaceuticals a,c | | 80,000 | | | 128,000 |
MannKind Corporation a,c | | 10,000 | | | 30,000 |
Momenta Pharmaceuticals a,c | | 62,500 | | | 768,750 |
Neuralstem a | | 40,000 | | | 58,000 |
Oncolytics Biotech a,c | | 36,000 | | | 69,480 |
Orchid Cellmark a,c | | 78,000 | | | 202,800 |
RTI Biologics a,c | | 24,400 | | | 213,500 |
Sangamo BioSciences a,c | | 10,000 | | | 99,500 |
Seattle Genetics a,c | | 57,000 | | | 482,220 |
Senomyx a,c | | 57,000 | | | 281,010 |
Sinovac Biotech a,c | | 70,000 | | | 227,500 |
Strategic Diagnostics a | | 56,200 | | | 204,568 |
Tapestry Pharmaceuticals a,c,d | | 863,000 | | | 9,493 |
Theragenics Corporation a,c | | 145,800 | | | 529,254 |
Trimeris | | 81,000 | | | 382,320 |
| | | | |
|
| | | | | | 8,111,142 |
| | | | |
|
| Health Services - 4.4% | | | | | |
Air Methods a,c | | 13,300 | | | 332,500 |
Albany Molecular Research a | | 30,000 | | | 398,100 |
Alliance Imaging a,c | | 35,200 | | | 305,184 |
Bio-Imaging Technologies a | | 19,100 | | | 141,340 |
BML | | 30,000 | | | 569,289 |
Computer Programs and Systems | | 13,900 | | | 240,887 |
CorVel Corporation a | | 40,125 | | | 1,359,034 |
eResearch Technology a | | 165,000 | | | 2,877,600 |
Gentiva Health Services a | | 23,000 | | | 438,150 |
HMS Holdings a,c | | 28,900 | | | 620,483 |
Hooper Holmes a,c | | 67,600 | | | 68,952 |
MedCath Corporation a,c | | 18,000 | | | 323,640 |
Mediware Information Systems a,c | | 30,200 | | | 176,670 |
On Assignment a,c | | 73,700 | | | 591,074 |
PharmaNet Development Group a,c | | 25,000 | | | 394,250 |
PharMerica Corporation a,c | | 100,000 | | | 2,259,000 |
RehabCare Group a,c | | 40,500 | | | 649,215 |
Sun Healthcare Group a,c | | 41,000 | | | 548,990 |
U.S. Physical Therapy a | | 10,000 | | | 164,100 |
| | | | |
|
| | | | | | 12,458,458 |
| | | | |
|
| Medical Products and Devices - 6.0% | | | | | |
ABIOMED a,c | | 15,000 | | | 266,250 |
Allied Healthcare Products a | | 246,998 | | | 1,679,586 |
Angio Dynamics a,c | | 14,000 | | | 190,680 |
Anika Therapeutics a | | 17,000 | | | 146,030 |
Atrion Corporation | | 4,000 | | | 383,280 |
| | | SHARES | | | VALUE |
| Health (continued) | | | | | |
| Medical Products and Devices (continued) | | | | | |
Caliper Life Sciences a | | 50,000 | | $ | 129,500 |
Cardiac Science a,c | | 26,243 | | | 215,193 |
CAS Medical Systems a,c | | 60,230 | | | 191,531 |
†Celsion Corporation a,c | | 20,212 | | | 77,816 |
Cerus Corporation a | | 109,600 | | | 448,264 |
CONMED Corporation a | | 3,900 | | | 103,545 |
Cutera a,c | | 42,800 | | | 386,484 |
†Cynosure Cl. A a,c | | 15,000 | | | 297,300 |
Del Global Technologies a | | 461,301 | | | 691,952 |
EPIX Pharmaceuticals a,c | | 24,666 | | | 42,672 |
Exactech a | | 110,000 | | | 2,828,100 |
HealthTronics a,c | | 61,700 | | | 201,759 |
Kensey Nash a | | 26,650 | | | 854,132 |
Medical Action Industries a,c | | 125,250 | | | 1,298,843 |
Merit Medical Systems a | | 8,700 | | | 127,890 |
Neurometrix a,c | | 21,500 | | | 30,100 |
NMT Medical a,c | | 17,000 | | | 79,390 |
Orthofix International a,c | | 28,000 | | | 810,600 |
OrthoLogic Corporation a,c | | 65,000 | | | 65,000 |
†Palomar Medical Technologies a,c | | 28,000 | | | 279,440 |
PLC Systems a | | 105,200 | | | 37,872 |
SenoRx a | | 40,100 | | | 309,572 |
Shamir Optical Industry | | 17,500 | | | 121,625 |
Syneron Medical a | | 80,400 | | | 1,321,776 |
Synovis Life Technologies a,c | | 20,000 | | | 376,600 |
Thermage a | | 145,400 | | | 415,844 |
Utah Medical Products | | 42,300 | | | 1,209,357 |
Vital Images a,c | | 16,300 | | | 202,772 |
Young Innovations | | 61,450 | | | 1,279,389 |
| | | | |
|
| | | | | | 17,100,144 |
| | | | |
|
| Total (Cost $37,857,161) | | | | | 41,451,869 |
| | | | |
|
| | | | | | |
| Industrial Products – 17.4% | | | | | |
| Automotive - 1.1% | | | | | |
†ATC Technology a,c | | 8,800 | | | 204,864 |
Commerical Vehicle Group a,c | | 24,000 | | | 224,400 |
LKQ Corporation a,c | | 22,800 | | | 411,996 |
SORL Auto Parts a,c | | 50,600 | | | 271,216 |
Spartan Motors | | 6,300 | | | 47,061 |
Strattec Security | | 28,300 | | | 996,726 |
†US Auto Parts Network a,c | | 225,900 | | | 817,758 |
Wescast Industries Cl. A a | | 12,900 | | | 85,519 |
| | | | |
|
| | | | | | 3,059,540 |
| | | | |
|
| Building Systems and Components - 1.1% | | | | | |
AAON | | 109,500 | | | 2,108,970 |
Bunka Shutter | | 90,000 | | | 361,068 |
LSI Industries | | 90,563 | | | 735,372 |
| | | | |
|
| | | | | | 3,205,410 |
| | | | |
|
| Construction Materials - 2.2% | | | | | |
Ash Grove Cement | | 8,000 | | | 1,912,000 |
Monarch Cement | | 50,410 | | | 1,504,738 |
Trex Company a,c | | 250,000 | | | 2,932,500 |
| | | | |
|
| | | | | | 6,349,238 |
| | | | |
|
| 38 | | | 2008 Semiannual Report to Stockholders | THE ACCOMPANYING NOTES ARE AN INTEGRAL PART OF THESE FINANCIAL STATEMENTS. |
| | | June 30, 2008 (unaudited) |
| | | SHARES | | | VALUE |
| Industrial Products (continued) | | | | | |
| Industrial Components - 2.0% | | | | | |
C&D Technologies a,c | | 53,000 | | $ | 448,380 |
Deswell Industries | | 105,300 | | | 595,998 |
Gerber Scientific a,c | | 103,600 | | | 1,178,968 |
†Orion Energy Systems a,c | | 17,436 | | | 174,360 |
Planar Systems a | | 142,000 | | | 369,200 |
Powell Industries a | | 26,800 | | | 1,350,988 |
Tech/Ops Sevcon | | 76,200 | | | 560,070 |
Zygo Corporation a,c | | 97,500 | | | 958,425 |
| | | | |
|
| | | | | | 5,636,389 |
| | | | |
|
| Machinery - 3.6% | | | | | |
Active Power a,c | | 187,500 | | | 219,375 |
Alamo Group | | 38,600 | | | 794,774 |
Astec Industries a | | 200 | | | 6,428 |
Burnham Holdings Cl. A | | 95,000 | | | 1,254,000 |
†Columbus McKinnon a,c | | 4,900 | | | 117,992 |
†DXP Enterprises a,c | | 4,500 | | | 187,380 |
Eastern Company (The) | | 39,750 | | | 604,200 |
FreightCar America | | 6,300 | | | 223,650 |
Gehl Company a | | 20,000 | | | 295,800 |
Gorman-Rupp Company | | 5,272 | | | 210,036 |
Hurco Companies a,c | | 20,500 | | | 633,245 |
Kadant a,c | | 16,600 | | | 375,160 |
K-Tron International a | | 1,500 | | | 194,400 |
Mueller (Paul) Company | | 9,650 | | | 443,900 |
StockerYale a | | 305,700 | | | 180,363 |
Sun Hydraulics | | 58,425 | | | 1,885,375 |
Tennant Company | | 88,200 | | | 2,652,174 |
| | | | |
|
| | | | | | 10,278,252 |
| | | | |
|
| Metal Fabrication and Distribution - 1.4% | | | | | |
Central Steel & Wire | | 1,088 | | | 718,080 |
Dynamic Materials | | 4,300 | | | 141,685 |
Encore Wire | | 15,000 | | | 317,850 |
Insteel Industries | | 400 | | | 7,324 |
Ladish Company a | | 10,000 | | | 205,900 |
NN | | 114,300 | | | 1,593,342 |
Olympic Steel | | 9,700 | | | 736,424 |
Universal Stainless & Alloy Products a | | 7,700 | | | 285,208 |
| | | | |
|
| | | | | | 4,005,813 |
| | | | |
|
| Miscellaneous Manufacturing - 3.2% | | | | | |
Peerless Manufacturing a | | 84,400 | | | 3,955,828 |
Quixote Corporation | | 245,400 | | | 2,019,642 |
Raven Industries | | 73,000 | | | 2,392,940 |
Synalloy Corporation | | 58,200 | | | 897,444 |
| | | | |
|
| | | | | | 9,265,854 |
| | | | |
|
| Paper and Packaging - 0.1% | | | | | |
MOD-PAC Corporation a,c | | 23,200 | | | 92,800 |
Wausau Paper | | 41,000 | | | 316,110 |
| | | | |
|
| | | | | | 408,910 |
| | | | |
|
| Pumps, Valves and Bearings - 0.5% | | | | | |
CIRCOR International | | 28,000 | | | 1,371,720 |
| | | | |
|
| Specialty Chemicals and Materials - 2.1% | | | | | |
Aceto Corporation | | 284,419 | | | 2,172,961 |
American Vanguard | | 19,333 | | | 237,796 |
Balchem Corporation | | 33,750 | | | 780,638 |
| | | SHARES | | | VALUE |
| Industrial Products (continued) | | | | | |
| Specialty Chemicals and Materials (continued) | | | | | |
Hawkins | | 118,167 | | $ | 1,767,778 |
Metabolix a,c | | 6,000 | | | 58,800 |
Park Electrochemical | | 25,900 | | | 629,629 |
Symyx Technologies a | | 29,000 | | | 202,420 |
| | | | |
|
| | | | | | 5,850,022 |
| | | | |
|
| Textiles - 0.1% | | | | | |
Unifi a | | 100,000 | | | 252,000 |
| | | | |
|
| Total (Cost $35,299,492) | | | | | 49,683,148 |
| | | | |
|
| | | | | | |
| Industrial Services – 15.0% | | | | | |
| Advertising and Publishing - 0.3% | | | | | |
DG FastChannel a,c | | 8,200 | | | 141,450 |
Voyager Learning a | | 125,000 | | | 631,250 |
| | | | |
|
| | | | | | 772,700 |
| | | | |
|
| Commercial Services - 6.7% | | | | | |
Acacia Research-Acacia Technologies a,c | | 84,450 | | | 378,336 |
Animal Health International a,c | | 50,000 | | | 311,500 |
Canadian Solar a,c | | 25,000 | | | 1,004,750 |
CBIZ a,c | | 87,000 | | | 691,650 |
CDI Corporation | | 9,000 | | | 228,960 |
ClearPoint Business Resources a | | 120,000 | | | 57,600 |
Diamond Management & Technology Consultants | | 188,100 | | | 980,001 |
eTelecare Global Solutions ADR a | | 78,500 | | | 419,190 |
Exponent a | | 117,600 | | | 3,693,816 |
Forrester Research a | | 101,500 | | | 3,134,320 |
General Finance a | | 28,100 | | | 154,550 |
Geo Group (The) a,c | | 68,300 | | | 1,536,750 |
Hudson Highland Group a | | 29,400 | | | 307,818 |
Impellam Group a | | 188,800 | | | 302,729 |
Kforce a | | 55,000 | | | 466,950 |
Landauer | | 21,300 | | | 1,197,912 |
Lincoln Educational Services a | | 33,100 | | | 384,953 |
PeopleSupport a | | 43,300 | | | 368,050 |
RCM Technologies a | | 179,500 | | | 773,645 |
†Rentrak Corporation a,c | | 13,300 | | | 187,264 |
SM&A a | | 31,300 | | | 149,301 |
StarTek a,c | | 21,800 | | | 204,920 |
Team a | | 4,400 | | | 151,008 |
†TravelCenters of America a,c | | 125,000 | | | 283,750 |
Volt Information Sciences a,c | | 74,600 | | | 888,486 |
Waste Services a,c | | 34,350 | | | 241,824 |
Westaff a | | 362,500 | | | 409,625 |
Willdan Group a | | 40,100 | | | 192,881 |
| | | | |
|
| | | | | | 19,102,539 |
| | | | |
|
| Engineering and Construction - 2.2% | | | | | |
Cavco Industries a | | 9,400 | | | 307,662 |
Hanfeng Evergreen a | | 17,900 | | | 229,960 |
Hill International a,c | | 20,000 | | | 328,800 |
HLS Systems International a | | 165,377 | | | 866,575 |
Insituform Technologies Cl. A a,c | | 56,400 | | | 858,972 |
Integrated Electrical Services a,c | | 132,000 | | | 2,270,400 |
Nobility Homes | | 13,800 | | | 220,110 |
Skyline Corporation | | 32,100 | | | 754,350 |
| THE ACCOMPANYING NOTES ARE AN INTEGRAL PART OF THESE FINANCIAL STATEMENTS. | 2008 Semiannual Report to Stockholders | | | 39 |
Royce Micro-Cap Trust
| | | SHARES | | | VALUE |
| Industrial Services (continued) | | | | | |
| Engineering and Construction (continued) | | | | | |
Sterling Construction a | | 28,300 | | $ | 562,038 |
| | | | |
|
| | | | | | 6,398,867 |
| | | | |
|
| Food, Tobacco and Agriculture - 1.5% | | | | | |
Cal-Maine Foods | | 45,000 | | | 1,484,550 |
Farmer Bros. | | 42,400 | | | 896,760 |
Galaxy Nutritional Foods a | | 4,700 | | | 705 |
Imperial Sugar | | 20,120 | | | 312,464 |
ML Macadamia Orchards L.P. a | | 120,200 | | | 411,084 |
Origin Agritech a,c | | 185,788 | | | 1,111,012 |
| | | | |
|
| | | | | | 4,216,575 |
| | | | |
|
| Industrial Distribution - 0.9% | | | | | |
Houston Wire & Cable | | 40,375 | | | 803,463 |
Lawson Products | | 61,000 | | | 1,511,580 |
Toshin Group | | 20,000 | | | 312,850 |
| | | | |
|
| | | | | | 2,627,893 |
| | | | |
|
| Printing - 1.1% | | | | | |
Bowne & Co. | | 66,500 | | | 847,875 |
Champion Industries | | 23,500 | | | 108,805 |
Courier Corporation | | 30,450 | | | 611,436 |
Ennis | | 7,200 | | | 112,680 |
Multi-Color Corporation | | 27,900 | | | 585,621 |
Schawk | | 60,900 | | | 730,191 |
| | | | |
|
| | | | | | 2,996,608 |
| | | | |
|
| Transportation and Logistics - 2.3% | | | | | |
Air Transport Services Group a,c | | 100,000 | | | 100,000 |
Euroseas | | 38,000 | | | 492,860 |
Forward Air | | 50,700 | | | 1,754,220 |
Frozen Food Express Industries | | 92,000 | | | 621,000 |
MAIR Holdings a,c | | 8,600 | | | 34,830 |
Marten Transport a | | 21,450 | | | 342,556 |
Patriot Transportation Holding a | | 3,000 | | | 240,000 |
Universal Truckload Services a | | 134,200 | | | 2,955,084 |
| | | | |
|
| | | | | | 6,540,550 |
| | | | |
|
| Other Industrial Services - 0.0% | | | | | |
Allen-Vanguard Corporation a | | 7,700 | | | 19,256 |
| | | | |
|
| Total (Cost $35,966,432) | | | | | 42,674,988 |
| | | | |
|
| | | | | | |
| Natural Resources – 13.9% | | | | | |
| Energy Services - 5.8% | | | | | |
Boots & Coots International Well Control a | | 200,000 | | | 476,000 |
Bronco Drilling a | | 25,200 | | | 463,176 |
CE Franklin a,c | | 31,450 | | | 315,443 |
Dril-Quip a,c | | 55,000 | | | 3,465,000 |
Environmental Power a,c | | 115,000 | | | 479,550 |
Foraco International | | 40,000 | | | 117,682 |
Gulf Island Fabrication | | 3,416 | | | 167,145 |
GulfMark Offshore a,c | | 55,400 | | | 3,223,172 |
ION Geophysical a,c | | 43,500 | | | 759,075 |
Particle Drilling Technologies a,c | | 44,410 | | | 111,025 |
Pason Systems | | 209,200 | | | 3,385,113 |
Pioneer Drilling a | | 7,500 | | | 141,075 |
T-3 Energy Services a,c | | 600 | | | 47,682 |
| | | SHARES | | | VALUE |
| Natural Resources (continued) | | | | | |
| Energy Services (continued) | | | | | |
Willbros Group a | | 54,100 | | $ | 2,370,121 |
World Energy Solutions a | | 875,300 | | | 1,115,907 |
| | | | |
|
| | | | | | 16,637,166 |
| | | | |
|
| Oil and Gas - 2.3% | | | | | |
Approach Resources a | | 12,000 | | | 321,480 |
Bonavista Energy Trust | | 40,100 | | | 1,472,732 |
Cano Petroleum a,c | | 26,000 | | | 206,440 |
GeoMet a,c | | 75,000 | | | 711,000 |
Gran Tierra Energy a,c | | 80,200 | | | 639,194 |
†Harvest Natural Resources a,c | | 45,000 | | | 497,700 |
†Kodiak Oil & Gas a,c | | 80,000 | | | 364,800 |
Nuvista Energy a | | 121,000 | | | 2,078,965 |
PetroCorp a,b | | 104,200 | | | 0 |
Storm Cat Energy a,c | | 102,500 | | | 118,900 |
| | | | |
|
| | | | | | 6,411,211 |
| | | | |
|
| Precious Metals and Mining - 4.0% | | | | | |
Allied Nevada Gold a | | 136,050 | | | 801,335 |
Aquiline Resources a | | 33,900 | | | 257,317 |
Aurizon Mines a,c | | 197,000 | | | 967,270 |
Brush Engineered Materials a,c | | 15,500 | | | 378,510 |
Central African Gold a | | 89,790 | | | 33,534 |
Chesapeake Gold a | | 20,000 | | | 147,102 |
Duluth Metals a | | 87,500 | | | 218,814 |
Endeavour Mining Capital | | 337,000 | | | 2,445,621 |
Endeavour Silver a | | 50,000 | | | 156,000 |
Entree Gold a | | 177,900 | | | 345,126 |
Etruscan Resources a | | 20,000 | | | 32,363 |
Gammon Gold a | | 83,836 | | | 909,621 |
Gateway Gold a | | 400,000 | | | 92,184 |
Golden Star Resources a,c | | 168,100 | | | 452,189 |
Great Basin Gold a | | 13,500 | | | 45,940 |
Greystar Resources a | | 11,900 | | | 45,163 |
Liberty Mines a | | 182,900 | | | 121,969 |
Mercator Minerals a | | 9,400 | | | 112,188 |
Metallica Resources a,c | | 50,000 | | | 334,500 |
Midway Gold a | | 347,500 | | | 681,573 |
Minefinders Corporation a | | 36,000 | | | 374,400 |
New Gold a,c | | 141,200 | | | 1,083,004 |
Northgate Minerals a | | 270,000 | | | 742,500 |
Quaterra Resources a | | 40,000 | | | 127,488 |
Uranium Resources a,c | | 18,565 | | | 68,505 |
US Silver a | | 79,700 | | | 35,172 |
Vista Gold a,c | | 50,000 | | | 182,500 |
Yamana Gold | | 8,145 | | | 134,718 |
| | | | |
|
| | | | | | 11,326,606 |
| | | | |
|
| Real Estate - 1.7% | | | | | |
†Avatar Holdings a,c | | 13,204 | | | 399,949 |
HomeFed Corporation a | | 11,352 | | | 532,977 |
Kennedy-Wilson a,c | | 21,500 | | | 919,125 |
PICO Holdings a | | 45,700 | | | 1,985,665 |
Pope Resources L.P. | | 33,000 | | | 1,065,900 |
| | | | |
|
| | | | | | 4,903,616 |
| | | | |
|
| 40 | | | 2008 Semiannual Report to Stockholders | THE ACCOMPANYING NOTES ARE AN INTEGRAL PART OF THESE FINANCIAL STATEMENTS. |
| | | June 30, 2008 (unaudited) |
| | | SHARES | | | VALUE |
| Natural Resources (continued) | | | | | |
| Other Natural Resources - 0.1% | | | | | |
Neo Material Technologies a | | 61,500 | | $ | 265,372 |
| | | | |
|
| Total (Cost $19,993,198) | | | | | 39,543,971 |
| | | | |
|
| | | | | | |
| Technology – 22.6% | | | | | |
| Aerospace and Defense - 2.3% | | | | | |
Aerovironment a | | 11,100 | | | 301,698 |
American Science & Engineering | | 2,400 | | | 123,672 |
Astronics Corporation a | | 26,400 | | | 367,224 |
Ducommun a | | 72,100 | | | 1,655,416 |
HEICO Corporation | | 41,600 | | | 1,353,664 |
HEICO Corporation Cl. A | | 24,160 | | | 642,173 |
Integral Systems a | | 40,510 | | | 1,567,737 |
SIFCO Industries a,c | | 45,800 | | | 462,580 |
| | | | |
|
| | | | | | 6,474,164 |
| | | | |
|
| Components and Systems - 3.3% | | | | | |
Aladdin Knowledge Systems a | | 40,500 | | | 546,750 |
CSP a,c | | 122,581 | | | 729,357 |
Evans & Sutherland Computer a | | 96,272 | | | 97,235 |
Excel Technology a | | 106,900 | | | 2,386,008 |
Giga-tronics a,c | | 3,200 | | | 4,032 |
InFocus Corporation a | | 318,100 | | | 477,150 |
Keithley Instruments | | 14,000 | | | 133,000 |
Maxwell Technologies a | | 28,600 | | | 303,732 |
Measurement Specialties a,c | | 20,000 | | | 351,800 |
MOCON | | 15,600 | | | 169,884 |
MTS Systems | | 10,000 | | | 358,800 |
OPTEX Company | | 35,000 | | | 474,313 |
Richardson Electronics | | 305,000 | | | 1,808,650 |
Rimage Corporation a,c | | 20,000 | | | 247,800 |
SCM Microsystems a,c | | 34,000 | | | 102,000 |
†SMART Modular Technologies (WWH) a,c | | 44,400 | | | 170,052 |
Spectrum Control a,c | | 41,400 | | | 339,480 |
TransAct Technologies a | | 78,600 | | | 650,808 |
| | | | |
|
| | | | | | 9,350,851 |
| | | | |
|
| Distribution - 0.5% | | | | | |
Agilysys | | 90,000 | | | 1,020,600 |
Alliance Distributors Holding a | | 578,400 | | | 138,816 |
China 3C Group a | | 181,300 | | | 233,877 |
Nu Horizons Electronics a,c | | 40,000 | | | 194,400 |
| | | | |
|
| | | | | | 1,587,693 |
| | | | |
|
| Internet Software and Services - 0.6% | | | | | |
Descartes Systems Group (The) a,c | | 49,200 | | | 165,312 |
iPass a,c | | 190,000 | | | 393,300 |
Jupitermedia Corporation a,c | | 355,800 | | | 498,120 |
NIC | | 26,800 | | | 183,044 |
Website Pros a,c | | 43,650 | | | 363,604 |
| | | | |
|
| | | | | | 1,603,380 |
| | | | |
|
| IT Services - 4.4% | | | | | |
CIBER a,c | | 182,662 | | | 1,134,331 |
Computer Task Group a | | 481,100 | | | 2,463,232 |
iGATE Corporation a,c | | 273,400 | | | 2,222,742 |
Rainmaker Systems a,c | | 2,000 | | | 5,860 |
Sapient Corporation a,c | | 500,000 | | | 3,210,000 |
| | | SHARES | | | VALUE |
| Technology (continued) | | | | | |
| IT Services (continued) | | | | | |
Syntel | | 54,300 | | $ | 1,830,996 |
TriZetto Group (The) a | | 72,600 | | | 1,552,188 |
Yucheng Technologies a,c | | 4,500 | | | 50,355 |
| | | | |
|
| | | | | | 12,469,704 |
| | | | |
|
| Semiconductors and Equipment - 4.2% | | | | | |
Actions Semiconductor ADR a | | 44,450 | | | 153,353 |
Cascade Microtech a | | 55,037 | | | 362,143 |
Catalyst Semiconductor a | | 269,800 | | | 1,170,932 |
CEVA a | | 47,534 | | | 378,846 |
Cohu | | 17,900 | | | 262,772 |
Eagle Test Systems a,c | | 17,500 | | | 196,000 |
Electroglas a,c | | 281,700 | | | 535,230 |
Exar Corporation a,c | | 121,208 | | | 913,908 |
GSI Technology a | | 41,300 | | | 160,244 |
Ikanos Communications a | | 98,700 | | | 332,619 |
Intevac a,c | | 40,550 | | | 457,404 |
†JDS Uniphase a,c | | 54,283 | | | 616,655 |
LeCroy Corporation a,c | | 2,000 | | | 17,840 |
†Mattson Technology a,c | | 36,000 | | | 171,360 |
Melco Holdings | | 30,000 | | | 589,066 |
Nanometrics a | | 37,000 | | | 215,340 |
PDF Solutions a,c | | 85,000 | | | 505,750 |
Photronics a | | 29,750 | | | 209,440 |
Rudolph Technologies a,c | | 24,500 | | | 188,650 |
Semitool a | | 25,500 | | | 191,505 |
†SiRF Technology Holdings a,c | | 20,600 | | | 88,992 |
Trident Microsystems a | | 82,400 | | | 300,760 |
TTM Technologies a | | 159,500 | | | 2,106,995 |
†Ultra Clean Holdings a,c | | 38,000 | | | 302,480 |
Virage Logic a | | 180,000 | | | 1,288,800 |
Zarlink Semiconductor a | | 188,700 | | | 166,075 |
| | | | |
|
| | | | | | 11,883,159 |
| | | | |
|
| Software - 4.6% | | | | | |
ACI Worldwide a | | 97,600 | | | 1,716,784 |
American Software Cl. A | | 56,100 | | | 316,404 |
Bottomline Technologies a | | 20,000 | | | 194,600 |
Convera Corporation Cl. A a,c | | 170,000 | | | 241,400 |
DivX a | | 23,200 | | | 170,288 |
Fundtech a | | 51,000 | | | 733,890 |
ILOG ADR a,c | | 35,000 | | | 346,500 |
JDA Software Group a,c | | 59,500 | | | 1,076,950 |
OpenTV Cl. A a,c | | 239,600 | | | 313,876 |
Pegasystems | | 353,500 | | | 4,758,110 |
Phase Forward a,c | | 43,000 | | | 772,710 |
PLATO Learning a | | 160,000 | | | 424,000 |
Renaissance Learning | | 2,365 | | | 26,512 |
SeaChange International a,c | | 20,000 | | | 143,200 |
SPSS a,c | | 41,800 | | | 1,520,266 |
TeleCommunication Systems Cl. A a | | 10,000 | | | 46,300 |
Trintech Group ADR a,c | | 82,700 | | | 191,037 |
Unica Corporation a,c | | 35,000 | | | 281,400 |
| | | | |
|
| | | | | | 13,274,227 |
| | | | |
|
| Telecommunications - 2.7% | | | | | |
Anaren a | | 50,900 | | | 538,013 |
| THE ACCOMPANYING NOTES ARE AN INTEGRAL PART OF THESE FINANCIAL STATEMENTS. | 2008 Semiannual Report to Stockholders | | | 41 |
Royce Micro-Cap Trust
| | | | SHARES | | | VALUE |
| Technology (continued) | | | | | | |
| Telecommunications (continued) | | | | | | |
Atlantic Tele-Network | | | 4,100 | | $ | 112,791 |
Captaris a | | | 43,300 | | | 175,365 |
Cogent Communications Group a,c | | | 24,800 | | | 332,320 |
Communications Systems | | | 10,700 | | | 115,025 |
Diguang International Development a | | | 300,000 | | | 300,000 |
†GeoEye a,c | | | 9,400 | | | 166,474 |
Global Telecom & Technology a,c | | | 68,500 | | | 35,620 |
Globecomm Systems a | | | 40,130 | | | 331,474 |
NMS Communications a | | | 630,000 | | | 699,300 |
Novatel Wireless a | | | 60,900 | | | 677,817 |
NumereX Corporation Cl. A a,c | | | 28,700 | | | 207,501 |
Oplink Communications a,c | | | 15,900 | | | 152,640 |
PC-Tel | | | 44,100 | | | 422,919 |
Performance Technologies a | | | 41,250 | | | 208,725 |
Radyne Corporation a | | | 2,000 | | | 22,860 |
REMEC | | | 143,387 | | | 172,064 |
†Sierra Wireless a,c | | | 19,900 | | | 290,540 |
Symmetricom a,c | | | 81,982 | | | 314,811 |
Tollgrade Communications a,c | | | 23,800 | | | 106,862 |
ViaSat a,c | | | 76,812 | | | 1,552,371 |
Zhone Technologies a | | | 931,600 | | | 726,648 |
| | | | | |
|
| | | | | | | 7,662,140 |
| | | | | |
|
| Total (Cost $51,756,471) | | | | | | 64,305,318 |
| | | | | |
|
| | | | | | | |
| Miscellaneouse – 2.6% | | | | | | |
| Total (Cost $7,814,836) | | | | | | 7,454,226 |
| | | | | |
|
| | | | | | | |
| TOTAL COMMON STOCKS | | | | | | |
(Cost $277,026,254) | | | | | | 339,855,592 |
| | | | | |
|
| | | | | | | |
| PREFERRED STOCK – 0.5% | | | | | | |
Seneca Foods Conv. a | | | | | | |
(Cost $943,607) | | | 75,409 | | | 1,511,950 |
| | | | | |
|
| | | | | | | |
| | | | | | | |
| REPURCHASE AGREEMENT – 2.0% | | | | | | |
| State Street Bank & Trust Company, | | | | | | |
2.05% dated 6/30/08, due 7/1/08, | | | | | | |
maturity value $5,551,316 (collateralized | | | | | | |
by obligations of various U.S. Government | | | | | | |
Agencies, valued at $5,692,938) | | | | | | |
(Cost $5,551,000) | | | | | | 5,551,000 |
| | | | | |
|
| | | | | | | |
| | | | PRINCIPAL | | | |
| | | | AMOUNT | | | |
| COLLATERAL RECEIVED FOR SECURITIES | | | | | | |
LOANED – 12.0% | | | | | | |
| Fannie Mae-Notes | | | | | | |
3.20%-5.38% | | | | | | |
due 5/6/10-10/30/14 | | $ | 155 | | | 158 |
| Federal Home Loan Bank-Bonds | | | | | | |
5.125% | | | | | | |
due 8/8/08 | | | 669 | | | 682 |
| | | | PRINCIPAL
AMOUNT | | | VALUE | |
| Federal Home Loan Bank-Discount Notes | | | | | | | |
due 8/1/08 | | $ | 153 | | $ | 153 | |
| Freddie Mac-Bonds | | | | | | | |
5.00% | | | | | | | |
due 12/14/18 | | | 202 | | | 203 | |
| Freddie Mac-Notes | | | | | | | |
3.30% | | | | | | | |
due 3/5/10 | | | 23,680 | | | 23,935 | |
| U.S. Treasury Bonds | | | | | | | |
2.00%-7.50% | | | | | | | |
due 11/15/16-2/15/31 | | | 6,715 | | | 6,758 | |
| U.S. Treasury Notes | | | | | | | |
3.50%-5.75% | | | | | | | |
due 7/15/09-6/30/12 | | | 38,526 | | | 39,201 | |
| U.S. Treasury Notes-TIPS | | | | | | | |
3.00% | | | | | | | |
due 7/15/12 | | | 3 | | | 3 | |
| Money Market Funds | | | | | | | |
State Street Navigator Securities Lending | | | | | | | |
Prime Portfolio (7 day yield-2.6748%) | | | | | | 34,282,421 | |
| | | | | |
| |
| | | | | | | | |
| TOTAL COLLATERAL RECEIVED FOR | | | | | | | |
SECURITIES LOANED | | | | | | | |
(Cost $34,353,514) | | | | | | 34,353,514 | |
| | | | | |
| |
| | | | | | | | |
| TOTAL INVESTMENTS – 133.7% | | | | | | | |
(Cost $317,874,375) | | | | | | 381,272,056 | |
| | | | | | | | |
| LIABILITIES LESS CASH | | | | | | | |
AND OTHER ASSETS – (12.7)% | | | | | | (36,026,961 | ) |
| | | | | | | | |
| PREFERRED STOCK – (21.0)% | | | | | | (60,000,000 | ) |
| | | | | |
| |
| | | | | | | | |
| NET ASSETS APPLICABLE TO COMMON | | | | | | | |
STOCKHOLDERS – 100.0% | | | | | $ | 285,245,095 | |
| | | | | |
| |
| 42 | | | 2008 Semiannual Report to Stockholders | THE ACCOMPANYING NOTES ARE AN INTEGRAL PART OF THESE FINANCIAL STATEMENTS. |
| | | June 30, 2008 (unaudited) |
|
| † | | New additions in 2008. |
| | | |
| a | | Non-income producing. |
| | | |
| b | | Securities for which market quotations are not readily available represent 0.05% of net assets. These securities have been valued at their fair value under procedures established by the Fund’s Board of Directors. |
| | | |
| c | | All or a portion of these securities were on loan at June 30, 2008. Total market value of loaned securities at June 30, 2008 was $32,319,901. |
| | | |
| d | | At June 30, 2008, the Fund owned 5% or more of the Company’s outstanding voting securities thereby making the Company an Affiliated Company as that term is defined in the Investment Company Act of 1940. |
| | | |
| e | | Includes securities first acquired in 2008 and less than 1% of net assets applicable to Common Stockholders. |
| | | |
| | | Bold indicates the Fund’s 20 largest equity holdings in terms of June 30, 2008 market value. |
| | | |
TAX INFORMATION: The cost of total investments for Federal income tax purposes was $318,579,309. At June 30, 2008, net unrealized appreciation for all securities was $62,692,747, consisting of aggregate gross unrealized appreciation of $113,566,281 and aggregate gross unrealized depreciation of $50,873,534. The primary difference in book and tax basis cost is the timing of the recognition of losses on securities sold. |
|
| THE ACCOMPANYING NOTES ARE AN INTEGRAL PART OF THESE FINANCIAL STATEMENTS. | 2008 Semiannual Report to Stockholders | | | 43 |
| Royce Micro-Cap Trust | | June 30, 2008 (unaudited) |
|
Statement of Assets and Liabilities |
| | | | | | |
| ASSETS: | | | | | |
| Investments at value (including collateral on loaned securities)* | | | | | |
Non-Affiliated Companies (cost $311,209,826) | | | $ | 375,711,563 | |
Affiliated Companies (cost $1,113,549) | | | | 9,493 | |
|
| Total investments at value | | | | 375,721,056 | |
| Repurchase agreements (at cost and value) | | | | 5,551,000 | |
| Cash and foreign currency | | | | 34,866 | |
| Receivable for investments sold | | | | 658,262 | |
| Receivable for dividends and interest | | | | 341,838 | |
| Prepaid expenses and other assets | | | | 10,198 | |
|
Total Assets | | | | 382,317,220 | |
|
| LIABILITIES: | | | | | |
| Payable for collateral on loaned securities | | | | 34,353,514 | |
| Payable for investments purchased | | | | 2,159,947 | |
| Payable for investment advisory fee | | | | 371,046 | |
| Preferred dividends accrued but not yet declared | | | | 80,000 | |
| Accrued expenses | | | | 107,618 | |
|
Total Liabilities | | | | 37,072,125 | |
|
| PREFERRED STOCK: | | | | | |
| 6.00% Cumulative Preferred Stock - $0.001 par value, $25 liquidation value per share; 2,400,000 shares outstanding | | | | 60,000,000 | |
|
Total Preferred Stock | | | | 60,000,000 | |
|
| NET ASSETS APPLICABLE TO COMMON STOCKHOLDERS | | | $ | 285,245,095 | |
|
| ANALYSIS OF NET ASSETS APPLICABLE TO COMMON STOCKHOLDERS: | | | | | |
| Common Stock paid-in capital - $0.001 par value per share; 25,397,380 shares outstanding (150,000,000 shares authorized) | | | $ | 230,792,944 | |
| Undistributed net investment income (loss) | | | | (1,628,009 | ) |
| Accumulated net realized gain (loss) on investments and foreign currency | | | | 10,433,395 | |
| Net unrealized appreciation (depreciation) on investments and foreign currency | | | | 63,397,503 | |
| Quarterly and accrued distributions | | | | (17,750,738 | ) |
|
Net Assets applicable to Common Stockholders (net asset value per share - $11.23) | | | $ | 285,245,095 | |
|
| *Investments at identified cost (including $34,353,514 of collateral on loaned securities) | | | $ | 312,323,375 | |
| Market value of loaned securities | | | | 32,319,901 | |
| 44 | 2008 Semiannual Report to Stockholders | | THE ACCOMPANYING NOTES ARE AN INTEGRAL PART OF THESE FINANCIAL STATEMENTS. |
| Royce Micro-Cap Trust | | Six Months Ended June 30, 2008 (unaudited) |
|
| INVESTMENT INCOME: | | | | | |
| Income: | | | | | |
Dividends* | | | | | |
Non-Affiliated Companies | | | $ | 1,755,968 | |
Affiliated Companies | | | | – | |
Interest | | | | 206,016 | |
Securities lending | | | | 253,438 | |
|
| Total income | | | | 2,215,422 | |
|
| Expenses: | | | | | |
Investment advisory fees | | | | 2,201,608 | |
Stockholder reports | | | | 69,948 | |
Custody and transfer agent fees | | | | 38,740 | |
Directors’ fees | | | | 29,643 | |
Professional fees | | | | 19,262 | |
Administrative and office facilities expenses | | | | 15,972 | |
Other expenses | | | | 32,750 | |
|
| Total expenses | | | | 2,407,923 | |
|
| Net investment income (loss) | | | | (192,501 | ) |
|
| REALIZED AND UNREALIZED GAIN (LOSS) ON INVESTMENTS AND FOREIGN CURRENCY: | | | | | |
| Net realized gain (loss)on investments and foreign currency | | | | | |
Non-Affiliated Companies | | | | 7,279,461 | |
Affiliated Companies | | | | (32,865 | ) |
| Net change in unrealized appreciation (depreciation) on investments and foreign currency | | | | (44,354,044 | ) |
|
| Net realized and unrealized gain (loss) on investments and foreign currency | | | | (37,107,448 | ) |
|
| NET INCREASE (DECREASE) IN NET ASSETS RESULTING FROM INVESTMENT OPERATIONS | | | | (37,299,949 | ) |
|
| DISTRIBUTIONS TO PREFERRED STOCKHOLDERS | | | | (1,800,000 | ) |
|
| NET INCREASE (DECREASE) IN NET ASSETS APPLICABLE TO COMMON STOCKHOLDERS RESULTING FROM INVESTMENT OPERATIONS | | | $ | (39,099,949 | ) |
* Net of foreign withholding tax of $29,874. | | | | | |
| THE ACCOMPANYING NOTES ARE AN INTEGRAL PART OF THESE FINANCIAL STATEMENTS. | | 2008 Semiannual Report to Stockholders | 45 |
Statement of Changes in Net Assets |
| | | Six months ended | | | | |
| | | 6/30/08 | | Year ended |
| | | (unaudited) | | 12/31/07 |
| INVESTMENT OPERATIONS: | | | | | | | | |
| Net investment income (loss) | | $ | (192,501 | ) | | $ | (234,430 | ) |
| Net realized gain (loss) on investments and foreign currency | | | 7,246,596 | | | | 32,803,797 | |
| Net change in unrealized appreciation (depreciation) on investments and foreign currency | | | (44,354,044 | ) | | | (27,184,286 | ) |
|
| Net increase (decrease) in net assets resulting from investment operations | | | (37,299,949 | ) | | | 5,385,081 | |
|
| DISTRIBUTIONS TO PREFERRED STOCKHOLDERS: | | | | | | | | |
| Net investment income | | | – | | | | (224,280 | ) |
| Net realized gain on investments and foreign currency | | | – | | | | (3,375,720 | ) |
| Quarterly distributions* | | | (1,800,000 | ) | | | – | |
|
| Total distributions to Preferred Stockholders | | | (1,800,000 | ) | | | (3,600,000 | ) |
|
NET INCREASE (DECREASE) IN NET ASSETS APPLICABLE TO COMMON STOCKHOLDERS
RESULTING FROM INVESTMENT OPERATIONS | | | (39,099,949 | ) | | | 1,785,081 | |
|
| DISTRIBUTIONS TO COMMON STOCKHOLDERS: | | | | | | | | |
| Net investment income | | | – | | | | (1,991,543 | ) |
| Net realized gain on investments and foreign currency | | | – | | | | (29,975,444 | ) |
| Quarterly distributions* | | | (15,870,738 | ) | | | – | |
|
| Total distributions to Common Stockholders | | | (15,870,738 | ) | | | (31,966,987 | ) |
|
| CAPITAL SHARE TRANSACTIONS: | | | | | | | | |
| Reinvestment of distributions to Common Stockholders | | | 8,740,266 | | | | 17,975,152 | |
|
| Total capital stock transactions | | | 8,740,266 | | | | 17,975,152 | |
|
| NET INCREASE (DECREASE) IN NET ASSETS APPLICABLE TO COMMON STOCKHOLDERS | | | (46,230,421 | ) | | | (12,206,754 | ) |
|
| NET ASSETS APPLICABLE TO COMMON STOCKHOLDERS: | | | | | | | | |
Beginning of period | | | 331,475,516 | | | | 343,682,270 | |
|
End of period (including undistributed net investment income (loss) of $(1,628,009) at 6/30/08 and $(1,435,509) at 12/31/07) | | $ | 285,245,095 | | | $ | 331,475,516 | |
* To be allocated to net investment income and capital gains at year end. | 46 | 2008 Semiannual Report to Stockholders | | THE ACCOMPANYING NOTES ARE AN INTEGRAL PART OF THESE FINANCIAL STATEMENTS. |
| This table is presented to show selected data for a share of Common Stock outstanding throughout each period, and to assist stockholders in evaluating the Fund’s performance for the periods presented. |
| | | | | | | |
| | | Six months | | Years ended December 31, |
| | | ended | |
|
| | | June 30, 2008 | | | | | | | | | | | | | | | | | | | | |
| | | (unaudited) | | | 2007 | | | | 2006 | | | | 2005 | | | | 2004 | | | | 2003 | |
|
| NET ASSET VALUE, BEGINNING OF PERIOD | | $ | 13.48 | | | $ | 14.77 | | | $ | 13.43 | | | $ | 14.34 | | | $ | 13.33 | | | $ | 9.39 | |
|
| INVESTMENT OPERATIONS: | | | | | | | | | | | | | | | | | | | | | | | | |
Net investment income (loss) | | | (0.01 | ) | | | (0.00 | ) | | | 0.01 | | | | (0.03 | ) | | | (0.08 | ) | | | (0.09 | ) |
Net realized and unrealized gain (loss) on investments and | | | | | | | | | | | | | | | | | | | | | | | | |
foreign currency | | | (1.50 | ) | | | 0.24 | | | | 3.04 | | | | 1.14 | | | | 2.62 | | | | 5.28 | |
|
Total investment operations | | | (1.51 | ) | | | 0.24 | | | | 3.05 | | | | 1.11 | | | | 2.54 | | | | 5.19 | |
|
| DISTRIBUTIONS TO PREFERRED STOCKHOLDERS: | | | | | | | | | | | | | | | | | | | | | | | | |
Net investment income | | | – | | | | (0.01 | ) | | | (0.02 | ) | | | – | | | | – | | | | – | |
Net realized gain on investments and foreign currency | | | – | | | | (0.14 | ) | | | (0.14 | ) | | | (0.17 | ) | | | (0.19 | ) | | | (0.18 | ) |
Quarterly distributions* | | | (0.07 | ) | | | – | | | | – | | | | – | | | | – | | | | – | |
|
Total distributions to Preferred Stockholders | | | (0.07 | ) | | | (0.15 | ) | | | (0.16 | ) | | | (0.17 | ) | | | (0.19 | ) | | | (0.18 | ) |
|
| NET INCREASE (DECREASE) IN NET ASSETS APPLICABLE TO COMMON | | | | | | | | | | | | | | | | | | | | | | | | |
STOCKHOLDERS RESULTING FROM INVESTMENT OPERATIONS | | | (1.58 | ) | | | 0.09 | | | | 2.89 | | | | 0.94 | | | | 2.35 | | | | 5.01 | |
|
| DISTRIBUTIONS TO COMMON STOCKHOLDERS: | | | | | | | | | | | | | | | | | | | | | | | | |
Net investment income | | | – | | | | (0.08 | ) | | | (0.20 | ) | | | – | | | | – | | | | – | |
Net realized gain on investments and foreign currency | | | – | | | | (1.27 | ) | | | (1.35 | ) | | | (1.85 | ) | | | (1.33 | ) | | | (0.92 | ) |
Quarterly distributions* | | | (0.64 | ) | | | – | | | | – | | | | – | | | | – | | | | – | |
|
Total distributions to Common Stockholders | | | (0.64 | ) | | | (1.35 | ) | | | (1.55 | ) | | | (1.85 | ) | | | (1.33 | ) | | | (0.92 | ) |
|
| CAPITAL STOCK TRANSACTIONS: | | | | | | | | | | | | | | | | | | | | | | | | |
Effect of reinvestment of distributions by Common Stockholders | | | (0.03 | ) | | | (0.03 | ) | | | (0.00 | ) | | | 0.00 | | | | (0.01 | ) | | | (0.04 | ) |
Effect of Preferred Stock offering | | | – | | | | – | | | | – | | | | – | | | | – | | | | (0.11 | ) |
|
Total capital stock transactions | | | (0.03 | ) | | | (0.03 | ) | | | (0.00 | ) | | | 0.00 | | | | (0.01 | ) | | | (0.15 | ) |
|
| NET ASSET VALUE, END OF PERIOD | | $ | 11.23 | | | $ | 13.48 | | | $ | 14.77 | | | $ | 13.43 | | | $ | 14.34 | | | $ | 13.33 | |
|
| MARKET VALUE, END OF PERIOD | | $ | 10.37 | | | $ | 11.94 | | | $ | 16.57 | | | $ | 14.56 | | | $ | 15.24 | | | $ | 12.60 | |
|
| TOTAL RETURN (a): | | | | | | | | | | | | | | | | | | | | | | | | |
| Market Value | | | (7.94 | )%*** | | | (20.54 | )% | | | 26.72 | % | | | 8.90 | % | | | 33.44 | % | | | 63.58 | % |
| Net Asset Value | | | (11.70 | )%*** | | | 0.64 | % | | | 22.46 | % | | | 6.75 | % | | | 18.69 | % | | | 55.55 | % |
| RATIOS BASED ON AVERAGE NET ASSETS APPLICABLE TO COMMON STOCKHOLDERS: | | | | | | | | | | | | | | | | | | | | | | | | |
| Total expenses (b,c) | | | 1.61 | %** | | | 1.56 | % | | | 1.64 | % | | | 1.63 | % | | | 1.62 | % | | | 1.82 | % |
Management fee expense (d) | | | 1.47 | %** | | | 1.44 | % | | | 1.49 | % | | | 1.43 | % | | | 1.43 | % | | | 1.59 | % |
Other operating expenses | | | 0.14 | %** | | | 0.12 | % | | | 0.15 | % | | | 0.20 | % | | | 0.19 | % | | | 0.23 | % |
| Net investment income (loss) | | | (0.13 | )%** | | | (0.07 | )% | | | 0.05 | % | | | (0.27 | )% | | | (0.56 | )% | | | (0.82 | )% |
| SUPPLEMENTAL DATA: | | | | | | | | | | | | | | | | | | | | | | | | |
| Net Assets Applicable to Common Stockholders, | | | | | | | | | | | | | | | | | | | | | | | | |
End of Period (in thousands) | | | $285,245 | | | | $331,476 | | | | $343,682 | | | | $293,719 | | | | $290,364 | | | | $253,425 | |
| Liquidation Value of Preferred Stock, End of Period (in thousands) | | | $60,000 | | | | $60,000 | | | | $60,000 | | | | $60,000 | | | | $60,000 | | | | $60,000 | |
| Portfolio Turnover Rate | | | 17 | % | | | 41 | % | | | 34 | % | | | 46 | % | | | 32 | % | | | 26 | % |
| PREFERRED STOCK: | | | | | | | | | | | | | | | | | | | | | | | | |
| Total shares outstanding | | | 2,400,000 | | | | 2,400,000 | | | | 2,400,000 | | | | 2,400,000 | | | | 2,400,000 | | | | 2,400,000 | |
| Asset coverage per share | | $ | 143.85 | | | $ | 163.11 | | | $ | 168.20 | | | $ | 147.38 | | | $ | 145.98 | | | $ | 130.59 | |
| Liquidation preference per share | | $ | 25.00 | | | $ | 25.00 | | | $ | 25.00 | | | $ | 25.00 | | | $ | 25.00 | | | $ | 25.00 | |
| Average market value per share (e): | | | | | | | | | | | | | | | | | | | | | | | | |
6.00% Cumulative | | $ | 24.17 | | | $ | 24.06 | | | $ | 24.15 | | | $ | 24.97 | | | $ | 24.66 | | | $ | 25.37 | |
7.75% Cumulative | | | – | | | | – | | | | – | | | | – | | | | – | | | $ | 25.70 | |
|
| (a) | | The Market Value Total Return is calculated assuming a purchase of Common Stock on the opening of the first business day and a sale on the closing of the last business day of each period reported. Dividends and distributions are assumed for the purposes of this calculation to be reinvested at prices obtained under the Fund’s Distribution Reinvestment and Cash Purchase Plan. Net Asset Value Total Return is calculated on the same basis, except that the Fund’s net asset value is used on the purchase and sale dates instead of market value. |
| (b) | | Expense ratios based on total average net assets including liquidation value of Preferred Stock were 1.34%, 1.33%, 1.38%, 1.35%, 1.32% and 1.49% for the periods ended June 30, 2008 and December 31, 2007, 2006, 2005, 2004 and 2003, respectively. |
| (c) | | Expense ratios based on average net assets applicable to Common Stockholders before waiver of fees by the investment adviser would have been 1.92% for the year ended December 31, 2003; before waiver of fees and earnings credits would have been 1.61%, 1.56%, 1.64%, 1.63%, 1.62% and 1.92% for the periods ended June 30, 2008 and December 31, 2007, 2006, 2005, 2004 and 2003, respectively. |
| (d) | | The management fee is calculated based on average net assets over a rolling 36-month basis, while the above ratios of management fee expenses are based on the average net assets applicable to Common Stockholders over a 12-month basis. |
| (e) | | The average of month-end market values during the period that the Preferred Stock was outstanding. |
| * To be allocated to net investment income and capital gains at year end. |
| ** Annualized. |
| *** Not annualized. |
| THE ACCOMPANYING NOTES ARE AN INTEGRAL PART OF THESE FINANCIAL STATEMENTS. | | 2008 Semiannual Report to Stockholders | 47 |
Notes to Financial Statements (unaudited) |
Summary of Significant Accounting Policies:
Royce Micro-Cap Trust, Inc. (the “Fund”), was incorporated under the laws of the State of Maryland on September 9, 1993 as a diversified closed-end investment company. The Fund commenced operations on December 14, 1993.
The preparation of financial statements in conformity with accounting principles generally accepted in the United States of America requires management to make estimates and assumptions that affect the reported amounts of assets and liabilities and the disclosure of contingent assets and liabilities at the date of the financial statements, and the reported amounts of income and expenses during the reporting period. Actual results could differ from those estimates.
Valuation of Investments:
Securities are valued as of the close of trading on the New York Stock Exchange (NYSE) (generally 4:00 p.m. Eastern time) on the valuation date. Securities that trade on an exchange, and securities traded on Nasdaq’s Electronic Bulletin Board, are valued at their last reported sales price or Nasdaq official closing price taken from the primary market in which each security trades or, if no sale is reported for such day, at their bid price. Other over-the-counter securities for which market quotations are readily available are valued at their highest bid price. Securities for which market quotations are not readily available are valued at their fair value under procedures established by the Fund’s Board of Directors. In addition, if, between the time trading ends on a particular security and the close of the customary trading session on the NYSE, events occur that are significant and may make the closing price unreliable, the Fund may fair value the security. The Fund uses an independent pricing service to provide fair value estimates for relevant non-U.S. equity securities on days when the U.S. market volatility exceeds a certain threshold. This pricing service uses proprietary correlations it has developed between the movement of prices of non-U.S. equity securities and indices of U.S.-traded securities, futures contracts and other indications to estimate the fair value of relevant non-U.S. securities. When fair value pricing is employed, the price of securities used by the Fund may differ from quoted or published prices for the same security. Bonds and other fixed income securities may be valued by reference to other securities with comparable ratings, interest rates and maturities, using established independent pricing services. Investments in money market funds are valued at net asset value per share.
| | Various inputs are used in determining the value of the Fund’s investments. These inputs are summarized in the three broad levels below: |
| | | Level 1 – quoted prices in active markets for identical securities |
| | | Level 2 – other significant observable inputs (including quoted prices for similar securities, foreign securities that may be fair valued and repurchase agreements) |
| | | Level 3 – significant observable inputs (including the Fund’s own assumptions in determining the fair value of investments) |
| | The inputs or methodology used for valuing securities are not necessarily an indication of the risk associated with investing in those securities. |
| | | |
| | The following is a summary of the inputs used to value the Fund’s investments as of June 30, 2008: |
| | Level 1 | | Level 2 | | Level 3 | | Total |
| |
|
| | $310,781,325 | | $70,335,964 | | $154,767 | | $381,272,056 |
| |
|
| | Level 3 Reconciliation: | | | | | | |
| | | Change in unrealized appreciation | | | |
| | Balance as of 12/31/07 | | (depreciation) | | Purchases | | Balance as of 6/30/08 |
| |
|
| | $0 | | $(2,568) | | $157,335 | | $154,767 |
| |
|
Repurchase Agreements:
The Fund may enter into repurchase agreements with institutions that the Fund’s investment adviser has determined are creditworthy. The Fund restricts repurchase agreements to maturities of no more than seven days. Securities pledged as collateral for repurchase agreements, which are held until maturity of the repurchase agreements, are marked-to-market daily and maintained at a value at least equal to the principal amount of the repurchase agreement (including accrued interest). Repurchase agreements could involve certain risks in the event of default or insolvency of the counter-party, including possible delays or restrictions upon the ability of the Fund to dispose of its underlying securities.
Foreign Currency:
The Fund values its non-U.S. securities in U.S. dollars daily at the prevailing foreign currency exchange rates as quoted by a major bank. The effects of changes in foreign exchange rates on investments and other assets and liabilities are included with net realized and unrealized gains and losses on investments.
Net realized foreign exchange gains or losses arise from sales and maturities of short-term securities, sales of foreign currencies, expiration of currency forward contracts, currency gains or losses realized between the trade and settlement dates on securities transactions, and the difference between the amounts of dividends, interest, and foreign withholding taxes recorded on the Fund’s books and the U.S. dollar equivalent of the amounts actually received or paid. Net unrealized foreign exchange gains and losses arise from changes in the value of assets and liabilities, including investments in securities at the end of the reporting period, as a result of changes in foreign currency exchange rates.
| 48 | 2008 Semiannual Report to Stockholders | | |
Notes to Financial Statements (unaudited) (continued) |
Securities Lending:
The Fund loans securities to qualified institutional investors for the purpose of realizing additional income. Collateral on all securities loaned for the Fund is accepted in cash and cash equivalents and invested temporarily by the custodian. The collateral is equal to at least 100% of the current market value of the loaned securities. The market value of the loaned securities is determined at the close of business of the Fund and any additional required collateral is delivered to the Fund on the next business day.
Taxes:
As a qualified regulated investment company under Subchapter M of the Internal Revenue Code, the Fund is not subject to income taxes to the extent that it distributes substantially all of its taxable income for its fiscal year. The Schedule of Investments includes information regarding income taxes under the caption “Income Tax Information”.
Distributions:
The Fund currently has a policy of paying quarterly distributions on the Fund’s Common Stock. Distributions are currently being made at the annual rate of 9% of the rolling average of the prior four calendar quarter-end NAVs of the Fund’s Common Stock, with the fourth quarter distribution being the greater of 2.25% of the rolling average or the distribution required by IRS regulations. Distributions to Preferred Stockholders are accrued daily and paid quarterly and distributions to Common Stockholders are recorded on ex-dividend date. The Fund is required to allocate long-term capital gain distributions and other types of income proportionately to distributions made to holders of shares of Common Stock and Preferred Stock. To the extent that distributions are not paid from long-term capital gains, net investment income or net short-term capital gains, they will represent a return of capital. Distributions are determined in accordance with income tax regulations that may differ from accounting principles generally accepted in the United States of America. Permanent book and tax differences relating to stockholder distributions will result in reclassifications within the capital accounts. Undistributed net investment income may include temporary book and tax basis differences, which will reverse in a subsequent period. Any taxable income or gain remaining undistributed at fiscal year end is distributed in the following year.
Investment Transactions and Related Investment Income:
Investment transactions are accounted for on the trade date. Dividend income is recorded on the ex-dividend date. Non-cash dividend income is recorded at the fair market value of the securities received. Interest income is recorded on an accrual basis. Premium and discounts on debt securities are amortized using the effective yield-to-maturity method. Realized gains and losses from investment transactions are determined on the basis of identified cost for book and tax purposes.
Expenses:
The Fund incurs direct and indirect expenses. Expenses directly attributable to the Fund are charged to the Fund’s operations, while expenses applicable to more than one of the Royce Funds are allocated equitably. Allocated personnel and occupancy costs related to The Royce Funds are included in administrative and office facilities expenses. The Fund has adopted a deferred fee agreement that allows the Directors to defer the receipt of all or a portion of Directors’ Fees otherwise payable. The deferred fees are invested in certain Royce Funds until distributed in accordance with the agreement.
Compensating Balance Credits:
The Fund has an arrangement with its custodian bank, whereby a portion of the custodian’s fee is paid indirectly by credits earned on the Fund’s cash on deposit with the bank. This deposit arrangement is an alternative to purchasing overnight investments. Conversely, the Fund pays interest to the custodian on any cash overdrafts, to the extent they are not offset by credits earned on positive cash balances.
Capital Stock:
The Fund issued 806,280 and 1,320,682 shares of Common Stock as reinvestment of distributions by Common Stockholders for the six months ended June 30, 2008 and the year ended December 31, 2007, respectively.
At June 30, 2008, 2,400,000 shares of 6.00% Cumulative Preferred Stock were outstanding. Commencing October 16, 2008 and thereafter, the Fund, at its option, may redeem the Cumulative Preferred Stock, in whole or in part, at the redemption price. The Cumulative Preferred Stock is classified outside of permanent equity (net assets applicable to Common Stockholders) in the accompanying financial statements in accordance with Emerging Issues Task Force (EITF) Topic D-98, Classification and Measurement of Redeemable Securities, that requires preferred securities that are redeemable for cash or other assets to be classified outside of permanent equity to the extent that the redemption is at a fixed or determinable price and at the option of the holder or upon the occurrence of an event that is not solely within the control of the issuer.
The Fund is required to meet certain asset coverage tests with respect to the Cumulative Preferred Stock as required by the 1940 Act. In addition, pursuant to the Rating Agency Guidelines established by Moody’s, the Fund is required to maintain a certain discounted asset coverage. If the Fund fails to meet these requirements and does not correct such failure, the Fund may be required to redeem, in part or in full, the Cumulative Preferred Stock at a redemption price of $25.00 per share, plus an amount equal to the accumulated and unpaid dividends, whether or not declared on such shares, in order to meet these requirements. Additionally, failure to meet the foregoing asset coverage requirements could restrict the Fund’s ability to pay dividends to Common Stockholders and could lead to sales of portfolio securities at inopportune times. The Fund has met these requirements since issuing the Cumulative Preferred Stock.
| | | 2008 Semiannual Report to Stockholders | 49 |
Notes to Financial Statements (unaudited) (continued) |
Investment Advisory Agreement:
As compensation for its services under the Investment Advisory Agreement, Royce & Associates, LLC (“Royce”) receives a fee comprised of a Basic Fee (“Basic Fee”) and an adjustment to the Basic Fee based on the investment performance of the Fund in relation to the investment record of the Russell 2000.
The Basic Fee is a monthly fee equal to 1/12 of 1% (1% on an annualized basis) of the average of the Fund’s month-end net assets applicable to Common Stockholders, plus the liquidation value of Preferred Stock, for the rolling 36-month period ending with such month (the “performance period”). The Basic Fee for each month is increased or decreased at the rate of 1/12 of .05% for each percentage point that the investment performance of the Fund exceeds, or is exceeded by, the percentage change in the investment record of the Russell 2000 for the performance period by more than two percentage points. The performance period for each such month is a rolling 36-month period ending with such month. The maximum increase or decrease in the Basic Fee for any month may not exceed 1/12 of .5%. Accordingly, for each month, the maximum monthly fee rate as adjusted for performance is 1/12 of 1.5% and is payable if the investment performance of the Fund exceeds the percentage change in the investment record of the Russell 2000 by 12 or more percentage points for the performance period, and the minimum monthly fee rate as adjusted for performance is 1/12 of .5% and is payable if the percentage change in the investment record of the Russell 2000 exceeds the investment performance of the Fund by 12 or more percentage points for the performance period.
Royce has voluntarily committed to waive the portion of its investment advisory fee attributable to an issue of the Fund’s Preferred Stock for any month in which the Fund’s average annual NAV total return since issuance of the Preferred Stock fails to exceed the applicable Preferred Stock’s dividend rate.
For the six rolling 36-month periods ended June 2008, the investment performance of the Fund exceeded the investment performance of the Russell 2000 by 3% to 8%. Accordingly, the investment advisory fee consisted of a Basic Fee of $1,928,494 and an upward adjustment of $273,114 for performance of the Fund above that of the Russell 2000. For the six months ended June 30, 2008, the Fund accrued and paid Royce advisory fees totaling $2,201,608.
Purchases and Sales of Investment Securities:
For the six months ended June 30, 2008, the cost of purchases and proceeds from sales of investment securities, other than short-term securities and collateral received for securities loaned, amounted to $66,394,531 and $60,554,146, respectively.
Transactions in Shares of Affiliated Companies:
An “Affiliated Company” as defined in the Investment Company Act of 1940, is a company in which a Fund owns 5% or more of the company’s outstanding voting securities at any time during the period. The Fund effected the following transactions in shares of such companies for the six months ended June 30, 2008:
| | | | | | | | | | | | | | | | | | | |
| | | Shares | | Market Value | | Cost of | | Cost of | | Realized | | Dividend | | Shares | | Market Value | |
| Affiliated Company | | 12/31/07 | | 12/31/07 | | Purchases | | Sales | | Gain (Loss) | | Income | | 6/30/08 | | 6/30/08 | |
| BKF Capital Group* | | 406,500 | | $ | 902,430 | | - | | $73,854 | | $(32,865) | | - | | | | | |
| Tapestry Pharmaceuticals | | 815,600 | | | 244,680 | | $13,272 | | - | | - | | - | | 863,000 | | $9,493 | |
| | | | | $ | 1,147,110 | | | | | | $(32,865) | | - | | | | $9,493 | |
| *Not an Affiliated Company at June 30, 2008. |
| 50 | 2008 Semiannual Report to Stockholders | | |
| Royce Focus Trust | | June 30, 2008 (unaudited) |
|
| | | SHARES | | VALUE |
| COMMON STOCKS – 97.5% | | | | | | |
| | | | | | | |
| Consumer Products – 10.0% | | | | | | |
| Apparel, Shoes and Accessories - 3.5% | | | | | | |
Fossil a,b | | 120,000 | | $ | 3,488,400 | |
Timberland Company (The) Cl. A b | | 150,000 | | | 2,452,500 | |
| | | | |
|
| | | | | | 5,940,900 | |
| | | | |
|
| Food/Beverage/Tobacco - 1.7% | | | | | | |
Sanderson Farms | | 80,000 | | | 2,761,600 | |
| | | | |
|
| Health, Beauty and Nutrition - 1.8% | | | | | | |
Nu Skin Enterprises Cl. A | | 200,000 | | | 2,984,000 | |
| | | | |
|
| Sports and Recreation - 3.0% | | | | | | |
Thor Industries | | 150,000 | | | 3,189,000 | |
Winnebago Industries | | 180,000 | | | 1,834,200 | |
| | | | |
|
| | | | | | 5,023,200 | |
| | | | |
|
| Total (Cost $20,993,363) | | | | | 16,709,700 | |
| | | | |
|
| Consumer Services – 2.1% | | | | | | |
| Retail Stores - 2.1% | | | | | | |
†AnnTaylor Stores b | | 40,100 | | | 960,796 | |
†Men’s Wearhouse (The) | | 100,000 | | | 1,629,000 | |
†Williams-Sonoma | | 50,000 | | | 992,000 | |
| | | | |
|
| Total (Cost $3,832,878) | | | | | 3,581,796 | |
| | | | |
|
| | | | | | | |
| Financial Intermediaries – 6.2% | | | | | | |
| Banking - 1.1% | | | | | | |
BB Holdings b | | 400,000 | | | 1,812,583 | |
| | | | |
|
| Securities Brokers - 3.2% | | | | | | |
Knight Capital Group Cl. A a,b | | 300,000 | | | 5,394,000 | |
| | | | |
|
| Other Financial Intermediaries - 1.9% | | | | | | |
KKR Financial Holdings | | 300,000 | | | 3,150,000 | |
| | | | |
|
| Total (Cost $9,674,832) | | | | | 10,356,583 | |
| | | | |
|
| Financial Services – 2.3% | | | | | | |
| Investment Management - 2.3% | | | | | | |
U.S. Global Investors Cl. A | | 226,000 | | | 3,785,500 | |
| | | | |
|
| Total (Cost $3,590,422) | | | | | 3,785,500 | |
| | | | |
|
| Health – 3.4% | | | | | | |
| Drugs and Biotech - 2.8% | | | | | | |
Endo Pharmaceuticals Holdings a,b | | 120,000 | | | 2,902,800 | |
Lexicon Pharmaceuticals a,b | | 500,000 | | | 800,000 | |
ULURU a,b | | 1,200,000 | | | 1,020,000 | |
| | | | |
|
| | | | | | 4,722,800 | |
| | | | |
|
| Medical Products and Devices - 0.6% | | | | | | |
Caliper Life Sciences a,b | | 352,300 | | | 912,457 | |
| | | | |
|
| Total (Cost $8,570,584) | | | | | 5,635,257 | |
| | | | |
|
| Industrial Products – 24.3% | | | | | | |
| Building Systems and Components - 1.8% | | | | | | |
Simpson Manufacturing | | 130,000 | | | 3,086,200 | |
| | | | |
|
| Machinery - 4.3% | | | | | | |
Lincoln Electric Holdings | | 60,000 | | | 4,722,000 | |
| | | SHARES | | VALUE |
| Industrial Products (continued) | | | | | | |
| Machinery (continued) | | | | | | |
Woodward Governor | | 70,000 | | $ | 2,496,200 | |
| | | | |
|
| | | | | | 7,218,200 | |
| | | | |
|
| Metal Fabrication and Distribution - 13.1% | | | | | | |
Dynamic Materials | | 30,000 | | | 988,500 | |
Kennametal | | 118,600 | | | 3,860,430 | |
Reliance Steel & Aluminum | | 100,000 | | | 7,709,000 | |
Schnitzer Steel Industries Cl. A | | 30,000 | | | 3,438,000 | |
†Sims Group ADR | | 150,000 | | | 5,985,000 | |
| | | | |
|
| | | | | | 21,980,930 | |
| | | | |
|
| Miscellaneous Manufacturing - 1.2% | | | | | | |
Rational | | 10,000 | | | 2,016,872 | |
| | | | |
|
| Pumps, Valves and Bearings - 3.9% | | | | | | |
†Gardner Denver a,b | | 60,000 | | | 3,408,000 | |
Pfeiffer Vacuum Technology | | 30,000 | | | 3,111,745 | |
| | | | |
|
| | | | | | 6,519,745 | |
| | | | |
|
| Total (Cost $18,348,521) | | | | | 40,821,947 | |
| | | | |
|
| Industrial Services – 8.5% | | | | | | |
| Commercial Services - 5.0% | | | | | | |
Corinthian Colleges a,b | | 149,900 | | | 1,740,339 | |
CRA International b | | 40,000 | | | 1,446,000 | |
Korn/Ferry International a,b | | 180,000 | | | 2,831,400 | |
ManTech International Cl. A a,b | | 30,000 | | | 1,443,600 | |
Universal Technical Institute b | | 80,100 | | | 998,046 | |
| | | | |
|
| | | | | | 8,459,385 | |
| | | | |
|
| Food, Tobacco and Agriculture - 1.8% | | | | | | |
†Industrias Bachoco ADR | | 100,000 | | | 2,960,000 | |
| | | | |
|
| Transportation and Logistics - 1.7% | | | | | | |
Arkansas Best | | 80,000 | | | 2,931,200 | |
| | | | |
|
| Total (Cost $13,897,624) | | | | | 14,350,585 | |
| | | | |
|
| Natural Resources – 29.2% | | | | | | |
| Energy Services - 14.7% | | | | | | |
Ensign Energy Services | | 250,000 | | | 5,447,681 | |
Pason Systems | | 180,000 | | | 2,912,621 | |
Tesco Corporation a,b | | 120,000 | | | 3,834,000 | |
Trican Well Service | | 200,000 | | | 4,972,051 | |
Unit Corporation b | | 90,000 | | | 7,467,300 | |
| | | | |
|
| | | | | | 24,633,653 | |
| | | | |
|
| Precious Metals and Mining - 14.5% | | | | | | |
Allied Nevada Gold b | | 350,000 | | | 2,061,500 | |
Endeavour Mining Capital | | 550,000 | | | 3,991,370 | |
Fronteer Development Group b | | 300,000 | | | 1,506,000 | |
Gammon Gold b | | 450,000 | | | 4,882,500 | |
Ivanhoe Mines b | | 320,000 | | | 3,491,200 | |
Pan American Silver a,b | | 120,000 | | | 4,149,600 | |
Silver Standard Resources a,b | | 150,000 | | | 4,297,500 | |
| | | | |
|
| | | | | | 24,379,670 | |
| | | | |
|
| Total (Cost $29,799,872) | | | | | 49,013,323 | |
| | | | |
|
| THE ACCOMPANYING NOTES ARE AN INTEGRAL PART OF THESE FINANCIAL STATEMENTS. | | 2008 Semiannual Report to Stockholders | 51 |
| Royce Focus Trust | | June 30, 2008 (unaudited) |
|
| | | SHARES | | VALUE |
| Technology – 11.5% | | | | | | |
| Aerospace and Defense - 1.4% | | | | | | |
†Ceradyne a,b | | 70,000 | | $ | 2,401,000 | |
| | | | |
|
| Components and Systems - 2.6% | | | | | | |
MKS Instruments a,b | | 200,000 | | | 4,380,000 | |
| | | | |
|
| Semiconductors and Equipment - 3.2% | | | | | | |
†LamResearch a,b | | 80,100 | | | 2,895,615 | |
†SigmaDesigns b | | 180,200 | | | 2,502,978 | |
| | | | |
|
| | | | | | 5,398,593 | |
| | | | |
|
| Telecommunications - 4.3% | | | | | | |
ADTRAN | | 150,000 | | | 3,576,000 | |
Foundry Networks b | | 300,000 | | | 3,546,000 | |
| | | | |
|
| | | | | | 7,122,000 | |
| | | | |
|
| Total (Cost $19,291,390) | | | | | 19,301,593 | |
| | | | |
|
| TOTAL COMMON STOCKS | | | | | | |
(Cost $127,999,486) | | | | | 163,556,284 | |
| | | | |
|
| | | | | | | |
| PREFERRED STOCK – 5.4% | | | | | | |
Kennedy-Wilson Conv. c,d | | | | | | |
(Cost $9,000,000) | | 9,000 | | | 9,160,740 | |
| | | | |
|
| | | PRINCIPAL | | | | |
| | | AMOUNT | | | | |
| GOVERNMENT BOND – 5.7% | | | | | | |
| (Principal Amount shown in local currency) | | | | | | |
Australia Government Bond 7.50% | | | | | | |
due 9/15/09 | | | | | | |
(Cost $8,424,285) | | 10,000,000 | | | 9,648,463 | |
| | | | |
|
| | | VALUE |
| REPURCHASE AGREEMENT – 6.2% | | | | |
| State Street Bank & Trust Company, | | | | |
2.05% dated 6/30/08, due 7/1/08, | | | | |
maturity value $10,372,591 (collateralized | | | | |
by obligations of various U.S. Government | | | | |
Agencies, valued at $10,633,838) | | | | |
(Cost $10,372,000) | | $ | 10,372,000 | |
| | |
|
| COLLATERAL RECEIVED FOR SECURITIES | | | | |
LOANED – 11.0% | | | | |
| Money Market Funds | | | | |
State Street Navigator Securities | | | | |
Lending Prime Portfolio (7 day yield-2.6748%) | | | | |
(Cost $18,418,888) | | | 18,418,888 | |
| | |
|
| TOTAL INVESTMENTS – 125.8% | | | | |
(Cost $174,214,659) | | | 211,156,375 | |
LIABILITIES LESS CASH | | | | |
AND OTHER ASSETS – (10.9)% | | | (18,353,594 | ) |
| | | | | |
| PREFERRED STOCK – (14.9)% | | | (25,000,000 | ) |
| | |
|
| NET ASSETS APPLICABLE TO COMMON | | | | |
STOCKHOLDERS – 100.0% | | $ | 167,802,781 | |
| | |
|
|
| † | | New additions in 2008. |
| | | |
| a | | All or a portion of these securities were on loan at June 30, 2008. Total market value of loaned securities at June 30, 2008 was $17,395,506. |
| | | |
| b | | Non-income producing. |
| | | |
| c | | A security for which market quotations are not readily available represents 5.4% of net assets. This security has been valued at its fair value under procedures established by the Fund’s Board of Directors. |
| | | |
| d | | This security, and the common stock into which the security is convertible, are not and will not be registered under the Securities Act of 1933 and related rules (“restricted security”). Accordingly, such securities may not be offered, sold, transferred or delivered, directly or indirectly, unless (i) such shares are registered under the Securities Act and any other applicable state securities laws, or (ii) an exemption from registration under the Securities Act and any other applicable state securities laws is available.
Bold indicates the Fund’s 20 largest equity holdings in terms of June 30, 2008 market value. |
| | | |
| TAX INFORMATION: The cost of total investments for Federal income tax purposes was $174,220,565. At June 30, 2008, net unrealized appreciation for all securities was $36,935,810, consisting of aggregate gross unrealized appreciation of $50,438,009 and aggregate gross unrealized depreciation of $13,502,199. The primary difference in book and tax basis cost is the timing of the recognition of losses on securities sold. |
|
| 52 | 2008 Semiannual Report to Stockholders | | THE ACCOMPANYING NOTES ARE AN INTEGRAL PART OF THESE FINANCIAL STATEMENTS. |
| Royce Focus Trust | | June 30, 2008 (unaudited) |
|
Statement of Assets and Liabilities |
| ASSETS: | | | | |
| Investments at value (including collateral on loaned securities)* | | $ | 200,784,375 | |
| Repurchase agreements (at cost and value) | | | 10,372,000 | |
| Cash and foreign currency | | | 8,843 | |
| Receivable for dividends and interest | | | 306,351 | |
| Prepaid expenses and other assets | | | 20,353 | |
|
Total Assets | | | 211,491,922 | |
|
| LIABILITIES: | | | | |
| Payable for collateral on loaned securities | | | 18,418,888 | |
| Payable for investment advisory fee | | | 161,726 | |
| Preferred dividends accrued but not yet declared | | | 33,331 | |
| Accrued expenses | | | 75,196 | |
|
Total Liabilities | | | 18,689,141 | |
|
| PREFERRED STOCK: | | | | |
| 6.00% Cumulative Preferred Stock - $0.001 par value, $25 liquidation value per share; 1,000,000 shares outstanding | | | 25,000,000 | |
|
Total Preferred Stock | | | 25,000,000 | |
|
| NET ASSETS APPLICABLE TO COMMON STOCKHOLDERS | | $ | 167,802,781 | |
|
| ANALYSIS OF NET ASSETS APPLICABLE TO COMMON STOCKHOLDERS: | | | | |
| Common Stock paid-in capital - $0.001 par value per share; 18,937,817 shares outstanding (150,000,000 shares authorized) | | $ | 132,308,692 | |
| Undistributed net investment income (loss) | | | (4,195,058 | ) |
| Accumulated net realized gain (loss) on investments and foreign currency | | | 8,197,858 | |
| Net unrealized appreciation (depreciation) on investments and foreign currency | | | 36,946,562 | |
| Quarterly and accrued distributions | | | (5,455,273 | ) |
|
Net Assets applicable to Common Stockholders (net asset value per share - $8.86) | | $ | 167,802,781 | |
|
*Investments at identified cost (including $18,418,888 of collateral on loaned securities) | | $ | 163,842,659 | |
| Market value of loaned securities | | | 17,395,306 | |
| THE ACCOMPANYING NOTES ARE AN INTEGRAL PART OF THESE FINANCIAL STATEMENTS. | | 2008 Semiannual Report to Stockholders | 53 |
| Royce Focus Trust | | Six Months Ended June 30, 2008 (unaudited) |
|
| INVESTMENT INCOME: | | | | |
| Income: | | | | |
Dividends* | | $ | 969,069 | |
Interest** | | | 669,024 | |
Securities lending | | | 38,767 | |
|
| Total income | | | 1,676,860 | |
|
| Expenses: | | | | |
Investment advisory fees | | | 932,944 | |
Stockholder reports | | | 57,573 | |
Custody and transfer agent fees | | | 30,405 | |
Professional fees | | | 17,054 | |
Directors’ fees | | | 14,804 | |
Administrative and office facilities expenses | | | 7,958 | |
Other expenses | | | 31,116 | |
|
| Total expenses | | | 1,091,854 | |
| Compensating balance credits | | | (2,778 | ) |
|
| Net expenses | | | 1,089,076 | |
|
| Net investment income (loss) | | | 587,784 | |
|
| REALIZED AND UNREALIZED GAIN (LOSS) ON INVESTMENTS AND FOREIGN CURRENCY: | | | | |
| Net realized gain (loss) on investments and foreign currency | | | 5,544,654 | |
| Net change in unrealized appreciation (depreciation) on investments and foreign currency | | | (1,612,223 | ) |
|
| Net realized and unrealized gain (loss) on investments and foreign currency | | | 3,932,431 | |
|
| NET INCREASE (DECREASE) IN NET ASSETS RESULTING FROM INVESTMENT OPERATIONS | | | 4,520,215 | |
|
| DISTRIBUTIONS TO PREFERRED STOCKHOLDERS | | | (750,000 | ) |
|
NET INCREASE (DECREASE) IN NET ASSETS APPLICABLE TO COMMON STOCKHOLDERS
RESULTING FROM INVESTMENT OPERATIONS | | $ | 3,770,215 | |
* Net of foreign withholding tax of $47,764. | | | | |
| **Net of foreign withholding tax of $34,458. | | | | |
| 54 | 2008 Semiannual Report to Stockholders | | THE ACCOMPANYING NOTES ARE AN INTEGRAL PART OF THESE FINANCIAL STATEMENTS. |
Statement of Changes in Net Assets |
| | | | Six months ended | | | | |
| | | | 6/30/08 | | Year ended |
| | | | (unaudited) | | 12/31/07 |
| INVESTMENT OPERATIONS: | | | | | | | | | |
| Net investment income (loss) | | | $ | 587,784 | | | $ | 1,988,494 | |
| Net realized gain (loss) on investments and foreign currency | | | | 5,544,654 | | | | 29,154,418 | |
| Net change in unrealized appreciation (depreciation) on investments and foreign currency | | | | (1,612,223 | ) | | | (10,391,522 | ) |
|
Net increase (decrease) in net assets resulting from investment operations | | | | 4,520,215 | | | | 20,751,390 | |
|
| DISTRIBUTIONS TO PREFERRED STOCKHOLDERS: | | | | | | | | | |
| Net investment income | | | | – | | | | (331,350 | ) |
| Net realized gain on investments and foreign currency | | | | – | | | | (1,168,650 | ) |
| Quarterly distributions* | | | | (750,000 | ) | | | – | |
|
| Total distributions to Preferred Stockholders | | | | (750,000 | ) | | | (1,500,000 | ) |
|
NET INCREASE (DECREASE) IN NET ASSETS APPLICABLE TO COMMON STOCKHOLDERS
RESULTING FROM INVESTMENT OPERATIONS | | | | 3,770,215 | | | | 19,251,390 | |
|
| DISTRIBUTIONS TO COMMON STOCKHOLDERS: | | | | | | | | | |
| Net investment income | | | | – | | | | (7,385,265 | ) |
| Net realized gain on investments and foreign currency | | | | – | | | | (26,047,361 | ) |
| Quarterly distributions* | | | | (4,671,940 | ) | | | – | |
|
| Total distributions to Common Stockholders | | | | (4,671,940 | ) | | | (33,432,626 | ) |
|
| CAPITAL SHARE TRANSACTIONS: | | | | | | | | | |
| Reinvestment of distributions to Common Stockholders | | | | 2,897,098 | | | | 21,421,393 | |
|
| Total capital stock transactions | | | | 2,897,098 | | | | 21,421,393 | |
|
| NET INCREASE (DECREASE) IN NET ASSETS APPLICABLE TO COMMON STOCKHOLDERS | | | | 1,995,373 | | | | 7,240,157 | |
|
| NET ASSETS APPLICABLE TO COMMON STOCKHOLDERS: | | | | | | | | | |
Beginning of period | | | | 165,807,408 | | | | 158,567,251 | |
|
End of period (including undistributed net investment income (loss) of $(4,195,058) at 6/30/08 and $(4,782,842) at 12/31/07) | | | $ | 167,802,781 | | | $ | 165,807,408 | |
* To be allocated to net investment income and capital gains at year end. | THE ACCOMPANYING NOTES ARE AN INTEGRAL PART OF THESE FINANCIAL STATEMENTS. | | 2008 Semiannual Report to Stockholders | 55 |
| This table is presented to show selected data for a share of Common Stock outstanding throughout each period, and to assist stockholders in evaluating the Fund’s performance for the periods presented. |
| | | Six months | | Years ended December 31, |
| | | ended | |
|
| | | June 30, 2008 | | | | | | | | | | | | | | | | | | | | |
| | | (unaudited) | | | 2007 | | | | 2006 | | | | 2005 | | | | 2004 | | | | 2003 | |
|
| NET ASSET VALUE, BEGINNING OF PERIOD | | $ | 8.92 | | | $ | 9.75 | | | $ | 9.76 | | | $ | 9.75 | | | $ | 9.00 | | | $ | 6.27 | |
|
| INVESTMENT OPERATIONS: | | | | | | | | | | | | | | | | | | | | | | | | |
Net investment income (loss) | | | 0.04 | | | | 0.15 | | | | 0.16 | | | | 0.06 | | | | 0.02 | | | | 0.08 | |
Net realized and unrealized gain (loss) on investments and | | | | | | | | | | | | | | | | | | | | | | | | |
foreign currency | | | 0.19 | | | | 1.12 | | | | 1.50 | | | | 1.44 | | | | 2.63 | | | | 3.57 | |
|
Total investment operations | | | 0.23 | | | | 1.27 | | | | 1.66 | | | | 1.50 | | | | 2.65 | | | | 3.65 | |
|
| DISTRIBUTIONS TO PREFERRED STOCKHOLDERS: | | | | | | | | | | | | | | | | | | | | | | | | |
Net investment income | | | – | | | | (0.02 | ) | | | (0.01 | ) | | | (0.01 | ) | | | (0.00 | ) | | | (0.02 | ) |
Net realized gain on investments and foreign currency | | | – | | | | (0.07 | ) | | | (0.09 | ) | | | (0.11 | ) | | | (0.15 | ) | | | (0.14 | ) |
Quarterly distributions* | | | (0.04 | ) | | | – | | | | – | | | | – | | | | – | | | | – | |
|
Total distributions to Preferred Stockholders | | | (0.04 | ) | | | (0.09 | ) | | | (0.10 | ) | | | (0.12 | ) | | | (0.15 | ) | | | (0.16 | ) |
|
| NET INCREASE (DECREASE) IN NET ASSETS APPLICABLE TO COMMON | | | | | | | | | | | | | | | | | | | | | | | | |
STOCKHOLDERS RESULTING FROM INVESTMENT OPERATIONS | | | 0.19 | | | | 1.18 | | | | 1.56 | | | | 1.38 | | | | 2.50 | | | | 3.49 | |
|
| DISTRIBUTIONS TO COMMON STOCKHOLDERS: | | | | | | | | | | | | | | | | | | | | | | | | |
Net investment income | | | – | | | | (0.44 | ) | | | (0.20 | ) | | | (0.06 | ) | | | (0.02 | ) | | | (0.06 | ) |
Net realized gain on investments and foreign currency | | | – | | | | (1.57 | ) | | | (1.37 | ) | | | (1.15 | ) | | | (1.72 | ) | | | (0.56 | ) |
Quarterly distributions* | | | (0.25 | ) | | | – | | | | – | | | | – | | | | – | | | | – | |
|
Total distributions to Common Stockholders | | | (0.25 | ) | | | (2.01 | ) | | | (1.57 | ) | | | (1.21 | ) | | | (1.74 | ) | | | (0.62 | ) |
|
| CAPITAL STOCK TRANSACTIONS: | | | | | | | | | | | | | | | | | | | | | | | | |
Effect of reinvestment of distributions by Common Stockholders | | | (0.00 | ) | | | (0.00 | ) | | | (0.00 | ) | | | (0.03 | ) | | | (0.01 | ) | | | (0.03 | ) |
Effect of rights offering and Preferred Stock offering | | | – | | | | – | | | | – | | | | (0.13 | ) | | | – | | | | (0.11 | ) |
|
Total capital stock transactions | | | (0.00 | ) | | | (0.00 | ) | | | (0.00 | ) | | | (0.16 | ) | | | (0.01 | ) | | | (0.14 | ) |
|
| NET ASSET VALUE, END OF PERIOD | | $ | 8.86 | | | $ | 8.92 | | | $ | 9.75 | | | $ | 9.76 | | | $ | 9.75 | | | $ | 9.00 | |
|
| MARKET VALUE, END OF PERIOD | | $ | 8.83 | | | $ | 8.97 | | | $ | 10.68 | | | $ | 9.53 | | | $ | 10.47 | | | $ | 8.48 | |
|
| TOTAL RETURN (a): | | | | | | | | | | | | | | | | | | | | | | | | |
| Market Value | | | 1.37 | %*** | | | 3.02 | % | | | 30.50 | % | | | 3.03 | % | | | 47.26 | % | | | 63.98 | % |
| Net Asset Value | | | 2.28 | %*** | | | 12.22 | % | | | 16.33 | % | | | 13.31 | % | | | 29.21 | % | | | 54.33 | % |
RATIOS BASED ON AVERAGE NET ASSETS APPLICABLE TO COMMON STOCKHOLDERS: | | | | | | | | | | | | | | | | | | | | | | | | |
| Total expenses (b,c) | | | 1.35 | %** | | | 1.31 | % | | | 1.36 | % | | | 1.48 | % | | | 1.53 | % | | | 1.57 | % |
Management fee expense | | | 1.16 | %** | | | 1.14 | % | | | 1.16 | % | | | 1.21 | % | | | 1.27 | % | | | 1.14 | % |
Other operating expenses | | | 0.19 | %** | | | 0.17 | % | | | 0.20 | % | | | 0.27 | % | | | 0.26 | % | | | 0.43 | % |
| Net investment income (loss) | | | 0.73 | %** | | | 1.13 | % | | | 1.54 | % | | | 0.63 | % | | | 0.24 | % | | | 1.07 | % |
| SUPPLEMENTAL DATA: | | | | | | | | | | | | | | | | | | | | | | | | |
| Net Assets Applicable to Common Stockholders, | | | | | | | | | | | | | | | | | | | | | | | | |
End of Period (in thousands) | | | $167,803 | | | | $165,807 | | | | $158,567 | | | | $143,244 | | | | $105,853 | | | | $87,012 | |
| Liquidation Value of Preferred Stock, End of Period (in thousands) | | | $25,000 | | | | $25,000 | | | | $25,000 | | | | $25,000 | | | | $25,000 | | | | $25,000 | |
| Portfolio Turnover Rate | | | 23 | % | | | 62 | % | | | 30 | % | | | 42 | % | | | 52 | % | | | 49 | % |
| PREFERRED STOCK: | | | | | | | | | | | | | | | | | | | | | | | | |
| Total shares outstanding | | | 1,000,000 | | | | 1,000,000 | | | | 1,000,000 | | | | 1,000,000 | | | | 1,000,000 | | | | 1,000,000 | |
| Asset coverage per share | | $ | 192.80 | | | $ | 190.81 | | | $ | 183.57 | | | $ | 168.24 | | | $ | 130.85 | | | $ | 112.01 | |
| Liquidation preference per share | | $ | 25.00 | | | $ | 25.00 | | | $ | 25.00 | | | $ | 25.00 | | | $ | 25.00 | | | $ | 25.00 | |
| Average market value per share (d): | | | | | | | | | | | | | | | | | | | | | | | | |
6.00% Cumulative | | $ | 24.03 | | | $ | 24.37 | | | $ | 24.98 | | | $ | 25.38 | | | $ | 24.83 | | | $ | 25.45 | |
7.45% Cumulative | | | – | | | | – | | | | – | | | | – | | | | – | | | $ | 25.53 | |
|
| (a) | | The Market Value Total Return is calculated assuming a purchase of Common Stock on the opening of the first business day and a sale on the closing of the last business day of each period reported. Dividends and distributions are assumed for the purposes of this calculation to be reinvested at prices obtained under the Fund’s Distribution Reinvestment and Cash Purchase Plan. Net Asset Value Total Return is calculated on the same basis, except that the Fund’s net asset value is used on the purchase and sale dates instead of market value. |
| (b) | | Expense ratios based on total average net assets including liquidation value of Preferred Stock were 1.17%, 1.15% 1.17%, 1.22%, 1.21% and 1.20% for the periods ended June 30, 2008 and December 31, 2007, 2006, 2005, 2004 and 2003, respectively. |
| (c) | | Expense ratios based on average net assets applicable to Common Stockholders before waiver of fees by the investment adviser would have been 1.73% for the year ended December 31, 2003; before waiver of fees and earnings credits would have been 1.35%, 1.32%, 1.36%, 1.48%, 1.53% and 1.73% for the periods ended June 30, 2008 and December 31, 2007, 2006, 2005, 2004 and 2003, respectively. |
| (d) | | The average of month-end market values during the period that the Preferred Stock was outstanding. |
| * To be allocated to net investment income and capital gains at year end. |
| ** Annualized. |
| *** Not annualized. |
| 56 | 2008 Semiannual Report to Stockholders | | THE ACCOMPANYING NOTES ARE AN INTEGRAL PART OF THESE FINANCIAL STATEMENTS. |
Notes to Financial Statements (unaudited) |
Summary of Significant Accounting Policies:
Royce Focus Trust, Inc. (the “Fund”), is a diversified closed-end investment company incorporated under the laws of the State of Maryland. The Fund commenced operations on March 2, 1988 and Royce & Associates, LLC (“Royce”) assumed investment management responsibility for the Fund on November 1, 1996.
The preparation of financial statements in conformity with accounting principles generally accepted in the United States of America requires management to make estimates and assumptions that affect the reported amounts of assets and liabilities and the disclosure of contingent assets and liabilities at the date of the financial statements, and the reported amounts of income and expenses during the reporting period. Actual results could differ from those estimates.
Valuation of Investments:
Securities are valued as of the close of trading on the New York Stock Exchange (NYSE) (generally 4:00 p.m. Eastern time) on the valuation date. Securities that trade on an exchange, and securities traded on Nasdaq’s Electronic Bulletin Board, are valued at their last reported sales price or Nasdaq official closing price taken from the primary market in which each security trades or, if no sale is reported for such day, at their bid price. Other over-the-counter securities for which market quotations are readily available are valued at their highest bid price. Securities for which market quotations are not readily available are valued at their fair value under procedures established by the Fund’s Board of Directors. In addition, if, between the time trading ends on a particular security and the close of the customary trading session on the NYSE, events occur that are significant and may make the closing price unreliable, the Fund may fair value the security. The Fund uses an independent pricing service to provide fair value estimates for relevant non-U.S. equity securities on days when the U.S. market volatility exceeds a certain threshold. This pricing service uses proprietary correlations it has developed between the movement of prices of non-U.S. equity securities and indices of U.S.-traded securities, futures contracts and other indications to estimate the fair value of relevant non-U.S. securities. When fair value pricing is employed, the price of securities used by the Fund may differ from quoted or published prices for the same security. Bonds and other fixed income securities may be valued by reference to other securities with comparable ratings, interest rates and maturities, using established independent pricing services. Investments in money market funds are valued at net asset value per share.
| | Various inputs are used in determining the value of the Fund’s investments. These inputs are summarized in the three broad levels below: |
| | | Level 1 – quoted prices in active markets for identical securities |
| | | Level 2 – other significant observable inputs (including quoted prices for similar securities, foreign securities that may be fair valued and repurchase agreements) |
| | | Level 3 – significant observable inputs (including the Fund’s own assumptions in determining the fair value of investments) |
| | The inputs or methodology used for valuing securities are not necessarily an indication of the risk associated with investing in those securities. |
| | | |
| | The following is a summary of the inputs used to value the Fund’s investments as of June 30, 2008: |
| | Level 1 | | Level 2 | | Level 3 | | Total |
|
| | $139,291,361 | | $62,704,274 | | $9,160,740 | | $211,156,375 |
|
| Level 3 Reconciliation: | | | | | | |
| | | Change in unrealized appreciation | | | |
| | Balance as of 12/31/07 | | (depreciation) | | Purchases | | Balance as of 6/30/2008 |
|
| | $0 | | $160,740 | | $9,000,000 | | $9,160,740 |
|
Repurchase Agreements:
The Fund may enter into repurchase agreements with institutions that the Fund’s investment adviser has determined are creditworthy. The Fund restricts repurchase agreements to maturities of no more than seven days. Securities pledged as collateral for repurchase agreements, which are held until maturity of the repurchase agreements, are marked-to-market daily and maintained at a value at least equal to the principal amount of the repurchase agreement (including accrued interest). Repurchase agreements could involve certain risks in the event of default or insolvency of the counter-party, including possible delays or restrictions upon the ability of the Fund to dispose of its underlying securities.
Foreign Currency:
The Fund values its non-U.S. securities in U.S. dollars daily at the prevailing foreign currency exchange rates as quoted by a major bank. The effects of changes in foreign exchange rates on investments and other assets and liabilities are included with net realized and unrealized gains and losses on investments.
Net realized foreign exchange gains or losses arise from sales and maturities of short-term securities, sales of foreign currencies, expiration of currency forward contracts, currency gains or losses realized between the trade and settlement dates on securities transactions, and the difference between the amounts of dividends, interest, and foreign withholding taxes recorded on the Fund’s books and the U.S. dollar equivalent of the amounts actually received or paid. Net unrealized foreign exchange gains and losses arise from changes in the value of assets and liabilities, including investments in securities at the end of the reporting period, as a result of changes in foreign currency exchange rates.
| | | 2008 Semiannual Report to Stockholders | 57 |
Notes to Financial Statements (unaudited) (continued) |
Securities Lending:
The Fund loans securities to qualified institutional investors for the purpose of realizing additional income. Collateral on all securities loaned for the Fund is accepted in cash and cash equivalents and invested temporarily by the custodian. The collateral is equal to at least 100% of the current market value of the loaned securities. The market value of the loaned securities is determined at the close of business of the Fund and any additional required collateral is delivered to the Fund on the next business day.
Taxes:
As a qualified regulated investment company under Subchapter M of the Internal Revenue Code, the Fund is not subject to income taxes to the extent that it distributes substantially all of its taxable income for its fiscal year. The Schedule of Investments includes information regarding income taxes under the caption “Income Tax Information”.
Distributions:
The Fund currently has a policy of paying quarterly distributions on the Fund’s Common Stock. Distributions are currently being made at the annual rate of 5% of the rolling average of the prior four calendar quarter-end NAVs of the Fund’s Common Stock, with the fourth quarter distribution being the greater of 1.25% of the rolling average or the distribution required by IRS regulations. Distributions to Preferred Stockholders are accrued daily and paid quarterly and distributions to Common Stockholders are recorded on ex-dividend date. The Fund is required to allocate long-term capital gain distributions and other types of income proportionately to distributions made to holders of shares of Common Stock and Preferred Stock. To the extent that distributions are not paid from long-term capital gains, net investment income or net short-term capital gains, they will represent a return of capital. Distributions are determined in accordance with income tax regulations that may differ from accounting principles generally accepted in the United States of America. Permanent book and tax differences relating to stockholder distributions will result in reclassifications within the capital accounts. Undistributed net investment income may include temporary book and tax basis differences, which will reverse in a subsequent period. Any taxable income or gain remaining undistributed at fiscal year end is distributed in the following year.
Investment Transactions and Related Investment Income:
Investment transactions are accounted for on the trade date. Dividend income is recorded on the ex-dividend date. Non-cash dividend income is recorded at the fair market value of the securities received. Interest income is recorded on an accrual basis. Premium and discounts on debt securities are amortized using the effective yield-to-maturity method. Realized gains and losses from investment transactions are determined on the basis of identified cost for book and tax purposes.
Expenses:
The Fund incurs direct and indirect expenses. Expenses directly attributable to the Fund are charged to the Fund’s operations, while expenses applicable to more than one of the Royce Funds are allocated equitably. Allocated personnel and occupancy costs related to The Royce Funds are included in administrative and office facilities expenses. The Fund has adopted a deferred fee agreement that allows the Directors to defer the receipt of all or a portion of Directors’ Fees otherwise payable. The deferred fees are invested in certain Royce Funds until distributed in accordance with the agreement.
Compensating Balance Credits:
The Fund has an arrangement with its custodian bank, whereby a portion of the custodian’s fee is paid indirectly by credits earned on the Fund’s cash on deposit with the bank. This deposit arrangement is an alternative to purchasing overnight investments. Conversely, the Fund pays interest to the custodian on any cash overdrafts, to the extent they are not offset by credits earned on positive cash balances.
Capital Stock:
The Fund issued 342,497 and 2,332,768 shares of Common Stock as reinvestment of distributions by Common Stockholders for the six months ended June 30, 2008 and the year ended December 31, 2007, respectively.
At June 30, 2008, 1,000,000 shares of 6.00% Cumulative Preferred Stock were outstanding. Commencing October 17, 2008 and thereafter, the Fund, at its option, may redeem the Cumulative Preferred Stock, in whole or in part, at the redemption price. The Cumulative Preferred Stock is classified outside of permanent equity (net assets applicable to Common Stockholders) in the accompanying financial statements in accordance with Emerging Issues Task Force (EITF) Topic D-98, Classification and Measurement of Redeemable Securities, that requires preferred securities that are redeemable for cash or other assets to be classified outside of permanent equity to the extent that the redemption is at a fixed or determinable price and at the option of the holder or upon the occurrence of an event that is not solely within the control of the issuer.
The Fund is required to meet certain asset coverage tests with respect to the Cumulative Preferred Stock as required by the 1940 Act. In addition, pursuant to the Rating Agency Guidelines established by Moody’s, the Fund is required to maintain a certain discounted asset coverage. If the Fund fails to meet these requirements and does not correct such failure, the Fund may be required to redeem, in part or in full, the Cumulative Preferred Stock at a redemption price of $25.00 per share, plus an amount equal to the accumulated and unpaid dividends, whether or not declared on such shares, in order to meet these requirements. Additionally, failure to meet the foregoing asset coverage requirements could restrict the Fund’s ability to pay dividends to Common Stockholders and could lead to sales of portfolio securities at inopportune times. The Fund has met these requirements since issuing the Cumulative Preferred Stock.
| 58 | 2008 Semiannual Report to Stockholders | | |
Notes to Financial Statements (unaudited) (continued) |
Investment Advisory Agreement:
The Investment Advisory Agreement between Royce and the Fund provides for fees to be paid at an annual rate of 1.0% of the Fund’s average daily net assets applicable to Common Stockholders plus the liquidation value of Preferred Stock. Royce has voluntarily committed to waive the portion of its investment advisory fee attributable to an issue of the Fund’s Preferred Stock for any month in which the Fund’s average annual NAV total return since issuance of the Preferred Stock fails to exceed the applicable Preferred Stock’s dividend rate. For the six months ended June 30, 2008, the Fund accrued and paid Royce advisory fees totaling $932,944.
Purchases and Sales of Investment Securities:
For the six months ended June 30, 2008, the cost of purchases and proceeds from sales of investment securities, other than short-term securities and collateral received for securities loaned, amounted to $48,394,774 and $38,523,359, respectively.
| | | 2008 Semiannual Report to Stockholders | 59 |
| Notes to Performance and Other Important Information | | |
|
The thoughts expressed in this Review and Report concerning recent market movements and future prospects for small company stocks are solely the opinion of Royce at June 30, 2008, and, of course, historical market trends are not necessarily indicative of future market movements. Statements regarding the future prospects for particular securities held in the Funds’ portfolios and Royce’s investment intentions with respect to those securities reflect Royce’s opinions as of June 30, 2008 and are subject to change at any time without notice. There can be no assurance that securities mentioned in this Review and Report will be included in any Royce-managed portfolio in the future. The Funds invest primarily in securities of micro-, small- and mid-cap companies, that may involve considerably more risk than investments of larger-cap companies. All publicly released material information is always disclosed by the Funds on the website at www.roycefunds.com. |
Standard deviation is a statistical measure within which a fund’s total returns have varied over time. The greater the standard deviation, the greater a fund’s volatility. |
The Russell 2000 is an index of domestic small-cap stocks. It measures the performance of the 2,000 smallest publicly traded U.S. companies in the Russell 3000 index. The Russell 2000 Value and Growth indices consist of the respective value and growth stocks within the Russell 2000 as determined by Russell Investments. The Russell Microcap Index measures the performance of the 1,000 smallest publicly traded U.S. companies in the Russell 2000 index. The S&P 500 and S&P SmallCap 600 are indices of U.S. large- and small-cap stocks, respectively, selected by Standard & Poor’s based on market size, liquidity and industry grouping, among other factors. The Nasdaq Composite is an index of the more than 3,000 common equities listed on the Nasdaq stock exchange. The MSCI EAFE Index (Europe, Australasia, Far East) is designed to measure the equity market performance of developed markets, excluding the U.S. and Canada. Returns for the market indices used in this Review and Report were based on information supplied to Royce by Russell Investments and Morningstar. Royce has not independently verified the above described information. The Royce Funds is a service mark of The Royce Funds. |
| |
| |
| Forward-Looking Statements |
| This material contains forward-looking statements within the meaning of the Securities Exchange Act of 1934, as amended (the “Exchange |
| Act”), that involve risks and uncertainties, including, among others, statements as to: |
| • the Funds’ future operating results |
| • the prospects of the Funds’ portfolio companies |
| • the impact of investments that the Funds have made or may make |
| • the dependence of the Funds’ future success on the general economy and its impact on the companies and industries in which the Funds invest, and |
| • the ability of the Funds’ portfolio companies to achieve their objectives. |
| |
This Review and Report uses words such as “anticipates,” “believes,” “expects,” “future,” “intends,” and similar expressions to identify forward-looking statements. Actual results may differ materially from those projected in the forward-looking statements for any reason.
The Royce Funds have based the forward-looking statements included in this Review and Report on information available to us on the date of the report, and we assume no obligation to update any such forward-looking statements. Although The Royce Funds undertake no obligation to revise or update any forward-looking statements, whether as a result of new information, future events or otherwise, you are advised to consult any additional disclosures that we may make through future stockholder communications or reports. |
| |
| Authorized Share Transactions |
Royce Value Trust, Royce Micro-Cap Trust and Royce Focus Trust may each repurchase up to 5% of the issued and outstanding shares of its respective common stock and up to 10% of the issued and outstanding shares of its respective preferred stock during the year ending December 31, 2008. Any such repurchases would take place at then prevailing prices in the open market or in other transactions. Common stock repurchases would be effected at a price per share that is less than the share’s then current net asset value, and preferred stock repurchases would be effected at a price per share that is less than the share’s liquidation value.
Royce Value Trust, Royce Micro-Cap Trust and Royce Focus Trust are also authorized to offer their common stockholders an opportunity to subscribe for additional shares of their common stock through rights offerings at a price per share that may be less than the share’s then current net asset value. The timing and terms of any such offerings are within each Board’s discretion. |
| | | |
| | Proxy Voting | |
| | A copy of the policies and procedures that The Royce Funds use to determine how to vote proxies relating to portfolio securities and information regarding how each of The Royce Funds voted proxies relating to portfolio securities during the most recent 12-month period ended June 30 is available, without charge, on the Royce Funds’ website at www.roycefunds.com, by calling 1-800-221-4268 (toll-free) and on the website of the Securities and Exchange Commission (“SEC”), at www.sec.gov. | |
| | | |
| | Form N-Q Filing | |
| | The Funds file their complete schedules of investments with the SEC for the first and third quarters of each fiscal year on Form N-Q. The Funds’ Forms N-Q are available on The Royce Funds’ website at www.roycefunds.com and on the SEC’s website at www.sec.gov. The Funds’ Forms N-Q may also be reviewed and copied at the SEC’s Public Reference Room in Washington, D.C. To find out more about this public service, call the SEC at 1-800-732-0330. The Funds’ complete schedules of investments are updated quarterly, and are available at www.roycefunds.com. | |
| | | |
| 60 | 2008 Semiannual Report to Stockholders | | |
| All Directors and Officers may be reached c/o The Royce Funds, 1414 Avenue of the Americas, New York, NY 10019 |
| |
| Charles M. Royce, Director*, President |
| Age: 68 | Number of Funds Overseen: 28 | Tenure: Since 1986 |
| Non-Royce Directorships: Director of Technology Investment Capital Corp. |
| |
| Principal Occupation(s) During Past Five Years: President, Chief Investment Officer and Member of Board of Managers of Royce & Associates, LLC (“Royce”), the Trust’s investment adviser. |
| |
| Mark R. Fetting, Director* |
| Age: 53 | Number of Funds Overseen: 42 | Tenure: Since 2001 |
| Non-Royce Directorships: Director/Trustee of registered investment companies constituting the 14 Legg Mason Funds. |
| |
| Principal Occupation(s) During Past Five Years: President and Chief Executive Officer of Legg Mason, Inc.; Member of Board of Managers of Royce. Mr. Fetting’s prior business experience includes having served as Senior Executive Vice President of Legg Mason, Inc.; Division President and Senior Officer, Prudential Financial Group, Inc. and related companies; Partner, Greenwich Associates and Vice President, T. Rowe Price Group, Inc. |
|
| Donald R. Dwight, Director |
| Age: 77 | Number of Funds Overseen: 28 | Tenure: Since 1998 |
| Non-Royce Directorships: None |
| |
| Principal Occupation(s) During Past Five Years: President of Dwight Partners, Inc., corporate communications consultant; Chairman (from 1982 to March 1998) and Chairman Emeritus (since March 1998) of Newspapers of New England, Inc. Mr. Dwight’s prior experience includes having served as Lieutenant Governor of the Commonwealth of Massachusetts, as President and Publisher of Minneapolis Star and Tribune Company and as a Trustee of the registered investment companies constituting the Eaton Vance Funds. |
| |
| Richard M. Galkin, Director |
| Age: 70 | Number of Funds Overseen: 28 | Tenure: Since 1986 |
| Non-Royce Directorships: None |
| |
| Principal Occupation(s) During Past Five Years: Private investor. Mr. Galkin’s prior business experience includes having served as President of Richard M. Galkin Associates, Inc., telecommunications consultants, President of Manhattan Cable Television (a subsidiary of Time, Inc.), President of Haverhills Inc. (another Time, Inc. subsidiary), President of Rhode Island Cable Television and Senior Vice President of Satellite Television Corp. (a subsidiary of Comsat). |
| |
| Stephen L. Isaacs, Director |
| Age: 69 | Number of Funds Overseen: 28 | Tenure: Since 1989 |
| Non-Royce Directorships: None |
| |
| Principal Occupation(s) During Past Five Years: President of The Center for Health and Social Policy (since September 1996); Attorney and President of Health Policy Associates, Inc., consultants. Mr. Isaacs’s prior business experience includes having served as Director of Columbia University Development Law and Policy Program and Professor at Columbia University (until August 1996). |
| |
| William L. Koke, Director |
| Age: 74 | Number of Funds Overseen: 28 | Tenure: Since 1996 |
| Non-Royce Directorships: None |
| |
| Principal Occupation(s) During Past Five Years: Private investor. Mr. Koke’s prior business experience includes having served as President of Shoreline Financial Consultants, Director of Financial Relations of SONAT, Inc., Treasurer of Ward Foods, Inc. and President of CFC, Inc. |
| |
| Arthur S. Mehlman, Director |
| Age: 66 | Number of Funds Overseen: 42 | Tenure: Since 2004 |
| Non-Royce Directorships: Director/Trustee of registered investment companies constituting the 14 Legg Mason Funds and Director of Municipal Mortgage & Equity, LLC. |
| |
| Principal Occupation(s) During Past Five Years: Director of The League for People with Disabilities, Inc.; Director of University of Maryland Foundation (non-profits). Formerly: Director of University of Maryland College Park Foundation (non-profit) (from 1998 to 2005); Partner, KPMG LLP (international accounting firm) (from 1972 to 2002); Director of Maryland Business Roundtable for Education (from July 1984 to June 2002). |
| David L. Meister, Director |
| Age: 68 | Number of Funds Overseen: 28 | Tenure: Since 1986 |
| Non-Royce Directorships: None |
| |
| Principal Occupation(s) During Past Five Years: Consultant. Chairman and Chief Executive Officer of The Tennis Channel (from June 2000 to March 2005). Mr. Meister’s prior business experience includes having served as Chief Executive Officer of Seniorlife.com, a consultant to the communications industry, President of Financial News Network, Senior Vice President of HBO, President of Time-Life Films and Head of Broadcasting for Major League Baseball. |
| |
| G. Peter O’Brien, Director |
| Age: 62 | Number of Funds Overseen: 42 | Tenure: Since 2001 |
| Non-Royce Directorships: Director/Trustee of registered investment companies constituting the 14 Legg Mason Funds; Director of Technology Investment Capital Corp. |
| |
| Principal Occupation(s) During Past Five Years: Trustee Emeritus of Colgate University (since 2005); Board Member of Hill House, Inc. (since 1999); Formerly: Trustee of Colgate University (from 1996 to 2005), President of Hill House, Inc. (from 2001 to 2005) and Managing Director/Equity Capital Markets Group of Merrill Lynch & Co. (from 1971 to 1999). |
|
| John D. Diederich, Vice President and Treasurer |
| Age: 57 | Tenure: Since 2001 |
| |
| Principal Occupation(s) During Past Five Years: Chief Operating Officer, Managing Director and member of the Board of Managers of Royce; Chief Financial Officer of Royce; Director of Administration of the Trust; and President of RFS, having been employed by Royce since April 1993. |
| |
| Jack E. Fockler, Jr., Vice President |
| Age: 49 | Tenure: Since 1995 |
| |
| Principal Occupation(s) During Past Five Years: Managing Director and Vice President of Royce, and Vice President of RFS, having been employed by Royce since October 1989. |
| |
| W. Whitney George, Vice President |
| Age: 50 | Tenure: Since 1995 |
| |
| Principal Occupation(s) During Past Five Years: Managing Director and Vice President of Royce, having been employed by Royce since October 1991. |
| |
| Daniel A. O’Byrne, Vice President and Assistant Secretary |
| Age: 46 | Tenure: Since 1994 |
| |
| Principal Occupation(s) During Past Five Years: Principal and Vice President of Royce, having been employed by Royce since October 1986. |
| |
| John E. Denneen, Secretary and Chief Legal Officer |
| Age: 41| Tenure: 1996-2001 and Since April 2002 |
| |
| Principal Occupation(s) During Past Five Years: General Counsel, Principal, Chief Legal and Compliance Officer and Secretary of Royce; Secretary and Chief Legal Officer of The Royce Funds. |
| |
| Lisa Curcio, Chief Compliance Officer |
| Age: 48 | Tenure: Since 2004 |
| |
| Principal Occupation(s) During Past Five Years: Chief Compliance Officer of The Royce Funds (since October 2004); Compliance Officer of Royce (since June 2004); Vice President, The Bank of New York (from February 2001 to June 2004). |
| |
|
| * Interested Director. |
| 2008 Semiannual Report to Stockholders | 61 |
| Board Approval of Investment Advisory Agreements | | |
|
At meetings held on June 4 – 5, 2008, each of the Funds’ respective Boards of Directors, including all of the non-interested directors, approved the continuance of the Investment Advisory Agreements between Royce & Associates, LLC (“R&A”) and each of Royce Value Trust, Royce Micro-Cap Trust and Royce Focus Trust (the “Funds”). In reaching these decisions, the Board reviewed the materials provided by R&A, which included, among other things, information prepared internally by R&A and independently by Morningstar Associates, LLC (“Morningstar”) containing detailed expense ratio and investment performance comparisons for the Funds with other funds in their “peer group”, information regarding the past performance of Funds managed by R&A and a memorandum outlining the legal duties of the Board prepared by independent counsel to the non-interested directors. R&A also provided the directors with an analysis of its profitability with respect to providing investment advisory services to each of the Funds. In addition, the Board took into account information furnished throughout the year at regular Board meetings, including reports on investment performance, shareholder services, regulatory compliance, brokerage commissions and research, brokerage and execution products and services provided to the Funds. The Board also considered other matters they deemed important to the approval process such as payments made to R&A or its affiliates relating to allocation of Fund brokerage commissions, and other direct and indirect benefits to R&A and its affiliates, from their relationship with the Funds. The directors also met throughout the year with investment advisory personnel from R&A. The Board, in its deliberations, recognized that, for many of the Funds’ stockholders, the decision to purchase Fund shares included a decision to select R&A as the investment adviser and that there was a strong association in the minds of Fund stockholders between R&A and each Fund. In considering factors relating to the approval of the continuance of the Investment Advisory Agreements, the non-interested directors received assistance and advice from, and met separately with, their independent counsel. While the Investment Advisory Agreements for the Funds were considered at the same Board meetings, the Board dealt with each agreement separately. Among other factors, the directors considered the following:
The nature, extent and quality of services provided by R&A: The Board considered the following factors to be of fundamental importance to their consideration of whether to approve the continuance of the Funds’ Investment Advisory Agreements: (i) R&A’s more than 30 years of small-cap value investing experience and track record; (ii) the history of long-tenured R&A portfolio managers managing the Funds; (iii) R&A’s sole focus on mid-cap, small-cap and micro-cap value investing; (iv) the consistency of R&A’s approach to managing both the Funds and open-end mutual funds over more than 30 years; (v) the integrity and high ethical standards adhered to at R&A; (vi) R&A’s specialized experience in the area of trading small- and micro-cap securities; (vii) R&A’s historical ability to attract and retain portfolio management talent and (viii) R&A’s focus on stockholder interests as exemplified by its voluntary fee waiver policy on preferred stock assets in certain circumstances where the Funds’ total return performance from the issuance of the preferred may not exceed the coupon rate on the preferred, and expansive stockholder reporting and communications. The Board reviewed the services that R&A provides to the Funds, including, but not limited to, managing each Fund’s investments in accordance with the stated policies of each Fund. The Board considered the fact that during 2008 R&A provided certain administrative services to the Funds at cost pursuant to the Administration Agreement between the Funds and R&A which went into effect on January 1, 2008. The Board determined that the services to be provided to each Fund by R&A would be the same as those it previously provided to the Funds. They also took into consideration the histories, reputations and backgrounds of R&A’s portfolio managers for the Funds, finding that these would likely have an impact on the continued success of the Funds. Lastly, the Board noted R&A’s ability to attract quality and experienced personnel. The directors concluded that the services provided by R&A to each Fund compared favorably to services provided by R&A to other R&A client accounts, including other funds, in both nature and quality, and that the scope of services provided by R&A would continue to be suitable for each Fund.
Investment performance of the Funds and R&A: In light of R&A’s risk-averse approach to investing, the Board believes that risk-adjusted performance continues to be an appropriate measure of each Fund’s investment performance. One measure of risk-adjusted performance the Board has historically used in their review of the Funds’ performance is the Sharpe Ratio. The Sharpe Ratio is a risk-adjusted measure of performance developed by Nobel Laureate William Sharpe. It is calculated by dividing a fund’s annualized excess returns by its annualized standard deviation to determine reward per unit of risk. The higher the Sharpe Ratio, the better a fund’s historical risk-adjusted performance. The Board attaches primary importance to risk-adjusted performance over relatively long periods of time, typically three, five and ten years. Morningstar compared each of the Funds’ risk-adjusted performance to that of its applicable open-end fund category. Royce Value Trust’s Sharpe Ratio placed in the 1st quartile within the small blend category assigned by Morningstar for the three- and five-year periods and the 2nd quartile for the ten-year period ended December 31, 2007. Similarly, Royce Micro-Cap Trust’s Sharpe Ratio placed in the 2nd quartile within the small blend, growth or value category assigned by Morningstar for the three-year period and in the 1st quartile for the five- and ten-year periods ended December 31, 2007. Finally, Royce Focus Trust’s Sharpe Ratio placed in the 1st quartile within the small growth category assigned by Morningstar for the three-, five- and ten-year periods ended December 31, 2007.
The Board noted that R&A manages a number of funds that invest in small-cap and micro-cap issuers, many of which were outperforming the Russell 2000 Index and their competitors. Although the Board recognized that past performance is not necessarily an indicator of future results, they found that R&A had the necessary qualifications, experience and track record in managing small-cap and micro-cap securities to manage the Funds. The directors determined that R&A continued to be an appropriate investment adviser for the Funds and concluded that each Fund’s performance supported the renewal of its Investment Advisory Agreement.
Cost of the services provided and profits realized by R&A from its relationship with each Fund: The Board considered the cost of the services provided by R&A and profits realized by R&A from its relationship with each Fund. As part of the analysis, the Board discussed with R&A its methodology in allocating its costs to each Fund and concluded that its allocations were reasonable. The Board concluded that R&A’s profits were reasonable in relation to the nature and quality of services provided.
| 62 | 2008 Semiannual Report to Stockholders | | |
| Board Approval of Investment Advisory Agreements (continued) | | |
|
The extent to which economies of scale would be realized as the Funds grow and whether fee levels would reflect such economies of scale: The Board considered whether there have been economies of scale in respect of the management of the Funds, whether the Funds have appropriately benefited from any economies of scale and whether there is potential for realization of any further economies of scale. The Board noted the time and effort involved in managing portfolios of small- and micro-cap stocks and that they did not involve the same efficiencies as do portfolios of large cap stocks. The Board concluded that the current fee structure for each Fund was reasonable, and that no changes were currently necessary.
Comparison of services to be rendered and fees to be paid to those under other investment advisory contracts, such as contracts of the same and other investment advisers or other clients: The Board reviewed the investment advisory fee paid by each Fund and compared both the services to be rendered and the fees to be paid under the Investment Advisory Agreements to other contracts of R&A and to contracts of other investment advisers with registered investment companies investing in small- and micro-cap stocks, as provided by Morningstar. The Board noted that, in the case of Royce Value Trust, the 1.00% basic fee that is subject to adjustment up or down (up to 0.50% in either direction) based on the Fund’s performance versus the S&P 600 SmallCap Index over rolling periods of 60 months. The fee is charged on average net assets over those rolling periods. As a result, in a rising market, the fee will be smaller than a fee calculated on the current year’s average net assets, and visa versa. The Board determined that the performance adjustment feature continued to serve as an appropriate incentive to R&A to manage the Fund for the benefit of its long-term common stockholders. The Board noted that R&A had also agreed to waive its management fee on Fund assets in an amount equal to the liquidation preference of the Fund’s outstanding preferred stock if the Fund’s total return from issuance of the preferred on such amount is less than the preferred’s coupon rate. The Board also noted that the fee arrangement, which also includes a provision for no fee in periods where the Fund’s trailing three-year performance is negative, requires R&A to measure the Fund’s performance monthly against the S&P 600, an unmanaged index. Instead of receiving a set fee regardless of its performance, R&A is penalized for poor performance. The Board noted that if the Fund’s expense ratio were based on total average net assets including net assets applicable to Preferred Stock, it would place in the 2nd quartile of its Morningstar-assigned open-end peer group.
In the case of Royce Micro-Cap Trust, the directors noted that the Fund has a 1.00% basic fee subject to adjustment up or down based on the Fund’s performance versus the Russell 2000 Index over rolling 36-month periods. The fee is charged on average net assets over those rolling periods. As a result, in a rising market, the fee will be smaller than a fee calculated on the current year’s average net assets, and visa versa. The Board determined that the performance adjustment feature continued to serve as an incentive to R&A to manage the Fund for the benefit of its long-term stockholders. The Board also noted R&A’s voluntarily waiver of its fee on the liquidation value of the outstanding preferred stock in circumstances where the Fund’s total return performance from the issuance of the preferred is less than the coupon rate on the preferred for each month during the year. The Board noted that if the Fund’s expense ratio were based on total average net assets including net assets applicable to Preferred Stock, it would fall effectively at the median when compared to its Morningstar-assigned open-end peer group.
Finally, in the case of Royce Focus Trust, the Board noted that R&A had agreed to waive its management fee on the liquidation value of outstanding preferred stock if the Fund’s total return from issuance of the preferred is less than the preferred’s coupon rate. The Board noted that if the Fund’s expense ratio were based on total average net assets including net assets applicable to Preferred Stock, it would place in the 2nd quartile of its Morningstar-assigned open-end peer group.
The Board also considered fees charged by R&A to institutional and other clients and noted that the Funds’ base advisory fees compared favorably to those other accounts.
The entire Board, including all the non-interested directors, approved the renewal of the existing Investment Advisory Agreements, concluding that a contract renewal on the existing terms was in the best interest of the stockholders of each Fund and that each investment advisory fee rate was reasonable in relation to the services provided.
| | | 2008 Semiannual Report to Stockholders | 63 |
This Page Left Intentionally Blank
Everyone can probably think of one example—that neighborhood restaurant only you and a few friends seem aware of; an uncrowded, out-of-the-way vacation spot that you stumbled on accidentally and have returned to each year since; maybe a band, a book or a film that you love but that escaped most other people’s notice. Back in the ‘70s, and lasting through much of the ‘80s, small-cap value investing was much like discovering, and regularly returning to, a favorite place or thing that few others seemed to know about.
There were not a lot of professional money managers devoting their attention to smaller stocks in those days. Most of those who did were looking for fast-growing, usually short-term opportunities. Being a value investor with a long-term | | Over time, things began to change. Little by little, the road began to fill with others looking for the same sort of bargain-priced, high-quality smaller companies that we loved. Simply knowing about the existence of all these wonderful, out-of-the-way businesses was no longer an advantage in itself. By the ‘90s, we wondered whether or not our waning edge in obtaining information would be a problem. If more and more people had access to all of this information, how would we continue to find what we deemed high-quality companies in our increasingly crowded marketplace? In the era of the cell phone, GPS, PDA, satellite radio and multiple all-news stations with regular updates of traffic and weather, the kind of person-to-person communication that a CB provided is a relic from a simpler time. How would our approach avoid a similar fate? |
investment horizon in the small-cap world was definitely a rarity, but we were more than content to follow our own path. Aside from a few other kindred spirits, we were mostly alone in choosing a long-term route to small-cap value, and we were happy to operate on nearly empty roads.
It was the ‘70s, after all, which perhaps explains why there were times when we felt a little bit like drivers using CB radios as we searched for undervalued smaller companies. Our work was not nearly as trendy—we never had a hit record—but we did share with CB enthusiasts access to information that others lacked, or perhaps did not want in the first place. A CB radio gave truckers and other drivers traffic and safety news, warnings about lurking ‘smokies’ on the highways and advice about where you could find a good cup of joe nearly anywhere in the continental U.S. at any hour of the day. Our intense scrutiny of smaller | |  | | One key element was the wealth of knowledge that we had built (and continue to build) about thousands of smaller companies. Our years of investment experience give us an advantage that few in our industry can match. As the ‘90s gave way to the current decade, we began to see that access to information, while vital to any investment enterprise, would not be enough. It is one thing to have information, it is something else entirely to know how to best put it to use. This, it seems to us, remains one of our major competitive advantages. As experienced smaller-company investors, we feel confident about our knowledge of the marketplace and how to select securities within it. |
companies gave us similar advantages. Many of the companies that drew our attention received little, if any, coverage from Wall Street analysts. For some, there was very little public information available. This meant that when we saw an interesting business along the small-cap road, there were few others pulling over to take a close look. | | It is one thing to have information, it is something else entirely to know how to best put it to use. This, it seems to us, remains one of our major competitive advantages. | | In the last four decades, we have seen the smaller-company universe go from being the province of a few professional managers to a widely accepted domestic asset class in which many investment managers traffic. We have continued to enjoy long-term success because throughout this time we never strayed from our commitment to our approach or our chosen asset class. Today, as smaller-companies face the challenge of becoming an asset class with global acceptance, we are even more committed to the principles that have guided us thus far. And that’s a big 10-4, buddy. |
| This page is not part of the 2008 Semiannual Report to Stockholders |
| |
| |
| | |
| | |
| | |
| | |
| | |
| | |
| | |
| |
Wealth Of ExperienceWith approximately $29 billion in open- and closed-end fund assets under management, Royce & Associates is committed to the same smaller-company investing principles that have served us well for more than 35 years. Charles M. Royce, our Chief Investment Officer, enjoys one of the longest tenures of any active mutual fund manager. Royce’s investment staff includes 12 Portfolio Managers, as well as nine assistant portfolio managers and analysts, and eight traders.
Multiple Funds, Common FocusOur goal is to offer both individual and institutional investors the best available smaller-cap value portfolios. Unlike a lot of fund groups with broad product offerings, we have chosen to concentrate on smaller-company value investing by providing investors with a range of funds that take full advantage of this large and diverse sector.
Consistent DisciplineOur approach emphasizes paying close attention to risk and maintaining the same discipline, regardless of market movements and trends. The price we pay for a security must be significantly below our appraisal of its current worth. This requires a thorough analysis of the financial and business dynamics of an enterprise, as though we were purchasing the entire company.
Co-Ownership Of FundsIt is important that our employees and shareholders share a common financial goal; our officers, employees and their families currently have approximately $117 million invested in The Royce Funds. | | |
| | | | | | |
| | |
| | General Information | Advisor Services | | | |
| | Additional Report Copies | For Fund Materials, Performance Updates, | | | |
| | and Fund Inquiries | Account Inquiries | | | |
| | (800) 221-4268 | (800) 33-ROYCE (337-6923) | | | |
| | | | | | |
| | Computershare | Broker/Dealer Services | | | |
| | Transfer Agent and Registrar | For Fund Materials and Performance Updates | | | |
| | (800) 426-5523 | (800) 59-ROYCE (597-6923) | | | |
| | | | | | |
| |
www.roycefunds.com | | |
| | | | | | |
| |
| 
| |
| | | | | |
| | | | | |
| | | | | |
| | |
| | |
|
| |
| | |
| | |
| | |
| | |
| CE-REP-0608 | |
| | |
| | |
| | |
| | |
Item 2. Code(s) of Ethics – Not applicable to this semi-annual report.
Item 3. Audit Committee Financial Expert – Not applicable to this semi-annual report.
Item 4. Principal Accountant Fees and Services – Not applicable to this semi-annual report.
Item 5. Audit Committee of Listed Registrants – Not applicable to this semi-annual report.
Item 6. Schedule of Investments
(a) See Item 1.
(b) Not applicable.
Item 7. Disclosure of Proxy Voting Policies and Procedures for Closed-End Management Investment Companies – Not applicable to this semi-annual report.
Item 8. Portfolio Managers of Closed-End Management Investment Companies – Not applicable to this semi-annual report.
Item 9. Purchases of Equity Securities by Closed-End Management Investment Company and Affiliated Purchasers – Not applicable.
Item 10. Submission of Matters to a Vote of Security Holders – None.
Item 11. Controls and Procedures.
(a) Disclosure Controls and Procedures. The Principal Executive and Financial Officers concluded that the Registrant’s Disclosure Controls and Procedures are effective based on their evaluation of the Disclosure Controls and Procedures as of a date within 90 days of the filing date of this report.
(b) Internal Control over Financial Reporting. There were no significant changes in Registrant’s internal control over financial reporting or in other factors that could significantly affect this control subsequent to the date of the evaluation, including any corrective actions with regard to significant deficiencies and material weaknesses during the second fiscal quarter of the period covered by this report.
Item 12. Exhibits attached hereto.
(a)(1) Not applicable.
(a)(2) Separate certifications by the Registrant’s Principal Executive Officer and Principal Financial Officer as required by Rule 30a-2(a) under the Investment Company Act of 1940.
(a)(3) Not Applicable
(b) Separate certifications by the Registrant’s Principal Executive Officer and Principal Financial Officer, pursuant to Section 906 of the Sarbanes-Oxley Act of 2002 and required by Rule 30a-2(b) under the Investment Company Act of 1940.
Pursuant to the requirements of the Securities Exchange Act of 1934 and the Investment Company Act of 1940, the registrant has duly caused this report to be signed on its behalf by the undersigned, thereunto duly authorized.
ROYCE VALUE TRUST, INC.
BY: /s/Charles M. Royce
Charles M. Royce
President
Date: August 27, 2008
Pursuant to the requirements of the Securities Exchange Act of 1934 and the Investment Company Act of 1940, this report has been signed below by the following persons on behalf of the registrant and in the capacities and on the dates indicated.
ROYCE VALUE TRUST, INC.
BY: /s/Charles M. Royce
Charles M. Royce
President
Date: August 27, 2008
ROYCE VALUE TRUST, INC.
BY: /s/John D. Diederich
John D. Diederich
Chief Financial Officer
Date: August 27, 2008