UNITED STATES
SECURITIES AND EXCHANGE COMMISSION
Washington, D.C. 20549
FORM N-CSR
CERTIFIED SHAREHOLDER REPORT
OF
REGISTERED MANAGEMENT INVESTMENT COMPANIES
Investment Company Act file number: 811-04875
Name of Registrant: Royce Value Trust, Inc.
Address of Registrant: 745 Fifth Avenue
New York, NY 10151
| Name and address of agent for service: | | John E. Denneen, Esquire |
| | | 745 Fifth Avenue |
| | | New York, NY 10151 |
Registrant’s telephone number, including area code: (212) 508-4500
Date of fiscal year end: December 31
Date of reporting period: January 1, 2009 – June 30, 2009
Item 1. Reports to Shareholders.
| A Few Words on Closed-End Funds | |
|
Royce & Associates, LLC manages three closed-end funds: Royce Value Trust, the first small-cap value closed-end fund offering; Royce Micro-Cap Trust, the only micro-cap closed-end fund; and Royce Focus Trust, a closed-end fund that invests in a limited number of primarily small-cap companies.
A closed-end fund is an investment company whose shares are listed and traded on a stock exchange. Like all investment companies, including open-end mutual funds, the assets of a closed-end fund are professionally managed in accordance with the investment objectives and policies approved by the fund’s Board of Directors. A closed-end fund raises cash for investment by issuing a fixed number of shares through initial and other public offerings that may include shelf offerings and periodic rights offerings. Proceeds from the offerings are invested in an actively managed portfolio of securities. Investors wanting to buy or sell shares of a publicly traded closed-end fund after the offerings must do so on a stock exchange, as with any publicly traded stock. This is in contrast to open-end mutual funds, in which the fund sells and redeems its shares on a continuous basis.
|
|
A Closed-End Fund Offers Several Distinct Advantages Not Available From An Open-End Fund Structure
| n | | Since a closed-end fund does not issue redeemable securities or offer its securities on a continuous basis, it does not need to liquidate securities or hold uninvested assets to meet investor demands for cash redemptions, as an open-end fund must. | | n | | The fixed capital structure allows permanent leverage to be employed as a means to enhance capital appreciation potential. | |
| | | | | | | | |
| n | | In a closed-end fund, not having to meet investor redemption requests or invest at inopportune times is ideal for value managers who attempt to buy stocks when prices are depressed and sell securities when prices are high. | | n | | Unlike Royce’s open-end funds, our closed-end funds are able to distribute capital gains on a quarterly basis. The Funds’ quarterly distribution policies for their common stock were suspended in May, 2009. | |
| | | | | | | | |
| n | | A closed-end fund may invest more freely in less liquid portfolio securities because it is not subject to potential stockholder redemption demands. This is particularly beneficial for Royce-managed closed-end funds, which invest in small- and micro-cap securities. | | We believe that the closed-end fund structure is very suitable for the long-term investor who understands the benefits of a stable pool of capital. |
| |
|
Why Dividend Reinvestment Is Important
A very important component of an investor’s total return comes from the reinvestment of distributions. By reinvesting distributions, our investors can maintain an undiluted investment in a Fund. To get a fair idea of the impact of reinvested distributions, please see the charts on pages 13, 15 and 17. For additional information on the Funds’ Distribution Reinvestment and Cash Purchase Options and the benefits for stockholders, please see page 19 or visit our website at www.roycefunds.com.
|
| This page is not part of the 2009 Semiannual Report to Stockholders |
| Table of Contents | | |
|
| Semiannual Review | | |
|
| Performance Table | | 2 |
| | | |
| Letter to Our Stockholders | | 3 |
| | | |
| Small-Cap Market Cycle Performance | | 10 |
| | | |
|
| | | |
| Semiannual Report to Stockholders | | 11 |
| | | |
|
For more than 35 years, we have used a value approach to invest in smaller-cap securities. We focus primarily on the quality of a company’s balance sheet, its ability to generate free cash flow and other measures of profitability or sound financial condition. At times, we may also look at other factors, such as a company’s unrecognized asset values, its future growth prospects or its turnaround potential following an earnings disappointment or other business difficulties. We then use these factors to assess the company’s current worth, basing the assessment on either what we believe a knowledgeable buyer might pay to acquire the entire company, or what we think the value of the company should be in the stock market.

| This page is not part of the 2009 Semiannual Report to Stockholders | 1 |
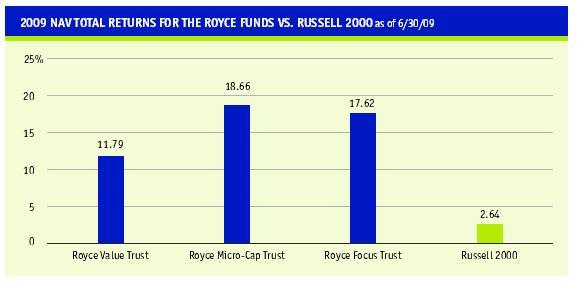
| NAV Average Annual Total Returns | Through June 30, 2009 |
| | | | Royce | | Royce | | Royce | | | |
| | | | Value Trust | | Micro-Cap Trust | | Focus Trust | | Russell 2000 |
|
| |
Second Quarter 2009* | | 29.22 | % | | 34.51 | % | | 26.91 | % | | 20.69 | % |
|
| | Year-to-Date 2009* | | 11.79 | | | 18.66 | | | 17.62 | | | 2.64 | |
|
| | One-Year | | -31.17 | | | -26.70 | | | -34.12 | | | -25.01 | |
|
| | Three-Year | | -11.38 | | | -10.58 | | | -6.77 | | | -9.89 | |
|
| | Five-Year | | -1.73 | | | -1.38 | | | 3.09 | | | -1.71 | |
|
| | 10-Year | | 5.49 | | | 7.40 | | | 8.61 | | | 2.38 | |
|
| | 15-Year | | 8.49 | | | 9.31 | | | n.a. | | | 6.55 | |
|
| | 20-Year | | 9.06 | | | n.a. | | | n.a. | | | 7.27 | |
|
| | Since Inception | | 9.28 | | | 9.05 | | | 8.93 | | | — | |
|
| | Inception Date | | 11/26/86 | | 12/14/93 | | 11/1/96** | | — | |
|
Important Performance and Risk Information
All performance information in this Review and Report reflects past performance, is presented on a total return basis and reflects the reinvestment of distributions. Past performance is no guarantee of future results. Investment return and principal value of an investment will fluctuate, so that shares may be worth more or less than their original cost when sold. Current performance may be higher or lower than performance quoted. Current month-end performance may be obtained at www.roycefunds.com. The Royce Funds invest primarily in securities of small-cap and/or micro-cap companies, which may involve considerably more risk than investments in securities of larger-cap companies.
The thoughts expressed in this Review and Report to Stockholders concerning recent market movements and future prospects for small-company stocks are solely the opinion of Royce at June 30, 2009, and, of course, historical market trends are not necessarily indicative of future market movements. Statements regarding the future prospects for particular securities held in the Funds’ portfolios and Royce’s investment intentions with respect to those securities reflect Royce’s opinions as of June 30, 2009 and are subject to change at any time without notice. There can be no assurance that securities mentioned in this Review and Report to Stockholders will be included in any Royce-managed portfolio in the future.
|
| ** | | Not annualized |
| ** | | Date Royce & Associates, LLC assumed investment management responsibility for the Fund. |
| 2 | This page is not part of the 2009 Semiannual Report to Stockholders |
| Letter to Our Stockholders | | | |
| | | |
 | | | |
| Simple Twist of Fate | | | |
It was one year ago that, taking a cue from a Bob Dylan song, we wrote that something significant was happening in the markets, but the nature and degree of the event had not yet become clear. The intervening 12 months have certainly clarified things, in about as painful and destructive a fashion as possible from an investment standpoint. Back in March 2008, the fall of Bear Stearns was initially hoped to be, with fingers crossed in one hand and the other knocking on wood, an isolated, anomalous event. It took a few months, but the ongoing implosion of the subprime mortgage market sent shock waves throughout the global financial system. A significant correction in housing prices probably would have created some thorny economic problems in and of itself, but as fate would have it, many of these ill-awarded mortgages were securitized, packaged, ‘tranched’ and traded in a dizzying array of complicated arrangements that may never be completely understood. And once September rolled around, the once-slow pace of decline picked up so quickly that matters barely had time to escalate from bad to disastrous.
| | Lacking the fatalism that has characterized many observers’ forecasts for the economy and the stock market, we believe in the cyclicality of markets and the resourcefulness of our economy, both of which should be factors in the next year as we make our way by fits and starts to better days. |
| | | | |
| This page is not part of the 2009 Semiannual Report to Stockholders | 3 |
| |

What do people do when they buy
stocks? What are their motives and
expectations? These may seem like odd,
or at least very simple, questions, but
we think that they are worth asking in
pursuit of a larger, more important
point. After all, myriad factors can
lead a company’s stock price to higher
levels—increased demand for the
company’s existing products and/or
services, a rapidly expanding business,
a higher public profile, an innovative
new product, etc. But none of these
events ensures that the share-price
gains will last. To us, the critical
question is, what kind of companies are
most likely to experience a sustainable
increase in their business value, and
thus an increase in share price?
As long-term investors with a
disciplined value approach, we are
therefore less concerned with what
may or may not make a stock price
climb, particularly in the short run.
Short-term gains for our portfolio
holdings are always welcome, but our
focus is on identifying companies
capable of long-term success as both
businesses and stocks. There are
several methods that we use to try to
determine this. The first critical step
entails a close examination of a
company’s financial profile and
Continued on page 6... | | |
Letter to Our Stockholders
The subprime fallout hit the markets with its most devastating blows less than one year ago, though it seems much further away in time, perhaps because so much trouble arrived so quickly and perhaps because so many other significant events—a deep recession, an ensuing credit crisis, a presidential election, the bankruptcy of two of the three major American automakers, two ongoing wars, and unrest and agitation in Iran—were occurring as the financial crisis was unfolding. As of this writing, we have seen the small-cap stock market go from a stumble to a near-collapse to a short-term (and hopefully more lasting) recovery in the space of a little less than two years, with the most eventful action coming between September 2008 and the present.
The pertinent questions are: How long can the nascent bull market last? Has the economy stabilized to the point that a sustainable recovery is just a matter of time? Will economic improvement arrive in time to prevent the recurrence of a stock market swoon? Will the federal government’s stimulus package have a tangibly positive effect on growth? For each question, the answer, unfortunately, is not ‘blowin’ in the wind’, or anywhere else for that matter. One need only look at the intensity of the debates over economic ‘green shoots’ and the question of whether they presage genuine resurgence or are simply anomalous occurrences in a still contracting economy. Our own take, about which we have more to say later in this letter, is guardedly optimistic. However, before moving on we wish to point out that our long-term perspective allows us some measure of distance from the heat of these debates. Lacking the fatalism that has characterized many observers’ forecasts for the economy and the stock market, we believe in the cyclicality of markets and the resourcefulness of our economy, both of which should be factors in the next year as we make our way by fits and starts to better days.
Modern Times
As for those days most recently passed, they were definitely better, as the market spent much of the period from March through June rallying from the worrisome depths it had tested in the fall and winter months. The better days began after the most recent market trough on March 9 and continued mostly unimpeded through the end of June, though there were notable sell-offs, particularly late in June and early in July. However, even the most fatalistic observer was likely cheered by the year-to-date results for the major equity indices: The small-cap Russell 2000 was up 2.6% through June 30, 2009, while the large-cap S&P 500 gained 3.2%, the more tech-laden Nasdaq Composite shot up 16.4% and the global MSCI EAFE (Europe, Australasia and Far East) rose 8.0%.
As the date of the recent market bottom indicates, the first half of 2009 offered the worst of the recent bear market and the sparkling hope of a new, more bullish era, all within a compact six months. During the first quarter, the Russell 2000 was down 15.0%, the S&P |
| | | | |
| |
| | | | |
| 4 | This page is not part of the 2009 Semiannual Report to Stockholders |
| | |
500 fell 11.0%, the Nasdaq Composite slipped “only” 3.1% and the MSCI EAFE sagged 13.9%. It should be remembered that these results included the beginning of the recent rally, more than three weeks’ worth of mostly rising stock prices that closed out the quarter and saw each index posting positive double-digit returns from March 9 through March 31, 2009. That the rally then took up almost the entire second quarter was thus a more than welcome development, especially as results for the four indices referenced above represented the largest respective quarterly advances since the second quarter of 2003. Yet we are still a long way from celebration. For the periods ended June 30, 2009, one-year and three-year average annual returns for all four indices remained negative, and only the MSCI EAFE managed a positive performance for the five-year period.
| | In such a volatile environment, the question of where market leadership will next reside remains an open one, as does the question of how long any such leadership period is likely to last. |
Market leadership remains unclear. Consider the following: The Russell 2000 trailed the S&P 500 in the first quarter, outperformed in the second quarter, but remained behind its large-cap counterpart for the year-to-date period ended June 30, 2009. The small-cap index led its large-cap sibling for the one-year period through the end of June, trailed in the three-year period, and led in the five- and 10-year periods. Small-cap stocks also significantly outperformed large-caps for the decade-to-date period, with the Russell 2000 gaining 14.0% versus the S&P 500’s decline of 25.9% from December 31, 1999 through June 30, 2009. With dramatic and well-defined bear and bull periods over the last two years, none of us needs a reminder that market volatility has been very much the norm. However, we think that another important example of its omnipresence can be seen in the near-regular rotation of small- and large-cap leadership over recent shorter-term calendar-based periods. In such an environment, the question of where market leadership will next reside remains an open one, as does the question of how long any such leadership period is likely to last.
| | |
| It Takes Growth to Laugh, It Takes Value to Cry | | |
| Within the small-cap universe, the current leadership issue is more than settled. Small-cap growth, as measured by the Russell 2000 Growth index, remained in the top spot over small-cap value, as measured by the Russell 2000 Value index. For the year-to-date period ended June 30, 2009, the Russell 2000 Growth index gained 11.4%, while the Russell 2000 Value index fell 5.2%. Both small-cap indices enjoyed robust results in the second quarter, but the Russell 2000 Value index’s 18.0% gain trailed its growth counterpart’s 23.4% return, so the turn in the tide of stock prices did little to help the small-cap value index to narrow the performance gap. Small-cap growth first gained its advantage in 2009 by outperforming in the bearish first quarter, down 9.7% compared to a decline of 19.6% for small-cap value, which marked the third consecutive quarter in which small-cap growth fared better than small-cap value in a negative return period. (However, at the end | | |
This page is not part of the 2009 Semiannual Report to Stockholders | 5
| |
history. We search for evidence of
our definition of quality—a strong
balance sheet, a history of solid
earnings, the ability to generate
positive cash flow and high returns on
invested capital. While it’s true that a
company possessing each of these
qualities is hardly guaranteed positive
stock performance (as returns for our
Funds in 2008 made painfully clear),
we think that businesses with these
characteristics are most likely to be
solid, if not strong, performers over
long-term time horizons.
Another route is of particular
significance to us, though it may at
first seem counterintuitive: A company
can achieve an attractive long-term
record by losing less during economic
or market downturns. Our years of
research bear out that those attributes
that we value so highly can help a firm
to weather these storms—profitable
companies with low debt and plentiful
cash have historically been stalwarts
in poor markets and/or economies (the
recent bear market notwithstanding).
In other words, we are seeking great
companies, not just great stocks.
At first, this may appear to be a
distinction without a difference, but
the difference is very real to us
because we see ourselves as business
buyers. We have always taken very
seriously the simple truth that when
one buys even one share of stock,
one becomes a stakeholder in a
business. This is why our approach
generally requires developing a deep
understanding of what a company
does and how it operates. In addition
Continued on page 8...
| |
| |
|
|
| | | | | | | | | | | | | | |
| | | | | | | | | | | | | | |
Letter to Our Stockholders
of 2008, small-cap value held a slender lead over growth from the small-cap peak on July 13, 2007, the official start of the small-cap bear market.) In a curious twist of fate, then, the small-cap growth index has solidified its leadership position in large part by defying its historical norm of trailing small-cap value in down markets.
The Russell 2000 Growth index also beat its small-cap value counterpart for the one-, three- and five-year periods ended June 30, 2009. Over longer-term periods, small-cap value held sway, thanks to an earlier period of long-term leadership. The end of 2006 marked the end of an extended span of small-cap value outperformance. In each of the first seven years of the current decade, small-cap value underperformed small-cap growth only once, in 2003, and by a slight margin. These years of often-decisive performance advantages helped the Russell 2000 Value index to outpace the small-cap growth index for the 10-, 15-, 20- and 25-year periods ended June 30, 2009.
As longstanding believers in reversion to the mean, we thought it likely that this long period of outperformance for small-cap value was likely to be succeeded by a strong turn for small-cap growth when the small-cap market cycle that began in March 9, 2000 came to an end, which happened in July 2007. For the periods ended June 30, 2009, the Russell 2000 Growth index outpaced its value sibling from the small-cap peak on July 13, 2007 (-35.2% versus -42.5%) and from the small-cap market low on March 9, 2009 (+49.9% versus +47.9%). We were not surprised to see small-cap growth hold an advantage throughout the recent bear market or thus far in the rally. As much as outperformance in both an up and a down market, even over a short-term period, is a convincing measure of leadership, the current volatile condition of the market makes small-cap growth’s ongoing dominance an uncertain proposition at best.
|
| Don’t Think Twice, It’s All Right |
| We were more than happy to see each of our closed-end funds bounce back with solid to very strong performances during the first six months of 2009, particularly after they endured the worst returns in their respective histories in 2008. The fact that all three portfolios turned in strong absolute performances, which is most meaningful to us, and also outperformed their respective benchmarks made 2009’s first-half results that much sweeter. Even more pleasing was the fact that our closed-end funds’ year-to-date returns were a combination of strong relative performance in the downturn between January and the small-cap low on March 9, followed by equally strong results in the rally that lasted into early June, though second-quarter market price results may have been adversely affected by the suspension of each Fund’s quarterly distribution. Losing less in poor markets has often been a historical hallmark of our management, and we welcomed its return, even in a short-term time frame. |
| 6 | This page is not part of the 2009 Semiannual Report to Stockholders |
| | |
 | | |
| The rally benefitted stocks across all asset and style categories, though it gave the strongest boost to non-dividend paying companies, those without earnings and low-priced stocks. The latter group was especially compelling because companies whose share prices had hit single digits needed very little to score large percentage-point gains. We do a lot of work in the low-priced area in our three closed-end portfolios, though our search is for quality smaller companies that have fallen on hard times. During the recent rally, however, many other investors seemed to be more focused on momentum. For the portfolios taken as a whole, net gains could be found in several industry groups, even some of those in the beleaguered consumer and financial sectors. The most significant net gains for the three portfolios as a group, however, were in the Technology sector, with Financial Services in RVT, Industrial Products and Natural Resources in RMT, and Natural Resources, Industrial Products and Consumer Products in FUND also enjoying encouraging rebounds. | | |
| | | |
Things Have Changed
The significant question, of course, is what happens next? Late June and early July saw just enough selling for many observers to be convinced that the rally might have breathed its last, at least until more compelling evidence of a growing economy surfaces. Our own take is that the first phase of the bull market is probably complete. The rally that began in March was characterized by dynamic, double-digit returns, and stocks of all sizes in nearly all sectors and industries benefiting greatly. Around the middle of June, the market fell into a corrective period, almost as if it were catching its breath after the wild run-up of stock prices. This period could last for another few months or could be over by the time this Semiannual Review and Report is being read. We would expect an overall modest decline in the range of 10%-15%, regardless of the time frame. We also expect | |
We were more than happy to see each of our closed-end funds collectively bounce back with solid to very strong performances during the first six months of 2009... Losing less in poor markets has often been a historical hallmark of our management, and we welcomed its return, even in a short-term time frame. |
| This page is not part of the 2009 Semiannual Report to Stockholders | 7 |
| | |
| | |
to our discussions with a company’s
management, we often speak to
suppliers, customers and competitors
in order to expand our knowledge of
the company.
To be sure, we buy stocks to make
money, but the means to that sought-after
end are very specific. We are
looking for the happy marriage of
a strong financial profile with a
wonderful business that we think we
know well. This necessitates a
commitment to a disciplined process,
one that demands we know as much
about these businesses as we possibly
can. It involves making an investment
in a business as if we were purchasing
the entire company, as if we were
owners, because, after all, that is
what we become when we buy stocks.
| |
Letter to Our Stockholders

the next phase in the current cycle to be different—still bullish, but with returns that will not be as lofty. It seems to us we will see more historically typical performance patterns, frequent sector and industry rotation and greater discrimination on the part of investors for quality companies. We also feel confident that stocks of higher quality companies—those with solid earnings, high returns on invested capital and/or that pay dividends—should take the lead in the next bull phase.
Our reasoning is that enough investors should begin to focus on company quality now that the period of momentum-driven results appears to be behind us and a recovering economy in front of us, though no one knows how far ahead it lies. Recent selling has been driven more by fundamentals than liquidity, which is a good sign for the stability of equities as a whole. Without the sense of panic that was so prevalent in the last four months of 2008, investors would be free to think more about factors such as risk, long-term performance and sustainable growth. In such a setting, we think that quality stocks would do well across virtually all asset classes and in all industries where they can be found. So we may see, for example, small-cap leadership for a short time, then a period of large-cap outperformance, etc. However, quality is likely to be a lingering presence—a constant in a solid bull market that should otherwise see regular rotations in leadership.
Beyond Here Lies...
The economy is the elephant in the room. The recent rally was fueled in large part by investors’ expectations of an economic recovery that, perhaps needless to say, has thus far not materialized. We suspect that some investors may have confused economic |
|
|
| 8 | This page is not part of the 2009 Semiannual Report to Stockholders |
| | |
| | | |
stabilization with economic recovery, something that surely helped the prices of certain stocks to run ahead of what their fundamentals might suggest, which in part explains why the rally lost steam in June. From an equity investor’s standpoint, economic recovery is necessary for the market’s bullish moves to be sustained. Rancorous debate about where the economy is and where it is going will continue. There will be plenty of disappointment and cynicism, as well as an ample supply of naysayers braying along the road to economic recovery, which we think will proceed slowly, at times at a pace of two steps forward one step back, to the point that within a year a recovery should be well under way. We do not think that it will be as driven by consumer spending, but instead will be led by revived industrial activity, natural resources and perhaps even financial services. Consumer activity will still play an important role, but we expect consumer spending to account for far less of GDP than it did prior to the recession, which will be a positive development.
We look forward to the next several months and even more so to the next three to five years. Our own confidence about the economy and the equity markets is tempered by the fact that ‘less bad’ does not equate to ‘good.’ We suspect that the next round of concerns will center on the pace of improvement rather than the question of its existence, which seems to dominate economic discussions as of this writing. Yet the current mood, part of which we have just described and which seems to shift from optimism to pessimism and back again, often in the space of a single day, is infinitely preferable to the panic and capitulation that made last fall and winter so chilling. This is the kind of incremental, at times imperceptible, progress that we expect the economy to make. The market’s moves, far easier to track, will be less subtle, but both should be moving, however slowly, to a far better place.
| | Quality is likely to be a lingering presence—a constant in a solid bull market that should otherwise see regular rotations in leadership. |
| | | |
Sincerely, | | | | | | | |
| | | | | | | | |
 | |  | |  | | | |
| Charles M. Royce | | W. Whitney George | | Jack E. Fockler, Jr. | | | |
| President | | Vice President | | Vice President | | | |
| | | | | | | | |
| | | | | | | | |
| July 31, 2009 | | | | | | | |
| This page is not part of the 2009 Semiannual Report to Stockholders | 9 |
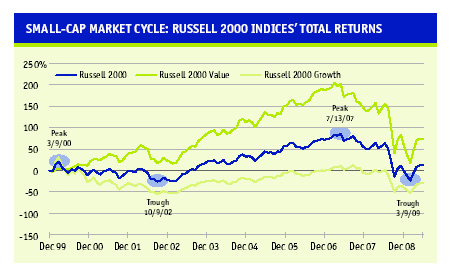
Small-Cap Market Cycle Performance
We believe strongly in the idea that a long-term investment perspective is crucial for determining the success of a particular investment approach. Flourishing in an up market is wonderful. Surviving a bear market by losing less (or not at all) is at least as good. However, the true test of a portfolio’s mettle is performance over full market cycle periods, which include both up and down market periods. We believe that providing full market cycle results is more appropriate even than showing three- to five-year standardized returns because the latter periods may not include the up and down phases that constitute a full market cycle.
Since the Russell 2000’s inception on 12/31/78, value—as measured by the Russell 2000 Value Index—outperformed growth—as measured by the Russell 2000 Growth Index—in six of the small-cap index’s eight full market cycles. The most recently concluded cycle, which ran from 3/9/00 through 7/13/07, was the longest in the index’s history, and represented what we believe was a return to more historically typical performance in that value provided a significant advantage during its downturn (3/9/00–10/9/02) and for the full cycle. In contrast, the new market cycle that began on 7/13/07 has so far favored growth over value, an unsurprising development when one considers how thoroughly value dominated growth in the previous full cycle.
Peak-to-Peak
For the full cycle, value provided a sizeable margin over growth, which finished the period with a loss. Each of our closed-end funds held a sizeable performance advantage over the Russell 2000 on both an NAV (net asset value) and market price basis. On an NAV basis, Royce Focus Trust (+264.2%) was our best performer by a wide margin, followed by Royce Micro-Cap Trust (+175.9%) and Royce Value Trust (+161.3%).
Peak-to-Current
During the difficult, volatile period ended 6/30/09, both value and growth posted similarly negative returns. Events in the financial markets immediately preceding the end of 2008’s third quarter caused the Russell 2000 to decline significantly. After a brief rally at the end of 2008, the index continued its fall, dropping it to a cyclical low on 3/9/09. Since then the index recovered significantly, gaining 48.9% from 3/9/09 through 6/30/09.
Royce Focus Trust managed to slightly outperform the index during the decline, while all three of our closed-end funds outperformed during the short rally from 3/9/09 through 6/30/09. |
 |
| |
ROYCE FUNDS NAV TOTAL RETURNS VS. RUSSELL 2000 INDEX:
MARKET CYCLE RESULTS |
|
| | Peak-to-Peak
3/9/00-7/13/07 | | Peak-to-Trough
7/13/07-3/9/09 | | Trough-to-Current
3/9/09-6/30/09 |
| |
| Russell 2000 | | 54.9 | % | | | -58.9 | % | | | 48.9 | % |
|
| Russell 2000 Value | | 189.5 | | | | -61.1 | | | | 47.9 | |
|
| Russell 2000 Growth | | -14.8 | | | | -56.8 | | | | 49.9 | |
|
| Royce Value Trust | | 161.3 | | | | -65.6 | | | | 64.2 | |
|
| Royce Micro-Cap Trust | | 175.9 | | | | -66.3 | | | | 73.3 | |
|
| Royce Focus Trust | | 264.2 | | | | -58.3 | | | | 49.5 | |
|
The thoughts concerning recent market movements and future prospects for smaller-company stocks are solely those of Royce & Associates and, of course, there can be no assurance with regard to future market movements. Smaller-company stocks may involve considerably more risk than larger-cap stocks. Past performance is no guarantee of future results. See page 2 for important performance information for all of the above funds.
| 10 | This page is not part of the 2009 Semiannual Report to Stockholders |
| Semiannual Report to Stockholders | |
|
| | |
| Managers’ Discussions of Fund Performance | |
| | |
| Royce Value Trust | 12 |
| | |
| Royce Micro-Cap Trust | 14 |
| | |
| Royce Focus Trust | 16 |
| | |
| History Since Inception | 18 |
| | |
| Distribution Reinvestment and Cash Purchase Options | 19 |
| | |
| Schedules of Investments and Other Financial Statements | |
| | |
| Royce Value Trust | 20 |
| | |
| Royce Micro-Cap Trust | 34 |
| | |
| Royce Focus Trust | 46 |
| | |
| Notes to Performance and Other Important Information | 55 |
| | |
| Board Approval and Investment Advisory Agreements | 56 |
| 2009 Semiannual Report to Stockholders | 11 |
| | | |
| | | |
| | | |
| | AVERAGE ANNUAL NAV TOTAL RETURNS
Through 6/30/09 | |
| |
| |
| | Second Quarter 2009* | | 29.22 | % | |
| |
| |
| | Year-to-Date 2009* | | 11.79 | | |
| |
| |
| | One-Year | | | | | -31.17 | | |
| |
| |
| | Three-Year | | | | | -11.38 | | |
| |
| |
| | Five-Year | | | | | -1.73 | | |
| |
| |
| | 10-Year | | | | | 5.49 | | |
| |
| |
| | 15-Year | | | | | 8.49 | | |
| |
| |
| | 20-Year | | | | | 9.06 | | |
| |
| |
| | Since Inception (11/26/86) | | | | | 9.28 | | |
| |
| |
| | * Not annualized | |
| | | | | |
| | CALENDAR YEAR NAV TOTAL RETURNS | |
| |
| |
| | Year | | RVT | | | Year | | | RVT | | |
| |
| |
| | 2008 | | -45.6 | % | | 1999 | | | 11.7 | % | |
| |
| |
| | 2007 | | 5.0 | | | 1998 | | | 3.3 | | |
| |
| |
| | 2006 | | 19.5 | | | 1997 | | | 27.5 | | |
| |
| |
| | 2005 | | 8.4 | | | 1996 | | | 15.5 | | |
| |
| |
| | 2004 | | 21.4 | | | 1995 | | | 21.6 | | |
| |
| |
| | 2003 | | 40.8 | | | 1994 | | | 0.1 | | |
| |
| |
| | 2002 | | -15.6 | | | 1993 | | | 17.3 | | |
| |
| |
| | 2001 | | 15.2 | | | 1992 | | | 19.3 | | |
| |
| |
| | 2000 | | 16.6 | | | 1991 | | | 38.4 | | |
| |
| |
| | | | | | | | | | | |
| | TOP 10 POSITIONS
% of Net Assets Applicable
to Common Stockholders | |
| |
| |
| | Ash Grove Cement Cl. B | | 1.4 | % | |
| |
| |
| | Ritchie Bros. Auctioneers | | 1.3 | | |
| |
| |
| | SEACOR Holdings | | 1.2 | | |
| |
| |
| | Simpson Manufacturing | | 1.0 | | |
| |
| |
| | AllianceBernstein Holding L.P. | | 1.0 | | |
| |
| |
| | Alleghany Corporation | | 1.0 | | |
| |
| |
| | SPSS | | 0.9 | | |
| |
| |
| | GAMCO Investors Cl. A | | 0.9 | | |
| |
| |
| | Forward Air | | 0.9 | | |
| |
| |
| | HEICO Corporation | | 0.9 | | |
| |
| |
| | | | | | | | | | | |
| | PORTFOLIO SECTOR BREAKDOWN
% of Net Assets Applicable
to Common Stockholders | |
| |
| |
| | Technology | | 21.1 | % | |
| |
| |
| | Industrial Products | | 20.1 | | |
| |
| |
| | Industrial Services | | 16.8 | | |
| |
| |
| | Financial Services | | 14.4 | | |
| |
| |
| | Financial Intermediaries | | 12.7 | | |
| |
| |
| | Natural Resources | | 8.4 | | |
| |
| |
| | Consumer Products | | 7.0 | | |
| |
| |
| | Health | | 6.2 | | |
| |
| |
| | Consumer Services | | 4.3 | | |
| |
| |
| | Diversified Investment Companies | | 0.5 | | |
| |
| |
| | Miscellaneous | | 4.7 | | |
| |
| |
| | Preferred Stock | | 0.7 | | |
| |
| |
| | Cash and Cash Equivalents | | 16.6 | | |
| |
| |
| | | |
|
|
Royce Value Trust
 Manager’s DiscussionFollowing a discouraging 2008, the rally in the first half of 2009 lifted stock prices and spirits, including those of us who manage Royce Value Trust (RVT). The Fund’s portfolio of small-cap and micro-cap stocks did well in the first half on both relative and absolute basis. Its results were strong on both a net asset value (NAV) and market price basis. For the year-to-date period ended 6/30/09, the Fund gained 11.8% on an NAV basis, and 5.5% based on market price, outpacing both of its unleveraged benchmarks, the Russell 2000, which was up 2.6%, and the S&P Small-Cap 600, which was up 0.7%, for the same period. After managing both to post a dismal absolute performance and to lag its benchmarks in 2008, we were very pleased to see such a strong rebound in 2009’s first half, particularly with the suspension of the Fund’s quarterly distribution policy negatively impacting its market price returns. RVT’s solid relative showing in the bearish first quarter was especially gratifying. During this period, the Fund was down 13.5% and 11.4% on an NAV and market price basis, respectively, while the Russell 2000 fell 15.0%, and the S&P 600 declined 16.8%. During the second quarter, when stock prices rose precipitously, RVT held its advantage with impressive gains of 29.2% (NAV) and 19.1% (market price), compared to the Russell 2000’s increase of 20.7%, and the S&P 600’s of 21.1%. Manager’s DiscussionFollowing a discouraging 2008, the rally in the first half of 2009 lifted stock prices and spirits, including those of us who manage Royce Value Trust (RVT). The Fund’s portfolio of small-cap and micro-cap stocks did well in the first half on both relative and absolute basis. Its results were strong on both a net asset value (NAV) and market price basis. For the year-to-date period ended 6/30/09, the Fund gained 11.8% on an NAV basis, and 5.5% based on market price, outpacing both of its unleveraged benchmarks, the Russell 2000, which was up 2.6%, and the S&P Small-Cap 600, which was up 0.7%, for the same period. After managing both to post a dismal absolute performance and to lag its benchmarks in 2008, we were very pleased to see such a strong rebound in 2009’s first half, particularly with the suspension of the Fund’s quarterly distribution policy negatively impacting its market price returns. RVT’s solid relative showing in the bearish first quarter was especially gratifying. During this period, the Fund was down 13.5% and 11.4% on an NAV and market price basis, respectively, while the Russell 2000 fell 15.0%, and the S&P 600 declined 16.8%. During the second quarter, when stock prices rose precipitously, RVT held its advantage with impressive gains of 29.2% (NAV) and 19.1% (market price), compared to the Russell 2000’s increase of 20.7%, and the S&P 600’s of 21.1%. |
The recent rally began on 3/9/09, just before the end of the first quarter. From that small-cap low through 6/30/09, RVT outpaced the Russell 2000, up 64.2% on an NAV basis and 70.2% on a market price basis versus 48.9% for the Russell 2000 and 48.4% for the S&P 600. This short-term outperformance would have been less encouraging had it not helped the Fund to narrow the performance gap on its benchmarks in the current severe bear market cycle. From the small-cap market peak on 7/13/07 through 6/30/09, RVT was down 43.5% on an NAV basis and 51.1% based on market price, compared to declines of 38.8% and 38.1% for the Russell 2000 and the S&P 600, respectively.
RVT trailed its two benchmarks for the one-year period ended 6/30/09 on both an NAV and market price basis. The performance picture was better on an NAV basis over longer-term periods. From the previous small-cap market peak on 3/9/00 through 6/30/09, RVT gained 47.8% and 51.8% on an NAV and market price basis, versus a decline of 5.2% for the Russell 2000 and a gain of 31.6% for the S&P 600. The Fund also outperformed the Russell 2000 for the 10-, 15-, 20-year, and since inception (11/26/86) periods ended 6/30/09 on an NAV basis, and the S&P 600 for the 10-, 20-, and 25-year periods. RVT’s NAV average annual total return since inception was 9.3%.
| | | | | |
| | | GOOD IDEAS THAT WORKED
Top Contributors to Performance*
Year-to-Date Through 6/30/09 |
| | |
|
| | | Diodes | | 0.43% |
| | |
|
| | | GAMCO Investors Cl. A | | 0.42 |
| | |
|
| | | Evercore Partners Cl. A | | 0.36 |
| | |
|
| | | Advent Software | | 0.33 |
| | |
|
| | | Waddell & Reed Financial Cl. A | | 0.31 |
| | |
|
| | | *Includes dividends | | |
| | | | | | |
| | | | | | |
Important Performance and Risk Information
All performance information reflects past performance, is presented on a total return basis and reflects the reinvestment of distributions. Past performance is no guarantee of future results. Current performance may be higher or lower than performance quoted. Returns as of the recent month-end may be obtained at www.roycefunds.com. The market price of the Fund’s shares will fluctuate, so that shares may be worth more or less than their original cost when sold. The Fund invests primarily in securities of small- and micro-cap companies, which may involve considerably more risk than investing in a more diversified portfolio of larger-cap companies. |
12 | 2009 Semiannual Report to Stockholders
| |
| |
| |
Performance and Portfolio Review
The Technology and Financial Services sectors made the most significant positive impact on performance through the end of June. Technology holdings were particularly strong as a group, as tech stocks in general enjoyed both a relatively better first quarter—that is, they tended to lose less than the market as a whole—and a stronger second quarter. Net gains were spread fairly evenly through the sector’s industry groups, with software companies, the semiconductors and equipment group, and components and systems businesses leading in terms of net gains. Diodes, which makes semiconductors used in a variety of industries, was RVT’s top performer in the first half, in part benefiting from better-than-expected earnings earlier in the year. Advent Software, a provider of financial management, accounting and trading software to asset managers, was also a strong contributor. The gradual recovery of investment management companies—themselves a key area of strength for RVT’s portfolio—combined with solid earnings that exceeded estimates helped its stock price to climb.
Four of the Fund’s top seven performers were investment management businesses: GAMCO Investors, which spun off an advisory unit in February, Evercore Partners, Waddell & Reed Financial and Federated Investors. Investment management is an area that we think we know well and in which we see strong potential going forward. It was an industry largely battered in the downturn, and stocks began to recover earlier in 2009. We were happy to hold good-sized positions in each at the end of June, though we sold some shares in each stock as share prices climbed.
|
| | | | We held our shares of Bermuda-based Bank of N.T. Butterfield & Son mostly owing to its strong core business, which has suffered amid the ongoing struggles of banking stocks. Our thought was that its shares could rebound when its industry comes back. Woodward Governor makes energy control systems for commercial and military aircraft. Its stock price plunged as the company announced a large acquisition around the same time it revised downward its outlook for the year due to continuing softening conditions in aircraft manufacturing. We reduced our stake as the acquisition caused enough balance sheet dilution to revise our view of its prospects. |
GOOD IDEAS AT THE TIME
Top Detractors from Performance*
Year-to-Date Through 6/30/09 | |
| |
| |
| Bank of N.T. Butterfield & Son | -0.37% | |
| |
| Woodward Governor | -0.32 | |
| |
| Lawson Products | -0.27 | |
| |
| Ash Grove Cement Cl. B | -0.25 | |
| |
| Adaptec | -0.25 | |
| |
| *Net of dividends | |
| | |
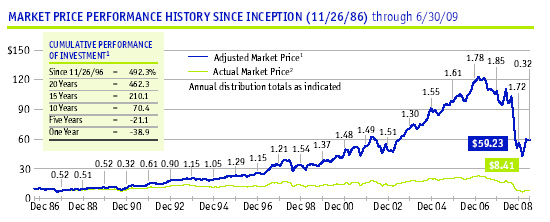 |
1Reflects the cumulative total return of an investment made by a stockholder who purchased one share at inception ($10.00 IPO), reinvested all annual distributions as indicated and fully participated in primary subscriptions of the Fund’s rights offerings. |
2Reflects the actual market price of one share as it traded on the NYSE. |
| | |
| | | |
| | | |
| | FUND INFORMATION AND
PORTFOLIO DIAGNOSTICS | |
| |
| |
| | Average Market Capitalization* | $866 million | |
| |
| |
| | Weighted Average P/E Ratio** | 14.4x | |
| |
| |
| | Weighted Average P/B Ratio | 1.5x | |
| |
| |
| | Weighted Average Portfolio Yield | 1.4% | |
| |
| |
| | Fund Total Net Assets | $877 million | |
| |
| |
| | Net Leverage† | 17% | |
| |
| |
| | Turnover Rate | 11% | |
| |
| |
| | Symbol | | |
| | Market Price | RVT | |
| | NAV | XRVTX | |
| |
| |
| | * Geometrically calculated | |
| | | |
| | **The Fund’s P/E ratio calculation excludes companies with zero or negative earnings (22% of portfolio holdings as of 6/30/09). | |
| | | |
| | † Net leverage is the percentage, in excess of 100%, of the total value of equity type investments, divided by net assets, excluding preferred stock. | |
| | | |
| | CAPITAL STRUCTURE
Publicly Traded Securities Outstanding
at 6/30/09 at NAV or Liquidation Value | |
| |
| |
| | 66.0 million shares
of Common Stock | $657 million | |
| |
| |
| | 5.90% Cumulative
Preferred Stock | $220 million | |
| |
| |
| | | |
| | DOWN MARKET PERFORMANCE COMPARISON
All Down Periods of 7.5% or Greater
Over the Last 10 Years, in Percentages(%) | |
| | | |
| | 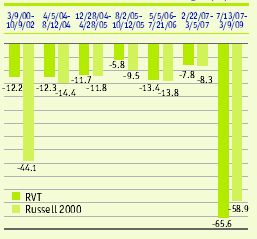 | |
| | | |
|
|
2009 Semiannual Report to Stockholders | 13
| | | |
| | | |
| | | |
| | AVERAGE ANNUAL NAV TOTAL RETURNS
Through 6/30/09 | |
| |
| |
| | Second Quarter 2009* | | 34.51 | % | |
| |
| |
| | Year-to-Date 2009* | | 18.66 | | |
| |
| |
| | One-Year | | | | | -26.70 | | |
| |
| |
| | Three-Year | | | | | -10.58 | | |
| |
| |
| | Five-Year | | | | | -1.38 | | |
| |
| |
| | 10-Year | | | | | 7.40 | | |
| |
| |
| | 15-Year | | | | | 9.31 | | |
| |
| |
| | Since Inception (12/14/93) | | | | | 9.05 | | |
| |
| |
| | * Not annualized | |
| | | | | |
| | CALENDAR YEAR NAV TOTAL RETURNS | |
| |
| |
| | Year | | RMT | | | Year | | | RMT | | |
| |
| |
| | 2008 | | -45.5 | % | | 2000 | | | 10.9 | % | |
| |
| |
| | 2007 | | 0.6 | | | 1999 | | | 12.7 | | |
| |
| |
| | 2006 | | 22.5 | | | 1998 | | | -4.1 | | |
| |
| |
| | 2005 | | 6.8 | | | 1997 | | | 27.1 | | |
| |
| |
| | 2004 | | 18.7 | | | 1996 | | | 16.6 | | |
| |
| |
| | 2003 | | 55.5 | | | 1995 | | | 22.9 | | |
| |
| |
| | 2002 | | -13.8 | | | 1994 | | | 5.0 | | |
| |
| |
| | 2001 | | 23.4 | | | | | | | | |
| |
| |
| | | | | | | | | | | | |
| | TOP 10 POSITIONS
% of Net Assets Applicable
to Common Stockholders | |
| |
| |
| | Seneca Foods | | 2.2 | % | |
| |
| |
| | Sapient Corporation | | 1.6 | | |
| |
| |
| | Pegasystems | | 1.1 | | |
| |
| |
| | Universal Truckload Services | | 1.1 | | |
| |
| |
| | Willbros Group | | 1.0 | | |
| |
| |
| | Deswell Industries | | 1.0 | | |
| |
| |
| | America’s Car-Mart | | 1.0 | | |
| |
| |
| | Computer Task Group | | 1.0 | | |
| |
| |
| | Movado Group | | 1.0 | | |
| |
| |
| | Hawkins | | 0.9 | | |
| |
| |
| | | | | | | | | | | | |
| | PORTFOLIO SECTOR BREAKDOWN
% of Net Assets Applicable
to Common Stockholders | |
| |
| |
| | Technology | | 20.2 | % | |
| |
| |
| | Industrial Products | | 19.6 | | |
| |
| |
| | Industrial Services | | 13.0 | | |
| |
| |
| | Natural Resources | | 11.0 | | |
| |
| |
| | Financial Intermediaries | | 9.9 | | |
| |
| |
| | Health | | 9.1 | | |
| |
| |
| | Consumer Products | | 7.2 | | |
| |
| |
| | Financial Services | | 6.3 | | |
| |
| |
| | Consumer Services | | 4.3 | | |
| |
| |
| | Diversified Investment Companies | | 0.9 | | |
| |
| |
| | Miscellaneous | | 4.9 | | |
| |
| |
| | Preferred Stock | | 1.1 | | |
| |
| |
| | Cash and Cash Equivalents | | 23.0 | | |
| |
| |
| | | |
|
|
Royce Micro-Cap Trust
Manager’s DiscussionPerformance for Royce Micro-Cap Trust (RMT) was solid during the first half of 2008, but the stubborn and unfortunate reality of the bear market must still be kept in mind. As things stand, we will settle for describing RMT’s strong first half as ‘encouraging.’ The Fund gained 18.7% for the year-to-date period ended 6/30/09 on a net asset value basis (NAV) and 12.5% based on market price, well ahead of its unleveraged small-cap benchmark, the Russell 2000, which was up 2.6%, and the Russell Microcap index, which rose 6.0%, for the same period. The Fund’s first-half outperformance was a near-ideal combination of a strong relative showing in the first-quarter downturn and a terrific absolute and relative result in the second-quarter upswing. RMT lost 11.8% on an NAV basis, and 5.9% based on market price, in the opening quarter of 2009, compared to respective declines of 15.0% and 15.2% for the Russell 2000 and Russell Microcap indices. When stock prices rose in the second quarter, the Fund was up 34.5% on an NAV basis and 19.5% on a market price basis as RMT’s market price return suffered from the suspension of the Fund’s quarterly distribution. For the same period, the Russell 2000 was up 20.7%, and the Russell Microcap rose 25.0%.
The Fund also showed much-improved relative returns on an NAV basis in the recent market cycle. First, in the rally that began following the small-cap low on 3/9/09 through 6/30/09, RMT was up 73.3% versus a gain of 48.9% for the Russell 2000 and 54.6% for the Russell Microcap index. For the market cycle period that began with the most recent small-cap peak on 7/13/07 (and thus marked the beginning of the current bear market) through 6/30/09, RMT trailed its benchmark, down 41.6% on an NAV basis versus a loss of 38.8% for the Russell 2000. However, the Fund did outpace the microcap index, which declined 44.7% for the same period.
|
The Fund’s market cycle returns were a critical factor in beating its benchmark on an NAV basis for the five-, 10-, 15-year and since inception (12/14/93) periods ended 6/30/09. On a market price basis, the news was less encouraging, as RMT was ahead of the Russell 2000 for the 10-year, 15-year and since inception periods. RMT’s NAV average annual total return since inception was 9.1%.
Technology and Industrial Products, the Fund’s two largest sectors at the end of June, also made the most significant positive contributions to performance in the first half. Tech stocks made a long-sought comeback, and the strongest net gains in the portfolio came from software companies, the semiconductors and equipment group and IT Services. RMT has held Pegasystems, which makes business process management software, since 2001. We liked
| | | GOOD IDEAS THAT WORKED
Top Contributors to Performance*
Year-to-Date Through 6/30/09 |
| | |
|
| | | Pegasystems | | 1.39% |
| | |
|
| | | Spherion Corporation | | 0.73 |
| | |
|
| | | Stein Mart | | 0.68 |
| | |
|
| | | Deswell Industries | | 0.60 |
| | |
|
| | | Sapient Corporation | | 0.52 |
| | |
|
| | | *Includes dividends | | |
| | | | | | |
| | | | | | |
Important Performance and Risk Information
All performance information reflects past performance, is presented on a total return basis and reflects the reinvestment of distributions. Past performance is no guarantee of future results. Current performance may be higher or lower than performance quoted. Returns as of the recent month-end may be obtained at www.roycefunds.com. The market price of the Fund’s shares will fluctuate, so that shares may be worth more or less than their original cost when sold. The Fund normally invests in micro-cap companies, which may involve considerably more risk than investing in a more diversified portfolio of larger-cap companies. |
14 | 2009 Semiannual Report to Stockholders
| | |
| |
| Performance and Portfolio Review |
|
| |
the company’s attractive niche almost as much as its strong balance sheet. With little analyst coverage, its stock price soared in April after better-than-expected first-quarter earnings results were announced. We continued to reduce our position as its stock price rose. Another key contributor and long-time favorite was Sapient Corporation, which provides business, marketing, and technology consulting services worldwide. Sapient benefitted from the general revival of tech stocks, and reported a positive earnings surprise, which helped to bring investors back to the stock.
Elsewhere in the portfolio, staffing and placement services company Spherion Corporation saw its share price begin to recover as it fought its way back from a dismal 2008. Deswell Industries, in the Industrial Products sector, was another top contributor. This manufacturer of injection-molded plastic parts and components experienced a revival in earnings and solid, if unspectacular, growth during the period, though it was enough to attract investors during the recent rally. The Industrial Products sector, however, was also home to some of RMT’s significant detractors during the period—Quixote Corporation and Trex Company. Trex manufactures and distributes wood/plastic composite products used in residential and commercial construction. The slowdown in each market has hurt its business. Our hope was that the company’s fortunes could revive with a pickup in its market, especially as the company has reduced operating costs. The ongoing recession also slowed the business of Quixote Corporation, which |
| | | manufactures highway and transportation safety products. Recent earnings were not only negative—a discouraging enough development—but also slightly worse than expected, which, along with its spotty profits, left us unsure about its long-term prospects. As a result, we trimmed our position in February and March. Pason Systems, which provides rental oilfield instrumentation and data acquisition systems, also disappointed, a result of the tough times for natural gas drilling and exploration. We still like its market share in what we think is a highly attractive industry niche. |
GOOD IDEAS AT THE TIME
Top Detractors from Performance*
Year-to-Date Through 6/30/09 |
|
| Quixote Corporation | | -0.68 | % |
|
| Pason Systems | | -0.43 | |
|
| Trex Company | | -0.30 | |
|
| NYMAGIC | | -0.29 | |
|
| Integral Systems | | -0.27 | |
|
| *Net of dividends | | | |
| |
MARKET PRICE PERFORMANCE HISTORY SINCE INCEPTION (12/14/93) through 6/30/09
 |
| |
1Reflects the cumulative total return of an investment made by a stockholder who purchased one share at inception ($7.50 IPO), reinvested distributions as indicated and fully participated in the primary subscription of the 1994 rights offering. 2 Reflects the actual market price of one share as it traded on the NYSE and, prior to 12/1/03, on Nasdaq. |
| | | | | |
| | | | | |
| | | | | |
| | FUND INFORMATION AND
PORTFOLIO DIAGNOSTICS | |
| |
| |
| | Average Market Capitalization* | | $228 million | |
| |
| |
| | Weighted Average P/B Ratio | | 1.2x | |
| |
| |
| | Weighted Average Portfolio Yield | | 1.1% | |
| |
| |
| | Fund Total Net Assets | | $257 million | |
| |
| |
| | Net Leverage† | | 8% | |
| |
| |
| | Turnover Rate | | 16% | |
| |
| |
| | Symbol | | | |
| | Market Price | | RMT | |
| | NAV | | XOTCX | |
| |
| |
| | *Geometrically calculated | |
| | †Net leverage is the percentage, in excess of 100%, of the total value of equity type investments, divided by net assets, excluding preferred stock. | |
| | | |
| | CAPITAL STRUCTURE
Publicly Traded Securities Outstanding
at 6/30/09 at NAV or Liquidation Value | |
| |
| |
| | 27.3 million shares of Common Stock | $197 million | |
| |
| |
| | 6.00% Cumulative Preferred Stock | $60 million | |
| |
| |
| |
| |
| | | |
| | DOWN MARKET PERFORMANCE COMPARISON
All Down Periods of 7.5% or Greater Over the
Last 10 Years, in Percentages(%) | |
| |
| |
| | | |
| | 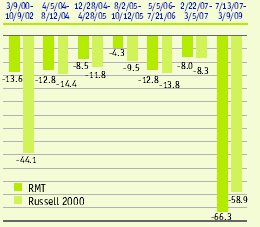 | |
| | | |
|
2009 Semiannual Report to Stockholders | 15
| | | | | | | | | | |
| | | | | | | | | | |
| | | | | | | | | | |
| | AVERAGE ANNUAL NAV TOTAL RETURNS
Through 6/30/09 | |
| |
| |
| | Second Quarter 2009* | | 26.91 | % | |
| |
| |
| | Year-to-Date 2009* | | 17.62 | | |
| |
| |
| | One-Year | | -34.12 | | |
| |
| |
| | Three-Year | | -6.77 | | |
| |
| |
| | Five-Year | | 3.09 | | |
| |
| |
| | 10-Year | | 8.61 | | |
| |
| |
| | Since Inception (11/1/96)† | | 8.93 | | |
| |
| |
| | * Not annualized | | | | |
| | † Royce & Associates assumed investment management responsibility for the Fund on 11/1/96. | |
| | | | | | | | | | |
| | CALENDAR YEAR NAV TOTAL RETURNS | |
| |
| |
| | Year | FUND | | Year | | FUND | |
| |
| |
| | 2008 | -42.7 | % | | 2002 | | -12.5 | % | |
| |
| |
| | 2007 | 12.2 | | | 2001 | | 10.0 | | |
| |
| |
| | 2006 | 16.3 | | | 2000 | | 20.9 | | |
| |
| |
| | 2005 | 13.3 | | | 1999 | | 8.7 | | |
| |
| |
| | 2004 | 29.2 | | | 1998 | | -6.8 | | |
| |
| |
| | 2003 | 54.3 | | | 1997 | | 20.5 | | |
| |
| |
| | | | | | | | | | |
| | TOP 10 POSITIONS
% of Net Assets Applicable
to Common Stockholders | |
| |
| |
| | Kennedy-Wilson Conv. | | 6.7 | % | |
| |
| |
| | Reliance Steel & Aluminum | | 3.6 | | |
| |
| |
| | Sims Metal Management ADR | | 3.1 | | |
| |
| |
| | Knight Capital Group Cl. A | | 2.8 | | |
| |
| |
| | Ensign Energy Services | | 2.7 | | |
| |
| |
| | Silver Standard Resources | | 2.6 | | |
| |
| |
| | Unit Corporation | | 2.6 | | |
| |
| |
| | Microsoft Corporation | | 2.2 | | |
| |
| |
| | GrafTech International | | 2.1 | | |
| |
| |
| | Sanderson Farms | | 2.1 | | |
| |
| |
| | | | | | | | | | |
| | PORTFOLIO SECTOR BREAKDOWN
% of Net Assets Applicable
to Common Stockholders | |
| |
| |
| | Natural Resources | | 29.2 | % | |
| |
| |
| | Industrial Products | | 24.9 | | |
| |
| |
| | Consumer Products | | 11.3 | | |
| |
| |
| | Technology | | 8.1 | | |
| |
| |
| | Financial Services | | 7.3 | | |
| |
| |
| | Industrial Services | | 4.5 | | |
| |
| |
| | Financial Intermediaries | | 3.8 | | |
| |
| |
| | Health | | 3.0 | | |
| |
| |
| | Diversified Investment Companies | | 1.9 | | |
| |
| |
| | Consumer Services | | 1.3 | | |
| |
| |
| | Miscellaneous | | 0.7 | | |
| |
| |
| | Preferred Stock | | 6.7 | | |
| |
| |
| | Cash and Cash Equivalents | | 20.4 | | |
| |
| |
| | | |
| | | |
|
| |
| |
| Royce Focus Trust |
|
| |
 Manager’s Discussion
After taking it on the chin in 2008, at least in the year’s second half, we were very pleased to see Royce Focus Trust (FUND) get off the mat and battle back in the first half of 2009. For the year-to-date period ended 6/30/09, FUND gained 17.6% on a net asset value (NAV) basis and 15.7% on a market price basis, in both cases substantially ahead of the 2.6% return during the same period for its unleveraged small-cap benchmark, the Russell 2000. Particularly gratifying was the Fund’s strong relative performance when stock prices were falling, though we were also cheered by its full participation in the rally that began early in March. During the bearish first quarter, the Fund lost 7.3% on an NAV basis and only 1.7% on a market price basis, while the Russell 2000 fell 15.0%. When the second quarter began, share prices had already begun to recover. FUND gained 26.9% on an NAV basis and 17.7% on a market price basis during this more bullish quarter compared to a gain of 20.7% for the small-cap index (the Fund’s market price return having been dampened somewhat by the suspension of the Fund’s quarterly distribution).
The Fund’s NAV performance has been better than its market price results through the current quite bearish market cycle, though both showed improvement at the end of the first half. From the small-cap peak on 7/13/07 through 6/30/09, FUND fell 37.6% on an NAV basis and was down 41.3% on a market price basis versus a decline of 38.8% for the Russell 2000. The recent rally—as well as strong relative results in the first quarter—was a factor. From the recent small-cap low on 3/9/09 through 6/30/09, FUND rose 49.5% on an NAV basis and 52.5% based on market price, while the Russell 2000 gained 48.9%. |
Longer-term and calendar-based results were solid as well, though the severity of the bear market means that returns look better the further out in time one goes. From the previous small-cap market peak on 3/9/00 through 6/30/09, FUND gained 127.2% on an NAV basis and was up 158.1% on a market price basis while the Russell 2000 was down 5.2% for the same period. The Fund was also ahead of its benchmark on both an NAV and market price basis for the three-, five-, 10-year and since inception of our management (11/1/96) periods ended 6/30/09. FUND’s NAV average annual total return since inception was 8.9%.
| | |
GOOD IDEAS THAT WORKED
Top Contributors to Performance*
Year-to-Date Through 6/30/09 |
|
| Reliance Steel & Aluminum | | 1.96 | % |
|
| Sims Metal Management ADR | | 1.63 | |
|
| Ivanhoe Mines | | 1.17 | |
|
| Sigma Designs | | 1.01 | |
|
| CF Industries Holdings | | 1.00 | |
|
| *Includes dividends | | | |
| All but two of the Fund’s sectors finished the first half in the black, with Natural Resources, Industrial Products and Consumer Products making the largest positive contributions to performance. The first of these three areas saw strong gains from holdings in the precious metals and mining group. These holdings profited from stable or rising commodity prices |
| |
Important Performance and Risk Information
All performance information reflects past performance, is presented on a total return basis and reflects the reinvestment of distributions. Past performance is no guarantee of future results. Current performance may be higher or lower than performance quoted. Returns as of the recent month-end may be obtained at www.roycefunds.com. The market price of the Fund’s shares will fluctuate, so that shares may be worth more or less than their original cost when sold. The Fund normally invests primarily in small-cap companies, which may involve considerably more risk than investing in a more diversified portfolio of larger-cap companies. |
| 16 | 2009 Semiannual Report to Stockholders |
| |
| |
| Performance and Portfolio Review |
|
| |
and a decline in mining costs. Improved commodity prices also had the apparent effect of making financing easier to obtain, which in turn seemed to help stock prices. Ivanhoe Mines was the leader in this group, followed by solid results from Gammon Gold, Allied Nevada Gold and Silver Standard Resources.
The portfolio’s leading industry was the metal fabrication and distribution group in the Industrial Products sector. Two of the Fund’s top-ten holdings dominated this group’s performance. Reliance Steel & Aluminum, a processor and distributor of metal products, had falling profits, but its earnings remained positive, which was sufficient to attract investors. The core business of Sims Metal Management, the world’s largest scrap metal recycler, gradually started to stabilize after an uptick in prices materialized from a stimulus-driven increase in demand from China, other Asian countries and Turkey. Sims also began to see a modest pick-up in orders from U.S. mills as destocking ran its course. Each stock’s success was mostly attributable to investors looking to metals-related stocks in anticipation of an industrial recovery in the second half of 2009. While these two companies experienced no significant improvement in fundamentals, modest growth or even “not getting worse” translated into “good” for many investors during the rally.
Sigma Designs makes semiconductors for use in various media, including specialized chips used in video image compression that creates high definition. Its earnings have remained positive and more recently were growing, and its other fundamentals remain strong. We reduced |
| | | our stake in February and March. During January and February, we sold some shares of Endo Pharmaceuticals Holdings. We were not quite certain about how it will handle the transition away from its core pain management products into new areas. The strong but suffering business of welding and cutting products maker (and long-time holding) Lincoln Electric Holdings inspired more confidence for the long run. We think that its stock could flourish in an economic recovery that would include a resumption in global infrastructure construction. |
GOOD IDEAS AT THE TIME
Top Detractors from Performance*
Year-to-Date Through 6/30/09 |
|
| Endo Pharmaceuticals Holdings | | -1.00 | % |
|
| Lincoln Electric Holdings | | -0.77 | |
|
| Pason Systems | | -0.74 | |
|
| Simpson Manufacturing | | -0.63 | |
|
| Kennedy-Wilson Conv. | | -0.59 | |
|
| *Net of dividends | | | |
| |
| |
 |
1Royce & Associates assumed investment management responsibility for the Fund on 11/1/96. 2Reflects the cumulative total return experience of a continuous common stockholder who reinvested all distributions as indicated and fully participated in the primary subscription of the 2005 rights offering. 3Reflects the actual market price of one share as it traded on Nasdaq. |
| | | | | | | | | | | | | | | |
| | | | | | | | | | | | | | | |
| | | | | | | | | | | | | | | |
| | FUND INFORMATION AND
PORTFOLIO DIAGNOSTICS | |
| |
| |
| | Average Market Capitalization* | | $1,492 million | |
| |
| |
| | Weighted Average P/E Ratio** | | 11.5x | |
| |
| |
| | Weighted Average P/B Ratio | | 1.7x | |
| |
| |
| | Weighted Average Portfolio Yield | | 1.6% | |
| |
| |
| | Fund Total Net Assets | | $133 million | |
| |
| |
| | Net Leverage† | | 3% | |
| |
| |
| | Turnover Rate | | 24% | |
| |
| |
| | Symbol | | | |
| | Market Price | | FUND | |
| | NAV | | XFUNX | |
| |
| |
| | *Geometrically calculated | |
| | **The Fund’s P/E ratio calculation excludes companies with zero or negative earnings (22% of portfolio holdings as of 6/30/09). | |
| | †Net leverage is the percentage, in excess of 100%, of the total value of equity type investments, divided by net assets, excluding preferred stock. | |
| | | |
| | CAPITAL STRUCTURE
Publicly Traded Securities Outstanding
at 6/30/09 at NAV or Liquidation Value | |
| |
| |
| | 19.8 million shares of Common Stock | $108 million | |
| |
| |
| | 6.00% Cumulative Preferred Stock | $25 million | |
| |
| |
| | | |
| | DOWN MARKET PERFORMANCE COMPARISON
All Down Periods of 7.5%
or Greater, in Percentages(%) | |
| |
| |
| |  |
| | | |
|
2009 Semiannual Report to Stockholders | 17
The following table details the share accumulations by an initial investor in the Funds who reinvested all distributions (including fractional shares) and participated fully in primary subscriptions for each of the rights offerings. Full participation in distribution reinvestments and rights offerings can maximize the returns available to a long-term investor. This table should be read in conjunction with the Performance and Portfolio Reviews of the Funds.
| | | | | | Amount | | | Purchase | | | | | NAV | | | Market | |
| | History | | | Invested | | | Price* | | Shares | | | Value** | | | Value** | |
| Royce Value Trust | | | | | | | | | | | | | | | |
| 11/26/86 | | Initial Purchase | | $ | 10,000 | | $ | 10.000 | | 1,000 | | $ | 9,280 | | $ | 10,000 | |
| 10/15/87 | | Distribution $0.30 | | | | | | 7.000 | | 42 | | | | | | | |
| 12/31/87 | | Distribution $0.22 | | | | | | 7.125 | | 32 | | | 8,578 | | | 7,250 | |
| 12/27/88 | | Distribution $0.51 | | | | | | 8.625 | | 63 | | | 10,529 | | | 9,238 | |
| 9/22/89 | | Rights Offering | | | 405 | | | 9.000 | | 45 | | | | | | | |
| 12/29/89 | | Distribution $0.52 | | | | | | 9.125 | | 67 | | | 12,942 | | | 11,866 | |
| 9/24/90 | | Rights Offering | | | 457 | | | 7.375 | | 62 | | | | | | | |
| 12/31/90 | | Distribution $0.32 | | | | | | 8.000 | | 52 | | | 11,713 | | | 11,074 | |
| 9/23/91 | | Rights Offering | | | 638 | | | 9.375 | | 68 | | | | | | | |
| 12/31/91 | | Distribution $0.61 | | | | | | 10.625 | | 82 | | | 17,919 | | | 15,697 | |
| 9/25/92 | | Rights Offering | | | 825 | | | 11.000 | | 75 | | | | | | | |
| 12/31/92 | | Distribution $0.90 | | | | | | 12.500 | | 114 | | | 21,999 | | | 20,874 | |
| 9/27/93 | | Rights Offering | | | 1,469 | | | 13.000 | | 113 | | | | | | | |
| 12/31/93 | | Distribution $1.15 | | | | | | 13.000 | | 160 | | | 26,603 | | | 25,428 | |
| 10/28/94 | | Rights Offering | | | 1,103 | | | 11.250 | | 98 | | | | | | | |
| 12/19/94 | | Distribution $1.05 | | | | | | 11.375 | | 191 | | | 27,939 | | | 24,905 | |
| 11/3/95 | | Rights Offering | | | 1,425 | | | 12.500 | | 114 | | | | | | | |
| 12/7/95 | | Distribution $1.29 | | | | | | 12.125 | | 253 | | | 35,676 | | | 31,243 | |
| 12/6/96 | | Distribution $1.15 | | | | | | 12.250 | | 247 | | | 41,213 | | | 36,335 | |
| 1997 | | Annual distribution total $1.21 | | | | | | 15.374 | | 230 | | | 52,556 | | | 46,814 | |
| 1998 | | Annual distribution total $1.54 | | | | | | 14.311 | | 347 | | | 54,313 | | | 47,506 | |
| 1999 | | Annual distribution total $1.37 | | | | | | 12.616 | | 391 | | | 60,653 | | | 50,239 | |
| 2000 | | Annual distribution total $1.48 | | | | | | 13.972 | | 424 | | | 70,711 | | | 61,648 | |
| 2001 | | Annual distribution total $1.49 | | | | | | 15.072 | | 437 | | | 81,478 | | | 73,994 | |
| 2002 | | Annual distribution total $1.51 | | | | | | 14.903 | | 494 | | | 68,770 | | | 68,927 | |
| 1/28/03 | | Rights Offering | | | 5,600 | | | 10.770 | | 520 | | | | | | | |
| 2003 | | Annual distribution total $1.30 | | | | | | 14.582 | | 516 | | | 106,216 | | | 107,339 | |
| 2004 | | Annual distribution total $1.55 | | | | | | 17.604 | | 568 | | | 128,955 | | | 139,094 | |
| 2005 | | Annual distribution total $1.61 | | | | | | 18.739 | | 604 | | | 139,808 | | | 148,773 | |
| 2006 | | Annual distribution total $1.78 | | | | | | 19.696 | | 693 | | | 167,063 | | | 179,945 | |
| 2007 | | Annual distribution total $1.85 | | | | | | 19.687 | | 787 | | | 175,469 | | | 165,158 | |
| 2008 | | Annual distribution total $1.72 | | | | | | 12.307 | | 1,294 | | | 95,415 | | | 85,435 | |
| 2009 | | Year-to-date distribution total $0.32 | | | | | | 6.070 | | 537 | | | | | | | |
|
| 6/30/09 | | | | $ | 21,922 | | | | | 10,720 | | $ | 106,664 | | $ | 90,155 | |
|
| Royce Micro-Cap Trust | | | | | | | | | | | | | | | |
| 12/14/93 | | Initial Purchase | | $ | 7,500 | | $ | 7.500 | | 1,000 | | $ | 7,250 | | $ | 7,500 | |
| 10/28/94 | | Rights Offering | | | 1,400 | | | 7.000 | | 200 | | | | | | | |
| 12/19/94 | | Distribution $0.05 | | | | | | 6.750 | | 9 | | | 9,163 | | | 8,462 | |
| 12/7/95 | | Distribution $0.36 | | | | | | 7.500 | | 58 | | | 11,264 | | | 10,136 | |
| 12/6/96 | | Distribution $0.80 | | | | | | 7.625 | | 133 | | | 13,132 | | | 11,550 | |
| 12/5/97 | | Distribution $1.00 | | | | | | 10.000 | | 140 | | | 16,694 | | | 15,593 | |
| 12/7/98 | | Distribution $0.29 | | | | | | 8.625 | | 52 | | | 16,016 | | | 14,129 | |
| 12/6/99 | | Distribution $0.27 | | | | | | 8.781 | | 49 | | | 18,051 | | | 14,769 | |
| 12/6/00 | | Distribution $1.72 | | | | | | 8.469 | | 333 | | | 20,016 | | | 17,026 | |
| 12/6/01 | | Distribution $0.57 | | | | | | 9.880 | | 114 | | | 24,701 | | | 21,924 | |
| 2002 | | Annual distribution total $0.80 | | | | | | 9.518 | | 180 | | | 21,297 | | | 19,142 | |
| 2003 | | Annual distribution total $0.92 | | | | | | 10.004 | | 217 | | | 33,125 | | | 31,311 | |
| 2004 | | Annual distribution total $1.33 | | | | | | 13.350 | | 257 | | | 39,320 | | | 41,788 | |
| 2005 | | Annual distribution total $1.85 | | | | | | 13.848 | | 383 | | | 41,969 | | | 45,500 | |
| 2006 | | Annual distribution total $1.55 | | | | | | 14.246 | | 354 | | | 51,385 | | | 57,647 | |
| 2007 | | Annual distribution total $1.35 | | | | | | 13.584 | | 357 | | | 51,709 | | | 45,802 | |
| 2008 | | Annual distribution total $1.19 | | | | | | 8.237 | | 578 | | | 28,205 | | | 24,807 | |
| 2009 | | Year-to-date distribution total $0.22 | | | | | | 4.260 | | 228 | | | | | | | |
|
| 6/30/09 | | | | $ | 8,900 | | | | | 4,642 | | $ | 33,469 | | $ | 27,898 | |
|
| Royce Focus Trust | | | | | | | | | | | | | | | |
| 10/31/96 | | Initial Purchase | | $ | 4,375 | | $ | 4.375 | | 1,000 | | $ | 5,280 | | $ | 4,375 | |
| 12/31/96 | | | | | | | | | | | | | 5,520 | | | 4,594 | |
| 12/5/97 | | Distribution $0.53 | | | | | | 5.250 | | 101 | | | 6,650 | | | 5,574 | |
| 12/31/98 | | | | | | | | | | | | | 6,199 | | | 5,367 | |
| 12/6/99 | | Distribution $0.145 | | | | | | 4.750 | | 34 | | | 6,742 | | | 5,356 | |
| 12/6/00 | | Distribution $0.34 | | | | | | 5.563 | | 69 | | | 8,151 | | | 6,848 | |
| 12/6/01 | | Distribution $0.14 | | | | | | 6.010 | | 28 | | | 8,969 | | | 8,193 | |
| 12/6/02 | | Distribution $0.09 | | | | | | 5.640 | | 19 | | | 7,844 | | | 6,956 | |
| 12/8/03 | | Distribution $0.62 | | | | | | 8.250 | | 94 | | | 12,105 | | | 11,406 | |
| 2004 | | Annual distribution total $1.74 | | | | | | 9.325 | | 259 | | | 15,639 | | | 16,794 | |
| 5/6/05 | | Rights offering | | | 2,669 | | | 8.340 | | 320 | | | | | | | |
| 2005 | | Annual distribution total $1.21 | | | | | | 9.470 | | 249 | | | 21,208 | | | 20,709 | |
| 2006 | | Annual distribution total $1.57 | | | | | | 9.860 | | 357 | | | 24,668 | | | 27,020 | |
| 2007 | | Annual distribution total $2.01 | | | | | | 9.159 | | 573 | | | 27,679 | | | 27,834 | |
| 2008 | | Annual distribution total $0.47 | | | | | | 6.535 | | 228 | | | 15,856 | | | 15,323 | |
| 2009 | | Year-to-date distribution total $0.09 | | | | | | 3.830 | | 78 | | | | | | | |
|
| 6/30/09 | | | | $ | 7,044 | | | | | 3,409 | | $ | 18,647 | | $ | 17,727 | |
|
| * | | Beginning with the 1997 (RVT), 2002 (RMT) and 2004 (FUND) distributions, the purchase price of distributions is a weighted average of the distribution reinvestment prices for the year. |
| ** | | Other than for initial purchase and June 30, 2009, values are stated as of December 31 of the year indicated, after reinvestment of distributions. |
18 | 2009 Semiannual Report to Stockholders
| Distribution Reinvestment and Cash Purchase Options |
|
| Why should I reinvest my distributions? |
| By reinvesting distributions, a stockholder can maintain an undiluted investment in the Fund. The regular reinvestment of distributions has a significant impact on stockholder returns. In contrast, the stockholder who takes distributions in cash is penalized when shares are issued below net asset value to other stockholders. |
| |
| How does the reinvestment of distributions from the Royce closed-end funds work? |
| The Funds automatically issue shares in payment of distributions unless you indicate otherwise. The shares are generally issued at the lower of the market price or net asset value on the valuation date. |
| |
| How does this apply to registered stockholders? |
| If your shares are registered directly with a Fund, your distributions are automatically reinvested unless you have otherwise instructed the Funds’ transfer agent, Computershare, in writing. A registered stockholder also has the option to receive the distribution in the form of a stock certificate or in cash if Computershare is properly notified. |
| |
| What if my shares are held by a brokerage firm or a bank? |
| If your shares are held by a brokerage firm, bank, or other intermediary as the stockholder of record, you should contact your brokerage firm or bank to be certain that it is automatically reinvesting distributions on your behalf. If they are unable to reinvest distributions on your behalf, you should have your shares registered in your name in order to participate. |
| |
| What other features are available for registered stockholders? |
| The Distribution Reinvestment and Cash Purchase Plans also allow registered stockholders to make optional cash purchases of shares of a Fund’s common stock directly through Computershare on a monthly basis, and to deposit certificates representing your Fund shares with Computershare for safekeeping. The Funds’ investment adviser is absorbing all commissions on optional cash purchases under the Plans through December 31, 2009. |
| How do the Plans work for registered stockholders? |
| Computershare maintains the accounts for registered stockholders in the Plans and sends written confirmation of all transactions in the account. Shares in the account of each participant will be held by Computershare in non-certificated form in the name of the participant, and each participant will be able to vote those shares at a stockholder meeting or by proxy. A participant may also send other stock certificates held by them to Computershare to be held in non-certificated form. There is no service fee charged to participants for reinvesting distributions. If a participant elects to sell shares from a Plan account, Computershare will deduct a $2.50 fee plus brokerage commissions from the sale transaction. If a nominee is the registered owner of your shares, the nominee will maintain the accounts on your behalf. |
| |
| How can I get more information on the Plans? |
| You can call an Investor Services Representative at (800) 221-4268 or you can request a copy of the Plan for your Fund from Computershare. All correspondence (including notifications) should be directed to: [Name of Fund] Distribution Reinvestment and Cash Purchase Plan, c/o Computershare, PO Box 43010, Providence, RI 02940-3010, telephone (800) 426-5523. |
2009 Semiannual Report to Stockholders | 19
| | | SHARES | | VALUE | |
| | | | | | | |
| COMMON STOCKS – 116.2% | | | | | | |
| | | | | | | |
| Consumer Products – 7.0% | | | | | | |
| Apparel, Shoes and Accessories - 1.8% | | | | | | |
Anta Sports Products | | 230,000 | | $ | 284,486 | |
Burberry Group | | 350,000 | | | 2,443,088 | |
Columbia Sportswear | | 42,600 | | | 1,317,192 | |
Daphne International Holdings | | 433,800 | | | 226,391 | |
K-Swiss Cl. A a | | 160,000 | | | 1,360,000 | |
Lazare Kaplan International a | | 95,437 | | | 244,319 | |
Polo Ralph Lauren | | 4,000 | | | 214,160 | |
Stella International Holdings | | 152,700 | | | 246,145 | |
Timberland Company (The) Cl. A a | | 17,500 | | | 232,225 | |
Van De Velde | | 28,000 | | | 1,022,965 | |
Volcom a,b | | 87,800 | | | 1,097,500 | |
Warnaco Group (The) a | | 28,500 | | | 923,400 | |
Weyco Group | | 97,992 | | | 2,262,635 | |
Xinyu Hengdeli Holdings | | 155,000 | | | 45,713 | |
Yue Yuen Industrial Holdings | | 17,000 | | | 38,089 | |
| | | | |
| |
| | | | | | 11,958,308 | |
| | | | |
| |
| Collectibles - 0.1% | | | | | | |
Russ Berrie & Company a | | 96,600 | | | 377,706 | |
| | | | |
| |
| Consumer Electronics - 0.7% | | | | | | |
Dolby Laboratories Cl. A a | | 80,000 | | | 2,982,400 | |
DTS a,b | | 64,100 | | | 1,735,187 | |
| | | | |
| |
| | | | | | 4,717,587 | |
| | | | |
| |
| Food/Beverage/Tobacco - 0.9% | | | | | | |
Asian Citrus Holdings | | 29,200 | | | 99,735 | |
B&G Foods (Units) | | 21,000 | | | 304,710 | |
B&G Foods Cl. A | | 5,000 | | | 42,050 | |
Hershey Creamery | | 709 | | | 1,205,300 | |
Seneca Foods Cl. A a,b | | 80,000 | | | 2,673,600 | |
Seneca Foods Cl. B a | | 13,251 | | | 443,246 | |
Tootsie Roll Industries | | 52,000 | | | 1,179,880 | |
| | | | |
| |
| | | | | | 5,948,521 | |
| | | | |
| |
| Health, Beauty and Nutrition - 0.0% | | | | | | |
Natural Beauty Bio-Technology | | 325,000 | | | 53,974 | |
| | | | |
| |
| Home Furnishing and Appliances - 1.9% | | | | | | |
American Woodmark | | 123,335 | | | 2,953,873 | |
Ekornes | | 100,000 | | | 1,332,290 | |
Ethan Allen Interiors | | 85,800 | | | 888,888 | |
Hunter Douglas | | 36,000 | | | 1,471,439 | |
Kimball International Cl. B | | 286,180 | | | 1,785,763 | |
Mohawk Industries a,b | | 102,200 | | | 3,646,496 | |
Samson Holding | | 500,000 | | | 78,318 | |
Universal Electronics a | | 10,000 | | | 201,700 | |
| | | | |
| |
| | | | | | 12,358,767 | |
| | | | |
| |
| Sports and Recreation - 1.6% | | | | | | |
Beneteau | | 125,000 | | | 1,360,741 | |
Coachmen Industries a,b | | 47,700 | | | 62,487 | |
RC2 Corporation a | | 132,600 | | | 1,754,298 | |
Sturm, Ruger & Company | | 272,900 | | | 3,394,876 | |
Thor Industries | | 110,900 | | | 2,037,233 | |
| | | SHARES | | VALUE | |
| | | | | | | |
| Consumer Products (continued) | | | | | | |
| Sports and Recreation (continued) | | | | | | |
Winnebago Industries a | | 247,500 | | $ | 1,838,925 | |
| | | | |
| |
| | | | | | 10,448,560 | |
| | | | |
| |
| Total (Cost $46,842,349) | | | | | 45,863,423 | |
| | | | |
| |
| Consumer Services – 4.3% | | | | | | |
Direct Marketing - 0.5% | | | | | | |
Manutan International | | 20,500 | | | 1,021,225 | |
†School Specialty a,b | | 11,000 | | | 222,310 | |
Takkt | | 153,000 | | | 1,631,097 | |
| | | | |
| |
| | | | | | 2,874,632 | |
| | | | |
| |
| Media and Broadcasting - 0.1% | | | | | | |
Discovery Communications Cl. B a,b | | 18,300 | | | 370,941 | |
Discovery Communications Cl. C a,b | | 18,300 | | | 375,699 | |
| | | | |
| |
| | | | | | 746,640 | |
| | | | |
| |
| Restaurants and Lodgings - 0.5% | | | | | | |
Benihana a,b | | 3,300 | | | 22,473 | |
Cafe de Coral Holdings | | 6,000 | | | 11,958 | |
CEC Entertainment a,b | | 64,100 | | | 1,889,668 | |
Steak n Shake a | | 82,000 | | | 716,680 | |
Tim Hortons | | 20,000 | | | 490,800 | |
| | | | |
| |
| | | | | | 3,131,579 | |
| | | | |
| |
| Retail Stores - 3.2% | | | | | | |
†Bed Bath & Beyond a,b | | 7,200 | | | 221,400 | |
Buckle (The) | | 3,500 | | | 111,195 | |
Bulgari | | 100,000 | | | 539,018 | |
CarMax a,b | | 160,000 | | | 2,352,000 | |
Charming Shoppes a | | 762,800 | | | 2,837,616 | |
China Nepstar Chain Drugstore ADR | | 20,000 | | | 114,000 | |
Dress Barn (The) a | | 248,280 | | | 3,550,404 | |
Lewis Group | | 260,000 | | | 1,629,234 | |
Men’s Wearhouse (The) | | 51,700 | | | 991,606 | |
Pier 1 Imports a | | 626,200 | | | 1,246,138 | |
Stein Mart a,b | | 182,800 | | | 1,619,608 | |
Tiffany & Co. | | 208,700 | | | 5,292,632 | |
West Marine a | | 131,100 | | | 722,361 | |
| | | | |
| |
| | | | | | 21,227,212 | |
| | | | |
| |
| Other Consumer Services - 0.0% | | | | | | |
†Universal Travel Group a,b | | 1,100 | | | 12,309 | |
| | | | |
| |
| Total (Cost $32,482,782) | | | | | 27,992,372 | |
| | | | |
| |
| Diversified Investment Companies – 0.5% | | | | | | |
| Closed-End Funds - 0.5% | | | | | | |
Central Fund of Canada Cl. A | | 211,500 | | | 2,483,010 | |
KKR Private Equity Investors L.P. a | | 105,000 | | | 634,527 | |
| | | | |
| |
| Total (Cost $4,094,944) | | | | | 3,117,537 | |
| | | | |
| |
| Financial Intermediaries – 12.7% | | | | | | |
| Banking - 4.1% | | | | | | |
Ameriana Bancorp | | 40,000 | | | 169,600 | |
Banca Finnat Euramerica | | 720,000 | | | 526,403 | |
Banca Generali | | 86,000 | | | 718,065 | |
Bank of N.T. Butterfield & Son | | 456,676 | | | 2,374,715 | |
Bank Sarasin & Cie Cl. B a | | 34,860 | | | 1,084,492 | |
| 20 | 2009 Semiannual Report to Stockholders | | THE ACCOMPANYING NOTES ARE AN INTEGRAL PART OF THESE FINANCIAL STATEMENTS. |
June 30, 2009 (unaudited) |
|
| | | SHARES | | VALUE | |
| | | | | | | |
| Financial Intermediaries (continued) | | | | | | |
| Banking (continued) | | | | | | |
Banque Privee Edmond de Rothschild | | 23 | | $ | 646,078 | |
BCB Holdings a | | 598,676 | | | 1,231,527 | |
Cadence Financial | | 40,300 | | | 89,869 | |
Center Bancorp | | 40,000 | | | 326,000 | |
Centrue Financial | | 82,200 | | | 364,146 | |
CFS Bancorp | | 75,000 | | | 317,250 | |
Chuo Mitsui Trust Holdings | | 118,000 | | | 447,810 | |
CNB Financial | | 11,116 | | | 157,514 | |
Commercial National Financial | | 54,900 | | | 811,422 | |
Farmers & Merchants Bank of Long Beach | | 1,200 | | | 4,260,000 | |
Fauquier Bankshares | | 160,800 | | | 2,092,008 | |
Hawthorn Bancshares | | 46,176 | | | 457,142 | |
HopFed Bancorp | | 104,500 | | | 1,016,785 | |
Jefferson Bancshares | | 32,226 | | | 175,632 | |
Kearny Financial | | 50,862 | | | 581,861 | |
Mauritius Commercial Bank | | 40,000 | | | 156,765 | |
Mechanics Bank | | 200 | | | 2,220,000 | |
Old Point Financial | | 25,000 | | | 462,500 | |
Peapack-Gladstone Financial | | 10,000 | | | 192,900 | |
State Bank of Mauritius | | 46,000 | | | 100,156 | |
Timberland Bancorp c | | 469,200 | | | 1,923,720 | |
Vontobel Holding | | 20,400 | | | 546,402 | |
Whitney Holding | | 41,500 | | | 380,140 | |
Wilber Corporation (The) | | 113,743 | | | 1,262,547 | |
Wilmington Trust | | 143,500 | | | 1,960,210 | |
| | | | |
| |
| | | | | | 27,053,659 | |
| | | | |
| |
| Insurance - 6.0% | | | | | | |
Alleghany Corporation a | | 23,096 | | | 6,259,016 | |
Argo Group International Holdings a,b | | 64,751 | | | 1,827,273 | |
Aspen Insurance Holdings | | 64,000 | | | 1,429,760 | |
CNA Financial a,b | | 40,000 | | | 618,800 | |
CNA Surety a | | 100,600 | | | 1,357,094 | |
E-L Financial | | 4,000 | | | 1,279,285 | |
Enstar Group a | | 26,000 | | | 1,530,100 | |
Erie Indemnity Cl. A | | 114,500 | | | 4,094,520 | |
First American | | 20,000 | | | 518,200 | |
Hilltop Holdings a | | 415,400 | | | 4,930,798 | |
Independence Holding | | 317,658 | | | 2,020,305 | |
IPC Holdings | | 7,000 | | | 191,380 | |
Leucadia National a | | 44,940 | | | 947,785 | |
Markel Corporation a,b | | 6,200 | | | 1,746,540 | |
Ming An Holdings a | | 300,000 | | | 57,807 | |
Montpelier Re Holdings | | 62,000 | | | 823,980 | |
NYMAGIC | | 202,200 | | | 2,806,536 | |
Old Republic International | | 20,000 | | | 197,000 | |
ProAssurance Corporation a | | 12,000 | | | 554,520 | |
RLI | | 90,724 | | | 4,064,435 | |
Zenith National Insurance | | 97,000 | | | 2,108,780 | |
| | | | |
| |
| | | | | | 39,363,914 | |
| | | | |
| |
| Real Estate Investment Trusts - 0.1% | | | | | | |
Gladstone Commercial | | 30,000 | | | 388,800 | |
| | | | |
| |
| Securities Brokers - 2.3% | | | | | | |
Broadpoint Gleacher Securities a,b | | 93,000 | | | 518,940 | |
| | | SHARES | | VALUE | |
| | | | | | | |
| Financial Intermediaries (continued) | | | | | | |
| Securities Brokers (continued) | | | | | | |
Close Brothers Group | | 43,000 | | $ | 466,429 | |
D. Carnegie & Co. a,d | | 14,000 | | | 0 | |
Daewoo Securities | | 5,000 | | | 74,066 | |
DundeeWealth | | 33,300 | | | 246,211 | |
Egyptian Financial Group-Hermes Holding GDR | | 57,900 | | | 457,410 | |
FBR Capital Markets a,b | | 145,800 | | | 685,260 | |
HQ | | 40,000 | | | 539,268 | |
Investcorp Bank GDR | | 27,000 | | | 135,000 | |
KBW a,b | | 70,058 | | | 2,014,868 | |
Kim Eng Holdings | | 220,000 | | | 281,605 | |
Lazard Cl. A | | 143,300 | | | 3,857,636 | |
Mirae Asset Securities | | 38,850 | | | 2,104,490 | |
Mizuho Securities | | 492,300 | | | 1,530,379 | |
Oppenheimer Holdings Cl. A | | 30,000 | | | 635,100 | |
optionsXpress Holdings b | | 53,000 | | | 823,090 | |
Phatra Securities | | 775,000 | | | 378,003 | |
UOB-Kay Hian Holdings | | 190,000 | | | 174,991 | |
Woori Investment & Securities | | 11,000 | | | 128,654 | |
| | | | |
| |
| | | | | | 15,051,400 | |
| | | | |
| |
| Securities Exchanges - 0.0% | | | | | | |
Hellenic Exchanges | | 5,500 | | | 61,336 | |
Singapore Exchange | | 27,000 | | | 131,909 | |
| | | | |
| |
| | | | | | 193,245 | |
| | | | |
| |
| Other Financial Intermediaries - 0.2% | | | | | | |
KKR Financial Holdings a | | 481,404 | | | 447,706 | |
NASDAQ OMX Group a | | 30,000 | | | 639,300 | |
| | | | |
| |
| | | | | | 1,087,006 | |
| | | | |
| |
| Total (Cost $113,390,197) | | | | | 83,138,024 | |
| | | | |
| |
| Financial Services – 14.4% | | | | | | |
| Diversified Financial Services - 0.9% | | | | | | |
Encore Capital Group a,b | | 88,000 | | | 1,166,000 | |
Franco-Nevada Corporation | | 10,000 | | | 240,382 | |
Ocwen Financial a,b | | 123,600 | | | 1,603,092 | |
Osaka Securities Exchange | | 19 | | | 90,537 | |
World Acceptance a,b | | 133,700 | | | 2,661,967 | |
| | | | |
| |
| | | | | | 5,761,978 | |
| | | | |
| |
| Information and Processing - 2.4% | | | | | | |
Broadridge Financial Solutions | | 35,000 | | | 580,300 | |
Interactive Data | | 112,300 | | | 2,598,622 | |
MoneyGram International a | | 558,500 | | | 994,130 | |
Morningstar a | | 119,800 | | | 4,939,354 | |
MSCI Cl. A a,b | | 57,100 | | | 1,395,524 | |
SEI Investments | | 304,300 | | | 5,489,572 | |
| | | | |
| |
| | | | | | 15,997,502 | |
| | | | |
| |
| Insurance Brokers - 1.2% | | | | | | |
Brown & Brown | | 224,900 | | | 4,482,257 | |
Crawford & Company Cl. A a | | 109,200 | | | 398,580 | |
Crawford & Company Cl. B a,b | | 162,300 | | | 779,040 | |
Gallagher (Arthur J.) & Co. | | 111,200 | | | 2,373,008 | |
| | | | |
| |
| | | | | | 8,032,885 | |
| | | | |
| |
| THE ACCOMPANYING NOTES ARE AN INTEGRAL PART OF THESE FINANCIAL STATEMENTS. | | 2009 Semiannual Report to Stockholders | 21 |
| | | SHARES | | VALUE | |
| | | | | | | |
| Financial Services (continued) | | | | | | |
| Investment Management - 8.8% | | | | | | |
A.F.P. Provida ADR a | | 22,100 | | $ | 571,948 | |
ABG Sundal Collier Holding | | 115,000 | | | 125,426 | |
Affiliated Managers Group a | | 42,800 | | | 2,490,532 | |
AllianceBernstein Holding L.P. | | 325,600 | | | 6,541,304 | |
AP Alternative Assets L.P. a | | 233,200 | | | 569,834 | |
Ashmore Group | | 170,000 | | | 529,350 | |
Azimut Holding | | 76,700 | | | 727,158 | |
BKF Capital Group | | 130,000 | | | 123,500 | |
BT Investment Management | | 207,000 | | | 348,648 | |
CapMan Cl. B a | | 21,900 | | | 30,834 | |
Coronation Fund Managers | | 526,000 | | | 416,893 | |
Deutsche Beteiligungs | | 103,605 | | | 1,773,201 | |
Eaton Vance | | 125,300 | | | 3,351,775 | |
Endeavour Financial b | | 150,000 | | | 180,544 | |
Equity Trustees | | 33,202 | | | 381,247 | |
Evercore Partners Cl. A | | 244,600 | | | 4,803,944 | |
F&C Asset Management | | 60,000 | | | 68,999 | |
Federated Investors Cl. B | | 195,000 | | | 4,697,550 | |
Fiducian Portfolio Services | | 227,000 | | | 233,940 | |
GAMCO Investors Cl. A | | 122,875 | | | 5,959,437 | |
GIMV | | 27,000 | | | 1,347,724 | |
GP Investments BDR a | | 15,000 | | | 59,633 | |
Investec | | 124,700 | | | 673,020 | |
JAFCO | | 37,300 | | | 1,243,649 | |
Janus Capital Group | | 40,000 | | | 456,000 | |
MVC Capital | | 424,200 | | | 3,588,732 | |
Onex Corporation | | 50,000 | | | 859,734 | |
Partners Group Holding | | 19,400 | | | 1,885,171 | |
Perpetual | | 12,700 | | | 290,810 | |
Platinum Asset Management | | 168,000 | | | 548,081 | |
RAB Capital | | 426,000 | | | 161,442 | |
Rathbone Brothers | | 35,400 | | | 477,729 | |
RHJ International a | | 177,500 | | | 1,135,033 | |
Schroders | | 168,890 | | | 2,286,181 | |
SHUAA Capital a | | 485,000 | | | 226,573 | |
SPARX Group a | | 7,220 | | | 1,480,912 | |
Sprott | | 269,600 | | | 706,942 | |
Tasmanian Perpetual Trustees | | 152,000 | | | 330,700 | |
†Teton Advisors a,d | | 1,867 | | | 4,238 | |
Treasury Group | | 51,500 | | | 169,650 | |
Trust Company | | 97,283 | | | 410,800 | |
Value Partners Group a | | 953,100 | | | 415,948 | |
VZ Holding | | 13,500 | | | 624,694 | |
Waddell & Reed Financial Cl. A | | 168,500 | | | 4,443,345 | |
| | | | |
| |
| | | | | | 57,752,805 | |
| | | | |
| |
| Special Purpose Acquisition Corporation - 0.6% | | | | | | |
Alternative Asset Management Acquisition (Units) a | | 250,000 | | | 2,450,000 | |
Prospect Acquisition (Units) a | | 150,000 | | | 1,459,500 | |
| | | | |
| |
| | | | | | 3,909,500 | |
| | | | |
| |
| Specialty Finance - 0.5% | | | | | | |
Credit Acceptance a,b | | 144,601 | | | 3,159,532 | |
| | | | |
| |
| Total (Cost $122,385,128) | | | | | 94,614,202 | |
| | | | |
| |
| | | SHARES | | VALUE | |
| | | | | | | |
| Health – 6.2% | | | | | | |
| Commercial Services - 0.7% | | | | | | |
PAREXEL International a | | 332,400 | | $ | 4,779,912 | |
| | | | |
| |
| Drugs and Biotech - 0.8% | | | | | | |
American Oriental Bioengineering a,b | | 15,700 | | | 83,053 | |
China Shineway Pharmaceutical Group | | 45,000 | | | 45,801 | |
Endo Pharmaceuticals Holdings a | | 158,300 | | | 2,836,736 | |
Pharmacyclics a | | 383,000 | | | 513,220 | |
Simcere Pharmaceutical Group ADR a | | 20,700 | | | 180,297 | |
Sinovac Biotech a | | 33,000 | | | 130,350 | |
Sunesis Pharmaceuticals a | | 552,000 | | | 216,881 | |
Virbac | | 14,000 | | | 1,128,632 | |
WuXi PharmaTech Cayman ADR a,b | | 14,800 | | | 139,712 | |
| | | | |
| |
| | | | | | 5,274,682 | |
| | | | |
| |
| Health Services - 1.8% | | | | | | |
Advisory Board (The) a,b | | 120,000 | | | 3,084,000 | |
Albany Molecular Research a | | 85,000 | | | 713,150 | |
Bangkok Chain Hospital | | 20,000 | | | 4,748 | |
Chem Rx (Units) a | | 280,000 | | | 28,000 | |
Cross Country Healthcare a | | 30,000 | | | 206,100 | |
eResearch Technology a | | 117,624 | | | 730,445 | |
HMS Holdings a,b | | 50,000 | | | 2,036,000 | |
ICON ADR a | | 105,400 | | | 2,274,532 | |
On Assignment a,b | | 375,400 | | | 1,467,814 | |
Res-Care a | | 65,460 | | | 936,078 | |
WellCare Health Plans a,b | | 5,000 | | | 92,450 | |
| | | | |
| |
| | | | | | 11,573,317 | |
| | | | |
| |
| Medical Products and Devices - 2.9% | | | | | | |
Affymetrix a | | 10,000 | | | 59,300 | |
Allied Healthcare Products a | | 180,512 | | | 776,202 | |
Atrion Corporation | | 15,750 | | | 2,111,917 | |
Carl Zeiss Meditec | | 110,000 | | | 1,543,058 | |
CONMED Corporation a | | 81,500 | | | 1,264,880 | |
Edwards Lifesciences a | | 2,200 | | | 149,666 | |
Fielmann | | 25,000 | | | 1,652,890 | |
Golden Meditech a | | 200,000 | | | 35,399 | |
IDEXX Laboratories a,b | | 119,600 | | | 5,525,520 | |
STERIS Corporation | | 98,600 | | | 2,571,488 | |
Straumann Holding | | 6,700 | | | 1,222,565 | |
Urologix a,b | | 445,500 | | | 552,420 | |
Young Innovations | | 62,550 | | | 1,362,965 | |
Zoll Medical a | | 400 | | | 7,736 | |
| | | | |
| |
| | | | | | 18,836,006 | |
| | | | |
| |
| Personal Care - 0.0% | | | | | | |
Chattem a,b | | 3,000 | | | 204,300 | |
| | | | |
| |
| Total (Cost $33,501,982) | | | | | 40,668,217 | |
| | | | |
| |
| Industrial Products – 20.1% | | | | | | |
| Automotive - 1.6% | | | | | | |
Dongfeng Motor Group | | 90,000 | | | 76,148 | |
Gentex Corporation | | 47,500 | | | 551,000 | |
Great Wall Motor | | 136,000 | | | 107,643 | |
LKQ Corporation a | | 310,000 | | | 5,099,500 | |
Minth Group | | 186,600 | | | 154,869 | |
Nokian Renkaat | | 82,000 | | | 1,546,090 | |
Norstar Founders Group a,d | | 524,000 | | | 24,679 | |
| 22 | 2009 Semiannual Report to Stockholders | | THE ACCOMPANYING NOTES ARE AN INTEGRAL PART OF THESE FINANCIAL STATEMENTS. |
June 30, 2009 (unaudited) |
|
| | | SHARES | | VALUE | |
| | | | | | | |
| Industrial Products (continued) | | | | | | |
| Automotive (continued) | | | | | | |
SORL Auto Parts a,b | | 26,423 | | $ | 100,936 | |
Superior Industries International | | 40,000 | | | 564,000 | |
WABCO Holdings | | 103,800 | | | 1,837,260 | |
Wonder Auto Technology a,b | | 9,600 | | | 97,248 | |
Xinyi Glass Holdings | | 260,000 | | | 223,682 | |
| | | | |
| |
| | | | | | 10,383,055 | |
| | | | |
| |
| Building Systems and Components - 1.9% | | | | | | |
Armstrong World Industries a | | 81,000 | | | 1,335,690 | |
Decker Manufacturing | | 6,022 | | | 78,888 | |
NCI Building Systems a,b | | 13,900 | | | 36,696 | |
Preformed Line Products | | 91,600 | | | 4,035,896 | |
Simpson Manufacturing | | 306,900 | | | 6,635,178 | |
Somfy | | 3,000 | | | 524,319 | |
| | | | |
| |
| | | | | | 12,646,667 | |
| | | | |
| |
| Construction Materials - 1.7% | | | | | | |
Ash Grove Cement Cl. B | | 50,518 | | | 9,345,830 | |
Owens Corning a,b | | 25,000 | | | 319,500 | |
Pretoria Portland Cement | | 287,240 | | | 1,082,340 | |
USG Corporation a,b | | 50,000 | | | 503,500 | |
| | | | |
| |
| | | | | | 11,251,170 | |
| | | | |
| |
| Industrial Components - 2.5% | | | | | | |
BYD Company a | | 7,000 | | | 28,313 | |
CLARCOR | | 92,500 | | | 2,700,075 | |
Donaldson Company | | 92,800 | | | 3,214,592 | |
GrafTech International a | | 273,490 | | | 3,093,172 | |
II-VI a | | 13,500 | | | 299,295 | |
Mueller Water Products Cl. A | | 72,500 | | | 271,150 | |
PerkinElmer | | 185,800 | | | 3,232,920 | |
Powell Industries a | | 92,400 | | | 3,425,268 | |
| | | | |
| |
| | | | | | 16,264,785 | |
| | | | |
| |
| Machinery - 4.0% | | | | | | |
Astec Industries a | | 52,300 | | | 1,552,787 | |
Baldor Electric | | 62,900 | | | 1,496,391 | |
Burckhardt Compression Holding | | 12,000 | | | 1,554,827 | |
Burnham Holdings Cl. B | | 36,000 | | | 316,800 | |
†Columbus McKinnon a | | 75,500 | | | 955,075 | |
Franklin Electric | | 104,600 | | | 2,711,232 | |
Hardinge | | 26,193 | | | 111,320 | |
HLS Systems International a | | 51,755 | | | 300,179 | |
Jinpan International | | 10,515 | | | 301,150 | |
Lincoln Electric Holdings | | 104,180 | | | 3,754,647 | |
Lonking Holdings | | 60,000 | | | 29,527 | |
Manitou BF a | | 102,200 | | | 1,219,646 | |
Nordson Corporation | | 137,200 | | | 5,304,152 | |
Shanghai Prime Machinery | | 450,000 | | | 82,497 | |
Spirax-Sarco Engineering | | 121,000 | | | 1,684,342 | |
Takatori Corporation a | | 40,000 | | | 107,693 | |
Wasion Group Holdings | | 50,000 | | | 37,347 | |
Williams Controls a | | 37,499 | | | 234,744 | |
Woodward Governor | | 231,600 | | | 4,585,680 | |
| | | | |
| |
| | | | | | 26,340,036 | |
| | | | |
| |
| Metal Fabrication and Distribution - 2.8% | | | | | | |
Central Steel & Wire | | 6,062 | | | 3,940,300 | |
| | | SHARES | | VALUE | |
| | | | | | | |
| Industrial Products (continued) | | | | | | |
| Metal Fabrication and Distribution (continued) | | | | | | |
Commercial Metals | | 36,600 | | $ | 586,698 | |
CompX International Cl. A | | 185,300 | | | 1,150,713 | |
Fushi Copperweld a,b | | 12,645 | | | 104,574 | |
NN a | | 197,100 | | | 331,128 | |
RBC Bearings a | | 55,000 | | | 1,124,750 | |
Reliance Steel & Aluminum | | 74,820 | | | 2,872,340 | |
Schnitzer Steel Industries Cl. A | | 100,000 | | | 5,286,000 | |
Sims Metal Management ADR | | 155,075 | | | 3,197,646 | |
| | | | |
| |
| | | | | | 18,594,149 | |
| | | | |
| |
| Miscellaneous Manufacturing - 2.7% | | | | | | |
Barnes Group | | 20,000 | | | 237,800 | |
Brady Corporation Cl. A | | 138,400 | | | 3,476,608 | |
China Automation Group | | 480,500 | | | 186,101 | |
Matthews International Cl. A | | 37,000 | | | 1,151,440 | |
Mettler-Toledo International a | | 33,500 | | | 2,584,525 | |
PMFG a | | 383,200 | | | 3,375,992 | |
Rational | | 14,000 | | | 1,615,006 | |
Raven Industries | | 86,200 | | | 2,206,720 | |
Semperit AG Holding | | 44,500 | | | 1,189,925 | |
Synalloy Corporation | | 198,800 | | | 1,650,040 | |
| | | | |
| |
| | | | | | 17,674,157 | |
| | | | |
| |
| Paper and Packaging - 0.3% | | | | | | |
Greif Cl. A | | 3,600 | | | 159,192 | |
Mayr-Melnhof Karton | | 23,000 | | | 1,940,050 | |
| | | | |
| |
| | | | | | 2,099,242 | |
| | | | |
| |
| Pumps, Valves and Bearings - 1.1% | | | | | | |
Graco | | 119,625 | | | 2,634,143 | |
IDEX Corporation | | 86,500 | | | 2,125,305 | |
Pfeiffer Vacuum Technology | | 34,595 | | | 2,538,195 | |
| | | | |
| |
| | | | | | 7,297,643 | |
| | | | |
| |
| Specialty Chemicals and Materials - 1.2% | | | | | | |
Cabot Corporation | | 121,000 | | | 1,522,180 | |
China Sky Chemical Fibre a | | 255,000 | | | 27,823 | |
Hawkins | | 206,878 | | | 4,671,305 | |
Kingboard Chemical Holdings | | 72,900 | | | 181,958 | |
Migao Corporation a | | 6,600 | | | 43,691 | |
Victrex | | 147,000 | | | 1,367,133 | |
| | | | |
| |
| | | | | | 7,814,090 | |
| | | | |
| |
| Textiles - 0.1% | | | | | | |
Pacific Textile Holdings | | 720,000 | | | 199,132 | |
Unifi a | | 121,000 | | | 171,820 | |
| | | | |
| |
| | | | | | 370,952 | |
| | | | |
| |
| Other Industrial Products - 0.2% | | | | | | |
China Fire & Security Group a,b | | 6,300 | | | 76,671 | |
Harbin Electric a,b | | 9,000 | | | 140,760 | |
Vacon | | 33,500 | | | 1,116,594 | |
| | | | |
| |
| | | | | | 1,334,025 | |
| | | | |
| |
| Total (Cost $98,785,756) | | | | | 132,069,971 | |
| | | | |
| |
| Industrial Services – 16.8% | | | | | | |
| Advertising and Publishing - 0.4% | | | | | | |
Airmedia Group ADR a | | 16,700 | | | 107,548 | |
Lamar Advertising Cl. A a | | 51,000 | | | 778,770 | |
| THE ACCOMPANYING NOTES ARE AN INTEGRAL PART OF THESE FINANCIAL STATEMENTS. | | 2009 Semiannual Report to Stockholders | 23 |
| | | SHARES | | VALUE | |
| | | | | | | |
| Industrial Services (continued) | | | | | | |
| Advertising and Publishing (continued) | | | | | | |
SinoMedia Holding | | 350,000 | | $ | 81,622 | |
Sun-Times Media Group Cl. A a,b | | 180,000 | | | 1,080 | |
ValueClick a | | 145,000 | | | 1,525,400 | |
Voyager Learning a | | 150,000 | | | 517,500 | |
| | | | |
| |
| | | | | | 3,011,920 | |
| | | | |
| |
| Commercial Services - 9.2% | | | | | | |
Animal Health International a,b | | 19,000 | | | 29,450 | |
ChinaCast Education a,b | | 11,900 | | | 84,728 | |
Convergys Corporation a,b | | 121,000 | | | 1,122,880 | |
Copart a | | 131,100 | | | 4,545,237 | |
Corinthian Colleges a,b | | 189,400 | | | 3,206,542 | |
CRA International a | | 54,587 | | | 1,515,335 | |
Diamond Management & Technology Consultants | | 80,400 | | | 337,680 | |
Epure International | | 50,000 | | | 15,421 | |
Forrester Research a | | 40,300 | | | 989,365 | |
Gartner a | | 213,000 | | | 3,250,380 | |
Global Sources a,b | | 12,536 | | | 90,385 | |
Hackett Group a,b | | 655,000 | | | 1,526,150 | |
Hewitt Associates Cl. A a | | 140,720 | | | 4,190,642 | |
ITT Educational Services a | | 21,000 | | | 2,113,860 | |
Landauer | | 83,900 | | | 5,146,426 | |
Manpower | | 62,600 | | | 2,650,484 | |
ManTech International Cl. A a | | 35,400 | | | 1,523,616 | |
MAXIMUS | | 124,900 | | | 5,152,125 | |
Michael Page International | | 365,000 | | | 1,439,735 | |
Monster Worldwide a,b | | 47,800 | | | 564,518 | |
MPS Group a | | 564,600 | | | 4,313,544 | |
Ritchie Bros. Auctioneers | | 375,200 | | | 8,798,440 | |
Robert Half International | | 70,000 | | | 1,653,400 | |
Sotheby’s | | 371,600 | | | 5,243,276 | |
Spherion Corporation a,b | | 62,800 | | | 258,736 | |
TeleTech Holdings a | | 10,000 | | | 151,500 | |
Watson Wyatt Worldwide Cl. A | | 20,500 | | | 769,365 | |
| | | | |
| |
| | | | | | 60,683,220 | |
| | | | |
| |
| Engineering and Construction - 1.4% | | | | | | |
Desarrolladora Homex ADR a,b | | 14,100 | | | 393,249 | |
Integrated Electrical Services a,b | | 355,400 | | | 2,775,674 | |
KBR | | 180,000 | | | 3,319,200 | |
NVR a,b | | 5,000 | | | 2,511,950 | |
| | | | |
| |
| | | | | | 9,000,073 | |
| | | | |
| |
| Food, Tobacco and Agriculture - 0.6% | | | | | | |
Agria Corporation ADR a,b | | 25,000 | | | 52,250 | |
Alico | | 27,000 | | | 810,540 | |
Chaoda Modern Agriculture | | 235,872 | | | 139,755 | |
China Green (Holdings) | | 289,700 | | | 303,990 | |
China Milk Products Group | | 105,000 | | | 28,946 | |
Genting Plantations | | 50,000 | | | 78,065 | |
Hanfeng Evergreen a | | 13,500 | | | 68,594 | |
†Intrepid Potash a | | 57,427 | | | 1,612,550 | |
MGP Ingredients a | | 127,400 | | | 364,364 | |
Nutreco Holding | | 58 | | | 2,263 | |
Origin Agritech a,b | | 97,500 | | | 452,400 | |
Want Want China Holdings | | 60,000 | | | 33,578 | |
| | | SHARES | | VALUE | |
| | | | | | | |
| Industrial Services (continued) | | | | | | |
| Food, Tobacco and Agriculture (continued) | | | | | | |
Zhongpin a,b | | 4,800 | | $ | 49,728 | |
| | | | |
| |
| | | | | | 3,997,023 | |
| | | | |
| |
| Industrial Distribution - 0.8% | | | | | | |
Lawson Products | | 161,431 | | | 2,293,934 | |
MSC Industrial Direct Cl. A | | 80,600 | | | 2,859,688 | |
| | | | |
| |
| | | | | | 5,153,622 | |
| | | | |
| |
| Transportation and Logistics - 4.4% | | | | | | |
Alexander & Baldwin | | 60,000 | | | 1,406,400 | |
C. H. Robinson Worldwide | | 56,000 | | | 2,920,400 | |
Expeditors International of Washington | | 6,000 | | | 200,040 | |
Forward Air | | 269,750 | | | 5,751,070 | |
Frozen Food Express Industries | | 286,635 | | | 911,499 | |
Hub Group Cl. A a | | 174,400 | | | 3,599,616 | |
Landstar System | | 133,200 | | | 4,783,212 | |
Pacific Basin Shipping a | | 10,000 | | | 6,308 | |
Patriot Transportation Holding a | | 70,986 | | | 5,177,009 | |
Universal Truckload Services | | 120,100 | | | 1,879,565 | |
UTI Worldwide a | | 175,000 | | | 1,995,000 | |
| | | | |
| |
| | | | | | 28,630,119 | |
| | | | |
| |
| Total (Cost $93,168,736) | | | | | 110,475,977 | |
| | | | |
| |
| Natural Resources – 8.4% | | | | | | |
| Energy Services - 4.3% | | | | | | |
Cal Dive International a | | 50,000 | | | 431,500 | |
CARBO Ceramics | | 109,700 | | | 3,751,740 | |
Core Laboratories | | 10,000 | | | 871,500 | |
Ensign Energy Services | | 225,100 | | | 3,289,946 | |
Exterran Holdings a | | 103,600 | | | 1,661,744 | |
Helmerich & Payne | | 66,200 | | | 2,043,594 | |
ION Geophysical a,b | | 464,500 | | | 1,193,765 | |
Jutal Offshore Oil Services a | | 120,000 | | | 12,787 | |
Major Drilling Group International | | 121,200 | | | 1,902,688 | |
Pason Systems | | 163,000 | | | 1,313,081 | |
RPC | | 25,000 | | | 208,750 | |
SEACOR Holdings a | | 101,300 | | | 7,621,812 | |
TETRA Technologies a,b | | 68,000 | | | 541,280 | |
Trican Well Service | | 99,900 | | | 860,592 | |
Unit Corporation a | | 50,000 | | | 1,378,500 | |
Willbros Group a,b | | 103,800 | | | 1,298,538 | |
Yingli Green Energy Holding ADR a,b | | 800 | | | 10,840 | |
| | | | |
| |
| | | | | | 28,392,657 | |
| | | | |
| |
| Oil and Gas - 0.7% | | | | | | |
Bill Barrett a | | 50,000 | | | 1,373,000 | |
Cimarex Energy | | 95,490 | | | 2,706,187 | |
CNPC Hong Kong | | 110,000 | | | 92,130 | |
Penn Virginia | | 22,880 | | | 374,546 | |
PetroCorp a,d | | 61,400 | | | 0 | |
| | | | |
| |
| | | | | | 4,545,863 | |
| | | | |
| |
| Precious Metals and Mining - 1.9% | | | | | | |
Etruscan Resources a | | 745,900 | | | 128,255 | |
Gammon Gold a | | 198,300 | | | 1,322,661 | |
Golden Star Resources a,b | | 350,000 | | | 717,500 | |
Harry Winston Diamond | | 10,000 | | | 59,600 | |
| 24 | 2009 Semiannual Report to Stockholders | | THE ACCOMPANYING NOTES ARE AN INTEGRAL PART OF THESE FINANCIAL STATEMENTS. |
June 30, 2009 (unaudited) |
|
| | | SHARES | | VALUE | |
| | | | | | | |
| Natural Resources (continued) | | | | | | |
| Precious Metals and Mining (continued) | | | | | | |
Hecla Mining a,b | | 528,600 | | $ | 1,416,648 | |
IAMGOLD Corporation | | 235,620 | | | 2,384,474 | |
Kimber Resources a,b | | 560,000 | | | 274,400 | |
New Gold a,b | | 640,000 | | | 1,708,800 | |
Northam Platinum | | 463,000 | | | 1,805,285 | |
Northgate Minerals a | | 140,000 | | | 299,600 | |
NovaGold Resources a,b | | 70,000 | | | 299,600 | |
Pan American Silver a | | 41,000 | | | 751,530 | |
Royal Gold | | 34,400 | | | 1,434,480 | |
Yanzhou Coal Mining ADR | | 8,000 | | | 110,080 | |
Zhaojin Mining Industry | | 15,000 | | | 24,281 | |
| | | | |
| |
| | | | | | 12,737,194 | |
| | | | |
| |
| Real Estate - 1.5% | | | | | | |
Consolidated-Tomoka Land | | 13,564 | | | 475,825 | |
PICO Holdings a | | 75,200 | | | 2,158,240 | |
St. Joe Company (The) a,b | | 174,100 | | | 4,611,909 | |
Tejon Ranch a,b | | 89,000 | | | 2,357,610 | |
| | | | |
| |
| | | | | | 9,603,584 | |
| | | | |
| |
| Other Natural Resources - 0.0% | | | | | | |
Hidili Industry International | | | | | | |
Development a | | 200,000 | | | 158,205 | |
Jiangxi Copper | | 47,000 | | | 76,479 | |
| | | | |
| |
| | | | | | 234,684 | |
| | | | |
| |
| Total (Cost $55,187,192) | | | | | 55,513,982 | |
| | | | |
| |
| Technology – 21.1% | | | | | | |
| Aerospace and Defense - 1.3% | | | | | | |
AerCap Holdings a | | 45,000 | | | 324,900 | |
Ducommun | | 117,200 | | | 2,202,188 | |
HEICO Corporation | | 119,700 | | | 4,340,322 | |
HEICO Corporation Cl. A | | 48,200 | | | 1,410,332 | |
Hexcel Corporation a | | 47,500 | | | 452,675 | |
| | | | |
| |
| | | | | | 8,730,417 | |
| | | | |
| |
| Components and Systems - 5.6% | | | | | | |
AAC Acoustic Technologies Holdings | | 180,700 | | | 143,406 | |
Analogic Corporation | | 40,135 | | | 1,482,988 | |
Belden | | 57,800 | | | 965,260 | |
Benchmark Electronics a | | 165,200 | | | 2,378,880 | |
Checkpoint Systems a | | 56,060 | | | 879,582 | |
China Digital TV Holding Company ADR | | 5,000 | | | 43,700 | |
China Security & Surveillance Technology a,b | | 6,000 | | | 45,240 | |
Diebold | | 73,600 | | | 1,940,096 | |
Dionex Corporation a | | 81,000 | | | 4,943,430 | |
Electronics for Imaging a,b | | 25,000 | | | 266,500 | |
Energy Conversion Devices a,b | | 84,500 | | | 1,195,675 | |
Intermec a | | 23,000 | | | 296,700 | |
Newport Corporation a | | 537,200 | | | 3,110,388 | |
Perceptron a | | 357,700 | | | 1,230,488 | |
Plexus Corporation a | | 264,700 | | | 5,415,762 | |
Richardson Electronics | | 520,712 | | | 1,702,728 | |
Technitrol | | 261,200 | | | 1,689,964 | |
Teradata Corporation a | | 82,500 | | | 1,932,975 | |
Vaisala Cl. A | | 96,000 | | | 3,394,146 | |
| | | SHARES | | VALUE | |
| | | | | | | |
| Technology (continued) | | | | | | |
| Components and Systems (continued) | | | | | | |
Vishay Intertechnology a | | 186,000 | | $ | 1,262,940 | |
VTech Holdings | | 42,500 | | | 291,308 | |
Zebra Technologies Cl. A a | | 83,025 | | | 1,964,372 | |
| | | | |
| |
| | | | | | 36,576,528 | |
| | | | |
| |
| Distribution - 0.9% | | | | | | |
Agilysys | | 165,125 | | | 772,785 | |
Anixter International a | | 61,795 | | | 2,322,874 | |
China 3C Group a | | 6,600 | | | 4,884 | |
Tech Data a | | 86,500 | | | 2,829,415 | |
| | | | |
| |
| | | | | | 5,929,958 | |
| | | | |
| |
| Internet Software and Services - 0.2% | | | | | | |
DealerTrack Holdings a,b | | 45,000 | | | 765,000 | |
NetEase.com ADR a,b | | 3,500 | | | 123,130 | |
NHN Corporation a | | 300 | | | 41,452 | |
Perficient a | | 10,000 | | | 69,900 | |
RealNetworks a | | 245,400 | | | 733,746 | |
| | | | |
| |
| | | | | | 1,733,228 | |
| | | | |
| |
| IT Services - 2.8% | | | | | | |
Alten a | | 70,000 | | | 1,171,700 | |
AsiaInfo Holdings a | | 11,680 | | | 201,013 | |
Black Box | | 42,300 | | | 1,415,781 | |
DST Systems a,b | | 5,000 | | | 184,750 | |
Metavante Technologies a,b | | 20,000 | | | 517,200 | |
Sapient Corporation a | | 806,602 | | | 5,073,527 | |
SRA International Cl. A a | | 190,800 | | | 3,350,448 | |
Syntel | | 152,679 | | | 4,800,228 | |
Total System Services | | 106,000 | | | 1,419,340 | |
Yucheng Technologies a,b | | 15,400 | | | 131,362 | |
| | | | |
| |
| | | | | | 18,265,349 | |
| | | | |
| |
| Semiconductors and Equipment - 4.0% | | | | | | |
Analog Devices | | 30,000 | | | 743,400 | |
ASM Pacific Technology | | 21,400 | | | 110,111 | |
BE Semiconductor Industries a,b | | 58,000 | | | 162,400 | |
Brooks Automation a | | 5,152 | | | 23,081 | |
Cognex Corporation | | 236,200 | | | 3,337,506 | |
Coherent a,b | | 215,500 | | | 4,456,540 | |
Diodes a,b | | 252,450 | | | 3,948,318 | |
Exar Corporation a | | 157,576 | | | 1,132,971 | |
Himax Technologies ADR | | 80,500 | | | 301,875 | |
Image Sensing Systems a | | 8,310 | | | 77,283 | |
International Rectifier a | | 120,000 | | | 1,777,200 | |
Intevac a | | 57,450 | | | 500,390 | |
Power Integrations | | 49,000 | | | 1,165,710 | |
Rofin-Sinar Technologies a | | 274,700 | | | 5,496,747 | |
Semitool a | | 50,000 | | | 231,000 | |
TTM Technologies a | | 221,400 | | | 1,762,344 | |
Varian a | | 2,000 | | | 78,860 | |
Vimicro International ADR a | | 270,000 | | | 540,000 | |
Virage Logic a,b | | 120,000 | | | 540,000 | |
| | | | |
| |
| | | | | | 26,385,736 | |
| | | | |
| |
| Software - 4.6% | | | | | | |
ACI Worldwide a | | 201,150 | | | 2,808,054 | |
Advent Software a,b | | 162,900 | | | 5,341,491 | |
ANSYS a,b | | 100,000 | | | 3,116,000 | |
| THE ACCOMPANYING NOTES ARE AN INTEGRAL PART OF THESE FINANCIAL STATEMENTS. | | 2009 Semiannual Report to Stockholders | 25 |
Royce Value Trust | June 30, 2009 (unaudited) |
|
| | | SHARES | | VALUE | |
| | | | | | | |
| Technology (continued) | | | | | | |
| Software (continued) | | | | | | |
Aspen Technology a | | 42,100 | | $ | 358,692 | |
Avid Technology a | | 186,000 | | | 2,494,260 | |
Blackbaud | | 36,890 | | | 573,640 | |
Epicor Software a | | 79,900 | | | 423,470 | |
Fair Isaac | | 59,500 | | | 919,870 | |
JDA Software Group a | | 99,900 | | | 1,494,504 | |
Majesco Entertainment a | | 36,255 | | | 70,697 | |
MSC.Software a | | 146,900 | | | 978,354 | |
National Instruments | | 82,900 | | | 1,870,224 | |
Net 1 UEPS Technologies a,b | | 50,000 | | | 679,500 | |
Pegasystems | | 16,200 | | | 427,356 | |
PLATO Learning a | | 149,642 | | | 598,568 | |
†Rosetta Stone a,b | | 5,000 | | | 137,200 | |
SPSS a | | 179,600 | | | 5,993,252 | |
Sybase a | | 57,600 | | | 1,805,184 | |
THQ a | | 20,000 | | | 143,200 | |
| | | | |
| |
| | | | | | 30,233,516 | |
| | | | |
| |
| Telecommunications - 1.7% | | | | | | |
Adaptec a | | 1,743,100 | | | 4,619,215 | |
ADTRAN | | 65,000 | | | 1,395,550 | |
Globecomm Systems a | | 233,700 | | | 1,680,303 | |
LiveWire Mobile a | | 380,000 | | | 62,700 | |
Sonus Networks a,b | | 454,000 | | | 730,940 | |
Sycamore Networks a | | 221,000 | | | 691,730 | |
Tandberg | | 92,500 | | | 1,561,586 | |
Zhone Technologies a | | 1,120,000 | | | 358,400 | |
| | | | |
| |
| | | | | | 11,100,424 | |
| | | | |
| |
| Total (Cost $156,430,021) | | | | | 138,955,156 | |
| | | | |
| |
| Miscellaneouse – 4.7% | | | | | | |
| Total (Cost $26,802,244) | | | | | 30,903,094 | |
| | | | |
| |
| TOTAL COMMON STOCKS | | | | | | |
(Cost $783,071,331) | | | | | 763,311,955 | |
| | | | |
| |
| | | SHARES | | VALUE | |
| | | | | | | |
| PREFERRED STOCKS – 0.7% | | | | | | |
Duratex | | 182,400 | | $ | 2,020,875 | |
Seneca Foods Conv. a,d | | 85,000 | | | 2,556,630 | |
| | | | |
| |
| TOTAL PREFERRED STOCKS | | | | | | |
(Cost $4,237,076) | | | | | 4,577,505 | |
| | | | |
| |
| REPURCHASE AGREEMENT – 16.6% | | | | | | |
State Street Bank & Trust Company, 0.01% dated 6/30/09, due 7/1/09, maturity value $108,658,030 (collateralized by obligations of various U.S. Government Agencies, 4.375% due 3/17/10-3/31/10, valued at $111,379,100)
(Cost $108,658,000) | | | | | 108,658,000 | |
| | | | |
| |
| COLLATERAL RECEIVED FOR SECURITIES LOANED – 5.3% | | | | | | |
Money Market Funds Federated Government Obligations Fund
(7 day yield-0.1864%)
(Cost $34,913,256) | | | | | 34,913,256 | |
| | | | |
| |
| TOTAL INVESTMENTS – 138.8% | | | | | | |
(Cost $930,879,663) | | | | | 911,460,716 | |
| | | | | | | |
| LIABILITIES LESS CASH AND OTHER ASSETS – (5.3)% | | | | | (34,784,694 | ) |
| | | | | | | |
| PREFERRED STOCK – (33.5)% | | | | | (220,000,000 | ) |
| | | | |
| |
| | | | | | | |
| NET ASSETS APPLICABLE TO COMMON STOCKHOLDERS – 100.0% | | $ | 656,676,022 | |
| | | | |
| |
|
| † | | New additions in 2009. |
| a | | Non-income producing. |
| b | | All or a portion of these securities were on loan at June 30, 2009. Total market value of loaned securities at June 30, 2009 was $33,354,410. |
| c | | At June 30, 2009, the Fund owned 5% or more of the Company’s outstanding voting securities thereby making the Company an Affiliated Company as that term is defined in the Investment Company Act of 1940. See notes to financial statements. |
| d | | Securities for which market quotations are not readily available represent 0.4% of net assets. These securities have been valued at their fair value under procedures established by the Fund’s Board of Directors. |
| e | | Includes securities first acquired in 2009 and less than 1% of net assets applicable to Common Stockholders. |
| | | Bold indicates the Fund’s 20 largest equity holdings in terms of June 30, 2009 market value. |
| | | |
| TAX INFORMATION: The cost of total investments for Federal income tax purposes was $932,691,425. At June 30, 2009, net unrealized depreciation for all securities was $(21,230,709), consisting of aggregate gross unrealized appreciation of $181,148,105 and aggregate gross unrealized depreciation of $202,378,814. The primary difference between book and tax basis cost is the timing of the recognition of losses on securities sold. |
|
| 26 | 2009 Semiannual Report to Stockholders | | THE ACCOMPANYING NOTES ARE AN INTEGRAL PART OF THESE FINANCIAL STATEMENTS. |
Royce Value Trust | June 30, 2009 (unaudited) |
|
Statement of Assets and Liabilities |
| | | | | |
| ASSETS: | | | | |
| Investments at value (including collateral on loaned securities)* | | | | |
Non-Affiliated Companies (cost $816,483,347) | | $ | 800,878,996 | |
Affiliated Companies (cost $5,738,316) | | | 1,923,720 | |
|
| Total investments at value | | | 802,802,716 | |
| Repurchase agreements (at cost and value) | | | 108,658,000 | |
| Cash and foreign currency | | | 52,458 | |
| Receivable for investments sold | | | 1,439,059 | |
| Receivable for dividends and interest | | | 778,929 | |
| Prepaid expenses and other assets | | | 222,914 | |
|
Total Assets | | | 913,954,076 | |
|
| LIABILITIES: | | | | |
| Payable for collateral on loaned securities | | | 34,913,256 | |
| Payable for investments purchased | | | 1,831,288 | |
| Preferred dividends accrued but not yet declared | | | 288,447 | |
| Accrued expenses | | | 245,063 | |
|
Total Liabilities | | | 37,278,054 | |
|
| PREFERRED STOCK: | | | | |
| 5.90% Cumulative Preferred Stock - $0.001 par value, $25 liquidation value per share; 8,800,000 shares outstanding | | | 220,000,000 | |
|
Total Preferred Stock | | | 220,000,000 | |
|
| NET ASSETS APPLICABLE TO COMMON STOCKHOLDERS | | $ | 656,676,022 | |
|
| ANALYSIS OF NET ASSETS APPLICABLE TO COMMON STOCKHOLDERS: | | | | |
| Common Stock paid-in capital - $0.001 par value per share; 66,023,310 shares outstanding (150,000,000 shares authorized) | | $ | 804,410,997 | |
| Undistributed net investment income (loss) | | | 8,762,588 | |
| Accumulated net realized gain (loss) on investments and foreign currency | | | (109,698,453 | ) |
| Net unrealized appreciation (depreciation) on investments and foreign currency | | | (19,420,227 | ) |
| Unallocated and accrued distributions | | | (27,378,883 | ) |
|
Net Assets applicable to Common Stockholders (net asset value per share - $9.95) | | $ | 656,676,022 | |
|
| *Investments at identified cost (including $34,913,256 of collateral on loaned securities) | | $ | 822,221,663 | |
| Market value of loaned securities | | | 33,354,410 | |
| THE ACCOMPANYING NOTES ARE AN INTEGRAL PART OF THESE FINANCIAL STATEMENTS. | | 2009 Semiannual Report to Stockholders | 27 |
Royce Value Trust | Six Months Ended June 30, 2009 (unaudited) |
|
| INVESTMENT INCOME: | | | | |
| Income: | | | | |
Dividends* | | | | |
Non-Affiliated Companies | | $ | 5,620,120 | |
Affiliated Companies | | | 103,224 | |
Interest | | | 61,026 | |
Securities lending | | | 192,610 | |
|
| Total income | | | 5,976,980 | |
|
| Expenses: | | | | |
Stockholder reports | | | 219,520 | |
Custody and transfer agent fees | | | 90,611 | |
Administrative and office facilities expenses | | | 64,148 | |
Directors’ fees | | | 52,547 | |
Professional fees | | | 42,915 | |
Other expenses | | | 75,879 | |
|
| Total expenses | | | 545,620 | |
|
| Net investment income (loss) | | | 5,431,360 | |
|
| REALIZED AND UNREALIZED GAIN (LOSS) ON INVESTMENTS AND FOREIGN CURRENCY: | | | | |
| Net realized gain (loss): | | | | |
Investments in Non-Affiliated Companies | | | (83,000,452 | ) |
Investments in Affiliated Companies | | | (2,488,607 | ) |
Foreign currency transactions | | | (4,955 | ) |
| Net change in unrealized appreciation (depreciation): | | | | |
Investments and foreign currency translations | | | 150,595,974 | |
Other assets and liabilities denominated in foreign currency | | | 2,304 | |
|
| Net realized and unrealized gain (loss) on investments and foreign currency | | | 65,104,264 | |
|
| NET INCREASE (DECREASE) IN NET ASSETS RESULTING FROM INVESTMENT OPERATIONS | | | 70,535,624 | |
|
| DISTRIBUTIONS TO PREFERRED STOCKHOLDERS | | | (6,490,000 | ) |
|
| NET INCREASE (DECREASE) IN NET ASSETS APPLICABLE TO COMMON STOCKHOLDERS RESULTING FROM INVESTMENT OPERATIONS | | $ | 64,045,624 | |
| * Net of foreign withholding tax of $268,250. | | | | |
| 28 | 2009 Semiannual Report to Stockholders | | THE ACCOMPANYING NOTES ARE AN INTEGRAL PART OF THESE FINANCIAL STATEMENTS. |
Statement of Changes in Net Assets |
| | | Six months ended | | | | |
| | | 6/30/09 | | Year ended |
| | | (unaudited) | | 12/31/08 |
| INVESTMENT OPERATIONS: | | | | | | | | |
| Net investment income (loss) | | $ | 5,431,360 | | | $ | 8,857,568 | |
| Net realized gain (loss) on investments and foreign currency | | | (85,494,014 | ) | | | 41,802,074 | |
| Net change in unrealized appreciation (depreciation) on investments and foreign currency | | | 150,598,278 | | | | (567,740,312 | ) |
|
| Net increase (decrease) in net assets resulting from investment operations | | | 70,535,624 | | | | (517,080,670 | ) |
|
| DISTRIBUTIONS TO PREFERRED STOCKHOLDERS: | | | | | | | | |
| Net investment income | | | – | | | | (621,668 | ) |
| Net realized gain on investments and foreign currency | | | – | | | | (12,358,332 | ) |
| Unallocated distributions* | | | (6,490,000 | ) | | | – | |
|
| Total distributions to Preferred Stockholders | | | (6,490,000 | ) | | | (12,980,000 | ) |
|
| NET INCREASE (DECREASE) IN NET ASSETS APPLICABLE TO COMMON STOCKHOLDERS RESULTING FROM INVESTMENT OPERATIONS | | | 64,045,624 | | | | (530,060,670 | ) |
|
| DISTRIBUTIONS TO COMMON STOCKHOLDERS: | | | | | | | | |
| Net investment income | | | – | | | | (3,638,680 | ) |
| Net realized gain on investments and foreign currency | | | – | | | | (72,334,389 | ) |
| Return of capital | | | – | | | | (29,418,267 | ) |
| Unallocated distributions* | | | (20,600,434 | ) | | | – | |
|
| Total distributions to Common Stockholders | | | (20,600,434 | ) | | | (105,391,336 | ) |
|
| CAPITAL SHARE TRANSACTIONS: | | | | | | | | |
| Reinvestment of distributions to Common Stockholders | | | 9,996,770 | | | | 54,016,743 | |
|
| Total capital stock transactions | | | 9,996,770 | | | | 54,016,743 | |
|
| NET INCREASE (DECREASE) IN NET ASSETS APPLICABLE TO COMMON STOCKHOLDERS | | | 53,441,960 | | | | (581,435,263 | ) |
|
| NET ASSETS APPLICABLE TO COMMON STOCKHOLDERS: | | | | | | | | |
Beginning of period | | | 603,234,062 | | | | 1,184,669,325 | |
|
End of period (including undistributed net investment income (loss) of $8,762,588 at 6/30/09 and $3,331,228 at 12/31/08) | | $ | 656,676,022 | | | $ | 603,234,062 | |
| * To be allocated to net investment income, net realized gains and/or return of capital at year end. |
THE ACCOMPANYING NOTES ARE AN INTEGRAL PART OF THESE FINANCIAL STATEMENTS. | | 2008 Annual Report to Stockholders | 29 |
This table is presented to show selected data for a share of Common Stock outstanding throughout each period, and to assist stockholders in evaluating the Fund’s performance for the periods presented.
| | | Six months | | Years ended December 31, |
| | | ended | |
|
| | | June 30, 2009 | | | | | | | | | | | | | | | | | | | | |
| | | (unaudited) | | | 2008 | | | | 2007 | | | | 2006 | | | | 2005 | | | | 2004 | |
|
| NET ASSET VALUE, BEGINNING OF PERIOD | | $ | 9.37 | | | $ | 19.74 | | | $ | 20.62 | | | $ | 18.87 | | | $ | 18.95 | | | $ | 17.03 | |
|
| INVESTMENT OPERATIONS: | | | | | | | | | | | | | | | | | | | | | | | | |
Net investment income (loss) | | | 0.08 | | | | 0.14 | | | | 0.09 | | | | 0.13 | | | | 0.01 | | | | (0.08 | ) |
Net realized and unrealized gain (loss) on investments and | | | | | | | | | | | | | | | | | | | | | | | | |
foreign currency | | | 0.94 | | | | (8.50 | ) | | | 1.13 | | | | 3.63 | | | | 1.75 | | | | 3.81 | |
|
Total investment operations | | | 1.02 | | | | (8.36 | ) | | | 1.22 | | | | 3.76 | | | | 1.76 | | | | 3.73 | |
|
| DISTRIBUTIONS TO PREFERRED STOCKHOLDERS: | | | | | | | | | | | | | | | | | | | | | | | | |
Net investment income | | | – | | | | (0.01 | ) | | | (0.01 | ) | | | (0.02 | ) | | | – | | | | – | |
Net realized gain on investments and foreign currency | | | – | | | | (0.20 | ) | | | (0.21 | ) | | | (0.21 | ) | | | (0.24 | ) | | | (0.26 | ) |
Unallocated distributions* | | | (0.10 | ) | | | – | | | | – | | | | – | | | | – | | | | – | |
|
Total distributions to Preferred Stockholders | | | (0.10 | ) | | | (0.21 | ) | | | (0.22 | ) | | | (0.23 | ) | | | (0.24 | ) | | | (0.26 | ) |
|
| NET INCREASE (DECREASE) IN NET ASSETS APPLICABLE TO COMMON | | | | | | | | | | | | | | | | | | | | | | | | |
STOCKHOLDERS RESULTING FROM INVESTMENT OPERATIONS | | | 0.92 | | | | (8.57 | ) | | | 1.00 | | | | 3.53 | | | | 1.52 | | | | 3.47 | |
|
| DISTRIBUTIONS TO COMMON STOCKHOLDERS: | | | | | | | | | | | | | | | | | | | | | | | | |
Net investment income | | | – | | | | (0.06 | ) | | | (0.09 | ) | | | (0.14 | ) | | | – | | | | – | |
Net realized gain on investments and foreign currency | | | – | | | | (1.18 | ) | | | (1.76 | ) | | | (1.64 | ) | | | (1.61 | ) | | | (1.55 | ) |
Return of capital | | | – | | | | (0.48 | ) | | | – | | | | – | | | | – | | | | – | |
Unallocated distributions* | | | (0.32 | ) | | | – | | | | – | | | | – | | | | – | | | | – | |
|
Total distributions to Common Stockholders | | | (0.32 | ) | | | (1.72 | ) | | | (1.85 | ) | | | (1.78 | ) | | | (1.61 | ) | | | (1.55 | ) |
|
| CAPITAL STOCK TRANSACTIONS: | | | | | | | | | | | | | | | | | | | | | | | | |
Effect of reinvestment of distributions by Common Stockholders | | | (0.02 | ) | | | (0.08 | ) | | | (0.03 | ) | | | (0.00 | ) | | | 0.01 | | | | 0.00 | |
|
Total capital stock transactions | | | (0.02 | ) | | | (0.08 | ) | | | (0.03 | ) | | | (0.00 | ) | | | 0.01 | | | | 0.00 | |
|
| NET ASSET VALUE, END OF PERIOD | | $ | 9.95 | | | $ | 9.37 | | | $ | 19.74 | | | $ | 20.62 | | | $ | 18.87 | | | $ | 18.95 | |
|
| MARKET VALUE, END OF PERIOD | | $ | 8.41 | | | $ | 8.39 | | | $ | 18.58 | | | $ | 22.21 | | | $ | 20.08 | | | $ | 20.44 | |
|
| TOTAL RETURN (a): | | | | | | | | | | | | | | | | | | | | | | | | |
| Market Value | | | 5.52 | %*** | | | (48.27 | )% | | | (8.21 | )% | | | 20.96 | % | | | 6.95 | % | | | 29.60 | % |
| Net Asset Value | | | 11.79 | %*** | | | (45.62 | )% | | | 5.04 | % | | | 19.50 | % | | | 8.41 | % | | | 21.42 | % |
| RATIOS BASED ON AVERAGE NET ASSETS APPLICABLE TO | | | | | | | | | | | | | | | | | | | | | | | | |
COMMON STOCKHOLDERS: | | | | | | | | | | | | | | | | | | | | | | | | |
| Total expenses (b,c) | | | 0.19 | %** | | | 1.39 | % | | | 1.38 | % | | | 1.29 | % | | | 1.49 | % | | | 1.51 | % |
Management fee expense (d) | | | 0.00 | %** | | | 1.27 | % | | | 1.29 | % | | | 1.20 | % | | | 1.37 | % | | | 1.39 | % |
Other operating expenses | | | 0.19 | %** | | | 0.12 | % | | | 0.09 | % | | | 0.09 | % | | | 0.12 | % | | | 0.12 | % |
Net investment income (loss) | | | 1.92 | %** | | | 0.94 | % | | | 0.43 | % | | | 0.62 | % | | | 0.03 | % | | | (0.50 | )% |
| SUPPLEMENTAL DATA: | | | | | | | | | | | | | | | | | | | | | | | | |
| Net Assets Applicable to Common Stockholders, | | | | | | | | | | | | | | | | | | | | | | | | |
End of Period (in thousands) | | $ | 656,676 | | | $ | 603,234 | | | $ | 1,184,669 | | | $ | 1,180,428 | | | $ | 1,032,120 | | | $ | 993,304 | |
| Liquidation Value of Preferred Stock, | | | | | | | | | | | | | | | | | | | | | | | | |
End of Period (in thousands) | | $ | 220,000 | | | $ | 220,000 | | | $ | 220,000 | | | $ | 220,000 | | | $ | 220,000 | | | $ | 220,000 | |
| Portfolio Turnover Rate | | | 11 | % | | | 25 | % | | | 26 | % | | | 21 | % | | | 31 | % | | | 30 | % |
| PREFERRED STOCK: | | | | | | | | | | | | | | | | | | | | | | | | |
| Total shares outstanding | | | 8,800,000 | | | | 8,800,000 | | | | 8,800,000 | | | | 8,800,000 | | | | 8,800,000 | | | | 8,800,000 | |
| Asset coverage per share | | $ | 99.62 | | | $ | 93.55 | | | $ | 159.62 | | | $ | 159.14 | | | $ | 142.29 | | | $ | 137.88 | |
| Liquidation preference per share | | $ | 25.00 | | | $ | 25.00 | | | $ | 25.00 | | | $ | 25.00 | | | $ | 25.00 | | | $ | 25.00 | |
| Average market value per share (e): | | $ | 22.37 | | | $ | 22.51 | | | $ | 23.68 | | | $ | 23.95 | | | $ | 24.75 | | | $ | 24.50 | |
|
| (a) | | The Market Value Total Return is calculated assuming a purchase of Common Stock on the opening of the first business day and a sale on the closing of the last business day of each period reported. Dividends and distributions are assumed for the purposes of this calculation to be reinvested at prices obtained under the Fund’s Distribution Reinvestment and Cash Purchase Plan. Net Asset Value Total Return is calculated on the same basis, except that the Fund’s net asset value is used on the purchase and sale dates instead of market value. |
| (b) | | Expense ratios based on total average net assets including liquidation value of Preferred Stock were 0.14%, 1.13%, 1.17%, 1.08%, 1.22% and 1.21% for the periods ended June 30, 2009 and December 31, 2008, 2007, 2006, 2005 and 2004, respectively. |
| (c) | | Expense ratios based on average net assets applicable to Common Stockholders before waiver of fees and after earnings credits would have been 0.19%, 1.39%, 1.38%, 1.29%, 1.49% and 1.51% for the periods ended June 30, 2009 and December 31, 2008, 2007, 2006, 2005 and 2004, respectively. |
| (d) | | The management fee is calculated based on average net assets over a rolling 60-month basis, while the above ratios of management fee expenses are based on the average net assets applicable to Common Stockholders over a 12-month basis. |
| (e) | | The average of month-end market values during the period that the 5.90% Preferred Stock was outstanding. |
| * | | To be allocated to net investment income, net realized gains and/or return of capital at year end. |
| ** | | Annualized. |
| *** | | Not Annualized. |
| 30 | 2009 Semiannual Report to Stockholders | | THE ACCOMPANYING NOTES ARE AN INTEGRAL PART OF THESE FINANCIAL STATEMENTS. |
Notes to Financial Statements (unaudited) |
| Summary of Significant Accounting Policies: |
| Royce Value Trust, Inc. (the “Fund”), was incorporated under the laws of the State of Maryland on July 1, 1986 as a diversified closed-end investment company. The Fund commenced operations on November 26, 1986. |
| The preparation of financial statements in conformity with accounting principles generally accepted in the United States of America requires management to make estimates and assumptions that affect the reported amounts of assets and liabilities and the disclosure of contingent assets and liabilities at the date of the financial statements and the evaluation of subsequent events through August 13, 2009, the issuance date of the financial statements, and the reported amounts of income and expenses during the reporting period. Actual results could differ from those estimates. |
| |
| Valuation of Investments: |
| Securities are valued as of the close of trading on the New York Stock Exchange (NYSE) (generally 4:00 p.m. Eastern time) on the valuation date. Securities that trade on an exchange, and securities traded on Nasdaq’s Electronic Bulletin Board, are valued at their last reported sales price or Nasdaq official closing price taken from the primary market in which each security trades or, if no sale is reported for such day, at their bid price. Other over-the-counter securities for which market quotations are readily available are valued at their highest bid price, except in the case of some bonds and other fixed income securities which may be valued by reference to other securities with comparable ratings, interest rates and maturities, using established independent pricing services. The Fund values its non-U.S. dollar denominated securities in U.S. dollars daily at the prevailing foreign currency exchange rates as quoted by a major bank. Securities for which market quotations are not readily available are valued at their fair value under procedures established by the Fund’s Board of Directors. In addition, if, between the time trading ends on a particular security and the close of the customary trading session on the NYSE, events occur that are significant and may make the closing price unreliable, the Fund may fair value the security. The Fund uses an independent pricing service to provide fair value estimates for relevant non-U.S. equity securities on days when the U.S. market volatility exceeds a certain threshold. This pricing service uses proprietary correlations it has developed between the movement of prices of non-U.S. equity securities and indices of U.S.-traded securities, futures contracts and other indications to estimate the fair value of relevant non-U.S. securities. When fair value pricing is employed, the prices of securities used by the Fund may differ from quoted or published prices for the same security. Investments in money market funds are valued at net asset value per share. |
| Various inputs are used in determining the value of the Fund’s investments, as noted above. These inputs are summarized in the three broad levels below: |
| Level 1 – quoted prices in active markets for identical securities |
| Level 2 – other significant observable inputs (including quoted prices for similar securities, foreign securities that may be fair valued and repurchase agreements) |
| Level 3 – significant unobservable inputs (including the Fund’s own assumptions in determining the fair value of investments) |
| The inputs or methodology used for valuing securities are not necessarily an indication of the risk associated with investing in those securities. |
| | The following is a summary of the inputs used to value the Fund’s investments as of June 30, 2009: |
| | | Level 1 | | | Level 2 | | | Level 3 | | | Total |
|
| Equities | | $644,476,958 | | | $120,826,955 | | | $2,585,547 | | | $767,889,460 |
| Cash Equivalents | | - | | | 143,571,256 | | | - | | | 143,571,256 |
|
Level 3 Reconciliation:
| | | | | | Change in | | | | | | | | | | | | | | | |
| | | | | | unrealized | | | | | | | | | | | | | | | |
| | | Balance as of | | | appreciation | | | | | | | | | | | | Realized Gain | | | Balance as of |
| | | 12/31/08 | | | (depreciation) | | | Purchases | | | Transfers In | | | Sales | | | (Loss) | | | 6/30/09 |
|
| Equities | | $1,639,582 | | | $1,888,478 | | | $2,098 | | | $62,339 | | | $52,424 | | | $(954,526) | | | $2,585,547 |
|
Repurchase Agreements:
The Fund may enter into repurchase agreements with institutions that the Fund’s investment adviser has determined are creditworthy. The Fund restricts repurchase agreements to maturities of no more than seven days. Securities pledged as collateral for repurchase agreements, which are held until maturity of the repurchase agreements, are marked-to-market daily and maintained at a value at least equal to the principal amount of the repurchase agreement (including accrued interest). Repurchase agreements could involve certain risks in the event of default or insolvency of the counter-party, including possible delays or restrictions upon the ability of the Fund to dispose of its underlying securities.
Foreign Currency:
Net realized foreign exchange gains or losses arise from sales and maturities of short-term securities, sales of foreign currencies, expiration of currency forward contracts, currency gains or losses realized between the trade and settlement dates on securities transactions, and the difference between the amounts of dividends, interest, and foreign withholding taxes recorded on the Fund’s books and the U.S. dollar equivalent of the
| 2009 Semiannual Report to Stockholders | 31 |
Notes to Financial Statements (unaudited) (continued) |
amounts actually received or paid. Net unrealized foreign exchange gains and losses arise from changes in the value of assets and liabilities, including investments in securities at the end of the reporting period, as a result of changes in foreign currency exchange rates.
Securities Lending:
The Fund loans securities to qualified institutional investors for the purpose of realizing additional income. Collateral on all securities loaned for the Fund is accepted in cash and cash equivalents and invested temporarily by the custodian. The collateral maintained is at least 100% of the current market value of the loaned securities. The market value of the loaned securities is determined at the close of business of the Fund and any additional required collateral is delivered to the Fund on the next business day. The Fund retains the risk of any loss on the securities on loan as well as incurring the potential loss on investments purchased with cash collateral received for securities lending.
Taxes:
As a qualified regulated investment company under Subchapter M of the Internal Revenue Code, the Fund is not subject to income taxes to the extent that it distributes substantially all of its taxable income for its fiscal year. The Schedule of Investments includes information regarding income taxes under the caption “Tax Information”.
Distributions:
Effective May 18, 2009, the Fund pays any dividends and capital gain distributions annually in December on the Fund’s Common Stock. Prior to that date, the Fund paid quarterly distributions on the Fund’s Common Stock at the annual rate of 9% of the rolling average of the prior four calendar quarter-end NAVs of the Fund’s Common Stock, with the fourth quarter distribution being the greater of 2.25% of the rolling average or the distribution required by IRS regulations. Distributions to Preferred Stockholders are accrued daily and paid quarterly and distributions to Common Stockholders are recorded on ex-dividend date. Distributable capital gains and/or net investment income are first allocated to Preferred Stockholder distributions, with any excess allocable to Common Stockholders. If capital gains and/or net investment income are allocated to both Preferred and Common Stockholders, the tax character of such allocations is proportional. To the extent that distributions are not paid from long-term capital gains, net investment income or net short-term capital gains, they will represent a return of capital. Distributions are determined in accordance with income tax regulations that may differ from accounting principles generally accepted in the United States of America. Permanent book and tax differences relating to stockholder distributions will result in reclassifications within the capital accounts. Undistributed net investment income may include temporary book and tax basis differences, which will reverse in a subsequent period. Any taxable income or gain remaining undistributed at fiscal year end is distributed in the following year.
Investment Transactions and Related Investment Income:
Investment transactions are accounted for on the trade date. Dividend income is recorded on the ex-dividend date. Non-cash dividend income is recorded at the fair market value of the securities received. Interest income is recorded on an accrual basis. Premium and discounts on debt securities are amortized using the effective yield-to-maturity method. Realized gains and losses from investment transactions are determined on the basis of identified cost for book and tax purposes.
Expenses:
The Fund incurs direct and indirect expenses. Expenses directly attributable to the Fund are charged to the Fund’s operations, while expenses applicable to more than one of the Royce Funds are allocated equitably. Certain personnel, occupancy costs and other administrative expenses related to The Royce Funds are allocated by Royce & Associates, LLC (“Royce”) under an administration agreement and are included in administrative and office facilities and legal expenses. The Fund has adopted a deferred fee agreement that allows the Directors to defer the receipt of all or a portion of Directors’ Fees otherwise payable. The deferred fees are invested in certain Royce Funds until distributed in accordance with the agreement.
Compensating Balance Credits:
The Fund has an arrangement with its custodian bank, whereby a portion of the custodian’s fee is paid indirectly by credits earned on the Fund’s cash on deposit with the bank. This deposit arrangement is an alternative to purchasing overnight investments. Conversely, the Fund pays interest to the custodian on any cash overdrafts, to the extent they are not offset by credits earned on positive cash balances.
Capital Stock:
The Fund issued 1,646,914 and 4,367,983 shares of Common Stock as reinvestment of distributions by Common Stockholders for the six months ended June 30, 2009 and the year ended December 31, 2008, respectively.
At June 30, 2009, 8,800,000 shares of 5.90% Cumulative Preferred Stock were outstanding. The Fund, at its option, may redeem the Cumulative Preferred Stock, in whole or in part, at the redemption price. The Cumulative Preferred Stock is classified outside of permanent equity (net assets applicable to Common Stockholders) in the accompanying financial statements in accordance with Emerging Issues Task Force (EITF) Topic D-98, Classification and Measurement of Redeemable Securities, that requires preferred securities that are redeemable for cash or other assets to be classified outside of permanent equity to the extent that the redemption is at a fixed or determinable price and at the option of the holder or upon the occurrence of an event that is not solely within the control of the issuer.
The Fund is required to meet certain asset coverage tests with respect to the Cumulative Preferred Stock as required by the 1940 Act. In addition,
| 32 | 2009 Semiannual Report to Stockholders |
Notes to Financial Statements (unaudited) (continued) |
pursuant to the Rating Agency Guidelines established by Moody’s, the Fund is required to maintain a certain discounted asset coverage. If the Fund fails to meet these requirements and does not correct such failure, the Fund may be required to redeem, in part or in full, the Cumulative Preferred Stock at a redemption price of $25.00 per share, plus an amount equal to the accumulated and unpaid dividends, whether or not declared on such shares, in order to meet these requirements. Additionally, failure to meet the foregoing asset coverage requirements could restrict the Fund’s ability to pay dividends to Common Stockholders and could lead to sales of portfolio securities at inopportune times. The Fund has met these requirements since issuing the Cumulative Preferred Stock.
Investment Advisory Agreement:
As compensation for its services under the Investment Advisory Agreement, Royce & Associates, LLC (“Royce”) receives a fee comprised of a Basic Fee (“Basic Fee”) and an adjustment to the Basic Fee based on the investment performance of the Fund in relation to the investment record of the S&P SmallCap 600 Index (“S&P 600").
The Basic Fee is a monthly fee equal to 1/12 of 1% (1% on an annualized basis) of the average of the Fund’s month-end net assets applicable to Common Stockholders, plus the liquidation value of Preferred Stock, for the rolling 60-month period ending with such month (the “performance period”). The Basic Fee for each month is increased or decreased at the rate of 1/12 of .05% for each percentage point that the investment performance of the Fund exceeds, or is exceeded by, the percentage change in the investment record of the S&P 600 for the performance period by more than two percentage points. The performance period for each such month is a rolling 60-month period ending with such month. The maximum increase or decrease in the Basic Fee for any month may not exceed 1/12 of .5%. Accordingly, for each month, the maximum monthly fee rate as adjusted for performance is 1/12 of 1.5% and is payable if the investment performance of the Fund exceeds the percentage change in the investment record of the S&P 600 by 12 or more percentage points for the performance period, and the minimum monthly fee rate as adjusted for performance is 1/12 of .5% and is payable if the percentage change in the investment record of the S&P 600 exceeds the investment performance of the Fund by 12 or more percentage points for the performance period.
Notwithstanding the foregoing, Royce is not entitled to receive any fee for any month when the investment performance of the Fund for the rolling 36-month period ending with such month is negative. In the event that the Fund’s investment performance for such a performance period is less than zero, Royce will not be required to refund to the Fund any fee earned in respect of any prior performance period.
Royce has voluntarily committed to waive the portion of its investment advisory fee attributable to an issue of the Fund’s Preferred Stock for any month in which the Fund’s average annual NAV total return since issuance of the Preferred Stock fails to exceed the applicable Preferred Stock’s dividend rate.
For each of the six rolling 36-month periods ended June 30, 2009, the Fund had negative investment performance and, accordingly, paid no advisory fee.
Purchases and Sales of Investment Securities:
For the six months ended June 30, 2009, the cost of purchases and proceeds from sales of investment securities, other than short-term securities and collateral received for securities loaned, amounted to $72,982,870 and $152,412,898, respectively.
Transactions in Affiliated Companies:
An “Affiliated Company” as defined in the Investment Company Act of 1940, is a company in which a fund owns 5% or more of the company’s outstanding voting securities at any time during the period. The Fund effected the following transactions in shares of such companies for the six months ended June 30, 2009:
| | | | Shares | | Market Value | | Cost of | | Cost of | | Realized | | Dividend | | Shares | | Market Value |
| Affiliated Company | | | 12/31/08 | | 12/31/08 | | Purchases | | Sales | | Gain (Loss) | | Income | | 6/30/09 | | 6/30/09 |
| Delta Apparel* | | | | 605,560 | | | $ | 2,210,294 | | | | | - | | $ | 4,297,286 | | | $ | (2,488,607) | | | | - | | | | | | | | | |
| Timberland Bancorp | | | | 469,200 | | | | 3,495,540 | | | | | - | | | - | | | | - | | | $ | 103,224 | | | | 469,200 | | | $ | 1,923,720 | |
| | | | | | | | $ | 5,705,834 | | | | | | | | | | | $ | (2,488,607) | | | $ | 103,224 | | | | | | | $ | 1,923,720 | |
*Not an Affiliated Company at June 30, 2009. | | | 2009 Semiannual Report to Stockholders | 33 |
| | | SHARES | | VALUE | |
| COMMON STOCKS – 106.4% | | | | | | |
| | | | | | | |
| Consumer Products – 7.2% | | | | | | |
| Apparel, Shoes and Accessories - 2.1% | | | | | | |
K-Swiss Cl. A a | | 47,400 | | $ | 402,900 | |
Movado Group | | 179,640 | | | 1,893,405 | |
Steven Madden a | | 10,300 | | | 262,135 | |
True Religion Apparel a,b | | 15,400 | | | 343,420 | |
Weyco Group | | 48,000 | | | 1,108,320 | |
Yamato International | | 40,000 | | | 168,043 | |
| | | | |
| |
| | | | | | 4,178,223 | |
| | | | |
| |
| Consumer Electronics - 0.7% | | | | | | |
DTS a | | 50,000 | | | 1,353,500 | |
| | | | |
| |
| Food/Beverage/Tobacco - 1.1% | | | | | | |
Seneca Foods Cl. A a,b | | 21,400 | | | 715,188 | |
Seneca Foods Cl. B a | | 42,500 | | | 1,421,625 | |
| | | | |
| |
| | | | | | 2,136,813 | |
| | | | |
| |
| Health, Beauty and Nutrition - 0.2% | | | | | | |
NutriSystem | | 29,500 | | | 427,750 | |
| | | | |
| |
| Home Furnishing and Appliances - 2.9% | | | | | | |
American Woodmark | | 72,000 | | | 1,724,400 | |
Flexsteel Industries | | 172,500 | | | 1,445,550 | |
Lumber Liquidators a,b | | 89,900 | | | 1,416,824 | |
Natuzzi ADR a | | 409,800 | | | 778,620 | |
Universal Electronics a | | 21,000 | | | 423,570 | |
| | | | |
| |
| | | | | | 5,788,964 | |
| | | | |
| |
| Sports and Recreation - 0.2% | | | | | | |
Sturm, Ruger & Company | | 23,583 | | | 293,373 | |
| | | | |
| |
| Total (Cost $11,709,961) | | | | | 14,178,623 | |
| | | | |
| |
| Consumer Services – 4.3% | | | | | | |
| Online Commerce - 0.6% | | | | | | |
Alloy a | | 66,002 | | | 349,151 | |
CryptoLogic | | 88,300 | | | 540,396 | |
Knot (The) a | | 10,000 | | | 78,800 | |
1-800-FLOWERS.COM Cl. A a | | 124,700 | | | 239,424 | |
| | | | |
| |
| | | | | | 1,207,771 | |
| | | | |
| |
| Restaurants and Lodgings - 0.1% | | | | | | |
Benihana Cl. A a,b | | 37,000 | | | 233,840 | |
| | | | |
| |
| Retail Stores - 3.5% | | | | | | |
America’s Car-Mart a | | 92,800 | | | 1,902,400 | |
Brown Shoe | | 9,400 | | | 68,056 | |
Build-A-Bear Workshop a | | 7,600 | | | 33,972 | |
Charming Shoppes a,b | | 416,200 | | | 1,548,264 | |
China Nepstar Chain Drugstore ADR | | 57,000 | | | 324,900 | |
dELiA*s a | | 75,000 | | | 178,500 | |
DSW Cl. A a,b | | 32,200 | | | 317,170 | |
Le Chateau Cl. A | | 27,900 | | | 287,119 | |
Pacific Sunwear of California a | | 40,000 | | | 134,800 | |
Stein Mart a | | 178,900 | | | 1,585,054 | |
West Marine a | | 86,000 | | | 473,860 | |
| | | | |
| |
| | | | | | 6,854,095 | |
| | | | |
| |
| | | SHARES | | VALUE | |
| Consumer Services (continued) | | | | | | |
| Other Consumer Services - 0.1% | | | | | | |
Shutterfly a,b | | 10,000 | | $ | 139,500 | |
| | | | |
| |
| Total (Cost $7,907,848) | | | | | 8,435,206 | |
| | | | |
| |
| Diversified Investment Companies – 0.9% | | | | | | |
| Closed-End Funds - 0.9% | | | | | | |
Central Fund of Canada Cl. A | | 131,700 | | | 1,546,158 | |
Urbana Corporation a | | 237,600 | | | 328,879 | |
| | | | |
| |
| Total (Cost $847,767) | | | | | 1,875,037 | |
| | | | |
| |
| Financial Intermediaries – 9.9% | | | | | | |
| Banking - 5.4% | | | | | | |
Alliance Bancorp, Inc. of Pennsylvania | | 50,420 | | | 428,570 | |
B of I Holding a,b | | 100,000 | | | 609,000 | |
BCB Holdings a | | 806,207 | | | 1,658,435 | |
Cass Information Systems | | 15,000 | | | 491,100 | |
Centrue Financial | | 46,600 | | | 206,438 | |
CFS Bancorp | | 75,000 | | | 317,250 | |
Chemung Financial | | 40,000 | | | 760,000 | |
CNB Financial | | 26,000 | | | 368,420 | |
Commercial National Financial | | 20,000 | | | 295,600 | |
Fauquier Bankshares | | 135,800 | | | 1,766,758 | |
Financial Institutions | | 36,000 | | | 491,760 | |
First Bancorp | | 40,200 | | | 782,694 | |
HopFed Bancorp | | 61,000 | | | 593,530 | |
LCNB Corporation | | 30,000 | | | 295,500 | |
Wilber Corporation (The) | | 137,550 | | | 1,526,805 | |
| | | | |
| |
| | | | | | 10,591,860 | |
| | | | |
| |
| Insurance - 1.2% | | | | | | |
Greenlight Capital Re Cl. A a | | 13,500 | | | 233,685 | |
Hilltop Holdings a | | 121,400 | | | 1,441,018 | |
Independence Holding | | 95,800 | | | 609,288 | |
| | | | |
| |
| | | | | | 2,283,991 | |
| | | | |
| |
| Real Estate Investment Trusts - 0.2% | | | | | | |
Vestin Realty Mortgage II a,b | | 144,230 | | | 383,652 | |
| | | | |
| |
| Securities Brokers - 2.7% | | | | | | |
Cowen Group a | | 123,600 | | | 1,032,060 | |
Diamond Hill Investment Group a | | 8,000 | | | 321,440 | |
FBR Capital Markets a,b | | 366,600 | | | 1,723,020 | |
International Assets Holding a,b | | 12,000 | | | 178,440 | |
Sanders Morris Harris Group | | 199,000 | | | 1,094,500 | |
Thomas Weisel Partners Group a | | 172,700 | | | 1,039,654 | |
| | | | |
| |
| | | | | | 5,389,114 | |
| | | | |
| |
| Securities Exchanges - 0.4% | | | | | | |
Bolsa Mexicana de Valores a | | 948,500 | | | 867,953 | |
| | | | |
| |
| Total (Cost $23,473,788) | | | | | 19,516,570 | |
| | | | |
| |
| Financial Services – 6.3% | | | | | | |
| Diversified Financial Services - 0.9% | | | | | | |
Encore Capital Group a | | 42,000 | | | 556,500 | |
FCStone Group a,b | | 18,000 | | | 71,100 | |
World Acceptance a,b | | 55,251 | | | 1,100,047 | |
| | | | |
| |
| | | | | | 1,727,647 | |
| | | | |
| |
| 34 | 2009 Semiannual Report to Stockholders | | THE ACCOMPANYING NOTES ARE AN INTEGRAL PART OF THESE FINANCIAL STATEMENTS. |
June 30, 2009 (unaudited) |
|
| | | SHARES | | VALUE | |
| Financial Services (continued) | | | | | | |
| Information and Processing - 0.5% | | | | | | |
Value Line | | 32,487 | | $ | 1,067,848 | |
| | | | |
| |
| Insurance Brokers - 0.1% | | | | | | |
Western Financial Group | | 148,000 | | | 245,574 | |
| | | | |
| |
| Investment Management - 3.9% | | | | | | |
BKF Capital Group | | 130,200 | | | 123,690 | |
Dundee Corporation Cl. A a | | 140,200 | | | 814,815 | |
Endeavour Financial b | | 343,200 | | | 413,085 | |
Epoch Holding Corporation | | 196,500 | | | 1,697,760 | |
Evercore Partners Cl. A | | 13,600 | | | 267,104 | |
JZ Capital Partners | | 80,666 | | | 298,757 | |
MVC Capital | | 136,200 | | | 1,152,252 | |
Queen City Investments a | | 948 | | | 900,600 | |
Sceptre Investment Counsel | | 78,000 | | | 362,120 | |
U.S. Global Investors Cl. A | | 91,500 | | | 847,290 | |
†VZ Holding | | 15,000 | | | 694,105 | |
| | | | |
| |
| | | | | | 7,571,578 | |
| | | | |
| |
| Special Purpose Acquisition Corporation - 0.7% | | | | | | |
Prospect Acquisition (Units) a | | 50,000 | | | 486,500 | |
Shellproof a | | 39,192 | | | 19,344 | |
Westway Group | | 220,000 | | | 913,000 | |
| | | | |
| |
| | | | | | 1,418,844 | |
| | | | |
| |
| Specialty Finance - 0.2% | | | | | | |
NGP Capital Resources | | 68,080 | | | 399,630 | |
| | | | |
| |
| Total (Cost $14,798,417) | | | | | 12,431,121 | |
| | | | |
| |
| Health – 9.1% | | | | | | |
| Commercial Services - 0.5% | | | | | | |
PAREXEL International a | | 40,000 | | | 575,200 | |
PDI a,b | | 104,800 | | | 429,680 | |
| | | | |
| |
| | | | | | 1,004,880 | |
| | | | |
| |
| Drugs and Biotech - 1.1% | | | | | | |
Anadys Pharmaceuticals a,b | | 105,400 | | | 196,044 | |
BioCryst Pharmaceuticals a,b | | 90,000 | | | 362,700 | |
Hi-Tech Pharmacal a | | 48,300 | | | 429,870 | |
Seattle Genetics a,b | | 39,000 | | | 379,080 | |
Sinovac Biotech a | | 60,000 | | | 237,000 | |
Strategic Diagnostics a | | 150,000 | | | 174,000 | |
Theragenics Corporation a,b | | 265,800 | | | 342,882 | |
| | | | |
| |
| | | | | | 2,121,576 | |
| | | | |
| |
| Health Services - 2.4% | | | | | | |
Advisory Board (The) a | | 51,700 | | | 1,328,690 | |
Air Methods a | | 11,707 | | | 320,304 | |
Computer Programs and Systems | | 3,800 | | | 145,578 | |
eResearch Technology a | | 137,000 | | | 850,770 | |
Gentiva Health Services a | | 23,000 | | | 378,580 | |
HMS Holdings a,b | | 11,900 | | | 484,568 | |
On Assignment a | | 41,100 | | | 160,701 | |
PharMerica Corporation a | | 40,000 | | | 785,200 | |
Psychemedics Corporation | | 37,500 | | | 258,000 | |
U.S. Physical Therapy a,b | | 10,000 | | | 147,500 | |
| | | | |
| |
| | | | | | 4,859,891 | |
| | | | |
| |
| Medical Products and Devices - 5.1% | | | | | | |
Allied Healthcare Products a | | 226,798 | | | 975,231 | |
| | | SHARES | | VALUE | |
| Health (continued) | | | | | | |
| Medical Products and Devices (continued) | | | | | | |
Atrion Corporation | | 5,500 | | $ | 737,495 | |
CAS Medical Systems a | | 62,600 | | | 100,786 | |
Cynosure Cl. A a,b | | 26,500 | | | 202,725 | |
Exactech a | | 121,000 | | | 1,754,500 | |
Kensey Nash a | | 20,000 | | | 524,200 | |
Medical Action Industries a | | 125,250 | | | 1,434,112 | |
MEDTOX Scientific a | | 20,000 | | | 188,600 | |
NMT Medical a,b | | 228,500 | | | 511,840 | |
Palomar Medical Technologies a | | 8,000 | | | 117,280 | |
Syneron Medical a | | 69,200 | | | 499,624 | |
Utah Medical Products | | 42,300 | | | 1,129,833 | |
Virtual Radiologic a,b | | 52,000 | | | 469,560 | |
Young Innovations | | 61,450 | | | 1,338,996 | |
| | | | |
| |
| | | | | | 9,984,782 | |
| | | | |
| |
| Total (Cost $17,124,057) | | | | | 17,971,129 | |
| | | | |
| |
| Industrial Products – 19.6% | | | | | | |
| Automotive - 0.8% | | | | | | |
Norstar Founders Group a,c | | 771,500 | | | 36,335 | |
SORL Auto Parts a | | 48,810 | | | 186,454 | |
US Auto Parts Network a,b | | 302,599 | | | 1,140,798 | |
Wonder Auto Technology a | | 13,200 | | | 133,716 | |
| | | | |
| |
| | | | | | 1,497,303 | |
| | | | |
| |
| Building Systems and Components - 2.3% | | | | | | |
AAON | | 73,000 | | | 1,454,160 | |
Apogee Enterprises | | 57,900 | | | 712,170 | |
Drew Industries a,b | | 100,000 | | | 1,217,000 | |
LSI Industries | | 79,812 | | | 434,975 | |
†NCI Building Systems a,b | | 42,000 | | | 110,880 | |
Preformed Line Products | | 16,000 | | | 704,960 | |
| | | | |
| |
| | | | | | 4,634,145 | |
| | | | |
| |
| Construction Materials - 2.2% | | | | | | |
Ash Grove Cement | | 8,000 | | | 1,480,000 | |
Louisiana-Pacific Corporation a | | 50,000 | | | 171,000 | |
Monarch Cement | | 52,303 | | | 1,569,090 | |
Trex Company a,b | | 90,000 | | | 1,203,300 | |
| | | | |
| |
| | | | | | 4,423,390 | |
| | | | |
| |
| Industrial Components - 1.6% | | | | | | |
Deswell Industries | | 574,371 | | | 1,924,143 | |
Graham Corporation | | 24,500 | | | 325,850 | |
Powell Industries a | | 26,800 | | | 993,476 | |
| | | | |
| |
| | | | | | 3,243,469 | |
| | | | |
| |
| Machinery - 4.7% | | | | | | |
Active Power a,b | | 36,952 | | | 32,148 | |
Burnham Holdings Cl. A | | 95,000 | | | 836,000 | |
Columbus McKinnon a | | 30,100 | | | 380,765 | |
Eastern Company (The) | | 39,750 | | | 655,875 | |
Flow International a | | 65,000 | | | 152,750 | |
FreightCar America | | 11,000 | | | 184,910 | |
Hardinge | | 240,000 | | | 1,020,000 | |
HLS Systems International a | | 192,692 | | | 1,117,614 | |
Hurco Companies a | | 56,666 | | | 885,689 | |
Jinpan International | | 23,592 | | | 675,675 | |
| THE ACCOMPANYING NOTES ARE AN INTEGRAL PART OF THESE FINANCIAL STATEMENTS. | | 2009 Semiannual Report to Stockholders | 35 |
| | | SHARES | | VALUE | |
| Industrial Products (continued) | | | | | | |
| Machinery (continued) | | | | | | |
K-Tron International a | | 8,426 | | $ | 671,384 | |
Sun Hydraulics | | 58,425 | | | 944,732 | |
Tennant Company | | 92,300 | | | 1,697,397 | |
| | | | |
| |
| | | | | | 9,254,939 | |
| | | | |
| |
Metal Fabrication and Distribution - 2.9% | | | | | | |
Central Steel & Wire | | 1,088 | | | 707,200 | |
CompX International Cl. A | | 107,500 | | | 667,575 | |
Encore Wire | | 15,000 | | | 320,250 | |
Foster (L.B.) Company Cl. A a,b | | 11,100 | | | 333,777 | |
Fushi Copperweld a | | 36,583 | | | 302,542 | |
Haynes International a | | 10,300 | | | 244,110 | |
Ladish Company a | | 45,000 | | | 583,650 | |
NN a | | 114,300 | | | 192,024 | |
Olympic Steel | | 20,500 | | | 501,635 | |
RTI International Metals a | | 101,900 | | | 1,800,573 | |
| | | | |
| |
| | | | | | 5,653,336 | |
| | | | |
| |
| Miscellaneous Manufacturing - 1.9% | | | | | | |
PMFG a | | 143,800 | | | 1,266,878 | |
Quixote Corporation a,b | | 183,400 | | | 519,022 | |
Raven Industries | | 58,400 | | | 1,495,040 | |
Synalloy Corporation | | 58,200 | | | 483,060 | |
| | | | |
| |
| | | | | | 3,764,000 | |
| | | | |
| |
| Pumps, Valves and Bearings - 0.2% | | | | | | |
CIRCOR International | | 14,000 | | | 330,540 | |
| | | | |
| |
| Specialty Chemicals and Materials - 2.5% | | | | | | |
Aceto Corporation | | 72,219 | | | 481,701 | |
Balchem Corporation | | 42,250 | | | 1,035,970 | |
Hawkins | | 82,166 | | | 1,855,308 | |
Park Electrochemical | | 15,400 | | | 331,562 | |
†Rogers Corporation a,b | | 58,400 | | | 1,181,432 | |
| | | | |
| |
| | | | | | 4,885,973 | |
| | | | |
| |
| Textiles - 0.4% | | | | | | |
Interface Cl. A | | 56,400 | | | 349,680 | |
J.G. Boswell Company | | 690 | | | 356,730 | |
| | | | |
| |
| | | | | | 706,410 | |
| | | | |
| |
| Other Industrial Products - 0.1% | | | | | | |
Research Frontiers a,b | | 50,000 | | | 179,000 | |
| | | | |
| |
| Total (Cost $33,452,448) | | | | | 38,572,505 | |
| | | | |
| |
| Industrial Services – 13.0% | | | | | | |
| Advertising and Publishing - 0.3% | | | | | | |
Airmedia Group ADR a | | 27,710 | | | 178,452 | |
Voyager Learning a | | 125,000 | | | 431,250 | |
| | | | |
| |
| | | | | | 609,702 | |
| | | | |
| |
| Commercial Services - 4.2% | | | | | | |
Acacia Research-Acacia Technologies a,b | | 82,990 | | | 653,131 | |
ATC Technology a | | 25,200 | | | 365,400 | |
CBIZ a | | 47,000 | | | 334,640 | |
Diamond Management & Technology Consultants | | 138,100 | | | 580,020 | |
Forrester Research a | | 54,900 | | | 1,347,795 | |
Global Sources a,b | | 33,330 | | | 240,309 | |
Heritage-Crystal Clean a | | 117,350 | | | 1,425,803 | |
| | | SHARES | | VALUE | |
| Industrial Services (continued) | | | | | | |
| Commercial Services (continued) | | | | | | |
Kforce a | | 55,000 | | $ | 454,850 | |
Rentrak Corporation a | | 13,300 | | | 218,519 | |
Spherion Corporation a | | 436,600 | | | 1,798,792 | |
Team a | | 27,300 | | | 427,791 | |
Waste Services a | | 92,852 | | | 480,974 | |
| | | | |
| |
| | | | | | 8,328,024 | |
| | | | |
| |
| Engineering and Construction - 2.3% | | | | | | |
Cavco Industries a | | 9,400 | | | 238,102 | |
Exponent a | | 58,400 | | | 1,431,384 | |
Insituform Technologies Cl. A a,b | | 34,300 | | | 582,071 | |
Integrated Electrical Services a | | 132,000 | | | 1,030,920 | |
Layne Christensen a,b | | 21,700 | | | 443,765 | |
Skyline Corporation | | 32,100 | | | 698,175 | |
Sterling Construction a,b | | 11,700 | | | 178,542 | |
| | | | |
| |
| | | | | | 4,602,959 | |
| | | | |
| |
| Food, Tobacco and Agriculture - 1.3% | | | | | | |
Cal-Maine Foods | | 22,500 | | | 561,600 | |
Farmer Bros. | | 42,400 | | | 970,112 | |
Origin Agritech a | | 197,788 | | | 917,736 | |
| | | | |
| |
| | | | | | 2,449,448 | |
| | | | |
| |
| Industrial Distribution - 0.9% | | | | | | |
Houston Wire & Cable | | 50,375 | | | 599,966 | |
Lawson Products | | 63,800 | | | 906,598 | |
Toshin Group | | 20,000 | | | 302,414 | |
| | | | |
| |
| | | | | | 1,808,978 | |
| | | | |
| |
| Printing - 0.9% | | | | | | |
Bowne & Co. a | | 68,442 | | | 445,558 | |
Courier Corporation | | 30,450 | | | 464,667 | |
CSS Industries | | 21,043 | | | 428,856 | |
Multi-Color Corporation | | 36,600 | | | 448,716 | |
| | | | |
| |
| | | | | | 1,787,797 | |
| | | | |
| |
| Transportation and Logistics - 3.0% | | | | | | |
Forward Air | | 50,700 | | | 1,080,924 | |
Frozen Food Express Industries | | 157,000 | | | 499,260 | |
Marten Transport a | | 8,550 | | | 177,498 | |
Pacer International a,b | | 117,500 | | | 262,025 | |
Patriot Transportation Holding a,b | | 19,000 | | | 1,385,670 | |
Transat A.T. Cl. B a | | 35,000 | | | 323,174 | |
Universal Truckload Services | | 134,200 | | | 2,100,230 | |
| | | | |
| |
| | | | | | 5,828,781 | |
| | | | |
| |
| Other Industrial Services - 0.1% | | | | | | |
American Ecology | | 6,000 | | | 107,520 | |
| | | | |
| |
| Total (Cost $25,567,633) | | | | | 25,523,209 | |
| | | | |
| |
| Natural Resources – 11.0% | | | | | | |
| Energy Services - 4.3% | | | | | | |
CE Franklin a,b | | 57,250 | | | 299,990 | |
Dawson Geophysical a,b | | 53,213 | | | 1,588,408 | |
Dril-Quip a | | 22,500 | | | 857,250 | |
Gulf Island Fabrication | | 29,116 | | | 460,906 | |
ION Geophysical a | | 93,500 | | | 240,295 | |
Lufkin Industries | | 1,000 | | | 42,050 | |
†North American Energy Partners a | | 50,000 | | | 304,500 | |
| 36 | 2009 Semiannual Report to Stockholders | | THE ACCOMPANYING NOTES ARE AN INTEGRAL PART OF THESE FINANCIAL STATEMENTS. |
June 30, 2009 (unaudited) |
|
| | | SHARES | | VALUE | |
| Natural Resources (continued) | | | | | | |
| Energy Services (continued) | | | | | | |
OYO Geospace a,b | | 7,130 | | $ | 182,956 | |
Pason Systems | | 139,200 | | | 1,121,355 | |
Pioneer Drilling a | | 57,500 | | | 275,425 | |
T-3 Energy Services a,b | | 29,150 | | | 347,176 | |
Tesco Corporation a | | 50,000 | | | 397,000 | |
Willbros Group a | | 159,200 | | | 1,991,592 | |
World Energy Solutions a,b | | 72,920 | | | 379,184 | |
| | | | |
| |
| | | | | | 8,488,087 | |
| | | | |
| |
| Oil and Gas - 0.4% | | | | | | |
Approach Resources a | | 12,000 | | | 82,800 | |
GeoMet a,b | | 75,000 | | | 82,500 | |
†GeoResources a,b | | 30,000 | | | 306,000 | |
PetroCorp a,c | | 104,200 | | | 0 | |
Rosetta Resources a | | 30,000 | | | 262,500 | |
| | | | |
| |
| | | | | | 733,800 | |
| | | | |
| |
| Precious Metals and Mining - 3.2% | | | | | | |
Alamos Gold a | | 47,100 | | | 387,118 | |
Allied Nevada Gold a | | 123,700 | | | 997,022 | |
Aurizon Mines a | | 197,000 | | | 699,350 | |
Brush Engineered Materials a,b | | 38,500 | | | 644,875 | |
Chesapeake Gold a | | 20,000 | | | 68,091 | |
Exeter Resource a | | 210,000 | | | 600,600 | |
Gammon Gold a | | 83,836 | | | 559,186 | |
Golden Star Resources a,b | | 168,100 | | | 344,605 | |
Horsehead Holding a | | 13,800 | | | 102,810 | |
Midway Gold a | | 345,000 | | | 237,287 | |
Minefinders Corporation a | | 36,000 | | | 248,040 | |
New Gold a | | 141,200 | | | 377,004 | |
Northgate Minerals a | | 270,000 | | | 577,800 | |
Seabridge Gold a | | 16,700 | | | 433,198 | |
Victoria Gold a | | 200,000 | | | 67,059 | |
Vista Gold a,b | | 50,000 | | | 86,000 | |
| | | | |
| |
| | | | | | 6,430,045 | |
| | | | |
| |
| Real Estate - 3.1% | | | | | | |
Avatar Holdings a,b | | 45,104 | | | 819,540 | |
Consolidated-Tomoka Land | | 29,100 | | | 1,020,828 | |
Kennedy-Wilson a | | 21,500 | | | 731,000 | |
PICO Holdings a | | 45,700 | | | 1,311,590 | |
Pope Resources L.P. | | 48,505 | | | 1,096,698 | |
Tejon Ranch a,b | | 39,000 | | | 1,033,110 | |
ZipRealty a,b | | 25,000 | | | 67,000 | |
| | | | |
| |
| | | | | | 6,079,766 | |
| | | | |
| |
| Total (Cost $19,735,782) | | | | | 21,731,698 | |
| | | | |
| |
| Technology – 20.2% | | | | | | |
| Aerospace and Defense - 2.4% | | | | | | |
Ducommun | | 72,100 | | | 1,354,759 | |
HEICO Corporation | | 33,600 | | | 1,218,336 | |
Innovative Solutions and Support a | | 100,000 | | | 447,000 | |
Integral Systems a | | 141,082 | | | 1,173,802 | |
SIFCO Industries a | | 45,800 | | | 485,022 | |
| | | | |
| |
| | | | | | 4,678,919 | |
| | | | |
| |
| | | SHARES | | VALUE | |
| Technology (continued) | | | | | | |
| Components and Systems - 3.5% | | | | | | |
Frequency Electronics a | | 240,000 | | $ | 900,000 | |
Methode Electronics | | 226,400 | | | 1,589,328 | |
Newport Corporation a | | 55,900 | | | 323,661 | |
OPTEX Company | | 35,000 | | | 343,920 | |
Richardson Electronics | | 240,900 | | | 787,743 | |
Rimage Corporation a | | 79,200 | | | 1,315,512 | |
†Silicon Graphics International a,b | | 50,000 | | | 227,000 | |
Technitrol | | 150,000 | | | 970,500 | |
TransAct Technologies a | | 78,600 | | | 391,428 | |
| | | | |
| |
| | | | | | 6,849,092 | |
| | | | |
| |
| Distribution - 0.3% | | | | | | |
Agilysys | | 90,000 | | | 421,200 | |
ScanSource a,b | | 7,600 | | | 186,352 | |
| | | | |
| |
| | | | | | 607,552 | |
| | | | |
| |
| Internet Software and Services - 0.9% | | | | | | |
ActivIdentity Corporation a | | 75,000 | | | 189,750 | |
DealerTrack Holdings a | | 31,000 | | | 527,000 | |
iPass a | | 221,889 | | | 355,022 | |
Marchex Cl. B | | 138,200 | | | 465,734 | |
WebMediaBrands a | | 525,000 | | | 288,173 | |
| | | | |
| |
| | | | | | 1,825,679 | |
| | | | |
| |
| IT Services - 4.3% | | | | | | |
AsiaInfo Holdings a | | 14,200 | | | 244,382 | |
Computer Task Group a | | 311,100 | | | 1,897,710 | |
iGATE Corporation | | 258,400 | | | 1,710,608 | |
Sapient Corporation a | | 500,000 | | | 3,145,000 | |
Syntel | | 43,300 | | | 1,361,352 | |
Yucheng Technologies a,b | | 20,500 | | | 174,865 | |
| | | | |
| |
| | | | | | 8,533,917 | |
| | | | |
| |
| Semiconductors and Equipment - 3.3% | | | | | | |
Advanced Energy Industries a | | 14,100 | | | 126,759 | |
ATMI a,b | | 6,400 | | | 99,392 | |
Coherent a | | 32,000 | | | 661,760 | |
Entropic Communications a,b | | 135,100 | | | 303,975 | |
Exar Corporation a | | 121,208 | | | 871,486 | |
Ikanos Communications a | | 75,000 | | | 120,000 | |
Micrel | | 90,000 | | | 658,800 | |
Microtune a,b | | 362,000 | | | 847,080 | |
PLX Technology a | | 80,000 | | | 301,600 | |
†Rofin-Sinar Technologies a | | 37,000 | | | 740,370 | |
TTM Technologies a | | 114,400 | | | 910,624 | |
Virage Logic a | | 200,000 | | | 900,000 | |
| | | | |
| |
| | | | | | 6,541,846 | |
| | | | |
| |
| Software - 3.9% | | | | | | |
ACI Worldwide a | | 69,600 | | | 971,616 | |
American Software Cl.A | | 63,700 | | | 366,912 | |
Bottomline Technologies a | | 28,600 | | | 257,686 | |
Double-Take Software a,b | | 22,400 | | | 193,760 | |
Fundtech a | | 51,000 | | | 515,100 | |
Majesco Entertainment a | | 11,287 | | | 22,010 | |
Pegasystems | | 84,000 | | | 2,215,920 | |
Phoenix Technologies a,b | | 32,310 | | | 87,560 | |
PLATO Learning a | | 160,000 | | | 640,000 | |
| THE ACCOMPANYING NOTES ARE AN INTEGRAL PART OF THESE FINANCIAL STATEMENTS. | | 2009 Semiannual Report to Stockholders | 37 |
Royce Micro-Cap Trust | | June 30, 2009 (unaudited) |
|
| | | SHARES | | VALUE | |
| Technology (continued) | | | | | | |
| Software (continued) | | | | | | |
SourceForge a,b | | 600,000 | | $ | 750,000 | |
SPSS a | | 44,600 | | | 1,488,302 | |
THQ a | | 25,000 | | | 179,000 | |
| | | | |
| |
| | | | | | 7,687,866 | |
| | | | |
| |
| Telecommunications - 1.6% | | | | | | |
Anaren a | | 8,000 | | | 141,440 | |
Atlantic Tele-Network | | 19,700 | | | 774,013 | |
Cogo Group a,b | | 11,700 | | | 69,849 | |
Diguang International Development a | | 230,000 | | | 55,200 | |
Globecomm Systems a | | 22,730 | | | 163,429 | |
PC-Tel a | | 44,100 | | | 235,935 | |
ViaSat a | | 46,812 | | | 1,200,259 | |
Zhone Technologies a | | 1,331,600 | | | 426,112 | |
| | | | |
| |
| | | | | | 3,066,237 | |
| | | | |
| |
| Total (Cost $31,897,207) | | | | | 39,791,108 | |
| | | | |
| |
| Miscellaneousd – 4.9% | | | | | | |
| Total (Cost $8,593,785) | | | | | 9,600,617 | |
| | | | |
| |
| TOTAL COMMON STOCKS | | | | | | |
(Cost $195,108,693) | | | | | 209,626,823 | |
| | | | |
| |
| PREFERRED STOCK – 1.1% | | | | | | |
Seneca Foods Conv. a | | | | | | |
(Cost $943,607) | | 75,409 | | | 2,111,452 | |
| | | | |
| |
| | | | | VALUE | |
| REPURCHASE AGREEMENT – 22.4% | | | | | | |
State Street Bank & Trust Company, 0.01% dated 6/30/09, due 7/1/09, maturity value $44,065,012 (collateralized by obligations of various U.S. Government Agencies, due 3/31/10, valued at $45,169,975) | | | | | | |
(Cost $44,065,000) | | | | $ | 44,065,000 | |
| | | | |
| |
COLLATERAL RECEIVED FOR SECURITIES LOANED – 7.7% | | | | | | |
| Money Market Funds | | | | | | |
Federated Government Obligations Fund | | | | | | |
(7 day yield-0.1864%) | | | | | | |
(Cost $15,157,191) | | | | | 15,157,191 | |
| | | | |
| |
| TOTAL INVESTMENTS – 137.6% | | | | | | |
(Cost $255,274,491) | | | | | 270,960,466 | |
| | | | | | | |
| LIABILITIES LESS CASH AND OTHER ASSETS – (7.1)% | | | (14,018,285 | ) |
| |
| PREFERRED STOCK – (30.5)% | | | | | (60,000,000 | ) |
| | | | |
| |
NET ASSETS APPLICABLE TO COMMON STOCKHOLDERS – 100.0% | | | | $ | 196,942,181 | |
| | | | |
| |
|
| † | New additions in 2009. |
| a | Non-income producing. |
| b | All or a portion of these securities were on loan at June 30, 2009. The market value of loaned securities at June 30, 2009 was $14,626,371. |
| c | Securities for which market quotations are not readily available represent 0.0% of net assets. These securities have been valued at their fair value under procedures established by the Fund’s Board of Directors. |
| d | Includes securities first acquired in 2009 and less than 1% of net assets applicable to Common Stockholders. |
| | Bold indicates the Fund’s 20 largest equity holdings in terms of June 30, 2009 market value. |
| | |
TAX INFORMATION: The cost of total investments for Federal income tax purposes was $255,893,860. At June 30, 2009, net unrealized appreciation for all securities was $15,066,606, consisting of aggregate gross unrealized appreciation of $54,793,801 and aggregate gross unrealized depreciation of $39,727,195. The primary difference between book and tax basis cost is the timing of the recognition of losses on securities sold. |
|
| 38 | 2009 Semiannual Report to Stockholders | | THE ACCOMPANYING NOTES ARE AN INTEGRAL PART OF THESE FINANCIAL STATEMENTS. |
Royce Micro-Cap Trust | June 30, 2009 (unaudited) |
|
Statement of Assets and Liabilities |
| ASSETS: | | | | |
| Investments at value (including collateral on loaned securities)* | | $ | 226,895,466 | |
| Repurchase agreements (at cost and value) | | | 44,065,000 | |
| Cash and foreign currency | | | 11,947 | |
| Receivable for investments sold | | | 1,931,994 | |
| Receivable for dividends and interest | | | 195,068 | |
| Prepaid expenses and other assets | | | 9,201 | |
|
Total Assets | | | 273,108,676 | |
|
| LIABILITIES: | | | | |
| Payable for collateral on loaned securities | | | 15,157,191 | |
| Payable for investments purchased | | | 606,144 | |
| Payable for investment advisory fee | | | 273,928 | |
| Preferred dividends accrued but not yet declared | | | 80,000 | |
| Accrued expenses | | | 49,232 | |
|
Total Liabilities | | | 16,166,495 | |
|
| PREFERRED STOCK: | | | | |
| 6.00% Cumulative Preferred Stock - $0.001 par value, $25 liquidation value per share; 2,400,000 shares outstanding | | | 60,000,000 | |
|
Total Preferred Stock | | | 60,000,000 | |
|
| NET ASSETS APPLICABLE TO COMMON STOCKHOLDERS | | $ | 196,942,181 | |
|
| ANALYSIS OF NET ASSETS APPLICABLE TO COMMON STOCKHOLDERS: | | | | |
| Common Stock paid-in capital - $0.001 par value per share; 27,333,915 shares outstanding (150,000,000 shares authorized) | | $ | 233,574,531 | |
| Undistributed net investment income (loss) | | | (796,354 | ) |
| Accumulated net realized gain (loss) on investments and foreign currency | | | (43,794,502 | ) |
| Net unrealized appreciation (depreciation) on investments and foreign currency | | | 15,685,452 | |
| Unallocated and accrued distributions | | | (7,726,946 | ) |
|
Net Assets applicable to Common Stockholders (net asset value per share - $7.21) | | $ | 196,942,181 | |
|
| *Investments at identified cost (including $15,157,191 of collateral on loaned securities) | | $ | 211,209,491 | |
| Market value of loaned securities | | | 14,626,371 | |
| THE ACCOMPANYING NOTES ARE AN INTEGRAL PART OF THESE FINANCIAL STATEMENTS. | | 2009 Semiannual Report to Stockholders | 39 |
Royce Micro-Cap Trust | Six Months Ended June 30, 2009 (unaudited) |
|
| INVESTMENT INCOME: | | | | |
| Income: | | | | |
Dividends* | | | | |
Non-Affiliated Companies | | $ | 1,513,092 | |
Affiliated Companies | | | 31,195 | |
Interest | | | 18,620 | |
Securities lending | | | 81,738 | |
|
| Total income | | | 1,644,645 | |
|
| Expenses: | | | | |
Investment advisory fees | | | 1,309,902 | |
Stockholder reports | | | 68,562 | |
Custody and transfer agent fees | | | 35,802 | |
Professional fees | | | 30,789 | |
Directors’ fees | | | 25,963 | |
Administrative and office facilities expenses | | | 18,038 | |
Other expenses | | | 28,259 | |
|
| Total expenses | | | 1,517,315 | |
| | | | | |
| Fees waived by investment adviser | | | (194,167 | ) |
|
| Net expenses | | | 1,323,148 | |
|
| Net investment income (loss) | | | 321,497 | |
|
| REALIZED AND UNREALIZED GAIN (LOSS) ON INVESTMENTS AND FOREIGN CURRENCY: | | | | |
| Net realized gain (loss): | | | | |
Investments in Non-Affiliated Companies | | | (14,484,468 | ) |
Investments in Affiliated Companies | | | (352,375 | ) |
Foreign currency transactions | | | 3,213 | |
| Net change in unrealized appreciation (depreciation): | | | | |
Investments and foreign currency translations | | | 46,023,688 | |
Other assets and liabilities denominated in foreign currency | | | (1,256 | ) |
|
| Net realized and unrealized gain (loss) on investments and foreign currency | | | 31,188,802 | |
|
| NET INCREASE (DECREASE) IN NET ASSETS RESULTING FROM INVESTMENT OPERATIONS | | | 31,510,299 | |
|
| DISTRIBUTIONS TO PREFERRED STOCKHOLDERS | | | (1,800,000 | ) |
|
| NET INCREASE (DECREASE) IN NET ASSETS APPLICABLE TO COMMON STOCKHOLDERS RESULTING FROM INVESTMENT OPERATIONS | | $ | 29,710,299 | |
| * Net of foreign withholding tax of $17,613. | | | | |
| 40 | 2009 Semiannual Report to Stockholders | | THE ACCOMPANYING NOTES ARE AN INTEGRAL PART OF THESE FINANCIAL STATEMENTS. |
Statement of Changes in Net Assets |
| | | Six months ended | | |
| | | 6/30/09 | | Year ended |
| | | (unaudited) | | 12/31/08 |
| INVESTMENT OPERATIONS: | | | | | | | | |
| Net investment income (loss) | | $ | 321,497 | | | $ | 408,780 | |
| Net realized gain (loss) on investments and foreign currency | | | (14,833,630 | ) | | | (6,824,087 | ) |
| Net change in unrealized appreciation (depreciation) on investments and foreign currency | | | 46,022,432 | | | | (138,088,528 | ) |
|
| Net increase (decrease) in net assets resulting from investment operations | | | 31,510,299 | | | | (144,503,835 | ) |
|
| DISTRIBUTIONS TO PREFERRED STOCKHOLDERS: | | | | | | | | |
| Net investment income | | | – | | | | (362,850 | ) |
| Net realized gain on investments and foreign currency | | | – | | | | (3,237,150 | ) |
| Unallocated distributions* | | | (1,800,000 | ) | | | – | |
|
| Total distributions to Preferred Stockholders | | | (1,800,000 | ) | | | (3,600,000 | ) |
|
| NET INCREASE (DECREASE) IN NET ASSETS APPLICABLE TO COMMON STOCKHOLDERS | | | | | | | | |
RESULTING FROM INVESTMENT OPERATIONS | | | 29,710,299 | | | | (148,103,835 | ) |
|
| DISTRIBUTIONS TO COMMON STOCKHOLDERS: | | | | | | | | |
| Net investment income | | | – | | | | (2,356,920 | ) |
| Net realized gain on investments and foreign currency | | | – | | | | (20,757,478 | ) |
| Return of capital | | | – | | | | (6,834,718 | ) |
| Unallocated distributions* | | | (5,846,946 | ) | | | – | |
|
| Total distributions to Common Stockholders | | | (5,846,946 | ) | | | (29,949,116 | ) |
|
| CAPITAL SHARE TRANSACTIONS: | | | | | | | | |
| Reinvestment of distributions to Common Stockholders | | | 3,224,397 | | | | 16,431,866 | |
|
| Total capital stock transactions | | | 3,224,397 | | | | 16,431,866 | |
|
| NET INCREASE (DECREASE) IN NET ASSETS APPLICABLE TO COMMON STOCKHOLDERS | | | 27,087,750 | | | | (161,621,085 | ) |
|
| NET ASSETS APPLICABLE TO COMMON STOCKHOLDERS: | | | | | | | | |
Beginning of period | | | 169,854,431 | | | | 331,475,516 | |
|
End of period (including undistributed net investment income (loss) of $(796,354) at 6/30/09 and | | | | | | | | |
$(1,117,851) at 12/31/08) | | $ | 196,942,181 | | | $ | 169,854,431 | |
* To be allocated to net investment income, net realized gains and/or return of capital at year end.
| THE ACCOMPANYING NOTES ARE AN INTEGRAL PART OF THESE FINANCIAL STATEMENTS. | | 2009 Semiannual Report to Stockholders | 41 |
This table is presented to show selected data for a share of Common Stock outstanding throughout each period, and to assist stockholders in evaluating the Fund’s performance for the periods presented.
| | | Six months | | |
| | | ended | | Years ended December 31, |
| | | June 30, 2009 | |
|
| | | (unaudited) | | | 2008 | | | | 2007 | | | | 2006 | | | | 2005 | | | | 2004 | |
|
| NET ASSET VALUE, BEGINNING OF PERIOD | | $ | 6.39 | | | $ | 13.48 | | | $ | 14.77 | | | $ | 13.43 | | | $ | 14.34 | | | $ | 13.33 | |
|
| INVESTMENT OPERATIONS: | | | | | | | | | | | | | | | | | | | | | | | | |
Net investment income (loss) | | | 0.01 | | | | 0.02 | | | | (0.00 | ) | | | 0.01 | | | | (0.03 | ) | | | (0.08 | ) |
Net realized and unrealized gain (loss) on investments and | | | | | | | | | | | | | | | | | | | | | | | | |
foreign currency | | | 1.12 | | | | (5.70 | ) | | | 0.24 | | | | 3.04 | | | | 1.14 | | | | 2.62 | |
|
Total investment operations | | | 1.13 | | | | (5.68 | ) | | | 0.24 | | | | 3.05 | | | | 1.11 | | | | 2.54 | |
|
| DISTRIBUTIONS TO PREFERRED STOCKHOLDERS: | | | | | | | | | | | | | | | | | | | | | | | | |
Net investment income | | | – | | | | (0.01 | ) | | | (0.01 | ) | | | (0.02 | ) | | | – | | | | – | |
Net realized gain on investments and foreign currency | | | – | | | | (0.13 | ) | | | (0.14 | ) | | | (0.14 | ) | | | (0.17 | ) | | | (0.19 | ) |
Unallocated distributions* | | | (0.07 | ) | | | – | | | | – | | | | – | | | | – | | | | – | |
|
Total distributions to Preferred Stockholders | | | (0.07 | ) | | | (0.14 | ) | | | (0.15 | ) | | | (0.16 | ) | | | (0.17 | ) | | | (0.19 | ) |
|
NET INCREASE (DECREASE) IN NET ASSETS APPLICABLE TO COMMON
STOCKHOLDERS RESULTING FROM INVESTMENT OPERATIONS | | | 1.06 | | | | (5.82 | ) | | | 0.09 | | | | 2.89 | | | | 0.94 | | | | 2.35 | |
|
| DISTRIBUTIONS TO COMMON STOCKHOLDERS: | | | | | | | | | | | | | | | | | | | | | | | | |
Net investment income | | | – | | | | (0.09 | ) | | | (0.08 | ) | | | (0.20 | ) | | | – | | | | – | |
Net realized gain on investments and foreign currency | | | – | | | | (0.83 | ) | | | (1.27 | ) | | | (1.35 | ) | | | (1.85 | ) | | | (1.33 | ) |
Return of capital | | | – | | | | (0.27 | ) | | | – | | | | – | | | | – | | | | – | |
Unallocated distributions* | | | (0.22 | ) | | | – | | | | – | | | | – | | | | – | | | | – | |
|
Total distributions to Common Stockholders | | | (0.22 | ) | | | (1.19 | ) | | | (1.35 | ) | | | (1.55 | ) | | | (1.85 | ) | | | (1.33 | ) |
|
| CAPITAL STOCK TRANSACTIONS: | | | | | | | | | | | | | | | | | | | | | | | | |
Effect of reinvestment of distributions by Common Stockholders | | | (0.02 | ) | | | (0.08 | ) | | | (0.03 | ) | | | (0.00 | ) | | | 0.00 | | | | (0.01 | ) |
|
Total capital stock transactions | | | (0.02 | ) | | | (0.08 | ) | | | (0.03 | ) | | | (0.00 | ) | | | 0.00 | | | | (0.01 | ) |
|
| NET ASSET VALUE, END OF PERIOD | | $ | 7.21 | | | $ | 6.39 | | | $ | 13.48 | | | $ | 14.77 | | | $ | 13.43 | | | $ | 14.34 | |
|
| MARKET VALUE, END OF PERIOD | | $ | 6.01 | | | $ | 5.62 | | | $ | 11.94 | | | $ | 16.57 | | | $ | 14.56 | | | $ | 15.24 | |
|
| TOTAL RETURN (a): | | | | | | | | | | | | | | | | | | | | | | | | |
| Market Value | | | 12.46 | %*** | | | (45.84 | )% | | | (20.54 | )% | | | 26.72 | % | | | 8.90 | % | | | 33.44 | % |
| Net Asset Value | | | 18.66 | %*** | | | (45.45 | )% | | | 0.64 | % | | | 22.46 | % | | | 6.75 | % | | | 18.69 | % |
| RATIOS BASED ON AVERAGE NET ASSETS APPLICABLE TO | | | | | | | | | | | | | | | | | | | | | | | | |
COMMON STOCKHOLDERS: | | | | | | | | | | | | | | | | | | | | | | | | |
| Total expenses (b,c) | | | 1.62 | %** | | | 1.55 | % | | | 1.56 | % | | | 1.64 | % | | | 1.63 | % | | | 1.62 | % |
Management fee expense (d) | | | 1.37 | %** | | | 1.39 | % | | | 1.44 | % | | | 1.49 | % | | | 1.43 | % | | | 1.43 | % |
Other operating expenses | | | 0.25 | %** | | | 0.16 | % | | | 0.12 | % | | | 0.15 | % | | | 0.20 | % | | | 0.19 | % |
| Net investment income (loss) | | | 0.39 | %** | | | 0.15 | % | | | (0.07 | )% | | | 0.05 | % | | | (0.27 | )% | | | (0.56 | )% |
| SUPPLEMENTAL DATA: | | | | | | | | | | | | | | | | | | | | | | | | |
| Net Assets Applicable to Common Stockholders, | | | | | | | | | | | | | | | | | | | | | | | | |
End of Period (in thousands) | | $ | 196,942 | | | $ | 169,854 | | | $ | 331,476 | | | $ | 343,682 | | | $ | 293,719 | | | $ | 290,364 | |
| Liquidation Value of Preferred Stock, | | | | | | | | | | | | | | | | | | | | | | | | |
End of Period (in thousands) | | $ | 60,000 | | | $ | 60,000 | | | $ | 60,000 | | | $ | 60,000 | | | $ | 60,000 | | | $ | 60,000 | |
| Portfolio Turnover Rate | | | 16 | % | | | 42 | % | | | 41 | % | | | 34 | % | | | 46 | % | | | 32 | % |
| PREFERRED STOCK: | | | | | | | | | | | | | | | | | | | | | | | | |
| Total shares outstanding | | | 2,400,000 | | | | 2,400,000 | | | | 2,400,000 | | | | 2,400,000 | | | | 2,400,000 | | | | 2,400,000 | |
| Asset coverage per share | | $ | 107.06 | | | $ | 95.77 | | | $ | 163.11 | | | $ | 168.20 | | | $ | 147.38 | | | $ | 145.98 | |
| Liquidation preference per share | | $ | 25.00 | | | $ | 25.00 | | | $ | 25.00 | | | $ | 25.00 | | | $ | 25.00 | | | $ | 25.00 | |
| Average market value per share (e): | | $ | 22.67 | | | $ | 23.08 | | | $ | 24.06 | | | $ | 24.15 | | | $ | 24.97 | | | $ | 24.66 | |
| (a) | | The Market Value Total Return is calculated assuming a purchase of Common Stock on the opening of the first business day and a sale on the closing of the last business day of each period reported. Dividends and distributions are assumed for the purposes of this calculation to be reinvested at prices obtained under the Fund’s Distribution Reinvestment and Cash Purchase Plan. Net Asset Value Total Return is calculated on the same basis, except that the Fund’s net asset value is used on the purchase and sale dates instead of market value. |
| (b) | Expense ratios based on total average net assets including liquidation value of Preferred Stock were 1.19%, 1.26%, 1.33%, 1.38%, 1.35% and 1.32% for the periods ended June 30, 2009 and December 31, 2008, 2007, 2006, 2005 and 2004, respectively. |
| (c) | Expense ratios based on average net assets applicable to Common Stockholders before waiver of fees by the investments advisor would have been 1.86% and 1.58% for the periods ended June 30, 2009 and December 31, 2008; before waiver of fees and after earnings credits would have been 1.86%, 1.58%, 1.56%, 1.64%, 1.63% and 1.62% for the periods ended June 30, 2009 and December 31, 2008, 2007, 2006, 2005 and 2004, respectively. |
| (d) | The management fee is calculated based on average net assets over a rolling 36-month basis, while the above ratios of management fee expenses are based on the average net assets applicable to Common Stockholders over a 12-month basis. |
| (e) | The average of month-end market values during the period that the 6.00% Preferred Stock was outstanding. |
| * | To be allocated to net investment income, net realized gains and/or return of capital at year end. |
| ** | Annualized. |
| *** | Not annualized. |
| 42 | 2009 Semiannual Report to Stockholders | | THE ACCOMPANYING NOTES ARE AN INTEGRAL PART OF THESE FINANCIAL STATEMENTS. |
Notes to Financial Statements (unaudited) |
Summary of Significant Accounting Policies:
Royce Micro-Cap Trust, Inc. (the “Fund”), was incorporated under the laws of the State of Maryland on September 9, 1993 as a diversified closed-end investment company. The Fund commenced operations on December 14, 1993.
The preparation of financial statements in conformity with accounting principles generally accepted in the United States of America requires management to make estimates and assumptions that affect the reported amounts of assets and liabilities and the disclosure of contingent assets and liabilities at the date of the financial statements and the evaluation of subsequent events through August 13, 2009, the issuance date of the financial statements, and the reported amounts of income and expenses during the reporting period. Actual results could differ from those estimates.
Valuation of Investments:
Securities are valued as of the close of trading on the New York Stock Exchange (NYSE) (generally 4:00 p.m. Eastern time) on the valuation date. Securities that trade on an exchange, and securities traded on Nasdaq’s Electronic Bulletin Board, are valued at their last reported sales price or Nasdaq official closing price taken from the primary market in which each security trades or, if no sale is reported for such day, at their bid price. Other over-the-counter securities for which market quotations are readily available are valued at their highest bid price, except in the case of some bonds and other fixed income securities which may be valued by reference to other securities with comparable ratings, interest rates and maturities, using established independent pricing services. The Fund values its non-U.S. dollar denominated securities in U.S. dollars daily at the prevailing foreign currency exchange rates as quoted by a major bank. Securities for which market quotations are not readily available are valued at their fair value under procedures established by the Fund’s Board of Directors. In addition, if, between the time trading ends on a particular security and the close of the customary trading session on the NYSE, events occur that are significant and may make the closing price unreliable, the Fund may fair value the security. The Fund uses an independent pricing service to provide fair value estimates for relevant non-U.S. equity securities on days when the U.S. market volatility exceeds a certain threshold. This pricing service uses proprietary correlations it has developed between the movement of prices of non-U.S. equity securities and indices of U.S.-traded securities, futures contracts and other indications to estimate the fair value of relevant non-U.S. securities. When fair value pricing is employed, the prices of securities used by the Fund may differ from quoted or published prices for the same security. Investments in money market funds are valued at net asset value per share.
| | Various inputs are used in determining the value of the Fund’s investments, as noted above. These inputs are summarized in the three broad levels below: |
| | | Level 1 – quoted prices in active markets for identical securities |
| | | Level 2 – other significant observable inputs (including quoted prices for similar securities, foreign securities that may be fair valued and repurchase agreements) |
| | | Level 3 – significant unobservable inputs (including the Fund’s own assumptions in determining the fair value of investments) |
| | The inputs or methodology used for valuing securities are not necessarily an indication of the risk associated with investing in those securities. |
| The following is a summary of the inputs used to value the Fund’s investments as of June 30, 2009: |
| | | | Level 1 | | | Level 2 | | | Level 3 | | | Total |
|
Equities | | | $190,170,562 | | | $21,531,378 | | | $36,335 | | | $211,738,275 |
Cash Equivalents | | | - | | | 59,222,191 | | | - | | | 59,222,191 |
|
| Level 3 Reconciliation: | | | | | | | | | | | | |
| | | | | | Change in | | | | | | | | | | | | | | | |
| | | | | | unrealized | | | | | | | | | | | | | | | |
| | | Balance as of | | | appreciation | | | | | | | | | | | | Realized Gain | | | Balance as of |
| | | 12/31/08 | | | (depreciation) | | | Purchases | | | Transfers In | | | Sales | | | (Loss) | | | 6/30/09 |
|
Equities | | - | | | $168,034 | | | $23,754 | | | $74,554 | | | $2 | | | $(230,005) | | | $36,335 |
|
Repurchase Agreements:
The Fund may enter into repurchase agreements with institutions that the Fund’s investment adviser has determined are creditworthy. The Fund restricts repurchase agreements to maturities of no more than seven days. Securities pledged as collateral for repurchase agreements, which are held until maturity of the repurchase agreements, are marked-to-market daily and maintained at a value at least equal to the principal amount of the repurchase agreement (including accrued interest). Repurchase agreements could involve certain risks in the event of default or insolvency of the counter-party, including possible delays or restrictions upon the ability of the Fund to dispose of its underlying securities.
Foreign Currency:
Net realized foreign exchange gains or losses arise from sales and maturities of short-term securities, sales of foreign currencies, expiration of currency forward contracts, currency gains or losses realized between the trade and settlement dates on securities transactions, and the difference between the amounts of dividends, interest, and foreign withholding taxes recorded on the Fund’s books and the U.S. dollar equivalent of the
| | | 2009 Semiannual Report to Stockholders | 43 |
Notes to Financial Statements (unaudited) (continued) |
amounts actually received or paid. Net unrealized foreign exchange gains and losses arise from changes in the value of assets and liabilities, including investments in securities at the end of the reporting period, as a result of changes in foreign currency exchange rates.
Securities Lending:
The Fund loans securities to qualified institutional investors for the purpose of realizing additional income. Collateral on all securities loaned for the Fund is accepted in cash and cash equivalents and invested temporarily by the custodian. The collateral maintained is at least 100% of the current market value of the loaned securities. The market value of the loaned securities is determined at the close of business of the Fund and any additional required collateral is delivered to the Fund on the next business day. The Fund retains the risk of any loss on the securities on loan as well as incurring the potential loss on investments purchased with cash collateral received for securities lending.
Taxes:
As a qualified regulated investment company under Subchapter M of the Internal Revenue Code, the Fund is not subject to income taxes to the extent that it distributes substantially all of its taxable income for its fiscal year. The Schedule of Investments includes information regarding income taxes under the caption “Tax Information”.
Distributions:
Effective May 18, 2009, the Fund pays any dividends and capital gain distributions annually in December on the Fund’s Common Stock. Prior to that date, the Fund paid quarterly distributions on the Fund’s Common Stock at the annual rate of 9% of the rolling average of the prior four calendar quarter-end NAVs of the Fund’s Common Stock, with the fourth quarter distribution being the greater of 2.25% of the rolling average or the distribution required by IRS regulations. Distributions to Preferred Stockholders are accrued daily and paid quarterly and distributions to Common Stockholders are recorded on ex-dividend date. Distributable capital gains and/or net investment income are first allocated to Preferred Stockholder distributions, with any excess allocable to Common Stockholders. If capital gains and/or net investment income are allocated to both Preferred and Common Stockholders, the tax character of such allocations is proportional. To the extent that distributions are not paid from long-term capital gains, net investment income or net short-term capital gains, they will represent a return of capital. Distributions are determined in accordance with income tax regulations that may differ from accounting principles generally accepted in the United States of America. Permanent book and tax differences relating to stockholder distributions will result in reclassifications within the capital accounts. Undistributed net investment income may include temporary book and tax basis differences, which will reverse in a subsequent period. Any taxable income or gain remaining undistributed at fiscal year end is distributed in the following year.
Investment Transactions and Related Investment Income:
Investment transactions are accounted for on the trade date. Dividend income is recorded on the ex-dividend date. Non-cash dividend income is recorded at the fair market value of the securities received. Interest income is recorded on an accrual basis. Premium and discounts on debt securities are amortized using the effective yield-to-maturity method. Realized gains and losses from investment transactions are determined on the basis of identified cost for book and tax purposes.
Expenses:
The Fund incurs direct and indirect expenses. Expenses directly attributable to the Fund are charged to the Fund’s operations, while expenses applicable to more than one of the Royce Funds are allocated equitably. Certain personnel, occupancy costs and other administrative expenses related to The Royce Funds are allocated by Royce & Associates, LLC (“Royce”) under an administration agreement and are included in administrative and office facilities and legal expenses. The Fund has adopted a deferred fee agreement that allows the Directors to defer the receipt of all or a portion of Directors’ Fees otherwise payable. The deferred fees are invested in certain Royce Funds until distributed in accordance with the agreement.
Compensating Balance Credits:
The Fund has an arrangement with its custodian bank, whereby a portion of the custodian’s fee is paid indirectly by credits earned on the Fund’s cash on deposit with the bank. This deposit arrangement is an alternative to purchasing overnight investments. Conversely, the Fund pays interest to the custodian on any cash overdrafts, to the extent they are not offset by credits earned on positive cash balances.
Capital Stock:
The Fund issued 756,901 and 1,985,915 shares of Common Stock as reinvestment of distributions by Common Stockholders for the six months ended June 30, 2009 and the year ended December 31, 2008, respectively.
At June 30, 2009, 2,400,000 shares of 6.00% Cumulative Preferred Stock were outstanding. The Fund, at its option, may redeem the Cumulative Preferred Stock, in whole or in part, at the redemption price. The Cumulative Preferred Stock is classified outside of permanent equity (net assets applicable to Common Stockholders) in the accompanying financial statements in accordance with Emerging Issues Task Force (EITF) Topic D-98, Classification and Measurement of Redeemable Securities, that requires preferred securities that are redeemable for cash or other assets to be classified outside of permanent equity to the extent that the redemption is at a fixed or determinable price and at the option of the holder or upon the occurrence of an event that is not solely within the control of the issuer.
| 44 | 2009 Semiannual Report to Stockholders | | |
Notes to Financial Statements (unaudited) (continued) |
The Fund is required to meet certain asset coverage tests with respect to the Cumulative Preferred Stock as required by the 1940 Act. In addition, pursuant to the Rating Agency Guidelines established by Moody’s, the Fund is required to maintain a certain discounted asset coverage. If the Fund fails to meet these requirements and does not correct such failure, the Fund may be required to redeem, in part or in full, the Cumulative Preferred Stock at a redemption price of $25.00 per share, plus an amount equal to the accumulated and unpaid dividends, whether or not declared on such shares, in order to meet these requirements. Additionally, failure to meet the foregoing asset coverage requirements could restrict the Fund’s ability to pay dividends to Common Stockholders and could lead to sales of portfolio securities at inopportune times. The Fund has met these requirements since issuing the Cumulative Preferred Stock.
Investment Advisory Agreement:
As compensation for its services under the Investment Advisory Agreement, Royce & Associates, LLC (“Royce”) receives a fee comprised of a Basic Fee (“Basic Fee”) and an adjustment to the Basic Fee based on the investment performance of the Fund in relation to the investment record of the Russell 2000.
The Basic Fee is a monthly fee equal to 1/12 of 1% (1% on an annualized basis) of the average of the Fund’s month-end net assets applicable to Common Stockholders, plus the liquidation value of Preferred Stock, for the rolling 36-month period ending with such month (the “performance period”). The Basic Fee for each month is increased or decreased at the rate of 1/12 of .05% for each percentage point that the investment performance of the Fund exceeds, or is exceeded by, the percentage change in the investment record of the Russell 2000 for the performance period by more than two percentage points. The performance period for each such month is a rolling 36-month period ending with such month. The maximum increase or decrease in the Basic Fee for any month may not exceed 1/12 of .5%. Accordingly, for each month, the maximum monthly fee rate as adjusted for performance is 1/12 of 1.5% and is payable if the investment performance of the Fund exceeds the percentage change in the investment record of the Russell 2000 by 12 or more percentage points for the performance period, and the minimum monthly fee rate as adjusted for performance is 1/12 of .5% and is payable if the percentage change in the investment record of the Russell 2000 exceeds the investment performance of the Fund by 12 or more percentage points for the performance period.
Royce has voluntarily committed to waive the portion of its investment advisory fee attributable to an issue of the Fund’s Preferred Stock for any month in which the Fund’s average annual NAV total return since issuance of the Preferred Stock fails to exceed the applicable Preferred Stock’s dividend rate.
For six rolling 36-month periods in 2009, the Fund’s investment performance ranged from 2% to 9% below the investment performance of the Russell 2000. Accordingly, the net investment advisory fee consisted of a Basic Fee of $1,795,811 and a net downward adjustment of $437,909 for the performance of the Fund relative to that of the Russell 2000. Additionally, Royce voluntarily waived a portion of its advisory fee ($194,167) attributable to issues of the Fund’s Preferred Stock for those months in which the Fund’s average annual NAV total return failed to exceed the applicable Preferred Stock’s dividend rate. For the six months ended June 30, 2009, the Fund paid Royce advisory fees totaling $1,163,735 and accrued $1,115,735.
Purchases and Sales of Investment Securities:
For the six months ended June 30, 2009, the cost of purchases and proceeds from sales of investment securities, other than short-term securities and collateral received for securities loaned, amounted to $29,967,038 and $55,581,514, respectively.
Transactions in Affiliated Companies:
An “Affiliated Company” as defined in the Investment Company Act of 1940, is a company in which a fund owns 5% or more of the company’s outstanding voting securities at any time during the period. The Fund effected the following transactions in shares of such companies for the six months ended June 30, 2009:
| | | | Shares | | Market Value | | Cost of | | Cost of | | Realized | | Dividend | | Shares | | Market Value |
| Affiliated Company | | | 12/31/08 | | 12/31/08 | | Purchases | | Sales | | Gain (Loss) | | Income | | 6/30/09 | | 6/30/09 |
| Deswell Industries* | | | | 824,371 | | | $ | 1,096,413 | | | | | - | | $ | 710,000 | | | | $(352,375 | ) | | | $31,195 | | | | | | | | | |
| | | | | | | | $ | 1,096,413 | | | | | | | | | | | | $(352,375 | ) | | | $31,195 | | | | | | | | | |
*Not an Affiliated Company at June 30, 2009. | | | 2009 Semiannual Report to Stockholders | 45 |
| | | SHARES | | | VALUE | |
| COMMON STOCKS – 96.0% | | | | | | | |
| | | | | | | | |
| Consumer Products – 11.3% | | | | | | | |
| Apparel, Shoes and Accessories - 4.0% | | | | | | | |
†Coach | | 50,000 | | | $ | 1,344,000 | |
Fossil a | | 70,000 | | | | 1,685,600 | |
Timberland Company (The) Cl. A a | | 100,000 | | | | 1,327,000 | |
| | | | | |
| |
| | | | | | | 4,356,600 | |
| | | | | |
| |
| Food/Beverage/Tobacco - 4.1% | | | | | | | |
Industrias Bachoco ADR | | 100,000 | | | | 2,130,000 | |
Sanderson Farms | | 50,000 | | | | 2,250,000 | |
| | | | | |
| |
| | | | | | | 4,380,000 | |
| | | | | |
| |
| Health, Beauty and Nutrition - 1.7% | | | | | | | |
Nu Skin Enterprises Cl. A | | 120,000 | | | | 1,836,000 | |
| | | | | |
| |
| Sports and Recreation - 1.5% | | | | | | | |
Thor Industries | | 90,000 | | | | 1,653,300 | |
| | | | | |
| |
| Total (Cost $14,477,349) | | | | | | 12,225,900 | |
| | | | | |
| |
| | | | | | | | |
| Consumer Services – 1.3% | | | | | | | |
| Retail Stores - 1.3% | | | | | | | |
Men’s Wearhouse (The) | | 75,000 | | | | 1,438,500 | |
| | | | | |
| |
| Total (Cost $1,478,655) | | | | | | 1,438,500 | |
| | | | | |
| |
| | | | | | | | |
| Diversified Investment Companies – 1.9% | | | | | | | |
| Exchange Traded Funds - 1.9% | | | | | | | |
†UltraShort 20+ Year Treasury ProShares a | | 40,000 | | | | 2,036,800 | |
| | | | | |
| |
| Total (Cost $1,711,208) | | | | | | 2,036,800 | |
| | | | | |
| |
| | | | | | | | |
| Financial Intermediaries – 3.8% | | | | | | | |
| Banking - 0.8% | | | | | | | |
BCB Holdings a | | 399,993 | | | | 822,819 | |
| | | | | |
| |
| Securities Brokers - 2.8% | | | | | | | |
Knight Capital Group Cl. A a | | 180,000 | | | | 3,069,000 | |
| | | | | |
| |
| Other Financial Intermediaries - 0.2% | | | | | | | |
KKR Financial Holdings a | | 200,000 | | | | 186,000 | |
| | | | | |
| |
| Total (Cost $5,995,837) | | | | | | 4,077,819 | |
| | | | | |
| |
| | | | | | | | |
| Financial Services – 7.3% | | | | | | | |
| Investment Management - 7.3% | | | | | | | |
Endeavour Financial b | | 600,000 | | | | 722,177 | |
†Franklin Resources | | 30,000 | | | | 2,160,300 | |
†Partners Group Holding | | 15,000 | | | | 1,457,606 | |
Sprott | | 550,000 | | | | 1,442,204 | |
U.S. Global Investors Cl. A | | 226,000 | | | | 2,092,760 | |
| | | | | |
| |
| Total (Cost $12,077,570) | | | | | | 7,875,047 | |
| | | | | |
| |
| | | | | | | | |
| Health – 3.0% | | | | | | | |
| Drugs and Biotech - 2.4% | | | | | | | |
Endo Pharmaceuticals Holdings a | | 100,000 | | | | 1,792,000 | |
Lexicon Pharmaceuticals a | | 500,000 | | | | 620,000 | |
ULURU a,b | | 1,000,009 | | | | 160,002 | |
| | | | | |
| |
| | | | | | | 2,572,002 | |
| | | | | |
| |
| | | SHARES | | | VALUE | |
| Health (continued) | | | | | | | |
| Medical Products and Devices - 0.6% | | | | | | | |
Caliper Life Sciences a | | 352,300 | | | $ | 623,571 | |
| | | | | |
| |
| Total (Cost $7,311,243) | | | | | | 3,195,573 | |
| | | | | |
| |
| | | | | | | | |
| Industrial Products – 24.9% | | | | | | | |
| Building Systems and Components - 2.5% | | | | | | | |
Simpson Manufacturing | | 70,000 | | | | 1,513,400 | |
†WaterFurnace Renewable Energy | | 50,000 | | | | 1,179,985 | |
| | | | | |
| |
| | | | | | | 2,693,385 | |
| | | | | |
| |
| Industrial Components - 2.1% | | | | | | | |
GrafTech International a | | 200,000 | | | | 2,262,000 | |
| | | | | |
| |
| Machinery - 2.8% | | | | | | | |
Lincoln Electric Holdings | | 50,000 | | | | 1,802,000 | |
Woodward Governor | | 60,000 | | | | 1,188,000 | |
| | | | | |
| |
| | | | | | | 2,990,000 | |
| | | | | |
| |
| Metal Fabrication and Distribution - 11.1% | | | | | | | |
Kennametal | | 80,000 | | | | 1,534,400 | |
†Nucor Corporation | | 40,000 | | | | 1,777,200 | |
Reliance Steel & Aluminum | | 100,000 | | | | 3,839,000 | |
Schnitzer Steel Industries Cl. A | | 30,000 | | | | 1,585,800 | |
Sims Metal Management ADR | | 160,000 | | | | 3,299,200 | |
| | | | | |
| |
| | | | | | | 12,035,600 | |
| | | | | |
| |
| Miscellaneous Manufacturing - 1.6% | | | | | | | |
Rational | | 15,000 | | | | 1,730,364 | |
| | | | | |
| |
| Pumps, Valves and Bearings - 2.8% | | | | | | | |
Gardner Denver a | | 60,000 | | | | 1,510,200 | |
Pfeiffer Vacuum Technology | | 20,000 | | | | 1,467,377 | |
| | | | | |
| |
| | | | | | | 2,977,577 | |
| | | | | |
| |
| Specialty Chemicals and Materials - 2.0% | | | | | | | |
†Mosaic Company (The) | | 50,000 | | | | 2,215,000 | |
| | | | | |
| |
| Total (Cost $20,602,226) | | | | | | 26,903,926 | |
| | | | | |
| |
| | | | | | | | |
| Industrial Services – 4.5% | | | | | | | |
| Commercial Services - 2.2% | | | | | | | |
CRA International a | | 40,000 | | | | 1,110,400 | |
Korn/Ferry International a | | 120,000 | | | | 1,276,800 | |
| | | | | |
| |
| | | | | | | 2,387,200 | |
| | | | | |
| |
| Food, Tobacco and Agriculture - 2.3% | | | | | | | |
CF Industries Holdings | | 15,000 | | | | 1,112,100 | |
Intrepid Potash a | | 50,000 | | | | 1,404,000 | |
| | | | | |
| |
| | | | | | | 2,516,100 | |
| | | | | |
| |
| Total (Cost $4,465,707) | | | | | | 4,903,300 | |
| | | | | |
| |
| | | | | | | | |
| Natural Resources – 29.2% | | | | | | | |
| Energy Services - 11.4% | | | | | | | |
Ensign Energy Services | | 200,000 | | | | 2,923,097 | |
Major Drilling Group International | | 120,000 | | | | 1,883,850 | |
Pason Systems | | 180,000 | | | | 1,450,028 | |
Tesco Corporation a | | 160,000 | | | | 1,270,400 | |
Trican Well Service | | 240,000 | | | | 2,067,489 | |
Unit Corporation a | | 100,300 | | | | 2,765,271 | |
| | | | | |
| |
| | | | | | | 12,360,135 | |
| | | | | |
| |
| 46 | 2009 Semiannual Report to Stockholders | | THE ACCOMPANYING NOTES ARE AN INTEGRAL PART OF THESE FINANCIAL STATEMENTS. |
| June 30, 2009 (unaudited) |
|
| | | SHARES | | | VALUE | |
| Natural Resources (continued) | | | | | | | |
| Oil and Gas - 1.9% | | | | | | | |
†Exxon Mobil | | 30,000 | | | $ | 2,097,300 | |
| | | | | |
| |
| Precious Metals and Mining - 13.9% | | | | | | | |
Alamos Gold a | | 250,000 | | | | 2,054,765 | |
Allied Nevada Gold a | | 200,000 | | | | 1,612,000 | |
†Fresnillo | | 200,000 | | | | 1,725,115 | |
Gammon Gold a | | 200,000 | | | | 1,334,000 | |
Ivanhoe Mines a | | 350,000 | | | | 1,960,000 | |
Pan American Silver a | | 120,000 | | | | 2,199,600 | |
†Seabridge Gold a | | 50,000 | | | | 1,297,000 | |
Silver Standard Resources a | | 150,000 | | | | 2,812,500 | |
| | | | | |
| |
| | | | | | | 14,994,980 | |
| | | | | |
| |
| Real Estate - 0.8% | | | | | | | |
†PICO Holdings a | | 30,000 | | | | 861,000 | |
| | | | | |
| |
| Other Natural Resources - 1.2% | | | | | | | |
†Magma Energy a,c,d | | 1,000,000 | | | | 1,289,601 | |
| | | | | |
| |
| Total (Cost $33,395,358) | | | | | | 31,603,016 | |
| | | | | |
| |
| | | | | | | | |
| Technology – 8.1% | | | | | | | |
| Aerospace and Defense - 1.0% | | | | | | | |
Ceradyne a | | 60,000 | | | | 1,059,600 | |
| | | | | |
| |
| Semiconductors and Equipment - 2.9% | | | | | | | |
MKS Instruments a,b | | 120,000 | | | | 1,582,800 | |
Sigma Designs a | | 100,325 | | | | 1,609,213 | |
| | | | | |
| |
| | | | | | | 3,192,013 | |
| | | | | |
| |
| Software - 2.2% | | | | | | | |
†Microsoft Corporation | | 100,000 | | | | 2,377,000 | |
| | | | | |
| |
| Telecommunications - 2.0% | | | | | | | |
ADTRAN | | 100,000 | | | | 2,147,000 | |
| | | | | |
| |
| Total (Cost $10,225,524) | | | | | | 8,775,613 | |
| | | | | |
| |
| | | SHARES | | | VALUE | |
| Miscellaneouse – 0.7% | | | | | | | |
| Total (Cost $858,383) | | | | | $ | 722,177 | |
| | | | | |
| |
| | | | | | | | |
| TOTAL COMMON STOCKS | | | | | | | |
(Cost $112,599,060) | | | | | | 103,757,671 | |
| | | | | |
| |
| | | | | | | | |
| PREFERRED STOCK – 6.7% | | | | | | | |
Kennedy-Wilson Conv. c,f | | | | | | | |
(Cost $9,000,000) | | 9,000 | | | | 7,285,707 | |
| | | | | |
| |
| | | | | | | | |
| REPURCHASE AGREEMENT – 21.6% | | | | | | | |
| State Street Bank & Trust Company, | | | | | | | |
0.01% dated 6/30/09, due 7/1/09, | | | | | | | |
maturity value $23,360,006 (collateralized | | | | | | | |
by obligations of various U.S. Government | | | | | | | |
Agencies, due 3/31/10, valued at $23,944,869) | | | | | | | |
(Cost $23,360,000) | | | | | | 23,360,000 | |
| | | | | |
| |
| | | | | | | | |
| COLLATERAL RECEIVED FOR SECURITIES | | | | | | | |
LOANED – 0.3% | | | | | | | |
| Money Market Funds | | | | | | | |
Federated Government Obligations Fund | | | | | | | |
(7 day yield-0.1864%) | | | | | | | |
(Cost $281,107) | | | | | | 281,107 | |
| | | | | |
| |
| | | | | | | | |
| TOTAL INVESTMENTS – 124.6% | | | | | | | |
(Cost $145,240,167) | | | | | | 134,684,485 | |
| | | | | | | | |
| LIABILITIES LESS CASH | | | | | | | |
AND OTHER ASSETS – (1.5)% | | | | | | (1,594,595 | ) |
| | | | | | | | |
| PREFERRED STOCK – (23.1)% | | | | | | (25,000,000 | ) |
| | | | | |
| |
| | | | | | | | |
| NET ASSETS APPLICABLE TO COMMON | | | | | | | |
STOCKHOLDERS – 100.0% | | | | | $ | 108,089,890 | |
| | | | | |
| |
|
| † | New additions in 2009. |
| a | Non-income producing. |
| b | All or a portion of these securities were on loan at June 30, 2009. Total market value of loaned securities at June 30, 2009 was $138,214. |
| c | Securities for which market quotations are not readily available represent 7.9% of net assets. These securities have been valued at their fair value under procedures established by the Fund’s Board of Directors. |
| d | This security is not registered under the Securities Act of 1933 and may be subject to contractual and/or legal restrictions on resale to the general public or to certain institutions. |
| e | Includes securities first acquired in 2009 and less than 1% of net assets applicable to Common Stockholders. |
| f | This security, and the common stock into which the security is convertible, are not and will not be registered under the Securities Act of 1933 and related rules (“restricted security”). Accordingly, such securities may not be offered, sold, transferred or delivered, directly or indirectly, unless (i) such shares are registered under the Securities Act and any other applicable state securities laws, or (ii) an exemption from registration under the Securities Act and any other applicable state securities laws is available. |
Bold indicates the Fund’s 20 largest equity holdings in terms of June 30, 2009 market value.
TAX INFORMATION: The cost of total investments for Federal income tax purposes was $145,240,167. At June 30, 2009 net unrealized depreciation for all securities was $(10,555,682), consisting of aggregate gross unrealized appreciation of $17,521,504 and aggregate gross unrealized depreciation of $28,077,186. The primary difference between book and tax basis cost is the timing of the recognition of losses on securities sold.
| THE ACCOMPANYING NOTES ARE AN INTEGRAL PART OF THESE FINANCIAL STATEMENTS. | | 2009 Semiannual Report to Stockholders | 47 |
Royce Focus Trust | June 30, 2009 (unaudited) |
|
Statement of Assets and Liabilities |
| ASSETS: | | | | |
| Total investments at value (including collateral on loaned securities)* | | $ | 111,324,485 | |
| Repurchase agreements (at cost and value) | | | 23,360,000 | |
| Cash and foreign currency | | | 106 | |
| Receivable for investments sold | | | 230,102 | |
| Receivable for dividends and interest | | | 97,967 | |
| Prepaid expenses and other assets | | | 9,466 | |
|
Total Assets | | | 135,022,126 | |
|
| LIABILITIES: | | | | |
| Payable for collateral on loaned securities | | | 281,107 | |
| Payable for investments purchased | | | 1,440,275 | |
| Payable for investment advisory fee | | | 113,416 | |
| Preferred dividends accrued but not yet declared | | | 33,329 | |
| Accrued expenses | | | 64,109 | |
|
Total Liabilities | | | 1,932,236 | |
|
| PREFERRED STOCK: | | | | |
| 6.00% Cumulative Preferred Stock - $0.001 par value, $25 liquidation value per share; 1,000,000 shares outstanding | | | 25,000,000 | |
|
Total Preferred Stock | | | 25,000,000 | |
|
| NET ASSETS APPLICABLE TO COMMON STOCKHOLDERS | | $ | 108,089,890 | |
|
| ANALYSIS OF NET ASSETS APPLICABLE TO COMMON STOCKHOLDERS: | | | | |
| Common Stock paid-in capital - $0.001 par value per share; 19,759,064 shares outstanding (150,000,000 shares authorized) | | $ | 130,246,419 | |
| Undistributed net investment income (loss) | | | 402,517 | |
| Accumulated net realized gain (loss) on investments and foreign currency | | | (9,467,528 | ) |
| Net unrealized appreciation (depreciation) on investments and foreign currency | | | (10,556,794 | ) |
| Unallocated and accrued distributions | | | (2,534,724 | ) |
|
Net Assets applicable to Common Stockholders (net asset value per share - $5.47) | | $ | 108,089,890 | |
|
| *Investments at identified cost (including $281,107 of collateral on loaned securities) | | $ | 121,880,167 | |
| Market value of loaned securities | | | 138,214 | |
| 48 | 2009 Semiannual Report to Stockholders | | THE ACCOMPANYING NOTES ARE AN INTEGRAL PART OF THESE FINANCIAL STATEMENTS. |
| Royce Focus Trust | Six Months Ended June 30, 2009 (unaudited) |
|
| |
| INVESTMENT INCOME: | | | | |
| Income: | | | | |
Dividends* | | $ | 801,078 | |
Interest | | | 12,859 | |
Securities lending | | | 1,206 | |
|
| Total income | | | 815,143 | |
|
| Expenses: | | | | |
Investment advisory fees | | | 597,172 | |
Stockholder reports | | | 51,541 | |
Custody and transfer agent fees | | | 27,986 | |
Professional fees | | | 20,439 | |
Directors’ fees | | | 14,814 | |
Administrative and office facilities expenses | | | 9,466 | |
Other expenses | | | 30,372 | |
|
| Total expenses | | | 751,790 | |
| | | | | |
| Fees waived by investment adviser | | | (65,753 | ) |
|
| Net expenses | | | 686,037 | |
|
| Net investment income (loss) | | | 129,106 | |
|
| REALIZED AND UNREALIZED GAIN (LOSS) ON INVESTMENTS AND FOREIGN CURRENCY: | | | | |
| Net realized gain (loss): | | | | |
Investments | | | (8,359,573 | ) |
Foreign currency transactions | | | 16,359 | |
| Net change in unrealized appreciation (depreciation): | | | | |
Investments and foreign currency translations | | | 25,109,277 | |
Other assets and liabilities denominated in foreign currency | | | 700 | |
|
| Net realized and unrealized gain (loss) on investments and foreign currency | | | 16,766,763 | |
|
| NET INCREASE (DECREASE) IN NET ASSETS RESULTING FROM INVESTMENT OPERATIONS | | | 16,895,869 | |
|
| DISTRIBUTIONS TO PREFERRED STOCKHOLDERS | | | (750,000 | ) |
|
| NET INCREASE (DECREASE) IN NET ASSETS APPLICABLE TO COMMON STOCKHOLDERS | | | | |
RESULTING FROM INVESTMENT OPERATIONS | | $ | 16,145,869 | |
| * Net of foreign withholding tax of $42,310. | | | | |
| THE ACCOMPANYING NOTES ARE AN INTEGRAL PART OF THESE FINANCIAL STATEMENTS. | | 2009 Semiannual Report to Stockholders | 49 |
Statement of Changes in Net Assets |
| | | Six months ended | | | | |
| | | 6/30/09 | | Year ended |
| | | (unaudited) | | 12/31/08 |
| INVESTMENT OPERATIONS: | | | | | | | | |
| Net investment income (loss) | | $ | 129,106 | | | $ | 1,025,652 | |
| Net realized gain (loss) on investments and foreign currency | | | (8,343,214 | ) | | | 4,693,291 | |
| Net change in unrealized appreciation (depreciation) on investments and foreign currency | | | 25,109,977 | | | | (74,225,556 | ) |
|
| Net increase (decrease) in net assets resulting from investment operations | | | 16,895,869 | | | | (68,506,613 | ) |
|
| DISTRIBUTIONS TO PREFERRED STOCKHOLDERS: | | | | | | | | |
| Net investment income | | | – | | | | (240,568 | ) |
| Net realized gain on investments and foreign currency | | | – | | | | (1,259,432 | ) |
| Unallocated distributions* | | | (750,000 | ) | | | – | |
|
| Total distributions to Preferred Stockholders | | | (750,000 | ) | | | (1,500,000 | ) |
|
| NET INCREASE (DECREASE) IN NET ASSETS APPLICABLE TO COMMON STOCKHOLDERS | | | | | | | | |
RESULTING FROM INVESTMENT OPERATIONS | | | 16,145,869 | | | | (70,006,613 | ) |
|
| DISTRIBUTIONS TO COMMON STOCKHOLDERS: | | | | | | | | |
| Net investment income | | | – | | | | (1,314,438 | ) |
| Net realized gain on investments and foreign currency | | | – | | | | (6,881,428 | ) |
| Return of capital | | | – | | | | (662,631 | ) |
| Unallocated distributions* | | | (1,751,391 | ) | | | – | |
|
| Total distributions to Common Stockholders | | | (1,751,391 | ) | | | (8,858,497 | ) |
|
| CAPITAL SHARE TRANSACTIONS: | | | | | | | | |
| Reinvestment of distributions to Common Stockholders | | | 1,145,740 | | | | 5,607,374 | |
|
| Total capital stock transactions | | | 1,145,740 | | | | 5,607,374 | |
|
| NET INCREASE (DECREASE) IN NET ASSETS APPLICABLE TO COMMON STOCKHOLDERS | | | 15,540,218 | | | | (73,257,736 | ) |
|
| NET ASSETS APPLICABLE TO COMMON STOCKHOLDERS: | | | | | | | | |
Beginning of period | | | 92,549,672 | | | | 165,807,408 | |
|
End of period (including undistributed net investment income (loss) of $402,517 at 6/30/09 and | | | | | | | | |
$273,411 at 12/31/08) | | $ | 108,089,890 | | | $ | 92,549,672 | |
| * To be allocated to net investment income, net realized gains and/or return of capital at year end. |
|
| |
50 | 2009 Semiannual Report to Stockholders | | THE ACCOMPANYING NOTES ARE AN INTEGRAL PART OF THESE FINANCIAL STATEMENTS. |
This table is presented to show selected data for a share of Common Stock outstanding throughout each period, and to assist stockholders in evaluating the Fund’s performance for the periods presented.
| | | Six months | | Years ended December 31, |
| | | ended | |
|
| | | June 30, 2009 | | | | | | | | | | | | | | | | | | | | |
| | | (unaudited) | | | 2008 | | | | 2007 | | | | 2006 | | | | 2005 | | | | 2004 | |
|
| NET ASSET VALUE, BEGINNING OF PERIOD | | $ | 4.76 | | | $ | 8.92 | | | $ | 9.75 | | | $ | 9.76 | | | $ | 9.75 | | | $ | 9.00 | |
|
| INVESTMENT OPERATIONS: | | | | | | | | | | | | | | | | | | | | | | | | |
Net investment income (loss) | | | 0.01 | | | | 0.07 | | | | 0.15 | | | | 0.16 | | | | 0.06 | | | | 0.02 | |
Net realized and unrealized gain (loss) on investments and | | | | | | | | | | | | | | | | | | | | | | | | |
foreign currency | | | 0.83 | | | | (3.67 | ) | | | 1.12 | | | | 1.50 | | | | 1.44 | | | | 2.63 | |
|
Total investment operations | | | 0.84 | | | | (3.60 | ) | | | 1.27 | | | | 1.66 | | | | 1.50 | | | | 2.65 | |
|
| DISTRIBUTIONS TO PREFERRED STOCKHOLDERS: | | | | | | | | | | | | | | | | | | | | | | | | |
Net investment income | | | – | | | | (0.01 | ) | | | (0.02 | ) | | | (0.01 | ) | | | (0.01 | ) | | | (0.00 | ) |
Net realized gain on investments and foreign currency | | | – | | | | (0.07 | ) | | | (0.07 | ) | | | (0.09 | ) | | | (0.11 | ) | | | (0.15 | ) |
Unallocated distributions* | | | (0.04 | ) | | | – | | | | – | | | | – | | | | – | | | | – | |
|
Total distributions to Preferred Stockholders | | | (0.04 | ) | | | (0.08 | ) | | | (0.09 | ) | | | (0.10 | ) | | | (0.12 | ) | | | (0.15 | ) |
|
NET INCREASE (DECREASE) IN NET ASSETS APPLICABLE TO COMMON STOCKHOLDERS RESULTING FROM INVESTMENT OPERATIONS | | | 0.80 | | | | (3.68 | ) | | | 1.18 | | | | 1.56 | | | | 1.38 | | | | 2.50 | |
|
| DISTRIBUTIONS TO COMMON STOCKHOLDERS: | | | | | | | | | | | | | | | | | | | | | | | | |
Net investment income | | | – | | | | (0.07 | ) | | | (0.44 | ) | | | (0.20 | ) | | | (0.06 | ) | | | (0.02 | ) |
Net realized gain on investments and foreign currency | | | – | | | | (0.37 | ) | | | (1.57 | ) | | | (1.37 | ) | | | (1.15 | ) | | | (1.72 | ) |
Return of capital | | | – | | | | (0.03 | ) | | | – | | | | – | | | | – | | | | – | |
Unallocated distributions* | | | (0.09 | ) | | | – | | | | – | | | | – | | | | – | | | | – | |
|
Total distributions to Common Stockholders | | | (0.09 | ) | | | (0.47 | ) | | | (2.01 | ) | | | (1.57 | ) | | | (1.21 | ) | | | (1.74 | ) |
|
| CAPITAL STOCK TRANSACTIONS: | | | | | | | | | | | | | | | | | | | | | | | | |
Effect of reinvestment of distributions by Common Stockholders | | | (0.00 | ) | | | (0.01 | ) | | | (0.00 | ) | | | (0.00 | ) | | | (0.03 | ) | | | (0.01 | ) |
Effect of rights offering and Preferred Stock offering | | | – | | | | – | | | | – | | | | – | | | | (0.13 | ) | | | – | |
|
Total capital stock transactions | | | (0.00 | ) | | | (0.01 | ) | | | (0.00 | ) | | | (0.00 | ) | | | (0.16 | ) | | | (0.01 | ) |
|
| NET ASSET VALUE, END OF PERIOD | | $ | 5.47 | | | $ | 4.76 | | | $ | 8.92 | | | $ | 9.75 | | | $ | 9.76 | | | $ | 9.75 | |
|
| MARKET VALUE, END OF PERIOD | | $ | 5.20 | | | $ | 4.60 | | | $ | 8.97 | | | $ | 10.68 | | | $ | 9.53 | | | $ | 10.47 | |
|
| TOTAL RETURN (a) | | | | | | | | | | | | | | | | | | | | | | | | |
| Market Value | | | 15.70 | %*** | | | (44.94 | )% | | | 3.02 | % | | | 30.50 | % | | | 3.03 | % | | | 47.26 | % |
| Net Asset Value | | | 17.62 | %*** | | | (42.71 | )% | | | 12.22 | % | | | 16.33 | % | | | 13.31 | % | | | 29.21 | % |
| RATIOS BASED ON AVERAGE NET ASSETS APPLICABLE TO | | | | | | | | | | | | | | | | | | | | | | | | |
COMMON STOCKHOLDERS: | | | | | | | | | | | | | | | | | | | | | | | | |
| Total expenses (b,c) | | | 1.45 | %** | | | 1.34 | % | | | 1.32 | % | | | 1.36 | % | | | 1.48 | % | | | 1.53 | % |
Management fee expense | | | 1.12 | %** | | | 1.13 | % | | | 1.14 | % | | | 1.16 | % | | | 1.21 | % | | | 1.27 | % |
Other operating expenses | | | 0.33 | %** | | | 0.21 | % | | | 0.18 | % | | | 0.20 | % | | | 0.27 | % | | | 0.26 | % |
| Net investment income (loss) | | | 0.27 | %** | | | 0.72 | % | | | 1.13 | % | | | 1.54 | % | | | 0.63 | % | | | 0.24 | % |
| SUPPLEMENTAL DATA: | | | | | | | | | | | | | | | | | | | | | | | | |
| Net Assets Applicable to Common Stockholders, | | | | | | | | | | | | | | | | | | | | | | | | |
End of Period (in thousands) | | $ | 108,090 | | | $ | 92,550 | | | $ | 165,807 | | | $ | 158,567 | | | $ | 143,244 | | | $ | 105,853 | |
| Liquidation Value of Preferred Stock, | | | | | | | | | | | | | | | | | | | | | | | | |
End of Period (in thousands) | | $ | 25,000 | | | $ | 25,000 | | | $ | 25,000 | | | $ | 25,000 | | | $ | 25,000 | | | $ | 25,000 | |
| Portfolio Turnover Rate | | | 24 | % | | | 51 | % | | | 62 | % | | | 30 | % | | | 42 | % | | | 52 | % |
| PREFERRED STOCK: | | | | | | | | | | | | | | | | | | | | | | | | |
| Total shares outstanding | | | 1,000,000 | | | | 1,000,000 | | | | 1,000,000 | | | | 1,000,000 | | | | 1,000,000 | | | | 1,000,000 | |
| Asset coverage per share | | $ | 133.09 | | | $ | 117.55 | | | $ | 190.81 | | | $ | 183.57 | | | $ | 168.24 | | | $ | 130.85 | |
| Liquidation preference per share | | $ | 25.00 | | | $ | 25.00 | | | $ | 25.00 | | | $ | 25.00 | | | $ | 25.00 | | | $ | 25.00 | |
| Average market value per share (d): | | $ | 22.77 | | | $ | 22.89 | | | $ | 24.37 | | | $ | 24.98 | | | $ | 25.38 | | | $ | 24.83 | |
|
| (a) | | The Market Value Total Return is calculated assuming a purchase of Common Stock on the opening of the first business day and a sale on the closing of the last business day of each period reported. Dividends and distributions are assumed for the purposes of this calculation to be reinvested at prices obtained under the Fund’s Distribution Reinvestment and Cash Purchase Plan. Net Asset Value Total Return is calculated on the same basis, except that the Fund’s net asset value is used on the purchase and sale dates instead of market value. |
| (b) | | Expense ratios based on total average net assets including liquidation value of Preferred Stock were 1.15%, 1.14%, 1.15%, 1.17%, 1.22% and 1.21% for the periods ended June 30, 2009 and December 31, 2008, 2007, 2006, 2005 and 2004, respectively. |
| (c) | | Expense ratios based on average net assets applicable to Common Stockholders before waiver of fees by the investment adviser would have been 1.59% and 1.39% for the periods ended June 30, 2009 and December 31, 2008; before waiver of fees and after earnings credits would have been 1.59%, 1.39%, 1.31%, 1.36%, 1.48% and 1.53% for the periods ended June 30, 2009 and December 31, 2008, 2007, 2006, 2005 and 2004, respectively. |
| (d) | | The average of month-end market values during the period that the 6.00% Preferred Stock was outstanding. |
| * | | To be allocated to net investment income, net realized gains and/or return of capital at year end. |
| ** | | Annualized. |
| *** | | Not annualized. |
| THE ACCOMPANYING NOTES ARE AN INTEGRAL PART OF THESE FINANCIAL STATEMENTS. | | 2009 Semiannual Report to Stockholders | 51 |
Notes to Financial Statements (unaudited) |
Summary of Significant Accounting Policies:
Royce Focus Trust, Inc. (the “Fund”), is a diversified closed-end investment company incorporated under the laws of the State of Maryland. The Fund commenced operations on March 2, 1988 and Royce & Associates, LLC (“Royce”) assumed investment management responsibility for the Fund on November 1, 1996.
The preparation of financial statements in conformity with accounting principles generally accepted in the United States of America requires management to make estimates and assumptions that affect the reported amounts of assets and liabilities and the disclosure of contingent assets and liabilities at the date of the financial statements and the evaluation of subsequent events through August 13, 2009, the issuance date of the financial statements, and the reported amounts of income and expenses during the reporting period. Actual results could differ from those estimates.
Valuation of Investments:
Securities are valued as of the close of trading on the New York Stock Exchange (NYSE) (generally 4:00 p.m. Eastern time) on the valuation date. Securities that trade on an exchange, and securities traded on Nasdaq’s Electronic Bulletin Board, are valued at their last reported sales price or Nasdaq official closing price taken from the primary market in which each security trades or, if no sale is reported for such day, at their bid price. Other over-the-counter securities for which market quotations are readily available are valued at their highest bid price, except in the case of some bonds and other fixed income securities which may be valued by reference to other securities with comparable ratings, interest rates and maturities, using established independent pricing services. The Fund values its non-U.S. dollar denominated securities in U.S. dollars daily at the prevailing foreign currency exchange rate as quoted by a major bank. Securities for which market quotations are not readily available are valued at their fair value under procedures established by the Fund’s Board of Directors. In addition, if, between the time trading ends on a particular security and the close of the customary trading session on the NYSE, events occur that are significant and may make the closing price unreliable, the Fund may fair value the security. The Fund uses an independent pricing service to provide fair value estimates for relevant non-U.S. equity securities on days when the U.S. market volatility exceeds a certain threshold. This pricing service uses proprietary correlations it has developed between the movement of prices of non-U.S. equity securities and indices of U.S.-traded securities, futures contracts and other indications to estimate the fair value of relevant non-U.S. securities. When fair value pricing is employed, the prices of securities used by the Fund may differ from quoted or published prices for the same security. Investments in money market funds are valued at net asset value per share.
| | Various inputs are used in determining the value of the Fund’s investments, as noted above. These inputs are summarized in the three broad levels below: |
| | Level 1 – quoted prices in active markets for identical securities |
| | Level 2 – other significant observable inputs (including quoted prices for similar securities, foreign securities that may be fair valued and repurchase agreements) |
| | Level 3 – significant unobservable inputs (including the Fund’s own assumptions in determining the fair value of investments) |
| | The inputs or methodology used for valuing securities are not necessarily an indication of the risk associated with investing in those securities. |
| | | | | | | | | | | | | |
| | The following is a summary of the inputs used to value the Fund’s investments as of June 30, 2009: |
| | | | Level 1 | | | Level 2 | | | Level 3 | | Total | |
| |
|
| | Equities | | $80,819,017 | | | $21,649,053 | | | $8,575,308 | | $111,043,378 | |
| | Cash Equivalents | | - | | | 23,641,107 | | | - | | 23,641,107 | |
| |
|
| | Level 3 Reconciliation: | | | | | | | | | | | |
| | | | | | | Change in unrealized | | | | | |
| | | | Balance as of 12/31/08 | | appreciation (depreciation) | | Purchases | | Balance as of 6/30/09 |
| |
|
| | Equities | | $7,285,707 | | | $(11,499) | | | $1,301,100 | | $8,575,308 | |
| |
|
Repurchase Agreements:
The Fund may enter into repurchase agreements with institutions that the Fund’s investment adviser has determined are creditworthy. The Fund restricts repurchase agreements to maturities of no more than seven days. Securities pledged as collateral for repurchase agreements, which are held until maturity of the repurchase agreements, are marked-to-market daily and maintained at a value at least equal to the principal amount of the repurchase agreement (including accrued interest). Repurchase agreements could involve certain risks in the event of default or insolvency of the counter-party, including possible delays or restrictions upon the ability of the Fund to dispose of its underlying securities.
Foreign Currency:
Net realized foreign exchange gains or losses arise from sales and maturities of short-term securities, sales of foreign currencies, expiration of currency forward contracts, currency gains or losses realized between the trade and settlement dates on securities transactions, and the difference between the amounts of dividends, interest, and foreign withholding taxes recorded on the Fund’s books and the U.S. dollar equivalent of the
| 52 | 2009 Semiannual Report to Stockholders | | |
Notes to Financial Statements (unaudited) (continued) |
amounts actually received or paid. Net unrealized foreign exchange gains and losses arise from changes in the value of assets and liabilities, including investments in securities at the end of the reporting period, as a result of changes in foreign currency exchange rates.
Securities Lending:
The Fund loans securities to qualified institutional investors for the purpose of realizing additional income. Collateral on all securities loaned for the Fund is accepted in cash and cash equivalents and invested temporarily by the custodian. The collateral maintained is at least 100% of the current market value of the loaned securities. The market value of the loaned securities is determined at the close of business of the Fund and any additional required collateral is delivered to the Fund on the next business day. The Fund retains the risk of any loss on the securities on loan as well as incurring the potential loss on investments purchased with cash collateral received for securities lending.
Taxes:
As a qualified regulated investment company under Subchapter M of the Internal Revenue Code, the Fund is not subject to income taxes to the extent that it distributes substantially all of its taxable income for its fiscal year. The Schedule of Investments includes information regarding income taxes under the caption “Tax Information”.
Distributions:
Effective May 18, 2009, the Fund pays any dividends and capital gain distributions annually in December on the Fund’s Common Stock. Prior to that date, the Fund paid quarterly distributions on the Fund’s Common Stock at the annual rate of 5% of the rolling average of the prior four calendar quarter-end NAVs of the Fund’s Common Stock, with the fourth quarter distribution being the greater of 1.25% of the rolling average or the distribution required by IRS regulations. Distributions to Preferred Stockholders are accrued daily and paid quarterly and distributions to Common Stockholders are recorded on ex-dividend date. Distributable capital gains and/or net investment income are first allocated to Preferred Stockholder distributions, with any excess allocable to Common Stockholders. If capital gains and/or net investment income are allocated to both Preferred and Common Stockholders, the tax character of such allocations is proportional. To the extent that distributions are not paid from long-term capital gains, net investment income or net short-term capital gains, they will represent a return of capital. Distributions are determined in accordance with income tax regulations that may differ from accounting principles generally accepted in the United States of America. Permanent book and tax differences relating to stockholder distributions will result in reclassifications within the capital accounts. Undistributed net investment income may include temporary book and tax basis differences, which will reverse in a subsequent period. Any taxable income or gain remaining undistributed at fiscal year end is distributed in the following year.
Investment Transactions and Related Investment Income:
Investment transactions are accounted for on the trade date. Dividend income is recorded on the ex-dividend date. Non-cash dividend income is recorded at the fair market value of the securities received. Interest income is recorded on an accrual basis. Premium and discounts on debt securities are amortized using the effective yield-to-maturity method. Realized gains and losses from investment transactions are determined on the basis of identified cost for book and tax purposes.
Expenses:
The Fund incurs direct and indirect expenses. Expenses directly attributable to the Fund are charged to the Fund’s operations, while expenses applicable to more than one of the Royce Funds are allocated equitably. Certain personnel, occupancy costs and other administrative expenses related to The Royce Funds are allocated by Royce & Associates, LLC (“Royce”) under an administration agreement and are included in administrative and office facilities and legal expenses. The Fund has adopted a deferred fee agreement that allows the Directors to defer the receipt of all or a portion of Directors’ Fees otherwise payable. The deferred fees are invested in certain Royce Funds until distributed in accordance with the agreement.
Compensating Balance Credits:
The Fund has an arrangement with its custodian bank, whereby a portion of the custodian’s fee is paid indirectly by credits earned on the Fund’s cash on deposit with the bank. This deposit arrangement is an alternative to purchasing overnight investments. Conversely, the Fund pays interest to the custodian on any cash overdrafts, to the extent they are not offset by credits earned on positive cash balances.
Capital Stock:
The Fund issued 299,149 and 864,595 shares of Common Stock as reinvestment of distributions by Common Stockholders for the six months ended June 30, 2009 and the year ended December 31, 2008, respectively.
At June 30, 2009, 1,000,000 shares of 6.00% Cumulative Preferred Stock were outstanding. The Fund, at its option, may redeem the Cumulative Preferred Stock, in whole or in part, at the redemption price. The Cumulative Preferred Stock is classified outside of permanent equity (net assets applicable to Common Stockholders) in the accompanying financial statements in accordance with Emerging Issues Task Force (EITF) Topic D-98, Classification and Measurement of Redeemable Securities, that requires preferred securities that are redeemable for cash or other assets to be classified outside of permanent equity to the extent that the redemption is at a fixed or determinable price and at the option of the holder or upon the occurrence of an event that is not solely within the control of the issuer.
| | | 2009 Semiannual Report to Stockholders | 53 |
Notes to Financial Statements (unaudited) (continued) |
The Fund is required to meet certain asset coverage tests with respect to the Cumulative Preferred Stock as required by the 1940 Act. In addition, pursuant to the Rating Agency Guidelines established by Moody’s, the Fund is required to maintain a certain discounted asset coverage. If the Fund fails to meet these requirements and does not correct such failure, the Fund may be required to redeem, in part or in full, the Cumulative Preferred Stock at a redemption price of $25.00 per share, plus an amount equal to the accumulated and unpaid dividends, whether or not declared on such shares, in order to meet these requirements. Additionally, failure to meet the foregoing asset coverage requirements could restrict the Fund’s ability to pay dividends to Common Stockholders and could lead to sales of portfolio securities at inopportune times. The Fund has met these requirements since issuing the Cumulative Preferred Stock.
Investment Advisory Agreement:
The Investment Advisory Agreement between Royce and the Fund provides for fees to be paid at an annual rate of 1.0% of the Fund’s average daily net assets applicable to Common Stockholders plus the liquidation value of Preferred Stock. Royce voluntarily waived a portion of its advisory fee ($65,753) attributable to issues of the Fund’s Preferred Stock for those months in which the Fund’s average annual NAV total return failed to exceed the applicable Preferred Stock’s dividend rate. For the six months ended June 30, 2009, the Fund accrued and paid Royce advisory fees totaling $531,419.
Purchases and Sales of Investment Securities:
For the six months ended June 30, 2009, the cost of purchases and proceeds from sales of investment securities, other than short-term securities and collateral received for securities loaned, amounted to $23,367,841 and $26,744,909, respectively.
Restricted Securities:
Certain of the Fund’s investments are restricted as to resale and are valued at their fair value under procedures established by the Fund’s Board of Directors.
| | | | | | Acquisition | | | | Fair Value at | | Percent of Net | | Distributions |
| Security | | Number of Shares | | Dates | | Cost | | 6/30/09 | | Assets | | Received |
| Kennedy-Wilson Conv. | | 9,000 | | | 5/08 | | $9,000,000 | | $7,285,707 | | | 6.7 | % | | $157,500 | |
| Magma Energy | | 1,000,000 | | | 6/09 | | 1,301,100 | | 1,289,601 | | | 1.2 | | | - | |
| 54 | 2009 Semiannual Report to Stockholders | | |
| Notes to Performance and Other Important Information | |
|
The thoughts expressed in this Review and Report concerning recent market movements and future prospects for small company stocks are solely the opinion of Royce at June 30, 2009, and, of course, historical market trends are not necessarily indicative of future market movements. Statements regarding the future prospects for particular securities held in the Funds’ portfolios and Royce’s investment intentions with respect to those securities reflect Royce’s opinions as of June 30, 2009 and are subject to change at any time without notice. There can be no assurance that securities mentioned in this Review and Report will be included in any Royce-managed portfolio in the future. The Funds invest primarily in securities of micro-, small- and mid-cap companies, that may involve considerably more risk than investments of larger-cap companies. All publicly released material information is always disclosed by the Funds on the website at www.roycefunds.com.
The Russell 2000 is an index of domestic small-cap stocks. It measures the performance of the 2,000 smallest publicly traded U.S. companies in the Russell 3000 index. The Russell 2000 Value and Growth indices consist of the respective value and growth stocks within the Russell 2000 as determined by Russell Investments. The Russell Microcap Index measures the performance of the smallest 1,000 companies in the Russell 2000. The S&P 500 and S&P SmallCap 600 are indices of U.S. large- and small-cap stocks, respectively, selected by Standard & Poor’s based on market size, liquidity and industry grouping, among other factors. The Nasdaq Composite is an index of the more than 3,000 common equities listed on the Nasdaq stock exchange. The MSCI EAFE Index (Europe, Australasia, Far East) is designed to measure the equity market performance of developed equity markets, excluding the U.S. and Canada. Returns for the market indices used in this Review and Report were based on information supplied to Royce by Russell Investments and Morningstar. Royce has not independently verified the above described information.The Royce Funds is a service mark of The Royce Funds.
Forward-Looking Statements
This material contains forward-looking statements within the meaning of the Securities Exchange Act of 1934, as amended (the “Exchange Act”), that involve risks and uncertainties, including, among others, statements as to:
• the Funds’ future operating results
• the prospects of the Funds’ portfolio companies |
| • | the impact of investments that the Funds have made or may make |
| • | the dependence of the Funds’ future success on the general economy and its impact on the companies and industries in which the Funds invest, and |
| • | the ability of the Funds’ portfolio companies to achieve their objectives. |
This Review and Report uses words such as “anticipates,” “believes,” “expects,” “future,” “intends,” and similar expressions to identify forward-looking statements. Actual results may differ materially from those projected in the forward-looking statements for any reason.
The Royce Funds have based the forward-looking statements included in this Review and Report on information available to us on the date of the report, and we assume no obligation to update any such forward-looking statements. Although The Royce Funds undertake no obligation to revise or update any forward-looking statements, whether as a result of new information, future events or otherwise, you are advised to consult any additional disclosures that we may make through future stockholder communications or reports.
Authorized Share Transactions
Royce Value Trust, Royce Micro-Cap Trust and Royce Focus Trust may each repurchase up to 5% of the issued and outstanding shares of its respective common stock and up to 10% of the issued and outstanding shares of its respective preferred stock during the year ending December 31, 2009. Any such repurchases would take place at then prevailing prices in the open market or in other transactions. Common stock repurchases would be effected at a price per share that is less than the share’s then current net asset value, and preferred stock repurchases would be effected at a price per share that is less than the share’s liquidation value.
Royce Value Trust, Royce Micro-Cap Trust and Royce Focus Trust are also authorized to offer their common stockholders an opportunity to subscribe for additional shares of their common stock through rights offerings at a price per share that may be less than the share’s then current net asset value. The timing and terms of any such offerings are within each Board’s discretion.
|
| | Proxy Voting | |
| | A copy of the policies and procedures that The Royce Funds use to determine how to vote proxies relating to portfolio securities and information regarding how each of The Royce Funds voted proxies relating to portfolio securities during the most recent 12-month period ended June 30 is available, without charge, on The Royce Funds’ website at www.roycefunds.com, by calling 1-800-221-4268 (toll-free) and on the website of the Securities and Exchange Commission (“SEC”), at www.sec.gov. | |
| | | |
| | Form N-Q Filing | |
| | The Funds file their complete schedules of investments with the SEC for the first and third quarters of each fiscal year on Form N-Q. The Funds’ Forms N-Q are available on The Royce Funds’ website at www.roycefunds.com and on the SEC’s website at www.sec.gov. The Funds’ Forms N-Q may also be reviewed and copied at the SEC’s Public Reference Room in Washington, D.C. To find out more about this public service, call the SEC at 1-800-732-0330. The Funds’ complete schedules of investments are updated quarterly, and are available at www.roycefunds.com. | |
| | | 2009 Semiannual Report to Stockholders | 55 |
| Board Approval and Investment Advisory Agreements | |
|
At meetings held on June 10 - 11, 2009, each of the Funds’ respective Boards of Directors, including all of the non-interested directors, approved the continuance of the Investment Advisory Agreements between Royce & Associates, LLC (“R&A”) and each of Royce Value Trust, Royce Micro-Cap Trust and Royce Focus Trust (the “Funds”). In reaching these decisions, the Board reviewed the materials provided by R&A, which included, among other things, information prepared internally by R&A and independently by Morningstar Associates, LLC (“Morningstar”) containing detailed expense ratio and investment performance comparisons for the Funds with other funds in their “peer group”, information regarding the past performance of Funds managed by R&A and a memorandum outlining the legal duties of the Board prepared by independent counsel to the non-interested directors. R&A also provided the directors with an analysis of its profitability with respect to providing investment advisory services to each of the Funds. In addition, the Board took into account information furnished throughout the year at regular Board meetings, including reports on investment performance, shareholder services, regulatory compliance, brokerage commissions and research, brokerage and execution products and services provided to the Funds. The Board also considered other matters they deemed important to the approval process such as payments made to R&A or its affiliates relating to allocation of Fund brokerage commissions, and other direct and indirect benefits to R&A and its affiliates, from their relationship with the Funds. The directors also met throughout the year with investment advisory personnel from R&A. The Board, in its deliberations, recognized that, for many of the Funds’ stockholders, the decision to purchase Fund shares included a decision to select R&A as the investment adviser and that there was a strong association in the minds of Fund stockholders between R&A and each Fund. In considering factors relating to the approval of the continuance of the Investment Advisory Agreements, the non-interested directors received assistance and advice from, and met separately with, their independent counsel. While the Investment Advisory Agreements for the Funds were considered at the same Board meetings, the Board dealt with each agreement separately. Among other factors, the directors considered the following:
The nature, extent and quality of services provided by R&A: The Board considered the following factors to be of fundamental importance to their consideration of whether to approve the continuance of the Funds’ Investment Advisory Agreements: (i) R&A’s more than 35 years of value investing experience and track record; (ii) the history of long-tenured R&A portfolio managers managing the Funds; (iii) R&A’s focus on mid-cap, small-cap and micro-cap value investing; (iv) the consistency of R&A’s approach to managing both the Funds and open-end mutual funds over more than 35 years; (v) the integrity and high ethical standards adhered to at R&A; (vi) R&A’s specialized experience in the area of trading small- and micro-cap securities; (vii) R&A’s historical ability to attract and retain portfolio management talent and (viii) R&A’s focus on stockholder interests as exemplified by its voluntary fee waiver policy on preferred stock assets in certain circumstances where the Funds’ total return performance from the issuance of the preferred may not exceed the coupon rate on the preferred, and expansive stockholder reporting and communications. The Board reviewed the services that R&A provides to the Funds, including, but not limited to, managing each Fund’s investments in accordance with the stated policies of each Fund. The Board considered the fact that during 2009 R&A provided certain administrative services to the Funds at cost pursuant to the Administration Agreement between the Funds and R&A which went into effect on January 1, 2008. The Board determined that the services to be provided to each Fund by R&A would be the same as those it previously provided to the Funds. They also took into consideration the histories, reputations and backgrounds of R&A’s portfolio managers for the Funds, finding that these would likely have an impact on the continued success of the Funds. Lastly, the Board noted R&A’s ability to attract and retain quality and experienced personnel. The directors concluded that the services provided by R&A to each Fund compared favorably to services provided by R&A to other R&A client accounts, including other funds, in both nature and quality, and that the scope of services provided by R&A would continue to be suitable for each Fund.
Investment performance of the Funds and R&A: In light of R&A’s risk-averse approach to investing, the Board believes that risk-adjusted performance continues to be an appropriate measure of each Fund’s investment performance. One measure of risk-adjusted performance the Board has historically used in their review of the Funds’ performance is the Sharpe Ratio. The Sharpe Ratio is a risk-adjusted measure of performance developed by Nobel Laureate William Sharpe. It is calculated by dividing a fund’s annualized excess returns by its annualized standard deviation to determine reward per unit of risk. The higher the Sharpe Ratio, the better a fund’s historical risk-adjusted performance. The Board attaches primary importance to risk-adjusted performance over relatively long periods of time, typically three, five and ten years. Morningstar compared each of the Funds’ risk-adjusted performance to that of its applicable open-end fund category. Royce Value Trust’s Sharpe Ratio placed in the 2nd quartile within the small blend category assigned by Morningstar for the three- and five-year periods and the 3rd quartile for the ten-year period ended December 31, 2008. Similarly, Royce Micro-Cap Trust’s Sharpe Ratio placed in the middle quintile, the 3rd quartile and the 2nd quartile within the small blend, growth or value category assigned by Morningstar for the three-, five- and ten- year period ended December 31, 2008, respectively. Finally, Royce Focus Trust’s Sharpe Ratio placed in the top quartile within the small growth category assigned by Morningstar for the three-, five- and ten-year periods ended December 31, 2008.
The Board noted that R&A manages a number of funds that invest in small-cap and micro-cap issuers, many of which were outperforming the Russell 2000 Index and their competitors. Although the Board recognized that past performance is not necessarily an indicator of future results, they found that R&A had the necessary qualifications, experience and track record in managing small-cap and micro-cap securities to manage the Funds. The directors determined that R&A continued to be an appropriate investment adviser for the Funds and concluded that each Fund’s performance supported the renewal of its Investment Advisory Agreement.
Cost of the services provided and profits realized by R&A from its relationship with each Fund: The Board considered the cost of the services provided by R&A and profits realized by R&A from its relationship with each Fund. As part of the analysis, the Board discussed with R&A its methodology in allocating its costs to each Fund and concluded that its allocations were reasonable. The Board concluded that R&A’s profits were reasonable in relation to the nature and quality of services provided.
| 56 | 2009 Semiannual Report to Stockholders | | |
| Board Approval and Investment Advisory Agreements (continued) | |
|
The extent to which economies of scale would be realized as the Funds grow and whether fee levels would reflect such economies of scale: The Board considered whether there have been economies of scale in respect of the management of the Funds, whether the Funds have appropriately benefited from any economies of scale and whether there is potential for realization of any further economies of scale. The Board noted the time and effort involved in managing portfolios of small- and micro-cap stocks and that they did not involve the same efficiencies as do portfolios of large cap stocks. The Board concluded that the current fee structure for each Fund was reasonable, and that no changes were currently necessary.
Comparison of services to be rendered and fees to be paid to those under other investment advisory contracts, such as contracts of the same and other investment advisers or other clients: The Board reviewed the investment advisory fee paid by each Fund and compared both the services to be rendered and the fees to be paid under the Investment Advisory Agreements to other contracts of R&A and to contracts of other investment advisers with registered investment companies investing in small- and micro-cap stocks, as provided by Morningstar. The Board noted that, in the case of Royce Value Trust, the 1.00% basic fee that is subject to adjustment up or down (up to 0.50% in either direction) based on the Fund’s performance versus the S&P 600 SmallCap Index over rolling periods of 60 months. The fee is charged on average net assets over those rolling periods. As a result, in a rising market, the fee will be smaller than a fee calculated on the current year’s average net assets, and visa versa. The Board determined that the performance adjustment feature continued to serve as an appropriate incentive to R&A to manage the Fund for the benefit of its long-term common stockholders. The Board noted that R&A had also agreed to waive its management fee on Fund assets in an amount equal to the liquidation preference of the Fund’s outstanding preferred stock if the Fund’s total return from issuance of the preferred on such amount is less than the preferred’s coupon rate. The Board also noted that the fee arrangement, which also includes a provision for no fee in periods where the Fund’s trailing three-year performance is negative, requires R&A to measure the Fund’s performance monthly against the S&P 600, an unmanaged index. Instead of receiving a set fee regardless of its performance, R&A is penalized for poor performance. The Board noted that if the Fund’s expense ratio were based on total average net assets including net assets applicable to Preferred Stock, it would place in the middle quintile of its Morningstar-assigned open-end peer group.
In the case of Royce Micro-Cap Trust, the directors noted that the Fund has a 1.00% basic fee subject to adjustment up or down based on the Fund’s performance versus the Russell 2000 Index over rolling 36-month periods. The fee is charged on average net assets over those rolling periods. As a result, in a rising market, the fee will be smaller than a fee calculated on the current year’s average net assets, and visa versa. The Board determined that the performance adjustment feature continued to serve as an incentive to R&A to manage the Fund for the benefit of its long-term stockholders. The Board also noted R&A’s voluntarily waiver of its fee on the liquidation value of the outstanding preferred stock in circumstances where the Fund’s total return performance from the issuance of the preferred is less than the coupon rate on the preferred for each month during the year. The Board noted that if the Fund’s expense ratio were based on total average net assets including net assets applicable to Preferred Stock, it would rank in the first quartile when compared to its Morningstar-assigned open-end peer group.
Finally, in the case of Royce Focus Trust, the Board noted that R&A had agreed to waive its management fee on the liquidation value of outstanding preferred stock if the Fund’s total return from issuance of the preferred is less than the preferred’s coupon rate. The Board noted that if the Fund’s expense ratio were based on total average net assets including net assets applicable to Preferred Stock, it would place in the 2nd quartile of its Morningstar-assigned open-end peer group.
The Board also considered fees charged by R&A to institutional and other clients and noted that the Funds’ base advisory fees compared favorably to those other accounts.
The entire Board, including all the non-interested directors, approved the renewal of the existing Investment Advisory Agreements, concluding that a contract renewal on the existing terms was in the best interest of the stockholders of each Fund and that each investment advisory fee rate was reasonable in relation to the services provided.
| | | 2009 Semiannual Report to Stockholders |
| |
| | |
| | |
| | |
| | |
| | |
| | |
| |
Wealth Of ExperienceWith approximately $22 billion in open- and closed-end fund assets under management, Royce & Associates is committed to the same small-company investing principles that have served us well for more than 35 years. Charles M. Royce, our President and Co-Chief Investment Officer, enjoys one of the longest tenures of any active mutual fund manager. Royce’s investment staff also includes Co-Chief Investment Officer W. Whitney George, 15 Portfolio Managers, nine assistant portfolio managers and analysts, and eight traders.
Multiple Funds, Common FocusOur goal is to offer both individual and institutional investors the best available small-cap value portfolios. Unlike a lot of mutual fund groups with broad product offerings, we have chosen to concentrate on small-company value investing by providing investors with a range of funds that take full advantage of this large and diverse sector.
Consistent DisciplineOur approach emphasizes paying close attention to risk and maintaining the same discipline, regardless of market movements and trends. The price we pay for a security must be significantly below our appraisal of its current worth. This requires a thorough analysis of the financial and business dynamics of an enterprise, as though we were purchasing the entire company.
Co-Ownership Of FundsIt is important that our employees and shareholders share a common financial goal; our officers, employees and their families currently have approximately $82 million invested in The Royce Funds. | | |
| | | | |
| | |
| | | | | | |
| | | | | | |
| | | | | | |
| | | | | | |
| | | | | | |
| |  | | | | |
| | 745 Fifth Avenue | New York, NY 10151 | (800) 221-4268 | www.roycefunds.com | | |
| | | | | | |
| | |
| | General Information | | RIA Services | | Broker/Dealer Services | | Computershare | | | |
| | Additional Report Copies | | Fund Materials and | | Fund Materials and | | Transfer Agent | | | |
| | and Prospectus Inquiries | | Performance Updates | | Performance Updates | | and Registrar | | | |
| | (800) 221-4268 | | (800) 33-ROYCE (337-6923) | | (800) 59-ROYCE (597-6923) | | (800) 426-5523 | | | |
| | |
Item 2. Code(s) of Ethics. Not applicable to this semi-annual report.
Item 3. Audit Committee Financial Expert. Not applicable to this semi-annual report.
Item 4. Principal Accountant Fees and Services. Not applicable to this semi-annual report.
Item 5. Audit Committee of Listed Registrants. Not applicable to this semi-annual report.
Item 6. Investments.
(a) See Item 1.
(b) Not applicable.
Item 7. Disclosure of Proxy Voting Policies and Procedures for Closed-End Management Investment Companies. Not applicable to this semi-annual report.
Item 8. Portfolio Managers of Closed-End Management Investment Companies.
(a)(1) Portfolio Managers of Closed-End Management Investment Companies – Not applicable to this semi-annual report. See response to Item 8(b) below relating to changes to Portfolio Managers since Form N-CSR for the period ended December 31, 2008 was filed on March 6, 2009.
(a)(2) Other Accounts Managed by Portfolio Manager and Potential Conflicts of Interest – Not applicable to this semi-annual report. See response to Item 8(b) below relating to changes to Portfolio Managers since Form N-CSR for the period ended December 31, 2008 was filed on March 6, 2009. Also, disclosure relating to Conflicts of Interest included in Form N-CSR for the period ended December 31, 2008, as filed on March 6, 2009, is replaced with the following (information as of June 30, 2009):
Conflicts of Interest
The fact that a Portfolio Manager has day-to-day management responsibility for more than one client account may create actual, potential or only apparent conflicts of interest. For example, the Portfolio Manager may have an opportunity to purchase securities of limited availability. In this circumstance, the Portfolio Manager is expected to review each account’s investment guidelines, restrictions, tax considerations, cash balances, liquidity needs and other factors to determine the suitability of the investment for each account and to ensure that his or her managed accounts are treated equitably. The Portfolio Manager may also decide to purchase or sell the same security for multiple managed accounts at approximately the same time. To address any conflicts that this situation may create, the Portfolio Manager will generally combine managed account orders (i.e., enter a “bunched” order) in an effort to obtain best execution or a more favorable commission rate. In addition, if orders to buy or sell a security for multiple accounts managed by common Portfolio Managers on the same day are executed at different prices or commission rates, the transactions will generally be allocated by Royce & Associates, LLC (“Royce”) to each of such managed accounts at the weighted average execution price and commission. In circumstances where a pre-allocated bunched order is not completely filled, each account will normally receive a pro-rated portion of the securities based upon the account’s level of participation in the order. Royce may under certain circumstances allocate securities in a manner other than pro-rata if it determines that the allocation is fair and equitable under the circumstances and does not discriminate against any account.
As described below, there is a revenue-based component of each Portfolio Manager’s Performance-Related Variable Compensation and the Portfolio Managers also receive Firm-Related Variable Compensation based on revenues (adjusted for certain imputed expenses) generated by Royce. In addition, Charles M. Royce receives variable compensation based on Royce’s retained pre-tax profits from operations. As a result, the Portfolio Managers may receive a greater relative benefit from activities that increase the value to Royce of The Royce Funds and/or other Royce client accounts, including, but not limited to, increases in sales of Registrant’s shares and assets under management.
Also, as described above, the Portfolio Managers generally manage more than one client account, including, among others, registered investment company accounts, separate accounts and private pooled accounts managed on behalf of institutions (e.g., pension funds, endowments and foundations) and for high-net-worth individuals. The appearance of a conflict of interest may arise where Royce has an incentive, such as a performance-based management fee (or any other variation in the level of fees payable by the Registrant or other Royce client accounts to Royce), which relates to the management of one or more of The Royce Funds or accounts with respect to which the same Portfolio Manager has day-to-day management responsibilities. Except as described below, no Royce Portfolio Manager’s compensation is tied to performance fees earned by Royce for the management of any
one client account. Although variable and other compensation derived from Royce revenues or profits is impacted to some extent, the impact is relatively minor given the small percentage of Royce firm assets under management for which Royce receives performance-measured revenue. Notwithstanding the above, the Performance-Related Variable Compensation paid to Charles M. Royce as Portfolio Manager of two registered investment company accounts (the Registrant and Royce Micro-Cap Trust) is based, in part, on performance-based fee revenues. The Registrant and Royce Micro-Cap Trust pay Royce a fulcrum fee that is adjusted up or down depending on the performance of the Fund relative to its benchmark index. In addition, five other registered investment company accounts, Royce Select Fund I, Royce Select Fund II, Royce Global Select Fund, Royce SMid-Cap Select Fund and Royce Asia-Pacific Select Fund, each pay Royce a performance-based fee.
Finally, conflicts of interest may arise when a Portfolio Manager personally buys, holds or sells securities held or to be purchased or sold for the Registrant or other Royce client account or personally buys, holds or sells the shares of one or more of The Royce Funds. To address this, Royce has adopted a written Code of Ethics designed to prevent and detect personal trading activities that may interfere or conflict with client interests (including Registrant’s stockholders’ interests). Royce generally does not permit its Portfolio Managers to purchase small and micro cap securities for their personal investment portfolios.
Royce and The Royce Funds have adopted certain compliance procedures which are designed to address the above-described types of conflicts. However, there is no guarantee that such procedures will detect each and every situation in which a conflict arises.
(a)(3) Description of Portfolio Manager Compensation Structure – Not applicable to this semi-annual report. Disclosure relating to Portfolio Manager Compensation included in Form N-CSR for the period ended December 31, 2008, as filed on March 6, 2009, is replaced with the following (information as of June 30, 2009):
Royce seeks to maintain a compensation program that is competitively positioned to attract and retain high-caliber investment professionals. All Portfolio Managers, receive from Royce a base salary, Performance-Related Variable Compensation (generally the largest element of each Portfolio Manager’s compensation with the exception of Charles M. Royce), Firm-Related Variable Compensation based primarily on registered investment company and other client account revenues generated by Royce and a benefits package. Portfolio Manager compensation is reviewed and may be modified from time to time as appropriate to reflect changes in the market, as well as to adjust the factors used to determine variable compensation. Except as described below, each Portfolio Manager’s compensation consists of the following elements:
| | - | | BASE SALARY. Each Portfolio Manager is paid a base salary. In setting the base salary, Royce seeks to be competitive in light of the particular Portfolio Manager’s experience and responsibilities. |
| | | | |
| | - | | PERFORMANCE-RELATED VARIABLE COMPENSATION. Each Portfolio Manager receives quarterly Performance-Related Variable Compensation that is either asset-based, or revenue-based and therefore in part based on the value of the net assets of the account for which he or she is being compensated, determined with reference to each of the registered investment company and other client accounts they are managing. The revenue used to determine the quarterly Performance-Related Variable Compensation received by Charles M. Royce that relates to each of the Registrant and Royce Micro-Cap Trust is performance-based fee revenue. For all Portfolio Managers, the Performance-Related Variable Compensation applicable to the registered investment company accounts managed by the Portfolio Manager is subject to downward adjustment or elimination based on a combination of 3-year and 5-year risk-adjusted pre-tax returns of such accounts relative to all small-cap objective funds with three years of history tracked by Morningstar (as of December 31, 2008 there were 344 such Funds tracked by Morningstar) and the 5-year absolute returns of such accounts relative to 5-year U.S. Treasury Notes. The Performance-Related Variable Compensation applicable to non-registered investment company accounts managed by a Portfolio Manager, and to Royce Select Funds, is not subject to performance-related adjustment. |
Payment of the Performance-Related Variable Compensation may be deferred as described below, and any amounts deferred are forfeitable, if the Portfolio Manager is terminated by Royce with or without cause or resigns. The amount of the deferred Performance-Related Variable Compensation will appreciate or depreciate during the deferral period, based on the total return performance of one or more Royce-managed registered investment company accounts selected by the Portfolio Manager at the beginning of the deferral period. The amount deferred will depend on the
Portfolio Manager’s total direct, indirect beneficial and deferred unvested investments in the Royce registered investment company account for which he or she is receiving portfolio management compensation.
| | - | | FIRM-RELATED VARIABLE COMPENSATION. Each Portfolio Manager receives quarterly variable compensation based on Royce’s net revenues. |
| | | | |
| | - | | BENEFIT PACKAGE. Each Portfolio Manager also receives benefits standard for all Royce employees, including health care and other insurance benefits, and participation in Royce’s 401(k) Plan and Money Purchase Pension Plan. From time to time, on a purely discretionary basis, Portfolio Managers may also receive options to acquire stock in Royce’s parent company, Legg Mason, Inc. Those options typically represent a relatively small portion of a Portfolio Managers’ overall compensation. |
Charles M. Royce, in addition to the above-described compensation, also receive variable compensation based on Royce’s retained pre-tax operating profit. This variable compensation, along with the Performance-Related Variable Compensation and Firm-Related Variable Compensation, generally represents the most significant element of Mr. Royce’s compensation. A portion of the above-described compensation payable to Mr. Royce relates to his responsibilities as Royce’s Chief Executive Officer, Co-Chief Investment Officer and President of The Royce Funds.
(a)(4) Dollar Range of Equity Securities in Registrant Beneficially Owned by Portfolio Manager – Not applicable to this semi-annual report. See responses to Item 8(b) below relating to changes to Portfolio Managers since Form N-CSR for the period ended December 31, 2008 was filed on March 6, 2009.
(b) Effective May 1, 2009, Michael Hveem is no longer an Assistant Portfolio Manager of the Registrant and Lauren Romeo has been named Assistant Portfolio Manager of the Registrant. As a result, references to Mr. Hveem in Form N-CSR for the period ended December 31, 2008, as filed on March 6, 2009, in response Items 8(a)(1), 8(a)(2) and 8(a)(4) are no longer applicable. To reflect the addition of Ms. Romeo as an Assistant Portfolio Manager of the Registrant, Items 8(a)(1), 8(a)(2) and 8(a)(4) are updated as follows (information as of June 30, 2009):
Item 8(a)(1)
Name | Title | Length of Service | Principal Occupation(s) During Past 5 Years |
Lauren Romeo | Assistant Portfolio Manager* | Since May 1, 2009 | Assistant Portfolio of the Registrant (since May 1, 2009); Portfolio Manager and Analyst at Royce (since 2004); Portfolio Manager at Dalton, Grenier, Hartman & Maher (since 2001); an Analyst with Legg Mason Funds Management (2000-2001); and an Analyst with T. Rowe Price Group (1996-2000). |
* Assistant Portfolio Managers may have investment discretion over a portion of the Registrant’s portfolio subject to the supervision of Registrant’s Portfolio Manager
Item 8(a)(2)
Other Accounts
Name of Portfolio Manager
| Type of Account
| Number of Accounts Managed
| Total Assets Managed
| Number of
Accounts
Managed for which
Advisory Fee is
Performance-Based
| Value of
Managed
Accounts for
which Advisory Fee is
Performance
Based
|
Lauren Romeo | | | | | |
| Registered investment companies | 6 | $8,321,043,449 | 2 | $894,155,701 |
| Private pooled investment vehicles | 0 | - | - | - |
| Other accounts* | 2 | $134,489,448 | - | - |
*Other accounts include all other accounts managed by the Portfolio Manager in either a professional or personal capacity except for personal accounts subject to pre-approval and reporting requirements under the Registrant’s Rule 17j-1 Code of Ethics.
Item 8(a)(4)
Portfolio Manager | Dollar Range of Registrant’s Shares Beneficially Owned |
Lauren Romeo | None |
Item 9. Purchases of Equity Securities by Closed-End Management Investment Company and Affiliated Purchasers. Not applicable.
Item 10. Submission of Matters to a Vote of Security Holders. Not applicable.
Item 11. Controls and Procedures.
(a) Disclosure Controls and Procedures. The Principal Executive and Financial Officers concluded that the Registrant’s Disclosure Controls and Procedures are effective based on their evaluation of the Disclosure Controls and Procedures as of a date within 90 days of the filing date of this report.
(b) Internal Control over Financial Reporting. There were no significant changes in Registrant’s internal control over financial reporting or in other factors that could significantly affect this control subsequent to the date of the evaluation, including any corrective actions with regard to significant deficiencies and material weaknesses during the second fiscal quarter of the period covered by this report.
Item 12. Exhibits. Attached hereto.
(a)(1) Not applicable to this semi-annual report.
(a)(2) Separate certifications by the Registrant’s Principal Executive Officer and Principal Financial Officer as required by Rule 30a-2(a) under the Investment Company Act of 1940.
(a)(3) Not applicable.
(b) Separate certifications by the Registrant’s Principal Executive Officer and Principal Financial Officer, pursuant to Section 906 of the Sarbanes-Oxley Act of 2002 and required by Rule 30a-2(b) under the Investment Company Act of 1940.
Pursuant to the requirements of the Securities Exchange Act of 1934 and the Investment Company Act of 1940, the registrant has duly caused this report to be signed on its behalf by the undersigned, thereunto duly authorized.
ROYCE VALUE TRUST, INC.
|
| BY: | /s/ Charles M. Royce |
| | Charles M. Royce |
| | President |
Date: September 3, 2009
Pursuant to the requirements of the Securities Exchange Act of 1934 and the Investment Company Act of 1940, this report has been signed below by the following persons on behalf of the registrant and in the capacities and on the dates indicated.
| ROYCE VALUE TRUST, INC. | | ROYCE VALUE TRUST, INC. |
| | | | | |
| BY: | /s/ Charles M. Royce | | BY: | /s/ John D. Diederich |
| | Charles M. Royce | | | John D. Diederich |
| | President | | | Chief Financial Officer |
| | | | | |
| Date: September 3, 2009 | | Date: September 3, 2009 |