
TEMPLETON GROWTH FUND, INC.

Annual Report
Templeton Growth Fund, Inc.
Your Fund’s Goal and Main Investments: Templeton Growth Fund seeks long-term
capital growth. Under normal market conditions, the Fund invests primarily in equity securities of com-
panies located anywhere in the world, including emerging markets.
This annual report for Templeton Growth Fund covers the fiscal year ended
August 31, 2011.
Performance Overview
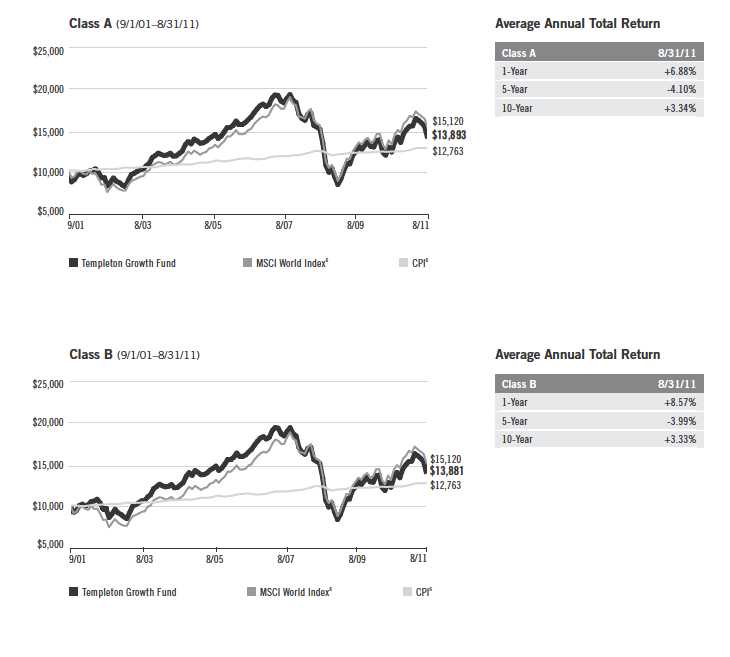
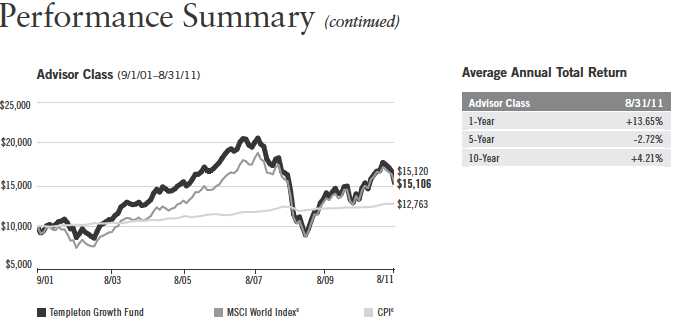
Templeton Growth Fund – Class A delivered a +13.38% cumulative total
return for the 12 months under review. The Fund’s Class A shares underper-
formed the +15.06% total return of the benchmark, the MSCI World Index,
which measures stock performance in global developed markets.1 The Fund’s
long-term relative results are shown in the Performance Summary beginning
on page 11. For the 10-year period ended August 31, 2011, Templeton
Growth Fund – Class A generated a +47.37% cumulative total return, com-
pared with the MSCI World Index’s +51.20% cumulative total return for the
same period.1 Please note index performance information is provided for
reference and we do not attempt to track the index but rather undertake
investments on the basis of fundamental research. You can find more
performance data in the Performance Summary.
Economic and Market Overview
Global equities broadly delivered gains during the 12 months under review,
although the positive momentum galvanizing markets throughout most of the
period reversed sharply in the final months as escalating sovereign debt woes
and economic growth concerns severely curtailed investor optimism. In
September 2010, stocks had just weathered a weak summer session marked by
signs of a growing debt crisis in Europe, potential overheating in emerging
1. Source: © 2011 Morningstar. All Rights Reserved. The information contained herein: (1) is proprietary to Morningstar
and/or its content providers; (2) may not be copied or distributed; and (3) is not warranted to be accurate, complete or
timely. Neither Morningstar nor its content providers are responsible for any damages or losses arising from any use of
this information. As of 8/31/11, the Fund’s Class A 10-year average annual total return not including the maximum sales
charge was +3.95%, compared with the MSCI World Index’s 10-year average annual total return of +4.22%. The index is
unmanaged and includes reinvested dividends. One cannot invest directly in an index, and an index is not representative
of the Fund’s portfolio.
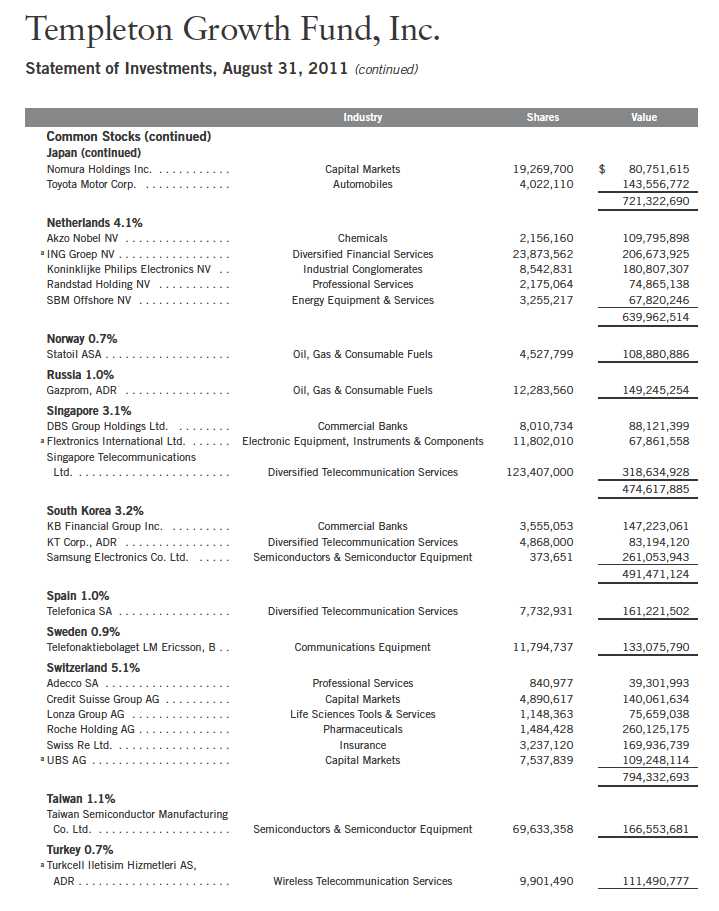
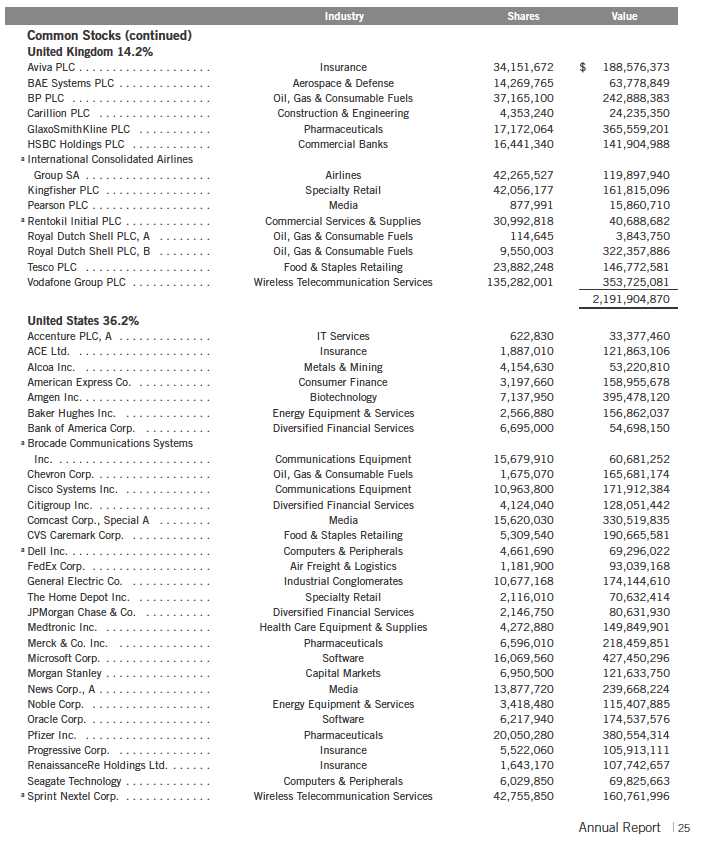
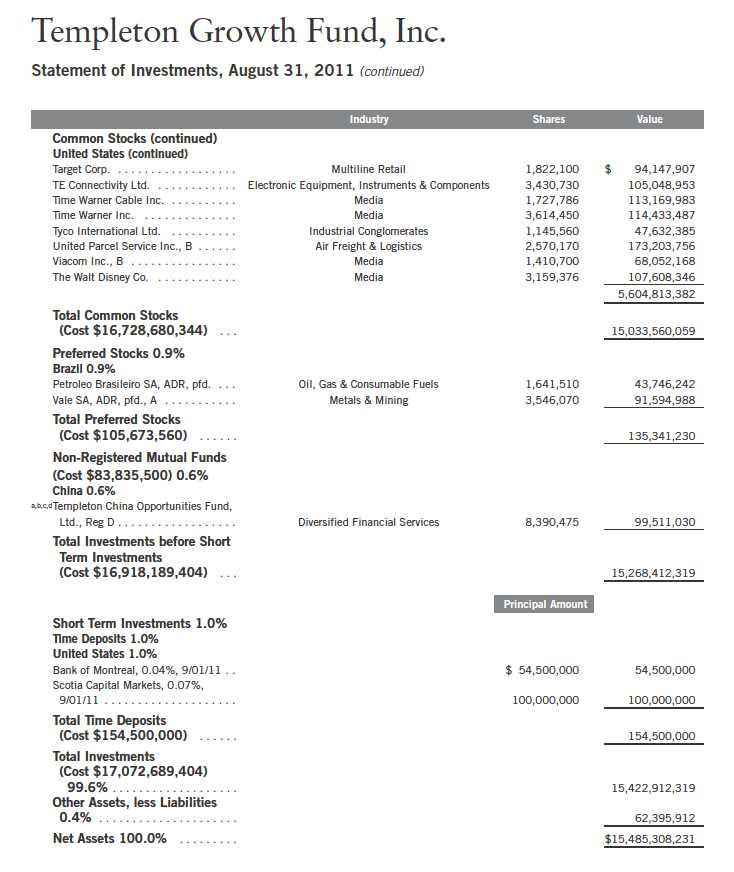
The dollar value, number of shares or principal amount, and names of all portfolio holdings are listed in the
Fund’s Statement of Investments (SOI). The SOI begins on page 23.
Annual Report | 3
markets, a slowing recovery in the developed world, and the prospective end of the Federal Reserve Board’s (Fed’s) quantitative easing program. Yet, most developed world policymakers signaled their support for further stimulus as the Fed introduced a new round of quantitative easing and European policy-makers amended the Lisbon Treaty to provide for a permanent regional bailout facility. In contrast, growth and debt concerns did not affect most emerging markets, which instead raised interest rates and tightened lending standards to combat rising inflation. This combination of high emerging market growth and vigilant developed market policy support, in addition to ongoing corporate earnings strength, propelled stocks higher into 2011.
Equities continued to rally before encountering unanticipated headwinds in the spring of 2011 that resulted in rising volatility and a fading economic growth outlook. First, revolutionary uprisings swept the Middle East and North Africa, deposing several longstanding regimes and roiling global oil and gas markets. Then on March 11, Japan suffered its worst earthquake on record and subsequent nuclear radiation leaks that shut down supply chains and crippled the near-term output of the world’s third-largest economy. Nor was the western world immune from turmoil. European austerity measures and interest rate hikes cast a shadow over regional economic growth forecasts, while a second bailout package for Greece and better-than-expected bank stress test results failed to ease concerns that the region’s fiscal crisis could spread to larger eurozone economies. In a game of high-stakes brinkmanship, U.S. politicians debated ways to close the country’s yawning fiscal deficit, ultimately reaching an eleventh-hour compromise to raise the federal debt ceiling and avoid an unprecedented default. The episode impaired confidence in the world’s largest economy, however, and independent credit rating agency Standard & Poor’s downgraded the U.S.’s AAA credit rating for the first time to AA+. This confluence of events sent equities reeling at the end of the review period as investors fled to perceived safe haven assets like gold and U.S. Treasuries. Despite such heightened volatility and risk aversion at period-end, global equities nonetheless finished the 12-month period with respectable gains.
Investment Strategy
Our investment strategy employs a bottom-up, value-oriented, long-term approach. We focus on the market price of a company’s securities relative to our evaluation of the company’s long-term earnings, asset value and cash flow potential. As we look worldwide, we consider specific companies, rather than sectors or countries, while doing in-depth research to construct a bargain list from which we buy. Before we make a purchase, we look at the company’s price/earnings ratio, price/cash flow ratio, profit margins and liquidation value.
4 | Annual Report
Manager’s Discussion
In our August 2010 annual report, we discussed the undue influence near-term economic trends and outlook had on stock prices. We noted that a market distracted by top-down economic and political concerns can create near-term performance challenges and long-term profit opportunities for bottom-up stock-pickers like us. Writing again 12 months later, we are pleased to report that performance held up well, and we continued to find what we considered attractive long-term investment opportunities in a market we believe mispriced fundamental value.
We find it a bit unsettling, however, just how few economic and political distractions holding markets in sway a year ago were actually resolved. While much happened during the year — a crippling Japanese earthquake, an ongoing revolution in the Arab world, a second round of quantitative easing in the U.S. and emergency bailouts in Europe — little changed. Markets suffered from the same pressures as a year earlier: unsustainable debt burdens and an uncertain economic growth outlook. What changed, however, were valuations. When we argued this time last year that global equities generally looked bargain priced to us, they were indeed trading at a discount to their historical average price-to-earnings multiples. But, with skeptical investors paying less and less for growth, multiples at fiscal year-end were more than 20% below last year’s already depressed levels. We believe this created some very attractive opportunities for long-term value investors, and history has shown that outsized returns generally follow periods of depressed valuations.
Investors should be aware, however, that the road to those returns may be bumpy. Much of the debt overhang that led to bankruptcies and bailouts in the private sector was not paid down but merely transferred to the public sector’s balance sheet. The growth jitters recently experienced may become more common as developed world governments are eventually forced to rein in monetary policy and embrace austerity to genuinely deleverage. Yet, as astute investors know, the equity market is a discounting mechanism. We believe that at recent depressed valuation levels, the market appeared to be already discounting a growth slowdown, so there remained ample opportunity for positive market surprises as well.
Therefore, in our view, it is an important time to recognize that acknowledging the challenges facing the global economy and equity markets does not require capitulating to them. Yet, that was exactly what investors were doing once again, as witnessed by the major spike in equity fund outflows in recent months. We applaud the hardy investors who did not follow this crowd; global equities, as measured by the MSCI World Index, have risen 36.99%
Annual Report | 5
since the end of October 2008, the last month investors abandoned stocks in such numbers. Market fluctuations based on near-term developments may impact share prices, but according to our research, they rarely impact long-term intrinsic business values, and so can be exploited as valuation opportunities by disciplined investors. At Templeton, we continually seek to use these opportunities to buy stocks at prices that we believe undervalue the long-term earnings, cash-flow and asset value potential of their underlying businesses.
We have recently found many such potential opportunities in the beleaguered global financials sector, an interesting development considering our significant sector underweighting in recent years.2 So far, we increased our exposure too early, particularly to European banks. Financials stocks became collateral damage in the attack on European sovereign credits and as such, the sector declined the most in the Fund and the index during the annual review period. Yet, corporate restructurings improved the quality and transparency of sector balance sheets that concerned us in recent years, and extreme pessimism created attractive valuation opportunities among select stocks, in our view. We notably increased exposure to European banks and insurers as the crisis in the periphery of the region, headlined by Greece, widely depressed valuations in the core of Europe.
In the banking industry, a tepid outlook for loan growth, concerns about regulatory interference, and lingering asset quality fears pressured companies we believe would normally thrive in an environment of low funding costs and steep yield curves. Yet, across the diverse industry landscape, many firms deleveraged, recapitalized and shed questionable assets. Meanwhile, global insurance valuations, normally discussed as price-to-book ratios, at period-end were at 25-year lows on average despite the sector’s relatively strong performance throughout the global financial crisis. Although the extraordinarily low valuations partly reflected the distortive effect of unusually low bond yields on industry book values, they nonetheless represented attractive recent buying opportunities to us as companies recover from natural disasters that generated the industry’s largest-ever insured losses. Similar to the banking industry, the strongest insurers have divested underpriced business, retained significant excess capital and steered away from risk assets.
Although our increased financials exposure was a somewhat new development, we have had an overweighted position in media stocks since the aftermath of the TMT (technology, media and telecommunications) bubble. That bubble burst spectacularly in 2001, affording us the opportunity to
2. The financials sector comprises capital markets, commercial banks, consumer finance, diversified financial services, insurance, and real estate management and development in the SOI.
6 | Annual Report
begin selectively purchasing quality media companies at what we considered steeply discounted prices. U.S. cable operator Comcast was a major media contributor during this review period. The stock benefited from Comcast’s popular bundled offerings and growing broadband market share, a powerful and profitable business position in an age of increasing reliance on technology for entertainment, information and communication. The U.S.’s Viacom, which owns television networks and movie studios, was another top media contributor, supported by surging demand for content from traditional cable operators like Comcast and new web-based services like NetFlix and Hulu. Media stocks were major contributors to performance during the period, and along with automotive industry stocks, helped the Fund’s overweighted consumer discretionary position deliver positive relative performance.3
We also remained overweighted in the telecommunication services sector, where we found globally diversified firms with what we considered attractive growth prospects and generous dividend yields trading at fairly low valuations.4 Our overweighting hindered relative returns as the sector under-performed the index overall. Stock-specific weakness also pressured relative performance, largely due to losses at Turkish mobile operator Turkcell Iletisim Hizmetleri, which declined due to weaker-than-expected earnings, an ongoing shareholder dispute and concerns about escalating geopolitical turmoil in the Mediterranean region.5 Nonetheless, we remained favorable toward the stock, which we regarded as undervalued, and continued to find what we considered attractive opportunities in the global telecommunication services sector. Industrials was another notable sector laggard, one also pressured by stock selection.6 However, we found what we considered increasing opportunities in the sector as the period progressed and risk-averse investors rotated out of cyclical stocks, depressing valuations. We believe select industrials holdings offer investors exposure to global growth trends at far more reasonable valuations than stocks in other cyclically leveraged sectors like materials.
We also remained favorable toward our overweighted exposure to health care holdings, a position shareholders will recall us defending in the recent past as
3. The consumer discretionary sector comprises auto components, automobiles, media, multiline retail and specialty retail in the SOI.
4. The telecommunication services sector comprises diversified telecommunication services and wireless telecommunication services in the SOI.
5. This holding is not an index component.
6. The industrials sector comprises aerospace and defense, air freight and logistics, airlines, commercial services and supplies, electrical equipment, industrial conglomerates, professional services, road and rail, and trading companies and distributors in the SOI.

Annual Report | 7
the sector frustratingly lagged the risk rally.7 We are pleased to report the Fund’s health care position began to outperform during the year under review and ended the period as a notable contributor, largely driven by our overweighted positioning and stock selection in pharmaceuticals. While we welcomed this turn of fortune, the catalyst for outperformance appeared to us to be more of a defensive rotation than fundamental value recognition, and we therefore believe considerable scope remains for further opportunities in the sector.
Although the market’s concerns about patent expirations, regulatory uncertainty and pipeline productivity persisted during the reporting period, in our view these issues seemed largely priced in to health care valuations at roughly half their long-term average. Furthermore, we believe pharmaceuticals companies have been proactive in addressing these concerns by prioritizing emerging market growth, restructuring their costs, diversifying away from patent-exposed products and directing robust cash flows to such productive uses as shareholder returns and mergers and acquisitions. French pharmaceuticals manufacturer Sanofi was a major contributor to Fund performance during the period, and is a good example of the type of pharmaceuticals stock we favored. Sanofi had little exposure to patent expirations, a diversified business mix achieved through a strategic two-year acquisition initiative and a strong geographic position with more than 30% of revenues derived from emerging markets, the most of any major global pharmaceuticals firm.
Sanofi is just one example of the revenue diversification available to investors in Europe, another theme we have discussed at length in recent years. Yet, despite what we considered attractive global exposure, strong brand equity and excellent fundamentals of select large-cap European equities, the region as a whole still traded at a significant discount to the global market and at roughly half its long-term average forward earnings multiple. Europe, in our opinion, is widely seen as a mature market hamstrung by debt and a monetary union ill-equipped to deal with the disparate challenges of its diverse member states. Such skepticism continued to mute the advances of European stocks, and while the Fund’s European holdings delivered absolute gains during the annual period, our overweighting in the unpopular region led to relative underperformance against the benchmark.
Investors should realize that Greece — or Portugal or Ireland for that matter — does not represent all of Europe. Despite distress among some countries, Europe’s core economies remain mostly healthy and solvent. Equally important, the most troubled European countries — Greece, Portugal and Ireland —
7. The health care sector comprises biotechnology, health care equipment and supplies, pharmaceuticals, and life sciences tools and services in the SOI.
8 | Annual Report
represent just 7% of European gross domestic product. We believe that while many investors may accept this and acknowledge Europe’s ability to absorb capital losses directly attributable to a peripheral default, it is the fear of systemic contagion that keeps them awake at night. Here we would point out that European rescue facilities seemed adequate, and the cost of not bailing out troubled member states was widely recognized as likely to exceed the cost of bailing them out. We believe policymakers remain highly motivated to prevent a regional debt contagion, and we continued to find some of the world’s most attractive companies trading at what we considered bargain valuations in beleaguered Europe.
It is important to recognize the effect of currency movements on the Fund’s performance. In general, if the value of the U.S. dollar goes up compared with a foreign currency, an investment traded in that foreign currency will go down in value because it will be worth fewer U.S. dollars. This can have a negative effect on Fund performance. Conversely, when the U.S. dollar weakens in relation to a foreign currency, an investment traded in that foreign currency will increase in value, which can contribute to Fund performance. For the 12 months ended August 31, 2011, the U.S. dollar declined in value relative to most currencies. As a result, the Fund’s performance was positively affected by the portfolio’s substantial investment in securities with non-U.S. currency exposure. However, one cannot expect the same result in future periods.
Our focus on bottom-up value helps us buffer the noise of an increasingly uncertain economic and geopolitical environment. We believe this noise could get louder if the combination of growing debt burdens, rising interest rates, creeping inflationary pressures and political discord impacting most regions of the world to varying degrees persists. As these issues are worked through, we feel intermittent bouts of volatility and anxiety may become more frequent. We believe the most successful investors in such an environment will be those who stick to the fundamentals and seek to use market volatility to their advantage. As Sir John Templeton observed, “People focus too little on the opportunities that problems present.” At Templeton, we believe the market remains ripe with opportunity for patient and disciplined investors with a long-term horizon.

Annual Report | 9

The foregoing information reflects our analysis, opinions and portfolio holdings as of August 31, 2011, the end of
the reporting period. The way we implement our main investment strategies and the resulting portfolio holdings
may change depending on factors such as market and economic conditions. These opinions may not be relied upon
as investment advice or an offer for a particular security. The information is not a complete analysis of every
aspect of any market, country, industry, security or the Fund. Statements of fact are from sources considered reli-
able, but the investment manager makes no representation or warranty as to their completeness or accuracy.
Although historical performance is no guarantee of future results, these insights may help you understand our
investment management philosophy.
10 | Annual Report
Performance Summary as of 8/31/11
Your dividend income will vary depending on dividends or interest paid by securities in the Fund’s portfolio, adjusted for operating expenses of each class. Capital gain distributions are net profits realized from the sale of portfolio securities. The performance table and graphs do not reflect any taxes that a shareholder would pay on Fund dividends, capital gain distributions, if any, or any realized gains on the sale of Fund shares. Total return reflects reinvestment of the Fund’s dividends and capital gain distributions, if any, and any unrealized gains or losses.

Annual Report | 11
Performance Summary (continued)
Performance
Cumulative total return excludes sales charges. Average annual total returns and value of $10,000 investment include maximum sales charges. Class A: 5.75% maximum initial sales charges; Class B: contingent deferred sales charge (CDSC) declining from 4% to 1% over six years, and eliminated thereafter; Class C: 1% CDSC in first year only; Class R/Advisor Class: no sales charges.

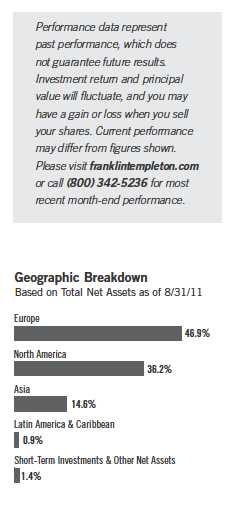
Performance data represent past performance, which does not guarantee future results. Investment return and principal value will fluctuate, and you may have a gain or loss when you sell your shares. Current performance may differ from figures shown. For most recent month-end performance, go to franklintempleton.com or call (800) 342-5236.
12 | Annual Report
Performance Summary (continued)
Total Return Index Comparison for a Hypothetical $10,000 Investment
Total return represents the change in value of an investment over the periods shown. It includes
any current, applicable, maximum sales charge, Fund expenses, account fees and reinvested distri-
butions. The unmanaged index includes reinvestment of any income or distributions. It differs
from the Fund in composition and does not pay management fees or expenses. One cannot invest
directly in an index.
Annual Report | 13

14 | Annual Report
Endnotes
Special risks are associated with foreign investing, including currency fluctuations, economic instability and political developments. Investments in developing markets involve heightened risks related to the same factors, in addition to those associated with these markets’ smaller size and lesser liquidity. The Fund is actively managed but there is no guarantee that the manager’s investment decisions will produce the desired results. The Fund’s prospectus also includes a description of the main investment risks.
| |
Class B: Class C: | These shares have higher annual fees and expenses than Class A shares. Prior to 1/1/04, these shares were offered with an initial sales charge; thus actual total returns would have differed. These shares have higher annual fees and expenses than Class A shares. |
Class R: | Shares are available to certain eligible investors as described in the prospectus. These shares have higher annual fees and expenses than Class A shares. |
Advisor Class: | Shares are available to certain eligible investors as described in the prospectus. |
1. Cumulative total return represents the change in value of an investment over the periods indicated.
2. Average annual total return represents the average annual change in value of an investment over the periods indicated.
3. These figures represent the value of a hypothetical $10,000 investment in the Fund over the periods indicated.
4. In accordance with SEC rules, we provide standardized average annual total return information through the latest calendar quarter.
5. Figures are as stated in the Fund’s prospectus current as of the date of this report. In periods of market volatility, assets may decline significantly, causing total annual Fund operating expenses to become higher than the figures shown.
6. Source: © 2011 Morningstar. The MSCI World Index is a free float-adjusted, market capitalization-weighted index designed to measure equity market performance in global developed markets. The Consumer Price Index (CPI), calculated by the U.S. Bureau of Labor Statistics, is a commonly used measure of the inflation rate.
Annual Report | 15
Your Fund’s Expenses
As a Fund shareholder, you can incur two types of costs:
- Transaction costs, including sales charges (loads) on Fund purchases; and
- Ongoing Fund costs, including management fees, distribution and service (12b-1) fees, and other Fund expenses. All mutual funds have ongoing costs, sometimes referred to as operating expenses.
The following table shows ongoing costs of investing in the Fund and can help you understand these costs and compare them with those of other mutual funds. The table assumes a $1,000 investment held for the six months indicated.
Actual Fund Expenses
The first line (Actual) for each share class listed in the table provides actual account values and expenses. The “Ending Account Value” is derived from the Fund’s actual return, which includes the effect of Fund expenses.
You can estimate the expenses you paid during the period by following these steps. Of course, your account value and expenses will differ from those in this illustration:
| 1. | Divide your account value by $1,000. |
| | If an account had an $8,600 value, then $8,600 ÷ $1,000 = 8.6. |
| 2. | Multiply the result by the number under the heading “Expenses Paid During Period.” |
| | If Expenses Paid During Period were $7.50, then 8.6 x $7.50 = $64.50. |
In this illustration, the estimated expenses paid this period are $64.50.
Hypothetical Example for Comparison with Other Funds
Information in the second line (Hypothetical) for each class in the table can help you compare ongoing costs of investing in the Fund with those of other mutual funds. This information may not be used to estimate the actual ending account balance or expenses you paid during the period. The hypothetical “Ending Account Value” is based on the actual expense ratio for each class and an assumed 5% annual rate of return before expenses, which does not represent the Fund’s actual return. The figure under the heading “Expenses Paid During Period” shows the hypothetical expenses your account would have incurred under this scenario. You can compare this figure with the 5% hypothetical examples that appear in shareholder reports of other funds.
16 | Annual Report
Your Fund’s Expenses (continued)
Please note that expenses shown in the table are meant to highlight ongoing costs and do not reflect any transaction costs, such as sales charges. Therefore, the second line for each class is useful in comparing ongoing costs only, and will not help you compare total costs of owning different funds. In addition, if transaction costs were included, your total costs would have been higher. Please refer to the Fund prospectus for additional information on operating expenses.
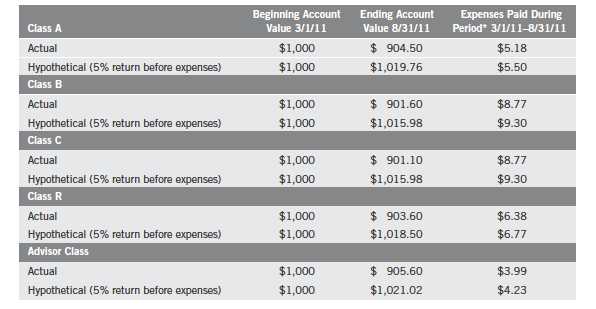
*Expenses are calculated using the most recent six-month expense ratio, annualized for each class (A: 1.08%; B: 1.83%; C: 1.83%; R: 1.33%; and Advisor: 0.83%), multiplied by the average account value over the period, multiplied by 184/365 to reflect the one-half year period.
Annual Report | 17
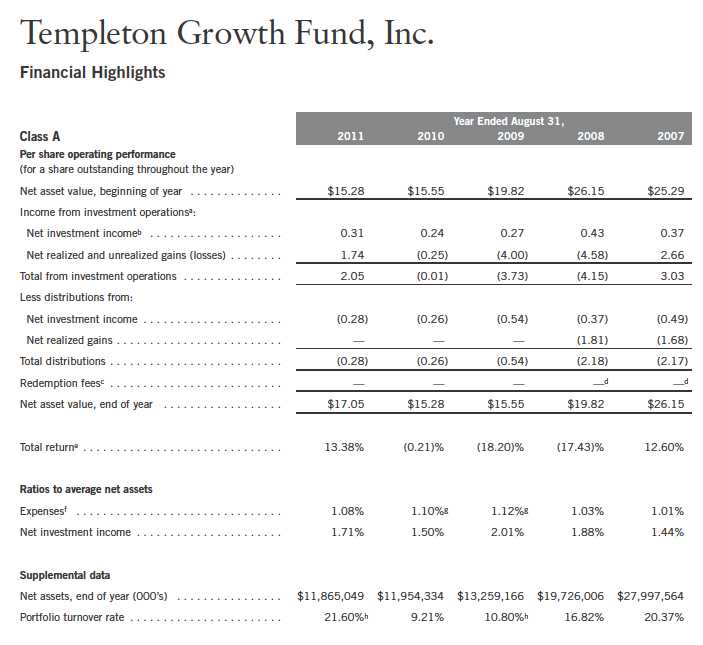
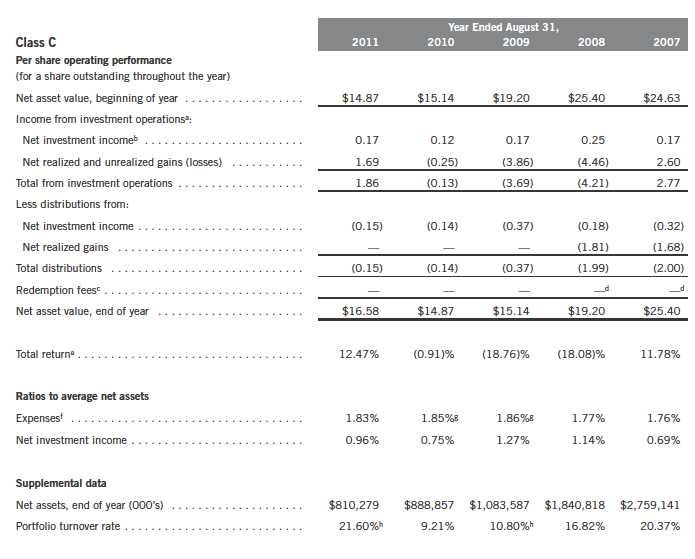
aThe amount shown for a share outstanding throughout the period may not correlate with the Statement of Operations for the period due to the timing of sales and repurchases of
the Fund shares in relation to income earned and/or fluctuating market value of the investments of the Fund.
bBased on average daily shares outstanding.
cEffective September 1, 2008, the redemption fee was eliminated.
dAmount rounds to less than $0.01 per share.
eTotal return does not reflect sales commissions or contingent deferred sales charges, if applicable.
fBenefit of expense reduction rounds to less than 0.01%.
gBenefit of waiver and payment by affiliate rounds to less than 0.01%.
hExcludes the value of portfolio securities delivered as a result of redemptions in-kind.
18 | The accompanying notes are an integral part of these financial statements. | Annual Report
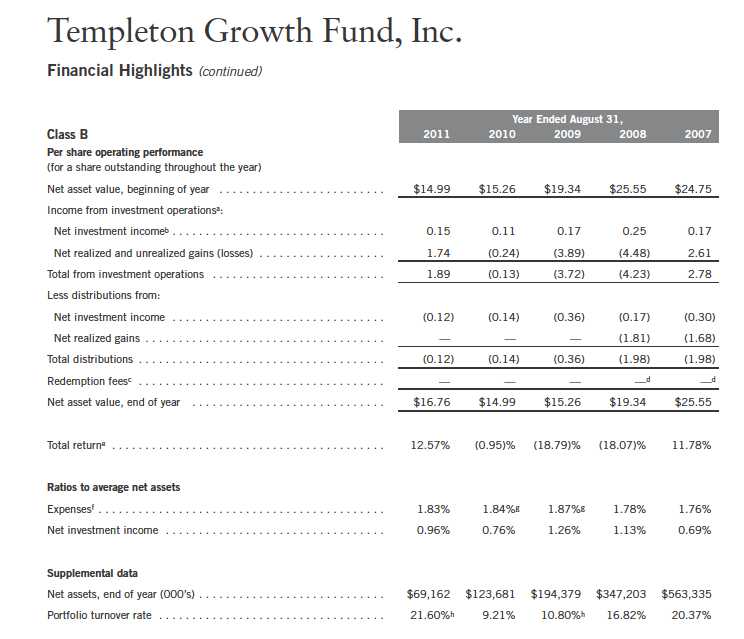
aThe amount shown for a share outstanding throughout the period may not correlate with the Statement of Operations for the period due to the timing of sales and repurchases of
the Fund shares in relation to income earned and/or fluctuating market value of the investments of the Fund.
bBased on average daily shares outstanding.
cEffective September 1, 2008, the redemption fee was eliminated.
dAmount rounds to less than $0.01 per share.
eTotal return does not reflect sales commissions or contingent deferred sales charges, if applicable.
fBenefit of expense reduction rounds to less than 0.01%.
gBenefit of waiver and payment by affiliate rounds to less than 0.01%.
hExcludes the value of portfolio securities delivered as a result of redemptions in-kind.
Annual Report | The accompanying notes are an integral part of these financial statements. | 19
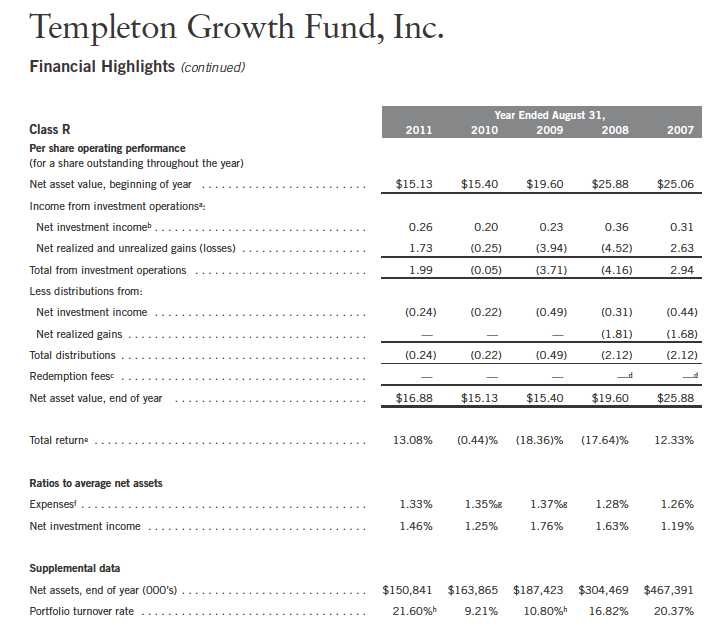
Templeton Growth Fund, Inc.
Financial Highlights (continued)
aThe amount shown for a share outstanding throughout the period may not correlate with the Statement of Operations for the period due to the timing of sales and repurchases of
the Fund shares in relation to income earned and/or fluctuating market value of the investments of the Fund.
bBased on average daily shares outstanding.
cEffective September 1, 2008, the redemption fee was eliminated.
dAmount rounds to less than $0.01 per share.
eTotal return does not reflect sales commissions or contingent deferred sales charges, if applicable.
fBenefit of expense reduction rounds to less than 0.01%.
gBenefit of waiver and payment by affiliate rounds to less than 0.01%.
hExcludes the value of portfolio securities delivered as a result of redemptions in-kind.
20 | The accompanying notes are an integral part of these financial statements. | Annual Report
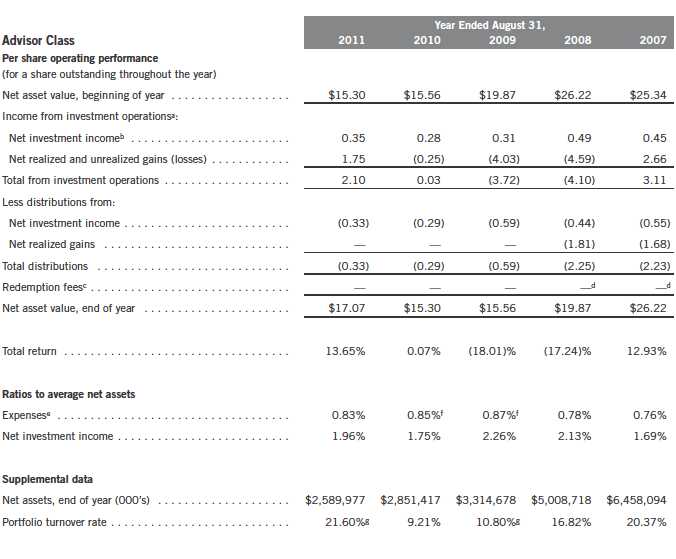
aThe amount shown for a share outstanding throughout the period may not correlate with the Statement of Operations for the period due to the timing of sales and repurchases of
the Fund shares in relation to income earned and/or fluctuating market value of the investments of the Fund.
bBased on average daily shares outstanding.
cEffective September 1, 2008, the redemption fee was eliminated.
dAmount rounds to less than $0.01 per share.
eTotal return does not reflect sales commissions or contingent deferred sales charges, if applicable.
fBenefit of expense reduction rounds to less than 0.01%.
gBenefit of waiver and payment by affiliate rounds to less than 0.01%.
hExcludes the value of portfolio securities delivered as a result redemptions in-kind.
Annual Report | The accompanying notes are an integral part of these financial statements. | 21
Templeton Growth Fund, Inc.
Financial Highlights (continued)
aThe amount shown for a share outstanding throughout the period may not correlate with the Statement of Operations for the period due to the timing of sales and repurchases of
the Fund shares in relation to income earned and/or fluctuating market value of the investments of the Fund.
bBased on average daily shares outstanding.
cEffective September 1, 2008, the redemption fee was eliminated.
dAmount rounds to less than $0.01 per share.
eBenefit of expense reduction rounds to less than 0.01%.
fBenefit of waiver and payment by affiliate rounds to less than 0.01%.
gExcludes the value of portfolio securities delivered as a result of redemptions in-kind.
22 | The accompanying notes are an integral part of these financial statements. | Annual Report
Templeton Growth Fund, Inc.
Statement of Investments, August 31, 2011
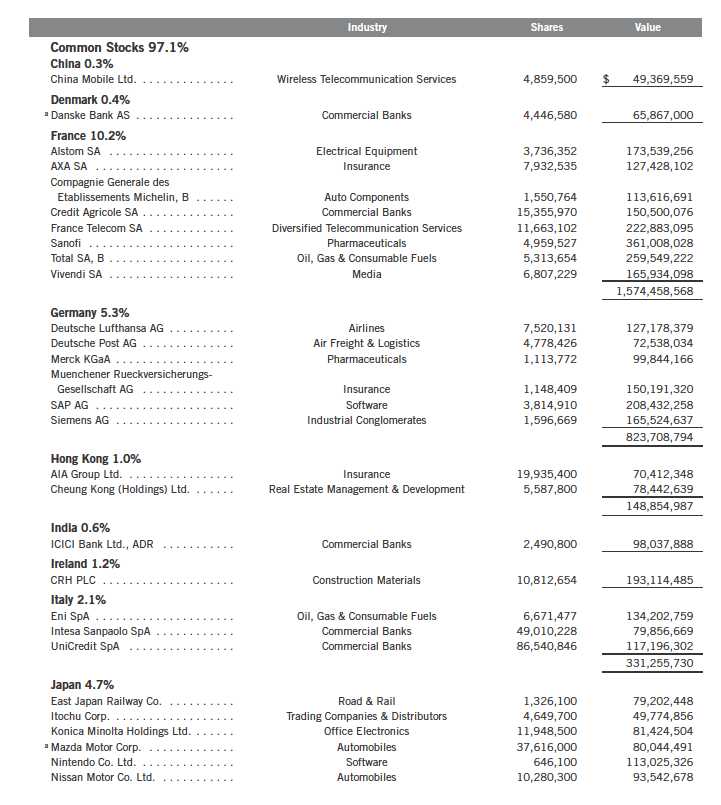
Annual Report | 23
24 | Annual Report
Templeton Growth Fund, Inc.
Statement of Investments, August 31, 2011 (continued)
26 | Annual Report
Templeton Growth Fund, Inc.
Statement of Investments, August 31, 2011 (continued)

See Abbreviations on page 43.
aNon-income producing.
bSee Note 8 regarding restricted securities.
cSee Note 9 regarding holdings of 5% voting securities.
dSee Note 1(c) regarding investment in Templeton China Opportunities Fund, Ltd.
Annual Report | The accompanying notes are an integral part of these financial statements. | 27

28 | The accompanying notes are an integral part of these financial statements. | Annual Report
Templeton Growth Fund, Inc.
Financial Statements (continued)
Statement of Assets and Liabilities (continued)
August 31, 2011
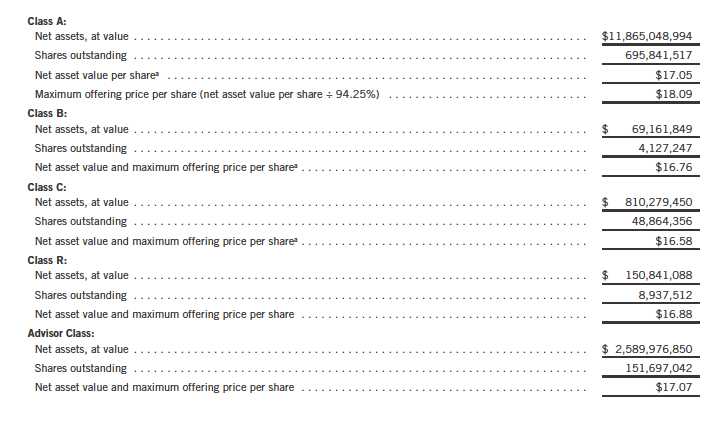
aRedemption price is equal to net asset value less contingent deferred sales charges, if applicable.
Annual Report | The accompanying notes are an integral part of these financial statements. | 29

30 | The accompanying notes are an integral part of these financial statements. | Annual Report
Templeton Growth Fund, Inc.
Financial Statements (continued)

Annual Report | The accompanying notes are an integral part of these financial statements. | 31
Templeton Growth Fund, Inc.
Notes to Financial Statements
1. ORGANIZATION AND SIGNIFICANT ACCOUNTING POLICIES
Templeton Growth Fund, Inc. (Fund) is registered under the Investment Company Act of 1940, as amended, (1940 Act) as an open-end investment company. The Fund offers five classes of shares: Class A, Class B, Class C, Class R, and Advisor Class. Each class of shares differs by its initial sales load, contingent deferred sales charges, distribution fees, voting rights on matters affecting a single class and its exchange privilege.
The following summarizes the Fund’s significant accounting policies.
a. Financial Instrument Valuation
The Fund’s investments in securities and other financial instruments are carried at fair value daily. Fair value is the price that would be received to sell an asset or paid to transfer a liability in an orderly transaction between market participants on the measurement date. Under procedures approved by the Fund’s Board of Directors, the Fund may utilize independent pricing services, quotations from securities and financial instrument dealers, and other market sources to determine fair value.
Equity securities listed on an exchange or on the NASDAQ National Market System are valued at the last quoted sale price or the official closing price of the day, respectively. Foreign equity securities are valued as of the close of trading on the foreign stock exchange on which the security is primarily traded, or the NYSE, whichever is earlier. The value is then converted into its U.S. dollar equivalent at the foreign exchange rate in effect at the close of the NYSE on the day that the value of the security is determined. Over-the-counter securities are valued within the range of the most recent quoted bid and ask prices. Securities that trade in multiple markets or on multiple exchanges are valued according to the broadest and most representative market. Certain equity securities are valued based upon fundamental characteristics or relationships to similar securities.
Debt and certain preferred securities generally trade in the over-the-counter market rather than on a securities exchange. The Fund’s pricing services use multiple valuation techniques to determine fair value. In instances where sufficient market activity exists, the pricing services may utilize a market-based approach through which quotes from market makers are used to determine fair value. In instances where sufficient market activity may not exist or is limited, the pricing services also utilize proprietary valuation models which may consider market characteristics such as benchmark yield curves, option-adjusted spreads, credit spreads, estimated default rates, coupon rates, anticipated timing of principal repayments, underlying collateral, and other unique security features in order to estimate the relevant cash flows, which are then discounted to calculate the fair value. Securities denominated in a foreign currency are converted into their U.S. dollar equivalent at the foreign exchange rate in effect at the close of the NYSE on the date that the values of the foreign debt securities are determined. Time deposits are valued at cost, which approximates market value.
32 | Annual Report
Templeton Growth Fund, Inc.
Notes to Financial Statements (continued)
| 1. | ORGANIZATION AND SIGNIFICANT ACCOUNTING POLICIES (continued) |
| a. | Financial Instrument Valuation (continued) |
The Fund has procedures to determine the fair value of securities and other financial instruments for which market prices are not readily available or which may not be reliably priced. Under these procedures, the Fund primarily employs a market-based approach which may use related or comparable assets or liabilities, recent transactions, market multiples, book values, and other relevant information for the investment to determine the fair value of the investment. The Fund may also use an income-based valuation approach in which the anticipated future cash flows of the investment are discounted to calculate fair value. Discounts may also be applied due to the nature or duration of any restrictions on the disposition of the investments. Due to the inherent uncertainty of valuations of such investments, the fair values may differ significantly from the values that would have been used had an active market existed.
Trading in securities on foreign securities stock exchanges and over-the-counter markets may be completed before the daily close of business on the NYSE. Occasionally, events occur between the time at which trading in a foreign security is completed and the close of the NYSE that might call into question the reliability of the value of a portfolio security held by the Fund. As a result, differences may arise between the value of the Fund’s portfolio securities as determined at the foreign market close and the latest indications of value at the close of the NYSE. In order to minimize the potential for these differences, the investment manager monitors price movements following the close of trading in foreign stock markets through a series of country specific market proxies (such as baskets of American Depositary Receipts, futures contracts and exchange traded funds). These price movements are measured against established trigger thresholds for each specific market proxy to assist in determining if an event has occurred that may call into question the reliability of the values of the foreign securities held by the Fund. If such an event occurs, the securities may be valued using fair value procedures, which may include the use of independent pricing services.
b. Foreign Currency Translation
Portfolio securities and other assets and liabilities denominated in foreign currencies are translated into U.S. dollars based on the exchange rate of such currencies against U.S. dollars on the date of valuation. The Fund may enter into foreign currency exchange contracts to facilitate transactions denominated in a foreign currency. Purchases and sales of securities, income and expense items denominated in foreign currencies are translated into U.S. dollars at the exchange rate in effect on the transaction date. Portfolio securities and assets and liabilities denominated in foreign currencies contain risks that those currencies will decline in value relative to the U.S. dollar. Occasionally, events may impact the availability or reliability of foreign exchange rates used to convert the U.S. dollar equivalent value. If such an event occurs, the foreign exchange rate will be valued at fair value using procedures established and approved by the Fund’s Board of Directors.
Annual Report | 33
Templeton Growth Fund, Inc.
Notes to Financial Statements (continued)
| 1. | ORGANIZATION AND SIGNIFICANT ACCOUNTING POLICIES (continued) |
| b. | Foreign Currency Translation (continued) |
The Fund does not separately report the effect of changes in foreign exchange rates from changes in market prices on securities held. Such changes are included in net realized and unrealized gain or loss from investments on the Statement of Operations.
Realized foreign exchange gains or losses arise from sales of foreign currencies, currency gains or losses realized between the trade and settlement dates on securities transactions and the difference between the recorded amounts of dividends, interest, and foreign withholding taxes and the U.S. dollar equivalent of the amounts actually received or paid. Net unrealized foreign exchange gains and losses arise from changes in foreign exchange rates on foreign denominated assets and liabilities other than investments in securities held at the end of the reporting period.
c. Investment in Templeton China Opportunities Fund, Ltd.
The Fund invests in Templeton China Opportunities Fund, Ltd. (China Fund), a private offering of unregistered shares in a Cayman Islands Exempt Company. The China Fund’s investment objective is to seek capital growth primarily through investments in A-shares of Chinese companies listed on the Shanghai and Shenzhen stock exchanges. Chinese A-shares are traded in Chinese Renminbi and are only available as an investment to domestic (Chinese) investors and holders of a Qualified Foreign Institutional Investors license. The China Fund is managed by Templeton Investment Counsel, LLC (an affiliate of the investment manager). No additional management or administrative fees are incurred on assets invested in the China Fund.
The China Fund may be subject to certain restrictions and administrative processes relating to its ability to repatriate cash balances, investment proceeds and earnings associated with its investment, as such activities are subject to approval by agencies of the Chinese government and thus the Fund may incur delays in redeeming its investment in the China Fund. The Fund’s investment in the China Fund is valued based upon the fair value of the China Fund’s portfolio securities and other assets and liabilities.
d. Securities Lending
The Fund participates in an agency based security lending program. The fund receives cash collateral against the loaned securities in an amount equal to at least 102% of the market value of the loaned securities. Collateral is maintained over the life of the loan in an amount not less than 100% of the market value of loaned securities, as determined at the close of fund business each day; any additional collateral required due to changes in security values is delivered to the fund on the next business day. The collateral is invested in a non-registered money fund by the fund’s custodian on the fund’s behalf. The fund receives income from the investment of cash collateral, in addition to lending fees and rebates paid by the borrower. The fund bears the market risk with respect to the collateral investment, securities loaned, and the risk that the agent may default on its obligations to the fund. The securities lending agent has agreed to indemnify the fund in the event of default by a third party borrower. At August 31, 2011, the Fund had no securities on loan.
34 | Annual Report
Templeton Growth Fund, Inc.
Notes to Financial Statements (continued)
| 1. | ORGANIZATION AND SIGNIFICANT ACCOUNTING POLICIES (continued) |
| e. | Income Taxes |
It is the Fund’s policy to qualify as a regulated investment company under the Internal Revenue Code. The Fund intends to distribute to shareholders substantially all of its taxable income and net realized gains to relieve it from federal income and excise taxes. As a result, no provision for U.S. federal income taxes is required. The Fund files U.S. income tax returns as well as tax returns in certain other jurisdictions. The Fund records a provision for taxes in its financial statements including penalties and interest, if any, for a tax position taken on a tax return (or expected to be taken) when it fails to meet the more likely than not (a greater than 50% probability) threshold and based on the technical merits, the tax position may not be sustained upon examination by the tax authorities.
As of August 31, 2011, and for all open tax years, the Fund has determined that no provision for income tax is required in the Fund’s financial statements. Open tax years are those that remain subject to examination and are based on each tax jurisdiction statute of limitation.
The Fund may be subject to foreign taxation related to income received, capital gains on the sale of securities and certain foreign currency transactions in the foreign jurisdictions in which it invests. Foreign taxes, if any, are recorded based on the tax regulations and rates that exist in the foreign markets in which the Fund invests. When a capital gain tax is determined to apply the Fund records an estimated deferred tax liability for unrealized gains on these securities in an amount that would be payable if the securities were disposed of on the valuation date.
f. Security Transactions, Investment Income, Expenses and Distributions
Security transactions are accounted for on trade date. Realized gains and losses on security transactions are determined on a specific identification basis. Interest income estimated expenses are accrued daily. Amortization of premium and accretion of discount on debt securities are included in interest income. Dividend income is recorded on the ex-dividend date except that certain dividends from foreign securities are recognized as soon as the Fund is notified of the ex-dividend date. Distributions to shareholders are recorded on the ex-dividend date and are determined according to income tax regulations (tax basis). Distributable earnings determined on a tax basis may differ from earnings recorded in accordance with accounting principles generally accepted in the United States of America. These differences may be permanent or temporary. Permanent differences are reclassified among capital accounts to reflect their tax character. These reclassifications have no impact on net assets or the results of operations. Temporary differences are not reclassified, as they may reverse in subsequent periods.
Realized and unrealized gains and losses and net investment income, not including class specific expenses, are allocated daily to each class of shares based upon the relative proportion of net assets of each class. Differences in per share distributions, by class, are generally due to differences in class specific expenses.
Annual Report | 35
Templeton Growth Fund, Inc.
Notes to Financial Statements (continued)
| 1. | ORGANIZATION AND SIGNIFICANT ACCOUNTING POLICIES (continued) |
| g. | Accounting Estimates |
The preparation of financial statements in accordance with accounting principles generally accepted in the United States of America requires management to make estimates and assumptions that affect the reported amounts of assets and liabilities at the date of the financial statements and the amounts of income and expenses during the reporting period. Actual results could differ from those estimates.
h. Guarantees and Indemnifications
Under the Fund’s organizational documents, its officers and directors are indemnified by the Fund against certain liabilities arising out of the performance of their duties to the Fund. Additionally, in the normal course of business, the Fund enters into contracts with service providers that contain general indemnification clauses. The Fund’s maximum exposure under these arrangements is unknown as this would involve future claims that may be made against the Fund that have not yet occurred. Currently, the Fund expects the risk of loss to be remote.
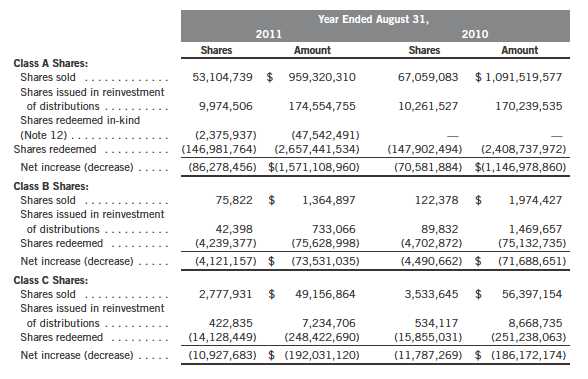
2. CAPITAL STOCK
At August 31, 2011, there were 2.4 billion shares authorized ($0.01 par value). Transactions in the Fund’s shares were as follows:
36 | Annual Report
Templeton Growth Fund, Inc.
Notes to Financial Statements (continued)

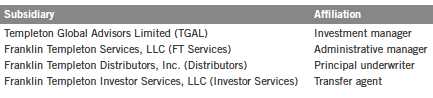
3. TRANSACTIONS WITH AFFILIATES
Franklin Resources, Inc. is the holding company for various subsidiaries that together are referred to as Franklin Templeton Investments. Certain officers and directors of the Fund are also officers and/or directors of the following subsidiaries:
a. Management Fees
The Fund pays an investment management fee to TGAL based on the average daily net assets of the Fund as follows:

Annual Report | 37
Templeton Growth Fund, Inc.
Notes to Financial Statements (continued)
| 3. | TRANSACTIONS WITH AFFILIATES (continued) |
| b. | Administrative Fees |
The Fund pays an administrative fee to FT Services based on the Fund’s average daily net assets as follows:

c. Distribution Fees
The Fund’s Board of Directors has adopted distribution plans for each share class, with the exception of Advisor Class shares, pursuant to Rule 12b-1 under the 1940 Act. Under the Fund’s Class A reimbursement distribution plan, the Fund reimburses Distributors for costs incurred in connection with the servicing, sale and distribution of the Fund’s shares up to the maximum annual plan rate. Under the Class A reimbursement distribution plan, costs exceeding the maximum for the current plan year cannot be reimbursed in subsequent periods.
In addition, under the Fund’s Class B, C, and R compensation distribution plans, the Fund pays Distributors for costs incurred in connection with the servicing, sale and distribution of the Fund’s shares up to the maximum annual plan rate for each class.
The maximum annual plan rates, based on the average daily net assets, for each class, are as follows:

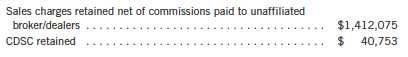
d. Sales Charges/Underwriting Agreements
Front-end sales charges and contingent deferred sales charges (CDSC) do not represent expenses of the Fund. These charges are deducted from the proceeds of sales of Fund shares prior to investment or from redemption proceeds prior to remittance, as applicable. Distributors has advised the Fund of the following commission transactions related to the sales and redemptions of the Fund’s shares for the year:
e. Transfer Agent Fees
For the year ended August 31, 2011, the Fund paid transfer agent fees of $20,602,437, of which $13,374,868 was retained by Investor Services.
38 | Annual Report
Templeton Growth Fund, Inc.
Notes to Financial Statements (continued)
4. EXPENSE OFFSET ARRANGEMENT
The Fund has entered into an arrangement with its custodian whereby credits realized as a result of uninvested cash balances are used to reduce a portion of the Fund’s custodian expenses. During the year ended August 31, 2011, the custodian fees were reduced as noted in the Statement of Operations.
5. INCOME TAXES
For tax purposes, capital losses may be carried over to offset future capital gains, if any. At August 31, 2011, the Fund had capital loss carryforwards of $3,099,781,759 expiring in 2018. During the year ended August 31, 2011, the Fund utilized $1,636,172,689 of capital loss carryforwards.
Under the Regulated Investment Company Modernization Act of 2010, the Fund will be permitted to carry forward capital losses incurred in taxable years beginning after December 22, 2010 for an unlimited period. Post-enactment capital loss carryforwards will retain their character as either short-term or long-term capital losses rather than being considered short-term as under previous law. Any post-enactment capital losses generated will be required to be utilized prior to the losses incurred in pre-enactment tax years.
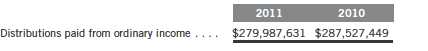
The tax character of distributions paid during the years ended August 31, 2011 and 2010, was as follows:
At August 31, 2011, the cost of investments, net unrealized appreciation (depreciation), and undistributed ordinary income for income tax purposes were as follows:

Differences between income and/or capital gains as determined on a book basis and a tax basis are primarily due to differing treatments of foreign currency transactions, pass-through entity income, regulatory settlements, wash sales, and gains realized on in-kind shareholder redemptions.
6. INVESTMENT TRANSACTIONS
Purchases and sales of investments (excluding short term securities) for the year ended August 31, 2011, aggregated $3,763,230,018 and $6,231,260,994, respectively. Sales of investments excludes redemption in-kind of $47,542,491.
Annual Report | 39
Templeton Growth Fund, Inc.
Notes to Financial Statements (continued)
7. CONCENTRATION OF RISK
Investing in foreign securities may include certain risks and considerations not typically associated with investing in U.S. securities, such as fluctuating currency values and changing local and regional economic, political and social conditions, which may result in greater market volatility. In addition, certain foreign securities may not be as liquid as U.S. securities.
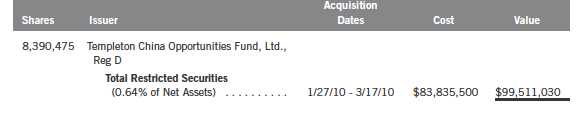
8. RESTRICTED SECURITIES
The Fund invests in securities that are restricted under the Securities Act of 1933 (1933 Act) or which are subject to legal, contractual, or other agreed upon restrictions on resale. Restricted securities are often purchased in private placement transactions, and cannot be sold without prior registration unless the sale is pursuant to an exemption under the 1933 Act. Disposal of these securities may require greater effort and expense, and prompt sale at an acceptable price may be difficult. The Fund may have registration rights for restricted securities. The issuer generally incurs all registration costs.
At August 31, 2011, the Fund held investments in restricted securities, excluding certain securities exempt from registration under the 1933 Act deemed to be liquid, as follows:
9. HOLDINGS OF 5% VOTING SECURITIES OF PORTFOLIO COMPANIES
The 1940 Act defines “affiliated companies” to include investments in portfolio companies in which a fund owns 5% or more of the outstanding voting securities. Investments in “affiliated companies” for the Fund for the year ended August 31, 2011, were as shown below.

40 | Annual Report
Templeton Growth Fund, Inc.
Notes to Financial Statements (continued)
10. SPECIAL SERVICING AGREEMENT
The Fund, which is an eligible underlying investment of one or more of the Franklin Templeton Fund Allocator Series Funds (Allocator Funds), participates in a Special Servicing Agreement (SSA) with the Allocator Funds and certain service providers of the Fund and the Allocator Funds. Under the SSA, the Fund may pay a portion of the Allocator Funds’ expenses (other than any asset allocation, administrative, and distribution fees) to the extent such payments are less than the amount of the benefits realized or expected to be realized by the Fund (e.g., due to reduced costs associated with servicing accounts) from the investment in the Fund by the Allocator Funds. The Allocator Funds are either managed by Franklin Advisers, Inc. or administered by FT Services, affiliates of TGAL. For the year ended August 31, 2011, the Fund was held by one or more of the Allocator Funds and the amount of expenses borne by the Fund is noted in the Statement of Operations.
At August 31, 2011, 14.14% of the Fund’s outstanding shares was held by one or more of the Allocator Funds.
11. CREDIT FACILITY
The Fund, together with other U.S. registered and foreign investment funds (collectively, Borrowers), managed by Franklin Templeton Investments, are borrowers in a joint syndicated senior unsecured credit facility totaling $750 million (Global Credit Facility) which matures on January 20, 2012. This Global Credit Facility provides a source of funds to the Borrowers for temporary and emergency purposes, including the ability to meet future unanticipated or unusually large redemption requests.
Under the terms of the Global Credit Facility, the Funds shall, in addition to interest charged on any borrowings made by the Fund and other costs incurred by the Fund, pay its share of fees and expenses incurred in connection with the implementation and maintenance of the Global Credit Facility, based upon its relative share of the aggregate net assets of all of the Borrowers, including an annual commitment fee of 0.08% based upon the unused portion of the Global Credit Facility, which is reflected in other expenses on the Statement of Operations. During the year ended August 31, 2011, the Funds did not use the Global Credit Facility.
12. REDEMPTION IN-KIND
During the year ended August 31, 2011, the Fund realized $4,961,497 of net gains resulting from a redemption in-kind in which a shareholder redeemed fund shares for securities held by the Fund rather than for cash. Because such gains are not taxable to the Fund, and are not distributed to remaining shareholders, they have been reclassified from accumulated net realized gains to paid-in capital.
Annual Report | 41
Templeton Growth Fund, Inc.
Notes to Financial Statements (continued)
13. FAIR VALUE MEASUREMENTS
The Fund follows a fair value hierarchy that distinguishes between market data obtained from independent sources (observable inputs) and the Fund’s own market assumptions (unobservable inputs). These inputs are used in determining the value of the Fund’s investments and are summarized in the following fair value hierarchy:
- Level 1 – quoted prices in active markets for identical securities
- Level 2 – other significant observable inputs (including quoted prices for similar securities, interest rates, prepayment speed, credit risk, etc.)
- Level 3 – significant unobservable inputs (including the Fund’s own assumptions in determining the fair value of investments)
The inputs or methodology used for valuing securities are not an indication of the risk associated with investing in those securities.
For movements between the levels within the fair value hierarchy, the Fund has adopted a policy of recognizing the transfers as of the date of the underlying event which caused the movement.
The following is a summary of the inputs used as of August 31, 2011, in valuing the Fund’s assets and liabilities carried at fair value:
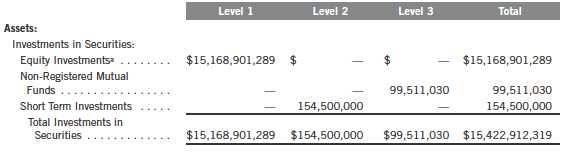
aIncludes common and preferred stocks. For detailed categories, see the accompanying Statement of Investments.
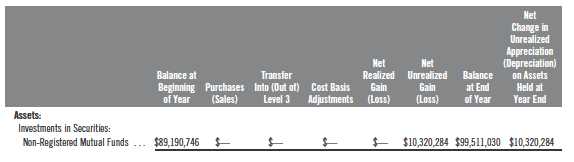
At August 31, 2011 the reconciliation of assets in which significant unobservable inputs (Level 3) were used in determining fair value, is as follows:
42 | Annual Report
Templeton Growth Fund, Inc.
Notes to Financial Statements (continued)
14. NEW ACCOUNTING PRONOUNCEMENTS
In May 2011, the Financial Accounting Standards Board (FASB) issued Accounting Standards Update (ASU) No. 2011-04, Fair Value Measurement (Topic 820): Amendments to Achieve Common Fair Value Measurement and Disclosure Requirements in U.S. GAAP and IFRSs. The amendments in the ASU will improve the comparability of fair value measurements presented and disclosed in financial statements prepared in accordance with U.S. GAAP (Generally Accepted Accounting Principles) and IFRS (International Financial Reporting Standards) and include new guidance for certain fair value measurement principles and disclosure requirements. The ASU is effective for interim and annual periods beginning after December 15, 2011. The Fund is currently evaluating the impact, if any, of applying this provision.
15. SUBSEQUENT EVENTS
The Fund has evaluated subsequent events through the issuance of the financial statements and determined that no events have occurred that require disclosure.
ABBREVIATIONS
Selected Portfolio
ADR - American Depositary Receipt
Annual Report | 43
Templeton Growth Fund, Inc.
Report of Independent Registered Public Accounting Firm
To the Board of Directors and Shareholders of Templeton Growth Fund, Inc.
In our opinion, the accompanying statement of assets and liabilities, including the statement of investments, and the related statements of operations and of changes in net assets and the financial highlights present fairly, in all material respects, the financial position of Templeton Growth Fund, Inc. (the “Fund”) at August 31, 2011, the results of its operations for the year then ended, the changes in its net assets for each of the two years in the period then ended and the financial highlights for each of the five years in the period then ended, in conformity with accounting principles generally accepted in the United States of America. These financial statements and financial highlights (hereafter referred to as “financial statements”) are the responsibility of the Fund’s management. Our responsibility is to express an opinion on these financial statements based on our audits. We conducted our audits of these financial statements in accordance with the standards of the Public Company Accounting Oversight Board (United States). Those standards require that we plan and perform the audit to obtain reasonable assurance about whether the financial statements are free of material misstatement. An audit includes examining, on a test basis, evidence supporting the amounts and disclosures in the financial statements, assessing the accounting principles used and significant estimates made by management, and evaluating the overall financial statement presentation. We believe that our audits, which included confirmation of securities at August 31, 2011 by correspondence with the custodian and brokers, provide a reasonable basis for our opinion.
PricewaterhouseCoopers LLP
San Francisco, California
October 19, 2011
44 | Annual Report
Templeton Growth Fund, Inc.
Tax Designation (unaudited)
Under Section 854(b)(2) of the Internal Revenue Code (Code), the Fund designates 41.31% of the ordinary income dividends as income qualifying for the dividends received deduction for the fiscal year ended August 31, 2011.
Under Section 854(b)(2) of the Code, the Fund designates the maximum amount allowable but no less than $459,009,558 as qualified dividends for purposes of the maximum rate under Section 1(h)(11) of the Code for the fiscal year ended August 31, 2011. Distributions, including qualified dividend income, paid during calendar year 2011 will be reported to shareholders on Form 1099-DIV in January 2012. Shareholders are advised to check with their tax advisors for information on the treatment of these amounts on their individual income tax returns.
Under Section 871(k)(1)(C) of the Code, the Fund designates the maximum amount allowable but no less than $96,307 as interest related dividends for purposes of the tax imposed under Section 871(a)(1)(A) of the Code for the fiscal year ended August 31, 2011.
At August 31, 2010, more than 50% of the Fund’s total assets were invested in securities of foreign issuers. In most instances, foreign taxes were withheld from income paid to the Fund on these investments. As shown in the table below, the Fund designates to shareholders the foreign source income and foreign taxes paid, pursuant to Section 853 of the Code. This designation will allow shareholders of record on December 9, 2010, to treat their proportionate share of foreign taxes paid by the Funds as having been paid directly by them. The shareholder shall consider these amounts as foreign taxes paid in the tax year in which they receive the Fund distribution.
The following table provides a detailed analysis of foreign tax paid, foreign source income, and foreign qualified dividends as designated by the Fund, to Class A, Class B, Class C, Class R, and Advisor Class shareholders of record.

Foreign Tax Paid Per Share (Column 1) is the amount per share available to you, as a tax credit (assuming you held your shares in the Fund for a minimum of 16 days during the 31-day period beginning 15 days before the ex-dividend date of the Fund’s distribution to which the foreign taxes relate), or, as a tax deduction.
Annual Report | 45
Templeton Growth Fund, Inc.
Tax Designation (unaudited) (continued)
Foreign Source Income Per Share (Column 2) is the amount per share of income dividends attributable to foreign securities held by the Fund, plus any foreign taxes withheld on these dividends. The amounts reported include foreign source qualified dividends that have not been adjusted for the rate differential applicable to such dividend income.1
Foreign Qualified Dividends Per Share (Column 3) is the amount per share of foreign source qualified dividends, plus any foreign taxes withheld on these dividends. These amounts represent the portion of the Foreign Source Income reported to you in column 2 that were derived from qualified foreign securities held by the Fund.1
In January 2011, shareholders received Form 1099-DIV which included their share of taxes paid and foreign source income distributed during the calendar year 2010. The Foreign Source Income reported on Form 1099-DIV has not been adjusted for the rate differential on foreign source qualified dividend income. Shareholders are advised to check with their tax advisors for information on the treatment of these amounts on their 2010 individual income tax returns.
1Qualified dividends are taxed at reduced long term capital gain tax rates. In determining the amount of foreign tax credit that may be applied against the U.S. tax liability of individuals receiving foreign source qualified dividends, adjustments may be required to the foreign tax credit limitation calculation to reflect the rate differential applicable to such dividend income. The rules however permit certain individuals to elect not to apply the rate differential adjustments for capital gains and/or dividends for any taxable year. Please consult your tax advisor and the instructions to Form 1116 for more information.
46 | Annual Report
Templeton Growth Fund, Inc.
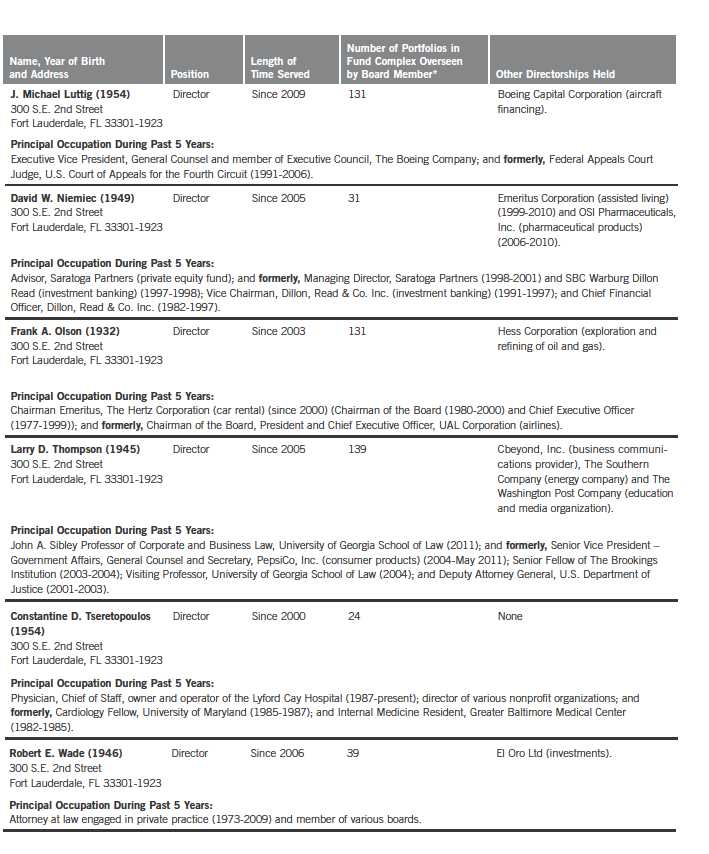
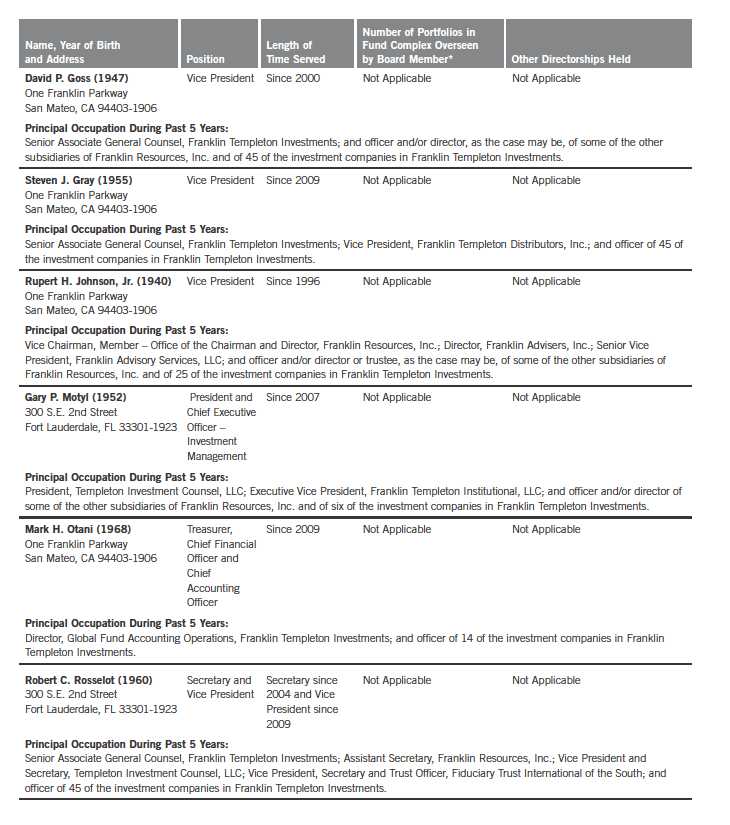
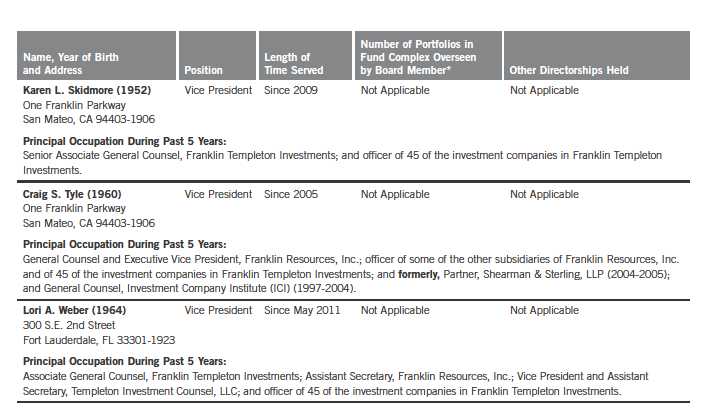
Board Members and Officers
The name, year of birth and address of the officers and board members, as well as their affiliations, positions held with
the Fund, principal occupations during the past five years and number of U.S. registered portfolios overseen in the
Franklin Templeton Investments fund complex are shown below. Generally, each board member serves until that
person’s successor is elected and qualified.
Independent Board Members

Annual Report | 47
48 | Annual Report

Annual Report | 49
50 | Annual Report
*We base the number of portfolios on each separate series of the U.S. registered investment companies within the Franklin Templeton Investments fund complex. These portfolios have a common investment manager or affiliated investment managers.
**Charles B. Johnson is considered to be an interested person of the Fund under the federal securities laws due to his position as officer and director and major shareholder of Franklin Resources, Inc. (Resources), which is the parent company of the Fund’s investment manager and distributor. Gregory E. Johnson is considered to be an interested person of the Fund under the federal securities laws due to his position as officer and director of Resources.
Note 1: Charles B. Johnson and Rupert H. Johnson, Jr. are brothers and the father and uncle, respectively, of Gregory E. Johnson.
Note 2: Officer information is current as of the date of this report. It is possible that after this date, information about officers may change.
The Sarbanes-Oxley Act of 2002 and Rules adopted by the U.S. Securities and Exchange Commission require the Fund to disclose whether the Fund’s Audit Committee includes at least one member who is an audit committee financial expert within the meaning of such Act and Rules. The Fund’s Board has determined that there is at least one such financial expert on the Audit Committee and has designated each of Ann Torre Bates and David W. Niemiec as an audit committee financial expert. The Board believes that Ms. Bates and Mr. Niemiec qualify as such an expert in view of their extensive business background and experience. Ms. Bates has served as a member of the Fund Audit Committee since 2008. She currently serves as a director of SLM Corporation and Ares Capital Corporation and was formerly a director of Allied Capital Corporation from 2003 to 2010, Executive Vice President and Chief Financial Officer of NHP Incorporated and Vice President and Treasurer of US Airways, Inc. Mr. Niemiec has served as a member of the Fund Audit Committee since 2005, currently serves as an Advisor to Saratoga Partners and was formerly its Managing Director from 1998 to 2001. Mr. Niemiec was formerly a director of Emeritus Corporation from 1999 to 2010 and OSI Pharmaceuticals, Inc. from 2006 to 2010, Managing Director of SBC Warburg Dillon Read from 1997 to 1998, and was Vice Chairman from 1991 to 1997 and Chief Financial Officer from 1982 to 1997 of Dillon, Read & Co. Inc. As a result of such background and experience, the Board believes that Ms. Bates and Mr. Niemiec have each acquired an understanding of generally accepted accounting principles and financial statements, the general application of such principles in connection with the accounting estimates, accruals and reserves, and analyzing and evaluating financial statements that present a breadth and level of complexity of accounting issues generally comparable to those of the Fund, as well as an understanding of internal controls and procedures for financial reporting and an understanding of audit committee functions. Ms. Bates and Mr. Niemiec are independent Board members as that term is defined under the applicable U.S. Securities and Exchange Commission Rules and Releases.
The Statement of Additional Information (SAI) includes additional information about the board members and is available, without charge, upon request. Shareholders may call (800) DIAL BEN/342-5236 to request the SAI.
Annual Report | 51
Templeton Growth Fund, Inc.
Shareholder Information
Board Review of Investment Management Agreement
At a meeting held May 17, 2011, the Board of Directors (Board), including a majority of non-interested or independent Directors, approved renewal of the investment management agreement for the Fund. In reaching this decision, the Board took into account information furnished throughout the year at regular Board meetings, as well as information prepared specifically in connection with the annual renewal review process. Information furnished and discussed throughout the year included investment performance reports and related financial information for the Fund, as well as periodic reports on expenses, shareholder services, legal, compliance, pricing, brokerage commissions and execution and other services provided by the Investment Manager (Manager) and its affiliates. Information furnished specifically in connection with the renewal process included a report for the Fund prepared by Lipper, Inc. (Lipper), an independent organization, as well as additional material, including a Fund profitability analysis prepared by management. The Lipper report compared the Fund’s investment performance and expenses with those of other mutual funds deemed comparable to the Fund as selected by Lipper. The Fund profitability analysis discussed the profitability to Franklin Templeton Investments from its overall U.S. fund operations, as well as on an individual fund-by-fund basis. Additional material accompanying such profitability analysis included information on a fund-by-fund basis listing portfolio managers and other accounts they manage, as well as information on management fees charged by the Manager and its affiliates to U.S. mutual funds and other accounts, including management’s explanation of differences where relevant and a three-year expense analysis with an explanation for any increase in expense ratios. Such material also included a memorandum prepared by management describing project initiatives and capital investments relating to the services provided to the Fund by the Franklin Templeton Investments organization, as well as a memorandum relating to economies of scale and a comparative analysis concerning transfer agent fees charged the Fund.
In considering such materials, the independent Directors received assistance and advice from and met separately with independent counsel. In approving continuance of the investment management agreement for the Fund, the Board, including a majority of independent Directors, determined that the existing management fee structure was fair and reasonable and that continuance of the investment management agreement was in the best interests of the Fund and its shareholders. While attention was given to all information furnished, the following discusses some primary factors relevant to the Board’s decision.
NATURE, EXTENT AND QUALITY OF SERVICES. The Board was satisfied with the nature and quality of the overall services provided by the Manager and its affiliates to the Fund and its shareholders. In addition to investment performance and expenses discussed later, the Board’s opinion was based, in part, upon periodic reports furnished it showing that the investment policies and restrictions for the Fund were consistently complied with as well as other reports periodically furnished the Board covering matters such as the compliance of portfolio managers and other management personnel with the code of ethics adopted throughout the Franklin Templeton fund complex, the adherence to fair value pricing procedures established by the Board, and the accuracy of net asset value calculations. The Board also noted the extent of benefits provided Fund shareholders from being part of the Franklin Templeton family of funds, including the right to exchange
52 | Annual Report
Templeton Growth Fund, Inc.
Shareholder Information (continued)
Board Review of Investment Management Agreement (continued)
investments between the same class of funds without a sales charge, the ability to reinvest Fund dividends into other funds and the right to combine holdings in other funds to obtain a reduced sales charge. Favorable consideration was given to management’s continuous efforts and expenditures in establishing back-up systems and recovery procedures to function in the event of a natural disaster, it being noted that such systems and procedures had functioned smoothly during the Florida hurricanes and blackouts experienced in previous years. Among other factors taken into account by the Board were the Manager’s best execution trading policies, including a favorable report by an independent portfolio trading analytical firm. Consideration was also given to the experience of the Fund’s portfolio management team, the number of accounts managed and general method of compensation. In this latter respect, the Board noted that a primary factor in management’s determination of a portfolio manager’s bonus compensation was the relative investment performance of the funds he or she managed and that a portion of such bonus was required to be invested in a predesignated list of funds within such person’s fund management area so as to be aligned with the interests of shareholders. The Board also took into account the quality of transfer agent and shareholder services provided Fund shareholders by an affiliate of the Manager and the continuous enhancements to the Franklin Templeton website. Particular attention was given to management’s conservative approach and diligent risk management procedures, including continuous monitoring of counterparty credit risk and attention given to derivatives and other complex instruments. The Board also took into account, among other things, management’s efforts in establishing a global credit facility for the benefit of the Fund and other accounts managed by Franklin Templeton Investments to provide a source of cash for temporary and emergency purposes or to meet unusual redemption requests as well as the strong financial position of the Manager’s parent company and its commitment to the mutual fund business as evidenced by its subsidization of money market funds.
INVESTMENT PERFORMANCE. The Board placed significant emphasis on the investment performance of the Fund in view of its importance to shareholders. While consideration was given to performance reports and discussions with portfolio managers at Board meetings during the year, particular attention in assessing performance was given to the Lipper reports furnished for the agreement renewal. The Lipper report prepared for the Fund showed the investment performance of its Class A shares for the one-year period ended February 28, 2011, as well as during the previous 10 years ended that date in comparison to a performance universe consisting of all retail and institutional global large-cap value funds as selected by Lipper. On a comparative basis, the Lipper report showed the Fund’s total return for the one-year period to be in the second-highest quintile of the Lipper performance universe, and on an annualized basis to also be in the second-highest quintile of such universe for each of the previous three- and 10-year periods, and the middle quin-tile of such universe for the previous five-year period. The Board found the Fund’s comparative performance as shown in the Lipper report to be satisfactory.
COMPARATIVE EXPENSES. Consideration was given to a comparative analysis of the management fees and total expense ratio of the Fund compared with a group of other funds selected by Lipper as constituting its appropriate Lipper expense group. Lipper expense data is based
Annual Report | 53
Templeton Growth Fund, Inc.
Shareholder Information (continued)
Board Review of Investment Management Agreement (continued)
upon information taken from each fund’s most recent annual report, which reflects historical asset levels that may be quite different from those currently existing, particularly in a period of market volatility. While recognizing such inherent limitation and the fact that expense ratios generally increase as assets decline and decrease as assets grow, the Board believed the independent analysis conducted by Lipper to be an appropriate measure of comparative expenses. In reviewing comparative costs, Lipper provides information on the Fund’s contractual investment management fee in comparison with the contractual investment management fee that would have been charged by other funds within its Lipper expense group assuming they were similar in size to the Fund, as well as the actual total expenses of the Fund in comparison with those of its Lipper expense group. The Lipper contractual investment management fee analysis includes administrative charges as being part of a management fee, and actual total expenses, for comparative consistency, are shown by Lipper for Fund Class A shares. The results of such expense comparisons showed that the contractual investment management fee rate for the Fund was below the median of its Lipper expense group, while its actual total expense ratio was in the least expensive quintile of such group. The Board was satisfied with the management fees and total expenses of the Fund in comparison to its Lipper expense group as shown in the Lipper report.
MANAGEMENT PROFITABILITY. The Board also considered the level of profits realized by the Manager and its affiliates in connection with the operation of the Fund. In this respect, the Board reviewed the Fund profitability analysis that addresses the overall profitability of Franklin Templeton’s U.S. fund business, as well as its profits in providing management and other services to each of the individual funds during the 12-month period ended September 30, 2010, being the most recent fiscal year-end for Franklin Resources, Inc., the Manager’s parent. In reviewing the analysis, attention was given to the methodology followed in allocating costs to the Fund, it being recognized that allocation methodologies are inherently subjective and various allocation methodologies may each be reasonable while producing different results. In this respect, the Board noted that, while being continuously refined and reflecting changes in the Manager’s own cost accounting, the allocation methodology was consistent with that followed in profitability report presentations for the Fund made in prior years and that the Fund’s independent registered public accounting firm had been engaged by the Manager to review the reasonableness of the allocation methodologies solely for use by the Fund’s Board in reference to the profitability analysis. In reviewing and discussing such analysis, management discussed with the Board its belief that costs incurred in establishing the infrastructure necessary for the type of mutual fund operations conducted by the Manager and its affiliates may not be fully reflected in the expenses allocated to the Fund in determining its profitability, as well as the fact that the level of profits, to a certain extent, reflected operational cost savings and efficiencies initiated by management. The Board also took into account management’s expenditures in improving shareholder services provided the Fund, as well as the need to meet additional regulatory and compliance requirements resulting from the Sarbanes-Oxley Act and recent SEC and other regulatory requirements. In addition, the Board considered a third-party study comparing the profitability of the Manager’s parent on an overall
54 | Annual Report
Templeton Growth Fund, Inc.
Shareholder Information (continued)
Board Review of Investment Management Agreement (continued)
basis to other publicly held managers broken down to show profitability from management operations exclusive of distribution expenses, as well as profitability including distribution expenses. The Board also considered the extent to which the Manager and its affiliates might derive ancillary benefits from fund operations, including revenues generated from transfer agent services and potential benefits resulting from allocation of fund brokerage and the use of commission dollars to pay for research. Based upon its consideration of all these factors, the Board determined that the level of profits realized by the Manager and its affiliates from providing services to the Fund was not excessive in view of the nature, quality and extent of services provided.
ECONOMIES OF SCALE. The Board also considered whether economies of scale are realized by the Manager and its affiliates as the Fund grows larger and the extent to which this is reflected in the level of management fees charged. While recognizing that any precise determination is inherently subjective, the Board noted that based upon the Fund profitability analysis, it appears that as some funds get larger, at some point economies of scale do result in the Manager realizing a larger profit margin on management services provided such a fund. The Board also noted that economies of scale are shared with a fund and its shareholders through management fee breakpoints so that as a fund grows in size, its effective management fee rate declines. The Fund’s investment management agreement provides a fee at the rate of 0.63% on the first $1 billion of Fund net assets declining in graduated stages thereafter to a fee of 0.49% on assets in excess of $45 billion. The Fund is also charged a separate fee for administrative services that starts at 0.15% on the first $200 million of Fund net assets, and declines through breakpoints to a fixed rate of 0.075% after net assets reach the $1.2 billion level. At the end of 2010, the Fund’s net assets were approximately $17.8 billion, and the Board believed that to the extent economies of scale may be realized by the Manager and its affiliates, the schedules of fees under the investment management agreement provide a sharing of benefits with the Fund and its shareholders.
Proxy Voting Policies and Procedures
The Fund’s investment manager has established Proxy Voting Policies and Procedures (Policies) that the Fund uses to determine how to vote proxies relating to portfolio securities. Shareholders may view the Fund’s complete Policies online at franklintempleton.com. Alternatively, shareholders may request copies of the Policies free of charge by calling the Proxy Group collect at (954) 527-7678 or by sending a written request to: Franklin Templeton Companies, LLC, 300 S.E. 2nd Street, Fort Lauderdale, FL 33301, Attention: Proxy Group. Copies of the Fund’s proxy voting records are also made available online at franklintempleton.com and posted on the U.S. Securities and Exchange Commission’s website at sec.gov and reflect the most recent 12-month period ended June 30.
Annual Report | 55
Templeton Growth Fund, Inc.
Shareholder Information (continued)
Quarterly Statement of Investments
The Fund files a complete statement of investments with the U.S. Securities and Exchange Commission for the first and third quarters for each fiscal year on Form N-Q. Shareholders may view the filed Form N-Q by visiting the Commission’s website at sec.gov. The filed form may also be viewed and copied at the Commission’s Public Reference Room in Washington, DC. Information regarding the operations of the Public Reference Room may be obtained by calling (800) SEC-0330.
Householding of Reports and Prospectuses
You will receive the Fund’s financial reports every six months as well as an annual updated summary prospectus (prospectus available upon request). To reduce Fund expenses, we try to identify related shareholders in a household and send only one copy of the financial reports and summary prospectus. This process, called “householding,” will continue indefinitely unless you instruct us otherwise. If you prefer not to have these documents householded, please call us at (800) 632-2301. At any time you may view current prospectuses/summary prospectuses and financial reports on our website. If you choose, you may receive these documents through electronic delivery.
56 | Annual Report

Item 2. Code of Ethics.
| (a) | The Registrant has adopted a code of ethics that applies to its principal executive officers and principal financial and accounting officer. |
| (c) | N/A |
| (d) | N/A |
| (f) | Pursuant to Item 12(a)(1), the Registrant is attaching as an exhibit a copy of its code of ethics that applies to its principal executive officers and principal financial and accounting officer. |
Item 3. Audit Committee Financial Expert.
(a)(1) The Registrant has an audit committee financial expert serving on its audit committee.
(2) The audit committee financial expert is David W. Niemiec and he is "independent" as defined under the relevant Securities and Exchange Commission Rules and Releases.
Item 4. Principal Accountant Fees and Services.
(a) Audit Fees
The aggregate fees paid to the principal accountant for professional services rendered by the principal accountant for the audit of the registrant’s annual financial statements or for services that are normally provided by the principal accountant in connection with statutory and regulatory filings or engagements were $122,870 for the fiscal year ended August 31, 2011 and $141,162 for the fiscal year ended August 31, 2010.
(b) Audit-Related Fees
The aggregate fees paid to the principal accountant for assurance and related services rendered by the principal accountant to the registrant that are reasonably related to the performance of the audit of the registrant's financial statements and are not reported under paragraph (a) of Item 4 were $33,033 for the fiscal year ended August 31, 2011 and $31,611 for the fiscal year ended August 31, 2010. The services for which these fees were paid included attestation services.
There were no fees paid to the principal accountant for assurance and related services rendered by the principal accountant to the registrant's investment adviser and any entity controlling, controlled by or under common control with the investment adviser that provides ongoing services to the registrant that are reasonably related to the performance of the audit of their financial statements.
(c) Tax Fees
There were no fees paid to the principal accountant for professional services rendered by the principal accountant to the registrant for tax compliance, tax advice and tax planning.
The aggregate fees paid to the principal accountant for professional services rendered by the principal accountant to the registrant’s investment adviser and any entity controlling, controlled by or under common control with the investment adviser that provides ongoing services to the registrant for tax
compliance, tax advice and tax planning were $85,000 for the fiscal year ended August 31, 2011 and $0 for the fiscal year ended August 31, 2010. The services for which these fees were paid included technical tax consultation for capital gain tax reporting to foreign governments and the application of the local country tax laws to investments made by various Franklin Templeton funds.
(d) All Other Fees
The aggregate fees paid to the principal accountant for products and services rendered by the principal accountant to the registrant, other than the services reported in paragraphs (a)-(c) of Item 4 were $6,440 for the fiscal year ended August 31, 2011 and $0 for the fiscal year ended August 31, 2010. The services for which these fees were paid included review of materials provided to the fund Board in connection with the investment management contract renewal process.
The aggregate fees paid to the principal accountant for products and services rendered by the principal accountant to the registrant’s investment adviser and any entity controlling, controlled by or under common control with the investment adviser that provides ongoing services to the registrant, other than the services reported in paragraphs (a)-(c) of Item 4 were $138,360 for the fiscal year ended August 31, 2011 and $0 for the fiscal year ended August 31, 2010. The services for which these fees were paid included review of materials provided to the fund Board in connection with the investment management contract renewal process.
(e) (1) The registrant’s audit committee is directly responsible for approving the services to be provided by the auditors, including:
| (i) | pre-approval of all audit and audit related services; |
| (ii) | pre-approval of all non-audit related services to be provided to |
the Fund by the auditors;
(iii) pre-approval of all non-audit related services to be provided to the registrant by the auditors to the registrant’s investment adviser or to any entity that controls, is controlled by or is under common control with the registrant’s investment adviser and that provides ongoing services to the registrant where the non-audit services relate directly to the operations or financial reporting of the registrant; and
(iv) establishment by the audit committee, if deemed necessary or appropriate, as an alternative to committee pre-approval of services to be provided by the auditors, as required by paragraphs (ii) and (iii) above, of policies and procedures to permit such services to be pre-approved by other means, such as through establishment of guidelines or by action of a designated member or members of the committee; provided the policies and procedures are detailed as to the particular service and the committee is informed of each service and such policies and procedures do not include delegation of audit committee responsibilities, as contemplated under the Securities Exchange Act of 1934, to management; subject, in the case of (ii) through (iv), to any waivers, exceptions or exemptions that may be available under applicable law or rules.
| (e) | (2) None of the services provided to the registrant described in paragraphs |
| (b) | -(d) of Item 4 were approved by the audit committee pursuant to paragraph |
(c)(7)(i)(C) of Rule 2-01 of regulation S-X.
(f) No disclosures are required by this Item 4(f).
(g) The aggregate non-audit fees paid to the principal accountant for services
rendered by the principal accountant to the registrant and the registrant’s
investment adviser and any entity controlling, controlled by or under common
control with the investment adviser that provides ongoing services to the
registrant were $262,833 for the fiscal year ended August 31, 2011 and $31,611
for the fiscal year ended August 31, 2010.
(h) The registrant’s audit committee of the board has considered whether the
provision of non-audit services that were rendered to the registrant’s
investment adviser (not including any sub-adviser whose role is primarily
portfolio management and is subcontracted with or overseen by another
investment adviser), and any entity controlling, controlled by, or under common
control with the investment adviser that provides ongoing services to the
registrant that were not pre-approved pursuant to paragraph (c)(7)(ii) of Rule
2-01 of Regulation S-X is compatible with maintaining the principal
accountant’s independence.
Item 5. Audit Committee of Listed Registrants. N/A
Item 6. Schedule of Investments. N/A
Item 7. Disclosure of Proxy Voting Policies and Procedures for Closed-End
Management Investment Companies. N/A
Item 8. Portfolio Managers of Closed-End Management Investment Companies. N/A
Item 9. Purchases of Equity Securities by Closed-End Management Investment
Company and Affiliated Purchasers. N/A
Item 10. Submission of Matters to a Vote of Security Holders.
There have been no changes to the procedures by which shareholders may
recommend nominees to the Registrant's Board of Directors that would require
disclosure herein.
Item 11. Controls and Procedures.
(a) Evaluation of Disclosure Controls and Procedures. The Registrant maintains
disclosure controls and procedures that are designed to ensure that information
required to be disclosed in the Registrant’s filings under the Securities
Exchange Act of 1934 and the Investment Company Act of 1940 is recorded,
processed, summarized and reported within the periods specified in the rules
and forms of the Securities and Exchange Commission. Such information is
accumulated and communicated to the Registrant’s management, including its
principal executive officer and principal financial officer, as appropriate, to
allow timely decisions regarding required disclosure. The Registrant’s
management, including the principal executive officer and the principal
financial officer, recognizes that any set of controls and procedures, no
matter how well designed and operated, can provide only reasonable assurance of
achieving the desired control objectives.
Within 90 days prior to the filing date of this Shareholder Report on Form N-CSR, the Registrant had carried out an evaluation, under the supervision and with the participation of the Registrant’s management, including the Registrant’s principal executive officer and the Registrant’s principal financial officer, of the effectiveness of the design and operation of the Registrant’s disclosure controls and procedures. Based on such evaluation, the Registrant’s principal executive officer and principal financial officer concluded that the Registrant’s disclosure controls and procedures are effective.
(b) Changes in Internal Controls.
There have been no significant changes in
the Registrant’s internal controls or in other factors that could significantly affect the internal controls subsequent to the date of their evaluation in connection with the preparation of this Shareholder Report on Form N-CSR.
Item 12. Exhibits.
(a)(1) Code of Ethics
(a)(2) Certifications pursuant to Section 302 of the Sarbanes-Oxley Act of 2002 of Laura F. Fergerson, Chief Executive Officer - Finance and Administration, and Mark H. Otani, Chief Financial Officer and Chief Accounting Officer (b) Certifications pursuant to Section 906 of the Sarbanes-Oxley Act of 2002 of Laura F. Fergerson, Chief Executive Officer - Finance and Administration, and Mark H. Otani, Chief Financial Officer and Chief Accounting Officer
SIGNATURES
Pursuant to the requirements of the Securities Exchange Act of 1934 and the Investment Company Act of 1940, the registrant has duly caused this report to be signed on its behalf by the undersigned, thereunto duly authorized.
TEMPLETON GROWTH FUND, INC.
By /s/LAURA F. FERGERSON
Laura F. Fergerson
Chief Executive Officer - Finance and
Administration
Date: October 27, 2011
Pursuant to the requirements of the Securities Exchange Act of 1934 and the Investment Company Act of 1940, this report has been signed below by the following persons on behalf of the registrant and in the capacities and on the dates indicated.
By /s/LAURA F. FERGERSON
Laura F. Fergerson
Chief Executive Officer - Finance and
Administration
Date: October 27, 2011
By /s/MARK H. OTANI
Mark H. Otani
Chief Financial Officer and
Chief Accounting Officer
Date: October 27, 2011