Annual Report
Templeton Growth Fund, Inc.
Your Fund’s Goal and Main Investments: Templeton Growth Fund seeks long-term
capital growth. Under normal market conditions, the Fund invests primarily in equity securities of
companies located anywhere in the world, including emerging markets.

This annual report for Templeton Growth Fund covers the fiscal year ended
August 31, 2012.
Performance Overview
Templeton Growth Fund – Class A delivered a cumulative total return of
+8.17% for the fiscal year under review. The Fund’s Class A shares underper-
formed the +8.77% total return of the benchmark, the MSCI World Index,
which measures stock performance in global developed markets.1 The Fund’s
long-term relative results are shown in the Performance Summary beginning
on page 11. For the 10-year period ended August 31, 2012, Templeton
Growth Fund – Class A generated a cumulative total return of +64.36%,
compared with the MSCI World Index’s +97.84% cumulative total return for
the same period.1 Please note index performance information is provided for
reference and we do not attempt to track the index but rather undertake
investments on the basis of fundamental research. You can find more per-
formance data in the Performance Summary.
Economic and Market Overview
After a volatile start to the review period, global stocks, as measured by the
MSCI World Index, rallied through the spring of 2012 before a brief drop in
early summer gave way to a recovery. The market ended the 12 months under
review with a solid gain. Periodic downturns throughout this capricious mar-
ket period were primarily attributable to concerns about global economic
growth and Europe’s unfolding fiscal crisis. Global stocks rallied from their
1. Source: © 2012 Morningstar. All Rights Reserved. The information contained herein: (1) is proprietary to Morningstar
and/or its content providers; (2) may not be copied or distributed; and (3) is not warranted to be accurate, complete or
timely. Neither Morningstar nor its content providers are responsible for any damages or losses arising from any use of
this information. As of 8/31/12, the Fund’s Class A 10-year average annual total return not including the maximum sales
charge was +5.09%, compared with the MSCI World Index’s 10-year average annual total return of +7.06%. The index is
unmanaged and includes reinvested dividends. One cannot invest directly in an index, and an index is not representative
of the Fund’s portfolio.
The dollar value, number of shares or principal amount, and names of all portfolio holdings are listed in the
Fund’s Statement of Investments (SOI). The SOI begins on page 23.
Annual Report | 3

lowest levels in more than a year at the beginning of the review period as
investors welcomed dramatic political transitions prompted by severe strains
in certain European debt markets. The prime ministers of Greece and Italy
were replaced by technocrats tasked with budget reform, and the European
Central Bank (ECB) and International Monetary Fund also experienced lead-
ership transitions. The new leadership’s initial policy responses — which
included enhanced liquidity measures and an ineffective Spanish banking
bailout — did little to address the structural imbalances of eurozone economies
or the solvency fears plaguing the region’s banking system, and debt yields for
certain European countries spiked to record levels in the first quarter of 2012.
However, measures intended to address the seemingly toxic link between
Europe’s banks and sovereign bonds emerged when European Union leaders
agreed to a deployment of temporary and permanent bailout funds. ECB
President Mario Draghi’s declaration that “the ECB is ready to do whatever
it takes to preserve the euro” further buoyed markets in the summer of 2012.
In the U.S., the Federal Reserve Board opted to extend its strategy designed to
lower systemically important interest rates, while in Asia the People’s Bank of
China cut borrowing costs for the first time since the global financial crisis
began. In addition to addressing investor confidence and European debt sus-
tainability issues, policy actions also responded to weakening global economic
growth. Most regions succumbed to growth headwinds by period-end, includ-
ing formerly resilient emerging markets. However, the slowdown appeared
less severe than expected in key developed markets such as Germany and the
U.S., and the likelihood of additional monetary stimulus remained elevated.
Although cautious optimism supported stocks at period-end, light trading vol-
ume highlighted a lack of directional conviction, and investors eagerly awaited
key policy events set to occur in the final months of 2012.
Investment Strategy
Our investment strategy employs a bottom-up, value-oriented, long-term
approach. We focus on the market price of a company’s securities relative to
our evaluation of the company’s long-term earnings, asset value and cash flow
potential. As we look worldwide, we consider specific companies, rather than
sectors or countries, while doing in-depth research to construct a bargain list
from which we buy. Before we make a purchase, we look at the company’s
price/earnings ratio, price/cash flow ratio, profit margins and liquidation value.
4 | Annual Report
Manager’s Discussion
Global equities, as measured by the MSCI World Index, remained unsettled during much of the 12 months under review as investor sentiment swung between crisis-induced pessimism and stimulus-driven optimism. Signs of slowing global economic growth and continued political uncertainty in Europe kept investors on edge through much of the period, although weak data were often accompanied by rising stimulus expectations, and equities ultimately delivered solid gains during the 12 months under review. With investor attention focused on near-term political or economic developments, conditions remained challenging for bottom-up, fundamental value investors with a long-term perspective. In fact, equity market correlation and the influence of beta — or general market, systemic risk — on portfolios approached all-time highs during the review period, suggesting to us that investors had rarely been more indifferent about the fundamental prospects of individual stocks. Despite this admittedly difficult environment, Templeton Growth Fund – Class A delivered a solid absolute gain for the one-year period.
While this general distraction from underlying fundamentals created certain challenges for disciplined value investors, it also presented opportunities to buy securities of companies whose future earnings, cash flows and asset growth potential we believe were being undervalued by a market preoccupied with other considerations. One sector where such fundamental oversights were particularly acute in our opinion was financials.2 Financial companies’ shares priced in extreme impairment during the review period, particularly in Europe, where we built an overweighted position after sustaining a cautious and beneficial underweighting in the run-up to the bursting of the credit bubble in 2008–2009. At the end of the review period, the overall market value of banks in Europe was less than that of banks in Australia, although Europe far exceeds Australia in population and economic size. In fact, the entire European banking system was worth about as much at period-end as a single U.S. company: Apple. Underscoring investors’ risk aversion, short interest in financials was higher than in any other sector.
Please keep in mind, Sir John Templeton’s strategy was not to blindly bet on the weakest stocks. “The best bargains are not stocks whose prices are down most, but rather those stocks having the lowest prices in relation to possible earnings power of future years,” he pointed out. At period-end levels, European bank valuations implied a mid-cycle future return on equity (RoE) of 8.7%.3 That
2. The financials sector comprises capital markets, commercial banks, consumer finance, diversified financial services, insurance, and real estate management and development in the SOI.
3. Source: Credit Suisse Group. Historical valuations for European banks not available.

Annual Report | 5
was more than 20% lower than the average RoE of U.S. banks in the three decades before excessive leverage and financial engineering began artificially inflating returns.3 While we do not anticipate a return to the unsustainable profitability levels achieved in the first decade of the 21st century, we also do not expect bank profitability to remain below its recent average.
With the main European banks trading at all-time low valuations in line with where U.S. banks were in 1932, the market seemed more focused on European political risks instead of the bottom-up profitability of regional lenders. However, analysis has shown that the costs of a European Union break-up would significantly exceed the costs of keeping the union intact, and powerful policy tools remain available. Consequently, we believe deeply discounted regional banks with adequate capital positions, solid brands and good core businesses will not only survive but could offer considerable upside potential should Europe ultimately establish a credible federal system of checks and balances on national fiscal policy. In addition to holding deep value European banks, we maintained diverse exposure to financials stocks with defensive characteristics and attractive growth profiles in other regions of the world. Encouragingly for us, financials performance began to recover as the period progressed, and our sector holdings were among the top contributors to Fund returns during the final three months of the review period.
Also encouraging to us was the significant outperformance of other high-conviction holdings. Most notably, our long-standing overweighting in the traditionally defensive health care sector outperformed during a period of continued investor anxiety.4 Stock-specific strength drove sector outperformance to an even greater degree than our favorable allocation. Leading returns was U.S.-based Amgen, the world’s largest biotechnology company. When we first acquired Amgen in 2007, concerns about the firm’s ability to maintain sales growth and research and development productivity weighed on the stock. Yet, the company’s excellent track record of bringing profitable drugs to market gave us no reason to doubt its continued capacity for innovation, and we sought to take advantage of favorable valuations to initiate a position. Since then, Amgen has demonstrated an ability to manage its maturing product portfolio, execute on key pipeline projects and prioritize shareholder returns, with a commitment to give back at least 60% of net income to investors through a dividend and buyback program. Having registered significant gains since our initial purchase, the stock is no longer an
4. The health care sector comprises biotechnology, health care equipment and supplies, life sciences tools and services and pharmaceuticals in the SOI.
6 | Annual Report
outright bargain; however, Amgen continues to pursue a sensible dual strategy of investing in growth and maximizing shareholder returns with existing cash flows, and we believe that continued strategic execution could yield additional potential results. In general, we continue to identify pharmaceuticals companies whose capacity for product innovation, cost reduction and global sales growth are being undervalued by a market overly concerned with pipeline pressures and regulatory interference.
Another sector in which we have long thought the market erred in its assigned value is consumer discretionary, in particular media.5 While the sector has not been as cheap as some other market cohorts in recent years, we still felt valuations underestimated what we viewed as the stellar growth potential of content producers and cable and Internet providers. Our overweighting in media and stock selection within the broader sector (which also includes retail and automotive companies) benefited performance. U.S. cable companies Comcast and Time Warner Cable benefited from their control of lucrative broadband pipelines and a regulatory structure that permits regional monopolies in the delivery of bundled video, data and voice services. Meanwhile, content producers such as News Corp. and Disney surged as the proliferation of devices and venues for media consumption significantly supported demand for quality content.
Elsewhere, we did not find the relationship between price and value so compelling. We maintained our long-standing underweighting in the materials sector during the period as slowing global economic growth and flagging demand from China — the marginal cost-setter for much of the industrial commodity complex — threatened to erode the metals and mining industry’s recent peak profits.6 Indeed, as mineral prices softened throughout the period, a number of the world’s biggest mining concerns issued profit warnings, leading to an industry-wide correction that — as was the case in the commodities sell-off in 2009 — vindicated our underweighted allocation. We also maintained the Fund’s underweighted position in consumer staples amid concerns that volatile input costs and aggressive price wars could erode the sector’s already thin profit margins.7 Indeed, margins have steadily contracted over the past two years and the sector traded at a slight premium to its historical average valuation, limiting the consumer staples opportunities we have uncovered. However, against a backdrop of continued market uncertainty, investors have
5. The consumer discretionary sector comprises auto components, automobiles, media, multiline retail and specialty retail in the SOI.
6. The materials sector comprises chemicals, construction materials, and metals and mining in the SOI.
7. The consumer staples sector comprises food and staples retailing in the SOI.
Annual Report | 7
been more interested in stocks’ near-term defensive characteristics than their longer term earnings and value potential. In this environment, the widely recognized counter-cyclical attributes of consumer staples stocks significantly supported shares, and our underweighted position in the strongly performing sector was a notable detractor.
The only other sector to materially underperform during the period was a nearly even-weighted position in industrials.8 Stock selection weighed on relative performance as laggards included European airlines Deutsche Lufthansa (Germany) and International Consolidated Airlines Group (IAG) (U.K.). Company-specific issues plagued both stocks — IAG’s Spanish Iberia unit struggled operationally, and weak earnings and industrial action pressured Deutsche Lufthansa. However, the overall economic picture remained the biggest source of concern as investors feared that slowing economic growth could pressure travel volume. Although weakness in European passenger volume occurred, growth remained positive and both companies aggressively restructured to reduce costs and improve profitability. Both stocks traded near their all-time lows at around 0.5 times book value during the review period —valuations that, in our opinion, significantly undervalued companies whose strong balance sheets and attractive market positions should make them long-term industry survivors.
Our regional allocations were also influenced by our long-term, bottom-up perspective. In a period when the U.S. outperformed Asia and Europe, our underweighted North American allocation and overweighted European and Asian allocations were detrimental. However, in the U.S. and Asia, the stocks we picked outperformed their benchmark counterparts, suggesting that our bottom-up process added value at the stock level. In Europe, on the other hand, overweighted exposures to France and Italy and holdings in off-benchmark Russia significantly detracted. While we remained overweighted in Europe due to valuation opportunities (we believe European stocks have never traded at a steeper discount to their U.S. counterparts), this does not suggest we did not find attractive opportunities elsewhere. Indeed, our U.S.
8. The industrials sector comprises aerospace and defense, air freight and logistics, airlines, commercial services and supplies, construction and engineering, electrical equipment, industrial conglomerates, and professional services in the SOI.
8 | Annual Report
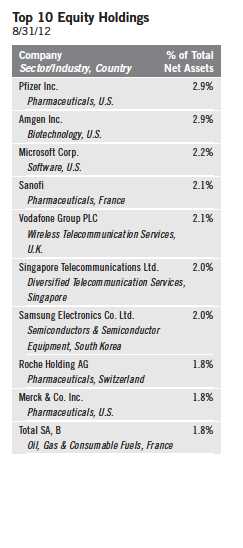
allocation composed over one-third of the portfolio, while Asian and emerging markets represented about 12%. As global bargain hunters, we are agnostic about our top-down allocations. We simply find what we believe are the most attractively valued equities in the world. As Sir John Templeton explained, “I search nation after nation for stocks, asking: ‘Where is the one that is the lowest priced in relation to what I believe it’s worth?’”
It is important to recognize the effect of currency movements on the Fund’s performance. In general, if the value of the U.S. dollar goes up compared with a foreign currency, an investment traded in that foreign currency will go down in value because it will be worth fewer U.S. dollars. This can have a negative effect on Fund performance. Conversely, when the U.S. dollar weakens in relation to a foreign currency, an investment traded in that foreign currency will increase in value, which can contribute to Fund performance. For the 12 months ended August 31, 2012, the U.S. dollar rose in value relative to most currencies. As a result, the Fund’s performance was negatively affected by the portfolio’s substantial investment in securities with non-U.S. currency exposure.
Although global markets tended to rise toward period-end, investors still struggled to find conviction, and a wide range of possible outcomes produced equally divergent opinions about the future trajectory of global equities. However, we remain optimistic amid supportive policy measures, improving leading economic indicators, attractive relative and absolute valuations, strong corporate balance sheets and contrarian signals such as equity fund outflows and investor pessimism. These developments suggest to us that stocks seem positioned to perform well over the long term. We are neither market strategists nor economic forecasters. However, history has shown that equities helped preserve and enhance wealth over time. We also believe stock prices tend to reflect business values over the long term. Ultimately, our optimism springs from our fundamental analysis, resulting in a portfolio we firmly believe contains many stocks trading at significant discounts to the long-term intrinsic values of their underlying businesses.
Annual Report | 9
Thank you for your continued participation in Templeton Growth Fund.
We look forward to serving your future investment needs.

The foregoing information reflects our analysis, opinions and portfolio holdings as of August 31, 2012, the end of
the reporting period. The way we implement our main investment strategies and the resulting portfolio holdings
may change depending on factors such as market and economic conditions. These opinions may not be relied upon
as investment advice or an offer for a particular security. The information is not a complete analysis of every
aspect of any market, country, industry, security or the Fund. Statements of fact are from sources considered
reliable, but the investment manager makes no representation or warranty as to their completeness or accuracy.
Although historical performance is no guarantee of future results, these insights may help you understand our
investment management philosophy.
10 | Annual Report
Performance Summary as of 8/31/12
Your dividend income will vary depending on dividends or interest paid by securities in the Fund’s
portfolio, adjusted for operating expenses of each class. Capital gain distributions are net profits
realized from the sale of portfolio securities. The performance table and graphs do not reflect any
taxes that a shareholder would pay on Fund dividends, capital gain distributions, if any, or any
realized gains on the sale of Fund shares. Total return reflects reinvestment of the Fund’s dividends
and capital gain distributions, if any, and any unrealized gains or losses.

Annual Report | 11
Performance Summary (continued)
Performance
Cumulative total return excludes sales charges. Average annual total returns and value of $10,000 investment include
maximum sales charges. Class A: 5.75% maximum initial sales charge; Class B: contingent deferred sales charge (CDSC)
declining from 4% to 1% over six years, and eliminated thereafter; Class C: 1% CDSC in first year only; Class R/Advisor
Class: no sales charges.
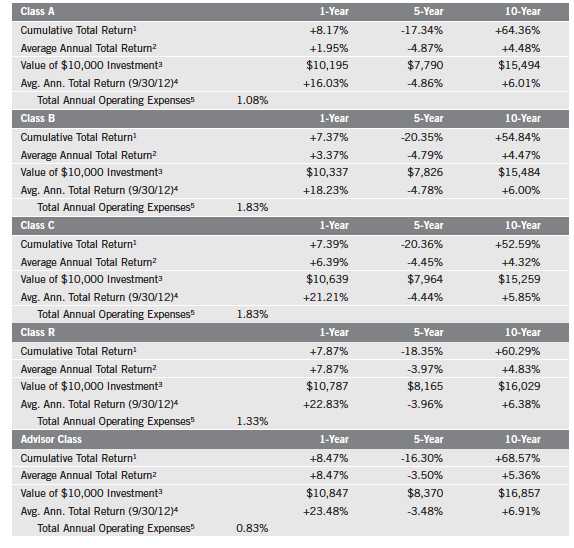
Performance data represent past performance, which does not guarantee future results. Investment return and principal
value will fluctuate, and you may have a gain or loss when you sell your shares. Current performance may differ from
figures shown. For most recent month-end performance, go to franklintempleton.com or call (800) 342-5236.
12 | Annual Report
Performance Summary (continued)
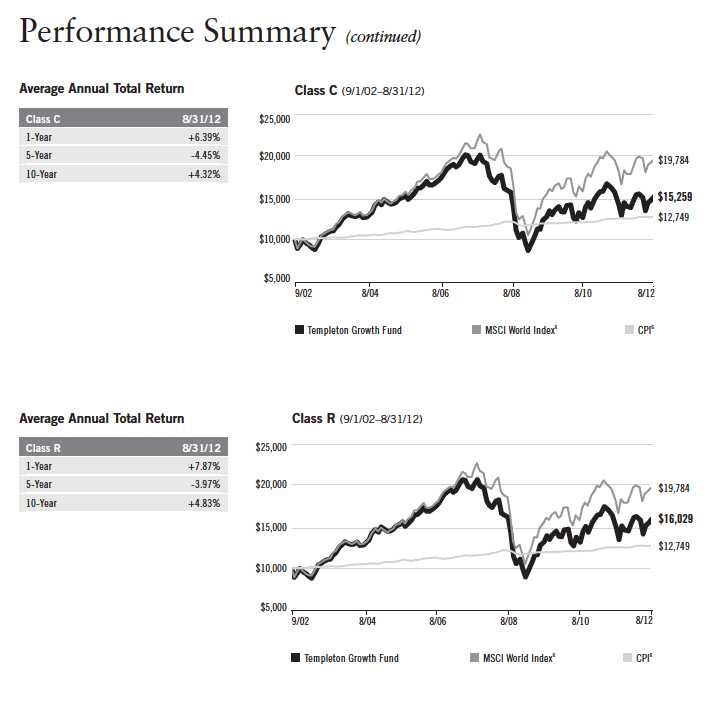
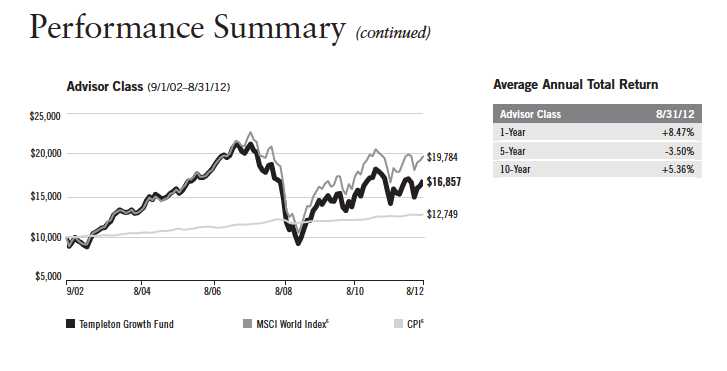
Total Return Index Comparison for a Hypothetical $10,000 Investment
Total return represents the change in value of an investment over the periods shown. It includes
any current, applicable, maximum sales charge, Fund expenses, account fees and reinvested distri-
butions. The unmanaged index includes reinvestment of any income or distributions. It differs
from the Fund in composition and does not pay management fees or expenses. One cannot invest
directly in an index.

Annual Report | 13
14 | Annual Report
Endnotes
All investments involve risks, including possible loss of principal. Special risks are associated with foreign
investing, including currency fluctuations, economic instability and political developments; investments in
emerging markets involve heightened risks related to the same factors. To the extent the Fund focuses on par-
ticular countries, regions, industries, sectors or types of investment from time to time, it may be subject to
greater risks of adverse developments in such areas of focus than a fund that invests in a wider variety of
countries, regions, industries, sectors or investments. Current political uncertainty surrounding the European
Union (EU) and its membership may increase market volatility. The financial instability of some countries in the
EU, including Greece, Italy and Spain, together with the risk of that impacting other more stable countries may
increase the economic risk of investing in companies in Europe. The Fund is actively managed but there is no
guarantee that the manager’s investment decisions will produce the desired results. The Fund’s prospectus also
includes a description of the main investment risks.
Class B: These shares have higher annual fees and expenses than Class A shares.
Class C: Prior to 1/1/04, these shares were offered with an initial sales charge; thus actual total returns
would have differed. These shares have higher annual fees and expenses than Class A shares.
Class R: Shares are available to certain eligible investors as described in the prospectus. These shares have
higher annual fees and expenses than Class A shares.
Advisor Class: Shares are available to certain eligible investors as described in the prospectus.
1. Cumulative total return represents the change in value of an investment over the periods indicated.
2. Average annual total return represents the average annual change in value of an investment over the periods
indicated.
3. These figures represent the value of a hypothetical $10,000 investment in the Fund over the periods indicated.
4. In accordance with SEC rules, we provide standardized average annual total return information through the latest
calendar quarter.
5. Figures are as stated in the Fund’s prospectus current as of the date of this report. In periods of market volatility,
assets may decline significantly, causing total annual Fund operating expenses to become higher than the figures
shown.
6. Source: © 2012 Morningstar. The MSCI World Index is a free float-adjusted, market capitalization-weighted index
designed to measure equity market performance in global developed markets. The Consumer Price Index (CPI), cal-
culated by the Bureau of Labor Statistics, is a commonly used measure of the inflation rate.
Annual Report | 15
Your Fund’s Expenses
As a Fund shareholder, you can incur two types of costs:
- Transaction costs, including sales charges (loads) on Fund purchases; and
- Ongoing Fund costs, including management fees, distribution and service (12b-1) fees, and other Fund expenses. All mutual funds have ongoing costs, sometimes referred to as operating expenses.
The following table shows ongoing costs of investing in the Fund and can help you understand these costs and compare them with those of other mutual funds. The table assumes a $1,000 investment held for the six months indicated.
Actual Fund Expenses
The first line (Actual) for each share class listed in the table provides actual account values and expenses. The “Ending Account Value” is derived from the Fund’s actual return, which includes the effect of Fund expenses.
You can estimate the expenses you paid during the period by following these steps. Of course, your account value and expenses will differ from those in this illustration:
| 1. | Divide your account value by $1,000. |
| | If an account had an $8,600 value, then $8,600 ÷ $1,000 = 8.6. |
| 2. | Multiply the result by the number under the heading “Expenses Paid During Period.” |
| | If Expenses Paid During Period were $7.50, then 8.6 x $7.50 = $64.50. |
In this illustration, the estimated expenses paid this period are $64.50.
Hypothetical Example for Comparison with Other Funds
Information in the second line (Hypothetical) for each class in the table can help you compare ongoing costs of investing in the Fund with those of other mutual funds. This information may not be used to estimate the actual ending account balance or expenses you paid during the period. The hypothetical “Ending Account Value” is based on the actual expense ratio for each class and an assumed 5% annual rate of return before expenses, which does not represent the Fund’s actual return. The figure under the heading “Expenses Paid During Period” shows the hypothetical expenses your account would have incurred under this scenario. You can compare this figure with the 5% hypothetical examples that appear in shareholder reports of other funds.
16 | Annual Report
Your Fund’s Expenses (continued)
Please note that expenses shown in the table are meant to highlight ongoing costs and do not
reflect any transaction costs, such as sales charges. Therefore, the second line for each class is use-
ful in comparing ongoing costs only, and will not help you compare total costs of owning different
funds. In addition, if transaction costs were included, your total costs would have been higher.
Please refer to the Fund prospectus for additional information on operating expenses.
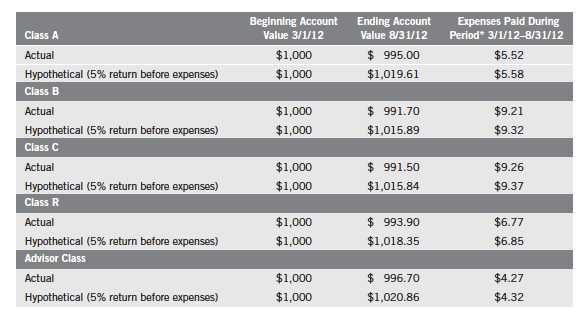
*Expenses are calculated using the most recent six-month expense ratio, annualized for each class (A: 1.10%; B: 1.84%; C: 1.85%; R: 1.35%;
and Advisor: 0.85%), multiplied by the average account value over the period, multiplied by 184/366 to reflect the one-half year period.
Annual Report | 17
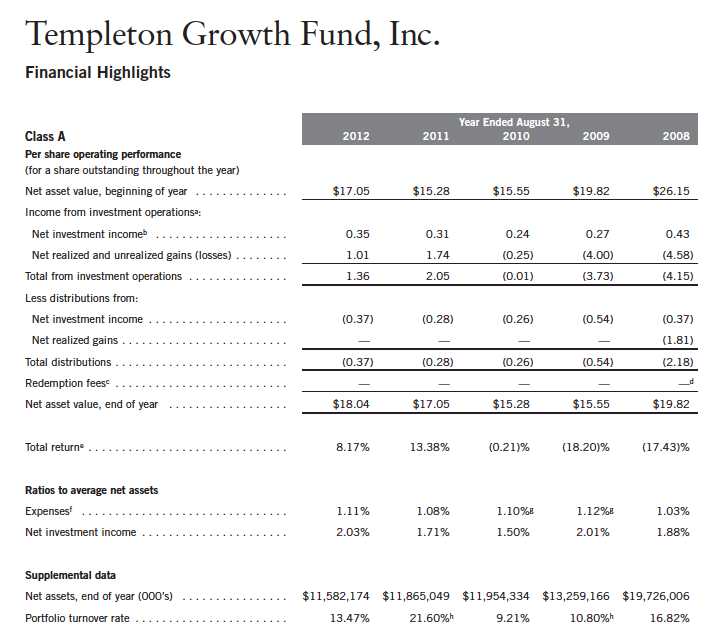
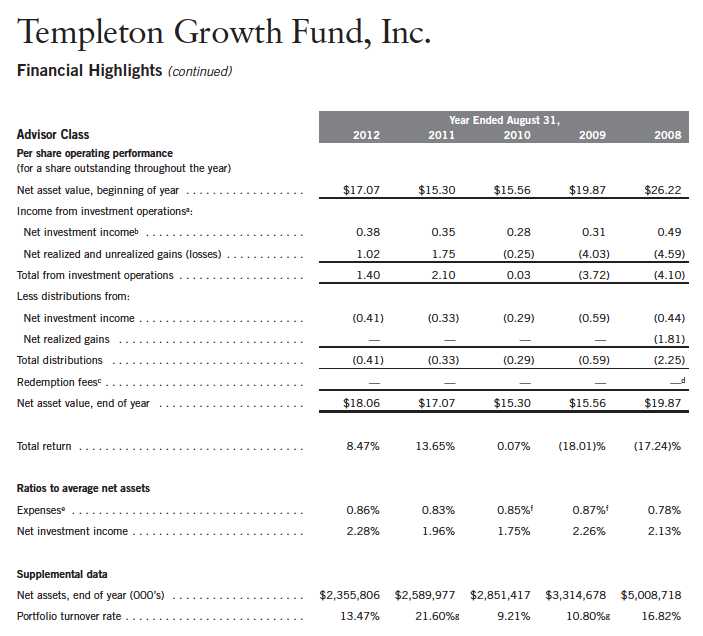
aThe amount shown for a share outstanding throughout the period may not correlate with the Statement of Operations for the period due to the timing of sales and repurchases of
the Fund shares in relation to income earned and/or fluctuating market value of the investments of the Fund.
bBased on average daily shares outstanding.
cEffective September 1, 2008, the redemption fee was eliminated.
dAmount rounds to less than $0.01 per share.
eTotal return does not reflect sales commissions or contingent deferred sales charges, if applicable.
fBenefit of expense reduction rounds to less than 0.01%.
gBenefit of waiver and payment by affiliate rounds to less than 0.01%.
hExcludes the value of portfolio securities delivered as a result of redemptions in-kind.
18 | The accompanying notes are an integral part of these financial statements. | Annual Report

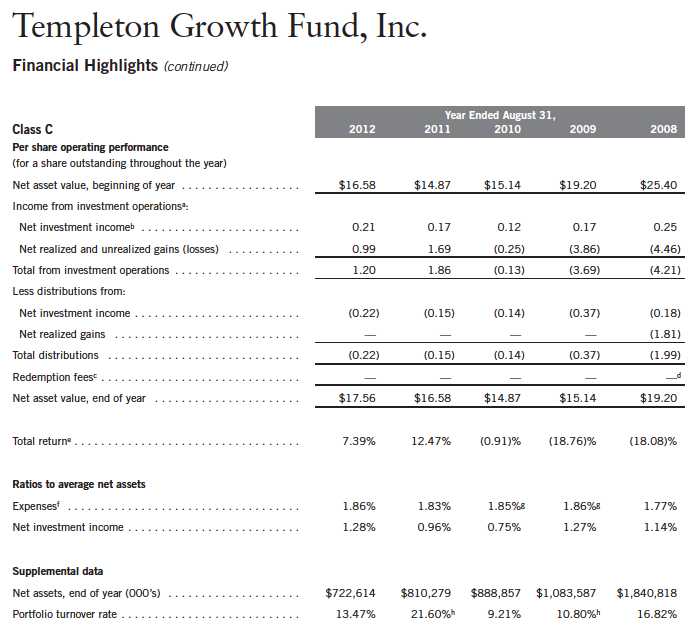
aThe amount shown for a share outstanding throughout the period may not correlate with the Statement of Operations for the period due to the timing of sales and repurchases of
the Fund shares in relation to income earned and/or fluctuating market value of the investments of the Fund.
bBased on average daily shares outstanding.
cEffective September 1, 2008, the redemption fee was eliminated.
dAmount rounds to less than $0.01 per share.
eTotal return does not reflect sales commissions or contingent deferred sales charges, if applicable.
fBenefit of expense reduction rounds to less than 0.01%.
gBenefit of waiver and payment by affiliate rounds to less than 0.01%.
hExcludes the value of portfolio securities delivered as a result of redemptions in-kind.
Annual Report | The accompanying notes are an integral part of these financial statements. | 19
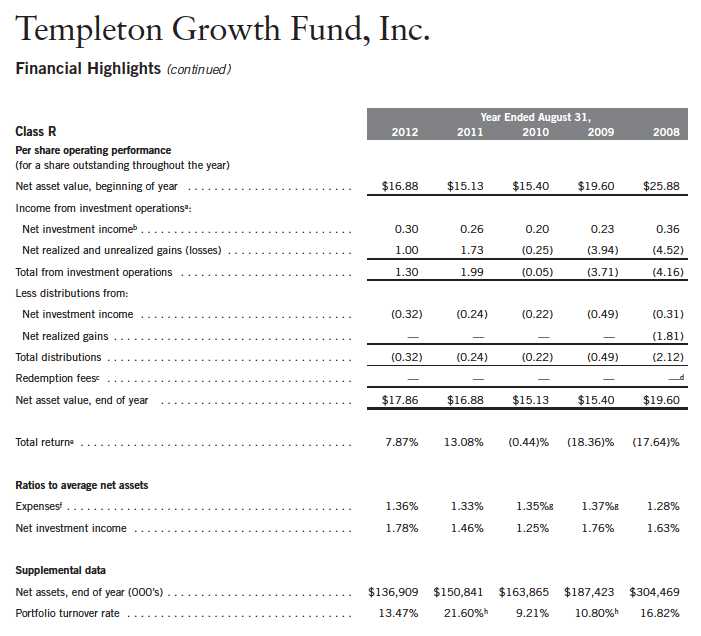
aThe amount shown for a share outstanding throughout the period may not correlate with the Statement of Operations for the period due to the timing of sales and repurchases of
the Fund shares in relation to income earned and/or fluctuating market value of the investments of the Fund.
bBased on average daily shares outstanding.
cEffective September 1, 2008, the redemption fee was eliminated.
dAmount rounds to less than $0.01 per share.
eTotal return does not reflect sales commissions or contingent deferred sales charges, if applicable.
fBenefit of expense reduction rounds to less than 0.01%.
gBenefit of waiver and payment by affiliate rounds to less than 0.01%.
hExcludes the value of portfolio securities delivered as a result of redemptions in-kind.
20 | The accompanying notes are an integral part of these financial statements. | Annual Report
aThe amount shown for a share outstanding throughout the period may not correlate with the Statement of Operations for the period due to the timing of sales and repurchases of
the Fund shares in relation to income earned and/or fluctuating market value of the investments of the Fund.
bBased on average daily shares outstanding.
cEffective September 1, 2008, the redemption fee was eliminated.
dAmount rounds to less than $0.01 per share.
eTotal return does not reflect sales commissions or contingent deferred sales charges, if applicable.
fBenefit of expense reduction rounds to less than 0.01%.
gBenefit of waiver and payment by affiliate rounds to less than 0.01%.
hExcludes the value of portfolio securities delivered as a result redemptions in-kind.
Annual Report | The accompanying notes are an integral part of these financial statements. | 21
aThe amount shown for a share outstanding throughout the period may not correlate with the Statement of Operations for the period due to the timing of sales and repurchases of
the Fund shares in relation to income earned and/or fluctuating market value of the investments of the Fund.
bBased on average daily shares outstanding.
cEffective September 1, 2008, the redemption fee was eliminated.
dAmount rounds to less than $0.01 per share.
eBenefit of expense reduction rounds to less than 0.01%.
fBenefit of waiver and payment by affiliate rounds to less than 0.01%.
gExcludes the value of portfolio securities delivered as a result of redemptions in-kind.
22 | The accompanying notes are an integral part of these financial statements. | Annual Report
Templeton Growth Fund, Inc.
Statement of Investments, August 31, 2012
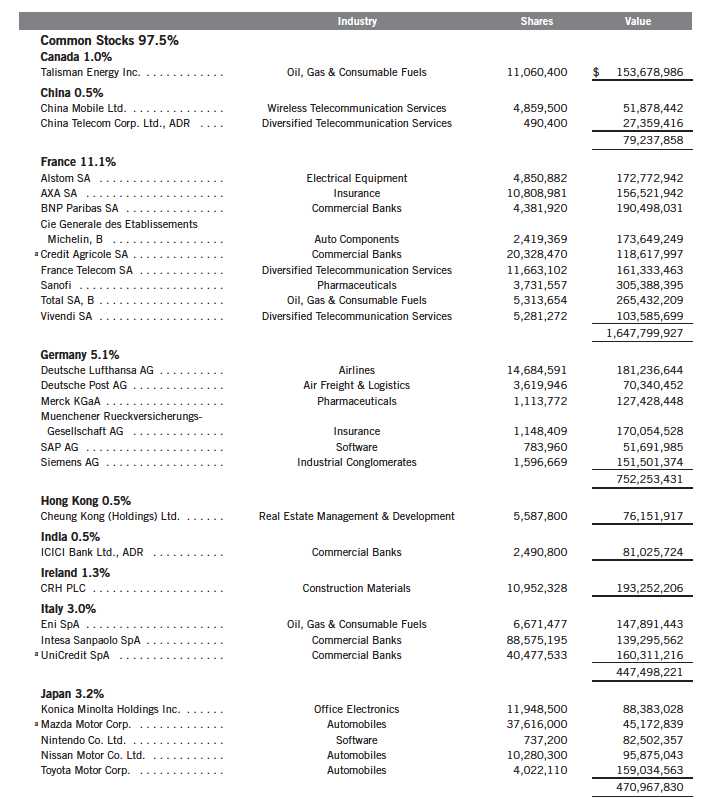
Annual Report | 23
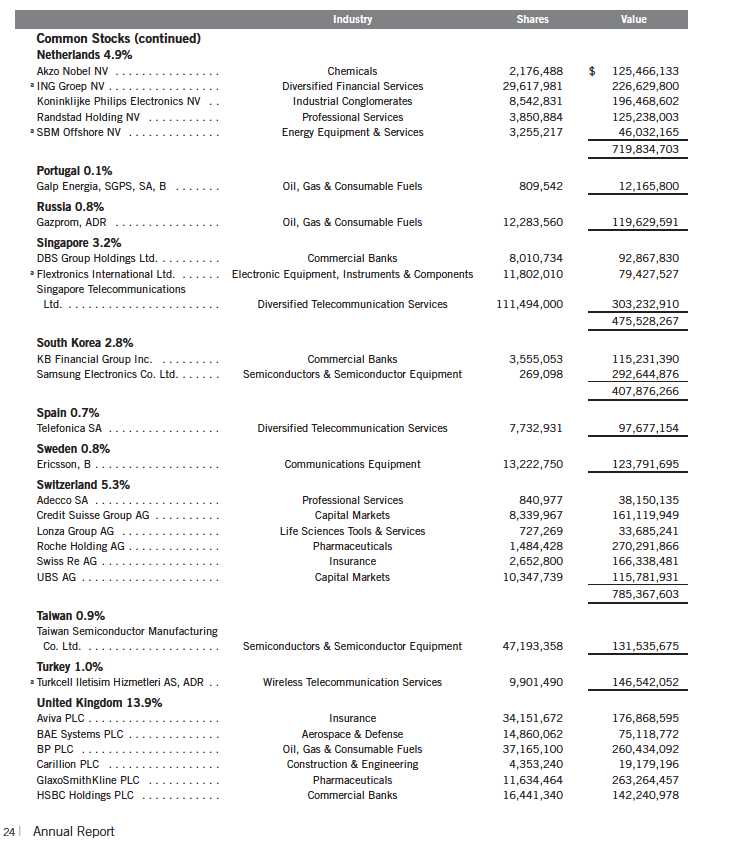
Templeton Growth Fund, Inc.
Statement of Investments, August 31, 2012 (continued)
Templeton Growth Fund, Inc.
Statement of Investments, August 31, 2012 (continued)
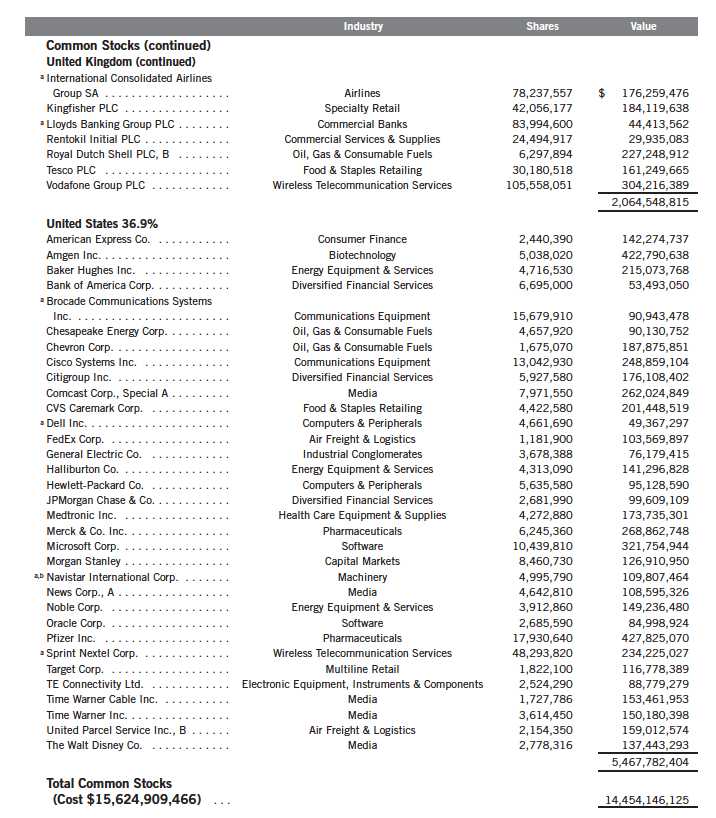
Annual Report | 25

26 | The accompanying notes are an integral part of these financial statements. | Annual Report
Annual Report | The accompanying notes are an integral part of these financial statements. | 27

28 | The accompanying notes are an integral part of these financial statements. | Annual Report
Templeton Growth Fund, Inc.
Financial Statements (continued)
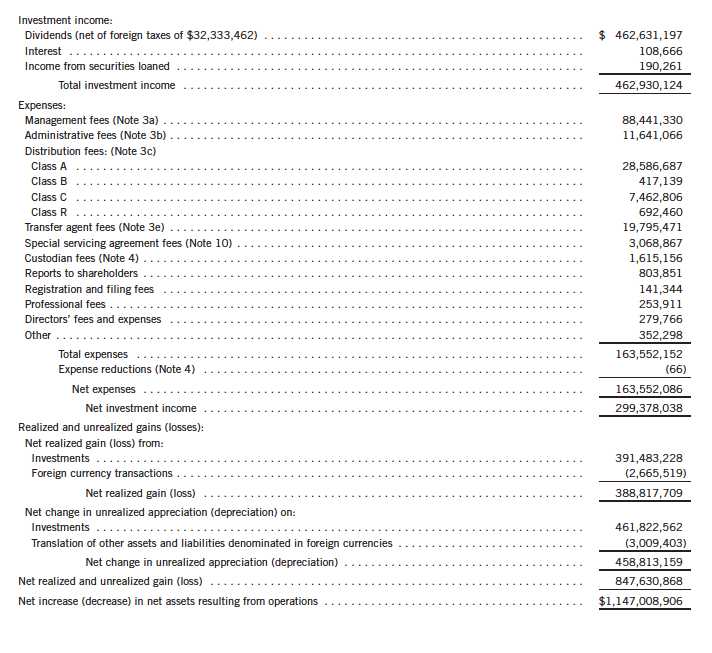
Statement of Operations
for the year ended August 31, 2012
Annual Report | The accompanying notes are an integral part of these financial statements. | 29
Templeton Growth Fund, Inc.
Financial Statements (continued)

30 | The accompanying notes are an integral part of these financial statements. | Annual Report
Templeton Growth Fund, Inc.
Notes to Financial Statements
1. ORGANIZATION AND SIGNIFICANT ACCOUNTING POLICIES
Templeton Growth Fund, Inc. (Fund) is registered under the Investment Company Act of 1940, as amended, (1940 Act) as an open-end investment company. The Fund offer five classes of shares: Class A, Class B, Class C, Class R, and Advisor Class. Each class of shares differs by its initial sales load, contingent deferred sales charges, distribution fees, voting rights on matters affecting a single class and its exchange privilege.
The following summarizes the Fund’s significant accounting policies.
a. Financial Instrument Valuation
The Fund’s investments in financial instruments are carried at fair value daily. Fair value is the price that would be received to sell an asset or paid to transfer a liability in an orderly transaction between market participants on the measurement date. Under procedures approved by the Fund’s Board of Directors (the Board), the Fund’s administrator, investment manager and other affiliates have formed the Valuation and Liquidity Oversight Committee (VLOC). The VLOC provides administration and oversight of the Fund’s valuation policies and procedures, which are approved annually by the Board. Among other things, these procedures allow the Fund to utilize independent pricing services, quotations from securities and financial instrument dealers, and other market sources to determine fair value.
Equity securities listed on an exchange or on the NASDAQ National Market System are valued at the last quoted sale price or the official closing price of the day, respectively. Foreign equity securities are valued as of the close of trading on the foreign stock exchange on which the security is primarily traded, or the NYSE, whichever is earlier. The value is then converted into its U.S. dollar equivalent at the foreign exchange rate in effect at the close of the NYSE on the day that the value of the security is determined. Over-the-counter (OTC) securities are valued within the range of the most recent quoted bid and ask prices. Securities that trade in multiple markets or on multiple exchanges are valued according to the broadest and most representative market. Certain equity securities are valued based upon fundamental characteristics or relationships to similar securities. Time deposits are valued at cost, which approximates market value.
The Fund has procedures to determine the fair value of financial instruments for which market prices are not reliable or readily available. Under these procedures, the VLOC convenes on a regular basis to review such financial instruments and considers a number of factors, including significant unobservable valuation inputs, when arriving at fair value. The VLOC primarily employs a market-based approach which may use related or comparable assets or liabilities, recent transactions, market multiples, book values, and other relevant information for the investment to determine the fair value of the investment. An income-based valuation approach may also be used in which the anticipated future cash flows of the investment are discounted to calculate fair value. Discounts may also be applied due to the nature or duration of any restrictions on the disposition of the investments. Due to the inherent uncertainty of valuations of such investments, the fair values may differ significantly from the values that would have been used
Annual Report | 31
Templeton Growth Fund, Inc.
Notes to Financial Statements (continued)
| 1. | ORGANIZATION AND SIGNIFICANT ACCOUNTING POLICIES (continued) |
| a. | Financial Instrument Valuation (continued) |
had an active market existed. The VLOC employs various methods for calibrating these valuation approaches including a regular review of key inputs and assumptions, transactional back-testing or disposition analysis, and reviews of any related market activity.
Trading in securities on foreign securities stock exchanges and OTC markets may be completed before the daily close of business on the NYSE. Occasionally, events occur between the time at which trading in a foreign security is completed and the close of the NYSE that might call into question the reliability of the value of a portfolio security held by the Fund. As a result, differences may arise between the value of the Fund’s portfolio securities as determined at the foreign market close and the latest indications of value at the close of the NYSE. In order to minimize the potential for these differences, the VLOC monitors price movements following the close of trading in foreign stock markets through a series of country specific market proxies (such as baskets of American Depositary Receipts, futures contracts and exchange traded funds). These price movements are measured against established trigger thresholds for each specific market proxy to assist in determining if an event has occurred that may call into question the reliability of the values of the foreign securities held by the Fund. If such an event occurs, the securities may be valued using fair value procedures, which may include the use of independent pricing services.
b. Foreign Currency Translation
Portfolio securities and other assets and liabilities denominated in foreign currencies are translated into U.S. dollars based on the exchange rate of such currencies against U.S. dollars on the date of valuation. The Fund may enter into foreign currency exchange contracts to facilitate transactions denominated in a foreign currency. Purchases and sales of securities, income and expense items denominated in foreign currencies are translated into U.S. dollars at the exchange rate in effect on the transaction date. Portfolio securities and assets and liabilities denominated in foreign currencies contain risks that those currencies will decline in value relative to the U.S. dollar. Occasionally, events may impact the availability or reliability of foreign exchange rates used to convert the U.S. dollar equivalent value. If such an event occurs, the foreign exchange rate will be valued at fair value using procedures established and approved by the Board.
The Fund does not separately report the effect of changes in foreign exchange rates from changes in market prices on securities held. Such changes are included in net realized and unrealized gain or loss from investments on the Statement of Operations.
Realized foreign exchange gains or losses arise from sales of foreign currencies, currency gains or losses realized between the trade and settlement dates on securities transactions and the difference between the recorded amounts of dividends, interest, and foreign withholding taxes and the U.S. dollar equivalent of the amounts actually received or paid. Net unrealized foreign exchange gains and losses arise from changes in foreign exchange rates on foreign denominated assets and liabilities other than investments in securities held at the end of the reporting period.
32 | Annual Report
Templeton Growth Fund, Inc.
Notes to Financial Statements (continued)
| 1. | ORGANIZATION AND SIGNIFICANT ACCOUNTING POLICIES (continued) |
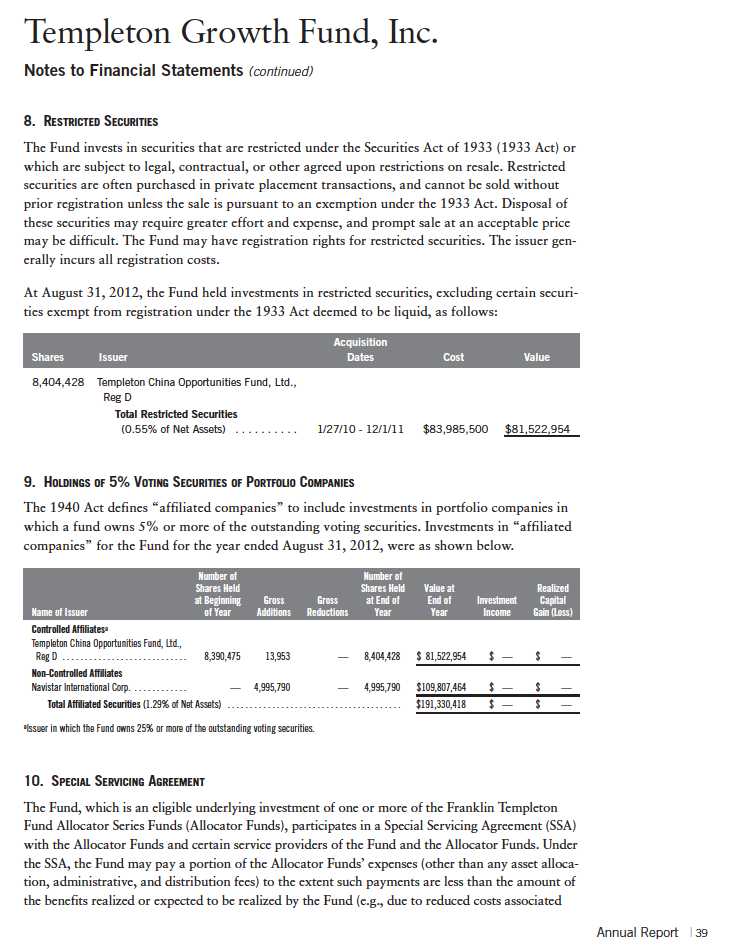
| c. | Investment in Templeton China Opportunities Fund, Ltd. |
The Fund invests in Templeton China Opportunities Fund, Ltd. (China Fund), a private offering of unregistered shares in a Cayman Islands Exempt Company. The China Fund investment objective is to seek capital growth primarily through investments in A-shares of Chinese companies listed on the Shanghai and Shenzhen stock exchanges. Chinese A-shares are traded in Chinese Renminbi and are only available as an investment to domestic (Chinese) investors and holders of a Qualified Foreign Institutional Investors license. The China Fund is managed by Templeton Investment Counsel, LLC (an affiliate of the investment manager). No additional management or administrative fees are incurred on assets invested in the China Fund.
The China Fund may be subject to certain restrictions and administrative processes relating to its ability to repatriate cash balances, investment proceeds and earnings associated with its investment, as such activities are subject to approval by agencies of the Chinese government and thus the Fund may incur delays in redeeming its investment in the China Fund. The Fund’s investments in the China Fund is valued based upon the fair value of the China Fund’s portfolio securities and other assets and liabilities.
d. Securities Lending
The Fund participates in a principal based securities lending program. The Fund receives cash collateral against the loaned securities in an amount equal to at least 102% of the market value of the loaned securities. Collateral is maintained over the life of the loan in an amount not less than 100% of the market value of loaned securities, as determined at the close of fund business each day; any additional collateral required due to changes in security values is delivered to the Fund on the next business day. The collateral is invested in a non-registered money fund as indicated on the Statement of Investments. The Fund receives income from the investment of cash collateral, in addition to lending fees and rebates paid by the borrower. The Fund bears the market risk with respect to the collateral investment, securities loaned, and the risk that the principal may default on its obligations to the Fund. The securities lending agent has agreed to indemnify the Fund in the event of default by a third party borrower. At August 31, 2012, the Fund had no securities on loan.
e. Income and Deferred Taxes
It is the Fund’s policy to qualify as a regulated investment company under the Internal Revenue Code. The Fund intends to distribute to shareholders substantially all of its taxable income and net realized gains to relieve it from federal income and excise taxes. As a result, no provision for U.S. federal income taxes is required.
The Fund may be subject to foreign taxation related to income received, capital gains on the sale of securities and certain foreign currency transactions in the foreign jurisdictions in which it invests. Foreign taxes, if any, are recorded based on the tax regulations and rates that exist in the foreign
Annual Report | 33
Templeton Growth Fund, Inc.
Notes to Financial Statements (continued)
| 1. | ORGANIZATION AND SIGNIFICANT ACCOUNTING POLICIES (continued) |
| e. | Income and Deferred Taxes (continued) |
markets in which the Fund invests. When a capital gain tax is determined to apply the Fund records an estimated deferred tax liability in an amount that would be payable if the securities were disposed of on the valuation date.
The Fund recognizes the tax benefits of uncertain tax positions only when the position is “more likely than not” to be sustained upon examination by the tax authorities based on the technical merits of the tax position. As of August 31, 2012, and for all open tax years, the Fund has determined that no liability for unrecognized tax benefits is required in the Fund’s financial statements related to uncertain tax positions taken on a tax return (or expected to be taken on future tax returns). Open tax years are those that remain subject to examination and are based on each tax jurisdiction statute of limitation.
f. Security Transactions, Investment Income, Expenses and Distributions
Security transactions are accounted for on trade date. Realized gains and losses on security transactions are determined on a specific identification basis. Interest income and estimated expenses are accrued daily. Amortization of premium and accretion of discount on debt securities are included in interest income. Dividend income is recorded on the ex-dividend date except that certain dividends from foreign securities are recognized as soon as the Fund is notified of the ex-dividend date. Distributions to shareholders are recorded on the ex-dividend date and are determined according to income tax regulations (tax basis). Distributable earnings determined on a tax basis may differ from earnings recorded in accordance with accounting principles generally accepted in the United States of America. These differences may be permanent or temporary. Permanent differences are reclassified among capital accounts to reflect their tax character. These reclassifications have no impact on net assets or the results of operations. Temporary differences are not reclassified, as they may reverse in subsequent periods.
Realized and unrealized gains and losses and net investment income, not including class specific expenses, are allocated daily to each class of shares based upon the relative proportion of net assets of each class. Differences in per share distributions, by class, are generally due to differences in class specific expenses.
g. Accounting Estimates
The preparation of financial statements in accordance with accounting principles generally accepted in the United States of America requires management to make estimates and assumptions that affect the reported amounts of assets and liabilities at the date of the financial statements and the amounts of income and expenses during the reporting period. Actual results could differ from those estimates.
34 | Annual Report
Templeton Growth Fund, Inc.
Notes to Financial Statements (continued)
| 1. | ORGANIZATION AND SIGNIFICANT ACCOUNTING POLICIES (continued) |
| h. | Guarantees and Indemnifications |
Under the Fund’s organizational documents, its officers and directors are indemnified by the Fund
against certain liabilities arising out of the performance of their duties to the Fund. Additionally, in
the normal course of business, the Fund enters into contracts with service providers that contain
general indemnification clauses. The Fund’s maximum exposure under these arrangements is
unknown as this would involve future claims that may be made against the Fund that have not yet
occurred. Currently, the Fund expects the risk of loss to be remote.
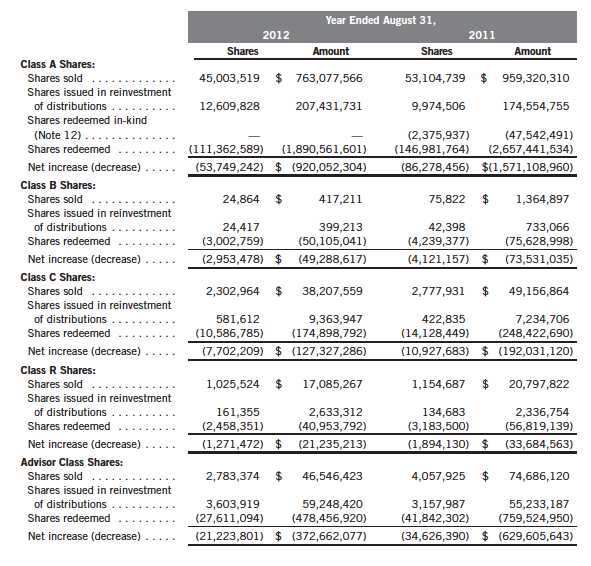
2. CAPITAL STOCK
At August 31, 2012, there were 2.4 billion shares authorized ($0.01 par value). Transactions in
the Fund’s shares were as follows:
Annual Report | 35

Annual Report | 37

Templeton Growth Fund, Inc.
Notes to Financial Statements (continued)
10. SPECIAL SERVICING AGREEMENT (continued)
with servicing accounts) from the investment in the Fund by the Allocator Funds. The Allocator Funds are either managed by Franklin Advisers, Inc. or administered by FT Services, affiliates of TGAL. For the year ended August 31, 2012, the Fund was held by one or more of the Allocator Funds and the amount of expenses borne by the Fund is noted in the Statement of Operations. At August 31, 2012, 13.50% of the Fund’s outstanding shares was held by one or more of the Allocator Funds.
11. CREDIT FACILITY
The Fund, together with other U.S. registered and foreign investment funds (collectively, Borrowers), managed by Franklin Templeton Investments, are borrowers in a joint syndicated senior unsecured credit facility totaling $1.5 billion (Global Credit Facility) which matures on January 18, 2013. This Global Credit Facility provides a source of funds to the Borrowers for temporary and emergency purposes, including the ability to meet future unanticipated or unusually large redemption requests.
Under the terms of the Global Credit Facility, the Fund shall, in addition to interest charged on any borrowings made by the Fund and other costs incurred by the Fund, pay its share of fees and expenses incurred in connection with the implementation and maintenance of the Global Credit Facility, based upon its relative share of the aggregate net assets of all of the Borrowers, including an annual commitment fee of 0.08% based upon the unused portion of the Global Credit Facility, which is reflected in other expenses on the Statement of Operations. During the year ended August 31, 2012, the Fund did not use the Global Credit Facility.
12. REDEMPTION IN-KIND
During the year ended August 31, 2011, the Fund realized $4,961,497 of net gains resulting from a redemption in-kind in which a shareholder redeemed fund shares for securities held by the Fund rather than for cash. Because such gains are not taxable to the Fund, and are not distributed to remaining shareholders, they have been reclassified from accumulated net realized gains to paid-in capital.
40 | Annual Report
Templeton Growth Fund, Inc.
Notes to Financial Statements (continued)
13. FAIR VALUE MEASUREMENTS
The Fund follows a fair value hierarchy that distinguishes between market data obtained from independent sources (observable inputs) and the Fund’s own market assumptions (unobservable inputs). These inputs are used in determining the value of the Fund’s financial instruments and are summarized in the following fair value hierarchy:
- Level 1 – quoted prices in active markets for identical financial instruments
- Level 2 – other significant observable inputs (including quoted prices for similar financial instruments, interest rates, prepayment speed, credit risk, etc.)
- Level 3 – significant unobservable inputs (including the Fund’s own assumptions in determining the fair value of financial instruments)
The inputs or methodology used for valuing financial instruments are not an indication of the risk associated with investing in those financial instruments.
For movements between the levels within the fair value hierarchy, the Fund has adopted a policy of recognizing the transfers as of the date of the underlying event which caused the movement.
A summary of inputs used as of August 31, 2012, in valuing the Fund’s assets carried at fair value, is as follows:

A reconciliation of assets in which Level 3 inputs are used in determining fair value is presented when there are significant Level 3 investments at the end of the period.
14. NEW ACCOUNTING PRONOUNCEMENTS
In December 2011, the Financial Accounting Standards Board issued Accounting Standards Update (ASU) No. 2011-11, Balance Sheet (Topic 210): Disclosures about Offsetting Assets and Liabilities. The amendments in the ASU enhance disclosures about offsetting of financial assets and liabilities to enable investors to understand the effect of these arrangements on a fund’s financial position. The ASU is effective for interim and annual reporting periods beginning on or after January 1, 2013. The Fund believes the adoption of this ASU will not have a material impact on its financial statements.
Annual Report | 41
Templeton Growth Fund, Inc.
Notes to Financial Statements (continued)
15. SUBSEQUENT EVENTS
The Fund has evaluated subsequent events through the issuance of the financial statements and
determined that no events have occurred that require disclosure.
ABBREVIATIONS
Selected Portfolio
ADR - American Depositary Receipt
42 | Annual Report
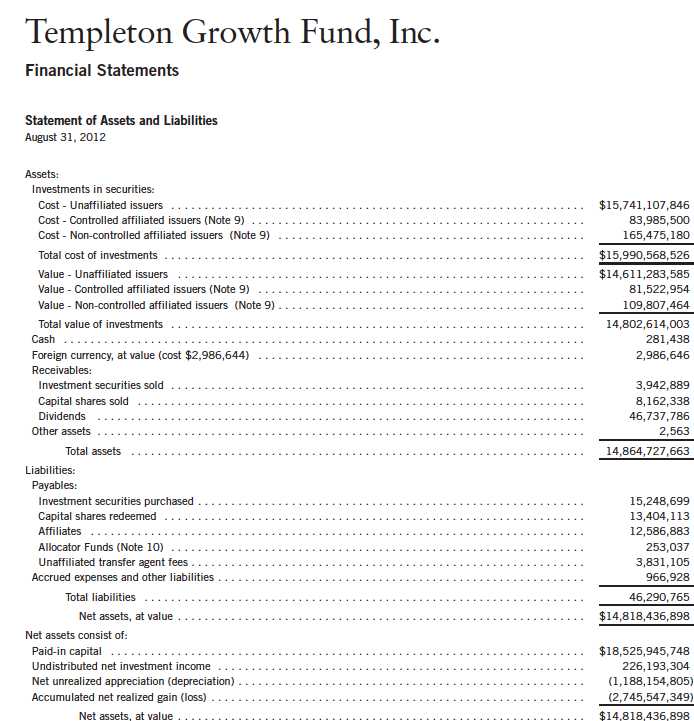
Templeton Growth Fund, Inc.
Report of Independent Registered Public Accounting Firm
To the Board of Directors and Shareholders of Templeton Growth Fund, Inc.
In our opinion, the accompanying statement of assets and liabilities, including the statement of investments, and the related statements of operations and of changes in net assets and the financial highlights present fairly, in all material respects, the financial position of Templeton Growth Fund, Inc. (the “Fund”) at August 31, 2012, the results of its operations for the year then ended, the changes in its net assets for each of the two years in the period then ended and the financial highlights for each of the five years in the period then ended, in conformity with accounting principles generally accepted in the United States of America. These financial statements and financial highlights (hereafter referred to as “financial statements”) are the responsibility of the Fund’s management. Our responsibility is to express an opinion on these financial statements based on our audits. We conducted our audits of these financial statements in accordance with the standards of the Public Company Accounting Oversight Board (United States). Those standards require that we plan and perform the audit to obtain reasonable assurance about whether the financial statements are free of material misstatement. An audit includes examining, on a test basis, evidence supporting the amounts and disclosures in the financial statements, assessing the accounting principles used and significant estimates made by management, and evaluating the overall financial statement presentation. We believe that our audits, which included confirmation of securities at August 31, 2012 by correspondence with the custodian and brokers, provide a reasonable basis for our opinion.
PricewaterhouseCoopers LLP
San Francisco, California
October 19, 2012
Annual Report | 43
Templeton Growth Fund, Inc.
Tax Information (unaudited)
Under Section 854(b)(1)(A) of the Internal Revenue Code (Code), the Fund hereby reports 32.81% of the ordinary income dividends as income qualifying for the dividends received deduction for the fiscal year ended August 31, 2012.
Under Section 854(b)(1)(B) of the Code, the Fund hereby reports the maximum amount allowable but no less than $431,525,636 as qualified dividends for purposes of the maximum rate under Section 1(h)(11) of the Code for the fiscal year ended August 31, 2012. Distributions, including qualified dividend income, paid during calendar year 2012 will be reported to shareholders on Form 1099-DIV by mid-February 2012. Shareholders are advised to check with their tax advisors for information on the treatment of these amounts on their individual income tax returns.
At August 31, 2011, more than 50% of the Fund’s total assets were invested in securities of foreign issuers. In most instances, foreign taxes were withheld from income paid to the Fund on these investments. As shown in the table below, the Fund hereby reports to shareholders the foreign source income and foreign taxes paid, pursuant to Section 853 of the Code. This written statement will allow shareholders of record on December 8, 2011, to treat their proportionate share of foreign taxes paid by the Fund as having been paid directly by them. The shareholder shall consider these amounts as foreign taxes paid in the tax year in which they receive the Fund distribution.
The following table provides a detailed analysis of foreign tax paid, foreign source income, and foreign qualified dividends as reported by the Fund, to Class A, Class B, Class C, Class R and Adviser Class shareholders of record.
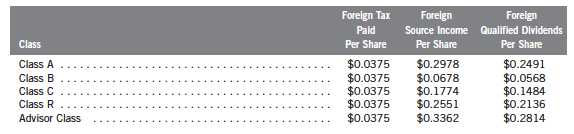
Foreign Tax Paid Per Share (Column 1) is the amount per share available to you, as a tax credit (assuming you held your shares in the Fund for a minimum of 16 days during the 31-day period beginning 15 days before the ex-dividend date of the Fund’s distribution to which the foreign taxes relate), or, as a tax deduction.
Foreign Source Income Per Share (Column 2) is the amount per share of income dividends attributable to foreign securities held by the Fund, plus any foreign taxes withheld on these dividends. The amounts reported include foreign source qualified dividends that have not been adjusted for the rate differential applicable to such dividend income.1
44 | Annual Report
Templeton Growth Fund, Inc.
Tax Information (unaudited) (continued)
Foreign Qualified Dividends Per Share (Column 3) is the amount per share of foreign source qualified dividends, plus any foreign taxes withheld on these dividends. These amounts represent the portion of the Foreign Source Income reported to you in column 2 that were derived from qualified foreign securities held by the Fund.1
By mid-February 2012, shareholders received Form 1099-DIV which included their share of taxes paid and foreign source income distributed during the calendar year 2011. The Foreign Source Income reported on Form 1099-DIV has not been adjusted for the rate differential on foreign source qualified dividend income. Shareholders are advised to check with their tax advisors for information on the treatment of these amounts on their 2011 individual income tax returns.
1Qualified dividends are taxed at reduced long term capital gains tax rates. In determining the amount of foreign tax credit that may be applied against the U.S. tax liability of individuals receiving foreign source qualified dividends, adjustments may be required to the foreign tax credit limitation calculation to reflect the rate differential applicable to such dividend income. The rules however permit certain individuals to elect not to apply the rate differential adjustments for capital gains and/or dividends for any taxable year. Please consult your tax advisor and the instructions to Form 1116 for more information.
Annual Report | 45


Templeton Growth Fund, Inc.
Shareholder Information
Board Review of Investment Management Agreement
At a meeting held May 22, 2012, the Board of Directors (Board), including a majority of non-interested or independent Directors, approved renewal of the investment management agreement for the Fund. In reaching this decision, the Board took into account information furnished throughout the year at regular Board meetings, as well as information prepared specifically in connection with the annual renewal review process. Information furnished and discussed throughout the year included investment performance reports and related financial information for the Fund, as well as periodic reports on expenses, shareholder services, legal and compliance matters, pricing, brokerage commissions and execution and other services provided by the Investment Manager (Manager) and its affiliates. Information furnished specifically in connection with the renewal process included a report for the Fund prepared by Lipper, Inc. (Lipper), an independent organization, as well as additional material, including a Fund profitability analysis prepared by management. The Lipper report compared the Fund’s investment performance and expenses with those of other mutual funds deemed comparable to the Fund as selected by Lipper. The Fund profitability analysis discussed the profitability to Franklin Templeton Investments from its overall U.S. fund operations, as well as on an individual fund-by-fund basis. Additional material accompanying such profitability analysis included information on a fund-by-fund basis listing portfolio managers and other accounts they manage, as well as information on management fees charged by the Manager and its affiliates to U.S. mutual funds and other accounts, including management’s explanation of differences where relevant and a three-year expense analysis with an explanation for any increase in expense ratios. Such material also included a memorandum prepared by management describing project initiatives and capital investments relating to the services provided to the Fund by the Franklin Templeton Investments organization, as well as a memorandum relating to economies of scale and an analysis concerning transfer agent fees charged by an affiliate of the Manager.
In considering such materials, the independent Directors received assistance and advice from and met separately with independent counsel. In approving continuance of the investment management agreement for the Fund, the Board, including a majority of independent Directors, determined that the existing management fee structure was fair and reasonable and that continuance of the investment management agreement was in the best interests of the Fund and its shareholders. While attention was given to all information furnished, the following discusses some primary factors relevant to the Board’s decision.
NATURE, EXTENT AND QUALITY OF SERVICES. The Board was satisfied with the nature and quality of the overall services provided by the Manager and its affiliates to the Fund and its shareholders. In addition to investment performance and expenses discussed later, the Board’s opinion was based, in part, upon periodic reports furnished it showing that the investment policies and restrictions for the Fund were consistently complied with as well as other reports periodically furnished the Board covering matters such as the compliance of portfolio managers and other management personnel with the code of ethics adopted throughout the Franklin Templeton fund complex, the adherence to fair value pricing procedures established by the Board, and the accuracy
Annual Report | 51
Templeton Growth Fund, Inc.
Shareholder Information (continued)
Board Review of Investment Management Agreement (continued)
of net asset value calculations. The Board also noted the extent of benefits provided Fund shareholders from being part of the Franklin Templeton family of funds, including the right to exchange investments between the same class of funds without a sales charge, the ability to reinvest Fund dividends into other funds and the right to combine holdings in other funds to obtain a reduced sales charge. Favorable consideration was given to management’s continuous efforts and expenditures in establishing back-up systems and recovery procedures to function in the event of a natural disaster, it being noted that such systems and procedures had functioned smoothly during the Florida hurricanes and blackouts experienced in previous years. Among other factors taken into account by the Board were the Manager’s best execution trading policies, including a favorable report by an independent portfolio trading analytical firm, which also covered FOREX transactions. Consideration was also given to the experience of the Fund’s portfolio management team, the number of accounts managed and general method of compensation. In this latter respect, the Board noted that a primary factor in management’s determination of a portfolio manager’s bonus compensation was the relative investment performance of the funds he or she managed and that a portion of such bonus was required to be invested in a predesignated list of funds within such person’s fund management area so as to be aligned with the interests of shareholders. The Board also took into account the quality of transfer agent and shareholder services provided Fund shareholders by an affiliate of the Manager and the continuous enhancements to the Franklin Templeton website. Particular attention was given to management’s conservative approach and diligent risk management procedures, including continuous monitoring of counterparty credit risk and attention given to derivatives and other complex instruments included expanded collateralization requirements. The Board also took into account, among other things, management’s efforts in establishing a global credit facility for the benefit of the Fund and other accounts managed by Franklin Templeton Investments to provide a source of cash for temporary and emergency purposes or to meet unusual redemption requests as well as the strong financial position of the Manager’s parent company and its commitment to the mutual fund business as evidenced by its subsidization of money market funds.
INVESTMENT PERFORMANCE. The Board placed significant emphasis on the investment performance of the Fund in view of its importance to shareholders. While consideration was given to performance reports and discussions with portfolio managers at Board meetings during the year, particular attention in assessing performance was given to the Lipper reports furnished for the agreement renewal. The Lipper report prepared for the Fund showed the investment performance of its Class A shares for the one-year period ended February 29, 2012, as well as during the previous 10 years ended that date in comparison to a performance universe consisting of all retail and institutional global large-cap value funds as selected by Lipper. On a comparative basis, the Lipper report showed the Fund’s total return for the one-year period to be in the upper half of the Lipper performance universe, and on an annualized basis to be in the highest or best performing quintile of such universe for the previous three-year period, and the middle quintile of such universe for each of the previous five- and 10-year periods. The Board found the Fund’s comparative performance as shown in the Lipper report to be satisfactory.
52 | Annual Report
Templeton Growth Fund, Inc.
Shareholder Information (continued)
Board Review of Investment Management Agreement (continued)
COMPARATIVE EXPENSES. Consideration was given to a comparative analysis of the management fees and total expense ratio of the Fund compared with a group of other funds selected by Lipper as constituting its appropriate Lipper expense group. Lipper expense data is based upon information taken from each fund’s most recent annual report, which reflects historical asset levels that may be quite different from those currently existing, particularly in a period of market volatility. While recognizing such inherent limitation and the fact that expense ratios generally increase as assets decline and decrease as assets grow, the Board believed the independent analysis conducted by Lipper to be an appropriate measure of comparative expenses. In reviewing comparative costs, Lipper provides information on the Fund’s contractual investment management fee in comparison with the contractual investment management fee that would have been charged by other funds within its Lipper expense group assuming they were similar in size to the Fund, as well as the actual total expenses of the Fund in comparison with those of its Lipper expense group. The Lipper contractual investment management fee analysis includes administrative charges as being part of a management fee, and actual total expenses, for comparative consistency, are shown by Lipper for Fund Class A shares. The results of such expense comparisons showed that the contractual investment management fee rate for the Fund was in the second least expensive quintile of its Lipper expense group, while its actual total expense ratio was in the least expensive quintile of such group. The Board was satisfied with the management fees and total expenses of the Fund in comparison to its Lipper expense group as shown in the Lipper report.
MANAGEMENT PROFITABILITY. The Board also considered the level of profits realized by the Manager and its affiliates in connection with the operation of the Fund. In this respect, the Board reviewed the Fund profitability analysis that addresses the overall profitability of Franklin Templeton’s U.S. fund business, as well as its profits in providing management and other services to each of the individual funds during the 12-month period ended September 30, 2011, being the most recent fiscal year-end for Franklin Resources, Inc., the Manager’s parent. In reviewing the analysis, attention was given to the methodology followed in allocating costs to the Fund, it being recognized that allocation methodologies are inherently subjective and various allocation methodologies may each be reasonable while producing different results. In this respect, the Board noted that, while being continuously refined and reflecting changes in the Manager’s own cost accounting, the allocation methodology was consistent with that followed in profitability report presentations for the Fund made in prior years and that the Fund’s independent registered public accounting firm had been engaged by the Manager to review the reasonableness of the allocation methodologies solely for use by the Fund’s Board in reference to the profitability analysis. In reviewing and discussing such analysis, management discussed with the Board its belief that costs incurred in establishing the infrastructure necessary for the type of mutual fund operations conducted by the Manager and its affiliates may not be fully reflected in the expenses allocated to the Fund in determining its profitability, as well as the fact that the level of profits, to a certain extent, reflected operational cost savings and efficiencies initiated by management. The Board also took into account management’s expenditures in improving shareholder services provided the Fund, as well as the need to implement systems and meet additional regulatory and compliance requirements resulting from statutes such as the Sarbanes-Oxley and Dodd-Frank Acts and recent SEC
Annual Report | 53
Templeton Growth Fund, Inc.
Shareholder Information (continued)
Board Review of Investment Management Agreement (continued)
and other regulatory requirements. In addition, the Board considered a third-party study comparing the profitability of the Manager’s parent on an overall basis to other publicly held managers broken down to show profitability from management operations exclusive of distribution expenses, as well as profitability including distribution expenses. The Board also considered the extent to which the Manager and its affiliates might derive ancillary benefits from fund operations, including revenues generated from transfer agent services and potential benefits resulting from allocation of fund brokerage and the use of commission dollars to pay for research. Based upon its consideration of all these factors, the Board determined that the level of profits realized by the Manager and its affiliates from providing services to the Fund was not excessive in view of the nature, quality and extent of services provided.
ECONOMIES OF SCALE. The Board also considered whether economies of scale are realized by the Manager and its affiliates as the Fund grows larger and the extent to which this is reflected in the level of management fees charged. While recognizing that any precise determination is inherently subjective, the Board noted that based upon the Fund profitability analysis, it appears that as some funds get larger, at some point economies of scale do result in the Manager realizing a larger profit margin on management services provided such a fund. The Board also noted that economies of scale are shared with a fund and its shareholders through management fee breakpoints so that as a fund grows in size, its effective management fee rate declines. The Fund’s investment management agreement provides a fee at the rate of 0.63% on the first $1 billion of Fund net assets declining in graduated stages thereafter to a fee of 0.49% on assets in excess of $45 billion. The Fund is also charged a separate fee for administrative services that starts at 0.15% on the first $200 million of Fund net assets and declines through breakpoints to a fixed rate of 0.075% after net assets reach the $1.2 billion level. At the end of 2011, the Fund’s net assets were approximately $14.5 billion, and the Board believed that to the extent economies of scale may be realized by the Manager and its affiliates, the schedule of fees under the investment management agreement provides a sharing of benefits with the Fund and its shareholders.
Proxy Voting Policies and Procedures
The Fund’s investment manager has established Proxy Voting Policies and Procedures (Policies) that the Fund uses to determine how to vote proxies relating to portfolio securities. Shareholders may view the Fund’s complete Policies online at franklintempleton.com. Alternatively, shareholders may request copies of the Policies free of charge by calling the Proxy Group collect at (954) 527-7678 or by sending a written request to: Franklin Templeton Companies, LLC, 300 S.E. 2nd Street, Fort Lauderdale, FL 33301, Attention: Proxy Group. Copies of the Fund’s proxy voting records are also made available online at franklintempleton.com and posted on the U.S. Securities and Exchange Commission’s website at sec.gov and reflect the most recent 12-month period ended June 30.
54 | Annual Report
Templeton Growth Fund, Inc.
Shareholder Information (continued)
Quarterly Statement of Investments
The Fund files a complete statement of investments with the U.S. Securities and Exchange Commission for the first and third quarters for each fiscal year on Form N-Q. Shareholders may view the filed Form N-Q by visiting the Commission’s website at sec.gov. The filed form may also be viewed and copied at the Commission’s Public Reference Room in Washington, DC. Information regarding the operations of the Public Reference Room may be obtained by calling (800) SEC-0330.
Householding of Reports and Prospectuses
You will receive the Fund’s financial reports every six months as well as an annual updated summary prospectus (prospectus available upon request). To reduce Fund expenses, we try to identify related shareholders in a household and send only one copy of the financial reports and summary prospectus. This process, called “householding,” will continue indefinitely unless you instruct us otherwise. If you prefer not to have these documents householded, please call us at (800) 632-2301. At any time you may view current prospectuses/summary prospectuses and financial reports on our website. If you choose, you may receive these documents through electronic delivery.
Annual Report | 55
This page intentionally left blank.

Item 2. Code of Ethics.
| (a) | The Registrant has adopted a code of ethics that applies to its principal executive officers and principal financial and accounting officer. |
| (c) | N/A |
| (d) | N/A |
| (f) | Pursuant to Item 12(a)(1), the Registrant is attaching as an exhibit a copy of its code of ethics that applies to its principal executive officers and principal financial and accounting officer. |
Item 3. Audit Committee Financial Expert.
(a)(1) The Registrant has an audit committee financial expert serving on its audit committee.
(2) The audit committee financial expert is David W. Niemiec and he is "independent" as defined under the relevant Securities and Exchange Commission Rules and Releases.
Item 4. Principal Accountant Fees and Services.
(a) Audit Fees
The aggregate fees paid to the principal accountant for professional services rendered by the principal accountant for the audit of the registrant’s annual financial statements or for services that are normally provided by the principal accountant in connection with statutory and regulatory filings or engagements were $89,952 for the fiscal year ended August 31, 2012 and $127,139 for the fiscal year ended August 31, 2011.
(b) Audit-Related Fees
The aggregate fees paid to the principal accountant for assurance and related services rendered by the principal accountant to the registrant that are reasonably related to the performance of the audit of the registrant's financial statements and are not reported under paragraph (a) of Item 4 were $33,033 for the fiscal year ended August 31, 2012 and $33,033 for the fiscal year ended August 31, 2011. The services for which these fees were paid included attestation services.
There were no fees paid to the principal accountant for assurance and related services rendered by the principal accountant to the registrant's investment adviser and any entity controlling, controlled by or under common control with the investment adviser that provides ongoing services to the registrant that are reasonably related to the performance of the audit of their financial statements.
(c) Tax Fees
There were no fees paid to the principal accountant for professional services rendered by the principal accountant to the registrant for tax compliance, tax advice and tax planning.
The aggregate fees paid to the principal accountant for professional services rendered by the principal accountant to the registrant’s investment adviser and any entity controlling, controlled by or under common control with the
investment adviser that provides ongoing services to the registrant for tax compliance, tax advice and tax planning were $54,600 for the fiscal year ended August 31, 2012 and $85,000 for the fiscal year ended August 31, 2011. The services for which these fees were paid included technical tax consultation for capital gain tax reporting to foreign governments, application of local country tax laws to investments and licensing securities with local country offices.
(d) All Other Fees
The aggregate fees paid to the principal accountant for products and services rendered by the principal accountant to the registrant, other than the services reported in paragraphs (a)-(c) of Item 4 were $5,459 for the fiscal year ended August 31, 2012 and $6,440 for the fiscal year ended August 31, 2011. The services for which these fees were paid included review of materials provided to the fund Board in connection with the investment management contract renewal process.
The aggregate fees paid to the principal accountant for products and services rendered by the principal accountant to the registrant’s investment adviser and any entity controlling, controlled by or under common control with the investment adviser that provides ongoing services to the registrant, other than the services reported in paragraphs (a)-(c) of Item 4 were $146,991 for the fiscal year ended August 31, 2012 and $138,360 for the fiscal year ended August 31, 2011. The services for which these fees were paid included review of materials provided to the fund Board in connection with the investment management contract renewal process.
(e) (1) The registrant’s audit committee is directly responsible for approving the services to be provided by the auditors, including:
| (i) | pre-approval of all audit and audit related services; |
| (ii) | pre-approval of all non-audit related services to be provided to |
the Fund by the auditors;
(iii) pre-approval of all non-audit related services to be provided to the registrant by the auditors to the registrant’s investment adviser or to any entity that controls, is controlled by or is under common control with the registrant’s investment adviser and that provides ongoing services to the registrant where the non-audit services relate directly to the operations or financial reporting of the registrant; and (iv) establishment by the audit committee, if deemed necessary or appropriate, as an alternative to committee pre-approval of services to be provided by the auditors, as required by paragraphs (ii) and (iii) above, of policies and procedures to permit such services to be pre-approved by other means, such as through establishment of guidelines or by action of a designated member or members of the committee; provided the policies and procedures are detailed as to the particular service and the committee is informed of each service and such policies and procedures do not include delegation of audit committee responsibilities, as contemplated under the Securities Exchange Act of 1934, to management; subject, in the case of (ii) through (iv), to any waivers, exceptions or exemptions that may be available under applicable law or rules.
| (e) | (2) None of the services provided to the registrant described in paragraphs |
| (b) | -(d) of Item 4 were approved by the audit committee pursuant to paragraph |
(c)(7)(i)(C) of Rule 2-01 of regulation S-X.
(f) No disclosures are required by this Item 4(f).
(g) The aggregate non-audit fees paid to the principal accountant for services rendered by the principal accountant to the registrant and the registrant’s investment adviser and any entity controlling, controlled by or under common control with the investment adviser that provides ongoing services to the registrant were $240,083 for the fiscal year ended August 31, 2012 and $262,833 for the fiscal year ended August 31, 2011.
(h) The registrant’s audit committee of the board has considered whether the provision of non-audit services that were rendered to the registrant’s investment adviser (not including any sub-adviser whose role is primarily portfolio management and is subcontracted with or overseen by another investment adviser), and any entity controlling, controlled by, or under common control with the investment adviser that provides ongoing services to the registrant that were not pre-approved pursuant to paragraph (c)(7)(ii) of Rule 2-01 of Regulation S-X is compatible with maintaining the principal accountant’s independence.
Item 5. Audit Committee of Listed Registrants. N/A
Item 6. Schedule of Investments. N/A
Item 7. Disclosure of Proxy Voting Policies and Procedures for Closed-End Management Investment Companies. N/A
Item 8. Portfolio Managers of Closed-End Management Investment Companies. N/A
Item 9. Purchases of Equity Securities by Closed-End Management Investment Company and Affiliated Purchasers. N/A
Item 10. Submission of Matters to a Vote of Security Holders.
There have been no changes to the procedures by which shareholders may recommend nominees to the Registrant's Board of Directors that would require disclosure herein.
Item 11. Controls and Procedures.
(a) Evaluation of Disclosure Controls and Procedures.
The Registrant maintains
disclosure controls and procedures that are designed to ensure that information required to be disclosed in the Registrant’s filings under the Securities Exchange Act of 1934 and the Investment Company Act of 1940 is recorded, processed, summarized and reported within the periods specified in the rules and forms of the Securities and Exchange Commission. Such information is accumulated and communicated to the Registrant’s management, including its principal executive officer and principal financial officer, as appropriate, to allow timely decisions regarding required disclosure. The Registrant’s management, including the principal executive officer and the principal financial officer, recognizes that any set of controls and procedures, no matter how well designed and operated, can provide only reasonable assurance of
achieving the desired control objectives.
Within 90 days prior to the filing date of this Shareholder Report on Form N-CSR, the Registrant had carried out an evaluation, under the supervision and with the participation of the Registrant’s management, including the Registrant’s principal executive officer and the Registrant’s principal financial officer, of the effectiveness of the design and operation of the Registrant’s disclosure controls and procedures. Based on such evaluation, the Registrant’s principal executive officer and principal financial officer concluded that the Registrant’s disclosure controls and procedures are effective.
(b) Changes in Internal Controls.
There have been no significant changes in
the Registrant’s internal controls or in other factors that could significantly affect the internal controls subsequent to the date of their evaluation in connection with the preparation of this Shareholder Report on Form N-CSR.
Item 12. Exhibits.
(a)(1) Code of Ethics
(a)(2) Certifications pursuant to Section 302 of the Sarbanes-Oxley Act of 2002 of Laura F. Fergerson, Chief Executive Officer - Finance and Administration, and Mark H. Otani, Chief Financial Officer and Chief Accounting Officer
(b) Certifications pursuant to Section 906 of the Sarbanes-Oxley Act of 2002 of Laura F. Fergerson, Chief Executive Officer - Finance and Administration, and Mark H. Otani, Chief Financial Officer and Chief Accounting Officer