Transport Corporation Of America (TCAM) Inactive
Filed: 30 Dec 05, 12:00am
Exhibit (c)(2)
Link to searchable text of slide shown above
Link to searchable text of slide shown above
Link to searchable text of slide shown above
Link to searchable text of slide shown above
Link to searchable text of slide shown above
Link to searchable text of slide shown above
Link to searchable text of slide shown above
Link to searchable text of slide shown above
Link to searchable text of slide shown above
Link to searchable text of slide shown above
Link to searchable text of slide shown above
Link to searchable text of slide shown above
Link to searchable text of slide shown above
Link to searchable text of slide shown above
Link to searchable text of slide shown above
Link to searchable text of slide shown above
Link to searchable text of slide shown above
Link to searchable text of slide shown above
Link to searchable text of slide shown above
Link to searchable text of slide shown above
Link to searchable text of slide shown above
Link to searchable text of slide shown above

Link to searchable text of slide shown above
Link to searchable text of slide shown above
Link to searchable text of slide shown above
Link to searchable text of slide shown above
Link to searchable text of slide shown above
Link to searchable text of slide shown above
Link to searchable text of slide shown above
Link to searchable text of slide shown above
Link to searchable text of slide shown above
Link to searchable text of slide shown above
Link to searchable text of slide shown above
Link to searchable text of slide shown above
Link to searchable text of slide shown above
Link to searchable text of slide shown above
Link to searchable text of slide shown above
Link to searchable text of slide shown above
Link to searchable text of slide shown above
Link to searchable text of slide shown above
Link to searchable text of slide shown above
Link to searchable text of slide shown above
Link to searchable text of slide shown above
Link to searchable text of slide shown above

Link to searchable text of slide shown above
Link to searchable text of slide shown above
Link to searchable text of slide shown above
Link to searchable text of slide shown above
Link to searchable text of slide shown above
Link to searchable text of slide shown above
Link to searchable text of slide shown above
Link to searchable text of slide shown above
Link to searchable text of slide shown above
Link to searchable text of slide shown above
Link to searchable text of slide shown above
Link to searchable text of slide shown above
Link to searchable text of slide shown above
Link to searchable text of slide shown above
Link to searchable text of slide shown above
Link to searchable text of slide shown above
Link to searchable text of slide shown above
Link to searchable text of slide shown above

Link to searchable text of slide shown above
Link to searchable text of slide shown above
Link to searchable text of slide shown above
Link to searchable text of slide shown above
Link to searchable text of slide shown above
Link to searchable text of slide shown above
Link to searchable text of slide shown above
Link to searchable text of slide shown above
Link to searchable text of slide shown above
Link to searchable text of slide shown above

Link to searchable text of slide shown above
Link to searchable text of slide shown above
Link to searchable text of slide shown above
Link to searchable text of slide shown above
Link to searchable text of slide shown above
Link to searchable text of slide shown above
Link to searchable text of slide shown above
Link to searchable text of slide shown above
Link to searchable text of slide shown above
Link to searchable text of slide shown above
Link to searchable text of slide shown above

Link to searchable text of slide shown above
Link to searchable text of slide shown above

Link to searchable text of slide shown above

Link to searchable text of slide shown above
Searchable text section of graphics shown above
CONFIDENTIAL
A Presentation to the Board of Directors of:
TWINS
regarding
Strategic Alternatives
June 29, 2005
[LOGO]
Table of Contents
I. |
| Overview of TWINS Current Situation |
| |
II. |
| Truckload Industry Outlook |
| |
III. |
| Overview of Strategic Alternatives |
| |
|
| A. | Organic Growth |
|
|
| B. | No Growth/Cost Reduction (to be distributed at meeting) |
|
|
| C. | Stock Repurchase |
|
|
| D. | Acquisitions |
|
|
| E. | Sale of Company |
|
IV. |
| COLTS Overview |
| |
V. |
| COLTS/TWINS Merger Consequences |
| |
|
|
|
| |
Exhibits |
| |||
A. |
| Tier I Strategic Buyer Profiles |
| |
B. |
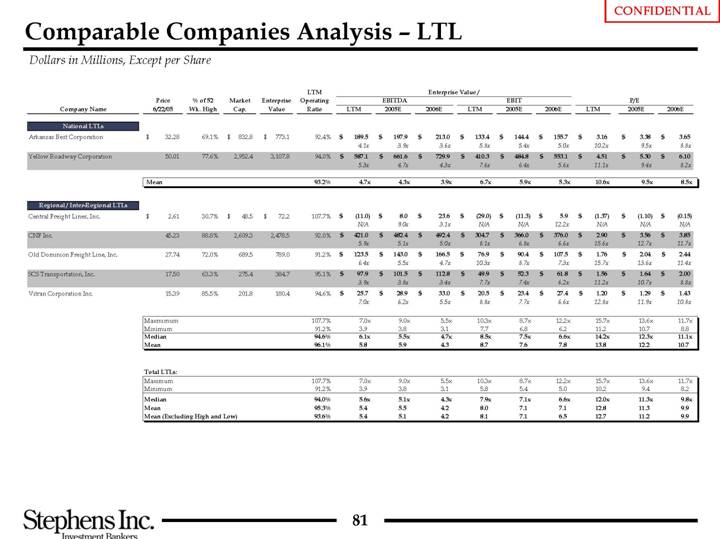
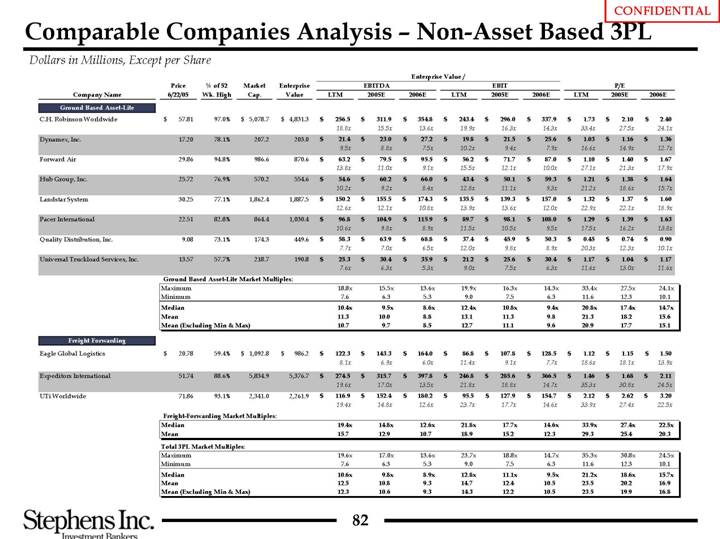
| Comparable Companies Analysis |
| |
[LOGO]
2
I. Overview of TWINS Current Situation
TWINS Current Situation
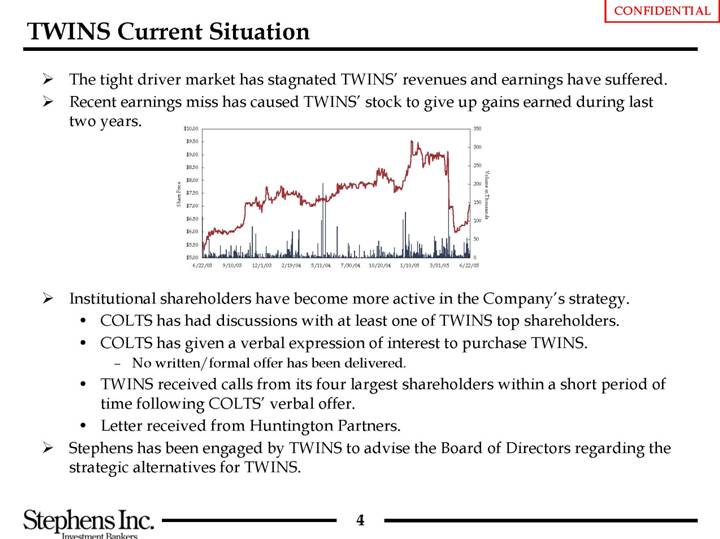
• The tight driver market has stagnated TWINS’ revenues and earnings have suffered.
• Recent earnings miss has caused TWINS’ stock to give up gains earned during last two years.
[CHART]
• Institutional shareholders have become more active in the Company’s strategy.
• COLTS has had discussions with at least one of TWINS top shareholders.
• COLTS has given a verbal expression of interest to purchase TWINS.
• No written/formal offer has been delivered.
• TWINS received calls from its four largest shareholders within a short period of time following COLTS’ verbal offer.
• Letter received from Huntington Partners.
• Stephens has been engaged by TWINS to advise the Board of Directors regarding the strategic alternatives for TWINS.
4
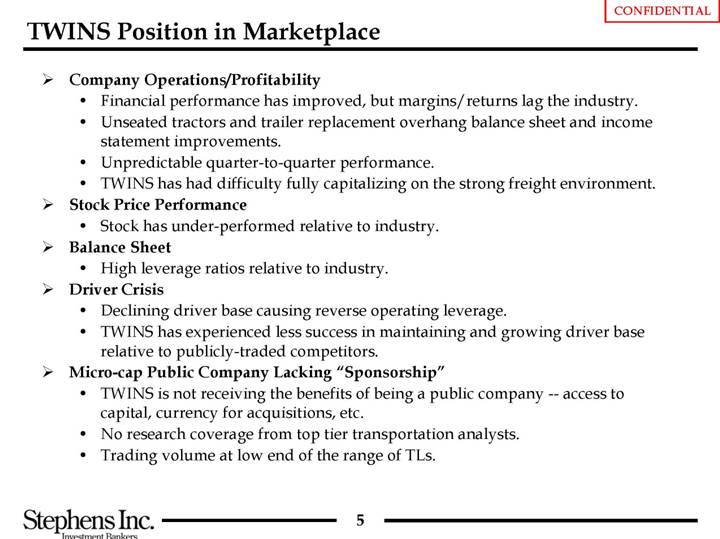
TWINS Position in Marketplace
• Company Operations/Profitability
• Financial performance has improved, but margins/returns lag the industry.
• Unseated tractors and trailer replacement overhang balance sheet and income statement improvements.
• Unpredictable quarter-to-quarter performance.
• TWINS has had difficulty fully capitalizing on the strong freight environment.
• Stock Price Performance
• Stock has under-performed relative to industry.
• Balance Sheet
• High leverage ratios relative to industry.
• Driver Crisis
• Declining driver base causing reverse operating leverage.
• TWINS has experienced less success in maintaining and growing driver base relative to publicly-traded competitors.
• Micro-cap Public Company Lacking “Sponsorship”
• TWINS is not receiving the benefits of being a public company — access to capital, currency for acquisitions, etc.
• No research coverage from top tier transportation analysts.
• Trading volume at low end of the range of TLs.
5
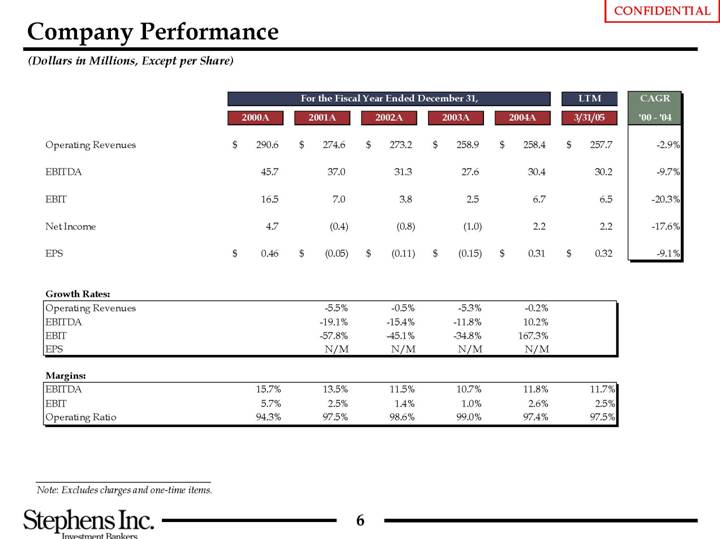
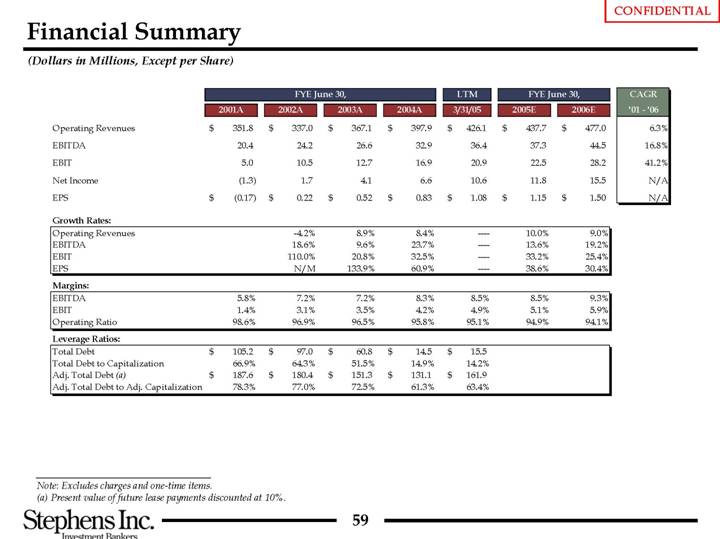
Company Performance
(Dollars in Millions, Except per Share)
|
| For the Fiscal Year Ended December 31, |
| LTM |
| CAGR |
| ||||||||||||||
|
| 2000A |
| 2001A |
| 2002A |
| 2003A |
| 2004A |
| 3/31/05 |
| ’00 - ’04 |
| ||||||
|
|
|
|
|
|
|
|
|
|
|
|
|
|
|
| ||||||
Operating Revenues |
| $ | 290.6 |
| $ | 274.6 |
| $ | 273.2 |
| $ | 258.9 |
| $ | 258.4 |
| $ | 257.7 |
| -2.9 | % |
|
|
|
|
|
|
|
|
|
|
|
|
|
|
|
| ||||||
EBITDA |
| 45.7 |
| 37.0 |
| 31.3 |
| 27.6 |
| 30.4 |
| 30.2 |
| -9.7 | % | ||||||
|
|
|
|
|
|
|
|
|
|
|
|
|
|
|
| ||||||
EBIT |
| 16.5 |
| 7.0 |
| 3.8 |
| 2.5 |
| 6.7 |
| 6.5 |
| -20.3 | % | ||||||
|
|
|
|
|
|
|
|
|
|
|
|
|
|
|
| ||||||
Net Income |
| 4.7 |
| (0.4 | ) | (0.8 | ) | (1.0 | ) | 2.2 |
| 2.2 |
| -17.6 | % | ||||||
|
|
|
|
|
|
|
|
|
|
|
|
|
|
|
| ||||||
EPS |
| $ | 0.46 |
| $ | (0.05 | ) | $ | (0.11 | ) | $ | (0.15 | ) | $ | 0.31 |
| $ | 0.32 |
| -9.1 | % |
|
|
|
|
|
|
|
|
|
|
|
|
|
|
|
| ||||||
Growth Rates: |
|
|
|
|
|
|
|
|
|
|
|
|
|
|
| ||||||
|
|
|
|
|
|
|
|
|
|
|
|
|
|
|
| ||||||
Operating Revenues |
|
|
| -5.5 | % | -0.5 | % | -5.3 | % | -0.2 | % |
|
|
|
| ||||||
EBITDA |
|
|
| -19.1 | % | -15.4 | % | -11.8 | % | 10.2 | % |
|
|
|
| ||||||
EBIT |
|
|
| -57.8 | % | -45.1 | % | -34.8 | % | 167.3 | % |
|
|
|
| ||||||
EPS |
|
|
| N/M |
| N/M |
| N/M |
| N/M |
|
|
|
|
| ||||||
|
|
|
|
|
|
|
|
|
|
|
|
|
|
|
| ||||||
Margins: |
|
|
|
|
|
|
|
|
|
|
|
|
|
|
| ||||||
|
|
|
|
|
|
|
|
|
|
|
|
|
|
|
| ||||||
EBITDA |
| 15.7 | % | 13.5 | % | 11.5 | % | 10.7 | % | 11.8 | % | 11.7 | % |
|
| ||||||
EBIT |
| 5.7 | % | 2.5 | % | 1.4 | % | 1.0 | % | 2.6 | % | 2.5 | % |
|
| ||||||
Operating Ratio |
| 94.3 | % | 97.5 | % | 98.6 | % | 99.0 | % | 97.4 | % | 97.5 | % |
|
| ||||||
Note: Excludes charges and one-time items.
6
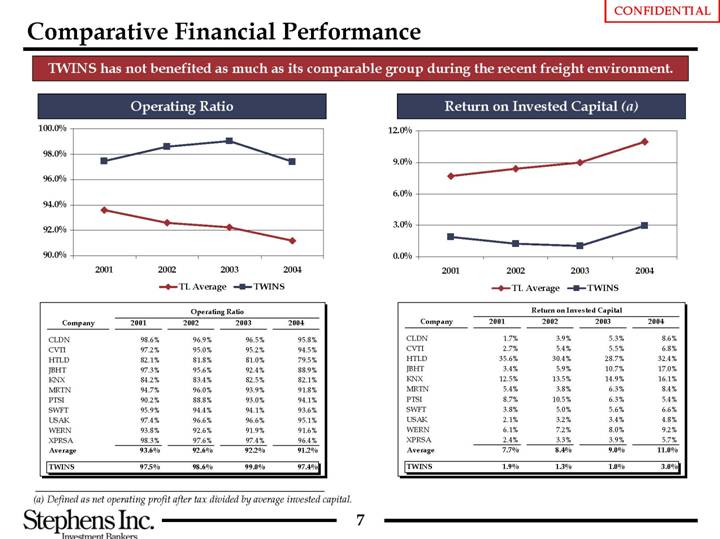
Comparative Financial Performance
TWINS has not benefited as much as its comparable group during the recent freight environment.
Operating Ratio
[CHART]
|
| Operating Ratio |
| ||||||
Company |
| 2001 |
| 2002 |
| 2003 |
| 2004 |
|
CLDN |
| 98.6 | % | 96.9 | % | 96.5 | % | 95.8 | % |
CVTI |
| 97.2 | % | 95.0 | % | 95.2 | % | 94.5 | % |
HTLD |
| 82.1 | % | 81.8 | % | 81.0 | % | 79.5 | % |
JBHT |
| 97.3 | % | 95.6 | % | 92.4 | % | 88.9 | % |
KNX |
| 84.2 | % | 83.4 | % | 82.5 | % | 82.1 | % |
MRTN |
| 94.7 | % | 96.0 | % | 93.9 | % | 91.8 | % |
PTSI |
| 90.2 | % | 88.8 | % | 93.0 | % | 94.1 | % |
SWFT |
| 95.9 | % | 94.4 | % | 94.1 | % | 93.6 | % |
USAK |
| 97.4 | % | 96.6 | % | 96.6 | % | 95.1 | % |
WERN |
| 93.8 | % | 92.6 | % | 91.9 | % | 91.6 | % |
XPRSA |
| 98.3 | % | 97.6 | % | 97.4 | % | 96.4 | % |
Average |
| 93.6 | % | 92.6 | % | 92.2 | % | 91.2 | % |
|
|
|
|
|
|
|
|
|
|
TWINS |
| 97.5 | % | 98.6 | % | 99.0 | % | 97.4 | % |
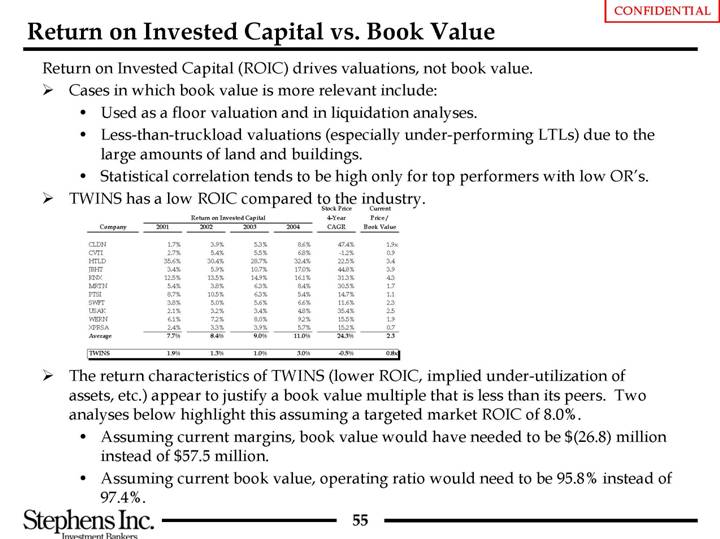
Return on Invested Capital (a)
[CHART]
|
| Return on Invested Capital |
| ||||||
Company |
| 2001 |
| 2002 |
| 2003 |
| 2004 |
|
CLDN |
| 1.7 | % | 3.9 | % | 5.3 | % | 8.6 | % |
CVTI |
| 2.7 | % | 5.4 | % | 5.5 | % | 6.8 | % |
HTLD |
| 35.6 | % | 30.4 | % | 28.7 | % | 32.4 | % |
JBHT |
| 3.4 | % | 5.9 | % | 10.7 | % | 17.0 | % |
KNX |
| 12.5 | % | 13.5 | % | 14.9 | % | 16.1 | % |
MRTN |
| 5.4 | % | 3.8 | % | 6.3 | % | 8.4 | % |
PTSI |
| 8.7 | % | 10.5 | % | 6.3 | % | 5.4 | % |
SWFT |
| 3.8 | % | 5.0 | % | 5.6 | % | 6.6 | % |
USAK |
| 2.1 | % | 3.2 | % | 3.4 | % | 4.8 | % |
WERN |
| 6.1 | % | 7.2 | % | 8.0 | % | 9.2 | % |
XPRSA |
| 2.4 | % | 3.3 | % | 3.9 | % | 5.7 | % |
Average |
| 7.7 | % | 8.4 | % | 9.0 | % | 11.0 | % |
|
|
|
|
|
|
|
|
|
|
TWINS |
| 1.9 | % | 1.3 | % | 1.0 | % | 3.0 | % |
(a) Defined as net operating profit after tax divided by average invested capital.
7
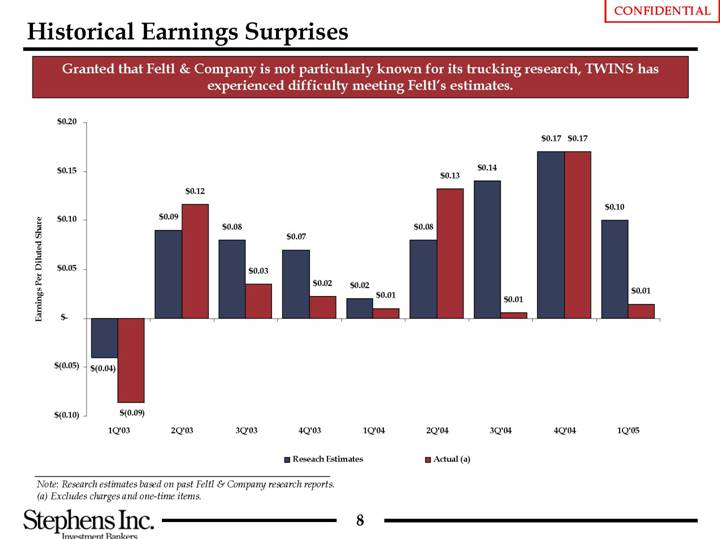
Historical Earnings Surprises
Granted that Feltl & Company is not particularly known for its trucking research, TWINS has experienced difficulty meeting Feltl’s estimates.
[CHART]
Note: Research estimates based on past Feltl & Company research reports.
(a) Excludes charges and one-time items.
8
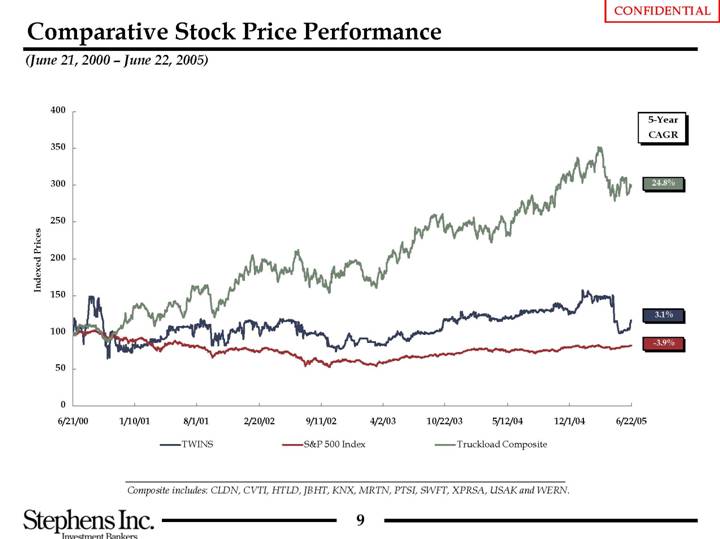
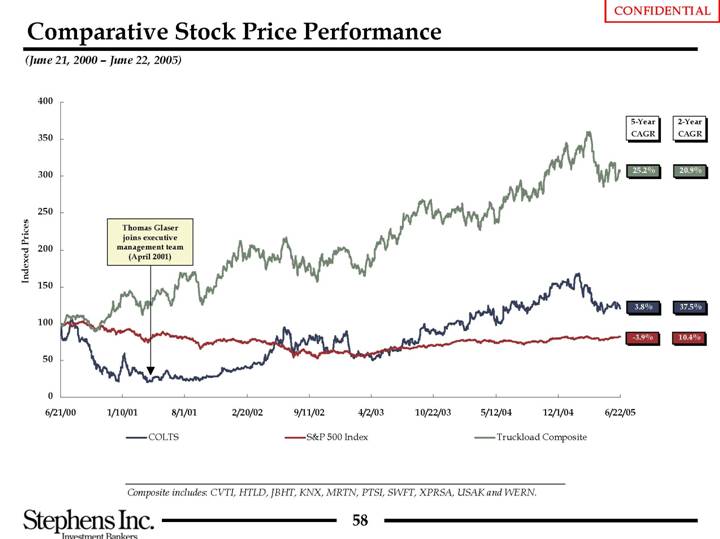
Comparative Stock Price Performance
(June 21, 2000 - June 22, 2005)
[CHART]
Composite includes: CLDN, CVTI, HTLD, JBHT, KNX, MRTN, PTSI, SWFT, XPRSA, USAK and WERN.
9
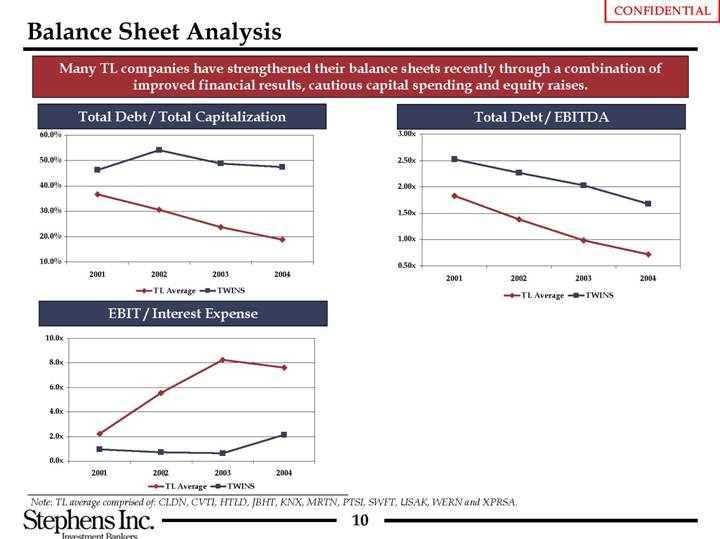
Balance Sheet Analysis
Many TL companies have strengthened their balance sheets recently through a combination of improved financial results, cautious capital spending and equity raises.
Total Debt / Total Capitalization
[CHART]
EBIT / Interest Expense
[CHART]
Total Debt / EBITDA
[CHART]
Note: TL average comprised of: CLDN, CVTI, HTLD, JBHT, KNX, MRTN, PTSI, SWFT, USAK, WERN and XPRSA.
10
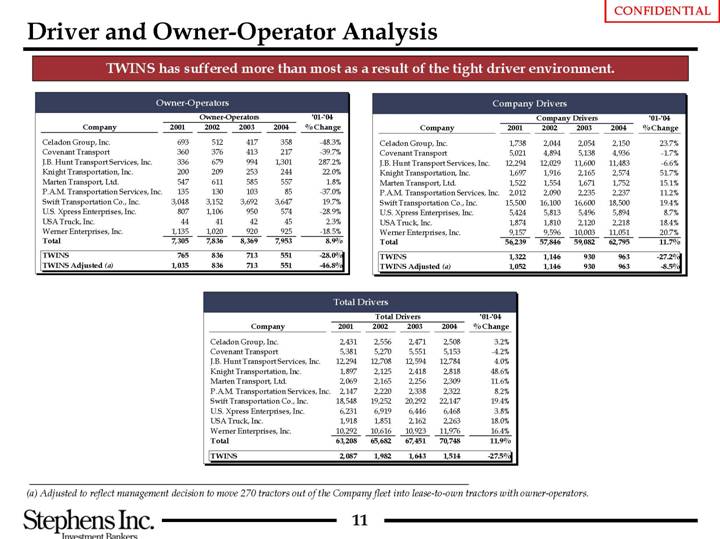
Driver and Owner-Operator Analysis
TWINS has suffered more than most as a result of the tight driver environment.
Owner-Operators
|
| Owner-Operators |
| ’01-’04 |
| ||||||
Company |
| 2001 |
| 2002 |
| 2003 |
| 2004 |
| % Change |
|
Celadon Group, Inc. |
| 693 |
| 512 |
| 417 |
| 358 |
| -48.3 | % |
Covenant Transport |
| 360 |
| 376 |
| 413 |
| 217 |
| -39.7 | % |
J.B. Hunt Transport Services, Inc. |
| 336 |
| 679 |
| 994 |
| 1,301 |
| 287.2 | % |
Knight Transportation, Inc. |
| 200 |
| 209 |
| 253 |
| 244 |
| 22.0 | % |
Marten Transport, Ltd. |
| 547 |
| 611 |
| 585 |
| 557 |
| 1.8 | % |
P.A.M. Transportation Services, Inc. |
| 135 |
| 130 |
| 103 |
| 85 |
| -37.0 | % |
Swift Transportation Co., Inc. |
| 3,048 |
| 3,152 |
| 3,692 |
| 3,647 |
| 19.7 | % |
U.S. Xpress Enterprises, Inc. |
| 807 |
| 1,106 |
| 950 |
| 574 |
| -28.9 | % |
USA Truck, Inc. |
| 44 |
| 41 |
| 42 |
| 45 |
| 2.3 | % |
Werner Enterprises, Inc. |
| 1,135 |
| 1,020 |
| 920 |
| 925 |
| -18.5 | % |
Total |
| 7,305 |
| 7,836 |
| 8,369 |
| 7,953 |
| 8.9 | % |
|
|
|
|
|
|
|
|
|
|
|
|
TWINS |
| 765 |
| 836 |
| 713 |
| 551 |
| -28.0 | % |
TWINS Adjusted (a) |
| 1,035 |
| 836 |
| 713 |
| 551 |
| -46.8 | % |
Company Drivers
|
| Company Drivers |
| ’01-’04 |
| ||||||
Company |
| 2001 |
| 2002 |
| 2003 |
| 2004 |
| % Change |
|
Celadon Group, Inc. |
| 1,738 |
| 2,044 |
| 2,054 |
| 2,150 |
| 23.7 | % |
Covenant Transport |
| 5,021 |
| 4,894 |
| 5,138 |
| 4,936 |
| -1.7 | % |
J.B. Hunt Transport Services, Inc. |
| 12,294 |
| 12,029 |
| 11,600 |
| 11,483 |
| -6.6 | % |
Knight Transportation, Inc. |
| 1,697 |
| 1,916 |
| 2,165 |
| 2,574 |
| 51.7 | % |
Marten Transport, Ltd. |
| 1,522 |
| 1,554 |
| 1,671 |
| 1,752 |
| 15.1 | % |
P.A.M. Transportation Services, Inc. |
| 2,012 |
| 2,090 |
| 2,235 |
| 2,237 |
| 11.2 | % |
Swift Transportation Co., Inc. |
| 15,500 |
| 16,100 |
| 16,600 |
| 18,500 |
| 19.4 | % |
U.S. Xpress Enterprises, Inc. |
| 5,424 |
| 5,813 |
| 5,496 |
| 5,894 |
| 8.7 | % |
USA Truck, Inc. |
| 1,874 |
| 1,810 |
| 2,120 |
| 2,218 |
| 18.4 | % |
Werner Enterprises, Inc. |
| 9,157 |
| 9,596 |
| 10,003 |
| 11,051 |
| 20.7 | % |
Total |
| 56,239 |
| 57,846 |
| 59,082 |
| 62,795 |
| 11.7 | % |
|
|
|
|
|
|
|
|
|
|
|
|
TWINS |
| 1,322 |
| 1,146 |
| 930 |
| 963 |
| -27.2 | % |
TWINS Adjusted (a) |
| 1,052 |
| 1,146 |
| 930 |
| 963 |
| -8.5 | % |
Total Drivers
|
| Total Drivers |
| ’01-’04 |
| ||||||
Company |
| 2001 |
| 2002 |
| 2003 |
| 2004 |
| % Change |
|
Celadon Group, Inc. |
| 2,431 |
| 2,556 |
| 2,471 |
| 2,508 |
| 3.2 | % |
Covenant Transport |
| 5,381 |
| 5,270 |
| 5,551 |
| 5,153 |
| -4.2 | % |
J.B. Hunt Transport Services, Inc. |
| 12,294 |
| 12,708 |
| 12,594 |
| 12,784 |
| 4.0 | % |
Knight Transportation, Inc. |
| 1,897 |
| 2,125 |
| 2,418 |
| 2,818 |
| 48.6 | % |
Marten Transport, Ltd. |
| 2,069 |
| 2,165 |
| 2,256 |
| 2,309 |
| 11.6 | % |
P.A.M. Transportation Services, Inc. |
| 2,147 |
| 2,220 |
| 2,338 |
| 2,322 |
| 8.2 | % |
Swift Transportation Co., Inc. |
| 18,548 |
| 19,252 |
| 20,292 |
| 22,147 |
| 19.4 | % |
U.S. Xpress Enterprises, Inc. |
| 6,231 |
| 6,919 |
| 6,446 |
| 6,468 |
| 3.8 | % |
USA Truck, Inc. |
| 1,918 |
| 1,851 |
| 2,162 |
| 2,263 |
| 18.0 | % |
Werner Enterprises, Inc. |
| 10,292 |
| 10,616 |
| 10,923 |
| 11,976 |
| 16.4 | % |
Total |
| 63,208 |
| 65,682 |
| 67,451 |
| 70,748 |
| 11.9 | % |
|
|
|
|
|
|
|
|
|
|
|
|
TWINS |
| 2,087 |
| 1,982 |
| 1,643 |
| 1,514 |
| -27.5 | % |
(a) Adjusted to reflect management decision to move 270 tractors out of the Company fleet into lease-to-own tractors with owner-operators.
11
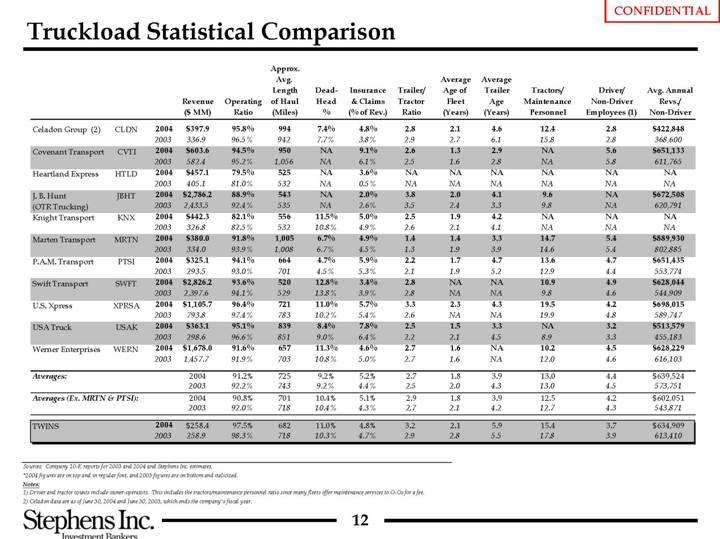
Truckload Statistical Comparison
|
|
|
|
|
|
|
|
|
| Approx. |
|
|
|
|
|
|
|
|
|
|
|
|
|
|
|
|
| ||
|
|
|
|
|
|
|
|
|
| Avg. |
|
|
|
|
|
|
| Average |
| Average |
|
|
|
|
|
|
| ||
|
|
|
|
|
|
|
|
|
| Length |
| Dead- |
| Insurance |
| Trailer/ |
| Age of |
| Trailer |
| Tractors/ |
| Driver/ |
| Avg. Annual |
| ||
|
|
|
|
|
| Revenue |
| Operating |
| of Haul |
| Head |
| & Claims |
| Tractor |
| Fleet |
| Age |
| Maintenance |
| Non-Driver |
| Revs./ |
| ||
|
|
|
|
|
| ($ MM) |
| Ratio |
| (Miles) |
| % |
| (% of Rev.) |
| Ratio |
| (Years) |
| (Years) |
| Personnel |
| Employees (1) |
| Non-Driver |
| ||
Celadon Group (2) |
| CLDN |
| 2004 |
| $ | 397.9 |
| 95.8 | % | 994 |
| 7.4 | % | 4.8 | % | 2.8 |
| 2.1 |
| 4.6 |
| 12.4 |
| 2.8 |
| $ | 422,848 |
|
|
|
|
| 2003 |
| 336.9 |
| 96.5 | % | 942 |
| 7.7 | % | 3.8 | % | 2.9 |
| 2.7 |
| 6.1 |
| 15.8 |
| 2.8 |
| 368,600 |
| ||
Covenant Transport |
| CVTI |
| 2004 |
| $ | 603.6 |
| 94.5 | % | 950 |
| NA |
| 9.1 | % | 2.6 |
| 1.3 |
| 2.9 |
| NA |
| 5.6 |
| $ | 651,133 |
|
|
|
|
| 2003 |
| 582.4 |
| 95.2 | % | 1,056 |
| NA |
| 6.1 | % | 2.5 |
| 1.6 |
| 2.8 |
| NA |
| 5.8 |
| 611,765 |
| ||
Heartland Express |
| HTLD |
| 2004 |
| $ | 457.1 |
| 79.5 | % | 525 |
| NA |
| 3.6 | % | NA |
| NA |
| NA |
| NA |
| NA |
| NA |
| |
|
|
|
| 2003 |
| 405.1 |
| 81.0 | % | 532 |
| NA |
| 0.5 | % | NA |
| NA |
| NA |
| NA |
| NA |
| NA |
| ||
J. B. Hunt |
| JBHT |
| 2004 |
| $ | 2,786.2 |
| 88.9 | % | 543 |
| NA |
| 2.0 | % | 3.8 |
| 2.0 |
| 4.1 |
| 9.6 |
| NA |
| $ | 672,508 |
|
(OTR Trucking) |
|
|
| 2003 |
| 2,433.5 |
| 92.4 | % | 535 |
| NA |
| 2.6 | % | 3.5 |
| 2.4 |
| 3.3 |
| 9.8 |
| NA |
| 620,791 |
| ||
Knight Transport |
| KNX |
| 2004 |
| $ | 442.3 |
| 82.1 | % | 556 |
| 11.5 | % | 5.0 | % | 2.5 |
| 1.9 |
| 4.2 |
| NA |
| NA |
| NA |
| |
|
|
|
| 2003 |
| 326.8 |
| 82.5 | % | 532 |
| 10.8 | % | 4.9 | % | 2.6 |
| 2.1 |
| 4.1 |
| NA |
| NA |
| NA |
| ||
Marten Transport |
| MRTN |
| 2004 |
| $ | 380.0 |
| 91.8 | % | 1,005 |
| 6.7 | % | 4.9 | % | 1.4 |
| 1.4 |
| 3.3 |
| 14.7 |
| 5.4 |
| $ | 889,930 |
|
|
|
|
| 2003 |
| 334.0 |
| 93.9 | % | 1,008 |
| 6.7 | % | 4.5 | % | 1.3 |
| 1.9 |
| 3.9 |
| 14.6 |
| 5.4 |
| 802,885 |
| ||
P.A.M. Transport |
| PTSI |
| 2004 |
| $ | 325.1 |
| 94.1 | % | 664 |
| 4.7 | % | 5.9 | % | 2.2 |
| 1.7 |
| 4.7 |
| 13.6 |
| 4.7 |
| $ | 651,435 |
|
|
|
|
| 2003 |
| 293.5 |
| 93.0 | % | 701 |
| 4.5 | % | 5.3 | % | 2.1 |
| 1.9 |
| 5.2 |
| 12.9 |
| 4.4 |
| 553,774 |
| ||
Swift Transport |
| SWFT |
| 2004 |
| $ | 2,826.2 |
| 93.6 | % | 520 |
| 12.8 | % | 3.4 | % | 2.8 |
| NA |
| NA |
| 10.9 |
| 4.9 |
| $ | 628,044 |
|
|
|
|
| 2003 |
| 2,397.6 |
| 94.1 | % | 529 |
| 13.8 | % | 3.9 | % | 2.8 |
| NA |
| NA |
| 9.8 |
| 4.6 |
| 544,909 |
| ||
U.S. Xpress |
| XPRSA |
| 2004 |
| $ | 1,105.7 |
| 96.4 | % | 721 |
| 11.0 | % | 5.7 | % | 3.3 |
| 2.3 |
| 4.3 |
| 19.5 |
| 4.2 |
| $ | 698,015 |
|
|
|
|
| 2003 |
| 793.8 |
| 97.4 | % | 783 |
| 10.2 | % | 5.4 | % | 2.6 |
| NA |
| NA |
| 19.9 |
| 4.8 |
| 589,747 |
| ||
USA Truck |
| USAK |
| 2004 |
| $ | 363.1 |
| 95.1 | % | 839 |
| 8.4 | % | 7.8 | % | 2.5 |
| 1.5 |
| 3.3 |
| NA |
| 3.2 |
| $ | 513,579 |
|
|
|
|
| 2003 |
| 298.6 |
| 96.6 | % | 851 |
| 9.0 | % | 6.4 | % | 2.2 |
| 2.1 |
| 4.5 |
| 8.9 |
| 3.3 |
| 455,183 |
| ||
Werner Enterprises |
| WERN |
| 2004 |
| $ | 1,678.0 |
| 91.6 | % | 657 |
| 11.3 | % | 4.6 | % | 2.7 |
| 1.6 |
| NA |
| 10.2 |
| 4.5 |
| $ | 628,229 |
|
|
|
|
| 2003 |
| 1,457.7 |
| 91.9 | % | 703 |
| 10.8 | % | 5.0 | % | 2.7 |
| 1.6 |
| NA |
| 12.0 |
| 4.6 |
| 616,103 |
| ||
Averages: |
|
|
|
|
| 2004 |
| 91.2 | % | 725 |
| 9.2 | % | 5.2 | % | 2.7 |
| 1.8 |
| 3.9 |
| 13.0 |
| 4.4 |
| $ | 639,524 |
| |
|
|
|
|
|
| 2003 |
| 92.2 | % | 743 |
| 9.2 | % | 4.4 | % | 2.5 |
| 2.0 |
| 4.3 |
| 13.0 |
| 4.5 |
| 573,751 |
| ||
Averages (Ex. MRTN & PTSI): |
|
|
|
|
| 2004 |
| 90.8 | % | 701 |
| 10.4 | % | 5.1 | % | 2.9 |
| 1.8 |
| 3.9 |
| 12.5 |
| 4.2 |
| $ | 602,051 |
| |
|
|
|
|
|
| 2003 |
| 92.0 | % | 718 |
| 10.4 | % | 4.3 | % | 2.7 |
| 2.1 |
| 4.2 |
| 12.7 |
| 4.3 |
| 543,871 |
| ||
TWINS |
|
|
| 2004 |
| $ | 258.4 |
| 97.5 | % | 682 |
| 11.0 | % | 4.8 | % | 3.2 |
| 2.1 |
| 5.9 |
| 15.4 |
| 3.7 |
| $ | 634,909 |
|
|
|
|
| 2003 |
| 258.9 |
| 98.3 | % | 718 |
| 10.3 | % | 4.7 | % | 2.9 |
| 2.8 |
| 5.5 |
| 17.8 |
| 3.9 |
| 613,410 |
| ||
Sources: Company 10-K reports for 2003 and 2004 and Stephens Inc. estimates.
*2004 figures are on top and in regular font, and 2003 figures are on bottom and italicized.
Notes:
(1) Driver and tractor counts include owner-operators. This includes the tractors/maintenance personnel ratio since many fleets offer maintenance services to O-Os for a fee.
(2) Celadon data are as of June 30, 2004 and June 30, 2003, which ends the company’s fiscal year.
12
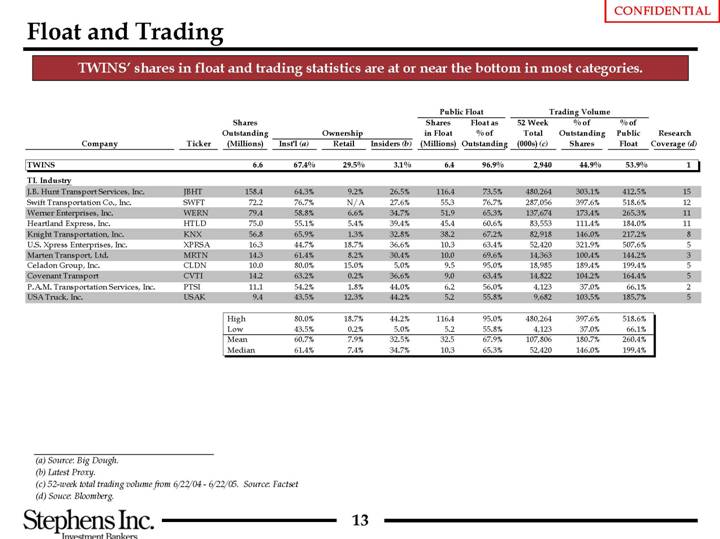
Float and Trading
TWINS’ shares in float and trading statistics are at or near the bottom in most categories.
|
|
|
|
|
|
|
|
|
|
|
| Public Float |
| Trading Volume |
|
|
| ||||||
|
|
|
|
|
|
|
|
|
|
|
|
|
| Float as |
| 52 Week |
| % of |
| % of |
|
|
|
|
|
|
| Shares |
| Ownership |
| Shares |
| % of |
| Total |
| Outstanding |
| Public |
| Research |
| ||||
Company |
| Ticker |
| Outstanding |
| Inst’l (a) |
| Retail |
| Insiders (b) |
| in Float |
| Outstanding |
| (c) |
| Shares |
| Float |
| Coverage (d) |
|
|
|
|
| (Millions) |
|
|
|
|
|
|
| (Millions) |
|
|
| (000s) |
|
|
|
|
|
|
|
TWINS |
|
|
| 6.6 |
| 67.4 | % | 29.5 | % | 3.1 | % | 6.4 |
| 96.9 | % | 2,940 |
| 44.9 | % | 53.9 | % | 1 |
|
|
|
|
|
|
|
|
|
|
|
|
|
|
|
|
|
|
|
|
|
|
|
|
|
TL Industry |
|
|
|
|
|
|
|
|
|
|
|
|
|
|
|
|
|
|
|
|
|
|
|
J.B. Hunt Transport Services, Inc. |
| JBHT |
| 158.4 |
| 64.3 | % | 9.2 | % | 26.5 | % | 116.4 |
| 73.5 | % | 480,264 |
| 303.1 | % | 412.5 | % | 15 |
|
Swift Transportation Co., Inc. |
| SWFT |
| 72.2 |
| 76.7 | % | N/A |
| 27.6 | % | 55.3 |
| 76.7 | % | 287,056 |
| 397.6 | % | 518.6 | % | 12 |
|
Werner Enterprises, Inc. |
| WERN |
| 79.4 |
| 58.8 | % | 6.6 | % | 34.7 | % | 51.9 |
| 65.3 | % | 137,674 |
| 173.4 | % | 265.3 | % | 11 |
|
Heartland Express, Inc. |
| HTLD |
| 75.0 |
| 55.1 | % | 5.4 | % | 39.4 | % | 45.4 |
| 60.6 | % | 83,553 |
| 111.4 | % | 184.0 | % | 11 |
|
Knight Transportation, Inc. |
| KNX |
| 56.8 |
| 65.9 | % | 1.3 | % | 32.8 | % | 38.2 |
| 67.2 | % | 82,918 |
| 146.0 | % | 217.2 | % | 8 |
|
U.S. Xpress Enterprises, Inc. |
| XPRSA |
| 16.3 |
| 44.7 | % | 18.7 | % | 36.6 | % | 10.3 |
| 63.4 | % | 52,420 |
| 321.9 | % | 507.6 | % | 5 |
|
Marten Transport, Ltd. |
| MRTN |
| 14.3 |
| 61.4 | % | 8.2 | % | 30.4 | % | 10.0 |
| 69.6 | % | 14,363 |
| 100.4 | % | 144.2 | % | 3 |
|
Celadon Group, Inc. |
| CLDN |
| 10.0 |
| 80.0 | % | 15.0 | % | 5.0 | % | 9.5 |
| 95.0 | % | 18,985 |
| 189.4 | % | 199.4 | % | 5 |
|
Covenant Transport |
| CVTI |
| 14.2 |
| 63.2 | % | 0.2 | % | 36.6 | % | 9.0 |
| 63.4 | % | 14,822 |
| 104.2 | % | 164.4 | % | 5 |
|
P.A.M. Transportation Services, Inc. |
| PTSI |
| 11.1 |
| 54.2 | % | 1.8 | % | 44.0 | % | 6.2 |
| 56.0 | % | 4,123 |
| 37.0 | % | 66.1 | % | 2 |
|
USA Truck, Inc. |
| USAK |
| 9.4 |
| 43.5 | % | 12.3 | % | 44.2 | % | 5.2 |
| 55.8 | % | 9,682 |
| 103.5 | % | 185.7 | % | 5 |
|
|
|
|
|
|
|
|
|
|
|
|
|
|
|
|
|
|
|
|
|
|
|
|
|
|
|
|
| High |
| 80.0 | % | 18.7 | % | 44.2 | % | 116.4 |
| 95.0 | % | 480,264 |
| 397.6 | % | 518.6 | % |
|
|
|
|
|
| Low |
| 43.5 | % | 0.2 | % | 5.0 | % | 5.2 |
| 55.8 | % | 4,123 |
| 37.0 | % | 66.1 | % |
|
|
|
|
|
| Mean |
| 60.7 | % | 7.9 | % | 32.5 | % | 32.5 |
| 67.9 | % | 107,806 |
| 180.7 | % | 260.4 | % |
|
|
|
|
|
| Median |
| 61.4 | % | 7.4 | % | 34.7 | % | 10.3 |
| 65.3 | % | 52,420 |
| 146.0 | % | 199.4 | % |
|
|
(a) Source: Big Dough.
(b) Latest Proxy.
(c) 52-week total trading volume from 6/22/04 - 6/22/05. Source: Factset
(d) Souce: Bloomberg.
13
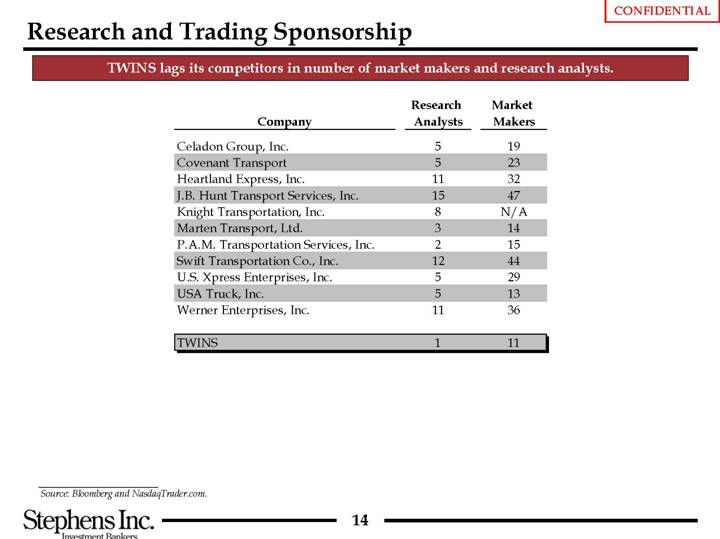
Research and Trading Sponsorship
TWINS lags its competitors in number of market makers and research analysts.
|
| Research |
| Market |
|
Company |
| Analysts |
| Makers |
|
Celadon Group, Inc. |
| 5 |
| 19 |
|
Covenant Transport |
| 5 |
| 23 |
|
Heartland Express, Inc. |
| 11 |
| 32 |
|
J.B. Hunt Transport Services, Inc. |
| 15 |
| 47 |
|
Knight Transportation, Inc. |
| 8 |
| N/A |
|
Marten Transport, Ltd. |
| 3 |
| 14 |
|
P.A.M. Transportation Services, Inc. |
| 2 |
| 15 |
|
Swift Transportation Co., Inc. |
| 12 |
| 44 |
|
U.S. Xpress Enterprises, Inc. |
| 5 |
| 29 |
|
USA Truck, Inc. |
| 5 |
| 13 |
|
Werner Enterprises, Inc. |
| 11 |
| 36 |
|
|
|
|
|
|
|
TWINS |
| 1 |
| 11 |
|
Source: Bloomberg and NasdaqTrader.com.
14
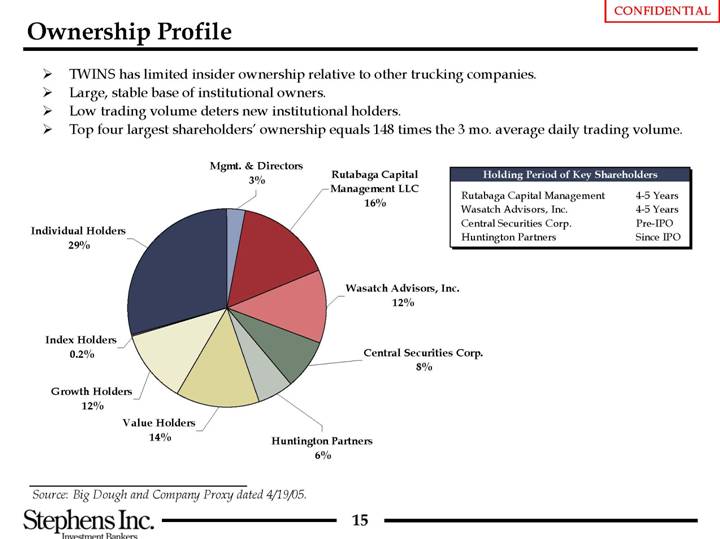
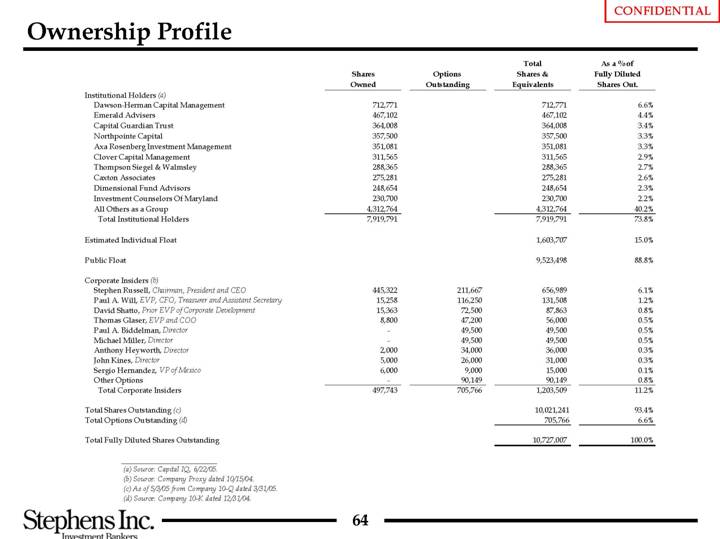
Ownership Profile
• TWINS has limited insider ownership relative to other trucking companies.
• Large, stable base of institutional owners.
• Low trading volume deters new institutional holders.
• Top four largest shareholders’ ownership equals 148 times the 3 mo. average daily trading volume.
[CHART]
Holding Period of Key Shareholders
Rutabaga Capital Management |
| 4-5 Years |
|
Wasatch Advisors, Inc. |
| 4-5 Years |
|
Central Securities Corp. |
| Pre-IPO |
|
Huntington Partners |
| Since IPO |
|
Source: Big Dough and Company Proxy dated 4/19/05.
15
II. Truckload Industry Outlook
Truckload Industry Outlook and Trends
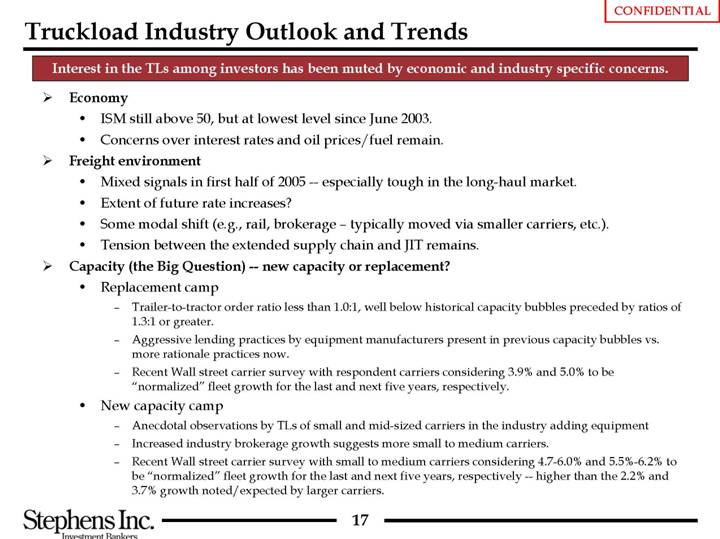
Interest in the TLs among investors has been muted by economic and industry specific concerns.
• Economy
• ISM still above 50, but at lowest level since June 2003.
• Concerns over interest rates and oil prices/fuel remain.
• Freight environment
• Mixed signals in first half of 2005 — especially tough in the long-haul market.
• Extent of future rate increases?
• Some modal shift (e.g., rail, brokerage – typically moved via smaller carriers, etc.).
• Tension between the extended supply chain and JIT remains.
• Capacity (the Big Question) — new capacity or replacement?
• Replacement camp
• Trailer-to-tractor order ratio less than 1.0:1, well below historical capacity bubbles preceded by ratios of 1.3:1 or greater.
• Aggressive lending practices by equipment manufacturers present in previous capacity bubbles vs. more rationale practices now.
• Recent Wall street carrier survey with respondent carriers considering 3.9% and 5.0% to be “normalized” fleet growth for the last and next five years, respectively.
• New capacity camp
• Anecdotal observations by TLs of small and mid-sized carriers in the industry adding equipment
• Increased industry brokerage growth suggests more small to medium carriers.
• Recent Wall street carrier survey with small to medium carriers considering 4.7-6.0% and 5.5%-6.2% to be “normalized” fleet growth for the last and next five years, respectively — higher than the 2.2% and 3.7% growth noted/expected by larger carriers.
[LOGO]
17
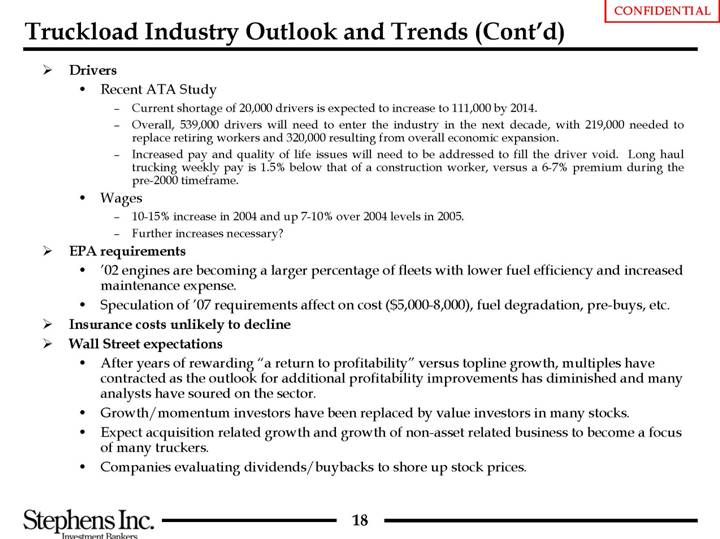
• Drivers
• Recent ATA Study
• Current shortage of 20,000 drivers is expected to increase to 111,000 by 2014.
• Overall, 539,000 drivers will need to enter the industry in the next decade, with 219,000 needed to replace retiring workers and 320,000 resulting from overall economic expansion.
• Increased pay and quality of life issues will need to be addressed to fill the driver void. Long haul trucking weekly pay is 1.5% below that of a construction worker, versus a 6-7% premium during the pre-2000 timeframe.
• Wages
• 10-15% increase in 2004 and up 7-10% over 2004 levels in 2005.
• Further increases necessary?
• EPA requirements
• ’02 engines are becoming a larger percentage of fleets with lower fuel efficiency and increased maintenance expense.
• Speculation of ’07 requirements affect on cost ($5,000-8,000), fuel degradation, pre-buys, etc.
• Insurance costs unlikely to decline
• Wall Street expectations
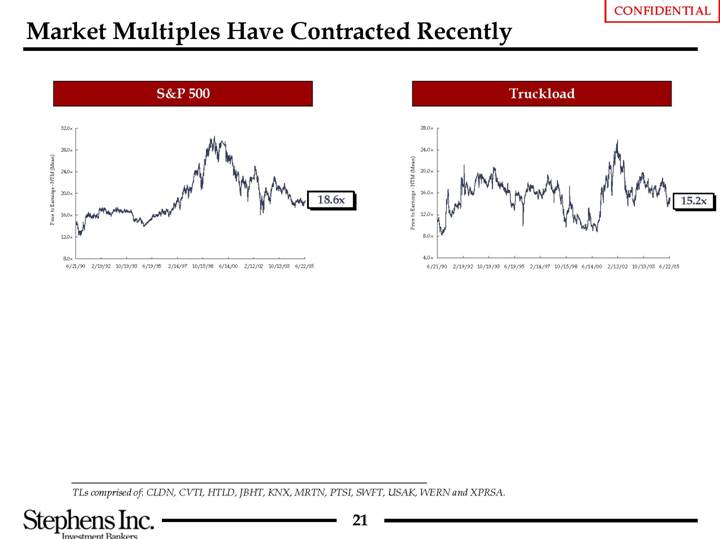
• After years of rewarding “a return to profitability” versus topline growth, multiples have contracted as the outlook for additional profitability improvements has diminished and many analysts have soured on the sector.
• Growth/momentum investors have been replaced by value investors in many stocks.
• Expect acquisition related growth and growth of non-asset related business to become a focus of many truckers.
• Companies evaluating dividends/buybacks to shore up stock prices.
18
Wall Street Analysts are Mixed on the TL Sector
Negative |
| Positive |
|
| Bear Stearns |
| Morgan Stanley |
| Deutsche Bank |
| A.G. Edwards |
| ||||||||||||||||
Company |
| Buy |
| Hold |
| Sell |
| Buy |
| Hold |
| Sell |
| Buy |
| Hold |
| Sell |
| Buy |
| Hold |
| Sell |
|
CLDN |
|
|
|
|
|
|
|
|
|
|
|
|
|
|
|
|
|
|
|
|
|
|
|
|
|
CVTI |
|
|
|
|
| X |
|
|
|
|
|
|
|
|
|
|
|
|
|
|
| X |
|
|
|
HTLD |
|
|
|
|
| X |
|
|
| X |
|
|
|
|
| X |
|
|
|
|
|
|
|
|
|
JBHT |
|
|
| X |
|
|
|
|
| X |
|
|
| X |
|
|
|
|
|
|
| X |
|
|
|
KNX |
|
|
|
|
| X |
|
|
|
|
|
|
|
|
| X |
|
|
|
|
| X |
|
|
|
MRTN |
|
|
|
|
|
|
|
|
|
|
|
|
|
|
|
|
|
|
|
|
|
|
|
|
|
PTSI |
|
|
|
|
|
|
|
|
|
|
|
|
|
|
|
|
|
|
|
|
| X |
|
|
|
SWFT |
|
|
|
|
| X |
|
|
| X |
|
|
|
|
| X |
|
|
|
|
|
|
|
|
|
USAK |
|
|
|
|
|
|
|
|
|
|
|
|
|
|
|
|
|
|
| X |
|
|
|
|
|
WERN |
|
|
|
|
| X |
|
|
| X |
|
|
|
|
| X |
|
|
| X |
|
|
|
|
|
XPRSA |
|
|
|
|
|
|
|
|
|
|
|
|
|
|
|
|
|
|
|
|
| X |
|
|
|
Firm Total |
| 0 |
| 1 |
| 5 |
| 0 |
| 4 |
| 0 |
| 1 |
| 4 |
| 0 |
| 2 |
| 5 |
| 1 |
|
|
| BB&T |
| Stephens |
| Morgan Keegan |
| Legg Mason |
| Company Total |
| ||||||||||||||||||||
Company |
| Buy |
| Hold |
| Sell |
| Buy |
| Hold |
| Sell |
| Buy |
| Hold |
| Sell |
| Buy |
| Hold |
| Sell |
| Buy |
| Hold |
| Sell |
|
CLDN |
|
|
| X |
|
|
| X |
|
|
|
|
|
|
|
|
|
|
| X |
|
|
|
|
| 2 |
| 1 |
| — |
|
CVTI |
|
|
| X |
|
|
|
|
| X |
|
|
| X |
|
|
|
|
|
|
|
|
|
|
| 1 |
| 3 |
| 1 |
|
HTLD |
|
|
| X |
|
|
| X |
|
|
|
|
|
|
| X |
|
|
| X |
|
|
|
|
| 2 |
| 4 |
| 1 |
|
JBHT |
| X |
|
|
|
|
| X |
|
|
|
|
| X |
|
|
|
|
| X |
|
|
|
|
| 5 |
| 3 |
| — |
|
KNX |
|
|
| X |
|
|
| X |
|
|
|
|
| X |
|
|
|
|
|
|
| X |
|
|
| 2 |
| 4 |
| 1 |
|
MRTN |
| X |
|
|
|
|
| X |
|
|
|
|
|
|
|
|
|
|
| X |
|
|
|
|
| 3 |
| — |
| — |
|
PTSI |
|
|
|
|
|
|
|
|
| X |
|
|
|
|
|
|
|
|
|
|
|
|
|
|
| — |
| 2 |
| — |
|
SWFT |
| X |
|
|
|
|
| X |
|
|
|
|
|
|
|
|
|
|
| X |
|
|
|
|
| 3 |
| 2 |
| 2 |
|
USAK |
| X |
|
|
|
|
| X |
|
|
|
|
| X |
|
|
|
|
|
|
|
|
|
|
| 4 |
| — |
| — |
|
WERN |
|
|
| X |
|
|
| X |
|
|
|
|
| X |
|
|
|
|
| X |
|
|
|
|
| 4 |
| 3 |
| 1 |
|
XPRSA |
|
|
| X |
|
|
|
|
| X |
|
|
| X |
|
|
|
|
| X |
|
|
|
|
| 2 |
| 3 |
| — |
|
Firm Total |
| 4 |
| 6 |
| 0 |
| 8 |
| 3 |
| 0 |
| 6 |
| 1 |
| 0 |
| 7 |
| 1 |
| 0 |
|
|
|
|
|
|
|
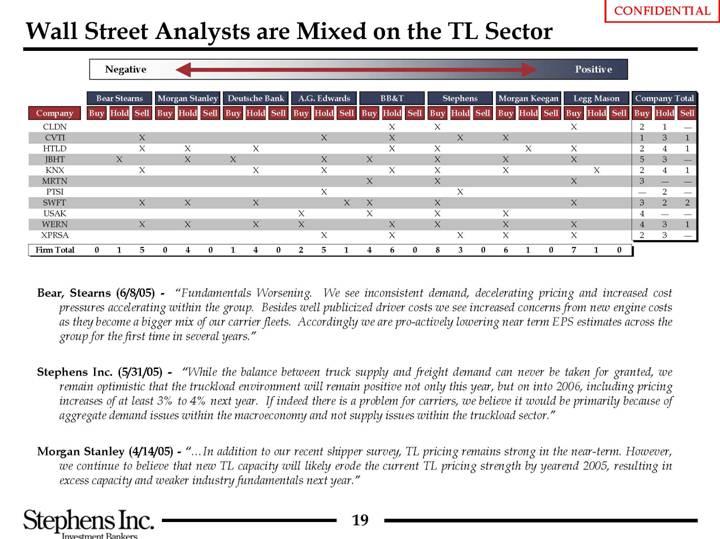
Bear, Stearns (6/8/05) - “Fundamentals Worsening. We see inconsistent demand, decelerating pricing and increased cost pressures accelerating within the group. Besides well publicized driver costs we see increased concerns from new engine costs as they become a bigger mix of our carrier fleets. Accordingly we are pro-actively lowering near term EPS estimates across the group for the first time in several years.”
Stephens Inc. (5/31/05) - “While the balance between truck supply and freight demand can never be taken for granted, we remain optimistic that the truckload environment will remain positive not only this year, but on into 2006, including pricing increases of at least 3% to 4% next year. If indeed there is a problem for carriers, we believe it would be primarily because of aggregate demand issues within the macroeconomy and not supply issues within the truckload sector.”
Morgan Stanley (4/14/05) - “…In addition to our recent shipper survey, TL pricing remains strong in the near-term. However, we continue to believe that new TL capacity will likely erode the current TL pricing strength by yearend 2005, resulting in excess capacity and weaker industry fundamentals next year.”
19
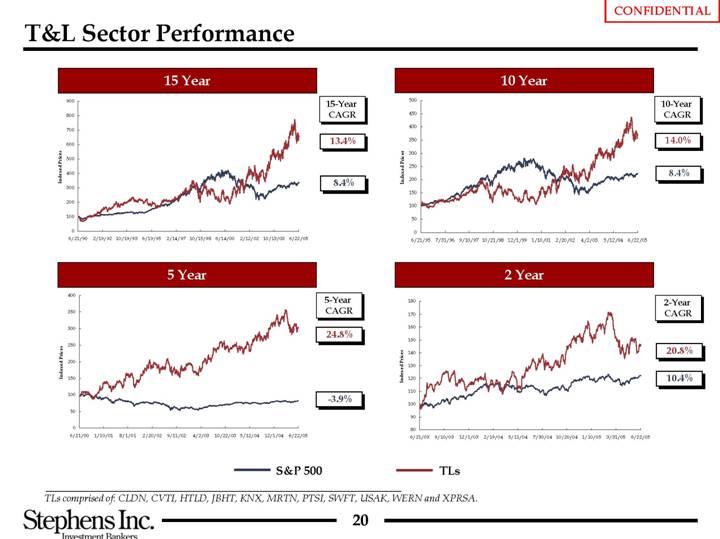
T&L Sector Performance
15 Year
[CHART]
10 Year
[CHART]
5 Year
[CHART]
2 Year
[CHART]
TLs comprised of: CLDN, CVTI, HTLD, JBHT, KNX, MRTN, PTSI, SWFT, USAK, WERN and XPRSA.
20
Market Multiples Have Contracted Recently
S&P 500
[CHART]
Truckload
[CHART]
TLs comprised of: CLDN, CVTI, HTLD, JBHT, KNX, MRTN, PTSI, SWFT, USAK, WERN and XPRSA.
21
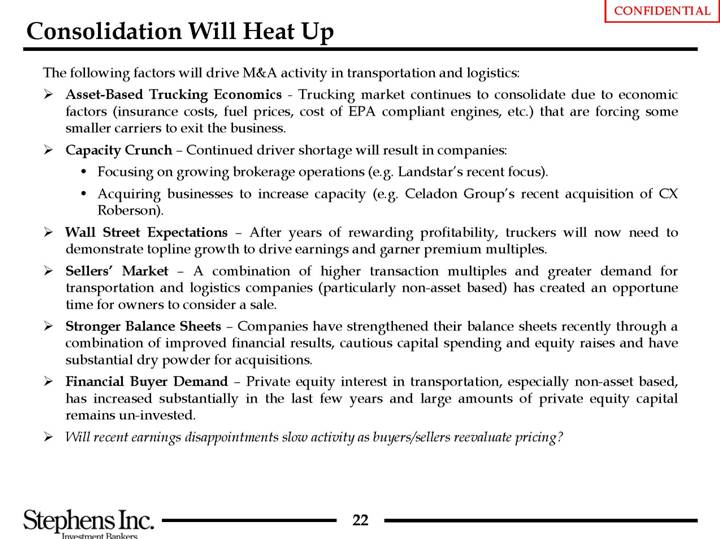
Consolidation Will Heat Up
The following factors will drive M&A activity in transportation and logistics:
• Asset-Based Trucking Economics - Trucking market continues to consolidate due to economic factors (insurance costs, fuel prices, cost of EPA compliant engines, etc.) that are forcing some smaller carriers to exit the business.
• Capacity Crunch – Continued driver shortage will result in companies:
• Focusing on growing brokerage operations (e.g. Landstar’s recent focus).
• Acquiring businesses to increase capacity (e.g. Celadon Group’s recent acquisition of CX Roberson).
• Wall Street Expectations – After years of rewarding profitability, truckers will now need to demonstrate topline growth to drive earnings and garner premium multiples.
• Sellers’ Market – A combination of higher transaction multiples and greater demand for transportation and logistics companies (particularly non-asset based) has created an opportune time for owners to consider a sale.
• Stronger Balance Sheets – Companies have strengthened their balance sheets recently through a combination of improved financial results, cautious capital spending and equity raises and have substantial dry powder for acquisitions.
• Financial Buyer Demand – Private equity interest in transportation, especially non-asset based, has increased substantially in the last few years and large amounts of private equity capital remains un-invested.
• Will recent earnings disappointments slow activity as buyers/sellers reevaluate pricing?
22
The Asset-Lite Model is in Vogue
The operational and financial benefits of asset-lite models have fueled M&A activity and high valuations in the sector.
• The operational and financial benefits of an asset-lite model are readily apparent…
• Higher returns on capital.
• Variable cost model leads to stability and predictability.
• Manage freight and customer relationships rather than assets.
• Little equipment risk or maintenance hassles.
• Ability to add capacity with little cost or capex.
• O/O growth, small fleet conversion, agency, etc.
• Brokerage has become a more important service.
• …and have attracted a wide range of financial and strategic buyers. Examples include:
• Thayer’s acquisition of Dawes Transport and RoadRunner Freight.
• Universal Truckload Services acquired an agent-based company and an intermodal brokerage company in last year.
• Fenway Partners:
• Transport Industries recently accelerated its M&A activity in order to gain scale and diversify its customer base.
• Recent acquisition of Panther II Transport marks its second entry into the sector.
• The consolidation is expected to continue, but at high valuations given the scarcity of asset-lite companies.
• We are aware of three M&A transactions that are pending or being considered.
• Of the ten asset-lite transactions with publicly disseminated information since June 2002, the median EBITDA and EBIT multiples were 7.0x and 10.9x, respectively.
• Anecdotal information leads us to conclude that recent transactions have and will trade at EBITDA and EBIT multiples approaching 8.0x and 12.0x, respectively.
23
III. Overview of Strategic Alternatives
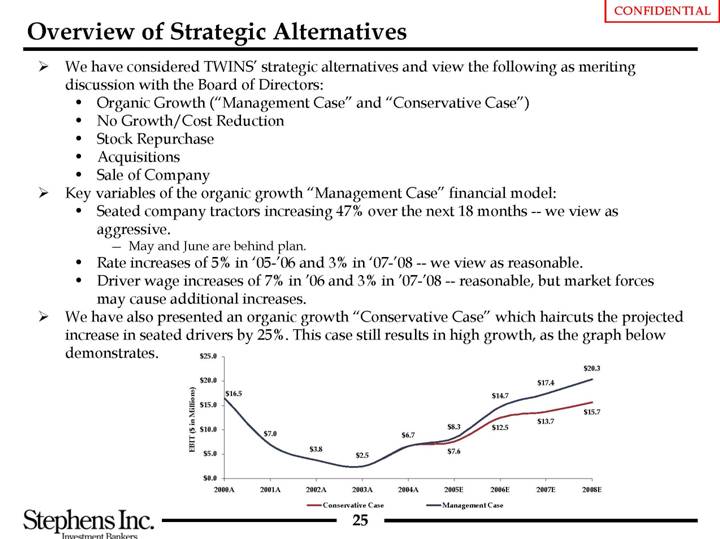
Overview of Strategic Alternatives
• We have considered TWINS’ strategic alternatives and view the following as meriting discussion with the Board of Directors:
• Organic Growth (“Management Case” and “Conservative Case”)
• No Growth/Cost Reduction
• Stock Repurchase
• Acquisitions
• Sale of Company
• Key variables of the organic growth “Management Case” financial model:
• Seated company tractors increasing 47% over the next 18 months — we view as aggressive.
• May and June are behind plan.
• Rate increases of 5% in ’05-’06 and 3% in ’07-’08 - -- we view as reasonable.
• Driver wage increases of 7% in ‘06 and 3% in ’07-’08 - -- reasonable, but market forces may cause additional increases.
• We have also presented an organic growth “Conservative Case” which haircuts the projected increase in seated drivers by 25%. This case still results in high growth, as the graph below demonstrates.
[CHART]
25
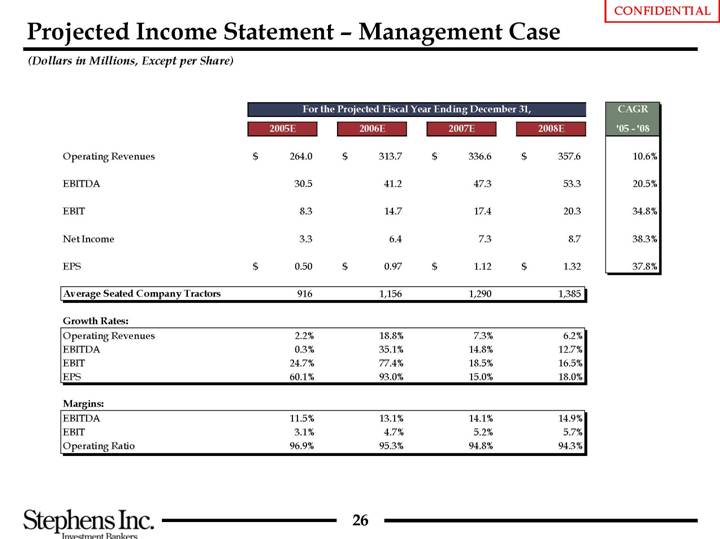
Projected Income Statement – Management Case
(Dollars in Millions, Except per Share)
|
| For the Projected Fiscal Year Ending December 31, |
| CAGR |
| |||||||||||
|
| 2005E |
| 2006E |
| 2007E |
| 2008E |
| ’05 - ’08 |
| |||||
|
|
|
|
|
|
|
|
|
|
|
| |||||
Operating Revenues |
| $ | 264.0 |
| $ | 313.7 |
| $ | 336.6 |
| $ | 357.6 |
| $ | 10.6 | % |
|
|
|
|
|
|
|
|
|
|
|
| |||||
EBITDA |
| 30.5 |
| 41.2 |
| 47.3 |
| 53.3 |
| 20.5 | % | |||||
|
|
|
|
|
|
|
|
|
|
|
| |||||
EBIT |
| 8.3 |
| 14.7 |
| 17.4 |
| 20.3 |
| 34.8 | % | |||||
|
|
|
|
|
|
|
|
|
|
|
| |||||
Net Income |
| 3.3 |
| 6.4 |
| 7.3 |
| 8.7 |
| 38.3 | % | |||||
|
|
|
|
|
|
|
|
|
|
|
| |||||
EPS |
| $ | 0.50 |
| $ | 0.97 |
| $ | 1.12 |
| $ | 1.32 |
| $ | 37.8 | % |
|
|
|
|
|
|
|
|
|
|
|
| |||||
Average Seated Company Tractors |
| 916 |
| 1,156 |
| 1,290 |
| 1,385 |
|
|
| |||||
|
|
|
|
|
|
|
|
|
|
|
| |||||
Growth Rates: |
|
|
|
|
|
|
|
|
|
|
| |||||
|
|
|
|
|
|
|
|
|
|
|
| |||||
Operating Revenues |
| 2.2 | % | 18.8 | % | 7.3 | % | 6.2 | % |
|
| |||||
EBITDA |
| 0.3 | % | 35.1 | % | 14.8 | % | 12.7 | % |
|
| |||||
EBIT |
| 24.7 | % | 77.4 | % | 18.5 | % | 16.5 | % |
|
| |||||
EPS |
| 60.1 | % | 93.0 | % | 15.0 | % | 18.0 | % |
|
| |||||
|
|
|
|
|
|
|
|
|
|
|
| |||||
Margins: |
|
|
|
|
|
|
|
|
|
|
| |||||
|
|
|
|
|
|
|
|
|
|
|
| |||||
EBITDA |
| 11.5 | % | 13.1 | % | 14.1 | % | 14.9 | % |
|
| |||||
EBIT |
| 3.1 | % | 4.7 | % | 5.2 | % | 5.7 | % |
|
| |||||
Operating Ratio |
| 96.9 | % | 95.3 | % | 94.8 | % | 94.3 | % |
|
| |||||
26
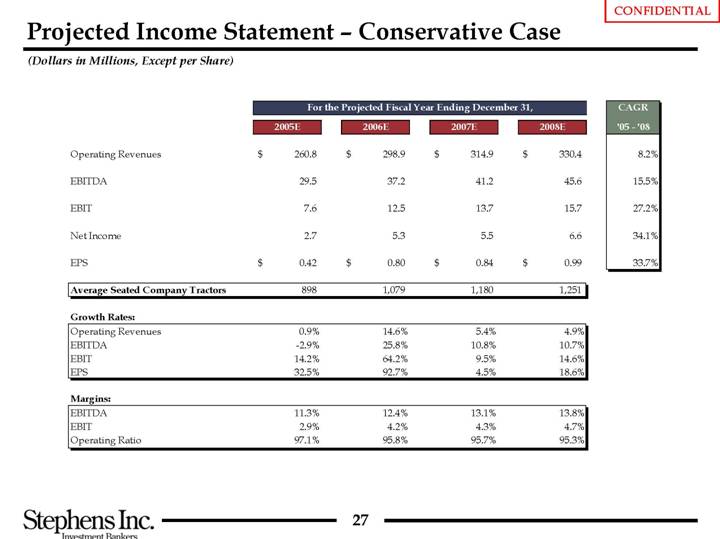
Projected Income Statement – Conservative Case
(Dollars in Millions, Except per Share)
|
| For the Projected Fiscal Year Ending December 31, |
| CAGR |
| |||||||||||
|
| 2005E |
| 2006E |
| 2007E |
| 2008E |
| ’05 - ’08 |
| |||||
|
|
|
|
|
|
|
|
|
|
|
| |||||
Operating Revenues |
| $ | 260.8 |
| $ | 298.9 |
| $ | 314.9 |
| $ | 330.4 |
| $ | 8.2 | % |
|
|
|
|
|
|
|
|
|
|
|
| |||||
EBITDA |
| 29.5 |
| 37.2 |
| 41.2 |
| 45.6 |
| 15.5 | % | |||||
|
|
|
|
|
|
|
|
|
|
|
| |||||
EBIT |
| 7.6 |
| 12.5 |
| 13.7 |
| 15.7 |
| 27.2 | % | |||||
|
|
|
|
|
|
|
|
|
|
|
| |||||
Net Income |
| 2.7 |
| 5.3 |
| 5.5 |
| 6.6 |
| 34.1 | % | |||||
|
|
|
|
|
|
|
|
|
|
|
| |||||
EPS |
| $ | 0.42 |
| $ | 0.80 |
| $ | 0.84 |
| $ | 0.99 |
| $ | 33.7 | % |
|
|
|
|
|
|
|
|
|
|
|
| |||||
Average Seated Company Tractors |
| 898 |
| 1,079 |
| 1,180 |
| 1,251 |
|
|
| |||||
|
|
|
|
|
|
|
|
|
|
|
| |||||
Growth Rates: |
|
|
|
|
|
|
|
|
|
|
| |||||
|
|
|
|
|
|
|
|
|
|
|
| |||||
Operating Revenues |
| 0.9 | % | 14.6 | % | 5.4 | % | 4.9 | % |
|
| |||||
EBITDA |
| -2.9 | % | 25.8 | % | 10.8 | % | 10.7 | % |
|
| |||||
EBIT |
| 14.2 | % | 64.2 | % | 9.5 | % | 14.6 | % |
|
| |||||
EPS |
| 32.5 | % | 92.7 | % | 4.5 | % | 18.6 | % |
|
| |||||
|
|
|
|
|
|
|
|
|
|
|
| |||||
Margins: |
|
|
|
|
|
|
|
|
|
|
| |||||
|
|
|
|
|
|
|
|
|
|
|
| |||||
EBITDA |
| 11.3 | % | 12.4 | % | 13.1 | % | 13.8 | % |
|
| |||||
EBIT |
| 2.9 | % | 4.2 | % | 4.3 | % | 4.7 | % |
|
| |||||
Operating Ratio |
| 97.1 | % | 95.8 | % | 95.7 | % | 95.3 | % |
|
| |||||
27
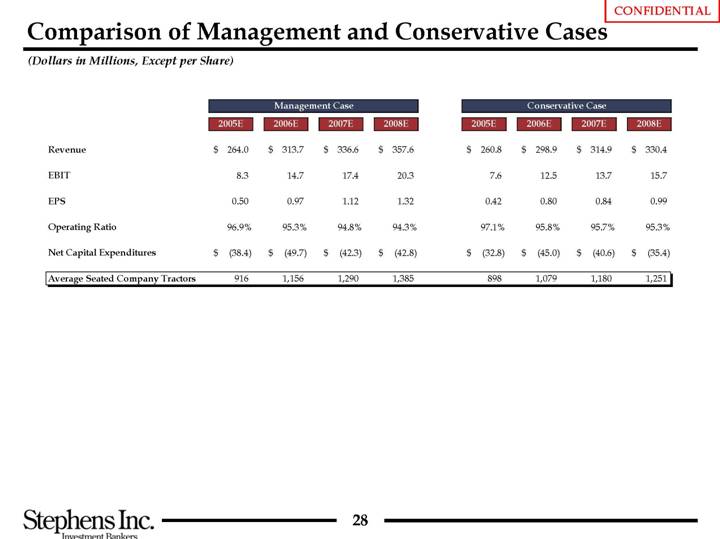
Comparison of Management and Conservative Cases
(Dollars in Millions, Except per Share)
|
| Management Case |
| Conservative Case |
| ||||||||||||||||||||
|
| 2005E |
| 2006E |
| 2007E |
| 2008E |
| 2005E |
| 2006E |
| 2007E |
| 2008E |
| ||||||||
|
|
|
|
|
|
|
|
|
|
|
|
|
|
|
|
|
| ||||||||
Revenue |
| $ | 264.0 |
| $ | 313.7 |
| $ | 336.6 |
| $ | 357.6 |
| $ | 260.8 |
| $ | 298.9 |
| $ | 314.9 |
| $ | 330.4 |
|
|
|
|
|
|
|
|
|
|
|
|
|
|
|
|
|
|
| ||||||||
EBIT |
| 8.3 |
| 14.7 |
| 17.4 |
| 20.3 |
| 7.6 |
| 12.5 |
| 13.7 |
| 15.7 |
| ||||||||
|
|
|
|
|
|
|
|
|
|
|
|
|
|
|
|
|
| ||||||||
EPS |
| 0.50 |
| 0.97 |
| 1.12 |
| 1.32 |
| 0.42 |
| 0.80 |
| 0.84 |
| 0.99 |
| ||||||||
|
|
|
|
|
|
|
|
|
|
|
|
|
|
|
|
|
| ||||||||
Operating Ratio |
| 96.9 | % | 95.3 | % | 94.8 | % | 94.3 | % | 97.1 | % | 95.8 | % | 95.7 | % | 95.3 | % | ||||||||
|
|
|
|
|
|
|
|
|
|
|
|
|
|
|
|
|
| ||||||||
Net Capital Expenditures |
| $ | (38.4 | ) | $ | (49.7 | ) | $ | (42.3 | ) | $ | (42.8 | ) | $ | (32.8 | ) | $ | (45.0 | ) | $ | (40.6 | ) | $ | (35.4 | ) |
|
|
|
|
|
|
|
|
|
|
|
|
|
|
|
|
|
| ||||||||
Average Seated Company Tractors |
| 916 |
| 1,156 |
| 1,290 |
| 1,385 |
| 898 |
| 1,079 |
| 1,180 |
| 1,251 |
| ||||||||
28
A. Organic Growth
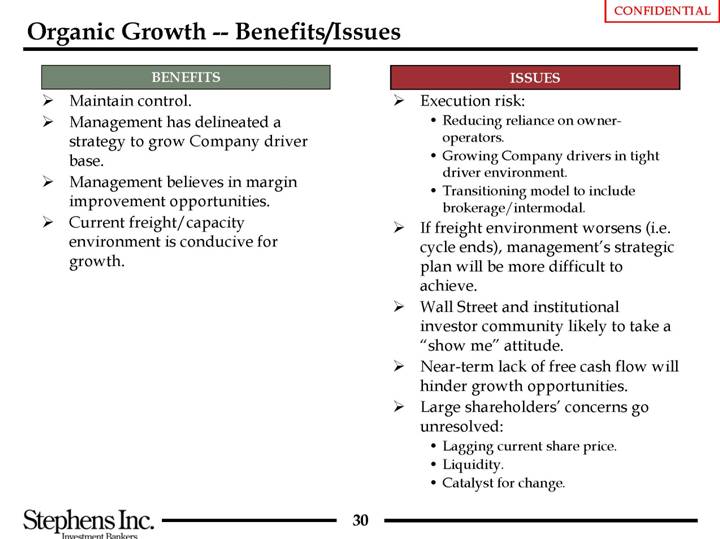
Organic Growth — Benefits/Issues
BENEFITS
• Maintain control.
• Management has delineated a strategy to grow Company driver base.
• Management believes in margin improvement opportunities.
• Current freight/capacity environment is conducive for growth.
ISSUES
• Execution risk:
• Reducing reliance on owner operators.
• Growing Company drivers in tight driver environment.
• Transitioning model to include brokerage/intermodal.
• If freight environment worsens (i.e. cycle ends), management’s strategic plan will be more difficult to achieve.
• Wall Street and institutional investor community likely to take a “show me” attitude.
• Near-term lack of free cash flow will hinder growth opportunities.
• Large shareholders’ concerns go unresolved:
• Lagging current share price.
• Liquidity.
• Catalyst for change.
30
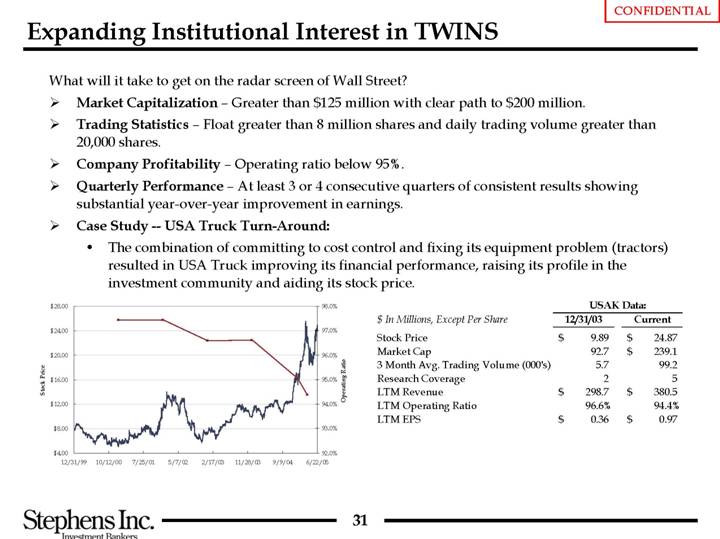
Expanding Institutional Interest in TWINS
What will it take to get on the radar screen of Wall Street?
• Market Capitalization – Greater than $125 million with clear path to $200 million.
• Trading Statistics – Float greater than 8 million shares and daily trading volume greater than 20,000 shares.
• Company Profitability – Operating ratio below 95%.
• Quarterly Performance – At least 3 or 4 consecutive quarters of consistent results showing substantial year-over-year improvement in earnings.
• Case Study — USA Truck Turn-Around:
• The combination of committing to cost control and fixing its equipment problem (tractors) resulted in USA Truck improving its financial performance, raising its profile in the investment community and aiding its stock price.
[CHART]
|
| USAK Data: |
| ||||
$ In Millions, Except Per Share |
| 12/31/03 |
| Current |
| ||
Stock Price |
| $ | 9.89 |
| $ | 24.87 |
|
Market Cap |
| 92.7 |
| $ | 239.1 |
| |
3 Month Avg. Trading Volume (000’s) |
| 5.7 |
| 99.2 |
| ||
Research Coverage |
| 2 |
| 5 |
| ||
LTM Revenue |
| $ | 298.7 |
| $ | 380.5 |
|
LTM Operating Ratio |
| 96.6 | % | 94.4 | % | ||
LTM EPS |
| $ | 0.36 |
| $ | 0.97 |
|
31
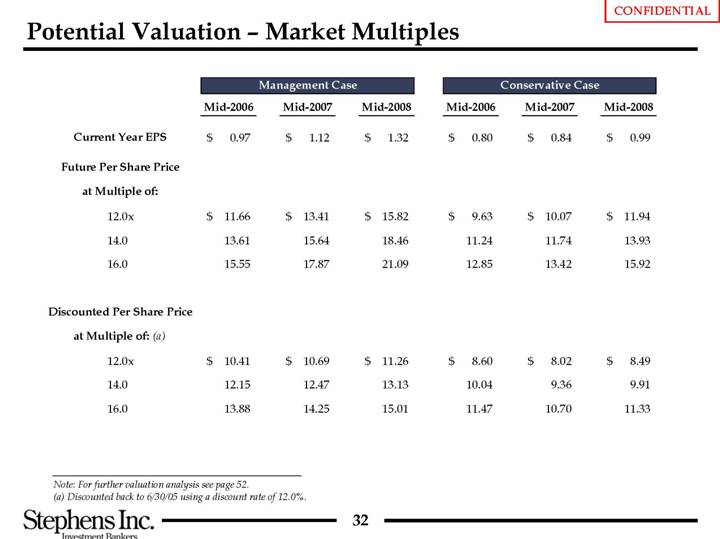
Potential Valuation – Market Multiples
|
| Management Case |
| Conservative Case |
| |||||||||||||||
|
| Mid-2006 |
| Mid-2007 |
| Mid-2008 |
| Mid-2006 |
| Mid-2007 |
| Mid-2008 |
| |||||||
|
|
|
|
|
|
|
|
|
|
|
|
|
| |||||||
Current Year EPS |
| $ | 0.97 |
| $ | 1.12 |
| $ | 1.32 |
| $ | 0.80 |
| $ | 0.84 |
| $ | 0.99 |
| |
|
|
|
|
|
|
|
|
|
|
|
|
|
| |||||||
Future Per Share Price at Multiple of: |
|
|
|
|
|
|
|
|
|
|
|
|
| |||||||
12.0 | x |
| $ | 11.66 |
| $ | 13.41 |
| $ | 15.82 |
| $ | 9.63 |
| $ | 10.07 |
| $ | 11.94 |
|
14.0 |
|
| 13.61 |
| 15.64 |
| 18.46 |
| 11.24 |
| 11.74 |
| 13.93 |
| ||||||
16.0 |
|
| 15.55 |
| 17.87 |
| 21.09 |
| 12.85 |
| 13.42 |
| 15.92 |
| ||||||
|
|
|
|
|
|
|
|
|
|
|
|
|
| |||||||
Discounted Per Share Price at Multiple of: (a) |
|
|
|
|
|
|
|
|
|
|
|
|
| |||||||
12.0 | x |
| $ | 10.41 |
| $ | 10.69 |
| $ | 11.26 |
| $ | 8.60 |
| $ | 8.02 |
| $ | 8.49 |
|
14.0 |
|
| 12.15 |
| 12.47 |
| 13.13 |
| 10.04 |
| 9.36 |
| 9.91 |
| ||||||
16.0 |
|
| 13.88 |
| 14.25 |
| 15.01 |
| 11.47 |
| 10.70 |
| 11.33 |
| ||||||
Note: For further valuation analysis see page 52.
(a) Discounted back to 6/30/05 using a discount rate of 12.0%.
32
B. No Growth/Cost Reduction
(handouts to be distributed at meeting)
C. Stock Repurchase
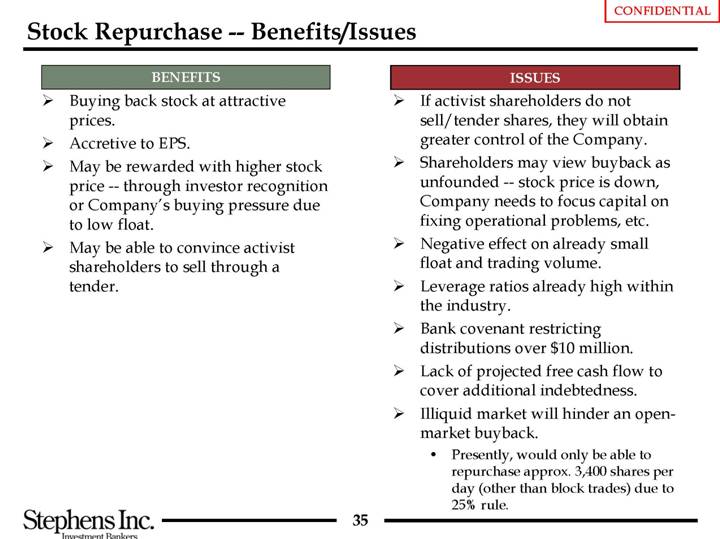
Stock Repurchase — Benefits/Issues
BENEFITS
• Buying back stock at attractive prices.
• Accretive to EPS.
• May be rewarded with higher stock price — through investor recognition or Company’s buying pressure due to low float.
• May be able to convince activist shareholders to sell through a tender.
ISSUES
• If activist shareholders do not sell/tender shares, they will obtain greater control of the Company.
• Shareholders may view buyback as unfounded — stock price is down, Company needs to focus capital on fixing operational problems, etc.
• Negative effect on already small float and trading volume.
• Leverage ratios already high within the industry.
• Bank covenant restricting distributions over $10 million.
• Lack of projected free cash flow to cover additional indebtedness.
• Illiquid market will hinder an open-market buyback.
• Presently, would only be able to repurchase approx. 3,400 shares per day (other than block trades) due to 25% rule.
35
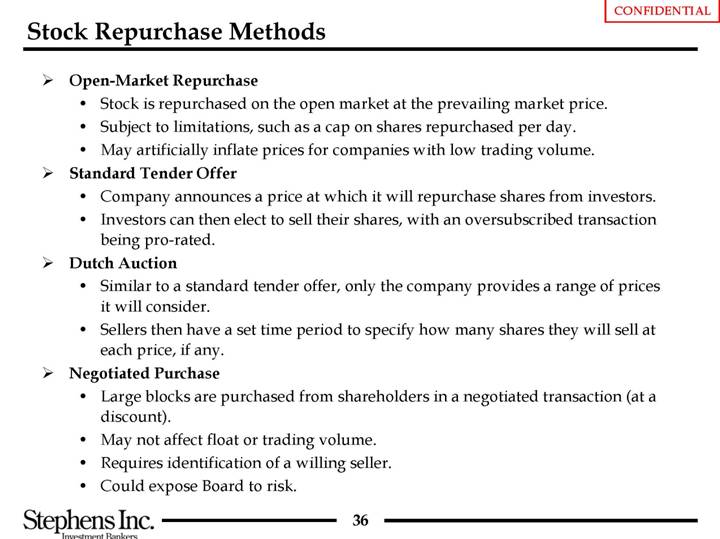
Stock Repurchase Methods
• Open-Market Repurchase
• Stock is repurchased on the open market at the prevailing market price.
• Subject to limitations, such as a cap on shares repurchased per day.
• May artificially inflate prices for companies with low trading volume.
• Standard Tender Offer
• Company announces a price at which it will repurchase shares from investors.
• Investors can then elect to sell their shares, with an oversubscribed transaction being pro-rated.
• Dutch Auction
• Similar to a standard tender offer, only the company provides a range of prices it will consider.
• Sellers then have a set time period to specify how many shares they will sell at each price, if any.
• Negotiated Purchase
• Large blocks are purchased from shareholders in a negotiated transaction (at a discount).
• May not affect float or trading volume.
• Requires identification of a willing seller.
• Could expose Board to risk.
36
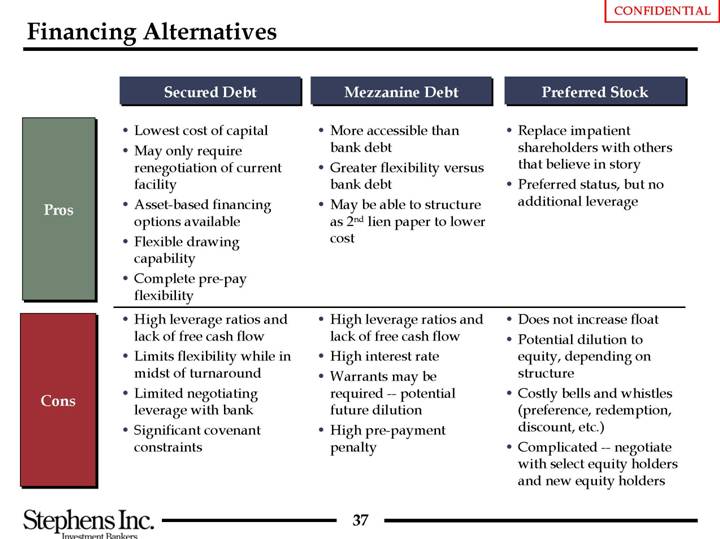
Financing Alternatives
|
| Secured Debt |
| Mezzanine Debt |
| Preferred Stock |
|
|
|
|
|
|
|
Pros |
| • Lowest cost of capital • May only require renegotiation of current facility • Asset-based financing options available • Flexible drawing capability • Complete pre-pay flexibility |
| • More accessible than bank debt • Greater flexibility versus bank debt • May be able to structure as 2nd lien paper to lower cost |
| • Replace impatient shareholders with others that believe in story • Preferred status, but no additional leverage |
|
|
|
|
|
|
|
Cons |
| • High leverage ratios and lack of free cash flow • Limits flexibility while in midst of turnaround • Limited negotiating leverage with bank • Significant covenant constraints |
| • High leverage ratios and lack of free cash flow • High interest rate • Warrants may be required — potential future dilution • High pre-payment penalty |
| • Does not increase float • Potential dilution to equity, depending on structure • Costly bells and whistles (preference, redemption, discount, etc.) • Complicated — negotiate with select equity holders and new equity holders |
37
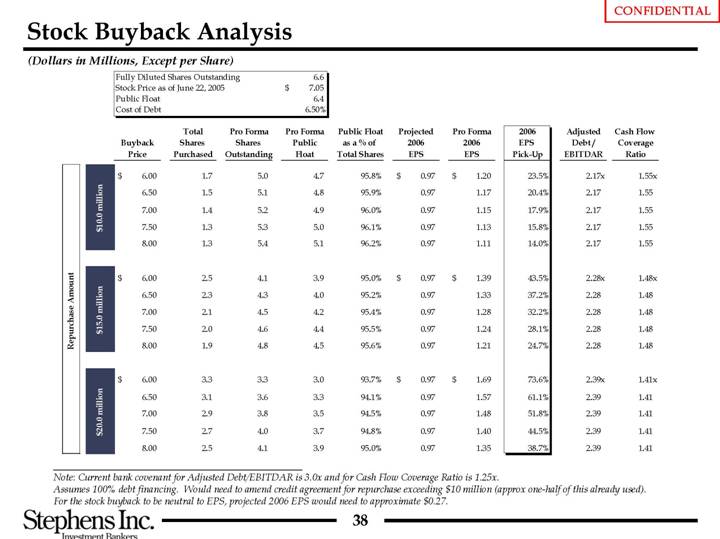
Stock Buyback Analysis
(Dollars in Millions, Except per Share)
Fully Diluted Shares Outstanding |
| 6.6 |
| |
Stock Price as of June 22, 2005 |
| $ | 7.05 |
|
Public Float |
| 6.4 |
| |
Cost of Debt |
| 6.50 | % | |
|
|
|
| Total |
| Pro Forma |
| Pro Forma |
| Public Float |
| Projected |
| Pro Forma |
| 2006 |
| Adjusted |
| Cash Flow |
| |||
|
| Buyback |
| Shares |
| Shares |
| Public |
| as a % of |
| 2006 |
| 2006 |
| EPS |
| Debt / |
| Coverage |
| |||
|
| Price |
| Purchased |
| Outstanding |
| Float |
| Total Shares |
| EPS |
| EPS |
| Pick-Up |
| EBITDAR |
| Ratio |
| |||
Repurchase Amount |
|
|
|
|
|
|
|
|
|
|
|
|
|
|
|
|
|
|
|
|
| |||
$10.0 million |
| $ | 6.00 |
| 1.7 |
| 5.0 |
| 4.7 |
| 95.8 | % | $ | 0.97 |
| $ | 1.20 |
| 23.5 | % | 2.17 | x | 1.55 | x |
|
| 6.50 |
| 1.5 |
| 5.1 |
| 4.8 |
| 95.9 | % | 0.97 |
| 1.17 |
| 20.4 | % | 2.17 |
| 1.55 |
| |||
|
| 7.00 |
| 1.4 |
| 5.2 |
| 4.9 |
| 96.0 | % | 0.97 |
| 1.15 |
| 17.9 | % | 2.17 |
| 1.55 |
| |||
|
| 7.50 |
| 1.3 |
| 5.3 |
| 5.0 |
| 96.1 | % | 0.97 |
| 1.13 |
| 15.8 | % | 2.17 |
| 1.55 |
| |||
|
| 8.00 |
| 1.3 |
| 5.4 |
| 5.1 |
| 96.2 | % | 0.97 |
| 1.11 |
| 14.0 | % | 2.17 |
| 1.55 |
| |||
|
|
|
|
|
|
|
|
|
|
|
|
|
|
|
|
|
|
|
|
|
| |||
$15.0 million |
| $ | 6.00 |
| 2.5 |
| 4.1 |
| 3.9 |
| 95.0 | % | $ | 0.97 |
| $ | 1.39 |
| 43.5 | % | 2.28 | x | 1.48 | x |
|
| 6.50 |
| 2.3 |
| 4.3 |
| 4.0 |
| 95.2 | % | 0.97 |
| 1.33 |
| 37.2 | % | 2.28 |
| 1.48 |
| |||
|
| 7.00 |
| 2.1 |
| 4.5 |
| 4.2 |
| 95.4 | % | 0.97 |
| 1.28 |
| 32.2 | % | 2.28 |
| 1.48 |
| |||
|
| 7.50 |
| 2.0 |
| 4.6 |
| 4.4 |
| 95.5 | % | 0.97 |
| 1.24 |
| 28.1 | % | 2.28 |
| 1.48 |
| |||
|
| 8.00 |
| 1.9 |
| 4.8 |
| 4.5 |
| 95.6 | % | 0.97 |
| 1.21 |
| 24.7 | % | 2.28 |
| 1.48 |
| |||
|
|
|
|
|
|
|
|
|
|
|
|
|
|
|
|
|
|
|
|
|
| |||
$20.0 million |
| $ | 6.00 |
| 3.3 |
| 3.3 |
| 3.0 |
| 93.7 | % | $ | 0.97 |
| $ | 1.69 |
| 73.6 | % | 2.39 | x | 1.41 | x |
|
| 6.50 |
| 3.1 |
| 3.6 |
| 3.3 |
| 94.1 | % | 0.97 |
| 1.57 |
| 61.1 | % | 2.39 |
| 1.41 |
| |||
|
| 7.00 |
| 2.9 |
| 3.8 |
| 3.5 |
| 94.5 | % | 0.97 |
| 1.48 |
| 51.8 | % | 2.39 |
| 1.41 |
| |||
|
| 7.50 |
| 2.7 |
| 4.0 |
| 3.7 |
| 94.8 | % | 0.97 |
| 1.40 |
| 44.5 | % | 2.39 |
| 1.41 |
| |||
|
| 8.00 |
| 2.5 |
| 4.1 |
| 3.9 |
| 95.0 | % | 0.97 |
| 1.35 |
| 38.7 | % | 2.39 |
| 1.41 |
| |||
Note: Current bank covenant for Adjusted Debt/EBITDAR is 3.0x and for Cash Flow Coverage Ratio is 1.25x.
Assumes 100% debt financing. Would need to amend credit agreement for repurchase exceeding $10 million (approx one-half of this already used). For the stock buyback to be neutral to EPS, projected 2006 EPS would need to approximate $0.27.
38
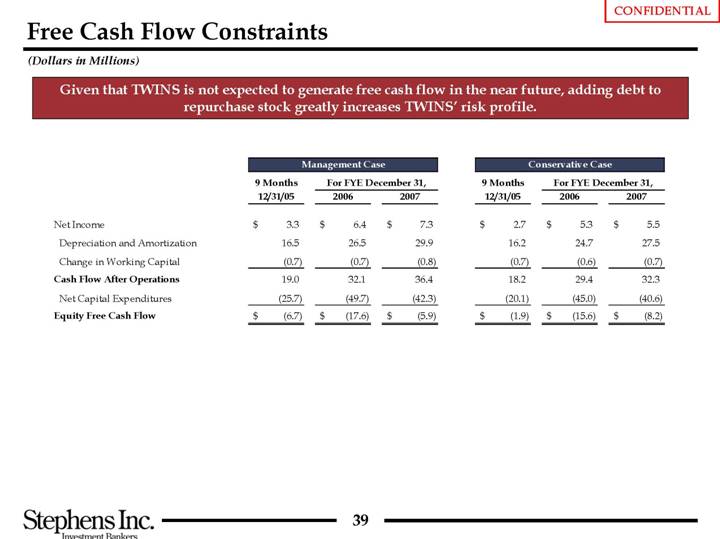
Free Cash Flow Constraints
(Dollars in Millions)
Given that TWINS is not expected to generate free cash flow in the near future, adding debt to repurchase stock greatly increases TWINS’ risk profile.
|
| Management Case |
| Conservative Case |
| ||||||||||||||
|
| 9 Months |
| For FYE December 31, |
| 9 Months |
| For FYE December 31, |
| ||||||||||
|
| 12/31/05 |
| 2006 |
| 2007 |
| 12/31/05 |
| 2006 |
| 2007 |
| ||||||
|
|
|
|
|
|
|
|
|
|
|
|
|
| ||||||
Net Income |
| $ | 3.3 |
| $ | 6.4 |
| $ | 7.3 |
| $ | 2.7 |
| $ | 5.3 |
| $ | 5.5 |
|
Depreciation and Amortization |
| 16.5 |
| 26.5 |
| 29.9 |
| 16.2 |
| 24.7 |
| 27.5 |
| ||||||
Change in Working Capital |
| (0.7 | ) | (0.7 | ) | (0.8 | ) | (0.7 | ) | (0.6 | ) | (0.7 | ) | ||||||
Cash Flow After Operations |
| 19.0 |
| 32.1 |
| 36.4 |
| 18.2 |
| 29.4 |
| 32.3 |
| ||||||
Net Capital Expenditures |
| (25.7 | ) | (49.7 | ) | (42.3 | ) | (20.1 | ) | (45.0 | ) | (40.6 | ) | ||||||
Equity Free Cash Flow |
| $ | (6.7 | ) | $ | (17.6 | ) | $ | (5.9 | ) | $ | (1.9 | ) | $ | (15.6 | ) | $ | (8.2 | ) |
39
D. Acquisitions
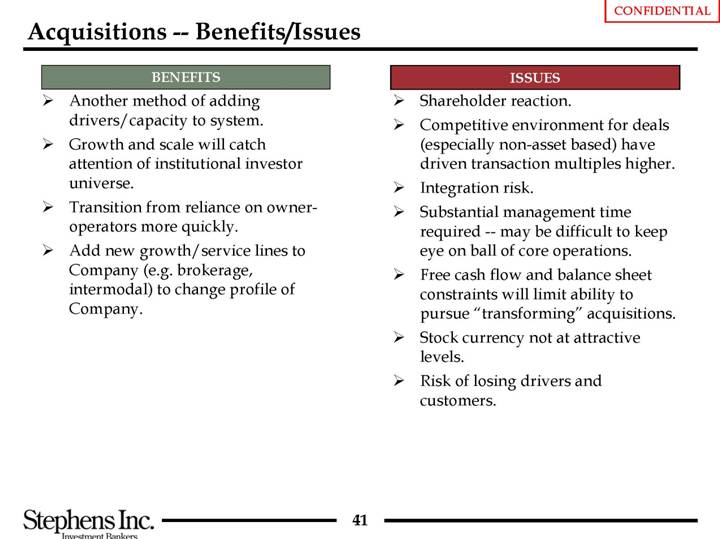
Acquisitions — Benefits/Issues
BENEFITS
• Another method of adding drivers/capacity to system.
• Growth and scale will catch attention of institutional investor universe.
• Transition from reliance on owner-operators more quickly.
• Add new growth/service lines to Company (e.g. brokerage, intermodal) to change profile of Company.
ISSUES
• Shareholder reaction.
• Competitive environment for deals (especially non-asset based) have driven transaction multiples higher.
• Integration risk.
• Substantial management time required — may be difficult to keep eye on ball of core operations.
• Free cash flow and balance sheet constraints will limit ability to pursue “transforming” acquisitions.
• Stock currency not at attractive levels.
• Risk of losing drivers and customers.
41
Pursue Strategic Acquisitions
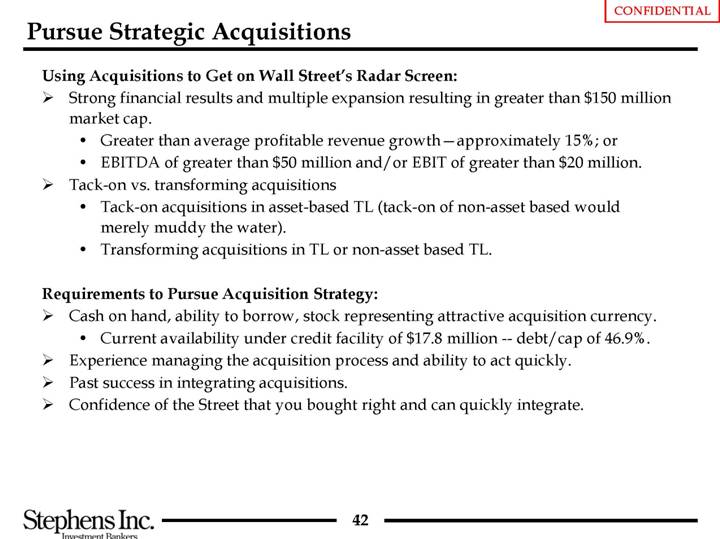
Using Acquisitions to Get on Wall Street’s Radar Screen:
• Strong financial results and multiple expansion resulting in greater than $150 million market cap.
• Greater than average profitable revenue growth–approximately 15%; or
• EBITDA of greater than $50 million and/or EBIT of greater than $20 million.
• Tack-on vs. transforming acquisitions
• Tack-on acquisitions in asset-based TL (tack-on of non-asset based would merely muddy the water).
• Transforming acquisitions in TL or non-asset based TL.
Requirements to Pursue Acquisition Strategy:
• Cash on hand, ability to borrow, stock representing attractive acquisition currency.
• Current availability under credit facility of $17.8 million — debt/cap of 46.9%.
• Experience managing the acquisition process and ability to act quickly.
• Past success in integrating acquisitions.
• Confidence of the Street that you bought right and can quickly integrate.
42
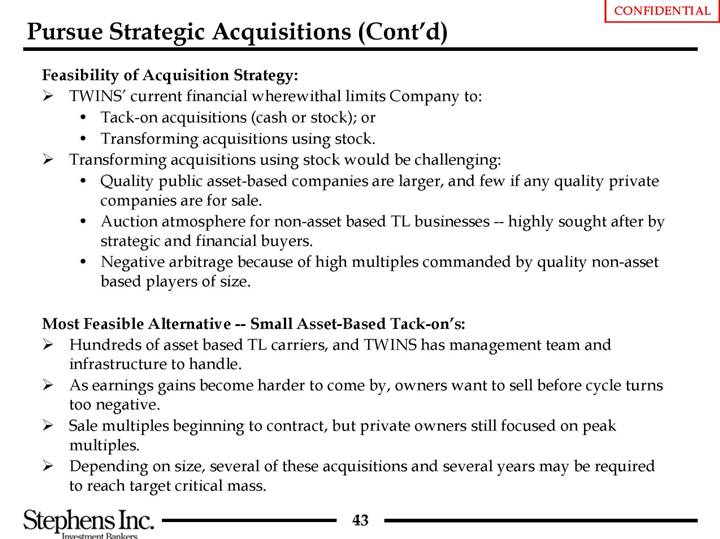
Feasibility of Acquisition Strategy:
• TWINS’ current financial wherewithal limits Company to:
• Tack-on acquisitions (cash or stock); or
• Transforming acquisitions using stock.
• Transforming acquisitions using stock would be challenging:
• Quality public asset-based companies are larger, and few if any quality private companies are for sale.
• Auction atmosphere for non-asset based TL businesses — highly sought after by strategic and financial buyers.
• Negative arbitrage because of high multiples commanded by quality non-asset based players of size.
Most Feasible Alternative — Small Asset-Based Tack-on’s:
• Hundreds of asset based TL carriers, and TWINS has management team and infrastructure to handle.
• As earnings gains become harder to come by, owners want to sell before cycle turns too negative.
• Sale multiples beginning to contract, but private owners still focused on peak multiples.
• Depending on size, several of these acquisitions and several years may be required to reach target critical mass.
43
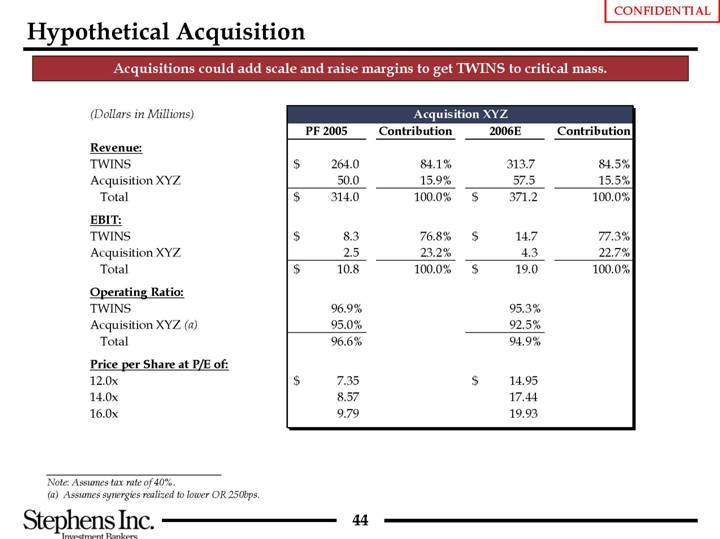
Hypothetical Acquisition
Acquisitions could add scale and raise margins to get TWINS to critical mass.
|
| Acquisition XYZ |
| ||||||||
(Dollars in Millions) |
| PF 2005 |
| Contribution |
| 2006E |
| Contribution |
| ||
Revenue: |
|
|
|
|
|
|
|
|
| ||
TWINS |
| $ | 264.0 |
| 84.1 | % | 313.7 |
| 84.5 | % | |
Acquisition XYZ |
| 50.0 |
| 15.9 | % | 57.5 |
| 15.5 | % | ||
Total |
| $ | 314.0 |
| 100.0 | % | $ | 371.2 |
| 100.0 | % |
|
|
|
|
|
|
|
|
|
| ||
EBIT: |
|
|
|
|
|
|
|
|
| ||
TWINS |
| $ | 8.3 |
| 76.8 | % | $ | 14.7 |
| 77.3 | % |
Acquisition XYZ |
| 2.5 |
| 23.2 | % | 4.3 |
| 22.7 | % | ||
Total |
| $ | 10.8 |
| 100.0 | % | $ | 19.0 |
| 100.0 | % |
|
|
|
|
|
|
|
|
|
| ||
Operating Ratio: |
|
|
|
|
|
|
|
|
| ||
TWINS |
| 96.9 | % |
|
| 95.3 | % |
|
| ||
Acquisition XYZ (a) |
| 95.0 | % |
|
| 92.5 | % |
|
| ||
Total |
| 96.6 | % |
|
| 94.9 | % |
|
| ||
|
|
|
|
|
|
|
|
|
| ||
Price per Share at P/E of: |
|
|
|
|
|
|
|
|
| ||
12.0x |
| $ | 7.35 |
|
|
| $ | 14.95 |
|
|
|
14.0x |
| 8.57 |
|
|
| 17.44 |
|
|
| ||
16.0x |
| 9.79 |
|
|
| 19.93 |
|
|
| ||
Note: Assumes tax rate of 40%.
(a) Assumes synergies realized to lower OR 250bps.
44
E. Sale of Company
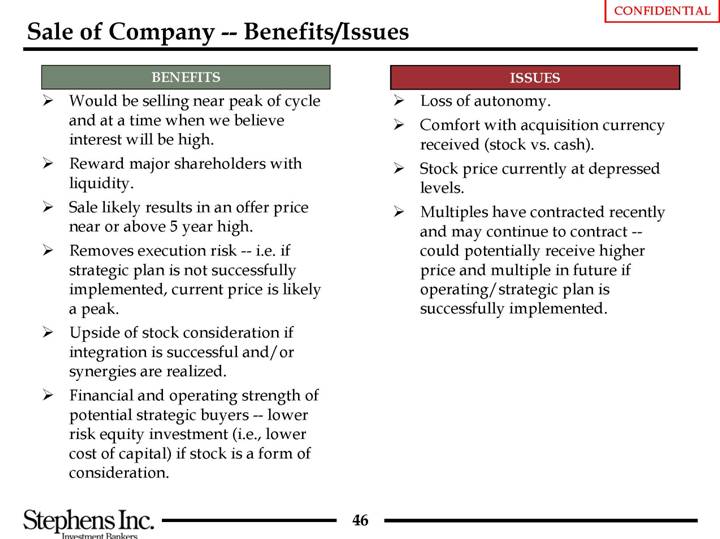
Sale of Company — Benefits/Issues
|
• Would be selling near peak of cycle and at a time when we believe interest will be high. • Reward major shareholders with liquidity. • Sale likely results in an offer price near or above 5 year high. • Removes execution risk — i.e. if strategic plan is not successfully implemented, current price is likely a peak. • Upside of stock consideration if integration is successful and/or synergies are realized. • Financial and operating strength of potential strategic buyers — lower risk equity investment (i.e., lower cost of capital) if stock is a form of consideration. |
|
ISSUES |
|
• Loss of autonomy. • Comfort with acquisition currency received (stock vs. cash). • Stock price currently at depressed levels. • Multiples have contracted recently and may continue to contract – could potentially receive higher price and multiple in future if operating/strategic plan is successfully implemented. |
|
46
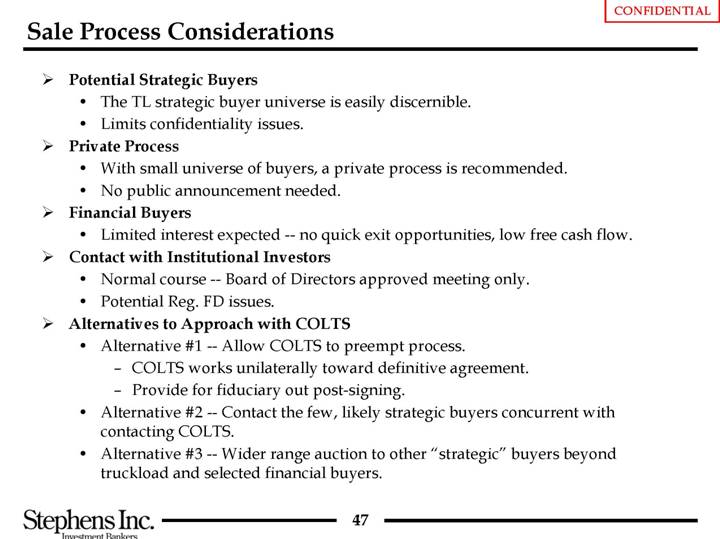
Sale Process Considerations
• Potential Strategic Buyers
• The TL strategic buyer universe is easily discernible.
• Limits confidentiality issues.
• Private Process
• With small universe of buyers, a private process is recommended.
• No public announcement needed.
• Financial Buyers
• Limited interest expected — no quick exit opportunities, low free cash flow.
• Contact with Institutional Investors
• Normal course — Board of Directors approved meeting only.
• Potential Reg. FD issues.
• Alternatives to Approach with COLTS
• Alternative #1 — Allow COLTS to preempt process.
• COLTS works unilaterally toward definitive agreement.
• Provide for fiduciary out post-signing.
• Alternative #2 — Contact the few, likely strategic buyers concurrent with contacting COLTS.
• Alternative #3 — Wider range auction to other “strategic” buyers beyond truckload and selected financial buyers.
47
Alternative Strategies for the Sale Process
Alternative #1 |
| Alternative #2 |
| Alternative #3 |
Negotiated Process |
| Narrow Solicitation |
| Controlled Auction |
|
|
|
|
|
Benefits |
|
|
|
|
• Least disruptive to business and employees. • Opportunity to capture preemptive value. • Opportunity to accelerate closing. • Greatest confidentiality. • Maximizes future alternatives if process is not successful. |
| • Signals credible alternatives to ultimate buyer. • Flexibility in timing and buyer selection. • Limited disruption of business and employees. • Reduces risk of failed auction. |
| • Creates maximum competition. • Limits buyer’s ability to assess negotiating position. • Maximizes pressure on buyers to submit fully financed bids. • Maximizes the likelihood that viable buyers will be contacted. |
|
|
|
|
|
Concerns |
|
|
|
|
|
|
|
|
|
• May not receive highest value. • Difficult to create competitive pressure. • Management is generally required to spend a significant amount of time with the buyer and its advisors. |
| • Confidentiality issues. • Can be more difficult to create competition. • May omit certain potential buyers. |
| • Confidentiality issues. • Broader profile may create higher degree of disruption. • Some buyers may refuse to participate in auction. |
48
Potential TL Strategic Buyers – Tier I
| Considerations | |
|
|
|
| • | Historically acquisitive company with a proven ability to integrate acquisitions. |
[LOGO] | • | TWINS would be a large acquisition relative to past deals. |
| • | Market has rewarded improved operations in the last four years. |
|
|
|
| • | Strong balance sheet — cash buyer ($288 million cash balance). |
[LOGO] | • | Shorter length of haul (525-mile average in 2004) than TWINS (682-mile). |
| • | Proven ability to make acquisitions and improve operations and cost structure of acquired company. |
|
|
|
[LOGO] | • | Been focused on profits, not growth for several years. |
| • | Significant free cash flow improvements which increasingly is being used to repurchase stock — TWINS would be a good use of cash flow. |
| • | JBHT would be attracted to TWINS’ dedicated business (DCS segment). |
| • | Strong public currency — balance sheet and stock currency. |
|
|
|
[LOGO] | • | $3 billion revenue transportation company. |
| • | Strong balance sheet — cash buyer. |
| • | Proven ability to make acquisitions. |
| • | TWINS’ dedicated operations would be attractive. |
|
|
|
[LOGO] | • | Historically acquisitive company, paying top dollar. |
| • | Several internal distractions may temper interest in TWINS. |
| • | Anything is possible with Swift, but Wall Street reaction likely negative. |
| • | Under-managed recently — allows new management to pick off “low-hanging fruit” and potentially outperform expectations. |
|
|
|
[LOGO] | • | Very acquisitive publicly-traded Canadian income fund. |
| • | TWINS would be attractive as TransForce has limited U.S. operations. |
| • | Approximately US$1 billion in market capitalization. |
Note: See detailed profiles on Tier I potential strategic buyers in Exhibit A.
49
Potential TL Strategic Buyers – Tier II
| Considerations | ||
|
|
|
|
[LOGO] | • |
| Very acquisitive publicly-traded Canadian income fund. |
| • |
| Market cap. of US$340 million – LTM revenue of approximately US$300 million. |
| • |
| Total debt/total cap of 23.6%. |
| • |
| TWINS would be attractive as Contrans has limited U.S. operations. |
|
|
|
|
[LOGO] | • |
| Large private company – over $700 million in revenue. |
| • |
| Strength of balance sheet unknown. |
| • |
| Headquartered in Lincoln, Nebraska. |
|
|
|
|
[LOGO] | • |
| Large private company – over $500 million in revenue. |
| • |
| Strength of balance sheet unknown. |
| • |
| Headquartered in Cedar Rapids, Iowa. |
|
|
|
|
[LOGO] | • |
| Successful organic growth model. |
| • |
| Historically not acquisitive, but always seeking growth. |
| • |
| $1.5 billion market capitalization, debt-free and $39 million of cash. |
|
|
|
|
[LOGO] | • |
| Comparable length of haul. |
| • |
| Recent interest in growing dedicated business. |
| • |
| Historically not acquisitive. |
| • |
| $1.6 billion market capitalization, debt-free and $96 million of cash. |
50
Other Buyers
Other “Strategic” — Certain other transportation companies may have an interest.
• Non-trucking companies seeking a “ground-based” service — Certain freight forwarders and integrators.
• These buyers may not have management skill to drive improvements in TWINS operations.
• Potential interest by deep pocket transportation owners/executives currently out of the business — most would require capital partners.
Financial — Financial buyer interest in TWINS would be limited.
• Capital-Intensive Industry — Most private equity firms avoid capital-intensive industries such as asset-based trucking due to low returns on capital characteristics. Capital requirements also limited ability to “load up” on acquisition debt.
• Turn-Around Scenario — TWINS would likely be viewed as a turn-around project as it is currently not generating substantial free cash flow. Few private equity firms are willing to take on a turn-around.
• Exit Possibilities — There are not clear exit alternatives for TWINS post-LBO. An initial public offering is unlikely in the near-term and the universe of strategic buyers is small.
51
Valuation Analysis
Based on recent financial performance, TWINS is not undervalued.
(Dollars in Millions, Except per Share)
[CHART]
|
| Comparable Company |
| Acquisition Multiple |
| DCF |
|
|
|
|
| |||||||||||
|
|
|
|
|
|
|
|
|
|
|
| Perpetual |
|
|
| Market |
| |||||
|
| LTM |
| FY 2005 |
| FY 2005 |
| FY 2005 |
| FY 2005 |
| Growth Rate |
| LBO |
| Price |
| |||||
|
| EBIT |
| EBIT |
| EPS |
| EBIT |
| EPS |
| 4.0% - 5.0% |
| IRR |
| 52 Week |
| |||||
Data: |
| $ | 6.5 |
| $ | 8.3 |
| $ | 0.50 |
| $ | 8.3 |
| $ | 0.50 |
| Discount Rate |
| 25.0% - 30.0% |
| High / Low |
|
Metric: |
| 10.0x - 12.0x |
| 9.0x - 11.0x |
| 12.0x - 16.0x |
| 9.0x - 11.0x |
| 13.0x - 17.0x |
| 11.0 | % |
|
|
|
| |||||
52
Comparable Companies
(Dollars in Millions, Except per Share)
|
|
|
|
|
|
|
|
|
| LTM |
| Enterprise Value / |
|
|
|
|
|
|
| ||||||||||
|
| Price |
| % of 52 |
| Market |
| Enterprise |
| Operating |
| EBITDA |
| EBIT |
| P/E |
| ||||||||||||
Company Name |
| 6/22/05 |
| Wk. High |
| Cap. |
| Value |
| Ratio |
| LTM |
| 2005E |
| 2006E |
| LTM |
| 2005E |
| 2006E |
| LTM |
| 2005E |
| 2006E |
|
|
|
|
|
|
|
|
|
|
|
|
|
|
|
|
|
|
|
|
|
|
|
|
|
|
|
|
|
|
|
Celadon Group, Inc. |
| $ | 17.21 |
| 70.2 | % | $ | 181.1 |
| $ | 195.9 |
| 95.1 | % | $ | 36.4 |
| $ | 41.4 |
| $ | 46.2 |
| $ | 20.9 |
| $ | 25.5 |
| $ | 29.6 |
| $ | 1.08 |
| $ | 1.32 |
| $ | 1.61 |
|
|
|
|
|
|
|
|
|
|
|
|
| 5.4 | x | 4.7 | x | 4.2 | x | 9.4 |
| 7.7 |
| 6.6 | x | 15.9x | x | 13.0 | x | 10.7 | x | ||||||||||||
Covenant Transport |
| 12.94 |
| 59.8 | % | 185.2 |
| 224.0 |
| 94.9 | % | $ | 73.5 |
|
| 80.1 |
| $ |
|
|
| 30.7 |
| $ |
|
|
| 46.7 |
| $ | 0.93 |
| $ | 1.10 |
| $ | 1.45 |
| |||
|
|
|
|
|
|
|
|
|
|
|
| 3.0 | x | 2.8 | x | 2.3 | x | 7.3 |
| 6.1 |
| 4.8 | x | 14.0x | x | 11.7 | x | 8.9 | x | ||||||||||||
Heartland Express |
| 19.50 |
| 84.0 | % | 1,462.5 |
| 1,174.3 |
| 79.6 | % | $ | 127.3 |
|
| 138.5 |
| $ |
|
|
| 95.8 |
| $ |
|
|
| 119.7 |
| $ | 0.86 |
| $ | 0.96 |
| $ | 1.09 |
| |||
|
|
|
|
|
|
|
|
|
|
|
| 9.2 | x | 8.5 | x | 7.7 | x | 12.3 |
| 11.2 |
| 9.8 | x | 22.7x | x | 20.3 | x | 17.9 | x | ||||||||||||
J.B. Hunt Transport Services |
| 19.60 |
| 78.3 | % | 3,278.6 |
| 3,344.6 |
| 88.5 | % | $ | 482.8 |
|
| 526.1 |
| $ |
|
|
| 330.8 |
| $ |
|
|
| 416.9 |
| $ | 1.16 |
| $ | 1.37 |
| $ | 1.60 |
| |||
|
|
|
|
|
|
|
|
|
|
|
| 6.9 | x | 6.4 | x | 5.7 | x | 10.1 |
| 9.1 |
| 8.0 | x | 16.8x | x | 14.4 | x | 12.3 | x | ||||||||||||
Knight Transportation |
| 24.02 |
| 82.8 | % | 1,396.5 |
| 1,357.8 |
| 81.9 | % | $ | 129.3 |
|
| 156.1 |
| $ |
|
|
| 85.1 |
| $ |
|
|
| 126.1 |
| $ | 0.89 |
| $ | 1.07 |
| $ | 1.30 |
| |||
|
|
|
|
|
|
|
|
|
|
|
| 10.5 | x | 8.7 | x | 7.1 | x | 16.0 |
| 13.3 |
| 10.8 | x | 27.1x | x | 22.4 | x | 18.5 | x | ||||||||||||
Marten Transport |
| 20.41 |
| 81.6 | % | 298.4 |
| 334.7 |
| 91.2 | % | $ | 68.9 |
|
| 73.6 |
| $ |
|
|
| 35.0 |
| $ |
|
|
| 42.1 |
| $ | 1.45 |
| $ | 1.52 |
| $ | 1.75 |
| |||
|
|
|
|
|
|
|
|
|
|
|
| 4.9 | x | 4.5 | x | 4.0 | x | 9.6 |
| 9.3 |
| 7.9 | x | 14.1x | x | 13.4 | x | 11.7 | x | ||||||||||||
P.A.M. Transportation Services |
| 16.37 |
| 77.9 | % | 182.6 |
| 195.5 |
| 93.8 | % | $ | 50.7 |
|
| 56.0 |
| $ |
|
|
| 20.7 |
| $ |
|
|
| 27.3 |
| $ | 1.02 |
| $ | 1.24 |
| $ | 1.40 |
| |||
|
|
|
|
|
|
|
|
|
|
|
| 3.9 | x | 3.5 | x | 3.2 | x | 9.5 |
| 7.9 |
| 7.2 | x | 16.1x | x | 13.2 | x | 11.7 | x | ||||||||||||
Swift Transportation |
| 23.63 |
| 90.2 | % | 1,778.2 |
| 2,338.5 |
| 93.3 | % | $ | 388.6 |
|
| 441.8 |
| $ |
|
|
| 197.4 |
| $ |
|
|
| 273.1 |
| $ | 1.44 |
| $ | 1.60 |
| $ | 2.00 |
| |||
|
|
|
|
|
|
|
|
|
|
|
| 6.0 | x | 5.3 | x | 4.5 | x | 11.8 |
| 10.6 |
| 8.6 | x | 16.4x | x | 14.8 | x | 11.8 | x | ||||||||||||
U.S. Xpress Enterprises |
| 12.16 |
| 35.3 | % | 198.9 |
| 329.4 |
| 97.0 | % | $ | 80.8 |
|
| 69.4 |
| $ |
|
|
| 34.6 |
| $ |
|
|
| 36.5 |
| $ | 0.93 |
| $ | 0.45 |
| $ | 1.03 |
| |||
|
|
|
|
|
|
|
|
|
|
|
| 4.1 | x | 4.7 | x | 3.6 | x | 9.5 |
| 17.0 |
| 9.0 | x | 13.0x | x | 27.0 | x | 11.8 | x | ||||||||||||
USA Truck |
| 24.87 |
| 88.9 | % | 239.1 |
| 383.9 |
| 94.4 | % | $ | 58.7 |
|
| 72.0 |
| $ |
|
|
| 21.4 |
| $ |
|
|
| 38.7 |
| $ | 0.97 |
| $ | 1.40 |
| $ | 1.97 |
| |||
|
|
|
|
|
|
|
|
|
|
|
| 6.5 | x | 5.3 | x | 4.4 | x | 18.0 |
| 13.0 |
| 9.9 | x | 25.6x | x | 17.8 | x | 12.6 | x | ||||||||||||
Werner Enterprises |
| 19.51 |
| 84.0 | % | 1,595.7 |
| 1,499.7 |
| 91.5 | % | $ | 298.5 |
|
| 333.1 |
| $ |
|
|
| 149.3 |
| $ |
|
|
| 201.3 |
| $ | 1.14 |
| $ | 1.33 |
| $ | 1.50 |
| |||
|
|
|
|
|
|
|
|
|
|
|
| 5.0 | x | 4.5 | x | 4.1 | x | 10.0 | x | 8.5 | x | 7.4 | x | 17.2 | x | 14.7 | x | 13.0 | x | ||||||||||||
|
|
|
|
|
|
|
|
|
|
|
|
|
|
|
|
|
|
|
|
|
|
|
|
|
|
|
|
|
| ||||||||||||
|
| Maximum |
|
|
|
|
| 97.0 | % | 10.5 | x | 8.7 | x | 7.7 | x | 18.0 | x | 17.0 | x | 10.8 | x | 27.1 | x | 27.0 | x | 18.5 | x | ||||||||||||||
|
| Minimum |
|
|
|
|
| 79.6 | % | 3.0 |
| 2.8 |
| 2.3 |
| 7.3 |
| 6.1 |
| 4.8 |
| 13.0 |
| 11.7 |
| 8.9 |
| ||||||||||||||
|
| Median |
|
|
|
|
| 93.3 | % | 5.4 | x | 4.7 | x | 4.2 | x | 10.0 | x | 9.3 | x | 8.0 | x | 16.4 | x | 14.7 | x | 11.8 | x | ||||||||||||||
|
| Mean |
|
|
|
|
| 91.0 | % | 6.0 |
| 5.4 |
| 4.6 |
| 11.2 |
| 10.3 |
| 8.2 |
| 18.1 |
| 16.6 |
| 12.8 |
| ||||||||||||||
|
| Mean (Excluding Min & Max) |
|
|
| 91.6 | % | 5.8 |
| 5.3 |
| 4.5 |
| 10.9 |
| 10.1 |
| 8.3 |
| 17.6 |
| 16.0 |
| 12.6 |
| ||||||||||||||||
|
|
|
|
|
|
|
|
|
|
|
|
|
|
|
|
|
|
|
|
|
|
|
|
|
|
|
|
|
| ||||||||||||
Research Case: |
|
|
|
|
|
|
|
|
|
|
|
|
|
|
|
|
|
|
|
|
|
|
|
|
|
|
|
|
| ||||||||||||
TWINS |
| $ | 7.05 | 70.4 | % | $ | 46.8 |
| $ | 94.1 |
| 97.5 | % | $ | 30.2 |
| $ | 36.4 |
| $ | 46.2 |
| $ | 6.5 |
| $ | 10.0 |
| $ | 13.8 |
| $ | 0.32 |
| $ | 0.61 |
| $ | 0.85 |
| |
|
|
|
|
|
|
|
|
|
|
|
| 3.1 | x | 2.6 | x | 2.0 | x | 14.5 | x | 9.4 | x | 6.8 | x | 21.8 | x | 11.6 | x | 8.3 | x | ||||||||||||
Management Case: |
|
|
|
|
|
|
|
|
|
|
|
|
|
|
|
|
|
|
|
|
|
|
|
|
|
|
|
|
| ||||||||||||
TWINS |
| $ | 7.05 |
| 70.4 | % | $ | 46.8 |
| $ | 94.1 |
| 97.5 | % | $ | 30.2 |
| $ | 30.5 |
| $ | 41.2 |
| $ | 6.5 |
| $ | 8.3 |
| $ | 14.7 |
| $ | 0.32 |
| $ | 0.50 |
| $ | 0.97 |
|
|
|
|
|
|
|
|
|
|
|
|
| 3.1 | x | 3.1 | x | 2.3 | x | 14.5 | x | 11.3 | x | 6.4 | x | 21.8 | x | 14.0 | x | 7.3 | x | ||||||||||||
53
Comparable Transactions
(Dollars in Millions)
|
|
|
|
|
|
|
| Total |
| LTM |
| Multiples |
| ||||||||||||||||||
Effective |
|
|
|
|
| Transaction |
| Transaction |
|
|
|
|
|
|
| Net |
|
|
|
|
|
|
| Net |
| ||||||
Date |
| Target |
| Acquiror |
| Value |
| Value |
| Revenue |
| EBITDA |
| EBIT |
| Income |
| Revenue |
| EBITDA |
| EBIT |
| Income |
| ||||||
|
|
|
|
|
|
|
|
|
|
|
|
|
|
|
|
|
|
|
|
|
|
|
|
|
| ||||||
Pending |
| Overnite Corp. |
| United Parcel Service, Inc. |
| $ | 1,222.2 |
| $ | 1,267.0 |
| $ | 1,686.9 |
| $ | 173.0 |
| $ | 115.0 |
| $ | 67.2 |
| 0.8 | x | 7.3x | x | 11.0x |
| 18.2 | x |
|
| Provides regional LTL services |
| Package delivery, logistics, SCM |
|
|
|
|
|
|
|
|
|
|
|
|
|
|
|
|
|
|
|
|
| ||||||
5/25/05 |
| USF Corporation |
| Yellow Roadway Corporation |
| 1,371.1 |
| 1,470.3 |
| 2,394.6 |
| 216.4 |
| 112.1 |
| 55.8 |
| 0.6 | x | 6.8 | x | 13.1 | x | 24.6 | x | ||||||
|
| Regional LTL, supply chain mgt. |
| National LTL services |
|
|
|
|
|
|
|
|
|
|
|
|
|
|
|
|
|
|
|
|
| ||||||
9/13/04 |
| Boyd Bros. Transportation Inc. |
| BBT Acquisition Corporation |
| 27.4 |
| 55.3 |
| 139.6 |
| 13.4 |
| 3.0 |
| 1.0 |
| 0.4 | x | 4.1 | x | 18.1 | x | 27.0 | x | ||||||
|
| Flatbed truckload carrier |
| Investors and Management |
|
|
|
|
|
|
|
|
|
|
|
|
|
|
|
|
|
|
|
|
| ||||||
2/16/04 |
| Clark Bros. Transfer, Inc. |
| SCS Transportation, Inc. |
| 24.5 |
| 30.5 |
| 66.0 |
| 5.0 |
| 4.0 |
| N/A |
| 0.5 | x | 6.1 | x | 7.6 | x | N/A |
| ||||||
|
| Provides LTL services |
| Provides LTL services |
|
|
|
|
|
|
|
|
|
|
|
|
|
|
|
|
|
|
|
|
| ||||||
12/11/03 |
| Roadway Corporation |
| Yellow Corporation |
| 965.5 |
| 1,121.9 |
| 3,165.9 |
| 183.5 |
| 108.5 |
| 46.4 |
| 0.4 | x | 6.1 | x | 10.3 | x | 20.8 | x | ||||||
|
| Provides LTL services |
| Provides LTL services |
|
|
|
|
|
|
|
|
|
|
|
|
|
|
|
|
|
|
|
|
| ||||||
7/2/03 |
| Merit Distribution Services |
| Swift Transportation |
| 76.0 |
| 76.0 |
| 140.0 |
| 10.4 |
| 2.0 |
| 8.4 |
| 0.5 | x | 7.3 | x | 9.0 | x | N/A |
| ||||||
|
| Long-haul refrig. carrier |
| Provides TL services |
|
|
|
|
|
|
|
|
|
|
|
|
|
|
|
|
|
|
|
|
| ||||||
2/28/03 |
| Landair Corporation |
| Management |
| 98.2 |
| 101.5 |
| 102.5 |
| 18.5 |
| 9.0 |
| 5.9 |
| 1.0 | x | 5.5 | x | 11.2 | x | 16.5 | x | ||||||
|
| Provides TL services |
|
|
|
|
|
|
|
|
|
|
|
|
|
|
|
|
|
|
|
|
|
|
| ||||||
1/23/03 |
| Arnold Transportation Services |
| Jefferies Capital Partners |
| 55.0 |
| 55.0 |
| 171.0 |
| 22.2 |
| 6.1 |
| 3.8 |
| 0.3 | x | 2.5 | x | 9.0 | x | 14.5 | x | ||||||
|
| Provides TL services |
| Private equity firm |
|
|
|
|
|
|
|
|
|
|
|
|
|
|
|
|
|
|
|
|
| ||||||
2/15/02 |
| Motor Cargo Industries |
| Overnite Transportation Co |
| 81.3 |
| 76.7 |
| 138.6 |
| 19.6 |
| 10.8 |
| 6.8 |
| 0.6 | x | 3.9 | x | 7.1 | x | 11.9 | x | ||||||
|
| Provides LTL services |
| Provides LTL services |
|
|
|
|
|
|
|
|
|
|
|
|
|
|
|
|
|
|
|
|
| ||||||
12/3/01 |
| Arnold Industries |
| Roadway Corporation |
| 478.0 |
| 430.1 |
| 393.8 |
| 68.0 |
| 42.0 |
| 29.2 |
| 1.1 | x | 6.3 | x | 10.2 | x | 16.4 | x | ||||||
|
| Provides TL & LTL services |
| Provides LTL services |
|
|
|
|
|
|
|
|
|
|
|
|
|
|
|
|
|
|
|
|
| ||||||
6/29/01 |
| M.S. Carriers |
| Swift Transportation Co Inc |
| 392.2 |
| 639.8 |
| 712.6 |
| 107.8 |
| 38.8 |
| 12.8 |
| 0.9 | x | 5.9 | x | 16.5 | x | 30.7 | x | ||||||
|
| Provides TL services |
| Provides TL services |
|
|
|
|
|
|
|
|
|
|
|
|
|
|
|
|
|
|
|
|
| ||||||
4/30/01 |
| Kenan Transport Company |
| Advantage Management Group |
| 87.2 |
| 89.2 |
| 157.6 |
| 21.2 |
| 12.3 |
| 8.9 |
| 0.6 | x | 4.2 | x | 10.0 | x | 16.4 | x | ||||||
|
| Petroleum and chemical trucking |
| Petroleum-transport company |
|
|
|
|
|
|
|
|
|
|
|
|
|
|
|
|
|
|
|
|
| ||||||
2/12/01 |
| American Freightways |
| FedEx |
| 946.4 |
| 1,208.4 |
| 1,352.6 |
| 189.3 |
| 126.9 |
| 66.3 |
| 0.9 | x | 6.4 | x | 9.5 | x | 14.3 | x | ||||||
|
| Provides LTL services |
| Provides global delivery services |
|
|
|
|
|
|
|
|
|
|
|
|
|
|
|
|
|
|
|
|
| ||||||
7/20/00 |
| KLLM Transport Services, Inc. |
| High Road Acquisition Group |
| 33.0 |
| 80.0 |
| 236.9 |
| 20.1 |
| 1.3 |
| (1.3 | ) | 0.3 | x | 4.0 | x | N/M |
| N/M |
| ||||||
|
| Provides TL services |
| Investment company |
|
|
|
|
|
|
|
|
|
|
|
|
|
|
|
|
|
|
|
|
| ||||||
|
|
|
|
|
|
|
|
|
|
|
|
|
|
|
|
|
|
|
|
|
|
|
|
|
| ||||||
|
|
|
|
|
|
|
|
|
|
|
| Minimum |
|
|
| 0.3 | x | 2.5 | x | 7.1 | x | 11.9 | x | ||||||||
|
|
|
|
|
|
|
|
|
|
|
| Maximum |
|
|
| 11 |
| 7.3 |
| 18.1 |
| 30.7 |
| ||||||||
|
|
|
|
|
|
|
|
|
|
|
| Mean |
|
|
| 0.6 | x | 5.5 | x | 11.0 | x | 19.2 | x | ||||||||
|
|
|
|
|
|
|
|
|
|
|
| Median |
|
|
| 0.6 |
| 6.0 |
| 10.2 |
| 16.5 |
| ||||||||
|
|
|
|
|
|
|
|
|
|
|
| Mean (Excluding Min and Max) |
| 0.7 |
| 6.1 |
| 11.8 |
| 21.1 |
| ||||||||||
54
Return on Invested Capital vs. Book Value
Return on Invested Capital (ROIC) drives valuations, not book value.
• Cases in which book value is more relevant include:
• Used as a floor valuation and in liquidation analyses.
• Less-than-truckload valuations (especially under-performing LTLs) due to the large amounts of land and buildings.
• Statistical correlation tends to be high only for top performers with low OR’s.
• TWINS has a low ROIC compared to the industry.
|
|
|
|
|
|
|
|
|
| Stock Price |
| Current |
|
|
| Return on Invested Capital |
| 4-Year |
| Price / |
| ||||||
Company |
| 2001 |
| 2002 |
| 2003 |
| 2004 |
| CAGR |
| Book Value |
|
|
|
|
|
|
|
|
|
|
|
|
|
|
|
CLDN |
| 1.7 | % | 3.9 | % | 5.3 | % | 8.6 | % | 47.4 | % | 1.9 | x |
CVTI |
| 2.7 | % | 5.4 | % | 5.5 | % | 6.8 | % | -1.2 | % | 0.9 |
|
HTLD |
| 35.6 | % | 30.4 | % | 28.7 | % | 32.4 | % | 22.5 | % | 3.4 |
|
JBHT |
| 3.4 | % | 5.9 | % | 10.7 | % | 17.0 | % | 44.8 | % | 3.9 |
|
KNX |
| 12.5 | % | 13.5 | % | 14.9 | % | 16.1 | % | 31.3 | % | 4.3 |
|
MRTN |
| 5.4 | % | 3.8 | % | 6.3 | % | 8.4 | % | 30.5 | % | 1.7 |
|
PTSI |
| 8.7 | % | 10.5 | % | 6.3 | % | 5.4 | % | 14.7 | % | 1.1 |
|
SWFT |
| 3.8 | % | 5.0 | % | 5.6 | % | 6.6 | % | 11.6 | % | 2.3 |
|
USAK |
| 2.1 | % | 3.2 | % | 3.4 | % | 4.8 | % | 35.4 | % | 2.5 |
|
WERN |
| 6.1 | % | 7.2 | % | 8.0 | % | 9.2 | % | 15.5 | % | 1.9 |
|
XPRSA |
| 2.4 | % | 3.3 | % | 3.9 | % | 5.7 | % | 15.2 | % | 0.7 |
|
Average |
| 7.7 | % | 8.4 | % | 9.0 | % | 11.0 | % | 24.3 | % | 2.3 |
|
|
|
|
|
|
|
|
|
|
|
|
|
|
|
TWINS |
| 1.9 | % | 1.3 | % | 1.0 | % | 3.0 | % | -0.5 | % | 0.8 | x |
• The return characteristics of TWINS (lower ROIC, implied under-utilization of assets, etc.) appear to justify a book value multiple that is less than its peers. Two analyses below highlight this assuming a targeted market ROIC of 8.0%.
• Assuming current margins, book value would have needed to be $(26.8) million instead of $57.5 million.
• Assuming current book value, operating ratio would need to be 95.8% instead of 97.4%.
55
IV. COLTS Overview
COLTS Overview
• Management Changes
• In April 2001, Thomas Glaser joined the executive management team and instilled a new culture/attitude of profitable growth.
• Financial Performance
• Since 2001, COLTS OR has improved from 98.6% to 95.1% and COLTS stock price has increased from $3.00 to $17.00 per share.
• Recent Acquisitions
• Strong history of ability to quickly integrate acquisitions (Burlington Motor in 2002, Highway Express in 2003, CX Roberson in 2005)
• Customer Base
• COLTS has made significant strides diversifying its customer base away from automotive.
• Operations
• Large international carrier — approximately one-half of its 2004 revenue was generated by international moves.
• COLTS is poised to capitalize on pending opening of Mexican border.
• Issues
• High debt levels when operating leases are including, but fixed charge coverage is comfortable.
• Stock may already discount benefit of Mexican border opening and delays persist.
57
Comparative Stock Price Performance
(June 21, 2000 – June 22, 2005)
[CHART]
Composite includes: CVTI, HTLD, JBHT, KNX, MRTN, PTSI, SWFT, XPRSA, USAK and WERN.
58
Financial Summary
(Dollars in Millions, Except per Share)
|
| FYE June 30, |
| LTM |
| FYE June 30, |
| CAGR |
| |||||||||||||||
|
| 2001A |
| 2002A |
| 2003A |
| 2004A |
| 3/31/05 |
| 2005E |
| 2006E |
| ’01 - ’06 |
| |||||||
Operating Revenues |
| $ | 351.8 |
| $ | 337.0 |
| $ | 367.1 |
| $ | 397.9 |
| $ | 426.1 |
| $ | 437.7 |
| $ | 477.0 |
| 6.3 | % |
EBITDA |
| 20.4 |
| 24.2 |
| 26.6 |
| 32.9 |
| 36.4 |
| 37.3 |
| 44.5 |
| 16.8 | % | |||||||
EBIT |
| 5.0 |
| 10.5 |
| 12.7 |
| 16.9 |
| 20.9 |
| 22.5 |
| 28.2 |
| 41.2 | % | |||||||
Net Income |
| (1.3 | ) | 1.7 |
| 4.1 |
| 6.6 |
| 10.6 |
| 11.8 |
| 15.5 |
| N/A |
| |||||||
EPS |
| $ | (0.17 | ) | $ | 0.22 |
| $ | 0.52 |
| $ | 0.83 |
| $ | 1.08 |
| $ | 1.15 |
| $ | 1.50 |
| N/A |
|
|
|
|
|
|
|
|
|
|
|
|
|
|
|
|
|
|
| |||||||
Growth Rates: |
|
|
|
|
|
|
|
|
|
|
|
|
|
|
|
|
| |||||||
Operating Revenues |
|
|
| -4.2 | % | 8.9 | % | 8.4 | % | — |
| 10.0 | % | 9.0 | % |
|
| |||||||
EBITDA |
|
|
| 18.6 | % | 9.6 | % | 23.7 | % | — |
| 13.6 | % | 19.2 | % |
|
| |||||||
EBIT |
|
|
| 110.0 | % | 20.8 | % | 32.5 | % | — |
| 33.2 | % | 25.4 | % |
|
| |||||||
EPS |
|
|
| N/M |
| 133.9 | % | 60.9 | % | — |
| 38.6 | % | 30.4 | % |
|
| |||||||
|
|
|
|
|
|
|
|
|
|
|
|
|
|
|
|
|
| |||||||
Margins: |
|
|
|
|
|
|
|
|
|
|
|
|
|
|
|
|
| |||||||
EBITDA |
| 5.8 | % | 7.2 | % | 7.2 | % | 8.3 | % | 8.5 | % | 8.5 | % | 9.3 | % |
|
| |||||||
EBIT |
| 1.4 | % | 3.1 | % | 3.5 | % | 4.2 | % | 4.9 | % | 5.1 | % | 5.9 | % |
|
| |||||||
Operating Ratio |
| 98.6 | % | 96.9 | % | 96.5 | % | 95.8 | % | 95.1 | % | 94.9 | % | 94.1 | % |
|
| |||||||
|
|
|
|
|
|
|
|
|
|
|
|
|
|
|
|
|
| |||||||
Leverage Ratios: |
|
|
|
|
|
|
|
|
|
|
|
|
|
|
|
|
| |||||||
Total Debt |
| $ | 105.2 |
| $ | 97.0 |
| $ | 60.8 |
| $ | 14.5 |
| $ | 15.5 |
|
|
|
|
|
|
| ||
Total Debt to Capitalization |
| 66.9 | % | 64.3 | % | 51.5 | % | 14.9 | % | 14.2 | % |
|
|
|
|
|
| |||||||
Adj. Total Debt (a) |
| $ | 187.6 |
| $ | 180.4 |
| $ | 151.3 |
| $ | 131.1 |
| $ | 161.9 |
|
|
|
|
|
|
| ||
Adj. Total Debt to Adj. Capitalization |
| 78.3 | % | 77.0 | % | 72.5 | % | 61.3 | % | 63.4 | % |
|
|
|
|
|
| |||||||
Note: Excludes charges and one-time items.
(a) Present value of future lease payments discounted at 10%.
59
Current Valuation
(Dollars in Millions, Except per Share)
Price (6/22/05) |
| $ | 17.21 |
|
|
|
|
| |
52 Week High |
| 24.53 |
| |
% of 52 Week High |
| 70.2 | % | |
|
|
|
| |
Shares Outstanding (5/3/05) |
| 10.0 |
| |
In-the-Money Options Outstanding (Treasury Method) |
| 0.5 |
| |
Diluted Shares Outstanding |
| 10.5 |
| |
|
|
|
| |
Market Capitalization |
| $ | 181.1 |
|
Less: Cash & Cash Equivalents (3/31/05) |
| (0.7 | ) | |
Plus: Debt (3/31/05) |
| 15.5 |
| |
Enterprise Value |
| $ | 195.9 |
|
Valuation Multiples
|
| LTM |
| FYE December 31, (a) |
| |||||
Data: |
| 3/31/05 |
| 2005 |
| 2006 |
| |||
Operating Revenues |
| $ | 426.1 |
| $ | 464.0 |
| $ | 488.9 |
|
EBITDA |
| 36.4 |
| 41.4 |
| 46.2 |
| |||
EBIT |
| 20.9 |
| 25.5 |
| 29.6 |
| |||
Net Income |
| 10.6 |
| 13.6 |
| 16.6 |
| |||
|
|
|
|
|
|
|
| |||
Multiples: |
|
|
|
|
|
|
| |||
EV / Revenue |
| 0.5 | x | 0.4 | x | 0.4 | x | |||
EV / EBITDA |
| 5.4 |
| 4.7 |
| 4.2 |
| |||
EV / EBIT |
| 9.4 |
| 7.7 |
| 6.6 |
| |||
MC / Net Income |
| 17.0 |
| 13.3 |
| 10.9 |
| |||
(a) Based on Stephens Inc. Research report dated 4/20/05.
60
Research Coverage and Commentary
Estimates
|
|
|
|
|
|
|
|
|
| Fiscal Year Ending June 30, |
| |||||||||||
|
|
|
|
|
| Last |
| Price |
| Revenue |
| EPS |
| |||||||||
Firm |
| Analyst |
| Recommendation |
| Report Date |
| Target |
| 2005E |
| 2006E |
| 2005E |
| 2006E |
| |||||
|
|
|
|
|
|
|
|
|
|
|
|
|
|
|
|
|
| |||||
Stephens Inc. |
| Thomas Albrecht |
| Overweight |
| 4/20/05 |
| $ | 25.00 |
| $ | 437.7 |
| $ | 477.0 |
| $ | 1.15 |
| $ | 1.50 |
|
Legg Mason Wood Walker Inc. |
| John Larkin |
| Buy |
| 4/19/05 |
| 26.00 |
| 438.9 |
| 478.4 |
| 1.17 |
| 1.55 |
| |||||
Oppenheimer & Company |
| Barry Sine |
| Buy |
| 6/9/05 |
| 24.00 |
| 442.3 |
| 487.5 |
| 1.16 |
| 1.60 |
| |||||
Sidoti & Company LLC |
| Robert Dunn |
| Buy |
| 4/19/05 |
| 27.00 |
| N/A |
| N/A |
| 1.19 |
| 1.61 |
| |||||
|
|
|
|
|
|
|
|
|
|
|
|
|
|
|
|
|
| |||||
|
|
|
| Mean |
|
|
|
|
| $ | 439.6 |
| $ | 481.0 |
| $ | 1.17 |
| $ | 1.57 |
| |
Commentary
“Once again, a solid operator in the truckload (TL) space has reported outstanding CQ05 results in what is normally a seasonally weak and therefore challenging quarter, despite the swell of negative sentiment on Wall Street regarding the TL sector. Our EPS estimate for F3Q05 was $0.24, in line with the Street consensus and at the low end of the company’s recent guidance of F3Q05 EPS between $0.24 and $0.26. “ John Larkin, CFA, Legg Mason Wood Walker Inc., 4/19/05
“A turnaround that continues to gain traction and a stock trading at just 13.7x our 2005 calendar EPS estimate of $1.33 are just two reasons why we recommend the stock of Celadon. [...] Perhaps nothing better illustrates the mix changes than the number of quarterly million-dollar customers. During March 2001 just 8 customers generated quarterly revenues exceeding $1 million; by March 2004 this was at 16 compared to 22 in the just-ended quarter. Another byproduct of a better revenue base is that the pretax margin of 4.5% (versus 2.9%) was nearly flat with the 4.6% figure realized during the seasonally stronger Dec. quarter.” Thomas Albrecht, Stephens Inc., 4/20/05
61
Executive Management
Stephen Russell, Chairman and CEO
• Chairman and CEO since inception in July 1986
• Served as President since September 2000
• Director of the Truckload Carriers Association and the Executive Committee of the American Trucking Associations
• Director of Star Gas Corporation, the General Partner of Star Gas L.P.
• Has been a member of the Board of Advisors of the Cornell University Johnson Graduate School of Management since 1983
• Member of the Board of the Indiana Heart Association and the Eiteljorg Museum
Paul A. Will, EVP, CFO, and Treasurer
• Has been EVP since September 2001 and CFO since December 1998
• Served as Treasurer since February 2004 and previously as Assistant Treasurer from December 2000 to February 2004
• Served as VP from January 1996 to December 2000 and as Controller from September 1993 to December 1998
Thomas Glaser, President and COO
• Has been EVP and COO since November 2003
• Served as EVP of Truckload Operations/Sales from April 2003 to November 2003, as EVP of Operations from September 2001 to April 2003, and VP of Transportation Services from May 2001 to September 2001
• Prior to joining, served in various management capacities at Contract Freighters, Inc. for over 13 years, most recently as VP of Operations
Sergio Hernandez, VP of Mexico
• Has been VP of Mexico since December 2001
• Served as Director of Mexico Sales from October 1996 to December 2001
• He has over 20 years of experience in marketing and transportation throughout Mexico
62
Board of Directors
Stephen Russell, Chairman and CEO
• See Executive Management Biography
Paul A. Biddelman, Director
• Director since October 1992
• Has been President of Hanseatic Corporation, a private investment company, since 1997
• Also serves as a director for Insituform Technologies, Inc., Six Flags, Inc., SystemOne Technologies, Inc. and Star Gas Corporation, the General Partner of Star Gas L.P.
Anthony Heyworth, Director
• Director since 1999
• Retired from KeyCorp in February 2001 as Vice Chairman of commercial banking, KeyBank N.A. after 36 years
• Continues as Chairman of KeyBank Central Indiana, having served as President and Chief Executive since 1991
• Joined the former Central National Bank in 1965 and was EVP when the bank emerged with Society National Bank of Cleveland in 1986 and KeyBank in 1994
The late John Kines, Director
• Director since June 2000
• Retired from Associates First Capital Corp. in May 2000 as President of the Diversified Service Group after a 22-year career
Michael Miller, Director
• Director since February 1992
• Has been Chairman of the Board and CEO of Aarnel Funding Corporation, a venture capital/real estate company since 1974
• Has served as a partner of Independence Realty, an owner and manager of real estate properties, since 1989
• Has been President and CEO of Miller Investment Company, Inc., a private investment company, since 1990
63
Ownership Profile
|
|
|
|
|
| Total |
| As a % of |
|
|
| Shares |
| Options |
| Shares & |
| Fully Diluted |
|
|
| Owned |
| Outstanding |
| Equivalents |
| Shares Out. |
|
Institutional Holders (a) |
|
|
|
|
|
|
|
|
|
Dawson-Herman Capital Management |
| 712,771 |
|
|
| 712,771 |
| 6.6 | % |
Emerald Advisers |
| 467,102 |
|
|
| 467,102 |
| 4.4 | % |
Capital Guardian Trust |
| 364,008 |
|
|
| 364,008 |
| 3.4 | % |
Northpointe Capital |
| 357,500 |
|
|
| 357,500 |
| 3.3 | % |
Axa Rosenberg Investment Management |
| 351,081 |
|
|
| 351,081 |
| 3.3 | % |
Clover Capital Management |
| 311,565 |
|
|
| 311,565 |
| 2.9 | % |
Thompson Siegel & Walmsley |
| 288,365 |
|
|
| 288,365 |
| 2.7 | % |
Caxton Associates |
| 275,281 |
|
|
| 275,281 |
| 2.6 | % |
Dimensional Fund Advisors |
| 248,654 |
|
|
| 248,654 |
| 2.3 | % |
Investment Counselors Of Maryland |
| 230,700 |
|
|
| 230,700 |
| 2.2 | % |
All Others as a Group |
| 4,312,764 |
|
|
| 4,312,764 |
| 40.2 | % |
Total Institutional Holders |
| 7,919,791 |
|
|
| 7,919,791 |
| 73.8 | % |
|
|
|
|
|
|
|
|
|
|
Estimated Individual Float |
|
|
|
|
| 1,603,707 |
| 15.0 | % |
|
|
|
|
|
|
|
|
|
|
Public Float |
|
|
|
|
| 9,523,498 |
| 88.8 | % |
|
|
|
|
|
|
|
|
|
|
Corporate Insiders (b) |
|
|
|
|
|
|
|
|
|
Stephen Russell, Chairman, President and CEO |
| 445,322 |
| 211,667 |
| 656,989 |
| 6.1 | % |
Paul A. Will, EVP, CFO, Treasurer and Assistant Secretary |
| 15,258 |
| 116,250 |
| 131,508 |
| 1.2 | % |
David Shatto, Prior EVP of Corporate Development |
| 15,363 |
| 72,500 |
| 87,863 |
| 0.8 | % |
Thomas Glaser, EVP and COO |
| 8,800 |
| 47,200 |
| 56,000 |
| 0.5 | % |
Paul A. Biddelman, Director |
| — |
| 49,500 |
| 49,500 |
| 0.5 | % |
Michael Miller, Director |
| — |
| 49,500 |
| 49,500 |
| 0.5 | % |
Anthony Heyworth, Director |
| 2,000 |
| 34,000 |
| 36,000 |
| 0.3 | % |
John Kines, Director |
| 5,000 |
| 26,000 |
| 31,000 |
| 0.3 | % |
Sergio Hernandez, VP of Mexico |
| 6,000 |
| 9,000 |
| 15,000 |
| 0.1 | % |
Other Options |
| — |
| 90,149 |
| 90,149 |
| 0.8 | % |
Total Corporate Insiders |
| 497,743 |
| 705,766 |
| 1,203,509 |
| 11.2 | % |
|
|
|
|
|
|
|
|
|
|
Total Shares Outstanding (c) |
|
|
|
|
| 10,021,241 |
| 93.4 | % |
Total Options Outstanding (d) |
|
|
|
|
| 705,766 |
| 6.6 | % |
|
|
|
|
|
|
|
|
|
|
Total Fully Diluted Shares Outstanding |
|
|
|
|
| 10,727,007 |
| 100.0 | % |
(a) Source: Capital IQ, 6/22/05.
(b) Source: Company Proxy dated 10/15/04.
(c) As of 5/3/05 from Company 10-Q dated 3/31/05.
(d) Source: Company 10-K dated 12/31/04.
64
V. COLTS/TWINS Merger Consequences
COLTS/TWINS Merger – Strategic Rationale
BENEFITS |
| ISSUES | ||||
|
|
|
|
| ||
• | Enhance lane density of overlapping geographies. |
| • | Continuity/management transitions. | ||
• | Add drivers (a key rationale for the CX Roberson transaction). |
| • | Disparity in driver pay may cause either driver turnover or increased expense on combined income statement. | ||
• | Allows for earnings growth in spite of any freight slowdown. |
| • | Potential for revenue degradation. | ||
• | Further diversifies customer base. |
| • | Long-term TWINS headquarter lease. | ||
• | Significant gain in scale. |
| • | Information Technology: | ||
| • | Increases TT100 rank from 49 to 28. |
|
| • | Write-off of TWINS proprietary system? |
• | Growth needed — low hanging fruit of management plan behind them (e.g. customer base, trailer issues). |
|
| • | Transition/integration with COLTS system (esp. in regards to SBOX). | |
• | Synergies (see pg 71) |
|
|
| ||
| • | Cut overhead/back-office costs. |
|
|
| |
| • | Combination of facilities. |
|
|
| |
| • | Public company and other professional fees. |
|
|
| |
66
Relative Stock Price Performance
(COLTS Price / TWINS Price)
[CHART]
67
COLTS/TWINS Merger – Operating Statistics
|
| TWINS |
| COLTS |
| Combined |
| |||
Financial Scale: (In Millions) |
|
|
|
|
|
|
| |||
Total Revenue |
| $ | 257.7 |
| $ | 426.1 |
| $ | 683.8 |
|
EDIT |
| 6.5 |
| 20.9 |
| 27.4 |
| |||
|
|
|
|
|
|
|
| |||
Equipment: |
|
|
|
|
|
|
| |||
Total Number of Tractors |
| 1,552 |
| 2,628 |
| 4,180 |
| |||
Total Number of Trailers |
| 4,861 |
| 7,885 |
| 12,746 |
| |||
Trailer / Tractor Ratio |
| 3.1 | x | 3.0 | x | 3.0 | x | |||
Tractor Age |
| 2.1 |
| 1.9 |
| 2.0 |
| |||
Trailer Age |
| 5.9 |
| 3.3 |
| 4.3 |
| |||
|
|
|
|
|
|
|
| |||
Operating Statistics: |
|
|
|
|
|
|
| |||
Total Miles (000’s) |
| 171,360 |
| 261,912 |
| 433,272 |
| |||
Loaded Miles (000’s) |
| 152,330 |
| 242,847 |
| 395,177 |
| |||
Empty Mile % |
| 11.1 | % | 7.3 | % | 8.8 | % | |||
Average Length of Haul |
| 675 |
| 1,009 |
| 847 |
| |||
Freight Revenue Per Loaded Mile |
| $ | 1.51 |
| $ | 1.42 |
| $ | 1.45 |
|
Freight Revenue Per Total Mile |
| $ | 1.34 |
| $ | 1.32 |
| $ | 1.33 |
|
Operating Revenue Per Loaded Mile |
| $ | 1.69 |
| $ | 1.55 |
| $ | 1.61 |
|
Freight Revenue per Tractor per Week |
| $ | 2,733 |
| $ | 2,784 |
| $ | 2,763 |
|
Operating Revenue per Tractor per Week |
| $ | 3,065 |
| $ | 3,051 |
| $ | 3,056 |
|
68
COLTS/TWINS – Ownership Overlap
|
| TWINS |
| TWINS |
| COLTS |
| COLTS |
|
|
| Shares |
| % of |
| Shares |
| % of |
|
Institution |
| Held |
| Total |
| Held |
| Total |
|
Rutabaga Capital Management LLC |
| 1,033,463 |
| 15.8 | % | 172,308 |
| 1.7 | % |
Wasatch Advisors, Inc. |
| 782,425 |
| 11.9 | % | N/A |
| N/A |
|
Central Securities Corp. |
| 531,557 |
| 8.1 | % | N/A |
| N/A |
|
T. Rowe Price Associates, Inc. |
| 351,800 |
| 5.4 | % | N/A |
| N/A |
|
Fifth Third Asset Management |
| 244,223 |
| 3.7 | % | 151,000 |
| 1.5 | % |
Keane Capital Management, Inc. |
| 210,628 |
| 3.2 | % | N/A |
| N/A |
|
Perritt Capital Management, Inc. |
| 189,100 |
| 2.9 | % | 153,000 |
| 1.5 | % |
Advisory Research, Inc. |
| 159,200 |
| 2.4 | % | N/A |
| N/A |
|
WS Capital LLC |
| 131,000 |
| 2.0 | % | N/A |
| N/A |
|
Dimensional Fund Advisors, Inc. |
| 97,095 |
| 1.5 | % | 248,654 |
| 2.5 | % |
Lehman Brothers, Inc. |
| 56,000 |
| 0.9 | % | 13,000 |
| 0.1 | % |
LSV Asset Management |
| 49,900 |
| 0.8 | % | N/A |
| N/A |
|
Sterling Johnston Capital Management |
| 48,915 |
| 0.7 | % | N/A |
| N/A |
|
White Pine Capital LLC |
| 33,443 |
| 0.5 | % | N/A |
| N/A |
|
Northern Trust Global Investments |
| 27,038 |
| 0.4 | % | 60,896 |
| 0.6 | % |
National Independent Trust Co. |
| 20,600 |
| 0.3 | % | N/A |
| N/A |
|
Babson Capital Management LLC |
| 20,200 |
| 0.3 | % | N/A |
| N/A |
|
AXA Rosenberg Investment Management |
| 19,755 |
| 0.3 | % | 351,081 |
| 3.5 | % |
US Bancorp Asset Management, Inc. |
| 10,000 |
| 0.2 | % | N/A |
| N/A |
|
California Public Employees Retirement System |
| 9,700 |
| 0.1 | % | 25,900 |
| 0.3 | % |
Barclays Global Investors, N.A. |
| 7,646 |
| 0.1 | % | 175,881 |
| 1.8 | % |
Charles Schwab Investment Management |
| 1,455 |
| 0.0 | % | 116,338 |
| 1.2 | % |
UBS Securities LLC |
| 1,056 |
| 0.0 | % | 42,114 |
| 0.4 | % |
Total |
| 4,036,199 |
| 61.6 | % | 1,510,172 |
| 15.1 | % |
Source: BigDough.com.
69
COLTS/TWINS Merger – Sensitivity Analysis
(Dollars in Millions, Except per Share)
|
| 100% Stock |
| 50% Stock / 50% Cash |
| 100% Cash |
| |||||||||||||||||||||
|
|
|
|
|
|
|
| |||||||||||||||||||||
|
| Assumed Offer Price per Share |
| Assumed Offer Price per Share |
| Assumed Offer Price per Share |
| |||||||||||||||||||||
|
| $ | 8.00 |
| $ | 9.00 |
| $ | 10.00 |
| $ | 8.00 |
| $ | 9.00 |
| $ | 10.00 |
| $ | 8.00 |
| $ | 9.00 |
| $ | 10.00 |
|
|
|
|
|
|
|
|
|
|
|
|
|
|
|
|
|
|
|
|
| |||||||||
Premium to Current |
| 13.5 | % | 27.7 | % | 41.8 | % | 13.5 | % | 27.7 | % | 41.8 | % | 13.5 | % | 27.7 | % | 41.8 | % | |||||||||
Implied Equity Value |
| $ | 53.0 |
| $ | 59.7 |
| $ | 66.3 |
| $ | 53.0 |
| $ | 59.7 |
| $ | 66.3 |
| $ | 53.0 |
| $ | 59.7 |
| $ | 66.3 |
|
Implied Enterprise Value |
| 100.3 |
| 107.0 |
| 113.6 |
| 100.3 |
| 107.0 |
| 113.6 |
| 100.3 |
| 107.0 |
| 113.6 |
| |||||||||
|
|
|
|
|
|
|
|
|
|
|
|
|
|
|
|
|
|
|
| |||||||||
Transaction Multiples: |
|
|
|
|
|
|
|
|
|
|
|
|
|
|
|
|
|
|
| |||||||||
2005E EBITDA |
| 3.3 | x | 3.5 | x | 3.7 | x | 3.3 | x | 3.5 | x | 3.7 | x | 3.3 | x | 3.5 | x | 3.7 | x | |||||||||
2005E EBIT |
| 12.1 |
| 12.9 |
| 13.7 |
| 12.1 |
| 12.9 |
| 13.7 |
| 12.1 |
| 12.9 |
| 13.7 |
| |||||||||
2005E Net Income |
| 16.1 |
| 18.1 |
| 20.1 |
| 16.1 |
| 18.1 |
| 20.1 |
| 16.1 |
| 18.1 |
| 20.1 |
| |||||||||
Book Value |
| 0.9 |
| 1.1 |
| 1.2 |
| 0.9 |
| 1.1 |
| 1.2 |
| 0.9 |
| 1.1 |
| 1.2 |
| |||||||||
|
|
|
|
|
|
|
|
|
|
|
|
|
|
|
|
|
|
|
| |||||||||
Total Debt / Pro Forma Combined EBITDA |
| 0.9 | x | 0.9 | x | 0.9 | x | 1.3 | x | 1.3 | x | 1.4 | x | 1.6 | x | 1.7 | x | 1.8 | x | |||||||||
Total Debt / Total Capitalization |
| 30.9 | % | 29.9 | % | 29.1 | % | 43.4 | % | 43.6 | % | 43.8 | % | 55.9 | % | 57.3 | % | 58.5 | % | |||||||||
Adj. Total Debt / Adj. Total Capitalization |
| 60.4 | % | 59.3 | % | 58.3 | % | 67.6 | % | 67.3 | % | 67.0 | % | 74.8 | % | 75.2 | % | 75.6 | % | |||||||||
|
|
|
|
|
|
|
|
|
|
|
|
|
|
|
|
|
|
|
| |||||||||
Accretion / Dilution): |
|
|
|
|
|
|
|
|
|
|
|
|
|
|
|
|
|
|
| |||||||||
2005 Accretion / (Dilution) - $ |
| $ | (0.06 | ) | $ | (0.10 | ) | $ | (0.14 | ) | $ | 0.02 |
| $ | (0.02 | ) | $ | (0.06 | ) | $ | 0.12 |
| $ | 0.09 |
| $ | 0.05 |
|
2005 Accretion / (Dilution) - % |
| -4.3 | % | -7.4 | % | -10.4 | % | 1.6 | % | -1.4 | % | -4.3 | % | 9.2 | % | 6.6 | % | 4.1 | % | |||||||||
2006 Accretion / (Dilution) - $ |
| $ | 0.11 |
| $ | 0.05 |
| $ | 0.00 |
| $ | 0.24 |
| $ | 0.19 |
| $ | 0.15 |
| $ | 0.42 |
| $ | 0.39 |
| $ | 0.35 |
|
2006 Accretion / (Dilution) - % |
| 6.6 | % | 3.2 | % | 0.1 | % | 15.0 | % | 12.1 | % | 9.2 | % | 26.0 | % | 23.9 | % | 21.9 | % | |||||||||
|
|
|
|
|
|
|
|
|
|
|
|
|
|
|
|
|
|
|
| |||||||||
Pro Forma Ownership: |
|
|
|
|
|
|
|
|
|
|
|
|
|
|
|
|
|
|
| |||||||||
CLDN |
| 77.3 | % | 75.2 | % | 73.2 | % | 87.2 | % | 85.9 | % | 84.5 | % | 100.0 | % | 100.0 | % | 100.0 | % | |||||||||
TCAM |
| 22.7 | % | 24.8 | % | 26.8 | % | 12.8 | % | 14.1 | % | 15.5 | % | 0.0 | % | 0.0 | % | 0.0 | % | |||||||||
70
COLTS/TWINS Merger – Synergies Analysis
(Dollars in Millions)
Cursory review of combined operations and TWINS overhead costs subject to resolution of driver pay disputes. Market may discount synergies based on other public trucking mergers.
|
|
|
| Synergies Expected |
| Rationale | |||||
|
| 2005E |
| Low |
| High |
|
| |||
Expenses: |
|
|
|
|
|
|
|
| |||
Communications |
| $ | 1,726 |
| $ | 173 |
| $ | 432 |
| Long Distance/WATS reduction due to reduced HQ headcount. |
|
|
|
|
|
|
|
|
| |||
G&A Wages & Benefits |
| 18,073 |
| 3,000 |
| 9,036 |
| Management believes 50% of line item could be reduced — represents HQ, management, financial and other redundant costs. | |||
|
|
|
|
|
|
|
|
| |||
Office Supplies |
| 486 |
| 50 |
| 486 |
| Management estimated savings. | |||
Meetings, Entert. & Travel |
| 823 |
| 150 |
| 700 |
| Management estimated savings. | |||
Driver Hiring & Training |
| 2,960 |
| 300 |
| 1,000 |
| Savings from combined programs. | |||
Building Repairs |
| 826 |
| 200 |
| 400 |
| Reduced due to decrease in facility count | |||
Rents, Taxes, & Utilities |
| 2,697 |
| 300 |
| 1,000 |
| Consolidation of Garland, Laredo and Clarksville facilities. | |||
|
|
|
|
|
|
|
|
| |||
Education & Professional |
| 1,201 |
| 300 |
| 1,000 |
| Elimination of legal, accounting and other public company expenses. | |||
|
|
|
|
|
|
|
|
| |||
Depreciation & Amortization |
| 22,191 |
| — |
| 2,100 |
| Elimination of TWINS internally developed software results in high case savings. However, IT integration and other related expenses will likely offset. | |||
|
|
|
|
|
|
|
|
| |||
TOTAL |
|
|
| $ | 4,473 |
| $ | 16,154 |
|
| |
% of 2005E Operating Expenses |
|
|
| 1.7 | % | 6.3 | % |
| |||
|
|
|
|
|
|
|
|
| |||
Other: |
|
|
|
|
|
|
|
| |||
Driver Pay Disparity |
|
|
| (5,691 | ) | (1,897 | ) | Migration of COLTS driver pay to TWINS to preserve driver base. Assumes 2%-6% increase. | |||
|
|
|
|
|
|
|
|
| |||
Net Synergies Currently Identified |
|
|
| $ | (1,219 | ) | $ | 14,257 |
|
| |
% of 2005E Operating Expenses |
|
|
| -0.5 | % | 5.6 | % |
| |||
To Explore:
• Customer revenue synergies/degradation.
• Benefits from COLTS per diem and Mexican driver programs.
71
Exhibits
A. Tier I Strategic Buyer Profiles
Heartland Express (NYSE: HTLD)
Summary Income Statement
(In Millions, Except per Share)
|
| For the FYE December 31, |
| CAGR |
| |||||||||||||
|
| 2002A |
| 2003A |
| 2004A |
| 2005E (a) |
| 2006E (a) |
| ’02-’06 |
| |||||
|
|
|
|
|
|
|
|
|
|
|
|
|
| |||||
Revenue |
| $ | 340.7 |
| $ | 405.1 |
| $ | 457.1 |
| $ | 514.7 |
| $ | 551.6 |
| 12.8 | % |
EBITDA |
| 82.4 |
| 103.3 |
| 123.2 |
| 138.5 |
| 153.5 |
| 16.8 | % | |||||
EBIT |
| 62.0 |
| 76.8 |
| 93.6 |
| 105.3 |
| 119.7 |
| 17.9 | % | |||||
Net Income |
| 42.8 |
| 51.8 |
| 62.4 |
| 71.6 |
| 81.4 |
| 17.4 | % | |||||
EPS |
| $ | 0.57 |
| $ | 0.69 |
| $ | 0.83 |
| $ | 0.96 |
| $ | 1.09 |
| 17.6 | % |
|
|
|
|
|
|
|
|
|
|
|
|
|
| |||||
Margins: |
|
|
|
|
|
|
|
|
|
|
|
|
| |||||
EBITDA |
| 24.2 | % | 25.5 | % | 27.0 | % | 26.9 | % | 27.8 | % |
|
| |||||
EBIT |
| 18.2 | % | 19.0 | % | 20.5 | % | 20.5 | % | 21.7 | % |
|
| |||||
Operating Ratio |
| 81.8 | % | 81.0 | % | 79.5 | % | 79.5 | % | 78.3 | % |
|
| |||||
Net Income |
| 12.6 | % | 12.8 | % | 13.7 | % | 13.9 | % | 14.8 | % |
|
| |||||
(a) Source: Stephens Inc. research dated 5/10/05.
Management and Directors
Name |
| Title |
Russell A. Gerdin |
| Chairman, CEO, President and Secretary |
John P. Cosaert |
| EVP of Finance, Treasurer |
Richard L. Meehan |
| EVP of Marketing and Operations |
Michael J. Gerdin |
| VP of Regional Operations, Director |
Dr. Benjamin J. Allen |
| Director, Provost at Iowa State University |
Lawrence D. Crouse |
| Director, President of Oak Creek Ranch, LLC |
Richard O. Jacobson |
| Director, former Chairman and CEO of Jacobson Warehouse Co. |
Market Valuation
Current Stock Price: |
|
|
| |
HTLD |
| $ | 19.50 |
|
% 52 Wk High |
| 84.0 | % | |
|
|
|
| |
Equity Value |
| $ | 1,462.5 |
|
Plus: Total Debt |
| — |
| |
Less: Cash |
| (288.2 | ) | |
Enterprise Value |
| $ | 1,174.3 |
|
|
|
|
| |
Leverage: |
|
|
| |
Total Debt/ EBITDA |
| 0.0 | x | |
Net Debt / EBITDA |
| N/M |
| |
Total Debt/Total Cap. |
| 0.0 | % | |
|
| FYE December 31, |
| ||||
|
| 2005E |
| 2006E |
| ||
Data: |
|
|
|
|
| ||
Revenue |
| $ | 514.7 |
| $ | 551.6 |
|
EBITDA |
| 138.5 |
| 153.5 |
| ||
EBIT |
| 105.3 |
| 119.7 |
| ||
EPS |
| $ | 0.96 |
| $ | 1.09 |
|
|
|
|
|
|
| ||
Valuation: |
|
|
|
|
| ||
EV/Revenue |
| 2.3 | x | 2.1 | x | ||
EV/EBITDA |
| 8.5 |
| 7.7 |
| ||
EV/EBIT |
| 11.2 |
| 9.8 |
| ||
EPS |
| 20.3 |
| 17.9 |
| ||
Two-Year Stock Price Performance
[CHART]
74
J.B. Hunt Transport Services (NYSE: JBHT)
Summary Income Statement
(In Millions, Except per Share)
|
| For the FYE December 31, |
| CAGR |
| |||||||||||||
|
| 2002A |
| 2003A |
| 2004A |
| 2005E (a) |
| 2006E (a) |
| ’02-’06 |
| |||||
|
|
|
|
|
|
|
|
|
|
|
|
|
| |||||
Revenue |
| $ | 2,247.9 |
| $ | 2,433.5 |
| $ | 2,786.0 |
| $ | 3,187.4 |
| $ | 3,571.2 |
| 12.3 | % |
EBITDA |
| 245.5 |
| 335.2 |
| 460.0 |
| 526.1 |
| 582.4 |
| 24.1 | % | |||||
EBIT |
| 99.6 |
| 184.9 |
| 310.2 |
| 366.8 |
| 416.9 |
| 43.0 | % | |||||
Net Income |
| 51.8 |
| 103.2 |
| 179.9 |
| 226.4 |
| 257.0 |
| 49.2 | % | |||||
EPS |
| $ | 0.33 |
| $ | 0.63 |
| $ | 1.08 |
| $ | 1.37 |
| $ | 1.60 |
| 48.1 | % |
|
|
|
|
|
|
|
|
|
|
|
|
|
| |||||
Margins: |
|
|
|
|
|
|
|
|
|
|
|
|
| |||||
EBITDA |
| 10.9 | % | 13.8 | % | 16.5 | % | 16.5 | % | 16.3 | % |
|
| |||||
EBIT |
| 4.4 | % | 7.6 | % | 11.1 | % | 11.5 | % | 11.7 | % |
|
| |||||
Operating Ratio |
| 95.6 | % | 92.4 | % | 88.9 | % | 88.5 | % | 88.3 | % |
|
| |||||
Net Income |
| 2.3 | % | 4.2 | % | 6.5 | % | 7.1 | % | 7.2 | % |
|
| |||||
(a) Source: Stephens Inc. research dated 4/15/05.
Name |
| Title |
Kirk Thompson |
| President, CEO and Director |
Craig Harper |
| EVP of Operations and COO |
Jerry Walton |
| EVP of Finance and Administration and CFO |
Paul Bergant |
| EVP of Marketing, CMO and President of Intermodal |
Johnelle D. Hunt |
| Corporate Secretary and Director |
John A. Cooper |
| Director and Chairman of Cooper Communities, Inc. |
Thomas L. Hardeman |
| Director and President of BTTB Investments |
Bryan Hunt |
| Director and President of Best Motor Company, son of founder |
Wayne Garrison |
| Chairman of the Board |
Coleman H. Peterson |
| Director and President and CEO of Hollis Enterprises LLC |
James L. Robo |
| Director and President of FPL Energy |
Leland E. Tollett |
| Director and Private Investor |
John A. White |
| Director and Chancellor of the Univ. of Arkansas |
Market Valuation
Current Stock Price: |
|
|
| |
JBHT |
| $ | 19.60 |
|
% 52 Wk High |
| 78.3 | % | |
|
|
|
| |
Equity Value |
| $ | 3,278.6 |
|
Plus: Total Debt |
| 68.0 |
| |
Less: Cash |
| (2.0 | ) | |
Enterprise Value |
| $ | 3,344.6 |
|
|
|
|
| |
Leverage: |
|
|
| |
Total Debt/ EBITDA |
| 0.1 | x | |
Net Debt / EBITDA |
| 0.1 |
| |
Total Debt/Total Cap. |
| 7.8 | % | |
|
| FYE December 31, |
| ||||
|
| 2005E |
| 2006E |
| ||
Data: |
|
|
|
|
| ||
Revenue |
| $ | 3,187.4 |
| $ | 3,571.2 |
|
EBITDA |
| 526.1 |
| 582.4 |
| ||
EBIT |
| 366.8 |
| 416.9 |
| ||
EPS |
| $ | 1.37 |
| $ | 1.60 |
|
|
|
|
|
|
| ||
Valuation: |
|
|
|
|
| ||
EV/Revenue |
| 1.0 | x | 0.9 | x | ||
EV/EBITDA |
| 6.4 |
| 5.7 |
| ||
EV/EBIT |
| 9.1 |
| 8.0 |
| ||
EPS |
| 14.4 |
| 12.3 |
| ||
|
|
|
|
|
| ||
Two-Year Stock Price Performance
[CHART]
75
Swift Transportation (NYSE: SWFT)
Summary Income Statement
(In Millions, Except per Share)
|
| For the FYE December 31, |
| CAGR |
| |||||||||||||
|
| 2002A |
| 2003A |
| 2004A |
| 2005E (a) |
| 2006E (a) |
| ‘02-’06 |
| |||||
|
|
|
|
|
|
|
|
|
|
|
|
|
| |||||
Revenue |
| $ | 2,101.5 |
| $ | 2,397.7 |
| $ | 2,826.2 |
| $ | 3,320.9 |
| $ | 3,613.4 |
| 14.5 | % |
EBITDA |
| 264.5 |
| 291.0 |
| 364.4 |
| 441.8 |
| 519.1 |
| 18.4 | % | |||||
EBIT |
| 117.1 |
| 141.0 |
| 180.6 |
| 221.5 |
| 273.1 |
| 23.6 | % | |||||
Net Income |
| 67.8 |
| 78.1 |
| 101.9 |
| 121.5 |
| 148.1 |
| 21.6 | % | |||||
EPS |
| $ | 0.78 |
| $ | 0.92 |
| $ | 1.27 |
| $ | 1.60 |
| $ | 2.00 |
| 26.6 | % |
|
|
|
|
|
|
|
|
|
|
|
|
|
| |||||
Margins: |
|
|
|
|
|
|
|
|
|
|
|
|
| |||||
EBITDA |
| 12.6 | % | 12.1 | % | 12.9 | % | 13.3 | % | 14.4 | % |
|
| |||||
EBIT |
| 5.6 | % | 5.9 | % | 6.4 | % | 6.7 | % | 7.6 | % |
|
| |||||
Operating Ratio |
| 94.4 | % | 94.1 | % | 93.6 | % | 93.3 | % | 92.4 | % |
|
| |||||
Net Income |
| 3.2 | % | 3.3 | % | 3.6 | % | 3.7 | % | 4.1 | % |
|
| |||||
(a) Source: Stephens research dated 4/26/05.
Management and Directors
Name |
| Title |
Jerry Moyes |
| CEO and Chairman |
Robert W. Cunningham |
| President, COO and Director |
Glynis A. Bryan |
| EVP and CFO |
Samuel C. Cowley |
| EVP and General Counsel |
William F. Riley |
| Senior EVP |
Kevin H. Jensen |
| EVP |
Mark A. Martin |
| EVP |
Rodney K. Sartor |
| EVP |
Karl Eller |
| Director, Chairman and CEO of The Eller Co. |
Alphonse E. Frei |
| Director, COO of Autom Co. |
David Goldman |
| Director, retired Senior Partner of Deloitte & Touche LLP |
Dale M. Jensen |
| Director, Private Investor |
Paul M. Mecray, III |
| Director, retired Partner of Wellington Managment Co., LLP |
Jock Patton |
| Director and Chairman of ING Funds Unified Board |
Karen E. Rasmussen |
| Director, President and CEO of Arizona Trucking Association |
Earl H. Scudder |
| Director, Chariman of Scudder Law Firm |
Market Valuation
Current Stock Price: |
|
|
| |
SWFT |
| $ | 23.63 |
|
% 52 Wk High |
| 90.2 | % | |
|
|
|
| |
Equity Value |
| $ | 1,778.2 |
|
Plus: Total Debt |
| 578.9 |
| |
Less: Cash |
| (18.6 | ) | |
Enterprise Value |
| $ | 2,338.5 |
|
|
|
|
| |
Leverage: |
|
|
| |
Total Debt/ EBITDA |
| 1.3 | x | |
Net Debt / EBITDA |
| 1.3 |
| |
Total Debt/Total Cap. |
| 43.2 | % | |
|
| FYE December 31, |
| ||||
|
| 2005E |
| 2006E |
| ||
Data: |
|
|
|
|
| ||
Revenue |
| $ | 3,320.9 |
| $ | 3,613.4 |
|
EBITDA |
| 441.8 |
| 519.1 |
| ||
EBIT |
| 221.5 |
| 273.1 |
| ||
EPS |
| $ | 1.60 |
| $ | 2.00 |
|
|
|
|
|
|
| ||
Valuation: |
|
|
|
|
| ||
EV/Revenue |
| 0.7 | x | 0.6 | x | ||
EV/EBITDA |
| 5.3 |
| 4.5 |
| ||
EV/EBIT |
| 10.6 |
| 8.6 |
| ||
EPS |
| 14.8 |
| 11.8 |
| ||
|
|
|
|
|
| ||
Two-Year Stock Price Performance
[CHART]
76
TransForce Income Fund (TSX: TIF.UN)
Summary Income Statement
(In Millions of U.S. Dollars, Except per Share)
|
| For the FYE December 31, |
| CAGR |
| |||||||||||||
|
| 2002A (a) |
| 2003A |
| 2004A |
| 2005E (a) |
| 2006E (b) |
| ‘02-’06 |
| |||||
|
|
|
|
|
|
|
|
|
|
|
|
|
| |||||
Revenue |
| $ | 284.3 |
| $ | 538.1 |
| $ | 861.3 |
| $ | 1,143.7 |
| $ | 1,196.9 |
| 43.2 | % |
EBITDA |
| 42.8 |
| 65.4 |
| 107.8 |
| 145.9 |
| 154.3 |
| 37.8 | % | |||||
EBIT |
| 27.5 |
| 41.4 |
| 73.4 |
| 95.0 |
| 107.0 |
| 40.5 | % | |||||
Net Income |
| 11.8 |
| 24.3 |
| 49.6 |
| 76.5 |
| 87.7 |
| 65.2 | % | |||||
EPS |
| $ | 0.27 |
| $ | 0.51 |
| $ | 0.89 |
| $ | 1.03 |
| $ | 1.18 |
| 43.9 | % |
|
|
|
|
|
|
|
|
|
|
|
|
|
| |||||
Margins: |
|
|
|
|
|
|
|
|
|
|
|
|
| |||||
EBITDA |
| 15.1 | % | 12.2 | % | 12.5 | % | 12.8 | % | 12.9 | % |
|
| |||||
EBIT |
| 9.7 | % | 7.7 | % | 8.5 | % | 8.3 | % | 8.9 | % |
|
| |||||
Operating Ratio |
| 90.3 | % | 92.3 | % | 91.5 | % | 91.7 | % | 91.1 | % |
|
| |||||
Net Income |
| 4.1 | % | 4.5 | % | 5.8 | % | 6.7 | % | 7.3 | % |
|
| |||||
(a) FY02 ended April 27, 2002.
(b) Source: RBC research dated 4/20/05.
Management and Directors
Name |
| Title |
Alain Bedard |
| Chairman, President and CEO |
Salvatore Vitale |
| CFO |
Josiane M. Langlois |
| Corporate Secretary |
Bernard Belanger |
| Director, Chairman and CEO of Premier Tech Ltd. |
Andre Berard |
| Director |
Jean-Claude Germain |
| Director, President of J.C. Germain |
Richard Guay |
| Director, Corporate Administrator and Consultant |
Joe Marsilii |
| Director, CFO of Jolina Capital Inc. |
Katherine A. Rethy |
| Director, SVP of Noranda Inc.-Falconbridge Ltd. |
Joey Saputo |
| Director, SVP of Saputo Inc. |
H. John Stollery |
| Director, Chairman of Process Capital Corp. |
Market Valuation
Current Stock Price: |
|
|
| |
TIF.UN |
| $ | 13.88 |
|
% 52 Wk High |
| 94.0 | % | |
|
|
|
| |
Equity Value |
| $ | 1,033.5 |
|
Plus: Total Debt |
| 180.6 |
| |
Less: Cash |
| — |
| |
Enterprise Value |
| $ | 1,214.1 |
|
|
|
|
| |
Leverage: |
|
|
| |
Total Debt/ EBITDA |
| 1.2x |
| |
Net Debt / EBITDA |
| 1.2 |
| |
Total Debt/Total Cap. |
| 39.0 | % | |
|
| FYE December 31, |
| ||||
|
| 2005E |
| 2006E |
| ||
Data: |
|
|
|
|
| ||
Revenue |
| $ | 1,143.7 |
| $ | 1,196.9 |
|
EBITDA |
| 145.9 |
| 154.3 |
| ||
EBIT |
| 95.0 |
| 107.0 |
| ||
EPS |
| $ | 1.03 |
| $ | 1.18 |
|
|
|
|
|
|
| ||
Valuation: |
|
|
|
|
| ||
EV/Revenue |
| 1.1 | x | 1.0 | x | ||
EV/EBITDA |
| 8.3 |
| 7.9 |
| ||
EV/EBIT |
| 12.8 |
| 11.3 |
| ||
EPS |
| 13.4 |
| 11.8 |
| ||
|
|
|
|
|
| ||
Two-Year Stock Price Performance
[CHART]
77
Schneider National, Inc.
Business Description
• Schneider National, Inc. is the largest TL in the U.S. and provides truckload and intermodal transportation solutions in North America, Canada, and Mexico.
• The Company has five divisions, which provide transportation and transportation related services: Schneider National Carriers, Inc., Schneider Bulk Carriers, Inc., Schneider Specialized, Schneider Payment Services and Schneider Finance.
• Within Schneider National Carriers there are six trademarked services: One-way Truckload, Dedicated, TruckRail, OptiModal, Brokerage and Expedited.
• Schneider Bulk Carriers, Inc. provides customers with product expertise for over 5,000 commodities.
• Schneider Specialized Carriers, Inc. is the premier carrier in the industrial glass industry.
• Schneider Payment Services provides transportation expense reconciliation services.
• Schneider Finance specializes in commercial financing and leasing on new and used tractors.
• The Company was founded in 1935 and is headquartered in Green Bay, Wisconsin.
Management and Directors
Name |
| Title |
|
|
|
Don Schneider |
| Chairman of the Board of Directors, Schneider National, Inc. |
Christopher Lofgren, Ph.D. |
| President and CEO, Schneider National, Inc. |
David Vander Ploeg |
| CFO |
Scott Arves |
| President, Transportation |
Tom Escott |
| President, Schneider Logistics |
Thomas A. Gannon |
| Vice-Chairman and Secretary of the Board |
Financial Results
|
| For the FYE December 31, |
| CAGR |
| |||||||||||||
|
| 2000A |
| 2001A |
| 2002A |
| 2003A |
| 2004A |
| ‘00-’04 |
| |||||
|
|
|
|
|
|
|
|
|
|
|
|
|
| |||||
Revenue |
| $ | 2,300.0 |
| $ | 2,388.0 |
| $ | 2,627.0 |
| $ | 2,900.0 |
| $ | 3,200.0 |
| 8.6 | % |
Recent News
• 3/23/05 – Announced an opening of a new office in Olomouc, Czech Republic.
• 3/1/05 – Achieved consolidated revenue growth and ended the year with $3.2 billion in revenue.
• 1/25/05 – Announced addition of 10 new regional brokerage offices in 2005, increasing its network to 27.
• 12/20/04 – Named David Vander Ploeg Chief Financial Officer.
• 11/15/04 – Debuted a new stackable intermodal container at the Intermodal Association of North America (IANA) Intermodal Expo.
• 11/2/04 – Named Steve Matheys to the newly-created role of chief marketing officer (CMO).
• 10/4/04 – Purchased QUALCOMM’s T2™ Untethered TrailerTRACS® Asset Management Solution and has begun implementing the technology across its fleet of more than 48,000 trailers.
78
B. Comparable Companies Analysis
79
Comparable Companies Analysis – Truckload
Dollars in Millions, Except per Share
|
|
|
|
|
|
|
|
|
| LTM |
| Enterprise Value / |
|
|
|
|
|
|
| ||||||||||
|
| Price |
| % of 52 |
| Market |
| Enterprise |
| Operating |
| EBITDA |
| EBIT |
| P/E |
| ||||||||||||
Company Name |
| 6/22/05 |
| Wk. High |
| Cap. |
| Value |
| Ratio |
| LTM |
| 2005E |
| 2006E |
| LTM |
| 2005E |
| 2006E |
| LTM |
| 2005E |
| 2006E |
|
|
|
|
|
|
|
|
|
|
|
|
|
|
|
|
|
|
|
|
|
|
|
|
|
|
|
|
|
|
|
Celadon Group, Inc. |
| $ | 17.21 |
| 70.2 | % | $ | 181.1 |
| $ | 195.9 |
| 95.1 | % | $ | 36.4 |
| $ | 41.4 |
| $ | 46.2 |
| $ | 20.9 |
| $ | 25.5 |
| $ | 29.6 |
| $ | 1.08 |
| $ | 1.32 |
| $ | 1.61 |
|
|
|
|
|
|
|
|
|
|
|
|
| 5.4 | x | 4.7 | x | 4.2 | x | 9.4 | x | 7.7 | x | 6.6 | x | 15.9 | x | 13.0 | x | 10.7 | x | ||||||||||||
Covenant Transport |
| 12.94 |
| 59.8 | % | 185.2 |
| 224.0 |
| 94.9 | % | $ | 73.5 |
| $ | 80.1 |
| $ | 96.6 |
| $ | 30.7 |
| $ | 36.5 |
| $ | 46.7 |
| $ | 0.93 |
| $ | 1.10 |
| $ | 1.45 |
| |||
|
|
|
|
|
|
|
|
|
|
|
| 3.0 | x | 2.8 | x | 2.3 | x | 7.3 | x | 6.1 | x | 4.8 | x | 14.0 | x | 11.7 | x | 8.9 | x | ||||||||||||
Heartland Express |
| 19.50 |
| 84.0 | % | 1,462.5 |
| 1,174.3 |
| 79.6 | % | $ | 127.3 |
| $ | 138.5 |
| $ | 153.5 |
| $ | 95.8 |
| $ | 105.3 |
| $ | 119.7 |
| $ | 0.86 |
| $ | 0.96 |
| $ | 1.09 |
| |||
|
|
|
|
|
|
|
|
|
|
|
| 9.2 | x | 8.5 | x | 7.7 | x | 12.3 | x | 11.2 | x | 9.8 | x | 22.7 | x | 20.3 | x | 17.9 | x | ||||||||||||
J.B. Hunt Transport Services |
| 19.60 |
| 78.3 | % | 3,278.6 |
| 3,344.6 |
| 88.5 | % | $ | 482.8 |
| $ | 526.1 |
| $ | 582.4 |
| $ | 330.8 |
| $ | 366.8 |
| $ | 416.9 |
| $ | 1.16 |
| $ | 1.37 |
| $ | 1.60 |
| |||
|
|
|
|
|
|
|
|
|
|
|
| 6.9 | x | 6.4 | x | 5.7 | x | 10.1 | x | 9.1 | x | 8.0 | x | 16.8 | x | 14.4 | x | 12.3 | x | ||||||||||||
Knight Transportation |
| 24.02 |
| 82.8 | % | 1,396.5 |
| 1,357.8 |
| 81.9 | % | $ | 129.3 |
| $ | 156.1 |
| $ | 191.0 |
| $ | 85.1 |
| $ | 102.1 |
| $ | 126.1 |
| $ | 0.89 |
| $ | 1.07 |
| $ | 1.30 |
| |||
|
|
|
|
|
|
|
|
|
|
|
| 10.5 | x | 8.7 | x | 7.1 | x | 16.0 | x | 13.3 | x | 10.8 | x | 27.1 | x | 22.4 | x | 18.5 | x | ||||||||||||
Marten Transport |
| 20.41 |
| 81.6 | % | 298.4 |
| 334.7 |
| 91.2 | % | $ | 68.9 |
| $ | 73.6 |
| $ | 84.4 |
| $ | 35.0 |
| $ | 36.1 |
| $ | 42.1 |
| $ | 1.45 |
| $ | 1.52 |
| $ | 1.75 |
| |||
|
|
|
|
|
|
|
|
|
|
|
| 4.9 | x | 4.5 | x | 4.0 | x | 9.6 | x | 9.3 | x | 7.9 | x | 14.1 | x | 13.4 | x | 11.7 | x | ||||||||||||
P.A.M. Transportation Services |
| 16.37 |
| 77.9 | % | 182.6 |
| 195.5 |
| 93.8 | % | $ | 50.7 |
| $ | 56.0 |
| $ | 61.0 |
| $ | 20.7 |
| $ | 24.6 |
| $ | 27.3 |
| $ | 1.02 |
| $ | 1.24 |
| $ | 1.40 |
| |||
|
|
|
|
|
|
|
|
|
|
|
| 3.9 | x | 3.5 | x | 3.2 | x | 9.5 | x | 7.9 | x | 7.2 | x | 16.1 | x | 13.2 | x | 11.7 | x | ||||||||||||
Swift Transportation |
| 23.63 |
| 90.2 | % | 1,778.2 |
| 2,338.5 |
| 93.3 | % | $ | 388.6 |
| $ | 441.8 |
| $ | 519.1 |
| $ | 197.4 |
| $ | 221.5 |
| $ | 273.1 |
| $ | 1.44 |
| $ | 1.60 |
| $ | 2.00 |
| |||
|
|
|
|
|
|
|
|
|
|
|
| 6.0 | x | 5.3 | x | 4.5 | x | 11.8 | x | 10.6 | x | 8.6 | x | 16.4 | x | 14.8 | x | 11.8 | x | ||||||||||||
U.S. Xpress Enterprises |
| 12.16 |
| 35.3 | % | 198.9 |
| 329.4 |
| 97.0 | % | $ | 80.8 |
| $ | 69.4 |
| $ | 92.3 |
| $ | 34.6 |
| $ | 19.4 |
| $ | 36.5 |
| $ | 0.93 |
| $ | 0.45 |
| $ | 1.03 |
| |||
|
|
|
|
|
|
|
|
|
|
|
| 4.1 | x | 4.7 | x | 3.6 | x | 9.5 | x | 17.0 | x | 9.0 | x | 13.0 | x | 27.0 | x | 11.8 | x | ||||||||||||
USA Truck |
| 24.87 |
| 88.9 | % | 239.1 |
| 383.9 |
| 94.4 | % | $ | 58.7 |
| $ | 72.0 |
| $ | 88.2 |
| $ | 21.4 |
| $ | 29.5 |
| $ | 38.7 |
| $ | 0.97 |
| $ | 1.40 |
| $ | 1.97 |
| |||
|
|
|
|
|
|
|
|
|
|
|
| 6.5 | x | 5.3 | x | 4.4 | x | 18.0 | x | 13.0 | x | 9.9 | x | 25.6 | x | 17.8 | x | 12.6 | x | ||||||||||||
Werner Enterprises |
| 19.51 |
| 84.0 | % | 1,595.7 |
| 1,499.7 |
| 91.5 | % | $ | 298.5 |
| $ | 333.1 |
| $ | 364.6 |
| $ | 149.3 |
| $ | 176.8 |
| $ | 201.3 |
| $ | 1.14 |
| $ | 1.33 |
| $ | 1.50 |
| |||
|
|
|
|
|
|
|
|
|
|
|
| 5.0 | x | 4.5 | x | 4.1 | x | 10.0 | x | 8.5 | x | 7.4 | x | 17.2 | x | 14.7 | x | 13.0 | x | ||||||||||||
|
| Maximum |
| 97.0 | % | 10.5 | x | 8.7 | x | 7.7 | x | 18.0 | x | 17.0 | x | 10.8 | x | 27.1 | x | 27.0 | x | 18.5 | x | ||||||
|
| Minimum |
| 79.6 | % | 3.0 |
| 2.8 |
| 2.3 |
| 7.3 |
| 6.1 |
| 4.8 |
| 13.0 |
| 11.7 |
| 8.9 |
| ||||||
|
| Median |
| 93.3 | % | 5.4 | x | 4.7 | x | 4.2 | x | 10.0 | x | 9.3 | x | 8.0 | x | 16.4 | x | 14.7 | x | 11.8 | x | ||||||
|
| Mean |
| 91.0 | % | 6.0 |
| 5.4 |
| 4.6 |
| 11.2 |
| 10.3 |
| 8.2 |
| 18.1 |
| 16.6 |
| 12.8 |
| ||||||
|
| Mean (Excluding Min & Max) |
| 91.6 | % | 5.8 |
| 5.3 |
| 4.5 |
| 10.9 |
| 10.1 |
| 8.3 |
| 17.6 |
| 16.0 |
| 12.6 |
| ||||||
Research Case: |
|
|
|
|
|
|
|
|
|
|
|
|
|
|
|
|
|
|
|
|
|
|
|
|
|
|
|
|
|
TWINS |
| $ | 7.05 |
| 70.4 | % | $ | 46.8 |
| $ | 94.1 |
| 97.5 | % | 30.2 |
| $ | 36.4 |
| $ | 46.2 |
| $ | 6.5 |
| $ | 10.0 |
| $ | 13.8 |
| $ | 0.32 |
| $ | 0.61 |
| $ | 0.85 |
|
|
|
|
|
|
|
|
|
|
|
|
| 3.1 | x | 2.6 | x | 2.0 | x | 14.5 | x | 9.4 | x | 6.8 | x | 21.8 | x | 11.6 | x | 8.3 | x | |||||||||||
|
|
|
|
|
|
|
|
|
|
|
|
|
|
|
|
|
|
|
|
|
|
|
|
|
|
|
|
|
| |||||||||||
Management Case: |
|
|
|
|
|
|
|
|
|
|
|
|
|
|
|
|
|
|
|
|
|
|
|
|
|
|
|
|
| |||||||||||
TWINS |
| $ | 7.05 |
| 70.4 | % | $ | 46.8 |
| $ | 94.1 |
| 97.5 | % | 30.2 |
| $ | 30.5 |
| $ | 41.2 |
| $ | 6.5 |
| $ | 8.3 |
| $ | 14.7 |
| $ | 0.32 |
| $ | 0.50 |
| $ | 0.97 |
|
|
|
|
|
|
|
|
|
|
|
|
| 3.1 | x | 3.1 | x | 2.3 | x | 14.5 | x | 11.3 | x | 6.4 | x | 21.8 | x | 14.0 | x | 7.3 | x | |||||||||||
80
Comparable Companies Analysis – LTL
Dollars in Millions, Except per Share
|
|
|
|
|
|
|
|
|
| LTM |
| Enterprise Value / |
|
|
|
|
|
|
| ||||||||||
|
| Price |
| % of 52 |
| Market |
| Enterprise |
| Operating |
| EBITDA |
| EBIT |
| P/E |
| ||||||||||||
Company Name |
| 6/22/05 |
| Wk. High |
| Cap. |
| Value |
| Ratio |
| LTM |
| 2005E |
| 2006E |
| LTM |
| 2005E |
| 2006E |
| LTM |
| 2005E |
| 2006E |
|
|
|
|
|
|
|
|
|
|
|
|
|
|
|
|
|
|
|
|
|
|
|
|
|
|
|
|
|
|
|
National LTLs |
|
|
|
|
|
|
|
|
|
|
|
|
|
|
|
|
|
|
|
|
|
|
|
|
|
|
|
|
|
Arkansas Best Corporation |
| $ | 32.28 |
| 69.1 | % | $ | 832.8 |
| $ | 773.1 |
| 92.4 | % | $ | 189.5 |
| $ | 197.9 |
| $ | 213.0 |
| $ | 133.4 |
| $ | 144.4 |
| $ | 155.7 |
| $ | 3.16 |
| $ | 3.38 |
| $ | 3.65 |
|
|
|
|
|
|
|
|
|
|
|
|
| 4.1 | x | 3.9 | x | 3.6 | x | 5.8 | x | 5.4 | x | 5.0 | x | 10.2 | x | 9.5 | x | 8.8 | x | ||||||||||||
Yellow Roadway Corporation |
| 50.01 |
| 77.6 | % | 2,952.4 |
| 3,107.8 |
| 94.0 | % | $ | 587.1 |
| $ | 661.6 |
| $ | 729.9 |
| $ | 410.3 |
| $ | 484.8 |
| $ | 553.1 |
| $ | 4.51 |
| $ | 5.30 |
| $ | 6.10 |
| |||
|
|
|
|
|
|
|
|
|
|
|
| 5.3 |
| 4.7 |
| 4.3 |
| 7.6 |
| 6.4 |
| 5.6 |
| 11.1 |
| 9.4 |
| 8.2 |
| ||||||||||||
|
|
|
|
|
|
|
|
|
|
|
|
|
|
|
|
|
|
|
|
|
|
|
|
|
|
|
|
|
| ||||||||||||
Mean |
|
|
|
|
|
|
|
|
| 93.2 | % | 4.7 | x | 4.3 | x | 3.9 | x | 6.7 | x | 5.9 | x | 5.3 | x | 10.6 | x | 9.5 | x | 8.5 | x | ||||||||||||
|
|
|
|
|
|
|
|
|
|
|
|
|
|
|
|
|
|
|
|
|
|
|
|
|
|
|
|
|
| ||||||||||||
Regional / Inter-Regional LTLs |
|
|
|
|
|
|
|
|
|
|
|
|
|
|
|
|
|
|
|
|
|
|
|
|
|
|
|
|
| ||||||||||||
Central Freight Lines, Inc. |
| $ | 2.61 |
| 30.7 | % | $ | 48.5 |
| $ | 72.2 |
| 107.7 | % | $ | (11.0 |
| $ | 8.0 | ) | $ | 23.6 | ) | $ | (29.0 | ) | $ | (11.3 | ) | $ | 5.9 | ) | $ | (1.37 | ) | $ | (1.10 | ) | $ | (0.15 | ) |
|
|
|
|
|
|
|
|
|
|
|
| N/A |
| 9.0 |
| 3.1 |
| N/A |
| N/A |
| 12.2 |
| N/A |
| N/A |
| N/A |
| ||||||||||||
CNF Inc. |
| 45.23 |
| 88.8 | % | 2,609.3 |
| 2,478.5 |
| 92.0 | % | $ | 421.0 |
| $ | 482.4 |
| $ | 492.4 |
| $ | 304.7 |
| $ | 366.0 |
| $ | 376.0 |
| $ | 2.90 |
| $ | 3.56 |
| $ | 3.85 |
| |||
|
|
|
|
|
|
|
|
|
|
|
| 5.9 | x | 5.1 | x | 5.0 | x | 8.1 | x | 6.8 | x | 6.6 | x | 15.6 | x | 12.7 | x | 11.7 | x | ||||||||||||
Old Dominion Freight Line, Inc. |
| 27.74 |
| 72.0 | % | 689.5 |
| 789.0 |
| 91.2 | % | $ | 123.5 |
| $ | 143.0 |
| $ | 166.5 |
| $ | 76.9 |
| $ | 90.4 |
| $ | 107.5 |
| $ | 1.76 |
| $ | 2.04 |
| $ | 2.44 |
| |||
|
|
|
|
|
|
|
|
|
|
|
| 6.4 | x | 5.5 | x | 4.7 | x | 10.3 | x | 8.7 | x | 7.3 | x | 15.7 | x | 13.6 | x | 11.4 | x | ||||||||||||
SCS Transportation, Inc. |
| 17.50 |
| 63.3 | % | 275.4 |
| 384.7 |
| 95.1 | % | $ | 97.9 |
| $ | 101.5 |
| $ | 112.8 |
| $ | 49.9 |
| $ | 52.3 |
| $ | 61.8 |
| $ | 1.56 |
| $ | 1.64 |
| $ | 2.00 |
| |||
|
|
|
|
|
|
|
|
|
|
|
| 3.9 | x | 3.8 | x | 3.4 | x | 7.7 | x | 7.4 | x | 6.2 | x | 11.2 | x | 10.7 | x | 8.8 | x | ||||||||||||
Vitran Corporation Inc. |
| 15.39 |
| 85.5 | % | 201.8 |
| 180.4 |
| 94.6 | % | $ | 25.7 |
| $ | 28.9 |
| $ | 33.0 |
| $ | 20.5 |
| $ | 23.4 |
| $ | 27.4 |
| $ | 1.20 |
| $ | 1.29 |
| $ | 1.43 |
| |||
|
|
|
|
|
|
|
|
|
|
|
| 7.0 | x | 6.2 | x | 5.5 | x | 8.8 | x | 7.7 | x | 6.6 | x | 12.8 | x | 11.9 | x | 10.8 | x | ||||||||||||
|
| Maxmimum |
|
|
|
|
| 107.7 | % | 7.0 | x | 9.0 | x | 5.5 | x | 10.3 | x | 8.7 | x | 12.2 | x | 15.7 | x | 13.6 | x | 11.7 | x | ||
|
| Minimum |
|
|
|
|
|
|
| 91.2 | % | 3.9 |
| 3.8 |
| 3.1 |
| 7.7 |
| 6.8 |
| 6.2 |
| 11.2 |
| 10.7 |
| 8.8 |
|
|
| Median |
|
|
|
|
|
|
| 94.6 | % | 6.1 | x | 5.5 | x | 4.7 | x | 8.5 | x | 7.5 | x | 6.6 | x | 14.2 | x | 12.3 | x | 11.1 | x |
|
| Mean |
|
|
|
|
|
|
| 96.1 | % | 5.8 |
| 5.9 |
| 4.3 |
| 8.7 |
| 7.6 |
| 7.8 |
| 13.8 |
| 12.2 |
| 10.7 |
|
|
|
|
|
|
|
|
|
|
|
|
|
|
|
|
|
|
|
|
|
|
|
|
|
|
|
|
|
|
|
|
| Total LTLs: |
|
|
|
|
|
|
|
|
|
|
|
|
|
|
|
|
|
|
|
|
|
|
|
|
|
| |
|
| Maximum |
|
|
|
|
|
|
| 107.7 | % | 7.0 | x | 9.0 | x | 5.5 | x | 10.3 | x | 8.7 | x | 12.2 | x | 15.7 | x | 13.6 | x | 11.7 | x |
|
| Minimum |
|
|
|
|
|
|
| 91.2 | % | 3.9 |
| 3.8 |
| 3.1 |
| 5.8 |
| 5.4 |
| 5.0 |
| 10.2 |
| 9.4 |
| 8.2 |
|
|
| Median |
|
|
|
|
|
|
| 94.0 | % | 5.6 | x | 5.1 | x | 4.3 | x | 7.9 | x | 7.1 | x | 6.6 | x | 12.0 | x | 11.3 | x | 9.8 | x |
|
| Mean |
|
|
|
|
|
|
| 95.3 | % | 5.4 |
| 5.5 |
| 4.2 |
| 8.0 |
| 7.1 |
| 7.1 |
| 12.8 |
| 11.3 |
| 9.9 |
|
|
| Mean (Excluding High and Low) |
|
|
| 93.6 | % | 5.4 |
| 5.1 |
| 4.2 |
| 8.1 |
| 7.1 |
| 6.5 |
| 12.7 |
| 11.2 |
| 9.9 |
| ||||
81
Comparable Companies Analysis – Non-Asset Based 3PL
Dollars in Millions, Except per Share
|
|
|
|
|
|
|
|
|
| Enterprise Value / |
|
|
|
|
|
|
| ||||||||||
|
| Price |
| % of 52 |
| Market |
| Enterprise |
| EBITDA |
| EBIT |
| P/E |
| ||||||||||||
Company Name |
| 6/22/05 |
| Wk. High |
| Cap. |
| Value |
| LTM |
| 2005E |
| 2006E |
| LTM |
| 2005E |
| 2006E |
| LTM |
| 2005E |
| 2006E |
|
|
|
|
|
|
|
|
|
|
|
|
|
|
|
|
|
|
|
|
|
|
|
|
|
|
|
|
|
Ground Based Asset-Lite |
|
|
|
|
|
|
|
|
|
|
|
|
|
|
|
|
|
|
|
|
|
|
|
|
|
|
|
C.H. Robinson Worldwide |
| $ | 57.81 |
| 97.0 | % | $ | 5,078.7 |
| $ | 4,831.3 |
| $ | 256.5 |
| $ | 311.9 |
| $ | 354.8 |
| $ | 243.4 |
| $ | 296.0 |
| $ | 337.9 |
| $ | 1.73 |
| $ | 2.10 |
| $ | 2.40 |
|
|
|
|
|
|
|
|
|
|
| 18.8 | x | 15.5 | x | 13.6 | x | 19.9 | x | 16.3 | x | 14.3 | x | 33.4 | x | 27.5 | x | 24.1 | x | ||||||||||||
Dynamex, Inc. |
| 17.20 |
| 78.1 | % | 207.2 |
| 203.0 |
| $ | 21.4 |
| $ | 23.0 |
| $ | 27.2 |
| $ | 19.8 |
| $ | 21.5 |
| $ | 25.6 |
| $ | 1.03 |
| $ | 1.16 |
| $ | 1.36 |
| |||
|
|
|
|
|
|
|
|
|
| 9.5 | x | 8.8 | x | 7.5 | x | 10.2 | x | 9.4 | x | 7.9 | x | 16.6 | x | 14.9 | x | 12.7 | x | ||||||||||||
Forward Air |
| 29.86 |
| 94.8 | % | 986.6 |
| 870.6 |
| $ | 63.2 |
| $ | 79.5 |
| $ | 95.5 |
| $ | 56.2 |
| $ | 71.7 |
| $ | 87.0 |
| $ | 1.10 |
| $ | 1.40 |
| $ | 1.67 |
| |||
|
|
|
|
|
|
|
|
|
| 13.8 | x | 11.0 | x | 9.1 | x | 15.5 | x | 12.1 | x | 10.0 | x | 27.1 | x | 21.3 | x | 17.9 | x | ||||||||||||
Hub Group, Inc. |
| 25.72 |
| 76.9 | % | 570.2 |
| 554.6 |
| $ | 54.6 |
| $ | 60.2 |
| $ | 66.0 |
| $ | 43.4 |
| $ | 50.1 |
| $ | 59.3 |
| $ | 1.21 |
| $ | 1.38 |
| $ | 1.64 |
| |||
|
|
|
|
|
|
|
|
|
| 10.2 | x | 9.2 | x | 8.4 | x | 12.8 | x | 11.1 | x | 9.3 | x | 21.2 | x | 18.6 | x | 15.7 | x | ||||||||||||
Landstar System |
| 30.25 |
| 77.1 | % | 1,862.4 |
| 1,887.5 |
| $ | 150.2 |
| $ | 155.5 |
| $ | 174.3 |
| $ | 135.5 |
| $ | 139.3 |
| $ | 157.0 |
| $ | 1.32 |
| $ | 1.37 |
| $ | 1.60 |
| |||
|
|
|
|
|
|
|
|
|
| 12.6 | x | 12.1 | x | 10.8 | x | 13.9 | x | 13.6 | x | 12.0 | x | 22.9 | x | 22.1 | x | 18.9 | x | ||||||||||||
Pacer International |
| 22.51 |
| 82.8 | % | 864.4 |
| 1,030.4 |
| $ | 96.8 |
| $ | 104.9 |
| $ | 115.9 |
| $ | 89.7 |
| $ | 98.1 |
| $ | 108.0 |
| $ | 1.29 |
| $ | 1.39 |
| $ | 1.63 |
| |||
|
|
|
|
|
|
|
|
|
| 10.6 | x | 9.8 | x | 8.9 | x | 11.5 | x | 10.5 | x | 9.5 | x | 17.5 | x | 16.2 | x | 13.8 | x | ||||||||||||
Quality Distribution, Inc. |
| 9.08 |
| 73.1 | % | 174.3 |
| 449.6 |
| $ | 58.3 |
| $ | 63.9 |
| $ | 68.8 |
| $ | 37.4 |
| $ | 45.9 |
| $ | 50.3 |
| $ | 0.45 |
| $ | 0.74 |
| $ | 0.90 |
| |||
|
|
|
|
|
|
|
|
|
| 7.7 | x | 7.0 | x | 6.5 | x | 12.0 | x | 9.8 | x | 8.9 | x | 20.3 | x | 12.3 | x | 10.1 | x | ||||||||||||
Universal Truckload Services, Inc. |
| 13.57 |
| 57.7 | % | 218.7 |
| 190.8 |
| $ | 25.3 |
| $ | 30.4 |
| $ | 35.9 |
| $ | 21.2 |
| $ | 25.6 |
| $ | 30.4 |
| $ | 1.17 |
| $ | 1.04 |
| $ | 1.17 |
| |||
|
|
|
|
|
|
|
|
|
| 7.6 | x | 6.3 | x | 5.3 | x | 9.0 | x | 7.5 | x | 6.3 | x | 11.6 | x | 13.0 | x | 11.6 | x | ||||||||||||
|
| Ground Based Asset-Lite Market Multiples: |
|
|
|
|
|
|
|
|
|
|
|
|
|
|
|
|
|
|
| ||||||
|
| Maximum |
|
|
|
|
|
|
| 18.8 | x | 15.5 | x | 13.6 | x | 19.9 | x | 16.3 | x | 14.3 | x | 33.4 | x | 27.5 | x | 24.1 | x |
|
| Minimum |
|
|
|
|
|
|
| 7.6 |
| 6.3 |
| 5.3 |
| 9.0 |
| 7.5 |
| 6.3 |
| 11.6 |
| 12.3 |
| 10.1 |
|
|
| Median |
|
|
|
|
|
|
| 10.4 | x | 9.5 | x | 8.6 | x | 12.4 | x | 10.8 | x | 9.4 | x | 20.8 | x | 17.4 | x | 14.7 | x |
|
| Mean |
|
|
|
|
|
|
| 11.3 |
| 10.0 |
| 8.8 |
| 13.1 |
| 11.3 |
| 9.8 |
| 21.3 |
| 18.2 |
| 15.6 |
|
|
| Mean (Excluding Min & Max) |
|
|
| 10.7 |
| 9.7 |
| 8.5 |
| 12.7 |
| 11.1 |
| 9.6 |
| 20.9 |
| 17.7 |
| 15.1 |
| ||||
Freight Forwarding |
|
|
|
|
|
|
|
|
|
|
|
|
|
|
|
|
|
|
|
|
|
|
|
|
|
|
|
Eagle Global Logistics |
| $ | 20.78 |
| 59.4 | % | $ | 1,092.8 |
| $ | 986.2 |
| $ | 122.3 |
| $ | 143.3 |
| $ | 164.0 |
| $ | 86.8 |
| $ | 107.8 |
| $ | 128.5 |
| $ | 1.12 |
| $ | 1.15 |
| $ | 1.50 |
|
|
|
|
|
|
|
|
|
|
| 8.1 | x | 6.9 | x | 6.0 | x | 11.4 | x | 9.1 | x | 7.7 | x | 18.6 | x | 18.1 | x | 13.9 | x | ||||||||||||
Expeditors International |
| 51.74 |
| 88.6 | % | 5,834.9 |
| 5,376.7 |
| $ | 274.5 |
| $ | 315.7 |
| $ | 397.8 |
| $ | 246.8 |
| $ | 285.6 |
| $ | 366.5 |
| $ | 1.46 |
| $ | 1.68 |
| $ | 2.11 |
| |||
|
|
|
|
|
|
|
|
|
| 19.6 | x | 17.0 | x | 13.5 | x | 21.8 | x | 18.8 | x | 14.7 | x | 35.3 | x | 30.8 | x | 24.5 | x | ||||||||||||
UTi Worldwide |
| 71.86 |
| 93.1 | % | 2,341.0 |
| 2,261.9 |
| $ | 116.9 |
| $ | 152.4 |
| $ | 180.2 |
| $ | 95.5 |
| $ | 127.9 |
| $ | 154.7 |
| $ | 2.12 |
| $ | 2.62 |
| $ | 3.20 |
| |||
|
|
|
|
|
|
|
|
|
| 19.4 | x | 14.8 | x | 12.6 | x | 23.7 | x | 17.7 | x | 14.6 | x | 33.9 | x | 27.4 | x | 22.5 | x | ||||||||||||
|
| Freight-Forwarding Market Multiples: |
|
|
|
|
|
|
|
|
|
|
|
|
|
|
|
|
|
|
|
| |||||
|
| Median |
|
|
|
|
|
|
| 19.4 | x | 14.8 | x | 12.6 | x | 21.8 | x | 17.7 | x | 14.6 | x | 33.9 | x | 27.4 | x | 22.5 | x |
|
| Mean |
|
|
|
|
|
|
| 15.7 |
| 12.9 |
| 10.7 |
| 18.9 |
| 15.2 |
| 12.3 |
| 29.3 |
| 25.4 |
| 20.3 |
|
|
|
|
|
|
|
|
|
|
|
|
|
|
|
|
|
|
|
|
|
|
|
|
|
|
|
|
|
|
| Total 3PL Market Multiples: |
|
|
|
|
|
|
|
|
|
|
|
|
|
|
|
|
|
|
|
|
| ||||
|
| Maximum |
|
|
|
|
|
|
| 19.6 | x | 17.0 | x | 13.6 | x | 23.7 | x | 18.8 | x | 14.7 | x | 35.3 | x | 30.8 | x | 24.5 | x |
|
| Minimum |
|
|
|
|
|
|
| 7.6 |
| 6.3 |
| 5.3 |
| 9.0 |
| 7.5 |
| 6.3 |
| 11.6 |
| 12.3 |
| 10.1 |
|
|
| Median |
|
|
|
|
|
|
| 10.6 | x | 9.8 | x | 8.9 | x | 12.8 | x | 11.1 | x | 9.5 | x | 21.2 | x | 18.6 | x | 15.7 | x |
|
| Mean |
|
|
|
|
|
|
| 12.5 |
| 10.8 |
| 9.3 |
| 14.7 |
| 12.4 |
| 10.5 |
| 23.5 |
| 20.2 |
| 16.9 |
|
|
| Mean (Excluding Min & Max) |
|
|
| 12.3 |
| 10.6 |
| 9.3 |
| 14.3 |
| 12.2 |
| 10.5 |
| 23.5 |
| 19.9 |
| 16.8 |
| ||||
82
B. No Growth/Cost Reduction
83
No Growth/Cost Reduction — Benefits/Issues
BENEFITS |
| ISSUES | ||
|
|
|
|
|
• | Maintain control. |
| • | Many measures of productivity (see pg. 12) already in-line with competition — is there much fat to cut without harming the business? |
|
|
|
|
|
• | Current strong freight/capacity environment will cushion the transition. |
| • | Likely detrimental effect on employee morale and driver turnover. |
|
|
|
|
|
• | Potentially mitigate headache of aggressive driver hiring in tough recruiting environment. |
| • | G&A reductions may result in lower quality services provided to customers and drivers. |
|
|
|
|
|
• | Potential to expedite OR improvement by six to nine months. |
| • | Probable volatility in stock price due to near-term “messy” earnings (onetime charges, low visibility on future earnings, etc.). |
|
|
|
|
|
|
|
| • | May result in increased activity of large shareholders — i.e. is cost cutting a “management last resort” policy forcing shareholders to seek change. |
|
|
|
|
|
|
|
| • | Possible customer attrition if customer service declines or the health of the Company is in question. |
2
Cost Reduction Detail
(In Thousands)
Management has identified areas for possible expense reduction. One-time charges negatively impact the P&L through the expense reduction period by an estimated $6.5 million (primarily Transcom write-off).
|
| P&L Impact |
| Considerations | ||||
|
| Low |
| High |
|
| ||
Reduce fleet size from 1050 tractors to 850: |
|
|
|
|
|
| ||
Reduce owned fleet by 150 — 99 units are parked, so depreciation savings on 51 units. |
| $ | (704 | ) | $ | (704 | ) |
|
Turn in 50 leased units early |
| (492 | ) | (492 | ) |
| ||
Reduced license and permit cost for tractor reduction |
| (456 | ) | (456 | ) |
| ||
Reduced tractor maintenance parts cost from fleet reduction |
| (225 | ) | (300 | ) |
| ||
Reduced tire cost from tractor and trailer fleet reduction |
| (180 | ) | (180 | ) |
| ||
Reduced abuse and damage cost due to fleet reduction |
| (100 | ) | (400 | ) |
| ||
Sell 700 trailers to reduce trailer to tractor ratio to 2.8:1 |
| (1,243 | ) | (1,243 | ) |
| ||
Abandon Transcom and convert to off-the-shelf applications. |
| 0 |
| (1,500 | ) | Large risks to any ERP conversion. | ||
Close 2 Service Centers, reduce mechanics by 20% and other personnel by 11 people |
| (1,464 | ) | (1,762 | ) | Driver turnover. | ||
Eliminate 45 G&A positions - 15% reduction in G&A |
| (771 | ) | (2,313 | ) | Employee morale, customer/driver service. | ||
Eliminate related benefits expense of G&A reduction |
| (133 | ) | (398 | ) |
| ||
Eliminate consulting fees |
| (200 | ) | (200 | ) |
| ||
Travel reduction post headcount reduction |
| (100 | ) | (200 | ) |
| ||
Office supplies reduction due to headcount reduction |
| (38 | ) | (50 | ) |
| ||
Move HQ to lower cost space and sublease existing space |
| (105 | ) | (420 | ) |
| ||
Office services reduction |
| (263 | ) | (350 | ) |
| ||
Total |
| $ | (6,473 | ) | $ | (10,968 | ) |
|
3
Pro Forma Income Statement
(In Thousands)
|
| No Growth Status Quo |
| Low Case |
| High Case |
| |||||||||||||||
|
| PF 2005E |
| % of Rev. |
| Cost Reduction |
| Year 1 |
| % of Rev. |
| Cost Reduction |
| Year 1 |
| % of Rev. |
| |||||
Revenue: |
|
|
|
|
|
|
|
|
|
|
|
|
|
|
|
|
| |||||
Linhaul and Accessorial |
| 207,651 |
|
|
|
|
| 207,651 |
|
|
|
|
| 207,651 |
|
|
| |||||
Fuel Surcharge |
| 25,763 |
|
|
|
|
| 25,763 |
|
|
|
|
| 25,763 |
|
|
| |||||
Outsource Power |
| 11,676 |
|
|
|
|
| 11,676 |
|
|
|
|
| 11,676 |
|
|
| |||||
Total Revenue |
| 245,090 |
| 100.0 | % |
|
| 245,090 |
| 100.0 | % |
|
| 245,090 |
| 100.0 | % | |||||
Operating Expenses: |
|
|
|
|
|
|
|
|
|
|
|
|
|
|
|
|
| |||||
Driver Wages |
| 43,724 |
| 17.8 | % |
|
| 43,724 |
| 17.8 | % |
|
| 43,724 |
| 17.8 | % | |||||
Student/Trainer Wages |
| 514 |
| 0.2 | % |
|
| 514 |
| 0.2 | % |
|
| 514 |
| 0.2 | % | |||||
Driver Benefits |
| 7,942 |
| 3.2 | % |
|
| 7,942 |
| 3.2 | % |
|
| 7,942 |
| 3.2 | % | |||||
Workers’ Compensation |
| 2,629 |
| 1.1 | % |
|
| 2,629 |
| 1.1 | % |
|
| 2,629 |
| 1.1 | % | |||||
Fuel |
| 32,134 |
| 13.1 | % |
|
| 32,134 |
| 13.1 | % |
|
| 32,134 |
| 13.1 | % | |||||
Tolls & Fuel Tax |
| 3,773 |
| 1.5 | % |
|
| 3,773 |
| 1.5 | % |
|
| 3,773 |
| 1.5 | % | |||||
Shop Wages |
| 2,773 |
| 1.1 | % | (416 | ) | 2,357 |
| 1.0 | % | (555 | ) | 2,218 |
| 0.9 | % | |||||
Shop Benefits |
| 921 |
| 0.4 | % | (138 | ) | 783 |
| 0.3 | % | (184 | ) | 737 |
| 0.3 | % | |||||
Maintenance |
| 3,201 |
| 1.3 | % | (225 | ) | 2,976 |
| 1.2 | % | (300 | ) | 2,901 |
| 1.2 | % | |||||
Tires |
| 2,367 |
| 1.0 | % | (180 | ) | 2,187 |
| 0.9 | % | (180 | ) | 2,187 |
| 0.9 | % | |||||
Insurance Claims |
| 9,732 |
| 4.0 | % |
|
| 9,732 |
| 4.0 | % |
|
| 9,732 |
| 4.0 | % | |||||
Abuse |
| 1,984 |
| 0.8 | % | (100 | ) | 1,884 |
| 0.8 | % | (400 | ) | 1,584 |
| 0.6 | % | |||||
Communications |
| 1,726 |
| 0.7 | % | (26 | ) | 1,700 |
| 0.7 | % | (26 | ) | 1,700 |
| 0.7 | % | |||||
Owner/Operators |
| 62,066 |
| 25.3 | % |
|
| 62,066 |
| 25.3 | % |
|
| 62,066 |
| 25.3 | % | |||||
Other Linehaul |
| 2,742 |
| 1.1 | % | (43 | ) | 2,699 |
| 1.1 | % | (43 | ) | 2,699 |
| 1.1 | % | |||||
Broker & Logistics Costs |
| 8,576 |
| 3.5 | % |
|
| 8,576 |
| 3.5 | % |
|
| 8,576 |
| 3.5 | % | |||||
Total Direct Expenses |
| 186,807 |
| 76.2 | % | (1,128 | ) | 185,678 |
| 75.8 | % | (1,688 | ) | 185,119 |
| 75.5 | % | |||||
Direct Profit Contribution |
| 58,284 |
| 23.8 | % | 1,128 |
| 59,412 |
| 24.2 | % | 1,688 |
| 59,972 |
| 24.5 | % | |||||
Fixed Expenses: |
|
|
|
|
|
|
|
|
|
|
|
|
|
|
|
|
| |||||
G&A Wages |
| 15,417 |
| 6.3 | % | (998 | ) | 14,419 |
| 5.9 | % | (2,615 | ) | 12,802 |
| 5.2 | % | |||||
G&A Benefits |
| 2,656 |
| 1.1 | % | (201 | ) | 2,455 |
| 1.0 | % | (489 | ) | 2,167 |
| 0.9 | % | |||||
Office Supplies |
| 486 |
| 0.2 | % | (65 | ) | 421 |
| 0.2 | % | (86 | ) | 400 |
| 0.2 | % | |||||
Office Other |
| 1,809 |
| 0.7 | % | (269 | ) | 1,540 |
| 0.6 | % | (359 | ) | 1,450 |
| 0.6 | % | |||||
Meetings, Entert. & Travel |
| 823 |
| 0.3 | % | (110 | ) | 713 |
| 0.3 | % | (213 | ) | 610 |
| 0.2 | % | |||||
Driver Hiring & Training |
| 2,960 |
| 1.2 | % |
|
| 2,960 |
| 1.2 | % |
|
| 2,960 |
| 1.2 | % | |||||
Building Repairs |
| 826 |
| 0.3 | % | (107 | ) | 719 |
| 0.3 | % | (107 | ) | 719 |
| 0.3 | % | |||||
License & Permits |
| 3,843 |
| 1.6 | % | (456 | ) | 3,387 |
| 1.4 | % | (456 | ) | 3,387 |
| 1.4 | % | |||||
Depr. Tractors & Other |
| 14,123 |
| 5.8 | % | (891 | ) | 13,232 |
| 5.4 | % | (2,391 | ) | 11,732 |
| 4.8 | % | |||||
Depr. Trailers |
| 8,073 |
| 3.3 | % | (1,243 | ) | 6,830 |
| 2.8 | % | (1,243 | ) | 6,830 |
| 2.8 | % | |||||
Revenue Equipment Leases |
| 1,554 |
| 0.6 | % | (492 | ) | 1,062 |
| 0.4 | % | (492 | ) | 1,062 |
| 0.4 | % | |||||
Rents, Taxes, & Utilities |
| 2,697 |
| 1.1 | % | (313 | ) | 2,384 |
| 1.0 | % | (628 | ) | 2,069 |
| 0.8 | % | |||||
Education & Professional |
| 1,201 |
| 0.5 | % | (200 | ) | 1,001 |
| 0.4 | % | (200 | ) | 1,001 |
| 0.4 | % | |||||
(Gain) Loss on Sale |
| 22 |
| 0.0 | % |
|
| 22 |
| 0.0 | % |
|
| 22 |
| 0.0 | % | |||||
Fixed Expenses |
| 56,490 |
| 23.0 | % | (5,344 | ) | 51,146 |
| 20.9 | % | (9,280 | ) | 47,210 |
| 19.3 | % | |||||
OperatingIncome |
| $ | 1,794 |
| 0.7 | % | $ | 6,473 |
| $ | 8,266 |
| 3.4 | % | 10,968 |
| $ | 12,761 |
| $ | 5.2 | % |
Operating Ratio |
|
|
| 99.3 | % |
|
|
|
| 96.6 | % |
|
|
|
| 94.8 | % | |||||
4
Potential Valuation – Market Multiples
• We would expect the multiple attributed to TWINS in a No Growth/Cost Reduction scenario would be lower than the Organic Growth scenario.
• We utilized a range of 9-13x EPS in this case versus the 12-16x in the Organic Growth case.
• Valuation range could be lower if growth does not follow the expense reduction —Wall Street unlikely to reward TWINS solely due to profitability improvements.
• Benefits of cost reduction are initially clouded by write-offs and one-time charges and may spook market.
|
| Low Case |
| High Case |
| ||
Year 1 OR |
| 96.6 | % | 94.8 | % | ||
Year 1 EPS |
| $ | 0.59 |
| $ | 1.00 |
|
|
|
|
|
|
|
|
|
Share Price |
|
|
|
|
| ||
at Multiple of: |
|
|
|
|
| ||
9.0x |
| $ | 5.33 |
| $ | 9.04 |
|
11.0x |
| 6.52 |
| 11.05 |
| ||
13.0x |
| 7.70 |
| 13.06 |
| ||
Assumes $17.6 million in cash flow generated from reduction in asset base used to repay debt.
Excludes impact on one-time expenses.
5