Transport Corporation Of America (TCAM) Inactive
Filed: 30 Dec 05, 12:00am
Exhibit (c)(4)
Link to searchable text of slide shown above
Link to searchable text of slide shown above
Link to searchable text of slide shown above
Link to searchable text of slide shown above
Link to searchable text of slide shown above
Link to searchable text of slide shown above
Link to searchable text of slide shown above
Link to searchable text of slide shown above
Link to searchable text of slide shown above
Link to searchable text of slide shown above
Link to searchable text of slide shown above
Link to searchable text of slide shown above
Link to searchable text of slide shown above
Link to searchable text of slide shown above
Link to searchable text of slide shown above
Searchable text section of graphics shown above
CONFIDENTIAL
[GRAPHIC]
A Presentation to:
The Board of Directors of
TWINS
Regarding:
Process Update
August 15, 2005
300 Crescent Court, Suite 600 |
|
|
Dallas, TX 75201 |
|
|
214-258-2700 |
|
|
www.stephens.com |
| [LOGO] |
Little Rock |
| Atlanta |
| Dallas |
| Nashville |
| New York |
Table of Contents
I. | Process Update |
|
|
II. | Valuation Update |
|
|
III. | GHJM Indication of Interest |
[LOGO]
2
I. Process Update
Process Update
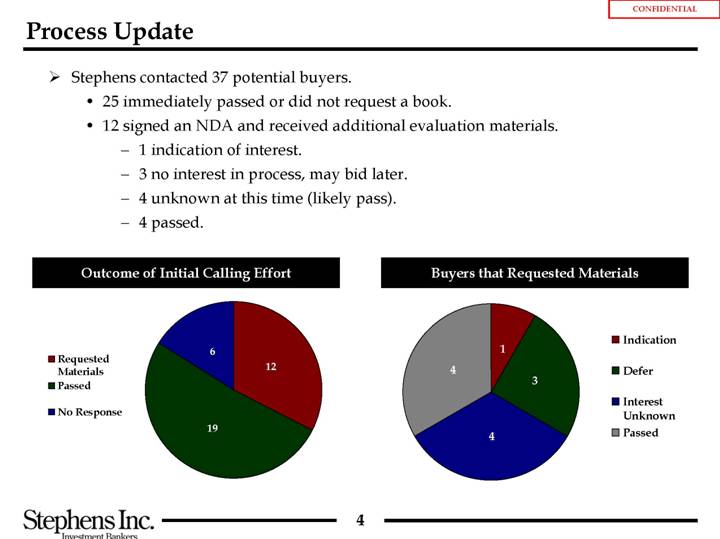
• Stephens contacted 37 potential buyers.
• 25 immediately passed or did not request a book.
• 12 signed an NDA and received additional evaluation materials.
• 1 indication of interest.
• 3 no interest in process, may bid later.
• 4 unknown at this time (likely pass).
• 4 passed.
Outcome of Initial Calling Effort
[CHART]
Buyers that Requested Materials
[CHART]
4
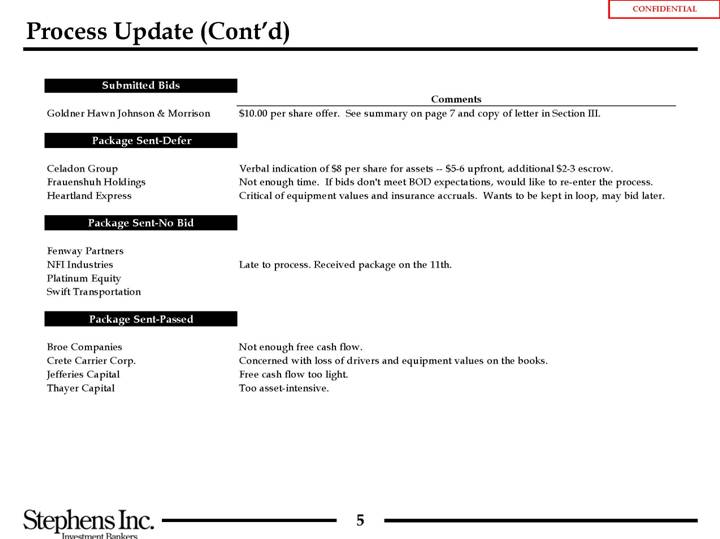
Submitted Bids |
|
|
|
| Comments |
Goldner Hawn Johnson & Morrison |
| $10.00 per share offer. See summary on page 7 and copy of letter in Section III. |
|
|
|
Package Sent-Defer |
|
|
|
|
|
Celadon Group |
| Verbal indication of $8 per share for assets — $5-6 upfront, additional $2-3 escrow. |
Frauenshuh Holdings |
| Not enough time. If bids don’t meet BOD expectations, would like to re-enter the process. |
Heartland Express |
| Critical of equipment values and insurance accruals. Wants to be kept in loop, may bid later. |
|
|
|
Package Sent-No Bid |
|
|
|
|
|
Fenway Partners |
|
|
NFI Industries |
| Late to process. Received package on the 11th. |
Platinum Equity |
|
|
Swift Transportation |
|
|
|
|
|
Package Sent-Passed |
|
|
|
|
|
Broe Companies |
| Not enough free cash flow. |
Crete Carrier Corp. |
| Concerned with loss of drivers and equipment values on the books. |
Jefferies Capital |
| Free cash flow too light. |
Thayer Capital |
| Too asset-intensive. |
5
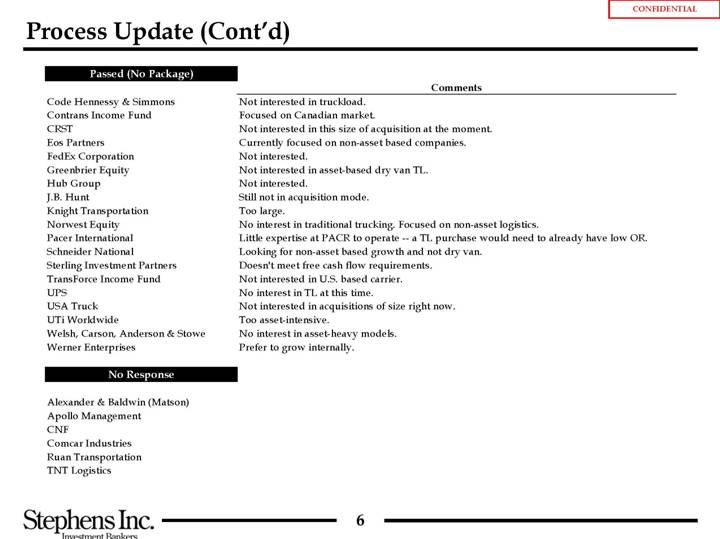
Passed (No Package) |
|
|
|
| Comments |
Code Hennessy & Simmons |
| Not interested in truckload. |
Contrans Income Fund |
| Focused on Canadian market. |
CRST |
| Not interested in this size of acquisition at the moment. |
Eos Partners |
| Currently focused on non-asset based companies. |
FedEx Corporation |
| Not interested. |
Greenbrier Equity |
| Not interested in asset-based dry van TL. |
Hub Group |
| Not interested. |
J.B. Hunt |
| Still not in acquisition mode. |
Knight Transportation |
| Too large. |
Norwest Equity |
| No interest in traditional trucking. Focused on non-asset logistics. |
Pacer International |
| Little expertise at PACR to operate — a TL purchase would need to already have low OR. |
Schneider National |
| Looking for non-asset based growth and not dry van. |
Sterling Investment Partners |
| Doesn’t meet free cash flow requirements. |
TransForce Income Fund |
| Not interested in U.S. based carrier. |
UPS |
| No interest in TL at this time. |
USA Truck |
| Not interested in acquisitions of size right now. |
UTi Worldwide |
| Too asset-intensive. |
Welsh, Carson, Anderson & Stowe |
| No interest in asset-heavy models. |
Werner Enterprises |
| Prefer to grow internally. |
|
|
|
No Response |
|
|
|
|
|
Alexander & Baldwin (Matson) |
|
|
Apollo Management |
|
|
CNF |
|
|
Comcar Industries |
|
|
Ruan Transportation |
|
|
TNT Logistics |
|
|
6
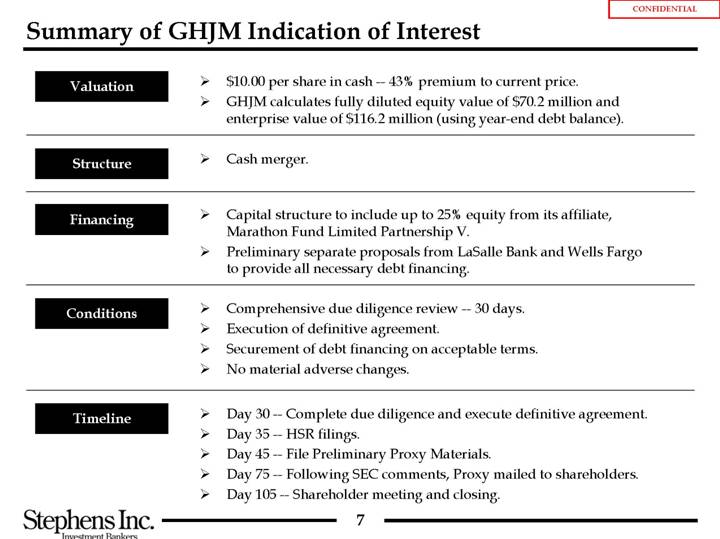
Summary of GHJM Indication of Interest
Valuation |
| • $10.00 per share in cash — 43% premium to current price. |
|
| • GHJM calculates fully diluted equity value of $70.2 million and enterprise value of $116.2 million (using year-end debt balance). |
|
|
|
Structure |
| • Cash merger. |
|
|
|
Financing |
| • Capital structure to include up to 25% equity from its affiliate, Marathon Fund Limited Partnership V. |
|
| • Preliminary separate proposals from LaSalle Bank and Wells Fargo to provide all necessary debt financing. |
|
|
|
Conditions |
| • Comprehensive due diligence review — 30 days. |
|
| • Execution of definitive agreement. |
|
| • Securement of debt financing on acceptable terms. |
|
| • No material adverse changes. |
|
|
|
Timeline |
| • Day 30 — Complete due diligence and execute definitive agreement. |
|
| • Day 35 — HSR filings. |
|
| • Day 45 — File Preliminary Proxy Materials. |
|
| • Day 75 — Following SEC comments, Proxy mailed to shareholders. |
|
| • Day 105 — Shareholder meeting and closing. |
7
II. Valuation Update
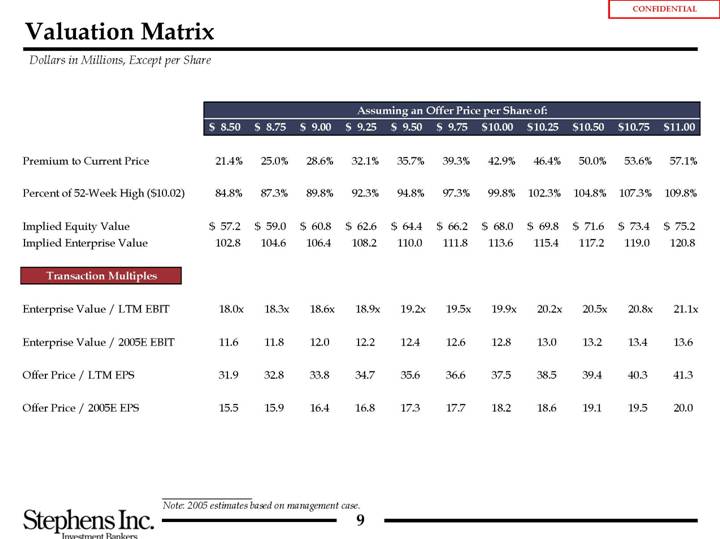
Valuation Matrix
Dollars in Millions, Except per Share
|
| Assuming an Offer Price per Share of: |
| |||||||||||||||||||||||||||||||
|
| $ 8.50 |
| $ 8.75 |
| $ 9.00 |
| $ 9.25 |
| $ 9.50 |
| $ 9.75 |
| $ 10.00 |
| $ 10.25 |
| $ 10.50 |
| $ 10.75 |
| $ 11.00 |
| |||||||||||
|
|
|
|
|
|
|
|
|
|
|
|
|
|
|
|
|
|
|
|
|
|
|
| |||||||||||
Premium to Current Price |
| 21.4 | % | 25.0 | % | 28.6 | % | 32.1 | % | 35.7 | % | 39.3 | % | 42.9 | % | 46.4 | % | 50.0 | % | 53.6 | % | 57.1 | % | |||||||||||
|
|
|
|
|
|
|
|
|
|
|
|
|
|
|
|
|
|
|
|
|
|
|
| |||||||||||
Percent of 52-Week High ($10.02) |
| 84.8 | % | 87.3 | % | 89.8 | % | 92.3 | % | 94.8 | % | 97.3 | % | 99.8 | % | 102.3 | % | 104.8 | % | 107.3 | % | 109.8 | % | |||||||||||
|
|
|
|
|
|
|
|
|
|
|
|
|
|
|
|
|
|
|
|
|
|
|
| |||||||||||
Implied Equity Value |
| $ | 57.2 |
| $ | 59.0 |
| $ | 60.8 |
| $ | 62.6 |
| $ | 64.4 |
| $ | 66.2 |
| $ | 68.0 |
| $ | 69.8 |
| $ | 71.6 |
| $ | 73.4 |
| $ | 75.2 |
|
Implied Enterprise Value |
| 102.8 |
| 104.6 |
| 106.4 |
| 108.2 |
| 110.0 |
| 111.8 |
| 113.6 |
| 115.4 |
| 117.2 |
| 119.0 |
| 120.8 |
| |||||||||||
|
|
|
|
|
|
|
|
|
|
|
|
|
|
|
|
|
|
|
|
|
|
|
| |||||||||||
Transaction Multiples |
|
|
|
|
|
|
|
|
|
|
|
|
|
|
|
|
|
|
|
|
|
|
| |||||||||||
|
|
|
|
|
|
|
|
|
|
|
|
|
|
|
|
|
|
|
|
|
|
|
| |||||||||||
Enterprise Value / LTM EBIT |
| 18.0 | x | 18.3 | x | 18.6 | x | 18.9 | x | 19.2 | x | 19.5 | x | 19.9 | x | 20.2 | x | 20.5 | x | 20.8 | x | 21.1 | x | |||||||||||
|
|
|
|
|
|
|
|
|
|
|
|
|
|
|
|
|
|
|
|
|
|
|
| |||||||||||
Enterprise Value / 2005E EBIT |
| 11.6 |
| 11.8 |
| 12.0 |
| 12.2 |
| 12.4 |
| 12.6 |
| 12.8 |
| 13.0 |
| 13.2 |
| 13.4 |
| 13.6 |
| |||||||||||
|
|
|
|
|
|
|
|
|
|
|
|
|
|
|
|
|
|
|
|
|
|
|
| |||||||||||
Offer Price / LTM EPS |
| 31.9 |
| 32.8 |
| 33.8 |
| 34.7 |
| 35.6 |
| 36.6 |
| 37.5 |
| 38.5 |
| 39.4 |
| 40.3 |
| 41.3 |
| |||||||||||
|
|
|
|
|
|
|
|
|
|
|
|
|
|
|
|
|
|
|
|
|
|
|
| |||||||||||
Offer Price / 2005E EPS |
| 15.5 |
| 15.9 |
| 16.4 |
| 16.8 |
| 17.3 |
| 17.7 |
| 18.2 |
| 18.6 |
| 19.1 |
| 19.5 |
| 20.0 |
| |||||||||||
Note: 2005 estimates based on management case.
9
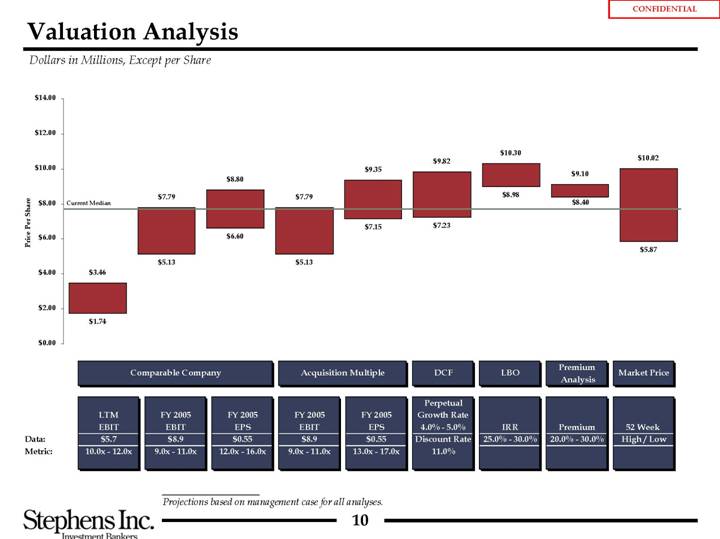
Valuation Analysis
Dollars in Millions, Except per Share
[CHART]
|
|
|
|
|
|
|
|
|
|
|
|
|
|
|
| Premium |
|
|
|
|
| Comparable Company |
| Acquisition Multiple |
| DCF |
| LBO |
| Analysis |
| Market Price |
| ||||||
|
|
|
|
|
| Perpetual |
|
|
|
|
|
|
| ||||||
|
| LTM |
| FY 2005 |
| FY 2005 |
| FY 2005 |
| FY 2005 |
| Growth Rate |
|
|
|
|
|
|
|
|
| EBIT |
| EBIT |
| EPS |
| EBIT |
| EPS |
| 4.0% - 5.0% |
| IRR |
| Premium |
| 52 Week |
|
Data: |
| $5.7 |
| $8.9 |
| $0.55 |
| $8.9 |
| $0.55 |
| Discount Rate |
| 25.0% - 30.0% |
| 20.0% - 30.0% |
| High / Low |
|
Metric: |
| 10.0x - 12.0x |
| 9.0x - 11.0x |
| 12.0x - 16.0x |
| 9.0x - 11.0x |
| 13.0x - 17.0x |
| 11.0% |
|
|
|
|
|
|
|
Projections based on management case for all analyses.
10
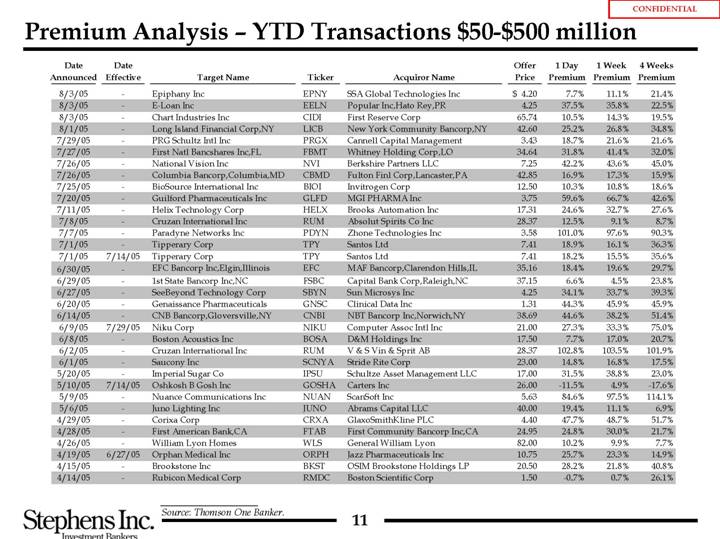
Premium Analysis – YTD Transactions $50-$500 million
Date |
| Date |
|
|
|
|
|
|
| Offer |
| 1 Day |
| 1 Week |
| 4 Weeks |
| |
Announced |
| Effective |
| Target Name |
| Ticker |
| Acquiror Name |
| Price |
| Premium |
| Premium |
| Premium |
| |
8/3/05 |
| — |
| Epiphany Inc |
| EPNY |
| SSA Global Technologies Inc |
| $ | 4.20 |
| 7.7 | % | 11.1 | % | 21.4 | % |
8/3/05 |
| — |
| E-Loan Inc |
| EELN |
| Popular Inc,Hato Rey,PR |
| 4.25 |
| 37.5 | % | 35.8 | % | 22.5 | % | |
8/3/05 |
| — |
| Chart Industries Inc |
| CIDI |
| First Reserve Corp |
| 65.74 |
| 10.5 | % | 14.3 | % | 19.5 | % | |
8/1/05 |
| — |
| Long Island Financial Corp,NY |
| LICB |
| New York Community Bancorp,NY |
| 42.60 |
| 25.2 | % | 26.8 | % | 34.8 | % | |
7/29/05 |
| — |
| PRG Schultz Intl Inc |
| PRGX |
| Cannell Capital Management |
| 3.43 |
| 18.7 | % | 21.6 | % | 21.6 | % | |
7/27/05 |
| — |
| First Natl Bancshares Inc,FL |
| FBMT |
| Whitney Holding Corp,LO |
| 34.64 |
| 31.8 | % | 41.4 | % | 32.0 | % | |
7/26/05 |
| — |
| National Vision Inc |
| NVI |
| Berkshire Partners LLC |
| 7.25 |
| 42.2 | % | 43.6 | % | 45.0 | % | |
7/26/05 |
| — |
| Columbia Bancorp,Columbia,MD |
| CBMD |
| Fulton Finl Corp,Lancaster,PA |
| 42.85 |
| 16.9 | % | 17.3 | % | 15.9 | % | |
7/25/05 |
| — |
| BioSource International Inc |
| BIOI |
| Invitrogen Corp |
| 12.50 |
| 10.3 | % | 10.8 | % | 18.6 | % | |
7/20/05 |
| — |
| Guilford Pharmaceuticals Inc |
| GLFD |
| MGI PHARMA Inc |
| 3.75 |
| 59.6 | % | 66.7 | % | 42.6 | % | |
7/11/05 |
| — |
| Helix Technology Corp |
| HELX |
| Brooks Automation Inc |
| 17.31 |
| 24.6 | % | 32.7 | % | 27.6 | % | |
7/8/05 |
| — |
| Cruzan International Inc |
| RUM |
| Absolut Spirits Co Inc |
| 28.37 |
| 12.5 | % | 9.1 | % | 8.7 | % | |
7/7/05 |
| — |
| Paradyne Networks Inc |
| PDYN |
| Zhone Technologies Inc |
| 3.58 |
| 101.0 | % | 97.6 | % | 90.3 | % | |
7/1/05 |
| — |
| Tipperary Corp |
| TPY |
| Santos Ltd |
| 7.41 |
| 18.9 | % | 16.1 | % | 36.3 | % | |
7/1/05 |
| 7/14/05 |
| Tipperary Corp |
| TPY |
| Santos Ltd |
| 7.41 |
| 18.2 | % | 15.5 | % | 35.6 | % | |
6/30/05 |
| — |
| EFC Bancorp Inc,Elgin,Illinois |
| EFC |
| MAF Bancorp,Clarendon Hills,IL |
| 35.16 |
| 18.4 | % | 19.6 | % | 29.7 | % | |
6/29/05 |
| — |
| 1st State Bancorp Inc,NC |
| FSBC |
| Capital Bank Corp,Raleigh,NC |
| 37.15 |
| 6.6 | % | 4.5 | % | 23.8 | % | |
6/27/05 |
| — |
| SeeBeyond Technology Corp |
| SBYN |
| Sun Microsys Inc |
| 4.25 |
| 34.1 | % | 33.7 | % | 39.3 | % | |
6/20/05 |
| — |
| Genaissance Pharmaceuticals |
| GNSC |
| Clinical Data Inc |
| 1.31 |
| 44.3 | % | 45.9 | % | 45.9 | % | |
6/14/05 |
| — |
| CNB Bancorp,Gloversville,NY |
| CNBI |
| NBT Bancorp Inc,Norwich,NY |
| 38.69 |
| 44.6 | % | 38.2 | % | 51.4 | % | |
6/9/05 |
| 7/29/05 |
| Niku Corp |
| NIKU |
| Computer Assoc Intl Inc |
| 21.00 |
| 27.3 | % | 33.3 | % | 75.0 | % | |
6/8/05 |
| — |
| Boston Acoustics Inc |
| BOSA |
| D&M Holdings Inc |
| 17.50 |
| 7.7 | % | 17.0 | % | 20.7 | % | |
6/2/05 |
| — |
| Cruzan International Inc |
| RUM |
| V & S Vin & Sprit AB |
| 28.37 |
| 102.8 | % | 103.5 | % | 101.9 | % | |
6/1/05 |
| — |
| Saucony Inc |
| SCNYA |
| Stride Rite Corp |
| 23.00 |
| 14.8 | % | 16.8 | % | 17.5 | % | |
5/20/05 |
| — |
| Imperial Sugar Co |
| IPSU |
| Schultze Asset Management LLC |
| 17.00 |
| 31.5 | % | 38.8 | % | 23.0 | % | |
5/10/05 |
| 7/14/05 |
| Oshkosh B Gosh Inc |
| GOSHA |
| Carters Inc |
| 26.00 |
| -11.5 | % | 4.9 | % | -17.6 | % | |
5/9/05 |
| — |
| Nuance Communications Inc |
| NUAN |
| ScanSoft Inc |
| 5.63 |
| 84.6 | % | 97.5 | % | 114.1 | % | |
5/6/05 |
| — |
| Juno Lighting Inc |
| JUNO |
| Abrams Capital LLC |
| 40.00 |
| 19.4 | % | 11.1 | % | 6.9 | % | |
4/29/05 |
| — |
| Corixa Corp |
| CRXA |
| GlaxoSmithKline PLC |
| 4.40 |
| 47.7 | % | 48.7 | % | 51.7 | % | |
4/28/05 |
| — |
| First American Bank,CA |
| FTAB |
| First Community Bancorp Inc,CA |
| 24.95 |
| 24.8 | % | 30.0 | % | 21.7 | % | |
4/26/05 |
| — |
| William Lyon Homes |
| WLS |
| General William Lyon |
| 82.00 |
| 10.2 | % | 9.9 | % | 7.7 | % | |
4/19/05 |
| 6/27/05 |
| Orphan Medical Inc |
| ORPH |
| Jazz Pharmaceuticals Inc |
| 10.75 |
| 25.7 | % | 23.3 | % | 14.9 | % | |
4/15/05 |
| — |
| Brookstone Inc |
| BKST |
| OSIM Brookstone Holdings LP |
| 20.50 |
| 28.2 | % | 21.8 | % | 40.8 | % | |
4/14/05 |
| — |
| Rubicon Medical Corp |
| RMDC |
| Boston Scientific Corp |
| 1.50 |
| -0.7 | % | 0.7 | % | 26.1 | % | |
Source: Thomson One Banker.
11
Date |
| Date |
|
|
|
|
|
|
| Offer |
| 1 Day |
| 1 Week |
| 4 Weeks |
|
Announced |
| Effective |
| Target Name |
| Ticker |
| Acquiror Name |
| Price |
| Premium |
| Premium |
| Premium |
|
4/12/05 |
| — |
| Noland Co |
| NOLD |
| Primus Inc |
| 74.00 |
| 52.3 | % | 60.4 | % | 49.0 | % |
4/7/05 |
| 6/8/05 |
| Concord Communications Inc |
| CCRD |
| Computer Assoc Intl Inc |
| 17.00 |
| 71.0 | % | 68.0 | % | 73.3 | % |
4/4/05 |
| 5/20/05 |
| Maxcor Financial Group Inc |
| MAXF |
| BGC Partners LP |
| 14.00 |
| 46.4 | % | 56.1 | % | 57.0 | % |
3/28/05 |
| 5/6/05 |
| Digital Impact Inc |
| DIGI |
| Acxiom Corp |
| 3.50 |
| 52.8 | % | 75.9 | % | 75.0 | % |
3/21/05 |
| — |
| State Finl Svcs Corp,WI |
| SFSW |
| Associated Banc,Green Bay,WI |
| 38.22 |
| 26.6 | % | 23.3 | % | 27.7 | % |
3/17/05 |
| 7/1/05 |
| Horizon PCS Inc |
| HZPS |
| IPCS Inc |
| 23.58 |
| -5.7 | % | -5.7 | % | -1.8 | % |
3/15/05 |
| — |
| Medicore Inc |
| MDKI |
| Dialysis Corp of America |
| 19.54 |
| 110.7 | % | 115.9 | % | 127.7 | % |
3/9/05 |
| 7/1/05 |
| Thomas Industries Inc |
| TII |
| Gardner Denver Inc |
| 40.00 |
| 0.2 | % | 1.5 | % | 2.7 | % |
3/7/05 |
| — |
| Summit Financial Corp,SC |
| SUMM |
| First Citizens Bancorp Inc,SC |
| 22.00 |
| -5.6 | % | -2.0 | % | 0.2 | % |
3/4/05 |
| 6/3/05 |
| Closure Medical Corp |
| CLSR |
| Johnson & Johnson Inc |
| 27.00 |
| 20.5 | % | 22.7 | % | 33.1 | % |
2/28/05 |
| 8/3/05 |
| NCRIC Group Inc |
| NCRI |
| ProAssurance Corp |
| 10.10 |
| -7.7 | % | -8.7 | % | -12.2 | % |
2/28/05 |
| — |
| Quinton Cardiology Systems Inc |
| QUIN |
| Cardiac Science Inc |
| 14.59 |
| 46.8 | % | 41.6 | % | 51.8 | % |
2/28/05 |
| 8/1/05 |
| First Bancshares Inc,CA |
| FSLO |
| Pacific Capital Bancorp,CA |
| 48.00 |
| 50.5 | % | 45.5 | % | 39.1 | % |
2/22/05 |
| 5/25/05 |
| Insurance Auto Auctions Inc |
| IAAI |
| Kelso & Co |
| 28.25 |
| 24.5 | % | 24.4 | % | 29.5 | % |
2/15/05 |
| 3/21/05 |
| Tickets.com Inc |
| TIXX |
| MLB Advanced Media LP |
| 1.10 |
| 32.5 | % | 29.4 | % | 46.7 | % |
2/15/05 |
| 4/8/05 |
| AMX Corp |
| AMXC |
| Duchossois Industries Inc |
| 22.50 |
| 5.4 | % | 21.6 | % | 35.4 | % |
2/8/05 |
| — |
| August Technology Corp |
| AUGT |
| KLA-Tencor Corp |
| 11.50 |
| 11.2 | % | 18.0 | % | 42.7 | % |
1/27/05 |
| 4/19/05 |
| MAPICS Inc |
| MAPX |
| Infor Global Solutions |
| 12.75 |
| 9.7 | % | 14.3 | % | 24.0 | % |
1/27/05 |
| 4/21/05 |
| Genencor International Inc |
| GCOR |
| Danisco A/S |
| 19.25 |
| 23.9 | % | 22.4 | % | 15.8 | % |
1/25/05 |
| 3/16/05 |
| Corio Inc |
| CRIO |
| IBM Corp |
| 2.82 |
| 37.6 | % | 34.3 | % | 51.6 | % |
1/25/05 |
| — |
| AlphaSmart Inc |
| ALSM |
| Renaissance Learning Inc |
| 3.75 |
| 27.1 | % | 26.3 | % | 26.3 | % |
1/21/05 |
| — |
| August Technology Corp |
| AUGT |
| Nanometrics Inc |
| 8.39 |
| -8.4 | % | -8.2 | % | -18.7 | % |
1/20/05 |
| 3/3/05 |
| Falcon Financial Investment |
| FLCN |
| iStar Financial Inc |
| 7.50 |
| 11.1 | % | 13.6 | % | 10.1 | % |
1/20/05 |
| — |
| Chester Valley Bancorp,PA |
| CVAL |
| Willow Grove Bancorp Inc,PA |
| 27.90 |
| 28.2 | % | 26.8 | % | 29.8 | % |
1/18/05 |
| 6/1/05 |
| Computer Network Technology |
| CMNT |
| McDATA Corp |
| 5.53 |
| -16.5 | % | -4.7 | % | -16.3 | % |
1/18/05 |
| 4/4/05 |
| Impac Medical Systems Inc |
| IMPC |
| Elekta AB |
| 24.00 |
| 32.4 | % | 32.4 | % | 32.4 | % |
1/18/05 |
| — |
| FFLC Bancorp,Leesburg,FL |
| FFLC |
| Colonial BancGroup Inc,AL |
| 42.00 |
| 19.9 | % | 19.8 | % | 20.3 | % |
1/17/05 |
| 5/25/05 |
| Penn Engr & Mnfr Corp |
| PNN |
| PEM Holding Co |
| 18.25 |
| 22.7 | % | 21.7 | % | 17.0 | % |
1/12/05 |
| 4/7/05 |
| Verisity Ltd |
| VRST |
| Cadence Design Systems Inc |
| 12.00 |
| 60.2 | % | 57.1 | % | 45.5 | % |
1/11/05 |
| 7/1/05 |
| SVB Financial Services Inc,NJ |
| SVBF |
| Fulton Finl Corp,Lancaster,PA |
| 21.27 |
| -3.3 | % | 4.5 | % | 3.6 | % |
1/7/05 |
| 4/1/05 |
| Vastera Inc |
| VAST |
| JPMorgan Chase Bank |
| 3.00 |
| 50.0 | % | 14.1 | % | 28.2 | % |
1/7/05 |
| 4/27/05 |
| Polaroid Holding Co |
| POHC |
| Petters Group Worldwide |
| 12.08 |
| 13.4 | % | 14.4 | % | 16.7 | % |
1/4/05 |
| 2/7/05 |
| Total Logistics Inc |
| TLCX |
| SuperValu Inc |
| 28.50 |
| 7.7 | % | 5.8 | % | 3.6 | % |
|
|
|
|
|
|
|
|
|
|
|
|
|
|
|
|
|
|
|
|
|
|
|
|
|
|
|
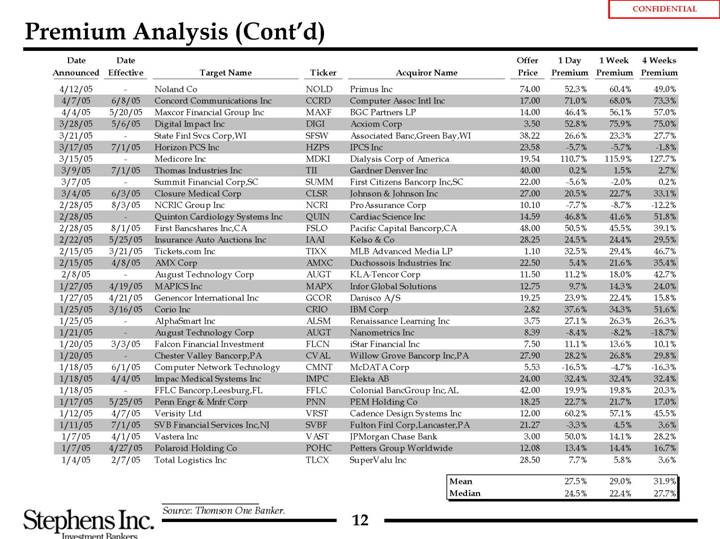
| Mean |
| 27.5 | % | 29.0 | % | 31.9 | % |
|
|
|
|
|
|
|
|
|
| Median |
| 24.5 | % | 22.4 | % | 27.7 | % |
Source: Thomson One Banker.
12
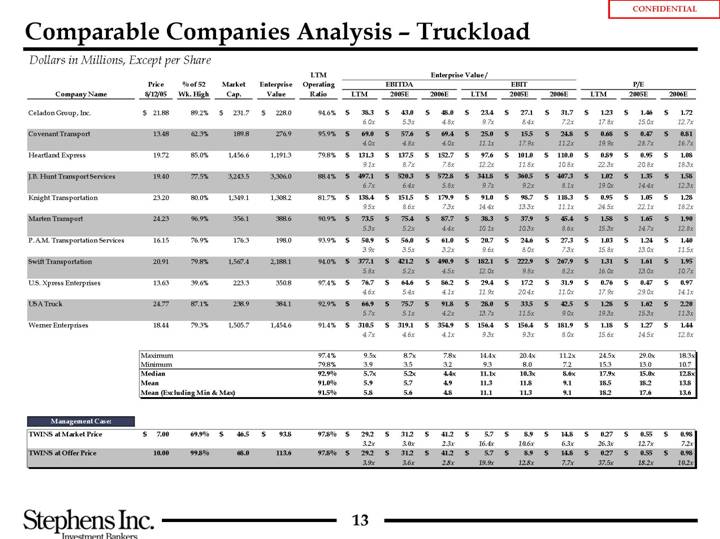
Comparable Companies Analysis – Truckload
Dollars in Millions, Except per Share
|
|
|
|
|
|
|
|
|
| LTM |
| Enterprise Value / |
|
|
|
|
|
|
| |||||||||||||||
|
| Price |
| % of 52 |
| Market |
| Enterprise |
| Operating |
| EBITDA |
| EBIT |
| P/E |
| |||||||||||||||||
Company Name |
| 8/12/05 |
| Wk. High |
| Cap. |
| Value |
| Ratio |
| LTM |
| 2005E |
| 2006E |
| LTM |
| 2005E |
| 2006E |
| LTM |
| 2005E |
| 2006E |
| |||||
|
|
|
|
|
|
|
|
|
|
|
|
|
|
|
|
|
|
|
|
|
|
|
|
|
|
|
|
|
| |||||
Celadon Group, Inc. |
| $ | 21.88 |
| 89.2 | % | $ | 231.7 |
| $ | 228.0 |
| 94.6 | % | $ | 38.3 |
| $ | 43.0 |
| $ | 48.0 |
| $ | 23.4 |
| $ | 27.1 |
| $ | 31.7 |
| $ | 1.23 |
| $ | 1.46 |
| $ | 1.72 |
|
|
|
|
|
|
|
|
|
|
|
|
| 6.0 | x | 5.3 | x | 4.8 | x | 9.7 | x | 8.4 | x | 7.2 | x | 17.8 | x | 15.0 | x | 12.7 | x | ||||||||||||
Covenant Transport |
| 13.48 |
| 62.3 | % | 189.8 |
| 276.9 |
| 95.9 | % | $ | 69.0 |
| $ | 57.6 |
| $ | 69.4 |
| $ | 25.0 |
| $ | 15.5 |
| $ | 24.8 |
| $ | 0.68 |
| $ | 0.47 |
| $ | 0.81 |
| |||
|
|
|
|
|
|
|
|
|
|
|
| 4.0 | x | 4.8 | x | 4.0 | x | 11.1 | x | 17.9 | x | 11.2 | x | 19.9 | x | 28.7 | x | 16.7 | x | ||||||||||||
Heartland Express |
| 19.72 |
| 85.0 | % | 1,456.6 |
| 1,191.3 |
| 79.8 | % | $ | 131.3 |
| $ | 137.5 |
| $ | 152.7 |
| $ | 97.6 |
| $ | 101.0 |
| $ | 110.0 |
| $ | 0.89 |
| $ | 0.95 |
| $ | 1.08 |
| |||
|
|
|
|
|
|
|
|
|
|
|
| 9.1 | x | 8.7 | x | 7.8 | x | 12.2 | x | 11.8 | x | 10.8 | x | 22.3 | x | 20.8 | x | 18.3 | x | ||||||||||||
J.B. Hunt Transport Services |
| 19.40 |
| 77.5 | % | 3,243.5 |
| 3,306.0 |
| 88.4 | % | $ | 497.1 |
| $ | 520.3 |
| $ | 572.8 |
| $ | 341.8 |
| $ | 360.5 |
| $ | 407.3 |
| $ | 1.02 |
| $ | 1.35 |
| $ | 1.58 |
| |||
|
|
|
|
|
|
|
|
|
|
|
| 6.7 | x | 6.4 | x | 5.8 | x | 9.7 | x | 9.2 | x | 8.1 | x | 19.0 | x | 14.4 | x | 12.3 | x | ||||||||||||
Knight Transportation |
| 23.20 |
| 80.0 | % | 1,349.1 |
| 1,308.2 |
| 81.7 | % | $ | 138.4 |
| $ | 151.5 |
| $ | 179.9 |
| $ | 91.0 |
| $ | 98.7 |
| $ | 118.3 |
| $ | 0.95 |
| $ | 1.05 |
| $ | 1.28 |
| |||
|
|
|
|
|
|
|
|
|
|
|
| 9.5 | x | 8.6 | x | 7.3 | x | 14.4 | x | 13.3 | x | 11.1 | x | 24.5 | x | 22.1 | x | 18.2 | x | ||||||||||||
Marten Transport |
| 24.23 |
| 96.9 | % | 356.1 |
| 388.6 |
| 90.9 | % | $ | 73.5 |
| $ | 75.4 |
| $ | 87.7 |
| $ | 38.3 |
| $ | 37.9 |
| $ | 45.4 |
| $ | 1.58 |
| $ | 1.65 |
| $ | 1.90 |
| |||
|
|
|
|
|
|
|
|
|
|
|
| 5.3 | x | 5.2 | x | 4.4 | x | 10.1 | x | 10.3 | x | 8.6 | x | 15.3 | x | 14.7 | x | 12.8 | x | ||||||||||||
P.A.M. Transportation Services |
| 16.15 |
| 76.9 | % | 176.3 |
| 198.0 |
| 93.9 | % | $ | 50.9 |
| $ | 56.0 |
| $ | 61.0 |
| $ | 20.7 |
| $ | 24.6 |
| $ | 27.3 |
| $ | 1.03 |
| $ | 1.24 |
| $ | 1.40 |
| |||
|
|
|
|
|
|
|
|
|
|
|
| 3.9 | x | 3.5 | x | 3.2 | x | 9.6 | x | 8.0 | x | 7.3 | x | 15.8 | x | 13.0 | x | 11.5 | x | ||||||||||||
Swift Transportation |
| 20.91 |
| 79.8 | % | 1,567.4 |
| 2,188.1 |
| 94.0 | % | $ | 377.1 |
| $ | 421.2 |
| $ | 490.9 |
| $ | 182.1 |
| $ | 222.9 |
| $ | 267.9 |
| $ | 1.31 |
| $ | 1.61 |
| $ | 1.95 |
| |||
|
|
|
|
|
|
|
|
|
|
|
| 5.8 | x | 5.2 | x | 4.5 | x | 12.0 | x | 9.8 | x | 8.2 | x | 16.0 | x | 13.0 | x | 10.7 | x | ||||||||||||
U.S. Xpress Enterprises |
| 13.63 |
| 39.6 | % | 223.3 |
| 350.8 |
| 97.4 | % | $ | 76.7 |
| $ | 64.6 |
| $ | 86.2 |
| $ | 29.4 |
| $ | 17.2 |
| $ | 31.9 |
| $ | 0.76 |
| $ | 0.47 |
| $ | 0.97 |
| |||
|
|
|
|
|
|
|
|
|
|
|
| 4.6 | x | 5.4 | x | 4.1 | x | 11.9 | x | 20.4 | x | 11.0 | x | 17.9 | x | 29.0 | x | 14.1 | x | ||||||||||||
USA Truck |
| 24.77 |
| 87.1 | % | 238.9 |
| 384.1 |
| 92.9 | % | $ | 66.9 |
| $ | 75.7 |
| $ | 91.8 |
| $ | 28.0 |
| $ | 33.5 |
| $ | 42.5 |
| $ | 1.28 |
| $ | 1.62 |
| $ | 2.20 |
| |||
|
|
|
|
|
|
|
|
|
|
|
| 5.7 | x | 5.1 | x | 4.2 | x | 13.7 | x | 11.5 | x | 9.0 | x | 19.3 | x | 15.3 | x | 11.3 | x | ||||||||||||
Werner Enterprises |
| 18.44 |
| 79.3 | % | 1,505.7 |
| 1,454.6 |
| 91.4 | % | $ | 310.5 |
| $ | 319.1 |
| $ | 354.9 |
| $ | 156.4 |
| $ | 156.4 |
| $ | 181.9 |
| $ | 1.18 |
| $ | 1.27 |
| $ | 1.44 |
| |||
|
|
|
|
|
|
|
|
|
|
|
| 4.7 | x | 4.6 | x | 4.1 | x | 9.3 | x | 9.3 | x | 8.0 | x | 15.6 | x | 14.5 | x | 12.8 | x | ||||||||||||
|
|
|
|
|
|
|
|
|
|
|
|
|
|
|
|
|
|
|
|
|
|
|
|
|
|
|
|
|
| ||||||||||||
|
| Maximum |
|
|
| 97.4 | % | 9.5 | x | 8.7 | x | 7.8 | x | 14.4 | x | 20.4 | x | 11.2 | x | 24.5 | x | 29.0 | x | 18.3 | x | ||||||||||||||||
|
| Minimum |
|
|
| 79.8 | % | 3.9 |
| 3.5 |
| 3.2 |
| 9.3 |
| 8.0 |
| 7.2 |
| 15.3 |
| 13.0 |
| 10.7 |
| ||||||||||||||||
|
| Median |
|
|
| 92.9 | % | 5.7 | x | 5.2 | x | 4.4 | x | 11.1 | x | 10.3 | x | 8.6 | x | 17.9 | x | 15.0 | x | 12.8 | x | ||||||||||||||||
|
| Mean |
|
|
| 91.0 | % | 5.9 |
| 5.7 |
| 4.9 |
| 11.3 |
| 11.8 |
| 9.1 |
| 18.5 |
| 18.2 |
| 13.8 |
| ||||||||||||||||
|
| Mean (Excluding Min & Max) |
|
|
| 91.5 | % | 5.8 |
| 5.6 |
| 4.8 |
| 11.1 |
| 11.3 |
| 9.1 |
| 18.2 |
| 17.6 |
| 13.6 |
| ||||||||||||||||
Management Case:
TWINS at Market Price |
| $ | 7.00 |
| 69.9 | % | $ | 46.5 |
| $ | 93.8 |
| $ | 97.8 | % | $ | 29.2 |
| $ | 31.2 |
| $ | 41.2 |
| $ | 5.7 |
| $ | 8.9 |
| $ | 14.8 |
| $ | 0.27 |
| $ | 0.55 |
| $ | 0.98 |
|
|
|
|
|
|
|
|
|
|
|
|
| 3.2 | x | 3.0 | x | 2.3 | x | 16.4 | x | 10.6 | x | 6.3 | x | 26.3 | x | 12.7 | x | 7.2 |
| |||||||||||||
TWINS at Offer Price |
| 10.00 |
| 99.8 | % | 68.0 |
| 113.6 |
| 97.8 | % | $ | 29.2 |
| $ | 31.2 |
| $ | 41.2 |
| $ | 5.7 |
| $ | 8.9 |
| $ | 14.8 |
| $ | 0.27 |
| $ | 0.55 |
| $ | 0.98 |
| ||||
|
|
|
|
|
|
|
|
|
|
|
| 3.9 | x | 3.6 | x | 2.8 | x | 19.9 | x | 12.8 | x | 7.7 | x | 37.5 | x | 18.2 | x | 10.2 | x | |||||||||||||
13
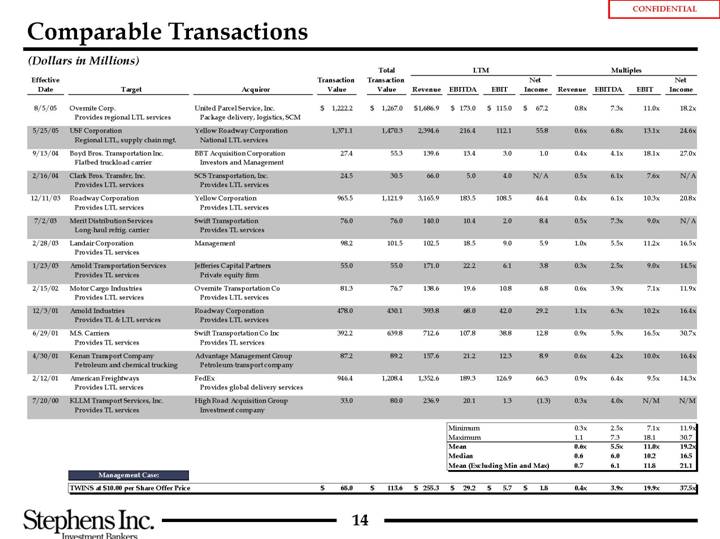
Comparable Transactions
(Dollars in Millions)
|
|
|
|
|
|
|
| Total |
| LTM |
| Multiples |
| ||||||||||||||||||
Effective |
|
|
|
|
| Transaction |
| Transaction |
|
|
|
|
|
|
| Net |
|
|
|
|
|
|
| Net |
| ||||||
Date |
| Target |
| Acquiror |
| Value |
| Value |
| Revenue |
| EBITDA |
| EBIT |
| Income |
| Revenue |
| EBITDA |
| EBIT |
| Income |
| ||||||
|
|
|
|
|
|
|
|
|
|
|
|
|
|
|
|
|
|
|
|
|
|
|
|
|
| ||||||
8/5/05 |
| Overnite Corp. |
| United Parcel Service, Inc. |
| $ | 1,222.2 |
| $ | 1,267.0 |
| $ | 1,686.9 |
| $ | 173.0 |
| $ | 115.0 |
| $ | 67.2 |
| 0.8 | x | 7.3 | x | 11.0 | x | 18.2 | x |
5/25/05 |
| USF Corporation Regional LTL, supply chain mgt. |
| Yellow Roadway Corporation |
| 1,371.1 |
| 1,470.3 |
| 2,394.6 |
| 216.4 |
| 112.1 |
| 55.8 |
| 0.6 | x | 6.8 | x | 13.1 | x | 24.6 |
| ||||||
9/13/04 |
| Boyd Bros. Transportation Inc. |
| BBT Acquisition Corporation |
| 27.4 |
| 55.3 |
| 139.6 |
| 13.4 |
| 3.0 |
| 1.0 |
| 0.4 | x | 4.1 | x | 18.1 | x | 27.0 |
| ||||||
2/16/04 |
| Clark Bros. Transfer, Inc. |
| SCS Transportation, Inc. |
| 24.5 |
| 30.5 |
| 66.0 |
| 5.0 |
| 4.0 |
| N/A |
| 0.5 | x | 6.1 | x | 7.6 | x | N/A |
| ||||||
12/11/03 |
| Roadway Corporation |
| Yellow Corporation |
| 965.5 |
| 1,121.9 |
| 3,165.9 |
| 183.5 |
| 108.5 |
| 46.4 |
| 0.4 | x | 6.1 | x | 10.3 | x | 20.8 |
| ||||||
7/2/03 |
| Merit Distribution Services |
| Swift Transportation |
| 76.0 |
| 76.0 |
| 140.0 |
| 10.4 |
| 2.0 |
| 8.4 |
| 0.5 | x | 7.3 | x | 9.0 | x | N/A |
| ||||||
2/28/03 |
| Landair Corporation |
| Management |
| 98.2 |
| 101.5 |
| 102.5 |
| 18.5 |
| 9.0 |
| 5.9 |
| 1.0 | x | 5.5 | x | 11.2 | x | 16.5 |
| ||||||
1/23/03 |
| Arnold Transportation Services |
| Jefferies Capital Partners |
| 55.0 |
| 55.0 |
| 171.0 |
| 22.2 |
| 6.1 |
| 3.8 |
| 0.3 | x | 2.5 | x | 9.0 | x | 14.5 |
| ||||||
2/15/02 |
| Motor Cargo Industries |
| Overnite Transportation Co |
| 81.3 |
| 76.7 |
| 138.6 |
| 19.6 |
| 10.8 |
| 6.8 |
| 0.6 | x | 3.9 | x | 7.1 | x | 11.9 |
| ||||||
12/3/01 |
| Arnold Industries |
| Roadway Corporation |
| 478.0 |
| 430.1 |
| 393.8 |
| 68.0 |
| 42.0 |
| 29.2 |
| 1.1 | x | 6.3 | x | 10.2 | x | 16.4 |
| ||||||
6/29/01 |
| M.S. Carriers |
| Swift Transportation Co Inc |
| 392.2 |
| 639.8 |
| 712.6 |
| 107.8 |
| 38.8 |
| 12.8 |
| 0.9 | x | 5.9 | x | 16.5 | x | 30.7 |
| ||||||
4/30/01 |
| Kenan Transport Company |
| Advantage Management Group |
| 87.2 |
| 89.2 |
| 157.6 |
| 21.2 |
| 12.3 |
| 8.9 |
| 0.6 | x | 4.2 | x | 10.0 | x | 16.4 |
| ||||||
2/12/01 |
| American Freightways |
| FedEx |
| 946.4 |
| 1,208.4 |
| 1,352.6 |
| 189.3 |
| 126.9 |
| 66.3 |
| 0.9 | x | 6.4 | x | 9.5 | x | 14.3 |
| ||||||
7/20/00 |
| KLLM Transport Services, Inc. |
| High Road Acquisition Group Investment company |
| 33.0 |
| 80.0 |
| 236.9 |
| 20.1 |
| 1.3 |
| (1.3 | ) | 0.3 | x | 4.0 | x | N/M |
| N/M |
| ||||||
|
|
|
|
|
|
|
|
|
|
|
|
|
|
|
|
|
|
|
|
|
|
|
|
|
| ||||||
|
|
|
|
|
|
|
| Minimum |
|
|
|
|
| 0.3 | x | 2.5 | x | 7.1 | x | 11.9 | x | ||||||||||
|
|
|
|
|
|
|
| Maximum |
|
|
|
|
| 1.1 |
| 7.3 |
| 18.1 |
| 30.7 |
| ||||||||||
|
|
|
|
|
|
|
| Mean |
|
|
|
|
| 0.6 | x | 5.5 | x | 11.0 | x | 19.2 | x | ||||||||||
|
|
|
|
|
|
|
| Median |
|
|
|
|
| 0.6 |
| 6.0 |
| 10.2 |
| 16.5 |
| ||||||||||
|
|
|
|
|
|
|
| Mean (Excluding Min and Max) |
|
|
|
|
| 0.7 |
| 6.1 |
| 11.8 |
| 21.1 |
| ||||||||||
Management Case:
TWINS at $10.00 per Share Offer Price |
| $ | 68.0 |
| $ | 113.6 |
| $ | 255.3 |
| $ | 29.2 |
| $ | 5.7 |
| $ | 1.8 |
| $ | 0.4 | x | 3.9 | x | 19.9 | x | 37.5 | x |
14
[GRAPHIC]
III. GHJM Indication of Interest
15
Goldner Hawn Johnson & Morrison
Incorporated
3700 Wells Fargo Center
90 South Seventh Street
Minneapolis, Minnesota 55402-4128
612-338-5912
Fax 612-338-2860
August 11, 2005
VIA FACSIMILE: 214-258-2750
Stephens Inc,
300 Crescent Court
Suite 600
Dallas, TX 75201
Attn: Michael Miller
Re: Transport Corporation of America, Inc.
Dear Mr. Miller:
Thank you very much for providing us with the Confidential Evaluation Materials (“CEM”) on Transport Corporation of America, Inc. (“TCAM”). Goldner Hawn Johnson & Morrison Incorporated (“GHJM”) is pleased to be able to submit to you this indication of our interest in acquiring all of the stock of TCAM, by cash merger, at a price of $10 per share net to the common stockholders. Based upon the information available to us, this represents a fully diluted equity value for TCAM of $70,230,207 and a fully diluted enterprise value for TCAM estimated at December 31, 2005 of $116,230,207.
GHJM proposes forming a new company (“Newco”) to acquire TCAM in an all cash purchase. The principal equity funding for Newco would be provided by our investment affiliate, Marathon Fund Limited Partnership V (“Marathon”). We derived the value of $10 per share after analysis of the business and financial projections contained in the CEM. Given the Company’s growth plan, quality of management and strong customer relationships, we are prepared to confirm and possibly increase this initial indication of value in the next phase of the process.
As currently contemplated, the capital structure of Newco at closing would include up to 25% equity, with the balance of the required capital sourced from senior bank or bank-equivalent financing. We have had preliminary discussions with several experienced transportation lending sources and, based upon these discussions, we are confident that we can arrange the financing necessary to close this transaction and to fund TCAM’s growth. In particular, the Wells Fargo and LaSalle Bank organizations have each made preliminary proposals to provide all the necessary debt financing. Contact numbers for these financing sources are set forth at the end of this letter.
August 11, 2005
Page 2 of 4
While Marathon has the ability to commit all of the required equity capital to complete the proposed acquisition of TCAM, we view management equity participation as an essential element it this transaction. Should we proceed, we will offer the top managers of TCAM the opportunity to roll over, on a tax-free basis, their existing ownership positions in TCAM and to purchase stock in Newco on the same terms as Marathon. We expect also to create an incentive compensation program focusing on equity returns for the Company’s key managers. As you know, GHJM originally identified TCAM as a desirable acquisition in the Winter of 2005 and first approached management to explore this idea in the Spring of 2005. We remain enthusiastic about the transaction.
The closing of the transaction described in this letter would be subject to customary terms including, but not limited to, completion of comprehensive due diligence review, execution of a mutually satisfactory definitive agreement, the securing of debt financing on acceptable terms, and the absence of material adverse changes prior to closing. At present, we anticipate the execution of a definitive cash merger agreement at the conclusion of a 30-day period during which we, our financing sources and our advisors would be permitted to conduct a comprehensive due diligence investigation of the Company’s business. Contemporaneously with the execution of the definitive agreement, we would deliver the financing commitments for all the financing necessary to complete the transaction. Hart-Scott-Rodino (“HSR”) filings would be made, promptly upon such execution. Closing would occur upon the later of (i) the date of TCAM shareholders’ approval, or (ii) HSR clearance. Thus we see the timetable as follows:
Day 1 – Agreement in principle on price and terms and commencement of intensive due diligence
Day 30 – Execution of definitive agreement and receipt of financing commitments
Day 35 – HSR filings
Day 45 – Preliminary Proxy Materials filed with SEC
Day 75 – After comments, Proxy Material cleared by SEC and mailed to shareholders
Day 105 – TCAM shareholders’ meeting and closing
We will be able to submit a documentary due diligence request after participating in management presentations.
As background, GHJM is a private equity investment firm based in Minneapolis, Minnesota. The firm was founded in 1989 and has successfully completed 22 acquisitions through Marathon Funds I-V including three “going private” transactions. The principals of GHJM own the General Partner of Marathon, an investment partnership focused to invest in private companies. Marathon Fund V commenced operations in late 2004 with commitments at first closing of $175 million and a targeted fund size of $350 million. The only approvals necessary to invest Marathon assets come from GHJM’s internal investment committee, which consists entirely of the firm’s principals. That group has authorized the delivery of this proposal.
Incorporated |
August 11, 2005
Page 3 of 4
Per your request, below is a list of lending and advisory contacts.
Lending Sources
Wells Fargo Business Credit, Inc.
Wells Fargo Center
Sixth and Marquette
Minneapolis, MN 55479
Attn: Stephen G. Bishop
Vice President
Ph: 612-673-8512 Fax: 612-673-8589
stephen.bishop@wellsfargo.com
LaSalle Bank
50 South Sixth Street
Suite 1400
Minneapolis, MN 55402
Attn: Michael J. Wolf
Vice President
Ph: 612-337-9877 Fax: 612-752-9881
michael.wolf@abnamro.com
Attn: Mark A. Thompson
Vice President
Ph: 612-752-9882 Fax: 612-752-9881
mark.thompson@abnamro.com
Advisors
Legal
Dorsey & Whitney LLP
50 South Sixth Street
Suite 1500
Minneapolis, MN 55402
Attn: Robert A. Rosenbaum, Esq.
Partner
Ph: 612-340-5681 Fax: 612-340-8738
rosenbaum.robert@dorseylaw.com
Accounting
PricewaterhouseCoopers LLP
225 South Sixth Street
Suite 1400
Minneapolis, MN 55402
Attn: Gordon A. Medeiros, Jr.
Partner, Transaction Services
Ph: 612-596-6434 Fax: 813-639-4474
gordon.medeiros@us.pwc.com
August 11, 2005
Page 4 of 4
Tax
Deloitte & Touche LLP
400 One Financial Plaza
120 South Sixth Street
Minneapolis, MN 55402
Attn: Scott Vickman
Partner
Ph: 612-397-4020 Fax: 612-692-4020
svickman@deloitte.com
Industry
Owen Gleason, Esq.
6277 Chasewood Drive
Eden Prairie, MN 55344
Ph: 952-942-6609 Fax: 952-833-1535
gleasowe@mn.rr.com
We have demonstrated the ability to work with sellers and management teams to devise and implement corporate strategies and operating plans that create superior long-term value in the companies in which we invest. GHJM has due diligence resources, financing relationships, and a decision-making process that allow us to review and complete desirable transactions very efficiently.
Again, GHJM extends its thanks to the Board of TCAM and to Stephens Inc. for the opportunity to make this proposal. We would very much like to have an opportunity to renew our acquaintance with the management team of TCAM and to visit the Company’s facilities. Please do not hesitate to contact Van Hawn or Joe Heinen at (612) 338-5912 to discuss this letter further. We look forward to hearing from you soon.
Very truly yours, | |
|
|
GOLDNER HAWN JOHNSON & MORRISON INCORPORATED | |
By | /s/ Van Zandt Hawn |
| Van Zandt Hawn, Managing Director |