Transport Corporation Of America (TCAM) Inactive
Filed: 30 Dec 05, 12:00am
Exhibit (c)(3)
Link to searchable text of slide shown above
Link to searchable text of slide shown above
Link to searchable text of slide shown above
Link to searchable text of slide shown above
Link to searchable text of slide shown above
Link to searchable text of slide shown above
Link to searchable text of slide shown above

Link to searchable text of slide shown above
Link to searchable text of slide shown above
Link to searchable text of slide shown above
Link to searchable text of slide shown above
Link to searchable text of slide shown above
Link to searchable text of slide shown above
Link to searchable text of slide shown above
Link to searchable text of slide shown above
Link to searchable text of slide shown above
Link to searchable text of slide shown above
Link to searchable text of slide shown above
Link to searchable text of slide shown above
Link to searchable text of slide shown above
Link to searchable text of slide shown above
Link to searchable text of slide shown above
Link to searchable text of slide shown above
Link to searchable text of slide shown above
Link to searchable text of slide shown above
Link to searchable text of slide shown above
Link to searchable text of slide shown above
Link to searchable text of slide shown above
Link to searchable text of slide shown above
Link to searchable text of slide shown above
Link to searchable text of slide shown above
Link to searchable text of slide shown above
Searchable text section of graphics shown above
CONFIDENTIAL
[GRAPHIC]
A Presentation to:
The Board of Directors of
TWINS
Regarding:
Update on Strategic Alternatives
July 20, 2005
300 Crescent Court, Suite 600 |
|
Dallas, TX 75201 | [LOGO] |
214-258-2700 |
|
www.stephens.com |
|
Little Rock |
| Atlanta |
| Dallas |
| Nashville |
| New York |
Table of Contents
| I. | Process Update |
|
|
|
| II. | TWINS Current Performance |
|
|
|
| III. | New Management Case |
|
|
|
| IV. | Migration to Non-Asset Based Model and Recap |
|
|
|
| V. | Next Steps |
|
|
|
| Exhibits | |
|
|
|
| A. | Comparable Companies Analysis |
[LOGO]
2
[GRAPHIC]
I. Process Update
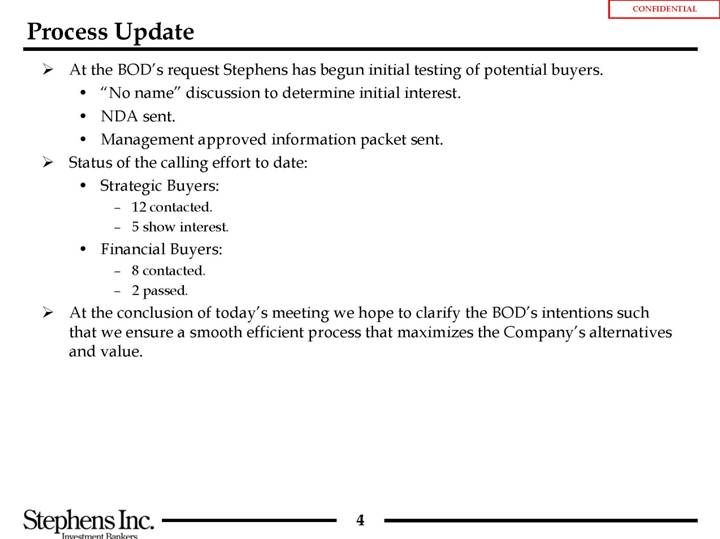
Process Update
• At the BOD’s request Stephens has begun initial testing of potential buyers.
• “No name” discussion to determine initial interest.
• NDA sent.
• Management approved information packet sent.
• Status of the calling effort to date:
• Strategic Buyers:
• 12 contacted.
• 5 show interest.
• Financial Buyers:
• 8 contacted.
• 2 passed.
• At the conclusion of today’s meeting we hope to clarify the BOD’s intentions such that we ensure a smooth efficient process that maximizes the Company’s alternatives and value.
4
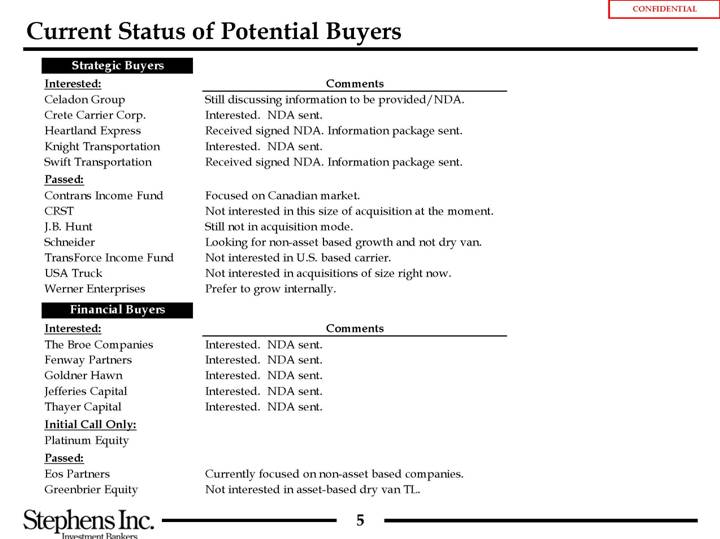
Current Status of Potential Buyers
Strategic Buyers
|
| Comments |
Interested: |
|
|
Celadon Group |
| Still discussing information to be provided/NDA. |
Crete Carrier Corp. |
| Interested. NDA sent. |
Heartland Express |
| Received signed NDA. Information package sent. |
Knight Transportation |
| Interested. NDA sent. |
Swift Transportation |
| Received signed NDA. Information package sent. |
|
|
|
Passed: |
|
|
Contrans Income Fund |
| Focused on Canadian market. |
CRST |
| Not interested in this size of acquisition at the moment. |
J.B. Hunt |
| Still not in acquisition mode. |
Schneider |
| Looking for non-asset based growth and not dry van. |
TransForce Income Fund |
| Not interested in U.S. based carrier. |
USA Truck |
| Not interested in acquisitions of size right now. |
Werner Enterprises |
| Prefer to grow internally. |
Financial Buyers
|
| Comments |
Interested: |
|
|
The Broe Companies |
| Interested. NDA sent. |
Fenway Partners |
| Interested. NDA sent. |
Goldner Hawn |
| Interested. NDA sent. |
Jefferies Capital |
| Interested. NDA sent. |
Thayer Capital |
| Interested. NDA sent. |
|
|
|
Initial Call Only: |
|
|
Platinum Equity |
|
|
|
|
|
Passed: |
|
|
Eos Partners |
| Currently focused on non-asset based companies. |
Greenbrier Equity |
| Not interested in asset-based dry van TL. |
5
[GRAPHIC]
II. TWINS Current Performance
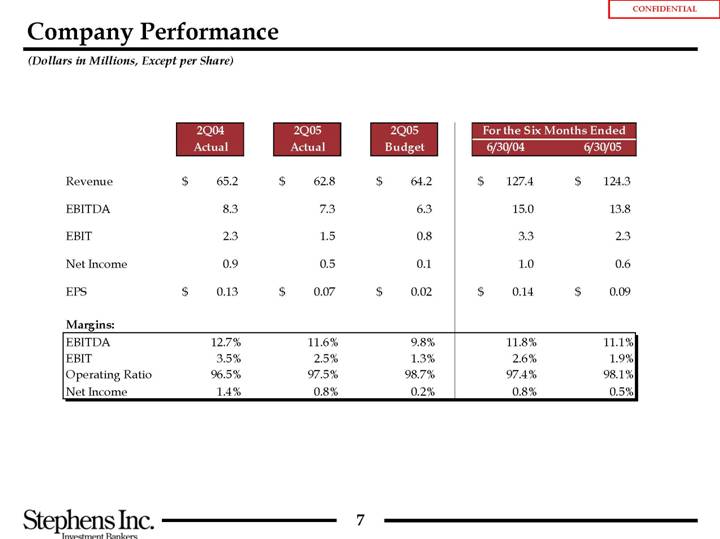
Company Performance
(Dollars in Millions, Except per Share)
|
| 2Q04 |
| 2Q05 |
| 2Q05 |
| For the Six Months Ended |
| |||||||
|
| Actual |
| Actual |
| Budget |
| 6/30/04 |
| 6/30/05 |
| |||||
|
|
|
|
|
|
|
|
|
|
|
| |||||
Revenue |
| $ | 65.2 |
| $ | 62.8 |
| $ | 64.2 |
| $ | 127.4 |
| $ | 124.3 |
|
|
|
|
|
|
|
|
|
|
|
|
| |||||
EBITDA |
| 8.3 |
| 7.3 |
| 6.3 |
| 15.0 |
| 13.8 |
| |||||
|
|
|
|
|
|
|
|
|
|
|
| |||||
EBIT |
| 2.3 |
| 1.5 |
| 0.8 |
| 3.3 |
| 2.3 |
| |||||
|
|
|
|
|
|
|
|
|
|
|
| |||||
Net Income |
| 0.9 |
| 0.5 |
| 0.1 |
| 1.0 |
| 0.6 |
| |||||
|
|
|
|
|
|
|
|
|
|
|
| |||||
EPS |
| $ | 0.13 |
| $ | 0.07 |
| $ | 0.02 |
| $ | 0.14 |
| $ | 0.09 |
|
|
|
|
|
|
|
|
|
|
|
|
| |||||
Margins: |
|
|
|
|
|
|
|
|
|
|
| |||||
EBITDA |
| 12.7 | % | 11.6 | % | 9.8 | % | 11.8 | % | 11.1 | % | |||||
EBIT |
| 3.5 | % | 2.5 | % | 1.3 | % | 2.6 | % | 1.9 | % | |||||
Operating Ratio |
| 96.5 | % | 97.5 | % | 98.7 | % | 97.4 | % | 98.1 | % | |||||
Net Income |
| 1.4 | % | 0.8 | % | 0.2 | % | 0.8 | % | 0.5 | % | |||||
7
Potential Market Reaction to 2Q Results
Initial market reaction could be neutral to slightly positive upon announcement, but may turn negative as outsiders continue to analyze TWINS operating metrics.
• Outperform Management Estimates, but Underperform 2004 and Feltl
• Market will be unaware of actual performance relative to management’s plan.
• Market will compare performance sequentially and based on prior year results.
• Those following Feltl will be disappointed as 2Q estimate is $0.13.
• Quality of Earnings
• Better than expected earnings driven primarily due to:
• Reduction of incentive plan bonus accruals — $0.02.
• Workers compensation (lower current claims, positive developments in old claims) — $0.025.
• Better medical claim experience — $0.015.
• Sustainability may be questioned.
• Key Operating Metrics Still Lagging
• Drivers
• Average monthly seated Company drivers have decreased sequentially month over month since February.
• New student enrollments have picked up in July however.
• Utilization decreased month over month in 2Q
• Revenue/total seated/week decreased from $3,519 in April to $3,497 in June.
• Deadhead increased from 10.9% in April to 11.1% in June versus an expected decline to 10.4%.
• Consider delaying announcement of Stephens role in advising the BOD on strategic alternatives.
8
[GRAPHIC]
III. New Management Case
Overview of New Management Case
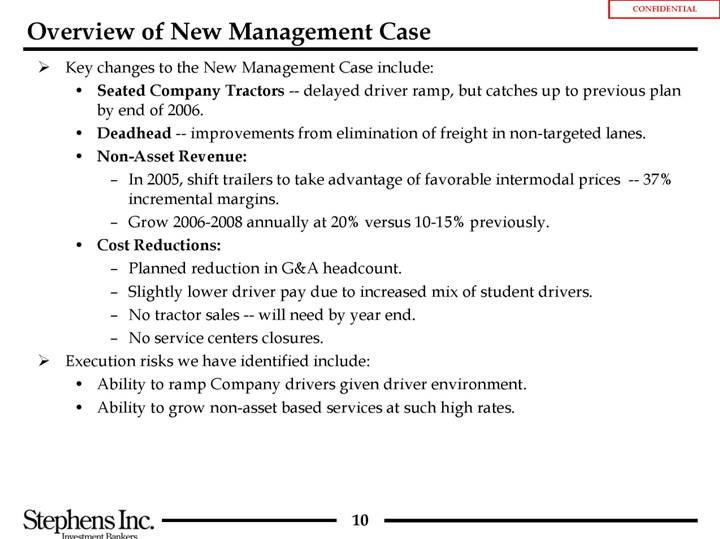
• Key changes to the New Management Case include:
• Seated Company Tractors — delayed driver ramp, but catches up to previous plan by end of 2006.
• Deadhead — improvements from elimination of freight in non-targeted lanes.
• Non-Asset Revenue:
• In 2005, shift trailers to take advantage of favorable intermodal prices — 37% incremental margins.
• Grow 2006-2008 annually at 20% versus 10-15% previously.
• Cost Reductions:
• Planned reduction in G&A headcount.
• Slightly lower driver pay due to increased mix of student drivers.
• No tractor sales — will need by year end.
• No service centers closures.
• Execution risks we have identified include:
• Ability to ramp Company drivers given driver environment.
• Ability to grow non-asset based services at such high rates.
10
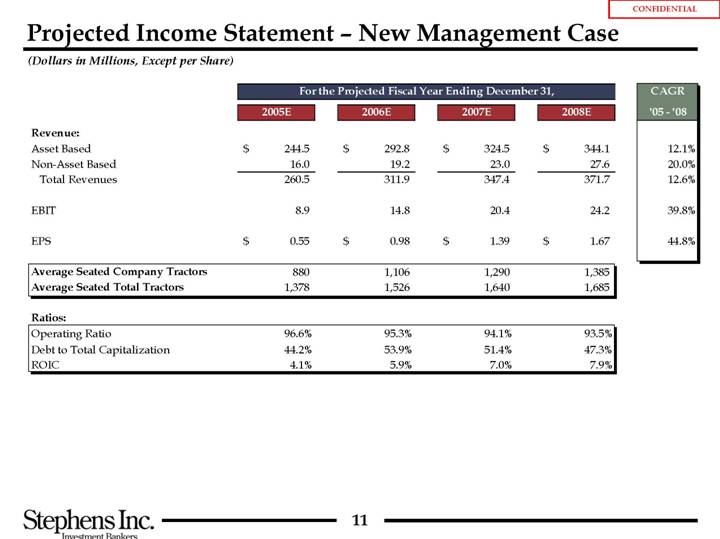
Projected Income Statement - New Management Case
(Dollars in Millions, Except per Share)
|
| For the Projected Fiscal Year Ending December 31, |
| CAGR |
| ||||||||||
|
| 2005E |
| 2006E |
| 2007E |
| 2008E |
| ‘05 - ‘08 |
| ||||
|
|
|
|
|
|
|
|
|
|
|
| ||||
Revenue: |
|
|
|
|
|
|
|
|
|
|
| ||||
Asset Based |
| $ | 244.5 |
| $ | 292.8 |
| $ | 324.5 |
| $ | 344.1 |
| 12.1 | % |
Non-Asset Based |
| 16.0 |
| 19.2 |
| 23.0 |
| 27.6 |
| 20.0 | % | ||||
Total Revenues |
| 260.5 |
| 311.9 |
| 347.4 |
| 371.7 |
| 12.6 | % | ||||
|
|
|
|
|
|
|
|
|
|
|
| ||||
EBIT |
| 8.9 |
| 14.8 |
| 20.4 |
| 24.2 |
| 39.8 | % | ||||
|
|
|
|
|
|
|
|
|
|
|
| ||||
EPS |
| $ | 0.55 |
| $ | 0.98 |
| $ | 1.39 |
| $ | 1.67 |
| 44.8 | % |
|
|
|
|
|
|
|
|
|
|
|
| ||||
Average Seated Company Tractors |
| 880 |
| 1,106 |
| 1,290 |
| 1,385 |
|
|
| ||||
Average Seated Total Tractors |
| 1,378 |
| 1,526 |
| 1,640 |
| 1,685 |
|
|
| ||||
|
|
|
|
|
|
|
|
|
|
|
| ||||
Ratios: |
|
|
|
|
|
|
|
|
|
|
| ||||
Operating Ratio |
| 96.6 | % | 95.3 | % | 94.1 | % | 93.5 | % |
|
| ||||
Debt to Total Capitalization |
| 44.2 | % | 53.9 | % | 51.4 | % | 47.3 | % |
|
| ||||
ROIC |
| 4.1 | % | 5.9 | % | 7.0 | % | 7.9 | % |
|
| ||||
11
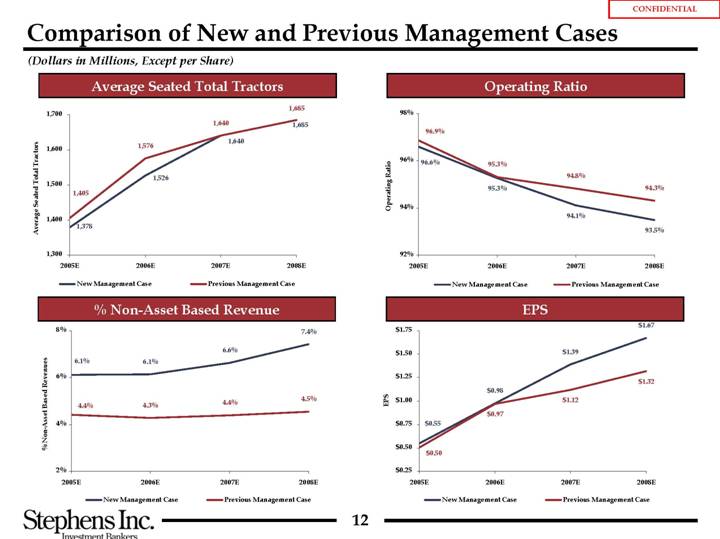
Comparison of New and Previous Management Cases
(Dollars in Millions, Except per Share)
Average Seated Total Tractors |
| Operating Ratio |
|
|
|
[CHART] |
| [CHART] |
|
|
|
% Non-Asset Based Revenue |
| EPS |
|
|
|
[CHART] |
| [CHART] |
12
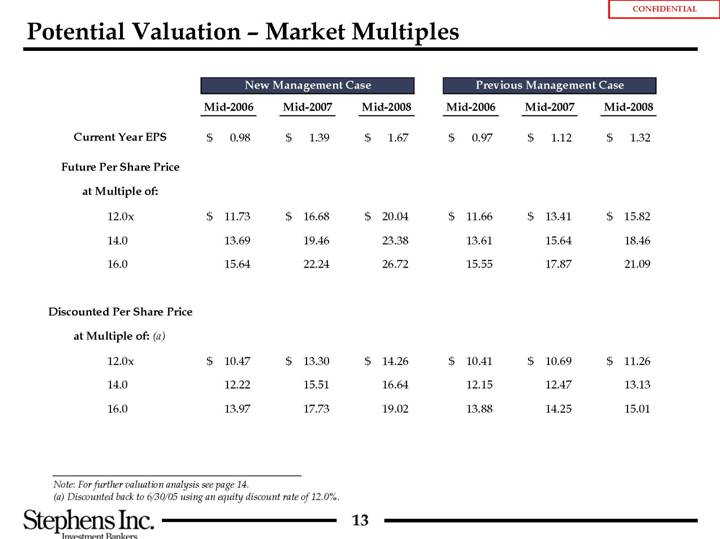
Potential Valuation - Market Multiples
|
| New Management Case |
| Previous Management Case |
| ||||||||||||||
|
| Mid-2006 |
| Mid-2007 |
| Mid-2008 |
| Mid-2006 |
| Mid-2007 |
| Mid-2008 |
| ||||||
|
|
|
|
|
|
|
|
|
|
|
|
|
| ||||||
Current Year EPS |
| $ | 0.98 |
| $ | 1.39 |
| $ | 1.67 |
| $ | 0.97 |
| $ | 1.12 |
| $ | 1.32 |
|
|
|
|
|
|
|
|
|
|
|
|
|
|
| ||||||
Future Per Share Price |
|
|
|
|
|
|
|
|
|
|
|
|
| ||||||
|
|
|
|
|
|
|
|
|
|
|
|
|
| ||||||
at Multiple of: |
|
|
|
|
|
|
|
|
|
|
|
|
| ||||||
|
|
|
|
|
|
|
|
|
|
|
|
|
| ||||||
12.0x |
| $ | 11.73 |
| $ | 16.68 |
| $ | 20.04 |
| $ | 11.66 |
| $ | 13.41 |
| $ | 15.82 |
|
|
|
|
|
|
|
|
|
|
|
|
|
|
| ||||||
14.0 |
| 13.69 |
| 19.46 |
| 23.38 |
| 13.61 |
| 15.64 |
| 18.46 |
| ||||||
|
|
|
|
|
|
|
|
|
|
|
|
|
| ||||||
16.0 |
| 15.64 |
| 22.24 |
| 26.72 |
| 15.55 |
| 17.87 |
| 21.09 |
| ||||||
|
|
|
|
|
|
|
|
|
|
|
|
|
| ||||||
Discounted Per Share Price |
|
|
|
|
|
|
|
|
|
|
|
|
| ||||||
|
|
|
|
|
|
|
|
|
|
|
|
|
| ||||||
at Multiple of: (a) |
|
|
|
|
|
|
|
|
|
|
|
|
| ||||||
|
|
|
|
|
|
|
|
|
|
|
|
|
| ||||||
12.0x |
| $ | 10.47 |
| $ | 13.30 |
| $ | 14.26 |
| $ | 10.41 |
| $ | 10.69 |
| $ | 11.26 |
|
|
|
|
|
|
|
|
|
|
|
|
|
|
| ||||||
14.0 |
| 12.22 |
| 15.51 |
| 16.64 |
| 12.15 |
| 12.47 |
| 13.13 |
| ||||||
|
|
|
|
|
|
|
|
|
|
|
|
|
| ||||||
16.0 |
| 13.97 |
| 17.73 |
| 19.02 |
| 13.88 |
| 14.25 |
| 15.01 |
| ||||||
Note: For further valuation analysis see page 14.
(a) Discounted back to 6/30/05 using an equity discount rate of 12.0%.
13
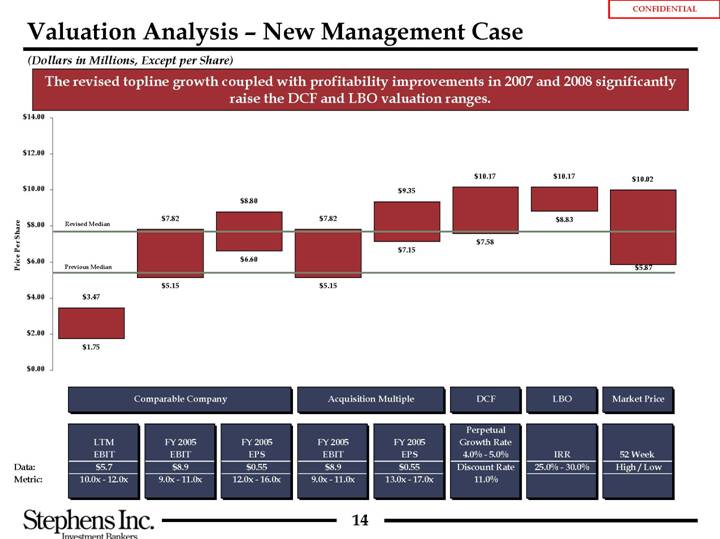
Valuation Analysis - New Management Case
(Dollars in Millions, Except per Share)
The revised topline growth coupled with profitability improvements in 2007 and 2008 significantly raise the DCF and LBO valuation ranges.
[CHART]
|
| Comparable Company |
| Acquisition Multiple |
| DCF |
| LBO |
| Market Price |
| |||||||||||
|
| LTM |
| FY 2005 |
| FY 2005 |
| FY 2005 |
| FY 2005 |
| Perpetual |
| IRR |
| 52 Week |
| |||||
Data: |
| $ | 5.7 |
| $ | 8.9 |
| $ | 0.55 |
| $ | 8.9 |
| $ | 0.55 |
| Discount Rate |
| 25.0 - 30.0% |
| High / Low |
|
Metric: |
| 10.0x - 12.0x |
| 9.0x - 11.0x |
| 12.0x - 16.0x |
| 9.0x - 11.0x |
| 13.0x - 17.0x |
| 11.0% |
|
|
|
|
| |||||
14
[GRAPHIC]
IV. Migration to Non-Asset Based Model and Recap
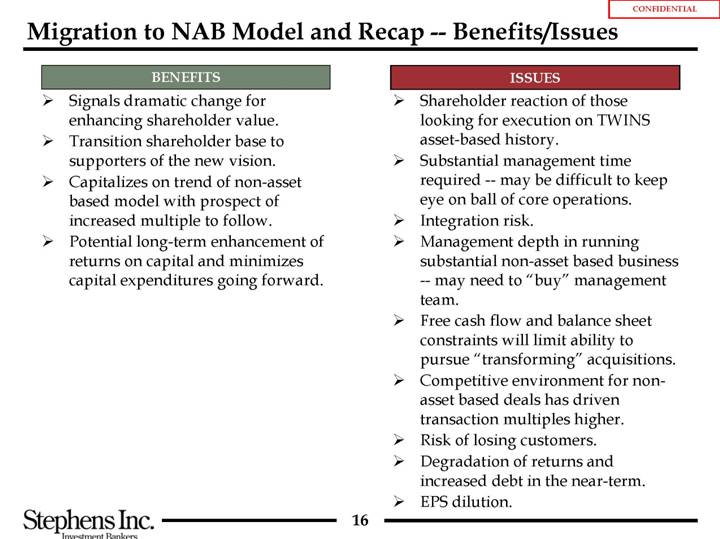
Migration to NAB Model and Recap — Benefits/Issues
BENEFITS |
| ISSUES |
• Signals dramatic change for enhancing shareholder value. • Transition shareholder base to supporters of the new vision. • Capitalizes on trend of non-asset based model with prospect of increased multiple to follow. • Potential long-term enhancement of returns on capital and minimizes capital expenditures going forward.
|
| • Shareholder reaction of those looking for execution on TWINS asset-based history. • Substantial management time required — may be difficult to keep eye on ball of core operations • Integration risk. • Management depth in running substantial non-asset based business — may need to “buy” management team. • Free cash flow and balance sheet constraints will limit ability to pursue “transforming” acquisitions. • Competitive environment for non-asset based deals has driven transaction multiples higher. • Risk of losing customers. • Degradation of returns and increased debt in the near-term. • EPS dilution. . |
16
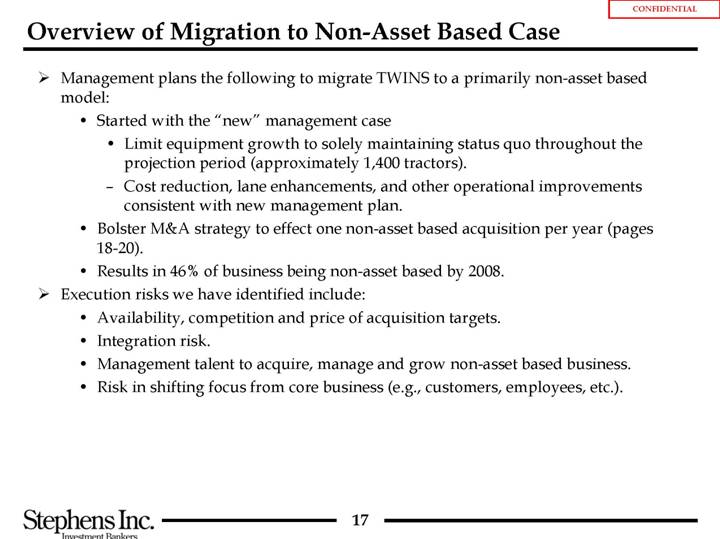
Overview of Migration to Non-Asset Based Case
• Management plans the following to migrate TWINS to a primarily non-asset based model:
• Started with the “new” management case
• Limit equipment growth to solely maintaining status quo throughout the projection period (approximately 1,400 tractors).
• Cost reduction, lane enhancements, and other operational improvements consistent with new management plan.
• Bolster M&A strategy to effect one non-asset based acquisition per year (pages 18-20).
• Results in 46% of business being non-asset based by 2008.
• Execution risks we have identified include:
• Availability, competition and price of acquisition targets.
• Integration risk.
• Management talent to acquire, manage and grow non-asset based business.
• Risk in shifting focus from core business (e.g., customers, employees, etc.).
17
Pursuing a Non-Asset Based Acquisition Strategy
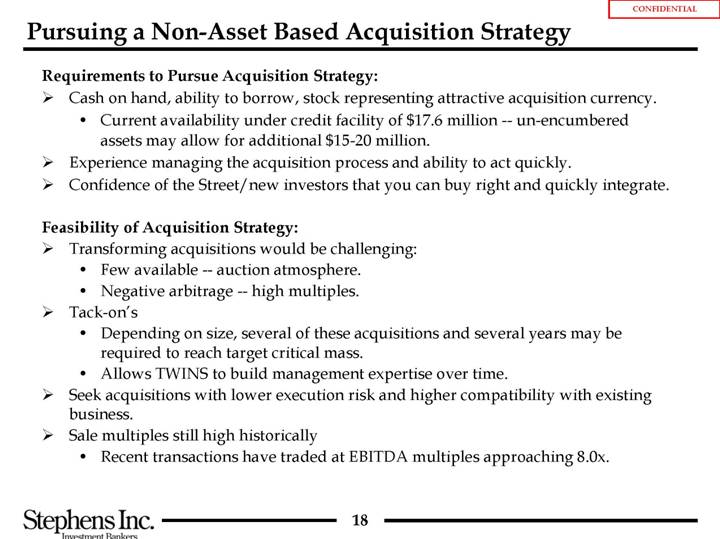
Requirements to Pursue Acquisition Strategy:
• Cash on hand, ability to borrow, stock representing attractive acquisition currency.
• Current availability under credit facility of $17.6 million — un-encumbered assets may allow for additional $15-20 million.
• Experience managing the acquisition process and ability to act quickly.
• Confidence of the Street/new investors that you can buy right and quickly integrate.
Feasibility of Acquisition Strategy:
• Transforming acquisitions would be challenging:
• Few available — auction atmosphere.
• Negative arbitrage — high multiples.
• Tack-on’s
• Depending on size, several of these acquisitions and several years may be required to reach target critical mass.
• Allows TWINS to build management expertise over time.
• Seek acquisitions with lower execution risk and higher compatibility with existing business.
• Sale multiples still high historically
• Recent transactions have traded at EBITDA multiples approaching 8.0x.
18
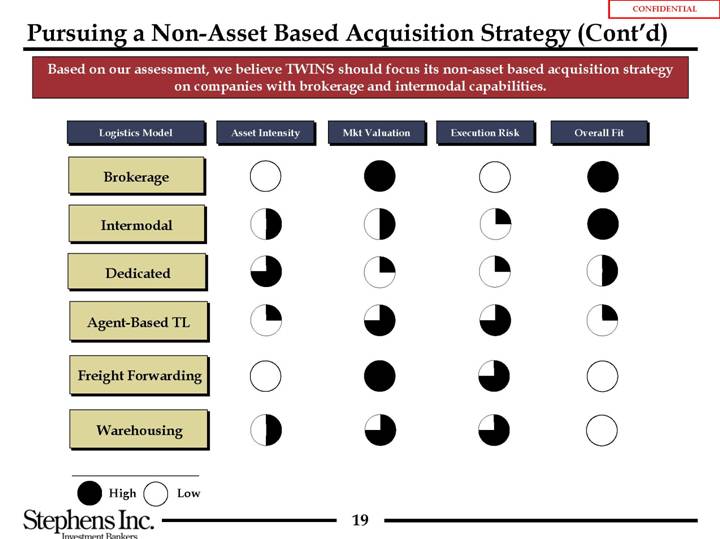
Based on our assessment, we believe TWINS should focus its non-asset based acquisition strategy on companies with brokerage and intermodal capabilities.
Logistics-Model |
| Asset Intensity |
| Mkt Valuation |
| Execution Risk |
| Overall Fit |
|
|
|
|
|
|
|
|
|
|
|
Brokerage |
|
|
|
|
|
|
|
|
|
|
|
|
|
|
|
|
|
|
|
Intermodal |
|
|
|
|
|
|
|
|
|
|
|
|
|
|
|
|
|
|
|
Dedicated |
|
|
|
|
|
|
|
|
|
|
|
|
|
|
|
|
|
|
|
Agent-Based TL |
|
|
|
|
|
|
|
|
|
|
|
|
|
|
|
|
|
|
|
Freight Forwarding |
|
|
|
|
|
|
|
|
|
|
|
|
|
|
|
|
|
|
|
Warehousing |
|
|
|
|
|
|
|
|
|
| High |
|
| Low |
19
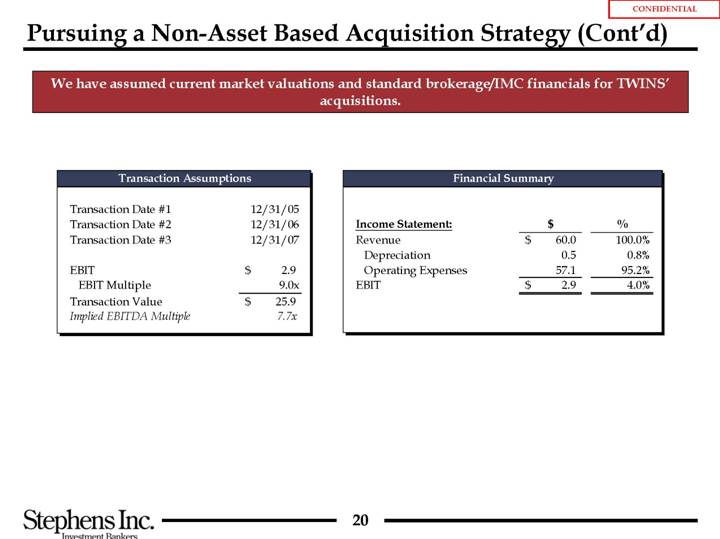
We have assumed current market valuations and standard brokerage/IMC financials for TWINS’
acquisitions.
Transaction Assumptions
Transaction Date #1 |
| 12/31/05 |
| |
Transaction Date #2 |
| 12/31/06 |
| |
Transaction Date #3 |
| 12/31/07 |
| |
|
|
|
| |
EBIT |
| $ | 2.9 |
|
EBIT Multiple |
| 9.0 | x | |
Transaction Value |
| $ | 25.9 |
|
Implied EBITDA Multiple |
| 7.7 | x | |
Financial Summary
Income Statement: |
| $ |
| % |
| ||
Revenue |
| 60.0 |
| $ | 100.0 | % | |
Depreciation |
| 0.5 |
| 0.8 | % | ||
Operating Expenses |
| 57.1 |
| 95.2 | % | ||
EBIT |
| $ | 2.9 |
| $ | 4.0 | % |
20
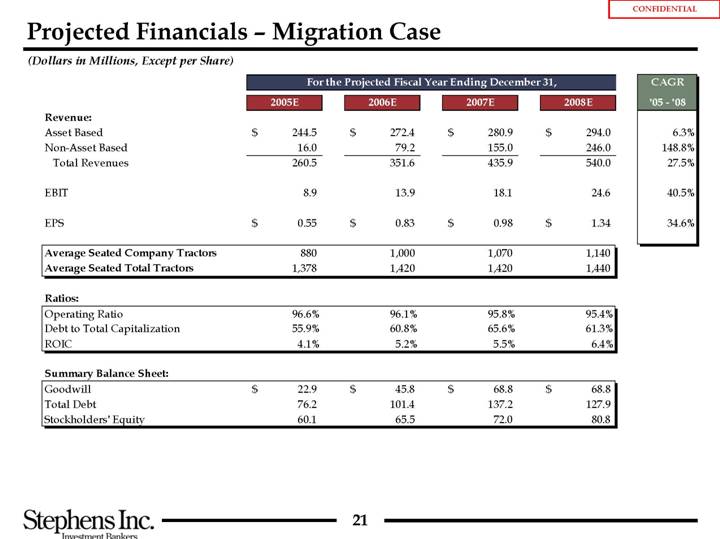
Projected Financials - Migration Case
(Dollars in Millions, Except per Share)
|
| For the Projected Fiscal Year Ending December 31, |
| CAGR |
| |||||||||||
|
| 2005E |
| 2006E |
| 2007E |
| 2008E |
| ’05 - ’08 |
| |||||
|
|
|
|
|
|
|
|
|
|
|
| |||||
Revenue: |
|
|
|
|
|
|
|
|
|
|
| |||||
Asset Based |
| 244.5 |
| $ | 272.4 |
| $ | 280.9 |
| $ | 294.0 |
| $ | 6.3 | % | |
Non-Asset Based |
| 16.0 |
| 79.2 |
| 155.0 |
| 246.0 |
| 148.8 | % | |||||
Total Revenues |
| 260.5 |
| 351.6 |
| 435.9 |
| 540.0 |
| 27.5 | % | |||||
|
|
|
|
|
|
|
|
|
|
|
| |||||
EBIT |
| 8.9 |
| 13.9 |
| 18.1 |
| 24.6 |
| 40.5 | % | |||||
|
|
|
|
|
|
|
|
|
|
|
| |||||
EPS |
| $ | 0.55 |
| $ | 0.83 |
| $ | 0.98 |
| $ | 1.34 |
| 34.6 | % | |
|
|
|
|
|
|
|
|
|
|
|
| |||||
Average Seated Company Tractors |
| 880 |
| 1,000 |
| 1,070 |
| 1,140 |
|
|
| |||||
Average Seated Total Tractors |
| 1,378 |
| 1,420 |
| 1,420 |
| 1,440 |
|
|
| |||||
|
|
|
|
|
|
|
|
|
|
|
| |||||
Ratios: |
|
|
|
|
|
|
|
|
|
|
| |||||
Operating Ratio |
| 96.6 | % | 96.1 | % | 95.8 | % | 95.4 | % |
|
| |||||
Debt to Total Capitalization |
| 55.9 | % | 60.8 | % | 65.6 | % | 61.3 | % |
|
| |||||
ROIC |
| 4.1 | % | 5.2 | % | 5.5 | % | 6.4 | % |
|
| |||||
|
|
|
|
|
|
|
|
|
|
|
| |||||
Summary Balance Sheet: |
|
|
|
|
|
|
|
|
|
|
| |||||
Goodwill |
| $ | 22.9 |
| $ | 45.8 |
| $ | 68.8 |
| $ | 68.8 |
|
|
| |
Total Debt |
| 76.2 |
| 101.4 |
| 137.2 |
| 127.9 |
|
|
| |||||
Stockholders’ Equity |
| 60.1 |
| 65.5 |
| 72.0 |
| 80.8 |
|
|
| |||||
21
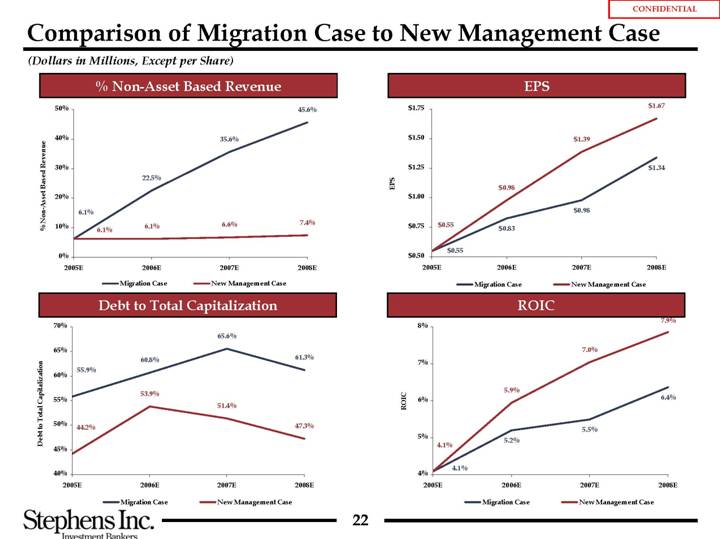
Comparison of Migration Case to New Management Case
(Dollars in Millions, Except per Share)
% Non-Asset Based Revenue
[CHART]
Debt to Total Capitalization
[CHART]
EPS
[CHART]
ROIC
[CHART]
22
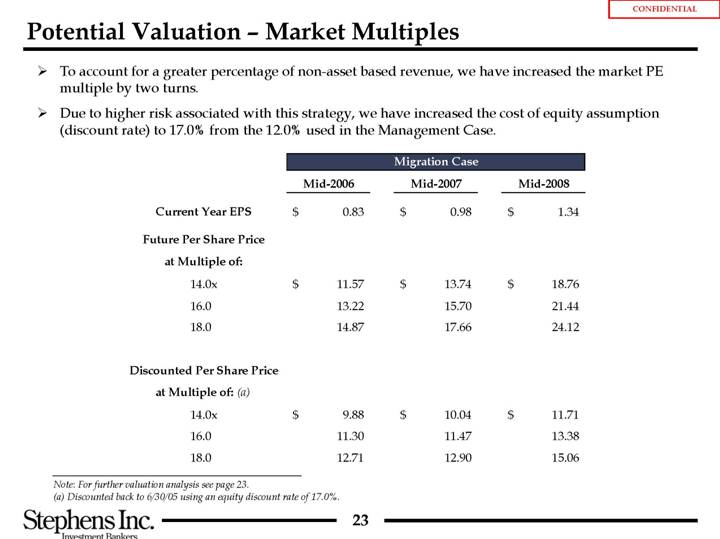
Potential Valuation - Market Multiples
• To account for a greater percentage of non-asset based revenue, we have increased the market PE multiple by two turns.
• Due to higher risk associated with this strategy, we have increased the cost of equity assumption (discount rate) to 17.0% from the 12.0% used in the Management Case.
|
| Migration Case |
| |||||||
|
| Mid-2006 |
| Mid-2007 |
| Mid-2008 |
| |||
|
|
|
|
|
|
|
| |||
Current Year EPS |
| $ | 0.83 |
| $ | 0.98 |
| $ | 1.34 |
|
Future Per Share Price |
|
|
|
|
|
|
| |||
14.0x |
| $ | 11.57 |
| $ | 13.74 |
| $ | 18.76 |
|
16.0 |
| 13.22 |
| 15.70 |
| 21.44 |
| |||
18.0 |
| 14.87 |
| 17.66 |
| 24.12 |
| |||
|
|
|
|
|
|
|
| |||
Discounted Per Share Price |
|
|
|
|
|
|
| |||
14.0x |
| 9.88 |
| $ | 10.04 |
| $ | 11.71 |
| |
16.0 |
| 11.30 |
| 11.47 |
| 13.38 |
| |||
18.0 |
| 12.71 |
| 12.90 |
| 15.06 |
| |||
Note: For further valuation analysis see page 23.
(a) Discounted back to 6/30/05 using an equity discount rate of 17.0%.
23
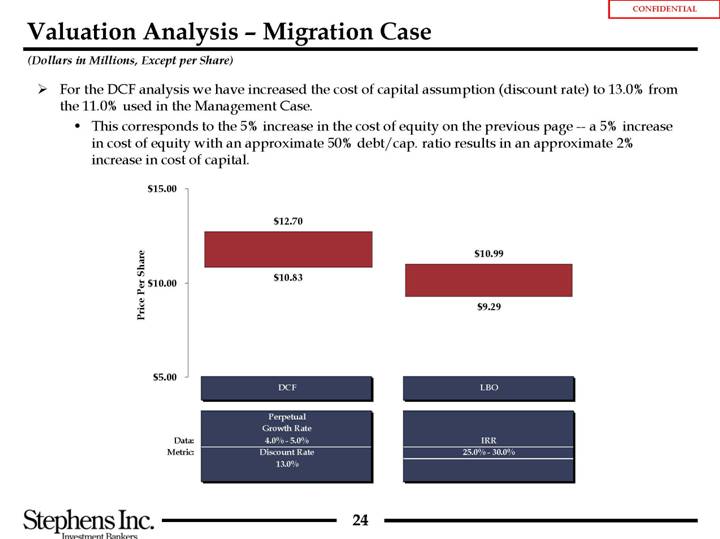
Valuation Analysis - Migration Case
(Dollars in Millions, Except per Share)
• For the DCF analysis we have increased the cost of capital assumption (discount rate) to 13.0% from the 11.0% used in the Management Case.
• This corresponds to the 5% increase in the cost of equity on the previous page — a 5% increase in cost of equity with an approximate 50% debt/cap. ratio results in an approximate 2% increase in cost of capital.
[CHART]
24
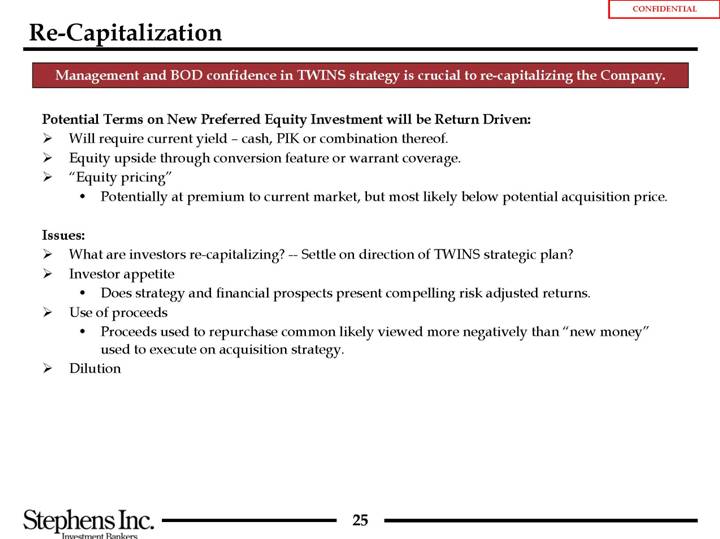
Re-Capitalization
Management and BOD confidence in TWINS strategy is crucial to re-capitalizing the Company.
Potential Terms on New Preferred Equity Investment will be Return Driven:
• Will require current yield - cash, PIK or combination thereof.
• Equity upside through conversion feature or warrant coverage.
• “Equity pricing”
• Potentially at premium to current market, but most likely below potential acquisition price.
Issues:
• What are investors re-capitalizing? — Settle on direction of TWINS strategic plan?
• Investor appetite
• Does strategy and financial prospects present compelling risk adjusted returns.
• Use of proceeds
• Proceeds used to repurchase common likely viewed more negatively than “new money” used to execute on acquisition strategy.
• Dilution
25
[GRAPHIC]
V. Next Steps
26
Next Steps
• Potential Sale
• Finalize NDA negotiations and information package disbursement to potential buyers.
• Inform buyers of timeline (week of July 18th).
• Request for initial indication of interest (due August 5th or 12th).
• BOD to evaluate interest level.
• Management meeting/due diligence for select parties if interest is acceptable to BOD.
• Process for Migration to Non-Asset Based Model and Recap
• BOD/management to evaluate and conclude on viability of scenario.
• If decision to proceed:
• Tighten model, operational plan and develop “roadshow.”
• Approach potential investors (weeks of August 1st and 8th).
• Determine initial investor interest/reaction and decide whether to proceed.
• Contact with Institutional Investors
• Normal course — Board of Directors approved meeting only.
27
[GRAPHIC]
Exhibits
[GRAPHIC]
A. Comparable Companies Analysis
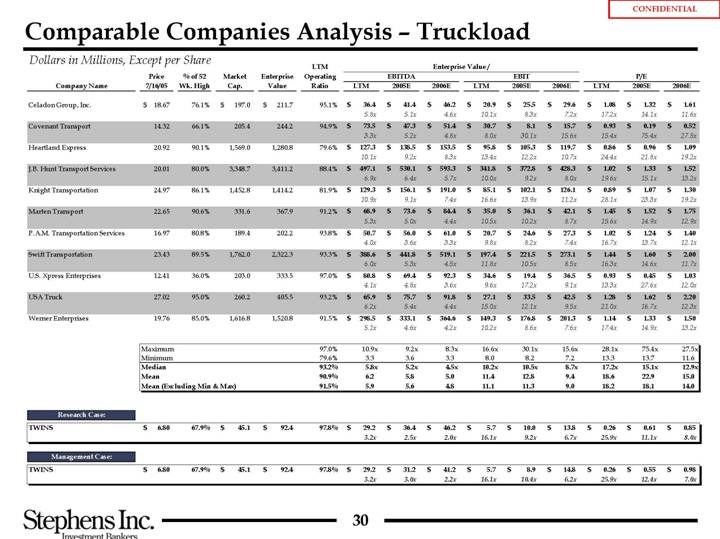
Comparable Companies Analysis - Truckload
Dollars in Millions, Except per Share
|
|
|
|
|
|
|
|
|
| LTM |
| Enterprise Value / |
|
|
|
|
|
|
| ||||||||||
|
| Price |
| % of 52 |
| Market |
| Enterprise |
| Operating |
| EBITDA |
| EBIT |
| P/E |
| ||||||||||||
Company Name |
| 7/16/05 |
| Wk. High |
| Cap. |
| Value |
| Ratio |
| LTM |
| 2005E |
| 2006E |
| LTM |
| 2005E |
| 2006E |
| LTM |
| 2005E |
| 2006E |
|
Celadon Group, Inc. |
| $ | 18.67 |
| 76.1 | % | $ | 197.0 |
| $ | 211.7 |
| 95.1 | % | $ | 36.4 |
| $ | 41.4 |
| $ | 46.2 |
| $ | 20.9 |
| $ | 25.5 |
| $ | 29.6 |
| $ | 1.08 |
| $ | 1.32 |
| $ | 1.61 |
|
|
|
|
|
|
|
|
|
|
|
|
| 5.8 | x | 5.1 | x | 4.6 | x | 10.1 | x | 8.3 | x | 7.2 | x | 17.2 | x | 14.1 | x | 11.6 | x | ||||||||||||
Covenant Transport |
| 14.32 |
| 66.1 | % | 205.4 |
| 244.2 |
| 94.9 | % | $ | 73.5 |
| $ | 47.3 |
| $ | 51.4 |
| $ | 30.7 |
| $ | 8.1 |
| $ | 15.7 |
| $ | 0.93 |
| $ | 0.19 |
| $ | 0.52 |
| |||
|
|
|
|
|
|
|
|
|
|
|
| 3.3 | x | 5.2 | x | 4.8 | x | 8.0 | x | 30.1 | x | 15.6 | x | 15.4 | x | 75.4 | x | 27.5 | x | ||||||||||||
Heartland Express |
| 20.92 |
| 90.1 | % | 1,569.0 |
| 1,280.8 |
| 79.6 | % | $ | 127.3 |
| $ | 138.5 |
| $ | 153.5 |
| $ | 95.8 |
| $ | 105.3 |
| $ | 119.7 |
| $ | 0.86 |
| $ | 0.96 |
| $ | 1.09 |
| |||
|
|
|
|
|
|
|
|
|
|
|
| 10.1 | x | 9.2 | x | 8.3 | x | 13.4 | x | 12.2 | x | 10.7 | x | 24.4 | x | 21.8 | x | 19.2 | x | ||||||||||||
J.B. Hunt Transport Services |
| 20.01 |
| 80.0 | % | 3,348.7 |
| 3,411.2 |
| 88.4 | % | $ | 497.1 |
| $ | 530.1 |
| $ | 593.3 |
| $ | 341.8 |
| $ | 372.8 |
| $ | 428.3 |
| $ | 1.02 |
| $ | 1.33 |
| $ | 1.52 |
| |||
|
|
|
|
|
|
|
|
|
|
|
| 6.9 | x | 6.4 | x | 5.7 | x | 10.0 | x | 9.2 | x | 8.0 | x | 19.6 | x | 15.1 | x | 13.2 | x | ||||||||||||
Knight Transportation |
| 24.97 |
| 86.1 | % | 1,452.8 |
| 1,414.2 |
| 81.9 | % | $ | 129.3 |
| $ | 156.1 |
| $ | 191.0 |
| $ | 85.1 |
| $ | 102.1 |
| $ | 126.1 |
| $ | 0.89 |
| $ | 1.07 |
| $ | 1.30 |
| |||
|
|
|
|
|
|
|
|
|
|
|
| 10.9 | x | 9.1 | x | 7.4 | x | 16.6 | x | 13.9 | x | 11.2 | x | 28.1 | x | 23.3 | x | 19.2 | x | ||||||||||||
Marten Transport |
| 22.65 |
| 90.6 | % | 331.6 |
| 367.9 |
| 91.2 | % | $ | 68.9 |
| $ | 73.6 |
| $ | 84.4 |
| $ | 35.0 |
| $ | 36.1 |
| $ | 42.1 |
| $ | 1.45 |
| $ | 1.52 |
| $ | 1.75 |
| |||
|
|
|
|
|
|
|
|
|
|
|
| 5.3 | x | 5.0 | x | 4.4 | x | 10.5 | x | 10.2 | x | 8.7 | x | 15.6 | x | 14.9 | x | 12.9 | x | ||||||||||||
P.A.M. Transportation Services |
| 16.97 |
| 80.8 | % | 189.4 |
| 202.2 |
| 93.8 | % | $ | 50.7 |
| $ | 56.0 |
| $ | 61.0 |
| $ | 20.7 |
| $ | 24.6 |
| $ | 27.3 |
| $ | 1.02 |
| $ | 1.24 |
| $ | 1.40 |
| |||
|
|
|
|
|
|
|
|
|
|
|
| 4.0 | x | 3.6 | x | 3.3 | x | 9.8 | x | 8.2 | x | 7.4 | x | 16.7 | x | 13.7 | x | 12.1 | x | ||||||||||||
Swift Transportation |
| 23.43 |
| 89.5 | % | 1,762.0 |
| 2,322.3 |
| 93.3 | % | $ | 388.6 |
| $ | 441.8 |
| $ | 519.1 |
| $ | 197.4 |
| $ | 221.5 |
| $ | 273.1 |
| $ | 1.44 |
| $ | 1.60 |
| $ | 2.00 |
| |||
|
|
|
|
|
|
|
|
|
|
|
| 6.0 | x | 5.3 | x | 4.5 | x | 11.8 | x | 10.5 | x | 8.5 | x | 16.3 | x | 14.6 | x | 11.7 | x | ||||||||||||
U.S. Xpress Enterprises |
| 12.41 |
| 36.0 | % | 203.0 |
| 333.5 |
| 97.0 | % | $ | 80.8 |
| $ | 69.4 |
| $ | 92.3 |
| $ | 34.6 |
| $ | 19.4 |
| $ | 36.5 |
| $ | 0.93 |
| $ | 0.45 |
| $ | 1.03 |
| |||
|
|
|
|
|
|
|
|
|
|
|
| 4.1 | x | 4.8 | x | 3.6 | x | 9.6 | x | 17.2 | x | 9.1 | x | 13.3 | x | 27.6 | x | 12.0 | x | ||||||||||||
USA Truck |
| 27.02 |
| 95.0 | % | 260.2 |
| 405.5 |
| 93.2 | % | $ | 65.9 |
| $ | 75.7 |
| $ | 91.8 |
| $ | 27.1 |
| $ | 33.5 |
| $ | 42.5 |
| $ | 1.28 |
| $ | 1.62 |
| $ | 2.20 |
| |||
|
|
|
|
|
|
|
|
|
|
|
| 6.2 | x | 5.4 | x | 4.4 | x | 15.0 | x | 12.1 | x | 9.5 | x | 21.0 | x | 16.7 | x | 12.3 | x | ||||||||||||
Werner Enterprises |
| 19.76 |
| 85.0 | % | 1,616.8 |
| 1,520.8 |
| 91.5 | % | $ | 298.5 |
| $ | 333.1 |
| $ | 364.6 |
| $ | 149.3 |
| $ | 176.8 |
| $ | 201.3 |
| $ | 1.14 |
| $ | 1.33 |
| $ | 1.50 |
| |||
|
|
|
|
|
|
|
|
|
|
|
| 5.1 | x | 4.6 | x | 4.2 | x | 10.2 | x | 8.6 | x | 7.6 | x | 17.4 | x | 14.9 | x | 13.2 | x | ||||||||||||
|
| Maximum |
| 97.0 | % | 10.9 | x | 9.2 | x | 8.3 | x | 16.6 | x | 30.1 | x | 15.6 | x | 28.1 | x | 75.4 | x | 27.5 | x |
|
| Minimum |
| 79.6 | % | 3.3 |
| 3.6 |
| 3.3 |
| 8.0 |
| 8.2 |
| 7.2 |
| 13.3 |
| 13.7 |
| 11.6 |
|
|
| Median |
| 93.2 | % | 5.8 | x | 5.2 | x | 4.5 | x | 10.2 | x | 10.5 | x | 8.7 | x | 17.2 | x | 15.1 | x | 12.9 | x |
|
| Mean |
| 90.9 | % | 6.2 |
| 5.8 |
| 5.0 |
| 11.4 |
| 12.8 |
| 9.4 |
| 18.6 |
| 22.9 |
| 15.0 |
|
|
| Mean (Excluding Min & Max) |
| 91.5 | % | 5.9 |
| 5.6 |
| 4.8 |
| 11.1 |
| 11.3 |
| 9.0 |
| 18.2 |
| 18.1 |
| 14.0 |
|
Research Case: |
|
|
|
|
|
|
|
|
|
|
|
|
|
|
|
|
|
|
|
|
|
|
|
|
|
|
TWINS |
| 6.80 |
|
| 67.9 | % | $ | 45.1 |
| $ | 92.4 |
| $ | 97.8 | % | $ | 29.2 |
| $ | 36.4 |
| $ | 46.2 |
| $ | 5.7 |
| $ | 10.0 |
| $ | 13.8 |
| $ | 0.26 |
| $ | 0.61 |
| $ | 0.85 |
|
|
|
|
|
|
|
|
|
|
|
|
| 3.2 | x | 2.5 | x | 2.0 | x | 16.1 | x | 9.2 | x | 6.7 | x | 25.9 | x | 11.1 | x | 8.0 | x | |||||||||||||
Management Case: |
|
|
|
|
|
|
|
|
|
|
|
|
|
|
|
|
|
|
|
|
|
|
|
|
|
TWINS |
| 6.80 |
|
| 67.9 | % | $ | 45.1 |
| $ | 92.4 |
| $ | 97.8 | % | $ | 29.2 |
| $ | 31.2 |
| $ | 41.2 |
| $ | 5.7 |
| $ | 8.9 |
| $ | 14.8 |
| $ | 0.26 |
| $ | 0.55 |
| $ | 0.98 |
|
|
|
|
|
|
|
|
|
|
|
|
| 3.2 | x | 3.0 | x | 2.2 | x | 16.1 | x | 10.4 | x | 6.2 | x | 25.9 | x | 12.4 | x | 7.0 | x | |||||||||||||
30
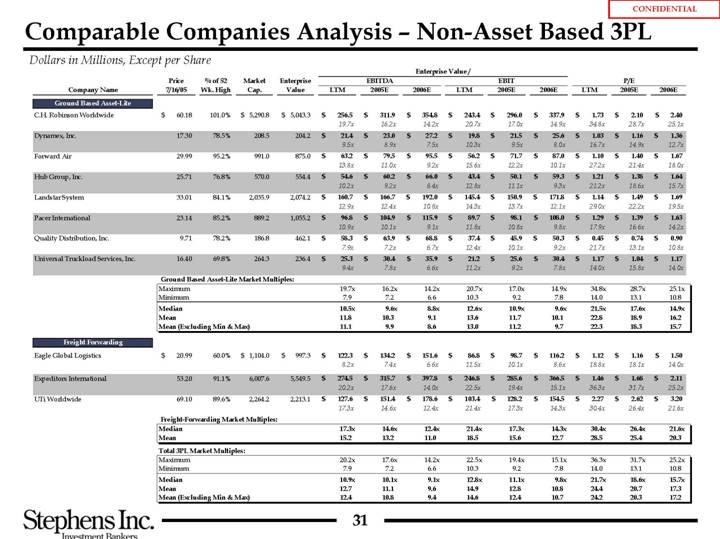
Comparable Companies Analysis - Non-Asset Based 3PL
Dollars in Millions, Except per Share
|
|
|
|
|
|
|
|
|
| Enterprise Value / |
|
|
|
|
|
|
| ||||||||||
|
| Price |
| % of 52 |
| Market |
| Enterprise |
| EBITDA |
| EBIT |
| P/E |
| ||||||||||||
Company Name |
| 7/16/05 |
| Wk. High |
| Cap. |
| Value |
| LTM |
| 2005E |
| 2006E |
| LTM |
| 2005E |
| 2006E |
| LTM |
| 2005E |
| 2006E |
|
Ground Based Asset-Lite |
|
|
|
|
|
|
|
|
|
|
|
|
|
|
|
|
|
|
|
|
|
|
|
|
|
|
|
C.H. Robinson Worldwide |
| $ | 60.18 |
| 101.0 | % | $ | 5,290.8 |
| $ | 5,043.3 |
| $ | 256.5 |
| $ | 311.9 |
| $ | 354.8 |
| $ | 243.4 |
| $ | 296.0 |
| $ | 337.9 |
| $ | 1.73 |
| $ | 2.10 |
| $ | 2.40 |
|
|
|
|
|
|
|
|
|
|
| 19.7 | x | 16.2 | x | 14.2 | x | 20.7 | x | 17.0 | x | 14.9 | x | 34.8 | x | 28.7 | x | 25.1 | x | ||||||||||||
Dynamex, Inc. |
| 17.30 |
| 78.5 | % | 208.5 |
| 204.2 |
| $ | 21.4 |
| $ | 23.0 |
| $ | 27.2 |
| $ | 19.8 |
| $ | 21.5 |
| $ | 25.6 |
| $ | 1.03 |
| $ | 1.16 |
| $ | 1.36 |
| |||
|
|
|
|
|
|
|
|
|
| 9.5 | x | 8.9 | x | 7.5 | x | 10.3 | x | 9.5 | x | 8.0 | x | 16.7 | x | 14.9 | x | 12.7 | x | ||||||||||||
Forward Air |
| 29.99 |
| 95.2 | % | 991.0 |
| 875.0 |
| $ | 63.2 |
| $ | 79.5 |
| $ | 95.5 |
| $ | 56.2 |
| $ | 71.7 |
| $ | 87.0 |
| $ | 1.10 |
| $ | 1.40 |
| $ | 1.67 |
| |||
|
|
|
|
|
|
|
|
|
| 13.8 | x | 11.0 | x | 9.2 | x | 15.6 | x | 12.2 | x | 10.1 | x | 27.2 | x | 21.4 | x | 18.0 | x | ||||||||||||
Hub Group, Inc. |
| 25.71 |
| 76.8 | % | 570.0 |
| 554.4 |
| $ | 54.6 |
| $ | 60.2 |
| $ | 66.0 |
| $ | 43.4 |
| $ | 50.1 |
| $ | 59.3 |
| $ | 1.21 |
| $ | 1.38 |
| $ | 1.64 |
| |||
|
|
|
|
|
|
|
|
|
| 10.2 | x | 9.2 | x | 8.4 | x | 12.8 | x | 11.1 | x | 9.3 | x | 21.2 | x | 18.6 | x | 15.7 | x | ||||||||||||
Landstar System |
| 33.01 |
| 84.1 | % | 2,035.9 |
| 2,074.2 |
| $ | 160.7 |
| $ | 166.7 |
| $ | 192.0 |
| $ | 145.4 |
| $ | 150.9 |
| $ | 171.8 |
| $ | 1.14 |
| $ | 1.49 |
| $ | 1.69 |
| |||
|
|
|
|
|
|
|
|
|
| 12.9 | x | 12.4 | x | 10.8 | x | 14.3 | x | 13.7 | x | 12.1 | x | 29.0 | x | 22.2 | x | 19.5 | x | ||||||||||||
Pacer International |
| 23.14 |
| 85.2 | % | 889.2 |
| 1,055.2 |
| $ | 96.8 |
| $ | 104.9 |
| $ | 115.9 |
| $ | 89.7 |
| $ | 98.1 |
| $ | 108.0 |
| $ | 1.29 |
| $ | 1.39 |
| $ | 1.63 |
| |||
|
|
|
|
|
|
|
|
|
| 10.9 | x | 10.1 | x | 9.1 | x | 11.8 | x | 10.8 | x | 9.8 | x | 17.9 | x | 16.6 | x | 14.2 | x | ||||||||||||
Quality Distribution, Inc. |
| 9.71 |
| 78.2 | % | 186.8 |
| 462.1 |
| $ | 58.3 |
| $ | 63.9 |
| $ | 68.8 |
| $ | 37.4 |
| $ | 45.9 |
| $ | 50.3 |
| $ | 0.45 |
| $ | 0.74 |
| $ | 0.90 |
| |||
|
|
|
|
|
|
|
|
|
| 7.9 | x | 7.2 | x | 6.7 | x | 12.4 | x | 10.1 | x | 9.2 | x | 21.7 | x | 13.1 | x | 10.8 | x | ||||||||||||
Universal Truckload Services, Inc. |
| 16.40 |
| 69.8 | % | 264.3 |
| 236.4 |
| $ | 25.3 |
| $ | 30.4 |
| $ | 35.9 |
| $ | 21.2 |
| $ | 25.6 |
| $ | 30.4 |
| $ | 1.17 |
| $ | 1.04 |
| $ | 1.17 |
| |||
|
|
|
|
|
|
|
|
|
| 9.4 | x | 7.8 | x | 6.6 | x | 11.2 | x | 9.2 | x | 7.8 | x | 14.0 | x | 15.8 | x | 14.0 | x | ||||||||||||
|
| Ground Based Asset-Lite Market Multiples: |
|
|
|
|
|
|
|
|
|
|
|
|
|
|
|
| Maximum |
|
|
|
|
| 19.7 | x | 16.2 | x | 14.2 | x | 20.7 | x | 17.0 | x | 14.9 | x | 34.8 | x | 28.7 | x | 25.1 | x |
|
| Minimum |
|
|
|
|
| 7.9 |
| 7.2 |
| 6.6 |
| 10.3 |
| 9.2 |
| 7.8 |
| 14.0 |
| 13.1 |
| 10.8 |
|
|
| Median |
|
|
|
| 10.5 | x | 9.6 | x | 8.8 | x | 12.6 | x | 10.9 | x | 9.6 | x | 21.5 | x | 17.6 | x | 14.9 | x | |
|
| Mean |
|
|
|
|
| 11.8 |
| 10.3 |
| 9.1 |
| 13.6 |
| 11.7 |
| 10.1 |
| 22.8 |
| 18.9 |
| 16.2 |
|
|
| Mean (Excluding Min & Max) |
|
|
|
|
| 11.1 |
| 9.9 |
| 8.6 |
| 13.0 |
| 11.2 |
| 9.7 |
| 22.3 |
| 18.3 |
| 15.7 |
|
Freight Forwarding |
|
|
|
|
|
|
|
|
|
|
|
|
|
|
|
|
|
| �� |
|
|
|
|
Eagle Global Logistics |
| 20.99 |
| $ | 60.0 | % | 1,104.0 |
| $ | 997.3 |
| $ | 122.3 |
| $ | 134.2 |
| $ | 151.6 |
| $ | 86.8 |
| $ | 98.7 |
| $ | 116.2 |
| $ | 1.12 |
| $ | 1.16 |
| $ | 1.50 |
|
|
|
|
|
|
|
|
|
|
| 8.2 | x | 7.4 | x | 6.6 | x | 11.5 | x | 10.1 | x | 8.6 | x | 18.8 | x | 18.1 | x | 14.0 | x | |||||||||||
Expeditors International |
| 53.20 |
| 91.1 | % | 6,007.6 |
| 5,549.5 |
| $ | 274.5 |
| $ | 315.7 |
| $ | 397.8 |
| $ | 246.8 |
| $ | 285.6 |
| $ | 366.5 |
| $ | 1.46 |
| $ | 1.68 |
| $ | 2.11 |
| ||
|
|
|
|
|
|
|
|
|
| 20.2 | x | 17.6 | x | 14.0 | x | 22.5 | x | 19.4 | x | 15.1 | x | 36.3 | x | 31.7 | x | 25.2 | x | |||||||||||
UTi Worldwide |
| 69.10 |
| 89.6 | % | 2,264.2 |
| 2,213.1 |
| $ | 127.6 |
| $ | 151.4 |
| $ | 178.6 |
| $ | 103.4 |
| $ | 128.2 |
| $ | 154.5 |
| $ | 2.27 |
| $ | 2.62 |
| $ | 3.20 |
| ||
|
|
|
|
|
|
|
|
|
| 17.3 | x | 14.6 | x | 12.4 | x | 21.4 | x | 17.3 | x | 14.3 | x | 30.4 | x | 26.4 | x | 21.6 | x | |||||||||||
|
| Freight-Forwarding Market Multiples: |
|
|
|
|
|
|
|
|
|
|
|
|
|
|
|
|
| Median |
| 17.3 | x | 14.6 | x | 12.4 | x | 21.4 | x | 17.3 | x | 14.3 | x | 30.4 | x | 26.4 | x | 21.6 | x |
|
| Mean |
| 15.2 |
| 13.2 |
| 11.0 |
| 18.5 |
| 15.6 |
| 12.7 |
| 28.5 |
| 25.4 |
| 20.3 |
|
|
| Total 3PL Market Multiples: |
|
|
|
|
|
|
|
|
|
|
|
|
|
|
|
|
|
|
| Maximum |
| 20.2 | x | 17.6 | x | 14.2 | x | 22.5 | x | 19.4 | x | 15.1 | x | 36.3 | x | 31.7 | x | 25.2 | x |
|
| Minimum |
| 7.9 |
| 7.2 |
| 6.6 |
| 10.3 |
| 9.2 |
| 7.8 |
| 14.0 |
| 13.1 |
| 10.8 |
|
|
| Median |
| 10.9 | x | 10.1 | x | 9.1 | x | 12.8 | x | 11.1 | x | 9.8 | x | 21.7 | x | 18.6 | x | 15.7 | x |
|
| Mean |
| 12.7 |
| 11.1 |
| 9.6 |
| 14.9 |
| 12.8 |
| 10.8 |
| 24.4 |
| 20.7 |
| 17.3 |
|
|
| Mean (Excluding Min & Max) |
| 12.4 |
| 10.8 |
| 9.4 |
| 14.6 |
| 12.4 |
| 10.7 |
| 24.2 |
| 20.3 |
| 17.2 |
|
31
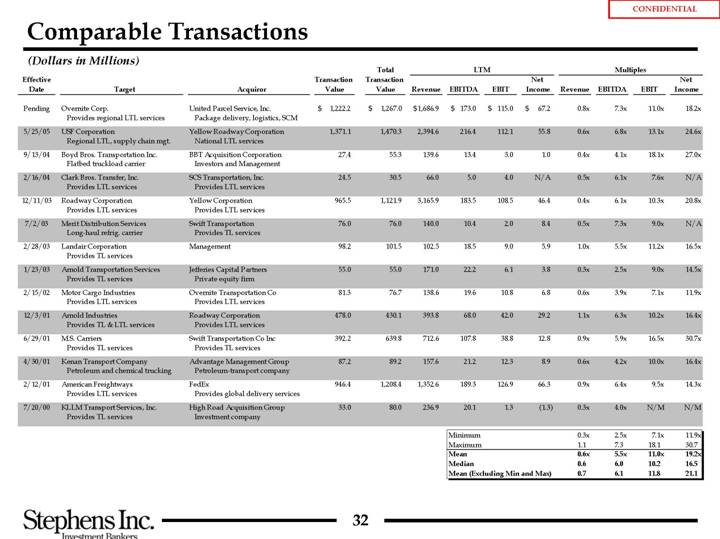
Comparable Transactions
(Dollars in Millions)
|
|
|
|
|
|
|
| Total |
| LTM |
| Multiples |
| ||||||||||||||||||
Effective |
|
|
|
|
| Transaction |
| Transaction |
|
|
|
|
|
|
| Net |
|
|
|
|
|
|
| Net |
| ||||||
Date |
| Target |
| Acquiror |
| Value |
| Value |
| Revenue |
| EBITDA |
| EBIT |
| Income |
| Revenue |
| EBITDA |
| EBIT |
| Income |
| ||||||
Pending |
| Overnite Corp. |
| United Parcel Service, Inc. |
| $ | 1,222.2 |
| $ | 1,267.0 |
| $ | 1,686.9 |
| $ | 173.0 |
| $ | 115.0 |
| $ | 67.2 |
| 0.8 | x | 7.3 | x | 11.0 | x | 18.2 | x |
|
| Provides regional LTL services |
| Package delivery, logistics, SCM |
|
|
|
|
|
|
|
|
|
|
|
|
|
|
|
|
|
|
|
|
| ||||||
5/25/05 |
| USF Corporation |
| Yellow Roadway Corporation |
| 1,371.1 |
| 1,470.3 |
| 2,394.6 |
| 216.4 |
| 112.1 |
| 55.8 |
| 0.6 | x | 6.8 | x | 13.1 | x | 24.6 | x | ||||||
|
| Regional LTL, supply chain mgt. |
| National LTL services |
|
|
|
|
|
|
|
|
|
|
|
|
|
|
|
|
|
|
|
|
| ||||||
9/13/04 |
| Boyd Bros. Transportation Inc. |
| BBT Acquisition Corporation |
| 27.4 |
| 55.3 |
| 139.6 |
| 13.4 |
| 3.0 |
| 1.0 |
| 0.4 | x | 4.1 | x | 18.1 | x | 27.0 | x | ||||||
|
| Flatbed truckload carrier |
| Investors and Management |
|
|
|
|
|
|
|
|
|
|
|
|
|
|
|
|
|
|
|
|
| ||||||
2/16/04 |
| Clark Bros. Transfer, Inc. |
| SCS Transportation, Inc. |
| 24.5 |
| 30.5 |
| 66.0 |
| 5.0 |
| 4.0 |
| N/A |
| 0.5 | x | 6.1 | x | 7.6 | x | N/A |
| ||||||
|
| Provides LTL services |
| Provides LTL services |
|
|
|
|
|
|
|
|
|
|
|
|
|
|
|
|
|
|
|
|
| ||||||
12/11/03 |
| Roadway Corporation |
| Yellow Corporation |
| 965.5 |
| 1,121.9 |
| 3,165.9 |
| 183.5 |
| 108.5 |
| 46.4 |
| 0.4 | x | 6.1 | x | 10.3 | x | 20.8 | x | ||||||
|
| Provides LTL services |
| Provides LTL services |
|
|
|
|
|
|
|
|
|
|
|
|
|
|
|
|
|
|
|
|
| ||||||
7/2/03 |
| Merit Distribution Services |
| Swift Transportation |
| 76.0 |
| 76.0 |
| 140.0 |
| 10.4 |
| 2.0 |
| 8.4 |
| 0.5 | x | 7.3 | x | 9.0 | x | N/A |
| ||||||
|
| Long-haul refrig. carrier |
| Provides TL services |
|
|
|
|
|
|
|
|
|
|
|
|
|
|
|
|
|
|
|
|
| ||||||
2/28/03 |
| Landair Corporation |
| Management |
| 98.2 |
| 101.5 |
| 102.5 |
| 18.5 |
| 9.0 |
| 5.9 |
| 1.0 | x | 5.5 | x | 11.2 | x | 16.5 | x | ||||||
|
| Provides TL services |
|
|
|
|
|
|
|
|
|
|
|
|
|
|
|
|
|
|
|
|
|
|
| ||||||
1/23/03 |
| Arnold Transportation Services |
| Jefferies Capital Partners |
| 55.0 |
| 55.0 |
| 171.0 |
| 22.2 |
| 6.1 |
| 3.8 |
| 0.3 | x | 2.5 | x | 9.0 | x | 14.5 | x | ||||||
|
| Provides TL services |
| Private equity firm |
|
|
|
|
|
|
|
|
|
|
|
|
|
|
|
|
|
|
|
|
| ||||||
2/15/02 |
| Motor Cargo Industries |
| Overnite Transportation Co |
| 81.3 |
| 76.7 |
| 138.6 |
| 19.6 |
| 10.8 |
| 6.8 |
| 0.6 | x | 3.9 | x | 7.1 | x | 11.9 | x | ||||||
|
| Provides LTL services |
| Provides LTL services |
|
|
|
|
|
|
|
|
|
|
|
|
|
|
|
|
|
|
|
|
| ||||||
12/3/01 |
| Arnold Industries |
| Roadway Corporation |
| 478.0 |
| 430.1 |
| 393.8 |
| 68.0 |
| 42.0 |
| 29.2 |
| 1.1 | x | 6.3 | x | 10.2 | x | 16.4 | x | ||||||
|
| Provides TL & LTL services |
| Provides LTL services |
|
|
|
|
|
|
|
|
|
|
|
|
|
|
|
|
|
|
|
|
| ||||||
6/29/01 |
| M.S. Carriers |
| Swift Transportation Co Inc |
| 392.2 |
| 639.8 |
| 712.6 |
| 107.8 |
| 38.8 |
| 12.8 |
| 0.9 | x | 5.9 | x | 16.5 | x | 30.7 | x | ||||||
|
| Provides TL services |
| Provides TL services |
|
|
|
|
|
|
|
|
|
|
|
|
|
|
|
|
|
|
|
|
| ||||||
4/30/01 |
| Kenan Transport Company |
| Advantage Management Group |
| 87.2 |
| 89.2 |
| 157.6 |
| 21.2 |
| 12.3 |
| 8.9 |
| 0.6 | x | 4.2 | x | 10.0 | x | 16.4 | x | ||||||
|
| Petroleum and chemical trucking |
| Petroleum-transport company |
|
|
|
|
|
|
|
|
|
|
|
|
|
|
|
|
|
|
|
|
| ||||||
2/12/01 |
| American Freightways |
| FedEx |
| 946.4 |
| 1,208.4 |
| 1,352.6 |
| 189.3 |
| 126.9 |
| 66.3 |
| 0.9 | x | 6.4 | x | 9.5 | x | 14.3 | x | ||||||
|
| Provides LTL services |
| Provides global delivery services |
|
|
|
|
|
|
|
|
|
|
|
|
|
|
|
|
|
|
|
|
| ||||||
7/20/00 |
| KLLM Transport Services, Inc. |
| High Road Acquisition Group |
| 33.0 |
| 80.0 |
| 236.9 |
| 20.1 |
| 1.3 |
| (1.3 | ) | 0.3 | x | 4.0 | x | N/M |
| N/M |
| ||||||
|
| Provides TL services |
| Investment company |
|
|
|
|
|
|
|
|
|
|
|
|
|
|
|
|
|
|
|
|
| ||||||
|
|
|
|
|
|
|
|
|
|
|
| Minimum |
| 0.3 | x | 2.5 | x | 7.1 | x | 11.9 | x |
|
|
|
|
|
|
|
|
|
|
|
| Maximum |
| 1.1 |
| 7.3 |
| 18.1 |
| 30.7 |
|
|
|
|
|
|
|
|
|
|
|
|
| Mean |
| 0.6 | x | 5.5 | x | 11.0 | x | 19.2 | x |
|
|
|
|
|
|
|
|
|
|
|
| Median |
| 0.6 |
| 6.0 |
| 10.2 |
| 16.5 |
|
|
|
|
|
|
|
|
|
|
|
|
| Mean (Excluding Min and Max) |
| 0.7 |
| 6.1 |
| 11.8 |
| 21.1 |
|
32