UNITED STATES
SECURITIES AND EXCHANGE COMMISSION
Washington, D.C. 20549
FORM N-CSR
CERTIFIED SHAREHOLDER REPORT OF REGISTERED
MANAGEMENT INVESTMENT COMPANIES
Investment Company Act file number: 811-4984
AMERICAN BEACON FUNDS
(Exact name of registrant as specified in charter)
4151 Amon Carter Boulevard, MD 2450
Fort Worth, Texas 76155
(Address of principal executive offices)-(Zip code)
Gene L. Needles, Jr., PRESIDENT
4151 Amon Carter Boulevard, MD 2450
Fort Worth, Texas 76155
(Name and address of agent for service)
Registrant’s telephone number, including area code: (817) 391-6100
Date of fiscal year end: January 31, 2015
Date of reporting period: January 31, 2015
ITEM 1. REPORT TO STOCKHOLDERS.
About American Beacon Advisors
Since 1986, American Beacon Advisors has offered a variety of products and investment advisory services to numerous institutional and retail clients, including a variety of mutual funds, corporate cash management, and separate account management.
Our clients include defined benefit plans, defined contribution plans, foundations, endowments, corporations, financial planners, and other institutional investors. With American Beacon Advisors, you can put the experience of a multi-billion dollar asset management firm to work for your company.
ACADIAN EMERGING MARKETS MANAGED VOLATILITY FUND Investing in foreign and emerging market securities may involve heightened risk due to currency fluctuations and economic and political risks. Investing in lower volatility securities may produce more modest gains than other stock funds as a trade-off for the potentially lower downside risk. The use of futures contracts for cash management may subject the Fund to losing more money than invested. EARNEST PARTNERS EMERGING MARKETS EQUITY FUND Investing in foreign and emerging market securities may involve heightened risk due to currency fluctuations and economic and political risks. Investing in small- and medium-capitalization stocks may involve greater volatility and lower liquidity than larger company stocks. The use of futures contracts for cash management may subject the Fund to losing more money than invested. SGA GLOBAL GROWTH FUND Investing in foreign and emerging market securities may involve heightened risk due to currency fluctuations and economic and political risks. Growth stocks typically are more volatile than value stocks; however, value stocks have a lower expected growth rate in earnings and sales. Because the Fund may invest in fewer issuers than a more diversified portfolio, the fluctuating value of a single holding may have a greater effect on the value of the Fund. The use of futures contracts for cash management may subject the Fund to losing more money than invested. The Fund may participate in a securities lending program. Please see the prospectus for a complete discussion of the Funds’ risks. There can be no assurances that the investment objectives of these Funds will be met.
Any opinions herein, including forecasts, reflect our judgment as of the end of the reporting period and are subject to change. Each advisor’s strategies and the Fund’s portfolio composition will change depending on economic and market conditions. This report is not a complete analysis of market conditions and, therefore, should not be relied upon as investment advice. Although economic and market information has been compiled from reliable sources, American Beacon Advisors, Inc. makes no representation as to the completeness or accuracy of the statements contained herein.
| | |
| American Beacon Funds | | January 31, 2015 |
| | |
 | | Dear Shareholders, During the 12 months ended January 31, 2015, many of the world’s economies and international equity investments struggled while the stronger U.S. dollar lowered the value of foreign investments. The MSCI EAFE Index, which measures the world’s developed markets, closed down at -0.43%. In contrast, the MSCI Emerging Markets Index gained 5.23% and the MSCI All Country World Index, which tracks developed and emerging markets, returned 6.80%. Domestic equity investors, on the other hand, enjoyed relatively calmer markets and stocks ended the period with positive returns following two modest pullbacks. The S&P 500 Index, a U.S. large-cap stock bellwether, gained 14.22% – buoyed by accelerated economic growth and |
increased earnings. Of the 10 industry sectors in which the S&P 500 Index is divided, only one lost ground during the period: Energy (-8.60%). The Russell Midcap Index, a barometer of mid-cap stocks, grew 13.66%. And the Russell 2000 Index, which generally represents the small-cap segment, increased 4.41%.
At American Beacon Advisors, we are proud to offer a broad range of equity funds that are capable of navigating economic storms and market downturns in the U.S. and abroad. We are fortunate to have asset managers with distinctive investment processes who have managed assets for many years and through a variety of economic and market conditions.
For the 12 months ended January 31, 2015:
| | • | | American Beacon Acadian Emerging Markets Managed Volatility Fund (Investor Class) returned 7.63%. |
| | • | | American Beacon Earnest Partners Emerging Markets Equity Fund (Investor Class) returned 5.30%. |
| | • | | American Beacon SGA Global Growth Fund (Investor Class) returned 5.60%. |
Thank you for your continued investment in the American Beacon Funds. For additional information about the Funds or to access your account information, please visit our website at www.americanbeaconfunds.com.
Best Regards,

Gene L. Needles, Jr.
President
American Beacon Funds
1
Global Equity and Emerging Markets Overview
January 31, 2015 (Unaudited)
Global equities registered positive gains for the 12 months ended January 31, 2015, with the MSCI All Country World Index returning 6.80%. Performance varied widely by region, with U.S. stocks leading the way among major equity markets as the S&P 500 Index gained more than 14% and the broad market Russell 3000 Index finished up nearly 13%. International developed markets declined 0.43% in U.S. dollars for the period as measured by the MSCI EAFE Index. Although emerging markets appreciated more than 5% for the period, performance varied significantly during the period’s first and second halves. The MSCI Emerging Markets Index climbed more than 15% during the first half, but fell more than 9% during the second half as global events pressured returns.
The U.S. economy continued to show improvement during the period, which provided support to emerging market economies. Although the U.S. Federal Reserve tapered its quantitative easing efforts, interest rates did not rise as feared. Instead, rates steadily declined and pushed investors into riskier asset classes, such as emerging markets, which provided the potential for greater returns. While the U.S. dollar’s strength made emerging market exports more competitive, it had a negative translational effect on the local currency returns relative to most developed markets. The MSCI Japan Index gained 17.67% in local currency, but gained only 2.16% in terms of U.S. dollars. The equivalent returns for the MSCI Europe Index were up 11.22% in local currency, but declined 2.41% in U.S. dollars. The MSCI Emerging Markets Index finished the 12-month period with a gain of 5.23% in U.S. dollars, while the return was 11.63% in local currency terms. Declining interest rates helped push bonds and other interest-rate-sensitive asset classes to solid returns for the fiscal year, with the Barclays U.S. Aggregate Index up 6.61% and the S&P U.S. REIT Index up 33.47%. Many central banks in emerging markets took action to stem weakness in their currency and equity markets by raising interest rates.
These modest overall returns masked meaningful volatility tied to global economic and geopolitical events. As the period came to a close, investors were increasingly concerned about the pace of global economic growth. While the U.S. economy grew at a 5% annual rate in the third quarter of 2014 - its fastest quarterly growth rate in 11 years - growth was considerably more subdued elsewhere in the world. In particular, the increasing possibility of recession and deflation in Europe, a recession in Japan, a currency crisis in Russia, and continued economic slowing in China and other emerging markets all affected market performance. Investors were cautiously optimistic that key emerging market economies, such as Brazil and China, would begin to recover after weakness over the past few years.
Falling commodity prices, particularly oil prices, helped many developed markets as consumers of raw materials. However, the falling commodity prices hurt emerging markets that export those commodities. Since July, oil prices fell from more than $100 to below $60 a barrel, its lowest level in five years. Several factors contributed to the decline in oil prices, including a surge in the U.S. oil supply that weakened the demand from other countries. Also, late in the fourth quarter of 2014, OPEC decided against reducing oil production to support oil prices – a surprising decision that roiled the global equity markets. Not surprisingly, Energy was the worst performing sector globally for the fiscal year.
Other factors influencing global and emerging equity market performance included concerns that the U.S. Federal Reserve may raise short-term interest rates sooner than anticipated, rising geopolitical tensions in Ukraine, conflict in the Middle East tied to the rise of the self-declared Islamic State, the Ebola virus outbreak in western Africa, and terrorist attacks like those carried out in Paris in January 2015.
American Beacon Acadian Emerging Markets Managed Volatility FundSM
Performance Overview
January 31, 2015 (Unaudited)
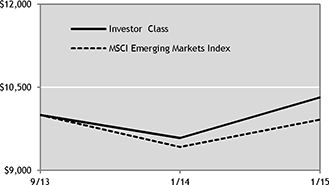
The Investor Class of the American Beacon Acadian Emerging Markets Managed Volatility Fund (the “Fund”) returned 7.63% for the twelve months ended January 31, 2015. The Fund outperformed the MSCI Emerging Markets Index (the “Index”) return of 5.23% for the period.
Comparison of Change in Value of a $10,000 Investment
For The Period From 9/27/13 Through 1/31/15
Total Returns for the Period ended 1/31/15
| | | | | | | | | | | | |
| | | 1 Year | | | Since
Incep.
(9/27/13) | | | Value of
$10,000
9/27/13-
1/31/15 | |
Institutional Class (1,3) | | | 8.04 | % | | | 2.71 | % | | $ | 10,366 | |
Y Class (1,3) | | | 7.83 | % | | | 2.56 | % | | | 10,346 | |
Investor Class (1,3) | | | 7.63 | % | | | 2.34 | % | | | 10,316 | |
A Class with sales charge (1,3) | | | 1.39 | % | | | (2.14 | )% | | | 9,714 | |
A Class without sales charge (1,3) | | | 7.53 | % | | | 2.27 | % | | | 10,306 | |
C Class with sales charge (1,3) | | | 5.66 | % | | | 1.42 | % | | | 10,191 | |
C Class without sales charge (1,3) | | | 6.66 | % | | | 1.42 | % | | | 10,191 | |
MSCI Emerging Markets Index (2) | | | 5.23 | % | | | (0.96 | )% | | | 9,916 | |
| 1. | Performance shown is historical and is not indicative of future returns. Investment returns and principal value will vary, and shares may be worth more or less at redemption than at original purchase. Performance shown is calculated based on the published end of day net asset values as of the date indicated and current performance may be lower or higher than the performance data quoted. To obtain performance as of the most recent month end, please visit www.americanbeaconfunds.com or call 1-800-967-9009. Fund performance in the table above does not reflect the deduction of taxes a shareholder would pay on distributions or the redemption of shares. A portion of the fees charged to each Class of the Fund has been waived since inception. Performance prior to waiving fees was lower than the actual returns shown since inception. A Class shares have a maximum sales charge of 5.75%. The maximum contingent deferred sales charge for the C Class is 1.00% for shares redeemed within one year of the date of purchase. |
| 2. | The MSCI Emerging Markets Index is a market capitalization weighted index composed of companies that are representative of the market structure of developing countries in Latin America, Asia, Eastern Europe, the Middle East and Africa. One cannot directly invest in an index. |
| 3. | The total annual Fund operating expense ratio set forth in the most recent Fund prospectus for the Institutional, Y, Investor, A, and C Class shares was 2.01%, 2.11%, 2.38%, 2.41%, and 3.16% respectively. The expense ratios above may vary from the expense ratios presented in other sections of this report that are based on expenses incurred during the period covered by this report. |
The Fund outperformed the Index over the one-year period due to stock selection and country allocation.
Stock selections in South Korea and Mexico added value to relative performance during the period, more than offsetting the impact of poor selections in Taiwan and India. The Fund added value in South Korea through holding Amorepacific Corp. (up 133.3%) and in Mexico through holding Grupo Financiero Interacciones, S.A. de C.V. (up 26.1%) and Infraestructura Energetica Nova, S.A.B. de C.V. (up 17.7%). In Taiwan, investment in Wowprime Corp. (down 39.9%) and in India, investment in Wipro Ltd. (up 0.7%) hurt relative performance.
Relative contribution from country allocation was positive for the twelve month period, due to underweighting Russia and Brazil during the year (down 40.7% and 9.9%, respectively) and overweighting South Africa (up 22.8%). Underweighting India (up 39.3%) and overweighting Malaysia (down 7.3%) detracted from relative performance during the period.
The Fund’s basic philosophy remains focused on investing in a well-diversified portfolio of low volatility stocks that aims to maximize risk-adjusted returns.
Top Ten Holdings (% Net Assets)
| | | | | | | | |
BGF Retail Co., Ltd. | | | | | | | 1.1 | |
Tata Motors Ltd., Sponsored ADR | | | | | | | 1.1 | |
Aboitiz Power Corp. | | | | | | | 1.1 | |
China Mobile Ltd. | | | | | | | 1.0 | |
China Construction Bank H | | | | | | | 1.0 | |
Agricultural Bank of China H | | | | | | | 1.0 | |
Bank of China Ltd. H | | | | | | | 1.0 | |
Dr. Reddy’s Laboratories Ltd., ADR | | | | | | | 1.0 | |
Axiata Group Bhd | | | | | | | 1.0 | |
Infosys Technologies Ltd., Sponsored ADR | | | | | | | 1.0 | |
Total Fund Holdings | | | 289 | | | | | |
American Beacon Acadian Emerging Markets Managed Volatility FundSM
Performance Overview
January 31, 2015 (Unaudited)
Sector Allocation (% Equities)
| | | | |
Financials | | | 17.7 | |
Consumer Staples | | | 17.4 | |
Telecommunication Services | | | 17.0 | |
Information Technology | | | 11.2 | |
Consumer Discretionary | | | 9.7 | |
Utilities | | | 8.6 | |
Industrials | | | 7.0 | |
Health Care | | | 5.8 | |
Energy | | | 3.1 | |
Materials | | | 2.5 | |
Country Allocation (% Equities)
| | | | |
Hong Kong/China | | | 16.4 | |
South Africa | | | 12.7 | |
Taiwan | | | 11.1 | |
Mexico | | | 9.1 | |
South Korea | | | 9.0 | |
Malaysia | | | 8.5 | |
Brazil | | | 5.7 | |
India | | | 4.6 | |
Poland | | | 4.6 | |
Philippines | | | 4.0 | |
Indonesia | | | 2.9 | |
Thailand | | | 2.9 | |
Chile | | | 2.7 | |
Peru | | | 1.2 | |
Colombia | | | 1.0 | |
Russia | | | 0.9 | |
Egypt | | | 0.7 | |
Czech Republic | | | 0.6 | |
Hungary | | | 0.5 | |
Panama | | | 0.5 | |
Turkey | | | 0.2 | |
Greece | | | 0.2 | |
American Beacon Earnest Partners Emerging Markets Equity FundSM
Performance Overview
January 31, 2015 (Unaudited)
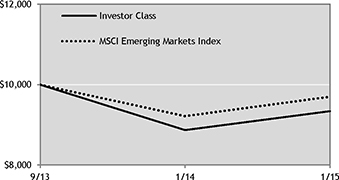
The Investor Class of the American Beacon Earnest Partners Emerging Markets Equity Fund (the “Fund”) returned 5.30% for twelve months ended January 31, 2015. The Fund outperformed the MSCI Emerging Markets Index (the “Index”) return of 5.23% for the period.
Comparison of Change in Value of a $10,000 Investment
For The Period From 9/19/13 Through 1/31/15
Total Returns for the Period ended 1/31/15
| | | | | | | | | | | | |
| | | 1 Year | | | Since
Incep.
(9/19/13) | | | Value of
$10,000
9/19/13-
1/31/15 | |
Institutional Class (1,3) | | | 5.51 | % | | | (4.57 | )% | | $ | 9,380 | |
Y Class (1,3) | | | 5.52 | % | | | (4.65 | )% | | | 9,370 | |
Investor Class (1,3) | | | 5.30 | % | | | (4.87 | )% | | | 9,340 | |
A Class with sales charge (1,3) | | | (0.85 | %) | | | (8.98 | )% | | | 8,794 | |
A Class without sales charge (1,3) | | | 5.19 | % | | | (4.95 | )% | | | 9,330 | |
C Class with sales charge (1,3) | | | 3.29 | % | | | (5.69 | )% | | | 9,230 | |
C Class without sales charge (1,3) | | | 4.29 | % | | | (5.69 | )% | | | 9,230 | |
MSCI Emerging Markets Index (2) | | | 5.23 | % | | | (2.95 | )% | | | 9,699 | |
| 1. | Performance shown is historical and is not indicative of future returns. Investment returns and principal value will vary, and shares may be worth more or less at redemption than at original purchase. Performance shown is calculated based on the published end of day net asset values as of the date indicated and current performance may be lower or higher than the performance data quoted. To obtain performance as of the most recent month end, please visit www.americanbeaconfunds.com or call 1-800-967-9009. Fund performance in the table above does not reflect the deduction of taxes a shareholder would pay on distributions or the redemption of shares. A portion of the fees charged to each Class of the Fund has been waived since inception. Performance prior to waiving fees was lower than the actual returns shown since inception. A Class shares have a maximum sales charge of 5.75%. The maximum contingent deferred sales charge for the C Class is 1.00% for shares redeemed within one year of the date of purchase. |
| 2. | The MSCI Emerging Markets Index is a market capitalization weighted index composed of companies that are representative of the market structure of developing countries in Latin America, Asia, Eastern Europe, the Middle East and Africa. One cannot directly invest in an index. |
| 3. | The total annual Fund operating expense ratio set forth in the most recent Fund prospectus for the Institutional, Y, Investor, A and C Class shares was 2.06%, 2.16%, 2.43%, 2.46%, and 3.21%, respectively. The expense ratios above may vary from the expense ratios presented in other sections of this report that are based on expenses incurred during the period covered by this report. |
The Fund outperformed the Index over the one-year period due to country allocation, as stock selections detracted from relative performance.
Relative to the Index, the Fund lost value through poor stock selections in China and South Africa. Lagging stocks in China included China Oilfield Services Ltd. (down 35.5%) and China BlueChemical Ltd. (down 36.3%), and in South Africa included African Rainbow Minerals Ltd. (down 48.5%) and Impala Platinum Holdings Ltd. (down 38.8%). The Fund added value through Banco Bradesco SA and Cielo SA (up 17.8% and 16.2%, respectively) in Brazil and ICICI Bank Ltd. and HDFC Bank Ltd. (up 91.9% and 82.1%, respectively) in India.
From a country allocation perspective, the Fund benefited from overweighting China (up 24.0%) and null weighting Russia (down 40.7%), but overweighting Brazil (down 9.9%) detracted from relative performance during the period.
The Fund’s basic philosophy remains focused on investing in companies using a fundamental, bottom-up investment approach in concert with an emphasis on reducing downside deviation.
Top Ten Holdings (% Net Assets)
| | | | | | | | |
Samsung Electronics Co., Ltd. | | | | | | | 4.2 | |
Weichai Power Co., Ltd. H | | | | | | | 4.1 | |
Advanced Semiconductor Engineering, Inc. | | | | | | | 4.1 | |
Orient Overseas International Ltd. | | | | | | | 3.4 | |
Cielo S.A. | | | | | | | 3.3 | |
Controladora Commercial Mexicana, S.A.B. de C.V. | | | | | | | 3.2 | |
Great Wall Motor Co., H | | | | | | | 3.0 | |
Investec Ltd. | | | | | | | 3.0 | |
Jiangxi Copper Co., Ltd. H | | | | | | | 2.9 | |
CJ Corp. | | | | | | | 2.9 | |
Total Fund Holdings | | | 43 | | | | | |
American Beacon Earnest Partners Emerging Markets Equity FundSM
Performance Overview
January 31, 2015 (Unaudited)
Sector Allocation (% Equities)
| | | | |
Financials | | | 32.6 | |
Industrials | | | 15.7 | |
Materials | | | 13.6 | |
Consumer Discretionary | | | 10.6 | |
Consumer Staples | | | 9.0 | |
Information Technology | | | 8.9 | |
Energy | | | 5.7 | |
Health Care | | | 2.1 | |
Telecommunication Services | | | 1.8 | |
Country Allocation (% Equities)
| | | | |
Hong Kong/China | | | 35.2 | |
South Korea | | | 14.0 | |
Brazil | | | 12.2 | |
Taiwan | | | 7.0 | |
South Africa | | | 5.8 | |
India | | | 5.6 | |
Indonesia | | | 4.5 | |
Mexico | | | 3.4 | |
Thailand | | | 3.2 | |
Turkey | | | 2.9 | |
Colombia | | | 2.4 | |
Czech Republic | | | 2.1 | |
Malaysia | | | 1.7 | |
American Beacon SGA Global Growth FundSM
Performance Overview
January 31, 2015 (Unaudited)
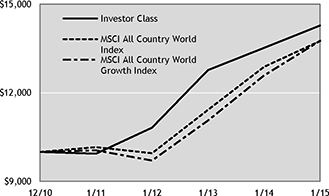
The Investor Class of the American Beacon SGA Global Growth Fund (the “Fund”) returned 5.60% for the twelve months ended January 31, 2015. The Fund underperformed the MSCI All Country World Index (the “Index”) return of 6.80% for the period.
Comparison of Change in Value of a $10,000 Investment
For The Period From 12/31/10 Through 1/31/15
Total Returns for the Period ended 1/31/15
| | | | | | | | | | | | | | | | |
| | | 1 Year | | | 3 Year | | | Since
Incep.
(12/31/10) | | | Value of
$10,000
12/31/10-
1/31/15 | |
Institutional Class (1,7) | | | 5.98 | % | | | 9.87 | % | | | 9.24 | % | | $ | 14,350 | |
Y Class (1,2,7) | | | 5.83 | % | | | 9.82 | % | | | 9.21 | % | | | 14,329 | |
Investor Class (1,3,7) | | | 5.60 | % | | | 9.68 | % | | | 9.11 | % | | | 14,277 | |
A Class with sales charge (1,4,7) | | | (0.51 | )% | | | 7.51 | % | | | 7.52 | % | | | 13,447 | |
A Class without sales charge (1,4,7) | | | 5.53 | % | | | 9.66 | % | | | 9.09 | % | | | 14,267 | |
C Class with sales charge (1,5,7) | | | 3.69 | % | | | 9.28 | % | | | 8.82 | % | | | 14,122 | |
C Class without sales charge (1,5,7) | | | 4.69 | % | | | 9.28 | % | | | 8.82 | % | | | 14,122 | |
MSCI All Country World Index (6) | | | 6.80 | % | | | 11.38 | % | | | 7.72 | % | | | 13,753 | |
MSCI All Country World Growth Index (6) | | | 9.29 | % | | | 12.34 | % | | | 8.52 | % | | | 13,758 | |
| 1. | Performance shown is historical and is not indicative of future returns. Investment returns and principal value will vary, and shares may be worth more or less at redemption than at original purchase. Performance shown is calculated based on the published end of day net asset values as of the date indicated and current performance may be lower or higher than the performance data quoted. To obtain performance as of the most recent month end, please visit www.americanbeaconfunds.com or call 1-800-967-9009. Fund performance in the table above does not reflect the deduction of taxes a shareholder would pay on distributions or the redemption of shares. A portion of the fees charged to each Class of the Fund has been waived since inception. Performance prior to waiving fees was lower than the actual returns shown since inception. |
| 2. | Fund performance for the three-year and since inception periods represent the total returns achieved by the Institutional Class from 12/31/10 up to 10/4/13, the inception date of the Y Class, and the returns of the Y Class since its inception. Expenses of the Y Class are higher than those of the Institutional Class. As a result, total returns shown may be higher than they would have been had the Y Class been in existence since 12/31/10. |
| 3. | Fund performance for the three-year and since inception periods represent the total returns achieved by the Institutional Class from 12/31/10 up to 10/4/13, the inception date of the Investor Class, and the returns of the Investor Class since its inception. Expenses of the Investor Class are higher than those of the Institutional Class. As a result, total returns shown may be higher than they would have been had the Investor Class been in existence since 12/31/10. |
| 4. | Fund performance for the three-year and since inception periods represent the total returns achieved by the Institutional Class from 12/31/10 up to 10/4/13, the inception date of the A Class, and the returns of the A Class since its inception. Expenses of the A Class are higher than those of the Institutional Class. As a result, total returns shown may be higher than they would have been had the A Class been in existence since 12/31/10. The maximum sales charge for A Class is 5.75%. |
| 5. | Fund performance for the three-year and since inception periods represent the total returns achieved by the Institutional Class from 12/31/10 up to 10/4/13, the inception date of the C Class, and the returns of the C Class since its inception. Expenses of the C Class are higher than those of the Institutional Class. As a result, total returns shown may be higher than they would have been had the C Class been in existence since 12/31/10. The maximum contingent deferred sales charge for C Class is 1.00% for shares redeemed within one year of the date of purchase |
| 6. | The MSCI All Country World Index (“ACWI”) is a free float-adjusted, market capitalization weighted index that is designed to measure the equity market performance of developed and emerging markets. The MSCI All Country World Growth Index is designed to measure equity market performance of companies with higher growth values in developed and emerging markets. One cannot directly invest in an index. |
| 7. | The total annual Fund operating expense ratio set forth in the most recent Fund prospectus for the Institutional, Y, Investor, A and C Class shares was 5.29%, 5.28%, 5.56%, 5.58% and 6.33%, respectively. The expense ratios above may vary from the expense ratios presented in other sections of this report that are based on expenses incurred during the period covered by this report. |
From a country perspective, stock selection detracted from performance relative to the Index over the one-year period, while country allocation added value.
American Beacon SGA Global Growth FundSM
Performance Overview
January 31, 2015 (Unaudited)
Stock selections in China and Sweden drove the Fund’s relative underperformance during the period, including Shandong Weigao Group Medical Polymer Co. Ltd. (down 30.4%) in China and Elekta AB (down 23.6%) in Sweden. Stock selection in the United Kingdom, including Aon PLC (up 15.1%) benefited the Fund.
From a country allocation perspective, overweighting China (up 24.0%) and null weighting Japan (up 2.2%) aided relative performance, overcoming value lost through overweighting France (down 3.5%).
The Fund’s basic philosophy remains focused on investing in low-risk companies that offer predictable earnings and cash flow growth over the long term.
Top Ten Holdings (% Net Assets)
| | | | | | | | |
Lowe’s Cos., Inc. | | | | | | | 4.2 | |
Nestle S.A. | | | | | | | 4.1 | |
Sanofi | | | | | | | 4.1 | |
AIA Group Ltd. | | | | | | | 4.0 | |
SAP AG, Sponsored ADR | | | | | | | 4.0 | |
Visa, Inc., Class A | | | | | | | 3.9 | |
Google, Inc., Class C | | | | | | | 3.9 | |
Danone S.A. | | | | | | | 3.8 | |
Amgen, Inc. | | | | | | | 3.7 | |
Aon PLC | | | | | | | 3.6 | |
Total Fund Holdings | | | 33 | | | | | |
Sector Allocation (% Equities)
| | | | |
Information Technology | | | 26.7 | |
Health Care | | | 18.4 | |
Consumer Staples | | | 15.8 | |
Consumer Discretionary | | | 15.6 | |
Financials | | | 13.7 | |
Energy | | | 4.9 | |
Materials | | | 2.9 | |
Industrials | | | 2.0 | |
Country Allocation (% Equities)
| | | | |
United States | | | 47.1 | |
Hong Kong/China | | | 10.7 | |
France | | | 8.2 | |
United Kingdom | | | 6.8 | |
Switzerland | | | 4.3 | |
Netherlands | | | 4.3 | |
Germany | | | 4.2 | |
Denmark | | | 3.7 | |
Ireland | | | 2.9 | |
Sweden | | | 2.2 | |
Brazil | | | 2.1 | |
Argentina | | | 1.8 | |
Mexico | | | 1.7 | |
American Beacon FundsSM
Fund Expenses
January 31, 2015 (Unaudited)
Fund Expense Example
As a shareholder of the Fund, you incur two types of costs: (1) transaction costs, such as sales charges (loads) on purchase payments and redemption fees, and (2) ongoing costs, including management fees, administrative service fees, distribution (12b-1) fees, and other Fund expenses. The examples below are intended to help you understand the ongoing cost (in dollars) of investing in the Fund and to compare these costs with the ongoing costs of investing in other mutual funds. The examples are based on an investment of $1,000 invested at the beginning of the period in each Class and held for the entire period from August 1, 2014 through January 31, 2015.
Actual Expenses
The “Actual” lines of the table provide information about actual account values and actual expenses. You may use the information in this line, together with the amount you invested, to estimate the expenses that you paid over the period. Simply divide your account value by $1,000 (for example, an $8,600 account value divided by $1,000 = 8.6), then multiply the result by the number in the first line under the heading “Expenses Paid During Period” to estimate the expenses you paid on your account during this period. Shareholders of the Investor and Institutional Classes that invest in the Fund through an IRA or Roth IRA may be subject to a custodial IRA fee of $15 that is typically deducted each December. If your account was subject to a custodial IRA fee during the period, your costs would have been $15 higher.
Hypothetical Example for Comparison Purposes
The “Hypothetical” lines of the table provide information about hypothetical account values and hypothetical expenses based on the Fund’s actual expense ratio and an assumed 5% per year rate of return before expenses (not the Fund’s actual return). You may compare the ongoing costs of investing in the Fund with other funds by contrasting this 5% hypothetical example and the 5% hypothetical examples that appear in the shareholder reports of the other funds. The hypothetical account values and expenses may not be used to estimate the actual ending account balance or expenses you paid for the period.
Shareholders of the Investor and Institutional Classes that invest in the Fund through an IRA or Roth IRA may be subject to a custodial IRA fee of $15 that is typically deducted each December. If your account was subject to a custodial IRA fee during the period, your costs would have been $15 higher.
You should also be aware that the expenses shown in the table highlight only your ongoing costs and do not reflect any transaction costs charged by the Fund, such as redemption fees. Similarly, the expense examples for other funds do not reflect any transaction costs charged by those funds, such as sales charges (loads), redemption fees or exchange fees. Therefore, the “Hypothetical” lines of the table are useful in comparing ongoing costs only and will not help you determine the relative total costs of owning different funds. If you were subject to any transaction costs during the period, your costs would have been higher.
9
American Beacon FundsSM
Fund Expenses
January 31, 2015 (Unaudited)
Acadian Emerging Markets Managed Volatility Fund
| | | | | | | | | | | | |
| | | Beginning
Account
Value
8/1/14 | | | Ending
Account
Value
1/31/15 | | | Expenses Paid
During Period*
8/1/14 - 1/31/15 | |
Institutional Class | | | | | | | | | | | | |
Actual | | $ | 1,000.00 | | | $ | 933.44 | | | $ | 6.58 | |
Hypothetical ** | | $ | 1,000.00 | | | $ | 1,018.40 | | | $ | 6.87 | |
Y Class | | | | | | | | | | | | |
Actual | | $ | 1,000.00 | | | $ | 932.46 | | | $ | 7.06 | |
Hypothetical ** | | $ | 1,000.00 | | | $ | 1,017.90 | | | $ | 7.38 | |
Investor Class | | | | | | | | | | | | |
Actual | | $ | 1,000.00 | | | $ | 932.28 | | | $ | 8.43 | |
Hypothetical ** | | $ | 1,000.00 | | | $ | 1,016.48 | | | $ | 8.79 | |
A Class | | | | | | | | | | | | |
Actual | | $ | 1,000.00 | | | $ | 932.22 | | | $ | 8.52 | |
Hypothetical ** | | $ | 1,000.00 | | | $ | 1,016.38 | | | $ | 8.89 | |
C Class | | | | | | | | | | | | |
Actual | | $ | 1,000.00 | | | $ | 927.69 | | | $ | 12.15 | |
Hypothetical ** | | $ | 1,000.00 | | | $ | 1,012.60 | | | $ | 12.68 | |
| * | Expenses are equal to the Fund’s annualized expense ratios for the six-month period of 1.35%, 1.45%, 1.73%, 1.75%, and 2.50% for the Institutional, Y, Investor, A, and C Classes respectively, multiplied by the average account value over the period, multiplied by the number derived by dividing the number of days in the most recent fiscal half-year (184) by days in the year (365) to reflect the half-year period. |
| ** | 5% return before expenses. |
Earnest Partners Emerging Markets Equity Fund
| | | | | | | | | | | | |
| | | Beginning
Account
Value
8/1/14 | | | Ending
Account
Value
1/31/15 | | | Expenses Paid
During Period*
8/1/14 - 1/31/15 | |
Institutional Class | | | | | | | | | | | | |
Actual | | $ | 1,000.00 | | | $ | 901.92 | | | $ | 6.47 | |
Hypothetical ** | | $ | 1,000.00 | | | $ | 1,018.40 | | | $ | 6.87 | |
Y Class | | | | | | | | | | | | |
Actual | | $ | 1,000.00 | | | $ | 901.82 | | | $ | 6.95 | |
Hypothetical ** | | $ | 1,000.00 | | | $ | 1,017.90 | | | $ | 7.38 | |
Investor Class | | | | | | | | | | | | |
Actual | | $ | 1,000.00 | | | $ | 901.54 | | | $ | 8.29 | |
Hypothetical ** | | $ | 1,000.00 | | | $ | 1,016.48 | | | $ | 8.79 | |
A Class | | | | | | | | | | | | |
Actual | | $ | 1,000.00 | | | $ | 901.45 | | | $ | 8.39 | |
Hypothetical ** | | $ | 1,000.00 | | | $ | 1,016.38 | | | $ | 8.89 | |
C Class | | | | | | | | | | | | |
Actual | | $ | 1,000.00 | | | $ | 896.98 | | | $ | 11.95 | |
Hypothetical ** | | $ | 1,000.00 | | | $ | 1,012.60 | | | $ | 12.68 | |
| * | Expenses are equal to the Fund’s annualized expense ratios for the six-month period of 1.35%, 1.45%, 1.73%, 1.75%, and 2.50% for the Institutional, Y, Investor, A, and C Classes respectively, multiplied by the average account value over the period, multiplied by the number derived by dividing the number of days in the most recent fiscal half-year (184) by days in the year (365) to reflect the half-year period. |
| ** | 5% return before expenses. |
SGA Global Growth Fund
| | | | | | | | | | | | |
| | | Beginning
Account
Value
8/1/14 | | | Ending
Account
Value
1/31/15 | | | Expenses Paid
During Period*
8/1/14 - 1/31/15 | |
Institutional Class | | | | | | | | | | | | |
Actual | | $ | 1,000.00 | | | $ | 1,018.42 | | | $ | 4.99 | |
Hypothetical ** | | $ | 1,000.00 | | | $ | 1,020.27 | | | $ | 4.99 | |
Y Class | | | | | | | | | | | | |
Actual | | $ | 1,000.00 | | | $ | 1,018.45 | | | $ | 5.49 | |
Hypothetical ** | | $ | 1,000.00 | | | $ | 1,019.76 | | | $ | 5.50 | |
Investor Class | | | | | | | | | | | | |
Actual | | $ | 1,000.00 | | | $ | 1,017.02 | | | $ | 6.91 | |
Hypothetical ** | | $ | 1,000.00 | | | $ | 1,018.35 | | | $ | 6.92 | |
A Class | | | | | | | | | | | | |
Actual | | $ | 1,000.00 | | | $ | 1,017.02 | | | $ | 7.02 | |
Hypothetical ** | | $ | 1,000.00 | | | $ | 1,018.25 | | | $ | 7.02 | |
C Class | | | | | | | | | | | | |
Actual | | $ | 1,000.00 | | | $ | 1,012.64 | | | $ | 10.81 | |
Hypothetical ** | | $ | 1,000.00 | | | $ | 1,014.47 | | | $ | 10.82 | |
| * | Expenses are equal to the Fund’s annualized expense ratios for the six-month period of 0.98%, 1.08%, 1.36%, 1.38%, and 2.13% for the Institutional, Y, Investor, A, and C Classes respectively, multiplied by the average account value over the period, multiplied by the number derived by dividing the number of days in the most recent fiscal half-year (184) by days in the year (365) to reflect the half-year period. |
| ** | 5% return before expenses. |
American Beacon FundsSM
Report of Independent Registered Public Accounting Firm
To the Board of Trustees and Shareholders of
American Beacon Acadian Emerging Markets Managed Volatility Fund, American Beacon Earnest Partners Emerging Markets Equity Fund, and American Beacon SGA Global Growth Fund:
We have audited the accompanying statements of assets and liabilities, including the schedules of investments, of American Beacon Acadian Emerging Markets Managed Volatility Fund, American Beacon Earnest Partners Emerging Markets Equity Fund, and American Beacon SGA Global Growth Fund (three of the funds constituting the American Beacon Funds) (collectively, the “Funds”), as of January 31, 2015, the related statements of operations for the year then ended, and the statements of changes in net assets and the financial highlights for each of the periods indicated therein. These financial statements and financial highlights are the responsibility of the Funds’ management. Our responsibility is to express an opinion on these financial statements and financial highlights based on our audits.
We conducted our audits in accordance with the standards of the Public Company Accounting Oversight Board (United States). Those standards require that we plan and perform the audit to obtain reasonable assurance about whether the financial statements and financial highlights are free of material misstatement. We were not engaged to perform an audit of the Funds’ internal control over financial reporting. Our audits included consideration of internal control over financial reporting as a basis for designing audit procedures that are appropriate in the circumstances, but not for the purpose of expressing an opinion on the effectiveness of each Fund’s internal control over financial reporting. Accordingly, we express no such opinion. An audit also includes examining, on a test basis, evidence supporting the amounts and disclosures in the financial statements and financial highlights, assessing the accounting principles used and significant estimates made by management, and evaluating the overall financial statement presentation. Our procedures included confirmation of securities owned as of January 31, 2015, by correspondence with the custodian and brokers or by other appropriate auditing procedures where replies from brokers were not received. We believe that our audits provide a reasonable basis for our opinion.
In our opinion, the financial statements and financial highlights referred to above present fairly, in all material respects, the financial position of American Beacon Acadian Emerging Markets Managed Volatility Fund, American Beacon Earnest Partners Emerging Markets Equity Fund, and American Beacon SGA Global Growth Fund at January 31, 2015, the results of their operations for the year then ended, and the changes in their net assets and the financial highlights for the periods indicated therein, in conformity with U.S. generally accepted accounting principles.

Dallas, Texas
March 31, 2015
11
American Beacon Acadian Emerging Markets Managed Volatility FundSM
Schedule of Investments
January 31, 2015
| | | | | | | | |
| | | Shares | | | Fair Value | |
| | | | | | (000’s) | |
Brazil - 5.61% | | | | | | | | |
Common Stocks - (Cost $1,541) | | | | | | | | |
Abril Educacao S.A. | | | 52,500 | | | $ | 189 | |
BRF - Brasil Foods S.A.A | | | 6,500 | | | | 156 | |
Cia Providencia Industria e Comercio S.A. | | | 1,200 | | | | 4 | |
Cielo S.A. | | | 3,600 | | | | 54 | |
Companhia Brasileira de Distribuição (Pao de Acucar), Sponsored ADRC | | | 2,105 | | | | 69 | |
CVC Brasil Operadora e Agencia de Viagens S.A. | | | 21,800 | | | | 103 | |
FII BTG Pactual Corp. Office FundD | | | 4,502 | | | | 181 | |
GAEC Educacao S.A. | | | 2,800 | | | | 22 | |
Linx S.A. | | | 3,200 | | | | 56 | |
Ouro Fino Saude Animal Participacoes S.A.A | | | 800 | | | | 9 | |
Qualicorp S.A.A | | | 2,400 | | | | 24 | |
Sao Martinho S.A. | | | 2,400 | | | | 30 | |
Ser Educacional S.A. | | | 17,300 | | | | 87 | |
Telefonica Brasil S.A., ADRC | | | 5,160 | | | | 95 | |
Totvs S.A. | | | 2,800 | | | | 35 | |
Via Varejo S.A.A E | | | 13,300 | | | | 87 | |
| | | | | | | | |
Total Common Stocks | | | | 1,201 | |
| | | | | | | | |
Preferred Stocks - (Cost $330) | | | | | | | | |
Cia Brasileira de Distribuicao Grupo Pao de Acucar | | | 400 | | | | 13 | |
Cia de Gas de Sao Paulo | | | 6,100 | | | | 102 | |
Net Servicos de Comunicacao S.A.A B | | | 2,358 | | | | 35 | |
Telefonica Brasil S.A. | | | 6,100 | | | | 113 | |
| | | | | | | | |
Total Preferred Stocks | | | | 263 | |
| | | | | | | | |
Total Brazil | | | | 1,464 | |
| | | | | | | | |
Chile - 2.63% | | | | | | | | |
Common Stocks - (Cost $794) | | | | | | | | |
Banco de Chile, ADRC | | | 1,420 | | | | 93 | |
Banco Santander Chile S.A., ADRC | | | 3,540 | | | | 67 | |
Compania Cervecerias Unidas S.A., Sponsored ADRC | | | 8,054 | | | | 147 | |
Corpbanca S.A., ADRC | | | 5,388 | | | | 90 | |
Empresa Nacional de Electricidad S.A., Sponsored ADRC | | | 5,845 | | | | 250 | |
Vina Concha y Toro S.A., Sponsored ADRC | | | 1,112 | | | | 41 | |
| | | | | | | | |
Total Chile | | | | 688 | |
| | | | | | | | |
Colombia - 1.02% | | | | | | | | |
Common Stocks - (Cost $329) | | | | | | | | |
Ecopetrol S.A., Sponsored ADRC | | | 1,603 | | | | 26 | |
Grupo Aval Acciones y Valores, ADRC | | | 23,300 | | | | 241 | |
| | | | | | | | |
Total Colombia | | | | 267 | |
| | | | | | | | |
Czech Republic - 0.57% | | | | | | | | |
Common Stocks - (Cost $183) | | | | | | | | |
CEZ A.S.B | | | 5,836 | | | | 137 | |
O2 Czech Republic A.S.B | | | 1,466 | | | | 13 | |
| | | | | | | | |
Total Czech Republic | | | | 150 | |
| | | | | | | | |
| | | | | | | | |
| | | Shares | | | Fair Value | |
| | | | | | (000’s) | |
Egypt - 0.71% | | | | | | | | |
Common Stocks - (Cost $157) | | | | | | | | |
Eastern TobaccoB | | | 3,817 | | | $ | 110 | |
Egyptian International PharmaceuticalsB | | | 492 | | | | 5 | |
Global Telecom Holding SAEA | | | 1,095 | | | | 3 | |
Global Telecom Holding, GDRA B F | | | 13,071 | | | | 38 | |
Oriental WeaversB | | | 7,515 | | | | 14 | |
Sidi Kerir Petrochemicals Co.B | | | 3,417 | | | | 7 | |
Telecom EgyptB | | | 5,457 | | | | 9 | |
| | | | | | | | |
Total Egypt | | | | 186 | |
| | | | | | | | |
Greece - 0.18% | | | | | | | | |
Common Stocks - (Cost $91) | | | | | | | | |
Athens Water Supply & Sewage Co.B | | | 7,267 | | | | 47 | |
| | | | | | | | |
Hong Kong/China - 15.93% | | | | | | | | |
Common Stocks - (Cost $3,797) | | | | | | | | |
Agricultural Bank of China HB | | | 545,000 | | | | 267 | |
Air China Ltd.B | | | 36,000 | | | | 34 | |
Anhui Expressway Co., Ltd. HB | | | 50,000 | | | | 36 | |
Baidu, Inc., Sponsored ADRA C | | | 24 | | | | 5 | |
Bank of China Ltd. HB | | | 471,000 | | | | 262 | |
Bank of Chongqing Co., Ltd. HB | | | 40,000 | | | | 33 | |
Bank of Communications Co., Ltd. B | | | 133,000 | | | | 111 | |
China Construction Bank HB | | | 341,000 | | | | 273 | |
China Creative Home Group Ltd. B | | | 68,000 | | | | 13 | |
China Everbright Bank Co., Ltd. HB | | | 174,000 | | | | 93 | |
China Life Insurance Co., Ltd. HB | | | 1,000 | | | | 4 | |
China Merchants Bank Co., Ltd. B | | | 58,500 | | | | 130 | |
China Mobile Ltd. B | | | 21,000 | | | | 274 | |
China Petroleum & Chemical Corp. HB | | | 130,000 | | | | 103 | |
China Shenhua Energy Co., Ltd. B | | | 70,500 | | | | 193 | |
China Telecom Corp., Ltd. HB | | | 400,000 | | | | 235 | |
China Travel International Investment Hong Kong Ltd. B | | | 102,000 | | | | 34 | |
China Unicom Hong Kong Ltd. B | | | 164,000 | | | | 246 | |
Datang International Power Generation Co., Ltd. B | | | 162,000 | | | | 88 | |
Fuguiniao Co., Ltd. B | | | 11,200 | | | | 18 | |
Goldlion Holdings Ltd. B | | | 14,000 | | | | 6 | |
Hopewell Highway Infrastructure Ltd. B | | | 205,500 | | | | 99 | |
Huandian Power International Corp., HB | | | 30,000 | | | | 27 | |
Huaneng Power International, Inc. B | | | 114,000 | | | | 159 | |
Huishang Bank Corp., Ltd. HB | | | 597,000 | | | | 260 | |
Industrial & Commercial Bank of China Ltd. HB | | | 313,000 | | | | 225 | |
NetEase, Inc., ADRC | | | 579 | | | | 63 | |
People’s Insurance Co., Group HB | | | 300,000 | | | | 145 | |
PetroChina Co., Ltd. HB | | | 188,000 | | | | 203 | |
Ports Design Ltd.A B | | | 50,500 | | | | 19 | |
Shanghai Jin Jiang International Hotels Group Co., Ltd. B | | | 88,000 | | | | 29 | |
Shenzhen Expressway Co., Ltd. HB | | | 90,000 | | | | 70 | |
Sinopharm Group Co. B | | | 14,800 | | | | 54 | |
Sun Art Retail Group Ltd. B | | | 65,000 | | | | 59 | |
Tencent Holdings Ltd.B | | | 9,500 | | | | 161 | |
Travelsky Technology Ltd. HB | | | 93,000 | | | | 98 | |
WuXi PharmaTech Cayman, Inc., ADRA C | | | 270 | | | | 11 | |
| | | | |
| | | See accompanying notes | | |
| | 12 | | |
American Beacon Acadian Emerging Markets Managed Volatility FundSM
Schedule of Investments
January 31, 2015
| | | | | | | | |
| | | Shares | | | Fair Value | |
| | | | | | (000’s) | |
Xinhua Winshare Publishing and Media Co., Ltd. HB | | | 29,000 | | | $ | 26 | |
| | | | | | | | |
Total Hong Kong/China | | | | | | | 4,166 | |
| | | | | | | | |
Hungary - 0.54% | | | | | | | | |
Common Stocks - (Cost $170) | | | | | | | | |
Magyar Telekom Telecommunications PLCA B G | | | 60,944 | | | | 79 | |
Richter Gedeon NyrtB | | | 4,516 | | | | 61 | |
| | | | | | | | |
Total Hungary | | | | | | | 140 | |
| | | | | | | | |
India - 4.53% | | | | | | | | |
Common Stocks - (Cost $931) | | | | | | | | |
Dr. Reddy’s Laboratories Ltd., ADRC | | | 5,191 | | | | 262 | |
HDFC Bank Ltd., ADRC | | | 1,413 | | | | 81 | |
Infosys Technologies Ltd., Sponsored ADRC | | | 7,852 | | | | 267 | |
Tata Motors Ltd., Sponsored ADRC | | | 5,794 | | | | 286 | |
Wipro Ltd., ADRC | | | 9,614 | | | | 124 | |
WNS Holdings Ltd., ADRA C | | | 7,261 | | | | 163 | |
| | | | | | | | |
Total India | | | | | | | 1,183 | |
| | | | | | | | |
Indonesia - 2.82% | | | | | | | | |
Common Stocks - (Cost $721) | | | | | | | | |
Central Proteinaprima Tbk PTA B | | | 12,064,300 | | | | 112 | |
Dharma Satya Nusantara Tbk PTB | | | 242,600 | | | | 81 | |
Indofood Sukses Makmur Tbk PTB | | | 332,800 | | | | 198 | |
Multipolar Technology Tbk PTB | | | 998,400 | | | | 79 | |
Sarana Meditama Metropolitan Tbk PTA B | | | 463,800 | | | | 106 | |
Siloam International Hospitals Tbk PTAB | | | 46,800 | | | | 49 | |
Telekomunikasi Indonesia Persero Tbk PTB | | | 509,500 | | | | 113 | |
| | | | | | | | |
Total Indonesia | | | | | | | 738 | |
| | | | | | | | |
Malaysia - 8.41% | | | | | | | | |
Common Stocks - (Cost $2,333) | | | | | | | | |
AMMB Holdings BhdB | | | 48,700 | | | | 84 | |
Axiata Group BhdB | | | 131,800 | | | | 260 | |
British American Tobacco BhdB | | | 5,600 | | | | 102 | |
DiGi.Com BhdB | | | 142,200 | | | | 251 | |
Dutch Lady Milk Industries BhdB | | | 300 | | | | 4 | |
Fraser & Neave Holdings BhdB | | | 2,500 | | | | 13 | |
Hartalega Holdings BhdB | | | 1,300 | | | | 3 | |
Hong Leong Bank BhdB | | | 13,300 | | | | 51 | |
IHH Healthcare BhdB | | | 150,400 | | | | 215 | |
Kossan Rubber IndustriesB | | | 3,400 | | | | 5 | |
Malayan Banking BhdB | | | 28,100 | | | | 67 | |
Maxis BhdB | | | 123,500 | | | | 241 | |
Mega First Corp., BhdB | | | 10,200 | | | | 7 | |
Nestle Malaysia BhdB | | | 8,200 | | | | 161 | |
NTPM Holdings BhdB | | | 9,800 | | | | 2 | |
Panasonic Manufacturing Malaysia BhdB | | | 1,400 | | | | 8 | |
PBA Holdings BhdB | | | 23,200 | | | | 8 | |
Petronas Chemicals Group BhdB | | | 47,500 | | | | 67 | |
Pharmaniaga BhdB | | | 13,900 | | | | 19 | |
Public Bank BhdB | | | 20,900 | | | | 104 | |
Sime Darby BhdB | | | 61,100 | | | | 158 | |
Star Publications BhdB | | | 43,100 | | | | 30 | |
Telekom Malaysia BhdB | | | 121,600 | | | | 234 | |
Tenaga Nasional BhdB | | | 16,500 | | | | 65 | |
| | | | | | | | |
| | | Shares | | | Fair Value | |
| | | | | | (000’s) | |
Tenaga Nasional Bhd, Sponsored ADRC | | | 543 | | | $ | 9 | |
VS Industry BhdB | | | 15,300 | | | | 15 | |
YTL Power International BhdB | | | 30,765 | | | | 14 | |
| | | | | | | | |
Total Malaysia | | | | | | | 2,197 | |
| | | | | | | | |
Mexico - 8.96% | | | | | | | | |
Common Stocks - (Cost $2,412) | | | | | | | | |
America Movil, S.A.B. de C.V., Series L | | | 107,905 | | | | 116 | |
America Movil, S.A.B. de C.V. Series L, ADR C | | | 5,488 | | | | 117 | |
Coca-Cola Femsa S.A.B. de C.V. | | | 28,074 | | | | 228 | |
Controladora Commercial Mexicana, S.A.B. de C.V. | | | 37,711 | | | | 115 | |
Corp Actinver S.A.B. de C.V. | | | 3,108 | | | | 3 | |
Embotelladoras Arca, S.A.B. de C.V. | | | 39,084 | | | | 232 | |
Fomento Economico Mexicano, S.A.B. de C.V., Sponsored ADR, Series BC | | | 2,082 | | | | 174 | |
Gruma S.A.B. de C.V., Sponsored ADRC | | | 3,389 | | | | 145 | |
Grupo Aeromexico S.A.B. de C.V.A | | | 58,592 | | | | 87 | |
Grupo Aeroportuario del Pacific | | | 1,974 | | | | 13 | |
Grupo Financiero Interacciones S.A. de C.V. | | | 27,820 | | | | 184 | |
Grupo Industrial Maseca S.A.B. de C.V. | | | 3,460 | | | | 5 | |
Grupo Lala S.A.B. de C.V. | | | 76,014 | | | | 149 | |
Grupo Lamosa S.A.B. de C.V. | | | 10,312 | | | | 19 | |
Grupo Sanborns S.A. de C.V. | | | 4,112 | | | | 6 | |
Grupo Sports World, S.A.B. de C.V.A | | | 56,823 | | | | 98 | |
Grupo Televisa S.A., Sponsored ADRC | | | 4,671 | | | | 153 | |
Industrias Bachoco S.A.B. de C.V. | | | 49,618 | | | | 204 | |
Infraestructura Energetica Nova S.A.B. de C.V. | | | 2,111 | | | | 10 | |
Megacable Holdings S.A.B. de C.V.A E | | | 25,646 | | | | 93 | |
Organizacion Cultiba S.A.B. de C.V. | | | 12,353 | | | | 15 | |
Organizacion Soriana S.A.B. de C.V. | | | 17,451 | | | | 40 | |
Prologis Property Mexico S.A. de C.V.D | | | 69,328 | | | | 135 | |
| | | | | | | | |
Total Mexico | | | | | | | 2,341 | |
| | | | | | | | |
Panama - 0.54% | | | | | | | | |
Common Stocks - (Cost $177) | | | | | | | | |
Avianca Holdings S.A., Sponsored ADRC | | | 11,802 | | | | 141 | |
| | | | | | | | |
Peru - 1.22% | | | | | | | | |
Common Stocks - (Cost $315) | | | | | | | | |
Credicorp Ltd. | | | 1,763 | | | | 255 | |
Edegel S.A. | | | 8,117 | | | | 10 | |
Edelnor S.A. | | | 17,888 | | | | 33 | |
Enersur S.A. | | | 4,374 | | | | 14 | |
Luz Del Sur S.A. | | | 2,046 | | | | 8 | |
| | | | | | | | |
Total Peru | | | | | | | 320 | |
| | | | | | | | |
Philippines - 3.98% | | | | | | | | |
Common Stocks - (Cost $954) | | | | | | | | |
Aboitiz Power Corp.B | | | 274,200 | | | | 275 | |
ABS-CBN Broadcasting Corp., PDRB K | | | 63,000 | | | | 72 | |
Cebu Air, Inc.B | | | 32,750 | | | | 70 | |
Century Pacific Food Inc.A B | | | 25,800 | | | | 11 | |
China Banking Corp. B | | | 5,184 | | | | 6 | |
Globe Telecom, Inc. B | | | 5,445 | | | | 214 | |
Lopez Holdings Corp. B | | | 198,100 | | | | 33 | |
Manila Electric Co. B | | | 2,640 | | | | 16 | |
Pepsi-Cola Products Philippines, Inc. B | | | 138,900 | | | | 13 | |
| | | | |
| | | See accompanying notes | | |
| | 13 | | |
American Beacon Acadian Emerging Markets Managed Volatility FundSM
Schedule of Investments
January 31, 2015
| | | | | | | | |
| | | Shares | | | Fair Value | |
| | | | | | (000’s) | |
Philippine Long Distance Telephone Co. B | | | 3,020 | | | $ | 203 | |
Philweb Corp. B | | | 54,900 | | | | 16 | |
San Miguel Pure Foods Co. B | | | 2,170 | | | | 10 | |
Universal Robina Corp. B | | | 21,720 | | | | 102 | |
| | | | | | | | |
Total Philippines | | | | | | | 1,041 | |
| | | | | | | | |
Poland - 4.57% | | | | | | | | |
Common Stocks - (Cost $1,281) | | | | | | | | |
Alumetal S.A.A B | | | 1,727 | | | | 22 | |
Amica Wronki S.A. B | | | 320 | | | | 9 | |
Asseco Poland S.A. B | | | 17,088 | | | | 253 | |
Enea S.A. B | | | 9,389 | | | | 42 | |
Energa S.A. B | | | 30,589 | | | | 173 | |
Netia S.A. B | | | 11,946 | | | | 19 | |
Neuca S.A. B | | | 134 | | | | 10 | |
Orange Polska S.A. B | | | 66,414 | | | | 161 | |
PGE S.A. B | | | 17,999 | | | | 94 | |
PKP Cargo S.A. B | | | 10,066 | | | | 243 | |
Powszechny Zaklad Ubezpieczen S.A. B | | | 910 | | | | 124 | |
Zaklady Lentex S.A. B | | | 2,609 | | | | 6 | |
Zespol Elektrowni PAK S.A. B | | | 5,052 | | | | 38 | |
| | | | | | | | |
Total Poland | | | | | | | 1,194 | |
| | | | | | | | |
Russia - 0.93% | | | | | | | | |
Common Stocks - (Cost $490) | | | | | | | | |
Cherkizovo Group OJSCA B I | | | 1,121 | | | | 8 | |
Gazprom OAO, Sponsored ADRB C | | | 4,246 | | | | 17 | |
Lukoil OAO, Sponsored ADRB C | | | 1,319 | | | | 52 | |
Mobile TeleSystems OJSC, Sponsored ADR C H | | | 5,337 | | | | 42 | |
Rostelecom, Sponsored ADRB C | | | 7,411 | | | | 52 | |
Sistema JSFC, Reg S, Sponsored GDRB F I | | | 1,041 | | | | 5 | |
Surgutneftegas OAO, Sponsored ADRB C | | | 15,620 | | | | 67 | |
| | | | | | | | |
Total Russia | | | | | | | 243 | |
| | | | | | | | |
South Africa - 12.52% | | | | | | | | |
Common Stocks - (Cost $2,950) | | | | | | | | |
Aeci Ltd.B | | | 3,896 | | | | 42 | |
Aspen Pharmacare Holdings Ltd. B | | | 1,115 | | | | 42 | |
Astral Foods Ltd. B | | | 8,925 | | | | 151 | |
Attacq Ltd.A B | | | 73,969 | | | | 145 | |
AVI Ltd. B | | | 35,842 | | | | 260 | |
Clicks Group Ltd. B | | | 21,096 | | | | 163 | |
Clover Industries Ltd. B | | | 72,845 | | | | 119 | |
Datatec Ltd. B | | | 7,891 | | | | 40 | |
EOH Holdings Ltd. B | | | 16,500 | | | | 171 | |
FirstRand Ltd. B | | | 11,455 | | | | 51 | |
Illovo Sugar Ltd. B | | | 16,652 | | | | 34 | |
Life Healthcare Group Holdings Ltd. B | | | 17,438 | | | | 65 | |
Mediclinic International Ltd. B | | | 21,844 | | | | 216 | |
Mondi Ltd. B | | | 1,939 | | | | 35 | |
MTN Group Ltd. B | | | 10,984 | | | | 190 | |
Netcare Ltd. B | | | 74,584 | | | | 246 | |
Pick n Pay Holdings Ltd. B | | | 18,924 | | | | 39 | |
Pick n Pay Stores Ltd. B | | | 28,773 | | | | 142 | |
Pioneer Foods Ltd. B | | | 4,235 | | | | 55 | |
Quantum Foods HoldingsA B | | | 4,235 | | | | 1 | |
Rhodes Food Group Pty. Ltd.A B | | | 5,176 | | | | 7 | |
Sasol Ltd. B | | | 3,767 | | | | 135 | |
Shoprite Holdings Ltd. B | | | 1,411 | | | | 22 | |
| | | | | | | | |
| | | Shares | | | Fair Value | |
| | | | | | (000’s) | |
Spar Group Ltd. B | | | 10,749 | | | $ | 170 | |
Standard Bank Group Ltd. B | | | 5,570 | | | | 73 | |
Steinhoff International Holdings Ltd. B | | | 28,557 | | | | 146 | |
Sun International Ltd. B | | | 2,902 | | | | 32 | |
Telkom S.A. Ltd.A B | | | 5,073 | | | | 30 | |
Tongaat Hulett Ltd. B | | | 13,776 | | | | 190 | |
Vodacom Group Pty. Ltd. B | | | 16,380 | | | | 188 | |
| | | | | | | | |
Total Common Stocks | | | | | | | 3,200 | |
| | | | | | | | |
Preferred Stocks - (Cost $87) | | | | | | | | |
Barclays Africa Group Ltd. B | | | 1,084 | | | | 73 | |
| | | | | | | | |
Total South Africa | | | | | | | 3,273 | |
| | | | | | | | |
South Korea - 8.88% | | | | | | | | |
Common Stocks - (Cost $2,228) | | | | | | | | |
Amorepacific Corp. B | | | 63 | | | | 152 | |
BGF Retail Co., Ltd.A B | | | 4,045 | | | | 296 | |
Busan City Gas Co., Ltd.B | | | 659 | | | | 22 | |
BYC Co., Ltd. B | | | 37 | | | | 9 | |
Daehan Flour Mills Co., Ltd.A B | | | 206 | | | | 31 | |
Daesung Energy Co., Ltd.B | | | 8,599 | | | | 44 | |
Dong-Il Corp.A B | | | 578 | | | | 38 | |
E1 Corp.B | | | 208 | | | | 12 | |
e-Credible Co., Ltd. B | | | 3,671 | | | | 28 | |
GMB Korea Corp. B | | | 4,370 | | | | 24 | |
Green Cross Corp. B | | | 647 | | | | 82 | |
Hanwha Corp. B | | | 1,807 | | | | 45 | |
Hyundai Motor Co. B | | | 89 | | | | 14 | |
Ilshin Spinning Co., Ltd. B | | | 96 | | | | 15 | |
Jinro Distillers Co., Ltd. B | | | 828 | | | | 23 | |
Kia Motors Corp. B | | | 1,050 | | | | 44 | |
KleanNara Co., Ltd.A B | | | 2,682 | | | | 12 | |
Korea Electric Power Corp. B | | | 1,770 | | | | 69 | |
Korea Life Insurance Co., Ltd. B | | | 5,311 | | | | 38 | |
KT Corp.B | | | 6,746 | | | | 184 | |
LG Display Co., Ltd., ADR C | | | 11,898 | | | | 193 | |
LG Electronics, Inc. B | | | 1,503 | | | | 83 | |
LS Networks Co., Ltd.A B | | | 780 | | | | 3 | |
POSCOB | | | 228 | | | | 53 | |
Sam Young Electronics Co., Ltd. B | | | 10,930 | | | | 120 | |
Samchully Co., Ltd. B | | | 612 | | | | 77 | |
Samsung Electronics Co., Ltd.B | | | 136 | | | | 168 | |
Samyang Corp. B | | | 1,200 | | | | 74 | |
Samyang Genex Co., Ltd. B | | | 324 | | | | 32 | |
Seoyeon Co., Ltd. B | | | 1,320 | | | | 16 | |
Shinsegae Information & Communication Co., Ltd. B | | | 1,839 | | | | 177 | |
SK Telecom Co., Ltd. B | | | 523 | | | | 137 | |
Telcoware Co., Ltd.A B | | | 500 | | | | 6 | |
| | | | | | | | |
Total South Korea | | | | | | | 2,321 | |
| | | | | | | | |
Taiwan - 10.90% | | | | | | | | |
Common Stocks - (Cost $2,776) | | | | | | | | |
Ability Enterprise Co., Ltd.B | | | 26,000 | | | | 15 | |
Advanced International Multitech Co., Ltd. B | | | 2,000 | | | | 2 | |
Charoen Pokphand Foods PCL B J | | | 18,900 | | | | 16 | |
China Airlines Ltd.A B | | | 165,000 | | | | 83 | |
China Bills Finance Corp. B | | | 22,000 | | | | 8 | |
China Steel Corp. B | | | 293,300 | | | | 248 | |
China Synthetic Rubber B | | | 94,000 | | | | 96 | |
Chunghwa Telecom Co., Ltd. B | | | 86,000 | | | | 260 | |
| | | | |
| | | See accompanying notes | | |
| | 14 | | |
American Beacon Acadian Emerging Markets Managed Volatility FundSM
Schedule of Investments
January 31, 2015
| | | | | | | | |
| | | Shares | | | Fair Value | |
| | | | | | (000’s) | |
Cyberlink Corp. B | | | 56,000 | | | $ | 162 | |
Eurocharm Holdings Co., Ltd.A B | | | 33,000 | | | | 64 | |
Far EasTone Telecommunication Co., Ltd. B | | | 94,000 | | | | 230 | |
Fine Blanking & Tool Co., Ltd. B | | | 5,000 | | | | 7 | |
First Financial Holding Co., Ltd. B | | | 322,070 | | | | 188 | |
Great Wall Enterprise Co., Ltd. B | | | 214,500 | | | | 189 | |
Greatek Electronics, Inc. B | | | 141,000 | | | | 171 | |
HON HAI Precision Industry Co., Ltd. B | | | 90,440 | | | | 247 | |
L&K Engineering Co., Ltd. B | | | 10,000 | | | | 8 | |
Lien Hwa Industrial Corp. B | | | 186,000 | | | | 122 | |
Microlife Corp. B | | | 10,000 | | | | 23 | |
Promate Electronic Co., Ltd. B | | | 17,000 | | | | 20 | |
Shihlin Electric & Engineering Corp. B | | | 11,000 | | | | 14 | |
Taichung Commercial Bank B | | | 143,973 | | | | 47 | |
Taiwan Cooperative Financial Holding Co., Ltd. B | | | 245,050 | | | | 127 | |
Taiwan Semicom B | | | 7,105 | | | | 18 | |
Taiwan Semiconductor Manufacturing Co., Ltd. B | | | 25,000 | | | | 111 | |
Taiwan Semiconductor Manufacturing Co., Ltd., Sponsored ADRC | | | 6,273 | | | | 142 | |
Taiwan Sogo Shin Kong SECB | | | 17,170 | | | | 21 | |
Test-Rite International Co. B | | | 26,000 | | | | 18 | |
Trade-Van Information Services Co. B | | | 16,000 | | | | 14 | |
TTet Union Corp. B | | | 12,000 | | | | 27 | |
Uni-President Enterprises Corp.B | | | 31,000 | | | | 49 | |
Wisdom Marine Lines Co., Ltd.B | | | 84,000 | | | | 99 | |
Wowprime Corp. B | | | 90 | | | | 1 | |
| | | | | | | | |
Total Taiwan | | | | 2,847 | |
| | | | | | | | |
Thailand - 2.85% | | | | | | | | |
Common Stocks - (Cost $714) | | | | | | | | |
Advanced Information Technology PCLJ | | | 88,900 | | | | 111 | |
CS Loxinfo PCLB J | | | 26,900 | | | | 6 | |
Electricity Generating PCLJ | | | 38,500 | | | | 192 | |
Modernform Group PCLJ | | | 33,200 | | | | 10 | |
Ratchaburi Electricity Generating Holding PCL, NVDRJ K | | | 103,400 | | | | 190 | |
Sappe PCLA J | | | 19,000 | | | | 22 | |
Thai Union Frozen Products PCLJ | | | 122,400 | | | | 79 | |
Thai Vegetable Oil PCLJ | | | 181,700 | | | | 123 | |
Thai Vegetable Oil PCL, NVDRBJ K | | | 16,100 | | | | 11 | |
| | | | | | | | |
Total Thailand | | | | 744 | |
| | | | | | | | |
Turkey - 0.18% | | | | | | | | |
Common Stocks - (Cost $43) | | | | | | | | |
Adana Cimento Sanayii TASB | | | 7,584 | | | | 20 | |
Bursa Cimento Fabrikasi A.S. B | | | 2,991 | | | | 7 | |
Turkcell Iletisim Hizmetleri A.S.A B | | | 3,251 | | | | 19 | |
| | | | | | | | |
Total Turkey | | | | 46 | |
| | | | | | | | |
SHORT-TERM
INVESTMENTS - 1.26% (Cost $328) | | | | | |
JPMorgan U.S. Government Money Market Fund, Capital Class | | | 327,812 | | | | 328 | |
| | | | | | | | |
TOTAL INVESTMENTS - 99.74%
(Cost $26,132) | | | $ | 26,065 | |
OTHER ASSETS, NET OF LIABILITIES - 0.26% | | | | 69 | |
| | | | | | | | |
TOTAL NET ASSETS - 100.00% | | | $ | 26,134 | |
| | | | | | | | |
Percentages are stated as a percent of net assets.
| A | Non-income producing security. |
| B | Fair valued pursuant to procedures approved by the Board of Trustees. At period end, the value of these securities amounted to $18,174 or 69.54% of net assets. |
| C | ADR - American Depositary Receipt. |
| D | REIT - Real Estate Investment Trust. |
| E | Par value represents units rather than shares. |
| F | GDR - Global Depositary Receipt. |
| G | PLC - Public Limited Company. |
| H | OJSC - Open Joint Stock Company. |
| I | Reg S - Security purchased under the Securities Act of 1933, which exempts from registration securities offered and sold outside of the United States. Such a security cannot be sold in the United States without either an effective registration statement filed pursuant to the Securities Act of 1933, or pursuant to an exemption from registration. |
| J | PCL - Public Company Limited (Thailand). |
| K | NVDR - Non Voting Depositary Receipt. |
| L | PDR - Philippine Depositary Receipt. |
| | | | |
| | | See accompanying notes | | |
| | 15 | | |
American Beacon Acadian Emerging Markets Managed Volatility FundSM
Schedule of Investments
January 31, 2015
Futures Contracts Open on January 31, 2015:
| | | | | | | | | | | | | | | | | | |
Description | | Type | | | Number of
Contracts | | Expiration
Date | | | Contract
Value | | | Unrealized
Appreciation
(Depreciation) | |
Mini MSCI Emerging Markets March Futures | | | Long | | | 7 | | | March 2015 | | | $ | 333,025 | | | $ | (9,263 | ) |
| | | | | | | | | | | | | | | | | | |
| | | | | | | | | | | | $ | 333,025 | | | $ | (9,263 | ) |
| | | | | | | | | | | | | | | | | | |
| | | | |
| | | See accompanying notes | | |
| | 16 | | |
American Beacon Earnest Partners Emerging Markets Equity FundSM
Schedule of Investments
January 31, 2015
| | | | | | | | |
| | | Shares | | | Fair Value | |
| | | | | | (000’s) | |
Brazil - 11.38% | |
Common Stocks - (Cost $618) | |
Banco Bradesco S.A., ADRA | | | 9,137 | | | $ | 114 | |
Cielo S.A. | | | 12,200 | | | | 182 | |
Embraer S.A. | | | 15,300 | | | | 135 | |
Natura Cosmeticos S.A. | | | 4,100 | | | | 48 | |
Petroleo Brasileiro S.A., Sponsored ADRA | | | 5,777 | | | | 35 | |
Qualicorp S.A. C | | | 100 | | | | 1 | |
| | | | | | | | |
Total Common Stocks | | | | 515 | |
| | | | | | | | |
Preferred Stocks - (Cost $128) | | | | | | | | |
Itau Unibanco Holding S.A., Sponsored ADRA | | | 9,299 | | | | 113 | |
| | | | | | | | |
Total Brazil | | | $ | 628 | |
| | | | | | | | |
Colombia - 2.26% | | | | | | | | |
Common Stocks - (Cost $151) | | | | | | | | |
Bancolombia S.A., Sponsored ADR A | | | 2,694 | | | | 125 | |
| | | | | | | | |
Czech Republic - 1.97% | | | | | | | | |
Common Stocks - (Cost $121) | | | | | | | | |
Komercni Banka A.S. B | | | 536 | | | | 109 | |
| | | | | | | | |
Hong Kong/China - 32.70% | | | | | | | | |
Common Stocks - (Cost $1,877) | | | | | | | | |
Anhui Conch Cement Co., Ltd. HB | | | 41,000 | | | | 138 | |
China BlueChemical Ltd. HB | | | 252,000 | | | | 87 | |
China Oilfield Services Ltd. HB | | | 84,000 | | | | 139 | |
China Petroleum & Chemical Corp. HB | | | 150,000 | | | | 119 | |
China Shipping Container Lines Co., Ltd. HB C | | | 466,000 | | | | 146 | |
Dongfeng Motor Group Co., Ltd. HB | | | 58,000 | | | | 84 | |
Great Wall Motor Co., HB | | | 29,500 | | | | 168 | |
Industrial & Commercial Bank of China Ltd. HB | | | 177,000 | | | | 127 | |
Jiangxi Copper Co., Ltd. HB | | | 99,000 | | | | 162 | |
Mindray Medical International Ltd., Class A, Sponsored ADR A | | | 3,917 | | | | 107 | |
Orient Overseas International Ltd.B | | | 28,500 | | | | 186 | |
Weichai Power Co., Ltd. HB | | | 57,000 | | | | 225 | |
Zhejiang Expressway Co., Ltd. HB | | | 92,000 | | | | 118 | |
| | | | | | | | |
Total Hong Kong/China | | | | 1,806 | |
| | | | | | | | |
India - 5.20% | | | | | | | | |
Common Stocks - (Cost $184) | | | | | | | | |
HDFC Bank Ltd., ADRA | | | 2,502 | | | | 143 | |
ICICI Bank Ltd., Sponsored ADRA | | | 12,007 | | | | 144 | |
| | | | | | | | |
Total India | | | | 287 | |
| | | | | | | | |
Indonesia - 4.17% | | | | | | | | |
Common Stocks - (Cost $211) | | | | | | | | |
Bank Rakyat Indonesia Persero Tbk PTB | | | 126,500 | | | | 116 | |
Indofood Sukses Makmur Tbk PTB | | | 192,000 | | | | 114 | |
| | | | | | | | |
Total Indonesia | | | | 230 | |
| | | | | | | | |
| | | | | | | | |
| | | Shares | | | Fair Value | |
| | | | | | (000’s) | |
Malaysia - 1.54% | | | | | | | | |
Common Stocks - (Cost $114) | | | | | | | | |
AMMB Holdings Bhd B | | | 49,300 | | | $ | 85 | |
| | | | | | | | |
Mexico - 3.17% | | | | | | | | |
Common Stocks - (Cost $236) | | | | | | | | |
Controladora Commercial Mexicana, S.A.B. de C.V. | | | 57,600 | | | | 175 | |
| | | | | | | | |
South Africa - 5.36% | | | | | | | | |
Common Stocks - (Cost $385) | | | | | | | | |
African Rainbow Minerals Ltd.B | | | 5,429 | | | | 54 | |
Anglo American Platinum Ltd.B C | | | 784 | | | | 24 | |
Impala Platinum Holdings Ltd.B C | | | 7,989 | | | | 52 | |
Investec Ltd.B | | | 19,750 | | | | 166 | |
| | | | | | | | |
Total South Africa | | | | 296 | |
| | | | | | | | |
South Korea - 12.99% | | | | | | | | |
Common Stocks - (Cost $771) | | | | | | | | |
CJ Corp.B | | | 1,031 | | | | 161 | |
Hyundai Mobis Co., Ltd.B | | | 510 | | | | 115 | |
KT Corp.B | | | 3,390 | | | | 92 | |
POSCOB | | | 512 | | | | 119 | |
Samsung Electronics Co., Ltd.B | | | 187 | | | | 231 | |
| | | | | | | | |
Total South Korea | | | | 718 | |
| | | | | | | | |
Taiwan - 6.54% | | | | | | | | |
Common Stocks - (Cost $324) | | | | | | | | |
Advanced Semiconductor Engineering, Inc.B | | | 178,000 | | | | 224 | |
Uni-President Enterprises Corp.B | | | 85,800 | | | | 137 | |
| | | | | | | | |
Total Taiwan | | | | 361 | |
| | | | | | | | |
Thailand - 3.01% | | | | | | | | |
Common Stocks - (Cost $179) | | | | | | | | |
Kasikornbank PCLB D | | | 15,500 | | | | 106 | |
PTT Global Chemical PCLD | | | 36,500 | | | | 60 | |
| | | | | | | | |
Total Thailand | | | | 166 | |
| | | | | | | | |
Turkey - 2.70% | | | | | | | | |
Common Stocks - (Cost $142) | | | | | | | | |
Akbank T.A.S.B | | | 24,281 | | | | 89 | |
Turkiye Garanti Bankasi A.S.B | | | 14,264 | | | | 60 | |
| | | | | | �� | | |
Total Turkey | | | | 149 | |
| | | | | | | | |
SHORT-TERM INVESTMENTS - 7.06% (Cost $390) | | | | | | | | |
JPMorgan U.S. Government Money Market Fund, Capital Class | | | 389,862 | | | | 390 | |
| | | | | | | | |
TOTAL INVESTMENTS - 100.05% (Cost $5,831) | | | | 5,525 | |
LIABILITIES, NET OF OTHER ASSETS - (0.05)% | | | | (3 | ) |
| | | | | | | | |
TOTAL NET ASSETS - 100.00% | | | $ | 5,522 | |
| | | | | | | | |
Percentages are stated as a percent of net assets.
| A | ADR - American Depositary Receipt. |
| | | | |
| | | See accompanying notes | | |
| | 17 | | |
American Beacon Earnest Partners Emerging Markets Equity FundSM
Schedule of Investments
January 31, 2015
| B | Fair valued pursuant to procedures approved by the Board of Trustees. At period end, the value of these securities amounted to $3,754 or 67.98% of net assets. |
| C | Non-income producing security. |
| D | PCL – Public Company Limited (Thailand). |
Futures Contracts Open on January 31, 2015:
| | | | | | | | | | | | | | |
Description | | Type | | Number of
Contracts | | Expiration Date | | Contract Value | | | Unrealized
Appreciation
(Depreciation) | |
Mini MSCI Emerging Markets March Futures | | Long | | 7 | | March 2015 | | $ | 333,025 | | | $ | (926 | ) |
| | | | | | | | | | | | | | |
| | | | | | | | $ | 333,025 | | | $ | (926 | ) |
| | | | | | | | | | | | | | |
| | | | |
| | | See accompanying notes | | |
| | 18 | | |
American Beacon SGA Global Growth FundSM
Schedule of Investments
January 31, 2015
| | | | | | | | |
| | | Shares | | | Fair Value | |
| | | | | | (000’s) | |
Argentina - 1.75% | |
Common Stocks - (Cost $85) | |
MercadoLibre, Inc., | | | 870 | | | $ | 108 | |
| | | | | | | | |
Brazil - 1.95% | | | | | | | | |
Common Stocks - (Cost $125) | | | | | | | | |
AmBev S.A., ADR A | | | 18,265 | | | | 120 | |
| | | | | | | | |
Denmark - 3.49% | | | | | | | | |
Common Stocks - (Cost $180) | | | | | | | | |
Novo Nordisk A.S., Class BB | | | 4,815 | | | | 215 | |
| | | | | | | | |
France - 7.81% | | | | | | | | |
Common Stocks - (Cost $516) | | | | | | | | |
Danone S.A.B | | | 3,439 | | | | 231 | |
SanofiB | | | 2,710 | | | | 250 | |
| | | | | | | | |
Total France | | | | 481 | |
| | | | | | | | |
Germany - 4.01% | | | | | | | | |
Common Stocks - (Cost $267) | | | | | | | | |
SAP AG, Sponsored ADR A | | | 3,783 | | | | 247 | |
| | | | | | | | |
Hong Kong/China - 10.17% | | | | | | | | |
Common Stocks - (Cost $547) | | | | | | | | |
AIA Group Ltd.B | | | 42,970 | | | | 249 | |
Ping An Insurance Group Co., HB | | | 11,190 | | | | 118 | |
Shandong Weigao Group Medical Co., Ltd. HB | | | 114,656 | | | | 89 | |
Tencent Holdings Ltd.B | | | 10,130 | | | | 171 | |
| | | | | | | | |
Total Hong Kong/China | | | | 627 | |
| | | | | | | | |
Ireland - 2.76% | | | | | | | | |
Common Stocks - (Cost $169) | | | | | | | | |
Perrigo Co., PLC C | | | 1,120 | | | | 170 | |
| | | | | | | | |
Mexico - 1.62% | | | | | | | | |
Common Stocks - (Cost $120) | | | | | | | | |
Fomento Economico Mexicano, S.A.B. de C.V., Series B, Sponsored ADRA | | | 1,195 | | | | 100 | |
| | | | | | | | |
Netherlands - 4.06% | | | | | | | | |
Common Stocks - (Cost $308) | | | | | | | | |
Core Laboratories N.V. | | | 1,300 | | | | 121 | |
Nielsen Holdings N.V. | | | 2,970 | | | | 129 | |
| | | | | | | | |
Total Netherlands | | | | 250 | |
| | | | | | | | |
Sweden - 2.06% | | | | | | | | |
Common Stocks - (Cost $158) | | | | | | | | |
Elekta A.B., Class BB | | | 11,825 | | | | 127 | |
| | | | | | | | |
Switzerland - 4.11% | | | | | | | | |
Common Stocks - (Cost $223) | | | | | | | | |
Nestle S.A., Regulated Security B | | | 3,300 | | | | 253 | |
| | | | | | | | |
| | | | | | | | |
| | | Shares | | | Fair Value | |
| | | | | | (000’s) | |
United Kingdom - 6.48% | | | | | | | | |
Common Stocks - (Cost $367) | | | | | | | | |
Aon PLCC | | | 2,460 | | | $ | 222 | |
ARM Holdings PLCB C | | | 11,355 | | | | 177 | |
| | | | | | | | |
Total United Kingdom | | | | 399 | |
| | | | | | | | |
United States - 44.72% | | | | | | | | |
Common Stocks - (Cost $2,267) | | | | | | | | |
Amazon.com, Inc.D | | | 548 | | | | 194 | |
Amgen, Inc. | | | 1,500 | | | | 228 | |
Colgate-Palmolive Co. | | | 3,256 | | | | 220 | |
Equinix, Inc.E | | | 754 | | | | 163 | |
Fastenal Co. | | | 2,650 | | | | 118 | |
Google, Inc., Class CD | | | 450 | | | | 240 | |
LinkedIn Corp., Class AD | | | 390 | | | | 88 | |
Lowe’s Cos., Inc. | | | 3,857 | | | | 261 | |
Monsanto Co. | | | 1,460 | | | | 172 | |
priceline.com, Inc.D | | | 160 | | | | 162 | |
Salesforce.com, Inc.D | | | 2,200 | | | | 124 | |
Schlumberger Ltd. | | | 1,985 | | | | 164 | |
Starbucks Corp. | | | 1,880 | | | | 165 | |
State Street Corp. | | | 3,022 | | | | 216 | |
Visa, Inc., Class A | | | 945 | | | | 241 | |
| | | | | | | | |
Total United States | | | | 2,756 | |
| | | | | | | | |
SHORT-TERM INVESTMENTS - 4.88% (Cost $301) | | | | | | | | |
JPMorgan U.S. Government Money Market Fund, Capital Class | | | 301,326 | | | | 301 | |
| | | | | | | | |
TOTAL INVESTMENTS - 99.87%
(Cost $5,633) | | | | 6,154 | |
OTHER ASSETS, NET OF
LIABILITIES - 0.13% | | | | 8 | |
| | | | | | | | |
TOTAL NET ASSETS - 100.00% | | | $ | 6,162 | |
| | | | | | | | |
Percentages are stated as a percent of net assets.
| A | ADR - American Depositary Receipt. |
| B | Fair valued pursuant to procedures approved by the Board of Trustees. At period end, the value of these securities amounted to $1,880 or 30.51% of net assets. |
| C | PLC - Public Limited Company. |
| D | Non-income producing security. |
| E | REIT - Real Estate Investment Trust. |
| | | | |
| | | See accompanying notes | | |
| | 19 | | |
American Beacon SGA Global Growth FundSM
Schedule of Investments
January 31, 2015
Futures Contracts Open on January 31, 2015:
| | | | | | | | | | | | | | |
Description | | Type | | Number of
Contracts | | Expiration Date | | Contract Value | | | Unrealized
Appreciation
(Depreciation) | |
Mini MSCI EAFE Emerging Markets March Futures | | Long | | 1 | | March 2015 | | $ | 88,330 | | | $ | 128 | |
Mini MSCI Emerging Markets March Futures | | Long | | 1 | | March 2015 | | | 47,575 | | | | 739 | |
S&P 500 Mini E Index March Futures | | Long | | 1 | | March 2015 | | | 99,420 | | | | (1,555 | ) |
| | | | | | | | | | | | | | |
| | | | | | | | $ | 235,325 | | | $ | (688 | ) |
| | | | | | | | | | | | | | |
| | | | |
| | | See accompanying notes | | |
| | 20 | | |
American Beacon FundsSM
Statements of Assets and Liabilities
January 31, 2015 (in thousands, except share and per share amounts)
| | | | | | | | | | | | |
| | | Acadian
Emerging
Markets
Managed
Volatility
Fund | | | Earnest
Partners
Emerging
Markets
Equity Fund | | | SGA Global
Growth
Fund | |
Assets: | |
Investments in unaffiliated securities, at fair value A | | $ | 26,065 | | | $ | 5,525 | | | $ | 6,154 | |
Foreign currency, at fair value B | | | 40 | | | | — | | | | — | |
Deposit with brokers for futures contracts | | | 11 | | | | 13 | | | | 10 | |
Dividends and interest receivable | | | 22 | | | | 7 | | | | 5 | |
Receivable for fund shares sold | | | 40 | | | | 10 | | | | 1 | |
Receivable for tax reclaims | | | 1 | | | | — | | | | 2 | |
Receivable for expense reimbursement (Note 2) | | | 10 | | | | 6 | | | | 11 | |
Prepaid expenses | | | 21 | | | | 19 | | | | 31 | |
| | | | | | | | | | | | |
Total assets | | | 26,210 | | | | 5,580 | | | | 6,214 | |
| | | | | | | | | | | | |
Liabilities: | | | | | | | | | | | | |
Payable for investments purchased | | | — | | | | — | | | | 14 | |
Payable for variation margin from open futures contracts | | | 9 | | | | 10 | | | | 4 | |
Management and investment advisory fees payable | | | 15 | | | | 3 | | | | 3 | |
Administrative service and service fees payable | | | 10 | | | | 2 | | | | 2 | |
Transfer agent fees payable | | | 1 | | | | — | | | | — | |
Custody and fund accounting fees payable | | | 6 | | | | 2 | | | | 2 | |
Professional fees payable | | | 34 | | | �� | 36 | | | | 22 | |
Payable for prospectus and shareholder reports | | | 1 | | | | 2 | | | | — | |
Other liabilities | | | — | | | | 3 | | | | 5 | |
| | | | | | | | | | | | |
Total liabilities | | | 76 | | | | 58 | | | | 52 | |
| | | | | | | | | | | | |
Net Assets | | $ | 26,134 | | | $ | 5,522 | | | $ | 6,162 | |
| | | | | | | | | | | | |
Analysis of Net Assets: | | | | | | | | | | | | |
Paid-in-capital | | | 26,388 | | | | 5,963 | | | | 5,552 | |
Undistributed (or overdistribution of) net investment income | | | (32 | ) | | | — | | | | 3 | |
Accumulated net realized gain (loss) | | | (144 | ) | | | (135 | ) | | | 86 | |
Unrealized appreciation or (depreciation) of investments | | | 1,371 | | | | (31 | ) | | | 671 | |
Unrealized (depreciation) of currency transactions | | | (1,439 | ) | | | (274 | ) | | | (149 | ) |
Unrealized (depreciation) of futures contracts | | | (10 | ) | | | (1 | ) | | | (1 | ) |
| | | | | | | | | | | | |
Net assets | | $ | 26,134 | | | $ | 5,522 | | | $ | 6,162 | |
| | | | | | | | | | | | |
Shares outstanding at no par value (unlimited shares authorized): | | | | | | | | | | | | |
Institutional Class | | | 1,277,740 | | | | 307,367 | | | | 380,116 | |
| | | | | | | | | | | | |
Y Class | | | 450,276 | | | | 104,894 | | | | 8,924 | |
| | | | | | | | | | | | |
Investor Class | | | 452,552 | | | | 159,709 | | | | 8,118 | |
| | | | | | | | | | | | |
A Class | | | 315,838 | | | | 10,114 | | | | 32,558 | |
| | | | | | | | | | | | |
C Class | | | 61,711 | | | | 10,043 | | | | 29,782 | |
| | | | | | | | | | | | |
Net assets (not in thousands): | | | | | | | | | | | | |
Institutional Class | | $ | 13,079,558 | | | $ | 2,871,982 | | | $ | 5,106,079 | |
| | | | | | | | | | | | |
Y Class | | $ | 4,603,907 | | | $ | 979,066 | | | $ | 119,680 | |
| | | | | | | | | | | | |
Investor Class | | $ | 4,612,098 | | | $ | 1,484,939 | | | $ | 108,458 | |
| | | | | | | | | | | | |
A Class | | $ | 3,214,591 | | | $ | 93,921 | | | $ | 434,636 | |
| | | | | | | | | | | | |
C Class | | $ | 623,506 | | | $ | 92,312 | | | $ | 393,478 | |
| | | | | | | | | | | | |
Net asset value, offering and redemption price per share: | | | | | | | | | | | | |
Institutional Class | | $ | 10.24 | | | $ | 9.34 | | | $ | 13.43 | |
| | | | | | | | | | | | |
Y Class | | $ | 10.22 | | | $ | 9.33 | | | $ | 13.41 | |
| | | | | | | | | | | | |
Investor Class | | $ | 10.19 | | | $ | 9.30 | | | $ | 13.36 | |
| | | | | | | | | | | | |
A Class | | $ | 10.18 | | | $ | 9.29 | | | $ | 13.35 | |
| | | | | | | | | | | | |
A Class (offering price) | | $ | 10.80 | | | $ | 9.86 | | | $ | 14.16 | |
| | | | | | | | | | | | |
C Class | | $ | 10.10 | | | $ | 9.19 | | | $ | 13.21 | |
| | | | | | | | | | | | |
A Cost of investments in unaffiliated securities | | $ | 26,132 | | | $ | 5,831 | | | $ | 5,633 | |
B Cost of foreign currency | | $ | 40 | | | $ | — | | | $ | — | |
| | | | |
| | | See accompanying notes | | |
| | 21 | | |
American Beacon FundsSM
Statements of Operations
For the year ended January 31, 2015 (in thousands)
| | | | | | | | | | | | |
| | | Acadian
Emerging
Markets
Managed
Volatility
Fund | | | Earnest
Partners
Emerging
Markets
Equity Fund | | | SGA Global
Growth
Fund | |
Investment Income: | | | | | | | | | | | | |
Dividend income from unaffiliated securities (net of foreign taxes) A | | $ | 534 | | | $ | 108 | | | $ | 83 | |
| | | | | | | | | | | | |
Total investment income | | | 534 | | | | 108 | | | | 83 | |
| | | | | | | | | | | | |
Expenses: | | | | | | | | | | | | |
Management and investment advisory fees (Note 2) | | | 142 | | | | 39 | | | | 29 | |
Administrative service fees (Note 2): | | | | | | | | | | | | |
Institutional Class | | | 37 | | | | 9 | | | | 15 | |
Y Class | | | 6 | | | | 2 | | | | — | |
Investor Class | | | 10 | | | | 4 | | | | — | |
A Class | | | 7 | | | | — | | | | 1 | |
C Class | | | 1 | | | | — | | | | 1 | |
Transfer agent fees: | | | | | | | | | | | | |
Institutional Class | | | 1 | | | | 1 | | | | 2 | |
Investor Class | | | 2 | | | | 2 | | | | 1 | |
Custody and fund accounting fees | | | 69 | | | | 40 | | | | 23 | |
Professional fees | | | 59 | | | | 57 | | | | 47 | |
Registration fees and expenses | | | 91 | | | | 90 | | | | 88 | |
Service fees (Note 2): | | | | | | | | | | | | |
Y Class | | | 2 | | | | 1 | | | | — | |
Investor Class | | | 9 | | | | 3 | | | | — | |
A Class | | | 3 | | | | — | | | | 1 | |
C Class | | | 1 | | | | — | | | | 1 | |
Distribution fees (Note 2): | | | | | | | | | | | | |
A Class | | | 6 | | | | — | | | | 1 | |
C Class | | | 4 | | | | 1 | | | | 3 | |
Prospectus and shareholder report expenses | | | 17 | | | | 7 | | | | 14 | |
Trustee fees | | | 1 | | | | — | | | | ��� | |
Other expenses | | | 8 | | | | 7 | | | | 8 | |
| | | | | | | | | | | | |
Total expenses | | | 476 | | | | 263 | | | | 235 | |
| | | | | | | | | | | | |
Net fees waived and expenses reimbursed (Note 2) | | | (170 | ) | | | (183 | ) | | | (170 | ) |
| | | | | | | | | | | | |
Net expenses | | | 306 | | | | 80 | | | | 65 | |
| | | | | | | | | | | | |
Net investment income | | | 228 | | | | 28 | | | | 18 | |
| | | | | | | | | | | | |
Realized and unrealized gain (loss) from investments: | | | | | | | | | | | | |
Net realized gain (loss) from: | | | | | | | | | | | | |
Investments | | | 31 | | | | (2 | ) | | | 230 | |
Foreign currency transactions | | | (147 | ) | | | (18 | ) | | | (5 | ) |
Futures contracts | | | 39 | | | | 14 | | | | 12 | |
Change in net unrealized appreciation or (depreciation) of: | | | | | | | | | | | | |
Investments | | | 1,556 | | | | 203 | | | | 215 | |
Foreign currency transactions | | | (1,107 | ) | | | (189 | ) | | | (149 | ) |
Futures contracts | | | 2 | | | | — | | | | 9 | |
| | | | | | | | | | | | |
Net gain from investments | | | 374 | | | | 8 | | | | 312 | |
| | | | | | | | | | | | |
Net increase in net assets resulting from operations | | $ | 602 | | | $ | 36 | | | $ | 330 | |
| | | | | | | | | | | | |
A Foreign taxes | | | 70 | | | | 13 | | | | 6 | |
| | | | |
| | | See accompanying notes | | |
| | 22 | | |
American Beacon FundsSM
Statements of Changes of Net Assets (in thousands)
| | | | | | | | | | | | | | | | | | | | | | | | | | | | |
| | | Acadian Emerging Markets
Managed Volatility Fund | | | Earnest Partners Emerging
Markets Equity Fund | | | SGA Global Growth Fund | |
| | | Year Ended
January 31,
2015 | | | From
Sept. 27A
to
January 31,
2014 | | | Year
Ended
January 31,
2015 | | | From
Sept. 19A
to
January 31,
2014 | | | Year Ended
January 31,
2015 | | | Four Months
Ended
January 31,
2014 | | | Year Ended
Sept. 30,
2014 | |
Increase (Decrease) in Net Assets: | | | | | | | | | | | | | | | | | | | | | | | | | | | | |
Operations: | | | | | | | | | | | | | | | | | | | | | | | | | | | | |
Net investment income (loss) | | $ | 228 | | | $ | 19 | | | $ | 28 | | | $ | (9 | ) | | $ | 18 | | | $ | 2 | | | $ | (8 | ) |
Net realized gain (loss) from investments, futures contracts, and foreign currency transactions | | | (77 | ) | | | (46 | ) | | | (6 | ) | | | (134 | ) | | | 237 | | | | 54 | | | | 81 | |
Change in net unrealized appreciation or (depreciation) from investments, futures contracts, and foreign currency transactions | | | 451 | | | | (529 | ) | | | 14 | | | | (320 | ) | | | 75 | | | | (24 | ) | | | 252 | |
| | | | | | | | | | | | | | | | | | | | | | | | | | | | |
Net increase (decrease) in net assets resulting from operations | | | 602 | | | | (556 | ) | | | 36 | | | | (463 | ) | | | 330 | | | | 32 | | | | 325 | |
| | | | | | | | | | | | | | | | | | | | | | | | | | | | |
Distributions to Shareholders: | | | | | | | | | | | | | | | | | | | | | | | | | | | | |
Net investment income: | | | | | | | | | | | | | | | | | | | | | | | | | | | | |
Institutional Class | | | (151 | ) | | | (5 | ) | | | (12 | ) | | | — | | | | (13 | ) | | | — | | | | — | |
Y Class | | | (49 | ) | | | — | | | | (4 | ) | | | — | | | | — | | | | — | | | | — | |
Investor Class | | | (52 | ) | | | (1 | ) | | | (7 | ) | | | — | | | | — | | | | — | | | | — | |
A Class | | | (39 | ) | | | — | | | | (1 | ) | | | — | | | | (1 | ) | | | — | | | | — | |
C Class | | | (5 | ) | | | — | | | | (1 | ) | | | — | | | | (1 | ) | | | — | | | | — | |
Net realized gain from investments: | | | | | | | | | | | | | | | | | | | | | | | | | | | | |
Institutional Class | | | — | | | | — | | | | — | | | | — | | | | (140 | ) | | | (86 | ) | | | (37 | ) |
Y Class | | | — | | | | — | | | | — | | | | — | | | | (3 | ) | | | (2 | ) | | | — | |
Investor Class | | | — | | | | — | | | | — | | | | — | | | | (3 | ) | | | (2 | ) | | | — | |
A Class | | | — | | | | — | | | | — | | | | — | | | | (12 | ) | | | (7 | ) | | | — | |
C Class | | | — | | | | — | | | | — | | | | — | | | | (10 | ) | | | (2 | ) | | | — | |
| | | | | | | | | | | | | | | | | | | | | | | | | | | | |
Net distributions to shareholders | | | (296 | ) | | | (6 | ) | | | (25 | ) | | | — | | | | (183 | ) | | | (99 | ) | | | (37 | ) |
| | | | | | | | | | | | | | | | | | | | | | | | | | | | |
Capital Share Transactions: | | | | | | | | | | | | | | | | | | | | | | | | | | | | |
Proceeds from sales of shares | | | 14,431 | | | | 8,053 | | | | 2,815 | | | | 1,974 | | | | 507 | | | | 994 | | | | 1,984 | |
Reinvestment of dividends and distributions | | | 294 | | | | 6 | | | | 25 | | | | — | | | | 179 | | | | 99 | | | | 37 | |
Cost of shares redeemed | | | (1,384 | ) | | | (10 | ) | | | (898 | ) | | | (942 | ) | | | (93 | ) | | | (9 | ) | | | (1 | ) |
| | | | | | | | | | | | | | | | | | | | | | | | | | | | |
Net increase in net assets from capital share transactions | | | 13,341 | | | | 8,049 | | | | 1,942 | | | | 1,032 | | | | 593 | | | | 1,084 | | | | 2,020 | |
| | | | | | | | | | | | | | | | | | | | | | | | | | | | |
Net increase in net assets | | | 13,647 | | | | 7,487 | | | | 1,953 | | | | 569 | | | | 740 | | | | 1,017 | | | | 2,308 | |
| | | | | | | | | | | | | | | | | | | | | | | | | | | | |
Net Assets: | | | | | | | | | | | | | | | | | | | | | | | | | | | | |
Beginning of period | | | 12,487 | | | | 5,000 | | | | 3,569 | | | | 3,000 | | | | 5,422 | | | | 4,405 | | | | 2,097 | |
| | | | | | | | | | | | | | | | | | | | | | | | | | | | |
End of Period * | | $ | 26,134 | | | $ | 12,487 | | | $ | 5,522 | | | $ | 3,569 | | | $ | 6,162 | | | $ | 5,422 | | | $ | 4,405 | |
| | | | | | | | | | | | | | | | | | | | | | | | | | | | |
*Includes undistributed (or overdistribution of) net investment income of | | $ | (32 | ) | | $ | 8 | | | $ | — | | | $ | (2 | ) | | $ | 3 | | | $ | — | | | $ | (7 | ) |
| | | | | | | | | | | | | | | | | | | | | | | | | | | | |
| A | Commencement of operations. |
| | | | |
| | | See accompanying notes | | |
| | 23 | | |
American Beacon FundsSM
Notes to Financial Statements
January 31, 2015
1. Organization and Significant Accounting Policies
American Beacon Funds (the “Trust”), which is comprised of thirty-one Funds, is organized as a Massachusetts business trust and is registered under the Investment Company Act of 1940, as amended (the “Act”), as a diversified, open-end management investment company. These financial statements and notes to the financial statements relate to the American Beacon Acadian Emerging Markets Managed Volatility Fund (“Acadian Fund”), the American Beacon Earnest Partners Emerging Markets Equity Fund (“Earnest Partners Fund”), and the American Beacon SGA Global Growth Fund (“SGA Fund”) (each a “Fund” and collectively, the “Funds”), each a series of the Trust.
American Beacon Advisors, Inc. (the “Manager”) is a wholly-owned subsidiary of Lighthouse Holdings, Inc. and was organized in 1986 to provide business management, advisory, administrative, and asset management consulting services to the Trust and other investors.
Class Disclosure
Each Fund has multiple classes of shares designed to meet the needs of different groups of investors; however, not all Funds offer all classes. The following table sets forth the differences amongst the classes:
| | |
Class: | | Offered to: |
| Institutional Class | | Investors making an initial investment of $250,000 |
| |
| Y Class | | Investors making an initial investment of $100,000 |
| |
| Investor Class | | General public and investors investing through an intermediary |
| |
| A Class | | General public and investors investing through an intermediary with applicable sales charges, which may include a front-end sales charge and a contingent deferred sales charge (“CDSC”) |
| |
| C Class | | General public and investors investing through an intermediary with applicable sales charges, which may include a CDSC |
Each class offered by the Trust has equal rights as to assets and voting privileges. Income and non-class specific expenses are allocated daily to each class on the basis of the relative net assets. Realized and unrealized capital gains and losses of each class are allocated daily based on the relative net assets of each class of the respective Fund. Class specific expenses, where applicable, currently include administrative service fees, service fees, and distribution fees and vary amongst the classes as described more fully in Note 2.
Recently Adopted Accounting Pronouncements
In June 2013, the Financial Accounting Standards Board (“FASB”) issued Accounting Standards Update (“ASU”) No. 2013-08, “Financial Services – Investment Companies (Topic 946): Amendments to the Scope, Measurement, and Disclosure Requirements,” which amends the criteria that define an investment company and clarifies the measurement guidance and requires new disclosures for investment companies. Under the ASU, an entity that is registered under the Investment Company Act of 1940 automatically qualifies as an investment company. The Funds adopted this ASU for the fiscal year ended January 31, 2015. Management has evaluated the implications of the ASU and determined that adoption thereof will not have a material impact on the financial statements.
2. Transactions with Affiliates
Management Agreement
The Trust and the Manager are parties to a Management Agreement that obligates the Manager to provide or oversee the provision of all investment advisory and fund management services. As compensation for performing the duties required under the Management Agreement, the Manager receives from the Funds an annualized fee equal to 0.05% of the average daily net assets. The Funds pay the unaffiliated investment
24
American Beacon FundsSM
Notes to Financial Statements
January 31, 2015
advisors hired to direct investment activities of the Funds. Management fees paid by the Funds during the year ended January 31, 2015 were as follows (in thousands):
| | | | | | | | | | | | | | | | |
Fund | | Management
Fee Rate | | | Management
Fee | | | Amounts paid to
Investment Advisors | | | Amounts Paid
to Manager | |
Acadian Fund | | | 0.69 | % | | $ | 142 | | | $ | 131 | | | $ | 11 | |
Earnest Partners Fund | | | 0.73 | % | | | 39 | | | | 36 | | | | 3 | |
SGA Fund | | | 0.49 | % | | | 29 | | | | 26 | | | | 3 | |
Administration Agreement
The Manager and the Trust entered into an Administration Agreement which obligates the Manager to provide or oversee administrative services to each Fund. As compensation for performing the duties required under the Administration Agreement, the Manager receives an annualized fee of 0.30% of the average daily net assets of the Institutional, Y, and Investor Classes of the Funds. Prior to July 1, 2014, the Manager received 0.40% of the average daily net assets of the A and C Classes of each Fund. Beginning July 1, 2014, the Manager received 0.30% of the average daily net assets of the A and C Classes of each Fund.
Distribution Plans
The Funds, except for the A and C Classes, have adopted a “defensive” Distribution Plan (the “Plan”) in accordance with Rule 12b-1 under the Act, pursuant to which no fees may be charged to the Funds for distribution purposes. However, the Plan authorizes the management and administration fees received by the Manager and the investment advisors hired by the Manager to be used for distribution purposes. Under this Plan, the Funds do not intend to separately compensate the Manager or any other party, either directly or indirectly, for the distribution of Fund shares.
Separate Distribution Plans (the “Distribution Plans”) have been adopted pursuant to Rule 12b-1 under the Act for the A and C Classes of the Funds. Under the Distribution Plans, as compensation for distribution assistance, the Manager receives an annual fee of 0.25% of the average daily net assets of the A Class and 1.00% of the average daily net assets of the C Class. The fee will be payable without regard to whether the amount of the fee is more or less than the actual expenses incurred in a particular month by the Manager for distribution assistance.
Service Plans
The Manager and the Trust entered into Service Plans that obligate the Manager to oversee additional shareholder servicing of the Y, Investor, A, and C Classes. As compensation for performing the duties required under the Service Plans, the Manager receives 0.10% of the average daily net assets of the Y Class, 0.15% of the average daily net assets of the A and C Classes, and up to 0.375% of the average daily net assets of the Investor Class of the Funds.
Investment in Affiliated Funds
The Funds may invest in the American Beacon Money Market Select Fund (the “MM Select Fund”) and the U.S. Government Money Market Select Fund (the “USG Select Fund”), (collectively the “Select Funds”). The Select Funds and the Funds have the same investment advisor and therefore, are considered to be affiliated. The Manager serves as investment advisor to the Select Funds and receives Management and Administrative Service fees totaling 0.10% of the average daily net assets of the Select Funds. During the year ended January 31, 2015, the Funds did not invest in the Select Funds.
Interfund Lending Program
Pursuant to an exemptive order by the Securities and Exchange Commission (“SEC”), the Funds, along with other registered investment companies having management contracts with the Manager, may participate
25
American Beacon FundsSM
Notes to Financial Statements
January 31, 2015
in an interfund lending program. This program provides an alternative credit facility allowing the Funds to borrow from other participating Funds. During the year ended January 31, 2015, Earnest Partners Fund borrowed on average $125,909 for three days at an average rate of 0.70% with interest charges of $7. This amount is recorded within “Other Expenses” on the accompanying Statements of Operations.
Expense Reimbursement Plan
The Manager contractually agreed to reimburse the following Funds to the extent that total operating expenses exceeded a Fund’s expense cap. During the periods ended January 31, 2015, the Manager reimbursed expenses as follows:
| | | | | | | | | | | | | | | | | | |
| | | | | Expense Caps | | | | | | | |
Fund | | Class | | 2/1/14-
6/30/14 | | | 7/1/14-
1/31/15 | | | Reimbursed
Expenses | | | Expiration of
Reimbursements | |
Acadian Fund | | Institutional | | | 1.35 | % | | | 1.35 | % | | $ | 113,139 | | | | 2018 | |
Acadian Fund | | Y | | | 1.45 | % | | | 1.45 | % | | | 13,680 | | | | 2018 | |
Acadian Fund | | Investor | | | 1.73 | % | | | 1.73 | % | | | 23,796 | | | | 2018 | |
Acadian Fund | | A | | | 1.85 | % | | | 1.75 | % | | | 16,244 | | | | 2018 | |
Acadian Fund | | C | | | 2.60 | % | | | 2.50 | % | | | 2,658 | | | | 2018 | |
Earnest Partners Fund | | Institutional | | | 1.35 | % | | | 1.35 | % | | | 120,163 | | | | 2018 | |
Earnest Partners Fund | | Y | | | 1.45 | % | | | 1.45 | % | | | 19,839 | | | | 2018 | |
Earnest Partners Fund | | Investor | | | 1.73 | % | | | 1.73 | % | | | 35,908 | | | | 2018 | |
Earnest Partners Fund | | A | | | 1.85 | % | | | 1.75 | % | | | 3,693 | | | | 2018 | |
Earnest Partners Fund | | C | | | 2.60 | % | | | 2.50 | % | | | 3,663 | | | | 2018 | |
SGA Fund | | Institutional | | | 0.98 | % | | | 0.98 | % | | | 143,362 | | | | 2018 | |
SGA Fund | | Y | | | 1.08 | % | | | 1.08 | % | | | 3,113 | | | | 2018 | |
SGA Fund | | Investor | | | 1.36 | % | | | 1.36 | % | | | 4,259 | | | | 2018 | |
SGA Fund | | A | | | 1.48 | % | | | 1.38 | % | | | 11,688 | | | | 2018 | |
SGA Fund | | C | | | 2.23 | % | | | 2.13 | % | | | 7,947 | | | | 2018 | |
Of these amounts, $9,664, $5,972, and $11,314 were receivable from the Manager to the Acadian, Earnest Partners, and SGA Funds respectively, at January 31, 2015. The Funds have adopted an Expense Reimbursement Plan whereby the Manager may seek repayment of fees waived or expenses reimbursed for a period of up to three years. However, reimbursement will occur only if the Class’ average net assets have grown or expenses have declined sufficiently to allow reimbursement without causing its expense ratio to exceed the previously agreed upon contractual expense limit. During the year ended January 31, 2015, the Funds did not record a liability for potential reimbursement, due to the current assessment that a reimbursement is unlikely. The carryover of excess expenses potentially reimbursable to the Manager are as follows:
| | | | | | | | | | | | |
Fund | | Recovered Expenses | | | Excess Expense
Carryover | | | Expiration of
Reimbursed
Expenses | |
Acadian Fund | | $ | — | | | $ | 118,179 | | | | 2017 | |
Earnest Partners Fund | | | — | | | | 148,500 | | | | 2017 | |
SGA Fund | | | — | | | | 79,392 | | | | 2017 | |
Sales Commissions
The Funds’ distributor, Foreside Fund Services, LLC (“Foreside”), may receive a portion of A Class sales charges from broker dealers and it may be used to offset distribution related expenses. During the year ended January 31, 2015, Foreside collected $1,894, $6, and $367 for Acadian, Earnest Partners, and SGA Funds, respectively from the sale of Class A Shares.
A CDSC of 0.50% will be deducted with respect to Class A Shares on certain purchases of $1,000,000 or more that are redeemed in whole or part within 18 months of purchase, unless waived as discussed in the Prospectus. Any applicable CDSC will be 0.50% of the lesser of the original purchase price or the value of the redemption of the Class A Shares redeemed. During the year ended January 31, 2015, there were no CDSC fees collected for Class A Shares.
26
American Beacon FundsSM
Notes to Financial Statements
January 31, 2015
A CDSC of 1.00% will be deducted with respect to Class C Shares redeemed within 12 months of purchase, unless waived as discussed in the Prospectus. Any applicable CDSC will be 1.00% of the lesser of the original purchase price or the value of the redemption of the Class C Shares redeemed. During the year ended January 31, 2015, CDSC fees of $10 and $99 were collected for the Acadian and SGA Funds, respectively.
3. Security Valuation and Fair Value Measurements
Investments are valued at the close of the New York Stock Exchange (the “Exchange”), normally 4 p.m. ET, each day that the Exchange is open for business. Equity securities, including exchange-traded funds (“ETFs”) for which market quotations are available are valued at the last sale price or official closing price (closing bid price or last evaluated quote if no sale has occurred) on the primary market or exchange on which they trade.
Investments in open-end mutual funds are valued at the closing net asset value (“NAV”) per share of the mutual fund on the day of valuation. Investment grade short-term obligations with 60 days or less to maturity are valued using the amortized cost method, which approximates fair value.
Securities for which the market prices are not readily available or are not reflective of the fair value of the security, as determined by the Manager, will be priced at fair value following procedures approved by the Trust’s Board of Trustees (the “Board”).
Futures contracts are valued based upon their quoted daily settlement prices. Upon entering into a futures contract, a Fund is required to deposit with its futures broker, an amount of cash or U.S. Government and Agency Obligations in accordance with the initial margin requirements of the broker or exchange. Futures contracts are marked to market daily and an appropriate payable or receivable for the change in value (“variation margin”) is recorded by the Fund. Gains or losses are recognized, but not considered realized until the contracts expire or are closed. Futures contracts involve, to varying degrees, risk of loss in excess of the variation margin disclosed on the Statements of Assets and Liabilities.
For valuation purposes, the last quoted prices of non-U.S. equity securities may be adjusted under the circumstances described below. If the Fund determines that developments between the earlier close of a foreign market and the close of the Exchange will, in its judgment, materially affect the value of some or all of its portfolio securities, the Fund will adjust the previous closing prices to reflect what it believes to be the fair value of the securities as of the close of the Exchange. In deciding whether it is necessary to adjust closing prices to reflect fair value, the Fund reviews a variety of factors, including developments in foreign markets, the performance of U.S. securities markets, and the performance of instruments trading in U.S. markets that represent foreign securities and baskets of foreign securities. In addition, the Fund may use fair value pricing for securities primarily traded in non-U.S. markets because most foreign markets close well before the close of the Exchange. The earlier close of these foreign markets gives rise to the possibility that significant events, including broad market moves, may have occurred in the interim and may materially affect the value of those securities. These securities are fair valued using a pricing service and are categorized as Level 2 in the fair value hierarchy. The pricing service, using methods approved by the Board, considers the correlation of the trading patterns of the foreign security to intraday trading in the U.S. markets, based on indices of domestic securities and other appropriate indicators such as prices of relevant ADRs and futures contracts.
Other investments, including restricted securities and those financial instruments for which the above valuation procedures are inappropriate or are deemed not to reflect fair value are stated at fair value as determined in good faith by the Valuation Committee, established by the Funds’ Board.
27
American Beacon FundsSM
Notes to Financial Statements
January 31, 2015
Valuation Inputs
Various inputs may be used to determine the fair value of the Funds’ investments. These inputs are summarized in three broad levels for financial statement purposes. The inputs or methodologies used to value securities are not necessarily an indication of the risk associated with investing in those securities.
Level 1 – Quoted prices in active markets for identical securities.
Level 2 – Prices determined using other significant observable inputs. These may include quoted prices for similar securities, interest rates, prepayment speeds, credit risk, and others.
Level 3 – Prices determined using other significant unobservable inputs. Unobservable inputs reflect the Fund’s own assumptions about the factors market participants would use in pricing an investment, and would be based on the best information available.
Level 1 and Level 2 trading assets and trading liabilities, at fair value
Common stocks and financial derivative instruments, such as futures contracts that are traded on a national securities exchange, are stated at the last reported sale or settlement price on the day of valuation. To the extent these securities are actively traded and valuation adjustments are not applied, they are categorized as Level 1 of the fair value hierarchy. Valuation adjustments may be applied to certain securities that are solely traded on a foreign exchange to account for the market movement between the close of the foreign market and the close of the Exchange. These securities are valued using pricing service providers that consider the correlation of the trading patterns of the foreign security to the intraday trading in the U.S. markets for investments. Securities using these valuation adjustments are categorized as Level 2 of the fair value hierarchy. Preferred securities and other equities traded on inactive markets or valued by reference to similar instruments are also categorized as Level 2 of the fair value hierarchy.
Investments in registered open-end investment management companies will be valued based upon the NAVs of such investments and are categorized as Level 1 of the fair value hierarchy. Short-term investments having a maturity of 60 days or less are generally valued at amortized cost which approximates fair value. These investments are categorized as Level 2 of the fair value hierarchy.
Over-the-counter (“OTC”) financial derivative instruments, such as foreign currency contracts, derive their value from underlying asset prices, indices, reference rates, and other inputs or a combination of these factors. These contracts are normally valued on the basis of broker dealer quotations or pricing service providers. Depending on the product and the terms of the transaction, the fair value of the financial derivative contracts can be estimated by a pricing service provider using a series of techniques, including simulation pricing models. The pricing models use inputs that are observed from actively quoted markets such as issuer details, indices, spreads, interest rates, curves, dividends, and exchange rates. Financial derivatives that use similar valuation techniques and inputs as described above are categorized as Level 2 of the fair value hierarchy.
The Funds’ investments are summarized by level based on the inputs used to determine their values. U.S. Generally Accepted Accounting Principles (“U.S. GAAP”) also requires all transfers between any levels to be disclosed. The end of the period timing recognition has been adopted for the transfers between levels of each Fund’s assets and liabilities. As of January 31, 2015, the investments were classified as described below (in thousands):
| | | | | | | | | | | | | | | | |
Acadian Fund* | | Level 1 | | | Level 2 | | | Level 3 | | | Total | |
Foreign Preferred Stocks | | $ | 228 | | | $ | 108 | | | $ | — | | | $ | 336 | |
Foreign Common Stocks | | | 7,335 | | | | 18,066 | | | | — | | | | 25,401 | |
Short-Term Investments – Money Market Funds | | | 328 | | | | — | | | | — | | | | 328 | |
| | | | | | | | | | | | | | | | |
Total Investments in Securities | | $ | 7,891 | | | $ | 18,174 | | | $ | — | | | $ | 26,065 | |
| | | | | | | | | | | | | | | | |
Financial Derivative Instruments | | | | | | | | | | | | | | | | |
Futures Contracts | | $ | (9 | ) | | $ | — | | | $ | — | | | $ | (9 | ) |
28
American Beacon FundsSM
Notes to Financial Statements
January 31, 2015
| | | | | | | | | | | | | | | | |
Earnest Partners Fund* | | Level 1 | | | Level 2 | | | Level 3 | | | Total | |
Foreign Preferred Stocks | | $ | 113 | | | $ | — | | | $ | — | | | $ | 113 | |
Foreign Common Stocks | | | 1,268 | | | | 3,754 | | | | — | | | | 5,022 | |
Short-Term Investments – Money Market Funds | | | 390 | | | | — | | | | — | | | | 390 | |
| | | | | | | | | | | | | | | | |
Total Investments in Securities | | $ | 1,771 | | | $ | 3,754 | | | $ | — | | | $ | 5,525 | |
| | | | | | | | | | | | | | | | |
Financial Derivative Instruments | | | | | | | | | | | | | | | | |
Futures Contracts | | $ | (1 | ) | | $ | — | | | $ | — | | | $ | (1 | ) |
| | | | | | | | | | | | | | | | |
SGA Fund* | | Level 1 | | | Level 2 | | | Level 3 | | | Total | |
Foreign Common Stocks | | $ | 1,217 | | | $ | 1,880 | | | $ | — | | | $ | 3,097 | |
Domestic Common Stocks | | | 2,756 | | | | — | | | | — | | | | 2,756 | |
Short-Term Investments – Money Market Funds | | | 301 | | | | — | | | | — | | | | 301 | |
| | | | | | | | | | | | | | | | |
Total Investments in Securities | | $ | 4,274 | | | $ | 1,880 | | | $ | — | | | $ | 6,154 | |
| | | | | | | | | | | | | | | | |
Financial Derivative Instruments-Assets | | | | | | | | | | | | | | | | |
Futures Contracts | | $ | 1 | | | $ | — | | | $ | — | | | $ | 1 | |
Financial Derivative Instruments-Liabilities | | | | | | | | | | | | | | | | |
Futures Contracts | | $ | (2 | ) | | $ | — | | | $ | — | | | $ | (2 | ) |
| * | Refer to the Schedules of Investments for country information. |
During the year ended January 31, 2015, Acadian transferred preferred stock with a value of $108 and common stock with a value of $18,066, Earnest Partners Fund transferred common stock with a value of $3,754, and SGA Fund transferred common stock with a value of $1,880 from Level 1 to Level 2 as of the end of period in accordance with fair value procedures established by the Board (in thousands).
Security Transactions and Investment Income
Security transactions are recorded on the trade date of the security purchase or sale. The Funds may purchase securities with delivery or payment to occur at a later date. At the time the Funds enter into a commitment to purchase a security, the transaction is recorded, and the value of the security is reflected in the NAV. The value of the security may vary with market fluctuations.
Dividend income, net of foreign taxes, is recorded on the ex-dividend date, except certain dividends from foreign securities which are recorded as soon as the information is available to the Funds. Interest income is earned from settlement date, recorded on the accrual basis, and adjusted, if necessary, for accretion of discounts and amortization of premiums. For financial and tax reporting purposes, realized gains and losses are determined on the basis of specific lot identification.
Currency Translation
All assets and liabilities initially expressed in foreign currency values are converted into U.S. dollar values at the mean of the bid and ask prices of such currencies against U.S. dollars as last quoted by a recognized dealer. Income, expenses, and purchases and sales of investments are translated into U.S. dollars at the rate of exchange prevailing on the respective dates of such transactions. The effect of changes in foreign currency exchange rates on investments is separately identified from the fluctuations arising from changes in fair values of securities held and is reported with all other foreign currency gains and losses in the Funds’ Statements of Operations.
Dividends to Shareholders
Dividends from net investment income of the Funds normally will be declared and paid at least annually. Distributions, if any, of net realized capital gains are generally paid at least annually and recorded on the ex-dividend date.
29
American Beacon FundsSM
Notes to Financial Statements
January 31, 2015
Commission Recapture
The Funds have established brokerage commission recapture arrangements with certain brokers or dealers. If a Fund’s investment advisor chooses to execute a transaction through a participating broker, the broker rebates a portion of the commission back to the Fund. Any collateral benefit received through participation in the commission recapture program is directed exclusively to the Fund. This amount is reported with the net realized gain in the Fund’s Statements of Operations, if applicable.
Allocation of Income, Expenses, Gains, and Losses
Income, expenses (other than those attributable to a specific class), gains, and losses are allocated daily to each class of shares based upon the relative proportion of net assets represented by such class. Operating expenses directly attributable to a specific class are charged against the operations of that class.
Use of Estimates
The preparation of financial statements in conformity with U.S. GAAP requires management to make estimates and assumptions that affect the amounts reported in the financial statements and accompanying notes. Actual results may differ from those estimated.
Redemption Fees
All Classes of the Acadian and Earnest Partners Funds impose a 2% redemption fee on shares held for less than 90 days. The fee is deducted from the redemption proceeds and is intended to offset the trading costs, market impact, and other costs associated with short-term trading activity in the Funds. The “first-in, first-out” method is used to determine the holding period. The fee is allocated to all classes of these Funds pro-rata based on their respective net assets.
Other
Under the Trust’s organizational documents, its officers and trustees are indemnified against certain liability arising out of the performance of their duties to the Trust. In the normal course of business, the Trust enters into contracts that provide indemnification to the other party or parties against potential costs or liabilities. The Trust’s maximum exposure under these arrangements is dependent on claims that may be made in the future and, therefore, cannot be estimated. The Trust has had no prior claims or losses pursuant to any such agreement.
4. Securities and Other Investments
American Depositary Receipts (“ADRs”), Global Depositary Receipts (“GDRs”), and Non-Voting Depositary Receipts (“NVDRs”)
ADRs are depositary receipts for foreign issuers in registered form traded in U.S. securities markets. GDRs are in bearer form and traded in both the U.S. and European securities markets. NVDRs represent financial interests in an issuer but the holder is not entitled to any voting rights. Depositary receipts may not be denominated in the same currency as the securities into which they may be converted. Investing in depositary receipts entails substantially the same risks as direct investment in foreign securities. There is generally less publicly available information about foreign companies and there may be less governmental regulation and supervision of foreign stock exchanges, brokers and listed companies. In addition, such companies may use different accounting and financial standards (and certain currencies may become unavailable for transfer from a foreign currency), resulting in the Fund’s possible inability to convert immediately into U.S. currency proceeds realized upon the sale of portfolio securities of the affected foreign
30
American Beacon FundsSM
Notes to Financial Statements
January 31, 2015
companies. In addition, the Fund may invest in unsponsored depositary receipts, the issuers of which are not obligated to disclose material information about the underlying securities to investors in the United States. Ownership of unsponsored depositary receipts may not entitle the Fund to the same benefits and rights as ownership of a sponsored depositary receipt or the underlying security.
Restricted Securities
Certain Funds may invest in securities that are subject to legal or contractual restrictions on resale. These securities may be sold privately, but are required to be registered or exempted from such registration before being sold to the public. Private placement securities are generally considered to be restricted except for those securities traded between qualified institutional investors under the provisions of Rule 144A of the Securities Act of 1933. Disposal of restricted securities may involve time-consuming negotiations and expenses, and prompt sale at an acceptable price may be difficult to achieve. Restricted securities outstanding at the year ended January 31, 2015 are disclosed in the Notes to the Schedules of Investments.
Real Estate Investment Trusts
The Funds may own shares of real estate investment trusts (“REITs”) which report information on the source of their distributions annually. The Funds re-characterize distributions received from REIT investments based on information provided by the REITs into the following categories: ordinary income, long-term capital gains, and return of capital. If information is not available on a timely basis from the REITs, the re-characterization will be estimated based on available information which may include the previous year allocation. If new or additional information becomes available from the REITs at a later date, a re-characterization will be made the following year. These re-characterizations are not recorded for financial statement purposes, but as an adjustment to the calculation of taxable income.
Other Investment Company Securities and Other Exchange Traded Products
The Funds may invest in shares of other investment companies, including open-end funds, closed-end funds, business development companies, ETFs, unit investment trusts, and other investment companies of the Trust. The Funds may invest in investment company securities advised by the Manager or a sub-advisor. Investments in the securities of other investment companies may involve duplication of advisory fees and certain other expenses. By investing in another investment company, a Fund becomes a shareholder of that investment company. As a result, Fund shareholders indirectly will bear a Fund’s proportionate share of the fees and expenses paid by shareholders of the other investment company, in addition to the fees and expenses Fund shareholders directly bear in connection with the Fund’s own operations. These other fees and expenses are reflected as Acquired Fund Fees and Expenses and are included in the Fees and Expenses Table for the Fund in its Prospectus, if applicable. Investments in other investment companies may involve the payment of substantial premiums above the value of such issuer’s portfolio securities.
5. Financial Derivative Instruments
Futures Contracts
Futures contracts are contracts to buy or sell a standard quantity of securities at a specified price on a future date. The Funds may enter into financial futures contracts as a method for keeping assets readily convertible to cash if needed to meet shareholder redemptions or for other needs while maintaining exposure to the stock or bond market, as applicable. The primary risks associated with the use of futures contracts are the possibility of illiquid markets or imperfect correlation between the values of the contracts and the underlying securities, or that the counterparty will fail to perform its obligations.
Upon entering into a futures contract, the Funds are required to set aside or deposit with a broker an amount, termed the initial margin, which typically represents a portion of the face value of the futures
31
American Beacon FundsSM
Notes to Financial Statements
January 31, 2015
contract. A Fund usually reflects this amount on the Schedule of Investments as a U.S. Treasury Bill held as collateral for futures contracts or as Cash deposited with broker on the Statements of Assets and Liabilities. Payments to and from the broker, known as variation margin, are required to be made on a daily basis as the price of the futures contract fluctuates. Changes in initial settlement values are accounted for as unrealized appreciation (depreciation) until the contracts are terminated, at which time realized gains and losses are recognized. Futures contracts are valued at the most recent settlement price established each day by the exchange on which they are traded.
For the year ended January 31, 2015, the Funds entered into future contracts primarily for return enhancement, hedging and exposing cash to markets.
The Funds’ average futures contracts outstanding fluctuate throughout the operating year as required to meet strategic requirements. The following table illustrates the quarterly volume of futures contracts. For purpose of this disclosure, volume is measured by contracts outstanding at period end.
| | |
| | | Number of Futures Contracts Outstanding |
For the Quarter Ended | | January 31, 2015 |
Acadian Fund | | 7 |
Earnest Partners Fund | | 7 |
SGA Fund | | 3 |
The following is a summary of the Funds’ derivative financial instruments categorized by risk exposure (in thousands) (1):
Fair Values of financial derivative instruments on the Statements of Assets and Liabilities not accounted for as hedging instruments as of January 31, 2015:
| | | | | | | | | | | | | | | | |
Liabilities | | Derivative | | | Acadian Fund | | | Earnest
Partners Fund | | | SGA Fund | |
Payable for variation margin from open futures contracts(2) | | | Equity Contract | | | $ | 9 | | | $ | 10 | | | $ | 4 | |
The effect of financial derivative instruments on the Statements of Operations not accounted for as hedging instruments for the periods ended January 31, 2015:
| | | | | | | | | | |
Statements of Operations: | | Derivative | | | Acadian Fund | | Earnest
Partners Fund | | SGA Fund |
Net realized gain (loss) from futures contracts | | | Equity Contract | | | 39 | | 14 | | 12 |
| | | | | | | | | | | | | | | | |
Statements of Operations: | | Derivative | | | Acadian Fund | | | Earnest
Partners Fund | | | SGA Fund | |
Change in net unrealized appreciation or (depreciation) of futures contracts | | | Equity Contract | | | $ | 2 | | | $ | — | | | $ | 9 | |
| (1) | See Note 6 in the Notes to Financial Statements for additional information. |
| (2) | Includes cumulative appreciation or (depreciation) of futures contracts as reported in the Schedule of Investment footnotes. Only current day’s variation margin is reported within the Statements of Assets and Liabilities. |
6. Principal Risks
In the normal course of business the Fund trades financial instruments and enters into financial transactions where risk of potential loss exists. Security values fluctuate (market risk) and may decline due to factors affecting securities markets in general, particular industries represented in the securities markets or conditions specifically related to a particular company. Failure of the other party to a transaction to perform (credit and counterparty risk), for example by not making principal and interest payments when due, reduces the value of the issuer’s debt and could reduce the Fund’s income. Similar to credit risk, the Fund may be exposed to counterparty risk, or the risk that an institution or other entity with which the Funds have unsettled or open transactions will fail to make required payments or otherwise comply with the terms of the instrument, transaction or contract. The potential loss could exceed the value of the financial assets recorded
32
American Beacon FundsSM
Notes to Financial Statements
January 31, 2015
in the financial statements. Some of the Fund’s investments may be illiquid and the Fund may not be able to vary the portfolio investments in response to changes in economic and other conditions. If a Fund is required to liquidate all or a portion of its investments quickly, the Fund may realize significantly less than the value at which it previously recorded those investments.
Market Risks
The Fund’s investments in financial derivatives and other financial instruments expose the Fund to various risks such as, but not limited to, interest rate, foreign currency and equity risks.
Interest rate risk is the risk that fixed income securities will decline in value because of changes in interest rates. As nominal interest rates rise, the value of certain fixed income securities held by the Fund is likely to decrease. A nominal interest rate can be described as the sum of a real interest rate and an expected inflation rate. Fixed income securities with longer durations tend to be more sensitive to changes in interest rates, usually making them more volatile than securities with shorter durations. Duration is useful primarily as a measure of the sensitivity of a fixed income’s market price to interest rate (i.e. yield) movements.
If the Fund invests directly in foreign currencies or in securities that trade in, and receive revenues in, foreign currencies, or in financial derivatives that provide exposure to foreign currencies, they will be subject to the risk that those currencies will decline in value relative to the base currency of the Fund, or, in the case of hedging positions, that the Fund’s base currency will decline in value relative to the currency being hedged. Currency rates in foreign countries may fluctuate significantly over short periods of time for a number of reasons, including changes in interest rates, intervention (or the failure to intervene) by U.S. or foreign governments, central banks or supranational entities such as the International Monetary Fund, or by the imposition of currency controls or other political developments in the United States or abroad. As a result, the Fund’s investments in foreign currency denominated securities may reduce the returns of the Fund.
The fair values of equities, such as common stocks and preferred securities or equity related investments such as futures, may decline due to general market conditions which are not specifically related to a particular company, such as real or perceived adverse economic conditions, changes in the general outlook for corporate earnings, changes in interest or currency rates or adverse investor sentiment generally. They may also decline due to factors which affect a particular industry or industries, such as labor shortages or increased production costs and competitive conditions within an industry. Equity securities and equity related investments generally have greater market price volatility than fixed income securities.
Counterparty Credit Risk
A derivative contract may suffer a mark to market loss if the value of the contract decreases due to an unfavorable change in the market rates or values of the underlying instrument. Losses can also occur if the counterparty does not perform under the contract.
With exchange traded futures, there is less counterparty credit risk to the Funds since the exchange or clearinghouse, as counterparty to such instruments, guarantees against a possible default. The clearinghouse stands between the buyer and the seller of the contract; therefore, the credit risk is limited to failure of the clearinghouse. While offset rights may exist under applicable law, a Fund does not have a contractual right of offset against a clearing broker or clearinghouse in the event of a default (including the bankruptcy or insolvency) of the clearing broker or clearinghouse. Additionally, credit risk exists in exchange traded futures with respect to initial and variation margin that is held in a clearing broker’s customer accounts. While clearing brokers are required to segregate customer margin from their own assets, in the event that a clearing broker becomes insolvent or goes into bankruptcy and at that time there is a shortfall in the aggregate amount of margin held by the clearing broker for all its clients, typically the shortfall would be allocated on a pro rata basis across all the clearing broker’s customers, potentially resulting in losses to the Funds.
33
American Beacon FundsSM
Notes to Financial Statements
January 31, 2015
Cash collateral that has been pledged to cover obligations of the Funds and cash collateral received from the counterparty, if any, is reported separately on the Statements of Assets and Liabilities as Deposits with brokers for futures contracts and Payable to brokers for futures contracts, respectively. Non-cash collateral pledged by the Funds, if any, is noted in the Schedules of Investments. Generally, the amount of collateral due from or to a party is determined at the close of business of the Funds and additional required collateral is delivered to/pledged by the Funds on the next business day. To the extent amounts due to the Funds from its counterparties are not fully collateralized, contractually or otherwise, the Funds bear the risk of loss from counterparty non-performance. The Funds attempt to mitigate counterparty risk by only entering into agreements with counterparties that it believes have the financial resources to honor their obligations and by monitoring the financial stability of those counterparties.
Offsetting Assets and Liabilities
The Funds are parties to enforceable master netting agreements between brokers and counterparties, which provide for the right to offset under certain circumstances. The Funds employ multiple money managers and counterparties and have elected not to offset qualifying financial and derivative instruments on the Statements of Assets and Liabilities, as such all financial and derivative instruments are presented on a gross basis. The impacts of netting arrangements that provide the right to offset are detailed below. The net amount represents the net receivable or payable that would be due from or to the counterparty in the event of default. Exposure from borrowings and other financing agreements such as repurchase agreements can only be netted across transactions governed by the same Master Agreement with the same legal entity. All amounts reported below represent the balance as of January 31, 2015.
Acadian Fund
Offsetting of Financial Liabilities and Derivative Liabilities as of January 31, 2015:
| | | | | | | | | | | | |
Description | | Gross Amounts of
Recognized
Liabilities | | | Gross Amounts
Offset in the
Statement of Assets
and Liabilities | | | Net Amounts of Liabilities
Presented in the
Statement of Assets
and Liabilities | |
Futures Contracts(1) | | $ | (8,619 | ) | | $ | — | | | $ | (8,619 | ) |
Financial Liabilities, Derivative Liabilities, and Collateral Pledged by Counterparty as of January 31, 2015:
| | | | | | | | | | | | | | | | |
| | | Net amount of Assets
Presented in the Statement of
Assets and Liabilities | | | Gross Amounts Not Offset in the
Statement of Assets and Liabilities | | | | |
Counterparty | | | Financial
Instruments | | | Cash Collateral
Received | | | Net
Amount | |
Goldman Sachs & Co.(1) | | $ | (8,619 | ) | | $ | — | | | $ | — | | | $ | (8,619 | ) |
Earnest Partners Fund
Offsetting of Financial Liabilities and Derivative Liabilities as of January 31, 2015:
| | | | | | | | | | | | |
Description | | Gross Amounts of
Recognized
Liabilities | | | Gross Amounts
Offset in the
Statement of Assets
and Liabilities | | | Net Amounts of Liabilities
Presented in the
Statement of Assets
and Liabilities | |
Futures Contracts(1) | | $ | (9,590 | ) | | $ | — | | | $ | (9,590 | ) |
Financial Liabilities, Derivative Liabilities, and Collateral Pledged by Counterparty as of January 31, 2015:
| | | | | | | | | | | | | | | | |
| | | Net amount of Assets
Presented in the Statement of
Assets and Liabilities | | | Gross Amounts Not Offset in the
Statement of Assets and Liabilities | | | | |
Counterparty | | | Financial
Instruments | | | Cash Collateral
Received | | | Net
Amount | |
Goldman Sachs & Co.(1) | | $ | (9,590 | ) | | $ | — | | | $ | — | | | $ | (9,590 | ) |
34
American Beacon FundsSM
Notes to Financial Statements
January 31, 2015
SGA Fund
Offsetting of Financial Liabilities and Derivative Liabilities as of January 31, 2015:
| | | | | | | | | | | | |
Description | | Gross Amounts of
Recognized
Liabilities | | | Gross Amounts
Offset in the
Statement of Assets
and Liabilities | | | Net Amounts of Liabilities
Presented in the
Statement of Assets
and Liabilities | |
Futures Contract(1) | | $ | (4,420 | ) | | $ | — | | | $ | (4,420 | ) |
Financial Liabilities, Derivative Liabilities, and Collateral Pledged by Counterparty as of January 31, 2015:
| | | | | | | | | | | | | | | | |
| | | Net amount of Liabilities
Presented in the Statement
of Assets and Liabilities | | | Gross Amounts Not Offset in the
Statement of Assets and Liabilities | | | | |
Counterparty | | | Financial
Instruments | | | Cash Collateral
Received | | | Net
Amount | |
Goldman Sachs & Co.(1) | | $ | (4,420 | ) | | $ | — | | | $ | — | | | $ | (4,420 | ) |
| (1) | The securities presented here within are not subject to Master Netting Agreements. As such, this is disclosed for informational purposes only. |
7. Federal Income and Excise Taxes
It is the policy of each Fund to qualify as a regulated investment company (“RIC”), by complying with all applicable provisions of Subchapter M of the Internal Revenue Code, as amended, and to make distribution of taxable income sufficient to relieve it from substantially all federal income and excise taxes. For federal income tax purposes, each Fund is treated as a single entity for the purpose of determining such qualification.
The Funds do not have any unrecognized tax benefits in the accompanying financial statements. The tax years for the periods ended September 30, 2012 and 2013 for the SGA Fund and the periods ended January 31, 2014 and 2015 for Acadian, Earnest Partners, and SGA Funds, respectively, remains subject to examination by the Internal Revenue Service. If applicable, the Funds recognize interest accrued related to unrecognized tax benefits in interest expense and penalties in “Other expenses” on the Statements of Operations.
Dividends are categorized in accordance with income tax regulations which may treat certain transactions differently than U.S. GAAP. Accordingly, the character of distributions and composition of net assets for tax purposes may differ from those reflected in the accompanying financial statements.
A Fund may be subject to taxes imposed by countries in which it invests. Such taxes are generally based on returns of income earned or gains realized or repatriated. Taxes are accrued and applied to net investment income, net realized capital gains and net unrealized appreciation or depreciation, as applicable, as the income is earned or capital gains are recorded.
The tax character of distributions paid were as follows (in thousands):
| | | | | | | | | | | | | | | | |
| | | Acadian Fund | | | Earnest Partners Fund | |
| Distributions paid from: | | Year Ended
January 31,
2015 | | | From Sept. 27
to
January. 31,
2014 | | | Year Ended
January 31,
2015 | | | From Sept. 19
to
January. 31,
2014 | |
Ordinary income* | | | | | | | | | | | | | | | | |
Institutional Class | | $ | 146 | | | $ | 5 | | | $ | 12 | | | $ | — | |
Y Class | | | 47 | | | | — | | | | 4 | | | | — | |
Investor Class | | | 50 | | | | 1 | | | | 7 | | | | — | |
A Class | | | 38 | | | | — | | | | 1 | | | | — | |
C Class | | | 5 | | | | — | | | | 1 | | | | — | |
Long-term capital gains | | | | | | | | | | | | | | | | |
Institutional Class | | | 5 | | | | — | | | | — | | | | — | |
Y Class | | | 2 | | | | — | | | | — | | | | — | |
Investor Class | | | 2 | | | | — | | | | — | | | | — | |
A Class | | | 1 | | | | — | | | | — | | | | — | |
C Class | | | — | | | | — | | | | — | | | | — | |
| | | | | | | | | | | | | | | | |
Total distributions paid | | $ | 296 | | | $ | 6 | | | $ | 25 | | | $ | — | |
| | | | | | | | | | | | | | | | |
| * | For tax purposes, short-term capital gains are considered ordinary income distributions. |
35
American Beacon FundsSM
Notes to Financial Statements
January 31, 2015
| | | | | | | | | | | | |
| | | SGA Fund | |
| Distributions paid from: | | Year ended
January 31,
2015 | | | Four Months Ended
January 31,
2014 | | | Year Ended
September 30,
2013 | |
Ordinary income* | | | | | | | | | | | | |
Institutional Class | | $ | 46 | | | $ | — | | | $ | — | |
Y Class | | | 1 | | | | — | | | | — | |
Investor Class | | | 1 | | | | — | | | | — | |
A Class | | | 3 | | | | — | | | | — | |
C Class | | | 4 | | | | — | | | | — | |
Long-term capital gains | | | | | | | | | | | | |
Institutional Class | | | 106 | | | | 86 | | | | 37 | |
Y Class | | | 3 | | | | 2 | | | | — | |
Investor Class | | | 2 | | | | 2 | | | | — | |
A Class | | | 10 | | | | 7 | | | | — | |
C Class | | | 7 | | | | 2 | | | | — | |
| | | | | | | | | | | | |
Total distributions paid | | $ | 183 | | | $ | 99 | | | $ | 37 | |
| | | | | | | | | | | | |
| * | For tax purposes, short-term capital gains are considered ordinary income distributions. |
As of January 31, 2015, the components of distributable earnings or (deficit) on a tax basis were as follows (in thousands):
| | | | | | | | | | | | |
| | | Acadian Fund | | | Earnest
Partners Fund | | | SGA Fund | |
Cost basis of investments for federal income tax purposes | | $ | 26,156 | | | $ | 5,905 | | | $ | 5,639 | |
Unrealized appreciation | | | 1,867 | | | | 340 | | | | 757 | |
Unrealized depreciation | | | (1,958 | ) | | | (720 | ) | | | (242 | ) |
| | | | | | | | | | | | |
Net unrealized appreciation or (depreciation) | | | (91 | ) | | | (380 | ) | | | 515 | |
Undistributed ordinary income | | | — | | | | — | | | | 4 | |
Accumulated gain or (loss) | | | (161 | ) | | | (61 | ) | | | 91 | |
Other temporary differences | | | (2 | ) | | | — | | | | — | |
| | | | | | | | | | | | |
Distributable earnings or (deficits) | | $ | (254 | ) | | $ | (441 | ) | | $ | 610 | |
| | | | | | | | | | | | |
Financial reporting records are adjusted for permanent book/tax differences to reflect tax character. Financial records are not adjusted for temporary differences. The temporary differences between financial reporting and tax-basis reporting of unrealized appreciation or depreciation are attributable primarily to the tax deferral of losses from wash sales, the realization for tax purposes of unrealized gain (losses) on certain derivative instruments, the realization for tax purposes of unrealized gain (losses) on investments in passive foreign investment companies, and deferral of late year losses.
Due to inherent differences in the recognition of income, expenses and realized gains (losses) under U.S. GAAP and federal income tax regulations, permanent differences between book and tax reporting have been identified and appropriately reclassified on the Statements of Assets and Liabilities.
Accordingly, the following amounts represent current year permanent differences derived from foreign currency, gains (losses) from sales of investments in passive foreign investment companies, and dividends that have been reclassified as of January 31, 2015 (in thousands):
| | | | | | | | | | | | |
| | | Acadian Fund | | | Earnest
Partners Fund | | | SGA Fund | |
Paid-in-capital | | $ | (2 | ) | | $ | (1 | ) | | $ | — | |
Undistributed net investment income (loss) | | | 28 | | | | (1 | ) | | | — | |
Accumulated net realized gain (loss) | | | (26 | ) | | | 2 | | | | — | |
Unrealized appreciation or depreciation of investments, futures contracts, and foreign currency contracts | | | — | | | | — | | | | — | |
36
American Beacon FundsSM
Notes to Financial Statements
January 31, 2015
Under the Regulated Investment Company Modernization Act of 2010 (the “RIC MOD”), net capital losses recognized by Funds are carried forward indefinitely and retain their character as short-term and/or long-term losses.
Losses incurred that will be carried forward under the provisions of RIC MOD for the periods ended January 31, 2015 are as follows (in thousands):
| | | | | | | | | | | | |
| | | Loss Carryforward Character | | | | |
Fund | | Short-Term | | | Long-Term | | | Total | |
Earnest Partners Fund | | $ | 61 | | | $ | — | | | $ | 61 | |
Acadian Fund utilized $26 of short-term and $26 of long-term capital loss carryforwards, and Earnest Partners Fund utilized $21 of short-term and $15 of long-term capital loss carryforwards (in thousands).
The Funds are permitted for tax purposes to defer into their next fiscal year qualified late year losses. Qualified late year capital losses are any capital losses incurred after October 31 through the Funds’ fiscal year January 31, 2015. Qualified late year ordinary losses are specified losses generally incurred after October 31 and ordinary losses incurred after December 31 through the end of the Funds’ fiscal year, January 31, 2015. For the periods ended January 31, 2015, the Acadian Fund deferred $8 of qualified late year ordinary losses, and $72 of qualified late year short-term capital losses, and $80 of qualified late year long-term capital losses to February 1, 2015 (in thousands).
8. Investment Transactions
The aggregate cost of purchases and proceeds from sales of investments, other than short-term obligations, for the periods ended January 31, 2015 were as follows (in thousands):
| | | | | | | | | | | | |
| | | Acadian Fund | | | Earnest
Partners Fund | | | SGA Fund | |
Purchases | | $ | 17,626 | | | $ | 2,775 | | | $ | 2,529 | |
Sales and Maturities | | | 4,393 | | | | 817 | | | | 2,128 | |
9. Capital Share Transactions
The tables below summarize the activity in capital shares for each Class of the Fund (shares and dollars in thousands):
For the Year ended January 31, 2015
| | | | | | | | | | | | | | | | | | | | | | | | |
| | | Institutional Class | | | Y Class | | | Investor Class | |
Acadian Emerging Markets Managed Volatility Fund | | Shares | | | Amount | | | Shares | | | Amount | | | Shares | | | Amount | |
Shares sold | | | 240 | | | $ | 2,535 | | | | 452 | | | $ | 4,832 | | | | 344 | | | $ | 3,650 | |
Reinvestment of dividends | | | 15 | | | | 151 | | | | 5 | | | | 49 | | | | 5 | | | | 52 | |
Shares redeemed | | | (17 | ) | | | (181 | ) | | | (57 | ) | | | (593 | ) | | | (35 | ) | | | (365 | ) |
| | | | | | | | | | | | | | | | | | | | | | | | |
Net increase in shares outstanding | | | 238 | | | $ | 2,505 | | | | 400 | | | $ | 4,288 | | | | 314 | | | $ | 3,337 | |
| | | | | | | | | | | | | | | | | | | | | | | | |
| | | | | | | | | | | | | | | | |
| | | A Class | | | C Class | |
Acadian Emerging Markets Managed Volatility Fund | | Shares | | | Amount | | | Shares | | | Amount | |
Shares sold | | | 271 | | | $ | 2,856 | | | | 53 | | | $ | 558 | |
Reinvestment of dividends | | | 4 | | | | 37 | | | | — | | | | 5 | |
Shares redeemed | | | (17 | ) | | | (173 | ) | | | (7 | ) | | | (72 | ) |
| | | | | | | | | | | | | | | | |
Net increase in shares outstanding | | | 258 | | | $ | 2,720 | | | | 46 | | | $ | 491 | |
| | | | | | | | | | | | | | | | |
37
American Beacon FundsSM
Notes to Financial Statements
January 31, 2015
| | | | | | | | | | | | | | | | | | | | | | | | |
| | | Institutional Class | | | Y Class | | | Investor Class | |
Earnest Partners Emerging Markets Equity Fund | | Shares | | | Amount | | | Shares | | | Amount | | | Shares | | | Amount | |
Shares sold | | | — | | | $ | — | | | | 91 | | | $ | 909 | | | | 191 | | | $ | 1,905 | |
Reinvestment of dividends | | | 1 | | | | 12 | | | | 1 | | | | 4 | | | | 1 | | | | 7 | |
Shares redeemed | | | (51 | ) | | | (478 | ) | | | — | | | | — | | | | (44 | ) | | | (420 | ) |
| | | | | | | | | | | | | | | | | | | | | | | | |
Net increase (decrease) in shares outstanding | | | (50 | ) | | $ | (466 | ) | | | 92 | | | $ | 913 | | | | 148 | | | $ | 1,492 | |
| | | | | | | | | | | | | | | | | | | | | | | | |
| | | | | | | | | | | | | | | | |
| | | A Class | | | C Class | |
Earnest Partners Emerging Markets Equity Fund | | Shares | | | Amount | | | Shares | | | Amount | |
Shares sold | | | — | | | $ | 1 | | | | — | | | $ | — | |
Reinvestment of dividends | | | — | | | | 1 | | | | — | | | | 1 | |
Shares redeemed | | | — | | | | — | | | | — | | | | — | |
| | | | | | | | | | | | | | | | |
Net increase in shares outstanding | | | — | | | $ | 2 | | | | — | | | $ | 1 | |
| | | | | | | | | | | | | | | | |
| | | | | | | | | | | | | | | | | | | | | | | | |
| | | Institutional Class | | | Y Class | | | Investor Class | |
SGA Global Growth Fund | | Shares | | | Amount | | | Shares | | | Amount | | | Shares | | | Amount | |
Shares sold | | | 11 | | | $ | 144 | | | | 1 | | | $ | 13 | | | | — | | | $ | 3 | |
Reinvestment of dividends | | | 11 | | | | 151 | | | | — | | | | 4 | | | | — | | | | 3 | |
Shares redeemed | | | (5 | ) | | | (63 | ) | | | — | | | | (5 | ) | | | — | | | | (7 | ) |
| | | | | | | | | | | | | | | | | | | | | | | | |
Net increase (decrease) in shares outstanding | | | 17 | | | $ | 232 | | | | 1 | | | $ | 12 | | | | — | | | $ | (1 | ) |
| | | | | | | | | | | | | | | | | | | | | | | | |
| | | | | | | | | | | | | | | | |
| | | A Class | | | C Class | |
SGA Global Growth Fund | | Shares | | | Amount | | | Shares | | | Amount | |
Shares sold | | | 4 | | | $ | 59 | | | | 21 | | | $ | 288 | |
Reinvestment of dividends | | | 1 | | | | 13 | | | | 1 | | | | 8 | |
Shares redeemed | | | — | | | | (8 | ) | | | (1 | ) | | | (10 | ) |
| | | | | | | | | | | | | | | | |
Net increase in shares outstanding | | | 5 | | | $ | 64 | | | | 21 | | | $ | 286 | |
| | | | | | | | | | | | | | | | |
For the Periods ended January 31, 2014
| | | | | | | | | | | | | | | | | | | | | | | | |
| | | Institutional Class | | | Y Class | | | Investor Class | |
Acadian Emerging Markets Managed Volatility Fund | | Shares | | | Amount | | | Shares | | | Amount | | | Shares | | | Amount | |
Shares sold | | | 579 | | | $ | 5,798 | | | | 41 | | | $ | 420 | | | | 129 | | | $ | 1,306 | |
Redemption fees | | | — | | | | — | | | | — | | | | — | | | | — | | | | — | |
Reinvestment of dividends | | | — | | | | 5 | | | | — | | | | — | | | | — | | | | 1 | |
Shares redeemed | | | — | | | | — | | | | — | | | | (4 | ) | | | (1 | ) | | | (6 | ) |
| | | | | | | | | | | | | | | | | | | | | | | | |
Net increase in shares outstanding | | | 579 | | | $ | 5,803 | | | | 41 | | | $ | 416 | | | | 128 | | | $ | 1,301 | |
| | | | | | | | | | | | | | | | | | | | | | | | |
| | | | | | | | | | | | | | | | | | | | | | | | |
| | | A Class | | | C Class | | | Total | |
Acadian Emerging Markets Managed Volatility Fund | | Shares | | | Amount | | | Shares | | | Amount | | | Shares | | | Amount | |
Shares sold | | | 48 | | | $ | 475 | | | | 6 | | | $ | 54 | | | | 803 | | | $ | 8,053 | |
Redemption fees | | | — | | | | — | | | | — | | | | — | | | | — | | | | — | |
Reinvestment of dividends | | | — | | | | — | | | | — | | | | — | | | | — | | | | 6 | |
Shares redeemed | | | — | | | | — | | | | — | | | | — | | | | (1 | ) | | | (10 | ) |
| | | | | | | | | | | | | | | | | | | | | | | | |
Net increase in shares outstanding | | | 48 | | | $ | 475 | | | | 6 | | | $ | 54 | | | | 802 | | | $ | 8,049 | |
| | | | | | | | | | | | | | | | | | | | | | | | |
| | | | | | | | | | | | | | | | | | | | | | | | |
| | | Institutional Class | | | Y Class | | | Investor Class | |
Earnest Partners Emerging Markets Equity Fund | | Shares | | | Amount | | | Shares | | | Amount | | | Shares | | | Amount | |
Shares sold | | | 198 | | | $ | 1,932 | | | | 3 | | | $ | 30 | | | | 1 | | | $ | 12 | |
Redemption fees | | | — | | | | — | | | | — | | | | — | | | | — | | | | — | |
Reinvestment of dividends | | | — | | | | — | | | | — | | | | — | | | | — | | | | — | |
Shares redeemed | | | (101 | ) | | | (942 | ) | | | — | | | | — | | | | — | | | | — | |
| | | | | | | | | | | | | | | | | | | | | | | | |
Net increase in shares outstanding | | | 97 | | | $ | 990 | | | | 3 | | | $ | 30 | | | | 1 | | | $ | 12 | |
| | | | | | | | | | | | | | | | | | | | | | | | |
38
American Beacon FundsSM
Notes to Financial Statements
January 31, 2015
| | | | | | | | | | | | | | | | | | | | | | | | |
| | | A Class | | | C Class | | | Total | |
Earnest Partners Emerging Markets Equity Fund | | Shares | | | Amount | | | Shares | | | Amount | | | Shares | | | Amount | |
Shares sold | | | — | | | $ | — | | | | — | | | $ | — | | | | 202 | | | $ | 1,974 | |
Redemption fees | | | — | | | | — | | | | — | | | | — | | | | — | | | | — | |
Reinvestment of dividends | | | — | | | | — | | | | — | | | | — | | | | — | | | | — | |
Shares redeemed | | | — | | | | — | | | | — | | | | — | | | | (101 | ) | | | (942 | ) |
| | | | | | | | | | | | | | | | | | | | | | | | |
Net increase in shares outstanding | | | — | | | $ | — | | | | — | | | $ | — | | | | 101 | | | $ | 1,032 | |
| | | | | | | | | | | | | | | | | | | | | | | | |
| | | | | | | | | | | | | | | | | | | | | | | | |
| | | Institutional Class | | | Y Class | | | Investor Class | |
SGA Global Growth Fund | | Shares | | | Amount | | | Shares | | | Amount | | | Shares | | | Amount | |
Shares sold | | | 22 | | | $ | 301 | | | | 8 | | | $ | 105 | | | | 8 | | | $ | 107 | |
Reinvestment of dividends | | | 6 | | | | 86 | | | | — | | | | 2 | | | | — | | | | 2 | |
Shares redeemed | | | (1 | ) | | | (9 | ) | | | — | | | | — | | | | — | | | | — | |
| | | | | | | | | | | | | | | | | | | | | | | | |
Net increase in shares outstanding | | | 27 | | | $ | 378 | | | | 8 | | | $ | 107 | | | | 8 | | | $ | 109 | |
| | | | | | | | | | | | | | | | | | | | | | | | |
| | | | | | | | | | | | | | | | | | | | | | | | |
| | | A Class | | | C Class | | | Total | |
SGA Global Growth Fund | | Shares | | | Amount | | | Shares | | | Amount | | | Shares | | | Amount | |
Shares sold | | | 27 | | | $ | 371 | | | | 8 | | | $ | 110 | | | | 73 | | | $ | 994 | |
Reinvestment of dividends | | | 1 | | | | 7 | | | | — | | | | 2 | | | | 8 | | | | 99 | |
Shares redeemed | | | — | | | | — | | | | — | | | | — | | | | (2 | ) | | | (9 | ) |
| | | | | | | | | | | | | | | | | | | | | | | | |
Net increase in shares outstanding | | | 28 | | | $ | 378 | | | | 8 | | | $ | 112 | | | | 81 | | | $ | 1,084 | |
| | | | | | | | | | | | | | | | | | | | | | | | |
For the Year Ended September 30, 2013
| | | | | | | | |
| | | Institutional Class | |
SGA Global Growth Fund | | Shares | | | Amount | |
Shares sold | | | 158 | | | $ | 1,984 | |
Reinvestment of dividends | | | 3 | | | | 37 | |
Shares redeemed | | | — | | | | (1 | ) |
| | | | | | | | |
Net increase in shares outstanding | | | 161 | | | $ | 2,020 | |
| | | | | | | | |
10. Subsequent Event
Agreement and Plan of Merger
On November 20, 2014, Lighthouse Holdings Parent, Inc. (“LHPI”), the indirect parent company of American Beacon Advisors, Inc., the Trusts’ investment manager, entered into an Agreement and Plan of Merger pursuant to which LHPI agreed to be acquired by investment funds managed by Kelso & Company, L.P. and Estancia Capital Management, LLC, both of which are private equity firms (“Transaction”). The Transaction is expected to close in the second calendar quarter of 2015, subject to customary closing conditions, including obtaining necessary client consents and approval from the Funds’ shareholders. There can be no assurance that the Transaction will be consummated as contemplated or that necessary conditions will be satisfied.
This change in control is deemed to be an “assignment” under the Investment Company Act of 1940 (the “1940 Act”) of the Trusts’ existing investment management agreement with the Manager and the sub-advisory agreements between the Trusts, the Manager, and each sub-advisor to the Funds and will result in automatic termination of each agreement. A new investment management agreement has been submitted to the Funds’ shareholders for approval and the Funds’ Board of Trustees approved new agreements with each sub-advisor under substantially the same terms as the current agreements.
The Transaction is not expected to result in any change in the portfolio management of the Fund or in the Fund’s investment objectives or policies.
39
American Beacon Acadian Emerging Markets Managed Volatility FundSM
Financial Highlights
(For a share outstanding throughout the period)
| | | | | | | | | | | | | | | | | | | | | | | | |
| | | Institutional Class | | | Y Class | | | Investor Class | |
| | | Year
ended
Jan. 31,
2015 | | | Sept. 27A
to
Jan. 31,
2014 | | | Year
ended
Jan. 31,
2015 | | | Sept. 27A
to
Jan. 31,
2014 | | | Year
ended
Jan. 31,
2015 | | | Sept. 27A
to
Jan. 31,
2014 | |
Net asset value, beginning of period | | $ | 9.59 | | | $ | 10.00 | | | $ | 9.59 | | | $ | 10.00 | | | $ | 9.58 | | | $ | 10.00 | |
| | | | | | | | | | | | | | | | | | | | | | | | |
Income from investment operations: | | | | | | | | | | | | | | | | | | | | | | | | |
Net investment income (loss) | | | 0.13 | | | | 0.02 | | | | 0.04 | | | | 0.01 | | | | 0.07 | | | | 0.00 | B |
Net gains (losses) on investments (both realized and unrealized) | | | 0.64 | | | | (0.42 | ) | | | 0.71 | | | | (0.41 | ) | | | 0.66 | | | | (0.41 | ) |
| | | | | | | | | | | | | | | | | | | | | | | | |
Total income (loss) from investment operations | | | 0.77 | | | | (0.40 | ) | | | 0.75 | | | | (0.40 | ) | | | 0.73 | | | | (0.41 | ) |
| | | | | | | | | | | | | | | | | | | | | | | | |
Less distributions: | | | | | | | | | | | | | | | | | | | | | | | | |
Dividends from net investment income | | | (0.12 | ) | | | (0.01 | ) | | | (0.12 | ) | | | (0.01 | ) | | | (0.12 | ) | | | (0.01 | ) |
Distributions from net realized gains | | | — | | | | — | | | | — | | | | — | | | | — | | | | — | |
| | | | | | | | | | | | | | | | | | | | | | | | |
Total distributions | | | (0.12 | ) | | | (0.01 | ) | | | (0.12 | ) | | | (0.01 | ) | | | (0.12 | ) | | | (0.01 | ) |
| | | | | | | | | | | | | | | | | | | | | | | | |
Redemption fees added to beneficial interests B | | | — | | | | — | | | | — | | | | — | | | | — | | | | — | |
| | | | | | | | | | | | | | | | | | | | | | | | |
Net asset value, end of period | | $ | 10.24 | | | $ | 9.59 | | | $ | 10.22 | | | $ | 9.59 | | | $ | 10.19 | | | $ | 9.58 | |
| | | | | | | | | | | | | | | | | | | | | | | | |
Total return C | | | 8.04 | % | | | (4.05 | )%D | | | 7.83 | % | | | (4.05 | )%D | | | 7.63 | % | | | (4.15 | )%D |
| | | | | | | | | | | | | | | | | | | | | | | | |
Ratios and supplemental data: | | | | | | | | | | | | | | | | | | | | | | | | |
Net assets, end of period (in thousands) | | $ | 13,080 | | | $ | 9,969 | | | $ | 4,604 | | | $ | 489 | | | $ | 4,612 | | | $ | 1,326 | |
Ratios to average net assets: | | | | | | | | | | | | | | | | | | | | | | | | |
Expenses, before reimbursements | | | 2.26 | % | | | 4.20 | %E | | | 2.12 | % | | | 6.19 | %E | | | 2.42 | % | | | 5.46 | %E |
Expenses, net of reimbursements | | | 1.35 | % | | | 1.35 | %E | | | 1.45 | % | | | 1.45 | %E | | | 1.73 | % | | | 1.73 | %E |
Net investment income (loss), before expense reimbursements | | | 0.44 | % | | | (2.30 | )%E | | | 0.01 | % | | | (4.30 | )%E | | | 0.12 | % | | | (3.60 | )%E |
Net investment income (loss), net of reimbursements | | | 1.35 | % | | | 0.55 | %E | | | 0.68 | % | | | 0.44 | %E | | | 0.81 | % | | | 0.13 | %E |
Portfolio turnover rate | | | 22 | % | | | 9 | %F | | | 22 | % | | | 9 | %F | | | 22 | % | | | 9 | %F |
| A | Commencement of operations. |
| B | Amount represents less than $0.01 per share. |
| C | Based on net asset value, which does not reflect the sales charge, redemption fee, or contingent deferred sales charge, if applicable. May include adjustments in accordance with accounting principles generally accepted in the United States of America and as such, the net asset value for reporting purposes and the returns based upon those net asset values may differ from the net asset value and returns for shareholder transactions. |
| F | Portfolio turnover rate is for the period from September 27, 2013 through January 31, 2014 and is not annualized. |
40
American Beacon Acadian Emerging Markets Managed Volatility FundSM
Financial Highlights
(For a share outstanding throughout the period)
| | | | | | | | | | | | | | |
| A Class | | | C Class | |
Year
ended
Jan. 31,
2015 | | | Sept. 27A
to
Jan. 31,
2014 | | | Year
ended
Jan. 31,
2015 | | | Sept. 27A
to
Jan. 31,
2014 | |
| $ | 9.58 | | | $ | 10.00 | | | $ | 9.55 | | | $ | 10.00 | |
| | | | | | | | | | | | | | |
| | | | | | | | | | | | | | | |
| | 0.06 | | | | 0.00 | B | | | 0.02 | | | | (0.01 | ) |
| | 0.66 | | | | (0.41 | ) | | | 0.62 | | | | (0.43 | ) |
| | | | | | | | | | | | | | |
| | 0.72 | | | | (0.41 | ) | | | 0.64 | | | | (0.44 | ) |
| | | | | | | | | | | | | | |
| | | | | | | | | | | | | | | |
| | (0.12 | ) | | | (0.01 | ) | | | (0.09 | ) | | | (0.01 | ) |
| | — | | | | — | | | | — | | | | — | |
| | | | | | | | | | | | | | |
| | (0.12 | ) | | | (0.01 | ) | | | (0.09 | ) | | | (0.01 | ) |
| | | | | | | | | | | | | | |
| | — | | | | — | | | | — | | | | — | |
| | | | | | | | | | | | | | |
| $ | 10.18 | | | $ | 9.58 | | | $ | 10.10 | | | $ | 9.55 | |
| | | | | | | | | | | | | | |
| | 7.53 | % | | | (4.15 | )%D | | | 6.66 | % | | | (4.45 | )%D |
| | | | | | | | | | | | | | |
| | | | | | | | | | | | | | | |
| $ | 3,215 | | | $ | 554 | | | $ | 623 | | | $ | 149 | |
| | | | | | | | | | | | | | | |
| | 2.49 | % | | | 7.71 | %E | | | 3.26 | % | | | 10.04 | %E |
| | 1.77 | % | | | 1.85 | %E | | | 2.52 | % | | | 2.60 | %E |
| | 0.09 | % | | | (5.92 | )%E | | | (0.90 | )% | | | (8.13 | )%E |
| | 0.81 | % | | | (0.07 | )%E | | | (0.16 | )% | | | (0.68 | )%E |
| | 22 | % | | | 9 | %F | | | 22 | % | | | 9 | %F |
41
American Beacon Earnest Partners Emerging Markets Equity FundSM
Financial Highlights
(For a share outstanding throughout the period)
| | | | | | | | | | | | | | | | | | | | | | | | |
| | | Institutional Class | | | Y Class | | | Investor Class | |
| | | Year
ended
Jan. 31,
2015 | | | Sept. 19A
to
Jan. 31,
2014 | | | Year
ended
Jan. 31,
2015 | | | Sept. 19A
to
Jan. 31,
2014 | | | Year
ended
Jan. 31,
2015 | | | Sept. 19A
to
Jan. 31,
2014 | |
Net asset value, beginning of period | | $ | 8.89 | | | $ | 10.00 | | | $ | 8.88 | | | $ | 10.00 | | | $ | 8.87 | | | $ | 10.00 | |
| | | | | | | | | | | | | | | | | | | | | | | | |
Income from investment operations: | | | | | | | | | | | | | | | | | | | | | | | | |
Net investment income (loss) | | | 0.06 | | | | (0.02 | ) | | | 0.05 | | | | (0.02 | ) | | | 0.05 | | | | (0.03 | ) |
Net gains (losses) on investments (both realized and unrealized) | | | 0.43 | | | | (1.09 | ) | | | 0.44 | | | | (1.10 | ) | | | 0.42 | | | | (1.10 | ) |
| | | | | | | | | | | | | | | | | | | | | | | | |
Total income (loss) from investment operations | | | 0.49 | | | | (1.11 | ) | | | 0.49 | | | | (1.12 | ) | | | 0.47 | | | | (1.13 | ) |
| | | | | | | | | | | | | | | | | | | | | | | | |
Less distributions: | | | | | | | | | | | | | | | | | | | | | | | | |
Dividends from net investment income | | | (0.04 | ) | | | — | | | | (0.04 | ) | | | — | | | | (0.04 | ) | | | — | |
Distributions from net realized gains | | | — | | | | — | | | | — | | | | — | | | | — | | | | — | |
| | | | | | | | | | | | | | | | | | | | | | | | |
Total distributions | | | (0.04 | ) | | | — | | | | (0.04 | ) | | | — | | | | (0.04 | ) | | | — | |
| | | | | | | | | | | | | | | | | | | | | | | | |
Redemption fees added to beneficial interestsB | | | — | | | | — | | | | — | | | | — | | | | — | | | | — | |
| | | | | | | | | | | | | | | | | | | | | | | | |
Net asset value, end of period | | $ | 9.34 | | | $ | 8.89 | | | $ | 9.33 | | | $ | 8.88 | | | $ | 9.30 | | | $ | 8.87 | |
| | | | | | | | | | | | | | | | | | | | | | | | |
Total return C | | | 5.51 | % | | | (11.10 | )%D | | | 5.52 | % | | | (11.20 | )%D | | | 5.30 | % | | | (11.30 | )%D |
| | | | | | | | | | | | | | | | | | | | | | | | |
Ratios and supplemental data: | | | | | | | | | | | | | | | | | | | | | | | | |
Net assets, end of period (in thousands) | | $ | 2,872 | | | $ | 3,175 | | | $ | 979 | | | $ | 116 | | | $ | 1,485 | | | $ | 100 | |
Ratios to average net assets: | | | | | | | | | | | | | | | | | | | | | | | | |
Expenses, before reimbursements | | | 5.26 | % | | | 10.52 | %E | | | 4.08 | % | | | 14.61 | %E | | | 4.38 | % | | | 15.15 | %E |
Expenses, net of reimbursements | | | 1.35 | % | | | 1.35 | %E | | | 1.45 | % | | | 1.45 | %E | | | 1.73 | % | | | 1.73 | %E |
Net investment (loss), before expense reimbursements | | | (3.26 | )% | | | (9.70 | )%E | | | (2.14 | )% | | | (13.67 | )%E | | | (2.33 | )% | | | (14.26 | )%E |
Net investment income (loss), net of reimbursements | | | 0.65 | % | | | (0.53 | )%E | | | 0.49 | % | | | (0.51 | )%E | | | 0.32 | % | | | (0.85 | )%E |
Portfolio turnover rate | | | 17 | % | | | 28 | %F | | | 17 | % | | | 28 | %F | | | 17 | % | | | 28 | %F |
| A | Commencement of operations. |
| B | Amounts represent less than $0.01 per share. |
| C | Based on net asset value, which does not reflect the sales charge, redemption fee, or contingent deferred sales charge, if applicable. May include adjustments in accordance with accounting principles generally accepted in the United States of America and as such, the net asset value for reporting purposes and the returns based upon those net asset values may differ from the net asset value and returns for shareholder transactions. |
| F | Portfolio turnover rate is for the period from September 19, 2013 through January 31, 2014 and is not annualized. |
42
American Beacon Earnest Partners Emerging Markets Equity FundSM
Financial Highlights
(For a share outstanding throughout the period)
| | | | | | | | | | | | | | |
| A Class | | | C Class | |
Year
ended
Jan. 31,
2015 | | | Sept. 19A
to
Jan. 31,
2014 | | | Year
ended
Jan. 31,
2015 | | | Sept. 19A
to
Jan. 31,
2014 | |
| $ | 8.87 | | | $ | 10.00 | | | $ | 8.85 | | | $ | 10.00 | |
| | | | | | | | | | | | | | |
| | | | | | | | | | | | | | | |
| | 0.02 | | | | (0.04 | ) | | | (0.05 | ) | | | (0.06 | ) |
| | 0.44 | | | | (1.09 | ) | | | 0.43 | | | | (1.09 | ) |
| | | | | | | | | | | | | | |
| | 0.46 | | | | (1.13 | ) | | | 0.38 | | | | (1.15 | ) |
| | | | | | | | | | | | | | |
| | | | | | | | | | | | | | | |
| | (0.04 | ) | | | — | | | | (0.04 | ) | | | — | |
| | — | | | | — | | | | — | | | | — | |
| | | | | | | | | | | | | | |
| | (0.04 | ) | | | — | | | | (0.04 | ) | | | — | |
| | | | | | | | | | | | | | |
| | — | | | | — | | | | — | | | | — | |
| | | | | | | | | | | | | | |
| $ | 9.29 | | | $ | 8.87 | | | $ | 9.19 | | | $ | 8.85 | |
| | | | | | | | | | | | | | |
| | 5.19 | % | | | (11.30 | )%D | | | 4.29 | % | | | (11.50 | )%D |
| | | | | | | | | | | | | | |
| | | | | | | | | | | | | | | |
| $ | 94 | | | $ | 89 | | | $ | 92 | | | $ | 89 | |
| | | | | | | | | | | | | | | |
| | 5.55 | % | | | 15.21 | %E | | | 6.31 | % | | | 15.97 | %E |
| | 1.79 | % | | | 1.85 | %E | | | 2.54 | % | | | 2.60 | %E |
| | (3.54 | )% | | | (14.35 | )%E | | | (4.29 | )% | | | (15.10 | )%E |
| | 0.22 | % | | | (0.99 | )%E | | | (0.53 | )% | | | (1.74 | )%E |
| | 17 | % | | | 28 | %F | | | 17 | % | | | 28 | %F |
43
American Beacon SGA Global Growth FundSM
Financial Highlights
(For a share outstanding throughout the period)
| | | | | | | | | | | | | | | | | | | | |
| | | Institutional Class | |
| | | Year
Ended
Jan. 31,
2015 | | | Four
Months
Ended
Jan. 31,
2014 | | | Year Ended
September 30, | | | Dec. 31E
to
Sept. 30,
2011 | |
| | | | 2013 | | | 2012 | | |
Net asset value, beginning of period | | $ | 13.05 | | | $ | 13.15 | | | $ | 12.04 | | | $ | 9.48 | | | $ | 10.00 | |
| | | | | | | | | | | | | | | | | | | | |
Income from investment operations: | | | | | | | | | | | | | | | | | | | | |
Net investment income (loss) | | | 0.06 | | | | 0.01 | | | | (0.04 | )F | | | (0.05 | )F | | | (0.04 | )F |
Net gains (losses) on investments (both realized and unrealized) | | | 0.72 | | | | 0.15 | | | | 1.36 | | | | 2.61 | | | | (0.48 | ) |
| | | | | | | | | | | | | | | | | | | | |
Total income (loss) from investment operations | | | 0.78 | | | | 0.16 | | | | 1.32 | | | | 2.56 | | | | (0.52 | ) |
| | | | | | | | | | | | | | | | | | | | |
Less distributions: | | | | | | | | | | | | | | | | | | | | |
Dividends from net investment income | | | (0.03 | ) | | | — | | | | — | | | | — | | | | — | |
Distributions from net realized gains | | | (0.37 | ) | | | (0.26 | ) | | | (0.21 | ) | | | — | | | | — | |
| | | | | | | | | | | | | | | | | | | | |
Total distributions | | | (0.40 | ) | | | (0.26 | ) | | | (0.21 | ) | | | — | | | | — | |
| | | | | | | | | | | | | | | | | | | | |
Net asset value, end of period | | $ | 13.43 | | | $ | 13.05 | | | $ | 13.15 | | | $ | 12.04 | | | $ | 9.48 | |
| | | | | | | | | | | | | | | | | | | | |
Total return A | | | 5.98 | % | | | 1.13 | %B | | | 11.21 | %H | | | 27.00 | %H | | | (5.20 | )%BH |
| | | | | | | | | | | | | | | | | | | | |
Ratios and supplemental data: | | | | | | | | | | | | | | | | | | | | |
Net assets, end of period (in thousands) | | $ | 5,106 | | | $ | 4,738 | | | $ | 4 | | | $ | 2 | | | $ | 1 | |
Ratios to average net assets: | | | | | | | | | | | | | | | | | | | | |
Expenses, before reimbursements | | | 3.82 | % | | | 5.28 | %C | | | 8.00 | % | | | 12.02 | % | | | 28.14 | %C |
Expenses, net of reimbursements | | | 0.98 | % | | | 1.00 | %C | | | 1.75 | % | | | 1.75 | % | | | 1.74 | %C |
Net investment (loss), before expense reimbursements | | | (2.41 | )% | | | (4.12 | )%C | | | (6.56 | )% | | | (10.76 | )% | | | (26.92 | )%C |
Net investment income (loss), net of reimbursements | | | 0.42 | % | | | 0.16 | %C | | | (0.31 | )% | | | (0.49 | )% | | | (0.52 | )%C |
Portfolio turnover rate | | | 38 | % | | | 15 | %G | | | 39 | % | | | 41 | % | | | 48 | % |
| A | Based on net asset value, which does not reflect the sales charge, redemption fee, or contingent deferred sales charge, if applicable. May include adjustments in accordance with accounting principles generally accepted in the United States of America and as such, the net asset value for reporting purposes and the returns based upon those net asset values may differ from the net asset value and returns for shareholder transactions. |
| D | Commencement of operations. |
| E | Commencement of operations for the Predecessor Fund is December 31, 2010. |
| F | The Predecessor Fund calculated the change in undistributed net investment income based on average shares outstanding during the period. |
| G | Portfolio turnover rate is for the period from October 1, 2013 through January 31, 2014 and is not annualized. |
| H | Total returns would have been lower had expenses not been waived or absorbed by the Predecessor Fund. Returns shown do not reflect the deduction of taxes that a shareholder would pay on Fund distribution or the redemption of Fund shares. |
| I | Amounts represent less than $0.01 per share. |
44
American Beacon SGA Global Growth FundSM
Financial Highlights
(For a share outstanding throughout the period)
| | | | | | | | | | | | | | | | | | | | | | | | | | | | | | |
| Y Class | | | Investor Class | | | A Class | | | C Class | |
| | | | | | | |
Year
ended
Jan. 31,
2015 | | | Oct. 4D
to
Jan. 31,
2014 | | | Year
ended
Jan. 31,
2015 | | | Oct. 4D
to
Jan. 31,
2014 | | | Year
ended
Jan. 31,
2015 | | | Oct. 4D
to
Jan. 31,
2014 | | | Year
ended
Jan. 31,
2015 | | | Oct. 4D
to
Jan. 31,
2014 | |
| $ | 13.05 | | | $ | 13.25 | | | $ | 13.03 | | | $ | 13.25 | | | $ | 13.03 | | | $ | 13.25 | | | $ | 13.00 | | | $ | 13.25 | |
| | | | | | | | | | | | | | | | | | | | | | | | | | | | | | |
| | | | | | | | | | | | | | | | | | | | | | | | | | | | | | | |
| | 0.04 | | | | 0.00 | I | | | 0.01 | | | | (0.01 | ) | | | 0.00 | I | | | 0.00 | I | | | (0.05 | ) | | | (0.04 | ) |
| | 0.72 | | | | 0.06 | | | | 0.72 | | | | 0.05 | | | | 0.72 | | | | 0.04 | | | | 0.66 | | | | 0.05 | |
| | | | | | | | | | | | | | | | | | | | | | | | | | | | | | |
| | 0.76 | | | | 0.06 | | | | 0.73 | | | | 0.04 | | | | 0.72 | | | | 0.04 | | | | 0.61 | | | | 0.01 | |
| | | | | | | | | | | | | | | | | | | | | | | | | | | | | | |
| | | | | | | | | | | | | | | | | | | | | | | | | | | | | | | |
| | (0.03 | ) | | | — | | | | (0.03 | ) | | | — | | | | (0.03 | ) | | | — | | | | (0.03 | ) | | | — | |
| | (0.37 | ) | | | (0.26 | ) | | | (0.37 | ) | | | (0.26 | ) | | | (0.37 | ) | | | (0.26 | ) | | | (0.37 | ) | | | (0.26 | ) |
| | | | | | | | | | | | | | | | | | | | | | | | | | | | | | |
| | (0.40 | ) | | | (0.26 | ) | | | (0.40 | ) | | | (0.26 | ) | | | (0.40 | ) | | | (0.26 | ) | | | (0.40 | ) | | | (0.26 | ) |
| | | | | | | | | | | | | | | | | | | | | | | | | | | | | | |
| $ | 13.41 | | | $ | 13.05 | | | $ | 13.36 | | | $ | 13.03 | | | $ | 13.35 | | | $ | 13.03 | | | $ | 13.21 | | | $ | 13.00 | |
| | | | | | | | | | | | | | | | | | | | | | | | | | | | | | |
| | 5.83 | % | | | 0.37 | %B | | | 5.60 | % | | | 0.22 | %B | | | 5.53 | % | | | 0.22 | %B | | | 4.69 | % | | | (0.01 | )%B |
| | | | | | | | | | | | | | | | | | | | | | | | | | | | | | |
| | | | | | | | | | | | | | | | | | | | | | | | | | | | | | | |
| $ | 120 | | | $ | 105 | | | $ | 108 | | | $ | 107 | | | $ | 435 | | | $ | 363 | | | $ | 393 | | | $ | 109 | |
| | | | | | | | | | | | | | | | | | | | | | | | | | | | | | | |
| | 3.84 | % | | | 10.23 | %C | | | 5.28 | % | | | 10.37 | %C | | | 4.19 | % | | | 8.22 | %C | | | 4.77 | % | | | 11.36 | %C |
| | 1.08 | % | | | 1.08 | %C | | | 1.36 | % | | | 1.36 | %C | | | 1.42 | % | | | 1.48 | %C | | | 2.16 | % | | | 2.23 | %C |
| | (2.44 | )% | | | (9.09 | )%C | | | (3.88 | )% | | | (9.22 | )%C | | | (2.78 | )% | | | (6.91 | )%C | | | (3.41 | )% | | | (10.22 | )%C |
| | 0.32 | % | | | 0.06 | %C | | | 0.05 | % | | | (0.22 | )%C | | | (0.01 | )% | | | (0.17 | )%C | | | (0.80 | )% | | | (1.09 | )%C |
| | 38 | % | | | 15 | %G | | | 38 | % | | | 15 | %G | | | 38 | % | | | 15 | %G | | | 38 | % | | | 15 | %G |
45
American Beacon FundsSM
Privacy Policy and Federal Tax Information
January 31, 2015 (Unaudited)
Privacy Policy
The American Beacon Funds recognize and respect the privacy of our shareholders. We are providing this notice to you so you will understand how shareholder information may be collected and used.
We may collect nonpublic personal information about you from one or more of the following sources:
| | • | | information we receive from you on applications or other forms; |
| | • | | information about your transactions with us or our service providers; and |
| | • | | information we receive from third parties. |
We do not disclose any nonpublic personal information about our customers or former customers to anyone, except as permitted by law.
We restrict access to your nonpublic personal information to those employees or service providers who need to know that information to provide products or services to you. To ensure the confidentiality of your nonpublic personal information, we maintain safeguards that comply with federal standards.
Federal Tax Information
Certain tax information regarding the Funds is required to be provided to shareholders based upon the Funds’ income and distributions for the taxable year ended January 31, 2015. The information and distributions reported herein may differ from information and distributions taxable to the shareholders for the calendar year ended December 31, 2014.
The Funds designated the following items with regard to distributions paid during the fiscal year ended January 31, 2015. All designations are based on financial information available as of this annual report and, accordingly, are subject to change. For each item, it is the intention of the Funds to designate the maximum amount permitted under the Internal Revenue Code of 1986, as amended, and the regulations there under.
| | | | | | | | | | | | |
| | | Acadian | | | Earnest Partners | | | SGA | |
Corporate Dividends Received Deduction | | | 0.3 | % | | | 1.3 | % | | | 35.2 | % |
Qualified Dividend Income | | | 100.0 | % | | | 100.0 | % | | | 100.0 | % |
Long-term Capital Gain Distributions | | $ | 10,768 | | | | — | | | $ | 128,945 | |
Short-term Capital Gain Distributions | | | — | | | | — | | | $ | 38,705 | |
Shareholders will receive notification in January 2015 of the applicable tax information necessary to prepare their 2014 income tax returns.
46
Trustees and Officers of the American Beacon FundsSM
(Unaudited)
The Trustees and officers of the American Beacon Funds (the “Trust”) are listed below, together with their principal occupations during the past five years. Unless otherwise indicated, the address of each person listed below is 220 East Las Colinas Boulevard, Suite 1200, Irving, Texas 75039. Each Trustee oversees thirty-three funds in the fund complex that includes the Trust and the American Beacon Select Funds. The Trust’s Statement of Additional Information contains additional information about the Trustees and is available without charge by calling 1-800-658-5811.
| | | | |
Name, Age and Address | | Position, Term of Office and Length of Time Served with the Trust | | Principal Occupation(s) During Past 5 Years and Current Directorships |
| | |
| INTERESTED TRUSTEES | | Term | | |
| | Lifetime of Trust until removal, resignation or retirement* | | |
| | |
| Alan D. Feld** (78) | | Trustee since 1996 | | Sole Shareholder of a professional corporation which is a Partner in the law firm of Akin, Gump, Strauss, Hauer & Feld, LLP (law firm) (1960-Present); Trustee, American Beacon Mileage Funds (1996-2012); Trustee, American Beacon Select Funds (1999-Present); Trustee, American Beacon Master Trust (1996-2012). |
| | |
| NON-INTERESTED | | Term | | |
| TRUSTEES | | Lifetime of Trust until removal, resignation or retirement* | | |
| | |
| Gerard J. Arpey (56) | | Trustee since 2012 | | Partner, Emerald Creek Group (private equity firm) (2011-Present); Chairman and Chief Executive Officer, AMR Corp. and American Airlines; Inc. (2003-2011); Director, S. C. Johnson & Son, Inc. (privately held company) (2008-present); Trustee, American Beacon Select Funds (2012-Present). |
| | |
| W. Humphrey Bogart (70) | | Trustee since 2004 | | Trustee, American Beacon Mileage Funds (2004-2012); Trustee, American Beacon Select Funds (2004-Present); Trustee, American Beacon Master Trust (2004-2012). |
| | |
| Brenda A. Cline (54) | | Trustee since 2004 | | Executive Vice President, Chief Financial Officer, Treasurer and Secretary, Kimbell Art Foundation (1993-Present); Trustee, American Beacon Mileage Funds (2004-2012); Trustee, American Beacon Select Funds (2004-Present); Trustee, American Beacon Master Trust (2004-2012). |
| | |
| Eugene J. Duffy (60) | | Trustee since 2008 | | Principal and Executive Vice President, Paradigm Asset Management (1994-Present); Director, Sunrise Bank of Atlanta (2008-Present); Trustee, American Beacon Mileage Funds (2008-2012); Trustee, American Beacon Select Funds (2008-Present); Trustee, American Beacon Master Trust (2008-2012). |
| | |
| Thomas M. Dunning (72) | | Trustee since 2008 | | Chairman Emeritus (2008-Present) and Chairman (1998-2008)), Lockton Dunning Benefits (consulting firm in employee benefits); Lead Director, Oncor Electric Delivery Company LLC (2007-Present); Board Member, BancTec (2010-Present); Trustee, American Beacon Mileage Funds (2008-2012); Trustee, American Beacon Select Funds (2008-Present); Trustee, American Beacon Master Trust (2008-2012). |
| | |
| Richard A. Massman (71) | | Trustee since 2004 Chairman since 2008 | | Consultant and General Counsel Emeritus (2009-Present) and Senior Vice President and General Counsel (1994-2009), Hunt Consolidated, Inc. (holding company engaged in oil and gas exploration and production, refining, real estate, farming, ranching and venture capital activities); Trustee, American Beacon Mileage Funds (2004-2012); Trustee, American Beacon Select Funds (2004-Present); Trustee, American Beacon Master Trust (2004-2012). |
| | |
| Barbara J. McKenna, CFA (51) | | Trustee since 2012 | | Managing Principal, Longfellow Investment Management Company (2005-Present); Trustee, American Beacon Select Funds (2012-Present). |
| | |
| R. Gerald Turner (68) | | Trustee since 2001 | | President, Southern Methodist University (1995-Present); Director, J.C. Penney Company, Inc. (1996-Present); Director, Kronus Worldwide Inc. (chemical manufacturing) (2003-Present); Trustee, American Beacon Mileage Funds (2001-2012); Trustee, American Beacon Select Funds (2001-Present); Trustee, American Beacon Master Trust (2001-2012). |
47
Trustees and Officers of the American Beacon FundsSM
(Unaudited)
| | | | |
Name, Age and Address | | Position, Term of Office and Length of Time Served with the Trust | | Principal Occupation(s) During Past 5 Years and Current Directorships |
| | |
| OFFICERS | | Term | | |
| | One Year | | |
| Gene L. Needles, Jr. (60) | | President since 2009 Executive Vice President since 2009 | | President, CEO and Director (2009-Present), American Beacon Advisors, Inc.; President (2009-Present), President, CEO and Director (2009-Present), Lighthouse Holdings, Inc.; President and CEO (2009-Present), Lighthouse Holdings Parent, Inc.; President (2009-Present), American Beacon Select Funds; President (2009-Present), American Beacon Mileage Funds; President (2008-2009), Touchstone Investments; President (2003-2007), CEO (2004-2007), AIM Distributors. |
| | |
| Rosemary K. Behan (55) | | VP, Secretary and Chief Legal Officer since 2006 | | General Counsel, Vice President, Legal and Compliance, American Beacon Advisors, Inc. (2006-Present); Secretary (2008 – Present), Lighthouse Holdings, Inc.; Secretary (2008-Present), Lighthouse Holdings Parent, Inc. |
| | |
| Brian E. Brett (53) | | VP since 2004 | | Vice President, Director of Sales, American Beacon Advisors, Inc. (2004-Present). |
| | |
| Wyatt L. Crumpler (48) | | VP since 2007 | | Chief Investment Officer (2012-Present), Vice President, Asset Management (2009-2012), and Vice President, Trust Investments (2007-2009), American Beacon Advisors, Inc. |
| | |
| Erica Duncan (44) | | VP Since 2011 | | Vice President, Marketing and Client Services (2011-Present), American Beacon Advisors, Inc.; Supervisor, Brand Marketing (2010-2011), Invesco; Supervisor, Marketing Communications (2009-2010) and Senior Financial Writer (2004-2009), Invesco AIM. |
| | |
| Michael W. Fields (60) | | VP since 1989 | | Chief Fixed Income Officer (2011-Present) and Vice President, Fixed Income Investments, American Beacon Advisors, Inc. (1988-2011); Director, American Beacon Global Funds SPC (2002-2011); Director, American Beacon Global Funds plc (2007-2009). |
| | |
| Melinda G. Heika (53) | | Treasurer since 2010 | | Treasurer (2010-Present), and Controller (2005-2009), American Beacon Advisors, Inc.; Treasurer, Lighthouse Holdings, Inc. (2010 – Present); Treasurer, Lighthouse Holdings Parent, Inc. (2010-Present). |
| | |
| Terri L. McKinney (51) | | VP since 2010 | | Vice President, Enterprise Services (2009-Present) and Managing Director (2003-2009), American Beacon Advisors, Inc. |
| | |
| Jeffrey K. Ringdahl (39) | | VP since 2010 | | Chief Operating Officer, American Beacon Advisors, Inc. (2010-Present); Vice President, Product Management, Touchstone Advisors, Inc. (2007-2010); Senior Director, Business Integration, Fidelity Investments (2005-2007). |
| | |
| Samuel J. Silver (51) | | VP Since 2011 | | Vice President, Fixed Income Investments (2011-Present) and Senior Portfolio Manager, Fixed Income Investments (1999-2011), American Beacon Advisors, Inc. |
| | |
| Christina E. Sears (43) | | Chief Compliance Officer since 2004 and Asst. Secretary since 1999 | | Chief Compliance Officer (2004-Present), American Beacon Advisors, Inc. |
| | |
| Sonia L. Bates (58) | | Asst. Treasurer since 2011 | | Director, Tax and Financial Reporting (2011—Present) and Manager, Tax and Financial Reporting (2005-2010), American Beacon Advisors, Inc.; Asst. Treasurer (2011-Present), Lighthouse Holdings, Inc.; Asst. Treasurer (2011-Present), Lighthouse Holdings Parent, Inc. |
| * | The Board has adopted a retirement plan that requires Trustees to retire no later than the last day of the calendar year in which they reach the age of 72, provided, however, that the board may determine to grant one or more annual exemptions to this requirement. |
| ** | Mr. Feld is deemed to be an “interested person” of the Trust, as defined by the 1940 Act. Mr. Feld’s law firm of Akin, Gump, Strauss, Hauer & Feld LLP has provided legal services within the past two years to the Manager and one or more of the Trust’s sub-advisors. |
48
This page intentionally left blank.
49

Delivery of Documents
eDelivery is NOW AVAILABLE – Stop traditional mail delivery and receive your
shareholder reports and summary prospectus on-line. Sign up at
www.americanbeaconfunds.com
If you invest in the Fund through a financial institution, you may be able to receive the Fund’s regulatory mailings, such as the Summary Prospectus, Annual Report and Semi-Annual Report, by e-mail. If you are interested in this option, please go to www.icsdelivery.com and search for your financial institution’s name or contact your financial institution directly.
To obtain more information about the Fund:
| | |
| | |
 | |  |
By E-mail: american_beacon.funds@ambeacon.com | | On the Internet: Visit our website at www.americanbeaconfunds.com |
|
| | |
 | |  |
By Telephone: Institutional, Y, Investor Call (800) 658-5811 | | By Mail: American Beacon Funds P.O. Box 219643 Kansas City, MO 64121-9643 |
|
| | |
Availability of Quarterly Portfolio Schedules In addition to the Schedule of Investments provided in each semi-annual and annual report, the Fund files a complete schedule of its portfolio holdings with the Securities and Exchange Commission (“SEC”) on Form N-Q as of the first and third fiscal quarters. The Fund’s Forms N-Q are available on the SEC’s website at www.sec.gov. The Forms N-Q may also be reviewed and copied at the SEC’s Public Reference Section, 100 F Street, NE, Washington, D.C. 20549-1520. Information regarding the operation of the SEC’s Public Reference Room may be obtained by calling 202-551-8090. A complete schedule of each Fund’s portfolio holdings is also made available on the Funds’ website at www.americanbeaconfunds.com approximately twenty days after the end of each month. | | Availability of Proxy Voting Policy and Records A description of the policies and procedures the Fund uses to determine how to vote proxies relating to portfolio securities is available in the Fund’s Statement of Additional Information, is available free of charge on the Fund’s website www.americanbeaconfunds.com and by calling 1-800-967-9009 or by accessing the SEC’s website at www.sec.gov. The Fund’s proxy voting record for the most recent year ended June 30 is filed annually with the SEC on Form N-PX. The Fund’s Forms N-PX are available on the SEC’s website at www.sec.gov. The Fund’s proxy voting record may also be obtained by calling 1-800-967-9009. |
Fund Service Providers:

This report is prepared for shareholders of the American Beacon Funds and may be distributed to others only if preceded or accompanied by a current Prospectus or summary prospectus.
American Beacon Funds, American Beacon Acadian Emerging Markets Managed Volatility Fund, American Beacon Earnest Partners Emerging Markets Equity Fund, and American Beacon SGA Global Growth Fund are service marks of American Beacon Advisors, Inc.
AR 1/15
About American Beacon Advisors
Since 1986, American Beacon Advisors has offered a variety of products and investment advisory services to numerous institutional and retail clients, including a variety of mutual funds, corporate cash management, and separate account management.
Our clients include defined benefit plans, defined contribution plans, foundations, endowments, corporations, financial planners, and other institutional investors. With American Beacon Advisors, you can put the experience of a multi-billion dollar asset management firm to work for your company.
CRESCENT SHORT DURATION HIGH INCOME FUND The Fund’s investments in high yield securities, including loans, restricted securities and floating rate securities are subject to greater levels of credit, interest rate, market and liquidity risks than investment-grade securities. Investing in foreign securities may involve heightened risk due to currency fluctuations and economic and political risks. GLOBAL EVOLUTION FRONTIER MARKETS INCOME FUND Investing in foreign, emerging and frontier market securities may involve heightened risk due to currency fluctuations and economic and political risks. Investing in derivative instruments involves liquidity, credit, interest rate and market risks. The use of fixed-income securities entails interest rate and credit risks. Because the Fund may invest in fewer issuers than a more diversified portfolio, the fluctuating value of a single holding may have a greater effect on the value of the Fund. Please see the prospectus for a complete discussion of the Funds’ risks. There can be no assurances that the investment objectives of these Funds will be met.
Any opinions herein, including forecasts, reflect our judgment as of the end of the reporting period and are subject to change. The advisor’s strategies and the Fund’s portfolio composition will change depending on economic and market conditions. This report is not a complete analysis of market conditions and therefore, should not be relied upon as investment advice. Although economic and market information has been compiled from reliable sources, American Beacon Advisors, Inc. makes no representation as to the completeness or accuracy of the statements contained herein.
| | |
| American Beacon Funds | | January 31, 2015 |
| | |
 | | Dear Shareholders, During the 12 months ended January 31, 2015, the U.S. equity market performed well overall, even as many of the world’s economies struggled. Buoyed by accelerated economic growth and increased earnings, the S&P 500 Index, a U.S. large-cap stock bellwether, gained 14.22%. In contrast, the MSCI EFM (Emerging + Frontier Market) Index, which measures the world’s emerging and frontier markets, gained 2.64%. Fixed-income investors experienced more muted results. For the period under review, the Bank of America Merrill Lynch U.S. High Yield Cash Pay BB-B 1-5 Year Index, which tracks the performance of BB-B rated U.S. dollar-denominated corporate bonds publicly |
| issued in the U.S. market, returned 1.51% despite generally favorable economic news in the U.S. However, the sharp decline in the Energy sector in the fourth quarter of 2014 drove down results, and Energy was the worst performing high-yield sector for the year. |
Looking beyond U.S. markets, the JPMorgan EMBI Global Diversified Index, which tracks dollar-denominated bonds issued by frontier and emerging market governments, returned 9.17% over the past year. Even though there was no shortage of concerning global headlines, some of these less-developed markets nonetheless offered positive investment opportunities for those willing to look in new corners of the world.
At American Beacon Advisors, we are proud to offer investments that are capable of navigating economic storms and market downturns in the U.S. and abroad. Among the funds we introduced in 2014 are two fixed-income funds designed to give investors access to domestic and international markets they might not otherwise consider.
| • | | American Beacon Crescent Short Duration High Income Fund (Investor Class) returned -1.78% for the period from October 1, 2014 (the Fund’s inception), to January 31, 2015. |
| • | | American Beacon Global Evolution Frontier Markets Income Fund (Investor Class) returned 2.47% for the period from February 25, 2014 (the Fund’s inception), to January 31, 2015. |
Thank you for your continued investment in the American Beacon Funds. For additional information about the Funds or to access your account information, please visit our website at www.americanbeaconfunds.com.
|
| Best Regards, |
 |
| Gene L. Needles, Jr. |
| President |
| American Beacon Funds |
1
High Yield Bond Market Overview
January 31, 2015 (Unaudited)
For the second consecutive quarter, the high-yield market reported a negative return. The BofA Merrill Lynch US High Yield Master II Index (“BAML HY Index”) lost approximately 1.1% in the fourth quarter of 2014, which limited 2014 performance to a gain of only 2.5%. In January 2015, the BAML HY Index turned around and returned 0.7% for the month.
Bank loans followed suit with the S&P/LSTA Leveraged Loan Index (“Leveraged Loan Index”) returning -0.5% for the fourth quarter of 2014 and ending the year up 1.6%. For January 2015, the Leveraged Loan Index was up approximately 0.3%.
The main story in the leveraged finance market for the last few months of this review period has been oil. With the Energy industry accounting for more than 13% of the BAML HY Index and Oil and Gas representing almost 4% of the Leveraged Loan Index, the rapid drop in oil prices in the fourth quarter of 2014 had a significant impact on the high-yield market.
Selling pressure in October and November 2014 ended in total capitulation by investors in December. The Energy sector fell more than 6% in that month alone and was down more than 10% for the fourth quarter of 2014. For the full year, Energy was the worst performing high-yield sector, down more than 7%.
According to Bank of America Merrill Lynch, revenues and EBITDA were up more than 7% and 11%, respectively, in the third quarter of 2014 for the 403 high-yield companies tracked by their analysts, which indicates that financial trends remain strong. Fundamentals are similarly strong among loan credits with the Leveraged Loan Index reporting average EBITDA growth in the third quarter of more than 8% for those issuers that file publicly. Despite price weakness in the fourth quarter of 2014, underlying fundamentals for the market continue to improve.
2
American Beacon Crescent Short Duration High Income FundSM
Performance Overview
January 31, 2015 (Unaudited)
The Investor Class of the American Beacon Crescent Short Duration High Income Fund (the “Fund”) returned -1.78% from October 1, 2014, the inception date of the Fund, through January 31, 2015. The Fund underperformed the Bank of America Merrill Lynch U.S. High Yield Cash Pay BB-B 1-5 Year Index (the “Index”) return of -0.27% for the same period.
Comparison of Change in Value of a $10,000 Investment
for the Period from 10/1/14* through 1/31/15

Total Returns for the Period ended 1/31/15
| | | | | | | | |
| | | Since
incep.
(10/1/14) | | | Value of
$10,000
10/1/14-
1/31/15 | |
Institutional Class (1,3) | | | (1.65 | )%** | | $ | 9,835 | |
Y Class (1,3) | | | (1.68 | )%** | | | 9,832 | |
Investor Class (1,3) | | | (1.78 | )%** | | | 9,822 | |
A Class with sales charge (1,3) | | | (4.27 | )%** | | | 9,573 | |
A Class without sales charge (1,3) | | | (1.78 | )%** | | | 9,822 | |
C Class with sales charge (1,3) | | | (3.03 | )%** | | | 9,697 | |
C Class without sales charge (1,3) | | | (2.03 | )%** | | | 9,797 | |
BofA Merrill Lynch Cash Pay BB-B 1-5 Index (2) | | | (0.27 | )%** | | | 9,973 | |
| 1. | Performance shown is historical and is not indicative of future returns. Investment returns and principal value will vary, and shares may be worth more or less at redemption than at original purchase. Performance shown is calculated based on the published end of day net asset values as of the date indicated, and current performance may be lower or higher than the performance data quoted. To obtain performance as of the most recent month end, please visit www.americanbeaconfunds.com or call 1-800-967-9009. Fund performance in the table above does not reflect the deduction of taxes a shareholder would pay on distributions or the redemption of shares. A portion of the fees charged to each Class of the Fund has been waived since Fund inception. Performance prior to |
| | waiving fees was lower than the actual returns shown since inception. A Class shares have a maximum sales charge of 2.50%. The maximum contingent deferred sales charge for the C Class is 1.00% for shares redeemed within one year of the date of purchase. |
| 2. | The BofA Merrill Lynch U.S. High Yield Cash Pay BB-B 1-5 Year Index is an unmanaged index that generally tracks the performance of BB-B rated U.S. dollar-denominated corporate bonds publicly issued in the U.S. domestic market with maturities of 1 to 5 years. |
| 3. | The total annual Fund operating expense ratio set forth in the most recent Fund prospectus for the Institutional, Y, Investor, A, and C Class shares was 1.55%, 1.65%, 1.93%, 1.95%, and 2.70%, respectively. The expense ratios above may vary from the expense ratios presented in other sections of this report that are based on expenses incurred during the period covered by this report. |
The following performance discussion covers the October 31, 2014 to January 31, 2015 period, and does not cover the time from inception of the Fund to October 31, 2014.
The Fund’s relative returns were hindered by its positioning and issue selection in the various credit quality categories as well as issue selection in multiple sectors. However, sector allocation helped offset the poor relative returns.
From a credit quality allocation perspective, underweighting the BB-rated credit group (down 0.1%) and overweighting the B-rated credit group (down 2.2%) contributed to the Fund’s relative underperformance.
From a credit quality perspective, issue selection in the BB-rated credit group hurt the Fund’s relative performance. This was offset partially by issue selections in the B-rated and CCC-rated credit groups which aided the Fund’s relative return.
From a sector allocation perspective, the Fund benefited from underweighting the Energy sector (down 9.8%) and overweighting the Service sector (up 0.2%). Underweighting the Finance sector (up 0.1%) detracted from relative performance.
From a sector standpoint, issue selections in the Manufacturing and Energy sectors reduced relative performance. However, this was offset slightly by issue selection within the Finance sector
American Beacon Crescent Short Duration High Income FundSM
Performance Overview
January 31, 2015 (Unaudited)
which contributed positively to relative performance.
The sub-advisor’s investment process involves a top-down approach to strategically allocate across fixed and floating rate, secured and unsecured, and public and private investments. The investment process is balanced by extensive, disciplined credit research on each issuer. This investment process has remained consistent since the Fund’s inception.
Top Ten Holdings (% Net Assets)
| | | | |
Frontier Communications Corp., 7.125%, Due 3/15/2019 | | | 1.6 | |
Cablevision Systems Corp., 7.750%, Due 4/15/2018 | | | 1.6 | |
Peninsula Gaming LLC / Peninsula Gaming Corp., 8.375%, Due 2/15/2018, 144A | | | 1.5 | |
Icahn Enterprises LP / Icahn Enterprises Finance Corp., 6.000%, Due 8/1/2020 | | | 1.5 | |
Pinnacle Entertainment, Inc., 7.500%, Due 4/15/2021 | | | 1.5 | |
T-Mobile USA, Inc., 6.625%, Due 11/15/2020 | | | 1.5 | |
NRG Energy, Inc., 6.625%, Due 3/15/2023 | | | 1.5 | |
CHS/Community Health Systems, Inc., 8.000%, Due 11/15/19 | | | 1.5 | |
Station Casinos LLC, 7.500%, Due 3/1/21 | | | 1.5 | |
AECOM Technology Corp., 5.750%, Due 10/15/2022, 144A | | | 1.5 | |
Total Fund Holdings | | | 91 | |
Sector Weightings (% Net Assets)
| | | | |
Service | | | 36.9 | |
Manufacturing | | | 26.9 | |
Telecommunications | | | 10.4 | |
Finance | | | 10.0 | |
Energy | | | 5.9 | |
Utilities | | | 4.5 | |
Consumer | | | 3.6 | |
Transportation | | | 1.5 | |
Cash Equivalent | | | 0.3 | |
Frontier Markets Overview
January 31, 2015 (Unaudited)
2014 proved a year to remember. The consensus call for the U.S. economy and the U.S dollar to gain strength proved right. However, the consensus call for 10-year U.S. Treasury yields to rise to 3.30% and higher in 2014 certainly proved wrong – despite better U.S. macro data, the bellwether S&P 500 Index climbing from one record high to another and the Federal Reserve (“the Fed”) unwinding its quantitative easing program. The Fed’s go-it-alone approach on monetary policy tightening became obvious as the European Central Bank and the Bank of Japan shifted into overdrive on monetary easing, leaving the former’s deposit rate negative and the latter’s target for annual monetary base expansion at 80 trillion yen. The dovish camp was joined by the People’s Bank of China, which unexpectedly cut its benchmark interest rates for the first time since 2012.
As to geopolitical and idiosyncratic markets drivers, Russia’s annexation of Crimea and ongoing conflict in the eastern Ukraine kept investors busy and defensive through most of the second half of 2014. As Western sanctions on Russia began to bite, capital outflows became a notable drag on the ruble and the performance of Russian assets in general. Elsewhere, despite U.S.-led airstrikes in Iraq and Syria, the self-declared Islamic State continued to question the balance of power in Iraq, Syria and much of the Arab world. For a while, Africa became the epicenter of global headlines as the Ebola virus took its toll primarily in three West African countries. However, global media lost interest once the Ebola virus appeared to be contained, and with crude oil entering a freefall following OPEC’s game-changing decision to keep output unchanged and defend market share amid the booming U.S. shale output, the global media and investors found a new focus area.
Performance wise, a few notable investment themes dominated the year. Going into 2014, the Fed’s tapering and the call for higher U.S. yields saw the so-called twin deficit “Fragile Five” countries - Turkey, Brazil, India, South Africa and Indonesia - on the firing line. Later on, in late spring and early summer the very same Fragile Five were back in vogue as the previous fear was replaced by complacency thanks to the unexpected low volatility/low yield environment ruling the U.S. Treasury market. The Russian/Ukrainian crisis and the downing of a Malaysian airliner over rebel-held eastern Ukraine was a wake-up call. Chinese slow-down worries came and went, and the Brazilian presidential election caused some local market volatility. However, it was the collapse in oil prices in the fourth quarter that proved decisive for full-year overall emerging and frontier markets’ performance as investors questioned the sustainability of oil exporters’ fiscal and external positions.
5
American Beacon Global Evolution Frontier Markets Income FundSM
Performance Overview
January 31, 2015 (Unaudited)
The Investor Class of the American Beacon Global Evolution Frontier Markets Income Fund (the “Fund”) delivered a return of 2.47% for the period February 25, 2014 through January 31, 2015.
Comparison of Change in Value of a $10,000 Investment
for the Period from 2/25/14* through 1/31/15
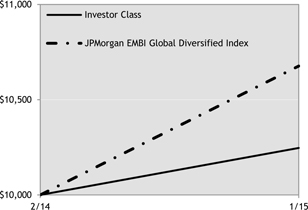
Total Returns for the Period ended 1/31/15
| | | | | | | | |
| | | Since
incep.
(2/25/14) | | | Value of
$10,000
2/25/14-
1/31/15 | |
Institutional Class (1,3) | | | 2.76 | %** | | $ | 10,276 | |
Y Class (1,3) | | | 2.87 | %** | | | 10,287 | |
Investor Class (1,3) | | | 2.47 | %** | | | 10,247 | |
A Class with sales charge (1,3) | | | (2.46 | )%** | | | 9,754 | |
A Class without sales charge (1,3) | | | 2.42 | %** | | | 10,242 | |
C Class with sales charge (1,3) | | | 0.60 | %** | | | 10,060 | |
C Class without sales charge (1,3) | | | 1.60 | %** | | | 10,160 | |
JP Morgan EMBI Global Diversified Index (2) | | | 6.77 | %** | | | 10,677 | |
| 1. | Performance shown is historical and is not indicative of future returns. Investment returns and principal value will vary, and shares may be worth more or less at redemption than at original purchase. Performance shown is calculated based on the published end of day net asset values as of date indicated, and current performance may be lower or higher than the performance data quoted. To obtain performance as of the most recent month end, please call 1-800-967-9009 or visit www.americanbeaconfunds.com. Fund per-formance in the table above does not reflect the deduction of taxes a shareholder would pay on distributions or the redemption of shares. A portion of the fees charged to each Class of the Fund has been waived since Fund inception. Performance prior to waiving fees was lower than the actual returns shown since inception. A Class shares have a maximum sales charge of 4.75%. The maximum contingent deferred sales charge for the C Class is 1.00% for shares redeemed within one year of the date of purchase. |
| 2. | The JP Morgan EMBI Global Diversified Index is an emerging market debt benchmark that tracks dollar-denominated bonds issued by frontier and emerging market governments. One cannot directly invest in an index. |
| 3. | The total annual Fund operating expense ratio set forth in the most recent Fund prospectus for the Institutional, Y, Investor, A, and C Class shares was 1.85%, 1.95%, 2.22%, 2.25%, and 3.00%, respectively. The expense ratios above may vary from the expense ratios presented in other sections of this report that are based on expenses incurred during the period covered by this report. |
An 86 basis point (0.86%) U.S. dollar debt supportive decline in 10-year U.S. treasury yields, broad-based U.S. dollar strength and the steep decline in oil prices were the dominant performance drivers in 2014. While Ebola took its toll on risk sentiment toward frontier Africa, it was the sudden slump in oil prices that negatively impacted local fixed income and foreign exchange, as well as U.S. dollar denominated debt backed by oil exporters.
The Fund’s exposure to Argentina (hard currency debt), Sri Lanka (local currency debt) and Bangladesh (local currency debt) performed very well, with Argentina up nearly 20% on the year despite being in selective default. Sri Lanka and Bangladesh benefited from being less exposed to global headline news and capital flows. Both countries are also oil importers which helped performance in the Fund. Ukraine went through a difficult period and was down nearly 30% over the course of 2014. The ongoing armed conflict with pro-Russian separatists in the Eastern regions of Ukraine and sanctions on Ukrainian exports to Russia led to fiscal distress with debt restructuring only being averted by international donor support. However, the Fund’s longstanding zero-weight in Ukrainian hard currency debt as well as local currency debt spared the Fund from negative performance. Also, although most currencies in the Fund were down against the dollar in 2014, the Fund was compensated via a generous carry, primarily in local fixed income.
The most extreme example of an oil dependent economy in dire need of structural reforms, Venezuela suffered and caused headwinds to the Fund’s overall performance as it lost nearly 30% over the course of 2014. In Africa, fiscal underperformance ruled in Ghana leaving investor
American Beacon Global Evolution Frontier Markets Income FundSM
Performance Overview
January 31, 2015 (Unaudited)
sentiment negative and the Ghanaian currency - cedi - under pressure. The cedi traded as weak as 3.9 to the U.S. dollar in August having started the year at 2.4. With its back against the wall, the Ghanaian government finally turned to the International Monetary Fund and the cedi recovered to 3.3. Still, the cedi was down almost 30% on the year contributing negatively to the Fund’s overall performance.
Top Ten Holdings (% Net Assets)
| | | | | | | | |
Uruguay Government International Bond, Inflation Indexed | | | | | | | 3.7 | % |
Mongolia Ministry of Finance (Issuer ING Bank NV) | | | | | | | 3.4 | % |
Ivory Coast Government Bond | | | | | | | 3.4 | % |
Empresa Administradora de Aeropuertos Internacionales (Issuer Zambezi BV) | | | | | | | 3.4 | % |
Moz Ematum Finance | | | | | | | 3.4 | % |
Federal Democratic Republic of Ethiopia | | | | | | | 2.9 | % |
Honduras Government Bond | | | | | | | 2.8 | % |
Republic of Malawi (Issuer Frontera Capital BV) | | | | | | | 2.8 | % |
Dominican Republic Government Bond | | | | | | | 2.6 | % |
Total Fund Holdings | | | 71 | | | | | |
Top Ten Country Weights (% Net Assets)
| | | | |
Sri Lanka | | | 4.9 | |
Pakistan | | | 4.8 | |
Kenya | | | 4.8 | |
Zambia | | | 4.7 | |
Mongolia | | | 4.5 | |
Serbia | | | 4.4 | |
Dominican Republic | | | 4.3 | |
Bangladesh | | | 4.2 | |
Ghana | | | 4.1 | |
Nicaragua | | | 4.0 | |
American Beacon FundsSM
Fund Expenses
January 31, 2015 (Unaudited)
Fund Expense Example
As a shareholder of the Fund, you incur two types of costs: (1) transaction costs, including sales charges (loads) on purchase payments and redemption fees if applicable, and (2) ongoing costs, including management fees, administrative service fees, distribution (12b-1) fees, and other Fund expenses. The examples below are intended to help you understand the ongoing costs (in dollars) of investing in the Fund and to compare these costs with the ongoing costs of investing in other mutual funds. The examples are based on an investment of $1,000 invested at the beginning of the period (or the inception date of the Fund) in each Class and held for the entire period from August 1, 2014 through January 31, 2015.
Actual Expenses
The “Actual” lines of the table provide information about actual account values and actual expenses. You may use the information in this line, together with the amount you invested, to estimate the expenses that you paid over the period. Simply divide your account value by $1,000 (for example, an $8,600 account value divided by $1,000 = 8.6), then multiply the result by the number in the first line under the heading “Expenses Paid During Period” to estimate the expenses you paid on your account during this period. Shareholders of the Institutional and Investor Classes that invest in the Fund through an IRA or Roth IRA may be subject to a custodial IRA fee of $15 that is typically deducted each December. If your account was subject to a custodial IRA fee during the period, your costs would have been $15 higher.
Hypothetical Example for Comparison Purposes
The “Hypothetical” lines of the table provide information about hypothetical account values and hypothetical expenses based on the Fund’s actual expense ratio and an assumed 5% per year rate of return before expenses (not the Fund’s actual return). You may compare the ongoing costs of investing in the Fund with other funds by contrasting this 5% hypothetical example and the 5% hypothetical examples that appear in the shareholder reports of the other funds. The hypothetical account values and expenses may not be used to estimate the actual ending account balance or expenses you paid for the period. Shareholders of the Institutional and Investor Classes that invest in the Fund through an IRA or Roth IRA may be subject to a custodial IRA fee of $15 that is typically deducted each December. If your account was subject to a custodial IRA fee during the period, your costs would have been $15 higher.
You should also be aware that the expenses shown in the table highlight only your ongoing costs and do not reflect any transaction costs charged by the Fund, such as sales charges (loads). Similarly, the expense examples for other funds do not reflect any transaction costs charged by those funds, such as sales charges (loads), redemption fees or exchange fees. Therefore, the “Hypothetical” lines of the table are useful in comparing ongoing costs only and will not help you determine the relative total costs of owning different funds. If you were subject to any transaction costs during the period, your costs would have been higher.
American Beacon FundsSM
Fund Expenses
January 31, 2015 (Unaudited)
Crescent Short Duration High Income Fund
| | | | | | | | | | | | |
| | | Beginning
Account
Value
10/1/14 | | | Ending
Account
Value
1/31/15 | | | Expenses Paid
During Period*
10/1/14 - 1/31/15 | |
Institutional Class | | | | | | | | | | | | |
Actual | | $ | 1,000.00 | | | $ | 983.49 | | | $ | 2.82 | |
Hypothetical ** | | $ | 1,000.00 | | | $ | 1,014.01 | | | $ | 2.86 | |
Y Class | | | | | | | | | | | | |
Actual | | $ | 1,000.00 | | | $ | 983.17 | | | $ | 3.15 | |
Hypothetical ** | | $ | 1,000.00 | | | $ | 1,013.67 | | | $ | 3.20 | |
Investor Class | | | | | | | | | | | | |
Actual | | $ | 1,000.00 | | | $ | 982.24 | | | $ | 4.09 | |
Hypothetical ** | | $ | 1,000.00 | | | $ | 1,012.73 | | | $ | 4.15 | |
A Class | | | | | | | | | | | | |
Actual | | $ | 1,000.00 | | | $ | 982.18 | | | $ | 4.14 | |
Hypothetical ** | | $ | 1,000.00 | | | $ | 1,012.67 | | | $ | 4.20 | |
C Class | | | | | | | | | | | | |
Actual | | $ | 1,000.00 | | | $ | 979.71 | | | $ | 6.62 | |
Hypothetical ** | | $ | 1,000.00 | | | $ | 1,010.16 | | | $ | 6.72 | |
| * | Expenses are equal to the Fund’s annualized expense ratios for the six-month period of 0.85%, 0.95%, 1.23%, 1.25% and 2.00% for the Institutional, Y, Investor, A and C Classes respectively, multiplied by the average account value over the period, multiplied by the number derived by dividing the number of days since Fund inception (123) by days in the year (365) to reflect the period. |
| ** | 5% return before expenses. |
Global Evolution Frontier Markets Income Fund
| | | | | | | | | | | | |
| | | Beginning
Account
Value
8/1/14 | | | Ending
Account
Value
1/31/15 | | | Expenses Paid
During Period*
8/1/14 -1/31/15 | |
Institutional Class | | | | | | | | | | | | |
Actual | | $ | 1,000.00 | | | $ | 973.18 | | | $ | 5.72 | |
Hypothetical ** | | $ | 1,000.00 | | | $ | 1,019.41 | | | $ | 5.85 | |
Y Class | | | | | | | | | | | | |
Actual | | $ | 1,000.00 | | | $ | 972.72 | | | $ | 6.22 | |
Hypothetical ** | | $ | 1,000.00 | | | $ | 1,018.90 | | | $ | 6.36 | |
Investor Class | | | | | | | | | | | | |
Actual | | $ | 1,000.00 | | | $ | 971.25 | | | $ | 7.60 | |
Hypothetical ** | | $ | 1,000.00 | | | $ | 1,017.49 | | | $ | 7.78 | |
A Class | | | | | | | | | | | | |
Actual | | $ | 1,000.00 | | | $ | 971.17 | | | $ | 7.70 | |
Hypothetical ** | | $ | 1,000.00 | | | $ | 1,017.39 | | | $ | 7.88 | |
C Class | | | | | | | | | | | | |
Actual | | $ | 1,000.00 | | | $ | 968.25 | | | $ | 11.41 | |
Hypothetical ** | | $ | 1,000.00 | | | $ | 1,013.61 | | | $ | 11.67 | |
| * | Expenses are equal to the Fund’s annualized expense ratios for the six-month period of 1.15%, 1.25%, 1.53%, 1.55%, and 2.30% for the Institutional, Y, Investor, A, and C Classes respectively, multiplied by the average account value over the period, multiplied by the number derived by dividing the number of days in the most recent fiscal half-year (184) by days in the year (365) to reflect the half-year period. |
| ** | 5% return before expenses. |
American Beacon FundsSM
Report of Independent Registered Public Accounting Firm
To the Shareholders and the Board of Trustees of
American Beacon Crescent Short Duration High Income Fund and American Beacon Global Evolution Frontier Markets Income Fund:
We have audited the accompanying statements of assets and liabilities, including the schedules of investments, of American Beacon Crescent Short Duration High Income Fund and American Beacon Global Evolution Frontier Markets Income Fund (two of the funds constituting the American Beacon Funds) (collectively, the “Funds”), as of January 31, 2015, and the related statements of operations, changes in net assets, financial highlights for each of the periods indicated therein, and the related statement of cash flows for the American Beacon Global Evolution Frontier Markets Income Fund for the period indicated therein. These financial statements and financial highlights are the responsibility of the Funds’ management. Our responsibility is to express an opinion on these financial statements and financial highlights based on our audits.
We conducted our audits in accordance with the standards of the Public Company Accounting Oversight Board (United States). Those standards require that we plan and perform the audit to obtain reasonable assurance about whether the financial statements and financial highlights are free of material misstatement. We were not engaged to perform an audit of the Funds’ internal control over financial reporting. Our audits included consideration of internal control over financial reporting as a basis for designing audit procedures that are appropriate in the circumstances, but not for the purpose of expressing an opinion on the effectiveness of each Fund’s internal control over financial reporting. Accordingly, we express no such opinion. An audit also includes examining, on a test basis, evidence supporting the amounts and disclosures in the financial statements and financial highlights, assessing the accounting principles used and significant estimates made by management, and evaluating the overall financial statement presentation. Our procedures included confirmation of securities owned as of January 31, 2015, by correspondence with the custodian and brokers or by other appropriate auditing procedures where replies from brokers were not received. We believe that our audits provide a reasonable basis for our opinion.
In our opinion, the financial statements and financial highlights referred to above present fairly, in all material respects, the financial position of American Beacon Crescent Short Duration High Income Fund and American Beacon Global Evolution Frontier Markets Income Fund at January 31, 2015, and the results of their operations, the changes in their net assets, the financial highlights, and the cash flows for American Beacon Global Evolution Frontier Markets Income Fund for the periods indicated therein, in conformity with U.S. generally accepted accounting principles.

Dallas, Texas
March 31, 2015
10
American Beacon Crescent Short Duration High Income FundSM
Schedule of Investments
January 31, 2015
| | | | | | | | |
| | | Par Amount | | | Fair Value | |
| | | (000’s) | | | (000’s) | |
BANK LOAN OBLIGATIONS - 34.14% | | | | | | | | |
Consumer - 1.45% | | | | | | | | |
Albertson’s Holdings LLC, Term Loan B4, 4.50%, Due 8/25/2021 A F | | $ | 500 | | | $ | 499 | |
| | | | | | | | |
Energy - 4.06% | | | | | | | | |
Green Plains Processing LLC, Term Loan, 6.50%, Due 6/3/2020A F | | | 476 | | | | 441 | |
McJunkin Red Man Corp., New Term Loan B, 5.00%, Due 11/9/2019F | | | 499 | | | | 454 | |
TPF II Power LLC, Syndicated Term Loan B, 5.50%, Due 10/2/2021A F | | | 500 | | | | 500 | |
| | | | | | | | |
| | | | | | | 1,395 | |
| | | | | | | | |
Finance - 2.88% | | | | | | | | |
Capital Automotive LP, New Second Lien Term Loan, 6.00%, Due 4/30/2020C F | | | 500 | | | | 498 | |
IG Investment Holdings LLC, Term Loan Extending Tranche B, 6.00%, Due 10/29/2021A F | | | 250 | | | | 248 | |
Kaufman Hall & Associates LLC, Initial Term Loan, 6.75%, Due 12/31/2020A F | | | 250 | | | | 243 | |
| | | | | | | | |
| | | | | | | 989 | |
| | | | | | | | |
Manufacturing - 10.18% | | | | | | | | |
AZ Chem US, Inc., First Lien Term Loan, 4.50%, Due 6/12/2021F | | | 488 | | | | 477 | |
BMC Software Finance, Inc., Term Loan, 5.00%, Due 9/10/2020 F | | | 499 | | | | 482 | |
Hilex Poly Co., LLC, Term Loan B, 6.00%, Due 12/5/2021A F | | | 250 | | | | 249 | |
Magic Newco LLC, First Lien Term Loan, 5.00%, Due 12/12/2018A F | | | 499 | | | | 499 | |
Murray Energy Corp., First Lien Term Loan, 5.25%, Due 12/5/2019 F | | | 499 | | | | 472 | |
Sensus USA, Inc., Second Lien Term Loan, 8.50%, Acquired 11/19/2014, Cost $122, Due 5/9/2018B D F | | | 125 | | | | 119 | |
Survey Sampling International LLC, First Lien Term Loan B, 6.00%, Acquired 12/12/2014, Cost $123, Due 12/4/2020A B F | | | 125 | | | | 123 | |
Survey Sampling International LLC, Second Lien Term Loan, 10.00%, Acquired 12/12/2014, Cost $123, Due 12/4/2021A B F | | | 125 | | | | 125 | |
Travelport Finance Luxembourg Sarl, 2014 Term Loan B, 6.00%, Due 9/2/2021F | | | 500 | | | | 500 | |
UTEX Industries, Inc., First Lien 2014 Term Loan, 5.00%, Due 5/22/2021F | | | 499 | | | | 454 | |
| | | | | | | | |
| | | | | | | 3,500 | |
| | | | | | | | |
Service - 14.13% | | | | | | | | |
Acosta Holdco, Inc., Term Loan, 5.00%, Due 9/26/2021F | | | 500 | | | | 501 | |
Carestream Health, Inc., Term Loan, 5.00%, Due 6/7/2019F | | | 493 | | | | 492 | |
Hudson’s Bay Company, First Lien Term Loan, 4.75%, Due 11/4/2020F | | | 176 | | | | 176 | |
IKaria, Inc., First Lien Term Loan, 5.00%, Due 2/12/2021F | | | 499 | | | | 497 | |
JC Penney Corp, Inc., Term Loan, 6.00%, Due 5/21/2018F | | | 499 | | | | 494 | |
Millennium Laboratiories, Inc., Term Loan B, 5.25%, Due 4/15/2021F | | | 499 | | | | 496 | |
Ortho Clinical Diagnostics S.A., Term Loan B, 4.75%, Due 6/30/2021F | | | 499 | | | | 478 | |
Rentpath, Inc., 1st Lien Term Loan, 6.25%, Due 12/17/2021F | | | 250 | | | | 245 | |
Scientific Games International, Inc., Incremental Term Loan B2, 6.00%, Due 10/1/2021F | | | 500 | | | | 493 | |
William Morris Endeavor Entertainment LLC, First Lien Term Loan, 5.25%, Due 5/6/2021A F | | | 499 | | | | 487 | |
Zebra Technologies Corp., Term Loan B, 4.75%, Due 10/27/2021F | | | 500 | | | | 503 | |
| | | | | | | | |
| | | | | | | 4,862 | |
| | | | | | | | |
Transportation - 1.44% | | | | | | | | |
American Tire Distributors, Inc., First Lien Term Loan B, 5.75%, Due 6/1/2018 F | | | 499 | | | | 495 | |
| | | | | | | | |
Total Bank Loan Obligations (Cost $11,967) | | | | | | | 11,740 | |
| | | | | | | | |
CORPORATE OBLIGATIONS - 63.32% | | | | | | | | |
Consumer - 1.37% | | | | | | | | |
Cott Beverages, Inc., | | | | | | | | |
6.75%, Due 1/1/2020E | | | 250 | | | | 247 | |
5.375%, Due 7/1/2022E | | | 250 | | | | 224 | |
| | | | | | | | |
| | | | | | | 471 | |
| | | | | | | | |
Energy - 2.64% | | | | | | | | |
Approach Resources, Inc., 7.00%, Due 6/15/2021 | | | 250 | | | | 201 | |
Bristow Group, Inc., 6.25%, Due 10/15/2022 | | | 350 | | | | 334 | |
California Resources Corp., 5.50%, Due 9/15/2021E | | | 250 | | | | 210 | |
Chesapeake Energy Corp., 5.375%, Due 6/15/2021 | | | 50 | | | | 50 | |
Energy XXI Gulf Coast, Inc., 7.50%, Due 12/15/2021 | | | 250 | | | | 114 | |
| | | | | | | | |
| | | | | | | 909 | |
| | | | | | | | |
Finance - 8.22% | | | | | | | | |
Aircastle Ltd., 5.50%, Due 2/15/2022 | | | 25 | | | | 26 | |
Aircastle Ltd., 6.25%, Due 12/1/2019 | | | 100 | | | | 108 | |
American Equity Investment Life Holding Co., 6.625%, Due 7/15/2021 | | | 250 | | | | 266 | |
| | | | |
| | | See accompanying notes | | |
| | 11 | | |
American Beacon Crescent Short Duration High Income FundSM
Schedule of Investments
January 31, 2015
| | | | | | | | |
| | | Par Amount | | | Fair Value | |
| | | (000’s) | | | (000’s) | |
Fly Leasing Ltd., 6.75%, Due 12/15/2020 | | $ | 500 | | | $ | 504 | |
Icahn Enterprises LP / Icahn Enterprises Finance Corp., 6.00%, Due 8/1/2020C | | | 500 | | | | 523 | |
Jefferies Finance LLC, 7.50%, Due 4/15/2021A E | | | 500 | | | | 470 | |
Navient Corp., 5.50%, Due 1/15/2019 | | | 500 | | | | 517 | |
OneMain Financial Holdings, Inc., 6.75%, Due 12/15/2019E | | | 150 | | | | 155 | |
Oxford Finance LLC, Inc., 7.25%, Due 1/15/2018A E | | | 250 | | | | 259 | |
| | | | | | | | |
| | | | | | | 2,828 | |
| | | | | | | | |
Manufacturing - 16.49% | | | | | | | | |
Abengoa Greenfield S.A., 6.50%, Acquired 11/18/2014, Cost $221, Due 10/1/2019B E | | | 250 | | | | 230 | |
AECOM Technology Corp., 5.75%, Due 10/15/2022E | | | 500 | | | | 523 | |
AK Steel Corp., 8.375%, Due 4/1/2022 | | | 500 | | | | 424 | |
ArcelorMittal, 6.00%, Due 3/1/2021D | | | 250 | | | | 258 | |
Bombardier, Inc., 6.00%, Due 10/15/2022E | | | 500 | | | | 471 | |
Building Materials Corp., 5.375%, Due 11/15/2024E | | | 250 | | | | 254 | |
Cemex SAB de CV, 7.25%, Due 1/15/2021E | | | 500 | | | | 516 | |
First Data Corp., 11.75%, Due 8/15/2021 | | | 250 | | | | 288 | |
FMG Resources August 2006 Property Ltd., 6.00%, Due 4/1/2017E | | | 250 | | | | 244 | |
Goodyear Tire & Rubber Co., 6.50%, Due 3/1/2021 | | | 250 | | | | 268 | |
IHS, Inc., 5.00%, Due 11/1/2022E | | | 75 | | | | 76 | |
INEOS Group Holdings S.A., 6.125%, Due 8/15/2018E | | | 500 | | | | 483 | |
Michael Baker International LLC, 8.25%, Acquired 10/2/2014, Cost $514,
Due 10/15/2018A B E | | | 500 | | | | 485 | |
PSPC Escrow Corp., 6.50%, Due 2/1/2022E | | | 150 | | | | 153 | |
Reynolds Group Issuer Inc. / Reynolds Group Issuer LLC, 8.25%, Due 2/15/2021A | | | 500 | | | | 508 | |
Signode Industrial Group US, Inc., 6.375%, Due 5/1/2022E | | | 250 | | | | 238 | |
SunGard Data Systems, Inc., 6.625%, Due 11/1/2019 | | | 250 | | | | 251 | |
| | | | | | | | |
| | | | | | | 5,670 | |
| | | | | | | | |
Service - 22.05% | | | | | | | | |
Ancestry.com, Inc., 9.625%, Due 10/15/2018E G | | | 500 | | | | 470 | |
Block Communications, Inc., 7.25%, Acquired 11/10/2014, Cost $471, Due 2/1/2020B E | | | 450 | | | | 457 | |
Cablevision Systems Corp., 7.75%, Due 4/15/2018 | | | 500 | | | | 547 | |
Capella Healthcare, Inc., 9.25%, Due 7/1/2017 | | | 250 | | | | 261 | |
CCO Holdings LLC / CCO Holdings Capital Corp., 6.50%, Due 4/30/2021A | | | 250 | | | | 263 | |
CHS/Community Health Systems, Inc., 8.00%, Due 11/15/2019 | | | 500 | | | | 532 | |
DISH DBS Corp., 5.125%, Due 5/1/2020 | | | 250 | | | | 254 | |
GRD Holdings III Corp., 10.75%, Acquired 10/22/2014, Cost $276, Due 6/1/2019B E | | | 250 | | | | 273 | |
HealthSouth Corp., 5.75%, Due 11/1/2024 | | | 500 | | | | 516 | |
Landry’s Holdings II, Inc., 10.25%, Due 1/1/2018E | | | 500 | | | | 515 | |
Lee Enterprises, Inc., 9.50%, Due 3/15/2022E | | | 500 | | | | 517 | |
NCL Corp Ltd., 5.25%, Due 11/15/2019E | | | 125 | | | | 127 | |
Numericable-SFR, 4.875%, Due 5/15/2019E | | | 250 | | | | 250 | |
Peninsula Gaming LLC / Peninsula Gaming Corp., 8.375%, Due 2/15/2018A E | | | 500 | | | | 523 | |
Pinnacle Entertainment, Inc., 7.50%, Due 4/15/2021 | | | 500 | | | | 520 | |
Sinclair Television Group, Inc., 5.375%, Due 4/1/2021 | | | 250 | | | | 251 | |
Station Casinos LLC, 7.50%, Due 3/1/2021A | | | 500 | | | | 524 | |
Tenet Healthcare Corp., 5.00%, Due 3/1/2019E | | | 250 | | | | 251 | |
United Rentals North America, Inc., 6.125%, Due 6/15/2023 | | | 250 | | | | 260 | |
Viking Cruises Ltd., 8.50%, Due 10/15/2022E | | | 250 | | | | 274 | |
| | | | | | | | |
| | | | | | | 7,585 | |
| | | | | | | | |
Telecommunications - 9.57% | | | | | | | | |
Altice S.A., 7.75%, Due 5/15/2022E | | | 500 | | | | 518 | |
Avanti Communications Group PLC, 10.00%, Acquired 10/2/2014, Cost $496, Due 10/1/2019B E H | | | 500 | | | | 460 | |
Frontier Communications Corp., 7.125%, Due 3/15/2019 | | | 500 | | | | 546 | |
Sprint Nextel Corp., 6.00%, Due 11/15/2022 | | | 500 | | | | 466 | |
Telecom Italia SpA, 5.303%, Due 5/30/2024E | | | 250 | | | | 260 | |
T-Mobile USA, Inc., 6.625%, Due 11/15/2020 | | | 500 | | | | 520 | |
Windstream Corp., 7.75%, Due 10/15/2020 | | | 500 | | | | 519 | |
| | | | | | | | |
| | | | | | | 3,289 | |
| | | | | | | | |
Utilities - 2.98% | | | | | | | | |
Calpine Corp., 5.375%, Due 1/15/2023 | | | 500 | | | | 505 | |
NRG Energy, Inc., 6.625%, Due 3/15/2023 | | | 500 | | | | 519 | |
| | | | | | | | |
| | | | | | | 1,024 | |
| | | | | | | | |
Total Corporate Obligations (Cost $22,347) | | | | | | | 21,776 | |
| | | | | | | | |
| | | | |
| | | See accompanying notes | | |
| | 12 | | |
American Beacon Crescent Short Duration High Income FundSM
Schedule of Investments
January 31, 2015
| | | | | | | | |
| | | Shares | | | Fair Value | |
| | | | | | (000’s) | |
SHORT-TERM INVESTMENTS - 1.41% (Cost $484) | | | | | | | | |
JPMorgan U.S. Government Money Market Fund, Capital Class | | | 484,102 | | | $ | 484 | |
| | | | | | | | |
TOTAL INVESTMENTS - 98.87% (Cost $34,798) | | | | | | | 34,000 | |
OTHER ASSETS, NET OF LIABILITIES - 1.13% | | | | 388 | |
| | | | | | | | |
TOTAL NET ASSETS - 100.00% | | | | | | $ | 34,388 | |
| | | | | | | | |
Percentages are stated as a percent of net assets.
| A | LLC - Limited Liability Company. |
| B | Illiquid Security. At period end, the amount of illiquid securities was $2,272 or 6.61% of net assets. |
| C | LP - Limited Partnership. |
| D | The coupon rate shown on floating or adjustable rate securities represents the rate at period end. The due date on these types of securities reflects the final maturity date. |
| E | Security exempt from registration under the Securities Act of 1933. These securities may be resold to qualified institutional buyers pursuant to Rule 144A. At the period end, the value of these securities amounted to $10,133 or 29.47% of net assets. The Fund has no right to demand registration of these securities. |
| H | PLC – Public Limited Company. |
| | | | |
| | | See accompanying notes | | |
| | 13 | | |
American Beacon Global Evolution Frontier Markets Income FundSM
Schedule of Investments
January 31, 2015
| | | | | | | | | | |
| | | | | Par AmountF | | | Fair Value | |
| | | | | (000’s) | | | (000’s) | |
Angola - 1.80% (Cost $3,148) | | | | | | | | | | |
Structured Notes - 1.80% | | | | | | | | | | |
Angola Ministry of Finance (Issuer Frontera Capital BV), 6.57%, Due 12/31/2023 | | | | $ | 3,000 | | | $ | 3,216 | |
| | | | | | | | | | |
Argentina - 3.70% | | | | | | | | | | |
Foreign Government Obligations - 3.70% | | | | | | | | | | |
Argentina Bonar Bonds, 7.00%, Due 4/17/2017 | | | | | 2,000 | | | | 1,925 | |
Provincia de Buenos Aires, 10.875%, Due 1/26/2021A | | | | | 350 | | | | 336 | |
Republic of Argentina, 8.75%, Due 5/7/2024 | | | | | 4,350 | | | | 4,337 | |
| | | | | | | | | | |
Total Argentina (Cost $6,251) | | | | | | | | | 6,598 | |
| | | | | | | | | | |
Armenia - 1.84% (Cost $3,540) | | | | | | | | | | |
Foreign Government Obligations - 1.84% | | | | | | | | | | |
Republic of Armenia, 6.00%, Due 9/30/2020A | | | | | 3,400 | | | | 3,290 | |
| | | | | | | | | | |
Bangladesh - 3.92% | | | | | | | | | | |
Structured Notes - 3.92% | | | | | | | | | | |
Bangladesh Treasury Bond (Issuer Standard Chartered Bank), | | | | | | | | | | |
11.25%, Due 2/8/2017B | | | | | 3,690 | | | | 3,797 | |
11.23%, Due 1/22/2019B | | BDT | | | 3,050 | | | | 3,199 | |
| | | | | | | | | | |
Total Bangladesh (Cost $6,935) | | | | | | | | | 6,996 | |
| | | | | | | | | | |
Bosnia and Herzegovina - 0.38% | | | | | | | | | | |
Foreign Government Obligations - 0.38% | | | | | | | | | | |
Bosnia & Herzegovina Government Bond, | | | | | | | | | | |
0.938%, Due 12/11/2017B | | EUR | | | 760 | | | | 396 | |
0.938%, Due 12/11/2021B | | EUR | | | 604 | | | | 289 | |
| | | | | | | | | | |
Total Bosnia and Herzegovina (Cost $813) | | | | | | | | | 685 | |
| | | | | | | | | | |
Costa Rica - 1.57% | | | | | | | | | | |
Foreign Government Obligations - 1.57% | | | | | | | | | | |
Republic of Costa Rica, | | | | | | | | | | |
9.20%, Due 3/27/2019 | | CRC | | | 1,300,000 | | | | 2,398 | |
11.50%, Due 12/21/2022A | | CRC | | | 210,000 | | | | 417 | |
| | | | | | | | | | |
Total Costa Rica (Cost $2,839) | | | | | | | | | 2,815 | |
| | | | | | | | | | |
Dominican Republic - 4.04% | | | | | | | | | | |
Foreign Government Obligations - 4.04% | | | | | | | | | | |
Dominican Republic Government Bond, | | | | | | | | | | |
15.95%, Due 6/4/2021A | | DOP | | | 21,500 | | | | 608 | |
16.95%, Due 2/4/2022 | | DOP | | | 158,000 | | | | 4,722 | |
11.50%, Due 5/10/2024A | | DOP | | | 80,000 | | | | 1,871 | |
| | | | | | | | | | |
Total Dominican Republic (Cost $7,273) | | | | | | | | | 7,201 | |
| | | | | | | | | | |
Ecuador - 1.93% | | | | | | | | | | |
Foreign Government Obligations - 1.93% | | | | | | | | | | |
Republic of Ecuador, | | | | | | | | | | |
9.375%, Due 12/15/2015A | | | | | 300 | | | | 296 | |
7.95%, Due 6/20/2024A | | | | | 3,550 | | | | 3,142 | |
| | | | | | | | | | |
Total Ecuador (Cost $3,977) | | | | | | | | | 3,438 | |
| | | | | | | | | | |
Egypt - 2.78% | | | | | | | | | | |
Structured Notes - 1.07% | | | | | | | | | | |
Arab Republic of Egypt (Issuer Citigroup, Inc.), 10.50%, Due 7/30/2015C | | | | | 2,000 | | | | 1,903 | |
| | | | | | | | | | |
Foreign Government Obligations - 1.71% | | | | | | | | | | |
Arab Republic of Egypt, 6.875%, Due 4/30/2040A | | | | | 3,000 | | | | 3,053 | |
| | | | | | | | | | |
Total Egypt (Cost $5,011) | | | | | | | | | 4,956 | |
| | | | | | | | | | |
| | | | |
| | | See accompanying notes | | |
| | 14 | | |
American Beacon Global Evolution Frontier Markets Income FundSM
Schedule of Investments
January 31, 2015
| | | | | | | | | | |
| | | | | Par AmountF | | | Fair Value | |
| | | | | (000’s) | | | (000’s) | |
Ethiopia - 2.86% (Cost $5,133) | | | | | | | | | | |
Foreign Government Obligations - 2.86% | | | | | | | | | | |
Federal Democratic Republic of Ethiopia, 6.625%, Due 12/11/2024 | | | | $ | 5,200 | | | $ | 5,096 | |
| | | | | | | | | | |
Gabon - 1.90% (Cost $3,824) | | | | | | | | | | |
Foreign Government Obligations - 1.90% | | | | | | | | | | |
Gabonese Republic, 6.375%, Due 12/12/2024A | | | | | 3,600 | | | | 3,384 | |
| | | | | | | | | | |
Gambia - 1.71% (Cost $3,050) | | | | | | | | | | |
Structured Notes - 1.71% | | | | | | | | | | |
Republic of Gambia (Issuer Frontera Capital BV), 15.00%, Due 7/29/2015B | | | | | 3,000 | | | | 3,049 | |
| | | | | | | | | | |
Georgia - 1.83% (Cost $3,363) | | | | | | | | | | |
Foreign Government Obligations - 1.83% | | | | | | | | | | |
Republic of Georgia, 6.875%, Due 4/12/2021A | | | | | 3,000 | | | | 3,263 | |
| | | | | | | | | | |
Ghana - 3.82% | | | | | | | | | | |
Foreign Government Obligations - 3.82% | | | | | | | | | | |
Ghana Government Bond, | | | | | | | | | | |
16.90%, Due 3/7/2016 | | GHS | | | 200 | | | | 56 | |
23.00%, Due 2/13/2017 | | GHS | | | 4,000 | | | | 1,229 | |
25.48%, Due 4/24/2017 | | GHS | | | 4,000 | | | | 1,281 | |
26.00%, Due 6/5/2017 | | GHS | | | 3,700 | | | | 1,198 | |
Republic of Ghana, | | | | | | | | | | |
7.875%, Due 8/7/2023A | | | | | 1,500 | | | | 1,313 | |
8.125%, Due 1/18/2026 | | | | | 2,000 | | | | 1,730 | |
| | | | | | | | | | |
Total Ghana (Cost $7,465) | | | | | | | | | 6,807 | |
| | | | | | | | | | |
Honduras - 2.83% (Cost $5,003) | | | | | | | | | | |
Foreign Government Obligations - 2.83% | | | | | | | | | | |
Honduras Government Bond, 7.50%, Due 3/15/2024A | | | | | 4,800 | | | | 5,040 | |
| | | | | | | | | | |
Ivory Coast - 3.43% (Cost $6,247) | | | | | | | | | | |
Foreign Government Obligations - 3.43% | | | | | | | | | | |
Ivory Coast Government Bond, 5.75%, Due 12/31/2032A B | | | | | 6,500 | | | | 6,110 | |
| | | | | | | | | | |
Kenya - 4.48% | | | | | | | | | | |
Foreign Government Obligations - 4.48% | | | | | | | | | | |
Kenya Infrastructure Bond, | | | | | | | | | | |
12.00%, Due 9/18/2023 | | KES | | | 202,500 | | | | 2,272 | |
11.00%, Due 9/15/2025 | | KES | | | 176,000 | | | | 1,923 | |
11.00%, Due 10/12/2026 | | KES | | | 350,000 | | | | 3,798 | |
| | | | | | | | | | |
Total Kenya (Cost $8,209) | | | | | | | | | 7,993 | |
| | | | | | | | | | |
Malawi - 2.80% (Cost $5,256) | | | | | | | | | | |
Structured Notes - 2.80% | | | | | | | | | | |
Republic of Malawi (Issuer Frontera Capital BV), 25.00%, Due 7/7/2017B | | | | | 5,500 | | | | 4,996 | |
| | | | | | | | | | |
Mongolia - 4.23% | | | | | | | | | | |
Foreign Government Obligations - 0.79% | | | | | | | | | | |
Mongolia International Bond, 5.125%, Due 12/5/2022A | | | | | 1,700 | | | | 1,411 | |
| | | | | | | | | | |
Structured Notes - 3.44% | | | | | | | | | | |
Mongolia Ministry of Finance (Issuer ING Bank NV), 13.175%, Due 3/25/2017 | | | | | 6,700 | | | | 6,126 | |
| | | | | | | | | | |
Total Mongolia (Cost $7,718) | | | | | | | | | 7,537 | |
| | | | | | | | | | |
Mozambique - 3.38% (Cost $6,408) | | | | | | | | | | |
Foreign Government Obligations - 3.38% | | | | | | | | | | |
Moz Ematum Finance, 6.305%, Due 9/11/2020A | | | | | 6,500 | | | | 6,029 | |
| | | | | | | | | | |
| | | | |
| | | See accompanying notes | | |
| | 15 | | |
American Beacon Global Evolution Frontier Markets Income FundSM
Schedule of Investments
January 31, 2015
| | | | | | | | | | |
| | | | | Par AmountF | | | Fair Value | |
| | | | | (000’s) | | | (000’s) | |
Nicaragua - 3.75% | | | | | | | | | | |
Foreign Government Obligations - 0.36% | | | | | | | | | | |
Republic of Nicaragua, 5.00%, Due 2/1/2019B | | | | $ | 690 | | | $ | 648 | |
| | | | | | | | | | |
Structured Notes - 3.39% | | | | | | | | | | |
Empresa Administradora de Aeropuertos Internacionales (Issuer Zambezi BV), 8.25%, Acquired 11/20/2014, Cost $5,999, Due 4/8/2024C G | | | | | 6,000 | | | | 6,048 | |
| | | | | | | | | | |
Total Nicaragua (Cost $6,656) | | | | | | | | | 6,696 | |
| | | | | | | | | | |
Pakistan - 4.50% | | | | | | | | | | |
Foreign Government Obligations - 2.66% | | | | | | | | | | |
Islamic Republic of Pakistan, | | | | | | | | | | |
7.25%, Due 4/15/2019A | | | | | 4,150 | | | | 4,228 | |
7.875%, Due 3/31/2036A | | | | | 300 | | | | 276 | |
Pakistan Government International Bond, 6.75%, Due 12/3/2019 | | | | | 250 | | | | 250 | |
Structured Notes - 1.84% | | | | | | | | | | |
Islamic Republic of Pakistan (Issuer Citigroup, Inc.), 11.25%, Due 7/20/2016B | | | | | 3,300 | | | | 3,282 | |
| | | | | | | | | | |
Total Pakistan (Cost $8,170) | | | | | | | | | 8,036 | |
| | | | | | | | | | |
Rwanda - 2.58% (Cost $4,734) | | | | | | | | | | |
Foreign Government Obligations - 2.58% | | | | | | | | | | |
Republic of Rwanda, 6.625%, Due 5/2/2023A | | | | | 4,600 | | | | 4,600 | |
| | | | | | | | | | |
Senegal - 3.50% | | | | | | | | | | |
Foreign Government Obligations - 3.50% | | | | | | | | | | |
Republic of Senegal, 6.25%, Due 7/30/2024A | | | | | 4,000 | | | | 3,972 | |
Senegal Government International Bond, 8.75%, Due 5/13/2021 | | | | | 2,000 | | | | 2,270 | |
| | | | | | | | | | |
Total Senegal (Cost $6,089) | | | | | | | | | 6,242 | |
| | | | | | | | | | |
Serbia - 4.08% | | | | | | | | | | |
Foreign Government Obligations - 4.08% | | | | | | | | | | |
Serbia Treasury Bonds, | | | | | | | | | | |
10.00%, Due 10/17/2016 | | RSD | | | 355,000 | | | | 3,235 | |
10.00%, Due 5/8/2017 | | RSD | | | 290,000 | | | | 2,629 | |
10.00%, Due 3/20/2021 | | RSD | | | 165,000 | | | | 1,421 | |
| | | | | | | | | | |
Total Serbia (Cost $8,634) | | | | | | | | | 7,285 | |
| | | | | | | | | | |
Seychelles - 0.38% (Cost $637) | | | | | | | | | | |
Foreign Government Obligations - 0.38% | | | | | | | | | | |
Republic of Seychelles, 7.00%, Due 1/1/2026A B D | | | | | 700 | | | | 674 | |
| | | | | | | | | | |
Sri Lanka - 4.56% | | | | | | | | | | |
Foreign Government Obligations - 4.56% | | | | | | | | | | |
Sri Lanka Government Bond, | | | | | | | | | | |
8.00%, Due 6/1/2016 | | LKR | | | 140,000 | | | | 1,074 | |
7.50%, Due 8/15/2018 | | LKR | | | 450,000 | | | | 3,440 | |
10.60%, Due 7/1/2019 | | LKR | | | 425,000 | | | | 3,621 | |
| | | | | | | | | | |
Total Sri Lanka (Cost $8,223) | | | | | | | | | 8,135 | |
| | | | | | | | | | |
Supranational - 0.38% (Cost $728) | | | | | | | | | | |
Foreign Government Obligations - 0.38% | | | | | | | | | | |
International Bank for Reconstruction and Development, Inflation Indexed, 3.40%, Due 4/15/2017E H | | UYU | | | 16,449 | | | | 686 | |
| | | | | | | | | | |
Tunisia - 1.43% (Cost $2,498) | | | | | | | | | | |
Foreign Government Obligations - 1.43% | | | | | | | | | | |
Banque Centrale de Tunisie S.A., 5.75%, Due 1/30/2025 | | | | | 2,500 | | | | 2,545 | |
| | | | | | | | | | |
Uganda - 2.88% | | | | | | | | | | |
Foreign Government Obligations - 2.88% | | | | | | | | | | |
Uganda Government Bond, | | | | | | | | | | |
13.375%, Due 2/25/2016 | | UGX | | | 1,000,000 | | | | 351 | |
| | | | |
| | | See accompanying notes | | |
| | 16 | | |
American Beacon Global Evolution Frontier Markets Income FundSM
Schedule of Investments
January 31, 2015
| | | | | | | | | | |
| | | | | Par AmountF | | | Fair
Value | |
| | | | | (000’s) | | | (000’s) | |
12.875%, Due 5/19/2016 | | UGX | | $ | 2,750,000 | | | $ | 964 | |
10.75%, Due 9/8/2016 | | UGX | | | 3,700,000 | | | | 1,206 | |
14.125%, Due 12/1/2016 | | UGX | | | 1,300,000 | | | | 442 | |
10.75%, Due 12/28/2017 | | UGX | | | 7,000,000 | | | | 2,149 | |
| | | | | | | | | | |
Total Uganda (Cost $5,698) | | | | | | | | | 5,112 | |
| | | | | | | | | | |
Uruguay - 3.72% (Cost $6,933) | | | | | | | | | | |
Foreign Government Obligations - 3.72% | | | | | | | | | | |
Uruguay Government International Bond, Inflation Indexed, 5.00%, Due 9/14/2018E | | UYU | | | 157,637 | | | | 6,618 | |
| | | | | | | | | | |
Venezuela - 1.71% | | | | | | | | | | |
Foreign Government Obligations - 1.71% | | | | | | | | | | |
Republic of Venezuela, | | | | | | | | | | |
7.75%, Due 10/13/2019 | | | | | 3,000 | | | | 983 | |
9.00%, Due 5/7/2023 | | | | | 2,775 | | | | 923 | |
8.25%, Due 10/13/2024 | | | | | 3,500 | | | | 1,146 | |
| | | | | | | | | | |
Total Venezuela (Cost $5,932) | | | | | | | | | 3,052 | |
| | | | | | | | | | |
Zambia - 4.40% | | | | | | | | | | |
Foreign Government Obligations - 4.40% | | | | | | | | | | |
Zambia Government Bond, | | | | | | | | | | |
10.00%, Due 9/3/2015 | | ZMW | | | 17,500 | | | | 2,561 | |
10.00%, Due 2/16/2017 | | ZMW | | | 5,500 | | | | 744 | |
11.00%, Due 9/2/2019 | | ZMW | | | 4,800 | | | | 518 | |
Zambia Treasury Bill, | | | | | | | | | | |
2.655%, Due 4/6/2015 | | ZMW | | | 7,000 | | | | 1,040 | |
2.150%, Due 9/7/2015 | | ZMW | | | 9,500 | | | | 1,328 | |
2.448%, Due 9/21/2015 | | ZMW | | | 12,000 | | | | 1,657 | |
| | | | | | | | | | |
Total Zambia (Cost $8,100) | | | | | | | | | 7,848 | |
| | | | | | | | | | |
| | | |
| | | | | Shares | | | | |
SHORT-TERM INVESTMENTS - 4.51% (Cost $8,045) | | | | | | | | | | |
Short-Term Investments - 4.51% | | | | | | | | | | |
JPMorgan U.S. Government Money Market Fund, Capital Class | | | | | 8,045,493 | | | | 8,045 | |
| | | | | | | | | | |
TOTAL INVESTMENTS - 97.61% (Cost $182,540) | | | | | | | | | 174,073 | |
OTHER ASSETS, NET OF LIABILITIES - 2.38% | | | | | | | | | 4,250 | |
| | | | | | | | | | |
TOTAL NET ASSETS - 100.00% | | | | | | | | $ | 178,323 | |
| | | | | | | | | | |
Percentages are stated as a percent of net assets.
| A | Reg S - Security purchased under the Securities Act of 1933, which exempts from registration securities offered and sold outside of the United States. Such a security cannot be sold in the United States without either an effective registration statement filed pursuant to the Securities Act of 1933, or pursuant to an exemption from registration. |
| B | The coupon rate shown on floating or adjustable rate securities represents the rate at period end. The due date on these types of securities reflects the final maturity date. |
| C | Security exempt from registration under the Securities Act of 1933. These securities may be resold to qualified institutional buyers pursuant to Rule 144A. At the period end, the value of these securities amounted to $7,951 or 4.46% of net assets. The Fund has no right to demand registration of these securities. |
| D | Step Up/Down - A scheduled increase in the exercise or conversion price at which a warrant, an option, or a convertible security may be used to acquire shares of common stock. |
| E | Inflation-Indexed Note. |
| F | In U.S. Dollars unless otherwise noted. |
| G | Illiquid. At period end, the amount of illiquid securities was $6,048 or 3.39% of net assets. |
| | | | |
| | | See accompanying notes | | |
| | 17 | | |
American Beacon Global Evolution Frontier Markets Income FundSM
Schedule of Investments
January 31, 2015
Forward Currency Contracts Open at January 31, 2015:
| | | | | | | | | | | | | | | | | | | | | | | | | | | | |
Type | | Currency | | | Principal Amount
Covered by Contract | | | Settlement
Date | | | Counterparty | | | Unrealized
Appreciation | | | Unrealized
(Depreciation) | | | Net Unrealized
Appreciation
(Depreciation) | |
Sell | | | EUR | | | | 1,582,238 | | | | 2/20/2015 | | | | SSB | | | $ | 143,724 | | | $ | — | | | $ | 143,724 | |
Sell | | | EUR | | | | 6,781,018 | | | | 2/20/2015 | | | | SSB | | | | 615,002 | | | | — | | | | 615,002 | |
| | | | | | | | | | | | | | | | | | | | | | | | | | | | |
| | | | | | | | | | | | | | | | | | $ | 758,726 | | | $ | — | | | $ | 758,726 | |
| | | | | | | | | | | | | | | | | | | | | | | | | | | | |
Glossary
| | | | | | |
Counterparty Abbreviations: |
| | | |
| SSB | | State Street Bank & Trust | | | | |
|
Currency Abbreviations: |
| | | |
| BDT | | Bankladeshi Taka | | LKR | | Sri Lanka Rupee |
| CRC | | Costa Rican Colon | | RSD | | Dinar |
| DOP | | Dominican Peso | | UGX | | Uganda Shilling |
| EUR | | Euro | | UYU | | Uruguayan Peso |
| GHS | | Ghanaian Cedi | | ZMW | | Zambian Kwacha |
| KES | | Kenyan Shilling | | | | |
| | | | |
| | | See accompanying notes | | |
| | 18 | | |
American Beacon FundsSM
Statements of Assets and Liabilities
January 31, 2015 (in thousands, except share and per share amounts)
| | | | | | | | |
| | | Crescent
Short
Duration High
Income Fund | | | Global
Evolution
Frontier
Markets
Income Fund | |
Assets: | |
Investments in unaffiliated securities, at fair value A | | $ | 34,000 | | | $ | 174,073 | |
Foreign currency, at fair value B | | | — | | | | 380 | |
Cash | | | 15 | | | | 125 | |
Dividends and interest receivable | | | 526 | | | | 3,213 | |
Receivable for investments sold | | | 642 | | | | — | |
Receivable for fund shares sold | | | — | | | | 211 | |
Receivable for expense reimbursement (Note 2) | | | 52 | | | | 26 | |
Unrealized appreciation from foreign currency contracts | | | — | | | | 759 | |
Prepaid expenses | | | 51 | | | | 22 | |
| | | | | | | | |
Total assets | | | 35,286 | | | | 178,809 | |
| | | | | | | | |
Liabilities: | | | | | | | | |
Payable for investments purchased | | | 841 | | | | — | |
Payable for fund shares redeemed | | | — | | | | 265 | |
Dividends payable | | | — | | | | 16 | |
Management and investment advisory fees payable | | | 12 | | | | 83 | |
Administrative service and service fees payable | | | 9 | | | | 64 | |
Transfer agent fees payable | | | 5 | | | | 1 | |
Custody and fund accounting fees payable | | | 4 | | | | 20 | |
Professional fees payable | | | 26 | | | | 32 | |
Payable for prospectus and shareholder reports | | | 1 | | | | 5 | |
| | | | | | | | |
Total liabilities | | | 898 | | | | 486 | |
| | | | | | | | |
Net Assets | | $ | 34,388 | | | $ | 178,323 | |
| | | | | | | | |
Analysis of Net Assets: | | | | | | | | |
Paid-in-capital | | | 35,498 | | | | 186,647 | |
Undistributed (or overdistribution of) net investment income | | | — | | | | (522 | ) |
Accumulated net realized (loss) | | | (312 | ) | | | (1 | ) |
Unrealized (depreciation) of investments | | | (798 | ) | | | (5,628 | ) |
Unrealized (depreciation) of currency transactions | | | — | | | | (2,173 | ) |
| | | | | | | | |
Net assets | | $ | 34,388 | | | $ | 178,323 | |
| | | | | | | | |
Shares outstanding at no par value (unlimited shares authorized): | | | | | | | | |
Institutional Class | | | 3,501,099 | | | | 952,936 | |
| | | | | | | | |
Y Class | | | 10,157 | | | | 14,249,303 | |
| | | | | | | | |
Investor Class | | | 19,606 | | | | 1,444,832 | |
| | | | | | | | |
A Class | | | 10,147 | | | | 1,629,802 | |
| | | | | | | | |
C Class | | | 10,111 | | | | 128,767 | |
| | | | | | | | |
Net assets (not in thousands): | | | | | | | | |
Institutional Class | | $ | 33,903,138 | | | $ | 9,225,629 | |
| | | | | | | | |
Y Class | | $ | 98,343 | | | $ | 138,082,358 | |
| | | | | | | | |
Investor Class | | $ | 189,898 | | | $ | 13,987,805 | |
| | | | | | | | |
A Class | | $ | 98,255 | | | $ | 15,782,502 | |
| | | | | | | | |
C Class | | $ | 97,911 | | | $ | 1,244,636 | |
| | | | | | | | |
Net asset value, offering and redemption price per share: | | | | | | | | |
Institutional Class | | $ | 9.68 | | | $ | 9.68 | |
| | | | | | | | |
Y Class | | $ | 9.68 | | | $ | 9.69 | |
| | | | | | | | |
Investor Class | | $ | 9.69 | | | $ | 9.68 | |
| | | | | | | | |
A Class | | $ | 9.68 | | | $ | 9.68 | |
| | | | | | | | |
A Class (offering price) | | $ | 9.93 | | | $ | 10.16 | |
| | | | | | | | |
C Class | | $ | 9.68 | | | $ | 9.67 | |
| | | | | | | | |
A Cost of investments in unaffiliated securities | | $ | 34,798 | | | $ | 182,540 | |
B Cost of foreign currency | | $ | — | | | $ | 395 | |
| | | | |
| | | See accompanying notes | | |
| | 19 | | |
American Beacon FundsSM
Statements of Operations
For the period ended January 31, 2015 (in thousands)
| | | | | | | | |
| | | Crescent
Short
Duration
High Income
Fund* | | | Global
Evolution
Frontier
Markets
Income
Fund** | |
Investment Income: | | | | | | | | |
Dividend income from unaffiliated securities (net of foreign taxes) A | | $ | — | | | $ | 1 | |
Interest income | | | 645 | | | | 5,249 | |
| | | | | | | | |
Total investment income | | | 645 | | | | 5,250 | |
| | | | | | | | |
Expenses: | | | | | | | | |
Management and investment advisory fees (Note 2) | | | 52 | | | | 373 | |
Administrative service fees (Note 2): | | | | | | | | |
Institutional Class | | | 34 | | | | 28 | |
Y Class | | | — | | | | 132 | |
Investor Class | | | — | | | | 20 | |
A Class | | | — | | | | 20 | |
C Class | | | — | | | | 2 | |
Transfer agent fees: | | | | | | | | |
Institutional Class | | | 2 | | | | 2 | |
Y Class | | | 2 | | | | 3 | |
Investor Class | | | 2 | | | | 3 | |
A Class | | | 2 | | | | 2 | |
C Class | | | 2 | | | | 2 | |
Custody and fund accounting fees | | | 16 | | | | 101 | |
Professional fees | | | 116 | | | | 207 | |
Registration fees and expenses | | | 24 | | | | 93 | |
Service fees (Note 2): | | | | | | | | |
Y Class | | | — | | | | 44 | |
Investor Class | | | — | | | | 16 | |
A Class | | | — | | | | 10 | |
C Class | | | — | | | | 1 | |
Distribution fees (Note 2): | | | | | | | | |
A Class | | | — | | | | 16 | |
C Class | | | — | | | | 7 | |
Prospectus and shareholder report expenses | | | 10 | | | | 25 | |
Trustee fees | | | — | | | | 3 | |
Other expenses | | | 3 | | | | 6 | |
| | | | | | | | |
Total expenses | | | 265 | | | | 1,116 | |
| | | | | | | | |
Net fees waived and expenses reimbursed (Note 2) | | | (167 | ) | | | (231 | ) |
| | | | | | | | |
Net expenses | | | 98 | | | | 885 | |
| | | | | | | | |
Net investment income | | | 547 | | | | 4,365 | |
| | | | | | | | |
Realized and unrealized gain (loss) from investments: | | | | | | | | |
Net realized gain (loss) from: | | | | | | | | |
Investments | | | (313 | ) | | | 291 | |
Foreign currency transactions | | | — | | | | (317 | ) |
Change in net unrealized appreciation or (depreciation) of: | | | | | | | | |
Investments | | | (798 | ) | | | (5,628 | ) |
Foreign currency transactions | | | — | | | | (2,173 | ) |
| | | | | | | | |
Net (loss) from investments | | | (1,111 | ) | | | (7,827 | ) |
| | | | | | | | |
Net (decrease) in net assets resulting from operations | | $ | (564 | ) | | $ | (3,462 | ) |
| | | | | | | | |
A Foreign taxes | | | — | | | | 141 | |
| * | Commencement date for the Crescent Short Duration High Income Fund is October 1, 2014. |
| ** | Commencement date for the Global Evolution Frontier Markets Income Fund is February 25, 2014. |
| | | | |
| | | See accompanying notes | | |
| | 20 | | |
American Beacon FundsSM
Statements of Changes in Net Assets
| | | | | | | | |
| | | Crescent
Short
Duration
High Income
Fund | | | Global
Evolution
Frontier
Markets
Income Fund | |
| | | From
October 1A
to
January 31,
2015 | | | From
February 25A
to
January 31,
2015 | |
Increase (Decrease) in Net Assets: | | | | | | | | |
Operations: | | | | | | | | |
Net investment income | | $ | 547 | | | $ | 4,365 | |
Net realized (loss) from investments and foreign currency transactions | | | (313 | ) | | | (26 | ) |
Change in net unrealized appreciation or (depreciation) from investments and foreign currency transactions | | | (798 | ) | | | (7,801 | ) |
| | | | | | | | |
Net (decrease) in net assets resulting from operations | | | (564 | ) | | | (3,462 | ) |
| | | | | | | | |
Distributions to Shareholders: | | | | | | | | |
Net investment income: | | | | | | | | |
Institutional Class | | | (540 | ) | | | (575 | ) |
Y Class | | | (2 | ) | | | (3,103 | ) |
Investor Class | | | (2 | ) | | | (422 | ) |
A Class | | | (1 | ) | | | (427 | ) |
C Class | | | (1 | ) | | | (39 | ) |
Net realized gain from investments: | | | | | | | | |
Institutional Class | | | — | | | | (15 | ) |
Y Class | | | — | | | | (231 | ) |
Investor Class | | | — | | | | (23 | ) |
A Class | | | — | | | | (26 | ) |
C Class | | | — | | | | (2 | ) |
| | | | | | | | |
Net distributions to shareholders | | | (546 | ) | | | (4,863 | ) |
| | | | | | | | |
Capital Share Transactions: | | | | | | | | |
Proceeds from sales of shares | | | 25,270 | | | | 198,489 | |
Reinvestment of dividends and distributions | | | 383 | | | | 4,795 | |
Cost of shares redeemed | | | (35 | ) | | | (26,646 | ) |
Redemption fees | | | — | | | | 10 | |
| | | | | | | | |
Net increase in net assets from capital share transactions | | | 25,618 | | | | 176,648 | |
| | | | | | | | |
Net increase in net assets | | | 24,508 | | | | 168,323 | |
| | | | | | | | |
Net Assets: | | | | | | | | |
Beginning of Period | | | 9,880 | | | | 10,000 | |
| | | | | | | | |
End of Period * | | $ | 34,388 | | | $ | 178,323 | |
| | | | | | | | |
*Includes undistributed (or overdistribution of) net investment income | | $ | — | | | $ | (522 | ) |
| | | | | | | | |
| A | Commencement of Operations. |
| | | | |
| | | See accompanying notes | | |
| | 21 | | |
American Beacon FundsSM
Statement of Cash Flows
For the period ended January 31, 2015 (in thousands)
| | | | |
| | | Global Evolution
Frontier Markets
Income Fund | |
Cash flows used in operating activities: | |
Net decrease in net assets resulting from operations | | $ | (3,462 | ) |
Adjustments to reconcile net decrease in net assets resulting from operations to net cash used in operating activities: | | | | |
Purchases of long-term securities | | | (189,617 | ) |
Proceeds from sales of long-term securities | | | 15,224 | |
Net purchases of short-term portfolio investments | | | (8,045 | ) |
Changes in operating assets and liabilities: | | | | |
Increase in dividend and interest receivable | | | (3,213 | ) |
Increase in receivable for fund shares sold | | | (211 | ) |
Increase in receivable for expense reimbursement | | | (26 | ) |
Increase in prepaid expenses | | | (22 | ) |
Increase in payable for fund shares redeemed | | | 265 | |
Increase in dividends payable | | | 16 | |
Increase in management and investment advisory fees payable | | | 83 | |
Increase in administrative service and service fees payable | | | 64 | |
Increase in transfer agent fees payable | | | 1 | |
Increase in custody and fund accounting fees payable | | | 20 | |
Increase in professional fees payable | | | 32 | |
Increase in payable for prospectus and shareholder reports | | | 5 | |
Net realized loss of investments and foreign currency transactions | | | 26 | |
Net change in unrealized depreciation of investments and foreign currency transactions | | | 7,801 | |
Overdistribution of net investment income | | | (522 | ) |
Net amortization and basis adjustments | | | 286 | |
| | | | |
Net cash used in operating activities | | | (181,295 | ) |
| | | | |
Cash flows provided by financing activities: | | | | |
Proceeds from shares sold | | | 208,489 | |
Cost of shares redeemed | | | (26,646 | ) |
Proceeds from redemption fees | | | 10 | |
Cash dividends paid | | | (53 | ) |
| | | | |
Net cash provided by financing activities | | | 181,800 | |
| | | | |
Cash and Foreign Currency: | | | | |
Beginning of fiscal year | | $ | — | |
| | | | |
End of fiscal year | | | 505 | |
| | | | |
Supplemental Disclosure of Cash Flow and Non-Cash Information: | | | | |
Reinvestment of dividends | | $ | 4,795 | |
| | | | |
| | | | |
| | | See accompanying notes | | |
| | 22 | | |
American Beacon FundsSM
Notes to Financial Statements
January 31, 2015
1. Organization and Significant Accounting Policies
American Beacon Funds (the “Trust”), which is comprised of thirty-one Funds, is organized as a Massachusetts business trust and is registered under the Investment Company Act of 1940, as amended (the “Act”), as a diversified, open-end management investment company. These financial statements and notes to the financial statements relate to the American Beacon Crescent Short Duration High Income Fund (“Crescent Fund”) and the American Beacon Global Evolution Frontier Markets Income Fund (“Global Evolution Fund”) (each a “Fund” and collectively, the “Funds”), each a series of the Trust.
American Beacon Advisors, Inc. (the “Manager”) is a wholly-owned subsidiary of Lighthouse Holdings, Inc. and was organized in 1986 to provide business management, advisory, administrative and asset management consulting services to the Trust and other investors.
Class Disclosure
October 1, 2014 was the inception date of all classes of the Crescent Short Duration High Income Fund. February 25, 2014 was the inception date of all classes of the Global Evolution Frontier Markets Income Fund.
Each Fund has multiple classes of shares designed to meet the needs of different groups of investors. The following table sets forth the differences amongst the classes:
| | |
Class: | | Offered to: |
| Institutional Class | | Investors making an initial investment of $250,000 |
| Y Class | | Investors making an initial investment of $100,000 |
| Investor Class | | General public and investors investing directly or through an intermediary |
| A Class | | General public and investors investing through an intermediary with applicable sales charges, which may include a front-end sales charge and a contingent deferred sales charge (“CDSC”) |
| C Class | | General public and investors investing through an intermediary with applicable sales charges, which may include a CDSC |
Each class offered by the Trust has equal rights as to assets and voting privileges. Income and non-class specific expenses are allocated daily to each class on the basis of the relative net assets. Realized and unrealized capital gains and losses of each class are allocated daily based on the relative net assets of each class of the respective Fund. Class specific expenses, where applicable, currently include administrative service fees, service fees, and distribution fees and vary amongst the classes as described more fully in Note 2.
Recently Adopted Accounting Pronouncements
In June 2013, the Financial Accounting Standards Board (“FASB”) issued Accounting Standards Update (“ASU”) No. 2013-08, “Financial Services - Investment Companies (Topic 946): Amendments to the Scope, Measurement, and Disclosure Requirements,” which amends the criteria that define an investment company and clarifies the measurement guidance and requires new disclosures for investment companies. Under the ASU, an entity that is registered under the Investment Company Act of 1940 automatically qualifies as an investment company. The Funds adopted this ASU for the periods ended January 31, 2015. Management has evaluated the implications of the ASU and determined that adoption thereof will not have a material impact on the financial statements.
2. Transactions with Affiliates
Management Agreement
The Trust and the Manager are parties to a Management Agreement that obligates the Manager to provide or oversee the provision of all investment advisory, fund management, and securities lending services.
23
American Beacon FundsSM
Notes to Financial Statements
January 31, 2015
As compensation for performing the duties required under the Management Agreement, the Manager receives from the Funds an annualized fee equal to 0.05% of the average daily net assets. The Funds pay the unaffiliated investment advisors hired to direct investment activities of the Funds. Management fees paid by the Funds during the periods ended January 31, 2015 were as follows (in thousands):
| | | | | | | | | | | | | | | | |
Fund | | Management
Fee Rate | | | Management
Fee | | | Amounts paid
to Investment
Advisors | | | Amounts Paid
to Manager | |
Crescent Fund | | | 0.45 | % | | $ | 52 | | | $ | 46 | | | $ | 6 | |
Global Evolution Fund | | | 0.55 | % | | | 373 | | | | 339 | | | | 34 | |
Administration Agreement
The Manager and the Trust entered into an Administration Agreement which obligates the Manager to provide or oversee administrative services to each Fund. As compensation for performing the duties required under the Administration Agreement, the Manager receives an annualized fee of 0.30% of the average daily net assets of the Institutional, Y, and Investor Classes of the Funds. Prior to July 1, 2014, the Manager received 0.40% of the average daily net assets of the A and C Classes of the Global Evolution Fund. Beginning July 1, 2014, the Manager received 0.30% of the average daily net assets of the A and C Classes of each Fund.
Distribution Plans
The Funds, except for the A and C Classes, have adopted a “defensive” Distribution Plan (the “Plan”) in accordance with Rule 12b-1 under the Act, pursuant to which no separate fees will be charged to the Funds for distribution purposes. However, the Plan authorizes the management and administration fees received by the Manager and the investment advisors hired by the Manager to be used for distribution purposes. Under this Plan, the Funds do not intend to separately compensate the Manager or any other party, either directly or indirectly, for the distribution of Fund shares.
Separate Distribution Plans (the “Distribution Plans”) have been adopted pursuant to Rule 12b-1 under the Act for the A and C Classes of the Funds. Under the Distribution Plans, as compensation for distribution assistance, the Manager receives an annual fee of 0.25% of the average daily net assets of the A Class and 1.00% of the average daily net assets of the C Class. The fee will be payable without regard to whether the amount of the fee is more or less than the actual expenses incurred in a particular month by the Manager for distribution assistance.
Service Plans
The Manager and the Trust entered into Service Plans that obligate the Manager to oversee additional shareholder servicing of the Y, Investor, A, and C Classes. As compensation for performing the duties required under the Service Plans, the Manager receives 0.10% of the average daily net assets of the Y Class, 0.15% of the average daily net assets of the A and C Classes, and up to 0.375% of the average daily net assets of the Investor Class of the Fund.
Investment in Affiliated Funds
The Funds may invest in the American Beacon Money Market Select Fund (the “MM Select Fund”) or the U.S. Government Money Market Select Fund (the “USG Select Fund”) (collectively, the “Select Funds”). The Select Funds and the Funds have the same investment advisor and therefore, are considered to be affiliated. The Manager serves as the investment advisor to the Select Funds and receives Management and Administration fees totaling 0.10% of the average daily net assets of the Select Funds. During the periods ended January 31, 2015, the Funds did not invest in the Select Funds.
24
American Beacon FundsSM
Notes to Financial Statements
January 31, 2015
Interfund Lending Program
Pursuant to an exemptive order issued by the Securities and Exchange Commission (“SEC”), the Funds, along with other registered investment companies having management contracts with the Manager, may participate in an interfund lending program. This program provides an alternative credit facility allowing the Funds to borrow from other participating Funds. During the periods ended January 31, 2015, the Funds did not utilize the credit facility.
Expense Reimbursement Plan
The Manager agreed to reimburse the following Funds to the extent that total annual fund operating expenses exceeded a Fund’s expense cap. For the periods ended January 31, 2015, the Manager waived or reimbursed expenses as follows:
| | | | | | | | | | | | | | | | | | |
| | | | | Expense Cap | | | | | | | |
Fund | | Class | | Since
inception
to
6/30/14 | | | 7/1/14
to
1/31/15 | | | Reimbursed or
(Recovered) Expenses | | | Expiration | |
Crescent Fund* | | Institutional | | | N/A | | | | 0.85 | % | | $ | 157,816 | | | | 2018 | |
Crescent Fund* | | Y | | | N/A | | | | 0.95 | % | | | 2,229 | | | | 2018 | |
Crescent Fund* | | Investor | | | N/A | | | | 1.23 | % | | | 2,556 | | | | 2018 | |
Crescent Fund* | | A | | | N/A | | | | 1.25 | % | | | 2,212 | | | | 2018 | |
Crescent Fund* | | C | | | N/A | | | | 2.00 | % | | | 2,204 | | | | 2018 | |
Global Evolution Fund** | | Institutional | | | 1.15 | % | | | 1.15 | % | | | 73,654 | | | | 2018 | |
Global Evolution Fund** | | Y | | | 1.25 | % | | | 1.25 | % | | | 113,658 | | | | 2018 | |
Global Evolution Fund** | | Investor | | | 1.53 | % | | | 1.53 | % | | | 16,920 | | | | 2018 | |
Global Evolution Fund** | | A | | | 1.65 | % | | | 1.55 | % | | | 21,846 | | | | 2018 | |
Global Evolution Fund** | | C | | | 2.40 | % | | | 2.30 | % | | | 4,983 | | | | 2018 | |
| * | October 1, 2014 is the inception date of the Fund. |
| ** | February 25, 2014 is the inception date of the Fund. |
Of these amounts, $51,997 and $25,959 was payable to the Manager at January 31, 2015 for the Crescent and Global Evolution Funds, respectively. The Funds have adopted an Expense Reimbursement Plan whereby the Manager may seek repayment of fees waived or expenses reimbursed for a period of up to three years. However, reimbursement will occur only if the Class’ average net assets have grown or expenses have declined sufficiently to allow reimbursement without causing its expense ratio to exceed the previously agreed upon contractual expense limit. During the periods ended January 31, 2015, the Funds did not record a liability for potential reimbursement, due to the current assessment that a reimbursement is unlikely.
Sales Commissions
The Funds’ distributor, Foreside Fund Services, LLC (“Foreside”), may receive a portion of A Class sales charges from broker dealers and it may be used to offset distribution related expenses. During the periods ended January 31, 2015, Foreside collected $2,577 for Global Evolution Fund from the sale of Class A Shares.
A CDSC of 0.50% will be deducted with respect to Class A Shares on certain purchases of $1,000,000 or more that are redeemed in whole or part within 18 months of purchase, unless waived as discussed in the Prospectus. Any applicable CDSC will be 0.50% of the lesser of the original purchase price or the value of the redemption of the Class A Shares redeemed. During the periods ended January 31, 2015, there were no CDSC fees collected for Class A Shares.
A CDSC of 1.00% will be deducted with respect to Class C Shares redeemed within 12 months of purchase, unless waived as discussed in the Prospectus. Any applicable CDSC will be 1.00% of the lesser of the original purchase price or the value of the redemption of the Class C Shares redeemed. During the periods ended January 31, 2015, CDSC fees of $93 and $711 were collected for the Crescent and Global Evolution Funds, respectively.
25
American Beacon FundsSM
Notes to Financial Statements
January 31, 2015
3. Security Valuation and Fair Value Measurements
Investments are valued at the close of the New York Stock Exchange (the “Exchange”), normally 4 p.m. ET, each day that the Exchange is open for business. Equity securities, including exchange-traded funds (“ETFs”) for which market quotations are available are valued at the last sale price or official closing price (closing bid price or last evaluated quote if no sale has occurred) on the primary market or exchange on which they trade.
Debt securities (other than short-term securities) normally are valued on the basis of prices provided by an independent pricing service and may take into account appropriate factors such as institution-size trading in similar groups of securities, yield, quality, coupon rate, maturity, type of issue, trading characteristics, and other market data. The prices of debt securities may be determined using quotes obtained from brokers.
Investments in open-end mutual funds are valued at the closing net asset value (“NAV”) per share of the mutual fund on the day of valuation. Investment grade short-term obligations with 60 days or less to maturity are valued using the amortized cost method, which approximates market value.
Securities for which the market prices are not readily available or are not reflective of the fair value of the security, as determined by the Manager, will be priced at fair value following procedures approved by the Trust’s Board of Trustees (the “Board”).
Futures contracts are valued based upon their quoted daily settlement prices. Upon entering into a futures contract, a Fund is required to deposit with its futures broker, an amount of cash or U.S. Government and Agency Obligations in accordance with the initial margin requirements of the broker or exchange. Futures contracts are marked to market daily and an appropriate payable or receivable for the change in value (“variation margin”) is recorded by the Fund. Gains or losses are recognized, but not considered realized until the contracts expire or are closed. Futures contracts involve, to varying degrees, risk of loss in excess of the variation margin disclosed on the Statement of Assets and Liabilities.
For valuation purposes, the last quoted price of non U.S. equity securities may be adjusted under the circumstances described below. If the Fund determines that developments between the close of a foreign market and the close of the Exchange will, in its judgment, materially affect the value of some or all of its portfolio securities, the Fund will adjust the previous closing prices to reflect what it believes to be the fair value of the securities as of the close of the Exchange. In deciding whether it is necessary to adjust closing prices to reflect fair value, the Fund reviews a variety of factors, including developments in foreign markets, the performance of U.S. securities markets, and the performance of instruments trading in U.S. markets that represent foreign securities and baskets of foreign securities. A Fund may also fair value securities in other situations, such as when a particular foreign market is closed but the Fund is open. Adjustments to closing prices to reflect fair value on affected foreign securities may be provided by an independent pricing service.
Other investments, including restricted securities and those financial instruments for which the above valuation procedures are inappropriate or are deemed not to reflect fair value are stated at fair value as determined in good faith by the Valuation Committee, established by the Fund’s Board.
Valuation Inputs
Various inputs may be used to determine the fair value of the Fund’s investments. These inputs are summarized in three broad levels for financial statement purposes. The inputs or methodologies used to value securities are not necessarily an indication of the risk associated with investing in those securities.
| | | | |
| | Level 1 - | | Quoted prices in active markets for identical securities. |
26
American Beacon FundsSM
Notes to Financial Statements
January 31, 2015
| | | | |
| | Level 2 - | | Prices determined using other significant observable inputs. These may include quoted prices for similar securities, interest rates, prepayment speeds, credit risk, and others. |
| | |
| | Level 3 - | | Prices determined using other significant unobservable inputs. Unobservable inputs reflect the Fund’s own assumptions about the factors market participants would use in pricing an investment, and would be based on the best information available. |
Level 1 and Level 2 trading assets and trading liabilities, at fair value
Fixed income securities including corporate, convertible and municipal bonds and notes, U.S. government agencies, U.S. treasury obligations, sovereign issues, bank loans, convertible preferred securities, and non-U.S. bonds are normally valued by pricing service providers that use broker dealer quotations, reported trades or valuation estimates from their internal pricing models. The service providers’ internal models use inputs that are observable such as issuer details, interest rates, yield curves, prepayment speeds, credit risks/spreads, default rates and quoted prices for similar assets. Securities that use similar valuation techniques and inputs as described above are categorized as Level 2 of the fair value hierarchy.
Fixed income securities purchased on a delayed-delivery basis are marked to market daily until settlement at the forward settlement date are categorized as Level 2 of the fair value hierarchy.
Common stocks and financial derivative instruments, such as futures contracts that are traded on a national securities exchange, are stated at the last reported sale or settlement price on the day of valuation. To the extent these securities are actively traded and valuation adjustments are not applied, they are categorized as Level 1 of the fair value hierarchy. Securities using these valuation adjustments are categorized as Level 2 of the fair value hierarchy. Preferred securities and other equities traded on inactive markets or valued by reference to similar instruments are also categorized as Level 2 of the fair value hierarchy.
Investments in registered open-end investment management companies will be valued based upon the NAVs of such investments and are categorized as Level 1 of the fair value hierarchy. Short-term investments having a maturity of 60 days or less are generally valued at amortized cost which approximates fair value. These investments are categorized as Level 2 of the fair value hierarchy.
Over-the-counter (“OTC”) financial derivative instruments, such as foreign currency contracts and structured notes, derive their value from underlying asset prices, indices, reference rates, and other inputs or a combination of these factors. These contracts are normally valued on the basis of broker dealer quotations or pricing service providers. Depending on the product and the terms of the transaction, the fair value of the financial derivative contracts can be estimated by a pricing service provider using a series of techniques, including simulation pricing models. The pricing models use inputs that are observed from actively quoted markets such as issuer details, indices, spreads, interest rates, curves, dividends, and exchange rates. Financial derivatives that use similar valuation techniques and inputs as described above are categorized as Level 2 of the fair value hierarchy.
Level 3 trading assets and trading liabilities, at fair value
The valuation techniques and significant inputs used in determining the fair values of financial instruments classified as Level 3 of the fair value hierarchy are as follows:
Securities and other assets for which market quotes are not readily available are valued at fair value as determined in good faith by the Board or persons acting at their direction and may be categorized as Level 3 of the fair value hierarchy.
Market quotes are considered not readily available in circumstances where there is an absence of current or reliable market-based data (e.g., trade information or broker quotes), including where events occur after the close of the relevant market, but prior to the Exchange close, that materially affect the values of a
27
American Beacon FundsSM
Notes to Financial Statements
January 31, 2015
Fund’s securities or assets. In addition, market quotes are considered not readily available when, due to extraordinary circumstances, the exchanges or markets on which the securities trade, do not open for trading for the entire day and no other market prices are available. The Board has delegated to the Manager the responsibility for monitoring significant events that may materially affect the fair values of a Fund’s securities or assets and for determining whether the value of the applicable securities or assets should be re-evaluated in light of such significant events.
The Board has adopted methods for valuing securities and other assets in circumstances where market quotes are not readily available, and has delegated the responsibility for applying the valuation methods to the Manager. For instances in which daily market quotes are not readily available, investments may be valued, pursuant to guidelines established by the Board. In the event that the security or asset cannot be valued pursuant to one of the valuation methods established by the Board, the fair value of the security or asset will be determined in good faith by the Valuation Committee, generally based upon recommendations provided by the Manager.
When a Fund uses fair valuation methods applied by the Manager that use significant unobservable inputs to determine its NAV, the securities priced using this methodology are categorized as Level 3 of the fair value hierarchy. These methods may require subjective determinations about the value of a security. While the Trust’s policy is intended to result in a calculation of a Fund’s NAV that fairly reflects security values as of the time of pricing, the Trust cannot guarantee that values determined by the Board or persons acting at their direction would accurately reflect the price that a Fund could obtain for a security if it were to dispose of that security as of the time of pricing (for instance, in a forced or distressed sale). The prices used by a Fund may differ from the value that would be realized if the securities were sold.
For fair valuations using significant unobservable inputs, U.S. Generally Accepted Accounting Principles (“U.S. GAAP”) requires a reconciliation of the beginning to ending balances for reported fair values that presents changes attributable to total realized and unrealized gains or losses, purchases and sales, and transfers in and out of the Level 3 category during the period. In accordance with the requirements of U.S. GAAP, a fair value hierarchy and Level 3 reconciliation, if any, have been included below.
The Funds’ investments are summarized by level based on the inputs used to determine their values. U.S. GAAP also requires all transfers between any levels to be disclosed. The end of period timing recognition has been adopted for the transfers between levels of each Fund’s assets and liabilities. As of January 31, 2015, the investments were classified as described below (in thousands):
| | | | | | | | | | | | | | | | |
Crescent Fund* | | Level 1 | | | Level 2 | | | Level 3 | | | Total | |
Bank Loan Obligations | | $ | — | | | $ | 11,740 | | | $ | — | | | $ | 11,740 | |
Corporate Obligations | | | — | | | | 21,776 | | | | — | | | | 21,776 | |
Short-Term Investments - Money Market Funds | | | 484 | | | | — | | | | — | | | | 484 | |
| | | | | | | | | | | | | | | | |
Total Investments in Securities | | $ | 484 | | | $ | 33,516 | | | $ | — | | | $ | 34,000 | |
| | | | | | | | | | | | | | | | |
| | | | |
Global Evolution Fund* | | Level 1 | | | Level 2 | | | Level 3 | | | Total | |
Foreign Government Obligations | | $ | — | | | $ | 129,413 | | | $ | 999 | | | $ | 130,412 | |
Structured Notes | | | — | | | | — | | | | 35,616 | | | | 35,616 | |
Short-Term Investments - Money Market Funds | | | 8,045 | | | | — | | | | — | | | | 8,045 | |
| | | | | | | | | | | | | | | | |
Total Investments in Securities | | $ | 8,045 | | | $ | 129,413 | | | $ | 36,615 | | | $ | 174,073 | |
| | | | | | | | | | | | | | | | |
Financial Derivative Instruments-Assets | | | | | | | | | | | | | | | | |
Forward Currency Contracts | | $ | 759 | | | $ | — | | | $ | — | | | $ | 759 | |
| * | Refer to the Schedules of Investments for industry information. |
As of January 31, 2015, there were no transfers between levels for the Crescent Fund.
The following is a reconciliation of Level 3 assets of the Global Evolution Fund for which significant unobservable inputs were used to determine fair value. Transfers in or out of Level 3 represent the ending
28
American Beacon FundsSM
Notes to Financial Statements
January 31, 2015
value of any security or instrument where a change in the level has occurred from the beginning to the end of the period (in thousands):
| | | | | | | | | | | | |
| | | Foreign
Government
Obligations | | | Structured
Notes | | | Totals | |
Balance as of 1/31/2014 | | $ | — | | | $ | — | | | $ | — | |
Net Purchases | | | 1,053 | | | | 35,932 | | | | 36,985 | |
Net Sales | | | — | | | | — | | | | — | |
Realized gain (loss) | | | — | | | | — | | | | — | |
Change in unrealized appreciation or (depreciation) | | | (54 | ) | | | (316 | ) | | | (370 | ) |
Transfer into Level 3 | | | — | | | | — | | | | — | |
Transfer out of Level 3 | | | — | | | | — | | | | — | |
| | | | | | | | | | | | |
Balance as of 1/31/2015 | | | 999 | | | | 35,616 | | | | 36,615 | |
| | | | | | | | | | | | |
Change in unrealized at period end** | | $ | (54 | ) | | $ | (316 | ) | | $ | (370 | ) |
| | | | | | | | | | | | |
The foreign government obligations and structured notes, classified as Level 3 were valued using single broker quotes. However, these securities are included in the Level 3 category due to limited market transparency and/or lack of corroboration to support the quoted prices.
| ** | Change in unrealized appreciation or (depreciation) attributable to Level 3 securities held at period end. This balance is included in the change in unrealized appreciation or (depreciation) on the Statements of Operations. |
Security Transactions and Investment Income
Security transactions are recorded on the trade date of the security purchase or sale. The Funds may purchase securities with delivery or payment to occur at a later date. At the time the Funds enter into a commitment to purchase a security, the transaction is recorded, and the value of the security is reflected in the NAV. The value of the security may vary with market fluctuations.
Dividend income, net of foreign taxes, is recorded on the ex-dividend date, except certain dividends from foreign securities which are recorded as soon as the information is available to the Funds. Interest income is earned from settlement date, recorded on the accrual basis, and adjusted, if necessary, for accretion of discounts and amortization of premiums. For financial and tax reporting purposes, realized gains and losses are determined on the basis of specific lot identification.
Dividends to Shareholders
Dividends from net investment income of the Funds generally will be declared daily and paid monthly. Distributions, if any, of net realized capital gains are generally paid at least annually and recorded on the ex-dividend date.
Commission Recapture
The Funds have established brokerage commission recapture arrangements with certain brokers or dealers. If the Funds’ investment advisor chooses to execute a transaction through a participating broker, the broker rebates a portion of the commission back to the Funds. Any collateral benefit received through participation in the commission recapture program is directed exclusively to the Funds. This amount is reported with the net realized gain in the Funds’ Statements of Operations, if applicable.
Allocation of Income, Expenses, Gains, and Losses
Income, expenses (other than those attributable to a specific class), gains, and losses are allocated daily to each class of shares based upon the relative proportion of net assets represented by such class. Operating expenses directly attributable to a specific class are charged against the operations of that class.
29
American Beacon FundsSM
Notes to Financial Statements
January 31, 2015
Use of Estimates
The preparation of financial statements in conformity with U.S. GAAP requires management to make estimates and assumptions that affect the amounts reported in the financial statements and accompanying notes. Actual results may differ from those estimated.
Redemption Fees
All Classes of the Global Evolution Fund impose a 2% redemption fee on shares held for less than 90 days. The fee is deducted from the redemption proceeds and is intended to offset the trading costs, market impact, and other costs associated with short-term trading activity in the Funds. The “first-in, first-out” method is used to determine the holding period. The fee is allocated to all classes of the Fund pro-rata based on their respective net assets.
Other
Under the Trust’s organizational documents, its officers and trustees are indemnified against certain liability arising out of the performance of their duties to the Trust. In the normal course of business, the Trust enters into contracts that provide indemnification to the other party or parties against potential costs or liabilities. The Trust’s maximum exposure under these arrangements is dependent on claims that may be made in the future and, therefore, cannot be estimated. The Trust has had no prior claims or losses pursuant to any such agreement.
4. Securities and Other Investments
Pay-In-Kind Securities
Certain Funds may invest in payment in-kind securities (“PIKs”). PIKs give the issuer the option at each interest payment date of making interest payments in either cash or additional debt securities. Those additional debt securities usually have the same terms, including maturity dates and interest rates, and associated risks as the original bonds. The daily market quotations of the original bonds may include the accrued interest (referred to as a dirty price) and require a pro-rata adjustment from the unrealized appreciation or depreciation on investment to interest receivable in the Statements of Assets and Liabilities.
Restricted Securities
Certain Funds may invest in securities that are subject to legal or contractual restrictions on resale. These securities may be sold privately, but are required to be registered or exempted from such registration before being sold to the public. Private placement securities are generally considered to be restricted except for those securities traded between qualified institutional investors under the provisions of Rule 144A of the Securities Act of 1933. Reg S securities cannot be sold in the United States without either an effective registration statement filed pursuant to the Securities Act of 1933, or pursuant to an exemption from registration. Disposal of restricted securities may involve time-consuming negotiations and expenses, and prompt sale at an acceptable price may be difficult to achieve. Restricted securities outstanding at the periods ended January 31, 2015 are disclosed in the Notes to the Schedules of Investments.
High-Yield Securities
Non-investment-grade securities are rated below the four highest credit grades by at least one of the public rating agencies (or are unrated if not publicly rated). Participation in high-yielding securities transactions generally involves greater returns in the form of higher average yields. However, participation in such transactions involves greater risks, including sensitivity to economic changes, solvency, and relative liquidity in the secondary trading market. Lower ratings may reflect a greater possibility that the financial
30
American Beacon FundsSM
Notes to Financial Statements
January 31, 2015
condition of the issuer, or adverse changes in general economic conditions, or both, may impair the ability of the issuer to make payments of interest and principal. The prices and yields of lower-rated securities generally fluctuate more than higher-quality securities, and such prices may decline significantly in periods of general economic difficulty or rising interest rates.
Inflation-Indexed Bonds
The Funds may invest in inflation-indexed bonds. Inflation-indexed bonds are fixed-income securities whose principal value is periodically adjusted based on the rate of inflation. The interest rate on these bonds is generally fixed at issuance at a rate lower than typical bonds. Over the life of an inflation-indexed bond, however, interest will be paid based on a principal value, which is adjusted for inflation. Any increase or decrease in the principal amount of an inflation-indexed bond will be included as interest income on the Statements of Operations, even though investors do not receive their principal until maturity.
Structured Notes
Structured notes are hybrid securities that combine a debt obligation with an embedded derivative component. The derivative component is linked to changes in the value of an underlying reference asset or index so as to modify the return characteristics of the debt obligation. During the period, the Global Evolution Fund invested in structured notes to obtain a customized exposure and return structure that was not otherwise available.
Fluctuations in the value of structured notes are recorded as unrealized gains and losses. Net payments are recorded as net realized gains and losses. At maturity, or when the note is sold, the Fund records a realized gain or loss. Structured notes are often leveraged, increasing the volatility of each note’s value relative to the change in the underlying reference asset or index. These notes may entail a greater degree of market risk than other types of debt securities because the investor bears the risk of a decline in the value of the underlying reference asset or index. Structured notes may also be more volatile, less liquid, and more difficult to accurately price than less complex or more traditional debt securities. These notes are subject to prepayment, credit, and interest rate risks similar to those of conventional fixed income securities.
Other Investment Company Securities and Other Exchange Traded Products
The Funds may invest in shares of other investment companies, including open-end funds, closed-end funds, business development companies, ETFs, unit investment trusts, and other investment companies of the Trust. The Funds may invest in investment company securities advised by the Manager or a sub-advisor. Investments in the securities of other investment companies may involve duplication of advisory fees and certain other expenses. By investing in another investment company, a Fund becomes a shareholder of that investment company. As a result, Fund shareholders indirectly will bear a Fund’s proportionate share of the fees and expenses paid by shareholders of the other investment company, in addition to the fees and expenses Fund shareholders directly bear in connection with the Fund’s own operations. These other fees and expenses are reflected as Acquired Fund Fees and Expenses and are included in the Fees and Expenses Table for the Fund in its Prospectus, if applicable. Investments in other investment companies may involve the payment of substantial premiums above the value of such issuer’s portfolio securities.
Master Agreements
The Global Evolution Fund is a party to International Swaps and Derivatives Association, Inc. Master Agreements (“ISDA Master Agreements”) with counterparties that govern transactions in over-the-counter derivative and foreign exchange contracts entered into by the Fund and those counterparties. The ISDA Master Agreements contain provisions for general obligations, representations, agreements, collateral and events of default or termination. Events of termination include conditions that may entitle counterparties to elect to terminate early and cause settlement of all outstanding transactions under the applicable ISDA Master
31
American Beacon FundsSM
Notes to Financial Statements
January 31, 2015
Agreement. Any election to terminate early could be material to the financial statements. Since different types of forward and OTC financial derivative transactions have different mechanics and are sometimes traded out of different legal entities of a particular counterparty organization, each type of transaction may be covered by a different Master Agreement, resulting in the need for multiple agreements with a single counterparty. As the Master Agreements are specific to unique operations of different asset types, they allow a Fund to net its total exposure to a counterparty in the event of a default with respect to all the transactions governed under a single agreement with a counterparty.
Master Securities Forward Transaction Agreements (“Master Forward Agreements”) govern the considerations and factors surrounding the settlement of certain forward settling transactions, such as delayed delivery or sale-buyback financing transactions by and between a Fund and select counterparties. The Master Forward Agreements maintain provisions for, among other things, initiation and confirmation, payment and transfer, events of default, termination, and maintenance of collateral.
5. Financial Derivative Instruments
Forward Foreign Currency Contracts
The Funds may enter into forward foreign currency contracts to hedge the exchange rate risk on investment transactions or to hedge the value of the Fund’s securities denominated in foreign currencies. Forward foreign currency contracts are valued at the forward exchange rate prevailing on the day of valuation. The Fund bears the market risk that arises from changes in foreign exchange rates, and accordingly, the unrealized gain (loss) on these contracts is reflected in the accompanying financial statements. The Funds also bear the credit risk if the counterparty fails to perform under the contract.
For the periods ended January 31, 2015, the Global Evolution Fund entered into foreign currency exchange contracts primarily for hedging.
The Fund’s foreign currency contract notional dollar values outstanding fluctuate throughout the operating year as required to meet strategic requirements. The following tables illustrate the average quarterly volume of foreign currency contracts. For the purpose of this disclosure, volume is measured by the amounts bought and sold in USD.
| | | | | | | | |
| | | Average Forward Foreign Currency Notional Amount
Outstanding at January 31, 2015 | |
Fund | | Purchased Contracts | | | Sold Contracts | |
Global Evoluation(1) | | $ | — | | | $ | 3,533,035 | |
| (1) | The averages presented are representative of the inception date to the period end. |
The following is a summary of the Global Evolution Fund’s derivative financial instruments categorized by risk exposure (in thousands) (1):
Fair values of financial derivative instruments on the Statements of Assets and Liabilities not accounted for as hedging instruments as of January 31, 2015 (in thousands):
| | | | |
| | | Foreign exchange
contracts | |
Assets: | | | | |
Unrealized appreciation of foreign currency contracts | | $ | 759 | |
The effect of financial derivative instruments on the Statements of Operations not accounted for as hedging instruments for the period ended January 31, 2015 (in thousands):
| | | | |
| | | Foreign exchange
contracts | |
Realized gain (loss) of derivatives recognized as a result from operations: | | | | |
Net realized gain (loss) from foreign currency transactions | | $ | 203 | |
Net change in unrealized appreciation or (depreciation) of derivatives recognized as a result from operations: | | | | |
Change in net unrealized appreciation or (depreciation) from foreign currency transactions | | $ | (2,173 | ) |
| (1) | See Note 6 in the Notes to Financial Statements for additional information. |
32
American Beacon FundsSM
Notes to Financial Statements
January 31, 2015
6. Principal Risks
In the normal course of business the Funds trade financial instruments and enter into financial transactions where risk of potential loss exists. Security values fluctuate (market risk) and may decline due to factors affecting securities markets in general, particular industries represented in the securities markets or conditions specifically related to a particular country or company. Failure of the other party to a transaction to perform (credit and counterparty risk), for example by not making principal and interest payments when due, reduces the value of the issuer’s debt and could reduce the Funds’ income. Similar to credit risk, the Funds may be exposed to counterparty risk, or the risk that an institution or other entity with which the Funds have unsettled or open transactions will fail to make required payments or otherwise comply with the terms of the instrument, transaction or contract. The potential loss could exceed the value of the financial assets recorded in the financial statements. Some of the Funds’ investments may be illiquid and the Funds may not be able to vary the portfolio investments in response to changes in economic and other conditions. If a Fund is required to liquidate all or a portion of its investments quickly, the Fund may realize significantly less than the value at which it previously recorded those investments.
Market Risks
The Funds’ investments in financial derivatives and other financial instruments expose the Funds to various risks such as, but not limited to, interest rate, foreign currency and equity risks.
Interest rate risk is the risk that fixed income securities will decline in value because of changes in interest rates. As nominal interest rates rise, the value of certain fixed income securities held by the Fund is likely to decrease. A nominal interest rate can be described as the sum of a real interest rate and an expected inflation rate. Fixed income securities with longer durations tend to be more sensitive to changes in interest rates, usually making them more volatile than securities with shorter durations. Duration is useful primarily as a measure of the sensitivity of a fixed income’s market price to interest rate (i.e. yield) movements.
If the Funds invest directly in foreign currencies or in securities that trade in, and receive revenues in, foreign currencies, or in financial derivatives that provide exposure to foreign currencies, they will be subject to the risk that those currencies will decline in value relative to the base currency of the Funds, or, in the case of hedging positions, that the Funds’ base currency will decline in value relative to the currency being hedged. Currency rates in foreign countries may fluctuate significantly over short periods of time for a number of reasons, including changes in interest rates, intervention (or the failure to intervene) by U.S. or foreign governments, central banks or supranational entities such as the International Monetary Fund, or by the imposition of currency controls or other political developments in the United States or abroad. As a result, the Funds’ investments in foreign currency denominated securities may reduce the returns of the Fund. These risks are heightened when a Fund invests in emerging and frontier market countries, which have less developed capital markets and legal, regulatory, and political systems.
Counterparty Credit Risk
A derivative contract may suffer a mark to market loss if the value of the contract decreases due to an unfavorable change in the market rates or values of the underlying instrument. Losses can also occur if the counterparty does not perform under the contract.
With exchange traded futures, there is less counterparty credit risk to the Funds since the exchange or clearinghouse, as counterparty to such instruments, guarantees against a possible default. The clearinghouse stands between the buyer and the seller of the contract; therefore, the credit risk is limited to failure of the clearinghouse. While offset rights may exist under applicable law, a Fund does not have a contractual right of offset against a clearing broker or clearinghouse in the event of a default (including the bankruptcy or insolvency) of the clearing broker or clearinghouse. Additionally, credit risk exists in exchange traded futures
33
American Beacon FundsSM
Notes to Financial Statements
January 31, 2015
with respect to initial and variation margin that is held in a clearing broker’s customer accounts. While clearing brokers are required to segregate customer margin from their own assets, in the event that a clearing broker becomes insolvent or goes into bankruptcy and at that time there is a shortfall in the aggregate amount of margin held by the clearing broker for all its clients, typically the shortfall would be allocated on a pro rata basis across all the clearing broker’s customers, potentially resulting in losses to the Funds.
Cash collateral that has been pledged to cover obligations of the Funds and cash collateral received from the counterparty, if any, is reported separately on the Statements of Assets and Liabilities as Deposits with brokers for futures contracts and Payable to brokers for futures contracts, respectively. Non-cash collateral pledged by the Funds, if any, is noted in the Schedules of Investments. Generally, the amount of collateral due from or to a party is determined at the close of business of the Funds and additional required collateral is delivered to/pledged by the Funds on the next business day. To the extent amounts due to the Funds from its counterparties are not fully collateralized, contractually or otherwise, the Funds bear the risk of loss from counterparty non-performance. The Funds attempt to mitigate counterparty risk by only entering into agreements with counterparties that it believes have the financial resources to honor their obligations and by monitoring the financial stability of those counterparties.
Offsetting Assets and Liabilities
The Funds are parties to enforceable master netting agreements between brokers and counterparties, such as ISDA, Master Repo Agreements and Master Forward Agreements which provide for the right to offset under certain circumstances. The Funds employ multiple money managers and counterparties and have elected not to offset qualifying financial and derivative instruments on the Statements of Assets and Liabilities, as such all financial and derivative instruments are presented on a gross basis. The impacts of netting arrangements that provide the right to offset are detailed below. The net amount represents the net receivable or payable that would be due from or to the counterparty in the event of default. Exposure from borrowings and other financing agreements such as repurchase agreements can only be netted across transactions governed by the same Master Agreement with the same legal entity. All amounts reported below represent the balance as of the report date, January 31, 2015.
Global Evolution
Offsetting of Financial Assets and Derivative Assets as of January 31, 2015:
| | | | | | | | | | | | |
Description | | Gross Amounts of
Recognized Assets | | | Gross Amounts
Offset in the
Statements of
Assets and
Liabilities | | | Net Amounts of Liabilities
Presented in the
Statements of Assets
and Liabilities | |
Forward Currency Contracts | | $ | 758,726 | | | $ | — | | | $ | 758,726 | |
Financial Assets, Derivative Assets, and Collateral Pledged by Counterparty as of January 31, 2015:
| | | | | | | | | | | | | | | | |
| | | Net amount of Assets
Presented in the Statements
of Assets and Liabilities | | | Gross Amounts Not Offset in the
Statements of Assets and Liabilities | | | | |
Counterparty | | | Financial
Instruments | | | Cash Collateral
Received | | | Net
Amount | |
State Street Bank & Trust Co. | | $ | 758,726 | | | $ | — | | | $ | — | | | $ | 758,726 | |
7. Federal Income and Excise Taxes
It is the policy of the Funds to qualify as a regulated investment company (“RIC”), by complying with all applicable provisions of Subchapter M of the Internal Revenue Code, as amended, and to make distribution of taxable income sufficient to relieve it from substantially all federal income and excise taxes. For federal income tax purposes, the Funds are treated as a single entity for the purpose of determining such qualification.
34
American Beacon FundsSM
Notes to Financial Statements
January 31, 2015
The Funds do not have any unrecognized tax benefits in the accompanying financial statements. The tax year ended January 31, 2015 is subject to examination by the Internal Revenue Service. If applicable, the Funds recognize interest accrued related to unrecognized tax benefits in interest expense and penalties in “Other expenses” on the Statements of Operations.
Dividends are categorized in accordance with income tax regulations which may treat certain transactions differently than U.S. GAAP. Accordingly, the character of distributions and composition of net assets for tax purposes may differ from those reflected in the accompanying financial statements.
A Fund may be subject to taxes imposed by countries in which it invests. Such taxes are generally based on returns of income earned or gains realized or repatriated. Taxes are accrued and applied to net investment income, net realized capital gains and net unrealized appreciation or depreciation, as applicable, as the income is earned or capital gains are recorded.
The tax character of distributions paid were as follows (in thousands):
| | | | | | | | |
| | | Crescent Fund | | | Global Evolution Fund | |
| | | From October 1,(1)
to
January 31, 2015 | | | From February 25,(1)
to
January 31, 2015 | |
Distributions paid from: | | | | | | | | |
Ordinary income(2) | | | | | | | | |
Institutional Class | | $ | 540 | | | $ | 590 | |
Y Class | | | 2 | | | | 3,334 | |
Investor Class | | | 2 | | | | 445 | |
A Class | | | 1 | | | | 453 | |
C Class | | | 1 | | | | 41 | |
| | | | | | | | |
Total distributions paid | | $ | 546 | | | $ | 4,863 | |
| | | | | | | | |
| (1) | Commencement of Operations. |
| (2) | For tax purposes, short-term capital gains are considered ordinary income distributions. |
As of January 31, 2015, the components of distributable earnings or (deficits) on a tax basis were as follows (in thousands):
| | | | | | | | |
| | | Crescent Fund | | | Global Evolution Fund | |
Cost basis of investments for federal income tax purposes | | $ | 34,797 | | | $ | 182,541 | |
Unrealized appreciation | | | 126 | | | | 892 | |
Unrealized depreciation | | | (924 | ) | | | (9,360 | ) |
| | | | | | | | |
Net unrealized appreciation or (depreciation) | | | (798 | ) | | | (8,468 | ) |
Undistributed ordinary income | | | — | | | | 252 | |
Accumulated gain or (loss) | | | (312 | ) | | | — | |
Other temporary differences | | | — | | | | (108 | ) |
| | | | | | | | |
Distributable earnings or (deficits) | | $ | (1,110 | ) | | $ | (8,324 | ) |
| | | | | | | | |
Financial reporting records are adjusted for permanent book/tax differences to reflect tax character. Financial records are not adjusted for temporary differences. The temporary differences between financial reporting and tax-basis reporting of unrealized appreciation or (depreciation) are attributable primarily to the tax deferral of losses from wash sales and the realization for tax purposes of unrealized gains or (losses) on certain derivative instruments.
Due to inherent differences in the recognition of income, expenses and realized gains or (losses) under U.S. GAAP and federal income tax regulations, permanent differences between book and tax reporting have been identified and appropriately reclassified on the Statement of Assets and Liabilities.
Accordingly, the following amounts represent current year permanent differences derived from foreign currency and dividends that have been reclassed as of January 31, 2015 (in thousands):
35
American Beacon FundsSM
Notes to Financial Statements
January 31, 2015
| | | | | | | | |
| | | Crescent Fund | | | Global Evolution Fund | |
Paid-in-capital | | $ | — | | | $ | (1 | ) |
Undistributed net investment income | | | (1 | ) | | | (321 | ) |
Accumulated net realized gain (loss) | | | 1 | | | | 322 | |
Unrealized appreciation or (depreciation) of investments and futures contracts | | | — | | | | — | |
Under the Regulated Investment Company Modernization Act of 2010 (the “RIC MOD”), net capital losses recognized by Funds are carried forward indefinitely and retain their character as short-term and/or long-term losses.
For the fiscal periods ended January 31, 2015, the Crescent Fund had $313 of short-term capital loss carryforwards (in thousands).
8. Investment Transactions
The aggregate cost of purchases and proceeds from sales of investments, other than short-term obligations, for the year ended January 31, 2015 were as follows (in thousands):
| | | | | | | | |
| | | Crescent Fund | | | Global Evolution Fund | |
Purchases (excluding U.S. government securities) | | $ | 44,921 | | | $ | 189,617 | |
Sales and maturities (excluding U.S. government securities) | | | 10,262 | | | | 15,224 | |
9. Capital Share Transactions
The tables below summarize the activity in capital shares for each Class of the Funds (dollars and shares in thousands):
For the Periods Ended January 31, 2015
| | | | | | | | | | | | | | | | | | | | | | | | |
| | | Institutional Class | | | Y Class | | | Investor Class | |
Crescent Short Duration High Income | | Shares | | | Amount | | | Shares | | | Amount | | | Shares | | | Amount | |
Shares sold | | | 2,514 | | | $ | 25,143 | | | | 3 | | | $ | 24 | | | | 9 | | | $ | 93 | |
Reinvestment of dividends | | | 39 | | | | 376 | | | | — | | | | 2 | | | | — | | | | 2 | |
Shares redeemed | | | — | | | | — | | | | (2 | ) | | | (24 | ) | | | — | | | | (1 | ) |
| | | | | | | | | | | | | | | | | | | | | | | | |
Net increase in shares outstanding | | | 2,553 | | | $ | 25,519 | | | | 1 | | | $ | 2 | | | | 9 | | | $ | 94 | |
| | | | | | | | | | | | | | | | | | | | | | | | |
| | | | | | | | | | | | | | | | |
| | | A Class | | | C Class | |
Crescent Short Duration High Income | | Shares | | | Amount | | | Shares | | | Amount | |
Shares sold | | | — | | | $ | — | | | | 1 | | | $ | 10 | |
Reinvestment of dividends | | | — | | | | 2 | | | | — | | | | 1 | |
Shares redeemed | | | — | | | | — | | | | (1 | ) | | | (10 | ) |
| | | | | | | | | | | | | | | | |
Net increase in shares outstanding | | | — | | | $ | 2 | | | | — | | | $ | 1 | |
| | | | | | | | | | | | | | | | |
| | | | | | | | | | | | | | | | | | | | | | | | |
| | | Institutional Class | | | Y Class | | | Investor Class | |
Global Evolution Frontier Markets Income | | Shares | | | Amount | | | Shares | | | Amount | | | Shares | | | Amount | |
Shares sold | | | 960 | | | $ | 9,803 | | | | 15,122 | | | $ | 152,956 | | | | 1,638 | | | $ | 16,655 | |
Redemption Fees | | | — | | | | 1 | | | | — | | | | 7 | | | | — | | | | 1 | |
Reinvestment of dividends | | | 56 | | | | 567 | | | | 337 | | | | 3,329 | | | | 43 | | | | 430 | |
Shares redeemed | | | (1,023 | ) | | | (10,493 | ) | | | (1,220 | ) | | | (11,959 | ) | | | (246 | ) | | | (2,415 | ) |
| | | | | | | | | | | | | | | | | | | | | | | | |
Net increase in shares outstanding | | | (7 | ) | | $ | (122 | ) | | | 14,239 | | | $ | 144,433 | | | | 1,435 | | | $ | 14,671 | |
| | | | | | | | | | | | | | | | | | | | | | | | |
36
American Beacon FundsSM
Notes to Financial Statements
January 31, 2015
| | | | | | | | | | | | | | | | |
| | | A Class | | | C Class | |
Global Evolution Frontier Markets Income | | Shares | | | Amount | | | Shares | | | Amount | |
Shares sold | | | 1,735 | | | $ | 17,708 | | | | 134 | | | $ | 1,367 | |
Redemption Fees | | | — | | | | 1 | | | | — | | | | — | |
Reinvestment of dividends | | | 44 | | | | 437 | | | | 3 | | | | 32 | |
Shares redeemed | | | (159 | ) | | | (1,588 | ) | | | (18 | ) | | | (191 | ) |
| | | | | | | | | | | | | | | | |
Net increase in shares outstanding | | | 1,620 | | | $ | 16,558 | | | | 119 | | | $ | 1,208 | |
| | | | | | | | | | | | | | | | |
10. Subsequent Event
Agreement and Plan of Merger
On November 20, 2014, Lighthouse Holdings Parent, Inc. (“LHPI”), the indirect parent company of American Beacon Advisors, Inc., the Trusts’ investment manager, entered into an Agreement and Plan of Merger pursuant to which LHPI agreed to be acquired by investment funds managed by Kelso & Company, L.P. and Estancia Capital Management, LLC, both of which are private equity firms (“Transaction”). The Transaction is expected to close in the second calendar quarter of 2015, subject to customary closing conditions, including obtaining necessary client consents and approval from the Funds’ shareholders. There can be no assurance that the Transaction will be consummated as contemplated or that necessary conditions will be satisfied.
This change in control is deemed to be an “assignment” under the Investment Company Act of 1940 (the “1940 Act”) of the Trusts’ existing investment management agreement with the Manager and the sub-advisory agreements between the Trusts, the Manager, and each sub-adviser to the Funds and will result in automatic termination of each agreement. A new investment management agreement has been submitted to the Funds’ shareholders for approval and the Funds’ Board of Trustees approved new agreements with each sub-advisor under substantially the same terms as the current agreements.
The Transaction is not expected to result in any change in the portfolio management of the Fund or in the Fund’s investment objectives or policies.
37
American Beacon Crescent Short Duration High Income FundSM
Financial Highlights
(For a share outstanding throughout the period)
| | | | | | | | | | | | | | | | | | | | |
| | | Institutional Class | | | Y Class | | | Investor Class | | | A Class | | | C Class | |
| | | October 1
to
January 31,
2015A | | | October 1
to
January 31,
2015A | | | October 1
to
January 31,
2015A | | | October 1
to
January 31,
2015A | | | October 1
to
January 31,
2015A | |
Net asset value, beginning of period | | $ | 10.00 | | | $ | 10.00 | | | $ | 10.00 | | | $ | 10.00 | | | $ | 10.00 | |
| | | | | | | | | | | | | | | | | | | | |
Income from investment operations: | | | | | | | | | | | | | | | | | | | | |
Net investment income | | | 0.16 | | | | 0.15 | | | | 0.14 | | | | 0.14 | | | | 0.12 | |
Net gains (losses) on investments (both realized and unrealized) | | | (0.32 | ) | | | (0.32 | ) | | | (0.31 | ) | | | (0.32 | ) | | | (0.32 | ) |
| | | | | | | | | | | | | | | | | | | | |
Total income (loss) from investment operations | | | (0.16 | ) | | | (0.17 | ) | | | (0.17 | ) | | | (0.18 | ) | | | (0.20 | ) |
| | | | | | | | | | | | | | | | | | | | |
Less distributions: | | | | | | | | | | | | | | | | | | | | |
Dividends from net investment income | | | (0.16 | ) | | | (0.15 | ) | | | (0.14 | ) | | | (0.14 | ) | | | (0.12 | ) |
Distributions from net realized gains | | | — | | | | — | | | | — | | | | — | | | | — | |
| | | | | | | | | | | | | | | | | | | | |
Total distributions | | | (0.16 | ) | | | (0.15 | ) | | | (0.14 | ) | | | (0.14 | ) | | | (0.12 | ) |
| | | | | | | | | | | | | | | | | | | | |
Net asset value, end of period | | $ | 9.68 | | | $ | 9.68 | | | $ | 9.69 | | | $ | 9.68 | | | $ | 9.68 | |
| | | | | | | | | | | | | | | | | | | | |
Total return B | | | (1.65 | )%C | | | (1.68 | )%C | | | (1.67 | )%C | | | (1.78 | )%C | | | (2.03 | )%C |
| | | | | | | | | | | | | | | | | | | | |
Ratios and supplemental data: | | | | | | | | | | | | | | | | | | | | |
Net assets, end of period (in thousands) | | $ | 33,903 | | | $ | 99 | | | $ | 190 | | | $ | 98 | | | $ | 98 | |
Ratios to average net assets: | | | | | | | | | | | | | | | | | | | | |
Expenses, before reimbursements | | | 2.24 | %D | | | 7.71 | %D | | | 6.21 | %D | | | 7.97 | %D | | | 8.70 | %D |
Expenses, net of reimbursements | | | 0.85 | %D | | | 0.95 | %D | | | 1.23 | %D | | | 1.25 | %D | | | 2.00 | %D |
Net investment income (loss), before expense reimbursements | | | 3.37 | %D | | | (2.11 | )%D | | | (0.41 | )%D | | | (2.37 | )%D | | | (3.12 | )%D |
Net investment income, net of reimbursements | | | 4.76 | %D | | | 4.64 | %D | | | 4.57 | %D | | | 4.36 | %D | | | 3.59 | %D |
Portfolio turnover rate | | | 31 | %E | | | 31 | %E | | | 31 | %E | | | 31 | %E | | | 31 | %E |
| A | October 1, 2014 is the inception date of the Crescent Short Duration High Income Fund. |
| B | Based on net asset value, which does not reflect the sales charge, redemption fee, or contingent deferred sales charge, if applicable. May include adjustments in accordance with accounting principles generally accepted in the United States of America and as such, the net asset value for reporting purposes and the returns based upon those net asset values may differ from the net asset value and returns for shareholder transactions. |
| E | Portfolio turnover rate is for the period from October 1, 2014 to January 31, 2015 and is not annualized. |
38
American Beacon Global Evolution Frontier Markets Income FundSM
Financial Highlights
(For a share outstanding throughout the period)
| | | | | | | | | | | | | | | | | | | | |
| | | Institutional Class | | | Y Class | | | Investor Class | | | A Class | | | C Class | |
| | | February 25
to
January 31,
2015A | | | February 25
to
January 31,
2015A | | | February 25
to
January 31,
2015A | | | February 25
to
January 31,
2015A | | | February 25
to
January 31,
2015A | |
Net asset value, beginning of period | | $ | 10.00 | | | $ | 10.00 | | | $ | 10.00 | | | $ | 10.00 | | | $ | 10.00 | |
| | | | | | | | | | | | | | | | | | | | |
Income from investment operations: | | | | | | | | | | | | | | | | | | | | |
Net investment income | | | 0.59 | | | | 0.58 | | | | 0.55 | | | | 0.54 | | | | 0.47 | |
Net gains (losses) on investments (both realized and unrealized) | | | (0.30 | ) | | | (0.28 | ) | | | (0.29 | ) | | | (0.29 | ) | | | (0.30 | ) |
| | | | | | | | | | | | | | | | | | | | |
Total income (loss) from investment operations | | | 0.29 | | | | 0.30 | | | | 0.26 | | | | 0.25 | | | | 0.17 | |
| | | | | | | | | | | | | | | | | | | | |
Less distributions: | | | | | | | | | | | | | | | | | | | | |
Dividends from net investment income | | | (0.59 | ) | | | (0.59 | ) | | | (0.56 | ) | | | (0.55 | ) | | | (0.48 | ) |
Distributions from net realized gains | | | (0.02 | ) | | | (0.02 | ) | | | (0.02 | ) | | | (0.02 | ) | | | (0.02 | ) |
| | | | | | | | | | | | | | | | | | | | |
Total distributions | | | (0.61 | ) | | | (0.61 | ) | | | (0.58 | ) | | | (0.57 | ) | | | (0.50 | ) |
| | | | | | | | | | | | | | | | | | | | |
Redemption fees added to beneficial interests F | | | — | | | | — | | | | — | | | | — | | | | — | |
| | | | | | | | | | | | | | | | | | | | |
Net asset value, end of period | | $ | 9.68 | | | $ | 9.69 | | | $ | 9.68 | | | $ | 9.68 | | | $ | 9.67 | |
| | | | | | | | | | | | | | | | | | | | |
Total return B | | | 2.76 | %C | | | 2.87 | %C | | | 2.47 | %C | | | 2.42 | %C | | | 1.60 | %C |
| | | | | | | | | | | | | | | | | | | | |
Ratios and supplemental data: | | | | | | | | | | | | | | | | | | | | |
Net assets, end of period (in thousands) | | $ | 9,226 | | | $ | 138,082 | | | $ | 13,988 | | | $ | 15,782 | | | $ | 1,245 | |
Ratios to average net assets: | | | | | | | | | | | | | | | | | | | | |
Expenses, before reimbursements | | | 1.95 | %D | | | 1.50 | %D | | | 1.78 | %D | | | 1.88 | %D | | | 3.01 | %D |
Expenses, net of reimbursements | | | 1.15 | %D | | | 1.25 | %D | | | 1.53 | %D | | | 1.55 | %D | | | 2.31 | %D |
Net investment income, before expense reimbursements | | | 5.43 | %D | | | 6.33 | %D | | | 5.86 | %D | | | 5.82 | %D | | | 4.62 | %D |
Net investment income, net of reimbursements | | | 6.22 | %D | | | 6.59 | %D | | | 6.12 | %D | | | 6.15 | %D | | | 5.33 | %D |
Portfolio turnover rate | | | 23 | %E | | | 23 | %E | | | 23 | %E | | | 23 | %E | | | 23 | %E |
| A | February 25, 2014 is the inception date of the Global Evolution Frontier Markets Income Fund. |
| B | Based on net asset value, which does not reflect the sales charge, redemption fee, or contingent deferred sales charge, if applicable. May include adjustments in accordance with accounting principles generally accepted in the United States of America and as such, the net asset value for reporting purposes and the returns based upon those net asset values may differ from the net asset value and returns for shareholder transactions. |
| E | Portfolio turnover rate is for the period from February 25, 2014 to January 31, 2015 and is not annualized. |
| F | Amount represents less than $0.01 per share. |
39
American Beacon FundsSM
Privacy Policy & Federal Tax Information
January 31, 2015 (Unaudited)
Privacy Policy
The American Beacon Funds recognize and respect the privacy of our shareholders. We are providing this notice to you so you will understand how shareholder information may be collected and used.
We may collect nonpublic personal information about you from one or more of the following sources:
| | • | | information we receive from you on applications or other forms; |
| | • | | information about your transactions with us or our service providers; and |
| | • | | information we receive from third parties. |
We do not disclose any nonpublic personal information about our customers or former customers to anyone, except as permitted by law.
We restrict access to your nonpublic personal information to those employees or service providers who need to know that information to provide products or services to you. To ensure the confidentiality of your nonpublic personal information, we maintain safeguards that comply with federal standards.
Federal Tax Information
Certain tax information regarding the Funds is required to be provided to shareholders based upon the Funds’ income and distribution for the taxable year ended January 31, 2015. The information and distributions reported herein may differ from information and distribution taxable to the shareholders for the calendar year ended December 31, 2014.
The Funds designated the following items with regard to distributions paid during the fiscal year ended January 31, 2015. All designations are based on financial information available as of this annual report and, accordingly, are subject to change. For each item, it is the intention of the Fund to designate the maximum amount permitted under the Internal Revenue Code of 1986, as amended, and the regulations there under.
| | | | | | | | |
| | | Crescent | | | Global
Evolution | |
Corporate Dividends Received Deduction | | | 0.0 | % | | | 0.0 | % |
Qualified Dividend Income | | | 0.0 | % | | | 0.0 | % |
Global Evolution Fund designated $220,928 as short-term capital gain distribution for the year ended January 31, 2015.
Shareholders should have received notification in January 2015 of the appropriate tax information necessary to prepare their 2014 income tax returns.
40
Disclosure Regarding the Board of Trustees’ Approval of the Management
Agreement and Investment Advisory Agreements of the Funds (Unaudited)
At its June 5, 2014 meeting, the Board of Trustees (“Board”) considered: (1) the approval of the Management Agreement between American Beacon Advisors, Inc. (“Manager”) and the American Beacon Funds (“Trust”) on behalf of American Beacon Crescent Short Duration High Income Fund (“Crescent Fund”), a new series of the Trust (“Fund”); and (2) the approval of a new investment advisory agreement among the Manager, Crescent Capital Group LP (“Crescent”) and the Trust with respect to the Crescent Fund (“Crescent Agreement”).
Approval of Management Agreement on Behalf of the Crescent Fund
In advance of the meeting, the Board requested and reviewed information provided by the Manager in connection with its consideration of the Management Agreement for the Crescent Fund and the Investment Committee of the Board met with representatives of the Manager. The Board considered, among other materials, responses by the Manager to inquiries requesting: a description of the advisory and related services proposed to be provided to the Crescent Fund; identification of the professional personnel who are proposed to be assigned primary responsibility for managing the Crescent Fund; an analysis of the proposed advisory fee, and fee waivers, a comparison to the fees charged to other comparable clients and an explanation of any differences between the fee schedules; and any other information the Manager believed would be material to the Board’s consideration of the Management Agreement. The Board also considered information that had been provided by the Manager to the Board at the May 15 and June 5, 2014 meetings in connection with the Board’s consideration of the renewal of the Management Agreement between the Manager and the Trust as it related to the existing series of the Trust (“Existing Funds”).
Provided below is an overview of the primary factors the Board or its committees considered at its June 5, 2014 meetings at which the Board considered the approval of the Management Agreement with respect to the Crescent Fund. In determining whether to approve the Management Agreement, the Board considered, among other things, the following factors: (1) the nature and quality of the services to be provided; (2) the estimated costs to be incurred by the Manager in rendering its services and the resulting profits or losses; (3) the extent to which economies of scale, if any, have been taken into account in setting the fee schedule; (4) whether fee levels reflect these economies of scale, if any, for the benefit of investors; (5) comparisons of services and fees with contracts entered into by the Manager with the Existing Funds; and (6) any other benefits derived or anticipated to be derived by the Manager from its relationship with the Crescent Fund.
The Board did not identify any particular information that was most relevant to its consideration of the Management Agreement, and each Trustee may have afforded different weight to the various factors. The Trustees posed questions to various management personnel of the Manager regarding certain key aspects of the materials submitted in support of the approval. Legal counsel to the independent Trustees provided the Board with a memorandum regarding its responsibilities pertaining to the approval of the Management Agreement. Based on its evaluation, the Board unanimously concluded that the terms of the Management Agreement were reasonable and fair and that the approval of the Management Agreement was in the best interest of the Crescent Fund.
Nature, Extent and Quality of Services. The Board noted that it had considered the renewal of the Management Agreement between the Manager and the Trust as it relates to the existing series of the Trust (“Existing Funds”) at its May 15, 2014 meeting and would formally vote on the renewal of that agreement at the June 5, 2014 meeting. At those meetings, the Board received detailed information regarding the Manager, including information with respect to the scope of services provided by the Manager to the Existing Funds and the background and experience of the Manager’s key investment personnel. At the May 15 and June 5, 2014 meetings, the Board also considered the Manager’s investment approach and goal to provide consistent above average long-term performance at below average costs on behalf of the Existing Funds and the Manager’s culture of compliance and support for compliance operations that reduces risks to the Existing Funds. The Board noted the Manager’s representation that the advisory and related services proposed to be provided to the Crescent Fund will be consistent with the services provided to the Existing Funds. The Board considered the background and experience of key investment personnel who will have primary responsibility for the day-to-day oversight of the Crescent Fund. Based on the foregoing information, the Board concluded that the nature, extent and quality of the management to be provided by the Manager were appropriate for the Crescent Fund.
Investment Performance. The Board noted that the Crescent Fund are newly organized and, therefore, had no historical performance for the Board to review. The Board also noted that the Trustees would review the performance of Crescent in connection with their consideration of the Crescent Agreement.
Costs of the Services Provided to the Crescent Fund and the Projected Profits or Losses to be Realized by the Manager from its Relationship with the Crescent Fund. In analyzing the cost of services and profitability of the Manager, the Board considered the estimated revenues to be earned and the expenses to be incurred by the Manager. Additionally, the Board considered that the Manager will receive administrative service fees to compensate the Manager for providing shareholder and administrative services to the Crescent Fund. The Board noted the Manager’s representation that its accounting system does not provide for cost allocation on a fund-by-fund basis. Accordingly, the Manager created an allocation of expenses based upon the estimated percentage of time to be spent by its employees on non-distribution related business. The Board then noted that the Manager was projected to incur losses from its first year of rendering services to the Crescent Fund.
Comparisons of the amounts to be paid to the Manager under the Management Agreement and other funds in the relevant Morningstar category. In evaluating the Management Agreement, the Board reviewed the Manager’s proposed management fee schedule. The Board considered a comparison of the management fee rate to be charged by the Manager under the Management Agreement versus the fee rates charged to comparable funds. The Board noted that the Manager provides comparable services to the Existing Funds at the same rate as proposed for the Crescent Fund. The Board also noted that the management fee rate proposed by the Manager for the Crescent Fund, on a stand-alone basis and combined with the proposed advisory fee rate to be paid to Crescent, respectively, is lower than the average advisory fee rate paid by peer group funds in each Fund’s Morningstar, Inc. (“Morningstar”) category. The Board also considered that the Manager has agreed to contractually limit the expenses of the Crescent Fund for at least one year following the Fund’s
Disclosure Regarding the Board of Trustees’ Approval of the Management
Agreement and Investment Advisory Agreements of the Funds (Unaudited)
inception date. This information assisted the Board in concluding that the management fee rate appeared to be within a reasonable range for the services to be provided to the Crescent Fund, in light of all the factors considered.
Economies of Scale. The Board considered that breakpoints were not included in the proposed management fee and noted the Manager’s representation that the proposed management fee rate for the Fund reflects economies of scale for the benefit of Crescent Fund shareholders.
Benefits Derived from the Relationship with the Crescent Fund. The Board considered the Manager’s representation that it does not anticipate any material “fall-out” benefits resulting from its proposed relationship with the Crescent Fund. Based on the foregoing information, the Board concluded that the potential benefits accruing to the Manager by virtue of its relationship with the Crescent Fund appear to be fair and reasonable.
Board’s Conclusion. Based on the various considerations described above, the Board, including a majority of Trustees who are not “interested persons” of the Crescent Fund or the Manager, as that term is defined in the 1940 Act: (1) concluded that the proposed management fee is fair and reasonable; (2) determined that the Crescent Fund and their shareholders would benefit from the Manager’s management of the Crescent Fund; and (3) approved the Management Agreement on behalf of the Crescent Fund.
Approval of Investment Advisory Agreement with Crescent
In advance of the meeting, the Board requested and reviewed information provided by Crescent in connection with its consideration of the Crescent Agreement, and the Investment Committee of the Board met with representatives of Crescent. The Board considered, among other materials, responses by Crescent to inquiries requesting: a description of the advisory and related services proposed to be provided to the Crescent Fund; identification of the professional personnel to perform services for the Crescent Fund and their education, experience and responsibilities; a comparison of investment performance of Crescent’s Capital High Income Fund, L.P. (“High Income Fund”) and composites of accounts managed pursuant to related strategies with the performance of applicable peer groups and indices; an analysis of the proposed advisory fee, including a comparison with fee rates charged to the High Income Fund, for which similar services are provided and anticipated economies of scale; a description of the portfolio managers’ compensation and, if compensation is tied to performance, a description of the oversight mechanism to prevent a manager with lagging performance from taking undue risks; a description of Crescent’s compliance program and any material compliance matters, as well as its trading activities; a discussion of Crescent’s financial condition and confirmation that Crescent’s financial condition would not impair its ability to provide high-quality services to the Crescent Fund; and any other information that Crescent believed would be material to the Board’s consideration of the Crescent Agreement.
Provided below is an overview of the primary factors the Board or its committees considered at its June 5, 2014 meetings at which the Board considered the approval of the Crescent Agreement. In determining whether to approve the Crescent Agreement, the Board considered, among other things, the following factors: (1) the nature and quality of the services to be provided; (2) the investment performance of Crescent; (3) the extent to which economies of scale, if any, have been taken into account in setting the fee schedule; (4) whether fee levels reflect these economies of scale, if any, for the benefit of investors; (5) comparisons of services and fees with contracts entered into by Crescent with other clients; and (6) any other benefits anticipated to be derived by Crescent from its relationship with the Crescent Fund.
The Board did not identify any particular information that was most relevant to its consideration of the Crescent Agreement, and each Trustee may have afforded different weight to the various factors. The Trustees posed questions to various management personnel of the Manager and Crescent regarding certain key aspects of the materials submitted in support of the approval. Legal counsel to the independent Trustees provided the Board with a memorandum regarding its responsibilities pertaining to the approval of the Crescent Agreement. Based on its evaluation, the Board unanimously concluded that the terms of the Crescent Agreement were reasonable and fair and that the approval of the Crescent Agreement was in the best interests of the Crescent Fund.
Nature, extent and quality of the services to be provided by Crescent. The Board considered information regarding Crescent’s principal business activities, its reputation, financial condition and overall capabilities to perform the services under the Crescent Agreement. The Board also considered Crescent’s investment resources, infrastructure and the adequacy of its compliance program. In addition, the Board considered the background and experience of the portfolio management personnel who will be assigned responsibility for managing the Crescent Fund. The Board considered Crescent’s representation that its financial condition is adequate to support the provision by Crescent of high quality advisory services to the Crescent Fund and that current staffing levels were adequate to service the Crescent Fund. In addition, the Board took into consideration the Manager’s recommendation of Crescent. Based on this information, the Board concluded that the nature, extent and quality of the advisory services to be provided by Crescent were appropriate for the Crescent Fund in light of its investment objective and, thus, supported a decision to approve the Crescent Agreement.
Performance of Crescent. The Board evaluated the performance information provided by Crescent and the Manager regarding the performance of Crescent’s High Income Fund and composites of accounts managed pursuant to Crescent’s bank loan strategy, high yield strategy and private debt strategy (“Composites”), gross of fees, as compared to the Bank of America Merrill Lynch High Yield Master II Index (“Merrill Lynch Index”), the S&P LSTA Leveraged Loan Index (“S&P Index”) and a custom index comprised 50% of the Merrill Lynch Index and the S&P Index (“Custom Index”). The Board also considered the performance of the High Income Fund and the Composites as compared to select peer funds and the Morningstar bank loan and high yield categories (“Morningstar Categories”). The Board considered that the annualized performance of the High Income Fund outperformed the peer funds, the Morningstar Categories and the Custom Index for the one-year period ended March 31, 2014. The Board also considered that the Composites outperformed the Custom Index and Morningstar Categories for the one- and three-year periods ended March 31, 2014, and that the bank loan and high yield Composites outperformed the Custom Index for the five-year period ended March 31, 2014. The Board noted that the private debt Composite did not
Disclosure Regarding the Board of Trustees’ Approval of the Management
Agreement and Investment Advisory Agreements of the Funds (Unaudited)
have a five-year performance history. Based on the foregoing information, the Board concluded that the historical investment performance record of Crescent supported approval of the Crescent Agreement.
Comparisons of the amounts to be paid under the Agreement with those under contracts between Crescent and its other clients. In evaluating the Crescent Agreement, the Board reviewed the proposed advisory fee rate for services to be performed by Crescent on behalf of and paid by the Crescent Fund. The Board considered Crescent’s representation that the Crescent’s proposed fee rate is lower than the fee schedule charged to other funds and accounts. The Board noted Crescent’s representation that Crescent’s other multi-strategy funds and accounts that utilize the same asset classes have a materially different asset allocation with higher amounts of private debt and are charged higher management fees. The Board also noted the Manager’s representation that the combined management and advisory fee rate to be paid to the Manager and Crescent was lower than the average for the Crescent Fund’s Morningstar Categories. After evaluating this information, the Board concluded that Crescent’s advisory fee rate under the Crescent Agreement was reasonable in light of the services to be provided to the Crescent Fund.
Costs of the services to be provided and profits to be realized by Crescent and its affiliates from its relationship with the Crescent Fund. The Board did not consider the costs of the services to be provided and profits to be realized by Crescent from its relationship with the Crescent Fund, noting instead the arm’s-length nature of the relationship between the Manager and Crescent with respect to the negotiation of the advisory fee rate on behalf of the Crescent Fund.
Economies of Scale. The Board considered Crescent’s representation that the proposed fee rate includes breakpoints, which anticipate any economies of scale in connection with the services that it will provide to the Crescent Fund. Based on the foregoing information, the Board concluded that the breakpoints under the proposed fee schedule reflect economies of scale associated with the services to be provided to the Crescent Fund by Crescent.
Benefits to be derived by Crescent from the relationship with the Crescent Fund. The Board considered the “fall-out” or ancillary benefits that might accrue to Crescent as a result of its relationship with the Crescent Fund, including greater exposure in the marketplace with respect to Crescent’s investment process and expanding the level of assets under management by Crescent. The Board also noted Crescent’s representation that potential benefits to Crescent may include the diversification of Crescent’s business, greater trading efficiencies and access to market information as a result of larger trading volumes. Based on the foregoing information, the Board concluded that the potential benefits accruing to Crescent by virtue of its relationship with the Crescent Fund appear to be fair and reasonable.
Board’s Conclusion. Based on the various considerations described above, the Board, including a majority of Trustees who are not “interested persons” of the Crescent Fund, the Manager or Crescent, as that term is defined in the 1940 Act, concluded that the proposed advisory fee rate is fair and reasonable and that the approval of the Crescent Agreement is in the best interests of the Crescent Fund and approved the Crescent Agreement.
Trustees and Officers of the American Beacon FundsSM
(Unaudited)
The Trustees and officers of the American Beacon Funds (the “Trust”) are listed below, together with their principal occupations during the past five years. Unless otherwise indicated, the address of each person listed below is 220 East Las Colinas Boulevard, Suite 1200, Irving, Texas 75039. Each Trustee oversees thirty-three funds in the fund complex that includes the Trust and the American Beacon Select Funds. The Trust’s Statement of Additional Information contains additional information about the Trustees and is available without charge by calling 1-800-658-5811.
| | | | |
Name, Age and Address | | Position, Term of Office and Length of Time Served with the Trust | | Principal Occupation(s) During Past 5 Years and Current Directorships |
| INTERESTED TRUSTEES | | Term | | |
| | Lifetime of Trust until removal, resignation or retirement* | | |
| | |
| Alan D. Feld** (78) | | Trustee since 1996 | | Sole Shareholder of a professional corporation which is a Partner in the law firm of Akin, Gump, Strauss, Hauer & Feld, LLP (law firm) (1960-Present); Trustee, American Beacon Mileage Funds (1996-2012); Trustee, American Beacon Select Funds (1999-Present); Trustee, American Beacon Master Trust (1996-2012). |
| | |
| NON-INTERESTED | | Term | | |
| TRUSTEES | | Lifetime of Trust until removal, resignation or retirement* | | |
| | |
| Gerard J. Arpey (56) | | Trustee since 2012 | | Partner, Emerald Creek Group (private equity firm) (2011-Present); Chairman and Chief Executive Officer, AMR Corp. and American Airlines; Inc. (2003-2011); Director, S.C. Johnson & Son, Inc. (privately held company) (2008-present); Trustee, American Beacon Select Funds (2012-Present). |
| | |
| W. Humphrey Bogart (70) | | Trustee since 2004 | | Trustee, American Beacon Mileage Funds (2004-2012); Trustee, American Beacon Select Funds (2004-Present); Trustee, American Beacon Master Trust (2004-2012). |
| | |
| Brenda A. Cline (54) | | Trustee since 2004 | | Executive Vice President, Chief Financial Officer, Treasurer and Secretary, Kimbell Art Foundation (1993-Present); Director, Tyler Technologies, Inc. (2014-Present); Trustee, American Beacon Mileage Funds (2004-2012); Trustee, American Beacon Select Funds (2004-Present); Trustee, American Beacon Master Trust (2004-2012). |
| | |
| Eugene J. Duffy (60) | | Trustee since 2008 | | Managing Director, Institutional Services, Intercontinental Real Estate Corporation (2014-Present); Principal and Executive Vice President, Paradigm Asset Management (1994-2014); Director, Sunrise Bank of Atlanta (2008-2013); Trustee, American Beacon Mileage Funds (2008-2012); Trustee, American Beacon Select Funds (2008-Present); Trustee, American Beacon Master Trust (2008-2012). |
| | |
| Thomas M. Dunning (72) | | Trustee since 2008 | | Chairman Emeritus, Lockton Dunning Benefits (2008-Present) (consulting firm in employee benefits); Board Director, Oncor Electric Delivery Company LLC (2007-Present); Board Member, BancTec (2010-Present) (software consulting); Trustee, American Beacon Mileage Funds (2008-2012); Trustee, American Beacon Select Funds (2008-Present); Trustee, American Beacon Master Trust (2008-2012). |
| | |
| Richard A. Massman (71) | | Trustee since 2004 Chairman since 2008 | | Consultant and General Counsel Emeritus (2009-Present) and Senior Vice President and General Counsel (1994-2009), Hunt Consolidated, Inc. (holding company engaged in oil and gas exploration and production, refining, real estate, farming, ranching and venture capital activities); Trustee, American Beacon Mileage Funds (2004-2012); Trustee, American Beacon Select Funds (2004-Present); Trustee, American Beacon Master Trust (2004-2012). |
| | |
| Barbara J. McKenna, CFA (51) | | Trustee since 2012 | | Managing Principal, Longfellow Investment Management Company (2005-Present); Trustee, American Beacon Select Funds (2012-Present). |
| | |
R. Gerald Turner (69) 225 Perkins Admin. Bldg. Southern Methodist Univ. Dallas, Texas75275 | | Trustee since 2001 | | President, Southern Methodist University (1995-Present); Director, J.C. Penney Company, Inc. (1996-Present); Director, Kronus Worldwide Inc. (chemical manufacturing) (2003-Present); Trustee, American Beacon Mileage Funds (2001-2012); Trustee, American Beacon Select Funds (2001-Present); Trustee, American Beacon Master Trust (2001-2012). |
44
Trustees and Officers of the American Beacon FundsSM
(Unaudited)
| | | | |
Name, Age and Address | | Position, Term of Office and Length of Time Served with the Trust | | Principal Occupation(s) During Past 5 Years and Current Directorships |
| OFFICERS | | Term | | |
| | One Year | | |
| | |
| Gene L. Needles, Jr. (60) | | President since 2009 Executive Vice President since 2009 | | President, CEO and Director, American Beacon Advisors, Inc. (2009-Present); President, CEO and Director, Lighthouse Holdings, Inc. (2009-Present); President and CEO, Lighthouse Holdings Parent, Inc. (2009-Present); Manager and President, American Private Equity Management, L.L.C. (2012-Present); President, American Beacon Cayman Managed Futures Strategy Fund, Ltd. (2014-Present); President, American Beacon Select Funds (2009-Present), President, American Beacon Mileage Funds (2008-2009), President Touchstone Investments (2008-2009). |
| | |
| Jeffrey K. Ringdahl (39) | | VP since 2010 | | Chief Operating Officer, American Beacon Advisors, Inc. (2010-Present); Vice President, American Private Equity Management, L.L.C. (2012-Present); Senior Vice President, Lighthouse Holdings, Inc. (2013-Present); Senior Vice President, Lighthouse Holdings Parent, Inc. (2013-Present); Director and Vice President, American Beacon Cayman Managed Futures Strategy Fund, Ltd. (2014-Present); Vice President, Product Management, Touchstone Advisors, Inc. (2007-2010). |
| | |
| Rosemary K. Behan (55) | | VP, Secretary and Chief Legal Officer since 2006 | | Secretary, American Beacon Advisors, Inc. (2006-Present); Secretary, Lighthouse Holdings, Inc. (2008-Present); Secretary, Lighthouse Holdings Parent, Inc. (2008-Present); Secretary, American Private Equity Management, L.L.C. (2008-Present); Secretary, American Beacon Cayman Managed Futures Strategy Fund, Ltd. (2014-Present). |
| | |
| Brian E. Brett (54) | | VP since 2004 | | Vice President, Director of Sales, American Beacon Advisors, Inc. (2004-Present). |
| | |
| Wyatt L. Crumpler (48) | | VP since 2007 | | Chief Investment Officer (2012-Present), Vice President, Asset Management (2009-2012), Vice President, Trust Investments (2007-2009), American Beacon Advisors, Inc.; Vice President, American Private Equity Management, L.L.C. (2012-Present). |
| | |
| Erica Duncan (44) | | VP Since 2011 | | Vice President, Marketing and Client Services American Beacon Advisors, Inc. (2011-Present); Supervisor, Brand Marketing (2010-2011); Supervisor, Marketing Communications (2009-2010) and Senior Financial Writer (2004-2009), Invesco AIM. |
| | |
| Michael W. Fields (60) | | VP since 1989 | | Chief Fixed Income Officer (2011-Present) and Vice President, Fixed Income Investments (1988-2011), American Beacon Advisors, Inc.; Director, American Beacon Global Funds SPC (2002-2011); Director, American Beacon Global Funds plc (2007-2009). |
| | |
| Melinda G. Heika (53) | | Treasurer since 2010 | | Treasurer (2010-Present), and Controller (2005-2009), American Beacon Advisors, Inc.; Treasurer, Lighthouse Holdings, Inc. (2010-Present); Treasurer, Lighthouse Holdings Parent, Inc. (2010-Present); Treasurer, American Private Equity Management, L.L.C. (2012-Present); Director and Treasurer, American Beacon Cayman Managed Futures Strategy Fund, Ltd. (2014-Present). |
| | |
| Terri L. McKinney (51) | | VP since 2010 | | Vice President, Enterprise Services (2009-Present) and Managing Director (2003-2009), American Beacon Advisors, Inc. |
| | |
| Samuel J. Silver (51) | | VP Since 2011 | | Vice President, Fixed Income Investments (2011-Present) and Senior Portfolio Manager, Fixed Income Investments (1999-2011), American Beacon Advisors, Inc. |
| | |
| Christina E. Sears (43) | | Chief Compliance Officer since 2004 and Asst. Secretary since 1999 | | Chief Compliance Officer, American Beacon Advisors, Inc. (2004-Present); Chief Compliance Officer, American Private Equity Management, L.L.C. (2012-Present). |
45
Trustees and Officers of the American Beacon FundsSM
(Unaudited)
| | | | |
Name, Age and Address | | Position, Term of Office and Length of Time Served with the Trust | | Principal Occupation(s) During Past 5 Years and Current Directorships |
| OFFICERS | | Term | | |
| | One Year | | |
| | |
| Sonia L. Bates (58) | | Asst. Treasurer since 2011 | | Director, Tax and Financial Reporting (2011-Present), Manager, Tax and Financial Reporting (2005-2010), American Beacon Advisors, Inc.; Asst. Treasurer, Lighthouse Holdings, Inc. (2011-Present); Asst. Treasurer, Lighthouse Holdings Parent, Inc. (2011-Present); Asst. Treasurer, American Private Equity Managmenet, L.L.C. (2012-Present). |
| * | As of 11/12/2014, the Board adopted a retirement plan that requires Trustees to retire no later than the last day of the calendar year in which they reach the age of 75. |
| ** | Mr. Feld is deemed to be an “interested person” of the Trusts, as defined by the 1940 Act. Mr. Feld’s law firm of Akin, Gump, Strauss, Hauer & Feld LLP has provided legal services within the past two fiscal years to the Manager and one or more of the Trust’s sub-advisors. |
46
This page intentionally left blank.
47
This page intentionally left blank.
48
This page intentionally left blank.
49

Delivery of Documents
eDelivery is NOW AVAILABLE- Stop traditional mail delivery and receive your
shareholder reports and summary prospectus on-line. Sign up at
www.americanbeaconfunds.com
If you invest in the Fund through a financial institution, you may be able to receive the Fund’s regulatory mailings, such as the Prospectus, Annual Report and Semi-Annual Report, by e-mail. If you are interested in this option, please go to www.icsdelivery.com and search for your financial institution’s name or contact your financial institution directly.
To obtain more information about the Fund:
| | | | |
| | |

| | | | 
|
By E-mail: american_beacon.funds@ambeacon.com | | | | On the Internet: Visit our website at www.americanbeaconfunds.com |
| | | | | |
| | | | |
| | |

| | | | 
|
By Telephone: Institutional, Y and Investor Call (800) 658-5811 | | | | By Mail: American Beacon Funds P.O. Box 219643 Kansas City, MO 64121-9643 |
| | | | | |
| | | | |
Availability of Quarterly Portfolio Schedules In addition to the Schedule of Investments provided in each semi-annual and annual report, the Fund files a complete schedule of its portfolio holdings with the Securities and Exchange Commission (“SEC”) on Form N-Q as of the first and third fiscal quarters. The Fund’s Forms N-Q are available on the SEC’s website at www.sec.gov. The Forms N-Q may also be reviewed and copied at the SEC’s Public Reference Section, 100 F Street, NE, Washington, D.C. 20549-1520. Information regarding the operation of the SEC’s Public Reference Room may be obtained by calling (202) 551-8090. A complete schedule of the Fund’s portfolio holdings is also available on www.americanbeaconfunds.com, approximately twenty days after the end of each month. | | | | Availability of Proxy Voting Policy and Records A description of the policies and procedures the Fund uses to determine how to vote proxies relating to portfolio securities is available in the Fund’s Statement of Additional Information, is available free of charge on the www.americanbeaconfunds.com and by calling 1-800-967-9009 or by accessing the SEC’s website at www.sec.gov. The Fund’s proxy voting record for the most recent year ended June 30 is filed annually with the SEC on Form N-PX. The Fund’s Forms N-PX are available on the SEC’s website at www.sec.gov. The Fund’s proxy voting record may also be obtained by calling 1-800-967-9009. |
Fund Service Providers:

This report is prepared for shareholders of the American Beacon Funds and may be distributed to others only if preceded or accompanied by a current Prospectus or Summary Prospectus.
American Beacon Funds, American Beacon Crescent Short Duration High Income Fund, and American Beacon Global Evolution Frontier Markets Income Fund are service marks of American Beacon Advisors, Inc.
AR 1/15
ITEM 2. CODE OF ETHICS.
The Trust has adopted a code of ethics that applies to its principal executive and financial officers (the “Code”). The Trust amended its code November 12, 2013 to disclose the removal of terminated Investment Companies. The Trust did not grant any waivers to the provisions of the Code during the period covered by the shareholder report presented in Item 1. The Code is filed herewith as Exhibit 99.CODE ETH.
ITEM 3. AUDIT COMMITTEE FINANCIAL EXPERT.
The Trust’s Board of Trustees has determined that Ms. Brenda Cline, a member of the Trust’s Audit and Compliance Committee, is an “audit committee financial expert” as defined in Form N-CSR. Ms. Brenda Cline is “independent” as defined in Form N-CSR.
ITEM 4. PRINCIPAL ACCOUNTANT FEES AND SERVICES.
(a)
| | | | |
Audit Fees | | Fiscal Year
Ended | |
| $105,556 | | | 1/31/2014 | |
| $197,167 | | | 1/31/2015 | |
(b)
| | | | |
Audit-Related Fees | | Fiscal Year
Ended | |
| $0 | | | 1/31/2014 | |
| $0 | | | 1/31/2015 | |
(c)
| | | | |
Tax Fees | | Fiscal Year
Ended | |
| $0 | | | 1/31/2014 | |
| $19,500 | | | 1/31/2015 | |
(d)
| | | | |
All Other Fees | | Fiscal Year
Ended | |
| $0 | | | 1/31/2014 | |
| $0 | | | 1/31/2015 | |
(e)(1) Pursuant to its charter, the Trust’s Audit and Compliance Committee shall have the following duties and powers pertaining to pre-approval of audit and non-audit services provided by the Trust’s principal accountant:
| | • | | to approve, prior to appointment, the engagement of auditors to annually audit and provide their opinion on the Trusts’ financial statements, and, in connection therewith, reviewing and evaluating matters potentially affecting the independence and capabilities of the auditors; |
| | • | | to approve, prior to appointment, the engagement of the auditors to provide non-audit services to the Trusts, an investment adviser to any series of the Trusts or any entity controlling, controlled by, or under common control with an investment adviser (“adviser affiliate”) that provides ongoing services to the Trusts, if the engagement relates directly to the operations and financial reporting of the Trusts; |
| | • | | to consider whether the non-audit services provided by a Trust’s auditor to an investment adviser or any adviser affiliate that provides ongoing services to a series of the Trusts, which services were not pre-approved by the Committee, are compatible with maintaining the auditor’s independence; |
| | • | | to review the arrangements for and scope of the annual audit and any special audits; and |
| | • | | to review and approving the fees proposed to be charged to the Trusts by the auditors for each audit and non-audit service. |
The Audit and Compliance Committee may delegate any portion of its authority, including the authority to grant pre-approvals of audit and permitted non-audit services, to a subcommittee of one or more members. Any decisions of the subcommittee to grant pre-approvals shall be presented to the full audit committee at its next regularly scheduled meeting.
(e)(2) None of the fees disclosed in paragraphs (b) through (d) above were approved by the audit committee pursuant to paragraph (c)(7)(i)(C) of Rule 2-01 of Regulation S-X.
(f) Not applicable.
(g)
Aggregate Non-Audit Fees for Services Rendered to the:
| | | | | | | | | | |
Registrant | | Adviser | | | Adviser’s Affiliates Providing
Ongoing Services to
Registrant | | Fiscal Year Ended | |
| $0 | | $ | 50,950 | | | N/A | | | 1/31/2014 | |
| $19,500 | | $ | 34,905 | | | N/A | | | 1/31/2015 | |
(h) Not applicable.
ITEM 5. AUDIT COMMITTEE OF LISTED REGISTRANTS.
Not applicable.
ITEM 6. SCHEDULE OF INVESTMENTS.
The schedules of investments for each series of the Trust are included in the shareholder report presented in Item 1.
ITEM 7. DISCLOSURE OF PROXY VOTING POLICIES AND PROCEDURES FOR CLOSED-END MANAGEMENT INVESTMENT COMPANIES.
Not applicable.
ITEM 8. PORTFOLIO MANAGERS OF CLOSED-END MANAGEMENT INVESTMENT COMPANIES.
Not applicable.
ITEM 9. PURCHASES OF EQUITY SECURITIES BY CLOSED-END MANAGEMENT INVESTMENT COMPANY AND AFFILIATED PURCHASERS.
Not applicable.
ITEM 10. SUBMISSION OF MATTERS TO A VOTE OF SECURITY HOLDERS.
The Trust has made no material changes to the procedures by which shareholders may recommend nominees to the Trust’s Board of Trustees since the Trust last disclosed such procedures in Schedule 14A.
ITEM 11. CONTROLS AND PROCEDURES.
(a) Based upon an evaluation within 90 days of the filing date of this report, the principal executive and financial officers concluded that the disclosure controls and procedures of the Trust are effective.
(b) There were no changes in the Trust’s internal control over financial reporting during the second fiscal quarter of the period covered by this report that has materially affected, or is reasonably likely to materially affect, the Trust’s internal control over financial reporting.
ITEM 12. EXHIBITS.
(a)(1) Filed herewith as EX-99.CODE ETH.
(a)(2) A separate certification for each principal executive officer and principal financial officer of the Trust as required by Rule 30a-2(a) under the Investment Company Act of 1940 is attached hereto as EX-99.CERT.
(a)(3) Not applicable.
(b) The certifications required by Rule 30a-2(b) under the Investment Company Act of 1940 are attached hereto as EX-99.906CERT.
SIGNATURES
Pursuant to the requirements of the Securities Exchange Act of 1934 and the Investment Company Act of 1940, the registrant has duly caused this report to be signed on its behalf by the undersigned, thereunto duly authorized.
| | |
| (Registrant): American Beacon Funds |
| |
| By | | /s/ Gene L. Needles, Jr. |
| | Gene L. Needles, Jr. |
| | President |
|
| Date: April 9, 2015 |
Pursuant to the requirements of the Securities Exchange Act of 1934 and the Investment Company Act of 1940, this report has been signed below by the following persons on behalf of the registrant and in the capacities and on the dates indicated.
| | |
| By | | /s/ Gene L. Needles, Jr. |
| | Gene L. Needles, Jr. |
| | President |
| | |
| |
| By | | /s/ Melinda G. Heika |
| | Melinda G. Heika |
| | Treasurer |