UNITED STATES
SECURITIES AND EXCHANGE COMMISSION
Washington, D.C. 20549
FORM N-CSR
CERTIFIED SHAREHOLDER REPORT OF REGISTERED
MANAGEMENT INVESTMENT COMPANIES
Investment Company Act file number: 811-4984
AMERICAN BEACON FUNDS
(Exact name of registrant as specified in charter)
220 East Las Colinas Boulevard, Suite 1200
Irving, Texas 75039
(Address of principal executive offices)-(Zip code)
Gene L. Needles, Jr., PRESIDENT
220 East Las Colinas Boulevard, Suite 1200
Irving, Texas 75039
(Name and address of agent for service)
Registrant’s telephone number, including area code: (817) 391-6100
Date of fiscal year end: August 31, 2015
Date of reporting period: August 31, 2015
ITEM 1. REPORT TO STOCKHOLDERS.
About American Beacon Advisors
Since 1986, American Beacon Advisors has offered a variety of products and investment advisory services to numerous institutional and retail clients, including a variety of mutual funds, corporate cash management, and separate account management.
Our clients include defined benefit plans, defined contribution plans, foundations, endowments, corporations, financial planners, and other institutional investors. With American Beacon Advisors, you can put the experience of a multi-billion dollar asset management firm to work for your company.
Important Information: Investing in derivative instruments involves liquidity, credit, interest rate and market risks. Investments in high yield securities are subject to greater levels of credit, interest rate, market and liquidity risks than investment-grade securities. Although the Fund has a flexible approach to investing, diversification does not ensure against loss. Investing in foreign and emerging market securities may involve heightened risk due to currency fluctuations and economic and political risks. Please see the prospectus for a complete discussion of the Fund’s risks. There can be no assurances that the investment objectives of this Fund will be met.
Any opinions herein, including forecasts, reflect our judgment as of the end of the reporting period and are subject to change. Each advisor’s strategies and the Fund’s portfolio composition will change depending on economic and market conditions. This report is not a complete analysis of market conditions and therefore, should not be relied upon as investment advice. Although economic and market information has been compiled from reliable sources, American Beacon Advisors, Inc. makes no representation as to the completeness or accuracy of the statements contained herein.
| | |
| American Beacon Funds | | August 31, 2015 |

Dear Shareholders,
During much of the 12-month period ended August 31, 2015, U.S. stocks in general posted slight gains. U.S. equity markets have had to contend with slower economic growth, modestly higher-than-average valuations, and geopolitical and financial turmoil in Greece. Uncertainty over the timing of the U.S. Federal Reserve’s first interest rate increase since emergency lending rates were established during the financial crisis has also continued to weigh on markets. At the same time, the weakening of many currencies against the U.S. dollar took a toll on total returns for dollar-based investors in many global markets.
In the U.S. fixed-income market, long-duration Treasuries had a positive return and lower-quality bonds represented by high yield had negative returns for the period. For the period under review, the BofA Merrill Lynch 3-Month LIBOR Index returned 0.24%, the Barclays Capital U.S. Aggregate Index returned 1.56%, and the Citi World Government Bond Index—which tracks the performance of more than 20 government bond markets—returned -7.71%.
Our American Beacon Flexible Bond Fund is designed to provide stability, diversification and flexibility. Our investment approach allocates investments across a wide range of global investment opportunities in an effort to achieve positive total returns over a full market cycle regardless of market conditions.
For the 12 months ended August 31, 2015:
| | • | | American Beacon Flexible Bond Fund (Investor Class) returned -3.01%. |
Thank you for your continued interest in American Beacon Funds. We are pleased to have a broad range of products that cover the global equity and fixed income markets. For additional information about the Funds or to access your account information, please visit our website www.americanbeaconfunds.com.
Best Regards,

Gene L. Needles, Jr.
President
American Beacon Funds
1
Global Bond Market Overview
August 31, 2015 (Unaudited)
During the 12-month period ended August 31, 2015, the biggest trouble spot for global growth has been the developing world, especially China. This group of economies represents almost 58% of global GDP and growth there has converged closer to the rate of U.S. growth than at any time since the late 1990s. Brazil, Russia, India and China (“BRIC countries”), which represent about 50% of this region, matched U.S. GDP last year. (In 2007, the U.S. economy was twice as big as the BRICs.) The collective trend in these countries is important. Monetary growth, when adjusted for inflation, is as low as it was in the late 1990s around the time of the emerging-market crisis, and their Purchasing Manager Indices point to recession. The BRICs are a part of the world in need of considerable reflation.
China’s monetary policy is dramatically behind the reflationary curve despite recent rate and reserve requirement cuts. Real interest rates remain elevated because inflation is falling faster than Chinese policymakers are cutting nominal rates as producers liquidate inventories, while deregulation has left corporate lending rates too high. Given the mounting evidence of slowing Chinese growth, the People’s Bank of China decided to weaken the renminbi to help stabilize the Chinese economy and re-establish strong growth. However, a weaker yuan may pump more deflationary pressures into the global economy, as it drives commodity prices down further and depresses emerging market currencies struggling to remain competitive, particularly in Asia.
In other emerging market countries, economic policy is hung up over inflation-pass-through anxiety tied to falling currencies. The decline in many of these currencies has matched the fall in their respective terms of trade. The latter, in turn, are linked to falling commodity prices. Tightening to prop up currencies weakened by a negative terms of trade shock is stagflationary. This stagflation is especially pronounced in Brazil where money growth is close to zero, and the economy is in recession but inflation remains sticky.
Part of the pressure on emerging-market currencies stems from generalized dollar strength along with expectations that the U.S. Federal Reserve (“Fed”) will raise rates this year. But Fed policy is data dependent and dollar strength has hurt the economy. In a world of low nominal
income growth, the surge in the U.S. dollar represents an internal tightening visible in reduced profit growth and lower corporate margins. S&P 500 Index revenue growth correlates closely with export growth, which is weak. Similarly, business sales growth correlates closely with producer price inflation, which has been weighed down by global deflationary trends. The Fed wants to end zero interest rate policy, but is struggling to do so with the current global backdrop. Therefore, the Fed has decided to delay the start to tightening given the potent deflationary pressures from outside the U.S. This imported global deflation may also anchor U.S. long yields. Investors are currently overreacting to a potential rate hike and pricing in a hard-landing in China. This uncertainty is causing the U.S. dollar to rally and emerging market currencies, stocks and commodities to sell off.
Europe’s economic fortunes seemed to be on the rise this year. Money growth has been a consistent and reliable indicator of future European growth, and it has been bolstered by a weaker euro, the end of austerity measures and European Central Bank (“ECB”) large-scale asset purchases. Early signs are visible that European credit growth has started to turn as well.
Nonetheless, it would be a mistake to call this a robust recovery or that deflation risks have passed. Market-based measures of inflation expectations have been fairly flat since April 2015, largely due to problematic negotiations with Greece, Chinese growth concerns and the speculation surrounding a Fed rate hike. Greece voted “No” in its austerity referendum, and the European Union (“EU”) gave Greece additional time to implement reform. Looking back, the effect of a “Grexit” is hard to assess. The direct effect on the EU’s Economic and Monetary Union seems small under most conventional guesses of how much it would contract because it is only 2% of eurozone GDP. However, a reasonable chance exists that the Greek economy could implode, which may carry with it more serious repercussions for the EU’s economy as a whole. In any event, it is clear that the ECB may likely double down its efforts to maintain stability and reflationary momentum.
2
American Beacon Flexible Bond Fund SM
Performance Overview
August 31, 2015 (Unaudited)
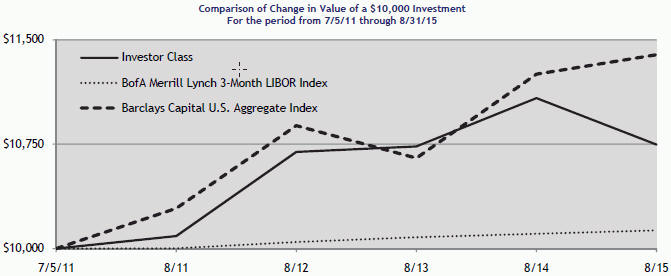
The Investor Class of the American Beacon Flexible Bond Fund (the “Fund”) returned negative 3.01% for the year ended August 31, 2015. The Fund underperformed the Bank of America Merrill Lynch 3-Month LIBOR Index (the “Index”) return of 0.24% during the same period.
Total Returns for the Period ended 8/31/15
| | | | | | | | | | | | | | | | | | |
| | | Ticker | | 1 Year | | | 3 Years | | | Since Inception
(7/5/2011) | | | Value of $10,000
7/5/11-8/31/15 | |
Institutional Class (1,2,4) | | AFXIX | | | (2.59 | )% | | | 0.52 | % | | | 2.04 | % | | $ | 10,875 | |
Y Class (1,2,4) | | AFXYX | | | (2.68 | )% | | | 0.44 | % | | | 1.95 | % | | | 10,834 | |
Investor Class(1,2,4) | | AFXPX | | | (3.01 | )% | | | 0.17 | % | | | 1.75 | % | | | 10,747 | |
A Class with sales charge (1,2,4) | | AFXAX | | | (7.72 | )% | | | (1.56 | )% | | | 0.39 | % | | | 10,161 | |
A Class without sales charge (1,2,4) | | AFXAX | | | (3.14 | )% | | | 0.05 | % | | | 1.57 | % | | | 10,669 | |
C Class with sales charge (1,2,4) | | AFXCX | | | (4.81 | )% | | | (0.70 | )% | | | 0.98 | % | | | 10,412 | |
C Class without sales charge (1,2,4) | | AFXCX | | | (3.81 | )% | | | (0.70 | )% | | | 0.98 | % | | | 10,412 | |
BofA Merrill Lynch 3-Month LIBOR Index(3) | | | | | 0.24 | % | | | 0.28 | % | | | 0.31 | % | | | 10,131 | |
Barclays Capital U.S. Aggregate Index (3) | | | | | 1.56 | % | | | 1.53 | % | | | 3.18 | % | | | 11,393 | |
| 1. | Performance shown is historical and is not indicative of future returns. Investment returns and principal value will vary, and shares may be worth more or less at redemption than at original purchase. Performance shown is calculated based on the published end of day net asset values as of date indicated, and current performance may be lower or higher than the performance data quoted. To obtain performance as of the most recent month end, please visit www.americanbeaconfunds.com or call 1-800-967-9009. Fund performance in the table above does not reflect the deduction of taxes a shareholder would pay on distributions or the redemption of shares. A Class shares have a maximum sales charge of 4.75%. The maximum contingent deferred sales charge for the C Class is 1.00% for shares redeemed within one year of the date of purchase. |
| 2. | A portion of the fees charged to each Class of the Fund was waived and/or reimbursed since inception. Performance prior to waiving and/or reimbursing fees was lower than the actual returns shown since inception. |
| 3. | The BofA Merrill Lynch U.S. Dollar 3-Month LIBOR Index represents the London interbank offered rate (LIBOR) with a constant 3-month average maturity. LIBOR is a composite of the rates of interest at which banks borrow from one another in the London market, and it is a widely used benchmark for short-term interest rates. The Barclays Capital U.S. Aggregate Index is a market weighted index of government, corporate, mortgage-backed and asset-backed fixed-rate debt securities of all maturities. |
| 4. | The total annual Fund operating expense ratio set forth in the most recent Fund prospectus for the Institutional, Y, Investor, A and C Class shares was 1.25%, 1.30%, 1.44%, 1.69%, and 2.44%, respectively. The expense ratios above may vary from the expense ratios presented in other sections of this report that are based on expenses incurred during the period covered by this report. |
Securities held in the Energy and Telecom sectors had a negative impact on performance over the annual period. Additionally, positions in Treasury Inflation Protected Securities were detrimental to Fund performance. Conversely, Fund holdings in the Finance sector, U.S. Treasuries, and Foreign Sovereign bonds all contributed to relative performance.
3
American Beacon Flexible Bond Fund SM
Performance Overview
August 31, 2015 (Unaudited)
The Fund’s holdings in bonds not rated by Standard & Poor’s detracted from performance during the period. Securities held by the Fund in the AA and A credit rating groups had a favorable impact on performance.
The Fund has the flexibility to utilize derivative instruments and will do so to enhance return, hedge risk, gain efficient exposure to an asset class, or to manage liquidity. During the period, the Fund’s largest detractor was due to the use of futures, options, swaps, and foreign currency transactions.
Looking forward, the Fund’s investment managers will continue to allocate investments across a wide range of global investment opportunities, seeking to achieve the Fund’s goal of positive total returns regardless of market conditions over a full market cycle.
Top Ten Holdings (% Net Assets)
| | | | | | | | |
U.S. Treasury Note/Bond, 1.625%, Due 7/31/2019 | | | | | | | 4.8 | |
U.S. Treasury Note/Bond, 2.50%, Due 5/15/2024 | | | | | | | 4.7 | |
U.S. Treasury Floating Rate Note, 0.104%, Due 1/31/2017 | | | | | | | 4.2 | |
U.S. Treasury Note/Bond, 1.375%, Due 3/31/2020 | | | | | | | 2.7 | |
Mexican Bonos Desarrollo, 7.75%, Due 11/13/2042 | | | | | | | 1.9 | |
U.S. Treasury Floating Rate Note, 0.124%, Due 4/30/2017 | | | | | | | 1.8 | |
Ford Motor Credit Co. LLC, 1.037%, Due 1/17/2017 | | | | | | | 1.5 | |
Mexican Bonos, 8.50%, Due 11/18/2038 | | | | | | | 1.4 | |
Mexican Bonos, 8.50%, Due 5/31/2029 | | | | | | | 1.3 | |
Fannie Mae TBA, 3.50%, Due 9/14/2045 | | | | | | | 1.3 | |
Total Fund Holdings | | | 256 | | | | | |
Sector Allocation* (% Investments)
| | | | |
Short-term Investments | | | 27.6 | |
U.S. Treasury Obligations | | | 20.7 | |
Sovereign Obligations | | | 15.1 | |
Finance | | | 14.0 | |
Asset-Backed Obligations | | | 6.2 | |
Collateralized Mortgage Obligations | | | 5.1 | |
U.S. Mortgage-Backed Obligations | | | 3.0 | |
Manufacturing | | | 2.8 | |
Service | | | 2.0 | |
Telecommunications | | | 1.4 | |
Energy | | | 1.2 | |
Consumer | | | 0.6 | |
Utilities | | | 0.2 | |
Municipal Obligations | | | 0.1 | |
| * | Foreign exchange holdings are excluded. U.S. Treasury Obligations and Short-term Investments may be offset by derivatives exposure. |
4
American Beacon Flexible Bond Fund SM
Performance Overview
August 31, 2015 (Unaudited)
Country Allocation (% Investments)
| | | | |
United States | | | 64.4 | |
Mexico | | | 5.8 | |
Brazil | | | 2.9 | |
Spain | | | 2.8 | |
United Kingdom | | | 2.7 | |
Australia | | | 2.4 | |
Cayman Islands | | | 1.7 | |
Hungary | | | 1.6 | |
Indonesia | | | 1.6 | |
South Africa | | | 1.5 | |
Portugal | | | 1.4 | |
New Zealand | | | 1.1 | |
Netherlands | | | 1.1 | |
Malaysia | | | 1.0 | |
South Korea | | | 0.9 | |
Poland | | | 0.8 | |
Slovenia | | | 0.8 | |
Norway | | | 0.6 | |
Germany | | | 0.6 | |
Switzerland | | | 0.6 | |
Qatar | | | 0.6 | |
Chile | | | 0.5 | |
Supranational | | | 0.5 | |
Luxembourg | | | 0.5 | |
Italy | | | 0.4 | |
Ireland | | | 0.4 | |
Greece | | | 0.4 | |
Canada | | | 0.1 | |
British Virgin Islands | | | 0.1 | |
Guernsey | | | 0.1 | |
5
American Beacon Flexible Bond Fund SM
Fund Expenses
August 31, 2015 (Unaudited)
Fund Expense Example
As a shareholder of the Fund, you incur two types of costs: (1) transaction costs, including sales charges (loads) on shares purchased and (2) ongoing costs, including management fees, administrative service fees, distribution (12b-1) fees, and other Fund expenses. The examples below are intended to help you understand the ongoing cost (in dollars) of investing in the Fund and to compare these costs with the ongoing costs of investing in other mutual funds.
The examples are based on an investment of $1,000 invested at the beginning of the period in each Class and held for the entire period from March 1, 2015 through August 31, 2015.
Actual Expenses
The “Actual” lines of the table provide information about actual account values and actual expenses. You may use the information in this line, together with the amount you invested, to estimate the expenses that you paid over the period. Simply divide your account value by $1,000 (for example, an $8,600 account value divided by $1,000 = 8.6), then multiply the result by the number in the first line under the heading “Expenses Paid During Period” to estimate the expenses you paid on your account during this period. Shareholders of the Investor and Institutional Classes that invest in the Fund through an IRA or Roth IRA may be subject to a custodial IRA fee of $15 that is typically deducted each December. If your account was subject to a custodial IRA fee during the period, your costs would have been $15 higher.
Hypothetical Example for Comparison Purposes
The “Hypothetical” lines of the table provide information about hypothetical account values and hypothetical expenses based on the Fund’s actual expense ratio and an assumed 5% per year rate of return before expenses (not the Fund’s actual return). You may compare the ongoing costs of investing in the Fund with other funds by contrasting this 5% hypothetical example and the 5% hypothetical examples that appear in the shareholder reports of the other funds. The hypothetical account values and expenses may not be used to estimate the actual ending account
balance or expenses you paid for the period. Shareholders of the Investor and Institutional Classes that invest in the Fund through an IRA or Roth IRA may be subject to a custodial IRA fee of $15 that is typically deducted each December. If your account was subject to a custodial IRA fee during the period, your costs would have been $15 higher.
You should also be aware that the expenses shown in the table highlight only your ongoing costs and do not reflect any transaction costs charged by the Fund, such as sales charges (loads). Similarly, the expense examples for other funds do not reflect any transaction costs charged by those funds, such as sales charges (loads), redemption fees or exchange fees. Therefore, the “Hypothetical” lines of the table are useful in comparing ongoing costs only and will not help you determine the relative total costs of owning different funds. If you were subject to any transaction costs during the period, your costs would have been higher.
| | | | | | | | | | | | |
| | | Beginning
Account
Value
3/1/15 | | | Ending
Account
Value
8/31/15 | | | Expenses Paid
During Period*
3/1/15 - 8/31/15 | |
Institutional Class | | | | | | | | | | | | |
Actual | | $ | 1,000.00 | | | $ | 974.38 | | | $ | 4.48 | |
Hypothetical ** | | $ | 1,000.00 | | | $ | 1,020.67 | | | $ | 4.58 | |
Y Class | | | | | | | | | | | | |
Actual | | $ | 1,000.00 | | | $ | 974.06 | | | $ | 4.93 | |
Hypothetical ** | | $ | 1,000.00 | | | $ | 1,020.21 | | | $ | 5.04 | |
Investor Class | | | | | | | | | | | | |
Actual | | $ | 1,000.00 | | | $ | 971.76 | | | $ | 6.31 | |
Hypothetical ** | | $ | 1,000.00 | | | $ | 1,018.80 | | | $ | 6.46 | |
A Class | | | | | | | | | | | | |
Actual | | $ | 1,000.00 | | | $ | 971.43 | | | $ | 6.41 | |
Hypothetical ** | | $ | 1,000.00 | | | $ | 1,018.70 | | | $ | 6.56 | |
C Class | | | | | | | | | | | | |
Actual | | $ | 1,000.00 | | | $ | 968.34 | | | $ | 10.12 | |
Hypothetical ** | | $ | 1,000.00 | | | $ | 1,014.92 | | | $ | 10.36 | |
|
* Expenses are equal to the Fund’s annualized expense ratios for the six-month period of 0.90%, 0.99%, 1.27%, 1.29%, and 2.04% for the Institutional, Y, Investor, A, and C Classes respectively, multiplied by the average account value over the period, multiplied by the number derived by dividing the number of days in the most recent fiscal half-year (184) by days in the year (365) to reflect the half-year period. | |
** 5% return before expenses. | |
6
American Beacon Flexible Bond Fund SM
Report of Independent Registered Public Accounting Firm
To the Shareholders and the Board of Trustees of
American Beacon Flexible Bond Fund:
We have audited the accompanying statement of assets and liabilities, including the schedule of investments, of American Beacon Flexible Bond Fund (one of the funds constituting the American Beacon Funds) (the “Fund”), as of August 31, 2015, and the related statement of operations for the year then ended, the statements of changes in net assets for each of the two years in the period then ended, and the financial highlights for each of the periods indicated therein. These financial statements and financial highlights are the responsibility of the Fund’s management. Our responsibility is to express an opinion on these financial statements and financial highlights based on our audits.
We conducted our audits in accordance with the standards of the Public Company Accounting Oversight Board (United States). Those standards require that we plan and perform the audit to obtain reasonable assurance about whether the financial statements and financial highlights are free of material misstatement. We were not engaged to perform an audit of the Fund’s internal control over financial reporting. Our audits included consideration of internal control over financial reporting as a basis for designing audit procedures that are appropriate in the circumstances, but not for the purpose of expressing an opinion on the effectiveness of the Fund’s internal control over financial reporting. Accordingly, we express no such opinion. An audit also includes examining, on a test basis, evidence supporting the amounts and disclosures in the financial statements and financial highlights, assessing the accounting principles used and significant estimates made by management, and evaluating the overall financial statement presentation. Our procedures included confirmation of securities owned as of August 31, 2015, by correspondence with the custodian and brokers or by other appropriate auditing procedures where replies from brokers were not received. We believe that our audits provide a reasonable basis for our opinion.
In our opinion, the financial statements and financial highlights referred to above present fairly, in all material respects, the financial position of American Beacon Flexible Bond Fund at August 31, 2015, the results of its operations for the year then ended, the changes in its net assets for each of the two years in the period then ended, and the financial highlights for each of the periods indicated therein in conformity with U.S. generally accepted accounting principles.

Dallas, Texas
October 30, 2015
7
American Beacon Flexible Bond FundSM
Schedule of Investments
August 31, 2015
| | | | | | | | |
| | | Par AmountO | | | Fair Value | |
| | | (000’s) | | | (000’s) | |
DOMESTIC BANK LOAN OBLIGATIONS—0.39% | | | | | | | | |
Service—0.35% | | | | | | | | |
Hilton Worldwide Finance LLC, 3.50%, Due 10/26/2020 A B C | | $ | 835 | | | $ | 833 | |
| | | | | | | | |
Telecommunications—0.04% | | | | | | | | |
CCO Safari III LLC, Term Loan 1, 3.50%, Due 1/20/2023 B C | | | 100 | | | | 100 | |
| | | | | | | | |
Total Domestic Bank Loan Obligations (Cost $934) | | | | | | | 933 | |
| | | | | | | | |
DOMESTIC OBLIGATIONS—23.85% | | | | | | | | |
Consumer—0.65% | | | | | | | | |
Anheuser-Busch InBev Worldwide, Inc., 7.75%, Due 1/15/2019 | | | 325 | | | | 383 | |
BAT International Finance PLC, | | | | | | | | |
1.125%, Due 3/29/2016D E | | | 300 | | | | 300 | |
9.50%, Due 11/15/2018E F | | | 300 | | | | 366 | |
Imperial Tobacco Finance PLC, 2.95%, Due 7/21/2020E F | | | 400 | | | | 397 | |
Kraft Heinz Foods Co., 3.95%, Due 7/15/2025, Acquired 6/23/2015, Cost $100F G | | | 100 | | | | 102 | |
| | | | | | | | |
| | | | | | | 1,548 | |
| | | | | | | | |
Energy—1.19% | | | | | | | | |
Petrobras Global Finance BV, | | | | | | | | |
3.25%, Due 3/17/2017 | | | 200 | | | | 192 | |
5.375%, Due 1/27/2021 | | | 100 | | | | 88 | |
Ras Laffan Liquefied Natural Gas Co., Ltd III, | | | | | | | | |
6.75%, Due 9/30/2019F | | | 500 | | | | 585 | |
6.75%, Due 9/30/2019 | | | 500 | | | | 586 | |
Sabine Pass Liquefaction LLC, 5.75%, Due 5/15/2024C | | | 800 | | | | 782 | |
Sinopec Group Overseas Development 2014 Ltd., 4.375%, Due 4/10/2024D | | | 200 | | | | 209 | |
Statoil ASA, 0.771%, Due 11/8/2018A | | | 400 | | | | 398 | |
| | | | | | | | |
| | | | | | | 2,840 | |
| | | | | | | | |
Finance—13.87% | | | | | | | | |
2013-2 Aviation Loan Trust, 2.396%, Due 12/15/2022, Acquired 3/02/2013, Cost $75A F G | | | 80 | | | | 75 | |
ABN AMRO Bank N.V., 1.094%, Due 10/28/2016A F | | | 1,400 | | | | 1,405 | |
AerCap Ireland Capital Ltd / AerCap Global Aviation Trust, 2.75%, Due 5/15/2017 | | | 550 | | | | 545 | |
AGFC Capital Trust I Limited, 6.00%, Due 1/15/2067A F | | | 300 | | | | 221 | |
American Express Credit Corp., 0.907%, Due 7/31/2018A | | | 820 | | | | 819 | |
American International Group, Inc., 2.30%, Due 7/16/2019 | | | 400 | | | | 399 | |
Banco Bilbao Vizcaya Argentaria S.A., 9.00%, Due 5/29/2049A D | | | 600 | | | | 644 | |
Banco Santander Brasil S.A., 4.25%, Due 1/14/2016F | | | 400 | | | | 402 | |
Banco Santander Chile S.A., 1.186%, Due 4/11/2017A F | | | 880 | | | | 873 | |
Bank of America Corp., | | | | | | | | |
6.50%, Due 8/1/2016 | | | 1,125 | | | | 1,178 | |
5.75%, Due 12/1/2017 | | | 60 | | | | 65 | |
6.875%, Due 4/25/2018 | | | 350 | | | | 392 | |
5.65%, Due 5/1/2018 | | | 700 | | | | 762 | |
1.329%, Due 1/15/2019A | | | 700 | | | | 707 | |
1.154%, Due 4/1/2019A | | | 1,115 | | | | 1,116 | |
7.625%, Due 6/1/2019 | | | 100 | | | | 118 | |
4.125%, Due 1/22/2024 | | | 100 | | | | 103 | |
Bank of America NA, 5.30%, Due 3/15/2017 | | | 250 | | | | 263 | |
Bank of New York Mellon Corp., 2.20%, Due 5/15/2019 | | | 400 | | | | 400 | |
Citigroup, Inc., | | | | | | | | |
0.822%, Due 3/10/2017A | | | 575 | | | | 574 | |
0.820%, Due 5/1/2017A | | | 500 | | | | 498 | |
1.029%, Due 11/24/2017A | | | 500 | | | | 497 | |
0.985%, Due 4/27/2018A | | | 595 | | | | 593 | |
6.125%, Due 5/15/2018 | | | 760 | | | | 838 | |
1.177%, Due 7/30/2018A | | | 200 | | | | 200 | |
Credit Suisse Group Funding Guernsey Ltd., 3.75%, Due 3/26/2025F | | | 250 | | | | 242 | |
Credit Suisse/New York NY, 0.975%, Due 4/27/2018A | | | 300 | | | | 297 | |
Deutsche Bank AG/London, 0.924%, Due 2/13/2017A | | | 1,115 | | | | 1,114 | |
Goldman Sachs Group, Inc., | | | | | | | | |
1.421%, Due 11/15/2018A | | | 2,930 | | | | 2,953 | |
7.50%, Due 2/15/2019 | | | 332 | | | | 388 | |
HBOS PLC, 0.979%, Due 9/6/2017A D E | | | 995 | | | | 989 | |
See accompanying notes
8
American Beacon Flexible Bond FundSM
Schedule of Investments
August 31, 2015
| | | | | | | | |
| | | Par AmountO | | | Fair Value | |
| | | (000’s) | | | (000’s) | |
HSBC Holdings PLC, 4.25%, Due 8/18/2025E | | $ | 200 | | | $ | 198 | |
HSBC USA, Inc., 2.35%, Due 3/5/2020 | | | 400 | | | | 394 | |
International Lease Finance Corp., | | | | | | | | |
6.75%, Due 9/1/2016F | | | 600 | | | | 623 | |
7.125%, Due 9/1/2018F | | | 130 | | | | 144 | |
JPMorgan Chase & Co., | | | | | | | | |
1.195%, Due 1/25/2018A | | | 640 | | | | 643 | |
2.75%, Due 6/23/2020 | | | 250 | | | | 251 | |
4.40%, Due 7/22/2020 | | | 10 | | | | 11 | |
3.90%, Due 7/15/2025 | | | 200 | | | | 203 | |
JPMorgan Chase Bank NA, 6.00%, Due 10/1/2017 | | | 300 | | | | 324 | |
Macquarie Bank Ltd., | | | | | | | | |
5.00%, Due 2/22/2017D | | | 500 | | | | 524 | |
1.072%, Due 3/24/2017A F | | | 500 | | | | 501 | |
0.925%, Due 10/27/2017A F | | | 610 | | | | 609 | |
Macquarie Group Ltd., 1.297%, Due 1/31/2017A F | | | 1,070 | | | | 1,075 | |
Morgan Stanley, | | | | | | | | |
1.575%, Due 4/25/2018A | | | 2,695 | | | | 2,734 | |
7.30%, Due 5/13/2019 | | | 300 | | | | 351 | |
1.266%, Due 6/16/2020A | | | 300 | | | | 300 | |
5.50%, Due 7/24/2020 | | | 350 | | | | 391 | |
Royal Bank of Scotland Group PLC, 2.55%, Due 9/18/2015E | | | 850 | | | | 850 | |
Royal Bank of Scotland PLC, 9.50%, Due 3/16/2022D E H | | | 300 | | | | 329 | |
Shinhan Bank, 0.934%, Due 4/8/2017A F | | | 1,430 | | | | 1,429 | |
UBS AG, 5.125%, Due 5/15/2024D | | | 900 | | | | 900 | |
Wells Fargo & Co., | | | | | | | | |
2.125%, Due 4/22/2019 | | | 400 | | | | 400 | |
1.175%, Due 7/22/2020A | | | 100 | | | | 100 | |
2.60%, Due 7/22/2020 | | | 100 | | | | 100 | |
| | | | | | | | |
| | | | | | | 33,054 | |
| | | | | | | | |
Manufacturing—3.02% | | | | | | | | |
Ardagh Packaging Finance PLC / Ardagh Holdings USA, Inc., 3.286%, Due 12/15/2019A E F | | | 200 | | | | 196 | |
Daimler Finance North America LLC, | | | | | | | | |
1.875%, Due 1/11/2018C F | | | 800 | | | | 799 | |
2.00%, Due 8/3/2018C F | | | 200 | | | | 199 | |
Ford Motor Credit Co. LLC, | | | | | | | | |
4.207%, Due 4/15/2016C | | | 450 | | | | 458 | |
1.069%, Due 1/17/2017A C | | | 3,560 | | | | 3,556 | |
6.625%, Due 8/15/2017C | | | 375 | | | | 406 | |
1.186%, Due 6/15/2018A C | | | 745 | | | | 742 | |
General Motors Financial Co. Inc., 3.15%, Due 1/15/2020 | | | 125 | | | | 123 | |
General Motors Financial Co., Inc., 2.75%, Due 5/15/2016 | | | 400 | | | | 403 | |
Schaeffler Holding Finance BV, 6.875%, Due 8/15/2018F I | | | 300 | | | | 310 | |
| | | | | | | | |
| | | | | | | 7,192 | |
| | | | | | | | |
Service—1.91% | | | | | | | | |
AbbVie, Inc., | | | | | | | | |
2.50%, Due 5/14/2020 | | | 610 | | | | 603 | |
3.60%, Due 5/14/2025 | | | 100 | | | | 98 | |
Actavis Funding SCS, 3.00%, Due 3/12/2020 | | | 100 | | | | 100 | |
CCO Safari II LLC, 4.464%, Due 7/23/2022C F | | | 100 | | | | 100 | |
CVS Health Corp., 4.875%, Due 7/20/2035 | | | 100 | | | | 103 | |
Dignity Health, 2.637%, Due 11/1/2019 | | | 400 | | | | 405 | |
DISH DBS Corp., 4.625%, Due 7/15/2017 | | | 680 | | | | 694 | |
HCA, Inc., | | | | | | | | |
6.50%, Due 2/15/2016 | | | 750 | | | | 763 | |
3.75%, Due 3/15/2019 | | | 115 | | | | 116 | |
6.50%, Due 2/15/2020 | | | 800 | | | | 884 | |
New Red Finance, Inc., 6.00%, Due 4/1/2022F | | | 270 | | | | 279 | |
Tencent Holdings Ltd., 2.875%, Due 2/11/2020F | | | 200 | | | | 198 | |
Tenet Healthcare Corp., 3.786%, Due 6/15/2020A F | | | 100 | | | | 101 | |
Zimmer Biomet Holdings, Inc., 3.15%, Due 4/1/2022 | | | 100 | | | | 97 | |
| | | | | | | | |
| | | | | | | 4,541 | |
| | | | | | | | |
See accompanying notes
9
American Beacon Flexible Bond FundSM
Schedule of Investments
August 31, 2015
| | | | | | | | | | |
| | | | | Par AmountO | | | Fair Value | |
| | | | | (000’s) | | | (000’s) | |
Sovereign—1.56% | | | | | | | | | | |
Corporacion Andina de Fomento, 0.844%, Due 1/29/2018A | | | | $ | 880 | | | $ | 885 | |
Eksportfinans ASA, | | | | | | | | | | |
2.375%, Due 5/25/2016 | | | | | 100 | | | | 100 | |
5.50%, Due 5/25/2016 | | | | | 100 | | | | 102 | |
5.50%, Due 6/26/2017 | | | | | 600 | | | | 632 | |
Export-Import Bank of Korea, 5.00%, Due 4/11/2022 | | | | | 200 | | | | 223 | |
Petrobras Global Finance BV, 2.643%, Due 3/17/2017A | | | | | 300 | | | | 284 | |
Slovenia Government Bond, | | | | | | | | | | |
4.75%, Due 5/10/2018D | | | | | 1,100 | | | | 1,169 | |
4.125%, Due 2/18/2019D | | | | | 200 | | | | 210 | |
5.85%, Due 5/10/2023D | | | | | 100 | | | | 114 | |
| | | | | | | | | | |
| | | | | | | | | 3,719 | |
| | | | | | | | | | |
Telecommunications—1.48% | | | | | | | | | | |
Altice Financing S.A., 6.625%, Due 2/15/2023F | | | | | 300 | | | | 299 | |
Altice Luxembourg S.A., 7.625%, Due 2/15/2025F | | | | | 500 | | | | 475 | |
AT&T, Inc., | | | | | | | | | | |
1.212%, Due 6/30/2020A | | | | | 100 | | | | 100 | |
3.00%, Due 6/30/2022 | | | | | 100 | | | | 96 | |
3.40%, Due 5/15/2025 | | | | | 300 | | | | 286 | |
CommScope, Inc., 4.375%, Due 6/15/2020F | | | | | 160 | | | | 161 | |
Frontier Communications Corp., 6.25%, Due 9/15/2021 | | | | | 310 | | | | 284 | |
Sprint Nextel Corp., | | | | | | | | | | |
8.375%, Due 8/15/2017 | | | | | 230 | | | | 245 | |
7.00%, Due 8/15/2020 | | | | | 100 | | | | 99 | |
Verizon Communications, Inc., | | | | | | | | | | |
1.816%, Due 9/15/2016A | | | | | 730 | | | | 738 | |
2.036%, Due 9/14/2018A | | | | | 200 | | | | 205 | |
3.65%, Due 9/14/2018 | | | | | 300 | | | | 314 | |
5.15%, Due 9/15/2023 | | | | | 200 | | | | 219 | |
| | | | | | | | | | |
| | | | | | | | | 3,521 | |
| | | | | | | | | | |
Utilities—0.17% | | | | | | | | | | |
Dominion Resources, Inc., 1.25%, Due 3/15/2017 | | | | | 400 | | | | 398 | |
| | | | | | | | | | |
Total Domestic Obligations (Cost $56,899) | | | | | | | | | 56,813 | |
| | | | | | | | | | |
FOREIGN OBLIGATIONS—16.76% | | | | | | | | | | |
Energy—0.09% | | | | | | | | | | |
Gazprom OAO Via Gaz Capital S.A., 3.755%, Due 3/15/2017D | | EUR | | | 100 | | | | 113 | |
Petrobras Global Finance BV, 3.75%, Due 1/14/2021 | | EUR | | | 100 | | | | 96 | |
| | | | | | | | | | |
| | | | | | | | | 209 | |
| | | | | | | | | | |
Finance—1.57% | | | | | | | | | | |
Banco Bilbao Vizcaya Argentaria S.A., 7.00%, Due 12/29/2049A D | | EUR | | | 1,000 | | | | 1,136 | |
Banco Popular Español S.A., 11.50%, Due 10/29/2049A D | | EUR | | | 200 | | | | 250 | |
Bank of America Corp. Inflation Indexed, 3.958%, Due 10/21/2025, Acquired 5/08/2014, Cost $255A G J | | MXN | | | 3,000 | | | | 194 | |
BPE Financiaciones S.A., 2.50%, Due 2/1/2017 | | EUR | | | 100 | | | | 113 | |
Lloyds Banking Group PLC, 7.625%, Due 12/29/2049D E | | GBP | | | 1,000 | | | | 1,583 | |
Novo Banco S.A., | | | | | | | | | | |
5.00%, Due 4/23/2019 | | EUR | | | 200 | | | | 229 | |
5.00%, Due 5/23/2019 | | EUR | | | 100 | | | | 114 | |
Royal Bank of Scotland PLC, 6.934%, Due 4/9/2018A E | | EUR | | | 100 | | | | 126 | |
| | | | | | | | | | |
| | | | | | | | | 3,745 | |
| | | | | | | | | | |
Sovereign—15.10% | | | | | | | | | | |
Buoni Poliennali Del Tesoro, 5.00%, Due 8/1/2039D | | EUR | | | 550 | | | | 844 | |
Hellenic Republic Government Bond, | | | | | | | | | | |
3.375%, Due 7/17/2017F | | EUR | | | 100 | | | | 97 | |
4.75%, Due 4/17/2019D F | | EUR | | | 100 | | | | 93 | |
3.00%, Due 2/24/2034L | | EUR | | | 400 | | | | 244 | |
Hellenic Republic Government International Bond, | | | | | | | | | | |
3.80%, Due 8/8/2017, Acquired 1/08/2015, Cost $192G | | JPY | | | 30,000 | | | | 206 | |
3.00%, Due 2/24/2041A D L | | EUR | | | 100 | | | | 59 | |
Heta Asset Resolution AG, 2.75%, Due 5/31/2016 | | CHF | | | 100 | | | | 65 | |
Hungary Government Bond, | | | | | | | | | | |
See accompanying notes
10
American Beacon Flexible Bond FundSM
Schedule of Investments
August 31, 2015
| | | | | | | | | | |
| | | | | Par AmountO | | | Fair Value | |
| | | | | (000’s) | | | (000’s) | |
7.00%, Due 6/24/2022 | | HUF | | $ | 180,000 | | | $ | 787 | |
6.00%, Due 11/24/2023 | | HUF | | | 430,000 | | | | 1,810 | |
5.50%, Due 6/24/2025 | | HUF | | | 100,000 | | | | 409 | |
Indonesia Government Bond, | | | | | | | | | | |
8.375%, Due 3/15/2024 | | IDR | | | 9,800,000 | | | | 681 | |
9.00%, Due 3/15/2029 | | IDR | | | 17,100,000 | | | | 1,209 | |
8.75%, Due 2/15/2044 | | IDR | | | 18,500,000 | | | | 1,220 | |
Malaysia Government Bond, | | | | | | | | | | |
3.659%, Due 10/15/2020 | | MYR | | | 3,010 | | | | 705 | |
4.048%, Due 9/30/2021 | | MYR | | | 1,205 | | | | 282 | |
3.48%, Due 3/15/2023 | | MYR | | | 4,380 | | | | 984 | |
Mexican Bonos Desarrollo, | | | | | | | | | | |
8.50%, Due 5/31/2029K | | MXN | | | 43,200 | | | | 3,092 | |
8.50%, Due 11/18/2038K | | MXN | | | 44,910 | | | | 3,259 | |
7.75%, Due 11/13/2042K | | MXN | | | 68,000 | | | | 4,604 | |
New Zealand Government Bond, | | | | | | | | | | |
6.00%, Due 5/15/2021D | | NZD | | | 2,245 | | | | 1,664 | |
5.50%, Due 4/15/2023D | | NZD | | | 625 | | | | 465 | |
Nota Do Tesouro Nacional, | | | | | | | | | | |
10.00%, Due 1/1/2021K | | BRL | | | 700 | | | | 169 | |
10.00%, Due 1/1/2023K | | BRL | | | 9,325 | | | | 2,154 | |
10.00%, Due 1/1/2025 | | BRL | | | 10,590 | | | | 2,367 | |
Obrigacoes do Tesouro, 4.95%, Due 10/25/2023F | | EUR | | | 1,680 | | | | 2,255 | |
Poland Government Bond, 3.25%, Due 7/25/2025 | | PLN | | | 5,545 | | | | 1,502 | |
Queensland Treasury Corp., 5.75%, Due 7/22/2024D | | AUD | | | 2,175 | | | | 1,865 | |
South Africa Government Bond, | | | | | | | | | | |
6.75%, Due 3/31/2021 | | ZAR | | | 7,800 | | | | 556 | |
6.50%, Due 2/28/2041 | | ZAR | | | 30,105 | | | | 1,725 | |
8.75%, Due 2/28/2048 | | ZAR | | | 8,205 | | | | 605 | |
| | | | | | | | | | |
| | | | | | | | | 35,977 | |
| | | | | | | | | | |
Total Foreign Obligations (Cost $48,230) | | | | | | | | | 39,931 | |
| | | | | | | | | | |
ASSET-BACKED OBLIGATIONS—6.85% | | | | | | | | | | |
ACE Securities Corp Home Equity Loan Trust, 0.354%, Due 8/25/2036, 2006 OP2 A1A | | | | | 943 | | | | 784 | |
Ameriquest Mortgage Securities Inc., 2.149%, Due 6/25/2034, 2004 R4 M2A | | | | | 840 | | | | 642 | |
Carrington Mortgage Loan Trust, 0.459%, Due 2/25/2037, 2007 FRE1 AC3A | | | | | 500 | | | | 355 | |
Chase Funding Trust, 5.323%, Due 2/26/2035, 2004-2 1A4 | | | | | 116 | | | | 118 | |
Citigroup Mortgage Loan Trust, Inc., | | | | | | | | | | |
0.569%, Due 1/25/2036, 2006 WFH1 M2 | | | | | 100 | | | | 91 | |
0.359%, Due 12/25/2036, 2007 AMCI A1A F | | | | | 626 | | | | 412 | |
0.279%, Due 1/25/2037, 2007 AMC2 A3A | | | | | 183 | | | | 118 | |
Countrywide Asset-Backed Certificates Trust, | | | | | | | | | | |
0.869%, Due 8/25/2035, 2005 3 MV5A | | | | | 400 | | | | 357 | |
0.329%, Due 12/25/2036, 2006 12 1AA | | | | | 177 | | | | 155 | |
0.349%, Due 1/25/2037, 2006 13 3AV2A | | | | | 210 | | | | 199 | |
0.359%, Due 3/25/2037, 2006 18 2A2 | | | | | 361 | | | | 332 | |
0.339%, Due 5/25/2037, 2006 21 1A | | | | | 1,202 | | | | 1,007 | |
0.399%, Due 6/25/2047, 2007 9 1AA | | | | | 1,050 | | | | 783 | |
First Franklin Mortgage Loan Trust, 0.559%, Due 11/25/2035, 2005 FF10 A5A | | | | | 1,000 | | | | 708 | |
Fremont Home Loan Trust, 0.369%, Due 2/25/2036, 2006 2 2A3A | | | | | 334 | | | | 284 | |
GoldenTree Loan Opportunities VII Ltd., 1.445%, Due 4/25/2025, 2013 7A AF | | | | | 500 | | | | 493 | |
GSAMP Trust, 0.319%, Due 12/25/2036, 2007 FM1 A2B | | | | | 1,602 | | | | 878 | |
Madison Park Funding Ltd., CLO, 0.501%, Due 3/22/2021, 2007 4A A1AA F | | | | | 1,430 | | | | 1,409 | |
Master Specialized Loan Trust, 0.459%, Due 2/25/2036, 2006 2 AA F | | | | | 919 | | | | 806 | |
Morgan Stanley ABS Capital I Inc. Trust, | | | | | | | | | | |
0.249%, Due 7/25/2036, 2006 A2FPA | | | | | 80 | | | | 37 | |
0.349%, Due 11/25/2036, 2007 HE1 A2CA | | | | | 526 | | | | 311 | |
Morgan Stanley Capital I Inc. Trust, 0.379%, Due 3/25/2036, 2006 MSAC HE2 A2C | | | | | 19 | | | | 18 | |
Morgan Stanley Home Equity Loan Trust, 0.299%, Due 4/25/2037, 2007 2 A1A | | | | | 1,152 | | | | 657 | |
Nomura Home Equity Loan Inc Home Equity Loan Trust, 0.529%, Due 10/25/2036, 2006 AF1 A4 | | | | | 1,138 | | | | 462 | |
Oak Hill Credit Partners, 1.407%, Due 4/20/2025, 2013 8A AF | | | | | 500 | | | | 494 | |
Oakwood Mortgage Investors, Inc., 6.61%, Due 6/15/2031, 2001 C A3 | | | | | 318 | | | | 160 | |
See accompanying notes
11
American Beacon Flexible Bond FundSM
Schedule of Investments
August 31, 2015
| | | | | | | | |
| | | Par AmountO | | | Fair Value | |
| | | (000’s) | | | (000’s) | |
RAAC Series Trust, 0.599%, Due 9/25/2045, 2006 SP1 M1A | | $ | 800 | | | $ | 650 | |
Renaissance Home Equity Loan Trust, 5.612%, Due 4/25/2037, 2007 1 AF3 | | | 965 | | | | 530 | |
Residential Asset Securities Corp., Trust, | | | | | | | | |
0.779%, Due 7/25/2033, 2003 KS5 AIIBA | | | 7 | | | | 6 | |
0.639%, Due 1/25/2036, 2005 KS12 M1A | | | 175 | | | | 165 | |
Structured Asset Investment Loan Trust, | | | | | | | | |
0.359%, Due 5/25/2036, 2006 BNC2 A5 | | | 898 | | | | 738 | |
0.349%, Due 9/25/2036, 2006 BNC3 A3 | | | 548 | | | | 440 | |
Structured Asset Securities Corp. Mortgage Pass-Through Certificates, 0.369%, Due 12/25/2036, 2006 BC5 A4A | | | 1,274 | | | | 1,120 | |
Tralee CDO Ltd., 1.637%, Due 7/20/2026, 2014 3A A2F | | | 600 | | | | 592 | |
| | | | | | | | |
Total Asset-Backed Obligations (Cost $16,071) | | | | | | | 16,311 | |
| | | | | | | | |
COLLATERALIZED MORTGAGE OBLIGATIONS—4.33% | | | | | | | | |
Adjustable Rate Mortgage Trust, 2.761%, Due 9/25/2035, 2005 5 2A1 | | | 75 | | | | 65 | |
American Home Mortgage Investment Trust, | | | | | | | | |
2.314%, Due 10/25/2034, 2004 3 5AA | | | 45 | | | | 45 | |
1.980%, Due 9/25/2045, 2005 2 4A1A | | | 6 | | | | 6 | |
Banc of America Alternative Loan Trust, 0.599%, Due 5/25/2035, 2005 4 CB6A | | | 51 | | | | 39 | |
Banc of America Funding Corporation, | | | | | | | | |
0.413%, Due 4/20/2047, 2007 B A1 | | | 646 | | | | 504 | |
0.503%, Due 5/20/2047, 2007 C 7A5A | | | 290 | | | | 240 | |
Banc of America Mortgage Securities, Inc., 3.548%, Due 7/20/2032, 2002 G1A3A | | | 14 | | | | 14 | |
Bear Stearns Adjustable Rate Mortgage Trust, | | | | | | | | |
2.767%, Due 11/25/2030, 2000 2 A1 | | | 33 | | | | 32 | |
2.589%, Due 8/25/2033, 2003 5 2A1A | | | 76 | | | | 76 | |
2.681%, Due 8/25/2033, 2003 5 1A1A | | | 47 | | | | 46 | |
2.625%, Due 4/25/2034, 2004 1 22A1A | | | 46 | | | | 46 | |
3.097%, Due 11/25/2034, 2004 9 22A1A | | | 20 | | | | 20 | |
2.66%, Due 10/25/2035, 2005 9 A1A | | | 48 | | | | 47 | |
Bear Stearns Alt-A Trust, | | | | | | | | |
2.620%, Due 11/25/2036, 2006 6 32A1 | | | 122 | | | | 88 | |
5.078%, Due 12/25/2046, 2006 7 23A1 | | | 1,002 | | | | 725 | |
Chase Mortgage Finance Corp., | | | | | | | | |
5.50%, Due 11/25/2035, 2005 S3 A10 | | | 200 | | | | 197 | |
2.595%, Due 2/25/2037, 2007 A1 1A5 | | | 36 | | | | 35 | |
2.615%, Due 3/25/2037, 2007 A1 12M3A | | | 255 | | | | 213 | |
Citigroup Mortgage Loan Trust, Inc., | | | | | | | | |
2.705%, Due 8/25/2035, 2005 3 2A2A | | | 41 | | | | 41 | |
2.07%, Due 9/25/2035, 2005 6 A3A | | | 41 | | | | 40 | |
Countrywide Alternative Loan Trust, | | | | | | | | |
5.50%, Due 10/25/2033, 2003 20CB 1A4 | | | 181 | | | | 184 | |
6.00%, Due 10/25/2033, 2003 J2 A1 | | | 23 | | | | 24 | |
0.369%, Due 11/25/2036, 2006 OCB 2A2B | | | 383 | | | | 372 | |
0.479%, Due 2/25/2037, 2005 81 A1A | | | 18 | | | | 14 | |
0.413%, Due 7/20/2046, 2006 OA9 2A1AA | | | 12 | | | | 9 | |
0.389%, Due 9/25/2046, 2006 OA11 A1BA | | | 15 | | | | 13 | |
0.398%, Due 12/20/2046, 2006 OA17 1A1A | | | 1,309 | | | | 995 | |
Countrywide Home Loan Mortgage Pass Through Trust, | | | | | | | | |
2.773%, Due 6/25/2033, 2003 27 A1A | | | 39 | | | | 38 | |
0.959%, Due 9/25/2034, 2004 16 1A4AA | | | 42 | | | | 39 | |
0.489%, Due 4/25/2035, 2005 3 2A1A | | | 196 | | | | 163 | |
0.429%, Due 5/25/2035, 2005 9 1A3A | | | 139 | | | | 117 | |
5.75%, Due 5/25/2037, 2007 5 A51 | | | 67 | | | | 63 | |
Credit Suisse First Boston Mortgage Securities Corp., 2.600%, Due 9/25/2034, 2004 AR8 2A1 | | | 25 | | | | 25 | |
Credit Suisse Mortgage-Backed Trust, 6.00%, Due 7/25/2036, 2006 6 1A4 | | | 529 | | | | 412 | |
Deutsche Alt-A Securities Mortgage Loan Trust, 0.349%, Due 3/25/2037, 2007 AR2 A1 | | | 718 | | | | 514 | |
Fannie Mae Grantor Trust, 6.00%, Due 2/25/2044, 2004 T3 CL 1A1 | | | 13 | | | | 15 | |
Fannie Mae REMIC, 0.399%, Due 10/27/2037, 2007-114 A6 | | | 485 | | | | 479 | |
First Horizon Asset Securities, Inc., 2.523%, Due 2/25/2034, 2004 AR1 2A1A | | | 49 | | | | 48 | |
See accompanying notes
12
American Beacon Flexible Bond FundSM
Schedule of Investments
August 31, 2015
| | | | | | | | | | |
| | | | | Par AmountO | | | Fair Value | |
| | | | | (000’s) | | | (000’s) | |
GSR Mortgage Loan Trust, | | | | | | | | | | |
6.00%, Due 3/25/2032, 2003 2F 3A1 | | | | $ | 2 | | | $ | 2 | |
2.302%, Due 6/25/2034, 2004 7 3A1 | | | | | 33 | | | | 32 | |
4.553%, Due 11/25/2035, 2005 AR7 6A1A | | | | | 29 | | | | 28 | |
JP Morgan Alternative Loan Trust, 1.792%, Due 5/26/2037, 2008 R3 3A1F | | | | | 280 | | | | 249 | |
Morgan Stanley ABS Capital I Inc. Trust, 0.259%, Due 12/25/2036, 2007 HE3 A2AA | | | | | 477 | | | | 276 | |
Morgan Stanley Mortgage Loan Trust, 2.128%, Due 6/25/2036, 2006 8AR 5A4A | | | | | 24 | | | | 23 | |
New Century Alternative Mortgage Loan Trust, 5.909%, Due 7/25/2036, 2006 ALT1 AF2 | | | | | 10 | | | | 7 | |
Nomura Asset Acceptance Corp., 7.50%, Due 3/25/2034, 2004 R1 A2F | | | | | 105 | | | | 103 | |
Prime Mortgage Trust, 0.699%, Due 2/25/2035, 2006 CL1 A1A | | | | | 77 | | | | 73 | |
Residential Accredit Loans, Inc., | | | | | | | | | | |
0.449%, Due 2/25/2036, 2006 QA2 1A1A | | | | | 603 | | | | 423 | |
0.299%, Due 5/25/2037, 2007 QA3 A1A | | | | | 324 | | | | 251 | |
Residential Asset Securitization Trust, 2.521%, Due 12/25/2034, 2004 IP2 4A | | | | | 76 | | | | 75 | |
Structured Adjustable Rate Mortgage Loan Trust, | | | | | | | | | | |
2.441%, Due 5/25/2034, 2004 5 3A2 | | | | | 53 | | | | 52 | |
2.491%, Due 7/25/2034, 2004 8 3AA | | | | | 54 | | | | 54 | |
Structured Asset Mortgage Investments II Trust, | | | | | | | | | | |
1.594%, Due 2/25/2036, 2005 ARB A2A | | | | | 898 | | | | 784 | |
0.429%, Due 5/25/2045, 2005 AR2 2A1A | | | | | 92 | | | | 81 | |
Structured Asset Mortgage Investments Trust, 0.885%, Due 11/19/2033, 2003 AR3 A1A | | | | | 579 | | | | 544 | |
Structured Asset Securities Corp. Mortgage Pass-Through Certificates, 5.50%, Due 5/25/2035, 2005 6 2A14 | | | | | 95 | | | | 98 | |
WaMu Mortgage Pass Through Certificates, | | | | | | | | | | |
2.166%, Due 2/25/2033, 2003 AR1 2AA | | | | | 4 | | | | 4 | |
2.441%, Due 3/25/2035, 2005 AR3 A1 | | | | | 38 | | | | 38 | |
5.50%, Due 11/25/2035, 2005 9 2A2 | | | | | 242 | | | | 238 | |
0.359%, Due 2/25/2037, 2007 HY1 A2AA | | | | | 307 | | | | 231 | |
2.411%, Due 3/25/2037, 2007 HY3 4A1A | | | | | 169 | | | | 160 | |
1.880%, Due 12/19/2039, 2001 AR5 1A | | | | | 83 | | | | 82 | |
0.489%, Due 10/25/2045, 2005 AR13 A1A1 | | | | | 309 | | | | 286 | |
Wells Fargo Mortgage Backed Securities Trust, 2.711%, Due 3/25/2035, 2005 AR3 2A1A | | | | | 71 | | | | 72 | |
| | | | | | | | | | |
Total Collateralized Mortgage Obligations (Cost $9,954) | | | | | | | | | 10,309 | |
| | | | | | | | | | |
FOREIGN COLLATERALIZED MORTGAGE OBLIGATIONS—1.35% | | | | | | | | | | |
Fondo de Titulizacion de Activos, 0.136%, Due 6/16/2049, 16 A2 | | EUR | | | 1,026 | | | | 936 | |
IM Pastor 4 Fondo de Titulizacion de Activos, 0.126%, Due 3/22/2044, 4 A | | EUR | | | 1,140 | | | | 1,072 | |
Rural Hipotecario I Fondo De Titulizacion Hipotecaria, 0.116%, Due 2/17/2050, 9 A2 | | EUR | | | 421 | | | | 457 | |
TDA CAM Fondo de Titulizacion de Activos, 0.098%, Due 2/26/2049, 8 A | | EUR | | | 781 | | | | 795 | |
| | | | | | | | | | |
Total Foreign Collateralized Mortgage Obligations (Cost $4,125) | | | | | | | | | 3,260 | |
| | | | | | | | | | |
U.S. AGENCY MORTGAGE-BACKED OBLIGATIONS—3.28% | | | | | | | | | | |
Federal National Mortgage Association—2.93% | | | | | | | | | | |
3.00%, Due 9/14/2045 | | | | | 2,900 | | | | 2,919 | |
3.50%, Due 9/14/2045 M | | | | | 2,900 | | | | 3,009 | |
4.00%, Due 9/14/2045 M | | | | | 500 | | | | 532 | |
4.00%, Due 10/14/2045 M | | | | | 500 | | | | 531 | |
| | | | | | | | | | |
| | | | | | | | | 6,991 | |
| | | | | | | | | | |
Government National Mortgage Association—0.35% | | | | | | | | | | |
3.50%, Due 10/21/2045 M | | | | | 800 | | | | 831 | |
| | | | | | | | | | |
Total U.S. Agency Mortgage-Backed Obligations (Cost $7,829) | | | | | | | | | 7,822 | |
| | | | | | | | | | |
U.S. TREASURY OBLIGATIONS—22.78% | | | | | | | | | | |
U.S. Treasury Inflation Protected Securities—2.37% | | | | | | | | | | |
0.125%, Due 7/15/2022 J | | | | | 726 | | | | 710 | |
0.125%, Due 7/15/2024 J | | | | | 1,306 | | | | 1,255 | |
0.25%, Due 1/15/2025 J | | | | | 906 | | | | 874 | |
2.375%, Due 1/15/2025 J | | | | | 924 | | | | 1,072 | |
2.00%, Due 1/15/2026 J | | | | | 60 | | | | 68 | |
2.375%, Due 1/15/2027 J | | | | | 450 | | | | 530 | |
3.875%, Due 4/15/2029 J | | | | | 491 | | | | 682 | |
See accompanying notes
13
American Beacon Flexible Bond FundSM
Schedule of Investments
August 31, 2015
| | | | | | | | |
| | | Par AmountO | | | Fair Value | |
| | | (000’s) | | | (000’s) | |
0.75%, Due 2/15/2045 J | | $ | 507 | | | $ | 456 | |
| | | | | | | | |
| | | | | | | 5,647 | |
| | | | | | | | |
U.S. Treasury Floating Rate Note—5.96% | | | | | | | | |
0.134%, Due 1/31/2017 | | | 9,950 | | | | 9,958 | |
0.124%, Due 4/30/2017 A | | | 4,235 | | | | 4,237 | |
| | | | | | | | |
| | | | | | | 14,195 | |
| | | | | | | | |
U.S. Treasury Notes/Bonds—14.45% | | | | | | | | |
1.625%, Due 7/31/2019 N | | | 11,400 | | | | 11,514 | |
1.375%, Due 3/31/2020 | | | 6,500 | | | | 6,467 | |
2.00%, Due 7/31/2022 | | | 2,700 | | | | 2,713 | |
2.50%, Due 5/15/2024 | | | 11,000 | | | | 11,313 | |
2.125%, Due 5/15/2025 | | | 50 | | | | 50 | |
2.00%, Due 8/15/2025 | | | 800 | | | | 786 | |
3.125%, Due 8/15/2044 | | | 1,100 | | | | 1,138 | |
3.00%, Due 5/15/2045 | | | 450 | | | | 455 | |
| | | | | | | | |
| | | | | | | 34,436 | |
| | | | | | | | |
Total U.S. Treasury Obligations (Cost $54,339) | | | | | | | 54,278 | |
| | | | | | | | |
MUNICIPAL OBLIGATIONS—0.12% | | | | | | | | |
Buckeye Tobacco Settlement Financing Authority, 6.00%, Due 6/1/2042 | | | 100 | | | | 81 | |
City of Chicago IL, 7.75%, Due 1/1/2042 | | | 100 | | | | 96 | |
Illinois State G.O. BAB, 7.35%, Due 7/1/2035 | | | 100 | | | | 107 | |
| | | | | | | | |
Total Municipal Obligations (Cost $290) | | | | | | | 284 | |
| | | | | | | | |
| | |
| | | Shares | | | | |
SHORT-TERM INVESTMENTS—30.31% (Cost $72,221) | | | | | | | | |
Short-Term Investments—30.31% | | | | | | | | |
JPMorgan U.S. Government Money Market Fund, Capital Class | | | 72,220,726 | | | | 72,221 | |
| | | | | | | | |
TOTAL INVESTMENTS—110.02% (Cost $270,893) | | | | | | | 262,162 | |
PURCHASED OPTIONS—0.16% (Cost $476) | | | | | | | 386 | |
WRITTEN OPTIONS—(0.19%) (Premiums $526) | | | | | | | (455 | ) |
LIABILITIES, NET OF OTHER ASSETS—(9.99%) | | | | | | | (23,804 | ) |
| | | | | | | | |
TOTAL NET ASSETS—100.00% | | | | | | $ | 238,289 | |
| | | | | | | | |
Percentages are stated as a percent of net assets.
| A | The coupon rate shown on floating or adjustable rate securities represents the rate at period end. The due date on these types of securities reflects the final maturity date. |
| C | LLC - Limited Liability Company. |
| D | Reg S - Security purchased under the Securities Act of 1933, which exempts from registration securities offered and sold outside of the United States. Such a security cannot be sold in the United States without either an effective registration statement filed pursuant to the Securities Act of 1933, or pursuant to an exemption from registration. |
| E | PLC - Public Limited Company. |
| F | Security exempt from registration under the Securities Act of 1933. These securities may be resold to qualified institutional buyers pursuant to Rule 144A. At the period end, the value of these securities amounted to $19,169 or 8.04% of net assets. The Fund has no right to demand registration of these securities. |
| G | Illiquid Security. At period end, the amount of illiquid securities was $577 or 0.24% of net assets. |
| J | Inflation-Indexed Note. |
| K | Par value represents units rather than shares. |
| L | Step Up/Down - A scheduled increase in the exercise or conversion price at which a warrant, an option, or a convertible security may be used to acquire shares of common stock. |
| N | This security or a piece thereof is held as segregated collateral for interest rate and credit default swaps. |
| O | In U.S. Dollars unless stated otherwise. |
See accompanying notes
14
American Beacon Flexible Bond FundSM
Schedule of Investments
August 31, 2015
Futures Contracts Open on August 31, 2015:
| | | | | | | | | | | | | | |
Description | | Type | | Number of
Contracts | | Expiration Date | | Contract Value | | | Unrealized
Appreciation
(Depreciation) | |
90-Day Eurodollar December Futures | | Long | | 51 | | December 2015 | | $ | 12,645,327 | | | $ | 43,340 | |
90-Day Eurodollar June Futures | | Short | | 13 | | June 2016 | | | (3,216,438 | ) | | | (7,700 | ) |
90-Day Eurodollar September Futures | | Short | | 12 | | September 2016 | | | (2,961,271 | ) | | | (9,001 | ) |
90-Day Eurodollar December Futures | | Short | | 153 | | December 2016 | | | (37,655,006 | ) | | | (139,391 | ) |
90-Day Eurodollar March Futures | | Short | | 11 | | March 2017 | | | (2,704,901 | ) | | | (7,676 | ) |
Australian 10-Year Bond September Futures | | Long | | 1 | | September 2015 | | | 89,740 | | | | 1,917 | |
Canadian 10-Year Bond December Futures | | Short | | 8 | | December 2015 | | | (871,408 | ) | | | 11,415 | |
Euro BUND December Futures | | Short | | 3 | | December 2015 | | | (518,150 | ) | | | 2,402 | |
Euro OAT September Futures | | Short | | 38 | | September 2015 | | | (6,225,148 | ) | | | (73,236 | ) |
U.S. Long Bond December Futures | | Short | | 3 | | December 2015 | | | (463,614 | ) | | | (260 | ) |
U.S. Treasury 10-Year Note December Futures | | Short | | 75 | | December 2015 | | | (9,624,002 | ) | | | 94,025 | |
U.S. Ultra Bond December Futures | | Long | | 39 | | December 2015 | | | 6,172,820 | | | | 5,008 | |
| | | | | | | | | | | | | | |
| | | | | | | | $ | (45,332,051 | ) | | $ | (79,157 | ) |
| | | | | | | | | | | | | | |
Centrally cleared swap agreements outstanding on August 31, 2015:
Interest Rate Swaps
| | | | | | | | | | | | | | | | | | | | | | | | | | |
Pay/Receive Floating Rate | | Floating Rate Index | | Fixed
Rate
(%) | | | Expiration
Date | | Curr | | Notional
Amount(4)
(000s) | | | Upfront
Premiums
Paid
(Received) | | | Unrealized
Appreciation
(Depreciation) | | | Fair Value | |
Pay | | 3-Month USD-LIBOR | | | 1.50 | | | 7/1/2017 | | USD | | | 10,400 | | | $ | (20,347 | ) | | $ | (19,629 | ) | | $ | (39,976 | ) |
Pay | | 3-Month USD-LIBOR | | | 1.50 | | | 7/1/2017 | | USD | | | 10,400 | | | | 30,788 | | | | 9,188 | | | | 39,976 | |
Pay | | 3-Month USD-LIBOR | | | 1.35 | | | 9/28/2017 | | USD | | | 64,250 | | | | 5,493 | | | | (47,414 | ) | | | (41,921 | ) |
Pay | | 3-Month USD-LIBOR | | | 1.50 | | | 12/16/2017 | | USD | | | 9,000 | | | | (38,549 | ) | | | (37,119 | ) | | | (75,668 | ) |
Pay | | 3-Month USD-LIBOR | | | 1.75 | | | 12/16/2018 | | USD | | | 2,200 | | | | (8,356 | ) | | | (17,035 | ) | | | (25,391 | ) |
Pay | | 3-Month USD-LIBOR | | | 1.75 | | | 12/16/2018 | | USD | | | 8,100 | | | | (30,200 | ) | | | (64,977 | ) | | | (95,177 | ) |
Pay | | 3-Month USD-LIBOR | | | 2.00 | | | 12/16/2019 | | USD | | | 1,200 | | | | (5,299 | ) | | | (14,435 | ) | | | (19,734 | ) |
Pay | | 6-Month GBP-LIBOR | | | 1.65 | | | 1/22/2020 | | GBP | | | 400 | | | | 14 | | | | (4,293 | ) | | | (4,279 | ) |
Pay | | 1-Month MXN-TIIE | | | 5.43 | | | 6/12/2020 | | MXN | | | 9,500 | | | | 168 | | | | (774 | ) | | | (606 | ) |
Pay | | 3-Month USD-LIBOR | | | 2.00 | | | 12/16/2020 | | USD | | | 38,500 | | | | 161,548 | | | | (580,759 | ) | | | (419,211 | ) |
Pay | | 1-Month MXN-TIIE | | | 5.61 | | | 7/7/2021 | | MXN | | | 7,800 | | | | (2,742 | ) | | | (349 | ) | | | (3,091 | ) |
Pay | | 1-Month MXN-TIIE | | | 5.63 | | | 10/11/2021 | | MXN | | | 1,200 | | | | 383 | | | | (1,039 | ) | | | (656 | ) |
Pay | | 1-Month MXN-TIIE | | | 5.66 | | | 11/5/2021 | | MXN | | | 8,700 | | | | — | | | | (4,378 | ) | | | (4,378 | ) |
Pay | | 1-Month MXN-TIIE | | | 5.66 | | | 11/9/2021 | | MXN | | | 2,000 | | | | — | | | | (1,024 | ) | | | (1,024 | ) |
Pay | | 1-Month MXN-TIIE | | | 5.58 | | | 11/10/2021 | | MXN | | | 1,600 | | | | — | | | | (1,244 | ) | | | (1,244 | ) |
Pay | | 6-Month GBP-LIBOR | | | 2.00 | | | 3/18/2022 | | GBP | | | 1,000 | | | | (8,982 | ) | | | (15,131 | ) | | | (24,113 | ) |
Pay | | 3-Month USD-LIBOR | | | 2.25 | | | 12/16/2022 | | USD | | | 13,200 | | | | (105,398 | ) | | | 254,064 | | | | 148,666 | |
Pay | | 1-Month MXN-TIIE | | | 5.98 | | | 8/26/2024 | | MXN | | | 800 | | | | 723 | | | | (1,664 | ) | | | (941 | ) |
Pay | | 1-Month MXN-TIIE | | | 5.89 | | | 3/26/2025 | | MXN | | | 20,000 | | | | 2,119 | | | | (42,077 | ) | | | (39,958 | ) |
Pay | | 1-Month MXN-TIIE | | | 6.36 | | | 6/9/2025 | | MXN | | | 2,000 | | | | — | | | | 186 | | | | 186 | |
Pay | | 1-Month MXN-TIIE | | | 6.50 | | | 6/16/2025 | | MXN | | | 2,700 | | | | 1,766 | | | | 190 | | | | 1,956 | |
Pay | | 3-Month USD-LIBOR | | | 2.33 | | | 8/19/2025 | | USD | | | 700 | | | | — | | | | (4,259 | ) | | | (4,259 | ) |
Pay | | 3-Month USD-LIBOR | | | 2.50 | | | 12/16/2025 | | USD | | | 2,000 | | | | 24,865 | | | | (54,999 | ) | | | (30,134 | ) |
Pay | | 3-Month USD-LIBOR | | | 2.50 | | | 12/16/2025 | | USD | | | 9,400 | | | | 130,046 | | | | (259,874 | ) | | | (129,828 | ) |
Pay | | 3-Month USD-LIBOR | | | 2.75 | | | 12/16/2045 | | USD | | | 100 | | | | 5,715 | | | | (5,630 | ) | | | 85 | |
| | | | | | | | | | | | | | | | | | | | | | | | | | |
| | | | | | | | | | | | | | | | $ | 143,755 | | | $ | (914,475 | ) | | $ | (770,720 | ) |
| | | | | | | | | | | | | | | | | | | | | | | | | | |
See accompanying notes
15
American Beacon Flexible Bond FundSM
Schedule of Investments
August 31, 2015
OTC Swap Agreements Outstanding on August 31, 2015:
Credit Default Swaps on Corporate and Sovereign Securities—Buy Protection (1)
| | | | | | | | | | | | | | | | | | | | | | | | | | | | | | |
Reference Entity | | Counter-
Party | | Fixed
Rate
(%) | | | Expiration
Date | | Implied
Credit
Spread at
8/31/2015(3)
(%) | | | Curr | | Notional
Amount (4)
(000s) | | | Premiums
Paid
(Received) | | | Unrealized
Appreciation
(Depreciation) | | | Fair
Value | |
State of Illinois | | CBK | | | 1.0000 | | | 3/20/2023 | | | 2.8370 | | | USD | | | 300 | | | $ | 15,630 | | | $ | 11,212 | | | $ | 26,842 | |
State of Illinois | | CBK | | | 1.0000 | | | 6/20/2023 | | | 2.8729 | | | USD | | | 200 | | | | 9,301 | | | | 9,194 | | | | 18,495 | |
State of Illinois | | CBK | | | 1.0000 | | | 12/20/2023 | | | 2.9416 | | | USD | | | 300 | | | | 19,842 | | | | 9,617 | | | | 29,459 | |
| | | | | | | | | | | | | | | | | | | | | | | | | | | | | | |
| | | | | | | | | | | | | | | | | | | | $ | 44,773 | | | $ | 30,023 | | | $ | 74,796 | |
| | | | | | | | | | | | | | | | | | | | | | | | | | | | | | |
Credit Default Swaps on Corporate and Sovereign Securities—Sell Protection (2)
| | | | | | | | | | | | | | | | | | | | | | | | | | | | | | |
Reference Entity | | Counter-
Party | | Fixed
Rate
(%) | | | Expiration
Date | | Implied
Credit
Spread at
8/31/2015(3)
(%) | | | Curr | | Notional
Amount (4)
(000s) | | | Premiums
Paid
(Received) | | | Unrealized
Appreciation
(Depreciation) | | | Fair
Value | |
Novo Banco, S.A. | | GST | | | 5.0000 | | | 12/20/2015 | | | 3.1384 | | | EUR | | | 200 | | | $ | — | | | $ | 1,278 | | | $ | 1,278 | |
People’s Republic of China | | CBK | | | 1.0000 | | | 12/20/2019 | | | 0.9870 | | | USD | | | 1,200 | | | | 7,597 | | | | (6,957 | ) | | | 640 | |
| | | | | | | | | | | | | | | | | | | | | | | | | | | | | | |
| | | | | | | | | | | | | | | | | | | | $ | 7,597 | | | $ | (5,679 | ) | | $ | 1,918 | |
| | | | | | | | | | | | | | | | | | | | | | | | | | | | | | |
Credit Default Swaps on Credit Indices—Buy Protection (1)
| | | | | | | | | | | | | | | | | | | | | | | | | | |
Index/Tranches | | Counter-
Party | | Fixed
Pay Rate
(%) | | | Expiration
Date | | Curr | | Notional
Amount(4)
(000s) | | | Premiums
Paid
(Received) | | | Unrealized
Appreciation
(Depreciation) | | | Fair
Value (5) | |
Markit ABX | | FBF | | | 1.00 | | | 5/25/2046 | | USD | | | 612 | | | $ | 174,069 | | | $ | (60,877 | ) | | $ | 113,192 | |
Markit ABX | | GST | | | 1.00 | | | 5/25/2046 | | USD | | | 1,224 | | | | 294,568 | | | | (68,184 | ) | | | 226,384 | |
| | | | | | | | | | | | | | | | | | | | | | | | | | |
| | | | | | | | | | | | | | | | $ | 468,637 | | | $ | (129,061 | ) | | $ | 339,576 | |
| | | | | | | | | | | | | | | | | | | | | | | | | | |
Credit Default Swaps on Credit Indices—Sell Protection (2)
| | | | | | | | | | | | | | | | | | | | | | | | | | |
Index/Tranches | | Counter-
Party | | Fixed
Pay Rate
(%) | | | Expiration
Date | | Curr | | Notional
Amount(4)
(000s) | | | Premiums
Paid
(Received) | | | Unrealized
Appreciation
(Depreciation) | | | Fair
Value (5) | |
Markit CDX HY | | MSC | | | 1.00 | | | 6/20/2020 | | USD | | | 8,600 | | | $ | 137,942 | | | $ | (66,115 | ) | | $ | 71,827 | |
Markit CDX HY | | MSC | | | 5.00 | | | 6/20/2020 | | USD | | | 1,584 | | | | 78,215 | | | | (7,426 | ) | | | 70,789 | |
Markit CMBX | | GST | | | 0.10 | | | 10/12/2052 | | USD | | | 32 | | | | (103 | ) | | | 100 | | | | (3 | ) |
| | | | | | | | | | | | | | | | | | | | | | | | | | |
| | | | | | | | | | | | | | | | $ | 216,054 | | | $ | (73,441 | ) | | $ | 142,613 | |
| | | | | | | | | | | | | | | | | | | | | | | | | | |
| (1) | If the Fund is a buyer of protection and a credit event occurs, as defined under the terms of that particular swap agreement, the Fund will either (i) receive from the seller of protection an amount equal to the notional amount of the swap and deliver the referenced obligation or underlying securities comprising the referenced index or (ii) receive a net settlement amount in the form of cash or securities equal to the notional amount of the swap less the recovery value of the referenced obligation or underlying securities comprising the referenced index. |
| (2) | If the Fund is a seller of protection and a credit event occurs, as defined under the terms of that particular swap agreement, the Fund will either (i) pay to the buyer of protection an amount equal to the notional amount of the swap and take delivery of the referenced obligation or underlying securities comprising the referenced index or (ii) pay a net settlement amount in the form of cash or securities equal to the notional amount of the swap less the recovery value of the referenced obligation or underlying securities comprising the referenced index. |
| (3) | Implied credit spreads, represented in absolute terms, utilized in determining the fair value of credit default swaps agreements on corporate issues and sovereign issues of an emerging country as of period end serve as an indicator of the current status of the payment/performance risk and represent the likelihood or risk of default for the credit derivative. The implied credit spread of a particular referenced entity reflects the cost of buying/selling protection and may include upfront payments required to be made to enter into the agreement. Wider credit spreads represent a deterioration of the referenced entity’s credit soundness and a greater likelihood or risk of default or other credit event occurring as defined under the terms of the agreement. |
| (4) | The maximum potential amount the Fund could be required to pay as a seller of credit protection or receive as a buyer of credit protection if a credit event occurs as defined under the terms of that particular swap agreement. |
See accompanying notes
16
American Beacon Flexible Bond FundSM
Schedule of Investments
August 31, 2015
| (5) | The quoted market prices and resulting values for credit default swaps on asset-backed securities and credit indices serve as an indicator of the current status of the payment/performance risk and represent the likelihood of an expected liability (or profit) for the credit derivative should the notional amount of the swap agreement be closed/ sold as of the period end. Increasing fair values, in absolute terms when compared to the notional amount of the swap, represent a deterioration of the referenced entity’s credit soundness and greater likelihood or risk of default or other credit event occurring as defined under the terms of the agreement. |
Inflation Rate Swaps
| | | | | | | | | | | | | | | | | | | | | | | | | | | | |
Pay/ Receive Floating Rate | | Floating Rate Index | | Counter-
Party | | Fixed
Rate
(%) | | | Expiration
Date | | Curr | | Notional
Amount(4)
(000s) | | | Premiums
Paid
(Received) | | | Unrealized
Appreciation
(Depreciation) | | | Fair
Value | |
Receive | | EUR-EXT-CPI | | GLM | | | 0.74 | | | 1/26/2020 | | EUR | | | 400 | | | $ | (1,075 | ) | | $ | (665 | ) | | $ | (1,740 | ) |
Receive | | EUR-EXT-CPI | | BOA | | | 0.71 | | | 1/29/2020 | | EUR | | | 900 | | | | (620 | ) | | | (1,735 | ) | | | (2,355 | ) |
Receive | | EUR-EXT-CPI | | GLM | | | 0.66 | | | 1/30/2020 | | EUR | | | 1,000 | | | | (65 | ) | | | 336 | | | | 271 | |
Pay | | EUR-EXT-CPI | | CBK | | | 0.99 | | | 3/31/2020 | | EUR | | | 1,700 | | | | (310 | ) | | | (21,841 | ) | | | (22,151 | ) |
Pay | | UK-RPI-CPI | | GLM | | | 3.14 | | | 1/14/2030 | | GBP | | | 300 | | | | — | | | | (180 | ) | | | (180 | ) |
Pay | | UK-RPI-CPI | | CBK | | | 3.40 | | | 6/15/2030 | | GBP | | | 10 | | | | (9 | ) | | | 424 | | | | 415 | |
Pay | | UK-RPI-CPI | | FBF | | | 3.55 | | | 11/15/2044 | | GBP | | | 20 | | | | 23 | | | | 1,535 | | | | 1,558 | |
Pay | | UK-RPI-CPI | | MYC | | | 3.55 | | | 11/15/2044 | | GBP | | | 20 | | | | 29 | | | | 1,529 | | | | 1,558 | |
Pay | | UK-RPI-CPI | | FBF | | | 3.45 | | | 12/15/2044 | | GBP | | | 30 | | | | (105 | ) | | | 306 | | | | 201 | |
| | | | | | | | | | | | | | | | | | | | | | | | | | | | |
| | | | | | | | | | | | | | | | | | $ | (2,132 | ) | | $ | (20,291 | ) | | $ | (22,423 | ) |
| | | | | | | | | | | | | | | | | | | | | | | | | | | | |
Interest Rate Indexed Swaps
| | | | | | | | | | | | | | | | | | | | | | | | | | | | | | |
Pay/ Receive Floating Rate | | Floating Rate Index | | Counter-
Party | | Fixed
Rate
(%) | | | Expiration
Date | | Curr | | | Notional
Amount(4)
(000s) | | | Premiums
Paid
(Received) | | | Unrealized
Appreciation
(Depreciation) | | | Fair
Value | |
Pay | | 1-Year BRL-CDI | | DUB | | | 12.180 | | | 1/2/2018 | | | BRL | | | | 1,000 | | | $ | (1,170 | ) | | $ | (8,248 | ) | | $ | (9,418 | ) |
Pay | | 1-Year BRL-CDI | | BOA | | | 12.360 | | | 1/2/2018 | | | BRL | | | | 1,900 | | | | 2,947 | | | | (18,041 | ) | | | (15,094 | ) |
Pay | | 1-Year BRL-CDI | | FBF | | | 12.360 | | | 1/2/2018 | | | BRL | | | | 2,400 | | | | 3,322 | | | | (22,388 | ) | | | (19,066 | ) |
Pay | | 1-Year BRL-CDI | | GLM | | | 12.180 | | | 1/2/2018 | | | BRL | | | | 1,000 | | | | 15 | | | | (9,433 | ) | | | (9,418 | ) |
Pay | | 1-Year BRL-CDI | | DUB | | | 12.360 | | | 1/2/2018 | | | BRL | | | | 1,300 | | | | 1,759 | | | | (12,087 | ) | | | (10,328 | ) |
Pay | | 1-Year BRL-CDI | | BOA | | | 12.230 | | | 1/4/2021 | | | BRL | | | | 500 | | | | 181 | | | | (5,455 | ) | | | (5,274 | ) |
Pay | | 1-Year BRL-CDI | | DUB | | | 12.055 | | | 1/4/2021 | | | BRL | | | | 18,400 | | | | 22,874 | | | | (277,355 | ) | | | (254,481 | ) |
Pay | | 1-Year BRL-CDI | | DUB | | | 12.230 | | | 1/4/2021 | | | BRL | | | | 5,600 | | | | 258 | | | | (67,444 | ) | | | (67,186 | ) |
Pay | | 1-Year BRL-CDI | | BRC | | | 12.230 | | | 1/4/2021 | | | BRL | | | | 4,000 | | | | (2,912 | ) | | | (39,276 | ) | | | (42,188 | ) |
Pay | | 1-Year BRL-CDI | | GLM | | | 12.230 | | | 1/4/2021 | | | BRL | | | | 1,000 | | | | 1,251 | | | | (11,798 | ) | | | (10,547 | ) |
Pay | | 1-Year BRL-CDI | | CBK | | | 12.230 | | | 1/4/2021 | | | BRL | | | | 2,000 | | | | (1,721 | ) | | | (19,373 | ) | | | (21,094 | ) |
Pay | | 1-Year BRL-CDI | | BOA | | | 12.055 | | | 1/4/2021 | | | BRL | | | | 400 | | | | (786 | ) | | | (4,746 | ) | | | (5,532 | ) |
Pay | | 1-Year BRL-CDI | | DUB | | | 12.810 | | | 1/4/2021 | | | BRL | | | | 600 | | | | (135 | ) | | | (4,286 | ) | | | (4,421 | ) |
Pay | | 1-Year BRL-CDI | | GLM | | | 12.810 | | | 1/4/2021 | | | BRL | | | | 7,900 | | | | 8,739 | | | | (66,943 | ) | | | (58,204 | ) |
Pay | | 1-Year BRL-CDI | | CBK | | | 12.810 | | | 1/4/2021 | | | BRL | | | | 500 | | | | (92 | ) | | | (3,592 | ) | | | (3,684 | ) |
Pay | | 1-Year BRL-CDI | | DUB | | | 12.600 | | | 1/4/2021 | | | BRL | | | | 3,300 | | | | 170 | | | | (28,762 | ) | | | (28,592 | ) |
Pay | | 1-Year BRL-CDI | | FBF | | | 12.560 | | | 1/4/2021 | | | BRL | | | | 1,200 | | | | (119 | ) | | | (8,533 | ) | | | (8,652 | ) |
| | | | | | | | | | | | | | | | | | | | | | | | | | | | | | |
| | | | | | | | | | | | | | | | | | | | $ | 34,581 | | | $ | (607,760 | ) | | $ | (573,179 | ) |
| | | | | | | | | | | | | | | | | | | | | | | | | | | | | | |
Purchased options outstanding on August 31, 2015:
Interest Rate Swaptions
| | | | | | | | | | | | | | | | | | | | | | | | | | | | |
Description | | Counter-
party | | Floating Rate Index | | Pay /
Receive
Floating
Rate | | Exercise
Rate
(%) | | | Expiration
Date | | Notional
Amount
(000s) | | | Fair
Value | | | Premiums
Paid | | | Unrealized
Appreciation
(Depreciation) | |
Call - OTC 2-Year IRS | | DUB | | 3M USD-LIBOR | | Pay | | | 0.95 | | | 12/1/2015 | | $ | 1,200 | | | $ | 1,888 | | | $ | 1,320 | | | $ | 568 | |
Call - OTC 2-Year IRS | | CBK | | 3M USD-LIBOR | | Pay | | | 0.95 | | | 12/1/2015 | | | 2,000 | | | | 3,344 | | | | 2,220 | | | | 1,124 | |
Call - OTC 2-Year IRS | | MYC | | 3M USD-LIBOR | | Receive | | | 0.95 | | | 12/1/2015 | | | 14,200 | | | | 23,745 | | | | 14,200 | | | | 9,545 | |
Call - OTC 2-Year IRS | | DUB | | 3M USD-LIBOR | | Pay | | | 0.95 | | | 12/16/2015 | | | 9,500 | | | | 15,422 | | | | 10,569 | | | | 4,853 | |
Call - OTC 2-Year IRS | | MYC | | 3M USD-LIBOR | | Pay | | | 0.95 | | | 1/6/2016 | | | 7,500 | | | | 13,083 | | | | 8,250 | | | | 4,833 | |
Put - OTC 3-Year IRS | | MYC | | 3M USD-LIBOR | | Pay | | | 2.90 | | | 2/4/2016 | | | 11,300 | | | | 10,132 | | | | 26,555 | | | | (16,423 | ) |
Put - OTC 3-Year IRS | | MYC | | 3M USD-LIBOR | | Pay | | | 2.90 | | | 2/18/2016 | | | 11,100 | | | | 9,332 | | | | 28,860 | | | | (19,528 | ) |
Put - OTC 30-Year IRS | | BOA | | 3M USD-LIBOR | | Pay | | | 4.21 | | | 4/25/2016 | | | 1,800 | | | | 2,506 | | | | 72,000 | | | | (69,494 | ) |
Put - OTC 30-Year IRS | | DUB | | 3M USD-LIBOR | | Pay | | | 3.75 | | | 10/27/2017 | | | 1,400 | | | | 48,199 | | | | 69,790 | | | | (21,591 | ) |
Put - OTC 30-Year IRS | | DUB | | 3M USD-LIBOR | | Pay | | | 3.75 | | | 11/27/2017 | | | 1,200 | | | | 41,989 | | | | 59,902 | | | | (17,913 | ) |
| | | | | | | | | | | | | | | | | | | | | | | | | | | | |
| | | | | | | | | | | | | | | | | | $ | 169,640 | | | $ | 293,666 | | | $ | (124,026 | ) |
| | | | | | | | | | | | | | | | | | | | | | | | | | | | |
See accompanying notes
17
American Beacon Flexible Bond FundSM
Schedule of Investments
August 31, 2015
Interest Rate Floors
| | | | | | | | | | | | | | | | | | | | | | | | | | | | |
Description | | Counter-
party | | Floating Rate Index | | Pay /
Receive
Floating
Rate | | Exercise
Rate
(%) | | | Expiration
Date | | Notional
Amount
(000s) | | | Fair
Value | | | Premiums
Paid | | | Unrealized
Appreciation
(Depreciation) | |
Call - INT FLR USD | | BRC | | 3M USD-LIBOR | | Pay | | | 1.63 | | | 8/15/2019 | | $ | 5,000 | | | $ | 44,879 | | | $ | 44,900 | | | $ | (21 | ) |
Call - INT FLR USD | | DUB | | 3M USD-LIBOR | | Pay | | | 1.63 | | | 8/15/2019 | | | 2,500 | | | | 22,440 | | | | 22,500 | | | | (60 | ) |
Call - INT FLR USD | | GSC | | 3M USD-LIBOR | | Pay | | | 1.63 | | | 8/15/2019 | | | 14,000 | | | | 129,654 | | | | 89,600 | | | | 40,054 | |
| | | | | | | | | | | | | | | | | | | | | | | | | | | | |
| | | | | | | | | | | | | | | | | | $ | 196,973 | | | $ | 157,000 | | | $ | 39,973 | |
| | | | | | | | | | | | | | | | | | | | | | | | | | | | |
OTC European Foreign Currency Options
| | | | | | | | | | | | | | | | | | | | | | | | |
Description | | Counter-
party | | Exercise
Price | | | Expiration
Date | | Notional
Amount
(000s) | | | Cost | | | Fair
Value | | | Unrealized
Appreciation
(Depreciation) | |
Call - OTC ECAL USD versus CNH | | FBF | | | 6.40 | | | 2/2/2016 | | | 417 | | | $ | 11,491 | | | $ | 10,592 | | | $ | (899 | ) |
Call - OTC ECAL USD versus CNH | | FBF | | | 7.40 | | | 2/2/2016 | | | 417 | | | | 2,611 | | | | 1,042 | | | | (1,569 | ) |
Call - OTC ECAL USD versus CNH | | BRC | | | 6.50 | | | 2/2/2016 | | | 417 | | | | 9,105 | | | | 7,108 | | | | (1,997 | ) |
Call - OTC ECAL USD versus CNH | | BRC | | | 7.50 | | | 2/2/2016 | | | 417 | | | | 2,466 | | | | 918 | | | | (1,548 | ) |
| | | | | | | | | | | | | | | | | | | | | | | | |
| | | | | | | | | | | | | | $ | 25,673 | | | $ | 19,660 | | | $ | (6,013 | ) |
| | | | | | | | | | | | | | | | | | | | | | | | |
Written options outstanding on August 31, 2015:
Interest Rate Swaptions
| | | | | | | | | | | | | | | | | | | | | | | | | | | | |
Description | | Counter-
party | | Floating Rate Index | | Pay /
Receive
Floating
Rate | | Exercise
Rate
(%) | | | Expiration
Date | | Notional
Amount
(000s) | | | Fair
Value | | | Premiums
Received | | | Unrealized
Appreciation
(Depreciation) | |
Call - OTC 10-Year IRS | | BOA | | 3M USD-LIBOR | | Receive | | | 2.15 | | | 12/1/2015 | | $ | (700 | ) | | $ | (6,053 | ) | | $ | (7,607 | ) | | $ | 1,554 | |
Call - OTC 10-Year IRS | | BOA | | 3M USD-LIBOR | | Receive | | | 2.30 | | | 12/1/2015 | | | (3,600 | ) | | | (50,638 | ) | | | (14,580 | ) | | | (36,058 | ) |
Call - OTC 10-Year IRS | | MYC | | 3M USD-LIBOR | | Receive | | | 2.00 | | | 12/16/2015 | | | (2,100 | ) | | | (12,151 | ) | | | (25,550 | ) | | | 13,399 | |
Call - OTC 10-Year IRS | | MYC | | 3M USD-LIBOR | | Receive | | | 1.75 | | | 1/6/2016 | | | (1,600 | ) | | | (4,454 | ) | | | (18,040 | ) | | | 13,586 | |
Put - OTC 2-Year IRS | | BOA | | 3M USD-LIBOR | | Receive | | | 2.50 | | | 2/4/2016 | | | (200 | ) | | | (167 | ) | | | (400 | ) | | | 233 | |
Put - OTC 2-Year IRS | | CBK | | 3M USD-LIBOR | | Receive | | | 2.50 | | | 2/4/2016 | | | (11,100 | ) | | | (9,108 | ) | | | (16,928 | ) | | | 7,820 | |
Put - OTC 2-Year IRS | | MYC | | 3M USD-LIBOR | | Receive | | | 2.50 | | | 2/18/2016 | | | (11,100 | ) | | | (10,601 | ) | | | (23,310 | ) | | | 12,709 | |
Put - OTC 5-Year IRS | | CBK | | 3M USD-LIBOR | | Pay | | | 5.20 | | | 7/29/2016 | | | (1,500 | ) | | | (30 | ) | | | (18,373 | ) | | | 18,343 | |
Put - OTC 5-Year IRS | | MYC | | 3M USD-LIBOR | | Receive | | | 3.55 | | | 10/27/2017 | | | (5,900 | ) | | | (46,262 | ) | | | (101,293 | ) | | | 55,031 | |
Put - OTC 5-Year IRS | | DUB | | 3M USD-LIBOR | | Receive | | | 3.55 | | | 11/27/2017 | | | (2,100 | ) | | | (17,621 | ) | | | (36,500 | ) | | | 18,879 | |
Put - OTC 5-Year IRS | | DUB | | 3M USD-LIBOR | | Receive | | | 3.46 | | | 11/27/2017 | | | (1,300 | ) | | | (12,074 | ) | | | (23,730 | ) | | | 11,656 | |
Put - OTC 5-Year IRS | | DUB | | 3M USD-LIBOR | | Receive | | | 3.53 | | | 11/27/2017 | | | (1,700 | ) | | | (14,674 | ) | | | (35,079 | ) | | | 20,405 | |
| | | | | | | | | | | | | | | | | | | | | | | | | | | | |
| | | | | | | | | | | | | | | | | | $ | (183,833 | ) | | $ | (321,390 | ) | | $ | 137,557 | |
| | | | | | | | | | | | | | | | | | | | | | | | | | | | |
Interest Rate Floors
| | | | | | | | | | | | | | | | | | | | | | | | | | | | |
Description | | Counter-
party | | Floating Rate Index | | Pay /
Receive
Floating
Rate | | Exercise
Rate
(%) | | | Expiration
Date | | Notional
Amount
(000s) | | | Fair
Value | | | Premiums
Received | | | Unrealized
Appreciation
(Depreciation) | |
Call - INT FLR USD | | DUB | | 3M USD-LIBOR | | Receive | | | 1.00 | | | 8/15/2019 | | $ | (5,000 | ) | | $ | (22,559 | ) | | $ | (22,500 | ) | | $ | (59 | ) |
Call - INT FLR USD | | BRC | | 3M USD-LIBOR | | Receive | | | 1.00 | | | 8/15/2019 | | | (10,000 | ) | | | (45,118 | ) | | | (45,770 | ) | | | 652 | |
Call - INT FLR USD | | GSC | | 3M USD-LIBOR | | Receive | | | 1.00 | | | 8/15/2019 | | | (28,000 | ) | | | (129,086 | ) | | | (89,600 | ) | | | (39,486 | ) |
| | | | | | | | | | | | | | | | | | | | | | | | | | | | |
| | | | | | | | | | | | | | | | | | $ | (196,763 | ) | | $ | (157,870 | ) | | $ | (38,893 | ) |
| | | | | | | | | | | | | | | | | | | | | | | | | | | | |
See accompanying notes
18
American Beacon Flexible Bond FundSM
Schedule of Investments
August 31, 2015
European Style Credit Default Swaptions
| | | | | | | | | | | | | | | | | | | | | | | | |
Description | | Counter-
party | | Exercise
Price | | | Expiration
Date | | Notional
Amount
(000s) | | | Cost | | | Fair
Value | | | Unrealized
Appreciation
(Depreciation) | |
Put - CDS USD CDX.IG | | BCC | | | 0.90 | | | 10/21/2015 | | $ | (500 | ) | | $ | (1,067 | ) | | $ | (883 | ) | | $ | (184 | ) |
| | | | | | | | | | | | | | | | | | | | | | | | |
| | | | | | | | | | | | | | $ | (1,067 | ) | | $ | (883 | ) | | $ | (184 | ) |
| | | | | | | | | | | | | | | | | | | | | | | | |
European Foreign Currency Options
| | | | | | | | | | | | | | | | | | | | | | | | |
Description | | Counter-
party | | Exercise
Price | | | Expiration
Date | | Notional
Amount
(000s) | | | Cost | | | Fair
Value | | | Unrealized
Appreciation
(Depreciation) | |
Call - OTC ECAL EUR versus AUD | | BOA | | | 1.49 | | | 9/28/2015 | | | (611 | ) | | $ | (9,189 | ) | | $ | (39,983 | ) | | $ | (30,794 | ) |
Put - OTC EPUT EUR versus AUD | | BOA | | | 1.41 | | | 9/28/2015 | | | (611 | ) | | | (4,765 | ) | | | (32 | ) | | | 4,733 | |
Call - OTC ECAL USD versus BRL | | FBF | | | 3.69 | | | 10/29/2015 | | | (390 | ) | | | (6,298 | ) | | | (13,632 | ) | | | (7,334 | ) |
Call - OTC ECAL USD versus CNY | | FBF | | | 6.90 | | | 2/2/2016 | | | (833 | ) | | | (8,959 | ) | | | (4,719 | ) | | | 4,240 | |
Call - OTC ECAL USD versus CNY | | BRC | | | 7.00 | | | 2/2/2016 | | | (833 | ) | | | (8,380 | ) | | | (3,882 | ) | | | 4,498 | |
Call - OTC ECAL USD versus BRL | | BOA | | | 3.96 | | | 3/10/2016 | | | (243 | ) | | | (7,776 | ) | | | (11,430 | ) | | | (3,654 | ) |
| | | | | | | | | | | | | | | | | | | | | | | | |
| | | | | | | | | | | | | | $ | (45,367 | ) | | $ | (73,678 | ) | | $ | (28,311 | ) |
| | | | | | | | | | | | | | | | | | | | | | | | |
Forward Currency Contracts Open on August 31, 2015
| | | | | | | | | | | | | | | | | | | | | | |
Type | | Currency | | Principal Amount
Covered by Contract | | | Settlement
Date | | Counterparty | | Unrealized
Appreciation | | | Unrealized
(Depreciation) | | | Net Unrealized
Appreciation
(Depreciation) | |
Buy | | CNY | | | 1,651,682 | | | 9/14/2015 | | BCC | | $ | 26,015 | | | $ | — | | | $ | 26,015 | |
Sell | | CNY | | | 1,651,682 | | | 9/14/2015 | | BCC | | | — | | | | (39,682 | ) | | | (39,682 | ) |
Sell | | CNY | | | 1,644,298 | | | 11/3/2015 | | BCC | | | — | | | | (28,098 | ) | | | (28,098 | ) |
Sell | | CNY | | | 130,402 | | | 4/7/2016 | | BCC | | | 719 | | | | — | | | | 719 | |
Sell | | GBP | | | 1,609,691 | | | 9/2/2015 | | BOA | | | 30,706 | | | | — | | | | 30,706 | |
Sell | | TWD | | | 159,592 | | | 9/14/2015 | | BOA | | | 408 | | | | — | | | | 408 | |
Sell | | KRW | | | 421,036 | | | 9/17/2015 | | BOA | | | — | | | | (4,036 | ) | | | (4,036 | ) |
Sell | | CNY | | | 1,166,878 | | | 9/29/2015 | | BOA | | | — | | | | (24,878 | ) | | | (24,878 | ) |
Sell | | MXN | | | 146,759 | | | 9/30/2015 | | BOA | | | 3,241 | | | | — | | | | 3,241 | |
Buy | | KRW | | | 491,043 | | | 10/20/2015 | | BOA | | | — | | | | (10,957 | ) | | | (10,957 | ) |
Sell | | CNY | | | 486,275 | | | 11/3/2015 | | BOA | | | 11,725 | | | | — | | | | 11,725 | |
Buy | | JPY | | | 2,370,664 | | | 11/12/2015 | | BOA | | | — | | | | (19,398 | ) | | | (19,398 | ) |
Buy | | MXN | | | 967,852 | | | 9/30/2015 | | BRC | | | — | | | | (36,437 | ) | | | (36,437 | ) |
Sell | | MXN | | | 63,731 | | | 9/30/2015 | | BRC | | | 1,129 | | | | — | | | | 1,129 | |
Sell | | MXN | | | 817,334 | | | 9/30/2015 | | BRC | | | 13,598 | | | | — | | | | 13,598 | |
Sell | | MXN | | | 87,563 | | | 9/30/2015 | | BRC | | | 2,123 | | | | — | | | | 2,123 | |
Sell | | SGD | | | 603,429 | | | 10/9/2015 | | BRC | | | 5,644 | | | | — | | | | 5,644 | |
Sell | | EUR | | | 5,637,684 | | | 9/2/2015 | | CBK | | | — | | | | (90,879 | ) | | | (90,879 | ) |
Sell | | JPY | | | 18,064,882 | | | 9/8/2015 | | CBK | | | — | | | | (452,452 | ) | | | (452,452 | ) |
Sell | | TWD | | | 445,189 | | | 9/14/2015 | | CBK | | | — | | | | (1,189 | ) | | | (1,189 | ) |
Buy | | MXN | | | 228,920 | | | 9/30/2015 | | CBK | | | — | | | | (13,520 | ) | | | (13,520 | ) |
Sell | | NZD | | | 5,217,628 | | | 10/16/2015 | | CBK | | | 279,402 | | | | — | | | | 279,402 | |
Sell | | CNY | | | 213,946 | | | 11/3/2015 | | CBK | | | 5,054 | | | | — | | | | 5,054 | |
Sell | | EUR | | | 21,715,912 | | | 11/13/2015 | | CBK | | | — | | | | (549,949 | ) | | | (549,949 | ) |
Buy | | INR | | | 24,573 | | | 11/18/2015 | | CBK | | | — | | | | (890 | ) | | | (890 | ) |
Buy | | CNY | | | 130,402 | | | 4/7/2016 | | CBK | | | — | | | | (9,598 | ) | | | (9,598 | ) |
Sell | | BRL | | | 1,409,052 | | | 5/3/2016 | | CBK | | | 173,602 | | | | — | | | | 173,602 | |
Buy | | EUR | | | 1,606,920 | | | 9/2/2015 | | DUB | | | 8,015 | | | | — | | | | 8,015 | |
Sell | | JPY | | | 2,687,153 | | | 9/2/2015 | | DUB | | | — | | | | (64,319 | ) | | | (64,319 | ) |
Sell | | CNY | | | 424,917 | | | 9/29/2015 | | DUB | | | — | | | | (9,917 | ) | | | (9,917 | ) |
Sell | | MXN | | | 68,160 | | | 9/30/2015 | | DUB | | | 2,840 | | | | — | | | | 2,840 | |
Sell | | MXN | | | 669,201 | | | 9/30/2015 | | DUB | | | 22,399 | | | | — | | | | 22,399 | |
Buy | | EUR | | | 1,834,395 | | | 10/2/2015 | | DUB | | | — | | | | (9,089 | ) | | | (9,089 | ) |
Sell | | SGD | | | 312,617 | | | 10/9/2015 | | DUB | | | 14,108 | | | | — | | | | 14,108 | |
Sell | | CNY | | | 1,256,799 | | | 11/3/2015 | | DUB | | | 30,201 | | | | — | | | | 30,201 | |
Buy | | JPY | | | 104,042 | | | 11/12/2015 | | DUB | | | 2,525 | | | | — | | | | 2,525 | |
Sell | | CHF | | | 103,703 | | | 11/12/2015 | | DUB | | | — | | | | (1,740 | ) | | | (1,740 | ) |
Buy | | EUR | | | 170,567 | | | 9/2/2015 | | FBF | | | 1,758 | | | | — | | | | 1,758 | |
See accompanying notes
19
American Beacon Flexible Bond FundSM
Schedule of Investments
August 31, 2015
| | | | | | | | | | | | | | | | | | | | | | |
Type | | Currency | | Principal Amount
Covered by Contract | | | Settlement
Date | | Counterparty | | Unrealized
Appreciation | | | Unrealized
(Depreciation) | | | Net Unrealized
Appreciation
(Depreciation) | |
Buy | | EUR | | | 3,860,198 | | | 9/2/2015 | | FBF | | $ | — | | | $ | (57,962 | ) | | $ | (57,962 | ) |
Buy | | JPY | | | 2,687,153 | | | 9/2/2015 | | FBF | | | — | | | | (21,502 | ) | | | (21,502 | ) |
Sell | | KRW | | | 178,098 | | | 9/17/2015 | | FBF | | | — | | | | (98 | ) | | | (98 | ) |
Sell | | KRW | | | 9,080 | | | 9/17/2015 | | FBF | | | — | | | | (80 | ) | | | (80 | ) |
Buy | | MXN | | | 1,229,442 | | | 9/30/2015 | | FBF | | | — | | | | (70,356 | ) | | | (70,356 | ) |
Sell | | EUR | | | 3,861,884 | | | 10/2/2015 | | FBF | | | 58,013 | | | | — | | | | 58,013 | |
Sell | | JPY | | | 2,688,524 | | | 10/2/2015 | | FBF | | | 21,652 | | | | — | | | | 21,652 | |
Sell | | KRW | | | 1,285,871 | | | 10/20/2015 | | FBF | | | 51,958 | | | | — | | | | 51,958 | |
Buy | | GBP | | | 1,609,691 | | | 9/2/2015 | | GLM | | | — | | | | (7,142 | ) | | | (7,142 | ) |
Sell | | AUD | | | 753,637 | | | 9/2/2015 | | GLM | | | 15,076 | | | | — | | | | 15,076 | |
Sell | | BRL | | | 138,015 | | | 9/2/2015 | | GLM | | | 540 | | | | — | | | | 540 | |
Sell | | CAD | | | 111,735 | | | 9/2/2015 | | GLM | | | — | | | | (95 | ) | | | (95 | ) |
Buy | | TWD | | | 604,781 | | | 9/14/2015 | | GLM | | | — | | | | (6,253 | ) | | | (6,253 | ) |
Sell | | MXN | | | 107,603 | | | 9/30/2015 | | GLM | | | 4,397 | | | | — | | | | 4,397 | |
Sell | | MXN | | | 185,176 | | | 9/30/2015 | | GLM | | | 3,824 | | | | — | | | | 3,824 | |
Sell | | MXN | | | 300,990 | | | 9/30/2015 | | GLM | | | 6,010 | | | | — | | | | 6,010 | |
Sell | | MXN | | | 149,635 | | | 9/30/2015 | | GLM | | | 3,365 | | | | — | | | | 3,365 | |
Buy | | BRL | | | 136,552 | | | 10/2/2015 | | GLM | | | — | | | | (595 | ) | | | (595 | ) |
Sell | | GBP | | | 1,609,418 | | | 10/2/2015 | | GLM | | | 7,131 | | | | — | | | | 7,131 | |
Sell | | TWD | | | 605,013 | | | 10/20/2015 | | GLM | | | 6,876 | | | | — | | | | 6,876 | |
Sell | | GBP | | | 19,941 | | | 11/12/2015 | | GLM | | | 460 | | | | — | | | | 460 | |
Buy | | CLP | | | 312,440 | | | 9/28/2015 | | HUS | | | — | | | | (37,797 | ) | | | (37,797 | ) |
Buy | | CLP | | | 4,491,523 | | | 10/19/2015 | | HUS | | | — | | | | (352,687 | ) | | | (352,687 | ) |
Buy | | NOK | | | 2,246,449 | | | 10/20/2015 | | HUS | | | — | | | | (24,003 | ) | | | (24,003 | ) |
Buy | | SEK | | | 2,424,272 | | | 10/21/2015 | | HUS | | | 14,548 | | | | — | | | | 14,548 | |
Buy | | CLP | | | 1,258,090 | | | 11/10/2015 | | HUS | | | — | | | | (14,677 | ) | | | (14,677 | ) |
Sell | | AUD | | | 1,914,123 | | | 11/16/2015 | | HUS | | | 43,917 | | | | — | | | | 43,917 | |
Sell | | SGD | | | 3,955,832 | | | 11/16/2015 | | HUS | | | 25,852 | | | | — | | | | 25,852 | |
Buy | | INR | | | 3,604,325 | | | 11/19/2015 | | HUS | | | — | | | | (15,247 | ) | | | (15,247 | ) |
Buy | | NZD | | | 300,045 | | | 10/16/2015 | | JPM | | | — | | | | (11,252 | ) | | | (11,252 | ) |
Sell | | MXN | | | 148,798 | | | 9/30/2015 | | RBS | | | 3,202 | | | | — | | | | 3,202 | |
| | | | | | | | | | | | | | | | | | | | | | |
| | | | | | | | | | | | $ | 902,033 | | | $ | (1,986,774 | ) | | $ | (1,084,741 | ) |
| | | | | | | | | | | | | | | | | | | | | | |
Borrowing and Other Financing Transactions
Reverse Repurchase Agreements
| | | | | | | | | | | | | | | | |
Counterparty | | Borrowing Rate | | | Borrowing Date | | Maturity Date | | Amount Borrowed | | | Payable for Reverse
Repurchase
Agreements | |
Royal Bank of Scotland (1) | | | 0.30 | % | | 8/26/2015 | | 9/3/2015 | | $ | 7,790,625 | (4) | | $ | 7,790,625 | |
Societe Generale (2) | | | 0.23 | % | | 8/18/2015 | | 9/2/2015 | | | 50,000 | (5) | | | 50,000 | |
Societe Generale (3) | | | 0.24 | % | | 8/27/2015 | | 9/4/2015 | | | 459,563 | (5) | | | 459,563 | |
| | | | | | | | | | | | | | | | |
| | | | $ | 8,300,188 | | | $ | 8,300,188 | |
| | | | | | | | | | | | | | | | |
Short Sales
| | | | | | | | | | | | | | | | | | | | |
Type of Investment | | Description | | Coupon (%) | | | Maturity
Date | | Principal
Amount (000s) | | | Proceeds | | | Fair Value | |
U.S. Agency Mortgage-Backed Obligation | | Fannie Mae TBA | | | 4.50 | | | 9/14/2045 | | $ | (7,300 | ) | | $ | (7,876,484 | ) | | $ | (7,911,375 | ) |
U.S. Agency Mortgage-Backed Obligation | | Fannie Mae TBA | | | 4.00 | | | 10/14/2045 | | | (500 | ) | | | (531,172 | ) | | | (530,351 | ) |
U.S. Agency Mortgage-Backed Obligation | | Fannie Mae TBA | | | 3.50 | | | 9/14/2045 | | | (2,300 | ) | | | (1,970,656 | ) | | | (1,966,069 | ) |
U.S. Agency Mortgage-Backed Obligation | | Fannie Mae TBA | | | 3.50 | | | 10/14/2045 | | | (1,900 | ) | | | (2,380,500 | ) | | | (2,386,699 | ) |
U.S. Agency Mortgage-Backed Obligation | | Fannie Mae TBA | | | 4.00 | | | 9/14/2045 | | | (500 | ) | | | (531,016 | ) | | | (531,504 | ) |
U.S. Agency Mortgage-Backed Obligation | | Fannie Mae TBA | | | 3.00 | | | 10/14/2045 | | | (5,200 | ) | | | (5,214,766 | ) | | | (5,216,453 | ) |
U.S. Agency Mortgage-Backed Obligation | | Fannie Mae TBA | | | 3.00 | | | 9/14/2045 | | | (2,100 | ) | | | (2,104,594 | ) | | | (2,113,847 | ) |
U.S. Treasury Obligation | | U.S. Treasury N/B | | | 3.00 | | | 5/15/2045 | | | (350 | ) | | | (357,240 | ) | | | (354,047 | ) |
| | | | | | | | | | | | | | | | | | | | |
| | | | | | | | | $ | (20,966,428 | ) | | $ | (21,010,345 | )(6) |
| | | | | | | | | | | | | | | | | | | | |
See accompanying notes
20
American Beacon Flexible Bond FundSM
Schedule of Investments
August 31, 2015
| 1) | Collateralized by a U.S. Treasury N/B valued at $7,790,625, 2.500%, 5/15/2024. |
| 2) | Collateralized by a U.S. Treasury N/B valued at $50,000, 2.125%, 5/15/2025. |
| 3) | Collateralized by a U.S. Treasury N/B valued at $459,563, 3.000%, 5/15/2045. |
| 4) | The average amount of borrowing during the period ended August 31, 2015 was $3,587,831 at a weighted average interest rate of 0.01%. |
| 5) | The average amount of borrowing during the period ended August 31, 2015 was $2,278,074 at a weighted average interest rate of 0.38%. |
| 6) | Short sales represent 8.82% of total net assets. |
Glossary
| | | | | | | | | | |
| Counterparty Abbreviations: |
| BCC | | Barclays Capital | | FBF | | Credit Suisse International | | JPM | | JPMorgan Chase Bank, N.A. |
| BOA | | Bank of America, N.A. | | GLM | | Goldman Sachs Bank USA | | MSC | | Morgan Stanley & Co. Inc. |
| BRC | | Barclays Bank PLC | | GSC | | Goldman Sachs Capital Markets | | MYC | | Morgan Stanley Capital Services |
| CBK | | Citibank, N.A. | | GST | | Goldman Sachs International | | RBS | | Royal Bank of Scotland PLC |
| DUB | | Deutsche Bank AG | | HUS | | HSBC Bank USA | | | | |
| |
| Currency Abbreviations: | | |
| AUD | | Australian Dollar | | INR | | Indian Rupee | | TWD | | Taiwanese Dollar |
| BRL | | Brazilian Real | | JPY | | Japanese Yen | | USD | | United States Dollar |
| CAD | | Canadian Dollar | | KRW | | South Korean Won | | ZAR | | South African Rand |
| CHF | | Swiss Franc | | MXN | | Mexican Peso | | | | |
| CLP | | Chilean Peso | | NOK | | Norwegian Krone | | | | |
| CNH | | Chinese Renminbi | | NZD | | New Zealand Dollar | | | | |
| EUR | | Euro | | SEK | | Swedish Krona | | | | |
| GBP | | Pound Sterling | | SGD | | Singapore Dollar | | | | |
| |
| Index Abbreviations: | | |
| ABX | | Asset Backed Securities Index | | CDX.IG | | Credit Derivatives Index—Investment Grade | | EXT-CPI | | Consumer Price Index, Excluding Tobacco |
| CDX.HY | | Credit Derivatives Index – High Yield | | CMBX | | Commercial Mortgage Backed Securities Index | | RPI | | Retail Price Index |
| |
| Exchange Abbreviations: | | |
| CME | | Chicago Mercantile Exchange | | OTC | | Over-the-Counter | | | | |
| |
| Other Abbreviations: | | |
| CCP | | Central Counterparty Clearing House | | ECAL | | European-style Call | | LIBOR | | London Interbank Offer Rate |
| CDI | | CETIP Deposito Interbancario | | EPUT | | European-style Put | | TIIE | | Tasa de Intere’s Interbancaria de Equilibrio |
| CDS | | Credit Default Swap | | IRS | | Interest Rate Swap | | TBA | | To be announced |
See accompanying notes
21
American Beacon Flexible Bond FundSM
Statement of Assets and Liabilities
August 31, 2015 (in thousands, except share and per share amounts)
| | | | |
Assets: | | | | |
Investments in unaffiliated securities, at fair value A | | $ | 262,162 | |
Foreign currency, at fair value B | | | 233 | |
Purchased options and swaptions outstanding (premiums paid $451) C | | | 386 | |
Cash | | | 423 | |
Swap premium paid | | | 1,143 | |
Swap Income receivable | | | 57 | |
Deposit with brokers for futures contracts | | | 1,201 | |
Receivable for investments sold | | | 34,737 | |
Receivable for fund shares sold | | | 170 | |
Dividends and interest receivable | | | 1,153 | |
Receivable for tax reclaims | | | 26 | |
Receivable for expense reimbursement (Note 2) | | | 84 | |
Receivable for foreign currency contracts sold | | | 307 | |
Receivable for options sold | | | 293 | |
Receivable for variation margin from open futures contracts | | | 75 | |
Unrealized appreciation from swap agreements | | | 299 | |
Unrealized appreciation from foreign currency contracts | | | 902 | |
Prepaid expenses | | | 41 | |
Cash due from broker | | | 2,531 | |
| | | | |
Total assets | | | 306,223 | |
| | | | |
Liabilities: | | | | |
Payable for investments purchased | | | 32,818 | |
Payable for fund shares redeemed | | | 179 | |
Payable for short sales | | | 21,010 | |
Payable for reverse repurchase agreements | | | 8,300 | |
Swap premium received | | | 229 | |
Swap income payable | | | 70 | |
Payable for written options | | | 291 | |
Written options, at fair value (premiums received $526) | | | 455 | |
Management and investment advisory fees payable | | | 122 | |
Administrative service and service fees payable | | | 78 | |
Transfer agent fees payable | | | 6 | |
Custody and fund accounting fees payable | | | 43 | |
Professional fees payable | | | 153 | |
Prospectus and shareholder reports fees payable | | | 9 | |
Trustee fees payable | | | 3 | |
Payable for variation margin from open futures contracts | | | 161 | |
Unrealized depreciation of swap agreements | | | 2,020 | |
Unrealized depreciation from foreign currency contracts | | | 1,987 | |
| | | | |
Total liabilities | | | 67,934 | |
| | | | |
Net assets | | $ | 238,289 | |
| | | | |
Analysis of Net Assets: | | | | |
Paid-in-capital | | | 254,258 | |
Undistributed (or overdistribution of) net investment income | | | 8,200 | |
Accumulated net realized (loss) | | | (12,472 | ) |
Unrealized appreciation of investments | | | 584 | |
Unrealized depreciation of foreign currency contracts | | | (10,417 | ) |
Unrealized depreciation of futures contracts | | | (79 | ) |
Unrealized depreciation of swap agreements | | | (1,721 | ) |
Unrealized depreciation of options and swaptions contracts | | | (20 | ) |
Unrealized depreciation of short sales | | | (44 | ) |
| | | | |
Net assets | | $ | 238,289 | |
| | | | |
See accompanying notes
22
American Beacon Flexible Bond FundSM
Statement of Assets and Liabilities
August 31, 2015 (in thousands, except share and per share amounts)
| | | | |
Shares outstanding at no par value (unlimited shares authorized): | |
Institutional Class | | | 16,792,399 | |
| | | | |
Y Class | | | 4,531,124 | |
| | | | |
Investor Class | | | 774,431 | |
| | | | |
A Class | | | 1,562,418 | |
| | | | |
C Class | | | 736,197 | |
| | | | |
Net assets (not in thousands): | | | | |
Institutional Class | | $ | 164,119,296 | |
| | | | |
Y Class | | $ | 44,284,677 | |
| | | | |
Investor Class | | $ | 7,560,586 | |
| | | | |
A Class | | $ | 15,190,886 | |
| | | | |
C Class | | $ | 7,133,191 | |
| | | | |
Net asset value, offering and redemption price per share: | | | | |
Institutional Class | | $ | 9.77 | |
| | | | |
Y Class | | $ | 9.77 | |
| | | | |
Investor Class | | $ | 9.76 | |
| | | | |
A Class | | $ | 9.72 | |
| | | | |
A Class (offering price) | | $ | 10.20 | |
| | | | |
C Class | | $ | 9.69 | |
| | | | |
A Cost of investments in unaffiliated securities | | $ | 270,893 | |
B Cost of foreign currency | | $ | 252 | |
C Cost of purchased options outstanding | | $ | 476 | |
See accompanying notes
23
American Beacon Flexible Bond FundSM
Statement of Operations
For the year ended August 31, 2015 (in thousands)
| | | | |
Investment income: | | | | |
Dividend income from unaffiliated securities (net of foreign taxes) A | | $ | 62 | |
Interest income | | | 8,593 | |
| | | | |
Total investment income | | | 8,655 | |
| | | | |
Expenses: | | | | |
Management and investment advisory fees (Note 2) | | | 1,418 | |
Administrative service fees (Note 2): | | | | |
Institutional Class | | | 468 | |
Y Class | | | 119 | |
Investor Class | | | 36 | |
A Class | | | 63 | |
C Class | | | 28 | |
Transfer agent fees: | | | | |
Institutional Class | | | 60 | |
Y Class | | | 1 | |
Investor Class | | | 1 | |
A Class | | | 4 | |
C Class | | | 1 | |
Custody and fund accounting fees | | | 389 | |
Professional fees | | | 265 | |
Registration fees and expenses | | | 75 | |
Service fees (Note 2): | | | | |
Y Class | | | 40 | |
Investor Class | | | 30 | |
A Class | | | 31 | |
C Class | | | 14 | |
Distribution fees (Note 2): | | | | |
A Class | | | 52 | |
C Class | | | 92 | |
Prospectus and shareholder report expenses | | | 36 | |
Trustee fees | | | 12 | |
Other expenses | | | 27 | |
| | | | |
Total expenses | | | 3,262 | |
| | | | |
Net fees waived and expenses reimbursed (Note 2) | | | (855 | ) |
| | | | |
Net expenses | | | 2,407 | |
| | | | |
Net investment income | | | 6,248 | |
| | | | |
Realized and unrealized gain (loss) from investments: | | | | |
Net realized gain (loss) from: | | | | |
Investments | | | 2,548 | |
Foreign currency transactions | | | 9,314 | |
Futures contracts | | | (4,270 | ) |
Swap agreements | | | (6,823 | ) |
Options and swaptions contracts | | | 446 | |
Change in net unrealized appreciation or (depreciation) of: | | | | |
Investments | | | (6,193 | ) |
Foreign currency transactions | | | (11,622 | ) |
Futures contracts | | | 1,620 | |
Swap agreements | | | 1,626 | |
Options and swaption contracts | | | 56 | |
Short sales | | | 69 | |
| | | | |
Net (loss) from investments | | | (13,229 | ) |
| | | | |
Net (decrease) in net assets resulting from operations | | $ | (6,981 | ) |
| | | | |
A Foreign taxes | | $ | 57 | |
See accompanying notes
24
American Beacon Flexible Bond FundSM
Statement of Changes of Net Assets (in thousands)
| | | | | | | | |
| | | Year Ended
August 31,
2015 | | | Year Ended
August 31,
2014 | |
Increase (Decrease) in Net Assets: | | | | | | | | |
Operations: | | | | | | | | |
Net investment income | | $ | 6,248 | | | $ | 4,998 | |
Net realized gain (loss) from investments, foreign currency transactions, futures contracts, swap agreements and option and swaptions contracts | | | 1,215 | | | | (5,453 | ) |
Change in net unrealized appreciation or (depreciation) from investments, foreign currency transactions, futures contracts, swap agreements, option and swaptions contracts, and short sales | | | (14,444 | ) | | | 10,002 | |
| | | | | | | | |
Net increase (decrease) in net assets resulting from operations | | | (6,981 | ) | | | 9,547 | |
| | | | | | | | |
Distributions to Shareholders: | | | | | | | | |
Net investment income: | | | | | | | | |
Institutional Class | | | (4,119 | ) | | | (2,789 | ) |
Y Class | | | (1,023 | ) | | | (621 | ) |
Investor Class | | | (349 | ) | | | (652 | ) |
A Class | | | (525 | ) | | | (457 | ) |
C Class | | | (139 | ) | | | (72 | ) |
Net realized gain from investments: | | | | | | | | |
Institutional Class | | | — | | | | (1,025 | ) |
Y Class | | | — | | | | (253 | ) |
Investor Class | | | — | | | | (349 | ) |
A Class | | | — | | | | (275 | ) |
C Class | | | — | | | | (92 | ) |
| | | | | | | | |
Net distributions to shareholders | | | (6,155 | ) | | | (6,585 | ) |
| | | | | | | | |
Capital Share Transactions: | | | | | | | | |
Proceeds from sales of shares | | | 81,294 | | | | 114,770 | |
Reinvestment of dividends and distributions | | | 5,888 | | | | 6,267 | |
Cost of shares redeemed | | | (113,676 | ) | | | (125,983 | ) |
| | | | | | | | |
Net (decrease) in net assets from capital share transactions | | | (26,494 | ) | | | (4,946 | ) |
| | | | | | | | |
Net (decrease) in net assets | | | (39,630 | ) | | | (1,984 | ) |
| | | | | | | | |
Net Assets: | | | | | | | | |
Beginning of period | | | 277,919 | | | | 279,903 | |
| | | | | | | | |
End of Period * | | $ | 238,289 | | | $ | 277,919 | |
| | | | | | | | |
*Includes undistributed (or overdistribution of) net investment income | | $ | 8,200 | | | $ | (832 | ) |
| | | | | | | | |
See accompanying notes
25
American Beacon Flexible Bond FundSM
Notes to Financial Statements
August 31, 2015
1. Organization and Significant Accounting Policies
American Beacon Funds (the “Trust”), is organized as a Massachusetts business trust and is registered under the Investment Company Act of 1940, as amended (the “Act”), as a diversified, open-end management investment company. As of August 31, 2015, the Trust consists of thirty-one active series, one of which is presented in this filing (the “Fund”): American Beacon Flexible Bond Fund. The remaining thirty active series are reported in separate filings.
Effective April 30, 2015 American Beacon Advisors, Inc. (the “Manager”) became a wholly-owned subsidiary of Astro AB Borrower, Inc., which is indirectly owned by investment funds affiliated with Kelso & Company, L.P. and Estancia Capital Management, LLC, two prominent private equity firms. Prior to April 30 the Manager was a wholly-owned subsidiary of Lighthouse Holdings, Inc. which was indirectly owned by investment funds affiliated with Pharos Capital Group, LLC and TPG Capital, L.P., two leading private equity firms.
The Flexible Bond Fund is a commodity pool, as defined in the regulations of the Commodity Futures Trading Commission (the “CFTC”) and operated by the Manager, a commodity pool operator registered with the CFTC.
Class Disclosure
The Fund has multiple classes of shares designed to meet the needs of different groups of investors. The following table sets forth the differences amongst the classes:
| | |
Class: | | Offered to: |
| Institutional Class | | Investors making an initial investment of $250,000 |
| Y Class | | Investors making an initial investment of $100,000 |
| Investor Class | | General public and investors investing directly or through an intermediary |
| A Class | | General public and investors investing through an intermediary with applicable sales charges, which may include a front-end sales charge and a contingent deferred sales charge (“CDSC”) |
| C Class | | General public and investors investing through an intermediary with applicable sales charges, which may include a CDSC |
Each class offered by the Trust has equal rights as to assets and voting privileges. Income and non-class specific expenses are allocated daily to each class on the basis of the relative net assets. Realized and unrealized capital gains and losses of each class are allocated daily based on the relative net assets of each class of the Fund. Class specific expenses, where applicable, currently include administrative service fees, service fees, and distribution fees and vary amongst the classes as described more fully in Note 2.
New Accounting Pronouncement
In June 2014, the Financial Accounting Standards Board (“FASB”) issued Accounting Standards Update (“ASU”) 2014-11, “Transfers and Servicing (Topic 860): Repurchase-to-Maturity Transactions, Repurchase Financings, and Disclosures” (“ASU 2014-11”), that expanded secured borrowing accounting for certain reverse repurchase agreements. ASU 2014-11 also sets forth additional disclosure requirements for certain transactions accounted for as sales in order to provide financial statement users with information to compare to similar transactions accounted for as secured borrowings. ASU 2014-11 is effective prospectively for annual periods beginning after December 15, 2014, and interim periods beginning after March 15, 2015. Management is currently evaluating the impact, if any, of ASU 2014-11 on the Fund’s financial statement disclosures.
26
American Beacon Flexible Bond FundSM
Notes to Financial Statements
August 31, 2015
2. Transactions with Affiliates
Management Agreement
The Trust and the Manager are parties to a Management Agreement that obligates the Manager to provide or oversee the provision of all investment advisory and fund management services. Investment assets of the Fund are managed by multiple investment advisors which have entered into separate investment advisory agreements with the Manager and the Trust. As compensation for performing the duties required under the Management Agreement, the Manager receives from the Fund 0.05% of the average daily net assets. The Fund pays the unaffiliated investment advisors hired to direct investment activities of the Fund. Management fees paid by the Fund during the year ended August 31, 2015 were as follows (dollars in thousands):
| | | | | | |
| Management Fee Rate | | Management Fee | | Amounts paid to
Investment Advisors | | Amounts
Paid to Manager |
| 0.60% | | $1,418 | | $1,299 | | $119 |
Administration Agreement
The Manager and the Trust entered into an Administration Agreement which obligates the Manager to provide or oversee administrative services to the Fund. As compensation for performing the duties required under the Administration Agreement, the Manager receives an annualized fee of 0.30% of the average daily net assets of the Institutional, Y, Investor, A, and C Classes of the Fund.
Distribution Plans
The Fund, except for the A and C Classes of the Fund, has adopted a “defensive” Distribution Plan (the “Plan”) in accordance with Rule 12b-1 under the Act, pursuant to which no fees may be charged to the Fund for distribution purposes. However, the Plan authorizes the management and administrative service fees received by the Manager and the investment advisor hired by the Manager to be used for distribution purposes. Under this Plan, the Fund does not intend to compensate the Manager or any other party, either directly or indirectly, for the distribution of Fund shares.
Separate Distribution Plans (the “Distribution Plans”) have been adopted pursuant to Rule 12b-1 under the Act for the A and C Classes of the Fund. Under the Distribution Plans, as compensation for distribution assistance, the Manager receives an annual fee of 0.25% of the average daily net assets of the A Class and 1.00% of the average daily net assets of the C Class of the Fund. The fee will be payable without regard to whether the amount of the fee is more or less than the actual expenses incurred in a particular month by the Manager for distribution assistance.
Service Plans
The Manager and the Trust entered into Service Plans that obligate the Manager to oversee additional shareholder servicing of the Y, Investor, A, and C Classes. As compensation for performing the duties required under the Service Plans, the Manager receives 0.10% of the average daily net assets of Y Class, 0.15% of the average daily net assets of the A and C Classes, and up to 0.375% of the average daily net assets of the Investor Class of the Fund.
Interfund Lending Program
Pursuant to an exemptive order issued by the Securities and Exchange Commission (“SEC”), the Fund, along with other registered investment companies having management contracts with the Manager, may participate in an interfund lending program as a borrower. This program provides an alternative credit facility allowing the Fund to borrow from other participating funds. During the year ended August 31, 2015, the Fund did not utilize the credit facility.
27
American Beacon Flexible Bond FundSM
Notes to Financial Statements
August 31, 2015
Expense Reimbursement Plan
The Manager contractually agreed to reimburse the classes of the Fund to the extent that total annual fund operating expenses exceeded the Fund’s expense cap. During the year ended August 31, 2015, the Manager reimbursed expenses as follows:
| | | | | | | | | | | | |
| | | Expense Cap | | | | | | | |
Class | | 9/1/14 - 8/31/15 | | | Reimbursed Expenses | | | Expiration of Reimbursements | |
Institutional | | | 0.90 | % | | $ | 580,034 | | | | 2018 | |
Y | | | 0.99 | % | | | 137,152 | | | | 2018 | |
Investor | | | 1.27 | % | | | 28,305 | | | | 2018 | |
A | | | 1.29 | % | | | 76,501 | | | | 2018 | |
C | | | 2.04 | % | | | 32,625 | | | | 2018 | |
Of these amounts, $84,171 is receivable from the Manager, as of August 31, 2015. The Fund has adopted an Expense Reimbursement Plan whereby the Manager may seek repayment of expenses reimbursed for a period of up to three years. However, reimbursement will occur only if the Class’s average net assets have grown or expenses have declined sufficiently to allow reimbursement without causing its expense ratio to exceed the previously agreed upon contractual expense limit. The reimbursed expenses listed above will expire in 2018. The carryover of excess expenses potentially reimbursable to the Manager, but not recorded as a liability is $378,404 and $854,833 expiring in 2016 and 2017, respectively. The Fund did not record a liability for potential reimbursements, due to the current assessment that a reimbursement is unlikely.
Sales Commissions
The Fund’s distributor, Foreside Fund Services, LLC (“Foreside”) may receive a portion of A Class sales charges from broker dealers and it may be used to offset distribution related expenses. For the year ended August 31, 2015 Foreside collected $2,515 from the sale of A Class Shares.
A contingent deferred sales charge (“CDSC”) of 0.50% will be deducted with respect to Class A Shares on certain purchases of $1,000,000 or more that are redeemed in whole or part within 18 months of purchase, unless waived as discussed in the Prospectus. Any applicable CDSC will be 0.50% of the lesser of the original purchase price or the value of the redemption of the Class A Shares redeemed. During the year ended August 31, 2015, there were no CDSC fees collected for the Fund.
A CDSC of 1.00% will be deducted with respect to Class C Shares redeemed within 12 months of purchase, unless waived as discussed in the Prospectus. Any applicable CDSC will be 1.00% of the lesser of the original purchase price or the value of the redemption of the Class C Shares redeemed. During the year ended August 31, 2015, CDSC charges of $2,602 were collected.
3. Security Valuation and Fair Value Measurements
Investments are valued at the close of the New York Stock Exchange (the “Exchange”), normally 4 p.m. ET, each day that the Exchange is open for business. Equity securities including exchange-traded funds (“ETFs”) for which market quotations are available are valued at the last sale price or official closing price (closing bid price or last evaluated quote if no sale has occurred) on the primary market or exchange on which they trade.
Debt securities (other than short-term securities) normally are valued on the basis of prices provided by an independent pricing service and may take into account appropriate factors such as institution-size trading in similar groups of securities, yield, quality, coupon rate, maturity, type of issue, trading characteristics, and other market data. The prices of debt securities may be determined using quotes obtained from brokers.
28
American Beacon Flexible Bond FundSM
Notes to Financial Statements
August 31, 2015
Investments in open-end mutual funds are valued at the closing net asset value (“NAV”) per share of the mutual fund on the day of valuation.
Securities for which the market prices are not readily available or are not reflective of the fair value of the security, as determined by the Manager, will be priced at fair value following procedures approved by the Trust’s Board of Trustees (the “Board”).
Futures contracts are valued based upon their quoted daily settlement prices. Upon entering into a futures contract, the Fund is required to deposit with its futures broker, an amount of cash or U.S. Government and Agency Obligations in accordance with the initial margin requirements of the broker or exchange. Futures contracts are marked to market daily and an appropriate payable or receivable for the change in value (“variation margin”) is recorded by the Fund. Gains or losses are recognized, but not considered realized until the contracts expire or are closed. Futures contracts involve, to varying degrees, risk of loss in excess of the variation margin disclosed on the Statement of Assets and Liabilities.
For valuation purposes, the last quoted prices of non-U.S. equity securities may be adjusted under the circumstances described below. If the Manager determines that developments between the close of a foreign market and the close of the Exchange will, in its judgment, materially affect the value of some or all of a fund’s portfolio securities, the Manager will adjust the previous closing prices to reflect what it believes to be the fair value of the securities as of the close of the Exchange. In deciding whether it is necessary to adjust closing prices to reflect fair value, the Manager reviews a variety of factors, including developments in foreign markets, the performance of U.S. securities markets, and the performance of instruments trading in U.S. markets that represent foreign securities and baskets of foreign securities. The Valuation Committee may also fair value securities in other situations, such as when a particular foreign market is closed but a Fund is open. The Fund uses outside pricing services to provide closing prices and information to evaluate and/or adjust those prices. As a means of evaluating its security valuation process, the Valuation Committee routinely compares closing prices, the next day’s opening prices in the same markets, and adjusted prices.
Other investments, including restricted securities, and those financial instruments for which the above valuation procedures are inappropriate or are deemed not to reflect fair value are stated at fair value as determined in good faith by the Valuation Committee, established by the Fund’s Board.
Valuation Inputs
Various inputs may be used to determine the value of the Fund’s investments. These inputs are summarized in three broad levels for financial statement purposes. The inputs or methodologies used to value securities are not necessarily an indication of the risk associated with investing in those securities.
| | Level 1 - | Quoted prices in active markets for identical securities. |
| | Level 2 - | Prices determined using other significant observable inputs. These may include quoted prices for similar securities, interest rates, prepayment speeds, credit risk, and others. Level 2 securities are fixed-income securities that are valued using observable inputs as stated above. |
| | Level 3 - | Prices determined using other significant unobservable inputs. Unobservable inputs reflect the Fund’s own assumptions about the factors market participants would use in pricing an investment, and would be based on the best information available. |
Level 1 and Level 2 trading assets and trading liabilities, at fair value.
Fixed income securities including corporate, convertible and municipal bonds and notes, U.S. government agencies, U.S. treasury obligations, sovereign issues, bank loans, convertible preferred securities and non-U.S. bonds are normally valued by pricing service providers that use broker dealer quotations, reported trades or valuation estimates from their internal pricing models. The service providers’ internal models use inputs that are observable such as issuer details, interest rates, yield curves, prepayment speeds, credit risks/spreads, default rates and quoted prices for similar assets. Securities that use similar valuation techniques and inputs as described above are categorized as Level 2 of the fair value hierarchy.
29
American Beacon Flexible Bond FundSM
Notes to Financial Statements
August 31, 2015
Fixed income securities purchased on a delayed-delivery basis are marked to market daily until settlement at the forward settlement date and categorized as Level 2 of the fair value hierarchy.
Mortgage-related and asset-backed securities are usually issued as separate tranches, or classes, of securities within each deal. These securities are also normally valued by pricing service providers that use broker dealer quotations or valuation estimates from their internal pricing models. The pricing models for these securities usually consider tranche-level attributes, current market data, estimated cash flows and market-based yield spreads for each tranche, and incorporates deal collateral performance, as available. Mortgage-related and asset-backed securities that use similar valuation techniques and inputs as described above are categorized as Level 2 of the fair value hierarchy.
Common stocks, ETFs and financial derivative instruments, such as futures contracts or options contracts that are traded on a national securities exchange, are stated at the last reported sale or settlement price on the day of valuation. To the extent these securities are actively traded and valuation adjustments are not applied, they are categorized as Level 1 of the fair value hierarchy. Valuation adjustments may be applied to certain securities that are solely traded on a foreign exchange to account for the market movement between the close of the foreign market and the close of the Exchange. These securities are valued using pricing service providers that consider the correlation of the trading patterns of the foreign security to the intraday trading in the U.S. markets for investments. Securities using these valuation adjustments are categorized as Level 2 of the fair value hierarchy. Preferred securities and other equities traded on inactive markets or valued by reference to similar instruments are also categorized as Level 2 of the fair value hierarchy.
Investments in registered open-end investment management companies will be valued based upon the NAVs of such investments and are categorized as Level 1 of the fair value hierarchy.
Over-the-counter (“OTC”) financial derivative instruments, such as foreign currency contracts, options contracts, or swaps agreements, derive their value from underlying asset prices, indices, reference rates, and other inputs or a combination of these factors. These contracts are normally valued on the basis of broker dealer quotations or pricing service providers. Depending on the product and the terms of the transaction, the value of the financial derivative contracts can be estimated by a pricing service provider using a series of techniques, including simulation pricing models. The pricing models use inputs that are observed from actively quoted markets such as issuer details, indices, spreads, interest rates, curves, dividends and exchange rates. Financial derivatives that use similar valuation techniques and inputs as described above are categorized as Level 2 of the fair value hierarchy.
Level 3 trading assets and trading liabilities, at fair value
The valuation techniques and significant inputs used in determining the fair values of financial instruments classified as Level 3 of the fair value hierarchy are as follows:
Securities and other assets for which market quotes are not readily available are valued at fair value as determined in good faith by the Board or persons acting at their direction and may be categorized as Level 3 of the fair value hierarchy.
Market quotes are considered not readily available in circumstances where there is an absence of current or reliable market-based data (e.g., trade information or broker quotes), including where events occur after the close of the relevant market, but prior to the Exchange close, that materially affect the values of a Fund’s securities or assets. In addition, market quotes are considered not readily available when, due to extraordinary circumstances, the exchanges or markets on which the securities trade, do not open for trading
30
American Beacon Flexible Bond FundSM
Notes to Financial Statements
August 31, 2015
for the entire day and no other market prices are available. The Board has delegated to the Manager the responsibility for monitoring significant events that may materially affect the fair values of a Fund’s securities or assets and for determining whether the value of the applicable securities or assets should be re-evaluated in light of such significant events.
The Board has adopted methods for valuing securities and other assets in circumstances where market quotes are not readily available, and has delegated the responsibility for applying the valuation methods to the Manager. For instances in which daily market quotes are not readily available, investments may be valued pursuant to guidelines established by the Board. In the event that the security or asset cannot be valued pursuant to one of the valuation methods established by the Board, the fair value of the security or asset will be determined in good faith by the Valuation Committee, generally based upon recommendations provided by the Manager.
When a Fund uses fair valuation methods applied by the Manager that use significant unobservable inputs to determine its NAV, the securities priced using this methodology are categorized as Level 3 of the fair value hierarchy. These methods may require subjective determinations about the value of a security. While the Trust’s policy is intended to result in a calculation of a Fund’s NAV that fairly reflects security values as of the time of pricing, the Trust cannot guarantee that values determined by the Board or persons acting at their direction would accurately reflect the price that a Fund could obtain for a security if it were to dispose of that security as of the time of pricing (for instance, in a forced or distressed sale). The prices used by a Fund may differ from the value that would be realized if the securities were sold.
For fair valuations using significant unobservable inputs, U.S. Generally Accepted Accounting Principles (“U.S. GAAP”) requires a reconciliation of the beginning to ending balances for reported fair values that presents changes attributable to total realized and unrealized gains or losses, purchases and sales, and transfers in and out of the Level 3 category during the period. In accordance with the requirements of U.S. GAAP, a fair value hierarchy and Level 3 reconciliation, if any, have been included below.
The Fund’s investments are summarized by level based on the inputs used to determine their values. U.S. GAAP also requires all transfers between any levels to be disclosed. The end of the period timing recognition has been adopted for transfers between levels of the Fund’s assets and liabilities. As of August 31, 2015, the investments were classified as described below (in thousands):
| | | | | | | | | | | | | | | | |
Flexible Bond Fund (1) | | Level 1 | | | Level 2 | | | Level 3 | | | Total | |
Domestic Bank Loan | | $ | — | | | $ | 933 | | | $ | — | | | $ | 933 | |
Domestic Obligations | | | — | | | | 56,813 | | | | — | | | | 56,813 | |
Foreign Obligations | | | — | | | | 39,931 | | | | — | | | | 39,931 | |
Asset-Backed Obligations | | | — | | | | 16,311 | | | | — | | | | 16,311 | |
Collateralized Mortgage Obligations | | | — | | | | 10,309 | | | | — | | | | 10,309 | |
Foreign Collateralized Mortgage-Backed Obligations | | | — | | | | 3,260 | | | | — | | | | 3,260 | |
U.S. Agency Mortgage-Backed Obligations | | | — | | | | 7,822 | | | | — | | | | 7,822 | |
U.S. Treasury Obligations | | | — | | | | 54,278 | | | | — | | | | 54,278 | |
Municipal Obligations | | | — | | | | 284 | | | | — | | | | 284 | |
Short-Term Investments – Money Market Funds | | | 72,221 | | | | — | | | | — | | | | 72,221 | |
| | | | | | | | | | | | | | | | |
Total Investments in Securities | | $ | 72,221 | | | $ | 189,941 | | | $ | — | | | $ | 262,162 | |
| | | | | | | | | | | | | | | | |
| | | | |
| Other Financial Instruments—Assets | | Level 1 | | | Level 2 | | | Level 3 | | | Total | |
Purchased Options Outstanding | | $ | — | | | $ | 386 | | | $ | — | | | $ | 386 | |
Futures Contracts | | | 158 | | | | — | | | | — | | | | 158 | |
Interest Rate Swaps | | | — | | | | 191 | | | | — | | | | 191 | |
Inflation Swap Agreements | | | — | | | | 4 | | | | — | | | | 4 | |
Credit Default Swap Agreements | | | — | | | | 559 | | | | — | | | | 559 | |
Forward Currency Contracts | | | — | | | | 902 | | | | — | | | | 902 | |
| | | | | | | | | | | | | | | | |
| | $ | 158 | | | $ | 2,042 | | | $ | — | | | $ | 2,200 | |
| | | | | | | | | | | | | | | | |
31
American Beacon Flexible Bond FundSM
Notes to Financial Statements
August 31, 2015
| | | | | | | | | | | | | | | | |
| Other Financial Instruments—Liabilities | | Level 1 | | | Level 2 | | | Level 3 | | | Total | |
Short Sales | | $ | — | | | $ | (21,010 | ) | | $ | — | | | $ | (21,010 | ) |
Reverse Repurchase Agreement | | | — | | | | (8,300 | ) | | | — | | | | (8,300 | ) |
Written Options Outstanding | | | — | | | | (455 | ) | | | — | | | | (455 | ) |
Futures Contracts | | | (237 | ) | | | — | | | | — | | | | (237 | ) |
Interest Rate Swap Agreements | | | — | | | | (1,535 | ) | | | — | | | | (1,535 | ) |
Inflation Swap Agreements | | | — | | | | (26 | ) | | | — | | | | (26 | ) |
Forward Currency Contracts | | | — | | | | (1,987 | ) | | | — | | | | (1,987 | ) |
| | | | | | | | | | | | | | | | |
| | $ | (237 | ) | | $ | (33,313 | ) | | $ | — | | | $ | (33,550 | ) |
| | | | | | | | | | | | | | | | |
| (1) | Refer to the Schedule of Investments for Industry Information |
The following is a reconciliation of Level 3 assets of the Fund for which significant unobservable inputs were used to determine fair value. Transfers in or out of Level 3 represent the ending value of any security or instrument where a change in the level has occurred from the beginning to the end of the period.
| | | | | | | | | | | | | | | | |
| | | Asset-Backed
Obligations | | | Domestic
Obligations | | | Foreign
Obligations | | | Totals | |
Beginning Balance as of 8/31/2014 | | $ | — | | | $ | 339 | | | $ | 5 | | | $ | 344 | |
Net Purchases | | | — | | | | — | | | | — | | | | — | |
Net Sales | | | — | | | | 339 | | | | 4 | | | | 343 | |
Accrued Discounts/(Premiums) | | | — | | | | — | | | | — | | | | — | |
Realized Gain/(Loss) | | | — | | | | — | | | | (1 | ) | | | (1 | ) |
Net Change in Unrealized Appreciation/(Depreciation) | | | — | | | | — | | | | — | | | | — | |
Transfers into Level 3 | | | — | | | | — | | | | — | | | | — | |
Transfers out of Level 3 | | | — | | | | — | | | | — | | | | — | |
| | | | | | | | | | | | | | | | |
Ending Balance 8/31/2015 | | $ | — | | | $ | — | | | $ | — | | | $ | — | |
| | | | | | | | | | | | | | | | |
Net Change in Unrealized Appreciation/(Depreciation) on Investments Held at 8/31/2015(2) | | $ | — | | | $ | — | | | $ | — | | | $ | — | |
| 2 | Change in unrealized appreciation or (depreciation) attributable to Level 3 securities held at period end. This balance is included in the change in unrealized appreciation or (depreciation) on the Statement of Operations. |
Security Transactions and Investment Income
Security transactions are recorded on the trade date of the security purchase or sale. The Fund may purchase securities with delivery or payment to occur at a later date. At the time the Fund enters into a commitment to purchase a security, the transaction is recorded and the value of the security is reflected in the NAV. The value of the security may vary with market fluctuations.
Dividend income, net of foreign taxes, is recorded on the ex-dividend date except certain dividends from foreign securities which are recorded as soon as the information is available to the Fund. Interest income is earned from settlement date, recorded on the accrual basis, and adjusted, if necessary, for accretion of discounts and amortization of premiums. For financial and tax reporting purposes, realized gains and losses are determined on the basis of specific lot identification.
Currency Translation
All assets and liabilities initially expressed in foreign currency values are converted into U.S. dollar values at the mean of the bid and ask prices of such currencies against U.S. dollars as last quoted by a recognized dealer. Income, expenses and purchases and sales of investments are translated into U.S. dollars at the rate of exchange prevailing on the respective dates of such transactions. The effect of changes in foreign currency exchange rates on investments is separately identified from the fluctuations arising from changes in market values of securities held and is reported with all other foreign currency gains and losses in the Fund’s Statement of Operations.
32
American Beacon Flexible Bond FundSM
Notes to Financial Statements
August 31, 2015
Dividends to Shareholders
Dividends from net investment income of the Fund normally will be declared and paid at least annually. Distributions, if any, of net realized capital gains are generally paid at least annually and recorded on the ex-dividend date.
Commission Recapture
The Fund has established brokerage commission recapture arrangements with certain brokers or dealers. If a Fund’s investment advisor chooses to execute a transaction through a participating broker, the broker rebates a portion of the commission back to the Fund. Any collateral benefit received through participation in the commission recapture program is directed exclusively to the Fund. This amount is reported with the net realized gain in the Fund’s Statement of Operations, if applicable. For the year ended August 31, 2015, the Fund did have commission recapture.
Allocation of Income, Expenses, Gains, and Losses
Income, expenses (other than those attributable to a specific class), gains, and losses are allocated daily to each class of shares based upon the relative proportion of net assets represented by such class. Operating expenses directly attributable to a specific class are charged against the operations of that class.
Use of Estimates
The preparation of financial statements in conformity with U.S. GAAP requires management to make estimates and assumptions that affect the amounts reported in the financial statements and accompanying notes. Actual results may differ from those estimated.
Other
Under the Trust’s organizational documents, its officers and trustees are indemnified against certain liability arising out of the performance of their duties to the Trust. In the normal course of business, the Trust enters into contracts that provide indemnification to the other party or parties against potential costs or liabilities. The Trust’s maximum exposure under these arrangements is dependent on claims that may be made in the future and, therefore, cannot be estimated. The Trust has had no prior claims or losses pursuant to any such agreement.
4. Securities and other Investments
Emerging Markets Debt
The Fund may invest in emerging markets debt. The Fund’s emerging markets debt securities may include obligations of government and corporations. As with any fixed income securities, emerging markets debt securities are subject to the risk of being downgraded in credit rating and to the risk of default. In the event of a default on any investments in foreign debt obligations, it may be more difficult for the Fund to obtain or to enforce a judgment against the issuers of such securities. With respect to debt issued by emerging markets governments, such issues may be unwilling to pay interest and repay principal when due, either due to inability to pay or submission to political pressure not to pay, and as a result my default, declare temporary suspensions of interest payments or require that the conditions of payments be renegotiated.
Repurchase Agreements
A repurchase agreement is a fixed income security in the form of an agreement between a Fund as purchaser and an approved counterparty as seller. The agreement is backed by collateral in the form of securities and/or cash transferred by the seller to the buyer to be held by an eligible third-party custodian.
33
American Beacon Flexible Bond FundSM
Notes to Financial Statements
August 31, 2015
Under the agreement a Fund acquires securities from the seller and the seller simultaneously commits to repurchase the securities at an agreed upon price and date, normally within a week. The price for the seller to repurchase the securities is greater than a Fund’s purchase price, reflecting an agreed upon “interest rate” that is effective for the period of time the purchaser’s money is invested in the security. During the term of the repurchase agreement, a Fund monitors on a daily basis the market value of the collateral subject to the agreement and, if the market value of the securities falls below the seller’s repurchase amount provided under the repurchase agreement, the seller is required to transfer additional securities or cash collateral equal to the amount by which the market value of the securities falls below the repurchase amount. Repurchase agreements may exhibit the economic characteristics of loans by a Fund.
The obligation of the seller under the repurchase agreement is not guaranteed, and there is a risk that the seller may fail to repurchase the underlying securities, whether because of the seller’s bankruptcy or otherwise. In such event, a Fund would attempt to exercise its rights with respect to the underlying collateral, including possible sale of the securities. A Fund may incur various expenses in connection with the exercise of its rights and may be subject to various delays and risks of loss, including (a) possible declines in the value of the underlying collateral, (b) possible reduction in levels of income and (c) lack of access to the collateral held through a third-party custodian and possible inability to enforce the Fund’s rights. The Board has established procedures pursuant to which the Manager monitors the creditworthiness of the counterparties with which the Fund enters into repurchase agreement transactions.
The Funds may enter into repurchase agreements with member banks of the Federal Reserve System or registered broker-dealers who, in the opinion of the Manager, present a minimal risk of default during the term of the agreement. The underlying securities which serve as collateral for repurchase agreements may include fixed income and equity securities such as U.S. government and agency securities, municipal obligations, corporate obligations, asset-backed securities, mortgage-backed securities, common and preferred stock, American Depositary Receipts, exchange-traded funds and convertible securities. There is no percentage restriction on each Fund’s ability to enter into repurchase agreements with terms of seven days or less.
Reverse Repurchase Agreements
Under a reverse repurchase agreement, the Fund sells securities and agrees to repurchase them at a mutually agreed upon date and price. At the time the Fund enters into a reverse repurchase agreement, it will establish a segregated account with the custodian containing liquid assets having at least equal value to the repurchase price.
Certificate of Deposit
A savings certificate entitling the bearer to receive interest. A Certificate of Deposit (“CD”) bears a fixed maturity date, has a specified fixed interest rate, and can be issued in any denomination. CDs are generally issued by commercial banks and are currently insured by the Federal Deposit Insurance Corporation (FDIC) up to a maximum of $250,000. CDs are generally offered at terms ranging from one month to five years.
Inflation-Indexed Bonds
The Fund may invest in inflation-indexed bonds. Inflation-indexed bonds are fixed-income securities whose principal value is periodically adjusted based on the rate of inflation. The interest rate on these bonds is generally fixed at issuance at a rate lower than typical bonds. Over the life of an inflation-indexed bond, however, interest will be paid based on a principal value, which is adjusted for inflation. Any increase or decrease in the principal amount of an inflation-indexed bond will be included as interest income on the Statement of Operations, even though investors do not receive their principal until maturity.
34
American Beacon Flexible Bond FundSM
Notes to Financial Statements
August 31, 2015
Pay-In-Kind Securities
The Fund may invest in payment in-kind securities. Payment in-kind securities (“PIKs”) give the issuer the option at each interest payment date of making interest payments in either cash or additional debt securities. Those additional debt securities usually have the same terms, including maturity dates and interest rates, and associated risks as the original bonds. The daily market quotations of the original bonds may include the accrued interest (referred to as a dirty price) and require a pro rata adjustment from the unrealized appreciation or depreciation on investment to interest receivable in the Statement of Assets and Liabilities.
Restricted Securities
The Fund may invest in securities that are subject to legal or contractual restrictions on resale. These securities may be sold privately, but are required to be registered or exempted from such registration before being sold to the public. Private placement securities are generally considered to be restricted except for those securities traded between qualified institutional investors under the provisions of Rule 144A of the Securities Act of 1933. Disposal of restricted securities may involve time-consuming negotiations and expenses, and prompt sale at an acceptable price may be difficult to achieve. Restricted securities outstanding as of August 31, 2015 are disclosed in the Notes to the Schedule of Investments.
High-Yield Securities
Non-investment-grade securities are rated below the four highest credit grades by at least one of the public rating agencies (or are unrated if not publicly rated). Participation in high-yielding securities transactions generally involves greater returns in the form of higher average yields. However, participation in such transactions involves greater risks, including sensitivity to economic changes, solvency, and relative liquidity in the secondary trading market. Lower ratings may reflect a greater possibility that the financial condition of the issuer, or adverse changes in general economic conditions, or both, may impair the ability of the issuer to make payments of interest and principal. The prices and yields of lower-rated securities generally fluctuate more than higher-quality securities, and such prices may decline significantly in periods of general economic difficulty or rising interest rates.
Real Estate Investment Trusts
The Fund may own shares of real estate investment trusts (“REITs”) which report information on the source of their distributions annually. The Fund re-characterizes distributions received from REIT investments based on information provided by the REITs into the following categories: ordinary income, long-term capital gains, and return of capital. If information is not available on a timely basis from the REITs, the re-characterization will be estimated based on available information, which may include the previous year allocation. If new or additional information becomes available from the REITs at a later date, a re-characterization will be made the following year. These re-characterizations are not recorded for financial statement purposes, but as an adjustment to the calculation of taxable income.
Other Investment Company Securities and Other Exchange Traded Products
The Fund may invest in shares of other investment companies, including open-end funds, closed-end funds, business development companies, ETFs, unit investment trusts, and other investment companies of the Trust. The Funds may invest in investment company securities advised by the Manager or a sub-advisor. Investments in the securities of other investment companies may involve duplication of advisory fees and certain other expenses. By investing in another investment company, a Fund becomes a shareholder of that investment company. As a result, Fund shareholders indirectly will bear a Fund’s proportionate share of the fees and expenses paid by shareholders of the other investment company, in addition to the fees and expenses Fund shareholders directly bear in connection with the Fund’s own operations. These other fees and expenses are reflected as Acquired Fund Fees and Expenses and are included in the Fees and Expenses Table for the Fund in its Prospectus, if applicable. Investments in other investment companies may involve the payment of substantial premiums above the value of such issuer’s portfolio securities.
35
American Beacon Flexible Bond FundSM
Notes to Financial Statements
August 31, 2015
Mortgage-Related and Other Asset-Backed Securities
The Fund may invest in mortgage or other asset-backed securities (“ABS”). These securities may include mortgage instruments issued by U.S. government agencies (“agency mortgages”) or those issued by private entities (“non-agency mortgages”). Specific types of instruments may include mortgage pass-through securities, collateralized mortgage obligations (“CMOs”), commercial mortgage-backed securities, mortgage dollar rolls, CMO residuals, stripped mortgage-backed securities and other securities that directly or indirectly represent a participation in, or are secured by a payable from, mortgage loans on real property. The value of the Fund’s mortgage-backed securities (“MBS”) may be affected by, among other things, changes or perceived changes in interest rates, factors concerning the interests in and structure of the issuer or the originator of the mortgage, or the quality of the underlying assets. The mortgages underlying the securities may default or decline in quality or value. Through its investments in MBS, a Fund has exposure to subprime loans, Alt-A loans and non-conforming loans as well as to the mortgage and credit markets generally. Underlying collateral related to subprime, Alt-A and non-conforming mortgage loans has become increasingly susceptible to defaults and declines in quality or value, especially in a declining residential real estate market. In addition, regulatory or tax changes may adversely affect the mortgage securities markets as a whole.
Mortgage-Backed Securities
MBS often have stated maturities of up to thirty years when they are issued, depending upon the length of the mortgages underlying the securities. In practice however, unscheduled or early payments of principal and interest on the underlying mortgages may make the securities’ effective maturity shorter than this, and the prevailing interest rates may be higher or lower than the current yield of the Fund’s portfolio at the time resulting in reinvestment risk.
Rising or high interest rates may result in slower than expected principal payments which may tend to extend the duration of MBS, making them more volatile and more sensitive to changes in interest rates. This is known as extension risk.
MBS may have less potential for capital appreciation than comparable fixed income securities due to the likelihood of increased prepayments of mortgages resulting from foreclosures or declining interest rates. These foreclosed or refinanced mortgages are paid off at face value (par) or less, causing a loss, particularly for any investor who may have purchased the security at a premium or a price above par. In such an environment, this risk limits the potential price appreciation of these securities.
Agency Mortgage-Backed Securities
Certain MBS may be issued or guaranteed by the U.S. government or a government sponsored entity, such as Fannie Mae (the Federal National Mortgage Association) or Freddie Mac (the Federal Home Loan Mortgage Corporation). Although these instruments may be guaranteed by the U.S. government or a government sponsored entity, many such MBS are not backed by the full faith and credit of the United States and are still exposed to the risk of non-payment.
Privately Issued Mortgage-Backed Securities
MBS held by a Fund may be issued by private issuers including commercial banks, savings associations, mortgage companies, investment banking firms, finance companies and special purpose finance entities (called special purpose vehicles or SPVs) and other entities that acquire and package mortgage loans for resale as MBS. These privately issued non-agency MBS may offer higher yields than those issued by government agencies, but also may be subject to greater price changes than governmental issues. Subprime loans refer to loans made to
36
American Beacon Flexible Bond FundSM
Notes to Financial Statements
August 31, 2015
borrowers with weakened credit histories or with a lower capacity to make timely payments on their loans. Alt-A loans refer to loans extended to borrowers who have incomplete documentation of income, assets, or other variables that are important to the credit underwriting processes. Non-conforming mortgages are loans that do not meet the standards that allow purchase by government-sponsored enterprises. MBS with exposure to subprime loans, Alt-A loans or non-conforming loans have had in many cases higher default rates than those loans that meet government underwriting requirements. The risk of non-payment is greater for MBS that are backed by mortgage pools that contain subprime, Alt-A and non-conforming loans, but a level of risk exists for all loans.
Unlike agency MBS issued or guaranteed by the U.S. government or a government-sponsored entity (e.g., Fannie Mae (the Federal National Mortgage Association) and Freddie Mac (the Federal Home Loan Mortgage Corporation), MBS issued by private issuers do not have a government or government-sponsored entity guarantee, but may have credit enhancements provided by external entities such as banks or financial institutions or achieved through the structuring of the transaction itself. Examples of such credit support arising out of the structure of the transaction include the issue of senior and subordinated securities (e.g., the issuance of securities by an SPV in multiple classes or “tranches,” with one or more classes being senior to other subordinated classes as to the payment of principal and interest, with the result that defaults on the underlying mortgage loans are borne first by the holders of the subordinated class); creation of “reserve funds” (in which case cash or investments, sometimes funded from a portion of the payments on the underlying mortgage loans, are held in reserve against future losses); and “overcollateralization” (in which case the scheduled payments on, or the principal amount of, the underlying mortgage loans exceeds that required to make payment on the securities and pay any servicing or other fees). However, there can be no guarantee that credit enhancements, if any, will be sufficient to prevent losses in the event of defaults on the underlying mortgage loans. In addition, MBS that are issued by private issuers are not subject to the underwriting requirements for the underlying mortgages that are applicable to those MBS that have a government or government-sponsored entity guarantee. As a result, the mortgage loans underlying private MBS may, and frequently do, have less favorable collateral, credit risk or other underwriting characteristics than government or government-sponsored MBS and have wider variances in a number of terms including interest rate, term, size, purpose and borrower characteristics. Privately issued pools more frequently include second mortgages, high loan-to-value mortgages and manufactured housing loans. The coupon rates and maturities of the underlying mortgage loans in a private-label MBS pool may vary to a greater extent than those included in a government guaranteed pool, and the pool may include subprime mortgage loans.
Privately issued MBS are not traded on an exchange and there may be a limited market for the securities, especially when there is a perceived weakness in the mortgage and real estate market sectors. Without an active trading market, MBS held in the Fund’s portfolio may be particularly difficult to value because of the complexities involved in assessing the value of the underlying mortgage loans.
Asset-Backed Securities
ABS may include MBS, loans, receivables or other assets. The value of the Fund’s ABS may be affected by, among other things, actual or perceived changes in interest rates, factors concerning the interests in and structure of the issuer or the originator of the receivables, the market’s assessment of the quality of underlying assets or actual or perceived changes in the credit worthiness of the individual borrowers, the originator, the servicing agent or the financial institution providing the credit support.
Payment of principal and interest may be largely dependent upon the cash flows generated by the assets backing the securities.
Rising or high interest rates tend to extend the duration of ABS, making them more volatile and more sensitive to changes in interest rates. The underlying assets are sometimes subject to prepayments which can shorten the security’s weighted average life and may lower its return. Defaults on loans underlying ABS have become an increasing risk for ABS that are secured by home equity loans related to sub-prime, Alt-A or non-conforming mortgage loans, especially in a declining residential real estate market.
37
American Beacon Flexible Bond FundSM
Notes to Financial Statements
August 31, 2015
ABS (other than MBS) present certain risks that are not presented by MBS. Primarily, these securities may not have the benefit of any security interest in the related assets. Credit card receivables are generally unsecured and the debtors are entitled to the protection of a number of state and federal consumer credit laws, many of which give such debtors the right to set off certain amounts owed on the credit cards, thereby reducing the balance due. There is the possibility that recoveries on repossessed collateral may not, in some cases, be available to support payments on these securities. ABS are often backed by a pool of assets representing the obligations of a number of different parties. To lessen the effect of failures by obligors on underlying assets to make payments, the securities may contain elements of credit support which fall into two categories: (i) liquidity protection, and (ii) protection against losses resulting from ultimate default by an obligor on the underlying assets. Liquidity protection refers to the provision of advances, generally by the entity administering the pool of assets, to ensure that the receipt of payments on the underlying pool occurs in a timely fashion. Protection against losses results from payment of the insurance obligations on at least a portion of the assets in the pool. This protection may be provided through guarantees, policies or letters of credit obtained by the issuer or sponsor from third parties, through various means of structuring the transaction or through a combination of such approaches. The Fund will not pay any additional or separate fees for credit support. The degree of credit support provided for each issue is generally based on historical information respecting the level of credit risk associated with the underlying assets.
Delinquency or loss in excess of that anticipated or failure of the credit support could adversely affect the return on an investment in such a security. The availability of ABS may be affected by legislative or regulatory developments. It is possible that such developments may require the Fund to dispose of any then existing holdings of such securities.
Short Sales
The Fund may enter into short sale transactions. A short sale is a transaction in which a Fund sells a security it does not own in anticipation of a decline in the market price of the security. Securities sold in short sale transactions and the interest payable on such securities, if any, are reflected as a liability on the Statements of Assets and Liabilities. A Fund is obligated to deliver the security at the market price at the time the short position is closed. The risk of loss on a short sale transaction is theoretically unlimited, because there is no limit to the cost of replacing the security sold short, whereas losses from purchase transactions cannot exceed the total amount invested. As of August 31, 2015, short positions were held by the Fund.
Master Agreements
The Fund is a party to International Swaps and Derivatives Association, Inc. Master Agreements (“ISDA Master Agreements”) with counterparties that govern transactions in over-the-counter derivative and foreign exchange contracts entered into by the Fund and those counterparties. The ISDA Master Agreements contain provisions for general obligations, representations, agreements, collateral and events of default or termination. Events of termination include conditions that may entitle counterparties to elect to terminate early and cause settlement of all outstanding transactions under the applicable ISDA Master Agreement. Any election to terminate early could be material to the financial statements. Since different types of forward and OTC financial derivative transactions have different mechanics and are sometimes traded out of different legal entities of particular counterparty organization, each type of transaction may be covered by a different Master Agreement, resulting in the need for multiple agreements with a single counterparty. As the Master Agreements are specific to unique operations of different asset types, they allow a Fund to net its total exposure to a counterparty in the event of a default with respect to all the transactions governed under a single agreement with a counterparty.
38
American Beacon Flexible Bond FundSM
Notes to Financial Statements
August 31, 2015
Master Repurchase Agreements (“Master Repo Agreements”) govern transactions between a Fund and select counterparties. The Master Repo Agreements maintain provisions for, among other things, initiation, income payments, events of default, and maintenance of collateral for Repurchase and Reverse Repurchase Agreements.
Master Securities Forward Transaction Agreements (“Master Forward Agreements”) govern the considerations and factors surrounding the settlement of certain forward settling transactions, such as delayed delivery or sale-buyback financing transactions by and between a Fund and select counterparties. The Master Forward Agreements maintain provisions for, among other things, initiation and confirmation, payment and transfer, events of default, termination, and maintenance of collateral.
5. Financial Derivative Instruments
The Fund may utilize derivative instruments to enhance return, hedge risk, gain efficient exposure to an asset class or to manage liquidity. When considering the Fund’s use of derivatives, it is important to note that the Fund does not use derivatives for the purpose of creating financial leverage.
Options Contracts
The Fund may write (1) call and put options on futures, swaps (“swaptions”), securities, commodities or currencies it owns or in which it may invest and (2) inflation-capped options. Writing put options tends to increase the Fund’s exposure to unfavorable movements of the underlying instrument in exchange for an upfront premium. Writing call options tends to decrease the Fund’s exposure to favorable movements of the underlying instrument in exchange for an upfront premium. When the Fund writes a call, put, or inflation-capped option, an amount equal to the premium received is recorded as a liability and subsequently marked to market to reflect the current value of the option written. The purpose of inflation-capped options is to protect the buyer from inflation erosion above a certain rate on a given notional exposure. A floor can be used to give downside protection to investments in inflation-linked products. These liabilities are reflected as written options outstanding on the Statement of Assets and Liabilities. Certain options may be written with premiums to be determined on a future date. Premiums received from writing options which expire are treated as realized gains. Premiums received from writing options which are exercised or closed are added to the proceeds or offset against amounts paid on the underlying futures, swap, security or currency transaction to determine the realized gain or loss when the underlying transaction is sold. The Fund as a writer of an option has no control over whether the underlying instrument may be sold (call) or purchased (put) and as a result bears the market risk of an unfavorable change in the price of the instrument underlying the written option. There is the risk the Fund may not be able to enter into a closing transaction because of an illiquid market.
The Fund may also purchase put and call options. Purchasing call options tends to increase the Fund’s exposure to favorable movements of the underlying instrument in exchange for paying an upfront premium. Purchasing put options tends to decrease the Fund’s exposure to unfavorable movements of the underlying instrument. The Fund pays a premium which is included on the Fund’s Statement of Assets and Liabilities as an investment and subsequently marked to market to reflect the current value of the option. Premiums paid for purchasing options which expire are treated as realized losses. Certain options may be purchased with premiums to be determined on a future date. The premiums for these options are based upon implied volatility parameters at specified terms. The risk associated with purchasing put and call options is limited to the premium paid. Premiums paid for purchasing options which are exercised or closed are added to the amounts paid or offset against the proceeds on the underlying investment transaction to determine the realized gain or loss when the underlying transaction is sold.
Options
For the year ended August 31, 2015, the Fund purchased/sold options primarily for return enhancement, hedging and exposing cash to markets.
The Fund’s option and swaption contracts outstanding fluctuate throughout the operating year as required to meet strategic requirements. The following table illustrates the average quarterly volume of options contracts. For the purpose of this disclosure, volume is measured by contracts outstanding at each quarter end (in thousands).
39
American Beacon Flexible Bond FundSM
Notes to Financial Statements
August 31, 2015
| | | | |
Average Purchased Option and Swaption Notional Amounts Outstanding | |
Fund | | Year ended August 31, 2015 | |
Flexible Bond | | $ | 1,386,297 | |
| | | | |
Average Written Option and Swaption Notional Amounts Outstanding | |
Fund | | Year ended August 31, 2015 | |
Flexible Bond | | $ | 2,129,427 | |
Straddle Options
The Fund may enter into differing forms of straddle options. A straddle is an investment strategy that uses combinations of options that allow a Fund to profit based on the future price movements of the underlying security, regardless of the direction of those movements. A written straddle involves simultaneously writing a call option and a put option on the same security with the same strike price and expiration date. The written straddle increases in value when the underlying security price has little volatility before the expiration date. A purchased straddle involves simultaneously purchasing a call option and a put option on the same security with the same strike price and expiration date. The purchased straddle increases in value when the underlying security price has high volatility, regardless of direction, before the expiration date.
Swap Agreements
The Fund may invest in swap agreements. Swap agreements are privately negotiated agreements between the Fund and a counterparty to exchange or swap investment cash flows, assets, foreign currencies, or market-linked returns at specified, future intervals. The Fund may enter into credit default, cross-currency, interest rate and other forms of swap agreements to manage its exposure to credit, currency, interest rate, and inflation risk. In connection with these agreements, securities or cash may be identified as collateral in accordance with the terms of the respective swap agreements to provide assets of value and recourse in the event of default or bankruptcy/insolvency.
Swaps are marked to market daily based upon values from third party vendors or quotations from market makers to the extent available and the change in value, if any, is recorded as an unrealized gain or loss on the Statement of Assets and Liabilities. In the event that market quotes are not readily available and the swap cannot be valued pursuant to one of the valuation methods, the value of the swap will be determined in good faith by the Valuation Committee pursuant to procedures approved by the Board.
Payments received or made at the beginning of the measurement period are reflected as such on the Statement of Assets and Liabilities and represent payments made or received upon entering into the swap agreement to compensate for differences between the stated terms of the swap agreement and prevailing market conditions (credit spreads, currency exchange rates, interest rates, and other relevant factors). These upfront payments are recorded as realized gains or losses on the Statement of Operations upon termination or maturity of the swap. A liquidation payment received or made at the termination of the swap is recorded as realized gain or loss on the Statement of Operations. Net periodic payments received or paid by the Fund are included as part of realized gains or losses on the Statement of Operations.
Entering into these agreements involves, to varying degrees, elements of credit, market and documentation risk in excess of the amounts recognized on the Statement of Assets and Liabilities. Such risks involve the possibility that there will be no liquid market for these agreements, that the counterparty to the agreements may default on its obligation to perform or disagree as to the meaning of contractual terms in the agreements and that there may be unfavorable changes in interest rates.
The Fund’s maximum risk of loss from counterparty credit risk is the discounted net value of the cash flows to be received from the counterparty over the contract’s remaining life, to the extent that amount is positive. The risk is mitigated by having a master netting arrangement between the Fund and the counterparty and by the posting of collateral to the Fund to cover the Fund’s exposure to the counterparty.
40
American Beacon Flexible Bond FundSM
Notes to Financial Statements
August 31, 2015
Credit Default Swap Agreements
Credit default swap agreements involve one party making a stream of payments (referred to as the buyer of protection) to another party (the seller of protection) in exchange for the right to receive a specified return in the event of a default or other credit event for the referenced entity, obligation or index. As a seller of protection on credit default swap agreements, the Fund will generally receive from the buyer of protection a fixed rate of periodic premium throughout the term of the swap provided that there is no credit event. As the seller, the Fund would effectively add leverage to its portfolio because, in addition to its total net assets, the Fund would be subject to investment exposure up to the notional amount of the swap.
If the Fund is a seller of protection and a credit event occurs, as defined under the terms of that particular swap agreement, the Fund will either (i) pay to the buyer of protection an amount equal to the notional amount of the swap and take delivery of the referenced obligation, other deliverable obligations or underlying securities comprising the referenced index or (ii) pay a net settlement amount in the form of cash or securities equal to the notional amount of the swap less the recovery value of the referenced obligation or underlying securities comprising the referenced index. If the Fund is a buyer of protection and a credit event occurs, as defined under the terms of that particular swap agreement, the Fund will either (i) receive from the seller of protection an amount equal to the notional amount of the swap and deliver the referenced obligation, other deliverable obligations or underlying securities comprising the referenced index or (ii) receive a net settlement amount in the form of cash or securities equal to the notional amount of the swap less the recovery value of the referenced obligation or underlying securities comprising the referenced index. Recovery values are estimated by market makers considering either industry standard recovery rates or entity specific factors and considerations until a credit event occurs. If a credit event has occurred, the recovery value is determined by a facilitated auction whereby a minimum number of allowable broker bids, together with a specified valuation method, are used to calculate the settlement value.
Credit default swap agreements on corporate issues, sovereign issues of an emerging country or U.S. municipal issues involve one party making a stream of payments to another party in exchange for the right to receive a specified return in the event of a default or other credit event. If a credit event occurs and cash settlement is not elected, a variety of other deliverable obligations may be delivered in lieu of the specific referenced obligation. The ability to deliver other obligations may result in a cheapest-to-deliver option (the buyer of protection’s right to choose the deliverable obligation with the lowest value following a credit event). The Fund may use credit default swaps on corporate issues, sovereign issues of an emerging country or U.S. municipal issues to provide a measure of protection against defaults of the issuers (i.e., to reduce risk where the Fund owns or has exposure to the referenced obligation) or to take an active long or short position with respect to the likelihood of a particular issuer’s default.
Credit default swap agreements on asset-backed securities involve one party making a stream of payments to another party in exchange for the right to receive a specified return in the event of a default or other credit event. Unlike credit default swaps on corporate issues, sovereign issues of an emerging country or U.S. municipal issues, deliverable obligations in most instances would be limited to the specific referenced obligation as performance for asset-backed securities can vary across deals. Prepayments, principal paydowns, and other writedown or loss events on the underlying mortgage loans will reduce the outstanding principal balance of the referenced obligation. These reductions may be temporary or permanent as defined under the terms of the swap agreement and the notional amount for the swap agreement will be adjusted by corresponding amounts. The Fund may use credit default swaps on asset-backed securities to provide a measure of protection against defaults of the referenced obligation that the Fund owns or to take an active long or short position with respect to the likelihood of a particular referenced obligation’s default that the Fund does not own.
41
American Beacon Flexible Bond FundSM
Notes to Financial Statements
August 31, 2015
Credit default swap agreements on credit indices involve one party making a stream of payments to another party in exchange for the right to receive a specified return in the event of a write-down, principal shortfall, interest shortfall or default of all or part of the referenced entities comprising the credit index. A credit index is a basket of credit instruments or exposures designed to be representative of some part of the credit market as a whole. These indices are made up of reference credits that are judged by a poll of dealers to be the most liquid entities in the credit default swap market based on the sector of the index. Components of the indices may include, but are not limited to, investment grade securities, high yield securities, asset-backed securities, emerging markets, and/or various credit ratings within each sector. Credit indices are traded using credit default swaps with standardized terms including a fixed spread and standard maturity dates. An index credit default swap references all the names in the index, and if there is a default, the credit event is settled based on that name’s weight in the index. The composition of the indices changes periodically, usually every six months, and for most indices, each name has an equal weight in the index. The Fund may use credit default swaps on credit indices to hedge a portfolio of credit default swaps or bonds, which is less expensive than it would be to buy many credit default swaps to achieve a similar effect. Credit default swaps on indices are benchmarks for protecting investors owning bonds against default, and traders use them to speculate on changes in credit quality.
Implied credit spreads, represented in absolute terms, utilized in determining the market value of credit default swap agreements on corporate issues, sovereign issues of an emerging country or U.S. municipal issues as of period end are disclosed in the Notes to the Schedule of Investments and serve as an indicator of the current status of the payment/performance risk and represent a market participant view of the likelihood or risk of default for the underlying referent security to credit derivative. The implied credit spread of a particular referenced entity reflects the cost of buying/selling protection and may include upfront payments required to be made to enter into the agreement. For credit default swap agreements on asset-backed securities and credit indices, the quoted market prices and resulting values serve as the indicator of the current status of the payment/performance risk. Wider credit spreads represent a deterioration of the referenced entity’s credit soundness and a greater likelihood or risk of default or other credit event occurring as defined under the terms of the agreement.
The maximum potential amount of future payments (undiscounted) that the Fund as a seller of protection could be required to make under a credit default swap agreement would be an amount equal to the notional amount of the agreement. Notional amounts of each individual credit default swap agreements outstanding as of August 31, 2015 for which the Fund is the seller of protection is disclosed in the Notes to the Schedule of Investments. These potential amounts would be partially offset by any recovery values of the respective referenced obligations, upfront payments received upon entering into the agreement, or net amounts received from the settlement of buy protection credit default swap agreements entered into by the Fund for the same referenced entity or entities.
For the year ended August 31, 2015, the Fund entered into credit default swaps primarily for return enhancement hedging and exposing cash to markets.
The Fund’s credit default swap contract notional amounts outstanding fluctuate throughout the operating year as required to meet the strategic requirements. The following table illustrates the average quarterly volume of credit default swap contracts. For the purpose of this disclosure, the volume is measured by the notional amounts outstanding at each quarter end (in thousands).
| | | | |
Average Credit Default Swap Notional Amounts Outstanding | |
Fund | | Year ended August 31, 2015 | |
Flexible Bond | | $ | 39,782 | |
42
American Beacon Flexible Bond FundSM
Notes to Financial Statements
August 31, 2015
Interest Rate Swap Agreements
The Fund is subject to interest rate risk exposure in the normal course of pursuing its investment objectives. Because the Fund holds fixed rate bonds, the value of these bonds may decrease if interest rates rise. To help hedge against this risk and to maintain its ability to generate income at prevailing market rates, the Fund may enter into interest rate swap agreements. Interest rate swap agreements involve the exchange by the Fund with another party of their respective commitments to pay or receive interest with respect to the notional amount of principal.
For the year ended August 31, 2015, the Fund entered into interest rate swaps primarily for return enhancement, hedging and exposing cash to markets.
The Fund’s interest rate swap contract notional amounts outstanding fluctuate throughout the operating year as required to meet the strategic requirements. The following table illustrates the average quarterly volume of interest rate swap contracts. For the purpose of this disclosure, the volume is measured by the notional amounts outstanding at each quarter end (in thousands).
| | | | |
Average Interest Rate Swap Notional Amounts Outstanding | |
Fund | | Year ended August 31, 2015 | |
Flexible Bond | | $ | 5,271,672 | |
Over-the-Counter Swap Agreements
OTC financial derivative instruments such as forward currency contracts, options contracts, interest rate, and credit default swap agreements derive their value from underlying asset prices, indices, reference rates and other inputs or a combination of these factors. These instruments are valued using evaluated prices furnished by a pricing service selected by the Board. In certain cases, when a valuation is not readily available from a pricing service, the Fund’s Manager may provide a valuation. Derivative instruments that use valuation techniques and inputs similar to those described above are normally categorized as Level 2 in the fair value hierarchy.
Total Return Swap Agreements
The Fund may enter into total return swaps in order to take a “long” or “short” position with respect to an underlying referenced asset. The Fund is subject to market price volatility of the underlying referenced asset. A total return swap involves commitments to pay interest in exchange for a market linked return based on a notional amount. To the extent that the total return of the security, group of securities or index underlying the transaction exceeds or falls short of the offsetting interest obligation, the Fund will receive a payment from or make a payment to the counterparty.
For the year ended August 31, 2015, the Fund didn’t have any total return swap agreements outstanding.
Inflation Swap Agreements
An inflation swap involves the use of inflation derivatives (or inflation-indexed derivatives) to transfer inflation risk from one party to another. The derivatives used may be over-the-counter or exchange-traded derivatives. Inflation swaps frequently include real rate swaps, such as asset swaps of inflation-indexed bonds. Inflation swaps are simply a linear form of such derivatives. Real rate swaps consist of the nominal interest swap rate minus the corresponding inflation swap.
In an inflation swap, one party pays a fixed rate on a notional principal amount, while the other party pays a floating rate linked to an inflation index, such as the Consumer Price Index (CPI). The party paying the floating rate pays the inflation adjusted rate multiplied by the notional principal amount.
43
American Beacon Flexible Bond FundSM
Notes to Financial Statements
August 31, 2015
There are three main types of inflation swap. In a standard interbank inflation-linked swap, or zero-coupon inflation-linked swap, cash flow is exchanged on the maturity date. This swap pays out the exact value of the cumulative inflation for a fixed capital sum over a determined period.
In a year-on-year inflation-linked swap, inflation is used on an annual basis rather than a cumulative one. Typically, an inflation swap is priced on a zero-coupon basis, with payment exchanged upon maturity. One party pays the compound fixed rate, while the other pays the actual inflation rate for the term of the swap. In Europe, inflation swaps are typically paid on a year-on-year basis where the year-on-year rate of change of the price index is paid. In the United States, payment is more typically on a month-on-month basis, although the inflation rate used is still the year-on-year rate.
In an inflation-linked income swap two cash flows are exchanged, each of which follows the inflation index. One party pays a fixed inflation increase annually over the period of the contract. The other party pays the actual inflation over the period of the contract. The swap itself consists of a series of zero-coupon swaps. Other traded inflation derivatives include caps, floors, and straddles, which are usually priced against year-on-year swaps.
The Fund’s inflation swap contract notional amounts outstanding fluctuate throughout the operating year as required to meet the strategic requirements. The following table illustrates the average quarterly volume of inflation swap contracts. For the purpose of this disclosure, the volume is measured by the notional amounts outstanding at each quarter end (in thousands).
| | | | |
Average Inflation Swap Notional Amounts Outstanding | |
Fund | | Year ended August 31, 2015 | |
Flexible Bond | | $ | 46,868 | |
Forward Foreign Currency Contracts
The Fund may enter into forward foreign currency contracts to hedge the exchange rate risk on investment transactions or to hedge the value of the Fund’s securities denominated in foreign currencies. Forward foreign currency contracts are valued at the forward exchange rate prevailing on the day of valuation. The Fund bears the market risk that arises from changes in foreign exchange rates, and accordingly, the unrealized gain (loss) on these contracts is reflected in the accompanying financial statements. The Fund also bears the credit risk if the counterparty fails to perform under the contract.
For the year ended August 31, 2015, the Fund entered into foreign currency exchange contracts primarily for return enhancement and hedging.
The Fund’s foreign currency contract notional dollar values outstanding fluctuate throughout the operating year as required to meet strategic requirements. The following tables illustrate the average quarterly volume of foreign currency contracts. For the purpose of this disclosure, volume is measured by the amounts bought and sold in USD at each quarter end (in thousands).
| | | | |
Average Forward Foreign Currency Notional Amount Outstanding – Purchased Contracts | |
Fund | | Year ended August 31, 2015 | |
Flexible Bond | | $ | 70,864 | |
| | | | |
Average Forward Foreign Currency Notional Amount Outstanding – Sold Contracts | |
Fund | | Year ended August 31, 2015 | |
Flexible Bond | | $ | 133,802 | |
44
American Beacon Flexible Bond FundSM
Notes to Financial Statements
August 31, 2015
Futures Contracts
Futures contracts are contracts to buy or sell a standard quantity of securities at a specified price on a future date. The Fund may enter into financial futures contracts as a method for keeping assets readily convertible to cash if needed to meet shareholder redemptions or for other needs while maintaining exposure to the stock or bond market, as applicable. The primary risks associated with the use of futures contracts are the possibility of illiquid markets or imperfect correlation between the values of the contracts and the underlying securities, or that the counterparty will fail to perform its obligations.
Upon entering into a futures contract, the Fund is required to set aside or deposit with a broker an amount, termed the initial margin, which typically represents a portion of the face value of the futures contract. The Fund usually reflects this amount on the Schedule of Investments as a U.S. Treasury Bill held as collateral for futures contracts or as cash deposited with broker on the Statement of Assets and Liabilities. Payments to and from the broker, known as variation margin, are required to be made on a daily basis as the price of the futures contract fluctuates. Changes in initial settlement values are accounted for as unrealized appreciation (depreciation) until the contracts are terminated, at which time realized gains and losses are recognized. Futures contracts are valued at the most recent settlement price established each day by the exchange on which they are traded.
For the year ended August 31, 2015, the Fund entered into future contracts primarily for return enhancement, hedging and exposing cash to markets.
The Fund’s futures contracts outstanding fluctuate throughout the operating year as required to meet strategic requirements. The following table illustrates the average quarterly volume of futures contracts. For purpose of this disclosure, volume is measured by contracts outstanding each quarter end.
| | | | |
Average Futures Contracts Outstanding | |
Fund | | Year ended August 31, 2015 | |
Flexible Bond | | | 595 | |
The following is a summary of the fair valuations of the Fund’s derivative instruments categorized by risk exposure(1):
Fair values of financial instruments on the Statement of Assets and Liabilities as of August 31, 2015 (in thousands):
| | | | | | | | | | | | | | | | | | | | |
| | | Derivatives not accounted for as hedging instruments | |
| | | Credit
contracts | | | Foreign
exchange
contracts | | | Interest
rate
contracts | | | Equity
contracts | | | Total | |
Assets: | | | | | | | | | | | | | | | | | | | | |
Unrealized appreciation of foreign currency contracts | | $ | — | | | $ | 902 | | | $ | — | | | $ | — | | | $ | 902 | |
Receivable for variation margin from open futures contracts(2) | | | — | | | | — | | | | 158 | | | | — | | | | 158 | |
Unrealized appreciation from swap agreements | | | 31 | | | | — | | | | 264 | | | | 4 | | | | 299 | |
Purchased options and swaptions outstanding | | | — | | | | 20 | | | | 366 | | | | — | | | | 386 | |
| | | | | | | | | | | | | | | | | | | | |
| | $ | 31 | | | $ | 922 | | | $ | 788 | | | $ | 4 | | | $ | 1,745 | |
| | | | | | | | | | | | | | | | | | | | |
Liabilities: | | | | | | | | | | | | | | | | | | | | |
Unrealized depreciation of foreign currency contracts | | $ | — | | | $ | (1,987 | ) | | $ | — | | | $ | — | | | $ | (1,987 | ) |
Payable for variation margin from open futures contracts(2) | | | — | | | | — | | | | (237 | ) | | | — | | | | (237 | ) |
Unrealized depreciation from swap agreements | | | (210 | ) | | | — | | | | (1,178 | ) | | | (632 | ) | | | (2,020 | ) |
Written options and swaptions outstanding | | | (1 | ) | | | (74 | ) | | | (380 | ) | | | — | | | | (455 | ) |
| | | | | | | | | | | | | | | | | | | | |
| | $ | (211 | ) | | $ | (2,061 | ) | | $ | (1,795 | ) | | $ | (632 | ) | | $ | (4,699 | ) |
| | | | | | | | | | | | | | | | | | | | |
45
American Beacon Flexible Bond FundSM
Notes to Financial Statements
August 31, 2015
The effect of financial derivative instruments on the Statement of Operations for the year ended August 31, 2015 (in thousands):
| | | | | | | | | | | | | | | | | | | | |
| | | Derivatives not accounted for as hedging instruments | |
| Realized gain (loss) of derivatives recognized as a result from operations: | | Credit
contracts | | | Foreign
exchange
contracts | | | Interest
rate
contracts | | | Equity
contracts | | | Total | |
Net realized gain (loss) from foreign currency transactions | | $ | — | | | $ | 17,785 | | | $ | — | | | $ | — | | | $ | 17,785 | |
Net realized gain (loss) from futures contracts | | | — | | | | (26 | ) | | | (4,296 | ) | | | 52 | | | | (4,270 | ) |
Net realized gain (loss) from swap agreements | | | (889 | ) | | | — | | | | (5,934 | ) | | | — | | | | (6,823 | ) |
Net realized gain (loss) from option and swaption contracts | | | 55 | | | | 672 | | | | (284 | ) | | | 3 | | | | 446 | |
| | | | | | | | | | | | | | | | | | | | |
| | $ | (834 | ) | | $ | 18,431 | | | $ | 10,514 | | | $ | 55 | | | $ | 7,138 | |
| | | | | | | | | | | | | | | | | | | | |
Net change in unrealized appreciation or (depreciation) of derivatives recognized as a result from operations: | | | | | | | | | | | | | | | | |
Change in net unrealized appreciation or (depreciation) from foreign currency contracts | | $ | — | | | $ | (3,189 | ) | | $ | — | | | $ | — | | | $ | (3,189 | ) |
Change in net unrealized appreciation or (depreciation) from futures contracts | | | 1,683 | | | | (120 | ) | | | 57 | | | | — | | | | 1,620 | |
Change in net unrealized appreciation or (depreciation) from swap agreements | | | 490 | | | | — | | | | 1,764 | | | | (628 | ) | | | 1,626 | |
Change in net unrealized appreciation or (depreciation) from option and swaption contracts | | | (29 | ) | | | (306 | ) | | | 395 | | | | (4 | ) | | | 56 | |
Change in net unrealized appreciation or (depreciation) from short sales | | | 69 | | | | — | | | | — | | | | — | | | | 69 | |
| | | | | | | | | | | | | | | | | | | | |
| | $ | 2,213 | | | $ | (3,615 | ) | | $ | 2,216 | | | $ | (632 | ) | | $ | 182 | |
| | | | | | | | | | | | | | | | | | | | |
| (1) | See Note 3 in the Notes to Financial Statements for additional information. |
| (2) | Includes cumulative appreciation or (depreciation) of futures contracts as reported in the Schedule of Investment footnotes. Only current day’s variation margin is reported within the Statement of Assets and Liabilities. |
6. Principal Risks
In the normal course of business the Fund trades financial instruments and enters into financial transactions where risk of potential loss exists. Security values fluctuate (market risk) and may decline due to factors affecting securities markets in general, particular industries represented in the securities markets or conditions specifically related to a particular company. Failure of the other party to a transaction to perform (credit risk), for example by not making principal and interest payments when due, reduces the value of the issuer’s debt and could reduce the Fund’s income. Similar to credit risk, the Fund may be exposed to counterparty risk, or the risk that an institution or other entity with which the Fund has unsettled or open transactions will fail to make required payments or otherwise comply with the terms of the instrument, transaction or contract. The potential loss could exceed the value of the financial assets recorded in the financial statements. Some of the Fund’s investments may be illiquid and the Fund may not be able to vary the portfolio investments in response to changes in economic and other conditions. If the Fund is required to liquidate all or a portion of its investments quickly, the Fund may realize significantly less than the value at which it previously recorded those investments.
Market Risks
The Fund’s investments in financial derivatives and other financial instruments expose the Fund to various risks such as, but not limited to, interest rate, foreign currency and equity risks.
Interest rate risk is the risk that fixed income securities will decline in value because of changes in interest rates. As nominal interest rates rise, the value of certain fixed income securities held by the Fund is likely to decrease. A nominal interest rate can be described as the sum of a real interest rate and an expected inflation rate. Fixed income securities with longer durations tend to be more sensitive to changes in interest rates, usually making them more volatile than securities with shorter durations. Duration is useful primarily as a measure of the sensitivity of a fixed income’s market price to interest rate (i.e. yield) movements.
46
American Beacon Flexible Bond FundSM
Notes to Financial Statements
August 31, 2015
If the Fund invests directly in foreign currencies or in securities that trade in, and receive revenues in, foreign currencies, or in financial derivatives that provide exposure to foreign currencies, it will be subject to the risk that those currencies will decline in value relative to the base currency of the Fund, or, in the case of hedging positions, that the Fund’s base currency will decline in value relative to the currency being hedged. Currency rates in foreign countries may fluctuate significantly over short periods of time for a number of reasons, including changes in interest rates, intervention (or the failure to intervene) by U.S. or foreign governments, central banks or supranational entities such as the International Monetary Fund, or by the imposition of currency controls or other political developments in the United States or abroad. As a result, the Fund’s investments in foreign currency denominated securities may reduce the returns of the Fund.
The fair values of equities, such as common stocks and preferred securities or equity related investments such as futures and options, may decline due to general market conditions which are not specifically related to a particular company, such as real or perceived adverse economic conditions, changes in the general outlook for corporate earnings, changes in interest or currency rates or adverse investor sentiment generally. They may also decline due to factors which affect a particular industry or industries, such as labor shortages or increased production costs and competitive conditions within an industry. Equity securities and equity related investments generally have greater market price volatility than fixed income securities.
Credit and Counterparty Risks
The Fund will be exposed to credit risk on parties with whom it trades and will also bear the risk of settlement default. The Fund minimizes concentrations of credit risk by undertaking transactions with a large number of customers and counterparties on recognized and reputable exchanges. The Fund could lose money if the issuer or guarantor of a fixed income security, or the counterparty to a financial derivatives contract, repurchase agreement or a loan of portfolio securities, is unable or unwilling to make timely principal and/or interest payments, or to otherwise honor its obligations. Securities are subject to varying degrees of credit risk, which are often reflected in credit ratings.
Similar to credit risk, the Fund may be exposed to counterparty risk, or the risk that an institution or other entity with which the Fund has unsettled or open transactions will default. Financial assets, which potentially expose the Fund to counterparty risk, consist principally of cash due from counterparties and investments. Furthermore, to the extent that unpaid amounts owed to the Fund exceed a predetermined threshold agreed to with the counterparty, such counterparty shall advance collateral to the Fund in the form of cash or cash equivalents equal in value to the unpaid amount owed to the Fund. The Fund may invest such collateral in securities or other instruments and will typically pay interest to the counterparty on the collateral received. If the unpaid amount owed to the Fund subsequently falls, the Fund would be required to return to the counterparty all or a portion of the collateral previously advanced to the Fund.
All transactions in listed securities are settled/paid for upon delivery using approved counterparties. The risk of default is considered minimal, as delivery of securities sold is only made once the Fund has received payment. Payment is made on a purchase once the securities have been delivered by the counterparty. The trade will fail if either party fails to meet its obligation.
The Fund is subject to various Master Agreements, which govern the terms of certain transactions with select counterparties. These Master Agreements reduce the counterparty risk associated with relevant transactions by specifying credit protection mechanisms and providing standardization that improves legal certainty. Since different types of forward and OTC derivative transactions have different mechanics and are sometimes traded out of different legal entities of a particular counterparty organization, each type of transaction may be covered by a different Master Agreement and result in the need for multiple agreements with a single counterparty. Therefore, exposure cannot be netted and collateralized across all types of transactions. Exposures can only be netted across transactions governed under the same Master Agreement with the same legal entity.
47
American Beacon Flexible Bond FundSM
Notes to Financial Statements
August 31, 2015
Master Agreements can also help limit counterparty risk by specifying collateral posting arrangements at pre-arranged exposure levels. Under the Master Agreements, collateral is routinely transferred if the total net exposure to certain transactions (net of existing collateral already in place) governed under the relevant master agreement with a counterparty in a given account exceeds a specified threshold, which typically ranges from zero to $250,000 depending on the counterparty and the type of Master Agreement. United States Treasury bills and US dollar cash are generally the preferred forms of collateral, although other forms of AAA rated paper may be used. The Fund’s overall exposure to counterparty risk can change substantially within a short period, as it is affected by each transaction subject to the relevant Master Agreement. Master Repurchase Agreements (“Master Repo Agreements”) govern transactions between the Fund and select counterparties. The Master Repo Agreements maintain provisions for, among other things, initiation, income payments, events of default, and maintenance of collateral for Repurchase Agreements.
Offsetting Assets and Liabilities
The Fund is party to enforceable master netting agreements between brokers and counterparties, such as ISDA, Master Repo Agreements and Master Forward Agreements which provide for the right to offset under certain circumstances. The Fund employs multiple money managers and counterparties and has elected not to offset qualifying financial and derivative instruments on the Statements of Assets and Liabilities, as such all financial and derivative instruments are presented on a gross basis. The impacts of netting arrangements that provide the right to offset are detailed below. Exchange traded futures and centrally cleared swap positions are not subject to master netting agreements, and as such are not included within the table. The net amount represents the net receivable or payable that would be due from or to the counterparty in the event of default. Exposure from borrowings and other financing agreements such as repurchase agreements can only be netted across transactions governed by the same Master Agreement with the same legal entity. All amounts reported below represent the balance as of the report date, August 31, 2015 (in thousands).
Flexible Bond Fund
Offsetting of Financial Assets and Derivative Assets as of August 31, 2015
| | | | | | | | | | | | |
Description | | Gross Amounts of
Recognized Assets | | | Gross Amounts Offset in
the Statement of Assets
and Liabilities | | | Net Amounts of Assets
Presented in the
Statement of Assets and
Liabilities | |
Swap Agreements | | $ | 36 | | | $ | — | | | $ | 36 | |
Purchased Options and Swaptions Outstanding | | | 386 | | | | — | | | | 386 | |
Foreign Currency Contracts | | | 902 | | | | — | | | | 902 | |
| | | | | | | | | | | | |
| | $ | 1,324 | | | $ | — | | | $ | 1,324 | |
| | | | | | | | | | | | |
Offsetting of Financial Liabilities and Derivative Liabilities as of August 31, 2015
| | | | | | | | | | | | |
Description | | Gross Amounts of
Recognized
Liabilities | | | Gross Amounts Offset in
the Statement of Assets
and Liabilities | | | Net Amounts of Liabilities
Presented in the
Statement of Assets and
Liabilities | |
Reverse Repurchase Agreement | | $ | (8,300 | ) | | $ | — | | | $ | (8,300 | ) |
Swap Agreements | | | (842 | ) | | | — | | | | (842 | ) |
Written Options and Swaptions Outstanding | | | (455 | ) | | | — | | | | (455 | ) |
Foreign Currency Contracts | | | (1,987 | ) | | | — | | | | (1,987 | ) |
| | | | | | | | | | | | |
| | $ | (11,584 | ) | | $ | — | | | $ | (11,584 | ) |
| | | | | | | | | | | | |
48
American Beacon Flexible Bond FundSM
Notes to Financial Statements
August 31, 2015
Financial Assets, Derivative Assets, and Collateral Pledged by Counterparty as of August 31, 2015
| | | | | | | | | | | | | | | | |
| | | Net amount of Liabilities
Presented in the Statement
of Assets and Liabilities | | | Gross Amounts Not Offset in the
Statement of Assets and Liabilities | | | | |
Counterparty | | | Financial
Instruments | | | Cash Collateral
Received | | | Net
Amount | |
Bank of America, N.A. | | $ | (149 | ) | | $ | — | | | $ | — | | | $ | (149 | ) |
Barclays Bank PLC | | | (49 | ) | | | — | | | | — | | | | (49 | ) |
Barclays Capital | | | (42 | ) | | | — | | | | — | | | | (42 | ) |
CitiBank, N.A | | | (688 | ) | | | — | | | | — | | | | (688 | ) |
Credit Suisse International | | | (113 | ) | | | — | | | | (300 | ) | | | 187 | |
Credit Suisse Securities USA LLC | | | — | | | | — | | | | 292 | | | | (292 | ) |
Deutsche Bank AG | | | (340 | ) | | | — | | | | (170 | ) | | | (170 | ) |
Goldman Sachs Bank USA | | | (55 | ) | | | — | | | | — | | | | (55 | ) |
Goldman Sachs Capital Market LP | | | 1 | | | | — | | | | 56 | | | | (55 | ) |
Goldman Sachs International | | | (67 | ) | | | — | | | | (350 | ) | | | 283 | |
HSBC Bank USA | | | (360 | ) | | | — | | | | — | | | | (360 | ) |
JPMorgan Chase Bank, N.A. | | | (11 | ) | | | — | | | | — | | | | (11 | ) |
Morgan Stanley & Co. Inc. | | | (74 | ) | | | — | | | | 326 | | | | (400 | ) |
Morgan Stanley Capital | | | (16 | ) | | | — | | | | 503 | | | | (519 | ) |
Royal Bank of Scotland | | | (7,787 | ) | | | 7,791 | | | | — | | | | 4 | |
Societe Generale | | | (510 | ) | | | 510 | | | | — | | | | — | |
| | | | | | | | | | | | | | | | |
| | $ | (10,260 | ) | | $ | 8,301 | | | $ | 357 | | | $ | (2,316 | ) |
| | | | | | | | | | | | | | | | |
7. Federal Income and Excise Taxes
It is the policy of the Fund to qualify as a regulated investment company (“RIC”), by complying with all applicable provisions of Subchapter M of the Internal Revenue Code, as amended, and to make distribution of taxable income sufficient to relieve it from substantially all federal income and excise taxes. For federal income tax purposes, the Fund is treated as a single entity for the purpose of determining such qualification.
The Fund does not have any unrecognized tax benefits in the accompanying financial statements. The tax years for the periods ended August 31, 2012, 2013, 2014, and 2015, remain subject to examination by the Internal Revenue Service. If applicable, the Fund recognizes interest accrued related to unrecognized tax benefits in interest expense and penalties in “Other expense” on the Statement of Operations.
Dividends are categorized in accordance with income tax regulations which may treat certain transactions differently than U.S. GAAP. Accordingly, the character of distributions and composition of net assets for tax purposes may differ from those reflected in the accompanying financial statements.
The Fund may be subject to taxes imposed by countries in which it invests. Such taxes are generally based on returns of income earned or gains realized or repatriated. Taxes are accrued and applied to net investment income, net realized capital gains and net unrealized appreciation or depreciation, as applicable, as the income is earned or capital gains are recorded.
49
American Beacon Flexible Bond FundSM
Notes to Financial Statements
August 31, 2015
The tax character of distributions paid was as follows (in thousands):
| | | | | | | | |
| | | Year ended
August 31, 2015 | | | Year ended
August 31,2014 | |
Distributions paid from: | | | | | | | | |
Ordinary income*: | | | | | | | | |
Institutional Class | | $ | 4,119 | | | $ | 3,409 | |
Y Class | | | 1,023 | | | | 766 | |
Investor Class | | | 349 | | | | 834 | |
A Class | | | 525 | | | | 600 | |
C Class | | | 139 | | | | 123 | |
Long-Term Capital Gain: | | | | | | | | |
Institutional Class | | | — | | | | 405 | |
Y Class | | | — | | | | 108 | |
Investor Class | | | — | | | | 167 | |
A Class | | | — | | | | 132 | |
C Class | | | — | | | | 41 | |
| | | | | | | | |
Total distributions paid | | $ | 6,155 | | | $ | 6,585 | |
| | | | | | | | |
| * | For tax purposes, short-term capital gains are considered ordinary income distributed. |
As of August 31, 2015, the components of distributable earnings (deficit) on a tax basis were as follows (in thousands):
| | | | |
Cost basis of investments for federal income tax purposes | | $ | 273,432 | |
Unrealized appreciation | | | 5,333 | |
Unrealized depreciation | | | (17,024 | ) |
| | | | |
Net unrealized appreciation (depreciation) | | | (11,691 | ) |
Undistributed ordinary income | | | 7,191 | |
Accumulated capital gain (loss) | | | (11,403 | ) |
Other temporary differences | | | (66 | ) |
| | | | |
Distributable earnings (deficit) | | $ | (15,969 | ) |
| | | | |
Financial reporting records are adjusted for permanent book/tax differences to reflect tax character. Financial records are not adjusted for temporary differences. The temporary differences between financial reporting and tax-basis reporting of unrealized appreciation or (depreciation) are attributable to the tax deferral of losses from wash sales and the realization for tax purposes of unrealized gain (losses) on certain derivative instruments.
Due to inherent differences in the recognition of income and expenses and realized gains and (losses) under U.S. GAAP and federal tax regulations, permanent differences between book and tax reporting have been identified and appropriately reclassed on the Statement of Assets and Liabilities.
Accordingly, the following amounts represent current year permanent differences derived from foreign currency, paydowns, swap income, and distributions that have been reclassified as of August 31, 2015 (in thousands):
| | | | |
Paid-in-capital | | $ | — | |
Undistributed net investment income | | | 8,939 | |
Accumulated net realized (loss) | | | (8,939 | ) |
Unrealized appreciation or (depreciation) of investments, foreign currency translations, futures contracts, and option and swaption contracts | | | — | |
Under the Regulated Investment Company Modernization Act of 2010 (the “RIC MOD”), net capital losses recognized by the Fund in taxable years beginning after December 22, 2010 are carried forward indefinitely and retain their character as short-term and/or long-term losses.
50
American Beacon Flexible Bond FundSM
Notes to Financial Statements
August 31, 2015
The Fund has $3,564 short-term and $7,839 long-term post RIC MOD capital loss carryforwards as of August 31, 2015 (in thousands).
8. Investment Transactions
The aggregate cost of purchases and proceeds from sales of investments other than short-term obligations for the year ended August 31, 2015 were (in thousands)
| | | | | | | | |
| | | Purchases | | | Sales | |
Securities | | $ | 1,193,476 | | | $ | 1,288,216 | |
U.S. Treasury Obligations | | | 748,662 | | | | 772,647 | |
9. Option Contracts Written
The premium amount and number of option contracts written during the year ended August 31, 2015 were as follows (shown in thousands):
| | | | | | | | | | | | |
| | | Number of
Contracts | | | Notional Amount | | | Amount of Premiums | |
Outstanding at August 31, 2014 | | | (2,768,750 | ) | | $ | (2,840,777 | ) | | $ | (3,775 | ) |
Options written | | | (4,627,830 | ) | | | (4,633,086 | ) | | | (7,689 | ) |
Options expired | | | 482,357 | | | | 485,769 | | | | 4,036 | |
Options exercised | | | 16,476 | | | | 16,482 | | | | 134 | |
Options closed | | | 6,805,755 | | | | 6,808,392 | | | | 6,604 | |
| | | | | | | | | | | | |
Outstanding at August 31, 2015 | | | (91,992 | ) | | $ | (163,220 | ) | | $ | (690 | ) |
| | | | | | | | | | | | |
10. Capital Share Transactions
The tables below summarize the activity in capital shares for each Class of the Fund (dollars and shares in thousands):
For the Year ended August 31, 2015
| | | | | | | | | | | | | | | | | | | | | | | | |
| | | Institutional Class | | | Y Class | | | Investor Class | |
Flexible Bond Fund | | Shares | | | Amount | | | Shares | | | Amount | | | Shares | | | Amount | |
Shares sold | | | 4,136 | | | $ | 41,536 | | | | 3,213 | | | $ | 32,530 | | | | 251 | | | $ | 2,541 | |
Reinvestment of dividends | | | 402 | | | | 4,053 | | | | 101 | | | | 1,013 | | | | 34 | | | | 344 | |
Shares redeemed | | | (4,906 | ) | | | (50,139 | ) | | | (2,466 | ) | | | (24,977 | ) | | | (1,878 | ) | | | (19,036 | ) |
| | | | | | | | | | | | | | | | | | | | | | | | |
Net increase (decrease) in shares outstanding | | | (368 | ) | | $ | (4,550 | ) | | | 848 | | | $ | 8,566 | | | | (1,593 | ) | | $ | (16,151 | ) |
| | | | | | | | | | | | | | | | | | | | | | | | |
| | | | | | | | | | | | | | | | |
| | | A Class | | | C Class | |
Flexible Bond Fund | | Shares | | | Amount | | | Shares | | | Amount | |
Shares sold | | | 303 | | | $ | 3,069 | | | | 161 | | | $ | 1,618 | |
Reinvestment of dividends | | | 35 | | | | 354 | | | | 13 | | | | 124 | |
Shares redeemed | | | (1,419 | ) | | | (14,260 | ) | | | (526 | ) | | | (5,264 | ) |
| | | | | | | | | | | | | | | | |
Net (decrease) in shares outstanding | | | (1,081 | ) | | $ | (10,837 | ) | | | (352 | ) | | $ | (3,522 | ) |
| | | | | | | | | | | | | | | | |
For the Year ended August 31, 2014
| | | | | | | | | | | | | | | | | | | | | | | | |
| | | Institutional Class | | | Y Class | | | Investor Class | |
Flexible Bond Fund | | Shares | | | Amount | | | Shares | | | Amount | | | Shares | | | Amount | |
Shares sold | | | 6,045 | | | $ | 62,069 | | | | 2,678 | | | $ | 27,490 | | | | 1,370 | | | $ | 14,002 | |
Reinvestment of dividends | | | 368 | | | | 3,757 | | | | 81 | | | | 827 | | | | 96 | | | | 979 | |
Shares redeemed | | | (1,719 | ) | | | (17,671 | ) | | | (2,978 | ) | | | (30,607 | ) | | | (4,588 | ) | | | (46,957 | ) |
| | | | | | | | | | | | | | | | | | | | | | | | |
Net increase (decrease) in shares outstanding | | | 4,694 | | | $ | 48,155 | | | | (219 | ) | | $ | (2,290 | ) | | | (3,122 | ) | | $ | (31,976 | ) |
| | | | | | | | | | | | | | | | | | | | | | | | |
51
American Beacon Flexible Bond FundSM
Notes to Financial Statements
August 31, 2015
| | | | | | | | | | | | | | | | |
| | | A Class | | | C Class | |
Flexible Bond Fund | | Shares | | | Amount | | | Shares | | | Amount | |
Shares sold | | | 900 | | | $ | 9,161 | | | | 202 | | | $ | 2,048 | |
Reinvestment of dividends | | | 56 | | | | 565 | | | | 14 | | | | 139 | |
Shares redeemed | | | (2,384 | ) | | | (24,266 | ) | | | (639 | ) | | | (6,482 | ) |
| | | | | | | | | | | | | | | | |
Net (decrease) in shares outstanding | | | (1,428 | ) | | $ | (14,540 | ) | | | (423 | ) | | $ | (4,295 | ) |
| | | | | | | | | | | | | | | | |
52
This page intentionally left blank.
53
American Beacon Flexible Bond FundSM
Financial Highlights
(For a share outstanding throughout the period)
| | | | | | | | | | | | | | | | | | | | | | | | | | | | | | | | | | | | | | | | |
| | | Institutional Class | | | Y Class | |
| | | Year Ended August 31, | | | July 5
to
Aug. 31,
2011 | | | Year Ended August 31, | | | July 5
to
Aug. 31,
2011 | |
| | 2015 | | | 2014 | | | 2013 | | | 2012 | | | | 2015 | | | 2014 | | | 2013 | | | 2012 | | |
Net asset value, beginning of period | | $ | 10.33 | | | $ | 10.21 | | | $ | 10.48 | | | $ | 10.05 | | | $ | 10.00 | | | $ | 10.33 | | | $ | 10.22 | | | $ | 10.51 | | | $ | 10.05 | | | $ | 10.00 | |
| | | | | | | | | | | | | | | | | | | | | | | | | | | | | | | | | | | | | | | | |
Income from investment operations: | | | | | | | | | | | | | | | | | | | | | | | | | | | | | | | | | | | | | | | | |
Net investment income (loss) | | | 0.29 | | | | 0.21 | | | | 0.34 | | | | 0.02 | | | | 0.02 | | | | 0.29 | | | | 0.18 | | | | 0.22 | | | | 0.10 | | | | 0.02 | |
Net gains (losses) from investments (both realized and unrealized) | | | (0.57 | ) | | | 0.16 | | | | (0.24 | ) | | | 0.59 | | | | 0.05 | | | | (0.58 | ) | | | 0.17 | | | | (0.15 | ) | | | 0.53 | | | | 0.05 | |
| | | | | | | | | | | | | | | | | | | | | | | | | | | | | | | | | | | | | | | | |
Total income (loss) from investment operations | | | (0.28 | ) | | | 0.37 | | | | 0.10 | | | | 0.61 | | | | 0.07 | | | | (0.29 | ) | | | 0.35 | | | | 0.07 | | | | 0.63 | | | | 0.07 | |
| | | | | | | | | | | | | | | | | | | | | | | | | | | | | | | | | | | | | | | | |
Less distributions: | | | | | | | | | | | | | | | | | | | | | | | | | | | | | | | | | | | | | | | | |
Dividends from net investment income | | | (0.28 | ) | | | (0.18 | ) | | | (0.23 | ) | | | (0.18 | ) | | | (0.02 | ) | | | (0.27 | ) | | | (0.17 | ) | | | (0.22 | ) | | | (0.17 | ) | | | (0.02 | ) |
Distributions from net realized gains | | | — | | | | (0.07 | ) | | | (0.14 | ) | | | — | | | | — | | | | — | | | | (0.07 | ) | | | (0.14 | ) | | | — | | | | — | |
Return of capital | | | — | | | | — | | | | — | | | | — | | | | 0 .00 | E | | | — | | | | — | | | | — | | | | — | | | | — | |
| | | | | | | | | | | | | | | | | | | | | | | | | | | | | | | | | | | | | | | | |
Total distributions | | | (0.28 | ) | | | (0.25 | ) | | | (0.37 | ) | | | (0.18 | ) | | | (0.02 | ) | | | (0.27 | ) | | | (0.24 | ) | | | (0.36 | ) | | | (0.17 | ) | | | (0.02 | ) |
| | | | | | | | | | | | | | | | | | | | | | | | | | | | | | | | | | | | | | | | |
Net asset value, end of period | | $ | 9.77 | | | $ | 10.33 | | | $ | 10.21 | | | $ | 10.48 | | | $ | 10.05 | | | $ | 9.77 | | | $ | 10.33 | | | $ | 10.22 | | | $ | 10.51 | | | $ | 10.05 | |
| | | | | | | | | | | | | | | | | | | | | | | | | | | | | | | | | | | | | | | | |
Total return A | | | (2.79 | )% | | | 3.70 | % | | | 0.83 | % | | | 6.34 | % | | | 0.70 | %B | | | (2.87 | )% | | | 3.51 | % | | | 0.58 | % | | | 6.20 | % | | | 0.69 | %B |
| | | | | | | | | | | | | | | | | | | | | | | | | | | | | | | | | | | | | | | | |
Ratios and supplemental data: | | | | | | | | | | | | | | | | | | | | | | | | | | | | | | | | | | | | | | | | |
Net assets, end of period (in thousands) | | $ | 164,119 | | | $ | 177,201 | | | $ | 127,322 | | | $ | 13,095 | | | $ | 28,105 | | | $ | 44,285 | | | $ | 38,034 | | | $ | 39,898 | | | $ | 13,132 | | | $ | 144 | |
Ratios to average net assets: | | | | | | | | | | | | | | | | | | | | | | | | | | | | | | | | | | | | | | | | |
Expenses, before reimbursements | | | 1.27 | % | | | 1.24 | % | | | 1.22 | % | | | 1.42 | % | | | 3.58 | %C | | | 1.34 | % | | | 1.29 | % | | | 1.26 | % | | | 1.49 | % | | | 18.27 | %C |
Expenses, net of reimbursements | | | 0.90 | % | | | 0.90 | % | | | 0.90 | % | | | 0.90 | % | | | — | %C | | | 0.99 | % | | | 0.99 | % | | | 0.99 | % | | | 0.99 | % | | | — | %C |
Net investment income (loss), before reimbursements | | | 2.37 | % | | | 1.61 | % | | | 0.84 | % | | | 0.44 | % | | | (2.37 | )%C | | | 2.33 | % | | | 1.51 | % | | | 0.91 | % | | | 0.54 | % | | | (17.04 | )%C |
Net investment income (loss), net of reimbursements | | | 2.74 | % | | | 1.94 | % | | | 1.15 | % | | | 0.96 | % | | | 1.20 | %C | | | 2.68 | % | | | 1.81 | % | | | 1.19 | % | | | 1.04 | % | | | 1.23 | %C |
Portfolio turnover rate | | | 492 | % | | | 387 | % | | | 112 | % | | | 88 | % | | | 44 | %D | | | 492 | % | | | 387 | % | | | 112 | % | | | 88 | % | | | 44 | %D |
| A | Based on net asset value, which does not reflect the sales charge, redemption fee, or contingent deferred sales charge, if applicable. May include adjustments in accordance with U.S. GAAP and as such, the net asset value for reporting purposes and the returns based upon those net asset values may differ from the net asset value and returns for shareholder transactions. |
| D | Portfolio turnover rate is for the period from July 5, 2011, the inception date, through August 31, 2011 and is not annualized. |
| E | Amount represents less than $0.01 per share. |
54
American Beacon Flexible Bond FundSM
Financial Highlights
(For a share outstanding throughout the period)
| | | | | | | | | | | | | | | | | | | | | | | | | | | | | | | | | | | | | | | | | | | | | | | | | | | | | | | | | | |
| Investor Class | | | A Class | | | C Class | |
| Year Ended August 31, | | | July 5
to
Aug. 31,
2011 | | | Year Ended August 31, | | | July 5
to
Aug. 31,
2011 | | | Year Ended August 31, | | | July 5
to
Aug. 31,
2011 | |
2015 | | | 2014 | | | 2013 | | | 2012 | | | | 2015 | | | 2014 | | | 2013 | | | 2012 | | | | 2015 | | | 2014 | | | 2013 | | | 2012 | | |
| | | | | | | | | | | | | | | | | | | | | | | | | | | | | | | | | | | | | | | | | | | | | | | | | | | | | | | | | | |
| $ | 10.31 | | | $ | 10.21 | | | $ | 10.51 | | | $ | 10.07 | | | $ | 10.00 | | | $ | 10.27 | | | $ | 10.16 | | | $ | 10.49 | | | $ | 10.06 | | | $ | 10.00 | | | $ | 10.22 | | | $ | 10.11 | | | $ | 10.49 | | | $ | 10.09 | | | $ | 10.00 | |
| | | | | | | | | | | | | | | | | | | | | | | | | | | | | | | | | | | | | | | | | | | | | | | | | | | | | | | | | | |
| | (0.33 | ) | | | 0.02 | | | | 0.18 | | | | 0.09 | | | | 0.02 | | | | 0.12 | | | | 0.10 | | | | 0.21 | | | | 0.07 | | | | 0.02 | | | | 0.07 | | | | 0.02 | | | | 0.14 | | | | 0.04 | | | | 0.02 | |
| | 0.01 | | | | 0.30 | | | | (0.13 | ) | | | 0.52 | | | | 0.07 | | | | (0.44 | ) | | | 0.21 | | | | (0.18 | ) | | | 0.51 | | | | 0.06 | | | | (0.46 | ) | | | 0.22 | | | | (0.19 | ) | | | 0.48 | | | | 0.09 | |
| | | | | | | | | | | | | | | | | | | | | | | | | | | | | | | | | | | | | | | | | | | | | | | | | | | | | | | | | | |
| | (0.32 | ) | | | 0.32 | | | | 0.05 | | | | 0.61 | | | | 0.09 | | | | (0.32 | ) | | | 0.31 | | | | 0.03 | | | | 0.58 | | | | 0.08 | | | | (0.39 | ) | | | 0.24 | | | | (0.05 | ) | | | 0.52 | | | | 0.11 | |
| | | | | | | | | | | | | | | | | | | | | | | | | | | | | | | | | | | | | | | | | | | | | | | | | | | | | | | | | | |
| | | | | | | | | | | | | | | | | | | | | | | | | | | | | | | | | | | | | | | | | | | | | | | | | | | | | | | | | | |
| | (0.23 | ) | | | (0.15 | ) | | | (0.21 | ) | | | (0.17 | ) | | | (0.02 | ) | | | (0.23 | ) | | | (0.13 | ) | | | (0.22 | ) | | | (0.15 | ) | | | (0.02 | ) | | | (0.14 | ) | | | (0.06 | ) | | | (0.19 | ) | | | (0.12 | ) | | | (0.02 | ) |
| | — | | | | (0.07 | ) | | | (0.14 | ) | | | — | | | | — | | | | — | | | | (0.07 | ) | | | (0.14 | ) | | | — | | | | — | | | | — | | | | (0.07 | ) | | | (0.14 | ) | | | — | | | | — | |
| | — | | | | — | | | | — | | | | — | | | | — | | | | — | | | | — | | | | — | | | | — | | | | — | | | | — | | | | — | | | | — | | | | — | | | | — | |
| | | | | | | | | | | | | | | | | | | | | | | | | | | | | | | | | | | | | | | | | | | | | | | | | | | | | | | | | | |
| | (0.23 | ) | | | (0.22 | ) | | | (0.35 | ) | | | (0.17 | ) | | | (0.02 | ) | | | (0.23 | ) | | | (0.20 | ) | | | (0.36 | ) | | | (0.15 | ) | | | (0.02 | ) | | | (0.14 | ) | | | (0.13 | ) | | | (0.33 | ) | | | (0.12 | ) | | | (0.02 | ) |
| | | | | | | | | | | | | | | | | | | | | | | | | | | | | | | | | | | | | | | | | | | | | | | | | | | | | | | | | | |
| $ | 9.76 | | | $ | 10.31 | | | $ | 10.21 | | | $ | 10.51 | | | $ | 10.07 | | | $ | 9 .72 | | | $ | 10.27 | | | $ | 10.16 | | | $ | 10.49 | | | $ | 10.06 | | | $ | 9 .69 | | | $ | 10.22 | | | $ | 10.11 | | | $ | 10.49 | | | $ | 10.09 | |
| | | | | | | | | | | | | | | | | | | | | | | | | | | | | | | | | | | | | | | | | | | | | | | | | | | | | | | | | | |
| | (3.11 | )% | | | 3.13 | % | | | 0.38 | % | | | 5.99 | % | | | 0.90 | %B | | | (3.14 | )% | | | 3.12 | % | | | 0.16 | % | | | 5.70 | % | | | 0.80 | %B | | | (3.81 | )% | | | 2.37 | % | | | (0.54 | )% | | | 5.15 | % | | | 1.11 | %B |
| | | | | | | | | | | | | | | | | | | | | | | | | | | | | | | | | | | | | | | | | | | | | | | | | | | | | | | | | | |
| | | | | | | | | | | | | | | | | | | | | | | | | | | | | | | | | | | | | | | | | | | | | | | | | | | | | | | | | | |
| $ | 7,561 | | | $ | 24,411 | | | $ | 56,015 | | | $ | 21,245 | | | $ | 277 | | | $ | 15,191 | | | $ | 27,146 | | | $ | 41,376 | | | $ | 10,387 | | | $ | 2,064 | | | $ | 7,133 | | | $ | 11,127 | | | $ | 15,292 | | | $ | 5,641 | | | $ | 380 | |
| | 1.51 | % | | | 1.43 | % | | | 1.54 | % | | | 1.76 | % | | | 8.22 | %C | | | 1.66 | % | | | 1.68 | % | | | 1.67 | % | | | 1.93 | % | | | 4.49 | %C | | | 2.40 | % | | | 2 .43 | % | | | 2 .43 | % | | | 2.74 | % | | | 9.66 | %C |
| | 1.27 | % | | | 1.27 | % | | | 1.27 | % | | | 1.27 | % | | | — | %C | | | 1.29 | % | | | 1.38 | % | | | 1.39 | % | | | 1.39 | % | | | — | %C | | | 2.04 | % | | | 2.13 | % | | | 2.14 | % | | | 2.14 | % | | | — | %C |
| | 2.15 | % | | | 1.34 | % | | | 0.65 | % | | | 0.30 | % | | | (6.93 | )%C | | | 1.95 | % | | | 1.10 | % | | | 0.50 | % | | | 0.05 | % | | | (3.25 | )%C | | | 1.21 | % | | | 0.35 | % | | | (0.24 | )% | | | (0.73 | )% | | | (8.48 | )%C |
| | 2.38 | % | | | 1.50 | % | | | 0.92 | % | | | 0.79 | % | | | 1.29 | %C | | | 2.32 | % | | | 1.40 | % | | | 0.79 | % | | | 0.59 | % | | | 1.24 | %C | | | 1.57 | % | | | 0.66 | % | | | 0.04 | % | | | (0.13 | )% | | | 1.18 | %C |
| | 492 | % | | | 387 | % | | | 112 | % | | | 88 | % | | | 44 | %D | | | 492 | % | | | 387 | % | | | 112 | % | | | 88 | % | | | 44 | %D | | | 492 | % | | | 387 | % | | | 112 | % | | | 88 | % | | | 44 | %D |
55
American Beacon FundsSM
Affirmation of the Commodity Pool Operator
August 31, 2015 (Unaudited)
To the best of my knowledge and belief, the information contained in the attached financial statements for the period from September 1, 2014 to August 31, 2015, is accurate and complete.

Melinda G. Heika, Treasurer
American Beacon Advisors, Inc.
Commodity Pool Operator for the American Beacon Flexible Bond Fund
56
American Beacon FundsSM
Privacy Policy
August 31, 2015 (Unaudited)
Privacy Policy
The American Beacon Funds recognizes and respects the privacy of our shareholders. We are providing this notice to you so you will understand how shareholder information may be collected and used.
We may collect nonpublic personal information about you from one or more of the following sources:
| | • | | information we receive from you on applications or other forms; |
| | • | | information about your transactions with us or our service providers; and |
| | • | | information we receive from third parties. |
We do not disclose any nonpublic personal information about our customers or former customers to anyone, except as permitted by law.
We restrict access to your nonpublic personal information to those employees or service providers who need to know that information to provide products or services to you. To ensure the confidentiality of your nonpublic personal information, we maintain safeguards that comply with federal standards.
Federal Tax Information
Certain tax information regarding the Fund is required to be provided to shareholders based upon the Fund’s income and distribution for the taxable year ended August 31, 2015. The information and distributions reported herein may differ from information and distribution taxable to the shareholders for the calendar year ended December 31, 2015.
The Fund designated the following items with regard to distributions paid during the fiscal year ended August 31, 2015. All designations are based on financial information available as of this annual report and, accordingly, are subject to change. For each item, it is the intention of the Fund to designate the maximum amount permitted under the Internal Revenue Code of 1986, as amended, and the regulations there under.
| | | | |
Corporate Dividends Received Deduction | | | 0.35 | % |
Qualified Dividend Income | | | 0.35 | % |
Long Term Capital Gain Distributions | | | — | |
Short-Term Capital Gain Distributions | | | — | |
Shareholders will receive notification in January 2016 of the applicable tax information necessary to prepare their 2015 income tax returns.
57
Disclosure Regarding the Board of Trustees’ Approval of the Management
Agreement and Investment Advisory Agreements of the Funds (Unaudited)
At an in-person meeting held on November 12, 2014, telephonic meetings held on November 26, 2014 and December 6, 2014 and an in-person meeting held on December 10, 2014 (collectively, the “Board Meetings”), the Board of Trustees (“Board”) considered the approval of: (1) a new Management Agreement (“New Management Agreement”) among American Beacon Advisors, Inc. (“Manager”) and the American Beacon Funds (“Trust”) on behalf of the American Beacon Flexible Bond Fund (“Fund”); (2) a new Investment Advisory Agreement among the Manager, Pacific Investment Management Company LLC (“PIMCO”) and the Trust, on behalf of the und; (3) a new Investment Advisory Agreement among the Manager, Brandywine Global Investment Management, LLC (“Brandywine”) and the Trust, on behalf of the Fund; and (4) a new Investment Advisory Agreement among the Manager, GAM International Management Ltd. (“GAM”) and the Trust, on behalf of the Fund (collectively, the “New Advisory Agreements”). Collectively, PIMCO, Brandywine and GAM are hereinafter referred to as the “Sub-Advisors.”
The Board meetings were held for the Trustees to consider the New Management Agreement and New Advisory Agreements (“New Agreements”) because, on November 20, 2014, Lighthouse Holdings Parent, Inc. (“LPHI”), the indirect parent company of the Manager, entered into an Agreement and Plan of Merger pursuant to which LHPI agreed to be acquired by Kelso Investment Associates VIII, L.P., KEP VI, LLC and Estancia Capital Partners L.P., investment funds affiliated with Kelso & Company, L.P. (“Kelso”) and Estancia Capital Management, LLC (“Estancia”) (collectively, the “Purchasers”), which are private equity firms (“Transaction”). As required by the Investment Company Act of 1940, as amended (“1940 Act”), the current Management Agreement (“Current Management Agreement”) among the Manager and the Trust on behalf of the Fund and the current Investment Advisory Agreements (“Current Advisory Agreements”) among the Manager, the Trust, on behalf of the Fund, and each of PIMCO, Brandywine and GAM, provide for their automatic termination in the event of an assignment. As a result, the Current Management Agreement and each Current Advisory Agreement (“Current Agreements”) would terminate upon the closing of the Transaction. (The Transaction closed on April 30, 2015).
The Board focused on the effect that the Transaction would have on the Manager and the Fund. Additionally, the Board considered that it had requested and evaluated the information relevant to the renewal of the Current Management Agreement and Current Advisory Agreements at in-person meetings held in May and June 2014. The Manager represented to the Board that there had been no material changes or developments relating to the Manager or any of the Sub-Advisors since the May and June 2014 meetings, other than the changes or developments subsequently reported to the Board or discussed in the due diligence materials submitted to the Trustees in connection with the Transaction. In light of the proximity of the Board’s consideration of the renewal or approval of the Current Agreements, and the Board’s ongoing due diligence review in connection with the Transaction, the Board determined that it was not necessary to repeat certain aspects of the review conducted in connection with the approvals in the past year.
In connection with the Board Meetings, the Trustees received and evaluated such information as they deemed necessary to their consideration of the New Agreements. The information requested on behalf of the Board included, among other information, the following:
| • | | a description of the Transaction, the effect of the Transaction on the Manager, the Trust and the Board, and any proposed changes to the Trust, its service providers, the Fund’s fee structures, fee waivers, and other information; |
| • | | a description of any anticipated significant changes, if any, to principal activities, personnel, services provided to the Fund, or any other area, including how these changes might affect the Fund; |
| • | | information regarding the financial resources of the Purchasers and the Manager’s capital structure after the Transaction, including confirmation that the Manager’s financial condition would not raise concerns that the Manager would be unable to continue providing the same scope and quality of services to the Fund; |
| • | | information regarding the Manager’s due diligence, bidding and selection process with respect to the Purchasers; |
| • | | information regarding the structure of the relationship between Kelso and Estancia and the role that each would assume in advance of and after the Closing; |
| • | | information regarding each Purchaser’s ownership structure and key personnel, including information regarding affiliations of the Purchaser and the Manager after the Transaction; |
| • | | information regarding each Purchaser’s asset management experience, including the experience of the Purchasers’ key personnel relating to the management of investment companies registered under the 1940 Act; |
| • | | the Purchasers’ business plans with respect to the Manager after the Transaction; |
| • | | information regarding the extent to which the Purchasers expect to be involved in the Manager’s day-to-day operations and the persons to whom the Manager’s key personnel will report; |
| • | | information regarding any anticipated impact that the Transaction might have on the Manager’s compliance activities or the resources available to the Fund’s Chief Compliance Officer; |
| • | | a discussion of any potential material changes to the Current Agreements; |
| • | | a description of any expected changes in distribution or marketing efforts and strategies for the Fund as a result of the Transaction; |
| • | | information regarding whether the Purchasers or the Manager anticipated proposing any changes to the membership of the Board; |
| • | | a discussion of the length of the Purchasers’ anticipated ownership of the Manager and the expected duration of the investment funds financing the Transaction; |
| • | | information regarding the ownership and investment of management personnel in the Manager; |
| • | | information regarding the Manager’s employee equity incentive plan after the Closing; |
| • | | a summary of any material past, pending or anticipated litigation or regulatory proceedings involving the Purchasers, or their personnel; |
| • | | verification of the continuation of the Manager’s insurance coverage after the Transaction with regard to the services provided to the Fund; and |
| • | | in-person presentations by and discussions with the Manager and representatives of the Purchasers regarding the Transaction. |
58
Disclosure Regarding the Board of Trustees’ Approval of the Management
Agreement and Investment Advisory Agreements of the Funds (Unaudited)
The Board also considered information that had been provided to the Board by the Manager and the Sub-Advisors for the May and June 2014 meetings in connection with the renewal of the Current Agreements.
Provided below is an overview of the primary factors the Trustees considered at the Board Meetings. The Board did not identify any particular information that was most relevant to its consideration to approve the New Agreements, and each Trustee may have afforded different weight to the various factors. In connection with the approval process for the New Agreements, the Trustees received advice from their legal counsel detailing the Board’s responsibilities pertaining thereto. Legal counsel to the non-interested Trustees provided the Board with a memorandum regarding its responsibilities pertaining to the approval of the New Agreements. Based on its evaluation, the Board unanimously concluded that the terms of the New Agreements were reasonable and fair and that the approval of the New Agreements was in the best interests of the Fund and its shareholders.
In determining whether to approve the New Agreements, the Trustees considered the best interests of the Fund. The Board considered the Fund’s investment management and sub-advisory relationships separately. In each instance, the Board considered its review of the Current Agreements in May and June 2014, and the information received in November and December 2014 with respect to, among other things, the following factors: (1) the nature, extent and quality of the services provided; (2) the investment performance of the Fund and, as applicable, each Sub-Advisor for the Fund; (3) the costs incurred by the Manager in rendering services to the Fund and its resulting profits or losses; (4) comparisons of services and fee rates with contracts entered into by the Manager or a Sub-Advisor or their affiliates with other clients (such as pension funds and other institutional clients); (5) the extent to which economies of scale have been taken into account in setting each fee rate schedule; (6) whether fee rate levels reflect these economies of scale for the benefit of Fund investors; and (7) any other benefits derived or anticipated to be derived by the Manager or a Sub-Advisor from its relationship with the Fund. The Trustees posed questions to various management personnel of the Manager and the Purchasers regarding certain key aspects of the materials submitted in support of the approval of the New Agreements.
Nature, Extent and Quality of the Services Provided. With respect to the approval of the New Agreements, the Board considered that the New Agreements provide for the Manager and each Sub-Advisor to provide the same services to the Fund on substantially the same terms as the Current Agreements. The Board considered representations by the Manager and/or Purchasers that the Transaction will not result in any changes to the manner in which the Fund’s assets are managed. The Board also considered representations by the Manager and/or Purchasers that the Transaction will not result in any adverse impact or changes to: the personnel involved in the management of the Fund; the Manager’s disciplined investment approach and goal to provide consistent above average long-term performance at a lower than average cost; the Manager’s continuing efforts to enhance distribution of the Fund’s shares and add new series to the Trust and share classes to the Fund’s product line; the adequacy of the Manager’s financial condition; the Manager’s day-to-day operations; the Manager’s compliance activities or the resources available to the Trust’s Chief Compliance Officer; or the Fund’s service providers or Sub-Advisors. The Board also considered the Manager’s representation that there had been no material changes or developments regarding the Manager or the Sub-Advisors since the Board’s consideration of the Current Agreements in May and June 2014 that had not previously been reported to the Board. The Board also considered information regarding the post-closing capitalization of the Purchasers and the Purchasers’ long-term business goals with regard to the Manager and the Manager’s activities with respect to the Trust, which are consistent with the Manager’s current goals. Based on the foregoing information, the Board concluded that the nature, extent and quality of the management and advisory services provided by the Manager and the Sub-Advisors were appropriate for the Fund and, thus, determined to approve the New Agreements for the Fund.
Investment Performance. The Board considered its review of the comparative information regarding the Fund’s investment performance relative to its benchmark index(es) and peer group in connection with the renewal of the Current Agreements. The Board also considered the performance reports and discussions with management at Board and Committee meetings since June 2014. The Manager also noted that it generally was satisfied with the performance of the Sub-Advisors.
Costs of the Services to be Provided to the Fund and the Projected Profits to be Realized by the Manager from its Relationship with the Fund. In analyzing the cost of services and profitability of the Manager with respect to the Fund, the Board considered that the Transaction would result in no changes to the fees charged to the Fund or the Manager’s fee waivers currently in place with respect to the Fund. Additionally, the Board noted that there had been no material changes in this regard since its consideration of the Current Agreements in May and June 2014. Based on the foregoing information and the Board’s considerations in connection with the renewal of the Current Agreements in May and June 2014, the Board concluded that the profitability levels were reasonable in light of the services performed by the Manager. The Board did not consider the costs of the services to be provided and profits to be realized by each Sub-Advisor from its relationship with the Fund, noting instead the substantially arm’s-length nature of the relationship between the Manager and each Sub-Advisor with respect to the negotiation of the advisory fee rate on behalf of the Fund.
Economies of Scale and Whether Fee Levels Reflect Economies of Scale. In considering the reasonableness of the management fees, the Board considered that the Fund would pay the same fee rates to the Manager under the New Management Agreement as the Fund currently pays under the Current Management Agreement. The Board also considered that the Fund would pay the same investment advisory fee rate to each Sub-Advisor under the New Advisory Agreements as the Fund pays under the Current Advisory Agreements. Based on the foregoing information and the Board’s considerations in connection with the renewal of the Current Agreements in May and June 2014, the Board concluded that the Manager’s fee schedule for the Fund, and each of PIMCO’s, Brandywine’s and GAM’s fee schedules for the Fund, provide for a reasonable sharing of benefits from any economies of scale with the Fund.
Benefits Derived by the Manager from Relationship With the Fund. The Board considered that the “fall-out” or ancillary benefits that accrue to the Manager and/or a Sub-Advisor as a result of its advisory relationship with the Fund would not change as a result of the Transaction. Based on the foregoing information and the Board’s considerations in connection with the renewal of the Current Agreements in May and June 2014, the Board concluded that the potential benefits accruing to the Manager under the New Management Agreement and the Sub-Advisors under the New Advisory Agreements, by virtue of the Manager’s, PIMCO’s, Brandywine’s and GAM’s relationship with the Fund, appear to be fair and reasonable.
59
Disclosure Regarding the Board of Trustees’ Approval of the Management
Agreement and Investment Advisory Agreements of the Funds (Unaudited)
Board’s Conclusion. Based on the various considerations described above, the Board, including a majority of Trustees who are not “interested persons” of the Fund, the Manager, PIMCO, Brandywine, or GAM, as that term is defined in the 1940 Act, concluded that the management and investment advisory fee rates to be paid by the Fund are fair and reasonable and that the approval of the New Agreements is in the best interests of the Fund, and approved the New Agreements.
60
American Beacon FundsSM
Results of Shareholder Meeting (Unaudited)
Special meetings of shareholders of each of the portfolios of the American Beacon Funds (the “Trust”) were held on April 7 and April 28, 2015. The shareholders of the Flexible Bond Fund (the “Fund”) approved a new investment management agreement between American Beacon Advisors, Inc. and the Fund. Approval of this proposal required a majority of the outstanding voting securities of the Fund. The following are the results of the shareholder votes for this proposal:
| | | | | | | | | | | | | | | | |
Funds | | For | | | Against | | | Abstain | | | Non-Voting | |
Flexible Bond Fund | | | 114,150,325.74 | | | | 286,410.92 | | | | 7,860,644.37 | | | | 66,937,212.21 | |
Special meetings of shareholders of the Trust were held on April 7 and April 28, 2015. The shareholders of the Trust approved the re-election of nine of the current Trustees to the Board of the American Beacon Trust and the election of two additional Trustees to the Board. Approval of this proposal required a plurality vote of the Trust’s shares. The following are the results of the election of each Trustee:
| | | | |
Gilbert G. Alvarado | | | | |
Affirmative | | | 16,655,574,211.10 | |
Withhold | | | 242,060,281.87 | |
Joseph B. Armes | | | | |
Affirmative | | | 16,653,130,207.99 | |
Withhold | | | 244,504,284.98 | |
Gerard J. Arpey | | | | |
Affirmative | | | 16,659,813,172.19 | |
Withhold | | | 237,821,320.78 | |
W. Humphrey Bogart | | | | |
Affirmative | | | 16,532,151,093.14 | |
Withhold | | | 365,483,399.83 | |
Brenda A. Cline | | | | |
Affirmative | | | 16,662,050,138.08 | |
Withhold | | | 235,584,354.89 | |
Eugene J. Duffy | | | | |
Affirmative | | | 16,430,210,258.21 | |
Withhold | | | 467,424,234.76 | |
Thomas M. Dunning | | | | |
Affirmative | | | 16,651,792,247.83 | |
Withhold | | | 245,842,245.14 | |
Alan D. Feld | | | | |
Affirmative | | | 14,899,039,186.08 | |
Withhold | | | 1,998,595,306.89 | |
Richard A. Massman | | | | |
Affirmative | | | 16,651,582,060.07 | |
Withhold | | | 246,052,432.90 | |
Barbara J. McKenna | | | | |
Affirmative | | | 16,435,773,869.81 | |
Withhold | | | 461,860,623.16 | |
R. Gerald Turner | | | | |
Affirmative | | | 16,653,429,720.08 | |
Withhold | | | 244,204,772.89 | |
61
Trustees and Officers of the American Beacon FundsSM
(Unaudited)
The Trustees and officers of the American Beacon Funds (the “Trust”) are listed below, together with their principal occupations during the past five years. Unless otherwise indicated, the address of each person listed below is 220 East Las Colinas Boulevard, Suite 1200, Irving, Texas 75039. Each Trustee oversees thirty-three funds in the fund complex that includes the Trust and the American Beacon Select Funds. The Trust’s Statement of Additional Information contains additional information about the Trustees and is available without charge by calling 1-800-658-5811.
| | | | |
Name, Age and Address | | Position, Term of Office and Length of Time Served with the Trust | | Principal Occupation(s) During Past 5 Years and Current Directorships |
| INTERESTED TRUSTEES | | Term | | |
| | Lifetime of Trust until removal, resignation or retirement* | | |
| | |
| Alan D. Feld** (78) | | Trustee since 1996 | | Sole Shareholder of a professional corporation which is a Partner in the law firm of Akin, Gump, Strauss, Hauer & Feld, LLP (law firm) (1960-Present); Trustee, American Beacon Mileage Funds (1996-2012); Trustee, American Beacon Select Funds (1999-Present); Trustee, American Beacon Master Trust (1996-2012). |
| | |
| NON-INTERESTED TRUSTEES | | Term | | |
| | Lifetime of Trust until removal, resignation or retirement* | | |
| | |
| Gilbert G. Alvarado (45) | | Trustee since 2015 | | Vice President & CFO, Sierra Health Foundation (health conversion private foundation) (2006-Present) Vice President & CFO, Sierra Health Foundation: Center for Health Program Management (California public benefit corporation) (2012-Present); Director, Innovative North State (2012-Present); Director, Sacramento Regional Technology Alliance (2011-Present); Director, Women’s Empowerment (2009-2014); Trustee, American Beacon Select Funds (2015-Present). |
| | |
| Joseph B. Armes (53) | | Trustee since 2015 | | Chairman, President & CEO, CSW Industrials f/k/a Capital Southwest Corporation (investment company) (2013-Present); President & CEO, JBA Investment Partners (family investment vehicle) (2010-Present); Chief Operating Officer, Hicks Holdings, LLC (Hicks Family assets and investments) (2005-2010); Trustee, Baylor University Board of Regents (2001-2010); Director and Chair of Audit Committee, RSP Permian (oil and gas producer) (2013-Present); Trustee, American Beacon Select Funds (2015-Present). |
| | |
| Gerard J. Arpey (57) | | Trustee since 2012 | | Director, The Home Depot, Inc. (2015-Present); Partner, Emerald Creek Group (private equity firm) (2011-Present); Chairman and Chief Executive Officer, AMR Corp. and American Airlines; Inc. (2003-2011); Director, S. C. Johnson & Son, Inc. (privately held company) (2008-present); Trustee, American Beacon Select Funds (2012-Present). |
| | |
| W. Humphrey Bogart (71) | | Trustee since 2004 | | Trustee, American Beacon Mileage Funds (2004-2012); Trustee, American Beacon Select Funds (2004-Present); Trustee, American Beacon Master Trust (2004-2012). |
| | |
| Brenda A. Cline (54) | | Trustee since 2004 | | Executive Vice President, Chief Financial Officer, Treasurer and Secretary, Kimbell Art Foundation (1993-Present); Director, Range Resources Corporation (oil and natural gas company) (2015-Present); Director, Tyler Technologies, Inc.(public sector software solutions company) (2014-Present); Trustee, American Beacon Mileage Funds (2004-2012); Trustee, American Beacon Select Funds (2004-Present); Trustee, American Beacon Master Trust (2004-2012). |
| | |
| Eugene J. Duffy (61) | | Trustee since 2008 | | Managing Director, Institutional Services, Intercontinental Real Estate Corporation (2014-Present); Principal and Executive Vice President, Paradigm Asset Management (1994-2014); Director, Sunrise Bank of Atlanta (2008-2013); Trustee, American Beacon Mileage Funds (2008-2012); Trustee, American Beacon Select Funds (2008-Present); Trustee, American Beacon Master Trust (2008-2012). |
62
Trustees and Officers of the American Beacon FundsSM
(Unaudited)
| | | | |
Name, Age and Address | | Position, Term of Office and Length of Time Served with the Trust | | Principal Occupation(s) During Past 5 Years and Current Directorships |
| OFFICERS | | Term | | |
| | One Year | | |
| | |
| Thomas M. Dunning (72) | | Trustee since 2008 | | Chairman Emeritus (2008-Present); Lockton Dunning Benefits (consulting firm in employee benefits); Board Director, Oncor Electric Delivery Company LLC (2007-Present); Board Member, BancTec (2010-Present) (software consulting); Trustee, American Beacon Mileage Funds (2008-2012); Trustee, American Beacon Select Funds (2008-Present); Trustee, American Beacon Master Trust (2008-2012). |
| | |
| Richard A. Massman (72) | | Trustee since 2004 Chairman since 2008 | | Chairman Emeritus (2008-Present) and Chairman (1998-2008), Lockton Dunning Benefits (consulting firm in employee benefits); Lead Director, Oncor Electric Delivery Company LLC (2007-Present); Board Member, BancTec (2010-Present); Trustee, American Beacon Mileage Funds (2008-2012); Trustee, American Beacon Select Funds (2008-Present); Trustee, American Beacon Master Trust (2008-2012). |
| | |
| Barbara J. McKenna, CFA (52) | | Trustee since 2012 | | Managing Principal, Longfellow Investment Management Company (2005-Present); Trustee, American Beacon Select Funds (2012-Present). |
| | |
R. Gerald Turner (69) 225 Perkins Admin. Bldg. Southern Methodist Univ. Dallas, Texas 75275 | | Trustee since 2001 | | President, Southern Methodist University (1995-Present); Director, J.C. Penney Company, Inc. (1996-Present); Director, Kronus Worldwide Inc. (chemical manufacturing) (2003-Present); Trustee, American Beacon Mileage Funds (2001-2012); Trustee, American Beacon Select Funds (2001-Present); Trustee, American Beacon Master Trust (2001-2012). |
| | |
| Gene L. Needles, Jr. (60) | | President since 2009 Executive Vice President since 2009 | | President, CEO and Director, American Beacon Advisors, Inc. (2009-Present); President, CEO and Director, Astro AB Borrower, Inc. (2015-Present); President, CEO and Director, Astro AB Acquisition, Inc.(2015-Present); President, CEO and Director, Astro AB Topco, Inc. (2015-Present), President, CEO and Director, Astro AB Holdings, LLC. (2015-Present); President, CEO and Director, Lighthouse Holdings, Inc.; (2009-2015); President and CEO, Lighthouse Holdings Parent, Inc. (2009-2015); Manager, President and CEO, American Private Equity Management, L.L.C. (2012-Present); President, American Beacon Cayman Managed Futures Strategy Fund, Ltd. (2014-Present). |
| | |
| Rosemary K. Behan (56) | | VP, Secretary and Chief Legal Officer since 2006 | | Secretary, American Beacon Advisors, Inc. (2006-Present); Secretary, Astro AB Borrower, Inc. (2015-Present); Secretary, Astro AB Acquisition, Inc. (2015-Present); Secretary, Astro AB Topco, Inc. (2015-Present); Secretary, Astro AB Holdings, LLC. (2015-Present); Secretary, Lighthouse Holdings, Inc. (2008-2015); Secretary, Lighthouse Holdings Parent, Inc. (2008-2015); Secretary, American Private Equity Management, L.L.C.(2008-Present); Secretary, American Beacon Cayman Managed Futures Strategy Fund, Ltd. (2014-Present). |
| | |
| Brian E. Brett (55) | | VP since 2004 | | Vice President, Director of Sales, American Beacon Advisors, Inc. (2004-Present). |
| | |
| Erica Duncan (44) | | VP Since 2011 | | Vice President, Marketing and Client Services, American Beacon Advisors, Inc. (2011-Present); Supervisor, Brand Marketing, Invesco (2010-2011); |
| | |
| Michael W. Fields (61) | | VP since 1989 | | Chief Fixed Income Officer (2011-Present) and Vice President, Fixed Income Investments, American Beacon Advisors, Inc. (1988-2011); Director, American Beacon Global Funds SPC (2002-2011); Director, American Beacon Global Funds plc (2007-2009). |
| | |
| Melinda G. Heika (54) | | Treasurer since 2010 | | Treasurer, American Beacon Advisors, Inc. (2010-Present); Treasurer, Astro AB Borrower, Inc. (2015-Present); Treasurer, Astro AB Acquisition, Inc. (2015-Present); Treasurer, Astro AB Topco, Inc. (2015-Presnt); Treasurer, Astro AB Holdings, LLC. (2015-Present); Treasurer, Lighthouse Holdings, Inc. (2010-2015); Treasurer, Lighthouse Holdings Parent Inc., (2010-2015); Treasurer, American Private Equity Management, L.L.C. (2012-Present); Director and Treasurer, American Beacon Cayman Managed Futures Strategy Fund, Ltd. (2014-Present). |
63
Trustees and Officers of the American Beacon FundsSM
(Unaudited)
| | | | |
Name, Age and Address | | Position, Term of Office and Length of Time Served with the Trust | | Principal Occupation(s) During Past 5 Years and Current Directorships |
| OFFICERS | | Term | | |
| | One Year | | |
| | |
| Terri L. McKinney (51) | | VP since 2010 | | Vice President, Enterprise Services (2009-Present) and Managing Director (2003-2009), American Beacon Advisors, Inc. |
| | |
| Jeffrey K. Ringdahl (40) | | VP since 2010 | | Chief Operating Officer, American Beacon Advisors, Inc. (2010-Present); Manager and Senior Vice President, American Private Equity Management, L.L.C. (2012-Present); Senior Vice President and Director, Astro AB Borrower, Inc. (2015-Present); Senior Vice President and Director, Astro AB Acquisition, Inc. (2015-Present); Senior Vice President and Director, Astro AB Topco, Inc. (2015-Present), Senior Vice President and Director, Astro AB Holdings, LLC.(2015-Present); Senior Vice President, Lighthouse Holdings, Inc. (2013-2015); Senior Vice President, Lighthouse Holdings Parent, Inc. (2013-2015); Director and Vice President, American Beacon Cayman Managed Futures Strategy Fund, Ltd. (2014-Present); Vice President, Product Management, Touchstone Advisors, Inc. (2007-2010). |
| | |
| Samuel J. Silver (52) | | VP Since 2011 | | Vice President, Fixed Income Investments (2011-Present) and Senior Portfolio Manager, Fixed Income Investments (1999-2011), American Beacon Advisors, Inc. |
| | |
| Christina E. Sears (43) | | Chief Compliance Officer since 2004 and Asst. Secretary since 1999 | | Chief Compliance Officer, American Beacon Advisors, Inc. (2004-Present); Chief Compliance Officer, American Private Equity Management, L.L.C. (2012-Present). |
| | |
| Sonia L. Bates (58) | | Asst. Treasurer since 2011 | | Director, Tax and Financial Reporting (2011-Present), Manager, Tax and Financial Reporting (2005-2010), American Beacon Advisors, Inc.; Asst. Treasurer, Astro AB Borrower, Inc. (2015-Present); Asst. Treasurer, Astro AB Acquisition, Inc.(2015-Present); Asst. Treasurer, Astro AB Topco, Inc. (2015-Present); Asst. Treasurer, Astro AB Holdings, LLC.; Asst. Treasurer, Lighthouse Holdings, Inc. (2011-2015); Asst. Treasurer, Lighthouse Holdings Parent Inc. (2011-2015); Asst. Treasurer, American Private Equity Management, L.L.C. (2012-Present). |
| * | The Board has adopted a retirement plan that requires Trustees to retire no later than the last day of the calendar year in which they reach the age of 72, provided, however, that the board may determine to grant one or more annual exemptions to this requirement. |
| ** | Mr. Feld is deemed to be an “interested person” of the Trust, as defined by the 1940 Act. Mr. Feld’s law firm of Akin, Gump, Strauss, Hauer & Feld LLP has provided legal services within the past two years to the Manager and one or more of the Trust’s sub-advisors. |
64
This page intentionally left blank.
65

Delivery of Documents
eDelivery is NOW AVAILABLE – Stop traditional mail delivery and receive your
shareholder reports and summary prospectus on-line. Sign up at
www.americanbeaconfunds.com
If you invest in the Fund through a financial institution, you may be able to receive the Fund’s regulatory mailings, such as the Summary Prospectus, Annual Report and Semi-Annual Report, by e-mail. If you are interested in this option, please go to www.icsdelivery.com and search for your financial institution’s name or contact your financial institution directly.
To obtain more information about the Fund:
| | |
 | |  |
By E-mail: american_beacon.funds@ambeacon.com | | On the Internet: Visit our website at www.americanbeaconfunds.com |
| | | |
| | |
 | |  |
By Telephone: Institutional, Y, and Investor Classes Call (800) 658-5811 | | By Mail: American Beacon Funds P.O. Box 219643 Kansas City, MO 64121-9643 |
| | | |
| | |
Availability of Quarterly Portfolio Schedules In addition to the Schedule of Investments provided in each semi-annual and annual report, the Fund files a complete schedule of its portfolio holdings with the Securities and Exchange Commission (“SEC”) on Form N-Q as of the first and third fiscal quarters. The Fund’s Forms N-Q are available on the SEC’s website at www.sec.gov. The Forms N-Q may also be reviewed and copied at the SEC’s Public Reference Section, 100 F Street, NE, Washington, D.C. 20549-1520. Information regarding the operation of the SEC’s Public Reference Room may be obtained by calling (202) 551-8090. A complete schedule of the Fund’s portfolio holdings is also made available on www.americanbeaconfunds.com, the Funds’ website approximately sixty days after the end of each quarter. | | Availability of Proxy Voting Policy and Records A description of the policies and procedures the Fund uses to determine how to vote proxies relating to portfolio securities is available in the Fund’s Statement of Additional Information, which is available free of charge on the Fund’s website www.americanbeaconfunds.com and by calling 1-800-967-9009 or by accessing the SEC’s website at www.sec.gov. The Fund’s proxy voting record for the most recent year ended August 31 is filed annually with the SEC on Form N-PX. The Fund’s Forms N-PX are available on the SEC’s website at www.sec.gov. The Fund’s proxy voting record may also be obtained by calling 1-800-967-9009. |
Fund Service Providers:
| | | | | | | | | | | | |
CUSTODIAN State Street Bank and Trust Boston, Massachusetts | | | | TRANSFER AGENT Boston Financial Data Services Kansas City, Missouri | | | | INDEPENDENT REGISTERED PUBLIC ACCOUNTING FIRM Ernst & Young LLP Dallas, Texas | | | | DISTRIBUTOR Foreside Fund Services, LLC Portland, Maine |
This report is prepared for shareholders of the American Beacon Funds and may be distributed to others only if preceded or accompanied by a current Prospectus or Summary Prospectus.
American Beacon Flexible Bond Fund and American Beacon Funds are service marks of American Beacon Advisors, Inc.
About American Beacon Advisors
Since 1986, American Beacon Advisors has offered a variety of products and investment advisory services to numerous institutional and retail clients, including a variety of mutual funds, corporate cash management, and separate account management.
Our clients include defined benefit plans, defined contribution plans, foundations, endowments, corporations, financial planners, and other institutional investors. With American Beacon Advisors, you can put the experience of a multi-billion dollar asset management firm to work for your company.
Contents
| | | | |
President’s Message | | | 1 | |
| |
Market and Performance Overviews | | | 2 | |
| |
Schedules of Investments: | | | | |
| |
The London Company Income Equity Fund | | | 20 | |
| |
Zebra Global Equity Fund | | | 22 | |
| |
Zebra Small Cap Equity Fund | | | 26 | |
| |
SiM High Yield Opportunities Fund | | | 31 | |
| |
Financial Statements | | | 35 | |
| |
Notes to the Financial Statements | | | 40 | |
| |
Financial Highlights | | | 66 | |
| |
Additional Information | | | Back Cover | |
THE LONDON COMPANY INCOME EQUITY FUND
Investing in small- and medium-capitalization stocks may involve greater volatility and lower liquidity than larger company stocks. Investing in foreign securities may involve heightened risk due to currency fluctuations and economic and political risks. Investing in dividend-paying stocks may result in less earnings growth or capital appreciation than investing in non-dividend paying stocks. The use of fixed-income securities entails interest rate and credit risks. Because the Fund may invest in fewer issuers than a more diversified portfolio, the fluctuating value of a single holding may have a greater effect on the value of the Fund. The use of futures contracts for cash management may subject the Fund to losing more money than invested.
ZEBRA GLOBAL EQUITY FUND
Investing in medium-capitalization stocks may involve greater volatility and lower liquidity than larger company stocks. At times, certain securities may have limited marketability and may be difficult to sell. Investing in foreign securities may involve heightened risk due to currency fluctuations and economic and political risks. The use of futures contracts for cash management may subject the Fund to losing more money than invested. The Fund may participate in a securities lending program.
ZEBRA SMALL CAP EQUITY FUND
Investing in small-capitalization stocks may involve greater volatility and lower liquidity than larger company stocks. Investing in foreign securities may involve heightened risk due to currency fluctuations and economic and political risks. At times, certain securities may have limited marketability and may be difficult to sell. The use of futures contracts for cash management may subject the Fund to losing more money than invested. The Fund may participate in a securities lending program.
SiM HIGH YIELD OPPORTUNITIES FUND
Investments in high yield securities are subject to greater levels of credit, interest rate, market and liquidity risks than investment-grade securities. Investing in foreign and emerging market securities may involve heightened risk due to currency fluctuations and economic and political risks. Investing in derivative instruments involves liquidity, credit, interest rate and market risks.
Please see the prospectus for a complete discussion of the Funds’ risks. There can be no assurances that the investment objectives of these Funds will be met.
Any opinions herein, including forecasts, reflect our judgment as of the end of the reporting period and are subject to change. Each advisor’s strategies and the Fund’s portfolio composition will change depending on economic and market conditions. This report is not a complete analysis of market conditions and therefore, should not be relied upon as investment advice. Although economic and market information has been compiled from reliable sources, American Beacon Advisors, Inc. makes no representation as to the completeness or accuracy of the statements contained herein.
| | |
| American Beacon Funds | | August 31, 2015 |
| | |
 | | Dear Shareholders, During much of the 12-month period ended August 31, 2015, uneven global economic growth, declining oil prices and disparate central bank policies set the stage for mixed returns in all markets. Uncertainty over the timing of the U.S. Federal Reserve’s first interest rate increase since emergency lending rates were established during the 2008 financial crisis also weighed on domestic equity markets, and the substantial weakening of many currencies against the U.S. dollar took a toll on total returns for dollar-based investors in numerous global markets. |
On August 24, 2015, the Dow Jones industrial average plunged 1,000 points during the course of the day. Although it rebounded to only lose roughly half that amount at market close, investors were unmistakably concerned about the global economy, especially China’s slowdown. However, following better-than-expected second quarter GDP growth results, many of the major U.S. and European indexes found their way back into the black that week after the Dow, the S&P 500 Index and the Nasdaq composite moved clear of a “correction,” which is defined as a drop of 10% or more from a recent high.
We are proud to offer a broad range of funds to help investors navigate the economic storms and market downturns in the U.S. and abroad. Our years of experience evaluating sub-advisors has led us to identify and partner with several asset managers who have adhered to their disciplined processes for many years and through a variety of economic and market conditions.
For the 12 months ended August 31, 2015:
| | • | | American Beacon The London Company Income Equity Fund (Investor Class) returned 0.71%. |
| | • | | American Beacon Zebra Global Equity Fund (Investor Class) returned -6.84%. |
| | • | | American Beacon Zebra Small Cap Equity Fund (Investor Class) returned 0.29%. |
| | • | | American Beacon SiM High Yield Opportunities Fund (Investor Class) returned -1.14%. |
Thank you for your continued interest in American Beacon Funds. We are pleased to have a broad range of products that cover the global equity and fixed income markets. For additional information about the Funds or to access your account information, please visit our website at www.americanbeaconfunds.com.
|
| Best Regards, |
|
 |
| Gene L. Needles, Jr. |
| President |
| American Beacon Funds |
1
Domestic Equity Market Overview
August 31, 2015 (Unaudited)
U.S. economic news was generally positive during the 12-month period ended August 31, 2015, including rising consumer confidence, higher consumer spending, lower unemployment and a stable/improving housing market. U.S. gross domestic product (“GDP”) was positive each quarter over the past year with first quarter 2015 being the weakest. Poor weather, a strong dollar and a West Coast dock strike had a negative effect on first quarter 2015 results. GDP growth was more than 2% for the rest of the period.
The U.S. equity markets were roughly flat for the 12-month period. Stocks traded in a fairly narrow range most of the year, but then declined in August. Investors turned more negative late in the summer of 2015, reflecting a slowdown in the Chinese economy, the significant drop in oil prices and constant worries about when the U.S. Federal Reserve would finally start raising rates. While the U.S. economy remains in good shape, much of the rest of the world looks weaker.
Overall, for the period under review, there was very little differentiation across market-cap ranges. Most of the major indexes posted slightly positive gains: The S&P 500 Index increased 0.5%, the Russell 1000 Index increased 0.4%, the small-cap Russell 2000 Index rose 0.03% and the broader Russell 3000 Index rose 0.4%. Growth stocks outperformed value as the Russell 1000 Growth Index rose 4.3% while the Russell 1000 Value Index declined 3.5%. The best performing sectors were Health Care and Consumer Discretionary, while Energy and Materials lagged the overall market.
2
American Beacon The London Company Income Equity FundSM
Performance Overview
August 31, 2015 (Unaudited)
The Investor Class of the American Beacon The London Company Income Equity Fund (the “Fund”) returned 0.71% for the twelve-month period ended August 31, 2015, outperforming the Russell 1000 Value Index (the “Index”) return of -3.48% for the same period.
Comparison of Change in Value of a $10,000 Investment
For the Period from 5/29/12 through 8/31/15
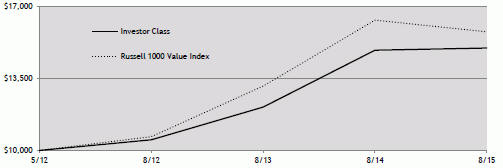
Total Returns for the Period ended 8/31/15
| | | | | | | | | | | | | | | | | | | | |
| | | Ticker | | | 1 Year | | | 3 Years | | | Since Incep.
(5/29/12) | | | Value of $10,000
5/29/12-
8/31/15 | |
Institutional Class (1,2,4) | | | ABCIX | | | | 1.08 | % | | | 12.88 | % | | | 13.59 | % | | $ | 15,145 | |
Y Class (1,2,4) | | | ABCYX | | | | 1.03 | % | | | 12.80 | % | | | 13.52 | % | | $ | 15,114 | |
Investor Class(1,2,4) | | | ABCVX | | | | 0.71 | % | | | 12.51 | % | | | 13.22 | % | | $ | 14,985 | |
A Class with sales charge(1,2,4) | | | ABCAX | | | | (5.06 | )% | | | 10.16 | % | | | 11.04 | % | | $ | 14,064 | |
A Class without sales charge(1,2,4) | | | ABCAX | | | | 0.71 | % | | | 12.35 | % | | | 13.07 | % | | $ | 14,922 | |
C Class with sales charge(1,2,4) | | | ABECX | | | | (1.04 | )% | | | 11.53 | % | | | 12.24 | % | | $ | 14,568 | |
C Class without sales charge(1,2,4) | | | ABECX | | | | (0.04 | )% | | | 11.53 | % | | | 12.24 | % | | $ | 14,568 | |
Russell 1000 Value Index (3) | | | | | | | (3.48 | )% | | | 13.92 | % | | | 15.03 | % | | $ | 15,778 | |
| 1. | Please note that the recent growth in the stock market has helped to produce short-term returns that are not typical and may not continue in the future. Performance shown is historical and is not indicative of future returns. Investment returns and principal value will vary, and shares may be worth more or less at redemption than at original purchase. Performance shown is calculated based on the published end of day net asset values as of date indicated, and current performance may be lower or higher than the performance data quoted. To obtain performance as of the most recent month end, please visit www.americanbeaconfunds.com or call 1-800-967-9009. Fund performance in the table above does not reflect the deduction of taxes a shareholder would pay on distributions or the redemption of shares. A Class shares have a maximum sales charge of 5.75%. The maximum contingent deferred sales charge for the C Class is 1.00% for shares redeemed within one year of the date of purchase. |
| 2. | A portion of the fees charged to the Institutional, Y, A, and C Classes of the Fund was waived from 2012 through 2014 and partially recovered in 2015. Performance prior to waiving fees was lower than the actual returns shown from 2012 through 2014. A portion of the fees charged to the Investor Class of the Fund was waived in 2012 and 2013 and partially recovered in 2014 and 2015. Performance prior to waiving fees was lower than actual returns shown in 2012 and 2013. |
| 3. | The Russell 1000 Value Index is an unmanaged index of those stocks in the Russell 1000 Index with lower price-to-book ratios and lower forecasted growth values. Russell 1000® Value Index and Russell 1000 Index are registered trademarks of the Frank Russell Company. One cannot directly invest in an index. |
| 4. | The total annual Fund operating expense ratio set forth in the most recent Fund prospectus for the Institutional, Y, Investor, A, and C Class shares was 0.83%, 0.90%, 1.07%, 1.29%, and 2.03%, respectively. The expense ratios above may vary from the expense ratios presented in other sections of this report that are based on expenses incurred during the period covered by this report. |
The Fund’s excess performance relative to the Index was attributable to strong security selection among the various economic sectors. While security selection contributed to performance, sector allocation slightly detracted from the Fund’s returns.
3
American Beacon The London Company Income Equity FundSM
Performance Overview
August 31, 2015 (Unaudited)
From a security selection standpoint, the Fund’s holdings in the Consumer Discretionary and Consumer Staples sectors contributed most to performance adding approximately 335 (3.35%) and 265 (2.65%) basis points, respectively. In the Consumer Discretionary sector, Hasbro (up 45.8%), Lowes (up 32.7%) and Carnival (up 33.2%) were the largest contributors. Reynolds American (up 51.6%) and Altria Group (up 29.0%) contributed most to performance in the Consumer Staples sector. The Fund’s Energy and Industrials sectors also benefited performance, adding more than 90 (0.90%) basis points each. In the Energy sector, not owning Exxon Mobil, Apache or Anadarko Petroleum, which were down 21.9%, 54.8% and 35.7%, respectively, in the Index, positively impacted performance. General Dynamics (up 17.3%) was the largest contributor in the Industrials sector. Not owning Caterpillar, which was down 27.6% in the Index, also contributed to the Fund’s returns.
The aforementioned good performance was somewhat offset by poor stock selection in the Utilities and Telecommunication Services sectors. In the Utilities sector, not owning PG&E or Public Service Enterprise, which were up 10.6% and 11.9%, respectively, in the Index, detracted relative value. In the Telecommunication Services sector, the Fund’s absence from AT&T and T-Mobile, which were up 0.3% and 31.7%, respectively, in the Index, also negatively impacted performance.
The Fund’s overweight position in Materials, one of the poorer performing sectors in the Index, detracted relative value through sector allocation. Significant underweight positions in Financials and Health Care, the two best performing sectors in the Index, also detracted from the Fund’s returns. The aforementioned underperformance was mostly negated by the Fund’s large underweight in Energy, the worst performing sector in the Index, which added relative value. An overweight in the Consumer Staples sector also contributed to the Fund’s returns.
The sub-advisor’s investment process focuses on downside protection, current income and total return appreciation.
| | | | |
Top Ten Holdings (% Net Assets) | |
General Dynamics Corp. | | | 4.8 | |
Hasbro, Inc. | | | 4.7 | |
Reynolds American, Inc. | | | 4.4 | |
Altria Group, Inc. | | | 4.3 | |
Wells Fargo & Co. | | | 4.3 | |
General Electric Co. | | | 4.2 | |
Kinder Morgan, Inc. | | | 4.0 | |
Lowe’s Cos., Inc. | | | 3.9 | |
Eli Lilly & Co. | | | 3.8 | |
Pfizer, Inc. | | | 3.6 | |
Total Fund Holdings | | | 32 | |
| | | | |
Sector Allocation (% Equities) | |
Financials | | | 17.6 | |
Information Technology | | | 16.8 | |
Industrials | | | 12.8 | |
Consumer Discretionary | | | 12.5 | |
Consumer Staples | | | 10.8 | |
Health Care | | | 10.7 | |
Energy | | | 7.9 | |
Materials | | | 5.5 | |
Utilities | | | 3.5 | |
Telecommunication Services | | | 1.9 | |
4
Global Equity Market Overview
August 31, 2015 (Unaudited)
Global equity markets, as represented by the MSCI World Index, declined 4.1% during the 12-month period ended August 31, 2015. The period was bookended by steep sell-offs in September-October 2014 and then again in mid-August 2015. In between, the MSCI World Index peaked at an all-time high on May 21, 2015.
The September-October 2014 drop was steep and coincided with the beginning of a more persistent decline in the price of oil. However, the onset of earning reports in mid-October 2014 gave investors a reason to buy equities, and stock prices quickly recovered. Indeed, for the full month of October 2014, the MSCI World Index ended slightly positive, resulting in a pronounced V-shaped price pattern. Oil prices did not enjoy the same resiliency and continued to fall. During the 12-month period, the price of Brent Crude Oil dropped from approximately $103 per barrel to approximately $49 per barrel.
More recently, the August 2015 weakness in equities was precipitated by concerns that global economic growth was in jeopardy and, specifically, that China’s economy was headed for a hard landing. The Chinese government’s devaluation of the yuan, followed by its subsequent support efforts, left investors questioning whether Chinese authorities are equipped to manage the world’s second largest economy.
As would be expected with the precipitous fall in oil prices, the Energy sector suffered the most during the period under review. Materials stocks also were hurt, led down by global mining firms like BHP Billiton and Freeport McMoran. On the positive side of the ledger, Health Care stocks were driven higher by a fair amount of mergers and acquisitions in the sector.
In reviewing global equity returns for the period, one element particularly stands out: the poor performance of value versus growth. Globally, value underperformed growth by 846 basis points (-8.46%) since September 2014. An even greater value/growth differential could be observed in the U.S., Europe and the U.K. Of the four largest developed equity markets, it was only in Japan that value outperformed growth and then only by a relatively modest 246 basis points (2.46%).
5
American Beacon Zebra Global Equity FundSM
Performance Overview
August 31, 2015 (Unaudited)
The Investor Class of the American Beacon Zebra Global Equity Fund (the “Fund”) returned -6.84% for the twelve-month period ended August 31, 2015, underperforming the MSCI World Index (the “Index”) return of -4.13% for the same period.
Comparison of Change in Value of a $10,000 Investment for the Period from 6/1/10 through 8/31/15
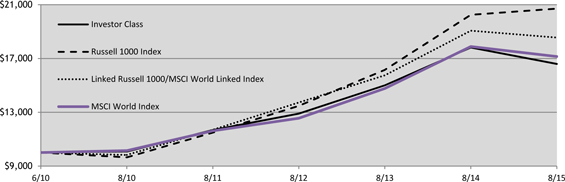
Total Returns for the Period ended 8/31/15
| | | | | | | | | | | | | | | | | | | | |
| | | Ticker | | | 1 Year | | | 5 Years | | | Since Incep.
(6/1/10) | | | Value of $10,000
6/1/10- 8/31/15 | |
Institutional Class (1,3,5) | | | AZLIX | | | | (6.41 | )% | | | 10.89 | % | | | 10.56 | % | | $ | 16,939 | |
Y Class (1,3,5) | | | AZLYX | | | | (6.46 | )% | | | 10.79 | % | | | 10.46 | % | | $ | 16,857 | |
Investor Class(1,3,5) | | | AZLPX | | | | (6.84 | )% | | | 10.49 | % | | | 10.13 | % | | $ | 16,596 | |
A Class with sales charge(1,3,5) | | | AZLAX | | | | (12.15 | )% | | | 9.09 | % | | | 8.80 | % | | $ | 15,569 | |
A Class without sales charge (1,3,5) | | | AZLAX | | | | (6.80 | )% | | | 10.38 | % | | | 10.03 | % | | $ | 16,518 | |
C Class with sales charge (1,2,3,5) | | | AZLCX | | | | (8.54 | )% | | | 9.56 | % | | | 9.25 | % | | $ | 15,914 | |
C Class without sales charge (1,2,3,5) | | | AZLCX | | | | (7.54 | )% | | | 9.56 | % | | | 9.25 | % | | $ | 15,914 | |
MSCI World Index (4) | | | | | | | (4.13 | )% | | | 11.07 | % | | | 10.81 | % | | $ | 17,148 | |
Russell 1000/MSCI World Linked Index (4) | | | | | | | (3.61 | )% | | | 13.55 | % | | | 12.49 | % | | $ | 18,556 | |
Russell 1000 Index (4) | | | | | | | 0.40 | % | | | 16.07 | % | | | 14.86 | % | | $ | 20,706 | |
| 1. | Please note that the recent growth in the stock market has helped to produce short-term returns that are not typical and may not continue in the future. Performance shown is historical and is not indicative of future returns. Investment returns and principal value will vary, and shares may be worth more or less at redemption than at original purchase. Performance shown is calculated based on the published end of day net asset values as of date indicated, and current performance may be lower or higher than the performance data quoted. To obtain performance as of the most recent month end, please call 1-800-967-9009 or visit www.americanbeaconfunds.com. Fund performance in the table above does not reflect the deduction of taxes a shareholder would pay on distributions or the redemption of shares. A Class shares have a maximum sales charge of 5.75%. |
| 2. | Fund performance represents the total returns achieved by the Investor Class from 6/1/10 up to 9/1/10, the inception date of the C Class, and the returns of the C Class since its inception. Expenses of the C Class are higher than those of the Investor Class. As a result, total returns shown may be higher than they would have been had the C Class been in existence since 6/1/10. The maximum contingent deferred sales charge is 1.00% for shares redeemed within one year of the date of purchase. |
| 3. | A portion of the fees charged to each Class of the Fund was waived since inception. Performance prior to waiving fees was lower than the actual returns shown since inception. |
| 4. | Prior to December 31, 2012, the Fund’s primary benchmark was the Russell 1000 Index, an index that measures the performance of the large-cap segment of the U.S. equity universe. The Fund changed its primary benchmark to the MSCI World Index, because the Fund changed its name and investment strategy. The Russell 1000/MSCI World Linked Index represents returns of the Russell 1000 Index up to December 31, 2012, and the MSCI World Index thereafter. The Russell 1000 Index is a registered trademark of the Frank Russell Company. The MSCI World Index is designed to measure the equity market performance of large- and mid-capitalization companies across 24 developed markets countries. The MSCI® information contained herein: (1) is provided “as is”, (2) is proprietary to MSCI and/or its content providers, (3) may not be used to create any financial instruments or products or any indexes and (4) may not be copied or distributed without MSCI’s express written consent. MSCI disclaims all warranties with respect to the information. Neither MSCI nor its content providers are responsible for any damages or losses arising from any use of this information. One cannot directly invest in an index. |
6
American Beacon Zebra Global Equity FundSM
Performance Overview
August 31, 2015 (Unaudited)
| 5. | The total annual Fund operating expense ratio set forth in the most recent Fund prospectus for the Institutional, Y, Investor, A and C Class shares was 2.56%, 2.51%, 2.88%, 3.03%, and 3.72% respectively. The expense ratios above may vary from the expense ratios presented in other sections of this report that are based on expenses incurred during the period covered by this report. |
From a stock selection standpoint, the Fund underperformed the Index as holdings in the Consumer Discretionary and Information Technology sectors detracted approximately 115 (1.15%) and 100 (1.00%) basis points, respectively, from performance. Viacom (down 48.4%) was the largest detractor in the Consumer Discretionary sector. Not owning Amazon.com, which was up 51.3% in the Index, also detracted from the Fund’s returns. In the Information Technology sector, not owning Apple or Visa, which were up 11.9% and 35.2%, respectively, in the Index, hurt performance. The aforementioned poor performance was somewhat offset by good stock selection in the Financials sector which added relative value. In the Financials sector, SEI Investments (up 34.9%) was the largest contributor. Not owning Banco Santander, which was down 34.1% in the Index, also positively impacted performance.
From a country allocation perspective, the Fund’s absence from Singapore and Norway, as well as its position in the United States, added relative value. The Fund’s lack of exposure to Denmark and Italy detracted from performance.
The sub-advisor continues to focus on uncovering opportunities by investing in a portfolio of securities that are generally less popular with investors but nevertheless have strong fundamental characteristics. At the same time, the portfolio will be underweight stocks that are heavily followed but have weak fundamentals. This contrarian style has tended to result in a portfolio with very good risk-adjusted returns over time. This emphasis on companies with good fundamentals can be observed through traditional measures of value. For example, the portfolio consistently exhibits price-earnings ratios (both forward and trailing) lower than the Index.
The predicted beta for the portfolio as of August 31st was 0.97, and over the past 12-months, the daily realized beta has been 0.95. Beta is a measure of the Fund’s systematic risk compared to the Index. For example, a beta of 0.90 would indicate that the Fund is expected to provide a 10% less return when the Index increases and a 10% better return when the Index decreases. The portfolio continues to have exposure to factors that the sub-advisor actively seeks. For example, the portfolio has negative exposure to stocks that are more popular (traded more frequently) and positive exposure to stocks with good quality and value characteristics. The sub-advisor’s strategy, and its resulting characteristics, should benefit the Fund’s performance over the longer term.
| | | | |
Top Ten Holdings (% Net Assets) | |
Exxon Mobil Corp. | | | 1.4 | |
Microsoft Corp. | | | 1.2 | |
Nestle S.A. | | | 1.1 | |
Roche Holding AG Genusschein | | | 1.1 | |
Johnson & Johnson | | | 1.1 | |
Wells Fargo & Co. | | | 1.1 | |
Wal-Mart Stores, Inc. | | | 1.0 | |
Tenaris S.A. | | | 1.0 | |
Zardoya Otis S.A. | | | 0.9 | |
Oracle Corp. | | | 0.9 | |
Total Fund Holdings | | | 228 | |
| | | | |
Sector Allocation (% Equities) | |
Consumer Discretionary | | | 16.5 | |
Financials | | | 16.3 | |
Information Technology | | | 13.6 | |
Industrials | | | 13.2 | |
Health Care | | | 10.4 | |
Consumer Staples | | | 9.7 | |
Energy | | | 8.9 | |
Materials | | | 5.3 | |
Utilities | | | 4.2 | |
Telecommunication Services | | | 1.9 | |
7
American Beacon Zebra Global Equity FundSM
Performance Overview
August 31, 2015 (Unaudited)
| | | | |
Country Allocation (% Equities) | |
United States | | | 55.1 | |
Japan | | | 9.3 | |
United Kingdom | | | 8.6 | |
Switzerland | | | 5.1 | |
France | | | 4.5 | |
Germany | | | 3.1 | |
Australia | | | 2.7 | |
Netherlands | | | 2.1 | |
Canada | | | 1.9 | |
Luxembourg | | | 1.6 | |
Spain | | | 1.6 | |
Ireland | | | 1.1 | |
Sweden | | | 1.1 | |
Hong Kong/China | | | 1.0 | |
Belgium | | | 0.6 | |
Finland | | | 0.4 | |
Cayman Islands | | | 0.1 | |
Austria | | | 0.1 | |
8
Domestic Equity Market Overview
August 31, 2015 (Unaudited)
U.S. economic news was generally positive during the 12-month period ended August 31, 2015, including rising consumer confidence, higher consumer spending, lower unemployment and a stable/improving housing market. U.S. gross domestic product (“GDP”) was positive each quarter over the past year with first quarter 2015 being the weakest. Poor weather, a strong dollar and a West Coast dock strike had a negative effect on first quarter 2015 results. GDP growth was more than 2% for the rest of the period.
The U.S. equity markets were roughly flat for the 12-month period. Stocks traded in a fairly narrow range most of the year, but then declined in August. Investors turned more negative late in the summer of 2015, reflecting a slowdown in the Chinese economy, the significant drop in oil prices and constant worries about when the U.S. Federal Reserve would finally start raising rates. While the U.S. economy remains in good shape, much of the rest of the world looks weaker.
Overall, for the period under review, there was very little differentiation across market-cap ranges. Most of the major indexes posted slightly positive gains: The S&P 500 Index increased 0.5%, the Russell 1000 Index increased 0.4%, the small-cap Russell 2000 Index rose 0.03% and the broader Russell 3000 Index rose 0.4%. Growth stocks outperformed value as the Russell 1000 Growth Index rose 4.3% while the Russell 1000 Value Index declined 3.5%. The best performing sectors were Health Care and Consumer Discretionary, while Energy and Materials lagged the overall market.
9
American Beacon Zebra Small Cap Equity FundSM
Performance Overview
August 31, 2015 (Unaudited)
The Investor Class of the American Beacon Zebra Small Cap Equity Fund (the “Fund”) returned 0.29% for the twelve-month period ended August 31, 2015, outperforming the Russell 2000® Index (the “Index”) return of 0.03% for the same period.
Comparison of Change in Value of a $10,000 Investment
For the Period from 6/1/10 through 8/31/15
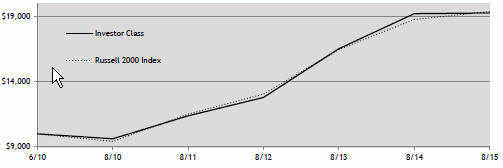
Total Returns for the Period ended 8/31/15
| | | | | | | | | | | | | | | | | | |
| | | Ticker | | 1 Year | | | 5 Years | | | Since Incep.
(6/1/10) | | | Value of $10,000
6/1/10-
8/31/15 | |
Institutional Class (1,3,5) | | AZSIX | | | 0.68 | % | | | 15.38 | % | | | 13.78 | % | | $ | 19,695 | |
Y Class (1,3,5) | | AZSYX | | | 0.54 | % | | | 15.28 | % | | | 13.67 | % | | $ | 19,589 | |
Investor Class(1,3,5) | | AZSPX | | | 0.29 | % | | | 14.94 | % | | | 13.35 | % | | $ | 19,302 | |
A Class with sales charge(1,3,5) | | AZSAX | | | (5.48 | )% | | | 13.51 | % | | | 11.99 | % | | $ | 18,119 | |
A Class without sales charge (1,3,5) | | AZSAX | | | 0.29 | % | | | 14.88 | % | | | 13.26 | % | | $ | 19,225 | |
C Class with sales charge(1,2,3,5) | | AZSCX | | | (1.48 | )% | | | 13.97 | % | | | 12.44 | % | | $ | 18,502 | |
C Class without sales charge (1,2,3,5) | | AZSCX | | | (0.48 | )% | | | 13.97 | % | | | 12.44 | % | | $ | 18,502 | |
Russell 2000 Index (4) | | | | | 0.03 | % | | | 15.55 | % | | | 13.46 | % | | $ | 19,412 | |
| 1. | Please note that the recent growth in the stock market has helped to produce short-term returns that are not typical and may not continue in the future. Performance shown is historical and is not indicative of future returns. Investment returns and principal value will vary, and shares may be worth more or less at redemption than at original purchase. Performance shown is calculated based on the published end of day net asset values as of date indicated, and current performance may be lower or higher than the performance data quoted. To obtain performance as of the most recent month end, please visit www.americanbeaconfunds.com or call 1-800-967-9009. Fund performance in the table above does not reflect the deduction of taxes a shareholder would pay on distributions or the redemption of shares. A Class shares have a maximum sales charge of 5.75%. |
| 2. | Fund performance represents the total returns achieved by the Investor Class from 6/1/10 up to 9/1/10, the inception date of the C Class, and the returns of the C Class since its inception. Expenses of the C Class are higher than those of the Investor Class. As a result, total returns shown may be higher than they would have been had the C Class been in existence since 6/1/10. The maximum contingent deferred sales charge is 1.00% for shares redeemed within one year of the date of purchase. |
| 3. | A portion of the fees charged to each Class of the Fund was waived since inception. Performance prior to waiving fees was lower than the actual returns shown since inception. |
| 4. | The Russell 2000 Index is an unmanaged index comprised of approximately 2,000 smaller-capitalization stocks from various industrial sectors. Russell 2000 Index is a registered trademark of the Frank Russell Company. One cannot directly invest in an index. |
| 5. | The total annual Fund operating expense ratio set forth in the most recent Fund prospectus for the Institutional, Y, Investor, A and C Class shares was 1.65%, 1.66%, 1.87%, 2.06%, and 2.82% respectively. The expense ratios above may vary from the expense ratios presented in other sections of this report that are based on expenses incurred during the period covered by this report. |
10
American Beacon Zebra Small Cap Equity FundSM
Performance Overview
August 31, 2015 (Unaudited)
The Fund outperformed the Index as both stock selection and sector allocation added relative value. From a stock selection standpoint, holdings in the Energy, Financials and Materials sectors contributed most to performance. In the Energy sector, not owning Helix Energy Solutions Group or Bonanza Creek Energy, which were down 74.6% and 87.5%, respectively, in the Index, positively impacted performance. In the Financials sector, Credit Acceptance (up 66.4%), Walker & Dunlop (up 79.2%) and Heartland Financial USA (up 55.2%) were the largest contributors. Not owning U.S. Silica Holdings or AK Steel Holdings, which were down 71.6% and 71.7%, respectively, in the Index, added relative value in the Materials sector. The Fund’s position in Innospec (up 13.1%) also contributed to performance. The aforementioned good performance was slightly offset by the Fund’s poor stock selection in the Health Care and Industrials sectors. In the Health Care sector, PDL BioPharma (down 38.1%) was the largest detractor. Not owning Anacor Pharmaceuticals, which was up 459.9% in the Index, also negatively impacted performance. West Corporation (down 17.7%), Altisource Portfolio Solutions (down 40.6%) and PHI (down 41.2%) detracted from the Fund’s returns in the Industrials sector.
The Fund’s underweight positions in Energy and Materials, the two worst performing sectors in the Index, contributed approximately 95 (0.95%) and 40 (0.40%) basis points, respectively, through sector allocation. Being overweight the Consumer Staples sector also contributed to the Fund’s returns. An underweight position in Health Care, the best performing sector in the Index and the Fund’s overweight in the Industrials sector, detracted relative value.
The sub-advisor continues to focus on uncovering opportunities by investing in a portfolio of securities that are generally less popular with investors but nevertheless have strong fundamental characteristics. At the same time the portfolio will be underweight stocks that are heavily followed but have weak fundamentals. This contrarian style has tended to result in a portfolio with very good risk-adjusted returns over time. This emphasis on companies with good fundamentals can be observed through traditional measures of value. For example, the portfolio consistently exhibits lower price-earnings ratios (both forward and trailing) than the Index.
Both the predicted and realized beta for the portfolio remain relatively low. Beta is a measure of the Fund’s systematic risk compared to the Index. For example, a beta of 0.90 would indicate that the Fund is expected to provide a 10% less return when the Index increases and a 10% better return when the Index decreases. As of August 31, 2015, the predicted beta was 0.89. Over the past 12-months, the daily realized beta has been 0.91. The portfolio continues to have exposure to factors that the sub-advisor actively seeks. For example, the portfolio has negative exposure to stocks that are traded more frequently and positive exposure to stocks with good value characteristics. The sub-advisor’s strategy, and its resulting characteristics, should benefit the Fund’s performance over the longer term.
| | | | |
Top Ten Holdings (% Net Assets) | |
Seaboard Corp. | | | 2.1 | |
Syntel, Inc. | | | 1.9 | |
Credit Acceptance Corp. | | | 1.7 | |
PDL BioPharma, Inc. | | | 1.5 | |
Columbia Sportswear Co. | | | 1.5 | |
Mentor Graphics Corp. | | | 1.4 | |
Enstar Group Ltd. | | | 1.4 | |
West Corp. | | | 1.3 | |
Intelsat S.A. | | | 1.2 | |
HSN, Inc. | | | 1.2 | |
Total Fund Holdings | | | 284 | |
11
American Beacon Zebra Small Cap Equity FundSM
Performance Overview
August 31, 2015 (Unaudited)
| | | | |
Sector Allocation (% Equities) | |
Financials | | | 29.7 | |
Information Technology | | | 16.2 | |
Industrials | | | 15.7 | |
Consumer Discretionary | | | 14.5 | |
Health Care | | | 11.0 | |
Consumer Staples | | | 5.4 | |
Materials | | | 3.0 | |
Utilities | | | 2.0 | |
Telecommunication Services | | | 1.9 | |
Energy | | | 0.6 | |
12
High Yield Bond Market Overview
August 31, 2015 (Unaudited)
For the 12-month period ended August 31, 2015, the BofA Merrill Lynch U.S. High Yield Master II Index (“the Index”) returned -3.07%. All of the negative return was due to the troubled Energy and Metals & Mining sectors. The price of West Texas Intermediate Crude Oil fell from approximately $93 per barrel at the beginning of the period to a low of approximately $39 per barrel and finished the period at approximately $49 per barrel. Almost all commodities in the Metals & Mining sector were under pressure for the year due to the slowdown in China. The Energy sector comprises 14% of the Index and returned -20% for the period. The Metals & Mining sector comprises 3.5% of the Index and returned -26% for the period. Excluding these two sectors, the Index gained 0.8% for the period.
For the period under review, high-yield bond market spreads widened from 400 basis points (4.00%) to 575 basis points (5.75%), while the Energy sector spread rose from 400 basis points (4.00%) to 960 basis points (9.60%), and the spread for the Metals & Mining sector rose from 515 basis points (5.15%) to 1,225 basis points (12.25%). Excluding those two sectors, the spread for the Index would have risen from 395 basis points (3.95%) to 490 basis points (4.90%). A spread of 490 basis points (4.90%) is essentially at the long-term median for the high-yield bond market.
An estimated $18 billion of outflows (about 5% of high-yield mutual fund assets) occurred during the period under review.
Even though the U.S. economy has been moving along fairly well, the widening of spreads (excluding Energy and Metals & Mining) was due to the inertia effect of those two troubled sectors on the rest of the market, uncertainties regarding the slowdown in China and emerging markets, and volatility around the U.S. Federal Reserve’s potential interest rate increase.
13
American Beacon SiM High Yield Opportunities FundSM
Performance Overview
August 31, 2015 (Unaudited)
The Investor Class of the American Beacon SiM High Yield Opportunities Fund (the “Fund”) returned -1.14% for the year ending August 31, 2015. The Fund outperformed the Bank of America Merrill Lynch U.S. High Yield Master II Index (the “Index”) which fell 3.06% during the same period.
Comparison of Change in Value of a $10,000 Investment
For the Period from 2/14/11 through 8/31/15
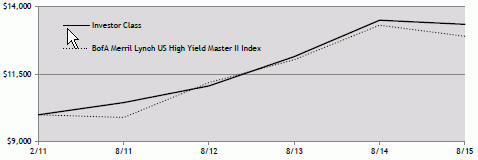
Total Returns for the Period ended 8/31/15
| | | | | | | | | | | | | | | | | | |
| | | Ticker | | 1 Year | | | 3 Years | | | Since Incep.
(2/14/11) | | | Value of
$10,000
2/14/11-8/31/15 | |
Institutional Class (1,2,4) | | SHOIX | | | (0.78 | )% | | | 6.81 | % | | | 7.01 | %�� | | $ | 13,603 | |
Y Class (1,2,4) | | SHOYX | | | (0.87 | )% | | | 6.70 | % | | | 6.87 | % | | $ | 13,522 | |
Investor Class(1,2,4) | | SHYPX | | | (1.14 | )% | | | 6.45 | % | | | 6.56 | % | | $ | 13,349 | |
A Class with sales charge (1,2,4) | | SHOAX | | | (5.99 | )% | | | 4.61 | % | | | 5.33 | % | | $ | 12,662 | |
A Class without sales charge(1,2,4) | | SHOAX | | | (1.27 | )% | | | 6.30 | % | | | 6.47 | % | | $ | 13,295 | |
C Class with sales charge(1,2,4) | | SHOCX | | | (2.98 | )% | | | 5.51 | % | | | 5.73 | % | | $ | 12,878 | |
C Class without sales charge(1,2,4) | | SHOCX | | | (1.98 | )% | | | 5.51 | % | | | 5.73 | % | | $ | 12,878 | |
BofA Merrill Lynch US High Yield Master II Index(3) | | | | | (3.06 | )% | | | 4.86 | % | | | 5.78 | % | | $ | 12,910 | |
| 1. | Performance shown is historical and is not indicative of future returns. Investment returns and principal value will vary, and shares may be worth more or less at redemption than at original purchase. Performance shown is calculated based on the published end of day net asset values as of date indicated, and current performance may be lower or higher than the performance data quoted. To obtain performance as of the most recent month end, please visit www.americanbeaconfunds.com or call 1-800-967-9009. Fund performance in the table above does not reflect the deduction of taxes a shareholder would pay on distributions or the redemption of shares. A Class shares have a maximum sales charge of 4.75%. The maximum contingent deferred sales charge for the C Class is 1.00% for shares redeemed within one year of the date of purchase. |
| 2. | A portion of the fees charged to the Institutional Class of the Fund has been waived since inception. Performance prior to waiving fees was lower than actual returns shown. A portion of the fees charged to the Investor Class of the Fund was waived in 2011 and 2012 and fully recovered in 2013. Performance prior to waiving fees was lower than actual returns shown in 2011 and 2012. A portion of the fees charged to the Y, A, and C Classes of the Fund was waived from 2011 through 2014 and partially recovered in 2015. Performance prior to waiving fees was lower than the actual returns shown from 2011 through 2014. |
| 3. | The BofA Merrill Lynch US High Yield Master II Index tracks the performance of U.S. dollar denominated below investment grade corporate debt publicly issued in the U.S. domestic market. Qualifying securities must have a below investment grade rating and an investment grade rated country of risk. In addition, qualifying securities must have at least one year remaining term to final maturity, a fixed coupon schedule and a minimum amount outstanding of $100 million. Defaulted securities and securities eligible for the dividends-received deduction are excluded from the Index. One cannot directly invest in an index. |
| 4. | The total annual Fund operating expense ratio set forth in the most recent Fund prospectus for the Institutional, Y, Investor, A, and C Class shares was 0.86%, 0.94%, 1.11%, 1.33%, and 2.08%, respectively. The expense ratios above may vary from the expense ratios presented in other sections of this report that are based on expenses incurred during the period covered by this report. |
From a sector allocation perspective, the Fund’s sizable underweight to the Energy sector added value to the Fund’s relative performance. The Energy sector was the worst performing sector during the period as it fell nearly 20%. Additionally, the Fund’s overweight to the Service sector aided positive relative returns.
14
American Beacon SiM High Yield Opportunities FundSM
Performance Overview
August 31, 2015 (Unaudited)
Issue selection within the Fund’s Manufacturing and Service sector holdings added to the Fund’s outperformance. On the other hand, holdings within the Fund’s Finance and Transportation sectors detracted from relative returns.
From a credit quality standpoint, the Fund benefited from strong security selection within the B, CCC and BB-rated credit categories.
From a credit quality allocation perspective, the Fund’s relative weightings within the high yield credit rating categories (BB, B, and CCC) were detrimental during the period. This was slightly offset by a small allocation to A-rated securities held by the Fund.
The Fund has the flexibility to utilize derivative instruments and will do so to enhance return, hedge risk, manage liquidity, or to gain efficient exposure to an asset class. When considering the Fund’s use of derivatives, it is important to note that the Fund does not use derivatives for the purpose of creating financial leverage. During the period, the Fund experienced modest losses from the use of derivatives.
The sub-advisor’s investment process of identifying long-term secular themes and seeking out of favor sectors through bottom-up fundamental research remains in place.
| | | | |
Top Ten Holdings (% Net Assets) | | | | |
CMA CGM S.A., 7.75%, Due 1/15/2021, 144A | | | 2.2 | |
ADS Tactical, Inc., 11.00%, Due 4/1/2018, 144A | | | 2.1 | |
Virgin Media Finance PLC, 6.375%, Due 4/15/2023, 144A | | | 2.1 | |
Sensata Technologies BV, 4.875%, Due 10/15/2023, 144A | | | 2.0 | |
Live Nation Entertainment, Inc., 7.00%, Due 9/1/2020, 144A | | | 2.0 | |
LifePoint Hospitals, Inc., 5.50%, Due 12/1/2021 | | | 1.9 | |
Tenet Healthcare Corp., 4.50%, Due 4/1/2021 | | | 1.9 | |
Orbital ATK, Inc., 5.25%, Due 10/1/2021 | | | 1.9 | |
Station Casinos LLC, 7.50%, Due 3/1/2021 | | | 1.8 | |
Sealed Air Corp., 6.50%, Due 12/1/2020, 144A | | | 1.7 | |
Total Fund Holdings | | | 87 | |
| |
Sector Allocation (% Investments) | | | | |
Service | | | 35.2 | |
Manufacturing | | | 23.8 | |
Transportation | | | 10.8 | |
Consumer | | | 8.5 | |
Finance | | | 5.1 | |
Telecommunications | | | 5.1 | |
Energy | | | 5.0 | |
Utilities | | | 2.2 | |
Short-Term Investments | | | 1.9 | |
Sovereign | | | 1.3 | |
Financials | | | 0.9 | |
Materials | | | 0.2 | |
15
American Beacon SiM High Yield Opportunities FundSM
Performance Overview
August 31, 2015 (Unaudited)
| | | | |
Country Allocation (% Fixed Income) | | | | |
United States | | | 72.2 | |
United Kingdom | | | 5.7 | |
Canada | | | 4.6 | |
France | | | 3.7 | |
Luxembourg | | | 3.0 | |
Mexico | | | 2.2 | |
Netherlands | | | 2.1 | |
Cyprus | | | 1.8 | |
Bermuda | | | 1.5 | |
Italy | | | 1.2 | |
Spain | | | 0.9 | |
Brazil | | | 0.5 | |
Greece | | | 0.4 | |
Norway | | | 0.2 | |
S&P credit ratings for long-term obligations (or issuers thereof) are AAA, AA, A, BBB, BB, B, CCC, CC, C, and D in decreasing order. For example, obligations rated AAA are judged to be of the highest quality, BBB to be of medium grade, CCC are judged to be speculative and obligations rated D are in default. Obligations rated in one of the four highest categories are considered to be investment grade while all other ratings are considered non-investment grade.
16
American Beacon FundsSM
Fund Expenses
August 31, 2015 (Unaudited)
Fund Expense Example
As a shareholder of the Fund, you incur two types of costs: (1) transaction costs including sales charges (loads) on purchased shares and (2) ongoing costs, including management fees, administrative service fees, distribution (12b-1) fees, and other Fund expenses. The examples below are intended to help you understand the ongoing cost (in dollars) of investing in the Fund and to compare these costs with the ongoing costs of investing in other mutual funds. The examples are based on an investment of $1,000 invested at the beginning of the period in each Class and held for the entire period from March 1, 2015 through August 31, 2015.
Actual Expenses
The “Actual” lines of the table provide information about actual account values and actual expenses. You may use the information in this line, together with the amount you invested, to estimate the expenses that you paid over the period. Simply divide your account value by $1,000 (for example, an $8,600 account value divided by $1,000 = 8.6), then multiply the result by the number in the first line under the heading “Expenses Paid During Period” to estimate the expenses you paid on your account during this period. Shareholders of the Investor and Institutional Classes that invest in the Fund through an IRA or Roth IRA may be subject to a custodial IRA fee of $15 that is typically deducted each December. If your account was subject to a custodial IRA fee during the period, your costs would have been $15 higher.
Hypothetical Example for Comparison Purposes
The “Hypothetical” lines of the table provide information about hypothetical account values and hypothetical expenses based on the Fund’s actual expense ratio and an assumed 5% per year rate of return before expenses (not the Fund’s actual return). You may compare the ongoing costs of investing in the Fund with other funds by contrasting this 5% hypothetical example and the 5% hypothetical examples that appear in the shareholder reports of the other funds. The hypothetical account values and expenses may not be used to estimate the actual ending account balance or expenses you paid for the period. Shareholders of the Investor and Institutional Classes that invest in the Fund through an IRA or Roth IRA may be subject to a custodial IRA fee of $15 that is typically deducted each December. If your account was subject to a custodial IRA fee during the period, your costs would have been $15 higher.
You should also be aware that the expenses shown in the table highlight only your ongoing costs and do not reflect any transaction costs charged by the Fund. Similarly, the expense examples for other funds do not reflect any transaction costs charged by those funds, such as sales charges (loads), redemption fees or exchange fees. Therefore, the “Hypothetical” lines of the table are useful in comparing ongoing costs only and will not help you determine the relative total costs of owning different funds. If you were subject to any transaction costs during the period, your costs would have been higher.
17
American Beacon FundsSM
Fund Expenses
August 31, 2015 (Unaudited)
The London Company Income Equity Fund
| | | | | | | | | | | | |
| | | Beginning
Account
Value
3/1/15 | | | Ending
Account
Value
8/31/15 | | | Expenses Paid
During Period*
3/1/15 - 8/31/15 | |
Institutional Class | | | | | | | | | | | | |
Actual | | $ | 1,000.00 | | | $ | 926.90 | | | $ | 3.84 | |
Hypothetical ** | | $ | 1,000.00 | | | $ | 1,021.22 | | | $ | 4.02 | |
Y Class | | | | | | | | | | | | |
Actual | | $ | 1,000.00 | | | $ | 927.05 | | | $ | 3.98 | |
Hypothetical ** | | $ | 1,000.00 | | | $ | 1,021.07 | | | $ | 4.18 | |
Investor Class | | | | | | | | | | | | |
Actual | | $ | 1,000.00 | | | $ | 925.78 | | | $ | 5.58 | |
Hypothetical ** | | $ | 1,000.00 | | | $ | 1,019.41 | | | $ | 5.85 | |
A Class | | | | | | | | | | | | |
Actual | | $ | 1,000.00 | | | $ | 925.21 | | | $ | 5.68 | |
Hypothetical ** | | $ | 1,000.00 | | | $ | 1,019.31 | | | $ | 5.96 | |
C Class | | | | | | | | | | | | |
Actual | | $ | 1,000.00 | | | $ | 922.30 | | | $ | 9.06 | |
Hypothetical ** | | $ | 1,000.00 | | | $ | 1,015.78 | | | $ | 9.50 | |
| * | Expenses are equal to the Fund’s annualized expense ratios for the six-month period of 0.79%, 0.82%, 1.15%, 1.17%, and 1.87% for the Institutional, Y, Investor, A, and C Classes respectively, multiplied by the average account value over the period, multiplied by the number derived by dividing the number of days in the most recent fiscal half-year (184) by days in the year (365) to reflect the half-year period. |
| ** | 5% return before expenses. |
Zebra Global Equity Fund
| | | | | | | | | | | | |
| | | Beginning
Account
Value
3/1/15 | | | Ending
Account
Value
8/31/15 | | | Expenses Paid
During Period*
3/1/15 - 8/31/15 | |
Institutional Class | | | | | | | | | | | | |
Actual | | $ | 1,000.00 | | | $ | 921.17 | | | $ | 3.83 | |
Hypothetical ** | | $ | 1,000.00 | | | $ | 1,021.22 | | | $ | 4.02 | |
Y Class | | | | | | | | | | | | |
Actual | | $ | 1,000.00 | | | $ | 920.85 | | | $ | 4.31 | |
Hypothetical ** | | $ | 1,000.00 | | | $ | 1,020.72 | | | $ | 4.53 | |
Investor Class | | | | | | | | | | | | |
Actual | | $ | 1,000.00 | | | $ | 918.37 | | | $ | 5.66 | |
Hypothetical ** | | $ | 1,000.00 | | | $ | 1,019.31 | | | $ | 5.96 | |
A Class | | | | | | | | | | | | |
Actual | | $ | 1,000.00 | �� | | $ | 918.21 | | | $ | 5.75 | |
Hypothetical ** | | $ | 1,000.00 | | | $ | 1,019.21 | | | $ | 6.06 | |
C Class | | | | | | | | | | | | |
Actual | | $ | 1,000.00 | | | $ | 915.33 | | | $ | 9.37 | |
Hypothetical ** | | $ | 1,000.00 | | | $ | 1,015.43 | | | $ | 9.86 | |
| * | Expenses are equal to the Fund’s annualized expense ratios for the six-month period of 0.79%, 0.89%, 1.17%, 1.19%, and 1.94% for the Institutional, Y, Investor, A, and C Classes respectively, multiplied by the average account value over the period, multiplied by the number derived by dividing the number of days in the most recent fiscal half-year (184) by days in the year (365) to reflect the half-year period. |
| ** | 5% return before expenses. |
Zebra Small Cap Equity Fund
| | | | | | | | | | | | |
| | | Beginning
Account
Value
3/1/15 | | | Ending
Account
Value
8/31/15 | | | Expenses Paid
During Period*
3/1/15 - 8/31/15 | |
Institutional Class | | | | | | | | | | | | |
Actual | | $ | 1,000.00 | | | $ | 960.78 | | | $ | 4.94 | |
Hypothetical ** | | $ | 1,000.00 | | | $ | 1,020.16 | | | $ | 5.09 | |
Y Class | | | | | | | | | | | | |
Actual | | $ | 1,000.00 | | | $ | 960.45 | | | $ | 5.44 | |
Hypothetical ** | | $ | 1,000.00 | | | $ | 1,019.66 | | | $ | 5.60 | |
Investor Class | | | | | | | | | | | | |
Actual | | $ | 1,000.00 | | | $ | 959.51 | | | $ | 6.77 | |
Hypothetical ** | | $ | 1,000.00 | | | $ | 1,018.30 | | | $ | 6.97 | |
A Class | | | | | | | | | | | | |
Actual | | $ | 1,000.00 | | | $ | 959.51 | | | $ | 6.91 | |
Hypothetical ** | | $ | 1,000.00 | | | $ | 1,018.15 | | | $ | 7.12 | |
C Class | | | | | | | | | | | | |
Actual | | $ | 1,000.00 | | | $ | 955.71 | | | $ | 10.60 | |
Hypothetical ** | | $ | 1,000.00 | | | $ | 1,014.37 | | | $ | 10.92 | |
| * | Expenses are equal to the Fund’s annualized expense ratios for the six-month period of 1.00%, 1.10%, 1.37%, 1.40%, and 2.15% for the Institutional, Y, Investor, A, and C Classes respectively, multiplied by the average account value over the period, multiplied by the number derived by dividing the number of days in the most recent fiscal half-year (184) by days in the year (365) to reflect the half-year period. |
| ** | 5% return before expenses. |
SiM High Yield Opportunities Fund
| | | | | | | | | | | | |
| | | Beginning
Account
Value
3/1/15 | | | Ending
Account
Value
8/31/15 | | | Expenses Paid
During Period*
3/1/15 - 8/31/15 | |
Institutional Class | | | | | | | | | | | | |
Actual | | $ | 1,000.00 | | | $ | 981.14 | | | $ | 4.19 | |
Hypothetical ** | | $ | 1,000.00 | | | $ | 1,020.97 | | | $ | 4.28 | |
Y Class | | | | | | | | | | | | |
Actual | | $ | 1,000.00 | | | $ | 981.71 | | | $ | 4.60 | |
Hypothetical ** | | $ | 1,000.00 | | | $ | 1,020.57 | | | $ | 4.69 | |
Investor Class | | | | | | | | | | | | |
Actual | | $ | 1,000.00 | | | $ | 980.31 | | | $ | 5.89 | |
Hypothetical ** | | $ | 1,000.00 | | | $ | 1,019.26 | | | $ | 6.01 | |
A Class | | | | | | | | | | | | |
Actual | | $ | 1,000.00 | | | $ | 979.17 | | | $ | 6.19 | |
Hypothetical ** | | $ | 1,000.00 | | | $ | 1,018.95 | | | $ | 6.31 | |
C Class | | | | | | | | | | | | |
Actual | | $ | 1,000.00 | | | $ | 975.68 | | | $ | 9.91 | |
Hypothetical ** | | $ | 1,000.00 | | | $ | 1,015.17 | | | $ | 10.11 | |
| * | Expenses are equal to the Fund’s annualized expense ratios for the six-month period of 0.84%, 0.92%, 1.18%, 1.24%, and 1.99% for the Institutional, Y, Investor, A, and C Classes respectively, multiplied by the average account value over the period, multiplied by the number derived by dividing the number of days in the most recent fiscal half-year (184) by days in the year (365) to reflect the half-year period. |
| ** | 5% return before expenses. |
18
American Beacon FundsSM
Report of Independent Registered Public Accounting Firm
To the Shareholders and the Board of Trustees of
American Beacon The London Company Income Equity Fund, American Beacon Zebra Global Equity Fund, American Beacon Zebra Small Cap Equity Fund, and American Beacon SiM High Yield Opportunities Fund:
We have audited the accompanying statements of assets and liabilities, including the schedules of investments, of American Beacon The London Company Income Equity Fund, American Beacon Zebra Global Equity Fund, American Beacon Zebra Small Cap Equity Fund and American Beacon SiM High Yield Opportunities Fund (four of the funds constituting the American Beacon Funds) (collectively, the “Funds”), as of August 31, 2015, and the related statements of operations for the year then ended, the statements of changes in net assets for each of the two years in the period then ended, and the financial highlights for each of the periods indicated therein. These financial statements and financial highlights are the responsibility of the Funds’ management. Our responsibility is to express an opinion on these financial statements and financial highlights based on our audits.
We conducted our audits in accordance with the standards of the Public Company Accounting Oversight Board (United States). Those standards require that we plan and perform the audit to obtain reasonable assurance about whether the financial statements and financial highlights are free of material misstatement. We were not engaged to perform an audit of the Funds’ internal control over financial reporting. Our audits included consideration of internal control over financial reporting as a basis for designing audit procedures that are appropriate in the circumstances, but not for the purpose of expressing an opinion on the effectiveness of the Funds’ internal control over financial reporting. Accordingly, we express no such opinion. An audit also includes examining, on a test basis, evidence supporting the amounts and disclosures in the financial statements and financial highlights, assessing the accounting principles used and significant estimates made by management, and evaluating the overall financial statement presentation. Our procedures included confirmation of securities owned as of August 31, 2015, by correspondence with the custodian and brokers or by other appropriate auditing procedures where replies from brokers were not received. We believe that our audits provide a reasonable basis for our opinion.
In our opinion, the financial statements and financial highlights referred to above present fairly, in all material respects, the financial position of American Beacon The London Company Income Equity Fund, American Beacon Zebra Global Equity Fund, American Beacon Zebra Small Cap Equity Fund and American Beacon SiM High Yield Opportunities Fund at August 31, 2015, the results of their operations for the year then ended, the changes in their net assets for each of the two years in the period then ended, and the financial highlights for each of the periods indicated therein in conformity with U.S. generally accepted accounting principles.

Dallas, Texas
October 30, 2015
19
American Beacon The London Company Income Equity FundSM
Schedule of Investments
August 31, 2015
| | | | | | | | |
| | | Shares | | | Fair Value | |
| | | | | | (000’s) | |
COMMON STOCK - 96.96% | | | | | | | | |
CONSUMER DISCRETIONARY - 12.15% | |
Hotels, Restaurants & Leisure - 3.55% | | | | | |
Carnival Corp. | | | 517,220 | | | $ | 25,463 | |
| | | | | | | | |
Leisure Equipment & Products - 4.72% | |
Hasbro, Inc. | | | 454,127 | | | | 33,873 | |
| | | | | | | | |
Specialty Retail - 3.88% | | | | | | | | |
Lowe’s Cos., Inc. | | | 401,963 | | | | 27,804 | |
| | | | | | | | |
Total Consumer Discretionary | | | | | | | 87,140 | |
| | | | | | | | |
CONSUMER STAPLES - 10.50% | | | | | | | | |
Beverages - 1.83% | | | | | | | | |
Coca-Cola Co. | | | 334,520 | | | | 13,153 | |
| | | | | | | | |
Tobacco - 8.67% | | | | | | | | |
Altria Group, Inc. | | | 576,750 | | | | 30,902 | |
Reynolds American, Inc. | | | 372,731 | | | | 31,217 | |
| | | | | | | | |
| | | | | | | 62,119 | |
| | | | | | | | |
Total Consumer Staples | | | | | | | 75,272 | |
| | | | | | | | |
ENERGY - 7.70% | | | | | | | | |
Oil & Gas - 7.70% | | | | | | | | |
Chevron Corp. | | | 142,506 | | | | 11,542 | |
ConocoPhillips | | | 301,039 | | | | 14,796 | |
Kinder Morgan, Inc. | | | 892,395 | | | | 28,922 | |
| | | | | | | | |
Total Energy | | | | | | | 55,260 | |
| | | | | | | | |
FINANCIALS - 17.03% | | | | | | | | |
Diversified Financials - 10.82% | | | | | | | | |
BlackRock, Inc., Class A | | | 77,322 | | | | 23,388 | |
Federated Investors, Inc., Class B | | | 757,490 | | | | 23,482 | |
Wells Fargo & Co. | | | 577,196 | | | | 30,782 | |
| | | | | | | | |
| | | | | | | 77,652 | |
| | | | | | | | |
Insurance - 2.85% | | | | | | | | |
Cincinnati Financial Corp. | | | 390,321 | | | | 20,425 | |
| | | | | | | | |
Real Estate - 3.36% | | | | | | | | |
Communications Sales & Leasing, Inc.A | | | 425,456 | | | | 8,552 | |
Corrections Corp. of AmericaA | | | 527,970 | | | | 15,511 | |
| | | | | | | | |
| | | | | | | 24,063 | |
| | | | | | | | |
Total Financials | | | | | | | 122,140 | |
| | | | | | | | |
HEALTH CARE - 10.35% | | | | | | | | |
Pharmaceuticals - 10.35% | | | | | | | | |
Bristol-Myers Squibb Co. | | | 359,755 | | | | 21,395 | |
Eli Lilly & Co. | | | 332,028 | | | | 27,343 | |
Pfizer, Inc. | | | 791,323 | | | | 25,496 | |
| | | | | | | | |
Total Health Care | | | | | | | 74,234 | |
| | | | | | | | |
INDUSTRIALS - 12.40% | | | | | | | | |
Aerospace & Defense - 4.76% | | | | | | | | |
General Dynamics Corp. | | | 239,965 | | | | 34,082 | |
| | | | | | | | |
Industrial Conglomerates - 4.18% | | | | | | | | |
General Electric Co. | | | 1,208,900 | | | | 30,005 | |
| | | | | | | | |
Road & Rail - 3.46% | | | | | | | | |
Norfolk Southern Corp. | | | 318,500 | | | | 24,814 | |
| | | | | | | | |
Total Industrials | | | | | | | 88,901 | |
| | | | | | | | |
| | | | | | | | |
| | | Shares | | | Fair Value | |
| | | | | | (000’s) | |
INFORMATION TECHNOLOGY - 16.26% | |
Communications Equipment - 5.53% | | | | | |
Cisco Systems, Inc. | | | 758,220 | | | $ | 19,623 | |
Corning, Inc. | | | 1,163,010 | | | | 20,015 | |
| | | | | | | | |
| | | | | | | 39,638 | |
| | | | | | | | |
IT Consulting & Services - 2.21% | |
Paychex, Inc. | | | 354,581 | | | | 15,836 | |
| | | | | | | | |
Semiconductor Equipment & Products - 2.99% | | | | | | | | |
Intel Corp. | | | 751,961 | | | | 21,461 | |
| | | | | | | | |
Software - 5.53% | | | | | | | | |
CA, Inc. | | | 811,030 | | | | 22,133 | |
Microsoft Corp. | | | 403,958 | | | | 17,580 | |
| | | | | | | | |
| | | | | | | 39,713 | |
| | | | | | | | |
Total Information Technology | | | | | | | 116,648 | |
| | | | | | | | |
MATERIALS - 5.37% | | | | | | | | |
Chemicals - 5.37% | | | | | | | | |
NewMarket Corp. | | | 47,251 | | | | 18,108 | |
The Mosaic Co. | | | 500,530 | | | | 20,437 | |
| | | | | | | | |
Total Materials | | | | | | | 38,545 | |
| | | | | | | | |
TELECOMMUNICATION SERVICES - 1.84% | |
Diversified Telecommunication Services - 1.84% | | | | | | | | |
Verizon Communications, Inc. | | | 286,894 | | | | 13,200 | |
| | | | | | | | |
UTILITIES - 3.36% | | | | | | | | |
Electric - 3.36% | | | | | | | | |
Dominion Resources, Inc. | | | 154,128 | | | | 10,750 | |
Duke Energy Corp. | | | 188,031 | | | | 13,334 | |
| | | | | | | | |
Total Utilities | | | | | | | 24,084 | |
| | | | | | | | |
Total Common Stock (Cost $692,707) | | | | | | | 695,424 | |
| | | | | | | | |
SHORT-TERM INVESTMENTS - 2.50% (Cost $17,901) | | | | | |
JPMorgan U.S. Government Money Market Fund, Capital Class | | | 17,901,062 | | | | 17,901 | |
| | | | | | | | |
TOTAL INVESTMENTS - 99.46% (Cost $710,608) | | | | 713,325 | |
OTHER ASSETS, NET OF LIABILITIES - 0.54% | | | | | | | 3,891 | |
| | | | | | | | |
TOTAL NET ASSETS - 100.00% | | | | | | $ | 717,216 | |
| | | | | | | | |
Percentages are stated as a percent of net assets.
| A | REIT - Real Estate Investment Trust. |
See accompanying notes
20
American Beacon The London Company Income Equity FundSM
Schedule of Investments
August 31, 2015
Futures Contracts Open on August 31, 2015:
| | | | | | | | | | | | | | | | |
Description | | Type | | | Number of
Contracts | | Expiration Date | | Contract Value | | | Unrealized
Appreciation
(Depreciation) | |
S&P 500 Mini E Index September Futures | | | Long | | | 169 | | September 2015 | | $ | 16,639,740 | | | $ | (416,446 | ) |
| | | | | | | | | | | | | | | | |
| | | | | | | | | | $ | 16,639,740 | | | $ | (416,446 | ) |
| | | | | | | | | | | | | | | | |
See accompanying notes
21
American Beacon Zebra Global Equity FundSM
Schedule of Investments
August 31, 2015
| | | | | | | | |
| | | Shares | | | Fair Value | |
| | | | | | (000’s) | |
Australia - 2.57% | |
Common Stock - (Cost $180) | |
ALS Ltd.A | | | 2,365 | | | $ | 9 | |
Australia & New Zealand Banking Group Ltd., ADRA B | | | 682 | | | | 14 | |
Bendigo & Adelaide Bank Ltd.A | | | 822 | | | | 6 | |
BHP Billiton Ltd., ADRA B | | | 698 | | | | 13 | |
CSL Ltd.A | | | 152 | | | | 10 | |
Goodman GroupA C | | | 2,019 | | | | 9 | |
National Australia Bank Ltd.A | | | 618 | | | | 14 | |
Orica Ltd.A | | | 523 | | | | 6 | |
South32 Ltd.A E | | | 872 | | | | 1 | |
Tabcorp Holdings Ltd.A | | | 2,012 | | | | 7 | |
Wesfarmers LimitedA | | | 471 | | | | 13 | |
Westpac Banking Corp.A | | | 696 | | | | 14 | |
Woolworths Holdings Ltd.A | | | 629 | | | | 12 | |
| | | | | | | | |
Total Australia | | | | 128 | |
| | | | | | | | |
Austria - 0.06% | |
Common Stock - (Cost $4) | |
Voestalpine AG A | | | 93 | | | | 3 | |
| | | | | | | | |
Belgium - 0.56% | |
Common Stock - (Cost $32) | |
Colruyt S.A.A | | | 304 | | | | 15 | |
Groupe Bruxelles Lambert S.A.A | | | 173 | | | | 13 | |
| | | | | | | | |
Total Belgium | | | | 28 | |
| | | | | | | | |
Canada - 1.87% | |
Common Stock - (Cost $111) | |
BCE, Inc. | | | 354 | | | | 14 | |
Imperial Oil Ltd. | | | 306 | | | | 11 | |
Magna International, Inc., Class A | | | 472 | | | | 23 | |
Potash Corp of Saskatchewan, Inc. | | | 827 | | | | 22 | |
Suncor Energy, Inc. | | | 835 | | | | 23 | |
| | | | | | | | |
Total Canada | | | | 93 | |
| | | | | | | | |
Finland - 0.34% | |
Common Stock - (Cost $15) | |
Orion Corp., Class BA | | | 287 | | | | 11 | |
Wartsila OYJ AbpA | | | 144 | | | | 6 | |
| | | | | | | | |
Total Finland | | | | 17 | |
| | | | | | | | |
France - 4.36% | |
Common Stock - (Cost $230) | |
Air Liquide S.A.A | | | 204 | | | | 24 | |
Christian Dior SEA | | | 100 | | | | 18 | |
Cie Generale des Etablissements MichelinA | | | 204 | | | | 20 | |
CNP AssurancesA | | | 987 | | | | 15 | |
Imerys S.A.A | | | 233 | | | | 16 | |
KlepierreA C | | | 264 | | | | 12 | |
Legrand S.A.A | | | 280 | | | | 16 | |
Scor SE, ADRA B | | | 600 | | | | 21 | |
Societe BIC S.A., ADRA B | | | 119 | | | | 19 | |
Total S.A.A | | | 897 | | | | 42 | |
Zodiac AerospaceA | | | 478 | | | | 14 | |
| | | | | | | | |
Total France | | | | 217 | |
| | | | | | | | |
| | | | | | | | |
| | | Shares | | | Fair Value | |
| | | | | | (000’s) | |
Germany - 3.04% | |
Common Stock - (Cost $80) | |
Brenntag AGA | | | 451 | | | $ | 25 | |
Henkel AG & Co., KGaAA | | | 286 | | | | 26 | |
Volkswagen AGA | | | 116 | | | | 22 | |
| | | | | | | | |
Total Common Stock | | | | 73 | |
| | | | | | | | |
Preferred Stock - (Cost $96) | |
Bayerische Motoren Werke AGA D | | | 345 | | | | 25 | |
Fuchs Petrolub SEA D | | | 612 | | | | 26 | |
Porsche Automobil Holding SEA D | | | 376 | | | | 27 | |
| | | | | | | | |
Total Preferred Stock | | | | 78 | |
| | | | | | | | |
Total Germany | | | | 151 | |
| | | | | | | | |
Hong Kong/China - 1.09% | |
Common Stock - (Cost $67) | |
ASM Pacific Technology Ltd.A | | | 700 | | | | 5 | |
Cheung Kong Property Holdings Ltd.A | | | 500 | | | | 4 | |
CK Hutchison Holdings Ltd.A | | | 500 | | | | 7 | |
First Pacific Co., Ltd.A | | | 8,000 | | | | 5 | |
Hang Lung Properties Ltd.A | | | 3,000 | | | | 6 | |
Hang Seng Bank Ltd.A | | | 500 | | | | 9 | |
Hopewell Highway Infrastructure Ltd.A | | | 125 | | | | 0 | |
MGM China Holdings Ltd.A | | | 4,000 | | | | 7 | |
PCCW Ltd.A | | | 12,000 | | | | 6 | |
SJM Holdings Ltd.A | | | 5,000 | | | | 5 | |
| | | | | | | | |
Total Hong Kong/China | | | | 54 | |
| | | | | | | | |
Ireland - 1.03% | |
Common Stock - (Cost $54) | |
Accenture, PLC, Class AF | | | 309 | | | | 29 | |
Seagate Technology, PLCF | | | 429 | | | | 22 | |
| | | | | | | | |
Total Ireland | | | | 51 | |
| | | | | | | | |
Japan - 8.99% | |
Common Stock - (Cost $465) | |
Air Water, Inc.A | | | 1,000 | | | | 16 | |
Asahi Kasei Corp.A | | | 2,000 | | | | 16 | |
Bridgestone Corp.A | | | 500 | | | | 17 | |
Brother Industries Ltd.A | | | 1,100 | | | | 15 | |
Canon, Inc.A | | | 700 | | | | 20 | |
Central Japan Railway Co.A | | | 100 | | | | 16 | |
Chugoku Bank Ltd.A | | | 800 | | | | 12 | |
Daiichi Sankyo Co., Ltd.A | | | 800 | | | | 15 | |
Fujitsu Ltd.A | | | 2,000 | | | | 10 | |
GungHo Online Entertainment Inc.A | | | 4,000 | | | | 12 | |
Hiroshima Bank Ltd.A | | | 2,000 | | | | 11 | |
Hitachi Ltd.A | | | 3,000 | | | | 17 | |
Hokuhoku Financial Group Inc.A | | | 5,000 | | | | 11 | |
Honda Motor Co., Ltd.A | | | 600 | | | | 19 | |
Hoya Corp.A | | | 300 | | | | 12 | |
IYO Bank Ltd.A | | | 800 | | | | 9 | |
Japan Tobacco, Inc.A | | | 500 | | | | 18 | |
Konica Minolta, Inc.A | | | 900 | | | | 10 | |
Miraca Holdings, Inc.A | | | 200 | | | | 9 | |
Mitsubishi Corp.A | | | 800 | | | | 15 | |
Mitsubishi Electric Corp.A | | | 1,000 | | | | 10 | |
Mixi, Inc.A | | | 200 | | | | 7 | |
NEC Corp.A | | | 4,000 | | | | 12 | |
Omron Corp.A | | | 200 | | | | 7 | |
Osaka Gas Co., Ltd.A | | | 4,000 | | | | 16 | |
Otsuka Holdings Co., Ltd.A | | | 500 | | | | 17 | |
See accompanying notes
22
American Beacon Zebra Global Equity FundSM
Schedule of Investments
August 31, 2015
| | | | | | | | |
| | | Shares | | | Fair Value | |
| | | | | | (000’s) | |
Ricoh Co., Ltd.A | | | 1,500 | | | $ | 15 | |
Seiko Epson Corp.A | | | 600 | | | | 10 | |
Sekisui Chemical Co., Ltd.A | | | 1,000 | | | | 11 | |
Sumitomo Rubber Industries Ltd.A | | | 600 | | | | 8 | |
Toho Gas Co., Ltd.A | | | 2,000 | | | | 12 | |
Tohoku Electric Power Co., Inc.A | | | 900 | | | | 12 | |
Tokyo Gas Co., Ltd.A | | | 3,000 | | | | 17 | |
Yamaguchi FinancialA | | | 1,000 | | | | 13 | |
| | | | | | | | |
Total Japan | | | | 447 | |
| | | | | | | | |
Luxembourg - 1.55% | | | | | | | | |
Common Stock - (Cost $94) | | | | | | | | |
Millicom International Cellular S.A.A | | | 129 | | | | 9 | |
RTL Group S.A.A | | | 238 | | | | 21 | |
Tenaris S.A.A | | | 3,616 | | | | 47 | |
| | | | | | | | |
Total Luxembourg | | | | 77 | |
| | | | | | | | |
Netherlands - 2.03% | | | | | | | | |
Common Stock - (Cost $101) | | | | | | | | |
Heineken Holding N.V.A | | | 179 | | | | 12 | |
Koninklijke Philips N.V.A | | | 979 | | | | 19 | |
LyondellBasell Industries N.V., Class A | | | 309 | | | | 26 | |
Unilever N.V., CVA, GDRA G H | | | 677 | | | | 28 | |
Wolters Kluwer N.V.A | | | 511 | | | | 16 | |
| | | | | | | | |
Total Netherlands | | | | 101 | |
| | | | | | | | |
Spain - 1.53% | | | | | | | | |
Common Stock - (Cost $89) | | | | | | | | |
ACS Actividades de Construccion y Servicios S.A.A | | | 934 | | | | 30 | |
Zardoya Otis S.A.A | | | 4,260 | | | | 46 | |
| | | | | | | | |
Total Spain | | | | 76 | |
| | | | | | | | |
Sweden - 1.11% | | | | | | | | |
Common Stock - (Cost $57) | | | | | | | | |
Atlas Copco ABA | | | 358 | | | | 8 | |
Hennes & Mauritz AB,
Class BA | | | 337 | | | | 13 | |
Investor AB, Class BA | | | 328 | | | | 12 | |
Nordea Bank ABA E | | | 1,118 | | | | 13 | |
Swedish Match ABA | | | 292 | | | | 9 | |
| | | | | | | | |
Total Sweden | | | | 55 | |
| | | | | | | | |
Switzerland - 4.95% | | | | | | | | |
Common Stock - (Cost $253) | | | | | | | | |
ACE Ltd. | | | 240 | | | | 25 | |
Garmin Ltd. | | | 639 | | | | 24 | |
Kuehne + Nagel International AG, Reg SA I | | | 100 | | | | 13 | |
Nestle S.A., Reg SA I | | | 761 | | | | 55 | |
Pargesa Holding S.A.A | | | 217 | | | | 13 | |
Roche Holding AG GenusscheinA | | | 200 | | | | 54 | |
Schindler Holding AGA | | | 92 | | | | 14 | |
Schindler Holding AG, Reg SA I | | | 108 | | | | 17 | |
Sika AG BRA | | | 5 | | | | 17 | |
Swatch Groug AG, Reg SA I | | | 184 | | | | 14 | |
| | | | | | | | |
Total Switzerland | | | | 246 | |
| | | | | | | | |
United Kingdom - 8.33% | | | | | | | | |
Common Stock - (Cost $461) | | | | | | | | |
3i Group PLCA F | | | 2,116 | | | | 16 | |
Aggreko PLCA F | | | 552 | | | | 9 | |
| | | | | | | | |
| | | Shares | | | Fair Value | |
| | | | | | (000’s) | |
AstraZeneca PLC ADRA B F | | | 451 | | | $ | 28 | |
Aviva PLCA F | | | 2,418 | | | | 18 | |
BAE Systems PLCA F | | | 2,493 | | | | 18 | |
British American Tobacco PLCA F | | | 634 | | | | 34 | |
BT Group PLCA F | | | 3,620 | | | | 24 | |
Bunzl PLCA F | | | 539 | | | | 14 | |
Centrica PLCA F | | | 4,374 | | | | 16 | |
GKN PLCA F | | | 2,391 | | | | 11 | |
GlaxoSmithKline PLCA F | | | 1,629 | | | | 34 | |
HSBC Holdings PLCA F | | | 5,003 | | | | 39 | |
IMI PLCA F | | | 822 | | | | 13 | |
Kingfisher PLCA F | | | 2,895 | | | | 16 | |
Marks & Spencer Group PLCA F | | | 1,966 | | | | 16 | |
National Grid PLCA F | | | 1,255 | | | | 16 | |
Next PLCA F | | | 156 | | | | 19 | |
Royal Dutch Shell PLC, Class AA F | | | 1,274 | | | | 33 | |
Sage Group PLCA F | | | 1,330 | | | | 10 | |
Smiths Group PLCA F | | | 900 | | | | 15 | |
Travis Perkins PLCA F | | | 497 | | | | 15 | |
| | | | | | | | |
Total United Kingdom | | | | 414 | |
| | | | | | | | |
United States - 53.53% | | | | | | | | |
Common Stock - (Cost $2,702) | | | | | | | | |
3M Co. | | | 265 | | | | 38 | |
AbbVie, Inc. | | | 552 | | | | 34 | |
AES Corp. | | | 1,760 | | | | 21 | |
Aflac, Inc. | | | 386 | | | | 23 | |
Airgas, Inc. | | | 227 | | | | 22 | |
Alleghany Corp. | | | 32 | | | | 15 | |
American Express Co. | | | 432 | | | | 33 | |
Amgen, Inc. | | | 162 | | | | 25 | |
Arch Capital Group Ltd.E | | | 416 | | | | 28 | |
Arrow Electronics, Inc. | | | 342 | | | | 19 | |
Avnet, Inc. | | | 519 | | | | 22 | |
Baxter International, Inc. | | | 460 | | | | 18 | |
Bed Bath & Beyond, Inc.E | | | 396 | | | | 25 | |
Biogen Idec, Inc.E | | | 89 | | | | 26 | |
CA, Inc. | | | 754 | | | | 21 | |
Chevron Corp. | | | 525 | | | | 43 | |
Cintas Corp. | | | 276 | | | | 23 | |
Cisco Systems, Inc. | | | 1,560 | | | | 40 | |
Colgate-Palmolive Co. | | | 392 | | | | 25 | |
ConocoPhillips | | | 562 | | | | 28 | |
Danaher Corp. | | | 308 | | | | 27 | |
EI du Pont de Nemours & Co. | | | 491 | | | | 26 | |
Eli Lilly & Co. | | | 313 | | | | 26 | |
Emerson Electric Co. | | | 545 | | | | 26 | |
EOG Resources, Inc. | | | 282 | | | | 22 | |
Exxon Mobil Corp. | | | 896 | | | | 67 | |
Fastenal Co. | | | 531 | | | | 20 | |
FMC Technologies, Inc.E | | | 548 | | | | 19 | |
Fossil Group, Inc.E | | | 270 | | | | 17 | |
Franklin Resources, Inc. | | | 577 | | | | 23 | |
Gap, Inc. | | | 613 | | | | 20 | |
Genuine Parts Co. | | | 316 | | | | 26 | |
Gilead Sciences, Inc. | | | 406 | | | | 43 | |
Google, Inc., Class AE | | | 39 | | | | 25 | |
Harley-Davidson, Inc. | | | 379 | | | | 21 | |
Henry Schein, Inc.E | | | 180 | | | | 25 | |
Home Depot, Inc. | | | 293 | | | | 33 | |
Honeywell International, Inc. | | | 254 | | | | 25 | |
Illinois Tool Works, Inc. | | | 271 | | | | 23 | |
Intel Corp. | | | 1,478 | | | | 42 | |
See accompanying notes
23
American Beacon Zebra Global Equity FundSM
Schedule of Investments
August 31, 2015
| | | | | | | | |
| | | Shares | | | Fair Value | |
| | | | | | (000’s) | |
International Business Machines Corp. | | | 237 | | | $ | 35 | |
Johnson & Johnson | | | 576 | | | | 54 | |
Johnson Controls, Inc. | | | 506 | | | | 21 | |
JPMorgan Chase & Co. | | | 660 | | | | 42 | |
Kellogg Co. | | | 414 | | | | 27 | |
Kimberly-Clark Corp. | | | 252 | | | | 27 | |
LKQ Corp.E | | | 935 | | | | 28 | |
Loews Corp. | | | 596 | | | | 22 | |
Marathon Petroleum Corp. | | | 216 | | | | 10 | |
Mattel, Inc. | | | 886 | | | | 21 | |
McDonald’s Corp. | | | 347 | | | | 33 | |
McGraw-Hill Cos., Inc. | | | 224 | | | | 22 | |
MDU Resources Group, Inc. | | | 1,288 | | | | 23 | |
Microsoft Corp. | | | 1,388 | | | | 60 | |
Moody’s Corp. | | | 227 | | | | 23 | |
Navient Corp. | | | 1,094 | | | | 14 | |
OGE Energy Corp. | | | 671 | | | | 19 | |
Oracle Corp. | | | 1,182 | | | | 44 | |
O’Reilly Automotive, Inc.E | | | 94 | | | | 23 | |
PACCAR, Inc. | | | 408 | | | | 24 | |
Patterson Cos., Inc. | | | 440 | | | | 20 | |
PepsiCo, Inc. | | | 458 | | | | 43 | |
Philip Morris International, Inc. | | | 310 | | | | 25 | |
Phillips 66 | | | 313 | | | | 25 | |
PNC Financial Services Group, Inc. | | | 317 | | | | 29 | |
Praxair, Inc. | | | 238 | | | | 25 | |
Procter & Gamble Co. | | | 545 | | | | 38 | |
Qualcomm, Inc. | | | 603 | | | | 34 | |
Rockwell Automation, Inc. | | | 203 | | | | 23 | |
Ross Stores, Inc. | | | 542 | | | | 26 | |
SCANA Corp. | | | 446 | | | | 24 | |
Schlumberger Ltd. | | | 441 | | | | 34 | |
SEI Investments Co. | | | 532 | | | | 27 | |
Snap-On, Inc. | | | 104 | | | | 17 | |
Southern Co. | | | 572 | | | | 25 | |
Stryker Corp. | | | 289 | | | | 28 | |
Symantec Corp. | | | 977 | | | | 20 | |
Synopsys, Inc.E | | | 329 | | | | 15 | |
T. Rowe Price Group, Inc. | | | 372 | | | | 27 | |
Texas Instruments, Inc. | | | 534 | | | | 26 | |
TJX Cos., Inc. | | | 436 | | | | 31 | |
Torchmark Corp. | | | 366 | | | | 21 | |
Travelers Cos., Inc. | | | 245 | | | | 24 | |
U.S. Bancorp | | | 812 | | | | 34 | |
Union Pacific Corp. | | | 301 | | | | 26 | |
United Technologies Corp. | | | 333 | | | | 31 | |
UnitedHealth Group, Inc. | | | 226 | | | | 26 | |
Verizon Communications, Inc. | | | 874 | | | | 40 | |
VF Corp. | | | 364 | | | | 26 | |
Viacom, Inc., Class B | | | 488 | | | | 20 | |
Wal-Mart Stores, Inc. | | | 771 | | | | 50 | |
Wells Fargo & Co. | | | 986 | | | | 53 | |
Western Digital Corp. | | | 272 | | | | 22 | |
Westlake Chemical Corp. | | | 402 | | | | 22 | |
WR Berkley Corp. | | | 475 | | | | 26 | |
WW Grainger, Inc. | | | 96 | | | | 22 | |
| | | | | | | | |
Total United States | | | | 2,662 | |
| | | | | | | | |
SHORT-TERM INVESTMENTS - 2.96% (Cost $147) | | | | | | | | |
JPMorgan U.S. Government Money Market Fund, Capital Class | | | 146,918 | | | | 147 | |
| | | | | | | | |
| | | | | | |
| | | | | Fair Value | |
| | | | | (000’s) | |
TOTAL INVESTMENTS - 99.90% (Cost $5,238) | | $ | 4,967 | |
OTHER ASSETS, NET OF LIABILITIES - 0.10% | | | 5 | |
| | | | | | |
TOTAL NET ASSETS - 100.00% | | $ | 4,972 | |
| | | | | | |
Percentages are stated as a percent of net assets.
| A | Fair valued pursuant to procedures approved by the Board of Trustees. At period end, the value of these securities amounted to $1,939 or 39% of net assets. |
| B | ADR - American Depositary Receipt. |
| C | REIT - Real Estate Investment Trust. |
| D | A type of Preferred Stock that has no maturity date. |
| E | Non-income producing security. |
| F | PLC - Public Limited Company. |
| G | CVA - Dutch Certificate. |
| H | GDR - Global Depositary Receipt. |
| I | Reg S - Security purchased under the Securities Act of 1933, which exempts from registration securities offered and sold outside of the United States. Such a security cannot be sold in the United States without either an effective registration statement filed pursuant to the Securities Act of 1933, or pursuant to an exemption from registration. |
See accompanying notes
24
American Beacon Zebra Global Equity FundSM
Schedule of Investments
August 31, 2015
Futures Contracts Open on August 31, 2015:
| | | | | | | | | | | | | | | | |
Description | | Type | | | Number of
Contracts | | Expiration Date | | Contract
Value | | | Unrealized
Appreciation
(Depreciation) | |
Mini MSCI EAFE Emerging Markets September Futures | | | Long | | | 1 | | September 2015 | | $ | 86,635 | | | $ | 695 | |
S&P 500 Mini E Index September Futures | | | Long | | | 1 | | September 2015 | | | 98,460 | | | | (6,028 | ) |
| | | | | | | | | | | | | | | | |
| | | | | | | | | | $ | 185,095 | | | $ | (5,333 | ) |
| | | | | | | | | | | | | | | | |
See accompanying notes
25
American Beacon Zebra Small Cap Equity FundSM
Schedule of Investments
August 31, 2015
| | | | | | | | |
| | | Shares | | | Fair Value | |
| | | | | | (000’s) | |
COMMON STOCK - 93.92% | |
CONSUMER DISCRETIONARY - 13.65% | |
Auto Components - 1.25% | |
Cooper-Standard Holding, Inc.A | | | 1,956 | | | $ | 113 | |
Horizon Global Corp.A | | | 1,690 | | | | 18 | |
Shiloh Industries, Inc. | | | 2,443 | | | | 28 | |
Standard Motor Products, Inc. | | | 2,046 | | | | 72 | |
Strattec Security Corp. | | | 372 | | | | 23 | |
| | | | | | | | |
| | | | | | | 254 | |
| | | | | | | | |
Automobiles - 0.44% | | | | | | | | |
Hyster-Yale Materials Handling, Inc. | | | 1,487 | | | | 90 | |
| | | | | | | | |
Distributors - 1.34% | | | | | | | | |
DXP Enterprises, Inc.A | | | 893 | | | | 27 | |
Pool Corp. | | | 3,003 | | | | 209 | |
Stock Building Supply Holdings, Inc.A | | | 1,900 | | | | 36 | |
| | | | | | | | |
| | | | | | | 272 | |
| | | | | | | | |
Hotels, Restaurants & Leisure - 0.75% | |
Interval Leisure Group, Inc. | | | 5,418 | | | | 109 | |
Monarch Casino & Resort, Inc.A | | | 1,463 | | | | 26 | |
Nathan’s Famous, Inc. | | | 535 | | | | 17 | |
| | | | | | | | |
| | | | | | | 152 | |
| | | | | | | | |
Household Durables - 0.58% | | | | | | | | |
CSS Industries, Inc. | | | 1,121 | | | | 30 | |
Flexsteel Industries, Inc. | | | 982 | | | | 30 | |
Haverty Furniture Companies, Inc. | | | 1,600 | | | | 37 | |
Lifetime Brands, Inc. | | | 1,448 | | | | 21 | |
| | | | | | | | |
| | | | | | | 118 | |
| | | | | | | | |
Internet & Catalog Retail - 2.07% | |
Global Sources Ltd.A | | | 2,361 | | | | 19 | |
HSN, Inc. | | | 4,066 | | | | 247 | |
Insight Enterprises, Inc.A | | | 3,950 | | | | 100 | |
Overstock.com, Inc.A | | | 2,727 | | | | 54 | |
| | | | | | | | |
| | | | | | | 420 | |
| | | | | | | | |
Leisure Equipment & Products - 0.35% | |
Escalade, Inc. | | | 1,294 | | | | 23 | |
Johnson Outdoors, Inc., Class A | | | 1,046 | | | | 26 | |
Marine Products Corp. | | | 3,268 | | | | 23 | |
| | | | | | | | |
| | | | | | | 72 | |
| | | | | | | | |
Media - 0.99% | | | | | | | | |
Crown Media Holdings, Inc., Class AA | | | 34,065 | | | | 182 | |
Salem Media Group, Inc. | | | 3,058 | | | | 20 | |
| | | | | | | | |
| | | | | | | 202 | |
| | | | | | | | |
Multiline Retail - 0.50% | | | | | | | | |
Fox Factory Holding Corp.A | | | 3,570 | | | | 53 | |
Stein Mart, Inc. | | | 4,536 | | | | 49 | |
| | | | | | | | |
| | | | | | | 102 | |
| | | | | | | | |
Specialty Retail - 3.71% | | | | | | | | |
America’s Car-Mart, Inc.A | | | 835 | | | | 30 | |
Big 5 Sporting Goods Corp. | | | 1,458 | | | | 17 | |
Buckle, Inc. | | | 3,932 | | | | 166 | |
Destination Maternity Corp. | | | 1,920 | | | | 22 | |
Essendant, Inc. | | | 4,422 | | | | 153 | |
Genesco, Inc.A | | | 1,610 | | | | 96 | |
PC Connection, Inc. | | | 3,125 | | | | 66 | |
Rush Enterprises, Inc., Class AA | | | 3,968 | | | | 101 | |
Shoe Carnival, Inc. | | | 1,678 | | | | 43 | |
Trans World Entertainment Corp. | | | 5,999 | | | | 22 | |
Winmark Corp. | | | 371 | | | | 37 | |
| | | | | | | | |
| | | | | | | 753 | |
| | | | | | | | |
| | | | | | | | |
| | | Shares | | | Fair Value | |
| | | | | | (000’s) | |
Textiles & Apparel - 1.67% | | | | | | | | |
Columbia Sportswear Co. | | | 4,986 | | | $ | 306 | |
Weyco Group, Inc. | | | 1,254 | | | | 34 | |
| | | | | | | | |
| | | | | | | 340 | |
| | | | | | | | |
Total Consumer Discretionary | | | | 2,775 | |
| | | | | | | | |
CONSUMER STAPLES - 5.12% | | | | | |
Beverages - 0.55% | | | | | | | | |
National Beverage Corp. | | | 4,255 | | | | 112 | |
| | | | | | | | |
Food & Drug Retailing - 1.21% | | | | | | | | |
SpartanNash Co. | | | 3,567 | | | | 101 | |
Village Super Market, Inc., Class A | | | 1,234 | | | | 34 | |
Weis Markets, Inc. | | | 2,717 | | | | 111 | |
| | | | | | | | |
| | | | | | | 246 | |
| | | | | | | | |
Food Products - 2.14% | | | | | | | | |
Seaboard Corp. | | | 131 | | | | 435 | |
| | | | | | | | |
Personal Products - 1.22% | | | | | | | | |
Nature’s Sunshine Products, Inc. | | | 2,178 | | | | 27 | |
Revlon, Inc., Class AA | | | 4,335 | | | | 144 | |
Steiner Leisure Ltd.A | | | 1,187 | | | | 76 | |
| | | | | | | | |
| | | | | | | 247 | |
| | | | | | | | |
Total Consumer Staples | | | | 1,040 | |
| | | | | | | | |
ENERGY - 0.57% | | | | | | | | |
Energy Equipment & Services - 0.29% | |
Matrix Service Co.A | | | 1,653 | | | | 33 | |
RigNet, Inc.A | | | 893 | | | | 26 | |
| | | | | | | | |
| | | | | | | 59 | |
| | | | | | | | |
Oil & Gas - 0.28% | | | | | | | | |
Adams Resources & Energy, Inc. | | | 402 | | | | 18 | |
Panhandle Oil and Gas, Inc., Class A | | | 1,174 | | | | 21 | |
Resource America, Inc., Class A | | | 2,402 | | | | 18 | |
| | | | | | | | |
| | | | | | | 57 | |
| | | | | | | | |
Total Energy | | | | 116 | |
| | | | | | | | |
FINANCIALS - 27.84% | | | | | | | | |
Banks - 11.13% | | | | | | | | |
1st Source Corp. | | | 2,443 | | | | 73 | |
American National Bankshares, Inc. | | | 1,085 | | | | 26 | |
Arrow Financial Corp. | | | 1,230 | | | | 34 | |
BancFirst Corp. | | | 1,325 | | | | 80 | |
BankFinancial Corp. | | | 2,726 | | | | 34 | |
BNC Bancorp | | | 2,910 | | | | 60 | |
Bryn Mawr Bank Corp. | | | 1,667 | | | | 49 | |
Camden National Corp. | | | 860 | | | | 34 | |
Century Bancorp, Inc., Class A | | | 828 | | | | 35 | |
Citizens & Northern Corp. | | | 1,098 | | | | 22 | |
City Holding Co. | | | 1,309 | | | | 62 | |
CNB Financial Corp. | | | 1,938 | | | | 33 | |
Community Trust Bancorp, Inc. | | | 1,610 | | | | 57 | |
Enterprise Bancorp, Inc. | | | 1,254 | | | | 27 | |
Enterprise Financial Services Corp. | | | 1,784 | | | | 43 | |
Fidelity Southern Corp. | | | 2,193 | | | | 42 | |
Financial Institutions, Inc. | | | 1,349 | | | | 33 | |
First Bancorp (NC) | | | 1,892 | | | | 32 | |
First Busey Corp. | | | 7,365 | | | | 47 | |
First Business Financial Services, Inc. | | | 1,122 | | | | 25 | |
First Community Bancshares, Inc. | | | 1,873 | | | | 33 | |
First Defiance Financial Corp. | | | 848 | | | | 32 | |
First Financial Corp. | | | 1,194 | | | | 39 | |
See accompanying notes
26
American Beacon Zebra Small Cap Equity FundSM
Schedule of Investments
August 31, 2015
| | | | | | | | |
| | | Shares | | | Fair Value | |
| | | | | | (000’s) | |
First Merchants Corp. | | | 3,487 | | | $ | 91 | |
German American Bancorp, Inc. | | | 1,259 | | | | 36 | |
Great Southern Bancorp, Inc. | | | 1,292 | | | | 52 | |
Horizon Bancorp | | | 1,275 | | | | 30 | |
International Bancshares Corp. | | | 7,473 | | | | 193 | |
Lakeland Bancorp, Inc. | | | 3,428 | | | | 38 | |
MainSource Financial Group, Inc. | | | 2,077 | | | | 43 | |
Mercantile Bank Corp. | | | 1,668 | | | | 34 | |
National Bankshares, Inc. | | | 1,034 | | | | 33 | |
OceanFirst Financial Corp. | | | 1,502 | | | | 28 | |
Pacific Premier Bancorp, Inc.A | | | 1,871 | | | | 35 | |
Penns Woods Bancorp, Inc. | | | 618 | | | | 27 | |
Peoples Bancorp, Inc. | | | 1,615 | | | | 35 | |
S&T Bancorp, Inc. | | | 2,919 | | | | 87 | |
Sierra Bancorp | | | 1,296 | | | | 22 | |
Stock Yards Bancorp, Inc. | | | 1,277 | | | | 45 | |
TowneBank | | | 4,623 | | | | 85 | |
Trico Bancshares | | | 2,180 | | | | 52 | |
Univest Corp of Pennsylvania | | | 2,066 | | | | 40 | |
Washington Trust Bancorp, Inc. | | | 1,451 | | | | 56 | |
WesBanco, Inc. | | | 3,366 | | | | 104 | |
West Bancorporation, Inc. | | | 1,507 | | | | 27 | |
Yadkin Financial Corp. | | | 5,775 | | | | 120 | |
| | | | | | | | |
| | | | | | | 2,265 | |
| | | | | | | | |
Diversified Financials - 5.06% | | | | | | | | |
CIFC Corp. | | | 3,186 | | | | 22 | |
Cohen & Steers, Inc. | | | 3,020 | | | | 91 | |
Credit Acceptance Corp.A | | | 1,674 | | | | 342 | |
Diamond Hill Investment Group, Inc. | | | 258 | | | | 50 | |
ExlService Holdings, Inc.A | | | 2,685 | | | | 97 | |
First Cash Financial Services, Inc.A | | | 1,829 | | | | 75 | |
GAMCO Investors, Inc., Class A | | | 1,624 | | | | 95 | |
Heartland Financial USA, Inc. | | | 1,775 | | | | 65 | |
Higher One Holdings, Inc.A | | | 7,450 | | | | 15 | |
HomeStreet, Inc. | | | 1,950 | | | | 43 | |
Meta Financial Group, Inc. | | | 613 | | | | 27 | |
MidWestOne Financial Group, Inc. | | | 1,125 | | | | 33 | |
Nicholas Financial, Inc. | | | 1,551 | | | | 19 | |
Pacific Continental Corp. | | | 1,699 | | | | 22 | |
Westwood Holdings Group, Inc. | | | 580 | | | | 32 | |
| | | | | | | | |
| | | | | | | 1,028 | |
| | | | | | | | |
Insurance - 5.83% | | | | | | | | |
AMERISAFE, Inc. | | | 1,600 | | | | 75 | |
Baldwin & Lyons, Inc., Class B | | | 1,681 | | | | 39 | |
Crawford & Co., Class B | | | 4,344 | | | | 28 | |
EMC Insurance Group, Inc. | | | 2,830 | | | | 65 | |
Enstar Group Ltd.A | | | 1,888 | | | | 275 | |
Global Indemnity PLCA B | | | 3,105 | | | | 83 | |
Greenlight Capital Re Ltd., Class AA | | | 4,528 | | | | 115 | |
Independence Holding Co. | | | 1,697 | | | | 21 | |
National Western Life Insurance Co., Class A | | | 558 | | | | 127 | |
Selective Insurance Group, Inc. | | | 5,759 | | | | 175 | |
Third Point Reinsurance Ltd.A | | | 13,043 | | | | 182 | |
| | | | | | | | |
| | | | | | | 1,185 | |
| | | | | | | | |
Real Estate - 5.82% | | | | | | | | |
Agree Realty Corp.C | | | 949 | | | | 27 | |
Alexander’s, Inc.C | | | 322 | | | | 117 | |
Armada Hoffler Properties, Inc.C | | | 6,915 | | | | 69 | |
Chesapeake Lodging TrustC | | | 2,114 | | | | 61 | |
EPR PropertiesC | | | 2,640 | | | | 134 | |
General Finance Corp.A C | | | 3,666 | | | | 14 | |
Geo Group, Inc.C | | | 3,278 | | | | 98 | |
| | | | | | | | |
| | | Shares | | | Fair Value | |
| | | | | | (000’s) | |
Getty Realty Corp.C | | | 2,571 | | | $ | 41 | |
LTC Properties, Inc.C | | | 1,806 | | | | 74 | |
National Health Investors, Inc.C | | | 2,020 | | | | 111 | |
One Liberty Properties, Inc.C | | | 1,262 | | | | 28 | |
PS Business Parks, Inc.C | | | 1,869 | | | | 136 | |
RLJ Lodging TrustC | | | 1,771 | | | | 49 | |
Sabra Health Care REIT, Inc.C | | | 3,258 | | | | 78 | |
Saul Centers, Inc.C | | | 1,645 | | | | 81 | |
Universal Health Realty Income TrustC | | | 773 | | | | 36 | |
Urstadt Biddle Properties, Inc., Class AC | | | 1,638 | | | | 29 | |
| | | | | | | | |
| | | | | | | 1,183 | |
| | | | | | | | |
Total Financials | | | | 5,661 | |
| | | | | | | | |
HEALTH CARE - 10.35% | | | | | | | | |
Biotechnology - 2.76% | | | | | | | | |
Genomic Health, Inc.A | | | 723 | | | | 20 | |
Luminex Corp.A | | | 2,586 | | | | 47 | |
MiMedx Group, Inc.A | | | 3,618 | | | | 35 | |
Neogen Corp.A | | | 1,787 | | | | 92 | |
PDL BioPharma, Inc. | | | 55,694 | | | | 315 | |
RTI Biologics, Inc.A | | | 3,246 | | | | 21 | |
SciClone Pharmaceuticals, Inc.A | | | 4,065 | | | | 32 | |
| | | | | | | | |
| | | | | | | 562 | |
| | | | | | | | |
Health Care Equipment &
Supplies - 3.18% | |
Atrion Corp. | | | 165 | | | | 64 | |
Computer Programs and Systems, Inc. | | | 748 | | | | 34 | |
Exactech, Inc.A | | | 1,413 | | | | 28 | |
Integra LifeSciences Holdings Corp.A | | | 2,321 | | | | 139 | |
Masimo Corp. | | | 2,845 | | | | 116 | |
Merge Healthcare, Inc. | | | 5,154 | | | | 37 | |
Meridian Bioscience, Inc. | | | 3,200 | | | | 61 | |
Merit Medical Systems, Inc.A | | | 2,804 | | | | 64 | |
Nutraceutical International Corp. | | | 1,040 | | | | 25 | |
SurModics, Inc.A | | | 942 | | | | 21 | |
Utah Medical Products, Inc. | | | 360 | | | | 19 | |
Vascular Solutions, Inc.A | | | 1,103 | | | | 38 | |
| | | | | | | | |
| | | | | | | 646 | |
| | | | | | | | |
Health Care Providers &
Services - 3.44% | |
Addus HomeCare Corp.A | | | 903 | | | | 26 | |
Alliance HealthCare Services, Inc.A | | | 1,160 | | | | 17 | |
Almost Family, Inc. | | | 866 | | | | 38 | |
Cantel Medical Corp. | | | 2,334 | | | | 116 | |
Corvel Corp.A | | | 1,698 | | | | 51 | |
Ensign Group, Inc. | | | 1,962 | | | | 92 | |
LHC Group, Inc.A | | | 1,437 | | | | 62 | |
National Healthcare Corp. | | | 1,331 | | | | 80 | |
National Research Corp. | | | 2,417 | | | | 31 | |
Omnicell, Inc.A | | | 2,082 | | | | 71 | |
Owens & Minor, Inc. | | | 3,354 | | | | 114 | |
| | | | | | | | |
| | | | | | | 698 | |
| | | | | | | | |
Pharmaceuticals - 0.97% | | | | | | | | |
Corcept Therapeutics, Inc.A | | | 4,040 | | | | 20 | |
Enanta Pharmaceuticals, Inc.A | | | 1,313 | | | | 51 | |
Sucampo Pharmaceuticals, Inc., Class AA | | | 2,632 | | | | 71 | |
Synutra International, Inc.A | | | 11,216 | | | | 56 | |
| | | | | | | | |
| | | | | | | 198 | |
| | | | | | | | |
Total Health Care | | | | 2,104 | |
| | | | | | | | |
INDUSTRIALS - 14.76% | | | | | | | | |
Aerospace & Defense - 0.48% | | | | | | | | |
Kaman Corp. | | | 2,501 | | | | 97 | |
| | | | | | | | |
See accompanying notes
27
American Beacon Zebra Small Cap Equity FundSM
Schedule of Investments
August 31, 2015
| | | | | | | | |
| | | Shares | | | Fair Value | |
| | | | | | (000’s) | |
Building Products - 1.30% | |
AAON, Inc. | | | 4,108 | | | $ | 85 | |
Omega Flex, Inc. | | | 627 | | | | 19 | |
Patrick Industries, Inc.A | | | 1,366 | | | | 52 | |
Universal Forest Products, Inc. | | | 1,821 | | | | 109 | |
| | | | | | | | |
| | | | | | | 265 | |
| | | | | | | | |
Commercial Services & Supplies - 7.52% | |
American Public Education, Inc.A | | | 1,554 | | | | 34 | |
Capella Education Co. | | | 943 | | | | 46 | |
CDI Corp. | | | 1,650 | | | | 17 | |
Ceco Environmental Corp. | | | 2,724 | | | | 26 | |
CSG Systems International, Inc. | | | 2,773 | | | | 86 | |
Deluxe Corp. | | | 4,064 | | | | 237 | |
Electro Rent Corp. | | | 2,381 | | | | 25 | |
Ennis, Inc. | | | 2,800 | | | | 46 | |
Franklin Covey Co.A | | | 1,439 | | | | 24 | |
Herman Miller, Inc. | | | 5,472 | | | | 148 | |
Kelly Services, Inc., Class A | | | 3,113 | | | | 45 | |
Kforce, Inc. | | | 2,566 | | | | 69 | |
Landauer, Inc. | | | 621 | | | | 24 | |
Marlin Business Services Corp. | | | 1,608 | | | | 22 | |
McGrath Rentcorp | | | 2,502 | | | | 64 | |
Monotype Imaging Holdings, Inc. | | | 2,588 | | | | 55 | |
PHI, Inc.A D | | | 2,381 | | | | 60 | |
Resources Connection, Inc. | | | 2,769 | | | | 43 | |
Strayer Education, Inc.A | | | 640 | | | | 33 | |
TeleTech Holdings, Inc. | | | 4,747 | | | | 128 | |
VSE Corp. | | | 603 | | | | 25 | |
West Corp. | | | 11,089 | | | | 271 | |
| | | | | | | | |
| | | | | | | 1,528 | |
| | | | | | | | |
Construction & Engineering - 0.43% | |
Primoris Services Corp. | | | 4,726 | | | | 87 | |
| | | | | | | | |
Electrical Equipment - 1.00% | | | | | |
Chase Corp. | | | 1,169 | | | | 46 | |
Franklin Electric Co., Inc. | | | 4,194 | | | | 122 | |
Houston Wire & Cable Co. | | | 1,907 | | | | 15 | |
Preformed Line Products Co. | | | 682 | | | | 21 | |
| | | | | | | | |
| | | | | | | 204 | |
| | | | | | | | |
Industrial Conglomerates - 1.21% | |
ICF International, Inc.A | | | 1,947 | | | | 67 | |
Park-Ohio Industries, Inc. | | | 1,540 | | | | 56 | |
Tredegar Corp. | | | 3,248 | | | | 47 | |
Trimas Corp.A | | | 4,227 | | | | 76 | |
| | | | | | | | |
| | | | | | | 246 | |
| | | | | | | | |
Machinery - 2.47% | | | | | | | | |
Alamo Group, Inc. | | | 1,087 | | | | 56 | |
Altra Industrial Motion Corp. | | | 2,219 | | | | 55 | |
Applied Industrial Technologies, Inc. | | | 3,400 | | | | 143 | |
Columbus McKinnon Corp. | | | 2,084 | | | | 40 | |
Hurco Co., Inc. | | | 744 | | | | 23 | |
Kadant, Inc. | | | 1,004 | | | | 45 | |
L.B. Foster Co., Class A | | | 1,017 | | | | 18 | |
Miller Industries, Inc. | | | 1,139 | | | | 25 | |
Sun Hydraulics Corp. | | | 2,250 | | | | 73 | |
Xerium Technologies, Inc.A | | | 1,931 | | | | 24 | |
| | | | | | | | |
| | | | | | | 502 | |
| | | | | | | | |
Road & Rail - 0.35% | | | | | | | | |
Universal Truckload Services, Inc. | | | 3,604 | | | | 71 | |
| | | | | | | | |
Total Industrials | | | | 3,000 | |
| | | | | | | | |
| | | | | | | | |
| | | Shares | | | Fair Value | |
| | | | | | (000’s) | |
INFORMATION TECHNOLOGY - 15.13% | |
Communications Equipment - 0.25% | | | | | |
Bel Fuse, Inc., Class B | | | 1,430 | | | $ | 25 | |
Black Box Corp. | | | 1,696 | | | | 26 | |
| | | | | | | | |
| | | | | | | 51 | |
| | | | | | | | |
Computers & Peripherals - 0.49% | | | | | |
Datalink Corp.A | | | 2,251 | | | | 13 | |
Eastman Kodak Co.A | | | 6,129 | | | | 86 | |
| | | | | | | | |
| | | | | | | 99 | |
| | | | | | | | |
Electronic Equipment & Instruments - 3.00% | |
Analogic Corp. | | | 813 | | | | 66 | |
Coherent, Inc. | | | 1,901 | | | | 111 | |
CTS Corp. | | | 3,404 | | | | 64 | |
Daktronics, Inc. | | | 3,811 | | | | 33 | |
ePlus, Inc. | | | 756 | | | | 57 | |
MTS Systems Corp. | | | 1,209 | | | | 72 | |
Newport Corp.A | | | 3,793 | | | | 58 | |
Scansource, Inc.A | | | 2,945 | | | | 113 | |
Tessco Technologies, Inc. | | | 847 | | | | 20 | |
Twin Disc, Inc. | | | 1,104 | | | | 15 | |
| | | | | | | | |
| | | | | | | 609 | |
| | | | | | | | |
Internet Software & Services - 1.66% | | | | | |
Grand Canyon Education, Inc.A | | | 3,797 | | | | 141 | |
Netgear, Inc.A | | | 2,445 | | | | 74 | |
NIC, Inc. | | | 3,956 | | | | 75 | |
Perficient, Inc.A | | | 2,860 | | | | 47 | |
| | | | | | | | |
| | | | | | | 337 | |
| | | | | | | | |
IT Consulting & Services - 3.35% | | | | | |
Forrester Research, Inc. | | | 1,050 | | | | 33 | |
Hackett Group, Inc. | | | 2,729 | | | | 38 | |
Lionbridge TechnologiesA | | | 7,337 | | | | 39 | |
MoneyGram International, Inc.A | | | 9,088 | | | | 79 | |
Sykes Enterprises, Inc.A | | | 4,071 | | | | 103 | |
Syntel, Inc.A | | | 8,737 | | | | 389 | |
| | | | | | | | |
| | | | | | | 681 | |
| | | | | | | | |
Semiconductor Equipment & Products - 3.53% | |
Amkor Technology, Inc.A | | | 32,196 | | | | 175 | |
Cabot Microelectronics Corp. | | | 1,934 | | | | 84 | |
Cascade Microtech, Inc.A | | | 1,573 | | | | 24 | |
Cohu, Inc. | | | 1,735 | | | | 17 | |
Diodes, Inc.A | | | 4,027 | | | | 79 | |
GSI Group, Inc.A | | | 3,036 | | | | 39 | |
Microsemi Corp. | | | 3,599 | | | | 114 | |
MKS Instruments, Inc. | | | 4,671 | | | | 157 | |
Xcerra Corp.A | | | 4,894 | | | | 31 | |
| | | | | | | | |
| | | | | | | 720 | |
| | | | | | | | |
Software - 2.85% | | | | | | | | |
American Software, Inc., Class A | | | 2,227 | | | | 20 | |
Mentor Graphics Corp. | | | 11,035 | | | | 286 | |
Netscout Systems, Inc.A | | | 2,730 | | | | 100 | |
Pegasystems, Inc. | | | 4,596 | | | | 113 | |
QAD, Inc., Class A | | | 997 | | | | 25 | |
Quality Systems, Inc. | | | 2,611 | | | | 35 | |
| | | | | | | | |
| | | | | | | 579 | |
| | | | | | | | |
Total Information Technology | | | | 3,076 | |
| | | | | | | | |
MATERIALS - 2.81% | | | | | | | | |
Chemicals - 2.32% | | | | | | | | |
Hawkins, Inc. | | | 983 | | | | 37 | |
Innospec, Inc. | | | 2,690 | | | | 133 | |
KMG Chemicals, Inc. | | | 1,056 | | | | 21 | |
See accompanying notes
28
American Beacon Zebra Small Cap Equity FundSM
Schedule of Investments
August 31, 2015
| | | | | | | | |
| | | Shares | | | Fair Value | |
| | | | | | (000’s) | |
Kronos Worldwide, Inc. | | | 10,946 | | | $ | 81 | |
Quaker Chemical Corp. | | | 999 | | | | 79 | |
Stepan Co. | | | 2,054 | | | | 93 | |
Trecora ResourcesA | | | 2,253 | | | | 29 | |
| | | | | | | | |
| | | | | | | 473 | |
| | | | | | | | |
Construction Materials - 0.12% | | | | | |
United States Lime & Minerals, Inc. | | | 515 | | | | 25 | |
| | | | | | | | |
Containers & Packaging - 0.10% | | | | | |
UFP Technologies, Inc.A | | | 943 | | | | 20 | |
| | | | | | | | |
Metals & Mining - 0.27% | | | | | | | | |
Hallador Energy Co. | | | 3,311 | | | | 27 | |
Handy & Harman Ltd.A | | | 1,071 | | | | 27 | |
| | | | | | | | |
| | | | | | | 54 | |
| | | | | | | | |
Total Materials | | | | 572 | |
| | | | | | | | |
TELECOMMUNICATION SERVICES - 1.81% | |
Diversified Telecommunication
Services - 1.64% | | | | | |
IDT Corp., Class B | | | 2,368 | | | | 37 | |
Intelsat S.A.A E | | | 25,572 | | | | 247 | |
Premiere Global Services, Inc.A | | | 4,450 | | | | 48 | |
| | | | | | | | |
| | | | | | | 332 | |
| | | | | | | | |
Wireless Telecommunication
Services - 0.17% | |
Spok Holdings, Inc. | | | 2,134 | | | | 35 | |
| | | | | | | | |
Total Telecommunication Services | | | | 367 | |
| | | | | | | | |
UTILITIES - 1.88% | | | | | | | | |
Electric - 1.11% | | | | | | | | |
MGE Energy, Inc. | | | 3,296 | | | | 127 | |
Otter Tail Corp. | | | 3,805 | | | | 98 | |
| | | | | | | | |
| | | | | | | 225 | |
| | | | | | | | |
Gas - 0.08% | | | | | | | | |
Delta Natural Gas Co., Inc. | | | 851 | | | | 17 | |
| | | | | | | | |
Water - 0.69% | | | | | | | | |
Artesian Resources Corp., Class A | | | 690 | | | | 15 | |
Connecticut Water Co. | | | 1,071 | | | | 37 | |
Middlesex Water Co. | | | 1,373 | | | | 31 | |
SJW Corp. | | | 1,963 | | | | 57 | |
| | | | | | | | |
| | | | | | | 140 | |
| | | | | | | | |
Total Utilities | | | | 382 | |
| | | | | | | | |
Total Common Stock (Cost $19,904) | | | | 19,093 | |
| | | | | | | | |
SHORT-TERM
INVESTMENTS - 5.44%
(Cost $1,105) | | | | | |
JPMorgan U.S. Government Money Market Fund, Capital Class | | | 1,104,855 | | | | 1,105 | |
| | | | | | | | |
SECURITIES LENDING COLLATERAL - 0.72% | | | | | | | | |
DWS Government and Agency Securities Portfolio, Institutional Class | | | 8,406 | | | | 8 | |
American Beacon U.S. Government Money Market Select Fund, Select ClassF | | | 138,594 | | | | 139 | |
| | | | | | | | |
Total Securities Lending Collateral (Cost $147) | | | | | | | 147 | |
| | | | | | | | |
| | | | | | |
| | | | | Fair Value | |
| | | | | (000’s) | |
TOTAL INVESTMENTS - 100.08% (Cost $21,156) | | $ | 20,345 | |
LIABILITIES, NET OF OTHER
ASSETS - (0.08%) | | | (16 | ) |
| | | | | | |
TOTAL NET ASSETS - 100.00% | | $ | 20,329 | |
| | | | | | |
Percentages are stated as a percent of net assets.
| A | Non-income producing security. |
| B | PLC - Public Limited Company. |
| C | REIT - Real Estate Investment Trust. |
| D | Non-voting participating shares. |
| E | All or a portion of this security is on loan at August 31, 2015. |
| F | The Fund is affiliated by having the same Investment Advisor. |
See accompanying notes
29
American Beacon Zebra Small Cap Equity FundSM
Schedule of Investments
August 31, 2015
Futures Contracts Open on August 31, 2015:
| | | | | | | | | | | | | | | | |
Description | | Type | | | Number of
Contracts | | Expiration Date | | Contract Value | | | Unrealized
Appreciation
(Depreciation) | |
Russell 2000 Mini Index September Futures | | | Long | | | 9 | | September 2015 | | $ | 1,041,750 | | | $ | (44,717 | ) |
| | | | | | | | | | | | | | | | |
| | | | | | | | | | $ | 1,041,750 | | | $ | (44,717 | ) |
| | | | | | | | | | | | | | | | |
See accompanying notes
30
American Beacon SiM High Yield Opportunities FundSM
Schedule of Investments
August 31, 2015
| | | | | | | | |
| | | Shares | | | Fair Value | |
| | | | | | (000’s) | |
COMMON STOCK - 1.58% | | | | | | | | |
FINANCIALS - 0.86% | | | | | | | | |
Other Finance - 0.23% | | | | | | | | |
Oslo Bors VPS Holdings ASA | | | 188,850 | | | $ | 1,986 | |
| | | | | | | | |
Real Estate - 0.63% | | | | | | | | |
Annaly Capital Management, Inc.A | | | 359,000 | | | | 3,611 | |
Omega Healthcare Investors, Inc.A | | | 60,000 | | | | 2,027 | |
| | | | | | | | |
| | | | | | | 5,638 | |
| | | | | | | | |
MANUFACTURING - 0.38% | | | | | | | | |
Basic Materials - 0.38% | | | | | | | | |
CVR Partners LP B C | | | 299,373 | | | | 3,335 | |
| | | | | | | | |
MATERIALS - 0.33% | | | | | | | | |
Basic Materials - 0.09% | | | | | | | | |
OCI Partners LPB C | | | 64,105 | | | | 781 | |
| | | | | | | | |
Metals/Mining - 0.24% | | | | | | | | |
OCI Resources LPB C | | | 91,000 | | | | 2,122 | |
| | | | | | | | |
TRANSPORTATION - 0.01% | | | | | | | | |
Other Transportation - 0.01% | | | | | | | | |
Knot Offshore Partners LP C D | | | 5,353 | | | | 98 | |
| | | | | | | | |
Total Common Stock (Cost $14,250) | | | | | | | 13,960 | |
| | | | | | | | |
| | |
| | | Par AmountK | | | | |
| | | (000’s) | | | | |
DOMESTIC BANK LOAN OBLIGATIONS - 2.50% | | | | | | | | |
Consumer - 1.21% | | | | | | | | |
North Atlantic Trading Co., Inc., 1st Lien Term Loan, 7.75%, Due 1/13/2020 | | $ | 5,090 | | | | 5,040 | |
North Atlantic Trading Co., Inc., 2nd Lien Term Loan, 11.50%, Due 6/30/2020 | | | 5,600 | | | | 5,656 | |
| | | | | | | | |
| | | | | | | 10,696 | |
| | | | | | | | |
Transportation - 1.29% | | | | | | | | |
Gol Luxco S.A., 1st Lien Term Loan, 6.50%, Due 8/19/2020 | | | 11,450 | | | | 11,336 | |
| | | | | | | | |
Total Domestic Bank Loan Obligations (Cost $21,917) | | | | | | | 22,032 | |
| | | | | | | | |
DOMESTIC CONVERTIBLE OBLIGATIONS - 1.21% | | | | | | | | |
Manufacturing - 0.56% | | | | | | | | |
Tesla Motors, Inc., 1.25%, Due 3/1/2021 | | | 5,225 | | | | 4,912 | |
| | | | | | | | |
Transportation - 0.65% | | | | | | | | |
Titan Machinery, Inc., 3.75%, Due 5/1/2019 | | | 7,450 | | | | 5,759 | |
| | | | | | | | |
Total Domestic Convertible Obligations (Cost $11,207) | | | | | | | 10,671 | |
| | | | | | | | |
DOMESTIC OBLIGATIONS - 79.24% | | | | | | | | |
Consumer - 6.95% | | | | | | | | |
Constellation Brands, Inc., 6.00%, Due 5/1/2022 | | | 9,000 | | | | 9,923 | |
Darling Ingredients, Inc., 5.375%, Due 1/15/2022 | | | 8,266 | | | | 8,163 | |
JBS USA LLC / JBS USA Finance, Inc., 5.875%, Due 7/15/2024E F | | | 13,550 | | | | 13,498 | |
Minerva Luxembourg S.A., 7.75%, Due 1/31/2023F | | | 10,600 | | | | 10,362 | |
Simmons Foods, Inc., 7.875%, Due 10/1/2021F | | | 10,505 | | | | 9,796 | |
TreeHouse Foods, Inc., 4.875%, Due 3/15/2022 | | | 9,600 | | | | 9,528 | |
| | | | | | | | |
| | | | | | | 61,270 | |
| | | | | | | | |
Energy - 4.89% | | | | | | | | |
Bonanza Creek Energy, Inc., 5.75%, Due 2/1/2023 | | | 11,575 | | | | 7,871 | |
MEG Energy Corp., 7.00%, Due 3/31/2024F | | | 16,200 | | | | 13,243 | |
Memorial Production Partners LP / Memorial Production Finance Corp., | | | | | | | | |
7.625%, Due 5/1/2021B | | | 8,550 | | | | 5,729 | |
6.875%, Due 8/1/2022B | | | 7,125 | | | | 4,471 | |
Northern Blizzard Resources, Inc., 7.25%, Due 2/1/2022F | | | 14,403 | | | | 11,810 | |
| | | | | | | | |
| | | | | | $ | 43,124 | |
| | | | | | | | |
See accompanying notes
31
American Beacon SiM High Yield Opportunities FundSM
Schedule of Investments
August 31, 2015
| | | | | | | | |
| | | Par AmountK | | | Fair Value | |
| | | (000’s) | | | (000’s) | |
Finance - 3.26% | | | | | | | | |
Carlson Travel Holdings, Inc., 7.50%, Due 8/15/2019F G | | $ | 9,475 | | | | 9,594 | |
DFC Finance Corp., 10.50%, Due 6/15/2020F | | | 5,700 | | | | 3,192 | |
Iron Mountain, Inc., 6.00%, Due 8/15/2023 | | | 9,040 | | | | 9,243 | |
Nationstar Mortgage LLC / Nationstar Capital Corp., 6.50%, Due 6/1/2022E | | | 8,000 | | | | 6,760 | |
| | | | | | | | |
| | | | | | | 28,789 | |
| | | | | | | | |
Manufacturing - 22.45% | | | | | | | | |
Activision Blizzard, Inc., 5.625%, Due 9/15/2021F | | | 8,900 | | | | 9,356 | |
Actuant Corp., 5.625%, Due 6/15/2022 | | | 11,000 | | | | 10,945 | |
ADS Tactical, Inc., 11.00%, Due 4/1/2018F | | | 17,500 | | | | 18,243 | |
Cloud Peak Energy Resources LLC / Cloud Peak Energy Finance Corp., | | | | | | | | |
8.50%, Due 12/15/2019E | | | 5,725 | | | | 3,936 | |
6.375%, Due 3/15/2024B E | | | 15,275 | | | | 8,783 | |
Crown Americas LLC / Crown Americas Capital Corp IV, 4.50%, Due 1/15/2023E | | | 14,175 | | | | 13,874 | |
IHS, Inc., 5.00%, Due 11/1/2022 | | | 13,081 | | | | 13,228 | |
Kissner Milling Co., Ltd., 7.25%, Due 6/1/2019F | | | 13,600 | | | | 13,895 | |
LSB Industries, Inc., 7.75%, Due 8/1/2019 | | | 13,250 | | | | 13,349 | |
Orbital ATK, Inc., 5.25%, Due 10/1/2021 | | | 16,128 | | | | 16,451 | |
Sealed Air Corp., 6.50%, Due 12/1/2020F | | | 13,846 | | | | 15,334 | |
Sensata Technologies BV, 4.875%, Due 10/15/2023F | | | 18,025 | | | | 17,710 | |
Servicios Corporativos Javer SAPI de CV, 9.875%, Due 4/6/2021F | | | 11,100 | | | | 11,752 | |
Southern Graphics, Inc., 8.375%, Due 10/15/2020F | | | 14,315 | | | | 14,351 | |
Techniplas LLC, 10.00%, Due 5/1/2020E F | | | 8,600 | | | | 8,127 | |
TransDigm, Inc., 6.50%, Due 7/15/2024 | | | 8,800 | | | | 8,602 | |
| | | | | | | | |
| | | | | | | 197,936 | |
| | | | | | | | |
Service - 31.21% | | | | | | | | |
Acadia Healthcare Co., Inc., 5.125%, Due 7/1/2022 | | | 10,765 | | | | 10,819 | |
Ancestry.com, Inc., 11.00%, Due 12/15/2020 | | | 7,000 | | | | 7,779 | |
CHS/Community Health Systems, Inc., 5.125%, Due 8/1/2021 | | | 13,350 | | | | 13,717 | |
Churchill Downs, Inc., 5.375%, Due 12/15/2021 | | | 14,800 | | | | 15,096 | |
Constellis Holdings LLC / Constellis Finance Corp., 9.75%, Due 5/15/2020E F | | | 14,350 | | | | 13,489 | |
DaVita HealthCare Partners, Inc., 5.75%, Due 8/15/2022 | | | 10,550 | | | | 11,225 | |
Envision Healthcare Corp., 5.125%, Due 7/1/2022F | | | 11,600 | | | | 11,760 | |
Halyard Health, Inc., 6.25%, Due 10/15/2022F | | | 12,725 | | | | 13,162 | |
HCA, Inc., 4.75%, Due 5/1/2023 | | | 13,645 | | | | 13,832 | |
Kindred Healthcare, Inc., 6.375%, Due 4/15/2022 | | | 13,525 | | | | 13,863 | |
Lansing Trade Group LLC / Lansing Finance Co. Inc, 9.25%, Due 2/15/2019E F | | | 11,900 | | | | 11,543 | |
LifePoint Health, Inc., 5.50%, Due 12/1/2021 | | | 15,885 | | | | 16,550 | |
Live Nation Entertainment, Inc., 7.00%, Due 9/1/2020F | | | 16,795 | | | | 17,803 | |
MGM Resorts International, 7.75%, Due 3/15/2022 | | | 12,000 | | | | 13,290 | |
Multi-Color Corp., 6.125%, Due 12/1/2022F | | | 9,625 | | | | 9,805 | |
Numericable-SFR SAS, 4.875%, Due 5/15/2019F | | | 11,900 | | | | 11,974 | |
Station Casinos LLC, 7.50%, Due 3/1/2021E | | | 14,637 | | | | 15,483 | |
Tenet Healthcare Corp., 4.50%, Due 4/1/2021 | | | 16,875 | | | | 16,960 | |
Univision Communications, Inc., 6.75%, Due 9/15/2022F | | | 13,100 | | | | 13,854 | |
Viking Cruises Ltd., 8.50%, Due 10/15/2022F | | | 11,275 | | | | 12,403 | |
Wynn Las Vegas LLC / Wynn Las Vegas Capital Corp., 5.375%, Due 3/15/2022E | | | 11,000 | | | | 10,698 | |
| | | | | | | | |
| | | | | | | 275,105 | |
| | | | | | | | |
Telecommunications - 4.58% | | | | | | | | |
DigitalGlobe, Inc., 5.25%, Due 2/1/2021F | | | 13,750 | | | | 13,200 | |
NeuStar, Inc., 4.50%, Due 1/15/2023 | | | 10,350 | | | | 8,798 | |
Virgin Media Finance PLC, 6.375%, Due 4/15/2023F H | | | 17,650 | | | | 18,345 | |
| | | | | | | | |
| | | | | | | 40,343 | |
| | | | | | | | |
Transportation - 3.75% | | | | | | | | |
Gol Luxco S.A., 8.875%, Due 1/24/2022F | | | 4,800 | | | | 3,504 | |
United Continental Holdings, Inc., | | | | | | | | |
6.375%, Due 6/1/2018 | | | 3,100 | | | | 3,243 | |
6.00%, Due 12/1/2020 | | | 7,675 | | | | 8,011 | |
US Airways Group, Inc., 6.125%, Due 6/1/2018 | | | 13,600 | | | | 14,093 | |
VRG Linhas Aereas S.A., 10.75%, Due 2/12/2023F | | | 5,000 | | | | 4,200 | |
| | | | | | | | |
| | | | | | | 33,051 | |
| | | | | | | | |
See accompanying notes
32
American Beacon SiM High Yield Opportunities FundSM
Schedule of Investments
August 31, 2015
| | | | | | | | |
| | | Par AmountK | | | Fair Value | |
| | | (000’s) | | | (000’s) | |
Utilities - 2.15% | | | | | | | | |
Calpine Corp., 7.875%, Due 1/15/2023F | | $ | 8,614 | | | $ | 9,217 | |
GenOn Americas Generation LLC, 9.125%, Due 5/1/2031E | | | 11,600 | | | | 9,744 | |
| | | | | | | | |
| | | | | | | 18,961 | |
| | | | | | | | |
Total Domestic Obligations (Cost $727,047) | | | | | | | 698,579 | |
| | | | | | | | |
FOREIGN CONVERTIBLE OBLIGATIONS - 0.16% | | | | | | | | |
Consumer - 0.16% | | | | | | | | |
Pescanova S.A., | | | | | | | | |
5.125%, Due 4/20/2017, Acquired 2/11/2013 - 2/24/2014, Cost $3,964L M | | | 7,450 | | | | 752 | |
8.75%, Due 2/17/2019, Acquired 4/26/2012 - 2/24/2014, Cost $6,101L M | | | 6,600 | | | | 667 | |
| | | | | | | | |
Total Foreign Convertible Obligations (Cost $10,076) | | | | | | | 1,419 | |
| | | | | | | | |
FOREIGN OBLIGATIONS - 11.67% | | | | | | | | |
Finance - 1.77% | | | | | | | | |
Emma Delta Finance PLC, | | | | | | | | |
8.50%, Due 10/15/2017F H | | EUR | 8,000 | | | | 8,079 | |
12.00%, Due 10/15/2017F H | | EUR | 7,000 | | | | 7,463 | |
| | | | | | | | |
| | | | | | | 15,542 | |
| | | | | | | | |
Service - 3.36% | | | | | | | | |
Cirsa Funding Luxembourg S.A., 8.75%, Due 5/15/2018F | | EUR | 5,417 | | | | 6,149 | |
Gala Electric Casinos, 11.50%, Due 6/1/2019F | | GBP | 7,950 | | | | 12,992 | |
Gamenet SpA, 7.25%, Due 8/1/2018F | | EUR | 10,000 | | | | 10,465 | |
| | | | | | | | |
| | | | | | | 29,606 | |
| | | | | | | | |
Sovereign - 1.23% | | | | | | | | |
Greece, Hellenic Republic, 3.00%, Due 2/24/2023I J | | EUR | 5,000 | | | | 3,729 | |
Mexican Bonos Desarr, 5.00%, Due 6/15/2017 | | MXN | 117,500 | | | | 7,120 | |
| | | | | | | | |
| | | | | | | 10,849 | |
| | | | | | | | |
Telecommunications - 0.44% | | | | | | | | |
OTE PLC, 3.50%, Due 7/9/2020 H | | EUR | 4,000 | | | | 3,916 | |
| | | | | | | | |
Transportation - 4.87% | | | | | | | | |
CMA CGM S.A., 7.75%, Due 1/15/2021F | | EUR | 17,690 | | | | 19,097 | |
Moto Finance PLC, 6.375%, Due 9/1/2020F H | | GBP | 8,755 | | | | 13,502 | |
VWR Funding, Inc., 4.625%, Due 4/15/2022 | | EUR | 9,500 | | | | 10,338 | |
| | | | | | | | |
| | | | | | | 42,937 | |
| | | | | | | | |
Total Foreign Obligations (Cost $111,762) | | | | | | | 102,850 | |
| | | | | | | | |
| | | Shares | | | | |
SHORT-TERM INVESTMENTS - 1.83% (Cost $16,144) | | | | | | | | |
Short-Term Investments - 1.83% | | | | | | | | |
JPMorgan U.S. Government Money Market Fund, Capital Class | | | 16,144,321 | | | | 16,144 | |
| | | | | | | | |
TOTAL INVESTMENTS - 98.19% (Cost $912,403) | | | | | | | 865,655 | |
OTHER ASSETS, NET OF LIABILITIES - 1.81% | | | | | | | 15,936 | |
| | | | | | | | |
TOTAL NET ASSETS - 100.00% | | | | | | $ | 881,591 | |
| | | | | | | | |
Percentages are stated as a percent of net assets.
| A | REIT - Real Estate Investment Trust. |
| B | LP - Limited Partnership. |
| C | MLP - Master Limited Partnership. |
| D | Non-income producing security. |
| E | LLC - Limited Liability Company. |
| F | Security exempt from registration under the Securities Act of 1933. These securities may be resold to qualified institutional buyers pursuant to Rule 144A. At the period end, the value of these securities amounted to $422,269 or 47.90% of net assets. The Fund has no right to demand registration of these securities. |
| H | PLC - Public Limited Company. |
See accompanying notes
33
American Beacon SiM High Yield Opportunities FundSM
Schedule of Investments
August 31, 2015
| J | Step Up/Down - A scheduled increase in the exercise or conversion price at which a warrant, an option, or a convertible security may be used to acquire shares of common stock. |
| K | In U.S Dollars unless otherwise noted. |
| L | Fair Valued pursuant to procedures approved by the Board of Trustees. At period end, the value of these securities amounted to $1,419 or 0.16% of net assets. |
| M | Illiquid security. At period end, the amount of illiquid securities was $1,419 or 0.16% of net assets. |
Futures Contracts Open on August 31, 2015:
| | | | | | | | | | | | | | | | | | |
Description | | Type | | | Number of
Contracts | | Expiration Date | | | Contract Value | | | Unrealized
Appreciation
(Depreciation) | |
British Pound Globex September Futures | | | Short | | | 285 | | | September 2015 | | | $ | 27,338,625 | | | $ | 302,547 | |
Euro Currency Globex September Futures | | | Short | | | 513 | | | September 2015 | | | | 72,070,088 | | | | 216,931 | |
| | | | | | | | | | | | | | | | | | |
| | | | | | | | | | | | $ | 99,408,713 | | | $ | 519,478 | |
| | | | | | | | | | | | | | | | | | |
Glossary:
Currency Abbreviations:
| | | | |
EUR | | Euro | | |
GBP | | British Pound | | |
MXN | | Mexican Peso | | |
Exchange Abbreviations:
| | | | |
Globex | | Chicago Mercantile Exchange | | |
See accompanying notes
34
American Beacon FundsSM
Statements of Assets and Liabilities
August 31, 2015 (in thousands, except share and per share amounts)
| | | | | | | | | | | | | | | | |
| | | The London
Company
Income
Equity Fund | | | Zebra
Global
Equity Fund | | | Zebra Small
Cap Equity
Fund | | | SiM High
Yield
Opportunities
Fund | |
Assets: | |
Investments in unaffiliated securities, at fair value A C | | $ | 713,325 | | | $ | 4,967 | | | $ | 20,206 | | | $ | 865,655 | |
Investments in affiliated securities, at fair value B | | | — | | | | — | | | | 139 | | | | — | |
Cash | | | — | | | | — | | | | — | | | | 1,839 | |
Deposit with brokers for futures contracts | | | 754 | | | | 8 | | | | 46 | | | | — | |
Dividends and interest receivable | | | 2,184 | | | | 14 | | | | 19 | | | | 15,450 | |
Receivable for investments sold | | | — | | | | — | | | | — | | | | 12,654 | |
Receivable for fund shares sold | | | 2,315 | | | | — | | | | 91 | | | | 5,171 | |
Receivable for tax reclaims | | | — | | | | 2 | | | | — | | | | — | |
Receivable for expense reimbursement (Note 2) | | | — | | | | 12 | | | | 5 | | | | 13 | |
Receivable for variation margin on open futures contracts | | | — | | | | — | | | | — | | | | 523 | |
Prepaid expenses | | | 42 | | | | 28 | | | | 31 | | | | 40 | |
| | | | | | | | | | | | | | | | |
Total assets | | | 718,620 | | | | 5,031 | | | | 20,537 | | | | 901,345 | |
| | | | | | | | | | | | | | | | |
Liabilities: | | | | | | | | | | | | | | | | |
Payable for investments purchased | | | — | | | | — | | | | — | | | | 16,195 | |
Payable for fund shares redeemed | | | 581 | | | | 21 | | | | 6 | | | | 2,350 | |
Payable for variation margin from open futures contracts | | | 167 | | | | 2 | | | | 6 | | | | — | |
Payable under excess expense reimbursement plan (Note 2) | | | 4 | | | | — | | | | — | | | | — | |
Payable upon return of securities loaned (Note 9) | | | — | | | | — | | | | 147 | | | | — | |
Dividends payable | | | — | | | | — | | | | — | | | | 364 | |
Management and investment advisory fees payable | | | 224 | | | | 1 | | | | 10 | | | | 334 | |
Administrative service and service fees payable | | | 360 | | | | 3 | | | | 10 | | | | 394 | |
Transfer agent fees payable | | | 8 | | | | — | | | | 1 | | | | 23 | |
Custody and fund accounting fees payable | | | 6 | | | | 2 | | | | 1 | | | | 8 | |
Professional fees payable | | | 25 | | | | 28 | | | | 26 | | | | 41 | |
Trustee fees payable | | | 10 | | | | — | | | | — | | | | 14 | |
Payable for prospectus and shareholder reports | | | 16 | | | | 2 | | | | 1 | | | | 25 | |
Other liabilities | | | 3 | | | | — | | | | — | | | | 6 | |
| | | | | | | | | | | | | | | | |
Total liabilities | | | 1,404 | | | | 59 | | | | 208 | | | | 19,754 | |
| | | | | | | | | | | | | | | | |
Net Assets | | $ | 717,216 | | | $ | 4,972 | | | $ | 20,329 | | | $ | 881,591 | |
| | | | | | | | | | | | | | | | |
Analysis of Net Assets: | | | | | | | | | | | | | | | | |
Paid-in-capital | | | 715,041 | | | | 4,844 | | | | 19,014 | | | | 935,369 | |
Undistributed (or overdistribution of) net investment income | | | 1,382 | | | | 72 | | | | 77 | | | | (6,376 | ) |
Accumulated net realized gain (loss) | | | (1,508 | ) | | | 332 | | | | 2,094 | | | | (1,176 | ) |
Unrealized appreciation or (depreciation) of investments | | | 2,717 | | | | (70 | ) | | | (811 | ) | | | (38,268 | ) |
Unrealized (depreciation) of currency transactions | | | — | | | | (201 | ) | | | — | | | | (8,477 | ) |
Unrealized appreciation or (depreciation) of futures contracts | | | (416 | ) | | | (5 | ) | | | (45 | ) | | | 519 | |
| | | | | | | | | | | | | | | | |
Net assets | | $ | 717,216 | | | $ | 4,972 | | | $ | 20,329 | | | $ | 881,591 | |
| | | | | | | | | | | | | | | | |
Shares outstanding at no par value (unlimited shares authorized): | | | | | | | | | | | | | | | | |
Institutional Class | | | 9,889,569 | | | | 54,765 | | | | 124,176 | | | | 24,421,849 | |
| | | | | | | | | | | | | | | | |
Y Class | | | 26,433,406 | | | | 38,868 | | | | 683,354 | | | | 31,847,680 | |
| | | | | | | | | | | | | | | | |
Investor Class | | | 1,489,510 | | | | 45,796 | | | | 180,979 | | | | 20,954,140 | |
| | | | | | | | | | | | | | | | |
A Class | | | 5,270,539 | | | | 257,694 | | | | 337,413 | | | | 8,601,184 | |
| | | | | | | | | | | | | | | | |
C Class | | | 8,998,644 | | | | 80,831 | | | | 101,257 | | | | 7,730,746 | |
| | | | | | | | | | | | | | | | |
Net assets (not in thousands): | | | | | | | | | | | | | | | | |
Institutional Class | | $ | 137,006,660 | | | $ | 569,418 | | | $ | 1,764,526 | | | $ | 230,287,454 | |
| | | | | | | | | | | | | | | | |
Y Class | | $ | 364,477,089 | | | $ | 406,765 | | | $ | 9,795,860 | | | $ | 300,014,547 | |
| | | | | | | | | | | | | | | | |
Investor Class | | $ | 20,564,814 | | | $ | 474,166 | | | $ | 2,573,002 | | | $ | 196,928,349 | |
| | | | | | | | | | | | | | | | |
A Class | | $ | 72,363,106 | | | $ | 2,691,085 | | | $ | 4,797,155 | | | $ | 81,147,262 | |
| | | | | | | | | | | | | | | | |
C Class | | $ | 122,804,166 | | | $ | 830,506 | | | $ | 1,398,217 | | | $ | 73,213,378 | |
| | | | | | | | | | | | | | | | |
See accompanying notes
35
American Beacon FundsSM
Statements of Assets and Liabilities
August 31, 2015 (in thousands, except share and per share amounts)
| | | | | | | | | | | | | | | | |
| | | The London
Company
Income
Equity Fund | | | Zebra
Global
Equity Fund | | | Zebra Small
Cap Equity
Fund | | | SiM High
Yield
Opportunities
Fund | |
Net asset value, offering and redemption price per share: | |
Institutional Class | | $ | 13.85 | | | $ | 10.40 | | | $ | 14.21 | | | $ | 9.43 | |
| | | | | | | | | | | | | | | | |
Y Class | | $ | 13.79 | | | $ | 10.47 | | | $ | 14.33 | | | $ | 9.42 | |
| | | | | | | | | | | | | | | | |
Investor Class | | $ | 13.81 | | | $ | 10.35 | | | $ | 14.22 | | | $ | 9.40 | |
| | | | | | | | | | | | | | | | |
A Class | | $ | 13.73 | | | $ | 10.44 | | | $ | 14.22 | | | $ | 9.43 | |
| | | | | | | | | | | | | | | | |
A Class (offering price) | | $ | 14.57 | | | $ | 11.08 | | | $ | 15.09 | | | $ | 9.90 | |
| | | | | | | | | | | | | | | | |
C Class | | $ | 13.65 | | | $ | 10.27 | | | $ | 13.81 | | | $ | 9.47 | |
| | | | | | | | | | | | | | | | |
| | | | |
A Cost of investments in unaffiliated securities | | $ | 710,608 | | | $ | 5,238 | | | $ | 21,017 | | | $ | 912,403 | |
B Cost of investments in affiliated securities | | $ | — | | | $ | — | | | $ | 139 | | | $ | — | |
C Fair value of securities on loan | | $ | — | | | $ | — | | | $ | 144 | | | $ | — | |
See accompanying notes
36
American Beacon FundsSM
Statements of Operations
For the year ended August 31, 2015 (in thousands)
| | | | | | | | | | | | | | | | |
| | | The London
Company
Income
Equity Fund | | | Zebra
Global
Equity
Fund | | | Zebra Small
Cap Equity
Fund | | | SiM High
Yield
Opportunities
Fund | |
Investment income: | | | | | | | | | | | | | | | | |
Dividend income from unaffiliated securities (net of foreign taxes) A | | $ | 16,064 | | | $ | 156 | | | $ | 341 | | | $ | 1,724 | |
Interest income | | | — | | | | — | | | | — | | | | 49,326 | |
Income derived from securities lending | | | — | | | | — | | | | 11 | | | | — | |
| | | | | | | | | | | | | | | | |
Total investment income | | | 16,064 | | | | 156 | | | | 352 | | | | 51,050 | |
| | | | | | | | | | | | | | | | |
Expenses: | | | | | | | | | | | | | | | | |
Management and investment advisory fees (Note 2) | | | 1,902 | | | | 25 | | | | 121 | | | | 3,648 | |
Administrative service fees (Note 2): | | | | | | | | | | | | | | | | |
Institutional Class | | | 299 | | | | 2 | | | | 5 | | | | 473 | |
Y Class | | | 754 | | | | 2 | | | | 28 | | | | 878 | |
Investor Class | | | 58 | | | | 2 | | | | 9 | | | | 609 | |
A Class | | | 168 | | | | 11 | | | | 14 | | | | 264 | |
C Class | | | 273 | | | | 3 | | | | 5 | | | | 230 | |
Transfer agent fees: | | | | | | | | | | | | | | | | |
Institutional Class | | | 23 | | | | — | | | | 1 | | | | 114 | |
Y Class | | | 10 | | | | — | | | | 1 | | | | 14 | |
Investor Class | | | 3 | | | | 1 | | | | 2 | | | | 9 | |
A Class | | | 5 | | | | 1 | | | | 1 | | | | 12 | |
C Class | | | 6 | | | | — | | | | — | | | | 7 | |
Custody and fund accounting fees | | | 44 | | | | 25 | | | | 10 | | | | 97 | |
Professional fees | | | 58 | | | | 43 | | | | 38 | | | | 98 | |
Registration fees and expenses | | | 105 | | | | 63 | | | | 66 | | | | 140 | |
Service fees (Note 2): | | | | | | | | | | | | | | | | |
Y Class | | | 251 | | | | 1 | | | | 9 | | | | 293 | |
Investor Class | | | 58 | | | | 1 | | | | 7 | | | | 760 | |
A Class | | | 84 | | | | 5 | | | | 7 | | | | 132 | |
C Class | | | 136 | | | | 1 | | | | 2 | | | | 115 | |
Distribution fees (Note 2): | | | | | | | | | | | | | | | | |
A Class | | | 140 | | | | 9 | | | | 12 | | | | 220 | |
C Class | | | 912 | | | | 10 | | | | 15 | | | | 768 | |
Prospectus and shareholder report expenses | | | 46 | | | | 3 | | | | 5 | | | | 94 | |
Trustee fees | | | 32 | | | | — | | | | 1 | | | | 49 | |
Other expenses | | | 27 | | | | 6 | | | | 7 | | | | 29 | |
| | | | | | | | | | | | | | | | |
Total expenses | | | 5,394 | | | | 214 | | | | 366 | | | | 9,053 | |
| | | | | | | | | | | | | | | | |
Net (fees waived and expenses reimbursed)/recovered by Manager (Note 2) | | | 123 | | | | (136 | ) | | | (106 | ) | | | 14 | |
| | | | | | | | | | | | | | | | |
Net expenses | | | 5,517 | | | | 78 | | | | 260 | | | | 9,067 | |
| | | | | | | | | | | | | | | | |
Net investment income | | | 10,547 | | | | 78 | | | | 92 | | | | 41,983 | |
| | | | | | | | | | | | | | | | |
Realized and unrealized gain (loss) from investments: | | | | | | | | | | | | | | | | |
Net realized gain (loss) from: | | | | | | | | | | | | | | | | |
Investments | | | (2,269 | ) | | | 747 | | | | 2,097 | | | | 3,365 | |
Commission recapture (Note 3) | | | 59 | | | | — | | | | — | | | | — | |
Foreign currency transactions | | | — | | | | (176 | ) | | | — | | | | (10,039 | ) |
Futures contracts | | | 833 | | | | 10 | | | | 27 | | | | 14,502 | |
Swap agreements | | | — | | | | — | | | | — | | | | 3,204 | |
Options and swaptions contracts | | | — | | | | — | | | | — | | | | (118 | ) |
Change in net unrealized appreciation or (depreciation) of: | | | | | | | | | | | | | | | | |
Investments | | | (29,538 | ) | | | (895 | ) | | | (2,152 | ) | | | (50,610 | ) |
Foreign currency transactions | | | — | | | | (145 | ) | | | — | | | | (7,531 | ) |
Futures contracts | | | (502 | ) | | | (13 | ) | | | (55 | ) | | | (2,017 | ) |
Swap agreements | | | — | | | | — | | | | — | | | | (1,937 | ) |
| | | | | | | | | | | | | | | | |
Net (loss) from investments | | | (31,417 | ) | | | (472 | ) | | | (83 | ) | | | (51,181 | ) |
| | | | | | | | | | | | | | | | |
Net increase (decrease) in net assets resulting from operations | | $ | (20,870 | ) | | $ | (394 | ) | | $ | 9 | | | $ | (9,198 | ) |
| | | | | | | | | | | | | | | | |
| | | | |
A Foreign taxes | | | — | | | | 8 | | | | — | | | | 51 | |
See accompanying notes
37
American Beacon FundsSM
Statements of Changes in Net Assets (in thousands)
| | | | | | | | | | | | | | | | |
| | | The London Company
Income Equity Fund | | | Zebra Global Equity Fund | |
| | | Year Ended
August 31,
2015 | | | Year Ended
August 31,
2014 | | | Year Ended
August 31,
2015 | | | Year Ended
August 31,
2014 | |
Increase (Decrease) in Net Assets: | | | | | | | | | | | | | | | | |
Operations: | | | | | | | | | | | | | | | | |
Net investment income | | $ | 10,547 | | | $ | 3,829 | | | $ | 78 | | | $ | 81 | |
Net realized gain (loss) from investments, commission recapture, foreign currency transactions, and futures contracts | | | (1,377 | ) | | | 3,210 | | | | 581 | | | | 617 | |
Change in net unrealized appreciation or (depreciation) from investments, foreign currency transactions, and futures contracts | | | (30,040 | ) | | | 30,033 | | | | (1,053 | ) | | | 502 | |
| | | | | | | | | | | | | | | | |
Net increase (decrease) in net assets resulting from operations | | | (20,870 | ) | | | 37,072 | | | | (394 | ) | | | 1,200 | |
| | | | | | | | | | | | | | | | |
Distributions to Shareholders: | | | | | | | | | | | | | | | | |
Net investment income: | | | | | | | | | | | | | | | | |
Institutional Class | | | (2,101 | ) | | | (1,034 | ) | | | (6 | ) | | | (8 | ) |
Y Class | | | (5,121 | ) | | | (1,468 | ) | | | (7 | ) | | | (2 | ) |
Investor Class | | | (347 | ) | | | (278 | ) | | | (5 | ) | | | (13 | ) |
A Class | | | (990 | ) | | | (366 | ) | | | (38 | ) | | | (40 | ) |
C Class | | | (1,005 | ) | | | (299 | ) | | | (9 | ) | | | — | |
Net realized gain from investments: | | | | | | | | | | | | | | | | |
Institutional Class | | | (556 | ) | | | (276 | ) | | | (76 | ) | | | (175 | ) |
Y Class | | | (1,564 | ) | | | (389 | ) | | | (89 | ) | | | (40 | ) |
Investor Class | | | (137 | ) | | | (93 | ) | | | (58 | ) | | | (159 | ) |
A Class | | | (342 | ) | | | (137 | ) | | | (460 | ) | | | (805 | ) |
C Class | | | (583 | ) | | | (144 | ) | | | (112 | ) | | | (118 | ) |
| | | | | | | | | | | | | | | | |
Net distributions to shareholders | | | (12,746 | ) | | | (4,484 | ) | | | (860 | ) | | | (1,360 | ) |
| | | | | | | | | | | | | | | | |
Capital Share Transactions: | | | | | | | | | | | | | | | | |
Proceeds from sales of shares | | | 579,989 | | | | 191,341 | | | | 717 | | | | 3,248 | |
Reinvestment of dividends and distributions | | | 5,799 | | | | 2,392 | | | | 798 | | | | 1,171 | |
Cost of shares redeemed | | | (110,716 | ) | | | (53,070 | ) | | | (2,813 | ) | | | (3,617 | ) |
| | | | | | | | | | | | | | | | |
Net increase (decrease) in net assets from capital share transactions | | | 475,072 | | | | 140,663 | | | | (1,298 | ) | | | 802 | |
| | | | | | | | | | | | | | | | |
Net increase (decrease) in net assets | | | 441,456 | | | | 173,251 | | | | (2,552 | ) | | | 642 | |
| | | | | | | | | | | | | | | | |
Net Assets: | | | | | | | | | | | | | | | | |
Beginning of period | | | 275,760 | | | | 102,509 | | | | 7,524 | | | | 6,882 | |
| | | | | | | | | | | | | | | | |
End of Period * | | $ | 717,216 | | | $ | 275,760 | | | $ | 4,972 | | | $ | 7,524 | |
| | | | | | | | | | | | | | | | |
* Includes undistributed (or overdistribution of) net investment income | | $ | 1,382 | | | $ | 564 | | | $ | 72 | | | $ | 64 | |
| | | | | | | | | | | | | | | | |
See accompanying notes
38
American Beacon FundsSM
Statements of Changes in Net Assets (in thousands)
| | | | | | | | | | | | | | | | |
| | | Zebra Small Cap Equity
Fund | | | SiM High Yield
Opportunities Fund | |
| | | Year Ended
August 31,
2015 | | | Year Ended
August 31,
2014 | | | Year Ended
August 31,
2015 | | | Year Ended
August 31,
2014 | |
Increase (Decrease) in Net Assets: | | | | | | | | | | | | | | | | |
Operations: | | | | | | | | | | | | | | | | |
Net investment income | | $ | 92 | | | $ | 102 | | | $ | 41,983 | | | $ | 33,318 | |
Net realized gain from investments, foreign currency transactions, futures contracts, swap agreements, and options and swaption contracts | | | 2,124 | | | | 1,493 | | | | 10,914 | | | | 8,048 | |
Change in net unrealized appreciation or (depreciation) from investments, foreign currency transactions, futures contracts, and swap agreements | | | (2,207 | ) | | | 360 | | | | (62,095 | ) | | | 18,878 | |
| | | | | | | | | | | | | | | | |
Net increase (decrease) in net assets resulting from operations | | | 9 | | | | 1,955 | | | | (9,198 | ) | | | 60,244 | |
| | | | | | | | | | | | | | | | |
Distributions to Shareholders: | | | | | | | | | | | | | | | | |
Net investment income: | | | | | | | | | | | | | | | | |
Institutional Class | | | (5 | ) | | | — | | | | (8,912 | ) | | | (3,357 | ) |
Y Class | | | (30 | ) | | | — | | | | (16,161 | ) | | | (8,079 | ) |
Investor Class | | | (1 | ) | | | — | | | | (10,695 | ) | | | (16,592 | ) |
A Class | | | (6 | ) | | | — | | | | (4,573 | ) | | | (5,141 | ) |
C Class | | | — | | | | — | | | | (3,422 | ) | | | (3,428 | ) |
Net realized gain from investments: | | | | | | | | | | | | | | | | |
Institutional Class | | | (24 | ) | | | (164 | ) | | | (2,661 | ) | | | (972 | ) |
Y Class | | | (139 | ) | | | (294 | ) | | | (7,970 | ) | | | (2,323 | ) |
Investor Class | | | (35 | ) | | | (633 | ) | | | (5,265 | ) | | | (5,955 | ) |
A Class | | | (67 | ) | | | (295 | ) | | | (2,461 | ) | | | (1,827 | ) |
C Class | | | (23 | ) | | | (104 | ) | | | (2,175 | ) | | | (1,418 | ) |
| | | | | | | | | | | | | | | | |
Net distributions to shareholders | | | (330 | ) | | | (1,490 | ) | | | (64,295 | ) | | | (49,092 | ) |
| | | | | | | | | | | | | | | | |
Capital Share Transactions: | | | | | | | | | | | | | | | | |
Proceeds from sales of shares | | | 9,379 | | | | 17,920 | | | | 482,098 | | | | 375,899 | |
Reinvestment of dividends and distributions | | | 315 | | | | 1,393 | | | | 57,657 | | | | 43,082 | |
Cost of shares redeemed | | | (8,185 | ) | | | (9,930 | ) | | | (276,477 | ) | | | (256,624 | ) |
Redemption fees | | | — | | | | — | | | | 107 | | | | 52 | |
| | | | | | | | | | | | | | | | |
Net increase in net assets from capital share transactions | | | 1,509 | | | | 9,383 | | | | 263,385 | | | | 162,409 | |
| | | | | | | | | | | | | | | | |
Net increase in net assets | | | 1,188 | | | | 9,848 | | | | 189,892 | | | | 173,561 | |
| | | | | | | | | | | | | | | | |
Net Assets: | | | | | | | | | | | | | | | | |
Beginning of period | | | 19,141 | | | | 9,293 | | | | 691,699 | | | | 518,138 | |
| | | | | | | | | | | | | | | | |
End of Period * | | $ | 20,329 | | | $ | 19,141 | | | $ | 881,591 | | | $ | 691,699 | |
| | | | | | | | | | | | | | | | |
* Includes undistributed (or overdistribution of) net investment income | | $ | 77 | | | $ | 67 | | | $ | (6,376 | ) | | $ | (1,578 | ) |
| | | | | | | | | | | | | | | | |
See accompanying notes
39
American Beacon FundsSM
Notes to Financial Statements
August 31, 2015
1. Organization and Significant Accounting Policies
American Beacon Funds (the “Trust”), is organized as a Massachusetts business trust and is registered under the Investment Company Act of 1940, as amended (the “Act”), as a diversified, open-end management investment company. As of August 31, 2015, the Trust consists of thirty-one active series, four of which are presented in this filing (collectively, the “Funds” and each individually a “Fund”): the American Beacon The London Company Income Equity Fund, the American Beacon Zebra Global Equity Fund, the American Beacon Zebra Small Cap Equity Fund, and the American Beacon SiM High Yield Opportunities Fund. The remaining twenty-seven active series are reported in separate filings.
Effective April 30, 2015 American Beacon Advisors, Inc. (the “Manager”) became a wholly-owned subsidiary of Astro AB Borrower, Inc., which is indirectly owned by investment funds affiliated with Kelso & Company, L.P. and Estancia Capital Management, LLC, two prominent private equity firms. Prior to April 30 the Manager was a wholly-owned subsidiary of Lighthouse Holdings, Inc. which was indirectly owned by investment funds affiliated with Pharos Capital Group, LLC and TPG Capital, L.P., two leading private equity firms.
The Manager has closed the Zebra Global Equity Fund to new shareholders as of the close of business on August 20, 2015. Existing shareholders as of that date may continue to purchase, redeem, or exchange shares of the Funds on any business day, which is any day the New York Stock Exchange is open for business.
Class Disclosure
Each Fund has multiple classes of shares designed to meet the needs of different groups of investors. The following table sets forth the differences amongst the classes:
| | |
Class: | | Offered to: |
Institutional Class | | Investors making an initial investment of $250,000 |
Y Class | | Investors making an initial investment of $100,000 |
Investor Class | | Individual investors investing directly or through an intermediary |
A Class | | General public and investors investing through an intermediary with applicable sales charges, which may include a front-end sales charge and a contingent deferred sales charge (“CDSC”) |
C Class | | General public and investors investing through an intermediary with applicable sales charges, which may include a CDSC |
Each class offered by the Trust has equal rights as to assets and voting privileges. Income and non-class specific expenses are allocated daily to each class on the basis of the relative net assets. Realized and unrealized capital gains and losses of each class are allocated daily based on the relative net assets of each class of the respective Fund. Class specific expenses, where applicable, currently include administrative service fees, service fees and distribution fees and vary amongst the classes as described more fully in Note 2.
New Account Pronouncement
In June 2014, the Financial Accounting Standards Board (“FASB”) issued Accounting Standards Update (“ASU”) 2014-11, “Transfers and Servicing (Topic 860): Repurchase-to-Maturity Transactions, Repurchase Financings, and Disclosures” (“ASU 2014-11”), that expanded secured borrowing accounting for certain reverse repurchase agreements. ASU 2014-11 also sets forth additional disclosure requirements for certain transactions accounted for as sales in order to provide financial statement users with information to compare to similar transactions accounted for as secured borrowings. ASU 2014-11 is effective prospectively for annual periods beginning after December 15, 2014, and interim periods beginning after March 15, 2015. Management is currently evaluating the impact, if any, of ASU 2014-11 on the Funds’ financial statement disclosures.
40
American Beacon FundsSM
Notes to Financial Statements
August 31, 2015
2. Transactions with Affiliates
Management Agreement
The Trust and the Manager are parties to a Management Agreement that obligates the Manager to provide or oversee the provision of all investment advisory, fund management, and securities lending services. As compensation for performing the duties required under the Management Agreement, the Manager receives from the Funds an annualized fee equal to 0.05% of the average daily net assets. The Funds pay the unaffiliated investment advisors hired to direct investment activities of the Funds. Management fees paid by the Funds during the year ended August 31, 2015 were as follows (in thousands):
| | | | | | | | | | | | | | | | |
Fund | | Management
Fee Rate | | | Management
Fee | | | Amounts paid to
Investment Advisors | | | Amounts Paid
to Manager | |
The London Company Income Equity | | | 0.37 | % | | $ | 1,902 | | | $ | 1,644 | | | $ | 258 | |
Zebra Global Equity | | | 0.39 | % | | | 25 | | | | 22 | | | | 3 | |
Zebra Small Cap Equity | | | 0.59 | % | | | 121 | | | | 109 | | | | 12 | |
SiM High Yield Opportunities | | | 0.45 | % | | | 3,648 | | | | 3,239 | | | | 409 | |
As compensation for services provided by the Manager in connection with securities lending activities conducted by the Zebra Small Cap Equity Fund, the lending Fund pays to the Manager, with respect to cash collateral posted by borrowers, a fee up to 25% of the net monthly interest income (the gross income earned by the investment of cash collateral, less the amount paid to borrowers and related expenses) from such activities and, with respect to loan fees paid by borrowers, a fee up to 25% of such loan fees. This fee is included in Income derived from securities lending and management and investment advisory fees on the Statements of Operations. During the year ended August 31, 2015, securities lending fees paid to the Manager were $1,265 for the Zebra Small Cap Equity Fund.
Administration Agreement
The Manager and the Trust entered into an Administration Agreement which obligates the Manager to provide or oversee administrative services to each Fund. As compensation for performing the duties required under the Administration Agreement, the Manager receives an annualized fee of 0.30% of the average daily net assets of the Institutional, Y, Investor, A, and C Classes of the Funds.
Distribution Plans
The Funds, except for the A and C Classes of the Funds, have adopted a “defensive” Distribution Plan (the “Plan”) in accordance with Rule 12b-1 under the Act, pursuant to which no separate fees may be charged to the Funds for distribution purposes. However, the Plan authorizes the management and administrative service fees received by the Manager and the investment advisor hired by the Manager to be used for distribution purposes. Under this Plan, the Funds do not intend to compensate the Manager or any other party, either directly or indirectly, for the distribution of Fund shares.
Separate Distribution Plans (the “Distribution Plans”) have been adopted pursuant to Rule 12b-1 under the Act for the A and C Classes of the Funds. Under the Distribution Plans, as compensation for distribution assistance, the Manager receives an annual fee of 0.25% of the average daily net assets of the A Classes and 1.00% of the average daily net assets of the C Classes of each Fund. The fee will be payable without regard to whether the amount of the fee is more or less than the actual expenses incurred in a particular month by the Manager for distribution assistance.
41
American Beacon FundsSM
Notes to Financial Statements
August 31, 2015
Service Plans
The Manager and the Trust entered into Service Plans that obligate the Manager to oversee additional shareholder servicing of the Y, Investor, A, and C Classes. As compensation for performing the duties required under the Service Plans, the Manager receives 0.10% of the average daily net assets of Y Class, 0.15% of the average daily net assets of the A and C Classes, and up to 0.375% of the average daily net assets of the Investor Class of the Funds.
Investment in Affiliated Funds
The Funds may invest in the American Beacon Money Market Select Fund (the “MM Select Fund”) and the American Beacon U.S. Government Money Market Select Fund (the “USG Select Fund”) (collectively the “Select Funds”). Cash collateral received by the Funds in connection with securities lending may be invested in the Select Funds. The Funds and the Select Funds have the same investment advisor and therefore, are considered to be affiliated. The Manager serves as investment advisor to the Select Funds and receives from the Select Funds an annualized management fee of 0.09% of the average daily net assets of the Select Funds. During the year ended August 31, 2015, fees earned by the Manager from the Select Funds were as follows:
| | | | | | | | | | | | |
Fund | | Direct Investments
in Select Funds | | | Fees Earned from Securities
Lending Collateral Invested in
Select Funds | | | Total | |
Zebra Small Cap Equity Fund | | $ | — | | | $ | 382 | | | $ | 382 | |
Interfund Lending Program
Pursuant to an exemptive order issued by the Securities and Exchange Commission (“SEC”), the Funds, along with other registered investment companies having management contracts with the Manager, may participate in an interfund lending program. This program provides an alternative credit facility allowing the Funds to borrow from other participating funds. During the year ended August 31, 2015, the Zebra Small Cap Equity Fund borrowed on average $804,185 for 4 days at an average equity rate of 0.74% with interest charges of $66, and the SiM High Yield Opportunities Fund borrowed on average $1,727,508 for 1 day at a rate of 0.77% with interest charges of $36.
Expense Reimbursement Plan
The Manager contractually agreed to reimburse the following Funds to the extent that total annual fund operating expenses exceeded the Funds’ expense cap. For the year ended August 31, 2015, the Manager waived or reimbursed expenses as follows:
| | | | | | | | | | |
Fund | | Class | | Expense Cap | | Reimbursed or
(Recovered) Expenses | | Expiration of
Reimbursed
Expenses |
| | | 9/1/14 -
12/31/14 | | 1/1/15 -
8/31/15 | | |
The London Company Income Equity | | Institutional | | 0.79% | | 0.79% | | $(41,438) | | 2018 |
The London Company Income Equity | | Y | | 0.89% | | N/A | | (25,686) | | 2018 |
The London Company Income Equity | | Investor | | 1.17% | | N/A | | (22,450) | | 2018 |
The London Company Income Equity | | A | | 1.19% | | 1.19% | | (23,295) | | 2018 |
The London Company Income Equity | | C | | 1.94% | | 1.94% | | (9,853) | | 2018 |
Zebra Global Equity | | Institutional | | 0.79% | | 0.79% | | 13,553 | | 2018 |
Zebra Global Equity | | Y | | 0.89% | | 0.89% | | 12,660 | | 2018 |
Zebra Global Equity | | Investor | | 1.17% | | 1.17% | | 12,413 | | 2018 |
Zebra Global Equity | | A | | 1.19% | | 1.19% | | 76,825 | | 2018 |
Zebra Global Equity | | C | | 1.94% | | 1.94% | | 20,073 | | 2018 |
Zebra Small Cap Equity | | Institutional | | 0.99% | | 0.99% | | 9,342 | | 2018 |
Zebra Small Cap Equity | | Y | | 1.09% | | 1.09% | | 48,761 | | 2018 |
Zebra Small Cap Equity | | Investor | | 1.37% | | 1.37% | | 13,195 | | 2018 |
Zebra Small Cap Equity | | A | | 1.39% | | 1.39% | | 26,108 | | 2018 |
Zebra Small Cap Equity | | C | | 2.14% | | 2.14% | | 8,270 | | 2018 |
SiM High Yield Opportunities | | Institutional | | 0.84% | | 0.84% | | 60,056 | | 2018 |
SiM High Yield Opportunities | | Y | | 0.94% | | N/A | | (41,950) | | 2018 |
SiM High Yield Opportunities | | A | | 1.24% | | 1.24% | | (14,640) | | 2018 |
SiM High Yield Opportunities | | C | | 1.99% | | 1.99% | | (17,075) | | 2018 |
42
American Beacon FundsSM
Notes to Financial Statements
August 31, 2015
Of these amounts, $12,350, $4,860, and $13,419 were disclosed as a receivable from the Manager to Zebra Global Equity, Zebra Small Cap Equity, and SiM High Yield Opportunities Funds, respectively and $3,897 was payable from The London Company Income Equity Fund to the Manager at August 31, 2015. The Funds have adopted an Expense Reimbursement Plan whereby the Manager may seek repayment of fees waived or expenses reimbursed for a period of up to three years. However, reimbursement will occur only if the Class’s average net assets have grown or expenses have declined sufficiently to allow reimbursement without causing its expense ratio to exceed the previously agreed upon contractual expense limit. The reimbursed expenses listed above will expire in 2018. The Funds did not record a liability for potential reimbursements, due to the current assessment that a reimbursement is unlikely. The carryover of excess expenses potentially reimbursable to the Manager are as follows:
| | | | | | | | | | | | | | | | |
Fund | | Recovered Expenses | | | Excess Expense
Carryover | | | Expired Expenses | | | Expiration of
Reimbursed
Expenses | |
The London Company Income Equity | | $ | 59,586 | | | $ | — | | | $ | 53,032 | | | | 2015 | |
The London Company Income Equity | | | 53,330 | | | | 85,612 | | | | — | | | | 2016 | |
The London Company Income Equity | | | 9,807 | | | | 13,005 | | | | — | | | | 2017 | |
Zebra Global Equity | | | — | | | | — | | | | 166,541 | | | | 2015 | |
Zebra Global Equity | | | — | | | | 162,423 | | | | — | | | | 2016 | |
Zebra Global Equity | | | — | | | | 124,025 | | | | — | | | | 2017 | |
Zebra Small Cap Equity | | | — | | | | — | | | | 155,383 | | | | 2015 | |
Zebra Small Cap Equity | | | — | | | | 122,920 | | | | — | | | | 2016 | |
Zebra Small Cap Equity | | | — | | | | 94,922 | | | | — | | | | 2017 | |
SiM High Yield Opportunities | | | 38,591 | | | | — | | | | 93,216 | | | | 2015 | |
SiM High Yield Opportunities | | | 34,268 | | | | 119,358 | | | | — | | | | 2016 | |
SiM High Yield Opportunities | | | 806 | | | | 23,730 | | | | — | | | | 2017 | |
The Manager recovered expenses from The London Company Income Equity and SiM High Yield Opportunities Funds during the year ended August 31, 2015 as follows:
| | | | | | | | | | |
Fund | | Class | | Recovered Expense | | | Expiration | |
The London Company Income Equity | | Institutional | | $ | 41,438 | | | | 2015 | |
The London Company Income Equity | | Y | | | 5,298 | | | | 2015 | |
The London Company Income Equity | | Y | | | 15,702 | | | | 2016 | |
The London Company Income Equity | | Y | | | 4,686 | | | | 2017 | |
The London Company Income Equity | | Investor | | | 3,807 | | | | 2015 | |
The London Company Income Equity | | Investor | | | 18,643 | | | | 2016 | |
The London Company Income Equity | | A | | | 5,411 | | | | 2015 | |
The London Company Income Equity | | A | | | 15,001 | | | | 2016 | |
The London Company Income Equity | | A | | | 2,884 | | | | 2017 | |
The London Company Income Equity | | C | | | 3,632 | | | | 2015 | |
The London Company Income Equity | | C | | | 3,984 | | | | 2016 | |
The London Company Income Equity | | C | | | 2,237 | | | | 2017 | |
SiM High Yield Opportunities | | Y | | | 8,348 | | | | 2015 | |
SiM High Yield Opportunities | | Y | | | 32,797 | | | | 2016 | |
SiM High Yield Opportunities | | Y | | | 806 | | | | 2017 | |
SiM High Yield Opportunities | | A | | | 14,640 | | | | 2015 | |
SiM High Yield Opportunities | | C | | | 15,603 | | | | 2015 | |
SiM High Yield Opportunities | | C | | | 1,471 | | | | 2016 | |
Sales Commissions
The Funds’ distributor, Foreside Fund Services, LLC (“Foreside”) may receive a portion of A Class sales charges from broker dealers and it may be used to offset distribution related expenses. For the year ended August 31, 2015, Foreside collected $169,922, $357, $533, and $33,716 in sales commissions from the sale of A Class shares for The London Company Income Equity, Zebra Global Equity, Zebra Small Cap Equity, and SiM High Yield Opportunities Funds, respectively.
A CDSC of 0.50% will be deducted with respect to Class A Shares on certain purchases of $1,000,000 or more that are redeemed in whole or part within 18 months of purchase, unless waived as discussed in the Prospectus. Any applicable CDSC will be 0.50% of the lesser of the original purchase price or the value of the redemption of the Class A Shares redeemed. During the year ended August 31, 2015, fees of $4,982 was collected for The London Company Income Equity Fund.
43
American Beacon FundsSM
Notes to Financial Statements
August 31, 2015
A CDSC of 1.00% will be deducted with respect to Class C Shares redeemed within 12 months of purchase, unless waived as discussed in the Prospectus. Any applicable CDSC will be 1.00% of the lesser of the original purchase price or the value of the redemption of the Class C Shares redeemed. During the year ended August 31, 2015, CDSC fees of $26,572, $718, and $13,660 were collected for The London Company Income Equity, Zebra Small Cap Equity, and SiM High Yield Opportunities Funds, respectively.
3. Security Valuation and Fair Value Measurements
Investments are valued at the close of the New York Stock Exchange (the “Exchange”), normally 4 p.m. ET, each day that the Exchange is open for business. Equity securities, including exchange-traded funds (“ETFs”), for which market quotations are available are valued at the last sale price or official closing price (closing bid price or last evaluated quote if no sale has occurred) on the primary market or exchange on which they trade.
Debt securities (other than short-term securities) normally are valued on the basis of prices provided by an independent pricing service and may take into account appropriate factors such as institution-size trading in similar groups of securities, yield, quality, coupon rate, maturity, type of issue, trading characteristics, and other market data. The prices of debt securities may be determined using quotes obtained from brokers.
Investments in open-end mutual funds are valued at the closing net asset value (“NAV”) per share of the mutual fund on the day of valuation.
Securities for which the market prices are not readily available or are not reflective of the fair value of the security, as determined by the Manager, will be priced at fair value following procedures approved by the Trust’s Board of Trustees (the “Board”).
Futures contracts are valued based upon their quoted daily settlement prices. Upon entering into a futures contract, a Fund is required to deposit with its futures broker, an amount of cash or U.S. Government and Agency Obligations in accordance with the initial margin requirements of the broker or exchange. Futures contracts are marked to market daily and an appropriate payable or receivable for the change in value (“variation margin”) is recorded by the Fund. Gains or losses are recognized but not considered realized until the contracts expire or are closed. Futures contracts involve, to varying degrees, risk of loss in excess of the variation margin disclosed on the Statements of Assets and Liabilities.
For valuation purposes, the last quoted prices of non-U.S. equity securities may be adjusted under the circumstances described below. If the Fund determines that developments between the close of a foreign market and the close of the Exchange will, in its judgment, materially affect the value of some or all of its portfolio securities, the Fund will adjust the previous closing prices to reflect what it believes to be the fair value of the securities as of the close of the Exchange. In deciding whether it is necessary to adjust closing prices to reflect fair value, the Fund reviews a variety of factors, including developments in foreign markets, the performance of U.S. securities markets, and the performance of instruments trading in U.S. markets that represent foreign securities and baskets of foreign securities. In addition, the Fund may use fair value pricing for securities primarily traded in non-U.S. markets because most foreign markets close well before the Funds’ pricing time of 4:00 p.m. ET. The earlier close of these foreign markets gives rise to the possibility that significant events, including broad market moves, may have occurred in the interim and may materially affect the value of those securities. These securities are fair valued using a pricing service and are categorized as Level 2 in the fair value hierarchy. The pricing service, using methods approved by the Board, considers the correlation of the trading patterns of the foreign security to intraday trading in the U.S. markets, based on indices of domestic securities and other appropriate indicators such as prices of relevant ADRs and futures
44
American Beacon FundsSM
Notes to Financial Statements
August 31, 2015
contracts. The Valuation Committee may also fair value securities in other situations, such as when a particular foreign market is closed but a Fund is open. The Funds use outside pricing services to provide closing prices and information to evaluate and/or adjust those prices. As a means of evaluating its security valuation process, the Valuation Committee routinely compares closing prices, the next day’s opening prices in the same markets, and adjusted prices.
Other investments, including restricted securities, and those financial instruments for which the above valuation procedures are inappropriate or are deemed not to reflect fair value are stated at fair value as determined in good faith by the Valuation Committee, established by the Fund’s Board.
Valuation Inputs
Various inputs may be used to determine the value of the Funds’ investments. These inputs are summarized in three broad levels for financial statement purposes. The inputs or methodologies used to value securities are not necessarily an indication of the risk associated with investing in those securities.
| | |
Level 1 - | | Quoted prices in active markets for identical securities. |
| |
Level 2 - | | Prices determined using other significant observable inputs. These may include quoted prices for similar securities, interest rates, prepayment speeds, credit risk, and others. |
| |
Level 3 - | | Prices determined using other significant unobservable inputs. Unobservable inputs reflect the Fund’s own assumptions about the factors market participants would use in pricing an investment, and would be based on the best information available. |
Level 1 and Level 2 trading assets and trading liabilities, at fair value.
Fixed income securities including corporate, convertible and municipal bonds and notes, U.S. government agencies, U.S. treasury obligations, sovereign issues, bank loans, convertible preferred securities and non-U.S. bonds are normally valued by pricing service providers that use broker dealer quotations, reported trades or valuation estimates from their internal pricing models. The service providers’ internal models use inputs that are observable such as issuer details, interest rates, yield curves, prepayment speeds, credit risks/spreads, default rates and quoted prices for similar assets. Securities that use similar valuation techniques and inputs as described above are categorized as Level 2 of the fair value hierarchy.
Fixed income securities purchased on a delayed-delivery basis are marked to market daily until settlement at the forward settlement date and are categorized as Level 2 of the fair value hierarchy.
Mortgage-related and asset-backed securities are usually issued as separate tranches, or classes, of securities within each deal. These securities are also normally valued by pricing service providers that use broker dealer quotations or valuation estimates from their internal pricing models. The pricing models for these securities usually consider tranche-level attributes, current market data, estimated cash flows and market-based yield spreads for each tranche, and incorporate deal collateral performance, as available. Mortgage-related and asset-backed securities that use similar valuation techniques and inputs as described above are categorized as Level 2 of the fair value hierarchy.
Common stocks, ETFs and financial derivative instruments, such as futures contracts or options contracts that are traded on a national securities exchange, are stated at the last reported sale or settlement price on the day of valuation. To the extent these securities are actively traded and valuation adjustments are not applied, they are categorized as Level 1 of the fair value hierarchy. Valuation adjustments may be applied to certain securities that are solely traded on a foreign exchange to account for the market movement between the close of the foreign market and the close of the Exchange. These securities are valued using pricing service providers that consider the correlation of the trading patterns of the foreign security to the intraday trading in the U.S. markets for investments. Securities using these valuation adjustments are categorized as Level 2 of the fair value hierarchy. Preferred securities and other equities traded on inactive markets or valued by reference to similar instruments are also categorized as Level 2 of the fair value hierarchy.
45
American Beacon FundsSM
Notes to Financial Statements
August 31, 2015
Investments in registered open-end investment management companies will be valued based upon the NAVs of such investments and are categorized as Level 1 of the fair value hierarchy.
Over-the-counter (“OTC”) financial derivative instruments, such as foreign currency contracts, options contracts, or swaps agreements, derive their value from underlying asset prices, indices, reference rates, and other inputs or a combination of these factors. These contracts are normally valued on the basis of broker dealer quotations or pricing service providers. Depending on the product and the terms of the transaction, the value of the financial derivative contracts can be estimated by a pricing service provider using a series of techniques, including simulation pricing models. The pricing models use inputs that are observed from actively quoted markets such as issuer details, indices, spreads, interest rates, curves, dividends and exchange rates. Financial derivatives that use similar valuation techniques and inputs as described above are categorized as Level 2 of the fair value hierarchy.
Level 3 trading assets and trading liabilities, at fair value
The valuation techniques and significant inputs used in determining the fair values of financial instruments classified as Level 3 of the fair value hierarchy are as follows:
Securities and other assets for which market quotes are not readily available are valued at fair value as determined in good faith by the Board or persons acting at their direction and may be categorized as Level 3 of the fair value hierarchy.
Market quotes are considered not readily available in circumstances where there is an absence of current or reliable market-based data (e.g., trade information or broker quotes), including where events occur after the close of the relevant market, but prior to the Exchange close, that materially affect the values of a Fund’s securities or assets. In addition, market quotes are considered not readily available when, due to extraordinary circumstances, the exchanges or markets on which the securities trade, do not open for trading for the entire day and no other market prices are available. The Board has delegated to the Manager the responsibility for monitoring significant events that may materially affect the fair values of a Fund’s securities or assets and for determining whether the value of the applicable securities or assets should be re-evaluated in light of such significant events.
The Board has adopted methods for valuing securities and other assets in circumstances where market quotes are not readily available, and has delegated the responsibility for applying the valuation methods to the Manager. For instances in which daily market quotes are not readily available, investments may be valued pursuant to guidelines established by the Board. In the event that the security or asset cannot be valued pursuant to one of the valuation methods established by the Board, the fair value of the security or asset will be determined in good faith by the Valuation Committee, generally based upon recommendations provided by the Manager.
When a Fund uses fair valuation methods applied by the Manager that use significant unobservable inputs to determine its NAV, the securities priced using this methodology are categorized as Level 3 of the fair value hierarchy. These methods may require subjective determinations about the value of a security. While the Trust’s policy is intended to result in a calculation of a Fund’s NAV that fairly reflects security values as of the time of pricing, the Trust cannot guarantee that values determined by the Board or persons acting at their direction would accurately reflect the price that a Fund could obtain for a security if it were to dispose of that security as of the time of pricing (for instance, in a forced or distressed sale). The prices used by a Fund may differ from the value that would be realized if the securities were sold.
46
American Beacon FundsSM
Notes to Financial Statements
August 31, 2015
For fair valuations using significant unobservable inputs, U.S. Generally Accepted Accounting Principles (“U.S. GAAP”) requires a reconciliation of the beginning to ending balances for reported fair values that presents changes attributable to total realized and unrealized gains or losses, purchases and sales, and transfers in and out of the Level 3 category during the period. In accordance with the requirements of U.S. GAAP, a fair value hierarchy and Level 3 reconciliation, if any, have been included below.
The Funds’ investments are summarized by level based on the inputs used to determine their values. As of August 31, 2015, the investments were classified as described on the following page below (in thousands):
| | | | | | | | | | | | | | | | |
The London Company Income Equity(1) | | Level 1 | | | Level 2 | | | Level 3 | | | Total | |
Common Stock | | $ | 695,424 | | | $ | — | | | $ | — | | | $ | 695,424 | |
Short-Term Investments - Money Markets | | | 17,901 | | | | — | | | | — | | | | 17,901 | |
| | | | | | | | | | | | | | | | |
Total Investments in Securities | | $ | 713,325 | | | $ | — | | | $ | — | | | $ | 713,325 | |
| | | | | | | | | | | | | | | | |
Financial Derivative Instruments-Liabilities | | | | | | | | | | | | | | | | |
Futures Contracts | | $ | (416 | ) | | $ | — | | | $ | — | | | $ | (416 | ) |
| | | | | | | | | | | | | | | | |
Total Financial Derivative Instruments | | $ | (416 | ) | | $ | — | | | $ | — | | | $ | (416 | ) |
| | | | | | | | | | | | | | | | |
| | | | |
Zebra Global Equity(1) | | Level 1 | | | Level 2 | | | Level 3 | | | Total | |
Foreign Common Stock | | $ | 219 | | | $ | 1,861 | | | $ | — | | | $ | 2,080 | |
Foreign Preferred Stock | | | — | | | | 78 | | | | — | | | | 78 | |
Domestic Common Stock | | | 2,662 | | | | — | | | | — | | | | 2,662 | |
Short-Term Investments - Money Markets | | | 147 | | | | — | | | | — | | | | 147 | |
| | | | | | | | | | | | | | | | |
Total Investments in Securities | | $ | 3,028 | | | $ | 1,939 | | | $ | — | | | $ | 4,967 | |
| | | | | | | | | | | | | | | | |
Financial Derivative Instruments-Liabilities | | | | | | | | | | | | | | | | |
Futures Contracts | | $ | (5 | ) | | $ | — | | | $ | — | | | $ | (5 | ) |
| | | | | | | | | | | | | | | | |
Total Financial Derivative Instruments | | $ | (5 | ) | | $ | — | | | $ | — | | | $ | (5 | ) |
| | | | | | | | | | | | | | | | |
| | | | |
Zebra Small Cap Equity(1) | | Level 1 | | | Level 2 | | | Level 3 | | | Total | |
Common Stock | | $ | 19,093 | | | $ | — | | | $ | — | | | $ | 19,093 | |
Short-Term Investments - Money Markets | | | 1,105 | | | | — | | | | — | | | | 1,105 | |
Securities Lending Collateral invested in Money Market Funds | | | 147 | | | | — | | | | — | | | | 147 | |
| | | | | | | | | | | | | | | | |
Total Investments in Securities | | $ | 20,345 | | | $ | — | | | $ | — | | | $ | 20,345 | |
| | | | | | | | | | | | | | | | |
Financial Derivative Instruments-Liabilities | | | | | | | | | | | | | | | | |
Futures Contracts | | $ | (45 | ) | | $ | — | | | $ | — | | | $ | (45 | ) |
| | | | | | | | | | | | | | | | |
Total Financial Derivative Instruments | | $ | (45 | ) | | $ | — | | | $ | — | | | $ | (45 | ) |
| | | | | | | | | | | | | | | | |
| | | | |
SiM High Yield Opportunites(1) | | Level 1 | | | Level 2 | | | Level 3 | | | Total | |
Common Stock | | $ | 13,960 | | | $ | — | | | $ | — | | | $ | 13,960 | |
Domestic Bank Loan Obligations | | | — | | | | 22,032 | | | | — | | | | 22,032 | |
Domestic Convertible Obligations | | | — | | | | 10,671 | | | | — | | | | 10,671 | |
Domestic Obligations | | | — | | | | 698,579 | | | | — | | | | 698,579 | |
Foreign Convertible Obligations | | | — | | | | — | | | | 1,419 | | | | 1,419 | |
Foreign Obligations | | | — | | | | 102,850 | | | | — | | | | 102,850 | |
Short-Term Investments - Money Markets | | | 16,144 | | | | — | | | | — | | | | 16,144 | |
| | | | | | | | | | | | | | | | |
Total Investments in Securities | | $ | 30,104 | | | $ | 834,132 | | | $ | 1,419 | | | $ | 865,655 | |
| | | | | | | | | | | | | | | | |
| | | | |
| Other Financial instruments - Assets | | Level 1 | | | Level 2 | | | Level 3 | | | Total | |
Futures Contracts | | $ | 519 | | | $ | — | | | $ | — | | | $ | 519 | |
| | | | | | | | | | | | | | | | |
Total other Financial instruments - Assets | | $ | 519 | | | $ | — | | | $ | — | | | $ | 519 | |
| | | | | | | | | | | | | | | | |
| (1) | Refer to the Schedule of Investments for Industry Information. |
47
American Beacon FundsSM
Notes to Financial Statements
August 31, 2015
U.S. GAAP also requires all transfers between any levels to be disclosed. The end of the period timing recognition has been adopted for the transfers between levels of each Fund’s assets and liabilities. During the year ended August 31, 2015, the Zebra Global Equity Fund transferred Foreign Common Stock and Foreign Preferred Stock with a total value of $1,939 from Level 1 to Level 2 as of the end of period in accordance with fair value procedures established by the Board (in thousands).
The following is a reconciliation of Level 3 assets of the SiM High Yield Opportunities Fund, for which significant unobservable inputs were used to determine fair value. Transfers in or out of Level 3 represent the ending value of any security or instrument where a change in the level has occurred from the beginning to the end of the period.
| | | | |
| | | Foreign Convertible
Obligations | |
Beginning Balance as of 8/31/2014 | | $ | 1,661 | |
Net Purchases | | | — | |
Net Sales | | | — | |
Accrued Discounts/(Premiums) | | | 1 | |
Realized Gain/(Loss) | | | — | |
Net Change in Unrealized Appreciation/(Depreciation) | | | (243 | ) |
Transfers into Level 3 | | | — | |
Transfers out of Level 3 | | | — | |
| | | | |
Ending Balance 8/31/2015 | | $ | 1,419 | |
| | | | |
Net Change in Unrealized Appreciation/(Depreciation) on Investments Held at 8/31/2015(2) | | $ | (243 | ) |
The following is a summary of significant unobservable inputs used in the fair valuation of the asset categorized within Level 3 of the fair value hierarchy:
| | | | | | | | | | | | |
Security Type | | Fair Value
At
8/31/2015 | | Valuation Technique | | Unobservable Inputs | | Input Assumptions(3) | | Fair
Value at
8/31/2015
per share |
Foreign Convertible Obligations | | $1,419 | | Discounted Cash Flow Analysis | | Cash Flows | | 125mm of a 20 year Super Senior Security with a 15% coupon 400mm of a 10 year Senior Security with a 3% coupon 300mm of a 15 year Junior Security with a 1% coupon 300mm of a 20 year Subordinated Security zero coupon | | 9.00 EUR/
$10.10 |
| | | | | | Discount Factor | | Super Senior | | 8.00% | | |
| | | | | | | | Senior | | 10.00% | | |
| | | | | | | | Junior | | 12.00% | | |
| | | | | | | | Subordinated | | 15.00% | | |
| | | | | | | | Additional Timing Discount | | 25.00% | | |
| (2) | Change in unrealized appreciation or (depreciation) attributable to Level 3 securities held at period end. This balance is included in the change in unrealized appreciation or (depreciation) on the Statement of Operations. |
| (3) | The key assumptions used in the discounted cash flow analysis are the future expected payments to be received, timing of the expected cash flows, and the discount rates used to present value the expected cash flows. The valuation estimate will change if one of the key assumptions either increase or decrease, keeping all other assumptions constant. For example, if the expected cash flows increase/decrease, the valuation estimate will increase/decrease. If the discount rates used decrease / increase, the valuation estimate will increase /decrease. |
Security Transactions and Investment Income
Security transactions are recorded on the trade date of the security purchase or sale. The Funds may purchase securities with delivery or payment to occur at a later date. At the time the Funds enter into a commitment to purchase a security, the transaction is recorded and the value of the security is reflected in the NAV. The value of the security may vary with market fluctuations.
Dividend income, net of foreign taxes, is recorded on the ex-dividend date except certain dividends from foreign securities which are recorded as soon as the information is available to the Funds. Interest income is earned from settlement date, recorded on the accrual basis, and adjusted, if necessary, for accretion of discounts and amortization of premiums. For financial and tax reporting purposes, realized gains and losses are determined on the basis of specific lot identification.
48
American Beacon FundsSM
Notes to Financial Statements
August 31, 2015
Currency Translation
All assets and liabilities initially expressed in foreign currency values are converted into U.S. dollar values at the mean of the bid and ask prices of such currencies against U.S. dollars as last quoted by a recognized dealer. Income, expenses, and purchases and sales of investments are translated into U.S. dollars at the rate of the exchange prevailing on the respective dates of such transactions. The effect of changes in foreign currency exchange rates on investments is separately identified from the fluctuations arising from changes in market values of securities held and is reported with all other foreign currency gains and losses in the Funds’ Statements of Operations.
Dividends to Shareholders
Dividends from net investment income of the Funds normally will be declared and paid at least annually. Distributions, if any, of net realized capital gains are generally paid at least annually and recorded on the ex-dividend date.
Commission Recapture
The Funds, except for the SiM High Yield Opportunities Fund, have established brokerage commission recapture arrangements with certain brokers or dealers. If a Fund’s investment advisor chooses to execute a transaction through a participating broker, the broker rebates a portion of the commission back to the Fund. Any collateral benefit received through participation in the commission recapture program is directed exclusively to the Funds. This amount is reported with the net realized gain in the Funds’ Statements of Operations, if applicable.
Allocation of Income, Expenses, Gains, and Losses
Income, expenses (other than those attributable to a specific class), gains, and losses are allocated daily to each class of shares based upon the relative proportion of net assets represented by such class. Operating expenses directly attributable to a specific class are charged against the operations of that class.
Redemption Fees
The SiM High Yield Opportunities Fund imposes a 2% redemption fee on shares held for less than 90 days. The fee is deducted from the redemption proceeds and is intended to offset the trading costs, market impact, and other costs associated with short-term trading activity in the Fund. The “first-in, first-out” method is used to determine the holding period. The fee is allocated to all classes of the Fund pro rata based on their respective net assets.
Use of Estimates
The preparation of financial statements in conformity with U.S. GAAP requires management to make estimates and assumptions that affect the amounts reported in the financial statements and accompanying notes. Actual results may differ from those estimated.
Other
Under the Trust’s organizational documents, its officers and trustees are indemnified against certain liability arising out of the performance of their duties to the Trust. In the normal course of business, the Trust enters into contracts that provide indemnification to the other party or parties against potential costs or liabilities. The Trust’s maximum exposure under these arrangements is dependent on claims that may be made in the future and, therefore, cannot be estimated. The Trust has had no prior claims or losses pursuant to any such agreement.
49
American Beacon FundsSM
Notes to Financial Statements
August 31, 2015
4. Securities and other Investments
Global Depositary Receipts (“GDRs”) and American Depositary Receipts (“ADRs”)
GDRs are in bearer form and traded in both the U.S. and European securities Markets. ADRs are depositary receipts for foreign issuers in registered form traded in U.S. securities markets. Depositary receipts may not be denominated in the same currency as the securities into which they may be converted. Investing in depositary receipts entails substantially the same risks as direct investment in foreign securities. There is generally less publicly available information about foreign companies and there may be less governmental regulation and supervision of foreign stock exchanges, brokers and listed companies. In addition, such companies may use different accounting and financial standards (and certain currencies may become unavailable for transfer from a foreign currency), resulting in the Fund’s possible inability to convert immediately into U.S. currency proceeds realized upon the sale of portfolio securities of the affected foreign companies. In addition, the Fund may invest in unsponsored depositary receipts, the issuers of which are not obligated to disclose material information about the underlying securities to investors in the United States. Ownership of unsponsored depositary receipts may not entitle the Fund to the same benefits and rights as ownership of a sponsored depositary receipt or the underlying security.
Inflation-Indexed Bonds
The SiM High Yield Opportunities Fund may invest in inflation-indexed bonds. Inflation-indexed bonds are fixed-income securities whose principal value is periodically adjusted based on the rate of inflation. The interest rate on these bonds is generally fixed at issuance at a rate lower than typical bonds. Over the life of an inflation-indexed bond, however, interest will be paid based on a principal value, which is adjusted for inflation. Any increase or decrease in the principal amount of an inflation-indexed bond will be included as interest income on the Statements of Operations, even though investors do not receive their principal until maturity.
In-Kind Securities
The SiM High Yield Opportunities Fund may invest in payment in-kind securities (“PIKs”). PIKs give the issuer the option at each interest payment date of making interest payments in either cash or additional debt securities. Those additional debt securities usually have the same terms, including maturity dates and interest rates, and associated risks as the original bonds. The daily market quotations of the original bonds may include the accrued interest (referred to as a dirty price) and require a pro rata adjustment from the unrealized appreciation or depreciation on investment to interest receivable in the Statements of Assets and Liabilities.
Restricted Securities
The Funds may invest in securities that are subject to legal or contractual restrictions on resale. These securities may be sold privately, but are required to be registered or exempted from such registration before being sold to the public. Private placement securities are generally considered to be restricted except for those securities traded between qualified institutional investors under the provisions of Rule 144A of the Securities Act of 1933. Reg S securities cannot be sold in the United States without either an effective registration statement filed pursuant to the Securities Act of 1933, or pursuant to an exemption from registration. Disposal of restricted securities may involve time-consuming negotiations and expenses, and prompt sale at an acceptable price may be difficult to achieve. Restricted securities outstanding at the year ended August 31, 2015 are disclosed in the Notes to the Schedules of Investments.
50
American Beacon FundsSM
Notes to Financial Statements
August 31, 2015
High-Yield Securities
Non-investment-grade securities are rated below the four highest credit grades by at least one of the public rating agencies (or are unrated if not publicly rated). Participation in high-yielding securities transactions generally involves greater returns in the form of higher average yields. However, participation in such transactions involves greater risks, including sensitivity to economic changes, solvency, and relative liquidity in the secondary trading market. Lower ratings may reflect a greater possibility that the financial condition of the issuer, or adverse changes in general economic conditions, or both, may impair the ability of the issuer to make payments of interest and principal. The prices and yields of lower-rated securities generally fluctuate more than higher-quality securities, and such prices may decline significantly in periods of general economic difficulty or rising interest rates.
Real Estate Investment Trusts
The Funds may own shares of real estate investment trusts (“REITs”) which report information on the source of their distributions annually. The Funds re-characterize distributions received from REIT investments based on information provided by the REITs into the following categories: ordinary income, long-term capital gains, and return of capital. If information is not available on a timely basis from the REITs, the re-characterization will be estimated based on available information which may include the previous year allocation. If new or additional information becomes available from the REITs at a later date, a re-characterization will be made the following year. These re-characterizations are not recorded for financial statement purposes, but as an adjustment to the calculation of taxable income.
Other Investment Company Securities and Other Exchange Traded Products
The Funds may invest in shares of other investment companies, including open-end funds, closed-end funds, business development companies, ETFs, unit investment trusts, and other investment companies of the Trust. The Funds may invest in investment company securities advised by the Manager or a sub-advisor. Investments in the securities of other investment companies may involve duplication of advisory fees and certain other expenses. By investing in another investment company, a Fund becomes a shareholder of that investment company. As a result, Fund shareholders indirectly will bear a Fund’s proportionate share of the fees and expenses paid by shareholders of the other investment company, in addition to the fees and expenses Fund shareholders directly bear in connection with the Fund’s own operations. These other fees and expenses are reflected as Acquired Fund Fees and Expenses and are included in the Fees and Expenses Table for the Fund in its Prospectus, if applicable. Investments in other investment companies may involve the payment of substantial premiums above the value of such issuer’s portfolio securities.
Master Agreements
The SiM High Yield Opportunities Fund is a party to International Swaps and Derivatives Association, Inc. Master Agreements (“ISDA Master Agreements”) with counterparties that govern transactions in over-the-counter derivative and foreign exchange contracts entered into by the Fund and those counterparties. The ISDA Master Agreements contain provisions for general obligations, representations, agreements, collateral and events of default or termination. Events of termination include conditions that may entitle counterparties to elect to terminate early and cause settlement of all outstanding transactions under the applicable ISDA Master Agreement. Any election to terminate early could be material to the financial statements. Since different types of forward and OTC financial derivative transactions have different mechanics and are sometimes traded out of different legal entities of a particular counterparty organization, each type of transaction may be covered by a different Master Agreement, resulting in the need for multiple agreements with a single counterparty. As the Master Agreements are specific to unique operations of different asset types, they allow a Fund to net its total exposure to a counterparty in the event of a default with respect to all the transactions governed under a single agreement with a counterparty.
51
American Beacon FundsSM
Notes to Financial Statements
August 31, 2015
Master Securities Forward Transaction Agreements (“Master Forward Agreements”) govern the considerations and factors surrounding the settlement of certain forward settling transactions, such as delayed delivery or sale-buyback financing transactions by and between a Fund and select counterparties. The Master Forward Agreements maintain provisions for, among other things, initiation and confirmation, payment and transfer, events of default, termination, and maintenance of collateral.
5. Financial Derivative Instruments
The Funds may utilize derivative instruments to enhance return, hedge risk, gain efficient exposure to an asset class or to manage liquidity. When considering the Fund’s use of derivatives, it is important to note that the Fund does not use derivatives for the purpose of creating financial leverage.
Swap Agreements
The SiM High Yield Opportunities Fund may invest in swap agreements. Swap agreements are privately negotiated agreements between the Fund and a counterparty to exchange or swap investment cash flows, assets, foreign currencies or market-linked returns at specified, future intervals. The Fund may enter into credit default, cross-currency, interest rate and other forms of swap agreements to manage its exposure to credit, currency, interest rate, and inflation risk. In connection with these agreements, securities or cash may be identified as collateral in accordance with the terms of the respective swap agreements to provide assets of value and recourse in the event of default or bankruptcy/insolvency.
Swaps are marked to market daily based upon values from third party vendors or quotations from market makers to the extent available and the change in value, if any, is recorded as an unrealized gain or loss on the Statements of Assets and Liabilities. In the event that market quotes are not readily available and the swap cannot be valued pursuant to one of the valuation methods, the value of the swap will be determined in good faith by the Valuation Committee pursuant to procedures approved by the Board.
Payments received or made at the beginning of the measurement period are reflected as such on the Statements of Assets and Liabilities and represent payments made or received upon entering into the swap agreement to compensate for differences between the stated terms of the swap agreement and prevailing market conditions (credit spreads, currency exchange rates, interest rates, and other relevant factors). These upfront payments are recorded as realized gains or losses on the Statements of Operations upon termination or maturity of the swap. A liquidation payment received or made at the termination of the swap is recorded as realized gain or loss on the Statements of Operations. Net periodic payments received or paid by a Fund are included as part of realized gains or losses on the Statements of Operations.
Entering into these agreements involves, to varying degrees, elements of credit, market and documentation risk in excess of the amounts recognized on the Statements of Assets and Liabilities. Such risks involve the possibility that there will be no liquid market for these agreements, that the counterparty to the agreements may default on its obligation to perform or disagree as to the meaning of contractual terms in the agreements and that there may be unfavorable changes in interest rates.
The Fund’s maximum risk of loss from counterparty credit risk is the discounted net value of the cash flows to be received from the counterparty over the contract’s remaining life, to the extent that amount is positive. The risk is mitigated by having a master netting arrangement between a Fund and the counterparty and by the posting of collateral to a Fund to cover a Fund’s exposure to the counterparty.
Credit Default Swap Agreements
Credit default swap agreements involve one party making a stream of payments (referred to as the buyer of protection) to another party (the seller of protection) in exchange for the right to receive a specified return in the event of a default or other credit event for the referenced entity, obligation or index. As a seller
52
American Beacon FundsSM
Notes to Financial Statements
August 31, 2015
of protection on credit default swap agreements, the Fund will generally receive from the buyer of protection a fixed rate of periodic premium throughout the term of the swap provided that there is no credit event. As the seller, the Fund would effectively add leverage to its portfolio because, in addition to its total net assets, the Fund would be subject to investment exposure up to the notional amount of the swap.
If the Fund is a seller of protection and a credit event occurs, as defined under the terms of that particular swap agreement, the Fund will either (i) pay to the buyer of protection an amount equal to the notional amount of the swap and take delivery of the referenced obligation, other deliverable obligations or underlying securities comprising the referenced index or (ii) pay a net settlement amount in the form of cash or securities equal to the notional amount of the swap less the recovery value of the referenced obligation or underlying securities comprising the referenced index. If the Fund is a buyer of protection and a credit event occurs, as defined under the terms of that particular swap agreement, the Fund will either (i) receive from the seller of protection an amount equal to the notional amount of the swap and deliver the referenced obligation, other deliverable obligations or underlying securities comprising the referenced index or (ii) receive a net settlement amount in the form of cash or securities equal to the notional amount of the swap less the recovery value of the referenced obligation or underlying securities comprising the referenced index. Recovery values are estimated by market makers considering either industry standard recovery rates or entity specific factors and considerations until a credit event occurs. If a credit event has occurred, the recovery value is determined by a facilitated auction whereby a minimum number of allowable broker bids, together with a specified valuation method, are used to calculate the settlement value.
Credit default swap agreements on corporate issues, sovereign issues of an emerging country or U.S. municipal issues involve one party making a stream of payments to another party in exchange for the right to receive a specified return in the event of a default or other credit event. If a credit event occurs and cash settlement is not elected, a variety of other deliverable obligations may be delivered in lieu of the specific referenced obligation. The ability to deliver other obligations may result in a cheapest-to-deliver option (the buyer of protection’s right to choose the deliverable obligation with the lowest value following a credit event). The Fund may use credit default swaps on corporate issues, sovereign issues of an emerging country or U.S. municipal issues to provide a measure of protection against defaults of the issuers (i.e., to reduce risk where the Fund owns or has exposure to the referenced obligation) or to take an active long or short position with respect to the likelihood of a particular issuer’s default.
Implied credit spreads, represented in absolute terms, utilized in determining the market value of credit default swap agreements on corporate issues, sovereign issues of an emerging country or U.S. municipal issues as of period end are disclosed in the Notes to the Schedule of Investments and serve as an indicator of the current status of the payment/performance risk and represent a market participant view of the likelihood or risk of default for the underlying referent security to credit derivative. The implied credit spread of a particular referenced entity reflects the cost of buying/selling protection and may include upfront payments required to be made to enter into the agreement. For credit default swap agreements on asset-backed securities and credit indices, the quoted market prices and resulting values serve as the indicator of the current status of the payment/performance risk. Wider credit spreads represent a deterioration of the referenced entity’s credit soundness and a greater likelihood or risk of default or other credit event occurring as defined under the terms of the agreement.
The maximum potential amount of future payments (undiscounted) that the Fund as a seller of protection could be required to make under a credit default swap agreement would be an amount equal to the notional amount of the agreement. These potential amounts would be partially offset by any recovery values of the respective referenced obligations, upfront payments received upon entering into the agreement, or net amounts received from the settlement of buy protection credit default swap agreements entered into by the Fund for the same referenced entity or entities. On August 31, 2015 there were no credit default swap agreements outstanding.
53
American Beacon FundsSM
Notes to Financial Statements
August 31, 2015
For the year ended August 31, 2015, the SiM High Yield Opportunities Fund entered into credit default swaps primarily for return enhancement, hedging, and exposing cash to markets.
The Fund’s credit default swap contract notional amounts outstanding fluctuate throughout the operating year as required to meet the strategic requirements. The following table illustrates the average quarterly volume of credit default swap contracts. For the purpose of this disclosure, the volume is measured by the notional amounts outstanding at each quarter end (in thousands).
| | | | |
Credit Default Swap Notional Amounts Outstanding | |
Fund | | Year ended August 31, 2015 | |
SiM High Yield Opportunities | | $ | 6,000 | |
Over-the-Counter Swap Agreements
OTC financial derivative instruments such as forward currency contracts, options contracts, interest rate, and credit default swap agreements derive their value from underlying asset prices, indices, reference rates, and other inputs or a combination of these factors. These instruments are valued using evaluated prices furnished by a pricing service selected by the Board. In certain cases, when a valuation is not readily available from a pricing service, the Fund’s Manager may provide a valuation pursuant to procedures approved by the Board. Derivative instruments that use valuation techniques and inputs similar to those described above are normally categorized as Level 2 in the fair valuation hierarchy.
Futures Contracts
Futures contracts are contracts to buy or sell a standard quantity of securities at a specified price on a future date. The Funds may enter into financial futures contracts as a method for keeping assets readily convertible to cash if needed to meet shareholder redemptions or for other needs while maintaining exposure to the stock or bond market, as applicable. The primary risks associated with the use of futures contracts are the possibility of illiquid markets or imperfect correlation between the values of the contracts and the underlying securities, or that the counterparty will fail to perform its obligations.
Upon entering into a futures contract, the Fund is required to set aside or deposit with a broker an amount, termed the initial margin, which typically represents a portion of the face value of the futures contract. The Funds usually reflects this amount on the Schedule of Investments as a U.S. Treasury Bill held as collateral for futures contracts or as Cash deposited with broker on the Statements of Assets and Liabilities. Payments to and from the broker, known as variation margin, are required to be made on a daily basis as the price of the futures contract fluctuates. Changes in initial settlement values are accounted for as unrealized appreciation (depreciation) until the contracts are terminated, at which time realized gains and losses are recognized. Futures contracts are valued at the most recent settlement price established each day by the exchange on which they are traded.
For the year ended August 31, 2015, the Funds entered into future contracts primarily for return enhancement, hedging and exposing cash to markets.
The Funds’ futures contracts outstanding fluctuate throughout the operating year as required to meet strategic requirements. The following table illustrates the average quarterly volume of futures contracts. For purpose of this disclosure, volume is measured by contracts outstanding at period end.
| | | | |
Number of Futures Contracts Outstanding | |
Fund | | Year ended August 31, 2015 | |
The London Company Income Equity | | | 187 | |
Zebra Global Equity | | | 3 | |
Zebra Small Cap Equity | | | 5 | |
SiM High Yield Opportunities | | | 726 | |
54
American Beacon FundsSM
Notes to Financial Statements
August 31, 2015
The following is a summary of the Funds’ derivative financial instruments categorized by risk exposure (in thousands) (1):
Fair Values of financial derivative instruments not accounted for as hedging instruments as of August 31, 2015 (000’s):
| | | | | | | | | | | | | | | | |
| | | Derivative | | | The London
Company
Income Equity | | | Zebra Global
Equity | | | Zebra
Small Cap
Equity | |
Statements of Assets and Liabilities | | | | | | | | | | | | | | | | |
Payable for variation margin from open futures contracts(2) | | | Equity Contracts | | | $ | 416 | | | $ | 5 | | | $ | 45 | |
The effect of financial derivative instruments not accounted for as hedging instruments during the year ended August 31, 2015 (000’s):
| | | | | | | | | | | | | | | | |
Statements of Operations | | | | | | | | | | | | | | | | |
Net realized gain (loss) from futures contracts | | | Equity Contracts | | | $ | 833 | | | $ | 10 | | | $ | 27 | |
Change in net unrealized appreciation or (depreciation) of futures contracts | | | Equity Contracts | | | | (502 | ) | | | (13 | ) | | | (55 | ) |
| (1) | See Note 3 in the Notes to Financial Statements for additional information. |
| (2) | Includes cumulative appreciation or (depreciation) of futures contracts as reported in the Schedule of Investment footnotes. Only current day’s variation margin is reported within the Statement of Assets and Liabilities. |
SiM High Yield Opportunities
The following is a summary of the Fund’s derivative financial instruments categorized by risk exposure(1):
Fair values of financial derivative instruments on the Statements of Assets and Liabilities as of August 31, 2015 (000’s):
| | | | | | | | | | | | | | | | | | | | |
| | | Derivatives not accounted for as hedging instruments | |
| | | Credit
contracts | | | Foreign
exchange
contracts | | | Interest
rate
contracts | | | Equity
contracts | | | Total | |
Assets: | | | | | | | | | | | | | | | | | | | | |
Receivable for variation margin from open futures contracts(2) | | $ | — | | | $ | 519 | | | $ | — | | | $ | — | | | $ | 519 | |
The effect of financial derivative instruments on the Statement of Operations for the year ended August 31, 2015 (000’s):
| | | | | | | | | | | | | | | | |
| | | Derivatives not accounted for as hedging instruments | |
| | | Credit
contracts | | | Foreign
exchange
contracts | | | Equity
contracts | | | Total | |
Realized gain or (loss) from derivatives recognized as a result from operations: | | | | | | | | | | | | | | | | |
Net realized gain (loss) from futures contracts | | $ | — | | | $ | 14,502 | | | $ | — | | | $ | 14,502 | |
Net realized gain (loss) from options and swaption contracts | | | — | | | | — | | | | (118 | ) | | | (118 | ) |
Net realized gain (loss) from swap agreements | | | 3,204 | | | | — | | | | — | | | | 3,204 | |
| | | | | | | | | | | | | | | | |
Total Realized gain (loss) on derivatives | | $ | 3,204 | | | $ | 14,502 | | | $ | (118 | ) | | $ | 17,588 | |
| | | | | | | | | | | | | | | | |
Net change in unrealized appreciation or (depreciation) of derivatives recognized as a result from operations: | | | | | | | | | | | | | | | | |
Change in net unrealized appreciation or (depreciation) of futures contracts | | $ | — | | | $ | (2,017 | ) | | $ | — | | | $ | (2,017 | ) |
Change in net unrealized appreciation or (depreciation) of swap agreements | | | (1,937 | ) | | | — | | | | — | | | | (1,937 | ) |
| | | | | | | | | | | | | | | | |
Total net change in unrealized depreciation | | $ | (1,937 | ) | | $ | (2,017 | ) | | $ | — | | | $ | (3,954 | ) |
| | | | | | | | | | | | | | | | |
| (1) | See Note 3 in the Notes to Financial Statements for additional information. |
| (2) | Includes cumulative appreciation or (depreciation) of futures contracts as reported in the Schedule of Investment footnotes. Only current day’s variation margin is reported within the Statement of Assets and Liabilities. |
6. Principal Risks
In the normal course of business the Funds trade financial instruments and enter into financial transactions where risk of potential loss exists. Security values fluctuate (market risk) and may decline due to factors affecting securities markets in general, particular industries represented in the securities markets or conditions specifically related to a particular company. Failure of the other party to a transaction to perform (credit risk), for example by not making principal and interest payments when due, reduces the value of the
55
American Beacon FundsSM
Notes to Financial Statements
August 31, 2015
issuer’s debt and could reduce the Funds’ income. Similar to credit risk, the Funds may be exposed to counterparty risk, or the risk that an institution or other entity with which the Funds have unsettled or open transactions will fail to make required payments or otherwise comply with the terms of the instrument, transaction or contract. The potential loss could exceed the value of the financial assets recorded in the financial statements. Some of the Funds’ investments may be illiquid and the Funds may not be able to vary the portfolio investments in response to changes in economic and other conditions. If a Fund is required to liquidate all or a portion of its investments quickly, the Fund may realize significantly less than the value at which it previously recorded those investments.
In the normal course of business the Funds trade financial instruments and enter into financial transactions where risk of potential loss exists due to changes in the market (market risk), or failure or inability of the other party to a transaction to perform (credit and counterparty risk). See below for a detailed description of select principal risks.
Market Risks
The Funds’ investments in financial derivatives and other financial instruments expose the Funds to various risks such as, but not limited to, interest rate, foreign currency and equity risks.
Interest rate risk is the risk that fixed income securities will decline in value because of changes in interest rates. As nominal interest rates rise, the value of certain fixed income securities held by the Fund is likely to decrease. A nominal interest rate can be described as the sum of a real interest rate and an expected inflation rate. Fixed income securities with longer durations tend to be more sensitive to changes in interest rates, usually making them more volatile than securities with shorter durations. Duration is useful primarily as a measure of the sensitivity of a fixed income’s market price to interest rate (i.e. yield) movements.
If the Funds invest directly in foreign currencies or in securities that trade in, and receive revenues in, foreign currencies, or in financial derivatives that provide exposure to foreign currencies, they will be subject to the risk that those currencies will decline in value relative to the base currency of the Funds, or, in the case of hedging positions, that the Funds’ base currency will decline in value relative to the currency being hedged. Currency rates in foreign countries may fluctuate significantly over short periods of time for a number of reasons, including changes in interest rates, intervention (or the failure to intervene) by U.S. or foreign governments, central banks or supranational entities such as the International Monetary Fund, or by the imposition of currency controls or other political developments in the United States or abroad. As a result, the Funds’ investments in foreign currency denominated securities may reduce the returns of the Fund.
The fair values of equities, such as common stocks and preferred securities or equity related investments such as futures and options, may decline due to general market conditions which are not specifically related to a particular company, such as real or perceived adverse economic conditions, changes in the general outlook for corporate earnings, changes in interest or currency rates or adverse investor sentiment generally. They may also decline due to factors which affect a particular industry or industries, such as labor shortages or increased production costs and competitive conditions within an industry. Equity securities and equity related investments generally have greater market price volatility than fixed income securities.
Credit and Counterparty Risks
The SiM High Yield Opportunities Fund will be exposed to credit risk with respect to issuers of portfolio securities. The Fund minimizes concentrations of credit risk by undertaking transactions with a large number of issuers. The Fund could lose money if the issuer or guarantor of a fixed income security, or the counterparty to a financial derivatives contract, repurchase agreement or a loan of portfolio securities, is unable or unwilling to make timely principal and/or interest payments, or to otherwise honor its obligations. Securities are subject to varying degrees of credit risk, which are often reflected in credit ratings.
56
American Beacon FundsSM
Notes to Financial Statements
August 31, 2015
Similar to credit risk, the SiM High Yield Opportunities Fund may be exposed to counterparty risk, or the risk that an institution or other entity with which the Fund has unsettled or open transactions will default. Financial assets, which potentially expose the Fund to counterparty risk, consist principally of cash due from counterparties and investments. Furthermore, to the extent that unpaid amounts owed to the Fund exceed a predetermined threshold agreed to with the counterparty, such counterparty shall advance collateral to the Fund in the form of cash or cash equivalents equal in value to the unpaid amount owed to the Fund. The Fund may invest such collateral in securities or other instruments and will typically pay interest to the counterparty on the collateral received. If the unpaid amount owed to the Fund subsequently falls, the Fund would be required to return to the counterparty all or a portion of the collateral previously advanced to the Fund.
All transactions in listed securities are settled/paid for upon delivery using approved counterparties. The risk of default is considered minimal, as delivery of securities sold is only made once the Fund has received payment. Payment is made on a purchase once the securities have been delivered by the counterparty. The trade will fail if either party fails to meet its obligation.
The SiM High Yield Opportunities Fund is subject to various Master Agreements, which govern the terms of certain transactions with select counterparties. These Master Agreements reduce the counterparty risk associated with relevant transactions by specifying credit protection mechanisms and providing standardization that improves legal certainty. Since different types of forward and OTC derivative transactions have different mechanics and are sometimes traded out of different legal entities of a particular counterparty organization, each type of transaction may be covered by a different Master Agreement and result in the need for multiple agreements with a single counterparty. Therefore, exposure cannot be netted and collateralized across all types of transactions. Exposures can only be netted across transactions governed under the same Master Agreement with the same legal entity.
Master Agreements can also help limit counterparty risk by specifying collateral posting arrangements at pre-arranged exposure levels. Under the Master Agreements, collateral is routinely transferred if the total net exposure to certain transactions (net of existing collateral already in place) governed under the relevant Master Agreement with a counterparty in a given account exceeds a specified threshold, which typically ranges from zero to $250,000 depending on the counterparty and the type of Master Agreement. United States Treasury bills and US dollar cash are generally the preferred forms of collateral, although other forms of AAA rated paper may be used. The Fund’s overall exposure to counterparty risk can change substantially within a short period, as it is affected by each transaction subject to the relevant Master Agreement. Master Repurchase Agreements (“Master Repo Agreements”) govern transactions between the Fund and select counterparties. The Master Repo Agreements maintain provisions for, among other things, initiation, income payments, events of default, and maintenance of collateral for Repurchase Agreements.
Offsetting Assets and Liabilities
The Funds are parties to enforceable master netting agreements between brokers and counterparties, which provide for the right to offset under certain circumstances. The Funds employ multiple money managers and counterparties and have elected not to offset qualifying financial and derivative instruments on the Statements of Assets and Liabilities, as such all financial and derivative instruments are presented on a gross basis. The impacts of netting arrangements that provide the right to offset are detailed below. The net amount represents the net receivable or payable that would be due from or to the counterparty in the event of default. Exposure from borrowings and other financing agreements such as repurchase agreements can only be netted across transactions governed by the same Master Agreement with the same legal entity. All amounts reported below represent the balance as of August 31, 2015 (in thousands).
57
American Beacon FundsSM
Notes to Financial Statements
August 31, 2015
The London Company Income Equity
Offsetting of Financial Liabilities and Derivative Liabilities as of August 31, 2015:
| | | | | | | | | | | | |
Description | | Gross Amounts of
Recognized
Liabilities | | | Gross Amounts
Offset in the
Statements of
Assets
and Liabilities | | | Net Amounts of Liabilities
Presented in the
Statements of Assets
and Liabilities | |
Futures Contracts (1) | | $ | 167 | | | $ | — | | | $ | 167 | |
Financial Liabilities, Derivative Liabilities, and Collateral Pledged by Counterparty as of August 31, 2015:
| | | | | | | | | | | | | | | | |
| | | Net amount of Liabilities
Presented in the Statements of
Assets and Liabilities | | | Gross Amounts Not Offset in the
Statements of Assets and Liabilities | | | | |
Counterparty | | | Financial
Instruments | | | Cash Collateral
Received | | | Net
Amount | |
Goldman Sachs & Co. | | $ | 167 | | | $ | — | | | $ | — | | | $ | 167 | |
| (1) | The securities presented here within are not subject to Master Netting Agreements. As such, this is disclosed for informational purposes only. |
Zebra Global Equity
Offsetting of Financial Liabilities and Derivative Liabilities as of August 31, 2015:
| | | | | | | | | | | | |
Description | | Gross Amounts of
Recognized
Liabilities | | | Gross Amounts
Offset in the
Statements of
Assets
and Liabilities | | | Net Amounts of Liabilities
Presented in the
Statements of Assets
and Liabilities | |
Futures Contracts (1) | | $ | 2 | | | $ | — | | | $ | 2 | |
Financial Assets, Derivative Liabilities, and Collateral Pledged by Counterparty as of August 31, 2015:
| | | | | | | | | | | | | | | | |
| | | Net amount of Liabilities
Presented in the Statements of
Assets and Liabilities | | | Gross Amounts Not Offset in the
Statements of Assets and Liabilities | | | | |
Counterparty | | | Financial
Instruments | | | Cash Collateral
Received | | | Net
Amount | |
Goldman Sachs & Co. | | $ | 2 | | | $ | — | | | $ | — | | | $ | 2 | |
| (1) | The securities presented here within are not subject to Master Netting Agreements. As such, this is disclosed for informational purposes only. |
Zebra Small Cap Equity
Offsetting of Financial Assets and Derivative Assets as of August 31, 2015:
| | | | | | | | | | | | |
Description | | Gross Amounts of
Recognized Assets | | | Gross Amounts
Offset in the
Statements of
Assets and
Liabilities | | | Net Amounts of Liabilities
Presented in the
Statements of Assets
and Liabilities | |
Securities on Loan | | $ | 144 | | | $ | — | | | $ | 144 | |
Offsetting of Financial Liabilities and Derivative Liabilities as of August 31, 2015:
| | | | | | | | | | | | |
Description | | Gross Amounts of
Recognized
Liabilities | | | Gross Amounts
Offset in the
Statements of
Assets and
Liabilities | | | Net Amounts of Liabilities
Presented in the
Statements of Assets
and Liabilities | |
Futures Contracts (1) | | $ | 6 | | | $ | — | | | $ | 6 | |
58
American Beacon FundsSM
Notes to Financial Statements
August 31, 2015
Financial Liabilities, Derivative Liabilities, and Collateral Pledged by Counterparty as of August 31, 2015
| | | | | | | | | | | | | | | | |
| | | Net amount of Assets
Presented in the Statements of
Assets and Liabilities | | | Gross Amounts Not Offset in the
Statements of Assets and Liabilities | | | | |
Counterparty | | | Financial
Instruments | | | Cash Collateral
Received(2) | | | Net
Amount | |
BMO Capital Markets | | $ | 144 | | | $ | — | | | $ | (144 | ) | | $ | — | |
Goldman Sachs & Co. | | | (6 | ) | | | — | | | | — | | | | (6 | ) |
| | | | | | | | | | | | | | | | |
| | $ | 138 | | | $ | — | | | $ | (144 | ) | | $ | (6 | ) |
| | | | | | | | | | | | | | | | |
| (1) | The securities presented here within are not subject to Master Netting Agreements. As such, this is disclosed for informational purposes only. |
| (2) | Excess of collateral received from the individual counterparty is not shown for financial reporting purposes. Collateral with a value of $147 has been received in connection with securities lending transactions. |
SiM High Yield Opportunities
Offsetting of Financial Assets and Derivative Assets as of August 31, 2015:
| | | | | | | | | | | | |
Description | | Gross Amounts of
Recognized Assets | | | Gross Amounts
Offset in the
Statements of
Assets
and Liabilities | | | Net Amounts of Liabilities
Presented in the
Statements of Assets
and Liabilities | |
Futures Contracts (1) | | $ | 523 | | | | — | | | $ | 523 | |
| | | | | | | | | | | | |
Financial Assets, Derivative Assets, and Collateral Pledged by Counterparty as of August 31, 2015:
| | | | | | | | | | | | | | | | |
| | | Net amount of Assets
Presented in the
Statements of Assets and
Liabilities | | | Gross Amounts Not Offset in the
Statements of Assets and Liabilities | | | | |
Counterparty | | | Financial
Instruments | | | Cash Collateral
Received | | | Net
Amount | |
ADM Investor Services | | $ | 523 | | | $ | — | | | $ | — | | | $ | 523 | |
| | | | | | | | | | | | | | | | |
| (1) | The securities presented here within are not subject to Master Netting Agreements. As such, this is disclosed for informational purposes only. |
7. Federal Income and Excise Taxes
It is the policy of each Fund to qualify as a regulated investment company (“RIC”), by complying with all applicable provisions of Subchapter M of the Internal Revenue Code, as amended, and to make distribution of taxable income sufficient to relieve it from substantially all federal income and excise taxes. For federal income tax purposes, each Fund is treated as a single entity for the purpose of determining such qualification.
The Funds do not have any unrecognized tax benefits in the accompanying financial statements. The tax years for the periods ended August 31, 2012, 2013, 2014 and 2015 remain subject to examination by the Internal Revenue Service. If applicable, the Funds recognized interest accrued related to unrecognized tax benefits in interest expense and penalties in “Other expenses” on the Statements of Operations.
Dividends are categorized in accordance with income tax regulations which may treat certain transactions differently than U.S. GAAP. Accordingly, the character of distributions and composition of net assets for tax purposes may differ from those reflected in the accompanying financial statements.
The Funds may be subject to taxes imposed by countries in which it invests. Such taxes are generally based on returns of income earned or gains realized or repatriated. Taxes are accrued and applied to net investment income, net realized capital gains and net unrealized appreciation or depreciation, as applicable, as the income is earned or capital gains are recorded.
59
American Beacon FundsSM
Notes to Financial Statements
August 31, 2015
The tax character of distributions paid were as follows (in thousands):
| | | | | | | | | | | | | | | | |
| | | The London Company Income
Equity | | | Zebra Global Equity | |
| | | Year Ended
August 31,
2015 | | | Year Ended
August 31,
2014 | | | Year Ended
August 31,
2015 | | | Year Ended
August 31,
2014 | |
Distributions paid from: | | | | | | | | | | | | | | | | |
Ordinary income* | | | | | | | | | | | | | | | | |
Institutional Class | | $ | 2,265 | | | $ | 1,201 | | | $ | 31 | | | $ | 91 | |
Y Class | | | 5,580 | | | | 1,703 | | | | 36 | | | | 21 | |
Investor Class | | | 387 | | | | 333 | | | | 24 | | | | 88 | |
A Class | | | 1,090 | | | | 450 | | | | 191 | | | | 419 | |
C Class | | | 1,176 | | | | 386 | | | | 46 | | | | 56 | |
Long-term Capital Gains | | | | | | | | | | | | | | | | |
Institutional Class | | | 393 | | | | 109 | | | | 51 | | | | 93 | |
Y Class | | | 1,105 | | | | 154 | | | | 60 | | | | 21 | |
Investor Class | | | 97 | | | | 37 | | | | 39 | | | | 84 | |
A Class | | | 241 | | | | 54 | | | | 307 | | | | 425 | |
C Class | | | 412 | | | | 57 | | | | 75 | | | | 62 | |
| | | | | | | | | | | | | | | | |
Total distributions paid | | $ | 12,746 | | | $ | 4,484 | | | $ | 860 | | | $ | 1,360 | |
| | | | | | | | | | | | | | | | |
| | |
| | | Zebra Small Cap Equity | | | SiM High Yield Opportunities | |
| | | Year Ended
August 31,
2015 | | | Year Ended
August 31,
2014 | | | Year Ended
August 31,
2015 | | | Year Ended
August 31,
2014 | |
Distributions paid from: | | | | | | | | | | | | | | | | |
Ordinary income* | | | | | | | | | | | | | | | | |
Institutional Class | | $ | 9 | | | $ | 97 | | | $ | 9,501 | | | $ | 3,754 | |
Y Class | | | 51 | | | | 175 | | | | 17,929 | | | | 9,029 | |
Investor Class | | | 6 | | | | 375 | | | | 11,863 | | | | 19,007 | |
A Class | | | 16 | | | | 175 | | | | 5,119 | | | | 5,884 | |
C Class | | | 4 | | | | 62 | | | | 3,904 | | | | 4,004 | |
Long-term Capital Gains | | | | | | | | | | | | | | | | |
Institutional Class | | | 20 | | | | 67 | | | | 2,072 | | | | 574 | |
Y Class | | | 118 | | | | 120 | | | | 6,202 | | | | 1,373 | |
Investor Class | | | 30 | | | | 257 | | | | 4,097 | | | | 3,540 | |
A Class | | | 57 | | | | 120 | | | | 1,915 | | | | 1,085 | |
C Class | | | 19 | | | | 42 | | | | 1,693 | | | | 842 | |
| | | | | | | | | | | | | | | | |
Total distributions paid | | $ | 330 | | | $ | 1,490 | | | $ | 64,295 | | | $ | 49,092 | |
| | | | | | | | | | | | | | | | |
| * | For tax purposes, short-term capital gains are considered ordinary income distributions. |
As of August 31, 2015, the components of distributable earnings or (deficits) on a tax basis were as follows (in thousands):
| | | | | | | | | | | | | | | | |
| | | The London
Company Income
Equity | | | Zebra Global
Equity | | | Zebra Small Cap
Equity | | | SiM High Yield
Opportunities | |
Cost basis of investments for federal income tax purposes | | $ | 710,615 | | | $ | 5,243 | | | $ | 21,182 | | | $ | 912,996 | |
Unrealized appreciation | | | 42,238 | | | | 278 | | | | 987 | | | | 7,545 | |
Unrealized depreciation | | | (39,528 | ) | | | (554 | ) | | | (1,824 | ) | | | (54,886 | ) |
| | | | | | | | | | | | | | | | |
Net unrealized appreciation or (depreciation) | | | 2,710 | | | | (276 | ) | | | (837 | ) | | | (47,341 | ) |
Undistributed ordinary income or (loss) | | | 1,356 | | | | 171 | | | | 658 | | | | (6,907 | ) |
Undistributed capital gain or (loss) | | | (1,891 | ) | | | 233 | | | | 1,494 | | | | 832 | |
Other temporary differences | | | — | | | | — | | | | — | | | | (362 | ) |
| | | | | | | | | | | | | | | | |
Distributable earnings or (deficits) | | $ | 2,175 | | | $ | 128 | | | $ | 1,315 | | | $ | (53,778 | ) |
| | | | | | | | | | | | | | | | |
Financial reporting records are adjusted for permanent book/tax differences to reflect tax character. Financial records are not adjusted for temporary differences. The temporary differences between financial reporting and tax-basis reporting of unrealized appreciation or (depreciation) are attributable primarily to the tax deferral of losses from wash sales, the realization for tax purposes of unrealized gains or (losses) on certain derivative instruments and the reclassification of income from real estate investment securities, royalty trusts, and publicly traded partnerships.
60
American Beacon FundsSM
Notes to Financial Statements
August 31, 2015
Due to inherent differences in the recognition of income, expenses and realized gains or (losses) under U.S. GAAP and federal income tax regulations, permanent differences between book and tax reporting have been identified and appropriately reclassified on the Statements of Assets and Liabilities.
Accordingly, the following amounts represent current year permanent differences derived from foreign currency, paydown reclasses, swap income, reclassifications of income from real estate investment securities, publicly traded partnerships, royalty trusts, and dividends that have been reclassified as of August 31, 2015 (in thousands):
| | | | | | | | | | | | | | | | |
| | | The London
Company Income
Equity | | | Zebra
Global
Equity | | | Zebra
Small Cap
Equity | | | SiM High
Yield
Opportunities | |
Paid-in-capital | | $ | — | | | $ | (1 | ) | | $ | — | | | $ | — | |
Undistributed or (overdistribution of) net investment income | | | (165 | ) | | | (5 | ) | | | (40 | ) | | | (3,018 | ) |
Accumulated net realized gain (loss) | | | 165 | | | | 6 | | | | 40 | | | | 3,018 | |
Unrealized appreciation or (depreciation) of investments, foreign currency transactions, and futures contracts | | | — | | | | — | | | | — | | | | — | |
Under the Regulated Investment Company Modernization Act of 2010 (the “RIC MOD”), net capital losses recognized by Funds in taxable years beginning after December 22, 2010 are carried forward indefinitely and retain their character as short-term and/or long-term losses.
As of August 31, 2015, The London Company Income Equity Fund has $1,891 of post RIC MOD short-term capital loss carryforward (in thousands).
The Funds are permitted for tax purposes to defer into their next fiscal year qualified late year losses. Qualified late year capital losses are any capital losses incurred after October 31 through the Funds’ fiscal year end, August 31, 2015. Qualified late year ordinary losses are specified losses generally incurred after October 31 and ordinary losses incurred after December 31 through the end of the Funds’ fiscal year, August 31, 2015. For the period ended August 31, 2015, SiM High Yield Opportunities Fund deferred $6,908 late year specified ordinary loss (in thousands).
8. Investment Transactions
The aggregate cost of purchases and proceeds from sales of investments other than short-term obligations for the year ended August 31, 2015 were (in thousands):
| | | | | | | | |
| | | Purchases | | | Sales | |
The London Company Income Equity | | $ | 533,412 | | | $ | 73,354 | |
Zebra Global Equity | | | 3,384 | | | | 5,267 | |
Zebra Small Cap Equity | | | 19,661 | | | | 18,955 | |
SiM High Yield Opportunities (non U.S. Government securities) | | | 583,703 | | | | 335,923 | |
SiM High Yield Opportunities (U.S. Government securities) | | | — | | | | 1,459 | |
A summary of the Zebra Small Cap Equity Fund’s transactions in the Select Funds for the year ended August 31, 2015 is set forth below (in thousands):
| | | | | | | | | | | | | | | | | | | | | | | | |
Type of Transaction | | Affiliated Fund | | | August 31, 2014
Shares/Fair Value | | | Purchases | | | Sales | | | August 31, 2015
Shares/Fair Value | | | Dividend
Income | |
Securities Lending | | | USG Select Fund | | | $ | — | | | $ | 4,847 | | | $ | 4,708 | | | $ | 139 | | | | N/A | |
61
American Beacon FundsSM
Notes to Financial Statements
August 31, 2015
9. Securities Lending
The Zebra Small Cap Equity Fund may lend its securities to qualified financial institutions, such as certain broker-dealers, to earn additional income. The borrowers are required to secure their loans continuously with collateral in an amount at least equal to the fair value of the securities loaned, initially in an amount at least equal to 102% of the fair value of domestic securities loaned and 105% of the fair value of international securities loaned. Collateral is monitored and marked to market daily. Daily mark to market amounts are required to be paid to the borrower or received from the borrower by the end of the following business day. This one day settlement for mark to market amounts may result in the collateral being temporarily less than the value of the securities on loan or temporarily more than the required minimum collateral.
To the extent that a loan is collateralized by cash, such cash collateral shall be invested by the securities lending agent (the “Agent”) in money market mutual funds, and other short-term investments, provided the investments meet certain quality and diversification requirements. Securities purchased with cash collateral proceeds are listed in the Fund’s Schedule of Investments and the collateral is shown on the Statements of Assets and Liabilities as a payable.
Securities lending income is generated from the demand premium (if any) paid by the borrower to borrow a specific security and from the return on investment of cash collateral, reduced by negotiated rebate fees paid to the borrower and transaction costs. To the extent that a loan is secured by non-cash collateral, securities lending income is generated as a demand premium reduced by transaction costs. The Fund, the Agent, and the Manager retained 80%, 10%, and 10%, respectively, of the income generated from securities lending.
While securities are on loan, the Fund continues to receive certain income associated with that security and any gain or loss in the market price that may occur during the term of the loan. In the case of domestic equities, the value of any dividend is received in the form of a substitute payment approximately equal to the dividend. In the case of foreign securities, a negotiated amount is received that is less than the actual dividend, but higher than the dividend amount minus the foreign tax that the Fund would be subject to on the dividend.
Securities lending transactions pose certain risks to the Fund, including that the borrower may not provide additional collateral when required or return the securities when due, that the value of the short-term investments will be less than the amount of cash collateral required to be returned to the borrower, that non-cash collateral may be subject to legal constraints in the event of a borrower bankruptcy, and that the cash collateral investments could become illiquid and unable to be used to return collateral to the borrower. The Fund could also experience delays and costs in gaining access to the collateral. The Fund bears the risk of any deficiency in the amount of the cash collateral available for return to the borrower and any action which impairs its ability to liquidate non-cash collateral to satisfy a borrower default.
At August 31, 2015, the value of outstanding securities on loan and the value of collateral was as follows (in thousands):
| | | | | | | | | | |
Fair Value of
Securities on Loan | | | Non-Cash Collateral | | | Cash Collateral
Posted by Borrower | |
| $ | 144,000 | | | $ | — | | | $ | 147,000 | |
Cash collateral is listed in the Funds’ Schedules of Investments and is shown on Statements of Assets and Liabilities. Income earned on these investments is included in Income derived from securities lending in the Statements of Operations.
Non-cash collateral received by the Funds may not be sold or re-pledged except to satisfy a borrower default. Therefore, non-cash collateral is not included on the Funds’ Schedules of Investments or Statements of Assets and Liabilities.
62
American Beacon FundsSM
Notes to Financial Statements
August 31, 2015
10. Capital Share Transactions
The tables below summarize the activity in capital shares for each Class of the Fund (dollars and shares in thousands):
For the year ended August 31, 2015
| | | | | | | | | | | | | | | | | | | | | | | | |
| | | Institutional Class | | | Y Class | | | Investor Class | |
| | | Shares | | | Amount | | | Shares | | | Amount | | | Shares | | | Amount | |
The London Company Income Equity Fund | | | | | | | | | | | | | | | | | | | | | | | | |
Shares sold | | | 6,701 | | | $ | 99,534 | | | | 21,660 | | | $ | 316,041 | | | | 942 | | | $ | 13,858 | |
Reinvestment of dividends | | | 169 | | | | 2,482 | | | | 127 | | | | 1,861 | | | | 31 | | | | 452 | |
Shares redeemed | | | (1,107 | ) | | | (16,279 | ) | | | (4,083 | ) | | | (59,823 | ) | | | (659 | ) | | | (9,571 | ) |
| | | | | | | | | | | | | | | | | | | | | | | | |
Net increase in shares outstanding | | | 5,763 | | | $ | 85,737 | | | | 17,704 | | | $ | 258,079 | | | | 314 | | | $ | 4,739 | |
| | | | | | | | | | | | | | | | | | | | | | | | |
| | | | | | | | | | | | | | | | |
| | | A Class | | | C Class | |
| | | Shares | | | Amount | | | Shares | | | Amount | |
The London Company Income Equity Fund | | | | | | | | | | | | | | | | |
Shares sold | | | 3,973 | | | $ | 58,224 | | | | 6,361 | | | $ | 92,332 | |
Reinvestment of dividends | | | 46 | | | | 669 | | | | 23 | | | | 335 | |
Shares redeemed | | | (1,004 | ) | | | (14,429 | ) | | | (734 | ) | | | (10,614 | ) |
| | | | | | | | | | | | | | | | |
Net increase in shares outstanding | | | 3,015 | | | $ | 44,464 | | | | 5,650 | | | $ | 82,053 | |
| | | | | | | | | | | | | | | | |
| | | | | | | | | | | | | | | | | | | | | | | | |
| | | Institutional Class | | | Y Class | | | Investor Class | |
| | | Shares | | | Amount | | | Shares | | | Amount | | | Shares | | | Amount | |
Zebra Global Equity Fund | | | | | | | | | | | | | | | | | | | | | | | | |
Shares sold | | | — | | | $ | — | | | | 24 | | | $ | 295 | | | | 17 | �� | | $ | 196 | |
Reinvestment of dividends | | | 7 | | | | 83 | | | | 9 | | | | 96 | | | | 6 | | | | 63 | |
Shares redeemed | | | (8 | ) | | | (94 | ) | | | (39 | ) | | | (440 | ) | | | (42 | ) | | | (497 | ) |
| | | | | | | | | | | | | | | | | | | | | | | | |
Net (decrease) in shares outstanding | | | (1 | ) | | $ | (11 | ) | | | (6 | ) | | $ | (49 | ) | | | (19 | ) | | $ | (238 | ) |
| | | | | | | | | | | | | | | | | | | | | | | | |
| | | | | | | | | | | | | | | | |
| | | A Class | | | C Class | |
| | | Shares | | | Amount | | | Shares | | | Amount | |
Zebra Global Equity Fund | | | | | | | | | | | | | | | | |
Shares sold | | | 15 | | | $ | 181 | | | | 4 | | | $ | 45 | |
Reinvestment of dividends | | | 39 | | | | 436 | | | | 11 | | | | 120 | |
Shares redeemed | | | (141 | ) | | | (1,622 | ) | | | (14 | ) | | | (160 | ) |
| | | | | | | | | | | | | | | | |
Net increase (decrease) in shares outstanding | | | (87 | ) | | $ | (1,005 | ) | | | 1 | | | $ | 5 | |
| | | | | | | | | | | | | | | | |
| | | | | | | | | | | | | | | | | | | | | | | | |
| | | Institutional Class | | | Y Class | | | Investor Class | |
| | | Shares | | | Amount | | | Shares | | | Amount | | | Shares | | | Amount | |
Zebra Small Cap Equity Fund | | | | | | | | | | | | | | | | | | | | | | | | |
Shares sold | | | 43 | | | $ | 650 | | | | 296 | | | $ | 4,334 | | | | 185 | | | $ | 2,778 | |
Reinvestment of dividends | | | 2 | | | | 30 | | | | 11 | | | | 166 | | | | 2 | | | | 35 | |
Shares redeemed | | | (33 | ) | | | (484 | ) | | | (187 | ) | | | (2,737 | ) | | | (215 | ) | | | (3,209 | ) |
| | | | | | | | | | | | | | | | | | | | | | | | |
Net increase (decrease) in shares outstanding | | | 12 | | | $ | 196 | | | | 120 | | | $ | 1,763 | | | | (28 | ) | | $ | (396 | ) |
| | | | | | | | | | | | | | | | | | | | | | | | |
| | | | | | | | | | | | | | | | |
| | | A Class | | | C Class | |
| | | Shares | | | Amount | | | Shares | | | Amount | |
Zebra Small Cap Equity Fund | | | | | | | | | | | | | | | | |
Shares sold | | | 90 | | | $ | 1,340 | | | | 20 | | | $ | 277 | |
Reinvestment of dividends | | | 5 | | | | 65 | | | | 1 | | | | 19 | |
Shares redeemed | | | (97 | ) | | | (1,413 | ) | | | (24 | ) | | | (342 | ) |
| | | | | | | | | | | | | | | | |
Net (decrease) in shares outstanding | | | (2 | ) | | $ | (8 | ) | | | (3 | ) | | $ | (46 | ) |
| | | | | | | | | | | | | | | | |
63
American Beacon FundsSM
Notes to Financial Statements
August 31, 2015
| | | | | | | | | | | | | | | | | | | | | | | | |
| | | Institutional Class | | | Y Class | | | Investor Class | |
| | | Shares | | | Amount | | | Shares | | | Amount | | | Shares | | | Amount | |
SiM High Yield Opportunities Fund | | | | | | | | | | | | | | | | | | | | | | | | |
Shares sold | | | 21,009 | | | $ | 205,596 | | | | 16,073 | | | $ | 158,912 | | | | 7,909 | | | $ | 77,529 | |
Redemption fees | | | — | | | | 19 | | | | — | | | | 39 | | | | — | | | | 27 | |
Reinvestment of dividends | | | 1,160 | | | | 11,291 | | | | 2,185 | | | | 21,309 | | | | 1,618 | | | | 15,745 | |
Shares redeemed | | | (5,028 | ) | | | (48,856 | ) | | | (10,310 | ) | | | (100,685 | ) | | | (7,908 | ) | | | (77,579 | ) |
| | | | | | | | | | | | | | | | | | | | | | | | |
Net increase in shares outstanding | | | 17,141 | | | $ | 168,050 | | | | 7,948 | | | $ | 79,575 | | | | 1,619 | | | $ | 15,722 | |
| | | | | | | | | | | | | | | | | | | | | | | | |
| | | | | | | | | | | | | | | | |
| | | A Class | | | C Class | |
| | | Shares | | | Amount | | | Shares | | | Amount | |
SiM High Yield Opportunities Fund | | | | | | | | | | | | | | | | |
Shares sold | | | 2,519 | | | $ | 24,849 | | | | 1,532 | | | $ | 15,212 | |
Redemption fees | | | — | | | | 12 | | | | — | | | | 10 | |
Reinvestment of dividends | | | 516 | | | | 5,042 | | | | 436 | | | | 4,270 | |
Shares redeemed | | | (3,418 | ) | | | (33,631 | ) | | | (1,599 | ) | | | (15,726 | ) |
| | | | | | | | | | | | | | | | |
Net increase (decrease) in shares outstanding | | | (383 | ) | | $ | (3,728 | ) | | | 369 | | | $ | 3,766 | |
| | | | | | | | | | | | | | | | |
For the Year ended August 31, 2014
| | | | | | | | | | | | | | | | | | | | | | | | |
| | | Institutional Class | | | Y Class | | | Investor Class | |
| | | Shares | | | Amount | | | Shares | | | Amount | | | Shares | | | Amount | |
The London Company Income Equity Fund | | | | | | | | | | | | | | | | | | | | | | | | |
Shares sold | | | 1,861 | | | $ | 23,942 | | | | 7,625 | | | $ | 98,479 | | | | 968 | | | $ | 12,613 | |
Reinvestment of dividends | | | 95 | | | | 1,226 | | | | 36 | | | | 467 | | | | 27 | | | | 348 | |
Shares redeemed | | | (1,621 | ) | | | (20,277 | ) | | | (1,384 | ) | | | (18,019 | ) | | | (571 | ) | | | (7,735 | ) |
| | | | | | | | | | | | | | | | | | | | | | | | |
Net increase in shares outstanding | | | 335 | | | $ | 4,891 | | | | 6,277 | | | $ | 80,927 | | | | 424 | | | $ | 5,226 | |
| | | | | | | | | | | | | | | | | | | | | | | | |
| | | | | | | | | | | | | | | | |
| | | A Class | | | C Class | |
| | | Shares | | | Amount | | | Shares | | | Amount | |
The London Company Income Equity Fund | | | | | | | | | | | | | | | | |
Shares sold | | | 1,610 | | | $ | 20,758 | | | | 2,786 | | | $ | 35,549 | |
Reinvestment of dividends | | | 18 | | | | 233 | | | | 9 | | | | 118 | |
Shares redeemed | | | (408 | ) | | | (5,305 | ) | | | (134 | ) | | | (1,734 | ) |
| | | | | | | | | | | | | | | | |
Net increase in shares outstanding | | | 1,220 | | | $ | 15,686 | | | | 2,661 | | | $ | 33,933 | |
| | | | | | | | | | | | | | | | |
| | | | | | | | | | | | | | | | | | | | | | | | |
| | | Institutional Class | | | Y Class | | | Investor Class | |
| | | Shares | | | Amount | | | Shares | | | Amount | | | Shares | | | Amount | |
Zebra Global Equity Fund | | | | | | | | | | | | | | | | | | | | | | | | |
Shares sold | | | 22 | | | $ | 308 | | | | 64 | | | $ | 802 | | | | 44 | | | $ | 552 | |
Reinvestment of dividends | | | 15 | | | | 170 | | | | 4 | | | | 42 | | | | 15 | | | | 171 | |
Shares redeemed | | | (31 | ) | | | (381 | ) | | | (39 | ) | | | (482 | ) | | | (96 | ) | | | (1,275 | ) |
| | | | | | | | | | | | | | | | | | | | | | | | |
Net increase (decrease) in shares outstanding | | | 6 | | | $ | 97 | | | | 29 | | | $ | 362 | | | | (37 | ) | | $ | (552 | ) |
| | | | | | | | | | | | | | | | | | | | | | | | |
| | | | | | | | | | | | | | | | |
| | | A Class | | | C Class | |
| | | Shares | | | Amount | | | Shares | | | Amount | |
Zebra Global Equity Fund | | | | | | | | | | | | | | | | |
Shares sold | | | 71 | | | $ | 905 | | | | 53 | | | $ | 681 | |
Reinvestment of dividends | | | 57 | | | | 673 | | | | 10 | | | | 115 | |
Shares redeemed | | | (110 | ) | | | (1,455 | ) | | | (2 | ) | | | (24 | ) |
| | | | | | | | | | | | | | | | |
Net increase in shares outstanding | | | 18 | | | $ | 123 | | | | 61 | | | $ | 772 | |
| | | | | | | | | | | | | | | | |
| | | | | | | | | | | | | | | | | | | | | | | | |
| | | Institutional Class | | | Y Class | | | Investor Class | |
| | | Shares | | | Amount | | | Shares | | | Amount | | | Shares | | | Amount | |
Zebra Small Cap Equity Fund | | | | | | | | | | | | | | | | | | | | | | | | |
Shares sold | | | 65 | | | $ | 911 | | | | 548 | | | $ | 7,861 | | | | 283 | | | $ | 4,077 | |
Reinvestment of dividends | | | 12 | | | | 163 | | | | 20 | | | | 286 | | | | 44 | | | | 631 | |
Shares redeemed | | | (76 | ) | | | (1,077 | ) | | | (127 | ) | | | (1,811 | ) | | | (359 | ) | | | (5,080 | ) |
| | | | | | | | | | | | | | | | | | | | | | | | |
Net increase (decrease) in shares outstanding | | | 1 | | | $ | (3 | ) | | | 441 | | | $ | 6,336 | | | | (32 | ) | | $ | (372 | ) |
| | | | | | | | | | | | | | | | | | | | | | | | |
64
American Beacon FundsSM
Notes to Financial Statements
August 31, 2015
| | | | | | | | | | | | | | | | |
| | | A Class | | | C Class | |
| | | Shares | | | Amount | | | Shares | | | Amount | |
Zebra Small Cap Equity Fund | | | | | | | | | | | | | | | | |
Shares sold | | | 280 | | | $ | 4,011 | | | | 75 | | | $ | 1,060 | |
Reinvestment of dividends | | | 16 | | | | 230 | | | | 6 | | | | 83 | |
Shares redeemed | | | (108 | ) | | | (1,559 | ) | | | (28 | ) | | | (403 | ) |
| | | | | | | | | | | | | | | | |
Net increase in shares outstanding | | | 188 | | | $ | 2,682 | | | | 53 | | | $ | 740 | |
| | | | | | | | | | | | | | | | |
| | | | | | | | | | | | | | | | | | | | | | | | |
| | | Institutional Class | | | Y Class | | | Investor Class | |
| | | Shares | | | Amount | | | Shares | | | Amount | | | Shares | | | Amount | |
SiM High Yield Opportunities Fund | | | | | | | | | | | | | | | | | | | | | | | | |
Shares sold | | | 4,682 | | | $ | 48,431 | | | | 17,585 | | | $ | 181,305 | | | | 9,097 | | | $ | 93,455 | |
Redemption fees | | | — | | | | 5 | | | | — | | | | 12 | | | | — | | | | 22 | |
Reinvestment of dividends | | | 389 | | | | 3,989 | | | | 801 | | | | 8,201 | | | | 2,181 | | | | 22,257 | |
Shares redeemed | | | (2,268 | ) | | | (23,347 | ) | | | (3,126 | ) | | | (32,139 | ) | | | (16,463 | ) | | | (169,250 | ) |
| | | | | | | | | | | | | | | | | | | | | | | | |
Net increase (decrease) in shares outstanding | | | 2,803 | | | $ | 29,078 | | | | 15,260 | | | $ | 157,379 | | | | (5,185 | ) | | $ | (53,516 | ) |
| | | | | | | | | | | | | | | | | | | | | | | | |
| | | | | | | | | | | | | | | | |
| | | A Class | | | C Class | |
| | | Shares | | | Amount | | | Shares | | | Amount | |
SiM High Yield Opportunities Fund | | | | | | | | | | | | | | | | |
Shares sold | | | 3,017 | | | $ | 31,114 | | | | 2,087 | | | $ | 21,594 | |
Redemption fees | | | — | | | | 7 | | | | — | | | | 6 | |
Reinvestment of dividends | | | 475 | | | | 4,861 | | | | 367 | | | | 3,774 | |
Shares redeemed | | | (2,012 | ) | | | (20,738 | ) | | | (1,079 | ) | | | (11,150 | ) |
| | | | | | | | | | | | | | | | |
Net increase in shares outstanding | | | 1,480 | | | $ | 15,244 | | | | 1,375 | | | $ | 14,224 | |
| | | | | | | | | | | | | | | | |
11. Subsequent Events
On August 6, 2015 the Manager announced the Board’s approval of a plan to liquidate and terminate the American Beacon Zebra Global Equity Fund. On or about November 30, 2015 the Fund will liquidate all remaining assets and be terminated.
65
American Beacon The London Company Income Equity FundSM
Financial Highlights
(For a share outstanding throughout the period)
| | | | | | | | | | | | | | | | | | | | | | | | | | | | | | | | |
| | | Institutional Class | | | Y Class | |
| | | Year Ended August 31, | | | May 29
to
Aug.
31,
2012 | | | Year Ended August 31, | | | May 29
to
Aug. 31,
2012 | |
| | 2015 | | | 2014 | | | 2013 | | | | 2015 | | | 2014 | | | 2013 | | |
Net asset value, beginning of period | | $ | 14.12 | | | $ | 11.80 | | | $ | 10.49 | | | $ | 10.00 | | | $ | 14.06 | | | $ | 11.75 | | | $ | 10.49 | | | $ | 10.00 | |
| | | | | | | | | | | | | | | | | | | | | | | | | | | | | | | | |
Income from investment operations: | | | | | | | | | | | | | | | | | | | | | | | | | | | | | | | | |
Net investment income | | | 0.31 | | | | 0.30 | | | | 0.31 | | | | 0.06 | | | | 0.31 | | | | 0.28 | | | | 0.33 | | | | 0.05 | |
Net gains (losses) on investments (both realized and unrealized) | | | (0.14 | ) | | | 2.39 | | | | 1.30 | | | | 0.47 | | | | (0.15 | ) | | | 2.39 | | | | 1.26 | | | | 0.48 | |
| | | | | | | | | | | | | | | | | | | | | | | | | | | | | | | | |
Total income from investment operations | | | 0.17 | | | | 2.69 | | | | 1.61 | | | | 0.53 | | | | 0.16 | | | | 2.67 | | | | 1.59 | | | | 0.53 | |
| | | | | | | | | | | | | | | | | | | | | | | | | | | | | | | | |
Less distributions: | | | | | | | | | | | | | | | | | | | | | | | | | | | | | | | | |
Dividends from net investment income | | | (0.32 | ) | | | (0.28 | ) | | | (0.29 | ) | | | (0.04 | ) | | | (0.31 | ) | | | (0.27 | ) | | | (0.32 | ) | | | (0.04 | ) |
Distributions from net realized gains | | | (0.12 | ) | | | (0.09 | ) | | | (0.01 | ) | | | — | | | | (0.12 | ) | | | (0.09 | ) | | | (0.01 | ) | | | — | |
| | | | | | | | | | | | | | | | | | | | | | | | | | | | | | | | |
Total distributions | | | (0.44 | ) | | | (0.37 | ) | | | (0.30 | ) | | | (0.04 | ) | | | (0.43 | ) | | | (0.36 | ) | | | (0.33 | ) | | | (0.04 | ) |
| | | | | | | | | | | | | | | | | | | | | | | | | | | | | | | | |
Net asset value, end of period | | $ | 13.85 | | | $ | 14.12 | | | $ | 11.80 | | | $ | 10.49 | | | $ | 13.79 | | | $ | 14.06 | | | $ | 11.75 | | | $ | 10.49 | |
| | | | | | | | | | | | | | | | | | | | | | | | | | | | | | | | |
Total return A | | | 1.08 | % | | | 23.13 | % | | | 15.55 | % | | | 5.31 | %B | | | 1.03 | % | | | 23.05 | % | | | 15.45 | % | | | 5.31 | %B |
| | | | | | | | | | | | | | | | | | | | | | | | | | | | | | | | |
Ratios and supplemental data: | | | | | | | | | | | | | | | | | | | | | | | | | | | | | | | | |
Net assets, end of period (in thousands) | | $ | 137,007 | | | $ | 58,277 | | | $ | 44,731 | | | $ | 10,331 | | | $ | 364,477 | | | $ | 122,715 | | | $ | 28,814 | | | $ | 551 | |
Ratios to average net assets: | | | | | | | | | | | | | | | | | | | | | | | | | | | | | | | | |
Expenses, before reimbursements or recoupments | | | 0.75 | % | | | 0.82 | % | | | 1.13 | % | | | 7.28 | %C | | | 0.83 | % | | | 0.89 | % | | | 1.09 | % | | | 10.59 | %C |
Expenses, net of reimbursements or recoupments | | | 0.79 | % | | | 0.79 | % | | | 0.79 | % | | | 0.79 | %C | | | 0.84 | % | | | 0.89 | % | | | 0.89 | % | | | 0.89 | %C |
Net investment income (loss), before expense reimbursements or recoupments | | | 2.35 | % | | | 2.31 | % | | | 2.32 | % | | | (3.99 | )%C | | | 2.27 | % | | | 2.24 | % | | | 2.22 | % | | | (7.30 | )%C |
Net investment income, net of reimbursements or recoupments | | | 2.30 | % | | | 2.33 | % | | | 2.66 | % | | | 2.50 | %C | | | 2.26 | % | | | 2.25 | % | | | 2.42 | % | | | 2.40 | %C |
Portfolio turnover rate | | | 15 | % | | | 10 | % | | | 15 | % | | | 6 | %D | | | 15 | % | | | 10 | % | | | 15 | % | | | 6 | %D |
| A | Based on net asset value, which does not reflect the sales charge, redemption fee, or contingent deferred sales charge, if applicable. May include adjustments in accordance with U.S. GAAP and as such, the net asset value for reporting purposes and the returns based upon those net asset values may differ from the net asset value and returns for shareholder transactions. |
| D | Portfolio turnover rate is for the period from May 29 through August 31, 2012, and is annualized. |
66
American Beacon The London Company Income Equity FundSM
Financial Highlights
(For a share outstanding throughout the period)
| | | | | | | | | | | | | | | | | | | | | | | | | | | | | | | | | | | | | | | | | | | | | | |
| Investor Class | | | A Class | | | C Class | |
| Year Ended August 31, | | | May 29
to
Aug. 31,
2012 | | | Year Ended August 31, | | | May 29
to
Aug. 31,
2012 | | | Year Ended August 31, | | | May 29
to
Aug. 31,
2012 | |
| 2015 | | | 2014 | | | 2013 | | | | 2015 | | | 2014 | | | 2013 | | | | 2015 | | | 2014 | | | 2013 | | |
| $ | 14.08 | | | $ | 11.76 | | | $ | 10.48 | | | $ | 10.00 | | | $ | 14.00 | | | $ | 11.70 | | | $ | 10.47 | | | $ | 10.00 | | | $ | 13.93 | | | $ | 11.66 | | | $ | 10.46 | | | $ | 10.00 | |
| | | | | | | | | | | | | | | | | | | | | | | | | | | | | | | | | | | | | | | | | | | | | | |
| | 0.28 | | | | 0.26 | | | | 0.27 | | | | 0.05 | | | | 0.27 | | | | 0.24 | | | | 0.31 | | | | 0.05 | | | | 0.18 | | | | 0.15 | | | | 0.24 | | | | 0.04 | |
| | (0.17 | ) | | | 2.39 | | | | 1.29 | | | | 0.47 | | | | (0.16 | ) | | | 2.37 | | | | 1.23 | | | | 0.46 | | | | (0.17 | ) | | | 2.35 | | | | 1.21 | | | | 0.46 | |
| | | | | | | | | | | | | | | | | | | | | | | | | | | | | | | | | | | | | | | | | | | | | | |
| | 0.11 | | | | 2.65 | | | | 1.56 | | | | 0.52 | | | | 0.11 | | | | 2.61 | | | | 1.54 | | | | 0.51 | | | | 0.01 | | | | 2.50 | | | | 1.45 | | | | 0.50 | |
| | | | | | | | | | | | | | | | | | | | | | | | | | | | | | | | | | | | | | | | | | | | | | |
| | (0.26 | ) | | | (0.24 | ) | | | (0.27 | ) | | | (0.04 | ) | | | (0.26 | ) | | | (0.22 | ) | | | (0.30 | ) | | | (0.04 | ) | | | (0.17 | ) | | | (0.14 | ) | | | (0.24 | ) | | | (0.04 | ) |
| | (0.12 | ) | | | (0.09 | ) | | | (0.01 | ) | | | — | | | | (0.12 | ) | | | (0.09 | ) | | | (0.01 | ) | | | — | | | | (0.12 | ) | | | (0.09 | ) | | | (0.01 | ) | | | — | |
| | | | | | | | | | | | | | | | | | | | | | | | | | | | | | | | | | | | | | | | | | | | | | |
| | (0.38 | ) | | | (0.33 | ) | | | (0.28 | ) | | | (0.04 | ) | | | (0.38 | ) | | | (0.31 | ) | | | (0.31 | ) | | | (0.04 | ) | | | (0.29 | ) | | | (0.23 | ) | | | (0.25 | ) | | | (0.04 | ) |
| | | | | | | | | | | | | | | | | | | | | | | | | | | | | | | | | | | | | | | | | | | | | | |
| $ | 13.81 | | | $ | 14.08 | | | $ | 11.76 | | | $ | 10.48 | | | $ | 13.73 | | | $ | 14.00 | | | $ | 11.70 | | | $ | 10.47 | | | $ | 13.65 | | | $ | 13.93 | | | $ | 11.66 | | | $ | 10.46 | |
| | | | | | | | | | | | | | | | | | | | | | | | | | | | | | | | | | | | | | | | | | | | | | |
| | 0.71 | % | | | 22.83 | % | | | 15.14 | % | | | 5.21 | %B | | | 0.71 | % | | | 22.58 | % | | | 14.99 | % | | | 5.11 | %B | | | (0.04 | )% | | | 21.69 | % | | | 14.05 | % | | | 5.01 | %B |
| | | | | | | | | | | | | | | | | | | | | | | | | | | | | | | | | | | | | | | | | | | | | | |
| $ | 20,565 | | | $ | 16,550 | | | $ | 8,840 | | | $ | 2,073 | | | $ | 72,363 | | | $ | 31,579 | | | $ | 12,109 | | | $ | 647 | | | $ | 122,804 | | | $ | 46,639 | | | $ | 8,015 | | | $ | 274 | |
| | 1.04 | % | | | 1.06 | % | | | 1.54 | % | | | 10.14 | %C | | | 1.13 | % | | | 1.28 | % | | | 1.59 | % | | | 11.94 | %C | | | 1.88 | % | | | 2.02 | % | | | 2.26 | % | | | 13.83 | %C |
| | 1.16 | % | | | 1.10 | % | | | 1.17 | % | | | 1.17 | %C | | | 1.17 | % | | | 1.27 | % | | | 1.29 | % | | | 1.29 | %C | | | 1.89 | % | | | 2.01 | % | | | 2.04 | % | | | 2.04 | %C |
| | 2.04 | % | | | 2.06 | % | | | 1.86 | % | | | (6.99 | )%C | | | 1.96 | % | | | 1.85 | % | | | 1.93 | % | | | (8.87 | )%C | | | 1.22 | % | | | 1.11 | % | | | 1.09 | % | | | (10.65 | )%C |
| | 1.93 | % | | | 2.02 | % | | | 2.23 | % | | | 1.99 | %C | | | 1.92 | % | | | 1.86 | % | | | 2.23 | % | | | 1.78 | %C | | | 1.21 | % | | | 1.12 | % | | | 1.31 | % | | | 1.14 | %C |
| | 15 | % | | | 10 | % | | | 15 | % | | | 6 | %D | | | 15 | % | | | 10 | % | | | 15 | % | | | 6 | %D | | | 15 | % | | | 10 | % | | | 15 | % | | | 6 | %D |
67
American Beacon Zebra Global Equity FundSM
Financial Highlights
(For a share outstanding throughout the period)
| | | | | | | | | | | | | | | | | | | | |
| | | Institutional Class | |
| | | Year Ended August 31, | |
| | | 2015 | | | 2014 | | | 2013 | | | 2012 | | | 2011 | |
Net asset value, beginning of period | | $ | 12.71 | | | $ | 13.33 | | | $ | 12.57 | | | $ | 11.46 | | | $ | 10.10 | |
| | | | | | | | | | | | | | | | | | | | |
Income from investment operations: | | | | | | | | | | | | | | | | | | | | |
Net investment income (loss) | | | 0.20 | | | | 0.14 | | | | 0.46 | | | | 0.39 | | | | 0.23 | |
Net gains (losses) from investments (both realized and unrealized) | | | (0.92 | ) | | | 2.15 | | | | 1.51 | | | | 0.84 | | | | 1.41 | |
| | | | | | | | | | | | | | | | | | | | |
Total income (loss) from investment operations | | | (0.72 | ) | | | 2.29 | | | | 1.97 | | | | 1.23 | | | | 1.64 | |
| | | | | | | | | | | | | | | | | | | | |
Less distributions: | | | | | | | | | | | | | | | | | | | | |
Dividends from net investment income | | | (0.12 | ) | | | (0.13 | ) | | | (0.35 | ) | | | (0.12 | ) | | | (0.17 | ) |
Distributions from net realized gains | | | (1.47 | ) | | | (2.78 | ) | | | (0.86 | ) | | | — | | | | (0.11 | ) |
Return of capital | | | — | | | | — | | | | — | | | | — | | | | — | |
| | | | | | | | | | | | | | | | | | | | |
Total distributions | | | (1.59 | ) | | | (2.91 | ) | | | (1.21 | ) | | | (0.12 | ) | | | (0.28 | ) |
| | | | | | | | | | | | | | | | | | | | |
Net asset value, end of period | | $ | 10.40 | | | $ | 12.71 | | | $ | 13.33 | | | $ | 12.57 | | | $ | 11.46 | |
| | | | | | | | | | | | | | | | | | | | |
Total return A | | | (6.41 | )% | | | 19.17 | % | | | 16.75 | % | | | 10.85 | % | | | 16.19 | % |
| | | | | | | | | | | | | | | | | | | | |
Ratios and supplemental data: | | | | | | | | | | | | | | | | | | | | |
Net assets, end of period (in thousands) | | $ | 569 | | | $ | 706 | | | $ | 656 | | | $ | 899 | | | $ | 1,776 | |
Ratios to average net assets: | | | | | | | | | | | | | | | | | | | | |
Expenses, before reimbursements | | | 2.94 | % | | | 2.55 | % | | | 2.56 | % | | | 1.84 | % | | | 2.38 | % |
Expenses, net of reimbursements | | | 0.79 | % | | | 0.79 | % | | | 0.79 | % | | | 0.79 | % | | | 0.77 | % |
Net investment income (loss), before reimbursements | | | (0.49 | )% | | | (0.25 | )% | | | 0.59 | % | | | 0.62 | % | | | (0.16 | )% |
Net investment income, net of reimbursements | | | 1.66 | % | | | 1.51 | % | | | 2.37 | % | | | 1.67 | % | | | 1.45 | % |
Portfolio turnover rate | | | 55 | % | | | 63 | % | | | 164 | % | | | 66 | % | | | 24 | % |
| A | Based on net asset value, which does not reflect the sales charge, redemption fee, or contingent deferred sales charge, if applicable. May include adjustments in accordance with U.S. GAAP and as such, the net asset value for reporting purposes and the returns based upon those net asset values may differ from the net asset value and returns for shareholder transactions. |
68
American Beacon Zebra Global Equity FundSM
Financial Highlights
(For a share outstanding throughout the period)
| | | | | | | | | | | | | | | | | | | | | | | | | | | | | | | | | | | | | | | | | | | | | | | | | | | | | | | | | | |
| Y Class | | | Investor Class | | | A Class | |
| Year Ended August 31, | | | Year Ended August 31, | | | Year Ended August 31, | |
| 2015 | | | 2014 | | | 2013 | | | 2012 | | | 2011 | | | 2015 | | | 2014 | | | 2013 | | | 2012 | | | 2011 | | | 2015 | | | 2014 | | | 2013 | | | 2012 | | | 2011 | |
| $ | 12.80 | | | $ | 13.45 | | | $ | 12.68 | | | $ | 11.58 | | | $ | 10.10 | | | $ | 12.71 | | | $ | 13.46 | | | $ | 12.64 | | | $ | 11.53 | | | $ | 10.08 | | | $ | 12.81 | | | $ | 13.47 | | | $ | 12.65 | | | $ | 11.54 | | | $ | 10.08 | |
| | | | | | | | | | | | | | | | | | | | | | | | | | | | | | | | | | | | | | | | | | | | | | | | | | | | | | | | | | |
| | 0.21 | | | | (0.04 | ) | | | 0.44 | | | | 0.38 | | | | 0.13 | | | | 0.31 | | | | 0.34 | | | | 0.35 | | | | 0.18 | | | | 0.09 | | | | 0.24 | | | | 0.15 | | | | 0.37 | | | | 0.14 | | | | 0.03 | |
| | (0.95 | ) | | | 2.34 | | | | 1.54 | | | | 0.84 | | | | 1.51 | | | | (1.08 | ) | | | 1.92 | | | | 1.59 | | | | 1.02 | | | | 1.51 | | | | (1.02 | ) | | | 2.11 | | | | 1.55 | | | | 1.04 | | | | 1.56 | |
| | | | | | | | | | | | | | | | | | | | | | | | | | | | | | | | | | | | | | | | | | | | | | | | | | | | | | | | | | |
| | (0.74 | ) | | | 2.30 | | | | 1.98 | | | | 1.22 | | | | 1.64 | | | | (0.77 | ) | | | 2.26 | | | | 1.94 | | | | 1.20 | | | | 1.60 | | | | (0.78 | ) | | | 2.26 | | | | 1.92 | | | | 1.18 | | | | 1.59 | |
| | | | | | | | | | | | | | | | | | | | | | | | | | | | | | | | | | | | | | | | | | | | | | | | | | | | | | | | | | |
| | (0.12 | ) | | | (0.17 | ) | | | (0.35 | ) | | | (0.12 | ) | | | (0.05 | ) | | | (0.12 | ) | | | (0.23 | ) | | | (0.26 | ) | | | (0.09 | ) | | | (0.04 | ) | | | (0.12 | ) | | | (0.14 | ) | | | (0.24 | ) | | | (0.07 | ) | | | (0.02 | ) |
| | (1.47 | ) | | | (2.78 | ) | | | (0.86 | ) | | | — | | | | (0.11 | ) | | | (1.47 | ) | | | (2.78 | ) | | | (0.86 | ) | | | — | | | | (0.11 | ) | | | (1.47 | ) | | | (2.78 | ) | | | (0.86 | ) | | | — | | | | (0.11 | ) |
| | — | | | | — | | | | — | | | | — | | | | — | | | | — | | | | — | | | | — | | | | — | | | | — | | | | — | | | | — | | | | — | | | | — | | | | — | |
| | | | | | | | | | | | | | | | | | | | | | | | | | | | | | | | | | | | | | | | | | | | | | | | | | | | | | | | | | |
| | (1.59 | ) | | | (2.95 | ) | | | (1.21 | ) | | | (0.12 | ) | | | (0.16 | ) | | | (1.59 | ) | | | (3.01 | ) | | | (1.12 | ) | | | (0.09 | ) | | | (0.15 | ) | | | (1.59 | ) | | | (2.92 | ) | | | (1.10 | ) | | | (0.07 | ) | | | (0.13 | ) |
| | | | | | | | | | | | | | | | | | | | | | | | | | | | | | | | | | | | | | | | | | | | | | | | | | | | | | | | | | |
| $ | 10.47 | | | $ | 12.80 | | | $ | 13.45 | | | $ | 12.68 | | | $ | 11.58 | | | $ | 10.35 | | | $ | 12.71 | | | $ | 13.46 | | | $ | 12.64 | | | $ | 11.53 | | | $ | 10.44 | | | $ | 12.81 | | | $ | 13.47 | | | $ | 12.65 | | | $ | 11.54 | |
| | | | | | | | | | | | | | | | | | | | | | | | | | | | | | | | | | | | | | | | | | | | | | | | | | | | | | | | | | |
| | (6.53 | )% | | | 19.08 | % | | | 16.60 | % | | | 10.68 | % | | | 16.18 | % | | | (6.84 | )% | | | 18.80 | % | | | 16.24 | % | | | 10.47 | % | | | 15.86 | % | | | (6.87 | )% | | | 18.71 | % | | | 16.08 | % | | | 10.33 | % | | | 15.74 | % |
| | | | | | | | | | | | | | | | | | | | | | | | | | | | | | | | | | | | | | | | | | | | | | | | | | | | | | | | | | |
| $ | 407 | | | $ | 575 | | | $ | 210 | | | $ | 285 | | | $ | 768 | | | $ | 474 | | | $ | 818 | | | $ | 1,365 | | | $ | 2,159 | | | $ | 4,160 | | | $ | 2,691 | | | $ | 4,410 | | | $ | 4,390 | | | $ | 9,945 | | | $ | 7,369 | |
| | 2.95 | % | | | 2.50 | % | | | 2.58 | % | | | 1.91 | % | | | 2.57 | % | | | 3.43 | % | | | 2.87 | % | | | 2.90 | % | | | 2.25 | % | | | 2.45 | % | | | 3.30 | % | | | 3.02 | % | | | 2.93 | % | | | 2.40 | % | | | 2.26 | % |
| | 0.89 | % | | | 0.89 | % | | | 0.89 | % | | | 0.89 | % | | | 0.86 | % | | | 1.17 | % | | | 1.17 | % | | | 1.17 | % | | | 1.17 | % | | | 1.14 | % | | | 1.19 | % | | | 1.27 | % | | | 1.29 | % | | | 1.29 | % | | | 1.25 | % |
| | (0.52 | )% | | | (0.05 | )% | | | 0.60 | % | | | 0.53 | % | | | (0.42 | )% | | | (0.96 | )% | | | (0.48 | )% | | | 0.28 | % | | | 0.17 | % | | | (0.23 | )% | | | (0.85 | )% | | | (0.63 | )% | | | 0.28 | % | | | 0.13 | % | | | (0.11 | )% |
| | 1.54 | % | | | 1.55 | % | | | 2.29 | % | | | 1.54 | % | | | 1.29 | % | | | 1.30 | % | | | 1.22 | % | | | 2.01 | % | | | 1.26 | % | | | 1.08 | % | | | 1.26 | % | | | 1.12 | % | | | 1.93 | % | | | 1.24 | % | | | 0.90 | % |
| | 55 | % | | | 63 | % | | | 164 | % | | | 66 | % | | | 24 | % | | | 55 | % | | | 63 | % | | | 164 | % | | | 66 | % | | | 24 | % | | | 55 | % | | | 63 | % | | | 164 | % | | | 66 | % | | | 24 | % |
69
American Beacon Zebra Global Equity FundSM
Financial Highlights
(For a share outstanding throughout the period)
| | | | | | | | | | | | | | | | | | | | |
| | | C Class | |
| | | Year Ended August 31, | |
| | | 2015 | | | 2014 | | | 2013 | | | 2012 | | | 2011 | |
Net asset value, beginning of period | | $ | 12.71 | | | $ | 13.36 | | | $ | 12.52 | | | $ | 11.46 | | | $ | 10.32 | |
Income from investment operations: | | | | | | | | | | | | | | | | | | | | |
Net investment income (loss) | | | 0.07 | | | | (0.03 | ) | | | 0.18 | | | | 0.06 | | | | 0.02 | |
Net gains (losses) from investments (both realized and unrealized) | | | (0.92 | ) | | | 2.17 | | | | 1.63 | | | | 1.03 | | | | 1.25 | |
| | | | | | | | | | | | | | | | | | | | |
Total income (loss) from investment operations | | | (0.85 | ) | | | 2.14 | | | | 1.81 | | | | 1.09 | | | | 1.27 | |
| | | | | | | | | | | | | | | | | | | | |
Less distributions: | | | | | | | | | | | | | | | | | | | | |
Dividends from net investment income | | | (0.12 | ) | | | (0.01 | ) | | | (0.11 | ) | | | (0.03 | ) | | | (0.02 | ) |
Distributions from net realized gains | | | (1.47 | ) | | | (2.78 | ) | | | (0.86 | ) | | | — | | | | (0.11 | ) |
Return of capital | | | — | | | | — | | | | — | | | | — | | | | — | |
| | | | | | | | | | | | | | | | | | | | |
Total distributions | | | (1.59 | ) | | | (2.79 | ) | | | (0.97 | ) | | | (0.03 | ) | | | (0.13 | ) |
| | | | | | | | | | | | | | | | | | | | |
Net asset value, end of period | | $ | 10.27 | | | $ | 12.71 | | | $ | 13.36 | | | $ | 12.52 | | | $ | 11.46 | |
| | | | | | | | | | | | | | | | | | | | |
Total return A | | | (7.54 | )% | | | 17.76 | % | | | 15.24 | % | | | 9.50 | % | | | 12.24 | % |
| | | | | | | | | | | | | | | | | | | | |
Ratios and supplemental data: | | | | | | | | | | | | | | | | | | | | |
Net assets, end of period (in thousands) | | $ | 831 | | | $ | 1,015 | | | $ | 261 | | | $ | 447 | | | $ | 437 | |
Ratios to average net assets: | | | | | | | | | | | | | | | | | | | | |
Expenses, before reimbursements | | | 4.05 | % | | | 3.71 | % | | | 3.74 | % | | | 3.18 | % | | | 3.92 | % |
Expenses, net of reimbursements | | | 1.94 | % | | | 2.02 | % | | | 2.04 | % | | | 2.04 | % | | | 1.96 | % |
Net investment income (loss), before reimbursements | | | (1.60 | )% | | | (1.22 | )% | | | (0.55 | )% | | | (0.67 | )% | | | (1.76 | )% |
Net investment income, net of reimbursements | | | 0.52 | % | | | 0.47 | % | | | 1.16 | % | | | 0.47 | % | | | 0.21 | % |
Portfolio turnover rate | | | 55 | % | | | 63 | % | | | 164 | % | | | 66 | % | | | 24 | % |
| A | Based on net asset value, which does not reflect the sales charge, redemption fee, or contingent deferred sales charge, if applicable. May include adjustments in accordance with U.S. GAAP and as such, the net asset value for reporting purposes and the returns based upon those net asset values may differ from the net asset value and returns for shareholder transactions. |
70
This page intentionally left blank.
71
American Beacon Zebra Small Cap Equity FundSM
Financial Highlights
(For a share outstanding throughout the period)
| | | | | | | | | | | | | | | | | | | | |
| | | Institutional Class | |
| | | Year Ended August 31, | |
| | | 2015 | | | 2014 | | | 2013 | | | 2012 | | | 2011 | |
Net asset value, beginning of period | | $ | 14.36 | | | $ | 13.66 | | | $ | 12.40 | | | $ | 11.30 | | | $ | 9.63 | |
| | | | | | | | | | | | | | | | | | | | |
Income from investment operations: | | | | | | | | | | | | | | | | | | | | |
Net investment income | | | 0.13 | | | | 0.14 | | | | 0.46 | | | | 0.27 | | | | 0.17 | |
Net gains (losses) from investments (both realized and unrealized) | | | (0.03 | ) | | | 2.12 | | | | 2.79 | | | | 1.15 | | | | 1.66 | |
| | | | | | | | | | | | | | | | | | | | |
Total income from investment operations | | | 0.10 | | | | 2.26 | | | | 3.25 | | | | 1.42 | | | | 1.83 | |
| | | | | | | | | | | | | | | | | | | | |
Less distributions: | | | | | | | | | | | | | | | | | | | | |
Dividends from net investment income | | | (0.04 | ) | | | — | | | | (1.17 | ) | | | (0.10 | ) | | | (0.11 | ) |
Distributions from net realized gains | | | (0.21 | ) | | | (1.56 | ) | | | (0.82 | ) | | | (0.22 | ) | | | (0.05 | ) |
Return of capital | | | — | | | | — | | | | — | | | | — | | | | — | |
| | | | | | | | | | | | | | | | | | | | |
Total distributions | | | (0.25 | ) | | | (1.56 | ) | | | (1.99 | ) | | | (0.32 | ) | | | (0.16 | ) |
| | | | | | | | | | | | | | | | | | | | |
Net asset value, end of period | | $ | 14.21 | | | $ | 14.36 | | | $ | 13.66 | | | $ | 12.40 | | | $ | 11.30 | |
| | | | | | | | | | | | | | | | | | | | |
Total return A | | | 0.68 | % | | | 16.67 | % | | | 29.81 | % | | | 12.78 | % | | | 18.93 | % |
| | | | | | | | | | | | | | | | | | | | |
Ratios and supplemental data: | | | | | | | | | | | | | | | | | | | | |
Net assets, end of period (in thousands) | | $ | 1,765 | | | $ | 1,606 | | | $ | 1,522 | | | $ | 923 | | | $ | 1,325 | |
Ratios to average net assets: | | | | | | | | | | | | | | | | | | | | |
Expenses, before reimbursements | | | 1.56 | % | | | 1.64 | % | | | 2.77 | % | | | 3.18 | % | | | 3.24 | % |
Expenses, net of reimbursements | | | 1.00 | % | | | 0.99 | % | | | 0.99 | % | | | 0.99 | % | | | 0.99 | % |
Net investment income (loss), before reimbursements | | | 0.17 | % | | | 0.33 | % | | | (0.28 | )% | | | (0.71 | )% | | | (1.16 | )% |
Net investment income (loss), net of reimbursements | | | 0.73 | % | | | 0.99 | % | | | 1.50 | % | | | 1.48 | % | | | 1.09 | % |
Portfolio turnover rate | | | 97 | % | | | 76 | % | | | 89 | % | | | 103 | % | | | 66 | % |
| A | Based on net asset value, which does not reflect the sales charge, redemption fee, or contingent deferred sales charge, if applicable. May include adjustments in accordance with U.S. GAAP and as such, the net asset value for reporting purposes and the returns based upon those net asset values may differ from the net asset value and returns for shareholder transactions. |
72
American Beacon Zebra Small Cap Equity FundSM
Financial Highlights
(For a share outstanding throughout the period)
| | | | | | | | | | | | | | | | | | | | | | | | | | | | | | | | | | | | | | |
| Y Class | | | Investor Class | |
| Year Ended August 31, | | | Year Ended August 31, | |
| 2015 | | | 2014 | | | 2013 | | | 2012 | | | 2011 | | | 2015 | | | 2014 | | | 2013 | | | 2012 | | | 2011 | |
| $ | 14.50 | | | $ | 13.79 | | | $ | 12.46 | | | $ | 11.36 | | | $ | 9.62 | | | $ | 14.39 | | | $ | 13.73 | | | $ | 12.44 | | | $ | 11.31 | | | $ | 9.62 | |
| | | | | | | | | | | | | | | | | | | | | | | | | | | | | | | | | | | | | | |
| | 0.10 | | | | 0.56 | | | | 0.37 | | | | 0.06 | | | | 0.15 | | | | 0.01 | | | | 0.10 | | | | 0.53 | | | | 0.17 | | | | 0.06 | |
| | (0.02 | ) | | | 1.71 | | | | 2.89 | | | | 1.37 | | | | 1.66 | | | | 0.04 | | | | 2.12 | | | | 2.68 | | | | 1.22 | | | | 1.71 | |
| | | | | | | | | | | | | | | | | | | | | | | | | | | | | | | | | | | | | | |
| | 0.08 | | | | 2.27 | | | | 3.26 | | | | 1.43 | | | | 1.81 | | | | 0.05 | | | | 2.22 | | | | 3.21 | | | | 1.39 | | | | 1.77 | |
| | | | | | | | | | | | | | | | | | | | | | | | | | | | | | | | | | | | | | |
| | (0.04 | ) | | | — | | | | (1.11 | ) | | | (0.11 | ) | | | (0.02 | ) | | | (0.01 | ) | | | — | | | | (1.10 | ) | | | (0.04 | ) | | | (0.03 | ) |
| | (0.21 | ) | | | (1.56 | ) | | | (0.82 | ) | | | (0.22 | ) | | | (0.05 | ) | | | (0.21 | ) | | | (1.56 | ) | | | (0.82 | ) | | | (0.22 | ) | | | (0.05 | ) |
| | — | | | | — | | | | — | | | | — | | | | — | | | | — | | | | — | | | | — | | | | — | | | | — | |
| | | | | | | | | | | | | | | | | | | | | | | | | | | | | | | | | | | | | | |
| | (0.25 | ) | | | (1.56 | ) | | | (1.93 | ) | | | (0.33 | ) | | | (0.07 | ) | | | (0.22 | ) | | | (1.56 | ) | | | (1.92 | ) | | | (0.26 | ) | | | (0.08 | ) |
| | | | | | | | | | | | | | | | | | | | | | | | | | | | | | | | | | | | | | |
| $ | 14.33 | | | $ | 14.50 | | | $ | 13.79 | | | $ | 12.46 | | | $ | 11.36 | | | $ | 14.22 | | | $ | 14.39 | | | $ | 13.73 | | | $ | 12.44 | | | $ | 11.31 | |
| | | | | | | | | | | | | | | | | | | | | | | | | | | | | | | | | | | | | | |
| | 0.54 | % | | | 16.59 | % | | | 29.65 | % | | | 12.78 | % | | | 18.81 | % | | | 0.29 | % | | | 16.27 | % | | | 29.30 | % | | | 12.45 | % | | | 18.34 | % |
| | | | | | | | | | | | | | | | | | | | | | | | | | | | | | | | | | | | | | |
| $ | 9,796 | | | $ | 8,168 | | | $ | 1,693 | | | $ | 1,174 | | | $ | 255 | | | $ | 2,573 | | | $ | 3,004 | | | $ | 3,302 | | | $ | 1,670 | | | $ | 2,207 | |
| | 1.61 | % | | | 1.65 | % | | | 2.79 | % | | | 3.39 | % | | | 3.08 | % | | | 1.82 | % | | | 1.86 | % | | | 3.07 | % | | | 3.60 | % | | | 3.18 | % |
| | 1.10 | % | | | 1.09 | % | | | 1.09 | % | | | 1.09 | % | | | 1.09 | % | | | 1.37 | % | | | 1.37 | % | | | 1.37 | % | | | 1.37 | % | | | 1.36 | % |
| | 0.12 | % | | | 0.19 | % | | | (0.23 | )% | | | (0.81 | )% | | | (1.25 | )% | | | (0.12 | )% | | | 0.15 | % | | | (0.60 | )% | | | (1.14 | )% | | | (1.21 | )% |
| | 0.64 | % | | | 0.75 | % | | | 1.47 | % | | | 1.49 | % | | | 0.75 | % | | | 0.33 | % | | | 0.64 | % | | | 1.11 | % | | | 1.08 | % | | | 0.61 | % |
| | 97 | % | | | 76 | % | | | 89 | % | | | 103 | % | | | 66 | % | | | 97 | % | | | 76 | % | | | 89 | % | | | 103 | % | | | 66 | % |
73
American Beacon Zebra Small Cap Equity FundSM
Financial Highlights
(For a share outstanding throughout the period)
| | | | | | | | | | | | | | | | | | | | |
| | | A Class | |
| | | Year Ended August 31, | |
| | | 2015 | | | 2014 | | | 2013 | | | 2012 | | | 2011 | |
Net asset value, beginning of period | | $ | 14.40 | | | $ | 13.75 | | | $ | 12.46 | | | $ | 11.32 | | | $ | 9.61 | |
| | | | | | | | | | | | | | | | | | | | |
Income from investment operations: | | | | | | | | | | | | | | | | | | | | |
Net investment income | | | 0.05 | | | | 0.48 | | | | 0.18 | | | | 0.13 | | | | 0.02 | |
Net gains (losses) from investments (both realized and unrealized) | | | 0.00 | | | | 1.73 | | | | 3.02 | | | | 1.24 | | | | 1.76 | |
| | | | | | | | | | | | | | | | | | | | |
Total income from investment operations | | | 0.05 | | | | 2.21 | | | | 3.20 | | | | 1.37 | | | | 1.78 | |
| | | | | | | | | | | | | | | | | | | | |
Less distributions: | | | | | | | | | | | | | | | | | | | | |
Dividends from net investment income | | | (0.02 | ) | | | — | | | | (1.09 | ) | | | (0.01 | ) | | | (0.02 | ) |
Distributions from net realized gains | | | (0.21 | ) | | | (1.56 | ) | | | (0.82 | ) | | | (0.22 | ) | | | (0.05 | ) |
Return of capital | | | — | | | | — | | | | — | | | | — | | | | — | |
| �� | | | | | | | | | | | | | | | | | | | |
Total distributions | | | (0.23 | ) | | | (1.56 | ) | | | (1.91 | ) | | | (0.23 | ) | | | (0.07 | ) |
| | | | | | | | | | | | | | | | | | | | |
Net asset value, end of period | | $ | 14.22 | | | $ | 14.40 | | | $ | 13.75 | | | $ | 12.46 | | | $ | 11.32 | |
| | | | | | | | | | | | | | | | | | | | |
Total return A | | | 0.29 | % | | | 16.17 | % | | | 29.07 | % | | | 12.28 | % | | | 18.48 | % |
| | | | | | | | | | | | | | | | | | | | |
Ratios and supplemental data: | | | | | | | | | | | | | | | | | | | | |
Net assets, end of period (in thousands) | | $ | 4,797 | | | $ | 4,894 | | | $ | 2,081 | | | $ | 2,232 | | | $ | 2,451 | |
Ratios to average net assets: | | | | | | | | | | | | | | | | | | | | |
Expenses, before reimbursements | | | 1.94 | % | | | 2.05 | % | | | 3.22 | % | | | 3.71 | % | | | 3.20 | % |
Expenses, net of reimbursements | | | 1.40 | % | | | 1.47 | % | | | 1.49 | % | | | 1.49 | % | | | 1.47 | % |
Net investment income (loss), before reimbursements | | | (0.21 | )% | | | (0.14 | )% | | | (0.62 | )% | | | (1.26 | )% | | | (1.29 | )% |
Net investment income (loss), net of reimbursements | | | 0.33 | % | | | 0.45 | % | | | 1.11 | % | | | 0.97 | % | | | 0.43 | % |
Portfolio turnover rate | | | 97 | % | | | 76 | % | | | 89 | % | | | 103 | % | | | 66 | % |
| A | Based on net asset value, which does not reflect the sales charge, redemption fee, or contingent deferred sales charge, if applicable. May include adjustments in accordance with U.S. GAAP and as such, the net asset value for reporting purposes and the returns based upon those net asset values may differ from the net asset value and returns for shareholder transactions. |
74
American Beacon Zebra Small Cap Equity FundSM
Financial Highlights
(For a share outstanding throughout the period)
| | | | | | | | | | | | | | | | | | | | |
| | | C Class | |
| | | Year Ended August 31, | |
| | | 2015 | | | 2014 | | | 2013 | | | 2012 | | | 2011 | |
Net asset value, beginning of period | | $ | 14.08 | | | $ | 13.57 | | | $ | 12.28 | | | $ | 11.24 | | | $ | 9.94 | |
| | | | | | | | | | | | | | | | | | | | |
Income from investment operations: | | | | | | | | | | | | | | | | | | | | |
Net investment income (loss) | | | (0.07 | ) | | | 0.33 | | | | 0.24 | | | | 0.03 | | | | (0.02 | ) |
Net gains (losses) from investments (both realized and unrealized) | | | 0.01 | | | | 1.74 | | | | 2.84 | | | | 1.23 | | | | 1.38 | |
| | | | | | | | | | | | | | | | | | | | |
Total income (loss) from investment operations | | | (0.06 | ) | | | 2.07 | | | | 3.08 | | | | 1.26 | | | | 1.36 | |
| | | | | | | | | | | | | | | | | | | | |
Less distributions: | | | | | | | | | | | | | | | | | | | | |
Dividends from net investment income | | | — | �� | | | — | | | | (0.97 | ) | | | — | | | | (0.01 | ) |
Distributions from net realized gains | | | (0.21 | ) | | | (1.56 | ) | | | (0.82 | ) | | | (0.22 | ) | | | (0.05 | ) |
Return of capital | | | — | | | | — | | | | — | | | | — | | | | — | |
| | | | | | | | | | | | | | | | | | | | |
Total distributions | | | (0.21 | ) | | | (1.56 | ) | | | (1.79 | ) | | | (0.22 | ) | | | (0.06 | ) |
| | | | | | | | | | | | | | | | | | | | |
Net asset value, end of period | | $ | 13.81 | | | $ | 14.08 | | | $ | 13.57 | | | $ | 12.28 | | | $ | 11.24 | |
| | | | | | | | | | | | | | | | | | | | |
Total return A | | | (0.48 | )% | | | 15.29 | % | | | 28.20 | % | | | 11.35 | % | | | 13.64 | % |
| | | | | | | | | | | | | | | | | | | | |
Ratios and supplemental data: | | | | | | | | | | | | | | | | | | | | |
Net assets, end of period (in thousands) | | $ | 1,398 | | | $ | 1,469 | | | $ | 695 | | | $ | 507 | | | $ | 410 | |
Ratios to average net assets: | | | | | | | | | | | | | | | | | | | | |
Expenses, before reimbursements | | | 2.69 | % | | | 2.81 | % | | | 3.95 | % | | | 4.48 | % | | | 4.35 | % |
Expenses, net of reimbursements | | | 2.15 | % | | | 2.22 | % | | | 2.24 | % | | | 2.24 | % | | | 2.22 | % |
Net investment income (loss), before reimbursements | | | (0.96 | )% | | | (0.89 | )% | | | (1.38 | )% | | | (2.02 | )% | | | (2.44 | )% |
Net investment income (loss), net of reimbursements | | | (0.41 | )% | | | (0.30 | )% | | | 0.33 | % | | | 0.23 | % | | | (0.31 | )% |
Portfolio turnover rate | | | 97 | % | | | 76 | % | | | 89 | % | | | 103 | % | | | 66 | % |
| A | Based on net asset value, which does not reflect the sales charge, redemption fee, or contingent deferred sales charge, if applicable. May include adjustments in accordance with U.S. GAAP and as such, the net asset value for reporting purposes and the returns based upon those net asset values may differ from the net asset value and returns for shareholder transactions. |
75
American Beacon SiM High Yield Opportunities FundSM
Financial Highlights
(For a share outstanding throughout the period)
| | | | | | | | | | | | | | | | | | | | | | | | | | | | | | | | | | | | | | | | |
| | | Institutional Class | | | Y Class | |
| | | Year Ended August 31, | | | Feb. 14
to
Aug. 31,
2011 | | | Year Ended August 31, | | | Feb. 14
to
Aug. 31,
2011 | |
| | 2015 | | | 2014 | | | 2013 | | | 2012 | | | | 2015 | | | 2014 | | | 2013 | | | 2012 | | |
Net asset value, beginning of period | | $ | 10.35 | | | $ | 10.16 | | | $ | 9.93 | | | $ | 9.42 | | | $ | 10.00 | | | $ | 10.34 | | | $ | 10.14 | | | $ | 9.92 | | | $ | 9.41 | | | $ | 10.00 | |
| | | | | | | | | | | | | | | | | | | | | | | | | | | | | | | | | | | | | | | | |
Income from investment operations: | | | | | | | | | | | | | | | | | | | | | | | | | | | | | | | | | | | | | | | | |
Net investment income | | | 0.57 | | | | 0.64 | | | | 0.75 | | | | 0.77 | | | | 0.37 | | | | 0.53 | | | | 0.64 | | | | 0.73 | | | | 0.76 | | | | 0.36 | |
Net gains (losses) from investments (both realized and unrealized) | | | (0.65 | ) | | | 0.47 | | | | 0.26 | | | | 0.51 | | | | (0.58 | ) | | | (0.62 | ) | | | 0.46 | | | | 0.25 | | | | 0.51 | | | | (0.59 | ) |
| | | | | | | | | | | | | | | | | | | | | | | | | | | | | | | | | | | | | | | | |
Total income (loss) from investment operations | | | (0.08 | ) | | | 1.11 | | | | 1.01 | | | | 1.28 | | | | (0.21 | ) | | | (0.09 | ) | | | 1.10 | | | | 0.98 | | | | 1.27 | | | | (0.23 | ) |
| | | | | | | | | | | | | | | | | | | | | | | | | | | | | | | | | | | | | | | | |
Less distributions: | | | | | | | | | | | | | | | | | | | | | | | | | | | | | | | | | | | | | | | | |
Dividends from net investment income | | | (0.55 | ) | | | (0.69 | ) | | | (0.75 | ) | | | (0.77 | ) | | | (0.37 | ) | | | (0.54 | ) | | | (0.67 | ) | | | (0.73 | ) | | | (0.76 | ) | | | (0.36 | ) |
Distributions from net realized gains | | | (0.29 | ) | | | (0.23 | ) | | | (0.03 | ) | | | — | | | | — | | | | (0.29 | ) | | | (0.23 | ) | | | (0.03 | ) | | | — | | | | — | |
| | | | | | | | | | | | | | | | | | | | | | | | | | | | | | | | | | | | | | | | |
Total distributions | | | (0.84 | ) | | | (0.92 | ) | | | (0.78 | ) | | | (0.77 | ) | | | 0.37 | | | | (0.83 | ) | | | (0.90 | ) | | | (0.76 | ) | | | (0.76 | ) | | | (0.36 | ) |
| | | | | | | | | | | | | | | | | | | | | | | | | | | | | | | | | | | | | | | | |
Redemption fees added to beneficial interests A | | | — | | | | — | | | | — | | | | — | | | | — | | | | — | | | | — | | | | — | | | | — | | | | — | |
| | | | | | | | | | | | | | | | | | | | | | | | | | | | | | | | | | | | | | | | |
Net asset value, end of period | | $ | 9.43 | | | $ | 10.35 | | | $ | 10.16 | | | $ | 9.93 | | | $ | 9.42 | | | $ | 9.42 | | | $ | 10.34 | | | $ | 10.14 | | | $ | 9.92 | | | $ | 9.41 | |
| | | | | | | | | | | | | | | | | | | | | | | | | | | | | | | | | | | | | | | | |
Total return B | | | (0.78 | )% | | | 11.34 | % | | | 10.29 | % | | | 14.19 | % | | | (2.24 | )%C | | | (0.87 | )% | | | 11.33 | % | | | 10.08 | % | | | 14.09 | % | | | (2.44 | )%C |
| | | | | | | | | | | | | | | | | | | | | | | | | | | | | | | | | | | | | | | | |
Ratios and supplemental data: | | | | | | | | | | | | | | | | | | | | | | | | | | | | | | | | | | | | | | | | |
Net assets, end of period (in thousands) | | $ | 230,288 | | | $ | 75,389 | | | $ | 45,471 | | | $ | 62,790 | | | $ | 9,839 | | | $ | 300,015 | | | $ | 247,179 | | | $ | 87,639 | | | $ | 19,129 | | | $ | 378 | |
Ratios to average net assets: | | | | | | | | | | | | | | | | | | | | | | | | | | | | | | | | | | | | | | | | |
Expenses, before reimbursements or recoupments | | | 0.88 | % | | | 0.86 | % | | | 0.93 | % | | | 1.06 | % | | | 2.62 | %D | | | 0.91 | % | | | 0.94 | % | | | 0.99 | % | | | 1.09 | % | | | 5.04 | %D |
Expenses, net of reimbursements or recoupments | | | 0.84 | % | | | 0.84 | % | | | 0.84 | % | | | 0.84 | % | | | 0.82 | %D | | | 0.93 | % | | | 0.94 | % | | | 0.93 | % | | | 0.94 | % | | | 0.92 | %D |
Net investment income, before reimbursements or recoupments | | | 5.38 | % | | | 5.88 | % | | | 7.11 | % | | | 7.90 | % | | | 5.03 | %D | | | 5.32 | % | | | 5.77 | % | | | 6.77 | % | | | 7.92 | % | | | 2.87 | %D |
Net investment income, net of reimbursements or recoupments | | | 5.41 | % | | | 5.90 | % | | | 7.20 | % | | | 8.12 | % | | | 6.83 | %D | | | 5.30 | % | | | 5.77 | % | | | 6.82 | % | | | 8.07 | % | | | 6.99 | %D |
Portfolio turnover rate | | | 43 | % | | | 38 | % | | | 65 | % | | | 43 | % | | | 20 | %E | | | 43 | % | | | 38 | % | | | 65 | % | | | 43 | % | | | 20 | %E |
| A | Amounts represent less than $0.01 per share. |
| B | Based on net asset value, which does not reflect the sales charge, redemption fee, or contingent deferred sales charge, if applicable. May include adjustments in accordance with U.S. GAAP and as such, the net asset value for reporting purposes and the returns based upon those net asset values may differ from the net asset value and returns for shareholder transactions. |
| E | Portfolio turnover rate is for the period from February 14, 2011, the inception date, through August 31, 2011 and is not annualized. |
76
American Beacon SiM High Yield Opportunities FundSM
Financial Highlights
(For a share outstanding throughout the period)
| | | | | | | | | | | | | | | | | | | | | | | | | | | | | | | | | | | | | | | | | | | | | | | | | | | | | | | | | | |
| Investor Class | | | A Class | | | C Class | |
| Year Ended August 31, | | | Feb. 14
to
Aug. 31,
2011 | | | Year Ended August 31, | | | Feb. 14
to
Aug. 31,
2011 | | | Year Ended August 31, | | | Feb. 14
to
Aug. 31,
2011 | |
| 2015 | | | 2014 | | | 2013 | | | 2012 | | | | 2015 | | | 2014 | | | 2013 | | | 2012 | | | | 2015 | | | 2014 | | | 2013 | | | 2012 | | |
| $ | 10.32 | | | $ | 10.12 | | | $ | 9.90 | | | $ | 9.38 | | | $ | 10.00 | | | $ | 10.36 | | | $ | 10.15 | | | $ | 9.92 | | | $ | 9.41 | | | $ | 10.00 | | | $ | 10.40 | | | $ | 10.16 | | | $ | 9.94 | | | $ | 9.42 | | | $ | 10.00 | |
| | | | | | | | | | | | | | | | | | | | | | | | | | | | | | | | | | | | | | | | | | | | | | | | | | | | | | | | | | |
| | 0.50 | | | | 0.56 | | | | 0.71 | | | | 0.73 | | | | 0.35 | | | | 0.49 | | | | 0.57 | | | | 0.69 | | | | 0.72 | | | | 0.34 | | | | 0.42 | | | | 0.49 | | | | 0.62 | | | | 0.65 | | | | 0.30 | |
| | (0.61 | ) | | | 0.52 | | | | 0.25 | | | | 0.52 | | | | (0.62 | ) | | | (0.62 | ) | | | 0.49 | | | | 0.26 | | | | 0.51 | | | | (0.59 | ) | | | (0.62 | ) | | | 0.50 | | | | 0.25 | | | | 0.52 | | | | (0.58 | ) |
| | | | | | | | | | | | | | | | | | | | | | | | | | | | | | | | | | | | | | | | | | | | | | | | | | | | | | | | | | |
| | (0.11 | ) | | | 1.08 | | | | 0.96 | | | | 1.25 | | | | (0.27 | ) | | | (0.13 | ) | | | 1.06 | | | | 0.95 | | | | 1.23 | | | | (0.25 | ) | | | (0.20 | ) | | | 0.99 | | | | 0.87 | | | | 1.17 | | | | (0.28 | ) |
| | | | | | | | | | | | | | | | | | | | | | | | | | | | | | | | | | | | | | | | | | | | | | | | | | | | | | | | | | |
| | (0.52 | ) | | | (0.65 | ) | | | (0.71 | ) | | | (0.73 | ) | | | (0.35 | ) | | | (0.51 | ) | | | (0.62 | ) | | | (0.69 | ) | | | (0.72 | ) | | | (0.34 | ) | | | (0.44 | ) | | | (0.52 | ) | | | (0.62 | ) | | | (0.65 | ) | | | (0.30 | ) |
| | (0.29 | ) | | | (0.23 | ) | | | (0.03 | ) | | | — | | | | — | | | | (0.29 | ) | | | (0.23 | ) | | | (0.03 | ) | | | — | | | | — | | | | (0.29 | ) | | | (0.23 | ) | | | (0.03 | ) | | | — | | | | — | |
| | | | | | | | | | | | | | | | | | | | | | | | | | | | | | | | | | | | | | | | | | | | | | | | | | | | | | | | | | |
| | (0.81 | ) | | | (0.88 | ) | | | (0.74 | ) | | | (0.73 | ) | | | (0.35 | ) | | | (0.80 | ) | | | (0.85 | ) | | | (0.72 | ) | | | (0.72 | ) | | | (0.34 | ) | | | (0.73 | ) | | | (0.75 | ) | | | (0.65 | ) | | | (0.65 | ) | | | (0.30 | ) |
| | | | | | | | | | | | | | | | | | | | | | | | | | | | | | | | | | | | | | | | | | | | | | | | | | | | | | | | | | |
| | — | | | | — | | | | — | | | | — | | | | — | | | | — | | | | — | | | | — | | | | — | | | | — | | | | — | | | | — | | | | — | | | | — | | | | — | |
| | | | | | | | | | | | | | | | | | | | | | | | | | | | | | | | | | | | | | | | | | | | | | | | | | | | | | | | | | |
| $ | 9.40 | | | $ | 10.32 | | | $ | 10.12 | | | $ | 9.90 | | | $ | 9.38 | | | $ | 9.43 | | | $ | 10.36 | | | $ | 10.15 | | | $ | 9.92 | | | $ | 9.41 | | | $ | 9.47 | | | $ | 10.40 | | | $ | 10.16 | | | $ | 9.94 | | | $ | 9.42 | |
| | | | | | | | | | | | | | | | | | | | | | | | | | | | | | | | | | | | | | | | | | | | | | | | | | | | | | | | | | |
| | (1.14 | )% | | | 11.08 | % | | | 9.84 | % | | | 13.92 | % | | | (2.85 | )%C | | | (1.27 | )% | | | 10.87 | % | | | 9.74 | % | | | 13.63 | % | | | (2.61 | )%C | | | (1.98 | )% | | | 10.12 | % | | | 8.81 | % | | | 12.90 | % | | | (2.88 | )%C |
| | | | | | | | | | | | | | | | | | | | | | | | | | | | | | | | | | | | | | | | | | | | | | | | | | | | | | | | | | |
| $ | 196,928 | | | $ | 199,534 | | | $ | 248,052 | | | $ | 150,396 | | | $ | 4,894 | | | $ | 81,147 | | | $ | 93,061 | | | $ | 76,146 | | | $ | 42,832 | | | $ | 4,932 | | | $ | 73,213 | | | $ | 76,536 | | | $ | 60,830 | | | $ | 26,679 | | | $ | 1,239 | |
| | 1.19 | % | | | 1.11 | % | | | 1.15 | % | | | 1.23 | % | | | 2.78 | %D | | | 1.22 | % | | | 1.33 | % | | | 1.41 | % | | | 1.53 | % | | | 2.92 | %D | | | 1.97 | % | | | 2.08 | % | | | 2.15 | % | | | 2.26 | % | | | 4.03 | %D |
| | 1.19 | % | | | 1.11 | % | | | 1.17 | % | | | 1.19 | % | | | 1.19 | %D | | | 1.24 | % | | | 1.32 | % | | | 1.35 | % | | | 1.34 | % | | | 1.31 | %D | | | 1.99 | % | | | 2.07 | % | | | 2.09 | % | | | 2.09 | % | | | 2.07 | %D |
| | 5.05 | % | | | 5.68 | % | | | 6.81 | % | | | 7.74 | % | | | 5.14 | %D | | | 5.01 | % | | | 5.44 | % | | | 6.53 | % | | | 7.44 | % | | | 4.98 | %D | | | 4.26 | % | | | 4.68 | % | | | 5.76 | % | | | 6.70 | % | | | 3.98 | %D |
| | 5.05 | % | | | 5.68 | % | | | 6.79 | % | | | 7.78 | % | | | 6.73 | %D | | | 4.99 | % | | | 5.45 | % | | | 6.60 | % | | | 7.62 | % | | | 6.60 | %D | | | 4.24 | % | | | 4.69 | % | | | 5.82 | % | | | 6.87 | % | | | 5.94 | %D |
| | 43 | % | | | 38 | % | | | 65 | % | | | 43 | % | | | 20 | %E | | | 43 | % | | | 38 | % | | | 65 | % | | | 43 | % | | | 20 | %E | | | 43 | % | | | 38 | % | | | 65 | % | | | 43 | % | | | 20 | %E |
77
American Beacon FundsSM
Privacy Policy and Federal Tax Information
August 31, 2015 (Unaudited)
Privacy Policy
The American Beacon Funds recognize and respect the privacy of our shareholders. We are providing this notice to you so you will understand how shareholder information may be collected and used.
We may collect nonpublic personal information about you from one or more of the following sources:
| | • | | information we receive from you on applications or other forms; |
| | • | | information about your transactions with us or our service providers; and |
| | • | | information we receive from third parties. |
We do not disclose any nonpublic personal information about our customers or former customers to anyone, except as permitted by law.
We restrict access to your nonpublic personal information to those employees or service providers who need to know that information to provide products or services to you. To ensure the confidentiality of your nonpublic personal information, we maintain safeguards that comply with federal standards.
Federal Tax Information
Certain tax information regarding the Funds is required to be provided to shareholders based upon the Funds’ income and distributions for the taxable year ended August 31, 2015. The information and distributions reported herein may differ from information and distributions taxable to the shareholders for the calendar year ended December 31, 2015.
The Funds designated the following items with regard to distributions paid during the fiscal year ended August 31, 2015. All designations are based on financial information available as of this annual report and, accordingly, are subject to change. For each item, it is the intention of the Funds to designate the maximum amount permitted under the Internal Revenue Code of 1986, as amended, and the regulations there under.
Corporate Dividends-Received Deduction:
| | | | |
The London Company Income Equity | | | 90.36 | % |
Zebra Global Equity | | | 46.09 | % |
Zebra Small Cap Equity | | | 97.40 | % |
SiM High Yield Opportunities | | | 1.96 | % |
Qualified Dividend Income:
| | | | |
The London Company Income Equity | | | 100.00 | % |
Zebra Global Equity | | | 100.00 | % |
Zebra Small Cap Equity | | | 100.00 | % |
SiM High Yield Opportunities | | | 2.51 | % |
Long-Term Capital Gain Distributions:
| | | | |
The London Company Income Equity | | $ | 2,247,821 | |
Zebra Global Equity | | | 531,856 | |
Zebra Small Cap Equity | | | 244,189 | |
SiM High Yield Opportunities | | | 10,611,379 | |
Short-Term Capital Gain Distributions:
| | | | |
The London Company Income Equity | | $ | 769,087 | |
Zebra Global Equity | | | 263,424 | |
Zebra Small Cap Equity | | | 43,418 | |
SiM High Yield Opportunities | | | 9,920,740 | |
Shareholders will receive notification in January 2016 of the applicable tax information necessary to prepare their 2015 income tax returns.
78
Disclosure Regarding the Board of Trustees’ Approval of the Management Agreement and Investment Advisory Agreements of the Funds (Unaudited)
At an in-person meeting held on November 12, 2014, telephonic meetings held on November 26, 2014 and December 6, 2014 and an in-person meeting held on December 10, 2014 (collectively, the “Board Meetings”), the Board of Trustees (“Board”) considered the approval of: (1) a new Management Agreement (“New Management Agreement”) among American Beacon Advisors, Inc. (“Manager”) and the American Beacon Funds (“Trust”) on behalf of the American Beacon The London Company Income Equity Fund (“London Company Fund”), the American Beacon SiM High Yield Opportunities Fund (“SiM Fund”), the American Beacon Zebra Global Equity Fund (“Zebra Global Fund”) and the American Beacon Zebra Small Cap Equity Fund (“Zebra Small Cap Fund” and, together with the Zebra Global Fund, the “Zebra Funds”) (collectively, the “Funds”); (2) a new Investment Advisory Agreement among the Manager, The London Company of Virginia, LLC (“TLC”) and the Trust, on behalf of the London Company Fund; (3) a new Investment Advisory Agreement among the Manager, Strategic Income Management, LLC (“SiM”) and the Trust, on behalf of the SiM Fund; and (4) a new Investment Advisory Agreement among the Manager, Zebra Capital Management, LLC (“Zebra”) and the Trust, on behalf of the Zebra Funds (collectively, the “New Advisory Agreements”). Collectively, TLC, SiM and Zebra are hereinafter referred to as the “Sub-Advisors.”
The Board meetings were held for the Trustees to consider the New Management Agreement and New Advisory Agreements (“New Agreements”) because, on November 20, 2014, Lighthouse Holdings Parent, Inc. (“LPHI”), the indirect parent company of the Manager, entered into an Agreement and Plan of Merger pursuant to which LHPI agreed to be acquired by Kelso Investment Associates VIII, L.P., KEP VI, LLC and Estancia Capital Partners L.P., investment funds affiliated with Kelso & Company, L.P. (“Kelso”) and Estancia Capital Management, LLC (“Estancia”) (collectively, the “Purchasers”), which are private equity firms (the “Transaction”). As required by the Investment Company Act of 1940, as amended (“1940 Act”), the current Management Agreement (“Current Management Agreement”) among the Manager and the Trust on behalf of the London Company Fund, SiM Fund and Zebra Funds and the current Investment Advisory Agreements (“Current Advisory Agreements”) among the Manager, TLC and the Trust, on behalf of the London Company Fund, the Manager, SiM and the Trust, on behalf of the SiM Fund, and the Manager, Zebra and the Trust, on behalf of the Zebra Funds, provide for their automatic termination in the event of an assignment. As a result, the Current Management Agreement and each Current Advisory Agreement (“Current Agreements”) would terminate upon the closing of the Transaction. (The Transaction closed on April 30, 2015).
The Board focused on the effect that the Transaction would have on the Manager and the Funds. Additionally, the Board considered that it had requested and evaluated the information relevant to the renewal of the Current Management Agreement and Current Advisory Agreements at in-person meetings held in May and June 2014. The Manager represented to the Board that there had been no material changes or developments relating to the Manager or any of the Sub-Advisors since the May and June 2014 meetings, other than the changes or developments subsequently reported to the Board or discussed in the due diligence materials submitted to the Trustees in connection with the Transaction. In light of the proximity of the Board’s consideration of the renewal or approval of the Current Agreements, and the Board’s ongoing due diligence review in connection with the Transaction, the Board determined that it was not necessary to repeat certain aspects of the review conducted in connection with the approvals in the past year.
In connection with the Board Meetings, the Trustees received and evaluated such information as they deemed necessary to their consideration of the New Agreements. The information requested on behalf of the Board included, among other information, the following:
| | • | | a description of the Transaction, the effect of the Transaction on the Manager, the Trust and the Board, and any proposed changes to the Trust, its service providers, the Funds’ fee structures, fee waivers, and other information; |
| | • | | a description of any anticipated significant changes, if any, to principal activities, personnel, services provided to the Funds, or any other area, including how these changes might affect the Funds; |
| | • | | information regarding the financial resources of the Purchasers and the Manager’s capital structure after the Transaction, including confirmation that the Manager’s financial condition would not raise concerns that the Manager would be unable to continue providing the same scope and quality of services to the Funds; |
| | • | | information regarding the Manager’s due diligence, bidding and selection process with respect to the Purchasers; |
| | • | | information regarding the structure of the relationship between Kelso and Estancia and the role that each would assume in advance of and after the Closing; |
| | • | | information regarding each Purchaser’s ownership structure and key personnel, including information regarding affiliations of the Purchasers and the Manager after the Transaction; |
| | • | | information regarding each Purchaser’s asset management experience, including the experience of the Purchasers’ key personnel relating to the management of investment companies registered under the 1940 Act; |
| | • | | the Purchasers’ business plans with respect to the Manager after the Transaction; |
| | • | | information regarding the extent to which the Purchasers expect to be involved in the Manager’s day-to-day operations and the persons to whom the Manager’s key personnel will report; |
| | • | | information regarding any anticipated impact that the Transaction might have on the Manager’s compliance activities or the resources available to the Funds’ Chief Compliance Officer; |
| | • | | a discussion of any potential material changes to the Current Agreements; |
| | • | | a description of any expected changes in distribution or marketing efforts and strategies for the Funds as a result of the Transaction; |
| | • | | information regarding whether the Purchasers or the Manager anticipated proposing any changes to the membership of the Board; |
| | • | | a discussion of the length of the Purchasers’ anticipated ownership of the Manager and the expected duration of the investment funds financing the Transaction; |
| | • | | information regarding the ownership and investment of management personnel in the Manager; |
| | • | | information regarding the Manager’s employee equity incentive plan after the Closing; |
79
Disclosure Regarding the Board of Trustees’ Approval of the Management Agreement and Investment Advisory Agreements of the Funds (Unaudited)
| | • | | a summary of any material past, pending or anticipated litigation or regulatory proceedings involving the Purchasers, or their personnel; |
| | • | | verification of the continuation of the Manager’s insurance coverage after the Transaction with regard to the services provided to the Funds; and |
| | • | | in-person presentations by and discussions with the Manager and representatives of the Purchasers regarding the Transaction. |
The Board also considered information that had been provided to the Board by the Manager and the Sub-Advisors for the May and June 2014 meetings in connection with the renewal of the Current Agreements.
Provided below is an overview of the primary factors the Trustees considered at the Board Meetings. The Board did not identify any particular information that was most relevant to its consideration to approve the New Agreements, and each Trustee may have afforded different weight to the various factors. In connection with the approval process for the New Agreements, the Trustees received advice from their legal counsel detailing the Board’s responsibilities pertaining thereto. Legal counsel to the non-interested Trustees provided the Board with a memorandum regarding its responsibilities pertaining to the approval of the New Agreements. Based on its evaluation, the Board unanimously concluded that the terms of the New Agreements were reasonable and fair and that the approval of the New Agreements was in the best interests of the Funds and their shareholders.
In determining whether to approve the New Agreements, the Trustees considered the best interests of each Fund separately. The Board considered each Fund’s investment management and sub-advisory relationships separately. In each instance, the Board considered its review of the Current Agreements in May and June 2014, and the information received in November and December 2014 with respect to, among other things, the following factors: (1) the nature, extent and quality of the services provided; (2) the investment performance of a Fund and, as applicable, each Sub-Advisor for a Fund; (3) the costs incurred by the Manager in rendering services to the Funds and its resulting profits or losses; (4) comparisons of services and fee rates with contracts entered into by the Manager or a Sub-Advisor or their affiliates with other clients (such as pension funds and other institutional clients); (5) the extent to which economies of scale have been taken into account in setting each fee rate schedule; (6) whether fee rate levels reflect these economies of scale for the benefit of Fund investors; and (7) any other benefits derived or anticipated to be derived by the Manager or a Sub-Advisor from their relationship with a Fund. The Trustees posed questions to various management personnel of the Manager and the Purchasers regarding certain key aspects of the materials submitted in support of the approval of the New Agreements.
Nature, Extent and Quality of the Services Provided. With respect to the approval of the New Agreements, the Board considered that the New Agreements provide for the Manager and each Sub-Advisor to provide the same services to each Fund on substantially the same terms as the Current Agreements. The Board considered representations by the Manager and/or Purchasers that the Transaction will not result in any changes to the manner in which each Fund’s assets are managed. The Board also considered representations by the Manager and/or the Purchasers that the Transaction will not result in any adverse impact or changes to: the personnel involved in the management of the Funds; the Manager’s disciplined investment approach and goal to provide consistent above average long-term performance at a lower than average cost; the Manager’s continuing efforts to enhance distribution of the Funds’ shares and add new series to the Trust and share classes to the Funds’ product line; the adequacy of the Manager’s financial condition; the Manager’s day-to-day operations; the Manager’s compliance activities or the resources available to the Trust’s Chief Compliance Officer; or the Funds’ service providers or Sub-Advisors. The Board also considered the Manager’s representation that there had been no material changes or developments regarding the Manager or the Sub-Advisors since the Board’s consideration of the Current Agreements in May and June 2014 that had not previously been reported to the Board. The Board also considered information regarding the post-closing capitalization of the Purchasers and the Purchasers’ long-term business goals with regard to the Manager and the Manager’s activities with respect to the Trust, which are consistent with the Manager’s current goals. Based on the foregoing information, the Board concluded that the nature, extent and quality of the management and advisory services provided by the Manager and the Sub-Advisors were appropriate for each Fund and, thus, determined to approve the New Agreements for each Fund.
Investment Performance. The Board considered its review of the comparative information regarding each Fund’s investment performance relative to its benchmark index(es) and peer group in connection with the renewal of the Current Agreements. The Board also considered the performance reports and discussions with management at Board and Committee meetings since June 2014. The Manager also noted that it generally was satisfied with the performance of the Sub-Advisors.
Costs of the Services to be Provided to the Funds and the Projected Profits to be Realized by the Manager from its Relationship with the Funds. In analyzing the cost of services and profitability of the Manager by Fund, the Board considered that the Transaction would result in no changes to the fees charged to the Funds or the Manager’s fee waivers currently in place with respect to each Fund. Additionally, the Board noted that there had been no material changes in this regard since its consideration of the Current Agreements in May and June 2014. Based on the foregoing information and the Board’s considerations in connection with the renewal of the Current Agreements in May and June 2014, the Board concluded that the profitability levels were reasonable in light of the services performed by the Manager. The Board did not consider the costs of the services to be provided and profits to be realized by each Sub-Advisor from its relationship with its respective Fund, noting instead the substantially arm’s-length nature of the relationship between the Manager and each Sub-Advisor with respect to the negotiation of the advisory fee rate on behalf of the Funds.
Economies of Scale and Whether Fee Levels Reflect Economies of Scale. In considering the reasonableness of the management fees, the Board considered that the Funds would pay the same fee rates to the Manager under the New Management Agreement as the Funds currently pay under the Current Management Agreement. The Board also considered that each Fund would pay the same investment advisory fee rate to its Sub-Advisor under the New Advisory Agreement as the Fund pays under its Current Advisory Agreement. Based on the foregoing information and the Board’s considerations in connection with the renewal of the Current Agreements in May and June 2014, the Board concluded that the Manager’s fee schedule for each Fund, TLC’s fee schedule for the London Company Fund, SiM’s fee schedule for the SiM Fund, and Zebra’s fee schedules for the Zebra Funds, provide for a reasonable sharing of benefits from any economies of scale with each Fund.
80
Disclosure Regarding the Board of Trustees’ Approval of the Management Agreement and Investment Advisory Agreements of the Funds (Unaudited)
Benefits Derived by the Manager from Relationship With the Funds. The Board considered that the “fall-out” or ancillary benefits that accrue to the Manager and/or the Sub-Advisors as a result of the advisory relationships with the Funds would not change as a result of the Transaction. Based on the foregoing information and the Board’s considerations in connection with the renewal of the Current Agreements in May and June 2014, the Board concluded that the potential benefits accruing to the Manager and the Sub-Advisors under the New Management Agreement and the New Advisory Agreements by virtue of the Manager’s relationship with the Funds, TLC’s relationship with the London Company Fund, SiM’s relationship with the SiM Fund, and Zebra’s relationship with the Zebra Funds appear to be fair and reasonable.
Board’s Conclusion. Based on the various considerations described above, the Board, including a majority of Trustees who are not “interested persons” of the Fund, the Manager, TLC, SiM or Zebra, as that term is defined in the 1940 Act, concluded that the management and investment advisory fee rates to be paid by the London Company Fund, the SiM Fund and the Zebra Funds are fair and reasonable and that the approval of the New Agreements is in the best interests of the London Company Fund, the SiM Fund and the Zebra Funds, and approved the New Agreements.
81
American Beacon FundsSM
Results of Shareholder Meeting (Unaudited)
Special meetings of shareholders of each of the portfolios of the American Beacon Funds (the “Trust”) were held on April 7 and April 28, 2015. The shareholders of the SiM High Yield Opportunities, The London Company Income Equity, Zebra Global Equity and Zebra Small Cap Equity Funds (the “Funds”) approved a new investment management agreement between American Beacon Advisors, Inc. and the Funds. Approval of this proposal required a majority of the outstanding voting securities of each Fund. The following are the results of the shareholder votes for this proposal:
| | | | | | | | | | | | | | | | |
Funds | | For | | | Against | | | Abstain | | | Non-Voting | |
SiM High Yield Opportunities Fund | | | 308,397,985.85 | | | | 3,537,544.32 | | | | 3,384,700.83 | | | | 114,266,762.54 | |
The London Company Income Equity Fund | | | 178,096,439.15 | | | | 1,424,866.79 | | | | 3,085,018.77 | | | | 60,528,416.61 | |
Zebra Global Equity Fund | | | 2,758,956.91 | | | | 143,690.53 | | | | 213,573.50 | | | | 564,475.60 | |
Zebra Small Cap Equity Fund | | | 7,681,714.87 | | | | 660,559.04 | | | | 269,719.70 | | | | 1,438,102.15 | |
Special meetings of shareholders of the Trust were held on April 7 and April 28, 2015. The shareholders of the Trust approved the re-election of nine of the current Trustees to the Board of the American Beacon Trust and the election of two additional Trustees to the Board. Approval of this proposal required a plurality vote of the Trust’s shares. The following are the results of the election of each Trustee:
| | | | |
Gilbert G. Alvarado | | | | |
Affirmative | | | 16,655,574,211.10 | |
Withhold | | | 242,060,281.87 | |
| |
Joseph B. Armes | | | | |
Affirmative | | | 16,653,130,207.99 | |
Withhold | | | 244,504,284.98 | |
| |
Gerard J. Arpey | | | | |
Affirmative | | | 16,659,813,172.19 | |
Withhold | | | 237,821,320.78 | |
| |
W. Humphrey Bogart | | | | |
Affirmative | | | 16,532,151,093.14 | |
Withhold | | | 365,483,399.83 | |
| |
Brenda A. Cline | | | | |
Affirmative | | | 16,662,050,138.08 | |
Withhold | | | 235,584,354.89 | |
| |
Eugene J. Duffy | | | | |
Affirmative | | | 16,430,210,258.21 | |
Withhold | | | 467,424,234.76 | |
| |
Thomas M. Dunning | | | | |
Affirmative | | | 16,651,792,247.83 | |
Withhold | | | 245,842,245.14 | |
| |
Alan D. Feld | | | | |
Affirmative | | | 14,899,039,186.08 | |
Withhold | | | 1,998,595,306.89 | |
| |
Richard A. Massman | | | | |
Affirmative | | | 16,651,582,060.07 | |
Withhold | | | 246,052,432.90 | |
| |
Barbara J. McKenna | | | | |
Affirmative | | | 16,435,773,869.81 | |
Withhold | | | 461,860,623.16 | |
| |
R. Gerald Turner | | | | |
Affirmative | | | 16,653,429,720.08 | |
Withhold | | | 244,204,772.89 | |
82
Trustees and Officers of the American Beacon FundsSM
(Unaudited)
The Trustees and officers of the American Beacon Funds (the “Trust”) are listed below, together with their principal occupations during the past five years. Unless otherwise indicated, the address of each person listed below is 220 East Las Colinas Boulevard, Suite 1200, Irving, Texas 75039. Each Trustee oversees thirty-three funds in the fund complex that includes the Trust and the American Beacon Select Funds. The Trust’s Statement of Additional Information contains additional information about the Trustees and is available without charge by calling 1-800-658-5811.
| | | | |
Name, Age and Address | | Position, Term of Office and Length of Time Served with the Trust | | Principal Occupation(s) During Past 5 Years and Current Directorships |
INTERESTED TRUSTEES | | Term | | |
| | |
| | Lifetime of Trust until removal, resignation or retirement* | | |
| | |
Alan D. Feld** (78) | | Trustee since 1996 | | Sole Shareholder of a professional corporation which is a Partner in the law firm of Akin, Gump, Strauss, Hauer & Feld, LLP (law firm) (1960-Present); Trustee, American Beacon Mileage Funds (1996-2012); Trustee, American Beacon Select Funds (1999-Present); Trustee, American Beacon Master Trust (1996-2012). |
| | |
| | Term | | |
| | |
NON-INTERESTED TRUSTEES | | Lifetime of Trust until removal, resignation or retirement* | | |
| | |
Gilbert G. Alvarado (45) | | Trustee since 2015 | | Vice President & CFO, Sierra Health Foundation (health conversion private foundation) (2006-Present) Vice President & CFO, Sierra Health Foundation: Center for Health Program Management (California public benefit corporation) (2012-Present); Director, Innovative North State (2012-Present); Director, Sacramento Regional Technology Alliance (2011-Present); Director, Women’s Empowerment (2009-2014); Trustee, American Beacon Select Funds (2015-Present). |
| | |
Joseph B. Armes (53) | | Trustee since 2015 | | Chairman, President & CEO, CSW Industrials f/k/a Capital Southwest Corporation (investment company) (2013-Present); President & CEO, JBA Investment Partners (family investment vehicle) (2010-Present); Chief Operating Officer, Hicks Holdings, LLC (Hicks Family assets and investments) (2005-2010); Trustee, Baylor University Board of Regents (2001-2010); Director and Chair of Audit Committee, RSP Permian (oil and gas producer) (2013-Present); Trustee, American Beacon Select Funds (2015-Present). |
| | |
Gerard J. Arpey (57) | | Trustee since 2012 | | Director, The Home Depot, Inc. (2015-Present); Partner, Emerald Creek Group (private equity firm) (2011-Present); Chairman and Chief Executive Officer, AMR Corp. and American Airlines; Inc. (2003-2011); Director, S. C. Johnson & Son, Inc. (privately held company) (2008-present); Trustee, American Beacon Select Funds (2012-Present). |
| | |
W. Humphrey Bogart (71) | | Trustee since 2004 | | Trustee, American Beacon Mileage Funds (2004-2012); Trustee, American Beacon Select Funds (2004-Present); Trustee, American Beacon Master Trust (2004-2012). |
| | |
Brenda A. Cline (54) | | Trustee since 2004 | | Executive Vice President, Chief Financial Officer, Treasurer and Secretary, Kimbell Art Foundation (1993-Present); Director, Range Resources Corporation (oil and natural gas company) (2015-Present); Director, Tyler Technologies, Inc.(public sector software solutions company) (2014-Present); Trustee, American Beacon Mileage Funds (2004-2012); Trustee, American Beacon Select Funds (2004-Present); Trustee, American Beacon Master Trust (2004-2012). |
| | |
Eugene J. Duffy (61) | | Trustee since 2008 | | Managing Director, Institutional Services, Intercontinental Real Estate Corporation (2014-Present); Principal and Executive Vice President, Paradigm Asset Management (1994-2014); Director, Sunrise Bank of Atlanta (2008-2013); Trustee, American Beacon Mileage Funds (2008-2012); Trustee, American Beacon Select Funds (2008-Present); Trustee, American Beacon Master Trust (2008-2012). |
83
Trustees and Officers of the American Beacon FundsSM
(Unaudited)
| | | | |
Name, Age and Address | | Position, Term of Office and Length of Time Served with the Trust | | Principal Occupation(s) During Past 5 Years and Current Directorships |
OFFICERS | | Term One Year | | |
| | |
Thomas M. Dunning (72) | | Trustee since 2008 | | Chairman Emeritus (2008-Present); Lockton Dunning Benefits (consulting firm in employee benefits); Board Director, Oncor Electric Delivery Company LLC (2007-Present); Board Member, BancTec (2010-Present) (software consulting); Trustee, American Beacon Mileage Funds (2008-2012); Trustee, American Beacon Select Funds (2008-Present); Trustee, American Beacon Master Trust (2008-2012). |
| | |
Richard A. Massman (72) | | Trustee since 2004 Chairman since 2008 | | Consultant and General Counsel Emeritus (2009-Present) and Senior Vice President and General Counsel (1994-2009), Hunt Consolidated, Inc. (holding company engaged in oil and gas exploration and production, refining, real estate, farming, ranching and venture capital activities); Trustee, American Beacon Mileage Funds (2004-2012); Trustee, American Beacon Select Funds (2004-Present); Trustee, American Beacon Master Trust (2004-2012). |
| | |
Barbara J. McKenna, CFA (52) | | Trustee since 2012 | | Managing Principal, Longfellow Investment Management Company (2005-Present); Trustee, American Beacon Select Funds (2012-Present). |
| | |
R. Gerald Turner (69) 225 Perkins Admin. Bldg. Southern Methodist Univ. Dallas, Texas75275 | | Trustee since 2001 | | President, Southern Methodist University (1995-Present); Director, J.C. Penney Company, Inc. (1996-Present); Director, Kronus Worldwide Inc. (chemical manufacturing) (2003-Present); Trustee, American Beacon Mileage Funds (2001-2012); Trustee, American Beacon Select Funds (2001-Present); Trustee, American Beacon Master Trust (2001-2012). |
| | |
Gene L. Needles, Jr. (60) | | President since 2009 Executive Vice President since 2009 | | President, CEO and Director, American Beacon Advisors, Inc. (2009-Present); President, CEO and Director, Astro AB Borrower, Inc. (2015-Present); President, CEO and Director, Astro AB Acquisition, Inc.(2015-Present); President, CEO and Director, Astro AB Topco, Inc. (2015-Present), President, CEO and Director, Astro AB Holdings, LLC. (2015-Present); President, CEO and Director, Lighthouse Holdings, Inc.; (2009-2015); President and CEO, Lighthouse Holdings Parent, Inc. (2009-2015); Manager, President and CEO, American Private Equity Management, L.L.C. (2012-Present); President, American Beacon Cayman Managed Futures Strategy Fund, Ltd. (2014-Present). |
| | |
Rosemary K. Behan (56) | | VP, Secretary and Chief Legal Officer since 2006 | | Secretary, American Beacon Advisors, Inc. (2006-Present); Secretary, Astro AB Borrower, Inc. (2015-Present); Secretary, Astro AB Acquisition, Inc. (2015-Present); Secretary, Astro AB Topco, Inc. (2015-Present); Secretary, Astro AB Holdings, LLC. (2015-Present); Secretary, Lighthouse Holdings, Inc. (2008-2015); Secretary, Lighthouse Holdings Parent, Inc. (2008-2015); Secretary, American Private Equity Management, L.L.C.(2008-Present); Secretary, American Beacon Cayman Managed Futures Strategy Fund, Ltd. (2014-Present). |
| | |
Brian E. Brett (55) | | VP since 2004 | | Vice President, Director of Sales, American Beacon Advisors, Inc. (2004-Present). |
| | |
Erica Duncan (44) | | VP Since 2011 | | Vice President, Marketing and Client Services, American Beacon Advisors, Inc. (2011-Present); Supervisor, Brand Marketing, Invesco (2010-2011); |
| | |
Michael W. Fields (61) | | VP since 1989 | | Chief Fixed Income Officer (2011-Present) and Vice President, Fixed Income Investments, American Beacon Advisors, Inc. (1988-2011); Director, American Beacon Global Funds SPC (2002-2011); Director, American Beacon Global Funds plc (2007-2009). |
| | |
Melinda G. Heika (54) | | Treasurer since 2010 | | Treasurer, American Beacon Advisors, Inc. (2010-Present); Treasurer, Astro AB Borrower, Inc. (2015-Present); Treasurer, Astro AB Acquisition, Inc. (2015-Present); Treasurer, Astro AB Topco, Inc. (2015-Presnt); Treasurer, Astro AB Holdings, LLC. (2015-Present); Treasurer, Lighthouse Holdings, Inc. (2010-2015); Treasurer, Lighthouse Holdings Parent Inc., (2010-2015); Treasurer, American Private Equity Management, L.L.C. (2012-Present); Director and Treasurer, American Beacon Cayman Managed Futures Strategy Fund, Ltd. (2014-Present). |
84
Trustees and Officers of the American Beacon FundsSM
(Unaudited)
| | | | |
Name, Age and Address | | Position, Term of Office and Length of Time Served with the Trust | | Principal Occupation(s) During Past 5 Years and Current Directorships |
OFFICERS | | Term One Year | | |
| | |
Terri L. McKinney (51) | | VP since 2010 | | Vice President, Enterprise Services (2009-Present) and Managing Director (2003-2009), American Beacon Advisors, Inc. |
| | |
Jeffrey K. Ringdahl (40) | | VP since 2010 | | Chief Operating Officer, American Beacon Advisors, Inc. (2010-Present); Manager and Senior Vice President, American Private Equity Management, L.L.C. (2012-Present); Senior Vice President and Director, Astro AB Borrower, Inc. (2015-Present); Senior Vice President and Director, Astro AB Acquisition, Inc. (2015-Present); Senior Vice President and Director, Astro AB Topco, Inc. (2015-Present), Senior Vice President and Director, Astro AB Holdings, LLC.(2015-Present); Senior Vice President, Lighthouse Holdings, Inc. (2013-2015); Senior Vice President, Lighthouse Holdings Parent, Inc. (2013-2015); Director and Vice President, American Beacon Cayman Managed Futures Strategy Fund, Ltd. (2014-Present); Vice President, Product Management, Touchstone Advisors, Inc. (2007-2010). |
| | |
Samuel J. Silver (52) | | VP Since 2011 | | Vice President, Fixed Income Investments (2011-Present) and Senior Portfolio Manager, Fixed Income Investments (1999-2011), American Beacon Advisors, Inc. |
| | |
Christina E. Sears (43) | | Chief Compliance Officer since 2004 and Asst. Secretary since 1999 | | Chief Compliance Officer, American Beacon Advisors, Inc. (2004-Present); Chief Compliance Officer, American Private Equity Management, L.L.C. (2012-Present). |
| | |
Sonia L. Bates (58) | | Asst. Treasurer since 2011 | | Director, Tax and Financial Reporting (2011-Present), Manager, Tax and Financial Reporting (2005-2010), American Beacon Advisors, Inc.; Asst. Treasurer, Astro AB Borrower, Inc. (2015-Present); Asst. Treasurer, Astro AB Acquisition, Inc.(2015-Present); Asst. Treasurer, Astro AB Topco, Inc. (2015-Present); Asst. Treasurer, Astro AB Holdings, LLC.; Asst. Treasurer, Lighthouse Holdings, Inc. (2011-2015); Asst. Treasurer, Lighthouse Holdings Parent Inc. (2011-2015); Asst. Treasurer, American Private Equity Management, L.L.C. (2012-Present). |
| * | The Board has adopted a retirement plan that requires Trustees to retire no later than the last day of the calendar year in which they reach the age of 72, provided, however, that the board may determine to grant one or more annual exemptions to this requirement. |
| ** | Mr. Feld is deemed to be an “interested person” of the Trust, as defined by the 1940 Act. Mr. Feld’s law firm of Akin, Gump, Strauss, Hauer & Feld LLP has provided legal services within the past two years to the Manager and one or more of the Trust’s sub-advisors. |
85

Delivery of Documents
eDelivery is NOW AVAILABLE - Stop traditional mail delivery and receive your
shareholder reports and summary prospectus on-line. Sign up at
www.americanbeaconfunds.com
If you invest in the Fund through a financial institution, you may be able to receive the Fund’s regulatory mailings, such as the Prospectus, Annual Report and Semi-Annual Report, by e-mail. If you are interested in this option, please go to www.icsdelivery.com and search for your financial institution’s name or contact your financial institution directly.
To obtain more information about the Fund:
| | |

| | 
|
By E-mail: american_beacon.funds@ambeacon.com | | On the Internet: Visit our website at www.americanbeaconfunds.com |
| |

| | 
|
By Telephone: Institutional, Y, and InvestorClasses Call (800) 658-5811 | | By Mail: American Beacon Funds P.O. Box 219643 Kansas City, MO64121-9643 |
| |
Availability of Quarterly Portfolio Schedules In addition to the Schedule of Investments provided in each semi-annual and annual report, the Fund files a complete schedule of its portfolio holdings with the Securities and Exchange Commission (“SEC”) on Form N-Q as of the first and third fiscal quarters. The Fund’s Forms N-Q are available on the SEC’s website at www.sec.gov. The Forms N-Q may also be reviewed and copied at the SEC’s Public Reference Section, 100 F Street, NE, Washington, D.C.20549-1520. Information regarding the operation of the SEC’s Public Reference Room may be obtained by calling (202) 551-8090. A complete schedule of each Fund’s portfolio holdings is also made available on the Funds’ website at www.americanbeaconfunds.com. | | Availability of Proxy Voting Policy and Records A description of the policies and procedures the Fund uses to determine how to vote proxies relating to portfolio securities is available in the Fund’s Statement of Additional Information, which is available free of charge on the Fund’s website at www.americanbeaconfunds.com and by calling 1-800-967-9009 or by accessing the SEC’s website at www.sec.gov. The Fund’s proxy voting record for the most recent year ended June 30 is filed annually with the SEC on Form N-PX. The Fund’s Forms N-PX are available on the SEC’s website at www.sec.gov. The Fund’s proxy voting record may also be obtained by calling 1-800-967-9009. |
Fund Service Providers:
| | | | | | |
CUSTODIAN State Street Bank and Trust Boston, Massachusetts | | TRANSFER AGENT Boston Financial Data Services Kansas City, Missouri | | INDEPENDENT REGISTERED
PUBLIC ACCOUNTINGFIRM Ernst & Young LLP Dallas, Texas | | DISTRIBUTOR
Foreside Fund Services,
LLC Portland, Maine |
This report is prepared for shareholders of the American Beacon Funds and may be distributed to others only if preceded or accompanied by a current Prospectus of Summary Prospectus.
American Beacon Funds, American Beacon The London Company Income Equity Fund, American Beacon Zebra Large Cap Equity Fund, American Beacon Zebra Small Cap Equity Fund, and American Beacon SiM High Yield Opportunities Fund are service marks of American Beacon Advisors, Inc.
AR 8/15
The Trust has adopted a code of ethics that applies to its principal executive and financial officers (the “Code”). The Trust amended its code November 12, 2013 to disclose the removal of terminated Investment Companies. The Trust did not grant any waivers to the provisions of the Code during the period covered by the shareholder report presented in Item 1. The Code is filed herewith as Exhibit 99.CODE ETH.
ITEM 3. AUDIT COMMITTEE FINANCIAL EXPERT.
The Trust’s Board of Trustees has determined that Ms. Brenda A. Cline, a member of the Trust’s Audit and Compliance Committee, is an “audit committee financial expert” as defined in Form N-CSR. Ms. Brenda Cline is “independent” as defined in Form N-CSR.
ITEM 4. PRINCIPAL ACCOUNTANT FEES AND SERVICES.
| | | | |
| (a) Audit Fees | | Fiscal Year Ended | |
$ 403,681 | | | 8/31/2014 | |
$ 348,423 | | | 8/31/2015 | |
| | | | |
| (b) Audit-Related Fees | | Fiscal Year Ended | |
$ 0 | | | 8/31/2014 | |
$ 0 | | | 8/31/2015 | |
| | | | |
| (c) Tax Fees | | Fiscal Year Ended | |
$ 38,250 | | | 8/31/2014 | |
$ 53,005 | | | 8/31/2015 | |
| | | | |
| (d) All Other Fees | | Fiscal Year Ended | |
$ 0 | | | 8/31/2014 | |
$ 0 | | | 8/31/2015 | |
(e)(1) Pursuant to its charter, the Trust’s Audit and Compliance Committee shall have the following duties and powers pertaining to pre-approval of audit and non-audit services provided by the Trust’s principal accountant:
| | • | | to approve, prior to appointment, the engagement of auditors to annually audit and provide their opinion on the Trusts’ financial statements, and, in connection therewith, reviewing and evaluating matters potentially affecting the independence and capabilities of the auditors; |
| | • | | to approve, prior to appointment, the engagement of the auditors to provide non-audit services to the Trusts, an investment adviser to any series of the Trusts or any entity controlling, controlled by, or under common control with an investment adviser (“adviser affiliate”) that provides ongoing services to the Trusts, if the engagement relates directly to the operations and financial reporting of the Trusts; |
| | • | | to consider whether the non-audit services provided by a Trust’s auditor to an investment adviser or any adviser affiliate that provides ongoing services to a series of the Trusts, which services were not pre-approved by the Committee, are compatible with maintaining the auditor’s independence; |
| | • | | to review the arrangements for and scope of the annual audit and any special audits; and |
| | • | | to review and approving the fees proposed to be charged to the Trusts by the auditors for each audit and non-audit service. |
The Audit and Compliance Committee may delegate any portion of its authority, including the authority to grant pre-approvals of audit and permitted non-audit services, to a subcommittee of one or more members. Any decisions of the subcommittee to grant pre-approvals shall be presented to the full audit committee at its next regularly scheduled meeting.
(e)(2) None of the fees disclosed in paragraphs (b) through (d) above were approved by the audit committee pursuant to paragraph (c)(7)(i)(C) of Rule 2-01 of Regulation S-X.
(f) Not applicable.
(g) Aggregate Non-Audit Fees for Services Rendered to the:
| | | | | | | | | | | | |
| Registrant | | Adviser | | | Adviser’s Affiliates Providing Ongoing Services to Registrant | | | Fiscal Year
Ended | |
$ 38,250 | | $ | 63,855 | | | | N/A | | | | 8/31/2014 | |
$ 53,005 | | $ | 46,065 | | | | N/A | | | | 8/31/2015 | |
(h) Not applicable.
| ITEM 5. | AUDIT COMMITTEE OF LISTED REGISTRANTS. |
Not applicable.
| ITEM 6. | SCHEDULE OF INVESTMENTS. |
The schedules of investments for each series of the Trust are included in the shareholder report presented in Item 1.
| ITEM 7. | DISCLOSURE OF PROXY VOTING POLICIES AND PROCEDURES FOR CLOSED-END MANAGEMENT INVESTMENT COMPANIES. |
Not applicable.
| ITEM 8. | PORTFOLIO MANAGERS OF CLOSED-END MANAGEMENT INVESTMENT COMPANIES. |
Not applicable.
| ITEM 9. | PURCHASES OF EQUITY SECURITIES BY CLOSED-END MANAGEMENT INVESTMENT COMPANY AND AFFILIATED PURCHASERS. |
Not applicable.
| ITEM 10. | SUBMISSION OF MATTERS TO A VOTE OF SECURITY HOLDERS. |
The Trust has made no material changes to the procedures by which shareholders may recommend nominees to the Trust’s Board of Trustees since the Trust last disclosed such procedures in Schedule 14A.
| ITEM 11. | CONTROLS AND PROCEDURES. |
(a) Based upon an evaluation within 90 days of the filing date of this report, the principal executive and financial officers concluded that the disclosure controls and procedures of the Trust are effective.
(b) There were no changes in the Trust’s internal control over financial reporting during the second fiscal quarter of the period covered by this report that has materially affected, or is reasonably likely to materially affect, the Trust’s internal control over financial reporting.
(a)(1) Filed herewith as EX-99.CODE ETH.
(a)(2) A separate certification for each principal executive officer and principal financial officer of the Trust as required by Rule 30a-2(a) under the Investment Company Act of 1940 is attached hereto as EX-99.CERT.
(a)(3) Not applicable.
(b) The certifications required by Rule 30a-2(b) under the Investment Company Act of 1940 are attached hereto as EX-99.906CERT.
SIGNATURES
Pursuant to the requirements of the Securities Exchange Act of 1934 and the Investment Company Act of 1940, the registrant has duly caused this report to be signed on its behalf by the undersigned, thereunto duly authorized.
(Registrant): American Beacon Funds
| | |
| By | | /s/ Gene L. Needles, Jr. |
| | Gene L. Needles, Jr. |
| | President American Beacon Funds |
Date: November 9, 2015
Pursuant to the requirements of the Securities Exchange Act of 1934 and the Investment Company Act of 1940, this report has been signed below by the following persons on behalf of the registrant and in the capacities and on the dates indicated.
| | |
| By | | /s/ Gene L. Needles, Jr. |
| | Gene L. Needles, Jr. President American Beacon Funds |
Date: November 9, 2015
| | |
| By | | /s/ Melinda G. Heika |
| | Melinda G. Heika Treasurer American Beacon Funds |
Date: November 9, 2015