UNITED STATES
SECURITIES AND EXCHANGE COMMISSION
Washington, D.C. 20549
FORM N-CSR
CERTIFIED SHAREHOLDER REPORT OF REGISTERED
MANAGEMENT INVESTMENT COMPANIES
Investment Company Act file number: 811-4984
AMERICAN BEACON FUNDS
(Exact name of registrant as specified in charter)
220 East Las Colinas Boulevard, Suite 1200
Irving, Texas 75039
(Address of principal executive offices)-(Zip code)
GENE L. NEEDLES, JR., PRESIDENT
220 East Las Colinas Boulevard, Suite 1200
Irving, Texas 75039
(Name and address of agent for service)
Registrant’s telephone number, including area code: (817) 391-6100
Date of fiscal year end: December 31, 2015
Date of reporting period: December 31, 2015
Form N-CSR is to be used by management investment companies to file reports with the Commission not later than 10 days after the transmission to stockholders of any report that is required to be transmitted to stockholders under Rule 30e-1 under the Investment Company Act of 1940 (17 CFR 270.30e-1). The Commission may use the information provided on Form N-CSR in its regulatory, disclosure review, inspection, and policymaking roles.
A registrant is required to disclose the information specified by Form N-CSR, and the Commission will make this information public. A registrant is not required to respond to the collection of information contained in Form N-CSR unless the Form displays a currently valid Office of Management and Budget (“OMB”) control number. Please direct comments concerning the accuracy of the information collection burden estimate and any suggestions for reducing the burden to Secretary, Securities and Exchange Commission, 450 Fifth Street, NW, Washington, DC 20549-0609. The OMB has reviewed this collection of information under the clearance requirements of 44 U.S.C. § 3507.
ITEM 1. REPORTS TO STOCKHOLDERS.

ANNUAL REPORT
December 31, 2015
TREASURY INFLATION PROTECTED SECURITIES FUND (CLOSED TO NEW INVESTORS)
| | | | | | | | | | |
About American Beacon Advisors | | | | | | Contents | |
Since 1986, American Beacon Advisors has offered a variety of products and investment advisory services to numerous institutional and retail clients, including a variety of mutual funds, corporate cash management, and separate account management. | | | | | | President’s Message | | | 1 | |
| | | | | | Market and Performance Overview | | | 2 | |
| | | | | | Schedule of Investments | | | 7 | |
| | | | | | Financial Statements | | | 8 | |
Our clients include defined benefit plans, defined contribution plans, foundations, endowments, corporations, financial planners, and other institutional investors. With American Beacon Advisors, you can put the experience of a multi-billion dollar asset management firm to work for your company. | | | | | | Notes to the Financial Statements | | | 11 | |
| | | | | | Financial Highlights | | | 20 | |
| | | | | | Additional Information | | | Back Cover | |
| | | | | | | | | | |
U.S. Treasury securities are guaranteed only as to the timely payment of interest and principal when held to maturity. The market prices for such securities are not guaranteed and will fluctuate. They are also subject to credit and interest rate risks. In a period of sustained deflation, inflation-indexed securities may not pay any income and may suffer a loss. Please see the prospectus for a complete discussion of the Fund’s risks. There can be no assurances that the investment objectives of this Fund will be met.
|
Any opinions herein, including forecasts, reflect our judgment as of the end of the reporting period and are subject to change. Each advisor’s strategies and the Fund’s portfolio composition will change depending on economic and market conditions. This report is not a complete analysis of market conditions and therefore, should not be relied upon as investment advice. Although economic and market information has been compiled from reliable sources, American Beacon Advisors, Inc. makes no representation as to the completeness or accuracy of the statements contained herein. |
| | |
| American Beacon Funds | | December 31, 2015 |

Dear Shareholders,
Since 1997, the U.S. Treasury has been issuing Treasury Inflation-Protected Securities (“TIPS”). The principal of these securities, backed by the full faith and credit of the federal government, is tied to the Consumer Price Index. With a rise in the index, or inflation, the principal increases. With a fall in the index, or deflation, the principal decreases. And, at maturity, the U.S. Treasury pays the original or adjusted principal, whichever is greater.
TIPS carry minimal credit risk thanks to their government guarantee. However, like all bonds, they are subject to interest rate risk. On December 16, 2015, the Federal Reserve’s Federal Open Market Committee decided to raise its benchmark lending rate from a range of 0% to 0.25% to a range of 0.25% to 0.5% - the first interest rate hike in nearly a decade.
The American Beacon Treasury Inflation Protected Securities Fund, unlike many other funds in its peer group, seeks to provide inflation protection and income by investing primarily in TIPS. This strategy provides inflation protection without unnecessary exposure to the risks associated with other instruments. By benchmarking against the lower duration Barclays Capital 1-10 Year U.S. TIPS Index, the Fund strives to be less sensitive to changes in real interest rates.
For the 12 months ended December 31, 2015, the American Beacon Treasury Inflation Protected Securities Fund (Investor Class), which is closed to new investors, returned -0.49%.
Thank you for your continued investment in the American Beacon Funds. For additional information about the Funds or to access your account information, please visit our website at www.americanbeaconfunds.com.
|
| Best Regards, |
|
 |
| Gene L. Needles, Jr. |
| President |
| American Beacon Funds |
1
Market Overview
December 31, 2015 (Unaudited)
After peaking in the second quarter of 2015 at 3.9% year-over-year growth, the U.S. economy decelerated in the second half of the year with annualized gross domestic product (“GDP”) growth of 2.0% in the third quarter of 2015 and estimated growth of 0.7% in the fourth quarter of 2015. Throughout 2015, the Federal Reserve (the “Fed”) continually debated raising its overnight federal funds rate target for the first time since 2006 from a range of 0% to 0.25%. After the probable date for the move was pushed back a few times, the Federal Open Market Committee (“FOMC”) finally moved off of the 0% lower bound at its December 2015 meeting and suggested a measured, data-dependent pace for further hikes in 2016.
Despite the softening of the aforementioned GDP numbers, nearly 2.7 million nonfarm jobs were created in 2015 and the unemployment rate declined from 5.6% at the end of 2014 to 5.0% at the end of 2015. Inflation as measured by the Consumer Price Index (“CPI”) increased at a 0.7% pace, slower than 2014’s 0.8% pace, and few were concerned about sustainable inflationary pressures. Indeed, unwanted disinflation was more of a concern to policymakers than unwanted inflation. However, the year-over-year core CPI (CPI excluding food and energy) increased at a 2.1% pace in December, a noteworthy increase from the 1.6% rate of one year earlier.
Higher real Treasury interest rates at longer maturities contributed to negative total returns for Treasury Inflation Protected Securities (“TIPS”). The Barclays Capital U.S. TIPS Index returned -1.44% in 2015, while the Barclays Capital 1-10-year U.S. TIPS Index returned -0.52%. The TIPS yield curve steepened in 2015; for example, according to Barclays, the yield on the TIPS 0.125% 4/15/19 fell from 0.35% on December 31, 2014, to 0.29% on December 31, 2015, while the yield on the TIPS 0.125% 1/15/24 rose over that same time frame from 0.55% to 0.75%. At the end of 2015, the total outstanding market value of the Barclays U.S. TIPS Index was approximately $993 billion.
2
American Beacon Treasury Inflation Protected Securities FundSM
Performance Overview
December 31, 2015 (Unaudited)
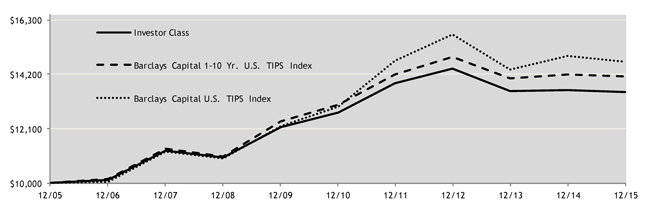
The Investor Class of the Treasury Inflation Protected Securities Fund (the “Fund”) returned -0.49% for the twelve months ended December 31, 2015, outperforming the Barclays Capital 1-10 Year U.S. TIPS Index (the “Index”) return of -0.52%.
Comparison of Change in Value of a $10,000 Investment
For the Period from 12/31/05 through 12/31/15
Total Returns for the Period ended 12/31/15
| | | | | | | | | | | | | | | | | | |
| | | Ticker | | 1 Year | | | 5 Years | | | 10 Years | | | Value of
$10,000
12/31/05-
12/31/15 | |
Institutional Class (1,7,8) | | ATPIX | | | (0.10 | )% | | | 1.61 | % | | | 3.35 | % | | $ | 13,899 | |
Y Class (1,2,7,8) | | ACUYX | | | (0.39 | )% | | | 1.29 | % | | | 3.16 | % | | | 13,647 | |
Investor Class (1,3,7,8) | | ABTPX | | | (0.49 | )% | | | 1.20 | % | | | 3.06 | % | | | 13,521 | |
A Class with sales charge (1,4,7,8) | | ATSAX | | | (5.50 | )% | | | (0.09 | )% | | | 2.39 | % | | | 12,663 | |
A Class without sales charge (1,4,7,8) | | ATSAX | | | (0.78 | )% | | | 0.90 | % | | | 2.89 | % | | | 13,299 | |
C Class with sales charge (1,5,7,8) | | ATSCX | | | (2.51 | )% | | | 0.13 | % | | | 2.47 | % | | | 12,767 | |
C Class without sales charge (1,5,7,8) | | ATSCX | | | (1.51 | )% | | | 0.13 | % | | | 2.47 | % | | | 12,767 | |
Barclays Capital 1-10 Yr. U.S. TIPS Index (6) | | | | | (0.52 | )% | | | 1.64 | % | | | 3.51 | % | | | 14,117 | |
Barclays Capital U.S. TIPS Index (6) | | | | | (1.44 | )% | | | 2.55 | % | | | 3.93 | % | | | 14,702 | |
| 1. | Performance shown is historical and is not indicative of future returns. Investment returns and principal value will vary, and shares may be worth more or less at redemption than at original purchase. Performance shown is calculated based on the published end of day net asset values as of the date indicated, and current performance may be lower or higher than the performance data quoted. To obtain performance as of the most recent month end, please visit www.americanbeaconfunds.com or call 1-800-967-9009. Fund performance in the table above does not reflect the deduction of taxes a shareholder would pay on distributions or the redemption of shares. |
| 2. | Fund performance for the ten-year period represents the total returns achieved by the Institutional Class up to 3/1/10, the inception date of the Y Class, and the returns of the Y Class since its inception. Expenses of the Y Class are higher than those of the Institutional Class. As a result, total returns shown may be higher than they would have been had the Y Class been in existence since 12/31/05. |
| 3. | Fund performance for the ten-year period represents the total returns achieved by the Institutional Class up to 3/2/09, the inception date of the Investor Class, and the returns of the Investor Class since its inception. Expenses of the Investor Class are higher than those of the Institutional Class. As a result, total returns shown may be higher than they would have been had the Investor Class been in existence since 12/31/05. |
| 4. | Fund performance for the ten-year period represents the total returns achieved by the Institutional Class from 12/31/05 through 3/1/09, and the Investor Class from 3/2/09 up to 5/17/10, the inception date of the A Class, and the returns of the A Class since its inception. Expenses of the A Class are higher than those of the Institutional and Investor Classes. As a result, total returns shown may be higher than they would have been had the A Class been in existence since 12/31/05. The maximum sales charge for A Class is 4.75%. |
3
American Beacon Treasury Inflation Protected Securities FundSM
Performance Overview
December 31, 2015 (Unaudited)
| 5. | Fund performance for the ten-year period represents the total returns achieved by the Institutional Class from 12/31/05 through 3/1/09, and the Investor Class from 3/2/09 up to 9/1/10, the inception date of the C Class, and the returns of the C Class since its inception. Expenses of the C Class are higher than those of the Institutional and Investor Classes. As a result, total returns shown may be higher than they would have been had the C Class been in existence since 12/31/05. The maximum contingent deferred sales charge for C Class is 1.00% for shares redeemed within one year of the date of purchase. |
| 6. | The Barclays Capital 1-10 Yr. U.S. TIPS Index is an unmanaged market index comprising U.S. Treasury inflation-indexed securities with maturities between one and ten years while the Barclays Capital U.S. TIPS Index includes all maturities. One cannot directly invest in an index. |
| 7. | A portion of the fees charged to the Institutional Class of the Fund has been waived since 2005. A portion of the fees charged to the Investor Class of the Fund has been waived since inception. A portion of the fees charged to the Y, A, and C Classes has been waived since 2011. Performance prior to waiving fees was lower than the actual returns shown. |
| 8. | The total annual Fund operating expense ratios set forth in the most recent Fund prospectus for the Institutional, Y, Investor, A, and C Class shares was 0.40%, 0.63%, 0.81%, 0.94%, and 1.69%, respectively. The expense ratios above may vary from the expense ratios presented in other sections of this report that are based on expenses incurred during the period covered by this report. |
The Fund produced negative absolute returns for the twelve-month time period, affected by global growth concerns and the first rise in the U.S. overnight federal funds rate in nearly ten years.
From a yield curve positioning standpoint, the Fund’s outperformance relative to the Index stemmed from underweighting the 7-8 year maturity range and from overweighting the 3-4 year maturity range. Security selections within the 2-3 year maturity range also benefited relative performance during the period. Underweighting the 2-3 year and 1-2 year maturity ranges detracted from relative performance during the year.
From a duration perspective, one sub-advisor began the period with a short duration position relative to the Index, which benefited performance. The sub-advisor moved to duration neutral during mid-January, and maintained that positioning until the fourth quarter of 2015. During the fourth quarter, the sub-advisor’s overweight duration position in the long end of the curve, in a rising rate environment, detracted from relative performance.
| | | | | | | | |
Top Ten Holdings (% Net Assets) | | | | | | | | |
Treasury Inflation Index Security, 0.125%, Due 4/15/2017 | | | | | | | 8.8 | |
Treasury Inflation Index Security, 0.125%, Due 4/15/2019 | | | | | | | 8.2 | |
Treasury Inflation Index Security, 0.625%, Due 1/15/2024 | | | | | | | 8.0 | |
Treasury Inflation Index Security, 0.125%, Due 1/15/2022 | | | | | | | 8.0 | |
Treasury Inflation Index Security, 2.375%, Due 1/15/2025 | | | | | | | 7.3 | |
Treasury Inflation Index Security, 0.625%, Due 7/15/2021 | | | | | | | 7.3 | |
Treasury Inflation Index Security, 1.25%, Due 7/15/2020 | | | | | | | 7.0 | |
Treasury Inflation Index Security, 0.125%, Due 1/15/2023 | | | | | | | 6.6 | |
Treasury Inflation Index Security, 0.375%, Due 7/15/2023 | | | | | | | 5.7 | |
Treasury Inflation Index Security, 0.125%, Due 4/15/2018 | | | | | | | 5.6 | |
| | |
Total Fund Holdings | | | 21 | | | | | |
| | | | |
Portfolio Statistics | |
Effective Maturity (years) | | | 4.9 | |
Effective Duration (years) | | | 5.3 | |
3-Year Standard Deviation | | | 3.8 | |
| | | | |
Security Type (% of Total Investments) | |
Treasury Inflation Index Security | | | 96.0 | |
Short-Term Investments | | | 4.0 | |
4
American Beacon Treasury Inflation Protected Securities FundSM
Fund Expenses
December 31, 2015 (Unaudited)
Fund Expense Example
As a shareholder of the Fund, you incur two types of costs: (1) transaction costs, including sales charges (loads) on purchase payments and redemption fees if applicable, and (2) ongoing costs, including management fees, administrative service fees, and other Fund expenses. The examples below are intended to help you understand the ongoing cost (in dollars) of investing in the Fund and to compare these costs with the ongoing costs of investing in other mutual funds.
The examples are based on an investment of $1,000 invested at the beginning of the period and held for the entire period from July 1, 2015 through December 31, 2015.
Actual Expenses
The “Actual” line of the table provides information about actual account values and actual expenses. You may use the information in this line, together with the amount you invested, to estimate the expenses that you paid over the period. Simply divide your account value by $1,000 (for example, an $8,600 account value divided by $1,000 = 8.6), then multiply the result by the number in the first line under the heading “Expenses Paid During Period” to estimate the expenses you paid on your account during this period. Shareholders that invest in the Fund through an IRA or Roth IRA may be subject to a custodial IRA fee of $15 that is typically deducted each December. If your account was subject to a custodial IRA fee during the period, your costs would have been $15 higher.
Hypothetical Example for Comparison Purposes
The “Hypothetical” line of the table provides information about hypothetical account values and hypothetical expenses based on the Fund’s actual expense ratio and an assumed 5% per year rate of return before expenses (not the Fund’s actual return). You may compare the ongoing costs of investing in the Fund with other funds by contrasting this 5% hypothetical example and the 5% hypothetical examples that appear in the shareholder reports of the other funds. The hypothetical account values and expenses may not be used to estimate the actual ending account
balance or expenses you paid for the period. Shareholders that invest in the Fund through an IRA or Roth IRA may be subject to a custodial IRA fee of $15 that is typically deducted each December. If your account was subject to a custodial IRA fee during the period, your costs would have been $15 higher.
You should also be aware that the expenses shown in the table highlight only your ongoing costs and do not reflect any transaction costs charged by the Fund. Similarly, the expense examples for other funds do not reflect any transaction costs charged by those funds, such as sales charges (loads), redemption fees or exchange fees. Therefore, the “Hypothetical” line of the table is useful in comparing ongoing costs only and will not help you determine the relative total costs of owning different funds. If you were subject to any transaction costs during the period, your costs would have been higher.
| | | | | | | | | | | | |
| | | Beginning
Account
Value
7/1/2015 | | | Ending
Account
Value
12/31/2015 | | | Expenses
Paid During
Period
7/1/2015-
12/31/2015* | |
Institutional Class | | | | | | | | | | | | |
Actual | | $ | 1,000.00 | | | $ | 988.48 | | | $ | 1.40 | |
Hypothetical** | | $ | 1,000.00 | | | $ | 1,023.77 | | | $ | 1.43 | |
Y Class | | | | | | | | | | | | |
Actual | | $ | 1,000.00 | | | $ | 988.49 | | | $ | 3.06 | |
Hypothetical** | | $ | 1,000.00 | | | $ | 1,022.13 | | | $ | 3.11 | |
Investor Class | | | | | | | | | | | | |
Actual | | $ | 1,000.00 | | | $ | 987.37 | | | $ | 3.46 | |
Hypothetical** | | $ | 1,000.00 | | | $ | 1,021.74 | | | $ | 3.52 | |
A Class | | | | | | | | | | | | |
Actual | | $ | 1,000.00 | | | $ | 985.43 | | | $ | 4.50 | |
Hypothetical** | | $ | 1,000.00 | | | $ | 1,020.69 | | | $ | 4.58 | |
C Class | | | | | | | | | | | | |
Actual | | $ | 1,000.00 | | | $ | 981.91 | | | $ | 8.39 | |
Hypothetical** | | $ | 1,000.00 | | | $ | 1,016.74 | | | $ | 8.54 | |
| * | Expenses are equal to the Fund’s annualized expense ratios for the six-month period of 0.28%, 0.61%, 0.69%, 0.90%, and 1.68% for the Institutional, Y, Investor, A, and C Classes respectively, multiplied by the average account value over the period, multiplied by the number derived by dividing the number of days in the most recent fiscal half-year (184) by days in the year (365) to reflect the half-year period. |
| ** | 5% return before expenses. |
5
American Beacon Treasury Inflation Protected Securities FundSM
Report of Independent Registered Public Accounting Firm
The Board of Trustees and Shareholders of
American Beacon Treasury Inflation Protected Securities Fund
We have audited the accompanying statement of assets and liabilities, including the schedule of investments, of American Beacon Treasury Inflation Protected Securities Fund (one of the funds constituting the American Beacon Funds) (the “Fund”), as of December 31, 2015, and the related statement of operations for the year then ended, the statement of changes in net assets for each of the two years in the period then ended and the financial highlights for each of the five years in the period then ended. These financial statements and financial highlights are the responsibility of the Fund’s management. Our responsibility is to express an opinion on these financial statements and financial highlights based on our audits.
We conducted our audits in accordance with the standards of the Public Company Accounting Oversight Board (United States). Those standards require that we plan and perform the audit to obtain reasonable assurance about whether the financial statements and financial highlights are free of material misstatement. We were not engaged to perform an audit of the Fund’s internal control over financial reporting. Our audits included consideration of internal control over financial reporting as a basis for designing audit procedures that are appropriate in the circumstances, but not for the purpose of expressing an opinion on the effectiveness of the Fund’s internal control over financial reporting. Accordingly, we express no such opinion. An audit also includes examining, on a test basis, evidence supporting the amounts and disclosures in the financial statements and financial highlights, assessing the accounting principles used and significant estimates made by management, and evaluating the overall financial statement presentation. Our procedures included confirmation of securities owned as of December 31, 2015, by correspondence with the custodian and brokers or by other appropriate auditing procedures where replies from brokers were not received. We believe that our audits provide a reasonable basis for our opinion.
In our opinion, the financial statements and financial highlights referred to above present fairly, in all material respects, the financial position of American Beacon Treasury Inflation Protected Securities Fund at December 31, 2015, the results of its operations for the year then ended, the changes in its net assets for each of the two years in the period then ended and the financial highlights for each of the five years in the period then ended in conformity with U.S. generally accepted accounting principles.

Dallas, Texas
February 29, 2016
6
American Beacon Treasury Inflation Protected Securities FundSM
Schedule of Investments
December 31, 2015
| | | | | | | | |
| | | Par Amount | | | Fair Value | |
| | | (000’s) | | | (000’s) | |
U.S. TREASURY OBLIGATIONS - 98.70% | | | | | | | | |
0.125%, Due 4/15/2017 A | | $ | 1,100 | | | $ | 1,096 | |
2.625%, Due 7/15/2017 A | | | 44 | | | | 46 | |
1.625%, Due 1/15/2018 A | | | 68 | | | | 70 | |
0.125%, Due 4/15/2018 A | | | 693 | | | | 692 | |
2.125%, Due 1/15/2019 A | | | 489 | | | | 517 | |
0.125%, Due 4/15/2019 A | | | 1,025 | | | | 1,019 | |
1.875%, Due 7/15/2019 A | | | 150 | | | | 159 | |
1.375%, Due 1/15/2020 A | | | 489 | | | | 509 | |
0.125%, Due 4/15/2020 A | | | 513 | | | | 506 | |
1.25%, Due 7/15/2020 A | | | 843 | | | | 877 | |
0.625%, Due 7/15/2021 A | | | 899 | | | | 905 | |
0.125%, Due 1/15/2022 A | | | 1,026 | | | | 994 | |
0.125%, Due 7/15/2022 A | | | 524 | | | | 508 | |
0.125%, Due 1/15/2023 A | | | 856 | | | | 821 | |
0.375%, Due 7/15/2023 A | | | 724 | | | | 707 | |
0.625%, Due 1/15/2024 A | | | 1,005 | | | | 994 | |
0.125%, Due 7/15/2024 A | | | 647 | | | | 615 | |
0.25%, Due 1/15/2025 A | | | 126 | | | | 120 | |
2.375%, Due 1/15/2025 A | | | 802 | | | | 912 | |
0.375%, Due 7/15/2025 A | | | 118 | | | | 115 | |
2.50%, Due 1/15/2029 A | | | 112 | | | | 133 | |
| | | | | | | | |
Total U.S. Treasury Obligations (Cost $12,424) | | | | | | | 12,315 | |
| | | | | | | | |
| | |
| | | Shares | | | | |
SHORT-TERM INVESTMENTS - 4.02% (Cost $502) | | | | | | | | |
JPMorgan U.S. Government Money Market Fund, Capital Class | | | 501,549 | | | | 502 | |
| | | | | | | | |
| | |
TOTAL INVESTMENTS - 102.72% (Cost $12,926) | | | | | | | 12,817 | |
LIABILITIES, NET OF OTHER ASSETS - (2.72%) | | | | | | | (340 | ) |
| | | | | | | | |
TOTAL NET ASSETS - 100.00% | | | | | | $ | 12,477 | |
| | | | | | | | |
Percentages are stated as a percent of net assets.
| A | Inflation-Indexed Note. |
American Beacon Treasury Inflation Protected Securities FundSM
Statement of Assets and Liabilities
December 31, 2015 (in thousands, except share and per share amounts)
| | | | |
Assets: | | | | |
Investments in unaffiliated securities, at fair value A | | $ | 12,817 | |
Receivable for investments sold | | | 381 | |
Receivable for fund shares sold | | | 49 | |
Interest receivable | | | 35 | |
Receivable for expense reimbursement (Note 2) | | | 1 | |
Prepaid expenses | | | 19 | |
| | | | |
Total assets | | | 13,302 | |
| | | | |
Liabilities: | | | | |
Payable for investments purchased | | | 745 | |
Payable for fund shares redeemed | | | 6 | |
Management and investment advisory fees payable | | | 11 | |
Administrative service and service fees payable | | | 15 | |
Transfer agent fees payable | | | 5 | |
Custody and fund accounting fees payable | | | 5 | |
Professional fees payable | | | 32 | |
Prospectus and shareholder reports fees payable | | | 2 | |
Trustee fees payable | | | 1 | |
Other liabilities | | | 3 | |
| | | | |
Total liabilities | | | 825 | |
| | | | |
Net assets | | $ | 12,477 | |
| | | | |
Analysis of Net Assets: | | | | |
Paid-in-capital | | | 25,613 | |
Undistributed (or overdistribution of) net investment income | | | — | |
Accumulated net realized (loss) | | | (13,027 | ) |
Unrealized (depreciation) of investments | | | (109 | ) |
| | | | |
Net assets | | $ | 12,477 | |
| | | | |
Shares outstanding at no par value (unlimited shares authorized): | | | | |
Institutional Class | | | 749,828 | |
| | | | |
Y Class | | | 49,654 | |
| | | | |
Investor Class | | | 362,228 | |
| | | | |
A Class | | | 51,367 | |
| | | | |
C Class | | | 4,003 | |
| | | | |
Net assets (not in thousands): | | | | |
Institutional Class | | $ | 7,719,788 | |
| | | | |
Y Class | | $ | 511,751 | |
| | | | |
Investor Class | | $ | 3,685,540 | |
| | | | |
A Class | | $ | 520,885 | |
| | | | |
C Class | | $ | 39,102 | |
| | | | |
Net asset value, offering and redemption price per share: | | | | |
Institutional Class | | $ | 10.30 | |
| | | | |
Y Class | | $ | 10.31 | |
| | | | |
Investor Class | | $ | 10.17 | |
| | | | |
A Class | | $ | 10.14 | |
| | | | |
A Class (offering price) | | $ | 10.65 | |
| | | | |
C Class | | $ | 9.77 | |
| | | | |
| |
A Cost of investments in unaffiliated securities | | $ | 12,926 | |
American Beacon Treasury Inflation Protected Securities FundSM
Statement of Operations
For the year ended December 31, 2015 (in thousands)
| | | | |
Investment income: | | | | |
Interest income | | $ | 620 | |
| | | | |
Total investment income | | | 620 | |
| | | | |
Expenses: | | | | |
Management and investment advisory fees (Note 2) | | | 260 | |
Administrative service fees (Note 2): | | | | |
Institutional Class | | | 343 | |
Y Class | | | 2 | |
Investor Class | | | 8 | |
A Class | | | 2 | |
Transfer agent fees: | | | | |
Institutional Class | | | 88 | |
Investor Class | | | 2 | |
Custody and fund accounting fees | | | 40 | |
Professional fees | | | 40 | |
Registration fees and expenses | | | 76 | |
Service fees (Note 2): | | | | |
Y Class | | | 1 | |
Investor Class | | | 6 | |
A Class | | | 1 | |
Distribution fees (Note 2): | | | | |
A Class | | | 1 | |
C Class | | | 1 | |
Prospectus and shareholder report expenses | | | 12 | |
Trustee fees | | | 13 | |
Other expenses | | | 15 | |
| | | | |
Total expenses | | | 911 | |
| | | | |
Net fees waived and expenses reimbursed (Note 2) | | | (233 | ) |
| | | | |
Net expenses | | | 678 | |
| | | | |
Net investment (loss) | | | (58 | ) |
| | | | |
| |
Realized and unrealized gain (loss) from investments: | | | | |
Net realized gain (loss) from: | | | | |
Investments | | | (6,827 | ) |
Change in net unrealized appreciation or (depreciation) of: | | | | |
Investments | | | 5,752 | |
| | | | |
Net (loss) from investments | | | (1,075 | ) |
| | | | |
Net (decrease) in net assets resulting from operations | | $ | (1,133 | ) |
| | | | |
American Beacon Treasury Inflation Protected Securities FundSM
Statement of Changes in Net Assets (in thousands)
| | | | | | | | |
| | | Year Ended
December 31,
2015 | | | Year Ended
December 31,
2014 | |
Increase (Decrease) in Net Assets: | | | | | | | | |
Operations: | | | | | | | | |
Net investment income (loss) | | $ | (58 | ) | | $ | 1,872 | |
Net realized gain (loss) from investments | | | (6,827 | ) | | | (758 | ) |
Change in net unrealized appreciation or (depreciation) of investments | | | 5,752 | | | | (609 | ) |
| | | | | | | | |
Net increase (decrease) in net assets resulting from operations | | | (1,133 | ) | | | 505 | |
| | | | | | | | |
| | |
| | | | | | | | |
Distributions to Shareholders: | | | | | | | | |
Net investment income: | | | | | | | | |
Institutional Class | | | — | | | | (1,861 | ) |
Y Class | | | — | | | | (3 | ) |
Investor Class | | | — | | | | (7 | ) |
A Class | | | — | | | | (1 | ) |
C Class | | | — | | | | — | |
Return of capital | | | | | | | | |
Institutional Class | | | — | | | | (248 | ) |
Y Class | | | — | | | | — | |
Investor Class | | | — | | | | (1 | ) |
A Class | | | — | | | | — | |
C Class | | | — | | | | — | |
| | | | | | | | |
Net distributions to shareholders | | | — | | | | (2,121 | ) |
| | | | | | | | |
| | |
Capital Share Transactions: | | | | | | | | |
Proceeds from sales of shares | | | 51,810 | | | | 85,648 | |
Reinvestment of dividends and distributions | | | — | | | | 2,119 | |
Cost of shares redeemed | | | (286,069 | ) | | | (45,874 | ) |
| | | | | | | | |
Net increase (decrease) in net assets from capital share transactions | | | (234,259 | ) | | | 41,893 | |
| | | | | | | | |
Net increase (decrease) in net assets | | | (235,392 | ) | | | 40,277 | |
| | | | | | | | |
Net Assets: | | | | | | | | |
Beginning of period | | | 247,869 | | | | 207,592 | |
| | | | | | | | |
End of Period * | | $ | 12,477 | | | $ | 247,869 | |
| | | | | | | | |
* Includes undistributed (or overdistribution of) net investment income | | $ | — | | | $ | — | |
| | | | | | | | |
American Beacon Treasury Inflation Protected Securities FundSM
Notes to Financial Statements
December 31, 2015
1. Organization
American Beacon Funds (the “Trust”) is organized as a Massachusetts business trust and is registered under the Investment Company Act of 1940 as amended (the “Act”), as a diversified, open-end management investment company. As of December 31, 2015, the Trust consists of twenty-five active series, one of which is presented in this filing (the “Fund”): American Beacon Treasury Inflation Protected Securities Fund. The remaining twenty-four active series are reported in separate filings.
American Beacon Advisors, Inc. (the “Manager”) is a wholly-owned subsidiary of Astro AB Borrower, Inc., which is indirectly owned by investment funds affiliated with Kelso & Company, L.P. and Estancia Capital Management, LLC, and was organized in 1986 to provide business management, advisory, administrative and asset management consulting services to the Trust and other investors.
The Y, A, and C Classes of the Fund were closed to new investors on September 22, 2015. On January 12, 2016, the Institutional and Investor Classes of the Fund were closed to new investors. Existing shareholders may continue to purchase, redeem, or exchange shares of the Fund on any business day the New York Stock Exchange is open for business.
Class Disclosure
The Fund has multiple classes of shares designed to meet the needs of different groups of investors. The following table sets forth the differences amongst the classes:
| | |
Class: | | Offered to: |
| Institutional Class | | Investors making an initial investment of $250,000 |
| Y Class | | Investors making an initial investment of $100,000 |
| Investor Class | | General public and investors investing through an intermediary |
| A Class | | General public and investors investing through an intermediary with applicable sales charges, which may include a front-end sales charge and a contingent deferred sales charge (“CDSC”) |
| C Class | | General public and investors investing through an intermediary with applicable sales charges, which may include a CDSC |
Each class offered by the Trust has equal rights as to assets and voting privileges. Income and non-class specific expenses are allocated daily to each class on the basis of the relative net assets. Realized and unrealized capital gains and losses of each class are allocated daily based on the relative net assets of each class of the Fund. Class specific expenses, where applicable, currently include administrative service fees, service fees, and distribution fees and vary amongst the classes as described more fully in Note 2.
2. Transactions with Affiliates
Management Agreement
The Trust and the Manager are parties to a Management Agreement that obligates the Manager to provide or oversee the provision of all investment advisory and fund management. Investment assets of the Fund may be managed by multiple investment advisors which have entered into separate investment advisory agreements with the Manager and the Trust. As compensation for performing the duties required under the Management Agreement, the Manager receives from the Fund an annualized fee equal to 0.05% of the average daily net assets. The Fund pays the unaffiliated investment advisors hired to direct investment activities of the Fund. Management fees paid during the year ended December 31, 2015 were as follows (dollars in thousands):
| | | | | | |
Management Fee Rate | | Management Fee | | Amounts paid to Investment Sub-Advisors | | Amount Paid to Manager |
0.11% | | $260 | | $144 | | $116 |
American Beacon Treasury Inflation Protected Securities FundSM
Notes to Financial Statements
December 31, 2015
Administration Agreement
The Manager and the Trust entered into an Administration Agreement which obligates the Manager to provide or oversee administrative services to the Fund. As compensation for performing the duties required under the Administration Agreement, the Manager receives an annualized fee of 0.15% of the average daily net assets of the Institutional Class, and 0.30% of the average daily net assets of the Y, Investor, A, and C Classes.
Distribution Plans
The Trust, except for the A and C Classes of the Fund, has adopted a “defensive” Distribution Plan (the “Plan”) in accordance with Rule 12b-1 under the Act, pursuant to which no separate fees will be charged to the Fund for distribution purposes. However, the Plan authorizes the management and administrative service fees received by the Manager and the investment advisors hired by the Manager to be used for distribution purposes. Under this Plan, the Fund does not intend to separately compensate the Manager or any other party, either directly or indirectly, for the distribution of Fund shares.
Separate Distribution Plans (the “Distribution Plans”) have been adopted pursuant to Rule 12b-1 under the Act for the A and C Classes of the Fund. Under the Distribution Plans, as compensation for distribution assistance, the Manager receives an annual fee of 0.25% of the average daily net assets of the A Class and 1.00% of the average daily net assets of the C Class of the Fund. The fee will be payable without regard to whether the amount of the fee is more or less than the actual expense incurred in a particular month by the Manager for distribution assistance.
Service Plan
The Manager and the Trust entered into Service Plans that obligate the Manager to oversee additional shareholder servicing of the Y, Investor, A, and C Classes of the Fund. As compensation for performing the duties required under the Service Plans, the Manager receives an annualized fee of 0.10% of the average daily net assets of the Y Class, 0.15% of the average daily net assets of the A and C Classes, and up to 0.375% of the average daily net assets of the Investor Class of the Fund.
Interfund Lending Program
Pursuant to an exemptive order by the Securities and Exchange Commission (the “SEC”), the Fund, along with other registered investment companies having management contracts with the Manager, may participate in an interfund lending program as a borrower. This program provides an alternative credit facility allowing the Fund to borrow from other participating Funds. During the year ended December 31, 2015, the Fund did not utilize the credit facility.
Expense Reimbursement Plan
The Manager contractually agreed to reimburse 0.10% of the Administrative Service fee for the Institutional Class. Additionally, the Manager contractually agreed to waive fees and/or reimburse expenses of the Y, Investor, A, and C classes to the extent that the total annual fund operating expenses exceeded each Funds’ expense cap. Of these amounts, $1,518 was receivable from the Manager at December 31, 2015:
| | | | | | |
| | | Expense Cap and Limits | | | | Expiration of |
Class | | 1/1/15 to 12/31/15 | | Reimbursed Expenses | | Reimbursements |
| Institutional | | 0.10% | | $229,613 | | 2018 |
| Y | | 0.61% | | 51 | | 2018 |
| Investor | | 0.69% | | 3,224 | | 2018 |
| A | | 0.90% | | 164 | | 2018 |
| C | | 1.68% | | 11 | | 2018 |
12
American Beacon Treasury Inflation Protected Securities FundSM
Notes to Financial Statements
December 31, 2015
The Fund has adopted an Expense Reimbursement Plan whereby the Manager may seek repayment of fees waived or expenses reimbursed for a period of up to three years. However, reimbursement will occur only if the Class’s average net assets have grown or expenses have declined sufficiently to allow reimbursement without causing its expense ratio to exceed the previously agreed upon contractual expense limit. The carryover of excess expenses potentially reimbursable to the Manager is $207,574 and $232,814 which will expire in 2016 and 2017, respectively. Carryover expenses of $246,503 expired in 2015. The Fund did not record a liability for these potential reimbursements due to the current assessment that reimbursements are unlikely.
Sales Commissions
The Fund’s distributor, Foreside Fund Services, LLC (“Foreside”) may receive a portion of A Class sales charges from broker dealers and it may be used to offset distribution related expenses. For the year ended December 31, 2015, Foreside collected $124 from the sale of Class A Shares.
A CDSC of 0.50% will be deducted with respect to Class A Shares on certain purchases of $1,000,000 or more that are redeemed in whole or part within 18 months of purchase, unless waived as discussed in the Prospectus. Any applicable CDSC will be 0.50% of the lesser of the original purchase price or the value of the redemption of the Class A Shares redeemed. During the year ended December 31, 2015, CDSC fees of $5,097 were collected for Class A Shares.
A CDSC of 1.00% will be deducted with respect to Class C Shares redeemed within 12 months of purchase, unless waived as discussed in the Prospectus. Any applicable CDSC will be 1.00% of the lesser of the original purchase price or the value of the redemption of the Class C Shares redeemed. During the year ended December 31, 2015, there were no CDSC fees for the Class C Shares.
3. Security Valuation and Fair Value Measurements
Investments are valued at the close of the New York Stock Exchange (the “Exchange”), normally 4 p.m. ET, each day that the Exchange is open for business.
Debt securities (other than short-term securities) normally are valued on the basis of prices provided by an independent pricing service and may take into account appropriate factors such as institution-size trading in similar groups of securities, yield, quality, coupon rate, maturity, type of issue, trading characteristics, and other market data. The prices of debt securities may be determined using quotes obtained from brokers.
Investments in open-end mutual funds are valued at the closing net asset value (“NAV”) per share of the mutual fund on the day of valuation.
Securities for which market prices are not readily available or are not reflective of the fair value of the security, as determined by the Manager, will be priced at fair value following procedures approved by the Trust’s Board of Trustees (the “Board”).
Valuation Inputs
Various inputs may be used to determine the fair value of the Fund’s investments. These inputs are summarized in three broad levels for financial statement purposes. The inputs or methodologies used to value securities are not necessarily an indication of the risk associated with investing in those securities.
| | |
| Level 1 – | | Quoted prices in active markets for identical securities. |
13
American Beacon Treasury Inflation Protected Securities FundSM
Notes to Financial Statements
December 31, 2015
| | |
| Level 2 – | | Prices determined using other significant observable inputs. These may include quoted prices for similar securities, interest rates, prepayment speeds, credit risk, and others. Level 2 securities are fixed-income securities that are valued using observable inputs as stated above. |
| Level 3 – | | Prices determined using other significant unobservable inputs. Unobservable inputs reflect the Fund’s own assumptions about the factors market participants would use in pricing an investment, and would be based on the best information available. |
Level 1 and Level 2 trading assets and trading liabilities, at fair value
Fixed income securities including corporate, U.S. government agencies, and U.S. treasury obligations, are normally valued by pricing service providers that use broker dealer quotations, reported trades or valuation estimates from their internal pricing models. The service providers’ internal models use inputs that are observable such as issuer details, interest rates, yield curves, prepayment speeds, credit risks/spreads, default rates, and quoted prices for similar assets. Securities that use similar valuation techniques and inputs as described above are categorized as Level 2 of the fair value hierarchy.
Fixed income securities purchased on a delayed-delivery basis are marked to market daily until settlement at the forward settlement date are categorized as Level 2 of the fair value hierarchy.
Investments in registered open-end investment management companies will be valued based upon the NAVs of such investments and are categorized as Level 1 of the fair value hierarchy.
The Fund’s investments are summarized by level based on the inputs used to determine their values. U.S. Generally Accepted Accounting Principles (“U.S. GAAP”) also requires all significant transfers between any levels to be disclosed. The end of period timing recognition has been adopted for the transfer between levels of the Fund’s assets and liabilities. During the year ended December 31, 2015, there were no transfers between levels. As of December 31, 2015, the investments were classified as described below (in thousands):
| | | | | | | | | | | | | | | | |
| | | Level 1 | | | Level 2 | | | Level 3 | | | Total | |
U.S. Treasury Obligations | | $ | — | | | $ | 12,315 | | | $ | — | | | $ | 12,315 | |
Short-term Investments - Money Market Funds | | | 502 | | | | — | | | | — | | | | 502 | |
| | | | | | | | | | | | | | | | |
Total Investments in Securities | | $ | 502 | | | $ | 12,315 | | | $ | — | | | $ | 12,817 | |
| | | | | | | | | | | | | | | | |
Security Transactions and Investment Income
Security transactions are recorded on the trade date of the security purchase or sale. The Fund may purchase securities with delivery or payment to occur at a later date. At the time the Fund enters into a commitment to purchase a security, the transaction is recorded, and the value of the security is reflected in the NAV. The value of the security may vary with market fluctuations.
Interest income is earned from settlement date, recorded on the accrual basis, and adjusted, if necessary, for accretion of discounts and amortization of premiums. For financial and tax reporting purposes, realized gains and losses are determined on the basis of specific lot identification.
Dividends to Shareholders
Dividends from net investment income of the Fund normally will be declared and paid at least annually. Distributions, if any, of net realized capital gains are generally paid at least annually and recorded on the ex-dividend date.
14
American Beacon Treasury Inflation Protected Securities FundSM
Notes to Financial Statements
December 31, 2015
Allocation of Income, Expenses, Gains, and Losses
Income, expenses (other than those attributable to a specific class), gains, and losses are allocated daily to each class of shares based up on the relative proportion of net assets represented by such class. Operating expenses directly attributable to a specific class are charged against the operations of that class.
Use of Estimates
The preparation of financial statements in conformity with U.S. GAAP requires management to make estimates and assumptions that affect the amounts reported in the financial statements and accompanying notes. Actual results may differ from those estimated.
Other
Under the Trust’s organizational documents, its officers and trustees are indemnified against certain liability arising out of the performance of their duties to the Trust. In the normal course of business, the Trust enters into contracts that provide indemnification to the other party or parties against potential costs or liabilities. The Trust’s maximum exposure under these arrangements is dependent on claims that may be made in the future and, therefore, cannot be estimated. The Trust has had no prior claims or losses pursuant to any such agreement.
4. Securities and Other Investments
U.S. Treasury Inflation Protected Securities
Treasury Inflation Protected securities (“TIPs”) are inflation-indexed bonds issued by the U.S. Treasury. The principal amount is adjusted daily to the rate of inflation. Interest is accrued based on the adjusted principal amount. The adjustments to the principal due to inflation are reflected as increases or decreases to interest income in the accompanying Statement of Operations, even though principal is not received until maturity. Such adjustments may have a significant impact on the Fund’s distributions.
Other Investment Company Securities and Other Exchange Traded Products
The Fund may invest in shares of other investment companies, including open-end funds, closed-end funds, business development companies, ETFs, unit investment trusts, and other investment companies of the Trust. The Fund may invest in investment company securities advised by the Manager or a sub-advisor. Investments in the securities of other investment companies may involve duplication of advisory fees and certain other expenses. By investing in another investment company, a Fund becomes a shareholder of that investment company. As a result, Fund shareholders indirectly will bear a Fund’s proportionate share of the fees and expenses paid by shareholders of the other investment company, in addition to the fees and expenses Fund shareholders directly bear in connection with the Fund’s own operations. These other fees and expenses are reflected as Acquired Fund Fees and Expenses and are included in the Fees and Expenses Table for the Fund in its Prospectus, if applicable. Investments in other investment companies may involve the payment of substantial premiums above the value of such issuer’s portfolio securities.
5. Principal Risks
In the normal course of business the Fund trades financial instruments and enters into financial transactions where risk of potential loss exists. Security values fluctuate (market risk) and may decline due to factors affecting securities markets in general, particular industries represented in the securities markets or conditions specifically related to a particular company. Failure of the other party to a transaction to perform (credit and counterparty risk), for example by not making principal and interest payments when due, reduces
15
American Beacon Treasury Inflation Protected Securities FundSM
Notes to Financial Statements
December 31, 2015
the value of the issuer’s debt and could reduce the Fund’s income. Similar to credit risk, the Fund may be exposed to counterparty risk, or the risk that an institution or other entity with which the Fund has unsettled or open transactions will fail to make required payments or otherwise comply with the terms of the instrument, transaction or contract. The potential loss could exceed the value of the financial assets recorded in the financial statements. Some of the Fund’s investments may be illiquid and the Fund may not be able to vary the portfolio investments in response to changes in economic and other conditions. If a Fund is required to liquidate all or a portion of its investments quickly, the Fund may realize significantly less than the value at which it previously recorded those investments.
6. Federal Income and Excise Taxes
It is the policy of the Fund to qualify as a regulated investment company (“RIC”), by complying with all applicable provisions of Subchapter M of the Internal Revenue Code, as amended, and to make distribution of taxable income sufficient to relieve it from substantially all federal income and excise taxes. For federal income tax purposes, the Fund is treated as a single entity for the purpose of determining such qualification.
The Fund does not have any unrecognized tax benefits in the accompanying financial statements. Each of the tax years in the four year period ended December 31, 2015 remains subject to examination by the Internal Revenue Service. If applicable, the Fund recognizes interest accrued related to unrecognized tax benefits in interest expense and penalties in “Other expenses” on the Statement of Operations.
Dividends are categorized in accordance with income tax regulations which may treat certain transactions differently than U.S. GAAP. Accordingly, the character of distributions and composition of net assets for tax purposes may differ from those reflected in the accompanying financial statements.
The tax character of distributions paid was as follows (in thousands):
| | | | | | | | |
| | | Year Ended
December 31,
2015 | | | Year Ended
December 31,
2014 | |
Distributions paid from: | | | | | | | | |
Ordinary income* | | | | | | | | |
Institutional Class | | $ | — | | | $ | 1,861 | |
Y Class | | | — | | | | 3 | |
Investor Class | | | — | | | | 7 | |
A Class | | | — | | | | 1 | |
C Class | | | — | | | | — | |
Return of capital | | | | | | | | |
Institutional Class | | | — | | | | 248 | |
Y Class | | | — | | | | — | |
Investor Class | | | — | | | | 1 | |
A Class | | | — | | | | — | |
C Class | | | — | | | | — | |
| | | | | | | | |
Total distributions paid | | $ | — | | | $ | 2,121 | |
| | | | | | | | |
| * | For tax purposes, short-term capital gains distributions are considered ordinary income distributions. |
As of December 31, 2015, the components of distributable earnings or (deficits) on a tax basis were as follows (in thousands):
| | | | |
Cost basis of investments for federal income tax purposes | | $ | 13,151 | |
Unrealized appreciation | | | — | |
Unrealized depreciation | | | (334 | ) |
| | | | |
Net unrealized appreciation or (depreciation) | | | (334 | ) |
| |
Undistributed ordinary income | | | — | |
Accumulated capital and other losses | | | (12,802 | ) |
Undistributed long-term capital gain | | | — | |
| | | | |
Distributable earnings or (deficits) | | $ | (13,136 | ) |
| | | | |
16
American Beacon Treasury Inflation Protected Securities FundSM
Notes to Financial Statements
December 31, 2015
Financial reporting records are adjusted for permanent book/tax differences to reflect tax character. Financial records are not adjusted for temporary differences. The temporary differences between financial reporting and tax-basis reporting of unrealized appreciation or depreciation are attributable primarily to the tax deferral of losses from wash sales.
Due to inherent differences in the recognition of income, expenses, and realized gains (losses) under U.S. GAAP and federal income tax regulations, permanent differences between book and tax reporting have been identified and appropriately reclassified on the Statement of Assets and Liabilities.
Accordingly, the following amounts represent current year permanent differences derived from the non-utilization of net operating loss as of December 31, 2015 (in thousands):
| | | | |
Paid-in-capital | | $ | (59 | ) |
Undistributed net investment income | | | 58 | |
Accumulated net realized gain (loss) | | | 1 | |
Unrealized appreciation or (depreciation) of investments | | | — | |
Under the Regulated Investment Company Modernization Act of 2010 (the “RIC MOD”), net capital losses recognized by the Fund in taxable years beginning after December 22, 2010 are carried forward indefinitely and retain their character as short-term and/or long-term losses.
As of December 31, 2015, the Fund has $5,802 of short-term and $7,000 of long-term post enactment capital loss carryforwards (in thousands).
7. Investment Transactions
Purchases and proceeds from sales of investments, other than short-term obligations, for the year ended December 31, 2015 were $287,920,393 and $519,168,347, respectively. These amounts also represent purchases and sales of U.S. Government securities.
8. Capital Share Transactions
The tables below summarize the activity in capital shares (dollars and shares in thousands):
For the Year Ended December 31, 2015
| | | | | | | | | | | | | | | | | | | | | | | | |
| | | Institutional Class | | | Y Class | | | Investor Class | |
| | | Shares | | | Amount | | | Shares | | | Amount | | | Shares | | | Amount | |
Shares sold | | | 4,630 | | | $ | 48,195 | | | | 15 | | | $ | 156 | | | | 186 | | | $ | 1,893 | |
Reinvestment of dividends | | | — | | | | — | | | | — | | | | — | | | | — | | | | — | |
Shares redeemed | | | (27,558 | ) | | | (283,555 | ) | | | (23 | ) | | | (236 | ) | | | (50 | ) | | | (510 | ) |
| | | | | | | | | | | | | | | | | | | | | | | | |
Net increase (decrease) in shares outstanding | | | (22,928 | ) | | $ | (235,360 | ) | | | (8 | ) | | $ | (80 | ) | | | 136 | | | $ | 1,383 | |
| | | | | | | | | | | | | | | | | | | | | | | | |
| | | | | | | | | | | | | | | | |
| | | A Class | | | C Class | |
| | | Shares | | | Amount | | | Shares | | | Amount | |
Shares sold | | | 153 | | | $ | 1,566 | | | | — | | | $ | — | |
Reinvestment of dividends | | | — | | | | — | | | | — | | | | — | |
Shares redeemed | | | (166 | ) | | | (1,700 | ) | | | (7 | ) | | | (68 | ) |
| | | | | | | | | | | | | | | | |
Net (decrease) in shares outstanding | | | (13 | ) | | $ | (134 | ) | | | (7 | ) | | $ | (68 | ) |
| | | | | | | | | | | | | | | | |
17
American Beacon Treasury Inflation Protected Securities FundSM
Notes to Financial Statements
December 31, 2015
For the Year Ended December 31, 2014
| | | | | | | | | | | | | | | | | | | | | | | | |
| | | Institutional Class | | | Y Class | | | Investor Class | |
| | | Shares | | | Amount | | | Shares | | | Amount | | | Shares | | | Amount | |
Shares sold | | | 8,046 | | | $ | 84,971 | | | | 22 | | | $ | 229 | | | | 17 | | | $ | 176 | |
Reinvestment of dividends | | | 204 | | | | 2,108 | | | | — | | | | 3 | | | | 1 | | | | 8 | |
Shares redeemed | | | (4,045 | ) | | | (42,621 | ) | | | (25 | ) | | | (264 | ) | | | (221 | ) | | | (2,294 | ) |
| | | | | | | | | | | | | | | | | | | | | | | | |
Net increase (decrease) in shares outstanding | | | 4,205 | | | $ | 44,458 | | | | (3 | ) | | $ | (32 | ) | | | (203 | ) | | $ | (2,110 | ) |
| | | | | | | | | | | | | | | | | | | | | | | | |
| | | | | | | | | | | | | | | | |
| | | A Class | | | C Class | |
| | | Shares | | | Amount | | | Shares | | | Amount | |
Shares sold | | | 14 | | | $ | 142 | | | | 13 | | | $ | 130 | |
Reinvestment of dividends | | | — | | | | — | | | | — | | | | — | |
Shares redeemed | | | (27 | ) | | | (276 | ) | | | (42 | ) | | | (419 | ) |
| | | | | | | | | | | | | | | | |
Net (decrease) in shares outstanding | | | (13 | ) | | $ | (134 | ) | | | (29 | ) | | $ | (289 | ) |
| | | | | | | | | | | | | | | | |
9. Subsequent Event
On September 22, 2015, the Manager announced the Board’s approval of a plan to liquidate and terminate the Y, A, and C Classes of the Fund. The Y, A, and C Classes were closed on January 15, 2016. On January 11, 2016, the Manager announced the Board’s approval of a plan to liquidate and terminate the Fund on or about March 31, 2016.
18
This page intentionally left blank.
American Beacon Treasury Inflation Protected Securities FundSM
Financial Highlights
(For a share outstanding throughout the period)
| | | | | | | | | | | | | | | | | | | | |
| | | Institutional Class | |
| | | Year Ended December 31, | |
| | | 2015 | | | 2014 | | | 2013 | | | 2012 | | | 2011 | |
Net asset value, beginning of period | | $ | 10.31 | | | $ | 10.34 | | | $ | 10.97 | | | $ | 11.16 | | | $ | 10.51 | |
| | | | | | | | | | | | | | | | | | | | |
Income from investment operations: | | | | | | | | | | | | | | | | | | | | |
Net investment income (loss) | | | (2.34 | ) | | | 0.09 | | | | (0.02 | ) | | | 0.04 | | | | 0.28 | |
Net gains (losses) from investments (both realized and unrealized) | | | 2.33 | | | | (0.03 | ) | | | (0.61 | ) | | | 0.49 | | | | 0.67 | |
| | | | | | | | | | | | | | | | | | | | |
Total income (loss) from investment operations | | | (0.01 | ) | | | 0.06 | | | | (0.63 | ) | | | 0.53 | | | | 0.95 | |
| | | | | | | | | | | | | | | | | | | | |
Less distributions: | | | | | | | | | | | | | | | | | | | | |
Dividends from net investment income | | | — | | | | (0.08 | ) | | | — | | | | (0.07 | ) | | | (0.29 | ) |
Distributions from net realized gains | | | — | | | | — | | | | — | | | | (0.49 | ) | | | — | |
Return of capital | | | — | | | | (0.01 | )A | | | — | | | | (0.16 | )A | | | (0.01 | )A |
| | | | | | | | | | | | | | | | | | | | |
Total distributions | | | — | | | | (0.09 | ) | | | — | | | | (0.72 | ) | | | (0.30 | ) |
| | | | | | | | | | | | | | | | | | | | |
Net asset value, end of period | | $ | 10.30 | | | $ | 10.31 | | | $ | 10.34 | | | $ | 10.97 | | | $ | 11.16 | |
| | | | | | | | | | | | | | | | | | | | |
Total return B | | | (0.10 | )% | | | 0.58 | % | | | (5.74 | )% | | | 4.80 | % | | | 9.14 | % |
| | | | | | | | | | | | | | | | | | | | |
Ratios and supplemental data: | | | | | | | | | | | | | | | | | | | | |
Net assets, end of period (in thousands) | | $ | 7,720 | | | $ | 244,192 | | | $ | 201,381 | | | $ | 202,274 | | | $ | 206,864 | |
Ratios to average net assets (annualized): | | | | | | | | | | | | | | | | | | | | |
Expenses, before reimbursements | | | 0.38 | % | | | 0.40 | % | | | 0.39 | % | | | 0.37 | % | | | 0.36 | % |
Expenses, net of reimbursements | | | 0.28 | % | | | 0.30 | % | | | 0.30 | % | | | 0.27 | % | | | 0.26 | % |
Net investment income (loss), before reimbursements | | | (0.11 | )% | | | 0.71 | % | | | (0.31 | )% | | | 0.64 | % | | | 2.24 | % |
Net investment income (loss), net of reimbursements | | | (0.01 | )% | | | 0.81 | % | | | (0.21 | )% | | | 0.74 | % | | | 2.34 | % |
Portfolio turnover rate | | | 131 | % | | | 102 | % | | | 252 | % | | | 286 | % | | | 381 | % |
| A | The return of capital is calculated based on outstanding shares at the time of distribution. |
| B | Based on net asset value, which does not reflect the sales charge, redemption fee, or contingent deferred sales charge, if applicable. May include adjustments in accordance with U.S. GAAP and as such, the net asset value for reporting purposes and the returns based upon those net asset values may differ from the net asset value and returns for shareholder transactions. |
| C | Amount represents less than $0.01 per share. |
20
American Beacon Treasury Inflation Protected Securities FundSM
Financial Highlights
(For a share outstanding throughout the period)
| | | | | | | | | | | | | | | | | | | | | | | | | | | | | | | | | | | | | | | | | | | | | | | | | | | | | | | | | | |
| Y Class | | | Investor Class | | | A Class | |
| Year Ended December 31, | | | Year Ended December 31, | | | Year Ended December 31, | |
| 2015 | | | 2014 | | | 2013 | | | 2012 | | | 2011 | | | 2015 | | | 2014 | | | 2013 | | | 2012 | | | 2011 | | | 2015 | | | 2014 | | | 2013 | | | 2012 | | | 2011 | |
| | | | | | | | | | | | | | |
| $ | 10.35 | | | $ | 10.37 | | | $ | 11.03 | | | $ | 11.24 | | | $ | 10.60 | | | $ | 10.22 | | | $ | 10.24 | | | $ | 10.90 | | | $ | 11.12 | | | $ | 10.48 | | | $ | 10.22 | | | $ | 10.23 | | | $ | 10.93 | | | $ | 11.15 | | | $ | 10.54 | |
| | | | | | | | | | | | | | | | | | | | | | | | | | | | | | | | | | | | | | | | | | | | | | | | | | | | | | | | | | |
| | | | | | | | | | | | | | | | | | | | | | | | | | | | | | | | | | | | | | | | | | | | | | | | | | | | | | | | | | |
| | (0.06 | ) | | | 0.05 | | | | (0.07 | ) | | | 0.09 | | | | 0.26 | | | | 0.02 | | | | (0.05 | ) | | | (0.13 | ) | | | 0.06 | | | | 0.24 | | | | (0.16 | ) | | | (0.01 | ) | | | (0.07 | ) | | | 0.00C | | | | 0.10 | |
| | 0.02 | | | | (0.02 | ) | | | (0.59 | ) | | | 0.41 | | | | 0.65 | | | | (0.07 | ) | | | 0.06 | | | | (0.53 | ) | | | 0.42 | | | | 0.66 | | | | 0.08 | | | | 0.01 | | | | (0.63 | ) | | | 0.45 | | | | 0.76 | |
| | | | | | | | | | | | | | | | | | | | | | | | | | | | | | | | | | | | | | | | | | | | | | | | | | | | | | | | | | |
| | (0.04 | ) | | | 0.03 | | | | (0.66 | ) | | | 0.50 | | | | 0.91 | | | | (0.05 | ) | | | 0.01 | | | | (0.66 | ) | | | 0.48 | | | | 0.90 | | | | (0.08 | ) | | | 0.00 | | | | (0.70 | ) | | | 0.45 | | | | 0.86 | |
| | | | | | | | | | | | | | | | | | | | | | | | | | | | | | | | | | | | | | | | | | | | | | | | | | | | | | | | | | |
| | | | | | | | | | | | | | | | | | | | | | | | | | | | | | | | | | | | | | | | | | | | | | | | | | | | | | | | | | |
| | — | | | | (0.04 | ) | | | — | | | | (0.06 | ) | | | (0.26 | ) | | | — | | | | (0.03 | ) | | | — | | | | (0.05 | ) | | | (0.25 | ) | | | — | | | | (0.01 | ) | | | — | | | | (0.02 | ) | | | (0.24 | ) |
| | — | | | | — | | | | — | | | | (0.49 | ) | | | — | | | | — | | | | — | | | | — | | | | (0.49 | ) | | | — | | | | — | | | | — | | | | — | | | | (0.49 | ) | | | — | |
| | — | | | | (0.01 | )A | | | — | | | | (0.16 | )A | | | (0.01 | )A | | | — | | | | (0.00 | )AC | | | — | | | | (0.16 | )A | | | (0.01 | )A | | | — | | | | (0.00 | )AC | | | — | | | | (0.16 | )A | | | (0.01 | )A |
| | | | | | | | | | | | | | | | | | | | | | | | | | | | | | | | | | | | | | | | | | | | | | | | | | | | | | | | | | |
| | — | | | | (0.05 | ) | | | — | | | | (0.71 | ) | | | (0.27 | ) | | | — | | | | (0.03 | ) | | | — | | | | (0.70 | ) | | | (0.26 | ) | | | — | | | | (0.01 | ) | | | — | | | | (0.67 | ) | | | (0.25 | ) |
| | | | | | | | | | | | | | | | | | | | | | | | | | | | | | | | | | | | | | | | | | | | | | | | | | | | | | | | | | |
| $ | 10.31 | | | $ | 10.35 | | | $ | 10.37 | | | $ | 11.03 | | | $ | 11.24 | | | $ | 10.17 | | | $ | 10.22 | | | $ | 10.24 | | | $ | 10.90 | | | $ | 11.12 | | | $ | 10.14 | | | $ | 10.22 | | | $ | 10.23 | | | $ | 10.93 | | | $ | 11.15 | |
| | | | | | | | | | | | | | | | | | | | | | | | | | | | | | | | | | | | | | | | | | | | | | | | | | | | | | | | | | |
| | (0.39 | )% | | | 0.32 | % | | | (5.98 | )% | | | 4.42 | % | | | 8.66 | % | | | (0.49 | )% | | | 0.14 | % | | | (6.06 | )% | | | 4.32 | % | | | 8.67 | % | | | (0.78 | )% | | | 0.03 | % | | | (6.40 | )% | | | 4.07 | % | | | 8.17 | % |
| | | | | | | | | | | | | | | | | | | | | | | | | | | | | | | | | | | | | | | | | | | | | | | | | | | | | | | | | | |
| | | | | | | | | | | | | | | | | | | | | | | | | | | | | | | | | | | | | | | | | | | | | | | | | | | | | | | | | | |
| $ | 512 | | | $ | 593 | | | $ | 627 | | | $ | 1,051 | | | $ | 501 | | | $ | 3,685 | | | $ | 2,315 | | | $ | 4,395 | | | $ | 19,438 | | | $ | 19,920 | | | $ | 521 | | | $ | 662 | | | $ | 793 | | | $ | 741 | | | $ | 855 | |
| | | | | | | | | | | | | | | | | | | | | | | | | | | | | | | | | | | | | | | | | | | | | | | | | | | | | | | | | | |
| | 0.62 | % | | | 0.63 | % | | | 0.63 | % | | | 0.62 | % | | | 1.04 | % | | | 0.82 | % | | | 0.81 | % | | | 0.79 | % | | | 0.77 | % | | | 0.77 | % | | | 0.93 | % | | | 0.99 | % | | | 1.06 | % | | | 1.07 | % | | | 1.32 | % |
| | 0.61 | % | | | 0.61 | % | | | 0.61 | % | | | 0.61 | % | | | 0.63 | % | | | 0.69 | % | | | 0.69 | % | | | 0.69 | % | | | 0.69 | % | | | 0.68 | % | | | 0.90 | % | | | 0.95 | % | | | 1.00 | % | | | 1.01 | % | | | 1.03 | % |
| | (0.50 | )% | | | 0.46 | % | | | (0.59 | )% | | | 0.81 | % | | | 1.80 | % | | | (0.89 | )% | | | 0.25 | % | | | (0.66 | )% | | | 0.44 | % | | | 2.24 | % | | | (0.84 | )% | | | 0.25 | % | | | (0.93 | )% | | | 0.07 | % | | | 0.88 | % |
| | (0.49 | )% | | | 0.47 | % | | | (0.57 | )% | | | 0.82 | % | | | 2.21 | % | | | (0.77 | )% | | | 0.37 | % | | | (0.56 | )% | | | 0.53 | % | | | 2.32 | % | | | (0.81 | )% | | | 0.29 | % | | | (0.86 | )% | | | 0.13 | % | | | 1.17 | % |
| | 131 | % | | | 102 | % | | | 252 | % | | | 286 | % | | | 381 | % | | | 131 | % | | | 102 | % | | | 252 | % | | | 286 | % | | | 381 | % | | | 131 | % | | | 102 | % | | | 252 | % | | | 286 | % | | | 381 | % |
21
American Beacon Treasury Inflation Protected Securities FundSM
Financial Highlights
(For a share outstanding throughout the period)
| | | | | | | | | | | | | | | | | | | | |
| | | C Class | |
| | | Year Ended December 31, | |
| | | 2015 | | | 2014 | | | 2013 | | | 2012 | | | 2011 | |
Net asset value, beginning of period | | $ | 9.92 | | | $ | 10.00 | | | $ | 10.77 | | | $ | 11.06 | | | $ | 10.46 | |
| | | | | | | | | | | | | | | | | | | | |
Income from investment operations: | | | | | | | | | | | | | | | | | | | | |
Net investment income (loss) | | | (2.05 | ) | | | (0.76 | ) | | | (0.15 | ) | | | (0.05 | ) | | | 0.13 | |
Net gains (losses) from investments (both realized and unrealized) | | | 1.90 | | | | 0.68 | | | | (0.62 | ) | | | 0.41 | | | | 0.65 | |
| | | | | | | | | | | | | | | | | | | | |
Total income (loss) from investment operations | | | (0.15 | ) | | | (0.08 | ) | | | (0.77 | ) | | | 0.36 | | | | 0.78 | |
| | | | | | | | | | | | | | | | | | | | |
Less distributions: | | | | | | | | | | | | | | | | | | | | |
Dividends from net investment income | | | — | | | | — | | | | — | | | | — | | | | (0.17 | ) |
Distributions from net realized gains | | | — | | | | — | | | | — | | | | (0.49 | ) | | | — | |
Return of capital | | | — | | | | — | | | | — | | | | (0.16 | )A | | | (0.01 | )A |
| | | | | | | | | | | | | | | | | | | | |
Total distributions | | | — | | | | — | | | | — | | | | (0.65 | ) | | | (0.18 | ) |
| | | | | | | | | | | | | | | | | | | | |
Net asset value, end of period | | $ | 9.77 | | | $ | 9.92 | | | $ | 10.00 | | | $ | 10.77 | | | $ | 11.06 | |
| | | | | | | | | | | | | | | | | | | | |
Total return B | | | (1.51 | )% | | | (0.80 | )% | | | (7.15 | )% | | | 3.26 | % | | | 7.47 | % |
| | | | | | | | | | | | | | | | | | | | |
Ratios and supplemental data: | | | | | | | | | | | | | | | | | | | | |
Net assets, end of period (in thousands) | | $ | 39 | | | $ | 107 | | | $ | 396 | | | $ | 307 | | | $ | 266 | |
Ratios to average net assets (annualized): | | | | | | | | | | | | | | | | | | | | |
Expenses, before reimbursements | | | 1.70 | % | | | 1.74 | % | | | 1.79 | % | | | 1.79 | % | | | 2.62 | % |
Expenses, net of reimbursements | | | 1.68 | % | | | 1.74 | % | | | 1.78 | % | | | 1.77 | % | | | 1.79 | % |
Net investment income (loss), before reimbursements | | | (1.82 | )% | | | (0.43 | )% | | | (1.71 | )% | | | (0.61 | )% | | | 0.25 | % |
Net investment income (loss), net of reimbursements | | | (1.80 | )% | | | (0.42 | )% | | | (1.69 | )% | | | (0.59 | )% | | | 1.08 | % |
Portfolio turnover rate | | | 131 | % | | | 102 | % | | | 252 | % | | | 286 | % | | | 381 | % |
| A | The return of capital is calculated based on outstanding shares at the time of distribution. |
| B | Based on net asset value, which does not reflect the sales charge, redemption fee, or contingent deferred sales charge, if applicable. May include adjustments in accordance with U.S. GAAP and as such, the net asset value for reporting purposes and the returns based upon those net asset values may differ from the net asset value and returns for shareholder transactions. |
22
American Beacon Treasury Inflation Protected Securities FundSM
Privacy Policy and Federal Tax Information
December 31, 2015 (Unaudited)
Privacy Policy
The American Beacon Funds recognize and respect the privacy of our shareholders. We are providing this notice to you so you will understand how shareholder information may be collected and used.
We may collect nonpublic personal information about you from one or more of the following sources:
| | • | | information we receive from you on applications or other forms; |
| | • | | information about your transactions with us or our service providers; and |
| | • | | information we receive from third parties. |
We do not disclose any nonpublic personal information about our customers or former customers to anyone, except as permitted by law.
We restrict access to your nonpublic personal information to those employees or service providers who need to know that information to provide products or services to you. To ensure the confidentiality of your nonpublic personal information, we maintain safeguards that comply with federal standards.
Federal Tax Information
Certain tax information regarding the Fund is required to be provided to shareholders relating to the Fund’s income and distributions for the taxable year ended December 31, 2015. The information and distributions reported herein may differ from information and distributions taxable to the shareholder for the calendar year ended December 31, 2015.
No dividends were paid to shareholders during the tax year ended December 31, 2015.
23
Trustees and Officers of the American Beacon FundsSM
(Unaudited)
The Trustees and officers of the American Beacon Funds (the “Trust”) are listed below, together with their principal occupations during the past five years. Unless otherwise indicated, the address of each person listed below is 220 East Las Colinas Boulevard, Suite 1200, Irving, Texas 75039. Each Trustee oversees twenty-seven funds in the fund complex that includes the Trust and the American Beacon Select Funds. The Trust’s Statement of Additional Information contains additional information about the Trustees and is available without charge by calling 1-800-658-5811.
| | | | |
Name, Age and Address | | Position, Term of Office and Length of Time Served with the Trust | | Principal Occupation(s) During Past 5 Years and Current Directorships |
| | |
INTERESTED TRUSTEES | | Term | | |
| | Lifetime of Trust until removal, resignation or retirement* | | |
| | |
Alan D. Feld** (79) | | Trustee since 1996 | | Sole Shareholder of a professional corporation which is a Partner in the law firm of Akin, Gump, Strauss, Hauer & Feld, LLP (law firm) (1960-Present); Trustee, American Beacon Mileage Funds (1996-2012); Trustee, American Beacon Select Funds (1999-Present); Trustee, American Beacon Master Trust (1996-2012). |
| | |
NON-INTERESTED | | Term | | |
TRUSTEES | | Lifetime of Trust until removal, resignation or retirement* | | |
| | |
Gilbert G. Alvarado (46) | | Trustee since 2015 | | Director, Kura MD, Inc. (local telehealth organization) (2015-Present); Vice President & CFO, Sierra Health Foundation (health conversion private foundation) (2006-Present) Vice President & CFO, Sierra Health Foundation: Center for Health Program Management (California public benefit corporation) (2012-Present); Director, Innovative North State (2012-Present); Director, Sacramento Regional Technology Alliance (2011-Present); Director, Women’s Empowerment (2009-2014); Trustee, American Beacon Select Funds (2015-Present). |
| | |
Joseph B. Armes (53) | | Trustee since 2015 | | Chairman & CEO, CSW Industrials f/k/a Capital Southwest Corporation (investment company) (2013-Present); President & CEO, JBA Investment Partners (family investment vehicle) (2010-Present); Chief Operating Officer, Hicks Holdings, LLC (Hicks Family assets and investments) (2005-2010); Trustee, Baylor University Board of Regents (2001-2010); Director and Chair of Audit Committee, RSP Permian (oil and gas producer) (2013-Present); Trustee, American Beacon Select Funds (2015-Present). |
| | |
Gerard J. Arpey (57) | | Trustee since 2012 | | Director, The Home Depot, Inc. (2015-Present); Partner, Emerald Creek Group (private equity firm) (2011-Present); Chairman and Chief Executive Officer, AMR Corp. and American Airlines; Inc. (2003-2011); Director, S. C. Johnson & Son, Inc. (privately held company) (2008-present); Trustee, American Beacon Select Funds (2012-Present). |
| | |
W. Humphrey Bogart (71) | | Trustee since 2004 | | Trustee, American Beacon Mileage Funds (2004-2012); Trustee, American Beacon Select Funds (2004-Present); Trustee, American Beacon Master Trust (2004-2012). |
| | |
Brenda A. Cline (55) | | Trustee since 2004 | | Executive Vice President, Chief Financial Officer, Treasurer and Secretary, Kimbell Art Foundation (1993-Present); Director, Range Resources Corporation (oil and natural gas company) (2015-Present); Director, Tyler Technologies, Inc.(public sector software solutions company) (2014-Present); Trustee, American Beacon Mileage Funds (2004-2012); Trustee, American Beacon Select Funds (2004-Present); Trustee, American Beacon Master Trust (2004-2012). |
| | |
Eugene J. Duffy (61) | | Trustee since 2008 | | Managing Director, Institutional Services, Intercontinental Real Estate Corporation (2014-Present); Principal and Executive Vice President, Paradigm Asset Management (1994-2014); Director, Sunrise Bank of Atlanta (2008-2013); Trustee, American Beacon Mileage Funds (2008-2012); Trustee, American Beacon Select Funds (2008-Present); Trustee, American Beacon Master Trust (2008-2012). |
24
Trustees and Officers of the American Beacon FundsSM
(Unaudited)
| | | | |
Name, Age and Address | | Position, Term of Office and Length of Time Served with the Trust | | Principal Occupation(s) During Past 5 Years and Current Directorships |
| | |
NON-INTERESTED | | Term | | |
TRUSTEES | | Lifetime of Trust until removal, resignation or retirement* | | |
| | |
Thomas M. Dunning (73) | | Trustee since 2008 | | Chairman Emeritus (2008-Present); Lockton Dunning Benefits (consulting firm in employee benefits); Board Director, Oncor Electric Delivery Company LLC (2007-Present); Board Member, BancTec (2010-Present) (software consulting); Trustee, American Beacon Mileage Funds (2008-2012); Trustee, American Beacon Select Funds (2008-Present); Trustee, American Beacon Master Trust (2008-2012). |
| | |
Richard A. Massman (72) | | Trustee since 2004 Chairman since 2008 | | Consultant and General Counsel Emeritus (2009-Present) and Senior Vice President and General Counsel (1994-2009), Hunt Consolidated, Inc. (holding company engaged in oil and gas exploration and production, refining, real estate, farming, ranching and venture capital activities); Trustee, American Beacon Mileage Funds (2004-2012); Trustee, American Beacon Select Funds (2004-Present); Trustee, American Beacon Master Trust (2004-2012). |
| | |
Barbara J. McKenna, CFA (52) | | Trustee since 2012 | | Managing Principal, Longfellow Investment Management Company (2005-Present); Trustee, American Beacon Select Funds (2012-Present). |
| | |
R. Gerald Turner (70) 225 Perkins Admin. Bldg. Southern Methodist Univ. Dallas, Texas75275 | | Trustee since 2001 | | President, Southern Methodist University (1995-Present); Director, J.C. Penney Company, Inc. (1996-Present); Director, Kronus Worldwide Inc. (chemical manufacturing) (2003-Present); Trustee, American Beacon Mileage Funds (2001-2012); Trustee, American Beacon Select Funds (2001-Present); Trustee, American Beacon Master Trust (2001-2012). |
| | |
OFFICERS | | Term | | |
| | One Year | | |
| | |
Gene L. Needles, Jr. (61) | | President since 2009 Executive Vice President since 2009 | | President, CEO and Director, American Beacon Advisors, Inc. (2009-Present); President, CEO and Director, Astro AB Borrower, Inc. (2015-Present); President, CEO and Director, Astro AB Acquisition, Inc.(2015-Present); President, CEO and Director, Astro AB Topco, Inc. (2015-Present), President, CEO and Director, Astro AB Holdings, LLC. (2015-Present); President, CEO and Director, Lighthouse Holdings, Inc.; (2009-2015); President and CEO, Lighthouse Holdings Parent, Inc. (2009-2015); Manager, President and CEO, American Private Equity Management, L.L.C. (2012-Present); President, American Beacon Cayman Managed Futures Strategy Fund, Ltd. (2014-Present). |
| | |
Rosemary K. Behan (56) | | VP, Secretary and Chief Legal Officer since 2006 | | Secretary, American Beacon Advisors, Inc. (2006-Present); Secretary, Astro AB Borrower, Inc. (2015-Present); Secretary, Astro AB Acquisition, Inc. (2015-Present); Secretary, Astro AB Topco, Inc. (2015-Present); Secretary, Astro AB Holdings, LLC. (2015-Present); Secretary, Lighthouse Holdings, Inc. (2008-2015); Secretary, Lighthouse Holdings Parent, Inc. (2008-2015); Secretary, American Private Equity Management, L.L.C. (2008-Present); Secretary, American Beacon Cayman Managed Futures Strategy Fund, Ltd. (2014-Present). |
| | |
Brian E. Brett (55) | | VP since 2004 | | Vice President, Director of Sales, American Beacon Advisors, Inc. (2004-Present). |
| | |
Erica Duncan (45) | | VP Since 2011 | | Vice President, Marketing and Client Services, American Beacon Advisors, Inc. (2011-Present); Supervisor, Brand Marketing, Invesco (2010-2011). |
| | |
Michael W. Fields (61) | | VP since 1989 | | Chief Fixed Income Officer (2011-Present) and Vice President, Fixed Income Investments, American Beacon Advisors, Inc. (1988-2011); Director, American Beacon Global Funds SPC (2002-2011); Director, American Beacon Global Funds plc (2007-2009). |
25
Trustees and Officers of the American Beacon FundsSM
(Unaudited)
| | | | |
Name, Age and Address | | Position, Term of Office and Length of Time Served with the Trust | | Principal Occupation(s) During Past 5 Years and Current Directorships |
| | |
OFFICERS | | Term | | |
| | One Year | | |
| | |
Melinda G. Heika (54) | | Treasurer since 2010 | | Treasurer, American Beacon Advisors, Inc. (2010-Present); Treasurer, Astro AB Borrower, Inc. (2015-Present); Treasurer, Astro AB Acquisition, Inc. (2015-Present); Treasurer, Astro AB Topco, Inc. (2015-Presnt); Treasurer, Astro AB Holdings, LLC. (2015-Present); Treasurer, Lighthouse Holdings, Inc. (2010-2015); Treasurer, Lighthouse Holdings Parent Inc., (2010-2015); Treasurer, American Private Equity Management, L.L.C. (2012-Present); Director and Treasurer, American Beacon Cayman Managed Futures Strategy Fund, Ltd. (2014-Present). |
| | |
Terri L. McKinney (52) | | VP since 2010 | | Vice President, Enterprise Services (2009-Present) and Managing Director (2003-2009), American Beacon Advisors, Inc . |
| | |
Jeffrey K. Ringdahl (40) | | VP since 2010 | | Chief Operating Officer, American Beacon Advisors, Inc. (2010-Present); Manager and Senior Vice President, American Private Equity Management, L.L.C. (2012-Present); Senior Vice President and Director, Astro AB Borrower, Inc. (2015-Present); Senior Vice President and Director, Astro AB Acquisition, Inc. (2015-Present); Senior Vice President and Director, Astro AB Topco, Inc. (2015-Present), Senior Vice President and Director, Astro AB Holdings, LLC.(2015-Present); Senior Vice President, Lighthouse Holdings, Inc. (2013-2015); Senior Vice President, Lighthouse Holdings Parent, Inc. (2013-2015); Director and Vice President, American Beacon Cayman Managed Futures Strategy Fund, Ltd. (2014-Present); Vice President, Product Management, Touchstone Advisors, Inc. (2007-2010). |
| | |
Samuel J. Silver (52) | | VP Since 2011 | | Vice President, Fixed Income Investments (2011-Present) and Senior Portfolio Manager, Fixed Income Investments (1999-2011), American Beacon Advisors, Inc. |
| | |
Christina E. Sears (44) | | Chief Compliance Officer since 2004 and Asst. Secretary since 1999 | | Chief Compliance Officer, American Beacon Advisors, Inc. (2004-Present); Chief Compliance Officer, American Private Equity Management, L.L.C. (2012-Present). |
| | |
Sonia L. Bates (59) | | Asst. Treasurer since 2011 | | Director, Tax and Financial Reporting (2011-Present), Manager, Tax and Financial Reporting (2005-2010), American Beacon Advisors, Inc.; Asst. Treasurer, Astro AB Borrower, Inc. (2015-Present); Asst. Treasurer, Astro AB Acquisition, Inc.(2015-Present); Asst. Treasurer, Astro AB Topco, Inc. (2015-Present); Asst. Treasurer, Astro AB Holdings, LLC.; Asst. Treasurer, Lighthouse Holdings, Inc. (2011-2015); Asst. Treasurer, Lighthouse Holdings Parent Inc. (2011-2015); Asst. Treasurer, American Private Equity Management, L.L.C. (2012-Present). |
| * | As of 11/12/2014, the Board adopted a retirement plan that requires Trustees to retire no later than the last day of the calendar year in they reach the age of 75. |
| ** | Mr. Feld is deemed to be an “interested person” of the Trust, as defined by the 1940 Act. Mr. Feld’s law firm of Akin, Gump, Strauss, Hauer & Feld LLP has provided legal services within the past two fiscal years to one or more of the Trust’s sub-advisors. |
26

This page intentionally left blank.
This page intentionally left blank.
This page intentionally left blank.
Delivery of Documents
eDelivery is NOW AVAILABLE - Stop traditional mail delivery and receive your
shareholder reports and summary prospectus on-line. Sign up at
www.americanbeaconfunds.com
If you invest in the Fund through a financial institution, you may be able to receive the Fund’s regulatory mailings, such as the Summary Prospectus, Annual Report and Semi-Annual Report, by e-mail. If you are interested in this option, please go to www.icsdelivery.com and search for your financial institution’s name or contact your financial institution directly.
To obtain more information about the Fund:
| | |
 | |  |
By E-mail: american_beacon.funds@ambeacon.com | | On the Internet: Visit our website at www.americanbeaconfunds.com |
| | | |
| | |
 | |  |
By Telephone: Institutional, Y and Investor Classes Call (800) 658-5811 | | By Mail: American Beacon Funds P.O. Box 219643 Kansas City, MO 64121-9643 |
| | | |
| | |
Availability of Quarterly Portfolio Schedules In addition to the Schedule of Investments provided in each semi-annual and annual report, the Fund files a complete schedule of its portfolio holdings with the Securities and Exchange Commission (“SEC”) on Form N-Q as of the first and third fiscal quarters. The Fund’s Forms N-Q are available on the SEC’s website at www.sec.gov. The Forms N-Q may also be reviewed and copied at the SEC’s Public Reference Section, 100 F Street, NE, Washington, DC 20549-1520. Information regarding the operation of the SEC’s Public Reference Room may be obtained by calling (202) 551-8090. A complete schedule of the Fund’s portfolio holdings is also available on www.americanbeaconfunds.com approximately twenty days after the end of each month. | | Availability of Proxy Voting Policy and Records A description of the policies and procedures the Fund uses to determine how to vote proxies relating to portfolio securities is available in the Fund’s Statement of Additional Information, is available free of charge on the Fund’s website www.americanbeaconfunds.com and by calling 1-800-967-9009 or by accessing the SEC’s website at www.sec.gov. The Fund’s proxy voting record for the most recent year ended June 30 is filed annually with the SEC on Form N-PX. The Fund’s Forms N-PX are available on the SEC’s website at www.sec.gov. The Fund’s proxy voting record may also be obtained by calling 1-800-967-9009. |
Fund Service Providers:
| | | | | | | | | | | | |
CUSTODIAN State Street Bank and Trust Boston, Massachusetts | | | | TRANSFER AGENT Boston Financial Data Services Kansas City, Missouri | | | | INDEPENDENT REGISTERED PUBLIC ACCOUNTING FIRM Ernst & Young LLP Dallas, Texas | | | | DISTRIBUTOR Foreside Fund Services, LLC Portland, Maine |
This report is prepared for shareholders of the American Beacon Funds and may be distributed to others only if preceded or accompanied by a current Prospectus or Summary Prospectus.
American Beacon Funds and the American Beacon Treasury Inflation Protected Securities Fund are service marks of American Beacon Advisors, Inc.
AR 12/15
About American Beacon Advisors
Since 1986, American Beacon Advisors has offered a variety of products and investment advisory services to numerous institutional and retail clients, including a variety of mutual funds, corporate cash management, and separate account management.
Our clients include defined benefit plans, defined contribution plans, foundations, endowments, corporations, financial planners, and other institutional investors. With American Beacon Advisors, you can put the experience of a multi-billion dollar asset management firm to work for your company.
BAHL & GAYNOR SMALL CAP GROWTH FUND Investing in small-capitalization stocks may involve greater volatility and lower liquidity than larger company stocks. Investing in foreign securities may involve heightened risk due to currency fluctuations and economic and political risks. Growth stocks typically are more volatile than value stocks; however, value stocks have a lower expected growth rate in earnings and sales. The use of futures contracts for cash management may subject the Fund to losing more money than invested. The Fund may participate in a securities lending program. Please see the prospectus for a complete discussion of the Fund’s risks. There can be no assurances that the investment objectives of this Fund will be met. BRIDGEWAY LARGE CAP VALUE FUND Investing in value stocks may limit downside risk over time; however, the Fund may produce more modest gains than riskier stock funds as a trade-off for this potentially lower risk. Investing in foreign securities may involve heightened risk due to currency fluctuations and economic and political risks. While the Fund is managed pursuant to a tax management strategy, the Fund’s investments could create capital gains. The use of futures contracts for cash management may subject the Fund to losing more money than invested. Please see the prospectus for a complete discussion of the Fund’s risks. There can be no assurances that the investment objectives of this Fund will be met. HOLLAND LARGE CAP GROWTH FUND Growth stocks typically are more volatile than value stocks; however, value stocks have a lower expected growth rate in earnings and sales. Investing in foreign securities may involve heightened risk due to currency fluctuations and economic and political risks. The use of futures contracts for cash management may subject the Fund to losing more money than invested. Please see the prospectus for a complete discussion of the Fund’s risks. There can be no assurances that the investment objectives of this Fund will be met. STEPHENS SMALL CAP GROWTH FUND Growth stocks typically are more volatile than value stocks; however, value stocks have a lower expected growth rate in earnings and sales. Investing in small-capitalization stocks may involve greater volatility and lower liquidity than larger company stocks. Investing in foreign securities may involve heightened risk due to currency fluctuations and economic and political risks. The use of futures contracts for cash management may subject the Fund to losing more money than invested. The Fund may participate in a securities lending program. Please see the prospectus for a complete discussion of the Fund’s risks. There can be no assurances that the investment objectives of this Fund will be met. STEPHENS MID-CAP GROWTH FUND Growth stocks typically are more volatile than value stocks; however, value stocks have a lower expected growth rate in earnings and sales. Investing in medium-capitalization stocks may involve greater volatility and lower liquidity than larger company stocks. Investing in foreign securities may involve heightened risk due to currency fluctuations and economic and political risks. The use of futures contracts for cash management may subject the Fund to losing more money than invested. The Fund may participate in a securities lending program. Please see the prospectus for a complete discussion of the Fund’s risks. There can be no assurances that the investment objectives of this Fund will be met.
Any opinions herein, including forecasts, reflect our judgment as of the end of the reporting period and are subject to change. The advisor’s strategies and the Fund’s portfolio composition will change depending on economic and market conditions. This report is not a complete analysis of market conditions and therefore, should not be relied upon as investment advice. Although economic and market information has been compiled from reliable sources, American Beacon Advisors, Inc. makes no representation as to the completeness or accuracy of the statements contained herein.
| | |
| American Beacon Funds | | December 31, 2015 |
| | |
 | | Dear Shareholders, 2015 was a lackluster year for domestic equity investors. The Dow Jones Industrial Average, a price-weighted average of 30 significant stocks that trade on the New York Stock Exchange and The NASDAQ Stock Market, returned 0.21% for the 12-month period. The S&P 500 Index, a U.S. large-cap stock bellwether, returned 1.38%. However, of the 10 industry sectors in which the S&P 500 Index is divided, half lost ground during the year. The Russell Midcap Index, a barometer of mid-cap stocks, declined -2.44%. And the Russell 2000 Index, which generally represents the small-cap segment, declined -4.41%. |
The weakening of many currencies against the U.S. dollar also took a toll on total returns for dollar-based investors in many international markets. For the period under review, international market benchmarks posted declines. The MSCI EAFE Index, which measures the world’s developed market, declined -0.81%; the MSCI Emerging Markets Index declined -14.92%; and the MSCI All Country World Index, which includes the equity market performance of developed and emerging markets, declined -2.36%.
At American Beacon Advisors, we are proud to offer a broad range of equity funds that are capable of navigating economic storms and market downturns in the U.S. and abroad. We are fortunate to have several asset managers who have stayed the course for many years and through a variety of economic and market conditions.
For the 12 months ended December 31, 2015:
| | • | | American Beacon Bahl & Gaynor Small Cap Growth Fund (Investor Class) returned -3.25%. |
| | • | | American Beacon Bridgeway Large Cap Value Fund (Investor Class) returned -1.51%. |
| | • | | American Beacon Holland Large Cap Growth Fund (Investor Class) returned 6.35%. |
| | • | | American Beacon Stephens Small Cap Growth Fund (Investor Class) returned -5.08%. |
| | • | | American Beacon Stephens Mid-Cap Growth Fund (Investor Class) returned -1.63%. |
Thank you for your continued investment in the American Beacon Funds. For additional information about the Funds or to access your account information, please visit www.americanbeaconfunds.com.
|
| Best Regards, |
|
 |
| Gene L. Needles, Jr. |
President American Beacon Funds |
1
Domestic Equity Market Overview
December 31, 2015 (Unaudited)
In the U.S. markets, the momentum of the prior six years seemed to lose steam in 2015. The broad markets were at once volatile and only modestly positive for the year; the broad-market proxy, S&P 500 Index, was up only 1.38%, and the Russell 1000 Index, which represents large-cap stocks, was up only 0.92%. Among the Russell-style indexes, large- and mid-cap stocks outpaced small-cap stocks, and growth stocks far outpaced value stocks. Throughout the year, the markets continued to demonstrate that macroeconomic events – such as China’s transitioning economy and rumors of Federal Reserve (the “Fed”) action – can affect short-term performance.
Most domestic equity markets posted gains in the first quarter of 2015, despite a weak January and March. The year started with U.S. stocks retreating in January, as investors pushed down the large-cap S&P 500 Index, blue-chip Dow Jones Industrial Average, small-cap Russell 2000 Index, and technology-focused NASDAQ Composite Index during the last week to declines that ranged around 2% to 3.5%. The Russell 1000 Index had strong gains in February. Investors were encouraged by positive corporate earnings growth rates, stabilizing oil prices and the Fed’s signals that it might begin to raise interest rates, albeit slowly in 2015. Investors began selling off in March on concerns that the Fed would begin a more rapid pace of interest rate increases. These concerns were supported by the release of February’s employment data, which showed the unemployment rate moving down to the Fed’s target of 5.5%.
Notwithstanding weak June performance, returns for the second quarter of 2015 were slightly positive for large- and small-cap stocks, although mid-cap stocks declined modestly. The S&P 500 Index and NASDAQ Composite Index achieved new record intraday highs in April on expectations the Fed would delay raising interest rates in light of weaker than expected U.S. economic growth. U.S. stocks advanced during May despite mixed economic signals headlined by weakness in the first quarter gross domestic product, solid employment figures, sudden surge in housing data, and the Fed’s comments indicating that some of the recent weakness may be considered “statistical noise,” which members of the Fed’s Board of Governors discounted in their assessment of the economy. Most U.S. large- and mid-cap equity benchmarks turned negative in June, largely due to the
economic crisis in Greece and lack of progress in negotiations intended to prevent the country’s exit from the European Union and the euro.
The third quarter of 2015 began with potential signs of strength as most broad domestic equity markets posted positive returns for the month of July, hoping to continue the positive, although volatile, momentum of the first two quarters. However, this was not meant to be as the month of August brought more volatility with the spotlight on China. Signs of cracks in that country’s growth have been appearing since at least early 2014; however, the debt crisis in Europe and U.S. economic growth dominated the headlines. All of that changed dramatically when China allowed the yuan to drop more than 4% over two days in mid-August and global markets turned negative. Broad U.S. markets also reacted negatively to Fed Chair Janet Yellen and the Federal Open Market Committee (“FOMC”) decision to not raise interest rates due to continued instability in economic and financial markets abroad. There also were concerns that a rise in interest rates could have negative effects on the broad U.S. market and possibly lead to suppressed growth and increased pressure on inflation. The quarter ended with broad U.S. equity markets in negative territory.
The fourth quarter of 2015 was buoyed by an early rally in the equities market despite relatively weak domestic payroll figures reported in October and the looming prospect of the Fed raising interest rates. Anticipation continued to build in November, as belief strengthened that the FOMC’s December meeting would yield an increase in interest rates due to improving economic indicators, including a drop in the unemployment rate to 5.0%. This belief was realized when the FOMC formally decided to raise rates in mid-December. However, given how long it had been anticipated, it was largely unsurprising. Outside of the U.S., China continued to struggle throughout this time period, facing the continued strength of the dollar. As a result, China marked the end of the quarter with its 10th consecutive month of decelerating manufacturing activity. Despite a very strong fourth quarter, the S&P 500 Index and Russell 1000 Index only managed modest positive returns for the entire year, while the Russell Midcap and Russell 2000 Indexes both declined for the year.
2
American Beacon Bahl & Gaynor Small Cap Growth FundSM
Performance Overview
December 31, 2015 (Unaudited)
The Investor Class of the Bahl & Gaynor Small Cap Growth Fund (the “Fund”) returned -3.25% for the twelve months ended December 31, 2015. The Fund underperformed the Russell 2000 Growth Index (the “Index”) return of -1.38% for the same period.
Comparison of Change in Value of a $10,000 Investment for the Period from 7/15/14* through 12/31/15
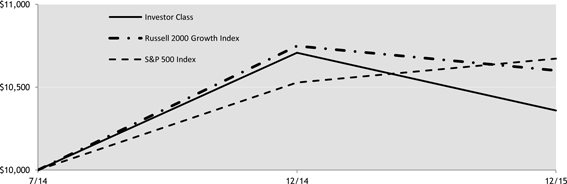
Total Returns for the Period ended 12/31/15
| | | | | | | | | | | | | | | | |
| | | Ticker | | | 1 Year | | | Since incep.
(7/15/14) | | | Value of $10,000
7/15/14-12/31/15 | |
Institutional Class (1,5) | | | GBSIX | | | | (2.96 | )% | | | 2.79 | % | | $ | 10,410 | |
Y Class (1,5) | | | GBSYX | | | | (3.05 | )% | | | 2.72 | % | | | 10,400 | |
Investor Class (1,5) | | | GBSPX | | | | (3.25 | )% | | | 2.45 | % | | | 10,360 | |
A Class with sales charge (1,2,5) | | | GBSAX | | | | (8.88 | )% | | | (1.68 | )% | | | 9,755 | |
A Class without sales charge (1,2,5) | | | GBSAX | | | | (3.34 | )% | | | 2.38 | % | | | 10,350 | |
C Class with sales charge (1,3,5) | | | GBSCX | | | | (5.01 | )% | | | 1.63 | % | | | 10,240 | |
C Class without sales charge (1,3,5) | | | GBSCX | | | | (4.01 | )% | | | 1.63 | % | | | 10,240 | |
Russell 2000 Growth Index (4) | | | | | | | (1.38 | )% | | | 4.07 | % | | | 10,601 | |
S&P 500 Index (4) | | | | | | | 1.38 | % | | | 4.60 | % | | | 10,673 | |
| 1. | Performance shown is historical and is not indicative of future returns. Investment returns and principal value will vary, and shares may be worth more or less at redemption than at original purchase. Performance shown is calculated based on the published end of day net asset values as of date indicated, and current performance may be lower or higher than the performance data quoted. To obtain performance as of the most recent month end, please call 1-800-967-9009 or visit www.americanbeaconfunds.com. Fund performance in the table above does not reflect the deduction of taxes a shareholder would pay on distributions or the redemption of shares. A portion of the fees charged to each Class of the Fund has been waived since Fund inception. Performance prior to waiving fees was lower than actual returns shown. |
| 2. | A Class shares have a maximum sales charge of 5.75%. |
| 3. | C Class has a maximum contingent deferred sales charge of 1.00% for shares redeemed within one year of the date of purchase. |
| 4. | The S&P 500 Index is a market capitalization weighted index of common stocks publicly traded in the United States. The Russell 2000 Growth Index and the Russell 2000 Index are registered trademarks of Frank Russell Company. The Russell 2000 Growth Index is an unmanaged index of those stocks in the Russell 2000 Index with higher price-to-book ratios and higher forecasted growth values. The Russell 2000 Index is an unmanaged index of approximately 2000 smaller-capitalization stocks from various industrial sectors. One cannot directly invest in an index. |
| 5. | The total annual Fund operating expense ratio set forth in the most recent Fund prospectus for the Institutional, Y, Investor, A, and C Class shares was 1.62%, 1.72%, 2.00%, 2.02%, and 2.77%, respectively. The expense ratios above may vary from the expense ratios presented in other sections of this report that are based on expenses incurred during the period covered by this report. |
The Fund underperformed the Index as both stock selection and sector allocation detracted value relative to the Index. From a stock selection standpoint, the Fund’s holdings in the Health Care, Energy, and Consumer Staples sectors subtracted the most from relative performance. In the Health Care sector, positions
3
American Beacon Bahl & Gaynor Small Cap Growth FundSM
Performance Overview
December 31, 2015 (Unaudited)
in Computer Programs + Systems (down 32.9%) and Trinity Biotech (down 32.8%) were the largest detractors. Within the Energy sector, holdings in Gaslog (down 59.4%), Bristow Group (down 63.9%), and Semgroup Corp Class A (down 56.4%) were the most detrimental to performance. Companies in the Consumer Staples sector detracted from returns led by United Natural Foods (down 45.4%) and Inter Parfums (down 13.0%).
The above-mentioned negative performance was partially offset by good stock selection in the Industrials and Information Technology sectors. In the Industrials sector, an out of Index holding Rollins Inc. (up 18.7%) and a position in Watsco Inc. (up 10.7%) contributed positively to relative returns. Within the Information Technology sector, positions in Marketaxess Holdings Inc. (up 55.0%) and Blackbaud Inc. (up 50.9%) added the most to performance.
From a sector allocation standpoint, the Fund’s underweight to the Health Care sector, the best performing sector in the Index, detracted approximately 81 basis points (-0.81%) to performance. Additionally, an overweight to the Energy sector, the worst performing sector in the Index, subtracted approximately 61 basis points (-0.61%) from performance. In contrast, an overweight to the Information Technology sector added approximately 38 basis points (0.38%) to performance.
The Fund’s basic philosophy remains focused on investing in companies using a fundamental investment approach that seeks price appreciation, capital preservation and income.
| | | | | | | | |
| Top Ten Holdings (% Net Assets) | | | | | | |
MarketAxess Holdings, Inc. | | | | | | | 3.8 | |
j2 Global, Inc. | | | | | | | 3.1 | |
Texas Roadhouse, Inc. | | | | | | | 3.0 | |
Cantel Medical Corp. | | | | | | | 2.7 | |
Blackbaud, Inc. | | | | | | | 2.6 | |
STERIS PLC | | | | | | | 2.6 | |
Evercore Partners, Inc. | | | | | | | 2.5 | |
Monolithic Power Systems, Inc. | | | | | | | 2.4 | |
Watsco, Inc. | | | | | | | 2.3 | |
Methode Electronics, Inc. | | | | | | | 2.3 | |
Total Fund Holdings | | | 67 | | | | | |
| | | | |
| Sector Allocation (% Equities) | | | |
Information Technology | | | 29.0 | |
Consumer Discretionary | | | 17.7 | |
Financials | | | 15.0 | |
Health Care | | | 14.8 | |
Industrials | | | 13.1 | |
Consumer Staples | | | 4.6 | |
Materials | | | 3.9 | |
Energy | | | 1.9 | |
4
American Beacon Bridgeway Large Cap Value FundSM
Performance Overview
December 31, 2015 (Unaudited)
The Investor Class of the American Beacon Bridgeway Large Cap Value Fund (the “Fund”) returned -1.51% for the twelve months ended December 31, 2015. The Fund outperformed the Russell 1000® Value Index (the “Index”) return of -3.83% for the same period.
Comparison of Change in Value of a $10,000 Investment for the Period from 12/31/05 through 12/31/15
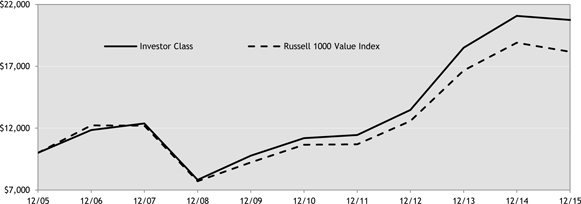
Total Returns for the Period ended 12/31/15
| | | | | | | | | | | | | | | | | | | | |
| | | Ticker | | | 1 Year | | | 5 Years | | | 10 Years | | | Value of
$10,000
12/31/05-
12/31/15 | |
Institutional Class (1,7) | | | BRLVX | | | | (1.23 | )% | | | 13.42 | % | | | 7.70 | % | | $ | 21,002 | |
Y Class (1,2,7) | | | BWLYX | | | | (1.26 | )% | | | 13.36 | % | | | 7.67 | % | | | 20,946 | |
Investor Class (1,3,7) | | | BWLIX | | | | (1.51 | )% | | | 13.15 | % | | | 7.57 | % | | | 20,751 | |
A Class with sales charge (1,4,7) | | | BWLAX | | | | (7.21 | )% | | | 11.70 | % | | | 6.88 | % | | | 19,458 | |
A Class without sales charge (1,4,7) | | | BWLAX | | | | (1.56 | )% | | | 13.03 | % | | | 7.52 | % | | | 20,649 | |
C Class with sales charge (1,5,7) | | | BWLCX | | | | (3.27 | )% | | | 12.42 | % | | | 7.23 | % | | | 20,095 | |
C Class without sales charge (1,5,7) | | | BWLCX | | | | (2.27 | )% | | | 12.42 | % | | | 7.23 | % | | | 20,095 | |
Russell 1000 Value Index (6) | | | | | | | (3.83 | )% | | | 11.27 | % | | | 6.16 | % | | | 18,175 | |
| 1. | Performance shown is historical and is not indicative of future returns. Investment returns and principal value will vary, and shares may be worth more or less at redemption than at original purchase. Performance shown is calculated based on the published end of day net asset values as of date indicated, and current performance may be lower or higher than the performance data quoted. To obtain performance as of the most recent month end, please call 1-800-967-9009 or visit www.americanbeaconfunds.com. Fund performance in the table above does not reflect the deduction of taxes a shareholder would pay on distributions or the redemption of shares. A portion of the fees charged to the Institutional Class was waived from 2008 through 2013 and partially recovered in 2014. Performance prior to waiving fees was lower than the actual returns shown from 2008 through 2013. |
| 2. | Fund performance for the five-year and ten-year periods represent the returns achieved by the Institutional Class from 12/31/05 up to 2/3/12, the inception date of the Y Class, and the returns of the Y Class since its inception. Expenses of the Y Class are higher than those of the Institutional Class. As a result, total returns shown may be higher than they would have been had the Y Class been in existence since 12/31/05. A portion of the fees charged to the Y Class was waived in 2012 and fully recovered in 2013 and 2014. Performance prior to waiving fees was lower than the actual returns shown in 2012. |
| 3. | Fund performance for the five-year and ten-year periods represent the returns achieved by the Institutional Class from 12/31/05 up to 2/3/12, the inception date of the Investor Class, and the returns of the Investor Class since its inception. Expenses of the Investor Class are higher than those of the Institutional Class. Therefore, total returns shown may be higher than they would have been had the Investor Class been in existence since 12/31/05. A portion of the fees charged to the Investor Class was waived in 2012 and fully recovered in 2013. Performance prior to waiving fees was lower than the actual returns shown in 2012. |
| 4. | Fund performance for the five-year and ten-year periods represent the returns achieved by the Institutional Class from 12/31/05 through 2/3/12, the inception date of the A Class, and the returns of the A Class since its inception. Expenses of the A Class are higher than those of the Institutional Class. As a result, total returns shown may be higher than they would have been had the A |
5
American Beacon Bridgeway Large Cap Value FundSM
Performance Overview
December 31, 2015 (Unaudited)
| | Class been in existence since 12/31/05. A portion of the fees charged to the A Class was waived in 2012 and 2013 and fully recovered in 2014. Performance prior to waiving fees was lower than the actual returns shown in 2012 and 2013. A Class shares have a maximum sales charge of 5.75%. |
| 5. | Fund performance for the five-year and ten-year periods represent the returns achieved by the Institutional Class from 12/31/05 through 2/3/12, the inception date of the C Class, and the returns of the C Class since its inception. Expenses of the C Class are higher than those of the Institutional Class. As a result, total returns shown may be higher than they would have been had the C Class been in existence since 12/31/05. A portion of the fees charged to the C Class was waived in 2012 and 2013 and fully recovered in 2014. Performance prior to waiving fees was lower than the actual returns shown in 2012 and 2013. C Class has a maximum contingent deferred sales charge of 1.00% for shares redeemed within one year of the date of purchase. |
| 6. | The Russell 1000 Value Index is an unmanaged index of those stocks in the Russell 1000 Index with lower price-to-book ratios and lower forecasted growth values. Russell 1000 Value Index and Russell 1000 Index are registered trademarks of the Frank Russell Company. One cannot directly invest in an index. |
| 7. | The total annual Fund operating expense ratio set forth in the most recent Fund prospectus for the Institutional, Y, Investor, A, and C Class shares was 0.80%, 0.85%, 1.12%, 1.15%, and 1.88%, respectively. The expense ratios above may vary from the expense ratios presented in other sections of this report that are based on expenses incurred during the period covered by this report. |
The Fund outperformed the Index entirely through stock selection as sector allocation detracted value relative to the Index.
From a stock selection standpoint, the Fund’s Energy and Information Technology sectors added approximately 205 (2.05%) and 105 (1.05%) basis points, respectively, to performance. In the Energy sector, Tesoro (up 44.5%) and Valero Energy (up 47.0%) contributed to returns. The Fund’s allocation in Kinder Morgan (down 7.9%) also added value in the sector. Companies in the Information Technology sector contributing to performance included Skyworks Solutions (up 38.7%) and Electronic Arts (up 53.1%). The Fund’s absence from SanDisk, which was down 21.4% in the Index, also positively impacted performance. The aforementioned good performance was somewhat offset by poor stock selection in the Materials sector. Freeport McMoRan (down 70.6%), Newmont Mining (down 26.4%) and CF Industries (down 23.4%) were the largest detractors in the Materials sector.
The Fund’s overweight position in Information Technology, Materials and Consumer Discretionary, three of the poorer performing sectors in the Index, detracted more than 30 (0.30%), 25 (0.25%) and 20 (0.20%) basis points, respectively, from performance through sector allocation. An underweight in Health Care, the best performing sector in the Index, also detracted from performance. The Fund’s underweight in Energy, the worst performing sector in the Index, added relative value.
The sub-advisor continues to invest in a broadly diversified portfolio of companies that they believe have attractive valuations and above-average earnings growth potential. This approach should allow the Fund to benefit over the longer term.
6
American Beacon Bridgeway Large Cap Value FundSM
Performance Overview
December 31, 2015 (Unaudited)
| | | | | | | | |
| Top Ten Holdings (% Net Assets) | | | | | | |
Cigna Corp. | | | | | | | 1.6 | |
Tesoro Corp. | | | | | | | 1.5 | |
SanDisk Corp. | | | | | | | 1.5 | |
JPMorgan Chase & Co. | | | | | | | 1.4 | |
Northrop Grumman Corp. | | | | | | | 1.3 | |
Activision Blizzard, Inc. | | | | | | | 1.3 | |
Valero Energy Corp. | | | | | | | 1.3 | |
Kellogg Co. | | | | | | | 1.2 | |
Xerox Corp. | | | | | | | 1.2 | |
HCA Holdings, Inc. | | | | | | | 1.2 | |
Total Fund Holdings | | | 106 | | | | | |
| | | | |
| Sector Allocation (% Equities) | | | |
Financials | | | 25.7 | |
Health Care | | | 12.6 | |
Information Technology | | | 11.6 | |
Industrials | | | 10.8 | |
Consumer Discretionary | | | 9.5 | |
Consumer Staples | | | 9.1 | |
Energy | | | 9.1 | |
Utilities | | | 5.7 | |
Materials | | | 4.1 | |
Telecommunication Services | | | 1.8 | |
7
American Beacon Holland Large Cap Growth FundSM
Performance Overview
December 31, 2015 (Unaudited)
The Investor Class of the American Beacon Holland Large Cap Growth Fund (the “Fund”) returned 6.35% for the twelve months ended December 31, 2015. The Fund outperformed the Russell 1000® Growth Index (the “Index”) return of 5.67%.
Comparison of Change in Value of a $10,000 Investment for the Period from 12/31/05 through 12/31/15
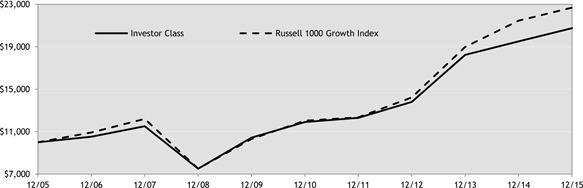
Total Returns for the Period ended 12/31/15
| | | | | | | | | | | | | | | | | | | | |
| | | Ticker | | | 1 Year | | | 5 Years | | | 10 Years | | | Value of
$10,000
12/31/05-
12/31/15 | |
Institutional Class (1,2,7) | | | LHGIX | | | | 6.74 | % | | | 12.11 | % | | | 7.75 | % | | $ | 21,101 | |
Y Class (1,3,7) | | | LHGYX | | | | 6.53 | % | | | 11.97 | % | | | 7.69 | % | | | 20,971 | |
Investor Class (1,7) | | | LHGFX | | | | 6.35 | % | | | 11.76 | % | | | 7.57 | % | | | 20,747 | |
A Class with sales charge (1,4,7) | | | LHGAX | | | | 0.17 | % | | | 10.35 | % | | | 6.88 | % | | | 19,461 | |
A Class without sales charge (1,4,7) | | | LHGAX | | | | 6.28 | % | | | 11.67 | % | | | 7.52 | % | | | 20,651 | |
C Class with sales charge (1,5,7) | | | LHGCX | | | | 4.51 | % | | | 11.03 | % | | | 7.21 | % | | | 20,069 | |
C Class without sales charge (1,5,7) | | | LHGCX | | | | 5.51 | % | | | 11.03 | % | | | 7.21 | % | | | 20,069 | |
Russell 1000 Growth Index (6) | | | | | | | 5.67 | % | | | 13.53 | % | | | 8.53 | % | | | 22,681 | |
| 1. | Performance shown is historical and is not indicative of future returns. Investment returns and principal value will vary, and shares may be worth more or less at redemption than at original purchase. Performance shown is calculated based on the published end of day net asset values as of date indicated, and current performance may be lower or higher than the performance data quoted. To obtain performance as of the most recent month end, please call 1-800-967-9009 or visit www.americanbeaconfunds.com. Fund performance in the table above does not reflect the deduction of taxes a shareholder would pay on distributions or the redemption of shares. A portion of the fees charged to the Investor Class was waived from 2002 through 2012 and fully recovered in 2013 and 2014. Performance prior to waiving fees was lower than the actual returns shown from 2002 through 2012. |
| 2. | Fund performance for the ten-year period represents the returns achieved by the Investor Class from 12/31/05 up to 3/1/10, the inception date of the Institutional Class, and the returns of the Institutional Class since its inception. Expenses of the Institutional Class are lower than those of the Investor Class. As a result, total returns shown may be lower than they would have been had the Institutional Class been in existence since 12/31/05. A portion of the fees charged to the Institutional Class was waived from 2010 through 2012 and partially recovered in 2013 and 2014. Performance prior to waiving fees was lower than the actual returns shown from 2010 through 2012. |
| 3. | Fund performance for the five-year and ten-year periods represent the returns achieved by the Investor Class from 12/31/05 up to 3/1/10, the Institutional Class from 3/1/10 to 3/23/12, the inception date of the Y Class, and the returns of the Y Class since its inception. Expenses of the Y Class are lower than those of the Investor Class. As a result, total returns shown may be lower than they would have been had the Y Class been in existence since 12/31/05. A portion of the fees charged to the Y Class was waived in 2012, partially recovered in 2013 and waived in 2014. Performance prior to waiving fees was lower than the actual returns shown in 2012 and 2014. |
| 4. | Fund performance for the ten-year period represents the returns achieved by the Investor Class from 12/31/05 through 2/1/10, the inception date of the A Class, and the returns of the A Class since its inception. Expenses of the A Class are higher than those of the Investor Class. As a result, total returns shown may be higher than they would have been had the A Class been in existence |
8
American Beacon Holland Large Cap Growth FundSM
Performance Overview
December 31, 2015 (Unaudited)
| | since 12/31/05. A portion of the fees charged to the A Class has been waived since 2010. Performance prior to waiving fees was lower than the actual returns shown since 2010. A Class shares have a maximum sales charge of 5.75%. |
| 5. | Fund performance for the five-year and ten-year periods represent the returns achieved by the Investor Class from 12/31/05 through 3/23/12, the inception date of the C Class, and the returns of the C Class since its inception. Expenses of the C Class are higher than those of the Investor Class. As a result, total returns shown may be higher than they would have been had the C Class been in existence since 12/31/05. A portion of the fees charged to the C Class has been waived since 2012. Performance prior to waiving fees was lower than the actual returns shown since 2012. C Class has a maximum contingent deferred sales charge of 1.00% for shares redeemed within one year of the date of purchase. |
| 6. | The Russell 1000 Growth Index is an unmanaged index of those stocks in the Russell 1000 Index with higher price-to-book ratios and higher forecasted growth values. Russell 1000 Growth Index and Russell 1000 Index are registered trademarks of the Frank Russell Company. One cannot directly invest in an index. |
| 7. | The total annual Fund operating expense ratio set forth in the most recent Fund prospectus for the Institutional, Y, Investor, A, and C Class shares was 0.90%, 1.12%, 1.16%, 1.31%, and 2.06% respectively. The expense ratios above may vary from the expense ratios presented in other sections of this report that are based on expenses incurred during the period covered by this report. |
The Fund outperformed the Index primarily due to good stock selection and, to a lesser extent, through sector allocation.
From a stock selection standpoint, holdings in the Industrials and Information Technology sectors contributed approximately 175 (1.75%) and 105 (1.05%) basis points, respectively, to performance. In the Industrials sector, the Fund’s general overweight position in Southwest Airlines (down 0.2%) added value relative to the Index. The Fund’s allocation in Roper Technologies (up 22.1%) also contributed to returns. Adobe Systems (up 29.3%), Visa (up 19.2%) and Citrix Systems (up 18.6%) were the largest contributors in the Information Technology sector. Companies within the Consumer Discretionary sector also added relative value. In the Consumer Discretionary sector, Amazon.com (up 117.4%) and Nike (up 32.0%) contributed most to performance. The aforementioned excess performance was somewhat offset by poor stock selection in the Consumer Staples and Health Care sectors. Mead Johnson Nutrition (down 19.8%) and Whole Foods Market (down 32.7%) were the largest detractors from performance in the Consumer Staples sector. In the Health Care sector, Envision Healthcare (down 35.3%) and Davita Healthcare Partners (down 8.1%) hurt performance.
The Fund’s slight underweight in the Health Care sector added value relative to the Index through sector allocation. Underweight positions in Materials and Financials, two of the poorer performing sectors in the Index, also contributed to the Fund’s returns. An overweight in Energy, the worst performing sector in the Index, detracted from performance.
Looking forward, the Fund’s sub-advisor will continue to maintain a disciplined, long-term approach to equity investing in larger stocks with above-average growth potential.
9
American Beacon Holland Large Cap Growth FundSM
Performance Overview
December 31, 2015 (Unaudited)
| | | | | | | | |
| Top Ten Holdings (% Net Assets) | | | | | | |
Alphabet, Inc. | | | | | | | 4.7 | |
Visa, Inc. | | | | | | | 4.7 | |
Amazon.com, Inc. | | | | | | | 4.6 | |
Adobe Systems, Inc. | | | | | | | 4.0 | |
Priceline.com, Inc. | | | | | | | 3.7 | |
Apple, Inc. | | | | | | | 3.6 | |
Citrix Systems, Inc. | | | | | | | 3.6 | |
Southwest Airlines Co. | | | | | | | 3.1 | |
Gilead Sciences, Inc. | | | | | | | 2.9 | |
Medtronic PLC | | | | | | | 2.9 | |
Total Fund Holdings | | | 50 | | | | | |
| | | | |
| Sector Allocation (% Equities) | |
Information Technology | | | 32.1 | |
Consumer Discretionary | | | 24.0 | |
Health Care | | | 15.2 | |
Industrials | | | 12.4 | |
Consumer Staples | | | 10.9 | |
Financials | | | 4.1 | |
Materials | | | 1.3 | |
10
American Beacon Stephens Small Cap Growth FundSM
Performance Overview
December 31, 2015 (Unaudited)
The Investor Class of the American Beacon Stephens Small Cap Growth Fund (the “Fund”) returned -5.08% for the twelve months ended December 31, 2015, trailing the Russell 2000® Growth Index (the “Index”) return of -1.38% for the same period.
Comparison of Change in Value of a $10,000 Investment for the Period from 12/31/05 through 12/31/15
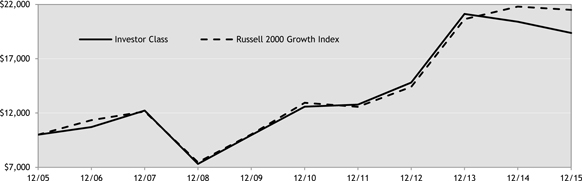
Total Returns for the Period ended 12/31/15
| | | | | | | | | | | | | | | | | | | | |
| | | Ticker | | | 1 Year | | | 5 Years | | | 10 Years /
Since incep. | | | Value of
$10,000
12/31/05-
12/31/15 | |
Institutional Class (1,2,7) | | | STSIX | | | | (4.75 | )% | | | 15.74 | % | | | 7.71 | % | | $ | 20,004 | |
Y Class (1,3,7) | | | SPWYX | | | | (4.94 | )% | | | 9.18 | % | | | 6.92 | % | | | 19,526 | |
Investor Class (1,7) | | | STSGX | | | | (5.08 | )% | | | 9.01 | % | | | 6.84 | % | | | 19,375 | |
A Class with sales charge (1,4,7) | | | SPWAX | | | | (10.55 | )% | | | 7.59 | % | | | 6.14 | % | | | 18,149 | |
A Class without sales charge (1,4,7) | | | SPWAX | | | | (5.11 | )% | | | 8.88 | % | | | 6.77 | % | | | 19,255 | |
C Class with sales charge (1,5,7) | | | SPWCX | | | | (6.89 | )% | | | 8.25 | % | | | 6.46 | % | | | 18,707 | |
C Class without sales charge (1,5,7) | | | SPWCX | | | | (5.89 | )% | | | 8.25 | % | | | 6.46 | % | | | 18,707 | |
S&P 500 Index (6) | | | | | | | 1.38 | % | | | 12.57 | % | | | 7.31 | % | | | 20,239 | |
Russell 2000 Growth Index (6) | | | | | | | (1.38 | )% | | | 10.67 | % | | | 7.95 | % | | | 21,496 | |
| 1. | Performance shown is historical and is not indicative of future returns. Investment returns and principal value will vary, and shares may be worth more or less at redemption than at original purchase. Performance shown is calculated based on the published end of day net asset values as of date indicated, and current performance may be lower or higher than the performance data quoted. To obtain performance as of the most recent month end, please call 1-800-967-9009 or visit www.americanbeaconfunds.com. Fund performance in the table above does not reflect the deduction of taxes a shareholder would pay on distributions or the redemption of shares. A portion of the fees charged to the Investor Class was waived from 2005 through 2013 and partially recovered in 2014. Performance prior to waiving fees was lower than the actual returns shown from 2005 through 2013. |
| 2. | Fund performance for the since inception period represents the returns achieved by the Institutional Class since its inception of 8/31/06. A portion of the fees charged to the Institutional Class was waived from 2006 through 2013 and partially recovered in 2014. Performance prior to waiving fees was lower than the actual returns shown from 2006 through 2013. |
| 3. | Fund performance for the five-year and ten-year periods represent the returns achieved by the Investor Class from 12/31/05 up to 2/24/12, the inception date of the Y Class, and the returns of the Y Class since its inception. Expenses of the Y Class are lower than those of the Investor Class. Therefore, total returns shown may be lower than they would have been had the Y Class been in existence since 12/31/05.A portion of the fees charged to the Y Class was waived in 2012 and 2013 and fully recovered in 2014. Performance prior to waiving fees was lower than the actual returns shown in 2012 and 2013. |
| 4. | Fund performance for the five-year and ten-year periods represent the returns achieved by the Investor Class from 12/31/05 up to 2/24/12, the inception date of the A Class, and the returns of the A Class since its inception. Expenses of the A Class are higher than those of the Investor Class. As a result, total returns shown may be higher than they would have been had the A Class been in existence since 12/31/05. A portion of the fees charged to the A Class was waived in 2012 and partially recovered in 2013 and 2014. Performance prior to waiving fees was lower than actual returns shown in 2012. A Class has a maximum sales charge of 5.75%. |
11
American Beacon Stephens Small Cap Growth FundSM
Performance Overview
December 31, 2015 (Unaudited)
| 5. | Fund performance for the five-year and ten-year periods represent the returns achieved by the Investor Class from 12/31/05 up to 2/24/12, the inception date of the C Class, and the returns of the C Class since its inception. Expenses of the C Class are higher than those of the Investor Class. As a result, total returns shown may be higher than they would have been had the C Class been in existence since 12/31/05. A portion of the fees charged to the C Class was waived in 2012 and partially recovered in 2013 and 2014. Performance prior to waiving fees was lower than actual returns shown in 2012. The maximum contingent deferred sales charge for C Class is 1.00% for shares redeemed within one year of the date of purchase. |
| 6. | The S&P 500 Index is a market capitalization weighted index of common stocks publicly traded in the United States. The Russell 2000 Growth Index and the Russell 2000 Index are registered trademarks of Frank Russell Company. The Russell 2000 Growth Index is an unmanaged index of those stocks in the Russell 2000 Index with higher price-to-book ratios and higher forecasted growth values. The Russell 2000 Index is an unmanaged index of approximately 2000 smaller-capitalization stocks from various industrial sectors. One cannot directly invest in an index. |
| 7. | The total annual Fund operating expense ratio set forth in the most recent Fund prospectus for the Institutional, Y, Investor, A, and C Class shares was 1.10%, 1.18%, 1.33%, 1.48%, and 2.23% respectively. The expense ratios above may vary from the expense ratios presented in other sections of this report that are based on expenses incurred during the period covered by this report. |
The Fund underperformed the Index primarily due to stock selection and, to a lesser extent, through sector allocation.
From a stock selection standpoint, the Fund’s Information Technology and Consumer Staples sectors detracted approximately 120 basis points (1.20%) each from performance. Companies detracting the most relative value in the Information Technology sector included Stratasys (down 52.3%), ChannelAdvisor (down 67.6%) and Envestnet (down 38.4%). In the Consumer Staples sector, United Natural Foods (down 48.9%) and Inventure Foods (down 44.7%) were the largest detractors. The Fund’s absence from Casey’s General Stores, which was up 34.5% in the Index, also negatively impacted performance in the sector. The Fund’s Financials and Industrials sectors also detracted value relative to the Index. Encore Capital Group (down 38.9%) and PRA Group (down 44.5%) detracted from performance in the Financials sector. Not owning Heartland Payment Systems, which was up 77.0% in the Index, also detracted value in the sector. In the Industrials sector, HMS Holdings (down 41.3%) and Power Solutions International (down 61.7%) hurt performance.
The aforementioned poor performance was somewhat offset by good stock selection in the Consumer Discretionary and Health Care sectors. Sportsman’s Warehouse (up 82.2%) and IMAX (up 16.1%) contributed most to the Fund’s returns in the Consumer Discretionary sector. In the Health Care sector, ICON (up 53.0%) and Ligand Pharmaceuticals (up 103.3%) were the largest contributors to performance.
The Fund’s significant overweight position in Energy, the worst performing sector in the Index, detracted more than 155 basis points (1.55%) from performance through sector allocation. This was largely offset by underweight positions in the Materials and Consumer Discretionary sectors, which contributed to the Fund’s returns. An overweight in the Information Technology sector also added relative value.
Looking forward, the Fund’s sub-advisor will continue to maintain a disciplined, long-term approach to equity investing in smaller capitalization stocks with above-average growth potential.
12
American Beacon Stephens Small Cap Growth FundSM
Performance Overview
December 31, 2015 (Unaudited)
| | | | | | | | |
| Top Ten Holdings (% Net Assets) | | | | | | |
ICON PLC | | | | | | | 2.0 | |
PAREXEL International Corp. | | | | | | | 1.8 | |
National CineMedia, Inc. | | | | | | | 1.8 | |
Neogen Corp. | | | | | | | 1.7 | |
Tyler Technologies, Inc. | | | | | | | 1.6 | |
Ligand Pharmaceuticals, Inc. | | | | | | | 1.6 | |
Euronet Worldwide, Inc. | | | | | | | 1.6 | |
Proofpoint, Inc. | | | | | | | 1.6 | |
Pacira Pharmaceuticals, Inc. | | | | | | | 1.6 | |
CoStar Group, Inc. | | | | | | | 1.6 | |
Total Fund Holdings | | | 109 | | | | | |
| | | | |
| Sector Allocation (% Equities) | |
Information Technology | | | 27.7 | |
Health Care | | | 26.6 | |
Consumer Discretionary | | | 15.6 | |
Industrials | | | 11.3 | |
Financials | | | 9.3 | |
Energy | | | 4.6 | |
Consumer Staples | | | 3.2 | |
Materials | | | 1.7 | |
13
American Beacon Stephens Mid-Cap Growth FundSM
Performance Overview
December 31, 2015 (Unaudited)
The Investor Class of the American Beacon Stephens Mid-Cap Growth Fund (the “Fund”) returned -1.63% for the twelve months ended December 31, 2015. The Fund trailed the Russell Midcap® Growth Index (the “Index”) return of -0.20%.
Comparison of Change in Value of a $10,000 Investment for the Period from 2/1/06* through 12/31/15
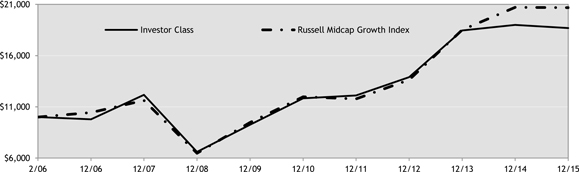
Total Returns for the Period ended 12/31/15
| | | | | | | | | | | | | | | | | | | | |
| | | Ticker | | | 1
Year | | | 5
Years | | | Since
Incep.
(2/1/06) | | | Value of
$10,000
2/1/06-
12/31/15 | |
Institutional Class (1,2,7) | | | SFMIX | | | | (1.28 | )% | | | 9.96 | % | | | 8.28 | % | | $ | 21,010 | |
Y Class (1,3,7) | | | SMFYX | | | | (1.39 | )% | | | 9.85 | % | | | 6.65 | % | | | 18,923 | |
Investor Class (1,7) | | | STMGX | | | | (1.63 | )% | | | 9.58 | % | | | 6.52 | % | | | 18,695 | |
A Class with sales charge (1,4,7) | | | SMFAX | | | | (7.27 | )% | | | 8.26 | % | | | 5.86 | % | | | 17,591 | |
A Class without sales charge (1,4,7) | | | SMFAX | | | | (1.63 | )% | | | 9.55 | % | | | 6.50 | % | | | 18,664 | |
C Class with sales charge (1,5,7) | | | SMFCX | | | | (3.46 | )% | | | 8.92 | % | | | 6.19 | % | | | 18,134 | |
C Class without sales charge (1,5,7) | | | SMFCX | | | | (2.46 | )% | | | 8.92 | % | | | 6.19 | % | | | 18,134 | |
S&P 500 Index (6) | | | | | | | 1.38 | % | | | 12.57 | % | | | 7.07 | % | | | 19,717 | |
Russell Midcap Growth Index (6) | | | | | | | (0.20 | )% | | | 11.54 | % | | | 7.59 | % | | | 20,677 | |
| 1. | Performance shown is historical and is not indicative of future returns. Investment returns and principal value will vary, and shares may be worth more or less at redemption than at original purchase. Performance shown is calculated based on the published end of day net asset values as of date indicated, and current performance may be lower or higher than the performance data quoted. To obtain performance as of the most recent month end, please call 1-800-967-9009 or visit www.americanbeaconfunds.com. Fund performance in the table above does not reflect the deduction of taxes a shareholder would pay on distributions or the redemption of shares. A portion of the fees charged to the Investor Class was waived from 2006 through 2013 and partially recovered in 2014. Performance prior to waiving fees was lower than actual returns shown from 2006 through 2013. |
| 2. | Fund performance for the since inception period represents the returns achieved by the Institutional Class since its inception of 8/31/06. A portion of fees charged to the Institutional Class has been waived since 2006. Performance prior to waiving fees was lower than actual returns shown since 2006. |
| 3. | Fund performance for the five-year and since inception periods represent the returns achieved by the Investor Class from 2/1/06 up to 2/24/12, the inception date of the Y Class, and the returns of the Y Class since its inception. Expenses of the Y Class are lower than those of the Investor Class. Therefore, total returns shown may be lower than they would have been had the Y Class been in existence since 2/1/06. A portion of the fees charged to the Y Class has been waived since 2012 and partially recovered in 2014. Performance prior to waiving fees was lower than actual returns shown since 2012. |
| 4. | Fund performance for the five-year and since inception periods represent the returns achieved by the Investor Class from 2/1/06 up to 2/24/12, the inception date of the A Class, and the returns of the A Class since its inception. Expenses of the A Class are higher than those of the Investor Class. Therefore, total returns shown may be higher than they would have been had the A Class been in existence since 2/1/06. A portion of the fees charged to the A Class has been waived since 2012. Performance prior to waiving fees was lower than the actual returns shown since 2012. A Class has a maximum sales charge of 5.75%. |
| 5. | Fund performance for the five-year and since inception periods represent the returns achieved by the Investor Class from 2/1/06 up to 2/24/12, the inception date of the C Class, and the returns of the C Class since its inception. Expenses of the C Class are |
14
American Beacon Stephens Mid-Cap Growth FundSM
Performance Overview
December 31, 2015 (Unaudited)
| | higher than those of the Investor Class. Therefore, total returns shown may be higher than they would have been had the C Class been in existence since 2/1/06. A portion of fees charged to the C Class has been waived since 2012. Performance prior to waiving fees was lower than actual returns shown since 2012. The maximum contingent deferred sales charge for C Class is 1.00% for shares redeemed within one year of the date of purchase. |
| 6. | The S&P 500 Index is a market capitalization weighted index of common stocks publicly traded in the United States. The Russell Midcap Growth Index is an unmanaged index of those stocks in the Russell Midcap Index with higher price-to-book ratios and higher forecasted growth values. Russell Midcap Index and Russell Midcap Growth Index are registered trademarks of Frank Russell Company. One cannot directly invest in an index. |
| 7. | The total annual Fund operating expense ratio set forth in the most recent Fund prospectus for the Institutional, Y, Investor, A, and C Class shares was 1.06%, 1.11%, 1.28%, 1.41%, and 2.18%, respectively. The expense ratios above may vary from the expense ratios presented in other sections of this report that are based on expenses incurred during the period covered by this report. |
The Fund’s poor performance was entirely attributed to stock selection as sector allocation added value relative to the Index.
From a stock selection standpoint, holdings in the Information Technology sector detracted more than 105 basis points (1.05%) from performance. In the Information Technology sector, Stratasys (down 52.4%) and SanDisk (down 34.8%) detracted value relative to the Index. The Fund’s absence from Avago Technologies also negatively impacted performance. The Fund’s Consumer Staples and Health Care sectors detracted more than 60 basis points (0.60%) each from performance. United Natural Foods (down 49.2%) was the largest detractor from performance in the Consumer Staples sector. Not owning Constellation Brands or Dr. Pepper Snapple Group, which were up 46.2% and 33.2%, respectively, in the Index, also hurt performance in the sector. In the Health Care sector, Cepheid (down 31.7%) detracted the most from returns. Good stock selection in the Consumer Discretionary sector added relative value. Netflix (up 140.1%) and Ulta Salon Cosmetics & Fragrances (up 49.4%) contributed most to performance in the Consumer Discretionary sector.
The Fund’s overweight positions in the Health Care and Information Technology sectors added value relative to the Index through sector allocation. Not having an allocation to Utilities, the worst performing sector in the Index, and underweighting the Materials sector also contributed to the Fund’s returns. An overweight in Energy, the second worst performing sector in the Index, detracted relative value.
Looking forward, the Fund’s sub-advisor will continue to maintain a disciplined, long-term approach to equity investing in medium capitalization stocks with above-average growth potential.
| | | | | | | | |
| Top Ten Holdings (% Net Assets) | |
Monster Beverage Corp. | | | | | | | 2.1 | |
Illumina, Inc. | | | | | | | 1.9 | |
Ross Stores, Inc. | | | | | | | 1.9 | |
Netflix, Inc. | | | | | | | 1.8 | |
CoStar Group, Inc. | | | | | | | 1.7 | |
Cerner Corp. | | | | | | | 1.6 | |
Palo Alto Networks, Inc. | | | | | | | 1.6 | |
Brown-Forman Corp. | | | | | | | 1.6 | |
SVB Financial Group | | | | | | | 1.5 | |
Athenahealth, Inc. | | | | | | | 1.5 | |
Total Fund Holdings | | | 104 | | | | | |
| | | | |
| Sector Allocation (% Equities) | |
Information Technology | | | 26.2 | |
Health Care | | | 22.1 | |
Consumer Discretionary | | | 21.6 | |
Industrials | | | 12.8 | |
Financials | | | 6.5 | |
Consumer Staples | | | 5.2 | |
Energy | | | 4.2 | |
Materials | | | 1.4 | |
15
American Beacon FundsSM
Fund Expenses
December 31, 2015 (Unaudited)
Fund Expense Example
As a shareholder of the Fund, you incur two types of costs: (1) transaction costs, including sales charges (loads) on purchase payments and redemption fees if applicable, and (2) ongoing costs, including management fees, administrative service fees, distribution (12b-1) fees, and other Fund expenses. The examples below are intended to help you understand the ongoing costs (in dollars) of investing in the Fund and to compare these costs with the ongoing costs of investing in other mutual funds.
The examples are based on an investment of $1,000 invested at the beginning of the period in each Class and held for the entire period from July 1, 2015 through December 31, 2015.
Actual Expenses
The “Actual” lines of the table provide information about actual account values and actual expenses. You may use the information in this line, together with the amount you invested, to estimate the expenses that you paid over the period. Simply divide your account value by $1,000 (for example, an $8,600 account value divided by $1,000 = 8.6), then multiply the result by the number in the first line under the heading “Expenses Paid During Period” to estimate the expenses you paid on your account during this period. Shareholders of the Institutional and Investor Classes that invest in the Fund through an IRA or Roth IRA may be subject to a custodial IRA fee of $15 that is typically deducted each December. If your account was subject to a custodial IRA fee during the period, your costs would have been $15 higher.
Hypothetical Example for Comparison Purposes
The “Hypothetical” lines of the table provide information about hypothetical account values and hypothetical expenses based on the Fund’s actual expense ratio and an assumed 5% per year rate of return before expenses (not the Fund’s actual return). You may compare the ongoing costs of investing in the Fund with other funds by contrasting this 5% hypothetical example and the 5% hypothetical examples that appear in the shareholder reports of the other funds. The hypothetical account values and expenses may not be used to estimate the actual ending account balance or expenses you paid for the period. Shareholders of the Institutional and Investor Classes that invest in the Fund through an IRA or Roth IRA may be subject to a custodial IRA fee of $15 that is typically deducted each December. If your account was subject to a custodial IRA fee during the period, your costs would have been $15 higher.
You should also be aware that the expenses shown in the table highlight only your ongoing costs and do not reflect any transaction costs charged by the Fund, such as sales charges (loads). Similarly, the expense examples for other funds do not reflect any transaction costs charged by those funds, such as sales charges (loads), redemption fees or exchange fees. Therefore, the “Hypothetical” lines of the table are useful in comparing ongoing costs only and will not help you determine the relative total costs of owning different funds. If you were subject to any transaction costs during the period, your costs would have been higher.
16
American Beacon FundsSM
Fund Expenses
December 31, 2015 (Unaudited)
Bahl & Gaynor Small Cap Growth Fund
| | | | | | | | | | | | |
| | | Beginning
Account
Value
7/1/15 | | | Ending
Account
Value
12/31/15 | | | Expenses Paid
During Period*
7/1/15 - 12/31/15 | |
Institutional Class | | | | | | | | | | | | |
Actual | | $ | 1,000.00 | | | $ | 949.13 | | | $ | 4.81 | |
Hypothetical ** | | $ | 1,000.00 | | | $ | 1,020.27 | | | $ | 4.99 | |
Y Class | | | | | | | | | | | | |
Actual | | $ | 1,000.00 | | | $ | 949.09 | | | $ | 5.31 | |
Hypothetical ** | | $ | 1,000.00 | | | $ | 1,019.76 | | | $ | 5.50 | |
Investor Class | | | | | | | | | | | | |
Actual | | $ | 1,000.00 | | | $ | 948.03 | | | $ | 6.68 | |
Hypothetical ** | | $ | 1,000.00 | | | $ | 1,018.35 | | | $ | 6.92 | |
A Class | | | | | | | | | | | | |
Actual | | $ | 1,000.00 | | | $ | 947.98 | | | $ | 6.78 | |
Hypothetical ** | | $ | 1,000.00 | | | $ | 1,018.25 | | | $ | 7.02 | |
C Class | | | | | | | | | | | | |
Actual | | $ | 1,000.00 | | | $ | 943.95 | | | $ | 10.44 | |
Hypothetical ** | | $ | 1,000.00 | | | $ | 1,014.47 | | | $ | 10.82 | |
| * | Expenses are equal to the Fund’s annualized expense ratios for the six-month period of 0.98%, 1.08%, 1.36%, 1.38%, and 2.13% for the Institutional, Y, Investor, A, and C Classes respectively, multiplied by the average account value over the period, multiplied by the number derived by dividing the number of days in the most recent fiscal half-year (184) by days in the year (365) to reflect the half-year period. |
| ** | 5% return before expenses. |
Bridgeway Large Cap Value Fund
| | | | | | | | | | | | |
| | | Beginning
Account
Value
7/1/15 | | | Ending
Account
Value
12/31/15 | | | Expenses Paid
During Period*
7/1/15 - 12/31/15 | |
Institutional Class | | | | | | | | | | | | |
Actual | | $ | 1,000.00 | | | $ | 967.81 | | | $ | 3.72 | |
Hypothetical ** | | $ | 1,000.00 | | | $ | 1,021.42 | | | $ | 3.82 | |
Y Class | | | | | | | | | | | | |
Actual | | $ | 1,000.00 | | | $ | 967.14 | | | $ | 4.02 | |
Hypothetical ** | | $ | 1,000.00 | | | $ | 1,021.12 | | | $ | 4.13 | |
Investor Class | | | | | | | | | | | | |
Actual | | $ | 1,000.00 | | | $ | 966.23 | | | $ | 5.40 | |
Hypothetical ** | | $ | 1,000.00 | | | $ | 1,019.71 | | | $ | 5.55 | |
A Class | | | | | | | | | | | | |
Actual | | $ | 1,000.00 | | | $ | 966.04 | | | $ | 5.55 | |
Hypothetical ** | | $ | 1,000.00 | | | $ | 1,019.56 | | | $ | 5.70 | |
C Class | | | | | | | | | | | | |
Actual | | $ | 1,000.00 | | | $ | 962.40 | | | $ | 9.25 | |
Hypothetical ** | | $ | 1,000.00 | | | $ | 1,015.78 | | | $ | 9.50 | |
| * | Expenses are equal to the Fund’s annualized expense ratios for the six-month period of 0.75%, 0.81%, 1.09%, 1.12%, and 1.87% for the Institutional, Y, Investor, A, and C Classes respectively, multiplied by the average account value over the period, multiplied by the number derived by dividing the number of days in the most recent fiscal half-year (184) by days in the year (365) to reflect the half-year period. |
| ** | 5% return before expenses. |
Holland Large Cap Growth Fund
| | | | | | | | | | | | |
| | | Beginning
Account
Value
7/1/15 | | | Ending
Account
Value
12/31/15 | | | Expenses Paid
During Period*
7/1/15 - 12/31/15 | |
Institutional Class | | | | | | | | | | | | |
Actual | | $ | 1,000.00 | | | $ | 1,023.54 | | | $ | 4.54 | |
Hypothetical ** | | $ | 1,000.00 | | | $ | 1,020.72 | | | $ | 4.53 | |
Y Class | | | | | | | | | | | | |
Actual | | $ | 1,000.00 | | | $ | 1,022.85 | | | $ | 5.00 | |
Hypothetical ** | | $ | 1,000.00 | | | $ | 1,020.27 | | | $ | 4.99 | |
Investor Class | | | | | | | | | | | | |
Actual | | $ | 1,000.00 | | | $ | 1,021.57 | | | $ | 6.37 | |
Hypothetical ** | | $ | 1,000.00 | | | $ | 1,018.90 | | | $ | 6.36 | |
A Class | | | | | | | | | | | | |
Actual | | $ | 1,000.00 | | | $ | 1,021.35 | | | $ | 6.57 | |
Hypothetical ** | | $ | 1,000.00 | | | $ | 1,018.70 | | | $ | 6.56 | |
C Class | | | | | | | | | | | | |
Actual | | $ | 1,000.00 | | | $ | 1,017.70 | | | $ | 10.37 | |
Hypothetical ** | | $ | 1,000.00 | | | $ | 1,014.92 | | | $ | 10.36 | |
| * | Expenses are equal to the Fund’s annualized expense ratios for the six-month period of 0.89%, 0.98%, 1.25%, 1.29%, and 2.04% for the Institutional, Y, Investor, A, and C Classes respectively, multiplied by the average account value over the period, multiplied by the number derived by dividing the number of days in the most recent fiscal half-year (184) by days in the year (365) to reflect the half-year period. |
| ** | 5% return before expenses. |
Stephens Small Cap Growth Fund
| | | | | | | | | | | | |
| | |
| | | Beginning
Account
Value
7/1/15 | | | Ending
Account
Value
12/31/15 | | | Expenses Paid
During Period*
7/1/15 - 12/31/15 | |
Institutional Class | | | | | | | | | | | | |
Actual | | $ | 1,000.00 | | | $ | 905.03 | | | $ | 5.19 | |
Hypothetical ** | | $ | 1,000.00 | | | $ | 1,019.76 | | | $ | 5.50 | |
Y Class | | | | | | | | | | | | |
Actual | | $ | 1,000.00 | | | $ | 903.63 | | | $ | 5.42 | |
Hypothetical ** | | $ | 1,000.00 | | | $ | 1,019.51 | | | $ | 5.75 | |
Investor Class | | | | | | | | | | | | |
Actual | | $ | 1,000.00 | | | $ | 903.22 | | | $ | 6.72 | |
Hypothetical ** | | $ | 1,000.00 | | | $ | 1,018.15 | | | $ | 7.12 | |
A Class | | | | | | | | | | | | |
Actual | | $ | 1,000.00 | | | $ | 902.64 | | | $ | 7.00 | |
Hypothetical ** | | $ | 1,000.00 | | | $ | 1,017.85 | | | $ | 7.43 | |
C Class | | | | | | | | | | | | |
Actual | | $ | 1,000.00 | | | $ | 899.29 | | | $ | 10.77 | |
Hypothetical ** | | $ | 1,000.00 | | | $ | 1,013.86 | | | $ | 11.42 | |
| * | Expenses are equal to the Fund’s annualized expense ratios for the six-month period of 1.08%, 1.13%, 1.40%, 1.46%, and 2.25% for the Institutional, Y, Investor, A, and C Classes respectively, multiplied by the average account value over the period, multiplied by the number derived by dividing the number of days in the most recent fiscal half-year (184) by days in the year (365) to reflect the half-year period. |
| ** | 5% return before expenses. |
17
American Beacon FundsSM
Fund Expenses
December 31, 2015 (Unaudited)
Stephens Mid-Cap Growth Fund
| | | | | | | | | | | | |
| | | Beginning
Account
Value
7/1/15 | | | Ending
Account
Value
12/31/15 | | | Expenses Paid
During Period*
7/1/15 - 12/31/15 | |
Institutional Class | | | | | | | | | | | | |
Actual | | $ | 1,000.00 | | | $ | 925.59 | | | $ | 4.81 | |
Hypothetical ** | | $ | 1,000.00 | | | $ | 1,020.21 | | | $ | 5.04 | |
Y Class | | | | | | | | | | | | |
Actual | | $ | 1,000.00 | | | $ | 925.43 | | | $ | 5.29 | |
Hypothetical ** | | $ | 1,000.00 | | | $ | 1,019.71 | | | $ | 5.55 | |
Investor Class | | | | | | | | | | | | |
Actual | | $ | 1,000.00 | | | $ | 923.79 | | | $ | 6.45 | |
Hypothetical ** | | $ | 1,000.00 | | | $ | 1,018.50 | | | $ | 6.77 | |
A Class | | | | | | | | | | | | |
Actual | | $ | 1,000.00 | | | $ | 924.19 | | | $ | 6.74 | |
Hypothetical ** | | $ | 1,000.00 | | | $ | 1,018.20 | | | $ | 7.07 | |
C Class | | | | | | | | | | | | |
Actual | | $ | 1,000.00 | | | $ | 919.90 | | | $ | 10.36 | |
Hypothetical ** | | $ | 1,000.00 | | | $ | 1,014.42 | | | $ | 10.87 | |
| * | Expenses are equal to the Fund’s annualized expense ratios for the six-month period of 0.99%, 1.09%, 1.33%, 1.39%, and 2.14% for the Institutional, Y, Investor, A, and C Classes respectively, multiplied by the average account value over the period, multiplied by the number derived by dividing the number of days in the most recent fiscal half-year (184) by days in the year (365) to reflect the half-year period. |
| ** | 5% return before expenses. |
18
American Beacon FundsSM
Report of Independent Registered Public Accounting Firm
The Board of Trustees and Shareholders of
American Beacon Bahl & Gaynor Small Cap Growth Fund, American Beacon Bridgeway Large Cap Value Fund, American Beacon Holland Large Cap Growth Fund, American Beacon Stephens Small Cap Growth Fund and American Beacon Stephens Mid-Cap Growth Fund
We have audited the accompanying statements of assets and liabilities, including the schedules of investments, of American Beacon Bahl & Gaynor Small Cap Growth Fund, American Beacon Bridgeway Large Cap Value Fund, American Beacon Holland Large Cap Growth Fund, American Beacon Stephens Small Cap Growth Fund and American Beacon Stephens Mid-Cap Growth Fund (five of the funds constituting the American Beacon Funds) (collectively, the “Funds”), as of December 31, 2015, and the related statements of operations for the year then ended and the statements of changes in net assets and the financial highlights for each of the periods indicated therein. These financial statements and financial highlights are the responsibility of the Funds’ management. Our responsibility is to express an opinion on these financial statements and financial highlights based on our audits.
We conducted our audits in accordance with the standards of the Public Company Accounting Oversight Board (United States). Those standards require that we plan and perform the audit to obtain reasonable assurance about whether the financial statements and financial highlights are free of material misstatement. We were not engaged to perform an audit of the Funds’ internal control over financial reporting. Our audits included consideration of internal control over financial reporting as a basis for designing audit procedures that are appropriate in the circumstances, but not for the purpose of expressing an opinion on the effectiveness of each Fund’s internal control over financial reporting. Accordingly, we express no such opinion. An audit also includes examining, on a test basis, evidence supporting the amounts and disclosures in the financial statements and financial highlights, assessing the accounting principles used and significant estimates made by management, and evaluating the overall financial statement presentation. Our procedures included confirmation of securities owned as of December 31, 2015, by correspondence with the custodian and brokers or by other appropriate auditing procedures where replies from brokers were not received. We believe that our audits provide a reasonable basis for our opinion.
In our opinion, the financial statements and financial highlights referred to above present fairly, in all material respects, the financial position of American Beacon Bahl & Gaynor Small Cap Growth Fund, American Beacon Bridgeway Large Cap Value Fund, American Beacon Holland Large Cap Growth Fund, American Beacon Stephens Small Cap Growth Fund and American Beacon Stephens Mid-Cap Growth Fund at December 31, 2015, the results of their operations for the year then ended and the changes in their net assets and the financial highlights for each of the periods indicated therein in conformity with U.S. generally accepted accounting principles.

Dallas, Texas
February 29, 2016
19
American Beacon Bahl & Gaynor Small Cap Growth FundSM
Schedule of Investments
December 31, 2015
| | | | | | | | |
| | | Shares | | | Fair Value | |
| | | | | | (000’s) | |
COMMON STOCK—97.43% | |
CONSUMER DISCRETIONARY—17.24% | |
Auto Components—1.44% | |
Strattec Security Corp. | | | 1,840 | | | $ | 104 | |
| | | | | | | | |
Automobiles—2.92% | | | | | | | | |
Hyster-Yale Materials Handling, Inc. | | | 1,105 | | | | 58 | |
Thor Industries, Inc. | | | 2,705 | | | | 152 | |
| | | | | | | | |
| | | | 210 | |
| | | | | | | | |
Hotels, Restaurants & Leisure—4.54% | | | | | |
Brinker International, Inc. | | | 2,290 | | | | 110 | |
Texas Roadhouse, Inc. | | | 6,090 | | | | 217 | |
| | | | | | | | |
| | | | | | | 327 | |
| | | | | | | | |
Household Durables—3.12% | | | | | | | | |
Flexsteel Industries, Inc. | | | 3,270 | | | | 145 | |
Matthews International Corp., Class A | | | 1,500 | | | | 80 | |
| | | | | | | | |
| | | | | | | 225 | |
| | | | | | | | |
Multiline Retail—1.69% | | | | | | | | |
Pricesmart, Inc. | | | 1,465 | | | | 122 | |
| | | | | | | | |
Specialty Retail—1.89% | | | | | | | | |
Monro Muffler Brake, Inc. | | | 2,060 | | | | 136 | |
| | | | | | | | |
Textiles & Apparel—1.64% | | | | | | | | |
Movado Group, Inc. | | | 2,030 | | | | 52 | |
Wolverine World Wide, Inc. | | | 3,925 | | | | 66 | |
| | | | | | | | |
| | | | | | | 118 | |
| | | | | | | | |
Total Consumer Discretionary | | | | 1,242 | |
| | | | | | | | |
CONSUMER STAPLES—4.50% | | | | | |
Food & Drug Retailing—1.04% | | | | | |
B&G Foods, Inc. | | | 1,390 | | | | 49 | |
United Natural Foods, Inc.A | | | 665 | | | | 26 | |
| | | | | | | | |
| | | | | | | 75 | |
| | | | | | | | |
Food Products—2.13% | | | | | | | | |
J&J Snack Foods Corp. | | | 1,315 | | | | 153 | |
| | | | | | | | |
Personal Products—1.33% | | | | | | | | |
Inter Parfums, Inc. | | | 4,010 | | | | 96 | |
| | | | | | | | |
Total Consumer Staples | | | | 324 | |
| | | | | | | | |
ENERGY—1.83% | | | | | | | | |
Energy Equipment & Services—0.67% | | | | | |
Bristow Group, Inc. | | | 1,840 | | | | 48 | |
| | | | | | | | |
Oil & Gas—1.16% | | | | | | | | |
GasLog Ltd. | | | 5,870 | | | | 48 | |
SemGroup Corp., Class A | | | 1,240 | | | | 36 | |
| | | | | | | | |
| | | | | | | 84 | |
| | | | | | | | |
Total Energy | | | | 132 | |
| | | | | | | | |
FINANCIALS—14.59% | | | | | | | | |
Banks—9.16% | | | | | | | | |
Bank of the Ozarks, Inc. | | | 1,570 | | | | 78 | |
Evercore Partners, Inc., Class A | | | 3,380 | | | | 183 | |
Glacier Bancorp, Inc. | | | 1,695 | | | | 45 | |
PacWest Bancorp | | | 3,870 | | | | 167 | |
S&T Bancorp, Inc. | | | 2,635 | | | | 81 | |
Virtu Financial, Inc., Class A | | | 4,695 | | | | 106 | |
| | | | | | | | |
| | | | | | | 660 | |
| | | | | | | | |
| | | | | | | | |
| | | Shares | | | Fair Value | |
| | | | | | (000’s) | |
Diversified Financials—3.79% | | | | | | | | |
MarketAxess Holdings, Inc. | | | 2,445 | | | $ | 273 | |
| | | | | | | | |
Insurance—1.64% | | | | | | | | |
Horace Mann Educators Corp. | | | 3,565 | | | | 118 | |
| | | | | | | | |
Total Financials | | | | 1,051 | |
| | | | | | | | |
HEALTH CARE—14.42% | | | | | | | | |
Biotechnology—1.85% | | | | | | | | |
Neogen Corp.A | | | 1,160 | | | | 66 | |
Trinity Biotech PLC, Sponsored ADRB C | | | 5,770 | | | | 67 | |
| | | | | | | | |
| | | | | | | 133 | |
| | | | | | | | |
Health Care Equipment & Supplies—8.71% | | | | | |
Abaxis, Inc. | | | 2,815 | | | | 157 | |
Atrion Corp. | | | 150 | | | | 57 | |
Bio-Techne Corp. | | | 710 | | | | 64 | |
STERIS PLCB | | | 2,515 | | | | 189 | |
West Pharmaceutical Services, Inc. | | | 2,670 | | | | 161 | |
| | | | | | | | |
| | | | | | | 628 | |
| | | | | | | | |
Health Care Providers & Services—3.86% | |
Cantel Medical Corp. | | | 3,120 | | | | 194 | |
HealthSouth Corp. | | | 2,410 | | | | 84 | |
| | | | | | | | |
| | | | | | | 278 | |
| | | | | | | | |
Total Health Care | | | | 1,039 | |
| | | | | | | | |
INDUSTRIALS—12.72% | | | | | | | | |
Building Products—2.32% | | | | | | | | |
Watsco, Inc. | | | 1,430 | | | | 167 | |
| | | | | | | | |
Commercial Services & Supplies—6.23% | |
G&K Services, Inc., Class A | | | 1,265 | | | | 80 | |
Healthcare Services Group, Inc. | | | 3,735 | | | | 129 | |
Monotype Imaging Holdings, Inc. | | | 4,960 | | | | 117 | |
MSA Safety, Inc. | | | 1,950 | | | | 85 | |
Rollins, Inc. | | | 1,450 | | | | 38 | |
| | | | | | | | |
| | | | | | | 449 | |
| | | | | | | | |
Electrical Equipment—0.75% | |
II-VI, Inc. | | | 2,895 | | | | 54 | |
| | | | | | | | |
Industrial Conglomerates—0.56% | |
Raven Industries, Inc. | | | 2,555 | | | | 40 | |
| | | | | | | | |
Machinery—2.86% | |
Applied Industrial Technologies, Inc. | | | 2,630 | | | | 107 | |
Valmont Industries, Inc. | | | 935 | | | | 99 | |
| | | | | | | | |
| | | | | | | 206 | |
| | | | | | | | |
Total Industrials | | | | 916 | |
| | | | | | | | |
INFORMATION TECHNOLOGY—28.37% | |
Communications Equipment—1.24% | |
Plantronics, Inc. | | | 1,880 | | | | 89 | |
| | | | | | | | |
Electronic Equipment & Instruments—4.86% | |
Analogic Corp. | | | 935 | | | | 77 | |
Intersil Corp., Class A | | | 5,125 | | | | 65 | |
Methode Electronics, Inc. | | | 5,260 | | | | 168 | |
NVE Corp. | | | 710 | | | | 40 | |
| | | | | | | | |
| | | | | | | 350 | |
| | | | | | | | |
Internet Software & Services—6.11% | | | | | |
GrubHub, Inc.A | | | 1,695 | | | | 41 | |
j2 Global, Inc. | | | 2,745 | | | | 226 | |
See accompanying notes
20
American Beacon Bahl & Gaynor Small Cap Growth FundSM
Schedule of Investments
December 31, 2015
| | | | | | | | |
| | | Shares | | | Fair Value | |
| | | | | | (000’s) | |
NIC, Inc. | | | 6,090 | | | $ | 120 | |
Reis, Inc. | | | 2,235 | | | | 53 | |
| | | | | | | | |
| | | | | | | 440 | |
| | | | | | | | |
IT Consulting & Services—3.68% | | | | | |
Hackett Group, Inc. | | | 7,965 | | | | 128 | |
Ritchie Bros Auctioneers, Inc. | | | 5,675 | | | | 137 | |
| | | | | | | | |
| | | | | | | 265 | |
| | | | | | | | |
Semiconductor Equipment & Products—6.04% | | | | | |
FEI Co. | | | 1,355 | | | | 108 | |
Monolithic Power Systems, Inc. | | | 2,670 | | | | 170 | |
Power Integrations, Inc. | | | 1,725 | | | | 84 | |
Silicon Motion Technology Corp., ADRC | | | 2,335 | | | | 73 | |
| | | | | | | | |
| | | | | | | 435 | |
| | | | | | | | |
Software—6.44% | | | | | | | | |
Blackbaud, Inc. | | | 2,815 | | | | 185 | |
Mentor Graphics Corp. | | | 5,185 | | | | 96 | |
National Instruments Corp. | | | 3,380 | | | | 97 | |
Pegasystems, Inc. | | | 3,155 | | | | 87 | |
| | | | | | | | |
| | | | | | | 465 | |
| | | | | | | | |
Total Information Technology | | | | 2,044 | |
| | | | | | | | |
MATERIALS—3.76% | | | | | | | | |
Chemicals—3.76% | | | | | | | | |
Balchem Corp. | | | 1,765 | | | | 107 | |
PolyOne Corp. | | | 3,905 | | | | 125 | |
Stepan Co. | | | 790 | | | | 39 | |
| | | | | | | | |
Total Materials | | | | 271 | |
| | | | | | | | |
Total Common Stock (Cost $7,021) | | | | 7,019 | |
| | | | | | | | |
SHORT-TERM INVESTMENTS—2.58% (Cost $186) | | | | | |
JPMorgan U.S. Government Money Market Fund, Capital Class | | | 186,464 | | | | 186 | |
| | | | | | | | |
TOTAL INVESTMENTS —100.01% (Cost $7,207) | | | | 7,205 | |
LIABILITIES, NET OF OTHER ASSETS—(0.01%) | | | | (1 | ) |
| | | | | | | | |
TOTAL NET ASSETS—100.00% | | | $ | 7,204 | |
| | | | | | | | |
Percentages are stated as a percent of net assets.
| A | Non-income producing security. |
| B | PLC - Public Limited Company. |
| C | ADR - American Depositary Receipt. |
Futures Contracts Open on December 31, 2015:
| | | | | | | | | | | | | | | | | | |
Description | | Type | | | Number of
Contracts | | | Expiration
Date | | Contract
Value | | | Unrealized
Appreciation
(Depreciation) | |
Russell 2000 Mini Index March Futures | | | Long | | | | 1 | | | March 2016 | | $ | 113,150 | | | $ | 958 | |
| | | | | | | | | | | | | | | | | | |
| | | | | | | | | | | | $ | 113,150 | | | $ | 958 | |
| | | | | | | | | | | | | | | | | | |
See accompanying notes
21
American Beacon Bridgeway Large Cap Value FundSM
Schedule of Investments
December 31, 2015
| | | | | | | | |
| | | Shares | | | Fair Value | |
| | | | | | (000’s) | |
COMMON STOCK—97.08% | |
CONSUMER DISCRETIONARY—9.25% | |
Auto Components—1.09% | |
Goodyear Tire & Rubber Co. | | | 769,000 | | | $ | 25,123 | |
| | | | | | | | |
Automobiles—1.92% | | | | | | | | |
Ford Motor Co. | | | 1,253,940 | | | | 17,668 | |
General Motors Co. | | | 786,180 | | | | 26,739 | |
| | | | | | | | |
| | | | | | | 44,407 | |
| | | | | | | | |
Home Builders—0.97% | | | | | | | | |
D.R. Horton, Inc. | | | 701,700 | | | | 22,475 | |
| | | | | | | | |
Household Durables—2.02% | | | | | |
Garmin Ltd. | | | 617,500 | | | | 22,952 | |
Mohawk Industries, Inc.A | | | 1,900 | | | | 360 | |
Stanley Black & Decker, Inc. | | | 218,000 | | | | 23,268 | |
| | | | | | | | |
| | | | | | | 46,580 | |
| | | | | | | | |
Media—1.19% | | | | | | | | |
Comcast Corp., Class A | | | 273,600 | | | | 15,439 | |
Time Warner, Inc. | | | 185,900 | | | | 12,022 | |
| | | | | | | | |
| | | | | | | 27,461 | |
| | | | | | | | |
Multiline Retail—1.00% | | | | | | | | |
Target Corp. | | | 317,300 | | | | 23,039 | |
| | | | | | | | |
Specialty Retail—1.06% | | | | | | | | |
Foot Locker, Inc. | | | 374,500 | | | | 24,376 | |
| | | | | | | | |
Total Consumer Discretionary | | | | 213,461 | |
| | | | | | | | |
CONSUMER STAPLES—8.81% | | | | | |
Food & Drug Retailing—3.04% | | | | | |
CVS Caremark Corp. | | | 219,600 | | | | 21,470 | |
Rite Aid Corp.A | | | 2,812,500 | | | | 22,050 | |
Sysco Corp. | | | 646,500 | | | | 26,507 | |
| | | | | | | | |
| | | | | | | 70,027 | |
| | | | | | | | |
Food Products—3.85% | | | | | | | | |
Archer Daniels Midland Co. | | | 506,700 | | | | 18,586 | |
JM Smucker Co. | | | 212,000 | | | | 26,148 | |
Kellogg Co. | | | 390,500 | | | | 28,221 | |
Pilgrim’s Pride Corp. | | | 719,400 | | | | 15,892 | |
| | | | | | | | |
| | | | | | | 88,847 | |
| | | | | | | | |
Household Products—1.92% | | | | | |
Clorox Co. | | | 188,700 | | | | 23,933 | |
Colgate-Palmolive Co. | | | 305,200 | | | | 20,332 | |
| | | | | | | | |
| | | | | | | 44,265 | |
| | | | | | | | |
Total Consumer Staples | | | | 203,139 | |
| | | | | | | | |
ENERGY—8.82% | | | | | | | | |
Energy Equipment & Services—1.20% | | | | | |
National Oilwell Varco, Inc. | | | 823,200 | | | | 27,569 | |
| | | | | | | | |
Oil & Gas—7.62% | | | | | | | | |
Apache Corp. | | | 206,700 | | | | 9,192 | |
Exxon Mobil Corp. | | | 221,570 | | | | 17,271 | |
Hess Corp. | | | 236,900 | | | | 11,485 | |
Marathon Petroleum Corp. | | | 299,740 | | | | 15,539 | |
Murphy Oil Corp. | | | 674,300 | | | | 15,138 | |
Noble Energy, Inc. | | | 468,800 | | | | 15,438 | |
Phillips 66 | | | 323,100 | | | | 26,430 | |
Tesoro Corp. | | | 338,000 | | | | 35,614 | |
| | | | | | | | |
| | | Shares | | | Fair Value | |
| | | | | | (000’s) | |
Valero Energy Corp. | | | 420,400 | | | $ | 29,726 | |
| | | | | | | | |
| | | | | | | 175,833 | |
| | | | | | | | |
Total Energy | | | | 203,402 | |
| | | | | | | | |
FINANCIALS—24.98% | | | | | | | | |
Banks—3.04% | | | | | | | | |
CIT Group, Inc. | | | 668,800 | | | | 26,552 | |
M&T Bank Corp. | | | 119,520 | | | | 14,483 | |
New York Community Bancorp, Inc. | | | 990,100 | | | | 16,159 | |
U.S. Bancorp | | | 305,800 | | | | 13,048 | |
| | | | | | | | |
| | | | | | | 70,242 | |
| | | | | | | | |
Diversified Financials—4.63% | |
Ally Financial, Inc.A | | | 1,284,400 | | | | 23,941 | |
Capital One Financial Corp. | | | 193,500 | | | | 13,967 | |
Citigroup, Inc. | | | 319,700 | | | | 16,544 | |
JPMorgan Chase & Co. | | | 504,600 | | | | 33,319 | |
Wells Fargo & Co. | | | 351,000 | | | | 19,080 | |
| | | | | | | | |
| | | | | | | 106,851 | |
| | | | | | | | |
Insurance—16.18% | | | | | | | | |
ACE Ltd. | | | 204,600 | | | | 23,908 | |
Aflac, Inc. | | | 399,500 | | | | 23,930 | |
Allstate Corp. | | | 388,300 | | | | 24,110 | |
American International Group, Inc. | | | 399,300 | | | | 24,745 | |
Arch Capital Group Ltd.A | | | 258,700 | | | | 18,044 | |
Berkshire Hathaway, Inc., Class BA | | | 201,900 | | | | 26,659 | |
Chubb Corp. | | | 105,200 | | | | 13,954 | |
Everest Re Group Ltd. | | | 121,700 | | | | 22,282 | |
Hartford Financial Services Group, Inc. | | | 454,400 | | | | 19,748 | |
Lincoln National Corp. | | | 409,100 | | | | 20,561 | |
MetLife, Inc. | | | 557,700 | | | | 26,886 | |
Progressive Corp. | | | 608,700 | | | | 19,357 | |
Torchmark Corp. | | | 227,400 | | | | 12,998 | |
Travelers Cos., Inc. | | | 227,900 | | | | 25,721 | |
Voya Financial, Inc. | | | 643,600 | | | | 23,755 | |
WR Berkley Corp. | | | 424,900 | | | | 23,263 | |
XL Group PLCB | | | 591,100 | | | | 23,159 | |
| | | | | | | | |
| | | | | | | 373,080 | |
| | | | | | | | |
Real Estate—1.13% | | | | | | | | |
Plum Creek Timber Co., Inc.C | | | 547,700 | | | | 26,136 | |
| | | | | | | | |
Total Financials | | | | 576,309 | |
| | | | | | | | |
HEALTH CARE—12.22% | | | | | | | | |
Health Care Equipment & Supplies—1.08% | |
Baxter International, Inc. | | | 655,500 | | | | 25,007 | |
| | | | | | | | |
Health Care Providers & Services—8.04% | |
Anthem, Inc. | | | 139,410 | | | | 19,439 | |
Cardinal Health, Inc. | | | 209,100 | | | | 18,666 | |
Cigna Corp. | | | 249,800 | | | | 36,554 | |
HCA Holdings, Inc. | | | 409,600 | | | | 27,702 | |
Humana, Inc. | | | 118,000 | | | | 21,064 | |
Mednax, Inc.A | | | 227,900 | | | | 16,331 | |
Quest Diagnostics, Inc. | | | 257,100 | | | | 18,290 | |
Universal Health Services, Inc., Class B | | | 230,000 | | | | 27,483 | |
| | | | | | | | |
| | | | | | | 185,529 | |
| | | | | | | | |
Pharmaceuticals—3.10% | | | | | | | | |
Abbott Laboratories | | | 514,200 | | | | 23,093 | |
Eli Lilly & Co. | | | 259,200 | | | | 21,840 | |
Johnson & Johnson | | | 258,100 | | | | 26,512 | |
| | | | | | | | |
| | | | | | | 71,445 | |
| | | | | | | | |
Total Health Care | | | | 281,981 | |
| | | | | | | | |
See accompanying notes
22
American Beacon Bridgeway Large Cap Value FundSM
Schedule of Investments
December 31, 2015
| | | | | | | | |
| | | Shares | | | Fair Value | |
| | | | | | (000’s) | |
INDUSTRIALS—10.46% | |
Aerospace & Defense—2.31% | |
General Dynamics Corp. | | | 161,300 | | | $ | 22,156 | |
Northrop Grumman Corp. | | | 164,900 | | | | 31,135 | |
| | | | | | | | |
| | | | | | | 53,291 | |
| | | | | | | | |
Airlines—3.56% | | | | | | | | |
Alaska Air Group, Inc. | | | 230,400 | | | | 18,550 | |
Delta Air Lines, Inc. | | | 318,500 | | | | 16,145 | |
JetBlue Airways Corp.A | | | 1,022,300 | | | | 23,155 | |
Southwest Airlines Co. | | | 558,900 | | | | 24,066 | |
| | | | | | | | |
| | | | | | | 81,916 | |
| | | | | | | | |
Commercial Services & Supplies—1.69% | |
Republic Services, Inc. | | | 549,700 | | | | 24,181 | |
Waste Management, Inc. | | | 279,400 | | | | 14,912 | |
| | | | | | | | |
| | | | | | | 39,093 | |
| | | | | | | | |
Electrical Equipment—0.89% | |
Emerson Electric Co. | | | 429,600 | | | | 20,548 | |
| | | | | | | | |
Machinery—2.01% | | | | | | | | |
Deere & Co. | | | 346,400 | | | | 26,419 | |
PACCAR, Inc. | | | 422,500 | | | | 20,027 | |
| | | | | | | | |
| | | | | | | 46,446 | |
| | | | | | | | |
Total Industrials | | | | 241,294 | |
| | | | | | | | |
INFORMATION TECHNOLOGY—11.30% | |
Communications Equipment—1.82% | |
Cisco Systems, Inc. | | | 648,600 | | | | 17,613 | |
Corning, Inc. | | | 1,337,500 | | | | 24,449 | |
| | | | | | | | |
| | | | | | | 42,062 | |
| | | | | | | | |
Computers & Peripherals—3.28% | |
HP, Inc. | | | 1,557,400 | | | | 18,440 | |
NVIDIA Corp. | | | 687,700 | | | | 22,667 | |
SanDisk Corp. | | | 455,600 | | | | 34,621 | |
| | | | | | | | |
| | | | | | | 75,728 | |
| | | | | | | | |
Electronic Equipment & Instruments—0.56% | |
The ADT Corp. | | | 389,700 | | | | 12,852 | |
| | | | | | | | |
IT Consulting & Services—0.24% | |
CSRA, Inc. | | | 181,900 | | | | 5,457 | |
| | | | | | | | |
Office Electronics—1.21% | | | | | | | | |
Xerox Corp. | | | 2,623,000 | | | | 27,882 | |
| | | | | | | | |
Semiconductor Equipment & Products—1.54% | |
Lam Research Corp. | | | 288,700 | | | | 22,928 | |
Micron Technology, Inc.A | | | 896,800 | | | | 12,699 | |
| | | | | | | | |
| | | | | | | 35,627 | |
| | | | | | | | |
Software—2.65% | | | | | | | | |
Activision Blizzard, Inc. | | | 791,300 | | | | 30,632 | |
Microsoft Corp. | | | 321,700 | | | | 17,848 | |
Navient Corp. | | | 1,100,900 | | | | 12,605 | |
| | | | | | | | |
| | | | | | | 61,085 | |
| | | | | | | | |
Total Information Technology | | | | 260,693 | |
| | | | | | | | |
MATERIALS—4.02% | | | | | | | | |
Chemicals—2.09% | | | | | | | | |
Ashland, Inc. | | | 133,500 | | | | 13,710 | |
CF Industries Holdings, Inc. | | | 320,500 | | | | 13,080 | |
Dow Chemical Co. | | | 419,400 | | | | 21,590 | |
| | | | | | | | |
| | | | | | | 48,380 | |
| | | | | | | | |
| | | | | | | | |
| | | Shares | | | Fair Value | |
| | | | | | (000’s) | |
Construction Materials—0.94% | |
Vulcan Materials Co. | | | 227,300 | | | $ | 21,587 | |
| | | | | | | | |
Metals & Mining—0.99% | | | | | | | | |
Newmont Mining Corp. | | | 1,267,900 | | | | 22,810 | |
| | | | | | | | |
Total Materials | | | | 92,777 | |
| | | | | | | | |
TELECOMMUNICATION SERVICES—1.74% | |
Diversified Telecommunication Services—0.85% | |
AT&T, Inc. | | | 571,449 | | | | 19,664 | |
| | | | | | | | |
Wireless Telecommunication Services—0.89% | |
T-Mobile US, Inc. | | | 521,000 | | | | 20,381 | |
| | | | | | | | |
Total Telecommunication Services | | | | 40,045 | |
| | | | | | | | |
UTILITIES—5.48% | | | | | | | | |
Electric—5.48% | | | | | | | | |
Consolidated Edison, Inc. | | | 295,100 | | | | 18,966 | |
Edison International | | | 315,300 | | | | 18,669 | |
Exelon Corp. | | | 937,800 | | | | 26,043 | |
PPL Corp. | | | 501,100 | | | | 17,103 | |
Public Service Enterprise Group, Inc. | | | 533,300 | | | | 20,633 | |
Southern Co. | | | 534,300 | | | | 25,000 | |
| | | | | | | | |
Total Utilities | | | | 126,414 | |
| | | | | | | | |
Total Common Stock (Cost $2,203,984) | | | | 2,239,515 | |
| | | | | | | | |
SHORT-TERM INVESTMENTS—1.77%
(Cost $40,875) | |
JPMorgan U.S. Government Money Market Fund, Capital Class | | | 40,874,872 | | | | 40,875 | |
| | | | | | | | |
TOTAL INVESTMENTS —98.85%
(Cost $2,244,859) | | | | 2,280,390 | |
OTHER ASSETS, NET OF LIABILITIES—1.15% | | | | 26,569 | |
| | | | | | | | |
TOTAL NET ASSETS—100.00% | | | $ | 2,306,959 | |
| | | | | | | | |
Percentages are stated as a percent of net assets.
| A | Non-income producing security. |
| B | PLC - Public Limited Company. |
| C | REIT - Real Estate Investment Trust. |
See accompanying notes
23
American Beacon Bridgeway Large Cap Value FundSM
Schedule of Investments
December 31, 2015
Futures Contracts Open on December 31, 2015:
| | | | | | | | | | | | | | | | | | |
Description | | Type | | | Number of
Contracts | | | Expiration Date | | Contract Value | | | Unrealized
Appreciation
(Depreciation) | |
S&P 500 Mini E Index March Futures | | | Long | | | | 488 | | | March 2016 | | $ | 49,663,760 | | | $ | (5,818 | ) |
| | | | | | | | | | | | | | | | | | |
| | | | | | | | | | | | $ | 49,663,760 | | | $ | (5,818 | ) |
| | | | | | | | | | | | | | | | | | |
See accompanying notes
24
American Beacon Holland Large Cap Growth FundSM
Schedule of Investments
December 31, 2015
| | | | | | | | |
| | | Shares | | | Fair Value | |
| | | | | | (000’s) | |
COMMON STOCK—95.50% | |
CONSUMER DISCRETIONARY—22.95% | |
Auto Components—1.39% | |
Delphi Automotive PLCA | | | 16,254 | | | $ | 1,393 | |
| | | | | | | | |
Hotels, Restaurants & Leisure—0.97% | | | | | |
Yum! Brands, Inc. | | | 13,218 | | | | 966 | |
| | | | | | | | |
Internet & Catalog Retail—8.26% | |
Amazon.com, Inc.B | | | 6,757 | | | | 4,566 | |
priceline.com, Inc.B | | | 2,893 | | | | 3,688 | |
| | | | | | | | |
| | | | | | | 8,254 | |
| | | | | | | | |
Media—1.66% | | | | | | | | |
Twenty-First Century Fox, Inc., Class A | | | 61,174 | | | | 1,661 | |
| | | | | | | | |
Multiline Retail—1.04% | | | | | | | | |
Dollar General Corp. | | | 14,428 | | | | 1,037 | |
| | | | | | | | |
Specialty Retail—6.18% | | | | | | | | |
Advance Auto Parts, Inc. | | | 12,045 | | | | 1,813 | |
GNC Holdings, Inc., Class A | | | 36,354 | | | | 1,128 | |
Lowe’s Cos., Inc. | | | 28,361 | | | | 2,156 | |
Restoration Hardware Holdings, Inc.B | | | 13,537 | | | | 1,076 | |
| | | | | | | | |
| | | | | | | 6,173 | |
| | | | | | | | |
Textiles & Apparel—3.45% | | | | | | | | |
NIKE, Inc., Class B | | | 29,428 | | | | 1,840 | |
Under Armour, Inc., Class AB | | | 19,952 | | | | 1,608 | |
| | | | | | | | |
| | | | | | | 3,448 | |
| | | | | | | | |
Total Consumer Discretionary | | | | 22,932 | |
| | | | | | | | |
CONSUMER STAPLES—10.40% | |
Beverages—3.08% | | | | | | | | |
Monster Beverage Corp.B | | | 14,382 | | | | 2,142 | |
PepsiCo, Inc. | | | 9,344 | | | | 934 | |
| | | | | | | | |
| | | | | | | 3,076 | |
| | | | | | | | |
Food & Drug Retailing—7.32% | |
Costco Wholesale Corp. | | | 13,099 | | | | 2,115 | |
CVS Caremark Corp. | | | 25,507 | | | | 2,495 | |
Mead Johnson Nutrition Co., Class A | | | 13,627 | | | | 1,076 | |
Whole Foods Market, Inc. | | | 48,488 | | | | 1,624 | |
| | | | | | | | |
| | | | | | | 7,310 | |
| | | | | | | | |
Total Consumer Staples | | | | 10,386 | |
| | | | | | | | |
FINANCIALS—3.93% | | | | | | | | |
Diversified Financials—3.93% | | | | | | | | |
BlackRock, Inc., Class A | | | 5,364 | | | | 1,827 | |
Greenhill & Co., Inc. | | | 17,937 | | | | 513 | |
TD Ameritrade Holding Corp. | | | 45,605 | | | | 1,583 | |
| | | | | | | | |
Total Financials | | | | 3,923 | |
| | | | | | | | |
HEALTH CARE—14.51% | | | | | | | | |
Biotechnology—6.02% | | | | | | | | |
Biogen Idec, Inc.B | | | 2,280 | | | | 698 | |
Gilead Sciences, Inc. | | | 28,595 | | | | 2,894 | |
Medivation, Inc. | | | 18,349 | | | | 887 | |
Quintiles Transnational Holdings, Inc.B | | | 10,827 | | | | 743 | |
Vertex Pharmaceuticals, Inc.B | | | 6,221 | | | | 783 | |
| | | | | | | | |
| | | | | | | 6,005 | |
| | | | | | | | |
Health Care Equipment & Supplies—2.89% | |
Medtronic PLCA | | | 37,529 | | | | 2,887 | |
| | | | | | | | |
| | | | | | | | |
| | | Shares | | | Fair Value | |
| | | | | | (000’s) | |
Health Care Providers & Services—4.12% | | | | | |
Cerner Corp.B | | | 30,736 | | | $ | 1,849 | |
DaVita HealthCare Partners, Inc.B | | | 25,730 | | | | 1,794 | |
Envision Healthcare Holdings, Inc.B | | | 18,283 | | | | 475 | |
| | | | | | | | |
| | | | | | | 4,118 | |
| | | | | | | | |
Pharmaceuticals—1.48% | | | | | | | | |
Bristol-Myers Squibb Co. | | | 21,498 | | | | 1,479 | |
| | | | | | | | |
Total Health Care | | | | 14,489 | |
| | | | | | | | |
INDUSTRIALS—11.80% | | | | | | | | |
Aerospace & Defense—3.32% | |
Boeing Co. | | | 11,380 | | | | 1,645 | |
Precision Castparts Corp. | | | 7,186 | | | | 1,668 | |
| | | | | | | | |
| | | | | | | 3,313 | |
| | | | | | | | |
Air Freight & Couriers—0.96% | |
United Parcel Service, Inc., Class B | | | 9,957 | | | | 958 | |
| | | | | | | | |
Airlines—3.09% | | | | | | | | |
Southwest Airlines Co. | | | 71,638 | | | | 3,085 | |
| | | | | | | | |
Electrical Equipment—2.00% | |
Roper Industries, Inc. | | | 10,546 | | | | 2,002 | |
| | | | | | | | |
Industrial Conglomerates—2.43% | | | | | |
Honeywell International, Inc. | | | 23,409 | | | | 2,424 | |
| | | | | | | | |
Total Industrials | | | | 11,782 | |
| | | | | | | | |
INFORMATION TECHNOLOGY—30.64% | |
Communications—1.76% | | | | | | | | |
Facebook, Inc., Class AB | | | 16,763 | | | | 1,754 | |
| | | | | | | | |
Communications Equipment—2.82% | | | | | |
Cisco Systems, Inc. | | | 103,867 | | | | 2,821 | |
| | | | | | | | |
Computers & Peripherals—4.31% | | | | | |
Apple, Inc. | | | 34,627 | | | | 3,645 | |
International Business Machines Corp. | | | 4,788 | | | | 659 | |
| | | | | | | | |
| | | | | | | 4,304 | |
| | | | | | | | |
Internet Software & Services—4.73% | | | | | |
Alphabet, Inc., Class CB | | | 6,227 | | | | 4,726 | |
| | | | | | | | |
IT Consulting & Services—6.66% | | | | | |
Automatic Data Processing, Inc. | | | 10,859 | | | | 920 | |
IHS, Inc., Class AB | | | 8,695 | | | | 1,030 | |
Visa, Inc., Class A | | | 60,671 | | | | 4,704 | |
| | | | | | | | |
| | | | | | | 6,654 | |
| | | | | | | | |
Software—10.36% | | | | | | | | |
Adobe Systems, Inc.B | | | 42,561 | | | | 3,997 | |
Citrix Systems, Inc.B | | | 47,580 | | | | 3,599 | |
Intuit, Inc. | | | 11,664 | | | | 1,126 | |
Microsoft Corp. | | | 29,451 | | | | 1,634 | |
| | | | | | | | |
| | | | | | | 10,356 | |
| | | | | | | | |
Total Information Technology | | | | 30,615 | |
| | | | | | | | |
MATERIALS—1.27% | | | | | | | | |
Chemicals—1.27% | | | | | | | | |
Ecolab, Inc. | | | 11,076 | | | | 1,267 | |
| | | | | | | | |
Total Common Stock (Cost $68,476) | | | | 95,394 | |
| | | | | | | | |
See accompanying notes
25
American Beacon Holland Large Cap Growth FundSM
Schedule of Investments
December 31, 2015
| | | | | | | | |
| | | Shares | | | Fair Value | |
| | | | | | (000’s) | |
SHORT-TERM INVESTMENTS—4.57%
(Cost $4,564) | |
JPMorgan U.S. Government Money Market Fund, Capital Class | | | 4,563,615 | | | $ | 4,564 | |
| | | | | | | | |
TOTAL INVESTMENTS —100.07% (Cost $73,040) | | | | 99,958 | |
LIABILITIES, NET OF OTHER
ASSETS—(0.07%) | | | | (73 | ) |
| | | | | | | | |
TOTAL NET ASSETS—100.00% | | | $ | 99,885 | |
| | | | | | | | |
Percentages are stated as a percent of net assets.
| A | PLC - Public Limited Company. |
| B | Non-income producing security. |
Futures Contracts Open on December 31, 2015:
| | | | | | | | | | | | | | | | | | |
Description | | Type | | | Number of
Contracts | | | Expiration Date | | Contract Value | | | Unrealized
Appreciation
(Depreciation) | |
S&P 500 Mini E Index March Futures | | | Long | | | | 41 | | | March 2016 | | $ | 4,172,570 | | | $ | 20,633 | |
| | | | | | | | | | | | | | | | | | |
| | | | | | | | | | | | $ | 4,172,570 | | | $ | 20,633 | |
| | | | | | | | | | | | | | | | | | |
See accompanying notes
26
American Beacon Stephens Small Cap Growth FundSM
Schedule of Investments
December 31, 2015
| | | | | | | | |
| | | Shares | | | Fair Value | |
| | | | | | (000’s) | |
COMMON STOCK—99.51% | |
CONSUMER DISCRETIONARY—15.53% | |
Auto Components—0.95% | |
Motorcar Parts of America, Inc.A | | | 143,330 | | | $ | 4,846 | |
| | | | | | | | |
Commercial Services—0.92% | | | | | | | | |
CEB, Inc. | | | 76,600 | | | | 4,702 | |
| | | | | | | | |
Hotels, Restaurants & Leisure—6.80% | | | | | |
Buffalo Wild Wings, Inc.A | | | 42,224 | | | | 6,741 | |
Chuy’s Holdings, Inc.A | | | 156,991 | | | | 4,920 | |
Krispy Kreme Doughnuts, Inc.A | | | 372,022 | | | | 5,606 | |
National CineMedia, Inc.B | | | 578,855 | | | | 9,094 | |
Papa John’s International, Inc. | | | 70,800 | | | | 3,956 | |
Potbelly Corp.A B C | | | 374,800 | | | | 4,389 | |
| | | | | | | | |
| | | | | | | 34,706 | |
| | | | | | | | |
Leisure Equipment & Products—1.99% | |
Callaway Golf Co. | | | 611,816 | | | | 5,763 | |
Sportsman’s Warehouse Holdings, Inc.A | | | 341,829 | | | | 4,410 | |
| | | | | | | | |
| | | | | | | 10,173 | |
| | | | | | | | |
Media—2.12% | | | | | | | | |
IMAX Corp.A | | | 217,778 | | | | 7,740 | |
TiVo, Inc.A | | | 358,800 | | | | 3,096 | |
| | | | | | | | |
| | | | | | | 10,836 | |
| | | | | | | | |
Specialty Retail—2.75% | | | | | | | | |
Aaron’s, Inc. | | | 143,200 | | | | 3,206 | |
Bright Horizons Family Solutions, Inc.A | | | 28,000 | | | | 1,870 | |
Cabela’s, Inc.A C | | | 57,800 | | | | 2,701 | |
Monro Muffler Brake, Inc. | | | 94,140 | | | | 6,235 | |
| | | | | | | | |
| | | | | | | 14,012 | |
| | | | | | | | |
Total Consumer Discretionary | | | | 79,275 | |
| | | | | | | | |
CONSUMER STAPLES—3.18% | |
Food & Drug Retailing—0.99% | |
United Natural Foods, Inc.A | | | 127,740 | | | | 5,028 | |
| | | | | | | | |
Food Products—2.19% | | | | | | | | |
Calavo Growers, Inc. | | | 98,542 | | | | 4,829 | |
Inventure Foods, Inc.A B C | | | 324,566 | | | | 2,304 | |
TreeHouse Foods, Inc.A | | | 51,800 | | | | 4,064 | |
| | | | | | | | |
| | | | | | | 11,197 | |
| | | | | | | | |
Total Consumer Staples | | | | 16,225 | |
| | | | | | | | |
ENERGY—4.55% | | | | | | | | |
Energy Equipment & Services—3.28% | | | | | |
Core Laboratories N.V.C | | | 25,600 | | | | 2,784 | |
Flotek Industries, Inc.A C | | | 259,914 | | | | 2,973 | |
Forum Energy Technologies, Inc.A | | | 166,500 | | | | 2,075 | |
PDC Energy, Inc.A | | | 72,100 | | | | 3,849 | |
RigNet, Inc.A | | | 146,706 | | | | 3,035 | |
RPC, Inc.C | | | 167,300 | | | | 1,999 | |
| | | | | | | | |
| | | | | | | 16,715 | |
| | | | | | | | |
Oil & Gas—1.27% | | | | | | | | |
Carrizo Oil & Gas, Inc.A | | | 95,600 | | | | 2,828 | |
Rice Energy, Inc.A | | | 262,400 | | | | 2,860 | |
Whiting Petroleum Corp.A | | | 86,688 | | | | 818 | |
| | | | | | | | |
| | | | | | | 6,506 | |
| | | | | | | | |
Total Energy | | | | 23,221 | |
| | | | | | | | |
FINANCIALS—9.28% | | | | | | | | |
Banks—1.34% | | | | | | | | |
East West Bancorp, Inc. | | | 81,000 | | | | 3,366 | |
| | | | | | | | |
| | | Shares | | | Fair Value | |
| | | | | | (000’s) | |
SVB Financial GroupA | | | 29,000 | | | $ | 3,448 | |
| | | | | | | | |
| | | | | | | 6,814 | |
| | | | | | | | |
Diversified Financials—6.18% | |
Cardtronics, Inc.A | | | 182,753 | | | | 6,150 | |
Demandware, Inc.A | | | 108,300 | | | | 5,845 | |
Encore Capital Group, Inc.A C | | | 79,832 | | | | 2,322 | |
Euronet Worldwide, Inc.A | | | 112,200 | | | | 8,127 | |
MarketAxess Holdings, Inc. | | | 34,700 | | | | 3,872 | |
PRA Group, Inc.C | | | 68,580 | | | | 2,379 | |
WisdomTree Investments, Inc. | | | 182,100 | | | | 2,855 | |
| | | | | | | | |
| | | | | | | 31,550 | |
| | | | | | | | |
Insurance—1.76% | | | | | | | | |
Hilltop Holdings, Inc.A | | | 257,200 | | | | 4,943 | |
WEX, Inc.A | | | 45,600 | | | | 4,031 | |
| | | | | | | | |
| | | | | | | 8,974 | |
| | | | | | | | |
Total Financials | | | | 47,338 | |
| | | | | | | | |
HEALTH CARE—26.47% | | | | | | | | |
Biotechnology—4.94% | | | | | | | | |
Cepheid, Inc.A | | | 175,200 | | | | 6,400 | |
MiMedx Group, Inc.A C | | | 373,680 | | | | 3,501 | |
Myriad Genetics, Inc.A C | | | 96,429 | | | | 4,162 | |
Neogen Corp.A | | | 149,650 | | | | 8,458 | |
Repligen Corp.A | | | 95,779 | | | | 2,710 | |
| | | | | | | | |
| | | | | | | 25,231 | |
| | | | | | | | |
Health Care Equipment & Supplies—5.47% | |
Abaxis, Inc. | | | 87,281 | | | | 4,860 | |
ABIOMED, Inc.A | | | 46,600 | | | | 4,207 | |
Bio-Techne Corp. | | | 38,800 | | | | 3,492 | |
DexCom, Inc.A | | | 26,600 | | | | 2,179 | |
Medidata Solutions, Inc.A | | | 146,942 | | | | 7,242 | |
NuVasive, Inc.A | | | 109,280 | | | | 5,913 | |
| | | | | | | | |
| | | | | | | 27,893 | |
| | | | | | | | |
Health Care Providers & Services—8.49% | |
AAC Holdings, Inc.A C | | | 82,200 | | | | 1,567 | |
Acadia Healthcare Co., Inc.A | | | 122,700 | | | | 7,664 | |
Advisory Board Co.A | | | 155,825 | | | | 7,730 | |
HealthEquity, Inc.A | | | 163,272 | | | | 4,093 | |
MAXIMUS, Inc. | | | 64,200 | | | | 3,611 | |
Omnicell, Inc.A | | | 93,300 | | | | 2,900 | |
PAREXEL International Corp.A | | | 136,600 | | | | 9,306 | |
VCA Antech, Inc.A | | | 117,555 | | | | 6,466 | |
| | | | | | | | |
| | | | | | | 43,337 | |
| | | | | | | | |
Pharmaceuticals—7.57% | | | | | | | | |
Akorn, Inc.A | | | 159,300 | | | | 5,943 | |
ICON PLCA D | | | 128,500 | | | | 9,985 | |
Ligand Pharmaceuticals, Inc. | | | 76,250 | | | | 8,267 | |
Pacira Pharmaceuticals, Inc.A | | | 103,228 | | | | 7,927 | |
Proto Labs, Inc.A | | | 102,405 | | | | 6,522 | |
| | | | | | | | |
| | | | | | | 38,644 | |
| | | | | | | | |
Total Health Care | | | | 135,105 | |
| | | | | | | | |
INDUSTRIALS—11.32% | | | | | | | | |
Aerospace & Defense—2.04% | |
Aerovironment, Inc.A | | | 104,400 | | | | 3,077 | |
Astronics Corp. | | | 110,895 | | | | 4,514 | |
Orbital ATK, Inc. | | | 31,400 | | | | 2,805 | |
| | | | | | | | |
| | | | | | | 10,396 | |
| | | | | | | | |
Air Freight & Couriers—1.13% | |
Echo Global Logistics, Inc.A | | | 164,900 | | | | 3,363 | |
HUB Group, Inc., Class AA | | | 72,300 | | | | 2,382 | |
| | | | | | | | |
| | | | | | | 5,745 | |
| | | | | | | | |
See accompanying notes
27
American Beacon Stephens Small Cap Growth FundSM
Schedule of Investments
December 31, 2015
| | | | | | | | |
| | | Shares | | | Fair Value | |
| | | | | | (000’s) | |
Building Products—0.88% | |
Trex Co., Inc.A | | | 118,300 | | | $ | 4,500 | |
| | | | | | | | |
Commercial Services & Supplies—4.07% | |
CoStar Group, Inc.A | | | 38,301 | | | | 7,917 | |
HMS Holdings Corp.A | | | 422,969 | | | | 5,219 | |
WageWorks, Inc.A | | | 168,042 | | | | 7,624 | |
| | | | | | | | |
| | | | | | | 20,760 | |
| | | | | | | | |
Diversified Manufacturing—0.67% | | | | | |
Acuity Brands, Inc. | | | 14,600 | | | | 3,413 | |
| | | | | | | | |
Electrical Equipment—1.28% | |
Cognex Corp. | | | 171,000 | | | | 5,775 | |
Power Solutions International, Inc.A C | | | 39,843 | | | | 762 | |
| | | | | | | | |
| | | | | | | 6,537 | |
| | | | | | | | |
Machinery—0.81% | | | | | | | | |
RBC Bearings, Inc. | | | 64,300 | | | | 4,153 | |
| | | | | | | | |
Trading Companies & Distributors—0.44% | |
MSC Industrial Direct Co., Inc., Class A | | | 39,945 | | | | 2,248 | |
| | | | | | | | |
Total Industrials | | | | 57,752 | |
| | | | | | | | |
INFORMATION TECHNOLOGY—27.44% | |
Communications Equipment—0.85% | | | | | |
CalAmp Corp.A | | | 218,659 | | | | 4,358 | |
| | | | | | | | |
Electronic Equipment & Instruments—1.17% | |
FLIR Systems, Inc. | | | 94,400 | | | | 2,650 | |
Taser International, Inc.A C | | | 192,100 | | | | 3,321 | |
| | | | | | | | |
| | | | | | | 5,971 | |
| | | | | | | | |
Internet Software & Services—4.83% | | | | | |
Athenahealth, Inc.A C | | | 37,602 | | | | 6,053 | |
Fortinet, Inc.A | | | 106,500 | | | | 3,320 | |
Global Eagle Entertainment, Inc.A | | | 315,270 | | | | 3,112 | |
HealthStream, Inc.A B | | | 192,514 | | | | 4,235 | |
Proofpoint, Inc.A | | | 122,026 | | | | 7,932 | |
| | | | | | | | |
| | | | | | | 24,652 | |
| | | | | | | | |
IT Consulting & Services—1.63% | | | | | |
Tyler Technologies, Inc. | | | 47,684 | | | | 8,312 | |
| | | | | | | | |
Semiconductor Equipment & Products—6.50% | |
8x8, Inc.A | | | 535,000 | | | | 6,127 | |
Cavium, Inc.A | | | 85,200 | | | | 5,598 | |
Integrated Device Technology, Inc.A | | | 140,900 | | | | 3,713 | |
Microsemi Corp. | | | 185,230 | | | | 6,037 | |
Power Integrations, Inc. | | | 112,300 | | | | 5,461 | |
Rudolph Technologies, Inc.A | | | 229,000 | | | | 3,256 | |
Semtech Corp.A | | | 158,786 | | | | 3,004 | |
| | | | | | | | |
| | | | | | | 33,196 | |
| | | | | | | | |
Software—12.46% | | | | | | | | |
Aspen Technology, Inc.A | | | 141,348 | | | | 5,337 | |
CyberArk Software Ltd.A C | | | 76,000 | | | | 3,431 | |
Envestnet, Inc.A | | | 171,809 | | | | 5,128 | |
Guidewire Software, Inc.A | | | 123,700 | | | | 7,442 | |
Imperva, Inc.A | | | 39,100 | | | | 2,475 | |
inContact, Inc.A | | | 399,300 | | | | 3,809 | |
Manhattan Associates, Inc.A | | | 118,717 | | | | 7,857 | |
National Instruments Corp. | | | 107,167 | | | | 3,075 | |
PROS Holdings, Inc.A | | | 240,200 | | | | 5,534 | |
Qualys, Inc.A | | | 152,100 | | | | 5,033 | |
SPS Commerce, Inc.A | | | 60,918 | | | | 4,277 | |
Ultimate Software Group, Inc.A | | | 39,500 | | | | 7,723 | |
| | | | | | | | |
| | | Shares | | | Fair Value | |
| | | | | | (000’s) | |
VASCO Data Security International, Inc.A C | | | 147,700 | | | $ | 2,471 | |
| | | | | | | | |
| | | | | | | 63,592 | |
| | | | | | | | |
Total Information Technology | | | | 140,081 | |
| | | | | | | | |
MATERIALS—1.74% | | | | | | | | |
Chemicals—0.81% | | | | | | | | |
Balchem Corp. | | | 67,766 | | | | 4,120 | |
| | | | | | | | |
Metals & Mining—0.93% | | | | | | | | |
Mueller Water Products, Inc., Class A | | | 552,100 | | | | 4,748 | |
| | | | | | | | |
Total Materials | | | | 8,868 | |
| | | | | | | | |
Total Common Stock (Cost $474,129) | | | | 507,865 | |
| | | | | | | | |
SHORT-TERM INVESTMENTS—0.30%
(Cost $1,539) | |
JPMorgan U.S. Government Money Market Fund, Capital Class | | | 1,539,227 | | | | 1,539 | |
| | | | | | | | |
SECURITIES LENDING COLLATERAL—8.63% | |
DWS Government and Agency Securities Portfolio, Institutional Class | | | 11,008,560 | | | | 11,008 | |
American Beacon U.S. Government Money Market Select Fund, Select Class E | | | 33,025,680 | | | | 33,026 | |
| | | | | | | | |
Total Securities Lending Collateral (Cost $44,034) | | | | | | | 44,034 | |
| | | | | | | | |
TOTAL INVESTMENTS —108.44% (Cost $519,702) | | | | 553,438 | |
LIABILITIES, NET OF OTHER ASSETS—(8.44%) | | | | (43,071 | ) |
| | | | | | | | |
TOTAL NET ASSETS—100.00% | | | $ | 510,367 | |
| | | | | | | | |
Percentages are stated as a percent of net assets.
| A | Non-income producing security. |
| B | Illiquid Security. At period end, the amount of illiquid securities was $20,022 or 3.9% of net assets. |
| C | All or a portion of this security is on loan at December 31, 2015. |
| D | PLC - Public Limited Company. |
| E | The Fund is affiliated by having the same investment advisor. |
See accompanying notes
28
American Beacon Stephens Mid-Cap Growth FundSM
Schedule of Investments
December 31, 2015
| | | | | | | | |
| | | Shares | | | Fair Value | |
| | | | | | (000’s) | |
COMMON STOCK—100.31% | |
CONSUMER DISCRETIONARY—21.66% | |
Auto Components—1.68% | |
LKQ Corp.A | | | 44,850 | | | $ | 1,329 | |
Mobileye N.V.A | | | 12,400 | | | | 524 | |
| | | | | | | | |
| | | | | | | 1,853 | |
| | | | | | | | |
Automobiles—0.76% | | | | | | | | |
Tesla Motors, Inc.A B | | | 3,500 | | | | 840 | |
| | | | | | | | |
Hotels, Restaurants & Leisure—3.27% | | | | | |
Buffalo Wild Wings, Inc.A | | | 8,750 | | | | 1,397 | |
National CineMedia, Inc.C | | | 85,000 | | | | 1,335 | |
Papa John’s International, Inc. | | | 15,550 | | | | 869 | |
| | | | | | | | |
| | | | | | | 3,601 | |
| | | | | | | | |
Household Durables—0.89% | |
Harman International Industries, Inc. | | | 10,350 | | | | 975 | |
| | | | | | | | |
Internet & Catalog Retail—1.56% | |
Expedia, Inc. | | | 5,268 | | | | 655 | |
TripAdvisor, Inc.A | | | 12,450 | | | | 1,061 | |
| | | | | | | | |
| | | | | | | 1,716 | |
| | | | | | | | |
Media—4.29% | | | | | | | | |
Cinemark Holdings, Inc. | | | 32,300 | | | | 1,080 | |
IMAX Corp.A | | | 45,662 | | | | 1,623 | |
Netflix, Inc.A | | | 17,600 | | | | 2,013 | |
| | | | | | | | |
| | | | | | | 4,716 | |
| | | | | | | | |
Specialty Retail—8.20% | | | | | | | | |
Aaron’s, Inc. | | | 27,650 | | | | 619 | |
Bright Horizons Family Solutions, Inc.A | | | 6,300 | | | | 421 | |
Cabela’s, Inc.A | | | 13,800 | | | | 645 | |
CarMax, Inc.A | | | 25,300 | | | | 1,365 | |
Copart, Inc.A | | | 25,650 | | | | 975 | |
Ross Stores, Inc. | | | 37,950 | | | | 2,043 | |
Tractor Supply Co. | | | 14,850 | | | | 1,270 | |
Ulta Salon Cosmetics & Fragrance, Inc. | | | 9,050 | | | | 1,674 | |
| | | | | | | | |
| | | | | | | 9,012 | |
| | | | | | | | |
Textiles & Apparel—1.01% | | | | | | | | |
Under Armour, Inc., Class AA | | | 13,800 | | | | 1,112 | |
| | | | | | | | |
Total Consumer Discretionary | | | | 23,825 | |
| | | | | | | | |
CONSUMER STAPLES—5.18% | |
Beverages—3.67% | | | | | | | | |
Brown-Forman Corp., Class B | | | 17,230 | | | | 1,711 | |
Monster Beverage Corp.A | | | 15,650 | | | | 2,331 | |
| | | | | | | | |
| | | | | | | 4,042 | |
| | | | | | | | |
Food & Drug Retailing—0.91% | |
United Natural Foods, Inc.A | | | 25,350 | | | | 998 | |
| | | | | | | | |
Food Products—0.60% | | | | | | | | |
White Waves Food Co.A | | | 17,050 | | | | 663 | |
| | | | | | | | |
Total Consumer Staples | | | | 5,703 | |
| | | | | | | | |
ENERGY—4.23% | | | | | | | | |
Energy Equipment & Services—2.52% | | | | | |
Core Laboratories N.V.B | | | 10,100 | | | | 1,097 | |
FMC Technologies, Inc.A | | | 19,880 | | | | 577 | |
Oceaneering International, Inc. | | | 17,100 | | | | 642 | |
RPC, Inc.B | | | 38,300 | | | | 458 | |
| | | | | | | | |
| | | | | | | 2,774 | |
| | | | | | | | |
| | | | | | | | |
| | | Shares | | | Fair Value | |
| | | | | | (000’s) | |
Oil & Gas—1.71% | | | | | | | | |
Pioneer Natural Resources Co. | | | 6,900 | | | $ | 866 | |
Range Resources Corp. | | | 22,150 | | | | 545 | |
Southwestern Energy Co.A B | | | 40,660 | | | | 289 | |
Whiting Petroleum Corp.A | | | 19,300 | | | | 182 | |
| | | | | | | | |
| | | | | | | 1,882 | |
| | | | | | | | |
Total Energy | | | | 4,656 | |
| | | | | | | | |
FINANCIALS—6.48% | | | | | | | | |
Banks—2.87% | | | | | | | | |
East West Bancorp, Inc. | | | 34,950 | | | | 1,453 | |
SVB Financial GroupA | | | 14,300 | | | | 1,699 | |
| | | | | | | | |
| | | | | | | 3,152 | |
| | | | | | | | |
Diversified Financials—2.65% | |
Affiliated Managers Group, Inc.A | | | 5,780 | | | | 924 | |
MarketAxess Holdings, Inc. | | | 7,350 | | | | 820 | |
PRA Group, Inc.B | | | 17,783 | | | | 617 | |
WisdomTree Investments, Inc. | | | 35,600 | | | | 558 | |
| | | | | | | | |
| | | | | | | 2,919 | |
| | | | | | | | |
Insurance—0.96% | | | | | | | | |
WEX, Inc.A | | | 11,900 | | | | 1,052 | |
| | | | | | | | |
Total Financials | | | | 7,123 | |
| | | | | | | | �� |
HEALTH CARE—22.21% | | | | | | | | |
Biotechnology—3.80% | | | | | | | | |
Alexion Pharmaceuticals, Inc.A | | | 4,600 | | | | 877 | |
Cepheid, Inc.A | | | 36,350 | | | | 1,328 | |
Medivation, Inc. | | | 17,000 | | | | 822 | |
QIAGEN N.V.A | | | 41,750 | | | | 1,154 | |
| | | | | | | | |
| | | | | | | 4,181 | |
| | | | | | | | |
Health Care Equipment & Supplies—9.28% | |
DexCom, Inc.A | | | 5,200 | | | | 426 | |
Hologic, Inc.A | | | 29,650 | | | | 1,147 | |
Idexx Laboratories, Inc.A | | | 19,750 | | | | 1,441 | |
Illumina, Inc.A | | | 11,000 | | | | 2,112 | |
Intuitive Surgical, Inc.A | | | 1,450 | | | | 792 | |
Medidata Solutions, Inc.A | | | 23,099 | | | | 1,139 | |
ResMed, Inc. | | | 22,500 | | | | 1,208 | |
Sirona Dental Systems, Inc. | | | 10,050 | | | | 1,101 | |
Varian Medical Systems, Inc.A | | | 10,500 | | | | 848 | |
| | | | | | | | |
| | | | | | | 10,214 | |
| | | | | | | | |
Health Care Providers & Services—6.24% | |
Acadia Healthcare Co., Inc.A | | | 13,800 | | | | 862 | |
Cerner Corp.A | | | 29,980 | | | | 1,804 | |
Henry Schein, Inc.A | | | 9,545 | | | | 1,510 | |
PAREXEL International Corp.A | | | 19,000 | | | | 1,294 | |
VCA Antech, Inc.A | | | 25,280 | | | | 1,390 | |
| | | | | | | | |
| | | | | | | 6,860 | |
| | | | | | | | |
Pharmaceuticals—2.89% | | | | | | | | |
Akorn, Inc.A | | | 23,750 | | | | 886 | |
ICON PLCA D | | | 12,450 | | | | 967 | |
Pacira Pharmaceuticals, Inc.A | | | 17,250 | | | | 1,325 | |
| | | | | | | | |
| | | | | | | 3,178 | |
| | | | | | | | |
Total Health Care | | | | 24,433 | |
| | | | | | | | |
INDUSTRIALS—12.83% | | | | | | | | |
Aerospace & Defense—1.14% | |
Orbital ATK, Inc. | | | 14,000 | | | | 1,251 | |
| | | | | | | | |
Commercial Services & Supplies—5.28% | |
CoStar Group, Inc.A | | | 9,220 | | | | 1,905 | |
See accompanying notes
29
American Beacon Stephens Mid-Cap Growth FundSM
Schedule of Investments
December 31, 2015
| | | | | | | | |
| | | Shares | | | Fair Value | |
| | | | | | (000’s) | |
HMS Holdings Corp.A | | | 70,562 | | | $ | 871 | |
Stericycle, Inc.A | | | 13,750 | | | | 1,658 | |
Verisk Analytics, Inc.A | | | 18,050 | | | | 1,388 | |
| | | | | | | | |
| | | | | | | 5,822 | |
| | | | | | | | |
Diversified Manufacturing—1.29% | | | | | |
Acuity Brands, Inc. | | | 6,050 | | | | 1,414 | |
| | | | | | | | |
Electrical Equipment—2.85% | |
Cognex Corp. | | | 34,100 | | | | 1,151 | |
IPG Photonics Corp. | | | 8,950 | | | | 798 | |
Roper Industries, Inc. | | | 4,050 | | | | 769 | |
Sensata Technologies Holding N.V.A | | | 8,950 | | | | 412 | |
| | | | | | | | |
| | | | | | | 3,130 | |
| | | | | | | | |
Road & Rail—0.79% | | | | | | | | |
J.B. Hunt Transport Services, Inc. | | | 11,800 | | | | 866 | |
| | | | | | | | |
Trading Companies & Distributors—1.48% | |
Fastenal Co.B | | | 22,760 | | | | 929 | |
MSC Industrial Direct Co., Inc., Class A | | | 12,380 | | | | 697 | |
| | | | | | | | |
| | | | | | | 1,626 | |
| | | | | | | | |
Total Industrials | | | | 14,109 | |
| | | | | | | | |
INFORMATION TECHNOLOGY—26.27% | |
Communications Equipment—1.63% | |
Palo Alto Networks, Inc.A | | | 10,150 | | | | 1,788 | |
| | | | | | | | |
Electronic Equipment & Instruments—1.24% | |
FLIR Systems, Inc. | | | 48,700 | | | | 1,367 | |
| | | | | | | | |
Internet Software & Services—6.28% | |
Akamai Technologies, Inc.A | | | 16,150 | | | | 850 | |
Athenahealth, Inc.A | | | 10,527 | | | | 1,694 | |
Fortinet, Inc.A | | | 48,400 | | | | 1,509 | |
LinkedIn Corp., Class AA | | | 3,500 | | | | 788 | |
MercadoLibre, Inc.B | | | 13,200 | | | | 1,509 | |
Twitter, Inc.A | | | 24,200 | | | | 560 | |
| | | | | | | | |
| | | | | | | 6,910 | |
| | | | | | | | |
IT Consulting & Services—1.60% | |
Alliance Data Systems Corp.A | | | 3,800 | | | | 1,051 | |
IHS, Inc., Class AA | | | 6,000 | | | | 711 | |
| | | | | | | | |
| | | | | | | 1,762 | |
| | | | | | | | |
Semiconductor Equipment & Products—4.67% | |
Cree, Inc.A | | | 15,550 | | | | 415 | |
FEI Co. | | | 14,387 | | | | 1,148 | |
Lam Research Corp. | | | 8,368 | | | | 665 | |
Microchip Technology, Inc. | | | 27,530 | | | | 1,280 | |
NXP Semiconductors N.V.A | | | 7,300 | | | | 615 | |
Xilinx, Inc. | | | 21,600 | | | | 1,015 | |
| | | | | | | | |
| | | | | | | 5,138 | |
| | | | | | | | |
Software—10.85% | | | | | | | | |
Ansys, Inc.A | | | 6,600 | | | | 611 | |
Aspen Technology, Inc.A | | | 30,800 | | | | 1,163 | |
Autodesk, Inc.A | | | 17,000 | | | | 1,036 | |
Cadence Design Systems, Inc.A | | | 46,100 | | | | 959 | |
Check Point Software Technologies Ltd.A | | | 14,400 | | | | 1,172 | |
FireEye, Inc.A | | | 27,069 | | | | 561 | |
Inovalon Holdings, Inc., Class AA B | | | 18,700 | | | | 318 | |
National Instruments Corp. | | | 28,555 | | | | 819 | |
Red Hat, Inc.A | | | 13,790 | | | | 1,142 | |
Salesforce.com, Inc.A | | | 9,770 | | | | 766 | |
Splunk, Inc.A | | | 11,900 | | | | 700 | |
Tableau Software, Inc., Class AA | | | 12,400 | | | | 1,168 | |
| | | | | | | | |
| | | Shares | | | Fair Value | |
| | | | | | (000’s) | |
Ultimate Software Group, Inc.A | | | 7,700 | | | $ | 1,505 | |
| | | | | | | | |
| | | | | | | 11,920 | |
| | | | | | | | |
Total Information Technology | | | | 28,885 | |
| | | | | | | | |
MATERIALS—1.45% | | | | | | | | |
Chemicals—1.45% | | | | | | | | |
Airgas, Inc. | | | 11,550 | | | | 1,598 | |
| | | | | | | | |
Total Common Stock (Cost $96,923) | | | | 110,332 | |
| | | | | | | | |
SECURITIES LENDING COLLATERAL—4.38% | |
American Beacon U.S. Government Money Market Select Fund, Select Class E | | | 3,611,273 | | | | 3,611 | |
DWS Government and Agency Securities Portfolio, Institutional Class | | | 1,203,758 | | | | 1,204 | |
| | | | | | | | |
Total Securities Lending Collateral (Cost $4,815) | | | | | | | 4,815 | |
| | | | | | | | |
TOTAL INVESTMENTS —104.69% (Cost $101,738) | | | | 115,147 | |
LIABILITIES, NET OF OTHER ASSETS—(4.69%) | | | | (5,155 | ) |
| | | | | | | | |
TOTAL NET ASSETS—100.00% | | | $ | 109,992 | |
| | | | | | | | |
Percentages are stated as a percent of net assets.
| A | Non-income producing security. |
| B | All or a portion of this security is on loan at December 31, 2015. |
| C | Illiquid Security. At period end, the amount of illiquid securities was $1,335 or 1.2% of net assets. |
| D | PLC - Public Limited Company. |
| E | The Fund is affiliated by having the same investment advisor. |
See accompanying notes
30
American Beacon FundsSM
Statements of Assets and Liabilities
December 31, 2015 (in thousands, except share and per share amounts)
| | | | | | | | | | | | | | | | | | | | |
| | | Bahl & | | | | | | | | | | | | | |
| | | Gaynor | | | | | | Holland | | | Stephens | | | Stephens | |
| | | Small Cap | | | Bridgeway | | | Large Cap | | | Small Cap | | | Mid-Cap | |
| | | Growth | | | Large Cap | | | Growth | | | Growth | | | Growth | |
| | | Fund | | | Value Fund | | | Fund | | | Fund | | | Fund | |
Assets: | | | | | | | | | | | | | | | | | | | | |
Investments in unaffiliated securities, at fair value A C | | $ | 7,205 | | | $ | 2,280,390 | | | $ | 99,958 | | | $ | 520,412 | | | $ | 111,536 | |
Investments in affiliated securities, at fair value B | | | — | | | | — | | | | — | | | | 33,026 | | | | 3,611 | |
Cash | | | — | | | | 288 | | | | — | | | | — | | | | 1 | |
Deposit with brokers for futures contracts | | | 3 | | | | 1,283 | | | | 112 | | | | — | | | | — | |
Dividends and interest receivable | | | 11 | | | | 2,563 | | | | 59 | | | | 26 | | | | 5 | |
Receivable for investments sold | | | — | | | | 28,382 | | | | 28 | | | | 2,277 | | | | 2,454 | |
Receivable for fund shares sold | | | — | | | | 19,477 | | | | 8 | | | | 839 | | | | 39 | |
Receivable for tax reclaims | | | — | | | | — | | | | — | | | | 1 | | | | — | |
Receivable for expense reimbursement (Note 2) | | | 6 | | | | — | | | | — | | | | — | | | | — | |
Receivable for variation margin on open futures contracts | | | 1 | | | | — | | | | 21 | | | | — | | | | — | |
Prepaid expenses | | | 18 | | | | 73 | | | | 11 | | | | 28 | | | | 15 | |
| | | | | | | | | | | | | | | | | | | | |
Total assets | | | 7,244 | | | | 2,332,456 | | | | 100,197 | | | | 556,609 | | | | 117,661 | |
| | | | | | | | | | | | | | | | | | | | |
Liabilities: | | | | | | | | | | | | | | | | | | | | |
Payable for investments purchased | | | — | | | | 18,486 | | | | — | | | | 79 | | | | — | |
Payable for fund shares redeemed | | | — | | | | 5,146 | | | | 191 | | | | 1,036 | | | | 2,017 | |
Payable for variation margin from open futures contracts | | | — | | | | 5 | | | | — | | | | — | | | | — | |
Cash overdraft | | | — | | | | — | | | | — | | | | 552 | | | | — | |
Payable for expense reimbursement (Note 2) | | | — | | | | 3 | | | | — | | | | 2 | | | | 5 | |
Payable upon return of securities loaned | | | — | | | | — | | | | — | | | | 44,034 | | | | 4,815 | |
Payable for interfund loan | | | — | | | | — | | | | — | | | | — | | | | 695 | |
Management and investment advisory fees payable | | | 3 | | | | 703 | | | | 38 | | | | 296 | | | | 53 | |
Administrative service and service fees payable | | | 3 | | | | 1,010 | | | | 44 | | | | 158 | | | | 40 | |
Transfer agent fees payable | | | — | | | | 38 | | | | 2 | | | | 16 | | | | 6 | |
Custody and fund accounting fees payable | | | 2 | | | | 29 | | | | 1 | | | | 12 | | | | 3 | |
Professional fees payable | | | 31 | | | | 33 | | | | 29 | | | | 31 | | | | 27 | |
Trustee fees payable | | | — | | | | — | | | | — | | | | — | | | | 1 | |
Payable for prospectus and shareholder reports | | | 1 | | | | 40 | | | | 2 | | | | 23 | | | | 7 | |
Other liabilities | | | — | | | | 4 | | | | 5 | | | | 3 | | | | — | |
| | | | | | | | | | | | | | | | | | | | |
Total liabilities | | | 40 | | | | 25,497 | | | | 312 | | | | 46,242 | | | | 7,669 | |
| | | | | | | | | | | | | | | | | | | | |
Net Assets | | $ | 7,204 | | | $ | 2,306,959 | | | $ | 99,885 | | | $ | 510,367 | | | $ | 109,992 | |
| | | | | | | | | | | | | | | | | | | | |
Analysis of Net Assets: | | | | | | | | | | | | | | | | | | | | |
Paid-in-capital | | | 7,431 | | | | 2,292,396 | | | | 73,564 | | | | 475,020 | | | | 92,371 | |
Undistributed (or overdistribution of) net investment income | | | — | | | | — | | | | — | | | | — | | | | — | |
Accumulated net realized gain (loss) | | | (226 | ) | | | (20,962 | ) | | | (618 | ) | | | 1,611 | | | | 4,212 | |
Unrealized appreciation or (depreciation) of investments | | | (2 | ) | | | 35,531 | | | | 26,918 | | | | 33,736 | | | | 13,409 | |
Unrealized appreciation or (depreciation) of futures contracts | | | 1 | | | | (6 | ) | | | 21 | | | | — | | | | — | |
| | | | | | | | | | | | | | | | | | | | |
Net assets | | $ | 7,204 | | | $ | 2,306,959 | | | $ | 99,885 | | | $ | 510,367 | | | $ | 109,992 | |
| | | | | | | | | | | | | | | | | | | | |
Shares outstanding at no par value (unlimited shares authorized): | | | | | | | | | | | | | | | | | | | | |
Institutional Class | | | 317,649 | | | | 30,017,996 | | | | 749,879 | | | | 19,959,172 | | | | 4,234,119 | |
| | | | | | | | | | | | | | | | | | | | |
Y Class | | | 266,833 | | | | 18,267,764 | | | | 13,530 | | | | 9,519,197 | | | | 137,303 | |
| | | | | | | | | | | | | | | | | | | | |
Investor Class | | | 49,231 | | | | 43,187,358 | | | | 3,237,555 | | | | 3,938,421 | | | | 937,364 | |
| | | | | | | | | | | | | | | | | | | | |
A Class | | | 44,957 | | | | 6,541,744 | | | | 52,605 | | | | 581,563 | | | | 882,082 | |
| | | | | | | | | | | | | | | | | | | | |
C Class | | | 30,885 | | | | 3,823,061 | | | | 32,511 | | | | 172,062 | | | | 138,999 | |
| | | | | | | | | | | | | | | | | | | | |
Net assets (not in thousands): | | | | | | | | | | | | | | | | | | | | |
Institutional Class | | $ | 3,231,461 | | | $ | 682,849,171 | | | $ | 18,600,679 | | | $ | 300,919,215 | | | $ | 76,666,136 | |
| | | | | | | | | | | | | | | | | | | | |
Y Class | | $ | 2,711,465 | | | $ | 414,585,125 | | | $ | 333,682 | | | $ | 142,980,166 | | | $ | 2,479,918 | |
| | | | | | | | | | | | | | | | | | | | |
Investor Class | | $ | 498,128 | | | $ | 977,719,149 | | | $ | 78,921,674 | | | $ | 55,921,959 | | | $ | 14,814,940 | |
| | | | | | | | | | | | | | | | | | | | |
A Class | | $ | 454,614 | | | $ | 147,394,607 | | | $ | 1,271,340 | | | $ | 8,197,136 | | | $ | 13,907,563 | |
| | | | | | | | | | | | | | | | | | | | |
C Class | | $ | 308,822 | | | $ | 84,411,378 | | | $ | 757,411 | | | $ | 2,348,424 | | | $ | 2,123,334 | |
| | | | | | | | | | | | | | | | | | | | |
See accompanying notes
31
American Beacon FundsSM
Statements of Assets and Liabilities
December 31, 2015 (in thousands, except share and per share amounts)
| | | | | | | | | | | | | | | | | | | | |
| | | Bahl & | | | | | | | | | | | | | |
| | | Gaynor | | | | | | Holland | | | Stephens | | | Stephens | |
| | | Small Cap | | | Bridgeway | | | Large Cap | | | Small Cap | | | Mid-Cap | |
| | | Growth | | | Large Cap | | | Growth | | | Growth | | | Growth | |
| | | Fund | | | Value Fund | | | Fund | | | Fund | | | Fund | |
Net asset value, offering and redemption price per share: | | | | | | | | | | | | | | | | | | | | |
Institutional Class | | $ | 10.17 | | | $ | 22.75 | | | $ | 24.80 | | | $ | 15.08 | | | $ | 18.11 | |
| | | | | | | | | | | | | | | | | | | | |
Y Class | | $ | 10.16 | | | $ | 22.69 | | | $ | 24.66 | | | $ | 15.02 | | | $ | 18.06 | |
| | | | | | | | | | | | | | | | | | | | |
Investor Class | | $ | 10.12 | | | $ | 22.64 | | | $ | 24.38 | | | $ | 14.20 | | | $ | 15.80 | |
| | | | | | | | | | | | | | | | | | | | |
A Class | | $ | 10.11 | | | $ | 22.53 | | | $ | 24.17 | | | $ | 14.10 | | | $ | 15.77 | |
| | | | | | | | | | | | | | | | | | | | |
A Class (offering price) | | $ | 10.73 | | | $ | 23.90 | | | $ | 25.64 | | | $ | 14.96 | | | $ | 16.73 | |
| | | | | | | | | | | | | | | | | | | | |
C Class | | $ | 10.00 | | | $ | 22.08 | | | $ | 23.30 | | | $ | 13.65 | | | $ | 15.28 | |
| | | | | | | | | | | | | | | | | | | | |
A Cost of investments in unaffiliated securities | | $ | 7,207 | | | $ | 2,244,859 | | | $ | 73,040 | | | $ | 486,676 | | | $ | 98,127 | |
B Cost of investments in affiliated securities | | $ | — | | | $ | — | | | $ | — | | | $ | 33,026 | | | $ | 3,611 | |
C Fair value of securities on loan | | $ | — | | | $ | — | | | $ | — | | | $ | 43,058 | | | $ | 4,716 | |
See accompanying notes
32
American Beacon FundsSM
Statements of Operations
For the year ended December 31, 2015 (in thousands)
| | | | | | | | | | | | | | | | | | | | |
| | | Bahl &
Gaynor
Small Cap
Growth
Fund | | | Bridgeway
Large Cap
Value Fund | | | Holland
Large Cap
Growth
Fund | | | Stephens
Small Cap
Growth
Fund | | | Stephens
Mid-Cap
Growth
Fund | |
Investment income: | | | | | | | | | | | | | | | | | | | | |
Dividend income from unaffiliated securities (net of foreign taxes) A | | $ | 111 | | | $ | 42,159 | | | $ | 1,161 | | | $ | 1,620 | | | $ | 561 | |
Income derived from securities lending | | | — | | | | — | | | | — | | | | 930 | | | | 45 | |
| | | | | | | | | | | | | | | | | | | | |
Total investment income | | | 111 | | | | 42,159 | | | | 1,161 | | | | 2,550 | | | | 606 | |
| | | | | | | | | | | | | | | | | | | | |
| | | | | |
Expenses: | | | | | | | | | | | | | | | | | | | | |
Management and investment advisory fees (Note 2) | | | 36 | | | | 6,529 | | | | 452 | | | | 4,312 | | | | 706 | |
Administrative service fees (Note 2): | | | | | | | | | | | | | | | | | | | | |
Institutional Class | | | 10 | | | | 1,465 | | | | 57 | | | | 1,032 | | | | 277 | |
Y Class | | | 6 | | | | 759 | | | | — | | | | 499 | | | | 8 | |
Investor Class | | | 2 | | | | 2,534 | | | | 242 | | | | 330 | | | | 52 | |
A Class | | | 1 | | | | 394 | | | | 3 | | | | 27 | | | | 48 | |
C Class | | | 1 | | | | 186 | | | | 2 | | | | 8 | | | | 6 | |
Transfer agent fees: | | | | | | | | | | | | | | | | | | | | |
Institutional Class | | | 1 | | | | 205 | | | | 2 | | | | 155 | | | | 55 | |
Y Class | | | — | | | | 10 | | | | — | | | | 17 | | | | — | |
Investor Class | | | 1 | | | | 30 | | | | 8 | | | | 8 | | | | 3 | |
A Class | | | — | | | | 17 | | | | — | | | | 1 | | | | 2 | |
C Class | | | — | | | | 7 | | | | — | | | | — | | | | — | |
Custody and fund accounting fees | | | 11 | | | | 142 | | | | 16 | | | | 56 | | | | 17 | |
Professional fees | | | 31 | | | | 73 | | | | 33 | | | | 45 | | | | 32 | |
Registration fees and expenses | | | 80 | | | | 189 | | | | 64 | | | | 85 | | | | 69 | |
Service fees (Note 2): | | | | | | | | | | | | | | | | | | | | |
Y Class | | | 2 | | | | 253 | | | | — | | | | 166 | | | | 3 | |
Investor Class | | | 1 | | | | 3,170 | | | | 288 | | | | 394 | | | | 61 | |
A Class | | | 1 | | | | 197 | | | | 2 | | | | 13 | | | | 24 | |
C Class | | | — | | | | 93 | | | | 1 | | | | 4 | | | | 3 | |
Distribution fees (Note 2): | | | | | | | | | | | | | | | | | | | | |
A Class | | | 1 | | | | 328 | | | | 3 | | | | 22 | | | | 40 | |
C Class | | | 2 | | | | 620 | | | | 7 | | | | 27 | | | | 20 | |
Prospectus and shareholder report expenses | | | 2 | | | | 161 | | | | 4 | | | | 49 | | | | 8 | |
Trustee fees | | | — | | | | 114 | | | | 6 | | | | 38 | | | | 8 | |
Other expenses | | | 6 | | | | 72 | | | | 10 | | | | 31 | | | | 5 | |
| | | | | | | | | | | | | | | | | | | | |
Total expenses | | | 195 | | | | 17,548 | | | | 1,200 | | | | 7,319 | | | | 1,447 | |
| | | | | | | | | | | | | | | | | | | | |
Net fees waived and expenses reimbursed/(recouped) by Manager (Note 2) | | | (124 | ) | | | 185 | | | | — | | | | (3 | ) | | | — | |
| | | | | | | | | | | | | | | | | | | | |
Net expenses | | | 71 | | | | 17,733 | | | | 1,200 | | | | 7,316 | | | | 1,447 | |
| | | | | | | | | | | | | | | | | | | | |
Net investment income (loss) | | | 40 | | | | 24,426 | | | | (39 | ) | | | (4,766 | ) | | | (841 | ) |
| | | | | | | | | | | | | | | | | | | | |
| | | | | |
Realized and unrealized gain (loss) from investments: | | | | | | | | | | | | | | | | | | | | |
Net realized gain (loss) from: | | | | | | | | | | | | | | | | | | | | |
Investments | | | (66 | ) | | | 25,408 | | | | 8,254 | | | | 27,105 | | | | 8,947 | |
Commission recapture (Note 3) | | | — | | | | — | | | | 3 | | | | — | | | | — | |
Futures contracts | | | (57 | ) | | | 4,471 | | | | 37 | | | | — | | | | — | |
Change in net unrealized appreciation or (depreciation) of: | | | | | | | | | | | | | | | | | | | | |
Investments | | | (230 | ) | | | (85,791 | ) | | | (1,920 | ) | | | (48,149 | ) | | | (9,578 | ) |
Futures contracts | | | (3 | ) | | | 163 | | | | (14 | ) | | | — | | | | — | |
| | | | | | | | | | | | | | | | | | | | |
Net gain (loss) from investments | | | (356 | ) | | | (55,749 | ) | | | 6,360 | | | | (21,044 | ) | | | (631 | ) |
| | | | | | | | | | | | | | | | | | | | |
Net increase (decrease) in net assets resulting from operations | | $ | (316 | ) | | $ | (31,323 | ) | | $ | 6,321 | | | $ | (25,810 | ) | | $ | (1,472 | ) |
| | | | | | | | | | | | | | | | | | | | |
A Foreign taxes | | | — | | | | — | | | | — | | | | 2 | | | | 3 | |
See accompanying notes
33
American Beacon FundsSM
Statements of Changes in Net Assets (in thousands)
| | | | | | | | | | | | | | | | | | | | | | | | |
| | | Bahl & Gaynor Small Cap
Growth Fund | | | Bridgeway Large Cap
Value Fund | | | Holland Large Cap
Growth Fund | |
| | | Year Ended
December 31,
2015 | | | From July 15
to December 31,
2014 | | | Year Ended
December 31,
2015 | | | Year Ended
December 31,
2014 | | | Year Ended
December 31,
2015 | | | Year Ended
December 31,
2014 | |
Increase (Decrease) in Net Assets: | | | | | | | | | | | | | | | | | | | | | | | | |
Operations: | | | | | | | | | | | | | | | | | | | | | | | | |
Net investment income (loss) | | $ | 40 | | | $ | 7 | | | $ | 24,426 | | | $ | 6,232 | | | $ | (39 | ) | | $ | (134 | ) |
Net realized gain (loss) from investments, commission recapture, and futures contracts | | | (123 | ) | | | 6 | | | | 29,879 | | | | 15,953 | | | | 8,294 | | | | 10,306 | |
Change in net unrealized appreciation or (depreciation) of investments and futures contracts | | | (233 | ) | | | 232 | | | | (85,628 | ) | | | 82,822 | | | | (1,934 | ) | | | (3,617 | ) |
| | | | | | | | | | | | | | | | | | | | | | | | |
Net increase (decrease) in net assets resulting from operations | | | (316 | ) | | | 245 | | | | (31,323 | ) | | | 105,007 | | | | 6,321 | | | | 6,555 | |
| | | | | | | | | | | | | | | | | | | | | | | | |
Distributions to Shareholders: | | | | | | | | | | | | | | | | | | | | | | | | |
Net investment income: | | | | | | | | | | | | | | | | | | | | | | | | |
Institutional Class | | | (18 | ) | | | (5 | ) | | | (8,277 | ) | | | (2,129 | ) | | | — | | | | — | |
Y Class | | | (15 | ) | | | (1 | ) | | | (5,057 | ) | | | (792 | ) | | | — | | | | — | |
Investor Class | | | (3 | ) | | | — | | | | (9,027 | ) | | | (2,728 | ) | | | — | | | | — | |
A Class | | | (3 | ) | | | — | | | | (1,294 | ) | | | (488 | ) | | | — | | | | — | |
C Class | | | (2 | ) | | | — | | | | (391 | ) | | | (93 | ) | | | — | | | | — | |
Net realized gain from investments: | | | | | | | | | | | | | | | | | | | | | | | | |
Institutional Class | | | (48 | ) | | | — | | | | (15,842 | ) | | | (4,669 | ) | | | (1,832 | ) | | | (1,687 | ) |
Y Class | | | (41 | ) | | | — | | | | (9,510 | ) | | | (1,747 | ) | | | (35 | ) | | | (7 | ) |
Investor Class | | | (7 | ) | | | — | | | | (23,035 | ) | | | (10,006 | ) | | | (8,194 | ) | | | (7,647 | ) |
A Class | | | (8 | ) | | | — | | | | (3,478 | ) | | | (1,551 | ) | | | (136 | ) | | | (97 | ) |
C Class | | | (5 | ) | | | — | | | | (2,016 | ) | | | (496 | ) | | | (84 | ) | | | (59 | ) |
Return of capital: | | | | | | | | | | | | | | | | | | | | | | | | |
Institutional Class | | | (3 | ) | | | — | | | | (76 | ) | | | — | | | | — | | | | — | |
Y Class | | | (3 | ) | | | — | | | | (47 | ) | | | — | | | | — | | | | — | |
Investor Class | | | (1 | ) | | | — | | | | (83 | ) | | | — | | | | — | | | | — | |
A Class | | | (1 | ) | | | — | | | | (12 | ) | | | — | | | | — | | | | — | |
C Class | | | — | | | | — | | | | (4 | ) | | | — | | | | — | | | | — | |
| | | | | | | | | | | | | | | | | | | | | | | | |
Net distributions to shareholders | | | (158 | ) | | | (6 | ) | | | (78,149 | ) | | | (24,699 | ) | | | (10,281 | ) | | | (9,497 | ) |
| | | | | | | | | | | | | | | | | | | | | | | | |
Capital Share Transactions: | | | | | | | | | | | | | | | | | | | | | | | | |
Proceeds from sales of shares | | | 5,716 | | | | 791 | | | | 1,721,211 | | | | 895,125 | | | | 6,243 | | | | 12,416 | |
Reinvestment of dividends and distributions | | | 158 | | | | 6 | | | | 75,997 | | | | 24,214 | | | | 10,280 | | | | 9,472 | |
Cost of shares redeemed | | | (2,232 | ) | | | — | | | | (619,512 | ) | | | (168,475 | ) | | | (13,613 | ) | | | (13,539 | ) |
| | | | | | | | | | | | | | | | | | | | | | | | |
Net increase in net assets from capital share transactions | | | 3,642 | | | | 797 | | | | 1,177,696 | | | | 750,864 | | | | 2,910 | | | | 8,349 | |
| | | | | | | | | | | | | | | | | | | | | | | | |
Net increase (decrease) in net assets | | | 3,168 | | | | 1,036 | | | | 1,068,224 | | | | 831,172 | | | | (1,050 | ) | | | 5,407 | |
| | | | | | | | | | | | | | | | | | | | | | | | |
Net Assets: | | | | | | | | | | | | | | | | | | | | | | | | |
Beginning of period | | | 4,036 | | | | 3,000 | | | | 1,238,735 | | | | 407,563 | | | | 100,935 | | | | 95,528 | |
| | | | | | | | | | | | | | | | | | | | | | | | |
End of Period * | | $ | 7,204 | | | $ | 4,036 | | | $ | 2,306,959 | | | $ | 1,238,735 | | | $ | 99,885 | | | $ | 100,935 | |
| | | | | | | | | | | | | | | | | | | | | | | | |
*Includes undistributed (or overdistribution of) net investment income | | $ | — | | | $ | 1 | | | $ | — | | | $ | — | | | $ | — | | | $ | — | |
| | | | | | | | | | | | | | | | | | | | | | | | |
See accompanying notes
34
American Beacon FundsSM
Statements of Changes in Net Assets (in thousands)
| | | | | | | | | | | | | | | | |
| | | Stephens Small Cap | | | Stephens Mid-Cap | |
| | | Growth Fund | | | Growth Fund | |
| | | Year Ended
December 31,
2015 | | | Year Ended
December 31,
2014 | | | Year Ended
December 31,
2015 | | | Year Ended
December 31,
2014 | |
Increase (Decrease) in Net Assets: | | | | | | | | | | | | | | | | |
Operations: | | | | | | | | | | | | | | | | |
Net investment (loss) | | $ | (4,766 | ) | | $ | (4,912 | ) | | $ | (841 | ) | | $ | (790 | ) |
Net realized gain (loss) from investments | | | 27,105 | | | | 31,911 | | | | 8,947 | | | | 8,718 | |
Change in net unrealized appreciation or (depreciation) from investments | | | (48,149 | ) | | | (54,645 | ) | | | (9,578 | ) | | | (4,843 | ) |
| | | | | | | | | | | | | | | | |
Net increase (decrease) in net assets resulting from operations | | | (25,810 | ) | | | (27,646 | ) | | | (1,472 | ) | | | 3,085 | |
| | | | | | | | | | | | | | | | |
Distributions to Shareholders: | | | | | | | | | | | | | | | | |
Net realized gain from investments: | | | | | | | | | | | | | | | | |
Institutional Class | | | (13,632 | ) | | | (14,779 | ) | | | (3,679 | ) | | | (5,108 | ) |
Y Class | | | (6,447 | ) | | | (7,036 | ) | | | (120 | ) | | | (185 | ) |
Investor Class | | | (2,688 | ) | | | (6,460 | ) | | | (795 | ) | | | (1,310 | ) |
A Class | | | (397 | ) | | | (420 | ) | | | (832 | ) | | | (1,127 | ) |
C Class | | | (113 | ) | | | (122 | ) | | | (114 | ) | | | (130 | ) |
| | | | | | | | | | | | | | | | |
Net distributions to shareholders | | | (23,277 | ) | | | (28,817 | ) | | | (5,540 | ) | | | (7,860 | ) |
| | | | | | | | | | | | | | | | |
Capital Share Transactions: | | | | | | | | | | | | | | | | |
Proceeds from sales of shares | | | 96,070 | | | | 226,308 | | | | 24,623 | | | | 54,295 | |
Reinvestment of dividends and distributions | | | 22,809 | | | | 28,166 | | | | 5,393 | | | | 7,117 | |
Cost of shares redeemed | | | (250,985 | ) | | | (215,176 | ) | | | (41,701 | ) | | | (44,790 | ) |
| | | | | | | | | | | | | | | | |
Net increase (decrease) in net assets from capital share transactions | | | (132,106 | ) | | | 39,298 | | | | (11,685 | ) | | | 16,622 | |
| | | | | | | | | | | | | | | | |
Net increase (decrease) in net assets | | | (181,193 | ) | | | (17,165 | ) | | | (18,697 | ) | | | 11,847 | |
| | | | | | | | | | | | | | | | |
Net Assets: | | | | | | | | | | | | | | | | |
Beginning of period | | | 691,560 | | | | 708,725 | | | | 128,689 | | | | 116,842 | |
| | | | | | | | | | | | | | | | |
End of Period * | | $ | 510,367 | | | $ | 691,560 | | | $ | 109,992 | | | $ | 128,689 | |
| | | | | | | | | | | | | | | | |
*Includes undistributed (or overdistribution of) net investment income | | $ | — | | | $ | — | | | $ | — | | | $ | — | |
| | | | | | | | | | | | | | | | |
See accompanying notes
35
American Beacon FundsSM
Notes to Financial Statements
December 31, 2015
1. Organization
American Beacon Funds (the “Trust”), is organized as a Massachusetts business trust and is registered under the Investment Company Act of 1940, as amended (the “Act”), as a diversified, open-end management investment company. As of December 31, 2015, the Trust consists of twenty-five active series, five of which are presented in this filing (collectively, the “Funds” and each individually a “Fund”): American Beacon Bahl & Gaynor Small Cap Growth Fund, American Beacon Bridgeway Large Cap Value Fund, American Beacon Holland Large Cap Growth Fund, American Beacon Stephens Small Cap Growth Fund, and American Beacon Stephens Mid-Cap Growth Fund. The remaining twenty active series are reported in separate filings.
American Beacon Advisors, Inc. (the “Manager”) is a wholly-owned subsidiary of Astro AB Borrower, Inc., which is indirectly owned by investment funds affiliated with Kelso & Company, L.P. and Estancia Capital Management, LLC, and was organized in 1986 to provide business management, advisory, administrative, and asset management consulting services to the Trust and other investors.
Class Disclosure
Each Fund has multiple classes of shares designed to meet the needs of different groups of investors. The following table sets forth the differences amongst the classes:
| | | | |
| | | Class: | | Offered to: |
| | Institutional Class | | Investors making an initial investment of $250,000 |
| | Y Class | | Investors making an initial investment of $100,000 |
| | Investor Class | | General public and investors investing directly or through an intermediary |
| | A Class | | General public and investors investing through an intermediary with applicable sales charges, which may include a front-end sales charge and a contingent deferred sales charge (“CDSC”) |
| | C Class | | General public and investors investing through an intermediary with applicable sales charges, which may include a CDSC |
Each class offered by the Trust has equal rights as to assets and voting privileges. Income and non-class specific expenses are allocated daily to each class on the basis of the relative net assets. Realized and unrealized capital gains and losses of each class are allocated daily based on the relative net assets of each class of the respective Fund. Class specific expenses, where applicable, currently include administrative service fees, service fees, and distribution fees and vary amongst the classes as described more fully in Note 2.
2. Transactions with Affiliates
Management Agreement
The Trust and the Manager are parties to a Management Agreement that obligates the Manager to provide or oversee the provision of all investment advisory, fund management, and securities lending services. As compensation for performing the duties required under the Management Agreement, the Manager receives from the Funds an annualized fee equal to 0.05% of the average daily net assets. The Funds pay the unaffiliated investment advisors hired to direct investment activities of the Funds. Management fees paid by the Funds during the year ended December 31, 2015 were as follows (in thousands):
| | | | | | | | | | | | | | | | |
Fund | | Management
Fee Rate | | | Management
Fee | | | Amounts paid
to Investment
Advisors | | | Amounts Paid
to Manager | |
Bahl & Gaynor Small Cap Growth | | | 0.56 | % | | $ | 36 | | | $ | 33 | | | $ | 3 | |
Bridgeway Large Cap Value | | | 0.37 | % | | | 6,529 | | | | 5,640 | | | | 889 | |
Holland Large Cap Growth | | | 0.45 | % | | | 452 | | | | 401 | | | | 51 | |
Stephens Small Cap Growth | | | 0.68 | % | | | 4,312 | | | | 3,892 | | | | 420 | |
Stephens Mid-Cap Growth | | | 0.54 | % | | | 706 | | | | 636 | | | | 70 | |
36
American Beacon FundsSM
Notes to Financial Statements
December 31, 2015
As compensation for services provided by the Manager in connection with securities lending activities conducted by the Stephens Small Cap Growth and Stephens Mid-Cap Growth Funds, the lending Fund pays to the Manager, with respect to cash collateral posted by borrowers, a fee up to 25% of the net monthly interest income (the gross income earned by the investment of cash collateral, less the amount paid to borrowers and related expenses) from such activities and, with respect to loan fees paid by borrowers, a fee up to 25% of such loan fees. Currently, the Manager receives 10% of such income. This fee is included in “Management and investment advisory fees” on the Statements of Operations. During the year ended December 31, 2015, securities lending fees paid to the Manager were $97,088 and $3,932 for the Stephens Small Cap Growth and Stephens Mid-Cap Growth Funds, respectively.
Administration Agreement
The Manager and the Trust entered into an Administration Agreement which obligates the Manager to provide or oversee administrative services to each Fund. As compensation for performing the duties required under the Administration Agreement, the Manager receives an annualized fee of 0.30% of the average daily net assets of the Institutional, Y, Investor, A, and C Classes of the Funds.
Distribution Plans
The Funds, except for the A and C Classes, have adopted a “defensive” Distribution Plan (the “Plan”) in accordance with Rule 12b-1 under the Act, pursuant to which no separate fees will be charged to the Funds for distribution purposes. However, the Plan authorizes the management and administrative service fees received by the Manager and the investment advisors hired by the Manager to be used for distribution purposes. Under this Plan, the Funds do not intend to separately compensate the Manager or any other party, either directly or indirectly, for the distribution of Fund shares.
Separate Distribution Plans (the “Distribution Plans”) have been adopted pursuant to Rule 12b-1 under the Act for the A and C Classes of the Funds. Under the Distribution Plans, as compensation for distribution assistance, the Manager receives an annual fee of 0.25% of the average daily net assets of the A Class and 1.00% of the average daily net assets of the C Class. The fee will be payable without regard to whether the amount of the fee is more or less than the actual expenses incurred in a particular month by the Manager for distribution assistance.
Service Plans
The Manager and the Trust entered into Service Plans that obligate the Manager to oversee additional shareholder servicing of the Y, Investor, A, and C Classes. As compensation for performing the duties required under the Service Plans, the Manager receives an annualized fee of 0.10% of the average daily net assets of the Y Class, 0.15% of the average daily net assets of the A and C Classes, and up to 0.375% of the average daily net assets of the Investor Class of the Fund.
Investment in Affiliated Funds
The Funds may invest in the American Beacon Money Market Select Fund (the “MM Select Fund”) or the U.S. Government Money Market Select Fund (the “USG Select Fund”) (collectively, the “Select Funds”). The Select Funds and the Funds have the same investment advisor and therefore, are considered to be affiliated. The Manager serves as the investment advisor to the Select Funds and receives management and administration fees totaling 0.10% of the average daily net assets of the Select Funds. During the year ended December 31, 2015, the Manager earned $43,828 and $3,989 from the Stephens Small Cap Growth and Stephens Mid-Cap Growth Funds’ securities lending collateral, respectively, invested in the Select Funds.
37
American Beacon FundsSM
Notes to Financial Statements
December 31, 2015
Interfund Lending Program
Pursuant to an exemptive order issued by the Securities and Exchange Commission (“SEC”), the Funds, along with other registered investment companies having management contracts with the Manager, may participate in an interfund lending program. This program provides an alternative credit facility allowing the Funds to borrow from other participating Funds. During the year ended December 31, 2015, the Bahl & Gaynor Small Cap Growth Fund borrowed on average $609,739 for 6 days at 0.85% with interest charges of $75, the Bridgeway Large Cap Value Fund borrowed on average $1,429,773 for 2 days at 0.75% with interest charges of $59, the Stephens Small Cap Growth Fund borrowed on average $2,943,490 for 30 days at 0.78% with interest charges of $1,887 and the Stephens Mid-Cap Growth Fund borrowed on average $1,073,233 for 8 days at 0.91% with interest charges of $197. These amounts are recorded as “Other Expenses” on the Statements of Operations herein. For the year ended December 31, 2015, the Stephens Mid-Cap Growth Fund had “Payable for interfund loan” of $695,343.
Expense Reimbursement Plan
The Manager agreed to reimburse the following Funds to the extent that total annual fund operating expenses exceeded a Fund’s expense cap. For the year ended December 31, 2015, the Manager waived or reimbursed expenses as follows:
| | | | | | | | | | | | | | | | | | |
| | | | | Expense Cap | | | | | | | |
Fund | | Class | | 1/1/15
to
4/30/15 | | | 5/1/15
to
12/31/15 | | | Reimbursed or
(Recovered) Expenses | | | Expiration | |
Bahl & Gaynor Small Cap Growth | | Institutional | | | 0.98 | % | | | 0.98 | % | | $ | 69,594 | | | | 2018 | |
Bahl & Gaynor Small Cap Growth | | Y | | | 1.08 | % | | | 1.08 | % | | | 33,058 | | | | 2018 | |
Bahl & Gaynor Small Cap Growth | | Investor | | | 1.36 | % | | | 1.36 | % | | | 10,864 | | | | 2018 | |
Bahl & Gaynor Small Cap Growth | | A | | | 1.38 | % | | | 1.38 | % | | | 5,968 | | | | 2018 | |
Bahl & Gaynor Small Cap Growth | | C | | | 2.13 | % | | | 2.13 | % | | | 4,344 | | | | 2018 | |
Bridgeway Large Cap Value | | Institutional | | | 0.84 | % | | | N/A | | | | (184,868 | ) | | | 2018 | |
Holland Large Cap Growth | | Institutional | | | N/A | | | | N/A | | | | (469 | ) | | | 2018 | |
Holland Large Cap Growth | | Y | | | N/A | | | | 0.99 | % | | | 64 | | | | 2018 | |
Holland Large Cap Growth | | A | | | 1.29 | % | | | 1.29 | % | | | 40 | | | | 2018 | |
Holland Large Cap Growth | | C | | | 2.04 | % | | | 2.04 | % | | | 66 | | | | 2018 | |
Stephens Small Cap Growth | | Institutional | | | 1.09 | % | | | N/A | | | | (284 | ) | | | 2018 | |
Stephens Small Cap Growth | | Investor | | | 1.35 | % | | | N/A | | | | 9,249 | | | | 2018 | |
Stephens Small Cap Growth | | A | | | 1.49 | % | | | N/A | | | | (3,867 | ) | | | 2018 | |
Stephens Small Cap Growth | | C | | | 2.24 | % | | | N/A | | | | (1,599 | ) | | | 2018 | |
Stephens Mid-Cap Growth | | Institutional | | | 0.99 | % | | | 0.99 | % | | | 13,444 | | | | 2018 | |
Stephens Mid-Cap Growth | | Y | | | 1.09 | % | | | N/A | | | | (931 | ) | | | 2018 | |
Stephens Mid-Cap Growth | | Investor | | | 1.37 | % | | | N/A | | | | (6,278 | ) | | | 2018 | |
Stephens Mid-Cap Growth | | A | | | 1.39 | % | | | 1.39 | % | | | (5,405 | ) | | | 2018 | |
Stephens Mid-Cap Growth | | C | | | 2.14 | % | | | 2.14 | % | | | (656 | ) | | | 2018 | |
Of these amounts, $2,767, $32, $1,629, and $4,585 were payable to the Manager at December 31, 2015 for the Bridgeway Large Cap Value, Holland Large Cap Growth, Stephens Small Cap Growth, and Stephens Mid-Cap Growth Funds, respectively. $6,611 was receivable from the Manager at December 31, 2015 for the Bahl and Gaynor Small Cap Growth Fund. The Funds have adopted an Expense Reimbursement Plan whereby the Manager may seek repayment of fees waived or expenses reimbursed for a period of up to three years. However, reimbursement will occur only if the Class’ average net assets have grown or expenses have declined sufficiently to allow reimbursement without causing its expense ratio to exceed the previously agreed upon contractual expense limit. The Funds did not record a liability for potential reimbursements due to the current assessment that reimbursements are unlikely.
38
American Beacon FundsSM
Notes to Financial Statements
December 31, 2015
The carryover of excess expenses potentially reimbursable to the Manager are as follows:
| | | | | | | | | | | | | | | | |
Fund | | Recovered
Expenses | | | Excess Expense
Carryover | | | Expired Expense
Carryover | | | Expiration of
Reimbursed Expenses | |
Bahl & Gaynor Small Cap Growth | | $ | — | | | $ | 132,904 | | | $ | — | | | | 2017 | |
Bridgeway Large Cap Value | | | 108,638 | | | | — | | | | — | | | | 2015 | |
Bridgeway Large Cap Value | | | 76,230 | | | | — | | | | — | | | | 2016 | |
Holland Large Cap Growth | | | 469 | | | | — | | | | 6,532 | | | | 2015 | |
Holland Large Cap Growth | | | — | | | | 104 | | | | — | | | | 2016 | |
Holland Large Cap Growth | | | — | | | | 156 | | | | — | | | | 2017 | |
Stephens Small Cap Growth | | | 5,465 | | | | — | | | | 4,046 | | | | 2015 | |
Stephens Small Cap Growth | | | 285 | | | | 55,745 | | | | — | | | | 2016 | |
Stephens Mid-Cap Growth | | | 13,270 | | | | — | | | | 76,967 | | | | 2015 | |
Stephens Mid-Cap Growth | | | — | | | | 60,289 | | | | — | | | | 2016 | |
Stephens Mid-Cap Growth | | | — | | | | 38,647 | | | | — | | | | 2017 | |
The Manager recovered expenses from various classes of the Bridgeway Large Cap Value, Holland Large Cap Growth, Stephens Small Cap Growth, and Stephens Mid-Cap Growth Funds during the year ended December 31, 2015 as follows:
| | | | | | | | | | | | |
Fund | | Class | | | Excess Expense Carryover | | | Expiration of
Reimbursed Expenses | |
Bridgeway Large Cap Value | | | Institutional | | | $ | 108,638 | | | | 2015 | |
Bridgeway Large Cap Value | | | Institutional | | | | 76,230 | | | | 2016 | |
Holland Large Cap Growth | | | Institutional | | | | 469 | | | | 2015 | |
Stephens Small Cap Growth | | | Institutional | | | | 285 | | | | 2016 | |
Stephens Small Cap Growth | | | A | | | | 3,867 | | | | 2015 | |
Stephens Small Cap Growth | | | C | | | | 1,598 | | | | 2015 | |
Stephens Mid-Cap Growth | | | Y | | | | 931 | | | | 2015 | |
Stephens Mid-Cap Growth | | | Investor | | | | 6,278 | | | | 2015 | |
Stephens Mid-Cap Growth | | | A | | | | 5,405 | | | | 2015 | |
Stephens Mid-Cap Growth | | | C | | | | 656 | | | | 2015 | |
Sales Commissions
The Funds’ distributor, Foreside Fund Services, LLC (“Foreside”), may receive a portion of A Class sales charges from broker dealers and it may be used to offset distribution related expenses. During the year ended December 31, 2015, Foreside collected $775, $109,023, $544, $3,886, and $2,917 for Bahl & Gaynor Small Cap Growth, Bridgeway Large Cap Value, Holland Large Cap Growth, Stephens Small Cap Growth, and Stephens Mid-Cap Growth Funds, respectively, from the sale of Class A Shares.
A CDSC of 0.50% will be deducted with respect to Class A Shares on certain purchases of $1,000,000 or more that are redeemed in whole or part within 18 months of purchase, unless waived as discussed in the Prospectus. Any applicable CDSC will be 0.50% of the lesser of the original purchase price or the value of the redemption of the Class A Shares redeemed. During the year ended December 31, 2015, CDSC fees of $1,000 and $96 were collected for the Bridgeway Large Cap Value and Stephens Small Cap Growth Funds, respectively.
A CDSC of 1.00% will be deducted with respect to Class C Shares redeemed within 12 months of purchase, unless waived as discussed in the Prospectus. Any applicable CDSC will be 1.00% of the lesser of the original purchase price or the value of the redemption of the Class C Shares redeemed. During the year ended December 31, 2015, CDSC fees of $101, $19,344, $181, $17, and $5,425 were collected for the Bahl & Gaynor Small Cap Growth, Bridgeway Large Cap Value, Holland Large Cap Growth, Stephens Small Cap Growth, and Stephens Mid-Cap Growth Funds, respectively.
3. Security Valuation and Fair Value Measurements
Investments are valued at the close of the New York Stock Exchange (the “Exchange”), normally 4 p.m. ET, each day that the Exchange is open for business. Equity securities, including exchange-traded funds (“ETFs”) for which market quotations are available are valued at the last sale price or official closing price
39
American Beacon FundsSM
Notes to Financial Statements
December 31, 2015
(closing bid price or last evaluated quote if no sale has occurred) on the primary market or exchange on which they trade.
Investments in open-end mutual funds are valued at the closing net asset value (“NAV”) per share of the mutual fund on the day of valuation.
Securities for which market prices are not readily available or are not reflective of the fair value of the security, as determined by the Manager, will be priced at fair value following procedures approved by the Trust’s Board of Trustees (the “Board”).
Futures contracts are valued based upon their quoted daily settlement prices. Upon entering into a futures contract, a Fund is required to deposit with its futures broker, an amount of cash or U.S. Government and Agency Obligations in accordance with the initial margin requirements of the broker or exchange. Futures contracts are marked to market daily and an appropriate payable or receivable for the change in value (“variation margin”) is recorded by the Fund. Gains or losses are recognized, but not considered realized until the contracts expire or are closed. Futures contracts involve, to varying degrees, risk of loss in excess of the variation margin disclosed on the Statements of Assets and Liabilities.
Other investments, including restricted securities and those financial instruments for which the above valuation procedures are inappropriate or are deemed not to reflect fair value are stated at fair value as determined in good faith by the Manager’s Valuation Committee, pursuant to procedures established by the Fund’s Board of Trustees (the “Board”).
Valuation Inputs
Various inputs may be used to determine the fair value of the Fund’s investments. These inputs are summarized in three broad levels for financial statement purposes. The inputs or methodologies used to value securities are not necessarily an indication of the risk associated with investing in those securities.
| | | | |
| | Level 1 - | | Quoted prices in active markets for identical securities. |
| | |
| | Level 2 - | | Prices determined using other significant observable inputs. These may include quoted prices for similar securities, interest rates, prepayment speeds, credit risk, and others. |
| | |
| | Level 3 - | | Prices determined using other significant unobservable inputs. Unobservable inputs reflect the Fund’s own assumptions about the factors market participants would use in pricing an investment, and would be based on the best information available. |
Level 1 and Level 2 trading assets and trading liabilities, at fair value
Common stocks and financial derivative instruments, such as futures contracts that are traded on a national securities exchange, are stated at the last reported sale or settlement price on the day of valuation. To the extent these securities are actively traded and valuation adjustments are not applied, they are categorized as Level 1 of the fair value hierarchy. Preferred securities and other equities traded on inactive markets or valued by reference to similar instruments are also categorized as Level 2 of the fair value hierarchy.
Investments in registered open-end investment management companies will be valued based upon the NAVs of such investments and are categorized as Level 1 of the fair value hierarchy.
The Funds’ investments are summarized by level based on the inputs used to determine their values. U.S. Generally Accepted Accounting Principles (“U.S. GAAP”) also requires all transfers between any levels to be disclosed. The end of period timing recognition has been adopted for the transfers between levels of each Fund’s assets and liabilities. During the year ended December 31, 2015, there were no transfers between levels.
40
American Beacon FundsSM
Notes to Financial Statements
December 31, 2015
As of December 31, 2015, the investments were classified as described below (in thousands):
| | | | | | | | | | | | | | | | |
Bahl & Gaynor Small Cap Growth Fund* | | Level 1 | | | Level 2 | | | Level 3 | | | Total | |
Common Stock | | $ | 7,019 | | | $ | — | | | $ | — | | | $ | 7,019 | |
Short-Term Investments – Money Market Funds | | | 186 | | | | — | | | | — | | | | 186 | |
| | | | | | | | | | | | | | | | |
Total Investments in Securities | | $ | 7,205 | | | $ | — | | | $ | — | | | $ | 7,205 | |
| | | | | | | | | | | | | | | | |
Financial Derivative Instruments | | | | | | | | | | | | | | | | |
Futures Contracts | | $ | 1 | | | $ | — | | | $ | — | | | $ | 1 | |
| | | | |
Bridgeway Large Cap Value Fund* | | Level 1 | | | Level 2 | | | Level 3 | | | Total | |
Common Stock | | $ | 2,239,515 | | | $ | — | | | $ | — | | | $ | 2,239,515 | |
Short-Term Investments – Money Market Funds | | | 40,875 | | | | — | | | | — | | | | 40,875 | |
| | | | | | | | | | | | | | | | |
Total Investments in Securities | | $ | 2,280,390 | | | $ | — | | | $ | — | | | $ | 2,280,390 | |
| | | | | | | | | | | | | | | | |
Financial Derivative Instruments | | | | | | | | | | | | | | | | |
Futures Contracts | | $ | (6 | ) | | $ | — | | | $ | — | | | $ | (6 | ) |
| | | | |
Holland Large Cap Growth Fund* | | Level 1 | | | Level 2 | | | Level 3 | | | Total | |
Common Stock | | $ | 95,394 | | | $ | — | | | $ | — | | | $ | 95,394 | |
Short-Term Investments – Money Market Funds | | | 4,564 | | | | — | | | | — | | | | 4,564 | |
| | | | | | | | | | | | | | | | |
Total Investments in Securities | | $ | 99,958 | | | $ | — | | | $ | — | | | $ | 99,958 | |
| | | | | | | | | | | | | | | | |
Financial Derivative Instruments | | | | | | | | | | | | | | | | |
Futures Contracts | | $ | 21 | | | $ | — | | | $ | — | | | $ | 21 | |
| | | | |
Stephens Small Cap Growth Fund* | | Level 1 | | | Level 2 | | | Level 3 | | | Total | |
Common Stock | | $ | 507,865 | | | $ | — | | | $ | — | | | $ | 507,865 | |
Short-Term Investments – Money Market Funds | | | 1,539 | | | | — | | | | — | | | | 1,539 | |
Securities Lending Collateral invested in Money Market Funds | | | 44,034 | | | | — | | | | — | | | | 44,034 | |
| | | | | | | | | | | | | | | | |
Total Investments in Securities | | $ | 553,438 | | | $ | — | | | $ | — | | | $ | 553,438 | |
| | | | | | | | | | | | | | | | |
| | | | |
Stephens Mid-Cap Growth Fund* | | Level 1 | | | Level 2 | | | Level 3 | | | Total | |
Common Stock | | $ | 110,332 | | | $ | — | | | $ | — | | | $ | 110,332 | |
Securities Lending Collateral invested in Money Market Funds | | | 4,815 | | | | — | | | | — | | | | 4,815 | |
| | | | | | | | | | | | | | | | |
Total Investments in Securities | | $ | 115,147 | | | $ | — | | | $ | — | | | $ | 115,147 | |
| | | | | | | | | | | | | | | | |
| * | Refer to the Schedule of Investments for industry information. |
Security Transactions and Investment Income
Security transactions are recorded on the trade date of the security purchase or sale. The Funds may purchase securities with delivery or payment to occur at a later date. At the time the Funds enter into a commitment to purchase a security, the transaction is recorded, and the value of the security is reflected in the NAV. The value of the security may vary with market fluctuations.
Dividend income, net of foreign taxes, is recorded on the ex-dividend date, except certain dividends from foreign securities which are recorded as soon as the information is available to the Funds. Interest income is earned from settlement date, recorded on the accrual basis, and adjusted, if necessary, for accretion of discounts and amortization of premiums. For financial and tax reporting purposes, realized gains and losses are determined on the basis of specific lot identification.
Dividends to Shareholders
Dividends from net investment income of the Funds normally will be declared and paid at least annually. Distributions, if any, of net realized capital gains are generally paid at least annually and recorded on the ex-dividend date.
41
American Beacon FundsSM
Notes to Financial Statements
December 31, 2015
Commission Recapture
The Funds have established brokerage commission recapture arrangements with certain brokers or dealers. If the Funds’ investment advisor chooses to execute a transaction through a participating broker, the broker rebates a portion of the commission back to the Funds. Any collateral benefit received through participation in the commission recapture program is directed exclusively to the Funds. This amount is reported with the net realized gain or loss in the Funds’ Statements of Operations, if applicable.
Allocation of Income, Expenses, Gains, and Losses
Income, expenses (other than those attributable to a specific class), gains, and losses are allocated daily to each class of shares based upon the relative proportion of net assets represented by such class. Operating expenses directly attributable to a specific class are charged against the operations of that class.
Use of Estimates
The preparation of financial statements in conformity with U.S. GAAP requires management to make estimates and assumptions that affect the amounts reported in the financial statements and accompanying notes. Actual results may differ from those estimated.
Other
Under the Trust’s organizational documents, its officers and trustees are indemnified against certain liability arising out of the performance of their duties to the Trust. In the normal course of business, the Trust enters into contracts that provide indemnification to the other party or parties against potential costs or liabilities. The Trust’s maximum exposure under these arrangements is dependent on claims that may be made in the future and, therefore, cannot be estimated. The Trust has had no prior claims or losses pursuant to any such agreement.
4. Securities and Other Investments
American Depositary Receipts (ADRs)
ADRs are depositary receipts for foreign issuers in registered form traded in U.S. securities markets. Depositary receipts may not be denominated in the same currency as the securities into which they may be converted. Investing in depositary receipts entails substantially the same risks as direct investment in foreign securities. There is generally less publicly available information about foreign companies and there may be less governmental regulation and supervision of foreign stock exchanges, brokers and listed companies. In addition, such companies may use different accounting and financial standards (and certain currencies may become unavailable for transfer from a foreign currency), resulting in the Fund’s possible inability to convert immediately into U.S. currency proceeds realized upon the sale of portfolio securities of the affected foreign companies. In addition, the Fund may invest in unsponsored depositary receipts, the issuers of which are not obligated to disclose material information about the underlying securities to investors in the United States. Ownership of unsponsored depositary receipts may not entitle the Fund to the same benefits and rights as ownership of a sponsored depositary receipt or the underlying security.
Real Estate Investment Trusts
The Funds may own shares of real estate investment trusts (“REITs”) which report information on the source of their distributions annually. The Funds re-characterize distributions received from REIT investments based on information provided by the REITs into the following categories: ordinary income, long-term capital gains, and return of capital. If information is not available on a timely basis from the REITs, the re-characterization will be estimated based on available information which may include the previous year
42
American Beacon FundsSM
Notes to Financial Statements
December 31, 2015
allocation. If new or additional information becomes available from the REITs at a later date, a re-characterization will be made the following year. These re-characterizations are not recorded for financial statement purposes, but as an adjustment to the calculation of taxable income.
Other Investment Company Securities and Other Exchange Traded Products
The Funds may invest in shares of other investment companies, including open-end funds, closed-end funds, business development companies, ETFs, unit investment trusts, and other investment companies of the Trust. The Funds may invest in investment company securities advised by the Manager or a sub-advisor. Investments in the securities of other investment companies may involve duplication of advisory fees and certain other expenses. By investing in another investment company, the Funds become a shareholder of that investment company. As a result, the Funds shareholders indirectly will bear a Fund’s proportionate share of the fees and expenses paid by shareholders of the other investment company, in addition to the fees and expenses Funds shareholders directly bear in connection with the Funds’ own operations. These other fees and expenses are reflected as Acquired Fund Fees and Expenses and are included in the Fees and Expenses Table for the Fund in its Prospectus, if applicable. Investments in other investment companies may involve the payment of substantial premiums above the value of such issuer’s portfolio securities.
5. Financial Derivative Instruments
Futures Contracts
Futures contracts are contracts to buy or sell a standard quantity of securities at a specified price on a future date. The Fund may enter into financial futures contracts as a method for keeping assets readily convertible to cash if needed to meet shareholder redemptions or for other needs while maintaining exposure to the stock or bond market, as applicable. The primary risks associated with the use of futures contracts are the possibility of illiquid markets or imperfect correlation between the values of the contracts and the underlying securities, or that the counterparty will fail to perform its obligations.
Upon entering into a futures contract, the Fund is required to set aside or deposit with a broker an amount, termed the initial margin, which typically represents a portion of the face value of the futures contract. The Fund usually reflects this amount on the Schedule of Investments as a U.S. Treasury Bill held as collateral for futures contracts or as cash deposited with broker on the Statement of Assets and Liabilities. Payments to and from the broker, known as variation margin, are required to be made on a daily basis as the price of the futures contract fluctuates. Changes in initial settlement values are accounted for as unrealized appreciation (depreciation) until the contracts are terminated, at which time realized gains and losses are recognized. Futures contracts are valued at the most recent settlement price established each day by the exchange on which they are traded.
During the year ended December 31, 2015, the Funds entered into futures contracts primarily for exposing cash to markets.
The Funds’ average futures contracts outstanding fluctuate throughout the operating year as required to meet strategic requirements. The following table illustrates the quarterly volume of futures contracts. For purpose of this disclosure, volume is measured by contracts outstanding at each quarter end.
| | | | |
Average Future Contracts Outstanding: | |
Fund | | Year Ended December 31, 2015 | |
Bahl & Gaynor Small Cap Growth | | | 3 | |
Bridgeway Large Cap Value | | | 335 | |
Holland Large Cap Growth | | | 26 | |
43
American Beacon FundsSM
Notes to Financial Statements
December 31, 2015
The following is a summary of the Funds’ derivative financial instruments categorized by risk exposure (in thousands) (1):
Fair Values of financial derivative instruments not accounted for as hedging instruments as of December 31, 2015:
| | | | | | | | | | | | | | |
| | | | |
Statements of Assets and Liabilities: | | Derivative | | Bahl &
Gaynor
Small Cap
Growth | | | Bridgeway
Large Cap
Value | | | Holland
Large
Cap Growth | |
Receivable for variation margin from open futures contracts(2) | | Equity
Contracts | | $ | 1 | | | $ | — | | | $ | 21 | |
Payable for variation margin from open futures contracts(2) | | Equity
Contracts | | | — | | | | (6 | ) | | | — | |
The effect of financial derivative instruments not accounted for as hedging instruments during the year ended December 31, 2015:
| | | | | | | | | | | | | | |
Statements of Operations: | | Derivative | | Bahl &
Gaynor
Small Cap
Growth | | | Bridgeway
Large Cap
Value | | | Holland
Large
Cap Growth | |
Net realized gain (loss) from futures contracts | | Equity
Contracts | | $ | (57 | ) | | $ | 4,471 | | | $ | 37 | |
Change in net unrealized appreciation or (depreciation) of futures contracts | | Equity
Contracts | | | (3 | ) | | | 163 | | | | (15 | ) |
| (1) | See Note 3 in the Notes to Financial Statements for additional information. |
| (2) | Includes cumulative appreciation or (depreciation) of futures contracts as reported in the Schedule of Investment footnotes. Only current day’s variation margin is reported within the Statement of Assets and Liabilities. |
6. Principal Risks
In the normal course of business, the Funds trade financial instruments and enter into financial transactions where risk of potential loss exists. Security values fluctuate (market risk) and may decline due to factors affecting securities markets in general, particular industries represented in the securities markets or conditions specifically related to a particular company. Failure of the other party to a transaction to perform (credit and counterparty risk), for example by not making principal and interest payments when due, reduces the value of the issuer’s debt and could reduce the Funds’ income. Similar to credit risk, the Funds may be exposed to counterparty risk, or the risk that an institution or other entity with which the Funds have unsettled or open transactions will fail to make required payments or otherwise comply with the terms of the instrument, transaction or contract. The potential loss could exceed the value of the financial assets recorded in the financial statements. Some of the Funds’ investments may be illiquid and the Funds may not be able to vary the portfolio investments in response to changes in economic and other conditions. If a Fund is required to liquidate all or a portion of its investments quickly, the Fund may realize significantly less than the value at which it previously recorded those investments.
Market Risks
The Funds’ investments in financial derivatives and other financial instruments expose the Funds to various risks such as, but not limited to, foreign currency and equity risks.
Interest rate risk is the risk that fixed income securities will decline in value because of changes in interest rates. As nominal interest rates rise, the value of certain fixed income securities held by the Fund is likely to decrease. A nominal interest rate can be described as the sum of a real interest rate and an expected inflation rate. Fixed income securities with longer durations tend to be more sensitive to changes in interest rates, usually making them more volatile than securities with shorter durations. Duration is useful primarily as a measure of the sensitivity of a fixed income’s market price to interest rate (i.e. yield) movements.
44
American Beacon FundsSM
Notes to Financial Statements
December 31, 2015
If the Funds invest directly in foreign currencies or in securities that trade in, and receive revenues in, foreign currencies, or in financial derivatives that provide exposure to foreign currencies, they will be subject to the risk that those currencies will decline in value relative to the base currency of the Funds, or, in the case of hedging positions, that the Funds’ base currency will decline in value relative to the currency being hedged. Currency rates in foreign countries may fluctuate significantly over short periods of time for a number of reasons, including changes in interest rates, intervention (or the failure to intervene) by U.S. or foreign governments, central banks or supranational entities such as the International Monetary Fund, or by the imposition of currency controls or other political developments in the United States or abroad. As a result, the Funds’ investments in foreign currency denominated securities may reduce the returns of the Fund.
The fair values of equities, such as common stocks and preferred securities or equity related investments such as futures, may decline due to general market conditions which are not specifically related to a particular company, such as real or perceived adverse economic conditions, changes in the general outlook for corporate earnings, changes in interest or currency rates or adverse investor sentiment generally. They may also decline due to factors which affect a particular industry or industries, such as labor shortages or increased production costs and competitive conditions within an industry. Equity securities and equity related investments generally have greater market price volatility than fixed income securities.
Counterparty Credit Risk
A derivative contract may suffer a mark to market loss if the value of the contract decreases due to an unfavorable change in the market rates or values of the underlying instrument. Losses can also occur if the counterparty does not perform under the contract.
With exchange traded futures, there is less counterparty credit risk to the Funds since the exchange or clearinghouse, as counterparty to such instruments, guarantees against a possible default. The clearinghouse stands between the buyer and the seller of the contract; therefore, the credit risk is limited to failure of the clearinghouse. While offset rights may exist under applicable law, a Fund does not have a contractual right of offset against a clearing broker or clearinghouse in the event of a default (including the bankruptcy or insolvency) of the clearing broker or clearinghouse. Additionally, credit risk exists in exchange traded futures with respect to initial and variation margin that is held in a clearing broker’s customer accounts. While clearing brokers are required to segregate customer margin from their own assets, in the event that a clearing broker becomes insolvent or goes into bankruptcy and at that time there is a shortfall in the aggregate amount of margin held by the clearing broker for all its clients, typically the shortfall would be allocated on a pro rata basis across all the clearing broker’s customers, potentially resulting in losses to the Funds.
Cash collateral that has been pledged to cover obligations of the Funds and cash collateral received from the counterparty, if any, is reported separately on the Statements of Assets and Liabilities as “Deposits with brokers for futures contracts”. Non-cash collateral pledged by the Funds, if any, is noted in the Schedules of Investments. Generally, the amount of collateral due from or to a party is determined at the close of business of the Funds and additional required collateral is delivered to/pledged by the Funds on the next business day. To the extent amounts due to the Funds from its counterparties are not fully collateralized, contractually or otherwise, the Funds bear the risk of loss from counterparty non-performance. The Funds attempt to mitigate counterparty risk by only entering into agreements with counterparties that it believes have the financial resources to honor their obligations and by monitoring the financial stability of those counterparties.
Offsetting Assets and Liabilities
The Funds are parties to enforceable master netting agreements between brokers and counterparties, such as International Swaps and Derivatives Association (“ISDA”) agreements, Master Repo Agreements and Master Forward Agreements which provide for the right to offset under certain circumstances. The Funds employ multiple money managers and counterparties and have elected not to offset qualifying financial and
45
American Beacon FundsSM
Notes to Financial Statements
December 31, 2015
derivative instruments on the Statements of Assets and Liabilities, as such all financial and derivative instruments are presented on a gross basis. The impacts of netting arrangements that provide the right to offset are detailed below. The net amount represents the net receivable or payable that would be due from or to the counterparty in the event of default. Exposure from borrowings and other financing agreements can only be netted across transactions governed by the same Master Agreement with the same legal entity. All amounts reported below represent the balance as of the report date, December 31, 2015 (in thousands).
Bahl & Gaynor Small Cap Growth Fund
Offsetting of Financial Assets and Derivative Assets as of December 31, 2015:
| | | | | | | | | | | | |
Description | | Gross Amounts of
Recognized Assets | | | Gross Amounts
Offset in the
Statements of
Assets and
Liabilities | | | Net Amounts of Assets
Presented in the
Statements of Assets
and Liabilities | |
Futures Contracts(1) | | $ | 1 | | | $ | — | | | $ | 1 | |
Financial Assets, Derivative Assets, and Collateral Pledged by Counterparty as of December 31, 2015:
| | | | | | | | | | | | | | | | |
| | | Net amount of Assets
Presented in the Statements of
Assets and Liabilities | | | Gross Amounts Not Offset in the
Statements of Assets and Liabilities | | | | |
Counterparty | | | Financial
Instruments | | | Cash Collateral
Received | | | Net
Amount | |
Goldman Sachs & Co.(1) | | $ | 1 | | | $ | — | | | $ | — | | | $ | 1 | |
| (1) | The securities presented here within are not subject to Master Netting Agreements. As such, this is disclosed for informational purposes only. |
Bridgeway Large Cap Value Fund
Offsetting of Financial Liabilities and Derivative Liabilities as of December 31, 2015:
| | | | | | | | | | | | |
Description | | Gross Amounts of
Recognized
Liabilities | | | Gross Amounts
Offset in the
Statements of
Assets and
Liabilities | | | Net Amounts of Liabilities
Presented in the
Statements of Assets
and Liabilities | |
Futures Contracts(1) | | $ | 6 | | | $ | — | | | $ | 6 | |
Financial Liabilities, Derivative Liabilities, and Collateral Pledged by Counterparty as of December 31, 2015:
| | | | | | | | | | | | | | | | |
| | | Net amount of Liabilities
Presented in the Statements
of Assets and Liabilities | | | Gross Amounts Not Offset in the
Statements of Assets and Liabilities | | | | |
Counterparty | | | Financial
Instruments | | | Cash Collateral
Received | | | Net
Amount | |
Goldman Sachs & Co.(1) | | $ | 6 | | | $ | — | | | $ | — | | | $ | 6 | |
| (1) | The securities presented here within are not subject to Master Netting Agreements. As such, this is disclosed for informational purposes only. |
Holland Large Cap Growth Fund
Offsetting of Financial Assets and Derivative Assets as of December 31, 2015:
| | | | | | | | | | | | |
Description | | Gross Amounts of
Recognized Assets | | | Gross Amounts
Offset in the
Statements of
Assets and
Liabilities | | | Net Amounts of Assets
Presented in the
Statements of Assets
and Liabilities | |
Futures Contracts(1) | | $ | 21 | | | $ | — | | | $ | 21 | |
Financial Assets, Derivative Assets, and Collateral Pledged by Counterparty as of December 31, 2015:
| | | | | | | | | | | | | | | | |
| | | Net amount of Assets
Presented in the Statements of
Assets and Liabilities | | | Gross Amounts Not Offset in the
Statements of Assets and Liabilities | | | | |
Counterparty | | | Financial
Instruments | | | Cash Collateral
Received | | | Net
Amount | |
Goldman Sachs & Co.(1) | | $ | 21 | | | $ | — | | | $ | — | | | $ | 21 | |
| (1) | The securities presented here within are not subject to Master Netting Agreements. As such, this is disclosed for informational purposes only. |
46
American Beacon FundsSM
Notes to Financial Statements
December 31, 2015
Stephens Small Cap Growth
Offsetting of Financial Assets and Derivative Assets as of December 31, 2015:
| | | | | | | | | | | | |
Description | | Gross Amounts of
Recognized Assets | | | Gross Amounts
Offset in the
Statements of
Assets
and Liabilities | | | Net Amounts of Assets
Presented in the
Statements of Assets
and Liabilities | |
Securities on Loan | | $ | 43,058 | | | $ | — | | | $ | 43,058 | |
Financial Assets, Derivative Assets, and Collateral Pledged by Counterparty as of December 31, 2015:
| | | | | | | | | | | | | | | | |
| | | Net amount of Assets
Presented in the
Statements of Assets and
Liabilities | | | Gross Amounts Not Offset in the
Statements of Assets and Liabilities | | | | |
Counterparty | | | Financial
Instruments | | | Cash Collateral
Received(1) | | | Net
Amount | |
Barclays Capital, Inc. | | $ | 4,357 | | | $ | — | | | $ | (4,357 | ) | | $ | — | |
Citigroup Global Markets, Inc. | | | 218 | | | | — | | | | (218 | ) | | | — | |
Credit Suisse Securities (USA) | | | 6,093 | | | | — | | | | (6,093 | ) | | | — | |
Goldman, Sachs & Co. | | | 2,383 | | | | — | | | | (2,383 | ) | | | — | |
JPMorgan Clearing Corp. | | | 2,375 | | | | — | | | | (2,375 | ) | | | — | |
MS Securities Services Inc. | | | 15,480 | | | | — | | | | (15,480 | ) | | | — | |
National Financial Services Corp. (NFS) | | | 9,626 | | | | — | | | | (9,626 | ) | | | — | |
Scotia Capital USA Inc. | | | 2,355 | | | | — | | | | (2,355 | ) | | | — | |
UBS Securities LLC | | | 171 | | | | — | | | | (171 | ) | | | — | |
| | | | | | | | | | | | | | | | |
| | $ | 43,058 | | | $ | — | | | $ | (43,058 | ) | | $ | — | |
| | | | | | | | | | | | | | | | |
| (1) | Excess of collateral received from the individual counterparty is not shown for financial reporting purposes. Collateral with a value of $44,034 has been received in connection with securities lending transactions. |
Stephens Mid-Cap Growth
Offsetting of Financial Assets and Derivative Assets as of December 31, 2015:
| | | | | | | | | | | | |
Description | | Gross Amounts of
Recognized Assets | | | Gross Amounts
Offset in the
Statements of
Assets
and Liabilities | | | Net Amounts of Assets
Presented in the
Statements of Assets
and Liabilities | |
Securities on Loan | | $ | 4,716 | | | $ | — | | | $ | 4,716 | |
Financial Assets, Derivative Assets, and Collateral Pledged by Counterparty as of December 31, 2015:
| | | | | | | | | | | | | | | | |
| | | Net amount of Assets
Presented in the
Statements of Assets and
Liabilities | | | Gross Amounts Not Offset in the
Statements of Assets and Liabilities | | | | |
Counterparty | | | Financial
Instruments | | | Cash Collateral
Received(1) | | | Net
Amount | |
Goldman Sachs & Co | | $ | 1,081 | | | $ | — | | | $ | (1,081 | ) | | $ | — | |
JP Morgan Clearing Corp | | | 405 | | | | — | | | | (405 | ) | | | — | |
MS Securities Services Inc. | | | 429 | | | | — | | | | (429 | ) | | | — | |
National Financial Services Corp (NFS) | | | 2,545 | | | | — | | | | (2,545 | ) | | | — | |
SG Americas Securities, LLC | | | 256 | | | | — | | | | (256 | ) | | | — | |
| | | | | | | | | | | | | | | | |
| | $ | 4,716 | | | $ | — | | | $ | (4,716 | ) | | $ | — | |
| | | | | | | | | | | | | | | | |
| (1) | Excess of collateral received from the individual counterparty is not shown for financial reporting purposes. Collateral with a value of $4,815 has been received in connection with securities lending transactions. |
7. Federal Income and Excise Taxes
It is the policy of the Funds to qualify as a regulated investment company (“RIC”), by complying with all applicable provisions of Subchapter M of the Internal Revenue Code, as amended, and to make distribution of taxable income sufficient to relieve it from substantially all federal income and excise taxes. For federal income tax purposes, the Funds are treated as a single entity for the purpose of determining such qualification.
47
American Beacon FundsSM
Notes to Financial Statements
December 31, 2015
The Funds do not have any unrecognized tax benefits in the accompanying financial statements. Each of the tax years in the four year period ended December 31, 2015 remains subject to examination by the Internal Revenue Service. If applicable, the Funds recognize interest accrued related to unrecognized tax benefits in interest expense and penalties in “Other expenses” on the Statements of Operations.
Dividends are categorized in accordance with income tax regulations which may treat certain transactions differently than U.S. GAAP. Accordingly, the character of distributions and composition of net assets for tax purposes may differ from those reflected in the accompanying financial statements.
A Fund may be subject to taxes imposed by countries in which it invests. Such taxes are generally based on returns of income earned or gains realized or repatriated. Taxes are accrued and applied to net investment income, net realized capital gains and net unrealized appreciation or depreciation, as applicable, as the income is earned or capital gains are recorded.
The tax character of distributions paid were as follows (in thousands):
| | | | | | | | | | | | | | | | | | | | | | | | |
| | | Bahl & Gaynor Small Cap Growth | | | Bridgeway Large Cap Value | | | Holland Large Cap Growth | |
| | | Year Ended
December 31,
2015 | | | Year Ended
December 31,
2014 | | | Year Ended
December 31,
2015 | | | Year Ended
December 31,
2014 | | | Year Ended
December 31,
2015 | | | Year Ended
December 31,
2014 | |
Distributions paid from: | | | | | | | | | | | | | | | | | | | | | | | | |
Ordinary income* | | | | | | | | | | | | | | | | | | | | | | | | |
Institutional Class | | $ | 21 | | | $ | 5 | | | $ | 8,277 | | | $ | 4,256 | | | $ | — | | | $ | 4 | |
Y Class | | | 18 | | | | 1 | | | | 5,057 | | | | 1,588 | | | | — | | | | — | |
Investor Class | | | 4 | | | | — | | | | 9,027 | | | | 7,289 | | | | — | | | | 18 | |
A Class | | | 4 | | | | — | | | | 1,294 | | | | 1,195 | | | | — | | | | 1 | |
C Class | | | 2 | | | | — | | | | 391 | | | | 319 | | | | — | | | | — | |
Long-term capital gain | | | | | | | | | | | | | | | | | | | | | | | | |
Institutional Class | | | 45 | | | | — | | | | 15,842 | | | | 2,542 | | | | 1,832 | | | | 1 683 | |
Y Class | | | 38 | | | | — | | | | 9,510 | | | | 951 | | | | 35 | | | | 7 | |
Investor Class | | | 6 | | | | — | | | | 23,035 | | | | 5,445 | | | | 8,194 | | | | 7 629 | |
A Class | | | 7 | | | | — | | | | 3,478 | | | | 844 | | | | 136 | | | | 96 | |
C Class | | | 5 | | | | — | | | | 2,016 | | | | 270 | | | | 84 | | | | 59 | |
Return of capital | | | | | | | | | | | | | | | | | | | | | | | | |
Institutional Class | | | 3 | | | | — | | | | 76 | | | | — | | | | — | | | | — | |
Y Class | | | 3 | | | | — | | | | 47 | | | | — | | | | — | | | | — | |
Investor Class | | | 1 | | | | — | | | | 83 | | | | — | | | | — | | | | — | |
A Class | | | 1 | | | | — | | | | 12 | | | | — | | | | — | | | | — | |
C Class | | | — | | | | — | | | | 4 | | | | — | | | | — | | | | — | |
| | | | | | | | | | | | | | | | | | | | | | | | |
Total distributions paid | | $ | 158 | | | $ | 6 | | | $ | 78,149 | | | $ | 24,699 | | | $ | 10,281 | | | $ | 9,497 | |
| | | | | | | | | | | | | | | | | | | | | | | | |
| | | | | | | | | | | | | | | | |
| | | Stephens Small Cap Growth | | | Stephens Mid-Cap Growth | |
| | | Year Ended
December 31,
2015 | | | Year Ended
December 31,
2014 | | | Year Ended
December 31,
2015 | | | Year Ended
December 31,
2014 | |
Distributions paid from: | | | | | | | | | | | | | | | | |
Ordinary income* | | | | | | | | | | | | | | | | |
Institutional Class | | $ | — | | | $ | — | | | $ | — | | | $ | — | |
Y Class | | | — | | | | — | | | | — | | | | — | |
Investor Class | | | — | | | | — | | | | — | | | | — | |
A Class | | | — | | | | — | | | | — | | | | — | |
C Class | | | — | | | | — | | | | — | | | | — | |
Long-term capital gain | | | | | | | | | | | | | | | | |
Institutional Class | | | 13,632 | | | | 14,779 | | | | 3,679 | | | | 5,108 | |
Y Class | | | 6,447 | | | | 7,036 | | | | 120 | | | | 185 | |
Investor Class | | | 2,688 | | | | 6,460 | | | | 795 | | | | 1,310 | |
A Class | | | 397 | | | | 420 | | | | 832 | | | | 1,127 | |
C Class | | | 113 | | | | 122 | | | | 114 | | | | 130 | |
| | | | | | | | | | | | | | | | |
Total distributions paid | | $ | 23,277 | | | $ | 28,817 | | | $ | 5,540 | | | $ | 7,860 | |
| | | | | | | | | | | | | | | | |
| * | For tax purposes, short-term capital gains are considered ordinary income distributions. |
48
American Beacon FundsSM
Notes to Financial Statements
December 31, 2015
As of December 31, 2015 the components of distributable earnings or (deficits) on a tax basis were as follows (in thousands):
| | | | | | | | | | | | | | | | | | | | |
| | | Bahl &
Gaynor
Small Cap
Growth | | | Bridgeway
Large Cap
Value | | | Holland
Large Cap
Growth | | | Stephens
Small Cap
Growth | | | Stephens
Mid-Cap
Growth | |
Cost basis of investments for federal income tax purposes | | $ | 7,430 | | | $ | 2,244,859 | | | $ | 73,155 | | | $ | 522,912 | | | $ | 102,168 | |
Unrealized appreciation | | | 468 | | | | 154,280 | | | | 28,918 | | | | 84,589 | | | | 22,863 | |
Unrealized depreciation | | | (693 | ) | | | (118,749 | ) | | | (2,115 | ) | | | (54,063 | ) | | | (9,884 | ) |
| | | | | | | | | | | | | | | | | | | | |
Net unrealized appreciation or (depreciation) | | | (225 | ) | | | 35,531 | | | | 26,803 | | | | 30,526 | | | | 12,979 | |
Undistributed ordinary income | | | — | | | | — | | | | — | | | | — | | | | — | |
Accumulated capital and other losses | | | (2 | ) | | | (20,968 | ) | | | (482 | ) | | | — | | | | — | |
Undistributed long-term capital gain | | | — | | | | — | | | | — | | | | 4,821 | | | | 4,642 | |
| | | | | | | | | | | | | | | | | | | | |
Distributable earnings or (deficits) | | $ | (227 | ) | | $ | 14,563 | | | $ | 26,321 | | | $ | 35,347 | | | $ | 17,621 | |
| | | | | | | | | | | | | | | | | | | | |
Financial reporting records are adjusted for permanent book/tax differences to reflect tax character. Financial records are not adjusted for temporary differences. The temporary differences between financial reporting and tax-basis reporting of unrealized appreciation or (depreciation) are attributable primarily to the tax deferral of losses from wash sales and the realization for tax purposes of unrealized gains or (losses) on certain derivative instruments.
Due to inherent differences in the recognition of income, expenses and realized gains or (losses) under U.S. GAAP and federal income tax regulations, permanent differences between book and tax reporting have been identified and appropriately reclassified on the Statement of Assets and Liabilities.
Accordingly, the following amounts represent current year permanent differences derived from the reclassifications of income from real estate investment securities, net operating losses used to offset short-term capital gains, non-utilization of net operating losses, return of capital, and dividends that have been reclassed as of December 31, 2015 (in thousands):
| | | | | | | | | | | | | | | | | | | | |
| | | Bahl &
Gaynor
Small Cap
Growth | | | Bridgeway
Large Cap
Value | | | Holland Large
Cap Growth | | | Stephens
Small Cap
Growth | | | Stephens
Mid-Cap
Growth | |
Paid-in-capital | | $ | — | | | $ | — | | | $ | (39 | ) | | $ | (4,765 | ) | | $ | (841 | ) |
Undistributed (or overdistribution of) net investment income | | | — | | | | (380 | ) | | | 39 | | | | 4,766 | | | | 841 | |
Accumulated net realized gain (loss) | | | — | | | | 380 | | | | — | | | | (1 | ) | | | — | |
Unrealized appreciation or (depreciation) of investments and futures contracts | | | — | | | | — | | | | — | | | | — | | | | — | |
For the fiscal year ended December 31, 2015, the Funds did not have capital loss carryforwards.
Net capital losses (in thousands) incurred after October 31, 2015 and within the taxable year are deemed to arise on the first business day of the Fund’s next taxable year. For the year ended December 31, 2015, the Bahl & Gaynor Small Cap Growth Fund deferred $23 of short-term capital loss and $21 of long-term capital gain, the Bridgeway Large Cap Value Fund deferred $9,888 of short-term capital loss and $11,080 of long-term capital loss, and the Holland Large Cap Growth Fund deferred $135 of short-term capital loss and $347 of long-term capital loss to January 1, 2016.
49
American Beacon FundsSM
Notes to Financial Statements
December 31, 2015
8. Investment Transactions
The aggregate cost of purchases and proceeds from sales of investments, other than short-term obligations, for the year ended December 31, 2015 were as follows (in thousands):
| | | | | | | | | | | | | | | | | | | | |
| | | Bahl &
Gaynor Small
Cap Growth | | | Bridgeway
Large Cap
Value | | | Holland
Large Cap
Growth | | | Stephens
Small Cap
Growth | | | Stephens
Mid-Cap
Growth | |
Purchases (excluding U.S. government securities) | | $ | 6,788 | | | $ | 1,833,479 | | | $ | 23,611 | | | $ | 156,310 | | | $ | 23,462 | |
Sales and maturities (excluding U.S. government securities) | | | 3,267 | | | | 741,742 | | | | 31,566 | | | | 319,695 | | | | 36,118 | |
A summary of the Funds’ security lending collateral transactions in the Select Funds for the year ended December 31, 2015 is set forth below ( in thousands):
| | | | | | | | | | | | | | | | | | | | | | | | |
Fund | | Affiliate | | | December 31, 2014
Shares/Fair Value | | | Purchases | | | Sales | | | December 31, 2015
Shares/Fair Value | | | Dividend
Income | |
Stephens Small Cap Growth | | | USG Select Fund | | | $ | 43,153 | | | $ | 254,513 | | | $ | 264,641 | | | $ | 33,025 | | | $ | 3 | |
Stephens Mid-Cap Growth | | | USG Select Fund | | | | 5,242 | | | | 57,456 | | | | 59,087 | | | | 3,611 | | | | — | |
9. Securities Lending
The Stephens Small Cap Growth and Stephens Mid-Cap Growth Funds may lend their securities to qualified financial institutions, such as certain broker-dealers, to earn additional income. The borrowers are required to secure their loans continuously with collateral in an amount at least equal to the fair value of the securities loaned, initially in an amount at least equal to 102% of the fair value of domestic securities loaned and 105% of the fair value of international securities loaned. Collateral is monitored and marked to market daily. Daily mark to market amounts are required to be paid to the borrower or received from the borrower by the end of the following business day. This one day settlement for mark to market amounts may result in the collateral being temporarily less than the value of the securities on loan or temporarily more than the required minimum collateral.
To the extent that a loan is collateralized by cash, such cash collateral shall be invested by the securities lending agent (the “Agent”) in money market mutual funds and other short-term investments as designated by the Manager.
Securities lending income is generated from the demand premium (if any) paid by the borrower to borrow a specific security and from the return on investment of cash collateral, reduced by negotiated rebate fees paid to the borrower and transaction costs. To the extent that a loan is secured by non-cash collateral, securities lending income is generated as a demand premium reduced by transaction costs. The Fund, the Agent, and the Manager retain 80%, 10%, and 10%, respectively, of the income generated from securities lending.
While securities are on loan, the Fund continues to receive certain income associated with that security and any gain or loss in the market price that may occur during the term of the loan. In the case of domestic equities, the value of any dividend is received in the form of a substitute payment approximately equal to the dividend. In the case of foreign securities, a negotiated amount is received that is less than the actual dividend, but higher than the dividend amount minus the foreign tax that the Fund would be subject to on the dividend.
Securities lending transactions pose certain risks to the Fund, including that the borrower may not provide additional collateral when required or return the securities when due, that the value of the short-term investments will be less than the amount of cash collateral required to be returned to the borrower, that non-cash collateral may be subject to legal constraints in the event of a borrower bankruptcy, and that the cash collateral investments could become illiquid and unable to be used to return collateral to the borrower. The
50
American Beacon FundsSM
Notes to Financial Statements
December 31, 2015
Fund could also experience delays and costs in gaining access to the collateral. The Fund bears the risk of any deficiency in the amount of the cash collateral available for return to the borrower and any action which impairs its ability to liquidate non-cash collateral to satisfy a borrower default.
As of December 31, 2015, the value of outstanding securities on loan and the value of collateral was as follows (in thousands):
| | | | | | | | | | | | |
Fund | | Fair Value of Securities on Loan | | | Non-Cash
Collateral | | | Cash Collateral
Posted by Borrower | |
Stephens Small Cap Growth | | $ | 43,058 | | | $ | — | | | $ | 44,034 | |
Stephens Mid-Cap Growth | | | 4,716 | | | | — | | | | 4,815 | |
Cash collateral is listed on the Stephens Small Cap Growth and Stephens Mid-Cap Growth Funds’ Schedules of Investments and is shown on the Statements of Assets and Liabilities. Income earned on these investments, grossed up by the securities lending fees paid to the Manager, is included in “Income derived from securities lending” on the Statements of Operations.
Non-cash collateral received by the Fund may not be sold or re-pledged except to satisfy a borrower default. Therefore, non-cash collateral is not included on the Fund’s Schedules of Investments or Statements of Assets and Liabilities.
10. Capital Share Transactions
The tables below summarize the activity in capital shares for each Class of the Funds (dollars and shares (in thousands):
For the Year Ended December 31, 2015
| | | | | | | | | | | | | | | | | | | | | | | | |
| | | Institutional Class | | | Y Class | | | Investor Class | |
Bahl & Gaynor Small Cap Growth Fund | | Shares | | | Amount | | | Shares | | | Amount | | | Shares | | | Amount | |
Shares sold | | | 27 | | | $ | 291 | | | | 255 | | | $ | 2,733 | | | | 176 | | | $ | 1,814 | |
Reinvestment of dividends | | | 7 | | | | 69 | | | | 6 | | | | 58 | | | | 1 | | | | 11 | |
Shares redeemed | | | (6 | ) | | | (59 | ) | | | (30 | ) | | | (314 | ) | | | (150 | ) | | | (1,482 | ) |
| | | | | | | | | | | | | | | | | | | | | | | | |
Net increase in shares outstanding | | | 28 | | | $ | 301 | | | | 231 | | | $ | 2,477 | | | | 27 | | | $ | 343 | |
| | | | | | | | | | | | | | | | | | | | | | | | |
| | | | | | | | | | | | | | | | |
| | | A Class | | | C Class | |
Bahl & Gaynor Small Cap Growth Fund | | Shares | | | Amount | | | Shares | | | Amount | |
Shares sold | | | 64 | | | $ | 686 | | | | 18 | | | $ | 192 | |
Reinvestment of dividends | | | 1 | | | | 13 | | | | 1 | | | | 7 | |
Shares redeemed | | | (35 | ) | | | (365 | ) | | | (1 | ) | | | (12 | ) |
| | | | | | | | | | | | | | | | |
Net increase in shares outstanding | | | 30 | | | $ | 334 | | | | 18 | | | $ | 187 | |
| | | | | | | | | | | | | | | | |
| | | | | | | | | | | | | | | | | | | | | | | | |
| | | Institutional Class | | | Y Class | | | Investor Class | |
Bridgeway Large Cap Value Fund | | Shares | | | Amount | | | Shares | | | Amount | | | Shares | | | Amount | |
Shares sold | | | 20,824 | | | $ | 493,978 | | | | 16,261 | | | $ | 385,881 | | | | 28,445 | | | $ | 676,887 | |
Reinvestment of dividends | | | 1,050 | | | | 23,860 | | | | 608 | | | | 13,790 | | | | 1,418 | | | | 32,070 | |
Shares redeemed | | | (4,986 | ) | | | (118,434 | ) | | | (3,599 | ) | | | (85,147 | ) | | | (14,804 | ) | | | (351,506 | ) |
| | | | | | | | | | | | | | | | | | | | | | | | |
Net increase in shares outstanding | | | 16,888 | | | $ | 399,404 | | | | 13,270 | | | $ | 314,524 | | | | 15,059 | | | $ | 357,451 | |
| | | | | | | | | | | | | | | | | | | | | | | | |
| | | | | | | | | | | | | | | | |
| | | A Class | | | C Class | |
Bridgeway Large Cap Value Fund | | Shares | | | Amount | | | Shares | | | Amount | |
Shares sold | | | 4,373 | | | $ | 103,916 | | | | 2,607 | | | $ | 60,549 | |
Reinvestment of dividends | | | 193 | | | | 4,339 | | | | 88 | | | | 1,938 | |
Shares redeemed | | | (2,408 | ) | | | (57,244 | ) | | | (313 | ) | | | (7,181 | ) |
| | | | | | | | | | | | | | | | |
Net increase in shares outstanding | | | 2,158 | | | $ | 51,011 | | | | 2,382 | | | $ | 55,306 | |
| | | | | | | | | | | | | | | | |
51
American Beacon FundsSM
Notes to Financial Statements
December 31, 2015
| | | | | | | | | | | | | | | | | | | | | | | | |
| | | Institutional Class | | | Y Class | | | Investor Class | |
Holland Large Cap Growth Fund | | Shares | | | Amount | | | Shares | | | Amount | | | Shares | | | Amount | |
Shares sold | | | 41 | | | $ | 1,045 | | | | 10 | | | $ | 282 | | | | 157 | | | $ | 4,211 | |
Reinvestment of dividends | | | 74 | | | | 1,832 | | | | 2 | | | | 35 | | | | 336 | | | | 8,193 | |
Shares redeemed | | | (64 | ) | | | (1,774 | ) | | | (1 | ) | | | (24 | ) | | | (429 | ) | | | (11,433 | ) |
| | | | | | | | | | | | | | | | | | | | | | | | |
Net increase in shares outstanding | | | 51 | | | $ | 1,103 | | | | 11 | | | $ | 293 | | | | 64 | | | $ | 971 | |
| | | | | | | | | | | | | | | | | | | | | | | | |
| | | | | | | | | | | | | | | | |
| | | A Class | | | C Class | |
Holland Large Cap Growth Fund | | Shares | | | Amount | | | Shares | | | Amount | |
Shares sold | | | 17 | | | $ | 455 | | | | 10 | | | $ | 250 | |
Reinvestment of dividends | | | 6 | | | | 136 | | | | 4 | | | | 84 | |
Shares redeemed | | | (10 | ) | | | (261 | ) | | | (5 | ) | | | (121 | ) |
| | | | | | | | | | | | | | | | |
Net increase in shares outstanding | | | 13 | | | $ | 330 | | | | 9 | | | $ | 213 | |
| | | | | | | | | | | | | | | | |
| | | | | | | | | | | | | | | | | | | | | | | | |
| | | Institutional Class | | | Y Class | | | Investor Class | |
Stephens Small Cap Growth Fund | | Shares | | | Amount | | | Shares | | | Amount | | | Shares | | | Amount | |
Shares sold | | | 3,369 | | | $ | 56,084 | | | | 1,841 | | | $ | 30,029 | | | | 530 | | | $ | 8,403 | |
Reinvestment of dividends | | | 887 | | | | 13,334 | | | | 420 | | | | 6,299 | | | | 189 | | | | 2,679 | |
Shares redeemed | | | (6,014 | ) | | | (100,387 | ) | | | (3,132 | ) | | | (51,053 | ) | | | (6,153 | ) | | | (96,717 | ) |
| | | | | | | | | | | | | | | | | | | | | | | | |
Net (decrease) in shares outstanding | | | (1,758 | ) | | $ | (30,969 | ) | | | (871 | ) | | $ | (14,725 | ) | | | (5,434 | ) | | $ | (85,635 | ) |
| | | | | | | | | | | | | | | | | | | | | | | | |
| | | | | | | | | | | | | | | | |
| | | A Class | | | C Class | |
Stephens Small Cap Growth Fund | | Shares | | | Amount | | | Shares | | | Amount | |
Shares sold | | | 87 | | | $ | 1,393 | | | | 11 | | | $ | 161 | |
Reinvestment of dividends | | | 27 | | | | 388 | | | | 8 | | | | 109 | |
Shares redeemed | | | (154 | ) | | | (2,402 | ) | | | (29 | ) | | | (426 | ) |
| | | | | | | | | | | | | | | | |
Net (decrease) in shares outstanding | | | (40 | ) | | $ | (621 | ) | | | (10 | ) | | $ | (156 | ) |
| | | | | | | | | | | | | | | | |
| | | | | | | | | | | | | | | | | | | | | | | | |
| | | Institutional Class | | | Y Class | | | Investor Class | |
Stephens Mid-Cap Growth Fund | | Shares | | | Amount | | | Shares | | | Amount | | | Shares | | | Amount | |
Shares sold | | | 919 | | | $ | 18,187 | | | | 32 | | | $ | 653 | | | | 29 | | | $ | 512 | |
Reinvestment of dividends | | | 203 | | | | 3,650 | | | | 6 | | | | 114 | | | | 49 | | | | 777 | |
Shares redeemed | | | (1,441 | ) | | | (28,147 | ) | | | (63 | ) | | | (1,225 | ) | | | (293 | ) | | | (5,071 | ) |
| | | | | | | | | | | | | | | | | | | | | | | | |
Net (decrease) in shares outstanding | | | (319 | ) | | $ | (6,310 | ) | | | (25 | ) | | $ | (458 | ) | | | (215 | ) | | $ | (3,782 | ) |
| | | | | | | | | | | | | | | | | | | | | | | | |
| | | | | | | | | | | | | | | | |
| | | A Class | | | C Class | |
Stephens Mid-Cap Growth Fund | | Shares | | | Amount | | | Shares | | | Amount | |
Shares sold | | | 267 | | | $ | 4,587 | | | | 40 | | | $ | 684 | |
Reinvestment of dividends | | | 48 | | | | 745 | | | | 7 | | | | 107 | |
Shares redeemed | | | (407 | ) | | | (6,870 | ) | | | (23 | ) | | | (388 | ) |
| | | | | | | | | | | | | | | | |
Net increase (decrease) in shares outstanding | | | (92 | ) | | $ | (1,538 | ) | | | 24 | | | $ | 403 | |
| | | | | | | | | | | | | | | | |
For the year ended December 31, 2014
| | | | | | | | | | | | | | | | | | | | | | | | |
| | | Institutional Class | | | Y Class | | | Investor Class | |
Bahl & Gaynor Small Cap Growth Fund | | Shares | | | Amount | | | Shares | | | Amount | | | Shares | | | Amount | |
Shares sold | | | 29 | | | $ | 295 | | | | 26 | | | $ | 276 | | | | 12 | | | $ | 130 | |
Reinvestment of dividends | | | 1 | | | | 5 | | | | — | | | | 1 | | | | — | | | | — | |
Shares redeemed | | | — | | | | — | | | | — | | | | — | | | | — | | | | — | |
| | | | | | | | | | | | | | | | | | | | | | | | |
Net increase in shares outstanding | | | 30 | | | $ | 300 | | | | 26 | | | $ | 277 | | | | 12 | | | $ | 130 | |
| | | | | | | | | | | | | | | | | | | | | | | | |
52
American Beacon FundsSM
Notes to Financial Statements
December 31, 2015
| | | | | | | | | | | | | | | | |
| | | A Class | | | C Class | |
Bahl & Gaynor Small Cap Growth Fund | | Shares | | | Amount | | | Shares | | | Amount | |
Shares sold | | | 5 | | | $ | 55 | | | | 4 | | | $ | 35 | |
Reinvestment of dividends | | | — | | | | — | | | | — | | | | — | |
Shares redeemed | | | — | | | | — | | | | — | | | | — | |
| | | | | | | | | | | | | | | | |
Net increase in shares outstanding | | | 5 | | | $ | 55 | | | | 4 | | | $ | 35 | |
| | | | | | | | | | | | | | | | |
| | | | | | | | | | | | | | | | | | | | | | | | |
| | | Institutional Class | | | Y Class | | | Investor Class | |
Bridgeway Large Cap Value Fund | | Shares | | | Amount | | | Shares | | | Amount | | | Shares | | | Amount | |
Shares sold | | | 10,620 | | | $ | 243,491 | | | | 4,580 | | | $ | 105,825 | | | | 19,278 | | | $ | 435,281 | |
Reinvestment of dividends | | | 282 | | | | 6,758 | | | | 100 | | | | 2,387 | | | | 532 | | | | 12,696 | |
Shares redeemed | | | (1,508 | ) | | | (34,472 | ) | | | (615 | ) | | | (14,093 | ) | | | (4,560 | ) | | | (103,940 | ) |
| | | | | | | | | | | | | | | | | | | | | | | | |
Net increase in shares outstanding | | | 9,394 | | | $ | 215,777 | | | | 4,065 | | | $ | 94,119 | | | | 15,250 | | | $ | 344,037 | |
| | | | | | | | | | | | | | | | | | | | | | | | |
| | | | | | | | | | | | | | | | |
| | | A Class | | | C Class | |
Bridgeway Large Cap Value Fund | | Shares | | | Amount | | | Shares | | | Amount | |
Shares sold | | | 3,516 | | | $ | 80,273 | | | | 1,342 | | | $ | 30,255 | |
Reinvestment of dividends | | | 78 | | | | 1,862 | | | | 22 | | | | 511 | |
Shares redeemed | | | (685 | ) | | | (15,181 | ) | | | (35 | ) | | | (789 | ) |
| | | | | | | | | | | | | | | | |
Net increase in shares outstanding | | | 2,909 | | | $ | 66,954 | | | | 1,329 | | | $ | 29,977 | |
| | | | | | | | | | | | | | | | |
| | | | | | | | | | | | | | | | | | | | | | | | |
| | | Institutional Class | | | Y Class | | | Investor Class | |
Holland Large Cap Growth Fund | | Shares | | | Amount | | | Shares | | | Amount | | | Shares | | | Amount | |
Shares sold | | | 30 | | | $ | 790 | | | | 1 | | | $ | 20 | | | | 406 | | | $ | 11,224 | |
Reinvestment of dividends | | | 64 | | | | 1,687 | | | | — | | | | 7 | | | | 296 | | | | 7,645 | |
Shares redeemed | | | (8 | ) | | | (226 | ) | | | (1 | ) | | | (30 | ) | | | (466 | ) | | | (12,671 | ) |
| | | | | | | | | | | | | | | | | | | | | | | | |
Net increase (decrease) in shares outstanding | | | 86 | | | $ | 2,251 | | | | — | | | $ | (3 | ) | | | 236 | | | $ | 6,198 | |
| | | | | | | | | | | | | | | | | | | | | | | | |
| | | | | | | | | | | | | | | | |
| | | A Class | | | C Class | |
Holland Large Cap Growth Fund | | Shares | | | Amount | | | Shares | | | Amount | |
Shares sold | | | 11 | | | $ | 290 | | | | 4 | | | $ | 92 | |
Reinvestment of dividends | | | 4 | | | | 92 | | | | 2 | | | | 41 | |
Shares redeemed | | | (14 | ) | | | (373 | ) | | | (9 | ) | | | (239 | ) |
| | | | | | | | | | | | | | | | |
Net increase (decrease) in shares outstanding | | | 1 | | | $ | 9 | | | | (3 | ) | | $ | (106 | ) |
| | | | | | | | | | | | | | | | |
| | | | | | | | | | | | | | | | | | | | | | | | |
| | | Institutional Class | | | Y Class | | | Investor Class | |
Stephens Small Cap Growth Fund | | Shares | | | Amount | | | Shares | | | Amount | | | Shares | | | Amount | |
Shares sold | | | 7,803 | | | $ | 133,916 | | | | 3,053 | | | $ | 52,340 | | | | 2,277 | | | $ | 36,690 | |
Reinvestment of dividends | | | 865 | | | | 14,382 | | | | 412 | | | | 6,840 | | | | 408 | | | | 6,431 | |
Shares redeemed | | | (4,750 | ) | | | (80,142 | ) | | | (4,766 | ) | | | (78,398 | ) | | | (3,312 | ) | | | (52,961 | ) |
| | | | | | | | | | | | | | | | | | | | | | | | |
Net increase (decrease) in shares outstanding | | | 3,918 | | | $ | 68,156 | | | | (1,301 | ) | | $ | (19,218 | ) | | | (627 | ) | | $ | (9,840 | ) |
| | | | | | | | | | | | | | | | | | | | | | | | |
| | | | | | | | | | | | | | | | |
| | | A Class | | | C Class | |
Stephens Small Cap Growth Fund | | Shares | | | Amount | | | Shares | | | Amount | |
Shares sold | | | 149 | | | $ | 2,425 | | | | 59 | | | $ | 937 | |
Reinvestment of dividends | | | 25 | | | | 401 | | | | 7 | | | | 112 | |
Shares redeemed | | | (200 | ) | | | (3,184 | ) | | | (31 | ) | | | (491 | ) |
| | | | | | | | | | | | | | | | |
Net increase (decrease) in shares outstanding | | | (26 | ) | | $ | (358 | ) | | | 35 | | | $ | 558 | |
| | | | | | | | | | | | | | | | |
53
American Beacon FundsSM
Notes to Financial Statements
December 31, 2015
| | | | | | | | | | | | | | | | | | | | | | | | |
| | | Institutional Class | | | Y Class | | | Investor Class | |
Stephens Mid-Cap Growth Fund | | Shares | | | Amount | | | Shares | | | Amount | | | Shares | | | Amount | |
Shares sold | | | 2,114 | | | $ | 42,235 | | | | 146 | | | $ | 2,898 | | | | 200 | | | $ | 3,555 | |
Reinvestment of dividends | | | 258 | | | | 4,995 | | | | 8 | | | | 155 | | | | 71 | | | | 1,224 | |
Shares redeemed | | | (1,018 | ) | | | (20,206 | ) | | | (77 | ) | | | (1,500 | ) | | | (929 | ) | | | (15,848 | ) |
| | | | | | | | | | | | | | | | | | | | | | | | |
Net increase (decrease) in shares outstanding | | | 1,354 | | | $ | 27,024 | | | | 77 | | | $ | 1,553 | | | | (658 | ) | | $ | (11,069 | ) |
| | | | | | | | | | | | | | | | | | | | | | | | |
| | | | | | | | | | | | | | | | |
| | | A Class | | | C Class | |
Stephens Mid-Cap Growth Fund | | Shares | | | Amount | | | Shares | | | Amount | |
Shares sold | | | 269 | | | $ | 4,753 | | | | 49 | | | $ | 854 | |
Reinvestment of dividends | | | 38 | | | | 643 | | | | 6 | | | | 100 | |
Shares redeemed | | | (377 | ) | | | (6,640 | ) | | | (34 | ) | | | (596 | ) |
| | | | | | | | | | | | | | | | |
Net increase (decrease) in shares outstanding | | | (70 | ) | | $ | (1,244 | ) | | | 21 | | | $ | 358 | |
| | | | | | | | | | | | | | | | |
54
This page intentionally left blank.
55
American Beacon Bahl & Gaynor Small Cap Growth FundSM
Financial Highlights
(For a share outstanding throughout the period)
| | | | | | | | | | | | | | | | | | | | | | | | |
| | | Institutional Class | | | Y Class | | | Investor Class | |
| | | Year
Ended
Dec. 31,
2015 | | | July 15A
to
Dec. 31,
2014 | | | Year
Ended
Dec. 31,
2015 | | | July 15A
to
Dec. 31,
2014 | | | Year
Ended
Dec. 31,
2015 | | | July 15A
to
Dec. 31,
2014 | |
Net asset value, beginning of period | | $ | 10.71 | | | $ | 10.00 | | | $ | 10.71 | | | $ | 10.00 | | | $ | 10.69 | | | $ | 10.00 | |
| | | | | | | | | | | | | | | | | | | | | | | | |
Income from investment operations: | | | | | | | | | | | | | | | | | | | | | | | | |
Net investment income (loss) | | | 0.08 | | | | 0.02 | | | | 0.06 | | | | 0.01 | | | | 0.05 | | | | 0.01 | |
Net gains (losses) on investments (both realized and unrealized) | | | (0.39 | ) | | | 0.71 | | | | (0.38 | ) | | | 0.72 | | | | (0.39 | ) | | | 0.70 | |
| | | | | | | | | | | | | | | | | | | | | | | | |
Total income (loss) from investment operations | | | (0.31 | ) | | | 0.73 | | | | (0.32 | ) | | | 0.73 | | | | (0.34 | ) | | | 0.71 | |
| | | | | | | | | | | | | | | | | | | | | | | | |
Less distributions: | | | | | | | | | | | | | | | | | | | | | | | | |
Dividends from net investment income | | | (0.06 | ) | | | (0.02 | ) | | | (0.06 | ) | | | (0.02 | ) | | | (0.06 | ) | | | (0.02 | ) |
Distributions from net realized gains | | | (0.16 | ) | | | — | | | | (0.16 | ) | | | — | | | | (0.16 | ) | | | — | |
Return of capital | | | (0.01 | )F | | | — | | | | (0.01 | )F | | | — | | | | (0.01 | )F | | | — | |
| | | | | | | | | | | | | | | | | | | | | | | | |
Total distributions | | | (0.23 | ) | | | (0.02 | ) | | | (0.23 | ) | | | (0.02 | ) | | | (0.23 | ) | | | (0.02 | ) |
| | | | | | | | | | | | | | | | | | | | | | | | |
Net asset value, end of period | | $ | 10.17 | | | $ | 10.71 | | | $ | 10.16 | | | $ | 10.71 | | | $ | 10.12 | | | $ | 10.69 | |
| | | | | | | | | | | | | | | | | | | | | | | | |
Total return B | | | (2.96 | )% | | | 7.28 | %C | | | (3.05 | )% | | | 7.28 | %C | | | (3.25 | )% | | | 7.08 | %C |
| | | | | | | | | | | | | | | | | | | | | | | | |
| | | | | | |
Ratios and supplemental data: | | | | | | | | | | | | | | | | | | | | | | | | |
Net assets, end of period (in thousands) | | $ | 3,231 | | | $ | 3,103 | | | $ | 2,711 | | | $ | 388 | | | $ | 498 | | | $ | 239 | |
Ratios to average net assets: | | | | | | | | | | | | | | | | | | | | | | | | |
Expenses, before reimbursements | | | 3.04 | % | | | 8.98 | %D | | | 2.76 | % | | | 11.71 | %D | | | 3.19 | % | | | 12.62 | %D |
Expenses, net of reimbursements | | | 0.98 | % | | | 0.98 | %D | | | 1.08 | % | | | 1.08 | %D | | | 1.36 | % | | | 1.36 | %D |
Net investment (loss), before expense reimbursements | | | (1.33 | )% | | | (7.51 | )%D | | | (0.98 | )% | | | (10.06 | )%D | | | (1.47 | )% | | | (11.12 | )%D |
Net investment income (loss), net of reimbursements | | | 0.72 | % | | | 0.49 | %D | | | 0.70 | % | | | 0.57 | %D | | | 0.35 | % | | | 0.14 | %D |
Portfolio turnover rate | | | 54 | % | | | 12 | %E | | | 54 | % | | | 12 | %E | | | 54 | % | | | 12 | %E |
| A | Commencement of operations. |
| B | Based on net asset value, which does not reflect the sales charge, redemption fee, or contingent deferred sales charge, if applicable. May include adjustments in accordance with U.S. GAAP and as such, the net asset value for reporting purposes and the returns based upon those net asset values may differ from the net asset value and returns for shareholder transactions. |
| E | Portfolio turnover rate is for the period from July 15, 2014 to December 31, 2014, and is not annualized. |
| F | The return of capital is calculated based on outstanding shares at the time of distribution. |
56
American Beacon Bahl & Gaynor Small Cap GrowthSM
Financial Highlights
(For a share outstanding throughout the period)
| | | | | | | | | | | | | | |
| A Class | | | C Class | |
Year
Ended
Dec. 31,
2015 | | | July 15A
to
Dec. 31,
2014 | | | Year
Ended
Dec. 31,
2015 | | | July 15 A
to
Dec. 31,
2014 | |
| $ | 10.69 | | | $ | 10.00 | | | $ | 10.65 | | | $ | 10.00 | |
| | | | | | | | | | | | | | |
| | | |
| | 0.03 | | | | 0.00 | | | | (0.01 | ) | | | (0.02 | ) |
| | (0.38 | ) | | | 0.71 | | | | (0.41 | ) | | | 0.69 | |
| | | | | | | | | | | | | | |
| | (0.35 | ) | | | 0.71 | | | | (0.42 | ) | | | 0.67 | |
| | | | | | | | | | | | | | |
| | | |
| | (0.06 | ) | | | (0.02 | ) | | | (0.06 | ) | | | (0.02 | ) |
| | (0.16 | ) | | | — | | | | (0.16 | ) | | | — | |
| | (0.01 | )F | | | — | | | | (0.01 | )F | | | — | |
| | | | | | | | | | | | | | |
| | (0.23 | ) | | | (0.02 | ) | | | (0.23 | ) | | | (0.02 | ) |
| | | | | | | | | | | | | | |
| $ | 10.11 | | | $ | 10.69 | | | $ | 10.00 | | | $ | 10.65 | |
| | | | | | | | | | | | | | |
| | (3.34 | )% | | | 7.08 | %C | | | (4.01 | )% | | | 6.68 | %C |
| | | | | | | | | | | | | | |
| | | |
| $ | 455 | | | $ | 164 | | | $ | 309 | | | $ | 142 | |
| | | |
| | 2.88 | % | | | 13.84 | %D | | | 3.84 | % | | | 13.72 | %D |
| | 1.38 | % | | | 1.38 | %D | | | 2.13 | % | | | 2.13 | %D |
| | (1.08 | )% | | | (12.35 | )%D | | | (2.09 | )% | | | (12.23 | )%D |
| | 0.41 | % | | | 0.10 | %D | | | (0.38 | )% | | | (0.64 | )%D |
| | 54 | % | | | 12 | %E | | | 54 | % | | | 12 | %E |
57
American Beacon Bridgeway Large Cap Value FundSM
Financial Highlights
(For a share outstanding throughout the period)
| | | | | | | | | | | | | | | | | | | | | | | | |
| | | Institutional Class | |
| | | Year Ended December 31, | | | Six
Months
Ended
Dec. 31,
2012 | | | Year Ended June 30, | |
| | 2015 | | | 2014 | | | 2013 | | | | 2012 | | | 2011 | |
Net asset value, beginning of period | | $ | 23.89 | | | $ | 21.39 | | | $ | 15.85 | | | $ | 14.80 | | | $ | 14.62 | | | $ | 11.44 | |
| | | | | | | | | | | | | | | | | | | | | | | | |
Income from investment operations: | | | | | | | | | | | | | | | | | | | | | | | | |
Net investment income | | | 0.28 | | | | 0.10 | | | | 0.11 | | | | 0.20 | | | | 0.24 | | | | 0.20 | A |
Net gains (losses) on investments (both realized and unrealized) | | | (0.58 | ) | | | 2.94 | | | | 5.87 | | | | 1.14 | | | | 0.12 | | | | 3.21 | |
| | | | | | | | | | | | | | | | | | | | | | | | |
Total income (loss) from investment operations | | | (0.30 | ) | | | 3.04 | | | | 5.98 | | | | 1.34 | | | | 0.36 | | | | 3.41 | |
| | | | | | | | | | | | | | | | | | | | | | | | |
Less distributions: | | | | | | | | | | | | | | | | | | | | | | | | |
Dividends from net investment income | | | (0.29 | ) | | | (0.17 | ) | | | (0.11 | ) | | | (0.29 | ) | | | (0.18 | ) | | | (0.23 | ) |
Distributions from net realized gains | | | (0.55 | ) | | | (0.37 | ) | | | (0.33 | ) | | | — | | | | — | | | | — | |
Return of capital | | | (0.00 | )G | | | — | | | | — | | | | — | | | | — | | | | — | |
| | | | | | | | | | | | | | | | | | | | | | | | |
Total distributions | | | (0.84 | ) | | | (0.54 | ) | | | (0.44 | ) | | | (0.29 | ) | | | (0.18 | ) | | | (0.23 | ) |
| | | | | | | | | | | | | | | | | | | | | | | | |
Net asset value, end of period | | $ | 22.75 | | | $ | 23.89 | | | $ | 21.39 | | | $ | 15.85 | | | $ | 14.80 | | | $ | 14.62 | |
| | | | | | | | | | | | | | | | | | | | | | | | |
Total return B | | | (1.23 | )% | | | 14.18 | % | | | 37.77 | % | | | 9.04 | %C | | | 2.60 | % | | | 30.02 | % |
| | | | | | | | | | | | | | | | | | | | | | | | |
| | | | | | |
Ratios and supplemental data: | | | | | | | | | | | | | | | | | | | | | | | | |
Net assets, end of period (in thousands) | | $ | 682,849 | | | $ | 313,661 | | | $ | 79,889 | | | $ | 26,669 | | | $ | 26,950 | | | $ | 29,647 | |
Ratios to average net assets: | | | | | | | | | | | | | | | | | | | | | | | | |
Expenses, before reimbursements or recoupments | | | 0.75 | % | | | 0.79 | % | | | 1.01 | % | | | 1.73 | %D | | | 1.30 | % | | | 1.17 | % |
Expenses, net of reimbursements or recoupments | | | 0.79 | % | | | 0.84 | % | | | 0.84 | % | | | 0.84 | %D | | | 0.82 | % | | | 0.84 | % |
Net investment income (loss), before reimbursements or recoupments | | | 1.61 | % | | | 1.08 | % | | | 0.98 | % | | | 1.38 | %D | | | 1.17 | % | | | 1.17 | % |
Net investment income (loss), net of reimbursements or recoupments | | | 1.57 | % | | | 1.04 | % | | | 1.16 | % | | | 2.27 | %D | | | 1.66 | % | | | 1.50 | % |
Portfolio turnover rate | | | 43 | % | | | 31 | % | | | 38 | % | | | 21 | %C | | | 36 | % | | | 43 | % |
| A | Per share amounts calculated based on average daily shares outstanding during the period. |
| B | Based on net asset value, which does not reflect the sales charge, redemption fee, or contingent deferred sales charge, if applicable. May include adjustments in accordance with U.S. GAAP and as such, the net asset value for reporting purposes and the returns based upon those net asset values may differ from the net asset value and returns for shareholder transactions. |
| E | Commencement of operations. |
| F | Portfolio turnover rate is for the period from July 1, 2011 to June 30, 2012. |
| G | The return of capital is calculated based on outstanding shares at the time of distribution. Amounts are less than $0.01 per share. |
58
American Beacon Bridgeway Large Cap Value FundSM
Financial Highlights
(For a share outstanding throughout the period)
| | | | | | | | | | | | | | | | | | | | | | | | | | | | | | | | | | | | | | | | | | | | | | | | | | | | | | | | | | |
| Y Class | | | Investor Class | | | A Class | |
Year Ended December 31, | | | Six
Months
Ended
Dec. 31,
2012 | | | Feb. 3E
to
June 30,
2012 | | | Year Ended December 31, | | | Six
Months
Ended
Dec. 31,
2012 | | | Feb. 3E
to
June 30,
2012 | | | Year Ended December 31, | | | Six
Months
Ended
Dec. 31,
2012 | | | Feb. 3E
to
June 30,
2012 | |
| 2015 | | | 2014 | | | 2013 | | | | | 2015 | | | 2014 | | | 2013 | | | | | 2015 | | | 2014 | | | 2013 | | | |
| $ | 23.84 | | | $ | 21.35 | | | $ | 15.84 | | | $ | 14.80 | | | $ | 14.46 | | | $ | 23.77 | | | $ | 21.28 | | | $ | 15.81 | | | $ | 14.78 | | | $ | 14.46 | | | $ | 23.66 | | | $ | 21.22 | | | $ | 15.78 | | | $ | 14.77 | | | $ | 14.46 | |
| | | | | | | | | | | | | | | | | | | | | | | | | | | | | | | | | | | | | | | | | | | | | | | | | | | | | | | | | | |
| | | | | | | | | | | | | | |
| | 0.27 | | | | 0.13 | | | | 0.22 | | | | 0.07 | | | | 0.09 | | | | 0.25 | | | | 0.14 | | | | 0.21 | | | | 0.12 | | | | 0.03 | | | | 0.27 | | | | 0.09 | | | | 0.19 | | | | 0.15 | | | | 0.01 | |
| | (0.57 | ) | | | 2.90 | | | | 5.72 | | | | 1.26 | | | | 0.25 | | | | (0.61 | ) | | | 2.82 | | | | 5.68 | | | | 1.19 | | | | 0.29 | | | | (0.64 | ) | | | 2.84 | | | | 5.64 | | | | 1.15 | | | | 0.30 | |
| | | | | | | | | | | | | | | | | | | | | | | | | | | | | | | | | | | | | | | | | | | | | | | | | | | | | | | | | | |
| | (0.30 | ) | | | 3.03 | | | | 5.94 | | | | 1.33 | | | | 0.34 | | | | (0.36 | ) | | | 2.96 | | | | 5.89 | | | | 1.31 | | | | 0.32 | | | | (0.37 | ) | | | 2.93 | | | | 5.83 | | | | 1.30 | | | | 0.31 | |
| | | | | | | | | | | | | | | | | | | | | | | | | | | | | | | | | | | | | | | | | | | | | | | | | | | | | | | | | | |
| | | | | | | | | | | | | | |
| | (0.30 | ) | | | (0.17 | ) | | | (0.10 | ) | | | (0.29 | ) | | | — | | | | (0.22 | ) | | | (0.10 | ) | | | (0.09 | ) | | | (0.28 | ) | | | — | | | | (0.21 | ) | | | (0.12 | ) | | | (0.06 | ) | | | (0.29 | ) | | | — | |
| | (0.55 | ) | | | (0.37 | ) | | | (0.33 | ) | | | — | | | | — | | | | (0.55 | ) | | | (0.37 | ) | | | (0.33 | ) | | | — | | | | — | | | | (0.55 | ) | | | (0.37 | ) | | | (0.33 | ) | | | — | | | | — | |
| | (0.00 | )G | | | — | | | | — | | | | — | | | | — | | | | (0.00 | )G | | | — | | | | — | | | | — | | | | — | | | | (0.00 | )G | | | — | | | | — | | | | — | | | | — | |
| | | | | | | | | | | | | | | | | | | | | | | | | | | | | | | | | | | | | | | | | | | | | | | | | | | | | | | | | | |
| | (0.85 | ) | | | (0.54 | ) | | | (0.43 | ) | | | (0.29 | ) | | | — | | | | (0.77 | ) | | | (0.47 | ) | | | (0.42 | ) | | | (0.28 | ) | | | — | | | | (0.76 | ) | | | (0.49 | ) | | | (0.39 | ) | | | (0.29 | ) | | | — | |
| | | | | | | | | | | | | | | | | | | | | | | | | | | | | | | | | | | | | | | | | | | | | | | | | | | | | | | | | | |
| $ | 22.69 | | | $ | 23.84 | | | $ | 21.35 | | | $ | 15.84 | | | $ | 14.80 | | | $ | 22.64 | | | $ | 23.77 | | | $ | 21.28 | | | $ | 15.81 | | | $ | 14.78 | | | $ | 22.53 | | | $ | 23.66 | | | $ | 21.22 | | | $ | 15.78 | | | $ | 14.77 | |
| | | | | | | | | | | | | | | | | | | | | | | | | | | | | | | | | | | | | | | | | | | | | | | | | | | | | | | | | | |
| | (1.26 | )% | | | 14.15 | % | | | 37.55 | % | | | 8.98 | %C | | | 2.35 | %C | | | (1.51 | )% | | | 13.89 | % | | | 37.28 | % | | | 8.84 | %C | | | 2.21 | %C | | | (1.56 | )% | | | 13.76 | % | | | 37.01 | % | | | 8.78 | %C | | | 2.14 | %C |
| | | | | | | | | | | | | | | | | | | | | | | | | | | | | | | | | | | | | | | | | | | | | | | | | | | | | | | | | | |
| | | | | | | | | | | | | | |
| $ | 414,585 | | | $ | 119,162 | | | $ | 19,914 | | | $ | 36 | | | $ | 5 | | | $ | 977,719 | | | $ | 668,659 | | | $ | 274,114 | | | $ | 489 | | | $ | 215 | | | $ | 147,395 | | | $ | 103,717 | | | $ | 31,300 | | | $ | 311 | | | $ | 276 | |
| | | | | | | | | | | | | | |
| | 0.81 | % | | | 0.84 | % | | | 0.93 | % | | | 3.75 | %D | | | 144.38 | %D | | | 1.09 | % | | | 1.11 | % | | | 1.08 | % | | | 2.26 | %D | | | 18.30 | %D | | | 1.12 | % | | | 1.19 | % | | | 1.38 | % | | | 2.21 | %D | | | 15.39 | %D |
| | 0.81 | % | | | 0.85 | % | | | 0.94 | % | | | 0.93 | %D | | | 0.94 | %D | | | 1.09 | % | | | 1.11 | % | | | 1.09 | % | | | 1.21 | %D | | | 1.22 | %D | | | 1.12 | % | | | 1.21 | % | | | 1.34 | % | | | 1.33 | %D | | | 1.34 | %D |
| | | | | | | | | | | | | | |
| | 1.55 | % | | | 1.03 | % | | | 1.07 | % | | | (0.51 | )%D | | | (141.90 | )%D | | | 1.28 | % | | | 0.76 | % | | | 0.95 | % | | | 1.00 | %D | | | (15.48 | )%D | | | 1.25 | % | | | 0.69 | % | | | 0.61 | % | | | 0.90 | %D | | | (13.13 | )%D |
| | | | | | | | | | | | | | |
| | 1.55 | % | | | 1.03 | % | | | 1.06 | % | | | 2.31 | %D | | | 1.54 | %D | | | 1.28 | % | | | 0.76 | % | | | 0.94 | % | | | 2.05 | %D | | | 1.59 | %D | | | 1.25 | % | | | 0.67 | % | | | 0.66 | % | | | 1.78 | %D | | | 0.92 | %D |
| | 43 | % | | | 31 | % | | | 38 | % | | | 21 | %C | | | 36 | %F | | | 43 | % | | | 31 | % | | | 38 | % | | | 21 | %C | | | 36 | %F | | | 43 | % | | | 31 | % | | | 38 | % | | | 21 | %C | | | 36 | %F |
59
American Beacon Bridgeway Large Cap Value FundSM
Financial Highlights
(For a share outstanding throughout the period)
| | | | | | | | | | | | | | | | | | | | |
| | | C Class | |
| | | Year Ended December 31, | | | Six
Months
Ended
Dec. 31,
2012 | | | Feb. 3E
to
June 30,
2012 | |
| | 2015 | | | 2014 | | | 2013 | | | |
Net asset value, beginning of period | | $ | 23.27 | | | $ | 21.00 | | | $ | 15.70 | | | $ | 14.73 | | | $ | 14.46 | |
| | | | | | | | | | | | | | | | | | | | |
Income from investment operations: | | | | | | | | | | | | | | | | | | | | |
Net investment income | | | 0.13 | | | | 0.02 | | | | 0.18 | | | | 0.09 | | | | 0.02 | |
Net gains (losses) on investments (both realized and unrealized) | | | (0.66 | ) | | | 2.69 | | | | 5.47 | | | | 1.17 | | | | 0.25 | |
| | | | | | | | | | | | | | | | | | | | |
Total income (loss) from investment operations | | | (0.53 | ) | | | 2.71 | | | | 5.65 | | | | 1.26 | | | | 0.27 | |
| | | | | | | | | | | | | | | | | | | | |
Less distributions: | | | | | | | | | | | | | | | | | | | | |
Dividends from net investment income | | | (0.11 | ) | | | (0.07 | ) | | | (0.02 | ) | | | (0.29 | ) | | | — | |
Distributions from net realized gains | | | (0.55 | ) | | | (0.37 | ) | | | (0.33 | ) | | | — | | | | — | |
Return of capital | | | (0.00 | )G | | | — | | | | — | | | | — | | | | — | |
| | | | | | | | | | | | | | | | | | | | |
Total distributions | | | (0.66 | ) | | | (0.44 | ) | | | (0.35 | ) | | | (0.29 | ) | | | — | |
| | | | | | | | | | | | | | | | | | | | |
Net asset value, end of period | | $ | 22.08 | | | $ | 23.27 | | | $ | 21.00 | | | $ | 15.70 | | | $ | 14.73 | |
| | | | | | | | | | | | | | | | | | | | |
Total return B | | | (2.27 | )% | | | 12.88 | % | | | 36.02 | % | | | 8.54 | %C | | | 1.87 | %C |
| | | | | | | | | | | | | | | | | | | | |
| | | | | |
Ratios and supplemental data: | | | | | | | | | | | | | | | | | | | | |
Net assets, end of period (in thousands) | | $ | 84,411 | | | $ | 33,536 | | | $ | 2,346 | | | $ | 20 | | | $ | 14 | |
Ratios to average net assets: | | | | | | | | | | | | | | | | | | | | |
Expenses, before reimbursements or recoupments | | | 1.87 | % | | | 1.92 | % | | | 2.13 | % | | | 6.81 | %D | | | 64.88 | %D |
Expenses, net of reimbursements or recoupments | | | 1.87 | % | | | 1.94 | % | | | 2.09 | % | | | 1.77 | %D | | | 2.09 | %D |
Net investment income (loss), before reimbursements or recoupments | | | 0.48 | % | | | (0.05 | )% | | | (0.13 | )% | | | (3.55 | )%D | | | (62.47 | )%D |
Net investment income (loss), net of reimbursements or recoupments | | | 0.48 | % | | | (0.08 | )% | | | (0.08 | )% | | | 1.49 | %D | | | 0.32 | %D |
Portfolio turnover rate | | | 43 | % | | | 31 | % | | | 38 | % | | | 21 | %C | | | 36 | %F |
| A | Per share amounts calculated based on average daily shares outstanding during the period. |
| B | Based on net asset value, which does not reflect the sales charge, redemption fee, or contingent deferred sales charge, if applicable. May include adjustments in accordance with U.S. GAAP and as such, the net asset value for reporting purposes and the returns based upon those net asset values may differ from the net asset value and returns for shareholder transactions. |
| E | Commencement of operations. |
| F | Portfolio turnover rate is for the period from July 1, 2011 to June 30, 2012. |
| G | The return of capital is calculated based on outstanding shares at the time of distribution. Amounts are less than $0.01 per share. |
60
This page intentionally left blank.
61
American Beacon Holland Large Cap Growth FundSM
Financial Highlights
(For a share outstanding throughout the period)
| | | | | | | | | | | | | | | | | | | | |
| | | Institutional Class | |
| | | Year Ended December 31, | |
| | 2015 | | | 2014 | | | 2013 | | | 2012 | | | 2011 | |
Net asset value, beginning of period | | $ | 25.88 | | | $ | 26.57 | | | $ | 21.60 | | | $ | 20.30 | | | $ | 20.00 | |
| | | | | | | | | | | | | | | | | | | | |
Income from investment operations: | | | | | | | | | | | | | | | | | | | | |
Net investment income (loss) | | | 0.06 | | | | 0.03 | | | | 0.02 | | | | 0.09 | | | | (0.02 | ) |
Net gains (losses) on securities (both realized and unrealized) | | | 1.67 | | | | 1.94 | | | | 7.02 | | | | 2.47 | | | | 0.71 | |
| | | | | | | | | | | | | | | | | | | | |
Total income (loss) from investment operations | | | 1.73 | | | | 1.97 | | | | 7.04 | | | | 2.56 | | | | 0.69 | |
| | | | | | | | | | | | | | | | | | | | |
Less distributions: | | | | | | | | | | | | | | | | | | | | |
Dividends from net investment income | | | — | | | | — | | | | (0.01 | ) | | | (0.08 | ) | | | — | |
Distributions from net realized gains | | | (2.81 | ) | | | (2.66 | ) | | | (2.06 | ) | | | (1.18 | ) | | | (0.39 | ) |
| | | | | | | | | | | | | | | | | | | | |
Total distributions | | | (2.81 | ) | | | (2.66 | ) | | | (2.07 | ) | | | (1.26 | ) | | | (0.39 | ) |
| | | | | | | | | | | | | | | | | | | | |
Net asset value, end of period | | $ | 24.80 | | | $ | 25.88 | | | $ | 26.57 | | | $ | 21.60 | | | $ | 20.30 | |
| | | | | | | | | | | | | | | | | | | | |
Total return A | | | 6.70 | % | | | 7.31 | % | | | 32.73 | % | | | 12.57 | % | | | 3.47 | % |
| | | | | | | | | | | | | | | | | | | | |
Ratios and supplemental data: | | | | | | | | | | | | | | | | | | | | |
Net assets, end of period (in thousands) | | $ | 18,601 | | | $ | 18,103 | | | $ | 16,292 | | | $ | 1,619 | | | $ | 1,193 | |
Ratios to average net assets: | | | | | | | | | | | | | | | | | | | | |
Expenses, before reimbursements or recoupments | | | 0.88 | % | | | 0.89 | % | | | 0.86 | % | | | 1.32 | % | | | 1.49 | % |
Expenses, net of reimbursements or recoupments | | | 0.89 | % | | | 0.89 | % | | | 0.89 | % | | | 0.96 | % | | | 1.20 | % |
Net investment income (loss), before expense reimbursements or recoupments | | | 0.26 | % | | | 0.14 | % | | | 0.24 | % | | | 0.07 | % | | | (0.38 | )% |
Net investment income (loss), net of reimbursements or recoupments | | | 0.25 | % | | | 0.13 | % | | | 0.21 | % | | | 0.43 | % | | | (0.09 | )% |
Portfolio turnover rate | | | 24 | % | | | 27 | % | | | 29 | % | | | 18 | % | | | 12 | % |
| A | Based on net asset value, which does not reflect the sales charge, redemption fee, or contingent deferred sales charge, if applicable. May include adjustments in accordance with U.S. GAAP and as such, the net asset value for reporting purposes and the returns based upon those net asset values may differ from the net asset value and returns for shareholder transactions. |
| B | Commencement of operations. |
| E | Portfolio turnover rate is for the period from March 23, 2012 to December 31, 2012. |
62
American Beacon Holland Large Cap Growth FundSM
Financial Highlights
(For a share outstanding throughout the period)
| | | | | | | | | | | | | | | | | | | | | | | | | | | | | | | | | | | | | | | | | | | | | | | | | | | | | | |
| Y Class | | | Investor Class | | | A Class | |
Year Ended
December 31, | | | March 23B
to
Dec. 31,
2012 | | | Year Ended December 31, | | | Year Ended December 31, | |
| 2015 | | | 2014 | | | 2013 | | | | 2015 | | | 2014 | | | 2013 | | | 2012 | | | 2011 | | | 2015 | | | 2014 | | | 2013 | | | 2012 | | | 2011 | |
| $ | 25.79 | | | $ | 26.53 | | | $ | 21.59 | | | $ | 23.00 | | | $ | 25.57 | | | $ | 26.36 | | | $ | 21.52 | | | $ | 20.24 | | | $ | 19.97 | | | $ | 25.39 | | | $ | 26.22 | | | $ | 21.43 | | | $ | 20.23 | | | $ | 19.96 | |
| | | | | | | | | | | | | | | | | | | | | | | | | | | | | | | | | | | | | | | | | | | | | | | | | | | | | | |
| | (0.02) | | | | (0.02 | ) | | | 0.02 | | | | 0.09 | | | | (0.02 | ) | | | (0.04 | ) | | | (0.05 | ) | | | 0.02 | | | | (0.05 | ) | | | 0.00 | | | | (0.08 | ) | | | (0.03 | ) | | | 0.03 | | | | (0.05 | ) |
| | 1.70 | | | | 1.94 | | | | 6.98 | | | | (0.26 | ) | | | 1.64 | | | | 1.91 | | | | 6.95 | | | | 2.45 | | | | 0.71 | | | | 1.59 | | | | 1.91 | | | | 6.88 | | | | 2.41 | | | | 0.71 | |
| | | | | | | | | | | | | | | | | | | | | | | | | | | | | | | | | | | | | | | | | | | | | | | | | | | | | | |
| | 1.68 | | | | 1.92 | | | | 7.00 | | | | (0.17 | ) | | | 1.62 | | | | 1.87 | | | | 6.90 | | | | 2.47 | | | | 0.66 | | | | 1.59 | | | | 1.83 | | | | 6.85 | | | | 2.44 | | | | 0.66 | |
| | | | | | | | | | | | | | | | | | | | | | | | | | | | | | | | | | | | | | | | | | | | | | | | | | | | | | |
| | — | | | | — | | | | 0.00 | | | | (0.06 | ) | | | — | | | | — | | | | 0.00 | | | | (0.01 | ) | | | — | | | | — | | | | — | | | | 0.00 | | | | (0.06 | ) | | | — | |
| | (2.81) | | | | (2.66 | ) | | | (2.06 | ) | | | (1.18 | ) | | | (2.81 | ) | | | (2.66 | ) | | | (2.06 | ) | | | (1.18 | ) | | | (0.39 | ) | | | (2.81 | ) | | | (2.66 | ) | | | (2.06 | ) | | | (1.18 | ) | | | (0.39 | ) |
| | | | | | | | | | | | | | | | | | | | | | | | | | | | | | | | | | | | | | | | | | | | | | | | | | | | | | |
| | (2.81) | | | | (2.66 | ) | | | (2.06 | ) | | | (1.24 | ) | | | (2.81 | ) | | | (2.66 | ) | | | (2.06 | ) | | | (1.19 | ) | | | (0.39 | ) | | | (2.81 | ) | | | (2.66 | ) | | | (2.06 | ) | | | (1.24 | ) | | | (0.39 | ) |
| | | | | | | | | | | | | | | | | | | | | | | | | | | | | | | | | | | | | | | | | | | | | | | | | | | | | | |
| $ | 24.66 | | | $ | 25.79 | | | $ | 26.53 | | | $ | 21.59 | | | $ | 24.38 | | | $ | 25.57 | | | $ | 26.36 | | | $ | 21.52 | | | $ | 20.24 | | | $ | 24.17 | | | $ | 25.39 | | | $ | 26.22 | | | $ | 21.43 | | | $ | 20.23 | |
| | | | | | | | | | | | | | | | | | | | | | | | | | | | | | | | | | | | | | | | | | | | | | | | | | | | | | |
| | 6.53% | | | | 7.13 | % | | | 32.59 | % | | | (0.79 | )%C | | | 6.35 | % | | | 6.99 | % | | | 32.21 | % | | | 12.18 | % | | | 3.33 | % | | | 6.28 | % | | | 6.88 | % | | | 32.11 | % | | | 11.99 | % | | | 3.33 | % |
| | | | | | | | | | | | | | | | | | | | | | | | | | | | | | | | | | | | | | | | | | | | | | | | | | | | | | |
| $ | 334 | | | $ | 74 | | | $ | 79 | | | $ | 23 | | | $ | 78,922 | | | $ | 81,154 | | | $ | 77,426 | | | $ | 66,568 | | | $ | 58,682 | | | $ | 1,271 | | | $ | 1,012 | | | $ | 1,028 | | | $ | 467 | | | $ | 13 | |
| | 1.08% | | | | 1.11 | % | | | 0.97 | % | | | 10.18 | %D | | | 1.24 | % | | | 1.15 | % | | | 1.26 | % | | | 1.44 | % | | | 1.64 | % | | | 1.29 | % | | | 1.35 | % | | | 1.40 | % | | | 2.73 | % | | | 10.06 | % |
| | 1.02% | | | | 1.08 | % | | | 0.99 | % | | | 0.98 | %D | | | 1.24 | % | | | 1.21 | % | | | 1.27 | % | | | 1.29 | % | | | 1.35 | % | | | 1.29 | % | | | 1.34 | % | | | 1.39 | % | | | 1.38 | % | | | 1.40 | % |
| | 0.00% | | | | (0.10 | )% | | | 0.15 | % | | | (8.77 | )%D | | | (0.10 | )% | | | (0.13 | )% | | | (0.17 | )% | | | (0.08 | )% | | | (0.53 | )% | | | (0.15 | )% | | | (0.32 | )% | | | (0.28 | )% | | | (0.97 | )% | | | (8.94 | )% |
| | 0.06% | | | | (0.06 | )% | | | 0.12 | % | | | 0.43 | %D | | | (0.10 | )% | | | (0.19 | )% | | | (0.18 | )% | | | 0.07 | % | | | (0.24 | )% | | | (0.15 | )% | | | (0.31 | )% | | | (0.27 | )% | | | 0.37 | % | | | (0.28 | )% |
| | 24% | | | | 27 | % | | | 29 | % | | | 18 | %E | | | 24 | % | | | 27 | % | | | 29 | % | | | 18 | % | | | 12 | % | | | 24 | % | | | 27 | % | | | 29 | % | | | 18 | % | | | 12 | |
63
American Beacon Holland Large Cap Growth FundSM
Financial Highlights
(For a share outstanding throughout the period)
| | | | | | | | | | | | | | | | |
| | | C Class | |
| | | Year Ended December 31, | | | March 23A
to
Dec. 31,
2012 | |
| | 2015 | | | 2014 | | | 2013 | | |
Net asset value, beginning of period | | $ | 24.75 | | | $ | 25.82 | | | $ | 21.29 | | | $ | 22.90 | |
| | | | | | | | | | | | | | | | |
Income from investment operations: | | | | | | | | | | | | | | | | |
Net investment income (loss) | | | (0.04 | ) | | | (0.36 | ) | | | (0.17 | ) | | | 0.01 | |
Net gains (losses) on securities (both realized and unrealized) | | | 1.40 | | | | 1.95 | | | | 6.76 | | | | (0.38 | ) |
| | | | | | | | | | | | | | | | |
Total income (loss) from investment operations | | | 1.36 | | | | 1.59 | | | | 6.59 | | | | (0.37 | ) |
| | | | | | | | | | | | | | | | |
Less distributions: | | | | | | | | | | | | | | | | |
Dividends from net investment income | | | — | | | | — | | | | 0.00 | | | | (0.06 | ) |
Distributions from net realized gains | | | (2.81 | ) | | | (2.66 | ) | | | (2.06 | ) | | | (1.18 | ) |
| | | | | | | | | | | | | | | | |
Total distributions | | | (2.81 | ) | | | (2.66 | ) | | | (2.06 | ) | | | (1.24 | ) |
| | | | | | | | | | | | | | | | |
Net asset value, end of period | | $ | 23.30 | | | $ | 24.75 | | | $ | 25.82 | | | $ | 21.29 | |
| | | | | | | | | | | | | | | | |
Total return B | | | 5.51 | % | | | 6.05 | % | | | 31.10 | % | | | (1.65 | )%C |
| | | | | | | | | | | | | | | | |
Ratios and supplemental data: | | | | | | | | | | | | | | | | |
Net assets, end of period (in thousands) | | $ | 757 | | | $ | 592 | | | $ | 703 | | | $ | 281 | |
Ratios to average net assets: | | | | | | | | | | | | | | | | |
Expenses, before reimbursements or recoupments | | | 2.05 | % | | | 2.10 | % | | | 2.15 | % | | | 6.17 | %D |
Expenses, net of reimbursements or recoupments | | | 2.04 | % | | | 2.09 | % | | | 2.14 | % | | | 2.12 | %D |
Net investment income (loss), before expense reimbursements or recoupments | | | (0.91 | )% | | | (1.07 | )% | | | (1.04 | )% | | | (3.85 | )%D |
Net investment income (loss), net of reimbursements or recoupments | | | (0.90 | )% | | | (1.07 | )% | | | (1.03 | )% | | | 0.20 | %D |
Portfolio turnover rate | | | 24 | % | | | 27 | % | | | 29 | % | | | 18 | %E |
| A | Based on net asset value, which does not reflect the sales charge, redemption fee, or contingent deferred sales charge, if applicable. May include adjustments in accordance with U.S. GAAP and as such, the net asset value for reporting purposes and the returns based upon those net asset values may differ from the net asset value and returns for shareholder transactions. |
| B | Commencement of operations. |
| E | Portfolio turnover rate is for the period from March 23, 2012 to December 31, 2012. |
64
This page intentionally left blank.
65
American Beacon Stephens Small Cap GrowthSM
Financial Highlights
(For a share outstanding throughout the period)
| | | | | | | | | | | | | | | | | | | | | | | | |
| | | Institutional Class | |
| | | Year Ended December 31, | | | One
Month
Ended
Dec. 31,
2012 | | | Year Ended November 30, | |
| | 2015 | | | 2014 | | | 2013 | | | | 2012I | | | 2011I | |
Net asset value, beginning of period | | $ | 16.57 | | | $ | 17.83 | | | $ | 12.99 | | | $ | 13.54 | | | $ | 13.14 | | | $ | 12.03 | |
| | | | | | | | | | | | | | | | | | | | | | | | |
Income from investment operations: | | | | | | | | | | | | | | | | | | | | | | | | |
Net investment income (loss) | | | (0.13 | ) | | | (0.07 | ) | | | (0.05 | ) | | | 0.06 | | | | (0.04 | )J | | | (0.11 | )A |
Net gains (losses) from investments (both realized and unrealized) | | | (0.65 | ) | | | (0.49 | ) | | | 5.60 | | | | 0.23 | | | | 1.43 | | | | 1.37 | |
| | | | | | | | | | | | | | | | | | | | | | | | |
Total income (loss) from investment operations | | | (0.78 | ) | | | (0.56 | ) | | | 5.55 | | | | 0.29 | | | | 1.39 | | | | 1.26 | |
| | | | | | | | | | | | | | | | | | | | | | | | |
Less distributions: | | | | | | | | | | | | | | | | | | | | | | | | |
Dividends from net investment income | | | — | | | | — | | | | 0.00 | | | | — | | | | — | | | | — | |
Distributions from net realized gains | | | (0.71 | ) | | | (0.70 | ) | | | (0.67 | ) | | | (0.84 | ) | | | (0.99 | ) | | | (0.15 | ) |
Return of capital K | | | — | | | | — | | | | (0.04 | ) | | | — | | | | — | | | | — | |
| | | | | | | | | | | | | | | | | | | | | | | | |
Total distributions | | | (0.71 | ) | | | (0.70 | ) | | | (0.71 | ) | | | (0.84 | ) | | | (0.99 | ) | | | (0.15 | ) |
| | | | | | | | | | | | | | | | | | | | | | | | |
Redemption fees added to beneficial interests | | | — | | | | — | | | | — | | | | — | | | | — | | | | — | |
| | | | | | | | | | | | | | | | | | | | | | | | |
Net asset value, end of period | | $ | 15.08 | | | $ | 16.57 | | | $ | 17.83 | | | $ | 12.99 | | | $ | 13.54 | | | $ | 13.14 | |
| | | | | | | | | | | | | | | | | | | | | | | | |
Total return B | | | (4.69 | )% | | | (3.14 | )% | | | 42.93 | % | | | 2.15 | %F | | | 11.74 | % | | | 10.49 | % |
| | | | | | | | | | | | | | | | | | | | | | | | |
Ratios and supplemental data: | | | | | | | | | | | | | | | | | | | | | | | | |
Net assets, end of period (in thousands) | | $ | 300,919 | | | $ | 359,959 | | | $ | 317,341 | | | $ | 130,342 | | | $ | 88,815 | | | $ | 52,336 | |
Ratios to average net assets: | | | | | | | | | | | | | | | | | | | | | | | | |
Expenses, before reimbursements or recoupments C | | | 1.08 | % | | | 1.08 | % | | | 1.11 | % | | | 1.20 | %G | | | 1.20 | % | | | 1.15 | % |
Expenses, net of reimbursements or recoupments C | | | 1.08 | % | | | 1.10 | % | | | 1.09 | % | | | 1.06 | %G | | | 1.10 | % | | | 1.10 | % |
Net investment income (loss), before reimbursements or recoupments | | | (0.67 | )% | | | (0.59 | )% | | | (0.73 | )% | | | 0.54 | %G | | | (0.84 | )% | | | (0.91 | )% |
Net investment income (loss), net of reimbursements or recoupments | | | (0.67 | )% | | | (0.61 | )% | | | (0.71 | )% | | | 0.68 | %G | | | (0.74 | )% | | | (0.86 | )% |
Portfolio turnover rate | | | 25 | % | | | 46 | % | | | 39 | % | | | 6 | %F | | | 45 | % | | | 36 | % |
| A | The Predecessor Fund calculated the change in undistributed net investment income per share by dividing the change in undistributed net investment income by average shares outstanding for the period. |
| B | Based on net asset value, which does not reflect the sales charge, redemption fee, or contingent deferred sales charge, if applicable. May include adjustments in accordance with U.S. GAAP and as such, the net asset value for reporting purposes and the returns based upon those net asset values may differ from the net asset value and returns for shareholder transactions. |
| C | Expense ratios may exceed stated expense caps in Note 2 due in part to security lending expenses. |
| D | Commencement of operations. |
| E | Amount represents less than $0.01 per share. |
| H | Portfolio turnover rate is for the period from December 1, 2011 through November 30, 2012. |
| I | Prior to the reorganization on February 24, 2012, the Institutional and Investor Classes were known as Class I and Class A, respectively. |
| J | For purposes of this calculation, the change in undistributed net investment income was derived by dividing the change in undistributed net investment income by shares outstanding at November 30, 2012. |
| K | The return of capital is calculated based on outstanding shares at the time of distribution. |
66
American Beacon Stephens Small Cap Growth FundSM
Financial Highlights
(For a share outstanding throughout the period)
| | | | | | | | | | | | | | | | | | | | | | | | | | | | | | | | | | | | | | | | | | |
| Y Class | | | Investor Class | |
Year Ended December 31, | | | One
Month
Ended
Dec. 31,
2012 | | | Feb. 24D
to
Nov. 30,
2012 | | | Year Ended December 31, | | | One
Month
Ended
Dec. 31,
2012 | | | Year Ended
November 30, | |
| 2015 | | | 2014 | | | 2013 | | | | | 2015 | | | 2014 | | | 2013 | | | | 2012I | | | 2011I | |
| $ | 16.54 | | | $ | 17.81 | | | $ | 12.98 | | | $ | 13.54 | | | $ | 13.59 | | | $ | 15.71 | | | $ | 16.98 | | | $ | 12.42 | | | $ | 12.99 | | | $ | 12.67 | | | $ | 11.64 | |
| | | | | | | | | | | | | | | | | | | | | | | | | | | | | | | | | | | | | | | | | | |
| | (0.14 | ) | | | (0.12 | ) | | | (0.04 | ) | | | 0.01 | | | | (0.02 | ) | | | (0.82 | ) | | | (0.16 | ) | | | (0.04 | ) | | | 0.02 | | | | (0.06 | )J | | | (0.14 | )A |
| | (0.67 | ) | | | (0.45 | ) | | | 5.58 | | | | 0.27 | | | | (0.03 | ) | | | 0.02 | | | | (0.41 | ) | | | 5.31 | | | | 0.25 | | | | 1.37 | | | | 1.32 | |
| | | | | | | | | | | | | | | | | | | | | | | | | | | | | | | | | | | | | | | | | | |
| | (0.81 | ) | | | (0.57 | ) | | | 5.54 | | | | 0.28 | | | | (0.05 | ) | | | (0.80 | ) | | | (0.57 | ) | | | 5.27 | | | | 0.27 | | | | 1.31 | | | | 1.18 | |
| | | | | | | | | | | | | | | | | | | | | | | | | | | | | | | | | | | | | | | | | | |
| | — | | | | — | | | | 0.00 | | | | — | | | | — | | | | — | | | | — | | | | 0.00 | | | | — | | | | — | | | | — | |
| | (0.71 | ) | | | (0.70 | ) | | | (0.68 | ) | | | (0.84 | ) | | | — | | | | (0.71 | ) | | | (0.70 | ) | | | (0.69 | ) | | | (0.84 | ) | | | (0.99 | ) | | | (0.15 | ) |
| | — | | | | — | | | | (0.03 | ) | | | — | | | | — | | | | — | | | | — | | | | (0.02 | ) | | | — | | | | — | | | | — | |
| | | | | | | | | | | | | | | | | | | | | | | | | | | | | | | | | | | | | | | | | | |
| | (0.71 | ) | | | (0.70 | ) | | | (0.71 | ) | | | (0.84 | ) | | | — | | | | (0.71 | ) | | | (0.70 | ) | | | (0.71 | ) | | | (0.84 | ) | | | (0.99 | ) | | | (0.15 | ) |
| | | | | | | | | | | | | | | | | | | | | | | | | | | | | | | | | | | | | | | | | | |
| | — | | | | — | | | | — | | | | — | | | | — | | | | — | | | | — | | | | — | | | | — | | | | — | | | | (0.00 | )E |
| | | | | | | | | | | | | | | | | | | | | | | | | | | | | | | | | | | | | | | | | | |
| $ | 15.02 | | | $ | 16.54 | | | $ | 17.81 | | | $ | 12.98 | | | $ | 13.54 | | | $ | 14.20 | | | $ | 15.71 | | | $ | 16.98 | | | $ | 12.42 | | | $ | 12.99 | | | $ | 12.67 | |
| | | | | | | | | | | | | | | | | | | | | | | | | | | | | | | | | | | | | | | | | | |
| | (4.88 | )% | | | (3.20 | )% | | | 42.88 | % | | | 2.07 | %F | | | (0.37 | )%F | | | (5.08 | )% | | | (3.35 | )% | | | 42.62 | % | | | 2.08 | %F | | | 11.44 | % | | | 10.15 | % |
| | | | | | | | | | | | | | | | | | | | | | | | | | | | | | | | | | | | | | | | | | |
| $ | 142,980 | | | $ | 171,901 | | | $ | 208,196 | | | $ | 4,563 | | | $ | 2,699 | | | $ | 55,922 | | | $ | 147,227 | | | $ | 169,799 | | | $ | 69,786 | | | $ | 67,506 | | | $ | 47,101 | |
| | 1.14 | % | | | 1.16 | % | | | 1.19 | % | | | 1.36 | %G | | | 2.05 | %G | | | 1.40 | % | | | 1.31 | % | | | 1.39 | % | | | 1.62 | %G | | | 1.56 | % | | | 1.40 | % |
| | 1.14 | % | | | 1.16 | % | | | 1.19 | % | | | 1.16 | %G | | | 1.21 | %G | | | 1.39 | % | | | 1.37 | % | | | 1.35 | % | | | 1.34 | %G | | | 1.36 | % | | | 1.35 | % |
| | (0.74 | )% | | | (0.67 | )% | | | (0.79 | )% | | | 0.19 | %G | | | (1.57 | )%G | | | (1.01 | )% | | | (0.81 | )% | | | (1.01 | )% | | | 0.23 | %G | | | (1.20 | )% | | | (1.16 | )% |
| | (0.74 | )% | | | (0.686 | )% | | | (0.78 | )% | | | 0.38 | %G | | | (0.73 | )%G | | | (1.00 | )% | | | (0.88 | )% | | | (0.96 | )% | | | 0.50 | %G | | | (1.00 | )% | | | (1.11 | )% |
| | 25 | % | | | 46 | % | | | 39 | % | | | 6 | %F | | | 45 | %H | | | 25 | % | | | 46 | % | | | 39 | % | | | 6 | %F | | | 45 | % | | | 36 | % |
67
American Beacon Stephens Small Cap Growth FundSM
Financial Highlights
(For a share outstanding throughout the period)
| | | | | | | | | | | | | | | | | | | | | | | | | | | | | | | | | | | | | | | | |
| | | A Class | | | C Class | |
| | | Year Ended December 31, | | | One
Month
Ended
Dec. 31,
2012 | | | Feb. 24D
to
Nov. 30,
2012 | | | Year Ended
December 31, | | | One
Month
Ended
Dec. 31,
2012 | | | Feb. 24D
to
Nov. 30,
2012 | |
| | 2015 | | | 2014 | | | 2013 | | | | | 2015 | | | 2014 | | | 2013 | | | |
Net asset value, beginning of period | | $ | 15.61 | | | $ | 16.91 | | | $ | 12.40 | | | $ | 12.98 | | | $ | 13.07 | | | $ | 15.26 | | | $ | 16.66 | | | $ | 12.32 | | | $ | 12.91 | | | $ | 13.07 | |
| | | | | | | | | | | | | | | | | | | | | | | | | | | | | | | | | | | | | | | | |
Income from investment operations: | | | | | | | | | | | | | | | | | | | | | | | | | | | | | | | | | | | | | | | | |
Net investment income (loss) | | | (0.19 | ) | | | (0.18 | ) | | | (0.10 | ) | | | 0.01 | | | | (0.07 | ) | | | (0.31 | ) | | | (0.24 | ) | | | (0.13 | ) | | | 0.00 | | | | (0.06 | ) |
Net gains (losses) from investments (both realized and unrealized) | | | (0.61 | ) | | | (0.42 | ) | | | 5.32 | | | | 0.25 | | | | (0.02 | ) | | | (0.59 | ) | | | (0.46 | ) | | | 5.18 | | | | 0.25 | | | | (0.10 | ) |
| | | | | | | | | | | | | | | | | | | | | | | | | | | | | | | | | | | | | | | | |
Total income (loss) from investment operations | | | (0.80 | ) | | | (0.60 | ) | | | 5.22 | | | | 0.26 | | | | (0.09 | ) | | | (0.90 | ) | | | (0.70 | ) | | | 5.05 | | | | 0.25 | | | | (0.16 | ) |
| | | | | | | | | | | | | | | | | | | | | | | | | | | | | | | | | | | | | | | | |
Less distributions: | | | | | | | | | | | | | | | | | | | | | | | | | | | | | | | | | | | | | | | | |
Dividends from net investment income | | | — | | | | — | | | | 0.00 | | | | — | | | | — | | | | — | | | | — | | | | 0.00 | | | | — | | | | — | |
Distributions from net realized gains | | | (0.71 | ) | | | (0.70 | ) | | | (0.71 | ) | | | (0.84 | ) | | | — | | | | (0.71 | ) | | | (0.70 | ) | | | (0.71 | ) | | | (0.84 | ) | | | — | |
Return of capital K | | | — | | | | — | | | | (0.00 | )E | | | — | | | | — | | | | — | | | | — | | | | — | | | | — | | | | — | |
| | | | | | | | | | | | | | | | | | | | | | | | | | | | | | | | | | | | | | | | |
Total distributions | | | (0.71 | ) | | | (0.70 | ) | | | (0.71 | ) | | | (0.84 | ) | | | — | | | | (0.71 | ) | | | (0.70 | ) | | | (0.71 | ) | | | (0.84 | ) | | | — | |
| | | | | | | | | | | | | | | | | | | | | | | | | | | | | | | | | | | | | | | | |
Redemption fees added to beneficial interests | | | — | | | | — | | | | — | | | | — | | | | — | | | | — | | | | — | | | | — | | | | — | | | | — | |
| | | | | | | | | | | | | | | | | | | | | | | | | | | | | | | | | | | | | | | | |
Net asset value, end of period | | $ | 14.10 | | | $ | 15.61 | | | $ | 16.91 | | | $ | 12.40 | | | $ | 12.98 | | | $ | 13.65 | | | $ | 15.26 | | | $ | 16.66 | | | $ | 12.32 | | | $ | 12.91 | |
| | | | | | | | | | | | | | | | | | | | | | | | | | | | | | | | | | | | | | | | |
Total return B | | | (5.11 | )% | | | (3.54 | )% | | | 42.28 | % | | | 2.01 | %F | | | (0.69 | )%F | | | (5.89 | )% | | | (4.20 | )% | | | 41.17 | % | | | 1.94 | %F | | | (1.22 | )%F |
| | | | | | | | | | | | | | | | | | | | | | | | | | | | | | | | | | | | | | | | |
Ratios and supplemental data: | | | | | | | | | | | | | | | | | | | | | | | | | | | | | | | | | | | | | | | | |
Net assets, end of period (in thousands) | | $ | 8,197 | | | $ | 9,702 | | | $ | 10,942 | | | $ | 3,131 | | | $ | 2,941 | | | $ | 2,349 | | | $ | 2,771 | | | $ | 2,447 | | | $ | 349 | | | $ | 343 | |
Ratios to average net assets: | | | | | | | | | | | | | | | | | | | | | | | | | | | | | | | | | | | | | | | | |
Expenses, before reimbursements or recoupments C | | | 1.44 | % | | | 1.51 | % | | | 1.57 | % | | | 1.79 | %G | | | 2.08 | %G | | | 2.19 | % | | | 2.26 | % | | | 2.33 | % | | | 3.21 | %G | | | 6.15 | %G |
Expenses, net of reimbursements or recoupments C | | | 1.48 | % | | | 1.52 | % | | | 1.59 | % | | | 1.58 | %G | | | 1.61 | %G | | | 2.26 | % | | | 2.27 | % | | | 2.34 | % | | | 2.33 | %G | | | 2.35 | %G |
Net investment income (loss), before reimbursements or recoupments | | | (1.03 | )% | | | (1.02 | )% | | | (1.18 | )% | | | 0.04 | %G | | | (1.68 | )%G | | | (1.79 | )% | | | (1.76 | )% | | | (1.93 | )% | | | (1.36 | )%G | | | (5.71 | )%G |
Net investment income (loss), net of reimbursements or recoupments | | | (1.08 | )% | | | (1.03 | )% | | | (1.20 | )% | | | 0.25 | %G | | | (1.21 | )%G | | | (1.85 | )% | | | (1.77 | )% | | | (1.94 | )% | | | (0.48 | )%G | | | (1.91 | )%G |
Portfolio turnover rate | | | 25 | % | | | 46 | % | | | 39 | % | | | 6 | %F | | | 45 | %H | | | 25 | % | | | 46 | % | | | 39 | % | | | 6 | %F | | | 45 | %H |
| A | The Predecessor Fund calculated the change in undistributed net investment income per share by dividing the change in undistributed net investment income by average shares outstanding for the period. |
| B | Based on net asset value, which does not reflect the sales charge, redemption fee, or contingent deferred sales charge, if applicable. May include adjustments in accordance with U.S. GAAP and as such, the net asset value for reporting purposes and the returns based upon those net asset values may differ from the net asset value and returns for shareholder transactions. |
| C | Expense ratios may exceed stated expense caps in Note 2 due in part to security lending expenses. |
| D | Commencement of operations. |
| E | Amount represents less than $0.01 per share. |
| H | Portfolio turnover rate is for the period from December 1, 2011 through November 30, 2012. |
| I | Prior to the reorganization on February 24, 2012, the Institutional and Investor Classes were known as Class I and Class A, respectively. |
| J | For purposes of this calculation, the change in undistributed net investment income was derived by dividing the change in undistributed net investment income by shares outstanding at November 30, 2012. |
| K | The return of capital is calculated based on outstanding shares at the time of distribution. |
68
This page intentionally left blank.
69
American Beacon Stephens Mid-Cap Growth FundSM
Financial Highlights
(For a share outstanding throughout the period)
| | | | | | | | | | | | | | | | | | | | | | | | |
| | | Institutional Class | |
| | | Year Ended December 31, | | | One
Month
Ended
Dec. 31,
2012 | | | Year Ended
November 30, | |
| | 2015 | | | 2014 | | | 2013 | | | | 2012A | | | 2011A | |
Net asset value, beginning of period | | $ | 19.24 | | | $ | 19.76 | | | $ | 15.38 | | | $ | 15.24 | | | $ | 13.69 | | | $ | 12.44 | |
| | | | | | | | | | | | | | | | | | | | | | | | |
Income from investment operations: | | | | | | | | | | | | | | | | | | | | | | | | |
Net investment income (loss) | | | (0.13 | ) | | | (0.04 | ) | | | (0.05 | ) | | | 0.02 | | | | — | B | | | (0.10 | )C |
Net gains (losses) from investments (both realized and unrealized) | | | (0.11 | ) | | | 0.72 | | | | 5.12 | | | | 0.20 | | | | 1.55 | | | | 1.35 | |
| | | | | | | | | | | | | | | | | | | | | | | | |
Total income (loss) from investment operations | | | (0.24 | ) | | | 0.68 | | | | 5.07 | | | | 0.22 | | | | 1.55 | | | | 1.25 | |
| | | | | | | | | | | | | | | | | | | | | | | | |
Less distributions: | | | | | | | | | | | | | | | | | | | | | | | | |
Dividends from net investment income | | | — | | | | — | | | | (0.01 | ) | | | — | | | | — | | | | — | |
Distributions from net realized gains | | | (0.89 | ) | | | (1.20 | ) | | | (0.66 | ) | | | (0.08 | ) | | | — | | | | — | |
Return of capital K | | | — | | | | — | | | | (0.02 | ) | | | — | | | | — | | | | — | |
| | | | | | | | | | | | | | | | | | | | | | | | |
Total distributions | | | (0.89 | ) | | | (1.20 | ) | | | (0.69 | ) | | | (0.08 | ) | | | — | | | | — | |
| | | | | | | | | | | | | | | | | | | | | | | | |
Net asset value, end of period | | $ | 18.11 | | | $ | 19.24 | | | $ | 19.76 | | | $ | 15.38 | | | $ | 15.24 | | | $ | 13.69 | |
| | | | | | | | | | | | | | | | | | | | | | | | |
Total return D | | | (1.23 | )% | | | 3.41 | % | | | 33.14 | % | | | 1.43 | %H | | | 11.32 | % | | | 10.05 | % |
| | | | | | | | | | | | | | | | | | | | | | | | |
Ratios and supplemental data: | | | | | | | | | | | | | | | | | | | | | | | | |
Net assets, end of period (in thousands) | | $ | 76,666 | | | $ | 87,620 | | | $ | 63,236 | | | $ | 31,005 | | | $ | 30,503 | | | $ | 13,208 | |
Ratios to average net assets: | | | | | | | | | | | | | | | | | | | | | | | | |
Expenses, before reimbursements or recoupments E | | | 1.01 | % | | | 1.05 | % | | | 1.12 | % | | | 1.31 | %F | | | 1.28 | % | | | 1.65 | % |
Expenses, net of reimbursements or recoupments E | | | 0.99 | % | | | 1.00 | % | | | 0.99 | % | | | 0.99 | %F | | | 1.03 | % | | | 1.25 | % |
Net investment income (loss), before reimbursements or recoupments | | | (0.54 | )% | | | (0.53 | )% | | | (0.70 | )% | | | 1.37 | %F | | | (0.62 | )% | | | (1.12 | )% |
Net investment income (loss), net of reimbursements or recoupments | | | (0.53 | )% | | | (0.48 | )% | | | (0.58 | )% | | | 1.69 | %F | | | (0.37 | )% | | | (0.72 | )% |
Portfolio turnover rate | | | 19 | % | | | 37 | % | | | 25 | % | | | 1 | %H | | | 27 | % | | | 30 | % |
| A | Prior to the reorganization on February 24, 2012, the Institutional Class and Investor Classes were known as Class I and Class A, respectively. |
| B | For purposes of this calculation, the change in undistributed net investment income per share was derived by dividing the change in undistributed net investment income by average shares outstanding for the period. |
| C | The Predecessor Fund calculated the change in undistributed net investment income per share by dividing the change in undistributed net investment income by average shares outstanding for the period. |
| D | Based on net asset value, which does not reflect the sales charge, redemption fee, or contingent deferred sales charge, if applicable. May include adjustments in accordance with U.S. GAAP and as such, the net asset value for reporting purposes and the returns based upon those net asset values may differ from the net asset value and returns for shareholder transactions. |
| E | Expense ratios may exceed stated expense caps in Note 2 due in part to security lending expenses. |
| G | Commencement of operations. |
| I | Portfolio turnover rate is for the period from December 1, 2011 through November 30, 2012. |
| J | Amount represents less than $0.01 per share. |
| K | The return of capital is calculated based on outstanding shares at the time of distribution. |
70
American Beacon Stephens Mid-Cap Growth FundSM
Financial Highlights
(For a share outstanding throughout the period)
| | | | | | | | | | | | | | | | | | | | | | | | | | | | | | | | | | | | | | | | | | |
| Y Class | | | Investor Class | |
Year Ended December 31, | | | One
Month
Ended
Dec. 31,
2012 | | | Feb. 24G
to
Nov. 30,
2012 | | | Year Ended December 31, | | | One
Month
Ended
Dec. 31,
2012 | | | Year Ended
November 30, | |
| 2015 | | | 2014 | | | 2013 | | | | | 2015 | | | 2014 | | | 2013 | | | | 2012A | | | 2011A | |
| $ | 19.22 | | | $ | 19.76 | | | $ | 15.38 | | | $ | 15.23 | | | $ | 15.09 | | | $ | 16.97 | | | $ | 17.64 | | | $ | 13.83 | | | $ | 13.72 | | | $ | 12.36 | | | $ | 11.26 | |
| | | | | | | | | | | | | | | | | | | | | | | | | | | | | | | | | | | | | | | | | | |
| | (0.15 | ) | | | (0.06 | ) | | | (0.08 | ) | | | 0.02 | | | | (0.03 | ) | | | (0.32 | ) | | | (0.36 | ) | | | (0.08 | ) | | | 0.02 | | | | (0.14 | )B | | | (0.11 | )C |
| | (0.12 | ) | | | 0.72 | | | | 5.15 | | | | 0.21 | | | | 0.17 | | | | 0.04 | | | | 0.89 | | | | 4.58 | | | | 0.17 | | | | 1.50 | | | | 1.21 | |
| | | | | | | | | | | | | | | | | | | | | | | | | | | | | | | | | | | | | | | | | | |
| | (0.27 | ) | | | 0.66 | | | | 5.07 | | | | 0.23 | | | | 0.14 | | | | (0.28 | ) | | | 0.53 | | | | 4.50 | | | | 0.19 | | | | 1.36 | | | | 1.10 | |
| | | | | | | | | | | | | | | | | | | | | | | | | | | | | | | | | | | | | | | | | | |
| | — | | | | — | | | | (0.01 | ) | | | — | | | | — | | | | — | | | | — | | | | (0.01 | ) | | | — | | | | — | | | | — | |
| | (0.89 | ) | | | (1.20 | ) | | | (0.68 | ) | | | (0.08 | ) | | | — | | | | (0.89 | ) | | | (1.20 | ) | | | (0.68 | ) | | | (0.08 | ) | | | — | | | | — | |
| | — | | | | — | | | | (0.00 | )J | | | — | | | | — | | | | — | | | | — | | | | (0.00 | )J | | | — | | | | — | | | | — | |
| | | | | | | | | | | | | | | | | | | | | | | | | | | | | | | | | | | | | | | | | | |
| | (0.89 | ) | | | (1.20 | ) | | | (0.69 | ) | | | (0.08 | ) | | | — | | | | (0.89 | ) | | | (1.20 | ) | | | (0.69 | ) | | | (0.08 | ) | | | — | | | | — | |
| | | | | | | | | | | | | | | | | | | | | | | | | | | | | | | | | | | | | | | | | | |
| $ | 18.06 | | | $ | 19.22 | | | $ | 19.76 | | | $ | 15.38 | | | $ | 15.23 | | | $ | 15.80 | | | $ | 16.97 | | | $ | 17.64 | | | $ | 13.83 | | | $ | 13.72 | | | $ | 12.36 | |
| | | | | | | | | | | | | | | | | | | | | | | | | | | | | | | | | | | | | | | | | | |
| | (1.39 | )% | | | 3.31 | % | | | 33.14 | % | | | 1.50 | %H | | | 0.93 | %H | | | (1.63 | )% | | | 2.97 | % | | | 32.71 | % | | | 1.37 | %H | | | 11.00 | % | | | 9.77 | % |
| | | | | | | | | | | | | | | | | | | | | | | | | | | | | | | | | | | | | | | | | | |
| $ | 2,480 | | | $ | 3,109 | | | $ | 1,672 | | | $ | 374 | | | $ | 222 | | | $ | 14,815 | | | $ | 19,552 | | | $ | 31,912 | | | $ | 18,585 | | | $ | 18,092 | | | $ | 20,034 | |
| | 1.06 | % | | | 1.10 | % | | | 1.14 | % | | | 1.53 | %F | | | 3.85 | %F | | | 1.32 | % | | | 1.27 | % | | | 1.38 | % | | | 1.68 | %F | | | 1.67 | % | | | 1.91 | % |
| | 1.09 | % | | | 1.10 | % | | | 1.09 | % | | | 1.09 | %F | | | 1.09 | %F | | | 1.35 | % | | | 1.38 | % | | | 1.37 | % | | | 1.37 | %F | | | 1.40 | % | | | 1.50 | % |
| | (0.60 | )% | | | (0.57 | )% | | | (0.73 | )% | | | 0.69 | %F | | | (3.09 | )%F | | | (0.85 | )% | | | (0.77 | )% | | | (0.98 | )% | | | 0.94 | %F | | | (1.04 | )% | | | (1.35 | )% |
| | (0.63 | )% | | | (0.58 | )% | | | (0.68 | )% | | | 1.13 | %F | | | (0.33 | )%F | | | (0.89 | )% | | | (0.88 | )% | | | (0.97 | )% | | | 1.26 | %F | | | (0.76 | )% | | | (0.94 | )% |
| | 19 | % | | | 37 | % | | | 25 | % | | | 1 | %H | | | 27 | %I | | | 19 | % | | | 37 | % | | | 25 | % | | | 1 | %H | | | 27 | % | | | 30 | % |
71
American Beacon Stephens Mid-Cap Growth FundSM
Financial Highlights
(For a share outstanding throughout the period)
| | | | | | | | | | | | | | | | | | | | | | | | | | | | | | | | | | | | | | | | |
| | | A Class | | | C Class | |
| | | Year Ended December 31, | | | One
Month
Ended
Dec. 31,
2012 | | | Feb. 24G
to
Nov. 30,
2012 | | | Year Ended
December 31, | | | One
Month
Ended
Dec. 31,
2012 | | | Feb. 24G
to
Nov. 30,
2012 | |
| | 2015 | | | 2014 | | | 2013 | | | | | 2015 | | | 2014 | | | 2013 | | | |
Net asset value, beginning of period | | $ | 16.94 | | | $ | 17.61 | | | $ | 13.83 | | | $ | 13.72 | | | $ | 13.62 | | | $ | 16.57 | | | $ | 17.38 | | | $ | 13.75 | | | $ | 13.63 | | | $ | 13.62 | |
| | | | | | | | | | | | | | | | | | | | | | | | | | | | | | | | | | | | | | | | |
Income from investment operations: | | | | | | | | | | | | | | | | | | | | | | | | | | | | | | | | | | | | | | | | |
Net investment income (loss) | | | (0.20 | ) | | | (0.19 | ) | | | (0.10 | ) | | | 0.02 | | | | (0.05 | ) | | | (0.17 | ) | | | (0.27 | ) | | | (0.16 | ) | | | 0.02 | | | | (0.04 | ) |
Net gains (losses) from investments (both realized and unrealized) | | | (0.08 | ) | | | 0.72 | | | | 4.57 | | | | 0.17 | | | | 0.15 | | | | (0.23 | ) | | | 0.66 | | | | 4.47 | | | | 0.18 | | | | 0.05 | |
| | | | | | | | | | | | | | | | | | | | | | | | | | | | | | | | | | | | | | | | |
Total income (loss) from investment operations | | | (0.28 | ) | | | 0.53 | | | | 4.47 | | | | 0.19 | | | | 0.10 | | | | (0.40 | ) | | | 0.39 | | | | 4.31 | | | | 0.20 | | | | 0.01 | |
| | | | | | | | | | | | | | | | | | | | | | | | | | | | | | | | | | | | | | | | |
Less distributions: | | | | | | | | | | | | | | | | | | | | | | | | | | | | | | | | | | | | | | | | |
Dividends from net investment income | | | — | | | | — | | | | (0.01 | ) | | | — | | | | — | | | | — | | | | — | | | | 0.00 | | | | — | | | | — | |
Distributions from net realized gains | | | (0.89 | ) | | | (1.20 | ) | | | (0.68 | ) | | | (0.08 | ) | | | — | | | | (0.89 | ) | | | (1.20 | ) | | | (0.68 | ) | | | (0.08 | ) | | | — | |
Return of capital K | | | — | | | | — | | | | (0.00 | )J | | | — | | | | — | | | | — | | | | — | | | | (0.00 | )J | | | — | | | | — | |
| | | | | | | | | | | | | | | | | | | | | | | | | | | | | | | | | | | | | | | | |
Total distributions | | | (0.89 | ) | | | (1.20 | ) | | | (0.69 | ) | | | (0.08 | ) | | | — | | | | (0.89 | ) | | | (1.20 | ) | | | (0.68 | ) | | | (0.08 | ) | | | — | |
| | | | | | | | | | | | | | | | | | | | | | | | | | | | | | | | | | | | | | | | |
Net asset value, end of period | | $ | 15.77 | | | $ | 16.94 | | | $ | 17.61 | | | $ | 13.83 | | | $ | 13.72 | | | $ | 15.28 | | | $ | 16.57 | | | $ | 17.38 | | | $ | 13.75 | | | $ | 13.63 | |
| | | | | | | | | | | | | | | | | | | | | | | | | | | | | | | | | | | | | | | | |
Total return D | | | (1.63 | )% | | | 2.97 | % | | | 32.49 | % | | | 1.37 | %H | | | 0.73 | %H | | | (2.39 | )% | | | 2.21 | % | | | 31.35 | % | | | 1.45 | %H | | | 0.07 | %H |
| | | | | | | | | | | | | | | | | | | | | | | | | | | | | | | | | | | | | | | | |
Ratios and supplemental data: | | | | | | | | | | | | | | | | | | | | | | | | | | | | | | | | | | | | | | | | |
Net assets, end of period (in thousands) | | $ | 13,908 | | | $ | 16,506 | | | $ | 18,396 | | | $ | 7,302 | | | $ | 7,063 | | | $ | 2,123 | | | $ | 1,902 | | | $ | 1,626 | | | $ | 302 | | | $ | 147 | |
Ratios to average net assets: | | | | | | | | | | | | | | | | | | | | | | | | | | | | | | | | | | | | | | | | |
Expenses, before reimbursements or recoupments E | | | 1.36 | % | | | 1.45 | % | | | 1.57 | % | | | 1.81 | %F | | | 1.83 | %F | | | 2.11 | % | | | 2.22 | % | | | 2.28 | % | | | 2.68 | %F | | | 14.54 | %F |
Expenses, net of reimbursements or recoupments E | | | 1.39 | % | | | 1.45 | % | | | 1.49 | % | | | 1.49 | %F | | | 1.49 | %F | | | 2.14 | % | | | 2.20 | % | | | 2.24 | % | | | 2.24 | %F | | | 2.24 | %F |
Net investment income (loss), before reimbursements or recoupments | | | (0.90 | )% | | | (0.94 | )% | | | (1.16 | )% | | | 0.86 | %F | | | (1.04 | )%F | | | (1.65 | )% | | | (1.69 | )% | | | (1.87 | )% | | | 0.15 | %F | | | (13.65 | )%F |
Net investment income (loss), net of reimbursements or recoupments | | | (0.93 | )% | | | (0.94 | )% | | | (1.09 | )% | | | 1.18 | %F | | | (0.70 | )%F | | | (1.68 | )% | | | (1.68 | )% | | | (1.84 | )% | | | 0.59 | %F | | | (1.36 | )%F |
Portfolio turnover rate | | | 19 | % | | | 37 | % | | | 25 | % | | | 1 | %H | | | 27 | %I | | | 19 | % | | | 37 | % | | | 25 | % | | | 1 | %H | | | 27 | %I |
| A | Prior to the reorganization on February 24, 2012, the Institutional Class and Investor Classes were known as Class I and Class A, respectively. |
| B | For purposes of this calculation, the change in undistributed net investment income per share was derived by dividing the change in undistributed net investment income by average shares outstanding for the period. |
| C | The Predecessor Fund calculated the change in undistributed net investment income per share by dividing the change in undistributed net investment income by average shares outstanding for the period. |
| D | Based on net asset value, which does not reflect the sales charge, redemption fee, or contingent deferred sales charge, if applicable. May include adjustments in accordance with U.S. GAAP and as such, the net asset value for reporting purposes and the returns based upon those net asset values may differ from the net asset value and returns for shareholder transactions. |
| E | Expense ratios may exceed stated expense caps in Note 2 due in part to security lending expenses. |
| G | Commencement of operations. |
| I | Portfolio turnover rate is for the period from December 1, 2011 through November 30, 2012. |
| J | Amount represents less than $0.01 per share. |
| K | The return of capital is calculated based on outstanding shares at the time of distribution. |
72
American Beacon FundsSM
Privacy Policy and Federal Tax Information
December 31, 2015 (Unaudited)
Privacy Policy
The American Beacon Funds recognize and respect the privacy of our shareholders. We are providing this notice to you so you will understand how shareholder information may be collected and used.
We may collect nonpublic personal information about you from one or more of the following sources:
| | • | | information we receive from you on applications or other forms; |
| | • | | information about your transactions with us or our service providers; and |
| | • | | information we receive from third parties. |
We do not disclose any nonpublic personal information about our customers or former customers to anyone, except as permitted by law.
We restrict access to your nonpublic personal information to those employees or service providers who need to know that information to provide products or services to you. To ensure the confidentiality of your nonpublic personal information, we maintain safeguards that comply with federal standards.
Federal Tax Information
Certain tax information regarding the Funds is required to be provided to shareholders based upon the Funds’ income and distribution for the taxable year ended December 31, 2015. The information and distributions reported herein may differ from information and distribution taxable to the shareholders for the calendar year ended December 31, 2015.
The Funds designated the following items with regard to distributions paid during the fiscal year ended December 31, 2015. All designations are based on financial information available as of this annual report and, accordingly, are subject to change. For each item, it is the intention of the Fund to designate the maximum amount permitted under the Internal Revenue Code of 1986, as amended, and the regulations there under.
| | | | | | | | | | | | | | | | | | | | |
| | | Bahl &
Gaynor
Small Cap
Growth | | | Bridgeway
Large Cap
Value | | | Holland
Large Cap
Growth | | | Stephens
Small Cap
Growth | | | Stephens
Mid-Cap
Growth | |
Corporate Dividends Received Deduction | | | 93.9 | % | | | 93.6 | % | | | 0.0 | % | | | 0.0 | % | | | 0.0 | % |
Qualified Dividend Income | | | 100.0 | % | | | 100.0 | % | | | 0.0 | % | | | 0.0 | % | | | 0.0 | % |
The Funds designated the following as short-term capital gain distributions for the year ended December 31, 2015:
| | | | |
Bahl & Gaynor Small Cap Growth Fund | | $ | 8,002 | |
The Funds designated the following as long-term capital gain distributions for the year ended December 31, 2015:
| | | | |
Bahl & Gaynor Small Cap Growth Fund | | $ | 109,466 | |
Bridgeway Large Cap Value Fund | | | 53,880,448 | |
Holland Large Cap Growth Fund | | | 10,280,979 | |
Stephens Small Cap Growth Fund | | | 23,276,880 | |
Stephens Mid-Cap Growth Fund | | | 5,540,175 | |
Shareholders will receive notification in January 2016 of the appropriate tax information necessary to prepare their 2015 income tax returns.
73
Trustees and Officers of the American Beacon FundsSM
(Unaudited)
The Trustees and officers of the American Beacon Funds (the “Trust”) are listed below, together with their principal occupations during the past five years. Unless otherwise indicated, the address of each person listed below is 220 Las Colinas Boulevard East, Suite 1200, Irving, Texas 75039. Each Trustee oversees twenty-seven funds in the fund complex that includes the Trust and the American Beacon Select Funds. The Trust’s Statement of Additional Information contains additional information about the Trustees and is available without charge by calling 1-800-658-5811.
| | | | |
Name, Age and Address | | Position, Term of Office and Length of Time Served with the Trust | | Principal Occupation(s) During Past 5 Years and Current Directorships |
INTERESTED TRUSTEES | | Term | | |
| | Lifetime of Trust until removal, resignation or retirement* | | |
| | |
| Alan D. Feld** (79) | | Trustee since 1996 | | Sole Shareholder of a professional corporation which is a Partner in the law firm of Akin, Gump, Strauss, Hauer & Feld, LLP (law firm) (1960-Present); Trustee, American Beacon Mileage Funds (1996-2012); Trustee, American Beacon Select Funds (1999-Present); Trustee, American Beacon Master Trust (1996-2012). |
| | |
| NON-INTERESTED | | Term | | |
| | |
| TRUSTEES | | Lifetime of Trust until removal, resignation or retirement* | | |
| | |
| Gilbert G. Alvarado (46) | | Trustee since 2015 | | Director, Kura MD, Inc. (local telehealth organization) (2015-Present); Vice President & CFO, Sierra Health Foundation (health conversion private foundation) (2006-Present) Vice President & CFO, Sierra Health Foundation: Center for Health Program Management (California public benefit corporation) (2012-Present); Director, Innovative North State (2012-Present); Director, Sacramento Regional Technology Alliance (2011-Present); Director, Women’s Empowerment (2009-2014); Trustee, American Beacon Select Funds (2015-Present). |
| | |
| Joseph B. Armes (53) | | Trustee since 2015 | | Chairman & CEO, CSW Industrials f/k/a Capital Southwest Corporation (investment company) (2013-Present); President & CEO, JBA Investment Partners (family investment vehicle) (2010-Present); Chief Operating Officer, Hicks Holdings, LLC (Hicks Family assets and investments) (2005-2010); Trustee, Baylor University Board of Regents (2001-2010); Director and Chair of Audit Committee, RSP Permian (oil and gas producer) (2013-Present); Trustee, American Beacon Select Funds (2015-Present). |
| | |
| Gerard J. Arpey (57) | | Trustee since 2012 | | Director, The Home Depot, Inc. (2015-Present); Partner, Emerald Creek Group (private equity firm) (2011-Present); Chairman and Chief Executive Officer, AMR Corp. and American Airlines; Inc. (2003-2011); Director, S. C. Johnson & Son, Inc. (privately held company) (2008-present); Trustee, American Beacon Select Funds (2012-Present). |
| | |
| W. Humphrey Bogart (71) | | Trustee since 2004 | | Trustee, American Beacon Mileage Funds (2004-2012); Trustee, American Beacon Select Funds (2004-Present); Trustee, American Beacon Master Trust (2004-2012). |
| | |
| Brenda A. Cline (55) | | Trustee since 2004 | | Executive Vice President, Chief Financial Officer, Treasurer and Secretary, Kimbell Art Foundation (1993-Present); Director, Range Resources Corporation (oil and natural gas company) (2015-Present); Director, Tyler Technologies, Inc.(public sector software solutions company) (2014-Present); Trustee, American Beacon Mileage Funds (2004-2012); Trustee, American Beacon Select Funds (2004-Present); Trustee, American Beacon Master Trust (2004-2012). |
| | |
| Eugene J. Duffy (61) | | Trustee since 2008 | | Managing Director, Institutional Services, Intercontinental Real Estate Corporation (2014-Present); Principal and Executive Vice President, Paradigm Asset Management (1994-2014); Director, Sunrise Bank of Atlanta (2008-2013); Trustee, American Beacon Mileage Funds (2008-2012); Trustee, American Beacon Select Funds (2008-Present); Trustee, American Beacon Master Trust (2008-2012). |
74
Trustees and Officers of the American Beacon FundsSM
(Unaudited)
| | | | |
Name, Age and Address | | Position, Term of Office and Length of Time Served with the Trust | | Principal Occupation(s) During Past 5 Years and Current Directorships |
NON-INTERESTED | | Term | | |
| TRUSTEES | | Lifetime of Trust until removal, resignation or retirement* | | |
| | |
| Thomas M. Dunning (73) | | Trustee since 2008 | | Chairman Emeritus (2008-Present); Lockton Dunning Benefits (consulting firm in employee benefits); Board Director, Oncor Electric Delivery Company LLC (2007-Present); Board Member, BancTec (2010-Present) (software consulting); Trustee, American Beacon Mileage Funds (2008-2012); Trustee, American Beacon Select Funds (2008-Present); Trustee, American Beacon Master Trust (2008-2012). |
| | |
| Richard A. Massman (72) | | Trustee since 2004 Chairman since 2008 | | Consultant and General Counsel Emeritus (2009-Present) and Senior Vice President and General Counsel (1994-2009), Hunt Consolidated, Inc. (holding company engaged in oil and gas exploration and production, refining, real estate, farming, ranching and venture capital activities); Trustee, American Beacon Mileage Funds (2004-2012); Trustee, American Beacon Select Funds (2004-Present); Trustee, American Beacon Master Trust (2004-2012). |
| | |
| Barbara J. McKenna, CFA (52) | | Trustee since 2012 | | Managing Principal, Longfellow Investment Management Company (2005-Present); Trustee, American Beacon Select Funds (2012-Present). |
| | |
R. Gerald Turner (70) 225 Perkins Admin. Bldg. Southern Methodist Univ. Dallas, Texas75275 | | Trustee since 2001 | | President, Southern Methodist University (1995-Present); Director, J.C. Penney Company, Inc. (1996-Present); Director, Kronus Worldwide Inc. (chemical manufacturing) (2003-Present); Trustee, American Beacon Mileage Funds (2001-2012); Trustee, American Beacon Select Funds (2001-Present); Trustee, American Beacon Master Trust (2001-2012). |
| | |
| OFFICERS | | Term | | |
| | |
| | One Year | | |
| | |
| Gene L. Needles, Jr. (61) | | President since 2009 Executive Vice President since 2009 | | President, CEO and Director, American Beacon Advisors, Inc. (2009-Present); President, CEO and Director, Astro AB Borrower, Inc. (2015-Present); President, CEO and Director, Astro AB Acquisition, Inc.(2015-Present); President, CEO and Director, Astro AB Topco, Inc. (2015-Present), President, CEO and Director, Astro AB Holdings, LLC. (2015-Present); President, CEO and Director, Lighthouse Holdings, Inc.; (2009-2015); President and CEO, Lighthouse Holdings Parent, Inc. (2009-2015); Manager, President and CEO, American Private Equity Management, L.L.C. (2012-Present); President, American Beacon Cayman Managed Futures Strategy Fund, Ltd. (2014-Present). |
| | |
| Rosemary K. Behan (56) | | VP, Secretary and Chief Legal Officer since 2006 | | Secretary, American Beacon Advisors, Inc. (2006-Present); Secretary, Astro AB Borrower, Inc. (2015-Present); Secretary, Astro AB Acquisition, Inc. (2015-Present); Secretary, Astro AB Topco, Inc. (2015-Present); Secretary, Astro AB Holdings, LLC. (2015-Present); Secretary, Lighthouse Holdings, Inc. (2008-2015); Secretary, Lighthouse Holdings Parent, Inc. (2008-2015); Secretary, American Private Equity Management, L.L.C.(2008-Present); Secretary, American Beacon Cayman Managed Futures Strategy Fund, Ltd. (2014-Present). |
| | |
| Brian E. Brett (55) | | VP since 2004 | | Vice President, Director of Sales, American Beacon Advisors, Inc. (2004-Present). |
| | |
| Erica Duncan (45) | | VP Since 2011 | | Vice President, Marketing and Client Services, American Beacon Advisors, Inc. (2011-Present); Supervisor, Brand Marketing, Invesco (2010-2011). |
| | |
| Michael W. Fields (61) | | VP since 1989 | | Chief Fixed Income Officer (2011-Present) and Vice President, Fixed Income Investments, American Beacon Advisors, Inc. (1988-2011); Director, American Beacon Global Funds SPC (2002-2011); Director, American Beacon Global Funds plc (2007-2009). |
75
Trustees and Officers of the American Beacon FundsSM
(Unaudited)
| | | | |
Name, Age and Address | | Position, Term of Office and Length of Time Served with the Trust | | Principal Occupation(s) During Past 5 Years and Current Directorships |
OFFICERS | | Term | | |
| | One Year | | |
| | |
| Melinda G. Heika (54) | | Treasurer since 2010 | | Treasurer, American Beacon Advisors, Inc. (2010-Present); Treasurer, Astro AB Borrower, Inc. (2015-Present); Treasurer, Astro AB Acquisition, Inc. (2015-Present); Treasurer, Astro AB Topco, Inc. (2015-Presnt); Treasurer, Astro AB Holdings, LLC. (2015-Present); Treasurer, Lighthouse Holdings, Inc. (2010-2015); Treasurer, Lighthouse Holdings Parent Inc., (2010-2015); Treasurer, American Private Equity Management, L.L.C. (2012-Present); Director and Treasurer, American Beacon Cayman Managed Futures Strategy Fund, Ltd. (2014-Present). |
| | |
| Terri L. McKinney (52) | | VP since 2010 | | Vice President, Enterprise Services (2009-Present) and Managing Director (2003-2009), American Beacon Advisors, Inc. |
| | |
| Jeffrey K. Ringdahl (40) | | VP since 2010 | | Chief Operating Officer, American Beacon Advisors, Inc. (2010-Present); Manager and Senior Vice President, American Private Equity Management, L.L.C. (2012-Present); Senior Vice President and Director, Astro AB Borrower, Inc. (2015-Present); Senior Vice President and Director, Astro AB Acquisition, Inc. (2015-Present); Senior Vice President and Director, Astro AB Topco, Inc. (2015-Present), Senior Vice President and Director, Astro AB Holdings, LLC.(2015-Present); Senior Vice President, Lighthouse Holdings, Inc. (2013-2015); Senior Vice President, Lighthouse Holdings Parent, Inc. (2013-2015); Director and Vice President, American Beacon Cayman Managed Futures Strategy Fund, Ltd. (2014-Present); Vice President, Product Management, Touchstone Advisors, Inc. (2007-2010). |
| | |
| Samuel J. Silver (52) | | VP Since 2011 | | Vice President, Fixed Income Investments (2011-Present) and Senior Portfolio Manager, Fixed Income Investments (1999-2011), American Beacon Advisors, Inc. |
| | |
| Christina E. Sears (44) | | Chief Compliance Officer since 2004 and Asst. Secretary since 1999 | | Chief Compliance Officer, American Beacon Advisors, Inc. (2004-Present); Chief Compliance Officer, American Private Equity Management, L.L.C. (2012-Present). |
| | |
| Sonia L. Bates (59) | | Asst. Treasurer since 2011 | | Director, Tax and Financial Reporting (2011-Present), Manager, Tax and Financial Reporting (2005-2010), American Beacon Advisors, Inc.; Asst. Treasurer, Astro AB Borrower, Inc. (2015-Present); Asst. Treasurer, Astro AB Acquisition, Inc.(2015-Present); Asst. Treasurer, Astro AB Topco, Inc. (2015-Present); Asst. Treasurer, Astro AB Holdings, LLC.; Asst. Treasurer, Lighthouse Holdings, Inc. (2011-2015); Asst. Treasurer, Lighthouse Holdings Parent Inc. (2011-2015); Asst. Treasurer, American Private Equity Management, L.L.C. (2012-Present). |
| * | The Board adopted a retirement plan that requires Trustees to retire no later than the last day of the calendar year in which they reach the age of 75. |
| ** | Mr. Feld is deemed to be an “interested person” of the Trusts, as defined by the 1940 Act. Mr. Feld’s law firm of Akin, Gump, Strauss, Hauer & Feld LLP has provided legal services within the past two fiscal years to one or more of the Trust’s sub-advisors. |
76
This page intentionally left blank.
77

Delivery of Documents
eDelivery is NOW AVAILABLE- Stop traditional mail delivery and receive your
shareholder reports and summary prospectus on-line. Sign up at
www.americanbeaconfunds.com
If you invest in the Fund through a financial institution, you may be able to receive the Fund’s regulatory mailings, such as the Prospectus, Annual Report and Semi-Annual Report, by e-mail. If you are interested in this option, please go to www.icsdelivery.com and search for your financial institution’s name or contact your financial institution directly.
To obtain more information about the Fund:
| | |
 | |  |
| | |
By E-mail: american_beacon.funds@ambeacon.com | | On the Internet: Visit our website at www.americanbeaconfunds.com |
| |
| | | |
| |
| | |
| | |
 | |  |
By Telephone: Institutional, Y and Investor Call (800) 658-5811 | | By Mail: American Beacon Funds P.O. Box 219643 Kansas City, MO 64121-9643 |
| |
| | | |
| | |
| | |
Availability of Quarterly Portfolio Schedules In addition to the Schedule of Investments provided in each
semi-annual and annual report, the Fund files a complete schedule
of its portfolio holdings with the Securities and Exchange
Commission (“SEC”) on Form N-Q as of the first and third fiscal
quarters. The Fund’s Forms N-Q are available on the SEC’s
website at www.sec.gov. The Forms N-Q may also be reviewed
and copied at the SEC’s Public Reference Section, 100 F Street,
NE, Washington, D.C. 20549-1520. Information regarding the
operation of the SEC’s Public Reference Room may be obtained
by calling (202) 551-8090. A complete schedule of the Fund’s
portfolio holdings is also available on
www.americanbeaconfunds.com, approximately twenty days after
the end of each month. | | Availability of Proxy Voting Policy and Records A description of the policies and procedures the Fund uses to
determine how to vote proxies relating to portfolio securities is
available in the Fund’s Statement of Additional Information, is
available free of charge on the www.americanbeaconfunds.com
and by calling 1-800-967-9009 or by accessing the SEC’s
website at www.sec.gov. The Fund’s proxy voting record for
the most recent year ended June 30 is filed annually with the
SEC on Form N-PX. The Fund’s Forms N-PX are available on
the SEC’s website at www.sec.gov. The Fund’s proxy voting
record may also be obtained by calling 1-800-967-9009. |
Fund Service Providers:
| | | | | | | | | | | | |
CUSTODIAN State Street Bank and Trust Boston, Massachusetts | | | | TRANSFER AGENT Boston Financial Data Services Kansas City, Missouri | | | | INDEPENDENT REGISTERED PUBLIC ACCOUNTING FIRM Ernst & Young LLP Dallas, Texas | | | | DISTRIBUTOR Foreside Fund Services, LLC Portland, Maine |
This report is prepared for shareholders of the American Beacon Funds and may be distributed to others only if preceded or accompanied by a current Prospectus or Summary Prospectus.
American Beacon Funds, American Beacon Bahl & Gaynor Small Cap Growth Fund, American Beacon Bridgeway Large Cap Value Fund, American Beacon Holland Large Cap Growth Fund, American Beacon Stephens Small Cap Growth Fund, and American Beacon Stephens Mid-Cap Growth Fund are service marks of American Beacon Advisors, Inc.
AR 12/15
About American Beacon Advisors
Since 1986, American Beacon Advisors has offered a variety of products and investment advisory services to numerous institutional and retail clients, including a variety of mutual funds, corporate cash management, and separate account management.
Our clients include defined benefit plans, defined contribution plans, foundations, endowments, corporations, financial planners, and other institutional investors. With American Beacon Advisors, you can put the experience of a multi-billion dollar asset management firm to work for your company.
AHL MANAGED FUTURES STRATEGY FUND Investing in derivative instruments involves liquidity, credit, interest rate and market risks. The use of quantitative models may lead to high levels of trading and concentration among certain investments, resulting in higher trading costs and return volatility. Investing in foreign and emerging market securities may involve heightened risk due to currency fluctuations and economic and political risks. Because the Fund may invest in fewer issuers than a more diversified portfolio, the fluctuating value of a single holding may have a greater effect on the value of the Fund. IONIC STRATEGIC ARBITRAGE FUND The Fund’s strategy of investing in a variety of arbitrage strategies entails certain risks including that the sub-advisor’s judgments about allocation between such strategies, as well as individual arbitrage opportunities, may not perform to expectations, resulting in the Fund’s underperformance or even losses versus other similar funds. Arbitrage is the simultaneous purchase and sale of an asset or assets to take advantage of a perceived pricing anomaly. Because the Fund may invest in fewer issuers than a more diversified portfolio, the fluctuating value of a single holding may have a greater effect on the value of the Fund. The Fund may have high portfolio turnover, which could increase the Fund’s transaction costs and possibly have a negative impact on performance. Small- or mid-capitalization stocks may involve greater volatility and lower liquidity than larger company stocks. The use of fixed-income securities, including convertible securities, entails interest rate and credit risks. In addition, the value of a convertible security could fluctuate based on the value of the underlying stock. Investing in foreign securities may involve heightened risk due to currency fluctuations and economic and political risks. Investing in derivative instruments involves liquidity, credit, interest rate and market risks. Short sales involve special risks, including greater reliance on the sub-advisor’s ability to accurately anticipate the future value of a security or instrument; the Fund’s losses are potentially unlimited in a short sale. Please see the prospectus for a complete discussion of the Funds’ risks. There can be no assurances that the investment objectives of these Funds will be met.
Any opinions herein, including forecasts, reflect our judgment as of the end of the reporting period and are subject to change. Each advisor’s strategies and the Fund’s portfolio composition will change depending on economic and market conditions. This report is not a complete analysis of market conditions and therefore, should not be relied upon as investment advice. Although economic and market information has been compiled from reliable sources, American Beacon Advisors, Inc. makes no representation as to the completeness or accuracy of the statements contained herein.
| | |
| American Beacon Funds | | December 31, 2015 |
Dear Shareholders,
Liquid alternative mutual funds provide investors with access to nontraditional assets and strategies. Such mutual funds allow investors to potentially benefit from alternative investment’s traditional strengths – including reduced portfolio volatility, greater portfolio diversity and the strong potential for risk-adjusted returns.
Liquid alternative mutual funds have certain distinguishing features. They typically seek to generate returns independent of market direction and are often used to help diversify investment portfolios so as to potentially reduce risk. They may also help protect against traditional capital market downturns, using investments outside those markets and/or tactically moving within and across markets.
We are proud to offer multiple liquid alternative products to help investors navigate the economic storms and market downturns. Our years of experience in evaluating sub-advisors has led us to identify and partner with several asset managers who have adhered to their disciplined processes for many years and through a variety of economic and market conditions.
For the 12 months ended December 31, 2015:
| | • | | American Beacon AHL Managed Futures Strategy Fund (Investor Class) returned -1.54%. |
| | • | | American Beacon Ionic Strategic Arbitrage Fund (Investor Class) returned 4.50%. |
Thank you for your continued investment in the American Beacon Funds. For additional information about the Funds or to access your account information, please visit our website at www.americanbeaconfunds.com.
|
Best Regards, |
|
 |
|
Gene L. Needles, Jr. President American Beacon Funds |
1
American Beacon AHL Managed Futures Strategy FundSM
Market Overview
December 31, 2015 (Unaudited)
Stock market returns were mixed in 2015. The S&P 500 Index was modestly down, although the S&P 500 Total Return Index, which reinvests dividends, was up slightly. In Europe, core eurozone markets were up, although Spain was down, and the United Kingdom’s Financial Times Stock Exchange (“FTSE”) 100 Index was negatively impacted by its exposure to stocks in the Energy and Materials sectors. In Asia, China ended a very volatile year with a marginal increase, although most other Asian and emerging market (“EM”) stock markets were down.
In foreign exchange (“FX”) markets, 2015 was another year of U.S. dollar strength against both G10* and EM currencies. The euro lost around 10%, and commodity currencies were hit harder (the Canadian dollar was down -19%). The year was difficult for EM – the Brazilian real lost nearly half its value, the Malaysian ringgit was down -19% and the Chilean peso was off -14%. Perhaps the most notable event was the Swiss National Bank’s removal of the euro peg that, in addition to outsized moves on the day, negatively affected liquidity in FX markets early in the year.
In fixed-income markets, 2015 was a year of divergence in policy between Europe and the U.S. – with Europe providing renewed stimulus (albeit not enough to assuage market expectations in December) – and the Federal Reserve finally raising U.S. rates at year end. Despite some sharp moves over the course of the year, the G10 benchmark 10-year yields ended the year little changed.
The commodities market was probably the biggest story in 2015, with the downtrend from 2014 coming back with a vengeance in the second half of 2015. West Texas Intermediate crude oil and Brent crude, the leading global price benchmark for Atlantic basin crude oils, were both down more than 40% in the second half of 2015. Petroleum products, natural gas and industrial metals followed oil’s decline as weakness in China weighed on sentiment. Grains and precious metals were also down, selling off in response to the strong U.S. dollar.
* The G10 currencies are the euro, Japanese yen, British pound, Swiss franc, Australian dollar, New Zealand dollar, Canadian dollar, Swedish krona, Norwegian krone and U.S. dollar. They are considered the world’s most liquid currencies.
2
American Beacon AHL Managed Futures Strategy FundSM
Performance Overview
December 31, 2015 (Unaudited)
The Investor Class of the American Beacon AHL Managed Futures Strategy Fund (the “Fund”) returned -1.54% for the twelve months ended December 31, 2015.
Comparison of Change in Value of a $10,000 Investment for the period from 8/19/14 through 12/31/15
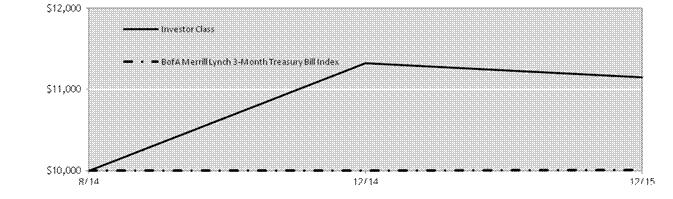
Total Returns for the Period ended 12/31/15
| | | | | | | | | | | | | | |
| | | Ticker | | 1 Year | | | Since incep.
(8/19/14) | | | Value of
$10,000
8/19/14-
12/31/15 | |
Institutional Class (1,5) | | AHLIX | | | (1.15 | )% | | | 8.73 | % | | $ | 11,213 | |
Y Class (1,5) | | AHLYX | | | (1.24 | )% | | | 8.59 | % | | | 11,192 | |
Investor Class (1,5) | | AHLPX | | | (1.54 | )% | | | 8.28 | % | | | 11,149 | |
A Class with sales load (1,2,5) | | AHLAX | | | (7.23 | )% | | | 3.69 | % | | | 10,507 | |
A Class without sales load (1,2,5) | | AHLAX | | | (1.55 | )% | | | 8.28 | % | | | 11,148 | |
C Class with sales load (1,3,5) | | AHLCX | | | (3.30 | )% | | | 7.46 | % | | | 11,034 | |
C Class without sales load (1,3,5) | | AHLCX | | | (2.30 | )% | | | 7.46 | % | | | 11,034 | |
BofA Merrill Lynch 3-Month Treasury Bill Index (4) | | | | | 0.05 | % | | | 0.05 | % | | | 10,006 | |
| 1. | Performance shown is historical and is not indicative of future returns. Investment returns and principal value will vary, and shares may be worth more or less at redemption than at original purchase. Performance shown is calculated based on the published end of day net asset values as of date indicated, and current performance may be lower or higher than the performance data quoted. To obtain performance as of the most recent month end, please visit www.americanbeaconfunds.com or call 1-800-967-9009. Fund performance in the table above does not reflect the deduction of taxes a shareholder would pay on distributions or the redemption of shares. A portion of the fees charged to each Class of the Fund has been waived since Fund inception. Performance prior to waiving fees was lower than actual returns shown. |
| 2. | A Class shares have a maximum sales charge of 5.75%. |
| 3. | C Class has a maximum contingent deferred sales charge of 1.00% for shares redeemed within one year of the date of purchase. |
| 4. | The BofA Merrill Lynch 3-Month Treasury Bill Index is designed to measure the total return on cash, including price and interest income, based on short-term government Treasury Bills of about 90-day maturity. |
| 5. | The total annual Fund operating expense ratio set forth in the most recent Fund prospectus for the Institutional, Y, Investor, A, and C Class shares was 2.29%, 2.39%, 2.67%, 2.69%, and 3.44%, respectively. The expense ratios above may vary from the expense ratios presented in other sections of this report that are based on expenses incurred during the period covered by this report. |
For the period, Energies was the best performing sector returning approximately 3.0%. The best markets were short positions in Crude Oil – Brent and Crude Oil – West Texas Intermediate.
Currencies also contributed positively to performance over the period, as holdings returned approximately 0.8%. Within Currencies, the largest contributor was a short position in the Malaysian ringgit versus the U.S. dollar. Additionally, a short position in the Brazilian real versus the U.S. dollar contributed to the Fund’s performance.
3
American Beacon AHL Managed Futures Strategy FundSM
Performance Overview
December 31, 2015 (Unaudited)
Positions in Metals aided performance during the period returning approximately 0.8%. In particular, short positions in both Copper and Aluminum contributed the most within Metals.
Interest Rates were slightly positive for the period, adding approximately 0.1%. A long position in Euribor and a short position in Eurodollar added to most to returns.
On the negative side, Bonds lost the most over the course of the period and were down approximately -1.6%. Short positions in the Australian three- and ten-year Bonds detracted the most from performance.
Positions in Stocks returned approximately -1.5%, detracting from Fund performance. Losses were led by long positions in the Standard and Poor’s 500 and the NASDAQ 100.
Lastly, the Agricultural sector weakened Fund performance as holdings fell approximately 1.0%. The poor performance was driven by long positions in Cocoa and short positions in Corn.
Looking forward, the Fund’s sub-advisor will continue to implement its trading strategy designed to capitalize on price trends (up or down) in a broad range of global stock index, bond, currency, short-term interest rate and commodity futures markets seeking to achieve the Fund’s goal of capital growth.
| | | | |
ASSET CLASS EXPOSURE | | % of VaR* | |
Currencies | | | 36.7 | |
Commodities | | | 29.9 | |
Equities | | | 24.1 | |
Fixed Income | | | 9.3 | |
|
HOLDINGS SUMMARY | |
Number of Long Holdings | | | 16 | |
Number of Short Holdings | | | 39 | |
Number of Currency Pairs | | | 18 | |
TOP ACTIVE EXPOSURES BY ASSET CLASS
| | | | | | |
| Commodities | | | | % of VaR* | |
Gold Futures | | Short | | | 4.93 | |
Crude Oil Futures | | Short | | | 4.64 | |
Corn Futures | | Short | | | 2.32 | |
| | | | | | |
| | |
| Currencies | | | | % of VaR* | |
AUD/USD | | Cross-currency | | | 4.93 | |
BRL/USD | | Cross-currency | | | 3.77 | |
MXN/USD | | Cross-currency | | | 3.77 | |
| | | | | | |
| | |
| Equities | | | | % of VaR* | |
NASDAQ 100 Index Futures | | Long | | | 3.19 | |
H-Shares Index Futures | | Short | | | 2.61 | |
Hang Seng Index Futures | | Short | | | 2.32 | |
| | | | | | |
| | |
| Fixed Income | | | | % of VaR* | |
Japanese Bonds Futures | | Long | | | 1.74 | |
Australian Bonds Futures | | Long | | | 1.45 | |
UK Gilts Futures | | Long | | | 1.45 | |
| * | Value at Risk (“VaR”) is a measure of the potential loss in value of a portfolio over a defined period for a given confidence interval. A one-day VaR at the 95% confidence level represented that there is a 5% probability that the mark-to-market loss on the portfolio over a one-day horizon will exceed this value (assuming normal markets and no trading in the portfolio. |
4
American Beacon AHL Managed Futures Strategy FundSM
Fund Expenses
December 31, 2015 (Unaudited)
Fund Expense Example
As a shareholder of the Fund, you incur two types of costs: (1) transaction costs, including sales charges (loads) on purchase payments and redemption fees if applicable, and (2) ongoing costs, including management fees, administrative service fees, and other Fund expenses. The examples below are intended to help you understand the ongoing cost (in dollars) of investing in the Fund and to compare these costs with the ongoing costs of investing in other mutual funds.
The examples are based on an investment of $1,000 invested at the beginning of the period and held for the entire period from July 1, 2015 through December 31, 2015.
Actual Expenses
The “Actual” line of the table provides information about actual account values and actual expenses. You may use the information in this line, together with the amount you invested, to estimate the expenses that you paid over the period. Simply divide your account value by $1,000 (for example, an $8,600 account value divided by $1,000 = 8.6), then multiply the result by the number in the first line under the heading “Expenses Paid During Period” to estimate the expenses you paid on your account during this period. Shareholders that invest in the Fund through an IRA or Roth IRA may be subject to a custodial IRA fee of $15 that is typically deducted each December. If your account was subject to a custodial IRA fee during the period, your costs would have been $15 higher.
Hypothetical Example for Comparison Purposes
The “Hypothetical” line of the table provides information about hypothetical account values and hypothetical expenses based on the Fund’s actual expense ratio and an assumed 5% per year rate of return before expenses (not the Fund’s actual return). You may compare the ongoing costs of investing in the Fund with other funds by contrasting this 5% hypothetical example and the 5% hypothetical examples that appear in the shareholder reports of the other funds. The hypothetical account values and expenses may not be used to estimate the actual ending account balance or expenses you paid for the period.
Shareholders that invest in the Fund through an IRA or Roth IRA may be subject to a custodial IRA fee of $15 that is typically deducted each December. If your account was subject to a custodial IRA fee during the period, your cost would have been $15 higher.
You should also be aware that the expenses shown in the table highlight only your ongoing costs and do not reflect any transaction costs charged by the Fund. Similarly, the expense examples for other funds do not reflect any transaction costs charged by those funds, such as sales charges (loads), redemption fees or exchange fees. Therefore, the “Hypothetical” line of the table is useful in comparing ongoing costs only and will not help you determine the relative total costs of owning different funds. If you were subject to any transaction costs during the period, your costs would have been higher.
| | | | | | | | | | | | |
| | | Beginning
Account
Value
7/1/15 | | | Ending
Account
Value
12/31/15 | | | Expenses Paid
During Period*
7/1/15 - 12/31/15 | |
Institutional Class | | | | | | | | | | | | |
Actual | | $ | 1,000.00 | | | $ | 1,003.13 | | | $ | 7.78 | |
Hypothetical ** | | $ | 1,000.00 | | | $ | 1,017.44 | | | $ | 7.83 | |
Y Class | | | | | | | | | | | | |
Actual | | $ | 1,000.00 | | | $ | 1,002.22 | | | $ | 8.28 | |
Hypothetical ** | | $ | 1,000.00 | | | $ | 1,016.94 | | | $ | 8.34 | |
Investor Class | | | | | | | | | | | | |
Actual | | $ | 1,000.00 | | | $ | 1,000.14 | | | $ | 9.68 | |
Hypothetical ** | | $ | 1,000.00 | | | $ | 1,015.53 | | | $ | 9.75 | |
A Class | | | | | | | | | | | | |
Actual | | $ | 1,000.00 | | | $ | 1,000.08 | | | $ | 9.78 | |
Hypothetical ** | | $ | 1,000.00 | | | $ | 1,015.43 | | | $ | 9.86 | |
C Class | | | | | | | | | | | | |
Actual | | $ | 1,000.00 | | | $ | 996.20 | | | $ | 13.53 | |
Hypothetical ** | | $ | 1,000.00 | | | $ | 1,011.64 | | | $ | 13.64 | |
| * | Expenses are equal to the Fund’s annualized expense ratios for the six-month period of 1.54%, 1.64%, 1.92%, 1.94%, and 2.69% for the Institutional, Y, Investor, A, and C Classes respectively, multiplied by the average account value over the period, multiplied by the number derived by dividing the number of days in the most recent fiscal half-year (184) by days in the year (365) to reflect the half-year period. |
| ** | 5% return before expenses. |
5
American Beacon Ionic Strategic Arbitrage FundSM
Market Overview
December 31, 2015 (Unaudited)
Market participants spent most of 2015 wondering whether the Federal Reserve (“the Fed”) would embark on a tightening cycle. As investors pondered both the implications and timing of any potential liftoff, uncertainty caused investor sentiment to vacillate between complacency and fear. Over the first six months of the year, the equity and credit markets shrugged off these concerns, but weakening commodity markets in July – plus growing fears regarding global growth prospects and divergent quantitative easing (“QE”) paths – led to a violent shift in sentiment. The strongest change in sentiment resulted from the steps taken by the People’s Bank of China to devalue its currency in early August. After the yuan devaluation, markets that had been characterized by narrow breadth and muted volatility fell sharply in a highly correlated fashion (the S&P 500 Index declined by 10% intra month in August).
The CBOE Volatility Index (“the VIX”) was emblematic of the shifting views during the second half of 2015. Years of QE around the world had suppressed volatility and pushed asset prices higher. After positive news from Greece in June, the VIX continued its downward trend and experienced the largest five-day price decrease in its history through July 16. After experiencing this historic decrease, however, the VIX then experienced its largest five-day increase less than a month later on August 21. This drastic change in the VIX over the summer was evidenced by growing investor angst toward any potential reversal of governmental QE policies.
Though large-cap equities seemingly recovered from the August sell off (at year end, the S&P 500 Index was +1.4% and was back at pre-sell off levels in early November), other markets did not. The Russell 2000 Index, which represents small-cap stocks, declined by -4.4% for the year and, after a momentary respite in September, U.S. high-yield bond prices continued to fall due to continuing weakness in the Energy and Mineral/Mining sectors. While higher-grade credits performed better, with the Barclays Capital U.S. Aggregate Bond Index generating a gain of 0.55% on the year, liquidity-driven fears surrounding a number of credit-oriented funds led to near contagion in the global high-yield bond market during the month of December. While numerous portions of the equity and credit markets had negative years in 2015, commodity prices virtually collapsed (the Bloomberg Commodity Index fell -27%), led primarily by oil and other constituents of the Energy sector.
In contrast to the level of movement in bond prices, interest rates ultimately held fairly steady over the course of the year and the yield curve flattened slightly. The Barclays Intermediate Term Bond Index gained 1.2% in 2015 and the Barclays Long Treasury Bond Index fell -1.2%.
Hedge-fund performance overall was disappointing in 2015. Many strategies were hurt by a lack of dispersion and sharp declines in small- and mid-cap stocks in the U.S. and emerging markets. A lack of sustainable trends negatively affected other strategies and pronounced weakness in the Energy sector caused losses for credit-focused funds in general.
6
American Beacon Ionic Strategic Arbitrage FundSM
Performance Overview
December 31, 2015 (Unaudited)
The Investor Class (inception date June 30, 2015) of the American Beacon Ionic Strategic Arbitrage Fund (the “Fund”) returned 1.36% for the six months ended December 31, 2015.
Comparison of Change in Value of a $10,000 Investment for the period from 9/1/13 through 12/31/15
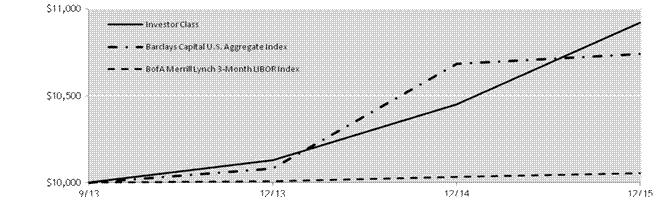
Total Returns for the Period ended 12/31/15
| | | | | | | | | | | | | | |
| | | Ticker | | 1 Year | | | Since incep.
(9/1/13) | | | Value of
$10,000
9/1/13-
12/31/15 | |
Institutional Class (1,7) | | IONIX | | | 4.60 | % | | | 3.90 | % | | $ | 10,934 | |
Y Class (1,2,7) | | IONYX | | | 4.71 | % | | | 3.95 | % | | | 10,944 | |
Investor Class (1,3,7) | | IONPX | | | 4.50 | % | | | 3.86 | % | | | 10,923 | |
A Class with sales load (1,4,7) | | IONAX | | | (0.43 | )% | | | 1.73 | % | | | 10,407 | |
A Class without sales load (1,4,7) | | IONAX | | | 4.50 | % | | | 3.86 | % | | | 10,923 | |
C Class with sales load (1,5,7) | | IONCX | | | 3.13 | % | | | 3.70 | % | | | 10,884 | |
C Class without sales load (1,5,7) | | IONCX | | | 4.13 | % | | | 3.70 | % | | | 10,884 | |
Barclays Capital U.S. Aggregate Index (6) | | | | | 0.55 | % | | | 3.11 | % | | | 10,742 | |
BofA Merrill Lynch 3-Month LIBOR Index (6) | | | | | 0.23 | % | | | 0.24 | % | | | 10,055 | |
| 1. | Performance shown is historical and is not indicative of future returns. Investment returns and principal value will vary, and shares may be worth more or less at redemption than at original purchase. Performance shown is calculated based on the published end of day net asset values as of date indicated, and current performance may be lower or higher than the performance data quoted. To obtain performance as of the most recent month end, please visit www.americanbeaconfunds.com or call 1-800-967-9009. Fund performance in the table above does not reflect the deduction of taxes a shareholder would pay on distributions or the redemption of shares. Simultaneous with the commencement of the Fund’s investment operations on June 30, 2015, the Ionic Absolute Return Fund LLC (“Private Fund”), a privately offered investment fund managed by the Fund’s sub-advisor transferred its assets to the Institutional Class shares of the Fund. A portion of the fees charged to each Class of the Fund has been waived since 6/30/15. Performance prior to waiving fees was lower than actual returns shown. |
| 2. | Fund performance for the one-year and since inception periods represents the total returns achieved by the Institutional Class from 9/1/13 up to 6/30/15, the inception date of the Y Class. Expenses of the Y Class are higher than those of the Institutional Class. As a result, total returns shown may be higher than they would have been had the Y Class been in existence since 9/1/13. |
| 3. | Fund performance for the one-year and since inception periods represents the total returns achieved by the Institutional Class from 9/1/13 up to 6/30/15, the inception date of the Investor Class. Expenses of the Investor Class are higher than those of the Institutional Class. As a result, total returns shown may be higher than they would have been had the Investor Class been in existence since 9/1/13. |
| 4. | Fund performance for the one-year and since inception periods represents the total returns achieved by the Institutional Class from 9/1/13 up to 6/30/15, the inception date of the A Class. Expenses of the A Class are higher than those of the Institutional Class. As a result, total returns shown may be higher than they would have been had the A Class been in existence since 9/1/13. A Class shares have a maximum sales charge of 5.75%. |
| 5. | Fund performance for the one-year and since inception periods represents the total returns achieved by the Institutional Class from 9/1/13 up to 6/30/15, the inception date of the C Class. Expenses of the C Class are higher than those of the Institutional Class. As a result, total returns shown may be higher than they would have been had the C Class been in existence since 9/1/13. C Class has a maximum contingent deferred sales charge of 1.00% for shares redeemed within one year of the date of purchase. |
7
American Beacon Ionic Strategic Arbitrage FundSM
Performance Overview
December 31, 2015 (Unaudited)
| 6. | The BofA Merrill Lynch U.S. Dollar 3-Month LIBOR Index represents the London interbank offered rate (LIBOR) with a constant 3-month average maturity. LIBOR is a composite of the rates of interest at which banks borrow from one another in the London market, and it is a widely used benchmark for short-term interest rates. The Barclays Capital U.S. Aggregate Index is a market weighted index of government, corporate, mortgage-backed and asset-backed fixed-rate debt securities of all maturities. One cannot directly invest in an index. |
| 7. | The total annual Fund operating expense ratio set forth in the most recent Fund prospectus for the Institutional, Y, Investor, A, and C Class shares was 4.21%, 4.31%, 4.59%, 4.61%, and 5.36%, respectively. The expense ratios above may vary from the expense ratios presented in other sections of this report that are based on expenses incurred during the period covered by this report. |
During the tumultuous third and fourth quarters of 2015, the Fund performed strongly on an absolute basis, resulting from efforts to limit exposure to corporate credit and energy in the Fund overall as well as the maintenance of a neutral duration stance within the Credit/Rates Relative Value Arbitrage strategy. Throughout the time period, the decision to limit exposure to merger and other event-driven opportunities in the Equity Arbitrage strategy helped the Fund stay positive. This decision also highlights the ability of our portfolio managers to find diversified arbitrage opportunities in the equity space.
Over the course of the year, the Credit/Rates Relative Value Arbitrage strategy (primarily mortgage derivatives) was the largest contributor to overall returns. The team continues to see pre-payment oriented valuation inefficiencies in the seasoned agency space that offer both attractive yields overall and the opportunity to isolate structural diversity at the security level. Collectively, these factors have enabled the Fund to build a portfolio of mortgage derivatives with a unique profile.
Equity Arbitrage was the second largest contributor to returns during the year, led by warrant and share class arbitrage. We increased exposure to closed-end funds in December due to widening net asset value discounts and relative value inefficiencies in a number of funds focusing on specific industry sectors. The Fund also began to selectively increase its merger arbitrage exposure due to a widening of spreads.
Convertible Arbitrage was the next largest contributor, with gains attributable to positions that benefited from a variety of corporate actions, including company specific mergers and earnings-driven equity price moves. The decision to focus on higher delta convertible bond and mandatory positions during the third quarter enabled the Fund to avoid weakness in the broader U.S. convertible markets, where returns were negative for the year.
The Volatility Arbitrage strategy was also positive on the year, highlighted by significant gains in August. The primary objective of the strategy is to provide insurance for residual risk exposures aggregated across the Fund.
Looking forward, the Fund’s sub-advisor will continue to implement its strategy by allocating the Fund’s assets among strategies: Convertible Arbitrage, Credit/Rates Relative Value Arbitrage, Equity Arbitrage, Volatility Arbitrage, seeking capital appreciation with low volatility and reduced correlation to equities and interest rates.
| | | | | | | | |
POSITIONS BY INVESTMENT STRATEGY | | | | | | |
Convertible Arbitrage | | | | | | | 37 | |
Credit/Rates Relative Value Arbitrage | | | | | | | 7 | |
Equity Arbitrage | | | | | | | 89 | |
Volatility Arbitrage | | | | | | | 27 | |
Total Fund Holdings | | | 160 | | | | | |
| | | | | | | | |
INVESTMENT STRATEGY EXPOSURE | | (% Long Market Value) | | | (% Short Market Value) | |
Convertible Arbitrage | | | 31.0 | | | | (22.0 | ) |
Credit/Rates Relative Value Arbitrage | | | 14.0 | | | | (2.0 | ) |
Equity Arbitrage | | | 19.0 | | | | (18.0 | ) |
Volatility Arbitrage | | | 4.0 | | | | (5.0 | ) |
8
American Beacon Ionic Strategic Arbitrage FundSM
Fund Expenses
December 31, 2015 (Unaudited)
Fund Expense Example
As a shareholder of the Fund, you incur two types of costs: (1) transaction costs, including sales charges (loads) on purchase payments and redemption fees if applicable, and (2) ongoing costs, including management fees, administrative service fees, and other Fund expenses. The examples below are intended to help you understand the ongoing cost (in dollars) of investing in the Fund and to compare these costs with the ongoing costs of investing in other mutual funds.
The examples are based on an investment of $1,000 invested at the beginning of the period and held for the entire period from July 1, 2015 through December 31, 2015.
Actual Expenses
The “Actual” line of the table provides information about actual account values and actual expenses. You may use the information in this line, together with the amount you invested, to estimate the expenses that you paid over the period. Simply divide your account value by $1,000 (for example, an $8,600 account value divided by $1,000 = 8.6), then multiply the result by the number in the first line under the heading “Expenses Paid During Period” to estimate the expenses you paid on your account during this period. Shareholders that invest in the Fund through an IRA or Roth IRA may be subject to a custodial IRA fee of $15 that is typically deducted each December. If your account was subject to a custodial IRA fee during the period, your costs would have been $15 higher.
Hypothetical Example for Comparison Purposes
The “Hypothetical” line of the table provides information about hypothetical account values and hypothetical expenses based on the Fund’s actual expense ratio and an assumed 5% per year rate of return before expenses (not the Fund’s actual return). You may compare the ongoing costs of investing in the Fund with other funds by contrasting this 5% hypothetical example and the 5% hypothetical examples that appear in the shareholder reports of the other funds. The hypothetical account values and expenses may not be used to estimate the actual ending account balance or expenses you paid for the period.
Shareholders that invest in the Fund through an IRA or Roth IRA may be subject to a custodial IRA fee of $15 that is typically deducted each December. If your account was subject to a custodial IRA fee during the period, your cost would have been $15 higher.
You should also be aware that the expenses shown in the table highlight only your ongoing costs and do not reflect any transaction costs charged by the Fund. Similarly, the expense examples for other funds do not reflect any transaction costs charged by those funds, such as sales charges (loads), redemption fees or exchange fees. Therefore, the “Hypothetical” line of the table is useful in comparing ongoing costs only and will not help you determine the relative total costs of owning different funds. If you were subject to any transaction costs during the period, your costs would have been higher.
| | | | | | | | | | | | |
| | | Beginning
Account
Value
7/1/15 | | | Ending
Account
Value
12/31/15 | | | Expenses Paid
During Period*
7/1/15 -
12/31/15 | |
Institutional Class | | | | | | | | | | | | |
Actual | | $ | 1,000.00 | | | $ | 1,014.63 | | | $ | 14.42 | |
Hypothetical ** | | $ | 1,000.00 | | | $ | 1,010.89 | | | $ | 14.39 | |
Y Class | | | | | | | | | | | | |
Actual | | $ | 1,000.00 | | | $ | 1,015.64 | | | $ | 16.61 | |
Hypothetical ** | | $ | 1,000.00 | | | $ | 1,008.72 | | | $ | 16.56 | |
Investor Class | | | | | | | | | | | | |
Actual | | $ | 1,000.00 | | | $ | 1,013.61 | | | $ | 16.39 | |
Hypothetical ** | | $ | 1,000.00 | | | $ | 1,008.92 | | | $ | 16.36 | |
A Class | | | | | | | | | | | | |
Actual | | $ | 1,000.00 | | | $ | 1,013.65 | | | $ | 17.10 | |
Hypothetical ** | | $ | 1,000.00 | | | $ | 1,008.22 | | | $ | 17.06 | |
C Class | | | | | | | | | | | | |
Actual | | $ | 1,000.00 | | | $ | 1,010.03 | | | $ | 20.82 | |
Hypothetical ** | | $ | 1,000.00 | | | $ | 1,004.49 | | | $ | 20.77 | |
| * | Expenses are equal to the Fund’s annualized expense ratios for the six-month period of 2.84%, 3.27%, 3.23%, 3.37%, and 4.11% for the Institutional, Y, Investor, A, and C Classes respectively, multiplied by the average account value over the period, multiplied by the number derived by dividing the number of days in the most recent fiscal half-year (184) by days in the year (365) to reflect the half-year period. |
| ** | 5% return before expenses. |
9
American Beacon Funds SM
Report of Independent Registered Public Accounting Firm
The Board of Trustees and Shareholders of
American Beacon AHL Managed Futures Strategy Fund and American Beacon Ionic Strategic Arbitrage Fund
We have audited the accompanying statements of assets and liabilities, including the schedules of investments, of American Beacon AHL Managed Futures Strategy Fund and American Beacon Ionic Strategic Arbitrage Fund (two of the funds constituting the American Beacon Funds) (collectively, the “Funds”), as of December 31, 2015, and the related statements of operations, statements of changes in net assets and the financial highlights for each of the periods indicated therein. These financial statements and financial highlights are the responsibility of the Funds’ management. Our responsibility is to express an opinion on these financial statements and financial highlights based on our audits.
We conducted our audits in accordance with the standards of the Public Company Accounting Oversight Board (United States). Those standards require that we plan and perform the audit to obtain reasonable assurance about whether the financial statements and financial highlights are free of material misstatement. We were not engaged to perform an audit of the Funds’ internal control over financial reporting. Our audits included consideration of internal control over financial reporting as a basis for designing audit procedures that are appropriate in the circumstances, but not for the purpose of expressing an opinion on the effectiveness of each Fund’s internal control over financial reporting. Accordingly, we express no such opinion. An audit also includes examining, on a test basis, evidence supporting the amounts and disclosures in the financial statements and financial highlights, assessing the accounting principles used and significant estimates made by management, and evaluating the overall financial statement presentation. Our procedures included confirmation of securities owned as of December 31, 2015, by correspondence with the custodian and brokers or by other appropriate auditing procedures where replies from brokers were not received. We believe that our audits provide a reasonable basis for our opinion.
In our opinion, the financial statements and financial highlights referred to above present fairly, in all material respects, the financial position of American Beacon AHL Managed Futures Strategy Fund and American Beacon Ionic Strategic Arbitrage Fund at December 31, 2015, the results of their operations, the changes in their net assets and the financial highlights for each of the periods indicated therein in conformity with U.S. generally accepted accounting principles.

Dallas, Texas
February 29, 2016
10
American Beacon AHL Managed Futures Strategy Fund SM
Consolidated Schedule of Investments
December 31, 2015
| | | | | | | | |
| | | Shares | | | Fair Value | |
| | | | | | (000’s) | |
SHORT-TERM INVESTMENTS – 94.52% | | | | | | | | |
Money Market Funds – 2.97% | | | | | | | | |
JPMorgan U.S. Government Money Market Fund, Capital Class A | | | 3,090 | | | $ | 3,090 | |
| | | | | | | | |
| | |
| | | Par Amount | | | | |
| | | (000’s) | | | | |
U.S. Treasury Bills – 91.55% | | | | | | | | |
0.009%, Due 2/4/2016 A | | $ | 5,800 | | | | 5,799 | |
0.102%, Due 1/14/2016 A | | | 71,200 | | | | 71,198 | |
0.142%, Due 1/21/2016 A | | | 2,500 | | | | 2,500 | |
0.066%, Due 1/28/2016 A | | | 5,200 | | | | 5,200 | |
0.092%, Due 2/11/2016 A | | | 5,300 | | | | 5,299 | |
0.101%, Due 2/18/2016 A | | | 1,500 | | | | 1,500 | |
0.121%, Due 2/25/2016 A | | | 3,700 | | | | 3,699 | |
| | | | | | | | |
| | | | | | | 95,195 | |
| | | | | | | | |
Total Short-Term Investments (Cost $98,285) | | | | | | | 98,285 | |
| | | | | | | | |
TOTAL INVESTMENTS —95.52% (Cost $98,285) | | | | | | | 98,285 | |
OTHER ASSETS, NET OF LIABILITIES – 5.48% | | | | 5,692 | |
| | | | | | | | |
TOTAL NET ASSETS—100.00% | | | | | | $ | 103,977 | |
| | | | | | | | |
| | |
Percentages are stated as a percent of net assets. | | | | | | | | |
| A | All or a portion represents positions held by the American Beacon Cayman Managed Futures Strategy Fund, Ltd. |
See accompanying notes
11
American Beacon AHL Managed Futures Strategy Fund SM
Consolidated Schedule of Investments
December 31, 2015
Purchased Futures Contracts Open on December 31, 2015:
Commodity Futures Contracts
| | | | | | | | | | | | | | | | |
Description | | Number of
Contracts | | | Expiration Date | | | Contract Value | | | Unrealized
Appreciation
(Depreciation) | |
Cocoa Futures A | | | 17 | | | | March 2016 | | | $ | 545,870 | | | $ | (16,717 | ) |
Cocoa Futures A | | | 21 | | | | May 2016 | | | | 673,470 | | | | (25,425 | ) |
LME Lead Futures A | | | 1 | | | | February 2016 | | | | 44,937 | | | | (62 | ) |
LME Lead Futures A | | | 8 | | | | January 2016 | | | | 359,350 | | | | 11,115 | |
LME Nickel Futures A | | | 1 | | | | January 2016 | | | | 52,728 | | | | (1,538 | ) |
LME Primary Aluminum Futures A | | | 10 | | | | February 2016 | | | | 377,187 | | | | (5,452 | ) |
LME Primary Aluminum Futures A | | | 2 | | | | January 2016 | | | | 75,275 | | | | (748 | ) |
LME Zinc Futures A | | | 2 | | | | January 2016 | | | | 80,000 | | | | (766 | ) |
Sugar #11 (World Markets) Futures A | | | 65 | | | | February 2016 | | | | 1,109,472 | | | | 24,870 | |
| | | | | | | | | | | | | | | | |
| | | $ | 3,318,289 | | | $ | (14,723 | ) |
| | | | | | | | | | | | | | | | |
Currency Futures Contracts
| | | | | | | | | | | | | | | | |
Description | | Number of
Contracts | | | Expiration Date | | | Contract Value | | | Unrealized
Appreciation
(Depreciation) | |
90-Day Eurodollar Futures | | | 1 | | | | December 2017 | | | $ | 245,562 | | | $ | (327 | ) |
90-Day Eurodollar Futures | | | 3 | | | | September 2018 | | | | 734,775 | | | | (606 | ) |
90-Day Sterling Futures | | | 48 | | | | December 2017 | | | | 8,711,638 | | | | (17,721 | ) |
90-Day Sterling Futures | | | 132 | | | | March 2017 | | | | 24,042,139 | | | | (30,891 | ) |
Austrailian Dollar Currency Futures | | | 165 | | | | March 2016 | | | | 11,988,900 | | | | 51,971 | |
| | | | | | | | | | | | | | | | |
| | | | | | | | | | $ | 45,723,014 | | | $ | 2,426 | |
| | | | | | | | | | | | | | | | |
Equity Futures Contracts
| | | | | | | | | | | | | | | | |
Description | | Number of
Contracts | | | Expiration Date | | | Contract Value | | | Unrealized
Appreciation
(Depreciation) | |
U.S. Dollar Index Futures | | | 27 | | | | March 2016 | | | $ | 2,666,115 | | | $ | (1,391 | ) |
FTSE/JSE Top 40 Index Futures | | | 9 | | | | March 2016 | | | | 269,284 | | | | 2,774 | |
NASDAQ 100 E-Mini Futures | | | 45 | | | | March 2016 | | | | 4,128,975 | | | | (43,271 | ) |
S&P 500 E-mini Futures | | | 33 | | | | March 2016 | | | | 3,358,410 | | | | (46,334 | ) |
| | | | | | | | | | | | | | | | |
| | | | | | | | | | $ | 10,422,784 | | | $ | (88,222 | ) |
| | | | | | | | | | | | | | | | |
Interest Rate Futures Contracts
| | | | | | | | | | | | | | | | |
| | |
Description | | Number of
Contracts | | | Expiration Date | | | Contract Value | | | Unrealized
Appreciation
(Depreciation) | |
3-Month Euro Euribor Futures | | | 38 | | | | December 2017 | | | $ | 10,324,639 | | | $ | (8,362 | ) |
3-Month Euro Euribor Futures | | | 222 | | | | March 2017 | | | | 60,408,102 | | | | (5,491 | ) |
3-Month Euro Euribor Futures | | | 91 | | | | September 2018 | | | | 24,666,694 | | | | (25,685 | ) |
Austrailia 10-Year Bond Futures | | | 21 | | | | March 2016 | | | | 1,941,795 | | | | (13,067 | ) |
Euro-Buxl 30-Year Bond Futures | | | 1 | | | | March 2016 | | | | 164,534 | | | | (3,956 | ) |
Euro-Bobl Futures | | | 11 | | | | March 2016 | | | | 1,562,062 | | | | 2,622 | |
Euro-Bund Futures | | | 18 | | | | March 2016 | | | | 3,089,152 | | | | 4,737 | |
10-Year Japanese Government Bond (OSE) Futures | | | 41 | | | | March 2016 | | | | 50,839,386 | | | | 100,583 | |
Long GILT Futures | | | 40 | | | | March 2016 | | | | 6,885,693 | | | | (63,914 | ) |
U.S. 10-Year Treasury Note Futures | | | 20 | | | | March 2016 | | | | 2,518,125 | | | | (15,126 | ) |
U.S. Long Bond (CBT) Futures | | | 10 | | | | March 2016 | | | | 1,537,500 | | | | (25,633 | ) |
U.S. Ultra Bond (CBT) Futures | | | 18 | | | | March 2016 | | | | 2,856,375 | | | | (48,389 | ) |
| | | | | | | | | | | | | | | | |
| | | | | | | | | | $ | 166,794,057 | | | $ | (101,681 | ) |
| | | | | | | | | | | | | | | | |
See accompanying notes
12
American Beacon AHL Managed Futures Strategy Fund SM
Consolidated Schedule of Investments
December 31, 2015
Sold Futures Contracts Open on December 31, 2015:
Commodity Futures Contracts
| | | | | | | | | | | | | | | | |
Description | | Number of
Contracts | | | Expiration Date | | | Contract Value | | | Unrealized
Appreciation
(Depreciation) | |
Brent Crude Futures A | | | 1 | | | | February 2016 | | | $ | (38,530 | ) | | $ | (591 | ) |
Brent Crude Futures A | | | 36 | | | | January 2016 | | | | (1,342,080 | ) | | | 165,205 | |
Coffee ‘C’ Futures A | | | 17 | | | | March 2016 | | | | (807,713 | ) | | | (42,449 | ) |
Copper Futures A | | | 29 | | | | March 2016 | | | | (1,547,875 | ) | | | (40,076 | ) |
Corn Futures A | | | 140 | | | | March 2016 | | | | (2,511,250 | ) | | | 86,057 | |
Gasoline RBOB Futures A | | | 11 | | | | January 2016 | | | | (587,202 | ) | | | (33,337 | ) |
Gold 100oz Futures A | | | 77 | | | | February 2016 | | | | (8,163,540 | ) | | | 124,357 | |
LME Copper Futures A | | | 3 | | | | February 2016 | | | | (353,344 | ) | | | (4,317 | ) |
LME Copper Futures A | | | 3 | | | | January 2016 | | | | (353,437 | ) | | | 20,166 | |
LME Lead Futures A | | | 7 | | | | February 2016 | | | | (314,563 | ) | | | (35,220 | ) |
LME Lead Futures A | | | 8 | | | | January 2016 | | | | (359,350 | ) | | | (29,434 | ) |
LME Nickel Futures A | | | 4 | | | | February 2016 | | | | (211,236 | ) | | | 2,745 | |
LME Nickel Futures A | | | 8 | | | | January 2016 | | | | (421,824 | ) | | | 47,604 | |
LME Nickel Futures A | | | 1 | | | | March 2016 | | | | (52,884 | ) | | | (608 | ) |
LME Primary Aluminum Futures A | | | 58 | | | | February 2016 | | | | (2,187,688 | ) | | | (24,391 | ) |
LME Primary Aluminum Futures A | | | 2 | | | | January 2016 | | | | (75,275 | ) | | | (102 | ) |
LME Primary Aluminum Futures A | | | 1 | | | | March 2016 | | | | (37,694 | ) | | | 248 | |
LME Zinc Futures A | | | 12 | | | | February 2016 | | | | (481,275 | ) | | | (19,054 | ) |
LME Zinc Futures A | | | 5 | | | | January 2016 | | | | (200,000 | ) | | | 7,760 | |
LME Zinc Futures A | | | 1 | | | | March 2016 | | | | (40,225 | ) | | | (2,990 | ) |
Low Sulphur Gasoil Futures A | | | 1 | | | | February 2016 | | | | (33,425 | ) | | | 799 | |
Low Sulphur Gasoil Futures A | | | 25 | | | | January 2016 | | | | (815,625 | ) | | | 180,626 | |
Natural Gas Futures A | | | 30 | | | | January 2016 | | | | (701,100 | ) | | | (143,248 | ) |
Natural Gas Swap Futures A | | | 12 | | | | March 2016 | | | | (71,610 | ) | | | 16,117 | |
Natural Gas Swap Futures A | | | 12 | | | | July 2016 | | | | (75,690 | ) | | | 12,037 | |
Natural Gas Swap Futures A | | | 16 | | | | November 2016 | | | | (110,640 | ) | | | 8,923 | |
Natural Gas Swap Futures A | | | 16 | | | | January 2017 | | | | (114,560 | ) | | | 5,003 | |
Natural Gas Swap Futures A | | | 16 | | | | December 2016 | | | | (114,880 | ) | | | 4,683 | |
Natural Gas Swap Futures A | | | 12 | | | | June 2016 | | | | (75,270 | ) | | | 12,457 | |
Natural Gas Swap Futures A | | | 12 | | | | May 2016 | | | | (74,040 | ) | | | 13,687 | |
Natural Gas Swap Futures A | | | 16 | | | | February 2017 | | | | (113,120 | ) | | | 6,443 | |
Natural Gas Swap Futures A | | | 12 | | | | April 2016 | | | | (72,720 | ) | | | 15,007 | |
Natural Gas Swap Futures A | | | 16 | | | | October 2016 | | | | (104,640 | ) | | | 14,923 | |
Natural Gas Swap Futures A | | | 12 | | | | September 2016 | | | | (76,350 | ) | | | 11,377 | |
Natural Gas Swap Futures A | | | 12 | | | | August 2016 | | | | (75,630 | ) | | | 12,097 | |
NY Harbor ULSD Futures A | | | 18 | | | | January 2016 | | | | (849,668 | ) | | | 19,110 | |
Silver Futures A | | | 28 | | | | March 2016 | | | | (1,932,420 | ) | | | 48,760 | |
Soybean Futures A | | | 73 | | | | March 2016 | | | | (3,154,512 | ) | | | 56,791 | |
Soybean Futures A | | | 1 | | | | May 2016 | | | | (43,475 | ) | | | 248 | |
Wheat (CBT) Futures A | | | 46 | | | | March 2016 | | | | (1,081,000 | ) | | | 40,690 | |
WTI Crude Futures A | | | 38 | | | | January 2016 | | | | (1,407,520 | ) | | | 20,649 | |
| | | | | | | | | | | | | | | | |
| | | $ | (31,184,880 | ) | | $ | 578,752 | |
| | | | | | | | | | | | | | | | |
Currency Futures Contracts
| | | | | | | | | | | | | | | | |
| | |
Description | | Number of
Contracts | | | Expiration Date | | | Contract Value | | | Unrealized
Appreciation
(Depreciation) | |
90-Day Eurodollar Futures | | | 44 | | | | December 2017 | | | $ | (10,804,750 | ) | | $ | (1,587 | ) |
90-Day Eurodollar Futures | | | 61 | | | | March 2017 | | | | (15,039,550 | ) | | | 2,652 | |
90-Day Eurodollar Futures | | | 21 | | | | September 2018 | | | | (5,143,425 | ) | | | (2,092 | ) |
Pound Sterling Currency Futures | | | 152 | | | | March 2016 | | | | (13,997,300 | ) | | | 249,860 | |
Canadian Dollar Currency Futures | | | 101 | | | | March 2016 | | | | (7,305,330 | ) | | | 161,503 | |
Swiss Franc Currency Futures | | | 28 | | | | March 2016 | | | | (3,511,200 | ) | | | 7,886 | |
Euro FX Currency Futures | | | 30 | | | | March 2016 | | | | (4,082,250 | ) | | | (5,041 | ) |
Japanese Yen Currency Futures | | | 12 | | | | March 2016 | | | | (1,249,875 | ) | | | (29,855 | ) |
Mexican Peso Futures | | | 300 | | | | March 2016 | | | | (8,670,000 | ) | | | (8,058 | ) |
| | | | | | | | | | | | | | | | |
| | | | | | | | | | $ | (69,803,680 | ) | | $ | 375,268 | |
| | | | | | | | | | | | | | | | |
See accompanying notes
13
American Beacon AHL Managed Futures Strategy Fund SM
Consolidated Schedule of Investments
December 31, 2015
Equity Futures Contracts
| | | | | | | | | | | | | | | | |
Description | | Number��of
Contracts | | | Expiration Date | | | Contract Value | | | Unrealized
Appreciation
(Depreciation) | |
Amsterdam Index Futures | | | 4 | | | | January 2016 | | | $ | (384,144 | ) | | $ | (8,873 | ) |
CAC40 Index Futures | | | 2 | | | | January 2016 | | | | (100,818 | ) | | | (240 | ) |
DAX Index Futures | | | 1 | | | | March 2016 | | | | (292,662 | ) | | | (7,730 | ) |
Euro Stoxx 50 Index Futures | | | 9 | | | | March 2016 | | | | (321,004 | ) | | | (5,581 | ) |
FTSE 100 Index Futures | | | 27 | | | | March 2016 | | | | (2,467,015 | ) | | | (80,420 | ) |
FTSE/MIB Index Futures | | | 4 | | | | March 2016 | | | | (466,042 | ) | | | (7,792 | ) |
Hang Seng Index Futures | | | 18 | | | | January 2016 | | | | (2,544,371 | ) | | | (3,271 | ) |
H-SHARES Index Futures | | | 35 | | | | January 2016 | | | | (2,191,437 | ) | | | 23,935 | |
IBEX 35 Index Futures | | | 9 | | | | January 2016 | | | | (931,743 | ) | | | 10,471 | |
KOSPI 200 Index Futures | | | 25 | | | | March 2016 | | | | (2,563,324 | ) | | | (26,609 | ) |
Mini MSCI EAFE Index Futures | | | 6 | | | | March 2016 | | | | (509,460 | ) | | | (8,891 | ) |
Mini MSCI Emerging Markets Index Futures | | | 28 | | | | March 2016 | | | | (1,102,500 | ) | | | (23,430 | ) |
MSCI Taiwan Stock Index Futures | | | 62 | | | | January 2016 | | | | (1,887,280 | ) | | | 24,757 | |
Nikkei 225 (SGX) Futures | | | 18 | | | | March 2016 | | | | (1,412,954 | ) | | | 6,639 | |
OMXS30 Index Futures | | | 66 | | | | January 2016 | | | | (1,132,128 | ) | | | (26,660 | ) |
E-Mini Russell 2000 Futures | | | 9 | | | | March 2016 | | | | (1,018,350 | ) | | | (12,433 | ) |
S&P/TSX 60 Index Futures | | | 23 | | | | March 2016 | | | | (2,529,551 | ) | | | (34,490 | ) |
TOPIX Index Futures | | | 4 | | | | March 2016 | | | | (514,996 | ) | | | (2,793 | ) |
| | | | | | | | | | | | | | | | |
| | | | | | | | | | $ | (22,369,779 | ) | | $ | (183,411 | ) |
| | | | | | | | | | | | | | | | |
Interest Rate Futures Contracts
| | | | | | | | | | | | | | | | |
Description | | Number of
Contracts | | | Expiration Date | | | Contract Value | | | Unrealized
Appreciation
(Depreciation) | |
Austrailia 3-Year Bond Futures | | | 333 | | | | March 2016 | | | $ | (27,048,295 | ) | | $ | (119,611 | ) |
U.S. 2-Year Treasury Note Futures | | | 104 | | | | March 2016 | | | | (22,592,375 | ) | | | 11,531 | |
U.S. 5-Year Treasury Note Futures | | | 23 | | | | March 2016 | | | | (2,721,367 | ) | | | (4,003 | ) |
| | | | | | | | | | | | | | | | |
| | | | | | | | | | $ | (52,362,037 | ) | | $ | (112,083 | ) |
| | | | | | | | | | | | | | | | |
Forward Currency Contracts Open on December 31, 2015:
| | | | | | | | | | | | | | | | | | | | | | | | | | | | |
Type | | Currency | | | Principal Amount
Covered by Contract | | | Settlement
Date | | | Counterparty | | | Unrealized
Appreciation | | | Unrealized
(Depreciation) | | | Net
Unrealized
Appreciation
(Depreciation) | |
Sell | | | MYR | | | | 58,218 | | | | 1/7/2016 | | | | DUB | | | $ | — | | | $ | (587 | ) | | $ | (587 | ) |
Sell | | | MYR | | | | 174,655 | | | | 1/7/2016 | | | | DUB | | | | 60 | | | | — | | | | 60 | |
Sell | | | MYR | | | | 523,966 | | | | 1/7/2016 | | | | DUB | | | | 2,966 | | | | — | | | | 2,966 | |
Sell | | | MYR | | | | 58,218 | | | | 1/7/2016 | | | | DUB | | | | 24 | | | | — | | | | 24 | |
Sell | | | MYR | | | | 116,437 | | | | 1/7/2016 | | | | DUB | | | | — | | | | (1,176 | ) | | | (1,176 | ) |
Sell | | | MYR | | | | 58,218 | | | | 1/7/2016 | | | | DUB | | | | — | | | | (256 | ) | | | (256 | ) |
Sell | | | MYR | | | | 58,218 | | | | 1/7/2016 | | | | DUB | | | | — | | | | (308 | ) | | | (308 | ) |
Sell | | | MYR | | | | 58,218 | | | | 1/7/2016 | | | | DUB | | | | — | | | | (301 | ) | | | (301 | ) |
Sell | | | MYR | | | | 116,437 | | | | 1/7/2016 | | | | DUB | | | | — | | | | (672 | ) | | | (672 | ) |
Sell | | | MYR | | | | 58,219 | | | | 1/7/2016 | | | | DUB | | | | — | | | | (478 | ) | | | (478 | ) |
Sell | | | MYR | | | | 58,218 | | | | 1/7/2016 | | | | DUB | | | | — | | | | (294 | ) | | | (294 | ) |
Sell | | | MYR | | | | 58,218 | | | | 1/7/2016 | | | | DUB | | | | 91 | | | | — | | | | 91 | |
Sell | | | MYR | | | | 116,437 | | | | 1/7/2016 | | | | DUB | | | | — | | | | (830 | ) | | | (830 | ) |
Sell | | | MYR | | | | 58,218 | | | | 1/7/2016 | | | | DUB | | | | — | | | | (480 | ) | | | (480 | ) |
Sell | | | MYR | | | | 465,748 | | | | 1/7/2016 | | | | DUB | | | | — | | | | (4,387 | ) | | | (4,387 | ) |
Sell | | | MYR | | | | 349,311 | | | | 1/7/2016 | | | | DUB | | | | 3,963 | | | | — | | | | 3,963 | |
Sell | | | MYR | | | | 58,218 | | | | 1/7/2016 | | | | DUB | | | | — | | | | (480 | ) | | | (480 | ) |
Sell | | | MYR | | | | 116,437 | | | | 1/7/2016 | | | | DUB | | | | — | | | | (798 | ) | | | (798 | ) |
Sell | | | MYR | | | | 116,437 | | | | 1/7/2016 | | | | DUB | | | | — | | | | (104 | ) | | | (104 | ) |
Sell | | | MYR | | | | 58,219 | | | | 1/7/2016 | | | | DUB | | | | — | | | | (574 | ) | | | (574 | ) |
Buy | | | INR | | | | 642,107 | | | | 1/8/2016 | | | | DUB | | | | 1,786 | | | | — | | | | 1,786 | |
Buy | | | INR | | | | 302,168 | | | | 1/8/2016 | | | | DUB | | | | 781 | | | | — | | | | 781 | |
See accompanying notes
14
American Beacon AHL Managed Futures Strategy Fund SM
Consolidated Schedule of Investments
December 31, 2015
| | | | | | | | | | | | | | | | | | | | | | |
Type | | Currency | | Principal Amount
Covered by Contract | | | Settlement
Date | | Counterparty | | Unrealized
Appreciation | | | Unrealized
(Depreciation) | | | Net
Unrealized
Appreciation
(Depreciation) | |
Buy | | INR | | | 1,368,216 | | | 1/8/2016 | | DUB | | $ | 7,843 | | | $ | — | | | $ | 7,843 | |
Buy | | INR | | | 4,146,346 | | | 1/8/2016 | | DUB | | | 22,220 | | | | — | | | | 22,220 | |
Buy | | INR | | | 3,059,449 | | | 1/8/2016 | | DUB | | | 16,167 | | | | — | | | | 16,167 | |
Buy | | INR | | | 365,170 | | | 1/8/2016 | | DUB | | | 1,397 | | | | — | | | | 1,397 | |
Buy | | INR | | | 365,019 | | | 1/8/2016 | | DUB | | | 1,451 | | | | — | | | | 1,451 | |
Buy | | INR | | | 377,710 | | | 1/8/2016 | | DUB | | | 1,351 | | | | — | | | | 1,351 | |
Buy | | INR | | | 365,170 | | | 1/8/2016 | | DUB | | | 1,328 | | | | — | | | | 1,328 | |
Buy | | INR | | | 377,710 | | | 1/8/2016 | | DUB | | | 1,260 | | | | — | | | | 1,260 | |
Buy | | INR | | | 339,939 | | | 1/8/2016 | | DUB | | | 726 | | | | — | | | | 726 | |
Buy | | INR | | | 302,168 | | | 1/8/2016 | | DUB | | | 673 | | | | — | | | | 673 | |
Buy | | PHP | | | 53,083 | | | 1/19/2016 | | DUB | | | 448 | | | | — | | | | 448 | |
Buy | | PHP | | | 106,166 | | | 1/19/2016 | | DUB | | | 436 | | | | — | | | | 436 | |
Buy | | PHP | | | 106,166 | | | 1/19/2016 | | DUB | | | 346 | | | | — | | | | 346 | |
Buy | | PHP | | | 690,082 | | | 1/19/2016 | | DUB | | | 2,543 | | | | — | | | | 2,543 | |
Buy | | PHP | | | 743,166 | | | 1/19/2016 | | DUB | | | 2,346 | | | | — | | | | 2,346 | |
Buy | | PHP | | | 53,083 | | | 1/19/2016 | | DUB | | | 307 | | | | — | | | | 307 | |
Buy | | PHP | | | 53,083 | | | 1/19/2016 | | DUB | | | 331 | | | | — | | | | 331 | |
Buy | | PHP | | | 53,083 | | | 1/19/2016 | | DUB | | | 380 | | | | — | | | | 380 | |
Buy | | INR | | | 377,034 | | | 1/19/2016 | | DUB | | | 1,940 | | | | — | | | | 1,940 | |
Buy | | INR | | | 565,550 | | | 1/19/2016 | | DUB | | | 5,473 | | | | — | | | | 5,473 | |
Buy | | INR | | | 414,737 | | | 1/19/2016 | | DUB | | | 4,044 | | | | — | | | | 4,044 | |
Buy | | INR | | | 3,129,379 | | | 1/19/2016 | | DUB | | | 22,580 | | | | — | | | | 22,580 | |
Buy | | PHP | | | 265,416 | | | 1/19/2016 | | DUB | | | 1,853 | | | | — | | | | 1,853 | |
Buy | | PHP | | | 106,167 | | | 1/19/2016 | | DUB | | | 302 | | | | — | | | | 302 | |
Buy | | PHP | | | 106,167 | | | 1/19/2016 | | DUB | | | 369 | | | | — | | | | 369 | |
Buy | | PHP | | | 106,166 | | | 1/19/2016 | | DUB | | | 391 | | | | — | | | | 391 | |
Buy | | PHP | | | 159,250 | | | 1/19/2016 | | DUB | | | 486 | | | | — | | | | 486 | |
Sell | | PHP | | | 106,167 | | | 1/19/2016 | | DUB | | | — | | | | (1,014 | ) | | | (1,014 | ) |
Sell | | MYR | | | 2,791,991 | | | 1/19/2016 | | DUB | | | — | | | | (23,186 | ) | | | (23,186 | ) |
Sell | | INR | | | 4,486,700 | | | 1/19/2016 | | DUB | | | — | | | | (72,098 | ) | | | (72,098 | ) |
Sell | | PHP | | | 7,537,822 | | | 1/19/2016 | | DUB | | | — | | | | (97,034 | ) | | | (97,034 | ) |
Buy | | TWD | | | 76,116 | | | 1/21/2016 | | DUB | | | 121 | | | | — | | | | 121 | |
Buy | | TWD | | | 76,116 | | | 1/21/2016 | | DUB | | | 47 | | | | — | | | | 47 | |
Buy | | KRW | | | 596,725 | | | 1/21/2016 | | DUB | | | — | | | | (4,649 | ) | | | (4,649 | ) |
Buy | | TWD | | | 76,115 | | | 1/21/2016 | | DUB | | | — | | | | (132 | ) | | | (132 | ) |
Buy | | TWD | | | 152,231 | | | 1/21/2016 | | DUB | | | — | | | | (138 | ) | | | (138 | ) |
Buy | | TWD | | | 76,115 | | | 1/21/2016 | | DUB | | | — | | | | (46 | ) | | | (46 | ) |
Buy | | KRW | | | 511,479 | | | 1/21/2016 | | DUB | | | — | | | | (2,444 | ) | | | (2,444 | ) |
Buy | | KRW | | | 511,479 | | | 1/21/2016 | | DUB | | | — | | | | (3,449 | ) | | | (3,449 | ) |
Buy | | TWD | | | 76,115 | | | 1/21/2016 | | DUB | | | — | | | | (160 | ) | | | (160 | ) |
Buy | | KRW | | | 255,739 | | | 1/21/2016 | | DUB | | | — | | | | (565 | ) | | | (565 | ) |
Buy | | TWD | | | 152,231 | | | 1/21/2016 | | DUB | | | — | | | | (69 | ) | | | (69 | ) |
Buy | | KRW | | | 255,739 | | | 1/21/2016 | | DUB | | | — | | | | (596 | ) | | | (596 | ) |
Buy | | TWD | | | 152,231 | | | 1/21/2016 | | DUB | | | — | | | | (138 | ) | | | (138 | ) |
Buy | | TWD | | | 152,231 | | | 1/21/2016 | | DUB | | | — | | | | (64 | ) | | | (64 | ) |
Buy | | TWD | | | 76,116 | | | 1/21/2016 | | DUB | | | — | | | | (11 | ) | | | (11 | ) |
Buy | | KRW | | | 255,739 | | | 1/21/2016 | | DUB | | | 679 | | | | — | | | | 679 | |
Buy | | TWD | | | 152,231 | | | 1/21/2016 | | DUB | | | 47 | | | | — | | | | 47 | |
Buy | | TWD | | | 152,231 | | | 1/21/2016 | | DUB | | | 163 | | | | — | | | | 163 | |
Buy | | KRW | | | 170,493 | | | 1/21/2016 | | DUB | | | 410 | | | | — | | | | 410 | |
Buy | | KRW | | | 85,247 | | | 1/21/2016 | | DUB | | | 223 | | | | — | | | | 223 | |
Buy | | TWD | | | 76,115 | | | 1/21/2016 | | DUB | | | 44 | | | | — | | | | 44 | |
Buy | | TWD | | | 380,578 | | | 1/21/2016 | | DUB | | | 60 | | | | — | | | | 60 | |
Buy | | KRW | | | 852,465 | | | 1/21/2016 | | DUB | | | — | | | | (1,193 | ) | | | (1,193 | ) |
Buy | | TWD | | | 76,115 | | | 1/21/2016 | | DUB | | | 12 | | | | — | | | | 12 | |
Buy | | KRW | | | 170,493 | | | 1/21/2016 | | DUB | | | — | | | | (755 | ) | | | (755 | ) |
Buy | | KRW | | | 170,493 | | | 1/21/2016 | | DUB | | | — | | | | (747 | ) | | | (747 | ) |
Buy | | TWD | | | 76,116 | | | 1/21/2016 | | DUB | | | — | | | | (11 | ) | | | (11 | ) |
Buy | | KRW | | | 85,246 | | | 1/21/2016 | | DUB | | | — | | | | (374 | ) | | | (374 | ) |
Buy | | TWD | | | 76,115 | | | 1/21/2016 | | DUB | | | 58 | | | | — | | | | 58 | |
Buy | | KRW | | | 170,493 | | | 1/21/2016 | | DUB | | | — | | | | (109 | ) | | | (109 | ) |
Buy | | KRW | | | 85,246 | | | 1/21/2016 | | DUB | | | — | | | | (83 | ) | | | (83 | ) |
Buy | | KRW | | | 85,246 | | | 1/21/2016 | | DUB | | | — | | | | (76 | ) | | | (76 | ) |
See accompanying notes
15
American Beacon AHL Managed Futures Strategy Fund SM
Consolidated Schedule of Investments
December 31, 2015
| | | | | | | | | | | | | | | | | | | | | | |
Type | | Currency | | Principal Amount
Covered by Contract | | | Settlement
Date | | Counterparty | | Unrealized
Appreciation | | | Unrealized
(Depreciation) | | | Net
Unrealized
Appreciation
(Depreciation) | |
Buy | | KRW | | | 85,246 | | | 1/21/2016 | | DUB | | $ | — | | | $ | (66 | ) | | $ | (66 | ) |
Buy | | TWD | | | 152,231 | | | 1/21/2016 | | DUB | | | 33 | | | | — | | | | 33 | |
Buy | | KRW | | | 426,232 | | | 1/21/2016 | | DUB | | | — | | | | (90 | ) | | | (90 | ) |
Buy | | TWD | | | 76,115 | | | 1/21/2016 | | DUB | | | 51 | | | | — | | | | 51 | |
Buy | | TWD | | | 76,115 | | | 1/21/2016 | | DUB | | | 139 | | | | — | | | | 139 | |
Sell | | KRW | | | 14,065,672 | | | 1/21/2016 | | DUB | | | — | | | | (133,979 | ) | | | (133,979 | ) |
Sell | | TWD | | | 9,971,133 | | | 1/21/2016 | | DUB | | | — | | | | (29,116 | ) | | | (29,116 | ) |
Sell | | TWD | | | 152,231 | | | 1/21/2016 | | DUB | | | — | | | | (977 | ) | | | (977 | ) |
Buy | | JPY | | | 179,191 | | | 1/22/2016 | | DUB | | | 1,661 | | | | — | | | | 1,661 | |
Buy | | EUR | | | 83,079 | | | 1/22/2016 | | DUB | | | 36 | | | | — | | | | 36 | |
Buy | | ZAR | | | 43,024 | | | 1/22/2016 | | DUB | | | — | | | | (1,184 | ) | | | (1,184 | ) |
Buy | | EUR | | | 40,170 | | | 1/22/2016 | | DUB | | | 8 | | | | — | | | | 8 | |
Buy | | EUR | | | 7,480 | | | 1/22/2016 | | DUB | | | — | | | | (82 | ) | | | (82 | ) |
Buy | | JPY | | | 5,823 | | | 1/22/2016 | | DUB | | | 10 | | | | — | | | | 10 | |
Sell | | SEK | | | 32,882 | | | 1/22/2016 | | DUB | | | — | | | | (368 | ) | | | (368 | ) |
Sell | | JPY | | | 24,290 | | | 1/22/2016 | | DUB | | | — | | | | (226 | ) | | | (226 | ) |
Sell | | EUR | | | 8,612 | | | 1/22/2016 | | DUB | | | 96 | | | | — | | | | 96 | |
Sell | | JPY | | | 27,759 | | | 1/22/2016 | | DUB | | | — | | | | (46 | ) | | | (46 | ) |
Sell | | SEK | | | 2,945 | | | 1/22/2016 | | DUB | | | 36 | | | | — | | | | 36 | |
Buy | | INR | | | 376,419 | | | 1/29/2016 | | DUB | | | 1,100 | | | | — | | | | 1,100 | |
Buy | | INR | | | 263,493 | | | 1/29/2016 | | DUB | | | 185 | | | | — | | | | 185 | |
Buy | | INR | | | 263,493 | | | 1/29/2016 | | DUB | | | — | | | | (29 | ) | | | (29 | ) |
Buy | | INR | | | 301,135 | | | 1/29/2016 | | DUB | | | — | | | | (6 | ) | | | (6 | ) |
Buy | | INR | | | 263,493 | | | 1/29/2016 | | DUB | | | — | | | | (81 | ) | | | (81 | ) |
Buy | | INR | | | 225,851 | | | 1/29/2016 | | DUB | | | — | | | | (164 | ) | | | (164 | ) |
Buy | | INR | | | 301,135 | | | 1/29/2016 | | DUB | | | — | | | | (763 | ) | | | (763 | ) |
Buy | | INR | | | 301,135 | | | 1/29/2016 | | DUB | | | 157 | | | | — | | | | 157 | |
Buy | | INR | | | 301,135 | | | 1/29/2016 | | DUB | | | — | | | | (143 | ) | | | (143 | ) |
Buy | | INR | | | 188,209 | | | 1/29/2016 | | DUB | | | 437 | | | | — | | | | 437 | |
Buy | | BRL | | | 4,398,104 | | | 1/5/2016 | | HUS | | | — | | | | (52,024 | ) | | | (52,024 | ) |
Buy | | BRL | | | 1,011,058 | | | 1/5/2016 | | HUS | | | — | | | | (47,647 | ) | | | (47,647 | ) |
Buy | | BRL | | | 859,400 | | | 1/5/2016 | | HUS | | | — | | | | (42,577 | ) | | | (42,577 | ) |
Buy | | BRL | | | 151,659 | | | 1/5/2016 | | HUS | | | — | | | | (7,417 | ) | | | (7,417 | ) |
Buy | | BRL | | | 1,086,888 | | | 1/5/2016 | | HUS | | | — | | | | (55,969 | ) | | | (55,969 | ) |
Buy | | BRL | | | 2,249,605 | | | 1/5/2016 | | HUS | | | — | | | | (37,607 | ) | | | (37,607 | ) |
Sell | | BRL | | | 151,659 | | | 1/5/2016 | | HUS | | | 3,700 | | | | — | | | | 3,700 | |
Sell | | BRL | | | 1,011,058 | | | 1/5/2016 | | HUS | | | 13,217 | | | | — | | | | 13,217 | |
Sell | | BRL | | | 1,086,888 | | | 1/5/2016 | | HUS | | | 16,327 | | | | — | | | | 16,327 | |
Sell | | BRL | | | 1,086,888 | | | 1/5/2016 | | HUS | | | 17,092 | | | | — | | | | 17,092 | |
Sell | | BRL | | | 227,488 | | | 1/5/2016 | | HUS | | | 2,373 | | | | — | | | | 2,373 | |
Sell | | BRL | | | 151,659 | | | 1/5/2016 | | HUS | | | 1,134 | | | | — | | | | 1,134 | |
Sell | | BRL | | | 75,829 | | | 1/5/2016 | | HUS | | | 143 | | | | — | | | | 143 | |
Sell | | BRL | | | 50,553 | | | 1/5/2016 | | HUS | | | 89 | | | | — | | | | 89 | |
Sell | | BRL | | | 50,553 | | | 1/5/2016 | | HUS | | | 66 | | | | — | | | | 66 | |
Sell | | BRL | | | 682,464 | | | 1/5/2016 | | HUS | | | — | | | | (3,082 | ) | | | (3,082 | ) |
Sell | | BRL | | | 808,847 | | | 1/5/2016 | | HUS | | | — | | | | (2,432 | ) | | | (2,432 | ) |
Sell | | BRL | | | 50,553 | | | 1/5/2016 | | HUS | | | 763 | | | | — | | | | 763 | |
Sell | | BRL | | | 25,277 | | | 1/5/2016 | | HUS | | | 375 | | | | — | | | | 375 | |
Sell | | BRL | | | 101,106 | | | 1/5/2016 | | HUS | | | 1,503 | | | | — | | | | 1,503 | |
Sell | | BRL | | | 834,123 | | | 1/5/2016 | | HUS | | | 13,835 | | | | — | | | | 13,835 | |
Sell | | BRL | | | 960,506 | | | 1/5/2016 | | HUS | | | 8,190 | | | | — | | | | 8,190 | |
Sell | | BRL | | | 985,782 | | | 1/5/2016 | | HUS | | | 1,472 | | | | — | | | | 1,472 | |
Sell | | BRL | | | 151,659 | | | 1/5/2016 | | HUS | | | 2,500 | | | | — | | | | 2,500 | |
Sell | | BRL | | | 25,277 | | | 1/5/2016 | | HUS | | | 373 | | | | — | | | | 373 | |
Sell | | BRL | | | 25,276 | | | 1/5/2016 | | HUS | | | 317 | | | | — | | | | 317 | |
Sell | | BRL | | | 25,276 | | | 1/5/2016 | | HUS | | | 362 | | | | — | | | | 362 | |
Sell | | BRL | | | 126,382 | | | 1/5/2016 | | HUS | | | 854 | | | | — | | | | 854 | |
Sell | | BRL | | | 25,276 | | | 1/5/2016 | | HUS | | | 302 | | | | — | | | | 302 | |
Sell | | BRL | | | 25,277 | | | 1/5/2016 | | HUS | | | 308 | | | | — | | | | 308 | |
Sell | | BRL | | | 126,382 | | | 1/5/2016 | | HUS | | | 2,869 | | | | — | | | | 2,869 | |
Sell | | BRL | | | 25,277 | | | 1/5/2016 | | HUS | | | 338 | | | | — | | | | 338 | |
Sell | | BRL | | | 50,553 | | | 1/5/2016 | | HUS | | | 627 | | | | — | | | | 627 | |
Sell | | BRL | | | 25,276 | | | 1/5/2016 | | HUS | | | 341 | | | | — | | | | 341 | |
See accompanying notes
16
American Beacon AHL Managed Futures Strategy FundSM
Consolidated Schedule of Investments
December 31, 2015
| | | | | | | | | | | | | | | | | | | | | | |
Type | | Currency | | Principal
Amount
Covered by
Contract | | | Settlement
Date | | Counterparty | | Unrealized
Appreciation | | | Unrealized
(Depreciation) | | | Net
Unrealized
Appreciation
(Depreciation) | |
Sell | | BRL | | | 50,553 | | | 1/5/2016 | | HUS | | $ | 922 | | | $ | — | | | $ | 922 | |
Sell | | BRL | | | 25,277 | | | 1/5/2016 | | HUS | | | 448 | | | | — | | | | 448 | |
Sell | | BRL | | | 50,553 | | | 1/5/2016 | | HUS | | | 901 | | | | — | | | | 901 | |
Sell | | BRL | | | 25,277 | | | 1/5/2016 | | HUS | | | 438 | | | | — | | | | 438 | |
Sell | | BRL | | | 176,935 | | | 1/5/2016 | | HUS | | | 3,273 | | | | — | | | | 3,273 | |
Sell | | BRL | | | 176,935 | | | 1/5/2016 | | HUS | | | 2,976 | | | | — | | | | 2,976 | |
Sell | | BRL | | | 25,276 | | | 1/5/2016 | | HUS | | | 452 | | | | — | | | | 452 | |
Sell | | BRL | | | 75,829 | | | 1/5/2016 | | HUS | | | 3,155 | | | | — | | | | 3,155 | |
Sell | | BRL | | | 50,553 | | | 1/5/2016 | | HUS | | | 2,101 | | | | — | | | | 2,101 | |
Sell | | BRL | | | 126,382 | | | 1/5/2016 | | HUS | | | 4,934 | | | | — | | | | 4,934 | |
Buy | | CLP | | | 70,341 | | | 2/1/2016 | | HUS | | | — | | | | (1,440 | ) | | | (1,440 | ) |
Buy | | CLP | | | 70,341 | | | 2/1/2016 | | HUS | | | — | | | | (1,144 | ) | | | (1,144 | ) |
Buy | | CLP | | | 140,682 | | | 2/1/2016 | | HUS | | | — | | | | (3,178 | ) | | | (3,178 | ) |
Buy | | CLP | | | 140,682 | | | 2/1/2016 | | HUS | | | — | | | | (2,501 | ) | | | (2,501 | ) |
Buy | | CLP | | | 211,022 | | | 2/1/2016 | | HUS | | | — | | | | (4,487 | ) | | | (4,487 | ) |
Buy | | CLP | | | 492,386 | | | 2/1/2016 | | HUS | | | — | | | | (3,155 | ) | | | (3,155 | ) |
Buy | | COP | | | 62,830 | | | 2/1/2016 | | HUS | | | 2,292 | | | | — | | | | 2,292 | |
Buy | | COP | | | 62,830 | | | 2/1/2016 | | HUS | | | 2,482 | | | | — | | | | 2,482 | |
Buy | | CLP | | | 70,341 | | | 2/1/2016 | | HUS | | | — | | | | (484 | ) | | | (484 | ) |
Buy | | CLP | | | 422,045 | | | 2/1/2016 | | HUS | | | — | | | | (9,451 | ) | | | (9,451 | ) |
Buy | | CLP | | | 70,341 | | | 2/1/2016 | | HUS | | | 7 | | | | — | | | | 7 | |
Buy | | CLP | | | 70,341 | | | 2/1/2016 | | HUS | | | — | | | | (406 | ) | | | (406 | ) |
Buy | | CLP | | | 703,408 | | | 2/1/2016 | | HUS | | | — | | | | (12,094 | ) | | | (12,094 | ) |
Buy | | CLP | | | 422,045 | | | 2/1/2016 | | HUS | | | — | | | | (9,480 | ) | | | (9,480 | ) |
Buy | | COP | | | 62,830 | | | 2/1/2016 | | HUS | | | 2,476 | | | | — | | | | 2,476 | |
Buy | | CLP | | | 140,682 | | | 2/1/2016 | | HUS | | | — | | | | (3,234 | ) | | | (3,234 | ) |
Buy | | CLP | | | 70,341 | | | 2/1/2016 | | HUS | | | — | | | | (149 | ) | | | (149 | ) |
Buy | | COP | | | 125,659 | | | 2/1/2016 | | HUS | | | — | | | | (1,401 | ) | | | (1,401 | ) |
Buy | | CLP | | | 70,341 | | | 2/1/2016 | | HUS | | | — | | | | (84 | ) | | | (84 | ) |
Buy | | COP | | | 62,830 | | | 2/1/2016 | | HUS | | | — | | | | (611 | ) | | | (611 | ) |
Sell | | CLP | | | 4,994,197 | | | 2/1/2016 | | HUS | | | — | | | | (1,931 | ) | | | (1,931 | ) |
Sell | | COP | | | 1,382,253 | | | 2/1/2016 | | HUS | | | — | | | | (36,893 | ) | | | (36,893 | ) |
Sell | | CLP | | | 633,067 | | | 2/1/2016 | | HUS | | | — | | | | (2,851 | ) | | | (2,851 | ) |
Buy | | BRL | | | 275,307 | | | 2/2/2016 | | HUS | | | — | | | | (4,620 | ) | | | (4,620 | ) |
Buy | | BRL | | | 175,195 | | | 2/2/2016 | | HUS | | | 1,988 | | | | — | | | | 1,988 | |
Buy | | BRL | | | 275,307 | | | 2/2/2016 | | HUS | | | — | | | | (7,917 | ) | | | (7,917 | ) |
Buy | | BRL | | | 125,140 | | | 2/2/2016 | | HUS | | | — | | | | (3,339 | ) | | | (3,339 | ) |
Buy | | BRL | | | 150,168 | | | 2/2/2016 | | HUS | | | — | | | | (3,706 | ) | | | (3,706 | ) |
Buy | | BRL | | | 150,168 | | | 2/2/2016 | | HUS | | | 1,255 | | | | — | | | | 1,255 | |
Sell | | BRL | | | 800,894 | | | 2/2/2016 | | HUS | | | — | | | | (4,973 | ) | | | (4,973 | ) |
Sell | | BRL | | | 675,754 | | | 2/2/2016 | | HUS | | | — | | | | (15,446 | ) | | | (15,446 | ) |
Sell | | BRL | | | 4,354,858 | | | 2/2/2016 | | HUS | | | 50,763 | | | | — | | | | 50,763 | |
Buy | | EUR | | | 15,499 | | | 1/22/2016 | | RBS | | | — | | | | (173 | ) | | | (173 | ) |
Buy | | GBP | | | 103,761 | | | 1/22/2016 | | RBS | | | — | | | | (1,150 | ) | | | (1,150 | ) |
Buy | | AUD | | | 48,560 | | | 1/22/2016 | | RBS | | | 105 | | | | — | | | | 105 | |
Sell | | KRW | | | 1,052,571 | | | 1/22/2016 | | RBS | | | — | | | | (12,018 | ) | | | (12,018 | ) |
Sell | | HKD | | | 4,605 | | | 1/22/2016 | | RBS | | | — | | | | (1 | ) | | | (1 | ) |
Sell | | AUD | | | 250,637 | | | 1/22/2016 | | RBS | | | — | | | | (4,529 | ) | | | (4,529 | ) |
Sell | | EUR | | | 767,572 | | �� | 1/22/2016 | | RBS | | | 4,446 | | | | — | | | | 4,446 | |
Sell | | AUD | | | 805,677 | | | 1/22/2016 | | RBS | | | 23 | | | | — | | | | 23 | |
Sell | | GBP | | | 1,046,410 | | | 1/22/2016 | | RBS | | | 30,595 | | | | — | | | | 30,595 | |
Sell | | CAD | | | 87,571 | | | 1/22/2016 | | RBS | | | — | | | | (489 | ) | | | (489 | ) |
Sell | | CAD | | | 59,641 | | | 1/22/2016 | | RBS | | | — | | | | (274 | ) | | | (274 | ) |
Sell | | EUR | | | 82,677 | | | 1/22/2016 | | RBS | | | — | | | | (16 | ) | | | (16 | ) |
Sell | | GBP | | | 147,871 | | | 1/22/2016 | | RBS | | | 1,454 | | | | — | | | | 1,454 | |
Sell | | HKD | | | 37,711 | | | 1/22/2016 | | RBS | | | — | | | | (1 | ) | | | (1 | ) |
Sell | | PEN | | | 801,708 | | | 2/1/2016 | | RBS | | | 6,283 | | | | — | | | | 6,283 | |
| | | | | | | | | | | | | | | | | | | | | | |
| | | | | | | | | | | | $ | 327,714 | | | $ | (790,567 | ) | | $ | (462,853 | ) |
| | | | | | | | | | | | | | | | | | | | | | |
A All or a portion represents positions held by the American Beacon Cayman Managed Futures Strategy Fund, Ltd.
See accompanying notes
17
American Beacon AHL Managed Futures Strategy FundSM
Consolidated Schedule of Investments
December 31, 2015
| | | | | | | | | | |
Counterparty Abbreviations: |
| DUB | | Deutsche Bank AG | | RBS | | Royal Bank Of Scotland | | | | |
| HUS | | HSBC Bank Plc | | | | | | | | |
|
Currency Abbreviations: |
| | | | | |
AUD | | Australian Dollar | | GBP | | Pound Sterling | | PEN | | Peruvian Nuevo Sol |
BRL | | Brazilian Real | | HKD | | Hong Kong Dollar | | PHP | | Philippine Peso |
CAD | | Canadian Dollar | | INR | | Indian Rupee | | SEK | | Swedish Krona |
CLP | | Chilean Peso | | JPY | | Japanese Yen | | TWD | | New Taiwan Dollar |
COP | | Columbian Peso | | KRW | | South Korean Won | | ZAR | | South African Rand |
EUR | | Euro | | MYR | | Malaysian Ringgit | | | | |
See accompanying notes
18
American Beacon Ionic Strategic Arbitrage FundSM
Schedule of Investments
December 31, 2015
| | | | | | | | |
| | | Shares | | | Fair Value | |
| | | | | | (000’s) | |
LONG SECURITIES | | | | | | | | |
COMMON STOCKS—10.78% | | | | | | | | |
CONSUMER DISCRETIONARY—2.10% | | | | | | | | |
Automobiles—0.01% | | | | | | | | |
General Motors Co. | | | 162 | | | $ | 6 | |
| | | | | | | | |
Hotels, Restaurants & Leisure—1.35% | | | | | | | | |
Carnival Corp. | | | 22,811 | | | | 1,243 | |
| | | | | | | | |
Internet & Catalog Retail—0.33% | | | | | | | | |
Liberty Tripadvisor Holdings, Inc.A | | | 9,924 | | | | 301 | |
| | | | | | | | |
Media—0.41% | | | | | | | | |
Liberty Media Corp.A | | | 9,935 | | | | 378 | |
| | | | | | | | |
Total Consumer Discretionary | | | | | | | 1,928 | |
| | | | | | | | |
CONSUMER STAPLES—0.28% | | | | | | | | |
Food Products—0.26% | | | | | | | | |
Nomad Foods Ltd.A | | | 19,938 | | | | 239 | |
| | | | | | | | |
Household Products—0.02% | | | | | | | | |
Central Garden and Pet Co.A | | | 1,105 | | | | 15 | |
| | | | | | | | |
Total Consumer Staples | | | | | | | 254 | |
| | | | | | | | |
ENERGY—0.02% | | | | | | | | |
Oil & Gas—0.02% | | | | | | | | |
Kinder Morgan, Inc. | | | 1,091 | | | | 16 | |
| | | | | | | | |
FINANCIALS—4.08% | | | | | | | | |
Diversified Financials—3.84% | | | | | | | | |
AR Capital Acquisition Corp.A C | | | 34,054 | B | | | 331 | |
Arowana, Inc.A C | | | 2,500 | B | | | 25 | |
Bank of America Corp. | | | 1,509 | | | | 25 | |
Barington/Hilco Acquisition Corp.A C | | | 1,209 | B | | | 12 | |
Boulevard Acquisition Corp. IIA C | | | 41,510 | | | | 411 | |
Boulevard Acquisition Corp. IIA C | | | 9,464 | B | | | 92 | |
Capitol Acquisition Corp. IIIA C | | | 9,300 | B | | | 93 | |
Double Eagle Acquisition Corp.A C | | | 8,011 | B | | | 80 | |
DT Asia Investments Ltd.A | | | 6,165 | | | | 62 | |
Electrum Special Acquisition Corp.A C | | | 68,228 | B | | | 658 | |
Garnero Group Acquisition Co.A C | | | 1,345 | B | | | 13 | |
Gores Holdings, Inc.A C | | | 9,000 | B | | | 90 | |
GP Investments Acquisition Corp.A C | | | 2,660 | B | | | 26 | |
Harmony Merger Corp.A | | | 846 | | | | 8 | |
Hennessy Capital Acquisition Corp. IIA C | | | 56,686 | B | | | 556 | |
Hydra Industries Acquisition Corp.A C | | | 1,566 | B | | | 15 | |
Pace Holdings Corp.A C | | | 8,011 | B | | | 81 | |
Quinpario Acquisition Corp. 2A C | | | 10,901 | B | | | 106 | |
Terrapin 3 Acquisition Corp.A C | | | 17,359 | B | | | 171 | |
WL Holding Corp.A | | | 67,825 | | | | 675 | |
| | | | | | | | |
| | | | | | | 3,530 | |
| | | | | | | | |
Insurance—0.24% | | | | | | | | |
PartnerRe Ltd. | | | 1,550 | | | | 217 | |
| | | | | | | | |
Total Financials | | | | | | | 3,747 | |
| | | | | | | | |
HEALTH CARE—0.21% | | | | | | | | |
Biotechnology—0.00% | | | | | | | | |
Oncocyte Corp.A | | | 220 | | | | 1 | |
| | | | | | | | |
See accompanying notes
19
American Beacon Ionic Strategic Arbitrage FundSM
Schedule of Investments
December 31, 2015
| | | | | | | | |
| | | Shares | | | Fair Value | |
| | | | | | (000’s) | |
Health Care Providers & Services—0.01% | | | | | | | | |
Kindred Healthcare, Inc. | | | 780 | | | $ | 9 | |
| | | | | | | | |
Pharmaceuticals—0.20% | | | | | | | | |
Sanofi, ADRD | | | 4,383 | | | | 187 | |
| | | | | | | | |
Total Health Care | | | | | | | 197 | |
| | | | | | | | |
INDUSTRIALS—0.64% | | | | | | | | |
Aerospace & Defense—0.64% | | | | | | | | |
HEICO Corp. | | | 6,924 | | | | 376 | |
Precision Castparts Corp. | | | 935 | | | | 217 | |
| | | | | | | | |
Total Industrials | | | | | | | 593 | |
| | | | | | | | |
INFORMATION TECHNOLOGY—1.77% | | | | | | | | |
Internet Software & Services—1.28% | | | | | | | | |
Alphabet, Inc., Class CA | | | 88 | | | | 67 | |
Global Eagle Entertainment, Inc.A | | | 8,090 | | | | 80 | |
Qihoo 360 Technology Co., Ltd., ADRA D | | | 3,022 | | | | 220 | |
Yahoo! Inc.A | | | 24,203 | | | | 805 | |
| | | | | | | | |
| | | | | | | 1,172 | |
| | | | | | | | |
Semiconductor Equipment & Products—0.25% | | | | | | | | |
Fairchild Semiconductor International, Inc.A | | | 10,897 | | | | 226 | |
| | | | | | | | |
Software—0.24% | | | | | | | | |
Solera Holdings, Inc. | | | 4,088 | | | | 224 | |
| | | | | | | | |
Total Information Technology | | | | | | | 1,622 | |
| | | | | | | | |
MATERIALS—0.03% | | | | | | | | |
Chemicals—0.03% | | | | | | | | |
Delta Technology Holdings Ltd., A | | | 17,778 | | | | 26 | |
| | | | | | | | |
Total COMMON STOCKS (Cost $8,374) | | | | | | | 8,383 | |
| | | | | | | | |
WARRANTS—4.87% | | | | | | | | |
CONSUMER DISCRETIONARY—0.96% | | | | | | | | |
Automobiles—0.06% | | | | | | | | |
Blue Bird Corp., 2/24/2020, Strike Price $5.75 | | | 60,432 | | | | 54 | |
| | | | | | | | |
Hotels, Restaurants & Leisure—0.73% | | | | | | | | |
Chanticleer Holdings, Inc., 6/21/2017, Strike Price $5.00 | | | 13,325 | | | | 2 | |
Del Taco Restaurants, Inc., 6/30/2020, Strike Price $11.50 | | | 134,828 | | | | 391 | |
Lindblad Expeditions Holdings, Inc., 7/8/2020, Strike Price $11.50 | | | 90,386 | | | | 276 | |
| | | | | | | | |
| | | | | | | 669 | |
| | | | | | | | |
Media—0.17% | | | | | | | | |
Hemisphere Media Group, Inc., 4/4/2018, Strike Price $12.00 | | | 103,668 | | | | 156 | |
| | | | | | | | |
Retail—0.00% | | | | | | | | |
KBS Fashion Group Ltd., 1/22/2018, Strike Price $11.50 | | | 40,000 | | | | 1 | |
| | | | | | | | |
Total Consumer Discretionary | | | | | | | 880 | |
| | | | | | | | |
ENERGY—0.01% | | | | | | | | |
Energy—0.00% | | | | | | | | |
FieldPoint Petroleum Corp., 3/23/2018, Strike Price $4.00 | | | 42,260 | | | | 1 | |
| | | | | | | | |
See accompanying notes
20
American Beacon Ionic Strategic Arbitrage FundSM
Schedule of Investments
December 31, 2015
| | | | | | | | |
| | | Shares | | | Fair Value | |
| | | | | | (000’s) | |
Oil & Gas—0.01% | |
Kinder Morgan, Inc., 5/25/2017, Strike Price $40.00 | | | 61,086 | | | $ | 4 | |
| | | | | | | | |
Total Energy | | | | 5 | |
| | | | | | | | |
FINANCIALS—2.36% | | | | | | | | |
Banks—2.35% | | | | | | | | |
Associated Banc-Corp., 11/21/2018, Strike Price $19.77 | | | 47,050 | | | | 136 | |
Comerica, Inc., 11/14/2018, Strike Price $29.40 | | | 1,283 | | | | 18 | |
PNC Financial Services Group, Inc., 12/31/2018, Strike Price $67.33 | | | 19,684 | | | | 565 | |
SunTrust Banks, Inc., 11/14/2018, Strike Price $44.15 | | | 50,849 | | | | 280 | |
TCF Financial Corp., 11/14/2018, Strike Price $16.93 | | | 94,608 | | | | 193 | |
Valley National Bancorp, 11/14/2018, Strike Price $16.11 | | | 42,943 | | | | 6 | |
Washington Federal, Inc., 11/14/2018, Strike Price $17.57 | | | 22,741 | | | | 146 | |
Zions Bancorporation, 5/22/2020, Strike Price $36.1976 | | | 238,561 | | | | 809 | |
Zions Bancorporation, 11/14/2018, Strike Price $36.27 | | | 7,947 | | | | 16 | |
| | | | | | | | |
| | | | | | | 2,169 | |
| | | | | | | | |
Diversified Financials—0.01% | | | | | | | | |
Arowana, Inc., 5/1/2020, Strike Price $12.50C | | | 117,141 | | | | 10 | |
| | | | | | | | |
Total Financials | | | | 2,179 | |
| | | | | | | | |
HEALTH CARE—0.33% | | | | | | | | |
Biotechnology—0.24% | | | | | | | | |
Biondvax Pharmaceuticals Ltd., 5/15/2020, Strike Price $6.25D | | | 4,686 | | | | 3 | |
BioTime, Inc., 10/1/2018, Strike Price $5.00 | | | 176,935 | | | | 188 | |
ContraFect Corp., 1/31/2017, Strike Price $4.80 | | | 20,200 | | | | 29 | |
OpGen, Inc., 5/5/2020, Strike Price $6.60 | | | 199 | | | | 0 | |
| | | | | | | | |
| | | | | | | 220 | |
| | | | | | | | |
Pharmaceuticals—0.09% | | | | | | | | |
Capnia, Inc., 11/13/2019, Strike Price $6.50 | | | 1,875 | | | | 1 | |
CEL-SCI Corp., 10/11/2018, Strike Price $1.25 | | | 20,000 | | | | 4 | |
EyeGate Pharmaceuticals, Inc., 7/31/2020, Strike Price $10.62 | | | 24,172 | | | | 13 | |
Kitov Pharmaceuticals Holdings Ltd., 11/20/2020, Strike Price $4.13 | | | 77,514 | | | | 37 | |
Medgenics, Inc., 4/12/2016, Strike Price $6.00 | | | 6,225 | | | | 8 | |
Oculus Innovative Sciences, Inc., 1/21/2020, Strike Price $1.30 | | | 78,295 | | | | 24 | |
| | | | | | | | |
| | | | | | | 87 | |
| | | | | | | | |
Total Health Care | | | | 307 | |
| | | | | | | | |
INDUSTRIALS—0.10% | | | | | | | | |
Chemicals—0.03% | | | | | | | | |
AgroFresh Solutions, Inc., 2/19/2019, Strike Price $11.50 | | | 25,623 | | | | 24 | |
| | | | | | | | |
Commercial Services & Supplies—0.07% | | | | | | | | |
Solar3D, Inc., 3/9/2020, Strike Price $4.15 | | | 68,850 | | | | 62 | |
Tempus Applied Solutions Holdings, Inc., 7/31/2020, Strike Price $11.50 | | | 37,152 | | | | 7 | |
| | | | | | | | |
| | | | | | | 69 | |
| | | | | | | | |
Total Industrials | | | | 93 | |
| | | | | | | | |
INFORMATION TECHNOLOGY—0.24% | | | | | | | | |
Computers & Peripherals—0.22% | | | | | | | | |
Applied DNA Sciences, Inc., 11/14/2019, Strike Price $3.50 | | | 113,326 | | | | 188 | |
Eastman Kodak Co., 9/3/2018, Strike Price $14.93 | | | 2,835 | | | | 8 | |
Eastman Kodak Co., 9/3/2018, Strike Price $16.12 | | | 5,514 | | | | 8 | |
| | | | | | | | |
| | | | | | | 204 | |
| | | | | | | | |
Information / Data Technology—0.00% | | | | | | | | |
DragonWave, Inc., 8/1/2016, Strike Price $2.25L | | | 10,000 | | | | — | |
| | | | | | | | |
Software & Services—0.02% | | | | | | | | |
Ability, Inc., 12/17/2018, Strike Price $11.50 | | | 10,998 | | | | 15 | |
See accompanying notes
21
American Beacon Ionic Strategic Arbitrage FundSM
Schedule of Investments
December 31, 2015
| | | | | | | | |
| | | Shares | | | Fair Value | |
| | | | | | (000’s) | |
RMG Networks Holding Corp., 4/8/2018, Strike Price $11.50L | | | 6,250 | | | $ | — | |
| | | | | | | | |
| | | | | | | 15 | |
| | | | | | | | |
Total Information Technology | | | | 219 | |
| | | | | | | | |
MATERIALS—0.87% | | | | | | | | |
Construction Materials—0.86% | | | | | | | | |
Tecnoglass, Inc., 12/16/2016, Strike Price $8.00 | | | 29,989 | | | | 178 | |
US Concrete, Inc., 8/31/2017, Strike Price $22.69 | | | 760 | | | | 24 | |
US Concrete, Inc., 8/31/2017, Strike Price $26.68 | | | 20,955 | | | | 587 | |
| | | | | | | | |
| | | | | | | 789 | |
| | | | | | | | |
Metals & Mining—0.01% | | | | | | | | |
Franco-Nevada Corp., 6/16/2017, Strike Price $75.00 | | | 465 | | | | 3 | |
New Gold, Inc., 6/28/2017, Strike Price $15.00 | | | 62,717 | | | | 3 | |
| | | | | | | | |
| | | | | | | 6 | |
| | | | | | | | |
Total Materials | | | | 795 | |
| | | | | | | | |
Total WARRANTS (Cost $4,356) | | | | 4,478 | |
| | | | | | | | |
CONVERTIBLE PREFERRED STOCKS—12.69% | | | | | | | | |
CONSUMER—2.66% | | | | | | | | |
Consumer Products—1.14% | | | | | | | | |
Tyson Foods, Inc., 4.75%, Due 7/15/2017 | | | 17,320 | | | | 1,051 | |
| | | | | | | | |
Food Processors—1.52% | | | | | | | | |
Bunge Ltd., 4.875%, Due 12/31/2049 | | | 15,000 | | | | 1,396 | |
| | | | | | | | |
Total Consumer | | | | 2,447 | |
| | | | | | | | |
ENERGY—1.35% | | | | | | | | |
Oil & Gas—1.19% | | | | | | | | |
Southwestern Energy Co., 6.25%, Due 1/15/2018 | | | 58,605 | | | | 1,087 | |
| | | | | | | | |
Power—0.16% | | | | | | | | |
SunEdison, Inc., 6.75%, Due 12/31/2029 | | | 500 | | | | 151 | |
| | | | | | | | |
Total Energy | | | | 1,238 | |
| | | | | | | | |
FINANCE—3.26% | | | | | | | | |
HMO—1.02% | | | | | | | | |
Anthem, Inc., 5.25%, Due 5/1/2018 | | | 20,284 | | | | 934 | |
| | | | | | | | |
Insurance—0.47% | | | | | | | | |
Maiden Holdings Ltd., 7.25%, Due 9/15/2016 | | | 8,208 | | | | 430 | |
| | | | | | | | |
Real Estate Investment Trusts—1.77% | | | | | | | | |
Crown Castle International Corp., 4.50%, Due 11/1/2016 | | | 7,003 | | | | 747 | |
Forestar Group, Inc., 6.00%, Due 12/15/2016 | | | 45,000 | | | | 692 | |
Invesco Mortgage Capital, Inc., 7.75%, Due 12/31/2049 | | | 9,187 | | | | 197 | |
| | | | | | | | |
| | | | | | | 1,636 | |
| | | | | | | | |
Total Finance | | | | 3,000 | |
| | | | | | | | |
MANUFACTURING—0.86% | | | | | | | | |
Home Builders – 0.86% | | | | | | | | |
William Lyon Homes, Inc., 6.50%, Due 12/01/2017 | | | 9,000 | | | | 795 | |
| | | | | | | | |
MATERIALS—0.80% | | | | | | | | |
Metals and Mining– 0.80% | | | | | | | | |
ArcelorMittal, 6.00%, Due 1/15/2016 | | | 112,677 | | | | 734 | |
| | | | | | | | |
See accompanying notes
22
American Beacon Ionic Strategic Arbitrage FundSM
Schedule of Investments
December 31, 2015
| | | | | | | | |
| | | Shares | | | Fair Value | |
| | | | | | (000’s) | |
SERVICE—2.21% | | | | | | | | |
Other Service—1.31% | | | | | | | | |
Amsurg Corp., 5.25%, Due 7/1/2017 | | | 851 | | | $ | 122 | |
Stericycle, Inc., 5.25%, Due 9/15/2018 | | | 11,801 | | | | 1,081 | |
| | | | | | | | |
| | | | | | | 1,203 | |
| | | | | | | | |
Pharmaceuticals—0.90% | | | | | | | | |
Allergan PLC, 5.50%, Due 3/1/2018F | | | 800 | | | | 824 | |
| | | | | | | | |
Total Service | | | | | | | 2,027 | |
| | | | | | | | |
TELECOMMUNICATIONS—0.70% | | | | | | | | |
Telecom—0.70% | | | | | | | | |
Intelsat S.A., 5.75%, Due 5/1/2016 | | | 9,200 | | | | 115 | |
T-Mobile US, Inc., 5.50%, Due 12/15/2017 | | | 7,786 | | | | 527 | |
| | | | | | | | |
Total Telecommunications | | | | | | | 642 | |
| | | | | | | | |
UTILITIES – 2.50% | | | | | | | | |
Electric – 2.50% | | | | | | | | |
Black Hills Corp., 7.75%, Due 11/1/2018 | | | 27,400 | E | | | 1,518 | |
NextEra Energy, Inc., 6.371%, Due 9/01/2018 | | | 14,730 | | | | 778 | |
| | | | | | | | |
Total Utilities | | | | | | | 2,296 | |
| | | | | | | | |
Total CONVERTIBLE PREFERRED STOCKS (Cost $12,968) | | | | | | | 13,179 | |
| | | | | | | | |
PREFERRED STOCKS—0.77% (Cost $700) | | | | | | | | |
SERVICE—0.77% | | | | | | | | |
Pharmaceuticals—0.77% | | | | | | | | |
Teva Pharmaceutical Industries Ltd., 7.00%, Due 12/15/2018A | | | 700 | | | | 712 | |
| | | | | | | | |
| | |
| | | Par Amount | | | | |
| | | (000’s) | | | | |
CONVERTIBLE OBLIGATIONS—16.08% | | | | | | | | |
Auto Manufacturing—0.86% | | | | | | | | |
Tesla Motors, Inc., | | | | | | | | |
1.50%, Due 6/1/2018 | | $ | 400 | | | | 788 | |
| | | | | | | | |
Electronics—4.35% | | | | | | | | |
Intel Corp., | | | | | | | | |
3.25%, Due 8/1/2039 | | | 550 | | | | 915 | |
NVIDIA Corp., | | | | | | | | |
1.00%, Due 12/1/2018 | | | 1,250 | | | | 2,081 | |
SunPower Corp., | | | | | | | | |
4.00%, Due 1/15/2023G | | | 833 | | | | 999 | |
| | | | | | | | |
| | | | | | | 3,995 | |
| | | | | | | | |
Information / Data Technology—0.72% | | | | | | | | |
Take-Two Interactive Software, Inc., | | | | | | | | |
1.00%, Due 7/1/2018 | | | 400 | | | | 665 | |
| | | | | | | | |
Internet Tech—3.70% | | | | | | | | |
Ctrip.com International Ltd., | | | | | | | | |
1.25%, Due 10/15/2018 | | | 1,575 | | | | 2,087 | |
j2 Global, Inc., | | | | | | | | |
3.25%, Due 6/15/2029 | | | 1,000 | | | | 1,311 | |
| | | | | | | | |
| | | | | | | 3,398 | |
| | | | | | | | |
Other Service—1.97% | | | | | | | | |
HealthSouth Corp., | | | | | | | | |
2.00%, Due 12/1/2043 | | | 500 | | | | 539 | |
Monster Worldwide, Inc., | | | | | | | | |
3.50%, Due 10/15/2019 | | | 1,000 | | | | 1,270 | |
| | | | | | | | |
| | | | | | | 1,809 | |
| | | | | | | | |
Other Transportation—0.22% | | | | | | | | |
Ship Finance International Ltd., | | | | | | | | |
3.75%, Due 2/10/2016 | | | 200 | | | | 204 | |
| | | | | | | | |
See accompanying notes
23
American Beacon Ionic Strategic Arbitrage Fund SM
Schedule of Investments
December 31, 2015
| | | | | | | | |
| | | Par Amount | | | Fair Value | |
| | | (000’s) | | | (000’s) | |
Pharmaceuticals—2.29% | | | | | | | | |
Depomed, Inc., | | | | | | | | |
2.50%, Due 9/1/2021 | | $ | 1,500 | | | $ | 1,707 | |
Horizon Pharma Investment Ltd., | | | | | | | | |
2.50%, Due 3/15/2022G | | | 400 | | | | 399 | |
| | | | | | | | |
| | | | | | | 2,106 | |
| | | | | | | | |
Retail—1.11% | | | | | | | | |
Restoration Hardware Holdings, Inc., | | | | | | | | |
0.00%, Due 7/15/2020 G | | | 1,150 | | | | 1,020 | |
| | | | | | | | |
Telecom—0.86% | | | | | | | | |
America Movil S.A.B. de C.V., | | | | | | | | |
5.50%, Due 9/17/2018 | | | 700 | | | | 793 | |
| | | | | | | | |
Total CONVERTIBLE OBLIGATIONS (Cost $14,616) | | | | | | | 14,778 | |
| | | | | | | | |
CORPORATE OBLIGATIONS—0.23% (Cost $281) | | | | | | | | |
Oil & Gas—0.23% | | | | | | | | |
Cobalt International Energy, Inc., | | | | | | | | |
3.125%, Due 5/15/2024 | | | 400 | | | | 209 | |
| | | | | | | | |
COLLATERALIZED MORTGAGE OBLIGATIONS—11.64% | | | | | | | | |
Fannie Mae Interest Strip, | | | | | | | | |
8.50%, Due 3/25/2023, 211 2 | | | 349 | | | | 72 | |
5.00%, Due 4/25/2034, 351 5 | | | 371 | | | | 80 | |
5.50%, Due 8/25/2035, 359 14 | | | 1,469 | | | | 301 | |
5.50%, Due 10/25/2035, 359 12 | | | 1,453 | | | | 294 | |
Fannie Mae REMICS, | | | | | | | | |
7.328%, Due 3/25/2032, 2002 8 SCH | | | 191 | | | | 39 | |
6.578%, Due 9/25/2032, 2002 90 DSH | | | 1,141 | | | | 232 | |
7.578%, Due 12/25/2032, 2002 86 USH | | | 753 | | | | 182 | |
4.50%, Due 12/25/2033, 2003 119 GI | | | 159 | | | | 31 | |
6.178%, Due 2/25/2035, 2005 2 SH | | | 244 | | | | 44 | |
6.148%, Due 6/25/2036, 2006 44 SFH | | | 2,638 | | | | 469 | |
5.628%, Due 11/25/2036, 2008 50 SAH | | | 242 | | | | 41 | |
6.218%, Due 12/25/2036, 2006 117 SAH | | | 1,903 | | | | 373 | |
7.00%, Due 2/25/2037, 381 17 | | | 1,256 | | | | 313 | |
5.00%, Due 2/25/2040, 2010 16 PI | | | 216 | | | | 40 | |
6.058%, Due 7/25/2040, 2010 68 SCH | | | 1,623 | | | | 328 | |
5.50%, Due 12/25/2043, 2014 38 QI | | | 1,819 | | | | 374 | |
5.50%, Due 5/25/2045, 2015 30 IO | | | 2,332 | | | | 529 | |
5.00%, Due 10/25/2045, 2015 70 JI | | | 1,877 | | | | 385 | |
1.941%, Due 6/25/2055, 42 AI | | | 1,961 | | | | 135 | |
1.705%, Due 9/25/2055, 64 SK | | | 8,034 | | | | 546 | |
Freddie Mac REMICS, | | | | | | | | |
7.770%, Due 2/15/2028, 2526 SWH | | | 145 | | | | 34 | |
8.50%, Due 1/15/2030, 2206 IO | | | 166 | | | | 44 | |
7.00%, Due 4/15/2032, 2525 IK | | | 132 | | | | 48 | |
7.470%, Due 6/15/2032, 3489 SDH | | | 153 | | | | 31 | |
6.370%, Due 10/15/2036, 3232 STH | | | 221 | | | | 37 | |
1.894%, Due 10/15/2041, 4413 WI | | | 1,270 | | | | 83 | |
0.953%, Due 4/15/2043, 4517 KIH | | | 8,334 | | | | 246 | |
6.00%, Due 11/15/2043, 4472 IJ | | | 1,645 | | | | 398 | |
Ginnie Mae REMIC Trust, | | | | | | | | |
4.00%, Due 12/20/2025, 2013 88 IM | | | 368 | | | | 23 | |
6.650%, Due 2/17/2029, 1999 40 TWH | | | 261 | | | | 54 | |
7.256%, Due 5/16/2029, 1999 18 SDH | | | 410 | | | | 97 | |
7.156%, Due 5/16/2031, 2001 22 SDH | | | 452 | | | | 106 | |
7.156%, Due 6/16/2032, 2002 41 SYH | | | 148 | | | | 26 | |
See accompanying notes
24
American Beacon Ionic Strategic Arbitrage Fund SM
Schedule of Investments
December 31, 2015
| | | | | | | | |
| | | Par Amount | | | Fair Value | |
| | | (000’s) | | | (000’s) | |
7.356%, Due 2/16/2033, 2003 11 SKH | | $ | 336 | | | $ | 58 | |
7.248%, Due 6/20/2033, 2004 56 SH | | | 490 | | | | 105 | |
6.086%, Due 10/16/2033, 2003 92 SNH | | | 212 | | | | 33 | |
6.24%, Due 11/20/2033, 2003 98 SCH | | | 1,383 | | | | 282 | |
6.748%, Due 11/20/2033, 2004 37 SMH | | | 1,897 | | | | 172 | |
6.698%, Due 6/20/2034, 2004 46 S | | | 1,814 | | | | 376 | |
5.698%, Due 9/20/2034, 2004 86 SPH | | | 209 | | | | 25 | |
5.50%, Due 1/20/2035, 2015 179 IV | | | 2,520 | | | | 190 | |
5.698%, Due 1/20/2035, 2009 25 SBH | | | 5,228 | | | | 279 | |
5.00%, Due 6/20/2035, 2014 183 IM | | | 1,800 | | | | 456 | |
5.50%, Due 7/20/2035, 2005 56 IC | | | 135 | | | | 31 | |
6.456%, Due 8/16/2036, 2006 47 SAH | | | 148 | | | | 32 | |
6.216%, Due 11/16/2036, 2008 83 SDH | | | 126 | | | | 26 | |
6.248%, Due 12/20/2037, 2007 81 SPH | | | 3,119 | | | | 560 | |
6.056%, Due 5/16/2038, 2008 40 SAH | | | 341 | | | | 61 | |
5.50%, Due 5/16/2039, 2009 776 GI | | | 1,451 | | | | 244 | |
4.50%, Due 9/20/2039, 2013 88 WI | | | 538 | | | | 79 | |
5.00%, Due 5/16/2042, 2013 44 IB | | | 524 | | | | 125 | |
5.00%, Due 6/20/2043, 2013 86 IA | | | 412 | | | | 89 | |
6.356%, Due 8/16/2043, 2013 113 SDH | | | 2,314 | | | | 455 | |
7.00%, Due 8/20/2043, 2013 114 IW | | | 166 | | | | 33 | |
5.748%, Due 11/20/2043, 2013 165 STH | | | 241 | | | | 45 | |
10.00%, Due 12/20/2043, 2013 190 IC | | | 102 | | | | 15 | |
0.998%, Due 1/16/2044, 2015 80 HI | | | 3,896 | | | | 153 | |
5.50%, Due 1/20/2044, 2014 2 TI | | | 604 | | | | 119 | |
8.00%, Due 5/20/2044, 2014 68 NI | | | 130 | | | | 44 | |
6.556%, Due 11/20/2044, 2014 161 SLH | | | 226 | | | | 50 | |
7.00%, Due 8/20/2045, 2015 111 YI | | | 511 | | | | 108 | |
5.00%, Due 12/16/2045, 2015 180 CII | | | 1,620 | | | | 423 | |
| | | | | | | | |
Total COLLATERALIZED MORTGAGE OBLIGATIONS (Cost $10,746) | | | | | | | 10,703 | |
| | | | | | | | |
| | |
| | | Shares | | | | |
INVESTMENT COMPANIES—5.85% | | | | | | | | |
CLOSED END FUNDS—5.85% | | | | | | | | |
Aberdeen Australia Equity Fund, Inc. | | | 48,000 | | | | 262 | |
Advent Claymore Convertible Securities and Income Fund | | | 7,596 | | | | 103 | |
Advent Claymore Convertible Securities and Income Fund II | | | 47,146 | | | | 262 | |
AllianzGI Convertible & Income Fund | | | 76,939 | | | | 426 | |
AllianzGI Convertible & Income Fund II | | | 32,466 | | | | 164 | |
AllianzGI NFJ Dividend Interest & Premium Strategy Fund | | | 28,900 | | | | 358 | |
Alpine Global Premier Properties Fund | | | 45,400 | | | | 262 | |
ASA Gold and Precious Metals Fund | | | 8,415 | | | | 60 | |
BlackRock Credit Allocation Income Trust | | | 21,467 | | | | 265 | |
BlackRock Resources & Commodities Strategy Trust | | | 44,693 | | | | 318 | |
Calamos Dynamic Convertible & Income Fund | | | 2,757 | | | | 50 | |
Cohen & Steers MLP Income and Energy Opportunity Fund, Inc. E K | | | 7,190 | | | | 75 | |
Cohen & Steers REIT and Preferred Income Fund, Inc. | | | 22,106 | | | | 408 | |
Fiduciary/Claymore MLP Opportunity Fund E K | | | 9,129 | | | | 119 | |
First Trust Energy Infrastructure Fund | | | 4,751 | | | | 69 | |
Invesco Dynamic Credit Opportunities Fund | | | 39,185 | | | | 413 | |
Kayne Anderson MLP Investment Co. E K | | | 6,150 | | | | 106 | |
LMP Capital and Income Fund, Inc. | | | 18,569 | | | | 230 | |
New America High Income Fund, Inc. | | | 32,020 | | | | 245 | |
Nuveen Energy MLP Total Return Fund E K | | | 12,847 | | | | 143 | |
Royce Micro-Cap Trust, Inc. | | | 27,652 | | | | 201 | |
Swiss Helvetia Fund, Inc. | | | 11,047 | | | | 117 | |
Tortoise Pipeline & Energy Fund, Inc. | | | 4,789 | | | | 70 | |
Wells Fargo Global Dividend Opportunity Fund | | | 56,144 | | | | 332 | |
See accompanying notes
25
American Beacon Ionic Strategic Arbitrage Fund SM
Schedule of Investments
December 31, 2015
| | | | | | | | |
| | | Shares | | | Fair Value | |
| | | | | | (000’s) | |
Western Asset/Claymore Inflation-Linked Opportunities & Income Fund | | | 17,509 | | | $ | 180 | |
Western Asset/Claymore Inflation-Linked Securities & Income Fund | | | 13,130 | | | | 139 | |
| | | | | | | | |
Total Closed End Funds | | | | 5,377 | |
| | | | | | | | |
Total INVESTMENT COMPANIES (Cost $5,366) | | | | 5,377 | |
| | | | | | | | |
EXCHANGE TRADED INSTRUMENTS—2.91% | | | | | | | | |
EXCHANGE TRADED FUNDS—1.96% | | | | | | | | |
iShares 3-7 Year Treasury Bond ETF | | | 989 | | | | 121 | |
iShares China Large-Cap Fund | | | 10,124 | | | | 357 | |
iShares MSCI Brazil Capped Fund | | | 594 | | | | 12 | |
iShares MSCI USA Momentum Factor ETF | | | 4,229 | | | | 310 | |
iShares Russell 2000 Index Fund | | | 5,944 | | | | 669 | |
Vanguard Total Bond Market ETF | | | 4,154 | | | | 335 | |
| | | | | | | | |
Total Exchange Traded Funds | | | | 1,804 | |
| | | | | | | | |
EXCHANGE TRADED NOTES—0.95% | | | | | | | | |
ETRACS Monthly Pay 2xLeveraged Closed-End Fund ETN | | | 19,735 | | | | 303 | |
iPATH S&P 500 VIX Short-Term Futures ETN | | | 9,406 | | | | 189 | |
VelocityShares Daily Inverse VIX Short Term ETN | | | 14,716 | | | | 380 | |
| | | | | | | | |
Total Exchange Traded Notes | | | | 872 | |
| | | | | | | | |
Total EXCHANGE TRADED INSTRUMENTS (Cost $2,766) | | | | 2,676 | |
| | | | | | | | |
SHORT-TERM INVESTMENTS—33.80% (Cost $31,071) | | | | | | | | |
JPMorgan U.S. Government Money Market Fund, Capital Class | | | 31,071,426 | | | | 31,071 | |
| | | | | | | | |
TOTAL SECURITIES HELD LONG (Cost: $91,246) | | | | | | | 91,566 | |
| | | | | | | | |
SECURITIES SOLD SHORT | | | | | | | | |
COMMON STOCKS—(36.94%) | | | | | | | | |
CONSUMER DISCRETIONARY—(6.87%) | | | | | | | | |
Automobiles—(0.89%) | | | | | | | | |
Blue Bird Corp.A | | | (8,386 | ) | | | (85 | ) |
Tesla Motors, Inc.A | | | (3,032 | ) | | | (728 | ) |
| | | | | | | | |
| | | | | | | (813 | ) |
| | | | | | | | |
Homebuilders—(0.66%) | | | | | | | | |
William Lyon Homes, Inc., Class AA | | | (36,520 | ) | | | (603 | ) |
| | | | | | | | |
Hotels, Restaurants & Leisure—(2.72%) | | | | | | | | |
Carnival PLC, ADRD | | | (23,831 | ) | | | (1,357 | ) |
Del Taco Restaurants, Inc.A | | | (58,723 | ) | | | (625 | ) |
Lindblad Expeditions Holdings, Inc.A | | | (46,531 | ) | | | (517 | ) |
| | | | | | | | |
| | | | | | | (2,499 | ) |
| | | | | | | | |
Internet & Catalog Retail—(2.01%) | | | | | | | | |
Ctrip.com International Ltd., ADRD | | | (32,584 | ) | | | (1,509 | ) |
TripAdvisor, Inc.A | | | (4,090 | ) | | | (349 | ) |
| | | | | | | | |
| | | | | | | (1,858 | ) |
| | | | | | | | |
Media—(0.42%) | | | | | | | | |
Liberty Media Corp.A | | | (9,935 | ) | | | (390 | ) |
| | | | | | | | |
Specialty Retail—(0.17%) | | | | | | | | |
Restoration Hardware Holdings, Inc.A | | | (1,917 | ) | | | (152 | ) |
| | | | | | | | |
Total Consumer Discretionary | | | | (6,315 | ) |
| | | | | | | | |
CONSUMER STAPLES—(1.72%) | | | | | | | | |
Food Processors—(0.80%) | | | | | | | | |
Bunge Ltd. | | | (10,700 | ) | | | (731 | ) |
See accompanying notes
26
American Beacon Ionic Strategic Arbitrage Fund SM
Schedule of Investments
December 31, 2015
| | | | | | | | |
| | | Shares | | | Fair Value | |
| | | | | | (000’s) | |
Food Products—(0.92%) | | | | | | | | |
Tyson Foods, Inc., Class A | | | (15,918 | ) | | $ | (848 | ) |
| | | | | | | | |
Total Consumer Staples | | | | (1,579 | ) |
| | | | | | | | |
ENERGY—(1.01%) | | | | | | | | |
Oil & Gas—(1.01%) | | | | | | | | |
Southwestern Energy Co. A | | | (130,830 | ) | | | (930 | ) |
| | | | | | | | |
FINANCIALS—(9.04%) | | | | | | | | |
Banks—(7.48%) | | | | | | | | |
Associated Banc-Corp. | | | (27,389 | ) | | | (514 | ) |
Comerica, Inc. | | | (1,108 | ) | | | (46 | ) |
PNC Financial Services Group, Inc. | | | (17,735 | ) | | | (1,690 | ) |
SunTrust Banks, Inc. | | | (26,171 | ) | | | (1,121 | ) |
TCF Financial Corp. | | | (41,722 | ) | | | (589 | ) |
Washington Federal, Inc. | | | (16,468 | ) | | | (392 | ) |
Zions Bancorporation | | | (92,287 | ) | | | (2,520 | ) |
| | | | | | | | |
| | | | | | | (6,872 | ) |
| | | | | | | | |
Diversified Financials—(0.15%) | | | | | | | | |
Citigroup, Inc. | | | (2,729 | ) | | | (141 | ) |
| | | | | | | | |
Insurance—(0.32%) | | | | | | | | |
Maiden Capital Financing Trust | | | (19,409 | ) | | | (290 | ) |
| | | | | | | | |
Real Estate—(1.09%) | | | | | | | | |
Crown Castle International Corp.J | | | (4,763 | ) | | | (412 | ) |
Forestar Group, Inc.A | | | (54,100 | ) | | | (592 | ) |
| | | | | | | | |
| | | | | | | (1,004 | ) |
| | | | | | | | |
Total Financials | | | | (8,307 | ) |
| | | | | | | | |
HEALTH CARE—(3.69%) | | | | | | | | |
Biotechnology—(0.17%) | | | | | | | | |
BioTime, Inc.A | | | (36,458 | ) | | | (150 | ) |
ContraFect Corp.A | | | (2,036 | ) | | | (10 | ) |
| | | | | | | | |
| | | | | | | (160 | ) |
| | | | | | | | |
Health Care Providers & Services—(1.08%) | | | | | | | | |
Amsurg Corp.A | | | (1,498 | ) | | | (114 | ) |
Anthem, Inc. | | | (4,058 | ) | | | (566 | ) |
HealthSouth Corp. | | | (8,890 | ) | | | (309 | ) |
| | | | | | | | |
| | | | | | | (989 | ) |
| | | | | | | | |
Pharmaceuticals—(2.44%) | | | | | | | | |
Allergan PLCA F | | | (1,773 | ) | | | (554 | ) |
Depomed, Inc.A | | | (58,450 | ) | | | (1,059 | ) |
EyeGate Pharmaceuticals, Inc.A L | | | (50 | ) | | | — | |
Horizon Pharma PLCA F | | | (10,000 | ) | | | (217 | ) |
OpGen, Inc.A | | | (460 | ) | | | (1 | ) |
Teva Pharmaceutical Industries Ltd., Sponsored, ADRD | | | (6,400 | ) | | | (420 | ) |
| | | | | | | | |
| | | | | | | (2,251 | ) |
| | | | | | | | |
Total Health Care | | | | (3,400 | ) |
| | | | | | | | |
INDUSTRIALS—(2.96%) | | | | | | | | |
Aerospace & Defense—(0.37%) | | | | | | | | |
HEICO Corp. | | | (6,996 | ) | | | (344 | ) |
| | | | | | | | |
Airlines—(0.30%) | | | | | | | | |
Delta Air Lines, Inc. | | | (5,469 | ) | | | (277 | ) |
| | | | | | | | |
Chemicals—(0.12%) | | | | | | | | |
AgroFresh Solutions, Inc.A | | | (15,199 | ) | | | (96 | ) |
Central Garden and Pet Co.A | | | (1,103 | ) | | | (15 | ) |
| | | | | | | | |
| | | | | | | (111 | ) |
| | | | | | | | |
See accompanying notes
27
American Beacon Ionic Strategic Arbitrage Fund SM
Schedule of Investments
December 31, 2015
| | | | | | | | |
| | | Shares | | | Fair Value | |
| | | | | | (000’s) | |
Commercial Services & Supplies—(1.80%) | |
Monster Worldwide, Inc.A | | | (160,773 | ) | | $ | (922 | ) |
Stericycle, Inc.A | | | (6,080 | ) | | | (733 | ) |
| | | | | | | | |
| | | | | | | (1,655 | ) |
| | | | | | | | |
Industrial Conglomerates—(0.25%) | | | | | | | | |
General Electric Co. | | | (7,494 | ) | | | (233 | ) |
| | | | | | | | |
Marine—(0.12%) | | | | | | | | |
Ship Finance International Ltd. | | | (6,620 | ) | | | (110 | ) |
| | | | | | | | |
Total Industrials | | | | (2,730 | ) |
| | | | | | | | |
INFORMATION TECHNOLOGY—(6.36%) | | | | | | | | |
Computers & Peripherals—(2.20%) | | | | | | | | |
Applied DNA Sciences, Inc.A | | | (69,214 | ) | | | (224 | ) |
Eastman Kodak Co.A | | | (1,821 | ) | | | (23 | ) |
NVIDIA Corp. | | | (53,917 | ) | | | (1,777 | ) |
| | | | | | | | |
| | | | | | | (2,024 | ) |
| | | | | | | | |
Electronic Equipment & Instruments—(0.01%) | | | | | | | | |
Daktronics, Inc. | | | (1,375 | ) | | | (12 | ) |
| | | | | | | | |
Internet Software & Services—(1.85%) | | | | | | | | |
Alibaba Group Holding Ltd., ADRA D | | | (8,646 | ) | | | (703 | ) |
Alphabet, Inc., Class AA | | | (88 | ) | | | (69 | ) |
j2 Global, Inc. | | | (11,245 | ) | | | (926 | ) |
| | | | | | | | |
| | | | | | | (1,698 | ) |
| | | | | | | | |
Semiconductor Equipment & Products—(1.68%) | | | | | | | | |
Intel Corp. | | | (20,662 | ) | | | (712 | ) |
SunEdison, Inc.A | | | (32,544 | ) | | | (166 | ) |
SunPower Corp.A | | | (22,093 | ) | | | (663 | ) |
| | | | | | | | |
| | | | | | | (1,541 | ) |
| | | | | | | | |
Software—(0.62%) | | | | | | | | |
Take-Two Interactive Software, Inc. | | | (16,400 | ) | | | (571 | ) |
| | | | | | | | |
Total Information Technology | | | | (5,846 | ) |
| | | | | | | | |
MATERIALS—(2.25%) | | | | | | | | |
Construction Materials—(1.43%) | | | | | | | | |
Tecnoglass, Inc.A | | | (25,471 | ) | | | (350 | ) |
US Concrete, Inc.A | | | (18,246 | ) | | | (961 | ) |
| | | | | | | | |
| | | | | | | (1,311 | ) |
| | | | | | | | |
Metals & Mining—(0.82%) | | | | | | | | |
ArcelorMittal | | | (175,663 | ) | | | (741 | ) |
Franco-Nevada Corp. | | | (265 | ) | | | (12 | ) |
| | | | | | | | |
| | | | | | | (753 | ) |
| | | | | | | | |
Total Materials | | | | (2,064 | ) |
| | | | | | | | |
TELECOMMUNICATION SERVICES—(1.20%) | | | | | | | | |
Diversified Telecommunication Services—(0.70%) | | | | | | | | |
Intelsat S.A.A | | | (25,593 | ) | | | (107 | ) |
Koninklijke KPN N.V.I | | | (141,900 | ) | | | (536 | ) |
| | | | | | | | |
| | | | | | | (643 | ) |
| | | | | | | | |
Wireless Telecommunication Services—(0.50%) | | | | | | | | |
T-Mobile US, Inc. | | | (11,683 | ) | | | (457 | ) |
| | | | | | | | |
Total Telecommunication Services | | | | (1,100 | ) |
| | | | | | | | |
UTILITIES—(1.84%) | | | | | | | | |
Electric—(1.25%) | | | | | | | | |
Black Hills Corp. | | | (24,757 | ) | | | (1,149 | )�� |
| | | | | | | | |
See accompanying notes
28
American Beacon Ionic Strategic Arbitrage Fund SM
Schedule of Investments
December 31, 2015
| | | | | | | | |
| | | Shares | | | Fair Value | |
| | | | | | (000’s) | |
Utilities—(0.59%) | |
NextEra Energy, Inc. | | | (5,215 | ) | | $ | (541 | ) |
| | | | | | | | |
Total Utilities | | | | (1,690 | ) |
| | | | | | | | |
Total COMMON STOCKS (Proceeds $(33,434)) | | | | (33,961 | ) |
| | | | | | | | |
WARRANTS—(0.05%) | | | | | | | | |
FINANCIALS—(0.05%) | | | | | | | | |
Diversified Financials—(0.05%) | | | | | | | | |
Bank of America Corp., 1/16/2019, Strike Price 13.137 | | | (3,600 | ) | | | (21 | ) |
Bank of America Corp., 10/28/2018, Strike Price 30.79 | | | (20,000 | ) | | | (6 | ) |
Citigroup, Inc., 1/4/2019, Strike Price 106.10 | | | (100,000 | ) | | | (18 | ) |
| | | | | | | | |
Total Financials | | | | (45 | ) |
| | | | | | | | |
Total WARRANTS (Proceeds $(106)) | | | | (45 | ) |
| | | | | | | | |
| | |
| | | Par Amount | | | | |
| | | (000’s) | | | | |
CONVERTIBLE OBLIGATIONS – (0.24%) (Proceeds $(303)) | | | | | | | | |
Oil & Gas – (0.24%) | | | | | | | | |
Cobalt International Energy, Inc., | | | | | | | | |
2.625%, Due 12/1/2019 | | $ | (400 | ) | | | (224 | ) |
| | | | | | | | |
| | |
| | | Shares | | | | |
INVESTMENT COMPANIES – (0.50%) (Proceeds $(398)) | | | | | | | | |
CLOSED END FUNDS – (0.50%) | | | | | | | | |
Alerian MLP ETF E K | | | (37,660 | ) | | | (454 | ) |
| | | | | | | | |
EXCHANGE TRADED INSTRUMENTS – (8.65%) | | | | | | | | |
EXCHANGE TRADED FUNDS – (8.65%) | | | | | | | | |
CurrencyShares Euro Trust | | | (2,703 | ) | | | (288 | ) |
Direxion Daily Emerging Markets Bear 3X Shares | | | (3,977 | ) | | | (187 | ) |
Direxion Daily Financial Bear 3X Shares | | | (3,977 | ) | | | (164 | ) |
Direxion Daily Financial Bull 3X Shares | | | (7,958 | ) | | | (231 | ) |
Direxion Daily Gold Miners Index Bull 3X Shares | | | (10,133 | ) | | | (246 | ) |
Direxion Daily Small Cap Bear 3X Shares | | | (6,832 | ) | | | (307 | ) |
iShares Global Healthcare ETF | | | (1,277 | ) | | | (131 | ) |
iShares iBoxx $ High Yield Corporate Bond ETF | | | (5,460 | ) | | | (440 | ) |
iShares iBoxx $ Investment Grade Corporate Bond ETF | | | (980 | ) | | | (112 | ) |
iShares MSCI Australia Fund | | | (13,837 | ) | | | (262 | ) |
iShares MSCI Switzerland Capped ETF | | | (3,802 | ) | | | (118 | ) |
iShares Select Dividend ETF | | | (4,450 | ) | | | (334 | ) |
iShares TIPS Bond ETF | | | (2,979 | ) | | | (327 | ) |
iShares US Preferred Stock ETF | | | (5,991 | ) | | | (233 | ) |
iShares US Real Estate ETF | | | (1,569 | ) | | | (118 | ) |
Market Vectors Gold Miners ETF | | | (4,143 | ) | | | (57 | ) |
PIMCO Total Return Active Exchange-Traded Fund | | | (3,664 | ) | | | (382 | ) |
PowerShares DB US Dollar Index Bullish Fund | | | (29,674 | ) | | | (760 | ) |
SPDR Barclays Convertible Securities ETF | | | (11,562 | ) | | | (500 | ) |
SPDR S&P 500 ETF Trust | | | (8,385 | ) | | | (1,709 | ) |
Vanguard FTSE Emerging Markets Fund | | | (18,399 | ) | | | (602 | ) |
Vanguard REIT Fund | | | (5,515 | ) | | | (440 | ) |
| | | | | | | | |
Total EXCHANGE TRADED INSTRUMENTS (Proceeds $(8,015)) | | | | (7,948 | ) |
| | | | | | | | |
TOTAL SECURITIES SOLD SHORT (Proceeds $(42,256)) | | | | | | | (42,632 | ) |
| | | | | | | | |
TOTAL INVESTMENTS IN SECURITIES (excludes securities sold short) - 99.62% (Cost $91,246) | | | | 91,566 | |
TOTAL SECURITIES SOLD SHORT— (46.38)% (Proceeds $(42,256)) | | | | (42,632 | ) |
| | | | | | | | |
See accompanying notes
29
American Beacon Ionic Strategic Arbitrage Fund SM
Schedule of Investments
December 31, 2015
| | | | |
| | | Fair Value | |
| | | (000’s) | |
OTHER ASSETS, NET OF LIABILITIES—46.76% | | $ | 42,981 | |
| | | | |
TOTAL NET ASSETS—100.00% | | $ | 91,915 | |
| | | | |
Percentages are stated as a percent of net assets.
| A | Non-income producing security. |
| B | Unit - Usually consists of one common stock and/or rights and warrants. |
| C | SPAC - Special Purpose Acquisition Company. |
| D | ADR - American Depositary Receipt. |
| E | Unit – Consists of one common stock and a portion of a re-marketable Junior Subordinated Note (“RSN”). |
| F | PLC - Public Limited Company. |
| G | Security exempt from registration under the Securities Act of 1933. These securities may be resold to qualified institutional buyers pursuant to Rule 144A. At the period end, the value of these securities amounted to $2,418 or 2.63% of net assets. The Fund has no right to demand registration of these securities. |
| H | The coupon rate shown on floating or adjustable rate securities represents the rate at period end. The due date on these types of securities reflects the final maturity date. |
| I | Fair valued pursuant to procedures approved by the Board of Trustees. At period end, the value of these securities amounted to $(113) or (0.00)% of net assets. |
| J | REIT - Real Estate Investment Trust. |
| K | MLP - Master Limited Partnership. |
| L | Amount is less than $500. |
See accompanying notes
30
American Beacon Ionic Strategic Arbitrage FundSM
Schedule of Investments
December 31, 2015
Futures Contracts Open on December 31, 2015:
| | | | | | | | | | | | | | |
Description | | Type | | Number of
Contracts | | Expiration Date | | Contract Value | | | Unrealized
Appreciation
(Depreciation) | |
U.S. Treasury 5-Year Note Futures | | Long | | 6 | | March 2016 | | $ | 708,615 | | | $ | (2,110 | ) |
E-Mini Russell 2000 Futures | | Short | | 8 | | March 2016 | | | (905,200 | ) | | | (5,080 | ) |
| | | | | | | | | | | | | | |
| | | | | | | | $ | (196,585 | ) | | $ | (7,190 | ) |
| | | | | | | | | | | | | | |
Purchased Options Outstanding on December 31, 2015:
Equity Options
| | | | | | | | | | | | | | | | | | | | | | | | |
Description | | Exercise
Price | | | Expiration Date | | | Number of
Contracts | | | Premiums
Paid | | | Fair Value | | | Net Unrealized
Appreciation
(Depreciation) | |
Call - Arcelormittal NA | | $ | 15.00 | | | | 1/15/2016 | | | | 12 | | | $ | 48 | | | $ | 6 | | | $ | (42 | ) |
Call - Arcelormittal NA | | | 12.00 | | | | 1/15/2016 | | | | 50 | | | | 1,077 | | | | 75 | | | | (1,002 | ) |
Call - Bank of America Corp. | | | 25.00 | | | | 1/15/2016 | | | | 50 | | | | 126 | | | | 25 | | | | (101 | ) |
Call - Bank of America Corp. | | | 22.00 | | | | 1/15/2016 | | | | 150 | | | | 977 | | | | 150 | | | | (827 | ) |
Call - Carnival Corp. | | | 55.00 | | | | 1/15/2016 | | | | 10 | | | | 1,150 | | | | 850 | | | | (300 | ) |
Call - Citigroup Inc. | | | 57.50 | | | | 1/15/2016 | | | | 15 | | | | 3,810 | | | | 30 | | | | (3,780 | ) |
Call - Citigroup Inc. | | | 85.00 | | | | 1/15/2016 | | | | 57 | | | | 56 | | | | 85 | | | | 29 | |
Call - Citigroup Inc. | | | 52.50 | | | | 1/15/2016 | | | | 77 | | | | 47,012 | | | | 5,775 | | | | (41,237 | ) |
Call - Daktronics Inc. | | | 10.00 | | | | 1/15/2016 | | | | 66 | | | | 4,151 | | | | 825 | | | | (3,326 | ) |
Call - General Motors Co. | | | 42.00 | | | | 1/15/2016 | | | | 150 | | | | 3,000 | | | | 150 | | | | (2,850 | ) |
Call - Wal-Mart Stores Inc. | | | 65.00 | | | | 1/15/2016 | | | | 500 | | | | 47,503 | | | | 1,500 | | | | (46,003 | ) |
Put - Crown Castle International Corp. | | | 70.00 | | | | 1/15/2016 | | | | 5 | | | | 321 | | | | 75 | | | | (246 | ) |
Put - Ctrip.Com International Ltd. | | | 40.00 | | | | 1/15/2016 | | | | 80 | | | | 4,818 | | | | 720 | | | | (4,098 | ) |
Put - SolarCity Corp. | | | 20.00 | | | | 1/15/2016 | | | | 50 | | | | 500 | | | | 200 | | | | (300 | ) |
Put - Southwestern Energy Co. | | | 4.00 | | | | 1/15/2016 | | | | 60 | | | | 1,203 | | | | 450 | | | | (753 | ) |
Put - Southwestern Energy Co. | | | 5.00 | | | | 1/15/2016 | | | | 150 | | | | 2,631 | | | | 750 | | | | (1,881 | ) |
Put - Stericycle Inc. | | | 105.00 | | | | 1/15/2016 | | | | 12 | | | | 787 | | | | 150 | | | | (637 | ) |
Call - Forestar Group Inc. | | | 17.50 | | | | 2/19/2016 | | | | 29 | | | | 651 | | | | 218 | | | | (433 | ) |
Call - Kindred Healthcare Inc. | | | 17.50 | | | | 2/19/2016 | | | | 6 | | | | 363 | | | | 90 | | | | (273 | ) |
Call - Omega Protein Corp. | | | 22.50 | | | | 2/19/2016 | | | | 60 | | | | 14,132 | | | | 8,700 | | | | (5,432 | ) |
Put - Maiden Holdings Ltd. | | | 12.50 | | | | 2/19/2016 | | | | 6 | | | | 243 | | | | 75 | | | | (168 | ) |
Call - Biotime Inc. | | | 5.00 | | | | 3/18/2016 | | | | 1 | | | | 51 | | | | 35 | | | | (16 | ) |
Call - Intelsat SA | | | 12.50 | | | | 3/18/2016 | | | | 50 | | | | 1,526 | | | | 250 | | | | (1,276 | ) |
Call - Southwestern Energy Co. | | | 18.00 | | | | 3/18/2016 | | | | 13 | | | | 501 | | | | 162 | | | | (339 | ) |
Put - Biotime Inc. | | | 5.00 | | | | 3/18/2016 | | | | 610 | | | | 87,330 | | | | 73,200 | | | | (14,130 | ) |
Put - Dycom Industries Inc. | | | 50.00 | | | | 3/18/2016 | | | | 27 | | | | 5,480 | | | | 2,497 | | | | (2,983 | ) |
Put - Intelsat SA | | | 5.00 | | | | 3/18/2016 | | | | 10 | | | | 652 | | | | 1,175 | | | | 523 | |
Put - Kinder Morgan Inc. | | | 17.50 | | | | 3/18/2016 | | | | 15 | | | | 3,098 | | | | 4,575 | | | | 1,477 | |
Put - Southwestern Energy Co. | | | 8.00 | | | | 3/18/2016 | | | | 25 | | | | 1,104 | | | | 4,750 | | | | 3,646 | |
Put - Southwestern Energy Co. | | | 6.00 | | | | 3/18/2016 | | | | 50 | | | | 1,824 | | | | 3,700 | | | | 1,876 | |
Put - Southwestern Energy Co. | | | 5.00 | | | | 3/18/2016 | | | | 55 | | | | 2,284 | | | | 2,200 | | | | (84 | ) |
Call - Clovis Oncology Inc. | | | 30.00 | | | | 4/15/2016 | | | | 20 | | | | 13,235 | | | | 16,900 | | | | 3,665 | |
Call - Daktronics Inc. | | | 10.00 | | | | 4/15/2016 | | | | 14 | | | | 1,023 | | | | 455 | | | | (568 | ) |
Call - John Bean Technologies Corp. | | | 50.00 | | | | 4/15/2016 | | | | 15 | | | | 4,508 | | | | 5,962 | | | | 1,454 | |
Put - Clovis Oncology Inc. | | | 30.00 | | | | 4/15/2016 | | | | 20 | | | | 16,667 | | | | 7,100 | | | | (9,567 | ) |
Put - Crown Castle International Corp. | | | 60.00 | | | | 4/15/2016 | | | | 7 | | | | 673 | | | | 123 | | | | (550 | ) |
Put - Tyson Foods Inc. | | | 30.00 | | | | 4/15/2016 | | | | 5 | | | | 275 | | | | 38 | | | | (237 | ) |
Call - Forestar Group Inc. | | | 17.50 | | | | 5/20/2016 | | | | 55 | | | | 2,670 | | | | 688 | | | | (1,982 | ) |
Put - Black Hills Corp. | | | 35.00 | | | | 5/20/2016 | | | | 2 | | | | 221 | | | | 75 | | | | (146 | ) |
Put - Kindred Healthcare Inc. | | | 10.00 | | | | 5/20/2016 | | | | 10 | | | | 605 | | | | 925 | | | | 320 | |
Put - Kindred Healthcare Inc. | | | 12.50 | | | | 5/20/2016 | | | | 15 | | | | 683 | | | | 3,150 | | | | 2,467 | |
Put - Restoration Hardware Holdings | | | 80.00 | | | | 5/20/2016 | | | | 105 | | | | 38,570 | | | | 82,950 | | | | 44,380 | |
Put - William Lyon Homes | | | 15.00 | | | | 5/20/2016 | | | | 7 | | | | 945 | | | | 963 | | | | 18 | |
Put - Biotime Inc. | | | 5.00 | | | | 6/17/2016 | | | | 89 | | | | 14,505 | | | | 12,682 | | | | (1,823 | ) |
Put - Biotime Inc. | | | 2.50 | | | | 6/17/2016 | | | | 395 | | | | 13,005 | | | | 9,875 | | | | (3,130 | ) |
Put - Southwestern Energy Co. | | | 7.00 | | | | 6/17/2016 | | | | 40 | | | | 2,398 | | | | 7,020 | | | | 4,622 | |
See accompanying notes
31
American Beacon Ionic Strategic Arbitrage FundSM
Schedule of Investments
December 31, 2015
| | | | | | | | | | | | | | | | | | | | | | | | |
Description | | Exercise
Price | | | Expiration Date | | | Number of
Contracts | | | Premiums
Paid | | | Fair Value | | | Net Unrealized
Appreciation
(Depreciation) | |
Put - Crown Castle International Corp. | | | 60.00 | | | | 7/15/2016 | | | | 14 | | | $ | 708 | | | $ | 420 | | | $ | (288 | ) |
Call - Global Eagle Entertainment Inc. | | | 12.50 | | | | 8/19/2016 | | | | 12 | | | | 787 | | | | 750 | | | | (37 | ) |
Call - Global Eagle Entertainment Inc. | | | 10.00 | | | | 8/19/2016 | | | | 24 | | | | 3,733 | | | | 3,300 | | | | (433 | ) |
Put - Global Eagle Entertainment Inc. | | | 7.50 | | | | 8/19/2016 | | | | 49 | | | | 2,926 | | | | 3,063 | | | | 137 | |
Put - Global Eagle Entertainment Inc. | | | 10.00 | | | | 8/19/2016 | | | | 220 | | | | 38,619 | | | | 30,800 | | | | (7,819 | ) |
Put - Bunge Ltd. | | | 35.00 | | | | 1/20/2017 | | | | 125 | | | | 6,943 | | | | 6,250 | | | | (693 | ) |
Call - Delta Air Lines Inc. | | | 60.00 | | | | 1/19/2018 | | | | 125 | | | | 82,263 | | | | 76,125 | | | | (6,138 | ) |
Call - General Electric Co. | | | 32.00 | | | | 1/19/2018 | | | | 163 | | | | 41,364 | | | | 43,032 | | | | 1,668 | |
| | | | | | | | | | | | | | | | | | | | | | | | |
| | | | | | | | | | | | | | $ | 525,735 | | | $ | 426,089 | | | $ | (99,646 | ) |
| | | | | | | | | | | | | | | | | | | | | | | | |
ETF and ETN Options
| | | | | | | | | | | | | | | | | | | | | | | | |
Description | | Exercise
Price | | | Expiration
Date | | | Number of
Contracts | | | Premiums
Paid | | | Fair Value | | | Net Unrealized
Appreciation
(Depreciation) | |
Call - CurrencyShares Euro Trust ETF | | $ | 107.00 | | | | 1/15/2016 | | | | 34 | | | $ | 5,910 | | | $ | 1,768 | | | $ | (4,142 | ) |
Call - CurrencyShares Euro Trust ETF | | | 111.00 | | | | 1/15/2016 | | | | 107 | | | | 11,351 | | | | 321 | | | | (11,030 | ) |
Call - CurrencyShares Euro Trust ETF | | | 100.00 | | | | 1/15/2016 | | | | 120 | | | | 65,406 | | | | 77,400 | | | | 11,994 | |
Call - iShares 3-7 Year Treasury Bond ETF | | | 124.00 | | | | 1/15/2016 | | | | 13 | | | | 1,176 | | | | 162 | | | | (1,014 | ) |
Call - iShares China Large-Cap ETF | | | 36.00 | | | | 1/15/2016 | | | | 24 | | | | 9,133 | | | | 960 | | | | (8,173 | ) |
Call - iShares Core US Credit Bond ETF | | | 110.00 | | | | 1/15/2016 | | | | 4 | | | | 297 | | | | 160 | | | | (137 | ) |
Call - iShares MSCI Brazil Capped ETF | | | 30.00 | | | | 1/15/2016 | | | | 100 | | | | 23,417 | | | | 100 | | | | (23,317 | ) |
Call - iShares MSCI Brazil Capped ETF | | | 35.00 | | | | 1/15/2016 | | | | 100 | | | | 16,500 | | | | 200 | | | | (16,300 | ) |
Call - Market Vectors Gold Miners ETF | | | 11.50 | | | | 1/15/2016 | | | | 493 | | | | 143,523 | | | | 108,214 | | | | (35,309 | ) |
Call - ProShares Ultrashort 20+ Year ETF | | | 60.00 | | | | 1/15/2016 | | | | 50 | | | | 1,877 | | | | 25 | | | | (1,852 | ) |
Call - SPDR S&P Midcap 400 ETF Trust | | | 290.00 | | | | 1/15/2016 | | | | 50 | | | | 21,000 | | | | 250 | | | | (20,750 | ) |
Call - Vanguard Intermediate-Term Bond ETF | | | 85.00 | | | | 1/15/2016 | | | | 2 | | | | 135 | | | | 10 | | | | (125 | ) |
Put - CurrencyShares Euro Trust ETF | | | 109.00 | | | | 1/15/2016 | | | | 67 | | | | 28,546 | | | | 17,889 | | | | (10,657 | ) |
Put - CurrencyShares Euro Trust ETF | | | 111.00 | | | | 1/15/2016 | | | | 107 | | | | 62,053 | | | | 50,183 | | | | (11,870 | ) |
Put - iShares 3-7 Year Treasury Bond ETF | | | 123.00 | | | | 1/15/2016 | | | | 37 | | | | 5,385 | | | | 2,220 | | | | (3,165 | ) |
Put - iShares China Large-Cap ETF | | | 40.00 | | | | 1/15/2016 | | | | 115 | | | | 13,915 | | | | 53,705 | | | | 39,790 | |
Put - iShares Core US Credit Bond ETF | | | 107.00 | | | | 1/15/2016 | | | | 9 | | | | 1,616 | | | | 697 | | | | (919 | ) |
Put - iShares US Preferred Stock ETF | | | 38.00 | | | | 1/15/2016 | | | | 214 | | | | 13,940 | | | | 1,712 | | | | (12,228 | ) |
Put - Vanguard Intermediate-Term Bond ETF | | | 83.00 | | | | 1/15/2016 | | | | 2 | | | | 241 | | | | 85 | | | | (156 | ) |
Call - iShares Russell 2000 ETF | | | 116.00 | | | | 2/19/2016 | | | | 270 | | | | 73,365 | | | | 37,800 | | | | (35,565 | ) |
Call - iShares Russell Mid-Cap Value ETF | | | 75.00 | | | | 2/19/2016 | | | | 691 | | | | 52,136 | | | | 19,002 | | | | (33,134 | ) |
Call - PIMCO Total Return Active ETF | | | 107.00 | | | | 2/19/2016 | | | | 57 | | | | 5,279 | | | | 998 | | | | (4,281 | ) |
Call - SPDR S&P 500 ETF Trust | | | 211.00 | | | | 2/19/2016 | | | | 307 | | | | 76,358 | | | | 42,366 | | | | (33,992 | ) |
Call - Vanguard Intermediate-Term Corp. ETF | | | 85.00 | | | | 2/19/2016 | | | | 7 | | | | 606 | | | | 3,500 | | | | 2,894 | |
Put - iShares Global Healthcare ETF | | | 105.88 | | | | 2/19/2016 | | | | 19 | | | | 7,800 | | | | 7,790 | | | | (10 | ) |
Put - Vanguard Intermediate-Term Corp. ETF | | | 83.00 | | | | 2/19/2016 | | | | 7 | | | | 865 | | | | 3,500 | | | | 2,635 | |
Call - Market Vectors Gold Miners ETF | | | 10.50 | | | | 3/18/2016 | | | | 172 | | | | 59,668 | | | | 57,190 | | | | (2,478 | ) |
Put - iPath S&P 500 VIX Short-Term Futures ETN | | | 14.00 | | | | 3/18/2016 | | | | 820 | | | | 66,864 | | | | 18,040 | | | | (48,824 | ) |
Put - Vanguard Total Bond Market ETF | | | 81.00 | | | | 3/18/2016 | | | | 4 | | | | 362 | | | | 460 | | | | 98 | |
Put - SPDR S&P 500 ETF Trust | | | 155.00 | | | | 3/31/2016 | | | | 430 | | | | 58,475 | | | | 18,920 | | | | (39,555 | ) |
Put - iShares 3-7 Year Treasury Bond ETF | | | 122.00 | | | | 4/15/2016 | | | | 3 | | | | 242 | | | | 300 | | | | 58 | |
Put - iShares 3-7 Year Treasury Bond ETF | | | 123.00 | | | | 4/15/2016 | | | | 7 | | | | 774 | | | | 1,068 | | | | 294 | |
| | | | | | | | | | | | | | | | | | | | | | | | |
| | | | | | | | | | | | | | $ | 828,215 | | | $ | 526,995 | | | $ | (301,220 | ) |
| | | | | | | | | | | | | | | | | | | | | | | | |
Index Options
| | | | | | | | | | | | | | | | | | | | | | | | |
Description | | Exercise
Price | | | Expiration
Date | | | Number of
Contracts | | | Premiums
Paid | | | Fair Value | | | Net Unrealized
Appreciation
(Depreciation) | |
Put - PowerShares DB US Dollar Index | | $ | 27.00 | | | | 1/15/2016 | | | | 170 | | | $ | 19,186 | | | $ | 23,205 | | | $ | 4,019 | |
Put - PowerShares DB US Dollar Index | | | 26.00 | | | | 1/15/2016 | | | | 407 | | | | 20,456 | | | | 17,908 | | | | (2,548 | ) |
Call - CBOE SPX Volatility Index | | | 30.00 | | | | 1/20/2016 | | | | 186 | | | | 19,098 | | | | 7,254 | | | | (11,844 | ) |
Call - CBOE SPX Volatility Index | | | 27.00 | | | | 1/20/2016 | | | | 631 | | | | 42,882 | | | | 34,705 | | | | (8,177 | ) |
Call - PowerShares DB US Dollar Index | | | 25.00 | | | | 3/18/2016 | | | | 1,130 | | | | 92,064 | | | | 85,880 | | | | (6,184 | ) |
Call - PowerShares DB US Dollar Index | | | 26.00 | | | | 3/18/2016 | | | | 1,633 | | | | 69,584 | | | | 39,192 | | | | (30,392 | ) |
See accompanying notes
32
American Beacon Ionic Strategic Arbitrage FundSM
Schedule of Investments
December 31, 2015
| | | | | | | | | | | | | | | | | | | | | | | | |
Description | | Exercise
Price | | | Expiration
Date | | | Number of
Contracts | | | Premiums
Paid | | | Fair Value | | | Net Unrealized
Appreciation
(Depreciation) | |
Put - PowerShares DB US Dollar Index | | | 24.00 | | | | 3/18/2016 | | | | 1,130 | | | $ | 14,595 | | | $ | 2,260 | | | $ | 12,335 | ) |
Put - PowerShares DB US Dollar Index | | | 25.00 | | | | 3/18/2016 | | | | 1,633 | | | | 51,036 | | | | 22,862 | | | | (28,174 | ) |
Call - PowerShares DB US Dollar Index | | | 26.00 | | | | 6/17/2016 | | | | 364 | | | | 16,279 | | | | 16,380 | | | | 101 | |
Put - PowerShares DB US Dollar Index | | | 25.00 | | | | 6/17/2016 | | | | 364 | | | | 17,371 | | | | 10,920 | | | | (6,451 | ) |
| | | | | | | | | | | | | | | | | | | | | | | | |
| | | | | | | | | | | | | | $ | 362,551 | | | $ | 260,566 | | | $ | (101,985 | ) |
| | | | | | | | | | | | | | | | | | | | | | | | |
Glossary
| | | | | | | | | | |
| Other Abbreviations: |
|
| ETF | | Exchange Traded Fund | | MSCI | | Morgan Stanley Composite Index | | SPDR | | Standard & Poors Depositary Receipt |
| ETN | | Exchange Traded Note | | REIT | | Regulated Investment Trust | | VIX | | Volatility Index |
| FTSE | | Financial Times Stock Exchange | | REMIC | | Real Estate Mortgage Investment Conduit | | | | |
See accompanying notes
33
American Beacon FundsSM
Statements of Assets and Liabilities
December 31, 2015 (in thousands, except share and per share amounts)
| | | | | | | | |
| | | AHL
Managed
Futures
Strategy
Fund** | | | Ionic
Strategic
Arbitrage
Fund | |
Assets: | | | | | | | | |
Investments in unaffiliated securities, at fair value A | | $ | 98,285 | | | $ | 91,566 | |
Purchased options outstanding (Premiums paid $1,717) E | | | – | | | | 1,214 | |
Foreign currency held at broker for futures contracts, at fair value D | | | – | | | | 2 | |
Cash | | | 5,523 | | | | 41,193 | |
Deposit with brokers for futures contracts | | | 1,865 | | | | 64 | |
Deposit with brokers for securities sold short | | | – | | | | 1,129 | |
Dividends and interest receivable | | | – | | | | 359 | |
Receivable for investments sold | | | – | | | | 7,194 | |
Receivable for fund shares sold | | | 1,019 | | | | 118 | |
Receivable for expense reimbursement (Note 2) | | | 132 | | | | 15 | |
Unrealized appreciation from foreign currency contracts | | | 328 | | | | – | |
Prepaid expenses | | | 27 | | | | 44 | |
| | | | | | | | |
Total assets | | | 107,179 | | | | 142,898 | |
| | | | | | | | |
Liabilities: | | | | | | | | |
Payable for securities sold short, at fair value B | | | – | | | | 42,632 | |
Payable for investments purchased | | | – | | | | 8,145 | |
Payable for fund shares redeemed | | | 2,094 | | | | 8 | |
Payable for foreign currency, at fair value C | | | – | | | | 6 | |
Payable for variation margin from open futures contracts | | | 42 | | | | 7 | |
Dividends expense payable | | | – | | | | 35 | |
Interest expense payable | | | – | | | | 1 | |
Management and investment advisory fees payable | | | 89 | | | | 62 | |
Administrative service and service fees payable | | | 40 | | | | 20 | |
Transfer agent fees payable | | | 1 | | | | – | |
Custody and fund accounting fees payable | | | 75 | | | | 1 | |
Professional fees payable | | | 57 | | | | 60 | |
Payable for prospectus and shareholder reports | | | 13 | | | | 6 | |
Unrealized depreciation from foreign currency contracts | | | 791 | | | | – | |
| | | | | | | | |
Total liabilities | | | 3,202 | | | | 50,983 | |
| | | | | | | | |
Net Assets | | $ | 103,977 | | | $ | 91,915 | |
| | | | | | | | |
Analysis of Net Assets: | | | | | | | | |
Paid-in-capital | | | 108,313 | | | | 93,420 | |
Undistributed (or overdistribution of) net investment income | | | (126 | ) | | | 118 | |
Accumulated net realized (loss) | | | (4,160 | ) | | | (1,052 | ) |
Unrealized appreciation of investments | | | – | | | | 324 | |
Unrealized (depreciation) of currency transactions | | | (466 | ) | | | (9 | ) |
Unrealized appreciation or (depreciation) of futures contracts | | | 416 | | | | (7 | ) |
Unrealized (depreciation) of purchased options | | | – | | | | (503 | ) |
Unrealized (depreciation) of short sales | | | – | | | | (376 | ) |
| | | | | | | | |
Net assets | | $ | 103,977 | | | $ | 91,915 | |
| | | | | | | | |
Shares outstanding at no par value (unlimited shares authorized): | | | | | | | | |
Institutional Class | | | 2,000,688 | | | | 6,413,066 | |
| | | | | | | | |
Y Class | | | 3,237,658 | | | | 2,632,183 | |
| | | | | | | | |
Investor Class | | | 3,570,644 | | | | 221,272 | |
| | | | | | | | |
A Class | | | 947,183 | | | | 11,665 | |
| | | | | | | | |
C Class | | | 208,024 | | | | 13,341 | |
| | | | | | | | |
Net assets (not in thousands): | | | | | | | | |
Institutional Class | | $ | 20,932,502 | | | $ | 63,421,998 | |
| | | | | | | | |
Y Class | | $ | 33,817,374 | | | $ | 26,059,687 | |
| | | | | | | | |
Investor Class | | $ | 37,185,001 | | | $ | 2,186,943 | |
| | | | | | | | |
A Class | | $ | 9,890,720 | | | $ | 115,261 | |
| | | | | | | | |
C Class | | $ | 2,151,492 | | | $ | 131,408 | |
| | | | | | | | |
See accompanying notes
34
American Beacon FundsSM
Statements of Assets and Liabilities
December 31, 2015 (in thousands, except share and per share amounts)
| | | | | | | | |
| | | AHL
Managed
Futures
Strategy
Fund** | | | Ionic
Strategic
Arbitrage
Fund | |
Net asset value, offering and redemption price per share: | | | | | | | | |
Institutional Class | | $ | 10.46 | | | $ | 9.89 | |
| | | | | | | | |
Y Class | | $ | 10.45 | | | $ | 9.90 | |
| | | | | | | | |
Investor Class | | $ | 10.41 | | | $ | 9.88 | |
| | | | | | | | |
A Class | | $ | 10.44 | | | $ | 9.88 | |
| | | | | | | | |
A Class (offering price) | | $ | 11.08 | | | $ | 10.37 | |
| | | | | | | | |
C Class | | $ | 10.34 | | | $ | 9.85 | |
| | | | | | | | |
A Cost of investments in unaffiliated securities | | $ | 98,285 | | | $ | 91,246 | |
B Proceeds of securities sold short | | $ | — | | | $ | 42,256 | |
C Cost of foreign currency | | $ | — | | | $ | (2 | ) |
D Cost of foreign currency held at broker for futures contracts | | $ | — | | | $ | 2 | |
E Cost of purchased options outstanding | | $ | — | | | $ | 1,717 | |
| ** | Consolidated financial statement. See Note 2 in the Notes to Financial Statements for additional information. |
See accompanying notes
35
American Beacon FundsSM
Statements of Operations
For the Year ended December 31, 2015 (in thousands)
| | | | | | | | |
| | | AHL
Managed
Futures
Strategy
Fund** | | | Ionic
Strategic
Arbitrage
Fund* | |
Investment income: | | | | | | | | |
Dividend income from unaffiliated securities | | $ | — | | | $ | 391 | |
Interest income | | | 17 | | | | 95 | |
| | | | | | | | |
Total investment income | | | 17 | | | | 486 | |
| | | | | | | | |
Expenses: | | | | | | | | |
Management and investment advisory fees (Note 2) | | | 739 | | | | 152 | |
Administrative service fees (Note 2): | | | | | | | | |
Institutional Class | | | 35 | | | | 41 | |
Y Class | | | 55 | | | | 2 | |
Investor Class | | | 68 | | | | 1 | |
A Class | | | 48 | | | | – | |
C Class | | | 3 | | | | – | |
Transfer agent fees: | | | | | | | | |
Institutional Class | | | 2 | | | | 2 | |
Y Class | | | 1 | | | | 2 | |
Investor Class | | | 3 | | | | 2 | |
A Class | | | 1 | | | | 2 | |
C Class | | | – | | | | 2 | |
Custody and fund accounting fees | | | 338 | | | | 4 | |
Professional fees | | | 95 | | | | 62 | |
Registration fees and expenses | | | 102 | | | | 39 | |
Service fees (Note 2): | | | | | | | | |
Y Class | | | 19 | | | | 1 | |
Investor Class | | | 56 | | | | 1 | |
A Class | | | 24 | | | | – | |
C Class | | | 2 | | | | – | |
Distribution fees (Note 2): | | | | | | | | |
A Class | | | 40 | | | | – | |
C Class | | | 12 | | | | 1 | |
Prospectus and shareholder report expenses | | | 30 | | | | 21 | |
Trustee fees | | | 5 | | | | 1 | |
Prime broker fees | | | – | | | | 54 | |
Dividends on securities sold short | | | – | | | | 139 | |
Other expenses | | | 6 | | | | 4 | |
| | | | | | | | |
Total expenses | | | 1,684 | | | | 533 | |
| | | | | | | | |
Net fees waived and expenses reimbursed (Note 2) | | | (416 | ) | | | (109 | ) |
| | | | | | | | |
Net expenses | | | 1,268 | | | | 424 | |
| | | | | | | | |
Net investment income(loss) | | | (1,251 | ) | | | 62 | |
| | | | | | | | |
Realized and unrealized gain (loss) from investments: | | | | | | | | |
Net realized gain (loss) from: | | | | | | | | |
Investments | | | (1 | ) | | | 410 | |
Foreign currency transactions | | | 1,392 | | | | 9 | |
Futures contracts | | | (1,071 | ) | | | 189 | |
Options contracts | | | – | | | | 56 | |
Change in net unrealized appreciation or (depreciation) of: | | | | | | | | |
Investments | | | – | | | | 324 | |
Foreign currency transactions | | | (541 | ) | | | (9 | ) |
Futures contracts | | | (1,198 | ) | | | (7 | ) |
Options contracts | | | – | | | | (503 | ) |
Short sales | | | – | | | | (376 | ) |
| | | | | | | | |
Net (loss) from investments | | | (1,419 | ) | | | 93 | |
| | | | | | | | |
Net increase (decrease) in net assets resulting from operations | | $ | (2,670 | ) | | $ | 155 | |
| | | | | | | | |
| * | For the period June 30, 2015 (commencement of operations) through December 31, 2015. |
| ** | Consolidated financial statement. See Note 2 in the Notes to Financial Statements for additional information. |
See accompanying notes
36
American Beacon FundsSM
Statements of Changes in Net Assets (in thousands)
| | | | | | | | | | | | |
| | | AHL Managed Futures
Strategy Fund** | | | Ionic
Strategic
Arbitrage
Fund | |
| | | Year Ended
December 31,
2015 | | | From August
19 to
December
31, 2014 | | | From June
30 to
December 31,
2015 | |
Increase (Decrease) in Net Assets: | | | | | | | | | | | | |
Operations: | | | | | | | | | | | | |
Net investment income | | $ | (1,251 | ) | | $ | 902 | | | $ | 62 | |
Net realized gain (loss) from investments, foreign currency transactions, futures contracts, and options contracts | | | 320 | | | | 1,239 | | | | 664 | |
Change in net unrealized appreciation or (depreciation) from investments, foreign currency transactions, futures contracts, options contracts, and short sales | | | (1,739 | ) | | | 1,689 | | | | (571 | ) |
| | | | | | | | | | | | |
Net increase (decrease) in net assets resulting from operations | | | (2,670 | ) | | | 3,830 | | | | 155 | |
| | | | | | | | | | | | |
Distributions to Shareholders: | | | | | | | | | | | | |
Net investment income: | | | | | | | | | | | | |
Institutional Class | | | (314 | ) | | | (774 | ) | | | (343 | ) |
Y Class | | | (665 | ) | | | (12 | ) | | | (3 | ) |
Investor Class | | | (702 | ) | | | (35 | ) | | | (10 | ) |
A Class | | | (182 | ) | | | (243 | ) | | | (1 | ) |
C Class | | | (31 | ) | | | (9 | ) | | | (1 | ) |
Net realized gain from investments: | | | | | | | | | | | | |
Institutional Class | | | (230 | ) | | | (210 | ) | | | (1,252 | ) |
Y Class | | | (489 | ) | | | (3 | ) | | | (9 | ) |
Investor Class | | | (549 | ) | | | (9 | ) | | | (36 | ) |
A Class | | | (159 | ) | | | (66 | ) | | | (2 | ) |
C Class | | | (31 | ) | | | (3 | ) | | | (3 | ) |
Return of Capital: | | | | | | | | | | | | |
Institutional Class | | | (2 | ) | | | – | | | | – | |
Y Class | | | (4 | ) | | | – | | | | – | |
Investor Class | | | (4 | ) | | | – | | | | – | |
A Class | | | (1 | ) | | | – | | | | – | |
C Class | | | – | | | | – | | | | – | |
| | | | | | | | | | | | |
Net distributions to shareholders | | | (3,363 | ) | | | (1,364 | ) | | | (1,660 | ) |
| | | | | | | | | | | | |
Capital Share Transactions: | | | | | | | | | | | | |
Proceeds from sales of shares | | | 134,235 | | | | 38,129 | | | | 93,244 | |
Reinvestment of dividends and distributions | | | 3,333 | | | | 1,364 | | | | 1,660 | |
Cost of shares redeemed | | | (69,232 | ) | | | (285 | ) | | | (1,484 | ) |
| | | | | | | | | | | | |
Net increase in net assets from capital share transactions | | | 68,336 | | | | 39,208 | | | | 93,420 | |
| | | | | | | | | | | | |
Net increase in net assets | | | 62,303 | | | | 41,674 | | | | 91,915 | |
| | | | | | | | | | | | |
Net Assets: | | | | | | | | | | | | |
Beginning of period | | | 41,674 | | | | – | | | | – | |
| | | | | | | | | | | | |
End of Period * | | $ | 103,977 | | | $ | 41,674 | | | $ | 91,915 | |
| | | | | | | | | | | | |
*Includes undistributed (or overdistribution of) net investment income | | $ | (126 | ) | | $ | 212 | | | $ | 118 | |
| | | | | | | | | | | | |
| ** | Consolidated financial statement. See Note 2 in the Notes to Financial Statements for additional information. |
See accompanying notes
37
American Beacon FundsSM
Notes to Financial Statements
December 31, 2015
1. Organization
American Beacon Funds (the “Trust”) is organized as a Massachusetts business trust and is registered under the Investment Company Act of 1940, as amended, (the “Act”) as a diversified, open-end management investment company. As of December 31, 2015, the Trust consists of twenty-five active series, two of which are presented in this filing (collectively, the “Funds” and each individually a “Fund”): American Beacon AHL Managed Futures Strategy Fund (“AHL Managed Futures”) and American Beacon Ionic Strategic Arbitrage Fund (“Ionic Strategic Arbitrage”). The remaining twenty-three active series are reported in separate filings.
American Beacon Advisors, Inc. (the “Manager”) is a wholly-owned subsidiary of Astro AB Borrower, Inc., which is indirectly owned by investment funds affiliated with Kelso & Company, L.P. and Estancia Capital Management, LLC, and was organized in 1986 to provide business management, advisory, administrative and asset management consulting services to the Trust and other investors.
Class Disclosure
June 30, 2015 was the inception date of all classes of the Ionic Strategic Arbitrage Fund.
The Funds have multiple classes of shares designed to meet the needs of different groups of investors. The following table sets forth the differences amongst the classes:
| | | | |
| | | Class: | | Offered to: |
| | Institutional Class | | Investors making an initial investment of $250,000 |
| | |
| | Y Class | | Investors making an initial investment of $100,000 |
| | |
| | Investor Class | | General public and investors investing through an intermediary |
| | |
| | A Class | | General public and investors investing through an intermediary with applicable sales charges, which may include a front-end sales charge and a contingent deferred sales charge (“CDSC”) |
| | |
| | C Class | | General public and investors investing through an intermediary with applicable sales charges, which may include a CDSC |
Each class offered by the Trust has equal rights as to assets and voting privileges. Income and non-class specific expenses are allocated daily to each class on the basis of the relative net assets. Realized and unrealized capital gains and losses of each class are allocated daily based on the relative net assets of each class of the respective Fund. Class specific expenses, where applicable, currently include administration fees, service fees, and distribution fees and vary amongst the classes as described more fully in Note 2.
2. Transactions with Affiliates
Management Agreement
The Trust and the Manager are parties to a Management Agreement that obligates the Manager to provide or oversee the provision of all investment advisory and portfolio management services. As compensation for performing the duties required under the Management Agreement, the Manager receives from the Funds an annualized fee equal to 0.05% of the average daily net assets. The Funds pay the unaffiliated investment advisors hired to direct investment activities of the Funds. Management fees paid by the Funds during the periods ended December 31, 2015 were as follows (in thousands):
| | | | | | | | | | | | | | | | |
Fund | | Management
Fee Rate | | | Management
Fee | | | Amounts Paid to
Investment Sub-
Advisors | | | Amounts Paid
to Manager | |
AHL Managed Futures | | | 1.05 | % | | $ | 739 | | | $ | 705 | | | $ | 34 | |
Ionic Strategic Arbitrage | | | 1.03 | % | | | 152 | | | | 145 | | | | 7 | |
38
American Beacon FundsSM
Notes to Financial Statements
December 31, 2015
Administration Agreement
The Manager and the Trust entered into an Administration Agreement which obligates the Manager to provide or oversee administrative services to each Fund. As compensation for performing the duties required under the Administration Agreement, the Manager receives an annualized fee of 0.30% of the average daily net assets of the Institutional, Y, Investor, A, and C Classes of the Funds.
Distribution Plans
The Funds, except for the A and C Classes, have adopted a “defensive” Distribution Plan (the “Plan”) in accordance with Rule 12b-1 under the Act, pursuant to which no separate fees will be charged to the Funds for distribution purposes. However, the Plan authorizes the management and administration fees received by the Manager and the investment advisors hired by the Manager to be used for distribution purposes. Under this Plan, the Funds do not intend to separately compensate the Manager or any other party, either directly or indirectly, for the distribution of Fund shares.
Separate Distribution Plans (the “Distribution Plans”) have been adopted pursuant to Rule 12b-1 under the Act for the A and C Classes of the Funds. Under the Distribution Plans, as compensation for distribution assistance, the Manager receives an annualized fee of 0.25% of the average daily net assets of the A Class and 1.00% of the average daily net assets of the C Class. The fee will be payable without regard to whether the amount of the fee is more or less than the actual expenses incurred in a particular month by the Manager for distribution assistance.
Service Plans
The Manager and the Trust entered into Service Plans that obligate the Manager to oversee additional shareholder servicing of the Y, Investor, A, and C Classes. As compensation for performing the duties required under the Service Plans, the Manager receives an annualized fee of 0.10% of the average daily net assets of the Y Class, 0.15% of the average daily net assets of the A and C Classes, and up to 0.375% of the average daily net assets of the Investor Class of the Funds.
Interfund Lending Program
Pursuant to an exemptive order by the Securities and Exchange Commission (“SEC”), the Funds, along with other registered investment companies having management contracts with the Manager, may participate in an interfund lending program. This program provides an alternative credit facility allowing the Funds to borrow from other participating Funds. For the period ended December 31, 2015, the Funds did not utilize the credit facility.
Expense Reimbursement Plan
The Manager contractually agreed to reimburse the classes of the Funds to the extent that total annual fund operating expenses exceeded each Fund’s expense cap. Of these amounts $131,984 and $15,411 was receivable from the Manager at December 31, 2015 for the AHL Managed Futures and Ionic Strategic Arbitrage Funds, respectively. For the periods ended December 31, 2015, the Manager reimbursed expenses as follows:
| | | | | | | | | | | | | | | | | | |
| | | | | Expense Cap and Limits | | | | | | | |
Fund | | Class | | 1/1/15 to
6/30/15 | | | 6/30/15 to
12/31/15 | | | Reimbursed
Expenses | | | Expiration of
Reimbursements | |
AHL Managed Futures | | Institutional | | | 1.54 | % | | | 1.54 | % | | $ | 83,713 | | | | 2018 | |
AHL Managed Futures | | Y | | | 1.64 | % | | | 1.64 | % | | | 119,112 | | | | 2018 | |
AHL Managed Futures | | Investor | | | 1.92 | % | | | 1.92 | % | | | 108,544 | | | | 2018 | |
AHL Managed Futures | | A | | | 1.94 | % | | | 1.94 | % | | | 97,360 | | | | 2018 | |
AHL Managed Futures | | C | | | 2.69 | % | | | 2.69 | % | | | 7,403 | | | | 2018 | |
39
American Beacon FundsSM
Notes to Financial Statements
December 31, 2015
| | | | | | | | | | | | | | | | |
| | | | | Expense Cap and Limits | | | | | | | |
Fund | | Class | | 1/1/15 to
6/30/15 | | 6/30/15 to
12/31/15 | | | Reimbursed
Expenses | | | Expiration of
Reimbursements | |
Ionic Strategic Arbitrage | | Institutional | | N/A | | | 1.54 | % | | $ | 97,443 | | | | 2018 | |
Ionic Strategic Arbitrage | | Y | | N/A | | | 1.64 | % | | | 3,540 | | | | 2018 | |
Ionic Strategic Arbitrage | | Investor | | N/A | | | 1.92 | % | | | 3,637 | | | | 2018 | |
Ionic Strategic Arbitrage | | A | | N/A | | | 1.94 | % | | | 2,089 | | | | 2018 | |
Ionic Strategic Arbitrage | | C | | N/A | | | 2.69 | % | | | 2,077 | | | | 2018 | |
The Fund has adopted an Expense Reimbursement Plan whereby the Manager may seek repayment of fees waived or expenses reimbursed for a period of up to three years. However, reimbursement will occur only if the Class’s average net assets have grown or expenses have declined sufficiently to allow reimbursement without causing its expense ratio to exceed the previously agreed upon contractual expense limit. The carryover of excess expenses potentially reimbursable to the Manager, is $371,247 for the AHL Managed Futures Fund which will expire in 2017. The Fund has not recorded a liability for these potential reimbursements due to the current assessment that reimbursements are unlikely.
Sales Commissions
The Funds’ distributor, Foreside Fund Services, LLC (“Foreside”) may receive a portion of A Class sales charges from broker dealers and it may be used to offset distribution related expenses. For the period ended December 31, 2015, Foreside collected $13,621 and $18 from the AHL Managed Futures and Ionic Strategic Arbitrage Funds, respectively from the sale of Class A Shares.
A CDSC of 0.50% will be deducted with respect to Class A Shares on certain purchases of $1,000,000 or more that are redeemed in whole or part within 18 months of purchase, unless waived as discussed in the Prospectus. Any applicable CDSC will be 0.50% of the lesser of the original purchase price or the value of the redemption of the Class A Shares redeemed. During the period ended December 31, 2015, there were no CDSC fees collected for Class A Shares.
A CDSC of 1.00% will be deducted with respect to Class C Shares redeemed within 12 months of purchase, unless waived as discussed in the Prospectus. Any applicable CDSC will be 1.00% of the lesser of the original purchase price or the value of the redemption of the Class C Shares redeemed. During the period ended December 31, 2015, CDSC fees of $329 were collected from the AHL Managed Futures Fund for Class C Shares.
Consolidation of Subsidiaries
The consolidated Schedule of Investments of the AHL Managed Futures Strategy Fund (the “CFC Fund”) includes the accounts of the American Beacon Cayman Managed Futures Strategy Fund, Ltd., a wholly-owned and controlled subsidiary (the “Subsidiary”). All inter-company accounts and transactions have been eliminated in consolidation for the CFC Fund.
For Federal tax purposes, taxable income for the CFC Fund and its Subsidiary are calculated separately. The Subsidiary is classified as a controlled foreign corporation under the Internal Revenue Code of 1986 (the “Code”) and the Subsidiary’s taxable income is included in the calculation of the Fund’s taxable income. Net losses of the Subsidiary are not deductible by the CFC Fund either in the current period or future periods. The Subsidiary has a fiscal year end of December 31st for financial statement consolidation purposes and a nonconforming tax year end of November 30th.
The CFC Fund may invest up to 25% of its total assets in the Subsidiary, which acts as an investment vehicle in order to effect certain investments consistent with the CFC Fund’s investment objectives and policies. The CFC Fund expects to achieve a significant portion of its exposure to commodities and
40
American Beacon FundsSM
Notes to Financial Statements
December 31, 2015
commodities-related investments through investment in the Subsidiary. Unlike the CFC Fund, the Subsidiary may invest without limitation in commodities and commodities-related investments.
| | | | | | | | | | | | | | |
Fund | | Inception Date of
Subsidiary | | Subsidiary Net
Assets at
December 31, 2015 | | | % of Total Net
Assets of the Fund at
December 31, 2015 | | | Net Realized
Gain (Loss)
from Investments
Held in
Subsidiary | |
American Beacon Cayman Managed Futures Strategy Fund, Ltd. | | August 19, 2014 | | $ | 23,831,176 | | | | 22.9 | % | | $ | 2,373,453 | |
CFTC Regulation
On August 13, 2013, the Commodity Futures Trading Commission (“CFTC”) adopted rules to harmonize conflicting United States Securities and Exchange Commission (the “SEC’’) and CFTC disclosure, reporting and recordkeeping requirements for registered investment companies that do not meet an exemption from the definition of commodity pool. The harmonization rules provide that the CFTC will accept the SEC’s disclosure, reporting, and recordkeeping regime as substituted compliance for substantially all of the otherwise applicable CFTC regulations as long as such investment companies meet the applicable SEC requirements.
The CFC Fund is a commodity pool, as defined in the regulation of the CFTC and operated by the Manager, a commodity pool operator regulated by the CFTC.
3. Security Valuation and Fair Value Measurements
Investments are valued at the close of the New York Stock Exchange (the “Exchange”), normally 4 p.m. ET, each day that the Exchange is open for business. Equity securities, including exchange-traded funds (“ETFs”) for which market quotations are available are valued at the last sale price or official closing price (closing bid price or last evaluated quote if no sale has occurred) on the primary market or exchange on which they trade.
Futures contracts are valued based upon their quoted daily settlement prices. Upon entering into a futures contract, a Fund is required to deposit with its futures broker an amount of cash or U.S. Government and Agency Obligations in accordance with the initial margin requirements of the broker or exchange. Futures contracts are marked to market daily and an appropriate payable or receivable for the change in value (“variation margin”) is recorded by the Fund. Gains or losses are recognized, but not considered realized until the contracts expire or are closed. Futures contracts involve, to varying degrees, risk of loss in excess of the variation margin disclosed on the Statement of Assets and Liabilities.
Debt securities (other than short-term securities) normally are valued on the basis of prices provided by an independent pricing service and may take into account appropriate factors such as institution-size trading in similar groups of securities, yield, quality, coupon rate, maturity, type of issue, trading characteristics and other market data. The prices of debt securities may be determined using quotes obtained from brokers.
Investments in open-end mutual funds are valued at the closing net asset value (“NAV”) per share of the mutual fund on the day of valuation.
Securities for which market prices are not readily available or are not reflective of the fair value of the security, as determined by the Manager, will be priced at fair value following procedures approved by the Board of Trustees (the “Board”).
For valuation purposes, the last quoted price of non U.S. equity securities may be adjusted under the circumstances described below. If the Fund determines that developments between the close of a foreign market and the close of the NYSE will, in its judgment, materially affect the value of some or all of its
41
American Beacon FundsSM
Notes to Financial Statements
December 31, 2015
portfolio securities, the Fund will adjust the previous closing prices to reflect what it believes to be the fair value of the securities as of the close of the NYSE. In deciding whether it is necessary to adjust closing prices to reflect fair value, the Fund reviews a variety of factors, including developments in foreign markets, the performance of U.S. securities markets and the performance of instruments trading in U.S. markets that represent foreign securities and baskets of foreign securities. A Fund may also fair value securities in other situations, such as when a particular foreign market is closed but the Fund is open. Adjustments to closing prices to reflect fair value on affected foreign securities may be provided by an independent pricing service.
Valuation Inputs
Various inputs may be used to determine the value of the Fund’s investments. These inputs are summarized in three broad levels for financial statement purposes. The inputs or methodologies used to value securities are not necessarily an indication of the risk associated with investing in those securities.
| | |
| Level 1 – | | Quoted prices in active markets for identical securities. |
| |
| Level 2 – | | Prices determined using other significant observable inputs. These may include quoted prices for similar securities, interest rates, prepayment speeds, credit risk, and others. Level 2 securities are fixed-income securities that are valued using observable inputs as stated above. |
| |
| Level 3 – | | Prices determined using other significant unobservable inputs. Unobservable inputs reflect the Fund’s own assumptions about the factors market participants would use in pricing an investment, and would be based on the best information available. |
Level 1 and Level 2 trading assets and trading liabilities, at fair value
Common stocks and financial derivative instruments, such as futures contracts that are traded on a national securities exchange, are stated at the last reported sale or settlement price on the day of valuation. To the extent these securities are actively traded and valuation adjustments are not applied, they are categorized as Level 1 of the fair value hierarchy. Securities using valuation adjustments are categorized as Level 2 of the fair value hierarchy. Preferred securities and other equities traded on inactive markets or valued by reference to similar instruments are also categorized as Level 2 of the fair value hierarchy.
Fixed income securities including corporate, U.S. government agencies, and U.S. treasury obligations are normally valued by pricing service providers that use broker dealer quotations, reported trades or valuation estimates from their internal pricing models. The service providers’ internal models use inputs that are observable such as issuer details, interest rates, yield curves, prepayment speeds, credit risks/spreads, default rates, and quoted prices for similar assets. Securities that use similar valuation techniques and inputs as described above are categorized as Level 2 of the fair value hierarchy.
Fixed income securities purchased on a delayed-delivery basis are marked to market daily until settlement at the forward settlement date and are categorized as Level 2 of the fair value hierarchy.
Investments in registered open-end investment management companies will be valued based upon the NAVs of such investments and are categorized as Level 1 of the fair value hierarchy.
The Fund’s investments are summarized by level based on the inputs used to determine their values. U.S. Generally Accepted Accounting Principles (“U.S. GAAP”) also requires all significant transfers between any levels to be disclosed. During the periods ended December 31, 2015, there were no transfers between levels.
42
American Beacon FundsSM
Notes to Financial Statements
December 31, 2015
As of December 31, 2015, the investments were classified as described below (in thousands):
| | | | | | | | | | | | | | | | |
AHL Managed Futures Strategy Fund1 | | Level 1 | | | Level 2 | | | Level 3 | | | Total | |
Money Market Funds | | $ | 3,090 | | | $ | — | | | $ | — | | | $ | 3,090 | |
U.S. Treasury Bills | | | — | | | | 95,195 | | | | — | | | | 95,195 | |
| | | | | | | | | | | | | | | | |
Total Investments in Securities | | $ | 3,090 | | | $ | 95,195 | | | $ | — | | | $ | 98,285 | |
| | | | | | | | | | | | | | | | |
| | | | |
AHL Managed Futures Strategy Fund1 | | Level 1 | | | Level 2 | | | Level 3 | | | Total | |
Financial Derivative Instruments—Assets | | | | | | | | | | | | | | | | |
Futures Contracts | | $ | 1,652 | | | $ | — | | | $ | — | | | $ | 1,652 | |
Forward Currency Contracts | | | — | | | | 328 | | | | — | | | | 328 | |
| | | | | | | | | | | | | | | | |
| | $ | 1,652 | | | $ | 328 | | | $ | — | | | $ | 1,980 | |
| | | | | | | | | | | | | | | | |
Financial Derivative Instruments—Liabilities | | | | | | | | | | | | | | | | |
Futures Contracts | | $ | (1,196 | ) | | $ | — | | | $ | — | | | $ | (1,196 | ) |
Forward Currency Contracts | | | — | | | | (791 | ) | | | — | | | | (791 | ) |
| | | | | | | | | | | | | | | | |
| | $ | (1,196 | ) | | $ | (791 | ) | | $ | — | | | $ | (1,987 | ) |
| | | | | | | | | | | | | | | | |
| | | | |
Ionic Strategic Arbitrage Fund1 | | Level 1 | | | Level 2 | | | Level 3 | | | Total | |
Assets | | | | | | | | | | | | | | | | |
Common Stocks | | $ | 8,383 | | | $ | — | | | $ | — | | | $ | 8,383 | |
Warrants | | | 4,478 | | | | — | | | | — | | | | 4,478 | |
Convertible Preferred Stocks C | | | 13,179 | | | | — | | | | — | | | | 13,179 | |
Preferred Stocks C | | | — | | | | 712 | | | | — | | | | 712 | |
Convertible Obligations C | | | — | | | | 14,778 | | | | — | | | | 14,778 | |
Corporate Obligations C | | | — | | | | 209 | | | | — | | | | 209 | |
Collateralized Mortgage Obligations | | | — | | | | 10,703 | | | | — | | | | 10,703 | |
Investment Companies | | | 5,377 | | | | — | | | | — | | | | 5,377 | |
Exchange Traded Instruments | | | 2,676 | | | | — | | | | — | | | | 2,676 | |
Short-Term Investments – Money Market Funds | | | 31,071 | | | | — | | | | — | | | | 31,071 | |
| | | | | | | | | | | | | | | | |
Total Investments in Securities—Assets | | $ | 65,164 | | | $ | 26,402 | | | $ | — | | | $ | 91,566 | |
| | | | | | | | | | | | | | | | |
Liabilities | | | | | | | | | | | | | | | | |
Common Stocks (Sold Short) | | $ | (33,425 | ) | | $ | (536 | ) | | $ | — | | | $ | (33,961 | ) |
Warrants (Sold Short) | | | (45 | ) | | | — | | | | — | | | | (45 | ) |
Convertible Obligations (Sold Short) | | | — | | | | (224 | ) | | | — | | | | (224 | ) |
Investment Companies (Sold Short) | | | (454 | ) | | | — | | | | — | | | | (454 | ) |
Exchange Traded Instruments (Sold Short) | | | (7,948 | ) | | | — | | | | — | | | | (7,948 | ) |
| | | | | | | | | | | | | | | | |
Total Investments in Securities—Liabilities | | | (41,872 | ) | | | (760 | ) | | | — | | | | (42,632 | ) |
| | | | | | | | | | | | | | | | |
Total Investments in Securities | | $ | 23,292 | | | $ | 25,642 | | | $ | — | | | $ | 48,934 | |
| | | | | | | | | | | | | | | | |
Financial Derivative Instruments—Assets | | | | | | | | | | | | | | | | |
Purchased Options | | $ | 1,214 | | | $ | — | | | $ | — | | | $ | 1,214 | |
| | | | | | | | | | | | | | | | |
Financial Derivative Instruments—Liabilities | | | | | | | | | | | | | | | | |
Futures Contracts | | $ | (7 | ) | | $ | — | | | $ | — | | | $ | (7 | ) |
| | | | | | | | | | | | | | | | |
| 1 | Refer to Schedules of Investments for Industry Information. |
Security Transactions and Investment Income
Security transactions are recorded on the trade date of the security purchase or sale. The Funds may purchase securities with delivery or payment to occur at a later date. At the time the Fund enters into a commitment to purchase a security, the transaction is recorded, and the value of the security is reflected in the NAV. The value of the security may vary with market fluctuations.
43
American Beacon FundsSM
Notes to Financial Statements
December 31, 2015
Dividend income is recorded on the ex-dividend date. Interest income is earned from settlement date, recorded on the accrual basis, and adjusted, if necessary, for accretion of discounts and amortization of premiums. For financial and tax reporting purposes, realized gains and losses are determined on the basis of specific lot identification.
Dividends to Shareholders
Dividends from net investment income of the Funds normally will be declared and paid at least annually. Distributions, if any, of net realized capital gains are generally paid at least annually and recorded on the ex-dividend date.
Allocation of Income, Expenses, Gains, and Losses
Income, expenses (other than those attributable to a specific class), gains, and losses are allocated daily to each class of shares based upon the relative proportion of net assets represented by such class. Operating expenses directly attributable to a specific class are charged against the operations of that class.
Use of Estimates
The preparation of financial statements in conformity with U.S. GAAP requires management to make estimates and assumptions that affect the amounts reported in the financial statements and accompanying notes. Actual results may differ from those estimated.
Other
Under the Trust’s organizational documents, its officers and directors are indemnified against certain liability arising out of the performance of their duties to the Trust. In the normal course of business, the Trust enters into contracts that provide indemnification to the other party or parties against potential costs or liabilities. The Trust’s maximum exposure under these arrangements is dependent on claims that may be made in the future and, therefore, cannot be estimated. The Trust has had no prior claims or losses pursuant to any such agreement.
4. Securities and Other Investments
Other Investment Company Securities and Other Exchange Traded Products
The Funds may invest in shares of other investment companies, including open-end funds, closed-end funds, business development companies, ETFs, unit investment trusts, and other investment companies of the Trust. The Funds may invest in investment company securities advised by the Manager or a sub-advisor. Investments in the securities of other investment companies may involve duplication of advisory fees and certain other expenses. By investing in another investment company, the Funds become a shareholder of that investment company. As a result, the Funds shareholders indirectly will bear a Funds’ proportionate share of the fees and expenses paid by shareholders of the other investment company, in addition to the fees and expenses the Funds shareholders directly bear in connection with the Funds’ own operations. These other fees and expenses are reflected as Acquired Fund Fees and Expenses and are included in the Fees and Expenses Table for the Fund in its Prospectus, if applicable. Investments in other investment companies may involve the payment of substantial premiums above the value of such issuer’s portfolio securities.
Convertible Securities
Convertible securities include corporate bonds, notes, preferred stock or other securities that may be converted into or exchanged for a prescribed amount of common stock of the same or a different issuer within
44
American Beacon FundsSM
Notes to Financial Statements
December 31, 2015
a particular period of time at a specified price or formula. A convertible security entitles the holder to receive interest paid or accrued on debt or dividends paid on preferred stock until the convertible security matures or is redeemed, converted or exchanged. While no securities investment is without some risk, investments in convertible securities generally entail less risk than the issuer’s common stock, although the extent to which such risk is reduced depends in large measure upon the degree to which the convertible security sells above its value as a fixed income security. The market value of convertible securities tends to decline as interest rates increase and, conversely, to increase as interest rates decline. While convertible securities generally offer lower interest or dividend yields than non-convertible debt securities of similar quality, they do enable the investor to benefit from increases in the market price of the underlying common stock. Holders of convertible securities have a claim on the assets of the issuer prior to the common stockholders, but may be subordinated to holders of similar non-convertible securities of the same issuer. Because of the conversion feature, certain convertible securities may be considered equity equivalents.
Illiquid and Restricted Securities
Certain Funds may invest in securities that are subject to legal or contractual restrictions on resale. These securities may be sold privately, but are required to be registered or exempted from such registration before being sold to the public. Private placement securities are generally considered to be restricted except for those securities traded between qualified institutional investors under the provisions of Rule 144A of the Securities Act of 1933 (the “Securities Act”). Illiquid securities have included securities that have not been registered under the Securities Act, securities that are otherwise not readily marketable, and repurchase agreements having a remaining maturity of longer than seven calendar days. Disposal of both illiquid and restricted securities may involve time-consuming negotiations and expenses, and prompt sale at an acceptable price may be difficult to achieve. Illiquid and restricted securities outstanding at the year ended December 31, 2015 are disclosed in the Notes to the Schedules of Investments.
Rights and Warrants
Rights are short-term warrants issued in conjunction with new stock or bond issues. Warrants are options to purchase an issuer’s securities at a stated price during a stated term. If the market price of the underlying common stock does not exceed the warrant’s exercise price during the life of the warrant, the warrant will expire worthless. Warrants usually have no voting rights, pay no dividends and have no rights with respect to the assets of the corporation issuing them. The percentage increase or decrease in the value of a warrant may be greater than the percentage increase or decrease in the value of the underlying common stock. Warrants may be purchased with values that vary depending on the change in value of one or more specified indices (“index warrants”). Index warrants are generally issued by banks or other financial institutions and give the holder the right, at any time during the term of the warrant, to receive upon exercise of the warrant a cash payment from the issuer based on the value of the underlying index at the time of the exercise. The market for warrants or rights may be very limited and it may be difficult to sell them promptly at an acceptable price. There is no specific limit on the percentage of assets the Fund may invest in rights and warrants.
Special Purpose Acquisition Company
A special purpose acquisition company (“SPAC”) is a collective investment structure that allows public stock market investors to invest in private equity type transactions, particularly leveraged buyouts. SPACs are shell or blank-check companies, governed by the SEC, that have no operations but go public with the intention of merging with or acquiring a company with the proceeds of the SPAC’s initial public offering (“IPO”). SPACs outstanding at the year ended December 31, 2015 are disclosed in the Notes to the Schedules of Investments.
45
American Beacon FundsSM
Notes to Financial Statements
December 31, 2015
Mortgage-Related and Other Asset-Backed Securities
The Fund may invest in mortgage or other asset-backed securities (“ABS”). These securities may include mortgage instruments issued by U.S. government agencies (“agency mortgages”) or those issued by private entities (“non-agency mortgages”). Specific types of instruments may include mortgage pass-through securities, collateralized mortgage obligations (“CMOs”), commercial mortgage-backed securities, mortgage dollar rolls, CMO residuals, stripped mortgage-backed securities and other securities that directly or indirectly represent a participation in, or are secured by a payable from, mortgage loans on real property. The value of the Fund’s mortgage-backed securities (“MBS”) may be affected by, among other things, changes or perceived changes in interest rates, factors concerning the interests in and structure of the issuer or the originator of the mortgage, or the quality of the underlying assets. The mortgages underlying the securities may default or decline in quality or value. Through its investments in MBS, a Fund has exposure to subprime loans, Alt-A loans and non-conforming loans as well as to the mortgage and credit markets generally. Underlying collateral related to subprime, Alt-A and non-conforming mortgage loans has become increasingly susceptible to defaults and declines in quality or value, especially in a declining residential real estate market. In addition, regulatory or tax changes may adversely affect the mortgage securities markets as a whole.
Mortgage-Backed Securities
MBS often have stated maturities of up to thirty years when they are issued, depending upon the length of the mortgages underlying the securities. In practice however, unscheduled or early payments of principal and interest on the underlying mortgages may make the securities’ effective maturity shorter than this, and the prevailing interest rates may be higher or lower than the current yield of the Fund’s portfolio at the time resulting in reinvestment risk.
Rising or high interest rates may result in slower than expected principal payments which may tend to extend the duration of MBS, making them more volatile and more sensitive to changes in interest rates. This is known as extension risk.
MBS may have less potential for capital appreciation than comparable fixed income securities due to the likelihood of increased prepayments of mortgages resulting from foreclosures or declining interest rates. These foreclosed or refinanced mortgages are paid off at face value (par) or less, causing a loss, particularly for any investor who may have purchased the security at a premium or a price above par. In such an environment, this risk limits the potential price appreciation of these securities.
Agency Mortgage-Backed Securities
Certain MBS may be issued or guaranteed by the U.S. government or a government sponsored entity, such as Fannie Mae (the Federal National Mortgage Association) or Freddie Mac (the Federal Home Loan Mortgage Corporation). Although these instruments may be guaranteed by the U.S. government or a government sponsored entity, many such MBS are not backed by the full faith and credit of the United States and are still exposed to the risk of non-payment.
Short Sales
The Funds may enter into short sale transactions. A short sale is a transaction in which a Fund sells a security it does not own in anticipation of a decline in the market price of the security. Securities sold in short sale transactions and the dividends and interest payable on such securities, if any, are reflected as a liability on the Statements of Assets and Liabilities. A Fund is obligated to deliver the security at the market price at the time the short position is closed. The risk of loss on a short sale transaction is theoretically unlimited, because there is no limit to the cost of replacing the security sold short, whereas losses from purchase transactions cannot exceed the total amount invested. As of December 31, 2015, short positions were held by the Ionic Strategic Arbitrage Fund.
46
American Beacon FundsSM
Notes to Financial Statements
December 31, 2015
Master Agreements
Each Fund is a party to International Swaps and Derivatives Association, Inc. Master Agreements (“ISDA Master Agreements”) with counterparties that govern transactions in over-the-counter derivative and foreign exchange contracts entered into by the Fund and those counterparties. The ISDA Master Agreements contain provisions for general obligations, representations, agreements, collateral and events of default or termination. Events of termination include conditions that may entitle counterparties to elect to terminate early and cause settlement of all outstanding transactions under the applicable ISDA Master Agreement. Any election to terminate early could be material to the financial statements. Since different types of forward and OTC financial derivative transactions have different mechanics and are sometimes traded out of different legal entities of particular counterparty organization, each type of transaction may be covered by a different Master Agreement, resulting in the need for multiple agreements with a single counterparty. As the Master Agreements are specific to unique operations of different asset types, they allow a Fund to net its total exposure to a counterparty in the event of a default with respect to all the transactions governed under a single agreement with a counterparty.
Master Securities Forward Transaction Agreements (“Master Forward Agreements”) govern the considerations and factors surrounding the settlement of certain forward settling transactions, such as delayed delivery or sale-buyback financing transactions by and between a Fund and select counterparties. The Master Forward Agreements maintain provisions for, among other things, initiation and confirmation, payment and transfer, events of default, termination, and maintenance of collateral.
5. Financial Derivative Instruments
Options Contracts
The Funds may write (1) call and put options on futures, swaps (“swaptions”), securities, commodities or currencies they own or in which they may invest and (2) inflation-capped options. Writing put options tends to increase the Fund’s exposure to unfavorable movements of the underlying instrument in exchange for an upfront premium. Writing call options tends to decrease the Fund’s exposure to favorable movements of the underlying instrument in exchange for an upfront premium. When the Fund writes a call, put, or inflation-capped option, an amount equal to the premium received is recorded as a liability and subsequently marked to market to reflect the current value of the option written. The purpose of inflation-capped options is to protect the buyer from inflation erosion above a certain rate on a given notional exposure. A floor can be used to give downside protection to investments in inflation-linked products. These liabilities are reflected as written options outstanding on the Statement of Assets and Liabilities. Certain options may be written with premiums to be determined on a future date. Premiums received from writing options which expire are treated as realized gains. Premiums received from writing options which are exercised or closed are added to the proceeds or offset against amounts paid on the underlying futures, swap, security or currency transaction to determine the realized gain or loss when the underlying transaction is sold. The Fund as a writer of an option has no control over whether the underlying instrument may be sold (call) or purchased (put) and as a result bears the market risk of an unfavorable change in the price of the instrument underlying the written option. There is the risk the Fund may not be able to enter into a closing transaction because of an illiquid market.
The Funds may also purchase put and call options. Purchasing call options tends to increase the Fund’s exposure to favorable movements of the underlying instrument in exchange for paying an upfront premium. Purchasing put options tends to decrease the Fund’s exposure to unfavorable movements of the underlying instrument. The Fund pays a premium which is included on the Fund’s Statement of Assets and Liabilities as an investment and subsequently marked to market to reflect the current value of the option. Premiums paid for purchasing options which expire are treated as realized losses. Certain options may be purchased with premiums to be determined on a future date. The premiums for these options are based upon implied volatility parameters at specified terms. The risk associated with purchasing put and call options is limited to the premium paid. Premiums paid for purchasing options which are exercised or closed are added to the amounts
47
American Beacon FundsSM
Notes to Financial Statements
December 31, 2015
paid or offset against the proceeds on the underlying investment transaction to determine the realized gain or loss when the underlying transaction is sold.
Options
For the periods ended December 31, 2015, the Ionic Strategic Arbitrage Fund purchased/sold options primarily for return enhancement, hedging and exposing cash to markets.
The Fund’s option contracts outstanding fluctuate throughout the operating year as required to meet strategic requirements. The following table illustrates the average quarterly volume of options contracts. For the purpose of this disclosure, volume is measured by contracts outstanding at each quarter end (in thousands).
| | | | | | |
| | | Average Purchased Option Notional Amounts Outstanding | | |
| | | Fund | | Period ended December 31, 2015 | | |
| | Ionic Strategic Arbitrage | | $1,052,300 | | |
| | |
| | | Average Written Option Notional Amounts Outstanding | | |
| | | Fund | | Period ended December 31, 2015 | | |
| | Ionic Strategic Arbitrage | | $ 22,750 | | |
Straddle Options
The Funds may enter into differing forms of straddle options. A straddle is an investment strategy that uses combinations of options that allow a Fund to profit based on the future price movements of the underlying security, regardless of the direction of those movements. A written straddle involves simultaneously writing a call option and a put option on the same security with the same strike price and expiration date. The written straddle increases in value when the underlying security price has little volatility before the expiration date. A purchased straddle involves simultaneously purchasing a call option and a put option on the same security with the same strike price and expiration date. The purchased straddle increases in value when the underlying security price has high volatility, regardless of direction, before the expiration date.
Forward Foreign Currency Contracts
The Funds may enter into forward foreign currency contracts to hedge the exchange rate risk on investment transactions or to hedge the value of the Fund’s securities denominated in foreign currencies. Forward foreign currency contracts are valued at the forward exchange rate prevailing on the day of valuation. The Funds may also use foreign currency forward contracts to increase exposure to a foreign currency or to shift exposure to foreign currency fluctuations from one country to another. The Fund bears the market risk that arises from changes in foreign exchange rates, and accordingly, the unrealized gain (loss) on these contracts is reflected in the accompanying financial statements. The Fund also bears the credit risk if the counterparty fails to perform under the contract.
For the period ended December 31, 2015, the AHL Managed Futures Fund entered into foreign currency exchange contracts primarily for speculative purposes.
The Funds’ foreign currency contract notional dollar values outstanding fluctuate throughout the operating year as required to meet strategic requirements. The following table illustrates the average quarterly volume of foreign currency contracts. For the purpose of this disclosure, volume is measured by the amounts bought and sold in USD (in thousands).
| | | | | | | | |
| | | Average Forward Foreign Currency
Notional Amount Outstanding during
the period ended December 31, 2015 | |
Fund | | Purchased Contracts | | | Sold Contracts | |
AHL Managed Futures Strategy | | $ | 40,947 | | | $ | 56,896 | |
48
American Beacon FundsSM
Notes to Financial Statements
December 31, 2015
Futures Contracts
Futures contracts are contracts to buy or sell a standard quantity of securities at a specified price on a future date. The Funds may enter into financial futures contracts as a method for keeping assets readily convertible to cash if needed to meet shareholder redemptions or for other needs while maintaining exposure to the stock or bond market, as applicable. The primary risks associated with the use of futures contracts are the possibility of illiquid markets or imperfect correlation between the values of the contracts and the underlying securities or that the counterparty will fail to perform its obligations.
Upon entering into a futures contract, the Fund is required to set aside or deposit with a broker an amount, termed the initial margin, which typically represents a portion of the face value of the futures contract. The Fund usually reflects this amount on the Schedule of Investments as a U.S. Treasury Bill held as collateral for futures contracts or as cash deposited with broker on the Statement of Assets and Liabilities. Payments to and from the broker, known as variation margin, are required to be made on a daily basis as the price of the futures contract fluctuates. Changes in initial settlement values are accounted for as unrealized appreciation (depreciation) until the contracts are terminated, at which time realized gains and losses are recognized. Futures contracts are valued at the most recent settlement price established each day by the exchange on which they are traded.
During the period ended December 31, 2015, the Funds entered into future contracts primarily for speculative purposes.
The Fund’s average futures contracts outstanding fluctuate throughout the operating year as required to meet strategic requirements. The following table illustrates the quarterly volume of futures contracts. For purpose of this disclosure, volume is measured by contracts outstanding at each quarter end (in thousands).
| | |
Average Futures Contracts Outstanding |
Fund | | Period ended December 31, 2015 |
AHL Managed Futures Strategy | | 2,903 |
Ionic Strategic Arbitrage | | 4 |
The following is a summary of the Funds’ derivative financial instruments categorized by risk exposure (in thousands) (1):
AHL Managed Futures Strategy
Fair values of financial instruments on the Statement of Assets and Liabilities as of December 31, 2015 (in thousands):
| | | | | | | | | | | | | | | | | | | | | | | | |
| | | Derivatives not accounted for as hedging instruments | |
| | | Foreign
Exchange
Contracts | | | Commodity
Contracts | | | Currency
Contracts | | | Equity
Contracts | | | Interest
Rate
Contracts | | | Total | |
Assets: | | | | | | | | | | | | | | | | | | | | | | | | |
Unrealized appreciation of foreign currency contracts | | $ | 328 | | | $ | — | | | $ | — | | | $ | — | | | $ | — | | | $ | 328 | |
Receivable for variation margin from open futures contracts(2) | | | — | | | | 991 | | | | 474 | | | | 69 | | | | 119 | | | | 1,653 | |
| | | | | | | | | | | | | | | | | | | | | | | | |
| | $ | 328 | | | $ | 991 | | | $ | 474 | | | $ | 69 | | | $ | 119 | | | $ | 1,981 | |
| | | | | | | | | | | | | | | | | | | | | | | | |
Liabilities: | | | | | | | | | | | | | | | | | | | | | | | | |
Unrealized depreciation of foreign currency contracts | | $ | (791 | ) | | $ | — | | | $ | — | | | $ | — | | | $ | — | | | $ | (791 | ) |
Payable for variation margin from open futures contracts(2) | | | — | | | | (427 | ) | | | (96 | ) | | | (340 | ) | | | (333 | ) | | | (1,196 | ) |
| | | | | | | | | | | | | | | | | | | | | | | | |
| | $ | (791 | ) | | $ | (427 | ) | | $ | (96 | ) | | $ | (340 | ) | | $ | (333 | ) | | $ | (1,987 | ) |
| | | | | | | | | | | | | | | | | | | | | | | | |
49
American Beacon FundsSM
Notes to Financial Statements
December 31, 2015
The effect of financial derivative instruments on the Statement of Operations for the year ended December 31, 2015 (in thousands):
| | | | | | | | | | | | | | | | | | | | | | | | |
| | | Derivatives not accounted for as hedging instruments | |
| | | Foreign
Exchange
Contracts | | | Commodity
Contracts | | | Currency
Contracts | | | Equity
Contracts | | | Interest
Rate
Contracts | | | Total | |
Realized gain (loss) of derivatives recognized as a result from operations: | | | | | | | | | | | | | | | | | | | | | | | | |
Net realized gain (loss) from foreign currency transactions | | $ | 1,392 | | | $ | — | | | $ | — | | | $ | — | | | $ | — | | | $ | 1,392 | |
Net realized gain (loss) from futures contracts | | | — | | | | 2,373 | | | | (1,494 | ) | | | (1,462 | ) | | | (488 | ) | | | (1,071 | ) |
| | | | | | | | | | | | | | | | | | | | | | | | |
| | $ | 1,392 | | | $ | 2,373 | | | $ | (1,494 | ) | | $ | (1,462 | ) | | $ | (488 | ) | | $ | 321 | |
| | | | | | | | | | | | | | | | | | | | | | | | |
Net change in unrealized appreciation or (depreciation) of derivatives recognized as a result from operations: | | | | | | | | | | | | | | | | | | | | |
Change in net unrealized appreciation or (depreciation) from foreign currency contracts | | $ | (538 | ) | | $ | — | | | $ | — | | | $ | — | | | $ | — | | | $ | (538 | ) |
Change in net unrealized appreciation or (depreciation) from futures contracts | | | — | | | | (65 | ) | | | 100 | | | | (362 | ) | | | (871 | ) | | | (1,198 | ) |
| | | | | | | | | | | | | | | | | | | | | | | | |
| | $ | (538 | ) | | $ | (65 | ) | | $ | 100 | | | $ | (362 | ) | | $ | (871 | ) | | $ | (1,736 | ) |
| | | | | | | | | | | | | | | | | | | | | | | | |
Ionic Strategic Arbitrage
Fair values of financial instruments on the Statement of Assets and Liabilities as of December 31, 2015 (in thousands):
| | | | | | | | | | | | |
| | | Derivatives not accounted for as hedging instruments | |
| | | Exchange
Traded
Contracts | | | Interest Rate
Contracts | | | Total | |
Assets: | | | | | | | | | | | | |
Purchased options outstanding | | $ | 1,214 | | | $ | — | | | $ | 1,214 | |
| | | | | | | | | | | | |
Liabilities: | | | | | | | | | | | | |
Payable for variation margin from open futures
contracts(2) | | $ | (5 | ) | | $ | (2) | | | $ | (7 | ) |
The effect of financial derivative instruments on the Statement of Operations for the period ended December 31, 2015 (in thousands):
| | | | | | | | | | | | |
| | | Derivatives not accounted for as hedging instruments | |
| | | Exchange
Traded
Contracts | | | Interest Rate
Contracts | | | Total | |
Realized gain (loss) of derivatives recognized as a result from operations: | | | | | | | | | | | | |
Net realized gain (loss) from options contracts | | $ | 56 | | | $ | — | | | $ | 56 | |
Net realized gain (loss) from futures contracts | | | 190 | | | | (1 | ) | | | 189 | |
| | | | | | | | | | | | |
| | $ | 246 | | | $ | (1 | ) | | $ | 245 | |
| | | | | | | | | | | | |
Net change in unrealized appreciation or (depreciation) of derivatives recognized as a result from operations: | | | | | | | | | | | | |
Change in net unrealized appreciation or (depreciation) from options contracts | | $ | (503 | ) | | $ | — | | | $ | (503 | ) |
Change in net unrealized appreciation or (depreciation) from futures contracts | | | (5 | ) | | | (2 | ) | | | (7 | ) |
| | | | | | | | | | | | |
| | $ | (508 | ) | | $ | (2 | ) | | $ | (510 | ) |
| | | | | | | | | | | | |
| (1) | See Note 3 in the Notes to Financial Statements for additional information. |
| (2) | Includes cumulative appreciation or (depreciation) of futures contracts as reported in the Schedule of Investment footnotes. Only current day’s variation margin is reported within the Statement of Assets and Liabilities. |
50
American Beacon FundsSM
Notes to Financial Statements
December 31, 2015
6. Principal Risks
In the normal course of business the Funds trade financial instruments and enter into financial transactions where risk of potential loss exists. Security values fluctuate (market risk) and may decline due to factors affecting securities markets in general, particular industries represented in the securities markets or conditions specifically related to a particular company. Failure of the other party to a transaction to perform (credit and counterparty risk), for example by not making principal and interest payments when due, reduces the value of the issuer’s debt and could reduce the Fund’s income. Similar to credit risk, the Fund may be exposed to counterparty risk, or the risk that an institution or other entity with which the Fund has unsettled or open transactions will fail to make required payments or otherwise comply with the terms of the instrument, transaction or contract. The potential loss could exceed the value of the financial assets recorded in the financial statements. Some of the Fund’s investments may be illiquid and the Fund may not be able to vary the portfolio investments in response to changes in economic and other conditions. If a Fund is required to liquidate all or a portion of its investments quickly, the Fund may realize significantly less than the value at which it previously recorded those investments.
Market Risks
The Funds’ investments in financial derivatives and other financial instruments expose the Funds to various risks such as, but not limited to, interest rate, foreign currency and equity risks.
Interest rate risk is the risk that fixed income securities will decline in value because of changes in interest rates. As nominal interest rates rise, the value of certain fixed income securities held by the Fund is likely to decrease. A nominal interest rate can be described as the sum of a real interest rate and an expected inflation rate. Fixed income securities with longer durations tend to be more sensitive to changes in interest rates, usually making them more volatile than securities with shorter durations. Duration is useful primarily as a measure of the sensitivity of a fixed income’s market price to interest rate (i.e. yield) movements.
If the Fund invests directly in foreign currencies or in securities that trade in, and receive revenues in, foreign currencies, or in financial derivatives that provide exposure to foreign currencies, it will be subject to the risk that those currencies will decline in value relative to the base currency of the Fund, or, in the case of hedging positions, that the Fund’s base currency will decline in value relative to the currency being hedged. Currency rates in foreign countries may fluctuate significantly over short periods of time for a number of reasons, including changes in interest rates, intervention (or the failure to intervene) by U.S. or foreign governments, central banks or supranational entities such as the International Monetary Fund, or by the imposition of currency controls or other political developments in the United States or abroad. As a result, the Fund’s investments in foreign currency denominated securities may reduce the returns of the Fund.
The fair values of equities, such as common stocks and preferred securities or equity related investments such as futures, may decline due to general market conditions which are not specifically related to a particular company, such as real or perceived adverse economic conditions, changes in the general outlook for corporate earnings, changes in interest or currency rates or adverse investor sentiment generally. They may also decline due to factors which affect a particular industry or industries, such as labor shortages or increased production costs and competitive conditions within an industry. Equity securities and equity related investments generally have greater market price volatility than fixed income securities.
Counterparty Credit Risk
A derivative contract may suffer a mark to market loss if the value of the contract decreases due to an unfavorable change in the market rates or values of the underlying instrument. Losses can also occur if the counterparty does not perform under the contract.
51
American Beacon FundsSM
Notes to Financial Statements
December 31, 2015
With exchange traded futures, there is less counterparty credit risk to the Funds since the exchange or clearinghouse, as counterparty to such instruments, guarantees against a possible default. The clearinghouse stands between the buyer and the seller of the contract; therefore, the credit risk is limited to failure of the clearinghouse. While offset rights may exist under applicable law, a Fund does not have a contractual right of offset against a clearing broker or clearinghouse in the event of a default (including the bankruptcy or insolvency) of the clearing broker or clearinghouse. Additionally, credit risk exists in exchange traded futures with respect to initial and variation margin that is held in a clearing broker’s customer accounts. While clearing brokers are required to segregate customer margin from their own assets, in the event that a clearing broker becomes insolvent or goes into bankruptcy and at that time there is a shortfall in the aggregate amount of margin held by the clearing broker for all its clients, typically the shortfall would be allocated on a pro rata basis across all the clearing broker’s customers, potentially resulting in losses to the Fund.
Cash collateral that has been pledged to cover obligations of the Funds and cash collateral received from the counterparty, if any, is reported separately on the Statements of Assets and Liabilities as deposits with brokers for futures contracts and payable to brokers for futures contracts, respectively. Non-cash collateral pledged by the Funds, if any, is noted in the Schedule of Investments. Generally, the amount of collateral due from or to a party is determined at the close of business of the Fund and additional required collateral is delivered to/pledged by the Fund on the next business day. To the extent amounts due to the Fund from its counterparties are not fully collateralized, contractually or otherwise, the Fund bears the risk of loss from counterparty non-performance. The Fund attempts to mitigate counterparty risk by only entering into agreements with counterparties that it believes have the financial resources to honor their obligations and by monitoring the financial stability of those counterparties.
Offsetting Assets and Liabilities
The Funds are parties to enforceable master netting agreements between brokers and counterparties, such as ISDA, Master Repo Agreements and Master Forward Agreements which provide for the right to offset under certain circumstances. The Fund employs multiple money managers and counterparties and has elected not to offset qualifying financial and derivative instruments on the Statement of Assets and Liabilities, as such all financial and derivative instruments are presented on a gross basis. The impacts of netting arrangements that provide the right to offset are detailed below. The net amount represents the net receivable or payable that would be due from or to the counterparty in the event of default. Exposure from borrowings and other financing agreements such as repurchase agreements can only be netted across transactions governed by the same Master Agreement with the same legal entity. All amounts reported below represent the balance as of the report date, December 31, 2015 (in thousands).
AHL Managed Futures
Offsetting of Financial Assets and Derivative Assets as of December 31, 2015:
| | | | | | | | | | | | |
Description | | Gross Amounts of
Recognized Assets | | | Gross Amounts
Offset in the
Statements of
Assets and
Liabilities | | | Net Amounts of Assets
Presented in the
Statements of Assets
and Liabilities | |
Futures Contracts(1) | | $ | 1,653 | | | $ | — | | | $ | 1,653 | |
Forward Currency Contracts | | | 328 | | | | — | | | | 328 | |
| | | | | | | | | | | | |
| | $ | 1,981 | | | $ | — | | | $ | 1,981 | |
| | | | | | | | | | | | |
52
American Beacon FundsSM
Notes to Financial Statements
December 31, 2015
Offsetting of Financial Liabilities and Derivative Liabilities as of December 31, 2015:
| | | | | | | | | | | | |
Description | | Gross Amounts of
Recognized
Liabilities | | | Gross Amounts
Offset in the
Statements of
Assets and
Liabilities | | | Net Amounts of
Liabilities
Presented in the
Statements of Assets
and Liabilities | |
Futures Contracts (1) | | $ | (1,196 | ) | | $ | — | | | $ | (1,196 | ) |
Forward Currency Contracts | | | (791 | ) | | | — | | | | (791 | ) |
| | | | | | | | | | | | |
| | $ | (1,987 | ) | | $ | — | | | $ | (1,987 | ) |
| | | | | | | | | | | | |
Financial Assets, Derivative Assets, and Collateral Pledged by Counterparty as of December 31, 2015:
| | | | | | | | | | | | | | | | |
| | | Net Amount of Liabilities
Presented in the
Statements of Assets and
Liabilities | | | Gross Amounts Not Offset in the
Statements of Assets and Liabilities | | | | |
Counterparty | | | Financial
Instruments | | | Cash
Collateral
Received | | | Net
Amount | |
BofA Merrill Lynch(1) | | $ | 312 | | | $ | — | | | $ | — | | | $ | 312 | |
JP Morgan(1) | | | 246 | | | | — | | | | — | | | | 246 | |
Credit Suisse(1) | | | (101 | ) | | | — | | | | — | | | | (101 | ) |
Deutsche Bank AG | | | (274 | ) | | | — | | | | — | | | | (274 | ) |
HSBC Bank PLC | | | (213 | ) | | | — | | | | — | | | | (213 | ) |
Royal Bank of Scotland PLC | | | 24 | | | | — | | | | — | | | | 24 | |
| | | | | | | | | | | | | | | | |
| | $ | (6 | ) | | $ | — | | | $ | — | | | $ | (6 | ) |
| | | | | | | | | | | | | | | | |
Ionic Strategic Arbitrage
Offsetting of Financial Assets and Derivative Assets as of December 31, 2015:
| | | | | | | | | | | | |
Description | | Gross Amounts of
Recognized
Assets | | | Gross Amounts
Offset in the
Statements of
Assets and
Liabilities | | | Net Amounts of Assets
Presented in the
Statements of Assets
and Liabilities | |
Purchased options outstanding | | $ | 1,214 | | | | — | | | $ | 1,214 | |
| | | | | | | | | | | | |
Offsetting of Financial Liabilities and Derivative Liabilities as of December 31, 2015:
| | | | | | | | | | | | |
Description | | Gross Amounts of
Recognized
Liabilities | | | Gross Amounts
Offset in the
Statements of
Assets and
Liabilities | | | Net Amounts of Liabilities
Presented in the
Statements of Assets
and Liabilities | |
Futures Contracts (1) | | $ | (7 | ) | | | — | | | $ | (7 | ) |
Financial Assets, Derivative Assets, and Collateral Pledged by Counterparty as of December 31, 2015:
| | | | | | | | | | | | | | | | |
| | | Net Amount of Assets
Presented in the
Statements of Assets
and Liabilities | | | Gross Amounts Not Offset in the
Statements of Assets and Liabilities | | | | |
Counterparty | | | Financial
Instruments | | | Cash
Collateral
Received | | | Net
Amount | |
Deutsche Bank AG | | $ | 1,207 | | | | — | | | | — | | | $ | 1,207 | |
| (1) | The securities presented here within are not subject to Master Netting Agreements. As such, this is disclosed for informational purposes only. |
7. Federal Income and Excise Taxes
It is the policy of the Funds to qualify as a regulated investment company (“RIC”), by complying with all applicable provisions of Subchapter M of the Internal Revenue Code, as amended, and to make distribution of taxable income sufficient to relieve it from substantially all federal income and excise taxes. For federal income tax purposes, the Funds are treated as a single entity for the purpose of determining such qualification.
53
American Beacon FundsSM
Notes to Financial Statements
December 31, 2015
The Funds do not have any unrecognized tax benefits in the accompanying financial statements. Each of the tax years in the four year period ended December 31, 2015 remains subject to examination by the Internal Revenue Service. If applicable, the Fund recognizes interest accrued related to unrecognized tax benefits in interest expense and penalties in “Other expenses” on the Statement of Operations.
Dividends are categorized in accordance with income tax regulations which may treat certain transactions differently than U.S. GAAP. Accordingly, the character of distributions and composition of net assets for tax purposes may differ from those reflected in the accompanying financial statements.
The tax character of distributions paid were as follows (in thousands):
| | | | | | | | | | | | |
| | | AHL Managed Futures | | | Ionic Strategic
Arbitrage | |
| | | Year Ended
Dec. 31,
2015 | | | Period Ended
Dec. 31,
2014 | | | Period Ended
Dec. 31,
2015 | |
Distributions paid from: | | | | | | | | | | | | |
Ordinary income* | | | | | | | | | | | | |
Institutional Class | | $ | 422 | | | $ | 863 | | | $ | 1,498 | |
Y Class | | | 895 | | | | 13 | | | | 11 | |
Investor Class | | | 960 | | | | 39 | | | | 44 | |
A Class | | | 257 | | | | 271 | | | | 3 | |
C Class | | | 45 | | | | 11 | | | | 3 | |
Long-term capital gain | | | | | | | | | | | | |
Institutional Class | | | 123 | | | | 121 | | | | 98 | |
Y Class | | | 259 | | | | 2 | | | | 1 | |
Investor Class | | | 291 | | | | 5 | | | | 2 | |
A Class | | | 84 | | | | 38 | | | | — | |
C Class | | | 16 | | | | 1 | | | | — | |
Return of capital | | | | | | | | | | | | |
Institutional Class | | | 2 | | | | — | | | | — | |
Y Class | | | 4 | | | | — | | | | — | |
Investor Class | | | 4 | | | | — | | | | — | |
A Class | | | 1 | | | | — | | | | — | |
C Class | | | — | | | | — | | | | — | |
| | | | | | | | | | | | |
Total distributions paid | | $ | 3,363 | | | $ | 1,364 | | | $ | 1,660 | |
| | | | | | | | | | | | |
| * | For tax purposes, short-term capital gains are considered ordinary income distributions. |
As of December 31, 2015, the components of distributable earnings or (deficits) on a tax basis were as follows (in thousands):
| | | | | | | | |
| | | AHL
Managed
Futures | | | Ionic
Strategic
Arbitrage | |
Cost basis of investments for federal income tax purposes | | $ | 98,365 | | | $ | 93,420 | |
Unrealized appreciation | | | — | | | | 1,689 | |
Unrealized depreciation | | | (1 | ) | | | (3,543 | ) |
| | | | | | | | |
Net unrealized appreciation or (depreciation) | | | (1 | ) | | | (1,854 | ) |
Undistributed ordinary income | | | — | | | | 1,364 | |
Undistributed long-term gain or (loss) | | | — | | | | — | |
Accumulated capital and other losses | | | (4,897 | ) | | | (30 | ) |
Other temporary differences | | | 562 | | | | (985 | ) |
| | | | | | | | |
Distributable earnings or (deficits) | | $ | (4,336 | ) | | $ | (1,505 | ) |
| | | | | | | | |
Financial reporting records are adjusted for permanent book/tax differences to reflect tax character. Financial records are not adjusted for temporary differences. The temporary differences between financial
54
American Beacon FundsSM
Notes to Financial Statements
December 31, 2015
reporting and tax-basis reporting of unrealized appreciation or (depreciation) are attributable primarily to the realization of unrealized gains or (losses) from certain derivative instruments, the tax deferral of losses from wash sales, and the realization for tax purposes of unrealized gain/(loss) on investments in passive foreign investment companies.
Due to inherent differences in the recognition of income, expenses, and realized gains (losses) under U.S. GAAP and federal income tax regulations, permanent differences between book and tax reporting have been identified and appropriately reclassified on the Statement of Assets and Liabilities.
Accordingly, the following amounts represent current year permanent differences derived from paydown reclasses, foreign currency reclasses, reclassifications of income from closed end fund, fund distribution, reclassification and income recognition from investment subsidiary, and dividends that have been reclassified as of December 31, 2015 (in thousands):
| | | | | | | | |
| | | AHL Managed
Futures | | | Ionic Strategic
Arbitrage | |
Paid-in-capital | | $ | 959 | | | $ | — | |
Undistributed net investment income | | | 2,807 | | | | 414 | |
Accumulated net realized gain (loss) | | | (3,766 | ) | | | (414 | ) |
Unrealized appreciation or (depreciation) of investments | | | — | | | | — | |
Under the Regulated Investment Company Modernization Act of 2010 (the “RIC MOD”), net capital losses recognized by the Funds in taxable years beginning after December 22, 2010 are carried forward indefinitely and retain their character as short-term and/or long-term losses.
As of December 31, 2015, the AHL Managed Futures Fund has $2,134 of short-term and $2,313 of long-term post enactment capital loss carryforwards (in thousands).
The Funds are permitted for tax purposes to defer into their next fiscal year qualified late year losses. Qualified late year losses are any capital losses incurred after October 31 through the Funds’ fiscal year December 31, 2015. For the period ended December 31, 2015, AHL Managed Futures Strategy Fund deferred $450 of qualified late year specified ordinary losses and Ionic Strategic Arbitrage Fund deferred $30 of long-term capital loss (in thousands).
8. Investment Transactions
The aggregate cost of purchases and proceeds from sales of investments other than short-term obligations for the year ended December 31, 2015 were (in thousands):
| | | | | | | | |
Fund | | Purchases | | | Sales | |
AHL Managed Futures | | $ | — | | | $ | — | |
Ionic Strategic Arbitrage | | | 181,532 | | | | 68,326 | |
55
American Beacon FundsSM
Notes to Financial Statements
December 31, 2015
9. Capital Share Transactions
The tables below summarize the activity in capital shares (dollars and shares in thousands):
For the Periods Ended December 31, 2015
| | | | | | | | | | | | | | | | | | | | | | | | |
| | | Institutional Class | | | Y Class | | | Investor Class | |
AHL Managed Futures Strategy Fund | | Shares | | | Amount | | | Shares | | | Amount | | | Shares | | | Amount | |
Shares sold | | | 2,166 | | | $ | 23,691 | | | | 4,162 | | | $ | 46,683 | | | | 3,881 | | | $ | 43,556 | |
Reinvestment of dividends | | | 52 | | | | 544 | | | | 110 | | | | 1,157 | | | | 120 | | | | 1,255 | |
Shares redeemed | | | (2,845 | ) | | | (32,558 | ) | | | (1,077 | ) | | | (11,830 | ) | | | (707 | ) | | | (7,798 | ) |
| | | | | | | | | | | | | | | | | | | | | | | | |
Net increase (decrease) in shares outstanding | | | (627 | ) | | $ | (8,323 | ) | | | 3,195 | | | $ | 36,010 | | | | 3,294 | | | $ | 37,013 | |
| | | | | | | | | | | | | | | | | | | | | | | | |
| | | | | | | | | | | | | | | | |
| | | A Class | | | C Class | |
AHL Managed Futures Strategy Fund | | Shares | | | Amount | | | Shares | | | Amount | |
Shares sold | | | 1,638 | | | $ | 18,288 | | | | 181 | | | $ | 2,017 | |
Reinvestment of dividends | | | 30 | | | | 316 | | | | 6 | | | | 61 | |
Shares redeemed | | | (1,546 | ) | | | (16,862 | ) | | | (16 | ) | | | (184 | ) |
| | | | | | | | | | | | | | | | |
Net increase in shares outstanding | | | 122 | | | $ | 1,742 | | | | 171 | | | $ | 1,894 | |
| | | | | | | | | | | | | | | | |
| | | | | | | | | | | | | | | | | | | | | | | | |
| | | Institutional Class | | | Y Class | | | Investor Class | |
Ionic Strategic Arbitrage Fund | | Shares | | | Amount | | | Shares | | | Amount | | | Shares | | | Amount | |
Shares sold | | | 6,369 | | | $ | 64,480 | | | | 2,646 | | | $ | 26,181 | | | | 231 | | | $ | 2,339 | |
Reinvestment of dividends | | | 162 | | | | 1,595 | | | | 1 | | | | 12 | | | | 5 | | | | 47 | |
Shares redeemed | | | (118 | ) | | | (1,187 | ) | | | (15 | ) | | | (150 | ) | | | (15 | ) | | | (146 | ) |
| | | | | | | | | | | | | | | | | | | | | | | | |
Net increase in shares outstanding | | | 6,413 | | | $ | 64,888 | | | | 2,632 | | | $ | 26,043 | | | | 221 | | | $ | 2,240 | |
| | | | | | | | | | | | | | | | | | | | | | | | |
| | | | | | | | | | | | | | | | |
| | | A Class | | | C Class | |
Ionic Strategic Arbitrage Fund | | Shares | | | Amount | | | Shares | | | Amount | |
Shares sold | | | 12 | | | $ | 114 | | | | 13 | | | $ | 130 | |
Reinvestment of dividends | | | — | | | | 3 | | | | — | | | | 3 | |
Shares redeemed | | | — | | | | (1 | ) | | | — | | | | — | |
| | | | | | | | | | | | | | | | |
Net increase in shares outstanding | | | 12 | | | $ | 116 | | | | 13 | | | $ | 133 | |
| | | | | | | | | | | | | | | | |
For the Year Ended December 31, 2014
| | | | | | | | | | | | | | | | | | | | | | | | |
| | | Institutional Class | | | Y Class | | | Investor Class | |
AHL Managed Futures Strategy Fund | | Shares | | | Amount | | | Shares | | | Amount | | | Shares | | | Amount | |
Shares sold | | | 2,078 | | | $ | 20,819 | | | | 31 | | | $ | 342 | | | | 269 | | | $ | 2,889 | |
Reinvestment of dividends | | | 91 | | | | 984 | | | | 1 | | | | 15 | | | | 4 | | | | 44 | |
Shares redeemed | | | (1 | ) | | | (6 | ) | | | — | | | | (3 | ) | | | (7 | ) | | | (73 | ) |
| | | | | | | | | | | | | | | | | | | | | | | | |
Net increase in shares outstanding | | | 2,168 | | | $ | 21,797 | | | | 32 | | | $ | 354 | | | | 266 | | | $ | 2,860 | |
| | | | | | | | | | | | | | | | | | | | | | | | |
| | | | | | | | | | | | | | | | |
| | | A Class | | | C Class | |
AHL Managed Futures Strategy Fund | | Shares | | | Amount | | | Shares | | | Amount | |
Shares sold | | | 805 | | | $ | 8,803 | | | | 26 | | | $ | 276 | |
Reinvestment of dividends | | | 29 | | | | 309 | | | | 1 | | | | 12 | |
Shares redeemed | | | (18 | ) | | | (203 | ) | | | — | | | | — | |
| | | | | | | | | | | | | | | | |
Net increase in shares outstanding | | | 816 | | | $ | 8,909 | | | | 27 | | | $ | 288 | |
| | | | | | | | | | | | | | | | |
56
This page intentionally left blank.
57
American Beacon AHL Managed Futures Strategy Fund SM
Financial Highlights
(For a share outstanding throughout the period)
| | | | | | | | | | | | | | | | | | | | | | | | |
| | | Institutional Class | | | Y Class | | | Investor Class | |
| | | Year
Ended
Dec. 31,
2015 | | | Aug. 19
to
Dec. 31,
2014A | | | Year
Ended
Dec. 31,
2015 | | | Aug. 19
to
Dec. 31,
2014A | | | Year
Ended
Dec. 31,
2015 | | | Aug. 19
to
Dec. 31,
2014A | |
Net asset value, beginning of period | | $ | 10.95 | | | $ | 10.00 | | | $ | 10.94 | | | $ | 10.00 | | | $ | 10.93 | | | $ | 10.00 | |
| | | | | | | | | | | | | | | | | | | | | | | | |
Income from investment operations: | | | | | | | | | | | | | | | | | | | | | | | | |
Net investment income | | | (0.06 | ) | | | 0.24 | | | | (0.05 | ) | | | 0.30 | | | | (0.09 | ) | | | 0.30 | |
Net gains (losses) on investments (both realized and unrealized) | | | (0.07 | ) | | | 1.10 | | | | (0.08 | ) | | | 1.03 | | | | (0.08 | ) | | | 1.02 | |
| | | | | | | | | | | | | | | | | | | | | | | | |
Total income (loss) from investment operations | | | (0.13 | ) | | | 1.34 | | | | (0.13 | ) | | | 1.33 | | | | (0.17 | ) | | | 1.32 | |
| | | | | | | | | | | | | | | | | | | | | | | | |
Less distributions: | | | | | | | | | | | | | | | | | | | | | | | | |
Dividends from net investment income | | | (0.21 | ) | | | (0.31 | ) | | | (0.21 | ) | | | (0.31 | ) | | | (0.20 | ) | | | (0.31 | ) |
Distributions from net realized gains | | | (0.15 | ) | | | (0.08 | ) | | | (0.15 | ) | | | (0.08 | ) | | | (0.15 | ) | | | (0.08 | ) |
Return of capital | | | (0.00 | )F | | | — | | | | (0.00 | )F | | | — | | | | (0.00 | )F | | | — | |
| | | | | | | | | | | | | | | | | | | | | | | | |
Total distributions | | | (0.36 | ) | | | (0.39 | ) | | | (0.36 | ) | | | (0.39 | ) | | | (0.35 | ) | | | (0.39 | ) |
| | | | | | | | | | | | | | | | | | | | | | | | |
Net asset value, end of period | | $ | 10.46 | | | $ | 10.95 | | | $ | 10.45 | | | $ | 10.94 | | | $ | 10.41 | | | $ | 10.93 | |
| | | | | | | | | | | | | | | | | | | | | | | | |
Total return B | | | (1.15 | )% | | | 13.43 | %C | | | (1.15 | )% | | | 13.33 | %C | | | (1.54 | )% | | | 13.23 | %C |
| | | | | | | | | | | | | | | | | | | | | | | | |
Ratios and supplemental data: | | | | | | | | | | | | | | | | | | | | | | | | |
Net assets, end of period (in thousands) | | $ | 20,933 | | | $ | 28,765 | | | $ | 33,817 | | | $ | 465 | | | $ | 37,185 | | | $ | 3,024 | |
Ratios to average net assets: | | | | | | | | | | | | | | | | | | | | | | | | |
Expenses, before reimbursements | | | 2.25 | % | | | 4.97 | %D | | | 2.28 | % | | | 7.71 | %D | | | 2.40 | % | | | 5.98 | %D |
Expenses, net of reimbursements | | | 1.54 | % | | | 1.54 | %D | | | 1.64 | % | | | 1.64 | %D | | | 1.92 | % | | | 1.92 | %D |
Net investment income (loss), before expense reimbursements | | | (2.29 | )% | | | 2.73 | %D | | | (1.70 | )% | | | 12.50 | %D | | | (2.07 | )% | | | 10.41 | %D |
Net investment income, net of reimbursements | | | (1.57 | )% | | | 6.17 | %D | | | (1.06 | )% | | | 18.58 | %D | | | (1.59 | )% | | | 14.47 | %D |
Portfolio turnover rate | | | — | %E | | | — | %E | | | — | %E | | | — | %E | | | — | %E | | | — | %E |
| A | August 19, 2014 is the inception date of the AHL Managed Futures Strategy Fund. |
| B | Based on net asset value, which does not reflect the sales charge, redemption fee, or contingent deferred sales charge, if applicable. May include adjustments in accordance with U.S. GAAP and as such, the net asset value for reporting purposes and the returns based upon those net asset values may differ from the net asset value and returns for shareholder transactions. |
| E | Portfolio turnover rate is based on the lesser of long-term purchases or sales divided by the average long-term fair value during the period. The Fund did not invest in any long-term securities during the reporting period. |
| F | The return of capital is calculated based on outstanding shares at the time of distribution. Amounts are less than $0.01 per share. |
58
American Beacon AHL Managed Futures Strategy Fund SM
Financial Highlights
(For a share outstanding throughout the period)
| | | | | | | | | | | | | | | | |
| A Class | | | C Class | | | |
Year
Ended
Dec. 31,
2015 | | | Aug. 19
to
Dec. 31,
2014A | | | Year
Ended
Dec. 31,
2015 | | | Aug. 19
to
Dec. 31,
2014A | | | |
| $ | 10.93 | | | $ | 10.00 | | | $ | 10.90 | | | $ | 10.00 | | |
| | | | | | | | | | | | | | | |
| | (0.52 | ) | | | 0.32 | | | | (0.09 | ) | | | 0.27 | | |
| | 0.36 | | | | 1.00 | | | | (0.16 | ) | | | 1.02 | | |
| | | | | | | | | | | | | | | |
| | (0.16 | ) | | | 1.32 | | | | (0.25 | ) | | | 1.29 | | |
| | | | | | | | | | | | | | | |
| | (0.18 | ) | | | (0.31 | ) | | | (0.16 | ) | | | (0.31 | ) | |
| | (0.15 | ) | | | (0.08 | ) | | | (0.15 | ) | | | (0.08 | ) | |
| | (0.00 | )F | | | — | | | | (0.00 | )F | | | — | | |
| | | | | | | | | | | | | | | |
| | (0.33 | ) | | | (0.39 | ) | | | (0.31 | ) | | | (0.39 | ) | |
| | | | | | | | | | | | | | | |
| $ | 10.44 | | | $ | 10.93 | | | $ | 10.34 | | | $ | 10.90 | | |
| | | | | | | | | | | | | | | |
| | (1.45 | )% | | | 13.23 | %C | | | (2.30 | )% | | | 12.93 | %C | |
| | | | | | | | | | | | | | | |
| $ | 9,891 | | | $ | 9,019 | | | $ | 2,151 | | | $ | 401 | | |
| | 2.55 | % | | | 5.31 | %D | | | 3.32 | % | | | 8.75 | %D | |
| | 1.94 | % | | | 1.94 | %D | | | 2.69 | % | | | 2.68 | %D | |
| | (3.59 | )% | | | 32.48 | %D | | | (2.88 | )% | | | 7.02 | %D | |
| | (2.98 | )% | | | 35.85 | %D | | | (2.25 | )% | | | 13.09 | %D | |
| | — | %E | | | — | %E | | | — | %E | | | — | %E | |
59
American Beacon Ionic Strategic Arbitrage Fund SM
Financial Highlights
(For a share outstanding throughout the period)
| | | | | | | | | | | | | | | | | | | | |
| | | Institutional Class | | | Y Class | | | Investor Class | | | A Class | | | C Class | |
| | | June 30D
to
Dec. 31,
2015 | | | June 30D
to
Dec. 31,
2015 | | | June 30D
to
Dec. 31,
2015 | | | June 30D
to
Dec. 31,
2015 | | | June 30D
to
Dec. 31,
2015 | |
Net asset value, beginning of period | | $ | 10.00 | | | $ | 10.00 | | | $ | 10.00 | | | $ | 10.00 | | | $ | 10.00 | |
| | | | | | | | | | | | | | | | | | | | |
Income from investment operations: | | | | | | | | | | | | | | | | | | | | |
Net investment income | | | 0.04 | | | | 0.06 | | | | 0.02 | | | | 0.08 | | | | 0.05 | |
Net gains (losses) on investments (both realized and unrealized) | | | 0.11 | | | | 0.10 | | | | 0.12 | | | | 0.06 | | | | 0.05 | |
| | | | | | | | | | | | | | | | | | | | |
Total income from investment operations | | | 0.15 | | | | 0.16 | | | | 0.14 | | | | 0.14 | | | | 0.10 | |
| | | | | | | | | | | | | | | | | | | | |
Less distributions: | | | | | | | | | | | | | | | | | | | | |
Dividends from net investment income | | | (0.06 | ) | | | (0.06 | ) | | | (0.06 | ) | | | (0.06 | ) | | | (0.05 | ) |
Distributions from net realized gains | | | (0.20 | ) | | | (0.20 | ) | | | (0.20 | ) | | | (0.20 | ) | | | (0.20 | ) |
| | | | | | | | | | | | | | | | | | | | |
Total distributions | | | (0.26 | ) | | | (0.26 | ) | | | (0.26 | ) | | | (0.26 | ) | | | (0.25 | ) |
| | | | | | | | | | | | | | | | | | | | |
Net asset value, end of period | | $ | 9.89 | | | $ | 9.90 | | | $ | 9.88 | | | $ | 9.88 | | | $ | 9.85 | |
| | | | | | | | | | | | | | | | | | | | |
Total return A | | | 1.46 | %C | | | 1.56 | %C | | | 1.36 | %C | | | 1.36 | %C | | | 1.00 | %C |
| | | | | | | | | | | | | | | | | | | | |
Ratios and supplemental data: | | | | | | | | | | | | | | | | | | | | |
Net assets, end of period (in thousands) | | $ | 63,422 | | | $ | 26,060 | | | $ | 2,187 | | | $ | 115 | | | $ | 131 | |
Ratios to average net assets: | | | | | | | | | | | | | | | | | | | | |
Expenses, before reimbursements | | | 3.55 | %B | | | 3.83 | %B | | | 4.23 | %B | | | 7.35 | %B | | | 8.14 | %B |
Expenses, before reimbursements, excluding non-operating expenses | �� | | 2.25 | %B | | | 2.21 | %B | | | 2.92 | %B | | | 5.93 | %B | | | 6.72 | %B |
Expenses, net of reimbursements | | | 2.84 | %B | | | 3.27 | %B | | | 3.23 | %B | | | 3.37 | %B | | | 4.11 | %B |
Expenses, net of reimbursements and non-operating expenses | | | 1.54 | %B | | | 1.64 | %B | | | 1.92 | %B | | | 1.94 | %B | | | 2.69 | %B |
Net investment income (loss), before expense reimbursements | | | (0.31 | )%B | | | 0.83 | %B | | | (1.52 | )%B | | | (3.54 | )%B | | | (4.30 | )%B |
Net investment income, net of reimbursements | | | 0.40 | %B | | | 1.40 | %B | | | (0.53 | )%B | | | 0.44 | %B | | | (0.28 | )%B |
Portfolio turnover rate | | | 159 | %C | | | 159 | %C | | | 159 | %C | | | 159 | %C | | | 159 | %C |
| A | Based on net asset value, which does not reflect the sales charge, redemption fee, or contingent deferred sales charge, if applicable. May include adjustments in accordance with U.S. GAAP and as such, the net asset value for reporting purposes and the returns based upon those net asset values may differ from the net asset value and returns for shareholder transactions. |
| D | Commencement of operations. |
60
American Beacon FundsSM
Affirmation of the Commodity Pool Operator
December 31, 2015
To the best of my knowledge and belief, the information contained in the attached financial statements for the American Beacon AHL Managed Futures Strategy Fund for the period from January 1, 2015 to December 31, 2015, is accurate and complete.

Melinda G. Heika, Treasurer
American Beacon Advisors, Inc.
Commodity Pool Operator for the American Beacon AHL Managed Futures Strategy Fund
61
American Beacon FundsSM
Privacy Policy and Federal Tax Information
December 31, 2015 (Unaudited)
Privacy Policy
The American Beacon Funds recognize and respect the privacy of our shareholders. We are providing this notice to you so you will understand how shareholder information may be collected and used.
| | We | may collect nonpublic personal information about you from one or more of the following sources: |
| | • | | information we receive from you on applications or other forms; |
| | • | | information about your transactions with us or our service providers; and |
| | • | | information we receive from third parties. |
We do not disclose any nonpublic personal information about our customers or former customers to anyone, except as permitted by law.
We restrict access to your nonpublic personal information to those employees or service providers who need to know that information to provide products or services to you. To ensure the confidentiality of your nonpublic personal information, we maintain safeguards that comply with federal standards.
Federal Tax Information
Certain tax information regarding the Funds is required to be provided to shareholders based upon the Funds’ income and distributions for the taxable year ended December 31, 2015. The information and distributions reported herein may differ from information and distributions taxable to the shareholders for the calendar year ended December 31, 2015.
The Funds designated the following items with regard to distributions paid during the fiscal year ended December 31, 2015. All designations are based on financial information available as of this annual report and, accordingly, are subject to change. For each item, it is the intention of the Funds to designate the maximum amount permitted under the Internal Revenue Code of 1986, as amended, and the regulations there under.
| | | | |
Corporate Dividends-Received Deduction: | | | | |
AHL Managed Futures Strategy Fund | | | 0.00 | % |
Ionic Strategic Arbitrage Fund | | | 22.65 | % |
Qualified Dividend Income: | | | | |
AHL Managed Futures Strategy Fund | | | 74.79 | % |
Ionic Strategic Arbitrage Fund | | | 44.38 | % |
Long-Term Capital Gain Distributions: | | | | |
AHL Managed Futures Strategy Fund | | $ | 773,163 | |
Ionic Strategic Arbitrage Fund | | | 101,843 | |
Short-Term Capital Gain Distributions: | | | | |
AHL Managed Futures Strategy Fund | | $ | 685,458 | |
Ionic Strategic Arbitrage Fund | | | 1,200,710 | |
Shareholders will receive notification in January 2016 of the applicable tax information necessary to prepare their 2015 income tax returns.
62
Disclosure Regarding the Board of Trustees’ Approval of the Management
Agreement and Investment Advisory Agreements of the Fund (Unaudited)
At its November 12-13, 2014 meetings, the Board of Trustees (“Board”) considered: (1) the approval of the Management Agreement among American Beacon Advisors, Inc. (“Manager”) and the American Beacon Funds (“Trust”) on behalf of American Beacon Ionic Strategic Arbitrage Fund, a new series of the Trust (“Fund”); and (2) the approval of a new investment advisory agreement among the Manager, Ionic Capital Management LLC (“Ionic”) and the Trust with respect to the Fund (“Advisory Agreement”).
Approval of Management Agreement on Behalf of the Ionic Fund
In advance of the meeting, the Board requested and reviewed information provided by the Manager in connection with its consideration of the Management Agreement for the Fund, and the Investment Committee of the Board met with representatives of the Manager. The Board considered, among other materials, responses by the Manager to inquiries requesting:
| | • | | a description of the advisory and related services proposed to be provided to the Fund; |
| | • | | identification of the professional personnel who are proposed to be assigned primary responsibility for managing the Fund; |
| | • | | an analysis of the proposed advisory fee, and fee waivers, a comparison to the fees charged to other comparable clients and an explanation of any differences between the fee schedules; and |
| | • | | any other information the Manager believed would be material to the Board’s consideration of the Management Agreement. |
The Board also considered information that had been provided by the Manager to the Board at the May 2014 meeting in connection with the renewal of the Management Agreement between the Manager and the Trust as it related to other existing series of the Trust (“Existing Funds”).
Provided below is an overview of the primary factors the Board considered at its November 12-13, 2014 meetings at which the Board considered the approval of the Management Agreement. In determining whether to approve the Management Agreement, the Board considered, among other things, the following factors: (1) the nature and quality of the services to be provided; (2) the estimated costs to be incurred by the Manager in rendering its services and the resulting profits or losses; (3) the extent to which economies of scale, if any, have been taken into account in setting the fee schedule; (4) whether fee levels reflect economies of scale, if any, for the benefit of investors; (5) comparisons of services and fees with contracts entered into by the Manager with the Existing Funds; and (6) any other benefits derived or anticipated to be derived by the Manager from its relationship with the Fund.
The Board did not identify any particular information that was most relevant to its consideration of the Management Agreement, and each Trustee may have afforded different weight to the various factors. The Trustees posed questions to various management personnel of the Manager regarding certain key aspects of the materials submitted in support of the approval. Legal counsel to the independent Trustees provided the Board with a memorandum regarding its responsibilities pertaining to the approval of the Management Agreement. The memorandum explained the regulatory requirements surrounding the Trustees’ process for evaluating investment advisors and the terms of investment advisory contracts. Based on its evaluation, the Board unanimously concluded that the terms of the Management Agreement were reasonable and fair and that the approval of the Management Agreement was in the best interests of the Fund.
Nature, Extent and Quality of Services. The Board noted that it had considered the renewal of the Management Agreement between the Manager and the Trust as it relates to the Existing Funds at its May 2014 meeting. At that meeting, the Board received detailed information regarding the Manager, including information with respect to the scope of services provided by the Manager to the Existing Funds and the background and experience of the Manager’s key investment personnel. At the May meeting, the Board also considered the Manager’s disciplined investment approach and goal to provide consistent above average long-term performance at a low cost on behalf of the Existing Funds and the Manager’s culture of compliance and support for compliance operations that reduces risks to the Existing Funds. The Board noted the Manager’s representation that the advisory and related services proposed to be provided to the Fund will be consistent with the services provided to the Existing Funds, except that the Fund is a single-manager fund and, therefore, the Manager will not allocate assets among multiple investment advisors, which it does for many of the Existing Funds. The Board considered the background and experience of key investment personnel who will have primary responsibility for the day-to-day oversight of the Fund. Based on the foregoing information, the Board concluded that the nature, extent and quality of the management to be provided by the Manager were appropriate for the Fund.
Investment Performance. The Board noted that the Fund is new and, therefore, had no historical performance for the Board to review. The Board also noted that the Trustees would review the performance of Ionic in connection with their consideration of the Advisory Agreement.
Costs of the Services Provided to the Fund and the Profits Realized by the Manager from its Relationship with the Fund. In analyzing the cost of services and profitability of the Manager, the Board considered the estimated revenues to be earned and the expenses to be incurred by the Manager. The Board also considered that the Manager will receive service and administrative fees to compensate the Manager for providing administrative services to the Fund. The Board noted the Manager’s representation that its accounting system does not provide for cost allocation. Accordingly, the Manager created an allocation of expenses based upon the estimated percentage of time spent by its employees on non-distribution related business. Based on the foregoing information, the Board concluded that the estimated profitability at projected asset levels were reasonable in light of the services to be performed by the Manager.
Comparisons of the amounts to be paid to the Manager under the Management Agreement and other funds in the relevant Morningstar category. In evaluating the Management Agreement, the Board reviewed the Manager’s proposed management fee schedule. The Board considered a comparison of the management fee rate to be charged by the Manager under the Management Agreement versus
63
Disclosure Regarding the Board of Trustees’ Approval of the Management
Agreement and Investment Advisory Agreements of the Fund (Unaudited)
the fee rates charged by comparable funds. The Board noted the Manager’s representation that the management fee rate proposed by the Manager for the Fund is lower than the average fee rate of Morningstar, Inc. (“Morningstar”) peer group funds. The Board also noted that the management fee rate proposed by the Manager is consistent with the fee rates paid by comparable Existing Funds. In addition, the Board considered that the Manager has agreed to contractually limit the expenses of the Fund for at least one year following the inception date of the Fund at competitive market levels. This information assisted the Board in concluding that the management fee rate appeared to be within a reasonable range for the services to be provided to the Fund, in light of all the factors considered.
Economies of Scale. The Board considered that the fee to be paid to Ionic will be paid directly by the Fund and that the Manager would not benefit economically from the proposed fee arrangement.
Benefits Derived from the Relationship with the Funds. The Board considered the Manager’s representation that it does not anticipate any material “fall-out” benefits resulting from its proposed relationship with the Fund. Based on the foregoing information, the Board concluded that the potential benefits accruing to the Manager by virtue of its relationships with the Funds appear to be fair and reasonable.
Board’s Conclusion. Based on the various considerations described above, the Board, including a majority of Trustees who are not “interested persons” of the Fund or the Manager, as that term is defined in the 1940 Act: (1) concluded that the proposed management fee is fair and reasonable; (2) determined that the Fund and its shareholders would benefit from the Manager’s management of the Fund; and (3) approved the Management Agreement.
Approval of Ionic Capital Management LLC
Prior to the meeting, the Board requested and reviewed information provided by Ionic in connection with its consideration of the Advisory Agreement, and the Investment Committee of the Board met with representatives of Ionic. The Board considered, among other materials, responses by Ionic to inquiries requesting:
| | • | | a description of the advisory and related services proposed to be provided to the Fund; |
| | • | | identification of the professional personnel to perform services for the Fund and their education, experience and responsibilities; |
| | • | | a comparison of investment performance of the Fund’s predecessor, the Ionic Absolute Return Fund LLC (“Prior Fund”), with the performance of applicable peer groups, as well as a registered investment company considered by Ionic to have investment objectives and strategies similar to those of the Fund; |
| | • | | an analysis of the proposed advisory fee; |
| | • | | a description of the portfolio managers’ compensation, including any incentive arrangement and, if compensation is tied to performance, a description of the oversight mechanism to prevent a manager with lagging performance from taking undue risks; |
| | • | | a description of Ionic’s compliance program and any material compliance matters, as well as its trading activities; |
| | • | | a discussion of Ionic’s financial condition and confirmation that Ionic’s financial condition would not impair its ability to provide high-quality services to the Fund; and |
| | • | | any other information that Ionic believed would be material to the Board’s consideration of the Advisory Agreement. |
Provided below is an overview of the primary factors the Board considered at its November 12-13, 2014 meetings at which the Board considered the approval of the Advisory Agreement. In determining whether to approve the Advisory Agreement, the Board considered, among other things, the following factors: (1) the nature and quality of the services to be provided; (2) the investment performance of Ionic; (3) the costs to be incurred by Ionic in rendering its services and the resulting profits or losses; (4) the extent to which economies of scale, if any, have been taken into account in setting the fee schedule; (5) whether fee levels reflect these economies of scale, if any, for the benefit of investors; (6) comparisons of services and fees with contracts entered into by Ionic with other clients; and (7) any other benefits anticipated to be derived by Ionic from its relationship with the Fund.
The Board did not identify any particular information that was most relevant to its consideration of the Advisory Agreement, and each Trustee may have afforded different weight to the various factors. The Trustees posed questions to various management personnel of Ionic regarding certain key aspects of the materials submitted in support of the approval. Legal counsel to the independent Trustees provided the Board with a memorandum regarding its responsibilities pertaining to the approval of the Advisory Agreement. The memorandum explained the regulatory requirements surrounding the Trustees’ process for evaluating investment advisors and the terms of investment advisory contracts. Based on its evaluation, the Board unanimously concluded that the terms of the Advisory Agreement were reasonable and fair and that the approval of the Advisory Agreement was in the best interests of the Fund.
Nature, extent and quality of the services to be provided by Ionic. The Board considered information regarding Ionic’s principal business activities, its reputation, financial condition and overall capabilities to perform the services under the Advisory Agreement. In addition, the Board considered the background and experience of the personnel who will be assigned responsibility for managing the Fund. The Board also considered Ionic’s investment resources, infrastructure and the adequacy of its compliance program. In addition, the Board took into consideration the Manager’s recommendation of Ionic. The Board considered Ionic’s representation that its financial condition is adequate to provide high quality advisory services to the Fund and that its current staffing levels were adequate to service the Fund. Based on this information, the Board concluded that the nature, extent and quality of the advisory services to be provided by Ionic were appropriate for the Fund in light of its investment objective, and, thus, supported a decision to approve the Advisory Agreement.
Performance of Ionic. The Board evaluated the performance information provided by Ionic and the Manager regarding the performance of the Prior Fund as compared to the Morningstar Multi-Alternative and Morningstar Market Neutral categories (together, the
64
Disclosure Regarding the Board of Trustees’ Approval of the Management
Agreement and Investment Advisory Agreements of the Fund (Unaudited)
“Morningstar Categories”), as well as the AQR Diversified Arbitrage Fund, a registered investment company considered by Ionic to have investment objectives and strategies similar to those of the Fund (the “AQR Fund”). The Board considered that, as of September 30, 2014, the Prior Fund outperformed the Morningstar Categories and the AQR Fund for the year-to-date period, and outperformed the Morningstar Market Neutral category and the AQR Fund and underperformed the Morningstar Multi-Alternative category since its inception in September 2013. Based on the foregoing information, the Board concluded that the historical investment performance record of Ionic supported approval of the Advisory Agreement.
Comparisons of the amounts to be paid under the Advisory Agreement with those under contracts between Ionic and its other clients. In evaluating the Advisory Agreement, the Board reviewed the proposed advisory fee rate for services to be performed by Ionic on behalf of the Fund. The Board noted that Ionic’s investment advisory fee rate under the Advisory Agreement would be paid to Ionic by the Fund. The Board considered the favorable nature of the advisory fee rate proposed for the Fund relative to the fee rates charged to other comparable clients of Ionic. The Board also noted the Manager’s representation that the combined management and advisory fee rate to be paid to the Manager and Ionic was lower than industry averages for actively managed mutual funds in both the Morningstar Market Neutral and Multialternative categories. After evaluating this information, the Board concluded that Ionic’s advisory fee rate under the Advisory Agreement was reasonable in light of the services to be provided to the Fund.
Costs of the services to be provided and profits to be realized by Ionic and its affiliates from its relationship with the Fund. The Board did not consider the costs of the services to be provided and profits to be realized by Ionic from its relationship with the Fund, noting instead the arm’s-length nature of the relationship between the Manager and Ionic with respect to the negotiation of the advisory fee rate on behalf of the Fund.
Economies of Scale. The Board considered Ionic’s representation that it was not currently able to determine the potential economies of scale for the benefit of the Fund’s investors.
Benefits to be derived by Ionic from the relationship with the Fund. The Board considered the “fall-out” or ancillary benefits that might accrue to Ionic as a result of its relationship with the Fund, including greater exposure in the marketplace with respect to Ionic’s investment process and expanding the level of assets under management by Ionic. The Board also noted Ionic’s representation that it intends to receive soft dollar benefits in connection with Fund transactions. Based on the foregoing information, the Board concluded that the potential benefits accruing to Ionic by virtue of its relationship with the Fund appear to be fair and reasonable.
Board’s Conclusion. Based on the various considerations described above, the Board, including a majority of Trustees who are not “interested persons” of the Fund, the Manager or Ionic, as that term is defined in the 1940 Act, concluded that the proposed investment advisory fee rate is fair and reasonable and that the approval of the Advisory Agreement is in the best interests of the Fund and approved the Advisory Agreement.
65
Trustees and Officers of the American Beacon FundsSM
(Unaudited)
The Trustees and officers of the American Beacon Funds (the “Trust”) are listed below, together with their principal occupations during the past five years. Unless otherwise indicated, the address of each person listed below is 220 East Las Colinas Boulevard, Suite 1200, Irving, Texas 75039. Each Trustee oversees twenty-seven funds in the fund complex that includes the Trust and the American Beacon Select Funds. The Trust’s Statement of Additional Information contains additional information about the Trustees and is available without charge by calling 1-800-658-5811.
| | | | |
Name, Age and Address | | Position, Term of Office and Length of Time Served with the Trust | | Principal Occupation(s) During Past 5 Years and Current Directorships |
| | |
| INTERESTED TRUSTEES | | Term Lifetime of Trust until removal, resignation or retirement* | | |
| | |
| Alan D. Feld** (79) | | Trustee since 1996 | | Sole Shareholder of a professional corporation which is a Partner in the law firm of Akin, Gump, Strauss, Hauer & Feld, LLP (law firm) (1960-Present); Trustee, American Beacon Mileage Funds (1996-2012); Trustee, American Beacon Select Funds (1999-Present); Trustee, American Beacon Master Trust (1996-2012). |
| | |
| | Term | | |
| NON-INTERESTED TRUSTEES | | Lifetime of Trust until removal, resignation or retirement* | | |
| | |
| Gilbert G. Alvarado (46) | | Trustee since 2015 | | Director, Kura MD, Inc. (local telehealth organization) (2015-Present); Vice President & CFO, Sierra Health Foundation (health conversion private foundation) (2006-Present) Vice President & CFO, Sierra Health Foundation: Center for Health Program Management (California public benefit corporation) (2012-Present); Director, Innovative North State (2012-Present); Director, Sacramento Regional Technology Alliance (2011-Present); Director, Women’s Empowerment (2009-2014); Trustee, American Beacon Select Funds (2015-Present). |
| | |
| Joseph B. Armes (53) | | Trustee since 2015 | | Chairman & CEO, CSW Industrials f/k/a Capital Southwest Corporation (investment company) (2013-Present); President & CEO, JBA Investment Partners (family investment vehicle) (2010-Present); Chief Operating Officer, Hicks Holdings, LLC (Hicks Family assets and investments) (2005-2010); Trustee, Baylor University Board of Regents (2001-2010); Director and Chair of Audit Committee, RSP Permian (oil and gas producer) (2013-Present); Trustee, American Beacon Select Funds (2015-Present). |
| | |
| Gerard J. Arpey (57) | | Trustee since 2012 | | Director, The Home Depot, Inc. (2015-Present); Partner, Emerald Creek Group (private equity firm) (2011-Present); Chairman and Chief Executive Officer, AMR Corp. and American Airlines; Inc. (2003-2011); Director, S. C. Johnson & Son, Inc. (privately held company) (2008-present); Trustee, American Beacon Select Funds (2012-Present). |
| | |
| W. Humphrey Bogart (71) | | Trustee since 2004 | | Trustee, American Beacon Mileage Funds (2004-2012); Trustee, American Beacon Select Funds (2004-Present); Trustee, American Beacon Master Trust (2004-2012). |
| | |
| Brenda A. Cline (55) | | Trustee since 2004 | | Executive Vice President, Chief Financial Officer, Treasurer and Secretary, Kimbell Art Foundation (1993-Present); Director, Range Resources Corporation (oil and natural gas company) (2015-Present); Director, Tyler Technologies, Inc.(public sector software solutions company) (2014-Present); Trustee, American Beacon Mileage Funds (2004-2012); Trustee, American Beacon Select Funds (2004-Present); Trustee, American Beacon Master Trust (2004-2012). |
| | |
| Eugene J. Duffy (61) | | Trustee since 2008 | | Managing Director, Institutional Services, Intercontinental Real Estate Corporation (2014-Present); Principal and Executive Vice President, Paradigm Asset Management (1994-2014); Director, Sunrise Bank of Atlanta (2008-2013); Trustee, American Beacon Mileage Funds (2008-2012); Trustee, American Beacon Select Funds (2008-Present); Trustee, American Beacon Master Trust (2008-2012). |
66
Trustees and Officers of the American Beacon FundsSM
(Unaudited)
| | | | |
Name, Age and Address | | Position, Term of Office and Length of Time Served with the Trust | | Principal Occupation(s) During Past 5 Years and Current Directorships |
| | |
| OFFICERS | | Term | | |
| | Lifetime of Trust until removal, resignation or retirement* | | |
| | |
| Thomas M. Dunning (73) | | Trustee since 2008 | | Chairman Emeritus (2008-Present); Lockton Dunning Benefits (consulting firm in employee benefits); Board Director, Oncor Electric Delivery Company LLC (2007-Present); Board Member, BancTec (2010-Present) (software consulting); Trustee, American Beacon Mileage Funds (2008-2012); Trustee, American Beacon Select Funds (2008-Present); Trustee, American Beacon Master Trust (2008-2012). |
| | |
| Richard A. Massman (72) | | Trustee since 2004 Chairman since 2008 | | Consultant and General Counsel Emeritus (2009-Present) and Senior Vice President and General Counsel (1994-2009), Hunt Consolidated, Inc. (holding company engaged in oil and gas exploration and production, refining, real estate, farming, ranching and venture capital activities); Trustee, American Beacon Mileage Funds (2004-2012); Trustee, American Beacon Select Funds (2004-Present); Trustee, American Beacon Master Trust (2004-2012). |
| | |
| Barbara J. McKenna, CFA (52) | | Trustee since 2012 | | Managing Principal, Longfellow Investment Management Company (2005-Present); Trustee, American Beacon Select Funds (2012-Present). |
| | |
R. Gerald Turner (70) 225 Perkins Admin. Bldg. Southern Methodist Univ. Dallas, Texas75275 | | Trustee since 2001 | | President, Southern Methodist University (1995-Present); Director, J.C. Penney Company, Inc. (1996-Present); Director, Kronus Worldwide Inc. (chemical manufacturing) (2003-Present); Trustee, American Beacon Mileage Funds (2001-2012); Trustee, American Beacon Select Funds (2001-Present); Trustee, American Beacon Master Trust (2001-2012). |
| | |
| OFFICERS | | Term | | |
| | One Year | | |
| | |
| Gene L. Needles, Jr. (61) | | President since 2009 Executive Vice President since 2009 | | President, CEO and Director, American Beacon Advisors, Inc. (2009-Present); President, CEO and Director, Astro AB Borrower, Inc. (2015-Present); President, CEO and Director, Astro AB Acquisition, Inc.(2015-Present); President, CEO and Director, Astro AB Topco, Inc. (2015-Present), President, CEO and Director, Astro AB Holdings, LLC. (2015-Present); President, CEO and Director, Lighthouse Holdings, Inc.; (2009-2015); President and CEO, Lighthouse Holdings Parent, Inc. (2009-2015); Manager, President and CEO, American Private Equity Management, L.L.C. (2012-Present); President, American Beacon Cayman Managed Futures Strategy Fund, Ltd. (2014-Present). |
| | |
| Rosemary K. Behan (56) | | VP, Secretary and Chief Legal Officer since 2006 | | Secretary, American Beacon Advisors, Inc. (2006-Present); Secretary, Astro AB Borrower, Inc. (2015-Present); Secretary, Astro AB Acquisition, Inc. (2015-Present); Secretary, Astro AB Topco, Inc. (2015-Present); Secretary, Astro AB Holdings, LLC. (2015-Present); Secretary, Lighthouse Holdings, Inc. (2008-2015); Secretary, Lighthouse Holdings Parent, Inc. (2008-2015); Secretary, American Private Equity Management, L.L.C.(2008-Present); Secretary, American Beacon Cayman Managed Futures Strategy Fund, Ltd. (2014-Present). |
| | |
| Brian E. Brett (55) | | VP since 2004 | | Vice President, Director of Sales, American Beacon Advisors, Inc. (2004-Present). |
| | |
| Erica Duncan (45) | | VP Since 2011 | | Vice President, Marketing and Client Services, American Beacon Advisors, Inc. (2011-Present); Supervisor, Brand Marketing, Invesco (2010-2011). |
| | |
| Michael W. Fields (61) | | VP since 1989 | | Chief Fixed Income Officer (2011-Present) and Vice President, Fixed Income Investments, American Beacon Advisors, Inc. (1988-2011); Director, American Beacon Global Funds SPC (2002-2011); Director, American Beacon Global Funds plc (2007-2009). |
67
Trustees and Officers of the American Beacon FundsSM
(Unaudited)
| | | | |
Name, Age and Address | | Position, Term of Office and Length of Time Served with the Trust | | Principal Occupation(s) During Past 5 Years and Current Directorships |
| | |
| OFFICERS | | Term | | |
| | One Year | | |
| Melinda G. Heika (54) | | Treasurer since 2010 | | Treasurer, American Beacon Advisors, Inc. (2010-Present); Treasurer, Astro AB Borrower, Inc. (2015-Present); Treasurer, Astro AB Acquisition, Inc. (2015-Present); Treasurer, Astro AB Topco, Inc. (2015-Presnt); Treasurer, Astro AB Holdings, LLC. (2015-Present); Treasurer, Lighthouse Holdings, Inc. (2010-2015); Treasurer, Lighthouse Holdings Parent Inc., (2010-2015); Treasurer, American Private Equity Management, L.L.C. (2012-Present); Director and Treasurer, American Beacon Cayman Managed Futures Strategy Fund, Ltd. (2014-Present). |
| | |
| Terri L. McKinney (52) | | VP since 2010 | | Vice President, Enterprise Services (2009-Present) and Managing Director (2003-2009), American Beacon Advisors, Inc. |
| | |
| Jeffrey K. Ringdahl (40) | | VP since 2010 | | Chief Operating Officer, American Beacon Advisors, Inc. (2010-Present); Manager and Senior Vice President, American Private Equity Management, L.L.C. (2012-Present); Senior Vice President and Director, Astro AB Borrower, Inc. (2015-Present); Senior Vice President and Director, Astro AB Acquisition, Inc. (2015-Present); Senior Vice President and Director, Astro AB Topco, Inc. (2015-Present), Senior Vice President and Director, Astro AB Holdings, LLC.(2015-Present); Senior Vice President, Lighthouse Holdings, Inc. (2013-2015); Senior Vice President, Lighthouse Holdings Parent, Inc. (2013-2015); Director and Vice President, American Beacon Cayman Managed Futures Strategy Fund, Ltd. (2014-Present); Vice President, Product Management, Touchstone Advisors, Inc. (2007-2010). |
| | |
| Samuel J. Silver (52) | | VP Since 2011 | | Vice President, Fixed Income Investments (2011-Present) and Senior Portfolio Manager, Fixed Income Investments (1999-2011), American Beacon Advisors, Inc. |
| | |
| Christina E. Sears (44) | | Chief Compliance Officer since 2004 and Asst. Secretary since 1999 | | Chief Compliance Officer, American Beacon Advisors, Inc. (2004-Present); Chief Compliance Officer, American Private Equity Management, L.L.C. (2012-Present). |
| | |
| Sonia L. Bates (59) | | Asst. Treasurer since 2011 | | Director, Tax and Financial Reporting (2011-Present), Manager, Tax and Financial Reporting (2005-2010), American Beacon Advisors, Inc.; Asst. Treasurer, Astro AB Borrower, Inc. (2015-Present); Asst. Treasurer, Astro AB Acquisition, Inc.(2015-Present); Asst. Treasurer, Astro AB Topco, Inc. (2015-Present); Asst. Treasurer, Astro AB Holdings, LLC.; Asst. Treasurer, Lighthouse Holdings, Inc. (2011-2015); Asst. Treasurer, Lighthouse Holdings Parent Inc. (2011-2015); Asst. Treasurer, American Private Equity Management, L.L.C. (2012-Present). |
| * | The Board has adopted a retirement plan that requires Trustees to retire no later than the last day of the calendar year in which they reach the age of 72, provided, however, that the board may determine to grant one or more annual exemptions to this requirement. |
| ** | Mr. Feld is deemed to be an “interested person” of the Trust, as defined by the 1940 Act. Mr. Feld’s law firm of Akin, Gump, Strauss, Hauer & Feld LLP has provided legal services within the past two years to one or more of the Trust’s sub-advisors. |
68
This page intentionally left blank.
69

Delivery of Documents
eDelivery is NOW AVAILABLE- Stop traditional mail delivery and receive your
shareholder reports and summary prospectus on-line. Sign up at
www.americanbeaconfunds.com
If you invest in the Fund through a financial institution, you may be able to receive the Fund’s regulatory mailings, such as the Summary Prospectus, Annual Report and Semi-Annual Report, by e-mail. If you are interested in this option, please go to www.icsdelivery.com and search for your financial institution’s name or contact your financial institution directly.
To obtain more information about the Fund:
| | |
 | |  |
| | | |
By E-mail: american_beacon.funds@ambeacon.com | | On the Internet: Visit our website at www.americanbeaconfunds.com |
| | | |
| | |
 | |  |
By Telephone: Institutional, Y and Investor Classes Call (800) 658-5811 | | By Mail: American Beacon Funds P.O. Box 219643 Kansas City, MO 64121-9643 |
| | | |
| | |
| | |
| Availability of Quarterly Portfolio Schedules | | Availability of Proxy Voting Policy and Records |
| | |
| In addition to the Schedule of Investments provided in each semi-annual and annual report, the Fund files a complete schedule of its portfolio holdings with the Securities and Exchange Commission (“SEC”) on Form N-Q as of the first and third fiscal quarters. The Fund’s Forms N-Q are available on the SEC’s website at www.sec.gov. The Forms N-Q may also be reviewed and copied at the SEC’s Public Reference Section, 100 F Street, NE, Washington, D.C. 20549-1520. Information regarding the operation of the SEC’s Public Reference Room may be obtained by calling (202) 551-8090. A complete schedule of the Fund’s portfolio holdings is also available at www.americanbeaconfunds.com, approximately twenty days after the end of each month. | | A description of the policies and procedures the Fund uses to determine how to vote proxies relating to portfolio securities is available in the Fund’s Statement of Additional Information, is available free of charge on the Fund’s website www.americanbeaconfunds.com and by calling 1-800-967-9009 or by accessing the SEC’s website at www.sec.gov. The Fund’s proxy voting record for the most recent year ended June 30 is filed annually with the SEC on Form N-PX. The Fund’s Forms N-PX are available on the SEC’s website at www.sec.gov. The Fund’s proxy voting record may also be obtained by calling 1-800-967-9009. |
Fund Service Providers:
| | | | | | | | | | | | |
CUSTODIAN State Street Bank and Trust Boston, Massachusetts | | | | TRANSFER AGENT Boston Financial Data Services Kansas City, Missouri | | | | INDEPENDENT REGISTERED PUBLIC ACCOUNTING FIRM Ernst & Young LLP Dallas, Texas | | | | DISTRIBUTOR Foreside Fund Services, LLC Portland, Maine |
This report is prepared for shareholders of the American Beacon Funds and may be distributed to others only if preceded or accompanied by a current Prospectus or Summary Prospectus.
American Beacon Funds, American Beacon AHL Managed Futures Strategy Fund, and American Beacon Ionic Strategic Arbitrage Fund are service marks of American Beacon Advisors, Inc.
AR 12/15
ITEM 2. CODE OF ETHICS.
The Trust has adopted a code of ethics that applies to its principal executive and financial officers (the “Code”). The trust amended its code November 12, 2013 to disclose the removal of terminated Investment Companies. The Trust did not grant any waivers to the provisions of the Code during the period covered by the shareholder report presented in Item 1. The Code is filed herewith as Exhibit 99.CODE.ETH.
ITEM 3. AUDIT COMMITTEE FINANCIAL EXPERT.
The Trust’s Board of Trustees has determined that Ms. Brenda A. Cline, a member of the Trust’s Audit and Compliance Committee, is an “audit committee financial expert” as defined in Form N-CSR. Ms. Brenda Cline is “independent” as defined in Form N-CSR.
ITEM 4. PRINCIPAL ACCOUNTANT FEES AND SERVICES.
(a)
| | | | |
Audit Fees | | Fiscal Year Ended | |
$236,768 | | | 12/31/2014 | |
$262,494 | | | 12/31/2015 | |
(b)
| | | | |
Audit-Related Fees | | Fiscal Year Ended | |
$0 | | | 12/31/2014 | |
$0 | | | 12/31/2015 | |
(c)
| | | | |
Tax Fees | | Fiscal Year Ended | |
$37,000 | | | 12/31/2014 | |
$35,500 | | | 12/31/2015 | |
(d)
| | | | |
All Other Fees | | Fiscal Year Ended | |
$0 | | | 12/31/2014 | |
$0 | | | 12/31/2015 | |
e)(1) Pursuant to its charter, the Trust’s Audit and Compliance Committee shall have the following duties and powers pertaining to pre-approval of audit and non-audit services provided by the Trust’s principal accountant:
| | • | | to approve, prior to appointment, the engagement of auditors to annually audit and provide their opinion on the Trusts’ financial statements, and, in connection therewith, reviewing and evaluating matters potentially affecting the independence and capabilities of the auditors; |
| | • | | to approve, prior to appointment, the engagement of the auditors to provide non-audit services to the Trusts, an investment adviser to any series of the Trusts or any entity controlling, controlled by, or under common control with an investment adviser (“adviser affiliate”) that provides ongoing services to the Trusts, if the engagement relates directly to the operations and financial reporting of the Trusts; |
| | • | | to consider whether the non-audit services provided by a Trust’s auditor to an investment adviser or any adviser affiliate that provides ongoing services to a series of the Trusts, which services were not pre-approved by the Committee, are compatible with maintaining the auditor’s independence; |
| | • | | to review the arrangements for and scope of the annual audit and any special audits; and |
| | • | | to review and approving the fees proposed to be charged to the Trusts by the auditors for each audit and non-audit service. |
The Audit and Compliance Committee may delegate any portion of its authority, including the authority to grant pre-approvals of audit and permitted non-audit services, to a subcommittee of one or more members. Any decisions of the subcommittee to grant pre-approvals shall be presented to the full audit committee at its next regularly scheduled meeting.
(e)(2) None of the fees disclosed in paragraphs (b) through (d) above were approved by the audit committee pursuant to paragraph (c)(7)(i)(C) of Rule 2-01 of Regulation S-X.
(f) Not applicable.
Aggregate Non-Audit Fees for Services Rendered to the:
| | | | | | | | | | |
| Registrant | | | Adviser | | | Adviser’s Affiliates Providing Ongoing Services to Registrant | | Fiscal Year Ended |
| $ | 37,000 | | | $ | 34,905 | | | N/A | | 12/31/2014 |
| $ | 35,500 | | | $ | 46,065 | | | N/A | | 12/31/2015 |
(h) Not applicable.
ITEM 5. AUDIT COMMITTEE OF LISTED REGISTRANTS.
Not applicable.
ITEM 6. SCHEDULE OF INVESTMENTS.
The schedules of investments for each series of the Trust are included in the shareholder reports presented in Item 1.
ITEM 7. DISCLOSURE OF PROXY VOTING POLICIES AND PROCEDURES FOR CLOSED-END MANAGEMENT INVESTMENT COMPANIES.
Not applicable.
ITEM 8. PORTFOLIO MANAGERS OF CLOSED-END MANAGEMENT INVESTMENT COMPANIES.
Not applicable.
ITEM 9. PURCHASES OF EQUITY SECURITIES BY CLOSED-END MANAGEMENT INVESTMENT COMPANY AND AFFILIATED PURCHASERS.
Not applicable.
ITEM 10. SUBMISSION OF MATTERS TO A VOTE OF SECURITY HOLDERS.
The Trust has made no material changes to the procedures by which shareholders may recommend nominees to the Trust’s Board of Trustees since the Trust last disclosed such procedures in Schedule 14A.
ITEM 11. CONTROLS AND PROCEDURES.
(a) Based upon an evaluation within 90 days of the filing date of this report, the principal executive and financial officers concluded that the disclosure controls and procedures of the Trust are effective.
(b) There were no changes in the Trust’s internal control over financial reporting during the second fiscal quarter of the period covered by this report that has materially affected, or is reasonably likely to materially affect, the Trust’s internal control over financial reporting.
ITEM 12. EXHIBITS.
(a)(1) Filed herewith as EX-99.CODE ETH.
(a)(2) A separate certification for each principal executive officer and principal financial officer of the Trust as required by Rule 30a-2(a) under the Investment Company Act of 1940 is attached hereto as EX-99.CERT.
(a)(3) Not applicable.
(b) The certifications required by Rule 30a-2(b) under the Investment Company Act of 1940 are attached hereto as EX-99.906CERT.
SIGNATURES
Pursuant to the requirements of the Securities Exchange Act of 1934 and the Investment Company Act of 1940, the registrant has duly caused this report to be signed on its behalf by the undersigned, thereunto duly authorized.
| | |
| (Registrant): American Beacon Funds |
| |
| By | | /s/ Gene L. Needles, Jr. |
|
| Gene L. Needles, Jr. |
| President |
| American Beacon Funds |
| Date: March 10, 2016 |
Pursuant to the requirements of the Securities Exchange Act of 1934 and the Investment Company Act of 1940, this report has been signed below by the following persons on behalf of the registrant and in the capacities and on the dates indicated.
| | |
| By | | /s/ Gene L. Needles, Jr. |
|
| Gene L. Needles, Jr. |
| President |
| American Beacon Funds |
| Date: March 10, 2016 |
| | |
| By | | /s/ Melinda G. Heika |
|
| Melinda G. Heika |
| Treasurer |
| American Beacon Funds |
| Date: March 10, 2016 |