This report must be preceded or accompanied by a prospectus. To obtain an additional prospectus or summary prospectus, if available, call (800) 728-3337 or your financial representative. We advise you to consider the Fund's objectives, risks, charges and expenses carefully before investing. The summary prospectus and prospectus contain this and other important information about the Fund. Please read the prospectus carefully before you invest.
Although allocation among different asset categories generally limits risk, fund management may favor an asset category that underperforms other assets or markets as a whole. The Fund expects to invest in underlying funds that emphasize alternatives or non-traditional asset categories or investment strategies, and as a result, it is subject to the risk factors of those underlying funds. Some of those risks include stock market risk, credit and interest rate risk, volatility in commodity prices and high-yield debt securities, short sales risk and the political, general economic, liquidity and currency risks of foreign investments, which may be particularly significant for emerging markets. Short sales — which involve selling borrowed securities in anticipation of a price decline, then returning an equal number of the securities at some point in the future — could magnify losses and increase volatility. The Fund may use derivatives, including as part of its Global Tactical Asset Allocation (GTAA) strategy. The Fund also expects to have direct and indirect exposure to derivatives, which may be more volatile and less liquid than traditional securities. The Fund could suffer losses on its derivative positions. See the prospectus for additional risks and specific details regarding the Fund's risk profile.
DWS Investments is part of the Deutsche Asset & Wealth Management division of Deutsche Bank AG.
Fund performance shown is historical, assumes reinvestment of all dividend and capital gain distributions and does not guarantee future results. Investment return and principal value fluctuate with changing market conditions so that, when redeemed, shares may be worth more or less than their original cost. Current performance may be lower or higher than the performance data quoted. Please contact your participating insurance company for the Fund's most recent month-end performance. Performance doesn't reflect charges and fees ("contract charges") associated with the separate account that invests in the Fund or any variable life insurance policy or variable annuity contract for which the Fund is an investment option. These charges and fees will reduce returns. While all share classes have the same underlying portfolio, their performance will differ.
The gross expense ratios of the Fund, as stated in the fee table of the prospectus dated May 1, 2012 are 1.91% and 2.16% for Class A and Class B shares, respectively, and may differ from the expense ratios disclosed in the Financial Highlights tables in this report. These expense ratios include net expenses of the underlying funds in which the Fund invests.
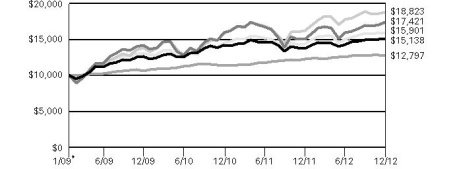
The growth of $10,000 is cumulative.
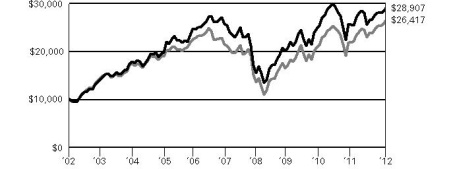
The growth of $10,000 is cumulative.
The Fund's opportunistic holdings finished the year in positive territory, including DWS Floating Rate Fund, the SPDR Barclays Capital Convertible Securities and the iShares U.S. Preferred Stock Index Fund.
We remain diligent in our search for additional asset classes that we can incorporate into the Fund, and we rebalance the portfolio frequently to maximize diversification and capitalize on moves in the financial markets. During the past year, for instance, we added two new exchange-traded funds — Market Vectors Agribusiness Fund and iShares S&P Global Timber & Forestry Index Fund — in order to augment the Fund's diversification.
The views expressed reflect those of the portfolio management team only through the end of the period of the report as stated on the cover. The management team's views are subject to change at any time based on market and other conditions and should not be construed as a recommendation. Past performance is no guarantee of future results. Current and future portfolio holdings are subject to risk.
Portfolio holdings and characteristics are subject to change.
Following the Fund's fiscal first and third quarter-end, a complete portfolio holdings listing is filed with the SEC on Form N-Q. The form will be available on the SEC's Web site at www.sec.gov, and it also may be reviewed and copied at the SEC's Public Reference Room in Washington, D.C. Information on the operation of the SEC's Public Reference Room may be obtained by calling (800) SEC-0330. The Fund's portfolio holdings are also posted on www.dws-investments.com from time to time. Please see the Fund's current prospectus for more information.
* Non-income producing security.
(a) Affiliated fund managed by Deutsche Investment Management Americas Inc.
(b) The rate shown is the annualized seven-day yield at period end.
Various inputs are used in determining the value of the Fund's investments. These inputs are summarized in three broad levels. Level 1 includes quoted prices in active markets for identical securities. Level 2 includes other significant observable inputs (including quoted prices for similar securities, interest rates, prepayment speeds, and credit risk). Level 3 includes significant unobservable inputs (including the Fund's own assumptions in determining the fair value of investments). The inputs or methodology used for valuing securities are not necessarily an indication of the risk associated with investing in those securities.
The following is a summary of the inputs used as of December 31, 2012 in valuing the Fund's investments. For information on the Fund's policy regarding the valuation of investments, please refer to the Security Valuation section of Note A in the accompanying Notes to Financial Statements.
There have been no transfers between fair value measurement levels during the year ended December 31, 2012.
The accompanying notes are an integral part of the financial statements.
The accompanying notes are an integral part of the financial statements.
The accompanying notes are an integral part of the financial statements.
The accompanying notes are an integral part of the financial statements.
A. Organization and Significant Accounting Policies
DWS Alternative Asset Allocation VIP (formerly DWS Alternative Asset Allocation Plus VIP) (the "Fund") is a diversified series of DWS Variable Series II (the "Trust"), which is registered under the Investment Company Act of 1940, as amended (the "1940 Act"), as an open-end management investment company organized as a Massachusetts business trust. The Fund mainly invests in other affiliated DWS funds (the "Underlying DWS Funds") and exchange-traded funds ("ETFs"). In addition, the Fund may invest in derivatives, including as part of its Global Tactical Asset Allocation (GTAA) strategy. ETFs and Underlying DWS Funds are collectively referred to as "Underlying Funds." Each Underlying DWS Fund's accounting policies and investment holdings are outlined in the Underlying DWS Funds' financial statements and are available upon request.
Investment income, realized and unrealized gains and losses, and certain fund-level expenses and expense reductions, if any, are borne pro rata on the basis of relative net assets by the holders of all classes of shares except that each class bears certain expenses unique to that class (including the applicable Rule 12b-1 fee). Differences in class-level expenses may result in payment of different per share dividends by class. All shares have equal rights with respect to voting subject to class-specific arrangements.
The Fund's financial statements are prepared in accordance with accounting principles generally accepted in the United States of America which require the use of management estimates. Actual results could differ from those estimates. The policies described below are followed consistently by the Fund in the preparation of its financial statements.
Various inputs are used in determining the value of the Fund's investments. These inputs are summarized in three broad levels. Level 1 includes quoted prices in active markets for identical securities. Level 2 includes other significant observable inputs (including quoted prices for similar securities, interest rates, prepayment speeds, and credit risk). Level 3 includes significant unobservable inputs (including the Fund's own assumptions in determining the fair value of investments). The inputs or methodology used for valuing securities are not necessarily an indication of the risk associated with investing in those securities.
Investments in the Underlying DWS Funds are valued at the net asset value per share of each class of the Underlying DWS Funds and are categorized as Level 1.
ETFs are valued at the most recent sale price or official closing price reported on the exchange (U.S. or foreign) or over-the-counter market on which they trade and are categorized as Level 1 securities. ETFs for which no sales are reported are valued at the calculated mean between the most recent bid and asked quotations on the relevant market or, if a mean cannot be determined, at the most recent bid quotation.
Disclosure about the classification of fair value measurements is included in a table following the Fund's Investment Portfolio.
Under the Regulated Investment Company Modernization Act of 2010, net capital losses incurred post-enactment may be carried forward indefinitely, and their character is retained as short-term and/or long-term. Previously, net capital losses were carried forward for eight years and treated as short-term losses.
At December 31, 2012, the Fund had a net tax basis capital loss carryforward of approximately $446,000 of post-enactment losses, which may be applied against realize net taxable capital gains indefinitely, including short-term losses ($68,000) and long-term losses ($378,000).
The Fund has reviewed the tax positions for the open tax years as of December 31, 2012 and has determined that no provision for income tax is required in the Fund's financial statements. The Fund's federal tax returns for the prior three fiscal years remain open subject to examination by the Internal Revenue Service.
The timing and characterization of certain income and capital gain distributions are determined annually in accordance with federal tax regulations which may differ from accounting principles generally accepted in the United States of America. These differences primarily relate to certain securities sold at a loss. As a result, net investment income (loss) and net realized gain (loss) on investment transactions for a reporting period may differ significantly from distributions during such period. Accordingly, the Fund may periodically make reclassifications among certain of its capital accounts without impacting the net asset value of the Fund.
At December 31, 2012, the Fund's components of distributable earnings on a tax basis were as follows:
In addition, the tax character of distributions paid by the Fund is summarized as follows:
* For tax purposes, short-term capital gain distributions are considered ordinary income distributions.
B. Purchases and Sales of Securities
During the year ended December 31, 2012, purchases and sales of affiliated Underlying Funds (excluding money market funds) aggregated $23,905,926 and $10,418,261, respectively. Purchases and sales of non-affiliated Underlying Funds (excluding money market funds) aggregated $9,534,803 and $2,318,259, respectively.
C. Related Parties
QS Investors, LLC ("QS Investors") acts as an investment subadvisor to the Fund. As an investment subadvisor to the Fund, QS Investors renders strategic asset allocation services and manages the portion of assets allocated from time to time to the Fund's global tactical asset allocation overlay strategy. QS Investors is paid by the Advisor for the services QS Investors provides to the Fund.
RREEF America L.L.C. ("RREEF") acts as an investment subadvisor to the Fund. As an investment subadvisor to the Fund, RREEF provides investment management services to the portions of the Fund's portfolio allocated to direct investments in global real estate and global infrastructure securities. RREEF is paid by the Advisor for the services RREEF provides to the Fund. As of the date of this report, the Fund obtained its exposure to global real estate and global infrastructure securities indirectly through investments in other Underlying DWS Funds.
The Fund does not invest in the Underlying DWS Funds for the purpose of exercising management or control; however, investments within the set limits may represent 5% or more of an Underlying DWS Fund's outstanding shares. At December 31, 2012, the Fund did not invest in more than 5% of any Underlying DWS Fund.
Pursuant to the Investment Management Agreement with the Advisor, the Fund pays a monthly management fee based on the Fund's average daily net assets, computed and accrued daily and payable monthly, at the following annual rates:
In addition, the Advisor will receive management fees from managing the Underlying DWS Funds in which the Fund invests.
For the period from January 1, 2012 through September 30, 2012, the Advisor had contractually agreed to waive its fee and/or reimburse certain operating expenses to the extent necessary to maintain the operating expenses (excluding certain expenses such as extraordinary expenses, taxes, brokerage, interest expense and indirect expenses of Underlying Funds) of each class as follows:
For the period from October 1, 2012 through September 30, 2013, the Advisor has contractually agreed to waive its fee and/or reimburse certain operating expenses to the extent necessary to maintain the operating expenses (excluding certain expenses such as extraordinary expenses, taxes, brokerage, interest expense and indirect expenses of Underlying Funds) of each class as follows:
For the year ended December 31, 2012, the Advisor agreed to waive 0.15% of the monthly management fee based on average daily net assets for the Fund.
Accordingly, for the year ended December 31, 2012, the Advisor waived a portion of its management fee pursuant to the Investment Management Agreement aggregating $194,106, and the amount charged aggregated $9,846, which was equivalent to an annual effective rate of 0.02% of the Fund's average daily net assets.
The Fund indirectly bears its proportionate share of fees and expenses incurred by the Underlying Funds in which it is invested.
In addition, for the year ended December 31, 2012, the Advisor reimbursed $2,876 of non-affiliated recordkeeping fees.
D. Ownership of the Fund
At December 31, 2012, one Participating Insurance Company was the owner of record of 10% or more of the total outstanding Class A shares of the Fund, owning 99%. Two Participating Insurance Companies were the owner of record of 10% or more of the total outstanding Class B shares of the Fund, owning 82% and 13%, respectively.
E. Transactions with Affiliates
The Fund mainly invests in Underlying DWS Funds and ETFs. The Underlying DWS Funds in which the Fund invests are considered to be affiliated investments. A summary of the Fund's transactions with affiliated Underlying DWS Funds during the year ended December 31, 2012 is as follows:
To the Board of Trustees of DWS Variable Series II and Shareholders of DWS Alternative Asset Allocation VIP:
We have audited the accompanying statement of assets and liabilities, including the investment portfolio, of DWS Alternative Asset Allocation VIP (formerly DWS Alternative Asset Allocation Plus VIP) (the "Fund"), one of the funds constituting DWS Variable Series II, as of December 31, 2012, and the related statement of operations for the year then ended, the statement of changes in net assets for each of the two years in the period then ended, and the financial highlights for each of the periods indicated therein. These financial statements and financial highlights are the responsibility of the Fund's management. Our responsibility is to express an opinion on these financial statements and financial highlights based on our audits.
In our opinion, the financial statements and financial highlights referred to above present fairly, in all material respects, the financial position of DWS Alternative Asset Allocation VIP (one of the funds constituting DWS Variable Series II) at December 31, 2012, the results of its operations for the year then ended, the changes in its net assets for each of the two years in the period then ended, and the financial highlights for each of the periods indicated therein, in conformity with U.S. generally accepted accounting principles.
As an investor of the Fund, you incur two types of costs: ongoing expenses and transaction costs. Ongoing expenses include management fees, distribution and service (12b-1) fees and other Fund expenses. Examples of transaction costs include contract charges and account maintenance fees, which are not shown in this section. The following tables are intended to help you understand your ongoing expenses (in dollars) of investing in the Fund and to help you compare these expenses with the ongoing expenses of investing in other mutual funds. In addition to the ongoing expenses which the Fund bears directly, the Fund's shareholders indirectly bear the expense of the Underlying Funds in which the Fund invests. These expenses are not included in the Fund's annualized expense ratios used to calculate the expense estimate in the tables. In the most recent six-month period, the Fund limited the ongoing expenses the Fund bears directly; had it not done so, expenses would have been higher. The examples in the table are based on an investment of $1,000 invested at the beginning of the six-month period and held for the entire period (July 1, 2012 to December 31, 2012).
Please note that the expenses shown in these tables are meant to highlight your ongoing expenses only and do not reflect any transaction costs. The "Expenses Paid per $1,000" line of the tables is useful in comparing ongoing expenses only and will not help you determine the relative total expense of owning different funds. If these transaction costs had been included, your costs would have been higher.
* Expenses are equal to the Fund's annualized expense ratio for each share class, multiplied by the average account value over the period, multiplied by 184 (the number of days in the most recent six-month period), then divided by 366.
** The Fund invests in other funds and indirectly bears its proportionate share of fees and expenses incurred by the Underlying Funds in which the Fund is invested. These ratios do not include these indirect fees and expenses.
For more information, please refer to the Fund's prospectus.
These tables do not reflect charges and fees ("contract charges") associated with the separate account that invests in the Fund or any variable life insurance policy or variable annuity contract for which the Fund is an investment option.
The Fund paid distributions of $0.11 per share from net long-term capital gains during its year ended December 31, 2012, of which 100% represents 15% rate gains.
For corporate shareholders, 3% of income dividends paid during the Fund's fiscal year ended December 31, 2012 qualified for the dividends received deduction.
Please consult a tax advisor if you have questions about federal or state income tax laws, or on how to prepare your tax returns. If you have specific questions about your account, please contact your insurance provider.
The Trust's policies and procedures for voting proxies for portfolio securities and information about how the Trust voted proxies related to its portfolio securities during the 12-month period ended June 30 are available on our Web site — www.dws-investments.com (click on "proxy voting" at the bottom of the page) — or on the SEC's Web site — www.sec.gov. To obtain a written copy of the Trust's policies and procedures without charge, upon request, call us toll free at (800) 728-3337.
The Board of Trustees approved the renewal of DWS Alternative Asset Allocation VIP's investment management agreement (the "Agreement") with Deutsche Investment Management Americas Inc. ("DWS") and sub-advisory agreements (the "Sub-Advisory Agreements" and together with the Agreement, the "Agreements") between DWS and RREEF America L.L.C. ("RREEF"), an affiliate of DWS, and DWS and QS Investors, LLC ("QS Investors") in September 2012.
In terms of the process that the Board followed prior to approving the Agreements, shareholders should know that:
In connection with the contract review process, the Contract Committee and the Board considered the factors discussed below, among others. The Board also considered that DWS and its predecessors have managed the Fund since its inception, and the Board believes that a long-term relationship with a capable, conscientious advisor is in the best interests of the Fund. The Board considered, generally, that shareholders chose to invest or remain invested in the Fund knowing that DWS managed the Fund. DWS and RREEF are part of Deutsche Bank, a major global banking institution that is engaged in a wide range of financial services. The Board believes that there are advantages to being part of a global asset management business that offers a wide range of investing expertise and resources, including hundreds of portfolio managers and analysts with research capabilities in many countries throughout the world.
As part of the contract review process, the Board carefully considered the fees and expenses of each DWS fund overseen by the Board in light of the fund's performance. In many cases, this led to a negotiation with DWS of lower expense caps for the coming year than had previously been in place. As part of these negotiations, the Board indicated that it would consider relaxing these new lower caps in future years following sustained improvements in performance, among other considerations.
In June 2012, Deutsche Bank ("DB"), DWS's parent company, announced that DB's new management team had concluded the strategic review of its global asset management business announced in late 2011 by DB's prior management team, and would combine its Asset Management (of which DWS is a part) and Wealth Management divisions. Prior to approving the investment management agreements, the Independent Trustees were apprised of the expected management and structure of the new combined Asset & Wealth Management division ("AWM") and DWS. DB also advised the Independent Trustees that the U.S. asset management business is a critical and integral part of DB and AWM, and that DB would be reinvesting a significant portion of the substantial savings it expects to realize by combining its Asset Management and Wealth Management divisions into a combined AWM division, including enhancements to its investment capabilities. DB also confirmed its commitment to maintaining strong legal and compliance groups within the combined division.
While shareholders may focus primarily on fund performance and fees, the Fund's Board considers these and many other factors, including the quality and integrity of DWS's, QS Investors' and RREEF's personnel and such other issues as back-office operations, fund valuations, and compliance policies and procedures.
The information considered by the Board as part of its review of management fees included information regarding fees charged by DWS and its affiliates to similar institutional accounts and to similar funds offered primarily to European investors ("DWS Europe funds"), in each case as applicable. The Board observed that advisory fee rates for institutional accounts generally were lower than the management fees charged by similarly managed DWS U.S. mutual funds ("DWS Funds"), but also took note of the differences in services provided to DWS Funds as compared to institutional accounts. In the case of DWS Europe funds, the Board observed that fee rates for DWS Europe funds generally were higher than for similarly managed DWS Funds, but noted that differences in the types of services provided to DWS Funds relative to DWS Europe funds made it difficult to compare such fees.
On the basis of the information provided, the Board concluded that management fees were reasonable and appropriate in light of the nature, quality and extent of services provided by DWS, QS Investors and RREEF.
Based on all of the information considered and the conclusions reached, the Board unanimously determined that the continuation of the Agreements is in the best interests of the Fund. In making this determination, the Board did not give particular weight to any single factor identified above. The Board considered these factors over the course of numerous meetings, certain of which were in executive session with only the Independent Trustees and their counsel present. It is possible that individual Trustees may have weighed these factors differently in reaching their individual decisions to approve the continuation of the Agreements.
Pursuant to an Order entered into by Deutsche Investment Management Americas and affiliates (collectively, "DeAM") with the Attorney General of New York, I, Thomas H. Mack, have been appointed the Independent Fee Consultant for the DWS Funds (formerly the DWS Scudder Funds). My duties include preparing an annual written evaluation of the management fees DeAM charges the Funds, considering among other factors the management fees charged by other mutual fund companies for like services, management fees DeAM charges other clients for like services, DeAM's costs of supplying services under the management agreements and related profit margins, possible economies of scale if a Fund grows larger, and the nature and quality of DeAM's services, including fund performance. This report summarizes my evaluation for 2012, including my qualifications, the evaluation process for each of the DWS Funds, consideration of certain complex-level factors, and my conclusions. I served in substantially the same capacity in 2007, 2008, 2009, 2010 and 2011.
For more than 35 years I have served in various professional capacities within the investment management business. I have held investment analysis and advisory positions, including securities analyst, portfolio strategist and director of investment policy with a large investment firm. I have also performed business management functions, including business development, financial management and marketing research and analysis.
Since 1991, I have been an independent consultant within the asset management industry. I have provided services to over 125 client organizations, including investment managers, mutual fund boards, product distributors and related organizations. Over the past ten years I have completed a number of assignments for mutual fund boards, specifically including assisting boards with management contract renewal.
I hold a Master of Business Administration degree, with highest honors, from Harvard University and Master of Science and Bachelor of Science (highest honors) degrees from the University of California at Berkeley. I am an independent director and audit committee financial expert for two closed-end mutual funds and have served in various leadership and financial oversight capacities with non-profit organizations.
My work focused primarily on evaluating, fund-by-fund, the fees charged to each of the 103 mutual fund portfolios in the DWS Fund family. For each Fund, I considered each of the key factors mentioned above, as well as any other relevant information. In doing so I worked closely with the Funds' Independent Directors in their annual contract renewal process, as well as in their approval of contracts for several new funds (documented separately).
In evaluating each Fund's fees, I reviewed comprehensive materials provided by or on behalf of DeAM, including expense information prepared by Lipper Analytical, comparative performance information, profitability data, manager histories, and other materials. I also accessed certain additional information from the Lipper and Morningstar databases and drew on my industry knowledge and experience.
To facilitate evaluating this considerable body of information, I prepared for each Fund a document summarizing the key data elements in each area as well as additional analytics discussed below. This made it possible to consider each key data element in the context of the others.
In the course of contract renewal, DeAM agreed to implement a number of fee and expense adjustments requested by the Independent Directors which will favorably impact future fees and expenses, and my evaluation includes the effects of these changes.
The competitive fee and expense evaluation for each fund focused on two primary comparisons:
The Fund's contractual management fee (the advisory fee plus the administration fee where applicable) compared with those of a group of typically 12-15 funds in the same Lipper investment category (e.g. Large Capitalization Growth) having similar distribution arrangements and being of similar size.
The Fund's total expenses compared with a broader universe of funds from the same Lipper investment category and having similar distribution arrangements.
These two comparisons provide a view of not only the level of the fee compared with funds of similar scale but also the total expense the Fund bears for all the services it receives, in comparison with the investment choices available in the Fund's investment category and distribution channel. The principal figure-of-merit used in these comparisons was the subject Fund's percentile ranking against peers.
DeAM provided management fee schedules for all of its US domiciled fund and non-fund investment management accounts in any of the investment categories where there is a DWS Fund. These similar products included the other DWS Funds, non-fund pooled accounts, institutional accounts and sub-advisory accounts. Using this information, I calculated for each Fund the fee that would be charged to each similar product, at the subject Fund's asset level.
Evaluating information regarding non-fund products is difficult because there are varying levels of services required for different types of accounts, with mutual funds generally requiring considerably more regulatory and administrative types of service as well as having more frequent cash flows than other types of accounts. Also, while mutual fund fees for similar fund products can be expected to be similar, there will be some differences due to different pricing conditions in different distribution channels (e.g. retail funds versus those used in variable insurance products), differences in underlying investment processes and other factors.
DeAM provided a detailed profitability analysis for each Fund. After making some adjustments so that the presentation would be more comparable to the available industry figures, I reviewed profit margins from investment management alone, from investment management plus other fund services (excluding distribution) provided to the Funds by DeAM (principally shareholder services), and DeAM profits from all sources, including distribution. A later section comments on overall profitability.
Economies of scale — an expected decline in management cost per dollar of fund assets as fund assets grow — are very rarely quantified and documented because of inherent difficulties in collecting and analyzing relevant data. However, in virtually every investment category that I reviewed, larger funds tend to have lower fees and lower total expenses than smaller funds. To see how each DWS Fund compares with this industry observation, I reviewed:
The trend in Fund assets over the last five years and the accompanying trend in total expenses. This shows if the Fund has grown and, if so, whether total expense (management fees as well as other expenses) have declined as a percent of assets.
Whether the Fund has break-points in its management fee schedule, the extent of the fee reduction built into the schedule and the asset levels where the breaks take effect, and in the case of a sub-advised Fund how the Fund's break-points compare with those of the sub-advisory fee schedule.
How the Fund's contractual fee schedule compares with trends in the industry data. To accomplish this, I constructed a chart showing how actual latest-fiscal-year contractual fees of the Fund and of other similar funds relate to average fund assets, with the subject Fund's contractual fee schedule superimposed.
The quality-of-service evaluation focused on investment performance, which is the principal result of the investment management service. Each Fund's performance was reviewed over the past 1, 3, 5 and 10 years, as applicable, and compared with that of other funds in the same investment category and with a suitable market index.
In addition, I calculated and reviewed risk-adjusted returns relative to an index of similar mutual funds' returns and a suitable market index. The risk-adjusted returns analysis provides a way of determining the extent to which the Fund's return comparisons are mainly the product of investment value-added (or lack thereof) or alternatively taking considerably more or less risk than is typical in its investment category.
I also received and considered the history of portfolio manager changes for each Fund, as this provided an important context for evaluating the performance results.
While this evaluation was conducted mainly at the individual fund level, there are some issues relating to the reasonableness of fees that can alternatively be considered across the whole fund complex:
I reviewed DeAM's profitability analysis for all DWS Funds, with a view toward determining if the allocation procedures used were reasonable and how profit levels compared with public data for other investment managers.
I considered whether DeAM and affiliates receive any significant ancillary or "fallout" benefits that should be considered in interpreting the direct profitability results. These would be situations where serving as the investment manager of the Funds is beneficial to another part of the Deutsche Bank organization.
I considered how aggregated DWS Fund expenses had varied over the years, by asset class and in the context of trends in asset levels.
I considered how aggregated DWS Fund performance measures relative to appropriate peers had varied by asset class and over time.
I reviewed the structure of the DeAM organization, trends in staffing levels, and information on compensation of investment management and other professionals compared with industry data.
Based on the process and analysis discussed above, which included reviewing a wide range of information from management and external data sources and considering among other factors the fees DeAM charges other clients, the fees charged by other fund managers, DeAM's costs and profits associated with managing the Funds, economies of scale, possible fall-out benefits, and the nature and quality of services provided, in my opinion the management fees charged the DWS Funds are reasonable.
Thomas H. Mack
President, Thomas H. Mack & Co., Inc.
The following table presents certain information regarding the Board Members and Officers of the fund. Each Board Member's year of birth is set forth in parentheses after his or her name. Unless otherwise noted, (i) each Board Member has engaged in the principal occupation(s) noted in the table for at least the most recent five years, although not necessarily in the same capacity; and (ii) the address of each Independent Board Member is c/o Kenneth C. Froewiss, Chairman, DWS Mutual Funds, P.O. Box 78, Short Hills, NJ 07078. Except as otherwise noted below, the term of office for each Board Member is until the election and qualification of a successor, or until such Board Member sooner dies, resigns, is removed or as otherwise provided in the governing documents of the fund. Because the fund does not hold an annual meeting of shareholders, each Board Member will hold office for an indeterminate period. The Board Members may also serve in similar capacities with other funds in the fund complex.
The fund's Statement of Additional Information ("SAI") includes additional information about the Board Members. The SAI is available, without charge, upon request. If you would like to request a copy of the SAI, you may do so by calling the following toll-free number: (800) 728-3337.
DWS Investments Distributors, Inc.
DECEMBER 31, 2012
ANNUAL REPORT
DWS VARIABLE SERIES II
DWS Diversified International Equity VIP
Contents
16 Statement of Assets and Liabilities 17 Statement of Operations 18 Statement of Changes in Net Assets 21 Notes to Financial Statements 26 Report of Independent Registered Public Accounting Firm 27 Information About Your Fund's Expenses 29 Investment Management Agreement Approval 32 Summary of Management Fee Evaluation by Independent Fee Consultant 34 Board Members and Officers |
This report must be preceded or accompanied by a prospectus. To obtain an additional prospectus or summary prospectus, if available, call (800) 728-3337 or your financial representative. We advise you to consider the Fund's objectives, risks, charges and expenses carefully before investing. The summary prospectus and prospectus contain this and other important information about the Fund. Please read the prospectus carefully before you invest.
Investing in derivatives entails special risks relating to liquidity, leverage and credit that may reduce returns and/or increase volatility. Investing in foreign securities, particularly those of emerging markets, presents certain risks, such as currency fluctuations, political and economic changes, and market risks. The Fund may lend securities to approved institutions. Stocks may decline in value. See the prospectus for details.
DWS Investments is part of the Deutsche Asset & Wealth Management division of Deutsche Bank AG.
NOT FDIC/NCUA INSURED NO BANK GUARANTEE MAY LOSE VALUE NOT A DEPOSIT
NOT INSURED BY ANY FEDERAL GOVERNMENT AGENCY
Performance Summary December 31, 2012 (Unaudited)
Fund performance shown is historical, assumes reinvestment of all dividend and capital gain distributions and does not guarantee future results. Investment return and principal value fluctuate with changing market conditions so that, when redeemed, shares may be worth more or less than their original cost. Current performance may be lower or higher than the performance data quoted. Please contact your participating insurance company for the Fund's most recent month-end performance. Performance doesn't reflect charges and fees ("contract charges") associated with the separate account that invests in the Fund or any variable life insurance policy or variable annuity contract for which the Fund is an investment option. These charges and fees will reduce returns.
The gross expense ratio of the Fund, as stated in the fee table of the prospectus dated May 1, 2012 is 1.07% for Class A shares and may differ from the expense ratio disclosed in the Financial Highlights table in this report.
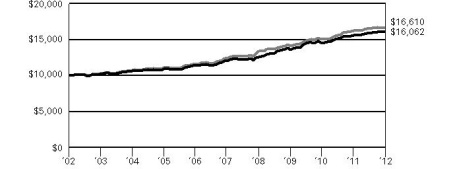
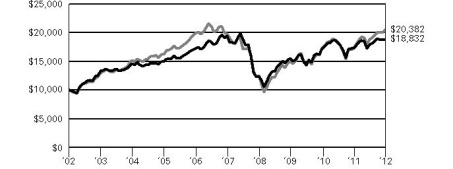
| Growth of an Assumed $10,000 Investment in DWS Diversified International Equity VIP |
| The Morgan Stanley Capital International (MSCI) Europe, Australasia and the Far East EAFE® Index is an unmanaged, free float-adjusted, market capitalization index that tracks international stock performance in the 21 developed markets of Europe, Australasia and the Far East. The index is calculated using closing local market prices and translates into U.S. dollars using the London close foreign exchange rates. Index returns do not reflect any fees or expenses and it is not possible to invest directly into an index. |
| |
| Yearly periods ended December 31 | |
| Comparative Results | |
| DWS Diversified International Equity VIP | | 1-Year | | | 3-Year | | | 5-Year | | | 10-Year | |
| Class A | Growth of $10,000 | | $ | 11,734 | | | $ | 11,445 | | | $ | 7,579 | | | $ | 19,524 | |
| Average annual total return | | | 17.34 | % | | | 4.60 | % | | | -5.39 | % | | | 6.92 | % |
| MSCI EAFE Index | Growth of $10,000 | | $ | 11,732 | | | $ | 11,106 | | | $ | 8,287 | | | $ | 22,021 | |
| Average annual total return | | | 17.32 | % | | | 3.56 | % | | | -3.69 | % | | | 8.21 | % |
The growth of $10,000 is cumulative.
Management Summary December 31, 2012 (Unaudited)
Class A shares of the Fund returned 17.34% (unadjusted for contract charges) for the year ended December 31, 2012, compared with the Fund's benchmark, the MSCI EAFE® Index, which returned 17.32% for the same period.1 While the developed international markets registered a robust return during the past year, the strong performance was largely a second-half story. During the first five months of the year, market performance was pressured by adverse headlines regarding the European debt crisis and the continued slowdown in China's economic growth. However, the summer months brought a gradual restoration of investor confidence that stemmed, in part, from the aggressive response of the world's central banks. In the United States, the U.S. Federal Reserve Board (the Fed) announced expansions of its stimulative "quantitative easing" policy and said that it would maintain near-zero interest rates until unemployment declines significantly. In addition, European Central Bank (ECB) President Mario Draghi announced in July that the ECB would do "whatever it takes" to keep the region's currency union together — an important event that marked a turning point for the markets in 2012.
The largest positive contribution to Fund performance came from our underweight positions in various segments of the Japanese market, including the technology, consumer discretionary and industrials sectors.2 Overall, Japan is the Fund's second-largest country overweight. Our performance was also helped by an overweight position in technology, excluding Japan, and an underweight in energy.
Among the most notable detractors from performance were the Fund's underweights in Germany and France, which outperformed, as well as its allocation to Canada, which lagged. The Fund was also hurt by holding overweight positions in two sectors that lagged the broader market by a wide margin: telecommunications and utilities. Both are "defensive" in nature, meaning that investors tend to gravitate away from these areas when risk appetites are improving — as was the case in the past year. An underweight position in financials, the best-performing sector in the index during 2012, also cost the Fund some performance relative to its benchmark.
The Fund holds a weighting of 10% in two exchanged-traded funds (ETFs) linked to the performance of the emerging markets: Vanguard MSCI Emerging Markets Fund and iShares MSCI Emerging Markets Index Fund.3 We have held a position in the emerging markets since the Fund's inception in order to provide exposure to the strong economic fundamentals and attractive valuations in the asset class. This position contributed to performance during 2012, as the 18.22% return of the MSCI Emerging Markets Index outpaced the 17.32% gain of the MSCI EAFE Index.4
We expect that volatility is likely to be high in 2013 due to the shifting headlines out of the European debt crisis, China's growth, and U.S. tax policy.
Robert Wang
Russell Shtern, CFA
Portfolio Managers, QS Investors, LLC, Subadvisor to the Fund
The views expressed reflect those of the portfolio management team only through the end of the period of the report as stated on the cover. The management team's views are subject to change at any time based on market and other conditions and should not be construed as a recommendation. Past performance is no guarantee of future results. Current and future portfolio holdings are subject to risk.
1 The Morgan Stanley Capital International (MSCI) Europe, Australasia and the Far East (EAFE) Index is an unmanaged, free float-adjusted, market-capitalization index that tracks international stock performance in the 21 developed markets of Europe, Australasia and the Far East. The index is calculated using closing local market prices and translates into U.S. dollars using the London close foreign exchange rates. Index returns do not reflect fees or expenses and it is not possible to invest directly into an index.
2 "Overweight" means the Fund holds a higher weighting in a given sector or security than the benchmark. "Underweight" means the Fund holds a lower weighting.
3 An exchange-traded fund (ETF) is a security that tracks an index or asset like an index fund, but trades like a stock on an exchange. The Vanguard MSCI Emerging Markets Fund invests in stocks of companies located in emerging markets around the world, such as Brazil, Russia, China, Korea and Taiwan. The fund seeks to track the return of the MSCI Emerging Markets Index over the long term. The iShares MSCI Emerging Markets Index Fund seeks to provide investment results that correspond generally to the price and yield performance, before fees and expenses, of publicly traded securities in emerging markets, as represented by the MSCI Emerging Markets Index.
4 The Morgan Stanley Capital International (MSCI) Emerging Markets Index is an unmanaged, capitalization-weighted index of companies in a universe of 26 emerging markets. The index is calculated using closing local market prices and translates into U.S. dollars using the London close foreign exchange rates. Index returns do not reflect fees or expenses and it is not possible to invest directly into an index.
Portfolio Summary (Unaudited) Asset Allocation (As a % of Investment Portfolio excluding Securities Lending Collateral) | 12/31/12 | 12/31/11 |
| | | |
| Common Stocks | 88% | 89% |
| Exchange-Traded Funds | 10% | 10% |
| Cash Equivalents | 2% | 0% |
| Preferred Stocks | 0% | 1% |
| | 100% | 100% |
Sector Diversification (As a % of Common and Preferred Stocks and Rights) | 12/31/12 | 12/31/11 |
| | | |
| Telecommunication Services | 15% | 14% |
| Financials | 13% | 11% |
| Health Care | 12% | 13% |
| Information Technology | 12% | 7% |
| Consumer Staples | 12% | 13% |
| Materials | 9% | 9% |
| Utilities | 8% | 11% |
| Industrials | 8% | 8% |
| Consumer Discretionary | 7% | 9% |
| Energy | 4% | 5% |
| | 100% | 100% |
Geographical Diversification (As a % of Investment Portfolio excluding Cash Equivalents and Securities Lending Collateral) | 12/31/12 | 12/31/11 |
| | | |
| Continental Europe | 54% | 49% |
| Japan | 12% | 13% |
| Emerging Markets | 10% | 10% |
| Canada | 7% | 11% |
| United Kingdom | 7% | 8% |
| Asia (excluding Japan) | 6% | 5% |
| Australia | 4% | 4% |
| | 100% | 100% |
Portfolio holdings and characteristics are subject to change.
For more complete details about the Fund's investment portfolio, see page 6.
Following the Fund's fiscal first and third quarter-end, a complete portfolio holdings listing is filed with the SEC on Form N-Q. The form will be available on the SEC's Web site at www.sec.gov, and it also may be reviewed and copied at the SEC's Public Reference Room in Washington, D.C. Information on the operation of the SEC's Public Reference Room may be obtained by calling (800) SEC-0330. The Fund's portfolio holdings are also posted on www.dws-investments.com from time to time. Please see the Fund's current prospectus for more information.
Investment Portfolio December 31, 2012 | | | Shares | | | Value ($) | |
| | | | |
| Common Stocks 88.2% | |
| Australia 3.9% | |
| AGL Energy Ltd. | | | 11,731 | | | | 188,385 | |
| APA Group | | | 20,392 | | | | 117,708 | |
| Asciano Ltd. | | | 5,759 | | | | 28,144 | |
| Aurizon Holdings Ltd. | | | 11,307 | | | | 44,407 | |
| Australia & New Zealand Banking Group Ltd. | | | 2,339 | | | | 61,237 | |
| BHP Billiton Ltd. | | | 4,758 | | | | 185,815 | |
| Brambles Ltd. | | | 9,482 | | | | 75,459 | |
| Coca-Cola Amatil Ltd. | | | 2,294 | | | | 32,252 | |
| Cochlear Ltd. | | | 479 | | | | 39,627 | |
| Commonwealth Bank of Australia | | | 354 | | | | 22,995 | |
| Crown Ltd. | | | 7,919 | | | | 88,216 | |
| CSL Ltd. | | | 2,736 | | | | 154,562 | |
| Echo Entertainment Group Ltd. | | | 6,555 | | | | 23,636 | |
| Leighton Holdings Ltd. | | | 986 | | | | 18,551 | |
| National Australia Bank Ltd. | | | 2,126 | | | | 55,601 | |
| Newcrest Mining Ltd. | | | 1,231 | | | | 28,740 | |
| Origin Energy Ltd. | | | 6,869 | | | | 84,061 | |
| Rio Tinto Ltd. | | | 735 | | | | 51,159 | |
| Santos Ltd. | | | 6,168 | | | | 72,237 | |
| Sonic Healthcare Ltd. | | | 3,281 | | | | 45,816 | |
| SP AusNet | | | 47,515 | | | | 54,572 | |
| TABCORP Holdings Ltd. | | | 15,130 | | | | 48,353 | |
| Tatts Group Ltd. | | | 24,689 | | | | 77,736 | |
| Telstra Corp., Ltd. | | | 106,742 | | | | 486,264 | |
| Toll Holdings Ltd. | | | 4,694 | | | | 22,471 | |
| Transurban Group | | | 7,777 | | | | 49,393 | |
| Wesfarmers Ltd. | | | 3,054 | | | | 117,849 | |
| Westfield Group (REIT) (Units) | | | 2,462 | | | | 27,167 | |
| Westpac Banking Corp. | | | 2,057 | | | | 56,235 | |
| Woodside Petroleum Ltd. | | | 3,625 | | | | 129,193 | |
| Woolworths Ltd. | | | 2,335 | | | | 71,367 | |
| WorleyParsons Ltd. | | | 1,091 | | | | 26,914 | |
| (Cost $1,710,216) | | | | 2,586,122 | |
| Austria 0.6% | |
| Erste Group Bank AG* | | | 5,175 | | | | 165,473 | |
| Immofinanz AG* (a) | | | 21,199 | | | | 89,372 | |
| Raiffeisen Bank International AG | | | 1,218 | | | | 50,914 | |
| Vienna Insurance Group AG Wiener Versicherung Gruppe | | | 1,323 | | | | 70,971 | |
| (Cost $235,592) | | | | 376,730 | |
| Belgium 1.7% | |
| Ageas | | | 4,615 | | | | 137,692 | |
| Anheuser-Busch InBev NV | | | 4,693 | | | | 410,115 | |
| Delhaize Group | | | 593 | | | | 23,753 | |
| Groupe Bruxelles Lambert SA | | | 2,184 | | | | 172,174 | |
| KBC Groep NV | | | 3,189 | | | | 111,001 | |
| Solvay SA | | | 1,060 | | | | 152,588 | |
| Umicore SA | | | 2,235 | | | | 123,240 | |
| (Cost $668,389) | | | | 1,130,563 | |
| Bermuda 0.1% | |
| Seadrill Ltd. (a) (Cost $25,496) | | | 2,436 | | | | 89,777 | |
| Canada 7.3% | |
| Agnico-Eagle Mines Ltd. | | | 600 | | | | 31,445 | |
| Alimentation Couche-Tard, Inc. "B" | | | 1,500 | | | | 73,786 | |
| Bank of Montreal (a) | | | 800 | | | | 48,947 | |
| | | Shares | | | Value ($) | |
| | | | | | | | | |
| Bank of Nova Scotia (a) | | | 1,100 | | | | 63,543 | |
| Barrick Gold Corp. (a) | | | 2,100 | | | | 73,512 | |
| BCE, Inc. (a) | | | 3,000 | | | | 128,571 | |
| Bell Aliant, Inc. (a) | | | 1,400 | | | | 37,044 | |
| Bombardier, Inc. "B" | | | 6,500 | | | | 24,570 | |
| Brookfield Asset Management, Inc. "A" (a) | | | 1,000 | | | | 36,634 | |
| CAE, Inc. (a) | | | 2,200 | | | | 22,272 | |
| Canadian Imperial Bank of Commerce (a) | | | 500 | | | | 40,198 | |
| Canadian National Railway Co. | | | 1,500 | | | | 136,217 | |
| Canadian Natural Resources Ltd. | | | 1,400 | | | | 40,310 | |
| Canadian Pacific Railway Ltd. (a) | | | 700 | | | | 71,006 | |
| Canadian Tire Corp., Ltd. "A" | | | 500 | | | | 34,875 | |
| Canadian Utilities Ltd. "A" | | | 1,800 | | | | 130,182 | |
| CGI Group, Inc. "A"* (a) | | | 23,300 | | | | 537,350 | |
| Eldorado Gold Corp. | | | 1,800 | | | | 23,163 | |
| Empire Co., Ltd. "A" | | | 500 | | | | 29,632 | |
| EnCana Corp. (a) | | | 1,000 | | | | 19,765 | |
| Finning International, Inc. | | | 900 | | | | 22,231 | |
| First Quantum Minerals Ltd. | | | 800 | | | | 17,621 | |
| Fortis, Inc. (a) | | | 6,400 | | | | 220,175 | |
| George Weston Ltd. | | | 700 | | | | 49,740 | |
| Gildan Activewear, Inc. | | | 800 | | | | 29,219 | |
| Goldcorp, Inc. | | | 1,800 | | | | 66,177 | |
| Kinross Gold Corp. | | | 2,300 | | | | 22,336 | |
| Loblaw Companies Ltd. (a) | | | 1,500 | | | | 63,230 | |
| Magna International, Inc. "A" (a) | | | 1,106 | | | | 55,239 | |
| Manulife Financial Corp. | | | 2,600 | | | | 35,313 | |
| Metro, Inc. "A" (a) | | | 1,300 | | | | 82,768 | |
| National Bank of Canada (a) | | | 400 | | | | 31,061 | |
| Open Text Corp.* | | | 6,600 | | | | 369,114 | |
| Potash Corp. of Saskatchewan, Inc. (a) | | | 1,300 | | | | 52,904 | |
| Research In Motion Ltd.* (a) | | | 50,600 | | | | 600,261 | |
| Rogers Communications, Inc. "B" (a) | | | 4,800 | | | | 217,923 | |
| Royal Bank of Canada (a) | | | 1,300 | | | | 78,259 | |
| Saputo, Inc. (a) | | | 1,800 | | | | 91,040 | |
| Shaw Communications, Inc. "B" (a) | | | 2,400 | | | | 55,108 | |
| Shoppers Drug Mart Corp. (a) | | | 2,700 | | | | 116,176 | |
| Silver Wheaton Corp. | | | 1,100 | | | | 39,656 | |
| SNC-Lavalin Group, Inc. (a) | | | 600 | | | | 24,321 | |
| Sun Life Financial, Inc. (a) | | | 1,000 | | | | 26,511 | |
| Suncor Energy, Inc. | | | 2,020 | | | | 66,426 | |
| Teck Resources Ltd. "B" (a) | | | 1,200 | | | | 43,611 | |
| Telus Corp. (Non-Voting Shares) (a) | | | 1,900 | | | | 123,547 | |
| Thomson Reuters Corp. (b) | | | 1,158 | | | | 33,651 | |
| Thomson Reuters Corp. (a) (b) | | | 800 | | | | 23,147 | |
| Tim Hortons, Inc. (a) | | | 1,000 | | | | 49,090 | |
| Toronto-Dominion Bank (a) | | | 900 | | | | 75,777 | |
| TransAlta Corp. (a) | | | 8,600 | | | | 130,725 | |
| Valeant Pharmaceuticals International, Inc.* | | | 5,700 | | | | 340,040 | |
| Yamana Gold, Inc. (a) | | | 1,100 | | | | 18,921 | |
| (Cost $4,203,376) | | | | 4,874,340 | |
| Denmark 2.1% | |
| A P Moller-Maersk AS "A" | | | 7 | | | | 49,849 | |
| A P Moller-Maersk AS "B" | | | 18 | | | | 137,780 | |
| Carlsberg AS "B" | | | 4,992 | | | | 490,786 | |
| Danske Bank AS* | | | 17,646 | | | | 299,991 | |
| | | Shares | | | Value ($) | |
| | | | | | | | | |
| DSV AS | | | 2,622 | | | | 68,372 | |
| Novo Nordisk AS "B" | | | 1,669 | | | | 272,581 | |
| Tryg AS | | | 621 | | | | 46,952 | |
| William Demant Holding AS* | | | 291 | | | | 24,974 | |
| (Cost $886,289) | | | | 1,391,285 | |
| Finland 4.3% | |
| Fortum Oyj | | | 14,781 | | | | 277,964 | |
| Kone Oyj "B" | | | 1,396 | | | | 103,370 | |
| Metso Corp. | | | 1,104 | | | | 48,093 | |
| Nokia Oyj (a) | | | 399,372 | | | | 1,570,570 | |
| Pohjola Bank PLC | | | 3,258 | | | | 48,652 | |
| Sampo Oyj "A" | | | 10,661 | | | | 344,738 | |
| Stora Enso Oyj "R" | | | 23,027 | | | | 162,866 | |
| UPM-Kymmene Oyj | | | 20,179 | | | | 239,799 | |
| Wartsila Oyj | | | 1,559 | | | | 68,954 | |
| (Cost $1,991,577) | | | | 2,865,006 | |
| France 6.9% | |
| Air Liquide SA | | | 1,652 | | | | 207,023 | |
| Arkema | | | 421 | | | | 44,266 | |
| AtoS | | | 697 | | | | 49,665 | |
| AXA SA | | | 4,348 | | | | 78,646 | |
| BNP Paribas SA | | | 2,000 | | | | 112,734 | |
| Bouygues SA | | | 734 | | | | 21,643 | |
| Cap Gemini | | | 2,014 | | | | 87,770 | |
| Carrefour SA | | | 2,147 | | | | 55,598 | |
| Casino Guichard-Perrachon SA | | | 247 | | | | 23,760 | |
| Cie de St-Gobain | | | 755 | | | | 32,305 | |
| DANONE SA | | | 2,453 | | | | 162,069 | |
| Dassault Systemes SA | | | 830 | | | | 92,915 | |
| Electricite de France | | | 2,181 | | | | 40,877 | |
| Essilor International SA | | | 2,621 | | | | 265,744 | |
| France Telecom SA | | | 28,037 | | | | 313,975 | |
| GDF Suez | | | 12,916 | | | | 266,120 | |
| Iliad SA | | | 426 | | | | 73,329 | |
| L'Oreal SA | | | 815 | | | | 113,847 | |
| Lafarge SA | | | 843 | | | | 54,018 | |
| LVMH Moet Hennessy Louis Vuitton SA | | | 420 | | | | 78,266 | |
| Pernod Ricard SA | | | 790 | | | | 92,894 | |
| Sanofi | | | 13,398 | | | | 1,270,602 | |
| Schneider Electric SA | | | 894 | | | | 66,678 | |
| Societe Generale* | | | 1,549 | | | | 58,264 | |
| Suez Environnement Co. | | | 1,869 | | | | 22,536 | |
| Technip SA | | | 427 | | | | 49,160 | |
| Total SA | | | 6,134 | | | | 317,481 | |
| Unibail-Rodamco SE (REIT) (a) | | | 265 | | | | 64,874 | |
| Veolia Environnement | | | 4,218 | | | | 51,417 | |
| Vinci SA (a) | | | 944 | | | | 44,927 | |
| Vivendi | | | 19,233 | | | | 433,121 | |
| (Cost $3,844,764) | | | | 4,646,524 | |
| Germany 5.2% | |
| Adidas AG | | | 551 | | | | 49,104 | |
| Allianz SE (Registered) | | | 1,916 | | | | 265,436 | |
| BASF SE | | | 1,618 | | | | 152,078 | |
| Bayer AG | | | 3,118 | | | | 296,093 | |
| Bayerische Motoren Werke (BMW) AG | | | 704 | | | | 67,895 | |
| Beiersdorf AG | | | 1,074 | | | | 87,756 | |
| Commerzbank AG* | | | 17,612 | | | | 33,517 | |
| Continental AG | | | 289 | | | | 33,439 | |
| Daimler AG (Registered) | | | 1,589 | | | | 86,830 | |
| | | Shares | | | Value ($) | |
| | | | | | | | | |
| Deutsche Boerse AG | | | 688 | | | | 41,993 | |
| Deutsche Post AG (Registered) (a) | | | 3,555 | | | | 77,952 | |
| Deutsche Telekom AG (Registered) | | | 67,999 | | | | 772,552 | |
| E.ON AG | | | 12,733 | | | | 237,121 | |
| Fresenius Medical Care AG & Co. KGaA | | | 940 | | | | 64,947 | |
| Fresenius SE & Co. KGaA | | | 632 | | | | 72,739 | |
| GEA Group AG | | | 1,223 | | | | 39,501 | |
| Henkel AG & Co. KGaA | | | 1,435 | | | | 98,285 | |
| Infineon Technologies AG | | | 4,778 | | | | 38,772 | |
| K+S AG (Registered) | | | 447 | | | | 20,666 | |
| Kabel Deutschland Holding AG | | | 301 | | | | 22,508 | |
| Linde AG | | | 332 | | | | 57,897 | |
| Merck KGaA | | | 233 | | | | 30,742 | |
| Metro AG | | | 2,014 | | | | 55,831 | |
| Muenchener Rueckversicherungs-Gesellschaft AG (Registered) | | | 388 | | | | 69,663 | |
| RWE AG | | | 3,136 | | | | 129,463 | |
| SAP AG | | | 2,863 | | | | 229,345 | |
| Siemens AG (Registered) | | | 2,778 | | | | 301,940 | |
| Suedzucker AG | | | 67 | | | | 2,742 | |
| Volkswagen AG | | | 110 | | | | 23,632 | |
| (Cost $2,593,709) | | | | 3,460,439 | |
| Hong Kong 2.5% | |
| AIA Group Ltd. | | | 23,000 | | | | 91,665 | |
| Cathay Pacific Airways Ltd. (a) | | | 15,000 | | | | 27,887 | |
| Cheung Kong (Holdings) Ltd. | | | 5,000 | | | | 77,394 | |
| Cheung Kong Infrastructure Holdings Ltd. | | | 7,000 | | | | 43,001 | |
| CLP Holdings Ltd. | | | 17,500 | | | | 147,292 | |
| Galaxy Entertainment Group Ltd.* | | | 12,000 | | | | 47,787 | |
| Hang Lung Properties Ltd. | | | 12,000 | | | | 48,114 | |
| Hang Seng Bank Ltd. (a) | | | 2,200 | | | | 33,986 | |
| Hong Kong & China Gas Co., Ltd. | | | 45,813 | | | | 125,646 | |
| Hong Kong Exchanges & Clearing Ltd. (a) | | | 3,500 | | | | 60,296 | |
| Hopewell Holdings Ltd. | | | 6,000 | | | | 25,944 | |
| Hutchison Whampoa Ltd. | | | 31,000 | | | | 328,857 | |
| Li & Fung Ltd. (a) | | | 36,000 | | | | 64,863 | |
| Link (REIT) | | | 2,000 | | | | 10,016 | |
| MTR Corp., Ltd. | | | 17,500 | | | | 69,273 | |
| Noble Group Ltd. | | | 51,363 | | | | 49,529 | |
| NWS Holdings Ltd. | | | 30,000 | | | | 51,205 | |
| Orient Overseas International Ltd. | | | 5,000 | | | | 32,955 | |
| Power Assets Holdings Ltd. | | | 14,000 | | | | 120,163 | |
| Shangri-La Asia Ltd. | | | 12,000 | | | | 24,180 | |
| SJM Holdings Ltd. | | | 12,000 | | | | 28,239 | |
| Sun Hung Kai Properties Ltd. | | | 5,000 | | | | 75,726 | |
| Swire Pacific Ltd. "A" | | | 2,000 | | | | 24,854 | |
| Wharf Holdings Ltd. | | | 6,000 | | | | 47,513 | |
| Yue Yuen Industrial (Holdings) Ltd. (a) | | | 5,000 | | | | 16,880 | |
| (Cost $1,155,346) | | | | 1,673,265 | |
| Ireland 3.1% | |
| CRH PLC (b) | | | 20,956 | | | | 434,855 | |
| CRH PLC (b) | | | 56,843 | | | | 1,188,225 | |
| Elan Corp. PLC* | | | 31,025 | | | | 320,408 | |
| Experian PLC | | | 1,159 | | | | 18,726 | |
| Prothena Corp. PLC* | | | 757 | | | | 5,547 | |
| Shire PLC | | | 3,629 | | | | 111,458 | |
| (Cost $1,879,352) | | | | 2,079,219 | |
| | | Shares | | | Value ($) | |
| | | | | | | | | |
| Italy 3.9% | |
| Assicurazioni Generali SpA | | | 6,464 | | | | 117,908 | |
| Atlantia SpA | | | 7,403 | | | | 134,268 | |
| Enel Green Power SpA | | | 16,188 | | | | 30,275 | |
| Enel SpA | | | 71,348 | | | | 296,835 | |
| Eni SpA | | | 9,990 | | | | 246,449 | |
| Fiat Industrial SpA | | | 18,223 | | | | 199,806 | |
| Fiat SpA* (a) | | | 22,794 | | | | 115,136 | |
| Finmeccanica SpA* | | | 7,959 | | | | 46,126 | |
| Intesa Sanpaolo | | | 40,339 | | | | 69,786 | |
| Luxottica Group SpA | | | 3,208 | | | | 133,296 | |
| Pirelli & C. SpA (a) | | | 5,969 | | | | 68,482 | |
| Prysmian SpA | | | 5,291 | | | | 107,048 | |
| Saipem SpA | | | 1,195 | | | | 46,363 | |
| Snam SpA | | | 16,191 | | | | 75,289 | |
| Telecom Italia SpA | | | 530,993 | | | | 479,976 | |
| Telecom Italia SpA (RSP) | | | 357,071 | | | | 282,551 | |
| Terna — Rete Elettrica Nationale SpA | | | 14,939 | | | | 59,828 | |
| UBI Banca — Unione di Banche Italiane ScpA | | | 3,919 | | | | 18,280 | |
| UniCredit SpA* | | | 21,088 | | | | 104,134 | |
| (Cost $2,579,369) | | | | 2,631,836 | |
| Japan 11.3% | |
| AEON Co., Ltd. | | | 5,200 | | | | 59,439 | |
| Ajinomoto Co., Inc. | | | 6,000 | | | | 79,387 | |
| Alfresa Holdings Corp. | | | 500 | | | | 19,539 | |
| Asahi Group Holdings Ltd. | | | 3,400 | | | | 72,070 | |
| Asahi Kasei Corp. | | | 5,000 | | | | 29,527 | |
| Astellas Pharma, Inc. | | | 3,800 | | | | 170,701 | |
| Bridgestone Corp. | | | 1,200 | | | | 31,105 | |
| Canon, Inc. | | | 1,500 | | | | 58,833 | |
| Central Japan Railway Co. | | | 300 | | | | 24,341 | |
| Chubu Electric Power Co., Inc. | | | 13,200 | | | | 176,131 | |
| Chugai Pharmaceutical Co., Ltd. | | | 2,300 | | | | 44,080 | |
| Chugoku Electric Power Co., Inc. | | | 6,300 | | | | 98,796 | |
| Dai-ichi Life Insurance Co., Ltd. | | | 35 | | | | 49,247 | |
| Daiichi Sankyo Co., Ltd. | | | 5,800 | | | | 88,969 | |
| Dainippon Sumitomo Pharma Co., Ltd. | | | 1,800 | | | | 21,625 | |
| Daito Trust Construction Co., Ltd. | | | 400 | | | | 37,641 | |
| Daiwa House Industry Co., Ltd. | | | 2,000 | | | | 34,413 | |
| Daiwa Securities Group, Inc. (a) | | | 10,000 | | | | 55,697 | |
| Denso Corp. | | | 800 | | | | 27,836 | |
| Eisai Co., Ltd. | | | 2,100 | | | | 87,684 | |
| Electric Power Development Co., Ltd. | | | 1,600 | | | | 37,929 | |
| FamilyMart Co., Ltd. | | | 500 | | | | 20,582 | |
| FANUC Corp. | | | 200 | | | | 37,193 | |
| FUJIFILM Holdings Corp. | | | 1,200 | | | | 24,170 | |
| Hisamitsu Pharmaceutical Co., Inc. (a) | | | 700 | | | | 34,708 | |
| Hitachi Ltd. | | | 7,000 | | | | 41,196 | |
| Hokkaido Electric Power Co., Inc. | | | 2,100 | | | | 25,501 | |
| Hokuriku Electric Power Co. | | | 2,800 | | | | 33,104 | |
| Honda Motor Co., Ltd. | | | 1,600 | | | | 58,973 | |
| HOYA Corp. | | | 1,400 | | | | 27,565 | |
| Idemitsu Kosan Co., Ltd. | | | 300 | | | | 26,129 | |
| INPEX Corp. | | | 21 | | | | 112,074 | |
| Japan Petroleum Exploration Co., Ltd. | | | 700 | | | | 24,464 | |
| Japan Real Estate Investment Corp. (REIT) | | | 5 | | | | 49,044 | |
| | | Shares | | | Value ($) | |
| | | | | | | | | |
| Japan Tobacco, Inc. | | | 7,400 | | | | 208,618 | |
| JFE Holdings, Inc. | | | 1,400 | | | | 26,394 | |
| JX Holdings, Inc. | | | 22,920 | | | | 129,091 | |
| Kansai Electric Power Co., Inc. | | | 15,900 | | | | 167,057 | |
| Kao Corp. | | | 4,500 | | | | 117,245 | |
| KDDI Corp. | | | 3,400 | | | | 240,159 | |
| Keyence Corp. | | | 110 | | | | 30,359 | |
| Kikkoman Corp. | | | 2,000 | | | | 28,570 | |
| Kirin Holdings Co., Ltd. | | | 8,000 | | | | 94,003 | |
| Komatsu Ltd. | | | 900 | | | | 23,031 | |
| Kyocera Corp. | | | 400 | | | | 36,272 | |
| Kyowa Hakko Kirin Co., Ltd. | | | 3,000 | | | | 29,627 | |
| Kyushu Electric Power Co., Inc. | | | 9,500 | | | | 108,446 | |
| Lawson, Inc. (a) | | | 500 | | | | 33,987 | |
| MEIJI Holdings Co., Ltd. | | | 500 | | | | 21,671 | |
| Miraca Holdings, Inc. | | | 500 | | | | 20,132 | |
| Mitsubishi Chemical Holdings Corp. | | | 6,500 | | | | 32,423 | |
| Mitsubishi Corp. | | | 1,900 | | | | 36,521 | |
| Mitsubishi Estate Co., Ltd. | | | 4,000 | | | | 95,625 | |
| Mitsubishi Tanabe Pharma Corp. | | | 2,200 | | | | 28,685 | |
| Mitsubishi UFJ Financial Group, Inc. | | | 43,700 | | | | 235,156 | |
| Mitsui & Co., Ltd. | | | 2,500 | | | | 37,401 | |
| Mitsui Fudosan Co., Ltd. | | | 3,000 | | | | 73,293 | |
| Mizuho Financial Group, Inc. | | | 77,200 | | | | 141,248 | |
| MS&AD Insurance Group Holdings, Inc. | | | 2,400 | | | | 47,948 | |
| Nintendo Co., Ltd. | | | 200 | | | | 21,340 | |
| Nippon Building Fund, Inc. (REIT) | | | 4 | | | | 41,241 | |
| Nippon Meat Packers, Inc. | | | 2,000 | | | | 27,534 | |
| Nippon Steel & Sumitomo Metal | | | 16,000 | | | | 39,357 | |
| Nippon Telegraph & Telephone Corp. | | | 5,409 | | | | 227,212 | |
| Nishi-Nippon City Bank Ltd. | | | 8,000 | | | | 19,708 | |
| Nissan Motor Co., Ltd. | | | 3,400 | | | | 32,271 | |
| Nisshin Seifun Group, Inc. | | | 3,000 | | | | 37,539 | |
| Nissin Foods Holdings Co., Ltd. | | | 700 | | | | 26,543 | |
| Nitto Denko Corp. | | | 600 | | | | 29,520 | |
| NKSJ Holdings, Inc. | | | 1,750 | | | | 37,269 | |
| Nomura Holdings, Inc. | | | 12,000 | | | | 70,851 | |
| Nomura Real Estate Office Fund, Inc. (REIT) | | | 5 | | | | 28,689 | |
| NTT DoCoMo, Inc. | | | 187 | | | | 268,560 | |
| Olympus Corp.* | | | 1,900 | | | | 36,877 | |
| Ono Pharmaceutical Co., Ltd. | | | 700 | | | | 35,721 | |
| Oriental Land Co., Ltd. | | | 200 | | | | 24,168 | |
| ORIX Corp. | | | 580 | | | | 65,447 | |
| Osaka Gas Co., Ltd. | | | 30,000 | | | | 108,967 | |
| Otsuka Holdings KK | | | 2,600 | | | | 72,995 | |
| Panasonic Corp. (a) | | | 3,100 | | | | 18,836 | |
| Resona Holdings, Inc. | | | 6,900 | | | | 31,283 | |
| Santen Pharmaceutical Co., Ltd. | | | 700 | | | | 26,801 | |
| Seven & I Holdings Co., Ltd. | | | 6,200 | | | | 174,499 | |
| Shikoku Electric Power Co., Inc. | | | 2,600 | | | | 41,465 | |
| Shin-Etsu Chemical Co., Ltd. | | | 700 | | | | 42,756 | |
| Shionogi & Co., Ltd. | | | 3,400 | | | | 56,636 | |
| Shiseido Co., Ltd. (a) | | | 3,500 | | | | 49,219 | |
| Showa Shell Sekiyu KK | | | 4,000 | | | | 22,712 | |
| SOFTBANK Corp. | | | 11,000 | | | | 402,509 | |
| Sony Corp. | | | 1,300 | | | | 14,546 | |
| Sumitomo Chemical Co., Ltd. | | | 6,000 | | | | 18,930 | |
| Sumitomo Metal Mining Co., Ltd. | | | 2,000 | | | | 28,223 | |
| Sumitomo Mitsui Financial Group, Inc. | | | 4,800 | | | | 174,379 | |
| | | Shares | | | Value ($) | |
| | | | | | | | | |
| Sumitomo Mitsui Trust Holdings, Inc. | | | 13,410 | | | | 47,115 | |
| Sumitomo Realty & Development Co., Ltd. | | | 2,000 | | | | 66,455 | |
| Suzuken Co., Ltd. | | | 900 | | | | 25,362 | |
| Sysmex Corp. | | | 400 | | | | 18,326 | |
| T&D Holdings, Inc. | | | 3,600 | | | | 43,877 | |
| Taisho Pharmaceutical Holdings Co., Ltd. | | | 300 | | | | 20,490 | |
| Takeda Pharmaceutical Co., Ltd. | | | 6,300 | | | | 281,545 | |
| Terumo Corp. | | | 1,400 | | | | 55,627 | |
| Toho Gas Co., Ltd. | | | 7,000 | | | | 37,576 | |
| Tohoku Electric Power Co., Inc.* | | | 10,000 | | | | 93,060 | |
| Tokio Marine Holdings, Inc. | | | 2,200 | | | | 61,340 | |
| Tokyo Electric Power Co., Inc.* | | | 24,100 | | | | 57,763 | |
| Tokyo Gas Co., Ltd. | | | 44,000 | | | | 201,166 | |
| TonenGeneral Sekiyu KK | | | 4,000 | | | | 34,468 | |
| Toray Industries, Inc. | | | 4,000 | | | | 24,391 | |
| Toshiba Corp. | | | 8,000 | | | | 31,634 | |
| Toyo Suisan Kaisha Ltd. | | | 1,000 | | | | 26,650 | |
| Toyota Motor Corp. | | | 2,200 | | | | 102,688 | |
| Tsumura & Co. | | | 700 | | | | 21,096 | |
| Unicharm Corp. | | | 900 | | | | 46,851 | |
| Yakult Honsha Co., Ltd. (a) | | | 700 | | | | 30,673 | |
| (Cost $6,903,485) | | | | 7,545,411 | |
| Luxembourg 0.3% | |
| ArcelorMittal | | | 4,154 | | | | 71,910 | |
| Millicom International Cellular SA (SDR) | | | 1,194 | | | | 103,778 | |
| Tenaris SA (a) | | | 1,718 | | | | 35,814 | |
| (Cost $164,913) | | | | 211,502 | |
| Macau 0.1% | |
| Sands China Ltd. | | | 16,000 | | | | 71,775 | |
| Wynn Macau Ltd.* (a) | | | 9,200 | | | | 25,355 | |
| (Cost $36,554) | | | | 97,130 | |
| Netherlands 6.6% | |
| AEGON NV | | | 13,027 | | | | 83,019 | |
| Akzo Nobel NV | | | 2,534 | | | | 167,211 | |
| ASML Holding NV | | | 23,043 | | | | 1,491,796 | |
| Corio NV (REIT) | | | 729 | | | | 33,164 | |
| Gemalto NV | | | 952 | | | | 86,190 | |
| Heineken Holding NV | | | 913 | | | | 50,011 | |
| Heineken NV | | | 780 | | | | 52,028 | |
| ING Groep NV (CVA)* | | | 27,123 | | | | 259,369 | |
| Koninklijke (Royal) KPN NV | | | 86,611 | | | | 428,309 | |
| Koninklijke Ahold NV | | | 6,503 | | | | 86,377 | |
| Koninklijke DSM NV | | | 1,774 | | | | 106,856 | |
| Koninklijke Philips Electronics NV | | | 5,110 | | | | 137,093 | |
| Koninklijke Vopak NV | | | 374 | | | | 26,371 | |
| Randstad Holding NV | | | 918 | | | | 33,887 | |
| Reed Elsevier NV | | | 23,165 | | | | 343,212 | |
| Royal Dutch Shell PLC "A" | | | 1,952 | | | | 68,973 | |
| Royal Dutch Shell PLC "B" | | | 2,331 | | | | 82,500 | |
| TNT Express NV | | | 2,201 | | | | 24,898 | |
| Unilever NV (CVA) | | | 7,993 | | | | 301,606 | |
| Wolters Kluwer NV | | | 11,096 | | | | 229,443 | |
| Ziggo NV | | | 9,664 | | | | 312,330 | |
| (Cost $3,617,125) | | | | 4,404,643 | |
| | | Shares | | | Value ($) | |
| | | | | | | | | |
| Norway 2.0% | |
| DnB ASA | | | 24,697 | | | | 314,811 | |
| Gjensidige Forsikring ASA | | | 2,423 | | | | 34,870 | |
| Norsk Hydro ASA | | | 22,115 | | | | 112,662 | |
| Statoil ASA | | | 7,119 | | | | 178,645 | |
| Telenor ASA | | | 23,063 | | | | 468,564 | |
| Yara International ASA | | | 4,676 | | | | 232,099 | |
| (Cost $690,347) | | | | 1,341,651 | |
| Singapore 3.2% | |
| CapitaLand Ltd. (a) | | | 20,000 | | | | 61,356 | |
| ComfortDelGro Corp., Ltd. | | | 29,000 | | | | 42,503 | |
| DBS Group Holdings Ltd. | | | 10,000 | | | | 122,413 | |
| Fraser & Neave Ltd. | | | 7,000 | | | | 55,715 | |
| Genting Singapore PLC (a) | | | 175,000 | | | | 200,240 | |
| Global Logistic Properties Ltd. | | | 17,000 | | | | 39,089 | |
| Golden Agri-Resources Ltd. | | | 173,000 | | | | 93,132 | |
| Hutchison Port Holdings Trust (Units) | | | 63,000 | | | | 50,157 | |
| Jardine Cycle & Carriage Ltd. | | | 3,000 | | | | 119,360 | |
| Keppel Corp., Ltd. | | | 15,400 | | | | 139,932 | |
| Olam International Ltd. (a) | | | 43,000 | | | | 55,148 | |
| Oversea-Chinese Banking Corp., Ltd. | | | 14,000 | | | | 112,639 | |
| SembCorp Industries Ltd. | | | 16,000 | | | | 69,716 | |
| SembCorp Marine Ltd. | | | 8,000 | | | | 30,456 | |
| Singapore Airlines Ltd. | | | 6,000 | | | | 53,064 | |
| Singapore Exchange Ltd. | | | 7,000 | | | | 40,582 | |
| Singapore Press Holdings Ltd. | | | 37,000 | | | | 122,415 | |
| Singapore Technologies Engineering Ltd. | | | 15,000 | | | | 47,349 | |
| Singapore Telecommunications Ltd. | | | 157,000 | | | | 426,734 | |
| StarHub Ltd. | | | 14,000 | | | | 43,716 | |
| United Overseas Bank Ltd. | | | 7,000 | | | | 114,649 | |
| Wilmar International Ltd. | | | 50,000 | | | | 138,191 | |
| (Cost $1,503,370) | | | | 2,178,556 | |
| Spain 5.0% | |
| Abertis Infraestructuras SA | | | 10,380 | | | | 172,989 | |
| Acciona SA | | | 263 | | | | 19,944 | |
| ACS, Actividades de Construccion y Servicios SA (a) | | | 2,511 | | | | 64,261 | |
| Amadeus IT Holding SA "A" | | | 16,502 | | | | 414,106 | |
| Banco Bilbao Vizcaya Argentaria SA (a) | | | 12,973 | | | | 119,097 | |
| Banco Santander SA | | | 26,579 | | | | 214,309 | |
| Enagas SA | | | 2,258 | | | | 48,319 | |
| Ferrovial SA (a) | | | 7,677 | | | | 113,191 | |
| Gas Natural SDG SA | | | 4,736 | | | | 86,602 | |
| Iberdrola SA | | | 50,661 | | | | 282,505 | |
| Industria de Diseno Textil SA | | | 3,008 | | | | 421,414 | |
| Red Electrica Corporacion SA (a) | | | 1,484 | | | | 73,321 | |
| Repsol SA | | | 20,305 | | | | 416,997 | |
| Telefonica SA | | | 61,238 | | | | 831,534 | |
| Zardoya Otis SA (a) | | | 3,050 | | | | 43,961 | |
| (Cost $2,910,128) | | | | 3,322,550 | |
| Sweden 3.5% | |
| Assa Abloy AB "B" | | | 1,207 | | | | 45,450 | |
| Atlas Copco AB "A" | | | 2,084 | | | | 57,692 | |
| Boliden AB | | | 10,746 | | | | 204,250 | |
| | | Shares | | | Value ($) | |
| | | | | | | | | |
| Electrolux AB "B" | | | 1,087 | | | | 28,549 | |
| Hennes & Mauritz AB "B" | | | 5,804 | | | | 201,685 | |
| Hexagon AB "B" | | | 2,788 | | | | 70,083 | |
| Husqvarna AB "B" | | | 4,852 | | | | 29,412 | |
| Nordea Bank AB | | | 10,270 | | | | 98,358 | |
| Sandvik AB | | | 3,095 | | | | 49,744 | |
| Skandinaviska Enskilda Banken AB "A" | | | 4,035 | | | | 34,409 | |
| Skanska AB "B" | | | 1,724 | | | | 28,365 | |
| SKF AB "B" | | | 1,279 | | | | 32,364 | |
| Svenska Cellulosa AB "B" | | | 13,283 | | | | 290,774 | |
| Svenska Handelsbanken AB "A" | | | 1,999 | | | | 71,624 | |
| Swedbank AB "A" | | | 3,758 | | | | 73,951 | |
| Swedish Match AB | | | 6,442 | | | | 216,972 | |
| Tele2 AB "B" | | | 5,797 | | | | 105,136 | |
| Telefonaktiebolaget LM Ericsson "B" | | | 42,182 | | | | 424,278 | |
| TeliaSonera AB | | | 38,625 | | | | 263,094 | |
| Volvo AB "B" | | | 2,677 | | | | 36,915 | |
| (Cost $1,784,181) | | | | 2,363,105 | |
| Switzerland 7.4% | |
| ABB Ltd. (Registered)* (a) | | | 7,290 | | | | 151,369 | |
| Actelion Ltd. (Registered)* | | | 481 | | | | 23,104 | |
| Adecco SA (Registered)* | | | 824 | | | | 43,677 | |
| Aryzta AG* | | | 598 | | | | 30,682 | |
| Compagnie Financiere Richemont SA "A" | | | 1,918 | | | | 153,370 | |
| Credit Suisse Group AG (Registered)* | | | 2,979 | | | | 74,747 | |
| Geberit AG (Registered)* | | | 246 | | | | 54,459 | |
| Givaudan SA (Registered)* | | | 61 | | | | 64,671 | |
| Glencore International PLC (a) | | | 4,330 | | | | 25,234 | |
| Holcim Ltd. (Registered)* | | | 1,280 | | | | 94,276 | |
| Lonza Group AG (Registered)* | | | 466 | | | | 25,205 | |
| Nestle SA (Registered) | | | 20,152 | | | | 1,313,389 | |
| Novartis AG (Registered) | | | 11,006 | | | | 696,806 | |
| Roche Holding AG (Genusschein) | | | 3,215 | | | | 654,976 | |
| Sika AG | | | 19 | | | | 44,035 | |
| Sonova Holding AG (Registered)* | | | 289 | | | | 32,017 | |
| STMicroelectronics NV | | | 8,506 | | | | 62,017 | |
| Swatch Group AG (Bearer) | | | 87 | | | | 44,773 | |
| Swiss Re AG.* | | | 723 | | | | 52,768 | |
| Swisscom AG (Registered) (a) | | | 2,114 | | | | 911,751 | |
| Syngenta AG (Registered) | | | 246 | | | | 99,232 | |
| UBS AG (Registered)* | | | 5,885 | | | | 92,549 | |
| Wolseley PLC | | | 878 | | | | 41,732 | |
| Xstrata PLC | | | 2,858 | | | | 50,833 | |
| Zurich Insurance Group AG* | | | 398 | | | | 106,422 | |
| (Cost $2,859,380) | | | | 4,944,094 | |
| United Kingdom 7.0% | |
| Anglo American PLC | | | 1,947 | | | | 62,151 | |
| ARM Holdings PLC | | | 28,328 | | | | 362,228 | |
| AstraZeneca PLC | | | 8,219 | | | | 388,556 | |
| BAE Systems PLC | | | 8,559 | | | | 47,023 | |
| Barclays PLC | | | 8,467 | | | | 36,564 | |
| BG Group PLC | | | 3,267 | | | | 54,782 | |
| BHP Billiton PLC | | | 3,282 | | | | 115,328 | |
| BP PLC | | | 14,756 | | | | 102,241 | |
| British American Tobacco PLC | | | 2,622 | | | | 132,857 | |
| British Sky Broadcasting Group PLC | | | 3,065 | | | | 38,288 | |
| BT Group PLC | | | 34,124 | | | | 128,630 | |
| | | Shares | | | Value ($) | |
| | | | | | | | | |
| Burberry Group PLC | | | 877 | | | | 17,956 | |
| Capita PLC | | | 1,652 | | | | 20,456 | |
| Centrica PLC | | | 23,148 | | | | 125,749 | |
| Compass Group PLC | | | 1,662 | | | | 19,656 | |
| Diageo PLC | | | 3,511 | | | | 102,214 | |
| GlaxoSmithKline PLC | | | 34,007 | | | | 738,346 | |
| HSBC Holdings PLC | | | 12,924 | | | | 136,695 | |
| Imperial Tobacco Group PLC | | | 1,507 | | | | 58,193 | |
| Inmarsat PLC | | | 3,673 | | | | 35,456 | |
| International Consolidated Airlines Group SA* | | | 16,625 | | | | 49,133 | |
| Kingfisher PLC | | | 7,038 | | | | 32,508 | |
| Lloyds Banking Group PLC* | | | 35,330 | | | | 28,309 | |
| Marks & Spencer Group PLC | | | 6,157 | | | | 38,387 | |
| National Grid PLC | | | 14,501 | | | | 166,101 | |
| Pearson PLC | | | 2,051 | | | | 40,096 | |
| Reckitt Benckiser Group PLC | | | 814 | | | | 50,992 | |
| Reed Elsevier PLC | | | 4,792 | | | | 50,316 | |
| Rio Tinto PLC | | | 1,800 | | | | 104,890 | |
| Rolls-Royce Holdings PLC* | | | 1,946 | | | | 28,038 | |
| SABMiller PLC | | | 1,281 | | | | 60,294 | |
| Severn Trent PLC | | | 1,531 | | | | 39,225 | |
| Smith & Nephew PLC | | | 6,163 | | | | 68,204 | |
| Smiths Group PLC | | | 1,710 | | | | 33,658 | |
| SSE PLC | | | 4,799 | | | | 110,910 | |
| Standard Chartered PLC | | | 1,687 | | | | 42,763 | |
| Subsea 7 SA | | | 1,418 | | | | 33,914 | |
| Tesco PLC | | | 10,251 | | | | 56,312 | |
| The Sage Group PLC | | | 35,008 | | | | 167,710 | |
| Unilever PLC | | | 1,529 | | | | 58,038 | |
| United Utilities Group PLC | | | 5,004 | | | | 54,910 | |
| Vodafone Group PLC | | | 238,662 | | | | 600,203 | |
| William Morrison Supermarkets PLC | | | 5,677 | | | | 24,281 | |
| WPP PLC | | | 3,863 | | | | 56,157 | |
| (Cost $3,239,030) | | | | 4,718,718 | |
| United States 0.2% | |
| Catamaran Corp.* (Cost $173,030) | | | 3,700 | | | | 174,008 | |
Total Common Stocks (Cost $45,655,018) | | | | 59,106,474 | |
| | |
| Preferred Stocks 0.4% | |
| Germany | |
| Bayerische Motoren Werke (BMW) AG | | | 416 | | | | 26,883 | |
| Henkel AG & Co. KGaA | | | 2,045 | | | | 167,942 | |
| Porsche Automobil Holding SE | | | 395 | | | | 32,187 | |
| Volkswagen AG | | | 123 | | | | 27,983 | |
Total Preferred Stocks (Cost $115,636) | | | | 254,995 | |
| | |
| Rights 0.0% | |
| Singapore 0.0% | |
| Olam International Ltd., Expiration Date 1/21/2013* (Cost $0) | | | 13,459 | | | | 0 | |
| Spain 0.0% | |
| Repsol SA, Expiration Date 1/16/2013* (Cost $12,699) | | | 20,305 | | | | 12,382 | |
Total Rights (Cost $12,699) | | | | 12,382 | |
| | |
| | | Shares | | | Value ($) | |
| | | | | | | | | |
| Exchange-Traded Funds 9.6% | |
| Emerging Markets | |
| iShares MSCI Emerging Markets Index Fund | | | 73,000 | | | | 3,237,550 | |
| Vanguard MSCI Emerging Markets Fund | | | 71,400 | | | | 3,179,442 | |
Total Exchange-Traded Funds (Cost $4,637,577) | | | | 6,416,992 | |
| | |
| | | Shares | | | Value ($) | |
| | | | | | | | | |
| Securities Lending Collateral 10.9% | |
| Daily Assets Fund Institutional, 0.20% (c) (d) (Cost $7,305,821) | | | 7,305,821 | | | | 7,305,821 | |
| | |
| Cash Equivalents 1.5% | |
| Central Cash Management Fund, 0.15% (c) (Cost $974,112) | | | 974,112 | | | | 974,112 | |
| | | % of Net Assets | | | Value ($) | |
| | | | |
Total Investment Portfolio (Cost $58,700,863)† | | | 110.6 | | | | 74,070,776 | |
| Other Assets and Liabilities, Net | | | (10.6 | ) | | | (7,083,974 | ) |
| Net Assets | | | 100.0 | | | | 66,986,802 | |
* Non-income producing security.
† The cost for federal income tax purposes was $58,987,622. At December 31, 2012, net unrealized appreciation for all securities based on tax cost was $15,083,154. This consisted of aggregate gross unrealized appreciation for all securities in which there was an excess of value over tax cost of $18,485,933 and aggregate gross unrealized depreciation for all securities in which there was an excess of tax cost over value of $3,402,779.
(a) All or a portion of these securities were on loan (see Notes to Financial Statements). The value of all securities loaned at December 31, 2012 amounted to $7,002,615, which is 10.5% of net assets.
(b) Securities with the same description are the same corporate entity but trade on different stock exchanges.
(c) Affiliated fund managed by Deutsche Investment Management Americas Inc. The rate shown is the annualized seven-day yield at period end.
(d) Represents collateral held in connection with securities lending. Income earned by the Fund is net of borrower rebates.
CVA: Certificaten Van Aandelen (Certificate of Stock)
MSCI: Morgan Stanley Capital International
REIT: Real Estate Investment Trust
RSP: Risparmio (Convertible Savings Shares)
SDR: Swedish Depositary Receipt
At December 31, 2012, open futures contracts purchased were as follows:
| Futures | Currency | Expiration Date | | Contracts | | | Notional Value ($) | | | Unrealized Appreciation/ (Depreciation) ($) | |
| ASX SPI 200 Index | AUD | 3/21/2013 | | | 1 | | | | 119,837 | | | | 153 | |
| Euro Stoxx 50 Index | EUR | 3/15/2013 | | | 24 | | | | 828,401 | | | | (10,201 | ) |
| FTSE 100 Index | GBP | 3/15/2013 | | | 1 | | | | 94,998 | | | | (1,091 | ) |
| Nikkei 225 Index | USD | 3/7/2013 | | | 3 | | | | 158,550 | | | | 15,219 | |
| Total net unrealized appreciation | | | | 4,080 | |
| Currency Abbreviations |
AUD Australian Dollar EUR Euro GBP British Pound USD United States Dollar |
For information on the Fund's policy and additional disclosures regarding futures contracts, please refer to Note B in the accompanying Notes to Financial Statements.
Fair Value Measurements
Various inputs are used in determining the value of the Fund's investments. These inputs are summarized in three broad levels. Level 1 includes quoted prices in active markets for identical securities. Level 2 includes other significant observable inputs (including quoted prices for similar securities, interest rates, prepayment speeds, and credit risk). Level 3 includes significant unobservable inputs (including the Fund's own assumptions in determining the fair value of investments). The inputs or methodology used for valuing securities are not necessarily an indication of the risk associated with investing in those securities.
The following is a summary of the inputs used as of December 31, 2012 in valuing the Fund's investments. For information on the Fund's policy regarding the valuation of investments, please refer to the Security Valuation section of Note A in the accompanying Notes to Financial Statements.
| Assets | | Level 1 | | | Level 2 | | | Level 3 | | | Total | |
| | |
| Common Stocks, Preferred Stocks and Rights (e) | |
| Australia | | $ | — | | | $ | 2,586,122 | | | $ | — | | | $ | 2,586,122 | |
| Austria | | | — | | | | 376,730 | | | | — | | | | 376,730 | |
| Belgium | | | — | | | | 1,130,563 | | | | — | | | | 1,130,563 | |
| Bermuda | | | — | | | | 89,777 | | | | — | | | | 89,777 | |
| Canada | | | 4,840,689 | | | | 33,651 | | | | — | | | | 4,874,340 | |
| Denmark | | | — | | | | 1,391,285 | | | | — | | | | 1,391,285 | |
| Finland | | | — | | | | 2,865,006 | | | | — | | | | 2,865,006 | |
| France | | | — | | | | 4,646,524 | | | | — | | | | 4,646,524 | |
| Germany | | | — | | | | 3,715,434 | | | | — | | | | 3,715,434 | |
| Hong Kong | | | — | | | | 1,673,265 | | | | — | | | | 1,673,265 | |
| Ireland | | | 5,547 | | | | 2,073,672 | | | | — | | | | 2,079,219 | |
| Italy | | | — | | | | 2,631,836 | | | | — | | | | 2,631,836 | |
| Japan | | | — | | | | 7,545,411 | | | | — | | | | 7,545,411 | |
| Luxembourg | | | — | | | | 211,502 | | | | — | | | | 211,502 | |
| Macau | | | — | | | | 97,130 | | | | — | | | | 97,130 | |
| Netherlands | | | — | | | | 4,404,643 | | | | — | | | | 4,404,643 | |
| Norway | | | — | | | | 1,341,651 | | | | — | | | | 1,341,651 | |
| Singapore | | | — | | | | 2,178,556 | | | | — | | | | 2,178,556 | |
| Spain | | | — | | | | 3,334,932 | | | | — | | | | 3,334,932 | |
| Sweden | | | — | | | | 2,363,105 | | | | — | | | | 2,363,105 | |
| Switzerland | | | — | | | | 4,944,094 | | | | — | | | | 4,944,094 | |
| United Kingdom | | | — | | | | 4,718,718 | | | | — | | | | 4,718,718 | |
| United States | | | 174,008 | | | | — | | | | — | | | | 174,008 | |
| Exchange-Traded Funds | | | 6,416,992 | | | | — | | | | — | | | | 6,416,992 | |
| Short-Term Investments (e) | | | 8,279,933 | | | | — | | | | — | | | | 8,279,933 | |
Derivatives (f) Futures Contracts | | | 15,372 | | | | — | | | | — | | | | 15,372 | |
| Total | | $ | 19,732,541 | | | $ | 54,353,607 | | | $ | — | | | $ | 74,086,148 | |
| Liabilities | |
Derivatives (f) Futures Contracts | | $ | (11,292 | ) | | $ | — | | | $ | — | | | $ | (11,292 | ) |
| Total | | $ | (11,292 | ) | | $ | — | | | $ | — | | | $ | (11,292 | ) |
There have been no transfers between fair value measurement levels during the year ended December 31, 2012.
(e) See Investment Portfolio for additional detailed categorizations.
(f) Derivatives include unrealized appreciation (depreciation) on open futures contracts.
The accompanying notes are an integral part of the financial statements.
Statement of Assets and Liabilities | as of December 31, 2012 | |
| Assets | |
Investments: Investments in non-affiliated securities, at value (cost $50,420,930) — including $7,002,615 of securities loaned | | $ | 65,790,843 | |
| Investment in Daily Assets Fund Institutional (cost $7,305,821)* | | | 7,305,821 | |
| Investment in Central Cash Management Fund (cost $974,112) | | | 974,112 | |
| Total investments in securities, at value (cost $58,700,863) | | | 74,070,776 | |
| Foreign currency, at value (cost $158,198) | | | 158,158 | |
| Deposits with broker for futures contracts | | | 221,790 | |
| Receivable for investments sold | | | 240 | |
| Receivable for Fund shares sold | | | 20 | |
| Dividends receivable | | | 74,146 | |
| Interest receivable | | | 7,344 | |
| Receivable for variation margin on futures contracts | | | 4,080 | |
| Foreign taxes recoverable | | | 51,326 | |
| Other assets | | | 1,246 | |
| Total assets | | | 74,589,126 | |
| Liabilities | |
| Payable upon return of securities loaned | | | 7,305,821 | |
| Payable for investments purchased | | | 12,677 | |
| Payable for Fund shares redeemed | | | 158,852 | |
| Accrued management fee | | | 36,531 | |
| Accrued Trustees' fees | | | 1,060 | |
| Other accrued expenses and payables | | | 87,383 | |
| Total liabilities | | | 7,602,324 | |
| Net assets, at value | | $ | 66,986,802 | |
| Net Assets Consist of | |
| Undistributed net investment income | | | 1,530,737 | |
Net unrealized appreciation (depreciation) on: Investments | | | 15,369,913 | |
| Futures | | | 4,080 | |
| Foreign currency | | | 28 | |
| Accumulated net realized gain (loss) | | | (64,680,792 | ) |
| Paid-in capital | | | 114,762,836 | |
| Net assets, at value | �� | $ | 66,986,802 | |
Class A Net Asset Value, offering and redemption price per share ($66,986,802 ÷ 8,411,945 outstanding shares of beneficial interest, no par value, unlimited number of shares authorized) | | $ | 7.96 | |
* Represents collateral on securities loaned.
The accompanying notes are an integral part of the financial statements.
Statement of Operations
| for the year ended December 31, 2012 | |
| Investment Income | |
Income: Dividends (net of foreign taxes withheld of $217,778) | | $ | 2,168,480 | |
| Interest | | | 603 | |
| Income distributions — Central Cash Management Fund | | | 1,029 | |
| Securities lending income, including income from Daily Assets Fund Institutional, net of borrower rebates | | | 100,996 | |
| Total income | | | 2,271,108 | |
Expenses: Management fee | | | 423,516 | |
| Administration fee | | | 65,156 | |
| Services to shareholders | | | 1,028 | |
| Custodian fee | | | 48,037 | |
| Legal fees | | | 7,477 | |
| Audit and tax fees | | | 58,274 | |
| Reports to shareholders | | | 28,134 | |
| Trustees' fees and expenses | | | 4,729 | |
| Other | | | 29,168 | |
| Total expenses | | | 665,519 | |
| Net investment income | | | 1,605,589 | |
| Realized and Unrealized Gain (Loss) | |
Net realized gain (loss) from: Investments (including foreign taxes of $392) | | | 8,663 | |
| Futures | | | 346,650 | |
| Foreign currency | | | (17,620 | ) |
| | | | 337,693 | |
Change in net unrealized appreciation (depreciation) on: Investments | | | 8,575,838 | |
| Futures | | | (14,183 | ) |
| Foreign currency | | | 914 | |
| | | | 8,562,569 | |
| Net gain (loss) | | | 8,900,262 | |
| Net increase (decrease) in net assets resulting from operations | | $ | 10,505,851 | |
The accompanying notes are an integral part of the financial statements.
Statement of Changes in Net Assets | | | Years Ended December 31, | |
| Increase (Decrease) in Net Assets | | 2012 | | | 2011 | |
Operations: Net investment income | | $ | 1,605,589 | | | $ | 1,861,273 | |
| Net realized gain (loss) | | | 337,693 | | | | 4,665,824 | |
| Change in net unrealized appreciation (depreciation) | | | 8,562,569 | | | | (15,377,629 | ) |
| Net increase (decrease) in net assets resulting from operations | | | 10,505,851 | | | | (8,850,532 | ) |
Distributions to shareholders from: Net investment income: Class A | | | (1,885,705 | ) | | | (1,512,225 | ) |
| Total distributions | | | (1,885,705 | ) | | | (1,512,225 | ) |
Fund share transactions: Class A Proceeds from shares sold | | | 2,442,886 | | | | 5,120,530 | |
| Reinvestment of distributions | | | 1,885,705 | | | | 1,512,225 | |
| Payments for shares redeemed | | | (10,767,707 | ) | | | (14,636,659 | ) |
| Net increase (decrease) in net assets from Class A share transactions | | | (6,439,116 | ) | | | (8,003,904 | ) |
| Increase (decrease) in net assets | | | 2,181,030 | | | | (18,366,661 | ) |
| Net assets at beginning of period | | | 64,805,772 | | | | 83,172,433 | |
| Net assets at end of period (including undistributed net investment income of $1,530,737 and $1,799,337, respectively) | | $ | 66,986,802 | | | $ | 64,805,772 | |
| Other Information | |
Class A Shares outstanding at beginning of period | | | 9,288,789 | | | | 10,297,508 | |
| Shares sold | | | 334,743 | | | | 689,406 | |
| Shares issued to shareholders in reinvestment of distributions | | | 258,316 | | | | 175,432 | |
| Shares redeemed | | | (1,469,903 | ) | | | (1,873,557 | ) |
| Net increase (decrease) in Class A shares | | | (876,844 | ) | | | (1,008,719 | ) |
| Shares outstanding at end of period | | | 8,411,945 | | | | 9,288,789 | |
The accompanying notes are an integral part of the financial statements.
| | | Years Ended December 31, | |
| Class A | | | 2012 | | | 2011 | | | 2010 | | | 2009 | | | 2008 | |
| Selected Per Share Data | |
| Net asset value, beginning of period | | $ | 6.98 | | | $ | 8.08 | | | $ | 7.45 | | | $ | 6.22 | | | $ | 16.76 | |
Income (loss) from investment operations: Net investment incomea | | | .18 | | | | .19 | | | | .14 | | | | .12 | | | | .33 | c |
| Net realized and unrealized gain (loss) | | | 1.01 | | | | (1.14 | ) | | | .66 | | | | 1.51 | | | | (6.67 | ) |
| Total from investment operations | | | 1.19 | | | | (.95 | ) | | | .80 | | | | 1.63 | | | | (6.34 | ) |
Less distributions from: Net investment income | | | (.21 | ) | | | (.15 | ) | | | (.17 | ) | | | (.40 | ) | | | (.13 | ) |
| Net realized gains | | | — | | | | — | | | | — | | | | — | | | | (4.07 | ) |
| Total distributions | | | (.21 | ) | | | (.15 | ) | | | (.17 | ) | | | (.40 | ) | | | (4.20 | ) |
| Net asset value, end of period | | $ | 7.96 | | | $ | 6.98 | | | $ | 8.08 | | | $ | 7.45 | | | $ | 6.22 | |
| Total Return (%) | | | 17.34 | | | | (12.07 | ) | | | 10.93 | | | | 29.36 | | | | (48.81 | )b,d |
| Ratios to Average Net Assets and Supplemental Data | |
| Net assets, end of period ($ millions) | | | 67 | | | | 65 | | | | 83 | | | | 86 | | | | 91 | |
| Ratio of expenses before expense reductions (%) | | | 1.02 | | | | 1.03 | | | | .99 | | | | .94 | | | | 1.02 | |
| Ratio of expenses after expense reductions (%) | | | 1.02 | | | | 1.03 | | | | .99 | | | | .94 | | | | 1.01 | |
| Ratio of net investment income (%) | | | 2.46 | | | | 2.44 | | | | 1.90 | | | | 1.89 | | | | 3.04 | c |
| Portfolio turnover rate (%) | | | 18 | | | | 26 | | | | 14 | | | | 139 | | | | 132 | |
a Based on average shares outstanding during the period. b Total return would have been lower had certain expenses not been reimbursed. c Net investment income per share and ratio of net investment income include non-recurring dividend income amounting to $0.16 per share and 1.49% of average daily net assets, respectively. d Includes a reimbursement from the Advisor to reimburse the effect of losses incurred as the result of certain operation errors during the period. Excluding this reimbursement, total return would have been 0.14% lower. | |
Notes to Financial Statements
A. Organization and Significant Accounting Policies
DWS Diversified International Equity VIP (the "Fund") is a diversified series of DWS Variable Series II (the "Trust"), which is registered under the Investment Company Act of 1940, as amended (the "1940 Act"), as an open-end management investment company organized as a Massachusetts business trust.
The Fund's financial statements are prepared in accordance with accounting principles generally accepted in the United States of America which require the use of management estimates. Actual results could differ from those estimates. The policies described below are followed consistently by the Fund in the preparation of its financial statements.
Security Valuation. Investments are stated at value determined as of the close of regular trading on the New York Stock Exchange on each day the exchange is open for trading.
Various inputs are used in determining the value of the Fund's investments. These inputs are summarized in three broad levels. Level 1 includes quoted prices in active markets for identical securities. Level 2 includes other significant observable inputs (including quoted prices for similar securities, interest rates, prepayment speeds, and credit risk). Level 3 includes significant unobservable inputs (including the Fund's own assumptions in determining the fair value of investments). The inputs or methodology used for valuing securities are not necessarily an indication of the risk associated with investing in those securities.
Equity securities and exchange-traded funds ("ETFs") are valued at the most recent sale price or official closing price reported on the exchange (U.S. or foreign) or over-the-counter market on which they trade and are categorized as Level 1 securities. Securities or ETFs for which no sales are reported are valued at the calculated mean between the most recent bid and asked quotations on the relevant market or, if a mean cannot be determined, at the most recent bid quotation. For certain international equity securities, in order to adjust for events which may occur between the close of the foreign exchanges and the close of the New York Stock Exchange, a fair valuation model may be used. This fair valuation model takes into account comparisons to the valuation of American Depository Receipts (ADRs), exchange-traded funds, futures contracts and certain indices and these securities are categorized as Level 2.
Futures contracts are generally valued at the settlement prices established each day on the exchange on which they are traded and are categorized as Level 1.
Investments in open-end investment companies are valued at their net asset value each business day and are categorized as Level 1.
Securities and other assets for which market quotations are not readily available or for which the above valuation procedures are deemed not to reflect fair value are valued in a manner that is intended to reflect their fair value as determined in accordance with procedures approved by the Board and are generally categorized as Level 3. In accordance with the Fund's valuation procedures, factors used in determining value may include, but are not limited to, the type of the security; the size of the holding; the initial cost of the security; the existence of any contractual restrictions on the security's disposition; the price and extent of public trading in similar securities of the issuer or of comparable companies; quotations or evaluated prices from broker-dealers and/or pricing services; information obtained from the issuer, analysts, and/or the appropriate stock exchange (for exchange-traded securities); an analysis of the company's or issuer's financial statements; an evaluation of the forces that influence the issuer and the market(s) in which the security is purchased and sold and with respect to debt securities; the maturity, coupon, creditworthiness, currency denomination and the movement of the market in which the security is normally traded. The value determined under these procedures may differ from published values for the same securities.
Disclosure about the classification of fair value measurements is included in a table following the Fund's Investment Portfolio.
New Accounting Pronouncement. In January 2013, Accounting Standard Update 2013-01 (ASU 2013-01), Clarifying the Scope of Disclosures about Offsetting Assets and Liabilities, replaced Accounting Standards Update 2011-11 (ASU 2011-11), Disclosures about Offsetting Assets and Liabilities. ASU 2013-01 is effective for fiscal years beginning on or after January 1, 2013, and interim periods within those annual periods. ASU 2011-11 was intended to enhance disclosure requirements on the offsetting of financial assets and liabilities. The ASU 2013-01 limits the scope of the new balance sheet offsetting disclosures to derivatives, repurchase agreements, and securities lending transactions to the extent that they are (1) offset in the financial statements or (2) subject to an enforceable master netting arrangement or similar agreement. Management is currently evaluating the application of ASU 2013-01 and its impact, if any, on the Fund's financial statements.
Securities Lending. The Fund lends securities to certain financial institutions. The Fund retains beneficial ownership of the securities it has loaned and continues to receive interest and dividends paid by the issuer of securities and to participate in any changes in their market value. The Fund requires the borrowers of the securities to maintain collateral with the Fund consisting of either cash or liquid, unencumbered assets having a value at least equal to the value of the securities loaned. When the collateral falls below specified amounts, the lending agent will use its best effort to obtain additional collateral on the next business day to meet required amounts under the security lending agreement. The Fund may invest the cash collateral into a joint trading account in an affiliated money market fund pursuant to Exemptive Orders issued by the SEC. The Fund receives compensation for lending its securities either in the form of fees or by earning interest on invested cash collateral net of borrower rebates and fees paid to a lending agent. Either the Fund or the borrower may terminate the loan. There may be risks of delay and costs in recovery of securities or even loss of rights in the collateral should the borrower of the securities fail financially. The Fund is also subject to all investment risks associated with the reinvestment of any cash collateral received, including, but not limited to, interest rate, credit and liquidity risk associated with such investments.
Foreign Currency Translations. The books and records of the Fund are maintained in U.S. dollars. Investment securities and other assets and liabilities denominated in a foreign currency are translated into U.S. dollars at the prevailing exchange rates at period end. Purchases and sales of investment securities, income and expenses are translated into U.S. dollars at the prevailing exchange rates on the respective dates of the transactions.
Net realized and unrealized gains and losses on foreign currency transactions represent net gains and losses between trade and settlement dates on securities transactions, the acquisition and disposition of foreign currencies, and the difference between the amount of net investment income accrued and the U.S. dollar amount actually received. That portion of both realized and unrealized gains and losses on investments that results from fluctuations in foreign currency exchange rates is not separately disclosed but is included with net realized and unrealized gain/appreciation and loss/depreciation on investments.
Taxes. The Fund's policy is to comply with the requirements of the Internal Revenue Code, as amended, which are applicable to regulated investment companies, and to distribute all of its taxable income to its shareholders.
Additionally, the Fund may be subject to taxes imposed by the governments of countries in which it invests and are generally based on income and/or capital gains earned or repatriated. Estimated tax liabilities on certain foreign securities are recorded on an accrual basis and are reflected as components of interest income or net change in unrealized gain/loss on investments. Tax liabilities realized as a result of security sales are reflected as a component of net realized gain/loss on investments.
Under the Regulated Investment Company Modernization Act of 2010, net capital losses incurred post-enactment may be carried forward indefinitely, and their character is retained as short-term and/or long-term. Previously, net capital losses were carried forward for eight years and treated as short-term losses. As a transition rule, the Act requires that post-enactment net capital losses be used before pre-enactment net capital losses.
At December 31, 2012, the Fund had a net tax basis capital loss carryforward of approximately $64,369,000 of pre-enactment losses, which may be applied against any realized net taxable capital gains of each succeeding year until fully utilized or until December 31, 2016 ($25,205,000) and December 31, 2017 ($39,164,000), the respective expiration dates, whichever occurs first.
In addition, from November 1, 2012 through December 31, 2012, the Fund elects to defer qualified late year losses of approximately $108,000 of net long-term realized capital losses and treat them as arising in the fiscal year ending December 31, 2013.
The Fund has reviewed the tax positions for the open tax years as of December 31, 2012 and has determined that no provision for income tax is required in the Fund's financial statements. The Fund's federal tax returns for the prior three fiscal years remain open subject to examination by the Internal Revenue Service.
Distribution of Income and Gains. Distributions from net investment income of the Fund, if any, is declared and distributed to shareholders annually. Net realized gains from investment transactions, in excess of available capital loss carryforwards, would be taxable to the Fund if not distributed and, therefore, will be distributed to shareholders at least annually. The Fund may also make additional distributions for tax purposes if necessary.
The timing and characterization of certain income and capital gain distributions are determined annually in accordance with federal tax regulations which may differ from accounting principles generally accepted in the United States of America. These differences primarily relate to investments in foreign denominated investments, investments in futures contracts, income received from passive foreign investment companies and and certain securities sold at a loss. As a result, net investment income (loss) and net realized gain (loss) on investment transactions for a reporting period may differ significantly from distributions during such period. Accordingly, the Fund may periodically make reclassifications among certain of its capital accounts without impacting the net asset value of the Fund.
At December 31, 2012, the Fund's components of distributable earnings on a tax basis were as follows:
| Undistributed ordinary income* | | $ | 1,627,000 | |
| Capital loss carryforwards | | $ | (64,369,000 | ) |
| Unrealized appreciation (depreciation) on investments | | $ | 15,083,154 | |
In addition, the tax character of distributions paid by the Fund is summarized as follows:
| | | Years Ended December 31, | |
| | | 2012 | | | 2011 | |
| Distributions from ordinary income* | | $ | 1,885,705 | | | $ | 1,512,225 | |
* For tax purposes, short-term capital gain distributions are considered ordinary income distributions.
Expenses. Expenses of the Trust arising in connection with a specific fund are allocated to that fund. Other Trust expenses which cannot be directly attributed to a fund are apportioned among the funds in the Trust based upon the relative net assets or other appropriate measures.
Contingencies. In the normal course of business, the Fund may enter into contracts with service providers that contain general indemnification clauses. The Fund's maximum exposure under these arrangements is unknown as this would involve future claims that may be made against the Fund that have not yet been made. However, based on experience, the Fund expects the risk of loss to be remote.
Other. Investment transactions are accounted for on a trade date plus one basis for daily net asset value calculations. However, for financial reporting purposes, investment transactions are reported on trade date. Interest income is recorded on the accrual basis. Dividend income is recorded on the ex-dividend date net of foreign withholding taxes. Certain dividends from foreign securities may be recorded subsequent to the ex-dividend date as soon as the Fund is informed of such dividends. Realized gains and losses from investment transactions are recorded on an identified cost basis and may include proceeds from litigation.
B. Derivative Instruments
Futures Contracts. A futures contract is an agreement between a buyer or seller and an established futures exchange or its clearinghouse in which the buyer or seller agrees to take or make a delivery of a specific amount of a financial instrument at a specified price on a specific date (settlement date). For the year ended December 31, 2012, the Fund entered into futures contracts as a means of gaining exposure to a particular asset class or to keep cash on hand to meet shareholder redemptions or other needs while maintaining exposure to the market.
Upon entering into a futures contract, the Fund is required to deposit with a financial intermediary cash or securities ("initial margin") in an amount equal to a certain percentage of the face value indicated in the futures contract. Subsequent payments ("variation margin") are made or received by the Fund dependent upon the daily fluctuations in the value and are recorded for financial reporting purposes as unrealized gains or losses by the Fund. Gains or losses are realized when the contract expires or is closed. Since all futures contracts are exchange-traded, counterparty risk is minimized as the exchange's clearinghouse acts as the counterparty, and guarantees the futures against default.
Certain risks may arise upon entering into futures contracts, including the risk that an illiquid market will limit the Fund's ability to close out a futures contract prior to the settlement date and the risk that the futures contract is not well correlated with the security, index or currency to which it relates. Risk of loss may exceed amounts disclosed in the Statement of Assets and Liabilities.
A summary of the open futures contracts as of December 31, 2012 is included in a table following the Fund's Investment Portfolio. For the year ended December 31, 2012, the investment in futures contracts purchased had a total notional value generally indicative of a range from approximately $750,000 to $1,265,000.
The following table summarizes the value of the Fund's derivative instruments held as of December 31, 2012 and the related location in the accompanying Statement of Assets and Liabilities, presented by primary underlying risk exposure:
| Asset Derivative | | Futures Contracts | |
| Equity Contracts (a) | | $ | 15,372 | |
The above derivative is located in the following Statement of Assets and Liabilities account:
(a) Includes cumulative appreciation of futures contracts as disclosed in the Investment Portfolio. Unsettled variation margin is disclosed separately within the Statement of Assets and Liabilities.
| Liability Derivative | | Futures Contracts | |
| Equity Contracts (a) | | $ | (11,292 | ) |
The above derivative is located in the following Statement of Assets and Liabilities account:
(a) Includes cumulative depreciation of futures contracts as disclosed in the Investment Portfolio. Unsettled variation margin is disclosed separately within the Statement of Assets and Liabilities.
Additionally, the amount of unrealized and realized gains and losses on derivative instruments recognized in Fund earnings during the year ended December 31, 2012 and the related location in the accompanying Statement of Operations is summarized in the following tables by primary underlying risk exposure:
| Realized Gain (Loss) | | Futures Contracts | |
| Equity Contracts (a) | | $ | 346,650 | |
The above derivative is located in the following Statement of Operations account:
(a) Net realized gain (loss) from futures
| Change in Net Unrealized Appreciation (Depreciation) | | Futures Contracts | |
| Equity Contracts (a) | | $ | (14,183 | ) |
The above derivative is located in the following Statement of Operations account:
(a) Change in net unrealized appreciation (depreciation) on futures
C. Purchases and Sales of Securities
During the year ended December 31, 2012, purchases and sales of investment transactions (excluding short-term investments) aggregated $11,645,399 and $18,497,325, respectively.
D. Related Parties
Management Agreement. Under the Investment Management Agreement with Deutsche Investment Management Americas Inc. ("DIMA" or the "Advisor"), an indirect, wholly owned subsidiary of Deutsche Bank AG, the Advisor directs the investments of the Fund in accordance with its investment objectives, policies and restrictions. The Advisor determines the securities, instruments and other contracts relating to investments to be purchased, sold or entered into by the Fund or delegates such responsibility to the Fund's subadvisor.
QS Investors, LLC ("QS Investors") serves as subadvisor with respect to the investment and reinvestment of assets in the Fund, and is paid by the Advisor for its services.
Pursuant to the Investment Management Agreement with the Advisor, the Fund pays a monthly management fee based on the Fund's average daily net assets, computed and accrued daily and payable monthly, at the following annual rates:
| First $1.5 billion | | | .650 | % |
| Next $1.75 billion | | | .635 | % |
| Next $1.75 billion | | | .620 | % |
| Over $5 billion | | | .605 | % |
Accordingly, for the year ended December 31, 2012, the fee pursuant to the Investment Management Agreement was equivalent to an annual effective rate of 0.65% of the Fund's average daily net assets.
For the period from October 1, 2012 through September 30, 2013, the Advisor has contractually agreed to waive its fees and/or reimburse certain operating expenses to the extent necessary to maintain the operating expenses (excluding certain expenses such as extraordinary expenses, taxes, brokerage and interest expense) of Class A shares at 0.99%.
Administration Fee. Pursuant to an Administrative Services Agreement, DIMA provides most administrative services to the Fund. For all services provided under the Administrative Services Agreement, the Fund pays DIMA an annual fee ("Administration Fee") of 0.10% of the Fund's average daily net assets, computed and accrued daily and payable monthly. For the year ended December 31, 2012, the Administration Fee was $65,156, of which $5,620 is unpaid.
Service Provider Fees. DWS Investments Service Company ("DISC"), an affiliate of the Advisor, is the transfer agent, dividend-paying agent and shareholder service agent for the Fund. Pursuant to a sub-transfer agency agreement between DISC and DST Systems, Inc. ("DST"), DISC has delegated certain transfer agent, dividend-paying agent and shareholder service agent functions to DST. DISC compensates DST out of the shareholder servicing fee it receives from the Fund. For the year ended December 31, 2012, the amounts charged to the Fund by DISC aggregated $111, of which $28 is unpaid.
Typesetting and Filing Service Fees. Under an agreement with DIMA, DIMA is compensated for providing typesetting and certain regulatory filing services to the Fund. For the year ended December 31, 2012, the amount charged to the Fund by DIMA included in the Statement of Operations under "reports to shareholders" aggregated $15,247, of which $5,263 is unpaid.
Trustees' Fees and Expenses. The Fund paid retainer fees to each Trustee not affiliated with the Advisor, plus specified amounts to the Board Chairperson and to each committee Chairperson.
Affiliated Cash Management Vehicle. The Fund may invest uninvested cash balances in Central Cash Management Fund, which is managed by the Advisor. The Fund indirectly bears its proportionate share of the expenses of Central Cash Management Fund. Central Cash Management Fund does not pay the Advisor an investment management fee. Central Cash Management Fund seeks a high level of current income consistent with liquidity and the preservation of capital.
Securities Lending Fees. Effective February 7, 2013, Deutsche Bank AG serves as lending agent for the Fund,
E. Investing in Emerging Markets
Investing in emerging markets may involve special risks and considerations not typically associated with investing in developed markets. These risks include revaluation of currencies, high rates of inflation or deflation, repatriation restrictions on income and capital, and future adverse political, social and economic developments. Moreover, securities issued in these markets may be less liquid, subject to government ownership controls or delayed settlements, and may have prices that are more volatile or less easily assessed than those of comparable securities of issuers in developed markets.
F. Ownership of the Fund
At December 31, 2012, three Participating Insurance Companies were owners of record of 10% or more of the total outstanding Class A shares of the Fund, each owning 46%, 29% and 24%.
G. Line of Credit
The Fund and other affiliated funds (the "Participants") share in a $375 million revolving credit facility provided by a syndication of banks. The Fund may borrow for temporary or emergency purposes, including the meeting of redemption requests that otherwise might require the untimely disposition of securities. The Participants are charged an annual commitment fee which is allocated based on net assets, among each of the Participants. Interest is calculated at a rate per annum equal to the sum of the Federal Funds Rate plus 1.25 percent plus if LIBOR exceeds the Federal Funds Rate the amount of such excess. The Fund may borrow up to a maximum of 33 percent of its net assets under the agreement. The Fund had no outstanding loans at December 31, 2012.
Report of Independent Registered Public Accounting Firm
To the Board of Trustees of DWS Variable Series II and Shareholders of DWS Diversified International Equity VIP:
We have audited the accompanying statement of assets and liabilities, including the investment portfolio of DWS Diversified International Equity VIP (the "Fund"), one of the funds constituting DWS Variable Series II (the "Trust"), as of December 31, 2012, and the related statement of operations for the year then ended, the statement of changes in net assets for each of the two years in the period then ended, and the financial highlights for each of the five years in the period then ended. These financial statements and financial highlights are the responsibility of the Fund's management. Our responsibility is to express an opinion on these financial statements and financial highlights based on our audits.
We conducted our audits in accordance with the standards of the Public Company Accounting Oversight Board (United States). Those standards require that we plan and perform the audit to obtain reasonable assurance about whether the financial statements and financial highlights are free of material misstatement. We were not engaged to perform an audit of the Fund's internal control over financial reporting. Our audits included consideration of internal control over financial reporting as a basis for designing audit procedures that are appropriate in the circumstances, but not for the purpose of expressing an opinion on the effectiveness of the Fund's internal control over financial reporting. Accordingly, we express no such opinion. An audit also includes examining, on a test basis, evidence supporting the amounts and disclosures in the financial statements and financial highlights, assessing the accounting principles used and significant estimates made by management, and evaluating the overall financial statement presentation. Our procedures included confirmation of securities owned as of December 31, 2012, by correspondence with the custodian and brokers, or by other appropriate auditing procedures where replies from brokers were not received. We believe that our audits provide a reasonable basis for our opinion.
In our opinion, the financial statements and financial highlights referred to above present fairly, in all material respects, the financial position of DWS Diversified International Equity VIP (one of funds constituting DWS Variable Series II) at December 31, 2012, the results of its operations for the year then ended, the changes in its net assets for each of the two years in the period then ended, and the financial highlights for each of the five years in the period then ended, in conformity with U.S. generally accepted accounting principles.
| | | |
Boston, Massachusetts February 13, 2013 | | |
Information About Your Fund's Expenses (Unaudited)
As an investor of the Fund, you incur two types of costs: ongoing expenses and transaction costs. Ongoing expenses include management fees and other Fund expenses. Examples of transaction costs include contract charges and account maintenance fees, which are not shown in this section. The following tables are intended to help you understand your ongoing expenses (in dollars) of investing in the Fund and to help you compare these expenses with the ongoing expenses of investing in other mutual funds. The example in the table is based on an investment of $1,000 invested at the beginning of the six-month period and held for the entire period (July 1, 2012 to December 31, 2012).
The tables illustrate your Fund's expenses in two ways:
•Actual Fund Return. This helps you estimate the actual dollar amount of ongoing expenses (but not transaction costs) paid on a $1,000 investment in the Fund using the Fund's actual return during the period. To estimate the expenses you paid over the period, simply divide your account value by $1,000 (for example, an $8,600 account value divided by $1,000 = 8.6), then multiply the result by the number in the "Expenses Paid per $1,000" line under the share class you hold.
• Hypothetical 5% Fund Return. This helps you to compare your Fund's ongoing expenses (but not transaction costs) with those of other mutual funds using the Fund's actual expense ratio and a hypothetical rate of return of 5% per year before expenses. Examples using a 5% hypothetical Fund return may be found in the shareholder reports of other mutual funds. The hypothetical account values and expenses may not be used to estimate the actual ending account balance or expenses you paid for the period.
Please note that the expenses shown in these tables are meant to highlight your ongoing expenses only and do not reflect any transaction costs. The "Expenses Paid per $1,000" line of the tables is useful in comparing ongoing expenses only and will not help you determine the relative total expense of owning different funds. If these transaction costs had been included, your costs would have been higher.
Expenses and Value of a $1,000 Investment for the six months ended December 31, 2012 | |
| Actual Fund Return | | Class A | |
| Beginning Account Value 7/1/12 | | $ | 1,000.00 | |
| Ending Account Value 12/31/12 | | $ | 1,140.40 | |
| Expenses Paid per $1,000* | | $ | 5.33 | |
| Hypothetical 5% Fund Return | | Class A | |
| Beginning Account Value 7/1/12 | | $ | 1,000.00 | |
| Ending Account Value 12/31/12 | | $ | 1,020.16 | |
| Expenses Paid per $1,000* | | $ | 5.03 | |
* Expenses are equal to the Fund's annualized expense ratio, multiplied by the average account value over the period, multiplied by 184 (the number of days in the most recent six-month period), then divided by 366.
| Annualized Expense Ratio | Class A | |
| DWS Variable Series II — DWS Diversified International Equity VIP | .99% | |
For more information, please refer to the Fund's prospectus.
These tables do not reflect charges and fees ("contract charges") associated with the separate account that invests in the Fund or any variable life insurance policy or variable annuity contract for which the Fund is an investment option.
Tax Information (Unaudited)
Please consult a tax advisor if you have questions about federal or state income tax laws, or on how to prepare your tax returns. If you have specific questions about your account, please contact your insurance provider.
The Trust's policies and procedures for voting proxies for portfolio securities and information about how the Trust voted proxies related to its portfolio securities during the 12-month period ended June 30 are available on our Web site — www.dws-investments.com (click on "proxy voting" at the bottom of the page) — or on the SEC's Web site — www.sec.gov. To obtain a written copy of the Trust's policies and procedures without charge, upon request, call us toll free at (800) 728-3337.
Investment Management Agreement Approval
The Board of Trustees approved the renewal of DWS Diversified International Equity VIP's investment management agreement (the "Agreement") with Deutsche Investment Management Americas Inc. ("DWS") and sub-advisory agreement (the "Sub-Advisory Agreement" and together with the Agreement, the "Agreements") between DWS and QS Investors, LLC ("QS Investors") in September 2012.
In terms of the process that the Board followed prior to approving the Agreements, shareholders should know that:
• In September 2012, all of the Fund's Trustees were independent of DWS and its affiliates.
• The Trustees met frequently during the past year to discuss fund matters and dedicated a substantial amount of time to contract review matters. Over the course of several months, the Board's Contract Committee, in coordination with the Board's Fixed Income and Quant Oversight Committee, reviewed comprehensive materials received from DWS, independent third parties and independent counsel. These materials included an analysis of the Fund's performance, fees and expenses, and profitability compiled by the Fund's independent fee consultant. The Board also received extensive information throughout the year regarding performance of the Fund.
• The Independent Trustees regularly meet privately with their independent counsel to discuss contract review and other matters. In addition, the Independent Trustees were also advised by the Fund's independent fee consultant in the course of their review of the Fund's contractual arrangements and considered a comprehensive report prepared by the independent fee consultant in connection with their deliberations (the "IFC Report").
• In connection with reviewing the Agreements, the Board also reviewed the terms of the Fund's distribution agreement, administrative services agreement, transfer agency agreement and other material service agreements.
• Based on its evaluation of the information provided, the Contract Committee presented its findings and recommendations to the Board. The Board then reviewed the Contract Committee's findings and recommendations.
In connection with the contract review process, the Contract Committee and the Board considered the factors discussed below, among others. The Board also considered that DWS and its predecessors have managed the Fund since its inception, and the Board believes that a long-term relationship with a capable, conscientious advisor is in the best interests of the Fund. The Board considered, generally, that shareholders chose to invest or remain invested in the Fund knowing that DWS managed the Fund, and that the Agreement was approved by the Fund's shareholders. DWS is part of Deutsche Bank, a major global banking institution that is engaged in a wide range of financial services. The Board believes that there are advantages to being part of a global asset management business that offers a wide range of investing expertise and resources, including hundreds of portfolio managers and analysts with research capabilities in many countries throughout the world.
As part of the contract review process, the Board carefully considered the fees and expenses of each DWS fund overseen by the Board in light of the fund's performance. In many cases, this led to a negotiation with DWS of lower expense caps for the coming year than had previously been in place. As part of these negotiations, the Board indicated that it would consider relaxing these new lower caps in future years following sustained improvements in performance, among other considerations.
In June 2012, Deutsche Bank ("DB"), DWS's parent company, announced that DB's new management team had concluded the strategic review of its global asset management business announced in late 2011 by DB's prior management team, and would combine its Asset Management (of which DWS is a part) and Wealth Management divisions. Prior to approving the investment management agreements, the Independent Trustees were apprised of the expected management and structure of the new combined Asset & Wealth Management division ("AWM") and DWS. DB also advised the Independent Trustees that the U.S. asset management business is a critical and integral part of DB and AWM, and that DB would be reinvesting a significant portion of the substantial savings it expects to realize by combining its Asset Management and Wealth Management divisions into a combined AWM division, including enhancements to its investment capabilities. DB also confirmed its commitment to maintaining strong legal and compliance groups within the combined division.
While shareholders may focus primarily on fund performance and fees, the Fund's Board considers these and many other factors, including the quality and integrity of DWS's and QS Investors' personnel and such other issues as back-office operations, fund valuations, and compliance policies and procedures.
Nature, Quality and Extent of Services. The Board considered the terms of the Agreements, including the scope of advisory services provided under the Agreements. The Board noted that, under the Agreements, DWS and QS Investors provide portfolio management services to the Fund and that, pursuant to a separate administrative services agreement, DWS provides administrative services to the Fund. The Board considered the experience and skills of senior management and investment personnel, the resources made available to such personnel, the ability of DWS to attract and retain high-quality personnel, and the organizational depth and stability of DWS. The Board also requested and received information regarding DWS's oversight of Fund sub-advisors, including QS Investors. The Board reviewed the Fund's performance over short-term and long-term periods and compared those returns to various agreed-upon performance measures, including market indices and a peer universe compiled by the independent fee consultant using information supplied by Lipper Inc. ("Lipper"), an independent fund data service. The Board also noted that it has put into place a process of identifying "Focus Funds" (e.g., funds performing poorly relative to their benchmark or a peer universe compiled by an independent fund data service), and receives more frequent reporting and information from DWS regarding such funds, along with DWS's remedial plans to address underperformance. The Board believes this process is an effective manner of identifying and addressing underperforming funds. Based on the information provided, the Board noted that for the one-, three- and five-year periods ended December 31, 2011, the Fund's performance (Class A shares) was in the 2nd quartile, 2nd quartile and 4th quartile, respectively, of the applicable Lipper universe (the 1st quartile being the best performers and the 4th quartile being the worst performers). The Board also observed that the Fund has outperformed its benchmark in the one- and three-year periods and has underperformed its benchmark in the five-year period ended December 31, 2011.
Fees and Expenses. The Board considered the Fund's investment management fee schedule, sub-advisory fee schedule, operating expenses and total expense ratios, and comparative information provided by Lipper and the independent fee consultant regarding investment management fee rates paid to other investment advisors by similar funds (1st quartile being the most favorable and 4th quartile being the least favorable). With respect to management fees paid to other investment advisors by similar funds, the Board noted that the contractual fee rates paid by the Fund, which include a 0.10% fee paid to DWS under the Fund's administrative services agreement, were lower than the median (1st quartile) of the applicable Lipper peer group (based on Lipper data provided as of December 31, 2011). With respect to the sub-advisory fee paid to QS Investors, the Board noted that the fee is paid by DWS out of its fee and not directly by the Fund. The Board noted that the Fund's Class A shares total (net) operating expenses were expected to be higher than the median (3rd quartile) of the applicable Lipper expense universe (based on Lipper data provided as of December 31, 2011, and analyzing Lipper expense universe Class A (net) expenses less any applicable 12b-1 fees) ("Lipper Universe Expenses"). The Board considered the Fund's management fee rate as compared to fees charged by DWS and certain of its affiliates for comparable mutual funds and considered differences in fund and fee structures between the DWS Funds. The Board also considered how the Fund's total (net) operating expenses compared to the total (net) operating expenses of a more customized peer group selected by Lipper (based on such factors as asset size). The Board also noted that the expense limitation agreed to by DWS helped to ensure that the Fund's total (net) operating expenses would remain competitive.
The information considered by the Board as part of its review of management fees included information regarding fees charged by DWS and its affiliates to similar institutional accounts and to similar funds offered primarily to European investors ("DWS Europe funds"), in each case as applicable. The Board observed that advisory fee rates for institutional accounts generally were lower than the management fees charged by similarly managed DWS U.S. mutual funds ("DWS Funds"), but also took note of the differences in services provided to DWS Funds as compared to institutional accounts. In the case of DWS Europe funds, the Board observed that fee rates for DWS Europe funds generally were higher than for similarly managed DWS Funds, but noted that differences in the types of services provided to DWS Funds relative to DWS Europe funds made it difficult to compare such fees.
On the basis of the information provided, the Board concluded that management fees were reasonable and appropriate in light of the nature, quality and extent of services provided by DWS and QS Investors.
Profitability. The Board reviewed detailed information regarding revenues received by DWS under the Agreement. The Board considered the estimated costs and pre-tax profits realized by DWS from advising the DWS Funds, as well as estimates of the pre-tax profits attributable to managing the Fund in particular. The Board also received information regarding the estimated enterprise-wide profitability of DWS and its affiliates with respect to all fund services in totality and by fund. The Board and the independent fee consultant reviewed DWS's methodology in allocating its costs to the management of the Fund. Based on the information provided, the Board concluded that the pre-tax profits realized by DWS in connection with the management of the Fund were not unreasonable. The Board also reviewed information regarding the profitability of certain similar investment management firms. The Board noted that while information regarding the profitability of such firms is limited (and in some cases is not necessarily prepared on a comparable basis), DWS and its affiliates' overall profitability with respect to the DWS fund complex (after taking into account distribution and other services provided to the funds by DWS and its affiliates) was lower than the overall profitability levels of many comparable firms for which such data was available. The Board did not consider the profitability of QS Investors with respect to the Fund. The Board noted that DWS pays QS Investors' fee out of its management fee, and its understanding that the Fund's sub-advisory fee schedule was the product of an arm's length negotiation with DWS.
Economies of Scale. The Board considered whether there are economies of scale with respect to the management of the Fund and whether the Fund benefits from any economies of scale. The Board noted that the Fund's management fee schedule includes fee breakpoints. The Board concluded that the Fund's fee schedule represents an appropriate sharing between the Fund and DWS of such economies of scale as may exist in the management of the Fund at current asset levels.
Other Benefits to DWS and QS Investors and Their Affiliates. The Board also considered the character and amount of other incidental benefits received by DWS and QS Investors and their affiliates, including any fees received by DWS for administrative services provided to the Fund and any fees received by an affiliate of DWS for distribution services. The Board also considered benefits to DWS and QS Investors related to brokerage and soft-dollar allocations, including allocating brokerage to pay for research generated by parties other than the executing broker dealers, which pertain primarily to funds investing in equity securities, along with the incidental public relations benefits to DWS and QS Investors related to DWS Funds advertising and cross-selling opportunities among DWS products and services. The Board concluded that management fees were reasonable in light of these fallout benefits.
Compliance. The Board considered the significant attention and resources dedicated by DWS to documenting and enhancing its compliance processes in recent years. The Board noted in particular (i) the experience and seniority of both DWS's chief compliance officer and the Fund's chief compliance officer; (ii) the large number of DWS compliance personnel; and (iii) the substantial commitment of resources by DWS and its affiliates to compliance matters. The Board also considered the attention and resources dedicated by DWS to the oversight of the investment sub-advisor's compliance program and compliance with the applicable fund policies and procedures.
Based on all of the information considered and the conclusions reached, the Board unanimously determined that the continuation of the Agreements is in the best interests of the Fund. In making this determination, the Board did not give particular weight to any single factor identified above. The Board considered these factors over the course of numerous meetings, certain of which were in executive session with only the Independent Trustees and their counsel present. It is possible that individual Trustees may have weighed these factors differently in reaching their individual decisions to approve the continuation of the Agreements.
Summary of Management Fee Evaluation by Independent Fee Consultant
September 17, 2012
Pursuant to an Order entered into by Deutsche Investment Management Americas and affiliates (collectively, "DeAM") with the Attorney General of New York, I, Thomas H. Mack, have been appointed the Independent Fee Consultant for the DWS Funds (formerly the DWS Scudder Funds). My duties include preparing an annual written evaluation of the management fees DeAM charges the Funds, considering among other factors the management fees charged by other mutual fund companies for like services, management fees DeAM charges other clients for like services, DeAM's costs of supplying services under the management agreements and related profit margins, possible economies of scale if a Fund grows larger, and the nature and quality of DeAM's services, including fund performance. This report summarizes my evaluation for 2012, including my qualifications, the evaluation process for each of the DWS Funds, consideration of certain complex-level factors, and my conclusions. I served in substantially the same capacity in 2007, 2008, 2009, 2010 and 2011.
Qualifications
For more than 35 years I have served in various professional capacities within the investment management business. I have held investment analysis and advisory positions, including securities analyst, portfolio strategist and director of investment policy with a large investment firm. I have also performed business management functions, including business development, financial management and marketing research and analysis.
Since 1991, I have been an independent consultant within the asset management industry. I have provided services to over 125 client organizations, including investment managers, mutual fund boards, product distributors and related organizations. Over the past ten years I have completed a number of assignments for mutual fund boards, specifically including assisting boards with management contract renewal.
I hold a Master of Business Administration degree, with highest honors, from Harvard University and Master of Science and Bachelor of Science (highest honors) degrees from the University of California at Berkeley. I am an independent director and audit committee financial expert for two closed-end mutual funds and have served in various leadership and financial oversight capacities with non-profit organizations.
Evaluation of Fees for each DWS Fund
My work focused primarily on evaluating, fund-by-fund, the fees charged to each of the 103 mutual fund portfolios in the DWS Fund family. For each Fund, I considered each of the key factors mentioned above, as well as any other relevant information. In doing so I worked closely with the Funds' Independent Directors in their annual contract renewal process, as well as in their approval of contracts for several new funds (documented separately).
In evaluating each Fund's fees, I reviewed comprehensive materials provided by or on behalf of DeAM, including expense information prepared by Lipper Analytical, comparative performance information, profitability data, manager histories, and other materials. I also accessed certain additional information from the Lipper and Morningstar databases and drew on my industry knowledge and experience.
To facilitate evaluating this considerable body of information, I prepared for each Fund a document summarizing the key data elements in each area as well as additional analytics discussed below. This made it possible to consider each key data element in the context of the others.
In the course of contract renewal, DeAM agreed to implement a number of fee and expense adjustments requested by the Independent Directors which will favorably impact future fees and expenses, and my evaluation includes the effects of these changes.
Fees and Expenses Compared with Other Funds
The competitive fee and expense evaluation for each fund focused on two primary comparisons:
The Fund's contractual management fee (the advisory fee plus the administration fee where applicable) compared with those of a group of typically 12-15 funds in the same Lipper investment category (e.g. Large Capitalization Growth) having similar distribution arrangements and being of similar size.
The Fund's total expenses compared with a broader universe of funds from the same Lipper investment category and having similar distribution arrangements.
These two comparisons provide a view of not only the level of the fee compared with funds of similar scale but also the total expense the Fund bears for all the services it receives, in comparison with the investment choices available in the Fund's investment category and distribution channel. The principal figure-of-merit used in these comparisons was the subject Fund's percentile ranking against peers.
DeAM's Fees for Similar Services to Others
DeAM provided management fee schedules for all of its US domiciled fund and non-fund investment management accounts in any of the investment categories where there is a DWS Fund. These similar products included the other DWS Funds, non-fund pooled accounts, institutional accounts and sub-advisory accounts. Using this information, I calculated for each Fund the fee that would be charged to each similar product, at the subject Fund's asset level.
Evaluating information regarding non-fund products is difficult because there are varying levels of services required for different types of accounts, with mutual funds generally requiring considerably more regulatory and administrative types of service as well as having more frequent cash flows than other types of accounts. Also, while mutual fund fees for similar fund products can be expected to be similar, there will be some differences due to different pricing conditions in different distribution channels (e.g. retail funds versus those used in variable insurance products), differences in underlying investment processes and other factors.
Costs and Profit Margins
DeAM provided a detailed profitability analysis for each Fund. After making some adjustments so that the presentation would be more comparable to the available industry figures, I reviewed profit margins from investment management alone, from investment management plus other fund services (excluding distribution) provided to the Funds by DeAM (principally shareholder services), and DeAM profits from all sources, including distribution. A later section comments on overall profitability.
Economies of Scale
Economies of scale — an expected decline in management cost per dollar of fund assets as fund assets grow — are very rarely quantified and documented because of inherent difficulties in collecting and analyzing relevant data. However, in virtually every investment category that I reviewed, larger funds tend to have lower fees and lower total expenses than smaller funds. To see how each DWS Fund compares with this industry observation, I reviewed:
The trend in Fund assets over the last five years and the accompanying trend in total expenses. This shows if the Fund has grown and, if so, whether total expense (management fees as well as other expenses) have declined as a percent of assets.
Whether the Fund has break-points in its management fee schedule, the extent of the fee reduction built into the schedule and the asset levels where the breaks take effect, and in the case of a sub-advised Fund how the Fund's break-points compare with those of the sub-advisory fee schedule.
How the Fund's contractual fee schedule compares with trends in the industry data. To accomplish this, I constructed a chart showing how actual latest-fiscal-year contractual fees of the Fund and of other similar funds relate to average fund assets, with the subject Fund's contractual fee schedule superimposed.
Quality of Service — Performance
The quality-of-service evaluation focused on investment performance, which is the principal result of the investment management service. Each Fund's performance was reviewed over the past 1, 3, 5 and 10 years, as applicable, and compared with that of other funds in the same investment category and with a suitable market index.
In addition, I calculated and reviewed risk-adjusted returns relative to an index of similar mutual funds' returns and a suitable market index. The risk-adjusted returns analysis provides a way of determining the extent to which the Fund's return comparisons are mainly the product of investment value-added (or lack thereof) or alternatively taking considerably more or less risk than is typical in its investment category.
I also received and considered the history of portfolio manager changes for each Fund, as this provided an important context for evaluating the performance results.
Complex-Level Considerations
While this evaluation was conducted mainly at the individual fund level, there are some issues relating to the reasonableness of fees that can alternatively be considered across the whole fund complex:
I reviewed DeAM's profitability analysis for all DWS Funds, with a view toward determining if the allocation procedures used were reasonable and how profit levels compared with public data for other investment managers.
I considered whether DeAM and affiliates receive any significant ancillary or "fallout" benefits that should be considered in interpreting the direct profitability results. These would be situations where serving as the investment manager of the Funds is beneficial to another part of the Deutsche Bank organization.
I considered how aggregated DWS Fund expenses had varied over the years, by asset class and in the context of trends in asset levels.
I considered how aggregated DWS Fund performance measures relative to appropriate peers had varied by asset class and over time.
I reviewed the structure of the DeAM organization, trends in staffing levels, and information on compensation of investment management and other professionals compared with industry data.
Findings
Based on the process and analysis discussed above, which included reviewing a wide range of information from management and external data sources and considering among other factors the fees DeAM charges other clients, the fees charged by other fund managers, DeAM's costs and profits associated with managing the Funds, economies of scale, possible fall-out benefits, and the nature and quality of services provided, in my opinion the management fees charged the DWS Funds are reasonable.
Thomas H. Mack
President, Thomas H. Mack & Co., Inc.
Board Members and Officers
The following table presents certain information regarding the Board Members and Officers of the fund. Each Board Member's year of birth is set forth in parentheses after his or her name. Unless otherwise noted, (i) each Board Member has engaged in the principal occupation(s) noted in the table for at least the most recent five years, although not necessarily in the same capacity; and (ii) the address of each Independent Board Member is c/o Kenneth C. Froewiss, Chairman, DWS Mutual Funds, P.O. Box 78, Short Hills, NJ 07078. Except as otherwise noted below, the term of office for each Board Member is until the election and qualification of a successor, or until such Board Member sooner dies, resigns, is removed or as otherwise provided in the governing documents of the fund. Because the fund does not hold an annual meeting of shareholders, each Board Member will hold office for an indeterminate period. The Board Members may also serve in similar capacities with other funds in the fund complex.
| Independent Board Members |
Name, Year of Birth, Position with the Fund and Length of Time Served1 | | Business Experience and Directorships During the Past Five Years | Number of Funds in DWS Fund Complex Overseen |
Other Directorships Held by Board Member |
Kenneth C. Froewiss (1945) Chairperson since 2013,9 and Board Member since 2001 | | Adjunct Professor of Finance, NYU Stern School of Business (September 2009-present; Clinical Professor from 1997-September 2009); Member, Finance Committee, Association for Asian Studies (2002-present); Director, Mitsui Sumitomo Insurance Group (US) (2004-present); prior thereto, Managing Director, J.P. Morgan (investment banking firm) (until 1996) | 103 | — |
William McClayton (1944) Vice Chairperson since 2013,9 and Board Member since 2004 | | Private equity investor (since October 2009); previously, Managing Director, Diamond Management & Technology Consultants, Inc. (global consulting firm) (2001-2009); Directorship: Board of Managers, YMCA of Metropolitan Chicago; formerly: Senior Partner, Arthur Andersen LLP (accounting) (1966-2001); Trustee, Ravinia Festival | 103 | — |
John W. Ballantine (1946) Board Member since 1999 | | Retired; formerly, Executive Vice President and Chief Risk Management Officer, First Chicago NBD Corporation/The First National Bank of Chicago (1996-1998); Executive Vice President and Head of International Banking (1995-1996). Directorships: Stockwell Capital Investments PLC (private equity); former Directorships: First Oak Brook Bancshares, Inc. and Oak Brook Bank; Prisma Energy International | 103 | Chairman of the Board, Healthways, Inc.2 (provider of disease and care management services) (2003- present); Portland General Electric2 (utility company) (2003-present) |
Henry P. Becton, Jr. (1943) Board Member since 1990 | | Vice Chair and former President, WGBH Educational Foundation. Directorships: Public Radio International; Public Radio Exchange (PRX); The PBS Foundation; North Bennett Street School (Boston); former Directorships: Association of Public Television Stations; Boston Museum of Science; American Public Television; Concord Academy; New England Aquarium; Mass. Corporation for Educational Telecommunications; Committee for Economic Development; Public Broadcasting Service; Connecticut College | 103 | Lead Director, Becton Dickinson and Company2 (medical technology company); Lead Director, Belo Corporation2 (media company) |
Dawn-Marie Driscoll (1946) Board Member since 1987 | | President, Driscoll Associates (consulting firm); Emeritus Executive Fellow, Center for Business Ethics, Bentley University; formerly, Partner, Palmer & Dodge (1988-1990); Vice President of Corporate Affairs and General Counsel, Filene's (1978-1988). Directorships: Director of ICI Mutual Insurance Company (since 2007); Advisory Board, Center for Business Ethics, Bentley University; Trustee, Southwest Florida Community Foundation (charitable organization); former Directorships: Sun Capital Advisers Trust (mutual funds) (2007-2012), Investment Company Institute (audit, executive, nominating committees) and Independent Directors Council (governance, executive committees) | 103 | — |
Keith R. Fox, CFA (1954) Board Member since 1996 | | Managing General Partner, Exeter Capital Partners (a series of private investment funds) (since 1986). Directorships: Progressive International Corporation (kitchen goods importer and distributor); The Kennel Shop (retailer); former Chairman, National Association of Small Business Investment Companies; former Directorships: BoxTop Media Inc. (advertising); Sun Capital Advisers Trust (mutual funds) (2011-2012) | 103 | — |
Paul K. Freeman (1950) Board Member since 1993, and Chairperson (2009-Jan. 8, 2013) | | Consultant, World Bank/Inter-American Development Bank; Executive and Governing Council of the Independent Directors Council (Chairman of Education Committee); formerly: Project Leader, International Institute for Applied Systems Analysis (1998-2001); Chief Executive Officer, The Eric Group, Inc. (environmental insurance) (1986-1998); Directorships: Denver Zoo Foundation (December 2012-present); former Directorships: Prisma Energy International | 103 | — |
Richard J. Herring (1946) Board Member since 1990 | | Jacob Safra Professor of International Banking and Professor, Finance Department, The Wharton School, University of Pennsylvania (since July 1972); Co-Director, Wharton Financial Institutions Center (since July 2000); Co-Chair, U.S. Shadow Financial Regulatory Committee; Executive Director, Financial Economists Roundtable; formerly: Vice Dean and Director, Wharton Undergraduate Division (July 1995-June 2000); Director, Lauder Institute of International Management Studies (July 2000-June 2006) | 103 | Director, Japan Equity Fund, Inc. (since September 2007), Thai Capital Fund, Inc. (since 2007), Singapore Fund, Inc. (since September 2007), Independent Director of Barclays Bank Delaware (since September 2010) |
Rebecca W. Rimel (1951) Board Member since 1995 | | President and Chief Executive Officer, The Pew Charitable Trusts (charitable organization) (1994 to present); Trustee, Washington College (2011-2013); formerly: Executive Vice President, The Glenmede Trust Company (investment trust and wealth management) (1983-2004); Board Member, Investor Education (charitable organization) (2004-2005); Trustee, Executive Committee, Philadelphia Chamber of Commerce (2001-2007); Director, Viasys Health Care2 (January 2007-June 2007); Trustee, Pro Publica (charitable organization) (2007-2010); Trustee, Thomas Jefferson Foundation (charitable organization) (1994-2012) | 103 | Director, Becton Dickinson and Company2 (medical technology company) (2012-present); Director, CardioNet, Inc.2 (health care) (2009-present) |
William N. Searcy, Jr. (1946) Board Member since 1993 | | Private investor since October 2003; formerly: Pension & Savings Trust Officer, Sprint Corporation2 (telecommunications) (November 1989-September 2003); Trustee, Sun Capital Advisers Trust (mutual funds) (1998-2012) | 103 | — |
Jean Gleason Stromberg (1943) Board Member since 1997 | | Retired. Formerly, Consultant (1997-2001); Director, Financial Markets U.S. Government Accountability Office (1996-1997); Partner, Fulbright & Jaworski, L.L.P. (law firm) (1978-1996). Directorships: The William and Flora Hewlett Foundation; former Directorships: Service Source, Inc., Mutual Fund Directors Forum (2002-2004), American Bar Retirement Association (funding vehicle for retirement plans) (1987-1990 and 1994-1996) | 103 | — |
Robert H. Wadsworth (1940) Board Member since 1999 | | President, Robert H. Wadsworth & Associates, Inc. (consulting firm) (1983 to present); Director, National Horizon, Inc. (non-profit organization); Director and Treasurer, The Phoenix Boys Choir Association | 106 | — |
Interested Board Member and Officer4 |
Name, Year of Birth, Position with the Fund and Length of Time Served1,6 | | Business Experience and Directorships During the Past Five Years | Number of Funds in DWS Fund Complex Overseen |
Other Directorships Held by Board Member |
Michael J. Woods5 (1967) Board Member since 2013,9 and Executive Vice President since 20139 | | Managing Director,3 Deutsche Asset & Wealth Management (2009-present); Head of the Americas Asset Management Business for Deutsche Bank, Member of the Asset and Wealth Management ("AWM") Extended Executive Committee, AWM Global Client Group Executive Committee and the AWM Active Asset Management Executive Committee; CEO and US Regional Head of DWS Investments; formerly: Sr. VP, Head of the Financial Intermediaries and Investments Group of Evergreen Investments (2007-2009), CEO and Vice Chairman of Board of Directors of XTF Global Asset Management (2006-2007), Managing Director — US Head of Sub-Advisory and Investment Only Business at Citigroup Asset Management (2000-2006). Mr. Woods is currently a board member of The Children's Village, The Big Brothers Big Sisters Organization, and The Mutual Fund Education Alliance. | 39 | — |
Officers4 |
Name, Year of Birth, Position with the Fund and Length of Time Served6 | | Business Experience and Directorships During the Past Five Years |
W. Douglas Beck, CFA7 (1967) President, 2011-present | | Managing Director,3 Deutsche Asset & Wealth Management (2006-present); President of DWS family of funds and Head of Product Management, U.S. for DWS Investments; formerly: Executive Director, Head of Product Management (2002-2006) and President (2005-2006) of the UBS Funds at UBS Global Asset Management; Co-Head of Manager Research/Managed Solutions Group, Merrill Lynch (1998-2002) |
John Millette8 (1962) Vice President and Secretary, 1999-present | | Director,3 Deutsche Asset & Wealth Management |
Paul H. Schubert7 (1963) Chief Financial Officer, 2004-present Treasurer, 2005-present | | Managing Director,3 Deutsche Asset & Wealth Management (since July 2004); formerly: Executive Director, Head of Mutual Fund Services and Treasurer for UBS Family of Funds (1998-2004); Vice President and Director of Mutual Fund Finance at UBS Global Asset Management (1994-1998) |
Caroline Pearson8 (1962) Chief Legal Officer, 2010-present | | Managing Director,3 Deutsche Asset & Wealth Management; formerly: Assistant Secretary for DWS family of funds (1997-2010) |
Melinda Morrow7 (1970) Vice President, 2012-present | | Director,3 Deutsche Asset & Wealth Management |
Hepsen Uzcan8 (1974) Assistant Secretary, since 20139 | | Vice President, Deutsche Asset & Wealth Management |
Paul Antosca8 (1957) Assistant Treasurer, 2007-present | | Director,3 Deutsche Asset & Wealth Management |
Jack Clark8 (1967) Assistant Treasurer, 2007-present | | Director,3 Deutsche Asset & Wealth Management |
Diane Kenneally8 (1966) Assistant Treasurer, 2007-present | | Director,3 Deutsche Asset & Wealth Management |
John Caruso7 (1965) Anti-Money Laundering Compliance Officer, 2010-present | | Managing Director,3 Deutsche Asset & Wealth Management |
Robert Kloby7 (1962) Chief Compliance Officer, 2006-present | | Managing Director,3 Deutsche Asset & Wealth Management |
1 The length of time served represents the year in which the Board Member joined the board of one or more DWS funds currently overseen by the Board.
2 A publicly held company with securities registered pursuant to Section 12 of the Securities Exchange Act of 1934.
3 Executive title, not a board directorship.
4 As a result of their respective positions held with the Advisor, these individuals are considered "interested persons" of the Advisor within the meaning of the 1940 Act. Interested persons receive no compensation from the fund.
5 The mailing address of Mr. Woods is 60 Wall Street, New York, New York 10005. Mr. Woods is an interested Board Member by virtue of his positions with Deutsche Asset & Wealth Management. As an interested person, Mr. Woods receives no compensation from the fund. Mr. Woods is a board member of the following trusts and corporations: Cash Account Trust, DWS Market Trust, DWS Money Funds, DWS State Tax-Free Income Series, DWS Target Fund, DWS Value Series, Inc., DWS Variable Series II, Investors Cash Trust, Tax-Exempt California Money Market Fund, DWS Global High Income Fund, Inc., DWS High Income Opportunities Fund, Inc., DWS High Income Trust, DWS Multi-Market Income Trust, DWS Municipal Income Trust, DWS Strategic Income Trust and DWS Strategic Municipal Income Trust.
6 The length of time served represents the year in which the officer was first elected in such capacity for one or more DWS funds.
7 Address: 60 Wall Street, New York, NY 10005.
8 Address: One Beacon Street, Boston, MA 02108.
9 Effective as of January 9, 2013.
The fund's Statement of Additional Information ("SAI") includes additional information about the Board Members. The SAI is available, without charge, upon request. If you would like to request a copy of the SAI, you may do so by calling the following toll-free number: (800) 728-3337.
DWS Investments Distributors, Inc.
222 South Riverside Plaza
Chicago, IL 60606
(800) 621-1148
VS2DIE-2 (R-025828-2 2/13)
DECEMBER 31, 2012
ANNUAL REPORT
DWS VARIABLE SERIES II
DWS Dreman Small Mid Cap Value VIP
Contents
9 Statement of Assets and Liabilities 10 Statement of Operations 10 Statement of Changes in Net Assets 13 Notes to Financial Statements 17 Report of Independent Registered Public Accounting Firm 18 Information About Your Fund's Expenses 20 Investment Management Agreement Approval 23 Summary of Management Fee Evaluation by Independent Fee Consultant 25 Board Members and Officers |
This report must be preceded or accompanied by a prospectus. To obtain an additional prospectus or summary prospectus, if available, call (800) 728-3337 or your financial representative. We advise you to consider the Fund's objectives, risks, charges and expenses carefully before investing. The summary prospectus and prospectus contain this and other important information about the Fund. Please read the prospectus carefully before you invest.
Any fund that focuses in a particular segment of the market will generally be more volatile than a fund that invests more broadly. Smaller and medium company stocks tend to be more volatile than large company stocks. The fund may lend securities to approved institutions. Stocks may decline in value. See the prospectus for details.
DWS Investments is part of the Deutsche Asset & Wealth Management division of Deutsche Bank AG.
NOT FDIC/NCUA INSURED NO BANK GUARANTEE MAY LOSE VALUE NOT A DEPOSIT
NOT INSURED BY ANY FEDERAL GOVERNMENT AGENCY
Performance Summary December 31, 2012 (Unaudited)
Fund performance shown is historical, assumes reinvestment of all dividend and capital gain distributions and does not guarantee future results. Investment return and principal value fluctuate with changing market conditions so that, when redeemed, shares may be worth more or less than their original cost. Current performance may be lower or higher than the performance data quoted. Please contact your participating insurance company for the Fund's most recent month-end performance. Performance doesn't reflect charges and fees ("contract charges") associated with the separate account that invests in the Fund or any variable life insurance policy or variable annuity contract for which the Fund is an investment option. These charges and fees will reduce returns. While all share classes have the same underlying portfolio, their performance will differ.
The gross expense ratios of the Fund, as stated in the fee table of the prospectus dated May 1, 2012 are 0.90% and 1.24% for Class A and Class B shares, respectively, and may differ from the expense ratios disclosed in the Financial Highlights tables in this report.
| Growth of an Assumed $10,000 Investment in DWS Dreman Small Mid Cap Value VIP |
| The Russell 2500™ Value Index is an unmanaged Index of those securities in the Russell 3000® Index with lower price-to-book ratios and lower forecasted growth values. Index returns do not reflect any fees or expenses and it is not possible to invest directly into an index. |
| |
| Yearly periods ended December 31 | |
| Comparative Results | |
| DWS Dreman Small Mid Cap Value VIP | | 1-Year | | | 3-Year | | | 5-Year | | | 10-Year | |
| Class A | Growth of $10,000 | | $ | 11,377 | | | $ | 13,150 | | | $ | 11,356 | | | $ | 28,907 | |
| Average annual total return | | | 13.77 | % | | | 9.56 | % | | | 2.58 | % | | | 11.20 | % |
| Russell 2500 Value Index | Growth of $10,000 | | $ | 11,921 | | | $ | 14,380 | | | $ | 12,487 | | | $ | 26,417 | |
| Average annual total return | | | 19.21 | % | | | 12.87 | % | | | 4.54 | % | | | 10.20 | % |
| DWS Dreman Small Mid Cap Value VIP | | 1-Year | | | 3-Year | | | 5-Year | | | 10-Year | |
| Class B | Growth of $10,000 | | $ | 11,338 | | | $ | 13,027 | | | $ | 11,170 | | | $ | 27,890 | |
| Average annual total return | | | 13.38 | % | | | 9.22 | % | | | 2.24 | % | | | 10.80 | % |
| Russell 2500 Value Index | Growth of $10,000 | | $ | 11,921 | | | $ | 14,380 | | | $ | 12,487 | | | $ | 26,417 | |
| Average annual total return | | | 19.21 | % | | | 12.87 | % | | | 4.54 | % | | | 10.20 | % |
The growth of $10,000 is cumulative.
Management Summary December 31, 2012 (Unaudited)
Class A shares of DWS Dreman Small Mid Cap Value VIP returned 13.77% (unadjusted for contract charges) in 2012, underperforming the 19.21% return of its benchmark, the Russell 2500™ Value Index.1
The largest detractors from performance were our positions in two deep-value stocks that we thought would emerge as turnaround stories: Pitney Bowes, Inc. and R.R. Donnelley & Sons Co. Both stocks weighed heavily on the Fund's return. Other notable detractors from performance were Arch Coal, Inc. and Ultra Petroleum Corp., which were pressured by the falling prices for coal and natural gas, respectively. On the plus side, we added value through an underweight in the utilities sector and favorable stock selection in technology and industrials. Our most significant individual contributors were the chemical producer Huntsman Corporation and Hanesbrands, Inc.2
Over the course of the year, we gradually moved to overweight positions in the technology, industrials, materials and banking sectors, as we found the most compelling individual stock opportunities in areas with above-average sensitivity to economic growth. In the materials sector, for instance, we believed many stocks offered favorable prospects at a time of positive global growth and the possibility of revived investor concerns about inflation. We also found a number of undervalued companies in the banking sector, where improving home sales and rising loan growth boosted the earnings outlook. We are beginning to look more closely at the energy sector, where the Fund is underweight, as the depressed prices of oil and natural gas have pushed valuations down to what we believe are very interesting levels.
As we head into the new year, we believe the Fund is well positioned. At the end of the period, the price-to-earnings (P/E) ratio of the stocks in the Fund was 11.4 times 12-month earnings estimates, compared with 14.3 for the stocks in the Russell 2500® Value Index.3 At the same time, the return on equity of our holdings exceeded that of the index, at 11.6% versus 8.1%.4
The Fund's subadvisor is Dreman Value Management, L.L.C., a renowned investment firm with a 35-year history of style-pure value investing.
Mark Roach
Managing Director of Dreman Value Management, L.L.C. and Lead Portfolio Manager of the Fund. Joined the Fund in 2006.
David N. Dreman
Chairman of Dreman Value Management, L.L.C. and Portfolio Manager of the Fund. Joined the Fund in 2002.
E. Clifton Hoover, Jr.
Chief Investment Officer and Managing Director of Dreman Value Management, L.L.C. and Portfolio Manager of the Fund.
Joined the Fund in 2006.
Mario Tufano
Associate Portfolio Manager of the Fund. Joined the Fund in 2010.
The views expressed reflect those of the portfolio management team only through the end of the period of the report as stated on the cover. The management team's views are subject to change at any time based on market and other conditions and should not be construed as a recommendation. Past performance is no guarantee of future results. Current and future portfolio holdings are subject to risk.
1 The Russell 2500 Value Index is an unmanaged index of those securities in the Russell 3000® Index with lower price-to-book ratios and lower forecasted growth values. Index returns do not reflect fees or expenses and it is not possible to invest directly into an index.
2 "Underweight" means the Fund holds a lower weighting in a given sector or security than the benchmark. "Overweight" means the Fund holds a higher weighting.
3 Price-to-earnings (P/E) ratio compares a company's current share price to its per-share earnings.
4 Return on equity measures a corporation's profitability. It is the amount of net income returned as a percentage of the money shareholders have invested (shareholder equity).
Portfolio Summary (Unaudited) Asset Allocation (As a % of Investment Portfolio excluding Securities Lending Collateral) | 12/31/12 | 12/31/11 |
| | | |
| Common Stocks | 98% | 99% |
| Cash Equivalents | 2% | 1% |
| | 100% | 100% |
Sector Diversification (As a % of Common Stocks) | 12/31/12 | 12/31/11 |
| | | |
| Financials | 27% | 26% |
| Industrials | 22% | 17% |
| Information Technology | 17% | 16% |
| Consumer Discretionary | 8% | 12% |
| Materials | 7% | 8% |
| Health Care | 7% | 8% |
| Energy | 5% | 6% |
| Utilities | 4% | 4% |
| Consumer Staples | 3% | 3% |
| | 100% | 100% |
Portfolio holdings and characteristics are subject to change.
For more complete details about the Fund's investment portfolio, see page 6.
Following the Fund's fiscal first and third quarter-end, a complete portfolio holdings listing is filed with the SEC on Form N-Q. The form will be available on the SEC's Web site at www.sec.gov, and it also may be reviewed and copied at the SEC's Public Reference Room in Washington, D.C. Information on the operation of the SEC's Public Reference Room may be obtained by calling (800) SEC-0330. The Fund's portfolio holdings are also posted on www.dws-investments.com from time to time. Please see the Fund's current prospectus for more information.
Investment Portfolio December 31, 2012 | | | Shares | | | Value ($) | |
| | | | |
| Common Stocks 98.2% | |
| Consumer Discretionary 7.4% | |
| Auto Components 1.7% | |
| Cooper Tire & Rubber Co. (a) | | | 159,050 | | | | 4,033,508 | |
| Hotels, Restaurants & Leisure 1.2% | |
| Brinker International, Inc. | | | 95,280 | | | | 2,952,727 | |
| Media 1.6% | |
| Meredith Corp. (a) | | | 108,375 | | | | 3,733,519 | |
| Textiles, Apparel & Luxury Goods 2.9% | |
| Hanesbrands, Inc.* (a) | | | 114,025 | | | | 4,084,375 | |
| The Jones Group, Inc. (a) | | | 247,215 | | | | 2,734,198 | |
| | | | | | | | 6,818,573 | |
| Consumer Staples 2.7% | |
| Beverages 1.4% | |
| Constellation Brands, Inc. "A"* | | | 91,600 | | | | 3,241,724 | |
| Household Products 1.3% | |
| Energizer Holdings, Inc. | | | 39,775 | | | | 3,181,205 | |
| Energy 5.4% | |
| Energy Equipment & Services 3.5% | |
| Atwood Oceanics, Inc.* (a) | | | 70,565 | | | | 3,231,172 | |
| Nabors Industries Ltd.* | | | 201,925 | | | | 2,917,816 | |
| Superior Energy Services, Inc.* | | | 96,400 | | | | 1,997,408 | |
| | | | | | | | 8,146,396 | |
| Oil, Gas & Consumable Fuels 1.9% | |
| Rosetta Resources, Inc.* (a) | | | 62,100 | | | | 2,816,856 | |
| Ultra Petroleum Corp.* (a) | | | 93,372 | | | | 1,692,834 | |
| | | | | | | | 4,509,690 | |
| Financials 27.0% | |
| Capital Markets 1.5% | |
| Raymond James Financial, Inc. (a) | | | 93,375 | | | | 3,597,739 | |
| Commercial Banks 10.3% | |
| Associated Banc-Corp. (a) | | | 227,100 | | | | 2,979,552 | |
| Bank of Hawaii Corp. (a) | | | 69,225 | | | | 3,049,361 | |
| BOK Financial Corp. | | | 52,250 | | | | 2,845,535 | |
| East West Bancorp., Inc. | | | 136,475 | | | | 2,932,847 | |
| FirstMerit Corp. (a) | | | 206,325 | | | | 2,927,752 | |
| Fulton Financial Corp. (a) | | | 297,275 | | | | 2,856,813 | |
| Webster Financial Corp. | | | 161,400 | | | | 3,316,770 | |
| Zions Bancorp. (a) | | | 154,125 | | | | 3,298,275 | |
| | | | | | | | 24,206,905 | |
| Insurance 8.2% | |
| Allied World Assurance Co. Holdings AG | | | 35,700 | | | | 2,813,160 | |
| Argo Group International Holdings Ltd. (a) | | | 108,063 | | | | 3,629,836 | |
| Axis Capital Holdings Ltd. | | | 96,700 | | | | 3,349,688 | |
| Everest Re Group Ltd. | | | 26,625 | | | | 2,927,419 | |
| Hartford Financial Services Group, Inc. (a) | | | 173,775 | | | | 3,899,511 | |
| Unum Group (a) | | | 129,900 | | | | 2,704,518 | |
| | | | | | | | 19,324,132 | |
| Real Estate Investment Trusts 7.0% | |
| CBL & Associates Properties, Inc. (REIT) | | | 189,825 | | | | 4,026,189 | |
| CommonWealth REIT (REIT) | | | 130,681 | | | | 2,069,987 | |
| | | Shares | | | Value ($) | |
| | | | | | | | | |
| EPR Properties (REIT) (a) | | | 73,775 | | | | 3,401,765 | |
| Hospitality Properties Trust (REIT) (a) | | | 151,300 | | | | 3,543,446 | |
| Weingarten Realty Investors (REIT) (a) | | | 127,825 | | | | 3,421,875 | |
| | | | | | | | 16,463,262 | |
| Health Care 8.2% | |
| Biotechnology 1.3% | |
| United Therapeutics Corp.* | | | 55,500 | | | | 2,964,810 | |
| Health Care Equipment & Supplies 1.8% | |
| Teleflex, Inc. (a) | | | 58,825 | | | | 4,194,811 | |
| Health Care Providers & Services 2.7% | |
| LifePoint Hospitals, Inc.* | | | 91,575 | | | | 3,456,956 | |
| Owens & Minor, Inc. (a) | | | 106,000 | | | | 3,022,060 | |
| | | | | | | | 6,479,016 | |
| Life Sciences Tools & Services 1.4% | |
| Charles River Laboratories International, Inc.* | | | 87,775 | | | | 3,288,929 | |
| Pharmaceuticals 1.0% | |
| Endo Health Solutions, Inc.* | | | 90,400 | | | | 2,374,808 | |
| Industrials 19.7% | |
| Aerospace & Defense 2.3% | |
| Alliant Techsystems, Inc. (a) | | | 46,650 | | | | 2,890,434 | |
| Spirit AeroSystems Holdings, Inc. "A"* | | | 141,400 | | | | 2,399,558 | |
| | | | | | | | 5,289,992 | |
| Commercial Services & Supplies 1.9% | |
| Pitney Bowes, Inc. (a) | | | 148,050 | | | | 1,575,252 | |
| The Brink's Co. (a) | | | 104,625 | | | | 2,984,951 | |
| | | | | | | | 4,560,203 | |
| Construction & Engineering 2.7% | |
| Tutor Perini Corp.* | | | 220,175 | | | | 3,016,398 | |
| URS Corp. (a) | | | 84,375 | | | | 3,312,562 | |
| | | | | | | | 6,328,960 | |
| Electrical Equipment 1.3% | |
| General Cable Corp.* | | | 101,937 | | | | 3,099,904 | |
| Machinery 8.6% | |
| Crane Co. | | | 76,800 | | | | 3,554,304 | |
| Harsco Corp. | | | 141,800 | | | | 3,332,300 | |
| Joy Global, Inc. | | | 50,525 | | | | 3,222,484 | |
| Oshkosh Corp.* | | | 135,575 | | | | 4,019,799 | |
| SPX Corp. | | | 43,400 | | | | 3,044,510 | |
| Trinity Industries, Inc. | | | 88,600 | | | | 3,173,652 | |
| | | | | | | | 20,347,049 | |
| Road & Rail 1.5% | |
| AMERCO (a) | | | 28,050 | | | | 3,557,021 | |
| Trading Companies & Distributors 1.4% | |
| Textainer Group Holdings Ltd. (a) | | | 102,575 | | | | 3,227,010 | |
| Information Technology 16.6% | |
| Communications Equipment 1.4% | |
| Arris Group, Inc.* | | | 226,750 | | | | 3,387,645 | |
| Computers & Peripherals 1.5% | |
| NCR Corp.* | | | 133,775 | | | | 3,408,587 | |
| | | Shares | | | Value ($) | |
| | | | | | | | | |
| Electronic Equipment, Instruments & Components 2.5% | |
| Arrow Electronics, Inc.* | | | 78,015 | | | | 2,970,811 | |
| Jabil Circuit, Inc. | | | 154,650 | | | | 2,983,199 | |
| | | | | | | | 5,954,010 | |
| IT Services 4.0% | |
| Amdocs Ltd. | | | 90,250 | | | | 3,067,597 | |
| DST Systems, Inc. | | | 68,175 | | | | 4,131,405 | |
| ManTech International Corp. "A" (a) | | | 88,275 | | | | 2,289,854 | |
| | | | | | | | 9,488,856 | |
| Semiconductors & Semiconductor Equipment 5.3% | |
| KLA-Tencor Corp. (a) | | | 68,700 | | | | 3,281,112 | |
| Microsemi Corp.* (a) | | | 160,975 | | | | 3,386,914 | |
| PMC-Sierra, Inc.* | | | 466,650 | | | | 2,431,246 | |
| Teradyne, Inc.* (a) | | | 197,700 | | | | 3,339,153 | |
| | | | | | | | 12,438,425 | |
| Software 1.9% | |
| Synopsys, Inc.* | | | 142,850 | | | | 4,548,344 | |
| Materials 7.3% | |
| Chemicals 1.1% | |
| Huntsman Corp. | | | 155,993 | | | | 2,480,289 | |
| Containers & Packaging 2.3% | |
| Owens-Illinois, Inc.* | | | 112,300 | | | | 2,388,621 | |
| Rock-Tenn Co. "A" | | | 45,050 | | | | 3,149,445 | |
| | | | | | | | 5,538,066 | |
| | | Shares | | | Value ($) | |
| | | | | | | | | |
| Metals & Mining 3.9% | |
| Coeur d'Alene Mines Corp.* | | | 119,950 | | | | 2,950,770 | |
| IAMGOLD Corp. (a) | | | 163,375 | | | | 1,873,911 | |
| Reliance Steel & Aluminum Co. (a) | | | 70,925 | | | | 4,404,443 | |
| | | | | | | | 9,229,124 | |
| Utilities 3.9% | |
| Electric Utilities 1.5% | |
| Portland General Electric Co. | | | 126,650 | | | | 3,465,144 | |
| Gas Utilities 1.2% | |
| AGL Resources, Inc. (a) | | | 71,300 | | | | 2,849,861 | |
| Multi-Utilities 1.2% | |
| Ameren Corp. | | | 90,975 | | | | 2,794,752 | |
Total Common Stocks (Cost $194,811,735) | | | | 231,504,996 | |
| | |
| Securities Lending Collateral 31.4% | |
| Daily Assets Fund Institutional, 0.20% (b) (c) (Cost $73,900,185) | | | 73,900,185 | | | | 73,900,185 | |
| | |
| Cash Equivalents 1.9% | |
| Central Cash Management Fund, 0.15% (b) (Cost $4,452,788) | | | 4,452,788 | | | | 4,452,788 | |
| | | % of Net Assets | | | Value ($) | |
| | | | |
Total Investment Portfolio (Cost $273,164,708)† | | | 131.5 | | | | 309,857,969 | |
| Other Assets and Liabilities, Net | | | (31.5 | ) | | | (74,176,184 | ) |
| Net Assets | | | 100.0 | | | | 235,681,785 | |
* Non-income producing security.
† The cost for federal income tax purposes was $273,504,314. At December 31, 2012, net unrealized appreciation for all securities based on tax cost was $36,353,655. This consisted of aggregate gross unrealized appreciation for all securities in which there was an excess of value over tax cost of $53,206,896 and aggregate gross unrealized depreciation for all securities in which there was an excess of tax cost over value of $16,853,241.
(a) All or a portion of these securities were on loan (see Notes to Financial Statements). The value of all securities loaned at December 31, 2012 amounted to $73,499,140, which is 31.2% of net assets.
(b) Affiliated fund managed by Deutsche Investment Management Americas Inc. The rate shown is the annualized seven-day yield at period end.
(c) Represents collateral held in connection with securities lending. Income earned by the Fund is net of borrower rebates.
REIT: Real Estate Investment Trust
Fair Value Measurements
Various inputs are used in determining the value of the Fund's investments. These inputs are summarized in three broad levels. Level 1 includes quoted prices in active markets for identical securities. Level 2 includes other significant observable inputs (including quoted prices for similar securities, interest rates, prepayment speeds, and credit risk). Level 3 includes significant unobservable inputs (including the Fund's own assumptions in determining the fair value of investments). The inputs or methodology used for valuing securities are not necessarily an indication of the risk associated with investing in those securities.
The following is a summary of the inputs used as of December 31, 2012 in valuing the Fund's investments. For information on the Fund's policy regarding the valuation of investments, please refer to the Security Valuation section of Note A in the accompanying Notes to Financial Statements.
| Assets | | Level 1 | | | Level 2 | | | Level 3 | | | Total | |
| | |
| Common Stocks (d) | | $ | 231,504,996 | | | $ | — | | | $ | — | | | $ | 231,504,996 | |
| Short-Term Investments (d) | | | 78,352,973 | | | | — | | | | — | | | | 78,352,973 | |
| Total | | $ | 309,857,969 | | | $ | — | | | $ | — | | | $ | 309,857,969 | |
There have been no transfers between fair value measurement levels during the year ended December 31, 2012.
(d) See Investment Portfolio for additional detailed categorizations.
The accompanying notes are an integral part of the financial statements.
Statement of Assets and Liabilities | as of December 31, 2012 | |
| Assets | |
Investments: Investments in non-affiliated securities, at value (cost $194,811,735) — including $73,499,140 of securities loaned | | $ | 231,504,996 | |
| Investment in Daily Assets Fund Institutional (cost $73,900,185)* | | | 73,900,185 | |
| Investment in Central Cash Management Fund (cost $4,452,788) | | | 4,452,788 | |
| Total investments in securities, at value (cost $273,164,708) | | | 309,857,969 | |
| Receivable for Fund shares sold | | | 12,840 | |
| Dividends receivable | | | 231,880 | |
| Interest receivable | | | 15,007 | |
| Other assets | | | 3,662 | |
| Total assets | | | 310,121,358 | |
| Liabilities | |
| Payable upon return of securities loaned | | | 73,900,185 | |
| Payable for Fund shares redeemed | | | 292,005 | |
| Accrued management fee | | | 128,569 | |
| Acrued Trustees' fees | | | 3,431 | |
| Accrued expenses and payables | | | 115,383 | |
| Total liabilities | | | 74,439,573 | |
| Net assets, at value | | $ | 235,681,785 | |
| Net Assets Consist of: | |
| Undistributed net investment income | | | 2,783,776 | |
| Net unrealized appreciation (depreciation) on investments | | | 36,693,261 | |
| Accumulated net realized gain (loss) | | | (71,774,637 | ) |
| Paid-in capital | | | 267,979,385 | |
| Net assets, at value | | $ | 235,681,785 | |
Class A Net Asset Value, offering and redemption price per share ($218,792,998 ÷ 17,113,875 outstanding shares of beneficial interest, no par value, unlimited number of shares authorized) | | $ | 12.78 | |
Class B Net Asset Value, offering and redemption price per share ($16,888,787 ÷ 1,321,925 outstanding shares of beneficial interest, no par value, unlimited number of shares authorized) | | $ | 12.78 | |
* Represents collateral on securities loaned.
The accompanying notes are an integral part of the financial statements.
Statement of Operations
| for the year ended December 31, 2012 | |
| Investment Income | |
Income: Dividends (net of foreign taxes withheld of $3,373) | | $ | 4,458,384 | |
| Interest | | | 15,785 | |
| Income distributions — Central Cash Management Fund | | | 4,855 | |
| Securities lending income, including income from Daily Assets Fund Institutional, net of borrower rebates | | | 322,636 | |
| Total income | | | 4,801,660 | |
Expenses: Management fee | | | 1,560,949 | |
| Administration fee | | | 240,220 | |
| Services to shareholders | | | 8,805 | |
| Distribution service fee (Class B) | | | 48,286 | |
| Record keeping fees (Class B) | | | 18,563 | |
| Custodian fee | | | 8,428 | |
| Professional fees | | | 62,546 | |
| Reports to shareholders | | | 58,554 | |
| Trustees' fees and expenses | | | 11,435 | |
| Other | | | 10,238 | |
| Total expenses | | | 2,028,024 | |
| Net investment income (loss) | | | 2,773,636 | |
| Realized and Unrealized Gain (Loss) | |
| Net realized gain (loss) from investments | | | 13,712,216 | |
| Change in net unrealized appreciation (depreciation) on investments | | | 14,140,156 | |
| Net gain (loss) | | | 27,852,372 | |
| Net increase (decrease) in net assets resulting from operations | | $ | 30,626,008 | |
The accompanying notes are an integral part of the financial statements.
Statement of Changes in Net Assets | | | Years Ended December 31, | |
| Increase (Decrease) in Net Assets | | 2012 | | | 2011 | |
Operations: Net investment income (loss) | | $ | 2,773,636 | | | $ | 2,755,641 | |
| Net realized gain (loss) | | | 13,712,216 | | | | 18,942,284 | |
| Change in net unrealized appreciation (depreciation) | | | 14,140,156 | | | | (38,142,173 | ) |
| Net increase (decrease) in net assets resulting from operations | | | 30,626,008 | | | | (16,444,248 | ) |
Distributions to shareholders from: Net investment income: Class A | | | (2,544,018 | ) | | | (2,506,080 | ) |
| Class B | | | (170,068 | ) | | | (161,946 | ) |
| Total distributions | | | (2,714,086 | ) | | | (2,668,026 | ) |
Fund share transactions: Class A Proceeds from shares sold | | | 15,242,621 | | | | 34,090,411 | |
| Reinvestment of distributions | | | 2,544,018 | | | | 2,506,080 | |
| Payments for shares redeemed | | | (40,361,547 | ) | | | (51,431,426 | ) |
| Net increase (decrease) in net assets from Class A share transactions | | | (22,574,908 | ) | | | (14,834,935 | ) |
Class B Proceeds from shares sold | | | 2,417,600 | | | | 3,518,495 | |
| Reinvestment of distributions | | | 170,068 | | | | 161,946 | |
| Payments for shares redeemed | | | (8,165,016 | ) | | | (7,516,325 | ) |
| Net increase (decrease) in net assets from Class B share transactions | | | (5,577,348 | ) | | | (3,835,884 | ) |
| Increase (decrease) in net assets | | | (240,334 | ) | | | (37,783,093 | ) |
| Net assets at beginning of period | | | 235,922,119 | | | | 273,705,212 | |
| Net assets at end of period (including undistributed net investment income of $2,783,776 and $2,724,226, respectively) | | $ | 235,681,785 | | | $ | 235,922,119 | |
| Other Information | |
Class A Shares outstanding at beginning of period | | | 18,969,648 | | | | 20,271,172 | |
| Shares sold | | | 1,248,625 | | | | 2,809,599 | |
| Shares issued to shareholders in reinvestment of distributions | | | 207,168 | | | | 187,020 | |
| Shares redeemed | | | (3,311,566 | ) | | | (4,298,143 | ) |
| Net increase (decrease) in Class A shares | | | (1,855,773 | ) | | | (1,301,524 | ) |
| Shares outstanding at end of period | | | 17,113,875 | | | | 18,969,648 | |
Class B Shares outstanding at beginning of period | | | 1,796,701 | | | | 2,147,844 | |
| Shares sold | | | 195,502 | | | | 291,322 | |
| Shares issued to shareholders in reinvestment of distributions | | | 13,827 | | | | 12,068 | |
| Shares redeemed | | | (684,105 | ) | | | (654,533 | ) |
| Net increase (decrease) in Class B shares | | | (474,776 | ) | | | (351,143 | ) |
| Shares outstanding at end of period | | | 1,321,925 | | | | 1,796,701 | |
The accompanying notes are an integral part of the financial statements.
| | | Years Ended December 31, | |
| Class A | | | 2012 | | | 2011 | | | 2010 | | | 2009 | | | 2008 | |
| Selected Per Share Data | |
| Net asset value, beginning of period | | $ | 11.36 | | | $ | 12.21 | | | $ | 10.04 | | | $ | 7.93 | | | $ | 20.12 | |
Income (loss) from investment operations: Net investment incomea | | | .14 | | | | .13 | | | | .12 | | | | .16 | | | | .13 | |
| Net realized and unrealized gain (loss) | | | 1.42 | | | | (.85 | ) | | | 2.19 | | | | 2.11 | | | | (4.92 | ) |
| Total from investment operations | | | 1.56 | | | | (.72 | ) | | | 2.31 | | | | 2.27 | | | | (4.79 | ) |
Less distributions from: Net investment income | | | (.14 | ) | | | (.13 | ) | | | (.14 | ) | | | (.16 | ) | | | (.29 | ) |
| Net realized gains | | | — | | | | — | | | | — | | | | — | | | | (7.11 | ) |
| Total distributions | | | (.14 | ) | | | (.13 | ) | | | (.14 | ) | | | (.16 | ) | | | (7.40 | ) |
| Net asset value, end of period | | $ | 12.78 | | | $ | 11.36 | | | $ | 12.21 | | | $ | 10.04 | | | $ | 7.93 | |
| Total Return (%) | | | 13.77 | | | | (6.08 | ) | | | 23.07 | | | | 29.70 | | | | (33.42 | )b |
| Ratios to Average Net Assets and Supplemental Data | |
| Net assets, end of period ($ millions) | | | 219 | | | | 216 | | | | 247 | | | | 235 | | | | 223 | |
| Ratio of expenses before expense reductions (%) | | | .82 | | | | .81 | | | | .82 | | | | .79 | | | | .83 | |
| Ratio of expenses after expense reductions (%) | | | .82 | | | | .81 | | | | .82 | | | | .79 | | | | .82 | |
| Ratio of net investment income (%) | | | 1.18 | | | | 1.08 | | | | 1.14 | | | | 1.92 | | | | 1.13 | |
| Portfolio turnover rate (%) | | | 11 | | | | 36 | | | | 38 | | | | 72 | | | | 49 | |
a Based on average shares outstanding during the period. b Total return would have been lower had certain expenses not been reduced. | |
| | | Years Ended December 31, | |
| Class B | | | 2012 | | | 2011 | | | 2010 | | | 2009 | | | 2008 | |
| Selected Per Share Data | |
| Net asset value, beginning of period | | $ | 11.36 | | | $ | 12.20 | | | $ | 10.03 | | | $ | 7.92 | | | $ | 20.08 | |
Income (loss) from investment operations: Net investment incomea | | | .10 | | | | .09 | | | | .08 | | | | .13 | | | | .09 | |
| Net realized and unrealized gain (loss) | | | 1.42 | | | | (.85 | ) | | | 2.19 | | | | 2.12 | | | | (4.92 | ) |
| Total from investment operations | | | 1.52 | | | | (.76 | ) | | | 2.27 | | | | 2.25 | | | | (4.83 | ) |
Less distributions from: Net investment income | | | (.10 | ) | | | (.08 | ) | | | (.10 | ) | | | (.14 | ) | | | (.22 | ) |
| Net realized gains | | | — | | | | — | | | | — | | | | — | | | | (7.11 | ) |
| Total distributions | | | (.10 | ) | | | (.08 | ) | | | (.10 | ) | | | (.14 | ) | | | (7.33 | ) |
| Net asset value, end of period | | $ | 12.78 | | | $ | 11.36 | | | $ | 12.20 | | | $ | 10.03 | | | $ | 7.92 | |
| Total Return (%) | | | 13.38 | | | | (6.33 | ) | | | 22.66 | | | | 29.28 | | | | (33.67 | )b |
| Ratios to Average Net Assets and Supplemental Data | |
| Net assets, end of period ($ millions) | | | 17 | | | | 20 | | | | 26 | | | | 23 | | | | 24 | |
| Ratio of expenses before expense reductions (%) | | | 1.16 | | | | 1.15 | | | | 1.17 | | | | 1.14 | | | | 1.18 | |
| Ratio of expenses after expense reductions (%) | | | 1.16 | | | | 1.15 | | | | 1.17 | | | | 1.14 | | | | 1.17 | |
| Ratio of net investment income (%) | | | .81 | | | | .74 | | | | .79 | | | | 1.57 | | | | .78 | |
| Portfolio turnover rate (%) | | | 11 | | | | 36 | | | | 38 | | | | 72 | | | | 49 | |
a Based on average shares outstanding during the period. b Total return would have been lower had certain expenses not been reduced. | |
Notes to Financial Statements
A. Organization and Significant Accounting Policies
DWS Dreman Small Mid Cap Value VIP (the "Fund") is a diversified series of DWS Variable Series II (the "Trust"), which is registered under the Investment Company Act of 1940, as amended (the "1940 Act"), as an open-end management investment company organized as a Massachusetts business trust.
Multiple Classes of Shares of Beneficial Interest. The Fund offers two classes of shares (Class A shares and Class B shares). Sales of Class B shares are subject to recordkeeping fees up to 0.15% and Rule 12b-1 fees under the 1940 Act equal to an annual rate of 0.25% of the average daily net assets of the Class B shares of the Fund. Class A shares are not subject to such fees.
Investment income, realized and unrealized gains and losses, and certain fund-level expenses and expense reductions, if any, are borne pro rata on the basis of relative net assets by the holders of all classes of shares except that each class bears certain expenses unique to that class (including the applicable Rule 12b-1 fee and recordkeeping fees). Differences in class-level expenses may result in payment of different per share dividends by class. All shares have equal rights with respect to voting subject to class-specific arrangements.
The Fund's financial statements are prepared in accordance with accounting principles generally accepted in the United States of America which require the use of management estimates. Actual results could differ from those estimates. The policies described below are followed consistently by the Fund in the preparation of its financial statements.
Security Valuation. Investments are stated at value determined as of the close of regular trading on the New York Stock Exchange on each day the exchange is open for trading.
Various inputs are used in determining the value of the Fund's investments. These inputs are summarized in three broad levels. Level 1 includes quoted prices in active markets for identical securities. Level 2 includes other significant observable inputs (including quoted prices for similar securities, interest rates, prepayment speeds, and credit risk). Level 3 includes significant unobservable inputs (including the Fund's own assumptions in determining the fair value of investments). The inputs or methodology used for valuing securities are not necessarily an indication of the risk associated with investing in those securities.
Equity securities are valued at the most recent sale price or official closing price reported on the exchange (U.S. or foreign) or over-the-counter market on which they trade and are categorized as Level 1 securities. Securities for which no sales are reported are valued at the calculated mean between the most recent bid and asked quotations on the relevant market or, if a mean cannot be determined, at the most recent bid quotation.
Investments in open-end investment companies are valued at their net asset value each business day and are categorized as Level 1.
Securities and other assets for which market quotations are not readily available or for which the above valuation procedures are deemed not to reflect fair value are valued in a manner that is intended to reflect their fair value as determined in accordance with procedures approved by the Board and are generally categorized as Level 3. In accordance with the Fund's valuation procedures, factors used in determining value may include, but are not limited to, the type of the security; the size of the holding; the initial cost of the security; the existence of any contractual restrictions on the security's disposition; the price and extent of public trading in similar securities of the issuer or of comparable companies; quotations or evaluated prices from broker-dealers and/or pricing services; information obtained from the issuer, analysts, and/or the appropriate stock exchange (for exchange-traded securities); an analysis of the company's or issuer's financial statements; an evaluation of the forces that influence the issuer and the market(s) in which the security is purchased and sold and with respect to debt securities; the maturity, coupon, creditworthiness, currency denomination and the movement of the market in which the security is normally traded. The value determined under these procedures may differ from published values for the same securities.
Disclosure about the classification of fair value measurements is included in a table following the Fund's Investment Portfolio.
New Accounting Pronouncement. In January 2013, Accounting Standard Update 2013-01 (ASU 2013-01), Clarifying the Scope of Disclosures about Offsetting Assets and Liabilities, replaced Accounting Standards Update 2011-11 (ASU 2011-11), Disclosures about Offsetting Assets and Liabilities. ASU 2013-01 is effective for fiscal years beginning on or after January 1, 2013, and interim periods within those annual periods. ASU 2011-11 was intended to enhance disclosure requirements on the offsetting of financial assets and liabilities. The ASU 2013-01 limits the scope of the new balance sheet offsetting disclosures to derivatives, repurchase agreements, and securities lending transactions to the extent that they are (1) offset in the financial statements or (2) subject to an enforceable master netting arrangement or similar agreement. Management is currently evaluating the application of ASU 2013-01 and its impact, if any, on the Fund's financial statements.
Foreign Currency Translations. The books and records of the Fund are maintained in U.S. dollars. Investment securities and other assets and liabilities denominated in a foreign currency are translated into U.S. dollars at the prevailing exchange rates at period end. Purchases and sales of investment securities, income and expenses are translated into U.S. dollars at the prevailing exchange rates on the respective dates of the transactions.
Net realized and unrealized gains and losses on foreign currency transactions represent net gains and losses between trade and settlement dates on securities transactions, the acquisition and disposition of foreign currencies, and the difference between the amount of net investment income accrued and the U.S. dollar amount actually received. That portion of both realized and unrealized gains and losses on investments that results from fluctuations in foreign currency exchange rates is not separately disclosed but is included with net realized and unrealized gain/appreciation and loss/depreciation on investments.
Securities Lending. The Fund lends securities to certain financial institutions. The Fund retains beneficial ownership of the securities it has loaned and continues to receive interest and dividends paid by the issuer of securities and to participate in any changes in their market value. The Fund requires the borrowers of the securities to maintain collateral with the Fund consisting of either cash or liquid, unencumbered assets having a value at least equal to the value of the securities loaned. When the collateral falls below specified amounts, the lending agent will use its best effort to obtain additional collateral on the next business day to meet required amounts under the security lending agreement. The Fund may invest the cash collateral into a joint trading account in an affiliated money market fund pursuant to Exemptive Orders issued by the SEC. The Fund receives compensation for lending its securities either in the form of fees or by earning interest on invested cash collateral net of borrower rebates and fees paid to a lending agent. Either the Fund or the borrower may terminate the loan. There may be risks of delay and costs in recovery of securities or even loss of rights in the collateral should the borrower of the securities fail financially. The Fund is also subject to all investment risks associated with the reinvestment of any cash collateral received, including, but not limited to, interest rate, credit and liquidity risk associated with such investments.
Taxes. The Fund's policy is to comply with the requirements of the Internal Revenue Code, as amended, which are applicable to regulated investment companies and to distribute all of its taxable income to its shareholders.
Under the Regulated Investment Company Modernization Act of 2010, net capital losses incurred post-enactment may be carried forward indefinitely, and their character is retained as short-term and/or long-term. Previously, net capital losses were carried forward for eight years and treated as short-term losses. As a transition rule, the Act requires that post-enactment net capital losses be used before pre-enactment net capital losses.
At December 31, 2012, the Fund had a net tax basis capital loss carryforward of approximately $(71,435,000) of pre-enactment losses, which may be applied against any realized net taxable capital gains of each succeeding year until fully utilized or until December 31, 2017, the expiration date, whichever occurs first.
The Fund has reviewed the tax positions for the open tax years as of December 31, 2012 and has determined that no provision for income tax is required in the Fund's financial statements. The Fund's federal tax returns for the prior three fiscal years remain open subject to examination by the Internal Revenue Service.
Distribution of Income and Gains. Distributions from net investment income of the Fund, if any, is declared and distributed to shareholders annually. Net realized gains from investment transactions, in excess of available capital loss carryforwards, would be taxable to the Fund if not distributed and, therefore, will be distributed to shareholders at least annually. The Fund may also make additional distributions for tax purposes if necessary.
The timing and characterization of certain income and capital gain distributions are determined annually in accordance with federal tax regulations which may differ from accounting principles generally accepted in the United States of America. These differences primarily relate to income received from Real Estate Investment Trusts and certain securities sold at a loss. As a result, net investment income (loss) and net realized gain (loss) on investment transactions for a reporting period may differ significantly from distributions during such period. Accordingly, the Fund may periodically make reclassifications among certain of its capital accounts without impacting the net asset value of the Fund.
At December 31, 2012, the Fund's components of distributable earnings on a tax basis were as follows:
| Undistributed ordinary income* | | $ | 2,728,445 | |
| Capital loss carryforwards | | $ | (71,435,000 | ) |
| Unrealized appreciation (depreciation) on investments | | $ | 36,353,655 | |
In addition, the tax character of distributions paid by the Fund is summarized as follows:
| | | Years Ended December 31, | |
| | | 2012 | | | 2011 | |
| Distributions from ordinary income* | | $ | 2,714,086 | | | $ | 2,668,026 | |
* For tax purposes, short-term capital gain distributions are considered ordinary income distributions.
Expenses. Expenses of the Trust arising in connection with a specific fund are allocated to that fund. Other Trust expenses which cannot be directly attributed to a fund are apportioned among the funds in the Trust based upon the relative net assets or other appropriate measures.
Contingencies. In the normal course of business, the Fund may enter into contracts with service providers that contain general indemnification clauses. The Fund's maximum exposure under these arrangements is unknown as this would involve future claims that may be made against the Fund that have not yet been made. However, based on experience, the Fund expects the risk of loss to be remote.
Real Estate Investment Trusts. The Fund periodically recharacterizes distributions received from a Real Estate Investment Trust ("REIT") investment based on information provided by the REIT into the following categories: ordinary income, long-term and short-term capital gains, and return of capital. If information is not available timely from a REIT, the recharacterization will be estimated for financial reporting purposes and a recharacterization will be made to the accounting records in the following year when such information becomes available. Distributions received from REITs in excess of income are recorded as either a reduction of cost of investments or realized gains. The Fund distinguishes between dividends received on a tax basis and a financial reporting basis and only distributions in excess of tax basis earnings and profits are reported in the financial statements as a return of capital.
Other. Investment transactions are accounted for on a trade date plus one basis for daily net asset value calculations. However, for financial reporting purposes, investment transactions are reported on trade date. Interest income is recorded on the accrual basis. Dividend income is recorded on the ex-dividend date net of foreign withholding taxes. Realized gains and losses from investment transactions are recorded on an identified cost basis and may include proceeds from litigation.
B. Purchases and Sales of Securities
During the year ended December 31, 2012, purchases and sales of investment transactions (excluding short-term investments) aggregated $26,213,087 and $56,657,497, respectively.
C. Related Parties
Management Agreement. Under the Investment Management Agreement with Deutsche Investment Management Americas Inc. ("DIMA" or the "Advisor"), an indirect, wholly owned subsidiary of Deutsche Bank AG, the Advisor directs the investments of the Fund in accordance with its investment objectives, policies and restrictions. The Advisor determines the securities, instruments and other contracts relating to investments to be purchased, sold or entered into by the Fund or delegates such responsibility to the Fund's subadvisor.
Dreman Value Management, L.L.C. ("DVM") serves as subadvisor. As a subadvisor to the Fund, DVM makes investment decisions and buys and sells securities for the Fund. DVM is paid by the Advisor for the services DVM provides to the Fund.
Pursuant to the Investment Management Agreement with the Advisor, the Fund pays a monthly management fee based on the Fund's average daily net assets, computed and accrued daily and payable monthly, at the following annual rates:
| First $250 million | | | .650 | % |
| Next $750 million | | | .620 | % |
| Next $1.5 billion | | | .600 | % |
| Next $2.5 billion | | | .580 | % |
| Next $2.5 billion | | | .550 | % |
| Next $2.5 billion | | | .540 | % |
| Next $2.5 billion | | | .530 | % |
| Over $12.5 billion | | | .520 | % |
Accordingly, for the year ended December 31, 2012, the fee pursuant to the Investment Management Agreement was equivalent to an annual effective rate of 0.65% of the Fund's average daily net assets.
For the period from October 1, 2012 through September 30, 2013, the Advisor has contractually agreed to waive its fee and/or reimburse certain operating expenses to the extent necessary to maintain the operating expenses (excluding certain expenses such as extraordinary expenses, taxes, brokerage and interest expense) of each class as follows:
| Class A | | | .84 | % |
| Class B | | | 1.20 | % |
Administration Fee. Pursuant to an Administrative Services Agreement, DIMA provides most administrative services to the Fund. For all services provided under the Administrative Services Agreement, the Fund pays DIMA an annual fee ("Administration Fee") of 0.10% of the Fund's average daily net assets, computed and accrued daily and payable monthly. For the year ended December 31, 2012, the Administration Fee was $240,220, of which $19,780 is unpaid.
Service Provider Fees. DWS Investments Service Company ("DISC"), an affiliate of the Advisor, is the transfer agent, dividend-paying agent and shareholder service agent for the Fund. Pursuant to a sub-transfer agency agreement between DISC and DST Systems, Inc. ("DST"), DISC has delegated certain transfer agent, dividend-paying agent and shareholder service agent functions to DST. DISC compensates DST out of the shareholder servicing fee it receives from the Fund. For the year ended December 31, 2012, the amounts charged to the Fund by DISC were as follows:
| Service to Shareholders | | Total Aggregated | | | Unpaid at December 31, 2012 | |
| Class A | | $ | 563 | | | $ | 139 | |
| Class B | | | 460 | | | | 121 | |
| | | $ | 1,023 | | | $ | 260 | |
Distribution Service Agreement. Under the Fund's Class B 12b-1 plans, DWS Investments Distributors, Inc. ("DIDI") received a fee ("Distribution Service Fee") of 0.25% of average daily net assets of Class B shares. For the year ended December 31, 2012, the Distribution Service Fee aggregated $48,286, of which $3,540 is unpaid.
Typesetting and Filing Service Fees. Under an agreement with DIMA, DIMA is compensated for providing typesetting and certain regulatory filing services to the Fund. For the year ended December 31, 2012, the amount charged to the Fund by DIMA included in the Statement of Operations under "reports to shareholders" aggregated $17,239, of which $5,356 is unpaid.
Trustees' Fees and Expenses. The Fund paid retainer fees to each Trustee not affiliated with the Advisor, plus specified amounts to the Board Chairperson and to each committee Chairperson.
Affiliated Cash Management Vehicle. The Fund may invest uninvested cash balances in Central Cash Management Fund, which is managed by the Advisor. The Fund indirectly bears its proportionate share of the expenses of Central Cash Management Fund. Central Cash Management Fund does not pay the Advisor an investment management fee. Central Cash Management Fund seeks a high level of current income consistent with liquidity and the preservation of capital.
D. Ownership of the Fund
At December 31, 2012, three Participating Insurance Companies were owners of record of 10% or more of the total outstanding Class A shares of the Fund, each owning 37%, 23% and 13%. Three participating Insurance Companies were owners of record of 10% or more of the total outstanding Class B shares of the Fund, each owning 46%, 14% and 10%.
E. Line of Credit
The Fund and other affiliated funds (the "Participants") share in a $375 million revolving credit facility provided by a syndication of banks. The Fund may borrow for temporary or emergency purposes, including the meeting of redemption requests that otherwise might require the untimely disposition of securities. The Participants are charged an annual commitment fee which is allocated based on net assets, among each of the Participants. Interest is calculated at a rate per annum equal to the sum of the Federal Funds Rate plus 1.25 percent plus if LIBOR exceeds the Federal Funds Rate the amount of such excess. The Fund may borrow up to a maximum of 33 percent of its net assets under the agreement. The Fund had no outstanding loans at December 31, 2012.
Report of Independent Registered Public Accounting Firm
To the Board of Trustees of DWS Variable Series II and Shareholders of DWS Dreman Small Mid Cap Value VIP:
We have audited the accompanying statement of assets and liabilities, including the investment portfolio of DWS Dreman Small Mid Cap Value VIP (the "Fund"), one of the funds constituting DWS Variable Series II, as of December 31, 2012, and the statement of operations for the year then ended, the statement of changes in net assets for each of the two years in the period then ended, and the financial highlights for each of the five years in the period then ended. These financial statements and financial highlights are the responsibility of the Fund's management. Our responsibility is to express an opinion on these financial statements and financial highlights based on our audits.
We conducted our audits in accordance with the standards of the Public Company Accounting Oversight Board (United States). Those standards require that we plan and perform the audit to obtain reasonable assurance about whether the financial statements and financial highlights are free of material misstatement. We were not engaged to perform an audit of the Fund's internal control over financial reporting. Our audits included consideration of internal control over financial reporting as a basis for designing audit procedures that are appropriate in the circumstances, but not for the purpose of expressing an opinion on the effectiveness of the Fund's internal control over financial reporting. Accordingly, we express no such opinion. An audit also includes examining, on a test basis, evidence supporting the amounts and disclosures in the financial statements and financial highlights, assessing the accounting principles used and significant estimates made by management, and evaluating the overall financial statement presentation. Our procedures included confirmation of securities owned as of December 31, 2012, by correspondence with the custodian and brokers. We believe that our audits provide a reasonable basis for our opinion.
In our opinion, the financial statements and financial highlights referred to above present fairly, in all material respects, the financial position of DWS Dreman Small Mid Cap Value VIP (one of the funds constituting DWS Variable Series II) at December 31, 2012, the results of its operations for the year then ended, the changes in its net assets for each of the two years in the period then ended, and the financial highlights for each of the five years in the period then ended, in conformity with U.S. generally accepted accounting principles.
| | | |
Boston, Massachusetts February 13, 2013 | | |
Information About Your Fund's Expenses (Unaudited)
As an investor of the Fund, you incur two types of costs: ongoing expenses and transaction costs. Ongoing expenses include management fees, distribution and service (12b-1) fees and other Fund expenses. Examples of transaction costs include contract charges and account maintenance fees, which are not shown in this section. The following tables are intended to help you understand your ongoing expenses (in dollars) of investing in the Fund and to help you compare these expenses with the ongoing expenses of investing in other mutual funds. The example in the table is based on an investment of $1,000 invested at the beginning of the six-month period and held for the entire period (July 1, 2012 to December 31, 2012).
The tables illustrate your Fund's expenses in two ways:
•Actual Fund Return. This helps you estimate the actual dollar amount of ongoing expenses (but not transaction costs) paid on a $1,000 investment in the Fund using the Fund's actual return during the period. To estimate the expenses you paid over the period, simply divide your account value by $1,000 (for example, an $8,600 account value divided by $1,000 = 8.6), then multiply the result by the number in the "Expenses Paid per $1,000" line under the share class you hold.
• Hypothetical 5% Fund Return. This helps you to compare your Fund's ongoing expenses (but not transaction costs) with those of other mutual funds using the Fund's actual expense ratio and a hypothetical rate of return of 5% per year before expenses. Examples using a 5% hypothetical Fund return may be found in the shareholder reports of other mutual funds. The hypothetical account values and expenses may not be used to estimate the actual ending account balance or expenses you paid for the period.
Please note that the expenses shown in these tables are meant to highlight your ongoing expenses only and do not reflect any transaction costs. The "Expenses Paid per $1,000" line of the tables is useful in comparing ongoing expenses only and will not help you determine the relative total expense of owning different funds. If these transaction costs had been included, your costs would have been higher.
Expenses and Value of a $1,000 Investment for the six months ended December 31, 2012 | |
| Actual Fund Return | | Class A | | | Class B | |
| Beginning Account Value 7/1/12 | | $ | 1,000.00 | | | $ | 1,000.00 | |
| Ending Account Value 12/31/12 | | $ | 1,085.80 | | | $ | 1,084.00 | |
| Expenses Paid per $1,000* | | $ | 4.25 | | | $ | 6.08 | |
| Hypothetical 5% Fund Return | | Class A | | | Class B | |
| Beginning Account Value 7/1/12 | | $ | 1,000.00 | | | $ | 1,000.00 | |
| Ending Account Value 12/31/12 | | $ | 1,021.06 | | | $ | 1,019.30 | |
| Expenses Paid per $1,000* | | $ | 4.12 | | | $ | 5.89 | |
* Expenses are equal to the Fund's annualized expense ratio for each share class, multiplied by the average account value over the period, multiplied by 184 (the number of days in the most recent six-month period), then divided by 366.
| Annualized Expense Ratios | Class A | | Class B | |
| DWS Variable Series II — DWS Dreman Small Mid Cap Value VIP | .81% | | 1.16% | |
For more information, please refer to the Fund's prospectus.
These tables do not reflect charges and fees ("contract charges") associated with the separate account that invests in the Fund or any variable life insurance policy or variable annuity contract for which the Fund is an investment option.
Tax Information (Unaudited)
For corporate shareholders, 100% of income dividends paid during the Fund's fiscal year ended December 31, 2012 qualified for the dividends received deduction.
Please consult a tax advisor if you have questions about federal or state income tax laws, or on how to prepare your tax returns. If you have specific questions about your account, please contact your insurance provider.
The Trust's policies and procedures for voting proxies for portfolio securities and information about how the Trust voted proxies related to its portfolio securities during the 12-month period ended June 30 are available on our Web site — www.dws-investments.com (click on "proxy voting" at the bottom of the page) — or on the SEC's Web site — www.sec.gov. To obtain a written copy of the Trust's policies and procedures without charge, upon request, call us toll free at (800) 728-3337.
Investment Management Agreement Approval
The Board of Trustees approved the renewal of DWS Dreman Small Mid Cap Value VIP's investment management agreement (the "Agreement") with Deutsche Investment Management Americas Inc. ("DWS") and sub-advisory agreement (the "Sub-Advisory Agreement" and together with the Agreement, the "Agreements") between DWS and Dreman Value Management, L.L.C. ("DVM") in September 2012.
In terms of the process that the Board followed prior to approving the Agreements, shareholders should know that:
• In September 2012, all of the Fund's Trustees were independent of DWS and its affiliates.
• The Trustees met frequently during the past year to discuss fund matters and dedicated a substantial amount of time to contract review matters. Over the course of several months, the Board's Contract Committee, in coordination with the Board's Equity Oversight Committee, reviewed comprehensive materials received from DWS, independent third parties and independent counsel. These materials included an analysis of the Fund's performance, fees and expenses, and profitability compiled by the Fund's independent fee consultant. The Board also received extensive information throughout the year regarding performance of the Fund.
• The Independent Trustees regularly meet privately with their independent counsel to discuss contract review and other matters. In addition, the Independent Trustees were also advised by the Fund's independent fee consultant in the course of their review of the Fund's contractual arrangements and considered a comprehensive report prepared by the independent fee consultant in connection with their deliberations (the "IFC Report").
• In connection with reviewing the Agreements, the Board also reviewed the terms of the Fund's Rule 12b-1 plan, distribution agreement, administrative services agreement, transfer agency agreement and other material service agreements.
• Based on its evaluation of the information provided, the Contract Committee presented its findings and recommendations to the Board. The Board then reviewed the Contract Committee's findings and recommendations.
In connection with the contract review process, the Contract Committee and the Board considered the factors discussed below, among others. The Board also considered that DWS and its predecessors have managed the Fund since its inception, and the Board believes that a long-term relationship with a capable, conscientious advisor is in the best interests of the Fund. The Board considered, generally, that shareholders chose to invest or remain invested in the Fund knowing that DWS managed the Fund, and that the Agreement was approved by the Fund's shareholders. DWS is part of Deutsche Bank, a major global banking institution that is engaged in a wide range of financial services. The Board believes that there are advantages to being part of a global asset management business that offers a wide range of investing expertise and resources, including hundreds of portfolio managers and analysts with research capabilities in many countries throughout the world.
As part of the contract review process, the Board carefully considered the fees and expenses of each DWS fund overseen by the Board in light of the fund's performance. In many cases, this led to a negotiation with DWS of lower expense caps for the coming year than had previously been in place. As part of these negotiations, the Board indicated that it would consider relaxing these new lower caps in future years following sustained improvements in performance, among other considerations.
In June 2012, Deutsche Bank ("DB"), DWS's parent company, announced that DB's new management team had concluded the strategic review of its global asset management business announced in late 2011 by DB's prior management team, and would combine its Asset Management (of which DWS is a part) and Wealth Management divisions. Prior to approving the investment management agreements, the Independent Trustees were apprised of the expected management and structure of the new combined Asset & Wealth Management division ("AWM") and DWS. DB also advised the Independent Trustees that the U.S. asset management business is a critical and integral part of DB and AWM, and that DB would be reinvesting a significant portion of the substantial savings it expects to realize by combining its Asset Management and Wealth Management divisions into a combined AWM division, including enhancements to its investment capabilities. DB also confirmed its commitment to maintaining strong legal and compliance groups within the combined division.
While shareholders may focus primarily on fund performance and fees, the Fund's Board considers these and many other factors, including the quality and integrity of DWS's and DVM's personnel and such other issues as back-office operations, fund valuations, and compliance policies and procedures.
Nature, Quality and Extent of Services. The Board considered the terms of the Agreements, including the scope of advisory services provided under the Agreements. The Board noted that, under the Agreements, DWS and DVM provide portfolio management services to the Fund and that, pursuant to a separate administrative services agreement, DWS provides administrative services to the Fund. The Board considered the experience and skills of senior management and investment personnel, the resources made available to such personnel, the ability of DWS to attract and retain high-quality personnel, and the organizational depth and stability of DWS. The Board also requested and received information regarding DWS's oversight of Fund sub-advisors, including DVM. The Board reviewed the Fund's performance over short-term and long-term periods and compared those returns to various agreed-upon performance measures, including market indices and a peer universe compiled by the independent fee consultant using information supplied by Lipper Inc. ("Lipper"), an independent fund data service. The Board also noted that it has put into place a process of identifying "Focus Funds" (e.g., funds performing poorly relative to their benchmark or a peer universe compiled by an independent fund data service), and receives more frequent reporting and information from DWS regarding such funds, along with DWS's remedial plans to address underperformance. The Board believes this process is an effective manner of identifying and addressing underperforming funds. Based on the information provided, the Board noted that for the one-, three- and five-year periods ended December 31, 2011, the Fund's performance (Class A shares) was in the 3rd quartile, 4th quartile and 2nd quartile, respectively, of the applicable Lipper universe (the 1st quartile being the best performers and the 4th quartile being the worst performers). The Board also observed that the Fund has outperformed its benchmark in the five-year period and has underperformed its benchmark in the one- and three-year periods ended December 31, 2011. The Board noted the disappointing investment performance of the Fund in recent periods and continued to discuss with senior management of DWS and DVM the factors contributing to such underperformance and actions being taken to improve performance. The Board observed that the Fund had experienced improved relative performance during the first seven months of 2012. The Board recognized that DVM has made changes in its investment personnel in recent years in an effort to improve long-term performance.
Fees and Expenses. The Board considered the Fund's investment management fee schedule, sub-advisory fee schedule, operating expenses and total expense ratios, and comparative information provided by Lipper and the independent fee consultant regarding investment management fee rates paid to other investment advisors by similar funds (1st quartile being the most favorable and 4th quartile being the least favorable). With respect to management fees paid to other investment advisors by similar funds, the Board noted that the contractual fee rates paid by the Fund, which include a 0.10% fee paid to DWS under the Fund's administrative services agreement, were lower than the median (1st quartile) of the applicable Lipper peer group (based on Lipper data provided as of December 31, 2011). With respect to the sub-advisory fee paid to DVM, the Board noted that the fee is paid by DWS out of its fee and not directly by the Fund. The Board noted that the Fund's Class A shares total (net) operating expenses were expected to be lower than the median (2nd quartile) of the applicable Lipper expense universe (based on Lipper data provided as of December 31, 2011, and analyzing Lipper expense universe Class A (net) expenses less any applicable 12b-1 fees) ("Lipper Universe Expenses"). The Board also reviewed data comparing each share class's total (net) operating expenses to the applicable Lipper Universe Expenses. The Board considered the Fund's management fee rate as compared to fees charged by DWS and certain of its affiliates for comparable mutual funds and considered differences in fund and fee structures between the DWS Funds. The Board also considered how the Fund's total (net) operating expenses compared to the total (net) operating expenses of a more customized peer group selected by Lipper (based on such factors as asset size). The Board also noted that the expense limitations agreed to by DWS helped to ensure that the Fund's total (net) operating expenses would remain competitive.
The information considered by the Board as part of its review of management fees included information regarding fees charged by DWS and its affiliates to similar institutional accounts and to similar funds offered primarily to European investors ("DWS Europe funds"), in each case as applicable. The Board observed that advisory fee rates for institutional accounts generally were lower than the management fees charged by similarly managed DWS U.S. mutual funds ("DWS Funds"), but also took note of the differences in services provided to DWS Funds as compared to institutional accounts. In the case of DWS Europe funds, the Board observed that fee rates for DWS Europe funds generally were higher than for similarly managed DWS Funds, but noted that differences in the types of services provided to DWS Funds relative to DWS Europe funds made it difficult to compare such fees.
On the basis of the information provided, the Board concluded that management fees were reasonable and appropriate in light of the nature, quality and extent of services provided by DWS and DVM.
Profitability. The Board reviewed detailed information regarding revenues received by DWS under the Agreement. The Board considered the estimated costs and pre-tax profits realized by DWS from advising the DWS Funds, as well as estimates of the pre-tax profits attributable to managing the Fund in particular. The Board also received information regarding the estimated enterprise-wide profitability of DWS and its affiliates with respect to all fund services in totality and by fund. The Board and the independent fee consultant reviewed DWS's methodology in allocating its costs to the management of the Fund. Based on the information provided, the Board concluded that the pre-tax profits realized by DWS in connection with the management of the Fund were not unreasonable. The Board also reviewed information regarding the profitability of certain similar investment management firms. The Board noted that while information regarding the profitability of such firms is limited (and in some cases is not necessarily prepared on a comparable basis), DWS and its affiliates' overall profitability with respect to the DWS fund complex (after taking into account distribution and other services provided to the funds by DWS and its affiliates) was lower than the overall profitability levels of many comparable firms for which such data was available. The Board did not consider the profitability of DVM with respect to the Fund. The Board noted that DWS pays DVM's fee out of its management fee, and its understanding that the Fund's sub-advisory fee schedule was the product of an arm's length negotiation with DWS.
Economies of Scale. The Board considered whether there are economies of scale with respect to the management of the Fund and whether the Fund benefits from any economies of scale. The Board noted that the Fund's management fee schedule includes fee breakpoints. The Board concluded that the Fund's fee schedule represents an appropriate sharing between the Fund and DWS of such economies of scale as may exist in the management of the Fund at current asset levels.
Other Benefits to DWS and DVM and Their Affiliates. The Board also considered the character and amount of other incidental benefits received by DWS and DVM and their affiliates, including any fees received by DWS for administrative services provided to the Fund and any fees received by an affiliate of DWS for distribution services. The Board also considered benefits to DWS related to brokerage and soft-dollar allocations, including allocating brokerage to pay for research generated by parties other than the executing broker dealers, which pertain primarily to funds investing in equity securities, along with the incidental public relations benefits to DWS and DVM related to DWS Funds advertising and cross-selling opportunities among DWS products and services. The Board concluded that management fees were reasonable in light of these fallout benefits.
Compliance. The Board considered the significant attention and resources dedicated by DWS to documenting and enhancing its compliance processes in recent years. The Board noted in particular (i) the experience and seniority of both DWS's chief compliance officer and the Fund's chief compliance officer; (ii) the large number of DWS compliance personnel; and (iii) the substantial commitment of resources by DWS and its affiliates to compliance matters. The Board also considered the attention and resources dedicated by DWS to the oversight of the investment sub-advisor's compliance program and compliance with the applicable fund policies and procedures.
Based on all of the information considered and the conclusions reached, the Board unanimously determined that the continuation of the Agreements is in the best interests of the Fund. In making this determination, the Board did not give particular weight to any single factor identified above. The Board considered these factors over the course of numerous meetings, certain of which were in executive session with only the Independent Trustees and their counsel present. It is possible that individual Trustees may have weighed these factors differently in reaching their individual decisions to approve the continuation of the Agreements.
Summary of Management Fee Evaluation by Independent Fee Consultant
September 17, 2012
Pursuant to an Order entered into by Deutsche Investment Management Americas and affiliates (collectively, "DeAM") with the Attorney General of New York, I, Thomas H. Mack, have been appointed the Independent Fee Consultant for the DWS Funds (formerly the DWS Scudder Funds). My duties include preparing an annual written evaluation of the management fees DeAM charges the Funds, considering among other factors the management fees charged by other mutual fund companies for like services, management fees DeAM charges other clients for like services, DeAM's costs of supplying services under the management agreements and related profit margins, possible economies of scale if a Fund grows larger, and the nature and quality of DeAM's services, including fund performance. This report summarizes my evaluation for 2012, including my qualifications, the evaluation process for each of the DWS Funds, consideration of certain complex-level factors, and my conclusions. I served in substantially the same capacity in 2007, 2008, 2009, 2010 and 2011.
Qualifications
For more than 35 years I have served in various professional capacities within the investment management business. I have held investment analysis and advisory positions, including securities analyst, portfolio strategist and director of investment policy with a large investment firm. I have also performed business management functions, including business development, financial management and marketing research and analysis.
Since 1991, I have been an independent consultant within the asset management industry. I have provided services to over 125 client organizations, including investment managers, mutual fund boards, product distributors and related organizations. Over the past ten years I have completed a number of assignments for mutual fund boards, specifically including assisting boards with management contract renewal.
I hold a Master of Business Administration degree, with highest honors, from Harvard University and Master of Science and Bachelor of Science (highest honors) degrees from the University of California at Berkeley. I am an independent director and audit committee financial expert for two closed-end mutual funds and have served in various leadership and financial oversight capacities with non-profit organizations.
Evaluation of Fees for each DWS Fund
My work focused primarily on evaluating, fund-by-fund, the fees charged to each of the 103 mutual fund portfolios in the DWS Fund family. For each Fund, I considered each of the key factors mentioned above, as well as any other relevant information. In doing so I worked closely with the Funds' Independent Directors in their annual contract renewal process, as well as in their approval of contracts for several new funds (documented separately).
In evaluating each Fund's fees, I reviewed comprehensive materials provided by or on behalf of DeAM, including expense information prepared by Lipper Analytical, comparative performance information, profitability data, manager histories, and other materials. I also accessed certain additional information from the Lipper and Morningstar databases and drew on my industry knowledge and experience.
To facilitate evaluating this considerable body of information, I prepared for each Fund a document summarizing the key data elements in each area as well as additional analytics discussed below. This made it possible to consider each key data element in the context of the others.
In the course of contract renewal, DeAM agreed to implement a number of fee and expense adjustments requested by the Independent Directors which will favorably impact future fees and expenses, and my evaluation includes the effects of these changes.
Fees and Expenses Compared with Other Funds
The competitive fee and expense evaluation for each fund focused on two primary comparisons:
The Fund's contractual management fee (the advisory fee plus the administration fee where applicable) compared with those of a group of typically 12-15 funds in the same Lipper investment category (e.g. Large Capitalization Growth) having similar distribution arrangements and being of similar size.
The Fund's total expenses compared with a broader universe of funds from the same Lipper investment category and having similar distribution arrangements.
These two comparisons provide a view of not only the level of the fee compared with funds of similar scale but also the total expense the Fund bears for all the services it receives, in comparison with the investment choices available in the Fund's investment category and distribution channel. The principal figure-of-merit used in these comparisons was the subject Fund's percentile ranking against peers.
DeAM's Fees for Similar Services to Others
DeAM provided management fee schedules for all of its US domiciled fund and non-fund investment management accounts in any of the investment categories where there is a DWS Fund. These similar products included the other DWS Funds, non-fund pooled accounts, institutional accounts and sub-advisory accounts. Using this information, I calculated for each Fund the fee that would be charged to each similar product, at the subject Fund's asset level.
Evaluating information regarding non-fund products is difficult because there are varying levels of services required for different types of accounts, with mutual funds generally requiring considerably more regulatory and administrative types of service as well as having more frequent cash flows than other types of accounts. Also, while mutual fund fees for similar fund products can be expected to be similar, there will be some differences due to different pricing conditions in different distribution channels (e.g. retail funds versus those used in variable insurance products), differences in underlying investment processes and other factors.
Costs and Profit Margins
DeAM provided a detailed profitability analysis for each Fund. After making some adjustments so that the presentation would be more comparable to the available industry figures, I reviewed profit margins from investment management alone, from investment management plus other fund services (excluding distribution) provided to the Funds by DeAM (principally shareholder services), and DeAM profits from all sources, including distribution. A later section comments on overall profitability.
Economies of Scale
Economies of scale — an expected decline in management cost per dollar of fund assets as fund assets grow — are very rarely quantified and documented because of inherent difficulties in collecting and analyzing relevant data. However, in virtually every investment category that I reviewed, larger funds tend to have lower fees and lower total expenses than smaller funds. To see how each DWS Fund compares with this industry observation, I reviewed:
The trend in Fund assets over the last five years and the accompanying trend in total expenses. This shows if the Fund has grown and, if so, whether total expense (management fees as well as other expenses) have declined as a percent of assets.
Whether the Fund has break-points in its management fee schedule, the extent of the fee reduction built into the schedule and the asset levels where the breaks take effect, and in the case of a sub-advised Fund how the Fund's break-points compare with those of the sub-advisory fee schedule.
How the Fund's contractual fee schedule compares with trends in the industry data. To accomplish this, I constructed a chart showing how actual latest-fiscal-year contractual fees of the Fund and of other similar funds relate to average fund assets, with the subject Fund's contractual fee schedule superimposed.
Quality of Service — Performance
The quality-of-service evaluation focused on investment performance, which is the principal result of the investment management service. Each Fund's performance was reviewed over the past 1, 3, 5 and 10 years, as applicable, and compared with that of other funds in the same investment category and with a suitable market index.
In addition, I calculated and reviewed risk-adjusted returns relative to an index of similar mutual funds' returns and a suitable market index. The risk-adjusted returns analysis provides a way of determining the extent to which the Fund's return comparisons are mainly the product of investment value-added (or lack thereof) or alternatively taking considerably more or less risk than is typical in its investment category.
I also received and considered the history of portfolio manager changes for each Fund, as this provided an important context for evaluating the performance results.
Complex-Level Considerations
While this evaluation was conducted mainly at the individual fund level, there are some issues relating to the reasonableness of fees that can alternatively be considered across the whole fund complex:
I reviewed DeAM's profitability analysis for all DWS Funds, with a view toward determining if the allocation procedures used were reasonable and how profit levels compared with public data for other investment managers.
I considered whether DeAM and affiliates receive any significant ancillary or "fallout" benefits that should be considered in interpreting the direct profitability results. These would be situations where serving as the investment manager of the Funds is beneficial to another part of the Deutsche Bank organization.
I considered how aggregated DWS Fund expenses had varied over the years, by asset class and in the context of trends in asset levels.
I considered how aggregated DWS Fund performance measures relative to appropriate peers had varied by asset class and over time.
I reviewed the structure of the DeAM organization, trends in staffing levels, and information on compensation of investment management and other professionals compared with industry data.
Findings
Based on the process and analysis discussed above, which included reviewing a wide range of information from management and external data sources and considering among other factors the fees DeAM charges other clients, the fees charged by other fund managers, DeAM's costs and profits associated with managing the Funds, economies of scale, possible fall-out benefits, and the nature and quality of services provided, in my opinion the management fees charged the DWS Funds are reasonable.
Thomas H. Mack
President, Thomas H. Mack & Co., Inc.
Board Members and Officers
The following table presents certain information regarding the Board Members and Officers of the fund. Each Board Member's year of birth is set forth in parentheses after his or her name. Unless otherwise noted, (i) each Board Member has engaged in the principal occupation(s) noted in the table for at least the most recent five years, although not necessarily in the same capacity; and (ii) the address of each Independent Board Member is c/o Kenneth C. Froewiss, Chairman, DWS Mutual Funds, P.O. Box 78, Short Hills, NJ 07078. Except as otherwise noted below, the term of office for each Board Member is until the election and qualification of a successor, or until such Board Member sooner dies, resigns, is removed or as otherwise provided in the governing documents of the fund. Because the fund does not hold an annual meeting of shareholders, each Board Member will hold office for an indeterminate period. The Board Members may also serve in similar capacities with other funds in the fund complex.
| Independent Board Members |
Name, Year of Birth, Position with the Fund and Length of Time Served1 | | Business Experience and Directorships During the Past Five Years | Number of Funds in DWS Fund Complex Overseen |
Other Directorships Held by Board Member |
Kenneth C. Froewiss (1945) Chairperson since 2013,9 and Board Member since 2001 | | Adjunct Professor of Finance, NYU Stern School of Business (September 2009-present; Clinical Professor from 1997-September 2009); Member, Finance Committee, Association for Asian Studies (2002-present); Director, Mitsui Sumitomo Insurance Group (US) (2004-present); prior thereto, Managing Director, J.P. Morgan (investment banking firm) (until 1996) | 103 | — |
William McClayton (1944) Vice Chairperson since 2013,9 and Board Member since 2004 | | Private equity investor (since October 2009); previously, Managing Director, Diamond Management & Technology Consultants, Inc. (global consulting firm) (2001-2009); Directorship: Board of Managers, YMCA of Metropolitan Chicago; formerly: Senior Partner, Arthur Andersen LLP (accounting) (1966-2001); Trustee, Ravinia Festival | 103 | — |
John W. Ballantine (1946) Board Member since 1999 | | Retired; formerly, Executive Vice President and Chief Risk Management Officer, First Chicago NBD Corporation/The First National Bank of Chicago (1996-1998); Executive Vice President and Head of International Banking (1995-1996). Directorships: Stockwell Capital Investments PLC (private equity); former Directorships: First Oak Brook Bancshares, Inc. and Oak Brook Bank; Prisma Energy International | 103 | Chairman of the Board, Healthways, Inc.2 (provider of disease and care management services) (2003- present); Portland General Electric2 (utility company) (2003-present) |
Henry P. Becton, Jr. (1943) Board Member since 1990 | | Vice Chair and former President, WGBH Educational Foundation. Directorships: Public Radio International; Public Radio Exchange (PRX); The PBS Foundation; North Bennett Street School (Boston); former Directorships: Association of Public Television Stations; Boston Museum of Science; American Public Television; Concord Academy; New England Aquarium; Mass. Corporation for Educational Telecommunications; Committee for Economic Development; Public Broadcasting Service; Connecticut College | 103 | Lead Director, Becton Dickinson and Company2 (medical technology company); Lead Director, Belo Corporation2 (media company) |
Dawn-Marie Driscoll (1946) Board Member since 1987 | | President, Driscoll Associates (consulting firm); Emeritus Executive Fellow, Center for Business Ethics, Bentley University; formerly, Partner, Palmer & Dodge (1988-1990); Vice President of Corporate Affairs and General Counsel, Filene's (1978-1988). Directorships: Director of ICI Mutual Insurance Company (since 2007); Advisory Board, Center for Business Ethics, Bentley University; Trustee, Southwest Florida Community Foundation (charitable organization); former Directorships: Sun Capital Advisers Trust (mutual funds) (2007-2012), Investment Company Institute (audit, executive, nominating committees) and Independent Directors Council (governance, executive committees) | 103 | — |
Keith R. Fox, CFA (1954) Board Member since 1996 | | Managing General Partner, Exeter Capital Partners (a series of private investment funds) (since 1986). Directorships: Progressive International Corporation (kitchen goods importer and distributor); The Kennel Shop (retailer); former Chairman, National Association of Small Business Investment Companies; former Directorships: BoxTop Media Inc. (advertising); Sun Capital Advisers Trust (mutual funds) (2011-2012) | 103 | — |
Paul K. Freeman (1950) Board Member since 1993, and Chairperson (2009-Jan. 8, 2013) | | Consultant, World Bank/Inter-American Development Bank; Executive and Governing Council of the Independent Directors Council (Chairman of Education Committee); formerly: Project Leader, International Institute for Applied Systems Analysis (1998-2001); Chief Executive Officer, The Eric Group, Inc. (environmental insurance) (1986-1998); Directorships: Denver Zoo Foundation (December 2012-present); former Directorships: Prisma Energy International | 103 | — |
Richard J. Herring (1946) Board Member since 1990 | | Jacob Safra Professor of International Banking and Professor, Finance Department, The Wharton School, University of Pennsylvania (since July 1972); Co-Director, Wharton Financial Institutions Center (since July 2000); Co-Chair, U.S. Shadow Financial Regulatory Committee; Executive Director, Financial Economists Roundtable; formerly: Vice Dean and Director, Wharton Undergraduate Division (July 1995-June 2000); Director, Lauder Institute of International Management Studies (July 2000-June 2006) | 103 | Director, Japan Equity Fund, Inc. (since September 2007), Thai Capital Fund, Inc. (since 2007), Singapore Fund, Inc. (since September 2007), Independent Director of Barclays Bank Delaware (since September 2010) |
Rebecca W. Rimel (1951) Board Member since 1995 | | President and Chief Executive Officer, The Pew Charitable Trusts (charitable organization) (1994 to present); Trustee, Washington College (2011-2013); formerly: Executive Vice President, The Glenmede Trust Company (investment trust and wealth management) (1983-2004); Board Member, Investor Education (charitable organization) (2004-2005); Trustee, Executive Committee, Philadelphia Chamber of Commerce (2001-2007); Director, Viasys Health Care2 (January 2007-June 2007); Trustee, Pro Publica (charitable organization) (2007-2010); Trustee, Thomas Jefferson Foundation (charitable organization) (1994-2012) | 103 | Director, Becton Dickinson and Company2 (medical technology company) (2012-present); Director, CardioNet, Inc.2 (health care) (2009-present) |
William N. Searcy, Jr. (1946) Board Member since 1993 | | Private investor since October 2003; formerly: Pension & Savings Trust Officer, Sprint Corporation2 (telecommunications) (November 1989-September 2003); Trustee, Sun Capital Advisers Trust (mutual funds) (1998-2012) | 103 | — |
Jean Gleason Stromberg (1943) Board Member since 1997 | | Retired. Formerly, Consultant (1997-2001); Director, Financial Markets U.S. Government Accountability Office (1996-1997); Partner, Fulbright & Jaworski, L.L.P. (law firm) (1978-1996). Directorships: The William and Flora Hewlett Foundation; former Directorships: Service Source, Inc., Mutual Fund Directors Forum (2002-2004), American Bar Retirement Association (funding vehicle for retirement plans) (1987-1990 and 1994-1996) | 103 | — |
Robert H. Wadsworth (1940) Board Member since 1999 | | President, Robert H. Wadsworth & Associates, Inc. (consulting firm) (1983 to present); Director, National Horizon, Inc. (non-profit organization); Director and Treasurer, The Phoenix Boys Choir Association | 106 | — |
Interested Board Member and Officer4 |
Name, Year of Birth, Position with the Fund and Length of Time Served1,6 | | Business Experience and Directorships During the Past Five Years | Number of Funds in DWS Fund Complex Overseen |
Other Directorships Held by Board Member |
Michael J. Woods5 (1967) Board Member since 2013,9 and Executive Vice President since 20139 | | Managing Director,3 Deutsche Asset & Wealth Management (2009-present); Head of the Americas Asset Management Business for Deutsche Bank, Member of the Asset and Wealth Management ("AWM") Extended Executive Committee, AWM Global Client Group Executive Committee and the AWM Active Asset Management Executive Committee; CEO and US Regional Head of DWS Investments; formerly: Sr. VP, Head of the Financial Intermediaries and Investments Group of Evergreen Investments (2007-2009), CEO and Vice Chairman of Board of Directors of XTF Global Asset Management (2006-2007), Managing Director — US Head of Sub-Advisory and Investment Only Business at Citigroup Asset Management (2000-2006). Mr. Woods is currently a board member of The Children's Village, The Big Brothers Big Sisters Organization, and The Mutual Fund Education Alliance. | 39 | — |
Officers4 |
Name, Year of Birth, Position with the Fund and Length of Time Served6 | | Business Experience and Directorships During the Past Five Years |
W. Douglas Beck, CFA7 (1967) President, 2011-present | | Managing Director,3 Deutsche Asset & Wealth Management (2006-present); President of DWS family of funds and Head of Product Management, U.S. for DWS Investments; formerly: Executive Director, Head of Product Management (2002-2006) and President (2005-2006) of the UBS Funds at UBS Global Asset Management; Co-Head of Manager Research/Managed Solutions Group, Merrill Lynch (1998-2002) |
John Millette8 (1962) Vice President and Secretary, 1999-present | | Director,3 Deutsche Asset & Wealth Management |
Paul H. Schubert7 (1963) Chief Financial Officer, 2004-present Treasurer, 2005-present | | Managing Director,3 Deutsche Asset & Wealth Management (since July 2004); formerly: Executive Director, Head of Mutual Fund Services and Treasurer for UBS Family of Funds (1998-2004); Vice President and Director of Mutual Fund Finance at UBS Global Asset Management (1994-1998) |
Caroline Pearson8 (1962) Chief Legal Officer, 2010-present | | Managing Director,3 Deutsche Asset & Wealth Management; formerly: Assistant Secretary for DWS family of funds (1997-2010) |
Melinda Morrow7 (1970) Vice President, 2012-present | | Director,3 Deutsche Asset & Wealth Management |
Hepsen Uzcan8 (1974) Assistant Secretary, since 20139 | | Vice President, Deutsche Asset & Wealth Management |
Paul Antosca8 (1957) Assistant Treasurer, 2007-present | | Director,3 Deutsche Asset & Wealth Management |
Jack Clark8 (1967) Assistant Treasurer, 2007-present | | Director,3 Deutsche Asset & Wealth Management |
Diane Kenneally8 (1966) Assistant Treasurer, 2007-present | | Director,3 Deutsche Asset & Wealth Management |
John Caruso7 (1965) Anti-Money Laundering Compliance Officer, 2010-present | | Managing Director,3 Deutsche Asset & Wealth Management |
Robert Kloby7 (1962) Chief Compliance Officer, 2006-present | | Managing Director,3 Deutsche Asset & Wealth Management |
1 The length of time served represents the year in which the Board Member joined the board of one or more DWS funds currently overseen by the Board.
2 A publicly held company with securities registered pursuant to Section 12 of the Securities Exchange Act of 1934.
3 Executive title, not a board directorship.
4 As a result of their respective positions held with the Advisor, these individuals are considered "interested persons" of the Advisor within the meaning of the 1940 Act. Interested persons receive no compensation from the fund.
5 The mailing address of Mr. Woods is 60 Wall Street, New York, New York 10005. Mr. Woods is an interested Board Member by virtue of his positions with Deutsche Asset & Wealth Management. As an interested person, Mr. Woods receives no compensation from the fund. Mr. Woods is a board member of the following trusts and corporations: Cash Account Trust, DWS Market Trust, DWS Money Funds, DWS State Tax-Free Income Series, DWS Target Fund, DWS Value Series, Inc., DWS Variable Series II, Investors Cash Trust, Tax-Exempt California Money Market Fund, DWS Global High Income Fund, Inc., DWS High Income Opportunities Fund, Inc., DWS High Income Trust, DWS Multi-Market Income Trust, DWS Municipal Income Trust, DWS Strategic Income Trust and DWS Strategic Municipal Income Trust.
6 The length of time served represents the year in which the officer was first elected in such capacity for one or more DWS funds.
7 Address: 60 Wall Street, New York, NY 10005.
8 Address: One Beacon Street, Boston, MA 02108.
9 Effective as of January 9, 2013.
The fund's Statement of Additional Information ("SAI") includes additional information about the Board Members. The SAI is available, without charge, upon request. If you would like to request a copy of the SAI, you may do so by calling the following toll-free number: (800) 728-3337.
DWS Investments Distributors, Inc.
222 South Riverside Plaza
Chicago, IL 60606
(800) 621-1148
VS2DSMC-2 (R-025829-2 2/13)
DECEMBER 31, 2012
ANNUAL REPORT
DWS VARIABLE SERIES II
DWS Global Income Builder VIP
(formerly DWS Balanced VIP)
Contents
22 Statement of Assets and Liabilities 22 Statement of Operations 23 Statement of Changes in Net Assets 26 Notes to Financial Statements 34 Report of Independent Registered Public Accounting Firm 35 Information About Your Fund's Expenses 37 Investment Management Agreement Approval 40 Summary of Management Fee Evaluation by Independent Fee Consultant 42 Board Members and Officers |
This report must be preceded or accompanied by a prospectus. To obtain an additional prospectus or summary prospectus, if available, call (800) 728-3337 or your financial representative. We advise you to consider the Fund's objectives, risks, charges and expenses carefully before investing. The summary prospectus and prospectus contain this and other important information about the Fund. Please read the prospectus carefully before you invest.
Although allocation among different asset categories generally limits risk, fund management may favor an asset category that underperforms other assets or markets as a whole. Bond investments are subject to interest-rate and credit risks. When interest rates rise, bond prices generally fall. Credit risk refers to the ability of an issuer to make timely payments of principal and interest. Investing in derivatives entails special risks relating to liquidity, leverage and credit that may reduce returns and/or increase volatility. Dividends are not guaranteed. If the dividend-paying stocks held by the Fund reduce or stop paying dividends, the Fund's ability to generate income may be adversely affected. Because ETFs trade on a securities exchange, their shares may trade at a premium or discount to their net asset value. ETFs also incur fees and expenses so they may not fully match the performance of the indexes they are designed to track. Investing in foreign securities, particularly those of emerging markets, presents certain risks, such as currency fluctuations, political and economic changes, and market risks. The Fund may lend securities to approved institutions. Stocks may decline in value. See the prospectus for details.
DWS Investments is part of the Deutsche Asset & Wealth Management division of Deutsche Bank AG.
NOT FDIC/NCUA INSURED NO BANK GUARANTEE MAY LOSE VALUE NOT A DEPOSIT
NOT INSURED BY ANY FEDERAL GOVERNMENT AGENCY
Performance Summary December 31, 2012 (Unaudited)
Fund performance shown is historical, assumes reinvestment of all dividend and capital gain distributions and does not guarantee future results. Investment return and principal value fluctuate with changing market conditions so that, when redeemed, shares may be worth more or less than their original cost. Current performance may be lower or higher than the performance data quoted. Please contact your participating insurance company for the Fund's most recent month-end performance. Performance doesn't reflect charges and fees ("contract charges") associated with the separate account that invests in the Fund or any variable life insurance policy or variable annuity contract for which the Fund is an investment option. These charges and fees will reduce returns.
The gross expense ratio of the Fund, as stated in the fee table of the prospectus dated May 1, 2012 is 0.62% for Class A shares and may differ from the expense ratio disclosed in the Financial Highlights table in this report.
| Growth of an Assumed $10,000 Investment in DWS Global Income Builder VIP |
| The Russell 1000® Index is an unmanaged index that measures the performance of the 1,000 largest companies in the Russell 3000® Index, which represents approximately 92% of the total market capitalization of the Russell 3000® Index. The Barclays U.S. Aggregate Bond Index is an unmanaged index representing domestic taxable investment-grade bonds, with index components for government and corporate securities, mortgage pass-through securities, and asset-backed securities with an average maturity of one year or more. The S&P® Target Risk Moderate Index is designed to measure the performance of S&P's proprietary moderate target risk allocation model. The S&P® Target Risk Moderate Index seeks to provide significant exposure to fixed income, while also allocating a smaller portion of exposure to equities in order to seek current income, some capital preservation, and an opportunity for moderate to low capital appreciation. Index returns do not reflect any fees or expenses and it is not possible to invest directly into an index. |
| |
| Yearly periods ended December 31 | |
| Comparative Results | |
| DWS Global Income Builder VIP | | 1-Year | | | 3-Year | | | 5-Year | | | 10-Year | |
| Class A | Growth of $10,000 | | $ | 11,298 | | | $ | 12,387 | | | $ | 11,111 | | | $ | 16,869 | |
| Average annual total return | | | 12.98 | % | | | 7.40 | % | | | 2.13 | % | | | 5.37 | % |
Russell 1000® Index | Growth of $10,000 | | $ | 11,642 | | | $ | 13,719 | | | $ | 10,995 | | | $ | 20,649 | |
| Average annual total return | | | 16.42 | % | | | 11.12 | % | | | 1.92 | % | | | 7.52 | % |
| Barclays U.S. Aggregate Bond Index | Growth of $10,000 | | $ | 10,422 | | | $ | 11,974 | | | $ | 13,349 | | | $ | 16,575 | |
| Average annual total return | | | 4.22 | % | | | 6.19 | % | | | 5.95 | % | | | 5.18 | % |
S&P® Target Risk Moderate Index | Growth of $10,000 | | $ | 10,859 | | | $ | 12,017 | | | $ | 11,272 | | | $ | 17,704 | |
| Average annual total return | | | 8.59 | % | | | 6.32 | % | | | 2.42 | % | | | 5.88 | % |
The growth of $10,000 is cumulative.
Effective May 1, 2012, the Fund's name, investment objective and certain investment strategies changed. The Fund's past performance may have been different if the Fund was managed using the current objective and investment strategies.
Management Summary December 31, 2012 (Unaudited)
During the 12 months ended December 31, 2012, Class A shares of the Fund (unadjusted for contract charges) returned 12.98% and lagged the 16.42% return of its benchmark, the Russell 1000® Index.1
The current management team assumed the Fund's management duties on May 1, 2012. Since we took over the Fund, the portfolio has held a target weighting of 55% stocks and 45% bonds. We will adjust these weightings as opportunities warrant, but we didn't think either asset class exhibited enough value, relative to the other, to prompt such a shift during 2012.
The fixed-income portion of the Fund has performed very well since the May 1 changeover. Our ability to invest across the full breadth of the global fixed-income market enabled us to capitalize on the favorable market environment via overweights in corporate, high-yield and emerging-markets bonds.2
In the equity portion of the Fund, our holdings slightly underperformed the broader universe of dividend-paying stocks since May 1. The largest detractors from performance were an underweight in financials and our tilt toward capital-intensive companies, which lagged, rather than stocks with growing dividends, which outperformed. We continue to emphasize companies that offer the most compelling combination of strong fundamentals, attractive valuations and rising dividends.
We held a positive view on the outlook for global equities, based on our view that the stimulative policies of the world's central banks would help fuel continued demand for stocks. In our view, the longer-term case for dividend-paying stocks remained particularly compelling given that dividends make up such an important part of equities' total return over time. We believe our opportunistic approach — rather than one that passively seeks out the highest-yielding stocks in the market regardless of their underlying fundamentals — will enable the Fund to capitalize on the full long-term benefits of dividend stocks.
While the U.S. Federal Reserve Board's (the Fed's) low-rate policy provided support for the bond market, we expect higher volatility and, in all likelihood, more muted returns for bonds in 2013. However, we welcome volatility, as it provides us with greater latitude to take advantage of market dislocations through our relative-value style. In addition, we believe our "go anywhere" approach is useful at a time of ultra-low short-term interest rates.
We will continue to employ both top-down and bottom-up investment strategies to construct a broadly diversified portfolio of income-producing securities.3
William Chepolis, CFA, Managing Director
Thomas Schuessler, PhD., Managing Director
John D. Ryan, Director
Fabian Degen, Assistant Vice President
Portfolio Managers
The views expressed reflect those of the portfolio management team only through the end of the period of the report as stated on the cover. The management team's views are subject to change at any time based on market and other conditions and should not be construed as a recommendation. Past performance is no guarantee of future results. Current and future portfolio holdings are subject to risk.
1 The Russell 1000 Index is an unmanaged index that measures the performance of the 1,000 largest companies in the Russell 3000® Index, which represents approximately 92% of the total market capitalization of the Russell 3000 Index. Index returns do not reflect any fees or expenses and it is not possible to invest directly into an index.
2 "Underweight" means the Fund holds a lower weighting in a given sector or security than the benchmark. "Overweight" means the Fund holds a higher weighting.
3 Diversification neither assures a profit nor guarantees against a loss.
Portfolio Summary (Unaudited) Asset Allocation (As a % of Investment Portfolio excluding Securities Lending Collateral) | 12/31/12 | 12/31/11 |
| | | |
| Equity | 55% | 58% |
| Common Stocks | 55% | 53% |
| Exchange-Traded Funds — Equity | — | 5% |
| | | |
| Fixed Income | 44% | 38% |
| Corporate Bonds | 28% | 7% |
| Government & Agency Obligations | 6% | 10% |
| Mortgage-Backed Securities Pass-Throughs | 3% | 7% |
| Loan Participations and Assignments | 3% | — |
| Collateralized Mortgage Obligations | 2% | — |
| Commercial Mortgage-Backed Securities | 1% | 1% |
| Asset-Backed | 1% | 1% |
| Municipal Bonds and Notes | 0% | 1% |
| Exchange-Traded Funds — Fixed Income | — | 11% |
| | | |
| Cash Equivalents | 1% | 4% |
| | 100% | 100% |
Sector Diversification (As a % of Equities, Corporate Bonds, Loan Participations and Assignments, Preferred Securities, Preferred Stocks, Convertible Bonds and Other Investments) | 12/31/12 | 12/31/11 |
| | | |
| Financials | 19% | 15% |
| Energy | 13% | 12% |
| Consumer Staples | 13% | 10% |
| Health Care | 11% | 12% |
| Materials | 8% | 6% |
| Consumer Discretionary | 8% | 10% |
| Information Technology | 8% | 15% |
| Telecommunication Services | 7% | 4% |
| Utilities | 7% | 6% |
| Industrials | 6% | 10% |
| | 100% | 100% |
Portfolio holdings and characteristics are subject to change.
For more complete details about the Fund's investment portfolio, see page 6.
Following the Fund's fiscal first and third quarter-end, a complete portfolio holdings listing is filed with the SEC on Form N-Q. The form will be available on the SEC's Web site at www.sec.gov, and it also may be reviewed and copied at the SEC's Public Reference Room in Washington, D.C. Information on the operation of the SEC's Public Reference Room may be obtained by calling (800) SEC-0330. The Fund's portfolio holdings are also posted on www.dws-investments.com from time to time. Please see the Fund's current prospectus for more information.
Investment Portfolio December 31, 2012 | | | Shares | | | Value ($) | |
| | | | |
| Common Stocks 56.0% | |
| Consumer Discretionary 4.0% | |
| Distributors 0.6% | |
| Genuine Parts Co. | | | 23,436 | | | | 1,490,061 | |
| Hotels, Restaurants & Leisure 0.0% | |
| Trump Entertainment Resorts, Inc.* | | | 2 | | | | 0 | |
| Media 2.3% | |
| Pearson PLC | | | 146,342 | | | | 2,860,890 | |
| Vertis Holdings, Inc.* | | | 111 | | | | 0 | |
| Wolters Kluwer NV | | | 157,221 | | | | 3,251,008 | |
| | | | | | | | 6,111,898 | |
| Specialty Retail 0.6% | |
| Staples, Inc. (a) | | | 127,563 | | | | 1,454,218 | |
| Textiles, Apparel & Luxury Goods 0.5% | |
| VF Corp. (a) | | | 9,370 | | | | 1,414,589 | |
| Consumer Staples 10.7% | |
| Beverages 2.5% | |
| PepsiCo, Inc. | | | 96,586 | | | | 6,609,380 | |
| Food Products 2.0% | |
| Nestle SA (Registered) | | | 38,522 | | | | 2,510,637 | |
| Unilever NV (CVA) | | | 70,398 | | | | 2,656,381 | |
| | | | | | | | 5,167,018 | |
| Household Products 3.3% | |
| Procter & Gamble Co. | | | 125,620 | | | | 8,528,342 | |
| Tobacco 2.9% | |
| Altria Group, Inc. | | | 43,800 | | | | 1,376,196 | |
| British American Tobacco PLC | | | 75,001 | | | | 3,800,303 | |
| Imperial Tobacco Group PLC | | | 57,375 | | | | 2,215,527 | |
| | | | | | | | 7,392,026 | |
| Energy 7.1% | |
| Energy Equipment & Services 1.8% | |
| Transocean Ltd. | | | 62,481 | | | | 2,789,776 | |
| WorleyParsons Ltd. | | | 76,902 | | | | 1,897,112 | |
| | | | | | | | 4,686,888 | |
| Oil, Gas & Consumable Fuels 5.3% | |
| Canadian Natural Resources Ltd. (b) | | | 60,600 | | | | 1,744,832 | |
| Canadian Natural Resources Ltd. (b) | | | 19,470 | | | | 562,099 | |
| ConocoPhillips | | | 57,138 | | | | 3,313,433 | |
| Enbridge, Inc. (a) | | | 62,767 | | | | 2,714,624 | |
| Phillips 66 | | | 48,501 | | | | 2,575,403 | |
| TransCanada Corp. (a) | | | 62,966 | | | | 2,976,436 | |
| | | | | | | | 13,886,827 | |
| Financials 6.1% | |
| Commercial Banks 1.8% | |
| Bank of Nova Scotia (a) | | | 42,153 | | | | 2,435,017 | |
| Toronto-Dominion Bank (a) | | | 26,057 | | | | 2,193,901 | |
| | | | | | | | 4,628,918 | |
| Insurance 4.3% | |
| PartnerRe Ltd. | | | 64,143 | | | | 5,162,870 | |
| Powszechny Zaklad Ubezpieczen SA | | | 19,922 | | | | 2,828,900 | |
| Sampo Oyj "A" | | | 97,659 | | | | 3,157,940 | |
| | | | | | | | 11,149,710 | |
| | | Shares | | | Value ($) | |
| | | | | | | | | |
| Real Estate Investment Trusts 0.0% | |
| Corio NV (REIT) | | | 81 | | | | 3,685 | |
| Health Care 7.8% | |
| Health Care Equipment & Supplies 1.1% | |
| Stryker Corp. | | | 53,814 | | | | 2,950,083 | |
| Health Care Providers & Services 1.7% | |
| Rhoen-Klinikum AG | | | 217,864 | | | | 4,409,847 | |
| Pharmaceuticals 5.0% | |
| Novartis AG (Registered) | | | 70,713 | | | | 4,476,947 | |
| Roche Holding AG (Genusschein) | | | 22,895 | | | | 4,664,282 | |
| Sanofi | | | 40,368 | | | | 3,828,308 | |
| | | | | | | | 12,969,537 | |
| Industrials 3.7% | |
| Aerospace & Defense 0.7% | |
| BAE Systems PLC | | | 333,558 | | | | 1,832,560 | |
| Air Freight & Logistics 0.6% | |
| Singapore Post Ltd. | | | 1,691,000 | | | | 1,591,818 | |
| Building Products 0.0% | |
| Congoleum Corp.* | | | 3,800 | | | | 0 | |
| Industrial Conglomerates 2.4% | |
| Koninklijke Philips Electronics NV | | | 132,940 | | | | 3,566,555 | |
| Smiths Group PLC | | | 132,457 | | | | 2,607,175 | |
| | | | | | | | 6,173,730 | |
| Information Technology 5.1% | |
| Computers & Peripherals 1.8% | |
| Diebold, Inc. | | | 73,183 | | | | 2,240,131 | |
| Wincor Nixdorf AG | | | 53,134 | | | | 2,488,704 | |
| | | | | | | | 4,728,835 | |
| IT Services 0.7% | |
| Automatic Data Processing, Inc. | | | 29,631 | | | | 1,689,263 | |
| Semiconductors & Semiconductor Equipment 1.5% | |
| Intel Corp. (a) | | | 190,770 | | | | 3,935,585 | |
| Software 1.1% | |
| Microsoft Corp. | | | 111,117 | | | | 2,970,158 | |
| Materials 4.8% | |
| Chemicals 2.1% | |
| Air Liquide SA | | | 20,107 | | | | 2,519,740 | |
| Air Products & Chemicals, Inc. | | | 34,215 | | | | 2,874,744 | |
| | | | | | | | 5,394,484 | |
| Construction Materials 0.0% | |
| Wolverine Tube, Inc.* | | | 366 | | | | 6,632 | |
| Containers & Packaging 1.2% | |
| Sealed Air Corp. | | | 104,279 | | | | 1,825,925 | |
| Sonoco Products Co. | | | 44,783 | | | | 1,331,399 | |
| | | | | | | | 3,157,324 | |
| Metals & Mining 1.5% | |
| Franco-Nevada Corp. (a) | | | 69,992 | | | | 3,995,321 | |
| Telecommunication Services 2.4% | |
| Diversified Telecommunication Services 0.8% | |
| Belgacom SA | | | 69,989 | | | | 2,063,032 | |
| | | Shares | | | Value ($) | |
| | | | | | | | | |
| Wireless Telecommunication Services 1.6% | |
| NTT DoCoMo, Inc. | | | 1,761 | | | | 2,529,058 | |
| Vodafone Group PLC | | | 647,520 | | | | 1,628,426 | |
| | | | | | | | 4,157,484 | |
| Utilities 4.3% | |
| Electric Utilities 1.1% | |
| Exelon Corp. | | | 39,193 | | | | 1,165,600 | |
| FirstEnergy Corp. | | | 38,422 | | | | 1,604,503 | |
| | | | | | | | 2,770,103 | |
| Gas Utilities 2.3% | |
| UGI Corp. | | | 185,851 | | | | 6,079,186 | |
| Multi-Utilities 0.9% | |
| National Grid PLC | | | 206,794 | | | | 2,368,707 | |
Total Common Stocks (Cost $136,482,576) | | | | 145,767,249 | |
| | |
| Preferred Stock 0.0% | |
| Financials | |
| Ally Financial, Inc. 144A, 7.0% (Cost $46,906) | | | 50 | | | | 49,111 | |
| | |
| Warrants 0.0% | |
| Consumer Discretionary 0.0% | |
| Reader's Digest Association, Inc., Expiration Date 2/19/2014* | | | 80 | | | | 14 | |
| Materials 0.0% | |
| GEO Specialty Chemicals, Inc., Expiration Date 3/31/2015* | | | 19,324 | | | | 8,618 | |
| Hercules Trust II, Expiration Date 3/31/2029* | | | 170 | | | | 1,485 | |
| | | | | | | | 10,103 | |
Total Warrants (Cost $30,283) | | | | 10,117 | |
| | | Principal Amount ($)(c) | | | Value ($) | |
| | | | |
| Corporate Bonds 28.7% | |
| Consumer Discretionary 3.0% | |
| 313 Group, Inc., 144A, 6.375%, 12/1/2019 | | | | 50,000 | | | | 49,563 | |
| AMC Entertainment, Inc., 8.75%, 6/1/2019 | | | | 405,000 | | | | 448,537 | |
| Asbury Automotive Group, Inc., 7.625%, 3/15/2017 | | | | 35,000 | | | | 36,138 | |
| Avis Budget Car Rental LLC, 8.25%, 1/15/2019 | | | | 15,000 | | | | 16,575 | |
| Block Communications, Inc., 144A, 7.25%, 2/1/2020 | | | | 20,000 | | | | 21,250 | |
| British Sky Broadcasting Group PLC, 144A, 3.125%, 11/26/2022 | | | | 90,000 | | | | 89,687 | |
| Caesar's Entertainment Operating Co., Inc.: | | |
| 8.5%, 2/15/2020 | | | | 610,000 | | | | 605,425 | |
| 11.25%, 6/1/2017 | | | | 80,000 | | | | 85,700 | |
| CCO Holdings LLC: | |
| 5.25%, 9/30/2022 | | | | 345,000 | | | | 349,312 | |
| 6.5%, 4/30/2021 | | | | 740,000 | | | | 798,275 | |
| 6.625%, 1/31/2022 | | | | 705,000 | | | | 770,212 | |
| 7.375%, 6/1/2020 | | | | 10,000 | | | | 11,100 | |
| CDR DB Sub, Inc., 144A, 7.75%, 10/15/2020 | | | | 55,000 | | | | 54,862 | |
| | | Principal Amount ($)(c) | | | Value ($) | |
| | | | | | | | | |
| Cequel Communications Holdings I LLC, 144A, 6.375%, 9/15/2020 | | | | 285,000 | | | | 296,756 | |
| Clear Channel Worldwide Holdings, Inc.: | | |
| Series A, 144A, 6.5%, 11/15/2022 | | | | 35,000 | | | | 35,963 | |
| Series B, 144A, 6.5%, 11/15/2022 | | | | 90,000 | | | | 93,375 | |
| Series A, 7.625%, 3/15/2020 | | | | 10,000 | | | | 9,975 | |
| Series B, 7.625%, 3/15/2020 | | | | 255,000 | | | | 256,912 | |
| Cox Communications, Inc., 144A, 3.25%, 12/15/2022 | | | | 80,000 | | | | 82,501 | |
| Cumulus Media Holdings, Inc., 7.75%, 5/1/2019 | | | | 20,000 | | | | 19,650 | |
| DISH DBS Corp.: | |
| 6.625%, 10/1/2014 | | | | 40,000 | | | | 43,000 | |
| 7.125%, 2/1/2016 | | | | 35,000 | | | | 39,200 | |
| 7.875%, 9/1/2019 | | | | 270,000 | | | | 319,950 | |
| Fontainebleau Las Vegas Holdings LLC, 144A, 11.0%, 6/15/2015* | | | | 25,000 | | | | 16 | |
| Griffey Intermediate, Inc., 144A, 7.0%, 10/15/2020 | | | | 95,000 | | | | 97,137 | |
| Harron Communications LP, 144A, 9.125%, 4/1/2020 | | | | 10,000 | | | | 10,950 | |
| Hertz Corp.: | |
| 144A, 6.75%, 4/15/2019 | | | | 10,000 | | | | 10,913 | |
| 6.75%, 4/15/2019 | | | | 270,000 | | | | 294,637 | |
| Jo-Ann Stores Holdings, Inc., 144A, 9.75%, 10/15/2019 (PIK) | | | | 55,000 | | | | 55,481 | |
| Libbey Glass, Inc., 6.875%, 5/15/2020 | | | | 30,000 | | | | 32,250 | |
| Mediacom Broadband LLC, 144A, 6.375%, 4/1/2023 | | | | 35,000 | | | | 35,613 | |
| Mediacom LLC, 9.125%, 8/15/2019 | | | | 580,000 | | | | 642,350 | |
| MGM Resorts International: | |
| 6.625%, 12/15/2021 | | | | 150,000 | | | | 150,000 | |
| 144A, 6.75%, 10/1/2020 | | | | 40,000 | | | | 40,850 | |
| 144A, 8.625%, 2/1/2019 (a) | | | | 400,000 | | | | 446,000 | |
| National CineMedia LLC, 6.0%, 4/15/2022 | | | | 10,000 | | | | 10,600 | |
| Penske Automotive Group, Inc., 144A, 5.75%, 10/1/2022 | | | | 70,000 | | | | 72,100 | |
| Petco Holdings, Inc., 144A, 8.5%, 10/15/2017 (PIK) | | | | 30,000 | | | | 30,825 | |
| Quebecor Media, Inc., 144A, 5.75%, 1/15/2023 | | | | 50,000 | | | | 52,688 | |
| Royal Caribbean Cruises Ltd., 5.25%, 11/15/2022 | | | | 35,000 | | | | 37,013 | |
| Servicios Corporativos Javer SAPI de CV, 144A, 9.875%, 4/6/2021 | | | | 100,000 | | | | 107,000 | |
| Sonic Automotive, Inc., 144A, 7.0%, 7/15/2022 | | | | 25,000 | | | | 27,375 | |
| Sotheby's, 144A, 5.25%, 10/1/2022 | | | | 45,000 | | | | 45,450 | |
| Travelport LLC, 4.936%**, 9/1/2014 | | | | 20,000 | | | | 15,650 | |
| Unitymedia Hessen GmbH & Co., KG: | | |
| 144A, 5.5%, 1/15/2023 | | | | 200,000 | | | | 206,500 | |
| 144A, 7.5%, 3/15/2019 | EUR | | | 400,000 | | | | 576,818 | |
| | | Principal Amount ($)(c) | | | Value ($) | |
| | | | | | | | | |
| Unitymedia KabelBW GmbH, 144A, 9.625%, 12/1/2019 | EUR | | | 110,000 | | | | 162,545 | |
| Univision Communications, Inc., 144A, 6.875%, 5/15/2019 | | | | 25,000 | | | | 26,000 | |
| Viking Cruises Ltd., 144A, 8.5%, 10/15/2022 | | | | 50,000 | | | | 54,000 | |
| Whirlpool Corp., 4.7%, 6/1/2022 | | | | 90,000 | | | | 95,653 | |
| | | | | 7,870,332 | |
| Consumer Staples 0.7% | |
| Anadolu Efes Biracilik Ve Malt Sanayii AS, 144A, 3.375%, 11/1/2022 | | | | 250,000 | | | | 246,250 | |
| ConAgra Foods, Inc., 3.25%, 9/15/2022 | | | | 235,000 | | | | 236,044 | |
| Constellation Brands, Inc., 6.0%, 5/1/2022 | | | | 5,000 | | | | 5,725 | |
| Del Monte Corp., 7.625%, 2/15/2019 | | | | 95,000 | | | | 99,037 | |
| JBS U.S.A. LLC, 144A, 8.25%, 2/1/2020 | | | | 370,000 | | | | 392,200 | |
| Minerva Luxembourg SA, 144A, 12.25%, 2/10/2022 | | | | 250,000 | | | | 299,375 | |
| Pilgrim's Pride Corp., 7.875%, 12/15/2018 | | | | 430,000 | | | | 435,912 | |
| Smithfield Foods, Inc., 6.625%, 8/15/2022 | | | | 105,000 | | | | 116,025 | |
| Tops Holding Corp., 144A, 8.875%, 12/15/2017 | | | | 25,000 | | | | 25,938 | |
| TreeHouse Foods, Inc., 7.75%, 3/1/2018 | | | | 10,000 | | | | 10,850 | |
| | | | | 1,867,356 | |
| Energy 2.6% | |
| Access Midstream Partners LP: | | |
| 4.875%, 5/15/2023 | | | | 60,000 | | | | 60,900 | |
| 6.125%, 7/15/2022 | | | | 15,000 | | | | 16,163 | |
| BreitBurn Energy Partners LP, 144A, 7.875%, 4/15/2022 | | | | 50,000 | | | | 51,875 | |
| Cenovus Energy, Inc., 3.0%, 8/15/2022 | | | | 280,000 | | | | 285,970 | |
| Chaparral Energy, Inc., 144A, 7.625%, 11/15/2022 | | | | 55,000 | | | | 57,200 | |
| Continental Resources, Inc., 5.0%, 9/15/2022 | | | | 40,000 | | | | 43,100 | |
| Crosstex Energy LP, 144A, 7.125%, 6/1/2022 | | | | 25,000 | | | | 26,063 | |
| DCP Midstream LLC, 144A, 9.75%, 3/15/2019 | | | | 200,000 | | | | 264,565 | |
| Eagle Rock Energy Partners LP, 8.375%, 6/1/2019 | | | | 125,000 | | | | 127,500 | |
| Enterprise Products Operating LLC, 6.125%, 10/15/2039 | | | | 230,000 | | | | 277,861 | |
| EP Energy LLC: | |
| 6.875%, 5/1/2019 | | | | 15,000 | | | | 16,275 | |
| 7.75%, 9/1/2022 | | | | 80,000 | | | | 84,800 | |
| EPE Holdings LLC, 144A, 8.125%, 12/15/2017 (PIK) | | | | 110,000 | | | | 109,038 | |
| EV Energy Partners LP, 8.0%, 4/15/2019 | | | | 35,000 | | | | 37,144 | |
| FMC Technologies, Inc., 3.45%, 10/1/2022 | | | | 200,000 | | | | 204,129 | |
| Halcon Resources Corp., 144A, 9.75%, 7/15/2020 | | | | 65,000 | | | | 70,200 | |
| | | Principal Amount ($)(c) | | | Value ($) | |
| | | | | | | | | |
| Holly Energy Partners LP, 144A, 6.5%, 3/1/2020 | | | | 10,000 | | | | 10,700 | |
| IPIC GMTN Ltd., 144A, 5.5%, 3/1/2022 | | | | 250,000 | | | | 294,687 | |
| Linn Energy LLC: | |
| 144A, 6.25%, 11/1/2019 | | | | 540,000 | | | | 542,700 | |
| 6.5%, 5/15/2019 | | | | 25,000 | | | | 25,250 | |
| MarkWest Energy Partners LP, 5.5%, 2/15/2023 | | | | 65,000 | | | | 70,525 | |
| MEG Energy Corp., 144A, 6.375%, 1/30/2023 | | | | 155,000 | | | | 161,587 | |
| Midstates Petroleum Co., Inc., 144A, 10.75%, 10/1/2020 | | | | 55,000 | | | | 58,438 | |
| Northern Oil & Gas, Inc., 8.0%, 6/1/2020 | | | | 125,000 | | | | 127,500 | |
| Oasis Petroleum, Inc.: | |
| 6.5%, 11/1/2021 (a) | | | | 225,000 | | | | 239,062 | |
| 7.25%, 2/1/2019 | | | | 60,000 | | | | 64,500 | |
| Offshore Group Investment Ltd., 144A, 7.5%, 11/1/2019 (a) | | | | 140,000 | | | | 141,400 | |
| OGX Austria GmbH, 144A, 8.375%, 4/1/2022 | | | | 250,000 | | | | 208,750 | |
| ONEOK Partners LP, 6.15%, 10/1/2016 | | | | 201,000 | | | | 233,977 | |
| Petroleos de Venezuela SA, 144A, 8.5%, 11/2/2017 | | | | 250,000 | | | | 246,875 | |
| Petroleos Mexicanos, 144A, 5.5%, 6/27/2044 | | | | 1,000,000 | | | | 1,100,000 | |
| Plains Exploration & Production Co.: | | |
| 6.125%, 6/15/2019 | | | | 10,000 | | | | 10,900 | |
| 6.75%, 2/1/2022 | | | | 50,000 | | | | 56,125 | |
| 6.875%, 2/15/2023 | | | | 125,000 | | | | 142,813 | |
| Quicksilver Resources, Inc., 11.75%, 1/1/2016 | | | | 275,000 | | | | 271,562 | |
| Reliance Holdings U.S.A., Inc., 144A, 5.4%, 2/14/2022 | | | | 250,000 | | | | 279,619 | |
| SandRidge Energy, Inc., 7.5%, 3/15/2021 | | | | 110,000 | | | | 117,700 | |
| SESI LLC, 7.125%, 12/15/2021 | | | | 30,000 | | | | 33,375 | |
| Shelf Drilling Holdings Ltd., 144A, 8.625%, 11/1/2018 | | | | 70,000 | | | | 71,750 | |
| Swift Energy Co.: | |
| 7.875%, 3/1/2022 | | | | 20,000 | | | | 20,900 | |
| 144A, 7.875%, 3/1/2022 | | | | 60,000 | | | | 62,700 | |
| Tesoro Corp.: | |
| 4.25%, 10/1/2017 | | | | 50,000 | | | | 51,750 | |
| 5.375%, 10/1/2022 | | | | 35,000 | | | | 37,275 | |
| Transocean, Inc., 3.8%, 10/15/2022 | | | | 370,000 | | | | 379,225 | |
| | | | | 6,794,428 | |
| Financials 9.4% | |
| Akbank TAS, 144A, 5.0%, 10/24/2022 (a) | | | | 250,000 | | | | 263,973 | |
| Ally Financial, Inc.: | |
| 5.5%, 2/15/2017 | | | | 15,000 | | | | 16,046 | |
| 6.25%, 12/1/2017 | | | | 560,000 | | | | 620,042 | |
| Alphabet Holding Co., Inc., 144A, 7.75%, 11/1/2017 (PIK) | | | | 50,000 | | | | 51,500 | |
| American International Group, Inc., 4.875%, 6/1/2022 | | | | 200,000 | | | | 228,324 | |
| | | Principal Amount ($)(c) | | | Value ($) | |
| | | | | | | | | |
| AmeriGas Finance LLC: | |
| 6.75%, 5/20/2020 | | | | 10,000 | | | | 10,975 | |
| 7.0%, 5/20/2022 | | | | 10,000 | | | | 11,125 | |
| Anglo American Capital PLC, 144A, 4.125%, 9/27/2022 (a) | | | | 500,000 | | | | 522,374 | |
| Banco Bradesco SA, 144A, 5.9%, 1/16/2021 | | | | 250,000 | | | | 272,500 | |
| Banco do Brasil SA, 144A, 5.875%, 1/26/2022 | | | | 250,000 | | | | 275,625 | |
| Banco Latinoamericano de Comercio Exterior SA, 144A, 3.75%, 4/4/2017 | | | | 250,000 | | | | 255,875 | |
| Bancolombia SA, 5.125%, 9/11/2022 | | | | 750,000 | | | | 780,000 | |
| Bangkok Bank PCL, 144A, 3.875%, 9/27/2022 | | | | 250,000 | | | | 257,750 | |
| Barclays Bank PLC, 7.625%, 11/21/2022 (a) | | | | 490,000 | | | | 489,387 | |
| BBVA Bancomer SA, 144A, 6.75%, 9/30/2022 | | | | 500,000 | | | | 562,500 | |
| BNP Paribas SA, 2.375%, 9/14/2017 | | | | 490,000 | | | | 497,030 | |
| BOE Merger Corp., 144A, 9.5%, 11/1/2017 (PIK) | | | | 100,000 | | | | 100,000 | |
| Braskem America Finance Co., 144A, 7.125%, 7/22/2041 | | | | 250,000 | | | | 263,125 | |
| Caesar's Operating Escrow LLC, 144A, 9.0%, 2/15/2020 | | | | 65,000 | | | | 65,000 | |
| Calpine Construction Finance Co., LP, 144A, 8.0%, 6/1/2016 | | | | 30,000 | | | | 31,875 | |
| Cemex Finance LLC, 144A, 9.375%, 10/12/2022 | | | | 200,000 | | | | 225,000 | |
| CIT Group, Inc.: | |
| 4.25%, 8/15/2017 | | | | 495,000 | | | | 509,722 | |
| 5.0%, 5/15/2017 | | | | 935,000 | | | | 991,100 | |
| 5.25%, 3/15/2018 | | | | 10,000 | | | | 10,700 | |
| CNA Financial Corp., 5.75%, 8/15/2021 | | | | 265,000 | | | | 310,820 | |
| Cooperatieve Centrale Raiffeisen-Boerenleenbank BA, 3.95%, 11/9/2022 | | | | 260,000 | | | | 266,249 | |
| Development Bank of Kazakhstan JSC, 6.5%, 6/3/2020 | | | | 500,000 | | | | 562,500 | |
| E*TRADE Financial Corp.: | |
| 6.375%, 11/15/2019 | | | | 140,000 | | | | 143,500 | |
| 6.75%, 6/1/2016 | | | | 745,000 | | | | 784,112 | |
| European Investment Bank, 6.125%, 1/23/2017 | AUD | | | 500,000 | | | | 564,837 | |
| Fibria Overseas Finance Ltd., 144A, 6.75%, 3/3/2021 (a) | | | | 400,000 | | | | 443,000 | |
| Ford Motor Credit Co., LLC: | |
| 3.0%, 6/12/2017 | | | | 200,000 | | | | 205,485 | |
| 4.25%, 9/20/2022 | | | | 205,000 | | | | 216,764 | |
| 5.875%, 8/2/2021 | | | | 260,000 | | | | 302,780 | |
| Fresenius Medical Care U.S. Finance II, Inc.: | | |
| 144A, 5.625%, 7/31/2019 | | | | 10,000 | | | | 10,738 | |
| 144A, 5.875%, 1/31/2022 | | | | 15,000 | | | | 16,275 | |
| Fresenius Medical Care U.S. Finance, Inc., 144A, 6.5%, 9/15/2018 | | | | 10,000 | | | | 11,175 | |
| | | Principal Amount ($)(c) | | | Value ($) | |
| | | | | | | | | |
| General Electric Capital Corp., 2.9%, 1/9/2017 | | | | 250,000 | | | | 264,336 | |
| Hartford Financial Services Group, Inc., 6.0%, 1/15/2019 | | | | 250,000 | | | | 291,167 | |
| Hexion U.S. Finance Corp.: | |
| 6.625%, 4/15/2020 | | | | 280,000 | | | | 284,900 | |
| 8.875%, 2/1/2018 | | | | 510,000 | | | | 524,025 | |
| ING Bank NV, 144A, 2.0%, 9/25/2015 | | | | 375,000 | | | | 377,775 | |
| International Lease Finance Corp.: | | |
| 6.25%, 5/15/2019 | | | | 410,000 | | | | 436,650 | |
| 8.625%, 1/15/2022 | | | | 10,000 | | | | 12,350 | |
| 8.75%, 3/15/2017 | | | | 75,000 | | | | 86,625 | |
| Itau Unibanco Holding SA, 144A, 5.65%, 3/19/2022 | | | | 250,000 | | | | 262,813 | |
| Kazakhstan Temir Zholy Finance BV, 144A, 6.95%, 7/10/2042 | | | | 250,000 | | | | 314,375 | |
| Level 3 Financing, Inc.: | |
| 144A, 7.0%, 6/1/2020 | | | | 185,000 | | | | 193,325 | |
| 8.625%, 7/15/2020 (a) | | | | 450,000 | | | | 499,500 | |
| Lukoil International Finance BV: | | |
| 144A, 6.125%, 11/9/2020 | | | | 250,000 | | | | 289,062 | |
| 144A, 7.25%, 11/5/2019 | | | | 250,000 | | | | 305,625 | |
| Macquarie Bank Ltd., 144A, 3.45%, 7/27/2015 | | | | 130,000 | | | | 135,186 | |
| MPT Operating Partnership LP, (REIT), 6.375%, 2/15/2022 | | | | 10,000 | | | | 10,500 | |
| Nationwide Financial Services, Inc., 144A, 5.375%, 3/25/2021 | | | | 119,000 | | | | 126,962 | |
| Neuberger Berman Group LLC: | | |
| 144A, 5.625%, 3/15/2020 | | | | 10,000 | | | | 10,475 | |
| 144A, 5.875%, 3/15/2022 | | | | 550,000 | | | | 583,000 | |
| Nielsen Finance LLC, 144A, 4.5%, 10/1/2020 | | | | 35,000 | | | | 34,825 | |
| Nordea Bank AB, 144A, 4.25%, 9/21/2022 (a) | | | | 375,000 | | | | 386,247 | |
| Odebrecht Finance Ltd.: | |
| 144A, 5.125%, 6/26/2022 | | | | 250,000 | | | | 271,250 | |
| 144A, 7.125%, 6/26/2042 | | | | 250,000 | | | | 290,000 | |
| Petrobras International Finance Co., 5.75%, 1/20/2020 | | | | 250,000 | | | | 284,589 | |
| PNC Bank NA, 6.875%, 4/1/2018 | | | | 300,000 | | | | 374,731 | |
| PPL Capital Funding, Inc., 3.5%, 12/1/2022 | | | | 280,000 | | | | 285,011 | |
| Principal Financial Group, Inc., 3.3%, 9/15/2022 | | | | 305,000 | | | | 309,401 | |
| Qtel International Finance Ltd., 144A, 3.25%, 2/21/2023 | | | | 1,000,000 | | | | 999,000 | |
| RBS Citizens Financial Group, Inc., 144A, 4.15%, 9/28/2022 | | | | 355,000 | | | | 362,259 | |
| Reynolds Group Issuer, Inc.: | |
| 144A, 5.75%, 10/15/2020 | | | | 95,000 | | | | 98,088 | |
| 7.125%, 4/15/2019 | | | | 1,015,000 | | | | 1,091,125 | |
| Santander U.S. Debt SA, 144A, 2.991%, 10/7/2013 | | | | 500,000 | | | | 500,845 | |
| Schaeffler Finance BV, 144A, 7.75%, 2/15/2017 | | | | 845,000 | | | | 937,950 | |
| | | Principal Amount ($)(c) | | | Value ($) | |
| | | | | | | | | |
| Serta Simmons Holdings LLC, 144A, 8.125%, 10/1/2020 | | | | 55,000 | | | | 55,000 | |
| Sky Growth Acquisition Corp., 144A, 7.375%, 10/15/2020 | | | | 40,000 | | | | 39,800 | |
| Tronox Finance LLC, 144A, 6.375%, 8/15/2020 | | | | 55,000 | | | | 55,550 | |
| Turkiye Garanti Bankasi AS, 144A, 5.25%, 9/13/2022 | | | | 500,000 | | | | 537,500 | |
| Turkiye Vakiflar Bankasi Tao, 144A, 6.0%, 11/1/2022 | | | | 500,000 | | | | 515,253 | |
| UPCB Finance III Ltd., 144A, 6.625%, 7/1/2020 | | | | 370,000 | | | | 396,362 | |
| Vale Overseas Ltd., 8.25%, 1/17/2034 | | | | 250,000 | | | | 341,901 | |
| WMG Acquisition Corp., 144A, 6.0%, 1/15/2021 | | | | 25,000 | | | | 26,375 | |
| Xstrata Finance Canada Ltd., 144A, 4.0%, 10/25/2022 | | | | 180,000 | | | | 181,946 | |
| | | | | 24,533,442 | |
| Health Care 1.4% | |
| Agilent Technologies, Inc., 3.2%, 10/1/2022 | | | | 200,000 | | | | 202,354 | |
| Amgen, Inc., 5.15%, 11/15/2041 | | | | 150,000 | | | | 168,805 | |
| Aviv Healthcare Properties LP, 7.75%, 2/15/2019 | | | | 10,000 | | | | 10,600 | |
| Biomet, Inc.: | |
| 144A, 6.5%, 8/1/2020 | | | | 85,000 | | | | 90,312 | |
| 144A, 6.5%, 10/1/2020 | | | | 25,000 | | | | 24,844 | |
| Community Health Systems, Inc.: | | |
| 5.125%, 8/15/2018 | | | | 290,000 | | | | 302,325 | |
| 7.125%, 7/15/2020 | | | | 170,000 | | | | 181,475 | |
| Gilead Sciences, Inc., 4.4%, 12/1/2021 (a) | | | | 100,000 | | | | 113,996 | |
| HCA, Inc.: | |
| 6.5%, 2/15/2020 | | | | 880,000 | | | | 990,000 | |
| 7.5%, 2/15/2022 | | | | 725,000 | | | | 830,125 | |
| 8.5%, 4/15/2019 | | | | 10,000 | | | | 11,150 | |
| Hologic, Inc., 144A, 6.25%, 8/1/2020 | | | | 40,000 | | | | 43,100 | |
| IMS Health, Inc., 144A, 6.0%, 11/1/2020 | | | | 60,000 | | | | 62,850 | |
| Laboratory Corp. of America Holdings, 3.75%, 8/23/2022 | | | | 140,000 | | | | 148,465 | |
| McKesson Corp., 4.75%, 3/1/2021 | | | | 200,000 | | | | 232,292 | |
| Mylan, Inc., 144A, 7.875%, 7/15/2020 | | | | 20,000 | | | | 23,635 | |
| Physio-Control International, Inc., 144A, 9.875%, 1/15/2019 | | | | 15,000 | | | | 16,463 | |
| Tenet Healthcare Corp., 6.25%, 11/1/2018 | | | | 230,000 | | | | 252,425 | |
| | | | | 3,705,216 | |
| Industrials 1.9% | |
| Accuride Corp., 9.5%, 8/1/2018 | | | | 10,000 | | | | 9,650 | |
| ADT Corp., 144A, 3.5%, 7/15/2022 | | | | 90,000 | | | | 87,533 | |
| BE Aerospace, Inc., 6.875%, 10/1/2020 | | | | 185,000 | | | | 205,812 | |
| Belden, Inc., 144A, 5.5%, 9/1/2022 | | | | 85,000 | | | | 87,338 | |
| | | Principal Amount ($)(c) | | | Value ($) | |
| | | | | | | | | |
| Bombardier, Inc., 144A, 5.75%, 3/15/2022 (a) | | | | 628,000 | | | | 645,270 | |
| Clean Harbors, Inc., 144A, 5.125%, 6/1/2021 | | | | 65,000 | | | | 67,275 | |
| CSX Corp., 6.15%, 5/1/2037 | | | | 370,000 | | | | 467,771 | |
| FTI Consulting, Inc., 144A, 6.0%, 11/15/2022 | | | | 50,000 | | | | 51,750 | |
| Huntington Ingalls Industries, Inc., 6.875%, 3/15/2018 | | | | 560,000 | | | | 609,000 | |
| Iron Mountain, Inc., 5.75%, 8/15/2024 | | | | 90,000 | | | | 91,125 | |
| JSC Georgian Railway, 144A, 7.75%, 7/11/2022 | | | | 250,000 | | | | 284,375 | |
| Kenan Advantage Group, Inc., 144A, 8.375%, 12/15/2018 | | | | 100,000 | | | | 102,000 | |
| Meritor, Inc., 8.125%, 9/15/2015 | | | | 100,000 | | | | 105,250 | |
| Navios Maritime Holdings, Inc., 8.875%, 11/1/2017 | | | | 60,000 | | | | 59,850 | |
| Nortek, Inc., 8.5%, 4/15/2021 | | | | 155,000 | | | | 172,050 | |
| Owens Corning, Inc., 4.2%, 12/15/2022 | | | | 60,000 | | | | 61,019 | |
| Ply Gem Industries, Inc., 144A, 9.375%, 4/15/2017 | | | | 40,000 | | | | 42,600 | |
| TransDigm, Inc., 7.75%, 12/15/2018 | | | | 80,000 | | | | 88,500 | |
| Transnet SOC Ltd., 144A, 4.0%, 7/26/2022 | | | | 500,000 | | | | 503,125 | |
| United Rentals North America, Inc.: | | |
| 144A, 5.75%, 7/15/2018 | | | | 90,000 | | | | 96,975 | |
| 6.125%, 6/15/2023 | | | | 10,000 | | | | 10,550 | |
| 144A, 7.375%, 5/15/2020 | | | | 25,000 | | | | 27,438 | |
| 144A, 7.625%, 4/15/2022 | | | | 270,000 | | | | 301,725 | |
| Urbi, Desarrollos Urbanos SAB de CV, 144A, 9.75%, 2/3/2022 (a) | | | | 250,000 | | | | 236,875 | |
| Voto-Votorantim Ltd., 144A, 6.75%, 4/5/2021 | | | | 250,000 | | | | 293,125 | |
| Votorantim Cimentos SA, 144A, 7.25%, 4/5/2041 | | | | 250,000 | | | | 280,000 | |
| | | | | 4,987,981 | |
| Information Technology 1.5% | |
| Alliance Data Systems Corp., 144A, 5.25%, 12/1/2017 | | | | 60,000 | | | | 60,900 | |
| CDW LLC, 8.5%, 4/1/2019 | | | | 610,000 | | | | 660,325 | |
| CyrusOne LP, 144A, 6.375%, 11/15/2022 | | | | 25,000 | | | | 26,063 | |
| Equinix, Inc., 7.0%, 7/15/2021 | | | | 470,000 | | | | 521,700 | |
| First Data Corp.: | |
| 144A, 6.75%, 11/1/2020 | | | | 365,000 | | | | 368,650 | |
| 144A, 7.375%, 6/15/2019 | | | | 725,000 | | | | 750,375 | |
| Fiserv, Inc., 3.5%, 10/1/2022 | | | | 475,000 | | | | 483,615 | |
| Freescale Semiconductor, Inc., 144A, 9.25%, 4/15/2018 | | | | 475,000 | | | | 518,937 | |
| Hewlett-Packard Co., 3.3%, 12/9/2016 | | | | 200,000 | | | | 203,578 | |
| Hughes Satellite Systems Corp.: | |
| 6.5%, 6/15/2019 | | | | 60,000 | | | | 66,150 | |
| 7.625%, 6/15/2021 | | | | 190,000 | | | | 216,125 | |
| IAC/InterActiveCorp., 144A, 4.75%, 12/15/2022 | | | | 50,000 | | | | 49,750 | |
| SunGard Data Systems, Inc., 144A, 6.625%, 11/1/2019 | | | | 60,000 | | | | 61,350 | |
| | | | | 3,987,518 | |
| | | Principal Amount ($)(c) | | | Value ($) | |
| | | | | | | | | |
| Materials 2.4% | |
| Alpek SA de CV, 144A, 4.5%, 11/20/2022 (a) | | | | 250,000 | | | | 260,625 | |
| China Oriental Group Co., Ltd., 144A, 7.0%, 11/17/2017 | | | | 250,000 | | | | 248,750 | |
| Corporacion Nacional del Cobre de Chile, 144A, 3.0%, 7/17/2022 | | | | 500,000 | | | | 505,553 | |
| Crown Americas LLC, 7.625%, 5/15/2017 | | | | 10,000 | | | | 10,563 | |
| Evraz Group SA, 144A, 7.4%, 4/24/2017 | | | | 250,000 | | | | 263,750 | |
| FMG Resources (August 2006) Pty Ltd.: | | |
| 144A, 6.0%, 4/1/2017 | | | | 195,000 | | | | 198,900 | |
| 144A, 6.375%, 2/1/2016 | | | | 250,000 | | | | 258,750 | |
| 144A, 6.875%, 4/1/2022 | | | | 990,000 | | | | 1,012,275 | |
| Freeport-McMoRan Copper & Gold, Inc., 3.55%, 3/1/2022 | | | | 220,000 | | | | 218,191 | |
| Huntsman International LLC: | |
| 144A, 4.875%, 11/15/2020 | | | | 55,000 | | | | 55,619 | |
| 8.625%, 3/15/2021 (a) | | | | 250,000 | | | | 285,625 | |
| IAMGOLD Corp., 144A, 6.75%, 10/1/2020 | | | | 75,000 | | | | 73,125 | |
| Inmet Mining Corp.: | |
| 144A, 7.5%, 6/1/2021 | | | | 145,000 | | | | 150,437 | |
| 144A, 8.75%, 6/1/2020 | | | | 45,000 | | | | 49,162 | |
| Kaiser Aluminum Corp., 8.25%, 6/1/2020 | | | | 40,000 | | | | 43,600 | |
| Molycorp, Inc., 144A, 10.0%, 6/1/2020 | | | | 95,000 | | | | 88,350 | |
| Momentive Performance Materials, Inc., 144A, 8.875%, 10/15/2020 | | | | 70,000 | | | | 70,700 | |
| Novelis, Inc., 8.75%, 12/15/2020 | | | | 955,000 | | | | 1,064,825 | |
| Owens-Brockway Glass Container, Inc., 7.375%, 5/15/2016 | | | | 10,000 | | | | 11,400 | |
| Polymer Group, Inc., 7.75%, 2/1/2019 | | | | 255,000 | | | | 273,487 | |
| Samarco Mineracao SA, 144A, 4.125%, 11/1/2022 | | | | 200,000 | | | | 203,500 | |
| Sealed Air Corp.: | |
| 144A, 8.125%, 9/15/2019 | | | | 10,000 | | | | 11,250 | |
| 144A, 8.375%, 9/15/2021 | | | | 10,000 | | | | 11,425 | |
| Southern Copper Corp.: | |
| 5.25%, 11/8/2042 | | | | 500,000 | | | | 500,414 | |
| 6.75%, 4/16/2040 | | | | 250,000 | | | | 300,969 | |
| Wolverine Tube, Inc., 6.0%, 6/28/2014 (PIK) | | | | 8,255 | | | | 8,082 | |
| | | | | 6,179,327 | |
| Telecommunication Services 4.0% | |
| America Movil SAB de CV, Series 12, 6.45%, 12/5/2022 | MXN | | | 2,000,000 | | | | 158,816 | |
| CC Holdings GS V LLC, 144A, 3.849%, 4/15/2023 | | | | 120,000 | | | | 122,077 | |
| Cincinnati Bell, Inc.: | |
| 8.25%, 10/15/2017 | | | | 100,000 | | | | 107,750 | |
| 8.375%, 10/15/2020 | | | | 695,000 | | | | 752,337 | |
| 8.75%, 3/15/2018 | | | | 350,000 | | | | 361,375 | |
| Cricket Communications, Inc., 7.75%, 10/15/2020 | | | | 685,000 | | | | 698,700 | |
| | | Principal Amount ($)(c) | | | Value ($) | |
| | | | | | | | | |
| Crown Castle International Corp., 144A, 5.25%, 1/15/2023 | | | | 30,000 | | | | 32,100 | |
| Digicel Group Ltd.: | |
| 144A, 8.25%, 9/30/2020 | | | | 200,000 | | | | 220,000 | |
| 144A, 10.5%, 4/15/2018 | | | | 200,000 | | | | 220,000 | |
| Digicel Ltd., 144A, 8.25%, 9/1/2017 | | | | 850,000 | | | | 909,500 | |
| ERC Ireland Preferred Equity Ltd., 144A, 7.69%**, 2/15/2017 (PIK)* | EUR | | | 120,439 | | | | 48 | |
| Frontier Communications Corp.: | | |
| 6.625%, 3/15/2015 | | | | 250,000 | | | | 271,250 | |
| 7.125%, 1/15/2023 (a) | | | | 150,000 | | | | 159,000 | |
| 8.5%, 4/15/2020 (a) | | | | 810,000 | | | | 931,500 | |
| Intelsat Jackson Holdings SA: | |
| 144A, 7.25%, 10/15/2020 | | | | 690,000 | | | | 748,650 | |
| 7.5%, 4/1/2021 | | | | 240,000 | | | | 264,600 | |
| Intelsat Luxembourg SA, 11.25%, 2/4/2017 | | | | 567,000 | | | | 599,602 | |
| Level 3 Communications, Inc., 144A, 8.875%, 6/1/2019 (a) | | | | 205,000 | | | | 218,325 | |
| MetroPCS Wireless, Inc., 6.625%, 11/15/2020 | | | | 655,000 | | | | 695,937 | |
| SBA Communications Corp., 144A, 5.625%, 10/1/2019 | | | | 50,000 | | | | 52,500 | |
| Sprint Nextel Corp.: | |
| 6.0%, 12/1/2016 | | | | 820,000 | | | | 891,750 | |
| 8.375%, 8/15/2017 | | | | 210,000 | | | | 244,125 | |
| 9.125%, 3/1/2017 | | | | 15,000 | | | | 17,663 | |
| tw telecom holdings, Inc., 144A, 5.375%, 10/1/2022 | | | | 75,000 | | | | 78,563 | |
| Windstream Corp.: | |
| 7.0%, 3/15/2019 | | | | 25,000 | | | | 25,563 | |
| 7.5%, 6/1/2022 | | | | 40,000 | | | | 42,400 | |
| 7.5%, 4/1/2023 | | | | 20,000 | | | | 21,050 | |
| 7.75%, 10/15/2020 (a) | | | | 1,100,000 | | | | 1,188,000 | |
| 7.75%, 10/1/2021 | �� | | | 80,000 | | | | 86,400 | |
| 7.875%, 11/1/2017 | | | | 130,000 | | | | 146,250 | |
| | | | | 10,265,831 | |
| Utilities 1.8% | |
| Abu Dhabi National Energy Co., 144A, 3.625%, 1/12/2023 | | | | 500,000 | | | | 515,000 | |
| AES Corp.: | |
| 8.0%, 10/15/2017 | | | | 45,000 | | | | 51,975 | |
| 8.0%, 6/1/2020 | | | | 30,000 | | | | 34,500 | |
| American Electric Power Co., Inc., Series F, 2.95%, 12/15/2022 | | | | 290,000 | | | | 290,093 | |
| Calpine Corp., 144A, 7.5%, 2/15/2021 | | | | 761,000 | | | | 840,905 | |
| Comision Federal de Electricidad, 144A, 5.75%, 2/14/2042 | | | | 200,000 | | | | 226,500 | |
| DTE Energy Co., 7.625%, 5/15/2014 | | | | 81,000 | | | | 88,438 | |
| Dubai Electricity & Water Authority, 144A, 8.5%, 4/22/2015 | | | | 250,000 | | | | 282,500 | |
| FirstEnergy Solutions Corp., 6.8%, 8/15/2039 | | | | 234,000 | | | | 262,967 | |
| GDF Suez, 144A, 2.875%, 10/10/2022 | | | | 600,000 | | | | 593,875 | |
| | | Principal Amount ($)(c) | | | Value ($) | |
| | | | | | | | | |
| Korea Gas Corp., 144A, 2.25%, 7/25/2017 | | | | 500,000 | | | | 505,071 | |
| NRG Energy, Inc., 8.25%, 9/1/2020 | | | | 485,000 | | | | 543,200 | |
| Oncor Electric Delivery Co., LLC, 4.1%, 6/1/2022 (a) | | | | 120,000 | | | | 130,792 | |
| Perusahaan Listrik Negara PT, 144A, 5.5%, 11/22/2021 (a) | | | | 250,000 | | | | 282,500 | |
| | | | | 4,648,316 | |
Total Corporate Bonds (Cost $72,305,131) | | | | 74,839,747 | |
| | |
| Asset-Backed 0.6% | |
| Credit Card Receivables 0.2% | |
| Citibank Omni Master Trust, "A14", Series 2009-A14A, 144A, 2.959%**, 8/15/2018 | | | 550,000 | | | | 572,157 | |
| Miscellaneous 0.4% | |
| ARES CLO Ltd., "D", Series 2012-3A, 144A, 4.856%**, 1/17/2024 | | | 250,000 | | | | 240,500 | |
| CIFC Funding Ltd., "B1L", Series 2012-2A, 144A, 4.61%, 12/5/2024 | | | 700,000 | | | | 662,991 | |
| | | | | 903,491 | |
Total Asset-Backed (Cost $1,472,040) | | | | 1,475,648 | |
| | |
| Mortgage-Backed Securities Pass-Throughs 3.4% | |
| Federal Home Loan Mortgage Corp., 6.0%, 3/1/2038 | | | | 18,437 | | | | 20,046 | |
| Federal National Mortgage Association: | | |
| 4.5%, 9/1/2035 | | | | 32,735 | | | | 35,322 | |
| 6.0%, 1/1/2024 | | | | 45,478 | | | | 50,739 | |
| 6.5%, with various maturities from 5/1/2017 until 1/1/2038 | | | | 20,857 | | | | 22,754 | |
| 8.0%, 9/1/2015 | | | | 21,860 | | | | 23,088 | |
| Government National Mortgage Association: | | |
| 3.0%, 6/1/2042 (d) | | | | 3,000,000 | | | | 3,188,672 | |
| 3.5%, 10/20/2042 | | | | 3,182,977 | | | | 3,377,079 | |
| 4.0%, 7/1/2040 (d) | | | | 2,000,000 | | | | 2,193,125 | |
Total Mortgage-Backed Securities Pass-Throughs (Cost $8,879,209) | | | | 8,910,825 | |
| | |
| Commercial Mortgage-Backed Securities 0.7% | |
| Banc of America Large Loan, Inc., "HLTN", Series 2010-HLTN, 144A, 2.509%**, 11/15/2015 | | | | 457,741 | | | | 456,798 | |
| Bear Stearns Commercial Mortgage Securities, Inc., "A4", Series 2007- PW16, 5.715%**, 6/11/2040 | | | | 66,000 | | | | 78,179 | |
| | | Principal Amount ($)(c) | | | Value ($) | |
| | | | | | | | | |
| JPMorgan Chase Commercial Mortgage Securities Corp.: | | |
| "C", Series 2012-HSBC, 144A, 4.021%, 7/5/2032 | | | | 380,000 | | | | 398,815 | |
| "A4", Series 2007-C1, 5.716%, 2/15/2051 | | | | 225,000 | | | | 266,622 | |
| LB-UBS Commercial Mortgage Trust, "A4", Series 2007-C6, 5.858%, 7/15/2040 | | | | 260,000 | | | | 310,385 | |
| PNC Mortgage Acceptance Corp., "J", Series 2000-C2, 144A, 6.22%, 10/12/2033 | | | | 250,000 | | | | 240,262 | |
Total Commercial Mortgage-Backed Securities (Cost $1,680,950) | | | | 1,751,061 | |
| | |
| Collateralized Mortgage Obligations 1.8% | |
| Federal Home Loan Mortgage Corp.: | | |
| "HI", Series 3979, Interest Only, 3.0%, 12/15/2026 | | | | 960,239 | | | | 94,906 | |
| "NI", Series 4020, Interest Only, 3.0%, 3/15/2027 | | | | 1,134,971 | | | | 104,550 | |
| "IK", Series 4048, Interest Only, 3.0%, 5/15/2027 | | | | 931,150 | | | | 86,287 | |
| "P", Series 3808, 4.0%, 11/15/2038 | | | | 1,000,000 | | | | 1,085,753 | |
| "LI", Series 3720, Interest Only, 4.5%, 9/15/2025 | | | | 2,006,807 | | | | 289,372 | |
| "PI", Series 3843, Interest Only, 4.5%, 5/15/2038 | | | | 871,281 | | | | 131,017 | |
| "H", Series 2278, 6.5%, 1/15/2031 | | | | 148 | | | | 166 | |
| Federal National Mortgage Association: | | |
| "I", Series 2003-84, Interest Only, 6.0%, 9/25/2033 | | | | 380,305 | | | | 83,901 | |
| "PI", Series 2006-20, Interest Only, 6.47%**, 11/25/2030 | | | | 567,326 | | | | 117,730 | |
| Government National Mortgage Association: | | |
| "QI", Series 2011-112, Interest Only, 4.0%, 5/16/2026 | | | | 1,308,550 | | | | 123,438 | |
| "NI", Series 2011-80, Interest Only, 4.5%, 5/16/2038 | | | | 1,767,422 | | | | 222,680 | |
| "GP", Series 2010-67, 4.5%, 3/20/2039 | | | | 250,000 | | | | 285,553 | |
| "BI", Series 2010-30, Interest Only, 4.5%, 7/20/2039 | | | | 189,289 | | | | 30,314 | |
| "ND", Series 2010-130, 4.5%, 8/16/2039 | | | | 600,000 | | | | 686,271 | |
| "MI", Series 2009-76, Interest Only, 5.0%, 3/20/2035 | | | | 555,854 | | | | 16,211 | |
| "IQ", Series 2011-18, Interest Only, 5.5%, 1/16/2039 | | | | 631,082 | | | | 46,362 | |
| "IV", Series 2009-69, Interest Only, 5.5%, 8/20/2039 | | | | 1,132,497 | | | | 158,782 | |
| | | Principal Amount ($)(c) | | | Value ($) | |
| | | | | | | | | |
| "IN", Series 2009-69, Interest Only, 5.5%, 8/20/2039 | | | | 1,140,032 | | | | 158,085 | |
| "IJ", Series 2009-75, Interest Only, 6.0%, 8/16/2039 | | | | 758,094 | | | | 119,759 | |
| Residential Funding Mortgage Securities I, Inc., "M1", Series 2003-S17, 5.5%, 9/25/2033 | | | | 753,027 | | | | 724,091 | |
Total Collateralized Mortgage Obligations (Cost $4,278,992) | | | | 4,565,228 | |
| | |
| Government & Agency Obligations 6.4% | |
| Sovereign Bonds 2.0% | |
| Government of Canada, 0.75%, 5/1/2014 | CAD | | | 1,000,000 | | | | 1,000,392 | |
| Government of Ukraine, 144A, 6.58%, 11/21/2016 | | | | 500,000 | | | | 499,400 | |
| Republic of Croatia, 144A, 6.25%, 4/27/2017 | | | | 250,000 | | | | 274,125 | |
| Republic of Hungary, 4.75%, 2/3/2015 | | | | 250,000 | | | | 257,500 | |
| Republic of Indonesia, 144A, 4.875%, 5/5/2021 | | | | 500,000 | | | | 575,000 | |
| Republic of Poland, 3.0%, 3/17/2023 | | | | 250,000 | | | | 249,375 | |
| Republic of Serbia, REG S, 6.75%, 11/1/2024 | | | | 200,000 | | | | 202,000 | |
| Republic of South Africa, 5.5%, 3/9/2020 | | | | 250,000 | | | | 296,250 | |
| Russian Federation, 144A, 5.625%, 4/4/2042 | | | | 400,000 | | | | 497,000 | |
| United Mexican States, 4.75%, 3/8/2044 | | | | 1,000,000 | | | | 1,130,000 | |
| Vnesheconombank, 144A, 6.025%, 7/5/2022 | | | | 250,000 | | | | 290,625 | |
| | | | | 5,271,667 | |
| U.S. Government Sponsored Agency 0.4% | |
| Federal National Mortgage Association, 3.0%, 11/15/2027 | | | | 1,000,000 | | | | 1,005,324 | |
| U.S. Treasury Obligations 4.0% | |
| U.S. Treasury Bills: | |
| 0.12%***, 3/7/2013 (e) | | | | 14,000 | | | | 13,999 | |
| 0.13%***, 3/7/2013 (e) | | | | 153,000 | | | | 152,991 | |
| 0.13%***, 3/7/2013 (e) | | | | 251,000 | | | | 250,985 | |
| U.S. Treasury Bond, 5.375%, 2/15/2031 | | | | 500,000 | | | | 713,750 | |
| U.S. Treasury Notes: | |
| 0.75%, 6/15/2014 | | | | 5,000,000 | | | | 5,038,865 | |
| 1.0%, 1/15/2014 | | | | 605,000 | | | | 610,057 | |
| 1.5%, 7/31/2016 | | | | 3,300,000 | | | | 3,421,688 | |
| 1.625%, 11/15/2022 | | | | 300,000 | | | | 296,719 | |
| | | | | 10,499,054 | |
Total Government & Agency Obligations (Cost $16,371,988) | | | | 16,776,045 | |
| | |
| Loan Participations and Assignments 3.0% | |
| Senior Loan** 1.5% | |
| Chesapeake Energy Corp., Term Loan, 5.75%, 12/1/2017 | | | | 3,775,000 | | | | 3,786,099 | |
| | | Principal Amount ($)(c) | | | Value ($) | |
| | | | | | | | | |
| Sovereign Loans 1.5% | |
| Bank of Moscow, 144A, 6.699%, 3/11/2015 | | | | 250,000 | | | | 265,000 | |
| Gazprom Neft OAO, 144A, 4.375%, 9/19/2022 | | | | 500,000 | | | | 511,250 | |
| Gazprom OAO, 144A, 4.95%, 7/19/2022 (a) | | | | 500,000 | | | | 537,750 | |
| OAO Novatek: | |
| 144A, 4.422%, 12/13/2022 | | | | 500,000 | | | | 503,125 | |
| 144A, 5.326%, 2/3/2016 | | | | 250,000 | | | | 267,812 | |
| Rosneft Oil Co., 144A, 4.199%, 3/6/2022 | | | | 250,000 | | | | 254,375 | |
| RZD Capital Ltd., 5.739%, 4/3/2017 | | | | 250,000 | | | | 280,000 | |
| Sberbank of Russia, 144A, 6.125%, 2/7/2022 | | | | 250,000 | | | | 285,625 | |
| Vimpel Communications, 144A, 7.748%, 2/2/2021 | | | | 250,000 | | | | 288,750 | |
| VTB Bank OJSC: | |
| 144A, 6.0%, 4/12/2017 | | | | 250,000 | | | | 270,250 | |
| 144A, 6.95%, 10/17/2022 | | | | 400,000 | | | | 430,000 | |
Total Loan Participations and Assignments (Cost $7,437,198) | | | | 7,680,036 | |
| | |
| Municipal Bonds and Notes 0.4% | |
| California, University Revenues, Build America Bonds, 5.946%, 5/15/2045 | | | 125,000 | | | | 153,814 | |
| Chicago, IL, Transit Authority, Sales Tax Receipts Revenue, Build America Bonds, Series B, 6.2%, 12/1/2040 | | | 185,000 | | | | 207,912 | |
| Kentucky, Asset/Liability Commission, General Fund Revenue, 3.165%, 4/1/2018 | | | 500,000 | | | | 522,980 | |
| Louisville & Jefferson County, KY, Metropolitan Sewer District & Drain System, Build America Bonds, 6.25%, 5/15/2043 | | | 150,000 | | | | 196,333 | |
Total Municipal Bonds and Notes (Cost $960,260) | | | | 1,081,039 | |
| | |
| Convertible Bond 0.1% | |
| Materials | |
| GEO Specialty Chemicals, Inc., 7.5%, 3/31/2015 (PIK) (Cost $204,624) | | | | 209,283 | | | | 248,021 | |
| | |
| Preferred Securities 0.1% | |
| Financials 0.1% | |
| Citigroup, Inc., Series A, 5.95%, 1/30/2023 (f) | | | 120,000 | | | | 121,500 | |
| Farm Credit Bank of Texas, Series 1, 7.561%, 12/15/2013 (f) | | | 218,000 | | | | 220,199 | |
| | | | | 341,699 | |
| Materials 0.0% | |
| Hercules, Inc., 6.5%, 6/30/2029 | | | 40,000 | | | | 35,721 | |
Total Preferred Securities (Cost $360,442) | | | | 377,420 | |
| | | Units | | | Value ($) | |
| | | | |
| Other Investments 0.0% | |
| Consumer Discretionary | |
| AOT Bedding Super Holdings LLC* (g) (Cost $2,000) | | | 2 | | | | 6,955 | |
| | | Contract Amount | | | Value ($) | |
| | | | |
| Call Options Purchased 0.0% | |
| Options on Interest Rate Swap Contracts | |
| Pay Fixed Rate — 3.583% - Receive Floating — LIBOR, Swap Expiration Date 5/11/2026, Option Expiration Date 5/9/2016 (Cost $108,330) | | | 2,300,000 | | | | 71,535 | |
| | | Shares | | | Value ($) | |
| | | | |
| Put Options Purchased 0.0% | |
| Options on Exchange-Traded Futures Contracts | |
| 10 Year U.S. Treasury Note Future, Expiration Date 2/22/2013, Strike Price $132.0 (Cost $12,232) | | | 20 | | | | 11,563 | |
| | | Shares | | | Value ($) | |
| | | | | | | | | |
| Securities Lending Collateral 10.9% | |
| Daily Assets Fund Institutional, 0.20% (h) (i) (Cost $28,394,483) | | | 28,394,483 | | | | 28,394,483 | |
| | |
| Cash Equivalents 1.2% | |
| Central Cash Management Fund, 0.15% (h) (Cost $3,107,194) | | | 3,107,194 | | | | 3,107,194 | |
| | | % of Net Assets | | | Value ($) | |
| | | | |
Total Investment Portfolio (Cost $282,134,838)† | | | 113.3 | | | | 295,123,277 | |
| Other Assets and Liabilities, Net | | | (13.3 | ) | | | (34,725,018 | ) |
| Net Assets | | | 100.0 | | | | 260,398,259 | |
The following table represents bonds that are in default:
| Security | | Coupon | | Maturity Date | | Principal Amount ($) | | Cost ($) | | | Value ($) | |
| ERC Ireland Preferred Equity Ltd.* | | | 7.69 | % | 2/15/2017 | | | 120,439 | | EUR | | | 165,016 | | | | 48 | |
| Fontainebleau Las Vegas Holdings LLC* | | | 11.0 | % | 6/15/2015 | | | 25,000 | | USD | | | 25,000 | | | | 16 | |
| | | | | | | | | | | | | | 190,016 | | | | 64 | |
* Non-income producing security.
** Floating rate securities' yields vary with a designated market index or market rate, such as the coupon-equivalent of the U.S. Treasury Bill rate. These securities are shown at their current rate as of December 31, 2012.
***Annualized yield at time of purchase; not a coupon rate.
† The cost for federal income tax purposes was $282,697,956. At December 31, 2012, net unrealized appreciation for all securities based on tax cost was $12,425,321. This consisted of aggregate gross unrealized appreciation for all securities in which there was an excess of value over tax cost of $17,125,812 and aggregate gross unrealized depreciation for all securities in which there was an excess of tax cost over value of $4,700,491.
(a) All or a portion of these securities were on loan (see Notes to Financial Statements). The value of all securities loaned at December 31, 2012 amounted to $27,528,870, which is 10.6% of net assets.
(b) Securities with the same description are the same corporate entity but trade on different stock exchanges.
(c) Principal amount stated in U.S. dollars unless otherwise noted.
(d) When-issued or delayed delivery security included.
(e) At December 31, 2012, this security has been pledged, in whole or in part, to cover initial margin requirements for open futures contracts.
(f) Date shown is call date; not a maturity date for the perpetual preferred securities.
(g) The Fund may purchase securities that are subject to legal or contractual restrictions on resale ("restricted securities"). Restricted securities are securities which have not been registered with the Securities and Exchange Commission under the Securities Act of 1933. The Fund may be unable to sell a restricted security and it may be more difficult to determine a market value for a restricted security. Moreover, if adverse market conditions were to develop during the period between the Fund's decision to sell a restricted security and the point at which the Fund is permitted or able to sell such security, the Fund might obtain a price less favorable than the price that prevailed when it decided to sell. This investment practice, therefore, could have the effect of increasing the level of illiquidity of the Fund. The future value of these securities is uncertain and there may be changes in the estimated value of these securities.
| Schedule of Restricted Securities | Acquisition Date | | Cost ($) | | | Value ($) | | | Value as % of Net Assets | |
| AOT Bedding Super Holdings LLC* | June 2010 | | | 2,000 | | | | 6,955 | | | | 0.00 | |
(h) Affiliated fund managed by Deutsche Investment Management Americas Inc. The rate shown is the annualized seven-day yield at period end.
(i) Represents collateral held in connection with securities lending. Income earned by the Fund is net of borrower rebates.
144A: Security exempt from registration under Rule 144A of the Securities Act of 1933. These securities may be resold in transactions exempt from registration, normally to qualified institutional buyers.
CVA: Certificaten Van Aandelen (Certificate of Stock)
Interest Only: Interest Only (IO) bonds represent the "interest only" portion of payments on a pool of underlying mortgages or mortgage-backed securities. IO securities are subject to prepayment risk of the pool of underlying mortgages.
PIK: Denotes that all or a portion of the income is paid in-kind in the form of additional principal.
REG S: Securities sold under Regulation S may not be offered, sold or delivered within the United States or to, or for the account or benefit of, U.S. persons, except pursuant to an exemption from, or in a transaction not subject to, the registration requirements of the Securities Act of 1933.
REIT: Real Estate Investment Trust
Included in the portfolio are investments in mortgage- or asset-backed securities which are interests in separate pools of mortgages or assets. Effective maturities of these investments may be shorter than stated maturities due to prepayments. Some separate investments in the Federal National Mortgage Association issues which have similar coupon rates have been aggregated for presentation purposes in this investment portfolio.
At December 31, 2012, open futures contracts purchased were as follows:
| Futures | Currency | Expiration Date | | Contracts | | | Notional Value ($) | | | Unrealized Depreciation ($) | |
| 10 Year Canadian Government Bond | CAD | 3/20/2013 | | | 10 | | | | 1,362,622 | | | | (9,593 | ) |
| Ultra Long U.S. Treasury Bond | USD | 3/19/2013 | | | 6 | | | | 975,563 | | | | (20,309 | ) |
| United Kingdom Long Gilt Bond | GBP | 3/26/2013 | | | 11 | | | | 2,124,975 | | | | (2,262 | ) |
| Total unrealized depreciation | | | | (32,164 | ) |
At December 31, 2012, open futures contracts sold were as follows:
| Futures | Currency | Expiration Date | | Contracts | | | Notional Value ($) | | | Unrealized Appreciation/ (Depreciation) ($) | |
| 10 Year U.S. Treasury Note | USD | 3/19/2013 | | | 15 | | | | 1,991,719 | | | | 10,320 | |
| 5 Year U.S. Treasury Note | USD | 3/28/2013 | | | 20 | | | | 2,488,281 | | | | (430 | ) |
| Total net unrealized appreciation | | | | 9,890 | |
At December 31, 2012, open written options contracts were as follows:
| Options on Exchange-Traded Futures Contracts | | Contracts | | Expiration Date | | Strike Price ($) | | | Premiums Received ($) | | | Value ($) (j) | |
Put Options 10 Year U.S. Treasury Note Future | | | 20 | | 2/22/2013 | | | 131.0 | | | | 7,769 | | | | (6,563 | ) |
(j) Unrealized appreciation on written options on exchange-traded futures contracts at December 31, 2012 was $1,206.
| Options on Interest Rate Swap Contracts | Swap Effective/ Expiration Date | | Contract Amount | | Option Expiration Date | | Premiums Received ($) | | | Value ($) (k) | |
Call Options Receive Fixed — 4.083% - Pay Floating — LIBOR | 5/11/2016 5/11/2026 | | | 2,300,000 | | 5/9/2016 | | | 78,200 | | | | (49,434 | ) |
| Receive Fixed — 1.828% - Pay Floating — LIBOR | 11/15/2013 11/15/2043 | | | 1,800,000 | | 11/13/2013 | | | 30,510 | | | | (6,794 | ) |
| Receive Fixed — 1.871% - Pay Floating — LIBOR | 11/14/2013 11/14/2043 | | | 1,800,000 | | 11/12/2013 | | | 28,440 | | | | (7,965 | ) |
| Total Call Options | | | 137,150 | | | | (64,193 | ) |
Put Options Pay Fixed — 2.07% - Receive Floating — LIBOR | 5/10/2013 5/10/2043 | | | 2,300,000 | | 5/8/2013 | | | 36,800 | | | | (3,722 | ) |
| Total | | | 173,950 | | | | (67,915 | ) |
(k) Unrealized appreciation on written options on interest rate swap contracts at December 31, 2012 was $106,035.
As of December 31, 2012, open credit default swap contracts sold were as follows:
Effective/ Expiration Date | | Notional Amount ($) (l) | | | Fixed Cash Flows Received | | Underlying Debt Obligation/ Quality Rating (m) | | Value ($) | | | Upfront Payments Paid/ (Received) ($) | | | Unrealized Appreciation ($) | |
9/20/2012 12/20/2017 | | | 1,200,000 | 1 | | | 1.0 | % | Kingdom of Spain, 5.5%, 7/30/2017, BBB- | | | (102,770 | ) | | | (149,051 | ) | | | 46,281 | |
9/20/2012 12/20/2017 | | | 600,000 | 2 | | | 1.0 | % | Kingdom of Spain, 5.5%, 7/30/2017, BBB- | | | (51,385 | ) | | | (67,440 | ) | | | 16,055 | |
9/20/2012 12/20/2017 | | | 125,000 | 3 | | | 5.0 | % | General Motors Corp., 3.3%, 12/20/2017, BB+ | | | 11,422 | | | | 9,232 | | | | 2,190 | |
| Total unrealized appreciation | | | | 64,526 | |
(l) The maximum potential amount of future undiscounted payments that the Fund could be required to make under a credit default swap contract would be the notional amount of the contract. These potential amounts would be partially offset by any recovery values of the referenced debt obligation or net amounts received from the settlement of buy protection credit default swap contracts entered into by the Fund for the same referenced debt obligation, if any.
(m) The quality ratings represent the higher of Moody's Investors Service, Inc. ("Moody's") or Standard & Poor's Corporation ("S&P") credit ratings.
At December 31, 2012, open interest rate swap contracts sold were as follows:
Effective/ Expiration Date | | Notional Amount ($) | | Cash Flows Paid by the Fund | Cash Flows Received by the Fund | | Value ($) | | | Upfront Payments Paid/ (Received) ($) | | | Unrealized Appreciation (Depreciation) ($) | |
7/16/2013 7/16/2023 | | | 700,000 | 2 | Fixed — 1.858% | Floating — LIBOR | | | 7,431 | | | | — | | | | 7,431 | |
7/16/2013 7/16/2018 | | | 6,400,000 | 2 | Floating — LIBOR | Fixed — 1.148% | | | 39,729 | | | | — | | | | 39,729 | |
9/17/2013 9/17/2022 | | | 2,000,000 | 4 | Fixed — 2.0% | Floating — LIBOR | | | (20,225 | ) | | | 388 | | | | (20,613 | ) |
7/16/2013 7/16/2033 | | | 400,000 | 2 | Fixed — 2.322% | Floating — LIBOR | | | 22,267 | | | | — | | | | 22,267 | |
7/16/2013 7/16/2014 | | | 12,100,000 | 2 | Floating — LIBOR | Fixed — 0.515% | | | 16,952 | | | | — | | | | 16,952 | |
7/16/2013 7/16/2043 | | | 1,200,000 | 2 | Floating — LIBOR | Fixed — 2.424% | | | (102,783 | ) | | | — | | | | (102,783 | ) |
| Total net unrealized depreciation | | | | (37,017 | ) |
Counterparties:
1 BNP Paribas
2 Citigroup, Inc.
3 UBS AG
4 Morgan Stanley
LIBOR: London Interbank Offered Rate
As of December 31, 2012, the Fund had the following open forward foreign currency exchange contracts:
| Contracts to Deliver | | In Exchange For | | Settlement Date | | Unrealized Appreciation ($) | | Counterparty |
| JPY | | | 80,000,000 | | USD | | | 961,677 | | 1/4/2013 | | | 38,263 | | BNP Paribas |
| USD | | | 1,748,747 | | EUR | | | 1,350,000 | | 1/7/2013 | | | 33,247 | | BNP Paribas |
| AUD | | | 1,100,000 | | USD | | | 1,150,919 | | 1/10/2013 | | | 9,217 | | Barclays Bank PLC |
| USD | | | 1,698,229 | | EUR | | | 1,300,000 | | 1/14/2013 | | | 17,868 | | Barclays Bank PLC |
| MXN | | | 2,002,288 | | USD | | | 155,768 | | 1/14/2013 | | | 1,017 | | JPMorgan Chase Securities, Inc. |
| EUR | | | 563,200 | | USD | | | 746,184 | | 1/30/2013 | | | 2,617 | | Citigroup, Inc. |
| USD | | | 278,252 | | MXN | | | 3,625,000 | | 2/5/2013 | | | 1,373 | | JPMorgan Chase Securities, Inc. |
| Total unrealized appreciation | | | | | 103,602 | |
| Contracts to Deliver | | In Exchange For | | Settlement Date | | Unrealized Depreciation ($) | | Counterparty |
| USD | | | 975,679 | | JPY | | | 80,000,000 | | 1/4/2013 | | | (52,264 | ) | BNP Paribas |
| EUR | | | 900,000 | | USD | | | 1,176,413 | | 1/7/2013 | | | (11,584 | ) | Nomura International PLC |
| EUR | | | 450,000 | | USD | | | 584,300 | | 1/7/2013 | | | (9,698 | ) | BNP Paribas |
| AUD | | | 550,000 | | USD | | | 556,474 | | 1/9/2013 | | | (14,420 | ) | Barclays Bank PLC |
| USD | | | 1,153,713 | | AUD | | | 1,100,000 | | 1/10/2013 | | | (12,011 | ) | Barclays Bank PLC |
| USD | | | 155,205 | | MXN | | | 2,002,288 | | 1/14/2013 | | | (454 | ) | JPMorgan Chase Securities, Inc. |
| EUR | | | 1,300,000 | | USD | | | 1,689,173 | | 1/14/2013 | | | (26,924 | ) | BNP Paribas |
| Total unrealized depreciation | | | | | (127,355 | ) |
| Currency Abbreviations |
AUD Australian Dollar CAD Canadian Dollar EUR Euro GBP British Pound JPY Japanese Yen MXN Mexican Peso USD United States Dollar |
For information on the Fund's policy and additional disclosures regarding options purchased, futures contracts, credit default swap contracts, forward foreign currency exchange contracts and written options contracts, please refer to Note B in the accompanying Notes to Financial Statements.
Fair Value Measurements
Various inputs are used in determining the value of the Fund's investments. These inputs are summarized in three broad levels. Level 1 includes quoted prices in active markets for identical securities. Level 2 includes other significant observable inputs (including quoted prices for similar securities, interest rates, prepayment speeds, and credit risk). Level 3 includes significant unobservable inputs (including the Fund's own assumptions in determining the fair value of investments). The inputs or methodology used for valuing securities are not necessarily an indication of the risk associated with investing in those securities.
The following is a summary of the inputs used as of December 31, 2012 in valuing the Fund's investments. For information on the Fund's policy regarding the valuation of investments, please refer to the Security Valuation section of Note A in the accompanying Notes to Financial Statements.
| Assets | | Level 1 | | | Level 2 | | | Level 3 | | | Total | |
| | |
| Common Stocks and/or Other Equity Investments (n) | |
| Consumer Discretionary | | $ | 4,358,868 | | | $ | 6,161,009 | | | $ | 0 | | | $ | 10,519,877 | |
| Consumer Staples | | | 16,513,918 | | | | 11,182,848 | | | | — | | | | 27,696,766 | |
| Energy | | | 16,676,603 | | | | 1,897,112 | | | | — | | | | 18,573,715 | |
| Financials | | | 9,791,788 | | | | 5,990,525 | | | | — | | | | 15,782,313 | |
| Health Care | | | 2,950,083 | | | | 17,379,384 | | | | — | | | | 20,329,467 | |
| Industrials | | | — | | | | 9,598,108 | | | | 0 | | | | 9,598,108 | |
| Information Technology | | | 10,835,137 | | | | 2,488,704 | | | | — | | | | 13,323,841 | |
| Materials | | | 10,027,389 | | | | 2,519,740 | | | | 6,632 | | | | 12,553,761 | |
| Telecommunication Services | | | — | | | | 6,220,516 | | | | — | | | | 6,220,516 | |
| Utilities | | | 8,849,289 | | | | 2,368,707 | | | | — | | | | 11,217,996 | |
| Warrants (n) | | | — | | | | — | | | | 10,117 | | | | 10,117 | |
| Fixed Income Investments (n) | |
| Corporate Bonds | | | — | | | | 74,831,665 | | | | 8,082 | | | | 74,839,747 | |
| Asset Backed | | | — | | | | 1,235,148 | | | | 240,500 | | | | 1,475,648 | |
| Mortgage-Backed Securities Pass-Throughs | | | — | | | | 8,910,825 | | | | — | | | | 8,910,825 | |
| Commercial Mortgage-Backed Securities | | | — | | | | 1,751,061 | | | | — | | | | 1,751,061 | |
| Collateralized Mortgage Obligations | | | — | | | | 4,565,228 | | | | — | | | | 4,565,228 | |
| Government & Agency Obligations | | | — | | | | 16,776,045 | | | | — | | | | 16,776,045 | |
| Loan Participations and Assignments | | | — | | | | 7,680,036 | | | | — | | | | 7,680,036 | |
| Municipal Bonds and Notes | | | — | | | | 1,081,039 | | | | — | | | | 1,081,039 | |
| Convertible Bond | | | — | | | | — | | | | 248,021 | | | | 248,021 | |
| Preferred Securities | | | — | | | | 377,420 | | | | — | | | | 377,420 | |
| Other Investments | | | — | | | | — | | | | 6,955 | | | | 6,955 | |
| Short-Term Investments (n) | | | 31,501,677 | | | | — | | | | — | | | | 31,501,677 | |
| Derivatives (o) | | | | | | | | | | | | | | | | |
| Futures Contracts | | | 10,320 | | | | — | | | | — | | | | 10,320 | |
| Purchased Options | | | 11,563 | | | | 71,535 | | | | — | | | | 83,098 | |
| Credit Default Swap Contracts | | | — | | | | 64,526 | | | | — | | | | 64,526 | |
| Interest Rate Swap Contracts | | | — | | | | 86,379 | | | | — | | | | 86,379 | |
| Forward Foreign Currency Exchange Contracts | | | — | | | | 103,602 | | | | — | | | | 103,602 | |
| Total | | $ | 111,526,635 | | | $ | 183,341,162 | | | $ | 520,307 | | | $ | 295,388,104 | |
| Liabilities | |
| Derivatives (o) | | | | | | | | | | | | | | | | |
| Futures Contracts | | $ | (32,594 | ) | | $ | — | | | $ | — | | | $ | (32,594 | ) |
| Written Options | | | (6,563 | ) | | | (67,915 | ) | | | — | | | | (74,478 | ) |
| Interest Rate Swap Contracts | | | — | | | | (123,396 | ) | | | — | | | | (123,396 | ) |
| Forward Foreign Currency Exchange Contracts | | | — | | | | (127,355 | ) | | | — | | | | (127,355 | ) |
| Total | | $ | (39,157 | ) | | $ | (318,666 | ) | | $ | — | | | $ | (357,823 | ) |
There have been no transfers between fair value measurement levels during the year ended December 31, 2012.
(n) See Investment Portfolio for additional detailed categorizations.
(o) Derivatives include value of options purchased, unrealized appreciation (depreciation) on open futures contracts, credit default swap contracts, interest rate swap contracts, forward foreign currency exchange contracts and written options, at value.
The accompanying notes are an integral part of the financial statements.
Statement of Assets and Liabilities | as of December 31, 2012 | |
| Assets | |
Investments: Investments in non-affiliated securities, at value (cost $250,633,161) — including $27,528,870 of securities loaned | | $ | 263,621,600 | |
| Investment in Daily Assets Fund Institutional (cost $28,394,483) | | | 28,394,483 | |
| Investment in Central Cash Management Fund (cost $3,107,194) | | | 3,107,194 | |
| Total investments in securities, at value (cost $282,134,838) | | | 295,123,277 | |
| Cash | | | 61,772 | |
| Foreign currency, at value (cost $349,109) | | | 347,659 | |
| Deposit with broker for futures contracts | | | 6,076 | |
| Receivable for investments sold | | | 1,413,983 | |
| Receivable for Fund shares sold | | | 136,523 | |
| Dividends receivable | | | 313,226 | |
| Interest receivable | | | 1,412,672 | |
| Receivable for variation margin on futures contracts | | | 5,092 | |
| Unrealized appreciation on swap contracts | | | 150,905 | |
| Unrealized appreciation on forward foreign currency exchange contracts | | | 103,602 | |
| Upfront payments paid on swap contracts | | | 9,620 | |
| Foreign taxes recoverable | | | 14,055 | |
| Other assets | | | 4,562 | |
| Total assets | | | 299,103,024 | |
| Liabilities | |
| Payable upon return of securities loaned | | | 28,394,483 | |
| Payable for investments purchased | | | 3,940,815 | |
| Payable for investments purchased — when-issued/delayed delivery securities | | | 5,392,886 | |
| Payable for Fund shares redeemed | | | 197,647 | |
| Options written, at value (premium received $181,719) | | | 74,478 | |
| Unrealized depreciation on swap contracts | | | 123,396 | |
| Unrealized depreciation on forward foreign currency exchange contracts | | | 127,355 | |
| Upfront payments received on swap contracts | | | 216,491 | |
| Accrued management fee | | | 81,770 | |
| Accrued Trustees' fees | | | 2,685 | |
| Other accrued expenses and payables | | | 152,759 | |
| Total liabilities | | | 38,704,765 | |
| Net assets, at value | | $ | 260,398,259 | |
| Net Assets Consist of | |
| Undistributed net investment income | | | 5,395,441 | |
Net unrealized appreciation (depreciation) on: Investments | | | 12,988,439 | |
| Swap contracts | | | 27,509 | |
| Futures | | | (22,274 | ) |
| Foreign currency | | | (24,245 | ) |
| Written options | | | 107,241 | |
| Accumulated net realized gain (loss) | | | (5,682,699 | ) |
| Paid-in capital | | | 247,608,847 | |
| Net assets, at value | | $ | 260,398,259 | |
Class A Net Asset Value, offering and redemption price per share ($260,398,259 ÷ 10,896,924 outstanding shares of beneficial interest, no par value, unlimited number of shares authorized) | | $ | 23.90 | |
* Represents collateral on securities loaned.
The accompanying notes are an integral part of the financial statements.
Statement of Operations
| for the year ended December 31, 2012 | |
| Investment Income | |
Income: Dividends (net of foreign taxes withheld of $267,528) | | $ | 4,446,940 | |
| Interest | | | 3,545,647 | |
| Income distributions — Central Cash Management Fund | | | 28,170 | |
| Securities lending income, including income from Daily Assets Fund Institutional, net of borrower rebates | | | 133,590 | |
| Total income | | | 8,154,347 | |
Expenses: Management fee | | | 978,432 | |
| Administration fee | | | 265,488 | |
| Services to shareholders | | | 1,462 | |
| Custodian fee | | | 101,214 | |
| Professional fees | | | 92,895 | |
| Reports to shareholders | | | 58,148 | |
| Trustees' fees and expenses | | | 11,764 | |
| Other | | | 67,807 | |
| Total expenses | | | 1,577,210 | |
| Net investment income | | | 6,577,137 | |
| Realized and Unrealized Gain (Loss) | |
Net realized gain (loss) from: Investments | | | 37,751,892 | |
| Swap contracts | | | (18,096 | ) |
| Futures | | | 775,582 | |
| Written options | | | 22,571 | |
| Foreign currency | | | (1,313,251 | ) |
| Payment by affiliate (see Note G) | | | 1,094 | |
| | | | 37,219,792 | |
Change in net unrealized appreciation (depreciation) on: Investments | | | (11,193,819 | ) |
| Swap contracts | | | 27,509 | |
| Futures | | | (311,560 | ) |
| Written options | | | 107,241 | |
| Foreign currency | | | 14,935 | |
| | | | (11,355,694 | ) |
| Net gain (loss) | | | 25,864,098 | |
| Net increase (decrease) in net assets resulting from operations | | $ | 32,441,235 | |
The accompanying notes are an integral part of the financial statements.
Statement of Changes in Net Assets | | | Years Ended December 31, | |
| Increase (Decrease) in Net Assets | | 2012 | | | 2011 | |
Operations: Net investment income (loss) | | $ | 6,577,137 | | | $ | 6,031,493 | |
| Net realized gain (loss) | | | 37,219,792 | | | | 8,487,703 | |
| Change in net unrealized appreciation (depreciation) | | | (11,355,694 | ) | | | (18,126,212 | ) |
| Net increase (decrease) in net assets resulting from operations | | | 32,441,235 | | | | (3,607,016 | ) |
Distributions to shareholders from: Net investment income: Class A | | | (4,191,340 | ) | | | (4,612,028 | ) |
| Total distributions | | | (4,191,340 | ) | | | (4,612,028 | ) |
Fund share transactions: Class A Proceeds from shares sold | | | 5,666,347 | | | | 6,208,413 | |
| Shares issued to shareholders in reinvestment of distributions | | | 4,191,340 | | | | 4,612,028 | |
| Payments for shares redeemed | | | (41,768,743 | ) | | | (46,814,172 | ) |
| Net increase (decrease) in net assets from Class A share transactions | | | (31,911,056 | ) | | | (35,993,731 | ) |
| Increase (decrease) in net assets | | | (3,661,161 | ) | | | (44,212,775 | ) |
| Net assets at beginning of period | | | 264,059,420 | | | | 308,272,195 | |
| Net assets at end of period (including undistributed net investment income of $5,395,441 and $4,179,961, respectively) | | $ | 260,398,259 | | | $ | 264,059,420 | |
| Other Information | |
Class A Shares outstanding at beginning of period | | | 12,288,136 | | | | 13,930,205 | |
| Shares sold | | | 246,623 | | | | 285,391 | |
| Shares issued to shareholders in reinvestment of distributions | | | 186,116 | | | | 200,698 | |
| Shares redeemed | | | (1,823,951 | ) | | | (2,128,158 | ) |
| Net increase (decrease) in Class A shares | | | (1,391,212 | ) | | | (1,642,069 | ) |
| Shares outstanding at end of period | | | 10,896,924 | | | | 12,288,136 | |
The accompanying notes are an integral part of the financial statements.
| | | Years Ended December 31, | |
| Class A | | | 2012 | | | 2011 | | | 2010 | | | 2009 | | | 2008 | |
| Selected Per Share Data | |
| Net asset value, beginning of period | | $ | 21.49 | | | $ | 22.13 | | | $ | 20.52 | | | $ | 17.35 | | | $ | 24.81 | |
Income (loss) from investment operations: Net investment incomea | | | .57 | | | | .46 | | | | .39 | | | | .44 | | | | .61 | |
| Net realized and unrealized gain (loss) | | | 2.20 | | | | (.75 | ) | | | 1.88 | | | | 3.43 | | | | (7.20 | ) |
| Total from investment operations | | | 2.77 | | | | (.29 | ) | | | 2.27 | | | | 3.87 | | | | (6.59 | ) |
Less distributions from: Net investment income | | | (.36 | ) | | | (.35 | ) | | | (.66 | ) | | | (.70 | ) | | | (.87 | ) |
| Net asset value, end of period | | $ | 23.90 | | | $ | 21.49 | | | $ | 22.13 | | | $ | 20.52 | | | $ | 17.35 | |
| Total Return (%) | | | 12.98 | | | | (1.42 | ) | | | 11.22 | | | | 23.43 | | | | (27.33 | )b |
| Ratios to Average Net Assets and Supplemental Data | |
| Net assets, end of period ($ millions) | | | 260 | | | | 264 | | | | 308 | | | | 319 | | | | 307 | |
| Ratio of expenses before expense reductions (%) | | | .59 | | | | .58 | | | | .65 | | | | .60 | | | | .64 | |
| Ratio of expenses after expense reductions (%) | | | .59 | | | | .58 | | | | .65 | | | | .60 | | | | .62 | |
| Ratio of net investment income (%) | | | 2.48 | | | | 2.09 | | | | 1.89 | | | | 2.40 | | | | 2.83 | |
| Portfolio turnover rate (%) | | | 188 | | | | 109 | | | | 203 | | | | 207 | | | | 263 | |
a Based on average shares outstanding during the period. b Total return would have been lower had certain expenses not been reduced. | |
Notes to Financial Statements
A. Organization and Significant Accounting Policies
DWS Global Income Builder VIP (formerly DWS Balanced VIP) (the "Fund") is a diversified series of DWS Variable Series II (the "Trust"), which is registered under the Investment Company Act of 1940, as amended (the "1940 Act"), as an open-end management investment company organized as a Massachusetts business trust.
The Fund's financial statements are prepared in accordance with accounting principles generally accepted in the United States of America which require the use of management estimates. Actual results could differ from those estimates. The policies described below are followed consistently by the Fund in the preparation of its financial statements.
Security Valuation. Investments are stated at value determined as of the close of regular trading on the New York Stock Exchange on each day the exchange is open for trading.
Various inputs are used in determining the value of the Fund's investments. These inputs are summarized in three broad levels. Level 1 includes quoted prices in active markets for identical securities. Level 2 includes other significant observable inputs (including quoted prices for similar securities, interest rates, prepayment speeds, and credit risk). Level 3 includes significant unobservable inputs (including the Fund's own assumptions in determining the fair value of investments). The inputs or methodology used for valuing securities are not necessarily an indication of the risk associated with investing in those securities.
Equity securities are valued at the most recent sale price or official closing price reported on the exchange (U.S. or foreign) or over-the-counter market on which they trade and are categorized as Level 1 securities. Securities for which no sales are reported are valued at the calculated mean between the most recent bid and asked quotations on the relevant market or, if a mean cannot be determined, at the most recent bid quotation. For certain international equity securities, in order to adjust for events which may occur between the close of the foreign exchanges and the close of the New York Stock Exchange, a fair valuation model may be used. This fair valuation model takes into account comparisons to the valuation of American Depository Receipts (ADRs), exchange-traded funds, futures contracts and certain indices and these securities are categorized as Level 2.
Debt securities and Loan Participations and Assignments are valued at prices supplied by independent pricing services approved by the Fund's Board. If the pricing services are unable to provide valuations, securities are valued at the most recent bid quotation or evaluated price, as applicable, obtained from one or more broker-dealers. Such services may use various pricing techniques which take into account appropriate factors such as yield, quality, coupon rate, maturity, type of issue, trading characteristics and other data, as well as broker quotes. These securities are generally categorized as Level 2.
Money market instruments purchased with an original or remaining maturity of sixty days or less, maturing at par, are valued at amortized cost, which approximates value, and are categorized as Level 2. Investments in open-end investment companies are valued at their net asset value each business day and are categorized as Level 1.
Futures contracts are generally valued at the settlement prices established each day on the exchange on which they are traded and are categorized as Level 1.
Forward currency contracts are valued at the prevailing forward exchange rate of the underlying currencies and are categorized as Level 2.
Swap contracts are valued daily based upon prices supplied by a Board approved pricing vendor, if available, and otherwise are valued at the price provided by the broker-dealer. Swap contracts are generally categorized as Level 2.
Exchange-traded options are valued at the last sale price or, in the absence of a sale, the mean between the closing bid and asked prices or at the most recent asked price (bid for purchased options) if no bid or asked price are available. Exchange-traded options are categorized as Level 1. Over-the-counter written or purchased options are valued at the price provided by the broker-dealer with which the option was traded and are generally categorized as Level 2.
Securities and other assets for which market quotations are not readily available or for which the above valuation procedures are deemed not to reflect fair value are valued in a manner that is intended to reflect their fair value as determined in accordance with procedures approved by the Board and are generally categorized as Level 3. In accordance with the Fund's valuation procedures, factors used in determining value may include, but are not limited to, the type of the security; the size of the holding; the initial cost of the security; the existence of any contractual restrictions on the security's disposition; the price and extent of public trading in similar securities of the issuer or of comparable companies; quotations or evaluated prices from broker-dealers and/or pricing services; information obtained from the issuer, analysts, and/or the appropriate stock exchange (for exchange-traded securities); an analysis of the company's or issuer's financial statements; an evaluation of the forces that influence the issuer and the market(s) in which the security is purchased and sold and with respect to debt securities; the maturity, coupon, creditworthiness, currency denomination and the movement of the market in which the security is normally traded. The value determined under these procedures may differ from published values for the same securities.
Disclosure about the classification of fair value measurements is included in a table following the Fund's Investment Portfolio.
New Accounting Pronouncement. In January 2013, Accounting Standard Update 2013-01 (ASU 2013-01), Clarifying the Scope of Disclosures about Offsetting Assets and Liabilities, replaced Accounting Standards Update 2011-11 (ASU 2011-11), Disclosures about Offsetting Assets and Liabilities. ASU 2013-01 is effective for fiscal years beginning on or after January 1, 2013, and interim periods within those annual periods. ASU 2011-11 was intended to enhance disclosure requirements on the offsetting of financial assets and liabilities. The ASU 2013-01 limits the scope of the new balance sheet offsetting disclosures to derivatives, repurchase agreements, and securities lending transactions to the extent that they are (1) offset in the financial statements or (2) subject to an enforceable master netting arrangement or similar agreement. Management is currently evaluating the application of ASU 2013-01 and its impact, if any, on the Fund's financial statements.
Foreign Currency Translations. The books and records of the Fund are maintained in U.S. dollars. Investment securities and other assets and liabilities denominated in a foreign currency are translated into U.S. dollars at the prevailing exchange rates at period end. Purchases and sales of investment securities, income and expenses are translated into U.S. dollars at the prevailing exchange rates on the respective dates of the transactions.
Net realized and unrealized gains and losses on foreign currency transactions represent net gains and losses between trade and settlement dates on securities transactions, the acquisition and disposition of foreign currencies, and the difference between the amount of net investment income accrued and the U.S. dollar amount actually received. That portion of both realized and unrealized gains and losses on investments that results from fluctuations in foreign currency exchange rates is not separately disclosed but is included with net realized and unrealized gain/appreciation and loss/depreciation on investments.
Securities Lending. The Fund lends securities to certain financial institutions. The Fund retains beneficial ownership of the securities it has loaned and continues to receive interest and dividends paid by the issuer of securities and to participate in any changes in their market value. The Fund requires the borrowers of the securities to maintain collateral with the Fund consisting of either cash or liquid, unencumbered assets having a value at least equal to the value of the securities loaned. When the collateral falls below specified amounts, the lending agent will use its best effort to obtain additional collateral on the next business day to meet required amounts under the security lending agreement. The Fund may invest the cash collateral into a joint trading account in an affiliated money market fund pursuant to Exemptive Orders issued by the SEC. The Fund receives compensation for lending its securities either in the form of fees or by earning interest on invested cash collateral net of borrower rebates and fees paid to a lending agent. Either the Fund or the borrower may terminate the loan. There may be risks of delay and costs in recovery of securities or even loss of rights in the collateral should the borrower of the securities fail financially. The Fund is also subject to all investment risks associated with the reinvestment of any cash collateral received, including, but not limited to, interest rate, credit and liquidity risk associated with such investments.
Loan Participations and Assignments. Loan Participations and Assignments are portions of loans originated by banks and sold in pieces to investors. These fixed and floating rate loans ("Loans") in which the Fund invests are arranged between the borrower and one or more financial institutions ("Lenders"). These Loans may take the form of Senior Loans, which are corporate obligations often issued in connection with recapitalizations, acquisitions, leveraged buy-outs and refinancings, and Sovereign Loans, which are debt instruments between a foreign sovereign entity and one or more financial institutions. The Fund invests in such Loans in the form of participations in Loans ("Participations") or assignments of all or a portion of Loans from third parties ("Assignments"). Participations typically result in the Fund having a contractual relationship only with the Lender, not with the borrower. The Fund has the right to receive payments of principal, interest and any fees to which it is entitled from the Lender selling the Participation and only upon receipt by the Lender of the payments from the borrower. In connection with purchasing Participations, the Fund generally has no right to enforce compliance by the borrower with the terms of the loan agreement relating to the Loan, or any rights of set-off against the borrower, and the Fund will not benefit directly from any collateral supporting the Loan in which it has purchased the Participation. As a result, the Fund assumes the credit risk of both the borrower and the Lender that is selling the Participation. Assignments typically result in the Fund having a direct contractual relationship with the borrower, and the Fund may enforce compliance by the borrower with the terms of the loan agreement. Loans held by the Fund are generally in the form of Assignments but the Fund may also invest in Participants. All Loan Participations and Assignments involve interest rate risk, liquidity risk and credit risk, including the potential default or insolvency of the borrower.
When-Issued/Delayed Delivery Securities. The Fund may purchase or sell securities with delivery or payment to occur at a later date beyond the normal settlement period. At the time the Fund enters into a commitment to purchase or sell a security, the transaction is recorded and the value of the transaction is reflected in the net asset value. The price of such security and the date when the security will be delivered and paid for are fixed at the time the transaction is negotiated. The value of the security may vary with market fluctuations. At the time the Fund enters into a purchase transaction it is required to segregate cash or other liquid assets at least equal to the amount of the commitment.
Certain risks may arise upon entering into when-issued or delayed delivery transactions from the potential inability of counterparties to meet the terms of their contracts or if the issuer does not issue the securities due to political, economic, or other factors. Additionally, losses may arise due to changes in the value of the underlying securities.
Taxes. The Fund's policy is to comply with the requirements of the Internal Revenue Code, as amended, which are applicable to regulated investment companies and to distribute all of its taxable income to its shareholders.
Additionally, the Fund may be subject to taxes imposed by the governments of countries in which it invests and are generally based on income and/or capital gains earned or repatriated. Estimated tax liabilities on certain foreign securities are recorded on an accrual basis and are reflected as components of interest income or net change in unrealized gain/loss on investments. Tax liabilities realized as a result of security sales are reflected as a component of net realized gain/loss on investments.
Under the Regulated Investment Company Modernization Act of 2010, net capital losses incurred post-enactment may be carried forward indefinitely, and their character is retained as short-term and/or long-term. Previously, net capital losses were carried forward for eight years and treated as short-term losses. As a transition rule, the Act requires that post-enactment net capital losses be used before pre-enactment net capital losses.
At December 31, 2012, the Fund had a net tax basis capital loss carryforward of approximately $5,132,000 of pre-enactment losses, which may be applied against any realized net taxable capital gains of each succeeding year until fully utilized or until December 31, 2017, the expiration date, whichever occurs first.
The Fund has reviewed the tax positions for the open tax years as of December 31, 2012 and has determined that no provision for income tax is required in the Fund's financial statements. The Fund's federal tax returns for the prior three fiscal years remain open subject to examination by the Internal Revenue Service.
Distribution of Income and Gains. Distributions from net investment income of the Fund, if any, is declared and distributed to shareholders annually. Net realized gains from investment transactions, in excess of available capital loss carryforwards, would be taxable to the Fund if not distributed and, therefore, will be distributed to shareholders at least annually. The Fund may also make additional distributions for tax purposes if necessary.
The timing and characterization of certain income and capital gain distributions are determined annually in accordance with federal tax regulations which may differ from accounting principles generally accepted in the United States of America. These differences primarily relate to investments in foreign denominated investments, forward currency contracts, futures contracts and certain securities sold at a loss. As a result, net investment income (loss) and net realized gain (loss) on investment transactions for a reporting period may differ significantly from distributions during such period. Accordingly, the Fund may periodically make reclassifications among certain of its capital accounts without impacting the net asset value of the Fund.
At December 31, 2012, the Fund's components of distributable earnings on a tax basis were as follows:
| Undistributed ordinary income* | | $ | 5,436,390 | |
| Capital loss carryforwards | | $ | (5,132,000 | ) |
| Unrealized appreciation (depreciation) on investments | | $ | 12,425,321 | |
In addition, the tax character of distributions paid by the Fund is summarized as follows:
| | | Years Ended December 31, | |
| | | 2012 | | | 2011 | |
| Distributions from ordinary income* | | $ | 4,191,340 | | | $ | 4,612,028 | |
* For tax purposes, short-term capital gain distributions are considered ordinary income distributions.
Expenses. Expenses of the Trust arising in connection with a specific fund are allocated to that fund. Other Trust expenses which cannot be directly attributed to a fund are apportioned among the funds in the Trust based upon the relative net assets or other appropriate measures.
Contingencies. In the normal course of business, the Fund may enter into contracts with service providers that contain general indemnification clauses. The Fund's maximum exposure under these arrangements is unknown as this would involve future claims that may be made against the Fund that have not yet been made. However, based on experience, the Fund expects the risk of loss to be remote.
Other. Investment transactions are accounted for on a trade date plus one basis for daily net asset value calculations. However, for financial reporting purposes, investment transactions are reported on trade date. Interest income is recorded on the accrual basis. Dividend income is recorded on the ex-dividend date net of foreign withholding taxes. Certain dividends from foreign securities may be recorded subsequent to the ex-dividend date as soon as the Fund is informed of such dividends. Realized gains and losses from investment transactions are recorded on an identified cost basis and may include proceeds from litigation. All discounts and premiums are accreted/amortized for both tax and financial reporting purposes, with the exception of securities in default of principal.
B. Derivative Instruments
Interest Rate Swap Contracts. For the year ended December 31, 2012, the Fund entered into interest rate swap transactions to gain exposure to different parts of the yield curve while managing overall duration and to enhance potential gains. The use of interest rate swaps is a highly specialized activity that involves investment techniques and risks different from those associated with ordinary portfolio security transactions. In an interest rate swap, the Fund agrees to pay to the other party to the interest rate swap (which is known as the "counterparty") a fixed rate payment in exchange for the counterparty agreeing to pay to the Fund a variable rate payment, or the Fund agrees to receive from the counterparty a fixed rate payment in exchange for the counterparty agreeing to receive from the Fund a variable rate payment. In addition, both the Fund and counterparty may agree to exchange variable rate payments based on different indices. The payment obligations are based on the notional amount of the swap. Certain risks may arise when entering into swap transactions including counterparty default, liquidity or unfavorable changes in interest rates. In connection with these agreements, securities and or cash may be identified as collateral in accordance with the terms of the swap agreements to provide assets of value and recourse in the event of default. The maximum counterparty credit risk is the net present value of the cash flows to be received from or paid to the counterparty over the term of the interest rate swap contract, to the extent that this amount is beneficial to the Fund, in addition to any related collateral posted to the counterparty by the Fund. This risk may be partially reduced by a master netting arrangement between the Fund and the counterparty. The value of the swap is adjusted daily and the change in value, if any, is recorded as unrealized appreciation or depreciation in the Statement of Assets and Liabilities. An upfront payment, if any, made by the Fund is recorded as an asset in the Statement of Assets and Liabilities. An upfront payment, if any, received by the Fund is recorded as a liability in the Statement of Assets and Liabilities. Payments received or made at the end of the measurement period are recorded as realized gain or loss in the Statement of Operations.
A summary of the open interest rate swap contracts as of December 31, 2012 is included in a table following the Fund's Investment Portfolio. For the year ended December 31, 2012, the investment in interest rate swap contracts had a total notional amount generally indicative of a range from $0 to approximately $22,800,000.
Credit Default Swap Contracts. A credit default swap is a contract between a buyer and a seller of protection against pre-defined credit events for the reference entity. The Fund may enter into credit default swap contracts to gain exposure to an underlying issuer's credit quality characteristics without directly investing in that issuer or to hedge against the risk of a credit event on debt securities. As a seller in the credit default swap contract, the Fund is required to pay the par (or other agreed-upon) value of the referenced entity to the counterparty with the occurrence of a credit event by a third party, such as a U.S. or foreign corporate issuer, on the reference entity, which would likely result in a loss to the Fund. In return, the Fund receives from the counterparty a periodic stream of payments over the term of the contract provided that no credit event has occurred. If no credit event occurs, the Fund keeps the stream of payments with no payment obligations. This involves the risk that the contract may expire worthless. It also involves counterparty risk that the seller may fail to satisfy its payment obligations to the Fund with the occurrence of a credit event. When the Fund sells a credit default swap contract it will cover its commitment. This may be achieved by, among other methods, maintaining cash or liquid assets equal to the aggregate notional value of the reference entities for all outstanding credit default swap contracts sold by the Fund. For the year ended December 31, 2012, the Fund entered into credit default swap contracts to gain exposure to the underlying issuer's credit quality characteristics.
The value of the credit default swap is adjusted daily and the change in value, if any, is recorded daily as unrealized appreciation or depreciation in the Statement of Assets and Liabilities. An upfront payment, if any, made by the Fund is recorded as an asset in the Statement of Assets and Liabilities. An upfront payment, if any, received by the Fund is recorded as a liability in the Statement of Assets and Liabilities. Under the terms of the credit default swap contracts, the Fund receives or makes quarterly payments based on a specified interest rate on a fixed notional amount. These payments are recorded as a realized gain or loss in the Statement of Operations. Payments received or made as a result of a credit event or termination of the contract are recognized, net of a proportional amount of the upfront payment, as realized gains or losses in the Statement of Operations.
A summary of the open credit default swap contracts as of December 31, 2012 is included in a table following the Fund's Investment Portfolio. For the year ended December 31, 2012, the investment in credit default swap contracts purchased had a total notional value generally indicative of a range from $0 to $5,200,000, and the investment in credit default swap contracts sold had a total notional value generally indicative of a range from $0 to $1,925,000.
Futures Contracts. A futures contract is an agreement between a buyer or seller and an established futures exchange or its clearinghouse in which the buyer or seller agrees to take or make a delivery of a specific amount of a financial instrument at a specified price on a specific date (settlement date). For the year ended December 31, 2012, the Fund entered into interest rate futures to gain exposure to different parts of the yield curve while managing overall duration, and to gain exposure to a particular asset class or to keep cash on hand to meet shareholder redemptions or other needs while maintaining exposure to the stock market. In addition, prior to May 1, 2012, the Fund sought to enhance returns by employing a global tactical asset allocation overlay strategy by entering into futures contracts on fixed-income securities, including on financial indices. As part of this strategy, the Fund used futures contracts to attempt to take advantage of inefficiencies within the global bond markets.
Upon entering into a futures contract, the Fund is required to deposit with a financial intermediary cash or securities ("initial margin") in an amount equal to a certain percentage of the face value indicated in the futures contract. Subsequent payments ("variation margin") are made or received by the Fund dependent upon the daily fluctuations in the value and are recorded for financial reporting purposes as unrealized gains or losses by the Fund. Gains or losses are realized when the contract expires or is closed. Since all futures contracts are exchange-traded, counterparty risk is minimized as the exchange's clearinghouse acts as the counterparty, and guarantees the futures against default.
Certain risks may arise upon entering into futures contracts, including the risk that an illiquid market will limit the Fund's ability to close out a futures contract prior to the settlement date and the risk that the futures contract is not well correlated with the security, index or currency to which it relates. Risk of loss may exceed amounts disclosed in the Statement of Assets and Liabilities.
A summary of the open futures contracts as of December 31, 2012 is included in a table following the Fund's Investment Portfolio. For the year ended December 31, 2012, the investment in futures contracts purchased had a total notional value generally indicative of a range from approximately $4,463,000 to $44,167,000, and the investment in futures contracts sold had a total notional value generally indicative of a range from $0 to approximately $50,425,000.
Options. An option contract is a contract in which the writer (seller) of the option grants the buyer of the option, upon payment of a premium, the right to purchase from (call option), or sell to (put option), the writer a designated instrument at a specified price within a specified period of time. Certain options, including options on indices and interest rate options, will require cash settlement by the Fund if exercised. For the year ended December 31, 2012, the Fund entered into options on interest rate futures and on interest rate swaps in order to hedge against potential adverse interest rate movements of portfolio assets.
If the Fund writes a covered call option, the Fund foregoes, in exchange for the premium, the opportunity to profit during the option period from an increase in the market value of the underlying security above the exercise price. If the Fund writes a put option it accepts the risk of a decline in the value of the underlying security below the exercise price. Over-the-counter options have the risk of the potential inability of counterparties to meet the terms of their contracts. For exchange traded contracts, the counterparty risk is minimized as the exchange's clearinghouse acts as the counterparty, and guarantees the futures against default. The Fund's maximum exposure to purchased options is limited to the premium initially paid. In addition, certain risks may arise upon entering into option contracts including the risk that an illiquid secondary market will limit the Fund's ability to close out an option contract prior to the expiration date and that a change in the value of the option contract may not correlate exactly with changes in the value of the securities or currencies hedged.
A summary of the open purchased option contracts as of December 31, 2012 is included in the Fund's Investment Portfolio. A summary of open written option contracts is included in a table following the Fund's Investment Portfolio. For the year ended December 31, 2012, the investment in written option contracts had a total value generally indicative of a range from $0 to approximately $137,000, and purchased option contracts had a total value generally indicative of a range from $0 to approximately $114,000.
Forward Foreign Currency Exchange Contracts. A forward foreign currency exchange contract ("forward currency contract") is a commitment to purchase or sell a foreign currency at the settlement date at a negotiated rate. For the year ended December 31, 2012, the Fund entered into forward currency contracts in order to hedge its exposure to changes in foreign currency exchange rates on its foreign currency denominated portfolio holdings, to facilitate transactions in foreign currency denominated securities and to enhance total returns. Prior to May 1, 2012, the Fund also entered into forward currency contracts as part of its global tactical asset allocation overlay strategy.
Forward currency contracts are valued at the prevailing forward exchange rate of the underlying currencies and unrealized gain (loss) is recorded daily. On the settlement date of the forward currency contract, the Fund records a realized gain or loss equal to the difference between the value of the contract at the time it was opened and the value of the contract at the time it was closed. Certain risks may arise upon entering into forward currency contracts from the potential inability of counterparties to meet the terms of their contracts. The maximum counterparty credit risk to the Fund is measured by the unrealized gain on appreciated contracts. Additionally, when utilizing forward currency contracts to hedge, the Fund gives up the opportunity to profit from favorable exchange rate movements during the term of the contract.
A summary of the open forward currency contracts as of December 31, 2012 is included in a table following the Fund's Investment Portfolio. For the year ended December 31, 2012, the investment in forward currency contracts short vs. U.S. dollars had a total contract value generally indicative of a range from approximately $7,021,000 to $47,248,000, and the investment in forward currency contracts long vs. U.S. dollars had a total contract value generally indicative of a range from approximately $6,010,000 to $47,692,000.
The following tables summarize the value of the Fund's derivative instruments held as of December 31, 2012 and the related location in the accompanying Statement of Assets and Liabilities, presented by primary underlying risk exposure:
| Asset Derivatives | | Purchased Options | | | Forward Contracts | | | Swap Contracts | | | Futures Contracts | | | Total | |
| Interest Rate Contracts (a) (b) | | $ | 83,098 | | | $ | — | | | $ | 86,379 | | | $ | 10,320 | | | $ | 179,797 | |
| Credit Contracts (a) | | | — | | | | — | | | | 64,526 | | | | — | | | | 64,526 | |
| Foreign Exchange Contracts (c) | | | — | | | | 103,602 | | | | — | | | | — | | | | 103,602 | |
| | | $ | 83,098 | | | $ | 103,602 | | | $ | 150,905 | | | $ | 10,320 | | | $ | 347,925 | |
Each of the above derivatives is located in the following Statement of Assets and Liabilities accounts:
(a) Investment in securities, at value (includes purchased options) and unrealized appreciation on swap contracts
(b) Includes cumulative appreciation of futures contracts as disclosed in the Investment Portfolio. Unsettled variation margin is disclosed separately within the Statement of Assets and Liabilities.
(c) Unrealized appreciation on forward foreign currency exchange contracts
| Liability Derivatives | | Written Options | | | Forward Contracts | | | Swap Contracts | | | Futures Contracts | | | Total | |
| Interest Rate Contracts (a) (b) | | $ | (74,478 | ) | | $ | — | | | $ | (123,396 | ) | | $ | (32,594 | ) | | $ | (230,468 | ) |
| Foreign Exchange Contracts (c) | | | — | | | | (127,355 | ) | | | — | | | | — | | | | (127,355 | ) |
| | | $ | (74,478 | ) | | $ | (127,355 | ) | | $ | (123,396 | ) | | $ | (32,594 | ) | | $ | (357,823 | ) |
Each of the above derivatives is located in the following Statement of Assets and Liabilities accounts:
(a) Options written, at value and unrealized depreciation on swap contracts
(b) Includes cumulative depreciation of futures contracts as disclosed in the Investment Portfolio. Unsettled variation margin is disclosed separately within the Statement of Assets and Liabilities.
(c) Unrealized depreciation on forward foreign currency exchange contracts
Additionally, the amount of unrealized and realized gains and losses on derivative instruments recognized in Fund earnings during the year ended December 31, 2012 and the related location in the accompanying Statement of Operations is summarized in the following tables by primary underlying risk exposure:
| Realized Gain (Loss) | | Purchased Options | | | Written Options | | | Forward Contracts | | | Swap Contracts | | | Futures Contracts | | | Total | |
| Interest Rate Contracts (a) | | $ | (2,007 | ) | | $ | 22,571 | | | $ | — | | | $ | — | | | $ | 634,773 | | | $ | 655,337 | |
| Equity Contracts (a) | | | — | | | | — | | | | — | | | | — | | | | 140,809 | | | | 140,809 | |
| Credit Contracts (a) | | | — | | | | — | | | | — | | | | (18,096 | ) | | | — | | | | (18,096 | ) |
| Foreign Exchange Contracts (b) | | | — | | | | — | | | | (1,284,835 | ) | | | — | | | | — | | | | (1,284,835 | ) |
| | | $ | (2,007 | ) | | $ | 22,571 | | | $ | (1,284,835 | ) | | $ | (18,096 | ) | | $ | 775,582 | | | $ | (506,785 | ) |
Each of the above derivatives is located in the following Statement of Operations accounts:
(a) Net realized gain (loss) from investments (includes purchased options), written options, swap contracts and futures, respectively
(b) Net realized gain (loss) from foreign currency (Statement of Operations includes both forward currency contracts and foreign currency transactions)
| Change in Net Unrealized Appreciation (Depreciation) | | Purchased Options | | | Written Options | | | Forward Contracts | | | Swap Contracts | | | Futures Contracts | | | Total | |
| Interest Rate Contracts (a) | | $ | (37,464 | ) | | $ | 107,241 | | | $ | — | | | $ | (37,017 | ) | | $ | (288,310 | ) | | $ | (255,550 | ) |
| Equity Contracts (a) | | | — | | | | — | | | | — | | | | — | | | | (23,250 | ) | | | (23,250 | ) |
| Credit Contracts (a) | | | — | | | | — | | | | — | | | | 64,526 | | | | — | | | | 64,526 | |
| Foreign Exchange Contracts (b) | | | — | | | | — | | | | 14,202 | | | | — | | | | — | | | | 14,202 | |
| | | $ | (37,464 | ) | | $ | 107,241 | | | $ | 14,202 | | | $ | 27,509 | | | $ | (311,560 | ) | | $ | (200,072 | ) |
Each of the above derivatives is located in the following Statement of Operations accounts:
(a) Change in net unrealized appreciation (depreciation) on investments (includes purchased options), written options, swap contracts and futures, respectively
(b) Change in net unrealized appreciation (depreciation) on foreign currency (Statement of Operations includes both forward currency contracts and foreign currency transactions)
C. Purchases and Sales of Securities
During the year ended December 31, 2012, purchases and sales of investment transactions (excluding short-term investments and U.S. Treasury obligations) aggregated $423,527,103 and $440,921,629, respectively. Purchases and sales of U.S. Treasury obligations aggregated $43,095,128 and $46,455,386, respectively.
For the year ended December 31, 2012, transactions for written options on interest rate swap contracts and futures contracts were as follows:
| | | Contract Amount | | | Premium | |
| Outstanding, beginning of period | | | — | | | $ | — | |
| Options written | | | 8,200,095 | | | | 208,429 | |
| Options closed | | | (70 | ) | | | (24,768 | ) |
| Options expired | | | (5 | ) | | | (1,942 | ) |
| Outstanding, end of period | | | 8,200,020 | | | $ | 181,719 | |
D. Related Parties
Management Agreement. Under the Investment Management Agreement with Deutsche Investment Management Americas Inc. ("DIMA" or the "Advisor"), an indirect, wholly owned subsidiary of Deutsche Bank AG, the Advisor directs the investments of the Fund in accordance with its investment objectives, policies and restrictions. The Advisor determines the securities, instruments and other contracts relating to investments to be purchased, sold or entered into by the Fund.
Prior to May 1, 2012, pursuant to an investment subadvisory agreement with the Advisor, QS Investors, LLC ("QS Investors") acted as an investment subadvisor to the Fund. QS Investors rendered strategic asset allocation services and managed the portion of assets allocated to the Fund's global tactical asset allocation overlay strategy. QS Investors was paid by the Advisor for the services QS Investors provided to the Fund. The Fund's board approved the termination of QS Investors as the Fund's subadvisor and effective May 1, 2012, the Advisor assumed all day-to-day advisory responsibilities for the Fund that were previously delegated to QS Investors.
Under the Investment Management Agreement, the Fund pays a monthly management fee based on the Fund's average daily net assets, computed and accrued daily and payable monthly, at the following annual rates:
| First $250 million | | | .370 | % |
| Next $750 million | | | .345 | % |
| Over $1 billion | | | .310 | % |
Accordingly, for the year ended December 31, 2012, the fee pursuant to the Investment Management Agreement was equivalent to an annual effective rate of 0.37% of the Fund's average daily net assets.
For the period from October 1, 2012 through September 30, 2013, the Advisor has contractually agreed to waive its fees and/or reimburse certain operating expenses to the extent necessary to maintain the operating expenses (excluding certain expenses such as extraordinary expenses, taxes, brokerage and interest expense) of Class A shares at 0.68%.
Administration Fee. Pursuant to an Administrative Services Agreement, DIMA provides most administrative services to the Fund. For all services provided under the Administrative Services Agreement, the Fund pays DIMA an annual fee ("Administration Fee") of 0.10% of the Fund's average daily net assets, computed and accrued daily and payable monthly. For the year ended December 31, 2012, the Administration Fee was $265,488, of which $22,167 is unpaid.
Service Provider Fees. DWS Investments Service Company ("DISC"), an affiliate of the Advisor, is the transfer agent, dividend-paying agent and shareholder service agent for the Fund. Pursuant to a sub-transfer agency agreement between DISC and DST Systems, Inc. ("DST"), DISC has delegated certain transfer agent, dividend-paying agent and shareholder service agent functions to DST. DISC compensates DST out of the shareholder servicing fee it receives from the Fund. For the year ended December 31, 2012, the amounts charged to the Fund by DISC aggregated $399, of which $99 is unpaid.
Typesetting and Filing Service Fees. Under an agreement with DIMA, DIMA is compensated for providing typesetting and certain regulatory filing services to the Fund. For the year ended December 31, 2012, the amount charged to the Fund by DIMA included in the Statement of Operations under "reports to shareholders" aggregated $19,745, of which $6,131 is unpaid.
Trustees' Fees and Expenses. The Fund paid retainer fees to each Trustee not affiliated with the Advisor, plus specified amounts to the Board Chairperson and to each committee Chairperson.
Affiliated Cash Management Vehicle. The Fund may invest uninvested cash balances in Central Cash Management Fund, which is managed by the Advisor. The Fund indirectly bears its proportionate share of the expenses of Central Cash Management Fund. Central Cash Management Fund does not pay the Advisor an investment management fee. Central Cash Management Fund seeks a high level of current income consistent with liquidity and the preservation of capital.
Securities Lending Agent Fees. Deutsche Bank AG serves as securities lending agent for the Fund. For the year ended December 31, 2012, the Fund incurred securities lending agent fees to Deutsche Bank AG in the amount of $14,804.
E. Ownership of the Fund
At December 31, 2012, three Participating Insurance Companies were owners of record of 10% or more of the total outstanding shares of the Fund, each owning 45%, 21% and 15%.
F. Line of Credit
The Fund and other affiliated funds (the "Participants") share in a $375 million revolving credit facility provided by a syndication of banks. The Fund may borrow for temporary or emergency purposes, including the meeting of redemption requests that otherwise might require the untimely disposition of securities. The Participants are charged an annual commitment fee which is allocated based on net assets, among each of the Participants. Interest is calculated at a rate per annum equal to the sum of the Federal Funds Rate plus 1.25 percent plus if LIBOR exceeds the Federal Funds Rate the amount of such excess. The Fund may borrow up to a maximum of 33 percent of its net assets under the agreement. The Fund had no outstanding loans at December 31, 2012.
G. Payment by Affiliate
During the year ended December 31, 2012, the Advisor fully reimbursed the Fund $1,094 for a loss incurred on a trade executed incorrectly. The amount reimbursed was less than 0.01% of the Fund's average net assets, thus having no impact on the Fund's total return.
H. Changes to Investment Strategies, Policies and Fund Name
Effective May 1, 2012, the Fund's investment objective changed from seeking the highest total return, a combination of income and capital appreciation, consistent with reasonable risk, to seeking to maximize income while maintaining prospects for capital appreciation. In connection with the implementation of the new objective, the Fund's name changed to DWS Global Income Builder VIP. For more information, please see the Fund's current prospectus.
Report of Independent Registered Public Accounting Firm
To the Board of Trustees of DWS Variable Series II and Shareholders of DWS Global Income Builder VIP:
We have audited the accompanying statement of assets and liabilities, including the investment portfolio, of DWS Global Income Builder VIP (formerly DWS Balanced VIP) (the "Fund"), one of the funds constituting DWS Variable Series II, as of December 31, 2012, and the related statement of operations for the year then ended, the statement of changes in net assets for each of the two years in the period then ended, and the financial highlights for each of the five years in the period then ended. These financial statements and financial highlights are the responsibility of the Fund's management. Our responsibility is to express an opinion on these financial statements and financial highlights based on our audits.
We conducted our audits in accordance with the standards of the Public Company Accounting Oversight Board (United States). Those standards require that we plan and perform the audit to obtain reasonable assurance about whether the financial statements and financial highlights are free of material misstatement. We were not engaged to perform an audit of the Fund's internal control over financial reporting. Our audits included consideration of internal control over financial reporting as a basis for designing audit procedures that are appropriate in the circumstances, but not for the purpose of expressing an opinion on the effectiveness of the Fund's internal control over financial reporting. Accordingly, we express no such opinion. An audit also includes examining, on a test basis, evidence supporting the amounts and disclosures in the financial statements and financial highlights, assessing the accounting principles used and significant estimates made by management, and evaluating the overall financial statement presentation. Our procedures included confirmation of securities owned as of December 31, 2012, by correspondence with the custodian and brokers, or by other appropriate auditing procedures where replies from brokers were not received. We believe that our audits provide a reasonable basis for our opinion.
In our opinion, the financial statements and financial highlights referred to above present fairly, in all material respects, the financial position of DWS Global Income Builder VIP (one of the funds constituting DWS Variable Series II) at December 31, 2012, the results of its operations for the year then ended, the changes in its net assets for each of the two years in the period then ended, and the financial highlights for each of the five years in the period then ended, in conformity with U.S. generally accepted accounting principles.
| | | |
Boston, Massachusetts February 13, 2013 | | |
Information About Your Fund's Expenses (Unaudited)
As an investor of the Fund, you incur two types of costs: ongoing expenses and transaction costs. Ongoing expenses include management fees and other Fund expenses. Examples of transaction costs include contract charges, redemption fees and account maintenance fees, which are not shown in this section. The following tables are intended to help you understand your ongoing expenses (in dollars) of investing in the Fund and to help you compare these expenses with the ongoing expenses of investing in other mutual funds. The example in the table is based on an investment of $1,000 invested at the beginning of the six-month period and held for the entire period (July 1, 2012 to December 31, 2012).
The tables illustrate your Fund's expenses in two ways:
•Actual Fund Return. This helps you estimate the actual dollar amount of ongoing expenses (but not transaction costs) paid on a $1,000 investment in the Fund using the Fund's actual return during the period. To estimate the expenses you paid over the period, simply divide your account value by $1,000 (for example, an $8,600 account value divided by $1,000 = 8.6), then multiply the result by the number in the "Expenses Paid per $1,000" line under the share class you hold.
• Hypothetical 5% Fund Return. This helps you to compare your Fund's ongoing expenses (but not transaction costs) with those of other mutual funds using the Fund's actual expense ratio and a hypothetical rate of return of 5% per year before expenses. Examples using a 5% hypothetical Fund return may be found in the shareholder reports of other mutual funds. The hypothetical account values and expenses may not be used to estimate the actual ending account balance or expenses you paid for the period.
Please note that the expenses shown in these tables are meant to highlight your ongoing expenses only and do not reflect any transaction costs. The "Expenses Paid per $1,000" line of the tables is useful in comparing ongoing expenses only and will not help you determine the relative total expense of owning different funds. If these transaction costs had been included, your costs would have been higher.
Expenses and Value of a $1,000 Investment for the six months ended December 31, 2012 | |
| Actual Fund Return | | Class A | |
| Beginning Account Value 7/1/12 | | $ | 1,000.00 | |
| Ending Account Value 12/31/12 | | $ | 1,067.00 | |
| Expenses Paid per $1,000* | | $ | 2.96 | |
| Hypothetical 5% Fund Return | | Class A | |
| Beginning Account Value 7/1/12 | | $ | 1,000.00 | |
| Ending Account Value 12/31/12 | | $ | 1,022.27 | |
| Expenses Paid per $1,000* | | $ | 2.90 | |
* Expenses are equal to the Fund's annualized expense ratio, multiplied by the average account value over the period, multiplied by 184 (the number of days in the most recent six-month period), then divided by 366.
| Annualized Expense Ratio | Class A | |
| DWS Variable Series II — DWS Global Income Builder VIP | .57% | |
For more information, please refer to the Fund's prospectus.
These tables do not reflect charges and fees ("contract charges") associated with the separate account that invests in the Fund or any variable life insurance policy or variable annuity contract for which the Fund is an investment option.
Tax Information (Unaudited)
For corporate shareholders, 84% of income dividends paid during the Fund's fiscal year ended December 31, 2012 qualified for the dividends received deduction:
Please consult a tax advisor if you have questions about federal or state income tax laws, or on how to prepare your tax returns. If you have specific questions about your account, please contact your insurance provider.
The Trust's policies and procedures for voting proxies for portfolio securities and information about how the Trust voted proxies related to its portfolio securities during the 12-month period ended June 30 are available on our Web site — www.dws-investments.com (click on "proxy voting" at the bottom of the page) — or on the SEC's Web site — www.sec.gov. To obtain a written copy of the Trust's policies and procedures without charge, upon request, call us toll free at (800) 728-3337.
Investment Management Agreement Approval
The Board of Trustees approved the renewal of DWS Global Income Builder VIP's investment management agreement (the "Agreement") with Deutsche Investment Management Americas Inc. ("DWS") in September 2012.
In terms of the process that the Board followed prior to approving the Agreement, shareholders should know that:
• In September 2012, all of the Fund's Trustees were independent of DWS and its affiliates.
• The Trustees met frequently during the past year to discuss fund matters and dedicated a substantial amount of time to contract review matters. Over the course of several months, the Board's Contract Committee, in coordination with the Board's Fixed Income and Quant Oversight Committee, reviewed comprehensive materials received from DWS, independent third parties and independent counsel. These materials included an analysis of the Fund's performance, fees and expenses, and profitability compiled by the Fund's independent fee consultant. The Board also received extensive information throughout the year regarding performance of the Fund.
• The Independent Trustees regularly meet privately with their independent counsel to discuss contract review and other matters. In addition, the Independent Trustees were also advised by the Fund's independent fee consultant in the course of their review of the Fund's contractual arrangements and considered a comprehensive report prepared by the independent fee consultant in connection with their deliberations (the "IFC Report").
• In connection with reviewing the Agreement, the Board also reviewed the terms of the Fund's distribution agreement, administrative services agreement, transfer agency agreement and other material service agreements.
• Based on its evaluation of the information provided, the Contract Committee presented its findings and recommendations to the Board. The Board then reviewed the Contract Committee's findings and recommendations.
In connection with the contract review process, the Contract Committee and the Board considered the factors discussed below, among others. The Board also considered that DWS and its predecessors have managed the Fund since its inception, and the Board believes that a long-term relationship with a capable, conscientious advisor is in the best interests of the Fund. The Board considered, generally, that shareholders chose to invest or remain invested in the Fund knowing that DWS managed the Fund, and that the Agreement was approved by the Fund's shareholders. DWS is part of Deutsche Bank, a major global banking institution that is engaged in a wide range of financial services. The Board believes that there are advantages to being part of a global asset management business that offers a wide range of investing expertise and resources, including hundreds of portfolio managers and analysts with research capabilities in many countries throughout the world.
As part of the contract review process, the Board carefully considered the fees and expenses of each DWS fund overseen by the Board in light of the fund's performance. In many cases, this led to a negotiation with DWS of lower expense caps for the coming year than had previously been in place. As part of these negotiations, the Board indicated that it would consider relaxing these new lower caps in future years following sustained improvements in performance, among other considerations.
In June 2012, Deutsche Bank ("DB"), DWS's parent company, announced that DB's new management team had concluded the strategic review of its global asset management business announced in late 2011 by DB's prior management team, and would combine its Asset Management (of which DWS is a part) and Wealth Management divisions. Prior to approving the investment management agreements, the Independent Trustees were apprised of the expected management and structure of the new combined Asset & Wealth Management division ("AWM") and DWS. DB also advised the Independent Trustees that the U.S. asset management business is a critical and integral part of DB and AWM, and that DB would be reinvesting a significant portion of the substantial savings it expects to realize by combining its Asset Management and Wealth Management divisions into a combined AWM division, including enhancements to its investment capabilities. DB also confirmed its commitment to maintaining strong legal and compliance groups within the combined division.
While shareholders may focus primarily on fund performance and fees, the Fund's Board considers these and many other factors, including the quality and integrity of DWS's personnel and such other issues as back-office operations, fund valuations, and compliance policies and procedures.
Nature, Quality and Extent of Services. The Board considered the terms of the Agreement, including the scope of advisory services provided under the Agreement. The Board noted that, under the Agreement, DWS provides portfolio management services to the Fund and that, pursuant to a separate administrative services agreement, DWS provides administrative services to the Fund. The Board considered the experience and skills of senior management and investment personnel, the resources made available to such personnel, the ability of DWS to attract and retain high-quality personnel, and the organizational depth and stability of DWS. The Board reviewed the Fund's performance over short-term and long-term periods and compared those returns to various agreed-upon performance measures, including market indices and a peer universe compiled by the independent fee consultant using information supplied by Lipper Inc. ("Lipper"), an independent fund data service. The Board also noted that it has put into place a process of identifying "Focus Funds" (e.g., funds performing poorly relative to their benchmark or a peer universe compiled by an independent fund data service), and receives more frequent reporting and information from DWS regarding such funds, along with DWS's remedial plans to address underperformance. The Board believes this process is an effective manner of identifying and addressing underperforming funds. Based on the information provided, the Board noted that for the one-, three- and five-year periods ended December 31, 2011, the Fund's performance (Class A shares) was in the 4th quartile, 3rd quartile and 4th quartile, respectively, of the applicable Lipper universe (the 1st quartile being the best performers and the 4th quartile being the worst performers). The Board also observed that the Fund has underperformed its benchmark in the one-, three- and five-year periods ended December 31, 2011. The Board noted the disappointing investment performance of the Fund in recent periods and continued to discuss with senior management of DWS the factors contributing to such underperformance and actions being taken to improve performance. The Board observed that the Fund had experienced improved relative performance during the first seven months of 2012. The Board recognized that DWS has made changes in an effort to improve Fund performance, including changes in the Fund's investment process and the introduction of new portfolio management team members in May 2012.
Fees and Expenses. The Board considered the Fund's investment management fee schedule, operating expenses and total expense ratios, and comparative information provided by Lipper and the independent fee consultant regarding investment management fee rates paid to other investment advisors by similar funds (1st quartile being the most favorable and 4th quartile being the least favorable). With respect to management fees paid to other investment advisors by similar funds, the Board noted that the contractual fee rates paid by the Fund, which include a 0.10% fee paid to DWS under the Fund's administrative services agreement, were lower than the median (1st quartile) of the applicable Lipper peer group (based on Lipper data provided as of December 31, 2011). The Board noted that the Fund's Class A shares total (net) operating expenses were expected to be lower than the median (2nd quartile) of the applicable Lipper expense universe (based on Lipper data provided as of December 31, 2011, and analyzing Lipper expense universe Class A (net) expenses less any applicable 12b-1 fees) ("Lipper Universe Expenses"). The Board considered the Fund's management fee rate as compared to fees charged by DWS and certain of its affiliates for comparable mutual funds and considered differences in fund and fee structures between the DWS Funds. The Board also considered how the Fund's total (net) operating expenses compared to the total (net) operating expenses of a more customized peer group selected by Lipper (based on such factors as asset size). The Board also noted that the expense limitation agreed to by DWS helped to ensure that the Fund's total (net) operating expenses would remain competitive.
The information considered by the Board as part of its review of management fees included information regarding fees charged by DWS and its affiliates to similar institutional accounts and to similar funds offered primarily to European investors ("DWS Europe funds"), in each case as applicable. The Board observed that advisory fee rates for institutional accounts generally were lower than the management fees charged by similarly managed DWS U.S. mutual funds ("DWS Funds"), but also took note of the differences in services provided to DWS Funds as compared to institutional accounts. In the case of DWS Europe funds, the Board observed that fee rates for DWS Europe funds generally were higher than for similarly managed DWS Funds, but noted that differences in the types of services provided to DWS Funds relative to DWS Europe funds made it difficult to compare such fees.
On the basis of the information provided, the Board concluded that management fees were reasonable and appropriate in light of the nature, quality and extent of services provided by DWS.
Profitability. The Board reviewed detailed information regarding revenues received by DWS under the Agreement. The Board considered the estimated costs and pre-tax profits realized by DWS from advising the DWS Funds, as well as estimates of the pre-tax profits attributable to managing the Fund in particular. The Board also received information regarding the estimated enterprise-wide profitability of DWS and its affiliates with respect to all fund services in totality and by fund. The Board and the independent fee consultant reviewed DWS's methodology in allocating its costs to the management of the Fund. Based on the information provided, the Board concluded that the pre-tax profits realized by DWS in connection with the management of the Fund were not unreasonable. The Board also reviewed information regarding the profitability of certain similar investment management firms. The Board noted that while information regarding the profitability of such firms is limited (and in some cases is not necessarily prepared on a comparable basis), DWS and its affiliates' overall profitability with respect to the DWS fund complex (after taking into account distribution and other services provided to the funds by DWS and its affiliates) was lower than the overall profitability levels of many comparable firms for which such data was available.
Economies of Scale. The Board considered whether there are economies of scale with respect to the management of the Fund and whether the Fund benefits from any economies of scale. The Board noted that the Fund's management fee schedule includes fee breakpoints. The Board concluded that the Fund's fee schedule represents an appropriate sharing between the Fund and DWS of such economies of scale as may exist in the management of the Fund at current asset levels.
Other Benefits to DWS and Its Affiliates. The Board also considered the character and amount of other incidental benefits received by DWS and its affiliates, including any fees received by DWS for administrative services provided to the Fund and any fees received by an affiliate of DWS for distribution services. The Board also considered benefits to DWS related to brokerage and soft-dollar allocations, including allocating brokerage to pay for research generated by parties other than the executing broker dealers, which pertain primarily to funds investing in equity securities, along with the incidental public relations benefits to DWS related to DWS Funds advertising and cross-selling opportunities among DWS products and services. The Board concluded that management fees were reasonable in light of these fallout benefits.
Compliance. The Board considered the significant attention and resources dedicated by DWS to documenting and enhancing its compliance processes in recent years. The Board noted in particular (i) the experience and seniority of both DWS's chief compliance officer and the Fund's chief compliance officer; (ii) the large number of DWS compliance personnel; and (iii) the substantial commitment of resources by DWS and its affiliates to compliance matters.
Based on all of the information considered and the conclusions reached, the Board unanimously determined that the continuation of the Agreement is in the best interests of the Fund. In making this determination, the Board did not give particular weight to any single factor identified above. The Board considered these factors over the course of numerous meetings, certain of which were in executive session with only the Independent Trustees and their counsel present. It is possible that individual Trustees may have weighed these factors differently in reaching their individual decisions to approve the continuation of the Agreement.
Summary of Management Fee Evaluation by Independent Fee Consultant
September 17, 2012
Pursuant to an Order entered into by Deutsche Investment Management Americas and affiliates (collectively, "DeAM") with the Attorney General of New York, I, Thomas H. Mack, have been appointed the Independent Fee Consultant for the DWS Funds (formerly the DWS Scudder Funds). My duties include preparing an annual written evaluation of the management fees DeAM charges the Funds, considering among other factors the management fees charged by other mutual fund companies for like services, management fees DeAM charges other clients for like services, DeAM's costs of supplying services under the management agreements and related profit margins, possible economies of scale if a Fund grows larger, and the nature and quality of DeAM's services, including fund performance. This report summarizes my evaluation for 2012, including my qualifications, the evaluation process for each of the DWS Funds, consideration of certain complex-level factors, and my conclusions. I served in substantially the same capacity in 2007, 2008, 2009, 2010 and 2011.
Qualifications
For more than 35 years I have served in various professional capacities within the investment management business. I have held investment analysis and advisory positions, including securities analyst, portfolio strategist and director of investment policy with a large investment firm. I have also performed business management functions, including business development, financial management and marketing research and analysis.
Since 1991, I have been an independent consultant within the asset management industry. I have provided services to over 125 client organizations, including investment managers, mutual fund boards, product distributors and related organizations. Over the past ten years I have completed a number of assignments for mutual fund boards, specifically including assisting boards with management contract renewal.
I hold a Master of Business Administration degree, with highest honors, from Harvard University and Master of Science and Bachelor of Science (highest honors) degrees from the University of California at Berkeley. I am an independent director and audit committee financial expert for two closed-end mutual funds and have served in various leadership and financial oversight capacities with non-profit organizations.
Evaluation of Fees for each DWS Fund
My work focused primarily on evaluating, fund-by-fund, the fees charged to each of the 103 mutual fund portfolios in the DWS Fund family. For each Fund, I considered each of the key factors mentioned above, as well as any other relevant information. In doing so I worked closely with the Funds' Independent Directors in their annual contract renewal process, as well as in their approval of contracts for several new funds (documented separately).
In evaluating each Fund's fees, I reviewed comprehensive materials provided by or on behalf of DeAM, including expense information prepared by Lipper Analytical, comparative performance information, profitability data, manager histories, and other materials. I also accessed certain additional information from the Lipper and Morningstar databases and drew on my industry knowledge and experience.
To facilitate evaluating this considerable body of information, I prepared for each Fund a document summarizing the key data elements in each area as well as additional analytics discussed below. This made it possible to consider each key data element in the context of the others.
In the course of contract renewal, DeAM agreed to implement a number of fee and expense adjustments requested by the Independent Directors which will favorably impact future fees and expenses, and my evaluation includes the effects of these changes.
Fees and Expenses Compared with Other Funds
The competitive fee and expense evaluation for each fund focused on two primary comparisons:
The Fund's contractual management fee (the advisory fee plus the administration fee where applicable) compared with those of a group of typically 12-15 funds in the same Lipper investment category (e.g. Large Capitalization Growth) having similar distribution arrangements and being of similar size.
The Fund's total expenses compared with a broader universe of funds from the same Lipper investment category and having similar distribution arrangements.
These two comparisons provide a view of not only the level of the fee compared with funds of similar scale but also the total expense the Fund bears for all the services it receives, in comparison with the investment choices available in the Fund's investment category and distribution channel. The principal figure-of-merit used in these comparisons was the subject Fund's percentile ranking against peers.
DeAM's Fees for Similar Services to Others
DeAM provided management fee schedules for all of its US domiciled fund and non-fund investment management accounts in any of the investment categories where there is a DWS Fund. These similar products included the other DWS Funds, non-fund pooled accounts, institutional accounts and sub-advisory accounts. Using this information, I calculated for each Fund the fee that would be charged to each similar product, at the subject Fund's asset level.
Evaluating information regarding non-fund products is difficult because there are varying levels of services required for different types of accounts, with mutual funds generally requiring considerably more regulatory and administrative types of service as well as having more frequent cash flows than other types of accounts. Also, while mutual fund fees for similar fund products can be expected to be similar, there will be some differences due to different pricing conditions in different distribution channels (e.g. retail funds versus those used in variable insurance products), differences in underlying investment processes and other factors.
Costs and Profit Margins
DeAM provided a detailed profitability analysis for each Fund. After making some adjustments so that the presentation would be more comparable to the available industry figures, I reviewed profit margins from investment management alone, from investment management plus other fund services (excluding distribution) provided to the Funds by DeAM (principally shareholder services), and DeAM profits from all sources, including distribution. A later section comments on overall profitability.
Economies of Scale
Economies of scale — an expected decline in management cost per dollar of fund assets as fund assets grow — are very rarely quantified and documented because of inherent difficulties in collecting and analyzing relevant data. However, in virtually every investment category that I reviewed, larger funds tend to have lower fees and lower total expenses than smaller funds. To see how each DWS Fund compares with this industry observation, I reviewed:
The trend in Fund assets over the last five years and the accompanying trend in total expenses. This shows if the Fund has grown and, if so, whether total expense (management fees as well as other expenses) have declined as a percent of assets.
Whether the Fund has break-points in its management fee schedule, the extent of the fee reduction built into the schedule and the asset levels where the breaks take effect, and in the case of a sub-advised Fund how the Fund's break-points compare with those of the sub-advisory fee schedule.
How the Fund's contractual fee schedule compares with trends in the industry data. To accomplish this, I constructed a chart showing how actual latest-fiscal-year contractual fees of the Fund and of other similar funds relate to average fund assets, with the subject Fund's contractual fee schedule superimposed.
Quality of Service — Performance
The quality-of-service evaluation focused on investment performance, which is the principal result of the investment management service. Each Fund's performance was reviewed over the past 1, 3, 5 and 10 years, as applicable, and compared with that of other funds in the same investment category and with a suitable market index.
In addition, I calculated and reviewed risk-adjusted returns relative to an index of similar mutual funds' returns and a suitable market index. The risk-adjusted returns analysis provides a way of determining the extent to which the Fund's return comparisons are mainly the product of investment value-added (or lack thereof) or alternatively taking considerably more or less risk than is typical in its investment category.
I also received and considered the history of portfolio manager changes for each Fund, as this provided an important context for evaluating the performance results.
Complex-Level Considerations
While this evaluation was conducted mainly at the individual fund level, there are some issues relating to the reasonableness of fees that can alternatively be considered across the whole fund complex:
I reviewed DeAM's profitability analysis for all DWS Funds, with a view toward determining if the allocation procedures used were reasonable and how profit levels compared with public data for other investment managers.
I considered whether DeAM and affiliates receive any significant ancillary or "fallout" benefits that should be considered in interpreting the direct profitability results. These would be situations where serving as the investment manager of the Funds is beneficial to another part of the Deutsche Bank organization.
I considered how aggregated DWS Fund expenses had varied over the years, by asset class and in the context of trends in asset levels.
I considered how aggregated DWS Fund performance measures relative to appropriate peers had varied by asset class and over time.
I reviewed the structure of the DeAM organization, trends in staffing levels, and information on compensation of investment management and other professionals compared with industry data.
Findings
Based on the process and analysis discussed above, which included reviewing a wide range of information from management and external data sources and considering among other factors the fees DeAM charges other clients, the fees charged by other fund managers, DeAM's costs and profits associated with managing the Funds, economies of scale, possible fall-out benefits, and the nature and quality of services provided, in my opinion the management fees charged the DWS Funds are reasonable.
Thomas H. Mack
President, Thomas H. Mack & Co., Inc.
Board Members and Officers
The following table presents certain information regarding the Board Members and Officers of the fund. Each Board Member's year of birth is set forth in parentheses after his or her name. Unless otherwise noted, (i) each Board Member has engaged in the principal occupation(s) noted in the table for at least the most recent five years, although not necessarily in the same capacity; and (ii) the address of each Independent Board Member is c/o Kenneth C. Froewiss, Chairman, DWS Mutual Funds, P.O. Box 78, Short Hills, NJ 07078. Except as otherwise noted below, the term of office for each Board Member is until the election and qualification of a successor, or until such Board Member sooner dies, resigns, is removed or as otherwise provided in the governing documents of the fund. Because the fund does not hold an annual meeting of shareholders, each Board Member will hold office for an indeterminate period. The Board Members may also serve in similar capacities with other funds in the fund complex.
| Independent Board Members |
Name, Year of Birth, Position with the Fund and Length of Time Served1 | | Business Experience and Directorships During the Past Five Years | Number of Funds in DWS Fund Complex Overseen |
Other Directorships Held by Board Member |
Kenneth C. Froewiss (1945) Chairperson since 2013,9 and Board Member since 2001 | | Adjunct Professor of Finance, NYU Stern School of Business (September 2009-present; Clinical Professor from 1997-September 2009); Member, Finance Committee, Association for Asian Studies (2002-present); Director, Mitsui Sumitomo Insurance Group (US) (2004-present); prior thereto, Managing Director, J.P. Morgan (investment banking firm) (until 1996) | 103 | — |
William McClayton (1944) Vice Chairperson since 2013,9 and Board Member since 2004 | | Private equity investor (since October 2009); previously, Managing Director, Diamond Management & Technology Consultants, Inc. (global consulting firm) (2001-2009); Directorship: Board of Managers, YMCA of Metropolitan Chicago; formerly: Senior Partner, Arthur Andersen LLP (accounting) (1966-2001); Trustee, Ravinia Festival | 103 | — |
John W. Ballantine (1946) Board Member since 1999 | | Retired; formerly, Executive Vice President and Chief Risk Management Officer, First Chicago NBD Corporation/The First National Bank of Chicago (1996-1998); Executive Vice President and Head of International Banking (1995-1996). Directorships: Stockwell Capital Investments PLC (private equity); former Directorships: First Oak Brook Bancshares, Inc. and Oak Brook Bank; Prisma Energy International | 103 | Chairman of the Board, Healthways, Inc.2 (provider of disease and care management services) (2003- present); Portland General Electric2 (utility company) (2003-present) |
Henry P. Becton, Jr. (1943) Board Member since 1990 | | Vice Chair and former President, WGBH Educational Foundation. Directorships: Public Radio International; Public Radio Exchange (PRX); The PBS Foundation; North Bennett Street School (Boston); former Directorships: Association of Public Television Stations; Boston Museum of Science; American Public Television; Concord Academy; New England Aquarium; Mass. Corporation for Educational Telecommunications; Committee for Economic Development; Public Broadcasting Service; Connecticut College | 103 | Lead Director, Becton Dickinson and Company2 (medical technology company); Lead Director, Belo Corporation2 (media company) |
Dawn-Marie Driscoll (1946) Board Member since 1987 | | President, Driscoll Associates (consulting firm); Emeritus Executive Fellow, Center for Business Ethics, Bentley University; formerly, Partner, Palmer & Dodge (1988-1990); Vice President of Corporate Affairs and General Counsel, Filene's (1978-1988). Directorships: Director of ICI Mutual Insurance Company (since 2007); Advisory Board, Center for Business Ethics, Bentley University; Trustee, Southwest Florida Community Foundation (charitable organization); former Directorships: Sun Capital Advisers Trust (mutual funds) (2007-2012), Investment Company Institute (audit, executive, nominating committees) and Independent Directors Council (governance, executive committees) | 103 | — |
Keith R. Fox, CFA (1954) Board Member since 1996 | | Managing General Partner, Exeter Capital Partners (a series of private investment funds) (since 1986). Directorships: Progressive International Corporation (kitchen goods importer and distributor); The Kennel Shop (retailer); former Chairman, National Association of Small Business Investment Companies; former Directorships: BoxTop Media Inc. (advertising); Sun Capital Advisers Trust (mutual funds) (2011-2012) | 103 | — |
Paul K. Freeman (1950) Board Member since 1993, and Chairperson (2009-Jan. 8, 2013) | | Consultant, World Bank/Inter-American Development Bank; Executive and Governing Council of the Independent Directors Council (Chairman of Education Committee); formerly: Project Leader, International Institute for Applied Systems Analysis (1998-2001); Chief Executive Officer, The Eric Group, Inc. (environmental insurance) (1986-1998); Directorships: Denver Zoo Foundation (December 2012-present); former Directorships: Prisma Energy International | 103 | — |
Richard J. Herring (1946) Board Member since 1990 | | Jacob Safra Professor of International Banking and Professor, Finance Department, The Wharton School, University of Pennsylvania (since July 1972); Co-Director, Wharton Financial Institutions Center (since July 2000); Co-Chair, U.S. Shadow Financial Regulatory Committee; Executive Director, Financial Economists Roundtable; formerly: Vice Dean and Director, Wharton Undergraduate Division (July 1995-June 2000); Director, Lauder Institute of International Management Studies (July 2000-June 2006) | 103 | Director, Japan Equity Fund, Inc. (since September 2007), Thai Capital Fund, Inc. (since 2007), Singapore Fund, Inc. (since September 2007), Independent Director of Barclays Bank Delaware (since September 2010) |
Rebecca W. Rimel (1951) Board Member since 1995 | | President and Chief Executive Officer, The Pew Charitable Trusts (charitable organization) (1994 to present); Trustee, Washington College (2011-2013); formerly: Executive Vice President, The Glenmede Trust Company (investment trust and wealth management) (1983-2004); Board Member, Investor Education (charitable organization) (2004-2005); Trustee, Executive Committee, Philadelphia Chamber of Commerce (2001-2007); Director, Viasys Health Care2 (January 2007-June 2007); Trustee, Pro Publica (charitable organization) (2007-2010); Trustee, Thomas Jefferson Foundation (charitable organization) (1994-2012) | 103 | Director, Becton Dickinson and Company2 (medical technology company) (2012-present); Director, CardioNet, Inc.2 (health care) (2009-present) |
William N. Searcy, Jr. (1946) Board Member since 1993 | | Private investor since October 2003; formerly: Pension & Savings Trust Officer, Sprint Corporation2 (telecommunications) (November 1989-September 2003); Trustee, Sun Capital Advisers Trust (mutual funds) (1998-2012) | 103 | — |
Jean Gleason Stromberg (1943) Board Member since 1997 | | Retired. Formerly, Consultant (1997-2001); Director, Financial Markets U.S. Government Accountability Office (1996-1997); Partner, Fulbright & Jaworski, L.L.P. (law firm) (1978-1996). Directorships: The William and Flora Hewlett Foundation; former Directorships: Service Source, Inc., Mutual Fund Directors Forum (2002-2004), American Bar Retirement Association (funding vehicle for retirement plans) (1987-1990 and 1994-1996) | 103 | — |
Robert H. Wadsworth (1940) Board Member since 1999 | | President, Robert H. Wadsworth & Associates, Inc. (consulting firm) (1983 to present); Director, National Horizon, Inc. (non-profit organization); Director and Treasurer, The Phoenix Boys Choir Association | 106 | — |
Interested Board Member and Officer4 |
Name, Year of Birth, Position with the Fund and Length of Time Served1,6 | | Business Experience and Directorships During the Past Five Years | Number of Funds in DWS Fund Complex Overseen |
Other Directorships Held by Board Member |
Michael J. Woods5 (1967) Board Member since 2013,9 and Executive Vice President since 20139 | | Managing Director,3 Deutsche Asset & Wealth Management (2009-present); Head of the Americas Asset Management Business for Deutsche Bank, Member of the Asset and Wealth Management ("AWM") Extended Executive Committee, AWM Global Client Group Executive Committee and the AWM Active Asset Management Executive Committee; CEO and US Regional Head of DWS Investments; formerly: Sr. VP, Head of the Financial Intermediaries and Investments Group of Evergreen Investments (2007-2009), CEO and Vice Chairman of Board of Directors of XTF Global Asset Management (2006-2007), Managing Director — US Head of Sub-Advisory and Investment Only Business at Citigroup Asset Management (2000-2006). Mr. Woods is currently a board member of The Children's Village, The Big Brothers Big Sisters Organization, and The Mutual Fund Education Alliance. | 39 | — |
Officers4 |
Name, Year of Birth, Position with the Fund and Length of Time Served6 | | Business Experience and Directorships During the Past Five Years |
W. Douglas Beck, CFA7 (1967) President, 2011-present | | Managing Director,3 Deutsche Asset & Wealth Management (2006-present); President of DWS family of funds and Head of Product Management, U.S. for DWS Investments; formerly: Executive Director, Head of Product Management (2002-2006) and President (2005-2006) of the UBS Funds at UBS Global Asset Management; Co-Head of Manager Research/Managed Solutions Group, Merrill Lynch (1998-2002) |
John Millette8 (1962) Vice President and Secretary, 1999-present | | Director,3 Deutsche Asset & Wealth Management |
Paul H. Schubert7 (1963) Chief Financial Officer, 2004-present Treasurer, 2005-present | | Managing Director,3 Deutsche Asset & Wealth Management (since July 2004); formerly: Executive Director, Head of Mutual Fund Services and Treasurer for UBS Family of Funds (1998-2004); Vice President and Director of Mutual Fund Finance at UBS Global Asset Management (1994-1998) |
Caroline Pearson8 (1962) Chief Legal Officer, 2010-present | | Managing Director,3 Deutsche Asset & Wealth Management; formerly: Assistant Secretary for DWS family of funds (1997-2010) |
Melinda Morrow7 (1970) Vice President, 2012-present | | Director,3 Deutsche Asset & Wealth Management |
Hepsen Uzcan8 (1974) Assistant Secretary, since 20139 | | Vice President, Deutsche Asset & Wealth Management |
Paul Antosca8 (1957) Assistant Treasurer, 2007-present | | Director,3 Deutsche Asset & Wealth Management |
Jack Clark8 (1967) Assistant Treasurer, 2007-present | | Director,3 Deutsche Asset & Wealth Management |
Diane Kenneally8 (1966) Assistant Treasurer, 2007-present | | Director,3 Deutsche Asset & Wealth Management |
John Caruso7 (1965) Anti-Money Laundering Compliance Officer, 2010-present | | Managing Director,3 Deutsche Asset & Wealth Management |
Robert Kloby7 (1962) Chief Compliance Officer, 2006-present | | Managing Director,3 Deutsche Asset & Wealth Management |
1 The length of time served represents the year in which the Board Member joined the board of one or more DWS funds currently overseen by the Board.
2 A publicly held company with securities registered pursuant to Section 12 of the Securities Exchange Act of 1934.
3 Executive title, not a board directorship.
4 As a result of their respective positions held with the Advisor, these individuals are considered "interested persons" of the Advisor within the meaning of the 1940 Act. Interested persons receive no compensation from the fund.
5 The mailing address of Mr. Woods is 60 Wall Street, New York, New York 10005. Mr. Woods is an interested Board Member by virtue of his positions with Deutsche Asset & Wealth Management. As an interested person, Mr. Woods receives no compensation from the fund. Mr. Woods is a board member of the following trusts and corporations: Cash Account Trust, DWS Market Trust, DWS Money Funds, DWS State Tax-Free Income Series, DWS Target Fund, DWS Value Series, Inc., DWS Variable Series II, Investors Cash Trust, Tax-Exempt California Money Market Fund, DWS Global High Income Fund, Inc., DWS High Income Opportunities Fund, Inc., DWS High Income Trust, DWS Multi-Market Income Trust, DWS Municipal Income Trust, DWS Strategic Income Trust and DWS Strategic Municipal Income Trust.
6 The length of time served represents the year in which the officer was first elected in such capacity for one or more DWS funds.
7 Address: 60 Wall Street, New York, NY 10005.
8 Address: One Beacon Street, Boston, MA 02108.
9 Effective as of January 9, 2013.
The fund's Statement of Additional Information ("SAI") includes additional information about the Board Members. The SAI is available, without charge, upon request. If you would like to request a copy of the SAI, you may do so by calling the following toll-free number: (800) 728-3337.
DWS Investments Distributors, Inc.
222 South Riverside Plaza
Chicago, IL 60606
(800) 621-1148
VS2GIB-2 (R-025825-2 2/13)
DECEMBER 31, 2012
ANNUAL REPORT
DWS VARIABLE SERIES II
DWS Global Thematic VIP
Contents
10 Statement of Assets and Liabilities 11 Statement of Operations 12 Statement of Changes in Net Assets 15 Notes to Financial Statements 20 Report of Independent Registered Public Accounting Firm 21 Information About Your Fund's Expenses 23 Investment Management Agreement Approval 26 Summary of Management Fee Evaluation by Independent Fee Consultant 28 Board Members and Officers |
This report must be preceded or accompanied by a prospectus. To obtain an additional prospectus or summary prospectus, if available, call (800) 728-3337 or your financial representative. We advise you to consider the Fund's objectives, risks, charges and expenses carefully before investing. The summary prospectus and prospectus contain this and other important information about the Fund. Please read the prospectus carefully before you invest.
Investing in derivatives entails special risks relating to liquidity, leverage and credit that may reduce returns and/or increase volatility. Investing in foreign securities, particularly those of emerging markets, presents certain risks, such as currency fluctuations, political and economic changes, and market risks. The fund may lend securities to approved institutions. Smaller company stocks tend to be more volatile than medium-sized or large company stocks. Stocks may decline in value. See the prospectus for details.
DWS Investments is part of the Deutsche Asset & Wealth Management division of Deutsche Bank AG.
NOT FDIC/NCUA INSURED NO BANK GUARANTEE MAY LOSE VALUE NOT A DEPOSIT
NOT INSURED BY ANY FEDERAL GOVERNMENT AGENCY
Performance Summary December 31, 2012 (Unaudited)
Fund performance shown is historical, assumes reinvestment of all dividend and capital gain distributions and does not guarantee future results. Investment return and principal value fluctuate with changing market conditions so that, when redeemed, shares may be worth more or less than their original cost. Current performance may be lower or higher than the performance data quoted. Please contact your participating insurance company for the Fund's most recent month-end performance. Performance doesn't reflect charges and fees ("contract charges") associated with the separate account that invests in the Fund or any variable life insurance policy or variable annuity contract for which the Fund is an investment option. These charges and fees will reduce returns. While all share classes have the same underlying portfolio, their performance will differ.
The gross expense ratios of the Fund, as stated in the fee table of the prospectus dated May 1, 2012 are 1.37% and 1.72% for Class A and Class B shares, respectively, and may differ from the expense ratios disclosed in the Financial Highlights tables in this report.
| Growth of an Assumed $10,000 Investment in DWS Global Thematic VIP |
| The Morgan Stanley Capital International (MSCI) World Index is an unmanaged, capitalization-weighted measure of global stock markets including the U.S., Canada, Europe, Australia and the Far East. The index is calculated using closing local market prices and translates into U.S. dollars using the London close foreign exchange rates. Index returns do not reflect any fees or expenses and it is not possible to invest directly into an index. |
| |
| Yearly periods ended December 31 | |
| Comparative Results | |
| DWS Global Thematic VIP | | 1-Year | | | 3-Year | | | 5-Year | | | 10-Year | |
| Class A | Growth of $10,000 | | $ | 11,860 | | | $ | 11,540 | | | $ | 8,672 | | | $ | 21,857 | |
| Average annual total return | | | 18.60 | % | | | 4.89 | % | | | -2.81 | % | | | 8.13 | % |
| MSCI World Index | Growth of $10,000 | | $ | 11,583 | | | $ | 12,228 | | | $ | 9,424 | | | $ | 20,626 | |
| Average annual total return | | | 15.83 | % | | | 6.93 | % | | | -1.18 | % | | | 7.51 | % |
| DWS Global Thematic VIP | | 1-Year | | | 3-Year | | | 5-Year | | | 10-Year | |
| Class B | Growth of $10,000 | | $ | 11,816 | | | $ | 11,418 | | | $ | 8,525 | | | $ | 21,130 | |
| Average annual total return | | | 18.16 | % | | | 4.52 | % | | | -3.14 | % | | | 7.77 | % |
| MSCI World Index | Growth of $10,000 | | $ | 11,583 | | | $ | 12,228 | | | $ | 9,424 | | | $ | 20,626 | |
| Average annual total return | | | 15.83 | % | | | 6.93 | % | | | -1.18 | % | | | 7.51 | % |
The growth of $10,000 is cumulative.
Management Summary December 31, 2012 (Unaudited)
Class A shares of the Fund returned 18.60% (unadjusted for contract charges) during 2012, outperforming the 15.83% return of the MSCI World Index.1 In managing the Fund during the fiscal year, we employed a combination of three analytical disciplines: bottom-up fundamental company research; growth orientation (companies that portfolio management believes have above-average potential for sustainable growth of revenue and earnings and whose market value appears reasonable in light of their business prospects); and top-down analysis of global themes. As of year-end, the Fund was diversified among 14 themes.
During 2012, the largest contribution to performance came from our Supply Chain Dominance theme, which holds companies that are gaining leverage over their suppliers, customers and competitors through economies of scale and/or cost savings.2 Our leading individual contributors within this theme were Samsung Electronics Co., Ltd. and NCR Corp. Two themes that tend to concentrate in the emerging markets — Indian Ocean (which seeks to capitalize on the region's emergence as an epicenter for competition among China, India and other nations for hegemony) and Large Units/Bottom Billion (which invests in companies that are benefiting from the growing population in the emerging-markets countries) — also made strong contributions during the year, reflecting the broader outperformance of the emerging markets.
The most notable underperformers among the Fund's themes were Market Hedge, which holds defensive companies that can provide a cushion against downside risk in the broader market, and Asymmetric Negotiators, which invests in companies whose access to resources in limited supply provides them with pricing power. Both themes are tilted toward commodity-oriented companies, which underperformed during 2012.
We expect that the improving outlook for Europe, together with the stabilization of the U.S. consumer, could be a positive combination for equities, especially at a time when the most important alternative — government bonds — largely offers yields that are less than the rate of inflation. We believe this is a favorable backdrop for our portfolio, as we have maintained our thematic positioning and abstained from "hiding" in popular consumer staples stocks or in other assets perceived to offer safety.
We also believe that the current economic and politically induced stress in the global markets will not derail the fundamental trends that should drive the long-term performance of individual stocks. Overall, we have remained focused on owning shares of businesses that we believe will prove resilient and adaptable to adverse economic and policy environments. This approach reflects our long-standing belief that company fundamentals — and not economic trends — are ultimately the most important driver of individual stock returns.
Effective on or about May 1, 2013, DWS Global Thematic VIP will change its name to DWS Global Growth VIP, and Global Thematic Partners, LLC will no longer serve as subadvisor to the fund. In addition, effective on or about May 1, 2013, the fund's portfolio management team will change and certain changes will be made to the fund's investment strategies and portfolio management process. More details regarding these changes are set forth in a supplement to the fund's prospectus dated January 14, 2013.
Oliver Kratz, PhD
Portfolio Manager, Global Thematic Partners, LLC
Subadvisor to the Fund
The views expressed reflect those of the portfolio management team only through the end of the period of the report as stated on the cover. The management team's views are subject to change at any time based on market and other conditions and should not be construed as a recommendation. Past performance is no guarantee of future results. Current and future portfolio holdings are subject to risk.
1 The Morgan Stanley Capital International (MSCI) World Index is an unmanaged, capitalization-weighted measure of global stock markets including the U.S., Canada, Europe, Australia and the Far East. The index is calculated using closing local market prices and translates into U.S. dollars using the London close foreign exchange rates. Index returns do not reflect fees or expenses and it is not possible to invest directly into an index.
2 Contribution incorporates both a stock's total return and its weighting in the Fund.
Portfolio Summary (Unaudited) Asset Allocation (As a % of Investment Portfolio excluding Securities Lending Collateral) | 12/31/12 | 12/31/11 |
| | | |
| Common Stocks | 97% | 98% |
| Preferred Stock | 2% | 2% |
| Cash Equivalents | 1% | — |
| | 100% | 100% |
Sector Diversification (As a % of Investment Portfolio excluding Cash Equivalents and Securities Lending Collateral) | 12/31/12 | 12/31/11 |
| | | |
| Information Technology | 15% | 16% |
| Financials | 14% | 16% |
| Materials | 13% | 9% |
| Industrials | 13% | 10% |
| Health Care | 12% | 15% |
| Consumer Discretionary | 10% | 8% |
| Consumer Staples | 8% | 8% |
| Energy | 8% | 13% |
| Telecommunication Services | 4% | 3% |
| Utilities | 3% | 2% |
| | 100% | 100% |
Geographical Diversification (As a % of Investment Portfolio excluding Cash Equivalents and Securities Lending Collateral) | 12/31/12 | 12/31/11 |
| | | |
| United States | 37% | 42% |
| Continental Europe | 31% | 28% |
| Asia (excluding Japan) | 10% | 11% |
| Latin America | 6% | 6% |
| Canada | 6% | 1% |
| Japan | 3% | 6% |
| Africa | 2% | 2% |
| United Kingdom | 2% | 1% |
| Middle East | 2% | 2% |
| Bermuda | 1% | 1% |
| | 100% | 100% |
Portfolio holdings and characteristics are subject to change.
For more complete details about the Fund's investment portfolio, see page 6.
Following the Fund's fiscal first and third quarter-end, a complete portfolio holdings listing is filed with the SEC on Form N-Q. The form will be available on the SEC's Web site at www.sec.gov, and it also may be reviewed and copied at the SEC's Public Reference Room in Washington, D.C. Information on the operation of the SEC's Public Reference Room may be obtained by calling (800) SEC-0330. The Fund's portfolio holdings are also posted on www.dws-investments.com from time to time. Please see the Fund's current prospectus for more information.
Investment Portfolio December 31, 2012 | | | Shares | | | Value ($) | |
| | | | |
| Common Stocks 98.1% | |
| Austria 1.2% | |
| Erste Group Bank AG* (Cost $373,072) | | | 21,131 | | | | 675,675 | |
| Bahrain 0.2% | |
| Aluminium Bahrain (GDR) 144A (Cost $265,218) | | | 21,937 | | | | 125,687 | |
| Belgium 0.8% | |
| Belgacom SA (Cost $445,038) | | | 14,523 | | | | 428,087 | |
| Bermuda 1.1% | |
| Lazard Ltd. "A" (a) | | | 15,309 | | | | 456,821 | |
| Teekay Corp. | | | 5,032 | | | | 161,527 | |
| (Cost $578,124) | | | | 618,348 | |
| Brazil 4.4% | |
| All America Latina Logistica | | | 49,152 | | | | 201,429 | |
| Braskem SA (ADR) (a) | | | 26,712 | | | | 356,605 | |
| Diagnosticos da America SA | | | 28,031 | | | | 182,161 | |
| Embraer SA (ADR) | | | 10,526 | | | | 300,096 | |
| Gol Linhas Aereas Inteligentes SA (ADR)* (a) | | | 39,590 | | | | 259,710 | |
| Itau Unibanco Holding SA (ADR) (Preferred) (a) | | | 22,641 | | | | 372,671 | |
| OGX Petroleo e Gas Participacoes SA* | | | 87,104 | | | | 190,973 | |
| SLC Agricola SA | | | 61,890 | | | | 600,691 | |
| (Cost $2,651,819) | | | | 2,464,336 | |
| Canada 5.5% | |
| Barrick Gold Corp. | | | 15,908 | | | | 556,939 | |
| Detour Gold Corp.* | | | 6,280 | | | | 157,142 | |
| Goldcorp, Inc. | | | 13,760 | | | | 504,992 | |
| Potash Corp. of Saskatchewan, Inc. | | | 34,482 | | | | 1,403,072 | |
| TransAlta Corp. | | | 33,000 | | | | 501,619 | |
| (Cost $3,395,879) | | | | 3,123,764 | |
| China 4.5% | |
| China Life Insurance Co., Ltd. "H" | | | 269,113 | | | | 889,330 | |
| China Life Insurance Co., Ltd. (ADR) | | | 1,207 | | | | 59,976 | |
| Home Inns & Hotels Management, Inc. (ADR)* (a) | | | 11,088 | | | | 320,443 | |
| Industrial & Commercial Bank of China Ltd. "H" | | | 490,783 | | | | 353,937 | |
| Li Ning Co., Ltd.* (a) | | | 184,438 | | | | 122,199 | |
| Mindray Medical International Ltd. (ADR) (a) | | | 6,857 | | | | 224,224 | |
| Ping An Insurance (Group) Co. of China Ltd. "H" | | | 44,833 | | | | 381,507 | |
| Yanzhou Coal Mining Co., Ltd. "H" | | | 105,012 | | | | 177,348 | |
| (Cost $2,529,110) | | | | 2,528,964 | |
| Denmark 0.6% | |
| A P Moller-Maersk AS "B" (Cost $317,389) | | | 44 | | | | 336,795 | |
| Egypt 0.5% | |
| Orascom Telecom Holding SAE (GDR) REG S* (Cost $129,696) | | | 97,029 | | | | 304,394 | |
| | | Shares | | | Value ($) | |
| | | | | | | | | |
| France 1.3% | |
| LVMH Moet Hennessy Louis Vuitton SA | | | 2,577 | | | | 480,217 | |
| Renault SA | | | 4,345 | | | | 239,722 | |
| (Cost $555,571) | | | | 719,939 | |
| Germany 10.4% | |
| Adidas AG | | | 5,201 | | | | 463,504 | |
| Axel Springer AG | | | 12,503 | | | | 533,604 | |
| Deutsche Lufthansa AG (Registered) | | | 21,258 | | | | 399,575 | |
| Deutsche Post AG (Registered) | | | 59,653 | | | | 1,308,031 | |
| Fraport AG | | | 16,048 | | | | 934,524 | |
| Infineon Technologies AG | | | 201,155 | | | | 1,632,327 | |
| TAG Immobilien AG | | | 4,797 | | | | 60,284 | |
| Telefonica Deutschland Holding AG* | | | 71,303 | | | | 543,885 | |
| (Cost $4,971,986) | | | | 5,875,734 | |
| Hungary 0.5% | |
| OTP Bank Nyrt. (Cost $265,684) | | | 14,735 | | | | 280,068 | |
| India 1.4% | |
| ICICI Bank Ltd. (ADR) (a) (Cost $506,960) | | | 18,087 | | | | 788,774 | |
| Ireland 0.5% | |
| Shire PLC (Cost $280,781) | | | 9,398 | | | | 288,641 | |
| Israel 1.4% | |
| Teva Pharmaceutical Industries Ltd. (ADR) (Cost $905,553) | | | 20,639 | | | | 770,660 | |
| Japan 2.6% | |
| FANUC Corp. | | | 4,700 | | | | 874,030 | |
| INPEX Corp. | | | 115 | | | | 613,738 | |
| (Cost $1,266,141) | | | | 1,487,768 | |
| Korea 2.0% | |
| Hyundai Engineering & Construction Co., Ltd.* | | | 3,033 | | | | 199,794 | |
| Samsung Electronics Co., Ltd. | | | 662 | | | | 947,471 | |
| (Cost $614,394) | | | | 1,147,265 | |
| Luxembourg 0.7% | |
| Millicom International Cellular SA (SDR) (Cost $387,126) | | | 4,385 | | | | 381,128 | |
| Malaysia 0.5% | |
| CIMB Group Holdings Bhd. (Cost $296,915) | | | 123,300 | | | | 307,981 | |
| Mexico 1.3% | |
| Wal-Mart de Mexico SAB de CV "V" (Cost $662,538) | | | 224,964 | | | | 734,083 | |
| Netherlands 3.8% | |
| Koninklijke (Royal) KPN NV | | | 75,608 | | | | 373,897 | |
| QIAGEN NV* | | | 30,806 | | | | 558,717 | |
| Unilever NV (CVA) (a) | | | 32,179 | | | | 1,222,838 | |
| (Cost $2,324,565) | | | | 2,155,452 | |
| Panama 0.4% | |
| Copa Holdings SA "A" (Cost $67,412) | | | 2,032 | | | | 202,082 | |
| | | Shares | | | Value ($) | |
| | | | | | | | | |
| Russia 2.9% | |
| Gazprom OAO (ADR) | | | 39,281 | | | | 376,661 | |
| LUKOIL OAO (ADR) | | | 14,101 | | | | 942,739 | |
| X5 Retail Group NV (GDR) REG S* | | | 17,066 | | | | 306,224 | |
| (Cost $1,541,827) | | | | 1,625,624 | |
| South Africa 2.5% | |
| MTN Group Ltd. | | | 14,872 | | | | 312,587 | |
| Murray & Roberts Holdings Ltd.* | | | 43,138 | | | | 126,377 | |
| Shoprite Holdings Ltd. | | | 10,929 | | | | 265,623 | |
| Standard Bank Group Ltd. | | | 34,945 | | | | 494,466 | |
| Tiger Brands Ltd. | | | 5,825 | | | | 224,295 | |
| (Cost $1,265,287) | | | | 1,423,348 | |
| Sweden 2.8% | |
| Telefonaktiebolaget LM Ericsson "B" (Cost $1,473,693) | | | 155,330 | | | | 1,562,350 | |
| Switzerland 5.0% | |
| Julius Baer Group Ltd.* | | | 38,575 | | | | 1,387,876 | |
| Novartis AG (Registered) | | | 11,304 | | | | 715,674 | |
| Roche Holding AG (Genusschein) | | | 3,664 | | | | 746,448 | |
| (Cost $2,568,488) | | | | 2,849,998 | |
| Thailand 1.5% | |
| Bangkok Bank PCL (Foreign Registered) | | | 36,300 | | | | 248,719 | |
| Kasikornbank PCL (Foreign Registered) | | | 36,100 | | | | 229,205 | |
| Seamico Securities PCL (Foreign Registered) | | | 1,748,260 | | | | 78,297 | |
| Siam Cement Public Co., Ltd. | | | 20,249 | | | | 292,253 | |
| (Cost $701,050) | | | | 848,474 | |
| United Kingdom 1.3% | |
| Rio Tinto PLC | | | 5,824 | | | | 339,379 | |
| SABMiller PLC | | | 7,564 | | | | 356,023 | |
| Vodafone Group PLC | | | 15,763 | | | | 39,642 | |
| (Cost $620,004) | | | | 735,044 | |
| United States 36.5% | |
| Abbott Laboratories | | | 4,409 | | | | 288,790 | |
| Adobe Systems, Inc.* | | | 13,513 | | | | 509,170 | |
| AGCO Corp.* | | | 17,961 | | | | 882,244 | |
| Apple, Inc. | | | 642 | | | | 342,205 | |
| Bank of America Corp. | | | 71,477 | | | | 829,133 | |
| Buffalo Wild Wings, Inc.* (a) | | | 1,601 | | | | 116,585 | |
| Bunge Ltd. | | | 7,179 | | | | 521,842 | |
| Calpine Corp.* | | | 65,921 | | | | 1,195,148 | |
| CSX Corp. | | | 57,963 | | | | 1,143,610 | |
| Dow Chemical Co. | | | 48,934 | | | | 1,581,547 | |
| Energy Transfer Equity LP | | | 7,115 | | | | 323,590 | |
| Energy Transfer Partners LP | | | 11,617 | | | | 498,718 | |
| Frontier Communications Corp. (a) | | | 17,542 | | | | 75,080 | |
| Harley-Davidson, Inc. (a) | | | 4,554 | | | | 222,417 | |
| Hasbro, Inc. | | | 17 | | | | 610 | |
| Hewlett-Packard Co. | | | 37,513 | | | | 534,560 | |
| iRobot Corp.* (a) | | | 6,251 | | | | 117,144 | |
| Laboratory Corp. of America Holdings* (a) | | | 18,597 | | | | 1,610,872 | |
| Life Technologies Corp.* | | | 11,598 | | | | 569,230 | |
| McDonald's Corp. | | | 3,064 | | | | 270,275 | |
| | | Shares | | | Value ($) | |
| | | | | | | | | |
| Microsoft Corp. | | | 14,229 | | | | 380,341 | |
| Monsanto Co. | | | 3,720 | | | | 352,098 | |
| NCR Corp.* | | | 38,672 | | | | 985,363 | |
| NetApp, Inc.* | | | 16,537 | | | | 554,816 | |
| New York Times Co. "A"* | | | 21,236 | | | | 181,143 | |
| NIKE, Inc. "B" | | | 6,206 | | | | 320,230 | |
| Oracle Corp. | | | 13,207 | | | | 440,057 | |
| Plains All American Pipeline LP | | | 4,374 | | | | 197,880 | |
| Quest Diagnostics, Inc. | | | 6,541 | | | | 381,144 | |
| Ryder System, Inc. | | | 3,695 | | | | 184,491 | |
| Schlumberger Ltd. | | | 9,757 | | | | 676,063 | |
| Starwood Hotels & Resorts Worldwide, Inc. | | | 14,651 | | | | 840,381 | |
| Symantec Corp.* | | | 22,548 | | | | 424,128 | |
| The Mosaic Co. | | | 31,933 | | | | 1,808,366 | |
| Tumi Holdings, Inc.* (a) | | | 8,898 | | | | 185,523 | |
| UnitedHealth Group, Inc. | | | 9,550 | | | | 517,992 | |
| Valero Energy Corp. | | | 582 | | | | 19,858 | |
| VF Corp. (a) | | | 2,033 | | | | 306,922 | |
| Weight Watchers International, Inc. (a) | | | 3,931 | | | | 205,827 | |
| (Cost $18,484,134) | | | | 20,595,393 | |
Total Common Stocks (Cost $50,445,454) | | | | 55,385,856 | |
| | |
| Preferred Stock 0.7% | |
| Germany | |
| Volkswagen AG (Cost $260,266) | | | 1,824 | | | | 414,971 | |
| | |
| Participatory Note 0.1% | |
| Nigeria | |
| Guaranty Trust Bank PLC (issuer HSBC Bank PLC), Expiration Date 9/15/2014 (Cost $20,453) | | | 228,273 | | | | 33,623 | |
| | |
| Warrant 0.3% | |
| United Kingdom | |
| HSBC Bank PLC, Expiration Date 9/28/2015* (Cost $127,114) | | | 1,383,174 | | | | 139,247 | |
| | |
| Securities Lending Collateral 6.0% | |
| Daily Assets Fund Institutional, 0.20% (b) (c) (Cost $3,399,626) | | | 3,399,626 | | | | 3,399,626 | |
| | |
| Cash Equivalents 1.4% | |
| Central Cash Management Fund, 0.15% (b) (Cost $775,406) | | | 775,406 | | | | 775,406 | |
| | | % of Net Assets | | | Value ($) | |
| | | | |
Total Investment Portfolio (Cost $55,028,319)† | | | 106.6 | | | | 60,148,729 | |
| Other Assets and Liabilities, Net | | | (6.6 | ) | | | (3,709,824 | ) |
| Net Assets | | | 100.0 | | | | 56,438,905 | |
* Non-income producing security.
† The cost for federal income tax purposes was $55,634,268. At December 31, 2012, net unrealized appreciation for all securities based on tax cost was $4,514,461. This consisted of aggregate gross unrealized appreciation for all securities in which there was an excess of value over tax cost of $7,449,472 and aggregate gross unrealized depreciation for all securities in which there was an excess of tax cost over value of $2,935,011.
(a) All or a portion of these securities were on loan (see Notes to Financial Statements). The value of all securities loaned at December 31, 2012 amounted to $3,362,461, which is 6.0% of net assets.
(b) Affiliated fund managed by Deutsche Investment Management Americas Inc. The rate shown is the annualized seven-day yield at period end.
(c) Represents collateral held in connection with securities lending. Income earned by the Fund is net of borrower rebates.
144A: Security exempt from registration under Rule 144A of the Securities Act of 1933. These securities may be resold in transactions exempt from registration, normally to qualified institutional buyers.
ADR: American Depositary Receipt
CVA: Certificaten Van Aandelen (Certificate of Stock)
GDR: Global Depositary Receipt
REG S: Securities sold under Regulation S may not be offered, sold or delivered within the United States or to, or for the account or benefit of, U.S. persons, except pursuant to an exemption from, or in a transaction not subject to, the registration requirements of the Securities Act of 1933.
SDR: Swedish Depositary Receipt
Fair Value Measurements
Various inputs are used in determining the value of the Fund's investments. These inputs are summarized in three broad levels. Level 1 includes quoted prices in active markets for identical securities. Level 2 includes other significant observable inputs (including quoted prices for similar securities, interest rates, prepayment speeds, and credit risk). Level 3 includes significant unobservable inputs (including the Fund's own assumptions in determining the fair value of investments). The inputs or methodology used for valuing securities are not necessarily an indication of the risk associated with investing in those securities.
The following is a summary of the inputs used as of December 31, 2012 in valuing the Fund's investments. For information on the Fund's policy regarding the valuation of investments, please refer to the Security Valuation section of Note A in the accompanying Notes to Financial Statements.
| Assets | | Level 1 | | | Level 2 | | | Level 3 | | | Total | |
| | |
| Common Stocks & Preferred Stock (d) | |
| Austria | | $ | — | | | $ | 675,675 | | | $ | — | | | $ | 675,675 | |
| Bahrain | | | — | | | | 125,687 | | | | — | | | | 125,687 | |
| Belgium | | | — | | | | 428,087 | | | | — | | | | 428,087 | |
| Bermuda | | | 618,348 | | | | — | | | | — | | | | 618,348 | |
| Brazil | | | 2,464,336 | | | | — | | | | — | | | | 2,464,336 | |
| Canada | | | 3,123,764 | | | | — | | | | — | | | | 3,123,764 | |
| China | | | 604,643 | | | | 1,924,321 | | | | — | | | | 2,528,964 | |
| Denmark | | | — | | | | 336,795 | | | | — | | | | 336,795 | |
| Egypt | | | — | | | | 304,394 | | | | — | | | | 304,394 | |
| France | | | — | | | | 719,939 | | | | — | | | | 719,939 | |
| Germany | | | — | | | | 6,290,705 | | | | — | | | | 6,290,705 | |
| Hungary | | | — | | | | 280,068 | | | | — | | | | 280,068 | |
| India | | | 788,774 | | | | — | | | | — | | | | 788,774 | |
| Ireland | | | — | | | | 288,641 | | | | — | | | | 288,641 | |
| Israel | | | 770,660 | | | | — | | | | — | | | | 770,660 | |
| Japan | | | — | | | | 1,487,768 | | | | — | | | | 1,487,768 | |
| Korea | | | — | | | | 1,147,265 | | | | — | | | | 1,147,265 | |
| Luxembourg | | | — | | | | 381,128 | | | | — | | | | 381,128 | |
| Malaysia | | | — | | | | 307,981 | | | | — | | | | 307,981 | |
| Mexico | | | 734,083 | | | | — | | | | — | | | | 734,083 | |
| Netherlands | | | — | | | | 2,155,452 | | | | — | | | | 2,155,452 | |
| Panama | | | 202,082 | | | | — | | | | — | | | | 202,082 | |
| Russia | | | — | | | | 1,625,624 | | | | — | | | | 1,625,624 | |
| South Africa | | | — | | | | 1,423,348 | | | | — | | | | 1,423,348 | |
| Sweden | | | — | | | | 1,562,350 | | | | — | | | | 1,562,350 | |
| Switzerland | | | — | | | | 2,849,998 | | | | — | | | | 2,849,998 | |
| Thailand | | | — | | | | 848,474 | | | | — | | | | 848,474 | |
| United Kingdom | | | — | | | | 735,044 | | | | — | | | | 735,044 | |
| United States | | | 20,595,393 | | | | — | | | | — | | | | 20,595,393 | |
| Warrant (d) | | | — | | | | 139,247 | | | | — | | | | 139,247 | |
| Participatory Note (d) | | | — | | | | 33,623 | | | | — | | | | 33,623 | |
| Short-Term Investments (d) | | | 4,175,032 | | | | — | | | | — | | | | 4,175,032 | |
| Total | | $ | 34,077,115 | | | $ | 26,071,614 | | | $ | — | | | $ | 60,148,729 | |
There have been no transfers between fair value measurement levels during the year ended December 31, 2012.
(d) See Investment Portfolio for additional detailed categorizations.
The accompanying notes are an integral part of the financial statements.
Statement of Assets and Liabilities | as of December 31, 2012 | |
| Assets | |
Investments: Investments in non-affiliated securities, at value (cost $50,853,287) — including $3,362,461 of securities loaned | | $ | 55,973,697 | |
Investment in Daily Assets Fund Institutional (cost $3,399,626)* | | | 3,399,626 | |
| Investment in Central Cash Management Fund (cost $775,406) | | | 775,406 | |
| Total investments in securities, at value (cost $55,028,319) | | | 60,148,729 | |
| Foreign currency, at value (cost $17,981) | | | 17,980 | |
| Receivable for investments sold | | | 256,639 | |
| Receivable for Fund shares sold | | | 7,052 | |
| Dividends receivable | | | 36,602 | |
| Interest receivable | | | 3,301 | |
| Foreign taxes recoverable | | | 19,351 | |
| Other assets | | | 1,115 | |
| Total assets | | | 60,490,769 | |
| Liabilities | |
| Cash overdraft | | | 15,947 | |
| Payable upon return of securities loaned | | | 3,399,626 | |
| Payable for investments purchased | | | 454,489 | |
| Payable for Fund shares redeemed | | | 80,994 | |
| Accrued management fee | | | 6,797 | |
| Accrued Trustees' fees | | | 1,034 | |
| Other accrued expenses and payables | | | 92,977 | |
| Total liabilities | | | 4,051,864 | |
| Net assets, at value | | $ | 56,438,905 | |
| Net Assets Consist of | |
| Undistributed net investment income | | | 696,736 | |
Net unrealized appreciation (depreciation) on: Investments | | | 5,120,410 | |
| Foreign currency | | | (417 | ) |
| Accumulated net realized gain (loss) | | | (53,284,462 | ) |
| Paid-in capital | | | 103,906,638 | |
| Net assets, at value | | $ | 56,438,905 | |
Class A Net Asset Value, offering and redemption price per share ($53,558,234 ÷ 5,793,732 outstanding shares of beneficial interest, no par value, unlimited number of shares authorized) | | $ | 9.24 | |
Class B Net Asset Value, offering and redemption price per share ($2,880,671 ÷ 311,300 outstanding shares of beneficial interest, no par value, unlimited number of shares authorized) | | $ | 9.25 | |
* Represents collateral on securities loaned.
The accompanying notes are an integral part of the financial statements.
Statement of Operations
| for the year ended December 31, 2012 | |
| Investment Income | |
Income: Dividends (net of foreign taxes withheld of $88,296) | | $ | 1,249,257 | |
| Income distributions — Central Cash Management Fund | | | 1,574 | |
| Securities lending income, including income from Daily Assets Fund Institutional, net of borrower rebates | | | 62,980 | |
| Total income | | | 1,313,811 | |
Expenses: Management fee | | | 503,957 | |
| Administration fee | | | 55,077 | |
| Services to shareholders | | | 795 | |
| Distribution service fee (Class B) | | | 7,356 | |
| Record keeping fees (Class B) | | | 2,826 | |
| Custodian fee | | | 98,447 | |
| Audit and tax fees | | | 63,294 | |
| Legal fees | | | 7,454 | |
| Reports to shareholders | | | 25,623 | |
| Trustees' fees and expenses | | | 4,108 | |
| Other | | | 21,543 | |
| Total expenses before expense reductions | | | 790,480 | |
| Expense reductions | | | (234,728 | ) |
| Total expenses after expense reductions | | | 555,752 | |
| Net investment income (loss) | | | 758,059 | |
| Realized and Unrealized Gain (Loss) | |
Net realized gain (loss) from: Investments | | | 132,526 | |
| Foreign currency | | | (34,618 | ) |
| | | | 97,908 | |
Change in net unrealized appreciation (depreciation) on: Investments | | | 8,392,620 | |
| Foreign currency | | | 2,186 | |
| | | | 8,394,806 | |
| Net gain (loss) | | | 8,492,714 | |
| Net increase (decrease) in net assets resulting from operations | | $ | 9,250,773 | |
The accompanying notes are an integral part of the financial statements.
Statement of Changes in Net Assets | | | Years Ended December 31, | |
| Increase (Decrease) in Net Assets | | 2012 | | | 2011 | |
Operations: Net investment income (loss) | | $ | 758,059 | | | $ | 781,153 | |
| Net realized gain (loss) | | | 97,908 | | | | 41,917 | |
| Change in net unrealized appreciation (depreciation) | | | 8,394,806 | | | | (9,895,185 | ) |
| Net increase (decrease) in net assets resulting from operations | | | 9,250,773 | | | | (9,072,115 | ) |
Distributions to shareholders from: Net investment income: Class A | | | (741,039 | ) | | | (391,766 | ) |
| Class B | | | (31,068 | ) | | | (9,700 | ) |
| Total distributions | | | (772,107 | ) | | | (401,466 | ) |
Fund share transactions: Class A Proceeds from shares sold | | | 7,619,915 | | | | 3,929,750 | |
| Reinvestment of distributions | | | 741,039 | | | | 391,766 | |
| Payments for shares redeemed | | | (12,066,736 | ) | | | (13,903,803 | ) |
| Net increase (decrease) in net assets from Class A share transactions | | | (3,705,782 | ) | | | (9,582,287 | ) |
Class B Proceeds from shares sold | | | 80,402 | | | | 106,041 | |
| Reinvestment of distributions | | | 31,068 | | | | 9,700 | |
| Payments for shares redeemed | | | (823,480 | ) | | | (1,299,469 | ) |
| Net increase (decrease) in net assets from Class B share transactions | | | (712,010 | ) | | | (1,183,728 | ) |
| Increase (decrease) in net assets | | | 4,060,874 | | | | (20,239,596 | ) |
| Net assets at beginning of period | | | 52,378,031 | | | | 72,617,627 | |
Net assets at end of period (including undistributed net investment income of $696,736 and $740,653, respectively) | | $ | 56,438,905 | | | $ | 52,378,031 | |
| Other Information | |
Class A Shares outstanding at beginning of period | | | 6,234,878 | | | | 7,301,949 | |
| Shares sold | | | 882,663 | | | | 458,129 | |
| Shares issued to shareholders in reinvestment of distributions | | | 85,967 | | | | 39,334 | |
| Shares redeemed | | | (1,409,776 | ) | | | (1,564,534 | ) |
| Net increase (decrease) in Class A shares | | | (441,146 | ) | | | (1,067,071 | ) |
| Shares outstanding at end of period | | | 5,793,732 | | | | 6,234,878 | |
Class B Shares outstanding at beginning of period | | | 393,322 | | | | 519,624 | |
| Shares sold | | | 9,525 | | | | 12,482 | |
| Shares issued to shareholders in reinvestment of distributions | | | 3,592 | | | | 971 | |
| Shares redeemed | | | (95,139 | ) | | | (139,755 | ) |
| Net increase (decrease) in Class B shares | | | (82,022 | ) | | | (126,302 | ) |
| Shares outstanding at end of period | | | 311,300 | | | | 393,322 | |
The accompanying notes are an integral part of the financial statements.
| | | Years Ended December 31, | |
| Class A | | | 2012 | | | 2011 | | | 2010 | | | 2009 | | | 2008 | |
| Selected Per Share Data | |
| Net asset value, beginning of period | | $ | 7.90 | | | $ | 9.28 | | | $ | 8.24 | | | $ | 5.84 | | | $ | 15.66 | |
Income (loss) from investment operations: Net investment incomea | | | .12 | | | | .11 | | | | .06 | | | | .08 | | | | .11 | |
| Net realized and unrealized gain (loss) | | | 1.34 | | | | (1.43 | ) | | | 1.06 | | | | 2.42 | | | | (5.83 | ) |
| Total from investment operations | | | 1.46 | | | | (1.32 | ) | | | 1.12 | | | | 2.50 | | | | (5.72 | ) |
Less distributions from: Net investment income | | | (.12 | ) | | | (.06 | ) | | | (.08 | ) | | | (.10 | ) | | | (.19 | ) |
| Net realized gains | | | — | | | | — | | | | — | | | | — | | | | (3.91 | ) |
| Total distributions | | | (.12 | ) | | | (.06 | ) | | | (.08 | ) | | | (.10 | ) | | | (4.10 | ) |
| Net asset value, end of period | | $ | 9.24 | | | $ | 7.90 | | | $ | 9.28 | | | $ | 8.24 | | | $ | 5.84 | |
Total Return (%)b | | | 18.60 | | | | (14.39 | ) | | | 13.65 | | | | 43.82 | | | | (47.75 | ) |
| Ratios to Average Net Assets and Supplemental Data | |
| Net assets, end of period ($ millions) | | | 54 | | | | 49 | | | | 68 | | | | 66 | | | | 59 | |
| Ratio of expenses before expense reductions (%) | | | 1.42 | | | | 1.37 | | | | 1.41 | | | | 1.38 | | | | 1.47 | |
| Ratio of expenses after expense reductions (%) | | | .99 | | | | 1.03 | | | | 1.05 | | | | 1.04 | | | | 1.09 | |
| Ratio of net investment income (%) | | | 1.40 | | | | 1.24 | | | | .77 | | | | 1.23 | | | | 1.09 | |
| Portfolio turnover rate (%) | | | 107 | | | | 127 | | | | 165 | | | | 190 | | | | 229 | |
a Based on average shares outstanding during the period. b Total return would have been lower had certain expenses not been reduced. | |
| | | Years Ended December 31, | |
| Class B | | | 2012 | | | 2011 | | | 2010 | | | 2009 | | | 2008 | |
| Selected Per Share Data | |
| Net asset value, beginning of period | | $ | 7.91 | | | $ | 9.29 | | | $ | 8.25 | | | $ | 5.85 | | | $ | 15.66 | |
Income (loss) from investment operations: Net investment incomea | | | .09 | | | | .08 | | | | .04 | | | | .06 | | | | .07 | |
| Net realized and unrealized gain (loss) | | | 1.34 | | | | (1.44 | ) | | | 1.05 | | | | 2.42 | | | | (5.83 | ) |
| Total from investment operations | | | 1.43 | | | | (1.36 | ) | | | 1.09 | | | | 2.48 | | | | (5.76 | ) |
Less distributions from: Net investment income | | | (.09 | ) | | | (.02 | ) | | | (.05 | ) | | | (.08 | ) | | | (.14 | ) |
| Net realized gains | | | — | | | | — | | | | — | | | | — | | | | (3.91 | ) |
| Total distributions | | | (.09 | ) | | | (.02 | ) | | | (.05 | ) | | | (.08 | ) | | | (4.05 | ) |
| Net asset value, end of period | | $ | 9.25 | | | $ | 7.91 | | | $ | 9.29 | | | $ | 8.25 | | | $ | 5.85 | |
Total Return (%)b | | | 18.16 | | | | (14.67 | ) | | | 13.24 | | | | 43.23 | | | | (47.87 | ) |
| Ratios to Average Net Assets and Supplemental Data | |
| Net assets, end of period ($ millions) | | | 3 | | | | 3 | | | | 5 | | | | 5 | | | | 4 | |
| Ratio of expenses before expense reductions (%) | | | 1.76 | | | | 1.72 | | | | 1.76 | | | | 1.73 | | | | 1.82 | |
| Ratio of expenses after expense reductions (%) | | | 1.34 | | | | 1.38 | | | | 1.40 | | | | 1.39 | | | | 1.45 | |
| Ratio of net investment income (%) | | | 1.04 | | | | .88 | | | | .42 | | | | .88 | | | | .73 | |
| Portfolio turnover rate (%) | | | 107 | | | | 127 | | | | 165 | | | | 190 | | | | 229 | |
a Based on average shares outstanding during the period. b Total return would have been lower had certain expenses not been reduced. | |
Notes to Financial Statements
A. Organization and Significant Accounting Policies
DWS Global Thematic VIP (the "Fund") is a diversified series of DWS Variable Series II (the "Trust"), which is registered under the Investment Company Act of 1940, as amended (the "1940 Act"), as an open-end management investment company organized as a Massachusetts business trust.
Multiple Classes of Shares of Beneficial Interest. The Fund offers two classes of shares (Class A shares and Class B shares). Sales of Class B shares are subject to recordkeeping fees up to 0.15% and Rule 12b-1 fees under the 1940 Act equal to an annual rate of 0.25% of the average daily net assets for Class B shares of the Fund. Class A shares are not subject to such fees.
Investment income, realized and unrealized gains and losses, and certain fund-level expenses and expense reductions, if any, are borne pro rata on the basis of relative net assets by the holders of all classes of shares except that each class bears certain expenses unique to that class (including the applicable Rule 12b-1 fee and recordkeeping fees). Differences in class-level expenses may result in payment of different per share dividends by class. All shares have equal rights with respect to voting subject to class-specific arrangements.
The Fund's financial statements are prepared in accordance with accounting principles generally accepted in the United States of America which require the use of management estimates. Actual results could differ from those estimates. The policies described below are followed consistently by the Fund in the preparation of its financial statements.
Security Valuation. Investments are stated at value determined as of the close of regular trading on the New York Stock Exchange on each day the exchange is open for trading.
Various inputs are used in determining the value of the Fund's investments. These inputs are summarized in three broad levels. Level 1 includes quoted prices in active markets for identical securities. Level 2 includes other significant observable inputs (including quoted prices for similar securities, interest rates, prepayment speeds, and credit risk). Level 3 includes significant unobservable inputs (including the Fund's own assumptions in determining the fair value of investments). The inputs or methodology used for valuing securities are not necessarily an indication of the risk associated with investing in those securities.
Equity securities are valued at the most recent sale price or official closing price reported on the exchange (U.S. or foreign) or over-the-counter market on which they trade and are categorized as Level 1 securities. Securities for which no sales are reported are valued at the calculated mean between the most recent bid and asked quotations on the relevant market or, if a mean cannot be determined, at the most recent bid quotation. For certain international equity securities, in order to adjust for events which may occur between the close of the foreign exchanges and the close of the New York Stock Exchange, a fair valuation model may be used. This fair valuation model takes into account comparisons to the valuation of American Depository Receipts (ADRs), exchange-traded funds, futures contracts and certain indices and these securities are categorized as Level 2.
Investments in open-end investment companies are valued at their net asset value each business day and are categorized as Level 1.
Securities and other assets for which market quotations are not readily available or for which the above valuation procedures are deemed not to reflect fair value are valued in a manner that is intended to reflect their fair value as determined in accordance with procedures approved by the Board and are generally categorized as Level 3. In accordance with the Fund's valuation procedures, factors used in determining value may include, but are not limited to, the type of the security; the size of the holding; the initial cost of the security; the existence of any contractual restrictions on the security's disposition; the price and extent of public trading in similar securities of the issuer or of comparable companies; quotations or evaluated prices from broker-dealers and/or pricing services; information obtained from the issuer, analysts, and/or the appropriate stock exchange (for exchange-traded securities); an analysis of the company's or issuer's financial statements; an evaluation of the forces that influence the issuer and the market(s) in which the security is purchased and sold and with respect to debt securities; the maturity, coupon, creditworthiness, currency denomination and the movement of the market in which the security is normally traded. The value determined under these procedures may differ from published values for the same securities.
Disclosure about the classification of fair value measurements is included in a table following the Fund's Investment Portfolio.
New Accounting Pronouncement. In January 2013, Accounting Standard Update 2013-01 (ASU 2013-01), Clarifying the Scope of Disclosures about Offsetting Assets and Liabilities, replaced Accounting Standards Update 2011-11 (ASU 2011-11), Disclosures about Offsetting Assets and Liabilities. ASU 2013-01 is effective for fiscal years beginning on or after January 1, 2013, and interim periods within those annual periods. ASU 2011-11 was intended to enhance disclosure requirements on the offsetting of financial assets and liabilities. The ASU 2013-01 limits the scope of the new balance sheet offsetting disclosures to derivatives, repurchase agreements, and securities lending transactions to the extent that they are (1) offset in the financial statements or (2) subject to an enforceable master netting arrangement or similar agreement. Management is currently evaluating the application of ASU 2013-01 and its impact, if any, on the Fund's financial statements.
Foreign Currency Translations. The books and records of the Fund are maintained in U.S. dollars. Investment securities and other assets and liabilities denominated in a foreign currency are translated into U.S. dollars at the prevailing exchange rates at period end. Purchases and sales of investment securities, income and expenses are translated into U.S. dollars at the prevailing exchange rates on the respective dates of the transactions.
Net realized and unrealized gains and losses on foreign currency transactions represent net gains and losses between trade and settlement dates on securities transactions, the acquisition and disposition of foreign currencies, and the difference between the amount of net investment income accrued and the U.S. dollar amount actually received. That portion of both realized and unrealized gains and losses on investments that results from fluctuations in foreign currency exchange rates is not separately disclosed but is included with net realized and unrealized gain/appreciation and loss/depreciation on investments.
Securities Lending. The Fund lends securities to certain financial institutions. The Fund retains beneficial ownership of the securities it has loaned and continues to receive interest and dividends paid by the issuer of securities and to participate in any changes in their market value. The Fund requires the borrowers of the securities to maintain collateral with the Fund consisting of either cash or liquid, unencumbered assets having a value at least equal to the value of the securities loaned. When the collateral falls below specified amounts, the lending agent will use its best effort to obtain additional collateral on the next business day to meet required amounts under the security lending agreement. The Fund may invest the cash collateral into a joint trading account in an affiliated money market fund pursuant to Exemptive Orders issued by the SEC. The Fund receives compensation for lending its securities either in the form of fees or by earning interest on invested cash collateral net of borrower rebates and fees paid to a lending agent. Either the Fund or the borrower may terminate the loan. There may be risks of delay and costs in recovery of securities or even loss of rights in the collateral should the borrower of the securities fail financially. The Fund is also subject to all investment risks associated with the reinvestment of any cash collateral received, including, but not limited to, interest rate, credit and liquidity risk associated with such investments.
Participatory Notes. The Fund invests in Participatory Notes (P-Notes). P-Notes are promissory notes designed to offer a return linked to the performance of a particular underlying equity security or market. P-Notes are issued by banks or broker-dealers and allow the Fund to gain exposure to local shares in foreign markets. Investments in P-Notes involve the same risks associated with a direct investment in the underlying foreign companies or foreign markets that they seek to replicate. Although each participation note is structured with a defined maturity date, early redemption may be possible. Risks associated with participation notes include the possible failure of a counterparty to perform in accordance with the terms of the agreement and potential delays or an inability to redeem before maturity under certain market conditions.
Taxes. The Fund's policy is to comply with the requirements of the Internal Revenue Code, as amended, which are applicable to regulated investment companies and to distribute all of its taxable income to its shareholders.
Additionally, the Fund may be subject to taxes imposed by the governments of countries in which it invests and are generally based on income and/or capital gains earned or repatriated. Estimated tax liabilities on certain foreign securities are recorded on an accrual basis and are reflected as components of interest income or net change in unrealized gain/loss on investments. Tax liabilities realized as a result of security sales are reflected as a component of net realized gain/loss on investments.
Under the Regulated Investment Company Modernization Act of 2010, net capital losses incurred post-enactment may be carried forward indefinitely, and their character is retained as short-term and/or long-term. Previously, net capital losses were carried forward for eight years and treated as short-term. As a transition rule, the Act requires that post-enactment net capital losses be used before pre-enactment net capital losses.
At December 31, 2012, the Fund had a net tax basis capital loss carryforward of approximately $52,710,000, including $51,528,000 of pre-enactment losses, which may be applied against any realized net taxable capital gains of each succeeding year until fully utilized or until December 31, 2016 ($33,717,000) and December 31, 2017 ($17,811,000), the respective expiration dates, whichever occurs first; and approximately $1,182,000 of post-enactment losses, which may be applied against realized net taxable capital gains indefinitely, including short-term losses ($775,000) and long-term losses ($407,000).
The Fund has reviewed the tax positions for the open tax years as of December 31, 2012 and has determined that no provision for income tax is required in the Fund's financial statements. The Fund's federal tax returns for the prior three fiscal years remain open subject to examination by the Internal Revenue Service.
Distribution of Income and Gains. Distributions from net investment income of the Fund, if any, is declared and distributed to shareholders annually. Net realized gains from investment transactions, in excess of available capital loss carryforwards, would be taxable to the Fund if not distributed and, therefore, will be distributed to shareholders at least annually. The Fund may also make additional distributions for tax purposes if necessary.
The timing and characterization of certain income and capital gain distributions are determined annually in accordance with federal tax regulations which may differ from accounting principles generally accepted in the United States of America. These differences primarily relate to investments in foreign denominated investments, income received from Passive Foreign Investment Companies and certain securities sold at a loss. As a result, net investment income (loss) and net realized gain (loss) on investment transactions for a reporting period may differ significantly from distributions during such period. Accordingly, the Fund may periodically make reclassifications among certain of its capital accounts without impacting the net asset value of the Fund.
At December 31, 2012, the Fund's components of distributable earnings on a tax basis were as follows:
| Undistributed ordinary income* | | $ | 727,458 | |
| Capital loss carryforwards | | $ | (52,710,000 | ) |
| Unrealized appreciation (depreciation) on investments | | $ | 4,514,461 | |
In addition, the tax character of distributions paid by the Fund is summarized as follows:
| | | Years Ended December 31, | |
| | | 2012 | | | 2011 | |
| Distributions from ordinary income* | | $ | 772,107 | | | $ | 401,466 | |
* For tax purposes, short-term capital gain distributions are considered ordinary income distributions.
Expenses. Expenses of the Trust arising in connection with a specific fund are allocated to that fund. Other Trust expenses which cannot be directly attributed to a fund are apportioned among the funds in the Trust based upon the relative net assets or other appropriate measures.
Contingencies. In the normal course of business, the Fund may enter into contracts with service providers that contain general indemnification clauses. The Fund's maximum exposure under these arrangements is unknown as this would involve future claims that may be made against the Fund that have not yet been made. However, based on experience, the Fund expects the risk of loss to be remote.
Other. Investment transactions are accounted for on a trade date plus one basis for daily net asset value calculations. However, for financial reporting purposes, investment transactions are reported on trade date. Interest income is recorded on the accrual basis. Dividend income is recorded on the ex-dividend date net of foreign withholding taxes. Certain dividends from foreign securities may be recorded subsequent to the ex-dividend date as soon as the Fund is informed of such dividends. Realized gains and losses from investment transactions are recorded on an identified cost basis and may include proceeds from litigation.
B. Purchases and Sales of Securities
During the year ended December 31, 2012, purchases and sales of investment transactions (excluding short-term investments) aggregated $57,532,783 and $62,626,153, respectively.
C. Related Parties
Management Agreement. Under the Investment Management Agreement with Deutsche Investment Management Americas Inc. ("DIMA" or the "Advisor"), an indirect, wholly owned subsidiary of Deutsche Bank AG, the Advisor directs the investments of the Fund in accordance with its investment objectives, policies and restrictions. The Advisor determines the securities, instruments and other contracts relating to investments to be purchased, sold or entered into by the Fund or delegates such responsibility to the Fund's subadvisor.
Global Thematic Partners, LLC ("GTP") serves as subadvisor. As a subadvisor to the Fund, GTP makes investment decisions and buys and sells securities for the Fund. GTP is paid by the Advisor for the services GTP provides to the Fund.
Pursuant to the Investment Management Agreement with the Advisor, the Fund pays a monthly management fee based on the Fund's average daily net assets, computed and accrued daily and payable monthly, at the following annual rates:
| First $250 million | | | .915 | % |
| Next $500 million | | | .865 | % |
| Next $750 million | | | .815 | % |
| Next $1.5 billion | | | .765 | % |
| Over $3 billion | | | .715 | % |
For the period from January 1, 2012 through September 30, 2012, the Advisor had contractually agreed to waive its fee and/or reimburse certain operating expenses to the extent necessary to maintain the operating expenses (excluding certain expenses such as extraordinary expenses, taxes, brokerage and interest expense) of each class as follows:
For the period from October 1, 2012 through September 30, 2013, the Advisor has contractually agreed to waive its fee and/or reimburse certain operating expenses to the extent necessary to maintain the operating expenses (excluding certain expenses such as extraordinary expenses, taxes, brokerage and interest expense) of each class as follows:
Accordingly, for the year ended December 31, 2012, the Advisor waived a portion of its management fee pursuant to the Investment Management Agreement aggregating $234,475, and the amount charged aggregated $269,482, which was equivalent to an annual effective rate of 0.49% of the Fund's average daily net assets.
Administration Fee. Pursuant to an Administrative Services Agreement, DIMA provides most administrative services to the Fund. For all services provided under the Administrative Services Agreement, the Fund pays DIMA an annual fee ("Administration Fee") of 0.10% of the Fund's average daily net assets, computed and accrued daily and payable monthly. For the year ended December 31, 2012, the Administration Fee was $55,077, of which $4,709 is unpaid.
Service Provider Fees. DWS Investments Service Company ("DISC"), an affiliate of the Advisor, is the transfer agent, dividend-paying agent and shareholder service agent for the Fund. Pursuant to a sub-transfer agency agreement between DISC and DST Systems, Inc. ("DST"), DISC has delegated certain transfer agent, dividend-paying agent and shareholder service agent functions to DST. DISC compensates DST out of the shareholder servicing fee it receives from the Fund. For the year ended December 31, 2012, the amounts charged to the Fund by DISC were as follows:
| Services to Shareholders | | Total Aggregated | | | Waived | | | Unpaid at December 31, 2012 | |
| Class A | | $ | 253 | | | $ | 253 | | | $ | — | |
| Class B | | | 61 | | | | — | | | | 15 | |
| | | $ | 314 | | | $ | 253 | | | $ | 15 | |
Distribution Service Agreement. Under the Fund's Class B 12b-1 plans, DWS Investments Distributors, Inc. ("DIDI") received a fee ("Distribution Service Fee") of 0.25% of average daily net assets of Class B shares. For the year ended December 31, 2012, the Distribution Service Fee aggregated $7,356, of which $602 is unpaid.
Typesetting and Filing Service Fees. Under an agreement with DIMA, DIMA is compensated for providing typesetting and certain regulatory filing services to the Fund. For the year ended December 31, 2012, the amount charged to the Fund by DIMA included in the Statement of Operations under "reports to shareholders" aggregated $16,713, of which $4,533 is unpaid.
Trustees' Fees and Expenses. The Fund paid retainer fees to each Trustee not affiliated with the Advisor, plus specified amounts to the Board Chairperson and to each committee Chairperson.
Affiliated Cash Management Vehicle. The Fund may invest uninvested cash balances in Central Cash Management Fund, which is managed by the Advisor. The Fund indirectly bears its proportionate share of the expenses of Central Cash Management Fund. Central Cash Management Fund does not pay the Advisor an investment management fee. Central Cash Management Fund seeks a high level of current income consistent with liquidity and the preservation of capital.
D. Investing in Emerging Markets
Investing in emerging markets may involve special risks and considerations not typically associated with investing in developed markets. These risks include revaluation of currencies, high rates of inflation or deflation, repatriation restrictions on income and capital, and future adverse political, social and economic developments. Moreover, securities issued in these markets may be less liquid, subject to government ownership controls or delayed settlements, and may have prices that are more volatile or less easily assessed than those of comparable securities of issuers in developed markets.
E. Ownership of the Fund
At December 31, 2012, two Participating Insurance Companies were owners of record of 10% or more of the total outstanding Class A shares of the Fund, each owning 61% and 28%. One Participating Insurance Company was the owner of record of 10% or more of the total outstanding Class B shares of the Fund, owning 96%.
F. Line of Credit
The Fund and other affiliated funds (the "Participants") share in a $375 million revolving credit facility provided by a syndication of banks. The Fund may borrow for temporary or emergency purposes, including the meeting of redemption requests that otherwise might require the untimely disposition of securities. The Participants are charged an annual commitment fee which is allocated based on net assets, among each of the Participants. Interest is calculated at a rate per annum equal to the sum of the Federal Funds Rate plus 1.25 percent plus if LIBOR exceeds the Federal Funds Rate the amount of such excess. The Fund may borrow up to a maximum of 33 percent of its net assets under the agreement. The Fund had no outstanding loans at December 31, 2012.
G. Subsequent Event
Effective on or about May 1, 2013, DWS Global Thematic VIP will change its name to DWS Global Growth VIP, and Global Thematic Partners, LLC will no longer serve as subadvisor to the fund. In addition, effective on or about May 1, 2013, the fund's portfolio management team will change and certain changes will be made to the fund's investment strategies and portfolio management process. More details regarding these changes are set forth in a supplement to the fund's prospectus dated January 14, 2013.
Report of Independent Registered Public Accounting Firm
To the Board of Trustees of DWS Variable Series II and Shareholders of DWS Global Thematic VIP:
We have audited the accompanying statement of assets and liabilities, including the investment portfolio, of DWS Global Thematic VIP (the "Fund"), one of the funds constituting DWS Variable Series II, as of December 31, 2012, and the related statement of operations for the year then ended, the statement of changes in net assets for each of the two years in the period then ended, and the financial highlights for each of the five years in the period then ended. These financial statements and financial highlights are the responsibility of the Fund's management. Our responsibility is to express an opinion on these financial statements and financial highlights based on our audits.
We conducted our audits in accordance with the standards of the Public Company Accounting Oversight Board (United States). Those standards require that we plan and perform the audit to obtain reasonable assurance about whether the financial statements and financial highlights are free of material misstatement. We were not engaged to perform an audit of the Fund's internal control over financial reporting. Our audits included consideration of internal control over financial reporting as a basis for designing audit procedures that are appropriate in the circumstances, but not for the purpose of expressing an opinion on the effectiveness of the Fund's internal control over financial reporting. Accordingly, we express no such opinion. An audit also includes examining, on a test basis, evidence supporting the amounts and disclosures in the financial statements and financial highlights, assessing the accounting principles used and significant estimates made by management, and evaluating the overall financial statement presentation. Our procedures included confirmation of securities owned as of December 31, 2012, by correspondence with the custodian and brokers, or by other appropriate auditing procedures where replies from brokers were not received. We believe that our audits provide a reasonable basis for our opinion.
In our opinion, the financial statements and financial highlights referred to above present fairly, in all material respects, the financial position of DWS Global Thematic VIP (one of the funds constituting DWS Variable Series II) at December 31, 2012, the results of its operations for the year then ended, the changes in its net assets for each of the two years in the period then ended, and the financial highlights for each of the five years in the period then ended, in conformity with U.S. generally accepted accounting principles.
| | | |
Boston, Massachusetts February 13, 2013 | | |
Information About Your Fund's Expenses (Unaudited)
As an investor of the Fund, you incur two types of costs: ongoing expenses and transaction costs. Ongoing expenses include management fees, distribution and service (12b-1) fees and other Fund expenses. Examples of transaction costs include contract charges, redemption fees and account maintenance fees, which are not shown in this section. The following tables are intended to help you understand your ongoing expenses (in dollars) of investing in the Fund and to help you compare these expenses with the ongoing expenses of investing in other mutual funds. In the most recent six-month period, the Fund limited these expenses; had it not done so, expenses would have been higher. The example in the table is based on an investment of $1,000 invested at the beginning of the six-month period and held for the entire period (July 1, 2012 to December 31, 2012).
The tables illustrate your Fund's expenses in two ways:
•Actual Fund Return. This helps you estimate the actual dollar amount of ongoing expenses (but not transaction costs) paid on a $1,000 investment in the Fund using the Fund's actual return during the period. To estimate the expenses you paid over the period, simply divide your account value by $1,000 (for example, an $8,600 account value divided by $1,000 = 8.6), then multiply the result by the number in the "Expenses Paid per $1,000" line under the share class you hold.
• Hypothetical 5% Fund Return. This helps you to compare your Fund's ongoing expenses (but not transaction costs) with those of other mutual funds using the Fund's actual expense ratio and a hypothetical rate of return of 5% per year before expenses. Examples using a 5% hypothetical Fund return may be found in the shareholder reports of other mutual funds. The hypothetical account values and expenses may not be used to estimate the actual ending account balance or expenses you paid for the period.
Please note that the expenses shown in these tables are meant to highlight your ongoing expenses only and do not reflect any transaction costs. The "Expenses Paid per $1,000" line of the tables is useful in comparing ongoing expenses only and will not help you determine the relative total expense of owning different funds. If these transaction costs had been included, your costs would have been higher.
Expenses and Value of a $1,000 Investment for the six months ended December 31, 2012 | |
| Actual Fund Return | | Class A | | | Class B | |
| Beginning Account Value 7/1/12 | | $ | 1,000.00 | | | $ | 1,000.00 | |
| Ending Account Value 12/31/12 | | $ | 1,128.20 | | | $ | 1,126.70 | |
| Expenses Paid per $1,000* | | $ | 5.14 | | | $ | 7.00 | |
| Hypothetical 5% Fund Return | | Class A | | | Class B | |
| Beginning Account Value 7/1/12 | | $ | 1,000.00 | | | $ | 1,000.00 | |
| Ending Account Value 12/31/12 | | $ | 1,020.31 | | | $ | 1,018.55 | |
| Expenses Paid per $1,000* | | $ | 4.88 | | | $ | 6.65 | |
* Expenses are equal to the Fund's annualized expense ratio for each share class, multiplied by the average account value over the period, multiplied by 184 (the number of days in the most recent six-month period), then divided by 366.
| Annualized Expense Ratios | Class A | | Class B | |
| DWS Variable Series II — DWS Global Thematic VIP | .96% | | 1.31% | |
For more information, please refer to the Fund's prospectus.
These tables do not reflect charges and fees ("contract charges") associated with the separate account that invests in the Fund or any variable life insurance policy or variable annuity contract for which the Fund is an investment option.
Tax Information (Unaudited)
For corporate shareholders, 38% of income dividends paid during the Fund's fiscal year ended December 31, 2012 qualified for the dividends received deduction.
Please consult a tax advisor if you have questions about federal or state income tax laws, or on how to prepare your tax returns. If you have specific questions about your account, please contact your insurance provider.
The Trust's policies and procedures for voting proxies for portfolio securities and information about how the Trust voted proxies related to its portfolio securities during the 12-month period ended June 30 are available on our Web site — www.dws-investments.com (click on "proxy voting" at the bottom of the page) — or on the SEC's Web site — www.sec.gov. To obtain a written copy of the Trust's policies and procedures without charge, upon request, call us toll free at (800) 728-3337.
Investment Management Agreement Approval
The Board of Trustees approved the renewal of DWS Global Thematic VIP's investment management agreement (the "Agreement") with Deutsche Investment Management Americas Inc. ("DWS") and sub-advisory agreement (the "Sub-Advisory Agreement" and together with the Agreement, the "Agreements") between DWS and Global Thematic Partners, LLC ("Global Thematic") in September 2012.
In terms of the process that the Board followed prior to approving the Agreements, shareholders should know that:
• In September 2012, all of the Fund's Trustees were independent of DWS and its affiliates.
• The Trustees met frequently during the past year to discuss fund matters and dedicated a substantial amount of time to contract review matters. Over the course of several months, the Board's Contract Committee, in coordination with the Board's Equity Oversight Committee, reviewed comprehensive materials received from DWS, independent third parties and independent counsel. These materials included an analysis of the Fund's performance, fees and expenses, and profitability compiled by the Fund's independent fee consultant. The Board also received extensive information throughout the year regarding performance of the Fund.
• The Independent Trustees regularly meet privately with their independent counsel to discuss contract review and other matters. In addition, the Independent Trustees were also advised by the Fund's independent fee consultant in the course of their review of the Fund's contractual arrangements and considered a comprehensive report prepared by the independent fee consultant in connection with their deliberations (the "IFC Report").
• In connection with reviewing the Agreements, the Board also reviewed the terms of the Fund's Rule 12b-1 plan, distribution agreement, administrative services agreement, transfer agency agreement and other material service agreements.
• Based on its evaluation of the information provided, the Contract Committee presented its findings and recommendations to the Board. The Board then reviewed the Contract Committee's findings and recommendations.
In connection with the contract review process, the Contract Committee and the Board considered the factors discussed below, among others. The Board also considered that DWS and its predecessors have managed the Fund since its inception, and the Board believes that a long-term relationship with a capable, conscientious advisor is in the best interests of the Fund. The Board considered, generally, that shareholders chose to invest or remain invested in the Fund knowing that DWS managed the Fund, and that the Agreement was approved by the Fund's shareholders. DWS is part of Deutsche Bank, a major global banking institution that is engaged in a wide range of financial services. The Board believes that there are advantages to being part of a global asset management business that offers a wide range of investing expertise and resources, including hundreds of portfolio managers and analysts with research capabilities in many countries throughout the world.
As part of the contract review process, the Board carefully considered the fees and expenses of each DWS fund overseen by the Board in light of the fund's performance. In many cases, this led to a negotiation with DWS of lower expense caps for the coming year than had previously been in place. As part of these negotiations, the Board indicated that it would consider relaxing these new lower caps in future years following sustained improvements in performance, among other considerations.
In June 2012, Deutsche Bank ("DB"), DWS's parent company, announced that DB's new management team had concluded the strategic review of its global asset management business announced in late 2011 by DB's prior management team, and would combine its Asset Management (of which DWS is a part) and Wealth Management divisions. Prior to approving the investment management agreements, the Independent Trustees were apprised of the expected management and structure of the new combined Asset & Wealth Management division ("AWM") and DWS. DB also advised the Independent Trustees that the U.S. asset management business is a critical and integral part of DB and AWM, and that DB would be reinvesting a significant portion of the substantial savings it expects to realize by combining its Asset Management and Wealth Management divisions into a combined AWM division, including enhancements to its investment capabilities. DB also confirmed its commitment to maintaining strong legal and compliance groups within the combined division.
While shareholders may focus primarily on fund performance and fees, the Fund's Board considers these and many other factors, including the quality and integrity of DWS's and Global Thematic's personnel and such other issues as back-office operations, fund valuations, and compliance policies and procedures.
Nature, Quality and Extent of Services. The Board considered the terms of the Agreements, including the scope of advisory services provided under the Agreements. The Board noted that, under the Agreements, DWS and Global Thematic provide portfolio management services to the Fund and that, pursuant to a separate administrative services agreement, DWS provides administrative services to the Fund. The Board considered the experience and skills of senior management and investment personnel, the resources made available to such personnel, the ability of DWS to attract and retain high-quality personnel, and the organizational depth and stability of DWS. The Board also requested and received information regarding DWS's oversight of Fund sub-advisors, including Global Thematic. The Board reviewed the Fund's performance over short-term and long-term periods and compared those returns to various agreed-upon performance measures, including market indices and a peer universe compiled by the independent fee consultant using information supplied by Lipper Inc. ("Lipper"), an independent fund data service. The Board also noted that it has put into place a process of identifying "Focus Funds" (e.g., funds performing poorly relative to their benchmark or a peer universe compiled by an independent fund data service), and receives more frequent reporting and information from DWS regarding such funds, along with DWS's remedial plans to address underperformance. The Board believes this process is an effective manner of identifying and addressing underperforming funds. Based on the information provided, the Board noted that for the one-, three- and five-year periods ended December 31, 2011, the Fund's performance (Class A shares) was in the 4th quartile, 3rd quartile and 4th quartile, respectively, of the applicable Lipper universe (the 1st quartile being the best performers and the 4th quartile being the worst performers). The Board also observed that the Fund has outperformed its benchmark in the three-year period and has underperformed its benchmark in the one- and five-year periods ended December 31, 2011. The Board noted the disappointing investment performance of the Fund in recent periods and continued to discuss with senior management of DWS and Global Thematic the factors contributing to such underperformance and actions being taken to improve performance. The Board recognized that Global Thematic has made changes in its investment processes in recent years in an effort to improve long-term performance.
Fees and Expenses. The Board considered the Fund's investment management fee schedule, sub-advisory fee schedule, operating expenses and total expense ratios, and comparative information provided by Lipper and the independent fee consultant regarding investment management fee rates paid to other investment advisors by similar funds (1st quartile being the most favorable and 4th quartile being the least favorable). With respect to management fees paid to other investment advisors by similar funds, the Board noted that the contractual fee rates paid by the Fund, which include a 0.10% fee paid to DWS under the Fund's administrative services agreement, were higher than the median (4th quartile) of the applicable Lipper peer group (based on Lipper data provided as of December 31, 2011). With respect to the sub-advisory fee paid to Global Thematic, the Board noted that the fee is paid by DWS out of its fee and not directly by the Fund. The Board noted that the Fund's Class A shares total (net) operating expenses were expected to be lower than the median (2nd quartile) of the applicable Lipper expense universe (based on Lipper data provided as of December 31, 2011, and analyzing Lipper expense universe Class A (net) expenses less any applicable 12b-1 fees) ("Lipper Universe Expenses"). The Board also reviewed data comparing each share class's total (net) operating expenses to the applicable Lipper Universe Expenses. The Board considered the Fund's management fee rate as compared to fees charged by DWS and certain of its affiliates for comparable mutual funds and considered differences in fund and fee structures between the DWS Funds. The Board also considered how the Fund's total (net) operating expenses compared to the total (net) operating expenses of a more customized peer group selected by Lipper (based on such factors as asset size). The Board also noted that the expense limitations agreed to by DWS helped to ensure that the Fund's total (net) operating expenses would remain competitive.
The information considered by the Board as part of its review of management fees included information regarding fees charged by DWS and its affiliates to similar institutional accounts and to similar funds offered primarily to European investors ("DWS Europe funds"), in each case as applicable. The Board observed that advisory fee rates for institutional accounts generally were lower than the management fees charged by similarly managed DWS U.S. mutual funds ("DWS Funds"), but also took note of the differences in services provided to DWS Funds as compared to institutional accounts. In the case of DWS Europe funds, the Board observed that fee rates for DWS Europe funds generally were higher than for similarly managed DWS Funds, but noted that differences in the types of services provided to DWS Funds relative to DWS Europe funds made it difficult to compare such fees.
On the basis of the information provided, the Board concluded that management fees were reasonable and appropriate in light of the nature, quality and extent of services provided by DWS and Global Thematic.
Profitability. The Board reviewed detailed information regarding revenues received by DWS under the Agreement. The Board considered the estimated costs and pre-tax profits realized by DWS from advising the DWS Funds, as well as estimates of the pre-tax profits attributable to managing the Fund in particular. The Board also received information regarding the estimated enterprise-wide profitability of DWS and its affiliates with respect to all fund services in totality and by fund. The Board and the independent fee consultant reviewed DWS's methodology in allocating its costs to the management of the Fund. Based on the information provided, the Board concluded that the pre-tax profits realized by DWS in connection with the management of the Fund were not unreasonable. The Board also reviewed information regarding the profitability of certain similar investment management firms. The Board noted that while information regarding the profitability of such firms is limited (and in some cases is not necessarily prepared on a comparable basis), DWS and its affiliates' overall profitability with respect to the DWS fund complex (after taking into account distribution and other services provided to the funds by DWS and its affiliates) was lower than the overall profitability levels of many comparable firms for which such data was available. The Board did not consider the profitability of Global Thematic with respect to the Fund. The Board noted that DWS pays Global Thematic's fee out of its management fee, and its understanding that the Fund's sub-advisory fee schedule was the product of an arm's length negotiation with DWS.
Economies of Scale. The Board considered whether there are economies of scale with respect to the management of the Fund and whether the Fund benefits from any economies of scale. The Board noted that the Fund's management fee schedule includes fee breakpoints. The Board concluded that the Fund's fee schedule represents an appropriate sharing between the Fund and DWS of such economies of scale as may exist in the management of the Fund at current asset levels.
Other Benefits to DWS and Global Thematic and Their Affiliates. The Board also considered the character and amount of other incidental benefits received by DWS and Global Thematic and their affiliates, including any fees received by DWS for administrative services provided to the Fund and any fees received by an affiliate of DWS for distribution services. The Board also considered benefits to DWS and Global Thematic related to brokerage and soft-dollar allocations, including allocating brokerage to pay for research generated by parties other than the executing broker dealers, which pertain primarily to funds investing in equity securities, along with the incidental public relations benefits to DWS and Global Thematic related to DWS Funds advertising and cross-selling opportunities among DWS products and services. The Board concluded that management fees were reasonable in light of these fallout benefits.
Compliance. The Board considered the significant attention and resources dedicated by DWS to documenting and enhancing its compliance processes in recent years. The Board noted in particular (i) the experience and seniority of both DWS's chief compliance officer and the Fund's chief compliance officer; (ii) the large number of DWS compliance personnel; and (iii) the substantial commitment of resources by DWS and its affiliates to compliance matters. The Board also considered the attention and resources dedicated by DWS to the oversight of the investment sub-advisor's compliance program and compliance with the applicable fund policies and procedures.
Based on all of the information considered and the conclusions reached, the Board unanimously determined that the continuation of the Agreements is in the best interests of the Fund. In making this determination, the Board did not give particular weight to any single factor identified above. The Board considered these factors over the course of numerous meetings, certain of which were in executive session with only the Independent Trustees and their counsel present. It is possible that individual Trustees may have weighed these factors differently in reaching their individual decisions to approve the continuation of the Agreements.
Summary of Management Fee Evaluation by Independent Fee Consultant
September 17, 2012
Pursuant to an Order entered into by Deutsche Investment Management Americas and affiliates (collectively, "DeAM") with the Attorney General of New York, I, Thomas H. Mack, have been appointed the Independent Fee Consultant for the DWS Funds (formerly the DWS Scudder Funds). My duties include preparing an annual written evaluation of the management fees DeAM charges the Funds, considering among other factors the management fees charged by other mutual fund companies for like services, management fees DeAM charges other clients for like services, DeAM's costs of supplying services under the management agreements and related profit margins, possible economies of scale if a Fund grows larger, and the nature and quality of DeAM's services, including fund performance. This report summarizes my evaluation for 2012, including my qualifications, the evaluation process for each of the DWS Funds, consideration of certain complex-level factors, and my conclusions. I served in substantially the same capacity in 2007, 2008, 2009, 2010 and 2011.
Qualifications
For more than 35 years I have served in various professional capacities within the investment management business. I have held investment analysis and advisory positions, including securities analyst, portfolio strategist and director of investment policy with a large investment firm. I have also performed business management functions, including business development, financial management and marketing research and analysis.
Since 1991, I have been an independent consultant within the asset management industry. I have provided services to over 125 client organizations, including investment managers, mutual fund boards, product distributors and related organizations. Over the past ten years I have completed a number of assignments for mutual fund boards, specifically including assisting boards with management contract renewal.
I hold a Master of Business Administration degree, with highest honors, from Harvard University and Master of Science and Bachelor of Science (highest honors) degrees from the University of California at Berkeley. I am an independent director and audit committee financial expert for two closed-end mutual funds and have served in various leadership and financial oversight capacities with non-profit organizations.
Evaluation of Fees for each DWS Fund
My work focused primarily on evaluating, fund-by-fund, the fees charged to each of the 103 mutual fund portfolios in the DWS Fund family. For each Fund, I considered each of the key factors mentioned above, as well as any other relevant information. In doing so I worked closely with the Funds' Independent Directors in their annual contract renewal process, as well as in their approval of contracts for several new funds (documented separately).
In evaluating each Fund's fees, I reviewed comprehensive materials provided by or on behalf of DeAM, including expense information prepared by Lipper Analytical, comparative performance information, profitability data, manager histories, and other materials. I also accessed certain additional information from the Lipper and Morningstar databases and drew on my industry knowledge and experience.
To facilitate evaluating this considerable body of information, I prepared for each Fund a document summarizing the key data elements in each area as well as additional analytics discussed below. This made it possible to consider each key data element in the context of the others.
In the course of contract renewal, DeAM agreed to implement a number of fee and expense adjustments requested by the Independent Directors which will favorably impact future fees and expenses, and my evaluation includes the effects of these changes.
Fees and Expenses Compared with Other Funds
The competitive fee and expense evaluation for each fund focused on two primary comparisons:
The Fund's contractual management fee (the advisory fee plus the administration fee where applicable) compared with those of a group of typically 12-15 funds in the same Lipper investment category (e.g. Large Capitalization Growth) having similar distribution arrangements and being of similar size.
The Fund's total expenses compared with a broader universe of funds from the same Lipper investment category and having similar distribution arrangements.
These two comparisons provide a view of not only the level of the fee compared with funds of similar scale but also the total expense the Fund bears for all the services it receives, in comparison with the investment choices available in the Fund's investment category and distribution channel. The principal figure-of-merit used in these comparisons was the subject Fund's percentile ranking against peers.
DeAM's Fees for Similar Services to Others
DeAM provided management fee schedules for all of its US domiciled fund and non-fund investment management accounts in any of the investment categories where there is a DWS Fund. These similar products included the other DWS Funds, non-fund pooled accounts, institutional accounts and sub-advisory accounts. Using this information, I calculated for each Fund the fee that would be charged to each similar product, at the subject Fund's asset level.
Evaluating information regarding non-fund products is difficult because there are varying levels of services required for different types of accounts, with mutual funds generally requiring considerably more regulatory and administrative types of service as well as having more frequent cash flows than other types of accounts. Also, while mutual fund fees for similar fund products can be expected to be similar, there will be some differences due to different pricing conditions in different distribution channels (e.g. retail funds versus those used in variable insurance products), differences in underlying investment processes and other factors.
Costs and Profit Margins
DeAM provided a detailed profitability analysis for each Fund. After making some adjustments so that the presentation would be more comparable to the available industry figures, I reviewed profit margins from investment management alone, from investment management plus other fund services (excluding distribution) provided to the Funds by DeAM (principally shareholder services), and DeAM profits from all sources, including distribution. A later section comments on overall profitability.
Economies of Scale
Economies of scale — an expected decline in management cost per dollar of fund assets as fund assets grow — are very rarely quantified and documented because of inherent difficulties in collecting and analyzing relevant data. However, in virtually every investment category that I reviewed, larger funds tend to have lower fees and lower total expenses than smaller funds. To see how each DWS Fund compares with this industry observation, I reviewed:
The trend in Fund assets over the last five years and the accompanying trend in total expenses. This shows if the Fund has grown and, if so, whether total expense (management fees as well as other expenses) have declined as a percent of assets.
Whether the Fund has break-points in its management fee schedule, the extent of the fee reduction built into the schedule and the asset levels where the breaks take effect, and in the case of a sub-advised Fund how the Fund's break-points compare with those of the sub-advisory fee schedule.
How the Fund's contractual fee schedule compares with trends in the industry data. To accomplish this, I constructed a chart showing how actual latest-fiscal-year contractual fees of the Fund and of other similar funds relate to average fund assets, with the subject Fund's contractual fee schedule superimposed.
Quality of Service — Performance
The quality-of-service evaluation focused on investment performance, which is the principal result of the investment management service. Each Fund's performance was reviewed over the past 1, 3, 5 and 10 years, as applicable, and compared with that of other funds in the same investment category and with a suitable market index.
In addition, I calculated and reviewed risk-adjusted returns relative to an index of similar mutual funds' returns and a suitable market index. The risk-adjusted returns analysis provides a way of determining the extent to which the Fund's return comparisons are mainly the product of investment value-added (or lack thereof) or alternatively taking considerably more or less risk than is typical in its investment category.
I also received and considered the history of portfolio manager changes for each Fund, as this provided an important context for evaluating the performance results.
Complex-Level Considerations
While this evaluation was conducted mainly at the individual fund level, there are some issues relating to the reasonableness of fees that can alternatively be considered across the whole fund complex:
I reviewed DeAM's profitability analysis for all DWS Funds, with a view toward determining if the allocation procedures used were reasonable and how profit levels compared with public data for other investment managers.
I considered whether DeAM and affiliates receive any significant ancillary or "fallout" benefits that should be considered in interpreting the direct profitability results. These would be situations where serving as the investment manager of the Funds is beneficial to another part of the Deutsche Bank organization.
I considered how aggregated DWS Fund expenses had varied over the years, by asset class and in the context of trends in asset levels.
I considered how aggregated DWS Fund performance measures relative to appropriate peers had varied by asset class and over time.
I reviewed the structure of the DeAM organization, trends in staffing levels, and information on compensation of investment management and other professionals compared with industry data.
Findings
Based on the process and analysis discussed above, which included reviewing a wide range of information from management and external data sources and considering among other factors the fees DeAM charges other clients, the fees charged by other fund managers, DeAM's costs and profits associated with managing the Funds, economies of scale, possible fall-out benefits, and the nature and quality of services provided, in my opinion the management fees charged the DWS Funds are reasonable.
Thomas H. Mack
President, Thomas H. Mack & Co., Inc.
Board Members and Officers
The following table presents certain information regarding the Board Members and Officers of the fund. Each Board Member's year of birth is set forth in parentheses after his or her name. Unless otherwise noted, (i) each Board Member has engaged in the principal occupation(s) noted in the table for at least the most recent five years, although not necessarily in the same capacity; and (ii) the address of each Independent Board Member is c/o Kenneth C. Froewiss, Chairman, DWS Mutual Funds, P.O. Box 78, Short Hills, NJ 07078. Except as otherwise noted below, the term of office for each Board Member is until the election and qualification of a successor, or until such Board Member sooner dies, resigns, is removed or as otherwise provided in the governing documents of the fund. Because the fund does not hold an annual meeting of shareholders, each Board Member will hold office for an indeterminate period. The Board Members may also serve in similar capacities with other funds in the fund complex.
| Independent Board Members |
Name, Year of Birth, Position with the Fund and Length of Time Served1 | | Business Experience and Directorships During the Past Five Years | Number of Funds in DWS Fund Complex Overseen |
Other Directorships Held by Board Member |
Kenneth C. Froewiss (1945) Chairperson since 2013,9 and Board Member since 2001 | | Adjunct Professor of Finance, NYU Stern School of Business (September 2009-present; Clinical Professor from 1997-September 2009); Member, Finance Committee, Association for Asian Studies (2002-present); Director, Mitsui Sumitomo Insurance Group (US) (2004-present); prior thereto, Managing Director, J.P. Morgan (investment banking firm) (until 1996) | 103 | — |
William McClayton (1944) Vice Chairperson since 2013,9 and Board Member since 2004 | | Private equity investor (since October 2009); previously, Managing Director, Diamond Management & Technology Consultants, Inc. (global consulting firm) (2001-2009); Directorship: Board of Managers, YMCA of Metropolitan Chicago; formerly: Senior Partner, Arthur Andersen LLP (accounting) (1966-2001); Trustee, Ravinia Festival | 103 | — |
John W. Ballantine (1946) Board Member since 1999 | | Retired; formerly, Executive Vice President and Chief Risk Management Officer, First Chicago NBD Corporation/The First National Bank of Chicago (1996-1998); Executive Vice President and Head of International Banking (1995-1996). Directorships: Stockwell Capital Investments PLC (private equity); former Directorships: First Oak Brook Bancshares, Inc. and Oak Brook Bank; Prisma Energy International | 103 | Chairman of the Board, Healthways, Inc.2 (provider of disease and care management services) (2003- present); Portland General Electric2 (utility company) (2003-present) |
Henry P. Becton, Jr. (1943) Board Member since 1990 | | Vice Chair and former President, WGBH Educational Foundation. Directorships: Public Radio International; Public Radio Exchange (PRX); The PBS Foundation; North Bennett Street School (Boston); former Directorships: Association of Public Television Stations; Boston Museum of Science; American Public Television; Concord Academy; New England Aquarium; Mass. Corporation for Educational Telecommunications; Committee for Economic Development; Public Broadcasting Service; Connecticut College | 103 | Lead Director, Becton Dickinson and Company2 (medical technology company); Lead Director, Belo Corporation2 (media company) |
Dawn-Marie Driscoll (1946) Board Member since 1987 | | President, Driscoll Associates (consulting firm); Emeritus Executive Fellow, Center for Business Ethics, Bentley University; formerly, Partner, Palmer & Dodge (1988-1990); Vice President of Corporate Affairs and General Counsel, Filene's (1978-1988). Directorships: Director of ICI Mutual Insurance Company (since 2007); Advisory Board, Center for Business Ethics, Bentley University; Trustee, Southwest Florida Community Foundation (charitable organization); former Directorships: Sun Capital Advisers Trust (mutual funds) (2007-2012), Investment Company Institute (audit, executive, nominating committees) and Independent Directors Council (governance, executive committees) | 103 | — |
Keith R. Fox, CFA (1954) Board Member since 1996 | | Managing General Partner, Exeter Capital Partners (a series of private investment funds) (since 1986). Directorships: Progressive International Corporation (kitchen goods importer and distributor); The Kennel Shop (retailer); former Chairman, National Association of Small Business Investment Companies; former Directorships: BoxTop Media Inc. (advertising); Sun Capital Advisers Trust (mutual funds) (2011-2012) | 103 | — |
Paul K. Freeman (1950) Board Member since 1993, and Chairperson (2009-Jan. 8, 2013) | | Consultant, World Bank/Inter-American Development Bank; Executive and Governing Council of the Independent Directors Council (Chairman of Education Committee); formerly: Project Leader, International Institute for Applied Systems Analysis (1998-2001); Chief Executive Officer, The Eric Group, Inc. (environmental insurance) (1986-1998); Directorships: Denver Zoo Foundation (December 2012-present); former Directorships: Prisma Energy International | 103 | — |
Richard J. Herring (1946) Board Member since 1990 | | Jacob Safra Professor of International Banking and Professor, Finance Department, The Wharton School, University of Pennsylvania (since July 1972); Co-Director, Wharton Financial Institutions Center (since July 2000); Co-Chair, U.S. Shadow Financial Regulatory Committee; Executive Director, Financial Economists Roundtable; formerly: Vice Dean and Director, Wharton Undergraduate Division (July 1995-June 2000); Director, Lauder Institute of International Management Studies (July 2000-June 2006) | 103 | Director, Japan Equity Fund, Inc. (since September 2007), Thai Capital Fund, Inc. (since 2007), Singapore Fund, Inc. (since September 2007), Independent Director of Barclays Bank Delaware (since September 2010) |
Rebecca W. Rimel (1951) Board Member since 1995 | | President and Chief Executive Officer, The Pew Charitable Trusts (charitable organization) (1994 to present); Trustee, Washington College (2011-2013); formerly: Executive Vice President, The Glenmede Trust Company (investment trust and wealth management) (1983-2004); Board Member, Investor Education (charitable organization) (2004-2005); Trustee, Executive Committee, Philadelphia Chamber of Commerce (2001-2007); Director, Viasys Health Care2 (January 2007-June 2007); Trustee, Pro Publica (charitable organization) (2007-2010); Trustee, Thomas Jefferson Foundation (charitable organization) (1994-2012) | 103 | Director, Becton Dickinson and Company2 (medical technology company) (2012-present); Director, CardioNet, Inc.2 (health care) (2009-present) |
William N. Searcy, Jr. (1946) Board Member since 1993 | | Private investor since October 2003; formerly: Pension & Savings Trust Officer, Sprint Corporation2 (telecommunications) (November 1989-September 2003); Trustee, Sun Capital Advisers Trust (mutual funds) (1998-2012) | 103 | — |
Jean Gleason Stromberg (1943) Board Member since 1997 | | Retired. Formerly, Consultant (1997-2001); Director, Financial Markets U.S. Government Accountability Office (1996-1997); Partner, Fulbright & Jaworski, L.L.P. (law firm) (1978-1996). Directorships: The William and Flora Hewlett Foundation; former Directorships: Service Source, Inc., Mutual Fund Directors Forum (2002-2004), American Bar Retirement Association (funding vehicle for retirement plans) (1987-1990 and 1994-1996) | 103 | — |
Robert H. Wadsworth (1940) Board Member since 1999 | | President, Robert H. Wadsworth & Associates, Inc. (consulting firm) (1983 to present); Director, National Horizon, Inc. (non-profit organization); Director and Treasurer, The Phoenix Boys Choir Association | 106 | — |
Interested Board Member and Officer4 |
Name, Year of Birth, Position with the Fund and Length of Time Served1,6 | | Business Experience and Directorships During the Past Five Years | Number of Funds in DWS Fund Complex Overseen |
Other Directorships Held by Board Member |
Michael J. Woods5 (1967) Board Member since 2013,9 and Executive Vice President since 20139 | | Managing Director,3 Deutsche Asset & Wealth Management (2009-present); Head of the Americas Asset Management Business for Deutsche Bank, Member of the Asset and Wealth Management ("AWM") Extended Executive Committee, AWM Global Client Group Executive Committee and the AWM Active Asset Management Executive Committee; CEO and US Regional Head of DWS Investments; formerly: Sr. VP, Head of the Financial Intermediaries and Investments Group of Evergreen Investments (2007-2009), CEO and Vice Chairman of Board of Directors of XTF Global Asset Management (2006-2007), Managing Director — US Head of Sub-Advisory and Investment Only Business at Citigroup Asset Management (2000-2006). Mr. Woods is currently a board member of The Children's Village, The Big Brothers Big Sisters Organization, and The Mutual Fund Education Alliance. | 39 | — |
Officers4 |
Name, Year of Birth, Position with the Fund and Length of Time Served6 | | Business Experience and Directorships During the Past Five Years |
W. Douglas Beck, CFA7 (1967) President, 2011-present | | Managing Director,3 Deutsche Asset & Wealth Management (2006-present); President of DWS family of funds and Head of Product Management, U.S. for DWS Investments; formerly: Executive Director, Head of Product Management (2002-2006) and President (2005-2006) of the UBS Funds at UBS Global Asset Management; Co-Head of Manager Research/Managed Solutions Group, Merrill Lynch (1998-2002) |
John Millette8 (1962) Vice President and Secretary, 1999-present | | Director,3 Deutsche Asset & Wealth Management |
Paul H. Schubert7 (1963) Chief Financial Officer, 2004-present Treasurer, 2005-present | | Managing Director,3 Deutsche Asset & Wealth Management (since July 2004); formerly: Executive Director, Head of Mutual Fund Services and Treasurer for UBS Family of Funds (1998-2004); Vice President and Director of Mutual Fund Finance at UBS Global Asset Management (1994-1998) |
Caroline Pearson8 (1962) Chief Legal Officer, 2010-present | | Managing Director,3 Deutsche Asset & Wealth Management; formerly: Assistant Secretary for DWS family of funds (1997-2010) |
Melinda Morrow7 (1970) Vice President, 2012-present | | Director,3 Deutsche Asset & Wealth Management |
Hepsen Uzcan8 (1974) Assistant Secretary, since 20139 | | Vice President, Deutsche Asset & Wealth Management |
Paul Antosca8 (1957) Assistant Treasurer, 2007-present | | Director,3 Deutsche Asset & Wealth Management |
Jack Clark8 (1967) Assistant Treasurer, 2007-present | | Director,3 Deutsche Asset & Wealth Management |
Diane Kenneally8 (1966) Assistant Treasurer, 2007-present | | Director,3 Deutsche Asset & Wealth Management |
John Caruso7 (1965) Anti-Money Laundering Compliance Officer, 2010-present | | Managing Director,3 Deutsche Asset & Wealth Management |
Robert Kloby7 (1962) Chief Compliance Officer, 2006-present | | Managing Director,3 Deutsche Asset & Wealth Management |
1 The length of time served represents the year in which the Board Member joined the board of one or more DWS funds currently overseen by the Board.
2 A publicly held company with securities registered pursuant to Section 12 of the Securities Exchange Act of 1934.
3 Executive title, not a board directorship.
4 As a result of their respective positions held with the Advisor, these individuals are considered "interested persons" of the Advisor within the meaning of the 1940 Act. Interested persons receive no compensation from the fund.
5 The mailing address of Mr. Woods is 60 Wall Street, New York, New York 10005. Mr. Woods is an interested Board Member by virtue of his positions with Deutsche Asset & Wealth Management. As an interested person, Mr. Woods receives no compensation from the fund. Mr. Woods is a board member of the following trusts and corporations: Cash Account Trust, DWS Market Trust, DWS Money Funds, DWS State Tax-Free Income Series, DWS Target Fund, DWS Value Series, Inc., DWS Variable Series II, Investors Cash Trust, Tax-Exempt California Money Market Fund, DWS Global High Income Fund, Inc., DWS High Income Opportunities Fund, Inc., DWS High Income Trust, DWS Multi-Market Income Trust, DWS Municipal Income Trust, DWS Strategic Income Trust and DWS Strategic Municipal Income Trust.
6 The length of time served represents the year in which the officer was first elected in such capacity for one or more DWS funds.
7 Address: 60 Wall Street, New York, NY 10005.
8 Address: One Beacon Street, Boston, MA 02108.
9 Effective as of January 9, 2013.
The fund's Statement of Additional Information ("SAI") includes additional information about the Board Members. The SAI is available, without charge, upon request. If you would like to request a copy of the SAI, you may do so by calling the following toll-free number: (800) 728-3337.
DWS Investments Distributors, Inc.
222 South Riverside Plaza
Chicago, IL 60606
(800) 621-1148
VS2GT-2 (R-025830-3 2/13)
DECEMBER 31, 2012
ANNUAL REPORT
DWS VARIABLE SERIES II
DWS Government & Agency Securities VIP
Contents
10 Statement of Assets and Liabilities 11 Statement of Operations 12 Statement of Changes in Net Assets 15 Notes to Financial Statements 22 Report of Independent Registered Public Accounting Firm 23 Information About Your Fund's Expenses 25 Investment Management Agreement Approval 28 Summary of Management Fee Evaluation by Independent Fee Consultant 30 Board Members and Officers |
This report must be preceded or accompanied by a prospectus. To obtain an additional prospectus or summary prospectus, if available, call (800) 728-3337 or your financial representative. We advise you to consider the Fund's objectives, risks, charges and expenses carefully before investing. The summary prospectus and prospectus contain this and other important information about the Fund. Please read the prospectus carefully before you invest.
Bond investments are subject to interest-rate and credit risks. When interest rates rise, bond prices generally fall. Credit risk refers to the ability of an issuer to make timely payments of principal and interest. Investing in derivatives entails special risks relating to liquidity, leverage and credit that may reduce returns and/or increase volatility. The Fund may lend securities to approved institutions. The "full faith and credit" guarantee of the U.S. government applies to the timely repayment of interest, and does not eliminate market risk. Because of the rising U.S. government debt burden, it is possible that the U.S. government may not be able to meet its financial obligations or that securities issued by the U.S. government may experience credit downgrades. See the prospectus for details.
DWS Investments is part of the Deutsche Asset & Wealth Management division of Deutsche Bank AG.
NOT FDIC/NCUA INSURED NO BANK GUARANTEE MAY LOSE VALUE NOT A DEPOSIT
NOT INSURED BY ANY FEDERAL GOVERNMENT AGENCY
Performance Summary December 31, 2012 (Unaudited)
Fund performance shown is historical, assumes reinvestment of all dividend and capital gain distributions and does not guarantee future results. Investment return and principal value fluctuate with changing market conditions so that, when redeemed, shares may be worth more or less than their original cost. Current performance may be lower or higher than the performance data quoted. Please contact your participating insurance company for the Fund's most recent month-end performance. Performance doesn't reflect charges and fees ("contract charges") associated with the separate account that invests in the Fund or any variable life insurance policy or variable annuity contract for which the Fund is an investment option. These charges and fees will reduce returns. While all share classes have the same underlying portfolio, their performance will differ.
The gross expense ratios of the Fund, as stated in the fee table of the prospectus dated May 1, 2012 are 0.67% and 1.01% for Class A and Class B shares, respectively, and may differ from the expense ratios disclosed in the Financial Highlights tables in this report.
| Growth of an Assumed $10,000 Investment in DWS Government & Agency Securities VIP |
| The Barclays GNMA Index is an unmanaged, market-value-weighted measure of all fixed-rate securities backed by mortgage pools of the Government National Mortgage Association. Index returns do not reflect any fees or expenses and it is not possible to invest directly into an index. |
| |
| Yearly periods ended December 31 | |
| Comparative Results | |
| DWS Government & Agency Securities VIP | | 1-Year | | | 3-Year | | | 5-Year | | | 10-Year | |
| Class A | Growth of $10,000 | | $ | 10,293 | | | $ | 11,792 | | | $ | 13,374 | | | $ | 16,062 | |
| Average annual total return | | | 2.93 | % | | | 5.65 | % | | | 5.99 | % | | | 4.85 | % |
| Barclays GNMA Index | Growth of $10,000 | | $ | 10,242 | | | $ | 11,789 | | | $ | 13,400 | | | $ | 16,610 | |
| Average annual total return | | | 2.42 | % | | | 5.64 | % | | | 6.03 | % | | | 5.21 | % |
| DWS Government & Agency Securities VIP | | 1-Year | | | 3-Year | | | 5-Year | | | 10-Year | |
| Class B | Growth of $10,000 | | $ | 10,248 | | | $ | 11,666 | | | $ | 13,142 | | | $ | 15,468 | |
| Average annual total return | | | 2.48 | % | | | 5.27 | % | | | 5.62 | % | | | 4.46 | % |
| Barclays GNMA Index | Growth of $10,000 | | $ | 10,242 | | | $ | 11,789 | | | $ | 13,400 | | | $ | 16,610 | |
| Average annual total return | | | 2.42 | % | | | 5.64 | % | | | 6.03 | % | | | 5.21 | % |
The growth of $10,000 is cumulative.
Management Summary December 31, 2012 (Unaudited)
During the 12-month period ended December 31, 2012, Class A shares of the Fund provided a total return of 2.93% (unadjusted for contract charges), compared with the 2.42% return of its benchmark, the Barclays GNMA Index.1
The U.S. Federal Reserve Board (the Fed) continued to maintain its benchmark short-term rate at near-zero levels during the same period and engage in bond purchases designed to lower longer-term interest rates as it sought to stimulate economic growth. Longer-term U.S. Treasury yields bounced around for most of the period in response to mixed growth signals and sputtering progress on dealing with Europe's debt crisis. Late in the period, fixed-income markets were focused primarily on the run-up to and aftermath of the presidential election, against a backdrop of wrangling over solutions to the country's budgetary dilemma. The net result was that yields finished the period in the same historically low range in which they started. Government National Mortgage Association securities (GNMAs or "Ginnie Maes") provided reasonable returns over most of the period as high-quality bonds that traded at a yield advantage vs. U.S. Treasuries were sought by investors, although prices eased late in the period as prepayment rates on underlying mortgages began to rise.
The Fund continued to have significant exposure to higher-coupon mortgage pools and interest-only securities in the belief that voluntary prepayments will remain manageable despite historically low rates, given tighter credit standards and reduced home equity levels.2 This allocation worked well for much of the period but was a modest negative late in the period as government efforts to ease refinancing contributed to an uptick in prepayments on some of these pools. Overall, our focus on seasoned and low-balance mortgage pools with characteristics that defend against increasing prepayments has proven pivotal in protecting the Fund's income stream. More recently, the Fund's relative performance was aided by maintaining an above-benchmark position in recently issued, low-coupon mortgage pools that have been the principal beneficiary of the Fed's most recent round of quantitative easing. We intend to maintain exposure to this segment while also keeping enough liquidity to reposition fairly quickly should higher current mortgage rates be in prospect. We will continue to closely monitor the refinancing environment and various policy proposals with the potential to increase prepayments.
William Chepolis, CFA
Ohn Choe, CFA
Portfolio Managers
The views expressed reflect those of the portfolio management team only through the end of the period of the report as stated on the cover. The management team's views are subject to change at any time based on market and other conditions and should not be construed as a recommendation. Past performance is no guarantee of future results. Current and future portfolio holdings are subject to risk.
1 The Barclays GNMA Index is an unmanaged, market-value-weighted measure of all fixed-rate securities backed by mortgage pools of the Government National Mortgage Association. Index returns do not reflect fees or expenses and it is not possible to invest directly into an index.
2 Interest-Only Securities represent the "interest only" portion of payments on a pool of underlying mortgages or mortgage-backed securities. IO securities are subject to prepayment risk of the pool of underlying mortgages. Interest-only securities are particularly vulnerable to rising prepayments as the investor is threatened with the loss of an income stream without receiving any return of principal.
Portfolio Summary (Unaudited) Asset Allocation (As a % of Investment Portfolio) | | 12/31/12 | | | 12/31/11 | |
| | | | | | | |
| Mortgage-Backed Securities Pass-Throughs* | | | 67 | % | | | 64 | % |
| Government & Agency Obligations | | | 17 | % | | | 22 | % |
| Collateralized Mortgage Obligations | | | 15 | % | | | 14 | % |
| Cash Equivalents | | | 1 | % | | | — | |
| | | | 100 | % | | | 100 | % |
| Coupons** | | | 12/31/12 | | | 12/31/11 | |
| | | | | | | | |
| Less than 4.5% | | | 35 | % | | | 43 | % |
| 4.5%-5.49% | | | 37 | % | | | 39 | % |
| 5.5%-6.49% | | | 24 | % | | | 13 | % |
| 6.5%-7.49% | | | 3 | % | | | 4 | % |
| 7.5% and Greater | | | 1 | % | | | 1 | % |
| | | | | | 100 | % | | | 100 | % |
| Interest Rate Sensitivity | 12/31/12 | 12/31/11 |
| | | |
| Effective Maturity | 7.0 years | 5.0 years |
| Effective Duration | 5.5 years | 4.4 years |
* Includes securities sold short.
** Excludes Cash Equivalents, U.S. Treasury Bills and Options Purchased.
Effective maturity is the weighted average of the maturity date of bonds held by the Fund taking into consideration any available maturity shortening features.
Effective duration is an approximate measure of the Fund's sensitivity to interest rate changes taking into consideration any maturity shortening features.
Portfolio holdings and characteristics are subject to change.
For more complete details about the Fund's investment portfolio, see page 6.
Following the Fund's fiscal first and third quarter-end, a complete portfolio holdings listing is filed with the SEC on Form N-Q. The form will be available on the SEC's Web site at www.sec.gov, and it also may be reviewed and copied at the SEC's Public Reference Room in Washington, D.C. Information on the operation of the SEC's Public Reference Room may be obtained by calling (800) SEC-0330. The Fund's portfolio holdings are also posted on www.dws-investments.com from time to time. Please see the Fund's current prospectus for more information.
Investment Portfolio December 31, 2012 | | | Principal Amount ($) | | | Value ($) | |
| | | | |
| Mortgage-Backed Securities Pass-Throughs 87.5% | |
| Federal Home Loan Mortgage Corp.: | | | |
| 3.0%, 7/1/2042 (a) | | | 16,000,000 | | | | 16,725,000 | |
| 7.0%, 6/1/2032 | | | 717 | | | | 819 | |
| Federal National Mortgage Association: | | | | | | | | |
| 3.5%, 12/1/2041 (a) | | | 14,000,000 | | | | 14,925,313 | |
| 5.0%, 10/1/2033 | | | 262,049 | | | | 284,201 | |
| Government National Mortgage Association: | | | | | | | | |
| 4.5%, with various maturities from 6/20/2033 until 12/20/2041 (a) | | | 15,068,691 | | | | 16,709,915 | |
| 4.55%, 1/15/2041 | | | 576,613 | | | | 645,417 | |
| 4.625%, 5/15/2041 | | | 199,303 | | | | 222,528 | |
| 5.0%, with various maturities from 11/20/2032 until 4/15/2042 | | | 22,155,994 | | | | 24,369,269 | |
| 5.5%, with various maturities from 10/15/2032 until 7/20/2040 | | | 17,428,244 | | | | 19,324,028 | |
| 6.0%, with various maturities from 7/15/2014 until 5/15/2040 | | | 12,152,991 | | | | 13,610,320 | |
| 6.5%, with various maturities from 4/15/2031 until 2/15/2039 | | | 2,614,180 | | | | 2,938,946 | |
| 7.0%, with various maturities from 2/20/2027 until 11/15/2038 | | | 491,396 | | | | 566,600 | |
| 7.5%, 10/20/2031 | | | 8,758 | | | | 10,279 | |
Total Mortgage-Backed Securities Pass-Throughs (Cost $107,378,175) | | | | 110,332,635 | |
| | |
| Collateralized Mortgage Obligations 18.0% | |
| Fannie Mae Benchmark Remic, "ZA", Series 2007-B2, 5.5%, 6/25/2037 | | | 1,901,901 | | | | 2,219,148 | |
| Federal Home Loan Mortgage Corp.: | |
| "OA", Series 3179, Principal Only, Zero Coupon, 7/15/2036 | | | 460,319 | | | | 424,341 | |
| "YI", Series 3936, Interest Only, 3.0%, 6/15/2025 | | | 177,623 | | | | 15,237 | |
| "AI", Series 4016, Interest Only, 3.0%, 9/15/2025 | | | 1,710,159 | | | | 134,505 | |
| "WI", Series 3939, Interest Only, 3.0%, 10/15/2025 | | | 731,804 | | | | 28,780 | |
| "EI", Series 3953, Interest Only, 3.0%, 11/15/2025 | | | 1,006,206 | | | | 90,377 | |
| "IO", Series 3974, Interest Only, 3.0%, 12/15/2025 | | | 272,648 | | | | 18,376 | |
| "DI", Series 4010, Interest Only, 3.0%, 2/15/2027 | | | 251,081 | | | | 18,911 | |
| "IP", Series 4046, Interest Only, 3.0%, 5/15/2027 | | | 528,170 | | | | 81,355 | |
| "IK", Series 4048, Interest Only, 3.0%, 5/15/2027 | | | 1,862,299 | | | | 172,574 | |
| "IA", Series 3800, Interest Only, 3.5%, 12/15/2022 | | | 1,314,001 | | | | 45,043 | |
| "IK", Series 3754, Interest Only, 3.5%, 6/15/2025 | | | 1,587,385 | | | | 128,558 | |
| "NI", Series 3657, Interest Only, 4.5%, 8/15/2027 | | | 1,012,991 | | | | 72,902 | |
| | | Principal Amount ($) | | | Value ($) | |
| | | | | | | | | |
| "22", Series 243, Interest Only, 4.847%*, 6/15/2021 | | | 1,065,069 | | | | 91,843 | |
| "ZK", Series 3382, 5.0%, 7/15/2037 | | | 1,288,706 | | | | 1,466,274 | |
| "PI", Series 2535, Interest Only, 6.0%, 9/15/2032 | | | 429,673 | | | | 20,325 | |
| "MI", Series 3871, Interest Only, 6.0%, 4/15/2040 | | | 253,216 | | | | 35,438 | |
| "A", Series 172, Interest Only, 6.5%, 1/1/2024 | | | 30,785 | | | | 4,559 | |
| "S", Series 2416, Interest Only, 7.891%*, 2/15/2032 | | | 410,916 | | | | 88,859 | |
| "ST", Series 2411, Interest Only, 8.541%*, 6/15/2021 | | | 1,358,872 | | | | 182,260 | |
| "KS", Series 2064, Interest Only, 9.9%*, 5/15/2022 | | | 394,124 | | | | 82,831 | |
| Federal National Mortgage Association: | | | | | | | | |
| "DI", Series 2011-136, Interest Only, 3.0%, 1/25/2026 | | | 269,879 | | | | 29,645 | |
| "HI", Series 2010-123, Interest Only, 3.5%, 3/25/2024 | | | 618,146 | | | | 55,182 | |
| "KI", Series 2011-72, Interest Only, 3.5%, 3/25/2025 | | | 1,966,818 | | | | 126,946 | |
| "25", Series 351, Interest Only, 4.5%, 5/1/2019 | | | 263,797 | | | | 25,098 | |
| "HI", Series 2009-77, Interest Only, 4.5%, 9/25/2027 | | | 571,160 | | | | 56,285 | |
| "IN", Series 2003-49, Interest Only, 4.75%, 3/25/2018 | | | 1,939,256 | | | | 133,415 | |
| "21", Series 334, Interest Only, 5.0%, 3/1/2018 | | | 124,338 | | | | 9,765 | |
| "20", Series 334, Interest Only, 5.0%, 3/1/2018 | | | 186,155 | | | | 16,821 | |
| ''23", Series 339, Interest Only, 5.0%, 7/1/2018 | | | 267,736 | | | | 21,962 | |
| "26", Series 381, Interest Only, 5.0%, 12/25/2020 | | | 84,976 | | | | 7,131 | |
| "ZA", Series 2008-24, 5.0%, 4/25/2038 | | | 665,417 | | | | 771,398 | |
| "30", Series 381, Interest Only, 5.5%, 11/25/2019 | | | 439,531 | | | | 46,854 | |
| "PI", Series 2009-14, Interest Only, 5.5%, 3/25/2024 | | | 825,310 | | | | 101,193 | |
| "WI", Series 2011-59, Interest Only, 6.0%, 5/25/2040 | | | 586,769 | | | | 58,825 | |
| "PI", Series 2007-75, Interest Only, 6.33%*, 8/25/2037 | | | 1,668,429 | | | | 342,518 | |
| "101", Series 383, Interest Only, 6.5%, 9/1/2022 | | | 1,494,238 | | | | 252,585 | |
| "SJ", Series 2007-36, Interest Only, 6.56%*, 4/25/2037 | | | 355,991 | | | | 53,319 | |
| "SA", Series 2005-42, Interest Only, 6.59%*, 5/25/2035 | | | 737,689 | | | | 87,417 | |
| "ES", Series 2003-17, Interest Only, 6.84%*, 9/25/2022 | | | 2,201,578 | | | | 136,558 | |
| "SA", Series G92-57, IOette, 82.85%*, 10/25/2022 | | | 48,568 | | | | 117,296 | |
| Government National Mortgage Association: | | | | | | | | |
| "IE", Series 2011-128, Interest Only, 3.5%, 9/20/2026 | | | 1,331,944 | | | | 156,959 | |
| "JY", Series 2010-20, 4.0%, 12/20/2033 | | | 1,935,004 | | | | 2,132,730 | |
| "LI", Series 2009-104, Interest Only, 4.5%, 12/16/2018 | | | 331,029 | | | | 24,468 | |
| | | Principal Amount ($) | | | Value ($) | |
| | | | | | | | | |
| "NI", Series 2010-44, Interest Only, 4.5%, 10/20/2037 | | | 746,336 | | | | 111,256 | |
| "CI", Series 2010-87, Interest Only, 4.5%, 11/20/2038 | | | 1,251,588 | | | | 367,109 | |
| "MI", Series 2010-169, Interest Only, 4.5%, 8/20/2040 | | | 983,305 | | | | 159,981 | |
| "AI", Series 2012-15, Interest Only, 4.5%, 9/20/2040 | | | 741,413 | | | | 140,600 | |
| "VB", Series 2010-26, 5.0%, 1/20/2024 | | | 600,000 | | | | 707,106 | |
| "ZM", Series 2004-24, 5.0%, 4/20/2034 | | | 2,311,503 | | | | 2,666,306 | |
| "Z", Series 2004-61, 5.0%, 8/16/2034 | | | 1,136,688 | | | | 1,316,838 | |
| "ZB", Series 2005-15, 5.0%, 2/16/2035 | | | 1,626,065 | | | | 1,862,275 | |
| "GZ", Series 2005-24, 5.0%, 3/20/2035 | | | 493,156 | | | | 601,331 | |
| "MI", Series 2009-76, Interest Only, 5.0%, 3/20/2035 | | | 1,389,634 | | | | 40,528 | |
| "ZA", Series 2005-75, 5.0%, 10/16/2035 | | | 554,793 | | | | 671,821 | |
| "MZ", Series 2009-98, 5.0%, 10/16/2039 | | | 995,496 | | | | 1,252,081 | |
| "Z", Series 2009-112, 5.0%, 11/20/2039 | | | 1,166,312 | | | | 1,356,475 | |
| "AI", Series 2008-51, Interest Only, 5.5%, 5/16/2023 | | | 656,540 | | | | 61,749 | |
| "AI", Series 2008-46, Interest Only, 5.5%, 5/16/2023 | | | 336,048 | | | | 33,284 | |
| "GI", Series 2003-19, Interest Only, 5.5%, 3/16/2033 | | | 1,090,909 | | | | 268,095 | |
| "IB", Series 2010-130, Interest Only, 5.5%, 2/20/2038 | | | 309,091 | | | | 23,552 | |
| "BS", Series 2011-93, Interest Only, 5.891%*, 7/16/2041 | | | 1,657,343 | | | | 241,793 | |
| "DI", Series 2009-10, Interest Only, 6.0%, 4/16/2038 | | | 421,031 | | | | 70,775 | |
| "QA", Series 2007-57, Interest Only, 6.289%*, 10/20/2037 | | | 483,994 | | | | 64,752 | |
| "IP", Series 2009-118, Interest Only, 6.5%, 12/16/2039 | | | 150,272 | | | | 26,880 | |
| "SA", Series 2006-69, Interest Only, 6.589%*, 12/20/2036 | | | 917,567 | | | | 114,903 | |
| "SK", Series 2003-11, Interest Only, 7.491%*, 2/16/2033 | | | 623,196 | | | | 138,536 | |
| "IC", Series 1997-4, Interest Only, 7.5%, 3/16/2027 | | | 701,727 | | | | 165,142 | |
Total Collateralized Mortgage Obligations (Cost $19,380,512) | | | | 22,650,034 | |
| | |
| Government & Agency Obligations 20.7% | |
| U.S. Government Sponsored Agency 12.7% | |
| Federal Home Loan Bank, 0.5%, 11/20/2015 | | | 16,000,000 | | | | 16,049,040 | |
| U.S. Treasury Obligations 8.0% | |
| U.S. Treasury Bill, 0.13%**, 3/7/2013 (b) | | | 1,045,000 | | | | 1,044,940 | |
| U.S. Treasury Notes: | |
| 0.75%, 6/15/2014 (c) | | | 1,000,000 | | | | 1,007,773 | |
| 0.75%, 12/31/2017 | | | 8,000,000 | | | | 8,013,128 | |
| | | | | 10,065,841 | |
Total Government & Agency Obligations (Cost $26,104,866) | | | | 26,114,881 | |
| | | Contract Amount | | | Value ($) | |
| | | | |
| Call Options Purchased 0.3% | |
| Options on Interest Rate Swap Contracts | |
| Pay Fixed Rate — 3.583% - Receive Floating — LIBOR, Swap Expiration Date 5/11/2026, Option Expiration Date 5/9/2016 | | | 2,700,000 | | | | 83,976 | |
| Pay Fixed Rate — 3.635% - Receive Floating — LIBOR, Swap Expiration Date 4/27/2026, Option Expiration Date 4/25/2016 | | | 2,600,000 | | | | 76,406 | |
| Pay Fixed Rate — 3.72% - Receive Floating — LIBOR, Swap Expiration Date 4/22/2026, Option Expiration Date 4/20/2016 | | | 2,600,000 | | | | 71,283 | |
| Pay Fixed Rate — 4.32% - Receive Floating — LIBOR, Swap Expiration Date 2/3/2027, Option Expiration Date 2/1/2017 | | | 6,000,000 | | | | 151,832 | |
Total Call Options Purchased (Cost $646,056) | | | | 383,497 | |
| | | Contracts | | | Value ($) | |
| | | | |
| Put Options Purchased 0.2% | |
| Options on Exchange-Traded Futures Contracts 0.0% | |
| 10 Year U.S. Treasury Note Future, Option Expiration Date 2/22/2013, Strike Price $132.0 | | | 30 | | | | 17,344 | |
| | | Contract Amount | | | Value ($) | |
| | | | |
| Options on Interest Rate Swap Contracts 0.2% | |
| Receive Fixed Rate — 2.32% - Pay Floating — LIBOR, Swap Expiration Date 2/3/2027, Option Expiration Date 2/1/2017 | | | 6,000,000 | | | | 174,390 | |
Total Put Options Purchased (Cost $222,231) | | | | 191,734 | |
| | | Shares | | | Value ($) | |
| | | | |
| Cash Equivalents 0.8% | |
| Central Cash Management Fund, 0.15% (d) (Cost $1,052,662) | | | 1,052,662 | | | | 1,052,662 | |
| | | % of Net Assets | | | Value ($) | |
| | | | |
Total Investment Portfolio (Cost $154,784,502)† | | | 127.5 | | | | 160,725,443 | |
| Other Assets and Liabilities, Net | | | (22.3 | ) | | | (28,071,691 | ) |
| Securities Sold Short | | | (5.2 | ) | | | (6,558,035 | ) |
| Net Assets | | | 100.0 | | | | 126,095,717 | |
| | | Principal Amount ($) | | | Value ($) | |
| | | | |
| Securities Sold Short (5.2%) | |
| Mortgage-Backed Securities Pass-Throughs | |
| Government National Mortgage Association: | | | |
| 3.0%, with various maturities from 7/1/2042 until 8/1/2042 (a) | | | 1,000,000 | | | | 1,062,110 | |
| 3.5%, with various maturities from 11/1/2041 until 10/20/2042 (a) | | | 2,841,847 | | | | 2,971,653 | |
| 4.0%, with various maturities from 7/15/2040 until 6/15/2042 (a) | | | 2,394,829 | | | | 2,524,272 | |
| (Proceeds $6,687,742) | | | | 6,558,035 | |
* These securities are shown at their current rate as of December 31, 2012.
** Annualized yield at time of purchase; not a coupon rate.
† The cost for federal income tax purposes was $154,784,524. At December 31, 2012, net unrealized appreciation for all securities based on tax cost was $5,940,919. This consisted of aggregate gross unrealized appreciation for all securities in which there was an excess of value over tax cost of $6,965,032 and aggregate gross unrealized depreciation for all securities in which there was an excess of tax cost over value of $1,024,113.
(a) When-issued or delayed delivery securities included.
(b) At December 31, 2012, this security has been pledged, in whole or in part, to cover initial margin requirements for open futures contracts.
(c) At December 31, 2012, this security has been pledged, in whole or in part, as collateral for open swap contracts.
(d) Affiliated fund managed by Deutsche Investment Management Americas Inc. The rate shown is the annualized seven-day yield at period end.
Interest Only: Interest Only (IO) bonds represent the "interest only" portion of payments on a pool of underlying mortgages or mortgage-backed securities. IO securities are subject to prepayment risk of the pool of underlying mortgages.
IOettes: These securities represent the right to receive interest payments on an underlying pool of mortgages with similar features as those associated with IO securities. Unlike IO's, a nominal amount of principal is assigned to an IOette which is small in relation to the interest flow that constitutes almost all of the IOette cash flow. The effective yield of this security is lower than the stated interest rate.
Principal Only: Principal Only (PO) bonds represent the "principal only" portion of payments on a pool of underlying mortgages or mortgage-backed securities.
Included in the portfolio are investments in mortgage- or asset-backed securities which are interests in separate pools of mortgages or assets. Effective maturities of these investments may be shorter than stated maturities due to prepayments. Some separate investments in the Government National Mortgage Association issues which have similar coupon rates have been aggregated for presentation purposes in this investment portfolio.
At December 31, 2012, open futures contracts bought were as follows:
| Futures | Currency | Expiration Date | | Contracts | | | Notional Value ($) | | | Unrealized Depreciation ($) | |
| Ultra Long U.S. Treasury Bond | USD | 3/19/2013 | | | 28 | | | | 4,552,625 | | | | (32,794 | ) |
At December 31, 2012, open futures contracts sold were as follows:
| Futures | Currency | Expiration Date | | Contracts | | | Notional Value ($) | | | Unrealized Appreciation ($) | |
| 5 Year U.S. Treasury Note | USD | 3/28/2013 | | | 30 | | | | 3,732,422 | | | | 10,956 | |
| Currency Abbreviation |
| USD United States Dollar |
At December 31, 2012, open written options contracts were as follows:
| Options on Exchange-Traded Futures Contracts | | Contracts | | Expiration Date | | Strike Price ($) | | | Premiums Received ($) | | | Value ($) (e) | |
Put Options 10 Year U.S. Treasury Note Future | | | 30 | | 2/22/2013 | | | 131.0 | | | | 11,653 | | | | (9,844 | ) |
(e) Unrealized appreciation on written options on exchange-traded futures contracts at December 31, 2012 was $1,809.
| Options on Interest Rate Swap Contracts | Swap Effective/ Expiration Date | | Contract Amount | | Option Expiration Date | | Premiums Received ($) | | | Value ($) (f) | |
Call Options Receive Fixed — 3.32% - Pay Floating — LIBOR | 2/3/2017 2/3/2027 | | | 3,000,000 | | 2/1/2017 | | | 216,990 | | | | (146,344 | ) |
| Receive Fixed — 4.083% - Pay Floating — LIBOR | 5/11/2016 5/11/2026 | | | 2,700,000 | | 5/9/2016 | | | 91,800 | | | | (58,031 | ) |
| Receive Fixed — 4.135% - Pay Floating — LIBOR | 4/27/2016 4/27/2026 | | | 2,600,000 | | 4/25/2016 | | | 96,200 | | | | (52,673 | ) |
| Receive Fixed — 4.22% - Pay Floating — LIBOR | 4/22/2016 4/22/2026 | | | 2,600,000 | | 4/20/2016 | | | 92,690 | | | | (49,152 | ) |
| Receive Fixed — 1.828% - Pay Floating — LIBOR | 11/15/2013 11/15/2043 | | | 1,900,000 | | 11/13/2013 | | | 32,205 | | | | (7,172 | ) |
| Receive Fixed — 1.871% - Pay Floating — LIBOR | 11/14/2013 11/14/2043 | | | 1,900,000 | | 11/12/2013 | | | 30,020 | | | | (8,407 | ) |
| Total Call Options | | | 559,905 | | | | (321,779 | ) |
Put Options Pay Fixed — 1.9% - Receive Floating — LIBOR | 4/24/2013 4/24/2023 | | | 2,600,000 | | 4/22/2013 | | | 35,620 | | | | (37,362 | ) |
| Pay Fixed — 2.07% - Receive Floating — LIBOR | 5/10/2013 5/10/2043 | | | 2,700,000 | | 5/8/2013 | | | 43,200 | | | | (4,369 | ) |
| Pay Fixed — 2.09% - Receive Floating — LIBOR | 4/25/2013 4/25/2043 | | | 2,600,000 | | 4/23/2013 | | | 48,880 | | | | (3,351 | ) |
| Pay Fixed — 3.32% - Receive Floating — LIBOR | 2/3/2017 2/3/2027 | | | 3,000,000 | | 2/1/2017 | | | 216,990 | | | | (213,281 | ) |
| Total Put Options | | | 344,690 | | | | (258,363 | ) |
| Total | | | 904,595 | | | | (580,142 | ) |
(f) Unrealized appreciation on written options on interest rate swap contracts at December 31, 2012 was $324,453.
At December 31, 2012, open interest rate swap contracts were as follows:
| Effective/ Expiration Date | | Notional Value ($) | | Cash Flows Paid by the Fund | Cash Flows Received by the Fund | | Value ($) | | | Upfront Payments Paid ($) | | | Unrealized Appreciation/ (Depreciation) ($) | |
7/16/2013 7/16/2014 | | | 4,900,000 | 1 | Fixed — 0.515% | Floating — LIBOR | | | (6,865 | ) | | | 195 | | | | (7,060 | ) |
7/16/2013 7/16/2018 | | | 1,900,000 | 1 | Fixed — 1.148% | Floating — LIBOR | | | (11,794 | ) | | | 397 | | | | (12,191 | ) |
7/16/2013 7/16/2023 | | | 7,500,000 | 1 | Fixed — 1.858% | Floating — LIBOR | | | 79,620 | | | | 3,408 | | | | 76,212 | |
7/16/2013 7/16/2033 | | | 1,600,000 | 1 | Floating — LIBOR | Fixed — 2.322% | | | (89,067 | ) | | | 640 | | | | (89,707 | ) |
7/16/2013 7/16/2043 | | | 3,200,000 | 1 | Floating — LIBOR | Fixed — 2.424% | | | (274,086 | ) | | | 4,491 | | | | (278,577 | ) |
12/27/2013 12/27/2020 | | | 21,600,000 | 1 | Fixed — 1.656% | Floating — LIBOR | | | (31,592 | ) | | | — | | | | (31,592 | ) |
| Total net unrealized depreciation | | | | (342,915 | ) |
Counterparty:
1 Nomura International PLC
LIBOR: London Interbank Offered Rate
For information on the Fund's policy and additional disclosures regarding futures contracts, purchased and written options contracts, interest rate swap contracts, please refer to the Derivatives section of Note B in the accompanying Notes to Financial Statements.
Fair Value Measurements
Various inputs are used in determining the value of the Fund's investments. These inputs are summarized in three broad levels. Level 1 includes quoted prices in active markets for identical securities. Level 2 includes other significant observable inputs (including quoted prices for similar securities, interest rates, prepayment speeds, and credit risk). Level 3 includes significant unobservable inputs (including the Fund's own assumptions in determining the fair value of investments). The inputs or methodology used for valuing securities are not necessarily an indication of the risk associated with investing in those securities.
The following is a summary of the inputs used as of December 31, 2012 in valuing the Fund's investments. For information on the Fund's policy regarding the valuation of investments, please refer to the Security Valuation section of Note A in the accompanying Notes to Financial Statements.
| Assets | | Level 1 | | | Level 2 | | | Level 3 | | | Total | |
| | |
| Fixed-Income Investments (g) | |
| Mortgage-Backed Securities Pass-Throughs | | $ | — | | | $ | 110,332,635 | | | $ | — | | | $ | 110,332,635 | |
| Collateralized Mortgage Obligations | | | — | | | | 22,650,034 | | | | — | | | | 22,650,034 | |
| Government & Agency Obligations | | | — | | | | 26,114,881 | | | | — | | | | 26,114,881 | |
| Short-Term Investments | | | 1,052,662 | | | | — | | | | — | | | | 1,052,662 | |
| Derivatives (h) | |
| Futures Contracts | | | 10,956 | | | | — | | | | — | | | | 10,956 | |
| Purchased Options | | | 17,344 | | | | 557,887 | | | | — | | | | 575,231 | |
| Interest Rate Swap Contracts | | | — | | | | 76,212 | | | | — | | | | 76,212 | |
| Total | | $ | 1,080,962 | | | $ | 159,731,649 | | | $ | — | | | $ | 160,812,611 | |
| Liabilities | |
| | |
| Investments Sold Short, at value (g) | | $ | — | | | $ | (6,558,035 | ) | | $ | — | | | $ | (6,558,035 | ) |
Derivatives (h) | |
| Futures Contracts | | | (32,794 | ) | | | — | | | | — | | | | (32,794 | ) |
| Written Options | | | (9,844 | ) | | | (580,142 | ) | | | — | | | | (589,986 | ) |
| Interest Rate Swap Contracts | | | — | | | | (419,127 | ) | | | — | | | | (419,127 | ) |
| Total | | $ | (42,638 | ) | | $ | (7,557,304 | ) | | $ | — | | | $ | (7,599,942 | ) |
There have been no transfers between fair value measurement levels during the year ended December 31, 2012.
(g) See Investment Portfolio for additional detailed categorizations.
(h) Derivatives include value of purchased options, unrealized appreciation (depreciation) on open futures contracts, interest rate swap contracts and written options, at value.
The accompanying notes are an integral part of the financial statements.
Statement of Assets and Liabilities | as of December 31, 2012 | |
| Assets | |
Investments Investments in non-affiliated securities, at value (cost $153,731,840) | | $ | 159,672,781 | |
| Investment in Central Cash Management Fund (cost $1,052,662) | | | 1,052,662 | |
| Total investments in securities, at value (cost $154,784,502) | | | 160,725,443 | |
| Receivable for investments sold | | | 9,110,043 | |
| Receivable for investments sold — when-issued/delayed delivery securities | | | 53,253,389 | |
| Receivable for Fund shares sold | | | 7,139 | |
| Interest receivable | | | 577,733 | |
| Unrealized appreciation on swap contracts | | | 76,212 | |
| Upfront payments paid on swap contracts | | | 9,131 | |
| Due from Advisor | | | 5,821 | |
| Other assets | | | 4,007 | |
| Total assets | | | 223,768,918 | |
| Liabilities | |
| Cash overdraft | | | 1,510 | |
| Payable for investments purchased | | | 29,792,640 | |
| Payable for investments purchased — when-issued/delayed delivery securities | | | 59,880,064 | |
| Payable for securities sold short, at value (proceeds of $6,687,742) | | | 6,558,035 | |
| Payable for Fund shares redeemed | | | 245,535 | |
| Payable for variation margin on futures contracts | | | 36,356 | |
| Options written, at value (premium received $916,248) | | | 589,986 | |
| Unrealized depreciation on swap contracts | | | 419,127 | |
| Accrued management fee | | | 43,036 | |
| Accrued Trustees' fees | | | 2,493 | |
| Other accrued expenses and payables | | | 104,419 | |
| Total liabilities | | | 97,673,201 | |
| Net assets, at value | | $ | 126,095,717 | |
| Net Assets Consist of | |
| Undistributed net investment income | | | 3,422,413 | |
Net unrealized appreciation (depreciation) on: Investments | | | 5,940,941 | |
| Swap contracts | | | (342,915 | ) |
| Securities sold short | | | 129,707 | |
| Futures | | | (21,838 | ) |
| Written options | | | 326,262 | |
| Accumulated net realized gain (loss) | | | 4,638,858 | |
| Paid-in capital | | | 112,002,289 | |
| Net assets, at value | | $ | 126,095,717 | |
Class A Net Asset Value, offering and redemption price per share ($120,662,900 ÷ 9,511,241 outstanding shares of beneficial interest, no par value, unlimited number of shares authorized) | | $ | 12.69 | |
Class B Net Asset Value, offering and redemption price per share ($5,432,817 ÷ 428,962 outstanding shares of beneficial interest, no par value, unlimited number of shares authorized) | | $ | 12.67 | |
The accompanying notes are an integral part of the financial statements.
Statement of Operations
| for the year ended December 31, 2012 | |
| Investment Income | |
Income: Interest | | $ | 4,504,666 | |
| Income distributions — Central Cash Management Fund | | | 3,822 | |
| Securities lending income, including income from Daily Assets Fund Institutional, net of borrower rebates | | | 772 | |
| Total income | | | 4,509,260 | |
Expenses: Management fee | | | 612,900 | |
| Administration fee | | | 136,200 | |
| Services to shareholders | | | 1,592 | |
| Distribution service fee (Class B) | | | 14,711 | |
| Record keeping fees (Class B) | | | 5,866 | |
| Custodian fee | | | 41,054 | |
| Audit and tax fees | | | 64,682 | |
| Legal fees | | | 9,724 | |
| Reports to shareholders | | | 35,144 | |
| Trustees' fees and expenses | | | 7,729 | |
| Other | | | 19,827 | |
| Total expenses before expense reductions | | | 949,429 | |
| Expense reductions | | | (26,578 | ) |
| Total expenses after expense reductions | | | 922,851 | |
| Net investment income | | | 3,586,409 | |
| Realized and Unrealized Gain (Loss) | |
Net realized gain (loss) from: Investments | | | 5,205,452 | |
| Swap contracts | | | (1,010,173 | ) |
| Futures | | | 283,245 | |
| Written options | | | 43,073 | |
| Payments made by affiliates (See Note G) | | | 5,821 | |
| | | | 4,527,418 | |
Change in net unrealized appreciation (depreciation) on: Investments | | | (4,401,764 | ) |
| Swap contracts | | | (186,231 | ) |
| Securities sold short | | | 129,707 | |
| Futures | | | (39,588 | ) |
| Written options | | | 317,597 | |
| | | | (4,180,279 | ) |
| Net gain (loss) | | | 347,139 | |
| Net increase (decrease) in net assets resulting from operations | | $ | 3,933,548 | |
The accompanying notes are an integral part of the financial statements.
Statement of Changes in Net Assets | | | Years Ended December 31, | |
| Increase (Decrease) in Net Assets | | 2012 | | | 2011 | |
Operations: Net investment income | | $ | 3,586,409 | | | $ | 5,666,902 | |
| Net realized gain (loss) | | | 4,527,418 | | | | 2,942,171 | |
| Change in net unrealized appreciation (depreciation) | | | (4,180,279 | ) | | | 2,382,498 | |
| Net increase (decrease) in net assets resulting from operations | | | 3,933,548 | | | | 10,991,571 | |
Distributions to shareholders from: Net investment income: Class A | | | (5,435,920 | ) | | | (6,311,902 | ) |
| Class B | | | (209,154 | ) | | | (230,895 | ) |
Net realized gain: Class A | | | (2,952,755 | ) | | | (2,391,762 | ) |
| Class B | | | (124,749 | ) | | | (95,528 | ) |
| Total distributions | | | (8,722,578 | ) | | | (9,030,087 | ) |
Fund share transactions: Class A Proceeds from shares sold | | | 18,065,811 | | | | 31,578,112 | |
| Reinvestment of distributions | | | 8,388,675 | | | | 8,703,664 | |
| Payments for shares redeemed | | | (47,401,824 | ) | | | (53,221,292 | ) |
| Net increase (decrease) in net assets from Class A share transactions | | | (20,947,338 | ) | | | (12,939,516 | ) |
Class B Proceeds from shares sold | | | 919,743 | | | | 1,566,129 | |
| Reinvestment of distributions | | | 333,903 | | | | 326,423 | |
| Payments for shares redeemed | | | (2,329,903 | ) | | | (1,133,228 | ) |
| Net increase (decrease) in net assets from Class B share transactions | | | (1,076,257 | ) | | | 759,324 | |
| Increase (decrease) in net assets | | | (26,812,625 | ) | | | (10,218,708 | ) |
| Net assets at beginning of period | | | 152,908,342 | | | | 163,127,050 | |
| Net assets at end of period (including undistributed net investment income of $3,422,413 and $5,641,251, respectively) | | $ | 126,095,717 | | | $ | 152,908,342 | |
| Other Information | |
Class A Shares outstanding at beginning of period | | | 11,145,622 | | | | 12,120,178 | |
| Shares sold | | | 1,389,466 | | | | 2,446,836 | |
| Shares issued to shareholders in reinvestment of distributions | | | 672,169 | | | | 700,214 | |
| Shares redeemed | | | (3,696,016 | ) | | | (4,121,606 | ) |
| Net increase (decrease) in Class A shares | | | (1,634,381 | ) | | | (974,556 | ) |
| Shares outstanding at end of period | | | 9,511,241 | | | | 11,145,622 | |
Class B Shares outstanding at beginning of period | | | 511,071 | | | | 452,192 | |
| Shares sold | | | 72,277 | | | | 120,662 | |
| Shares issued to shareholders in reinvestment of distributions | | | 26,755 | | | | 26,240 | |
| Shares redeemed | | | (181,141 | ) | | | (88,023 | ) |
| Net increase (decrease) in Class B shares | | | (82,109 | ) | | | 58,879 | |
| Shares outstanding at end of period | | | 428,962 | | | | 511,071 | |
The accompanying notes are an integral part of the financial statements.
| | | Years Ended December 31, | |
| Class A | | | 2012 | | | 2011 | | | 2010 | | | 2009 | | | 2008 | |
| Selected Per Share Data | |
| Net asset value, beginning of period | | $ | 13.12 | | | $ | 12.98 | | | $ | 12.78 | | | $ | 12.40 | | | $ | 12.38 | |
Income (loss) from investment operations: Net investment incomea | | | .34 | | | | .48 | | | | .50 | | | | .52 | | | | .56 | |
| Net realized and unrealized gain (loss) | | | .03 | | | | .45 | | | | .32 | | | | .45 | | | | .04 | |
| Total from investment operations | | | .37 | | | | .93 | | | | .82 | | | | .97 | | | | .60 | |
Less distributions from: Net investment income | | | (.52 | ) | | | (.57 | ) | | | (.62 | ) | | | (.59 | ) | | | (.58 | ) |
| Net realized gains | | | (.28 | ) | | | (.22 | ) | | | — | | | | — | | | | — | |
| Total distributions | | | (.80 | ) | | | (.79 | ) | | | (.62 | ) | | | (.59 | ) | | | (.58 | ) |
| Net asset value, end of period | | $ | 12.69 | | | $ | 13.12 | | | $ | 12.98 | | | $ | 12.78 | | | $ | 12.40 | |
| Total Return (%) | | | 2.93 | b | | | 7.46 | | | | 6.61 | | | | 8.08 | | | | 4.93 | b |
| Ratios to Average Net Assets and Supplemental Data | |
| Net assets, end of period ($ millions) | | | 121 | | | | 146 | | | | 157 | | | | 169 | | | | 211 | |
| Ratio of expenses before expense reductions (%) | | | .68 | | | | .67 | | | | .64 | | | | .58 | | | | .66 | |
| Ratio of expenses after expense reductions (%) | | | .66 | | | | .67 | | | | .64 | | | | .58 | | | | .65 | |
| Ratio of net investment income (%) | | | 2.65 | | | | 3.68 | | | | 3.86 | | | | 4.16 | | | | 4.58 | |
| Portfolio turnover rate (%) | | | 796 | | | | 673 | | | | 423 | | | | 390 | | | | 543 | |
a Based on average shares outstanding during the period. b Total return would have been lower had certain expenses not been reduced. | |
| | | Years Ended December 31, | |
| Class B | | | 2012 | | | 2011 | | | 2010 | | | 2009 | | | 2008 | |
| Selected Per Share Data | |
| Net asset value, beginning of period | | $ | 13.10 | | | $ | 12.95 | | | $ | 12.75 | | | $ | 12.37 | | | $ | 12.35 | |
Income (loss) from investment operations: Net investment incomea | | | .29 | | | | .43 | | | | .46 | | | | .48 | | | | .52 | |
| Net realized and unrealized gain (loss) | | | .03 | | | | .46 | | | | .31 | | | | .45 | | | | .03 | |
| Total from investment operations | | | .32 | | | | .89 | | | | .77 | | | | .93 | | | | .55 | |
Less distributions from: Net investment income | | | (.47 | ) | | | (.52 | ) | | | (.57 | ) | | | (.55 | ) | | | (.53 | ) |
| Net realized gains | | | (.28 | ) | | | (.22 | ) | | | — | | | | — | | | | — | |
| Total distributions | | | (.75 | ) | | | (.74 | ) | | | (.57 | ) | | | (.55 | ) | | | (.53 | ) |
| Net asset value, end of period | | $ | 12.67 | | | $ | 13.10 | | | $ | 12.95 | | | $ | 12.75 | | | $ | 12.37 | |
| Total Return (%) | | | 2.48 | b | | | 7.15 | | | | 6.24 | | | | 7.70 | | | | 4.60 | b |
| Ratios to Average Net Assets and Supplemental Data | |
| Net assets, end of period ($ millions) | | | 5 | | | | 7 | | | | 6 | | | | 7 | | | | 8 | |
| Ratio of expenses before expense reductions (%) | | | 1.03 | | | | 1.01 | | | | .99 | | | | .92 | | | | 1.00 | |
| Ratio of expenses after expense reductions (%) | | | 1.01 | | | | 1.01 | | | | .99 | | | | .92 | | | | 1.00 | |
| Ratio of net investment income (%) | | | 2.29 | | | | 3.34 | | | | 3.51 | | | | 3.81 | | | | 4.24 | |
| Portfolio turnover rate (%) | | | 796 | | | | 673 | | | | 423 | | | | 390 | | | | 543 | |
a Based on average shares outstanding during the period. b Total return would have been lower had certain expenses not been reduced. | |
Notes to Financial Statements
A. Organization and Significant Accounting Policies
DWS Government & Agency Securities VIP (the "Fund") is a diversified series of DWS Variable Series II (the "Trust"), which is registered under the Investment Company Act of 1940, as amended (the "1940 Act"), as an open-end management investment company organized as a Massachusetts business trust.
Multiple Classes of Shares of Beneficial Interest. The Fund offers two classes of shares (Class A shares and Class B shares). Sales of Class B shares are subject to recordkeeping fees up to 0.15% and Rule 12b-1 fees under the 1940 Act equal to an annual rate of 0.25% of the average daily net assets of the Class B shares of the Fund. Class A shares are not subject to such fees.
Investment income, realized and unrealized gains and losses, and certain fund-level expenses and expense reductions, if any, are borne pro rata on the basis of relative net assets by the holders of all classes of shares except that each class bears certain expenses unique to that class (including the applicable Rule 12b-1 fee and recordkeeping fees). Differences in class-level expenses may result in payment of different per share dividends by class. All shares have equal rights with respect to voting subject to class-specific arrangements.
The Fund's financial statements are prepared in accordance with accounting principles generally accepted in the United States of America which require the use of management estimates. Actual results could differ from those estimates. The policies described below are followed consistently by the Fund in the preparation of its financial statements.
Security Valuation. Investments are stated at value determined as of the close of regular trading on the New York Stock Exchange on each day the exchange is open for trading.
Various inputs are used in determining the value of the Fund's investments. These inputs are summarized in three broad levels. Level 1 includes quoted prices in active markets for identical securities. Level 2 includes other significant observable inputs (including quoted prices for similar securities, interest rates, prepayment speeds, and credit risk). Level 3 includes significant unobservable inputs (including the Fund's own assumptions in determining the fair value of investments). The inputs or methodology used for valuing securities are not necessarily an indication of the risk associated with investing in those securities.
Debt securities are valued at prices supplied by independent pricing services approved by the Fund's Board. If the pricing services are unable to provide valuations, securities are valued at the most recent bid quotation or evaluated price, as applicable, obtained from one or more broker-dealers. Such services may use various pricing techniques which take into account appropriate factors such as yield, quality, coupon rate, maturity, type of issue, trading characteristics and other data, as well as broker quotes. These securities are generally categorized as Level 2.
Money market instruments purchased with an original or remaining maturity of sixty days or less, maturing at par, are valued at amortized cost, which approximates value, and are categorized as Level 2. Investments in open-end investment companies are valued at their net asset value each business day and are categorized as Level 1.
Futures contracts are generally valued at the settlement prices established each day on the exchange on which they are traded and are categorized as Level 1.
Swap contracts are valued daily based upon prices supplied by a Board approved pricing vendor, if available, and otherwise are valued at the price provided by the broker-dealer. Swap contracts are generally categorized as Level 2.
Exchange-traded options are valued at the last sale price or, in the absence of a sale, the mean between the closing bid and asked prices or at the most recent asked price (bid for purchased options) if no bid or asked price are available. Exchange-traded options are categorized as Level 1. Over-the-counter written or purchased options are valued at the price provided by the broker-dealer with which the option was traded and are generally categorized as Level 2.
Securities and other assets for which market quotations are not readily available or for which the above valuation procedures are deemed not to reflect fair value are valued in a manner that is intended to reflect their fair value as determined in accordance with procedures approved by the Board and are generally categorized as Level 3. In accordance with the Fund's valuation procedures, factors used in determining value may include, but are not limited to, the type of the security; the size of the holding; the initial cost of the security; the existence of any contractual restrictions on the security's disposition; the price and extent of public trading in similar securities of the issuer or of comparable companies; quotations or evaluated prices from broker-dealers and/or pricing services; information obtained from the issuer, analysts, and/or the appropriate stock exchange (for exchange-traded securities); an analysis of the company's or issuer's financial statements; an evaluation of the forces that influence the issuer and the market(s) in which the security is purchased and sold and with respect to debt securities; the maturity, coupon, creditworthiness, currency denomination and the movement of the market in which the security is normally traded. The value determined under these procedures may differ from published values for the same securities.
Disclosure about the classification of fair value measurements is included in a table following the Fund's Investment Portfolio.
New Accounting Pronouncement. In January 2013, Accounting Standard Update 2013-01 (ASU 2013-01), Clarifying the Scope of Disclosures about Offsetting Assets and Liabilities, replaced Accounting Standards Update 2011-11 (ASU 2011-11), Disclosures about Offsetting Assets and Liabilities. ASU 2013-01 is effective for fiscal years beginning on or after January 1, 2013, and interim periods within those annual periods. ASU 2011-11 was intended to enhance disclosure requirements on the offsetting of financial assets and liabilities. The ASU 2013-01 limits the scope of the new balance sheet offsetting disclosures to derivatives, repurchase agreements, and securities lending transactions to the extent that they are (1) offset in the financial statements or (2) subject to an enforceable master netting arrangement or similar agreement. Management is currently evaluating the application of ASU 2013-01 and its impact, if any, on the Fund's financial statements.
Securities Lending. The Fund may lend securities to certain financial institutions. The Fund retains beneficial ownership of the securities it has loaned and continues to receive interest and dividends paid by the issuer of securities and to participate in any changes in their market value. The Fund requires the borrowers of the securities to maintain collateral with the Fund consisting of either cash or liquid, unencumbered assets having a value at least equal to the value of the securities loaned. When the collateral falls below specified amounts, the lending agent will use its best effort to obtain additional collateral on the next business day to meet required amounts under the security lending agreement. The Fund may invest the cash collateral into a joint trading account in an affiliated money market fund pursuant to Exemptive Orders issued by the SEC. The Fund receives compensation for lending its securities either in the form of fees or by earning interest on invested cash collateral net of borrower rebates and fees paid to a lending agent. Either the Fund or the borrower may terminate the loan. There may be risks of delay and costs in recovery of securities or even loss of rights in the collateral should the borrower of the securities fail financially. The Fund is also subject to all investment risks associated with the reinvestment of any cash collateral received, including, but not limited to, interest rate, credit and liquidity risk associated with such investments. The Fund had no securities on loan at December 31, 2012.
Mortgage Dollar Rolls. The Fund may enter into mortgage dollar rolls in which the Fund sells to a bank or broker/dealer (the "counterparty") mortgage-backed securities for delivery in the current month and simultaneously contracts to repurchase similar, but not identical, securities on a fixed date. The counterparty receives all principal and interest payments, including prepayments, made on the security while it is the holder. The Fund receives compensation as consideration for entering into the commitment to repurchase. The compensation is paid in the form of a lower price for the security upon its repurchase, or alternatively, a fee. Mortgage dollar rolls may be renewed with a new sale and repurchase price and a cash settlement made at each renewal without physical delivery of the securities subject to the contract.
Certain risks may arise upon entering into mortgage dollar rolls from the potential inability of counterparties to meet the terms of their commitments. Additionally, the value of such securities may change adversely before the Fund is able to repurchase them. There can be no assurance that the Fund's use of the cash that it receives from a mortgage dollar roll will provide a return that exceeds its costs.
When-Issued/Delayed Delivery Securities. The Fund may purchase or sell securities with delivery or payment to occur at a later date beyond the normal settlement period. At the time the Fund enters into a commitment to purchase or sell a security, the transaction is recorded and the value of the transaction is reflected in the net asset value. The price of such security and the date when the security will be delivered and paid for are fixed at the time the transaction is negotiated. The value of the security may vary with market fluctuations. At the time the Fund enters into a purchase transaction it is required to segregate cash or other liquid assets at least equal to the amount of the commitment.
Certain risks may arise upon entering into when-issued or delayed delivery transactions from the potential inability of counterparties to meet the terms of their contracts or if the issuer does not issue the securities due to political, economic, or other factors. Additionally, losses may arise due to changes in the value of the underlying securities.
Federal Income Taxes. The Fund's policy is to comply with the requirements of the Internal Revenue Code, as amended, which are applicable to regulated investment companies and to distribute all of its taxable income to its shareholders.
Under the Regulated Investment Company Modernization Act of 2010, net capital losses incurred post-enactment may be carried forward indefinitely, and their character is retained as short-term and/or long-term. Previously, net capital losses were carried forward for eight years and treated as short-term losses.
The Fund has reviewed the tax positions for the open tax years as of December 31, 2012 and has determined that no provision for income tax is required in the Fund's financial statements. The Fund's federal tax returns for the prior three fiscal years remain open subject to examination by the Internal Revenue Service.
Distribution of Income and Gains. Distributions from net investment income of the Fund, if any, is declared and distributed to shareholders annually. Net realized gains from investment transactions, in excess of available capital loss carryforwards, would be taxable to the Fund if not distributed and, therefore, will be distributed to shareholders at least annually. The Fund may also make additional distributions for tax purposes if necessary.
The timing and characterization of certain income and capital gain distributions are determined annually in accordance with federal tax regulations which may differ from accounting principles generally accepted in the United States of America. These differences primarily relate to investments in futures contracts, investments in swap contracts and certain securities sold at a loss. As a result, net investment income (loss) and net realized gain (loss) on investment transactions for a reporting period may differ significantly from distributions during such period. Accordingly, the Fund may periodically make reclassifications among certain of its capital accounts without impacting the net asset value of the Fund.
At December 31, 2012, the Fund's components of distributable earnings on a tax basis were as follows:
| Undistributed ordinary income* | | $ | 5,048,906 | |
| Undistributed net long-term capital gains | | $ | 2,959,762 | |
| Unrealized appreciation (depreciation) on investments | | $ | 5,940,919 | |
In addition, the tax character of distributions paid by the Fund is summarized as follows:
| | | Years Ended December 31, | |
| | | 2012 | | | 2011 | |
| Distributions from ordinary income* | | $ | 6,020,886 | | | $ | 7,717,287 | |
| Distributions from long-term capital gains | | $ | 2,701,692 | | | $ | 1,312,800 | |
* For tax purposes, short-term capital gain distributions are considered ordinary income distributions.
Expenses. Expenses of the Trust arising in connection with a specific fund are allocated to that fund. Other Trust expenses which cannot be directly attributed to a fund are apportioned among the funds in the Trust based upon the relative net assets or other appropriate measures.
Contingencies. In the normal course of business, the Fund may enter into contracts with service providers that contain general indemnification clauses. The Fund's maximum exposure under these arrangements is unknown as this would involve future claims that may be made against the Fund that have not yet been made. However, based on experience, the Fund expects the risk of loss to be remote.
Other. Investment transactions are accounted for on a trade date plus one basis for daily net asset value calculations. However, for financial reporting purposes, investment transactions are reported on trade date. Interest income is recorded on the accrual basis. Realized gains and losses from investment transactions are recorded on an identified cost basis and may include proceeds from litigation. All discounts and premiums are accreted/amortized for both tax and financial reporting purposes for the Fund.
B. Derivative Instruments
Interest Rate Swap Contracts. For the year ended December 31, 2012, the Fund entered into interest rate swap transactions to gain exposure to different parts of the yield curve while managing overall duration. The use of interest rate swaps is a highly specialized activity that involves investment techniques and risks different from those associated with ordinary portfolio security transactions. In an interest rate swap, the Fund agrees to pay to the other party to the interest rate swap (which is known as the "counterparty") a fixed rate payment in exchange for the counterparty agreeing to pay to the Fund a variable rate payment, or the Fund agrees to receive from the counterparty a fixed rate payment in exchange for the counterparty agreeing to receive from the Fund a variable rate payment. In addition, both the Fund and counterparty may agree to exchange variable rate payments based on different indices. The payment obligations are based on the notional amount of the swap. Certain risks may arise when entering into swap transactions including counterparty default, liquidity or unfavorable changes in interest rates. In connection with these agreements, securities and or cash may be identified as collateral in accordance with the terms of the swap agreements to provide assets of value and recourse in the event of default. The maximum counterparty credit risk is the net present value of the cash flows to be received from or paid to the counterparty over the term of the interest rate swap contract, to the extent that this amount is beneficial to the Fund, in addition to any related collateral posted to the counterparty by the Fund. This risk may be partially reduced by a master netting arrangement between the Fund and the counterparty. The value of the swap is adjusted daily and the change in value, if any, is recorded as unrealized appreciation or depreciation in the Statement of Assets and Liabilities. An upfront payment, if any, made by the Fund is recorded as an asset in the Statement of Assets and Liabilities. An upfront payment, if any, received by the Fund is recorded as a liability in the Statement of Assets and Liabilities. Payments received or made at the end of the measurement period are recorded as realized gain or loss in the Statement of Operations.
For the year ended December 31, 2012, the investment in interest rate swap contracts had a total notional amount generally indicative of a range from $0 to $40,700,000.
Total Return Swap Contracts. Total return swaps involve commitments to pay interest in exchange for a market-linked return based on a notional amount. For the year ended December 31, 2012, the Fund entered into total return swap transactions to enhance potential gains. To the extent the total return of the reference security or index underlying the total return swap exceeds or falls short of the offsetting interest rate obligation, the Fund will receive a payment or make a payment to the counterparty, respectively. Certain risks may arise when entering into swap transactions including counterparty default, liquidity or unfavorable changes in the value of underlying reference security or index. The value of the swap is adjusted daily and the change in value, if any, is recorded as unrealized appreciation or depreciation in the Statement of Assets and Liabilities. An upfront payment, if any, made by the Fund is recorded as an asset in the Statement of Assets and Liabilities. An upfront payment, if any, received by the Fund is recorded as a liability in the Statement of Assets and Liabilities. Payments received or made at the end of each measurement period are recorded as realized gain or loss in the Statement of Operations.
For the year ended December 31, 2012, the investment in total return swap contracts had a total notional amount generally indicative of a range from $0 to $6,900,000.
Options. An option contract is a contract in which the writer (seller) of the option grants the buyer of the option, upon payment of a premium, the right to purchase from (call option), or sell to (put option), the writer a designated instrument at a specified price within a specified period of time. Certain options, including options on indices and interest rate options, will require cash settlement by the Fund if exercised. For the year ended December 31, 2012, the Fund entered into options on interest rate futures and on interest rate swap contracts in order to hedge portfolio assets against potential adverse interest rate movements of portfolio assets.
If the Fund writes a covered call option, the Fund foregoes, in exchange for the premium, the opportunity to profit during the option period from an increase in the market value of the underlying security above the exercise price. If the Fund writes a put option it accepts the risk of a decline in the value of the underlying security below the exercise price. Over-the-counter options have the risk of the potential inability of counterparties to meet the terms of their contracts. For exchange-traded contracts, the counterparty risk is minimized as the exchange's clearinghouse acts as the counterparty, and guarantees the futures against default. The Fund's maximum exposure to purchased options is limited to the premium initially paid. In addition, certain risks may arise upon entering into option contracts, including the risk that an illiquid secondary market will limit the Fund's ability to close out an option contract prior to the expiration date and that a change in the value of the option contract may not correlate exactly with changes in the value of the securities or currencies hedged.
A summary of the open purchased option contracts as of December 31, 2012 is included in the Fund's Investment Portfolio. A summary of open written option contracts is included in a table following the Fund's Investment Portfolio. For the year ended December 31, 2012, the investment in written option contracts had a total value generally indicative of a range from approximately $16,000 to $825,000, and purchased option contracts had a total value generally indicative of a range from $30,000 to approximately $723,000.
Futures Contracts. A futures contract is an agreement between a buyer or seller and an established futures exchange or its clearinghouse in which the buyer or seller agrees to take or make a delivery of a specific amount of a financial instrument at a specified price on a specific date (settlement date). For the year ended December 31, 2012, the Fund entered into interest rate futures to gain exposure to different parts of the yield curve while managing overall duration.
Upon entering into a futures contract, the Fund is required to deposit with a financial intermediary cash or securities ("initial margin") in an amount equal to a certain percentage of the face value indicated in the futures contract. Subsequent payments ("variation margin") are made or received by the Fund dependent upon the daily fluctuations in the value and are recorded for financial reporting purposes as unrealized gains or losses by the Fund. Gains or losses are realized when the contract expires or is closed. Since all futures contracts are exchange-traded, counterparty risk is minimized as the exchange's clearinghouse acts as the counterparty, and guarantees the futures against default.
Certain risks may arise upon entering into futures contracts, including the risk that an illiquid market will limit the Fund's ability to close out a futures contract prior to the settlement date and the risk that the futures contract is not well correlated with the security, index or currency to which it relates. Risk of loss may exceed amounts disclosed in the Statement of Assets and Liabilities.
A summary of the open futures contracts as of December 31, 2012, is included in a table following the Fund's Investment Portfolio. For the period ended December 31, 2012, the investment in futures contracts purchased had a total notional value generally indicative of a range from $0 to approximately $13,959,000, and the investment in futures contracts sold had a total notional value generally indicative of a range from $0 to approximately $19,355,000.
The following tables summarize the value of the Fund's derivative instruments held as of December 31, 2012 and the related location in the accompanying Statement of Assets and Liabilities, presented by primary underlying risk exposure:
| Asset Derivatives | | Purchased Options | | | Swap Contracts | | | Futures Contracts | | | Total | |
| Interest Rate Contracts (a) (b) | | $ | 575,231 | | | $ | 76,212 | | | $ | 10,956 | | | $ | 662,399 | |
Each of the above derivatives is located in the following Statement of Assets and Liabilities accounts:
(a) Investments in securities, at value (includes purchased options) and unrealized appreciation on swap contracts
(b) Includes cumulative appreciation of futures contracts as disclosed in the Investment Portfolio. Unsettled variation margin is disclosed separately within the Statement of Assets and Liabilities.
| Liability Derivatives | | Written Options | | | Swap Contracts | | | Futures Contracts | | | Total | |
| Interest Rate Contracts (a) (b) | | $ | (589,986 | ) | | $ | (419,127 | ) | | $ | (32,794 | ) | | $ | (1,041,907 | ) |
Each of the above derivatives is located in the following Statement of Assets and Liabilities accounts:
(a) Options written, at value and unrealized depreciation on swap contracts
(b) Includes cumulative depreciation of futures contracts as disclosed in the Investment Portfolio. Unsettled variation margin is disclosed separately within the Statement of Assets and Liabilities.
Additionally, the amount of unrealized and realized gains and losses on derivative instruments recognized in Fund earnings during the year ended December 31, 2012 and the related location in the accompanying Statement of Operations is summarized in the following tables by primary underlying risk exposure:
| Realized Gain (Loss) | | Purchased Options | | | Written Options | | | Swap Contracts | | | Futures Contracts | | | Total | |
| Interest Rate Contracts (a) | | $ | (28,874 | ) | | $ | 43,073 | | | $ | (1,010,173 | ) | | $ | 283,245 | | | $ | (712,729 | ) |
Each of the above derivatives is located in the following Statement of Operations accounts:
(a) Net realized gain (loss) from investments (includes purchased options), written options, swap contracts and futures, respectively
| Change in Net Unrealized Appreciation (Depreciation) | | Purchased Options | | | Written Options | | | Swap Contracts | | | Futures Contracts | | | Total | |
| Interest Rate Contracts (a) | | $ | (277,971 | ) | | $ | 317,597 | | | $ | (186,231 | ) | | $ | (39,588 | ) | | $ | (186,193 | ) |
Each of the above derivatives is located in the following Statement of Operations accounts:
(a) Change in net unrealized appreciation (depreciation) from investments (includes purchased options), written options, swap contracts and futures, respectively
C. Purchases and Sales of Securities
During the year ended December 31, 2012, purchases and sales of investment securities (excluding short-term investments and U.S. Treasury securities) aggregated $1,267,339,916 and $1,256,964,308, respectively. Purchases and sales of U.S. Treasury securities aggregated $25,391,144 and $31,560,066, respectively.
For the year ended December 31, 2012, transactions for written options on futures and interest rate swap contracts were as follows:
| | | Contracts/ Contract Amount | | | Premiums | |
| Outstanding, beginning of period | | | 200 | | | $ | 24,915 | |
| Options written | | | 25,600,200 | | | | 954,155 | |
| Options closed | | | (170 | ) | | | (37,907 | ) |
| Options expired | | | (200 | ) | | | (24,915 | ) |
| Outstanding, end of period | | | 25,600,030 | | �� | $ | 916,248 | |
D. Related Parties
Management Agreement. Under the Investment Management Agreement with Deutsche Investment Management Americas Inc. ("DIMA" or the "Advisor"), an indirect, wholly owned subsidiary of Deutsche Bank AG, the Advisor directs the investments of the Fund in accordance with its investment objectives, policies and restrictions. The Advisor determines the securities, instruments and other contracts relating to investments to be purchased, sold or entered into by the Fund.
Pursuant to the Investment Management Agreement with the Advisor, the Fund pays a monthly management fee based on the Fund's average daily net assets, computed and accrued daily and payable monthly, at the following annual rates:
| First $250 million | | | .450 | % |
| Next $750 million | | | .430 | % |
| Next $1.5 billion | | | .410 | % |
| Next $2.5 billion | | | .400 | % |
| Next $2.5 billion | | | .380 | % |
| Next $2.5 billion | | | .360 | % |
| Next $2.5 billion | | | .340 | % |
| Over $12.5 billion | | | .320 | % |
For the period from January 1, 2012 through April 30, 2013, the Advisor has contractually agreed to waive its fees and/or reimburse certain operating expenses to the extent necessary to maintain the operating expenses (excluding certain expenses such as extraordinary expenses, taxes, brokerage and interest expense) of Class A at 0.66%.
For the period from October 1, 2012 through September 30, 2013, the Advisor has contractually agreed to waive its fees and/or reimburse certain operating expenses to the extent necessary to maintain the operating expenses (excluding certain expenses such as extraordinary expenses, taxes, brokerage and interest expense) of Class B at 0.99%.
Accordingly, for the year ended December 31, 2012, the Advisor waived a portion of its management fee pursuant to the Investment Management Agreement aggregating $26,306, and the amount charged aggregated $586,594, which was equivalent to an annual effective rate of 0.43% of the Fund's average daily net assets.
Administration Fee. Pursuant to an Administrative Services Agreement, DIMA provides most administrative services to the Fund. For all services provided under the Administrative Services Agreement, the Fund pays DIMA an annual fee ("Administration Fee") of 0.10% of the Fund's average daily net assets, computed and accrued daily and payable monthly. For the year ended December 31, 2012, the Administration Fee was $136,200, of which $10,751 is unpaid.
Service Provider Fees. DWS Investments Service Company ("DISC"), an affiliate of the Advisor, is the transfer agent, dividend-paying agent and shareholder service agent for the Fund. Pursuant to a sub-transfer agency agreement between DISC and DST Systems, Inc. ("DST"), DISC has delegated certain transfer agent, dividend-paying agent and shareholder service agent functions to DST. DISC compensates DST out of the shareholder servicing fee it receives from the Fund. For the year ended December 31, 2012, the amounts charged to the Fund by DISC were as follows:
| | | Total Aggregated | | | Amount Waived | | | Unpaid at December 31, 2012 | |
| Class A | | $ | 272 | | | $ | 272 | | | $ | — | |
| Class B | | | 70 | | | | — | | | | 18 | |
| | | $ | 342 | | | $ | 272 | | | $ | 18 | |
Distribution Service Agreement. Under the Fund's Class B 12b-1 plans, DWS Investments Distributors, Inc. ("DIDI") received a fee ("Distribution Service Fee") of 0.25% of average daily net assets of Class B shares. For the year ended December 31, 2012, the Distribution Service Fee aggregated $14,711, of which $1,241 is unpaid.
Typesetting and Filing Service Fees. Under an agreement with DIMA, DIMA is compensated for providing typesetting and certain regulatory filing services to the Fund. For the year ended December 31, 2012, the amount charged to the Fund by DIMA included in the Statement of Operations under "reports to shareholders" aggregated $19,759, of which $5,485 is unpaid.
Trustees' Fees and Expenses. The Fund paid retainer fees to each Trustee not affiliated with the Advisor, plus specified amounts to the Board Chairperson and to each committee Chairperson.
Affiliated Cash Management Vehicle. The Fund may invest uninvested cash balances in Central Cash Management Fund, which is managed by the Advisor. The Fund indirectly bears its proportionate share of the expenses of Central Cash Management Fund. Central Cash Management Fund does not pay the Advisor an investment management fee. Central Cash Management Fund seeks a high level of current income consistent with liquidity and the preservation of capital.
E. Ownership of the Fund
At December 31, 2012, three Participating Insurance Companies were owners of record of 10% or more of the total outstanding Class A shares of the Fund, each owning 42%, 34% and 17%. One Participating Insurance Company was the owner of record of 10% or more of the total outstanding Class B shares of the Fund, owning 94%.
F. Line of Credit
The Fund and other affiliated funds (the "Participants") share in a $375 million revolving credit facility provided by a syndication of banks. The Fund may borrow for temporary or emergency purposes, including the meeting of redemption requests that otherwise might require the untimely disposition of securities. The Participants are charged an annual commitment fee which is allocated based on net assets, among each of the Participants. Interest is calculated at a rate per annum equal to the sum of the Federal Funds Rate plus 1.25 percent plus if LIBOR exceeds the Federal Funds Rate the amount of such excess. The Fund may borrow up to a maximum of 33 percent of its net assets under the agreement. The Fund had no outstanding loans at December 31, 2012.
G. Payment by Affiliate
The Advisor has agreed to fully reimburse the Fund $5,821 to compensate for a breach of the Fund's procedures. The amount of the loss to be reimbursed is less than 0.01% of the Fund's average net assets, thus having no impact on the Fund's total return.
Report of Independent Registered Public Accounting Firm
To the Board of Trustees of DWS Variable Series II and Shareholders of DWS Government & Agency Securities VIP:
We have audited the accompanying statement of assets and liabilities, including the investment portfolio, of DWS Government & Agency Securities VIP (the "Fund"), one of the funds constituting DWS Variable Series II, as of December 31, 2012, and the related statement of operations for the year then ended, the statement of changes in net assets for each of the two years in the period then ended and the financial highlights for each of the five years in the period then ended. These financial statements and financial highlights are the responsibility of the Fund's management. Our responsibility is to express an opinion on these financial statements and financial highlights based on our audits.
We conducted our audits in accordance with the standards of the Public Company Accounting Oversight Board (United States). Those standards require that we plan and perform the audit to obtain reasonable assurance about whether the financial statements and financial highlights are free of material misstatement. We were not engaged to perform an audit of the Fund's internal control over financial reporting. Our audits included consideration of internal control over financial reporting as a basis for designing audit procedures that are appropriate in the circumstances, but not for the purpose of expressing an opinion on the effectiveness of the Fund's internal control over financial reporting. Accordingly, we express no such opinion. An audit also includes examining, on a test basis, evidence supporting the amounts and disclosures in the financial statements and financial highlights, assessing the accounting principles used and significant estimates made by management, and evaluating the overall financial statement presentation. Our procedures included confirmation of securities owned as of December 31, 2012, by correspondence with the custodian and brokers or by other appropriate auditing procedures where replies from brokers were not received. We believe that our audits provide a reasonable basis for our opinion.
In our opinion, the financial statements and financial highlights referred to above present fairly, in all material respects, the financial position of DWS Government & Agency Securities VIP (one of the funds constituting DWS Variable Series II) at December 31, 2012, the results of its operations for the year then ended, the changes in its net assets for each of the two years in the period then ended and the financial highlights for each of the five years in the period then ended, in conformity with U.S. generally accepted accounting principles.
| | | |
Boston, Massachusetts February 13, 2013 | | |
Information About Your Fund's Expenses (Unaudited)
As an investor of the Fund, you incur two types of costs: ongoing expenses and transaction costs. Ongoing expenses include management fees, distribution and service (12b-1) fees and other Fund expenses. Examples of transaction costs include contract charges, redemption fees and account maintenance fees, which are not shown in this section. The following tables are intended to help you understand your ongoing expenses (in dollars) of investing in the Fund and to help you compare these expenses with the ongoing expenses of investing in other mutual funds. In the most recent six-month period, the Fund limited these expenses; had it not done so, expenses would have been higher. The example in the table is based on an investment of $1,000 invested at the beginning of the six-month period and held for the entire period (July 1, 2012 to December 31, 2012).
The tables illustrate your Fund's expenses in two ways:
•Actual Fund Return. This helps you estimate the actual dollar amount of ongoing expenses (but not transaction costs) paid on a $1,000 investment in the Fund using the Fund's actual return during the period. To estimate the expenses you paid over the period, simply divide your account value by $1,000 (for example, an $8,600 account value divided by $1,000 = 8.6), then multiply the result by the number in the "Expenses Paid per $1,000" line under the share class you hold.
• Hypothetical 5% Fund Return. This helps you to compare your Fund's ongoing expenses (but not transaction costs) with those of other mutual funds using the Fund's actual expense ratio and a hypothetical rate of return of 5% per year before expenses. Examples using a 5% hypothetical Fund return may be found in the shareholder reports of other mutual funds. The hypothetical account values and expenses may not be used to estimate the actual ending account balance or expenses you paid for the period.
Please note that the expenses shown in these tables are meant to highlight your ongoing expenses only and do not reflect any transaction costs. The "Expenses Paid per $1,000" line of the tables is useful in comparing ongoing expenses only and will not help you determine the relative total expense of owning different funds. If these transaction costs had been included, your costs would have been higher.
Expenses and Value of a $1,000 Investment for the six months ended December 31, 2012 | |
| Actual Fund Return | | Class A | | | Class B | |
| Beginning Account Value 7/1/12 | | $ | 1,000.00 | | | $ | 1,000.00 | |
| Ending Account Value 12/31/12 | | $ | 1,013.60 | | | $ | 1,011.20 | |
| Expenses Paid per $1,000* | | $ | 3.34 | | | $ | 5.16 | |
| Hypothetical 5% Fund Return | | Class A | | | Class B | |
| Beginning Account Value 7/1/12 | | $ | 1,000.00 | | | $ | 1,000.00 | |
| Ending Account Value 12/31/12 | | $ | 1,021.82 | | | $ | 1,020.01 | |
| Expenses Paid per $1,000* | | $ | 3.35 | | | $ | 5.18 | |
* Expenses are equal to the Fund's annualized expense ratio for each share class, multiplied by the average account value over the period, multiplied by 184 (the number of days in the most recent six-month period), then divided by 366.
| Annualized Expense Ratios | Class A | | Class B | |
| DWS Variable Series II — DWS Government & Agency Securities VIP | .66% | | 1.02% | |
For more information, please refer to the Fund's prospectus.
These tables do not reflect charges and fees ("contract charges") associated with the separate account that invests in the Fund or any variable life insurance policy or variable annuity contract for which the Fund is an investment option.
Tax Information (Unaudited)
The Fund paid distributions of $0.25 per share from net long-term capital gains during its year ended December 31, 2012, of which 100% represents 15% rate gains.
Pursuant to Section 852 of the Internal Revenue Code, the Fund designates $3,269,000 as capital gain dividends for its year ended December 31, 2012, of which 100% represents 15% rate gains.
Please consult a tax advisor if you have questions about federal or state income tax laws, or on how to prepare your tax returns. If you have specific questions about your account, please contact your insurance provider.
The Trust's policies and procedures for voting proxies for portfolio securities and information about how the Trust voted proxies related to its portfolio securities during the 12-month period ended June 30 are available on our Web site — www.dws-investments.com (click on "proxy voting" at the bottom of the page) — or on the SEC's Web site — www.sec.gov. To obtain a written copy of the Trust's policies and procedures without charge, upon request, call us toll free at (800) 728-3337.
Investment Management Agreement Approval
The Board of Trustees approved the renewal of DWS Government & Agency Securities VIP's investment management agreement (the "Agreement") with Deutsche Investment Management Americas Inc. ("DWS") in September 2012.
In terms of the process that the Board followed prior to approving the Agreement, shareholders should know that:
• In September 2012, all of the Fund's Trustees were independent of DWS and its affiliates.
• The Trustees met frequently during the past year to discuss fund matters and dedicated a substantial amount of time to contract review matters. Over the course of several months, the Board's Contract Committee, in coordination with the Board's Fixed Income and Quant Oversight Committee, reviewed comprehensive materials received from DWS, independent third parties and independent counsel. These materials included an analysis of the Fund's performance, fees and expenses, and profitability compiled by the Fund's independent fee consultant. The Board also received extensive information throughout the year regarding performance of the Fund.
• The Independent Trustees regularly meet privately with their independent counsel to discuss contract review and other matters. In addition, the Independent Trustees were also advised by the Fund's independent fee consultant in the course of their review of the Fund's contractual arrangements and considered a comprehensive report prepared by the independent fee consultant in connection with their deliberations (the "IFC Report").
• In connection with reviewing the Agreement, the Board also reviewed the terms of the Fund's Rule 12b-1 plan, distribution agreement, administrative services agreement, transfer agency agreement and other material service agreements.
• Based on its evaluation of the information provided, the Contract Committee presented its findings and recommendations to the Board. The Board then reviewed the Contract Committee's findings and recommendations.
In connection with the contract review process, the Contract Committee and the Board considered the factors discussed below, among others. The Board also considered that DWS and its predecessors have managed the Fund since its inception, and the Board believes that a long-term relationship with a capable, conscientious advisor is in the best interests of the Fund. The Board considered, generally, that shareholders chose to invest or remain invested in the Fund knowing that DWS managed the Fund, and that the Agreement was approved by the Fund's shareholders. DWS is part of Deutsche Bank, a major global banking institution that is engaged in a wide range of financial services. The Board believes that there are advantages to being part of a global asset management business that offers a wide range of investing expertise and resources, including hundreds of portfolio managers and analysts with research capabilities in many countries throughout the world.
As part of the contract review process, the Board carefully considered the fees and expenses of each DWS fund overseen by the Board in light of the fund's performance. In many cases, this led to a negotiation with DWS of lower expense caps for the coming year than had previously been in place. As part of these negotiations, the Board indicated that it would consider relaxing these new lower caps in future years following sustained improvements in performance, among other considerations.
In June 2012, Deutsche Bank ("DB"), DWS's parent company, announced that DB's new management team had concluded the strategic review of its global asset management business announced in late 2011 by DB's prior management team, and would combine its Asset Management (of which DWS is a part) and Wealth Management divisions. Prior to approving the investment management agreements, the Independent Trustees were apprised of the expected management and structure of the new combined Asset & Wealth Management division ("AWM") and DWS. DB also advised the Independent Trustees that the U.S. asset management business is a critical and integral part of DB and AWM, and that DB would be reinvesting a significant portion of the substantial savings it expects to realize by combining its Asset Management and Wealth Management divisions into a combined AWM division, including enhancements to its investment capabilities. DB also confirmed its commitment to maintaining strong legal and compliance groups within the combined division.
While shareholders may focus primarily on fund performance and fees, the Fund's Board considers these and many other factors, including the quality and integrity of DWS's personnel and such other issues as back-office operations, fund valuations, and compliance policies and procedures.
Nature, Quality and Extent of Services. The Board considered the terms of the Agreement, including the scope of advisory services provided under the Agreement. The Board noted that, under the Agreement, DWS provides portfolio management services to the Fund and that, pursuant to a separate administrative services agreement, DWS provides administrative services to the Fund. The Board considered the experience and skills of senior management and investment personnel, the resources made available to such personnel, the ability of DWS to attract and retain high-quality personnel, and the organizational depth and stability of DWS. The Board reviewed the Fund's performance over short-term and long-term periods and compared those returns to various agreed-upon performance measures, including market indices and a peer universe compiled by the independent fee consultant using information supplied by Lipper Inc. ("Lipper"), an independent fund data service. The Board also noted that it has put into place a process of identifying "Focus Funds" (e.g., funds performing poorly relative to their benchmark or a peer universe compiled by an independent fund data service), and receives more frequent reporting and information from DWS regarding such funds, along with DWS's remedial plans to address underperformance. The Board believes this process is an effective manner of identifying and addressing underperforming funds. Based on the information provided, the Board noted that for the one-, three- and five-year periods ended December 31, 2011, the Fund's performance (Class A shares) was in the 1st quartile of the applicable Lipper universe (the 1st quartile being the best performers and the 4th quartile being the worst performers). The Board also observed that the Fund has outperformed its benchmark in the three-year period and has underperformed its benchmark in the one- and five-year periods ended December 31, 2011.
Fees and Expenses. The Board considered the Fund's investment management fee schedule, operating expenses and total expense ratios, and comparative information provided by Lipper and the independent fee consultant regarding investment management fee rates paid to other investment advisors by similar funds (1st quartile being the most favorable and 4th quartile being the least favorable). With respect to management fees paid to other investment advisors by similar funds, the Board noted that the contractual fee rates paid by the Fund, which include a 0.10% fee paid to DWS under the Fund's administrative services agreement, were lower than the median (1st quartile) of the applicable Lipper peer group (based on Lipper data provided as of December 31, 2011). The Board noted that the Fund's Class A shares total (net) operating expenses were expected to be higher than the median (3rd quartile) of the applicable Lipper expense universe (based on Lipper data provided as of December 31, 2011, and analyzing Lipper expense universe Class A (net) expenses less any applicable 12b-1 fees) ("Lipper Universe Expenses"). The Board also reviewed data comparing each share class's total (net) operating expenses to the applicable Lipper Universe Expenses. The Board considered the Fund's management fee rate as compared to fees charged by DWS and certain of its affiliates for comparable mutual funds and considered differences in fund and fee structures between the DWS Funds. The Board also considered how the Fund's total (net) operating expenses compared to the total (net) operating expenses of a more customized peer group selected by Lipper (based on such factors as asset size). The Board also noted that the expense limitations agreed to by DWS helped to ensure that the Fund's total (net) operating expenses would remain competitive.
The information considered by the Board as part of its review of management fees included information regarding fees charged by DWS and its affiliates to similar institutional accounts and to similar funds offered primarily to European investors ("DWS Europe funds"), in each case as applicable. The Board observed that advisory fee rates for institutional accounts generally were lower than the management fees charged by similarly managed DWS U.S. mutual funds ("DWS Funds"), but also took note of the differences in services provided to DWS Funds as compared to institutional accounts. In the case of DWS Europe funds, the Board observed that fee rates for DWS Europe funds generally were higher than for similarly managed DWS Funds, but noted that differences in the types of services provided to DWS Funds relative to DWS Europe funds made it difficult to compare such fees.
On the basis of the information provided, the Board concluded that management fees were reasonable and appropriate in light of the nature, quality and extent of services provided by DWS.
Profitability. The Board reviewed detailed information regarding revenues received by DWS under the Agreement. The Board considered the estimated costs and pre-tax profits realized by DWS from advising the DWS Funds, as well as estimates of the pre-tax profits attributable to managing the Fund in particular. The Board also received information regarding the estimated enterprise-wide profitability of DWS and its affiliates with respect to all fund services in totality and by fund. The Board and the independent fee consultant reviewed DWS's methodology in allocating its costs to the management of the Fund. Based on the information provided, the Board concluded that the pre-tax profits realized by DWS in connection with the management of the Fund were not unreasonable. The Board also reviewed information regarding the profitability of certain similar investment management firms. The Board noted that while information regarding the profitability of such firms is limited (and in some cases is not necessarily prepared on a comparable basis), DWS and its affiliates' overall profitability with respect to the DWS fund complex (after taking into account distribution and other services provided to the funds by DWS and its affiliates) was lower than the overall profitability levels of many comparable firms for which such data was available.
Economies of Scale. The Board considered whether there are economies of scale with respect to the management of the Fund and whether the Fund benefits from any economies of scale. The Board noted that the Fund's management fee schedule includes fee breakpoints. The Board concluded that the Fund's fee schedule represents an appropriate sharing between the Fund and DWS of such economies of scale as may exist in the management of the Fund at current asset levels.
Other Benefits to DWS and Its Affiliates. The Board also considered the character and amount of other incidental benefits received by DWS and its affiliates, including any fees received by DWS for administrative services provided to the Fund and any fees received by an affiliate of DWS for distribution services. The Board also considered benefits to DWS related to brokerage and soft-dollar allocations, including allocating brokerage to pay for research generated by parties other than the executing broker dealers, which pertain primarily to funds investing in equity securities, along with the incidental public relations benefits to DWS related to DWS Funds advertising and cross-selling opportunities among DWS products and services. The Board concluded that management fees were reasonable in light of these fallout benefits.
Compliance. The Board considered the significant attention and resources dedicated by DWS to documenting and enhancing its compliance processes in recent years. The Board noted in particular (i) the experience and seniority of both DWS's chief compliance officer and the Fund's chief compliance officer; (ii) the large number of DWS compliance personnel; and (iii) the substantial commitment of resources by DWS and its affiliates to compliance matters.
Based on all of the information considered and the conclusions reached, the Board unanimously determined that the continuation of the Agreement is in the best interests of the Fund. In making this determination, the Board did not give particular weight to any single factor identified above. The Board considered these factors over the course of numerous meetings, certain of which were in executive session with only the Independent Trustees and their counsel present. It is possible that individual Trustees may have weighed these factors differently in reaching their individual decisions to approve the continuation of the Agreement.
Summary of Management Fee Evaluation by Independent Fee Consultant
September 17, 2012
Pursuant to an Order entered into by Deutsche Investment Management Americas and affiliates (collectively, "DeAM") with the Attorney General of New York, I, Thomas H. Mack, have been appointed the Independent Fee Consultant for the DWS Funds (formerly the DWS Scudder Funds). My duties include preparing an annual written evaluation of the management fees DeAM charges the Funds, considering among other factors the management fees charged by other mutual fund companies for like services, management fees DeAM charges other clients for like services, DeAM's costs of supplying services under the management agreements and related profit margins, possible economies of scale if a Fund grows larger, and the nature and quality of DeAM's services, including fund performance. This report summarizes my evaluation for 2012, including my qualifications, the evaluation process for each of the DWS Funds, consideration of certain complex-level factors, and my conclusions. I served in substantially the same capacity in 2007, 2008, 2009, 2010 and 2011.
Qualifications
For more than 35 years I have served in various professional capacities within the investment management business. I have held investment analysis and advisory positions, including securities analyst, portfolio strategist and director of investment policy with a large investment firm. I have also performed business management functions, including business development, financial management and marketing research and analysis.
Since 1991, I have been an independent consultant within the asset management industry. I have provided services to over 125 client organizations, including investment managers, mutual fund boards, product distributors and related organizations. Over the past ten years I have completed a number of assignments for mutual fund boards, specifically including assisting boards with management contract renewal.
I hold a Master of Business Administration degree, with highest honors, from Harvard University and Master of Science and Bachelor of Science (highest honors) degrees from the University of California at Berkeley. I am an independent director and audit committee financial expert for two closed-end mutual funds and have served in various leadership and financial oversight capacities with non-profit organizations.
Evaluation of Fees for each DWS Fund
My work focused primarily on evaluating, fund-by-fund, the fees charged to each of the 103 mutual fund portfolios in the DWS Fund family. For each Fund, I considered each of the key factors mentioned above, as well as any other relevant information. In doing so I worked closely with the Funds' Independent Directors in their annual contract renewal process, as well as in their approval of contracts for several new funds (documented separately).
In evaluating each Fund's fees, I reviewed comprehensive materials provided by or on behalf of DeAM, including expense information prepared by Lipper Analytical, comparative performance information, profitability data, manager histories, and other materials. I also accessed certain additional information from the Lipper and Morningstar databases and drew on my industry knowledge and experience.
To facilitate evaluating this considerable body of information, I prepared for each Fund a document summarizing the key data elements in each area as well as additional analytics discussed below. This made it possible to consider each key data element in the context of the others.
In the course of contract renewal, DeAM agreed to implement a number of fee and expense adjustments requested by the Independent Directors which will favorably impact future fees and expenses, and my evaluation includes the effects of these changes.
Fees and Expenses Compared with Other Funds
The competitive fee and expense evaluation for each fund focused on two primary comparisons:
The Fund's contractual management fee (the advisory fee plus the administration fee where applicable) compared with those of a group of typically 12-15 funds in the same Lipper investment category (e.g. Large Capitalization Growth) having similar distribution arrangements and being of similar size.
The Fund's total expenses compared with a broader universe of funds from the same Lipper investment category and having similar distribution arrangements.
These two comparisons provide a view of not only the level of the fee compared with funds of similar scale but also the total expense the Fund bears for all the services it receives, in comparison with the investment choices available in the Fund's investment category and distribution channel. The principal figure-of-merit used in these comparisons was the subject Fund's percentile ranking against peers.
DeAM's Fees for Similar Services to Others
DeAM provided management fee schedules for all of its US domiciled fund and non-fund investment management accounts in any of the investment categories where there is a DWS Fund. These similar products included the other DWS Funds, non-fund pooled accounts, institutional accounts and sub-advisory accounts. Using this information, I calculated for each Fund the fee that would be charged to each similar product, at the subject Fund's asset level.
Evaluating information regarding non-fund products is difficult because there are varying levels of services required for different types of accounts, with mutual funds generally requiring considerably more regulatory and administrative types of service as well as having more frequent cash flows than other types of accounts. Also, while mutual fund fees for similar fund products can be expected to be similar, there will be some differences due to different pricing conditions in different distribution channels (e.g. retail funds versus those used in variable insurance products), differences in underlying investment processes and other factors.
Costs and Profit Margins
DeAM provided a detailed profitability analysis for each Fund. After making some adjustments so that the presentation would be more comparable to the available industry figures, I reviewed profit margins from investment management alone, from investment management plus other fund services (excluding distribution) provided to the Funds by DeAM (principally shareholder services), and DeAM profits from all sources, including distribution. A later section comments on overall profitability.
Economies of Scale
Economies of scale — an expected decline in management cost per dollar of fund assets as fund assets grow — are very rarely quantified and documented because of inherent difficulties in collecting and analyzing relevant data. However, in virtually every investment category that I reviewed, larger funds tend to have lower fees and lower total expenses than smaller funds. To see how each DWS Fund compares with this industry observation, I reviewed:
The trend in Fund assets over the last five years and the accompanying trend in total expenses. This shows if the Fund has grown and, if so, whether total expense (management fees as well as other expenses) have declined as a percent of assets.
Whether the Fund has break-points in its management fee schedule, the extent of the fee reduction built into the schedule and the asset levels where the breaks take effect, and in the case of a sub-advised Fund how the Fund's break-points compare with those of the sub-advisory fee schedule.
How the Fund's contractual fee schedule compares with trends in the industry data. To accomplish this, I constructed a chart showing how actual latest-fiscal-year contractual fees of the Fund and of other similar funds relate to average fund assets, with the subject Fund's contractual fee schedule superimposed.
Quality of Service — Performance
The quality-of-service evaluation focused on investment performance, which is the principal result of the investment management service. Each Fund's performance was reviewed over the past 1, 3, 5 and 10 years, as applicable, and compared with that of other funds in the same investment category and with a suitable market index.
In addition, I calculated and reviewed risk-adjusted returns relative to an index of similar mutual funds' returns and a suitable market index. The risk-adjusted returns analysis provides a way of determining the extent to which the Fund's return comparisons are mainly the product of investment value-added (or lack thereof) or alternatively taking considerably more or less risk than is typical in its investment category.
I also received and considered the history of portfolio manager changes for each Fund, as this provided an important context for evaluating the performance results.
Complex-Level Considerations
While this evaluation was conducted mainly at the individual fund level, there are some issues relating to the reasonableness of fees that can alternatively be considered across the whole fund complex:
I reviewed DeAM's profitability analysis for all DWS Funds, with a view toward determining if the allocation procedures used were reasonable and how profit levels compared with public data for other investment managers.
I considered whether DeAM and affiliates receive any significant ancillary or "fallout" benefits that should be considered in interpreting the direct profitability results. These would be situations where serving as the investment manager of the Funds is beneficial to another part of the Deutsche Bank organization.
I considered how aggregated DWS Fund expenses had varied over the years, by asset class and in the context of trends in asset levels.
I considered how aggregated DWS Fund performance measures relative to appropriate peers had varied by asset class and over time.
I reviewed the structure of the DeAM organization, trends in staffing levels, and information on compensation of investment management and other professionals compared with industry data.
Findings
Based on the process and analysis discussed above, which included reviewing a wide range of information from management and external data sources and considering among other factors the fees DeAM charges other clients, the fees charged by other fund managers, DeAM's costs and profits associated with managing the Funds, economies of scale, possible fall-out benefits, and the nature and quality of services provided, in my opinion the management fees charged the DWS Funds are reasonable.
Thomas H. Mack
President, Thomas H. Mack & Co., Inc.
Board Members and Officers
The following table presents certain information regarding the Board Members and Officers of the fund. Each Board Member's year of birth is set forth in parentheses after his or her name. Unless otherwise noted, (i) each Board Member has engaged in the principal occupation(s) noted in the table for at least the most recent five years, although not necessarily in the same capacity; and (ii) the address of each Independent Board Member is c/o Kenneth C. Froewiss, Chairman, DWS Mutual Funds, P.O. Box 78, Short Hills, NJ 07078. Except as otherwise noted below, the term of office for each Board Member is until the election and qualification of a successor, or until such Board Member sooner dies, resigns, is removed or as otherwise provided in the governing documents of the fund. Because the fund does not hold an annual meeting of shareholders, each Board Member will hold office for an indeterminate period. The Board Members may also serve in similar capacities with other funds in the fund complex.
| Independent Board Members |
Name, Year of Birth, Position with the Fund and Length of Time Served1 | | Business Experience and Directorships During the Past Five Years | Number of Funds in DWS Fund Complex Overseen |
Other Directorships Held by Board Member |
Kenneth C. Froewiss (1945) Chairperson since 2013,9 and Board Member since 2001 | | Adjunct Professor of Finance, NYU Stern School of Business (September 2009-present; Clinical Professor from 1997-September 2009); Member, Finance Committee, Association for Asian Studies (2002-present); Director, Mitsui Sumitomo Insurance Group (US) (2004-present); prior thereto, Managing Director, J.P. Morgan (investment banking firm) (until 1996) | 103 | — |
William McClayton (1944) Vice Chairperson since 2013,9 and Board Member since 2004 | | Private equity investor (since October 2009); previously, Managing Director, Diamond Management & Technology Consultants, Inc. (global consulting firm) (2001-2009); Directorship: Board of Managers, YMCA of Metropolitan Chicago; formerly: Senior Partner, Arthur Andersen LLP (accounting) (1966-2001); Trustee, Ravinia Festival | 103 | — |
John W. Ballantine (1946) Board Member since 1999 | | Retired; formerly, Executive Vice President and Chief Risk Management Officer, First Chicago NBD Corporation/The First National Bank of Chicago (1996-1998); Executive Vice President and Head of International Banking (1995-1996). Directorships: Stockwell Capital Investments PLC (private equity); former Directorships: First Oak Brook Bancshares, Inc. and Oak Brook Bank; Prisma Energy International | 103 | Chairman of the Board, Healthways, Inc.2 (provider of disease and care management services) (2003- present); Portland General Electric2 (utility company) (2003-present) |
Henry P. Becton, Jr. (1943) Board Member since 1990 | | Vice Chair and former President, WGBH Educational Foundation. Directorships: Public Radio International; Public Radio Exchange (PRX); The PBS Foundation; North Bennett Street School (Boston); former Directorships: Association of Public Television Stations; Boston Museum of Science; American Public Television; Concord Academy; New England Aquarium; Mass. Corporation for Educational Telecommunications; Committee for Economic Development; Public Broadcasting Service; Connecticut College | 103 | Lead Director, Becton Dickinson and Company2 (medical technology company); Lead Director, Belo Corporation2 (media company) |
Dawn-Marie Driscoll (1946) Board Member since 1987 | | President, Driscoll Associates (consulting firm); Emeritus Executive Fellow, Center for Business Ethics, Bentley University; formerly, Partner, Palmer & Dodge (1988-1990); Vice President of Corporate Affairs and General Counsel, Filene's (1978-1988). Directorships: Director of ICI Mutual Insurance Company (since 2007); Advisory Board, Center for Business Ethics, Bentley University; Trustee, Southwest Florida Community Foundation (charitable organization); former Directorships: Sun Capital Advisers Trust (mutual funds) (2007-2012), Investment Company Institute (audit, executive, nominating committees) and Independent Directors Council (governance, executive committees) | 103 | — |
Keith R. Fox, CFA (1954) Board Member since 1996 | | Managing General Partner, Exeter Capital Partners (a series of private investment funds) (since 1986). Directorships: Progressive International Corporation (kitchen goods importer and distributor); The Kennel Shop (retailer); former Chairman, National Association of Small Business Investment Companies; former Directorships: BoxTop Media Inc. (advertising); Sun Capital Advisers Trust (mutual funds) (2011-2012) | 103 | — |
Paul K. Freeman (1950) Board Member since 1993, and Chairperson (2009-Jan. 8, 2013) | | Consultant, World Bank/Inter-American Development Bank; Executive and Governing Council of the Independent Directors Council (Chairman of Education Committee); formerly: Project Leader, International Institute for Applied Systems Analysis (1998-2001); Chief Executive Officer, The Eric Group, Inc. (environmental insurance) (1986-1998); Directorships: Denver Zoo Foundation (December 2012-present); former Directorships: Prisma Energy International | 103 | — |
Richard J. Herring (1946) Board Member since 1990 | | Jacob Safra Professor of International Banking and Professor, Finance Department, The Wharton School, University of Pennsylvania (since July 1972); Co-Director, Wharton Financial Institutions Center (since July 2000); Co-Chair, U.S. Shadow Financial Regulatory Committee; Executive Director, Financial Economists Roundtable; formerly: Vice Dean and Director, Wharton Undergraduate Division (July 1995-June 2000); Director, Lauder Institute of International Management Studies (July 2000-June 2006) | 103 | Director, Japan Equity Fund, Inc. (since September 2007), Thai Capital Fund, Inc. (since 2007), Singapore Fund, Inc. (since September 2007), Independent Director of Barclays Bank Delaware (since September 2010) |
Rebecca W. Rimel (1951) Board Member since 1995 | | President and Chief Executive Officer, The Pew Charitable Trusts (charitable organization) (1994 to present); Trustee, Washington College (2011-2013); formerly: Executive Vice President, The Glenmede Trust Company (investment trust and wealth management) (1983-2004); Board Member, Investor Education (charitable organization) (2004-2005); Trustee, Executive Committee, Philadelphia Chamber of Commerce (2001-2007); Director, Viasys Health Care2 (January 2007-June 2007); Trustee, Pro Publica (charitable organization) (2007-2010); Trustee, Thomas Jefferson Foundation (charitable organization) (1994-2012) | 103 | Director, Becton Dickinson and Company2 (medical technology company) (2012-present); Director, CardioNet, Inc.2 (health care) (2009-present) |
William N. Searcy, Jr. (1946) Board Member since 1993 | | Private investor since October 2003; formerly: Pension & Savings Trust Officer, Sprint Corporation2 (telecommunications) (November 1989-September 2003); Trustee, Sun Capital Advisers Trust (mutual funds) (1998-2012) | 103 | — |
Jean Gleason Stromberg (1943) Board Member since 1997 | | Retired. Formerly, Consultant (1997-2001); Director, Financial Markets U.S. Government Accountability Office (1996-1997); Partner, Fulbright & Jaworski, L.L.P. (law firm) (1978-1996). Directorships: The William and Flora Hewlett Foundation; former Directorships: Service Source, Inc., Mutual Fund Directors Forum (2002-2004), American Bar Retirement Association (funding vehicle for retirement plans) (1987-1990 and 1994-1996) | 103 | — |
Robert H. Wadsworth (1940) Board Member since 1999 | | President, Robert H. Wadsworth & Associates, Inc. (consulting firm) (1983 to present); Director, National Horizon, Inc. (non-profit organization); Director and Treasurer, The Phoenix Boys Choir Association | 106 | — |
Interested Board Member and Officer4 |
Name, Year of Birth, Position with the Fund and Length of Time Served1,6 | | Business Experience and Directorships During the Past Five Years | Number of Funds in DWS Fund Complex Overseen |
Other Directorships Held by Board Member |
Michael J. Woods5 (1967) Board Member since 2013,9 and Executive Vice President since 20139 | | Managing Director,3 Deutsche Asset & Wealth Management (2009-present); Head of the Americas Asset Management Business for Deutsche Bank, Member of the Asset and Wealth Management ("AWM") Extended Executive Committee, AWM Global Client Group Executive Committee and the AWM Active Asset Management Executive Committee; CEO and US Regional Head of DWS Investments; formerly: Sr. VP, Head of the Financial Intermediaries and Investments Group of Evergreen Investments (2007-2009), CEO and Vice Chairman of Board of Directors of XTF Global Asset Management (2006-2007), Managing Director — US Head of Sub-Advisory and Investment Only Business at Citigroup Asset Management (2000-2006). Mr. Woods is currently a board member of The Children's Village, The Big Brothers Big Sisters Organization, and The Mutual Fund Education Alliance. | 39 | — |
Officers4 |
Name, Year of Birth, Position with the Fund and Length of Time Served6 | | Business Experience and Directorships During the Past Five Years |
W. Douglas Beck, CFA7 (1967) President, 2011-present | | Managing Director,3 Deutsche Asset & Wealth Management (2006-present); President of DWS family of funds and Head of Product Management, U.S. for DWS Investments; formerly: Executive Director, Head of Product Management (2002-2006) and President (2005-2006) of the UBS Funds at UBS Global Asset Management; Co-Head of Manager Research/Managed Solutions Group, Merrill Lynch (1998-2002) |
John Millette8 (1962) Vice President and Secretary, 1999-present | | Director,3 Deutsche Asset & Wealth Management |
Paul H. Schubert7 (1963) Chief Financial Officer, 2004-present Treasurer, 2005-present | | Managing Director,3 Deutsche Asset & Wealth Management (since July 2004); formerly: Executive Director, Head of Mutual Fund Services and Treasurer for UBS Family of Funds (1998-2004); Vice President and Director of Mutual Fund Finance at UBS Global Asset Management (1994-1998) |
Caroline Pearson8 (1962) Chief Legal Officer, 2010-present | | Managing Director,3 Deutsche Asset & Wealth Management; formerly: Assistant Secretary for DWS family of funds (1997-2010) |
Melinda Morrow7 (1970) Vice President, 2012-present | | Director,3 Deutsche Asset & Wealth Management |
Hepsen Uzcan8 (1974) Assistant Secretary, since 20139 | | Vice President, Deutsche Asset & Wealth Management |
Paul Antosca8 (1957) Assistant Treasurer, 2007-present | | Director,3 Deutsche Asset & Wealth Management |
Jack Clark8 (1967) Assistant Treasurer, 2007-present | | Director,3 Deutsche Asset & Wealth Management |
Diane Kenneally8 (1966) Assistant Treasurer, 2007-present | | Director,3 Deutsche Asset & Wealth Management |
John Caruso7 (1965) Anti-Money Laundering Compliance Officer, 2010-present | | Managing Director,3 Deutsche Asset & Wealth Management |
Robert Kloby7 (1962) Chief Compliance Officer, 2006-present | | Managing Director,3 Deutsche Asset & Wealth Management |
1 The length of time served represents the year in which the Board Member joined the board of one or more DWS funds currently overseen by the Board.
2 A publicly held company with securities registered pursuant to Section 12 of the Securities Exchange Act of 1934.
3 Executive title, not a board directorship.
4 As a result of their respective positions held with the Advisor, these individuals are considered "interested persons" of the Advisor within the meaning of the 1940 Act. Interested persons receive no compensation from the fund.
5 The mailing address of Mr. Woods is 60 Wall Street, New York, New York 10005. Mr. Woods is an interested Board Member by virtue of his positions with Deutsche Asset & Wealth Management. As an interested person, Mr. Woods receives no compensation from the fund. Mr. Woods is a board member of the following trusts and corporations: Cash Account Trust, DWS Market Trust, DWS Money Funds, DWS State Tax-Free Income Series, DWS Target Fund, DWS Value Series, Inc., DWS Variable Series II, Investors Cash Trust, Tax-Exempt California Money Market Fund, DWS Global High Income Fund, Inc., DWS High Income Opportunities Fund, Inc., DWS High Income Trust, DWS Multi-Market Income Trust, DWS Municipal Income Trust, DWS Strategic Income Trust and DWS Strategic Municipal Income Trust.
6 The length of time served represents the year in which the officer was first elected in such capacity for one or more DWS funds.
7 Address: 60 Wall Street, New York, NY 10005.
8 Address: One Beacon Street, Boston, MA 02108.
9 Effective as of January 9, 2013.
The fund's Statement of Additional Information ("SAI") includes additional information about the Board Members. The SAI is available, without charge, upon request. If you would like to request a copy of the SAI, you may do so by calling the following toll-free number: (800) 728-3337.
DWS Investments Distributors, Inc.
222 South Riverside Plaza
Chicago, IL 60606
(800) 621-1148
VS2GAS-2 (R-025831-2 2/13)
DECEMBER 31, 2012
ANNUAL REPORT
DWS VARIABLE SERIES II
DWS High Income VIP
Contents
21 Statement of Assets and Liabilities 22 Statement of Operations 23 Statement of Changes in Net Assets 25 Notes to Financial Statements 31 Report of Independent Registered Public Accounting Firm 32 Information About Your Fund's Expenses 35 Investment Management Agreement Approval 38 Summary of Management Fee Evaluation by Independent Fee Consultant 40 Board Members and Officers |
This report must be preceded or accompanied by a prospectus. To obtain an additional prospectus or summary prospectus, if available, call (800) 728-3337 or your financial representative. We advise you to consider the Fund's objectives, risks, charges and expenses carefully before investing. The summary prospectus and prospectus contain this and other important information about the Fund. Please read the prospectus carefully before you invest.
Bond investments are subject to interest-rate and credit risks. When interest rates rise, bond prices generally fall. Credit risk refers to the ability of an issuer to make timely payments of principal and interest. Investments in lower-quality ("junk bonds") and non-rated securities present greater risk of loss than investments in higher-quality securities. Investing in derivatives entails special risks relating to liquidity, leverage and credit that may reduce returns and/or increase volatility. The Fund may lend securities to approved institutions. See the prospectus for details.
DWS Investments is part of the Deutsche Asset & Wealth Management division of Deutsche Bank AG.
NOT FDIC/NCUA INSURED NO BANK GUARANTEE MAY LOSE VALUE NOT A DEPOSIT
NOT INSURED BY ANY FEDERAL GOVERNMENT AGENCY
Performance Summary December 31, 2012 (Unaudited)
Fund performance shown is historical, assumes reinvestment of all dividend and capital gain distributions and does not guarantee future results. Investment return and principal value fluctuate with changing market conditions so that, when redeemed, shares may be worth more or less than their original cost. Current performance may be lower or higher than the performance data quoted. Please contact your participating insurance company for the Fund's most recent month-end performance. Performance doesn't reflect charges and fees ("contract charges") associated with the separate account that invests in the Fund or any variable life insurance policy or variable annuity contract for which the Fund is an investment option. These charges and fees will reduce returns. While all share classes have the same underlying portfolio, their performance will differ.
The gross expense ratios of the Fund, as stated in the fee table of the prospectus dated May 1, 2012 are 0.72% and 0.99% for Class A and Class B shares, respectively, and may differ from the expense ratios disclosed in the Financial Highlights tables in this report.
| Growth of an Assumed $10,000 Investment in DWS High Income VIP |
| The Credit Suisse High Yield Index tracks the performance of the global high-yield debt market. Index returns do not reflect any fees or expenses and it is not possible to invest directly into an index. |
| |
| Yearly periods ended December 31 | |
| Comparative Results | |
| DWS High Income VIP | | 1-Year | | | 3-Year | | | 5-Year | | | 10-Year | |
| Class A | Growth of $10,000 | | $ | 11,491 | | | $ | 13,603 | | | $ | 14,484 | | | $ | 23,510 | |
| Average annual total return | | | 14.91 | % | | | 10.80 | % | | | 7.69 | % | | | 8.92 | % |
| Credit Suisse High Yield Index | Growth of $10,000 | | $ | 11,471 | | | $ | 13,843 | | | $ | 15,761 | | | $ | 26,520 | |
| Average annual total return | | | 14.71 | % | | | 11.45 | % | | | 9.53 | % | | | 10.24 | % |
| DWS High Income VIP | | 1-Year | | | 3-Year | | | 5-Year | | | 10-Year | |
| Class B | Growth of $10,000 | | $ | 11,470 | | | $ | 13,499 | | | $ | 14,302 | | | $ | 22,782 | |
| Average annual total return | | | 14.70 | % | | | 10.52 | % | | | 7.42 | % | | | 8.58 | % |
| Credit Suisse High Yield Index | Growth of $10,000 | | $ | 11,471 | | | $ | 13,843 | | | $ | 15,761 | | | $ | 26,520 | |
| Average annual total return | | | 14.71 | % | | | 11.45 | % | | | 9.53 | % | | | 10.24 | % |
The growth of $10,000 is cumulative.
Management Summary December 31, 2012 (Unaudited)
The Class A shares of the DWS High Income VIP rose 14.91% (unadjusted for contract charges) during 2012, outperforming the 14.71% of the benchmark, Credit Suisse High Yield Index.1
Despite the headwinds represented by slowing global growth, the Credit Suisse High Yield Index exceeded the 5.16% return of the investment-grade bond market, as measured by the Barclays U.S. Aggregate Bond Index.2 High-yield bonds continued to benefit from strong investor demand at a time of extremely depressed yields on government bonds and other low-risk investments. Investors were encouraged by the improving fundamentals of the high-yield asset class, as seen in a default rate that remains very low by historical measures. High-yield companies also exhibited rising cash balances, reduced leverage and the ability to refinance existing debt at more attractive rates.
Favorable security selection was the most important factor driving the Fund's relative performance during the past year, as we were helped by our positions in Energy Future Holdings Corp. and Cricket Communications, Inc. Performance detractors included our overweight in bonds issued by Essar Steel Algoma, Inc. and an underweight in the junior, higher-risk bonds of First Data Corp.3
We maintain a cautiously optimistic outlook on high-yield bonds. At the end of December, the yield advantage — or "spread" — of high-yield bonds relative to comparable Treasuries was 5.54 percentage points, 1.75 percentage points lower than it was one year ago. At this level, the yield spread is not meaningfully below its long-run average, and it continues to price in a higher default rate than we expect to materialize over the near term.4 We believe that yield spreads continue to look reasonably attractive relative to global growth risks and the risks of contagion out of Europe, especially in light of the broader environment of low bond yields.
Global central banks continue to provide liquidity, though not without some market volatility given the ongoing European debt problems, slow global growth and another U.S. debt ceiling debate. In this context, we remain true to our rigorous bottom-up credit research and security selection processes given that individual defaults are likely to have an amplified impact on performance.
Our investment process remains focused on total return analysis, broad diversification among countries, sectors, industries, individual issuers, and maturities as well as on using credit research to identify the most compelling investment opportunities for the portfolio.
Gary Russell, CFA
Portfolio Manager
The views expressed reflect those of the portfolio management team only through the end of the period of the report as stated on the cover. The management team's views are subject to change at any time based on market and other conditions and should not be construed as a recommendation. Past performance is no guarantee of future results. Current and future portfolio holdings are subject to risk.
1 The Credit Suisse High Yield Index tracks the performance of the global high-yield debt market.
2 The Barclays U.S. Aggregate Bond Index is an unmanaged index representing domestic taxable investment-grade bonds, with index components for government and corporate securities, mortgage pass-through securities, and asset-backed securities with an average maturity of one year or more.
Index returns do not reflect fees or expenses and it is not possible to invest directly into an index.
3 "Overweight" means the Fund holds a higher weighting in a given sector or security than the benchmark. "Underweight" means it holds a lower weighting.
4 "Spread" refers to the excess yield various bond sectors offer over financial instruments with similar maturities. When spreads widen, yield differences are increasing between bonds in the two sectors being compared. When spreads narrow, the opposite is true.
Portfolio Summary (Unaudited) Asset Allocation (As a % of Investment Portfolio excluding Securities Lending Collateral) | 12/31/12 | 12/31/11 |
| | | |
| Corporate Bonds | 86% | 90% |
| Cash Equivalents | 11% | 8% |
| Convertible Bonds | 1% | — |
| Preferred Securities | 1% | 0% |
| Preferred Stocks | 1% | — |
| Loan Participations and Assignments | 0% | 1% |
| Government & Agency Obligations | — | 1% |
| | 100% | 100% |
Sector Diversification (As a % of Investment Portfolio excluding Government & Agency Obligations, Cash Equivalents and Securities Lending Collateral) | 12/31/12 | 12/31/11 |
| | | |
| Consumer Discretionary | 23% | 22% |
| Financials | 16% | 15% |
| Telecommunication Services | 14% | 14% |
| Energy | 12% | 12% |
| Materials | 10% | 12% |
| Industrials | 9% | 10% |
| Health Care | 5% | 3% |
| Information Technology | 5% | 5% |
| Consumer Staples | 3% | 4% |
| Utilities | 3% | 3% |
| | 100% | 100% |
Quality (As a % of Investment Portfolio excluding Cash Equivalents and Securities Lending Collateral) | 12/31/12 | 12/31/11 |
| | | |
| AAA | — | 1% |
| BBB | 2% | 3% |
| BB | 29% | 32% |
| B | 57% | 52% |
| CCC | 10% | 11% |
| CC | 1% | — |
| Not Rated | 1% | 1% |
| | 100% | 100% |
The quality ratings represent the higher of Moody's Investors Service, Inc. ("Moody's") or Standard & Poor's Corporation ("S&P") credit ratings. The ratings of Moody's and S&P represent their opinions as to the quality of the securities they rate. Credit quality measures a bond issuer's ability to repay interest and principal in a timely manner. Ratings are relative and subjective and are not absolute standards of quality. Credit quality does not remove market risk and is subject to change.
Portfolio holdings and characteristics are subject to change.
For more complete details about the Fund's investment portfolio, see page 7.
Following the Fund's fiscal first and third quarter-end, a complete portfolio holdings listing is filed with the SEC on Form N-Q. The form will be available on the SEC's Web site at www.sec.gov, and it also may be reviewed and copied at the SEC's Public Reference Room in Washington, D.C. Information on the operation of the SEC's Public Reference Room may be obtained by calling (800) SEC-0330. The Fund's portfolio holdings are also posted on www.dws-investments.com from time to time. Please see the Fund's current prospectus for more information.
Investment Portfolio December 31, 2012 | | | Principal Amount ($)(a) | | | Value ($) | |
| | | | |
| Corporate Bonds 84.8% | |
| Consumer Discretionary 19.5% | |
| 313 Group, Inc., 144A, 6.375%, 12/1/2019 | | | | 205,000 | | | | 203,206 | |
| AMC Entertainment, Inc., 8.75%, 6/1/2019 | | | | 765,000 | | | | 847,237 | |
| AMC Networks, Inc., 7.75%, 7/15/2021 | | | | 80,000 | | | | 91,600 | |
| Asbury Automotive Group, Inc.: | |
| 7.625%, 3/15/2017 | | | | 590,000 | | | | 609,175 | |
| 8.375%, 11/15/2020 | | | | 460,000 | | | | 510,600 | |
| Avis Budget Car Rental LLC: | |
| 8.25%, 1/15/2019 | | | | 535,000 | | | | 591,175 | |
| 9.625%, 3/15/2018 | | | | 260,000 | | | | 289,900 | |
| Block Communications, Inc., 144A, 7.25%, 2/1/2020 | | | | 375,000 | | | | 398,437 | |
| Cablevision Systems Corp.: | |
| 7.75%, 4/15/2018 | | | | 35,000 | | | | 38,938 | |
| 8.0%, 4/15/2020 | | | | 65,000 | | | | 73,206 | |
| Caesar's Entertainment Operating Co., Inc.: | | |
| 8.5%, 2/15/2020 | | | | 760,000 | | | | 754,300 | |
| 10.0%, 12/15/2018 | | | | 450,000 | | | | 298,125 | |
| 11.25%, 6/1/2017 | | | | 715,000 | | | | 765,944 | |
| Carlson Wagonlit BV, 144A, 6.875%, 6/15/2019 | | | | 215,000 | | | | 226,825 | |
| CCO Holdings LLC: | |
| 5.25%, 9/30/2022 | | | | 1,405,000 | | | | 1,422,562 | |
| 6.5%, 4/30/2021 | | | | 1,155,000 | | | | 1,245,956 | |
| 6.625%, 1/31/2022 | | | | 450,000 | | | | 491,625 | |
| 7.0%, 1/15/2019 | | | | 120,000 | | | | 129,450 | |
| 7.25%, 10/30/2017 (b) | | | | 520,000 | | | | 566,800 | |
| 7.375%, 6/1/2020 | | | | 50,000 | | | | 55,500 | |
| 7.875%, 4/30/2018 | | | | 225,000 | | | | 242,156 | |
| 8.125%, 4/30/2020 (b) | | | | 150,000 | | | | 168,000 | |
| CDR DB Sub, Inc., 144A, 7.75%, 10/15/2020 | | | | 230,000 | | | | 229,425 | |
| Cequel Communications Holdings I LLC, 144A, 6.375%, 9/15/2020 | | | | 1,215,000 | | | | 1,265,119 | |
| Chester Downs & Marina LLC, 144A, 9.25%, 2/1/2020 | | | | 145,000 | | | | 142,463 | |
| Clear Channel Worldwide Holdings, Inc.: | | |
| Series A, 144A, 6.5%, 11/15/2022 | | | | 135,000 | | | | 138,713 | |
| Series B, 144A, 6.5%, 11/15/2022 | | | | 365,000 | | | | 378,687 | |
| Series A, 7.625%, 3/15/2020 | | | | 110,000 | | | | 109,725 | |
| Series B, 7.625%, 3/15/2020 | | | | 1,115,000 | | | | 1,123,362 | |
| CSC Holdings LLC, 144A, 6.75%, 11/15/2021 | | | | 1,400,000 | | | | 1,552,250 | |
| Cumulus Media Holdings, Inc., 7.75%, 5/1/2019 (b) | | | | 250,000 | | | | 245,625 | |
| DineEquity, Inc., 9.5%, 10/30/2018 (b) | | | | 385,000 | | | | 437,456 | |
| DISH DBS Corp.: | |
| 6.75%, 6/1/2021 | | | | 50,000 | | | | 57,000 | |
| 7.125%, 2/1/2016 | | | | 465,000 | | | | 520,800 | |
| 7.875%, 9/1/2019 | | | | 270,000 | | | | 319,950 | |
| | | Principal Amount ($)(a) | | | Value ($) | |
| | | | | | | | | |
| Fontainebleau Las Vegas Holdings LLC, 144A, 11.0%, 6/15/2015* | | | | 490,000 | | | | 306 | |
| Griffey Intermediate, Inc., 144A, 7.0%, 10/15/2020 | | | | 405,000 | | | | 414,112 | |
| Harron Communications LP, 144A, 9.125%, 4/1/2020 | | | | 270,000 | | | | 295,650 | |
| Hertz Corp.: | |
| 6.75%, 4/15/2019 | | | | 90,000 | | | | 98,213 | |
| 144A, 6.75%, 4/15/2019 | | | | 215,000 | | | | 234,619 | |
| 7.5%, 10/15/2018 | | | | 905,000 | | | | 1,000,025 | |
| Jo-Ann Stores Holdings, Inc., 144A, 9.75%, 10/15/2019 (PIK) | | | | 230,000 | | | | 232,013 | |
| Lear Corp., 8.125%, 3/15/2020 | | | | 207,000 | | | | 233,393 | |
| Libbey Glass, Inc., 6.875%, 5/15/2020 | | | | 130,000 | | | | 139,750 | |
| Lions Gate Entertainment, Inc., 144A, 10.25%, 11/1/2016 | | | | 540,000 | | | | 597,375 | |
| Mediacom Broadband LLC, 144A, 6.375%, 4/1/2023 | | | | 425,000 | | | | 432,437 | |
| Mediacom LLC: | |
| 7.25%, 2/15/2022 | | | | 110,000 | | | | 118,250 | |
| 9.125%, 8/15/2019 | | | | 560,000 | | | | 620,200 | |
| MGM Resorts International: | |
| 6.625%, 12/15/2021 | | | | 590,000 | | | | 590,000 | |
| 144A, 6.75%, 10/1/2020 | | | | 170,000 | | | | 173,613 | |
| 7.5%, 6/1/2016 | | | | 205,000 | | | | 219,863 | |
| 7.625%, 1/15/2017 | | | | 560,000 | | | | 599,200 | |
| 144A, 8.625%, 2/1/2019 (b) | | | | 840,000 | | | | 936,600 | |
| 10.0%, 11/1/2016 | | | | 225,000 | | | | 260,438 | |
| National CineMedia LLC, 6.0%, 4/15/2022 | | | | 200,000 | | | | 212,000 | |
| Norcraft Companies LP, 10.5%, 12/15/2015 | | | | 1,260,000 | | | | 1,269,450 | |
| Palace Entertainment Holdings LLC, 144A, 8.875%, 4/15/2017 | | | | 435,000 | | | | 457,837 | |
| Penske Automotive Group, Inc., 144A, 5.75%, 10/1/2022 | | | | 300,000 | | | | 309,000 | |
| Petco Animal Supplies, Inc., 144A, 9.25%, 12/1/2018 | | | | 315,000 | | | | 349,650 | |
| Petco Holdings, Inc., 144A, 8.5%, 10/15/2017 (PIK) (b) | | | | 115,000 | | | | 118,163 | |
| Quebecor Media, Inc., 144A, 5.75%, 1/15/2023 | | | | 205,000 | | | | 216,019 | |
| Regal Entertainment Group, 9.125%, 8/15/2018 (b) | | | | 180,000 | | | | 200,700 | |
| Royal Caribbean Cruises Ltd., 5.25%, 11/15/2022 | | | | 155,000 | | | | 163,913 | |
| Sabre Holdings Corp., 8.35%, 3/15/2016 | | | | 305,000 | | | | 324,825 | |
| Seminole Indian Tribe of Florida: | |
| 144A, 7.75%, 10/1/2017 | | | | 200,000 | | | | 216,250 | |
| 144A, 7.804%, 10/1/2020 | | | | 380,000 | | | | 390,412 | |
| Sonic Automotive, Inc.: | |
| 144A, 7.0%, 7/15/2022 | | | | 95,000 | | | | 104,025 | |
| Series B, 9.0%, 3/15/2018 | | | | 565,000 | | | | 620,087 | |
| Sotheby's, 144A, 5.25%, 10/1/2022 | | | | 200,000 | | | | 202,000 | |
| | | Principal Amount ($)(a) | | | Value ($) | |
| | | | | | | | | |
| Toys "R" Us-Delaware, Inc., 144A, 7.375%, 9/1/2016 (b) | | | | 200,000 | | | | 204,500 | |
| Travelport LLC: | |
| 4.936%**, 9/1/2014 | | | | 390,000 | | | | 305,175 | |
| 9.0%, 3/1/2016 (b) | | | | 75,000 | | | | 58,125 | |
| UCI International, Inc., 8.625%, 2/15/2019 | | | | 310,000 | | | | 307,287 | |
| Unitymedia Hessen GmbH & Co., KG: | | |
| 144A, 5.5%, 1/15/2023 | | | | 745,000 | | | | 769,212 | |
| 144A, 7.5%, 3/15/2019 | | | | 435,000 | | | | 478,500 | |
| Unitymedia KabelBW GmbH, 144A, 9.625%, 12/1/2019 | EUR | | | 550,000 | | | | 812,727 | |
| Univision Communications, Inc.: | |
| 144A, 6.875%, 5/15/2019 | | | | 60,000 | | | | 62,400 | |
| 144A, 7.875%, 11/1/2020 | | | | 140,000 | | | | 151,550 | |
| UPC Holding BV: | |
| 144A, 8.375%, 8/15/2020 | EUR | | | 480,000 | | | | 710,873 | |
| 144A, 9.75%, 4/15/2018 | EUR | | | 425,000 | | | | 599,687 | |
| Viking Cruises Ltd., 144A, 8.5%, 10/15/2022 | | | | 205,000 | | | | 221,400 | |
| Visant Corp., 10.0%, 10/1/2017 | | | | 460,000 | | | | 412,850 | |
| Visteon Corp., 6.75%, 4/15/2019 (b) | | | | 391,000 | | | | 416,415 | |
| Yonkers Racing Corp., 144A, 11.375%, 7/15/2016 | | | | 335,000 | | | | 361,800 | |
| | | | | 34,764,181 | |
| Consumer Staples 2.6% | |
| Del Monte Corp., 7.625%, 2/15/2019 | | | | 410,000 | | | | 427,425 | |
| Dole Food Co., Inc., 144A, 8.0%, 10/1/2016 | | | | 130,000 | | | | 135,200 | |
| FAGE Dairy Industry SA, 144A, 9.875%, 2/1/2020 | | | | 810,000 | | | | 860,625 | |
| JBS U.S.A. LLC, 144A, 8.25%, 2/1/2020 | | | | 160,000 | | | | 169,600 | |
| NBTY, Inc., 9.0%, 10/1/2018 | | | | 190,000 | | | | 214,700 | |
| Pilgrim's Pride Corp., 7.875%, 12/15/2018 | | | | 290,000 | | | | 293,987 | |
| Smithfield Foods, Inc.: | |
| 6.625%, 8/15/2022 | | | | 240,000 | | | | 265,200 | |
| 7.75%, 7/1/2017 | | | | 1,180,000 | | | | 1,374,700 | |
| Tops Holding Corp.: | |
| 144A, 8.875%, 12/15/2017 | | | | 100,000 | | | | 103,750 | |
| 10.125%, 10/15/2015 | | | | 330,000 | | | | 348,150 | |
| TreeHouse Foods, Inc., 7.75%, 3/1/2018 | | | | 125,000 | | | | 135,625 | |
| U.S. Foods, Inc., 144A, 8.5%, 6/30/2019 | | | | 400,000 | | | | 408,000 | |
| | | | | 4,736,962 | |
| Energy 10.9% | |
| Access Midstream Partners LP: | | |
| 4.875%, 5/15/2023 | | | | 270,000 | | | | 274,050 | |
| 6.125%, 7/15/2022 | | | | 325,000 | | | | 350,187 | |
| Arch Coal, Inc., 7.25%, 10/1/2020 (b) | | | | 110,000 | | | | 102,025 | |
| Berry Petroleum Co., 6.75%, 11/1/2020 | | | | 335,000 | | | | 360,125 | |
| BreitBurn Energy Partners LP: | |
| 144A, 7.875%, 4/15/2022 | | | | 205,000 | | | | 212,687 | |
| 8.625%, 10/15/2020 | | | | 225,000 | | | | 245,250 | |
| Chaparral Energy, Inc., 144A, 7.625%, 11/15/2022 | | | | 235,000 | | | | 244,400 | |
| | | Principal Amount ($)(a) | | | Value ($) | |
| | | | | | | | | |
| Chesapeake Oilfield Operating LLC, 144A, 6.625%, 11/15/2019 | | | | 150,000 | | | | 141,375 | |
| Cloud Peak Energy Resources LLC: | | |
| 8.25%, 12/15/2017 | | | | 145,000 | | | | 155,150 | |
| 8.5%, 12/15/2019 | | | | 75,000 | | | | 82,313 | |
| Continental Resources, Inc.: | |
| 5.0%, 9/15/2022 | | | | 180,000 | | | | 193,950 | |
| 7.125%, 4/1/2021 | | | | 175,000 | | | | 197,750 | |
| 7.375%, 10/1/2020 | | | | 195,000 | | | | 220,350 | |
| 8.25%, 10/1/2019 | | | | 105,000 | | | | 117,600 | |
| Crestwood Midstream Partners LP, 7.75%, 4/1/2019 | | | | 610,000 | | | | 632,875 | |
| Crosstex Energy LP: | |
| 144A, 7.125%, 6/1/2022 | | | | 105,000 | | | | 109,463 | |
| 8.875%, 2/15/2018 | | | | 365,000 | | | | 394,200 | |
| Dresser-Rand Group, Inc., 6.5%, 5/1/2021 | | | | 420,000 | | | | 445,200 | |
| Eagle Rock Energy Partners LP, 8.375%, 6/1/2019 | | | | 535,000 | | | | 545,700 | |
| EP Energy LLC: | |
| 6.875%, 5/1/2019 | | | | 330,000 | | | | 358,050 | |
| 7.75%, 9/1/2022 | | | | 175,000 | | | | 185,500 | |
| 9.375%, 5/1/2020 | | | | 150,000 | | | | 169,125 | |
| EPE Holdings LLC, 144A, 8.125%, 12/15/2017 (PIK) | | | | 475,000 | | | | 470,844 | |
| EV Energy Partners LP, 8.0%, 4/15/2019 | | | | 835,000 | | | | 886,144 | |
| Frontier Oil Corp., 6.875%, 11/15/2018 | | | | 315,000 | | | | 338,625 | |
| Global Geophysical Services, Inc., 10.5%, 5/1/2017 | | | | 775,000 | | | | 689,750 | |
| Halcon Resources Corp., 144A, 9.75%, 7/15/2020 | | | | 280,000 | | | | 302,400 | |
| Holly Energy Partners LP: | |
| 144A, 6.5%, 3/1/2020 | | | | 105,000 | | | | 112,350 | |
| 8.25%, 3/15/2018 | | | | 330,000 | | | | 358,875 | |
| Linn Energy LLC: | |
| 144A, 6.25%, 11/1/2019 | | | | 595,000 | | | | 597,975 | |
| 6.5%, 5/15/2019 | | | | 115,000 | | | | 116,150 | |
| MarkWest Energy Partners LP, 5.5%, 2/15/2023 | | | | 255,000 | | | | 276,675 | |
| MEG Energy Corp.: | |
| 144A, 6.375%, 1/30/2023 | | | | 510,000 | | | | 531,675 | |
| 144A, 6.5%, 3/15/2021 | | | | 235,000 | | | | 247,337 | |
| Midstates Petroleum Co., Inc., 144A, 10.75%, 10/1/2020 | | | | 230,000 | | | | 244,375 | |
| Murray Energy Corp., 144A, 10.25%, 10/15/2015 | | | | 170,000 | | | | 164,900 | |
| Newfield Exploration Co., 7.125%, 5/15/2018 | | | | 270,000 | | | | 284,850 | |
| Northern Oil & Gas, Inc., 8.0%, 6/1/2020 | | | | 545,000 | | | | 555,900 | |
| Oasis Petroleum, Inc.: | |
| 6.5%, 11/1/2021 | | | | 175,000 | | | | 185,938 | |
| 7.25%, 2/1/2019 | | | | 665,000 | | | | 714,875 | |
| Offshore Group Investment Ltd.: | |
| 144A, 7.5%, 11/1/2019 (b) | | | | 580,000 | | | | 585,800 | |
| 11.5%, 8/1/2015 | | | | 158,000 | | | | 172,220 | |
| Plains Exploration & Production Co.: | |
| 6.125%, 6/15/2019 | | | | 215,000 | | | | 234,350 | |
| 6.75%, 2/1/2022 | | | | 525,000 | | | | 589,312 | |
| 6.875%, 2/15/2023 | | | | 510,000 | | | | 582,675 | |
| 7.625%, 6/1/2018 | | | | 320,000 | | | | 336,800 | |
| | | Principal Amount ($)(a) | | | Value ($) | |
| | | | | | | | | |
| SandRidge Energy, Inc., 7.5%, 3/15/2021 | | | | 125,000 | | | | 133,750 | |
| SESI LLC, 6.375%, 5/1/2019 | | | | 235,000 | | | | 251,450 | |
| Shelf Drilling Holdings Ltd., 144A, 8.625%, 11/1/2018 (b) | | | | 290,000 | | | | 297,250 | |
| Swift Energy Co.: | |
| 7.875%, 3/1/2022 | | | | 435,000 | | | | 454,575 | |
| 144A, 7.875%, 3/1/2022 | | | | 255,000 | | | | 266,475 | |
| Tesoro Corp.: | |
| 4.25%, 10/1/2017 | | | | 215,000 | | | | 222,525 | |
| 5.375%, 10/1/2022 | | | | 150,000 | | | | 159,750 | |
| Venoco, Inc., 8.875%, 2/15/2019 | | | | 590,000 | | | | 553,125 | |
| WPX Energy, Inc.: | |
| 5.25%, 1/15/2017 | | | | 960,000 | | | | 1,017,600 | |
| 6.0%, 1/15/2022 | | | | 705,000 | | | | 759,637 | |
| | | | | 19,434,257 | |
| Financials 13.2% | |
| Abengoa Finance SAU, 144A, 8.875%, 11/1/2017 | | | | 470,000 | | | | 441,800 | |
| AerCap Aviation Solutions BV, 6.375%, 5/30/2017 (b) | | | | 470,000 | | | | 493,500 | |
| Ally Financial, Inc.: | |
| 5.5%, 2/15/2017 | | | | 385,000 | | | | 411,859 | |
| 8.0%, 3/15/2020 | | | | 340,000 | | | | 416,500 | |
| 8.0%, 11/1/2031 | | | | 340,000 | | | | 430,525 | |
| Alphabet Holding Co., Inc., 144A, 7.75%, 11/1/2017 (PIK) | | | | 205,000 | | | | 211,150 | |
| Altice Financing SA, 144A, 7.875%, 12/15/2019 | | | | 235,000 | | | | 248,513 | |
| Altice Finco SA, 144A, 9.875%, 12/15/2020 | | | | 235,000 | | | | 253,213 | |
| AmeriGas Finance LLC: | |
| 6.75%, 5/20/2020 | | | | 110,000 | | | | 120,725 | |
| 7.0%, 5/20/2022 | | | | 110,000 | | | | 122,375 | |
| Antero Resources Finance Corp.: | | |
| 7.25%, 8/1/2019 | | | | 285,000 | | | | 310,650 | |
| 9.375%, 12/1/2017 | | | | 390,000 | | | | 428,025 | |
| AWAS Aviation Capital Ltd., 144A, 7.0%, 10/17/2016 | | | | 484,800 | | | | 511,464 | |
| BOE Merger Corp., 144A, 9.5%, 11/1/2017 (PIK) | | | | 410,000 | | | | 410,000 | |
| Caesar's Operating Escrow LLC, 144A, 9.0%, 2/15/2020 | | | | 245,000 | | | | 245,000 | |
| CIT Group, Inc.: | |
| 5.0%, 5/15/2017 | | | | 385,000 | | | | 408,100 | |
| 5.25%, 3/15/2018 | | | | 540,000 | | | | 577,800 | |
| DuPont Fabros Technology LP, (REIT), 8.5%, 12/15/2017 | | | | 435,000 | | | | 475,237 | |
| E*TRADE Financial Corp.: | |
| 6.375%, 11/15/2019 | | | | 585,000 | | | | 599,625 | |
| 6.75%, 6/1/2016 | | | | 710,000 | | | | 747,275 | |
| Fresenius Medical Care U.S. Finance II, Inc.: | | |
| 144A, 5.625%, 7/31/2019 | | | | 220,000 | | | | 236,225 | |
| 144A, 5.875%, 1/31/2022 | | | | 195,000 | | | | 211,575 | |
| Fresenius U.S. Finance II, Inc., 144A, 9.0%, 7/15/2015 | | | | 420,000 | | | | 484,050 | |
| Hellas Telecommunications Finance SCA, 144A, 8.21%**, 7/15/2015 (PIK)* | EUR | | | 322,107 | | | | 0 | |
| | | Principal Amount ($)(a) | | | Value ($) | |
| | | | | | | | | |
| Hexion U.S. Finance Corp.: | |
| 6.625%, 4/15/2020 | | | | 95,000 | | | | 96,663 | |
| 8.875%, 2/1/2018 | | | | 1,790,000 | | | | 1,839,225 | |
| International Lease Finance Corp.: | | |
| Series R, 5.65%, 6/1/2014 | | | | 340,000 | | | | 353,811 | |
| 5.75%, 5/15/2016 | | | | 105,000 | | | | 110,679 | |
| 6.25%, 5/15/2019 | | | | 320,000 | | | | 340,800 | |
| 8.625%, 9/15/2015 | | | | 235,000 | | | | 264,081 | |
| 8.625%, 1/15/2022 (b) | | | | 310,000 | | | | 382,850 | |
| 8.75%, 3/15/2017 | | | | 370,000 | | | | 427,350 | |
| JBS Finance II Ltd., 144A, 8.25%, 1/29/2018 | | | | 255,000 | | | | 270,300 | |
| Level 3 Financing, Inc.: | |
| 144A, 7.0%, 6/1/2020 | | | | 750,000 | | | | 783,750 | |
| 8.125%, 7/1/2019 | | | | 670,000 | | | | 730,300 | |
| 8.625%, 7/15/2020 (b) | | | | 510,000 | | | | 566,100 | |
| MPT Operating Partnership LP: | | |
| (REIT), 6.375%, 2/15/2022 | | | | 185,000 | | | | 194,250 | |
| (REIT), 6.875%, 5/1/2021 | | | | 295,000 | | | | 320,075 | |
| National Money Mart Co., 10.375%, 12/15/2016 | | | | 790,000 | | | | 872,950 | |
| Neuberger Berman Group LLC: | |
| 144A, 5.625%, 3/15/2020 | | | | 160,000 | | | | 167,600 | |
| 144A, 5.875%, 3/15/2022 | | | | 265,000 | | | | 280,900 | |
| Nielsen Finance LLC, 144A, 4.5%, 10/1/2020 | | | | 150,000 | | | | 149,250 | |
| NII Capital Corp., 7.625%, 4/1/2021 | | | | 395,000 | | | | 299,213 | |
| Pinnacle Foods Finance LLC: | |
| 8.25%, 9/1/2017 | | | | 425,000 | | | | 452,625 | |
| 9.25%, 4/1/2015 | | | | 261,000 | | | | 264,915 | |
| Reynolds Group Issuer, Inc.: | |
| 144A, 5.75%, 10/15/2020 | | | | 405,000 | | | | 418,162 | |
| 6.875%, 2/15/2021 | | | | 540,000 | | | | 581,850 | |
| 7.125%, 4/15/2019 | | | | 415,000 | | | | 446,125 | |
| 8.25%, 2/15/2021 | | | | 225,000 | | | | 228,375 | |
| 8.5%, 5/15/2018 | | | | 455,000 | | | | 466,375 | |
| 9.875%, 8/15/2019 | | | | 125,000 | | | | 133,750 | |
| Schaeffler Finance BV: | |
| 144A, 7.75%, 2/15/2017 | | | | 420,000 | | | | 466,200 | |
| 144A, 8.5%, 2/15/2019 | | | | 200,000 | | | | 226,000 | |
| Serta Simmons Holdings LLC, 144A, 8.125%, 10/1/2020 | | | | 230,000 | | | | 230,000 | |
| Sky Growth Acquisition Corp., 144A, 7.375%, 10/15/2020 | | | | 175,000 | | | | 174,125 | |
| Telenet Finance V Luxembourg SCA: | | |
| 144A, 6.25%, 8/15/2022 | EUR | | | 235,000 | | | | 331,281 | |
| 144A, 6.75%, 8/15/2024 | EUR | | | 235,000 | | | | 331,902 | |
| Tronox Finance LLC, 144A, 6.375%, 8/15/2020 | | | | 255,000 | | | | 257,550 | |
| UPCB Finance III Ltd., 144A, 6.625%, 7/1/2020 | | | | 185,000 | | | | 198,181 | |
| UPCB Finance V Ltd., 144A, 7.25%, 11/15/2021 | | | | 230,000 | | | | 253,000 | |
| Virgin Media Finance PLC, 4.875%, 2/15/2022 | | | | 260,000 | | | | 265,850 | |
| Wind Acquisition Finance SA, 144A, 7.25%, 2/15/2018 | | | | 410,000 | | | | 415,125 | |
| WMG Acquisition Corp., 144A, 6.0%, 1/15/2021 | | | | 100,000 | | | | 105,500 | |
| | | | | 23,492,224 | |
| | | Principal Amount ($)(a) | | | Value ($) | |
| | | | | | | | | |
| Health Care 4.7% | |
| Aviv Healthcare Properties LP, 7.75%, 2/15/2019 | | | | 500,000 | | | | 530,000 | |
| Biomet, Inc.: | |
| 144A, 6.5%, 8/1/2020 | | | | 355,000 | | | | 377,187 | |
| 144A, 6.5%, 10/1/2020 | | | | 100,000 | | | | 99,375 | |
| Community Health Systems, Inc.: | | |
| 5.125%, 8/15/2018 | | | | 1,155,000 | | | | 1,204,087 | |
| 7.125%, 7/15/2020 | | | | 635,000 | | | | 677,862 | |
| HCA, Inc.: | |
| 5.875%, 3/15/2022 | | | | 275,000 | | | | 299,063 | |
| 6.5%, 2/15/2020 | | | | 890,000 | | | | 1,001,250 | |
| 7.5%, 2/15/2022 | | | | 605,000 | | | | 692,725 | |
| Hologic, Inc., 144A, 6.25%, 8/1/2020 | | | | 200,000 | | | | 215,500 | |
| IMS Health, Inc., 144A, 6.0%, 11/1/2020 | | | | 250,000 | | | | 261,875 | |
| Mylan, Inc., 144A, 7.875%, 7/15/2020 | | | | 185,000 | | | | 218,626 | |
| Physio-Control International, Inc., 144A, 9.875%, 1/15/2019 | | | | 315,000 | | | | 345,713 | |
| STHI Holding Corp., 144A, 8.0%, 3/15/2018 | | | | 345,000 | | | | 373,463 | |
| Tenet Healthcare Corp., 6.25%, 11/1/2018 | | | | 1,470,000 | | | | 1,613,325 | |
| Warner Chilcott Co., LLC, 7.75%, 9/15/2018 | | | | 420,000 | | | | 447,300 | |
| | | | | 8,357,351 | |
| Industrials 7.6% | |
| Accuride Corp., 9.5%, 8/1/2018 | | | | 465,000 | | | | 448,725 | |
| Aguila 3 SA, 144A, 7.875%, 1/31/2018 | | | | 480,000 | | | | 508,800 | |
| Air Lease Corp., 5.625%, 4/1/2017 (b) | | | | 445,000 | | | | 471,700 | |
| Armored Autogroup, Inc., 9.25%, 11/1/2018 | | | | 610,000 | | | | 516,975 | |
| BakerCorp International, Inc., 8.25%, 6/1/2019 | | | | 335,000 | | | | 335,000 | |
| BE Aerospace, Inc., 6.875%, 10/1/2020 | | | | 180,000 | | | | 200,250 | |
| Belden, Inc., 144A, 5.5%, 9/1/2022 | | | | 355,000 | | | | 364,763 | |
| Bombardier, Inc., 144A, 5.75%, 3/15/2022 (b) | | | | 430,000 | | | | 441,825 | |
| Briggs & Stratton Corp., 6.875%, 12/15/2020 | | | | 160,000 | | | | 181,000 | |
| Casella Waste Systems, Inc., 7.75%, 2/15/2019 | | | | 415,000 | | | | 394,250 | |
| CHC Helicopter SA, 9.25%, 10/15/2020 | | | | 540,000 | | | | 568,350 | |
| Clean Harbors, Inc., 144A, 5.125%, 6/1/2021 | | | | 240,000 | | | | 248,400 | |
| Ducommun, Inc., 9.75%, 7/15/2018 | | | | 305,000 | | | | 327,875 | |
| DynCorp International, Inc., 10.375%, 7/1/2017 | | | | 490,000 | | | | 448,350 | |
| Florida East Coast Railway Corp., 8.125%, 2/1/2017 | | | | 225,000 | | | | 238,500 | |
| FTI Consulting, Inc., 144A, 6.0%, 11/15/2022 | | | | 205,000 | | | | 212,175 | |
| Garda World Security Corp., 144A, 9.75%, 3/15/2017 | | | | 375,000 | | | | 392,813 | |
| | | Principal Amount ($)(a) | | | Value ($) | |
| | | | | | | | | |
| Huntington Ingalls Industries, Inc.: | | |
| 6.875%, 3/15/2018 | | | | 280,000 | | | | 304,500 | |
| 7.125%, 3/15/2021 (b) | | | | 60,000 | | | | 65,250 | |
| Interline Brands, Inc., 7.5%, 11/15/2018 | | | | 295,000 | | | | 318,600 | |
| Iron Mountain, Inc., 5.75%, 8/15/2024 | | | | 355,000 | | | | 359,438 | |
| Kenan Advantage Group, Inc., 144A, 8.375%, 12/15/2018 | | | | 410,000 | | | | 418,200 | |
| Meritor, Inc., 8.125%, 9/15/2015 (b) | | | | 410,000 | | | | 431,525 | |
| Navios Maritime Holdings, Inc.: | | |
| 8.125%, 2/15/2019 (b) | | | | 760,000 | | | | 661,200 | |
| 8.875%, 11/1/2017 | | | | 210,000 | | | | 209,475 | |
| Navios South American Logistics, Inc., 9.25%, 4/15/2019 | | | | 295,000 | | | | 289,469 | |
| Nortek, Inc., 8.5%, 4/15/2021 | | | | 440,000 | | | | 488,400 | |
| Ply Gem Industries, Inc., 144A, 9.375%, 4/15/2017 | | | | 170,000 | | | | 181,050 | |
| Sitel LLC, 11.5%, 4/1/2018 | | | | 565,000 | | | | 398,325 | |
| Spirit AeroSystems, Inc.: | |
| 6.75%, 12/15/2020 | | | | 205,000 | | | | 219,350 | |
| 7.5%, 10/1/2017 | | | | 215,000 | | | | 230,050 | |
| Titan International, Inc., 7.875%, 10/1/2017 | | | | 525,000 | | | | 557,812 | |
| United Rentals North America, Inc.: | | |
| 144A, 5.75%, 7/15/2018 | | | | 365,000 | | | | 393,287 | |
| 6.125%, 6/15/2023 | | | | 25,000 | | | | 26,375 | |
| 144A, 7.375%, 5/15/2020 | | | | 595,000 | | | | 653,012 | |
| 144A, 7.625%, 4/15/2022 | | | | 595,000 | | | | 664,912 | |
| Welltec AS, 144A, 8.0%, 2/1/2019 | | | | 400,000 | | | | 424,000 | |
| | | | | 13,593,981 | |
| Information Technology 4.2% | |
| Alliance Data Systems Corp., 144A, 5.25%, 12/1/2017 | | | | 255,000 | | | | 258,825 | |
| Avaya, Inc., 144A, 7.0%, 4/1/2019 | | | | 830,000 | | | | 776,050 | |
| CDW LLC, 8.5%, 4/1/2019 | | | | 1,180,000 | | | | 1,277,350 | |
| CommScope, Inc., 144A, 8.25%, 1/15/2019 | | | | 485,000 | | | | 531,075 | |
| CyrusOne LP, 144A, 6.375%, 11/15/2022 | | | | 105,000 | | | | 109,463 | |
| eAccess Ltd., 144A, 8.25%, 4/1/2018 | | | | 335,000 | | | | 375,200 | |
| Equinix, Inc.: | |
| 7.0%, 7/15/2021 | | | | 215,000 | | | | 238,650 | |
| 8.125%, 3/1/2018 | | | | 120,000 | | | | 132,300 | |
| First Data Corp.: | |
| 144A, 6.75%, 11/1/2020 | | | | 940,000 | | | | 949,400 | |
| 144A, 7.375%, 6/15/2019 | | | | 250,000 | | | | 258,750 | |
| 144A, 8.875%, 8/15/2020 | | | | 495,000 | | | | 539,550 | |
| Freescale Semiconductor, Inc., 144A, 9.25%, 4/15/2018 | | | | 990,000 | | | | 1,081,575 | |
| Hughes Satellite Systems Corp.: | | |
| 6.5%, 6/15/2019 | | | | 225,000 | | | | 248,062 | |
| 7.625%, 6/15/2021 | | | | 230,000 | | | | 261,625 | |
| IAC/InterActiveCorp., 144A, 4.75%, 12/15/2022 | | | | 215,000 | | | | 213,925 | |
| | | Principal Amount ($)(a) | | | Value ($) | |
| | | | | | | | | |
| SunGard Data Systems, Inc., 144A, 6.625%, 11/1/2019 | | | | 255,000 | | | | 260,737 | |
| | | | | 7,512,537 | |
| Materials 7.2% | |
| APERAM: | |
| 144A, 7.375%, 4/1/2016 | | | | 215,000 | | | | 200,488 | |
| 144A, 7.75%, 4/1/2018 | | | | 260,000 | | | | 228,800 | |
| Berry Plastics Corp.: | |
| 9.5%, 5/15/2018 | | | | 390,000 | | | | 429,000 | |
| 9.75%, 1/15/2021 (b) | | | | 460,000 | | | | 530,150 | |
| Clearwater Paper Corp., 7.125%, 11/1/2018 | | | | 390,000 | | | | 425,100 | |
| Continental Rubber of America Corp., 144A, 4.5%, 9/15/2019 | | | | 160,000 | | | | 163,743 | |
| Crown Americas LLC, 6.25%, 2/1/2021 | | | | 50,000 | | | | 54,813 | |
| Essar Steel Algoma, Inc.: | |
| 144A, 9.375%, 3/15/2015 | | | | 1,410,000 | | | | 1,276,050 | |
| 144A, 9.875%, 6/15/2015 | | | | 195,000 | | | | 133,575 | |
| Exopack Holding Corp., 10.0%, 6/1/2018 | | | | 230,000 | | | | 208,150 | |
| FMG Resources (August 2006) Pty Ltd.: | | |
| 144A, 6.0%, 4/1/2017 | | | | 315,000 | | | | 321,300 | |
| 144A, 6.875%, 4/1/2022 | | | | 225,000 | | | | 230,062 | |
| 144A, 7.0%, 11/1/2015 | | | | 360,000 | | | | 378,000 | |
| 144A, 8.25%, 11/1/2019 | | | | 270,000 | | | | 287,550 | |
| Huntsman International LLC: | |
| 144A, 4.875%, 11/15/2020 | | | | 230,000 | | | | 232,587 | |
| 8.625%, 3/15/2020 | | | | 330,000 | | | | 373,725 | |
| 8.625%, 3/15/2021 | | | | 335,000 | | | | 382,737 | |
| IAMGOLD Corp., 144A, 6.75%, 10/1/2020 | | | | 310,000 | | | | 302,250 | |
| Ineos Finance PLC, 144A, 7.5%, 5/1/2020 | | | | 155,000 | | | | 162,363 | |
| Inmet Mining Corp.: | |
| 144A, 7.5%, 6/1/2021 | | | | 610,000 | | | | 632,875 | |
| 144A, 8.75%, 6/1/2020 | | | | 190,000 | | | | 207,575 | |
| JMC Steel Group, 144A, 8.25%, 3/15/2018 | | | | 350,000 | | | | 365,750 | |
| Kaiser Aluminum Corp., 8.25%, 6/1/2020 | | | | 260,000 | | | | 283,400 | |
| Koppers, Inc., 7.875%, 12/1/2019 | | | | 440,000 | | | | 484,000 | |
| LyondellBasell Industries NV, 5.0%, 4/15/2019 | | | | 320,000 | | | | 353,600 | |
| Molycorp, Inc., 144A, 10.0%, 6/1/2020 | | | | 410,000 | | | | 381,300 | |
| Momentive Performance Materials, Inc.: | | |
| 144A, 8.875%, 10/15/2020 (b) | | | | 285,000 | | | | 287,850 | |
| 9.5%, 1/15/2021 | EUR | | | 385,000 | | | | 370,972 | |
| Novelis, Inc., 8.375%, 12/15/2017 | | | | 85,000 | | | | 93,713 | |
| OI European Group BV, 144A, 6.75%, 9/15/2020 | EUR | | | 130,000 | | | | 194,759 | |
| Packaging Dynamics Corp., 144A, 8.75%, 2/1/2016 | | | | 535,000 | | | | 559,075 | |
| Polymer Group, Inc., 7.75%, 2/1/2019 | | | | 300,000 | | | | 321,750 | |
| Rain CII Carbon LLC: | |
| 144A, 8.0%, 12/1/2018 | | | | 270,000 | | | | 274,725 | |
| 144A, 8.25%, 1/15/2021 | | | | 200,000 | | | | 204,500 | |
| | | Principal Amount ($)(a) | | | Value ($) | |
| | | | | | | | | |
| Sealed Air Corp.: | |
| 144A, 8.125%, 9/15/2019 | | | | 150,000 | | | | 168,750 | |
| 144A, 8.375%, 9/15/2021 | | | | 150,000 | | | | 171,375 | |
| Viskase Companies, Inc., 144A, 9.875%, 1/15/2018 | | | | 940,000 | | | | 958,800 | |
| Wolverine Tube, Inc., 6.0%, 6/28/2014 (PIK) | | | | 158,940 | | | | 155,602 | |
| | | | | 12,790,814 | |
| Telecommunication Services 12.5% | |
| Cincinnati Bell, Inc.: | |
| 8.25%, 10/15/2017 | | | | 1,020,000 | | | | 1,099,050 | |
| 8.375%, 10/15/2020 | | | | 1,030,000 | | | | 1,114,975 | |
| 8.75%, 3/15/2018 | | | | 350,000 | | | | 361,375 | |
| CPI International, Inc., 8.0%, 2/15/2018 | | | | 260,000 | | | | 253,825 | |
| Cricket Communications, Inc., 7.75%, 10/15/2020 | | | | 1,595,000 | | | | 1,626,900 | |
| Crown Castle International Corp., 144A, 5.25%, 1/15/2023 | | | | 130,000 | | | | 139,100 | |
| Digicel Group Ltd.: | |
| 144A, 8.25%, 9/30/2020 | | | | 790,000 | | | | 869,000 | |
| 144A, 10.5%, 4/15/2018 | | | | 495,000 | | | | 544,500 | |
| Digicel Ltd.: | |
| 144A, 7.0%, 2/15/2020 | | | | 200,000 | | | | 214,000 | |
| 144A, 8.25%, 9/1/2017 | | | | 1,090,000 | | | | 1,166,300 | |
| ERC Ireland Preferred Equity Ltd., 144A, 7.69%**, 2/15/2017 (PIK)* | EUR | | | 709,137 | | | | 281 | |
| Frontier Communications Corp.: | |
| 7.125%, 1/15/2023 (b) | | | | 375,000 | | | | 397,500 | |
| 7.875%, 4/15/2015 | | | | 43,000 | | | | 48,053 | |
| 8.25%, 4/15/2017 | | | | 395,000 | | | | 456,225 | |
| 8.5%, 4/15/2020 | | | | 490,000 | | | | 563,500 | |
| 8.75%, 4/15/2022 | | | | 560,000 | | | | 649,600 | |
| Intelsat Jackson Holdings SA: | |
| 7.25%, 10/15/2020 | | | | 695,000 | | | | 755,812 | |
| 7.5%, 4/1/2021 (b) | | | | 855,000 | | | | 942,637 | |
| 8.5%, 11/1/2019 (b) | | | | 580,000 | | | | 649,600 | |
| Intelsat Luxembourg SA: | |
| 11.25%, 2/4/2017 | | | | 1,450,000 | | | | 1,533,375 | |
| 11.5%, 2/4/2017 (PIK) | | | | 1,785,625 | | | | 1,897,227 | |
| Level 3 Communications, Inc., 144A, 8.875%, 6/1/2019 (b) | | | | 55,000 | | | | 58,575 | |
| MetroPCS Wireless, Inc.: | |
| 6.625%, 11/15/2020 | | | | 705,000 | | | | 749,062 | |
| 7.875%, 9/1/2018 | | | | 420,000 | | | | 454,650 | |
| Pacnet Ltd., 144A, 9.25%, 11/9/2015 | | | | 225,000 | | | | 230,063 | |
| SBA Communications Corp., 144A, 5.625%, 10/1/2019 | | | | 200,000 | | | | 210,000 | |
| Sprint Nextel Corp.: | |
| 6.0%, 12/1/2016 | | | | 2,025,000 | | | | 2,202,187 | |
| 9.125%, 3/1/2017 | | | | 310,000 | | | | 365,025 | |
| Syniverse Holdings, Inc., 9.125%, 1/15/2019 | | | | 130,000 | | | | 138,775 | |
| tw telecom holdings, Inc., 144A, 5.375%, 10/1/2022 | | | | 280,000 | | | | 293,300 | |
| Windstream Corp.: | |
| 7.0%, 3/15/2019 | | | | 430,000 | | | | 439,675 | |
| 7.5%, 6/1/2022 | | | | 170,000 | | | | 180,200 | |
| 7.5%, 4/1/2023 | | | | 420,000 | | | | 442,050 | |
| | | Principal Amount ($)(a) | | | Value ($) | |
| | | | | | | | | |
| 7.75%, 10/15/2020 | | | | 180,000 | | | | 194,400 | |
| 7.75%, 10/1/2021 | | | | 310,000 | | | | 334,800 | |
| 7.875%, 11/1/2017 | | | | 495,000 | | | | 556,875 | |
| 8.125%, 9/1/2018 (b) | | | | 180,000 | | | | 196,650 | |
| | | | | 22,329,122 | |
| Utilities 2.4% | |
| AES Corp.: | |
| 8.0%, 10/15/2017 | | | | 415,000 | | | | 479,325 | |
| 8.0%, 6/1/2020 | | | | 525,000 | | | | 603,750 | |
| Calpine Corp.: | |
| 144A, 7.5%, 2/15/2021 | | | | 436,000 | | | | 481,780 | |
| 144A, 7.875%, 7/31/2020 | | | | 306,000 | | | | 343,485 | |
| Energy Future Holdings Corp., Series Q, 6.5%, 11/15/2024 | | | | 1,110,000 | | | | 660,450 | |
| Energy Future Intermediate Holding Co., LLC: | | |
| 10.0%, 12/1/2020 | | | | 125,000 | | | | 140,938 | |
| 144A, 11.75%, 3/1/2022 | | | | 1,100,000 | | | | 1,221,000 | |
| NRG Energy, Inc.: | |
| 7.625%, 1/15/2018 | | | | 200,000 | | | | 222,000 | |
| 8.25%, 9/1/2020 | | | | 65,000 | | | | 72,800 | |
| Texas Competitive Electric Holdings Co., LLC, Series A, 10.25%, 11/1/2015 | | | | 275,000 | | | | 79,750 | |
| | | | | 4,305,278 | |
Total Corporate Bonds (Cost $145,509,565) | | | | 151,316,707 | |
| | |
| Loan Participations and Assignments 0.4% | |
| Senior Loans** | |
| Alliance Mortgage Cycle Loan, Term Loan A, 9.5%, 6/15/2010* | | | | 700,000 | | | | 0 | |
| Buffets, Inc., Letter of Credit, First Lien, LIBOR plus 9.25%, 4/22/2015* | | | | 80,862 | | | | 39,781 | |
| Caesars Entertainment Operating Co., Term Loan B6, 5.46%, 1/26/2018 | | | | 234,000 | | | | 209,513 | |
| Chesapeake Energy Corp., Term Loan, 5.75%, 12/1/2017 | | | | 400,000 | | | | 401,176 | |
Total Loan Participations and Assignments (Cost $1,400,435) | | | | 650,470 | |
| | |
| Convertible Bonds 1.3% | |
| Consumer Discretionary 0.4% | |
| Group 1 Automotive, Inc., 3.0%, 3/15/2020 | | | | 375,000 | | | | 663,281 | |
| Industrials 0.1% | |
| Meritor, Inc., Step-down Coupon, 4.625% to 3/1/2016, 0% to 3/1/2026 | | | | 125,000 | | | | 116,641 | |
| Materials 0.8% | |
| GEO Specialty Chemicals, Inc., 144A, 7.5%, 3/31/2015 (PIK) | | | | 1,297,793 | | | | 1,538,014 | |
Total Convertible Bonds (Cost $1,756,991) | | | | 2,317,936 | |
| | |
| | | Principal Amount ($)(a) | | | Value ($) | |
| | | | | | | | | |
| Preferred Securities 0.8% | |
| Financials 0.3% | |
| Citigroup, Inc., Series A, 5.95%, 1/30/2023 (c) | | | | 505,000 | | | | 511,312 | |
| Materials 0.5% | |
| Hercules, Inc., 6.5%, 6/30/2029 | | | | 1,135,000 | | | | 1,013,578 | |
Total Preferred Securities (Cost $1,256,468) | | | | 1,524,890 | |
| | | Units | | | Value ($) | |
| | | | |
| Other Investments 0.1% | |
| Consumer Discretionary | |
| AOT Bedding Super Holdings LLC* (d) (Cost $31,000) | | | 31 | | | | 107,806 | |
| | | Shares | | | Value ($) | |
| | | | |
| Common Stocks 0.1% | |
| Consumer Discretionary 0.0% | |
| Buffets Restaurants Holdings, Inc.* | | | 661 | | | | 6,941 | |
| Trump Entertainment Resorts, Inc.* | | | 45 | | | | 0 | |
| Vertis Holdings, Inc.* | | | 676 | | | | 0 | |
| | | | | | | | 6,941 | |
| Industrials 0.0% | |
| Congoleum Corp.* | | | 24,000 | | | | 0 | |
| Materials 0.1% | |
| GEO Specialty Chemicals, Inc.* | | | 24,225 | | | | 11,022 | |
| GEO Specialty Chemicals, Inc. 144A* | | | 2,206 | | | | 1,004 | |
| Wolverine Tube, Inc.* | | | 7,045 | | | | 127,656 | |
| | | | | | | | 139,682 | |
Total Common Stocks (Cost $474,190) | | | | 146,623 | |
| | |
| Preferred Stock 0.4% | |
| Financials | |
| Ally Financial, Inc. 144A, 7.0% (Cost $738,837) | | | 810 | | | | 795,597 | |
| | |
| Warrants 0.0% | |
| Consumer Discretionary 0.0% | |
| Reader's Digest Association, Inc., Expiration Date 2/19/2014* | | | 1,115 | | | | 189 | |
| Materials 0.0% | |
| GEO Specialty Chemicals, Inc., Expiration Date 3/31/2015* | | | 119,802 | | | | 53,432 | |
| Hercules Trust II, Expiration Date 3/31/2029* | | | 1,100 | | | | 9,606 | |
| | | | | | | | 63,038 | |
Total Warrants (Cost $244,286) | | | | 63,227 | |
| | |
| Securities Lending Collateral 5.0% | |
| Daily Assets Fund Institutional, 0.20% (e) (f) (Cost $8,880,988) | | | 8,880,988 | | | | 8,880,988 | |
| | |
| | | Shares | | | Value ($) | |
| | | | | | | | | |
| Cash Equivalents 10.4% | |
| Central Cash Management Fund, 0.15% (e) (Cost $18,542,026) | | | 18,542,026 | | | | 18,542,026 | |
| | | % of Net Assets | | | Value ($) | |
| | | | |
Total Investment Portfolio (Cost $178,834,786)† | | | 103.3 | | | | 184,346,270 | |
| Other Assets and Liabilities, Net | | | (3.3 | ) | | | (5,943,672 | ) |
| Net Assets | | | 100.0 | | | | 178,402,598 | |
The following table represents bonds and senior loans that are in default:
| Securities | | Coupon | | Maturity Date | | Principal Amount | | Cost ($) | | | Value ($) | |
| Alliance Mortgage Cycle Loan* | | | 9.5 | % | 6/15/2010 | | | 700,000 | | USD | | | 700,000 | | | | 0 | |
| Buffets, Inc.* | | LIBOR plus 9.25 | % | 4/22/2015 | | | 80,862 | | USD | | | 78,246 | | | | 39,781 | |
| ERC Ireland Preferred Equity Ltd.* | | | 7.69 | % | 2/15/2017 | | | 709,137 | | EUR | | | 965,174 | | | | 281 | |
| Fontainebleau Las Vegas Holdings LLC* | | | 11.0 | % | 6/15/2015 | | | 490,000 | | USD | | | 490,576 | | | | 306 | |
| Hellas Telecommunications Finance SCA* | | | 8.21 | % | 7/15/2015 | | | 322,107 | | EUR | | | 92,199 | | | | 0 | |
| | | | | | | | | | | | | | 2,326,195 | | | | 40,368 | |
* Non-income producing security.
** Floating rate securities' yields vary with a designated market index or market rate, such as the coupon-equivalent of the U.S. Treasury Bill rate. These securities are shown at their current rate as of December 31, 2012.
† The cost for federal income tax purposes was $178,834,786. At December 31, 2012, net unrealized appreciation for all securities based on tax cost was $5,511,484. This consisted of aggregate gross unrealized appreciation for all securities in which there was an excess of value over tax cost of $9,988,367 and aggregate gross unrealized depreciation for all securities in which there was an excess of tax cost over value of $4,476,883.
(a) Principal amount stated in U.S. dollars unless otherwise noted.
(b) All or a portion of these securities were on loan (see Notes to Financial Statements). The value of all securities loaned at December 31, 2012 amounted to $8,521,935, which is 4.8% of net assets.
(c) Date shown is call date; not a maturity date for the perpetual preferred securities.
(d) The Fund may purchase securities that are subject to legal or contractual restrictions on resale ("restricted securities"). Restricted securities are securities which have not been registered with the Securities and Exchange Commission under the Securities Act of 1933. The Fund may be unable to sell a restricted security and it may be more difficult to determine a market value for a restricted security. Moreover, if adverse market conditions were to develop during the period between the Fund's decision to sell a restricted security and the point at which the Fund is permitted or able to sell such security, the Fund might obtain a price less favorable than the price that prevailed when it decided to sell. This investment practice, therefore, could have the effect of increasing the level of illiquidity of the Fund. The future value of these securities is uncertain and there may be changes in the estimated value of these securities.
| Schedule of Restricted Securities | Acquisition Date | | Cost ($) | | | Value ($) | | | Value as % of Net Assets | |
| AOT Bedding Super Holdings LLC* | June 2010 | | | 31,000 | | | | 107,806 | | | | 0.06 | |
(e) Affiliated fund managed by Deutsche Investment Management Americas Inc. The rate shown is the annualized seven-day yield at period end.
(f) Represents collateral held in connection with securities lending. Income earned by the Fund is net of borrower rebates.
144A: Security exempt from registration under Rule 144A of the Securities Act of 1933. These securities may be resold in transactions exempt from registration, normally to qualified institutional buyers.
LIBOR: London Interbank Offered Rate
PIK: Denotes that all or a portion of the income is paid in-kind in the form of additional principal.
REIT: Real Estate Investment Trust
At December 31, 2012, open credit default swap contracts sold were as follows:
Effective/ Expiration Date | | Notional Amount ($) (g) | | | Fixed Cash Flows Received | | Underlying Debt Obligation/ Quality Rating (h) | | Value ($) | | | Upfront Payments Paid/ (Received) ($) | | | Unrealized Appreciation/ (Depreciation) ($) | |
12/20/2011 3/20/2017 | | | 370,000 | 1 | | | 5.0 | % | CIT Group, Inc., 5.5%, 2/15/2019, BB- | | | 41,245 | | | | 13,152 | | | | 28,093 | |
6/21/2010 9/20/2013 | | | 380,000 | 2 | | | 5.0 | % | Ford Motor Co., 6.5%, 8/1/2018, BBB- | | | 13,059 | | | | 4,658 | | | | 8,401 | |
6/21/2010 9/20/2013 | | | 385,000 | 3 | | | 5.0 | % | Ford Motor Co., 6.5%, 8/1/2018, BBB- | | | 13,232 | | | | (13,475 | ) | | | 26,707 | |
6/21/2010 9/20/2013 | | | 525,000 | 3 | | | 5.0 | % | Ford Motor Co., 6.5%, 8/1/2018, BBB- | | | 18,043 | | | | (15,094 | ) | | | 33,137 | |
6/21/2010 9/20/2013 | | | 320,000 | 3 | | | 5.0 | % | Ford Motor Co., 6.5%, 8/1/2018, BBB- | | | 10,997 | | | | (9,200 | ) | | | 20,197 | |
6/21/2010 9/20/2015 | | | 215,000 | 1 | | | 5.0 | % | Ford Motor Co., 6.5%, 8/1/2018, BBB- | | | 21,589 | | | | (19,350 | ) | | | 40,939 | |
6/21/2010 9/20/2015 | | | 105,000 | 1 | | | 5.0 | % | Ford Motor Co., 6.5%, 8/1/2018, BBB- | | | 10,544 | | | | (8,400 | ) | | | 18,944 | |
6/21/2010 9/20/2015 | | | 100,000 | 3 | | | 5.0 | % | Ford Motor Co., 6.5%, 8/1/2018, BBB- | | | 10,042 | | | | (6,896 | ) | | | 16,938 | |
6/21/2010 9/20/2015 | | | 560,000 | 4 | | | 5.0 | % | Ford Motor Co., 6.5%, 8/1/2018, BBB- | | | 56,233 | | | | (9,983 | ) | | | 66,216 | |
6/21/2010 9/20/2015 | | | 175,000 | 5 | | | 5.0 | % | Ford Motor Co., 6.5%, 8/1/2018, BBB- | | | 17,573 | | | | (16,625 | ) | | | 34,198 | |
6/20/2011 9/20/2016 | | | 575,000 | 4 | | | 5.0 | % | Ford Motor Co., 6.5%, 8/1/2018, BBB- | | | 70,593 | | | | 39,538 | | | | 31,055 | |
3/21/2011 6/20/2016 | | | 1,085,000 | 6 | | | 5.0 | % | Ford Motor Credit Co., LLC, 5.0%, 5/15/2018, BBB- | | | 147,112 | | | | 90,200 | | | | 56,912 | |
6/20/2011 9/20/2016 | | | 440,000 | 6 | | | 5.0 | % | Forest Oil Corp., 7.25%, 6/15/2019, B | | | 2,220 | | | | 12,196 | | | | (9,976 | ) |
9/20/2011 12/20/2016 | | | 250,000 | 6 | | | 5.0 | % | Forest Oil Corp., 7.25%, 6/15/2019, B | | | (739 | ) | | | (3,874 | ) | | | 3,135 | |
9/20/2011 12/20/2016 | | | 165,000 | 3 | | | 5.0 | % | Forest Oil Corp., 7.25%, 6/15/2019, B | | | (488 | ) | | | (2,557 | ) | | | 2,069 | |
6/20/2011 9/20/2015 | | | 1,145,000 | 3 | | | 5.0 | % | HCA, Inc., 6.375%, 1/15/2015, B- | | | 99,568 | | | | 39,635 | | | | 59,933 | |
3/21/2011 6/20/2016 | | | 610,000 | 5 | | | 5.0 | % | HCA, Inc., 6.375%, 1/15/2015, B- | | | 53,189 | | | | 15,834 | | | | 37,355 | |
9/20/2012 12/20/2017 | | | 8,000,000 | 1 | | | 5.0 | % | Markit Dow Jones CDX North America High Yield Index | | | 58,388 | | | | 54,400 | | | | 3,988 | |
9/20/2012 12/20/2017 | | | 3,000,000 | 5 | | | 5.0 | % | Markit Dow Jones CDX North America High Yield Index | | | 21,896 | | | | (12,883 | ) | | | 34,779 | |
9/20/2012 12/20/2017 | | | 2,000,000 | 2 | | | 5.0 | % | Markit Dow Jones CDX North America High Yield Index | | | 14,597 | | | | 618 | | | | 13,979 | |
9/20/2012 12/20/2017 | | | 485,000 | 7 | | | 5.0 | % | General Motors Co., 3.3%, 12/20/2017, BB+ | | | 44,318 | | | | 35,820 | | | | 8,498 | |
| Total net unrealized appreciation | | | | 535,497 | |
(g) The maximum potential amount of future undiscounted payments that the Fund could be required to make under a credit default swap contract would be the notional amount of the contract. These potential amounts would be partially offset by any recovery values of the referenced debt obligation or net amounts received from the settlement of buy protection credit default swap contracts entered into by the Fund for the same referenced debt obligation, if any.
(h) The quality ratings represent the higher of Moody's Investors Service, Inc. ("Moody's") or Standard & Poor's Corporation ("S&P") credit ratings and are unaudited.
Counterparties:
1 Credit Suisse
2 Citigroup, Inc.
3 The Goldman Sachs & Co.
4 Bank of America
5 JPMorgan Chase Securities, Inc.
6 Barclays Bank PLC
7 UBS AG
At December 31, 2012, the Fund had the following open forward foreign currency exchange contracts:
| Contracts to Deliver | | In Exchange For | | Settlement Date | | Unrealized Appreciation ($) | | Counterparty |
| EUR | | | 2,524,100 | | USD | | | 3,344,183 | | 1/30/2013 | | | 11,586 | | Citigroup, Inc. |
| Currency Abbreviations |
EUR Euro USD United States Dollar |
For information on the Fund's policy and additional disclosures regarding credit default swap contracts and forward foreign currency exchange contracts, please refer to Note B in the accompanying Notes to Financial Statements.
Fair Value Measurements
Various inputs are used in determining the value of the Fund's investments. These inputs are summarized in three broad levels. Level 1 includes quoted prices in active markets for identical securities. Level 2 includes other significant observable inputs (including quoted prices for similar securities, interest rates, prepayment speeds, and credit risk). Level 3 includes significant unobservable inputs (including the Fund's own assumptions in determining the fair value of investments). The inputs or methodology used for valuing securities are not necessarily an indication of the risk associated with investing in those securities.
The following is a summary of the inputs used as of December 31, 2012 in valuing the Fund's investments. For information on the Fund's policy regarding the valuation of investments, please refer to the Security Valuation section of Note A in the accompanying Notes to Financial Statements.
| Assets | | Level 1 | | | Level 2 | | | Level 3 | | | Total | |
| | |
Fixed Income Investments (i) | |
| Corporate Bonds | | $ | — | | | $ | 151,161,105 | | | $ | 155,602 | | | $ | 151,316,707 | |
| Loan Participations and Assignments | | | — | | | | 650,470 | | | | 0 | | | | 650,470 | |
| Convertible Bonds | | | — | | | | 779,922 | | | | 1,538,014 | | | | 2,317,936 | |
| Preferred Securities | | | — | | | | 1,524,890 | | | | — | | | | 1,524,890 | |
| Other Investments | | | — | | | | — | | | | 107,806 | | | | 107,806 | |
| Common Stocks (i) | | | — | | | | 6,941 | | | | 139,682 | | | | 146,623 | |
| Preferred Stock | | | — | | | | 795,597 | | | | — | | | | 795,597 | |
| Warrants (i) | | | — | | | | — | | | | 63,227 | | | | 63,227 | |
| Short-Term Investments (i) | | | 27,423,014 | | | | — | | | | — | | | | 27,423,014 | |
| Derivatives (j) | |
| Credit Default Swap Contracts | | | — | | | | 545,473 | | | | — | | | | 545,473 | |
| Forward Foreign Currency Exchange Contracts | | | — | | | | 11,586 | | | | — | | | | 11,586 | |
| Total | | $ | 27,423,014 | | | $ | 155,475,984 | | | $ | 2,004,331 | | | $ | 184,903,329 | |
| Liabilities | |
| Derivatives (j) | |
| Credit Default Swap Contracts | | $ | — | | | $ | (9,976 | ) | | $ | — | | | $ | (9,976 | ) |
| Total | | $ | — | | | $ | (9,976 | ) | | $ | — | | | $ | (9,976 | ) |
There have been no transfers between fair value measurement levels during the year ended December 31, 2012.
(i) See Investment Portfolio for additional detailed categorizations.
(j) Derivatives include unrealized appreciation (depreciation) on credit default swap contracts and forward foreign currency exchange contracts.
Level 3 Reconciliation
The following is a reconciliation of the Fund's Level 3 investments for which significant unobservable inputs were used in determining value:
| | | Corporate Bonds | | | Loan Participations and Assignments | | | Convertible Bonds | | | Other Investments | | | Common Stocks | | | Warrants | | | Total | |
| Balance as of December 31, 2011 | | $ | 1,592,953 | | | $ | 0 | | | $ | 1,140,760 | | | $ | 31,000 | | | $ | 177,317 | | | $ | 9,254 | | | $ | 2,951,284 | |
| Realized gains (loss) | | | (1,013,791 | ) | | | — | | | | — | | | | — | | | | — | | | | — | | | | (1,013,791 | ) |
| Change in unrealized appreciation (depreciation) | | | 979,420 | | | | 0 | | | | 386,676 | | | | 76,806 | | | | (37,635 | ) | | | 53,973 | | | | 1,459,240 | |
| Amortization of premium/accretion of discount | | | 16,714 | | | | — | | | | 10,578 | | | | — | | | | — | | | | — | | | | 27,292 | |
| Purchases | | | 23,030 | | | | — | | | | — | | | | — | | | | — | | | | — | | | | 23,030 | |
| (Sales) | | | (1,442,724 | ) | | | — | | | | — | | | | — | | | | — | | | | — | | | | (1,442,724 | ) |
| Transfers into Level 3 | | | — | | | | — | | | | — | | | | — | | | | — | | | | — | | | | — | |
| Transfers (out) of Level 3 | | | — | | | | — | | | | — | | | | — | | | | — | | | | — | | | | — | |
| Balance as of December 31, 2012 | | $ | 155,602 | | | $ | 0 | | | $ | 1,538,014 | | | $ | 107,806 | | | $ | 139,682 | | | $ | 63,227 | | | $ | 2,004,331 | |
| Net change in unrealized appreciation (depreciation) from investments still held as of December 31, 2012 | | $ | 7,054 | | | $ | 0 | | | $ | 386,676 | | | $ | 76,806 | | | $ | (37,635 | ) | | $ | 53,973 | | | $ | 486,874 | |
| Quantitative Disclosure About Significant Unobservable Inputs | |
| Asset Class | | Fair Value at 12/31/12 | | Valuation Technique(s) | Unobservable Input | | Range (Weighted Average) | |
| Other Investments | |
| Consumer Discretionary | | $ | 107,806 | | Market Approach | Takeover Price | | $3,477.60 per share | |
| Discount for Lack of Marketability | | | 20 | % |
| Common Stock | |
| Consumer Discretionary | | $ | 0 | | Market Approach | EV/EBITDA Multiple | | | 5.0 | |
| Discount for Lack of Marketability | | | 10 | % |
| Industrials | | $ | 0 | | Asset Valuation | Book Value of Equity | | | 0 | |
| Materials | | $ | 139,682 | | Market Approach | EV/EBITDA Multiple | | | 4.5-5.71 | (5.63) |
| Discount for Lack of Marketability | | | 25%-30 | % |
| Warrants | |
| Consumer Discretionary | | $ | 189 | | Broker Quote | Discount for Lack of Marketability | | | 20 | % |
| Materials | | $ | 9,606 | | Black Scholes Option Pricing Model | Implied Volatility | | | 32 | % |
| Discount for Lack of Marketability | | | 20 | % |
| | $ | 53,432 | | Market Approach | EV/EBITDA Multiple | | | 4.5 | |
| | | | | | | Discount for Lack of Marketability | | | 30 | % |
| Loan Participations & Assignments | |
| Senior Loans | | $ | 0 | | Market Approach | Evaluated by Management | | | 0 | |
| Corporate Bonds | |
| Materials | | $ | 155,602 | | Discounted Cash Flow Methodology | Discount Rate | | | 15 | % |
| | | | | | Discount for Lack of Marketability | | | 10 | % |
| Convertible Bonds | |
| Materials | | $ | 1,538,014 | | Convertible Bond Methodology | EV/EBITDA Multiple | | | 4.5 | |
| Discount to Public Comparable | | | 20 | % |
| | | | | | Discount for Lack of Marketability | | | 10 | % |
Qualitative Disclosure About Unobservable Inputs
Significant unobservable inputs developed by the Pricing Committee and used in the fair value measurement of the Fund's equity investments include book value of equity with a discount for lack of marketability and enterprise value (EV) to earnings before interest, taxes, depreciation and amortization (EBITDA) ratio with a discount for lack of marketability. A significant change in the EV to EBITDA ratio may result in a significant change in the fair value measurement, while a significant change in the discount for lack of marketability is unlikely to result in a materially higher or lower fair value measurement.
Significant unobservable inputs developed by the Pricing Committee and used in the fair value measurement of the Fund's fixed income investments include the discounted cash flow methodology. A significant change in the discount rate could have a material change on the fair value measurement, while a significant change in the discount for lack of marketability is unlikely to result in a materially higher or lower fair value measurement. Generally, there is an inverse relationship between the discount rate and the fair value measurement of a fixed income investment.
The accompanying notes are an integral part of the financial statements.
Statement of Assets and Liabilities | as of December 31, 2012 | |
| Assets | |
Investments: Investments in non-affiliated securities, at value (cost $151,411,772) — including $8,521,935 of securities loaned | | $ | 156,923,256 | |
| Investment in Daily Assets Fund Institutional (cost $8,880,988)* | | | 8,880,988 | |
| Investment in Central Cash Management Fund (cost $18,542,026) | | | 18,542,026 | |
| Total investments in securities, at value (cost $178,834,786) | | | 184,346,270 | |
| Cash | | | 31,768 | |
| Foreign currency, at value (cost $17,163) | | | 16,982 | |
| Deposit from broker on swap contracts | | | 140,000 | |
| Receivable for Fund shares sold | | | 8,386 | |
| Interest receivable | | | 2,949,552 | |
| Unrealized appreciation on swap contracts | | | 545,473 | |
| Unrealized appreciation on forward foreign currency exchange contracts | | | 11,586 | |
| Upfront payments paid on swap contracts | | | 306,051 | |
| Other assets | | | 2,954 | |
| Total assets | | | 188,359,022 | |
| Liabilities | |
| Payable upon return of securities loaned | | | 8,880,988 | |
| Payable for investments purchased | | | 392,000 | |
| Payable upon return of deposit for swap contracts | | | 140,000 | |
| Payable for Fund shares redeemed | | | 217,197 | |
| Unrealized depreciation on swap contracts | | | 9,976 | |
| Upfront payments received on swap contracts | | | 118,337 | |
| Accrued management fee | | | 74,356 | |
| Accrued Trustees' fees | | | 2,284 | |
| Other accrued expenses and payables | | | 121,286 | |
| Total liabilities | | | 9,956,424 | |
| Net assets, at value | | $ | 178,402,598 | |
| Net Assets Consist of | |
| Undistributed net investment income | | | 11,701,062 | |
Net unrealized appreciation (depreciation) on: Investments | | | 5,511,484 | |
| Swap contracts | | | 535,497 | |
| Foreign currency | | | 13,311 | |
| Accumulated net realized gain (loss) | | | (44,346,076 | ) |
| Paid-in capital | | | 204,987,320 | |
| Net assets, at value | | $ | 178,402,598 | |
Class A Net Asset Value, offering and redemption price per share ($178,310,540 ÷ 25,717,511 outstanding shares of beneficial interest, no par value, unlimited number of shares authorized) | | $ | 6.93 | |
Class B Net Asset Value, offering and redemption price per share ($92,058 ÷ 13,214 outstanding shares of beneficial interest, no par value, unlimited number of shares authorized) | | $ | 6.97 | |
* Represents collateral on securities loaned.
The accompanying notes are an integral part of the financial statements.
Statement of Operations
| for the year ended December 31, 2012 | |
| Investment Income | |
| Interest | | $ | 12,682,097 | |
| Dividends | | | 22,983 | |
| Income distributions — Central Cash Management Fund | | | 15,949 | |
| Securities lending income, including income from Daily Assets Fund Institutional, net of borrower rebates | | | 51,662 | |
| Total income | | | 12,772,691 | |
Expenses: Management fee | | | 862,635 | |
| Administration fee | | | 172,527 | |
| Distribution service fee (Class B) | | | 228 | |
| Services to shareholders | | | 729 | |
| Custodian fee | | | 32,221 | |
| Audit and tax fees | | | 72,590 | |
| Legal fees | | | 13,544 | |
| Reports to shareholders | | | 39,970 | |
| Trustees' fees and expenses | | | 8,525 | |
| Other | | | 41,871 | |
| Total expenses before expense reductions | | | 1,244,840 | |
| Expense reductions | | | (4 | ) |
| Total expenses after expense reductions | | | 1,244,836 | |
| Net investment income (loss) | | | 11,527,855 | |
| Realized and Unrealized Gain (Loss) | |
Net realized gain (loss) from: Investments | | | 1,099,240 | |
| Swap contracts | | | 490,658 | |
| Foreign currency | | | (46,648 | ) |
| | | | 1,543,250 | |
Change in net unrealized appreciation (depreciation) on: Investments | | | 10,068,527 | |
| Swap contracts | | | 445,527 | |
| Foreign currency | | | (15,931 | ) |
| | | | 10,498,123 | |
| Net gain (loss) | | | 12,041,373 | |
| Net increase (decrease) in net assets resulting from operations | | $ | 23,569,228 | |
The accompanying notes are an integral part of the financial statements.
Statement of Changes in Net Assets | | | Years Ended December 31, | |
| Increase (Decrease) in Net Assets | | 2012 | | | 2011 | |
Operations: Net investment income | | $ | 11,527,855 | | | $ | 13,489,647 | |
| Net realized gain (loss) | | | 1,543,250 | | | | (3,786,632 | ) |
| Change in net unrealized appreciation (depreciation) | | | 10,498,123 | | | | (2,401,972 | ) |
| Net increase (decrease) in net assets resulting from operations | | | 23,569,228 | | | | 7,301,043 | |
Distributions to shareholders from: Net investment income: Class A | | | (13,517,771 | ) | | | (16,387,608 | ) |
| Class B | | | (7,507 | ) | | | (11,864 | ) |
| Total distributions | | | (13,525,278 | ) | | | (16,399,472 | ) |
Fund share transactions: Class A Proceeds from shares sold | | | 49,009,407 | | | | 46,414,241 | |
| Reinvestment of distributions | | | 13,517,771 | | | | 16,387,608 | |
| Payments for shares redeemed | | | (63,694,430 | ) | | | (79,145,753 | ) |
| Net increase (decrease) in net assets from Class A share transactions | | | (1,167,252 | ) | | | (16,343,904 | ) |
Class B Proceeds from shares sold | | | 8,301 | | | | 9,003 | |
| Reinvestment of distributions | | | 7,507 | | | | 11,864 | |
| Payments for shares redeemed | | | (13,053 | ) | | | (73,315 | ) |
| Net increase (decrease) in net assets from Class B share transactions | | | 2,755 | | | | (52,448 | ) |
| Increase (decrease) in net assets | | | 8,879,453 | | | | (25,494,781 | ) |
| Net assets at beginning of period | | | 169,523,145 | | | | 195,017,926 | |
| Net assets at end of period (including undistributed net investment income of $11,701,062 and $13,303,364, respectively) | | $ | 178,402,598 | | | $ | 169,523,145 | |
| Other Information | |
Class A Shares outstanding at beginning of period | | | 25,818,935 | | | | 28,235,548 | |
| Shares sold | | | 7,431,954 | | | | 7,106,488 | |
| Shares issued to shareholders in reinvestment of distributions | | | 2,118,773 | | | | 2,479,214 | |
| Shares redeemed | | | (9,652,151 | ) | | | (12,002,315 | ) |
| Net increase (decrease) in Class A shares | | | (101,424 | ) | | | (2,416,613 | ) |
| Shares outstanding at end of period | | | 25,717,511 | | | | 25,818,935 | |
Class B Shares outstanding at beginning of period | | | 12,847 | | | | 20,802 | |
| Shares sold | | | 1,197 | | | | 1,284 | |
| Shares issued to shareholders in reinvestment of distributions | | | 1,168 | | | | 1,784 | |
| Shares redeemed | | | (1,998 | ) | | | (11,023 | ) |
| Net increase (decrease) in Class B shares | | | 367 | | | | (7,955 | ) |
| Shares outstanding at end of period | | | 13,214 | | | | 12,847 | |
The accompanying notes are an integral part of the financial statements.
| | �� | Years Ended December 31, | |
| Class A | | | 2012 | | | 2011 | | | 2010 | | | 2009 | | | 2008 | |
| Selected Per Share Data | |
| Net asset value, beginning of period | | $ | 6.56 | | | $ | 6.90 | | | $ | 6.55 | | | $ | 5.30 | | | $ | 7.81 | |
Income (loss) from investment operations: Net investment incomea | | | .45 | | | | .51 | | | | .52 | | | | .51 | | | | .57 | |
| Net realized and unrealized gain (loss) | | | .48 | | | | (.24 | ) | | | .36 | | | | 1.40 | | | | (2.29 | ) |
| Total from investment operations | | | .93 | | | | .27 | | | | .88 | | | | 1.91 | | | | (1.72 | ) |
Less distributions from: Net investment income | | | (.56 | ) | | | (.61 | ) | | | (.53 | ) | | | (.66 | ) | | | (.79 | ) |
| Net asset value, end of period | | $ | 6.93 | | | $ | 6.56 | | | $ | 6.90 | | | $ | 6.55 | | | $ | 5.30 | |
| Total Return (%) | | | 14.91 | | | | 3.84 | | | | 14.00 | | | | 39.99 | | | | (23.94 | )b |
| Ratios to Average Net Assets and Supplemental Data | |
| Net assets, end of period ($ millions) | | | 178 | | | | 169 | | | | 195 | | | | 197 | | | | 154 | |
| Ratio of expenses before expense reductions (%) | | | .72 | | | | .72 | | | | .72 | | | | .67 | | | | .80 | |
| Ratio of expenses after expense reductions (%) | | | .72 | | | | .72 | | | | .72 | | | | .67 | | | | .79 | |
| Ratio of net investment income (%) | | | 6.68 | | | | 7.59 | | | | 7.90 | | | | 8.81 | | | | 8.42 | |
| Portfolio turnover rate (%) | | | 58 | | | | 59 | | | | 93 | | | | 66 | | | | 38 | |
a Based on average shares outstanding during the period. b Total return would have been lower had certain expenses not been reduced. | |
| | | Years Ended December 31, | |
| Class B | | | 2012 | | | 2011 | | | 2010 | | | 2009 | | | 2008 | |
| Selected Per Share Data | |
| Net asset value, beginning of period | | $ | 6.59 | | | $ | 6.93 | | | $ | 6.58 | | | $ | 5.31 | | | $ | 7.81 | |
Income (loss) from investment operations: Net investment incomea | | | .43 | | | | .49 | | | | .50 | | | | .49 | | | | .53 | |
| Net realized and unrealized gain (loss) | | | .49 | | | | (.24 | ) | | | .36 | | | | 1.42 | | | | (2.27 | ) |
| Total from investment operations | | | .92 | | | | .25 | | | | .86 | | | | 1.91 | | | | (1.74 | ) |
Less distributions from: Net investment income | | | (.54 | ) | | | (.59 | ) | | | (.51 | ) | | | (.64 | ) | | | (.76 | ) |
| Net asset value, end of period | | $ | 6.97 | | | $ | 6.59 | | | $ | 6.93 | | | $ | 6.58 | | | $ | 5.31 | |
| Total Return (%) | | | 14.70 | b | | | 3.57 | | | | 13.64 | | | | 39.64 | | | | (24.13 | )b |
| Ratios to Average Net Assets and Supplemental Data | |
| Net assets, end of period ($ millions) | | | .1 | | | | .1 | | | | .1 | | | | .2 | | | | .1 | |
| Ratio of expenses before expense reductions (%) | | | .99 | | | | .99 | | | | .99 | | | | .94 | | | | 1.25 | |
| Ratio of expenses after expense reductions (%) | | | .99 | | | | .99 | | | | .99 | | | | .94 | | | | 1.23 | |
| Ratio of net investment income (%) | | | 6.42 | | | | 7.33 | | | | 7.63 | | | | 8.54 | | | | 7.98 | |
| Portfolio turnover rate (%) | | | 58 | | | | 59 | | | | 93 | | | | 66 | | | | 38 | |
a Based on average shares outstanding during the period. b Total return would have been lower had certain expenses not been reduced. | |
Notes to Financial Statements
A. Organization and Significant Accounting Policies
DWS High Income VIP (the "Fund") is a diversified series of DWS Variable Series II (the "Trust"), which is registered under the Investment Company Act of 1940, as amended (the "1940 Act"), as an open-end management investment company organized as a Massachusetts business trust.
Multiple Classes of Shares of Beneficial Interest. The Fund offers two classes of shares (Class A shares and Class B shares). Sales of Class B shares are subject to Rule 12b-1 fees under the 1940 Act equal to an annual rate of 0.25% of the average daily net assets of the Class B shares of the Fund. Class A shares are not subject to such fees.
Investment income, realized and unrealized gains and losses, and certain fund-level expenses and expense reductions, if any, are borne pro rata on the basis of relative net assets by the holders of all classes of shares except that each class bears certain expenses unique to that class (including the applicable Rule 12b-1 fee and recordkeeping fees). Differences in class-level expenses may result in payment of different per share dividends by class. All shares have equal rights with respect to voting subject to class-specific arrangements.
The Fund's financial statements are prepared in accordance with accounting principles generally accepted in the United States of America which require the use of management estimates. Actual results could differ from those estimates. The policies described below are followed consistently by the Fund in the preparation of its financial statements.
Security Valuation. Investments are stated at value determined as of the close of regular trading on the New York Stock Exchange on each day the exchange is open for trading.
Various inputs are used in determining the value of the Fund's investments. These inputs are summarized in three broad levels. Level 1 includes quoted prices in active markets for identical securities. Level 2 includes other significant observable inputs (including quoted prices for similar securities, interest rates, prepayment speeds, and credit risk). Level 3 includes significant unobservable inputs (including the Fund's own assumptions in determining the fair value of investments). The inputs or methodology used for valuing securities are not necessarily an indication of the risk associated with investing in those securities.
Equity securities are valued at the most recent sale price or official closing price reported on the exchange (U.S. or foreign) or over-the-counter market on which they trade and are categorized as Level 1 securities. Securities for which no sales are reported are valued at the calculated mean between the most recent bid and asked quotations on the relevant market or, if a mean cannot be determined, at the most recent bid quotation.
Debt securities and loan participations and assignments are valued at prices supplied by independent pricing services approved by the Fund's Board. If the pricing services are unable to provide valuations, securities are valued at the most recent bid quotation or evaluated price, as applicable, obtained from one or more broker-dealers. Such services may use various pricing techniques which take into account appropriate factors such as yield, quality, coupon rate, maturity, type of issue, trading characteristics and other data, as well as broker quotes. These securities are generally categorized as Level 2.
Investments in open-end investment companies are valued at their net asset value each business day and are categorized as Level 1.
Forward currency contracts are valued at the prevailing forward exchange rate of the underlying currencies and are categorized as Level 2.
Swap contracts are valued daily based upon prices supplied by a Board approved pricing vendor, if available, and otherwise are valued at the price provided by the broker-dealer. Swap contracts are generally categorized as Level 2.
Securities and other assets for which market quotations are not readily available or for which the above valuation procedures are deemed not to reflect fair value are valued in a manner that is intended to reflect their fair value as determined in accordance with procedures approved by the Board and are generally categorized as Level 3. In accordance with the Fund's valuation procedures, factors used in determining value may include, but are not limited to, the type of the security; the size of the holding; the initial cost of the security; the existence of any contractual restrictions on the security's disposition; the price and extent of public trading in similar securities of the issuer or of comparable companies; quotations or evaluated prices from broker-dealers and/or pricing services; information obtained from the issuer, analysts, and/or the appropriate stock exchange (for exchange-traded securities); an analysis of the company's or issuer's financial statements; an evaluation of the forces that influence the issuer and the market(s) in which the security is purchased and sold and with respect to debt securities; the maturity, coupon, creditworthiness, currency denomination and the movement of the market in which the security is normally traded. The value determined under these procedures may differ from published values for the same securities.
Disclosure about the classification of fair value measurements is included in a table following the Fund's Investment Portfolio.
New Accounting Pronouncement. In January 2013, Accounting Standard Update 2013-01 (ASU 2013-01), Clarifying the Scope of Disclosures about Offsetting Assets and Liabilities, replaced Accounting Standards Update 2011-11 (ASU 2011-11), Disclosures about Offsetting Assets and Liabilities. ASU 2013-01 is effective for fiscal years beginning on or after January 1, 2013, and interim periods within those annual periods. ASU 2011-11 was intended to enhance disclosure requirements on the offsetting of financial assets and liabilities. The ASU 2013-01 limits the scope of the new balance sheet offsetting disclosures to derivatives, repurchase agreements, and securities lending transactions to the extent that they are (1) offset in the financial statements or (2) subject to an enforceable master netting arrangement or similar agreement. Management is currently evaluating the application of ASU 2013-01 and its impact, if any, on the Fund's financial statements.
Foreign Currency Translations. The books and records of the Fund are maintained in U.S. dollars. Investment securities and other assets and liabilities denominated in a foreign currency are translated into U.S. dollars at the prevailing exchange rates at period end. Purchases and sales of investment securities, income and expenses are translated into U.S. dollars at the prevailing exchange rates on the respective dates of the transactions.
Net realized and unrealized gains and losses on foreign currency transactions represent net gains and losses between trade and settlement dates on securities transactions, the acquisition and disposition of foreign currencies, and the difference between the amount of net investment income accrued and the U.S. dollar amount actually received. That portion of both realized and unrealized gains and losses on investments that results from fluctuations in foreign currency exchange rates is not separately disclosed but is included with net realized and unrealized gain/appreciation and loss/depreciation on investments.
Securities Lending. The Fund lends securities to certain financial institutions. The Fund retains beneficial ownership of the securities it has loaned and continues to receive interest and dividends paid by the issuer of securities and to participate in any changes in their market value. The Fund requires the borrowers of the securities to maintain collateral with the Fund consisting of either cash or liquid, unencumbered assets having a value at least equal to the value of the securities loaned. When the collateral falls below specified amounts, the lending agent will use its best effort to obtain additional collateral on the next business day to meet required amounts under the security lending agreement. The Fund may invest the cash collateral into a joint trading account in an affiliated money market fund pursuant to Exemptive Orders issued by the SEC. The Fund receives compensation for lending its securities either in the form of fees or by earning interest on invested cash collateral net of borrower rebates and fees paid to a lending agent. Either the Fund or the borrower may terminate the loan. There may be risks of delay and costs in recovery of securities or even loss of rights in the collateral should the borrower of the securities fail financially. The Fund is also subject to all investment risks associated with the reinvestment of any cash collateral received, including, but not limited to, interest rate, credit and liquidity risk associated with such investments.
Loan Participations and Assignments. Senior loans are portions of loans originated by banks and sold in pieces to investors. These U.S. dollar-denominated fixed and floating rate loans ("Loans") in which the Fund invests are arranged through private negotiations between the borrower and one or more financial institutions ("Lenders"). The Fund invests in such Loans in the form of participations in Loans ("Participations") or assignments of all or a portion of loans from third parties ("Assignments"). Participations typically result in the Fund having a contractual relationship only with the Lender, not with the borrower. The Fund has the right to receive payments of principal, interest and any fees to which it is entitled from the Lender selling the Participation and only upon receipt by the Lender of the payments from the borrower. In connection with purchasing Participations, the Fund generally has no right to enforce compliance by the borrower with the terms of the loan agreement relating to the Loan, nor any rights of set-off against the borrower, and the Fund will not benefit directly from any collateral supporting the Loan in which it has purchased the Participation. As a result, the Fund assumes the credit risk of both the borrower and the Lender that is selling the Participation. Assignments typically result in the Fund having a direct contractual relationship with the borrower, and the Fund may enforce compliance by the borrower with the terms of the loan agreement. Senior loans held by the Fund are generally in the form of Assignments, but the Fund may also invest in Participations. All senior loans involve interest rate risk, liquidity risk and credit risk, including the potential default or insolvency of the borrower.
When-Issued/Delayed Delivery Securities. The Fund may purchase securities with delivery or payment to occur at a later date beyond the normal settlement period. At the time the Fund enters into a commitment to purchase a security, the transaction is recorded and the value of the transaction is reflected in the net asset value. The price of such security and the date when the security will be delivered and paid for are fixed at the time the transaction is negotiated. The value of the security may vary with market fluctuations. At the time the Fund enters into a purchase transaction it is required to segregate cash or other liquid assets at least equal to the amount of the commitment.
Certain risks may arise upon entering into when-issued or delayed delivery transaction from the potential inability of counterparties to meet the terms of their contracts or if the issuer does not issue the securities due to political, economic, or other factors. Additionally, losses may arise due to changes in the value of the underlying securities.
Taxes. The Fund's policy is to comply with the requirements of the Internal Revenue Code, as amended, which are applicable to regulated investment companies and to distribute all of its taxable income to its shareholders.
Under the Regulated Investment Company Modernization Act of 2010, net capital losses incurred post-enactment may be carried forward indefinitely, and their character is retained as short-term and/or long-term. Previously, net capital losses were carried forward for eight years and treated as short-term losses. As a transition rule, the Act requires that post-enactment net capital losses be used before pre-enactment net capital losses.
At December 31, 2012, the Fund had a net tax basis capital loss carryforward of approximately $44,347,000, including $39,235,000 of pre-enactment losses, which may be applied against any realized net taxable capital gains of each succeeding year until fully utilized or until December 31, 2014 ($3,844,000), December 31, 2015 ($858,000), December 31, 2016 ($17,301,000) and December 31, 2017 ($17,232,000), the respective expiration dates, whichever occurs first; and approximately $5,112,000 of post-enactment long-term losses, which may be applied against realized net taxable capital gains indefinitely.
The Fund has reviewed the tax positions for the open tax years as of December 31, 2012 and has determined that no provision for income tax is required in the Fund's financial statements. The Fund's federal tax returns for the prior three fiscal years remain open subject to examination by the Internal Revenue Service.
Distribution of Income and Gains. Distributions from net investment income of the Fund, if any, is declared and distributed to shareholders annually. Net realized gains from investment transactions, in excess of available capital loss carryforwards, would be taxable to the Fund if not distributed and, therefore, will be distributed to shareholders at least annually. The Fund may also make additional distributions for tax purposes if necessary.
The timing and characterization of certain income and capital gain distributions are determined annually in accordance with federal tax regulations which may differ from accounting principles generally accepted in the United States of America. These differences primarily relate to investments in foreign denominated investments, investments in forward currency contracts, investments in swap contracts and certain securities sold at a loss. As a result, net investment income (loss) and net realized gain (loss) on investment transactions for a reporting period may differ significantly from distributions during such period. Accordingly, the Fund may periodically make reclassifications among certain of its capital accounts without impacting the net asset value of the Fund.
At December 31, 2012, the Fund's components of distributable earnings on a tax basis were as follows:
| Undistributed ordinary income* | | $ | 12,248,145 | |
| Capital loss carryforwards | | $ | (44,347,000 | ) |
| Unrealized appreciation (depreciation) on investments | | $ | 5,511,484 | |
In addition, the tax character of distributions paid by the Fund is summarized as follows:
| | | Years Ended December 31, | |
| | | 2012 | | | 2011 | |
| Distributions from ordinary income* | | $ | 13,525,278 | | | $ | 16,399,472 | |
* For tax purposes, short-term capital gain distributions are considered ordinary income distributions.
Expenses. Expenses of the Trust arising in connection with a specific fund are allocated to that fund. Other Trust expenses which cannot be directly attributed to a fund are apportioned among the funds in the Trust based upon the relative net assets or other appropriate measures.
Contingencies. In the normal course of business, the Fund may enter into contracts with service providers that contain general indemnification clauses. The Fund's maximum exposure under these arrangements is unknown as this would involve future claims that may be made against the Fund that have not yet been made. However, based on experience, the Fund expects the risk of loss to be remote.
Other. Investment transactions are accounted for on a trade date plus one basis for daily net asset value calculations. However, for financial reporting purposes, investment transactions are reported on trade date. Interest income is recorded on the accrual basis. Realized gains and losses from investment transactions are recorded on an identified cost basis and may include proceeds from litigation. All discounts and premiums are accreted/amortized for both tax and financial reporting purposes for the Fund, with the exception of securities in default of principal.
B. Derivative Instruments
Credit Default Swap Contracts. A credit default swap is a contract between a buyer and a seller of protection against pre-defined credit events for the reference entity. The Fund may enter into credit default swap contracts to gain exposure to an underlying issuer's credit quality characteristics without directly investing in that issuer or to hedge against the risk of a credit event on debt securities. As a seller in the credit default swap contract, the Fund is required to pay the par (or other agreed-upon) value of the referenced entity to the counterparty with the occurrence of a credit event by a third party, such as a U.S. or foreign corporate issuer, on the reference entity, which would likely result in a loss to the Fund. In return, the Fund receives from the counterparty a periodic stream of payments over the term of the contract provided that no credit event has occurred. If no credit event occurs, the Fund keeps the stream of payments with no payment obligations. This involves the risk that the contract may expire worthless. It also involves counterparty risk that the seller may fail to satisfy its payment obligations to the Fund with the occurrence of a credit event. When the Fund sells a credit default swap contract it will cover its commitment. This is achieved by, among other methods, maintaining cash or liquid assets equal to the aggregate notional value of the reference entities for all outstanding credit default swap contracts sold by the Fund. For the year ended December 31, 2012, the Fund entered into credit default swap contracts to gain exposure to the underlying issuer's credit quality characteristics.
The value of the credit default swap is adjusted daily and the change in value, if any, is recorded daily as unrealized appreciation or depreciation in the Statement of Assets and Liabilities. An upfront payment, if any, made by the Fund is recorded as an asset in the Statement of Assets and Liabilities. An upfront payment, if any, received by the Fund is recorded as a liability in the Statement of Assets and Liabilities. Under the terms of the credit default swap contracts, the Fund receives or makes quarterly payments based on a specified interest rate on a fixed notional amount. These payments are recorded as a realized gain or loss in the Statement of Operations. Payments received or made as a result of a credit event or termination of the contract are recognized, net of a proportional amount of the upfront payment, as realized gains or losses in the Statement of Operations.
A summary of the open credit default swap contracts as of December 31, 2012 is included in a table following the Fund's Investment Portfolio. For the year ended December 31, 2012, the Fund's investment in credit default swap contracts sold had a total notional value generally indicative of a range from approximately $6,455,000 to $20,890,000.
Forward Foreign Currency Exchange Contracts. A forward foreign currency exchange contract ("forward currency contract") is a commitment to purchase or sell a foreign currency at the settlement date at a negotiated rate. For the year ended December 31, 2012, the Fund entered into forward currency contracts in order to hedge its exposure to changes in foreign currency exchange rates on its foreign currency denominated portfolio holdings and to facilitate transactions in foreign currency denominated securities.
Forward currency contracts are valued at the prevailing forward exchange rate of the underlying currencies and unrealized gain (loss) is recorded daily. On the settlement date of the forward currency contract, the Fund records a realized gain or loss equal to the difference between the value of the contract at the time it was opened and the value of the contract at the time it was closed. Certain risks may arise upon entering into forward currency contracts from the potential inability of counterparties to meet the terms of their contracts. The maximum counterparty credit risk to the Fund is measured by the unrealized gain on appreciated contracts. Additionally, when utilizing forward currency contracts to hedge, the Fund gives up the opportunity to profit from favorable exchange rate movements during the term of the contract.
A summary of the open forward currency contracts as of December 31, 2012 is included in a table following the Fund's Investment Portfolio. For the year ended December 31, 2012, the Fund's investment in forward currency contracts short vs. U.S. dollars had a total contract value generally indicative of a range from approximately $3,001,000 to $4,377,000, and the investment in forward currency contracts long vs. U.S. dollars had a total contract value generally indicative of a range from $0 to approximately $48,000.
The following tables summarize the value of the Fund's derivative instruments held as of December 31, 2012 and the related location in the accompanying Statement of Assets and Liabilities, presented by primary underlying risk exposure:
| Asset Derivative | | Forward Contracts | | | Swap Contracts | | | Total | |
| Credit Contracts (a) | | $ | — | | | $ | 545,473 | | | $ | 545,473 | |
| Foreign Exchange Contracts (b) | | | 11,586 | | | | — | | | | 11,586 | |
| | | $ | 11,586 | | | $ | 545,473 | | | $ | 557,059 | |
Each of the above derivatives is located in the following Statement of Assets and Liabilities accounts:
(a) Unrealized appreciation on swap contracts
(b) Unrealized appreciation on forward foreign currency exchange contracts
| Liability Derivative | | Swap Contracts | |
| Credit Contracts (a) | | $ | (9,976 | ) |
The above derivative is located in the following Statement of Assets and Liabilities account:
(a) Unrealized depreciation on swap contracts
Additionally, the amount of unrealized and realized gains and losses on derivative instruments recognized in Fund earnings during the year ended December 31, 2012 and the related location in the accompanying Statement of Operations is summarized in the following tables by primary underlying risk exposure:
| Realized Gain (Loss) | | Forward Contracts | | | Swap Contracts | | | Total | |
| Credit Contracts (a) | | $ | — | | | $ | 490,658 | | | $ | 490,658 | |
| Foreign Exchange Contracts (b) | | | 48,343 | | | | — | | | | 48,343 | |
| | | $ | 48,343 | | | $ | 490,658 | | | $ | 539,001 | |
Each of the above derivatives is located in the following Statement of Operations accounts:
(a) Net realized gain (loss) from swap contracts
(b) Net realized gain (loss) from foreign currency (Statement of Operations includes both forward currency contracts and foreign currency transactions)
| Change in Net Unrealized Appreciation (Depreciation) | | Forward Contracts | | | Swap Contracts | | | Total | |
| Credit Contracts (a) | | $ | — | | | $ | 445,527 | | | $ | 445,527 | |
| Foreign Exchange Contracts (b) | | | (21,082 | ) | | | — | | | | (21,082 | ) |
| | | $ | (21,082 | ) | | $ | 445,527 | | | $ | 424,445 | |
Each of the above derivatives is located in the following Statement of Operations accounts:
(a) Change in net unrealized appreciation (depreciation) on swap contracts
(b) Change in net unrealized appreciation (depreciation) on foreign currency (Statement of Operations includes both forward currency contracts and foreign currency transactions)
C. Purchases and Sales of Securities
During the year ended December 31, 2012, purchases and sales of investment securities (excluding short-term investments and U.S. Treasury securities) aggregated $90,211,939 and $96,084,915, respectively. Purchases and sales of U.S. Treasury securities aggregated $1,018,128 and $2,016,517, respectively.
D. Related Parties
Management Agreement. Under the Investment Management Agreement with Deutsche Investment Management Americas Inc. ("DIMA" or the "Advisor"), an indirect, wholly owned subsidiary of Deutsche Bank AG, the Advisor directs the investments of the Fund in accordance with its investment objectives, policies and restrictions. The Advisor determines the securities, instruments and other contracts relating to investments to be purchased, sold or entered into by the Fund.
Pursuant to the Investment Management Agreement with the Advisor, the Fund pays a monthly management fee based on the Fund's average daily net assets, computed and accrued daily and payable monthly, at the following annual rates:
| First $250 million | | | .500 | % |
| Next $750 million | | | .470 | % |
| Next $1.5 billion | | | .450 | % |
| Next $2.5 billion | | | .430 | % |
| Next $2.5 billion | | | .400 | % |
| Next $2.5 billion | | | .380 | % |
| Next $2.5 billion | | | .360 | % |
| Over $12.5 billion | | | .340 | % |
Accordingly, for the year ended December 31, 2012, the fee pursuant to the Investment Management Agreement was equivalent to an annual effective rate of 0.50% of the Fund's average daily net assets.
Effective October 1, 2012 through September 30, 2013, the Advisor has contractually agreed to waive all or a portion of its fees and/or reimburse certain operating expenses of the Fund to the extent necessary to maintain the operating expenses (excluding certain expenses such as extraordinary expenses, taxes, brokerage and interest) of each class as follows:
Administration Fee. Pursuant to an Administrative Services Agreement, DIMA provides most administrative services to the Fund. For all services provided under the Administrative Services Agreement, the Fund pays DIMA an annual fee ("Administration Fee") of 0.10% of the Fund's average daily net assets, computed and accrued daily and payable monthly. For the year ended December 31, 2012, the Administration Fee was $172,527, of which $14,871 is unpaid.
Service Provider Fees. DWS Investments Service Company ("DISC"), an affiliate of the Advisor, is the transfer agent, dividend-paying agent and shareholder service agent for the Fund. Pursuant to a sub-transfer agency agreement between DISC and DST Systems, Inc. ("DST"), DISC has delegated certain transfer agent, dividend-paying agent and shareholder service agent functions to DST. DISC compensates DST out of the shareholder servicing fee it receives from the Fund. For the year ended December 31, 2012, the amounts charged to the Fund by DISC were as follows:
| Services to Shareholders | | Total Aggregated | | | Waived | | | Unpaid at December 31, 2012 | |
| Class A | | $ | 261 | | | $ | — | | | $ | 66 | |
| Class B | | | 20 | | | | 4 | | | | 1 | |
| | | $ | 281 | | | $ | 4 | | | $ | 67 | |
Distribution Service Agreement. Under the Fund's Class B 12b-1 plans, DWS Investments Distributors, Inc. ("DIDI") received a fee ("Distribution Service Fee") of 0.25% of average daily net assets of Class B shares. For the year ended December 31, 2012, the Distribution Service Fee aggregated $228, of which $20 is unpaid.
Typesetting and Filing Service Fees. Under an agreement with DIMA, DIMA is compensated for providing typesetting and certain regulatory filing services to the Fund. For the year ended December 31, 2012, the amount charged to the Fund by DIMA included in the Statement of Operations under "reports to shareholders" aggregated $20,552, of which $6,040 is unpaid.
Trustees' Fees and Expenses. The Fund paid retainer fees to each Trustee not affiliated with the Advisor, plus specified amounts to the Board Chairperson and to each committee Chairperson.
Affiliated Cash Management Vehicle. The Fund may invest uninvested cash balances in Central Cash Management Fund, which is managed by the Advisor. The Fund indirectly bears its proportionate share of the expenses of Central Cash Management Fund. Central Cash Management Fund does not pay the Advisor an investment management fee. Central Cash Management Fund seeks a high level of current income consistent with liquidity and the preservation of capital.
Security Lending Fees. Effective January 27, 2012, Deutsche Bank AG serves as lending agent for the Fund. For the period from January 27, 2012 through December 31, 2012, the Fund incurred lending agent fees to Deutsche Bank AG for the amount of $5,718.
E. Investing in High-Yield Securities
The Fund's performance could be hurt if a security declines in credit quality or goes into default, or if an issuer does not make timely payments of interest or principal. Because the issuers of high-yield debt securities or junk bonds (debt securities rated below the fourth-highest category) may be in uncertain financial health, the risk of loss from default by the issuer is significantly greater. Prices and yields of high-yield securities will fluctuate over time and, during periods of economic uncertainty, volatility of high-yield securities may adversely affect a fund's net asset value. Because the Fund may invest in securities not paying current interest or in securities already in default, these risks may be more pronounced.
F. Ownership of the Fund
At December 31, 2012, three Participating Insurance Companies were owners of record of 10% or more of the total outstanding Class A shares of the Fund, each owning 35%, 29% and 28%. One Participating Insurance Company was the owner of record of 10% or more of the total outstanding Class B shares of the Fund, owning 100%.
G. Line of Credit
The Fund and other affiliated funds (the "Participants") share in a $375 million revolving credit facility provided by a syndication of banks. The Fund may borrow for temporary or emergency purposes, including the meeting of redemption requests that otherwise might require the untimely disposition of securities. The Participants are charged an annual commitment fee which is allocated based on net assets, among each of the Participants. Interest is calculated at a rate per annum equal to the sum of the Federal Funds Rate plus 1.25 percent plus if LIBOR exceeds the Federal Funds Rate the amount of such excess. The Fund may borrow up to a maximum of 33 percent of its net assets under the agreement. The Fund had no outstanding loans at December 31, 2012.
Report of Independent Registered Public Accounting Firm
To the Board of Trustees of DWS Variable Series II and Shareholders of DWS High Income VIP:
We have audited the accompanying statement of assets and liabilities, including the investment portfolio, of DWS High Income VIP (the "Fund"), one of the funds constituting DWS Variable Series II, as of December 31, 2012, and the related statement of operations for the year then ended, the statement of changes in net assets for each of the two years in the period then ended, and the financial highlights for each of the five years in the period then ended. These financial statements and financial highlights are the responsibility of the Fund's management. Our responsibility is to express an opinion on these financial statements and financial highlights based on our audits.
We conducted our audits in accordance with the standards of the Public Company Accounting Oversight Board (United States). Those standards require that we plan and perform the audit to obtain reasonable assurance about whether the financial statements and financial highlights are free of material misstatement. We were not engaged to perform an audit of the Fund's internal control over financial reporting. Our audits included consideration of internal control over financial reporting as a basis for designing audit procedures that are appropriate in the circumstances, but not for the purpose of expressing an opinion on the effectiveness of the Fund's internal control over financial reporting. Accordingly, we express no such opinion. An audit also includes examining, on a test basis, evidence supporting the amounts and disclosures in the financial statements and financial highlights, assessing the accounting principles used and significant estimates made by management, and evaluating the overall financial statement presentation. Our procedures included confirmation of securities owned as of December 31, 2012, by correspondence with the custodian and brokers, or by other appropriate auditing procedures where replies from brokers were not received. We believe that our audits provide a reasonable basis for our opinion.
In our opinion, the financial statements and financial highlights referred to above present fairly, in all material respects, the financial position of DWS High Income VIP (one of the funds constituting DWS Variable Series II) at December 31, 2012, the results of its operations for the year then ended, the changes in its net assets for each of the two years in the period then ended, and the financial highlights for each of the five years in the period then ended, in conformity with U.S. generally accepted accounting principles.
| | | |
Boston, Massachusetts February 13, 2013 | | |
Information About Your Fund's Expenses (Unaudited)
As an investor of the Fund, you incur two types of costs: ongoing expenses and transaction costs. Ongoing expenses include management fees, distribution and service (12b-1) fees and other Fund expenses. Examples of transaction costs include contract charges, redemption fees and account maintenance fees, which are not shown in this section. The following tables are intended to help you understand your ongoing expenses (in dollars) of investing in the Fund and to help you compare these expenses with the ongoing expenses of investing in other mutual funds. In the most recent six-month period, Class B shares limited these expenses; had it not done so, expenses would have been higher. The example in the table is based on an investment of $1,000 invested at the beginning of the six-month period and held for the entire period (July 1, 2012 to December 31, 2012).
The tables illustrate your Fund's expenses in two ways:
•Actual Fund Return. This helps you estimate the actual dollar amount of ongoing expenses (but not transaction costs) paid on a $1,000 investment in the Fund using the Fund's actual return during the period. To estimate the expenses you paid over the period, simply divide your account value by $1,000 (for example, an $8,600 account value divided by $1,000 = 8.6), then multiply the result by the number in the "Expenses Paid per $1,000" line under the share class you hold.
• Hypothetical 5% Fund Return. This helps you to compare your Fund's ongoing expenses (but not transaction costs) with those of other mutual funds using the Fund's actual expense ratio and a hypothetical rate of return of 5% per year before expenses. Examples using a 5% hypothetical Fund return may be found in the shareholder reports of other mutual funds. The hypothetical account values and expenses may not be used to estimate the actual ending account balance or expenses you paid for the period.
Please note that the expenses shown in these tables are meant to highlight your ongoing expenses only and do not reflect any transaction costs. The "Expenses Paid per $1,000" line of the tables is useful in comparing ongoing expenses only and will not help you determine the relative total expense of owning different funds. If these transaction costs had been included, your costs would have been higher.
Expenses and Value of a $1,000 Investment for the six months ended December 31, 2012 | |
| Actual Fund Return | | Class A | | | Class B | |
| Beginning Account Value 7/1/12 | | $ | 1,000.00 | | | $ | 1,000.00 | |
| Ending Account Value 12/31/12 | | $ | 1,076.10 | | | $ | 1,075.60 | |
| Expenses Paid per $1,000* | | $ | 3.76 | | | $ | 5.17 | |
| Hypothetical 5% Fund Return | | Class A | | | Class B | |
| Beginning Account Value 7/1/12 | | $ | 1,000.00 | | | $ | 1,000.00 | |
| Ending Account Value 12/31/12 | | $ | 1,021.52 | | | $ | 1,020.16 | |
| Expenses Paid per $1,000* | | $ | 3.66 | | | $ | 5.03 | |
* Expenses are equal to the Fund's annualized expense ratio for each share class, multiplied by the average account value over the period, multiplied by 184 (the number of days in the most recent six-month period), then divided by 366.
| Annualized Expense Ratios | Class A | | Class B | |
| DWS Variable Series II — DWS High Income VIP | .72% | | .99% | |
For more information, please refer to the Fund's prospectus.
These tables do not reflect charges and fees ("contract charges") associated with the separate account that invests in the Fund or any variable life insurance policy or variable annuity contract for which the Fund is an investment option.
Tax Information (Unaudited)
Please consult a tax advisor if you have questions about federal or state income tax laws, or on how to prepare your tax returns. If you have specific questions about your account, please contact your insurance provider.
The Trust's policies and procedures for voting proxies for portfolio securities and information about how the Trust voted proxies related to its portfolio securities during the 12-month period ended June 30 are available on our Web site — www.dws-investments.com (click on "proxy voting" at the bottom of the page) — or on the SEC's Web site — www.sec.gov. To obtain a written copy of the Trust's policies and procedures without charge, upon request, call us toll free at (800) 728-3337.
Investment Management Agreement Approval
The Board of Trustees approved the renewal of DWS High Income VIP's investment management agreement (the "Agreement") with Deutsche Investment Management Americas Inc. ("DWS") in September 2012.
In terms of the process that the Board followed prior to approving the Agreement, shareholders should know that:
• In September 2012, all of the Fund's Trustees were independent of DWS and its affiliates.
• The Trustees met frequently during the past year to discuss fund matters and dedicated a substantial amount of time to contract review matters. Over the course of several months, the Board's Contract Committee, in coordination with the Board's Fixed Income and Quant Oversight Committee, reviewed comprehensive materials received from DWS, independent third parties and independent counsel. These materials included an analysis of the Fund's performance, fees and expenses, and profitability compiled by the Fund's independent fee consultant. The Board also received extensive information throughout the year regarding performance of the Fund.
• The Independent Trustees regularly meet privately with their independent counsel to discuss contract review and other matters. In addition, the Independent Trustees were also advised by the Fund's independent fee consultant in the course of their review of the Fund's contractual arrangements and considered a comprehensive report prepared by the independent fee consultant in connection with their deliberations (the "IFC Report").
• In connection with reviewing the Agreement, the Board also reviewed the terms of the Fund's Rule 12b-1 plan, distribution agreement, administrative services agreement, transfer agency agreement and other material service agreements.
• Based on its evaluation of the information provided, the Contract Committee presented its findings and recommendations to the Board. The Board then reviewed the Contract Committee's findings and recommendations.
In connection with the contract review process, the Contract Committee and the Board considered the factors discussed below, among others. The Board also considered that DWS and its predecessors have managed the Fund since its inception, and the Board believes that a long-term relationship with a capable, conscientious advisor is in the best interests of the Fund. The Board considered, generally, that shareholders chose to invest or remain invested in the Fund knowing that DWS managed the Fund, and that the Agreement was approved by the Fund's shareholders. DWS is part of Deutsche Bank, a major global banking institution that is engaged in a wide range of financial services. The Board believes that there are advantages to being part of a global asset management business that offers a wide range of investing expertise and resources, including hundreds of portfolio managers and analysts with research capabilities in many countries throughout the world.
As part of the contract review process, the Board carefully considered the fees and expenses of each DWS fund overseen by the Board in light of the fund's performance. In many cases, this led to a negotiation with DWS of lower expense caps for the coming year than had previously been in place. As part of these negotiations, the Board indicated that it would consider relaxing these new lower caps in future years following sustained improvements in performance, among other considerations.
In June 2012, Deutsche Bank ("DB"), DWS's parent company, announced that DB's new management team had concluded the strategic review of its global asset management business announced in late 2011 by DB's prior management team, and would combine its Asset Management (of which DWS is a part) and Wealth Management divisions. Prior to approving the investment management agreements, the Independent Trustees were apprised of the expected management and structure of the new combined Asset & Wealth Management division ("AWM") and DWS. DB also advised the Independent Trustees that the U.S. asset management business is a critical and integral part of DB and AWM, and that DB would be reinvesting a significant portion of the substantial savings it expects to realize by combining its Asset Management and Wealth Management divisions into a combined AWM division, including enhancements to its investment capabilities. DB also confirmed its commitment to maintaining strong legal and compliance groups within the combined division.
While shareholders may focus primarily on fund performance and fees, the Fund's Board considers these and many other factors, including the quality and integrity of DWS's personnel and such other issues as back-office operations, fund valuations, and compliance policies and procedures.
Nature, Quality and Extent of Services. The Board considered the terms of the Agreement, including the scope of advisory services provided under the Agreement. The Board noted that, under the Agreement, DWS provides portfolio management services to the Fund and that, pursuant to a separate administrative services agreement, DWS provides administrative services to the Fund. The Board considered the experience and skills of senior management and investment personnel, the resources made available to such personnel, the ability of DWS to attract and retain high-quality personnel, and the organizational depth and stability of DWS. The Board reviewed the Fund's performance over short-term and long-term periods and compared those returns to various agreed-upon performance measures, including market indices and a peer universe compiled by the independent fee consultant using information supplied by Lipper Inc. ("Lipper"), an independent fund data service. The Board also noted that it has put into place a process of identifying "Focus Funds" (e.g., funds performing poorly relative to their benchmark or a peer universe compiled by an independent fund data service), and receives more frequent reporting and information from DWS regarding such funds, along with DWS's remedial plans to address underperformance. The Board believes this process is an effective manner of identifying and addressing underperforming funds. Based on the information provided, the Board noted that for the one-, three- and five-year periods ended December 31, 2011, the Fund's performance (Class A shares) was in the 3rd quartile of the applicable Lipper universe (the 1st quartile being the best performers and the 4th quartile being the worst performers). The Board also observed that the Fund has underperformed its benchmark in the one-, three- and five-year periods ended December 31, 2011.
Fees and Expenses. The Board considered the Fund's investment management fee schedule, operating expenses and total expense ratios, and comparative information provided by Lipper and the independent fee consultant regarding investment management fee rates paid to other investment advisors by similar funds (1st quartile being the most favorable and 4th quartile being the least favorable). With respect to management fees paid to other investment advisors by similar funds, the Board noted that the contractual fee rates paid by the Fund, which include a 0.10% fee paid to DWS under the Fund's administrative services agreement, were lower than the median (1st quartile) of the applicable Lipper peer group (based on Lipper data provided as of December 31, 2011). The Board noted that the Fund's Class A shares total (net) operating expenses were expected to be equal to the median (2nd quartile) of the applicable Lipper expense universe (based on Lipper data provided as of December 31, 2011, and analyzing Lipper expense universe Class A (net) expenses less any applicable 12b-1 fees) ("Lipper Universe Expenses"). The Board also reviewed data comparing each share class's total (net) operating expenses to the applicable Lipper Universe Expenses. The Board considered the Fund's management fee rate as compared to fees charged by DWS and certain of its affiliates for comparable mutual funds and considered differences in fund and fee structures between the DWS Funds. The Board also considered how the Fund's total (net) operating expenses compared to the total (net) operating expenses of a more customized peer group selected by Lipper (based on such factors as asset size). The Board also noted that the expense limitations agreed to by DWS helped to ensure that the Fund's total (net) operating expenses would remain competitive.
The information considered by the Board as part of its review of management fees included information regarding fees charged by DWS and its affiliates to similar institutional accounts and to similar funds offered primarily to European investors ("DWS Europe funds"), in each case as applicable. The Board observed that advisory fee rates for institutional accounts generally were lower than the management fees charged by similarly managed DWS U.S. mutual funds ("DWS Funds"), but also took note of the differences in services provided to DWS Funds as compared to institutional accounts. In the case of DWS Europe funds, the Board observed that fee rates for DWS Europe funds generally were higher than for similarly managed DWS Funds, but noted that differences in the types of services provided to DWS Funds relative to DWS Europe funds made it difficult to compare such fees.
On the basis of the information provided, the Board concluded that management fees were reasonable and appropriate in light of the nature, quality and extent of services provided by DWS.
Profitability. The Board reviewed detailed information regarding revenues received by DWS under the Agreement. The Board considered the estimated costs and pre-tax profits realized by DWS from advising the DWS Funds, as well as estimates of the pre-tax profits attributable to managing the Fund in particular. The Board also received information regarding the estimated enterprise-wide profitability of DWS and its affiliates with respect to all fund services in totality and by fund. The Board and the independent fee consultant reviewed DWS's methodology in allocating its costs to the management of the Fund. Based on the information provided, the Board concluded that the pre-tax profits realized by DWS in connection with the management of the Fund were not unreasonable. The Board also reviewed information regarding the profitability of certain similar investment management firms. The Board noted that while information regarding the profitability of such firms is limited (and in some cases is not necessarily prepared on a comparable basis), DWS and its affiliates' overall profitability with respect to the DWS fund complex (after taking into account distribution and other services provided to the funds by DWS and its affiliates) was lower than the overall profitability levels of many comparable firms for which such data was available.
Economies of Scale. The Board considered whether there are economies of scale with respect to the management of the Fund and whether the Fund benefits from any economies of scale. The Board noted that the Fund's management fee schedule includes fee breakpoints. The Board concluded that the Fund's fee schedule represents an appropriate sharing between the Fund and DWS of such economies of scale as may exist in the management of the Fund at current asset levels.
Other Benefits to DWS and Its Affiliates. The Board also considered the character and amount of other incidental benefits received by DWS and its affiliates, including any fees received by DWS for administrative services provided to the Fund and any fees received by an affiliate of DWS for distribution services. The Board also considered benefits to DWS related to brokerage and soft-dollar allocations, including allocating brokerage to pay for research generated by parties other than the executing broker dealers, which pertain primarily to funds investing in equity securities, along with the incidental public relations benefits to DWS related to DWS Funds advertising and cross-selling opportunities among DWS products and services. The Board concluded that management fees were reasonable in light of these fallout benefits.
Compliance. The Board considered the significant attention and resources dedicated by DWS to documenting and enhancing its compliance processes in recent years. The Board noted in particular (i) the experience and seniority of both DWS's chief compliance officer and the Fund's chief compliance officer; (ii) the large number of DWS compliance personnel; and (iii) the substantial commitment of resources by DWS and its affiliates to compliance matters.
Based on all of the information considered and the conclusions reached, the Board unanimously determined that the continuation of the Agreement is in the best interests of the Fund. In making this determination, the Board did not give particular weight to any single factor identified above. The Board considered these factors over the course of numerous meetings, certain of which were in executive session with only the Independent Trustees and their counsel present. It is possible that individual Trustees may have weighed these factors differently in reaching their individual decisions to approve the continuation of the Agreement.
Summary of Management Fee Evaluation by Independent Fee Consultant
September 17, 2012
Pursuant to an Order entered into by Deutsche Investment Management Americas and affiliates (collectively, "DeAM") with the Attorney General of New York, I, Thomas H. Mack, have been appointed the Independent Fee Consultant for the DWS Funds (formerly the DWS Scudder Funds). My duties include preparing an annual written evaluation of the management fees DeAM charges the Funds, considering among other factors the management fees charged by other mutual fund companies for like services, management fees DeAM charges other clients for like services, DeAM's costs of supplying services under the management agreements and related profit margins, possible economies of scale if a Fund grows larger, and the nature and quality of DeAM's services, including fund performance. This report summarizes my evaluation for 2012, including my qualifications, the evaluation process for each of the DWS Funds, consideration of certain complex-level factors, and my conclusions. I served in substantially the same capacity in 2007, 2008, 2009, 2010 and 2011.
Qualifications
For more than 35 years I have served in various professional capacities within the investment management business. I have held investment analysis and advisory positions, including securities analyst, portfolio strategist and director of investment policy with a large investment firm. I have also performed business management functions, including business development, financial management and marketing research and analysis.
Since 1991, I have been an independent consultant within the asset management industry. I have provided services to over 125 client organizations, including investment managers, mutual fund boards, product distributors and related organizations. Over the past ten years I have completed a number of assignments for mutual fund boards, specifically including assisting boards with management contract renewal.
I hold a Master of Business Administration degree, with highest honors, from Harvard University and Master of Science and Bachelor of Science (highest honors) degrees from the University of California at Berkeley. I am an independent director and audit committee financial expert for two closed-end mutual funds and have served in various leadership and financial oversight capacities with non-profit organizations.
Evaluation of Fees for each DWS Fund
My work focused primarily on evaluating, fund-by-fund, the fees charged to each of the 103 mutual fund portfolios in the DWS Fund family. For each Fund, I considered each of the key factors mentioned above, as well as any other relevant information. In doing so I worked closely with the Funds' Independent Directors in their annual contract renewal process, as well as in their approval of contracts for several new funds (documented separately).
In evaluating each Fund's fees, I reviewed comprehensive materials provided by or on behalf of DeAM, including expense information prepared by Lipper Analytical, comparative performance information, profitability data, manager histories, and other materials. I also accessed certain additional information from the Lipper and Morningstar databases and drew on my industry knowledge and experience.
To facilitate evaluating this considerable body of information, I prepared for each Fund a document summarizing the key data elements in each area as well as additional analytics discussed below. This made it possible to consider each key data element in the context of the others.
In the course of contract renewal, DeAM agreed to implement a number of fee and expense adjustments requested by the Independent Directors which will favorably impact future fees and expenses, and my evaluation includes the effects of these changes.
Fees and Expenses Compared with Other Funds
The competitive fee and expense evaluation for each fund focused on two primary comparisons:
The Fund's contractual management fee (the advisory fee plus the administration fee where applicable) compared with those of a group of typically 12-15 funds in the same Lipper investment category (e.g. Large Capitalization Growth) having similar distribution arrangements and being of similar size.
The Fund's total expenses compared with a broader universe of funds from the same Lipper investment category and having similar distribution arrangements.
These two comparisons provide a view of not only the level of the fee compared with funds of similar scale but also the total expense the Fund bears for all the services it receives, in comparison with the investment choices available in the Fund's investment category and distribution channel. The principal figure-of-merit used in these comparisons was the subject Fund's percentile ranking against peers.
DeAM's Fees for Similar Services to Others
DeAM provided management fee schedules for all of its US domiciled fund and non-fund investment management accounts in any of the investment categories where there is a DWS Fund. These similar products included the other DWS Funds, non-fund pooled accounts, institutional accounts and sub-advisory accounts. Using this information, I calculated for each Fund the fee that would be charged to each similar product, at the subject Fund's asset level.
Evaluating information regarding non-fund products is difficult because there are varying levels of services required for different types of accounts, with mutual funds generally requiring considerably more regulatory and administrative types of service as well as having more frequent cash flows than other types of accounts. Also, while mutual fund fees for similar fund products can be expected to be similar, there will be some differences due to different pricing conditions in different distribution channels (e.g. retail funds versus those used in variable insurance products), differences in underlying investment processes and other factors.
Costs and Profit Margins
DeAM provided a detailed profitability analysis for each Fund. After making some adjustments so that the presentation would be more comparable to the available industry figures, I reviewed profit margins from investment management alone, from investment management plus other fund services (excluding distribution) provided to the Funds by DeAM (principally shareholder services), and DeAM profits from all sources, including distribution. A later section comments on overall profitability.
Economies of Scale
Economies of scale — an expected decline in management cost per dollar of fund assets as fund assets grow — are very rarely quantified and documented because of inherent difficulties in collecting and analyzing relevant data. However, in virtually every investment category that I reviewed, larger funds tend to have lower fees and lower total expenses than smaller funds. To see how each DWS Fund compares with this industry observation, I reviewed:
The trend in Fund assets over the last five years and the accompanying trend in total expenses. This shows if the Fund has grown and, if so, whether total expense (management fees as well as other expenses) have declined as a percent of assets.
Whether the Fund has break-points in its management fee schedule, the extent of the fee reduction built into the schedule and the asset levels where the breaks take effect, and in the case of a sub-advised Fund how the Fund's break-points compare with those of the sub-advisory fee schedule.
How the Fund's contractual fee schedule compares with trends in the industry data. To accomplish this, I constructed a chart showing how actual latest-fiscal-year contractual fees of the Fund and of other similar funds relate to average fund assets, with the subject Fund's contractual fee schedule superimposed.
Quality of Service — Performance
The quality-of-service evaluation focused on investment performance, which is the principal result of the investment management service. Each Fund's performance was reviewed over the past 1, 3, 5 and 10 years, as applicable, and compared with that of other funds in the same investment category and with a suitable market index.
In addition, I calculated and reviewed risk-adjusted returns relative to an index of similar mutual funds' returns and a suitable market index. The risk-adjusted returns analysis provides a way of determining the extent to which the Fund's return comparisons are mainly the product of investment value-added (or lack thereof) or alternatively taking considerably more or less risk than is typical in its investment category.
I also received and considered the history of portfolio manager changes for each Fund, as this provided an important context for evaluating the performance results.
Complex-Level Considerations
While this evaluation was conducted mainly at the individual fund level, there are some issues relating to the reasonableness of fees that can alternatively be considered across the whole fund complex:
I reviewed DeAM's profitability analysis for all DWS Funds, with a view toward determining if the allocation procedures used were reasonable and how profit levels compared with public data for other investment managers.
I considered whether DeAM and affiliates receive any significant ancillary or "fallout" benefits that should be considered in interpreting the direct profitability results. These would be situations where serving as the investment manager of the Funds is beneficial to another part of the Deutsche Bank organization.
I considered how aggregated DWS Fund expenses had varied over the years, by asset class and in the context of trends in asset levels.
I considered how aggregated DWS Fund performance measures relative to appropriate peers had varied by asset class and over time.
I reviewed the structure of the DeAM organization, trends in staffing levels, and information on compensation of investment management and other professionals compared with industry data.
Findings
Based on the process and analysis discussed above, which included reviewing a wide range of information from management and external data sources and considering among other factors the fees DeAM charges other clients, the fees charged by other fund managers, DeAM's costs and profits associated with managing the Funds, economies of scale, possible fall-out benefits, and the nature and quality of services provided, in my opinion the management fees charged the DWS Funds are reasonable.
Thomas H. Mack
President, Thomas H. Mack & Co., Inc.
Board Members and Officers
The following table presents certain information regarding the Board Members and Officers of the fund. Each Board Member's year of birth is set forth in parentheses after his or her name. Unless otherwise noted, (i) each Board Member has engaged in the principal occupation(s) noted in the table for at least the most recent five years, although not necessarily in the same capacity; and (ii) the address of each Independent Board Member is c/o Kenneth C. Froewiss, Chairman, DWS Mutual Funds, P.O. Box 78, Short Hills, NJ 07078. Except as otherwise noted below, the term of office for each Board Member is until the election and qualification of a successor, or until such Board Member sooner dies, resigns, is removed or as otherwise provided in the governing documents of the fund. Because the fund does not hold an annual meeting of shareholders, each Board Member will hold office for an indeterminate period. The Board Members may also serve in similar capacities with other funds in the fund complex.
| Independent Board Members |
Name, Year of Birth, Position with the Fund and Length of Time Served1 | | Business Experience and Directorships During the Past Five Years | Number of Funds in DWS Fund Complex Overseen |
Other Directorships Held by Board Member |
Kenneth C. Froewiss (1945) Chairperson since 2013,9 and Board Member since 2001 | | Adjunct Professor of Finance, NYU Stern School of Business (September 2009-present; Clinical Professor from 1997-September 2009); Member, Finance Committee, Association for Asian Studies (2002-present); Director, Mitsui Sumitomo Insurance Group (US) (2004-present); prior thereto, Managing Director, J.P. Morgan (investment banking firm) (until 1996) | 103 | — |
William McClayton (1944) Vice Chairperson since 2013,9 and Board Member since 2004 | | Private equity investor (since October 2009); previously, Managing Director, Diamond Management & Technology Consultants, Inc. (global consulting firm) (2001-2009); Directorship: Board of Managers, YMCA of Metropolitan Chicago; formerly: Senior Partner, Arthur Andersen LLP (accounting) (1966-2001); Trustee, Ravinia Festival | 103 | — |
John W. Ballantine (1946) Board Member since 1999 | | Retired; formerly, Executive Vice President and Chief Risk Management Officer, First Chicago NBD Corporation/The First National Bank of Chicago (1996-1998); Executive Vice President and Head of International Banking (1995-1996). Directorships: Stockwell Capital Investments PLC (private equity); former Directorships: First Oak Brook Bancshares, Inc. and Oak Brook Bank; Prisma Energy International | 103 | Chairman of the Board, Healthways, Inc.2 (provider of disease and care management services) (2003- present); Portland General Electric2 (utility company) (2003-present) |
Henry P. Becton, Jr. (1943) Board Member since 1990 | | Vice Chair and former President, WGBH Educational Foundation. Directorships: Public Radio International; Public Radio Exchange (PRX); The PBS Foundation; North Bennett Street School (Boston); former Directorships: Association of Public Television Stations; Boston Museum of Science; American Public Television; Concord Academy; New England Aquarium; Mass. Corporation for Educational Telecommunications; Committee for Economic Development; Public Broadcasting Service; Connecticut College | 103 | Lead Director, Becton Dickinson and Company2 (medical technology company); Lead Director, Belo Corporation2 (media company) |
Dawn-Marie Driscoll (1946) Board Member since 1987 | | President, Driscoll Associates (consulting firm); Emeritus Executive Fellow, Center for Business Ethics, Bentley University; formerly, Partner, Palmer & Dodge (1988-1990); Vice President of Corporate Affairs and General Counsel, Filene's (1978-1988). Directorships: Director of ICI Mutual Insurance Company (since 2007); Advisory Board, Center for Business Ethics, Bentley University; Trustee, Southwest Florida Community Foundation (charitable organization); former Directorships: Sun Capital Advisers Trust (mutual funds) (2007-2012), Investment Company Institute (audit, executive, nominating committees) and Independent Directors Council (governance, executive committees) | 103 | — |
Keith R. Fox, CFA (1954) Board Member since 1996 | | Managing General Partner, Exeter Capital Partners (a series of private investment funds) (since 1986). Directorships: Progressive International Corporation (kitchen goods importer and distributor); The Kennel Shop (retailer); former Chairman, National Association of Small Business Investment Companies; former Directorships: BoxTop Media Inc. (advertising); Sun Capital Advisers Trust (mutual funds) (2011-2012) | 103 | — |
Paul K. Freeman (1950) Board Member since 1993, and Chairperson (2009-Jan. 8, 2013) | | Consultant, World Bank/Inter-American Development Bank; Executive and Governing Council of the Independent Directors Council (Chairman of Education Committee); formerly: Project Leader, International Institute for Applied Systems Analysis (1998-2001); Chief Executive Officer, The Eric Group, Inc. (environmental insurance) (1986-1998); Directorships: Denver Zoo Foundation (December 2012-present); former Directorships: Prisma Energy International | 103 | — |
Richard J. Herring (1946) Board Member since 1990 | | Jacob Safra Professor of International Banking and Professor, Finance Department, The Wharton School, University of Pennsylvania (since July 1972); Co-Director, Wharton Financial Institutions Center (since July 2000); Co-Chair, U.S. Shadow Financial Regulatory Committee; Executive Director, Financial Economists Roundtable; formerly: Vice Dean and Director, Wharton Undergraduate Division (July 1995-June 2000); Director, Lauder Institute of International Management Studies (July 2000-June 2006) | 103 | Director, Japan Equity Fund, Inc. (since September 2007), Thai Capital Fund, Inc. (since 2007), Singapore Fund, Inc. (since September 2007), Independent Director of Barclays Bank Delaware (since September 2010) |
Rebecca W. Rimel (1951) Board Member since 1995 | | President and Chief Executive Officer, The Pew Charitable Trusts (charitable organization) (1994 to present); Trustee, Washington College (2011-2013); formerly: Executive Vice President, The Glenmede Trust Company (investment trust and wealth management) (1983-2004); Board Member, Investor Education (charitable organization) (2004-2005); Trustee, Executive Committee, Philadelphia Chamber of Commerce (2001-2007); Director, Viasys Health Care2 (January 2007-June 2007); Trustee, Pro Publica (charitable organization) (2007-2010); Trustee, Thomas Jefferson Foundation (charitable organization) (1994-2012) | 103 | Director, Becton Dickinson and Company2 (medical technology company) (2012-present); Director, CardioNet, Inc.2 (health care) (2009-present) |
William N. Searcy, Jr. (1946) Board Member since 1993 | | Private investor since October 2003; formerly: Pension & Savings Trust Officer, Sprint Corporation2 (telecommunications) (November 1989-September 2003); Trustee, Sun Capital Advisers Trust (mutual funds) (1998-2012) | 103 | — |
Jean Gleason Stromberg (1943) Board Member since 1997 | | Retired. Formerly, Consultant (1997-2001); Director, Financial Markets U.S. Government Accountability Office (1996-1997); Partner, Fulbright & Jaworski, L.L.P. (law firm) (1978-1996). Directorships: The William and Flora Hewlett Foundation; former Directorships: Service Source, Inc., Mutual Fund Directors Forum (2002-2004), American Bar Retirement Association (funding vehicle for retirement plans) (1987-1990 and 1994-1996) | 103 | — |
Robert H. Wadsworth (1940) Board Member since 1999 | | President, Robert H. Wadsworth & Associates, Inc. (consulting firm) (1983 to present); Director, National Horizon, Inc. (non-profit organization); Director and Treasurer, The Phoenix Boys Choir Association | 106 | — |
Interested Board Member and Officer4 |
Name, Year of Birth, Position with the Fund and Length of Time Served1,6 | | Business Experience and Directorships During the Past Five Years | Number of Funds in DWS Fund Complex Overseen |
Other Directorships Held by Board Member |
Michael J. Woods5 (1967) Board Member since 2013,9 and Executive Vice President since 20139 | | Managing Director,3 Deutsche Asset & Wealth Management (2009-present); Head of the Americas Asset Management Business for Deutsche Bank, Member of the Asset and Wealth Management ("AWM") Extended Executive Committee, AWM Global Client Group Executive Committee and the AWM Active Asset Management Executive Committee; CEO and US Regional Head of DWS Investments; formerly: Sr. VP, Head of the Financial Intermediaries and Investments Group of Evergreen Investments (2007-2009), CEO and Vice Chairman of Board of Directors of XTF Global Asset Management (2006-2007), Managing Director — US Head of Sub-Advisory and Investment Only Business at Citigroup Asset Management (2000-2006). Mr. Woods is currently a board member of The Children's Village, The Big Brothers Big Sisters Organization, and The Mutual Fund Education Alliance. | 39 | — |
Officers4 |
Name, Year of Birth, Position with the Fund and Length of Time Served6 | | Business Experience and Directorships During the Past Five Years |
W. Douglas Beck, CFA7 (1967) President, 2011-present | | Managing Director,3 Deutsche Asset & Wealth Management (2006-present); President of DWS family of funds and Head of Product Management, U.S. for DWS Investments; formerly: Executive Director, Head of Product Management (2002-2006) and President (2005-2006) of the UBS Funds at UBS Global Asset Management; Co-Head of Manager Research/Managed Solutions Group, Merrill Lynch (1998-2002) |
John Millette8 (1962) Vice President and Secretary, 1999-present | | Director,3 Deutsche Asset & Wealth Management |
Paul H. Schubert7 (1963) Chief Financial Officer, 2004-present Treasurer, 2005-present | | Managing Director,3 Deutsche Asset & Wealth Management (since July 2004); formerly: Executive Director, Head of Mutual Fund Services and Treasurer for UBS Family of Funds (1998-2004); Vice President and Director of Mutual Fund Finance at UBS Global Asset Management (1994-1998) |
Caroline Pearson8 (1962) Chief Legal Officer, 2010-present | | Managing Director,3 Deutsche Asset & Wealth Management; formerly: Assistant Secretary for DWS family of funds (1997-2010) |
Melinda Morrow7 (1970) Vice President, 2012-present | | Director,3 Deutsche Asset & Wealth Management |
Hepsen Uzcan8 (1974) Assistant Secretary, since 20139 | | Vice President, Deutsche Asset & Wealth Management |
Paul Antosca8 (1957) Assistant Treasurer, 2007-present | | Director,3 Deutsche Asset & Wealth Management |
Jack Clark8 (1967) Assistant Treasurer, 2007-present | | Director,3 Deutsche Asset & Wealth Management |
Diane Kenneally8 (1966) Assistant Treasurer, 2007-present | | Director,3 Deutsche Asset & Wealth Management |
John Caruso7 (1965) Anti-Money Laundering Compliance Officer, 2010-present | | Managing Director,3 Deutsche Asset & Wealth Management |
Robert Kloby7 (1962) Chief Compliance Officer, 2006-present | | Managing Director,3 Deutsche Asset & Wealth Management |
1 The length of time served represents the year in which the Board Member joined the board of one or more DWS funds currently overseen by the Board.
2 A publicly held company with securities registered pursuant to Section 12 of the Securities Exchange Act of 1934.
3 Executive title, not a board directorship.
4 As a result of their respective positions held with the Advisor, these individuals are considered "interested persons" of the Advisor within the meaning of the 1940 Act. Interested persons receive no compensation from the fund.
5 The mailing address of Mr. Woods is 60 Wall Street, New York, New York 10005. Mr. Woods is an interested Board Member by virtue of his positions with Deutsche Asset & Wealth Management. As an interested person, Mr. Woods receives no compensation from the fund. Mr. Woods is a board member of the following trusts and corporations: Cash Account Trust, DWS Market Trust, DWS Money Funds, DWS State Tax-Free Income Series, DWS Target Fund, DWS Value Series, Inc., DWS Variable Series II, Investors Cash Trust, Tax-Exempt California Money Market Fund, DWS Global High Income Fund, Inc., DWS High Income Opportunities Fund, Inc., DWS High Income Trust, DWS Multi-Market Income Trust, DWS Municipal Income Trust, DWS Strategic Income Trust and DWS Strategic Municipal Income Trust.
6 The length of time served represents the year in which the officer was first elected in such capacity for one or more DWS funds.
7 Address: 60 Wall Street, New York, NY 10005.
8 Address: One Beacon Street, Boston, MA 02108.
9 Effective as of January 9, 2013.
The fund's Statement of Additional Information ("SAI") includes additional information about the Board Members. The SAI is available, without charge, upon request. If you would like to request a copy of the SAI, you may do so by calling the following toll-free number: (800) 728-3337.
Notes
DWS Investments Distributors, Inc.
222 South Riverside Plaza
Chicago, IL 60606
(800) 621-1148
VS2HI-2 (R-025832-2 2/13)
DECEMBER 31, 2012
ANNUAL REPORT
DWS VARIABLE SERIES II
DWS Large Cap Value VIP
Contents
11 Statement of Assets and Liabilities 12 Statement of Operations 13 Statement of Changes in Net Assets 15 Notes to Financial Statements 19 Report of Independent Registered Public Accounting Firm 20 Information About Your Fund's Expenses 23 Investment Management Agreement Approval 26 Summary of Management Fee Evaluation by Independent Fee Consultant 28 Board Members and Officers |
This report must be preceded or accompanied by a prospectus. To obtain an additional prospectus or summary prospectus, if available, call (800) 728-3337 or your financial representative. We advise you to consider the Fund's objectives, risks, charges and expenses carefully before investing. The summary prospectus and prospectus contain this and other important information about the Fund. Please read the prospectus carefully before you invest.
Investing in derivatives entails special risks relating to liquidity, leverage and credit that may reduce returns and/or increase volatility. The Fund may lend securities to approved institutions. Stocks may decline in value. See the prospectus for details.
DWS Investments is part of the Deutsche Asset & Wealth Management division of Deutsche Bank AG.
NOT FDIC/NCUA INSURED NO BANK GUARANTEE MAY LOSE VALUE NOT A DEPOSIT
NOT INSURED BY ANY FEDERAL GOVERNMENT AGENCY
Performance Summary December 31, 2012 (Unaudited)
Fund performance shown is historical, assumes reinvestment of all dividend and capital gain distributions and does not guarantee future results. Investment return and principal value fluctuate with changing market conditions so that, when redeemed, shares may be worth more or less than their original cost. Current performance may be lower or higher than the performance data quoted. Please contact your participating insurance company for the Fund's most recent month-end performance. Performance doesn't reflect charges and fees ("contract charges") associated with the separate account that invests in the Fund or any variable life insurance policy or variable annuity contract for which the Fund is an investment option. These charges and fees will reduce returns. While all share classes have the same underlying portfolio, their performance will differ.
The gross expense ratios of the Fund, as stated in the fee table of the prospectus dated May 1, 2012 are 0.79% and 1.10% for Class A and Class B shares, respectively, and may differ from the expense ratios disclosed in the Financial Highlights tables in this report.
| Growth of an Assumed $10,000 Investment in DWS Large Cap Value VIP |
| The Russell 1000® Value Index is an unmanaged index that consists of those stocks in the Russell 1000® Index with less-than-average growth orientation. The Russell 1000® Index is an unmanaged price-only index of the 1,000 largest capitalized companies that are domiciled in the U.S. and whose common stocks are traded. Index returns do not reflect any fees or expenses and it is not possible to invest directly into an index. |
| |
| Yearly periods ended December 31 | |
| Comparative Results | |
| DWS Large Cap Value VIP | | 1-Year | | | 3-Year | | | 5-Year | | | 10-Year | |
| Class A | Growth of $10,000 | | $ | 10,979 | | | $ | 12,153 | | | $ | 9,691 | | | $ | 18,832 | |
| Average annual total return | | | 9.79 | % | | | 6.72 | % | | | -0.63 | % | | | 6.53 | % |
Russell 1000® Value Index | Growth of $10,000 | | $ | 11,751 | | | $ | 13,626 | | | $ | 10,299 | | | $ | 20,382 | |
| Average annual total return | | | 17.51 | % | | | 10.86 | % | | | 0.59 | % | | | 7.38 | % |
| DWS Large Cap Value VIP | | 1-Year | | | 3-Year | | | 5-Year | | | 10-Year | |
| Class B | Growth of $10,000 | | $ | 10,944 | | | $ | 12,053 | | | $ | 9,534 | | | $ | 18,197 | |
| Average annual total return | | | 9.44 | % | | | 6.42 | % | | | -0.95 | % | | | 6.17 | % |
Russell 1000® Value Index | Growth of $10,000 | | $ | 11,751 | | | $ | 13,626 | | | $ | 10,299 | | | $ | 20,382 | |
| Average annual total return | | | 17.51 | % | | | 10.86 | % | | | 0.59 | % | | | 7.38 | % |
The growth of $10,000 is cumulative.
Management Summary December 31, 2012 (Unaudited)
Class A shares of DWS Large Cap Value VIP returned 9.79% (unadjusted for contract charges) in 2012, but underperformed the 17.51% return of the benchmark, the Russell 1000® Value Index.1
Although the Fund delivered a solid total return during the past year, it did not fully participate in the market's upside. One of the most important factors in our shortfall was our underweight position in financials.2 This element of our positioning — which we held due to the sector's questionable fundamentals and exposure to elevated regulatory risk — added quite a bit of value in the 2010 to 2011 period, when financials underperformed the broader market by a wide margin. During the past 12 months, however, financial stocks performed exceptionally well, due in part to the improving housing market and the strengthening economy. We added to the sector throughout the year — and held only a modest below-market weighting at the close of the period — but our average underweight prevented us from gaining the full benefit of the sector's rally.
The Fund was also hurt by its position in the Canadian energy stock Canadian Natural Resources Ltd., which lost ground as the growing U.S. oil supply and lack of pipeline capacity led to reduced demand from the United States, its key export market. The materials sector also proved to be a challenging area due to our position in the gold mining stocks Newmont Mining Corp. and Goldcorp, Inc., both of which lost ground as operational issues and rising costs led them to miss earnings estimates. Our positions in Humana, Inc. and Sonoco Products Co. also detracted from performance.
On the plus side, we added value via our positions in Marathon Petroleum Corp., Fidelity National Financial, Inc. and Nexen, Inc., which was bought out at a premium by the Chinese company CNOOC Ltd.
The Fund underperformed the broader market during 2012, and we are taking steps to rectify this issue in the year ahead. One of the largest factors in our shortfall was our large deviations from the benchmark weightings in certain sectors, such as our underweight in financials. We also had a number of out-of-benchmark positions or substantial overweights that cost us return in 2012. Our solution to these issues is to bring the Fund's sector weightings more closely in line with the benchmark and to trim our positions in securities that aren't represented in the index. We believe this approach will help reduce the risk of substantial underperformance, and it should enable our individual stock selection to have a greater impact on the Fund's return by reducing the potential impact of allocation factors.
We anticipate that these moves will help position the Fund for the positive environment we see emerging in 2013. We expect that investors will gradually return their attention to company fundamentals as political issues recede from the headlines — an environment that could prove favorable for the Fund by providing greater latitude for us to add value via individual stock selection.
Thomas Schuessler, PhD.
Lead Portfolio Manager
Peter Steffen, CFA
Oliver Pfeil, PhD.
Portfolio Managers
The views expressed reflect those of the portfolio management team only through the end of the period of the report as stated on the cover. The management team's views are subject to change at any time based on market and other conditions and should not be construed as a recommendation. Past performance is no guarantee of future results. Current and future portfolio holdings are subject to risk.
1 The Russell 1000 Value Index is an unmanaged index that consists of those stocks in the Russell 1000® Index with less-than-average growth orientation. The Russell 1000 Index is an unmanaged, price-only index of the 1,000 largest capitalized companies that are domiciled in the U.S. and whose common stocks are traded. Index returns do not reflect fees or expenses and it is not possible to invest directly into an index.
2 "Overweight" means the Fund holds a higher weighting in a given sector or security than the benchmark. "Underweight" means the Fund holds a lower weighting.
Portfolio Summary (Unaudited) Asset Allocation (As a % of Investment Portfolio excluding Securities Lending Collateral) | 12/31/12 | 12/31/11 |
| | | |
| Common Stocks | 98% | 94% |
| Cash Equivalents | 1% | 5% |
| Exchange-Traded Fund | 1% | 1% |
| | 100% | 100% |
Sector Diversification (As a % of Common Stocks) | 12/31/12 | 12/31/11 |
| | | |
| Financials | 24% | 14% |
| Energy | 17% | 15% |
| Health Care | 14% | 13% |
| Industrials | 10% | 6% |
| Consumer Discretionary | 9% | 4% |
| Consumer Staples | 8% | 13% |
| Information Technology | 6% | 7% |
| Materials | 5% | 10% |
| Utilities | 4% | 12% |
| Telecommunication Services | 3% | 6% |
| | 100% | 100% |
Portfolio holdings and characteristics are subject to change.
For more complete details about the Fund's investment portfolio, see page 7.
Following the Fund's fiscal first and third quarter-end, a complete portfolio holdings listing is filed with the SEC on Form N-Q. The form will be available on the SEC's Web site at www.sec.gov, and it also may be reviewed and copied at the SEC's Public Reference Room in Washington, D.C. Information on the operation of the SEC's Public Reference Room may be obtained by calling (800) SEC-0330. The Fund's portfolio holdings are also posted on www.dws-investments.com from time to time. Please see the Fund's current prospectus for more information.
Investment Portfolio December 31, 2012 | | | Shares | | | Value ($) | |
| | | | |
| Common Stocks 97.7% | |
| Consumer Discretionary 9.2% | |
| Automobiles 1.7% | |
| Ford Motor Co. (a) | | | 487,478 | | | | 6,312,840 | |
| Diversified Consumer Services 1.3% | |
| H&R Block, Inc. | | | 274,010 | | | | 5,088,366 | |
| Media 3.5% | |
| Comcast Corp. "A" | | | 174,752 | | | | 6,532,230 | |
| Time Warner, Inc. | | | 110,093 | | | | 5,265,748 | |
| Walt Disney Co. | | | 30,853 | | | | 1,536,171 | |
| | | | | | | | 13,334,149 | |
| Multiline Retail 1.0% | |
| Target Corp. | | | 67,568 | | | | 3,997,998 | |
| Specialty Retail 1.3% | |
| Tiffany & Co. (a) | | | 35,588 | | | | 2,040,616 | |
| TJX Companies, Inc. | | | 66,517 | | | | 2,823,647 | |
| | | | | | | | 4,864,263 | |
| Textiles, Apparel & Luxury Goods 0.4% | |
| Coach, Inc. | | | 27,240 | | | | 1,512,092 | |
| Consumer Staples 7.4% | |
| Beverages 1.0% | |
| PepsiCo, Inc. | | | 56,337 | | | | 3,855,141 | |
| Food & Staples Retailing 1.7% | |
| CVS Caremark Corp. | | | 130,342 | | | | 6,302,036 | |
| Food Products 1.4% | |
| Kellogg Co. | | | 93,637 | | | | 5,229,626 | |
| Household Products 1.8% | |
| Procter & Gamble Co. | | | 102,430 | | | | 6,953,973 | |
| Tobacco 1.5% | |
| Altria Group, Inc. | | | 120,028 | | | | 3,771,280 | |
| Philip Morris International, Inc. | | | 22,393 | | | | 1,872,950 | |
| | | | | | | | 5,644,230 | |
| Energy 16.9% | |
| Energy Equipment & Services 4.3% | |
| Cameron International Corp.* | | | 71,242 | | | | 4,022,323 | |
| Halliburton Co. (a) | | | 143,600 | | | | 4,981,484 | |
| Helmerich & Payne, Inc. | | | 55,155 | | | | 3,089,231 | |
| Noble Corp. | | | 128,568 | | | | 4,476,738 | |
| | | | | | | | 16,569,776 | |
| Oil, Gas & Consumable Fuels 12.6% | |
| Chevron Corp. | | | 100,304 | | | | 10,846,875 | |
| ConocoPhillips | | | 79,517 | | | | 4,611,191 | |
| Exxon Mobil Corp. | | | 152,041 | | | | 13,159,149 | |
| Marathon Oil Corp. | | | 159,855 | | | | 4,901,154 | |
| Occidental Petroleum Corp. | | | 63,922 | | | | 4,897,064 | |
| Peabody Energy Corp. | | | 68,570 | | | | 1,824,648 | |
| Phillips 66 | | | 53,272 | | | | 2,828,743 | |
| Suncor Energy, Inc. | | | 146,989 | | | | 4,847,697 | |
| | | | | | | | 47,916,521 | |
| Financials 23.6% | |
| Capital Markets 2.6% | |
| Ameriprise Financial, Inc. | | | 77,094 | | | | 4,828,397 | |
| The Goldman Sachs Group, Inc. | | | 39,108 | | | | 4,988,617 | |
| | | | | | | | 9,817,014 | |
| | | Shares | | | Value ($) | |
| | | | | | | | | |
| Commercial Banks 3.8% | |
| PNC Financial Services Group, Inc. | | | 84,562 | | | | 4,930,810 | |
| U.S. Bancorp. | | | 120,175 | | | | 3,838,390 | |
| Wells Fargo & Co. | | | 165,935 | | | | 5,671,658 | |
| | | | | | | | 14,440,858 | |
| Consumer Finance 1.4% | |
| Capital One Financial Corp. | | | 91,494 | | | | 5,300,247 | |
| Diversified Financial Services 7.0% | |
| Bank of America Corp. | | | 682,613 | | | | 7,918,311 | |
| Citigroup, Inc. | | | 78,047 | | | | 3,087,539 | |
| JPMorgan Chase & Co. | | | 266,137 | | | | 11,702,044 | |
| The NASDAQ OMX Group, Inc. | | | 161,715 | | | | 4,044,492 | |
| | | | | | | | 26,752,386 | |
| Insurance 8.8% | |
| Alleghany Corp.* | | | 7,907 | | | | 2,652,166 | |
| Chubb Corp. | | | 60,508 | | | | 4,557,462 | |
| Fidelity National Financial, Inc. "A" | | | 189,683 | | | | 4,467,035 | |
| HCC Insurance Holdings, Inc. | | | 128,720 | | | | 4,789,671 | |
| Lincoln National Corp. | | | 133,324 | | | | 3,453,092 | |
| MetLife, Inc. | | | 161,038 | | | | 5,304,592 | |
| PartnerRe Ltd. | | | 56,751 | | | | 4,567,888 | |
| Prudential Financial, Inc. | | | 71,874 | | | | 3,833,040 | |
| | | | | | | | 33,624,946 | |
| Health Care 13.6% | |
| Health Care Equipment & Supplies 1.4% | |
| Baxter International, Inc. | | | 58,633 | | | | 3,908,476 | |
| St. Jude Medical, Inc. | | | 42,162 | | | | 1,523,735 | |
| | | | | | | | 5,432,211 | |
| Health Care Providers & Services 3.1% | |
| Aetna, Inc. | | | 124,152 | | | | 5,748,237 | |
| McKesson Corp. | | | 63,705 | | | | 6,176,837 | |
| | | | | | | | 11,925,074 | |
| Pharmaceuticals 9.1% | |
| Johnson & Johnson (a) | | | 114,394 | | | | 8,019,019 | |
| Merck & Co., Inc. | | | 159,823 | | | | 6,543,154 | |
| Pfizer, Inc. | | | 430,961 | | | | 10,808,502 | |
| Sanofi (ADR) | | | 119,143 | | | | 5,644,995 | |
| Teva Pharmaceutical Industries Ltd. (ADR) | | | 90,000 | | | | 3,360,600 | |
| | | | | | | | 34,376,270 | |
| Industrials 9.3% | |
| Aerospace & Defense 2.4% | |
| Raytheon Co. | | | 68,419 | | | | 3,938,198 | |
| United Technologies Corp. | | | 61,516 | | | | 5,044,927 | |
| | | | | | | | 8,983,125 | |
| Air Freight & Logistics 0.8% | |
| FedEx Corp. | | | 31,457 | | | | 2,885,236 | |
| Industrial Conglomerates 3.5% | |
| General Electric Co. | | | 644,713 | | | | 13,532,526 | |
| Machinery 2.6% | |
| Caterpillar, Inc. | | | 56,613 | | | | 5,071,392 | |
| Stanley Black & Decker, Inc. | | | 63,781 | | | | 4,717,881 | |
| | | | | | | | 9,789,273 | |
| | | Shares | | | Value ($) | |
| | | | | | | | | |
| Information Technology 5.7% | |
| Communications Equipment 1.8% | |
| Cisco Systems, Inc. | | | 355,955 | | | | 6,994,516 | |
| Computers & Peripherals 1.2% | |
| EMC Corp.* | | | 185,619 | | | | 4,696,161 | |
| Semiconductors & Semiconductor Equipment 0.5% | |
| Intel Corp. (a) | | | 94,341 | | | | 1,946,255 | |
| Software 2.2% | |
| Microsoft Corp. | | | 199,336 | | | | 5,328,251 | |
| Oracle Corp. | | | 84,273 | | | | 2,807,976 | |
| | | | | | | | 8,136,227 | |
| Materials 4.9% | |
| Chemicals 2.0% | |
| LyondellBasell Industries NV "A" | | | 28,035 | | | | 1,600,518 | |
| Potash Corp. of Saskatchewan, Inc. | | | 49,109 | | | | 1,998,245 | |
| Praxair, Inc. | | | 37,430 | | | | 4,096,714 | |
| | | | | | | | 7,695,477 | |
| Containers & Packaging 1.0% | |
| Sonoco Products Co. | | | 129,919 | | | | 3,862,492 | |
| Metals & Mining 1.9% | |
| BHP Billiton Ltd. (ADR) (a) | | | 76,857 | | | | 6,028,663 | |
| Newmont Mining Corp. | | | 20,193 | | | | 937,763 | |
| | | | | | | | 6,966,426 | |
| Telecommunication Services 3.0% | |
| Diversified Telecommunication Services | |
| AT&T, Inc. | | | 247,470 | | | | 8,342,214 | |
| CenturyLink, Inc. (a) | | | 76,469 | | | | 2,991,467 | |
| | | | | | | | 11,333,681 | |
| | | Shares | | | Value ($) | |
| | | | | | | | | |
| Utilities 4.1% | |
| Electric Utilities | |
| American Electric Power Co., Inc. | | | 109,634 | | | | 4,679,179 | |
| Duke Energy Corp. | | | 57,958 | | | | 3,697,721 | |
| FirstEnergy Corp. | | | 84,186 | | | | 3,515,607 | |
| Southern Co. | | | 89,931 | | | | 3,849,946 | |
| | | | | | | | 15,742,453 | |
Total Common Stocks (Cost $316,070,553) | | | | 371,813,865 | |
| | |
| Exchange-Traded Fund 1.0% | |
| SPDR Gold Trust* (Cost $3,969,995) | | | 23,405 | | | | 3,791,844 | |
| | |
| Securities Lending Collateral 7.5% | |
| Daily Assets Fund Institutional, 0.20% (b) (c) (Cost $28,497,475) | | | 28,497,475 | | | | 28,497,475 | |
| | |
| Cash Equivalents 1.3% | |
| Central Cash Management Fund, 0.15% (b) (Cost $5,005,967) | | | 5,005,967 | | | | 5,005,967 | |
| | | % of Net Assets | | | Value ($) | |
| | | | |
Total Investment Portfolio (Cost $353,543,990)† | | | 107.5 | | | | 409,109,151 | |
| Other Assets and Liabilities, Net | | | (7.5 | ) | | | (28,579,322 | ) |
| Net Assets | | | 100.0 | | | | 380,529,829 | |
* Non-income producing security.
† The cost for federal income tax purposes was $355,558,011. At December 31, 2012, net unrealized appreciation for all securities based on tax cost was $53,551,140. This consisted of aggregate gross unrealized appreciation for all securities in which there was an excess of value over tax cost of $60,925,599 and aggregate gross unrealized depreciation for all securities in which there was an excess of tax cost over value of $7,374,459.
(a) All or a portion of these securities were on loan (see Notes to Financial Statements). The value of all securities loaned at December 31, 2012 amounted to $28,207,086, which is 7.4% of net assets.
(b) Affiliated fund managed by Deutsche Investment Management Americas Inc. The rate shown is the annualized seven-day yield at period end.
(c) Represents collateral held in connection with securities lending. Income earned by the Fund is net of borrower rebates.
ADR: American Depositary Receipt
SPDR: Standard & Poor's Depositary Receipt
Fair Value Measurements
Various inputs are used in determining the value of the Fund's investments. These inputs are summarized in three broad levels. Level 1 includes quoted prices in active markets for identical securities. Level 2 includes other significant observable inputs (including quoted prices for similar securities, interest rates, prepayment speeds, and credit risk). Level 3 includes significant unobservable inputs (including the Fund's own assumptions in determining the fair value of investments). The inputs or methodology used for valuing securities are not necessarily an indication of the risk associated with investing in those securities.
The following is a summary of the inputs used as of December 31, 2012 in valuing the Fund's investments. For information on the Fund's policy regarding the valuation of investments, please refer to the Security Valuation section of Note A in the accompanying Notes to Financial Statements.
| Assets | | Level 1 | | | Level 2 | | | Level 3 | | | Total | |
| | |
| Common Stocks (d) | | $ | 371,813,865 | | | $ | — | | | $ | — | | | $ | 371,813,865 | |
| Exchange-Traded Fund | | | 3,791,844 | | | | — | | | | — | | | | 3,791,844 | |
| Short-Term Investments (d) | | | 33,503,442 | | | | — | | | | — | | | | 33,503,442 | |
| Total | | $ | 409,109,151 | | | $ | — | | | $ | — | | | $ | 409,109,151 | |
There have been no transfers between fair value measurement levels during the year ended December 31, 2012.
(d) See Investment Portfolio for additional detailed categorizations.
The accompanying notes are an integral part of the financial statements.
Statement of Assets and Liabilities | as of December 31, 2012 | |
| Assets | |
Investments: Investments in non-affiliated securities, at value (cost $320,040,548) — including $28,207,086 of securities loaned | | $ | 375,605,709 | |
Investment in Daily Assets Fund Institutional (cost $28,497,475)* | | | 28,497,475 | |
| Investment in Central Cash Management Fund (cost $5,005,967) | | | 5,005,967 | |
| Total investments in securities, at value (cost $353,543,990) | | | 409,109,151 | |
| Foreign currency, at value (cost $29,619) | | | 31,639 | |
| Receivable for Fund shares sold | | | 17,480 | |
| Dividends receivable | | | 563,984 | |
| Interest receivable | | | 3,830 | |
| Foreign taxes recoverable | | | 2,107 | |
| Due from Advisor | | | 350 | |
| Other assets | | | 5,868 | |
| Total assets | | | 409,734,409 | |
| Liabilities | |
| Payable upon return of securities loaned | | | 28,497,475 | |
| Payable for Fund shares redeemed | | | 378,841 | |
| Accrued management fee | | | 208,239 | |
| Accrued Trustees' fees | | | 3,887 | |
| Other accrued expenses and payables | | | 116,138 | |
| Total liabilities | | | 29,204,580 | |
| Net assets, at value | | $ | 380,529,829 | |
| Net Assets Consist of | |
| Undistributed net investment income | | | 7,947,397 | |
Net unrealized appreciation (depreciation) on: Investments | | | 55,565,161 | |
| Foreign currency | | | 2,020 | |
| Accumulated net realized gain (loss) | | | (141,067,411 | ) |
| Paid-in capital | | | 458,082,662 | |
| Net assets, at value | | $ | 380,529,829 | |
Class A Net Asset Value, offering and redemption price per share ($376,954,595 ÷ 30,284,545 outstanding shares of beneficial interest, no par value, unlimited number of shares authorized) | | $ | 12.45 | |
Class B Net Asset Value, offering and redemption price per share ($3,575,234 ÷ 286,965 outstanding shares of beneficial interest, no par value, unlimited number of shares authorized) | | $ | 12.46 | |
* Represents collateral on securities loaned.
The accompanying notes are an integral part of the financial statements.
Statement of Operations
| for the year ended December 31, 2012 | |
| Investment Income | |
Income: Dividends (net of foreign taxes withheld of $50,748) | | $ | 11,107,560 | |
| Income distributions — Central Cash Management Fund | | | 19,716 | |
| Securities lending income, including income from Daily Assets Fund Institutional, net of borrower rebates | | | 42,942 | |
| Total income | | | 11,170,218 | |
Expenses: Management fee | | | 2,541,292 | |
| Administration fee | | | 396,607 | |
| Services to shareholders | | | 4,383 | |
| Record keeping fees (Class B) | | | 1,824 | |
| Distribution service fee (Class B) | | | 8,696 | |
| Custodian fee | | | 13,015 | |
| Professional fees | | | 66,459 | |
| Reports to shareholders | | | 45,058 | |
| Trustees' fees and expenses | | | 18,403 | |
| Other | | | 14,561 | |
| Total expenses before expense reductions | | | 3,110,298 | |
| Expense reductions | | | (27,336 | ) |
| Total expenses after expense reductions | | | 3,082,962 | |
| Net investment income | | | 8,087,256 | |
| Realized and Unrealized Gain (Loss) | |
Net realized gain (loss) from: Investments | | | 9,766,415 | |
| Foreign currency | | | (79 | ) |
| | | | 9,766,336 | |
Change in net unrealized appreciation (depreciation) on: Investments | | | 19,604,984 | |
| Foreign currency | | | (738 | ) |
| | | | 19,604,246 | |
| Net gain (loss) | | | 29,370,582 | |
| Net increase (decrease) in net assets resulting from operations | | $ | 37,457,838 | |
The accompanying notes are an integral part of the financial statements.
Statement of Changes in Net Assets | | | Years Ended December 31, | |
| Increase (Decrease) in Net Assets | | 2012 | | | 2011 | |
Operations: Net investment income | | $ | 8,087,256 | | | $ | 7,625,478 | |
| Net realized gain (loss) | | | 9,766,336 | | | | (4,703,481 | ) |
| Change in net unrealized appreciation (depreciation) | | | 19,604,246 | | | | (23,495,585 | ) |
| Net increase (decrease) in net assets resulting from operations | | | 37,457,838 | | | | (20,573,588 | ) |
Distributions to shareholders from: Net investment income: Class A | | | (7,645,527 | ) | | | (4,120,416 | ) |
| Class B | | | (54,663 | ) | | | (23,046 | ) |
| Total distributions | | | (7,700,190 | ) | | | (4,143,462 | ) |
Fund share transactions: Class A Proceeds from shares sold | | | 10,324,918 | | | | 16,221,346 | |
| Net assets acquired in tax-free reorganization (see Note F) | | | — | | | | 273,358,779 | |
| Reinvestment of distributions | | | 7,645,527 | | | | 4,120,416 | |
| Payments for shares redeemed | | | (66,665,475 | ) | | | (78,529,959 | ) |
| Net increase (decrease) in net assets from Class A share transactions | | | (48,695,030 | ) | | | 215,170,582 | |
Class B Proceeds from shares sold | | | 728,624 | | | | 1,297,157 | |
| Net assets acquired in tax-free reorganization (see Note F) | | | — | | | | 1,731,132 | |
| Reinvestment of distributions | | | 54,663 | | | | 23,046 | |
| Payments for shares redeemed | | | (918,486 | ) | | | (661,197 | ) |
| Net increase (decrease) in net assets from Class B share transactions | | | (135,199 | ) | | | 2,390,138 | |
| Increase (decrease) in net assets | | | (19,072,581 | ) | | | 192,843,670 | |
| Net assets at beginning of period | | | 399,602,410 | | | | 206,758,740 | |
| Net assets at end of period (including undistributed net investment income of $7,947,397 and $7,574,376, respectively) | | $ | 380,529,829 | | | $ | 399,602,410 | |
| Other Information | |
Class A Shares outstanding at beginning of period | | | 34,282,579 | | | | 17,416,427 | |
| Shares sold | | | 851,162 | | | | 1,390,527 | |
| Shares issued in tax-free reorganization | | | — | | | | 21,886,687 | |
| Shares issued to shareholders in reinvestment of distributions | | | 631,340 | | | | 332,559 | |
| Shares redeemed | | | (5,480,536 | ) | | | (6,743,621 | ) |
| Net increase (decrease) in Class A shares | | | (3,998,034 | ) | | | 16,866,152 | |
| Shares outstanding at end of period | | | 30,284,545 | | | | 34,282,579 | |
Class B Shares outstanding at beginning of period | | | 298,416 | | | | 105,172 | |
| Shares sold | | | 59,337 | | | | 108,601 | |
| Shares issued in tax-free reorganization | | | — | | | | 138,157 | |
| Shares issued to shareholders in reinvestment of distributions | | | 4,499 | | | | 1,856 | |
| Shares redeemed | | | (75,287 | ) | | | (55,370 | ) |
| Net increase (decrease) in Class B shares | | | (11,451 | ) | | | 193,244 | |
| Shares outstanding at end of period | | | 286,965 | | | | 298,416 | |
The accompanying notes are an integral part of the financial statements.
| | | Years Ended December 31, | |
| Class A | | | 2012 | | | 2011 | | | 2010 | | | 2009 | | | 2008 | |
| Selected Per Share Data | |
| Net asset value, beginning of period | | $ | 11.56 | | | $ | 11.80 | | | $ | 10.86 | | | $ | 8.92 | | | $ | 19.21 | |
Income (loss) from investment operations: Net investment income (loss)a | | | .25 | | | | .25 | | | | .23 | | | | .21 | | | | .21 | |
| Net realized and unrealized gain (loss) | | | .87 | | | | (.24 | ) | | | .93 | | | | 1.97 | | | | (5.68 | ) |
| Total from investment operations | | | 1.12 | | | | .01 | | | | 1.16 | | | | 2.18 | | | | (5.47 | ) |
Less distributions from: Net investment income | | | (.23 | ) | | | (.25 | ) | | | (.22 | ) | | | (.24 | ) | | | (.34 | ) |
| Net realized gains | | | — | | | | — | | | | — | | | | — | | | | (4.48 | ) |
| Total distributions | | | (.23 | ) | | | (.25 | ) | | | (.22 | ) | | | (.24 | ) | | | (4.82 | ) |
| Net asset value, end of period | | $ | 12.45 | | | $ | 11.56 | | | $ | 11.80 | | | $ | 10.86 | | | $ | 8.92 | |
| Total Return (%) | | | 9.79 | b | | | (.07 | ) | | | 10.77 | | | | 25.37 | | | | (36.40 | )b |
| Ratios to Average Net Assets and Supplemental Data | |
| Net assets, end of period ($ millions) | | | 377 | | | | 396 | | | | 206 | | | | 214 | | | | 118 | |
| Ratio of expenses before expense reductions (%) | | | .78 | | | | .79 | | | | .82 | | | | .76 | | | | .87 | |
| Ratio of expenses after expense reductions (%) | | | .77 | | | | .79 | | | | .82 | | | | .76 | | | | .86 | |
| Ratio of net investment income (loss) (%) | | | 2.04 | | | | 2.15 | | | | 2.13 | | | | 2.22 | | | | 1.59 | |
| Portfolio turnover rate (%) | | | 63 | | | | 28 | | | | 32 | | | | 76 | | | | 97 | |
a Based on average shares outstanding during the period. b Total return would have been lower had certain expenses not been reduced. | |
| | | Years Ended December 31, | |
| Class B | | | 2012 | | | 2011 | | | 2010 | | | 2009 | | | 2008 | |
| Selected Per Share Data | |
| Net asset value, beginning of period | | $ | 11.57 | | | $ | 11.81 | | | $ | 10.86 | | | $ | 8.92 | | | $ | 19.20 | |
Income (loss) from investment operations: Net investment income (loss)a | | | .21 | | | | .22 | | | | .20 | | | | .19 | | | | .12 | |
| Net realized and unrealized gain (loss) | | | .88 | | | | (.25 | ) | | | .93 | | | | 1.96 | | | | (5.64 | ) |
| Total from investment operations | | | 1.09 | | | | (.03 | ) | | | 1.13 | | | | 2.15 | | | | (5.52 | ) |
Less distributions from: Net investment income | | | (.20 | ) | | | (.21 | ) | | | (.18 | ) | | | (.21 | ) | | | (.28 | ) |
| Net realized gains | | | — | | | | — | | | | — | | | | — | | | | (4.48 | ) |
| Total distributions | | | (.20 | ) | | | (.21 | ) | | | (.18 | ) | | | (.21 | ) | | | (4.76 | ) |
| Net asset value, end of period | | $ | 12.46 | | | $ | 11.57 | | | $ | 11.81 | | | $ | 10.86 | | | $ | 8.92 | |
| Total Return (%) | | | 9.44 | b | | | (.36 | ) | | | 10.53 | | | | 24.86 | | | | (36.64 | )b |
| Ratios to Average Net Assets and Supplemental Data | |
| Net assets, end of period ($ millions) | | | 4 | | | | 3 | | | | 1 | | | | 1 | | | | .29 | |
| Ratio of expenses before expense reductions (%) | | | 1.09 | | | | 1.10 | | | | 1.11 | | | | 1.06 | | | | 1.28 | |
| Ratio of expenses after expense reductions (%) | | | 1.08 | | | | 1.10 | | | | 1.11 | | | | 1.06 | | | | 1.26 | |
| Ratio of net investment income (loss) (%) | | | 1.73 | | | | 1.84 | | | | 1.84 | | | | 1.92 | | | | 1.20 | |
| Portfolio turnover rate (%) | | | 63 | | | | 28 | | | | 32 | | | | 76 | | | | 97 | |
a Based on average shares outstanding during the period. b Total return would have been lower had certain expenses not been reduced. | |
Notes to Financial Statements
A. Organization and Significant Accounting Policies
DWS Large Cap Value VIP (the "Fund") is a diversified series of DWS Variable Series II (the "Trust"), which is registered under the Investment Company Act of 1940, as amended (the "1940 Act"), as an open-end management investment company organized as a Massachusetts business trust.
Multiple Classes of Shares of Beneficial Interest. The Fund offers two classes of shares (Class A shares and Class B shares). Sales of Class B shares are subject to recordkeeping fees up to 0.15% and Rule 12b-1 fees under the 1940 Act equal to an annual rate of 0.25% of the average daily net assets of the Class B shares of the Fund. Class A shares are not subject to such fees.
Investment income, realized and unrealized gains and losses, and certain fund-level expenses and expense reductions, if any, are borne pro rata on the basis of relative net assets by the holders of all classes of shares except that each class bears certain expenses unique to that class (including the applicable Rule 12b-1 fee and recordkeeping fees). Differences in class-level expenses may result in payment of different per share dividends by class. All shares have equal rights with respect to voting subject to class-specific arrangements.
The Fund's financial statements are prepared in accordance with accounting principles generally accepted in the United States of America which require the use of management estimates. Actual results could differ from those estimates. The policies described below are followed consistently by the Fund in the preparation of its financial statements.
Security Valuation. Investments are stated at value determined as of the close of regular trading on the New York Stock Exchange on each day the exchange is open for trading.
Various inputs are used in determining the value of the Fund's investments. These inputs are summarized in three broad levels. Level 1 includes quoted prices in active markets for identical securities. Level 2 includes other significant observable inputs (including quoted prices for similar securities, interest rates, prepayment speeds, and credit risk). Level 3 includes significant unobservable inputs (including the Fund's own assumptions in determining the fair value of investments). The inputs or methodology used for valuing securities are not necessarily an indication of the risk associated with investing in those securities.
Equity securities and exchange traded funds ("ETFs") are valued at the most recent sale price or official closing price reported on the exchange (U.S. or foreign) or over-the-counter market on which they trade and are categorized as Level 1 securities. Securities for which no sales are reported are valued at the calculated mean between the most recent bid and asked quotations on the relevant market or, if a mean cannot be determined, at the most recent bid quotation.
Investments in open-end investment companies are valued at their net asset value each business day and are categorized as Level 1.
Securities and other assets for which market quotations are not readily available or for which the above valuation procedures are deemed not to reflect fair value are valued in a manner that is intended to reflect their fair value as determined in accordance with procedures approved by the Board and are generally categorized as Level 3. In accordance with the Fund's valuation procedures, factors used in determining value may include, but are not limited to, the type of the security; the size of the holding; the initial cost of the security; the existence of any contractual restrictions on the security's disposition; the price and extent of public trading in similar securities of the issuer or of comparable companies; quotations or evaluated prices from broker-dealers and/or pricing services; information obtained from the issuer, analysts, and/or the appropriate stock exchange (for exchange-traded securities); an analysis of the company's or issuer's financial statements; an evaluation of the forces that influence the issuer and the market(s) in which the security is purchased and sold and with respect to debt securities; the maturity, coupon, creditworthiness, currency denomination and the movement of the market in which the security is normally traded. The value determined under these procedures may differ from published values for the same securities.
Disclosure about the classification of fair value measurements is included in a table following the Fund's Investment Portfolio.
New Accounting Pronouncement. In January 2013, Accounting Standard Update 2013-01 (ASU 2013-01), Clarifying the Scope of Disclosures about Offsetting Assets and Liabilities, replaced Accounting Standards Update 2011-11 (ASU 2011-11), Disclosures about Offsetting Assets and Liabilities. ASU 2013-01 is effective for fiscal years beginning on or after January 1, 2013, and interim periods within those annual periods. ASU 2011-11 was intended to enhance disclosure requirements on the offsetting of financial assets and liabilities. The ASU 2013-01 limits the scope of the new balance sheet offsetting disclosures to derivatives, repurchase agreements, and securities lending transactions to the extent that they are (1) offset in the financial statements or (2) subject to an enforceable master netting arrangement or similar agreement. Management is currently evaluating the application of ASU 2013-01 and its impact, if any, on the Fund's financial statements.
Foreign Currency Translations. The books and records of the Fund are maintained in U.S. dollars. Investment securities and other assets and liabilities denominated in a foreign currency are translated into U.S. dollars at the prevailing exchange rates at period end. Purchases and sales of investment securities, income and expenses are translated into U.S. dollars at the prevailing exchange rates on the respective dates of the transactions.
Net realized and unrealized gains and losses on foreign currency transactions represent net gains and losses between trade and settlement dates on securities transactions, the acquisition and disposition of foreign currencies, and the difference between the amount of net investment income accrued and the U.S. dollar amount actually received. That portion of both realized and unrealized gains and losses on investments that results from fluctuations in foreign currency exchange rates is not separately disclosed but is included with net realized and unrealized gain/appreciation and loss/depreciation on investments.
Securities Lending. The Fund lends securities to certain financial institutions. The Fund retains beneficial ownership of the securities it has loaned and continues to receive interest and dividends paid by the issuer of securities and to participate in any changes in their market value. The Fund requires the borrowers of the securities to maintain collateral with the Fund consisting of either cash or liquid, unencumbered assets having a value at least equal to the value of the securities loaned. When the collateral falls below specified amounts, the lending agent will use its best effort to obtain additional collateral on the next business day to meet required amounts under the security lending agreement. The Fund may invest the cash collateral into a joint trading account in an affiliated money market fund pursuant to Exemptive Orders issued by the SEC. The Fund receives compensation for lending its securities either in the form of fees or by earning interest on invested cash collateral net of borrower rebates and fees paid to a lending agent. Either the Fund or the borrower may terminate the loan. There may be risks of delay and costs in recovery of securities or even loss of rights in the collateral should the borrower of the securities fail financially. The Fund is also subject to all investment risks associated with the reinvestment of any cash collateral received, including, but not limited to, interest rate, credit and liquidity risk associated with such investments.
Federal Income Taxes. The Fund's policy is to comply with the requirements of the Internal Revenue Code, as amended, which are applicable to regulated investment companies and to distribute all of its taxable income to its shareholders.
Under the Regulated Investment Company Modernization Act of 2010, net capital losses incurred post-enactment may be carried forward indefinitely, and their character is retained as short-term and/or long-term. Previously, net capital losses were carried forward for eight years and treated as short-term losses. As a transition rule, the Act requires that post-enactment net capital losses be used before pre-enactment net capital losses.
At December 31, 2012, the Fund had a net tax basis capital loss carryforward of approximately $137,753,000 of pre-enactment losses, including approximately $116,135,000 inherited from its merger with an affiliated fund in previous years, which may be applied against any realized net taxable capital gains of each succeeding year until fully utilized or until December 31, 2015 ($8,454,000), December 31, 2016 ($120,989,000) and December 31, 2017 ($8,310,000), the respective expiration dates, whichever occurs first, and which may be subject to certain limitations under Section 382-384 of Internal Revenue Code.
In addition, from November 1, 2012 through December 31, 2012, the Fund elects to defer qualified late year losses of approximately $1,300,000 of net short-term realized capital losses and treat them as arising in the fiscal year ending December 31, 2013.
The Fund has reviewed the tax positions for the open tax years as of December 31, 2012 and has determined that no provision for income tax is required in the Fund's financial statements. The Fund's federal tax returns for the prior three fiscal years remain open subject to examination by the Internal Revenue Service.
Distribution of Income and Gains. Distributions from net investment income of the Fund, if any, is declared and distributed to shareholders annually. Net realized gains from investment transactions, in excess of available capital loss carryforwards, would be taxable to the Fund if not distributed and, therefore, will be distributed to shareholders at least annually. The Fund may also make additional distributions for tax purposes if necessary.
The timing and characterization of certain income and capital gain distributions are determined annually in accordance with federal tax regulations which may differ from accounting principles generally accepted in the United States of America. These differences primarily relate to certain securities sold at a loss. As a result, net investment income (loss) and net realized gain (loss) on investment transactions for a reporting period may differ significantly from distributions during such period. Accordingly, the Fund may periodically make reclassifications among certain of its capital accounts without impacting the net asset value of the Fund.
At December 31, 2012, the Fund's components of distributable earnings on a tax basis were as follows:
| Undistributed ordinary income* | | $ | 7,947,397 | |
| Capital loss carryforwards | | $ | (137,753,000 | ) |
| Unrealized appreciation (depreciation) on investments | | $ | 53,551,140 | |
In addition, the tax character of distributions paid by the Fund is summarized as follows:
| | | Years Ended December 31, | |
| | | 2012 | | | 2011 | |
| Distributions from ordinary income* | | $ | 7,700,190 | | | $ | 4,143,462 | |
* For tax purposes, short-term capital gain distributions are considered ordinary income distributions.
Expenses. Expenses of the Trust arising in connection with a specific fund are allocated to that fund. Other Trust expenses which cannot be directly attributed to a fund are apportioned among the funds in the Trust based upon the relative net assets or other appropriate measures.
Contingencies. In the normal course of business, the Fund may enter into contracts with service providers that contain general indemnification clauses. The Fund's maximum exposure under these arrangements is unknown as this would involve future claims that may be made against the Fund that have not yet been made. However, based on experience, the Fund expects the risk of loss to be remote.
Other. Investment transactions are accounted for on a trade date plus one basis for daily net asset value calculations. However, for financial reporting purposes, investment transactions are reported on trade date. Interest income is recorded on the accrual basis. Dividend income is recorded on the ex-dividend date net of foreign withholding taxes. Realized gains and losses from investment transactions are recorded on an identified cost basis and may include proceeds from litigation.
B. Purchases and Sales of Securities
During the year ended December 31, 2012, purchases and sales of investment transactions (excluding short-term investments) aggregated $241,886,682 and $275,468,565, respectively.
C. Related Parties
Management Agreement. Under the Investment Management Agreement with Deutsche Investment Management Americas Inc. ("DIMA" or the "Advisor"), an indirect, wholly owned subsidiary of Deutsche Bank AG, the Advisor directs the investments of the Fund in accordance with its investment objectives, policies and restrictions. The Advisor determines the securities, instruments and other contracts relating to investments to be purchased, sold or entered into by the Fund.
Under the Investment Management Agreement with the Advisor, the Fund pays a monthly management fee based on the Fund's average daily net assets, computed and accrued daily and payable monthly, at the following annual rates:
| First $250 million | | | .650 | % |
| Next $750 million | | | .625 | % |
| Next $1.5 billion | | | .600 | % |
| Next $2.5 billion | | | .575 | % |
| Next $2.5 billion | | | .550 | % |
| Next $2.5 billion | | | .525 | % |
| Next $2.5 billion | | | .500 | % |
| Over $12.5 billion | | | .475 | % |
For the period from October 1, 2012 through September 30, 2013, the Advisor has contractually agreed to waive all or a portion of its fees and/or reimburse certain operating expenses of the Fund to the extent necessary to maintain the operating expenses (excluding certain expenses such as extraordinary expenses, taxes, brokerage and interest) of each class as follows:
Accordingly, for the year ended December 31, 2012, the Advisor waived a portion of its management fee pursuant to the Investment Management Agreement aggregating $26,848, and the amount charged aggregated $2,514,444, which was equivalent to an annual effective rate of 0.63% of the Fund's average daily net assets.
Administration Fee. Pursuant to an Administrative Services Agreement, DIMA provides most administrative services to the Fund. For all services provided under the Administrative Services Agreement, the Fund pays DIMA an annual fee ("Administration Fee") of 0.10% of the Fund's average daily net assets, computed and accrued daily and payable monthly. For the year ended December 31, 2012, the Administration Fee was $396,607, of which $32,308 is unpaid.
Service Provider Fees. DWS Investments Service Company ("DISC"), an affiliate of the Advisor, is the transfer agent, dividend-paying agent and shareholder service agent for the Fund. Pursuant to a sub-transfer agency agreement between DISC and DST Systems, Inc. ("DST"), DISC has delegated certain transfer agent, dividend-paying agent and shareholder service agent functions to DST. DISC compensates DST out of the shareholder servicing fee it receives from the Fund. For the year ended December 31, 2012, the amounts charged to the Fund by DISC were as follows:
| Services to Shareholders | | Total Aggregated | | | Waived | |
| Class A | | $ | 367 | | | $ | 367 | |
| Class B | | | 182 | | | | 121 | |
| | | $ | 549 | | | $ | 488 | |
Distribution Service Agreement. Under the Fund's Class B 12b-1 plans, DWS Investments Distributors, Inc. ("DIDI") received a fee ("Distribution Service Fee") of 0.25% of average daily net assets of Class B shares. For the year ended December 31, 2012, the Distribution Service Fee aggregated $8,696, of which $741 is unpaid.
Typesetting and Filing Service Fees. Under an agreement with DIMA, DIMA is compensated for providing typesetting and certain regulatory filing services to the Fund. For the year ended December 31, 2012, the amount charged to the Fund by DIMA included in the Statement of Operations under "reports to shareholders" aggregated $16,910, of which $4,584 is unpaid.
Trustees' Fees and Expenses. The Fund paid retainer fees to each Trustee not affiliated with the Advisor, plus specified amounts to the Board Chairperson and to each committee Chairperson.
Affiliated Cash Management Vehicle. The Fund may invest uninvested cash balances in Central Cash Management Fund, which is managed by the Advisor. The Fund indirectly bears its proportionate share of the expenses of Central Cash Management Fund. Central Cash Management Fund does not pay the Advisor an investment management fee. Central Cash Management Fund seeks a high level of current income consistent with liquidity and the preservation of capital.
Securities Lending Agent Fees. Deutsche Bank AG serves as securities lending agent for the Fund. For the year ended December 31, 2012, the Fund incurred securities lending agent fees to Deutsche Bank AG in the amount of $4,746.
D. Ownership of the Fund
At December 31, 2012, two Participating Insurance Companies were owners of record of 10% or more of the total outstanding Class A shares of the Fund, each owning 54% and 28%. Two Participating Insurance Companies were owners of record of 10% or more of the total outstanding Class B shares of the Fund, each owning 64% and 11%.
E. Line of Credit
The Fund and other affiliated funds (the "Participants") share in a $375 million revolving credit facility provided by a syndication of banks. The Fund may borrow for temporary or emergency purposes, including the meeting of redemption requests that otherwise might require the untimely disposition of securities. The Participants are charged an annual commitment fee which is allocated based on net assets, among each of the Participants. Interest is calculated at a rate per annum equal to the sum of the Federal Funds Rate plus 1.25 percent plus if LIBOR exceeds the Federal Funds Rate the amount of such excess. The Fund may borrow up to a maximum of 33 percent of its net assets under the agreement. The Fund had no outstanding loans at December 31, 2012.
F. Acquisition of Assets
On April 29, 2011, the Fund acquired all of the net assets of DWS Strategic Value VIP pursuant to a plan of reorganization approved by shareholders on January 12, 2011. The acquisition was accomplished by a tax-free exchange of 31,515,416 Class A shares and 198,385 Class B shares of DWS Strategic Value VIP for 21,886,687 Class A shares and 138,157 Class B shares of the Fund, respectively, outstanding on April 29, 2011. DWS Strategic Value VIP's net assets at that date, $275,089,911, including $20,489,725 of net unrealized appreciation, were combined with those of the Fund. The aggregate net assets of the Fund immediately before the acquisition were $212,494,328. The combined net assets of the Fund immediately following the acquisition were $487,584,239.
Report of Independent Registered Public Accounting Firm
To the Board of Trustees of DWS Variable Series II and Shareholders of DWS Large Cap Value VIP:
We have audited the accompanying statement of assets and liabilities, including the investment portfolio of DWS Large Cap Value VIP (the "Fund"), one of the funds constituting DWS Variable Series II, as of December 31, 2012, and the related statement of operations for the year then ended, the statement of changes in net assets for each of the two years in the period then ended, and the financial highlights for each of the five years in the period then ended. These financial statements and financial highlights are the responsibility of the Fund's management. Our responsibility is to express an opinion on these financial statements and financial highlights based on our audits.
We conducted our audits in accordance with the standards of the Public Company Accounting Oversight Board (United States). Those standards require that we plan and perform the audit to obtain reasonable assurance about whether the financial statements and financial highlights are free of material misstatement. We were not engaged to perform an audit of the Fund's internal control over financial reporting. Our audits included consideration of internal control over financial reporting as a basis for designing audit procedures that are appropriate in the circumstances, but not for the purpose of expressing an opinion on the effectiveness of the Fund's internal control over financial reporting. Accordingly, we express no such opinion. An audit also includes examining, on a test basis, evidence supporting the amounts and disclosures in the financial statements and financial highlights, assessing the accounting principles used and significant estimates made by management, and evaluating the overall financial statement presentation. Our procedures included confirmation of securities owned as of December 31, 2012, by correspondence with the custodian and brokers. We believe that our audits provide a reasonable basis for our opinion.
In our opinion, the financial statements and financial highlights referred to above present fairly, in all material respects, the financial position of DWS Large Cap Value VIP (one of the funds constituting DWS Variable Series II) at December 31, 2012, the results of its operations for the year then ended, the changes in its net assets for each of the two years in the period then ended, and the financial highlights for each of the five years in the period then ended, in conformity with U.S. generally accepted accounting principles.
| | | |
Boston, Massachusetts February 13, 2013 | | |
Information About Your Fund's Expenses (Unaudited)
As an investor of the Fund, you incur two types of costs: ongoing expenses and transaction costs. Ongoing expenses include management fees, distribution and service (12b-1) fees and other Fund expenses. Examples of transaction costs include contract charges and account maintenance fees, which are not shown in this section. The following tables are intended to help you understand your ongoing expenses (in dollars) of investing in the Fund and to help you compare these expenses with the ongoing expenses of investing in other mutual funds. In the most recent six-month period, the Fund limited these expenses; had it not done so, expenses would have been higher. The example in the table is based on an investment of $1,000 invested at the beginning of the six-month period and held for the entire period (July 1, 2012 to December 31, 2012).
The tables illustrate your Fund's expenses in two ways:
•Actual Fund Return. This helps you estimate the actual dollar amount of ongoing expenses (but not transaction costs) paid on a $1,000 investment in the Fund using the Fund's actual return during the period. To estimate the expenses you paid over the period, simply divide your account value by $1,000 (for example, an $8,600 account value divided by $1,000 = 8.6), then multiply the result by the number in the "Expenses Paid per $1,000" line under the share class you hold.
• Hypothetical 5% Fund Return. This helps you to compare your Fund's ongoing expenses (but not transaction costs) with those of other mutual funds using the Fund's actual expense ratio and a hypothetical rate of return of 5% per year before expenses. Examples using a 5% hypothetical Fund return may be found in the shareholder reports of other mutual funds. The hypothetical account values and expenses may not be used to estimate the actual ending account balance or expenses you paid for the period.
Please note that the expenses shown in these tables are meant to highlight your ongoing expenses only and do not reflect any transaction costs. The "Expenses Paid per $1,000" line of the tables is useful in comparing ongoing expenses only and will not help you determine the relative total expense of owning different funds. If these transaction costs had been included, your costs would have been higher.
Expenses and Value of a $1,000 Investment for the six months ended December 31, 2012 | |
| Actual Fund Return | | Class A | | | Class B | |
| Beginning Account Value 7/1/12 | | $ | 1,000.00 | | | $ | 1,000.00 | |
| Ending Account Value 12/31/12 | | $ | 1,050.60 | | | $ | 1,048.80 | |
| Expenses Paid per $1,000* | | $ | 3.97 | | | $ | 5.51 | |
| Hypothetical 5% Fund Return | | Class A | | | Class B | |
| Beginning Account Value 7/1/12 | | $ | 1,000.00 | | | $ | 1,000.00 | |
| Ending Account Value 12/31/12 | | $ | 1,021.27 | | | $ | 1,019.76 | |
| Expenses Paid per $1,000* | | $ | 3.91 | | | $ | 5.43 | |
* Expenses are equal to the Fund's annualized expense ratio for each share class, multiplied by the average account value over the period, multiplied by 184 (the number of days in the most recent six-month period), then divided by 366.
| Annualized Expense Ratios | Class A | | Class B | |
| DWS Variable Series II — DWS Large Cap Value VIP | .77% | | 1.07% | |
For more information, please refer to the Fund's prospectus.
These tables do not reflect charges and fees ("contract charges") associated with the separate account that invests in the Fund or any variable life insurance policy or variable annuity contract for which the Fund is an investment option.
Tax Information (Unaudited)
For corporate shareholders, 100% of the ordinary dividends (i.e., income dividends plus short-term capital gains) paid during the Fund's fiscal year ended December 31, 2012, qualified for the dividends received deduction.
Please consult a tax advisor if you have questions about federal or state income tax laws, or on how to prepare your tax returns. If you have specific questions about your account, please contact your insurance provider.
The Trust's policies and procedures for voting proxies for portfolio securities and information about how the Trust voted proxies related to its portfolio securities during the 12-month period ended June 30 are available on our Web site — www.dws-investments.com (click on "proxy voting" at the bottom of the page) — or on the SEC's Web site — www.sec.gov. To obtain a written copy of the Trust's policies and procedures without charge, upon request, call us toll free at (800) 728-3337.
Investment Management Agreement Approval
The Board of Trustees approved the renewal of DWS Large Cap Value VIP's investment management agreement (the "Agreement") with Deutsche Investment Management Americas Inc. ("DWS") in September 2012.
In terms of the process that the Board followed prior to approving the Agreement, shareholders should know that:
• In September 2012, all of the Fund's Trustees were independent of DWS and its affiliates.
• The Trustees met frequently during the past year to discuss fund matters and dedicated a substantial amount of time to contract review matters. Over the course of several months, the Board's Contract Committee, in coordination with the Board's Equity Oversight Committee, reviewed comprehensive materials received from DWS, independent third parties and independent counsel. These materials included an analysis of the Fund's performance, fees and expenses, and profitability compiled by the Fund's independent fee consultant. The Board also received extensive information throughout the year regarding performance of the Fund.
• The Independent Trustees regularly meet privately with their independent counsel to discuss contract review and other matters. In addition, the Independent Trustees were also advised by the Fund's independent fee consultant in the course of their review of the Fund's contractual arrangements and considered a comprehensive report prepared by the independent fee consultant in connection with their deliberations (the "IFC Report").
• In connection with reviewing the Agreement, the Board also reviewed the terms of the Fund's Rule 12b-1 plan, distribution agreement, administrative services agreement, transfer agency agreement and other material service agreements.
• Based on its evaluation of the information provided, the Contract Committee presented its findings and recommendations to the Board. The Board then reviewed the Contract Committee's findings and recommendations.
In connection with the contract review process, the Contract Committee and the Board considered the factors discussed below, among others. The Board also considered that DWS and its predecessors have managed the Fund since its inception, and the Board believes that a long-term relationship with a capable, conscientious advisor is in the best interests of the Fund. The Board considered, generally, that shareholders chose to invest or remain invested in the Fund knowing that DWS managed the Fund, and that the Agreement was approved by the Fund's shareholders. DWS is part of Deutsche Bank, a major global banking institution that is engaged in a wide range of financial services. The Board believes that there are advantages to being part of a global asset management business that offers a wide range of investing expertise and resources, including hundreds of portfolio managers and analysts with research capabilities in many countries throughout the world.
As part of the contract review process, the Board carefully considered the fees and expenses of each DWS fund overseen by the Board in light of the fund's performance. In many cases, this led to a negotiation with DWS of lower expense caps for the coming year than had previously been in place. As part of these negotiations, the Board indicated that it would consider relaxing these new lower caps in future years following sustained improvements in performance, among other considerations.
In June 2012, Deutsche Bank ("DB"), DWS's parent company, announced that DB's new management team had concluded the strategic review of its global asset management business announced in late 2011 by DB's prior management team, and would combine its Asset Management (of which DWS is a part) and Wealth Management divisions. Prior to approving the investment management agreements, the Independent Trustees were apprised of the expected management and structure of the new combined Asset & Wealth Management division ("AWM") and DWS. DB also advised the Independent Trustees that the U.S. asset management business is a critical and integral part of DB and AWM, and that DB would be reinvesting a significant portion of the substantial savings it expects to realize by combining its Asset Management and Wealth Management divisions into a combined AWM division, including enhancements to its investment capabilities. DB also confirmed its commitment to maintaining strong legal and compliance groups within the combined division.
While shareholders may focus primarily on fund performance and fees, the Fund's Board considers these and many other factors, including the quality and integrity of DWS's personnel and such other issues as back-office operations, fund valuations, and compliance policies and procedures.
Nature, Quality and Extent of Services. The Board considered the terms of the Agreement, including the scope of advisory services provided under the Agreement. The Board noted that, under the Agreement, DWS provides portfolio management services to the Fund and that, pursuant to a separate administrative services agreement, DWS provides administrative services to the Fund. The Board considered the experience and skills of senior management and investment personnel, the resources made available to such personnel, the ability of DWS to attract and retain high-quality personnel, and the organizational depth and stability of DWS. The Board reviewed the Fund's performance over short-term and long-term periods and compared those returns to various agreed-upon performance measures, including market indices and a peer universe compiled by the independent fee consultant using information supplied by Lipper Inc. ("Lipper"), an independent fund data service. The Board also noted that it has put into place a process of identifying "Focus Funds" (e.g., funds performing poorly relative to their benchmark or a peer universe compiled by an independent fund data service), and receives more frequent reporting and information from DWS regarding such funds, along with DWS's remedial plans to address underperformance. The Board believes this process is an effective manner of identifying and addressing underperforming funds. Based on the information provided, the Board noted that for the one-, three- and five-year periods ended December 31, 2011, the Fund's performance (Class A shares) was in the 1st quartile, 3rd quartile and 1st quartile, respectively, of the applicable Lipper universe (the 1st quartile being the best performers and the 4th quartile being the worst performers). The Board also observed that the Fund has underperformed its benchmark in the one- and three-year periods and has outperformed its benchmark in the five-year period ended December 31, 2011.
Fees and Expenses. The Board considered the Fund's investment management fee schedule, operating expenses and total expense ratios, and comparative information provided by Lipper and the independent fee consultant regarding investment management fee rates paid to other investment advisors by similar funds (1st quartile being the most favorable and 4th quartile being the least favorable). With respect to management fees paid to other investment advisors by similar funds, the Board noted that the contractual fee rates paid by the Fund, which include a 0.10% fee paid to DWS under the Fund's administrative services agreement, were equal to the median (2nd quartile) of the applicable Lipper peer group (based on Lipper data provided as of December 31, 2011). The Board noted that the Fund's Class A shares total (net) operating expenses were expected to be higher than the median (3rd quartile) of the applicable Lipper expense universe (based on Lipper data provided as of December 31, 2011, and analyzing Lipper expense universe Class A (net) expenses less any applicable 12b-1 fees) ("Lipper Universe Expenses"). The Board also reviewed data comparing each share class's total (net) operating expenses to the applicable Lipper Universe Expenses. The Board considered the Fund's management fee rate as compared to fees charged by DWS and certain of its affiliates for comparable mutual funds and considered differences in fund and fee structures between the DWS Funds. The Board also considered how the Fund's total (net) operating expenses compared to the total (net) operating expenses of a more customized peer group selected by Lipper (based on such factors as asset size). The Board also noted that the expense limitations agreed to by DWS helped to ensure that the Fund's total (net) operating expenses would remain competitive.
The information considered by the Board as part of its review of management fees included information regarding fees charged by DWS and its affiliates to similar institutional accounts and to similar funds offered primarily to European investors ("DWS Europe funds"), in each case as applicable. The Board observed that advisory fee rates for institutional accounts generally were lower than the management fees charged by similarly managed DWS U.S. mutual funds ("DWS Funds"), but also took note of the differences in services provided to DWS Funds as compared to institutional accounts. In the case of DWS Europe funds, the Board observed that fee rates for DWS Europe funds generally were higher than for similarly managed DWS Funds, but noted that differences in the types of services provided to DWS Funds relative to DWS Europe funds made it difficult to compare such fees.
On the basis of the information provided, the Board concluded that management fees were reasonable and appropriate in light of the nature, quality and extent of services provided by DWS.
Profitability. The Board reviewed detailed information regarding revenues received by DWS under the Agreement. The Board considered the estimated costs and pre-tax profits realized by DWS from advising the DWS Funds, as well as estimates of the pre-tax profits attributable to managing the Fund in particular. The Board also received information regarding the estimated enterprise-wide profitability of DWS and its affiliates with respect to all fund services in totality and by fund. The Board and the independent fee consultant reviewed DWS's methodology in allocating its costs to the management of the Fund. Based on the information provided, the Board concluded that the pre-tax profits realized by DWS in connection with the management of the Fund were not unreasonable. The Board also reviewed information regarding the profitability of certain similar investment management firms. The Board noted that while information regarding the profitability of such firms is limited (and in some cases is not necessarily prepared on a comparable basis), DWS and its affiliates' overall profitability with respect to the DWS fund complex (after taking into account distribution and other services provided to the funds by DWS and its affiliates) was lower than the overall profitability levels of many comparable firms for which such data was available.
Economies of Scale. The Board considered whether there are economies of scale with respect to the management of the Fund and whether the Fund benefits from any economies of scale. The Board noted that the Fund's management fee schedule includes fee breakpoints. The Board concluded that the Fund's fee schedule represents an appropriate sharing between the Fund and DWS of such economies of scale as may exist in the management of the Fund at current asset levels.
Other Benefits to DWS and Its Affiliates. The Board also considered the character and amount of other incidental benefits received by DWS and its affiliates, including any fees received by DWS for administrative services provided to the Fund and any fees received by an affiliate of DWS for distribution services. The Board also considered benefits to DWS related to brokerage and soft-dollar allocations, including allocating brokerage to pay for research generated by parties other than the executing broker dealers, which pertain primarily to funds investing in equity securities, along with the incidental public relations benefits to DWS related to DWS Funds advertising and cross-selling opportunities among DWS products and services. The Board concluded that management fees were reasonable in light of these fallout benefits.
Compliance. The Board considered the significant attention and resources dedicated by DWS to documenting and enhancing its compliance processes in recent years. The Board noted in particular (i) the experience and seniority of both DWS's chief compliance officer and the Fund's chief compliance officer; (ii) the large number of DWS compliance personnel; and (iii) the substantial commitment of resources by DWS and its affiliates to compliance matters.
Based on all of the information considered and the conclusions reached, the Board unanimously determined that the continuation of the Agreement is in the best interests of the Fund. In making this determination, the Board did not give particular weight to any single factor identified above. The Board considered these factors over the course of numerous meetings, certain of which were in executive session with only the Independent Trustees and their counsel present. It is possible that individual Trustees may have weighed these factors differently in reaching their individual decisions to approve the continuation of the Agreement.
Summary of Management Fee Evaluation by Independent Fee Consultant
September 17, 2012
Pursuant to an Order entered into by Deutsche Investment Management Americas and affiliates (collectively, "DeAM") with the Attorney General of New York, I, Thomas H. Mack, have been appointed the Independent Fee Consultant for the DWS Funds (formerly the DWS Scudder Funds). My duties include preparing an annual written evaluation of the management fees DeAM charges the Funds, considering among other factors the management fees charged by other mutual fund companies for like services, management fees DeAM charges other clients for like services, DeAM's costs of supplying services under the management agreements and related profit margins, possible economies of scale if a Fund grows larger, and the nature and quality of DeAM's services, including fund performance. This report summarizes my evaluation for 2012, including my qualifications, the evaluation process for each of the DWS Funds, consideration of certain complex-level factors, and my conclusions. I served in substantially the same capacity in 2007, 2008, 2009, 2010 and 2011.
Qualifications
For more than 35 years I have served in various professional capacities within the investment management business. I have held investment analysis and advisory positions, including securities analyst, portfolio strategist and director of investment policy with a large investment firm. I have also performed business management functions, including business development, financial management and marketing research and analysis.
Since 1991, I have been an independent consultant within the asset management industry. I have provided services to over 125 client organizations, including investment managers, mutual fund boards, product distributors and related organizations. Over the past ten years I have completed a number of assignments for mutual fund boards, specifically including assisting boards with management contract renewal.
I hold a Master of Business Administration degree, with highest honors, from Harvard University and Master of Science and Bachelor of Science (highest honors) degrees from the University of California at Berkeley. I am an independent director and audit committee financial expert for two closed-end mutual funds and have served in various leadership and financial oversight capacities with non-profit organizations.
Evaluation of Fees for each DWS Fund
My work focused primarily on evaluating, fund-by-fund, the fees charged to each of the 103 mutual fund portfolios in the DWS Fund family. For each Fund, I considered each of the key factors mentioned above, as well as any other relevant information. In doing so I worked closely with the Funds' Independent Directors in their annual contract renewal process, as well as in their approval of contracts for several new funds (documented separately).
In evaluating each Fund's fees, I reviewed comprehensive materials provided by or on behalf of DeAM, including expense information prepared by Lipper Analytical, comparative performance information, profitability data, manager histories, and other materials. I also accessed certain additional information from the Lipper and Morningstar databases and drew on my industry knowledge and experience.
To facilitate evaluating this considerable body of information, I prepared for each Fund a document summarizing the key data elements in each area as well as additional analytics discussed below. This made it possible to consider each key data element in the context of the others.
In the course of contract renewal, DeAM agreed to implement a number of fee and expense adjustments requested by the Independent Directors which will favorably impact future fees and expenses, and my evaluation includes the effects of these changes.
Fees and Expenses Compared with Other Funds
The competitive fee and expense evaluation for each fund focused on two primary comparisons:
The Fund's contractual management fee (the advisory fee plus the administration fee where applicable) compared with those of a group of typically 12-15 funds in the same Lipper investment category (e.g. Large Capitalization Growth) having similar distribution arrangements and being of similar size.
The Fund's total expenses compared with a broader universe of funds from the same Lipper investment category and having similar distribution arrangements.
These two comparisons provide a view of not only the level of the fee compared with funds of similar scale but also the total expense the Fund bears for all the services it receives, in comparison with the investment choices available in the Fund's investment category and distribution channel. The principal figure-of-merit used in these comparisons was the subject Fund's percentile ranking against peers.
DeAM's Fees for Similar Services to Others
DeAM provided management fee schedules for all of its US domiciled fund and non-fund investment management accounts in any of the investment categories where there is a DWS Fund. These similar products included the other DWS Funds, non-fund pooled accounts, institutional accounts and sub-advisory accounts. Using this information, I calculated for each Fund the fee that would be charged to each similar product, at the subject Fund's asset level.
Evaluating information regarding non-fund products is difficult because there are varying levels of services required for different types of accounts, with mutual funds generally requiring considerably more regulatory and administrative types of service as well as having more frequent cash flows than other types of accounts. Also, while mutual fund fees for similar fund products can be expected to be similar, there will be some differences due to different pricing conditions in different distribution channels (e.g. retail funds versus those used in variable insurance products), differences in underlying investment processes and other factors.
Costs and Profit Margins
DeAM provided a detailed profitability analysis for each Fund. After making some adjustments so that the presentation would be more comparable to the available industry figures, I reviewed profit margins from investment management alone, from investment management plus other fund services (excluding distribution) provided to the Funds by DeAM (principally shareholder services), and DeAM profits from all sources, including distribution. A later section comments on overall profitability.
Economies of Scale
Economies of scale — an expected decline in management cost per dollar of fund assets as fund assets grow — are very rarely quantified and documented because of inherent difficulties in collecting and analyzing relevant data. However, in virtually every investment category that I reviewed, larger funds tend to have lower fees and lower total expenses than smaller funds. To see how each DWS Fund compares with this industry observation, I reviewed:
The trend in Fund assets over the last five years and the accompanying trend in total expenses. This shows if the Fund has grown and, if so, whether total expense (management fees as well as other expenses) have declined as a percent of assets.
Whether the Fund has break-points in its management fee schedule, the extent of the fee reduction built into the schedule and the asset levels where the breaks take effect, and in the case of a sub-advised Fund how the Fund's break-points compare with those of the sub-advisory fee schedule.
How the Fund's contractual fee schedule compares with trends in the industry data. To accomplish this, I constructed a chart showing how actual latest-fiscal-year contractual fees of the Fund and of other similar funds relate to average fund assets, with the subject Fund's contractual fee schedule superimposed.
Quality of Service — Performance
The quality-of-service evaluation focused on investment performance, which is the principal result of the investment management service. Each Fund's performance was reviewed over the past 1, 3, 5 and 10 years, as applicable, and compared with that of other funds in the same investment category and with a suitable market index.
In addition, I calculated and reviewed risk-adjusted returns relative to an index of similar mutual funds' returns and a suitable market index. The risk-adjusted returns analysis provides a way of determining the extent to which the Fund's return comparisons are mainly the product of investment value-added (or lack thereof) or alternatively taking considerably more or less risk than is typical in its investment category.
I also received and considered the history of portfolio manager changes for each Fund, as this provided an important context for evaluating the performance results.
Complex-Level Considerations
While this evaluation was conducted mainly at the individual fund level, there are some issues relating to the reasonableness of fees that can alternatively be considered across the whole fund complex:
I reviewed DeAM's profitability analysis for all DWS Funds, with a view toward determining if the allocation procedures used were reasonable and how profit levels compared with public data for other investment managers.
I considered whether DeAM and affiliates receive any significant ancillary or "fallout" benefits that should be considered in interpreting the direct profitability results. These would be situations where serving as the investment manager of the Funds is beneficial to another part of the Deutsche Bank organization.
I considered how aggregated DWS Fund expenses had varied over the years, by asset class and in the context of trends in asset levels.
I considered how aggregated DWS Fund performance measures relative to appropriate peers had varied by asset class and over time.
I reviewed the structure of the DeAM organization, trends in staffing levels, and information on compensation of investment management and other professionals compared with industry data.
Findings
Based on the process and analysis discussed above, which included reviewing a wide range of information from management and external data sources and considering among other factors the fees DeAM charges other clients, the fees charged by other fund managers, DeAM's costs and profits associated with managing the Funds, economies of scale, possible fall-out benefits, and the nature and quality of services provided, in my opinion the management fees charged the DWS Funds are reasonable.
Thomas H. Mack
President, Thomas H. Mack & Co., Inc.
Board Members and Officers
The following table presents certain information regarding the Board Members and Officers of the fund. Each Board Member's year of birth is set forth in parentheses after his or her name. Unless otherwise noted, (i) each Board Member has engaged in the principal occupation(s) noted in the table for at least the most recent five years, although not necessarily in the same capacity; and (ii) the address of each Independent Board Member is c/o Kenneth C. Froewiss, Chairman, DWS Mutual Funds, P.O. Box 78, Short Hills, NJ 07078. Except as otherwise noted below, the term of office for each Board Member is until the election and qualification of a successor, or until such Board Member sooner dies, resigns, is removed or as otherwise provided in the governing documents of the fund. Because the fund does not hold an annual meeting of shareholders, each Board Member will hold office for an indeterminate period. The Board Members may also serve in similar capacities with other funds in the fund complex.
| Independent Board Members |
Name, Year of Birth, Position with the Fund and Length of Time Served1 | | Business Experience and Directorships During the Past Five Years | Number of Funds in DWS Fund Complex Overseen |
Other Directorships Held by Board Member |
Kenneth C. Froewiss (1945) Chairperson since 2013,9 and Board Member since 2001 | | Adjunct Professor of Finance, NYU Stern School of Business (September 2009-present; Clinical Professor from 1997-September 2009); Member, Finance Committee, Association for Asian Studies (2002-present); Director, Mitsui Sumitomo Insurance Group (US) (2004-present); prior thereto, Managing Director, J.P. Morgan (investment banking firm) (until 1996) | 103 | — |
William McClayton (1944) Vice Chairperson since 2013,9 and Board Member since 2004 | | Private equity investor (since October 2009); previously, Managing Director, Diamond Management & Technology Consultants, Inc. (global consulting firm) (2001-2009); Directorship: Board of Managers, YMCA of Metropolitan Chicago; formerly: Senior Partner, Arthur Andersen LLP (accounting) (1966-2001); Trustee, Ravinia Festival | 103 | — |
John W. Ballantine (1946) Board Member since 1999 | | Retired; formerly, Executive Vice President and Chief Risk Management Officer, First Chicago NBD Corporation/The First National Bank of Chicago (1996-1998); Executive Vice President and Head of International Banking (1995-1996). Directorships: Stockwell Capital Investments PLC (private equity); former Directorships: First Oak Brook Bancshares, Inc. and Oak Brook Bank; Prisma Energy International | 103 | Chairman of the Board, Healthways, Inc.2 (provider of disease and care management services) (2003- present); Portland General Electric2 (utility company) (2003-present) |
Henry P. Becton, Jr. (1943) Board Member since 1990 | | Vice Chair and former President, WGBH Educational Foundation. Directorships: Public Radio International; Public Radio Exchange (PRX); The PBS Foundation; North Bennett Street School (Boston); former Directorships: Association of Public Television Stations; Boston Museum of Science; American Public Television; Concord Academy; New England Aquarium; Mass. Corporation for Educational Telecommunications; Committee for Economic Development; Public Broadcasting Service; Connecticut College | 103 | Lead Director, Becton Dickinson and Company2 (medical technology company); Lead Director, Belo Corporation2 (media company) |
Dawn-Marie Driscoll (1946) Board Member since 1987 | | President, Driscoll Associates (consulting firm); Emeritus Executive Fellow, Center for Business Ethics, Bentley University; formerly, Partner, Palmer & Dodge (1988-1990); Vice President of Corporate Affairs and General Counsel, Filene's (1978-1988). Directorships: Director of ICI Mutual Insurance Company (since 2007); Advisory Board, Center for Business Ethics, Bentley University; Trustee, Southwest Florida Community Foundation (charitable organization); former Directorships: Sun Capital Advisers Trust (mutual funds) (2007-2012), Investment Company Institute (audit, executive, nominating committees) and Independent Directors Council (governance, executive committees) | 103 | — |
Keith R. Fox, CFA (1954) Board Member since 1996 | | Managing General Partner, Exeter Capital Partners (a series of private investment funds) (since 1986). Directorships: Progressive International Corporation (kitchen goods importer and distributor); The Kennel Shop (retailer); former Chairman, National Association of Small Business Investment Companies; former Directorships: BoxTop Media Inc. (advertising); Sun Capital Advisers Trust (mutual funds) (2011-2012) | 103 | — |
Paul K. Freeman (1950) Board Member since 1993, and Chairperson (2009-Jan. 8, 2013) | | Consultant, World Bank/Inter-American Development Bank; Executive and Governing Council of the Independent Directors Council (Chairman of Education Committee); formerly: Project Leader, International Institute for Applied Systems Analysis (1998-2001); Chief Executive Officer, The Eric Group, Inc. (environmental insurance) (1986-1998); Directorships: Denver Zoo Foundation (December 2012-present); former Directorships: Prisma Energy International | 103 | — |
Richard J. Herring (1946) Board Member since 1990 | | Jacob Safra Professor of International Banking and Professor, Finance Department, The Wharton School, University of Pennsylvania (since July 1972); Co-Director, Wharton Financial Institutions Center (since July 2000); Co-Chair, U.S. Shadow Financial Regulatory Committee; Executive Director, Financial Economists Roundtable; formerly: Vice Dean and Director, Wharton Undergraduate Division (July 1995-June 2000); Director, Lauder Institute of International Management Studies (July 2000-June 2006) | 103 | Director, Japan Equity Fund, Inc. (since September 2007), Thai Capital Fund, Inc. (since 2007), Singapore Fund, Inc. (since September 2007), Independent Director of Barclays Bank Delaware (since September 2010) |
Rebecca W. Rimel (1951) Board Member since 1995 | | President and Chief Executive Officer, The Pew Charitable Trusts (charitable organization) (1994 to present); Trustee, Washington College (2011-2013); formerly: Executive Vice President, The Glenmede Trust Company (investment trust and wealth management) (1983-2004); Board Member, Investor Education (charitable organization) (2004-2005); Trustee, Executive Committee, Philadelphia Chamber of Commerce (2001-2007); Director, Viasys Health Care2 (January 2007-June 2007); Trustee, Pro Publica (charitable organization) (2007-2010); Trustee, Thomas Jefferson Foundation (charitable organization) (1994-2012) | 103 | Director, Becton Dickinson and Company2 (medical technology company) (2012-present); Director, CardioNet, Inc.2 (health care) (2009-present) |
William N. Searcy, Jr. (1946) Board Member since 1993 | | Private investor since October 2003; formerly: Pension & Savings Trust Officer, Sprint Corporation2 (telecommunications) (November 1989-September 2003); Trustee, Sun Capital Advisers Trust (mutual funds) (1998-2012) | 103 | — |
Jean Gleason Stromberg (1943) Board Member since 1997 | | Retired. Formerly, Consultant (1997-2001); Director, Financial Markets U.S. Government Accountability Office (1996-1997); Partner, Fulbright & Jaworski, L.L.P. (law firm) (1978-1996). Directorships: The William and Flora Hewlett Foundation; former Directorships: Service Source, Inc., Mutual Fund Directors Forum (2002-2004), American Bar Retirement Association (funding vehicle for retirement plans) (1987-1990 and 1994-1996) | 103 | — |
Robert H. Wadsworth (1940) Board Member since 1999 | | President, Robert H. Wadsworth & Associates, Inc. (consulting firm) (1983 to present); Director, National Horizon, Inc. (non-profit organization); Director and Treasurer, The Phoenix Boys Choir Association | 106 | — |
Interested Board Member and Officer4 |
Name, Year of Birth, Position with the Fund and Length of Time Served1,6 | | Business Experience and Directorships During the Past Five Years | Number of Funds in DWS Fund Complex Overseen |
Other Directorships Held by Board Member |
Michael J. Woods5 (1967) Board Member since 2013,9 and Executive Vice President since 20139 | | Managing Director,3 Deutsche Asset & Wealth Management (2009-present); Head of the Americas Asset Management Business for Deutsche Bank, Member of the Asset and Wealth Management ("AWM") Extended Executive Committee, AWM Global Client Group Executive Committee and the AWM Active Asset Management Executive Committee; CEO and US Regional Head of DWS Investments; formerly: Sr. VP, Head of the Financial Intermediaries and Investments Group of Evergreen Investments (2007-2009), CEO and Vice Chairman of Board of Directors of XTF Global Asset Management (2006-2007), Managing Director — US Head of Sub-Advisory and Investment Only Business at Citigroup Asset Management (2000-2006). Mr. Woods is currently a board member of The Children's Village, The Big Brothers Big Sisters Organization, and The Mutual Fund Education Alliance. | 39 | — |
Officers4 |
Name, Year of Birth, Position with the Fund and Length of Time Served6 | | Business Experience and Directorships During the Past Five Years |
W. Douglas Beck, CFA7 (1967) President, 2011-present | | Managing Director,3 Deutsche Asset & Wealth Management (2006-present); President of DWS family of funds and Head of Product Management, U.S. for DWS Investments; formerly: Executive Director, Head of Product Management (2002-2006) and President (2005-2006) of the UBS Funds at UBS Global Asset Management; Co-Head of Manager Research/Managed Solutions Group, Merrill Lynch (1998-2002) |
John Millette8 (1962) Vice President and Secretary, 1999-present | | Director,3 Deutsche Asset & Wealth Management |
Paul H. Schubert7 (1963) Chief Financial Officer, 2004-present Treasurer, 2005-present | | Managing Director,3 Deutsche Asset & Wealth Management (since July 2004); formerly: Executive Director, Head of Mutual Fund Services and Treasurer for UBS Family of Funds (1998-2004); Vice President and Director of Mutual Fund Finance at UBS Global Asset Management (1994-1998) |
Caroline Pearson8 (1962) Chief Legal Officer, 2010-present | | Managing Director,3 Deutsche Asset & Wealth Management; formerly: Assistant Secretary for DWS family of funds (1997-2010) |
Melinda Morrow7 (1970) Vice President, 2012-present | | Director,3 Deutsche Asset & Wealth Management |
Hepsen Uzcan8 (1974) Assistant Secretary, since 20139 | | Vice President, Deutsche Asset & Wealth Management |
Paul Antosca8 (1957) Assistant Treasurer, 2007-present | | Director,3 Deutsche Asset & Wealth Management |
Jack Clark8 (1967) Assistant Treasurer, 2007-present | | Director,3 Deutsche Asset & Wealth Management |
Diane Kenneally8 (1966) Assistant Treasurer, 2007-present | | Director,3 Deutsche Asset & Wealth Management |
John Caruso7 (1965) Anti-Money Laundering Compliance Officer, 2010-present | | Managing Director,3 Deutsche Asset & Wealth Management |
Robert Kloby7 (1962) Chief Compliance Officer, 2006-present | | Managing Director,3 Deutsche Asset & Wealth Management |
1 The length of time served represents the year in which the Board Member joined the board of one or more DWS funds currently overseen by the Board.
2 A publicly held company with securities registered pursuant to Section 12 of the Securities Exchange Act of 1934.
3 Executive title, not a board directorship.
4 As a result of their respective positions held with the Advisor, these individuals are considered "interested persons" of the Advisor within the meaning of the 1940 Act. Interested persons receive no compensation from the fund.
5 The mailing address of Mr. Woods is 60 Wall Street, New York, New York 10005. Mr. Woods is an interested Board Member by virtue of his positions with Deutsche Asset & Wealth Management. As an interested person, Mr. Woods receives no compensation from the fund. Mr. Woods is a board member of the following trusts and corporations: Cash Account Trust, DWS Market Trust, DWS Money Funds, DWS State Tax-Free Income Series, DWS Target Fund, DWS Value Series, Inc., DWS Variable Series II, Investors Cash Trust, Tax-Exempt California Money Market Fund, DWS Global High Income Fund, Inc., DWS High Income Opportunities Fund, Inc., DWS High Income Trust, DWS Multi-Market Income Trust, DWS Municipal Income Trust, DWS Strategic Income Trust and DWS Strategic Municipal Income Trust.
6 The length of time served represents the year in which the officer was first elected in such capacity for one or more DWS funds.
7 Address: 60 Wall Street, New York, NY 10005.
8 Address: One Beacon Street, Boston, MA 02108.
9 Effective as of January 9, 2013.
The fund's Statement of Additional Information ("SAI") includes additional information about the Board Members. The SAI is available, without charge, upon request. If you would like to request a copy of the SAI, you may do so by calling the following toll-free number: (800) 728-3337.
Notes
DWS Investments Distributors, Inc.
222 South Riverside Plaza
Chicago, IL 60606
(800) 621-1148
VS2LCV-2 (R-025833-2 2/13)
DECEMBER 31, 2012
ANNUAL REPORT
DWS VARIABLE SERIES II
DWS Money Market VIP
Contents
12 Statement of Assets and Liabilities 13 Statement of Operations 14 Statement of Changes in Net Assets 16 Notes to Financial Statements 19 Report of Independent Registered Public Accounting Firm 20 Information About Your Fund's Expenses 23 Investment Management Agreement Approval 26 Summary of Management Fee Evaluation by Independent Fee Consultant 28 Board Members and Officers |
This report must be preceded or accompanied by a prospectus. To obtain an additional prospectus or summary prospectus, if available, call (800) 728-3337 or your financial representative. We advise you to consider the Fund's objectives, risks, charges and expenses carefully before investing. The summary prospectus and prospectus contain this and other important information about the Fund. Please read the prospectus carefully before you invest.
An investment in this Fund is not insured or guaranteed by the Federal Deposit Insurance Corporation (FDIC) or by any other government agency. Although the Fund seeks to preserve the value of your investment at $1.00 per share, it is possible to lose money by investing in the Fund. The share price of money market funds can fall below the $1.00 share price. You should not rely on or expect the Advisor to enter into support agreements or take other actions to maintain the Fund's $1.00 share price. The credit quality of the Fund's holdings can change rapidly in certain markets, and the default of a single holding could have an adverse impact on the Fund's share price. The Fund's share price can also be negatively affected during periods of high redemption pressures and/or illiquid markets. The actions of a few large investors in the Fund may have a significant adverse effect on the share price of the Fund. See the prospectus for specific details regarding the Fund's risk profile.
DWS Investments is part of the Deutsche Asset & Wealth Management division of Deutsche Bank AG.
NOT FDIC/NCUA INSURED NO BANK GUARANTEE MAY LOSE VALUE NOT A DEPOSIT
NOT INSURED BY ANY FEDERAL GOVERNMENT AGENCY
Performance Summary December 31, 2012 (Unaudited)
DWS Money Market VIP
All performance shown is historical, assumes reinvestment of all dividend and capital gain distributions and does not guarantee future results. Investment return and principal value fluctuate with changing market conditions so that, when redeemed, shares may be worth more or less than their original cost. Current performance may be lower or higher than the performance data quoted. Please contact your participating insurance company for the Fund's most recent month-end performance. Performance doesn't reflect charges and fees ("contract charges") associated with the separate account that invests in the Fund or any variable life insurance policy or variable annuity contract for which the Fund is an investment option. These charges and fees will reduce returns. The yield quotation more closely reflects the current earnings of the Fund than the total return quotation.
An investment in this Fund is not insured or guaranteed by the Federal Deposit Insurance Corporation (FDIC) or by any other government agency. Although the Fund seeks to preserve the value of your investment at $1.00 per share, it is possible to lose money by investing in the Fund. The share price of money market funds can fall below the $1.00 share price.
| Fund's Class A Shares Yield | | 7-day current yield | |
| December 31, 2012 | | | 0.01 | %* |
| December 31, 2011 | | | 0.01 | %* |
* The investment advisor has agreed to waive fees/reimburse expenses. Without such fee waivers/expense reimbursements, the 7-day current yield would have been lower.
Yields are historical, will fluctuate and do not guarantee future performance. The 7-day current yield refers to the income paid by the Fund over a 7-day period expressed as an annual percentage rate of the Fund's shares outstanding.
Management Summary December 31, 2012 (Unaudited)
During the 12-month period ended December 31, 2012, Class A shares of the Fund provided a total return of 0.01% (unadjusted for contract charges). (All performance is historical and does not guarantee future results. Yields fluctuate and are not guaranteed.)
Over the Fund's most recent fiscal year ended December 31, 2012, short-term rates were slightly volatile in response to the current state of the European sovereign debt crisis. During the first quarter, efforts by the European Central Bank (ECB) to ensure adequate funding access at low rates for the Continent's major banks reassured investors and led to a rally in global financial markets. In July 2012, the head of the ECB, Mario Draghi, stated that the central bank would do "whatever is needed" to preserve the euro, which further stabilized financial markets. Lastly, in December 2012, the U.S. Federal Reserve Board (the Fed) altered its guidance regarding rate levels, stating that it would maintain short-term interest rates near zero until U.S. unemployment dropped below 6.5%, and as long as inflation levels did not exceed 2.5%.
Over the period, we continued to hold a large percentage of Fund assets in short-maturity instruments for liquidity purposes as well as for high quality and yield. We also maintained a relatively conservative average maturity, with Fund assets broadly diversified among a number of geographical areas for money market investment, such as Canada, Scandinavia, the United States and the United Kingdom. Because we believed that overnight money market yields would begin to decline due to heavy investor demand, we permitted the Fund's weighted average maturity to lengthen somewhat in order to capture additional yield for the portfolio.1
A group of investment professionals is responsible for the day-to-day management of the Fund. These investment professionals have a broad range of experience managing money market funds.
The views expressed reflect those of the portfolio management team only through the end of the period of the report as stated on the cover. The management team's views are subject to change at any time based on market and other conditions and should not be construed as a recommendation. Past performance is no guarantee of future results. Current and future portfolio holdings are subject to risk.
1 Weighted average maturity — the average maturity of all the securities that make up a fund portfolio, expressed in days or years.
Portfolio Summary (Unaudited) Asset Allocation (As a % of Investment Portfolio) | 12/31/12 | 12/31/11 |
| | | |
| Commercial Paper | 38% | 36% |
| Repurchase Agreements | 23% | 18% |
| Short-Term Notes | 13% | 16% |
| Certificates of Deposit and Bank Notes | 12% | 18% |
| Government & Agency Obligations | 10% | 12% |
| Time Deposit | 2% | — |
| Municipal Bonds and Notes | 2% | — |
| | 100% | 100% |
| Weighted Average Maturity* | 12/31/12 | 12/31/11 |
| | | |
| DWS Variable Series II — DWS Money Market VIP | 48 days | 43 days |
| First Tier Retail Money Fund Average | 43 days | 38 days |
* The Fund is compared to its respective iMoneyNet Category: First Tier Retail Money Fund Average — Category includes a widely recognized composite of money market funds that invest in only first tier (highest rating) securities. Portfolio Holdings of First Tier funds include U.S. Treasury, U.S. Other, Repos, Time Deposits, Domestic Bank Obligations, Foreign Bank Obligations, First Tier Commercial Paper, Floating Rate Notes and Asset Backed Commercial Paper.
Weighted average maturity, also known as effective maturity, is the weighted average of the maturity date of bonds held by the Fund taking into consideration any available maturity shortening features.
Portfolio holdings and characteristics are subject to change.
For more complete details about the Fund's investment portfolio, see page 7.
Following the Fund's fiscal first and third quarter-end, a complete portfolio holdings listing is filed with the SEC on Form N-Q. In addition, each month, information about the Fund and its portfolio holdings is filed with the SEC on Form N-MFP. The SEC delays the public availability of the information filed on Form N-MFP for 60 days after the end of the reporting period included in the filing. These forms will be available on the SEC's Web site at www.sec.gov, and they may also be reviewed and copied at the SEC's Public Reference Room in Washington, D.C. Information on the operation of the SEC's Public Reference Room may be obtained by calling (800) SEC-0330. The Fund's portfolio holdings are also posted on www.dws-investments.com from time to time. Please see the Fund's current prospectus for more information.
Investment Portfolio December 31, 2012 | | | Principal Amount ($) | | | Value ($) | |
| | | | |
| Certificates of Deposit and Bank Notes 12.0% | |
| Australia & New Zealand Banking Group Ltd., 0.255%, 4/23/2013 | | | 1,000,000 | | | | 1,000,016 | |
| Banco del Estado de Chile: | |
| 0.28%, 2/19/2013 | | | 1,000,000 | | | | 1,000,000 | |
| 0.28%, 3/7/2013 | | | 500,000 | | | | 499,995 | |
| 0.3%, 2/8/2013 | | | 1,000,000 | | | | 1,000,000 | |
| Bank of China Ltd., 0.41%, 2/15/2013 | | | 1,000,000 | | | | 1,000,013 | |
| China Construction Bank Corp.: | |
| 0.34%, 2/26/2013 | | | 1,200,000 | | | | 1,200,000 | |
| 0.35%, 1/2/2013 | | | 1,000,000 | | | | 1,000,000 | |
| DnB Bank ASA, 0.23%, 2/4/2013 | | | 1,000,000 | | | | 1,000,000 | |
| DZ Bank: | |
| 0.22%, 2/8/2013 | | | 2,000,000 | | | | 2,000,000 | |
| 0.24%, 2/22/2013 | | | 2,000,000 | | | | 2,000,000 | |
| 0.25%, 3/1/2013 | | | 1,000,000 | | | | 1,000,000 | |
| 0.26%, 1/18/2013 | | | 1,000,000 | | | | 1,000,000 | |
| Mitsubishi UFJ Trust & Banking Corp., 0.26%, 1/11/2013 | | | 1,000,000 | | | | 1,000,000 | |
| Nordea Bank Finland PLC: | |
| 0.3%, 6/14/2013 | | | 1,000,000 | | | | 1,000,000 | |
| 0.31%, 3/18/2013 | | | 1,000,000 | | | | 1,000,000 | |
| Norinchukin Bank, 0.21%, 1/4/2013 | | | 1,000,000 | | | | 1,000,000 | |
| Oversea-Chinese Banking Corp., Ltd., 0.2%, 1/22/2013 | | | 500,000 | | | | 500,000 | |
| Rabobank Nederland NV, 0.5%, 3/15/2013 | | | 1,000,000 | | | | 1,000,000 | |
| Skandinaviska Enskilda Banken AB, 0.26%, 2/25/2013 | | | 1,000,000 | | | | 1,000,000 | |
| Svenska Handelsbanken AB, 0.24%, 2/5/2013 | | | 2,500,000 | | | | 2,500,012 | |
| Toronto-Dominion Bank, 0.3%, 4/22/2013 | | | 750,000 | | | | 750,092 | |
Total Certificates of Deposit and Bank Notes (Cost $23,450,128) | | | | 23,450,128 | |
| | |
| Collateralized Mortgage Obligation 0.3% | |
| The Superannuation Members Home Loan Programme, "A1", Series 2012-1, 0.611%*, 3/20/2013 (Cost $500,000) | | | 500,000 | | | | 500,000 | |
| | |
| Commercial Paper 38.2% | |
| Issued at Discount** 34.3% | |
| Caisse des Depots et Consignations: | |
| 144A, 0.25%, 2/15/2013 | | | 1,000,000 | | | | 999,687 | |
| 144A, 0.27%, 3/6/2013 | | | 2,000,000 | | | | 1,999,040 | |
| Coca-Cola Co., 0.24%, 3/1/2013 | | | 1,500,000 | | | | 1,499,410 | |
| Collateralized Commercial Paper Co., LLC: | | | | | | | | |
| 0.3%, 3/11/2013 | | | 1,000,000 | | | | 999,425 | |
| 0.33%, 4/4/2013 | | | 6,000,000 | | | | 5,994,885 | |
| 0.33%, 4/22/2013 | | | 2,500,000 | | | | 2,497,456 | |
| DnB Bank ASA, 0.26%, 4/8/2013 | | | 1,300,000 | | | | 1,299,089 | |
| Erste Abwicklungsanstalt: | |
| 0.39%, 7/22/2013 | | | 1,000,000 | | | | 997,812 | |
| 0.42%, 5/21/2013 | | | 800,000 | | | | 798,693 | |
| 0.425%, 7/8/2013 | | | 1,000,000 | | | | 997,781 | |
| 0.43%, 7/19/2013 | | | 1,000,000 | | | | 997,623 | |
| | | Principal Amount ($) | | | Value ($) | |
| | | | | | | | | |
| 0.43%, 8/13/2013 | | | 800,000 | | | | 797,860 | |
| 0.46%, 4/11/2013 | | | 1,000,000 | | | | 998,722 | |
| 0.48%, 5/2/2013 | | | 1,500,000 | | | | 1,497,580 | |
| 0.5%, 2/19/2013 | | | 400,000 | | | | 399,728 | |
| 0.55%, 2/26/2013 | | | 1,000,000 | | | | 999,144 | |
| 0.57%, 1/8/2013 | | | 400,000 | | | | 399,956 | |
| General Electric Capital Corp.: | |
| 0.25%, 5/1/2013 | | | 1,000,000 | | | | 999,167 | |
| 0.35%, 1/9/2013 | | | 1,000,000 | | | | 999,922 | |
| Gotham Funding Corp., 144A, 0.2%, 1/8/2013 | | | 3,000,000 | | | | 2,999,883 | |
| Hannover Funding Co., LLC, 0.36%, 1/7/2013 | | | 1,000,000 | | | | 999,940 | |
| Kells Funding LLC: | |
| 144A, 0.41%, 4/4/2013 | | | 800,000 | | | | 799,153 | |
| 144A, 0.42%, 4/2/2013 | | | 2,500,000 | | | | 2,497,346 | |
| 144A, 0.55%, 2/25/2013 | | | 1,000,000 | | | | 999,160 | |
| Kreditanstalt Fuer Wiederaufbau: | |
| 144A, 0.2%, 1/17/2013 | | | 1,000,000 | | | | 999,911 | |
| 144A, 0.2%, 1/25/2013 | | | 1,500,000 | | | | 1,499,800 | |
| Manhattan Asset Funding Co., LLC, 144A, 0.219%, 1/11/2013 | | | 2,000,000 | | | | 1,999,878 | |
| Market Street Funding LLC, 144A, 0.23%, 1/18/2013 | | | 2,000,000 | | | | 1,999,783 | |
| Nestle Capital Corp., 0.26%, 3/22/2013 | | | 1,500,000 | | | | 1,499,133 | |
| Nestle Finance International Ltd.: | |
| 0.25%, 4/15/2013 | | | 1,200,000 | | | | 1,199,133 | |
| 0.26%, 3/25/2013 | | | 1,000,000 | | | | 999,401 | |
| 0.27%, 5/7/2013 | | | 700,000 | | | | 699,339 | |
| Nissan Motor Acceptance Corp., 0.42%, 1/7/2013 | | | 800,000 | | | | 799,944 | |
| Nordea North America, Inc.: | |
| 0.3%, 3/13/2013 | | | 500,000 | | | | 499,704 | |
| 0.31%, 3/18/2013 | | | 2,000,000 | | | | 1,998,691 | |
| 0.32%, 3/18/2013 | | | 1,000,000 | | | | 999,324 | |
| Queensland Treasury Corp.: | |
| 0.2%, 2/14/2013 | | | 1,000,000 | | | | 999,756 | |
| 0.21%, 3/18/2013 | | | 1,000,000 | | | | 999,557 | |
| Rabobank U.S.A. Financial Corp., 0.46%, 3/7/2013 | | | 600,000 | | | | 599,502 | |
| Regency Markets No. 1 LLC, 144A, 0.21%, 1/22/2013 | | | 3,250,000 | | | | 3,249,602 | |
| SBAB Bank AB: | |
| 144A, 0.27%, 2/26/2013 | | | 700,000 | | | | 699,706 | |
| 144A, 0.3%, 1/11/2013 | | | 1,500,000 | | | | 1,499,875 | |
| Societe Generale North America, Inc., 0.27%, 1/2/2013 | | | 1,200,000 | | | | 1,199,991 | |
| Standard Chartered Bank, 0.26%, 3/11/2013 | | | 2,000,000 | | | | 1,999,003 | |
| Straight-A Funding LLC, 144A, 0.19%, 3/6/2013 | | | 1,000,000 | | | | 999,662 | |
| Svenska Handelsbanken AB, 0.235%, 2/28/2013 | | | 1,000,000 | | | | 999,621 | |
| Sydney Capital Corp., 144A, 0.3%, 1/8/2013 | | | 500,000 | | | | 499,971 | |
| UOB Funding LLC: | |
| 0.205%, 2/19/2013 | | | 1,000,000 | | | | 999,721 | |
| 0.22%, 4/23/2013 | | | 800,000 | | | | 799,452 | |
| 0.24%, 2/22/2013 | | | 1,000,000 | | | | 999,653 | |
| Working Capital Management Co., 144A, 0.25%, 1/11/2013 | | | 1,000,000 | | | | 999,931 | |
| | | | | 67,207,506 | |
| | | Principal Amount ($) | | | Value ($) | |
| | | | | | | | | |
| Issued at Par 3.9% | |
| ASB Finance Ltd.: | |
| 144A, 0.44%*, 9/4/2013 | | | 1,000,000 | | | | 1,000,000 | |
| 144A, 0.461%*, 2/13/2013 | | | 1,500,000 | | | | 1,500,000 | |
| Australia & New Zealand Banking Group Ltd., 144A, 0.39%*, 12/6/2013 | | | 1,000,000 | | | | 1,000,000 | |
| BNZ International Funding Ltd., 144A, 0.395%*, 10/23/2013 | | | 500,000 | | | | 500,000 | |
| Kells Funding LLC: | |
| 144A, 0.351%*, 3/19/2013 | | | 500,000 | | | | 500,000 | |
| 144A, 0.44%*, 1/17/2013 | | | 1,500,000 | | | | 1,500,000 | |
| Westpac Banking Corp.: | |
| 144A, 0.305%*, 9/3/2013 | | | 1,000,000 | | | | 1,000,000 | |
| 144A, 0.39%*, 11/29/2013 | | | 750,000 | | | | 750,000 | |
| | | | | 7,750,000 | |
Total Commercial Paper (Cost $74,957,506) | | | | 74,957,506 | |
| | |
| Short-Term Notes* 13.0% | |
| Bank of Nova Scotia: | |
| 0.29%, 8/9/2013 | | | 1,000,000 | | | | 1,000,000 | |
| 0.34%, 1/9/2013 | | | 2,000,000 | | | | 2,000,000 | |
| Canadian Imperial Bank of Commerce: | | | | | | | | |
| 0.334%, 4/26/2013 | | | 1,500,000 | | | | 1,500,000 | |
| 0.535%, 2/7/2013 | | | 1,000,000 | | | | 1,000,000 | |
| 0.54%, 4/26/2013 | | | 2,500,000 | | | | 2,500,000 | |
| Commonwealth Bank of Australia, 144A, 0.473%, 3/1/2013 | | | 3,000,000 | | | | 3,000,000 | |
| HSBC Bank PLC, 144A, 0.74%, 5/15/2013 | | | 1,000,000 | | | | 1,001,649 | |
| National Australia Bank Ltd.: | |
| 0.293%, 8/13/2013 | | | 1,000,000 | | | | 1,000,000 | |
| 0.471%, 3/8/2013 | | | 1,500,000 | | | | 1,500,000 | |
| Rabobank Nederland NV: | |
| 0.41%, 6/27/2013 | | | 1,000,000 | | | | 1,000,000 | |
| 0.417%, 1/23/2013 | | | 2,000,000 | | | | 2,000,000 | |
| 0.462%, 5/7/2013 | | | 1,000,000 | | | | 1,000,000 | |
| Royal Bank of Canada: | |
| 0.57%, 6/4/2013 | | | 1,000,000 | | | | 1,000,000 | |
| 0.57%, 6/13/2013 | | | 1,500,000 | | | | 1,500,000 | |
| Sumitomo Mitsui Banking Corp., 0.48%, 3/15/2013 | | | 1,000,000 | | | | 1,000,000 | |
| Svensk Exportkredit AB, 144A, 0.46%, 5/22/2013 | | | 700,000 | | | | 700,000 | |
| Toronto-Dominion Bank, 0.3%, 4/19/2013 | | | 800,000 | | | | 800,198 | |
| Westpac Banking Corp.: | |
| 0.383%, 5/3/2013 | | | 1,000,000 | | | | 1,000,296 | |
| 0.39%, 11/15/2013 | | | 1,000,000 | | | | 1,000,000 | |
Total Short-Term Notes (Cost $25,502,143) | | | | 25,502,143 | |
| | |
| Time Deposit 2.0% | |
| National Australia Bank Ltd., 0.03%, 1/2/2013 (Cost $4,000,000) | | | 4,000,000 | | | | 4,000,000 | |
| | |
| | | Principal Amount ($) | | | Value ($) | |
| | | | | | | | | |
| Government & Agency Obligations 10.2% | |
| U.S. Government Sponsored Agencies 3.9% | |
| Federal Farm Credit Bank, 0.337%, 10/29/2014 | | | 500,000 | | | | 500,140 | |
| Federal Home Loan Bank: | |
| 0.17%, 1/23/2013 | | | 800,000 | | | | 799,989 | |
| 0.17%*, 11/8/2013 | | | 500,000 | | | | 499,831 | |
| 0.36%, 5/16/2013 | | | 750,000 | | | | 750,310 | |
| 0.5%, 8/28/2013 | | | 1,000,000 | | | | 1,001,951 | |
| Federal Home Loan Mortgage Corp.: | | | | | | | | |
| 0.16%**, 1/9/2013 | | | 1,000,000 | | | | 999,960 | |
| 0.169%**, 5/29/2013 | | | 1,200,000 | | | | 1,199,161 | |
| Federal National Mortgage Association: | | | | | | | | |
| 0.127%**, 2/19/2013 | | | 1,000,000 | | | | 999,823 | |
| 0.158%**, 3/4/2013 | | | 1,000,000 | | | | 999,724 | |
| | | | | 7,750,889 | |
| U.S. Treasury Obligations 6.3% | |
| U.S. Treasury Bills, 0.177%**, 10/17/2013 | | | 1,975,000 | | | | 1,972,186 | |
| U.S. Treasury Notes: | |
| 0.5%, 5/31/2013 | | | 3,500,000 | | | | 3,505,163 | |
| 0.5%, 10/15/2013 | | | 1,200,000 | | | | 1,202,976 | |
| 0.625%, 2/28/2013 | | | 1,350,000 | | | | 1,350,992 | |
| 1.375%, 1/15/2013 | | | 2,000,000 | | | | 2,000,917 | |
| 1.375%, 3/15/2013 | | | 1,000,000 | | | | 1,002,400 | |
| 2.5%, 3/31/2013 | | | 1,250,000 | | | | 1,257,083 | |
| | | | | 12,291,717 | |
Total Government & Agency Obligations (Cost $20,042,606) | | | | 20,042,606 | |
| | |
| Municipal Bonds and Notes 1.5% | |
| Texas, JPMorgan Chase Putters/Drivers Trust, Various States, Series 4264, 144A, 0.14%***, 8/30/2013, LIQ: JPMorgan Chase Bank NA | | | 2,000,000 | | | | 2,000,000 | |
| Texas, State Transportation Revenue, 2.5%, 8/30/2013 | | | 1,000,000 | | | | 1,015,015 | |
Total Municipal Bonds and Notes (Cost $3,015,015) | | | | 3,015,015 | |
| | |
| Repurchase Agreements 22.7% | |
| BNP Paribas, 0.2%, dated 12/31/2012, to be repurchased at $3,000,033 on 1/2/2013 (a) | | | 3,000,000 | | | | 3,000,000 | |
| HSBC Securities, Inc., 0.22%, dated 12/31/2012, to be repurchased at $2,000,024 on 1/2/2013 (b) | | | 2,000,000 | | | | 2,000,000 | |
| JPMorgan Securities, Inc., 0.18%, dated 12/26/2012, to be repurchased at $3,000,105 on 1/2/2013 (c) | | | 3,000,000 | | | | 3,000,000 | |
| JPMorgan Securities, Inc., 0.18%, dated 12/31/2012, to be repurchased at $5,000,117 on 1/2/2013 (d) | | | 5,000,000 | | | | 5,000,000 | |
| | | Principal Amount ($) | | | Value ($) | |
| | | | | | | | | |
| JPMorgan Securities, Inc., 0.42%, dated 12/10/2012, to be repurchased at $2,002,217 on 3/15/2013 (e) | | | 2,000,000 | | | | 2,000,000 | |
| Merrill Lynch & Co., Inc., 0.15%, dated 12/31/2012, to be repurchased at $10,529,370 on 1/2/2013 (f) | | | 10,529,282 | | | | 10,529,282 | |
| Merrill Lynch & Co., Inc., 0.19%, dated 12/31/2012, to be repurchased at $9,000,095 on 1/2/2013 (g) | | | 9,000,000 | | | | 9,000,000 | |
| The Goldman Sachs & Co., 0.25%, dated 12/31/2012, to be repurchased at $5,000,069 on 1/2/2013 (h) | | | 5,000,000 | | | | 5,000,000 | |
| | | Principal Amount ($) | | | Value ($) | |
| | | | | | | | | |
| Toronto Dominion Bank, 0.14%, dated 12/31/2012, to be repurchased at $2,000,016 on 1/2/2013 (i) | | | 2,000,000 | | | | 2,000,000 | |
| Toronto Dominion Bank, 0.16%, dated 12/26/2012, to be repurchased at $3,000,093 on 1/2/2013 (j) | | | 3,000,000 | | | | 3,000,000 | |
Total Repurchase Agreements (Cost $44,529,282) | | | | 44,529,282 | |
| | | % of Net Assets | | | Value ($) | |
| | | | |
Total Investment Portfolio (Cost $195,996,680)† | | | 99.9 | | | | 195,996,680 | |
| Other Assets and Liabilities, Net | | | 0.1 | | | | 147,124 | |
| Net Assets | | | 100.0 | | | | 196,143,804 | |
* Floating rate securities' yields vary with a designated market index or market rate, such as the coupon-equivalent of the U.S. Treasury Bill rate. These securities are shown at their current rate as of December 31, 2012.
** Annualized yield at time of purchase; not a coupon rate.
*** Variable rate demand notes are securities whose interest rates are reset periodically at market levels. These securities are payable on demand and are shown at their current rates as of December 31, 2012.
† The cost for federal income tax purposes was $195,996,680.
(a) Collateralized by $2,745,913 Government National Mortgage Association, with the various coupon rates from 4.0-8.0%, with various maturity dates of 8/15/2016-5/15/2053 with a value of $3,060,000.
(b) Collateralized by $2,040,000 U.S. Treasury Note, 0.75%, maturing on 12/31/2017 with a value of $2,043,509.
(c) Collateralized by $3,160,000 U.S. Treasury STRIPS, maturing on 8/15/2017 with a value of $3,060,270.
(d) Collateralized by $5,270,000 U.S. Treasury STRIPS, maturing on 8/15/2017 with a value of $5,103,679.
(e) Collateralized by:
| Principal Amount ($) | | Security | | Rate (%) | | Maturity Date | | Collateral Value ($) | |
| | 1,180,000 | | Goldentree Loan Opportunities V Ltd. | | | 1.02 | | 10/18/2021 | | | 1,167,523 | |
| | 911,838 | | SLM Student Loan Trust | | | 1.058 | | 3/15/2033 | | | 901,144 | |
| Total Collateral Value | | | 2,068,667 | |
(f) Collateralized by $10,569,200 U.S. Treasury Note, 0.875%, maturing on 2/28/2017 with a value of $10,739,881.
(g) Collateralized by $8,761,981 Federal National Mortgage Association, 2.5%, maturing on 8/1/2027 with a value of $9,180,000.
(h) Collateralized by:
| Principal Amount ($) | | Security | | Rate (%) | | Maturity Date | | Collateral Value ($) | |
| | 798,106 | | Federal Home Loan Mortgage Corp. | | | 2.562 | | 1/1/2042 | | | 838,128 | |
| | 3,962,162 | | Federal National Mortgage Association | | | 3.373-6.0 | | 7/1/2020-12/1/2040 | | | 4,261,872 | |
| Total Collateral Value | | | 5,100,000 | |
(i) Collateralized by:
| Principal Amount ($) | | Security | | Rate (%) | | Maturity Date | | Collateral Value ($) | |
| | 1,767 | | Bank of New York Mellon Corp. | | | 4.6 | | 1/15/2020 | | | 2,062 | |
| | 14,448 | | Canadian Imperial Bank of Commerce | | | 2.0 | | 2/4/2013 | | | 14,588 | |
| | 1,631,436 | | ConocoPhillips | | | 5.75 | | 2/1/2019 | | | 2,049,489 | |
| | 4,354 | | ConocoPhillips Canada Funding Co. I | | | 5.95 | | 10/15/2036 | | | 5,686 | |
| | 1,811 | | Georgia Power Co. | | | 5.65 | | 3/1/2037 | | | 2,298 | |
| Total Collateral Value | | | 2,074,123 | |
(j) Collateralized by $2,985,300 U.S. Treasury Note, 1.875%, maturing on 4/30/2014 with a value of $3,060,498.
144A: Security exempt from registration under Rule 144A of the Securities Act of 1933. These securities may be resold in transactions exempt from registration, normally to qualified institutional buyers.
STRIPS: Separate Trading of Registered Interest and Principal Securities
Fair Value Measurements
Various inputs are used in determining the value of the Fund's investments. These inputs are summarized in three broad levels. Level 1 includes quoted prices in active markets for identical securities. Level 2 includes other significant observable inputs (including quoted prices for similar securities, interest rates, prepayment speeds, and credit risk). Level 3 includes significant unobservable inputs (including the Fund's own assumptions in determining the fair value of investments). The inputs or methodology used for valuing securities are not necessarily an indication of the risk associated with investing in those securities. Securities held by the Fund are reflected as Level 2 because the securities are valued at amortized cost (which approximates fair value) and, accordingly, the inputs used to determine value are not quoted prices in an active market.
The following is a summary of the inputs used as of December 31, 2012 in valuing the Fund's investments. For information on the Fund's policy regarding the valuation of investments, please refer to the Security Valuation section of Note A in the accompanying Notes to Financial Statements.
| Assets | | Level 1 | | | Level 2 | | | Level 3 | | | Total | |
| | |
| Investments in Securities (k) | | $ | — | | | $ | 151,467,398 | | | $ | — | | | $ | 151,467,398 | |
| Repurchase Agreements | | | — | | | | 44,529,282 | | | | — | | | | 44,529,282 | |
| Total | | $ | — | | | $ | 195,996,680 | | | $ | — | | | $ | 195,996,680 | |
There have been no transfers between fair value measurement levels during the period ended December 31, 2012.
(k) See Investment Portfolio for additional detailed categorizations.
The accompanying notes are an integral part of the financial statements.
Statement of Assets and Liabilities | as of December 31, 2012 | |
| Assets | |
Investments: Investments in non-affiliated securities, valued at amortized cost | | $ | 151,467,398 | |
| Repurchase agreements, valued at amortized cost | | | 44,529,282 | |
| Total investments, valued at amortized cost | | | 195,996,680 | |
| Cash | | | 2 | |
| Receivable for Fund shares sold | | | 323,229 | |
| Interest receivable | | | 75,596 | |
| Other assets | | | 3,168 | |
| Total assets | | | 196,398,675 | |
| Liabilities | |
| Payable for Fund shares redeemed | | | 127,225 | |
| Distributions payable | | | 796 | |
| Accrued management fee | | | 18,673 | |
| Accrued Trustees' fees | | | 4,278 | |
| Other accrued expenses and payables | | | 103,899 | |
| Total liabilities | | | 254,871 | |
| Net assets, at value | | $ | 196,143,804 | |
| Net Assets Consist of | |
| Undistributed net investment income | | | 204 | |
| Paid-in capital | | | 196,143,600 | |
| Net assets, at value | | $ | 196,143,804 | |
Class A Net Asset Value, offering and redemption price per share ($196,143,804 ÷ 196,227,316 outstanding shares of beneficial interest, no par value, unlimited number of shares authorized) | | $ | 1.00 | |
The accompanying notes are an integral part of the financial statements.
Statement of Operations
| for the year ended December 31, 2012 | |
| Investment Income | |
Income: Interest | | $ | 658,851 | |
Expenses: Management fee | | | 582,917 | |
| Administration fee | | | 204,443 | |
| Services to shareholders | | | 1,820 | |
| Custodian fee | | | 24,399 | |
| Professional fees | | | 50,704 | |
| Reports to shareholders | | | 46,382 | |
| Trustees' fee and expenses | | | 11,639 | |
| Other | | | 7,764 | |
| Total expenses before expense reductions | | | 930,068 | |
| Expense reductions | | | (291,730 | ) |
| Total expenses after expense reductions | | | 638,338 | |
| Net investment income | | | 20,513 | |
| Net realized gain (loss) | | | 863 | |
| Net increase (decrease) in net assets resulting from operations | | $ | 21,376 | |
The accompanying notes are an integral part of the financial statements.
Statement of Changes in Net Assets | | | Years Ended December 31, | |
| Increase (Decrease) in Net Assets | | 2012 | | | 2011 | |
Operations: Net investment income | | $ | 20,513 | | | $ | 21,576 | |
| Net realized gain (loss) | | | 863 | | | | 348 | |
| Net increase (decrease) in net assets resulting from operations | | | 21,376 | | | | 21,924 | |
Distributions to shareholders from: Net investment income Class A | | | (20,513 | ) | | | (21,576 | ) |
| Total distributions | | | (20,513 | ) | | | (21,576 | ) |
Fund share transactions: Class A Proceeds from shares sold | | | 76,110,395 | | | | 147,415,537 | |
| Reinvestment of distributions | | | 20,711 | | | | 21,589 | |
| Cost of shares redeemed | | | (96,940,382 | ) | | | (150,401,802 | ) |
| Net increase (decrease) in net assets from Class A share transactions | | | (20,809,276 | ) | | | (2,964,676 | ) |
| Increase (decrease) in net assets | | | (20,808,413 | ) | | | (2,964,328 | ) |
| Net assets at beginning of period | | | 216,952,217 | | | | 219,916,545 | |
| Net assets at end of period (including undistributed net investment income and distributions in excess of net investment income of $204 and $659, respectively) | | $ | 196,143,804 | | | $ | 216,952,217 | |
| Other Information | |
Class A Shares outstanding at beginning of period | | | 217,036,592 | | | | 220,001,268 | |
| Shares sold | | | 76,110,395 | | | | 147,415,537 | |
| Shares issued to shareholders in reinvestment of distributions | | | 20,711 | | | | 21,589 | |
| Shares redeemed | | | (96,940,382 | ) | | | (150,401,802 | ) |
| Net increase (decrease) in Class A shares | | | (20,809,276 | ) | | | (2,964,676 | ) |
| Shares outstanding at end of period | | | 196,227,316 | | | | 217,036,592 | |
The accompanying notes are an integral part of the financial statements.
| | | Years Ended December 31, | |
| Class A | | | 2012 | | | 2011 | | | 2010 | | | 2009 | | | 2008 | |
| Selected Per Share Data | |
| Net asset value, beginning of period | | $ | 1.000 | | | $ | 1.000 | | | $ | 1.000 | | | $ | 1.000 | | | $ | 1.000 | |
Income from investment operations: Net investment income | | | .000 | * | | | .000 | * | | | .000 | * | | | .003 | | | | .026 | |
| Total from investment operations | | | .000 | * | | | .000 | * | | | .000 | * | | | .003 | | | | .026 | |
Less distributions from: Net investment income | | | (.000 | )* | | | (.000 | )* | | | (.000 | )* | | | (.003 | ) | | | (.026 | ) |
| Net asset value, end of period | | $ | 1.000 | | | $ | 1.000 | | | $ | 1.000 | | | $ | 1.000 | | | $ | 1.000 | |
| Total Return (%) | | | .01 | a | | | .01 | a | | | .01 | a | | | .34 | | | | 2.64 | a |
| Ratios to Average Net Assets and Supplemental Data | |
| Net assets, end of period ($ millions) | | | 196 | | | | 217 | | | | 220 | | | | 270 | | | | 398 | |
| Ratio of expenses before expense reductions (%) | | | .45 | | | | .51 | | | | .46 | | | | .43 | | | | .52 | |
| Ratio of expenses after expense reductions (%) | | | .31 | | | | .25 | | | | .34 | | | | .43 | | | | .50 | |
| Ratio of net investment income (%) | | | .01 | | | | .01 | | | | .01 | | | | .37 | | | | 2.56 | |
a Total return would have been lower had certain expenses not been reduced. * Amount is less than $.0005. | |
Notes to Financial Statements
A. Organization and Significant Accounting Policies
DWS Money Market VIP (the "Fund") is a diversified series of DWS Variable Series II (the "Trust"), which is registered under the Investment Company Act of 1940, as amended (the "1940 Act"), as an open-end management investment company organized as a Massachusetts business trust.
The Fund's financial statements are prepared in accordance with accounting principles generally accepted in the United States of America which require the use of management estimates. Actual results could differ from those estimates. The policies described below are followed consistently by the Fund in the preparation of its financial statements.
Security Valuation. Various inputs are used in determining the value of the Fund's investments. These inputs are summarized in three broad levels. Level 1 includes quoted prices in active markets for identical securities. Level 2 includes other significant observable inputs (including quoted prices for similar securities, interest rates, prepayment speeds, and credit risk). Level 3 includes significant unobservable inputs (including the Fund's own assumptions in determining the fair value of investments). The inputs or methodology used for valuing securities are not necessarily an indication of the risk associated with investing in those securities.
The Fund values all securities utilizing the amortized cost method permitted in accordance with Rule 2a-7 under the 1940 Act and certain conditions therein. Under this method, which does not take into account unrealized capital gains or losses on securities, an instrument is initially valued at its cost and thereafter assumes a constant accretion/amortization rate to maturity of any discount or premium. Securities held by the Fund are reflected as Level 2 because the securities are valued at amortized cost (which approximates fair value) and, accordingly, the inputs used to determine value are not quoted prices in an active market.
Disclosure about the classification of fair value measurements is included in a table following the Fund's Investment Portfolio.
New Accounting Pronouncement. In January 2013, Accounting Standard Update 2013-01 (ASU 2013-01), Clarifying the Scope of Disclosures about Offsetting Assets and Liabilities, replaced Accounting Standards Update 2011-11 (ASU 2011-11), Disclosures about Offsetting Assets and Liabilities. ASU 2013-01 is effective for fiscal years beginning on or after January 1, 2013, and interim periods within those annual periods. ASU 2011-11 was intended to enhance disclosure requirements on the offsetting of financial assets and liabilities. The ASU 2013-01 limits the scope of the new balance sheet offsetting disclosures to derivatives, repurchase agreements, and securities lending transactions to the extent that they are (1) offset in the financial statements or (2) subject to an enforceable master netting arrangement or similar agreement. Management is currently evaluating the application of ASU 2013-01 and its impact, if any, on the Fund's financial statements.
Repurchase Agreements. The Fund may enter into repurchase agreements with certain banks and broker/dealers whereby the Fund, through its custodian or a sub-custodian bank, receives delivery of the underlying securities, the amount of which at the time of purchase and each subsequent business day is required to be maintained at such a level that the value is equal to at least the principal amount of the repurchase price plus accrued interest. The custodian or another designated sub-custodian bank holds the collateral in a separate account until the agreement matures. If the value of the securities falls below the principal amount of the repurchase agreement plus accrued interest, the financial institution deposits additional collateral by the following business day. If the financial institution either fails to deposit the required additional collateral or fails to repurchase the securities as agreed, the Fund has the right to sell the securities and recover any resulting loss from the financial institution. If the financial institution enters into bankruptcy, the Fund's claim on the collateral may be subject to legal proceedings.
Federal Income Taxes. The Fund's policy is to comply with the requirements of the Internal Revenue Code, as amended, which are applicable to regulated investment companies and to distribute all of its taxable income to its shareholders.
The Fund has reviewed the tax positions for the open tax years as of December 31, 2012 and has determined that no provision for income tax is required in the Fund's financial statements. The Fund's federal tax returns for the prior three fiscal years remain open subject to examination by the Internal Revenue Service.
Distribution of Income and Gains. Net investment income of the Fund is declared as a daily dividend and is distributed to shareholders monthly. The Fund may take into account capital gains and losses in its daily dividend declarations. The Fund may also make additional distributions for tax purposes if necessary.
Permanent book and tax differences relating to shareholder distributions will result in reclassifications to paid-in capital. Temporary book and tax differences will reverse in a subsequent period. There were no significant book to tax differences for the Fund.
At December 31, 2012, the Fund's components of distributable earnings on a tax basis were as follows:
| Undistributed ordinary income* | | $ | 204 | |
In addition, the tax character of distributions paid by the Fund is summarized as follows:
| | | Years Ended December 31, | |
| | | 2012 | | | 2011 | |
| Distributions from ordinary income* | | $ | 20,513 | | | $ | 21,576 | |
* For tax purposes, short-term capital gain distributions are considered ordinary income distributions.
Expenses. Expenses of the Trust arising in connection with a specific fund are allocated to that fund. Other Trust expenses which cannot be directly attributed to a fund are apportioned among the funds in the Trust based upon the relative net assets or other appropriate measures.
Contingencies. In the normal course of business, the Fund may enter into contracts with service providers that contain general indemnification clauses. The Fund's maximum exposure under these arrangements is unknown as this would involve future claims that may be made against the Fund that have not yet been made. However, based on experience, the Fund expects the risk of loss to be remote.
Other. Investment transactions are accounted for on a trade date. Interest income is recorded on the accrual basis. Realized gains and losses from investment transactions are recorded on an identified cost basis. All discounts and premiums are accreted/amortized for both tax and financial reporting purposes.
B. Related Parties
Management Agreement. Under the Investment Management Agreement with Deutsche Investment Management Americas Inc. ("DIMA" or the "Advisor"), an indirect, wholly owned subsidiary of Deutsche Bank AG, the Advisor directs the investments of the Fund in accordance with its investment objectives, policies and restrictions. The Advisor determines the securities, instruments and other contracts relating to investments to be purchased, sold or entered into by the Fund.
Pursuant to the Investment Management Agreement with the Advisor, the Fund pays a monthly management fee based on the Fund's average daily net assets, computed and accrued daily and payable monthly, at the following annual rates:
| First $500 million | | | .285 | % |
| Next $500 million | | | .270 | % |
| Next $1.0 billion | | | .255 | % |
| Over $2.0 billion | | | .240 | % |
For the period from January 1, 2012 through September 30, 2013, the Advisor has contractually agreed to waive its fee and/or reimburse certain operating expenses to the extent necessary to maintain the operating expenses (excluding certain expenses such as extraordinary expenses, taxes, brokerage and interest expense) at 0.51%.
In addition, the Advisor has agreed to voluntarily waive additional expenses for the Fund. The waiver may be changed or terminated at any time without notice. Under this arrangement, the Advisor waived certain expenses of the Fund.
Accordingly, for the year ended December 31, 2012, the Advisor waived a portion of its management fee pursuant to the Investment Management Agreement aggregating $291,138, and the amount charged aggregated $291,779, which was equivalent to an annual effective rate of 0.14% of the Fund's average daily net assets.
Administration Fee. Pursuant to an Administrative Services Agreement, DIMA provides most administrative services to the Fund. For all services provided under the Administrative Services Agreement, the Fund pays DIMA an annual fee ("Administration Fee") of 0.10% of the Fund's average daily net assets, computed and accrued daily and payable monthly. For the year ended December 31, 2012, the Administration Fee was $204,443, of which $16,593 is unpaid.
Service Provider Fees. DWS Investments Service Company ("DISC"), an affiliate of the Advisor, is the transfer agent, dividend-paying agent and shareholder service agent for the Fund. Pursuant to a sub-transfer agency agreement between DISC and DST Systems, Inc. ("DST"), DISC has delegated certain transfer agent, dividend-paying agent and shareholder service agent functions to DST. DISC compensates DST out of the shareholder servicing fee it receives from the Fund. For the year ended December 31, 2012, the amounts charged to the Fund by DISC aggregated $592, all of which was waived.
Typesetting and Filing Service Fees. Under an agreement with DIMA, DIMA is compensated for providing typesetting and certain regulatory filing services to the Fund. For the year ended December 31, 2012, the amount charged to the Fund by DIMA included in the Statement of Operations under "reports to shareholders" aggregated $11,777, of which $4,677 is unpaid.
Trustees' Fees and Expenses. The Fund paid retainer fees to each Trustee not affiliated with the Advisor, plus specified amounts to the Board Chairperson and to each committee Chairperson.
C. Ownership of the Fund
At December 31, 2012, four Participating Insurance Companies were owners of record of 10% or more of the total outstanding Class A shares of the Fund, each owning 35%, 20%, 10% and 10%.
D. Line of Credit
The Fund and other affiliated funds (the "Participants") share in a $375 million revolving credit facility provided by a syndication of banks. The Fund may borrow for temporary or emergency purposes, including the meeting of redemption requests that otherwise might require the untimely disposition of securities. The Participants are charged an annual commitment fee which is allocated based on net assets, among each of the Participants. Interest is calculated at a rate per annum equal to the sum of the Federal Funds Rate, plus 1.25 percent plus if LIBOR exceeds the Federal Funds Rate, the amount of such excess. The Fund may borrow up to a maximum of 33 percent of its net assets under the agreement: The Fund had no outstanding loans at December 31, 2012.
Report of Independent Registered Public Accounting Firm
To the Board of Trustees of DWS Variable Series II and Shareholders of DWS Money Market VIP:
We have audited the accompanying statement of assets and liabilities, including the investment portfolio, of DWS Money Market VIP (the "Fund"), one of the funds constituting DWS Variable Series II, as of December 31, 2012, and the related statement of operations for the year then ended, the statement of changes in net assets for each of the two years in the period then ended, and the financial highlights for each of the five years in the period then ended. These financial statements and financial highlights are the responsibility of the Fund's management. Our responsibility is to express an opinion on these financial statements and financial highlights based on our audits.
We conducted our audits in accordance with the standards of the Public Company Accounting Oversight Board (United States). Those standards require that we plan and perform the audit to obtain reasonable assurance about whether the financial statements and financial highlights are free of material misstatement. We were not engaged to perform an audit of the Fund's internal control over financial reporting. Our audits included consideration of internal control over financial reporting as a basis for designing audit procedures that are appropriate in the circumstances, but not for the purpose of expressing an opinion on the effectiveness of the Fund's internal control over financial reporting. Accordingly, we express no such opinion. An audit also includes examining, on a test basis, evidence supporting the amounts and disclosures in the financial statements and financial highlights, assessing the accounting principles used and significant estimates made by management, and evaluating the overall financial statement presentation. Our procedures included confirmation of securities owned as of December 31, 2012, by correspondence with the custodian and brokers. We believe that our audits provide a reasonable basis for our opinion.
In our opinion, the financial statements and financial highlights referred to above present fairly, in all material respects, the financial position of DWS Money Market VIP (one of the funds constituting DWS Variable Series II) at December 31, 2012, the results of its operations for the year then ended, the changes in its net assets for each of the two years in the period then ended, and the financial highlights for each of the five years in the period then ended, in conformity with U.S. generally accepted accounting principles.
| | | |
Boston, Massachusetts February 13, 2013 | | |
Information About Your Fund's Expenses (Unaudited)
As an investor of the Fund, you incur two types of costs: ongoing expenses and transaction costs. Ongoing expenses include management fees and other Fund expenses. Examples of transaction costs include contract charges and account maintenance fees, which are not shown in this section. The following tables are intended to help you understand your ongoing expenses (in dollars) of investing in the Fund and to help you compare these expenses with the ongoing expenses of investing in other mutual funds. In the most recent six-month period the Fund limited these expenses; had it not done so, expenses would have been higher. The example in the table is based on an investment of $1,000 invested at the beginning of the six-month period and held for the entire period (July 1, 2012 to December 31, 2012).
The tables illustrate your Fund's expenses in two ways:
•Actual Fund Return. This helps you estimate the actual dollar amount of ongoing expenses (but not transaction costs) paid on a $1,000 investment in the Fund using the Fund's actual return during the period. To estimate the expenses you paid over the period, simply divide your account value by $1,000 (for example, an $8,600 account value divided by $1,000 = 8.6), then multiply the result by the number in the "Expenses Paid per $1,000" line under the share class you hold.
• Hypothetical 5% Fund Return. This helps you to compare your Fund's ongoing expenses (but not transaction costs) with those of other mutual funds using the Fund's actual expense ratio and a hypothetical rate of return of 5% per year before expenses. Examples using a 5% hypothetical Fund return may be found in the shareholder reports of other mutual funds. The hypothetical account values and expenses may not be used to estimate the actual ending account balance or expenses you paid for the period.
Please note that the expenses shown in these tables are meant to highlight your ongoing expenses only and do not reflect any transaction costs. The "Expenses Paid per $1,000" line of the tables is useful in comparing ongoing expenses only and will not help you determine the relative total expense of owning different funds. If these transaction costs had been included, your costs would have been higher.
Expenses and Value of a $1,000 Investment for the six months ended December 31, 2012 | |
| Actual Fund Return | | Class A | |
| Beginning Account Value 7/1/12 | | $ | 1,000.00 | |
| Ending Account Value 12/31/12 | | $ | 1,000.05 | |
| Expenses Paid per $1,000* | | $ | 1.51 | |
| Hypothetical 5% Fund Return | | Class A | |
| Beginning Account Value 7/1/12 | | $ | 1,000.00 | |
| Ending Account Value 12/31/12 | | $ | 1,023.63 | |
| Expenses Paid per $1,000* | | $ | 1.53 | |
* Expenses are equal to the Fund's annualized expense ratio, multiplied by the average account value over the period, multiplied by 184 (the number of days in the most recent six-month period), then divided by 366.
| Annualized Expense Ratio | Class A | |
| DWS Variable Series II — DWS Money Market VIP | .30% | |
For more information, please refer to the Fund's prospectus.
These tables do not reflect charges and fees ("contract charges") associated with the separate account that invests in the Fund or any variable life insurance policy or variable annuity contract for which the Fund is an investment option.
Tax Information (Unaudited)
Please consult a tax advisor if you have questions about federal or state income tax laws, or on how to prepare your tax returns. If you have specific questions about your account, please contact your insurance provider.
The Trust's policies and procedures for voting proxies for portfolio securities and information about how the Trust voted proxies related to its portfolio securities during the 12-month period ended June 30 are available on our Web site — www.dws-investments.com (click on "proxy voting" at the bottom of the page) — or on the SEC's Web site — www.sec.gov. To obtain a written copy of the Trust's policies and procedures without charge, upon request, call us toll free at (800) 728-3337.
Investment Management Agreement Approval
The Board of Trustees approved the renewal of DWS Money Market VIP's investment management agreement (the "Agreement") with Deutsche Investment Management Americas Inc. ("DWS") in September 2012.
In terms of the process that the Board followed prior to approving the Agreement, shareholders should know that:
• In September 2012, all of the Fund's Trustees were independent of DWS and its affiliates.
• The Trustees met frequently during the past year to discuss fund matters and dedicated a substantial amount of time to contract review matters. Over the course of several months, the Board's Contract Committee, in coordination with the Board's Fixed Income and Quant Oversight Committee, reviewed comprehensive materials received from DWS, independent third parties and independent counsel. These materials included an analysis of the Fund's performance, fees and expenses, and profitability compiled by the Fund's independent fee consultant. The Board also received extensive information throughout the year regarding performance of the Fund.
• The Independent Trustees regularly meet privately with their independent counsel to discuss contract review and other matters. In addition, the Independent Trustees were also advised by the Fund's independent fee consultant in the course of their review of the Fund's contractual arrangements and considered a comprehensive report prepared by the independent fee consultant in connection with their deliberations (the "IFC Report").
• In connection with reviewing the Agreement, the Board also reviewed the terms of the Fund's distribution agreement, administrative services agreement, transfer agency agreement and other material service agreements.
• Based on its evaluation of the information provided, the Contract Committee presented its findings and recommendations to the Board. The Board then reviewed the Contract Committee's findings and recommendations.
In connection with the contract review process, the Contract Committee and the Board considered the factors discussed below, among others. The Board also considered that DWS and its predecessors have managed the Fund since its inception, and the Board believes that a long-term relationship with a capable, conscientious advisor is in the best interests of the Fund. The Board considered, generally, that shareholders chose to invest or remain invested in the Fund knowing that DWS managed the Fund, and that the Agreement was approved by the Fund's shareholders. DWS is part of Deutsche Bank, a major global banking institution that is engaged in a wide range of financial services. The Board believes that there are advantages to being part of a global asset management business that offers a wide range of investing expertise and resources, including hundreds of portfolio managers and analysts with research capabilities in many countries throughout the world.
As part of the contract review process, the Board carefully considered the fees and expenses of each DWS fund overseen by the Board in light of the fund's performance. In many cases, this led to a negotiation with DWS of lower expense caps for the coming year than had previously been in place. As part of these negotiations, the Board indicated that it would consider relaxing these new lower caps in future years following sustained improvements in performance, among other considerations.
In June 2012, Deutsche Bank ("DB"), DWS's parent company, announced that DB's new management team had concluded the strategic review of its global asset management business announced in late 2011 by DB's prior management team, and would combine its Asset Management (of which DWS is a part) and Wealth Management divisions. Prior to approving the investment management agreements, the Independent Trustees were apprised of the expected management and structure of the new combined Asset & Wealth Management division ("AWM") and DWS. DB also advised the Independent Trustees that the U.S. asset management business is a critical and integral part of DB and AWM, and that DB would be reinvesting a significant portion of the substantial savings it expects to realize by combining its Asset Management and Wealth Management divisions into a combined AWM division, including enhancements to its investment capabilities. DB also confirmed its commitment to maintaining strong legal and compliance groups within the combined division.
While shareholders may focus primarily on fund performance and fees, the Fund's Board considers these and many other factors, including the quality and integrity of DWS's personnel and such other issues as back-office operations, fund valuations, and compliance policies and procedures.
Nature, Quality and Extent of Services. The Board considered the terms of the Agreement, including the scope of advisory services provided under the Agreement. The Board noted that, under the Agreement, DWS provides portfolio management services to the Fund and that, pursuant to a separate administrative services agreement, DWS provides administrative services to the Fund. The Board considered the experience and skills of senior management and investment personnel, the resources made available to such personnel, the ability of DWS to attract and retain high-quality personnel, and the organizational depth and stability of DWS. The Board reviewed the Fund's performance over short-term and long-term periods and compared those returns to various agreed-upon performance measures, including a peer universe compiled by the independent fee consultant using information supplied by iMoneyNet Inc. ("iMoneyNet") an independent fund data service. The Board also noted that it has put into place a process of identifying "Focus Funds" (e.g., funds performing poorly relative to their benchmark or a peer universe compiled by an independent fund data service), and receives more frequent reporting and information from DWS regarding such funds, along with DWS's remedial plans to address underperformance. The Board believes this process is an effective manner of identifying and addressing underperforming funds. Based on the information provided, the Board noted that for the one- and three-year periods ended December 31, 2011, the Fund's gross performance (Class A shares) was in the 2nd quartile and 1st quartile, respectively, of the applicable iMoneyNet universe (the 1st quartile being the best performers and the 4th quartile being the worst performers).
Fees and Expenses. The Board considered the Fund's investment management fee schedule, operating expenses and total expense ratios, and comparative information provided by Lipper Inc. ("Lipper") and the independent fee consultant regarding investment management fee rates paid to other investment advisors by similar funds (1st quartile being the most favorable and 4th quartile being the least favorable). With respect to management fees paid to other investment advisors by similar funds, the Board noted that the contractual fee rates paid by the Fund, which include a 0.10% fee paid to DWS under the Fund's administrative services agreement, were lower than the median (2nd quartile) of the applicable Lipper peer group (based on Lipper data provided as of December 31, 2011). The Board noted that the Fund's Class A shares total (net) operating expenses were higher than the median (3rd quartile) of the applicable Lipper expense universe (based on Lipper data provided as of December 31, 2011). The Board considered the Fund's management fee rate as compared to fees charged by DWS and certain of its affiliates for comparable mutual funds and considered differences in fund and fee structures between the DWS Funds. The Board also considered how the Fund's total (net) operating expenses compared to the total (net) operating expenses of a more customized peer group selected by Lipper (based on such factors as asset size). The Board noted the expense limitation agreed to by DWS. The Board also noted the significant voluntary fee waivers implemented by DWS to ensure the Fund maintained a positive yield.
The information considered by the Board as part of its review of management fees included information regarding fees charged by DWS and its affiliates to similar institutional accounts and to similar funds offered primarily to European investors ("DWS Europe funds"), in each case as applicable. The Board observed that advisory fee rates for institutional accounts generally were lower than the management fees charged by similarly managed DWS U.S. mutual funds ("DWS Funds"), but also took note of the differences in services provided to DWS Funds as compared to institutional accounts. In the case of DWS Europe funds, the Board observed that fee rates for DWS Europe funds generally were higher than for similarly managed DWS Funds, but noted that differences in the types of services provided to DWS Funds relative to DWS Europe funds made it difficult to compare such fees.
On the basis of the information provided, the Board concluded that management fees were reasonable and appropriate in light of the nature, quality and extent of services provided by DWS.
Profitability. The Board reviewed detailed information regarding revenues received by DWS under the Agreement. The Board considered the estimated costs and pre-tax profits realized by DWS from advising the DWS Funds, as well as estimates of the pre-tax profits attributable to managing the Fund in particular. The Board also received information regarding the estimated enterprise-wide profitability of DWS and its affiliates with respect to all fund services in totality and by fund. The Board and the independent fee consultant reviewed DWS's methodology in allocating its costs to the management of the Fund. Based on the information provided, the Board concluded that the pre-tax profits realized by DWS in connection with the management of the Fund were not unreasonable. The Board also reviewed information regarding the profitability of certain similar investment management firms. The Board noted that while information regarding the profitability of such firms is limited (and in some cases is not necessarily prepared on a comparable basis), DWS and its affiliates' overall profitability with respect to the DWS fund complex (after taking into account distribution and other services provided to the funds by DWS and its affiliates) was lower than the overall profitability levels of many comparable firms for which such data was available.
Economies of Scale. The Board considered whether there are economies of scale with respect to the management of the Fund and whether the Fund benefits from any economies of scale. The Board noted that the Fund's management fee schedule includes fee breakpoints. The Board concluded that the Fund's fee schedule represents an appropriate sharing between the Fund and DWS of such economies of scale as may exist in the management of the Fund at current asset levels.
Other Benefits to DWS and Its Affiliates. The Board also considered the character and amount of other incidental benefits received by DWS and its affiliates, including any fees received by DWS for administrative services provided to the Fund and any fees received by an affiliate of DWS for distribution services. The Board also considered benefits to DWS related to brokerage and soft-dollar allocations, including allocating brokerage to pay for research generated by parties other than the executing broker dealers, which pertain primarily to funds investing in equity securities, along with the incidental public relations benefits to DWS related to DWS Funds advertising and cross-selling opportunities among DWS products and services. The Board concluded that management fees were reasonable in light of these fallout benefits.
Compliance. The Board considered the significant attention and resources dedicated by DWS to documenting and enhancing its compliance processes in recent years. The Board noted in particular (i) the experience and seniority of both DWS's chief compliance officer and the Fund's chief compliance officer; (ii) the large number of DWS compliance personnel; and (iii) the substantial commitment of resources by DWS and its affiliates to compliance matters.
Based on all of the information considered and the conclusions reached, the Board unanimously determined that the continuation of the Agreement is in the best interests of the Fund. In making this determination, the Board did not give particular weight to any single factor identified above. The Board considered these factors over the course of numerous meetings, certain of which were in executive session with only the Independent Trustees and their counsel present. It is possible that individual Trustees may have weighed these factors differently in reaching their individual decisions to approve the continuation of the Agreement.
Summary of Management Fee Evaluation by Independent Fee Consultant
September 17, 2012
Pursuant to an Order entered into by Deutsche Investment Management Americas and affiliates (collectively, "DeAM") with the Attorney General of New York, I, Thomas H. Mack, have been appointed the Independent Fee Consultant for the DWS Funds (formerly the DWS Scudder Funds). My duties include preparing an annual written evaluation of the management fees DeAM charges the Funds, considering among other factors the management fees charged by other mutual fund companies for like services, management fees DeAM charges other clients for like services, DeAM's costs of supplying services under the management agreements and related profit margins, possible economies of scale if a Fund grows larger, and the nature and quality of DeAM's services, including fund performance. This report summarizes my evaluation for 2012, including my qualifications, the evaluation process for each of the DWS Funds, consideration of certain complex-level factors, and my conclusions. I served in substantially the same capacity in 2007, 2008, 2009, 2010 and 2011.
Qualifications
For more than 35 years I have served in various professional capacities within the investment management business. I have held investment analysis and advisory positions, including securities analyst, portfolio strategist and director of investment policy with a large investment firm. I have also performed business management functions, including business development, financial management and marketing research and analysis.
Since 1991, I have been an independent consultant within the asset management industry. I have provided services to over 125 client organizations, including investment managers, mutual fund boards, product distributors and related organizations. Over the past ten years I have completed a number of assignments for mutual fund boards, specifically including assisting boards with management contract renewal.
I hold a Master of Business Administration degree, with highest honors, from Harvard University and Master of Science and Bachelor of Science (highest honors) degrees from the University of California at Berkeley. I am an independent director and audit committee financial expert for two closed-end mutual funds and have served in various leadership and financial oversight capacities with non-profit organizations.
Evaluation of Fees for each DWS Fund
My work focused primarily on evaluating, fund-by-fund, the fees charged to each of the 103 mutual fund portfolios in the DWS Fund family. For each Fund, I considered each of the key factors mentioned above, as well as any other relevant information. In doing so I worked closely with the Funds' Independent Directors in their annual contract renewal process, as well as in their approval of contracts for several new funds (documented separately).
In evaluating each Fund's fees, I reviewed comprehensive materials provided by or on behalf of DeAM, including expense information prepared by Lipper Analytical, comparative performance information, profitability data, manager histories, and other materials. I also accessed certain additional information from the Lipper and Morningstar databases and drew on my industry knowledge and experience.
To facilitate evaluating this considerable body of information, I prepared for each Fund a document summarizing the key data elements in each area as well as additional analytics discussed below. This made it possible to consider each key data element in the context of the others.
In the course of contract renewal, DeAM agreed to implement a number of fee and expense adjustments requested by the Independent Directors which will favorably impact future fees and expenses, and my evaluation includes the effects of these changes.
Fees and Expenses Compared with Other Funds
The competitive fee and expense evaluation for each fund focused on two primary comparisons:
The Fund's contractual management fee (the advisory fee plus the administration fee where applicable) compared with those of a group of typically 12-15 funds in the same Lipper investment category (e.g. Large Capitalization Growth) having similar distribution arrangements and being of similar size.
The Fund's total expenses compared with a broader universe of funds from the same Lipper investment category and having similar distribution arrangements.
These two comparisons provide a view of not only the level of the fee compared with funds of similar scale but also the total expense the Fund bears for all the services it receives, in comparison with the investment choices available in the Fund's investment category and distribution channel. The principal figure-of-merit used in these comparisons was the subject Fund's percentile ranking against peers.
DeAM's Fees for Similar Services to Others
DeAM provided management fee schedules for all of its US domiciled fund and non-fund investment management accounts in any of the investment categories where there is a DWS Fund. These similar products included the other DWS Funds, non-fund pooled accounts, institutional accounts and sub-advisory accounts. Using this information, I calculated for each Fund the fee that would be charged to each similar product, at the subject Fund's asset level.
Evaluating information regarding non-fund products is difficult because there are varying levels of services required for different types of accounts, with mutual funds generally requiring considerably more regulatory and administrative types of service as well as having more frequent cash flows than other types of accounts. Also, while mutual fund fees for similar fund products can be expected to be similar, there will be some differences due to different pricing conditions in different distribution channels (e.g. retail funds versus those used in variable insurance products), differences in underlying investment processes and other factors.
Costs and Profit Margins
DeAM provided a detailed profitability analysis for each Fund. After making some adjustments so that the presentation would be more comparable to the available industry figures, I reviewed profit margins from investment management alone, from investment management plus other fund services (excluding distribution) provided to the Funds by DeAM (principally shareholder services), and DeAM profits from all sources, including distribution. A later section comments on overall profitability.
Economies of Scale
Economies of scale — an expected decline in management cost per dollar of fund assets as fund assets grow — are very rarely quantified and documented because of inherent difficulties in collecting and analyzing relevant data. However, in virtually every investment category that I reviewed, larger funds tend to have lower fees and lower total expenses than smaller funds. To see how each DWS Fund compares with this industry observation, I reviewed:
The trend in Fund assets over the last five years and the accompanying trend in total expenses. This shows if the Fund has grown and, if so, whether total expense (management fees as well as other expenses) have declined as a percent of assets.
Whether the Fund has break-points in its management fee schedule, the extent of the fee reduction built into the schedule and the asset levels where the breaks take effect, and in the case of a sub-advised Fund how the Fund's break-points compare with those of the sub-advisory fee schedule.
How the Fund's contractual fee schedule compares with trends in the industry data. To accomplish this, I constructed a chart showing how actual latest-fiscal-year contractual fees of the Fund and of other similar funds relate to average fund assets, with the subject Fund's contractual fee schedule superimposed.
Quality of Service — Performance
The quality-of-service evaluation focused on investment performance, which is the principal result of the investment management service. Each Fund's performance was reviewed over the past 1, 3, 5 and 10 years, as applicable, and compared with that of other funds in the same investment category and with a suitable market index.
In addition, I calculated and reviewed risk-adjusted returns relative to an index of similar mutual funds' returns and a suitable market index. The risk-adjusted returns analysis provides a way of determining the extent to which the Fund's return comparisons are mainly the product of investment value-added (or lack thereof) or alternatively taking considerably more or less risk than is typical in its investment category.
I also received and considered the history of portfolio manager changes for each Fund, as this provided an important context for evaluating the performance results.
Complex-Level Considerations
While this evaluation was conducted mainly at the individual fund level, there are some issues relating to the reasonableness of fees that can alternatively be considered across the whole fund complex:
I reviewed DeAM's profitability analysis for all DWS Funds, with a view toward determining if the allocation procedures used were reasonable and how profit levels compared with public data for other investment managers.
I considered whether DeAM and affiliates receive any significant ancillary or "fallout" benefits that should be considered in interpreting the direct profitability results. These would be situations where serving as the investment manager of the Funds is beneficial to another part of the Deutsche Bank organization.
I considered how aggregated DWS Fund expenses had varied over the years, by asset class and in the context of trends in asset levels.
I considered how aggregated DWS Fund performance measures relative to appropriate peers had varied by asset class and over time.
I reviewed the structure of the DeAM organization, trends in staffing levels, and information on compensation of investment management and other professionals compared with industry data.
Findings
Based on the process and analysis discussed above, which included reviewing a wide range of information from management and external data sources and considering among other factors the fees DeAM charges other clients, the fees charged by other fund managers, DeAM's costs and profits associated with managing the Funds, economies of scale, possible fall-out benefits, and the nature and quality of services provided, in my opinion the management fees charged the DWS Funds are reasonable.
Thomas H. Mack
President, Thomas H. Mack & Co., Inc.
Board Members and Officers
The following table presents certain information regarding the Board Members and Officers of the fund. Each Board Member's year of birth is set forth in parentheses after his or her name. Unless otherwise noted, (i) each Board Member has engaged in the principal occupation(s) noted in the table for at least the most recent five years, although not necessarily in the same capacity; and (ii) the address of each Independent Board Member is c/o Kenneth C. Froewiss, Chairman, DWS Mutual Funds, P.O. Box 78, Short Hills, NJ 07078. Except as otherwise noted below, the term of office for each Board Member is until the election and qualification of a successor, or until such Board Member sooner dies, resigns, is removed or as otherwise provided in the governing documents of the fund. Because the fund does not hold an annual meeting of shareholders, each Board Member will hold office for an indeterminate period. The Board Members may also serve in similar capacities with other funds in the fund complex.
| Independent Board Members |
Name, Year of Birth, Position with the Fund and Length of Time Served1 | | Business Experience and Directorships During the Past Five Years | Number of Funds in DWS Fund Complex Overseen |
Other Directorships Held by Board Member |
Kenneth C. Froewiss (1945) Chairperson since 2013,9 and Board Member since 2001 | | Adjunct Professor of Finance, NYU Stern School of Business (September 2009-present; Clinical Professor from 1997-September 2009); Member, Finance Committee, Association for Asian Studies (2002-present); Director, Mitsui Sumitomo Insurance Group (US) (2004-present); prior thereto, Managing Director, J.P. Morgan (investment banking firm) (until 1996) | 103 | — |
William McClayton (1944) Vice Chairperson since 2013,9 and Board Member since 2004 | | Private equity investor (since October 2009); previously, Managing Director, Diamond Management & Technology Consultants, Inc. (global consulting firm) (2001-2009); Directorship: Board of Managers, YMCA of Metropolitan Chicago; formerly: Senior Partner, Arthur Andersen LLP (accounting) (1966-2001); Trustee, Ravinia Festival | 103 | — |
John W. Ballantine (1946) Board Member since 1999 | | Retired; formerly, Executive Vice President and Chief Risk Management Officer, First Chicago NBD Corporation/The First National Bank of Chicago (1996-1998); Executive Vice President and Head of International Banking (1995-1996). Directorships: Stockwell Capital Investments PLC (private equity); former Directorships: First Oak Brook Bancshares, Inc. and Oak Brook Bank; Prisma Energy International | 103 | Chairman of the Board, Healthways, Inc.2 (provider of disease and care management services) (2003- present); Portland General Electric2 (utility company) (2003-present) |
Henry P. Becton, Jr. (1943) Board Member since 1990 | | Vice Chair and former President, WGBH Educational Foundation. Directorships: Public Radio International; Public Radio Exchange (PRX); The PBS Foundation; North Bennett Street School (Boston); former Directorships: Association of Public Television Stations; Boston Museum of Science; American Public Television; Concord Academy; New England Aquarium; Mass. Corporation for Educational Telecommunications; Committee for Economic Development; Public Broadcasting Service; Connecticut College | 103 | Lead Director, Becton Dickinson and Company2 (medical technology company); Lead Director, Belo Corporation2 (media company) |
Dawn-Marie Driscoll (1946) Board Member since 1987 | | President, Driscoll Associates (consulting firm); Emeritus Executive Fellow, Center for Business Ethics, Bentley University; formerly, Partner, Palmer & Dodge (1988-1990); Vice President of Corporate Affairs and General Counsel, Filene's (1978-1988). Directorships: Director of ICI Mutual Insurance Company (since 2007); Advisory Board, Center for Business Ethics, Bentley University; Trustee, Southwest Florida Community Foundation (charitable organization); former Directorships: Sun Capital Advisers Trust (mutual funds) (2007-2012), Investment Company Institute (audit, executive, nominating committees) and Independent Directors Council (governance, executive committees) | 103 | — |
Keith R. Fox, CFA (1954) Board Member since 1996 | | Managing General Partner, Exeter Capital Partners (a series of private investment funds) (since 1986). Directorships: Progressive International Corporation (kitchen goods importer and distributor); The Kennel Shop (retailer); former Chairman, National Association of Small Business Investment Companies; former Directorships: BoxTop Media Inc. (advertising); Sun Capital Advisers Trust (mutual funds) (2011-2012) | 103 | — |
Paul K. Freeman (1950) Board Member since 1993, and Chairperson (2009-Jan. 8, 2013) | | Consultant, World Bank/Inter-American Development Bank; Executive and Governing Council of the Independent Directors Council (Chairman of Education Committee); formerly: Project Leader, International Institute for Applied Systems Analysis (1998-2001); Chief Executive Officer, The Eric Group, Inc. (environmental insurance) (1986-1998); Directorships: Denver Zoo Foundation (December 2012-present); former Directorships: Prisma Energy International | 103 | — |
Richard J. Herring (1946) Board Member since 1990 | | Jacob Safra Professor of International Banking and Professor, Finance Department, The Wharton School, University of Pennsylvania (since July 1972); Co-Director, Wharton Financial Institutions Center (since July 2000); Co-Chair, U.S. Shadow Financial Regulatory Committee; Executive Director, Financial Economists Roundtable; formerly: Vice Dean and Director, Wharton Undergraduate Division (July 1995-June 2000); Director, Lauder Institute of International Management Studies (July 2000-June 2006) | 103 | Director, Japan Equity Fund, Inc. (since September 2007), Thai Capital Fund, Inc. (since 2007), Singapore Fund, Inc. (since September 2007), Independent Director of Barclays Bank Delaware (since September 2010) |
Rebecca W. Rimel (1951) Board Member since 1995 | | President and Chief Executive Officer, The Pew Charitable Trusts (charitable organization) (1994 to present); Trustee, Washington College (2011-2013); formerly: Executive Vice President, The Glenmede Trust Company (investment trust and wealth management) (1983-2004); Board Member, Investor Education (charitable organization) (2004-2005); Trustee, Executive Committee, Philadelphia Chamber of Commerce (2001-2007); Director, Viasys Health Care2 (January 2007-June 2007); Trustee, Pro Publica (charitable organization) (2007-2010); Trustee, Thomas Jefferson Foundation (charitable organization) (1994-2012) | 103 | Director, Becton Dickinson and Company2 (medical technology company) (2012-present); Director, CardioNet, Inc.2 (health care) (2009-present) |
William N. Searcy, Jr. (1946) Board Member since 1993 | | Private investor since October 2003; formerly: Pension & Savings Trust Officer, Sprint Corporation2 (telecommunications) (November 1989-September 2003); Trustee, Sun Capital Advisers Trust (mutual funds) (1998-2012) | 103 | — |
Jean Gleason Stromberg (1943) Board Member since 1997 | | Retired. Formerly, Consultant (1997-2001); Director, Financial Markets U.S. Government Accountability Office (1996-1997); Partner, Fulbright & Jaworski, L.L.P. (law firm) (1978-1996). Directorships: The William and Flora Hewlett Foundation; former Directorships: Service Source, Inc., Mutual Fund Directors Forum (2002-2004), American Bar Retirement Association (funding vehicle for retirement plans) (1987-1990 and 1994-1996) | 103 | — |
Robert H. Wadsworth (1940) Board Member since 1999 | | President, Robert H. Wadsworth & Associates, Inc. (consulting firm) (1983 to present); Director, National Horizon, Inc. (non-profit organization); Director and Treasurer, The Phoenix Boys Choir Association | 106 | — |
Interested Board Member and Officer4 |
Name, Year of Birth, Position with the Fund and Length of Time Served1,6 | | Business Experience and Directorships During the Past Five Years | Number of Funds in DWS Fund Complex Overseen |
Other Directorships Held by Board Member |
Michael J. Woods5 (1967) Board Member since 2013,9 and Executive Vice President since 20139 | | Managing Director,3 Deutsche Asset & Wealth Management (2009-present); Head of the Americas Asset Management Business for Deutsche Bank, Member of the Asset and Wealth Management ("AWM") Extended Executive Committee, AWM Global Client Group Executive Committee and the AWM Active Asset Management Executive Committee; CEO and US Regional Head of DWS Investments; formerly: Sr. VP, Head of the Financial Intermediaries and Investments Group of Evergreen Investments (2007-2009), CEO and Vice Chairman of Board of Directors of XTF Global Asset Management (2006-2007), Managing Director — US Head of Sub-Advisory and Investment Only Business at Citigroup Asset Management (2000-2006). Mr. Woods is currently a board member of The Children's Village, The Big Brothers Big Sisters Organization, and The Mutual Fund Education Alliance. | 39 | — |
Officers4 |
Name, Year of Birth, Position with the Fund and Length of Time Served6 | | Business Experience and Directorships During the Past Five Years |
W. Douglas Beck, CFA7 (1967) President, 2011-present | | Managing Director,3 Deutsche Asset & Wealth Management (2006-present); President of DWS family of funds and Head of Product Management, U.S. for DWS Investments; formerly: Executive Director, Head of Product Management (2002-2006) and President (2005-2006) of the UBS Funds at UBS Global Asset Management; Co-Head of Manager Research/Managed Solutions Group, Merrill Lynch (1998-2002) |
John Millette8 (1962) Vice President and Secretary, 1999-present | | Director,3 Deutsche Asset & Wealth Management |
Paul H. Schubert7 (1963) Chief Financial Officer, 2004-present Treasurer, 2005-present | | Managing Director,3 Deutsche Asset & Wealth Management (since July 2004); formerly: Executive Director, Head of Mutual Fund Services and Treasurer for UBS Family of Funds (1998-2004); Vice President and Director of Mutual Fund Finance at UBS Global Asset Management (1994-1998) |
Caroline Pearson8 (1962) Chief Legal Officer, 2010-present | | Managing Director,3 Deutsche Asset & Wealth Management; formerly: Assistant Secretary for DWS family of funds (1997-2010) |
Melinda Morrow7 (1970) Vice President, 2012-present | | Director,3 Deutsche Asset & Wealth Management |
Hepsen Uzcan8 (1974) Assistant Secretary, since 20139 | | Vice President, Deutsche Asset & Wealth Management |
Paul Antosca8 (1957) Assistant Treasurer, 2007-present | | Director,3 Deutsche Asset & Wealth Management |
Jack Clark8 (1967) Assistant Treasurer, 2007-present | | Director,3 Deutsche Asset & Wealth Management |
Diane Kenneally8 (1966) Assistant Treasurer, 2007-present | | Director,3 Deutsche Asset & Wealth Management |
John Caruso7 (1965) Anti-Money Laundering Compliance Officer, 2010-present | | Managing Director,3 Deutsche Asset & Wealth Management |
Robert Kloby7 (1962) Chief Compliance Officer, 2006-present | | Managing Director,3 Deutsche Asset & Wealth Management |
1 The length of time served represents the year in which the Board Member joined the board of one or more DWS funds currently overseen by the Board.
2 A publicly held company with securities registered pursuant to Section 12 of the Securities Exchange Act of 1934.
3 Executive title, not a board directorship.
4 As a result of their respective positions held with the Advisor, these individuals are considered "interested persons" of the Advisor within the meaning of the 1940 Act. Interested persons receive no compensation from the fund.
5 The mailing address of Mr. Woods is 60 Wall Street, New York, New York 10005. Mr. Woods is an interested Board Member by virtue of his positions with Deutsche Asset & Wealth Management. As an interested person, Mr. Woods receives no compensation from the fund. Mr. Woods is a board member of the following trusts and corporations: Cash Account Trust, DWS Market Trust, DWS Money Funds, DWS State Tax-Free Income Series, DWS Target Fund, DWS Value Series, Inc., DWS Variable Series II, Investors Cash Trust, Tax-Exempt California Money Market Fund, DWS Global High Income Fund, Inc., DWS High Income Opportunities Fund, Inc., DWS High Income Trust, DWS Multi-Market Income Trust, DWS Municipal Income Trust, DWS Strategic Income Trust and DWS Strategic Municipal Income Trust.
6 The length of time served represents the year in which the officer was first elected in such capacity for one or more DWS funds.
7 Address: 60 Wall Street, New York, NY 10005.
8 Address: One Beacon Street, Boston, MA 02108.
9 Effective as of January 9, 2013.
The fund's Statement of Additional Information ("SAI") includes additional information about the Board Members. The SAI is available, without charge, upon request. If you would like to request a copy of the SAI, you may do so by calling the following toll-free number: (800) 728-3337.
Notes
DWS Investments Distributors, Inc.
222 South Riverside Plaza
Chicago, IL 60606
(800) 621-1148
VS2MM-2 (R-025834-2 2/13)
DECEMBER 31, 2012
ANNUAL REPORT
DWS VARIABLE SERIES II
DWS Small Mid Cap Growth VIP
Contents
11 Statement of Assets and Liabilities 12 Statement of Operations 13 Statement of Changes in Net Assets 15 Notes to Financial Statements 19 Report of Independent Registered Public Accounting Firm 20 Information About Your Fund's Expenses 23 Investment Management Agreement Approval 26 Summary of Management Fee Evaluation by Independent Fee Consultant 28 Board Members and Officers |
This report must be preceded or accompanied by a prospectus. To obtain an additional prospectus or summary prospectus, if available, call (800) 728-3337 or your financial representative. We advise you to consider the Fund's objectives, risks, charges and expenses carefully before investing. The summary prospectus and prospectus contain this and other important information about the Fund. Please read the prospectus carefully before you invest.
Investing in derivatives entails special risks relating to liquidity, leverage and credit that may reduce returns and/or increase volatility. Smaller and medium company stocks tend to be more volatile than large company stocks. The Fund may lend securities to approved institutions. Stocks may decline in value. See the prospectus for details.
DWS Investments is part of the Deutsche Asset & Wealth Management division of Deutsche Bank AG.
NOT FDIC/NCUA INSURED NO BANK GUARANTEE MAY LOSE VALUE NOT A DEPOSIT
NOT INSURED BY ANY FEDERAL GOVERNMENT AGENCY
Performance Summary December 31, 2012 (Unaudited)
Fund performance shown is historical, assumes reinvestment of all dividend and capital gain distributions and does not guarantee future results. Investment return and principal value fluctuate with changing market conditions so that, when redeemed, shares may be worth more or less than their original cost. Current performance may be lower or higher than the performance data quoted. Please contact your participating insurance company for the Fund's most recent month-end performance. Performance doesn't reflect charges and fees ("contract charges") associated with the separate account that invests in the Fund or any variable life insurance policy or variable annuity contract for which the Fund is an investment option. These charges and fees will reduce returns.
The gross expense ratio of the Fund, as stated in the fee table of the prospectus dated May 1, 2012 is 0.73% for Class A shares and may differ from the expense ratio disclosed in the Financial Highlights table in this report.
| Growth of an Assumed $10,000 Investment in DWS Small Mid Cap Growth VIP |
| The Russell 2500™ Growth Index is an unmanaged index that measures the performance of the small- to mid-cap growth segment of the U.S. equity universe. It includes those Russell 2500 companies with higher price-to-book ratios and higher forecasted growth values. Index returns do not reflect any fees or expenses and it is not possible to invest directly into an index. |
| |
| Yearly periods ended December 31 | |
| Comparative Results | |
| DWS Small Mid Cap Growth VIP | | 1-Year | | | 3-Year | | | 5-Year | | | 10-Year | |
| Class A | Growth of $10,000 | | $ | 11,435 | | | $ | 14,223 | | | $ | 10,099 | | | $ | 17,842 | |
| Average annual total return | | | 14.35 | % | | | 12.46 | % | | | 0.20 | % | | | 5.96 | % |
| Russell 2500 Growth Index | Growth of $10,000 | | $ | 11,613 | | | $ | 14,730 | | | $ | 12,206 | | | $ | 27,260 | |
| Average annual total return | | | 16.13 | % | | | 13.78 | % | | | 4.07 | % | | | 10.55 | % |
The growth of $10,000 is cumulative.
Management Summary December 31, 2012 (Unaudited)
For the 12-month period ended December 31, 2012, Class A shares of the Fund returned 14.35% (unadjusted for contract charges), compared with the 16.13% return of the Russell 2500™ Growth Index.1
The Fund's fiscal year ended December 31, 2012 had an encouraging start, as positive momentum from October 2011 carried over into early 2012 — the best start to the New Year for small- and mid-cap stocks since 2006. Low U.S. inflation and attractive equity valuations helped investors to become more confident that the U.S. recovery could be sustained, despite lingering concerns regarding sovereign debt problems in Greece and Spain and a possible hard economic landing in China.2 In May 2012, investor risk aversion resurfaced, owing to heightened concerns about Greece's possible departure from the Eurozone. Markets then received a major boost in July 2012 on encouraging statements by European Central Bank President Mario Draghi concerning his determination to preserve the euro currency. During the fourth quarter 2012, severe damage from Hurricane Sandy as well as uncertainty over the outcome of the U.S. fiscal cliff standoff and the presidential election dampened market sentiment. From mid-November through year-end 2012, however, investor enthusiasm improved owing to a better tone to U.S. economic data and a likely reacceleration in China's economy. Lastly, after a long series of contentious congressional negotiations, a fiscal cliff deal was finally reached at the end of the year.
The Fund's underperformance vs. the benchmark derived primarily from weak stock selection in consumer staples, materials and energy. In contrast, Fund positions in consumer discretionary, financials and industrials benefited from strong selection. Overall, sector allocation had a negative effect on returns, based on an overweight in consumer staples and underweights to financials and telecom services.3 Overweight positions in health care and energy contributed to performance.
We continue to maintain a long-term perspective, investing in quality small- and mid-cap growth stocks.
Joseph Axtell, CFA
Rafaelina M. Lee
Portfolio Managers
The views expressed reflect those of the portfolio management team only through the end of the period of the report as stated on the cover. The management team's views are subject to change at any time based on market and other conditions and should not be construed as a recommendation. Past performance is no guarantee of future results. Current and future portfolio holdings are subject to risk.
1 The Russell 2500 Growth Index is an unmanaged index that measures the performance of the small- to mid-cap growth segment of the U.S. equity universe. It includes those Russell 2500 companies with higher price-to-book ratios and higher forecasted growth values.
Index returns do not reflect fees or expenses and it is not possible to invest directly into an index.
2 Sovereign debt is debt that is issued by a national government.
3 "Overweight" means that the Fund holds a higher weighting in a given sector or security than the benchmark. "Underweight" means that the Fund holds a lower weighting.
Portfolio Summary (Unaudited) Asset Allocation (As a % of Investment Portfolio excluding Securities Lending Collateral) | 12/31/12 | 12/31/11 |
| | | |
| Common Stocks | 96% | 98% |
| Cash Equivalents | 4% | 2% |
| Exchange-Traded Fund | 0% | — |
| | 100% | 100% |
Sector Diversification (As a % of Common Stocks) | 12/31/12 | 12/31/11 |
| | | |
| Industrials | 20% | 19% |
| Consumer Discretionary | 17% | 17% |
| Information Technology | 16% | 22% |
| Health Care | 16% | 17% |
| Energy | 9% | 8% |
| Financials | 8% | 6% |
| Materials | 7% | 6% |
| Consumer Staples | 6% | 5% |
| Telecommunication Services | 1% | — |
| | 100% | 100% |
Portfolio holdings and characteristics are subject to change.
For more complete details about the Fund's investment portfolio, see page 7.
Following the Fund's fiscal first and third quarter-end, a complete portfolio holdings listing is filed with the SEC on Form N-Q. The form will be available on the SEC's Web site at www.sec.gov, and it also may be reviewed and copied at the SEC's Public Reference Room in Washington, D.C. Information on the operation of the SEC's Public Reference Room may be obtained by calling (800) SEC-0330. The Fund's portfolio holdings are also posted on www.dws-investments.com from time to time. Please see the Fund's current prospectus for more information.
Investment Portfolio December 31, 2012 | | | Shares | | | Value ($) | |
| | | | |
| Common Stocks 95.8% | |
| Consumer Discretionary 16.4% | |
| Auto Components 1.4% | |
| BorgWarner, Inc.* (a) | | | 15,012 | | | | 1,075,159 | |
| Tenneco, Inc.* | | | 25,873 | | | | 908,401 | |
| | | | | | | | 1,983,560 | |
| Hotels, Restaurants & Leisure 2.4% | |
| Life Time Fitness, Inc.* (a) | | | 23,107 | | | | 1,137,096 | |
| Panera Bread Co. "A"* | | | 14,533 | | | | 2,308,276 | |
| | | | | | | | 3,445,372 | |
| Household Durables 1.2% | |
| Jarden Corp. | | | 34,041 | | | | 1,759,920 | |
| Leisure Equipment & Products 1.2% | |
| Polaris Industries, Inc. | | | 20,841 | | | | 1,753,770 | |
| Media 0.9% | |
| Cinemark Holdings, Inc. | | | 53,417 | | | | 1,387,774 | |
| Specialty Retail 6.3% | |
| Advance Auto Parts, Inc. | | | 12,251 | | | | 886,360 | |
| Ascena Retail Group, Inc.* | | | 74,289 | | | | 1,373,604 | |
| Children's Place Retail Stores, Inc.* | | | 24,575 | | | | 1,088,427 | |
| DSW, Inc. "A" | | | 21,104 | | | | 1,386,322 | |
| Guess?, Inc. | | | 31,136 | | | | 764,077 | |
| PetSmart, Inc. | | | 28,716 | | | | 1,962,451 | |
| Ulta Salon, Cosmetics & Fragrance, Inc. | | | 17,632 | | | | 1,732,520 | |
| | | | | | | | 9,193,761 | |
| Textiles, Apparel & Luxury Goods 3.0% | |
| Carter's, Inc.* | | | 23,581 | | | | 1,312,283 | |
| Deckers Outdoor Corp.* (a) | | | 18,170 | | | | 731,706 | |
| Hanesbrands, Inc.* (a) | | | 63,258 | | | | 2,265,901 | |
| | | | | | | | 4,309,890 | |
| Consumer Staples 5.5% | |
| Food & Staples Retailing 1.1% | |
| United Natural Foods, Inc.* | | | 28,141 | | | | 1,508,076 | |
| Food Products 3.2% | |
| Green Mountain Coffee Roasters, Inc.* (a) | | | 29,462 | | | | 1,218,548 | |
| Hain Celestial Group, Inc.* | | | 34,690 | | | | 1,880,892 | |
| TreeHouse Foods, Inc.* | | | 30,438 | | | | 1,586,733 | |
| | | | | | | | 4,686,173 | |
| Household Products 1.2% | |
| Church & Dwight Co., Inc. | | | 32,931 | | | | 1,764,114 | |
| Energy 8.3% | |
| Energy Equipment & Services 4.6% | |
| Core Laboratories NV (a) | | | 12,622 | | | | 1,379,711 | |
| Dresser-Rand Group, Inc.* | | | 29,786 | | | | 1,672,186 | |
| Dril-Quip, Inc.* | | | 29,991 | | | | 2,190,842 | |
| Hornbeck Offshore Services, Inc.* | | | 42,514 | | | | 1,459,931 | |
| | | | | | | | 6,702,670 | |
| Oil, Gas & Consumable Fuels 3.7% | |
| Alpha Natural Resources, Inc.* (a) | | | 64,834 | | | | 631,483 | |
| Approach Resources, Inc.* (a) | | | 58,754 | | | | 1,469,438 | |
| Energy XXI (Bermuda) Ltd. (a) | | | 43,308 | | | | 1,394,084 | |
| Rosetta Resources, Inc.* (a) | | | 40,369 | | | | 1,831,138 | |
| | | | | | | | 5,326,143 | |
| | | Shares | | | Value ($) | |
| | | | | | | | | |
| Financials 7.3% | |
| Capital Markets 2.3% | |
| Affiliated Managers Group, Inc.* | | | 16,674 | | | | 2,170,121 | |
| Lazard Ltd. "A" | | | 39,209 | | | | 1,169,997 | |
| | | | | | | | 3,340,118 | |
| Commercial Banks 1.1% | |
| Signature Bank* | | | 21,457 | | | | 1,530,742 | |
| Consumer Finance 0.8% | |
| DFC Global Corp.* | | | 66,316 | | | | 1,227,509 | |
| Insurance 1.4% | |
| W.R. Berkley Corp. | | | 51,871 | | | | 1,957,612 | |
| Real Estate Management & Development 1.1% | |
| CBRE Group, Inc. "A"* | | | 65,285 | | | | 1,299,172 | |
| Realogy Holdings Corp.* | | | 8,090 | | | | 339,456 | |
| | | | | | | | 1,638,628 | |
| Thrifts & Mortgage Finance 0.6% | |
| Ocwen Financial Corp.* | | | 25,564 | | | | 884,259 | |
| Health Care 15.5% | |
| Biotechnology 2.1% | |
| Alkermes PLC* | | | 47,501 | | | | 879,718 | |
| ARIAD Pharmaceuticals, Inc.* | | | 30,228 | | | | 579,773 | |
| Cubist Pharmaceuticals, Inc.* (a) | | | 11,462 | | | | 482,092 | |
| Incyte Corp., Ltd.* (a) | | | 42,355 | | | | 703,517 | |
| Pharmacyclics, Inc.* | | | 7,344 | | | | 425,218 | |
| | | | | | | | 3,070,318 | |
| Health Care Equipment & Supplies 3.5% | |
| Analogic Corp. | | | 19,981 | | | | 1,484,588 | |
| ArthroCare Corp.* | | | 33,526 | | | | 1,159,664 | |
| HeartWare International, Inc.* (a) | | | 11,204 | | | | 940,576 | |
| Thoratec Corp.* | | | 40,313 | | | | 1,512,544 | |
| | | | | | | | 5,097,372 | |
| Health Care Providers & Services 6.8% | |
| AmerisourceBergen Corp. (a) | | | 26,559 | | | | 1,146,818 | |
| Catamaran Corp.* | | | 57,536 | | | | 2,710,521 | |
| Centene Corp.* | | | 23,888 | | | | 979,408 | |
| DaVita HealthCare Partners, Inc.* | | | 15,967 | | | | 1,764,832 | |
| ExamWorks Group, Inc.* | | | 114,481 | | | | 1,601,589 | |
| Humana, Inc. | | | 12,817 | | | | 879,631 | |
| Team Health Holdings, Inc.* | | | 28,474 | | | | 819,197 | |
| | | | | | | | 9,901,996 | |
| Health Care Technology 0.5% | |
| athenahealth, Inc.* (a) | | | 10,776 | | | | 791,497 | |
| Pharmaceuticals 2.6% | |
| Hi-Tech Pharmacal Co., Inc. (a) | | | 44,219 | | | | 1,546,781 | |
| Pacira Pharmaceuticals, Inc.* (a) | | | 127,296 | | | | 2,223,861 | |
| | | | | | | | 3,770,642 | |
| Industrials 19.1% | |
| Aerospace & Defense 1.3% | |
| BE Aerospace, Inc.* | | | 38,918 | | | | 1,922,549 | |
| Commercial Services & Supplies 1.3% | |
| Portfolio Recovery Associates, Inc.* | | | 17,919 | | | | 1,914,824 | |
| Construction & Engineering 1.1% | |
| MYR Group, Inc.* | | | 74,029 | | | | 1,647,145 | |
| | | Shares | | | Value ($) | |
| | | | | | | | | |
| Electrical Equipment 2.9% | |
| General Cable Corp.* | | | 48,920 | | | | 1,487,657 | |
| The Babcock & Wilcox Co. | | | 45,744 | | | | 1,198,493 | |
| Thermon Group Holdings, Inc.* | | | 68,431 | | | | 1,541,751 | |
| | | | | | | | 4,227,901 | |
| Machinery 7.8% | |
| Altra Holdings, Inc. | | | 41,817 | | | | 922,065 | |
| Chart Industries, Inc.* | | | 31,851 | | | | 2,123,506 | |
| Joy Global, Inc. | | | 23,292 | | | | 1,485,564 | |
| Manitowoc Co., Inc. | | | 109,137 | | | | 1,711,268 | |
| Sauer-Danfoss, Inc. | | | 29,205 | | | | 1,558,671 | |
| Valmont Industries, Inc. | | | 11,857 | | | | 1,619,073 | |
| WABCO Holdings, Inc.* | | | 29,435 | | | | 1,918,868 | |
| | | | | | | | 11,339,015 | |
| Professional Services 1.0% | |
| Robert Half International, Inc. (a) | | | 44,050 | | | | 1,401,671 | |
| Road & Rail 1.7% | |
| Kansas City Southern | | | 28,580 | | | | 2,385,858 | |
| Trading Companies & Distributors 2.0% | |
| Applied Industrial Technologies, Inc. | | | 25,858 | | | | 1,086,295 | |
| United Rentals, Inc.* | | | 41,158 | | | | 1,873,512 | |
| | | | | | | | 2,959,807 | |
| Information Technology 15.8% | |
| Communications Equipment 1.6% | |
| Finisar Corp.* (a) | | | 51,684 | | | | 842,449 | |
| Harris Corp. | | | 31,404 | | | | 1,537,540 | |
| | | | | | | | 2,379,989 | |
| Computers & Peripherals 1.9% | |
| Western Digital Corp. | | | 65,741 | | | | 2,793,335 | |
| Electronic Equipment, Instruments & Components 0.9% | |
| Cognex Corp. | | | 17,010 | | | | 626,308 | |
| Coherent, Inc. | | | 14,001 | | | | 708,731 | |
| | | | | | | | 1,335,039 | |
| Internet Software & Services 0.9% | |
| Equinix, Inc.* | | | 6,053 | | | | 1,248,129 | |
| IT Services 4.2% | |
| Cardtronics, Inc.* | | | 58,941 | | | | 1,399,259 | |
| MAXIMUS, Inc. | | | 34,528 | | | | 2,182,860 | |
| Syntel, Inc. | | | 21,085 | | | | 1,129,945 | |
| VeriFone Systems, Inc.* | | | 48,151 | | | | 1,429,122 | |
| | | | | | | | 6,141,186 | |
| Software 6.3% | |
| Allot Communications Ltd.* | | | 28,993 | | | | 516,655 | |
| Concur Technologies, Inc.* (a) | | | 17,465 | | | | 1,179,237 | |
| Informatica Corp.* | | | 33,494 | | | | 1,015,538 | |
| | | Shares | | | Value ($) | |
| | | | | | | | | |
| MICROS Systems, Inc.* | | | 43,650 | | | | 1,852,506 | |
| NQ Mobile, Inc. (ADR)* (a) | | | 83,404 | | | | 503,760 | |
| Parametric Technology Corp.* | | | 68,372 | | | | 1,539,054 | |
| Red Hat, Inc.* | | | 19,658 | | | | 1,041,088 | |
| Ultimate Software Group, Inc.* | | | 15,689 | | | | 1,481,198 | |
| | | | | | | | 9,129,036 | |
| Materials 6.9% | |
| Chemicals 3.6% | |
| CF Industries Holdings, Inc. | | | 7,954 | | | | 1,615,935 | |
| Rockwood Holdings, Inc. | | | 34,128 | | | | 1,687,971 | |
| Westlake Chemical Corp. (a) | | | 24,072 | | | | 1,908,909 | |
| | | | | | | | 5,212,815 | |
| Containers & Packaging 1.2% | |
| Crown Holdings, Inc.* | | | 48,858 | | | | 1,798,463 | |
| Metals & Mining 1.2% | |
| Detour Gold Corp.* | | | 31,861 | | | | 797,246 | |
| Haynes International, Inc. | | | 17,250 | | | | 894,757 | |
| | | | | | | | 1,692,003 | |
| Paper & Forest Products 0.9% | |
| Schweitzer-Mauduit International, Inc. | | | 35,062 | | | | 1,368,470 | |
| Telecommunication Services 1.0% | |
| Wireless Telecommunication Services | |
| SBA Communications Corp. "A"* (a) | | | 21,056 | | | | 1,495,397 | |
Total Common Stocks (Cost $114,262,612) | | | | 139,424,548 | |
| | |
| Exchange-Traded Fund 0.5% | |
| SPDR S&P Biotech (a) (Cost $728,338) | | | 7,865 | | | | 691,412 | |
| | |
| Securities Lending Collateral 17.0% | |
| Daily Assets Fund Institutional, 0.20% (b) (c) (Cost $24,672,741) | | | 24,672,741 | | | | 24,672,741 | |
| | |
| Cash Equivalents 3.8% | |
| Central Cash Management Fund, 0.15% (b) (Cost $5,496,710) | | | 5,496,710 | | | | 5,496,710 | |
| | | % of Net Assets | | | Value ($) | |
| | | | |
Total Investment Portfolio (Cost $145,160,401)† | | | 117.1 | | | | 170,285,411 | |
| Other Assets and Liabilities, Net | | | (17.1 | ) | | | (24,826,326 | ) |
| Net Assets | | | 100.0 | | | | 145,459,085 | |
* Non-income producing security.
† The cost for federal income tax purposes was $145,612,810. At December 31, 2012, net unrealized appreciation for all securities based on tax cost was $24,672,601. This consisted of aggregate gross unrealized appreciation for all securities in which there was an excess of value over tax cost of $28,845,659 and aggregate gross unrealized depreciation for all securities in which there was an excess of tax cost over value of $4,173,058.
(a) All or a portion of these securities were on loan (see Notes to Financial Statements).The value of all securities loaned at December 31, 2012 amounted to $24,636,513, which is 16.9% of net assets.
(b) Affiliated fund managed by Deutsche Investment Management Americas Inc. The rate shown is the annualized seven-day yield at period end.
(c) Represents collateral held in connection with securities lending. Income earned by the Fund is net of borrower rebates.
ADR: American Depositary Receipt
S&P: Standard & Poor's
SPDR: Standard & Poor's Depositary Receipt
Fair Value Measurements
Various inputs are used in determining the value of the Fund's investments. These inputs are summarized in three broad levels. Level 1 includes quoted prices in active markets for identical securities. Level 2 includes other significant observable inputs (including quoted prices for similar securities, interest rates, prepayment speeds, and credit risk). Level 3 includes significant unobservable inputs (including the Fund's own assumptions in determining the fair value of investments). The inputs or methodology used for valuing securities are not necessarily an indication of the risk associated with investing in those securities.
The following is a summary of the inputs used as of December 31, 2012 in valuing the Fund's investments. For information on the Fund's policy regarding the valuation of investments, please refer to the Security Valuation section of Note A in the accompanying Notes to Financial Statements.
| Assets | | Level 1 | | | Level 2 | | | Level 3 | | | Total | |
| | |
| Common Stocks (d) | | $ | 139,424,548 | | | $ | — | | | $ | — | | | $ | 139,424,548 | |
| Exchange-Traded Fund | | | 691,412 | | | | — | | | | — | | | | 691,412 | |
| Short-Term Investments (d) | | | 30,169,451 | | | | — | | | | — | | | | 30,169,451 | |
| Total | | $ | 170,285,411 | | | $ | — | | | $ | — | | | $ | 170,285,411 | |
There have been no transfers between fair value measurement levels during the year ended December 31, 2012.
(d) See Investment Portfolio for additional detailed categorizations.
The accompanying notes are an integral part of the financial statements.
Statement of Assets and Liabilities | as of December 31, 2012 | |
| Assets | |
Investments: Investments in non-affiliated securities, at value (cost $114,990,950) — including $24,636,513 of securities loaned | | $ | 140,115,960 | |
Investment in Daily Assets Fund Institutional (cost $24,672,741)* | | | 24,672,741 | |
| Investment in Central Cash Management Fund (cost $5,496,710) | | | 5,496,710 | |
| Total investments in securities, at value (cost $145,160,401) | | | 170,285,411 | |
| Cash | | | 61,871 | |
| Foreign currency, at value (cost $275) | | | 284 | |
| Receivable for investments sold | | | 56,456 | |
| Receivable for Fund shares sold | | | 464 | |
| Dividends receivable | | | 18,503 | |
| Interest receivable | | | 14,817 | |
| Other assets | | | 2,461 | |
| Total assets | | | 170,440,267 | |
| Liabilities | |
| Payable upon return of securities loaned | | | 24,672,741 | |
| Payable for Fund shares redeemed | | | 116,857 | |
| Accrued management fee | | | 67,160 | |
| Accrued Trustees' fees | | | 3,179 | |
| Other accrued expenses and payables | | | 121,245 | |
| Total liabilities | | | 24,981,182 | |
| Net assets, at value | | $ | 145,459,085 | |
| Net Assets Consist of | |
| Undistributed net investment income | | | 114,625 | |
Net unrealized appreciation (depreciation) on: Investments | | | 25,125,010 | |
| Foreign currency | | | 9 | |
| Accumulated net realized gain (loss) | | | (31,261,863 | ) |
| Paid-in capital | | | 151,481,304 | |
| Net assets, at value | | $ | 145,459,085 | |
Class A Net Asset Value, offering and redemption price per share ($145,459,085 ÷ 9,604,576 outstanding shares of beneficial interest, no par value, unlimited number of shares authorized) | | $ | 15.14 | |
* Represents collateral on securities loaned.
The accompanying notes are an integral part of the financial statements.
Statement of Operations
| for the year ended December 31, 2012 | |
| Investment Income | |
Income: Dividends (net of foreign taxes withheld of $3,363) | | $ | 1,094,121 | |
| Income distributions — Central Cash Management Fund | | | 6,021 | |
| Securities lending income, including income from Daily Assets Fund Institutional, net of borrower rebates | | | 174,998 | |
| Total income | | | 1,275,140 | |
Expenses: Management fee | | | 826,918 | |
| Administration fee | | | 150,349 | |
| Services to shareholders | | | 4,590 | |
| Custodian fee | | | 10,217 | |
| Audit and tax fees | | | 68,108 | |
| Legal fees | | | 8,825 | |
| Reports to shareholders | | | 27,628 | |
| Trustees' fees and expenses | | | 8,736 | |
| Other | | | 9,183 | |
| Total expenses | | | 1,114,554 | |
| Net investment income (loss) | | | 160,586 | |
| Realized and Unrealized Gain (Loss) | |
Net realized gain (loss) from: Investments | | | 3,935,543 | |
| Foreign currency | | | (360 | ) |
| | | | 3,935,183 | |
Change in net unrealized appreciation (depreciation) on: Investments | | | 16,236,975 | |
| Foreign currency | | | (2 | ) |
| | | | 16,236,973 | |
| Net gain (loss) | | | 20,172,156 | |
| Net increase (decrease) in net assets resulting from operations | | $ | 20,332,742 | |
The accompanying notes are an integral part of the financial statements.
Statement of Changes in Net Assets | | | Years Ended December 31, | |
| Increase (Decrease) in Net Assets | | 2012 | | | 2011 | |
Operations: Net investment income (loss) | | $ | 160,586 | | | $ | (318,019 | ) |
| Net realized gain (loss) | | | 3,935,183 | | | | 15,261,496 | |
| Change in net unrealized appreciation (depreciation) | | | 16,236,973 | | | | (32,232,742 | ) |
| Net increase (decrease) in net assets resulting from operations | | | 20,332,742 | | | | (17,289,265 | ) |
Distributions to shareholders from: Net investment income: Class A | | | — | | | | (545,355 | ) |
| Total distributions | | | — | | | | (545,355 | ) |
Fund share transactions: Class A Proceeds from shares sold | | | 4,543,991 | | | | 15,498,269 | |
| Net assets acquired in tax-free reorganization (see Note F) | | | — | | | | 93,892,921 | |
| Reinvestment of distributions | | | — | | | | 545,355 | |
| Cost of shares redeemed | | | (26,306,762 | ) | | | (33,642,074 | ) |
| Net increase (decrease) in net assets from Class A share transactions | | | (21,762,771 | ) | | | 76,294,471 | |
| Increase (decrease) in net assets | | | (1,430,029 | ) | | | 58,459,851 | |
| Net assets at beginning of period | | | 146,889,114 | | | | 88,429,263 | |
| Net assets at end of period (including undistributed net investment income and distributions in excess of net investment income of $114,625 and $45,601, respectively) | | $ | 145,459,085 | | | $ | 146,889,114 | |
| Other Information | |
Class A Shares outstanding at beginning of period | | | 11,094,343 | | | | 6,384,947 | |
| Shares sold | | | 306,987 | | | | 1,084,284 | |
| Shares issued in tax-free reorganization (see Note F) | | | — | | | | 6,003,455 | |
| Shares issued to shareholders in reinvestment of distributions | | | — | | | | 34,959 | |
| Shares redeemed | | | (1,796,754 | ) | | | (2,413,302 | ) |
| Net increase (decrease) in Class A shares | | | (1,489,767 | ) | | | 4,709,396 | |
| Shares outstanding at end of period | | | 9,604,576 | | | | 11,094,343 | |
The accompanying notes are an integral part of the financial statements.
| | | Years Ended December 31, | |
| Class A | | | 2012 | | | 2011 | | | 2010 | | | 2009 | | | 2008 | |
| Selected Per Share Data | |
| Net asset value, beginning of period | | $ | 13.24 | | | $ | 13.85 | | | $ | 10.70 | | | $ | 7.61 | | | $ | 15.07 | |
Income (loss) from investment operations: Net investment income (loss)a | | | .02 | | | | (.03 | ) | | | (.01 | ) | | | (.02 | ) | | | (.01 | ) |
| Net realized and unrealized gain (loss) | | | 1.88 | | | | (.50 | ) | | | 3.16 | | | | 3.11 | | | | (7.45 | ) |
| Total from investment operations | | | 1.90 | | | | (.53 | ) | | | 3.15 | | | | 3.09 | | | | (7.46 | ) |
Less distributions from: Net investment income | | | — | | | | (.08 | ) | | | — | | | | — | | | | — | |
| Net asset value, end of period | | $ | 15.14 | | | $ | 13.24 | | | $ | 13.85 | | | $ | 10.70 | | | $ | 7.61 | |
| Total Return (%) | | | 14.35 | | | | (3.91 | ) | | | 29.44 | | | | 40.60 | | | | (49.50 | )b |
| Ratios to Average Net Assets and Supplemental Data | |
| Net assets, end of period ($ millions) | | | 145 | | | | 147 | | | | 88 | | | | 80 | | | | 69 | |
| Ratio of expenses before expense reductions (%) | | | .74 | | | | .73 | | | | .78 | | | | .77 | | | | .88 | |
| Ratio of expenses after expense reductions (%) | | | .74 | | | | .73 | | | | .78 | | | | .77 | | | | .85 | |
| Ratio of net investment income (loss) (%) | | | .11 | | | | (.23 | ) | | | (.12 | ) | | | (.22 | ) | | | (.04 | ) |
| Portfolio turnover rate (%) | | | 57 | | | | 84 | | | | 64 | | | | 93 | | | | 67 | |
a Based on average shares outstanding during the period. b Total return would have been lower had certain expenses not been reduced. | |
Notes to Financial Statements
A. Organization and Significant Accounting Policies
DWS Small Mid Cap Growth VIP (the "Fund") is a diversified series of DWS Variable Series II (the "Trust"), which is registered under the Investment Company Act of 1940, as amended (the "1940 Act"), as an open-end management investment company organized as a Massachusetts business trust.
The Fund's financial statements are prepared in accordance with accounting principles generally accepted in the United States of America which require the use of management estimates. Actual results could differ from those estimates. The policies described below are followed consistently by the Fund in the preparation of its financial statements.
Security Valuation. Investments are stated at value determined as of the close of regular trading on the New York Stock Exchange on each day the exchange is open for trading.
Various inputs are used in determining the value of the Fund's investments. These inputs are summarized in three broad levels. Level 1 includes quoted prices in active markets for identical securities. Level 2 includes other significant observable inputs (including quoted prices for similar securities, interest rates, prepayment speeds, and credit risk). Level 3 includes significant unobservable inputs (including the Fund's own assumptions in determining the fair value of investments). The inputs or methodology used for valuing securities are not necessarily an indication of the risk associated with investing in those securities.
Equity securities and exchange-traded funds ("ETFs") are valued at the most recent sale price or official closing price reported on the exchange (U.S. or foreign) or over-the-counter market on which they trade and are categorized as Level 1 securities. Securities or ETFs for which no sales are reported are valued at the calculated mean between the most recent bid and asked quotations on the relevant market or, if a mean cannot be determined, at the most recent bid quotation.
Investments in open-end investment companies are valued at their net asset value each business day and are categorized as Level 1.
Securities and other assets for which market quotations are not readily available or for which the above valuation procedures are deemed not to reflect fair value are valued in a manner that is intended to reflect their fair value as determined in accordance with procedures approved by the Board and are generally categorized as Level 3. In accordance with the Fund's valuation procedures, factors used in determining value may include, but are not limited to, the type of the security; the size of the holding; the initial cost of the security; the existence of any contractual restrictions on the security's disposition; the price and extent of public trading in similar securities of the issuer or of comparable companies; quotations or evaluated prices from broker-dealers and/or pricing services; information obtained from the issuer, analysts, and/or the appropriate stock exchange (for exchange-traded securities); an analysis of the company's or issuer's financial statements; an evaluation of the forces that influence the issuer and the market(s) in which the security is purchased and sold and with respect to debt securities; the maturity, coupon, creditworthiness, currency denomination and the movement of the market in which the security is normally traded. The value determined under these procedures may differ from published values for the same securities.
Disclosure about the classification of fair value measurements is included in a table following the Fund's Investment Portfolio.
New Accounting Pronouncement. In January 2013, Accounting Standard Update 2013-01 (ASU 2013-01), Clarifying the Scope of Disclosures about Offsetting Assets and Liabilities, replaced Accounting Standards Update 2011-11 (ASU 2011-11), Disclosures about Offsetting Assets and Liabilities. ASU 2013-01 is effective for fiscal years beginning on or after January 1, 2013, and interim periods within those annual periods. ASU 2011-11 was intended to enhance disclosure requirements on the offsetting of financial assets and liabilities. The ASU 2013-01 limits the scope of the new balance sheet offsetting disclosures to derivatives, repurchase agreements, and securities lending transactions to the extent that they are (1) offset in the financial statements or (2) subject to an enforceable master netting arrangement or similar agreement. Management is currently evaluating the application of ASU 2013-01 and its impact, if any, on the Fund's financial statements.
Securities Lending. The Fund lends securities to certain financial institutions. The Fund retains beneficial ownership of the securities it has loaned and continues to receive interest and dividends paid by the issuer of securities and to participate in any changes in their market value. The Fund requires the borrowers of the securities to maintain collateral with the Fund consisting of either cash or liquid, unencumbered assets having a value at least equal to the value of the securities loaned. When the collateral falls below specified amounts, the lending agent will use its best effort to obtain additional collateral on the next business day to meet required amounts under the security lending agreement. The Fund may invest the cash collateral into a joint trading account in an affiliated money market fund pursuant to Exemptive Orders issued by the SEC. The Fund receives compensation for lending its securities either in the form of fees or by earning interest on invested cash collateral net of borrower rebates and fees paid to a lending agent. Either the Fund or the borrower may terminate the loan. There may be risks of delay and costs in recovery of securities or even loss of rights in the collateral should the borrower of the securities fail financially. The Fund is also subject to all investment risks associated with the reinvestment of any cash collateral received, including, but not limited to, interest rate, credit and liquidity risk associated with such investments.
Federal Income Taxes. The Fund's policy is to comply with the requirements of the Internal Revenue Code, as amended, which are applicable to regulated investment companies, and to distribute all of its taxable income to its shareholders.
Under the Regulated Investment Company Modernization Act of 2010, net capital losses incurred post-enactment may be carried forward indefinitely, and their character is retained as short-term and/or long-term. Previously, net capital losses were carried forward for eight years and treated as short-term losses. As a transition rule, the Act requires that post-enactment net capital losses be used before pre-enactment net capital losses.
At December 31, 2012, the Fund had a net tax basis capital loss carryforward of approximately $30,593,000, including $29,395,000 of pre-enactment losses, including approximately $5,435,000 inherited from its mergers with affiliated funds in previous years, which may be applied against any realized net taxable capital gains of each succeeding year until fully utilized or until December 31, 2016 ($5,435,000) and December 31, 2017 ($23,960,000), the respective expiration dates, whichever occurs first, and which may be subject to certain limitations under Section 382-384 of Internal Revenue Code; and approximately $1,198,000 of post-enactment short-term losses, which may be applied against realized net taxable capital gains indefinitely.
The Fund has reviewed the tax positions for the open tax years as of December 31, 2012 and has determined that no provision for income tax is required in the Fund's financial statements. The Fund's federal tax returns for the prior three fiscal years remain open subject to examination by the Internal Revenue Service.
Distribution of Income and Gains. Distributions from net investment income of the Fund, if any, is declared and distributed to shareholders annually. Net realized gains from investment transactions, in excess of available capital loss carryforwards, would be taxable to the Fund if not distributed and, therefore, will be distributed to shareholders at least annually. The Fund may also make additional distributions for tax purposes if necessary.
The timing and characterization of certain income and capital gain distributions are determined annually in accordance with federal tax regulations which may differ from accounting principles generally accepted in the United States of America. These differences primarily relate to net operating losses and certain securities sold at a loss. As a result, net investment income (loss) and net realized gain (loss) on investment transactions for a reporting period may differ significantly from distributions during such period. Accordingly, the Fund may periodically make reclassifications among certain of its capital accounts without impacting the net asset value of the Fund.
At December 31, 2012, the Fund's components of distributable earnings on a tax basis were as follows:
| Undistributed ordinary income* | | $ | 139,275 | |
| Capital loss carryforwards | | $ | (30,593,000 | ) |
| Unrealized appreciation (depreciation) on investments | | $ | 24,672,601 | |
In addition, the tax character of distributions paid by the Fund is summarized as follows:
| | | Years Ended December 31, | |
| | | 2012 | | | 2011 | |
| Distributions from ordinary income* | | $ | — | | | $ | 545,355 | |
* For tax purposes, short-term capital gain distributions are considered ordinary income distributions.
Expenses. Expenses of the Trust arising in connection with a specific fund are allocated to that fund. Other Trust expenses which cannot be directly attributed to a fund are apportioned among the funds in the Trust based upon the relative net assets or other appropriate measures.
Contingencies. In the normal course of business, the Fund may enter into contracts with service providers that contain general indemnification clauses. The Fund's maximum exposure under these arrangements is unknown as this would involve future claims that may be made against the Fund that have not yet been made. However, based on experience, the Fund expects the risk of loss to be remote.
Other. Investment transactions are accounted for on a trade date plus one basis for daily net asset value calculations. However, for financial reporting purposes, investment transactions are reported on trade date. Interest income is recorded on the accrual basis. Dividend income is recorded on the ex-dividend date net of foreign withholding taxes. Realized gains and losses from investment transactions are recorded on an identified cost basis and may include proceeds from litigation.
B. Purchases and Sales of Securities
During the year ended December 31, 2012, purchases and sales of investment transactions (excluding short-term investments) aggregated $83,041,903 and $106,420,443, respectively.
C. Related Parties
Management Agreement. Under the Investment Management Agreement with Deutsche Investment Management Americas Inc. ("DIMA" or the "Advisor"), an indirect, wholly owned subsidiary of Deutsche Bank AG, the Advisor directs the investments of the Fund in accordance with its investment objectives, policies and restrictions. The Advisor determines the securities, instruments and other contracts relating to investments to be purchased, sold or entered into by the Fund.
Pursuant to the Investment Management Agreement with the Advisor, the Fund pays a monthly management fee based on the Fund's average daily net assets, computed and accrued daily and payable monthly, at the following annual rates:
| First $250 million | | | .550 | % |
| Next $750 million | | | .525 | % |
| Over $1 billion | | | .500 | % |
Accordingly, for the year ended December 31, 2012, the fee pursuant to the Investment Management Agreement was equivalent to an annual effective rate of 0.55% of the Fund's average daily net assets.
Administration Fee. Pursuant to an Administrative Services Agreement, DIMA provides most administrative services to the Fund. For all services provided under the Administrative Services Agreement, the Fund pays DIMA an annual fee ("Administration Fee") of 0.10% of the Fund's average daily net assets, computed and accrued daily and payable monthly. For the year ended December 31, 2012, the Administration Fee was $150,349, of which $12,211 is unpaid.
Service Provider Fees. DWS Investments Service Company ("DISC"), an affiliate of the Advisor, is the transfer agent, dividend-paying agent and shareholder service agent for the Fund. Pursuant to a sub-transfer agency agreement between DISC and DST Systems, Inc. ("DST"), DISC has delegated certain transfer agent, dividend-paying agent and shareholder service agent functions to DST. DISC compensates DST out of the shareholder servicing fee it receives from the Fund. For the year ended December 31, 2012, the amounts charged to the Fund by DISC aggregated $350, of which $88 is unpaid.
Typesetting and Filing Service Fees. Under an agreement with DIMA, DIMA is compensated for providing typesetting and certain regulatory filing services to the Fund. For the year ended December 31, 2012, the amount charged to the Fund by DIMA included in the Statement of Operations under "reports to shareholders" aggregated $12,757, of which $4,507 is unpaid.
Trustees' Fees and Expenses. The Fund paid retainer fees to each Trustee not affiliated with the Advisor, plus specified amounts to the Board Chairperson and to each committee Chairperson.
Affiliated Cash Management Vehicle. The Fund may invest uninvested cash balances in Central Cash Management Fund, which is managed by the Advisor. The Fund indirectly bears its proportionate share of the expenses of Central Cash Management Fund. Central Cash Management Fund does not pay the Advisor an investment management fee. Central Cash Management Fund seeks a high level of current income consistent with liquidity and the preservation of capital.
Securities Lending Agent Fees. Deutsche Bank AG serves as securities lending agent for the Fund. For the year ended December 31, 2012, the Fund incurred securities lending agent fees to Deutsche Bank AG in the amount of $19,320.
D. Ownership of the Fund
At December 31, 2012, three Participating Insurance Companies were owners of record of 10% or more of the total outstanding Class A shares of the Fund, each owning 54%, 23% and 15%.
E. Line of Credit
The Fund and other affiliated funds (the "Participants") share in a $375 million revolving credit facility provided by a syndication of banks. The Fund may borrow for temporary or emergency purposes, including the meeting of redemption requests that otherwise might require the untimely disposition of securities. The Participants are charged an annual commitment fee which is allocated based on net assets, among each of the Participants. Interest is calculated at a rate per annum equal to the sum of the Federal Funds Rate plus 1.25 percent plus if LIBOR exceeds the Federal Funds Rate the amount of such excess. The Fund may borrow up to a maximum of 33 percent of its net assets under the agreement. The Fund had no outstanding loans at December 31, 2012.
F. Acquisition of Assets
On April 29, 2011, the Fund acquired all of the net assets of DWS Mid Cap Growth VIP and DWS Turner Mid Cap Growth VIP pursuant to a plan of reorganization approved by shareholders on January 12, 2011. The acquisition was accomplished by a tax-free exchange of 2,029,578 Class A shares of DWS Mid Cap Growth VIP and 6,543,235 Class A shares of DWS Turner Mid Cap Growth VIP for 1,818,964 Class A shares and 4,184,491 Class A shares of the Fund, respectively, outstanding on April 29, 2011. DWS Mid Cap Growth VIP and DWS Turner Mid Cap Growth VIP's net assets at that date, $28,448,304 and $65,444,617, respectively, including $6,234,926 and $6,931,871 of net unrealized appreciation, respectively, were combined with those of the Fund. The aggregate net assets of the Fund immediately before the acquisition were $105,299,610. The combined net assets of the Fund immediately following the acquisition were $199,192,531.
Report of Independent Registered Public Accounting Firm
To the Board of Trustees of DWS Variable Series II and Shareholders of DWS Small Mid Cap Growth VIP:
We have audited the accompanying statement of assets and liabilities, including the investment portfolio of DWS Small Mid Cap Growth VIP (the "Fund"), one of the funds constituting DWS Variable Series II, as of December 31, 2012, and the related statement of operations for the year then ended, the statement of changes in net assets for the two years in the period then ended, and the financial highlights for each of the five years in the period then ended. These financial statements and financial highlights are the responsibility of the Fund's management. Our responsibility is to express an opinion on these financial statements and financial highlights based on our audits.
We conducted our audits in accordance with the standards of the Public Company Accounting Oversight Board (United States). Those standards require that we plan and perform the audit to obtain reasonable assurance about whether the financial statements and financial highlights are free of material misstatement. We were not engaged to perform an audit of the Fund's internal control over financial reporting. Our audits included consideration of internal control over financial reporting as a basis for designing audit procedures that are appropriate in the circumstances, but not for the purpose of expressing an opinion on the effectiveness of the Fund's internal control over financial reporting. Accordingly, we express no such opinion. An audit also includes examining, on a test basis, evidence supporting the amounts and disclosures in the financial statements and financial highlights, assessing the accounting principles used and significant estimates made by management, and evaluating the overall financial statement presentation. Our procedures included confirmation of securities owned as of December 31, 2012, by correspondence with the custodian and brokers. We believe that our audits provide a reasonable basis for our opinion.
In our opinion, the financial statements and financial highlights referred to above present fairly, in all material respects, the financial position of DWS Small Mid Cap Growth VIP (one of the funds constituting DWS Variable Series II) at December 31, 2012, the results of its operations for the year then ended, the changes in its net assets for each of the two years in the period then ended, and the financial highlights for each of the five years in the period then ended, in conformity with U.S. generally accepted accounting principles.
| | | |
Boston, Massachusetts February 13, 2013 | | |
Information About Your Fund's Expenses (Unaudited)
As an investor of the Fund, you incur two types of costs: ongoing expenses and transaction costs. Ongoing expenses include management fees and other Fund expenses. Examples of transaction costs include contract charges and account maintenance fees, which are not shown in this section. The following tables are intended to help you understand your ongoing expenses (in dollars) of investing in the Fund and to help you compare these expenses with the ongoing expenses of investing in other mutual funds. The example in the table is based on an investment of $1,000 invested at the beginning of the six-month period and held for the entire period (July 1, 2012 to December 31, 2012).
The tables illustrate your Fund's expenses in two ways:
•Actual Fund Return. This helps you estimate the actual dollar amount of ongoing expenses (but not transaction costs) paid on a $1,000 investment in the Fund using the Fund's actual return during the period. To estimate the expenses you paid over the period, simply divide your account value by $1,000 (for example, an $8,600 account value divided by $1,000 = 8.6), then multiply the result by the number in the "Expenses Paid per $1,000" line under the share class you hold.
• Hypothetical 5% Fund Return. This helps you to compare your Fund's ongoing expenses (but not transaction costs) with those of other mutual funds using the Fund's actual expense ratio and a hypothetical rate of return of 5% per year before expenses. Examples using a 5% hypothetical Fund return may be found in the shareholder reports of other mutual funds. The hypothetical account values and expenses may not be used to estimate the actual ending account balance or expenses you paid for the period.
Please note that the expenses shown in these tables are meant to highlight your ongoing expenses only and do not reflect any transaction costs. The "Expenses Paid per $1,000" line of the tables is useful in comparing ongoing expenses only and will not help you determine the relative total expense of owning different funds. If these transaction costs had been included, your costs would have been higher.
Expenses and Value of a $1,000 Investment for the six months ended December 31, 2012 | |
| Actual Fund Return | | Class A | |
| Beginning Account Value 7/1/12 | | $ | 1,000.00 | |
| Ending Account Value 12/31/12 | | $ | 1,072.20 | |
| Expenses Paid per $1,000* | | $ | 3.85 | |
| Hypothetical 5% Fund Return | | Class A | |
| Beginning Account Value 7/1/12 | | $ | 1,000.00 | |
| Ending Account Value 12/31/12 | | $ | 1,021.42 | |
| Expenses Paid per $1,000* | | $ | 3.76 | |
* Expenses are equal to the Fund's annualized expense ratio, multiplied by the average account value over the period, multiplied by 184 (the number of days in the most recent six-month period), then divided by 366.
| Annualized Expense Ratio | Class A | |
| DWS Variable Series II — DWS Small Mid Cap Growth VIP | .74% | |
For more information, please refer to the Fund's prospectus.
These tables do not reflect charges and fees ("contract charges") associated with the separate account that invests in the Fund or any variable life insurance policy or variable annuity contract for which the Fund is an investment option.
Tax Information (Unaudited)
Please consult a tax advisor if you have questions about federal or state income tax laws, or on how to prepare your tax returns. If you have specific questions about your account, please contact your insurance provider.
The Trust's policies and procedures for voting proxies for portfolio securities and information about how the Trust voted proxies related to its portfolio securities during the 12-month period ended June 30 are available on our Web site — www.dws-investments.com (click on "proxy voting" at the bottom of the page) — or on the SEC's Web site — www.sec.gov. To obtain a written copy of the Trust's policies and procedures without charge, upon request, call us toll free at (800) 728-3337.
Investment Management Agreement Approval
The Board of Trustees approved the renewal of DWS Small Mid Cap Growth VIP's investment management agreement (the "Agreement") with Deutsche Investment Management Americas Inc. ("DWS") in September 2012.
In terms of the process that the Board followed prior to approving the Agreement, shareholders should know that:
• In September 2012, all of the Fund's Trustees were independent of DWS and its affiliates.
• The Trustees met frequently during the past year to discuss fund matters and dedicated a substantial amount of time to contract review matters. Over the course of several months, the Board's Contract Committee, in coordination with the Board's Equity Oversight Committee, reviewed comprehensive materials received from DWS, independent third parties and independent counsel. These materials included an analysis of the Fund's performance, fees and expenses, and profitability compiled by the Fund's independent fee consultant. The Board also received extensive information throughout the year regarding performance of the Fund.
• The Independent Trustees regularly meet privately with their independent counsel to discuss contract review and other matters. In addition, the Independent Trustees were also advised by the Fund's independent fee consultant in the course of their review of the Fund's contractual arrangements and considered a comprehensive report prepared by the independent fee consultant in connection with their deliberations (the "IFC Report").
• In connection with reviewing the Agreement, the Board also reviewed the terms of the Fund's distribution agreement, administrative services agreement, transfer agency agreement and other material service agreements.
• Based on its evaluation of the information provided, the Contract Committee presented its findings and recommendations to the Board. The Board then reviewed the Contract Committee's findings and recommendations.
In connection with the contract review process, the Contract Committee and the Board considered the factors discussed below, among others. The Board also considered that DWS and its predecessors have managed the Fund since its inception, and the Board believes that a long-term relationship with a capable, conscientious advisor is in the best interests of the Fund. The Board considered, generally, that shareholders chose to invest or remain invested in the Fund knowing that DWS managed the Fund, and that the Agreement was approved by the Fund's shareholders. DWS is part of Deutsche Bank, a major global banking institution that is engaged in a wide range of financial services. The Board believes that there are advantages to being part of a global asset management business that offers a wide range of investing expertise and resources, including hundreds of portfolio managers and analysts with research capabilities in many countries throughout the world.
As part of the contract review process, the Board carefully considered the fees and expenses of each DWS fund overseen by the Board in light of the fund's performance. In many cases, this led to a negotiation with DWS of lower expense caps for the coming year than had previously been in place. As part of these negotiations, the Board indicated that it would consider relaxing these new lower caps in future years following sustained improvements in performance, among other considerations.
In June 2012, Deutsche Bank ("DB"), DWS's parent company, announced that DB's new management team had concluded the strategic review of its global asset management business announced in late 2011 by DB's prior management team, and would combine its Asset Management (of which DWS is a part) and Wealth Management divisions. Prior to approving the investment management agreements, the Independent Trustees were apprised of the expected management and structure of the new combined Asset & Wealth Management division ("AWM") and DWS. DB also advised the Independent Trustees that the U.S. asset management business is a critical and integral part of DB and AWM, and that DB would be reinvesting a significant portion of the substantial savings it expects to realize by combining its Asset Management and Wealth Management divisions into a combined AWM division, including enhancements to its investment capabilities. DB also confirmed its commitment to maintaining strong legal and compliance groups within the combined division.
While shareholders may focus primarily on fund performance and fees, the Fund's Board considers these and many other factors, including the quality and integrity of DWS's personnel and such other issues as back-office operations, fund valuations, and compliance policies and procedures.
Nature, Quality and Extent of Services. The Board considered the terms of the Agreement, including the scope of advisory services provided under the Agreement. The Board noted that, under the Agreement, DWS provides portfolio management services to the Fund and that, pursuant to a separate administrative services agreement, DWS provides administrative services to the Fund. The Board considered the experience and skills of senior management and investment personnel, the resources made available to such personnel, the ability of DWS to attract and retain high-quality personnel, and the organizational depth and stability of DWS. The Board reviewed the Fund's performance over short-term and long-term periods and compared those returns to various agreed-upon performance measures, including market indices and a peer universe compiled by the independent fee consultant using information supplied by Lipper Inc. ("Lipper"), an independent fund data service. The Board also noted that it has put into place a process of identifying "Focus Funds" (e.g., funds performing poorly relative to their benchmark or a peer universe compiled by an independent fund data service), and receives more frequent reporting and information from DWS regarding such funds, along with DWS's remedial plans to address underperformance. The Board believes this process is an effective manner of identifying and addressing underperforming funds. Based on the information provided, the Board noted that for the one-, three- and five-year periods ended December 31, 2011, the Fund's performance (Class A shares) was in the 2nd quartile, 2nd quartile and 4th quartile, respectively, of the applicable Lipper universe (the 1st quartile being the best performers and the 4th quartile being the worst performers). The Board also observed that the Fund has underperformed its benchmark in the one-, three- and five-year periods ended December 31, 2011.
Fees and Expenses. The Board considered the Fund's investment management fee schedule, operating expenses and total expense ratios, and comparative information provided by Lipper and the independent fee consultant regarding investment management fee rates paid to other investment advisors by similar funds (1st quartile being the most favorable and 4th quartile being the least favorable). With respect to management fees paid to other investment advisors by similar funds, the Board noted that the contractual fee rates paid by the Fund, which include a 0.10% fee paid to DWS under the Fund's administrative services agreement, were lower than the median (1st quartile) of the applicable Lipper peer group (based on Lipper data provided as of December 31, 2011). The Board noted that the Fund's Class A shares total (net) operating expenses were expected to be lower than the median (1st quartile) of the applicable Lipper expense universe (based on Lipper data provided as of December 31, 2011, and analyzing Lipper expense universe Class A (net) expenses less any applicable 12b-1 fees) ("Lipper Universe Expenses"). The Board considered the Fund's management fee rate as compared to fees charged by DWS and certain of its affiliates for comparable mutual funds and considered differences in fund and fee structures between the DWS Funds. The Board also considered how the Fund's total (net) operating expenses compared to the total (net) operating expenses of a more customized peer group selected by Lipper (based on such factors as asset size).
The information considered by the Board as part of its review of management fees included information regarding fees charged by DWS and its affiliates to similar institutional accounts and to similar funds offered primarily to European investors ("DWS Europe funds"), in each case as applicable. The Board observed that advisory fee rates for institutional accounts generally were lower than the management fees charged by similarly managed DWS U.S. mutual funds ("DWS Funds"), but also took note of the differences in services provided to DWS Funds as compared to institutional accounts. In the case of DWS Europe funds, the Board observed that fee rates for DWS Europe funds generally were higher than for similarly managed DWS Funds, but noted that differences in the types of services provided to DWS Funds relative to DWS Europe funds made it difficult to compare such fees.
On the basis of the information provided, the Board concluded that management fees were reasonable and appropriate in light of the nature, quality and extent of services provided by DWS.
Profitability. The Board reviewed detailed information regarding revenues received by DWS under the Agreement. The Board considered the estimated costs and pre-tax profits realized by DWS from advising the DWS Funds, as well as estimates of the pre-tax profits attributable to managing the Fund in particular. The Board also received information regarding the estimated enterprise-wide profitability of DWS and its affiliates with respect to all fund services in totality and by fund. The Board and the independent fee consultant reviewed DWS's methodology in allocating its costs to the management of the Fund. Based on the information provided, the Board concluded that the pre-tax profits realized by DWS in connection with the management of the Fund were not unreasonable. The Board also reviewed information regarding the profitability of certain similar investment management firms. The Board noted that while information regarding the profitability of such firms is limited (and in some cases is not necessarily prepared on a comparable basis), DWS and its affiliates' overall profitability with respect to the DWS fund complex (after taking into account distribution and other services provided to the funds by DWS and its affiliates) was lower than the overall profitability levels of many comparable firms for which such data was available.
Economies of Scale. The Board considered whether there are economies of scale with respect to the management of the Fund and whether the Fund benefits from any economies of scale. The Board noted that the Fund's management fee schedule includes fee breakpoints. The Board concluded that the Fund's fee schedule represents an appropriate sharing between the Fund and DWS of such economies of scale as may exist in the management of the Fund at current asset levels.
Other Benefits to DWS and Its Affiliates. The Board also considered the character and amount of other incidental benefits received by DWS and its affiliates, including any fees received by DWS for administrative services provided to the Fund and any fees received by an affiliate of DWS for distribution services. The Board also considered benefits to DWS related to brokerage and soft-dollar allocations, including allocating brokerage to pay for research generated by parties other than the executing broker dealers, which pertain primarily to funds investing in equity securities, along with the incidental public relations benefits to DWS related to DWS Funds advertising and cross-selling opportunities among DWS products and services. The Board concluded that management fees were reasonable in light of these fallout benefits.
Compliance. The Board considered the significant attention and resources dedicated by DWS to documenting and enhancing its compliance processes in recent years. The Board noted in particular (i) the experience and seniority of both DWS's chief compliance officer and the Fund's chief compliance officer; (ii) the large number of DWS compliance personnel; and (iii) the substantial commitment of resources by DWS and its affiliates to compliance matters.
Based on all of the information considered and the conclusions reached, the Board unanimously determined that the continuation of the Agreement is in the best interests of the Fund. In making this determination, the Board did not give particular weight to any single factor identified above. The Board considered these factors over the course of numerous meetings, certain of which were in executive session with only the Independent Trustees and their counsel present. It is possible that individual Trustees may have weighed these factors differently in reaching their individual decisions to approve the continuation of the Agreement.
Summary of Management Fee Evaluation by Independent Fee Consultant
September 17, 2012
Pursuant to an Order entered into by Deutsche Investment Management Americas and affiliates (collectively, "DeAM") with the Attorney General of New York, I, Thomas H. Mack, have been appointed the Independent Fee Consultant for the DWS Funds (formerly the DWS Scudder Funds). My duties include preparing an annual written evaluation of the management fees DeAM charges the Funds, considering among other factors the management fees charged by other mutual fund companies for like services, management fees DeAM charges other clients for like services, DeAM's costs of supplying services under the management agreements and related profit margins, possible economies of scale if a Fund grows larger, and the nature and quality of DeAM's services, including fund performance. This report summarizes my evaluation for 2012, including my qualifications, the evaluation process for each of the DWS Funds, consideration of certain complex-level factors, and my conclusions. I served in substantially the same capacity in 2007, 2008, 2009, 2010 and 2011.
Qualifications
For more than 35 years I have served in various professional capacities within the investment management business. I have held investment analysis and advisory positions, including securities analyst, portfolio strategist and director of investment policy with a large investment firm. I have also performed business management functions, including business development, financial management and marketing research and analysis.
Since 1991, I have been an independent consultant within the asset management industry. I have provided services to over 125 client organizations, including investment managers, mutual fund boards, product distributors and related organizations. Over the past ten years I have completed a number of assignments for mutual fund boards, specifically including assisting boards with management contract renewal.
I hold a Master of Business Administration degree, with highest honors, from Harvard University and Master of Science and Bachelor of Science (highest honors) degrees from the University of California at Berkeley. I am an independent director and audit committee financial expert for two closed-end mutual funds and have served in various leadership and financial oversight capacities with non-profit organizations.
Evaluation of Fees for each DWS Fund
My work focused primarily on evaluating, fund-by-fund, the fees charged to each of the 103 mutual fund portfolios in the DWS Fund family. For each Fund, I considered each of the key factors mentioned above, as well as any other relevant information. In doing so I worked closely with the Funds' Independent Directors in their annual contract renewal process, as well as in their approval of contracts for several new funds (documented separately).
In evaluating each Fund's fees, I reviewed comprehensive materials provided by or on behalf of DeAM, including expense information prepared by Lipper Analytical, comparative performance information, profitability data, manager histories, and other materials. I also accessed certain additional information from the Lipper and Morningstar databases and drew on my industry knowledge and experience.
To facilitate evaluating this considerable body of information, I prepared for each Fund a document summarizing the key data elements in each area as well as additional analytics discussed below. This made it possible to consider each key data element in the context of the others.
In the course of contract renewal, DeAM agreed to implement a number of fee and expense adjustments requested by the Independent Directors which will favorably impact future fees and expenses, and my evaluation includes the effects of these changes.
Fees and Expenses Compared with Other Funds
The competitive fee and expense evaluation for each fund focused on two primary comparisons:
The Fund's contractual management fee (the advisory fee plus the administration fee where applicable) compared with those of a group of typically 12-15 funds in the same Lipper investment category (e.g. Large Capitalization Growth) having similar distribution arrangements and being of similar size.
The Fund's total expenses compared with a broader universe of funds from the same Lipper investment category and having similar distribution arrangements.
These two comparisons provide a view of not only the level of the fee compared with funds of similar scale but also the total expense the Fund bears for all the services it receives, in comparison with the investment choices available in the Fund's investment category and distribution channel. The principal figure-of-merit used in these comparisons was the subject Fund's percentile ranking against peers.
DeAM's Fees for Similar Services to Others
DeAM provided management fee schedules for all of its US domiciled fund and non-fund investment management accounts in any of the investment categories where there is a DWS Fund. These similar products included the other DWS Funds, non-fund pooled accounts, institutional accounts and sub-advisory accounts. Using this information, I calculated for each Fund the fee that would be charged to each similar product, at the subject Fund's asset level.
Evaluating information regarding non-fund products is difficult because there are varying levels of services required for different types of accounts, with mutual funds generally requiring considerably more regulatory and administrative types of service as well as having more frequent cash flows than other types of accounts. Also, while mutual fund fees for similar fund products can be expected to be similar, there will be some differences due to different pricing conditions in different distribution channels (e.g. retail funds versus those used in variable insurance products), differences in underlying investment processes and other factors.
Costs and Profit Margins
DeAM provided a detailed profitability analysis for each Fund. After making some adjustments so that the presentation would be more comparable to the available industry figures, I reviewed profit margins from investment management alone, from investment management plus other fund services (excluding distribution) provided to the Funds by DeAM (principally shareholder services), and DeAM profits from all sources, including distribution. A later section comments on overall profitability.
Economies of Scale
Economies of scale — an expected decline in management cost per dollar of fund assets as fund assets grow — are very rarely quantified and documented because of inherent difficulties in collecting and analyzing relevant data. However, in virtually every investment category that I reviewed, larger funds tend to have lower fees and lower total expenses than smaller funds. To see how each DWS Fund compares with this industry observation, I reviewed:
The trend in Fund assets over the last five years and the accompanying trend in total expenses. This shows if the Fund has grown and, if so, whether total expense (management fees as well as other expenses) have declined as a percent of assets.
Whether the Fund has break-points in its management fee schedule, the extent of the fee reduction built into the schedule and the asset levels where the breaks take effect, and in the case of a sub-advised Fund how the Fund's break-points compare with those of the sub-advisory fee schedule.
How the Fund's contractual fee schedule compares with trends in the industry data. To accomplish this, I constructed a chart showing how actual latest-fiscal-year contractual fees of the Fund and of other similar funds relate to average fund assets, with the subject Fund's contractual fee schedule superimposed.
Quality of Service — Performance
The quality-of-service evaluation focused on investment performance, which is the principal result of the investment management service. Each Fund's performance was reviewed over the past 1, 3, 5 and 10 years, as applicable, and compared with that of other funds in the same investment category and with a suitable market index.
In addition, I calculated and reviewed risk-adjusted returns relative to an index of similar mutual funds' returns and a suitable market index. The risk-adjusted returns analysis provides a way of determining the extent to which the Fund's return comparisons are mainly the product of investment value-added (or lack thereof) or alternatively taking considerably more or less risk than is typical in its investment category.
I also received and considered the history of portfolio manager changes for each Fund, as this provided an important context for evaluating the performance results.
Complex-Level Considerations
While this evaluation was conducted mainly at the individual fund level, there are some issues relating to the reasonableness of fees that can alternatively be considered across the whole fund complex:
I reviewed DeAM's profitability analysis for all DWS Funds, with a view toward determining if the allocation procedures used were reasonable and how profit levels compared with public data for other investment managers.
I considered whether DeAM and affiliates receive any significant ancillary or "fallout" benefits that should be considered in interpreting the direct profitability results. These would be situations where serving as the investment manager of the Funds is beneficial to another part of the Deutsche Bank organization.
I considered how aggregated DWS Fund expenses had varied over the years, by asset class and in the context of trends in asset levels.
I considered how aggregated DWS Fund performance measures relative to appropriate peers had varied by asset class and over time.
I reviewed the structure of the DeAM organization, trends in staffing levels, and information on compensation of investment management and other professionals compared with industry data.
Findings
Based on the process and analysis discussed above, which included reviewing a wide range of information from management and external data sources and considering among other factors the fees DeAM charges other clients, the fees charged by other fund managers, DeAM's costs and profits associated with managing the Funds, economies of scale, possible fall-out benefits, and the nature and quality of services provided, in my opinion the management fees charged the DWS Funds are reasonable.
Thomas H. Mack
President, Thomas H. Mack & Co., Inc.
Board Members and Officers
The following table presents certain information regarding the Board Members and Officers of the fund. Each Board Member's year of birth is set forth in parentheses after his or her name. Unless otherwise noted, (i) each Board Member has engaged in the principal occupation(s) noted in the table for at least the most recent five years, although not necessarily in the same capacity; and (ii) the address of each Independent Board Member is c/o Kenneth C. Froewiss, Chairman, DWS Mutual Funds, P.O. Box 78, Short Hills, NJ 07078. Except as otherwise noted below, the term of office for each Board Member is until the election and qualification of a successor, or until such Board Member sooner dies, resigns, is removed or as otherwise provided in the governing documents of the fund. Because the fund does not hold an annual meeting of shareholders, each Board Member will hold office for an indeterminate period. The Board Members may also serve in similar capacities with other funds in the fund complex.
| Independent Board Members |
Name, Year of Birth, Position with the Fund and Length of Time Served1 | | Business Experience and Directorships During the Past Five Years | Number of Funds in DWS Fund Complex Overseen |
Other Directorships Held by Board Member |
Kenneth C. Froewiss (1945) Chairperson since 2013,9 and Board Member since 2001 | | Adjunct Professor of Finance, NYU Stern School of Business (September 2009-present; Clinical Professor from 1997-September 2009); Member, Finance Committee, Association for Asian Studies (2002-present); Director, Mitsui Sumitomo Insurance Group (US) (2004-present); prior thereto, Managing Director, J.P. Morgan (investment banking firm) (until 1996) | 103 | — |
William McClayton (1944) Vice Chairperson since 2013,9 and Board Member since 2004 | | Private equity investor (since October 2009); previously, Managing Director, Diamond Management & Technology Consultants, Inc. (global consulting firm) (2001-2009); Directorship: Board of Managers, YMCA of Metropolitan Chicago; formerly: Senior Partner, Arthur Andersen LLP (accounting) (1966-2001); Trustee, Ravinia Festival | 103 | — |
John W. Ballantine (1946) Board Member since 1999 | | Retired; formerly, Executive Vice President and Chief Risk Management Officer, First Chicago NBD Corporation/The First National Bank of Chicago (1996-1998); Executive Vice President and Head of International Banking (1995-1996). Directorships: Stockwell Capital Investments PLC (private equity); former Directorships: First Oak Brook Bancshares, Inc. and Oak Brook Bank; Prisma Energy International | 103 | Chairman of the Board, Healthways, Inc.2 (provider of disease and care management services) (2003- present); Portland General Electric2 (utility company) (2003-present) |
Henry P. Becton, Jr. (1943) Board Member since 1990 | | Vice Chair and former President, WGBH Educational Foundation. Directorships: Public Radio International; Public Radio Exchange (PRX); The PBS Foundation; North Bennett Street School (Boston); former Directorships: Association of Public Television Stations; Boston Museum of Science; American Public Television; Concord Academy; New England Aquarium; Mass. Corporation for Educational Telecommunications; Committee for Economic Development; Public Broadcasting Service; Connecticut College | 103 | Lead Director, Becton Dickinson and Company2 (medical technology company); Lead Director, Belo Corporation2 (media company) |
Dawn-Marie Driscoll (1946) Board Member since 1987 | | President, Driscoll Associates (consulting firm); Emeritus Executive Fellow, Center for Business Ethics, Bentley University; formerly, Partner, Palmer & Dodge (1988-1990); Vice President of Corporate Affairs and General Counsel, Filene's (1978-1988). Directorships: Director of ICI Mutual Insurance Company (since 2007); Advisory Board, Center for Business Ethics, Bentley University; Trustee, Southwest Florida Community Foundation (charitable organization); former Directorships: Sun Capital Advisers Trust (mutual funds) (2007-2012), Investment Company Institute (audit, executive, nominating committees) and Independent Directors Council (governance, executive committees) | 103 | — |
Keith R. Fox, CFA (1954) Board Member since 1996 | | Managing General Partner, Exeter Capital Partners (a series of private investment funds) (since 1986). Directorships: Progressive International Corporation (kitchen goods importer and distributor); The Kennel Shop (retailer); former Chairman, National Association of Small Business Investment Companies; former Directorships: BoxTop Media Inc. (advertising); Sun Capital Advisers Trust (mutual funds) (2011-2012) | 103 | — |
Paul K. Freeman (1950) Board Member since 1993, and Chairperson (2009-Jan. 8, 2013) | | Consultant, World Bank/Inter-American Development Bank; Executive and Governing Council of the Independent Directors Council (Chairman of Education Committee); formerly: Project Leader, International Institute for Applied Systems Analysis (1998-2001); Chief Executive Officer, The Eric Group, Inc. (environmental insurance) (1986-1998); Directorships: Denver Zoo Foundation (December 2012-present); former Directorships: Prisma Energy International | 103 | — |
Richard J. Herring (1946) Board Member since 1990 | | Jacob Safra Professor of International Banking and Professor, Finance Department, The Wharton School, University of Pennsylvania (since July 1972); Co-Director, Wharton Financial Institutions Center (since July 2000); Co-Chair, U.S. Shadow Financial Regulatory Committee; Executive Director, Financial Economists Roundtable; formerly: Vice Dean and Director, Wharton Undergraduate Division (July 1995-June 2000); Director, Lauder Institute of International Management Studies (July 2000-June 2006) | 103 | Director, Japan Equity Fund, Inc. (since September 2007), Thai Capital Fund, Inc. (since 2007), Singapore Fund, Inc. (since September 2007), Independent Director of Barclays Bank Delaware (since September 2010) |
Rebecca W. Rimel (1951) Board Member since 1995 | | President and Chief Executive Officer, The Pew Charitable Trusts (charitable organization) (1994 to present); Trustee, Washington College (2011-2013); formerly: Executive Vice President, The Glenmede Trust Company (investment trust and wealth management) (1983-2004); Board Member, Investor Education (charitable organization) (2004-2005); Trustee, Executive Committee, Philadelphia Chamber of Commerce (2001-2007); Director, Viasys Health Care2 (January 2007-June 2007); Trustee, Pro Publica (charitable organization) (2007-2010); Trustee, Thomas Jefferson Foundation (charitable organization) (1994-2012) | 103 | Director, Becton Dickinson and Company2 (medical technology company) (2012-present); Director, CardioNet, Inc.2 (health care) (2009-present) |
William N. Searcy, Jr. (1946) Board Member since 1993 | | Private investor since October 2003; formerly: Pension & Savings Trust Officer, Sprint Corporation2 (telecommunications) (November 1989-September 2003); Trustee, Sun Capital Advisers Trust (mutual funds) (1998-2012) | 103 | — |
Jean Gleason Stromberg (1943) Board Member since 1997 | | Retired. Formerly, Consultant (1997-2001); Director, Financial Markets U.S. Government Accountability Office (1996-1997); Partner, Fulbright & Jaworski, L.L.P. (law firm) (1978-1996). Directorships: The William and Flora Hewlett Foundation; former Directorships: Service Source, Inc., Mutual Fund Directors Forum (2002-2004), American Bar Retirement Association (funding vehicle for retirement plans) (1987-1990 and 1994-1996) | 103 | — |
Robert H. Wadsworth (1940) Board Member since 1999 | | President, Robert H. Wadsworth & Associates, Inc. (consulting firm) (1983 to present); Director, National Horizon, Inc. (non-profit organization); Director and Treasurer, The Phoenix Boys Choir Association | 106 | — |
Interested Board Member and Officer4 |
Name, Year of Birth, Position with the Fund and Length of Time Served1,6 | | Business Experience and Directorships During the Past Five Years | Number of Funds in DWS Fund Complex Overseen |
Other Directorships Held by Board Member |
Michael J. Woods5 (1967) Board Member since 2013,9 and Executive Vice President since 20139 | | Managing Director,3 Deutsche Asset & Wealth Management (2009-present); Head of the Americas Asset Management Business for Deutsche Bank, Member of the Asset and Wealth Management ("AWM") Extended Executive Committee, AWM Global Client Group Executive Committee and the AWM Active Asset Management Executive Committee; CEO and US Regional Head of DWS Investments; formerly: Sr. VP, Head of the Financial Intermediaries and Investments Group of Evergreen Investments (2007-2009), CEO and Vice Chairman of Board of Directors of XTF Global Asset Management (2006-2007), Managing Director — US Head of Sub-Advisory and Investment Only Business at Citigroup Asset Management (2000-2006). Mr. Woods is currently a board member of The Children's Village, The Big Brothers Big Sisters Organization, and The Mutual Fund Education Alliance. | 39 | — |
Officers4 |
Name, Year of Birth, Position with the Fund and Length of Time Served6 | | Business Experience and Directorships During the Past Five Years |
W. Douglas Beck, CFA7 (1967) President, 2011-present | | Managing Director,3 Deutsche Asset & Wealth Management (2006-present); President of DWS family of funds and Head of Product Management, U.S. for DWS Investments; formerly: Executive Director, Head of Product Management (2002-2006) and President (2005-2006) of the UBS Funds at UBS Global Asset Management; Co-Head of Manager Research/Managed Solutions Group, Merrill Lynch (1998-2002) |
John Millette8 (1962) Vice President and Secretary, 1999-present | | Director,3 Deutsche Asset & Wealth Management |
Paul H. Schubert7 (1963) Chief Financial Officer, 2004-present Treasurer, 2005-present | | Managing Director,3 Deutsche Asset & Wealth Management (since July 2004); formerly: Executive Director, Head of Mutual Fund Services and Treasurer for UBS Family of Funds (1998-2004); Vice President and Director of Mutual Fund Finance at UBS Global Asset Management (1994-1998) |
Caroline Pearson8 (1962) Chief Legal Officer, 2010-present | | Managing Director,3 Deutsche Asset & Wealth Management; formerly: Assistant Secretary for DWS family of funds (1997-2010) |
Melinda Morrow7 (1970) Vice President, 2012-present | | Director,3 Deutsche Asset & Wealth Management |
Hepsen Uzcan8 (1974) Assistant Secretary, since 20139 | | Vice President, Deutsche Asset & Wealth Management |
Paul Antosca8 (1957) Assistant Treasurer, 2007-present | | Director,3 Deutsche Asset & Wealth Management |
Jack Clark8 (1967) Assistant Treasurer, 2007-present | | Director,3 Deutsche Asset & Wealth Management |
Diane Kenneally8 (1966) Assistant Treasurer, 2007-present | | Director,3 Deutsche Asset & Wealth Management |
John Caruso7 (1965) Anti-Money Laundering Compliance Officer, 2010-present | | Managing Director,3 Deutsche Asset & Wealth Management |
Robert Kloby7 (1962) Chief Compliance Officer, 2006-present | | Managing Director,3 Deutsche Asset & Wealth Management |
1 The length of time served represents the year in which the Board Member joined the board of one or more DWS funds currently overseen by the Board.
2 A publicly held company with securities registered pursuant to Section 12 of the Securities Exchange Act of 1934.
3 Executive title, not a board directorship.
4 As a result of their respective positions held with the Advisor, these individuals are considered "interested persons" of the Advisor within the meaning of the 1940 Act. Interested persons receive no compensation from the fund.
5 The mailing address of Mr. Woods is 60 Wall Street, New York, New York 10005. Mr. Woods is an interested Board Member by virtue of his positions with Deutsche Asset & Wealth Management. As an interested person, Mr. Woods receives no compensation from the fund. Mr. Woods is a board member of the following trusts and corporations: Cash Account Trust, DWS Market Trust, DWS Money Funds, DWS State Tax-Free Income Series, DWS Target Fund, DWS Value Series, Inc., DWS Variable Series II, Investors Cash Trust, Tax-Exempt California Money Market Fund, DWS Global High Income Fund, Inc., DWS High Income Opportunities Fund, Inc., DWS High Income Trust, DWS Multi-Market Income Trust, DWS Municipal Income Trust, DWS Strategic Income Trust and DWS Strategic Municipal Income Trust.
6 The length of time served represents the year in which the officer was first elected in such capacity for one or more DWS funds.
7 Address: 60 Wall Street, New York, NY 10005.
8 Address: One Beacon Street, Boston, MA 02108.
9 Effective as of January 9, 2013.
The fund's Statement of Additional Information ("SAI") includes additional information about the Board Members. The SAI is available, without charge, upon request. If you would like to request a copy of the SAI, you may do so by calling the following toll-free number: (800) 728-3337.
Notes
DWS Investments Distributors, Inc.
222 South Riverside Plaza
Chicago, IL 60606
(800) 621-1148
VS2SMCG-2 (R-025835-2 2/13)
DECEMBER 31, 2012
ANNUAL REPORT
DWS VARIABLE SERIES II
DWS Unconstrained Income VIP
Contents
25 Statement of Assets and Liabilities 26 Statement of Operations 27 Statement of Changes in Net Assets 29 Notes to Financial Statements 37 Report of Independent Registered Public Accounting Firm 38 Information About Your Fund's Expenses 41 Investment Management Agreement Approval 44 Summary of Management Fee Evaluation by Independent Fee Consultant 46 Board Members and Officers |
This report must be preceded or accompanied by a prospectus. To obtain an additional prospectus or summary prospectus, if available, call (800) 728-3337 or your financial representative. We advise you to consider the Fund's objectives, risks, charges and expenses carefully before investing. The summary prospectus and prospectus contain this and other important information about the Fund. Please read the prospectus carefully before you invest.
Bond investments are subject to interest-rate and credit risks. When interest rates rise, bond prices generally fall. Credit risk refers to the ability of an issuer to make timely payments of principal and interest. Investments in lower-quality ("junk bonds") and non-rated securities present greater risk of loss than investments in higher-quality securities. The Fund may use derivatives, including as part of its Global Tactical Asset Allocation (GTAA) strategy. Investing in derivatives entails special risks relating to liquidity, leverage and credit that may reduce returns and/or increase volatility. Investing in foreign securities, particularly those of emerging markets, presents certain risks, such as currency fluctuations, political and economic changes, and market risks. The Fund may lend securities to approved institutions. See the prospectus for details.
DWS Investments is part of the Deutsche Asset & Wealth Management division of Deutsche Bank AG.
NOT FDIC/NCUA INSURED NO BANK GUARANTEE MAY LOSE VALUE NOT A DEPOSIT
NOT INSURED BY ANY FEDERAL GOVERNMENT AGENCY
Performance Summary December 31, 2012 (Unaudited)
Fund performance shown is historical, assumes reinvestment of all dividend and capital gain distributions and does not guarantee future results. Investment return and principal value fluctuate with changing market conditions so that, when redeemed, shares may be worth more or less than their original cost. Current performance may be lower or higher than the performance data quoted. Please contact your participating insurance company for the Fund's most recent month-end performance. Performance doesn't reflect charges and fees ("contract charges") associated with the separate account that invests in the Fund or any variable life insurance policy or variable annuity contract for which the Fund is an investment option. These charges and fees will reduce returns.
The gross expense ratio of the Fund, as stated in the fee table of the prospectus dated May 1, 2012 is 0.99% for Class A shares and may differ from the expense ratio disclosed in the Financial Highlights table in this report.
| Growth of an Assumed $10,000 Investment in DWS Unconstrained Income VIP |
| The Barclays U.S. Aggregate Bond Index is an unmanaged index representing domestic taxable investment-grade bonds, with index components for government and corporate securities, mortgage pass-through securities, and asset-backed securities with an average maturity of one year or more. Index returns do not reflect any fees or expenses and it is not possible to invest directly into an index. |
| |
| Yearly periods ended December 31 | |
| Comparative Results | |
| DWS Unconstrained Income VIP | | 1-Year | | | 3-Year | | | 5-Year | | | 10-Year | |
| Class A | Growth of $10,000 | | $ | 11,308 | | | $ | 13,104 | | | $ | 14,837 | | | $ | 20,443 | |
| Average annual total return | | | 13.08 | % | | | 9.43 | % | | | 8.21 | % | | | 7.41 | % |
| Barclays U.S. Aggregate Bond Index | Growth of $10,000 | | $ | 10,422 | | | $ | 11,974 | | | $ | 13,349 | | | $ | 16,575 | |
| Average annual total return | | | 4.22 | % | | | 6.19 | % | | | 5.95 | % | | | 5.18 | % |
The growth of $10,000 is cumulative.
Management Summary December 31, 2012 (Unaudited)
The Fund returned 13.08% during 2012, outperforming the 4.22% return of the Barclays U.S. Aggregate Bond Index.1 The Fund has outpaced the benchmark in the three-, five- and 10-year periods ended December 31, 2012.
The global bond markets delivered robust performance during the annual period. The aggressive policies of the U.S. Federal Reserve Board (the Fed) pushed down yields on U.S. Treasuries, leading to outperformance for other market segments as investors sought the higher income available in the non-Treasury "spread sectors."2 The Fund, which can invest across the full breadth of the global fixed-income market, capitalized on the favorable environment through its overweights in high-yield, investment-grade corporate and emerging-markets bonds, all of which delivered robust total returns and helped the Fund's return exceed that of the benchmark.3 We were very active in our efforts to adjust the Fund's positioning among, and within, these sectors in order to take advantage of values as they emerged.
While we continue to like the underlying fundamentals and supply-and-demand dynamics in all three market segments, we began to take a more cautious approach later in the period given that yields had fallen so far during the past year. At the same time, we established a larger-than-normal position in U.S. Treasuries as a "hedge" against potential financial-market disruptions stemming from U.S. political headlines or a revival of the European debt crisis.
Our developed-market international holdings largely consisted of exposure to the government bonds of Great Britain, Germany and Canada, which reflected our preference for the bonds of larger, lower-risk countries rather than for seeking the higher yields in smaller, riskier economies. The Fund continues to employ a global tactical asset allocation strategy (GTAA), which detracted slightly from performance in 2012.4
While the Fed's low-rate policy should provide a measure of continued support for the bond market, we expect higher volatility and, in all likelihood, more muted returns in the year ahead. However, we welcome volatility, as it provides us with greater latitude to take advantage of market dislocations through our relative-value style. In addition, we believe our "go anywhere" approach is useful at a time in which global central banks are likely to keep short-term interest rates at ultralow levels.
Gary Russell, CFA
William Chepolis, CFA
John D. Ryan
Philip G. Condon
Ohn Choe, CFA
Darwei Kung
Portfolio Managers, Deutsche Investment Management Americas Inc.
Robert Wang
Thomas Picciochi
Portfolio Managers, QS Investors, LLC,
Subadvisor to the Fund
The views expressed reflect those of the portfolio management team only through the end of the period of the report as stated on the cover. The management team's views are subject to change at any time based on market and other conditions and should not be construed as a recommendation. Past performance is no guarantee of future results. Current and future portfolio holdings are subject to risk.
1 The Barclays U.S. Aggregate Bond Index is an unmanaged index representing domestic taxable investment-grade bonds, with index components for government and corporate securities, mortgage pass-through securities, and asset-backed securities with an average maturity of one year or more. Index returns do not reflect any fees or expenses and it is not possible to invest directly into an index.
2 Spread sectors include all non-U.S. Treasury, investment-grade sectors including federal agency securities, corporate bonds, asset-backed securities, mortgage-backed securities, and commercial mortgage-backed securities.
3 "Overweight" means the Fund holds a higher weighting in a given sector or security than the benchmark. "Underweight" means the Fund holds a lower weighting.
4 The global tactical asset allocation (GTAA) strategy is a total return strategy designed to add value by benefiting from global market inefficiencies. The strategy combines diverse macro investment views to determine the positions, using a disciplined, risk-managed process. The result is a collection of long and short investment positions within global markets designed to generate excess returns that have little correlation to major markets. These positions are then implemented through futures and forward contracts.
Portfolio Summary (Unaudited) Asset Allocation (As a % of Investment Portfolio excluding Securities Lending Collateral) | 12/31/12 | 12/31/11 |
| | | |
| Corporate Bonds | 56% | 66% |
| Government & Agency Obligations | 15% | 11% |
| Loan Participations and Assignments | 8% | 3% |
| Cash Equivalents | 6% | 8% |
| Mortgage-Backed Securities Pass-Throughs | 6% | — |
| Collateralized Mortgage Obligations | 4% | 4% |
| Commercial Mortgage-Backed Securities | 3% | 2% |
| Municipal Bonds and Notes | 1% | 1% |
| Asset-Backed | 1% | 1% |
| Convertible Bonds | 0% | 3% |
| Preferred Securities | 0% | 1% |
| | 100% | 100% |
Quality (Excludes Cash Equivalents and Securities Lending Collateral) | 12/31/12 | 12/31/11 |
| | | |
| AAA | 21% | 8% |
| AA | 2% | 3% |
| A | 7% | 9% |
| BBB | 23% | 23% |
| BB | 18% | 24% |
| B | 24% | 25% |
| CCC | 2% | 4% |
| Not Rated | 3% | 4% |
| | 100% | 100% |
| Interest Rate Sensitivity | 12/31/12 | 12/31/11 |
| | | |
| Effective Maturity | 7.4 years | 6.0 years |
| Effective Duration | 5.2 years | 4.4 years |
The quality ratings represent the higher of Moody's Investors Service, Inc. ("Moody's") or Standard & Poor's Corporation ("S&P") credit ratings. The ratings of Moody's and S&P represent their opinions as to the quality of the securities they rate. Credit quality measures a bond issuer's ability to repay interest and principal in a timely manner. Ratings are relative and subjective and are not absolute standards of quality. Credit quality does not remove market risk and is subject to change.
Effective maturity is the weighted average of the maturity date of bonds held by the Fund taking into consideration any available maturity shortening features.
Effective duration is an approximate measure of the Fund's sensitivity to interest rate changes taking into consideration any maturity shortening features.
Portfolio holdings and characteristics are subject to change.
For more complete details about the Fund's investment portfolio, see page 7.
Following the Fund's fiscal first and third quarter-end, a complete portfolio holdings listing is filed with the SEC on Form N-Q. The form will be available on the SEC's Web site at www.sec.gov, and it also may be reviewed and copied at the SEC's Public Reference Room in Washington, D.C. Information on the operation of the SEC's Public Reference Room may be obtained by calling (800) SEC-0330. The Fund's portfolio holdings are also posted on www.dws-investments.com from time to time. Please see the Fund's current prospectus for more information.
Investment Portfolio December 31, 2012 | | | Principal Amount ($)(a) | | | Value ($) | |
| | | | |
| Corporate Bonds 58.4% | |
| Consumer Discretionary 7.5% | |
| AMC Networks, Inc., 7.75%, 7/15/2021 | | | | 15,000 | | | | 17,175 | |
| Asbury Automotive Group, Inc., 8.375%, 11/15/2020 | | | | 80,000 | | | | 88,800 | |
| Avis Budget Car Rental LLC: | |
| 8.25%, 1/15/2019 | | | | 95,000 | | | | 104,975 | |
| 9.625%, 3/15/2018 | | | | 45,000 | | | | 50,175 | |
| Block Communications, Inc., 144A, 7.25%, 2/1/2020 | | | | 65,000 | | | | 69,062 | |
| Bresnan Broadband Holdings LLC, 144A, 8.0%, 12/15/2018 | | | | 95,000 | | | | 102,600 | |
| British Sky Broadcasting Group PLC, 144A, 3.125%, 11/26/2022 | | | | 90,000 | | | | 89,687 | |
| Cablevision Systems Corp., 8.0%, 4/15/2020 | | | | 10,000 | | | | 11,263 | |
| Caesar's Entertainment Operating Co., Inc.: | | |
| 8.5%, 2/15/2020 | | | | 120,000 | | | | 119,100 | |
| 11.25%, 6/1/2017 | | | | 240,000 | | | | 257,100 | |
| CCO Holdings LLC: | |
| 5.25%, 9/30/2022 | | | | 220,000 | | | | 222,750 | |
| 6.5%, 4/30/2021 | | | | 215,000 | | | | 231,931 | |
| 6.625%, 1/31/2022 | | | | 70,000 | | | | 76,475 | |
| 7.0%, 1/15/2019 | | | | 20,000 | | | | 21,575 | |
| 7.25%, 10/30/2017 | | | | 90,000 | | | | 98,100 | |
| 7.375%, 6/1/2020 | | | | 10,000 | | | | 11,100 | |
| 7.875%, 4/30/2018 | | | | 40,000 | | | | 43,050 | |
| 8.125%, 4/30/2020 | | | | 25,000 | | | | 28,000 | |
| CDR DB Sub, Inc., 144A, 7.75%, 10/15/2020 | | | | 35,000 | | | | 34,913 | |
| Cequel Communications Holdings I LLC, 144A, 6.375%, 9/15/2020 | | | | 160,000 | | | | 166,600 | |
| Chester Downs & Marina LLC, 144A, 9.25%, 2/1/2020 | | | | 25,000 | | | | 24,563 | |
| Clear Channel Worldwide Holdings, Inc.: | | |
| Series A, 7.625%, 3/15/2020 | | | | 20,000 | | | | 19,950 | |
| Series B, 7.625%, 3/15/2020 | | | | 185,000 | | | | 186,387 | |
| Cox Communications, Inc., 144A, 3.25%, 12/15/2022 | | | | 60,000 | | | | 61,875 | |
| Crown Media Holdings, Inc., 10.5%, 7/15/2019 | | | | 55,000 | | | | 61,944 | |
| Cumulus Media Holdings, Inc., 7.75%, 5/1/2019 | | | | 45,000 | | | | 44,213 | |
| DIRECTV Holdings LLC, 3.8%, 3/15/2022 | | | | 200,000 | | | | 206,331 | |
| DISH DBS Corp.: | |
| 6.625%, 10/1/2014 | | | | 65,000 | | | | 69,875 | |
| 6.75%, 6/1/2021 | | | | 10,000 | | | | 11,400 | |
| 7.125%, 2/1/2016 | | | | 155,000 | | | | 173,600 | |
| Fontainebleau Las Vegas Holdings LLC, 144A, 11.0%, 6/15/2015* | | | | 65,000 | | | | 41 | |
| Griffey Intermediate, Inc., 144A, 7.0%, 10/15/2020 | | | | 65,000 | | | | 66,462 | |
| Harron Communications LP, 144A, 9.125%, 4/1/2020 | | | | 45,000 | | | | 49,275 | |
| | | Principal Amount ($)(a) | | | Value ($) | |
| | | | | | | | | |
| Hertz Corp.: | |
| 6.75%, 4/15/2019 | | | | 15,000 | | | | 16,369 | |
| 144A, 6.75%, 4/15/2019 | | | | 35,000 | | | | 38,194 | |
| 7.5%, 10/15/2018 | | | | 155,000 | | | | 171,275 | |
| Jo-Ann Stores Holdings, Inc., 144A, 9.75%, 10/15/2019 (PIK) | | | | 35,000 | | | | 35,306 | |
| Lear Corp., 8.125%, 3/15/2020 | | | | 36,000 | | | | 40,590 | |
| Libbey Glass, Inc., 6.875%, 5/15/2020 | | | | 20,000 | | | | 21,500 | |
| Limited Brands, Inc., 7.0%, 5/1/2020 | | | | 20,000 | | | | 23,000 | |
| Lions Gate Entertainment, Inc., 144A, 10.25%, 11/1/2016 | | | | 95,000 | | | | 105,094 | |
| Mattel, Inc., 5.45%, 11/1/2041 | | | | 141,400 | | | | 159,730 | |
| Mediacom Broadband LLC, 144A, 6.375%, 4/1/2023 | | | | 65,000 | | | | 66,137 | |
| Mediacom LLC: | |
| 7.25%, 2/15/2022 | | | | 20,000 | | | | 21,500 | |
| 9.125%, 8/15/2019 | | | | 30,000 | | | | 33,225 | |
| MGM Resorts International: | |
| 144A, 6.75%, 10/1/2020 | | | | 25,000 | | | | 25,531 | |
| 7.625%, 1/15/2017 | | | | 100,000 | | | | 107,000 | |
| 144A, 8.625%, 2/1/2019 | | | | 140,000 | | | | 156,100 | |
| National CineMedia LLC: | |
| 6.0%, 4/15/2022 | | | | 35,000 | | | | 37,100 | |
| 7.875%, 7/15/2021 | | | | 45,000 | | | | 49,837 | |
| Palace Entertainment Holdings LLC, 144A, 8.875%, 4/15/2017 | | | | 75,000 | | | | 78,937 | |
| Penske Automotive Group, Inc., 144A, 5.75%, 10/1/2022 | | | | 50,000 | | | | 51,500 | |
| Petco Holdings, Inc., 144A, 8.5%, 10/15/2017 (PIK) | | | | 20,000 | | | | 20,550 | |
| Quebecor Media, Inc., 144A, 5.75%, 1/15/2023 | | | | 30,000 | | | | 31,613 | |
| Regal Entertainment Group, 9.125%, 8/15/2018 | | | | 35,000 | | | | 39,025 | |
| Sabre Holdings Corp., 8.35%, 3/15/2016 | | | | 55,000 | | | | 58,575 | |
| Seminole Indian Tribe of Florida: | | |
| 144A, 7.75%, 10/1/2017 | | | | 40,000 | | | | 43,250 | |
| 144A, 7.804%, 10/1/2020 | | | | 70,000 | | | | 71,918 | |
| Servicios Corporativos Javer SAPI de CV, 144A, 9.875%, 4/6/2021 | | | | 100,000 | | | | 107,000 | |
| Sirius XM Radio, Inc., 144A, 8.75%, 4/1/2015 | | | | 155,000 | | | | 175,537 | |
| Sonic Automotive, Inc.: | |
| 144A, 7.0%, 7/15/2022 | | | | 15,000 | | | | 16,425 | |
| Series B, 9.0%, 3/15/2018 | | | | 95,000 | | | | 104,262 | |
| Sotheby's, 144A, 5.25%, 10/1/2022 | | | | 30,000 | | | | 30,300 | |
| Toys "R" Us-Delaware, Inc., 144A, 7.375%, 9/1/2016 (b) | | | | 35,000 | | | | 35,788 | |
| Travelport LLC, 9.0%, 3/1/2016 | | | | 10,000 | | | | 7,750 | |
| UCI International, Inc., 8.625%, 2/15/2019 | | | | 20,000 | | | | 19,825 | |
| | | Principal Amount ($)(a) | | | Value ($) | |
| | | | | | | | | |
| Univision Communications, Inc.: | | |
| 144A, 6.875%, 5/15/2019 | | | | 10,000 | | | | 10,400 | |
| 144A, 7.875%, 11/1/2020 | | | | 25,000 | | | | 27,063 | |
| UPC Holding BV: | |
| 144A, 8.375%, 8/15/2020 | EUR | | | 50,000 | | | | 74,049 | |
| 144A, 9.75%, 4/15/2018 | EUR | | | 100,000 | | | | 141,103 | |
| Viking Cruises Ltd., 144A, 8.5%, 10/15/2022 | | | | 30,000 | | | | 32,400 | |
| Visteon Corp., 6.75%, 4/15/2019 | | | | 68,000 | | | | 72,420 | |
| Whirlpool Corp., 4.7%, 6/1/2022 | | | | 110,000 | | | | 116,909 | |
| Wyndham Worldwide Corp., 5.75%, 2/1/2018 | | | | 135,000 | | | | 150,905 | |
| Yonkers Racing Corp., 144A, 11.375%, 7/15/2016 | | | | 60,000 | | | | 64,800 | |
| | | | | 5,510,139 | |
| Consumer Staples 1.9% | |
| Alliance One International, Inc., 10.0%, 7/15/2016 | | | | 25,000 | | | | 26,312 | |
| Altria Group, Inc., 9.95%, 11/10/2038 | | | | 145,000 | | | | 238,879 | |
| Anadolu Efes Biracilik Ve Malt Sanayii AS, 144A, 3.375%, 11/1/2022 | | | | 250,000 | | | | 246,250 | |
| ConAgra Foods, Inc., 3.25%, 9/15/2022 | | | | 45,000 | | | | 45,200 | |
| Constellation Brands, Inc., 6.0%, 5/1/2022 | | | | 15,000 | | | | 17,175 | |
| Darling International, Inc., 8.5%, 12/15/2018 | | | | 80,000 | | | | 91,900 | |
| Del Monte Corp., 7.625%, 2/15/2019 (b) | | | | 80,000 | | | | 83,400 | |
| Delhaize Group SA, 4.125%, 4/10/2019 | | | | 140,000 | | | | 144,515 | |
| Dole Food Co., Inc., 144A, 8.0%, 10/1/2016 | | | | 20,000 | | | | 20,800 | |
| FAGE Dairy Industry SA, 144A, 9.875%, 2/1/2020 | | | | 85,000 | | | | 90,312 | |
| JBS U.S.A. LLC, 144A, 8.25%, 2/1/2020 | | | | 25,000 | | | | 26,500 | |
| NBTY, Inc., 9.0%, 10/1/2018 | | | | 25,000 | | | | 28,250 | |
| Pilgrim's Pride Corp., 7.875%, 12/15/2018 | | | | 45,000 | | | | 45,619 | |
| Smithfield Foods, Inc.: | |
| 6.625%, 8/15/2022 | | | | 40,000 | | | | 44,200 | |
| 7.75%, 7/1/2017 | | | | 140,000 | | | | 163,100 | |
| TreeHouse Foods, Inc., 7.75%, 3/1/2018 | | | | 45,000 | | | | 48,825 | |
| | | | | 1,361,237 | |
| Energy 6.8% | |
| Access Midstream Partners LP, 6.125%, 7/15/2022 | | | | 55,000 | | | | 59,262 | |
| Arch Coal, Inc.: | |
| 7.0%, 6/15/2019 | | | | 20,000 | | | | 18,600 | |
| 7.25%, 10/1/2020 | | | | 20,000 | | | | 18,550 | |
| Berry Petroleum Co., 6.75%, 11/1/2020 | | | | 90,000 | | | | 96,750 | |
| BreitBurn Energy Partners LP: | |
| 144A, 7.875%, 4/15/2022 | | | | 30,000 | | | | 31,125 | |
| 8.625%, 10/15/2020 | | | | 35,000 | | | | 38,150 | |
| Chesapeake Oilfield Operating LLC, 144A, 6.625%, 11/15/2019 | | | | 25,000 | | | | 23,563 | |
| CITGO Petroleum Corp., 144A, 11.5%, 7/1/2017 | | | | 105,000 | | | | 121,275 | |
| | | Principal Amount ($)(a) | | | Value ($) | |
| | | | | | | | | |
| Continental Resources, Inc.: | |
| 5.0%, 9/15/2022 | | | | 30,000 | | | | 32,325 | |
| 7.125%, 4/1/2021 | | | | 30,000 | | | | 33,900 | |
| 7.375%, 10/1/2020 | | | | 35,000 | | | | 39,550 | |
| 8.25%, 10/1/2019 | | | | 20,000 | | | | 22,400 | |
| Crestwood Midstream Partners LP, 7.75%, 4/1/2019 | | | | 105,000 | | | | 108,937 | |
| Crosstex Energy LP: | |
| 144A, 7.125%, 6/1/2022 | | | | 15,000 | | | | 15,638 | |
| 8.875%, 2/15/2018 | | | | 55,000 | | | | 59,400 | |
| Dresser-Rand Group, Inc., 6.5%, 5/1/2021 | | | | 75,000 | | | | 79,500 | |
| Eagle Rock Energy Partners LP, 8.375%, 6/1/2019 | | | | 95,000 | | | | 96,900 | |
| El Paso LLC, 7.25%, 6/1/2018 | | | | 55,000 | | | | 63,571 | |
| EP Energy LLC: | |
| 6.875%, 5/1/2019 | | | | 60,000 | | | | 65,100 | |
| 7.75%, 9/1/2022 | | | | 25,000 | | | | 26,500 | |
| 9.375%, 5/1/2020 | | | | 25,000 | | | | 28,188 | |
| EPE Holdings LLC, 144A, 8.125%, 12/15/2017 (PIK) | | | | 55,000 | | | | 54,519 | |
| EV Energy Partners LP, 8.0%, 4/15/2019 | | | | 140,000 | | | | 148,575 | |
| FMC Technologies, Inc., 3.45%, 10/1/2022 | | | | 40,000 | | | | 40,826 | |
| Frontier Oil Corp., 6.875%, 11/15/2018 | | | | 55,000 | | | | 59,125 | |
| Global Geophysical Services, Inc., 10.5%, 5/1/2017 | | | | 130,000 | | | | 115,700 | |
| Halcon Resources Corp., 144A, 9.75%, 7/15/2020 | | | | 50,000 | | | | 54,000 | |
| Holly Energy Partners LP: | |
| 144A, 6.5%, 3/1/2020 | | | | 20,000 | | | | 21,400 | |
| 8.25%, 3/15/2018 | | | | 55,000 | | | | 59,812 | |
| IPIC GMTN Ltd., 144A, 5.5%, 3/1/2022 | | | | 200,000 | | | | 235,750 | |
| Kinder Morgan Energy Partners LP, 5.8%, 3/1/2021 | | | | 194,000 | | | | 232,185 | |
| Linn Energy LLC: | |
| 144A, 6.25%, 11/1/2019 | | | | 110,000 | | | | 110,550 | |
| 6.5%, 5/15/2019 | | | | 15,000 | | | | 15,150 | |
| MarkWest Energy Partners LP, 5.5%, 2/15/2023 | | | | 40,000 | | | | 43,400 | |
| MEG Energy Corp.: | |
| 144A, 6.375%, 1/30/2023 | | | | 65,000 | | | | 67,762 | |
| 144A, 6.5%, 3/15/2021 | | | | 40,000 | | | | 42,100 | |
| Midstates Petroleum Co., Inc., 144A, 10.75%, 10/1/2020 | | | | 35,000 | | | | 37,188 | |
| Newfield Exploration Co., 7.125%, 5/15/2018 | | | | 90,000 | | | | 94,950 | |
| Northern Oil & Gas, Inc., 8.0%, 6/1/2020 | | | | 85,000 | | | | 86,700 | |
| Oasis Petroleum, Inc.: | |
| 6.5%, 11/1/2021 | | | | 25,000 | | | | 26,563 | |
| 7.25%, 2/1/2019 | | | | 40,000 | | | | 43,000 | |
| Offshore Group Investment Ltd., 11.5%, 8/1/2015 | | | | 10,000 | | | | 10,900 | |
| OGX Austria GmbH, 144A, 8.375%, 4/1/2022 | | | | 200,000 | | | | 167,000 | |
| Petroleos de Venezuela SA: | |
| 144A, 8.5%, 11/2/2017 | | | | 400,000 | | | | 395,000 | |
| 144A, 9.0%, 11/17/2021 | | | | 300,000 | | | | 286,200 | |
| | | Principal Amount ($)(a) | | | Value ($) | |
| | | | | | | | | |
| Petroleos Mexicanos, 144A, 5.5%, 6/27/2044 | | | | 250,000 | | | | 275,000 | |
| Plains Exploration & Production Co.: | | |
| 6.125%, 6/15/2019 | | | | 40,000 | | | | 43,600 | |
| 6.75%, 2/1/2022 | | | | 80,000 | | | | 89,800 | |
| 7.625%, 6/1/2018 | | | | 60,000 | | | | 63,150 | |
| Quicksilver Resources, Inc., 11.75%, 1/1/2016 | | | | 15,000 | | | | 14,813 | |
| Reliance Holdings U.S.A., Inc., 144A, 5.4%, 2/14/2022 | | | | 250,000 | | | | 279,619 | |
| SandRidge Energy, Inc., 7.5%, 3/15/2021 | | | | 20,000 | | | | 21,400 | |
| SESI LLC: | |
| 6.375%, 5/1/2019 | | | | 40,000 | | | | 42,800 | |
| 7.125%, 12/15/2021 | | | | 115,000 | | | | 127,937 | |
| Shelf Drilling Holdings Ltd., 144A, 8.625%, 11/1/2018 | | | | 45,000 | | | | 46,125 | |
| Swift Energy Co.: | |
| 144A, 7.875%, 3/1/2022 | | | | 40,000 | | | | 41,800 | |
| 7.875%, 3/1/2022 | | | | 70,000 | | | | 73,150 | |
| Tesoro Corp.: | |
| 4.25%, 10/1/2017 | | | | 35,000 | | | | 36,225 | |
| 5.375%, 10/1/2022 | | | | 25,000 | | | | 26,625 | |
| Transocean, Inc., 3.8%, 10/15/2022 | | | | 75,000 | | | | 76,870 | |
| Venoco, Inc., 8.875%, 2/15/2019 | | | | 105,000 | | | | 98,437 | |
| WPX Energy, Inc.: | |
| 5.25%, 1/15/2017 | | | | 75,000 | | | | 79,500 | |
| 6.0%, 1/15/2022 | | | | 55,000 | | | | 59,262 | |
| | | | | 5,023,652 | |
| Financials 19.2% | |
| Akbank TAS, 144A, 5.0%, 10/24/2022 (b) | | | | 200,000 | | | | 211,178 | |
| Ally Financial, Inc.: | |
| 5.5%, 2/15/2017 | | | | 60,000 | | | | 64,186 | |
| 6.25%, 12/1/2017 | | | | 95,000 | | | | 105,186 | |
| 8.0%, 3/15/2020 | | | | 115,000 | | | | 140,875 | |
| 8.3%, 2/12/2015 | | | | 135,000 | | | | 150,356 | |
| Alphabet Holding Co., Inc., 144A, 7.75%, 11/1/2017 (PIK) | | | | 30,000 | | | | 30,900 | |
| American International Group, Inc., 3.8%, 3/22/2017 | | | | 60,000 | | | | 64,940 | |
| AmeriGas Finance LLC: | |
| 6.75%, 5/20/2020 | | | | 20,000 | | | | 21,950 | |
| 7.0%, 5/20/2022 | | | | 20,000 | | | | 22,250 | |
| Anglo American Capital PLC, 144A, 4.125%, 9/27/2022 | | | | 250,000 | | | | 261,187 | |
| Antero Resources Finance Corp.: | | |
| 7.25%, 8/1/2019 | | | | 50,000 | | | | 54,500 | |
| 9.375%, 12/1/2017 | | | | 30,000 | | | | 32,925 | |
| Banco Bradesco SA, 144A, 5.9%, 1/16/2021 | | | | 250,000 | | | | 272,500 | |
| Banco do Brasil SA, 144A, 5.875%, 1/26/2022 | | | | 200,000 | | | | 220,500 | |
| Banco Latinoamericano de Comercio Exterior SA, 144A, 3.75%, 4/4/2017 | | | | 150,000 | | | | 153,525 | |
| Bancolombia SA, 5.125%, 9/11/2022 | | | | 250,000 | | | | 260,000 | |
| Bangkok Bank PCL, 144A, 3.875%, 9/27/2022 | | | | 200,000 | | | | 206,200 | |
| | | Principal Amount ($)(a) | | | Value ($) | |
| | | | | | | | | |
| Bank of Ireland Mortgage Bank, 4.0%, 7/5/2013 | EUR | | | 750,000 | | | | 999,925 | |
| Barclays Bank PLC, 7.625%, 11/21/2022 | | | | 400,000 | | | | 399,500 | |
| BBVA Bancomer SA, 144A, 6.75%, 9/30/2022 | | | | 200,000 | | | | 225,000 | |
| BNP Paribas SA, 2.375%, 9/14/2017 | | | | 125,000 | | | | 126,793 | |
| Braskem America Finance Co., 144A, 7.125%, 7/22/2041 | | | | 200,000 | | | | 210,500 | |
| Calpine Construction Finance Co., LP, 144A, 8.0%, 6/1/2016 | | | | 200,000 | | | | 212,500 | |
| Case New Holland, Inc., 7.75%, 9/1/2013 | | | | 45,000 | | | | 46,800 | |
| Cemex Finance LLC, 144A, 9.375%, 10/12/2022 | | | | 200,000 | | | | 225,000 | |
| CIT Group, Inc.: | |
| 144A, 4.75%, 2/15/2015 | | | | 260,000 | | | | 270,400 | |
| 5.0%, 5/15/2017 | | | | 80,000 | | | | 84,800 | |
| 5.25%, 3/15/2018 | | | | 90,000 | | | | 96,300 | |
| Deutsche Telekom International Finance BV, 144A, 4.875%, 3/6/2042 | | | | 200,000 | | | | 213,497 | |
| Development Bank of Kazakhstan JSC, Series 3, 6.5%, 6/3/2020 | | | | 500,000 | | | | 562,500 | |
| E*TRADE Financial Corp., 6.75%, 6/1/2016 | | | | 130,000 | | | | 136,825 | |
| European Investment Bank, 6.125%, 1/23/2017 | AUD | | | 500,000 | | | | 564,837 | |
| Fibria Overseas Finance Ltd., 144A, 6.75%, 3/3/2021 (b) | | | | 150,000 | | | | 166,125 | |
| Ford Motor Credit Co., LLC, 3.984%, 6/15/2016 | | | | 145,000 | | | | 153,965 | |
| Fresenius Medical Care U.S. Finance II, Inc.: | | |
| 144A, 5.625%, 7/31/2019 | | | | 35,000 | | | | 37,581 | |
| 144A, 5.875%, 1/31/2022 | | | | 30,000 | | | | 32,550 | |
| Fresenius Medical Care U.S. Finance, Inc., 144A, 6.5%, 9/15/2018 | | | | 20,000 | | | | 22,350 | |
| General Electric Capital Corp., 5.3%, 2/11/2021 | | | | 75,000 | | | | 87,059 | |
| Grupo Aval Ltd., 144A, 4.75%, 9/26/2022 | | | | 200,000 | | | | 202,500 | |
| Hartford Financial Services Group, Inc., 6.0%, 1/15/2019 | | | | 250,000 | | | | 291,167 | |
| HCP, Inc., (REIT), 5.375%, 2/1/2021 | | | | 143,000 | | | | 162,842 | |
| Hellas Telecommunications Finance SCA, 144A, 8.21%**, 7/15/2015 (PIK)* | EUR | | | 109,187 | | | | 0 | |
| Hexion U.S. Finance Corp.: | |
| 6.625%, 4/15/2020 | | | | 15,000 | | | | 15,263 | |
| 8.875%, 2/1/2018 | | | | 305,000 | | | | 313,387 | |
| ING Bank NV, 144A, 2.0%, 9/25/2015 | | | | 200,000 | | | | 201,480 | |
| International Lease Finance Corp.: | | |
| 5.75%, 5/15/2016 | | | | 20,000 | | | | 21,082 | |
| 6.25%, 5/15/2019 | | | | 50,000 | | | | 53,250 | |
| 8.625%, 9/15/2015 | | | | 40,000 | | | | 44,950 | |
| 8.625%, 1/15/2022 | | | | 45,000 | | | | 55,575 | |
| 8.75%, 3/15/2017 | | | | 180,000 | | | | 207,900 | |
| Itau Unibanco Holding SA, 144A, 5.65%, 3/19/2022 | | | | 200,000 | | | | 210,250 | |
| | | Principal Amount ($)(a) | | | Value ($) | |
| | | | | | | | | |
| JPMorgan Chase & Co., 4.35%, 8/15/2021 | | | | 200,000 | | | | 223,647 | |
| Kazakhstan Temir Zholy Finance BV, 144A, 6.95%, 7/10/2042 | | | | 250,000 | | | | 314,375 | |
| Level 3 Financing, Inc.: | |
| 144A, 7.0%, 6/1/2020 | | | | 75,000 | | | | 78,375 | |
| 8.125%, 7/1/2019 | | | | 75,000 | | | | 81,750 | |
| 8.625%, 7/15/2020 (b) | | | | 50,000 | | | | 55,500 | |
| Lukoil International Finance BV, 144A, 6.125%, 11/9/2020 | | | | 250,000 | | | | 289,062 | |
| Macquarie Bank Ltd., 144A, 3.45%, 7/27/2015 | | | | 105,000 | | | | 109,189 | |
| MPT Operating Partnership LP: | |
| (REIT), 6.375%, 2/15/2022 | | | | 30,000 | | | | 31,500 | |
| (REIT), 6.875%, 5/1/2021 | | | | 50,000 | | | | 54,250 | |
| Neuberger Berman Group LLC: | |
| 144A, 5.625%, 3/15/2020 | | | | 25,000 | | | | 26,188 | |
| 144A, 5.875%, 3/15/2022 | | | | 45,000 | | | | 47,700 | |
| Nielsen Finance LLC, 144A, 4.5%, 10/1/2020 | | | | 25,000 | | | | 24,875 | |
| NII Capital Corp., 7.625%, 4/1/2021 | | | | 70,000 | | | | 53,025 | |
| Odebrecht Finance Ltd., 144A, 5.125%, 6/26/2022 | | | | 200,000 | | | | 217,000 | |
| Petrobras International Finance Co., 5.75%, 1/20/2020 | | | | 200,000 | | | | 227,671 | |
| PPL Capital Funding, Inc., 3.5%, 12/1/2022 | | | | 50,000 | | | | 50,895 | |
| Principal Financial Group, Inc., 3.3%, 9/15/2022 | | | | 150,000 | | | | 152,164 | |
| Qtel International Finance Ltd., 144A, 3.25%, 2/21/2023 | | | | 500,000 | | | | 499,500 | |
| Raizen Fuels Finance Ltd., 144A, 9.5%, 8/15/2014 | | | | 100,000 | | | | 111,000 | |
| RBS Citizens Financial Group, Inc., 144A, 4.15%, 9/28/2022 | | | | 200,000 | | | | 204,090 | |
| Reynolds Group Issuer, Inc.: | |
| 144A, 5.75%, 10/15/2020 | | | | 65,000 | | | | 67,112 | |
| 6.875%, 2/15/2021 | | | | 100,000 | | | | 107,750 | |
| 7.125%, 4/15/2019 | | | | 100,000 | | | | 107,500 | |
| Santander US Debt SAU, 144A, 3.724%, 1/20/2015 | | | | 45,000 | | | | 45,204 | |
| Serta Simmons Holdings LLC, 144A, 8.125%, 10/1/2020 | | | | 35,000 | | | | 35,000 | |
| Sky Growth Acquisition Corp., 144A, 7.375%, 10/15/2020 | | | | 30,000 | | | | 29,850 | |
| Telemovil Finance Co., Ltd., 144A, 8.0%, 10/1/2017 | | | | 100,000 | | | | 107,750 | |
| The Goldman Sachs Group, Inc., 5.75%, 1/24/2022 | | | | 160,000 | | | | 189,154 | |
| Toys "R" Us Property Co. I, LLC, 10.75%, 7/15/2017 | | | | 50,000 | | | | 53,875 | |
| Tronox Finance LLC, 144A, 6.375%, 8/15/2020 | | | | 40,000 | | | | 40,400 | |
| Turkiye Garanti Bankasi AS, 144A, 5.25%, 9/13/2022 | | | | 500,000 | | | | 537,500 | |
| Turkiye Vakiflar Bankasi Tao, 144A, 6.0%, 11/1/2022 | | | | 200,000 | | | | 206,101 | |
| Vale Overseas Ltd., 8.25%, 1/17/2034 | | | | 250,000 | | | | 341,901 | |
| Virgin Media Secured Finance PLC, 6.5%, 1/15/2018 | | | | 375,000 | | | | 403,594 | |
| | | Principal Amount ($)(a) | | | Value ($) | |
| | | | | | | | | |
| Xstrata Finance Canada Ltd., 144A, 4.0%, 10/25/2022 | | | | 70,000 | | | | 70,757 | |
| | | | | 14,122,815 | |
| Health Care 2.9% | |
| Agilent Technologies, Inc., 3.2%, 10/1/2022 | | | | 40,000 | | | | 40,471 | |
| Amgen, Inc., 3.875%, 11/15/2021 | | | | 100,000 | | | | 109,818 | |
| Aviv Healthcare Properties LP, 7.75%, 2/15/2019 | | | | 85,000 | | | | 90,100 | |
| Biomet, Inc.: | |
| 144A, 6.5%, 8/1/2020 | | | | 55,000 | | | | 58,438 | |
| 144A, 6.5%, 10/1/2020 | | | | 15,000 | | | | 14,906 | |
| Community Health Systems, Inc.: | | |
| 5.125%, 8/15/2018 | | | | 185,000 | | | | 192,863 | |
| 7.125%, 7/15/2020 | | | | 60,000 | | | | 64,050 | |
| Gilead Sciences, Inc., 5.65%, 12/1/2041 | | | | 145,000 | | | | 180,132 | |
| HCA Holdings, Inc., 7.75%, 5/15/2021 | | | | 105,000 | | | | 113,925 | |
| HCA, Inc.: | |
| 5.875%, 3/15/2022 | | | | 40,000 | | | | 43,500 | |
| 6.5%, 2/15/2020 | | | | 210,000 | | | | 236,250 | |
| 7.5%, 2/15/2022 | | | | 155,000 | | | | 177,475 | |
| 7.875%, 2/15/2020 | | | | 365,000 | | | | 406,063 | |
| 8.5%, 4/15/2019 | | | | 45,000 | | | | 50,175 | |
| Hologic, Inc., 144A, 6.25%, 8/1/2020 | | | | 30,000 | | | | 32,325 | |
| Laboratory Corp. of America Holdings, 3.75%, 8/23/2022 | | | | 35,000 | | | | 37,116 | |
| Mylan, Inc., 144A, 7.875%, 7/15/2020 | | | | 15,000 | | | | 17,726 | |
| Physio-Control International, Inc., 144A, 9.875%, 1/15/2019 | | | | 50,000 | | | | 54,875 | |
| STHI Holding Corp., 144A, 8.0%, 3/15/2018 | | | | 60,000 | | | | 64,950 | |
| Tenet Healthcare Corp., 6.25%, 11/1/2018 | | | | 80,000 | | | | 87,800 | |
| Warner Chilcott Co., LLC, 7.75%, 9/15/2018 | | | | 75,000 | | | | 79,875 | |
| | | | | 2,152,833 | |
| Industrials 4.4% | |
| Accuride Corp., 9.5%, 8/1/2018 | | | | 85,000 | | | | 82,025 | |
| ADT Corp., 144A, 3.5%, 7/15/2022 | | | | 90,000 | | | | 87,533 | |
| Air Lease Corp., 5.625%, 4/1/2017 | | | | 75,000 | | | | 79,500 | |
| Armored Autogroup, Inc., 9.25%, 11/1/2018 | | | | 105,000 | | | | 88,987 | |
| BE Aerospace, Inc., 6.875%, 10/1/2020 | | | | 25,000 | | | | 27,813 | |
| Belden, Inc., 144A, 5.5%, 9/1/2022 | | | | 55,000 | | | | 56,513 | |
| Bombardier, Inc.: | |
| 144A, 5.75%, 3/15/2022 (b) | | | | 55,000 | | | | 56,513 | |
| 144A, 7.75%, 3/15/2020 | | | | 45,000 | | | | 51,075 | |
| Briggs & Stratton Corp., 6.875%, 12/15/2020 | | | | 25,000 | | | | 28,281 | |
| Casella Waste Systems, Inc., 7.75%, 2/15/2019 | | | | 110,000 | | | | 104,500 | |
| Ducommun, Inc., 9.75%, 7/15/2018 | | | | 65,000 | | | | 69,875 | |
| | | Principal Amount ($)(a) | | | Value ($) | |
| | | | | | | | | |
| DynCorp International, Inc., 10.375%, 7/1/2017 | | | | 85,000 | | | | 77,775 | |
| Florida East Coast Railway Corp., 8.125%, 2/1/2017 | | | | 40,000 | | | | 42,400 | |
| FTI Consulting, Inc., 6.75%, 10/1/2020 | | | | 145,000 | | | | 154,787 | |
| Garda World Security Corp., 144A, 9.75%, 3/15/2017 | | | | 60,000 | | | | 62,850 | |
| Georgian Railway JSC, 144A, 7.75%, 7/11/2022 | | | | 200,000 | | | | 227,500 | |
| Huntington Ingalls Industries, Inc.: | | |
| 6.875%, 3/15/2018 | | | | 50,000 | | | | 54,375 | |
| 7.125%, 3/15/2021 | | | | 10,000 | | | | 10,875 | |
| Interline Brands, Inc., 7.5%, 11/15/2018 | | | | 50,000 | | | | 54,000 | |
| Iron Mountain, Inc., 5.75%, 8/15/2024 | | | | 55,000 | | | | 55,688 | |
| Masco Corp., 7.125%, 3/15/2020 | | | | 145,000 | | | | 168,697 | |
| Meritor, Inc.: | |
| 8.125%, 9/15/2015 | | | | 55,000 | | | | 57,888 | |
| 10.625%, 3/15/2018 | | | | 60,000 | | | | 62,550 | |
| Navios Maritime Holdings, Inc.: | |
| 8.125%, 2/15/2019 | | | | 135,000 | | | | 117,450 | |
| 8.875%, 11/1/2017 | | | | 35,000 | | | | 34,913 | |
| Nortek, Inc., 8.5%, 4/15/2021 | | | | 75,000 | | | | 83,250 | |
| Owens Corning, Inc.: | |
| 4.2%, 12/15/2022 | | | | 30,000 | | | | 30,510 | |
| 9.0%, 6/15/2019 | | | | 29,000 | | | | 36,242 | |
| Ply Gem Industries, Inc., 144A, 9.375%, 4/15/2017 | | | | 25,000 | | | | 26,625 | |
| RBS Global, Inc. & Rexnord Corp., 8.5%, 5/1/2018 | | | | 120,000 | | | | 130,050 | |
| Sitel LLC, 11.5%, 4/1/2018 | | | | 95,000 | | | | 66,975 | |
| Spirit AeroSystems, Inc., 6.75%, 12/15/2020 | | | | 75,000 | | | | 80,250 | |
| Titan International, Inc., 7.875%, 10/1/2017 | | | | 90,000 | | | | 95,625 | |
| TransDigm, Inc., 7.75%, 12/15/2018 | | | | 65,000 | | | | 71,906 | |
| Transnet SOC Ltd., 144A, 4.0%, 7/26/2022 | | | | 200,000 | | | | 201,250 | |
| United Rentals North America, Inc.: | | |
| 144A, 5.75%, 7/15/2018 | | | | 60,000 | | | | 64,650 | |
| 144A, 7.375%, 5/15/2020 | | | | 95,000 | | | | 104,262 | |
| 144A, 7.625%, 4/15/2022 | | | | 95,000 | | | | 106,162 | |
| Urbi, Desarrollos Urbanos SAB de CV, 144A, 9.75%, 2/3/2022 (b) | | | | 200,000 | | | | 189,500 | |
| | | | | 3,201,620 | |
| Information Technology 1.7% | |
| Avaya, Inc., 144A, 7.0%, 4/1/2019 (b) | | | | 145,000 | | | | 135,575 | |
| CDW LLC, 8.5%, 4/1/2019 | | | | 45,000 | | | | 48,712 | |
| CommScope, Inc., 144A, 8.25%, 1/15/2019 | | | | 85,000 | | | | 93,075 | |
| eAccess Ltd., 144A, 8.25%, 4/1/2018 | | | | 60,000 | | | | 67,200 | |
| Equinix, Inc.: | |
| 7.0%, 7/15/2021 | | | | 40,000 | | | | 44,400 | |
| 8.125%, 3/1/2018 | | | | 140,000 | | | | 154,350 | |
| Fidelity National Information Services, Inc.: | | |
| 5.0%, 3/15/2022 | | | | 15,000 | | | | 16,088 | |
| 7.625%, 7/15/2017 | | | | 10,000 | | | | 10,875 | |
| | | Principal Amount ($)(a) | | | Value ($) | |
| | | | | | | | | |
| First Data Corp.: | |
| 144A, 6.75%, 11/1/2020 | | | | 110,000 | | | | 111,100 | |
| 144A, 7.375%, 6/15/2019 | | | | 45,000 | | | | 46,575 | |
| 144A, 8.875%, 8/15/2020 | | | | 85,000 | | | | 92,650 | |
| Fiserv, Inc., 3.5%, 10/1/2022 | | | | 95,000 | | | | 96,723 | |
| Freescale Semiconductor, Inc., 144A, 9.25%, 4/15/2018 | | | 190,000 | | | | 207,575 | |
| Hughes Satellite Systems Corp.: | |
| 6.5%, 6/15/2019 | | | | 40,000 | | | | 44,100 | |
| 7.625%, 6/15/2021 | | | | 40,000 | | | | 45,500 | |
| IAC/InterActiveCorp., 144A, 4.75%, 12/15/2022 | | | | 25,000 | | | | 24,875 | |
| Jabil Circuit, Inc., 7.75%, 7/15/2016 | | | | 30,000 | | | | 35,250 | |
| | | | | 1,274,623 | |
| Materials 4.9% | |
| Alpek SA de CV, 144A, 4.5%, 11/20/2022 | | | | 200,000 | | | | 208,500 | |
| APERAM, 144A, 7.375%, 4/1/2016 | | | | 150,000 | | | | 139,875 | |
| Ball Corp.: | |
| 7.125%, 9/1/2016 | | | | 30,000 | | | | 32,100 | |
| 7.375%, 9/1/2019 | | | | 25,000 | | | | 27,813 | |
| China Oriental Group Co., Ltd., 144A, 7.0%, 11/17/2017 | | | | 100,000 | | | | 99,500 | |
| Clearwater Paper Corp., 7.125%, 11/1/2018 | | | | 65,000 | | | | 70,850 | |
| Corp. Nacional del Cobre de Chile, 144A, 3.0%, 7/17/2022 | | | | 200,000 | | | | 202,221 | |
| Crown Americas LLC: | |
| 6.25%, 2/1/2021 | | | | 10,000 | | | | 10,963 | |
| 7.625%, 5/15/2017 | | | | 30,000 | | | | 31,687 | |
| Essar Steel Algoma, Inc.: | |
| 144A, 9.375%, 3/15/2015 | | | | 240,000 | | | | 217,200 | |
| 144A, 9.875%, 6/15/2015 | | | | 35,000 | | | | 23,975 | |
| Evraz Group SA, 144A, 7.4%, 4/24/2017 | | | | 200,000 | | | | 211,000 | |
| Exopack Holding Corp., 10.0%, 6/1/2018 | | | | 40,000 | | | | 36,200 | |
| FMG Resources (August 2006) Pty Ltd.: | | |
| 144A, 6.0%, 4/1/2017 | | | | 55,000 | | | | 56,100 | |
| 144A, 6.875%, 4/1/2022 | | | | 40,000 | | | | 40,900 | |
| 144A, 7.0%, 11/1/2015 | | | | 65,000 | | | | 68,250 | |
| 144A, 8.25%, 11/1/2019 | | | | 45,000 | | | | 47,925 | |
| Greif, Inc., 7.75%, 8/1/2019 | | | | 195,000 | | | | 225,225 | |
| Huntsman International LLC: | |
| 8.625%, 3/15/2020 | | | | 60,000 | | | | 67,950 | |
| 8.625%, 3/15/2021 | | | | 25,000 | | | | 28,563 | |
| IAMGOLD Corp., 144A, 6.75%, 10/1/2020 | | | | 40,000 | | | | 39,000 | |
| Inmet Mining Corp.: | |
| 144A, 7.5%, 6/1/2021 | | | | 80,000 | | | | 83,000 | |
| 144A, 8.75%, 6/1/2020 | | | | 20,000 | | | | 21,850 | |
| International Paper Co., 7.95%, 6/15/2018 | | | | 145,000 | | | | 187,460 | |
| JMC Steel Group, 144A, 8.25%, 3/15/2018 | | | | 60,000 | | | | 62,700 | |
| Kaiser Aluminum Corp., 8.25%, 6/1/2020 | | | | 40,000 | | | | 43,600 | |
| KGHM International Ltd., 144A, 7.75%, 6/15/2019 | | | | 115,000 | | | | 119,312 | |
| LyondellBasell Industries NV, 6.0%, 11/15/2021 | | | | 15,000 | | | | 17,588 | |
| | | Principal Amount ($)(a) | | | Value ($) | |
| | | | | | | | | |
| Molycorp, Inc., 144A, 10.0%, 6/1/2020 | | | | 65,000 | | | | 60,450 | |
| Momentive Performance Materials, Inc., 144A, 8.875%, 10/15/2020 | | | | 45,000 | | | | 45,450 | |
| Novelis, Inc.: | |
| 8.375%, 12/15/2017 | | | | 160,000 | | | | 176,400 | |
| 8.75%, 12/15/2020 | | | | 110,000 | | | | 122,650 | |
| Owens-Brockway Glass Container, Inc., 7.375%, 5/15/2016 | | | | 110,000 | | | | 125,400 | |
| Packaging Dynamics Corp., 144A, 8.75%, 2/1/2016 | | | | 90,000 | | | | 94,050 | |
| Polymer Group, Inc., 7.75%, 2/1/2019 | | | | 55,000 | | | | 58,987 | |
| Rain CII Carbon LLC, 144A, 8.0%, 12/1/2018 | | | | 45,000 | | | | 45,787 | |
| Samarco Mineracao SA, 144A, 4.125%, 11/1/2022 | | | | 200,000 | | | | 203,500 | |
| Sealed Air Corp.: | |
| 144A, 8.125%, 9/15/2019 | | | | 30,000 | | | | 33,750 | |
| 144A, 8.375%, 9/15/2021 | | | | 30,000 | | | | 34,275 | |
| Viskase Companies, Inc., 144A, 9.875%, 1/15/2018 | | | | 145,000 | | | | 147,900 | |
| Wolverine Tube, Inc., 6.0%, 6/28/2014 (PIK) | | | | 17,544 | | | | 17,176 | |
| | | | | 3,587,082 | |
| Telecommunication Services 5.9% | |
| America Movil SAB de CV, Series 12, 6.45%, 12/5/2022 | MXN | | | 2,000,000 | | | | 158,816 | |
| CC Holdings GS V LLC: | |
| 144A, 3.849%, 4/15/2023 | | | | 70,000 | | | | 71,212 | |
| 144A, 7.75%, 5/1/2017 | | | | 60,000 | | | | 63,708 | |
| Cincinnati Bell, Inc.: | |
| 8.25%, 10/15/2017 | | | | 55,000 | | | | 59,263 | |
| 8.375%, 10/15/2020 | | | | 180,000 | | | | 194,850 | |
| 8.75%, 3/15/2018 (b) | | | | 170,000 | | | | 175,525 | |
| CPI International, Inc., 8.0%, 2/15/2018 | | | | 45,000 | | | | 43,931 | |
| Cricket Communications, Inc., 7.75%, 10/15/2020 | | | | 280,000 | | | | 285,600 | |
| Crown Castle International Corp.: | | |
| 144A, 5.25%, 1/15/2023 | | | | 20,000 | | | | 21,400 | |
| 9.0%, 1/15/2015 | | | | 195,000 | | | | 206,797 | |
| Digicel Group Ltd., 144A, 10.5%, 4/15/2018 | | | | 100,000 | | | | 110,000 | |
| Digicel Ltd., 144A, 8.25%, 9/1/2017 | | | | 400,000 | | | | 428,000 | |
| ERC Ireland Preferred Equity Ltd., 144A, 7.69%**, 2/15/2017 (PIK)* | EUR | | | 88,319 | | | | 35 | |
| Frontier Communications Corp.: | |
| 7.125%, 1/15/2023 | | | | 60,000 | | | | 63,600 | |
| 7.875%, 4/15/2015 | | | | 7,000 | | | | 7,823 | |
| 8.25%, 4/15/2017 | | | | 70,000 | | | | 80,850 | |
| 8.5%, 4/15/2020 | | | | 90,000 | | | | 103,500 | |
| 8.75%, 4/15/2022 | | | | 10,000 | | | | 11,600 | |
| Intelsat Jackson Holdings SA: | |
| 7.25%, 10/15/2020 | | | | 120,000 | | | | 130,500 | |
| 7.5%, 4/1/2021 | | | | 150,000 | | | | 165,375 | |
| 8.5%, 11/1/2019 | | | | 100,000 | | | | 112,000 | |
| Intelsat Luxembourg SA: | |
| 11.25%, 2/4/2017 | | | | 145,000 | | | | 153,337 | |
| 11.5%, 2/4/2017 (PIK) | | | | 384,218 | | | | 408,232 | |
| | | Principal Amount ($)(a) | | | Value ($) | |
| | | | | | | | | |
| iPCS, Inc., 2.438%**, 5/1/2013 | | | 35,000 | | | | 34,913 | |
| Level 3 Communications, Inc., 144A, 8.875%, 6/1/2019 | | | 10,000 | | | | 10,650 | |
| MetroPCS Wireless, Inc.: | |
| 6.625%, 11/15/2020 | | | | 65,000 | | | | 69,062 | |
| 7.875%, 9/1/2018 | | | | 75,000 | | | | 81,187 | |
| SBA Communications Corp., 144A, 5.625%, 10/1/2019 | | | | 30,000 | | | | 31,500 | |
| SBA Telecommunications, Inc., 8.25%, 8/15/2019 | | | | 16,000 | | | | 17,880 | |
| Sprint Nextel Corp.: | |
| 6.0%, 12/1/2016 | | | | 320,000 | | | | 348,000 | |
| 8.375%, 8/15/2017 | | | | 55,000 | | | | 63,937 | |
| 9.125%, 3/1/2017 | | | | 50,000 | | | | 58,875 | |
| Syniverse Holdings, Inc., 9.125%, 1/15/2019 | | | | 25,000 | | | | 26,688 | |
| tw telecom holdings, Inc., 144A, 5.375%, 10/1/2022 | | | | 35,000 | | | | 36,663 | |
| Windstream Corp.: | |
| 7.0%, 3/15/2019 | | | | 60,000 | | | | 61,350 | |
| 7.5%, 6/1/2022 | | | | 25,000 | | | | 26,500 | |
| 7.5%, 4/1/2023 | | | | 75,000 | | | | 78,937 | |
| 7.75%, 10/15/2020 | | | | 35,000 | | | | 37,800 | |
| 7.875%, 11/1/2017 | | | | 205,000 | | | | 230,625 | |
| 8.125%, 9/1/2018 | | | | 70,000 | | | | 76,475 | |
| | | | | 4,346,996 | |
| Utilities 3.2% | |
| Abu Dhabi National Energy Co., 144A, 3.625%, 1/12/2023 | | | | 200,000 | | | | 206,000 | |
| AES Corp.: | |
| 8.0%, 10/15/2017 | | | | 10,000 | | | | 11,550 | |
| 8.0%, 6/1/2020 | | | | 175,000 | | | | 201,250 | |
| American Electric Power Co., Inc., Series F, 2.95%, 12/15/2022 | | | | 140,000 | | | | 140,045 | |
| Calpine Corp.: | |
| 144A, 7.5%, 2/15/2021 | | | | 72,000 | | | | 79,560 | |
| 144A, 7.875%, 7/31/2020 | | | | 54,000 | | | | 60,615 | |
| Comision Federal de Electricidad, 144A, 5.75%, 2/14/2042 | | | | 200,000 | | | | 226,500 | |
| Dubai Electricity & Water Authority, 144A, 7.375%, 10/21/2020 | | | | 200,000 | | | | 246,000 | |
| Energy Future Holdings Corp., Series Q, 6.5%, 11/15/2024 | | | | 205,000 | | | | 121,975 | |
| GDF Suez, 144A, 2.875%, 10/10/2022 | | | | 120,000 | | | | 118,775 | |
| IPALCO Enterprises, Inc., 5.0%, 5/1/2018 | | | | 145,000 | | | | 151,888 | |
| Korea Gas Corp., 144A, 6.25%, 1/20/2042 | | | | 200,000 | | | | 267,436 | |
| NRG Energy, Inc.: | |
| 7.625%, 1/15/2018 | | | | 35,000 | | | | 38,850 | |
| 8.25%, 9/1/2020 | | | | 15,000 | | | | 16,800 | |
| Oncor Electric Delivery Co., LLC, 4.1%, 6/1/2022 | | | | 160,000 | | | | 174,389 | |
| Texas Competitive Electric Holdings Co., LLC, Series A, 10.25%, 11/1/2015 | | | 50,000 | | | | 14,500 | |
| Toledo Edison Co., 7.25%, 5/1/2020 | | | 230,000 | | | | 292,368 | |
| | | | | 2,368,501 | |
Total Corporate Bonds (Cost $40,718,624) | | | | 42,949,498 | |
| | | Principal Amount ($)(a) | | | Value ($) | |
| | | | | | | | | |
| Mortgage-Backed Securities Pass-Throughs 6.1% | |
| Government National Mortgage Association: | |
| 3.0%, 6/1/2042 (c) | | | | 3,000,000 | | | | 3,188,672 | |
| 3.5%, 10/20/2042 | | | | 1,182,800 | | | | 1,259,139 | |
Total Mortgage-Backed Securities Pass-Throughs (Cost $4,449,545) | | | | 4,447,811 | |
| | |
| Asset-Backed 1.4% | |
| Home Equity Loans 0.5% | |
| CIT Group Home Equity Loan Trust, "AF6", Series 2002-1, 6.2%, 2/25/2030 | | | 74,297 | | | | 74,065 | |
| Citifinancial Mortgage Securities, Inc., "AFS", Series 2003-4, 5.326%, 10/25/2033 | | | 190,000 | | | | 198,497 | |
| Countrywide Home Equity Loan Trust, "2A", Series 2006-I, 0.349%**, 1/15/2037 | | | 145,814 | | | | 113,648 | |
| | | | | 386,210 | |
| Miscellaneous 0.9% | |
| ARES CLO Ltd., "D", Series 2012-3A, 144A, 4.856%**, 1/17/2024 | | | 250,000 | | | | 240,500 | |
| CIFC Funding Ltd., "B1L", Series 2012-2A, 144A, 4.61%, 12/5/2024 | | | 400,000 | | | | 378,852 | |
| | | | | 619,352 | |
Total Asset-Backed (Cost $968,833) | | | | 1,005,562 | |
| | |
| Commercial Mortgage-Backed Securities 2.8% | |
| Banc of America Large Loan, Inc., "HLTN", Series 2010-HLTN, 144A, 2.509%**, 11/15/2015 | | | 549,289 | | | | 548,157 | |
| Greenwich Capital Commercial Funding Corp., "AM", Series 2007-GG11, 5.867%, 12/10/2049 | | | 290,000 | | | | 324,211 | |
| JPMorgan Chase Commercial Mortgage Securities Corp.: | | | | | | | | |
| "C", Series 2012-HSBC, 144A, 4.021%, 7/5/2032 | | | 150,000 | | | | 157,427 | |
| "A4", Series 2006-LDP7, 5.871%**, 4/15/2045 | | | 140,000 | | | | 161,114 | |
| LB-UBS Commercial Mortgage Trust, "A3", Series 2006-C7, 5.347%, 11/15/2038 | | | 440,000 | | | | 505,628 | |
| PNC Mortgage Acceptance Corp., "J", Series 2000-C2, 144A, 6.22%, 10/12/2033 | | | 200,000 | | | | 192,209 | |
| Wachovia Bank Commercial Mortgage Trust, "A4", Series 2005-C22, 5.293%**, 12/15/2044 | | | 140,000 | | | | 156,116 | |
Total Commercial Mortgage-Backed Securities (Cost $1,884,043) | | | | 2,044,862 | |
| | |
| Collateralized Mortgage Obligations 3.5% | |
| Banc of America Mortgage Securities, "2A2", Series 2004-A, 2.971%**, 2/25/2034 | | | 134,090 | | | | 133,732 | |
| Bear Stearns Adjustable Rate Mortgage Trust, "2A1", Series 2005-11, 3.457%**, 12/25/2035 | | | 189,721 | | | | 191,626 | |
| | | Principal Amount ($)(a) | | | Value ($) | |
| | | | | | | | | |
| Countrywide Home Loans: | |
| "A16", Series 2005-21, 5.0%, 10/25/2035 | | | | 22,357 | | | | 22,295 | |
| "2A5", Series 2004-13, 5.75%, 8/25/2034 | | | | 136,018 | | | | 125,582 | |
| Federal Home Loan Mortgage Corp.: | | |
| "AI", Series 4016, Interest Only, 3.0%, 9/15/2025 | | | | 1,710,159 | | | | 134,505 | |
| "JI", Series 3558, Interest Only, 4.5%, 12/15/2023 | | | | 125,283 | | | | 7,909 | |
| "PI", Series 3843, Interest Only, 4.5%, 5/15/2038 | | | | 552,204 | | | | 83,037 | |
| "HI", Series 2934, Interest Only, 5.0%, 2/15/2020 | | | | 188,671 | | | | 21,168 | |
| "WI", Series 3010, Interest Only, 5.0%, 7/15/2020 | | | | 311,302 | | | | 32,006 | |
| Federal National Mortgage Association: | | |
| "BI", Series 2010-13, Interest Only, 5.0%, 12/25/2038 | | | | 223,618 | | | | 52,006 | |
| "PI", Series 2006-20, Interest Only, 6.47%**, 11/25/2030 | | | | 567,326 | | | | 117,730 | |
| "JS", Series 2004-59, Interest Only, 6.89%**, 4/25/2023 | | | | 359,845 | | | | 17,374 | |
| Government National Mortgage Association: | | |
| "GP", Series 2010-67, 4.5%, 3/20/2039 | | | | 250,000 | | | | 285,553 | |
| "MI", Series 2009-76, Interest Only, 5.0%, 3/20/2035 | | | | 555,854 | | | | 16,211 | |
| "ID", Series 2003-79, Interest Only, 5.5%, 12/20/2031 | | | | 61,349 | | | | 1,281 | |
| "IV", Series 2009-69, Interest Only, 5.5%, 8/20/2039 | | | | 754,998 | | | | 105,855 | |
| "IN", Series 2009-69, Interest Only, 5.5%, 8/20/2039 | | | | 760,021 | | | | 105,390 | |
| "IJ", Series 2009-75, Interest Only, 6.0%, 8/16/2039 | | | | 634,904 | | | | 100,298 | |
| JPMorgan Mortgage Trust, "2A1", Series 2006-A2, 5.138%**, 4/25/2036 | | | | 386,692 | | | | 339,566 | |
| Merrill Lynch Mortgage Investors Trust, "2A", Series 2003-A6, 3.132%**, 10/25/2033 | | | | 99,192 | | | | 97,512 | |
| Morgan Stanley Mortgage Loan Trust, "5A5", Series 2005-4, 5.5%, 8/25/2035 | | | | 58,910 | | | | 59,676 | |
| Vericrest Opportunity Loan Transferee, "A2", Series 2012-NL1A, 144A, 8.112%, 3/25/2049 | | | | 150,000 | | | | 151,664 | |
| Washington Mutual Mortgage Pass-Through Certificates Trust, "1A1", Series 2005-AR12, 2.472%**, 10/25/2035 | | | | 31,222 | | | | 30,841 | |
| | | Principal Amount ($)(a) | | | Value ($) | |
| | | | | | | | | |
| Wells Fargo Mortgage-Backed Securities Trust: | | |
| "2A3",Series 2004-EE, 2.626%**, 12/25/2034 | | | | 173,708 | | | | 174,621 | |
| "B1", Series 2004-1, 5.5%, 2/25/2034 | | | | 204,740 | | | | 191,279 | |
Total Collateralized Mortgage Obligations (Cost $2,503,150) | | | | 2,598,717 | |
| | |
| Government & Agency Obligations 15.2% | |
| Other Government Related (d) 0.3% | |
| Penerbangan Malaysia Bhd., 144A, 5.625%, 3/15/2016 | | | | 200,000 | | | | 224,236 | |
| Sovereign Bonds 5.5% | |
| Federative Republic of Brazil, 12.5%, 1/5/2016 | BRL | | | 250,000 | | | | 150,489 | |
| Government of Canada, 0.75%, 5/1/2014 | CAD | | | 1,400,000 | | | | 1,400,549 | |
| Government of Ukraine, 144A, 6.58%, 11/21/2016 | | | | 250,000 | | | | 249,700 | |
| Republic of Argentina-Inflation Linked Bond, 5.83%, 12/31/2033 | ARS | | | 468 | | | | 96 | |
| Republic of Belarus, REG S, 8.75%, 8/3/2015 | | | | 145,000 | | | | 148,538 | |
| Republic of Croatia, 144A, 6.25%, 4/27/2017 | | | | 200,000 | | | | 219,300 | |
| Republic of Hungary: | |
| 4.75%, 2/3/2015 | | | | 100,000 | | | | 103,000 | |
| 7.625%, 3/29/2041 | | | | 100,000 | | | | 115,500 | |
| Republic of Indonesia, 144A, 4.875%, 5/5/2021 | | | | 250,000 | | | | 287,500 | |
| Republic of Poland, 3.0%, 3/17/2023 | | | | 100,000 | | | | 99,750 | |
| Republic of Serbia, REG S, 6.75%, 11/1/2024 | | | | 160,000 | | | | 161,600 | |
| Republic of Uruguay, 4.125%, 11/20/2045 | | | | 91,152 | | | | 91,015 | |
| Russian Federation, 144A, 3.25%, 4/4/2017 | | | | 200,000 | | | | 212,500 | |
| United Mexican States, 4.75%, 3/8/2044 | | | | 500,000 | | | | 565,000 | |
| Vnesheconombank, 144A, 6.025%, 7/5/2022 | | | | 200,000 | | | | 232,500 | |
| | | | | 4,037,037 | |
| U.S. Treasury Obligations 9.4% | |
| U.S. Treasury Bills: | |
| 0.13%***, 3/7/2013 (e) | | | | 294,000 | | | | 293,983 | |
| 0.131%***, 3/7/2013 (e) | | | | 44,000 | | | | 43,997 | |
| U.S. Treasury Bonds: | |
| 3.0%, 5/15/2042 | | | | 600,000 | | | | 611,250 | |
| 4.75%, 2/15/2037 | | | | 400,000 | | | | 545,750 | |
| U.S. Treasury Notes: | |
| 0.75%, 6/15/2014 | | | | 500,000 | | | | 503,887 | |
| 1.5%, 7/31/2016 | | | | 4,375,000 | | | | 4,536,328 | |
| 1.625%, 11/15/2022 | | | | 400,000 | | | | 395,625 | |
| | | | | 6,930,820 | |
Total Government & Agency Obligations (Cost $11,043,932) | | | | 11,192,093 | |
| | |
| | | Principal Amount ($)(a) | | | Value ($) | |
| | | | | | | | | |
| Loan Participations and Assignments 8.0% | |
| Senior Loans** 4.3% | |
| Buffalo Gulf Coast Terminals LLC, Term Loan, 5.25%, 10/31/2017 | | | 74,813 | | | | 76,028 | |
| Buffets, Inc., Letter of Credit, First Lien, LIBOR plus 9.25%, 4/22/2015* | | | 10,268 | | | | 5,051 | |
| Burger King Corp., Term Loan B, 3.75%, 9/27/2019 | | | 69,825 | | | | 70,310 | |
| Charter Communications Operating LLC, Term Loan C, 3.47%, 9/6/2016 | | | 105,744 | | | | 106,424 | |
| Chesapeake Energy Corp., Term Loan, 5.75%, 12/1/2017 | | | 75,000 | | | | 75,221 | |
| Clear Channel Communication, Inc., Term Loan B, 3.862%, 1/29/2016 | | | 45,318 | | | | 37,565 | |
| Crown Castle International Corp., Term Loan B, 4.0%, 1/31/2019 | | | 49,749 | | | | 50,107 | |
| Cumulus Media Holdings, Inc., Second Lien Term Loan, 7.5%, 9/16/2019 | | | 50,000 | | | | 51,656 | |
| Goodyear Tire & Rubber Co., Second Lien Term Loan, 4.75%, 4/30/2019 | | | 220,000 | | | | 221,925 | |
| Kabel Deutschland GmbH, Term Loan F, 4.25%, 2/1/2019 | | | 385,000 | | | | 388,850 | |
| MetroPCS Wireless, Inc., Term Loan B3, 4.0%, 3/16/2018 | | | 109,443 | | | | 109,892 | |
| NRG Energy, Inc., Term Loan B, 4.0%, 7/2/2018 | | | 89,545 | | | | 90,659 | |
| Par Pharmaceutical Companies, Inc., Term Loan B, 5.0%, 9/30/2019 | | | 119,700 | | | | 119,763 | |
| Pilot Travel Centers LLC: | |
| Term Loan B, 3.75%, 3/30/2018 | | | 90,739 | | | | 91,429 | |
| Term Loan B2, 4.25%, 8/7/2019 | | | 339,150 | | | | 341,551 | |
| Pinnacle Foods Finance LLC, Term Loan F, 4.75%, 10/17/2018 | | | 89,550 | | | | 90,538 | |
| Plains Exploration & Production, 7 year Term Loan, 4.0%, 11/30/2019 | | | 120,000 | | | | 120,676 | |
| QS0001 Corp., First Lien Term Loan, 5.25%, 11/1/2018 | | | 65,000 | | | | 65,691 | |
| Samson Investment Co., Second Lien Term Loan, 6.0%, 9/25/2018 | | | 175,000 | | | | 177,115 | |
| Tallgrass Energy Partners LP, Term Loan, 5.25%, 11/13/2018 | | | 205,000 | | | | 207,392 | |
| Tomkins LLC, Term Loan B, 4.25%, 9/29/2016 | | | 438,635 | | | | 442,107 | |
| Univision Communications, Inc., Term Loan, 4.462%, 3/31/2017 | | | 59,959 | | | | 59,088 | |
| Warner Chilcott Co., LLC, Term Loan B2, 4.25%, 3/15/2018 | | | 16,471 | | | | 16,644 | |
| Warner Chilcott Corp.: | |
| Incremental Term Loan B1, 4.25%, 3/15/2018 | | | 12,510 | | | | 12,642 | |
| Term Loan B1, 4.25%, 3/15/2018 | | | 32,942 | | | | 33,289 | |
| WC Luxco SARL, Term Loan B3, 4.25%, 3/15/2018 | | | 22,647 | | | | 22,886 | |
| WMG Acquisition Corp., Term Loan, 5.25%, 11/1/2018 | | | 50,000 | | | | 50,703 | |
| | | | | 3,135,202 | |
| | | Principal Amount ($)(a) | | | Value ($) | |
| | | | | | | | | |
| Sovereign Loans 3.7% | |
| Bank of Moscow, 144A, 6.699%, 3/11/2015 | | | | 250,000 | | | | 265,000 | |
| Gazprom Neft OAO, 144A, 4.375%, 9/19/2022 | | | | 250,000 | | | | 255,625 | |
| Gazprom OAO, 144A, 4.95%, 7/19/2022 (b) | | | | 200,000 | | | | 215,100 | |
| OAO Novatek: | |
| 144A, 4.422%, 12/13/2022 | | | | 250,000 | | | | 251,562 | |
| 144A, 5.326%, 2/3/2016 | | | | 200,000 | | | | 214,250 | |
| Rosneft Oil Co., 144A, 4.199%, 3/6/2022 | | | | 250,000 | | | | 254,375 | |
| RZD Capital Ltd., 5.739%, 4/3/2017 | | | 145,000 | | | | 162,400 | |
| Sberbank of Russia, 144A, 6.125%, 2/7/2022 | | | | 200,000 | | | | 228,500 | |
| Vimpel Communications, 144A, 7.748%, 2/2/2021 | | | 200,000 | | | | 231,000 | |
| VTB Bank OJSC: | |
| 144A, 6.0%, 4/12/2017 | | | | 200,000 | | | | 216,200 | |
| 144A, 6.95%, 10/17/2022 | | | | 400,000 | | | | 430,000 | |
| | | | | 2,724,012 | |
Total Loan Participations and Assignments (Cost $5,690,775) | | | | 5,859,214 | |
| | |
| Municipal Bonds and Notes 1.3% | |
| Chicago, IL, Airport Revenue, O'Hare International Airport, Series B, 6.0%, 1/1/2041 | | | 145,000 | | | | 177,329 | |
| Massachusetts, State School Building Authority, Sales Tax Revenue, Qualified School Construction Bond, Series A, 4.885%, 7/15/2028 | | | 300,000 | | | | 348,294 | |
| Orlando & Orange County, FL, Expressway Authority Revenue, Series C, 5.0%, 7/1/2040 | | | 145,000 | | | | 160,904 | |
| Port Authority of New York & New Jersey, 4.926%, 10/1/2051 | | | 260,000 | | | | 284,533 | |
Total Municipal Bonds and Notes (Cost $851,497) | | | | 971,060 | |
| | |
| Convertible Bonds 0.4% | |
| Consumer Discretionary 0.2% | |
| Group 1 Automotive, Inc., 3.0%, 3/15/2020 | | | 65,000 | | | | 114,969 | |
| Industrials 0.0% | |
| Meritor, Inc., Step-down Coupon, 4.625% to 3/1/2016, 0.0% to 3/1/2026 | | | 20,000 | | | | 18,663 | |
| Materials 0.2% | |
| GEO Specialty Chemicals, Inc., 144A, 7.5%, 3/31/2015 | | | 120,175 | | | | 142,419 | |
Total Convertible Bonds (Cost $200,393) | | | | 276,051 | |
| | |
| Preferred Security 0.1% | |
| Materials | |
| Hercules, Inc., 6.5%, 6/30/2029 (Cost $58,381) | | | 95,000 | | | | 84,837 | |
| | Units | Value ($) |
| | |
| Other Investments 0.0% |
| Consumer Discretionary |
| AOT Bedding Super Holdings LLC* (f) (Cost $4,000) | 4 | 13,910 |
| | Shares | Value ($) |
| | |
| Common Stocks 0.0% |
| Consumer Discretionary 0.0% |
| Buffets Restaurants Holdings, Inc.* | 84 | 882 |
| Trump Entertainment Resorts, Inc.* | 6 | 0 |
| Vertis Holdings, Inc.* | 63 | 0 |
| | 882 |
| Industrials 0.0% |
| Congoleum Corp.* | 2,500 | 0 |
| Materials 0.0% |
| GEO Specialty Chemicals, Inc.* | 2,058 | 937 |
| Wolverine Tube, Inc.* | 778 | 14,097 |
| | 15,034 |
Total Common Stocks (Cost $39,949) | 15,916 |
| |
| Preferred Stock 0.1% |
| Financials |
| Ally Financial, Inc., 144A, 7.0% (Cost $41,756) | 45 | 44,200 |
| |
| Warrants 0.0% |
| Consumer Discretionary 0.0% |
| Reader's Digest Association, Inc., Expiration Date 2/19/2014* | 159 | 27 |
| Materials 0.0% |
| GEO Specialty Chemicals, Inc., Expiration Date 3/31/2015* | 11,138 | 4,968 |
| Hercules Trust II, Expiration Date 3/31/2029* | 85 | 742 |
| | 5,710 |
Total Warrants (Cost $17,432) | 5,737 |
| | Shares | Value ($) |
| | |
| Exchange-Traded Fund 0.0% |
| SPDR Barclays Capital Convertible Securities (Cost $15,862) | 400 | 16,120 |
| | Contract Amount | Value ($) |
| | |
| Call Options Purchased 0.3% |
| Options on Interest Rate Swap Contracts |
| Pay Fixed Rate — 3.583% - Receive Floating — LIBOR, Swap Expiration Date 5/11/2026, Option Expiration Date 5/9/2016 | 1,400,000 | 43,543 |
| Pay Fixed Rate — 3.635% - Receive Floating — LIBOR, Swap Expiration Date 4/27/2026, Option Expiration Date 4/25/2016 | 1,300,000 | 38,203 |
| | Contract Amount | Value ($) |
| | |
| Pay Fixed Rate — 3.72% - Receive Floating — LIBOR, Swap Expiration Date 4/22/2026, Option Expiration Date 4/20/2016 | 1,300,000 | 35,642 |
| Pay Fixed Rate — 4.19% - Receive Floating — LIBOR, Swap Expiration Date 2/3/2027, Option Expiration Date 2/1/2017 | 1,500,000 | 41,310 |
| Pay Fixed Rate — 4.32% - Receive Floating — LIBOR, Swap Expiration Date 2/3/2027, Option Expiration Date 2/1/2017 | 1,400,000 | 35,428 |
Total Call Options Purchased (Cost $321,480) | 194,126 |
| | Contracts | Value ($) |
| | |
| Put Options Purchased 0.1% |
| Options on Exchange-Traded Futures Contracts 0.0% |
| 10 Year U.S. Treasury Note Future, Expiration Date 2/22/2013, Strike Price $132.0 | 20 | 11,563 |
| | Contract Amount | Value ($) |
| | |
| Options on Interest Rate Swap Contracts 0.1% |
| Receive Fixed Rate — 2.19% - Pay Floating — LIBOR, Swap Expiration Date 2/3/2027, Option Expiration Date 2/1/2017 | 1,500,000 | 37,852 |
| Receive Fixed Rate — 2.32% - Pay Floating — LIBOR, Swap Expiration Date 2/3/2027, Option Expiration Date 2/1/2017 | 1,400,000 | 40,691 |
| | 78,543 |
Total Put Options Purchased (Cost $110,804) | 90,106 |
| | Shares | Value ($) |
| | |
| Securities Lending Collateral 1.7% |
| Daily Assets Fund Institutional, 0.20% (g) (h) (Cost $1,251,728) | 1,251,728 | 1,251,728 |
| |
| Cash Equivalents 6.5% |
| Central Cash Management Fund, 0.15% (g) (Cost $4,749,659) | 4,749,659 | 4,749,659 |
| | | % of Net Assets | | | Value ($) | |
| | | | |
Total Investment Portfolio (Cost $74,921,843)† | | | 105.9 | | | | 77,811,207 | |
| Other Assets and Liabilities, Net | | | (5.9 | ) | | | (4,311,228 | ) |
| Net Assets | | | 100.0 | | | | 73,499,979 | |
The following table represents bonds and senior loans that are in default:
| Securities | | Coupon | | Maturity Date | | Principal Amount ($) | | Cost ($) | | | Value ($) | |
| Buffets, Inc.* | | LIBOR plus 9.25% | | 4/22/2015 | | | 10,268 | | USD | | | 9,873 | | | | 5,051 | |
| ERC Ireland Preferred Equity Ltd.* | | | 7.69 | % | 2/15/2017 | | | 88,319 | | EUR | | | 120,275 | | | | 35 | |
| Fontainebleau Las Vegas Holdings LLC* | | | 11.0 | % | 6/15/2015 | | | 65,000 | | USD | | | 65,022 | | | | 41 | |
| Hellas Telecommunications Finance SCA* | | | 8.21 | % | 7/15/2015 | | | 109,187 | | EUR | | | 32,169 | | | | 0 | |
| | | | | | | | | | | | | | 227,339 | | | | 5,127 | |
* Non-income producing security.
** Floating rate securities' yields vary with a designated market index or market rate, such as the coupon-equivalent of the U.S. Treasury Bill rate. These securities are shown at their current rate as of December 31, 2012.
*** Annualized yield at time of purchase; not a coupon rate.
† The cost for federal income tax purposes was $74,921,883. At December 31, 2012, net unrealized appreciation for all securities based on tax cost was $2,889,324. This consisted of aggregate gross unrealized appreciation for all securities in which there was an excess of value over tax cost of $3,786,570 and aggregate gross unrealized depreciation for all securities in which there was an excess of tax cost over value of $897,246.
(a) Principal amount stated in U.S. dollars unless otherwise noted.
(b) All or a portion of these securities were on loan (see Notes to Financial Statements). The value of all securities loaned at December 31, 2012 amounted to $1,197,557, which is 1.6% of net assets.
(c) When-issued or delayed delivery security included.
(d) Government-backed debt issued by financial companies or government-sponsored enterprises.
(e) At December 31, 2012, this security has been pledged, in whole or in part, to cover initial margin requirements for open futures contracts.
(f) The Fund may purchase securities that are subject to legal or contractual restrictions on resale ("restricted securities"). Restricted securities are securities which have not been registered with the Securities and Exchange Commission under the Securities Act of 1933. The Fund may be unable to sell a restricted security and it may be more difficult to determine a market value for a restricted security. Moreover, if adverse market conditions were to develop during the period between the Fund's decision to sell a restricted security and the point at which the Fund is permitted or able to sell such security, the Fund might obtain a price less favorable than the price that prevailed when it decided to sell. This investment practice, therefore, could have the effect of increasing the level of illiquidity of the Fund. The future value of these securities is uncertain and there may be changes in the estimated value of these securities.
| Schedule of Restricted Securities | Acquisition Date | | Cost ($) | | | Value ($) | | | Value as % of Net Assets | |
| AOT Bedding Super Holdings LLC* | June 2010 | | | 4,000 | | | | 13,910 | | | | .02 | |
(g) Affiliated fund managed by Deutsche Investment Management Americas Inc. The rate shown is the annualized seven-day yield at period end.
(h) Represents collateral held in connection with securities lending. Income earned by the Fund is net of borrower rebates.
144A: Security exempt from registration under Rule 144A of the Securities Act of 1933. These securities may be resold in transactions exempt from registration, normally to qualified institutional buyers.
Interest Only: Interest Only (IO) bonds represent the "interest only" portion of payments on a pool of underlying mortgages or mortgage-backed securities. IO securities are subject to prepayment risk of the pool of underlying mortgages.
LIBOR: London Interbank Offered Rate
PIK: Denotes that all or a portion of the income is paid in-kind in the form of additional principal.
��
REG S: Securities sold under Regulation S may not be offered, sold or delivered within the United States or to, or for the account or benefit of, U.S. persons, except pursuant to an exemption from, or in a transaction not subject to, the registration requirements of the Securities Act of 1933.
REIT: Real Estate Investment Trust
SPDR: Standard & Poor's Depositary Receipt
The Fund can invest in certain Senior Loan agreements that include the obligation to make additional loans in certain circumstances. The Fund reserves against such contingent obligations by segregating cash, liquid securities and liquid Senior Loans. At December 31, 2012, the Fund had an unfunded loan commitment of $49,507, which could be extended at the option of the borrower, pursuant to the following loan agreement:
| Borrower | | Unfunded Loan Commitment ($) | | | Value ($) | | | Unrealized Appreciation ($) | |
| Tallgrass Energy Partners LP, Term Delay Draw, 11/13/2017 | | | 49,507 | | | | 49,625 | | | | 118 | |
At December 31, 2012, open futures contracts purchased were as follows:
| Futures | Currency | Expiration Date | | Contracts | | | Notional Value ($) | | | Unrealized Depreciation ($) | |
| 10 Year Canadian Government Bond | CAD | 3/20/2013 | | | 10 | | | | 1,362,622 | | | | (9,593 | ) |
| 10 Year U.S. Treasury Note | USD | 3/19/2013 | | | 15 | | | | 1,991,719 | | | | (6,189 | ) |
| Ultra Long U.S. Treasury Bond | USD | 3/19/2013 | | | 4 | | | | 650,375 | | | | (13,487 | ) |
| United Kingdom Long Gilt Bond | GBP | 3/26/2013 | | | 11 | | | | 2,124,975 | | | | (2,262 | ) |
| Total unrealized depreciation | | | | (31,531 | ) |
At December 31, 2012, open futures contracts sold were as follows:
| Futures | Currency | Expiration Date | | Contracts | | | Notional Value ($) | | | Unrealized Depreciation ($) | |
| 5 Year U.S. Treasury Note | USD | 3/28/2013 | | | 20 | | | | 2,488,281 | | | | (430 | ) |
At December 31, 2012, open written options contracts were as follows:
| Options on Exchange-Traded Futures Contracts | | Contracts | | Expiration Date | | Strike Price ($) | | | Premiums Received ($) | | | Value ($) (i) | |
Put Options 10 Year U.S. Treasury Note Future | | | 20 | | 2/22/2013 | | | 131.0 | | | | 7,769 | | | | (6,563 | ) |
| |
(i) Unrealized appreciation on written options on exchange-traded futures contracts at December 31, 2012 was $1,206.
| Options on Interest Rate Swap Contracts | Swap Effective/ Expiration Date | | Contract Amount | | Option Expiration Date | | Premiums Received ($) | | | Value ($) (j) | |
Call Options Receive Fixed — 3.19% - Pay Floating — LIBOR | 2/3/2017 2/3/2027 | | | 700,000 | | 2/1/2017 | | | 50,400 | | | | (37,167 | ) |
| Receive Fixed — 3.32% - Pay Floating — LIBOR | 2/3/2017 2/3/2027 | | | 700,000 | | 2/1/2017 | | | 50,631 | | | | (34,147 | ) |
| Receive Fixed — 4.083% - Pay Floating — LIBOR | 5/11/2016 5/11/2026 | | | 1,400,000 | | 5/9/2016 | | | 47,600 | | | | (30,090 | ) |
| Receive Fixed — 4.135% - Pay Floating — LIBOR | 4/27/2016 4/27/2026 | | | 1,300,000 | | 4/25/2016 | | | 48,100 | | | | (26,336 | ) |
| Receive Fixed — 4.22% - Pay Floating — LIBOR | 4/22/2016 4/22/2026 | | | 1,300,000 | | 4/20/2016 | | | 46,345 | | | | (24,576 | ) |
| Total Call Options | | | 243,076 | | | | (152,316 | ) |
Put Options Pay Fixed — 1.9% - Receive Floating — LIBOR | 4/24/2013 4/24/2023 | | | 1,300,000 | | 4/22/2013 | | | 17,810 | | | | (18,682 | ) |
| Pay Fixed — 2.07% - Receive Floating — LIBOR | 5/10/2013 5/10/2043 | | | 1,400,000 | | 5/8/2013 | | | 22,400 | | | | (2,265 | ) |
| Pay Fixed — 2.09% - Receive Floating — LIBOR | 4/25/2013 4/25/2043 | | | 1,300,000 | | 4/23/2013 | | | 24,440 | | | | (1,675 | ) |
| Pay Fixed — 3.19% - Receive Floating — LIBOR | 2/3/2017 2/3/2027 | | | 700,000 | | 2/1/2017 | | | 50,400 | | | | (45,080 | ) |
| Pay Fixed — 3.32% - Receive Floating — LIBOR | 2/3/2017 2/3/2027 | | | 700,000 | | 2/1/2017 | | | 50,631 | | | | (49,766 | ) |
| Total Put Options | | | 165,681 | | | | (117,468 | ) |
| Total | | | 408,757 | | | | (269,784 | ) |
(j) Unrealized appreciation on written options on interest rate swap contracts at December 31, 2012 was $138,973.
At December 31, 2012, open credit default swap contracts sold were as follows:
Effective/ Expiration Date | | Notional Amount ($) (k) | | | Fixed Cash Flows Received | | Underlying Debt Obligation/Quality Rating (l) | | Value ($) | | | Upfront Payments Paid/ (Received) ($) | | | Unrealized Appreciation ($) | |
9/21/2009 12/20/2014 | | | 290,000 | 1 | | | 1.0 | % | Berkshire Hathaway Finance Corp., 4.625%, 10/15/2013, AA+ | | | 1,931 | | | | (7,340 | ) | | | 9,271 | |
6/21/2010 9/20/2013 | | | 70,000 | 2 | | | 5.0 | % | Ford Motor Co., 6.5%, 8/1/2018, BBB- | | | 2,406 | | | | 858 | | | | 1,548 | |
6/21/2010 9/20/2015 | | | 90,000 | 3 | | | 5.0 | % | Ford Motor Co., 6.5%, 8/1/2018, BBB- | | | 9,038 | | | | (1,604 | ) | | | 10,642 | |
12/20/2010 3/20/2016 | | | 290,000 | 4 | | | 1.0 | % | Freeport-McMoRan Copper & Gold, Inc., 3.55%, 3/1/2022, BBB- | | | 429 | | | | (87 | ) | | | 516 | |
3/21/2011 6/20/2016 | | | 120,000 | 1 | | | 5.0 | % | HCA, Inc., 6.375%, 1/15/2015, B- | | | 10,463 | | | | 3,115 | | | | 7,348 | |
12/20/2011 3/20/2017 | | | 60,000 | 5 | | | 5.0 | % | CIT Group, Inc., 5.5%, 2/15/2019, BB- | | | 6,689 | | | | 2,133 | | | | 4,556 | |
9/20/2012 12/20/2017 | | | 75,000 | 6 | | | 5.0 | % | General Motors Corp., 3.3%, 12/20/2017, BB+ | | | 6,853 | | | | 5,539 | | | | 1,314 | |
9/20/2012 12/20/2017 | | | 800,000 | 7 | | | 1.0 | % | Kingdom of Spain, 5.5%, 7/30/2017, BBB- | | | (68,514 | ) | | | (99,368 | ) | | | 30,854 | |
9/20/2012 12/20/2017 | | | 400,000 | 2 | | | 1.0 | % | Kingdom of Spain, 5.5%, 7/30/2017, BBB- | | | (34,257 | ) | | | (44,960 | ) | | | 10,703 | |
| Total unrealized appreciation | | | | 76,752 | |
(k) The maximum potential amount of future undiscounted payments that the Fund could be required to make under a credit default swap contract would be the notional amount of the contract. These potential amounts would be partially offset by any recovery values of the referenced debt obligation or net amounts received from the settlement of buy protection credit default swap contracts entered into by the Fund for the same referenced debt obligation, if any.
(l) The quality ratings represent the higher of Moody's Investors Service, Inc. ("Moody's") or Standard & Poor's Corporation ("S&P") credit ratings and are unaudited.
At December 31, 2012, open interest rate swap contracts were as follows:
| Effective/ Expiration Date | | Notional Amount ($) | | Cash Flows Paid by the Fund | Cash Flows Received by the Fund | | Value ($) | | | Upfront Payments Paid/ (Received) ($) | | | Unrealized Appreciation ($) | |
4/13/2012 4/13/2016 | | | 1,500,000 | 7 | Floating — LIBOR | Fixed — 1.22% | | | 37,235 | | | | — | | | | 37,235 | |
7/16/2013 7/16/2014 | | | 1,800,000 | 8 | Floating — LIBOR | Fixed — 0.515% | | | 2,521 | | | | (72 | ) | | | 2,593 | |
7/16/2013 7/16/2018 | | | 800,000 | 8 | Floating —- LIBOR | Fixed — 1.148% | | | 4,966 | | | | (163 | ) | | | 5,129 | |
7/16/2013 7/16/2043 | | | 400,000 | 8 | Fixed — 2.424% | Floating — LIBOR | | | 34,261 | | | | (269 | ) | | | 34,530 | |
| Total unrealized appreciation | | | | 79,487 | |
Counterparties:
1 JPMorgan Chase Securities, Inc.
2 Citigroup, Inc.
3 Bank of America
4 Morgan Stanley
5 Credit Suisse
6 UBS AG
7 BNP Paribas
8 Nomura International PLC
At December 31, 2012, the Fund had the following open forward foreign currency exchange contracts:
| Contracts to Deliver | | In Exchange For | | Settlement Date | | Unrealized Appreciation ($) | | Counterparty |
| JPY | | | 50,000,000 | | USD | | | 601,048 | | 1/4/2013 | | | 23,914 | | BNP Paribas |
| USD | | | 1,165,831 | | EUR | | | 900,000 | | 1/7/2013 | | | 22,165 | | BNP Paribas |
| CAD | | | 1,500,000 | | USD | | | 1,533,029 | | 1/9/2013 | | | 25,246 | | Barclays Bank PLC |
| AUD | | | 700,000 | | USD | | | 732,403 | | 1/10/2013 | | | 5,866 | | Barclays Bank PLC |
| USD | | | 1,045,064 | | EUR | | | 800,000 | | 1/14/2013 | | | 10,996 | | Barclays Bank PLC |
| MXN | | | 2,002,288 | | USD | | | 155,768 | | 1/14/2013 | | | 1,017 | | JPMorgan Chase Securities, Inc. |
| EUR | | | 163,500 | | USD | | | 216,621 | | 1/30/2013 | | | 750 | | Citigroup, Inc. |
| USD | | | 182,303 | | MXN | | | 2,375,000 | | 2/5/2013 | | | 899 | | JPMorgan Chase Securities, Inc. |
| Total unrealized appreciation | | | | | 90,853 | |
| Contracts to Deliver | | In Exchange For | | Settlement Date | | Unrealized Depreciation ($) | | Counterparty |
| USD | | | 609,799 | | JPY | | | 50,000,000 | | 1/4/2013 | | | (32,664 | ) | BNP Paribas |
| EUR | | | 600,000 | | USD | | | 784,275 | | 1/7/2013 | | | (7,722 | ) | Nomura International PLC |
| EUR | | | 300,000 | | USD | | | 389,533 | | 1/7/2013 | | | (6,466 | ) | BNP Paribas |
| EUR | | | 750,000 | | USD | | | 978,439 | | 1/9/2013 | | | (11,575 | ) | JPMorgan Chase Securities, Inc. |
| AUD | | | 550,000 | | USD | | | 556,474 | | 1/9/2013 | | | (14,420 | ) | Barclays Bank PLC |
| USD | | | 734,181 | | AUD | | | 700,000 | | 1/10/2013 | | | (7,644 | ) | Barclays Bank PLC |
| USD | | | 155,205 | | MXN | | | 2,002,288 | | 1/14/2013 | | | (454 | ) | JPMorgan Chase Securities, Inc. |
| EUR | | | 800,000 | | USD | | | 1,039,491 | | 1/14/2013 | | | (16,568 | ) | BNP Paribas |
| Total unrealized depreciation | | | | | (97,513 | ) |
| Currency Abbreviations |
ARS Argentine Peso AUD Australian Dollar BRL Brazilian Real CAD Canadian Dollar EUR Euro GBP British Pound JPY Japanese Yen MXN Mexican Peso USD United States Dollar |
For information on the Fund's policy and additional disclosures regarding options purchased, futures contracts, credit default swap contracts, interest rate swap contracts, forward foreign currency exchange contracts and written option contracts, please refer to Note B in the accompanying Notes to Financial Statements.
Fair Value Measurements
Various inputs are used in determining the value of the Fund's investments. These inputs are summarized in three broad levels. Level 1 includes quoted prices in active markets for identical securities. Level 2 includes other significant observable inputs (including quoted prices for similar securities, interest rates, prepayment speeds, and credit risk). Level 3 includes significant unobservable inputs (including the Fund's own assumptions in determining the fair value of investments). The inputs or methodology used for valuing securities are not necessarily an indication of the risk associated with investing in those securities.
The following is a summary of the inputs used as of December 31, 2012 in valuing the Fund's investments. For information on the Fund's policy regarding the valuation of investments, please refer to the Security Valuation section of Note A in the accompanying Notes to Financial Statements.
| Assets | | Level 1 | | | Level 2 | | | Level 3 | | | Total | |
| | |
| Fixed Income Investments (m) | | | | | | | | | | | | |
| Corporate Bonds | | $ | — | | | $ | 42,932,322 | | | $ | 17,176 | | | $ | 42,949,498 | |
| Mortgage-Backed Securities Pass-Throughs | | | — | | | | 4,447,811 | | | | — | | | | 4,447,811 | |
| Asset-Backed | | | — | | | | 765,062 | | | | 240,500 | | | | 1,005,562 | |
| Commercial Mortgage-Backed Securities | | | — | | | | 2,044,862 | | | | — | | | | 2,044,862 | |
| Collateralized Mortgage Obligations | | | — | | | | 2,598,717 | | | | — | | | | 2,598,717 | |
| Government & Agency Obligations | | | — | | | | 11,192,093 | | | | — | | | | 11,192,093 | |
| Loan Participations and Assignments | | | — | | | | 5,859,214 | | | | — | | | | 5,859,214 | |
| Municipal Bonds and Notes | | | — | | | | 971,060 | | | | — | | | | 971,060 | |
| Convertible Bonds | | | — | | | | 133,632 | | | | 142,419 | | | | 276,051 | |
| Preferred Securities | | | — | | | | 84,837 | | | | — | | | | 84,837 | |
| Other Investments | | | — | | | | — | | | | 13,910 | | | | 13,910 | |
| Common Stocks (m) | | | — | | | | 882 | | | | 15,034 | | | | 15,916 | |
| Preferred Stock | | | — | | | | 44,200 | | | | — | | | | 44,200 | |
| Warrants (m) | | | — | | | | — | | | | 5,737 | | | | 5,737 | |
| Exchange-Traded Fund | | | 16,120 | | | | — | | | | — | | | | 16,120 | |
| Short-Term Investments (m) | | | 6,001,387 | | | | — | | | | — | | | | 6,001,387 | |
| Unfunded Loan Commitment | | | — | | | | 118 | | | | — | | | | 118 | |
Derivatives (n) Purchased Options | | | 11,563 | | | | 272,669 | | | | — | | | | 284,232 | |
| Credit Default Swap Contracts | | | — | | | | 76,752 | | | | — | | | | 76,752 | |
| Interest Rate Swap Contracts | | | — | | | | 79,487 | | | | — | | | | 79,487 | |
| Forward Foreign Currency Exchange Contracts | | | — | | | | 90,853 | | | | — | | | | 90,853 | |
| Total | | $ | 6,029,070 | | | $ | 71,594,571 | | | $ | 434,776 | | | $ | 78,058,417 | |
| Liabilities | |
Derivatives (n) Written Options | | $ | (6,563 | ) | | $ | (269,784 | ) | | $ | — | | | $ | (276,347 | ) |
| Futures Contracts | | | (31,961 | ) | | | — | | | | — | | | | (31,961 | ) |
| Forward Foreign Currency Exchange Contracts | | | — | | | | (97,513 | ) | | | — | | | | (97,513 | ) |
| Total | | $ | (38,524 | ) | | $ | (367,297 | ) | | $ | — | | | $ | (405,821 | ) |
There have been no transfers between fair value measurement levels during the year ended December 31, 2012.
(m) See Investment Portfolio for additional detailed categorizations.
(n) Derivatives include value of options purchased, written options, at value, and unrealized appreciation (depreciation) on futures contracts, credit default swap contracts, interest rate swap contracts and forward foreign currency exchange contracts.
The accompanying notes are an integral part of the financial statements.
Statement of Assets and Liabilities | as of December 31, 2012 | |
| Assets | |
Investments: Investments in non-affiliated securities, at value (cost $68,920,456) — including $1,197,557 of securities loaned | | $ | 71,809,820 | |
| Investment in Daily Assets Fund Institutional (cost $1,251,728)* | | | 1,251,728 | |
| Investment in Central Cash Management Fund (cost $4,749,659) | | | 4,749,659 | |
| Total investments in securities, at value (cost $74,921,843) | | | 77,811,207 | |
| Cash | | | 298,553 | |
| Foreign currency, at value (cost $82,877) | | | 82,547 | |
| Receivable for investments sold | | | 19,971 | |
| Receivable for Fund shares sold | | | 18,116 | |
| Dividends receivable | | | 151 | |
| Interest receivable | | | 960,121 | |
| Receivable for variation margin on futures contracts | | | 6,475 | |
| Unrealized appreciation on unfunded loan commitment | | | 118 | |
| Unrealized appreciation on swap contracts | | | 156,239 | |
| Unrealized appreciation on forward foreign currency exchange contracts | | | 90,853 | |
| Upfront payments paid on swap contracts | | | 11,645 | |
| Foreign taxes recoverable | | | 1,181 | |
| Other assets | | | 1,758 | |
| Total assets | | | 79,458,935 | |
| Liabilities | |
| Payable upon return of securities loaned | | | 1,251,728 | |
| Payable for investments purchased | | | 677,518 | |
| Payable for investments purchased — when-issued/delayed delivery securities | | | 3,202,594 | |
| Payable for Fund shares redeemed | | | 183,443 | |
| Options written, at value (premium received $416,526) | | | 276,347 | |
| Unrealized depreciation on forward foreign currency exchange contracts | | | 97,513 | |
| Upfront payments received on swap contracts | | | 153,863 | |
| Accrued management fee | | | 15,482 | |
| Accrued Trustees' fees | | | 1,093 | |
| Other accrued expenses and payables | | | 99,375 | |
| Total liabilities | | | 5,958,956 | |
| Net assets, at value | | $ | 73,499,979 | |
| Net Assets Consist of | |
| Undistributed net investment income | | $ | 3,595,395 | |
Net unrealized appreciation (depreciation) on: Investments | | | 2,889,364 | |
| Unfunded loan commitment | | | 118 | |
| Swap contracts | | | 156,239 | |
| Futures | | | (31,961 | ) |
| Foreign currency | | | 5,227 | |
| Written options | | | 140,179 | |
| Accumulated net realized gain (loss) | | | 2,061,843 | |
| Paid-in-capital | | | 64,683,575 | |
| Net assets, at value | | $ | 73,499,979 | |
Class A Net Asset Value, offering and redemption price per share ($73,499,979 ÷ 5,832,490 outstanding shares of beneficial interest, no par value, unlimited number of shares authorized) | | $ | 12.60 | |
* Represents collateral on securities loaned.
The accompanying notes are an integral part of the financial statements.
Statement of Operations
| for the year ended December 31, 2012 | |
| Investment Income | |
Income: Interest | | $ | 3,908,266 | |
| Dividends | | | 2,446 | |
| Income distributions — Central Cash Management Fund | | | 6,904 | |
| Securities lending income, including income from Daily Assets Fund Institutional, net of borrower rebates | | | 9,397 | |
| Total income | | | 3,927,013 | |
Expenses: Management fee | | | 393,604 | |
| Administration fee | | | 71,564 | |
| Services to shareholders | | | 790 | |
| Custodian fee | | | 66,891 | |
| Audit and tax fees | | | 73,653 | |
| Legal fees | | | 13,756 | |
| Reports to shareholders | | | 31,825 | |
| Trustees' fees and expenses | | | 5,103 | |
| Other | | | 53,862 | |
| Total expenses before expense reductions | | | 711,048 | |
| Expense reductions | | | (158,392 | ) |
| Total expenses after expense reductions | | | 552,656 | |
| Net investment income (loss) | | | 3,374,357 | |
| Realized and Unrealized Gain (Loss) | |
Net realized gain (loss) from: Investments | | | 2,101,080 | |
| Swap contracts | | | 50,165 | |
| Futures | | | 395,063 | |
| Written options | | | 19,354 | |
| Foreign currency | | | 330,725 | |
| | | | 2,896,387 | |
Change in net unrealized appreciation (depreciation) on: Investments | | | 2,722,190 | |
| Unfunded loan commitment | | | 118 | |
| Swap contracts | | | 98,916 | |
| Futures | | | (59,478 | ) |
| Written options | | | 135,846 | |
| Foreign currency | | | (414,188 | ) |
| | | | 2,483,404 | |
| Net gain (loss) | | | 5,379,791 | |
| Net increase (decrease) in net assets resulting from operations | | $ | 8,754,148 | |
The accompanying notes are an integral part of the financial statements.
Statement of Changes in Net Assets | | | Years Ended December 31, | |
| Increase (Decrease) in Net Assets | | 2012 | | | 2011 | |
Operations: Net investment income | | $ | 3,374,357 | | | $ | 3,881,224 | |
| Net realized gain (loss) | | | 2,896,387 | | | | 920,963 | |
| Change in net unrealized appreciation (depreciation) | | | 2,483,404 | | | | (1,145,151 | ) |
| Net increase (decrease) in net assets resulting from operations | | | 8,754,148 | | | | 3,657,036 | |
Distributions to shareholders from: Net investment income: Class A | | | (4,311,037 | ) | | | (4,074,552 | ) |
Net realized gains: Class A | | | (143,246 | ) | | | — | |
| Total distributions | | | (4,454,283 | ) | | | (4,074,552 | ) |
Fund share transactions: Class A Proceeds from shares sold | | | 8,860,430 | | | | 6,939,450 | |
| Reinvestment of distributions | | | 4,454,283 | | | | 4,074,552 | |
| Payments for shares redeemed | | | (13,217,365 | ) | | | (17,200,574 | ) |
| Net increase (decrease) in net assets from Class A share transactions | | | 97,348 | | | | (6,186,572 | ) |
| Increase (decrease) in net assets | | | 4,397,213 | | | | (6,604,088 | ) |
| Net assets at beginning of period | | | 69,102,766 | | | | 75,706,854 | |
| Net assets at end of period (including undistributed net investment income of $3,595,395 and $3,867,140, respectively) | | $ | 73,499,979 | | | $ | 69,102,766 | |
| Other Information | |
Class A Shares outstanding at beginning of period | | | 5,808,640 | | | | 6,329,747 | |
| Shares sold | | | 731,149 | | | | 592,646 | |
| Shares issued to shareholders in reinvestment of distributions | | | 381,360 | | | | 348,849 | |
| Shares redeemed | | | (1,088,659 | ) | | | (1,462,602 | ) |
| Net increase (decrease) in Class A shares | | | 23,850 | | | | (521,107 | ) |
| Shares outstanding at end of period | | | 5,832,490 | | | | 5,808,640 | |
The accompanying notes are an integral part of the financial statements.
| | | Years Ended December 31, | |
| Class A | | | 2012 | | | 2011 | | | 2010 | | | 2009 | | | 2008 | |
| Selected Per Share Data | |
| Net asset value, beginning of period | | $ | 11.90 | | | $ | 11.96 | | | $ | 11.61 | | | $ | 10.03 | | | $ | 11.70 | |
Income (loss) from investment operations: Net investment incomea | | | .57 | | | | .63 | | | | .66 | | | | .63 | | | | .55 | |
| Net realized and unrealized gain (loss) | | | .92 | | | | (.01 | ) | | | .47 | | | | 1.50 | | | | (1.38 | ) |
| Total from investment operations | | | 1.49 | | | | .62 | | | | 1.13 | | | | 2.13 | | | | (.83 | ) |
Less distributions from: Net investment income | | | (.76 | ) | | | (.68 | ) | | | (.78 | ) | | | (.55 | ) | | | (.69 | ) |
| Net realized gains | | | (.03 | ) | | | — | | | | — | | | | — | | | | (.15 | ) |
| Total distributions | | | (.79 | ) | | | (.68 | ) | | | (.78 | ) | | | (.55 | ) | | | (.84 | ) |
| Net asset value, end of period | | $ | 12.60 | | | $ | 11.90 | | | $ | 11.96 | | | $ | 11.61 | | | $ | 10.03 | |
Total Return (%)b | | | 13.08 | | | | 5.31 | | | | 10.05 | | | | 22.73 | | | | (7.75 | ) |
| Ratios to Average Net Assets and Supplemental Data | |
| Net assets, end of period ($ millions) | | | 73 | | | | 69 | | | | 76 | | | | 74 | | | | 73 | |
| Ratio of expenses before expense reductions (%) | | | .99 | | | | .99 | | | | .95 | | | | .86 | | | | .89 | |
| Ratio of expenses after expense reductions (%) | | | .77 | | | | .79 | | | | .86 | | | | .80 | | | | .87 | |
| Ratio of net investment income (%) | | | 4.72 | | | | 5.38 | | | | 5.62 | | | | 5.96 | | | | 5.06 | |
| Portfolio turnover rate (%) | | | 164 | | | | 144 | | | | 167 | | | | 370 | | | | 234 | |
a Based on average shares outstanding during the period. b Total return would have been lower had certain expenses not been reduced. | |
Notes to Financial Statements
A. Organization and Significant Accounting Policies
DWS Unconstrained Income VIP (the "Fund") is a diversified series of DWS Variable Series II (the "Trust"), which is registered under the Investment Company Act of 1940, as amended (the "1940 Act"), as an open-end management investment company organized as a Massachusetts business trust.
The Fund's financial statements are prepared in accordance with accounting principles generally accepted in the United States of America which require the use of management estimates. Actual results could differ from those estimates. The policies described below are followed consistently by the Fund in the preparation of its financial statements.
Security Valuation. Investments are stated at value determined as of the close of regular trading on the New York Stock Exchange on each day the exchange is open for trading.
Various inputs are used in determining the value of the Fund's investments. These inputs are summarized in three broad levels. Level 1 includes quoted prices in active markets for identical securities. Level 2 includes other significant observable inputs (including quoted prices for similar securities, interest rates, prepayment speeds, and credit risk). Level 3 includes significant unobservable inputs (including the Fund's own assumptions in determining the fair value of investments). The inputs or methodology used for valuing securities are not necessarily an indication of the risk associated with investing in those securities.
Debt securities and loan participations and assignments are valued at prices supplied by independent pricing services approved by the Fund's Board. If the pricing services are unable to provide valuations, securities are valued at the most recent bid quotation or evaluated price, as applicable, obtained from one or more broker-dealers. Such services may use various pricing techniques which take into account appropriate factors such as yield, quality, coupon rate, maturity, type of issue, trading characteristics and other data, as well as broker quotes. These securities are generally categorized as Level 2.
Equity securities and exchange-traded funds ("ETFs") are valued at the most recent sale price or official closing price reported on the exchange (U.S. or foreign) or over-the-counter market on which they trade and are categorized as Level 1 securities. Securities or ETFs for which no sales are reported are valued at the calculated mean between the most recent bid and asked quotations on the relevant market or, if a mean cannot be determined, at the most recent bid quotation.
Money market instruments purchased with an original or remaining maturity of sixty days or less, maturing at par, are valued at amortized cost, which approximates value, and are categorized as Level 2. Investments in open-end investment companies are valued at their net asset value each business day and are categorized as Level 1.
Futures contracts are generally valued at the settlement prices established each day on the exchange on which they are traded and are categorized as Level 1.
Forward currency contracts are valued at the prevailing forward exchange rate of the underlying currencies and are categorized as Level 2.
Swap contracts are valued daily based upon prices supplied by a Board approved pricing vendor, if available, and otherwise are valued at the price provided by the broker-dealer. Swap contracts are generally categorized as Level 2.
Exchange-traded options are valued at the last sale price or, in the absence of a sale, the mean between the closing bid and asked prices or at the most recent asked price (bid for purchased options) if no bid or asked price are available. Exchange-traded options are categorized as Level 1. Over-the-counter written or purchased options are valued at the price provided by the broker-dealer with which the option was traded and are generally categorized as Level 2.
Securities and other assets for which market quotations are not readily available or for which the above valuation procedures are deemed not to reflect fair value are valued in a manner that is intended to reflect their fair value as determined in accordance with procedures approved by the Board and are generally categorized as Level 3. In accordance with the Fund's valuation procedures, factors used in determining value may include, but are not limited to, the type of the security; the size of the holding; the initial cost of the security; the existence of any contractual restrictions on the security's disposition; the price and extent of public trading in similar securities of the issuer or of comparable companies; quotations or evaluated prices from broker-dealers and/or pricing services; information obtained from the issuer, analysts, and/or the appropriate stock exchange (for exchange-traded securities); an analysis of the company's or issuer's financial statements; an evaluation of the forces that influence the issuer and the market(s) in which the security is purchased and sold and with respect to debt securities; the maturity, coupon, creditworthiness, currency denomination and the movement of the market in which the security is normally traded. The value determined under these procedures may differ from published values for the same securities.
Disclosure about the classification of fair value measurements is included in a table following the Fund's Investment Portfolio.
New Accounting Pronouncement. In January 2013, Accounting Standard Update 2013-01 (ASU 2013-01), Clarifying the Scope of Disclosures about Offsetting Assets and Liabilities, replaced Accounting Standards Update 2011-11 (ASU 2011-11), Disclosures about Offsetting Assets and Liabilities. ASU 2013-01 is effective for fiscal years beginning on or after January 1, 2013, and interim periods within those annual periods. ASU 2011-11 was intended to enhance disclosure requirements on the offsetting of financial assets and liabilities. The ASU 2013-01 limits the scope of the new balance sheet offsetting disclosures to derivatives, repurchase agreements, and securities lending transactions to the extent that they are (1) offset in the financial statements or (2) subject to an enforceable master netting arrangement or similar agreement. Management is currently evaluating the application of ASU 2013-01 and its impact, if any, on the Fund's financial statements.
Foreign Currency Translations. The books and records of the Fund are maintained in U.S. dollars. Investment securities and other assets and liabilities denominated in a foreign currency are translated into U.S. dollars at the prevailing exchange rates at period end. Purchases and sales of investment securities, income and expenses are translated into U.S. dollars at the prevailing exchange rates on the respective dates of the transactions.
Net realized and unrealized gains and losses on foreign currency transactions represent net gains and losses between trade and settlement dates on securities transactions, the acquisition and disposition of foreign currencies, and the difference between the amount of net investment income accrued and the U.S. dollar amount actually received. That portion of both realized and unrealized gains and losses on investments that results from fluctuations in foreign currency exchange rates is not separately disclosed but is included with net realized and unrealized gain/appreciation and loss/depreciation on investments.
Securities Lending. The Fund lends securities to certain financial institutions. The Fund retains beneficial ownership of the securities it has loaned and continues to receive interest and dividends paid by the issuer of securities and to participate in any changes in their market value. The Fund requires the borrowers of the securities to maintain collateral with the Fund consisting of either cash or liquid, unencumbered assets having a value at least equal to the value of the securities loaned. When the collateral falls below specified amounts, the lending agent will use its best effort to obtain additional collateral on the next business day to meet required amounts under the security lending agreement. The Fund may invest the cash collateral into a joint trading account in an affiliated money market fund pursuant to Exemptive Orders issued by the SEC. The Fund receives compensation for lending its securities either in the form of fees or by earning interest on invested cash collateral net of borrower rebates and fees paid to a lending agent. Either the Fund or the borrower may terminate the loan. There may be risks of delay and costs in recovery of securities or even loss of rights in the collateral should the borrower of the securities fail financially. The Fund is also subject to all investment risks associated with the reinvestment of any cash collateral received, including, but not limited to, interest rate, credit and liquidity risk associated with such investments.
Loan Participations and Assignments. Loan participations and assignments are portions of loans originated by banks and sold in pieces to investors. These U.S. dollar-denominated fixed and floating rate loans ("Loans") in which the Fund invests, are arranged between the borrower and one or more financial institutions ("Lenders"). These Loans may take the form of Senior Loans, which are corporate obligations often issued in connection with recapitalizations, acquisitions, leveraged buy-outs and refinancings, and Sovereign Loans, which are debt instruments between a foreign sovereign entity and one or more financial institutions. The Fund invests in such Loans in the form of participations in Loans ("Participations") or assignments of all or a portion of Loans from third parties ("Assignments"). Participations typically result in the Fund having a contractual relationship only with the Lender, not with the borrower. The Fund has the right to receive payments of principal, interest and any fees to which it is entitled from the Lender selling the Participation and only upon receipt by the Lender of the payments from the borrower. In connection with purchasing Participations, the Fund generally has no right to enforce compliance by the borrower with the terms of the loan agreement relating to the Loan, or any rights of set-off against the borrower, and the Fund will not benefit directly from any collateral supporting the Loan in which it has purchased the Participation. As a result, the Fund assumes the credit risk of both the borrower and the Lender that is selling the Participation. Assignments typically result in the Fund having a direct contractual relationship with the borrower, and the Fund may enforce compliance by the borrower with the terms of the loan agreement. Senior loans held by the Fund generally are in the form of Assignments but the Fund may also invest in Participations. All Loan Participations and Assignments involve interest rate risk, liquidity risk and credit risk, including the potential default or insolvency of the borrower.
When-Issued/Delayed Delivery Securities. The Fund may purchase or sell securities with delivery or payment to occur at a later date beyond the normal settlement period. At the time the Fund enters into a commitment to purchase or sell a security, the transaction is recorded and the value of the transaction is reflected in the net asset value. The price of such security and the date when the security will be delivered and paid for are fixed at the time the transaction is negotiated. The value of the security may vary with market fluctuations. At the time the Fund enters into this type of transaction, it is required to segregate cash or other liquid assets at least equal to the amount of the commitment.
Certain risks may arise upon entering into when-issued or delayed delivery transactions from the potential inability of counterparties to meet the terms of their contracts or if the issuer does not issue the securities due to political, economic, or other factors. Additionally, losses may arise due to changes in the value of the underlying securities.
Taxes. The Fund's policy is to comply with the requirements of the Internal Revenue Code, as amended, which are applicable to regulated investment companies and to distribute all of its taxable income to its shareholders.
Additionally, the Fund may be subject to taxes imposed by the governments of countries in which it invests and are generally based on income and/or capital gains earned or repatriated. Estimated tax liabilities on certain foreign securities are recorded on an accrual basis and are reflected as components of interest income or net change in unrealized gain/loss on investments. Tax liabilities realized as a result of security sales are reflected as a component of net realized gain/loss on investments.
Under the Regulated Investment Company Modernization Act of 2010, net capital losses incurred post-enactment may be carried forward indefinitely, and their character is retained as short-term and/or long-term. Previously, net capital losses were carried forward for eight years and treated as short-term losses. As a transition rule, the Act requires that post-enactment net capital losses be used before pre-enactment net capital losses.
The Fund has reviewed the tax positions for the open tax years as of December 31, 2012 and has determined that no provision for income tax is required in the Fund's financial statements. The Fund's federal tax returns for the prior three fiscal years remain open subject to examination by the Internal Revenue Service.
Distribution of Income and Gains. Distributions from net investment income of the Fund, if any, is declared and distributed to shareholders annually. Net realized gains from investment transactions, in excess of available capital loss carryforwards, would be taxable to the Fund if not distributed and, therefore, will be distributed to shareholders at least annually. The Fund may also make additional distributions for tax purposes if necessary.
The timing and characterization of certain income and capital gain distributions are determined annually in accordance with federal tax regulations which may differ from accounting principles generally accepted in the United States of America. These differences primarily relate to investments in foreign denominated investments, forward currency contracts, futures contracts, swap contracts and certain securities sold at a loss. As a result, net investment income (loss) and net realized gain (loss) on investment transactions for a reporting period may differ significantly from distributions during such period. Accordingly, the Fund may periodically make reclassifications among certain of its capital accounts without impacting the net asset value of the Fund.
At December 31, 2012, the Fund's components of distributable earnings on a tax basis were as follows:
| Undistributed ordinary income* | | $ | 5,052,783 | |
| Undistributed long-term capital gains | | $ | 669,744 | |
| Unrealized appreciation (depreciation) on investments | | $ | 2,889,324 | |
In addition, the tax character of distributions paid by the Fund is summarized as follows:
| | | Years Ended December 31, | |
| | | 2012 | | | 2011 | |
| Distributions from ordinary income* | | $ | 4,311,037 | | | $ | 4,074,552 | |
| Distributions from long-term capital gains | | $ | 143,246 | | | $ | — | |
* For tax purposes, short-term capital gain distributions are considered ordinary income distributions.
Expenses. Expenses of the Trust arising in connection with a specific fund are allocated to that fund. Other Trust expenses which cannot be directly attributed to a fund are apportioned among the funds in the Trust based upon the relative net assets or other appropriate measures.
Contingencies. In the normal course of business, the Fund may enter into contracts with service providers that contain general indemnification clauses. The Fund's maximum exposure under these arrangements is unknown, as this would involve future claims that may be made against the Fund that have not yet been made. However, based on experience, the Fund expects the risk of loss to be remote.
Other. Investment transactions are accounted for on a trade date plus one basis for daily net asset value calculations. However, for financial reporting purposes, investment transactions are reported on trade date. Interest income is recorded on the accrual basis. Dividend income is recorded on the ex-dividend date net of foreign withholding taxes. Realized gains and losses from investment transactions are recorded on an identified cost basis and may include proceeds from litigation. All discounts and premiums are accreted/amortized for both tax and financial reporting purposes for the Fund, with the exception of securities in default of principal.
B. Derivative Instruments
Interest Rate Swap Contracts. For the year ended December 31, 2012, the Fund entered into interest rate swap transactions to gain exposure to different parts of the yield curve while managing overall duration and to enhance potential gains. The value of the Fund's underlying bond investments is subject to interest rate risk. As interest rates increase, the value of the Fund's fixed rate bonds may fall. The longer the duration of the Fund's securities, the more sensitive the Fund will be to interest rate changes. To help mitigate this interest rate risk, the Fund invests in interest rate swap contracts to reduce the duration of the Investment Portfolio. The use of interest rate swaps is a highly specialized activity that involves investment techniques and risks different from those associated with ordinary portfolio security transactions. In an interest rate swap, the Fund agrees to pay to the other party to the interest rate swap (which is known as the "counterparty") a fixed rate payment in exchange for the counterparty agreeing to pay to the Fund a variable rate payment, or the Fund agrees to receive from the counterparty a fixed rate payment in exchange for the counterparty agreeing to receive from the Fund a variable rate payment. In addition, both the Fund and counterparty may agree to exchange variable rate payments based on different indices. The payment obligations are based on the notional amount of the swap. Certain risks may arise when entering into swap transactions including counterparty default, liquidity or unfavorable changes in interest rates. In connection with these agreements, securities and or cash may be identified as collateral in accordance with the terms of the swap agreements to provide assets of value and recourse in the event of default. The maximum counterparty credit risk is the net present value of the cash flows to be received from or paid to the counterparty over the term of the interest rate swap contract, to the extent that this amount is beneficial to the Fund, in addition to any related collateral posted to the counterparty by the Fund. This risk may be partially reduced by a master netting arrangement between the Fund and the counterparty. The value of the swap is adjusted daily and the change in value, if any, is recorded as unrealized appreciation or depreciation in the Statement of Assets and Liabilities. An upfront payment, if any, made by the Fund is recorded as an asset in the Statement of Assets and Liabilities. An upfront payment, if any, received by the Fund is recorded as a liability in the Statement of Assets and Liabilities. Payments received or made at the end of the measurement period are recorded as realized gain or loss in the Statement of Operations.
A summary of the open interest rate swap contracts as of December 31, 2012 is included in a table following the Fund's Investment Portfolio. For the year ended December 31, 2012, the investment in interest rate swap contracts had a total notional amount generally indicative of a range from $4,500,000 to $9,390,000.
Credit Default Swap Contracts. A credit default swap is a contract between a buyer and a seller of protection against pre-defined credit events for the reference entity. The Fund may enter into credit default swap contracts to gain exposure to an underlying issuer's credit quality characteristics without directly investing in that issuer or to hedge against the risk of a credit event on debt securities. As a seller in the credit default swap contract, the Fund is required to pay the par (or other agreed-upon) value of the referenced entity to the counterparty with the occurrence of a credit event by a third party, such as a U.S. or foreign corporate issuer, on the reference entity, which would likely result in a loss to the Fund. In return, the Fund receives from the counterparty a periodic stream of payments over the term of the contract provided that no credit event has occurred. If no credit event occurs, the Fund keeps the stream of payments with no payment obligations. The Fund may also buy credit default swap contracts, in which case the Fund functions as the counterparty referenced above. This involves the risk that the contract may expire worthless. It also involves counterparty risk that the seller may fail to satisfy its payment obligations to the Fund with the occurrence of a credit event. When the Fund sells a credit default swap contract it will cover its commitment. This may be achieved by, among other methods, maintaining cash or liquid assets equal to the aggregate notional value of the reference entities for all outstanding credit default swap contracts sold by the Fund. For the year ended December 31, 2012, the Fund entered into credit default swap contracts to gain exposure to the underlying issuer's credit quality characteristics.
The value of the credit default swap is adjusted daily and the change in value, if any, is recorded daily as unrealized appreciation or depreciation in the Statement of Assets and Liabilities. An upfront payment, if any, made by the Fund is recorded as an asset in the Statement of Assets and Liabilities. An upfront payment, if any, received by the Fund is recorded as a liability in the Statement of Assets and Liabilities. Under the terms of the credit default swap contracts, the Fund receives or makes quarterly payments based on a specified interest rate on a fixed notional amount. These payments are recorded as a realized gain or loss in the Statement of Operations. Payments received or made as a result of a credit event or termination of the contract are recognized, net of a proportional amount of the upfront payment, as realized gains or losses in the Statement of Operations.
A summary of the open credit default swap contracts as of December 31, 2012 is included in a table following the Fund's Investment Portfolio. For the year ended December 31, 2012, the investment in credit default swap contracts purchased had a total notional value generally indicative of a range from $0 to $800,000, and the investment in credit default swap contracts sold had a total notional value generally indicative of a range from $860,000 to $2,195,000.
Total Return Swap Contracts. Total return swaps involve commitments to pay interest in exchange for a market-linked return based on a notional amount. For the year ended December 31, 2012, the Fund entered into total return swap transactions to enhance potential gains. To the extent the total return of the reference security or index underlying the total return swap exceeds or falls short of the offsetting interest rate obligation, the Fund will receive a payment or make a payment to the counterparty, respectively. Certain risks may arise when entering into swap transactions including counterparty default, liquidity or unfavorable changes in the value of underlying reference security or index. The value of the swap is adjusted daily and the change in value, if any, is recorded as unrealized appreciation or depreciation in the Statement of Assets and Liabilities. An upfront payment, if any, made by the Fund is recorded as an asset in the Statement of Assets and Liabilities. An upfront payment, if any, received by the Fund is recorded as a liability in the Statement of Assets and Liabilities. Payments received or made at the end of each measurement period are recorded as realized gain or loss in the Statement of Operations.
There were no open total return swap contracts as of December 31, 2012. For the year ended December 31, 2012, the investment in total return swap contracts had a total notional amount generally indicative of a range from $0 to $3,900,000.
Options. An option contract is a contract in which the writer (seller) of the option grants the buyer of the option, upon payment of a premium, the right to purchase from (call option), or sell to (put option), the writer a designated instrument at a specified price within a specified period of time. Certain options, including options on indices, will require cash settlement by the Fund if the option is exercised. For the year ended December 31, 2012, the Fund entered into options on interest rate futures and on interest rates swaps in order to hedge against potential adverse interest rate movements of portfolio assets.
If the Fund writes a covered call option, the Fund foregoes, in exchange for the premium, the opportunity to profit during the option period from an increase in the market value of the underlying security above the exercise price. If the Fund writes a put option it accepts the risk of a decline in the value of the underlying security below the exercise price. Over-the-counter options have the risk of the potential inability of counterparties to meet the terms of their contracts. The Fund's maximum exposure to purchased options is limited to the premium initially paid. In addition, certain risks may arise upon entering into option contracts including the risk that an illiquid secondary market will limit the Fund's ability to close out an option contract prior to the expiration date and that a change in the value of the option contract may not correlate exactly with changes in the value of the securities or currencies hedged.
A summary of the open purchased option contracts as of December 31, 2012 is included in the Fund's Investment Portfolio. A summary of open written option contracts is included in a table following the Fund's Investment Portfolio. For the year ended December 31, 2012, the investment in written option contracts had a total value generally indicative of a range from approximately $8,000 to $394,000, and purchased option contracts had a total value generally indicative of a range from $15,000 to approximately $343,000.
Futures Contracts. A futures contract is an agreement between a buyer or seller and an established futures exchange or its clearinghouse in which the buyer or seller agrees to take or make a delivery of a specific amount of a financial instrument at a specified price on a specific date (settlement date). For the year ended December 31, 2012, the Fund entered into interest rate futures to gain exposure to different parts of the yield curve while managing overall duration. In addition, the Fund seeks to enhance returns by employing a global tactical asset allocation overlay strategy. The Fund enters into futures contracts on global bonds, including indices, as part of its global tactical asset allocation overlay strategy. For the year ended December 31, 2012, as part of this strategy, the Fund used futures contracts to attempt to take advantage of inefficiencies within the global bond markets.
Upon entering into a futures contract, the Fund is required to deposit with a financial intermediary cash or securities ("initial margin") in an amount equal to a certain percentage of the face value indicated in the futures contract. Subsequent payments ("variation margin") are made or received by the Fund dependent upon the daily fluctuations in the value and are recorded for financial reporting purposes as unrealized gains or losses by the Fund. Gains or losses are realized when the contract expires or is closed. Since all futures contracts are exchange-traded, counterparty risk is minimized as the exchange's clearinghouse acts as the counterparty, and guarantees the futures against default.
Certain risks may arise upon entering into futures contracts, including the risk that an illiquid market will limit the Fund's ability to close out a futures contract prior to the settlement date and the risk that the futures contract is not well correlated with the security, index or currency to which it relates. Risk of loss may exceed amounts disclosed in the Statement of Assets and Liabilities.
A summary of the open futures contracts as of December 31, 2012 is included in a table following the Fund's Investment Portfolio. For the year ended December 31, 2012, the investment in futures contracts purchased had a total notional value generally indicative of a range from approximately $4,511,000 to $19,032,000, and the investment in futures contracts sold had a total notional value generally indicative of a range from approximately $2,488,000 to $27,477,000.
Forward Foreign Currency Exchange Contracts. A forward foreign currency exchange contract ("forward currency contract") is a commitment to purchase or sell a foreign currency at the settlement date at a negotiated rate. For the year ended December 31, 2012, the Fund entered into forward currency contracts in order to hedge against anticipated currency market changes and for non-hedging purposes to seek to enhance potential gains. In addition, the Fund seeks to enhance returns by employing a global tactical asset allocation overlay strategy. For the year ended December 31, 2012, as part of this strategy, the Fund used forward currency contracts to gain exposure to changes in the value of foreign currencies to attempt to take advantage of inefficiencies within the currency markets.
Forward currency contracts are valued at the prevailing forward exchange rate of the underlying currencies and unrealized gain (loss) is recorded daily. On the settlement date of the forward currency contract, the Fund records a realized gain or loss equal to the difference between the value of the contract at the time it was opened and the value of the contract at the time it was closed. Certain risks may arise upon entering into forward currency contracts from the potential inability of counterparties to meet the terms of their contracts. The maximum counterparty credit risk to the Fund is measured by the unrealized gain on appreciated contracts. Additionally, when utilizing forward currency contracts to hedge, the Fund gives up the opportunity to profit from favorable exchange rate movements during the term of the contract.
A summary of the open forward currency contracts as of December 31, 2012 is included in a table following the Fund's Investment Portfolio. For the year ended December 31, 2012, the investment in forward currency contracts short vs. U.S. dollars had a total contract value generally indicative of a range from approximately $6,987,000 to $24,173,000, and the investment in forward currency contracts long vs. U.S. dollars had a total contract value generally indicative of a range from approximately $3,892,000 to $21,423,000. The investment in forward currency contracts long vs. other foreign currencies sold had a total contract value generally indicative of a range from $0 to approximately $3,129,000.
The following tables summarize the value of the Fund's derivative instruments held as of December 31, 2012 and the related location in the accompanying Statement of Assets and Liabilities, presented by primary underlying risk exposure:
| Asset Derivatives | | Purchased Options | | | Forward Contracts | | | Swap Contracts | | | Total | |
| Interest Rate Contracts (a) | | $ | 284,232 | | | $ | — | | | $ | 79,487 | | | $ | 363,719 | |
| Credit Contracts (a) | | | — | | | | — | | | | 76,752 | | | | 76,752 | |
| Foreign Exchange Contracts (b) | | | — | | | | 90,853 | | | | — | | | | 90,853 | |
| | | $ | 284,232 | | | $ | 90,853 | | | $ | 156,239 | | | $ | 531,324 | |
Each of the above derivatives is located in the following Statement of Assets and Liabilities accounts:
(a) Investments in securities, at value (includes purchased options) and unrealized appreciation on swap contracts
(b) Unrealized appreciation on forward foreign currency exchange contracts
| Liability Derivatives | | Written Options | | | Forward Contracts | | | Futures Contracts | | | Total | |
| Interest Rate Contracts (a) (b) | | $ | (276,347 | ) | | $ | — | | | $ | (31,961 | ) | | $ | (308,308 | ) |
| Foreign Exchange Contracts (c) | | | — | | | | (97,513 | ) | | | — | | | | (97,513 | ) |
| | | $ | (276,347 | ) | | $ | (97,513 | ) | | $ | (31,961 | ) | | $ | (405,821 | ) |
Each of the above derivatives is located in the following Statement of Assets and Liabilities accounts:
(a) Options written, at value
(b) Includes cumulative depreciation of futures contracts as disclosed in the Investment Portfolio. Unsettled variation margin is disclosed separately within the Statement of Assets and Liabilities.
(c) Unrealized depreciation on forward foreign currency exchange contracts
Additionally, the amount of unrealized and realized gains and losses on derivative instruments recognized in Fund earnings during the year ended December 31, 2012 and the related location in the accompanying Statement of Operations is summarized in the following tables by primary underlying risk exposure:
| Realized Gain (Loss) | | Purchased Options | | | Written Options | | | Forward Contracts | | | Swap Contracts | | | Futures Contracts | | | Total | |
| Interest Rate Contracts (a) | | $ | (15,287 | ) | | $ | 19,354 | | | $ | — | | | $ | 61,583 | | | $ | 395,063 | | | $ | 460,713 | |
| Credit Contracts (a) | | | — | | | | — | | | | — | | | | (11,418 | ) | | | — | | | | (11,418 | ) |
| Foreign Exchange Contracts (b) | | | — | | | | — | | | | 321,330 | | | | — | | | | — | | | | 321,330 | |
| | | $ | (15,287 | ) | | $ | 19,354 | | | $ | 321,330 | | | $ | 50,165 | | | $ | 395,063 | | | $ | 770,625 | |
Each of the above derivatives is located in the following Statement of Operations accounts:
(a) Net realized gain (loss) from investments (includes purchased options), written options, swap contracts and futures, respectively
(b) Net realized gain (loss) from foreign currency (Statement of Operations includes both forward currency contracts and foreign currency transactions)
| Change in Net Unrealized Appreciation (Depreciation) | | Purchased Options | | | Written Options | | | Forward Contracts | | | Swap Contracts | | | Futures Contracts | | | Total | |
| Interest Rate Contracts (a) | | $ | (140,509 | ) | | $ | 135,846 | | | $ | — | | | $ | 21,525 | | | $ | (59,478 | ) | | $ | (42,616 | ) |
| Credit Contracts (a) | | | — | | | | — | | | | — | | | | 77,391 | | | | — | | | | 77,391 | |
| Foreign Exchange Contracts (b) | | | — | | | | — | | | | (418,947 | ) | | | | | | | — | | | | (418,947 | ) |
| | | $ | (140,509 | ) | | $ | 135,846 | | | $ | (418,947 | ) | | $ | 98,916 | | | $ | (59,478 | ) | | $ | (384,172 | ) |
Each of the above derivatives is located in the following Statement of Operations accounts:
(a) Change in net unrealized appreciation (depreciation) on investments (includes purchased options), written options, swap contracts and futures, respectively
(b) Change in net unrealized appreciation (depreciation) on foreign currency (Statement of Operations includes both forward currency contracts and foreign currency transactions)
C. Purchases and Sales of Securities
During the year ended December 31, 2012, purchases and sales of investment transactions (excluding short-term investments and U.S. Treasury obligations) aggregated $106,367,121 and $105,370,081, respectively. Purchases and sales of U.S. Treasury obligations aggregated $9,813,400 and $5,806,755, respectively.
For the year ended December 31, 2012, transactions for written options on futures contracts and interest rate swap contracts were as follows:
| | | Contracts/ Contract Amount | | | Premium | |
| Outstanding, beginning of period | | | 100 | | | $ | 12,458 | |
| Options written | | | 10,800,085 | | | | 431,695 | |
| Options closed | | | (60 | ) | | | (13,227 | ) |
| Options expired | | | (105 | ) | | | (14,400 | ) |
| Outstanding, end of period | | | 10,800,020 | | | $ | 416,526 | |
D. Related Parties
Management Agreement. Under the Investment Management Agreement with Deutsche Investment Management Americas Inc. ("DIMA" or the "Advisor"), an indirect, wholly owned subsidiary of Deutsche Bank AG, the Advisor directs the investments of the Fund in accordance with its investment objectives, policies and restrictions. The Advisor determines the securities, instruments and other contracts relating to investments to be purchased, sold or entered into by the Fund or delegates such responsibility to the Fund's subadvisor.
QS Investors, LLC ("QS Investors") acts as an investment subadvisor to the Fund and manages the portion of assets allocated to the Fund's global tactical asset allocation overlay strategy. QS Investors is paid by the Advisor for the services QS Investors provides to the Fund.
Pursuant to the Investment Management Agreement with the Advisor, the Fund pays a monthly management fee based on the Fund's average daily net assets, computed and accrued daily and payable monthly, at the following annual rates:
| First $250 million | .550% |
| Next $750 million | .520% |
| Next $1.5 billion | .500% |
| Next $2.5 billion | .480% |
| Next $2.5 billion | .450% |
| Next $2.5 billion | .430% |
| Next $2.5 billion | .410% |
| Over $12.5 billion | .390% |
For the period from January 1, 2012 through September 30, 2012, the Advisor had contractually agreed to waive its fee and/or reimburse certain operating expenses to the extent necessary to maintain the operating expenses (excluding certain expenses such as extraordinary expenses, taxes, brokerage and interest expense) at 0.78%.
For the period from October 1, 2012 through September 30, 2013, the Advisor has contractually agreed to waive its fee and/or reimburse certain operating expenses to the extent necessary to maintain the operating expenses (excluding certain expenses such as extraordinary expenses, taxes, brokerage and interest expense) at 0.73%.
Accordingly, for the year ended December 31, 2012, the Advisor waived a portion of its management fee pursuant to the Investment Management Agreement aggregating $158,274, and the amount charged aggregated $235,330, which was equivalent to an annual effective rate of 0.33% of the Fund's average daily net assets.
Administration Fee. Pursuant to an Administrative Services Agreement, DIMA provides most administrative services to the Fund. For all services provided under the Administrative Services Agreement, the Fund pays DIMA an annual fee ("Administration Fee") of 0.10% of the Fund's average daily net assets, computed and accrued daily and payable monthly. For the year ended December 31, 2012, the Administration Fee was $71,564, of which $6,236 is unpaid.
Service Provider Fees. DWS Investments Service Company ("DISC"), an affiliate of the Advisor, is the transfer agent, dividend-paying agent and shareholder service agent for the Fund. Pursuant to a sub-transfer agency agreement between DISC and DST Systems, Inc. ("DST"), DISC has delegated certain transfer agent, dividend-paying agent and shareholder service agent functions to DST. DISC compensates DST out of the shareholder servicing fee it receives from the Fund. For the year ended December 31, 2012, the amounts charged to the Fund by DISC aggregated $118, all of which was waived.
Typesetting and Filing Service Fees. Under an agreement with DIMA, DIMA is compensated for providing typesetting and certain regulatory filing services to the Fund. For the year ended December 31, 2012, the amount charged to the Fund by DIMA included in the Statement of Operations under "reports to shareholders" aggregated $22,967, of which $7,091 is unpaid.
Trustees' Fees and Expenses. The Fund paid retainer fees to each Trustee not affiliated with the Advisor, plus specified amounts to the Board Chairperson and to each committee Chairperson.
Affiliated Cash Management Vehicle. The Fund may invest uninvested cash balances in Central Cash Management Fund, which is managed by the Advisor. The Fund indirectly bears its proportionate share of the expenses of Central Cash Management Fund. Central Cash Management Fund does not pay the Advisor an investment management fee. Central Cash Management Fund seeks a high level of current income consistent with liquidity and the preservation of capital.
Security Lending Fees. Effective January 27, 2012, Deutsche Bank AG serves as lending agent for the Fund. For the period from January 27, 2012 through December 31, 2012, the Fund incurred lending agent fees to Deutsche Bank AG for the amount of $1,037.
E. Investing in High-Yield Securities
The Fund's performance could be hurt if a security declines in credit quality or goes into default, or if an issuer does not make timely payments of interest or principal. Because the issuers of high-yield debt securities or junk bonds (debt securities rated below the fourth-highest category) may be in uncertain financial health, the risk of loss from default by the issuer is significantly greater. Prices and yields of high-yield securities will fluctuate over time and, during periods of economic uncertainty, volatility of high-yield securities may adversely affect a fund's net asset value. Because the Fund may invest in securities not paying current interest or in securities already in default, these risks may be more pronounced.
F. Investing in Emerging Markets
Investing in emerging markets may involve special risks and considerations not typically associated with investing in developed markets. These risks include revaluation of currencies, high rates of inflation or deflation, repatriation restrictions on income and capital, and future adverse political, social and economic developments. Moreover, securities issued in these markets may be less liquid, subject to government ownership controls or delayed settlements, and may have prices that are more volatile or less easily assessed than those of comparable securities of issuers in developed markets.
G. Ownership of the Fund
At December 31, 2012, two Participating Insurance Companies were owners of record of 10% or more of the total outstanding Class A shares of the Fund, each owning 63% and 34%.
H. Line of Credit
The Fund and other affiliated funds (the "Participants") share in a $375 million revolving credit facility provided by a syndication of banks. The Fund may borrow for temporary or emergency purposes, including the meeting of redemption requests that otherwise might require the untimely disposition of securities. The Participants are charged an annual commitment fee which is allocated based on net assets, among each of the Participants. Interest is calculated at a rate per annum equal to the sum of the Federal Funds Rate plus 1.25 percent plus if LIBOR exceeds the Federal Funds Rate the amount of such excess. The Fund may borrow up to a maximum of 33 percent of its net assets under the agreement. The Fund had no outstanding loans at December 31, 2012.
Report of Independent Registered Public Accounting Firm
To the Board of Trustees of DWS Variable Series II and Shareholders of DWS Unconstrained Income VIP:
We have audited the accompanying statement of assets and liabilities, including the investment portfolio, of DWS Unconstrained Income VIP (the "Fund"), one of the funds constituting DWS Variable Series II, as of December 31, 2012, and the related statement of operations for the year then ended, the statement of changes in net assets for each of the two years in the period then ended, and the financial highlights for each of the five years in the period then ended. These financial statements and financial highlights are the responsibility of the Fund's management. Our responsibility is to express an opinion on these financial statements and financial highlights based on our audits.
We conducted our audits in accordance with the standards of the Public Company Accounting Oversight Board (United States). Those standards require that we plan and perform the audit to obtain reasonable assurance about whether the financial statements and financial highlights are free of material misstatement. We were not engaged to perform an audit of the Fund's internal control over financial reporting. Our audits included consideration of internal control over financial reporting as a basis for designing audit procedures that are appropriate in the circumstances, but not for the purpose of expressing an opinion on the effectiveness of the Fund's internal control over financial reporting. Accordingly, we express no such opinion. An audit also includes examining, on a test basis, evidence supporting the amounts and disclosures in the financial statements and financial highlights, assessing the accounting principles used and significant estimates made by management, and evaluating the overall financial statement presentation. Our procedures included confirmation of securities owned as of December 31, 2012, by correspondence with the custodian and brokers, or by other appropriate auditing procedures where replies from brokers were not received. We believe that our audits provide a reasonable basis for our opinion.
In our opinion, the financial statements and financial highlights referred to above present fairly, in all material respects, the financial position of DWS Unconstrained Income VIP (one of the funds constituting DWS Variable Series II) at December 31, 2012, the results of its operations for the year then ended, the changes in its net assets for each of the two years in the period then ended, and the financial highlights for each of the five years in the period then ended, in conformity with U.S. generally accepted accounting principles.
| | | |
Boston, Massachusetts February 13, 2013 | | |
Information About Your Fund's Expenses (Unaudited)
As an investor of the Fund, you incur two types of costs: ongoing expenses and transaction costs. Ongoing expenses include management fees and other Fund expenses. Examples of transaction costs include contract charges and account maintenance fees, which are not shown in this section. The following tables are intended to help you understand your ongoing expenses (in dollars) of investing in the Fund and to help you compare these expenses with the ongoing expenses of investing in other mutual funds. In the most recent six-month period, the Fund limited these expenses; had it not done so, expenses would have been higher. The example in the table is based on an investment of $1,000 invested at the beginning of the six-month period and held for the entire period (July 1, 2012 to December 31, 2012).
The tables illustrate your Fund's expenses in two ways:
•Actual Fund Return. This helps you estimate the actual dollar amount of ongoing expenses (but not transaction costs) paid on a $1,000 investment in the Fund using the Fund's actual return during the period. To estimate the expenses you paid over the period, simply divide your account value by $1,000 (for example, an $8,600 account value divided by $1,000 = 8.6), then multiply the result by the number in the "Expenses Paid per $1,000" line under the share class you hold.
• Hypothetical 5% Fund Return. This helps you to compare your Fund's ongoing expenses (but not transaction costs) with those of other mutual funds using the Fund's actual expense ratio and a hypothetical rate of return of 5% per year before expenses. Examples using a 5% hypothetical Fund return may be found in the shareholder reports of other mutual funds. The hypothetical account values and expenses may not be used to estimate the actual ending account balance or expenses you paid for the period.
Please note that the expenses shown in these tables are meant to highlight your ongoing expenses only and do not reflect any transaction costs. The "Expenses Paid per $1,000" line of the tables is useful in comparing ongoing expenses only and will not help you determine the relative total expense of owning different funds. If these transaction costs had been included, your costs would have been higher.
Expenses and Value of a $1,000 Investment for the six months ended December 31, 2012 | |
| Actual Fund Return | | Class A | |
| Beginning Account Value 7/1/12 | | $ | 1,000.00 | |
| Ending Account Value 12/31/12 | | $ | 1,070.50 | |
| Expenses Paid per $1,000* | | $ | 3.96 | |
| Hypothetical 5% Fund Return | | Class A | |
| Beginning Account Value 7/1/12 | | $ | 1,000.00 | |
| Ending Account Value 12/31/12 | | $ | 1,021.32 | |
| Expenses Paid per $1,000* | | $ | 3.86 | |
* Expenses are equal to the Fund's annualized expense ratio, multiplied by the average account value over the period, multiplied by 184 (the number of days in the most recent six-month period), then divided by 366.
Expenses and Value of a $1,000 Investment for the six months ended December 31, 2012 |
| Annualized Expense Ratio | Class A | |
| DWS Variable Series II — DWS Unconstrained Income VIP | .76% | |
For more information, please refer to the Fund's prospectus.
These tables do not reflect charges and fees ("contract charges") associated with the separate account that invests in the Fund or any variable life insurance policy or variable annuity contract for which the Fund is an investment option.
Tax Information (Unaudited)
The Fund paid distributions $0.03 per share from net long-term capital gains during the year ended December 31, 2012, of which 100% represents 15% rate gains.
Pursuant to Section 852 of the Internal Revenue Code, the Fund designates $742,000 as capital gain dividends for its year ended December 31, 2012, of which 100% represents 15% rate gains.
Please consult a tax advisor if you have questions about federal or state income tax laws, or on how to prepare your tax returns. If you have specific questions about your account, please contact your insurance provider.
The Trust's policies and procedures for voting proxies for portfolio securities and information about how the Trust voted proxies related to its portfolio securities during the 12-month period ended June 30 are available on our Web site — www.dws-investments.com (click on "proxy voting" at the bottom of the page) — or on the SEC's Web site — www.sec.gov. To obtain a written copy of the Trust's policies and procedures without charge, upon request, call us toll free at (800) 728-3337.
Investment Management Agreement Approval
The Board of Trustees approved the renewal of DWS Unconstrained Income VIP's investment management agreement (the "Agreement") with Deutsche Investment Management Americas Inc. ("DWS") and sub-advisory agreement (the "Sub-Advisory Agreement" and together with the Agreement, the "Agreements") between DWS and QS Investors, LLC ("QS Investors") in September 2012.
In terms of the process that the Board followed prior to approving the Agreements, shareholders should know that:
• In September 2012, all of the Fund's Trustees were independent of DWS and its affiliates.
• The Trustees met frequently during the past year to discuss fund matters and dedicated a substantial amount of time to contract review matters. Over the course of several months, the Board's Contract Committee, in coordination with the Board's Fixed Income and Quant Oversight Committee, reviewed comprehensive materials received from DWS, independent third parties and independent counsel. These materials included an analysis of the Fund's performance, fees and expenses, and profitability compiled by the Fund's independent fee consultant. The Board also received extensive information throughout the year regarding performance of the Fund.
• The Independent Trustees regularly meet privately with their independent counsel to discuss contract review and other matters. In addition, the Independent Trustees were also advised by the Fund's independent fee consultant in the course of their review of the Fund's contractual arrangements and considered a comprehensive report prepared by the independent fee consultant in connection with their deliberations (the "IFC Report").
• In connection with reviewing the Agreements, the Board also reviewed the terms of the Fund's distribution agreement, administrative services agreement, transfer agency agreement and other material service agreements.
• Based on its evaluation of the information provided, the Contract Committee presented its findings and recommendations to the Board. The Board then reviewed the Contract Committee's findings and recommendations.
In connection with the contract review process, the Contract Committee and the Board considered the factors discussed below, among others. The Board also considered that DWS and its predecessors have managed the Fund since its inception, and the Board believes that a long-term relationship with a capable, conscientious advisor is in the best interests of the Fund. The Board considered, generally, that shareholders chose to invest or remain invested in the Fund knowing that DWS managed the Fund, and that the Agreement was approved by the Fund's shareholders. DWS is part of Deutsche Bank, a major global banking institution that is engaged in a wide range of financial services. The Board believes that there are advantages to being part of a global asset management business that offers a wide range of investing expertise and resources, including hundreds of portfolio managers and analysts with research capabilities in many countries throughout the world.
As part of the contract review process, the Board carefully considered the fees and expenses of each DWS fund overseen by the Board in light of the fund's performance. In many cases, this led to a negotiation with DWS of lower expense caps for the coming year than had previously been in place. As part of these negotiations, the Board indicated that it would consider relaxing these new lower caps in future years following sustained improvements in performance, among other considerations.
In June 2012, Deutsche Bank ("DB"), DWS's parent company, announced that DB's new management team had concluded the strategic review of its global asset management business announced in late 2011 by DB's prior management team, and would combine its Asset Management (of which DWS is a part) and Wealth Management divisions. Prior to approving the investment management agreements, the Independent Trustees were apprised of the expected management and structure of the new combined Asset & Wealth Management division ("AWM") and DWS. DB also advised the Independent Trustees that the U.S. asset management business is a critical and integral part of DB and AWM, and that DB would be reinvesting a significant portion of the substantial savings it expects to realize by combining its Asset Management and Wealth Management divisions into a combined AWM division, including enhancements to its investment capabilities. DB also confirmed its commitment to maintaining strong legal and compliance groups within the combined division.
While shareholders may focus primarily on fund performance and fees, the Fund's Board considers these and many other factors, including the quality and integrity of DWS's and QS Investors' personnel and such other issues as back-office operations, fund valuations, and compliance policies and procedures.
Nature, Quality and Extent of Services. The Board considered the terms of the Agreements, including the scope of advisory services provided under the Agreements. The Board noted that, under the Agreements, DWS and QS Investors provide portfolio management services to the Fund and that, pursuant to a separate administrative services agreement, DWS provides administrative services to the Fund. The Board considered the experience and skills of senior management and investment personnel, the resources made available to such personnel, the ability of DWS to attract and retain high-quality personnel, and the organizational depth and stability of DWS. The Board also requested and received information regarding DWS's oversight of Fund sub-advisors, including QS Investors. The Board reviewed the Fund's performance over short-term and long-term periods and compared those returns to various agreed-upon performance measures, including market indices and a peer universe compiled by the independent fee consultant using information supplied by Lipper Inc. ("Lipper"), an independent fund data service. The Board also noted that it has put into place a process of identifying "Focus Funds" (e.g., funds performing poorly relative to their benchmark or a peer universe compiled by an independent fund data service), and receives more frequent reporting and information from DWS regarding such funds, along with DWS's remedial plans to address underperformance. The Board believes this process is an effective manner of identifying and addressing underperforming funds. Based on the information provided, the Board noted that for the one-, three- and five-year periods ended December 31, 2011, the Fund's performance (Class A shares) was in the 2nd quartile, 3rd quartile and 2nd quartile, respectively, of the applicable Lipper universe (the 1st quartile being the best performers and the 4th quartile being the worst performers). The Board also observed that the Fund has outperformed its benchmark in the three- and five-year periods and has underperformed its benchmark in the one-year period ended December 31, 2011.
Fees and Expenses. The Board considered the Fund's investment management fee schedule, sub-advisory fee schedule, operating expenses and total expense ratios, and comparative information provided by Lipper and the independent fee consultant regarding investment management fee rates paid to other investment advisors by similar funds (1st quartile being the most favorable and 4th quartile being the least favorable). With respect to management fees paid to other investment advisors by similar funds, the Board noted that the contractual fee rates paid by the Fund, which include a 0.10% fee paid to DWS under the Fund's administrative services agreement, were lower than the median (2nd quartile) of the applicable Lipper peer group (based on Lipper data provided as of December 31, 2011). With respect to the sub-advisory fee paid to QS Investors, the Board noted that the fee is paid by DWS out of its fee and not directly by the Fund. The Board noted that the Fund's Class A shares total (net) operating expenses were expected to be higher than the median (3rd quartile) of the applicable Lipper expense universe (based on Lipper data provided as of December 31, 2011, and analyzing Lipper expense universe Class A (net) expenses less any applicable 12b-1 fees) ("Lipper Universe Expenses"). The Board considered the Fund's management fee rate as compared to fees charged by DWS and certain of its affiliates for comparable mutual funds and considered differences in fund and fee structures between the DWS Funds. The Board also considered how the Fund's total (net) operating expenses compared to the total (net) operating expenses of a more customized peer group selected by Lipper (based on such factors as asset size). The Board also noted that the expense limitation agreed to by DWS helped to ensure that the Fund's total (net) operating expenses would remain competitive.
The information considered by the Board as part of its review of management fees included information regarding fees charged by DWS and its affiliates to similar institutional accounts and to similar funds offered primarily to European investors ("DWS Europe funds"), in each case as applicable. The Board observed that advisory fee rates for institutional accounts generally were lower than the management fees charged by similarly managed DWS U.S. mutual funds ("DWS Funds"), but also took note of the differences in services provided to DWS Funds as compared to institutional accounts. In the case of DWS Europe funds, the Board observed that fee rates for DWS Europe funds generally were higher than for similarly managed DWS Funds, but noted that differences in the types of services provided to DWS Funds relative to DWS Europe funds made it difficult to compare such fees.
On the basis of the information provided, the Board concluded that management fees were reasonable and appropriate in light of the nature, quality and extent of services provided by DWS and QS Investors.
Profitability. The Board reviewed detailed information regarding revenues received by DWS under the Agreement. The Board considered the estimated costs and pre-tax profits realized by DWS from advising the DWS Funds, as well as estimates of the pre-tax profits attributable to managing the Fund in particular. The Board also received information regarding the estimated enterprise-wide profitability of DWS and its affiliates with respect to all fund services in totality and by fund. The Board and the independent fee consultant reviewed DWS's methodology in allocating its costs to the management of the Fund. Based on the information provided, the Board concluded that the pre-tax profits realized by DWS in connection with the management of the Fund were not unreasonable. The Board also reviewed information regarding the profitability of certain similar investment management firms. The Board noted that while information regarding the profitability of such firms is limited (and in some cases is not necessarily prepared on a comparable basis), DWS and its affiliates' overall profitability with respect to the DWS fund complex (after taking into account distribution and other services provided to the funds by DWS and its affiliates) was lower than the overall profitability levels of many comparable firms for which such data was available. The Board did not consider the profitability of QS Investors with respect to the Fund. The Board noted that DWS pays QS Investors' fee out of its management fee, and its understanding that the Fund's sub-advisory fee schedule was the product of an arm's length negotiation with DWS.
Economies of Scale. The Board considered whether there are economies of scale with respect to the management of the Fund and whether the Fund benefits from any economies of scale. The Board noted that the Fund's management fee schedule includes fee breakpoints. The Board concluded that the Fund's fee schedule represents an appropriate sharing between the Fund and DWS of such economies of scale as may exist in the management of the Fund at current asset levels.
Other Benefits to DWS and QS Investors and Their Affiliates. The Board also considered the character and amount of other incidental benefits received by DWS and QS Investors and their affiliates, including any fees received by DWS for administrative services provided to the Fund and any fees received by an affiliate of DWS for distribution services. The Board also considered benefits to DWS and QS Investors related to brokerage and soft-dollar allocations, including allocating brokerage to pay for research generated by parties other than the executing broker dealers, which pertain primarily to funds investing in equity securities, along with the incidental public relations benefits to DWS and QS Investors related to DWS Funds advertising and cross-selling opportunities among DWS products and services. The Board concluded that management fees were reasonable in light of these fallout benefits.
Compliance. The Board considered the significant attention and resources dedicated by DWS to documenting and enhancing its compliance processes in recent years. The Board noted in particular (i) the experience and seniority of both DWS's chief compliance officer and the Fund's chief compliance officer; (ii) the large number of DWS compliance personnel; and (iii) the substantial commitment of resources by DWS and its affiliates to compliance matters. The Board also considered the attention and resources dedicated by DWS to the oversight of the investment sub-advisor's compliance program and compliance with the applicable fund policies and procedures.
Based on all of the information considered and the conclusions reached, the Board unanimously determined that the continuation of the Agreements is in the best interests of the Fund. In making this determination, the Board did not give particular weight to any single factor identified above. The Board considered these factors over the course of numerous meetings, certain of which were in executive session with only the Independent Trustees and their counsel present. It is possible that individual Trustees may have weighed these factors differently in reaching their individual decisions to approve the continuation of the Agreements.
Summary of Management Fee Evaluation by Independent Fee Consultant
September 17, 2012
Pursuant to an Order entered into by Deutsche Investment Management Americas and affiliates (collectively, "DeAM") with the Attorney General of New York, I, Thomas H. Mack, have been appointed the Independent Fee Consultant for the DWS Funds (formerly the DWS Scudder Funds). My duties include preparing an annual written evaluation of the management fees DeAM charges the Funds, considering among other factors the management fees charged by other mutual fund companies for like services, management fees DeAM charges other clients for like services, DeAM's costs of supplying services under the management agreements and related profit margins, possible economies of scale if a Fund grows larger, and the nature and quality of DeAM's services, including fund performance. This report summarizes my evaluation for 2012, including my qualifications, the evaluation process for each of the DWS Funds, consideration of certain complex-level factors, and my conclusions. I served in substantially the same capacity in 2007, 2008, 2009, 2010 and 2011.
Qualifications
For more than 35 years I have served in various professional capacities within the investment management business. I have held investment analysis and advisory positions, including securities analyst, portfolio strategist and director of investment policy with a large investment firm. I have also performed business management functions, including business development, financial management and marketing research and analysis.
Since 1991, I have been an independent consultant within the asset management industry. I have provided services to over 125 client organizations, including investment managers, mutual fund boards, product distributors and related organizations. Over the past ten years I have completed a number of assignments for mutual fund boards, specifically including assisting boards with management contract renewal.
I hold a Master of Business Administration degree, with highest honors, from Harvard University and Master of Science and Bachelor of Science (highest honors) degrees from the University of California at Berkeley. I am an independent director and audit committee financial expert for two closed-end mutual funds and have served in various leadership and financial oversight capacities with non-profit organizations.
Evaluation of Fees for each DWS Fund
My work focused primarily on evaluating, fund-by-fund, the fees charged to each of the 103 mutual fund portfolios in the DWS Fund family. For each Fund, I considered each of the key factors mentioned above, as well as any other relevant information. In doing so I worked closely with the Funds' Independent Directors in their annual contract renewal process, as well as in their approval of contracts for several new funds (documented separately).
In evaluating each Fund's fees, I reviewed comprehensive materials provided by or on behalf of DeAM, including expense information prepared by Lipper Analytical, comparative performance information, profitability data, manager histories, and other materials. I also accessed certain additional information from the Lipper and Morningstar databases and drew on my industry knowledge and experience.
To facilitate evaluating this considerable body of information, I prepared for each Fund a document summarizing the key data elements in each area as well as additional analytics discussed below. This made it possible to consider each key data element in the context of the others.
In the course of contract renewal, DeAM agreed to implement a number of fee and expense adjustments requested by the Independent Directors which will favorably impact future fees and expenses, and my evaluation includes the effects of these changes.
Fees and Expenses Compared with Other Funds
The competitive fee and expense evaluation for each fund focused on two primary comparisons:
The Fund's contractual management fee (the advisory fee plus the administration fee where applicable) compared with those of a group of typically 12-15 funds in the same Lipper investment category (e.g. Large Capitalization Growth) having similar distribution arrangements and being of similar size.
The Fund's total expenses compared with a broader universe of funds from the same Lipper investment category and having similar distribution arrangements.
These two comparisons provide a view of not only the level of the fee compared with funds of similar scale but also the total expense the Fund bears for all the services it receives, in comparison with the investment choices available in the Fund's investment category and distribution channel. The principal figure-of-merit used in these comparisons was the subject Fund's percentile ranking against peers.
DeAM's Fees for Similar Services to Others
DeAM provided management fee schedules for all of its US domiciled fund and non-fund investment management accounts in any of the investment categories where there is a DWS Fund. These similar products included the other DWS Funds, non-fund pooled accounts, institutional accounts and sub-advisory accounts. Using this information, I calculated for each Fund the fee that would be charged to each similar product, at the subject Fund's asset level.
Evaluating information regarding non-fund products is difficult because there are varying levels of services required for different types of accounts, with mutual funds generally requiring considerably more regulatory and administrative types of service as well as having more frequent cash flows than other types of accounts. Also, while mutual fund fees for similar fund products can be expected to be similar, there will be some differences due to different pricing conditions in different distribution channels (e.g. retail funds versus those used in variable insurance products), differences in underlying investment processes and other factors.
Costs and Profit Margins
DeAM provided a detailed profitability analysis for each Fund. After making some adjustments so that the presentation would be more comparable to the available industry figures, I reviewed profit margins from investment management alone, from investment management plus other fund services (excluding distribution) provided to the Funds by DeAM (principally shareholder services), and DeAM profits from all sources, including distribution. A later section comments on overall profitability.
Economies of Scale
Economies of scale — an expected decline in management cost per dollar of fund assets as fund assets grow — are very rarely quantified and documented because of inherent difficulties in collecting and analyzing relevant data. However, in virtually every investment category that I reviewed, larger funds tend to have lower fees and lower total expenses than smaller funds. To see how each DWS Fund compares with this industry observation, I reviewed:
The trend in Fund assets over the last five years and the accompanying trend in total expenses. This shows if the Fund has grown and, if so, whether total expense (management fees as well as other expenses) have declined as a percent of assets.
Whether the Fund has break-points in its management fee schedule, the extent of the fee reduction built into the schedule and the asset levels where the breaks take effect, and in the case of a sub-advised Fund how the Fund's break-points compare with those of the sub-advisory fee schedule.
How the Fund's contractual fee schedule compares with trends in the industry data. To accomplish this, I constructed a chart showing how actual latest-fiscal-year contractual fees of the Fund and of other similar funds relate to average fund assets, with the subject Fund's contractual fee schedule superimposed.
Quality of Service — Performance
The quality-of-service evaluation focused on investment performance, which is the principal result of the investment management service. Each Fund's performance was reviewed over the past 1, 3, 5 and 10 years, as applicable, and compared with that of other funds in the same investment category and with a suitable market index.
In addition, I calculated and reviewed risk-adjusted returns relative to an index of similar mutual funds' returns and a suitable market index. The risk-adjusted returns analysis provides a way of determining the extent to which the Fund's return comparisons are mainly the product of investment value-added (or lack thereof) or alternatively taking considerably more or less risk than is typical in its investment category.
I also received and considered the history of portfolio manager changes for each Fund, as this provided an important context for evaluating the performance results.
Complex-Level Considerations
While this evaluation was conducted mainly at the individual fund level, there are some issues relating to the reasonableness of fees that can alternatively be considered across the whole fund complex:
I reviewed DeAM's profitability analysis for all DWS Funds, with a view toward determining if the allocation procedures used were reasonable and how profit levels compared with public data for other investment managers.
I considered whether DeAM and affiliates receive any significant ancillary or "fallout" benefits that should be considered in interpreting the direct profitability results. These would be situations where serving as the investment manager of the Funds is beneficial to another part of the Deutsche Bank organization.
I considered how aggregated DWS Fund expenses had varied over the years, by asset class and in the context of trends in asset levels.
I considered how aggregated DWS Fund performance measures relative to appropriate peers had varied by asset class and over time.
I reviewed the structure of the DeAM organization, trends in staffing levels, and information on compensation of investment management and other professionals compared with industry data.
Findings
Based on the process and analysis discussed above, which included reviewing a wide range of information from management and external data sources and considering among other factors the fees DeAM charges other clients, the fees charged by other fund managers, DeAM's costs and profits associated with managing the Funds, economies of scale, possible fall-out benefits, and the nature and quality of services provided, in my opinion the management fees charged the DWS Funds are reasonable.
Thomas H. Mack
President, Thomas H. Mack & Co., Inc.
Board Members and Officers
The following table presents certain information regarding the Board Members and Officers of the fund. Each Board Member's year of birth is set forth in parentheses after his or her name. Unless otherwise noted, (i) each Board Member has engaged in the principal occupation(s) noted in the table for at least the most recent five years, although not necessarily in the same capacity; and (ii) the address of each Independent Board Member is c/o Kenneth C. Froewiss, Chairman, DWS Mutual Funds, P.O. Box 78, Short Hills, NJ 07078. Except as otherwise noted below, the term of office for each Board Member is until the election and qualification of a successor, or until such Board Member sooner dies, resigns, is removed or as otherwise provided in the governing documents of the fund. Because the fund does not hold an annual meeting of shareholders, each Board Member will hold office for an indeterminate period. The Board Members may also serve in similar capacities with other funds in the fund complex.
| Independent Board Members |
Name, Year of Birth, Position with the Fund and Length of Time Served1 | | Business Experience and Directorships During the Past Five Years | Number of Funds in DWS Fund Complex Overseen |
Other Directorships Held by Board Member |
Kenneth C. Froewiss (1945) Chairperson since 2013,9 and Board Member since 2001 | | Adjunct Professor of Finance, NYU Stern School of Business (September 2009-present; Clinical Professor from 1997-September 2009); Member, Finance Committee, Association for Asian Studies (2002-present); Director, Mitsui Sumitomo Insurance Group (US) (2004-present); prior thereto, Managing Director, J.P. Morgan (investment banking firm) (until 1996) | 103 | — |
William McClayton (1944) Vice Chairperson since 2013,9 and Board Member since 2004 | | Private equity investor (since October 2009); previously, Managing Director, Diamond Management & Technology Consultants, Inc. (global consulting firm) (2001-2009); Directorship: Board of Managers, YMCA of Metropolitan Chicago; formerly: Senior Partner, Arthur Andersen LLP (accounting) (1966-2001); Trustee, Ravinia Festival | 103 | — |
John W. Ballantine (1946) Board Member since 1999 | | Retired; formerly, Executive Vice President and Chief Risk Management Officer, First Chicago NBD Corporation/The First National Bank of Chicago (1996-1998); Executive Vice President and Head of International Banking (1995-1996). Directorships: Stockwell Capital Investments PLC (private equity); former Directorships: First Oak Brook Bancshares, Inc. and Oak Brook Bank; Prisma Energy International | 103 | Chairman of the Board, Healthways, Inc.2 (provider of disease and care management services) (2003- present); Portland General Electric2 (utility company) (2003-present) |
Henry P. Becton, Jr. (1943) Board Member since 1990 | | Vice Chair and former President, WGBH Educational Foundation. Directorships: Public Radio International; Public Radio Exchange (PRX); The PBS Foundation; North Bennett Street School (Boston); former Directorships: Association of Public Television Stations; Boston Museum of Science; American Public Television; Concord Academy; New England Aquarium; Mass. Corporation for Educational Telecommunications; Committee for Economic Development; Public Broadcasting Service; Connecticut College | 103 | Lead Director, Becton Dickinson and Company2 (medical technology company); Lead Director, Belo Corporation2 (media company) |
Dawn-Marie Driscoll (1946) Board Member since 1987 | | President, Driscoll Associates (consulting firm); Emeritus Executive Fellow, Center for Business Ethics, Bentley University; formerly, Partner, Palmer & Dodge (1988-1990); Vice President of Corporate Affairs and General Counsel, Filene's (1978-1988). Directorships: Director of ICI Mutual Insurance Company (since 2007); Advisory Board, Center for Business Ethics, Bentley University; Trustee, Southwest Florida Community Foundation (charitable organization); former Directorships: Sun Capital Advisers Trust (mutual funds) (2007-2012), Investment Company Institute (audit, executive, nominating committees) and Independent Directors Council (governance, executive committees) | 103 | — |
Keith R. Fox, CFA (1954) Board Member since 1996 | | Managing General Partner, Exeter Capital Partners (a series of private investment funds) (since 1986). Directorships: Progressive International Corporation (kitchen goods importer and distributor); The Kennel Shop (retailer); former Chairman, National Association of Small Business Investment Companies; former Directorships: BoxTop Media Inc. (advertising); Sun Capital Advisers Trust (mutual funds) (2011-2012) | 103 | — |
Paul K. Freeman (1950) Board Member since 1993, and Chairperson (2009-Jan. 8, 2013) | | Consultant, World Bank/Inter-American Development Bank; Executive and Governing Council of the Independent Directors Council (Chairman of Education Committee); formerly: Project Leader, International Institute for Applied Systems Analysis (1998-2001); Chief Executive Officer, The Eric Group, Inc. (environmental insurance) (1986-1998); Directorships: Denver Zoo Foundation (December 2012-present); former Directorships: Prisma Energy International | 103 | — |
Richard J. Herring (1946) Board Member since 1990 | | Jacob Safra Professor of International Banking and Professor, Finance Department, The Wharton School, University of Pennsylvania (since July 1972); Co-Director, Wharton Financial Institutions Center (since July 2000); Co-Chair, U.S. Shadow Financial Regulatory Committee; Executive Director, Financial Economists Roundtable; formerly: Vice Dean and Director, Wharton Undergraduate Division (July 1995-June 2000); Director, Lauder Institute of International Management Studies (July 2000-June 2006) | 103 | Director, Japan Equity Fund, Inc. (since September 2007), Thai Capital Fund, Inc. (since 2007), Singapore Fund, Inc. (since September 2007), Independent Director of Barclays Bank Delaware (since September 2010) |
Rebecca W. Rimel (1951) Board Member since 1995 | | President and Chief Executive Officer, The Pew Charitable Trusts (charitable organization) (1994 to present); Trustee, Washington College (2011-2013); formerly: Executive Vice President, The Glenmede Trust Company (investment trust and wealth management) (1983-2004); Board Member, Investor Education (charitable organization) (2004-2005); Trustee, Executive Committee, Philadelphia Chamber of Commerce (2001-2007); Director, Viasys Health Care2 (January 2007-June 2007); Trustee, Pro Publica (charitable organization) (2007-2010); Trustee, Thomas Jefferson Foundation (charitable organization) (1994-2012) | 103 | Director, Becton Dickinson and Company2 (medical technology company) (2012-present); Director, CardioNet, Inc.2 (health care) (2009-present) |
William N. Searcy, Jr. (1946) Board Member since 1993 | | Private investor since October 2003; formerly: Pension & Savings Trust Officer, Sprint Corporation2 (telecommunications) (November 1989-September 2003); Trustee, Sun Capital Advisers Trust (mutual funds) (1998-2012) | 103 | — |
Jean Gleason Stromberg (1943) Board Member since 1997 | | Retired. Formerly, Consultant (1997-2001); Director, Financial Markets U.S. Government Accountability Office (1996-1997); Partner, Fulbright & Jaworski, L.L.P. (law firm) (1978-1996). Directorships: The William and Flora Hewlett Foundation; former Directorships: Service Source, Inc., Mutual Fund Directors Forum (2002-2004), American Bar Retirement Association (funding vehicle for retirement plans) (1987-1990 and 1994-1996) | 103 | — |
Robert H. Wadsworth (1940) Board Member since 1999 | | President, Robert H. Wadsworth & Associates, Inc. (consulting firm) (1983 to present); Director, National Horizon, Inc. (non-profit organization); Director and Treasurer, The Phoenix Boys Choir Association | 106 | — |
Interested Board Member and Officer4 |
Name, Year of Birth, Position with the Fund and Length of Time Served1,6 | | Business Experience and Directorships During the Past Five Years | Number of Funds in DWS Fund Complex Overseen |
Other Directorships Held by Board Member |
Michael J. Woods5 (1967) Board Member since 2013,9 and Executive Vice President since 20139 | | Managing Director,3 Deutsche Asset & Wealth Management (2009-present); Head of the Americas Asset Management Business for Deutsche Bank, Member of the Asset and Wealth Management ("AWM") Extended Executive Committee, AWM Global Client Group Executive Committee and the AWM Active Asset Management Executive Committee; CEO and US Regional Head of DWS Investments; formerly: Sr. VP, Head of the Financial Intermediaries and Investments Group of Evergreen Investments (2007-2009), CEO and Vice Chairman of Board of Directors of XTF Global Asset Management (2006-2007), Managing Director — US Head of Sub-Advisory and Investment Only Business at Citigroup Asset Management (2000-2006). Mr. Woods is currently a board member of The Children's Village, The Big Brothers Big Sisters Organization, and The Mutual Fund Education Alliance. | 39 | — |
Officers4 |
Name, Year of Birth, Position with the Fund and Length of Time Served6 | | Business Experience and Directorships During the Past Five Years |
W. Douglas Beck, CFA7 (1967) President, 2011-present | | Managing Director,3 Deutsche Asset & Wealth Management (2006-present); President of DWS family of funds and Head of Product Management, U.S. for DWS Investments; formerly: Executive Director, Head of Product Management (2002-2006) and President (2005-2006) of the UBS Funds at UBS Global Asset Management; Co-Head of Manager Research/Managed Solutions Group, Merrill Lynch (1998-2002) |
John Millette8 (1962) Vice President and Secretary, 1999-present | | Director,3 Deutsche Asset & Wealth Management |
Paul H. Schubert7 (1963) Chief Financial Officer, 2004-present Treasurer, 2005-present | | Managing Director,3 Deutsche Asset & Wealth Management (since July 2004); formerly: Executive Director, Head of Mutual Fund Services and Treasurer for UBS Family of Funds (1998-2004); Vice President and Director of Mutual Fund Finance at UBS Global Asset Management (1994-1998) |
Caroline Pearson8 (1962) Chief Legal Officer, 2010-present | | Managing Director,3 Deutsche Asset & Wealth Management; formerly: Assistant Secretary for DWS family of funds (1997-2010) |
Melinda Morrow7 (1970) Vice President, 2012-present | | Director,3 Deutsche Asset & Wealth Management |
Hepsen Uzcan8 (1974) Assistant Secretary, since 20139 | | Vice President, Deutsche Asset & Wealth Management |
Paul Antosca8 (1957) Assistant Treasurer, 2007-present | | Director,3 Deutsche Asset & Wealth Management |
Jack Clark8 (1967) Assistant Treasurer, 2007-present | | Director,3 Deutsche Asset & Wealth Management |
Diane Kenneally8 (1966) Assistant Treasurer, 2007-present | | Director,3 Deutsche Asset & Wealth Management |
John Caruso7 (1965) Anti-Money Laundering Compliance Officer, 2010-present | | Managing Director,3 Deutsche Asset & Wealth Management |
Robert Kloby7 (1962) Chief Compliance Officer, 2006-present | | Managing Director,3 Deutsche Asset & Wealth Management |
1 The length of time served represents the year in which the Board Member joined the board of one or more DWS funds currently overseen by the Board.
2 A publicly held company with securities registered pursuant to Section 12 of the Securities Exchange Act of 1934.
3 Executive title, not a board directorship.
4 As a result of their respective positions held with the Advisor, these individuals are considered "interested persons" of the Advisor within the meaning of the 1940 Act. Interested persons receive no compensation from the fund.
5 The mailing address of Mr. Woods is 60 Wall Street, New York, New York 10005. Mr. Woods is an interested Board Member by virtue of his positions with Deutsche Asset & Wealth Management. As an interested person, Mr. Woods receives no compensation from the fund. Mr. Woods is a board member of the following trusts and corporations: Cash Account Trust, DWS Market Trust, DWS Money Funds, DWS State Tax-Free Income Series, DWS Target Fund, DWS Value Series, Inc., DWS Variable Series II, Investors Cash Trust, Tax-Exempt California Money Market Fund, DWS Global High Income Fund, Inc., DWS High Income Opportunities Fund, Inc., DWS High Income Trust, DWS Multi-Market Income Trust, DWS Municipal Income Trust, DWS Strategic Income Trust and DWS Strategic Municipal Income Trust.
6 The length of time served represents the year in which the officer was first elected in such capacity for one or more DWS funds.
7 Address: 60 Wall Street, New York, NY 10005.
8 Address: One Beacon Street, Boston, MA 02108.
9 Effective as of January 9, 2013.
The fund's Statement of Additional Information ("SAI") includes additional information about the Board Members. The SAI is available, without charge, upon request. If you would like to request a copy of the SAI, you may do so by calling the following toll-free number: (800) 728-3337.
Notes
DWS Investments Distributors, Inc.
222 South Riverside Plaza
Chicago, IL 60606
(800) 621-1148
VS2UI-2 (R-025836-2 2/13)